UNITED STATES
SECURITIES AND EXCHANGE COMMISSION
Washington, D.C. 20549
FORM N-CSR
CERTIFIED SHAREHOLDER REPORT OF REGISTERED MANAGEMENT
INVESTMENT COMPANIES
Investment Company Act file number 811-05518
The RBB Fund, Inc.
(Exact name of registrant as specified in charter)
Bellevue Park Corporate Center
103 Bellevue Parkway
Wilmington, DE 19809
(Address of principal executive offices) (Zip code)
Salvatore Faia
BNY Mellon Investment Servicing (US) Inc.
103 Bellevue Parkway
Wilmington, DE 19809
(Name and address of agent for service)
Registrant’s telephone number, including area code: 302-791-1851
Date of fiscal year end: August 31
Date of reporting period: February 28, 2014
Form N-CSR is to be used by management investment companies to file reports with the Commission not later than 10 days after the transmission to stockholders of any report that is required to be transmitted to stockholders under Rule 30e-1 under the Investment Company Act of 1940 (17 CFR 270.30e-1). The Commission may use the information provided on Form N-CSR in its regulatory, disclosure review, inspection, and policymaking roles.
A registrant is required to disclose the information specified by Form N-CSR, and the Commission will make this information public. A registrant is not required to respond to the collection of information contained in Form N-CSR unless the Form displays a currently valid Office of Management and Budget (“OMB”) control number. Please direct comments concerning the accuracy of the information collection burden estimate and any suggestions for reducing the burden to Secretary, Securities and Exchange Commission, 100 F Street, NE, Washington, DC 20549. The OMB has reviewed this collection of information under the clearance requirements of 44 U.S.C. § 3507.
Item 1. Reports to Stockholders.
The Report to Shareholders is attached herewith.
The Bedford Class
of
The RBB Fund, Inc.
Money Market
Portfolio
Semi-Annual Report
February 28, 2014
(Unaudited)
An investment in the Portfolio is not insured or guaranteed by the Federal Deposit Insurance Corporation or any other government agency. Although the Portfolio seeks to preserve the value of your investment at $1.00 per share, it’s possible to lose money by investing in the Portfolio.
This report is submitted for the general information of the shareholders of the Portfolio. It is not authorized for distribution unless preceded or accompanied by a prospectus for the Portfolio.
THE RBB FUND, INC.
Money Market Portfolio
Fund Expense Examples
(Unaudited)
As a shareholder of the Money Market Portfolio (the “Portfolio”), you incur two types of costs: (1) transaction costs and (2) ongoing costs, including management fees, distribution fees, and other Portfolio expenses. These examples are intended to help you understand your ongoing costs (in dollars) of investing in the Portfolio and to compare these costs with the ongoing costs of investing in other mutual funds.
These examples are based on an investment of $1,000 invested at the beginning of the six-month period from September 1, 2013 through February 28, 2014 and held for the entire period.
Actual Expenses
The first line of the accompanying tables provides information about actual account values and actual expenses. You may use the information in this line, together with the amount you invested, to estimate the expenses that you paid over the period. Simply divide your account value by $1,000 (for example, an $8,600 account value divided by $1,000 = 8.6), then multiply the result by the number in the first line under the heading entitled “Expenses Paid During Period” to estimate the expenses you paid on your account during this period.
Hypothetical Example for Comparison Purposes
The second line of the accompanying tables provides information about hypothetical account values and hypothetical expenses based on the Portfolio’s actual expense ratio and an assumed rate of return of 5% per year before expenses, which is not the Portfolio’s actual return. The hypothetical account values and expenses may not be used to estimate the actual ending account balance or expenses you paid for the period. You may use this information to compare the ongoing costs of investing in the Portfolio and other funds. To do so, compare these 5% hypothetical examples with the 5% hypothetical examples that appear in the shareholder reports of other funds.
Please note that the expenses shown in the accompanying tables are meant to highlight your ongoing costs only and do not reflect any transactional costs, such as redemption fees that may be incurred by shareholders of other funds. Therefore, the second line of the accompanying tables is useful in comparing ongoing costs only, and will not help you determine the relative total costs of owning different funds.
| | | | | | | | | | | | |
| | | Money Market Portfolio – Bedford Class | |
| | | Beginning
Account Value
September 1, 2013 | | | Ending
Account Value
February 28, 2014 | | | Expenses Paid
During
Period* | |
Actual | | $ | 1,000.00 | | | $ | 1,000.10 | | | $ | 0.94 | |
Hypothetical (5% return before expenses) | | | 1,000.00 | | | | 1,023.85 | | | | 0.95 | |
| |
| | | Money Market Portfolio – Sansom Street Class | |
| | | Beginning
Account Value
September 1, 2013 | | | Ending
Account Value
February 28, 2014 | | | Expenses Paid
During
Period* | |
Actual | | $ | 1,000.00 | | | $ | 1,000.20 | | | $ | 0.84 | |
Hypothetical (5% return before expenses) | | | 1,000.00 | | | | 1,023.95 | | | | 0.85 | |
| * | Expenses are equal to the Portfolio’s annualized six month expense ratio of 0.19% for the Bedford Class shares and 0.17% for the Sansom Street Class shares, which includes waived fees or reimbursed expenses, multiplied by the average account value over the period, multiplied by the number of days (181) in the most recent fiscal half-year, then divided by 365 to reflect the one-half year period. The Portfolio’s ending account value on the first line in each table is based on the actual six-month total return of 0.01% for the Bedford Class shares and 0.02% for the Sansom Street Class shares. |
1
THE RBB FUND, INC.
Money Market Portfolio
Portfolio Holdings Summary Table
February 28, 2014
(Unaudited)
| | | | | | | | |
Security
Type | | % of Net
Assets | | | Value | |
| | |
Short Term Investments: | | | | | | | | |
Certificates of Deposit | | | 42.6 | % | | $ | 255,535,066 | |
Commercial Paper | | | 36.3 | | | | 217,321,351 | |
Municipal Bonds | | | 8.4 | | | | 50,240,000 | |
U.S. Treasury Obligations | | | 5.9 | | | | 35,304,831 | |
Repurchase Agreements | | | 5.0 | | | | 30,000,000 | |
Agency Obligations | | | 1.0 | | | | 5,998,500 | |
Variable Rate Obligations | | | 0.8 | | | | 4,900,000 | |
Other Assets in Excess of Liabilities | | | 0.0 | | | | 117,233 | |
| | | | | | | | |
NET ASSETS | | | 100.0 | % | | $ | 599,416,981 | |
| | | | | | | | |
Portfolio holdings are subject to change at any time.
2
THE RBB FUND, INC.
Money Market Portfolio
Schedule of Investments
February 28, 2014
(Unaudited)
| | | | | | | | |
| | | Par
(000) | | | Value | |
CERTIFICATES OF DEPOSIT—42.6% | | | | | |
Euro Dollar Certificates Of Deposit—1.0% | | | | | |
National Australia Bank Ltd., London(a) | | | | | | | | |
0.230%, 10/23/14 | | $ | 6,000 | | | $ | 6,000,000 | |
| | | | | | | | |
Yankee Dollar Certificates Of Deposit—41.6%(b) | |
Australia & New Zealand Banking | | | | | | | | |
Ltd.(a) 0.226%, 02/25/15 | | | 5,000 | | | | 5,000,000 | |
Bank of Montreal, Chicago(a) | | | | | | | | |
0.227%, 09/05/14 | | | 8,000 | | | | 8,000,000 | |
Bank of Nova Scotia, Houston(a) | | | | | | | | |
0.260%, 08/08/14 | | | 7,000 | | | | 7,000,000 | |
0.206%, 09/10/14 | | | 5,000 | | | | 5,000,000 | |
0.224%, 12/01/14 | | | 5,000 | | | | 5,000,000 | |
Bank of Tokyo-Mitsuibishi UFJ, Ltd. | | | | | | | | |
0.210%, 05/28/14 | | | 7,000 | | | | 7,000,000 | |
BNP Paribas SA, New York | | | | | | | | |
0.286%, 05/09/14 (a) | | | 5,500 | | | | 5,500,000 | |
0.650%, 06/03/14 | | | 3,000 | | | | 3,003,122 | |
0.300%, 08/04/14 | | | 5,000 | | | | 5,000,000 | |
Canadian Imperial Bank of Commerce, New York(a) | |
0.260%, 03/03/14 | | | 10,000 | | | | 10,000,000 | |
0.244%, 06/13/14 | | | 1,910 | | | | 1,910,000 | |
Citibank N.A. | | | | | | | | |
0.230%, 08/06/14 | | | 5,000 | | | | 5,000,000 | |
Credit Agricole CIB, New York | | | | | | | | |
0.120%, 03/04/14 | | | 12,000 | | | | 12,000,000 | |
Credit Agricole Corporate & Investment | | | | | |
0.110%, 03/03/14 | | | 9,422 | | | | 9,422,000 | |
Credit Suisse, New York | | | | | | | | |
0.260%, 03/18/14 | | | 5,000 | | | | 5,000,000 | |
0.260%, 04/22/14 | | | 7,000 | | | | 7,000,000 | |
0.308%, 06/06/14(a) | | | 2,000 | | | | 2,000,000 | |
Deutsche Bank AG, New York(a) | | | | | | | | |
0.240%, 04/30/14 | | | 5,000 | | | | 5,000,000 | |
0.290%, 08/22/14 | | | 4,000 | | | | 4,000,000 | |
Mizuho Bank Ltd., New York | | | | | | | | |
0.250%, 08/28/14 | | | 6,000 | | | | 6,000,000 | |
National Australia Bank Ltd., New York(a) | | | | | |
0.237%, 08/08/14 | | | 5,000 | | | | 5,000,256 | |
Natixis, New York(a) | | | | | | | | |
0.278%, 09/08/14 | | | 6,000 | | | | 5,999,688 | |
Norinchukin Bank, New York | | | | | | | | |
0.100%, 03/05/14 | | | 18,000 | | | | 18,000,000 | |
Rabobank Nederland NV, New York | | | | | | | | |
0.278%, 09/16/14 (a) | | | 12,000 | | | | 12,000,000 | |
0.350%, 01/12/15 | | | 6,000 | | | | 6,000,000 | |
Royal Bank of Canada, New York | | | | | | | | |
0.260%, 10/10/14 (a) | | | 4,000 | | | | 4,000,000 | |
0.235%, 10/23/14 | | | 3,000 | | | | 3,000,000 | |
0.240%, 12/05/14(a) | | | 6,000 | | | | 6,000,000 | |
0.240%, 01/21/15(a) | | | 5,000 | | | | 5,000,000 | |
0.240%, 02/04/15(a) | | | 3,000 | | | | 3,000,000 | |
| | | | | | | | |
| | | Par
(000) | | | Value | |
CERTIFICATES OF DEPOSIT—(Continued) | | | | | |
Yankee Dollar Certificates Of Deposit—(Continued) | |
Skandinaviska Enskilda Banken | | | | | | | | |
0.250%, 07/14/14 | | $ | 5,000 | | | $ | 5,000,000 | |
Societe Generale, New York | | | | | | | | |
0.290%, 05/02/14 | | | 2,200 | | | | 2,200,000 | |
0.324%, 09/19/14(a) | | | 3,000 | | | | 3,000,000 | |
Sumitomo Mitsui Trust Bank Ltd., New York | | | | | |
0.220%, 04/04/14 | | | 3,000 | | | | 3,000,000 | |
Toronto Dominion Bank, Montreal | | | | | | | | |
0.220%, 04/24/14 | | | 5,000 | | | | 5,000,000 | |
Toronto Dominion Bank, New York | | | | | | | | |
0.226%, 07/24/14 (a) | | | 4,000 | | | | 4,000,000 | |
0.250%, 08/12/14 | | | 5,000 | | | | 5,000,000 | |
0.250%, 10/08/14 | | | 3,000 | | | | 3,000,000 | |
Wells Fargo Bank NA(a) | | | | | | | | |
0.170%, 03/12/14 | | | 6,000 | | | | 6,000,000 | |
0.224%, 11/26/14 | | | 8,000 | | | | 8,000,000 | |
0.240%, 02/17/15 | | | 4,000 | | | | 4,000,000 | |
Westpac Banking Corp., New York(a) | | | | | | | | |
0.270%, 04/15/14 | | | 5,500 | | | | 5,500,000 | |
0.226%, 10/08/14 | | | 10,000 | | | | 10,000,000 | |
| | | | | | | | |
| | | | | | | 249,535,066 | |
| | | | | | | | |
TOTAL CERTIFICATES OF DEPOSIT | | | | | |
(Cost $255,535,066) | | | | | | | 255,535,066 | |
| | | | | | | | |
COMMERCIAL PAPER—36.3% | | | | | | | | |
Asset Backed—7.0% | | | | | | | | |
Fairway Finance Co. LLC | | | | | | | | |
0.150%, 05/01/14 (c) | | | 4,000 | | | | 3,998,983 | |
0.184%, 07/18/14(a) | | | 5,000 | | | | 5,000,000 | |
0.188%, 08/06/14(a) | | | 4,000 | | | | 4,000,000 | |
Old Line Funding LLC(c) | | | | | | | | |
0.230%, 06/09/14 | | | 4,000 | | | | 3,997,444 | |
0.220%, 07/25/14 | | | 4,000 | | | | 3,996,431 | |
Salisbury Receivables Co. LLC(c) | | | | | | | | |
0.190%, 04/22/14 | | | 6,000 | | | | 5,998,353 | |
Victory Receivables Corp.(c) | | | | | | | | |
0.170%, 03/10/14 | | | 5,000 | | | | 4,999,788 | |
0.140%, 04/01/14 | | | 10,000 | | | | 9,998,795 | |
| | | | | | | | |
| | | | | | | 41,989,794 | |
| | | | | | | | |
Banks—29.3% | | | | | | | | |
Australia & New Zealand Banking Ltd.(a) | | | | | | | | |
0.274%, 04/17/14 | | | 5,000 | | | | 5,000,000 | |
Bedford Row Funding Corp.(c) | | | | | | | | |
0.300%, 11/25/14 | | | 5,000 | | | | 4,988,792 | |
BNP Paribas Finance Inc.(c) | | | | | | | | |
0.310%, 03/18/14 | | | 6,000 | | | | 5,999,122 | |
0.321%, 06/10/14 | | | 4,000 | | | | 3,996,409 | |
BNZ International(c) | | | | | | | | |
0.220%, 07/07/14 | | | 5,000 | | | | 4,996,089 | |
BPCE SA(c) | | | | | | | | |
0.282%, 05/01/14 | | | 3,000 | | | | 2,998,551 | |
The accompanying notes are an integral part of these financial statements.
3
THE RBB FUND, INC.
Money Market Portfolio
Schedule of Investments (Continued)
February 28, 2014
(Unaudited)
| | | | | | | | |
| | | Par
(000) | | | Value | |
COMMERCIAL PAPER—(Continued) | | | | | | | | |
Banks—(Continued) | | | | | | | | |
CAFCO LLC(c) | | | | | | | | |
0.240%, 08/19/14 | | $ | 5,500 | | | $ | 5,493,730 | |
Caisse Centrale Desjardins Du Quebec(c) | | | | | |
0.220%, 03/05/14 | | | 5,000 | | | | 4,999,878 | |
Collateralized Commercial Paper Co. LLC(c) | | | | | |
0.300%, 03/11/14 | | | 9,000 | | | | 8,999,250 | |
Commonwealth Bank of Australia(a) | | | | | | | | |
0.198%, 03/03/14 | | | 5,000 | | | | 4,999,999 | |
0.263%, 03/28/14 | | | 8,000 | | | | 8,000,372 | |
0.235%, 11/20/14 | | | 1,450 | | | | 1,450,000 | |
CPPIB Capital Inc(c) | | | | | | | | |
0.301%, 02/09/15 | | | 3,200 | | | | 3,190,800 | |
Credit Suisse, New York(c) | | | | | | | | |
0.180%, 04/24/14 | | | 4,000 | | | | 3,998,920 | |
HSBC Bank PLC(a) | | | | | | | | |
0.256%, 09/09/14 | | | 3,000 | | | | 3,000,000 | |
0.256%, 09/11/14 | | | 3,000 | | | | 3,000,000 | |
0.244%, 11/19/14 | | | 5,000 | | | | 5,000,000 | |
ING US Funding LLC(c) | | | | | | | | |
0.200%, 03/03/14 | | | 5,000 | | | | 4,999,944 | |
0.225%, 03/13/14 | | | 6,000 | | | | 5,999,550 | |
Mizuho Funding LLC(c) | | | | | | | | |
0.225%, 05/06/14 | | | 5,000 | | | | 4,997,938 | |
Natexis Banques Populaires(c) | | | | | | | | |
0.100%, 03/04/14 | | | 7,000 | | | | 6,999,942 | |
Nordea Bank AB(c) | | | | | | | | |
0.200%, 06/09/14 | | | 6,000 | | | | 5,996,667 | |
0.240%, 08/12/14 | | | 5,000 | | | | 4,994,533 | |
0.215%, 08/26/14 | | | 4,250 | | | | 4,245,482 | |
NRW Bank(c) | | | | | | | | |
0.130%, 03/24/14 | | | 9,000 | | | | 8,999,252 | |
Scaldis Capital LLC(c) | | | | | | | | |
0.200%, 05/19/14 | | | 5,000 | | | | 4,997,806 | |
Skandinaviska Enskilda Banken AB, New York(c) | | | | | |
0.275%, 04/09/14 | | | 9,000 | | | | 8,997,319 | |
0.275%, 05/07/14 | | | 7,000 | | | | 6,996,417 | |
Societe Generale North America Inc.(c) | | | | | |
0.250%, 03/03/14 | | | 8,000 | | | | 7,999,889 | |
Starbird Funding Corp.(c) | | | | | | | | |
0.060%, 03/03/14 | | | 8,000 | | | | 7,999,973 | |
Westpac Banking Corp. | | | | | | | | |
0.247%, 04/24/14(a) | | | 5,000 | | | | 5,000,050 | |
0.224%, 10/30/14(a) | | | 4,000 | | | | 4,000,000 | |
0.300%, 01/02/15(c) | | | 2,000 | | | | 1,994,883 | |
| | | | | | | | |
| | | | | | | 175,331,557 | |
| | | | | | | | |
TOTAL COMMERCIAL PAPER (Cost $217,321,351) | | | | | | | 217,321,351 | |
| | | | | | | | |
| | | | | | | | |
| | | Par
(000) | | | Value | |
MUNICIPAL BONDS—8.4% | | | | | | | | |
California—1.1% | | | | | | | | |
California Housing Finance Agency Revenue, Series A, RB (LOC: Fannie Mae, Freddie Mac)(a)(d) 0.030%, 03/05/14 | | $ | 2,900 | | | $ | 2,900,000 | |
San Francisco, City & County Redevelopment Agency, Multifamily Revenue, Series A, RB (LOC: Fannie Mae)(a)(d) 0.030%, 03/06/14 | | | 3,800 | | | | 3,800,000 | |
| | | | | | | | |
| | | | | | | 6,700,000 | |
| | | | | | | | |
Connecticut—0.9% | | | | | | | | |
Connecticut State, Health & Educational Facilities Authority Revenue, New Haven Hospital, Series K-2, RB (LOC: JPMorgan Chase Bank)(a)(d)
0.030%, 03/05/14 | | | 5,055 | | | | 5,055,000 | |
| | | | | | | | |
New Jersey—0.8% | | | | | | | | |
New Jersey State, Housing & Mortgage Financial Agency Revenue, Variable Amount Single Family Housing, Series V(a)(d) 0.030%, 03/06/14 | | | 5,000 | | | | 5,000,000 | |
| | | | | | | | |
New York—4.3% | | | | | | | | |
New York City, Housing Development Corp., Multifamily Rent Housing Revenue, Series A, RB (LOC: Fannie Mae)(a)(d) 0.040%, 03/05/14 | | | 6,000 | | | | 6,000,000 | |
New York City, Industrial Development Agency Civic Facility Revenue, New York Law School Project, Series A, RB (LOC: JPMorgan Chase Bank)(a)(d)
0.020%, 03/06/14 | | | 4,335 | | | | 4,335,000 | |
New York State Dormitory Authority, City University, Series D, RB (LOC: TD Bank NA)(a)(d) 0.030%, 03/06/14 | | | 4,950 | | | | 4,950,000 | |
New York State, Housing Finance Agency Revenue, RB (LOC: Freddie Mac)(a)(d)
0.040%, 03/05/14 | | | 5,200 | | | | 5,200,000 | |
Westchester County, Health Care Revenue, RB (LOC: TD Bank NA)(a)(d)
0.100%, 03/05/14 | | | 5,000 | | | | 5,000,000 | |
| | | | | | | | |
| | | | | | | 25,485,000 | |
| | | | | | | | |
The accompanying notes are an integral part of these financial statements.
4
THE RBB FUND, INC.
Money Market Portfolio
Schedule of Investments (Concluded)
February 28, 2014
(Unaudited)
| | | | | | | | |
| | | Par
(000) | | | Value | |
MUNICIPAL BONDS—(Continued) | | | | | | | | |
Tennessee—1.3% | | | | | | | | |
Eclipse Funding Trust, Various 2007-0005-Solar Eclipse-Blount, RB (LOC: U.S. Bank NA)(a)(d) 0.030%, 03/06/14 | | $ | 8,000 | | | $ | 8,000,000 | |
| | | | | | | | |
TOTAL MUNICIPAL BONDS
(Cost $50,240,000) | | | | | | | 50,240,000 | |
| | | | | | | | |
VARIABLE RATE OBLIGATIONS—0.8% | | | | | |
Banks—0.8% | | | | | | | | |
Svenska Handelsbanken AB(a) 0.264%, 08/15/14 | | | 4,900 | | | | 4,900,000 | |
| | | | | | | | |
TOTAL VARIABLE RATE OBLIGATIONS | | | | | |
(Cost $4,900,000) | | | | | | | 4,900,000 | |
| | | | | | | | |
AGENCY OBLIGATIONS—1.0% | | | | | | | | |
Fannie Mae | | | | | | | | |
0.124%, 02/27/15 (a) | | | 6,000 | | | | 5,998,500 | |
| | | | | | | | |
TOTAL AGENCY OBLIGATIONS (Cost $5,998,500) | | | | | | | 5,998,500 | |
| | | | | | | | |
U.S. TREASURY OBLIGATIONS—5.9% | | | | | |
U.S. Treasury Bill | | | | | | | | |
0.075%, 08/21/14(c) | | | 8,000 | | | | 7,997,117 | |
0.085%, 08/21/14(c) | | | 8,000 | | | | 7,996,732 | |
0.118%, 01/08/15(c) | | | 3,190 | | | | 3,186,733 | |
U.S. Treasury Notes | | | | | | | | |
0.250%, 10/31/14 | | | 8,000 | | | | 8,006,210 | |
2.375%, 10/31/14 | | | 8,000 | | | | 8,118,039 | |
| | | | | | | | |
TOTAL U.S. TREASURY OBLIGATIONS | | | | | |
(Cost $35,304,831) | | | | | | | 35,304,831 | |
| | | | | | | | |
REPURCHASE AGREEMENTS—5.0% | | | | | | | | |
Deutsche Bank Securities Inc. (Tri-Party Agreement dated 02/28/14 to be repurchased at $15,000,062, collateralized by $15,448,000 par value, various U.S. Government Sponsored Agency Obligations, 0.000%-2.000%, due 08/18/2015-10/24/2022, Fair Value of the collateral is $15,302,838)
0.050%, 03/03/14 | | | 15,000 | | | | 15,000,000 | |
Morgan Stanley & Co. LLC (Tri-Party Agreement dated 02/28/14 to be repurchased at $15,000,075, collateralized by $19,830,560 par value, various U.S. Government Sponsored Agency Obligations, 0.000%-6.193%, due 06/01/2027-10/01/2043, Fair Value of the collateral is $15,455,121)
0.060%, 03/03/14 | | | 15,000 | | | | 15,000,000 | |
| | | | | | | | |
TOTAL REPURCHASE AGREEMENTS | | | | | |
(Cost $30,000,000) | | | | | | | 30,000,000 | |
| | | | | | | | |
| | | | | | |
| | | | | Value | |
TOTAL INVESTMENTS AT VALUE—100.0% | | | | |
(Cost $599,299,748)* | | | | $ | 599,299,748 | |
| | | | | | |
OTHER ASSETS IN EXCESS OF LIABILITIES—0.0% | | | | | 117,233 | |
| | | | | | |
NET ASSETS (APPLICABLE TO 598,931,356 BEDFORD SHARES AND 481,200 SANSOM STREET SHARES )—100.0% | | | | $ | 599,416,981 | |
| | | | | | |
| * | Aggregate cost is the same for financial reporting and Federal tax purposes. |
| (a) | Variable Rate Security. Rate shown is as of report date. |
| (b) | Issuer is a US branch of a foreign domiciled bank. |
| (c) | Rate disclosed represents the discount rate at the time of purchase. |
| (d) | Rate shown is as of report date and the date shown is date on which principal and accrued interest may be recovered through demand. |
| PLC | Public Liability Company |
The accompanying notes are an integral part of these financial statements.
5
THE RBB FUND, INC.
Money Market Portfolio
Statement of Assets and Liabilities
February 28, 2014
(Unaudited)
| | | | |
ASSETS | | | | |
Investments, at value (Cost $ 569,299,748) | | $ | 569,299,748 | |
Repurchase agreements, at value (Cost $30,000,000) | | | 30,000,000 | |
Cash | | | 550 | |
Receivables | | | | |
Interest receivable | | | 169,462 | |
Prepaid expenses and other assets | | | 40,890 | |
| | | | |
Total assets | | | 599,510,650 | |
| | | | |
| |
LIABILITIES | | | | |
Payables | | | | |
Investment advisory and administration fees | | | 30,134 | |
Printing fees | | | 12,209 | |
Professional fees | | | 11,855 | |
Transfer agent fees | | | 11,633 | |
Distribution fees (Bedford Class) | | | 9,241 | |
Custodian fees | | | 8,707 | |
Regulatory administration fees | | | 5,922 | |
Other accrued expenses and liabilities | | | 3,968 | |
| | | | |
Total liabilities | | | 93,669 | |
| | | | |
Net Assets | | $ | 599,416,981 | |
| | | | |
| |
NET ASSETS CONSIST OF | | | | |
Par Value | | $ | 599,413 | |
Paid-in Capital | | | 598,813,119 | |
Accumulated net realized gain from investments | | | 4,449 | |
| | | | |
Net Assets | | $ | 599,416,981 | |
| | | | |
| |
BEDFORD CLASS | | | | |
Net assets | | $ | 598,935,802 | |
| | | | |
Shares outstanding ($0.001 par value, 1,500,000,000 shares authorized) | | | 598,931,356 | |
| | | | |
Net asset value, offering and redemption price per share | | $ | 1.00 | |
| | | | |
| |
SANSOM STREET CLASS | | | | |
Net assets | | $ | 481,179 | |
| | | | |
Shares outstanding ($0.001 par value, 1,500,000,000 shares authorized) | | | 481,200 | |
| | | | |
Net asset value, offering and redemption price per share | | $ | 1.00 | |
| | | | |
The accompanying notes are an integral part of these financial statements.
6
THE RBB FUND, INC.
Money Market Portfolio
Statement of Operations
For the Six Months Ended February 28, 2014
(Unaudited)
| | | | |
Investment Income | | | | |
Interest | | $ | 655,521 | |
| | | | |
Total investment income | | | 655,521 | |
| | | | |
| |
Expenses | | | | |
Distribution fees (Bedford Class)(1) | | | 2,108,578 | |
Investment advisory and administration fees | | | 1,322,290 | |
Custodian fees | | | 73,485 | |
Professional fees | | | 39,895 | |
Regulatory administration fees | | | 25,849 | |
Transfer agent fees | | | 23,534 | |
Directors’ and officers’ fees | | | 21,294 | |
Registration and filing fees | | | 17,100 | |
Printing and shareholder reporting fees | | | 14,540 | |
Insurance fees | | | 12,010 | |
Other expenses | | | 7,242 | |
| | | | |
Total expenses before waivers | | | 3,665,817 | |
Less: Advisory and administration waivers | | | (1,013,761 | ) |
Less: Distribution fee waivers (Bedford Class)(1) | | | (2,043,699 | ) |
| | | | |
Net expenses after waivers | | | 608,357 | |
| | | | |
Net investment income | | | 47,164 | |
| | | | |
Net realized gain from investments | | | 8,035 | |
| | | | |
Net increase in net assets resulting from operations | | $ | 55,199 | |
| | | | |
| (1) | See Note 2 in Notes to Financial Statements |
The accompanying notes are an integral part of the financial statements.
7
THE RBB FUND, INC.
Money Market Portfolio
Statements of Changes in Net Assets
| | | | | | | | |
| | | For the
Six Months Ended
February 28, 2014
(Unaudited) | | | For the
Year Ended
August 31,
2013 | |
Increase in net assets: | | | | | | | | |
From operations: | | | | | | | | |
Net investment income | | $ | 47,164 | | | $ | 74,478 | |
Net realized gain from investments | | | 8,035 | | | | 16,418 | |
| | | | | | | | |
Net increase in net assets resulting from operations | | | 55,199 | | | | 90,896 | |
| | | | | | | | |
Dividends to shareholders from: | | | | | | | | |
Net investment income: | | | | | | | | |
Bedford Class | | | (47,083 | ) | | | (74,298 | ) |
Sansom Street Class | | | (81 | ) | | | (180 | ) |
Net realized gains: | | | | | | | | |
Bedford Class | | | (14,277 | ) | | | (16,199 | ) |
Sansom Street Class | | | (24 | ) | | | (16 | ) |
| | | | | | | | |
Net decrease in net assets from dividends and distributions to shareholders | | | (61,465 | ) | | | (90,693 | ) |
| | | | | | | | |
Capital transactions (at $1.00 per share): | | | | | | | | |
Proceeds from shares sold: | | | | | | | | |
Bedford Class | | | 177,298,224 | | | | 457,230,576 | |
Sansom Street Class | | | 689,062 | | | | 1,025,683 | |
Shares issued on reinvestment of distributions: | | | | | | | | |
Bedford Class | | | 60,974 | | | | 89,452 | |
Sansom Street Class | | | 87 | | | | 175 | |
Shares repurchased: | | | | | | | | |
Bedford Class | | | (233,729,562 | ) | | | (443,718,982 | ) |
Sansom Street Class | | | (825,487 | ) | | | (648,367 | ) |
| | | | | | | | |
Increase/(decrease) in net assets derived from capital transactions | | | (56,506,702 | ) | | | 13,978,537 | |
| | | | | | | | |
Total increase/(decrease) in net assets | | | (56,512,968 | ) | | | 13,978,740 | |
Net assets: | | | | | | | | |
Beginning of period | | | 655,929,949 | | | | 641,951,209 | |
| | | | | | | | |
End of period | | $ | 599,416,981 | | | $ | 655,929,949 | |
| | | | | | | | |
Share Transactions: | | | | | | | | |
Shares sold | | | | | | | | |
Bedford Class | | | 177,298,224 | | | | 457,230,576 | |
Sansom Street Class | | | 689,062 | | | | 1,025,683 | |
Shares reinvested | | | | | | | | |
Bedford Class | | | 60,974 | | | | 89,452 | |
Sansom Street Class | | | 87 | | | | 175 | |
Shares repurchased | | | | | | | | |
Bedford Class | | | (233,729,562 | ) | | | (443,718,982 | ) |
Sansom Street Class | | | (825,487 | ) | | | (648,367 | ) |
| | | | | | | | |
Total Share Activity | | | (56,506,702 | ) | | | 13,978,537 | |
| | | | | | | | |
The accompanying notes are an integral part of the financial statements.
8
THE RBB FUND, INC.
Money Market Portfolio
Financial Highlights
(For a Share Outstanding Throughout each Period)
| | | | | | | | | | | | | | | | | | | | | | | | |
| | | The Bedford Class | |
| | | | | | |
| | | For the
Six Months
Ended
February 28, 2014
(Unaudited) | | | For the
Year
Ended
August 31, 2013 | | | For the
Year
Ended
August 31, 2012 | | | For the
Year
Ended
August 31, 2011 | | | For the
Year
Ended
August 31, 2010 | | | For the
Year
Ended
August 31, 2009 | |
| | | | | | |
Net asset value, beginning of period | | $ | 1.00 | | | $ | 1.00 | | | $ | 1.00 | | | $ | 1.00 | | | $ | 1.00 | | | $ | 1.00 | |
| | | | | | | | | | | | | | | | | | | | | | | | |
Income from investment operations: | | | | | | | | | | | | | | | | | | | | | | | | |
Net investment income | | | 0.0001 | | | | 0.0001 | | | | 0.0003 | | | | 0.0002 | | | | 0.0003 | | | | 0.0074 | |
Net gains (losses) on securities | | | — | (a) | | | — | (a) | | | — | (a) | | | — | (a) | | | — | (a) | | | — | (a) |
| | | | | | | | | | | | | | | | | | | | | | | | |
Total net income from investment operations | | | 0.0001 | | | | 0.0001 | | | | 0.0003 | | | | 0.0002 | | | | 0.0003 | | | | 0.0074 | |
| | | | | | | | | | | | | | | | | | | | | | | | |
Less dividends and distributions: | | | | | | | | | | | | | | | | | | | | | | | | |
Net investment income | | | (0.0001 | ) | | | (0.0001 | ) | | | (0.0003 | ) | | | (0.0002 | ) | | | (0.0003 | ) | | | (0.0074 | ) |
Net realized gains | | | — | (a) | | | — | (a) | | | — | | | | — | | | | — | | | | — | |
| | | | | | | | | | | | | | | | | | | | | | | | |
Total dividends and distribution to shareholders | | | (0.0001 | ) | | | (0.0001 | ) | | | (0.0003 | ) | | | (0.0002 | ) | | | (0.0003 | ) | | | (0.0074 | ) |
| | | | | | | | | | | | | | | | | | | | | | | | |
Net asset value, end of period | | $ | 1.00 | | | $ | 1.00 | | | $ | 1.00 | | | $ | 1.00 | | | $ | 1.00 | | | $ | 1.00 | |
| | | | | | | | | | | | | | | | | | | | | | | | |
Total Return | | | 0.01% | (b) | | | 0.02% | | | | 0.03% | | | | 0.02% | | | | 0.03% | | | | 0.74% | |
| | | | | | |
Ratios/Supplemental Data | | | | | | | | | | | | | | | | | | | | | | | | |
Net assets, end of period
(000’s omitted) | | $ | 598,936 | | | $ | 655,312 | | | $ | 641,711 | | | $ | 721,145 | | | $ | 593,570 | | | $ | 545,194 | |
Ratios of expenses to average
net assets(c) | | | 0.19% | (d) | | | 0.24% | | | | 0.25% | | | | 0.27% | | | | 0.31% | | | | 0.69% | |
Ratios of net investment income
to average net assets | | | 0.01% | (d) | | | 0.01% | | | | 0.02% | | | | 0.02% | | | | 0.02% | | | | 0.65% | |
| (a) | Amount is less than $0.00005 per share. |
| (c) | Without the waiver of advisory fees, distribution fees, and/or reimbursement of certain operating expenses, the ratios of expenses to average net assets for the Bedford Class of the Money Market Portfolio would have been 1.13% (annualized) for the six months ended February 28, 2014 and 1.15%, 1.15%, 1.12%, 1.18% and 1.24% for the years ended August 31, 2013, 2012, 2011, 2010 and 2009, respectively. |
The accompanying notes are an integral part of the financial statements.
9
THE RBB FUND, INC.
Money Market Portfolio
Financial Highlights (Concluded)
(For a Share Outstanding Throughout each Period)
| | | | | | | | | | | | | | | | | | | | | | | | |
| | | The Sansom Street Class | |
| | | | | | |
| | | For the
Six Months
Ended
February 28, 2014
(Unaudited) | | | For the
Year
Ended
August 31, 2013 | | | For the
Year
Ended
August 31, 2012 | | | For the
Year
Ended
August 31, 2011 | | | For the
Year
Ended
August 31, 2010 | | | For the
Year
Ended
August 31, 2009 | |
| | | | | | |
Net asset value, beginning of period | | $ | 1.00 | | | $ | 1.00 | | | $ | 1.00 | | | $ | 1.00 | | | $ | 1.00 | | | $ | 1.00 | |
| | | | | | | | | | | | | | | | | | | | | | | | |
Income from investment operations: | | | | | | | | | | | | | | | | | | | | | | | | |
Net investment income | | | 0.0002 | | | | 0.0004 | | | | 0.0004 | | | | 0.0006 | | | | 0.0010 | | | | 0.0121 | |
Net gains (losses) on securities | | | — | (a) | | | — | (a) | | | — | (a) | | | — | (a) | | | — | (a) | | | — | (a) |
| | | | | | | | | | | | | | | | | | | | | | | | |
Total net income from investment operations | | | 0.0002 | | | | 0.0004 | | | | 0.0004 | | | | 0.0006 | | | | 0.0010 | | | | 0.0121 | |
| | | | | | | | | | | | | | | | | | | | | | | | |
Less dividends and distributions: | | | | | | | | | | | | | | | | | | | | | | | | |
Net investment income | | | (0.0002 | ) | | | (0.0004 | ) | | | (0.0004 | ) | | | (0.0006 | ) | | | (0.0010 | ) | | | (0.0121 | ) |
Net realized gains | | | — | (a) | | | — | (a) | | | — | | | | — | | | | — | | | | — | |
| | | | | | | | | | | | | | | | | | | | | | | | |
Total dividends and distributions to shareholders | | | (0.0002 | ) | | | (0.0004 | ) | | | (0.0004 | ) | | | (0.006 | ) | | | (0.0010 | ) | | | (0.0121 | ) |
| | | | | | | | | | | | | | | | | | | | | | | | |
Net asset value, end of period | | $ | 1.00 | | | $ | 1.00 | | | $ | 1.00 | | | $ | 1.00 | | | $ | 1.00 | | | $ | 1.00 | |
| | | | | | | | | | | | | | | | | | | | | | | | |
Total Return | | | 0.02% | (b) | | | 0.04% | | | | 0.05% | | | | 0.06% | | | | 0.10% | | | | 1.21% | |
| | | | | | |
Ratios/Supplemental Data | | | | | | | | | | | | | | | | | | | | | | | | |
Net assets, end of period
(000’s omitted) | | $ | 481 | | | $ | 618 | | | $ | 240 | | | $ | 19,520 | | | $ | 37,708 | | | $ | 32,496 | |
Ratios of expenses to average
net assets(c) | | | 0.17% | (d) | | | 0.21% | | | | 0.23% | | | | 0.23% | | | | 0.24% | | | | 0.25% | |
Ratios of net investment income
to average net assets | | | 0.03% | (d) | | | 0.04% | | | | 0.04% | | | | 0.06% | | | | 0.09% | | | | 0.93% | |
| (a) | Amount is less than $0.00005 per share. |
| (c) | Without the waiver of advisory fees and reimbursement of certain operating expenses, the ratios of expenses to average net assets for the Sansom Street Class of the Money Market Portfolio would have been 0.48% (annualized) for the six months ended February 28, 2014 and 0.50%, 0.50%, 0.47%, 0.54% and 0.60% for the years ended August 31, 2013, 2012, 2011, 2010 and 2009, respectively. |
The accompanying notes are an integral part of the financial statements.
10
THE RBB FUND, INC.
Money Market Portfolio
Notes to Financial Statements
February 28, 2014
(Unaudited)
1. Summary of Significant Accounting Policies
The RBB Fund, Inc. (“RBB” or the “Company”) was incorporated under the laws of the State of Maryland on February 29, 1988, and is registered under the Investment Company Act of 1940, as amended (the “1940 Act”), as an open-end management investment company. RBB is a “series fund,” which is a mutual fund divided into separate portfolios. Each portfolio is treated as a separate entity for certain matters under the 1940 Act, and for other purposes, and a shareholder of one portfolio is not deemed to be a shareholder of any other portfolio. Currently, RBB has twenty-one active investment portfolios, including the Money Market Portfolio (“Portfolio”).
RBB has authorized capital of one hundred billion shares of common stock of which 81.373 billion shares are currently classified into one hundred and forty-eight classes of common stock. Each class represents an interest in an active or inactive RBB investment portfolio. The Portfolio has issued shares with a par value of $0.001.
SECURITY VALUATION — Securities held in the Portfolio are valued under the amortized cost method, which approximates fair value. Under this method, securities are valued at cost when purchased and thereafter a constant accretion of discount or amortization of premium is recorded until maturity of the security. Regular review and monitoring of the valuation is performed to ensure that cost continues to approximate fair value and to avoid dilution or other unfair results to shareholders. The Portfolio seeks to maintain net asset value (“NAV”) per share at $1.00.
Fair Value Measurements — The inputs and valuations techniques used to measure fair value of the Portfolio’s investments are summarized into three levels as described in the hierarchy below:
| | • | | Level 1 — quoted prices in active markets for identical securities; |
| | • | | Level 2 — other significant observable inputs (including quoted prices for similar securities, interest rates, prepayment speeds, credit risk, etc.); and |
| | • | | Level 3 — significant unobservable inputs (including the Portfolio’s own assumptions in determining the fair value of net assets). |
The inputs or methodology used for valuing securities are not necessarily an indication of the risk associated with investing in those securities.
The following is a summary of the inputs used, as of February 28, 2014, in valuing the Portfolio’s net assets carried at fair value:
| | | | | | | | | | | | | | | | |
| | | Total
Value at
February 28, 2014 | | | Level 1
Quoted
Price | | | Level 2
Significant
Observable
Inputs | | | Level 3
Significant
Unobservable
Inputs | |
Investments in Securities* | | $ | 599,299,748 | | | $ | — | | | $ | 599,299,748 | | | $ | — | |
| | | | | | | | | | | | | | | | |
| * | Please refer to the Schedule of Investments for further details on portfolio holdings. |
Securities held in the Portfolio are valued at amortized cost, in accordance with rules under the 1940 Act. Generally, amortized cost approximates the current fair value of a security, but since the value is not obtained from a quoted price in an active market, such securities are reflected as Level 2.
At the end of each fiscal quarter, management evaluates the classification of Levels 1, 2 and 3 assets and liabilities. Various factors are considered, such as changes in liquidity from the prior reporting period; whether or not a broker is willing to execute at the quoted price; the depth and consistency of prices from third party pricing services; and the existence of contemporaneous, observable trades in the market. Additionally, management evaluates the classification of Level 1 and Level 2 assets and liabilities on a quarterly basis for changes in listings or delistings on national exchanges.
Due to the inherent uncertainty of determining the fair value of investments that do not have a readily available market value, the fair value of the Portfolio’s investments may fluctuate from period to period. Additionally, the fair value of
11
THE RBB FUND, INC.
Money Market Portfolio
Notes to Financial Statements (Continued)
February 28, 2014
(Unaudited)
investments may differ significantly from the values that would have been used had a ready market existed for such investments and may differ materially from the values the Portfolio may ultimately realize. Further, such investments may be subject to legal and other restrictions on resale or otherwise less liquid than publicly traded securities.
For fair valuations using significant unobservable inputs, U.S. generally accepted accounting principles (“U.S. GAAP”) require the Fund to present a reconciliation of the beginning to ending balances for reported market values that presents changes attributable to total realized and unrealized gains or losses, purchase and sales, and transfers in and out of Level 3 during the period. Transfers in and out between Levels are based on values at the end of the period. U.S. GAAP also requires the Fund to disclose amounts and reasons for all transfers in and out of Level 1 and Level 2 fair value measurements. A reconciliation of Level 3 investments is presented only when the Fund had an amount of Level 3 investments at the end of the reporting period that was meaningful in relation to its net assets. The amounts and reasons for all transfers in and out of each Level within the three-tier hierarchy are disclosed when the Fund had an amount of total transfers during the reporting period that was meaningful in relation to its net assets as of the end of the reporting period.
For the six months ended February 28, 2014, there were no transfers between Levels 1, 2 and 3 for the Portfolio.
SECURITY TRANSACTIONS, INVESTMENT INCOME, AND EXPENSES — The Fund records security transactions based on the trade date for financial reporting purposes. The cost of investments sold is determined by use of the specific identification method for both financial reporting and income tax purposes. Interest income is accrued when earned. Certain expenses, such as distribution fee and service organization fees, are class specific expenses and vary by class. Expenses not directly attributable to a specific portfolio or class are allocated based on relative net assets of each portfolio and class. Expenses incurred on behalf of a specific class, fund or fund family of the Company are charged directly to the class, fund or fund family (in proportion to net assets). Expenses incurred for all portfolios within the Company (such as director or professional fees) are charged to all portfolios in proportion to their average net assets of RBB, or in such other manner as the Company’s Board of Directors deems fair or equitable. Expenses and fees, including investment advisory and administration fees, are accrued daily and taken into account for the purpose of determining the NAV of the Portfolio.
DIVIDENDS AND DISTRIBUTIONS TO SHAREHOLDERS — Dividends from net investment income are declared daily, recorded on the ex-dividend date and paid monthly. All dividends from net investment income are taxed as ordinary income. Any net realized capital gains are distributed at least annually. Income subject to dividends and capital gain subject to distributions are determined in accordance with U.S. federal income tax regulations, which may differ from U.S. GAAP.
FEDERAL INCOME TAXES — No provision is made for federal income taxes. It is the Company’s intention to have the Portfolio continue to qualify for and elect the tax treatment applicable to regulated investment companies under Subchapter M of the Internal Revenue Code of 1986, as amended and make the requisite distributions to its shareholders which will be sufficient to relieve it from federal income and excise taxes.
REPURCHASE AGREEMENTS — Money market instruments may be purchased from financial institutions, such as banks and non-bank dealers, subject to the seller’s agreement to repurchase them at an agreed upon date and price. Collateral for repurchase agreements may have longer maturities than the maximum permissible remaining maturity of portfolio investments, provided the repurchase agreements themselves mature in 13 months or less. The seller is required on a daily basis to maintain the value of the securities subject to the agreement at no less than the repurchase price. The agreements are conditioned upon the collateral being deposited under the Federal Reserve book entry system or held in a separate account by the Portfolio’s custodian or an authorized securities depository. In the event the counterparty defaults and the fair value of the collateral declines, the Portfolio could experience losses, delays and costs in liquidating the collateral.
Master Repurchase Agreements (“MRA”) permit the Portfolio, under certain circumstances, including an event of default (such as bankruptcy or insolvency), to offset payables and/or receivables under the MRA with collateral held and/or posted to the counterparty and create one single net payment due to or from the Portfolio. However, bankruptcy or insolvency laws of a particular jurisdiction may impose restrictions on or prohibitions against such a right of offset in the
12
THE RBB FUND, INC.
Money Market Portfolio
Notes to Financial Statements (Continued)
February 28, 2014
(Unaudited)
event of the MRA counterparty’s bankruptcy or insolvency. Pursuant to the terms of the MRA, the Portfolio receives or posts securities as collateral with a market value in excess of the repurchase price to be paid or received by the Portfolio upon the maturity of the transaction. Upon a bankruptcy or insolvency of the MRA counterparty, the Portfolio would recognize a liability with respect to such excess collateral to reflect the Portfolio’s obligation under bankruptcy law to return the excess to the counterparty.
The Portfolio had investments in repurchase agreements. The gross value and related collateral received for these investments are presented in the Portfolio’s Schedule of Investments and the value of these investments is also presented in the Statements of Assets and Liabilities. The value of the related collateral held by the Portfolio exceeded the value of the repurchase agreements as of February 28, 2014.
USE OF ESTIMATES — The preparation of financial statements in conformity with U.S. GAAP requires management to make estimates and assumptions. These estimates and assumptions affect the reported amounts of assets and liabilities and disclosure of contingent assets and liabilities at the date of the financial statements and the reported amounts of revenues and expenses during the reporting period. Actual results could differ from those estimates and those differences could be significant.
CASH AND CASH EQUIVALENTS — The Portfolio considers liquid assets deposited with a bank demand deposit account to be cash equivalents. These investments represent amounts held with financial institutions that are readily accessible to pay Portfolio expenses or purchase investments. Cash and cash equivalents are valued at cost plus accrued interest, which approximates market value.
OTHER — In the normal course of business, the Portfolio may enter into contracts that provide general indemnifications. The Portfolio’s maximum exposure under these arrangements is dependent on claims that may be made against the Portfolio in the future and therefore, cannot be estimated; however, based on experience, the risk of material loss for such claims is considered remote.
2. Investment Adviser and Other Services
Pursuant to an Investment Advisory and Administration Agreement, BlackRock Advisors LLC (the “Adviser” or “BALLC”), an indirect wholly owned subsidiary of BlackRock, Inc., serves as investment adviser and administrator for the Portfolio.
BALLC (assignee of BlackRock Institutional Management Corporation) and BNY Mellon Investment Servicing (US) Inc, (“BNY Mellon”), have entered into a delegation agreement on behalf of the Portfolio, wherein BNY Mellon has agreed to perform administration and accounting services for an annual fee of 0.10% of the average net assets of the Portfolio, paid out of the fee paid to BALLC.
For its advisory services, BALLC is entitled to receive the following fees, computed daily and payable monthly, and based on the Portfolio’s average daily net assets:
|
Annual Rate |
0.45% of first $250 million of net assets; |
0.40% of next $250 million of net assets; and |
0.35% of net assets in excess of $500 million. |
The Adviser has contractually agreed to waive fees and/or reimburse expenses for the Portfolio such that total annual Portfolio operating expenses after fee waivers and/or expense reimbursements (excluding certain Portfolio expenses) do not exceed 0.25%. The following expenses are excluded from the contractual limitation: dividend expenses, interest expenses, acquired fund fees and expenses, distribution and service (12b-1) fees and certain other Portfolio expenses. This contractual limitation is in effect through December 31, 2014 and may not be terminated without the approval of the Company’s Board of Directors. The Adviser may terminate this arrangement at any time after December 31, 2014.
13
THE RBB FUND, INC.
Money Market Portfolio
Notes to Financial Statements (Continued)
February 28, 2014
(Unaudited)
For each class of shares within the Portfolio, the net advisory fee charged to each class is the same on a relative basis. For the six months ended February 28, 2014, advisory fees and waivers were as follows:
| | | | | | | | | | |
Gross Advisory
and
Administration
Fee | | | Waiver | | | Net Advisory
and
Administration
Fee | |
| | $1,322,290 | | | $ | (1,013,761 | ) | | $ | 308,529 | |
As of February 28, 2014, the Portfolio owed BALLC $30,134 in advisory and administration fees.
For providing regulatory administration services to RBB, BNY Mellon is entitled to receive compensation as agreed to by the Company and BNY Mellon. This fee is allocated to each portfolio of the Company in proportion to its net assets of the Company.
In addition, BNY Mellon serves as the Portfolio’s transfer and dividend disbursing agent. For providing transfer agent services, BNY Mellon is entitled to receive a monthly fee equal to an annual percentage rate of the Portfolio’s average daily net assets, subject to certain minimum monthly fees.
The Bank of New York Mellon provides certain custodian services to the Portfolio and is entitled to receive out of pocket expenses.
BNY Mellon may also voluntarily waive a portion of their fees and/or reimburse expenses.
The Portfolio, on behalf of the Bedford Class of shares of the Portfolio, has adopted a Distribution Plan pursuant to Rule 12b-1 under the 1940 Act (the “Plan”). The Portfolio has entered into a Distribution Agreement with Foreside Funds Distributors LLC (“Foreside Distributors”).
The Plan provides for the Bedford Class to make monthly payments, based on average net assets, to Foreside Distributors of up to 0.65% on an annualized basis. Foreside Distributors may voluntarily waive these fees at its discretion. For the six months ended February 28, 2014, distribution fees retained by Foreside Distributors for the Bedford Class were as follows:
| | | | | | | | | | | | |
| | | Gross
Distribution
Fee | | | Waiver | | | Net
Distribution
Fee | |
Bedford Class | | $ | 2,108,578 | | | $ | (2,043,699 | ) | | $ | 64,879 | |
The Portfolio will not pay BALLC, BNY Mellon or Foreside Distributors at a later time for any amounts waived or assumed.
3. Director Compensation
The Directors of the Company receive an annual retainer and meeting fees for meetings attended. The remuneration paid to the Directors by the Portfolio during the six months ended February 28, 2014 was $16,891. Certain employees of BNY Mellon serve as an Officer or Director of the Company. They are not compensated by the Portfolio or the Company.
4. Federal Income Tax Information
The Portfolio intends to continue to qualify as a regulated investment company and distribute all of its taxable income. Therefore, no federal tax provision is required.
The Portfolio has followed the authoritative guidance on accounting for and disclosure of uncertainty in tax positions, which requires the Portfolio to determine whether a tax position is more likely than not to be sustained upon examination, including resolution of any related appeals or litigation processes, based on the technical merits of the position. The Portfolio has determined that there was no effect on the financial statements from following this authoritative guidance. In the normal course of business, the Portfolio is subject to examination by federal, state and local jurisdictions, where applicable, for tax years for which applicable statutes of limitations have not expired.
14
THE RBB FUND, INC.
Money Market Portfolio
Notes to Financial Statements (Concluded)
February 28, 2014
(Unaudited)
The tax-basis cost of investments equals the book-basis cost of investments of $599,299,748.
Distributions to shareholders from net investment income and realized gains are determined in accordance with federal income tax regulations, which may differ from net investment income and realized gains recognized for financial reporting purposes. Accordingly, the character of distributions and composition of net assets for tax purposes may differ from those reflected in the accompanying financial statements. To the extent these differences are permanent, such amounts are reclassified within the capital accounts based on the tax treatment; temporary differences do not require such reclassification.
As of August 31, 2013, the Portfolio had $10,715 of undistributed ordinary income for federal tax purposes.
The difference between the book and tax basis components of distributable earnings relate principally to the timing of recognition of income and gains for Federal income tax purposes. Short-term capital gains are reported as ordinary income dividends for Federal income tax purposes.
The tax character of dividends and distributions paid during the last fiscal year was as follows:
| | | | |
| | | Ordinary
Income | |
August 31, 2013 | | $ | 90,693 | |
Dividends paid from net investment income and short-term capital gains are treated as ordinary income distributions for federal income tax purposes.
Under the Regulated Investment Company Modernization Act of 2010 (the “Modernization Act”), the Portfolio is permitted to carry forward capital losses incurred in taxable years beginning after December 22, 2010 for an unlimited period. Any losses incurred during those future taxable years will be required to be utilized prior to any losses incurred in pre-enactment taxable years. Additionally, post-enactment capital losses that are carried forward will retain their character as either short-term or long-term capital losses rather than being considered all short-term as under the previous law. The Portfolio’s first fiscal year-end subject to the Modernization Act was August 31, 2012. As of August 31, 2013, the Portfolio had no capital loss carryforwards.
5. Subsequent Event
Management has evaluated the impact of all subsequent events on the Portfolio through the date the financial statements were issued, and has determined that there were no subsequent events requiring recognition or disclosure in the financial statements.
15
THE RBB FUND, INC.
Money Market Portfolio
Additional Information
(Unaudited)
Proxy Voting
Policies and procedures that the Portfolio uses to determine how to vote proxies relating to portfolio securities as well as information regarding how the Portfolio voted proxies relating to portfolio securities for the most recent 12-month period ended June 30 are available without charge, upon request, by calling the number shown below and on the Securities and Exchange Commission’s (“SEC”) website at http://www.sec.gov.
| | |
Bedford | | (800) 888-9723 |
Sansom Street | | (800) 430-9618 |
Quarterly Portfolio Schedules
The Company files its complete schedule of portfolio holdings with the SEC for the first and third fiscal quarter of each fiscal year (quarters ended November 30 and May 31) on Form N-Q. The Company’s Form N-Q is available on the SEC website at http://www.sec.gov and may be reviewed and copied at the SEC Public Reference Room in Washington, D.C. Information on the operation of the SEC Public Reference Room may be obtained by calling (202) 551-8090.
16
Investment Adviser
BlackRock Advisors LLC
100 Bellevue Parkway
Wilmington, DE 19809
Transfer Agent
BNY Mellon Investment Servicing (US) Inc.
4400 Computer Drive
Westborough, MA 01581
Principal Underwriter
Foreside Funds Distributors LLC
400 Berwyn Park
899 Cassatt Road
Berwyn, PA 19312
Custodian
The Bank of New York Mellon
One Wall Street
New York, NY 10286
Independent Registered Public Accounting Firm
PricewaterhouseCoopers LLP
Two Commerce Square, Suite 1700
2001 Market Street
Philadelphia, PA 19103-7042
Counsel
Drinker Biddle & Reath LLP
One Logan Square, Ste. 2000
Philadelphia, PA 19103-6996
BOGLE INVESTMENT MANAGEMENT
SMALL CAP
GROWTH FUND
of THE RBB FUND, INC.
SEMI-ANNUAL REPORT
FEBRUARY 28, 2014
(UNAUDITED)
This report is submitted for the general information of the shareholders of the Fund. It is not authorized for distribution unless preceded or accompanied by a current prospectus for the Fund.
BOGLE INVESTMENT MANAGEMENT
SMALL CAP GROWTH FUND
SEMI-ANNUAL REPORT FOR THE SIX-MONTH PERIOD ENDED FEBRUARY 28, 2014
(UNAUDITED)
Fellow Shareholder:
For the most recent semiannual reporting period ended February 28, 2014, the Bogle Investment Management Small Cap Growth Fund (the “Fund”) Investor shares returned +21.34% and the Institutional shares returned +21.36%, both net of fees, outperforming by over three percentage points their benchmark, the unmanaged Russell 2000® Index of small cap stocks, which returned +17.75%. The Fund’s longer term annualized returns since inception are shown in the chart below. The balance of this letter covers the market environment, performance attribution, Fund characteristics, and a discussion of some of the business and investment philosophies at Bogle Investment Management, L.P.
INVESTMENT PERFORMANCE — PERIODS ENDING FEBRUARY 28, 2014
BOGLE FUNDVS. RUSSELL 2000® BENCHMARK
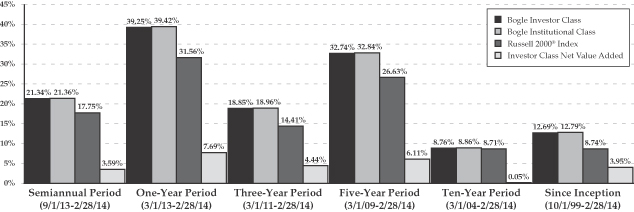
All Fund returns are presented net of fees and include the reinvestment of all dividends and other earnings. Multi-year period returns are annualized. Returns shown represent past performance and do not guarantee future results. Current performance may be lower or higher than the returns shown above. The investment return and principal value of an investment in the Fund will fluctuate so that an investor’s shares, when redeemed, may be worth more or less than their original cost. Returns current to the most recent month-end may be obtained at 1-877-264-5346. The figures do not reflect the deduction of taxes that a shareholder would pay on Fund distributions or the redemption of Fund shares. The performance quoted reflects fee waivers in effect and would have been less in their absence. The Fund’s annual operating expenses, as stated in the current prospectus, are 1.39% for the Institutional Class and 1.49% for the Investor Class, prior to fee waivers.
1
Market Environment. U.S. equity markets advanced steadily during most of the recent semiannual period. Both the Fund and its Russell 2000® Index benchmark delivered positive performance in five out of the six months of the period. The only month with negative performance was January 2014. From September 1, 2013 through December 31, 2013, the Fund’s Investor shares had risen +19.05% while the Russell 2000® Index was up +15.66%. Both the Fund and the Russell 2000® Index dropped in January, returning -3.22% and -2.77%, respectively, in a broad market decline that was widely attributed to the Federal Reserve’s tapering of its stimulus program and concerns regarding future growth prospects of U.S. companies’ earnings. Fear quickly subsided in February as the Fund and the Russell 2000® Index strongly rebounded, returning +5.27% and +4.71%, respectively.
For much of the semiannual period, investors tended to favor riskier stocks with higher betas and price volatilities over more stable, lower beta stocks. These preferences were reflected in the small cap Russell 2000® Index outperforming the large cap Russell 1000® Index by over two percentage points (up +17.75% versus +15.67%), and by growth stocks generally outperforming value with Russell 2000® Growth Index advancing +19.20%, compared with the Russell 2000® Value Index returning +16.23%. Market volatility, as measured by the VIX index of implied, expected volatility, remained generally below longer term averages. Likewise, the volatilities of the Fund and Russell 2000® Index, as measured by the variability (standard deviation) of their daily returns, were also below long term averages.
Performance Attribution. For the most recent semiannual reporting period, the Fund’s Investor Class of shares outperformed the benchmark Russell 2000® Index by +3.59%, net of all fees, and the Institutional Class of shares outperformed by +3.61%, net of all fees. The Fund’s outperformance is attributed both to positive stock selection as well as certain Fund exposures that differ from the benchmark. On average the Fund tends to have somewhat greater exposure to stocks that exhibit higher earnings growth prospects, smaller market capitalizations, and higher price volatilities. These tilts reflect the tendency of our models to be particularly effective, on average, among these companies compared with larger, lower growth companies. Further, the more focused business models and more variable financial characteristics that typify these companies cause them to have stronger signals that more readily push them to the most (or least) attractive extremes of our investment models. Recall that our investment process is driven by a proprietary stock selection model that combines insights from longer-term fundamental financial data with non-fundamental, often shorter-term data. This combination can be thought of, conceptually, as the exploitation of investment opportunities created, primarily, by stocks with attractive financial characteristics that are not fully understood, or discounted, by the market as a whole, and secondarily, by opportunistically trading these securities when certain data indicates to us that there is a statistical probability that their current prices will either revert toward, or start to diverge from, their short-term equilibrium price levels. Stocks that our model finds attractive will typically have some or most of the following characteristics when compared to their closest peers: stronger free cash flows, less leverage, more conservative accounting, organic business improvement, less expensive share prices, improving earnings outlooks, and less market controversy. Our non-fundamental models consider recent share price volatility and direction, trading volume, and other market data to determine whether or not a stock is likely to diverge from or regress toward its shorter-term fundamental level. Our fundamental models tend to work best when markets are focused more on discriminating between similar stocks than on broader macroeconomic themes that tend to result in investors moving into or out of groups or portfolios of stocks in unison. During these latter environments we expect our non-fundamental signals to add value by finding both a greater number of opportunities from, and greater likelihood of success with, mispricings caused by structurally- driven trading. Given the relatively stable market environment during the most recent semiannual period, and consistent with model tendencies, our fundamental models contributed the most to our outperformance. The economic sector groups that were most productive for us were financials (stocks with positive contributions were LPL Financial Holdings, LPLA and Interactive Brokers Group, IBKR); and health technology (positive contributors included Santarus, SNTS, and Lannet Company, LCI). As usual, we also suffered our share of losers, notably Multimedia Games Holding Company, MGAM, Renewable Energy Group, REGI, and Orbitz Worldwide, OWW, and while our losses were not concentrated among a group of similar stocks, the consumer services sector had the worst overall performance.
2
Fund Characteristics. As of the end of the most recent semiannual reporting period, the Fund held 208 stocks, with the largest holding representing 1.68% of portfolio assets. As shown in the table to the right, the Fund looks similar to the benchmark across a variety of fundamental risk characteristics. As of February 28, 2014, the Fund’s median market capitalization was slightly larger than the benchmark’s. We attribute this to our holding on to, and trimming only slowly, some of our top performing stocks that have increased in market capitalization faster than the benchmark. Compared to the Russell 2000® Index, the Fund continued to have, at the median, a small positive exposure toward companies with modestly higher expected long-term earnings growth rates and a below-benchmark allocation to slower growing stocks (14% of Fund assets were invested in stocks with expected earnings growth less than 9% per year, while the benchmark allocation was 21%). As mentioned above, we believe this modest growth bias provides a long-term benefit to investment performance. Finally, the Fund’s median price-to-sales ratio was below benchmark, reflecting the influence of our relative valuation model.
The Fund’s annualized active volatility (the variability of the daily differences between Fund and benchmark performance, also called “tracking error”) was 5.3% during the most recent semiannual reporting period,
| | | | | | | | |
FUNDAMENTAL CHARACTERISTICS FEBRUARY 28, 2014 | |
Median | | Fund | | | Russell
2000® | |
Market Cap. ($mil.) | | | $2,055 | | | | $1,624 | |
Price/Historical Earnings | | | 22.4x | | | | 23.0x | |
Price/Forward Earnings | | | 18.1x | | | | 19.0x | |
Price/Sales | | | 1.7x | | | | 2.4x | |
Median characteristics refer to the Fund’s holdings, not the Fund itself. | |
| | | | | | | | |
RISK STATISTICS*
SEMI ANNUAL PERIOD | |
Measurement | | BOGLX** | | | Russell
2000® | |
Standard Deviation | | | 16.7% | | | | 14.6% | |
Active Volatility | | | 5.3% | | | | | |
Beta with Russell 2000® | | | 1.09 | | | | | |
* Risk statistics apply to the Fund and benchmark. Standard deviation is a statistical measure of the range of performance. Active volatility is the standard deviation of the difference between the Fund and benchmark performance. Beta is a measure of a portfolio’s sensitivity to market movement. ** The Bogle Small Cap Growth Fund Investor Shares. | |
below the Fund’s long-term average of 6.4%. The lower number indicates that the value we added during the semiannual period over the benchmark was steadier than normal. The Fund’s beta with the Russell 2000® Index, at approximately 1.09, was stable during the period.
Progress at Bogle Investment Management, L.P. At the end of February 2014, assets in the Fund were $237.6 million. This 34% increase from the end of the Fund’s fiscal year, August 31, 2013, is due to investment performance as well as existing and new investors demonstrating their confidence and trust in us by adding to their, or making initial, investments. As gratifying as this growth is, and while we have capacity to manage, under our current investment process and market liquidity, an additional approximately $200 million, we continue to be content with the approach to growth that we have always had- that the Fund be “bought and not sold.” In other words, do no advertising, provide to thoughtful investors information about our firm and our investment process and philosophies, and let them decide whether it is a good fit in their portfolios.
As a reminder, information about the Fund, including historical NAVs, sector allocation, fundamental characteristics, and top ten holdings, can be viewed on our website, www.boglefunds.com. The net asset values of the Fund are updated daily while Fund characteristics and other information are updated quarterly.
As always, please let us know if there is any way we can improve your investment experience with us.
Respectfully,
Bogle Investment Management, L.P.
Advisor Office: 781-283-5000
Shareholder Services Toll Free: 1-877-BOGLEIM (264-5346)
The Fund’s investment adviser, Bogle Investment Management, L.P., has contractually agreed to waive management fees and reimburse expenses through December 31, 2014 to the extent that total annual Fund operating expenses exceed 1.25% and 1.35% for the Institutional Class and Investor Class, respectively. The Adviser, in its discretion, has the right to extend this waiver.
3
The Russell 2000® Index is an index of stocks 1001 through 3000 in the Russell 3000® Index as ranked by total market capitalization. A direct investment in the index is not possible. The Russell ® Indexes are a trademark of the Frank Russell Company (“FRC”). FRC is the owner of the copyrights relating to the Russell Indexes and is the source of the Performance Values for the Russell Indexes.
Investing in small companies can involve more volatility, less liquidity and less available information than investing in large companies.
Portfolio composition is subject to change. The current and future portfolio holdings of the Fund are subject to investment risk.
4
BOGLE INVESTMENT MANAGEMENT
SMALL CAP GROWTH FUND
FUND EXPENSE EXAMPLES
(UNAUDITED)
As a shareholder of the Fund, you incur two types of costs: (1) transaction costs and (2) ongoing costs, including management fees, shareholder servicing fees and other Fund expenses. These examples are intended to help you understand your ongoing costs (in dollars) of investing in the Fund and to compare these costs with the ongoing costs of investing in other mutual funds.
These examples are based on an investment of $1,000 invested at the beginning of the six-month period from September 1, 2013 through February 28, 2014, and held for the entire period.
ACTUAL EXPENSES
The first line of the accompanying tables provides information about actual account values and actual expenses. You may use the information in this line, together with the amount you invested, to estimate the expenses that you paid over the period. Simply divide your account value by $1,000 (for example, an $8,600 account value divided by $1,000 = 8.6), then multiply the result by the number in the first line under the heading entitled “Expenses Paid During Period” to estimate the expenses you paid on your account during this period.
HYPOTHETICAL EXAMPLEFOR COMPARISON PURPOSES
The second line of the accompanying tables provides information about hypothetical account values and hypothetical expenses based on the Fund’s actual expense ratio and an assumed rate of return of 5% per year before expenses, which is not the Fund’s actual return. The hypothetical account values and expenses may not be used to estimate the actual ending account balance or expenses you paid for the period. You may use this information to compare the ongoing costs of investing in the Fund and other funds. To do so, compare these 5% hypothetical examples with the 5% hypothetical examples that appear in the shareholder reports of other funds.
Please note that the expenses shown in the accompanying tables are meant to highlight your ongoing costs only and do not reflect any transactional costs, such as redemption fees. Therefore, the second line of the accompanying tables is useful in comparing ongoing costs only, and will not help you determine the relative total costs of owning different funds. In addition, if these transactional costs were included, your costs would have been higher.
| | | | | | | | | | | | |
| | | INSTITUTIONAL CLASS | |
| | | BEGINNING ACCOUNT VALUE
SEPTEMBER 1, 2013 | | | ENDING ACCOUNT VALUE
FEBRUARY 28, 2014 | | | EXPENSES PAID DURING
PERIOD* | |
Actual | | $ | 1,000.00 | | | $ | 1,213.60 | | | $ | 6.86 | |
Hypothetical
(5% return before expenses) | | | 1,000.00 | | | | 1,018.60 | | | | 6.26 | |
| |
| | | INVESTOR CLASS | |
| | | BEGINNING ACCOUNT VALUE
SEPTEMBER 1, 2013 | | | ENDING ACCOUNT VALUE
FEBRUARY 28, 2014 | | | EXPENSES PAID DURING
PERIOD* | |
Actual | | $ | 1,000.00 | | | $ | 1,213.40 | | | $ | 7.41 | |
Hypothetical
(5% return before expenses) | | | 1,000.00 | | | | 1,018.10 | | | | 6.76 | |
| * | Expenses are equal to the Fund’s annualized six-month expense ratio of 1.25% for the Institutional Class and 1.35% for the Investor Class, which includes waived fees or reimbursed expenses, multiplied by the average account value over the period, multiplied by the number of days (181) in the most recent fiscal half-year, then divided by 365 to reflect the one-half year period. The Fund’s ending account values on the first line in each table are based on the actual six-month total investment return for each class of 21.36% for the Institutional Class and 21.34% for the Investor Class. |
5
BOGLE INVESTMENT MANAGEMENT
SMALL CAP GROWTH FUND
PORTFOLIO HOLDINGS SUMMARY TABLE
FEBRUARY 28, 2014
(UNAUDITED)
The following table presents a summary by security type of the portfolio holdings of the Fund:
| | | | | | | | |
| SECURITY TYPE & SECTOR CLASSIFICATION | | % OF NET
ASSETS | | | VALUE | |
| | |
COMMON STOCKS: | | | | | | | | |
Consumer Growth | | | 22.7% | | | $ | 53,861,271 | |
Financial | | | 19.7 | | | | 46,752,770 | |
Consumer Cyclical | | | 13.7 | | | | 32,556,448 | |
Technology | | | 12.1 | | | | 28,753,703 | |
Industrial | | | 9.7 | | | | 22,919,103 | |
Energy | | | 9.4 | | | | 22,423,969 | |
Communications | | | 9.0 | | | | 21,309,285 | |
Basic Industry | | | 2.6 | | | | 6,255,067 | |
Utility | | | 0.0 | | | | 74,830 | |
SHORT-TERM INVESTMENTS | | | 1.0 | | | | 2,474,454 | |
OTHER ASSETSIN EXCESSOF LIABILITIES | | | 0.1 | | | | 213,128 | |
| | | | | | | | |
NET ASSETS | | | 100.0% | | | $ | 237,594,028 | |
| | | | | | | | |
Portfolio holdings are subject to change at any time.
The accompanying notes are an integral part of the financial statements.
6
BOGLE INVESTMENT MANAGEMENT
SMALL CAP GROWTH FUND
PORTFOLIOOF INVESTMENTS
FEBRUARY 28, 2014 (UNAUDITED)
| | | | | | | | |
| | | NUMBER
OF SHARES | | | VALUE | |
| | | | | | | | |
COMMON STOCKS—98.9% | | | | | |
BASIC INDUSTRY—2.6% | | | | | |
Aceto Corp. | | | 1,031 | | | $ | 18,857 | |
Ferro Corp. * | | | 127,154 | | | | 1,668,260 | |
Gerdau SA, SP ADR | | | 241,311 | | | | 1,508,194 | |
Neenah Paper, Inc. | | | 8,683 | | | | 435,973 | |
Steel Dynamics, Inc. | | | 35,388 | | | | 617,167 | |
Ternium SA, SP ADR | | | 55,061 | | | | 1,630,907 | |
United States Lime & Minerals, Inc. | | | 107 | | | | 6,056 | |
Xerium Technologies, Inc. * | | | 23,470 | | | | 369,653 | |
| | | | | | | | |
| | | | | | | 6,255,067 | |
| | | | | | | | |
COMMUNICATIONS—9.0% | | | | | |
Alcatel-Lucent, ADR | | | 415,908 | | | | 1,780,086 | |
Autobytel, Inc. * | | | 28,879 | | | | 455,133 | |
Bitauto Holdings Ltd., ADR * | | | 76,378 | | | | 3,055,120 | |
Brightcove, Inc. * | | | 727 | | | | 7,052 | |
Calix Inc * | | | 14,188 | | | | 112,795 | |
Clicksoftware Technologies Ltd. | | | 503 | | | | 5,030 | |
Comverse, Inc. * | | | 10,245 | | | | 354,579 | |
Cumulus Media, Inc., Class A * | | | 6,664 | | | | 43,716 | |
Earthlink Holdings Corp | | | 40,518 | | | | 158,831 | |
Entravision Communications Corp., Class A | | | 57,502 | | | | 381,238 | |
Inteliquent, Inc. | | | 176,271 | | | | 2,460,743 | |
IntraLinks Holdings, Inc. * | | | 43,181 | | | | 501,331 | |
Lee Enterprises, Inc. * | | | 50,788 | | | | 261,050 | |
Liberty Ventures * | | | 14,749 | | | | 2,101,880 | |
Lionbridge Technologies, Inc. * | | | 4,616 | | | | 33,051 | |
MDC Partners, Inc. | | | 11,379 | | | | 255,914 | |
Radio One, Inc., Class D * | | | 7,145 | | | | 35,511 | |
SouFun Holdings Ltd., ADR | | | 24,900 | | | | 1,961,622 | |
Ubiquiti Networks, Inc. * | | | 51,309 | | | | 2,535,178 | |
United Online Inc * | | | 7,452 | | | | 83,537 | |
Valuevision Media, Inc., Class A * | | | 1,586 | | | | 8,866 | |
YY, Inc., ADR * | | | 34,568 | | | | 2,602,625 | |
Zhone Technologies, Inc. * | | | 34 | | | | 132 | |
Zynga, Inc., Class A * | | | 417,839 | | | | 2,114,265 | |
| | | | | | | | |
| | | | | | | 21,309,285 | |
| | | | | | | | |
CONSUMER CYCLICAL—13.7% | | | | | |
Buffalo Wild Wings, Inc. * | | | 15,068 | | | | 2,184,860 | |
Burlington Stores, Inc. * | | | 12,019 | | | | 327,518 | |
Citi Trends, Inc. * | | | 4,615 | | | | 75,686 | |
Core-Mark Holding Co., Inc. | | | 24,273 | | | | 1,898,149 | |
Delta Air Lines, Inc. | | | 49,990 | | | | 1,660,168 | |
Foot Locker, Inc. | | | 44,700 | | | | 1,864,437 | |
Gentherm, Inc. * | | | 2,500 | | | | 70,700 | |
| | | | | | | | |
| | | NUMBER
OF SHARES | | | VALUE | |
| | | | | | | | |
CONSUMER CYCLICAL—(CONTINUED) | | | | | |
Goodyear Tire & Rubber Co., (The) | | | 81,250 | | | $ | 2,183,187 | |
Haverty Furniture Co., Inc. | | | 45,333 | | | | 1,321,457 | |
Jetblue Airways Corp. * | | | 218,782 | | | | 1,931,845 | |
Kimball International, Inc., Class B | | | 32,599 | | | | 611,883 | |
Kona Grill, Inc. * | | | 1,100 | | | | 21,230 | |
Motorcar Parts of America, Inc. * | | | 1,922 | | | | 47,339 | |
Nu Skin Enterprises, Inc., Class A | | | 24,918 | | | | 2,081,151 | |
Oshkosh Truck Corp. | | | 20,055 | | | | 1,159,781 | |
Pantry, Inc., (The) * | | | 7,331 | | | | 110,551 | |
Republic Airways Holdings, Inc. * | | | 136,671 | | | | 1,309,308 | |
Rite Aid Corp * | | | 355,519 | | | | 2,342,870 | |
Ruth’s Hospitality Group, Inc. | | | 3,234 | | | | 39,972 | |
ScanSource, Inc. * | | | 50,532 | | | | 1,983,886 | |
Sony Corp., ADR | | | 100,755 | | | | 1,768,250 | |
Tenneco, Inc. * | | | 32,083 | | | | 1,932,680 | |
TiVo, Inc. * | | | 150,868 | | | | 2,036,718 | |
Tower International, Inc. * | | | 45,565 | | | | 1,170,109 | |
UniFirst Corp. | | | 3,211 | | | | 352,215 | |
Universal Electronics, Inc. * | | | 6,687 | | | | 279,450 | |
Wendy’s Co. (The) | | | 186,957 | | | | 1,791,048 | |
| | | | | | | | |
| | | | | | | 32,556,448 | |
| | | | | | | | |
CONSUMER GROWTH—22.7% | | | | | | | | |
Addus HomeCare Corp. * | | | 48,741 | | | | 1,401,791 | |
Affymetrix, Inc. * | | | 71,934 | | | | 555,330 | |
Align Technology, Inc. * | | | 31,178 | | | | 1,631,545 | |
Alliance HealthCare Services, Inc. * | | | 7,117 | | | | 214,506 | |
Andersons, Inc., (The) | | | 34,002 | | | | 1,864,670 | |
Anika Therapeutics, Inc. * | | | 16,684 | | | | 656,849 | |
ARC Document Solutions, Inc. * | | | 5,906 | | | | 46,598 | |
Barrett Business Services, Inc. | | | 13,809 | | | | 966,630 | |
BioTelemetry, Inc. * | | | 9,559 | | | | 107,443 | |
Capella Education Co. | | | 8,608 | | | | 572,260 | |
Charles River Laboratories International, Inc. * | | | 32,184 | | | | 1,912,051 | |
China Distance Education Holdings, Ltd. | | | 3,499 | | | | 84,921 | |
CoreLogic, Inc. * | | | 31,642 | | | | 1,031,529 | |
Corvel Corp. * | | | 11,264 | | | | 518,257 | |
Cross Country Healthcare, Inc. * | | | 41,073 | | | | 427,159 | |
Enzon Pharmaceuticals, Inc. | | | 67,546 | | | | 64,844 | |
Euronet Worldwide, Inc. * | | | 42,651 | | | | 1,631,827 | |
Farmer Bros. Co. * | | | 1,506 | | | | 31,746 | |
The accompanying notes are an integral part of the financial statements.
7
BOGLE INVESTMENT MANAGEMENT
SMALL CAP GROWTH FUND
PORTFOLIOOF INVESTMENTS (CONTINUED)
FEBRUARY 28, 2014 (UNAUDITED)
| | | | | | | | |
| | | NUMBER
OF SHARES | | | VALUE | |
| | | | | | | | |
CONSUMER GROWTH—(CONTINUED) | | | | | |
Global Cash Access Holdings, Inc. * | | | 176,386 | | | $ | 1,481,642 | |
HealthSouth Corp. | | | 57,586 | | | | 1,881,910 | |
Huron Consulting Group, Inc. * | | | 29,653 | | | | 1,962,139 | |
ICON PLC * | | | 44,729 | | | | 2,095,106 | |
Idera Pharmaceuticals, Inc. * | | | 55,198 | | | | 319,596 | |
Impax Laboratories, Inc. * | | | 45,466 | | | | 1,171,659 | |
Information Services Group, Inc. * | | | 30,432 | | | | 159,159 | |
Insys Therapeutics, Inc. * | | | 14,772 | | | | 993,860 | |
Lannett Co., Inc. * | | | 57,849 | | | | 2,481,144 | |
Liberator Medical Holdings, Inc. | | | 40,675 | | | | 183,038 | |
Live Nation Entertainment, Inc. * | | | 89,859 | | | | 2,038,901 | |
Magellan Health Services, Inc. * | | | 29,075 | | | | 1,777,645 | |
Mannatech, Inc. * | | | 1,042 | | | | 17,922 | |
Manpowergroup, Inc. | | | 25,350 | | | | 1,981,356 | |
MoneyGram International, Inc. * | | | 26,264 | | | | 499,804 | |
Natus Medical, Inc. * | | | 33,876 | | | | 850,288 | |
Navigant Consulting, Inc. * | | | 64,321 | | | | 1,121,115 | |
NuVasive, Inc. * | | | 31,671 | | | | 1,163,909 | |
Pacific Biosciences of California, Inc. * | | | 579 | | | | 3,856 | |
Pilgrim’s Pride Corp. * | | | 120,183 | | | | 2,106,808 | |
Repligen Corp. * | | | 27,980 | | | | 418,861 | |
Sagent Pharmaceuticals, Inc. * | | | 12,797 | | | | 270,785 | |
Sanderson Farms, Inc. | | | 25,407 | | | | 1,952,274 | |
SEI Investments Co. | | | 53,896 | | | | 1,809,289 | |
Spartan Stores, Inc. | | | 17,381 | | | | 392,637 | |
TAL Education Group, ADR * | | | 84,181 | | | | 1,996,773 | |
Taro Pharmaceutical Industries, Ltd. * | | | 893 | | | | 99,668 | |
United Therapeutics Corp. * | | | 23,385 | | | | 2,371,707 | |
Vanda Pharmaceuticals, Inc. * | | | 142,546 | | | | 2,156,721 | |
Vascular Solutions, Inc. * | | | 10,489 | | | | 272,924 | |
WuXi PharmaTech Cayman, Inc., ADR * | | | 71,609 | | | | 2,754,082 | |
Zalicus, Inc. * | | | 67,641 | | | | 102,138 | |
Zeltiq Aesthetics, Inc. * | | | 65,961 | | | | 1,252,599 | |
| | | | | | | | |
| | | | | | | 53,861,271 | |
| | | | | | | | |
ENERGY—9.4% | | | | | |
Clayton Williams Energy, Inc. * | | | 2,850 | | | | 276,450 | |
Comstock Resources, Inc. | | | 105,986 | | | | 2,094,283 | |
Crosstex Energy, Inc. | | | 33,366 | | | | 1,389,027 | |
Dril-Quip, Inc. * | | | 14,670 | | | | 1,577,905 | |
Gran Tierra Energy, Inc. * | | | 222,999 | | | | 1,581,063 | |
| | | | | | | | |
| | | NUMBER
OF SHARES | | | VALUE | |
| | | | | | | | |
ENERGY—(CONTINUED) | | | | | |
Green Plains Renewable Energy, Inc. | | | 115,614 | | | $ | 3,055,678 | |
Matador Resources Co. * | | | 94,997 | | | | 2,304,627 | |
Matrix Service Co. * | | | 59,692 | | | | 1,932,230 | |
MRC Global, Inc. * | | | 63,173 | | | | 1,624,810 | |
Murphy USA, Inc. * | | | 33,396 | | | | 1,354,542 | |
Pattern Energy Group, Inc. | | | 6,064 | | | | 166,154 | |
Pioneer Energy Services Corp. * | | | 76,023 | | | | 866,662 | |
Renewable Energy Group, Inc. * | | | 105,936 | | | | 1,236,273 | |
REX American Resources Corp. * | | | 15,329 | | | | 730,887 | |
SM Energy Co. | | | 22,230 | | | | 1,639,463 | |
Tesco Corp. * | | | 27,458 | | | | 520,878 | |
Warren Resources, Inc. * | | | 16,487 | | | | 73,037 | |
| | | | | | | | |
| | | | | | | 22,423,969 | |
| | | | | | | | |
FINANCIAL—19.7% | | | | | |
AerCap Holdings N.V. * | | | 92,766 | | | | 3,988,938 | |
Allied World Assurance Co. Holdings AG | | | 19,270 | | | | 1,921,604 | |
Aspen Insurance Holdings Ltd. | | | 50,199 | | | | 1,885,474 | |
Assurant, Inc. | | | 28,982 | | | | 1,902,089 | |
Assured Guaranty Ltd. | | | 91,708 | | | | 2,251,431 | |
Axis Capital Holdings Ltd. | | | 42,778 | | | | 1,880,949 | |
Banco Bradesco SA, ADR | | | 133,611 | | | | 1,569,929 | |
Calamos Asset Management, Inc., Class A | | | 75,801 | | | | 904,306 | |
E-House China Holdings Ltd., ADR | | | 165,459 | | | | 2,071,547 | |
Evercore Partners, Inc., Class A | | | 12,934 | | | | 719,648 | |
FBR & Co. * | | | 8,914 | | | | 231,764 | |
Federated National Holding Co. | | | 1,259 | | | | 19,993 | |
First NBC Bank Holding Co. * | | | 1,500 | | | | 50,055 | |
Genworth Financial, Inc., Class A * | | | 178,518 | | | | 2,774,170 | |
Greenlight Capital Re Ltd., Class A * | | | 12,936 | | | | 406,837 | |
HFF, Inc., Class A | | | 65,784 | | | | 2,098,510 | |
Hilltop Holdings, Inc. * | | | 75,694 | | | | 1,855,260 | |
Interactive Brokers Group, Inc., Class A | | | 95,697 | | | | 2,128,301 | |
Investment Technology Group, Inc. * | | | 133,289 | | | | 2,303,234 | |
JGWPT Holdings, Inc., Class A * | | | 20,275 | | | | 387,658 | |
Legg Mason, Inc. | | | 43,100 | | | | 1,980,876 | |
LPL Financial Holdings, Inc. | | | 38,939 | | | | 2,090,246 | |
Manning & Napier, Inc. | | | 2,290 | | | | 33,640 | |
The accompanying notes are an integral part of the financial statements.
8
BOGLE INVESTMENT MANAGEMENT
SMALL CAP GROWTH FUND
PORTFOLIOOF INVESTMENTS (CONCLUDED)
FEBRUARY 28, 2014 (UNAUDITED)
| | | | | | | | |
| | | NUMBER
OF SHARES | | | VALUE | |
| | | | | | | | |
FINANCIAL—(CONTINUED) | | | | | |
Navigators Group, Inc., (The) * | | | 28,098 | | | $ | 1,703,301 | |
PartnerRe Ltd. | | | 18,700 | | | | 1,849,056 | |
Reinsurance Group of America, Inc. | | | 24,149 | | | | 1,859,232 | |
Symetra Financial Corp. | | | 98,776 | | | | 1,945,887 | |
Universal Insurance Holdings, Inc. | | | 62,686 | | | | 837,485 | |
Waddell & Reed Financial, Inc., Class A | | | 26,530 | | | | 1,849,141 | |
WSFS Financial Corp. | | | 17,565 | | | | 1,252,209 | |
| | | | | | | | |
| | | | | | | 46,752,770 | |
| | | | | | | | |
INDUSTRIAL—9.7% | | | | | | | | |
AECOM Technology, Corp. * | | | 59,517 | | | | 1,900,973 | |
AEP Industries, Inc. * | | | 3,248 | | | | 138,430 | |
AMERCO, Inc. | | | 7,946 | | | | 1,850,941 | |
American Science & Engineering, Inc. | | | 1,796 | | | | 118,087 | |
Argan, Inc. | | | 8,031 | | | | 229,606 | |
Arkansas Best Corp. | | | 18,997 | | | | 631,840 | |
Broadwind Energy, Inc. * | | | 32,966 | | | | 318,122 | |
Caesarstone Sdot-Yam Ltd. | | | 48,976 | | | | 2,895,461 | |
Canadian Solar, Inc. * | | | 55,181 | | | | 2,308,773 | |
Casella Waste Systems, Inc., Class A * | | | 1,554 | | | | 8,329 | |
CIRCOR International, Inc. | | | 23,691 | | | | 1,695,328 | |
Comfort Systems USA, Inc. | | | 93,568 | | | | 1,537,322 | |
Drew Industries, Inc. | | | 1,200 | | | | 59,088 | |
Fuel-Tech N.V. * | | | 11,173 | | | | 71,395 | |
Graphic Packaging Holding Co. * | | | 22,700 | | | | 232,448 | |
Griffon Corp. | | | 54,549 | | | | 676,408 | |
Methode Electronics, Inc. | | | 49,712 | | | | 1,685,237 | |
Mueller Water Products, Inc., Class A | | | 216,044 | | | | 2,084,825 | |
Navios Maritime Holdings, Inc. | | | 8,625 | | | | 82,714 | |
NN, Inc. | | | 35,217 | | | | 679,336 | |
Orion Energy Systems, Inc. * | | | 22,446 | | | | 124,126 | |
PGT, Inc. * | | | 12,233 | | | | 141,780 | |
Spirit Aerosystems Holdings, Inc., Class A * | | | 66,314 | | | | 1,911,833 | |
Star Bulk Carriers Corp. * | | | 29,603 | | | | 365,597 | |
Trex Co, Inc. * | | | 14,361 | | | | 1,123,317 | |
Universal Forest Products, Inc. | | | 624 | | | | 34,776 | |
US Concrete, Inc. * | | | 478 | | | | 13,011 | |
| | | | | | | | |
| | | | | | | 22,919,103 | |
| | | | | | | | |
| | | | | | | | |
| | | NUMBER
OF SHARES | | | VALUE | |
| | | | | | | | |
TECHNOLOGY—12.1% | | | | | | | | |
Aspen Technology, Inc. * | | | 51,066 | | | $ | 2,397,549 | |
Brocade Communications Systems, Inc. * | | | 277,310 | | | | 2,653,857 | |
Callidus Software, Inc. * | | | 39,421 | | | | 486,061 | |
Cascade Microtech, Inc. * | | | 2,734 | | | | 24,333 | |
Cimatron, Ltd. * | | | 24,014 | | | | 233,176 | |
Dot Hill Systems Corp. * | | | 6,358 | | | | 33,888 | |
Electronics for Imaging, Inc. * | | | 3,800 | | | | 169,480 | |
Himax Technologies, Inc., ADR | | | 253,843 | | | | 3,505,572 | |
iGATE Corp. * | | | 52,857 | | | | 1,789,209 | |
Intersil Corp., Class A | | | 131,012 | | | | 1,666,473 | |
Lattice Semiconductor Corp. * | | | 123,365 | | | | 933,873 | |
Manhattan Associates, Inc. * | | | 78,800 | | | | 2,985,732 | |
Marvell Technology Group, Ltd. | | | 122,951 | | | | 1,879,921 | |
MaxLinear, Inc., Class A * | | | 20,715 | | | | 193,685 | |
MedAssets, Inc. * | | | 42,598 | | | | 1,034,705 | |
MicroStrategy, Inc., Class A * | | | 137 | | | | 17,691 | |
Omnicell, Inc. * | | | 71,051 | | | | 2,044,848 | |
Pegasystems, Inc. | | | 39,861 | | | | 1,659,413 | |
Pixelworks, Inc. * | | | 28,624 | | | | 142,548 | |
Silicon Image, Inc. * | | | 205,581 | | | | 1,243,765 | |
Take-Two Interactive Software, Inc. * | | | 106,189 | | | | 2,099,357 | |
Ultra Clean Holdings * | | | 28,511 | | | | 375,205 | |
Unisys Corp. * | | | 34,581 | | | | 1,183,362 | |
| | | | | | | | |
| | | | | | | 28,753,703 | |
| | | | | | | | |
UTILITY—0.0% | | | | | | | | |
Pampa Energia SA, SP ADR * | | | 15,334 | | | | 74,830 | |
| | | | | | | | |
TOTAL COMMON STOCKS
(Cost $191,522,864) | | | | 234,906,446 | |
| | | | | | | | |
SHORT-TERM INVESTMENTS—1.0% | | | | | |
BofA Cash Reserves Fund | | | 2,474,454 | | | | 2,474,454 | |
| | | | | | | | |
TOTAL SHORT-TERM INVESTMENTS (Cost $2,474,454) | | | | 2,474,454 | |
| | | | | | | | |
TOTAL INVESTMENTS—99.9%
(Cost $193,997,318) | | | | 237,380,900 | |
| | | | | | | | |
OTHER ASSETSIN EXCESSOF LIABILITIES—0.1% | | | | 213,128 | |
| | | | | | | | |
NET ASSETS—100.0% | | | $ | 237,594,028 | |
| | | | | | | | |
* Non-income producing.
ADR—American Depositary Receipt.
SP ADR—Sponsored American Depositary Receipt.
The accompanying notes are an integral part of the financial statements.
9
BOGLE INVESTMENT MANAGEMENT
SMALL CAP GROWTH FUND
STATEMENTOF ASSETSAND LIABILITIES
FEBRUARY 28, 2014
(UNAUDITED)
| | | | |
ASSETS | | | | |
Investments, at value (cost $193,997,318) | | $ | 237,380,900 | |
Receivables for: | | | | |
Investments sold | | | 5,827,377 | |
Capital shares sold | | | 437,700 | |
Dividends and interest | | | 122,549 | |
Prepaid expenses and other assets | | | 29,330 | |
| | | | |
Total assets | | | 243,797,856 | |
| | | | |
LIABILITIES | | | | |
Payables for: | | | | |
Investments purchased | | | 5,642,225 | |
Capital shares redeemed | | | 301,733 | |
Investment advisory fees and shareholder servicing fees | | | 172,719 | |
Other accrued expenses and liabilities | | | 87,151 | |
| | | | |
Total liabilities | | | 6,203,828 | |
| | | | |
Net assets | | $ | 237,594,028 | |
| | | | |
NET ASSETS CONSIST OF | | | | |
Capital stock, $0.001 par value | | $ | 6,699 | |
Paid-in capital | | | 190,130,617 | |
Accumulated net investment loss | | | (727,956 | ) |
Accumulated net realized gain from investments | | | 4,801,086 | |
Net unrealized appreciation on investments | | | 43,383,582 | |
| | | | |
Net assets | | $ | 237,594,028 | |
| | | | |
INSTITUTIONAL CLASS | | | | |
Net assets | | $ | 133,040,853 | |
| | | | |
Shares outstanding ($0.001 par value, 100,000,000 shares authorized) | | | 3,724,803 | |
| | | | |
Net asset value, offering and redemption price per share | | $ | 35.72 | |
| | | | |
INVESTOR CLASS | | | | |
Net assets | | $ | 104,553,175 | |
| | | | |
Shares outstanding ($0.001 par value, 100,000,000 shares authorized) | | | 2,974,465 | |
| | | | |
Net asset value, offering and redemption price per share | | $ | 35.15 | |
| | | | |
The accompanying notes are an integral part of the financial statements.
10
BOGLE INVESTMENT MANAGEMENT
SMALL CAP GROWTH FUND
STATEMENTOF OPERATIONS
FORTHE SIX MONTHS ENDED FEBRUARY 28, 2014
(UNAUDITED)
| | | | |
INVESTMENT INCOME | | | | |
Dividends (net of foreign withholding taxes of $6,383) | | $ | 580,081 | |
| | | | |
Total investment income | | | 580,081 | |
| | | | |
EXPENSES | | | | |
Advisory fees | | | 1,011,305 | |
Administration and accounting fees | | | 142,349 | |
Transfer agent fees | | | 84,414 | |
Shareholder servicing fees (Investor Class) | | | 43,906 | |
Custodian fees | | | 29,526 | |
Professional fees | | | 27,750 | |
Registration and filing fees | | | 16,623 | |
Directors’ and officers’ fees | | | 13,152 | |
Printing and shareholder reporting fees | | | 7,143 | |
Insurance fees | | | 4,822 | |
Other expenses | | | 2,850 | |
| | | | |
Total expenses before waivers | | | 1,383,840 | |
Less: waivers | | | (75,803 | ) |
| | | | |
Net expenses after waivers | | | 1,308,037 | |
| | | | |
Net investment loss | | | (727,956 | ) |
| | | | |
NET REALIZED AND UNREALIZED GAIN FROM INVESTMENTS | | | | |
Net realized gain from investments | | | 15,708,651 | |
Net change in unrealized appreciation on investments | | | 23,751,846 | |
| | | | |
Net realized and unrealized gain from investments | | | 39,460,497 | |
| | | | |
NET INCREASE IN NET ASSETS RESULTING FROM OPERATIONS | | $ | 38,732,541 | |
| | | | |
The accompanying notes are an integral part of the financial statements.
11
BOGLE INVESTMENT MANAGEMENT
SMALL CAP GROWTH FUND
STATEMENTOF CHANGESIN NET ASSETS
| | | | | | | | |
| | | SIX MONTHS ENDED
FEBRUARY 28, 2014
(UNAUDITED) | | | FORTHE
YEAR ENDED
AUGUST 31, 2013 | |
INCREASE IN NET ASSETS FROM OPERATIONS: | | | | | | | | |
Net investment income/(loss) | | $ | (727,956 | ) | | $ | 444,946 | |
Net realized gain from investments | | | 15,708,651 | | | | 27,538,811 | |
Net change in unrealized appreciation on investments | | | 23,751,846 | | | | 12,575,436 | |
| | | | | | | | |
Net increase in net assets resulting from operations | | | 38,732,541 | | | | 40,559,193 | |
| | | | | | | | |
DISTRIBUTIONS TO SHAREHOLDERS FROM: | | | | | | | | |
Net investment income: | | | | | | | | |
Institutional Class | | | (211,233 | ) | | | – | |
Investor Class | | | (92,940 | ) | | | – | |
| | | | | | | | |
Net decrease in net assets from distributions to shareholders | | | (304,173 | ) | | | – | |
| | | | | | | | |
INCREASE/(DECREASE) IN NET ASSETS DERIVED FROM CAPITAL TRANSACTIONS: | | | | | | | | |
Institutional Class | | | | | | | | |
Proceeds from shares sold | | | 25,860,676 | | | | 42,247,780 | |
Reinvestment of distributions | | | 205,141 | | | | – | |
Distributions for shares redeemed | | | (13,439,283 | ) | | | (12,679,166 | ) |
| | | | | | | | |
Total Institutional Class | | | 12,626,534 | | | | 29,568,614 | |
Investor Class | | | | | | | | |
Proceeds from shares sold | | | 15,910,431 | | | | 11,489,567 | |
Reinvestment of distributions | | | 87,770 | | | | – | |
Distributions for shares redeemed | | | (5,940,979 | ) | | | (11,672,816 | ) |
| | | | | | | | |
Total Investor Class | | | 10,057,222 | | | | (183,249 | ) |
| | | | | | | | |
Net increase in net assets from capital share transactions | | | 22,683,756 | | | | 29,385,365 | |
| | | | | | | | |
Total increase in net assets | | | 61,112,124 | | | | 69,944,558 | |
NET ASSETS | | | | | | | | |
Beginning of period | | | 176,481,904 | | | | 106,537,346 | |
| | | | | | | | |
End of period | | $ | 237,594,028 | | | $ | 176,481,904 | |
| | | | | | | | |
Undistributed accumulated net investment income/(loss), end of period | | $ | (727,956 | ) | | $ | 304,173 | |
| | | | | | | | |
The accompanying notes are an integral part of the financial statements.
12
BOGLE INVESTMENT MANAGEMENT
SMALL CAP GROWTH FUND
STATEMENTOF CHANGESIN NET ASSETS (CONCLUDED)
| | | | | | | | |
| | | SIX MONTHS ENDED
FEBRUARY 28, 2014
(UNAUDITED) | | | FORTHE
YEAR ENDED
AUGUST 31, 2013 | |
INCREASE/(DECREASE) IN SHARES OUTSTANDING DERIVED FROM SHARE TRANSACTIONS: | | | | | | | | |
Institutional Class | | | | | | | | |
Shares sold | | | 768,185 | | | | 1,605,385 | |
Shares reinvested | | | 6,207 | | | | – | |
Shares redeemed | | | (403,669 | ) | | | (481,557 | ) |
| | | | | | | | |
Total Institutional Class | | | 370,723 | | | | 1,123,828 | |
| | | | | | | | |
Investor Class | | | | | | | | |
Shares sold | | | 481,277 | | | | 432,705 | |
Shares reinvested | | | 2,698 | | | | – | |
Shares redeemed | | | (184,400 | ) | | | (465,512 | ) |
| | | | | | | | |
Total Investor Class | | | 299,575 | | | | (32,807 | ) |
| | | | | | | | |
Total increase in shares outstanding derived from share transactions | | | 670,298 | | | | 1,091,021 | |
| | | | | | | | |
The accompanying notes are an integral part of the financial statements.
13
BOGLE INVESTMENT MANAGEMENT
SMALL CAP GROWTH FUND
FINANCIAL HIGHLIGHTS
Contained below is per share operating performance data for each class of shares outstanding, total investment return, ratios to average net assets and other supplemental data for the respective periods. This information has been derived from information provided in the financial statements.
| | | | | | | | | | | | | | | | | | | | | | | | |
| | | INSTITUTIONAL CLASS | |
| | | FOR THE
SIX MONTHS
ENDED
2/28/14
(UNAUDITED) | | | FOR THE
YEAR
ENDED
8/31/13 | | | FOR THE
YEAR
ENDED
8/31/12 | | | FOR THE
YEAR
ENDED
8/31/11 | | | FOR THE
YEAR
ENDED
8/31/10 | | | FOR THE
YEAR
ENDED
8/31/09 | |
PER SHARE OPERATING PERFORMANCE | | | | | | | | | | | | | | | | | | | | | | | | |
Net asset value, beginning of period | | $ | 29.49 | | | $ | 21.76 | | | $ | 19.38 | | | $ | 14.81 | | | $ | 14.03 | | | $ | 17.35 | |
| | | | | | | | | | | | | | | | | | | | | | | | |
Net investment gain/(loss)* | | | (0.11 | ) | | | 0.10 | | | | (0.04 | ) | | | (0.10 | ) | | | (0.07 | ) | | | (0.05 | ) |
Net realized and unrealized gain/(loss)
from investments | | | 6.40 | | | | 7.63 | | | | 2.42 | | | | 4.67 | | | | 0.85 | | | | (3.27 | ) |
| | | | | | | | | | | | | | | | | | | | | | | | |
Net increase/(decrease) in net assets resulting
from operations | | | 6.29 | | | | 7.73 | | | | 2.38 | | | | 4.57 | | | | 0.78 | | | | (3.32 | ) |
| | | | | | | | | | | | | | | | | | | | | | | | |
Dividends and distributions to shareholders from: | | | | | | | | | | | | | | | | | | | | | | | | |
Net investment income | | | (0.06 | ) | | | — | | | | — | | | | — | | | | — | | | | — | |
| | | | | | | | | | | | | | | | | | | | | | | | |
Total dividends and distributions to shareholders | | | (0.06 | ) | | | — | | | | — | | | | — | | | | — | | | | — | |
| | | | | | | | | | | | | | | | | | | | | | | | |
Net asset value, end of period | | $ | 35.72 | | | $ | 29.49 | | | $ | 21.76 | | | $ | 19.38 | | | $ | 14.81 | | | $ | 14.03 | |
| | | | | | | | | | | | | | | | | | | | | | | | |
Total investment return(1) | | | 21.36 | %(3) | | | 35.52 | % | | | 12.28 | % | | | 30.86 | % | | | 5.56 | % | | | (19.08 | )% |
| | | | | | | | | | | | | | | | | | | | | | | | |
RATIOS/SUPPLEMENTAL DATA | | | | | | | | | | | | | | | | | | | | | | | | |
Net assets, end of period (000’s omitted) | | $ | 133,041 | | | $ | 98,898 | | | $ | 48,526 | | | $ | 38,274 | | | $ | 31,714 | | | $ | 35,571 | |
Ratio of expenses to average net assets
with waivers and reimbursements | | | 1.25 | %(2) | | | 1.25 | % | | | 1.25 | % | | | 1.25 | % | | | 1.25 | % | | | 1.25 | % |
Ratio of expenses to average net assets
without waivers and reimbursements | | | 1.32 | %(2) | | | 1.39 | % | | | 1.51 | % | | | 1.44 | % | | | 1.51 | % | | | 1.57 | % |
Ratio of net investment gain/(loss) to average net assets | | | (0.68 | )%(2) | | | 0.37 | % | | | (0.21 | )% | | | (0.48 | )% | | | (0.48 | )% | | | (0.44 | )% |
Portfolio turnover rate | | | 85.08 | %(3) | | | 237.59 | % | | | 288.88 | % | | | 302.71 | % | | | 196.03 | % | | | 159.14 | % |
| * | Calculated based on average shares outstanding for the period. |
| (1) | Total investment return is calculated assuming a purchase of shares on the first day and a sale of shares on the last day of each period reported and includes reinvestments of dividends and distributions, if any. |
The accompanying notes are an integral part of the financial statements.
14
BOGLE INVESTMENT MANAGEMENT
SMALL CAP GROWTH FUND
FINANCIAL HIGHLIGHTS
Contained below is per share operating performance data for each class of shares outstanding, total investment return, ratios to average net assets and other supplemental data for the respective periods. This information has been derived from information provided in the financial statements.
| | | | | | | | | | | | | | | | | | | | | | | | |
| | | INVESTOR CLASS | |
| | | FOR THE
SIX MONTHS
ENDED
2/28/14
(UNAUDITED) | | | FOR THE
YEAR
ENDED
8/31/13 | | | FOR THE
YEAR
ENDED
8/31/12 | | | FOR THE
YEAR
ENDED
8/31/11 | | | FOR THE
YEAR
ENDED
8/31/10 | | | FOR THE
YEAR
ENDED
8/31/09 | |
PER SHARE OPERATING PERFORMANCE | | | | | | | | | | | | | | | | | | | | | | | | |
Net asset value, beginning of period | | $ | 29.00 | | | $ | 21.42 | | | $ | 19.10 | | | $ | 14.61 | | | $ | 13.86 | | | $ | 17.14 | |
| | | | | | | | | | | | | | | | | | | | | | | | |
Net investment gain/(loss)* | | | (0.13 | ) | | | 0.07 | | | | (0.07 | ) | | | (0.12 | ) | | | (0.09 | ) | | | (0.06 | ) |
Net realized and unrealized gain/(loss)
from investments | | | 6.31 | | | | 7.51 | | | | 2.39 | | | | 4.61 | | | | 0.84 | | | | (3.22 | ) |
| | | | | | | | | | | | | | | | | | | | | | | | |
Net increase/(decrease) in net assets resulting
from operations | | | 6.18 | | | | 7.58 | | | | 2.32 | | | | 4.49 | | | | 0.75 | | | | (3.28 | ) |
| | | | | | | | | | | | | | | | | | | | | | | | |
Dividends and distributions to shareholders from: | | | | | | | | | | | | | | | | | | | | | | | | |
Net investment income | | | (0.03 | ) | | | — | | | | — | | | | — | | | | — | | | | — | |
| | | | | | | | | | | | | | | | | | | | | | | | |
Total dividends and distributions to shareholders | | | (0.03 | ) | | | — | | | | — | | | | — | | | | — | | | | — | |
| | | | | | | | | | | | | | | | | | | | | | | | |
Net asset value, end of period | | $ | 35.15 | | | $ | 29.00 | | | $ | 21.42 | | | $ | 19.10 | | | $ | 14.61 | | | $ | 13.86 | |
| | | | | | | | | | | | | | | | | | | | | | | | |
Total investment return(1) | | | 21.34 | %(3) | | | 35.39 | % | | | 12.15 | % | | | 30.73 | % | | | 5.41 | % | | | (19.14 | )% |
| | | | | | | | | | | | | | | | | | | | | | | | |
RATIOS/SUPPLEMENTAL DATA | | | | | | | | | | | | | | | | | | | | | | | | |
Net assets, end of period (000’s omitted) | | $ | 104,553 | | | $ | 77,584 | | | $ | 58,011 | | | $ | 74,155 | | | $ | 48,446 | | | $ | 53,379 | |
Ratio of expenses to average net assets
with waivers and reimbursements | | | 1.35 | %(2) | | | 1.35 | % | | | 1.35 | % | | | 1.35 | % | | | 1.35 | % | | | 1.35 | % |
Ratio of expenses to average net assets
without waivers and reimbursements | | | 1.42 | %(2) | | | 1.49 | % | | | 1.60 | % | | | 1.54 | % | | | 1.62 | % | | | 1.67 | % |
Ratio of net investment gain/(loss) to
average net assets | | | (0.78 | )%(2) | | | 0.27 | % | | | (0.36 | )% | | | (0.58 | )% | | | (0.58 | )% | | | (0.56 | )% |
Portfolio turnover rate | | | 85.08 | %(3) | | | 237.59 | % | | | 288.88 | % | | | 302.71 | % | | | 196.03 | % | | | 159.14 | % |
| * | Calculated based on average shares outstanding for the period. |
| (1) | Total investment return is calculated assuming a purchase of shares on the first day and a sale of shares on the last day of each period reported and includes reinvestments of dividends and distributions, if any. |
The accompanying notes are an integral part of the financial statements.
15
BOGLE INVESTMENT MANAGEMENT
SMALL CAP GROWTH FUND
NOTESTO FINANCIAL STATEMENTS
(UNAUDITED)
| 1. | ORGANIZATIONAND SIGNIFICANT ACCOUNTING POLICIES |
The RBB Fund, Inc. (“RBB” or the “Company”) was incorporated under the laws of the State of Maryland on February 29, 1988 and is registered under the Investment Company Act of 1940, as amended, (the “1940 Act”) as an open-end management investment company. RBB is a “series fund,” which is a mutual fund divided into separate portfolios. Each portfolio is treated as a separate entity for certain matters under the 1940 Act, and for other purposes, and a shareholder of one portfolio is not deemed to be a shareholder of any other portfolio. Currently, RBB has twenty-one active investment portfolios, including the Bogle Investment Management Small Cap Growth Fund (the “Fund”), which commenced investment operations on October 1, 1999. As of February 28, 2014, the Fund offers two classes of shares, Institutional Class and Investor Class.
RBB has authorized capital of one hundred billion shares of common stock of which 81.373 billion shares are currently classified into one hundred and forty-eight classes of common stock. Each class represents an interest in an active or inactive RBB investment portfolio.
PORTFOLIO VALUATION — The Fund’s net asset value (“NAV”) is calculated once daily at the close of regular trading hours on the New York Stock Exchange (“NYSE”) (generally 4:00 p.m. Eastern time) on each day the NYSE is open. Securities held by the Fund are valued using the closing price or the last sale price on a national securities exchange or the National Association of Securities Dealers Automatic Quotation System (“NASDAQ”) market system where they are primarily traded. Equity securities traded in the over-the-counter market are valued at their closing prices. If there were no transactions on that day, securities traded principally on an exchange or on NASDAQ will be valued at the mean of the last bid and ask prices prior to the market close. Fixed income securities having a remaining maturity of greater than 60 days are valued using an independent pricing service. Fixed income securities having a remaining maturity of 60 days or less are valued at amortized cost, which approximates market value. Investments in other open-end investment companies are valued based on the NAV of those investment companies (which may use fair value pricing as discussed in their prospectuses). If market quotations are unavailable or deemed unreliable, securities will be valued in accordance with procedures adopted by RBB’s Board of Directors (the “Board”). Relying on prices supplied by pricing services or dealers or using fair valuation may result in values that are higher or lower than the values used by other investment companies and investors to price the same investments.
FAIR VALUE MEASUREMENTS — The inputs and valuation techniques used to measure fair value of the Fund’s investments are summarized into three levels as described in the hierarchy below:
| | • Level 1 – | quoted prices in active markets for identical securities; |
| | • Level 2 – | other significant observable inputs (including quoted prices for similar securities, interest rates, prepayment speeds, credit risk, etc.); and |
| | • Level 3 – | significant unobservable inputs (including the Fund’s own assumptions in determining the fair value of investments). |
The inputs or methodology used for valuing securities are not necessarily an indication of the risk associated with investing in those securities.
The following is a summary of the inputs used, as of February 28, 2014, in valuing the Fund’s investments carried at fair value:
| | | | | | | | | | | | | | | | |
| | | Total
Value at
February 28, 2014 | | | Level 1
Quoted
Price | | | Level 2
Significant
Observable
Inputs | | | Level 3
Significant
Unobservable
Inputs | |
TOTAL INVESTMENTS* | | | $237,380,900 | | | | $237,380,900 | | | | $ — | | | | $ — | |
| | | | | | | | | | | | | | | | |
| * | See Portfolio of Investments for detail on portfolio holdings. |
16
BOGLE INVESTMENT MANAGEMENT
SMALL CAP GROWTH FUND
NOTESTO FINANCIAL STATEMENTS (CONTINUED)
(UNAUDITED)
At the end of each fiscal quarter, management evaluates the classification of Levels 1, 2 and 3 assets and liabilities. Various factors are considered, such as changes in liquidity from the prior reporting period; whether or not a broker is willing to execute at the quoted price; the depth and consistency of prices from third party pricing services; and the existence of contemporaneous, observable trades in the market. Additionally, management evaluates the classification of Level 1 and Level 2 assets and liabilities on a quarterly basis for changes in listings or delistings on national exchanges.
Due to the inherent uncertainty of determining the fair value of investments that do not have a readily available market value, the fair value of the Fund’s investments may fluctuate from period to period. Additionally, the fair value of investments may differ significantly from the values that would have been used had a ready market existed for such investments and may differ materially from the values the Fund may ultimately realize. Further, such investments may be subject to legal and other restrictions on resale or otherwise less liquid than publicly traded securities.
For fair valuations using significant unobservable inputs, U.S. generally accepted accounting principles (“U.S. GAAP”) require the Fund to present a reconciliation of the beginning to ending balances for reported market values that presents changes attributable to total realized and unrealized gains or losses, purchase and sales, and transfers in and out of Level 3 during the period. Transfers in and out between Levels are based on values at the end of the period. U.S. GAAP also requires the Fund to disclose amounts and reasons for all transfers in and out of Level 1 and Level 2 fair value measurements. A reconciliation of Level 3 investments is presented only when the Fund had an amount of Level 3 investments at the end of the reporting period that was meaningful in relation to its net assets. The amounts and reasons for all transfers in and out of each Level within the three-tier hierarchy are disclosed when the Fund had an amount of total transfers during the reporting period that was meaningful in relation to its net assets as of the end of the reporting period.
For the six months ended February 28, 2014, there were no transfers between Levels 1, 2 and 3 for the Fund.
USEOF ESTIMATES — The preparation of financial statements in conformity with U.S. GAAP requires management to make estimates and assumptions that affect the reported amounts of assets and liabilities and disclosure of contingent assets and liabilities at the date of the financial statements and the reported amounts of revenues and expenses during the period. Actual results could differ from those estimates and those differences could be significant.
INVESTMENT TRANSACTIONS, INVESTMENT INCOMEAND EXPENSES — The Fund records security transactions based on trade date for financial reporting purposes. The cost of investments sold is determined by use of the specific identification method for both financial reporting and income tax purposes in determining realized gains and losses on investments. Interest income is accrued when earned. Dividend income is recorded on the ex-dividend date. The Fund’s net investment income (other than class specific shareholder servicing fees) and unrealized and realized gains and losses are allocated daily to each class of shares based upon the relative proportion of net assets of each class at the beginning of the day. Expenses incurred on behalf of a specific class, fund or fund family of the Company are charged directly to the class, fund or fund family (in proportion to net assets). Expenses incurred for all of the RBB funds (such as director or professional fees) are charged to all funds in proportion to their average net assets of RBB, or in such other manner as the Company’s Board deems fair or equitable. Expenses and fees, including investment advisory and administration fees, are accrued daily for the purpose of determining the NAV of the Fund.
DIVIDENDSAND DISTRIBUTIONSTO SHAREHOLDERS — Dividends from net investment income and distributions from net realized capital gains, if any, will be declared and paid at least annually to shareholders and recorded on the ex-dividend date. Income dividends and capital gains distributions are determined in accordance with U.S. federal income tax regulations which may differ from U.S. GAAP.
17
BOGLE INVESTMENT MANAGEMENT
SMALL CAP GROWTH FUND
NOTESTO FINANCIAL STATEMENTS (CONTINUED)
(UNAUDITED)
U.S. TAX STATUS — No provision is made for U.S. income taxes as it is the Fund’s intention to qualify for and elect the tax treatment applicable to regulated investment companies under Subchapter M of the Internal Revenue Code of 1986, as amended, and make the requisite distributions to its shareholders which will be sufficient to relieve it from U.S. income and excise taxes.
CASHAND CASH EQUIVALENTS — The Fund considers liquid assets deposited into bank demand deposit accounts to be cash equivalents. These investments represent amounts held with financial institutions that are readily accessible to pay Fund expenses or purchase investments. Cash and cash equivalents are valued at cost plus accrued interest, which approximates market value.
OTHER — In the normal course of business, the Fund may enter into contracts that provide general indemnifications. The Fund’s maximum exposure under these arrangements is dependent on claims that may be made against the Fund in the future, and, therefore, cannot be estimated; however, based on experience, the risk of material loss from such claims is considered remote.
| 2. | INVESTMENT ADVISERAND OTHER SERVICES |
Bogle Investment Management, L.P. (the “Adviser” or “Bogle”) serves as the Fund’s investment adviser. For its advisory services, the Adviser is entitled to receive a monthly fee from the Fund calculated at an annual rate of 1.00% of the Fund’s average daily net assets.
The Adviser has contractually agreed to waive management fees and reimburse expenses to the extent that total annual Fund operating expenses (excluding certain items discussed below) exceed 1.25% and 1.35% for the Institutional Class and Investor Class, respectively. In determining the Adviser’s obligation to waive advisory fees and/or reimburse expenses, the following expenses are not taken into account: acquired fund fees and expenses, brokerage commissions, extraordinary items, interest or taxes. This contractual limitation is in effect until December 31, 2014 and may not be terminated without the approval of the Company’s Board. The Adviser may discontinue these arrangements at any time after December 31, 2014.
The contractual fee waiver does not provide for recoupment of fees that were waived or expenses that were reimbursed. For the six months ended February 28, 2014, investment advisory fees and waivers of the Fund were as follows:
| | | | | | | | | | |
GROSS
ADVISORY FEES | | | WAIVERS | | | NET
ADVISORY FEES | |
| $ | 1,011,305 | | | $ | 63,162 | | | $ | 948,143 | |
The Fund will not pay the Adviser at a later time for any amounts waived or any amounts assumed.
In addition to serving as the Fund’s investment adviser, Bogle provides certain shareholder services to the Investor Class of the Fund. As compensation for such services, the Adviser receives a monthly fee equal to an annual rate of 0.10% of the average daily net assets of the Fund’s Investor Class.
BNY Mellon Investment Servicing (US) Inc. (“BNY Mellon”) serves as administrator for the Fund. For providing administrative and accounting services, BNY Mellon is entitled to receive a monthly fee equal to an annual percentage rate of the Fund’s average daily net assets, subject to certain minimum monthly fees.
BNY Mellon has voluntarily agreed to waive a portion of its administration and accounting fees for the Fund. For the six months ended February 28, 2014, administration and accounting fees and waivers of the Fund were as follows:
| | | | | | | | | | |
GROSS ADMINISTRATION
AND ACCOUNTING
FEES | | | WAIVERS | | | NET ADMINISTRATION
AND ACCOUNTING
FEES | |
| $ | 142,349 | | | $ | 12,641 | | | $ | 129,708 | |
18
BOGLE INVESTMENT MANAGEMENT
SMALL CAP GROWTH FUND
NOTESTO FINANCIAL STATEMENTS (CONTINUED)
(UNAUDITED)
Included in the administration and accounting services fees, shown on the Statement of Operations, are fees for providing regulatory administration services to RBB. For providing these services, BNY Mellon is entitled to receive compensation as agreed to by the Company and BNY Mellon. This fee is allocated to each portfolio of the Company in proportion to its net assets of the Company.
In addition, BNY Mellon serves as the Fund’s transfer and dividend disbursing agent. For providing transfer agent services, BNY Mellon is entitled to receive a monthly fee equal to an annual percentage rate of the Fund’s average daily net assets and is subject to certain minimum monthly fees.
The Bank of New York Mellon (the “Custodian”) provides certain custodial services to the Fund. The Custodian is entitled to receive a monthly fee equal to an annual percentage rate of the Fund’s average daily net assets, subject to certain minimum monthly fees.
Foreside Funds Distributors LLC serves as the principal underwriter and distributor of the Fund’s shares pursuant to a Distribution Agreement with RBB.
The Fund will not pay The Bank of New York Mellon Corporation or any of its members or BNY Mellon’s affiliates at a later time for any amounts waived or any amounts assumed.
The Directors of the Company receive an annual retainer, meeting fees and reimbursement of out-of-pocket expenses for meetings attended. The remuneration paid to the Directors by the Fund during the six months ended February 28, 2014 was $7,575. Certain employees of BNY Mellon serve as an Officer or Director of the Company. They are not compensated by the Fund or the Company.
| 4. | INVESTMENTIN SECURITIES |
For the six months ended February 28, 2014, aggregate purchases and sales of investment securities (excluding short-term investments) of the Fund were as follows:
| | | | | | |
| INVESTMENT SECURITIES | |
| PURCHASES | | | SALES | |
| $ | 192,951,430 | | | $ | 172,442,083 | |
| 5. | FEDERAL INCOME TAX INFORMATION |
The Fund has followed the authoritative guidance on accounting for and disclosure of uncertainty in tax positions, which requires the Fund to determine whether a tax position is more likely than not to be sustained upon examination, including resolution of any related appeals or litigation processes, based on the technical merits of the position. The Fund has determined that there was no effect on the financial statements from following this authoritative guidance. In the normal course of business, the Fund is subject to examination by federal, state and local jurisdictions, where applicable, for tax years for which applicable statutes of limitations have not expired.
As of February 28, 2014, federal tax cost, aggregate gross unrealized appreciation and depreciation of securities held by the Fund were as follows:
| | | | | | | | | | | | | | |
FEDERAL TAX
COST | | | UNREALIZED
APPRECIATION | | | UNREALIZED
DEPRECIATION | | | NET UNREALIZED
APPRECIATION | |
| $ | 193,997,318 | | | $ | 45,971,137 | | | $ | (2,587,555 | ) | | $ | 43,383,582 | |
Distributions to shareholders from net investment income and realized gains are determined in accordance with federal income tax regulations, which may differ from net investment income and realized gains recognized for financial reporting purposes. Accordingly, the character of distributions and composition of net
19
BOGLE INVESTMENT MANAGEMENT
SMALL CAP GROWTH FUND
NOTESTO FINANCIAL STATEMENTS (CONCLUDED)
(UNAUDITED)
assets for tax purposes may differ from those reflected in the accompanying financial statements. To the extent these differences are permanent, such amounts are reclassified within the capital accounts based on the tax treatment; temporary differences do not require such reclassification.
As of August 31, 2013, the components of distributable earnings on a tax basis were as follows:
| | | | | | | | | | | | | | |
CAPITAL LOSS
CARRYFORWARD | | | UNDISTRIBUTED
ORDINARY INCOME | | | UNDISTRIBUTED
LONG-TERM GAINS | | | UNREALIZED
APPRECIATION | |
| $ | (10,532,621 | ) | | $ | 304,173 | | | $ | — | | | $ | 19,256,792 | |
The differences between the book and tax basis components of distributable earnings relate principally to the timing of recognition of income and gains for federal income tax purposes. Short-term and foreign currency gains are reported as ordinary income for federal income tax purposes.
Pursuant to federal income tax rules applicable to regulated investment companies, the Fund may elect to treat certain capital losses between November 1 and August 31 and late year ordinary losses ((i) ordinary losses between January 1 and August 31, and (ii) specified ordinary and currency losses between November 1 and August 31) as occurring on the first day of the following tax year. For the year ended August 31, 2013, any amount of losses elected within the tax return will not be recognized for federal income tax purposes until September 1, 2013.
Accumulated capital losses represent net capital loss carryforwards as of August 31, 2013 that may be available to offset future realized capital gains and thereby reduce future capital gains distributions. Under the Regulated Investment Company Modernization Act of 2010 (the “Modernization Act”), the Fund is permitted to carry forward capital losses incurred in taxable years beginning after December 22, 2010 for an unlimited period. Any losses incurred during those future taxable years will be required to be utilized prior to any losses incurred in pre-enactment taxable years. Additionally, post-enactment capital losses that are carried forward will retain their character as either short-term or long-term capital losses rather than being considered all short-term as under the previous law. The Fund’s first fiscal year end subject to the Modernization Act was August 31, 2012.
As of August 31, 2013, the Fund had the following pre-enactment net capital loss carryforwards to offset future net capital gains, if any, to the extent provided by Treasury regulations. To the extent that these carryforwards are used to offset future capital gains, it is probable that the gains that are offset will not be distributed to shareholders.
| | | | | | | | | | |
| AUGUST 31, 2017 | | | AUGUST 31, 2018 | | | TOTAL | |
| $ | — | | | $ | 10,532,621 | | | $ | 10,532,621 | |
As of August 31, 2013, the Fund did not have any post-enactment capital loss carryforwards.
Management has evaluated the impact of all subsequent events on the Fund through the date the financial statements were issued, and has determined that there were no subsequent events requiring recognition or disclosure in the financial statements.
20
BOGLE INVESTMENT MANAGEMENT
SMALL CAP GROWTH FUND
OTHER INFORMATION
(UNAUDITED)
PROXY VOTING
Policies and procedures that the Fund uses to determine how to vote proxies relating to portfolio securities as well as information regarding how the Fund voted proxies relating to portfolio securities for the most recent 12-month period ended June 30 are available without charge, upon request, by calling (877) 264-5346 and on the Securities and Exchange Commission’s (“SEC”) website at http://www.sec.gov.
QUARTERLY PORTFOLIO SCHEDULES
The Company files its complete schedule of portfolio holdings with the SEC for the first and third fiscal quarters of each fiscal year (quarters ended November 30 and May 31) on Form N-Q. The Company’s Form N-Q is available on the SEC website at http://www.sec.gov and may be reviewed and copied at the SEC Public Reference Room in Washington, D.C. Information on the operation of the SEC Public Reference Room may be obtained by calling (202) 551-8090.
21
Investment Adviser
Bogle Investment Management, L.P.
2310 Washington Street
Suite 310
Newton Lower Falls, MA 02462
Administrator
BNY Mellon Investment Servicing (US) Inc.
301 Bellevue Parkway
Wilmington, DE 19809
Transfer Agent
BNY Mellon Investment Servicing (US) Inc.
4400 Computer Drive
Westborough, MA 01581
Principal Underwriter
Foreside Funds Distributors LLC
400 Berwyn Park
899 Cassatt Road
Berwyn, PA 19312
Custodian
The Bank of New York Mellon
One Wall Street
New York, NY 10286
Independent Registered Public Accounting Firm
PricewaterhouseCoopers LLP
Two Commerce Square, Suite 1700
2001 Market Street
Philadelphia, PA 19103-7042
Counsel
Drinker Biddle & Reath LLP
One Logan Square
Suite 2000
Philadelphia, PA 19103-6996
FREE MARKET U.S. EQUITY FUND
FREE MARKET INTERNATIONAL EQUITY FUND
FREE MARKET FIXED INCOME FUND
of
THE RBB FUND, INC.
SEMI-ANNUAL REPORT
February 28, 2014
(Unaudited)
This report is submitted for the general information of the shareholders of the Funds. It is not authorized for distribution unless preceded or accompanied by a current prospectus for the Funds.
FREE MARKET FUNDS
Semi-Annual Investment Adviser’s Report
February 28, 2014
(Unaudited)
Dear Shareholder,
The Free Market Funds (the “Funds”) have continued to gain assets and have well surpassed the $4 billion mark. We would like to extend a warm and grateful thank you to all investors who have embraced our Free Market Portfolio Strategies.
Over the past six months, investors who remained invested and diversified have continued to experience the gains from the upward rally (despite a few bumps along the way). Global equity markets over the six-month period ended February 28, 2014 have risen 13.81% as measured by the MSCI All Country World Index. Furthermore, U.S. stocks also performed well at 15.07%, as measured by the S&P 500 Index, outpacing international markets slightly over the same period. The Barclays Capital US Government/Credit Intermediate Bond Index was also in the positive with a return of 2.10% for the last six months.
Matson Money, Inc. (“Matson Money”) strives to deliver the performance of capital markets and add value through Free Market Investment Strategies and Structured Market Portfolios. Grounded in the conviction that Free Markets work, Matson Money avoids the cost-generating activity of stock picking and market timing. Instead, we focus on the dimensions of capital markets that we believe reward investors as intelligently and effectively as possible. Our disciplined approach to life-long investing provides both the individual investor and the financial professional with the academic foundation upon which to help achieve investment goals.
Sound economic and financial research has documented that, over the long term, small cap stocks have outperformed large cap stocks, and value stocks have outperformed growth stocks. These returns seem to be compensation for risk. In fixed income, risk is well described by bond maturity and credit quality. Matson Money’s vehicles deliberately target specific risk and return trade-offs. The Funds are broadly diversified and designed to work together in your total investment plan.
We invite you to contact your financial professional or explore our website, www.MatsonMoney.com, to learn more about the concepts and strategies of Matson Money’s investing.
We appreciate your support and confidence in our firm’s investment philosophy, process and people.

Daniel J List
Chief Compliance Officer and Vice President
Matson Money, Inc.
1
FREE MARKET FUNDS
Performance Data
(Unaudited)
Free Market U.S. Equity Fund
| | | | | | | | | | | | | | | | | | | | |
| Total Returns for the Period Ended February 28, 2014 | |
| | | Average Annual | |
| | | Six
Months* | | | 1 Year | | | 3 Years | | | 5 Years | | | Since
Inception** | |
Free Market U.S. Equity Fund | | | 16.14% | | | | 29.57% | | | | 14.39% | | | | 27.46% | | | | 10.00% | |
Russell 2500® Index | | | 17.96% | | | | 29.97% | | | | 14.94% | | | | 27.63% | | | | 9.37% | |
Composite Index*** | | | 15.73% | | | | 26.78% | | | | 13.88% | | | | 24.55% | | | | 7.13% | |
| ** | Annualized — The Fund commenced operations on December 31, 2007. |
| *** | The Composite Index is comprised of the S&P 500® Index, Russell 1000® Value Index, Russell 2000® Index and Russell 2000® Value Index, each weighted 25%, 25%, 25% and 25%, respectively. |
The performance data quoted represents past performance. Past performance is not indicative of future results. Investment return and principal value will fluctuate so that an investor’s shares, when redeemed, may be worth more or less than their original cost. Current performance may be lower or higher. Returns shown include the reinvestment of all dividends and other distributions and do not reflect taxes that a shareholder would pay on Fund distributions or on the redemption of Fund shares. For performance data current to the most recent month-end, please call 1-866-780-0357 ext. 3863. The Fund’s annual operating expense ratio, as stated in the current prospectus, is 0.94% (included in the ratio is 0.32% attributable to acquired fund fees and expenses).
The Fund’s aggregate total return since inception is based on an increase in net asset value from $10.00 per share on December 31, 2007 (commencement of operations) to $16.47 per share on February 28, 2014.
The Free Market U.S. Equity Fund’s underlying funds invest in small-cap and micro-cap stocks, large-cap stocks and other equity securities. In addition to the ordinary risks of equity investing, small companies entail special risk. Small companies tend to have more risk than large companies. An investor in the Fund will incur the expenses of the underlying funds in addition to the Fund expenses.
Free Market International Equity Fund
| | | | | | | | | | | | | | | | | | | | |
| Total Returns for the Period Ended February 28, 2014 | |
| | | Average Annual | |
| | | Six
Months* | | | 1 Year | | | 3 Years | | | 5 Years | | | Since
Inception** | |
Free Market International Equity Fund | | | 17.63% | | | | 20.99% | | | | 5.54% | | | | 20.72% | | | | 3.38% | |
MSCI World (excluding U.S.) Index | | | 14.37% | | | | 17.91% | | | | 5.72% | | | | 17.47% | | | | 0.46% | |
Composite Index*** | | | 14.51% | | | | 15.21% | | | | 5.35% | | | | 19.21% | | | | 0.97% | |
| ** | Annualized — The Fund commenced operations on December 31, 2007. |
| *** | The Composite Index is comprised of the MSCI EAFE Index, MSCI EAFE Value Index, MSCI EAFE Small Company Index, and MSCI Emerging Markets Free Index, each weighted 25%, 25%, 25% and 25%, respectively. |
The performance data quoted represents past performance. Past performance is not indicative of future results. Investment return and principal value will fluctuate so that an investor’s shares, when redeemed, may be worth more or less than their original cost. Current performance may be lower or higher. Returns shown include the reinvestment of all dividends and other distributions and do not reflect taxes that a shareholder would pay on Fund distributions or on the redemption of Fund shares. For performance data current to the most recent month-end, please call 1-866-780-0357 ext. 3863. The Fund’s annual operating expense ratio, as stated in the current prospectus, is 1.18% (included in the ratio is 0.53% attributable to acquired fund fees and expenses).
The Fund’s aggregate total return since inception is based on an increase in net asset value from $10.00 per share on December 31, 2007 (commencement of operations) to $10.66 per share on February 28, 2014.
Portfolio composition is subject to change.
The Free Market International Equity Fund’s underlying funds invest in common stock, preferred stock, securities convertible into stocks and other equity securities issued by foreign companies. In addition to the ordinary risks of equity investing, foreign and small companies entail special risk. The return on foreign equities may be adversely affected by currency fluctuations. Emerging markets may be subject to social instability and lack of market liquidity. Small companies tend to have more risk than large companies. An investor in the Fund will incur the expenses of the underlying funds in addition to the Fund expenses.
2
FREE MARKET FUNDS
Performance Data
(Unaudited)
Free Market Fixed Income Fund
| | | | | | | | | | | | | | | | | | | | |
| Total Returns for the Period Ended February 28, 2014 | |
| | | Average Annual | |
| | | Six
Months* | | | 1 Year | | | 3 Years | | | 5 Years | | | Since
Inception** | |
Free Market Fixed Income Fund | | | 0.89% | | | | -0.76% | | | | 1.36% | | | | 1.82% | | | | 2.02% | |
Citigroup World Govt. Bond 1-5 Year Currency | | | 1.14% | | | | 1.04% | | | | 1.92% | | | | 1.93% | | | | 2.66% | |
Composite Index*** | | | 1.34% | | | | 0.20% | | | | 2.01% | | | | 2.60% | | | | 2.89% | |
| ** | Annualized — The Fund commenced operations on December 31, 2007. |
| *** | The Composite Index is comprised of the Three-Month Treasury Bill Index, Barclays Capital Intermediate Government Bond Index, BofA Merrill Lynch 1-3 Year US Government/Corporate Index and Barclays Capital Aggregate Bond Index, each weighted 25%, 25%, 25% and 25%, respectively. |
The performance data quoted represents past performance. Past performance is not indicative of future results. Investment return and principal value will fluctuate so that an investor’s shares, when redeemed, may be worth more or less than their original cost. Current performance may be lower or higher. Returns shown include the reinvestment of all dividends and other distributions and do not reflect taxes that a shareholder would pay on Fund distributions or on the redemption of Fund shares. For performance data current to the most recent month-end, please call 1-866-780-0357 ext. 3863. The Fund’s annual operating expense ratio, as stated in the current prospectus, is 0.81% (included in the ratio is 0.19% attributable to acquired fund fees and expenses).
The Fund’s aggregate total return since inception is based on an increase in net asset value from $10.00 per share on December 31, 2007 (commencement of operations) to $10.27 per share on February 28, 2014.
Portfolio composition is subject to change.
The Free Market Fixed Income Fund’s underlying funds invest in fixed income securities. The underlying funds may invest their assets in bonds and other debt securities issued by domestic and foreign governments and companies. Debt instruments involve the risk that their prices will fall when interest rates rise, and they are subject to the risk that the borrower may default. In addition, the return on foreign debt securities may be adversely affected by currency fluctuations. An investor in the Fund will incur expenses of the underlying funds in addition to the Fund expenses.
3
FREE MARKET FUNDS
Fund Expense Examples
(Unaudited)
As a shareholder of the Fund(s), you incur two types of costs: (1) transaction costs, including redemption fees; and (2) ongoing costs, including management fees and other Fund expenses. These examples are intended to help you understand your ongoing costs (in dollars) of investing in the Fund(s) and to compare these costs with the ongoing costs of investing in other mutual funds.
These examples are based on an investment of $1,000 invested at the beginning of the six-month period from September 1, 2013 through February 28, 2014, and held for the entire period.
Actual Expenses
The first line of the accompanying tables provides information about actual account values and actual expenses. You may use the information in this line, together with the amount you invested, to estimate the expenses that you paid over the period. Simply divide your account value by $1,000 (for example, an $8,600 account value divided by $1,000 = 8.6), then multiply the result by the number in the first line under the heading entitled “Expenses Paid During Period” to estimate the expenses you paid on your account during this period.
Hypothetical Example for Comparison Purposes
The second line of the accompanying tables provides information about hypothetical account values and hypothetical expenses based on the Fund’s actual expense ratio and an assumed rate of return of 5% per year before expenses, which is not your Fund’s actual return. The hypothetical account values and expenses may not be used to estimate the actual ending account balance or expenses you paid for the period. You may use this information to compare the ongoing costs of investing in the Fund and other funds. To do so, compare these 5% hypothetical examples with the 5% hypothetical examples that appear in the shareholder reports of other funds.
Please note that the expenses shown in the accompanying tables are meant to highlight your ongoing costs only and do not reflect any transactional costs, such as redemption fees. Therefore, the second line of the accompanying tables is useful in comparing ongoing costs only, and will not help you determine the relative total costs of owning different funds. In addition, if these transactional costs were included, your costs would have been higher.
| | | | | | | | | | | | |
| | | Free Market U.S. Equity Fund | |
| | | Beginning Account Value
September 1, 2013 | | | Ending Account Value
February 28, 2014 | | | Expenses Paid
During Period* | |
Actual | | $ | 1,000.00 | | | $ | 1,161.40 | | | $ | 3.22 | |
Hypothetical (5% return before expenses) | | | 1,000.00 | | | | 1,021.82 | | | | 3.01 | |
| |
| | | Free Market International Equity Fund | |
| | | Beginning Account Value
September 1, 2013 | | | Ending Account Value
February 28, 2014 | | | Expenses Paid
During Period* | |
Actual | | $ | 1,000.00 | | | $ | 1,176.30 | | | $ | 3.35 | |
Hypothetical (5% return before expenses) | | | 1,000.00 | | | | 1,021.72 | | | | 3.11 | |
4
FREE MARKET FUNDS
Fund Expense Examples (Concluded)
(Unaudited)
| | | | | | | | | | | | |
| |
| | | Free Market Fixed Income Fund | |
| | | Beginning Account Value
September 1, 2013 | | | Ending Account Value
February 28, 2014 | | | Expenses Paid
During Period* | |
Actual | | $ | 1,000.00 | | | $ | 1,008.90 | | | $ | 2.99 | |
Hypothetical (5% return before expenses) | | | 1,000.00 | | | | 1,021.82 | | | | 3.01 | |
| * | Expenses are equal to an annualized six-month expense ratio of 0.60% for the Free Market U.S. Equity Fund, 0.62% for the Free Market International Equity Fund and 0.60% for the Free Market Fixed Income Fund, multiplied by the average account value over the period, multiplied by the number of days in the most recent fiscal half-year (181), then divided by 365 to reflect the one-half year period. The annualized expense ratios do not reflect fees and expenses associated with the underlying funds. If such fees and expenses had been included, the expenses would have been higher. The range of weighted expense ratios of the underlying funds held by the Funds, as stated in the underlying funds’ current prospectuses, were as follows: |
| | | | |
Free Market U.S.
Equity Fund | | Free Market International
Equity Fund | | Free Market Fixed
Income Fund |
| 0.01%-0.13% | | 0.01%-0.28% | | 0.01%-0.07% |
Each Fund’s ending account values on the first line in each table are based on the actual six-month total return for each Fund of 16.14% for the Free Market U.S. Equity Fund, 17.63% for the Free Market International Equity Fund and 0.89% for the Free Market Fixed Income Fund.
5
FREE MARKET FUNDS
FREE MARKET U.S. EQUITY FUND
Portfolio of Investments
February 28, 2014
(Unaudited)
| | | | | | | | |
| | | Number of
Shares | | | Value | |
| | |
EQUITY FUNDS — 99.9% | | | | | | | | |
U.S. Large Cap Value
Portfolio III(a) | | | 21,486,738 | | | $ | 505,797,806 | |
U.S. Large Company Portfolio(a) | | | 17,058,550 | | | | 250,760,685 | |
U.S. Micro Cap Portfolio(b) | | | 12,672,247 | | | | 253,825,098 | |
U.S. Small Cap Portfolio(b) | | | 8,142,155 | | | | 253,139,606 | |
U.S. Small Cap Value Portfolio(b) | | | 12,017,340 | | | | 425,654,189 | |
| | | | | | | | |
TOTAL EQUITY FUNDS
(Cost $1,117,633,176) | | | | | | | 1,689,177,384 | |
| | | | | | | | |
TOTAL INVESTMENTS — 99.9%
(Cost $1,117,633,176) | | | | | | | 1,689,177,384 | |
| | | | | | | | |
OTHER ASSETS IN EXCESS OF LIABILITIES — 0.1% | | | | | | | 2,160,710 | |
| | | | | | | | |
NET ASSETS — 100.0% | | | | | | $ | 1,691,338,094 | |
| | | | | | | | |
Portfolio Holdings Summary Table
| | | | | | | | |
| | | % of
Net Assets | | | Value | |
Equity Funds | | | 99.9% | | | $ | 1,689,177,384 | |
Other Assets In Excess Of Liabilities | | | 0.1% | | | | 2,160,710 | |
| | | | | | | | |
NET ASSETS | | | 100.0% | | | $ | 1,691,338,094 | |
| | | | | | | | |
| (a) | A portfolio of Dimensional Investment Group Inc. |
| (b) | A portfolio of DFA Investment Dimensions Group Inc. |
Portfolio holdings are subject to change at any time.
The accompanying notes are an integral part of the financial statements.
6
FREE MARKET FUNDS
FREE MARKET INTERNATIONAL EQUITY FUND
Portfolio of Investments
February 28, 2014
(Unaudited)
| | | | | | | | |
| | | Number of
Shares | | | Value | |
| |
INTERNATIONAL EQUITY FUNDS — 99.8% | | | | | |
Asia Pacific Small Company Portfolio(a) | | | 681,837 | | | $ | 15,954,979 | |
Canadian Small Company Series(b) | | | 1,303,692 | | | | 15,607,990 | |
Continental Small Company Portfolio(a) | | | 1,487,427 | | | | 34,002,582 | |
Continental Small Company Series(b) | | | 94,868 | | | | 6,626,975 | |
DFA International Small Cap Value Portfolio(a) | | | 23,414,333 | | | | 502,237,442 | |
DFA International Value Portfolio III(c) | | | 21,023,818 | | | | 373,593,245 | |
Emerging Markets Portfolio(a) | | | 2,633,170 | | | | 65,881,906 | |
Emerging Markets Small Cap Portfolio(a) | | | 3,043,115 | | | | 61,166,604 | |
Emerging Markets Value Portfolio(a) | | | 2,313,283 | | | | 60,723,675 | |
Japanese Small Company Portfolio(a) | | | 1,512,727 | | | | 27,955,186 | |
Large Cap International Portfolio(a) | | | 2,713,181 | | | | 61,996,191 | |
United Kingdom Small Company Portfolio(a) | | | 234,276 | | | | 9,684,990 | |
United Kingdom Small Company Series(b) | | | 209,147 | | | | 13,975,674 | |
| | | | | | | | |
TOTAL INTERNATIONAL EQUITY FUNDS
(Cost $1,020,073,002) | | | | | | | 1,249,407,439 | |
| | | | | | | | |
TOTAL INVESTMENTS — 99.8%
(Cost $1,020,073,002) | | | | | | | 1,249,407,439 | |
| | | | | | | | |
OTHER ASSETS IN EXCESS OF LIABILITIES — 0.2% | | | | | | | 1,907,399 | |
| | | | | | | | |
NET ASSETS — 100.0% | | | | | | $ | 1,251,314,838 | |
| | | | | | | | |
Portfolio Holdings Summary Table
| | | | | | | | |
| | | % of
Net Assets | | | Value | |
International Equity Funds | | | 99.8% | | | $ | 1,249,407,439 | |
Other Assets In Excess Of Liabilities | | | 0.2% | | | | 1,907,399 | |
| | | | | | | | |
NET ASSETS | | | 100.0% | | | $ | 1,251,314,838 | |
| | | | | | | | |
| (a) | A portfolio of DFA Investment Dimensions Group Inc. |
| (b) | A portfolio of DFA Investment Trust Company. |
| (c) | A portfolio of Dimensional Investment Group Inc. |
Portfolio holdings are subject to change at any time.
The accompanying notes are an integral part of the financial statements.
7
FREE MARKET FUNDS
FREE MARKET FIXED INCOME FUND
Portfolio of Investments
February 28, 2014
(Unaudited)
| | | | | | | | |
| | | Number of
Shares | | | Value | |
| |
FIXED INCOME FUNDS — 99.4% | | | | | |
DFA Five-Year Global Fixed Income Portfolio(a) | | | 35,660,649 | | | $ | 391,553,924 | |
DFA Inflation-Protected Securities Portfolio(a) | | | 6,674,065 | | | | 78,553,741 | |
DFA Intermediate Government Fixed Income Portfolio(a) | | | 15,038,346 | | | | 187,979,330 | |
DFA One-Year Fixed Income Portfolio(a) | | | 37,182,413 | | | | 384,094,328 | |
DFA Short-Term Government Portfolio(a) | | | 11,721,003 | | | | 125,180,316 | |
DFA Two-Year Global Fixed Income Portfolio(a) | | | 39,115,417 | | | | 391,936,480 | |
| | | | | | | | |
TOTAL FIXED INCOME FUND
(Cost $1,569,096,753) | | | | | | | 1,559,298,119 | |
| | | | | | | | |
TOTAL INVESTMENTS — 99.4%
(Cost $1,569,096,753) | | | | | | | 1,559,298,119 | |
| | | | | | | | |
OTHER ASSETS IN EXCESS OF LIABILITIES — 0.6% | | | | | | | 9,533,224 | |
| | | | | | | | |
NET ASSETS — 100.0% | | | | | | $ | 1,568,831,343 | |
| | | | | | | | |
Portfolio Holdings Summary Table
| | | | | | | | |
| | | % of
Net Assets | | | Value | |
Fixed Income Funds | | | 99.4% | | | $ | 1,559,298,119 | |
Other Assets In Excess Of Liabilities | | | 0.6% | | | | 9,533,224 | |
| | | | | | | | |
NET ASSETS | | | 100.0% | | | $ | 1,568,831,343 | |
| | | | | | | | |
| (a) | A portfolio of DFA Investment Dimensions Group Inc. |
Portfolio holdings are subject to change at any time.
The accompanying notes are an integral part of the financial statements.
8
FREE MARKET FUNDS
Statements of Assets And Liabilities
February 28, 2014
(Unaudited)
| | | | | | | | | | | | |
| | | Free Market
U.S. Equity
Fund | | | Free Market
International
Equity Fund | | | Free Market
Fixed Income
Fund | |
ASSETS | | | | | | | | | | | | |
Investments in non-affiliated funds, at value † | | $ | 1,689,177,384 | | | $ | 1,249,407,439 | | | $ | 1,559,298,119 | |
Cash and cash equivalents | | | 1,481,654 | | | | 1,431,833 | | | | 7,941,065 | |
Receivables | | | | | | | | | | | | |
Receivable for capital shares sold | | | 2,075,628 | | | | 1,498,743 | | | | 2,631,802 | |
Dividends and interest receivable | | | 128 | | | | 76 | | | | 347 | |
Prepaid expenses and other assets | | | 59,551 | | | | 55,917 | | | | 77,104 | |
| | | | | | | | | | | | |
Total assets | | | 1,692,794,345 | | | | 1,252,394,008 | | | | 1,569,948,437 | |
| | | | | | | | | | | | |
LIABILITIES | | | | | | | | | | | | |
Payables | | | | | | | | | | | | |
Capital shares redeemed | | | 624,759 | | | | 441,909 | | | | 335,517 | |
Investment adviser | | | 616,846 | | | | 458,886 | | | | 589,104 | |
Administration and accounting fees | | | 60,783 | | | | 49,291 | | | | 57,396 | |
Other accrued expenses and liabilities | | | 153,863 | | | | 129,084 | | | | 135,077 | |
| | | | | | | | | | | | |
Total liabilities | | | 1,456,251 | | | | 1,079,170 | | | | 1,117,094 | |
| | | | | | | | | | | | |
Net Assets | | $ | 1,691,338,094 | | | $ | 1,251,314,838 | | | $ | 1,568,831,343 | |
| | | | | | | | | | | | |
NET ASSETS CONSISTS OF | | | | | | | | | | | | |
Par value | | $ | 102,680 | | | $ | 117,338 | | | $ | 152,734 | |
Paid-in capital | | | 1,076,101,479 | | | | 1,012,572,658 | | | | 1,575,116,072 | |
Accumulated net investment loss | | | (2,908,032 | ) | | | (1,888,316 | ) | | | (2,414,115 | ) |
Accumulated net realized gain from investments | | | 46,497,759 | | | | 11,178,721 | | | | 5,775,286 | |
Net unrealized appreciation/(depreciation) on investments | | | 571,544,208 | | | | 229,334,437 | | | | (9,798,634 | ) |
| | | | | | | | | | | | |
Net Assets | | $ | 1,691,338,094 | | | $ | 1,251,314,838 | | | $ | 1,568,831,343 | |
| | | | | | | | | | | | |
Shares outstanding ($0.001 par value, 200,000,000 shares authorized) | | | 102,680,204 | | | | 117,338,371 | | | | 152,733,865 | |
| | | | | | | | | | | | |
Net asset value, offering and redemption price per share | | $ | 16.47 | | | $ | 10.66 | | | $ | 10.27 | |
| | | | | | | | | | | | |
† Investment in non-affiliated funds, at cost | | $ | 1,117,633,176 | | | $ | 1,020,073,002 | | | $ | 1,569,096,753 | |
| | | | | | | | | | | | |
The accompanying notes are an integral part of the financial statements.
9
FREE MARKET FUNDS
Statements of Operations
For the Period Ended February 28, 2014
(Unaudited)
| | | | | | | | | | | | |
| | | Free Market
U.S. Equity
Fund | | | Free Market
International
Equity Fund | | | Free Market
Fixed Income
Fund | |
Investment Income | | | | | | | | | | | | |
Dividends from non-affiliated funds | | $ | 10,710,747 | | | $ | 13,649,718 | | | $ | 7,718,033 | |
Interest from non-affiliated funds | | | 207 | | | | 173 | | | | 729 | |
| | | | | | | | | | | | |
Total investment income | | | 10,710,954 | | | | 13,649,891 | | | | 7,718,762 | |
| | | | | | | | | | | | |
| | | |
Expenses | | | | | | | | | | | | |
Advisory fees (Note 2) | | | 3,814,888 | | | | 2,835,158 | | | | 3,544,419 | |
Administration and accounting fees (Note 2) | | | 341,083 | | | | 247,297 | | | | 315,127 | |
Transfer agent fees (Note 2) | | | 178,226 | | | | 131,224 | | | | 165,967 | |
Professional fees | | | 127,764 | | | | 95,635 | | | | 116,594 | |
Custodian fees (Note 2) | | | 50,866 | | | | 40,355 | | | | 48,180 | |
Printing and shareholder reporting fees | | | 27,928 | | | | 29,514 | | | | 26,231 | |
Directors’ and officers’ fees | | | 27,888 | | | | 20,100 | | | | 25,441 | |
Other expenses | | | 51,647 | | | | 79,799 | | | | 61,232 | |
| | | | | | | | | | | | |
Total expenses | | | 4,620,290 | | | | 3,479,082 | | | | 4,303,191 | |
| | | | | | | | | | | | |
Net investment income | | | 6,090,664 | | | | 10,170,809 | | | | 3,415,571 | |
| | | | | | | | | | | | |
| | | |
Net realized and unrealized gain from investments | | | | | | | | | | | | |
Net realized gain from: | | | | | | | | | | | | |
Non-affiliated funds | | | 8,541,838 | | | | 2,108,588 | | | | — | |
Capital gain distributions from non-affiliated fund investments | | | 45,292,164 | | | | 22,656,848 | | | | 5,945,686 | |
Net change in unrealized appreciation on: | | | | | | | | | | | | |
Non-affiliated funds | | | 165,315,608 | | | | 141,533,804 | | | | 3,445,367 | |
| | | | | | | | | | | | |
Net realized and unrealized gain from investments | | | 219,149,610 | | | | 166,299,240 | | | | 9,391,053 | |
| | | | | | | | | | | | |
Net increase in net assets resulting from operations | | $ | 225,240,274 | | | $ | 176,470,049 | | | $ | 12,806,624 | |
| | | | | | | | | | | | |
The accompanying notes are an integral part of the financial statements.
10
FREE MARKET U.S. EQUITY FUND
Statements of Changes in Net Assets
| | | | | | | | |
| | | For the
Six Months Ended
February 28, 2014
(Unaudited) | | | For the
Year Ended
August 31, 2013 | |
Increase in net assets from operations: | | | | | | | | |
Net investment income | | $ | 6,090,664 | | | $ | 10,504,555 | |
Net realized gain from investments | | | 53,834,002 | | | | 44,972,976 | |
Net change in unrealized appreciation from investments | | | 165,315,608 | | | | 218,975,399 | |
| | | | | | | | |
Net increase in net assets resulting from operations | | | 225,240,274 | | | | 274,452,930 | |
| | | | | | | | |
| | |
Dividends and distributions to shareholders from: | | | | | | | | |
Net investment income | | | (9,536,519 | ) | | | (12,059,460 | ) |
Net realized capital gains | | | (44,315,395 | ) | | | (6,612,476 | ) |
| | | | | | | | |
Net decrease in net assets from dividends and distributions to shareholders | | | (53,851,914 | ) | | | (18,671,936 | ) |
| | | | | | | | |
| | |
Capital share transactions: | | | | | | | | |
Proceeds from shares sold | | | 238,578,855 | | | | 365,120,672 | |
Reinvestment of distributions | | | 53,851,914 | | | | 18,671,936 | |
Shares redeemed | | | (128,134,397 | ) | | | (217,434,730 | ) |
| | | | | | | | |
Net increase in net assets from capital shares | | | 164,296,372 | | | | 166,357,878 | |
| | | | | | | | |
Total increase in net assets | | | 335,684,732 | | | | 422,138,872 | |
| | | | | | | | |
| | |
Net assets: | | | | | | | | |
Beginning of period | | | 1,355,653,362 | | | | 933,514,490 | |
| | | | | | | | |
End of period | | $ | 1,691,338,094 | | | $ | 1,355,653,362 | |
| | | | | | | | |
Undistributed/accumulated net investment income (loss), end of period | | $ | (2,908,032 | ) | | $ | 537,823 | |
| | | | | | | | |
| | |
Capital share transactions: | | | | | | | | |
Shares sold | | | 14,912,507 | | | | 27,274,386 | |
Dividends and distributions reinvested | | | 3,277,658 | | | | 1,519,279 | |
Shares redeemed | | | (7,976,234 | ) | | | (16,128,774 | ) |
| | | | | | | | |
Total share transactions | | | 10,213,931 | | | | 12,664,891 | |
| | | | | | | | |
The accompanying notes are an integral part of the financial statements.
11
FREE MARKET INTERNATIONAL EQUITY FUND
Statements of Changes in Net Assets
| | | | | | | | |
| | | For the
Six Months Ended
February 28, 2014
(Unaudited) | | | For the
Year Ended
August 31, 2013 | |
Increase in net assets from operations: | | | | | | | | |
Net investment income | | $ | 10,170,809 | | | $ | 16,197,219 | |
Net realized gain from investments | | | 24,765,436 | | | | 12,763,765 | |
Net change in unrealized appreciation from investments | | | 141,533,804 | | | | 104,634,778 | |
| | | | | | | | |
Net increase in net assets resulting from operations | | | 176,470,049 | | | | 133,595,762 | |
| | | | | | | | |
| | |
Dividends and distributions to shareholders from: | | | | | | | | |
Net investment income | | | (21,275,248 | ) | | | (13,261,063 | ) |
Net realized capital gains | | | (16,001,172 | ) | | | (6,448,810 | ) |
| | | | | | | | |
Net decrease in net assets from dividends and distributions to shareholders | | | (37,276,420 | ) | | | (19,709,873 | ) |
| | | | | | | | |
| | |
Capital share transactions: | | | | | | | | |
Proceeds from shares sold | | | 180,676,791 | | | | 290,005,224 | |
Reinvestment of distributions | | | 37,276,420 | | | | 19,709,873 | |
Shares redeemed | | | (69,927,528 | ) | | | (108,215,843 | ) |
| | | | | | | | |
Net increase in net assets from capital shares | | | 148,025,683 | | | | 201,499,254 | |
| | | | | | | | |
Total increase in net assets | | | 287,219,312 | | | | 315,385,143 | |
| | | | | | | | |
| | |
Net assets: | | | | | | | | |
Beginning of period | | | 964,095,526 | | | | 648,710,383 | |
| | | | | | | | |
End of period | | $ | 1,251,314,838 | | | $ | 964,095,526 | |
| | | | | | | | |
Undistributed/accumulated net investment income (loss), end of period | | $ | (1,888,316 | ) | | $ | 9,216,123 | |
| | | | | | | | |
| | |
Capital share transactions: | | | | | | | | |
Shares sold | | | 17,486,147 | | | | 32,070,579 | |
Dividends and distributions reinvested | | | 3,594,640 | | | | 2,234,680 | |
Shares redeemed | | | (6,762,604 | ) | | | (11,983,409 | ) |
| | | | | | | | |
Total share transactions | | | 14,318,183 | | | | 22,321,850 | |
| | | | | | | | |
The accompanying notes are an integral part of the financial statements.
12
FREE MARKET FIXED INCOME FUND
Statements of Changes in Net Assets
| | | | | | | | |
| | | For the
Six Months Ended
February 28, 2014
(Unaudited) | | | For the
Year Ended
August 31, 2013 | |
Increase/(decrease) in net assets from operations: | | | | | | | | |
Net investment income | | $ | 3,415,571 | | | $ | 5,775,226 | |
Net realized gain from investments | | | 5,945,686 | | | | 4,618,659 | |
Net change in unrealized appreciation (depreciation) from investments | | | 3,445,367 | | | | (29,635,839 | ) |
| | | | | | | | |
Net increase/(decrease) in net assets resulting from operations | | | 12,806,624 | | | | (19,241,954 | ) |
| | | | | | | | |
| | |
Dividends and distributions to shareholders from: | | | | | | | | |
Net investment income | | | (5,571,070 | ) | | | (7,743,898 | ) |
Net realized capital gains | | | (3,094,776 | ) | | | (5,959,159 | ) |
| | | | | | | | |
Net decrease in net assets from dividends and distributions to shareholders | | | (8,665,846 | ) | | | (13,703,057 | ) |
| | | | | | | | |
| | |
Capital share transactions: | | | | | | | | |
Proceeds from shares sold | | | 315,762,513 | | | | 515,861,880 | |
Reinvestment of distributions | | | 8,665,846 | | | | 13,703,057 | |
Shares redeemed | | | (76,537,069 | ) | | | (126,795,373 | ) |
| | | | | | | | |
Net increase in net assets from capital shares | | | 247,891,290 | | | | 402,769,564 | |
| | | | | | | | |
Total increase in net assets | | | 252,032,068 | | | | 369,824,553 | |
| | | | | | | | |
| | |
Net assets: | | | | | | | | |
Beginning of period | | | 1,316,799,275 | | | | 946,974,722 | |
| | | | | | | | |
End of period | | $ | 1,568,831,343 | | | $ | 1,316,799,275 | |
| | | | | | | | |
Undistributed/accumulated net investment income (loss), end of period | | $ | (2,414,115 | ) | | $ | (258,616 | ) |
| | | | | | | | |
| | |
Capital share transactions: | | | | | | | | |
Shares sold | | | 30,751,241 | | | | 49,641,221 | |
Dividends and distributions reinvested | | | 848,158 | | | | 1,315,155 | |
Shares redeemed | | | (7,451,115 | ) | | | (12,178,076 | ) |
| | | | | | | | |
Total share transactions | | | 24,148,284 | | | | 38,778,300 | |
| | | | | | | | |
The accompanying notes are an integral part of the financial statements.
13
FREE MARKET FUNDS
FREE MARKET U.S. EQUITY FUND
Financial Highlights
Contained below is per share operating performance data for each share outstanding, total investment return, ratios to average net assets and other supplemental data for the respective periods. This information has been derived from information provided in the financial statements.
| | | | | | | | | | | | | | | | | | | | | | | | |
| | | For the
Six Months Ended
February 28, 2014
(Unaudited) | | | For the
Year Ended
August 31, 2013 | | | For the
Year Ended
August 31, 2012 | | | For the
Year Ended
August 31, 2011 | | | For the
Year Ended
August 31, 2010 | | | For the
Year Ended
August 31, 2009 | |
Per Share Operating Performance | | | | | | | | | | | | | | | | | | | | | | | | |
Net asset value, beginning of period | | $ | 14.66 | | | $ | 11.70 | | | $ | 10.33 | | | $ | 8.65 | | | $ | 8.21 | | | $ | 10.29 | |
| | | | | | | | | | | | | | | | | | | | | | | | |
Net investment income(1) | | | 0.06 | | | | 0.12 | | | | 0.08 | | | | 0.06 | | | | 0.02 | | | | 0.10 | |
Net realized and unrealized gain/(loss) on investments | | | 2.31 | | | | 3.07 | | | | 1.43 | | | | 1.68 | | | | 0.46 | | | | (2.09 | ) |
| | | | | | | | | | | | | | | | | | | | | | | | |
Net increase/(decrease) in net assets resulting from operations | | | 2.37 | | | | 3.19 | | | | 1.51 | | | | 1.74 | | | | 0.48 | | | | (1.99 | ) |
| | | | | | | | | | | | | | | | | | | | | | | | |
Dividends and distributions to shareholders from: | | | | | | | | | | | | | | | | | | | | | | | | |
Net investment income | | | (0.10 | ) | | | (0.15 | ) | | | (0.06 | ) | | | (0.06 | ) | | | (0.03 | ) | | | (0.09 | ) |
Net realized capital gains | | | (0.46 | ) | | | (0.08 | ) | | | (0.08 | ) | | | — | (2) | | | — | | | | — | |
Tax return of capital | | | — | | | | — | | | | — | | | | — | | | | (0.01 | ) | | | — | |
| | | | | | | | | | | | | | | | | | | | | | | | |
Total dividends and distributions to shareholders | | | (0.56 | ) | | | (0.23 | ) | | | (0.14 | ) | | | (0.06 | ) | | | (0.04 | ) | | | (0.09 | ) |
| | | | | | | | | | | | | | | | | | | | | | | | |
Net asset value, end of period | | $ | 16.47 | | | $ | 14.66 | | | $ | 11.70 | | | $ | 10.33 | | | $ | 8.65 | | | $ | 8.21 | |
| | | | | | | | | | | | | | | | | | | | | | | | |
Total investment return(3) | | | 16.14 | %(4) | | | 27.61 | % | | | 14.77 | % | | | 20.11 | % | | | 5.88 | % | | | (19.19 | )% |
| | | | | | | | | | | | | | | | | | | | | | | | |
| | | | | | |
Ratio/Supplemental Data | | | | | | | | | | | | | | | | | | | | | | | | |
Net assets, end of period (000’s omitted) | | $ | 1,691,338 | | | $ | 1,355,653 | | | $ | 933,514 | | | $ | 679,147 | | | $ | 485,191 | | | $ | 312,104 | |
Ratio of expenses to average net assets(5) | | | 0.60 | %(6) | | | 0.62 | % | | | 0.64 | % | | | 0.64 | % | | | 0.67 | % | | | 0.72 | % |
Ratio of net investment income to average net assets(5) | | | 0.79 | %(6) | | | 0.91 | % | | | 0.73 | % | | | 0.55 | % | | | 0.22 | % | | | 1.37 | % |
Portfolio turnover rate | | | 2 | %(4) | | | 6 | % | | | 4 | % | | | 9 | % | | | 3 | % | | | 1 | % |
| (1) | The selected per share data was calculated using the average shares outstanding method for the period. |
| (2) | Amount less than $(0.005) per share. |
| (3) | Total investment return is calculated by assuming a purchase of shares on the first day and a sale of shares on the last day of each period reported and includes reinvestments of dividends and distributions, if any. |
| (5) | The Fund also will indirectly bear its prorated share of expenses of the underlying funds. Such expenses are not included in the calculation of this ratio. |
The accompanying notes are an integral part of the financial statements.
14
FREE MARKET FUNDS
FREE MARKET INTERNATIONAL EQUITY FUND
Financial Highlights
Contained below is per share operating performance data for each share outstanding, total investment return, ratios to average net assets and other supplemental data for the respective periods. This information has been derived from information provided in the financial statements.
| | | | | | | | | | | | | | | | | | | | | | | | |
| | | For the
Six Months Ended
February 28, 2014
(Unaudited) | | | For the
Year Ended
August 31, 2013 | | | For the
Year Ended
August 31, 2012 | | | For the
Year Ended
August 31, 2011 | | | For the
Year Ended
August 31, 2010 | | | For the
Year Ended
August 31, 2009 | |
Per Share Operating Performance | | | | | | | | | | | | | | | | | | | | | | | | |
Net asset value, beginning of period | | $ | 9.36 | | | $ | 8.04 | | | $ | 8.78 | | | $ | 7.97 | | | $ | 8.02 | | | $ | 8.85 | |
| | | | | | | | | | | | | | | | | | | | | | | | |
Net investment income(1) | | | 0.09 | | | | 0.18 | | | | 0.18 | | | | 0.16 | | | | 0.11 | | | | 0.13 | |
Net realized and unrealized gain/(loss) on investments | | | 1.55 | | | | 1.36 | | | | (0.64 | ) | | | 0.78 | | | | (0.04 | ) | | | (0.85 | ) |
| | | | | | | | | | | | | | | | | | | | | | | | |
Net increase/(decrease) in net assets resulting from operations | | | 1.64 | | | | 1.54 | | | | (0.46 | ) | | | 0.94 | | | | 0.07 | | | | (0.72 | ) |
| | | | | | | | | | | | | | | | | | | | | | | | |
Dividends and distributions to shareholders from: | | | | | | | | | | | | | | | | | | | | | | | | |
Net investment income | | | (0.19 | ) | | | (0.15 | ) | | | (0.17 | ) | | | (0.13 | ) | | | (0.09 | ) | | | (0.11 | ) |
Net realized capital gains | | | (0.15 | ) | | | (0.07 | ) | | | (0.11 | ) | | | — | | | | (0.03 | ) | | | — | |
| | | | | | | | | | | | | | | | | | | | | | | | |
Total dividends and distributions to shareholders | | | (0.34 | ) | | | (0.22 | ) | | | (0.28 | ) | | | (0.13 | ) | | | (0.12 | ) | | | (0.11 | ) |
| | | | | | | | | | | | | | | | | | | | | | | | |
Net asset value, end of period | | $ | 10.66 | | | $ | 9.36 | | | $ | 8.04 | | | $ | 8.78 | | | $ | 7.97 | | | $ | 8.02 | |
| | | | | | | | | | | | | | | | | | | | | | | | |
Total investment return(2) | | | 17.63 | %(3) | | | 19.44 | % | | | (4.98 | )% | | | 11.60 | % | | | 0.86 | % | | | (7.71 | )% |
| | | | | | | | | | | | | | | | | | | | | | | | |
| | | | | | |
Ratio/Supplemental Data | | | | | | | | | | | | | | | | | | | | | | | | |
Net assets, end of period (000’s omitted) | | $ | 1,251,315 | | | $ | 964,096 | | | $ | 648,710 | | | $ | 516,073 | | | $ | 365,465 | | | $ | 258,632 | |
Ratio of expenses to average net assets(4) | | | 0.62 | %(5) | | | 0.65 | % | | | 0.65 | % | | | 0.66 | % | | | 0.68 | % | | | 0.73 | % |
Ratio of net investment income to average net assets(4) | | | 1.82 | %(5) | | | 1.96 | % | | | 2.21 | % | | | 1.66 | % | | | 1.29 | % | | | 2.01 | % |
Portfolio turnover rate | | | 0.2 | %(3) | | | 3 | % | | | 3 | % | | | 4 | % | | | 8 | % | | | 2 | % |
| (1) | The selected per share data was calculated using the average shares outstanding method for the period. |
| (2) | Total investment return is calculated by assuming a purchase of shares on the first day and a sale of shares on the last day of each period reported and includes reinvestments of dividends and distributions, if any. |
| (4) | The Fund also will indirectly bear its prorated share of expenses of the underlying funds. Such expenses are not included in the calculation of this ratio. |
The accompanying notes are an integral part of the financial statements.
15
FREE MARKET FUNDS
FREE MARKET FIXED INCOME FUND
Financial Highlights
Contained below is per share operating performance data for each share outstanding, total investment return, ratios to average net assets and other supplemental data for the respective periods. This information has been derived from information provided in the financial statements.
| | | | | | | | | | | | | | | | | | | | | | | | |
| | | For the
Six Months Ended
February 28, 2014
(Unaudited) | | | For the
Year Ended
August 31, 2013 | | | For the
Year Ended
August 31, 2012 | | | For the
Year Ended
August 31, 2011 | | | For the
Year Ended
August 31, 2010 | | | For the
Year Ended
August 31, 2009 | |
Per Share Operating Performance | | | | | | | | | | | | | | | | | | | | | | | | |
Net asset value, beginning of period | | $ | 10.24 | | | $ | 10.54 | | | $ | 10.48 | | | $ | 10.50 | | | $ | 10.35 | | | $ | 10.04 | |
| | | | | | | | | | | | | | | | | | | | | | | | |
Net investment income(1) | | | 0.02 | | | | 0.05 | | | | 0.11 | | | | 0.12 | | | | 0.13 | | | | 0.21 | |
Net realized and unrealized gain/(loss) on investments | | | 0.07 | | | | (0.21 | ) | | | 0.09 | | | | 0.09 | | | | 0.27 | | | | 0.25 | |
| | | | | | | | | | | | | | | | | | | | | | | | |
Net increase/(decrease) in net assets resulting from operations | | | 0.09 | | | | (0.16 | ) | | | 0.20 | | | | 0.21 | | | | 0.40 | | | | 0.46 | |
| | | | | | | | | | | | | | | | | | | | | | | | |
Dividends and distributions to shareholders from: | | | | | | | | | | | | | | | | | | | | | | | | |
Net investment income | | | (0.04 | ) | | | (0.08 | ) | | | (0.14 | ) | | | (0.22 | ) | | | (0.21 | ) | | | (0.15 | ) |
Net realized capital gains | | | (0.02 | ) | | | (0.06 | ) | | | — | (2) | | | — | (2) | | | (0.04 | ) | | | — | |
Tax return of capital | | | — | | | | — | | | | — | | | | (0.01 | ) | | | — | | | | — | |
| | | | | | | | | | | | | | | | | | | | | | | | |
Total dividends and distributions to shareholders | | | (0.06 | ) | | | (0.14 | ) | | | (0.14 | ) | | | (0.23 | ) | | | (0.25 | ) | | | (0.15 | ) |
| | | | | | | | | | | | | | | | | | | | | | | | |
Net asset value, end of period | | $ | 10.27 | | | $ | 10.24 | | | $ | 10.54 | | | $ | 10.48 | | | $ | 10.50 | | | $ | 10.35 | |
| | | | | | | | | | | | | | | | | | | | | | | | |
Total investment return(3) | | | 0.89 | %(4) | | | (1.50 | )% | | | 1.90 | % | | | 2.06 | % | | | 3.96 | % | | | 4.62 | % |
| | | | | | | | | | | | | | | | | | | | | | | | |
| | | | | | |
Ratio/Supplemental Data | | | | | | | | | | | | | | | | | | | | | | | | |
Net assets, end of period (000’s omitted) | | $ | 1,568,831 | | | $ | 1,316,799 | | | $ | 946,975 | | | $ | 761,683 | | | $ | 459,282 | | | $ | 210,107 | |
Ratio of expenses to average net assets(5) | | | 0.60 | %(6) | | | 0.62 | % | | | 0.63 | % | | | 0.65 | % | | | 0.68 | % | | | 0.75 | % |
Ratio of net investment income to average net assets(5) | | | 0.48 | %(6) | | | 0.52 | % | | | 1.08 | % | | | 1.12 | % | | | 1.31 | % | | | 2.06 | % |
Portfolio turnover rate | | | 0 | %(4) | | | 0 | % | | | 1 | % | | | 0 | % | | | 1 | % | | | 84 | % |
| (1) | The selected per share data was calculated using the average shares outstanding method for the period. |
| (2) | Amount less than $(0.005) per share. |
| (3) | Total investment return is calculated by assuming a purchase of shares on the first day and a sale of shares on the last day of each period reported and includes reinvestments of dividends and distributions, if any. |
| (5) | The Fund also will indirectly bear its prorated share of expenses of the underlying funds. Such expenses are not included in the calculation of this ratio. |
The accompanying notes are an integral part of the financial statements.
16
FREE MARKET FUNDS
Notes to Financial Statements
February 28, 2014
(Unaudited)
| 1. | Organization and Significant Accounting Policies |
The RBB Fund, Inc. (“RBB” or the “Company”) was incorporated under the laws of the State of Maryland on February 29, 1988 and is registered under the Investment Company Act of 1940, as amended (the “1940 Act”), as an open-end management investment company. RBB is a “series fund,” which is a mutual fund divided into separate portfolios. Each portfolio is treated as a separate entity for certain matters under the 1940 Act, and for other purposes, and a shareholder of one portfolio is not deemed to be a shareholder of any other portfolio. Currently, RBB has twenty-one active investment portfolios, including the Free Market U.S. Equity Fund, the Free Market International Equity Fund, and the Free Market Fixed Income Fund (each a “Fund,” collectively the “Funds”). Each Fund operates as a “Fund of Funds” and commenced investment operations on December 31, 2007.
RBB has authorized capital of one hundred billion shares of common stock of which 81.373 billion shares are currently classified into one hundred and forty-eight classes of common stock. Each class represents an interest in an active or inactive RBB investment portfolio.
PORTFOLIO VALUATION — Investments in the underlying funds are valued at each fund’s net asset value determined as of the close of business on the New York Stock Exchange (generally 4:00 p.m. Eastern time). As required, some securities and assets may be valued at fair value as determined in good faith by the Company’s Board of Directors. Direct investments in fixed income securities having a remaining maturity of 60 days or less are valued at amortized cost, which approximates market value.
Fair Value Measurements — The inputs and valuations techniques used to measure fair value of the Funds’ investments are summarized into three levels as described in the hierarchy below:
| | • Level 1 — | quoted prices in active markets for identical securities; |
| | • Level 2 — | other significant observable inputs (including quoted prices for similar securities, interest rates, prepayment speeds, credit risk, etc.); and |
| | • Level 3 — | significant unobservable inputs (including the Funds’ own assumptions in determining the fair value of investments). |
The inputs or methodology used for valuing securities are not necessarily an indication of the risk associated with investing in those securities.
The following is a summary of the inputs used, as of February 28, 2014, in valuing the Funds’ investments carried at fair value:
FREE MARKET U.S. EQUITY FUND
| | | | | | | | | | | | | | | | |
| | | Total Value at
February 28, 2014 | | | Level 1
Quoted
Price | | | Level 2
Significant
Observable
Input | | | Level 3
Significant
Unobservable
Input | |
Investments in Securities* | | $ | 1,689,177,384 | | | $ | 1,689,177,384 | | | $ | — | | | $ | — | |
| | | | | | | | | | | | | | | | |
*Please refer to the Portfolio of Investments for further details.
FREE MARKET INTERNATIONAL EQUITY FUND
| | | | | | | | | | | | | | | | |
| | | Total Value at
February 28, 2014 | | | Level 1
Quoted
Price | | | Level 2
Significant
Observable
Input | | | Level 3
Significant
Unobservable
Input | |
Investments in Securities* | | $ | 1,249,407,439 | | | $ | 1,249,407,439 | | | $ | — | | | $ | — | |
| | | | | | | | | | | | | | | | |
*Please refer to the Portfolio of Investments for further details.
17
FREE MARKET FUNDS
Notes to Financial Statements (Continued)
February 28, 2014
(Unaudited)
FREE MARKET FIXED INCOME FUND
| | | | | | | | | | | | | | | | |
| | | Total Value at
February 28, 2014 | | | Level 1
Quoted
Price | | | Level 2
Significant
Observable
Input | | | Level 3
Significant
Unobservable
Input | |
Investments in Securities* | | $ | 1,559,298,119 | | | $ | 1,559,298,119 | | | $ | — | | | $ | — | |
| | | | | | | | | | | | | | | | |
*Please refer to the Portfolio of Investments for further details.
At the end of each fiscal quarter, management evaluates the classification of Levels 1, 2 and 3 assets and liabilities. Various factors are considered, such as changes in liquidity from the prior reporting period; whether or not a broker is willing to execute at the quoted price; the depth and consistency of prices from third party pricing services; and the existence of contemporaneous, observable trades in the market. Additionally, management evaluates the classification of Level 1 and Level 2 assets and liabilities on a quarterly basis for changes in listings or delistings on national exchanges.
Due to the inherent uncertainty of determining the fair value of investments that do not have a readily available market value, the fair value of the Funds’ investments may fluctuate from period to period. Additionally, the fair value of investments may differ significantly from the values that would have been used had a ready market existed for such investments and may differ materially from the values the Funds may ultimately realize. Further, such investments may be subject to legal and other restrictions on resale or otherwise less liquid than publicly traded securities.
For fair valuations using significant unobservable inputs, U.S. generally accepted accounting principles (“U.S. GAAP”) require each Fund to present a reconciliation of the beginning to ending balances for reported market values that presents changes attributable to total realized and unrealized gains or losses, purchase and sales, and transfers in and out of Level 3 during the period. Transfers in and out between Levels are based on values at the end of the period. U.S. GAAP also requires a Fund to disclose amounts and reasons for all transfers in and out of Level 1 and Level 2 fair value measurements. A reconciliation of Level 3 investments is presented only when a Fund had an amount of Level 3 investments at the end of the reporting period that was meaningful in relation to its net assets. The amounts and reasons for all transfers in and out of each Level within the three-tier hierarchy are disclosed when a Fund had an amount of total transfers during the reporting period that was meaningful in relation to its net assets as of the end of the reporting period.
For the six months ended February 28, 2014 , there were no transfers between Levels 1, 2 and 3 for the Funds.
USE OF ESTIMATES — The preparation of financial statements in conformity with U.S. GAAP requires management to make estimates and assumptions that affect the reported amounts of assets and liabilities and disclosure of contingent assets and liabilities at the date of the financial statements and the reported amounts of revenues and expenses during the period. Actual results could differ from those estimates and those differences could be significant.
INVESTMENT TRANSACTIONS, INVESTMENT INCOME AND EXPENSES — Transactions are accounted for on the trade date for financial reporting purposes. The cost of investments sold is determined by use of the specific identification method for both financial reporting and income tax purposes in determining realized gains and losses on investments. Interest income is accrued when earned. Dividend income is recorded on the ex-dividend date. Distributions received on securities that represent a return of capital or capital gain are recorded as a reduction of cost of investments and/or as a realized gain. The Funds estimate the components of distributions received that may be considered return of capital distributions or capital gain distributions. Each Fund’s investment income, expenses and unrealized and realized gains and losses are allocated daily. Expenses incurred on behalf of a specific class, fund or fund family of the Company are charged directly to the class, fund or fund family (in proportion to net assets). Expenses incurred for all of the RBB funds (such as director or professional fees) are charged to all funds in proportion to their average net assets of RBB, or in such other manner as the Company’s Board of Directors deems fair or equitable. Expenses and fees, including investment advisory and administration fees, are accrued daily and taken into account for the purpose of determining the net asset value of the Funds. In addition to the net annual operating expenses that the Funds bear directly, the shareholders indirectly bear the Funds’ pro-rata expenses of the underlying mutual funds in which each Fund invests.
18
FREE MARKET FUNDS
Notes to Financial Statements (Continued)
February 28, 2014
(Unaudited)
DIVIDENDS AND DISTRIBUTIONS TO SHAREHOLDERS — Dividends from net investment income and distributions from net realized capital gains, if any, are declared and paid at least annually to shareholders and recorded on the ex-dividend date for all Funds with the exception of the Free Market Fixed Income Fund which declares and pays quarterly dividends from net investment income. Income dividends and capital gain distributions are determined in accordance with U.S. federal income tax regulations which may differ from U.S. GAAP.
U.S. TAX STATUS — No provision is made for U.S. income taxes as it is each Fund’s intention to qualify for and elect the tax treatment applicable to regulated investment companies under Subchapter M of the Internal Revenue Code of 1986, as amended, and make the requisite distributions to its shareholders which will be sufficient to relieve it from U.S. income and excise taxes.
CASH AND CASH EQUIVALENTS — The Funds consider liquid assets deposited with a bank demand deposit account to be cash equivalents. These investments represent amounts held with financial institutions that are readily accessible to pay Fund expenses or purchase investments. Cash and cash equivalents are valued at cost plus accrued interest, which approximates market value.
OTHER — In the normal course of business, the Funds may enter into contracts that provide general indemnifications. The Funds’ maximum exposure under these arrangements is dependent on claims that may be made against the Funds in the future, and, therefore, cannot be estimated; however, based on experience, the risk of material loss for such claims is considered remote.
| 2. | Investment Adviser and Other Services |
Matson Money, Inc. (“Matson Money” or the “Adviser”), serves as each Fund’s investment adviser. For its advisory services, Matson Money is entitled to receive 0.50% of the first $1 billion of each Fund’s average daily net assets, 0.49% of each Fund’s average daily net assets over $1 billion to $5 billion and 0.47% of each Fund’s average daily net assets over $5 billion, computed daily and payable monthly. The Adviser has voluntarily agreed to waive its advisory fee and/or reimburse expenses in order to limit Total Annual Fund Operating Expenses to 1.13%, 1.35% and 1.00% of the average daily net assets of the Free Market U.S. Equity Fund, Free Market International Equity Fund and Free Market Fixed Income Fund, respectively. The Adviser may discontinue these arrangements at any time.
BNY Mellon Investment Servicing (US) Inc. (“BNY Mellon”), serves as administrator for the Funds. For providing administrative and accounting services, BNY Mellon is entitled to receive a monthly fee equal to an annual percentage rate of the Funds’ average daily net assets and is subject to certain minimum monthly fees.
Included in the administration and accounting service fees, shown on the Statement of Operations, are fees for providing regulatory administration services to RBB. For providing these services, BNY Mellon is entitled to receive compensation as agreed to by the Company and BNY Mellon. This fee is allocated to each portfolio of the Company in proportion to its net assets of the Company.
In addition, BNY Mellon serves as the Funds’ transfer and dividend disbursing agent. For providing transfer agent services, BNY Mellon is entitled to receive a monthly fee equal to an annual percentage rate of each Fund’s average daily net assets, subject to certain minimum monthly fees.
The Bank of New York Mellon (the “Custodian”) provides custodian services to the Funds. The Custodian is entitled to receive a monthly fee equal to an annual percentage rate of the Funds’ average daily net assets, subject to certain minimum monthly fees.
Foreside Funds Distributors LLC serves as the principal underwriter and distributor of the Funds’ shares pursuant to a Distribution Agreement with RBB.
19
FREE MARKET FUNDS
Notes to Financial Statements (Continued)
February 28, 2014
(Unaudited)
The Directors of the Company receive an annual retainer and meeting fees for meetings attended. The aggregate remuneration paid to the Directors by the Funds during the six months ended February 28, 2014 was $88,680. Certain employees of BNY Mellon serve as an Officer or Director of the Company. They are not compensated by the Funds or the Company.
| 4. | Investment in Securities |
For the six months ended February 28, 2014, aggregate purchases and sales of investment securities (excluding short-term investments) of the Funds were as follows:
| | | | | | | | |
| | | Purchases | | | Sales | |
Free Market U.S. Equity Fund | | $ | 185,575,094 | | | $ | 24,013,536 | |
Free Market International Equity Fund | | | 144,119,564 | | | | 2,250,000 | |
Free Market Fixed Income Fund | | | 246,485,389 | | | | — | |
| 5. | Federal Income Tax Information |
The Funds have followed the authoritative guidance on accounting for and disclosure of uncertainty in tax positions, which requires the Funds to determine whether a tax position is more likely than not to be sustained upon examination, including resolution of any related appeals or litigation processes, based on the technical merits of the position. The Funds have determined that there was no effect on the financial statements from following this authoritative guidance. In the normal course of business, the Funds are subject to examination by federal, state and local jurisdictions, where applicable, for tax years for which applicable statutes of limitations have not expired. (Management evaluation to follow)
As of February 28, 2014, the federal tax cost, aggregate gross unrealized appreciation and depreciation of securities held by each Fund were as follows:
| | | | | | | | | | | | | | | | |
| | | Federal Tax
Cost | | | Unrealized
Appreciation | | | Unrealized
Depreciation | | | Net
Unrealized
Appreciation
(Depreciation) | |
Free Market U.S. Equity Fund | | $ | 1,117,633,176 | | | $ | 571,544,208 | | | $ | — | | | $ | 571,544,208 | |
Free Market International Equity Fund | | | 1,020,073,002 | | | | 234,469,797 | | | | (5,135,360 | ) | | | 229,334,437 | |
Free Market Fixed Income Fund | | | 1,569,096,753 | | | | 335,364 | | | | (10,133,998 | ) | | | (9,798,634 | ) |
Distributions to shareholders from net investment income and realized gains are determined in accordance with federal income tax regulations, which may differ from net investment income and realized gains recognized for financial reporting purposes. Accordingly, the character of distributions and composition of net assets for tax purposes may differ from those reflected in the accompanying financial statements. To the extent these differences are permanent, such amounts are reclassified within the capital accounts based on the tax treatment; temporary differences do not require such reclassification.
As of August 31, 2013, the components of distributable earnings on a tax basis were as follows:
| | | | | | | | | | | | | | | | |
| | | Undistributed
Ordinary Income | | | Undistributed
Long-Term
Capital Gains | | | Unrealized
Appreciation/
(Depreciation) | | | Other
Temporary
Differences | |
Free Market U.S. Equity Fund | | $ | 537,823 | | | $ | 42,333,099 | | | $ | 400,874,653 | | | $ | — | |
Free Market International Equity Fund | | | 8,648,004 | | | | 14,747,530 | | | | 76,035,679 | | | | — | |
Free Market Fixed Income Fund | | | — | | | | 3,094,750 | | | | (13,414,375 | ) | | | (258,616 | ) |
20
FREE MARKET FUNDS
Notes to Financial Statements (Continued)
February 28, 2014
(Unaudited)
The differences between the book and tax basis components of distributable earnings relate primarily to the timing of recognition of income and gains for federal income tax purposes. Short-term and foreign currency gains are reported as ordinary income for federal income tax purposes.
The tax characters of distributions paid during the fiscal year ended August 31, 2013 were as follows:
| | | | | | | | | | | | |
| | | Ordinary
Income | | | Long-Term
Gains | | | Total | |
Free Market U.S. Equity Fund | | $ | 12,059,460 | | | $ | 6,612,476 | | | $ | 18,671,936 | |
Free Market International Equity Fund | | | 13,261,063 | | | | 6,448,810 | | | | 19,709,873 | |
Free Market Fixed Income Fund | | | 7,741,842 | | | | 5,961,215 | | | | 13,703,057 | |
Distributions from net investment income and short term capital gains are treated as ordinary income for federal income tax purposes.
Under the Regulated Investment Company Modernization Act of 2010 (the “Modernization Act”), the Funds are permitted to carry forward capital losses incurred in taxable years beginning after December 22, 2010 for an unlimited period. Any losses incurred during those future taxable years will be required to be utilized prior to any losses incurred in pre-enactment taxable years. Additionally, post-enactment capital losses that are carried forward will retain their character as either short-term or long-term capital losses rather than being considered all short-term as under the previous law. The Funds’ first fiscal year-end subject to the Modernization Act was August 31, 2012. As of August 31, 2013, the Funds did not have any pre- or post-enactment capital loss carryforwards.
Management has evaluated the impact of all subsequent events on the Funds through the date the financial statements were issued, and has determined that there were no subsequent events requiring recognition or disclosure in the financial statements.
21
FREE MARKET FUNDS
Other Information
(Unaudited)
Proxy Voting
Policies and procedures that the Funds use to determine how to vote proxies relating to portfolio securities as well as information regarding how the Funds voted proxies relating to portfolio securities for the most recent 12-month period ended June 30 are available without charge, upon request, by calling Free Market Funds at (866) 780-0357, ext. 3863 and on the Securities and Exchange Commission’s (“SEC”) website at http://www.sec.gov.
Quarterly Portfolio Schedules
The Company files a complete schedule of portfolio holdings with the SEC for the first and third fiscal quarters of each fiscal year (quarters ended November 30 and May 31) on Form N-Q. The Company’s Form N-Q is available on the SEC website at http://www.sec.gov and may be reviewed and copied at the SEC Public Reference Room in Washington, D.C. Information on the operation of the SEC Public Reference Room may be obtained by calling (202) 551-8090.
22
Investment Adviser
MATSON MONEY, INC.
5955 Deerfield Blvd.
Mason, OH 45040
Administrator
BNY Mellon Investment Servicing (US) Inc.
301 Bellevue Parkway
Wilmington, DE 19809
Transfer Agent
BNY Mellon Investment Servicing (US) Inc.
4400 Computer Drive
Westborough, MA 01581
Principal Underwriter
Foreside Funds Distributors LLC
400 Berwyn Park
899 Cassatt Road
Berwyn, PA 19312
Custodian
The Bank of New York Mellon
One Wall Street
New York, NY 10286
Independent Registered Public Accounting Firm
PricewaterhouseCoopers LLP
Two Commerce Square, Suite 1700
2001 Market Street
Philadelphia, PA 19103-7042
Counsel
Drinker Biddle & Reath LLP
One Logan Square, Ste. 2000
Philadelphia, PA 19103-6996
MATSON MONEY U.S. EQUITY VI PORTFOLIO
MATSON MONEY INTERNATIONAL EQUITY VI PORTFOLIO
MATSON MONEY FIXED INCOME VI PORTFOLIO
of
THE RBB FUND, INC.
SEMI-ANNUAL REPORT
February 28, 2014
(Unaudited)
This report is submitted for the general information of the shareholders of the Funds. It is not authorized for distribution unless preceded or accompanied by a current prospectus for the Funds.
MATSON MONEY VI PORTFOLIOS
Semi-Annual Investment Adviser’s Report
February 28, 2014
(Unaudited)
February 28, 2014
Dear Shareholder,
The Matson Money VI Portfolios (the “Portfolios”) have gained assets since their launch in early February and have already surpassed the $5 million mark. We would like to extend a warm and grateful thank you to all investors who have embraced our Free Market Portfolio Strategies.
Over the past six months, investors who remained invested and diversified have continued to experience the gains from the upward rally (despite a few bumps along the way). Global equity markets over the six months ended February 28, 2014 have risen 13.81% as measured by the MSCI All Country World Index. Furthermore, U.S. stocks also performed well at 15.07% as measured by the S&P 500 Index, outpacing international markets slightly over the past half a year. The Barclays Capital US Government/Credit Intermediate Bond Index was also in positive territory with a return of 2.10% for the six months ended February 28, 2014.
Matson Money, Inc. (“Matson Money”) strives to deliver the performance of capital markets and add value through Free Market Investment Strategies and Structured Market Portfolios. Grounded in the conviction that Free Markets work, Matson Money avoids the cost-generating activity of stock picking and market timing. Instead, we focus on the dimensions of capital markets that we believe reward investors as intelligently and effectively as possible. Our disciplined approach to life-long investing provides both the individual investor and the financial professional with the academic foundation upon which to help achieve investment goals.
Sound economic and financial research has documented that, over the long term, small cap stocks have outperformed large cap stocks, and value stocks have outperformed growth stocks. These returns seem to be compensation for risk. In fixed income, risk is well described by bond maturity and credit quality. Matson Money’s vehicles deliberately target specific risk and return trade offs. The Portfolios are broadly diversified and designed to work together in your total investment plan.
We invite you to contact your financial professional or explore our website, www.MatsonMoney.com, to learn more about the concepts and strategies of Matson Money’s investing.
We appreciate your support and confidence in our firm’s investment philosophy, process and people.

Daniel J List
Chief Compliance Officer and
Vice President
Matson Money, Inc.
1
MATSON MONEY VI PORTFOLIOS
Fund Expense Examples
(Unaudited)
As a shareholder of the Portfolio(s), you incur two types of costs: (1) transaction costs, including redemption fees; and (2) ongoing costs, including management fees and other Portfolio expenses. These examples are intended to help you understand your ongoing costs (in dollars) of investing in the Portfolio(s) and to compare these costs with the ongoing costs of investing in other mutual funds.
These examples are based on an investment of $1,000 invested on February 18, 2014 (commencement of operations) through February 28, 2014, and held for the entire period.
Actual Expenses
The first line of the accompanying tables provides information about actual account values and actual expenses. You may use the information in this line, together with the amount you invested, to estimate the expenses that you paid over the period. Simply divide your account value by $1,000 (for example, an $8,600 account value divided by $1,000 = 8.6), then multiply the result by the number in the first line under the heading entitled “Expenses Paid During Period” to estimate the expenses you paid on your account during this period.
Hypothetical Example for Comparison Purposes
The second line of the accompanying tables provides information about hypothetical account values and hypothetical expenses based on the Portfolio’s actual expense ratio and an assumed rate of return of 5% per year before expenses, which is not your Portfolio’s actual return. The hypothetical account values and expenses may not be used to estimate the actual ending account balance or expenses you paid for the period. You may use this information to compare the ongoing costs of investing in the Portfolio and other funds. To do so, compare these 5% hypothetical examples with the 5% hypothetical examples that appear in the shareholder reports of other funds.
Please note that the expenses shown in the accompanying tables are meant to highlight your ongoing costs only and do not reflect any transactional costs, such as redemption fees. Therefore, the second line of the accompanying tables is useful in comparing ongoing costs only, and will not help you determine the relative total costs of owning different funds. In addition, if these transactional costs were included, your costs would have been higher.
| | | | | | | | | | | | |
| | | Matson Money U.S. Equity VI Portfolio | |
| | | Beginning Account Value
February 18, 2014 | | | Ending Account Value
February 28, 2014 | | | Expenses Paid
During Period | |
Actual* | | $ | 1,000.00 | | | $ | 1,014.80 | | | $ | 0.28 | |
Hypothetical (5% return before expenses)** | | | 1,000.00 | | | | 1,019.19 | | | | 5.66 | |
| |
| | | Matson Money International Equity VI Portfolio | |
| | | Beginning Account Value
February 18, 2014 | | | Ending Account Value
February 28, 2014 | | | Expenses Paid
During Period | |
Actual* | | $ | 1,000.00 | | | $ | 1,012.80 | | | $ | 0.34 | |
Hypothetical (5% return before expenses)** | | | 1,000.00 | | | | 1,018.10 | | | | 6.76 | |
2
MATSON MONEY VI PORTFOLIOS
Fund Expense Examples (Concluded)
(Unaudited)
| | | | | | | | | | | | |
| |
| | | Matson Money Fixed Income VI Portfolio | |
| | | Beginning Account Value
February 18, 2014 | | | Ending Account Value
February 28, 2014 | | | Expenses Paid
During Period | |
Actual* | | $ | 1,000.00 | | | $ | 1,001.20 | | | $ | 0.25 | |
Hypothetical (5% return before expenses)** | | | 1,000.00 | | | | 1,019.84 | | | | 5.01 | |
| * | Expenses are equal to an annualized expense ratio for the period from February 18, 2014, commencement of operations, to February 28, 2014 of 1.13%, 1.35% and 1.00% for Matson Money U.S. Equity VI Portfolio, Matson Money International Equity VI Portfolio and Matson Money Fixed Income VI Portfolio, respectively, multiplied by the average account value over the period, multiplied by the number of days in the most recent period (9), then divided by 365 to reflect the period. The Portfolios’ ending account value on the first line in each table is based on the returns since inception for the Funds of 1.48%, 1.28% and 0.12% for Matson Money U.S. Equity VI Portfolio, Matson Money International Equity VI Portfolio and Matson Money Fixed Income VI Portfolio, respectively. |
| ** | Hypothetical expenses are as if each Portfolio had been in existence from September 1, 2013 and are equal to its annualized expense ratios, multiplied by the average account value over the period, multiplied by the number of days in the most recent six-month period (181), then divided by 365 to reflect the period. |
The annualized expense ratios do not reflect fees and expenses associated with the underlying funds. If such fees and expenses had been included, the expenses would have been higher. The range weighted expense ratios of the underlying funds held by the Portfolios, as stated in their current prospectuses, were as follows:
| | | | |
Matson Money U.S.
Equity VI Portfolio | | Matson Money International
Equity VI Portfolio | | Matson Money Fixed
Income VI Portfolio |
| 0.01%-0.08% | | 0.01%-0.19% | | 0.01%-0.05% |
3
MATSON MONEY VI PORTFOLIOS
MATSON MONEY U.S. EQUITY VI PORTFOLIO
Portfolio of Investments
February 28, 2014
(Unaudited)
| | | | | | | | |
| | | Number of
Shares | | | Value | |
| | |
EQUITY FUNDS — 97.8% | | | | | | | | |
U.S. Large Cap Value
Portfolio III(a) | | | 17,984 | | | $ | 423,332 | |
U.S. Large Company Portfolio(a) | | | 16,387 | | | | 240,889 | |
U.S. Micro Cap Portfolio(b) | | | 12,132 | | | | 243,007 | |
U.S. Small Cap Portfolio(b) | | | 7,825 | | | | 243,293 | |
U.S. Small Cap Value Portfolio(b) | | | 4,590 | | | | 162,566 | |
VA U.S. Large Value Portfolio(b) | | | 2,993 | | | | 65,120 | |
VA U.S. Targeted Value Portfolio(b) | | | 12,930 | | | | 243,991 | |
| | | | | | | | |
TOTAL EQUITY FUNDS
(Cost $1,601,189) | | | | | | | 1,622,198 | |
| | | | | | | | |
TOTAL INVESTMENTS — 97.8% | | | | | | | | |
(Cost $1,601,189) | | | | | | | 1,622,198 | |
| | | | | | | | |
OTHER ASSETS IN EXCESS OF LIABILITIES — 2.2% | | | | | | | 36,022 | |
| | | | | | | | |
NET ASSETS — 100.0% | | | | | | $ | 1,658,220 | |
| | | | | | | | |
Portfolio Holdings Summary Table
| | | | | | | | |
| | | % of
Net Assets | | | Value | |
Equity Funds | | | 97.8% | | | $ | 1,622,198 | |
Other Assets In Excess Of Liabilities | | | 2.2% | | | | 36,022 | |
| | | | | | | | |
NET ASSETS | | | 100.0% | | | $ | 1,658,220 | |
| | | | | | | | |
| (a) | A portfolio of Dimensional Investment Group Inc. |
| (b) | A portfolio of DFA Investment Dimensions Group Inc. |
Portfolio holdings are subject to change at any time.
The accompanying notes are an integral part of the financial statements.
4
MATSON MONEY VI PORTFOLIOS
MATSON MONEY INTERNATIONAL EQUITY VI PORTFOLIO
Portfolio of Investments
February 28, 2014
(Unaudited)
| | | | | | | | |
| | | Number of
Shares | | | Value | |
| |
INTERNATIONAL EQUITY FUNDS — 98.2% | | | | | |
DFA International Small Cap Value
Portfolio(a) | | | 14,621 | | | $ | 313,620 | |
DFA International Value Portfolio III(b) | | | 18,808 | | | | 334,211 | |
Emerging Markets Portfolio(a) | | | 2,329 | | | | 58,283 | |
Emerging Markets Small Cap Portfolio(a) | | | 2,697 | | | | 54,217 | |
Emerging Markets Value Portfolio(a) | | | 2,058 | | | | 54,013 | |
Large Cap International Portfolio(a) | | | 2,340 | | | | 53,468 | |
VA International Small Portfolio(b) | | | 14,810 | | | | 190,309 | |
VA International Value Portfolio(b) | | | 4,144 | | | | 55,700 | |
| | | | | | | | |
TOTAL INTERNATIONAL EQUITY FUNDS
(Cost $1,101,102) | | | | | | | 1,113,821 | |
| | | | | | | | |
TOTAL INVESTMENTS — 98.2%
(Cost $1,101,102) | | | | | | | 1,113,821 | |
| | | | | | | | |
OTHER ASSETS IN EXCESS OF LIABILITIES — 1.8% | | | | | | | 20,854 | |
| | | | | | | | |
NET ASSETS — 100.0% | | | | | | $ | 1,134,675 | |
| | | | | | | | |
Portfolio Holdings Summary Table
| | | | | | | | |
| | | % of
Net Assets | | | Value | |
International Equity Funds | | | 98.2% | | | $ | 1,113,821 | |
Other Assets In Excess Of Liabilities | | | 1.8% | | | | 20,854 | |
| | | | | | | | |
NET ASSETS | | | 100.0% | | | $ | 1,134,675 | |
| | | | | | | | |
| (a) | A portfolio of DFA Investment Dimensions Group Inc. |
| (b) | A portfolio of Dimensional Investment Group Inc. |
Portfolio holdings are subject to change at any time.
The accompanying notes are an integral part of the financial statements.
5
MATSON MONEY VI PORTFOLIOS
MATSON MONEY FIXED INCOME VI PORTFOLIO
Portfolio of Investments
February 28, 2014
(Unaudited)
| | | | | | | | |
| | | Number of
Shares | | | Value | |
| |
FIXED INCOME FUNDS — 96.5% | | | | | |
DFA Five-Year Global Fixed
Income Portfolio(a) | | | 22,527 | | | $ | 247,349 | |
DFA Inflation Protected
Securities Portfolio(a) | | | 10,516 | | | | 123,774 | |
DFA Intermediate Government Fixed Income Portfolio(a) | | | 23,748 | | | | 296,848 | |
DFA One-Year Fixed Income
Portfolio(a) | | | 59,431 | | | | 613,919 | |
DFA Short-Term Government
Portfolio(a) | | | 18,543 | | | | 198,039 | |
DFA Two-Year Global Fixed
Income Portfolio(a) | | | 61,764 | | | | 618,871 | |
VA Global Bond Portfolio(a) | | | 34,417 | | | | 371,018 | |
| | | | | | | | |
TOTAL FIXED INCOME FUNDS
(Cost $2,466,531) | | | | | | | 2,469,818 | |
| | | | | | | | |
TOTAL INVESTMENTS — 96.5% | | | | | | | | |
(Cost $2,466,531) | | | | | | | 2,469,818 | |
| | | | | | | | |
OTHER ASSETS IN EXCESS OF LIABILITIES — 3.5% | | | | | | | 89,345 | |
| | | | | | | | |
NET ASSETS — 100.0% | | | | | | $ | 2,559,163 | |
| | | | | | | | |
Portfolio Holdings Summary Table
| | | | | | | | |
| | | % of
Net Assets | | | Value | |
Fixed Income Funds | | | 96.5% | | | $ | 2,469,818 | |
Other Assets In Excess Of Liabilities | | | 3.5% | | | | 89,345 | |
| | | | | | | | |
NET ASSETS | | | 100.0% | | | $ | 2,559,163 | |
| | | | | | | | |
| (a) | A portfolio of DFA Investment Dimensions Group Inc. |
Portfolio holdings are subject to change at any time.
The accompanying notes are an integral part of the financial statements.
6
MATSON MONEY VI PORTFOLIOS
Statements of Assets and Liabilities
February 28, 2014 (Unaudited)
| | | | | | | | | | | | |
| | | Matson Money
U.S. Equity
VI Portfolio | | | Matson Money
International Equity
VI Portfolio | | | Matson Money
Fixed Income
VI Portfolio | |
ASSETS | | | | | | | | | | | | |
Investments in non-affiliated funds, at value † | | $ | 1,622,198 | | | $ | 1,113,821 | | | $ | 2,469,818 | |
Cash and cash equivalents | | | 3,246 | | | | 2,220 | | | | 4,951 | |
Receivables | | | | | | | | | | | | |
Receivable for capital shares sold | | | 32,617 | | | | 18,409 | | | | 84,381 | |
Receivable from Investment Adviser | | | 1,812 | | | | 1,866 | | | | 1,740 | |
| | | | | | | | | | | | |
Total assets | | | 1,659,873 | | | | 1,136,316 | | | | 2,560,890 | |
| | | | | | | | | | | | |
LIABILITIES | | | | | | | | | | | | |
Payables | | | | | | | | | | | | |
Audit fees | | | 510 | | | | 510 | | | | 510 | |
Custodian fees | | | 335 | | | | 335 | | | | 335 | |
Administration and accounting fees | | | 246 | | | | 229 | | | | 276 | |
Printing fees | | | 242 | | | | 242 | | | | 242 | |
Directors’ and officers’ fees | | | 186 | | | | 195 | | | | 200 | |
Other accrued expenses and liabilities | | | 134 | | | | 130 | | | | 164 | |
| | | | | | | | | | | | |
Total liabilities | | | 1,653 | | | | 1,641 | | | | 1,727 | |
| | | | | | | | | | | | |
Net Assets | | $ | 1,658,220 | | | $ | 1,134,675 | | | $ | 2,559,163 | |
| | | | | | | | | | | | |
NET ASSETS CONSISTS OF | | | | | | | | | | | | |
Par value | | $ | 65 | | | $ | 45 | | | $ | 102 | |
Paid-in capital | | | 1,637,486 | | | | 1,122,185 | | | | 2,556,261 | |
Accumulated net investment loss | | | (340 | ) | | | (274 | ) | | | (487 | ) |
Net unrealized appreciation on investments | | | 21,009 | | | | 12,719 | | | | 3,287 | |
| | | | | | | | | | | | |
Net Assets | | $ | 1,658,220 | | | $ | 1,134,675 | | | $ | 2,559,163 | |
| | | | | | | | | | | | |
Shares outstanding ($0.001 par value, 100,000,000 shares authorized) | | | 65,362 | | | | 44,809 | | | | 102,232 | |
| | | | | | | | | | | | |
Net asset value, offering and redemption price per share | | $ | 25.37 | | | $ | 25.32 | | | $ | 25.03 | |
| | | | | | | | | | | | |
† Investment in non-affiliated funds, at cost | | $ | 1,601,189 | | | $ | 1,101,102 | | | $ | 2,466,531 | |
| | | | | | | | | | | | |
The accompanying notes are an integral part of the financial statements.
7
MATSON MONEY VI PORTFOLIOS
Statements of Operations
For the Period Ended February 28, 2014
(Unaudited)
| | | | | | | | | | | | |
| | | Matson Money
U.S. Equity
VI Portfolio* | | | Matson Money
International Equity
VI Portfolio* | | | Matson Money
Fixed Income
VI Portfolio* | |
Investment Income | | | | | | | | | | | | |
Dividends from non-affiliated funds | | $ | — | | | $ | — | | | $ | — | |
| | | | | | | | | | | | |
| | | |
Expenses | | | | | | | | | | | | |
Professional fees | | | 548 | | | | 543 | | | | 562 | |
Directors’ and officers’ fees | | | 469 | | | | 488 | | | | 483 | |
Custodian fees (Note 2) | | | 367 | | | | 367 | | | | 367 | |
Administration and accounting fees (Note 2) | | | 241 | | | | 221 | | | | 273 | |
Printing and shareholder reporting fees | | | 241 | | | | 241 | | | | 242 | |
Transfer agent fees (Note 2) | | | 202 | | | | 195 | | | | 215 | |
Advisory fees (Note 2) | | | 151 | | | | 101 | | | | 243 | |
Other expenses | | | 84 | | | | 85 | | | | 85 | |
| | | | | | | | | | | | |
Total expenses | | | 2,303 | | | | 2,241 | | | | 2,470 | |
Less: Advisory fee waiver | | | (151 | ) | | | (101 | ) | | | (243 | ) |
Less: Reimbursement | | | (1,812 | ) | | | (1,866 | ) | | | (1,740 | ) |
| | | | | | | | | | | | |
Net operating expenses | | | 340 | | | | 274 | | | | 487 | |
| | | | | | | | | | | | |
Net investment loss | | | (340 | ) | | | (274 | ) | | | (487 | ) |
| | | | | | | | | | | | |
| | | |
Net realized and unrealized gain from investments | | | | | | | | | | | | |
Net change in unrealized appreciation on: | | | | | | | | | | | | |
Non-affiliated funds | | | 21,009 | | | | 12,719 | | | | 3,287 | |
| | | | | | | | | | | | |
Net realized and unrealized gain from investments | | | 21,009 | | | | 12,719 | | | | 3,287 | |
| | | | | | | | | | | | |
Net increase in net assets resulting from operations | | $ | 20,669 | | | $ | 12,445 | | | $ | 2,800 | |
| | | | | | | | | | | | |
| * | Commenced operations on February 18, 2014 |
The accompanying notes are an integral part of the financial statements.
8
MATSON MONEY U.S. EQUITY VI PORTFOLIO
Statements of Changes in Net Assets
| | | | |
| | | For the Period
February 18, 2014*
through
February 28, 2014
(Unaudited) | |
Increase in net assets from operations: | | | | |
Net investment loss | | $ | (340 | ) |
Net change in unrealized appreciation from investments | | | 21,009 | |
| | | | |
Net increase in net assets resulting from operations | | | 20,669 | |
| | | | |
| |
Capital share transactions: | | | | |
Proceeds from shares sold | | | 1,637,573 | |
Shares redeemed | | | (22 | ) |
| | | | |
Net increase in net assets from capital shares | | | 1,637,551 | |
| | | | |
Total increase in net assets | | | 1,658,220 | |
| | | | |
| |
Net assets: | | | | |
Beginning of period | | | — | |
| | | | |
End of period | | $ | 1,658,220 | |
| | | | |
Accumulated net investment loss, end of period | | $ | (340 | ) |
| | | | |
| |
Capital share transactions: | | | | |
Shares sold | | | 65,363 | |
Shares redeemed | | | (1 | ) |
| | | | |
Total share transactions | | | 65,362 | |
| | | | |
| * | Commencement of operations |
The accompanying notes are an integral part of the financial statements.
9
MATSON MONEY INTERNATIONAL EQUITY VI PORTFOLIO
Statements of Changes in Net Assets
| | | | |
| | | For the Period
February 18, 2014*
through
February 28, 2014
(Unaudited) | |
Increase in net assets from operations: | | | | |
Net investment loss | | $ | (274 | ) |
Net change in unrealized appreciation from investments | | | 12,719 | |
| | | | |
Net increase in net assets resulting from operations | | | 12,445 | |
| | | | |
| |
Capital share transactions: | | | | |
Proceeds from shares sold | | | 1,122,245 | |
Shares redeemed | | | (15 | ) |
| | | | |
Net increase in net assets from capital shares | | | 1,122,230 | |
| | | | |
Total increase in net assets | | | 1,134,675 | |
| | | | |
| |
Net assets: | | | | |
Beginning of period | | | — | |
| | | | |
End of period | | $ | 1,134,675 | |
| | | | |
Accumulated net investment loss, end of period | | $ | (274 | ) |
| | | | |
| |
Capital share transactions: | | | | |
Shares sold | | | 44,810 | |
Shares redeemed | | | (1 | ) |
| | | | |
Total share transactions | | | 44,809 | |
| | | | |
| * | Commencement of operations |
The accompanying notes are an integral part of the financial statements.
10
MATSON MONEY FIXED INCOME VI PORTFOLIO
Statements of Changes in Net Assets
| | | | |
| | | For the Period
February 18, 2014*
through
February 28, 2014
(Unaudited) | |
| | | | |
Increase in net assets from operations: | | | | |
Net investment loss | | $ | (487 | ) |
Net change in unrealized appreciation from investments | | | 3,287 | |
| | | | |
Net increase in net assets resulting from operations | | | 2,800 | |
| | | | |
| |
Capital share transactions: | | | | |
Proceeds from shares sold | | | 2,556,395 | |
Shares redeemed | | | (32 | ) |
| | | | |
Net increase in net assets from capital shares | | | 2,556,363 | |
| | | | |
Total increase in net assets | | | 2,559,163 | |
| | | | |
| |
Net assets: | | | | |
Beginning of period | | | — | |
| | | | |
End of period | | $ | 2,559,163 | |
| | | | |
Accumulated net investment loss, end of period | | $ | (487 | ) |
| | | | |
| |
Capital share transactions: | | | | |
Shares sold | | | 102,233 | |
Shares redeemed | | | (1 | ) |
| | | | |
Total share transactions | | | 102,232 | |
| | | | |
| * | Commencement of operations |
The accompanying notes are an integral part of the financial statements.
11
MATSON MONEY VI PORTFOLIOS
MATSON MONEY U.S. EQUITY VI PORTFOLIO
Financial Highlights
Contained below is per share operating performance data for each share outstanding, total investment return, ratios to average net assets and other supplemental data for the period. This information has been derived from information provided in the financial statements.
| | | | |
| | | For the Period
February 18, 2014(1)
through
February 28, 2014
(Unaudited) | |
Per Share Operating Performance | | | | |
Net asset value, beginning of period | | $ | 25.00 | |
| | | | |
Net investment loss(2) | | | (0.01 | ) |
Net realized and unrealized gain on investments | | | 0.38 | |
| | | | |
Net increase in net assets resulting from operations | | | 0.37 | |
| | | | |
Dividends and distributions to shareholders from: | | | | |
Net investment income | | | — | |
Net realized capital gains | | | — | |
| | | | |
Total dividends and distributions to shareholders | | | — | |
| | | | |
Net asset value, end of period | | $ | 25.37 | |
| | | | |
Total investment return(3) | | | 1.48 | %(4) |
| | | | |
| |
Ratio/Supplemental Data | | | | |
Net assets, end of period (000’s omitted) | | $ | 1,658 | |
Ratio of expenses to average net assets with waivers(5) | | | 1.13 | %(6) |
Ratio of expenses to average net assets without waivers | | | 7.64 | %(6) |
Ratio of net investment (loss) to average net assets with waivers(5) | | | (1.13 | )%(6) |
Portfolio turnover rate | | | 0 | %(4) |
| (1) | Commencement of operations. |
| (2) | The selected per share data was calculated using the average shares outstanding method for the period. |
| (3) | Total investment return is calculated by assuming a purchase of shares on the first day and a sale of shares on the last day of each period reported and includes reinvestments of dividends and distributions, if any. |
| (5) | The Portfolio also will indirectly bear its prorated share of expenses of the underlying funds. Such expenses are not included in the calculation of this ratio. |
The accompanying notes are an integral part of the financial statements.
12
MATSON MONEY VI PORTFOLIOS
MATSON MONEY INTERNATIONAL EQUITY VI PORTFOLIO
Financial Highlights
Contained below is per share operating performance data for each share outstanding, total investment return, ratios to average net assets and other supplemental data for the period. This information has been derived from information provided in the financial statements.
| | | | |
| | | For the Period
February 18, 2014(1)
through
February 28, 2014
(Unaudited) | |
Per Share Operating Performance | | | | |
Net asset value, beginning of period | | $ | 25.00 | |
| | | | |
Net investment loss(2) | | | (0.01 | ) |
Net realized and unrealized gain on investments | | | 0.33 | |
| | | | |
Net increase in net assets resulting from operations | | | 0.32 | |
| | | | |
Dividends and distributions to shareholders from: | | | | |
Net investment income | | | — | |
Net realized capital gains | | | — | |
| | | | |
Total dividends and distributions to shareholders | | | — | |
| | | | |
Net asset value, end of period | | $ | 25.32 | |
| | | | |
Total investment return(3) | | | 1.28 | %(4) |
| | | | |
| |
Ratio/Supplemental Data | | | | |
Net assets, end of period (000’s omitted) | | $ | 1,135 | |
Ratio of expenses to average net assets with waivers(5) | | | 1.35 | %(6) |
Ratio of expenses to average net assets without waivers | | | 11.04 | %(6) |
Ratio of net investment (loss) to average net assets with waivers(4) | | | (1.35 | )%(6) |
Portfolio turnover rate | | | 0 | %(4) |
| (1) | Commencement of operations. |
| (2) | The selected per share data was calculated using the average shares outstanding method for the period. |
| (3) | Total investment return is calculated by assuming a purchase of shares on the first day and a sale of shares on the last day of each period reported and includes reinvestments of dividends and distributions, if any. |
| (5) | The Portfolio also will indirectly bear its prorated share of expenses of the underlying funds. Such expenses are not included in the calculation of this ratio. |
The accompanying notes are an integral part of the financial statements.
13
MATSON MONEY VI PORTFOLIOS
MATSON MONEY FIXED INCOME VI PORTFOLIO
Financial Highlights
Contained below is per share operating performance data for each share outstanding, total investment return, ratios to average net assets and other supplemental data for the period. This information has been derived from information provided in the financial statements.
| | | | |
| | | For the Period
February 18, 2014(1)
through
February 28, 2014
(Unaudited) | |
Per Share Operating Performance | | | | |
Net asset value, beginning of period | | $ | 25.00 | |
| | | | |
Net investment loss(2) | | | (0.01 | ) |
Net realized and unrealized gain on investments | | | 0.04 | |
| | | | |
Net increase in net assets resulting from operations | | | 0.03 | |
| | | | |
Dividends and distributions to shareholders from: | | | | |
Net investment income | | | — | |
Net realized capital gains | | | — | |
| | | | |
Total dividends and distributions to shareholders | | | — | |
| | | | |
Net asset value, end of period | | $ | 25.03 | |
| | | | |
Total investment return(3) | | | 0.12 | %(4) |
| | | | |
| |
Ratio/Supplemental Data | | | | |
Net assets, end of period (000’s omitted) | | $ | 2,559 | |
Ratio of expenses to average net assets with waivers(5) | | | 1.00 | %(6) |
Ratio of expenses to average net assets without waivers | | | 5.08 | %(6) |
Ratio of net investment loss to average net assets with waivers(5) | | | (1.00 | )%(6) |
Portfolio turnover rate | | | 0 | %(4) |
| (1) | Commencement of operations. |
| (2) | The selected per share data was calculated using the average shares outstanding method for the period. |
| (3) | Total investment return is calculated by assuming a purchase of shares on the first day and a sale of shares on the last day of each period reported and includes reinvestments of dividends and distributions, if any. |
| (5) | The Portfolio also will indirectly bear its prorated share of expenses of the underlying funds. Such expenses are not included in the calculation of this ratio. |
The accompanying notes are an integral part of the financial statements.
14
MATSON MONEY VI PORTFOLIOS
Notes to Financial Statements
February 28, 2014
(Unaudited)
| 1. | Organization and Significant Accounting Policies |
The RBB Fund, Inc. (“RBB” or the “Company”) was incorporated under the laws of the State of Maryland on February 29, 1988 and is registered under the Investment Company Act of 1940, as amended (the “1940 Act”), as an open-end management investment company. RBB is a “series fund,” which is a mutual fund divided into separate portfolios. Each portfolio is treated as a separate entity for certain matters under the 1940 Act, and for other purposes, and a shareholder of one portfolio is not deemed to be a shareholder of any other portfolio. Currently, RBB has twenty-one active investment portfolios, including the Matson Money U.S. Equity VI Portfolio, the Matson Money International Equity VI Portfolio, and the Matson Money Fixed Income VI Portfolio (each a “Portfolio,” collectively the “Portfolios”). Each Portfolio operates as a “fund of funds” and commenced investment operations on February 18, 2014. Shares of the Portfolios are offered to separate accounts of participating life insurance companies for the purpose of funding variable annuity contracts and variable life insurance policies.
RBB has authorized capital of one hundred billion shares of common stock of which 81.373 billion shares are currently classified into one hundred and forty-eight classes of common stock. Each class represents an interest in an active or inactive RBB investment portfolio.
PORTFOLIO VALUATION — Investments in the underlying funds are valued at each fund’s net asset value determined as of the close of business on the New York Stock Exchange (generally 4:00 p.m. Eastern time). As required, some securities and assets may be valued at fair value as determined in good faith by the Company’s Board of Directors. Direct investments in fixed income securities having a remaining maturity of 60 days or less are valued at amortized cost, which approximates market value.
Fair Value Measurements — The inputs and valuations techniques used to measure fair value of the Portfolios’ investments are summarized into three levels as described in the hierarchy below:
| | • Level 1 — | quoted prices in active markets for identical securities; |
| | • Level 2 — | other significant observable inputs (including quoted prices for similar securities, interest rates, prepayment speeds, credit risk, etc.); and |
| | • Level 3 — | significant unobservable inputs (including the Portfolios’ own assumptions in determining the fair value of investments). |
The inputs or methodology used for valuing securities are not necessarily an indication of the risk associated with investing in those securities.
The following is a summary of the inputs used, as of February 28, 2014, in valuing the Portfolios’ investments carried at fair value:
MATSON MONEY U.S. EQUITY VI PORTFOLIO
| | | | | | | | | | | | | | | | |
| | | Total Value at
February 28, 2014 | | | Level 1
Quoted
Price | | | Level 2
Significant
Observable
Input | | | Level 3
Significant
Unobservable
Input | |
Investments in Securities* | | $ | 1,622,198 | | | $ | 1,622,198 | | | $ | — | | | $ | — | |
| | | | | | | | | | | | | | | | |
*Please refer to the Portfolio of Investments for further details.
MATSON MONEY INTERNATIONAL EQUITY VI PORTFOLIO
| | | | | | | | | | | | | | | | |
| | | Total Value at
February 28, 2014 | | | Level 1
Quoted
Price | | | Level 2
Significant
Observable
Input | | | Level 3
Significant
Unobservable
Input | |
Investments in Securities* | | $ | 1,113,821 | | | $ | 1,113,821 | | | $ | — | | | $ | — | |
| | | | | | | | | | | | | | | | |
*Please refer to the Portfolio of Investments for further details.
15
MATSON MONEY VI PORTFOLIOS
Notes to Financial Statements (Continued)
February 28, 2014 (Unaudited)
MATSON MONEY FIXED INCOME VI PORTFOLIO
| | | | | | | | | | | | | | | | |
| | | Total Value at
February 28, 2014 | | | Level 1
Quoted
Price | | | Level 2
Significant
Observable
Input | | | Level 3
Significant
Unobservable
Input | |
Investments in Securities* | | $ | 2,469,818 | | | $ | 2,469,818 | | | $ | — | | | $ | — | |
| | | | | | | | | | | | | | | | |
*Please refer to the Portfolio of Investments for further details.
At the end of each fiscal quarter, management evaluates the classification of Levels 1, 2 and 3 assets and liabilities. Various factors are considered, such as changes in liquidity from the prior reporting period; whether or not a broker is willing to execute at the quoted price; the depth and consistency of prices from third party pricing services; and the existence of contemporaneous, observable trades in the market. Additionally, management evaluates the classification of Level 1 and Level 2 assets and liabilities on a quarterly basis for changes in listings or delistings on national exchanges.
Due to the inherent uncertainty of determining the fair value of investments that do not have a readily available market value, the fair value of the Portfolios’ investments may fluctuate from period to period. Additionally, the fair value of investments may differ significantly from the values that would have been used had a ready market existed for such investments and may differ materially from the values the Portfolios may ultimately realize. Further, such investments may be subject to legal and other restrictions on resale or otherwise less liquid than publicly traded securities.
For fair valuations using significant unobservable inputs, U.S. generally accepted accounting principles (“U.S. GAAP”) require each Portfolio to present a reconciliation of the beginning to ending balances for reported market values that presents changes attributable to total realized and unrealized gains or losses, purchase and sales, and transfers in and out of Level 3 during the period. Transfers in and out between Levels are based on values at the end of the period. U.S. GAAP also requires a Portfolio to disclose amounts and reasons for all transfers in and out of Level 1 and Level 2 fair value measurements. A reconciliation of Level 3 investments is presented only when a Portfolio had an amount of Level 3 investments at the end of the reporting period that was meaningful in relation to its net assets. The amounts and reasons for all transfers in and out of each Level within the three-tier hierarchy are disclosed when a Portfolio had an amount of total transfers during the reporting period that was meaningful in relation to its net assets as of the end of the reporting period.
For the period ended February 28, 2014, there were no transfers between Levels 1, 2 and 3 for the Portfolios.
USE OF ESTIMATES — The preparation of financial statements in conformity with U.S. GAAP requires management to make estimates and assumptions that affect the reported amounts of assets and liabilities and disclosure of contingent assets and liabilities at the date of the financial statements and the reported amounts of revenues and expenses during the period. Actual results could differ from those estimates and those differences could be significant.
INVESTMENT TRANSACTIONS, INVESTMENT INCOME AND EXPENSES — Transactions are accounted for on the trade date for financial reporting purposes. The cost of investments sold is determined by use of the specific identification method for both financial reporting and income tax purposes in determining realized gains and losses on investments. Interest income is accrued when earned. Dividend income is recorded on the ex-dividend date. Distributions received on securities that represent a return of capital or capital gain are recorded as a reduction of cost of investments and/or as a realized gain. The Portfolios estimate the components of distributions received that may be considered return of capital distributions or capital gain distributions. Each Portfolio’s investment income, expenses and unrealized and realized gains and losses are allocated daily. Expenses incurred on behalf of a specific class, fund or fund family of the Company are charged directly to the class, fund or fund family (in proportion to net assets). Expenses incurred for all of the RBB funds (such as director or professional fees) are charged to all Portfolios in proportion to their average net assets of RBB, or in such other manner as the Company’s Board of Directors deems fair or equitable. Expenses and fees, including investment advisory and administration fees, are accrued daily and taken into account for the purpose of determining the net asset value of the Portfolios. In addition to the net annual operating expenses that the Portfolios bear directly, the shareholders indirectly bear the Portfolios’ pro-rata expenses of the underlying mutual funds in which each Portfolio invests.
16
MATSON MONEY VI PORTFOLIOS
Notes to Financial Statements (Continued)
February 28, 2014
(Unaudited)
DIVIDENDS AND DISTRIBUTIONS TO SHAREHOLDERS — Dividends from net investment income and distributions from net realized capital gains, if any, are declared and paid at least annually to shareholders and recorded on ex-dividend date for all Portfolios with the exception of the Matson Money Fixed Income VI Portfolio which declares and pays quarterly dividends from net investment income. Income dividends and capital gain distributions are determined in accordance with U.S. federal income tax regulations which may differ from U.S. GAAP.
U.S. TAX STATUS — No provision is made for U.S. income taxes as it is each Portfolio’s intention to qualify for and elect the tax treatment applicable to regulated investment companies under Subchapter M of the Internal Revenue Code of 1986, as amended, and make the requisite distributions to its shareholders which will be sufficient to relieve it from U.S. income and excise taxes.
CASH AND CASH EQUIVALENTS — The Portfolios consider liquid assets deposited with a bank demand deposit account to be cash equivalents. These investments represent amounts held with financial institutions that are readily accessible to pay Portfolio expenses or purchase investments. Cash and cash equivalents are valued at cost plus accrued interest, which approximates market value.
OTHER — In the normal course of business, the Portfolios may enter into contracts that provide general indemnifications. The Portfolios’ maximum exposure under these arrangements is dependent on claims that may be made against the Portfolios in the future, and, therefore, cannot be estimated; however, based on experience, the risk of material loss for such claims is considered remote.
| 2. | Investment Adviser and Other Services |
Matson Money, Inc. (“Matson Money” or the “Adviser”), serves as each Portfolio’s investment adviser. The Adviser is entitled to an advisory fee at the annual rate of 0.50% of the first $1 billion of each Portfolio’s average daily net assets, 0.49% of each Portfolio’s average daily net assets over $1 billion to $5 billion and 0.47% of each Portfolio’s average daily net assets over $5 billion. The Adviser has voluntarily agreed to waive its advisory fee and/or reimburse expenses in order to limit Total Annual Portfolio Operating Expenses to 1.13%, 1.35% and 1.00% of the average daily net assets of the Matson Money U.S. Equity VI Portfolio, Matson Money International Equity VI Portfolio and Matson Money Fixed Income VI Portfolio, respectively. The Adviser may discontinue these arrangements at any time.
As of February 28, 2014, Matson Money has waived and reimbursed fees as follows:
| | | | | | | | |
Funds | | Investment
Advisor
Expense
Waived | | | Investment
Advisor
Expense
Reimbursement | |
Matson Money U.S. Equity VI Portfolio | | $ | 151 | | | $ | 1,812 | |
Matson Money International Equity VI Portfolio | | | 101 | | | | 1,866 | |
Matson Money Fixed Income VI Portfolio | | | 243 | | | | 1,740 | |
BNY Mellon Investment Servicing (US) Inc. (“BNY Mellon”), serves as administrator for the Portfolios. For providing administrative and accounting services, BNY Mellon is entitled to receive a monthly fee equal to an annual percentage rate of the Funds’ average daily net assets and is subject to certain minimum monthly fees.
Included in the administration and accounting service fees, shown on the Statement of Operations, are fees for providing regulatory administration services to RBB. For providing these services, BNY Mellon is entitled to receive compensation as agreed to by the Company and BNY Mellon. This fee is allocated to each portfolio of the Company in proportion to its net assets of the Company.
17
MATSON MONEY VI PORTFOLIOS
Notes to Financial Statements (Continued)
February 28, 2014
(Unaudited)
In addition, BNY Mellon serves as the Portfolios’ transfer and dividend disbursing agent. For providing transfer agent services, BNY Mellon is entitled to receive a monthly fee equal to an annual percentage rate of each Portfolio’s average daily net assets, subject to certain minimum monthly fees.
The Bank of New York Mellon (the “Custodian”) provides custodian services to the Portfolios. The Custodian is entitled to receive a monthly fee equal to an annual percentage rate of the Portfolios’ average daily net assets, subject to certain minimum monthly fees.
Foreside Funds Distributors LLC serves as the principal underwriter and distributor of the Portfolios’ shares pursuant to a Distribution Agreement with RBB.
The Directors of the Company receive an annual retainer and meeting fees for meetings attended. There were no aggregate remuneration paid to the Directors by the Portfolios during the period ended February 28, 2014. Certain employees of BNY Mellon serve as an Officer or Director of the Company. They are not compensated by the Portfolios or the Company.
| 4. | Investment in Securities |
For the period from February 18, 2014 (commencement of operation) through February 28, 2014, aggregate purchases and sales of investment securities (excluding short-term investments) of the Portfolios were as follows:
| | | | | | | | |
| | | Purchases | | | Sales | |
Matson Money U.S. Equity VI Portfolio | | $ | 1,601,189 | | | $ | — | |
Matson Money International Equity VI Portfolio | | | 1,101,102 | | | | — | |
Matson Money Fixed Income VI Portfolio | | | 2,466,531 | | | | — | |
| 5. | Federal Income Tax Information |
The Portfolios have followed the authoritative guidance on accounting for and disclosure of uncertainty in tax positions, which requires the Portfolios to determine whether a tax position is more likely than not to be sustained upon examination, including resolution of any related appeals or litigation processes, based on the technical merits of the position. The Portfolios have determined that there was no effect on the financial statements from following this authoritative guidance. In the normal course of business, the Portfolios are subject to examination by federal, state and local jurisdictions, where applicable, for tax years for which applicable statutes of limitations have not expired.
As of February 28, 2014, the federal tax cost, aggregate gross unrealized appreciation and depreciation of securities held by each Portfolio were as follows:
| | | | | | | | | | | | | | | | |
| | | Federal Tax
Cost | | | Unrealized
Appreciation | | | Unrealized
Depreciation | | | Net
Unrealized
Appreciation | |
Matson Money U.S. Equity VI Portfolio | | $ | 1,601,189 | | | $ | 21,009 | | | $ | — | | | $ | 21,009 | |
Matson Money International Equity VI Portfolio | | | 1,101,102 | | | | 12,759 | | | | (40 | ) | | | 12,719 | |
Matson Money Fixed Income VI Portfolio | | | 2,466,531 | | | | 3,292 | | | | (5 | ) | | | 3,287 | |
Management has evaluated the impact of all subsequent events on the Portfolios through the date the financial statements were issued, and has determined that there were no subsequent events requiring recognition or disclosure in the financial statements.
18
MATSON MONEY VI PORTFOLIOS
Other Information
(Unaudited)
Proxy Voting
Policies and procedures that the Portfolios use to determine how to vote proxies relating to portfolio securities as well as information regarding how the Portfolios voted proxies relating to portfolio securities for the most recent 12-month period ended June 30 are available without charge, upon request, by calling Matson Money Portfolios at (866) 780-0357, ext. 3863 and on the Securities and Exchange Commission’s (“SEC”) website at http://www.sec.gov.
Quarterly Portfolio Schedules
The Company files a complete schedule of portfolio holdings with the SEC for the first and third fiscal quarters of each fiscal year (quarters ended November 30 and May 31) on Form N-Q. The Company’s Form N-Q is available on the SEC website at http://www.sec.gov and may be reviewed and copied at the SEC Public Reference Room in Washington, D.C. Information on the operation of the SEC Public Reference Room may be obtained by calling (202) 551-8090.
Approval of Investment Advisory Agreement
As required by the 1940 Act, the Board of the Company, including all of the Directors who are not “interested persons” of the Company, as that term is defined in the 1940 Act (the “Independent Directors”), considered the approval of the investment advisory agreement between Matson Money, Inc. (“Matson Money”) and the Company (the “Investment Advisory Agreement”) on behalf of the Matson Money U.S. Equity VI Portfolio, Matson Money International Equity VI Portfolio and Matson Money Fixed Income VI Portfolio (collectively the “Portfolios”) at a meeting of the Board held on November 21, 2013 (the “Meeting”). At the Meeting, the Board, including all of the Independent Directors, approved the Investment Advisory Agreement for an initial term through August 16, 2015. The Board’s decision to approve the Investment Advisory Agreement reflects the exercise of its business judgment. In considering the approval of the Investment Advisory Agreement, the Board considered information provided by Matson Money with the assistance and advice of counsel to the Independent Directors and the Company.
In considering the approval of the Investment Advisory Agreement with Matson Money, the Directors took into account all materials provided prior to and during the Meeting, the presentation made during the Meeting, and the discussions during the Meeting. Among other things, the Directors considered (i) the nature, extent, and quality of services to be provided to the Portfolios by Matson Money; (ii) descriptions of the experience and qualifications of the personnel providing those services; (iii) Matson Money’s investment philosophies and processes; (iv) Matson Money’s assets under management and client descriptions; (v) Matson Money’s soft dollar commission and trade allocation policies, including information on the types of research and services obtained in connection with soft dollar commissions; (vi) Matson Money’s proposed advisory fee arrangements with the Company and other similarly managed clients; (vii) Matson Money’s compliance procedures; (viii) Matson Money’s financial information and insurance coverage; (ix) the extent to which economies of scale are relevant to the Portfolios; and (x) performance information provided by Matson Money regarding similarly managed accounts.
As part of their review, the Directors considered the nature, extent and quality of the services to be provided by Matson Money. The Directors concluded that Matson Money has substantial resources to provide services to the Portfolios.
The Board of Directors also considered the advisory fee rate payable under the Investment Advisory Agreement. In this regard, the Directors noted that Matson Money had contractually agreed to waive management fees and reimburse expenses for the Portfolios’ first year of operations to limit total annual operating expenses to agreed upon levels.
After reviewing the information regarding Matson Money’s costs and economies of scale, and after considering the services to be provided by Matson Money, the Directors concluded that the investment advisory fees to be paid by the Portfolios to Matson Money were fair and reasonable.
19
MATSON MONEY VI PORTFOLIOS
Privacy Notice
(Unaudited)
| | |
| FACTS | | WHAT DO THE MATSON MONEY VI PORTFOLIOS DO WITH YOUR PERSONAL INFORMATION? |
| Why? | | Financial companies choose how they share your personal information. Federal law gives consumers the right to limit some but not all sharing. Federal law also requires us to tell you how we collect, share, and protect your personal information. Please read this notice carefully to understand what we do. |
| What? | | The types of personal information we collect and share depend on the product or service you have with us. This information can include: • Social Security number • account balances • account transactions • transaction history • wire transfer instructions • checking account information When you are no longer our customer, we continue to share your information as described in this notice. |
| How? | | All financial companies need to share customers’ personal information to run their everyday business. In the section below, we list the reasons financial companies can share their customers’ personal information; the reasons the Matson Money VI Portfolios choose to share; and whether you can limit this sharing. |
| | | | |
| Reasons we can share your personal information | | Do the Matson Money VI Portfolios share? | | Can you limit this sharing? |
For our everyday business purposes – such as to process your transactions, maintain your account(s), respond to court orders and legal investigations, or report to credit bureaus | | Yes | | No |
For our marketing purposes – to offer our products and services to you | | Yes | | No |
| For joint marketing with other financial companies | | Yes | | No |
For our affiliates’ everyday business purposes – information about your transactions and experiences | | Yes | | No |
For our affiliates’ everyday business purposes – information about your creditworthiness | | No | | We don’t share |
| For our affiliates to market to you | | No | | We don’t share |
| For nonaffiliates to market to you | | No | | We don’t share |
| | |
| Questions? | | Call (866) 573-2152 or go to www.MatsonMoney.com |
20
MATSON MONEY VI PORTFOLIOS
Privacy Notice (Concluded)
(Unaudited)
| | |
What we do | | |
| | |
| How do the Matson Money VI Portfolios protect my personal information? | | To protect your personal information from unauthorized access and use, we use security measures that comply with federal law. These measures include computer safeguards and secured files and buildings. |
| How do the Matson Money VI Portfolios collect my personal information? | | We collect your personal information, for example, when you • open an account • provide account information • give us your contact information • make a wire transfer • tell us where to send the money We also collect your information from others, such as credit bureaus, affiliates, or other companies. |
| Why can’t I limit all sharing? | | Federal law gives you the right to limit only • sharing for affiliates’ everyday business purposes – information about your creditworthiness • affiliates from using your information to market to you • sharing for nonaffiliates to market to you State laws and individual companies may give you additional rights to limit sharing. |
Definitions |
| Affiliates | | Companies related by common ownership or control. They can be financial and nonfinancial companies. • Our affiliates include McGriff Video Productions and Matson Money, Inc. |
| Nonaffiliates | | Companies not related by common ownership or control. They can be financial and nonfinancial companies. • The Matson Money VI Portfolios don’t share with nonaffiliates so they can market to you. The Funds may share information with nonaffiliates that perform marketing services on our behalf. |
| Joint marketing | | A formal agreement between nonaffiliated financial companies that together market financial products or services to you. • The Matson Money VI Portfolios may share your information with other financial institutions with whom we have joint marketing arrangements who may suggest additional fund services or other investment products which may be of interest to you. |
21
Investment Adviser
MATSON MONEY, INC.
5955 Deerfield Blvd.
Mason, OH 45040
Administrator
BNY Mellon Investment Servicing (US) Inc.
301 Bellevue Parkway
Wilmington, DE 19809
Transfer Agent
BNY Mellon Investment Servicing (US) Inc.
4400 Computer Drive
Westborough, MA 01581
Principal Underwriter
Foreside Funds Distributors LLC
400 Berwyn Park
899 Cassatt Road
Berwyn, PA 19312
Custodian
The Bank of New York Mellon
One Wall Street
New York, NY 10286
Independent Registered Public Accounting Firm
PricewaterhouseCoopers LLP
Two Commerce Square, Suite 1700
2001 Market Street
Philadelphia, PA 19103-7042
Counsel
Drinker Biddle & Reath LLP
One Logan Square, Ste. 2000
Philadelphia, PA 19103-6996
Perimeter Small Cap Growth Fund
of The RBB Fund, Inc.
| | | | |
| Semi-Annual Report | | | | February 28, 2014 |
| | | | (Unaudited) |
PERIMETER
SMALL CAP GROWTH FUND
Semi-Annual Investment Adviser’s Report
February 28, 2014
(Unaudited)
Dear Shareholder:
The Perimeter Small Cap Growth Fund (the “Fund”) posted a return of 17.4% (I shares) net of fees for the six-month period ended February 28, 2014 trailing the Russell 2000 Growth Index return of 19.2%. Although it was a solid 2013 calendar year in small caps, higher quality companies with strong fundamentals still lagged their higher valuation, lower quality counterparts. Small cap growth stocks continued to reach new highs, despite a pullback in early December 2013 from worries surrounding the Federal Reserve tapering activities (i.e. a less aggressive monetary policy). Overall, the market has been benefitting from the positive backdrop of economic recovery (albeit slow), low inflation, positive equity inflows, and improving consumer confidence. The world economy is entering an era of low growth as the population of consumers is in decline and nations are still repairing balance sheets. This backdrop should provide for solid relative performance from dynamic small cap (growth) companies that have better products or business processes and can rapidly take market share from others, rather than relying just on demand-driven pricing.
As we have suggested in recent letters, we continue to expect the landscape of the market will change from being driven by companies with lower quality and high valuation factors (like biotech), to being driven by higher quality companies with more reasonable valuation. Overall small cap price/earnings ratios have climbed to levels that are above historical averages versus large caps, but with low inflation and still low interest rates, valuation metrics are not overly stretched and there remain many solid investment opportunities in the space. That being said, small cap returns will become increasingly reliant on earnings growth versus multiple expansion, which will favor Perimeter’s investment process.
Exiting the first six months of the Fund’s fiscal year, we remain well underweight in the biotech industry within the Healthcare sector. We favor those companies with diversified revenue streams, multiple catalysts, and the ability to drive shareholder value. Much of our underweight in biotech is offset by our overweight in Technology. While this has been a headwind in the short run as the market has indiscriminately sold off certain groups of stocks within Technology, we maintain a high level of conviction in the fundamentals of our companies in this sector. Other sectors where we maintain an overweight bias include the Industrials and Energy sectors, believing that both should see a tailwind from an economy that continues to gain traction. Lastly, while we are still leery of consumer spending weakness, an improving employment picture combined with improving consumer confidence should bode well for those companies with superior offerings and business models. As a result, we have seen our underweight position in consumer spending migrate toward a neutral position versus the benchmark.
Following very strong recent returns through February 28, 2014 we believe the equity markets have been due for a pause, pullback, or correction. Such a pause in the midst of an uptrend, while sometimes unsettling, can be healthy for the overall market and necessary to allow fundamentals and earnings a chance to catch up with valuations. The current market pause has led to a change in leadership and presents us with the opportunity to identify those stocks or types of stocks that are emerging as the new market leaders. We are particularly pleased because we believe that new leadership will possess higher quality characteristics that better represent the type of stock that emerges through the Perimeter investment process.
Sincerely,
Perimeter Capital Management
This report represents the manager’s assessment of the Fund and the market environment at a specific point in time and should not be relied upon by the reader as research or investment advice.
Portfolio composition is subject to change. The current and future portfolio holdings of the Fund are subject to investment risk.
The Russell 2000® Index is a widely-recognized, capitalization-weighted index that measures the performance of the smallest 2,000 companies in the Russell 3000® Index. The Russell 2000® Growth Index measures the performance of those Russell 2000 companies with higher price-to-book ratios and higher forecasted growth values. Direct investment into an index is not possible.
2
PERIMETER
SMALL CAP GROWTH FUND
Semi-Annual Investment Adviser’s Report
February 28, 2014
(Unaudited)
Average Annual Total Returns For The Periods Ended February 28, 2014
| | | | | | | | | | | | | | | | | | | | |
| | | Six
Months* | | | One
Year | | | Three
Year | | | Five
Year | | | Since
Inception**** | |
Perimeter Small Cap Growth Fund, Investor Class Shares** | | | 17.22% | | | | 34.09% | | | | 12.85% | | | | 23.74% | | | | 7.68% | |
Perimeter Small Cap Growth Fund, I Shares*** | | | 17.37% | | | | 34.53% | | | | 13.15% | | | | 24.02% | | | | 6.88% | |
Russell 2000® Growth Index | | | 19.20% | | | | 37.06% | | | | 15.96% | | | | 28.01% | | | | 10.08% | |
| ** | Investor Class Shares were offered beginning September 29, 2006. |
| *** | I Shares were offered beginning December 31, 2007. The performance shown for the I Shares prior to December 31, 2007 is based on the performance and expenses of the Investor Class Shares, and has not been adjusted for the shareholder servicing fee charged specifically to the Investor Class Shares. |
| **** | The Fund commenced operations on September 29, 2006 as a separate portfolio ( the “Predecessor Fund”) of the The Advisors’ Inner Circle Fund II. The performance shown for periods prior to February 8, 2010 represents the performance of the Predecessor Fund. |
The performance data quoted herein represents past performance. Past performance does not guarantee future results. Investment return and principal value will fluctuate so that an investor’s shares, when redeemed, may be worth more or less than its original cost. Current performance may be higher or lower than the performance quoted. For performance current to the most recent month-end, please call 1-888-968-4964. Performance assumes reinvestment of dividends and capital gains. Unlike a mutual fund, index returns do not reflect taxes, fees or expenses. The Fund’s gross total expense ratio as stated in the prospectus is 1.50% for Investor Shares and 1.25% for I Shares. The performance quoted reflects fee waivers in effect and would have been lower in their absence. The Fund charges a 2.00% redemption fee if redeemed within 7 days. The Adviser has contractually agreed to limit the total expenses of the Investor Class Shares and I Shares of the Fund (excluding acquired fund fees and expenses, brokerage commissions, extraordinary items, interest and taxes) to 1.35% and 1.10% of the average daily net assets of the Fund’s Investor Class Shares and I Shares, respectively, through December 31, 2014.
Returns shown do not reflect the deduction of taxes that a shareholder would pay on Fund distributions or the redemption of Fund shares.
Mutual fund investing involves risk including the possible loss of principal. The Fund invests in small cap stocks which generally involve more risk than large cap stocks due to potentially greater volatility and less market liquidity.
3
PERIMETER
SMALL CAP GROWTH FUND
Fund Expense Disclosure
February 28, 2014
(Unaudited)
As a shareholder of the Fund, you incur two types of costs: (1) transaction costs, including redemption fees; and (2) ongoing costs, including management fees, distribution fees and other Fund expenses. These examples are intended to help you understand your ongoing costs (in dollars) of investing in the Fund and to compare these costs with the ongoing costs of investing in other mutual funds.
These examples are based on an investment of $1,000 invested at the beginning of the six-month period from September 1, 2013 through February 28, 2014, and held for the entire period.
Actual Expenses
The first line of the accompanying table provides information about actual account values and actual expenses. You may use the information in this line, together with the amount you invested, to estimate the expenses that you paid over the period. Simply divide your account value by $1,000 (for example, an $8,600 account value divided by $1,000 = 8.6), then multiply the result by the number in the first line under the heading entitled “Expenses Paid During Period” to estimate the expenses you paid on your account during this period.
Hypothetical Examples for Comparison Purposes
The second line of the accompanying table provides information about hypothetical account values and hypothetical expenses based on the Fund’s actual expense ratio and an assumed rate of return of 5% per year before expenses, which is not your Fund’s actual return. The hypothetical account values and expenses may not be used to estimate the actual ending account balance or expenses you paid for the period. You may use this information to compare the ongoing costs of investing in the Fund and other funds. To do so, compare these 5% hypothetical examples with the 5% hypothetical examples that appear in the shareholder reports of other funds.
Please note that the expenses shown in the accompanying table are meant to highlight your ongoing costs only and do not reflect any transactional costs, such as redemption fees. Therefore, the second line of the accompanying table is useful in comparing ongoing costs only and will not help you determine the relative total costs of owning different funds. In addition, if these transactional costs were included, your costs would have been higher.
| | | | | | | | | | | | |
| | | Perimeter Small Cap Growth Fund — Investor Class Shares | |
| | | |
| | | Beginning Account Value | | | Ending Account Value | | | Expenses Paid | |
| | | September 1, 2013 | | | February 28, 2014 | | | During Period* | |
Actual | | | $1,000.00 | | | | $1,172.20 | | | | $7.27 | |
Hypothetical - (5% return before expenses) | | | 1,000.00 | | | | 1,018.10 | | | | 6.76 | |
| |
| | | Perimeter Small Cap Growth Fund — I Shares | |
| | | |
| | | Beginning Account Value | | | Ending Account Value | | | Expenses Paid | |
| | | September 1, 2013 | | | February 28, 2014 | | | During Period* | |
Actual | | | $1,000.00 | | | | $1,173.70 | | | | $5.93 | |
Hypothetical - (5% return before expenses) | | | 1,000.00 | | | | 1,019.34 | | | | 5.51 | |
| | * | Expenses are equal to an annualized six-month expense ratio of 1.35% for the Investor Class Shares and 1.10% for the I Shares which includes waived fees, reimbursed expenses or recoupment, multiplied by the average account value over the period, multiplied by the number of days in the most recent period (181), then divided by 365 to reflect the six-month period. The Fund’s ending account values on the first line in each table are based on the actual six-month total return for the Fund of 17.22% for the Investor Class Shares and 17.37% for the I Shares. |
4
PERIMETER
SMALL CAP GROWTH FUND
Portfolio Holdings Summary Table
February 28, 2014
(Unaudited)
The following table presents a summary by sector of the portfolio holdings of the Fund.
| | | | | | | | |
| | | %of Net | | | | |
| | | Assets | | | Value | |
Domestic Common Stocks: | | | | | | | | |
Consumer Non-cyclical | | | 21.8 | % | | $ | 17,541,987 | |
Communications | | | 17.4 | | | | 13,976,940 | |
Industrial. | | | 14.4 | | | | 11,593,925 | |
Technology | | | 13.6 | | | | 10,929,298 | |
Consumer Cyclical. | | | 13.3 | | | | 10,692,335 | |
Financial | | | 8.0 | | | | 6,410,318 | |
Energy | | | 7.2 | | | | 5,819,831 | |
Basic Materials | | | 2.4 | | | | 1,919,502 | |
Other Assets in Excess of Liabilities | | | 1.9 | | | | 1,560,989 | |
| | | | | | | | |
| | | 100.0 | % | | $ | 80,445,125 | |
| | | | | | | | |
Portfolio holdings are subject to change at any time.
The accompanying notes are an integral part of the financial statements.
5
PERIMETER
SMALL CAP GROWTH FUND
Portfolio of Investments
February 28, 2014
(Unaudited)
| | | | | | | | |
| | | Shares | | | Value | |
COMMON STOCKS† — 98.1% | | | | | | | | |
Basic Materials — 2.4% | | | | | | | | |
Balchem | | | 6,044 | | | $ | 305,282 | |
Horsehead Holding* | | | 46,095 | | | | 819,108 | |
Polyone | | | 21,203 | | | | 795,112 | |
| | | | | | | | |
| | | | | | | 1,919,502 | |
| | | | | | | | |
Communications — 17.4% | | | | | | | | |
Allot Communications* | | | 39,760 | | | | 668,763 | |
Blue Nile, Inc.* | | | 14,592 | | | | 513,492 | |
ClickSoftware Technologies | | | 69,785 | | | | 697,850 | |
Constant Contact* | | | 31,690 | | | | 873,693 | |
eGain* | | | 62,588 | | | | 524,487 | |
Finisar* | | | 36,290 | | | | 860,073 | |
HealthStream* | | | 23,615 | | | | 680,584 | |
IntraLinks Holdings* | | | 72,094 | | | | 837,011 | |
Kofax Ltd.* | | | 79,270 | | | | 645,258 | |
LogMein, Inc. | | | 25,570 | | | | 1,070,104 | |
NIC | | | 27,371 | | | | 532,092 | |
NICE Systems, Ltd, SP ADR | | | 14,150 | | | | 581,282 | |
Perficient* | | | 23,470 | | | | 479,023 | |
Perion Network* | | | 68,553 | | | | 817,837 | |
RigNet* | | | 13,498 | | | | 645,474 | |
Sapient* | | | 36,290 | | | | 631,810 | |
ShoreTel* | | | 111,770 | | | | 982,458 | |
Sizmek, Inc.* | | | 52,440 | | | | 649,732 | |
SPS Commerce* | | | 9,848 | | | | 667,694 | |
Zix* | | | 136,775 | | | | 618,223 | |
| | | | | | | | |
| | | | | | | 13,976,940 | |
| | | | | | | | |
Consumer Cyclical — 13.3% | | | | | | | | |
Brown Shoe | | | 30,410 | | | | 747,478 | |
Casey’s General Stores, Inc | | | 11,580 | | | | 793,114 | |
Core-Mark Holding | | | 9,000 | | | | 703,800 | |
Destination XL Group* | | | 127,311 | | | | 725,673 | |
Gentherm* | | | 23,930 | | | | 676,740 | |
G-III Apparel Group* | | | 12,790 | | | | 888,777 | |
La-Z-Boy | | | 19,721 | | | | 503,674 | |
Motorcar Parts of America, Inc.* | | | 34,924 | | | | 860,178 | |
Pool | | | 4,770 | | | | 278,854 | |
Popeyes Louisiana Kitchen, Inc.* | | | 8,990 | | | | 360,139 | |
Rite Aid* | | | 122,020 | | | | 804,112 | |
Ryland Group, Inc., (The) | | | 8,830 | | | | 411,390 | |
Spirit Airlines* | | | 13,360 | | | | 754,573 | |
Standard Pacific Corp.* | | | 34,640 | | | | 315,570 | |
Susser Holdings* | | | 7,820 | | | | 473,736 | |
Tenneco* | | | 8,010 | | | | 482,522 | |
UniFirst | | | 6,510 | | | | 714,083 | |
Wabash National* | | | 14,650 | | | | 197,922 | |
| | | | | | | | |
| | | | | | | 10,692,335 | |
| | | | | | | | |
Consumer Non-cyclical — 21.8% | | | | | | | | |
Akorn* | | | 24,904 | | | | 643,021 | |
Align Technology* | | | 10,820 | | | | 566,211 | |
| | | | | | | | |
| | | Shares | | | Value | |
Consumer Non-cyclical — (Continued) | | | | | | | | |
Anacor Pharmaceuticals, Inc.* | | | 16,140 | | | $ | 306,660 | |
Aspen Insurance Holdings, Ltd. | | | 15,790 | | | | 593,072 | |
Barrett Business Services, Inc. | | | 11,020 | | | | 771,400 | |
Capella Education | | | 5,955 | | | | 395,888 | |
Cardtronics* | | | 16,280 | | | | 659,666 | |
Charles River Laboratories International* | | | 12,460 | | | | 740,249 | |
Corporate Executive Board | | | 10,740 | | | | 803,137 | |
Corvel Corp.* | | | 11,530 | | | | 530,495 | |
CoStar Group* | | | 1,030 | | | | 207,071 | |
Cynosure, Inc., Cl A* | | | 20,620 | | | | 634,684 | |
Heartland Payment Systems | | | 12,100 | | | | 489,324 | |
ICON, PLC* | | | 16,737 | | | | 783,961 | |
Insulet* | | | 12,810 | | | | 607,322 | |
Inter Parfums, Inc. | | | 5,940 | | | | 199,643 | |
Isis Pharmaceuticals* | | | 12,570 | | | | 641,070 | |
ITT Educational Services, Cl A* | | | 24,500 | | | | 760,235 | |
KAR Auction Services | | | 24,770 | | | | 771,833 | |
Ligand Pharmaceuticals, Cl B* | | | 9,048 | | | | 631,098 | |
Matthews International | | | 12,100 | | | | 496,463 | |
MAXIMUS | | | 18,168 | | | | 868,249 | |
MiMedx Group* | | | 89,265 | | | | 638,245 | |
Novadaq Technologies* | | | 35,583 | | | | 725,893 | |
Sagent Pharmaceuticals* | | | 26,450 | | | | 559,682 | |
SunOpta* | | | 63,510 | | | | 616,682 | |
Supernus Pharmaceuticals, Inc.* | | | 50,280 | | | | 504,811 | |
Team Health Holdings* | | | 14,850 | | | | 668,547 | |
Thoratec* | | | 5,335 | | | | 198,143 | |
TravelCenters of America* | | | 58,414 | | | | 529,232 | |
| | | | | | | | |
| | | | | | | 17,541,987 | |
| | | | | | | | |
Energy — 7.2% | | | | | | | | |
Aegean Marine Petroleum Network | | | 56,580 | | | | 573,155 | |
Carrizo Oil & Gas* | | | 11,710 | | | | 582,455 | |
Flotek Industries* | | | 37,000 | | | | 941,650 | |
Geospace Technologies* | | | 1,115 | | | | 85,599 | |
Helix Energy Solutions Group* | | | 24,274 | | | | 573,837 | |
Key Energy Services* | | | 89,300 | | | | 807,272 | |
Oasis Petroleum, Inc.* | | | 7,100 | | | | 309,347 | |
Rex Energy* | | | 22,796 | | | | 433,124 | |
Synergy Resources* | | | 64,351 | | | | 681,477 | |
Ultra Petroleum Corp.* | | | 15,970 | | | | 401,805 | |
Western Refining. | | | 11,800 | | | | 430,110 | |
| | | | | | | | |
| | | | | | | 5,819,831 | |
| | | | | | | | |
Financial — 8.0% | | | | | | | | |
Boston Private Financial Holdings | | | 50,149 | | | | 653,944 | |
Cubesmart, REIT | | | 28,160 | | | | 493,082 | |
eHealth* | �� | | 16,720 | | | | 802,560 | |
Endurance Specialty Holdings | | | 7,500 | | | | 391,050 | |
FXCM, Cl A | | | 42,120 | | | | 709,722 | |
Hilltop Holdings* | | | 25,491 | | | | 624,784 | |
International Bancshares | | | 15,460 | | | | 358,363 | |
The accompanying notes are an integral part of the financial statements.
6
PERIMETER
SMALL CAP GROWTH FUND
Portfolio of Investments (Concluded)
February 28, 2014
(Unaudited)
| | | | | | | | |
| | | Shares | | | Value | |
| | |
Financial — (Continued) | | | | | | | | |
Pinnacle Financial Partners | | | 11,230 | | | $ | 405,178 | |
ProAssurance | | | 6,546 | | | | 297,581 | |
Texas Capital Bancshares* | | | 5,700 | | | | 358,815 | |
WageWorks* | | | 9,690 | | | | 573,164 | |
WisdomTree Investments* | | | 47,630 | | | | 742,075 | |
| | | | | | | | |
| | | | | | | 6,410,318 | |
| | | | | | | | |
Industrial — 14.4% | | | | | | | | |
AAON | | | 2,889 | | | | 86,323 | |
AMERCO | | | 3,240 | | | | 754,726 | |
Barnes Group | | | 19,796 | | | | 761,156 | |
Belden | | | 9,110 | | | | 657,104 | |
Berry Plastics Group* | | | 29,805 | | | | 725,156 | |
DXP Enterprises* | | | 4,800 | | | | 488,448 | |
EnPro Industries* | | | 8,440 | | | | 604,557 | |
Generac Holdings | | | 15,000 | | | | 854,550 | |
Graphic Packaging Holding Co. | | | 61,440 | | | | 629,146 | |
Masonite International* | | | 10,680 | | | | 616,236 | |
Methode Electronics. | | | 23,419 | | | | 793,904 | |
Park-Ohio Holdings Corp.* | | | 8,027 | | | | 422,541 | |
PGT* | | | 71,730 | | | | 831,351 | |
Power Solutions International* | | | 9,720 | | | | 720,252 | |
Primoris Services | | | 22,350 | | | | 698,884 | |
Swift Transportation* | | | 14,230 | | | | 346,643 | |
Taser International* | | | 50,695 | | | | 974,866 | |
Tutor Perini Corp.* | | | 25,480 | | | | 628,082 | |
| | | | | | | | |
| | | | | | | 11,593,925 | |
| | | | | | | | |
Technology — 13.6% | | | | | | | | |
Acxiom Corp.* | | | 19,002 | | | | 707,444 | |
Aspen Technology* | | | 16,630 | | | | 780,778 | |
AVG Technologies NV* | | | 30,754 | | | | 576,022 | |
GT Advanced Technologies* | | | 55,100 | | | | 789,583 | |
| | | | | | | | |
| | | Shares | | | Value | |
| | |
Technology — (Continued) | | | | | | | | |
inContact, Inc. | | | 87,950 | | | $ | 793,309 | |
Liveperson, Inc.* | | | 46,438 | | | | 607,409 | |
Magnachip Semiconductor* | | | 27,432 | | | | 404,348 | |
Medidata Solutions* | | | 4,570 | | | | 292,937 | |
Mellanox Technologies Ltd.* | | | 17,210 | | | | 628,509 | |
Mentor Graphics | | | 28,540 | | | | 617,606 | |
Netscout Systems, Inc.* | | | 17,820 | | | | 676,804 | |
Omnicell* | | | 20,790 | | | | 598,336 | |
PTC, Inc.* | | | 20,050 | | | | 788,166 | |
SS&C Technologies Holdings* | | | 20,650 | | | | 798,742 | |
Tyler Technologies* | | | 8,500 | | | | 797,130 | |
Ultimate Software Group* | | | 3,410 | | | | 566,060 | |
Unisys Corp.* | | | 14,790 | | | | 506,115 | |
| | | | | | | | |
| | | | | | | 10,929,298 | |
| | | | | | | | |
TOTAL COMMON STOCKS | | | | | | | | |
(Cost $60,567,131) | | | | | | | 78,884,136 | |
| | | | | | | | |
TOTAL INVESTMENTS - 98.1% | | | | | | | | |
(Cost $60,567,131) | | | | | | | 78,884,136 | |
| | | | | | | | |
OTHER ASSETS IN EXCESS OF LIABILITIES - 1.9% | | | | | | | 1,560,989 | |
| | | | | | | | |
NET ASSETS - 100.0% | | | | | | $ | 80,445,125 | |
| | | | | | | | |
| |
† More narrow industries are utilized for compliance purposes, whereas broad sectors are utilized for reporting purposes. | |
* Non-income producing security. | |
| | |
Cl | | Class |
PLC | | Public Limited Company |
REIT | | Real Estate Investment Trusts |
SP ADR | | Sponsored American Depositary Receipt |
The accompanying notes are an integral part of the financial statements.
7
PERIMETER
SMALL CAP GROWTH FUND
Statement of Assets and Liabilities
February 28, 2014
(Unaudited)
| | | | |
ASSETS | | | | |
Investments, at value (Cost $60,567,131) | | $ | 78,884,136 | |
Cash | | | 964,221 | |
Receivables | | | | |
Investments sold | | | 1,835,542 | |
Capital shares sold | | | 368,113 | |
Dividends and Interest | | | 13,120 | |
Prepaid expenses and other assets | | | 27,750 | |
| | | | |
Total assets | | | 82,092,882 | |
| | | | |
| |
LIABILITIES | | | | |
Payable for investments purchased | | | 1,419,038 | |
Capital shares redeemed | | | 130,178 | |
Investment advisory fees | | | 38,285 | |
Administration and accounting fees | | | 8,086 | |
Other accrued expenses and liabilities | | | 52,170 | |
| | | | |
Total liabilities | | | 1,647,757 | |
| | | | |
Net Assets | | $ | 80,445,125 | |
| | | | |
NET ASSETS CONSISTS OF | | | | |
Par value | | $ | 13,855 | |
Paid-in capital | | | 58,611,578 | |
Accumulated net investment loss | | | (289,995 | ) |
Accumulated net realized gain from investments | | | 3,792,682 | |
Net unrealized appreciation on investments | | | 18,317,005 | |
| | | | |
Net Assets | | $ | 80,445,125 | |
| | | | |
| |
Investor Class Shares: | | | | |
Net Assets | | $ | 7,028,688 | |
| | | | |
Shares outstanding ($0.001 par value, 100,000,000 shares authorized) | | | 1,253,220 | |
| | | | |
Net asset value, offering and redemption price per share | | $ | 5.61 | |
| | | | |
| |
I Shares: | | | | |
Net Assets | | $ | 73,416,437 | |
| | | | |
Shares outstanding ($0.001 par value, 100,000,000 shares authorized) | | | 12,601,621 | |
| | | | |
Net asset value, offering and redemption price per share | | $ | 5.83 | |
| | | | |
The accompanying notes are an integral part of the financial statements.
8
PERIMETER
SMALL CAP GROWTH FUND
Statement of Operations
Six Months Ended February 28, 2014
(Unaudited)
| | | | |
Investment Income | | | | |
Dividends (net of foreign taxes withheld of $589) | | $ | 157,990 | |
Interest | | | 52 | |
| | | | |
Total investment income | | | 158,042 | |
| | | | |
Expenses | | | | |
Advisory fees | | | 358,215 | |
Transfer agent fees | | | 61,295 | |
Administration and accounting fees | | | 44,707 | |
Professional fees | | | 21,597 | |
Registration and filing fees | | | 15,460 | |
Distribution fees(1) | | | 11,203 | |
Directors’ and officers’ fees | | | 11,001 | |
Printing and shareholder reporting fees | | | 5,830 | |
Insurance fees | | | 4,506 | |
Custodian fees | | | 2,328 | |
Other expenses | | | 3,627 | |
| | | | |
Total expenses before waivers | | | 539,769 | |
Less: waivers of Advisory fees | | | (91,732 | ) |
| | | | |
Net expenses after waivers | | | 448,037 | |
| | | | |
Net investment loss | | | (289,995 | ) |
| | | | |
Net realized and unrealized gain from investments | | | | |
Net realized gain from: | | | | |
Investments | | | 12,773,811 | |
Net change in unrealized appreciation on: | | | | |
Investments | | | 855,440 | |
| | | | |
Net realized and unrealized gain from investments | | | 13,629,251 | |
| | | | |
Net increase in net assets resulting from operations | | $ | 13,339,256 | |
| | | | |
(1) Attributable to Investor Class Shares
The accompanying notes are an integral part of the financial statements.
9
PERIMETER
SMALL CAP GROWTH FUND
Statements of Changes in Net Assets
| | | | | | | | |
| | | For the Six Months
Ended
February 28, 2014
(Unaudited) | | | For the Year
Ended
August 31, 2013 | |
Increase in net assets from operations: | | | | | | | | |
Net investment loss | | $ | (289,995 | ) | | $ | (88,563 | ) |
Net realized gain from investments and written options | | | 12,773,811 | | | | 54,148,626 | |
Net change in unrealized appreciation/(depreciation) on investments | | | 855,440 | | | | (15,787,817 | ) |
| | | | | | | | |
Net increase in net assets resulting from operations | | | 13,339,256 | | | | 38,272,246 | |
| | | | | | | | |
Dividends and Distributions to shareholders from: | | | | | | | | |
Net Realized gains | | | | | | | | |
Investor Class Shares | | | (4,484,213 | ) | | | (2,127,625 | ) |
I Shares | | | (34,587,780 | ) | | | (22,740,311 | ) |
| | | | | | | | |
Net decrease in net assets from dividends and distributions to shareholders | | | (39,071,993 | ) | | | (24,867,936 | ) |
| | | | | | | | |
Increase/(decrease) in net assets from capital transactions: | | | | | | | | |
Investor Class Shares | | | | | | | | |
Proceeds from shares sold | | | 1,451,006 | | | | 2,393,871 | |
Reinvestment of distributions | | | 4,436,888 | | | | 2,117,679 | |
Shares redeemed | | | (6,176,246 | ) | | | (15,885,113 | ) |
| | | | | | | | |
Total Investor Class Shares | | | (288,352 | ) | | | (11,373,563 | ) |
| | | | | | | | |
I Shares | | | | | | | | |
Proceeds from shares sold | | | 11,300,586 | | | | 29,663,943 | |
Reinvestment of distributions | | | 34,542,726 | | | | 22,371,805 | |
Shares redeemed | | | (29,688,080 | ) | | | (176,200,091 | ) |
| | | | | | | | |
Total I Shares | | | 16,155,232 | | | | (124,164,343 | ) |
| | | | | | | | |
Redemption fees | | | 453 | | | | 4,294 | |
| | | | | | | | |
Net increase/(decrease) in net assets from capital share transactions | | | 15,867,333 | | | | (135,533,612 | ) |
| | | | | | | | |
Total decrease in net assets | | | (9,865,404 | ) | | | (122,129,302 | ) |
Net assets | | | | | | | | |
Beginning of period | | | 90,310,529 | | | | 212,439,831 | |
| | | | | | | | |
End of period | | $ | 80,445,125 | | | $ | 90,310,529 | |
| | | | | | | | |
Accumulated net investment loss, end of period | | $ | (289,995 | ) | | $ | — | |
| | | | | | | | |
Increase/(decrease) in shares outstanding derived from share transactions: | | | | | | | | |
Investor Class Shares | | | | | | | | |
Shares sold | | | 202,105 | | | | 260,820 | |
Dividends and distributions reinvested | | | 845,121 | | | | 263,066 | |
Shares redeemed | | | (809,309 | ) | | | (1,787,710 | ) |
| | | | | | | | |
Total Investor Class Shares | | | 237,917 | | | | (1,263,824 | ) |
| | | | | | | | |
I Shares | | | | | | | | |
Shares sold | | | 1,530,759 | | | | 3,236,483 | |
Dividends and distributions reinvested | | | 6,338,115 | | | | 2,738,287 | |
Shares redeemed | | | (2,996,116 | ) | | | (18,842,321 | ) |
| | | | | | | | |
Total I Shares | | | 4,872,758 | | | | (12,867,551 | ) |
| | | | | | | | |
Net increase/(decrease) in shares outstanding from share transactions | | | 5,110,675 | | | | (14,131,375 | ) |
| | | | | | | | |
The accompanying notes are an integral part of the financial statements.
10
PERIMETER
SMALL CAP GROWTH FUND
Financial Highlights
Contained below is per share operating performance data for shares outstanding, total investment return, ratios to average net assets and other supplemental data for the respective periods. This information has been derived from information provided in the financial statements.
| | | | | | | | | | | | | | | | | | | | | | | | | | | | |
| | | Investor Class Shares | |
| | | Six Month
Period
Ended
February 28,
2014
(Unaudited) | | | Year
Ended
August 31,
2013 | | | Year
Ended
August 31,
2012 | | | Year
Ended
August 31,
2011 | | | One
Month
Period
Ended
August 31,
2010(1)(2) | | | Year
Ended
July 31,
2010(2) | | | Year
Ended
July 31,
2009(2) | |
Net asset value, Beginning of Period | | $ | 10.17 | | | $ | 9.18 | | | $ | 10.75 | | | $ | 8.79 | | | $ | 9.53 | | | $ | 8.45 | | | $ | 10.40 | |
| | | | | | | | | | | | | | | | | | | | | | | | | | | | |
Income/(Loss) from Operations: | | | | | | | | | | | | | | | | | | | | | | | | | | | | |
Net Investment Loss(3) | | | (0.04 | ) | | | (0.03 | ) | | | (0.09 | ) | | | (0.11 | ) | | | (0.01 | ) | | | (0.09 | ) | | | (0.05 | ) |
Net Realized and Unrealized Gains/(Loss)on Investments | | | 1.39 | | | | 2.23 | | | | 0.58 | | | | 2.07 | | | | (0.73 | ) | | | 1.17 | | | | (1.90 | ) |
| | | | | | | | | | | | | | | | | | | | | | | | | | | | |
Total from Operations | | | 1.35 | | | | 2.20 | | | | 0.49 | | | | 1.96 | | | | (0.74 | ) | | | 1.08 | | | | (1.95 | ) |
| | | | | | | | | | | | | | | | | | | | | | | | | | | | |
Dividends and Distributions from: | | | | | | | | | | | | | | | | | | | | | | | | | | | | |
Net Realized Gains | | | (5.91 | ) | | | (1.21 | ) | | | (2.06 | ) | | | — | | | | — | | | | — | | | | — | |
| | | | | | | | | | | | | | | | | | | | | | | | | | | | |
Total Dividends and Distributions | | | (5.91 | ) | | | (1.21 | ) | | | (2.06 | ) | | | — | | | | — | | | | — | | | | — | |
| | | | | | | | | | | | | | | | | | | | | | | | | | | | |
Redemption Fees(4) | | | — | | | | — | | | | — | | | | — | | | | — | | | | — | | | | — | |
| | | | | | | | | | | | | | | | | | | | | | | | | | | | |
Net asset value, End of Period | | $ | 5.61 | | | $ | 10.17 | | | $ | 9.18 | | | $ | 10.75 | | | $ | 8.79 | | | $ | 9.53 | | | $ | 8.45 | |
| | | | | | | | | | | | | | | | | | | | | | | | | | | | |
Total Return(5) | | | 17.22 | % | | | 27.47 | % | | | 6.56 | % | | | 22.30 | % | | | (7.77 | )% | | | 12.78 | % | | | (18.75 | )% |
| | | | | | | | | | | | | | | | | | | | | | | | | | | | |
Ratios/Supplemental Data | | | | | | | | | | | | | | | | | | | | | | | | | | | | |
Net assets, End of Period (Thousands) | | $ | 7,029 | | | $ | 10,330 | | | $ | 20,930 | | | $ | 120,543 | | | $ | 160,496 | | | $ | 174,434 | | | $ | 138,929 | |
Ratio of Expenses to Average Net Assets (including waivers and recoupment, excluding fees paid indirectly) | | | 1.35 | %(6) | | | 1.35 | % | | | 1.35 | % | | | 1.35 | % | | | 1.35 | %(6) | | | 1.29 | % | | | 1.11 | % |
Ratio of Expenses to Average Net Assets (excluding waivers and recoupment and fees paid indirectly) | | | 1.58 | %(6) | | | 1.50 | % | | | 1.45 | % | | | 1.38 | % | | | 1.47 | %(6) | | | 1.34 | % | | | 1.41 | % |
Ratio of Net Investment Loss to Average Net Assets | | | (0.95 | )%(6) | | | (0.29 | )% | | | (0.93 | )% | | | (0.93 | )% | | | (0.97 | )%(6) | | | (0.93 | )% | | | (0.66 | )% |
Portfolio Turnover Rate(7) | | | 68 | % | | | 131 | % | | | 138 | % | | | 122 | % | | | 7 | % | | | 97 | % | | | 126 | % |
| (1) | The Fund changed its fiscal year end to August 31. |
| (2) | Effective February 8, 2010, the Fund acquired all the assets and liabilities of the Perimeter Small Cap Growth Fund, a series of The Advisors’ Inner Circle Fund II (the “Predecessor Fund”). The financial highlights for the period to that date reflect the performance of the Predecessor Fund. |
| (3) | Per share data calculated using average share method. |
| (4) | Amount is less than $0.01 per share. |
| (5) | Total return has not been annualized for periods less than one year. Total return would have been lower had certain expenses not been waived by the Adviser during the period. The return shown does not reflect the deduction of taxes that a shareholder would pay on Fund distributions or the redemptions of Fund shares. |
| (7) | Portfolio turnover rate has not been annualized for periods less than one year. |
The accompanying notes are an integral part of the financial statements.
11
PERIMETER
SMALL CAP GROWTH FUND
��
Financial Highlights
Contained below is per share operating performance data for shares outstanding, total investment return, ratios to average net assets and other supplemental data for the respective period. This information has been derived from information provided in the financial statements.
| | | | | | | | | | | | | | | | | | | | | | | | | | | | |
| | | I Shares | |
| | | Six Month
Period Ended
February 28,
2014
(Unaudited) | | | Year
Ended
August 31,
2013 | | | Year
Ended
August 31,
2012 | | | Year
Ended
August 31,
2011 | | | One
Month
Period
Ended
August 31,
2010(1)(2) | | | Year
Ended
July 31,
2010(2) | | | Year
Ended
July 31,
2009(2) | |
Net asset value, Beginning of Period | | $ | 10.35 | | | $ | 9.30 | | | $ | 10.83 | | | $ | 8.84 | | | $ | 9.58 | | | $ | 8.48 | | | $ | 10.42 | |
| | | | | | | | | | | | | | | | | | | | | | | | | | | | |
Income/(Loss) from Operations: | | | | | | | | | | | | | | | | | | | | | | | | | | | | |
Net Investment Loss(3) | | | (0.03 | ) | | | (— | )(4) | | | (0.07 | ) | | | (0.08 | ) | | | (0.01 | ) | | | (0.07 | ) | | | (0.05 | ) |
Net Realized and Unrealized Gains (Loss) on Investments | | | 1.42 | | | | 2.26 | | | | 0.60 | | | | 2.07 | | | | (0.73 | ) | | | 1.17 | | | | (1.89 | ) |
| | | | | | | | | | | | | | | | | | | | | | | | | | | | |
Total from Operations | | | 1.39 | | | | 2.26 | | | | 0.53 | | | | 1.99 | | | | (0.74 | ) | | | 1.10 | | | | (1.94 | ) |
| | | | | | | | | | | | | | | | | | | | | | | | | | | | |
Dividends and Distributions from: | | | | | | | | | | | | | | | | | | | | | | | | | | | | |
Net Realized Gains | | | (5.91 | ) | | | (1.21 | ) | | | (2.06 | ) | | | — | | | | — | | | | — | | | | — | |
| | | | | | | | | | | | | | | | | | | | | | | | | | | | |
Total Dividends and Distributions | | | (5.91 | ) | | | (1.21 | ) | | | (2.06 | ) | | | — | | | | — | | | | — | | | | — | |
| | | | | | | | | | | | | | | | | | | | | | | | | | | | |
Redemption Fees(4) | | | — | | | | — | | | | — | | | | — | | | | — | | | | — | | | | — | |
| | | | | | | | | | | | | | | | | | | | | | | | | | | | |
Net asset value, End of Period | | $ | 5.83 | | | $ | 10.35 | | | $ | 9.30 | | | $ | 10.83 | | | $ | 8.84 | | | $ | 9.58 | | | $ | 8.48 | |
| | | | | | | | | | | | | | | | | | | | | | | | | | | | |
Total Return(5) | | | 17.37 | % | | | 27.81 | % | | | 6.93 | % | | | 22.51 | % | | | (7.73 | )% | | | 12.97 | % | | | (18.62 | )% |
| | | | | | | | | | | | | | | | | | | | | | | | | | | | |
Ratios/Supplemental Data | | | | | | | | | | | | | | | | | | | | | | | | | | | | |
Net assets, End of Period (Thousands) | | $ | 73,416 | | | $ | 79,981 | | | $ | 191,510 | | | $ | 215,789 | | | $ | 165,334 | | | $ | 179,290 | | | $ | 154,905 | |
Ratio of Expenses to Average Net Assets (including waivers and recoupment, excluding fees paid indirectly) | | | 1.10 | %(6) | | | 1.10 | % | | | 1.10 | % | | | 1.10 | % | | | 1.10 | %(6) | | | 1.10 | % | | | 1.04 | % |
Ratio of Expenses to Average Net Assets (excluding waivers and recoupment and fees paid indirectly) | | | 1.33 | %(6) | | | 1.25 | % | | | 1.20 | % | | | 1.14 | % | | | 1.22 | %(6) | | | 1.16 | % | | | 1.36 | % |
Ratio of Net Investment Loss to Average Net Assets | | | (0.70 | )%(6) | | | (0.04 | )% | | | (0.68 | )% | | | (0.69 | )% | | | (0.72 | )%(6) | | | (0.74 | )% | | | (0.64 | )% |
Portfolio Turnover Rate(7) | | | 68 | % | | | 131 | % | | | 138 | % | | | 122 | % | | | 7 | % | | | 97 | % | | | 126 | % |
| (1) | The Fund changed its fiscal year end to August 31. |
| (2) | Effective February 8, 2010, the Fund acquired all the assets and liabilities of the Perimeter Small Cap Growth Fund, a series of The Advisors’ Inner Circle Fund II (the “Predecessor Fund”). The financial highlights for the period to that date reflect the performance of the Pedecessor Fund. |
| (3) | Per share data calculated using average share method. |
| (4) | Amount is less than $0.01 per share. |
| (5) | Total return has not been annualized for periods less than one year. Total return would have been lower had certain expenses not been waived by the Adviser during the period. The return shown does not reflect the deduction of taxes that a shareholder would pay on Fund distributions or the redemptions of Fund shares. |
| (7) | Portfolio turnover rate has not been annualized for periods less than one year. |
The accompanying notes are an integral part of the financial statements.
12
PERIMETER
SMALL CAP GROWTH FUND
Notes to Financial Statements
February 28, 2014
(Unaudited)
1. Organization and Significant Accounting Policies
The RBB Fund, Inc. (“RBB” or the “Company”) was incorporated under the laws of the State of Maryland on February 29, 1988 and is registered under the Investment Company Act of 1940, as amended, (the “1940 Act”) as an open-end management investment company. RBB is a “series fund,” which is a mutual fund divided into separate portfolios. Each portfolio is treated as a separate entity for certain matters under the 1940 Act, and for other purposes, and a shareholder of one portfolio is not deemed to be a shareholder of any other portfolio. Currently, RBB has twenty-one active investment portfolios, including the Perimeter Small Cap Growth Fund (the “Fund”). As of February 28, 2014, the Fund offers Investor Class Shares and I Shares.
RBB has authorized capital of one hundred billion shares of common stock of which 81.373 billion shares are currently classified into one hundred and forty-eight classes of common stock. Each class represents an interest in an active or inactive RBB investment portfolio.
PORTFOLIO VALUATION – The Fund’s net asset value (“NAV”) is calculated once daily at the close of regular trading hours on the New York Stock Exchange (“NYSE”) (generally 4:00 p.m. Eastern time) on each day the NYSE is open. Securities held by the Fund are valued using the closing price or the last sale price on a national securities exchange or the National Association of Securities Dealers Automatic Quotation System (“NASDAQ”) market system where they are primarily traded. Equity securities traded in the over-the-counter market are valued at their closing prices. If there were no transactions on that day, securities traded principally on an exchange or on NASDAQ will be valued at the mean of the last bid and ask prices prior to the market close. If market quotations are unavailable or deemed unreliable, securities will be valued in accordance with procedures adopted by the Company’s Board of Directors. Relying on prices supplied by pricing services or dealers or using fair valuation may result in values that are higher or lower than the values used by other investment companies and investors to price the same investments.
Fair Value Measurements – The inputs and valuation techniques used to measure fair value of the Fund’s investments are summarized into three levels as described in the hierarchy below:
| | |
• Level 1 — | | quoted prices in active markets for identical securities; |
| |
• Level 2 — | | other significant observable inputs (including quoted prices for similar securities, interest rates, prepayment speeds, credit risk, etc.); and |
| |
• Level 3 — | | significant unobservable inputs (including the Fund’s own assumptions in determining the fair value of investments). |
The inputs or methodology used for valuing securities are not necessarily an indication of the risk associated with investing in those securities.
The following is a summary of the inputs used, as of February 28, 2014, in valuing the Fund’s investments carried at fair value:
| | | | | | | | | | | | | | | | |
| | | Total
Value at
February 28, 2014 | | | Level 1
Quoted
Price | | | Level 2
Other Significant
Observable
Inputs | | | Level 3
Significant
Unobservable
Inputs | |
Total Investments* | | | $78,884,136 | | | | $78,884,136 | | | | $— | | | | $— | |
| | | | | | | | | | | | | | | | |
| |
* Please refer to Portfolio of Investments for details on portfolio holdings. | |
At the end of each fiscal quarter, management evaluates the classification of Levels 1, 2 and 3 assets and liabilities. Various factors are considered, such as changes in liquidity from the prior reporting period; whether or not a broker is willing to execute at the quoted price; the depth and consistency of prices from third party pricing services; and the existence of contemporaneous, observable trades in the market. Additionally, management evaluates the classification of Level 1 and Level 2 assets and liabilities on a quarterly basis for changes in listings or delistings on national exchanges.
Due to the inherent uncertainty of determining the fair value of investments that do not have a readily available market value, the fair value of the Fund’s investments may fluctuate from period to period. Additionally, the fair value of investments may differ significantly from the values that would have been used had a ready market existed for such investments and may differ materially from the values the Fund may ultimately realize. Furthermore, such investments may be subject to legal and other restrictions on resale or otherwise less liquid than publicly traded securities.
13
PERIMETER
SMALL CAP GROWTH FUND
Notes to Financial Statements (Continued)
February 28, 2014
(Unaudited)
For fair valuations using significant unobservable inputs, U.S. generally accepted accounting principles (“U.S. GAAP”) require the Fund to present a reconciliation of the beginning to ending balances for reported market values that presents changes attributable to total realized and unrealized gains or losses, purchase and sales, and transfers in and out of Level 3 during the period. Transfers in and out between Levels are based on values at the end of the period. U.S. GAAP also requires the Fund to disclose amounts and reasons for all transfers in and out of Level 1 and Level 2 fair value measurements. A reconciliation of Level 3 investments is presented only when the Fund had an amount of Level 3 investments at the end of the reporting period that was meaningful in relation to its net assets. The amounts and reasons for all transfers in and out of each Level within the three-tier hierarchy are disclosed when the Fund had an amount of total transfers during the reporting period that was meaningful in relation to its net assets as of the end of the reporting period.
For the period ended February 28, 2014, there were no significant transfers between Levels 1, 2 and 3 for the Fund.
Options Written – The Fund is subject to equity price risk in the normal course of pursuing its investment objectives and may enter into options written to hedge against changes in the value of equities. Such options may relate to particular securities or domestic stock indices, and may or may not be listed on a domestic securities exchange or issued by the Options Clearing Corporation. The risk in writing a call option is that a Fund gives up the opportunity for profit if the market price of the security increases. The risk in writing a put option is that a Fund may incur a loss if the market price of the security decreases and the option is exercised. A Fund also has the additional risk of being unable to enter into a closing transaction at an acceptable price if a liquid secondary market does not exist. A Fund also may write over-the counter options where completing the obligation depends upon the credit standing of the other party. Option contracts also involve the risk that they may result in loss due to unanticipated developments in market conditions or other causes.
Written options are initially recorded as liabilities to the extent of premiums received and subsequently marked to market to reflect the current value of the option written. Gains or losses are realized when the option transaction expires or closes. When an option is exercised, the proceeds on sales for a written call option or the purchase cost for a written put option is adjusted by the amount of the premium received.
The Perimeter Small Cap Growth Fund had no transactions in options written during the period ended February 28, 2014.
USE OF ESTIMATES — The preparation of financial statements in conformity with U.S. GAAP requires management to make estimates and assumptions that affect the reported amounts of assets and liabilities and disclosure of contingent assets and liabilities at the date of the financial statements and the reported amounts of revenues and expenses during the period. Actual results could differ from those estimates and those differences could be significant.
INVESTMENT TRANSACTIONS, INVESTMENT INCOME AND EXPENSES — The Fund records security transactions based on trade date for financial reporting purposes. The cost of investments sold is determined by use of the specific identification method for both financial reporting and income tax purposes in determining realized gains and losses on investments. Interest income is accrued when earned. Dividend income is recorded on the ex-dividend date. Distributions received on securities that represent a return of capital or capital gains are recorded as a reduction of cost of investments and/or as a realized gain. The Fund’s investment income, expenses and unrealized and realized gains and losses are allocated daily. Expenses incurred on behalf of a specific class, fund or fund family of the Company are charged directly to the class, fund or fund family to each class of shares based upon the relative proportion of net assets of each class at the beginning of the day. Expenses incurred for all the RBB funds (such as director or professional fees) are charged to all funds in proportion to their average net assets of RBB, or in such other manner as the Company’s Board of Directors deems fair or equitable. Expenses and fees, including investment advisory and administration fees, are accrued daily and taken into account for the purpose of determining the NAV of the Fund.
DIVIDENDS AND DISTRIBUTIONS TO SHAREHOLDERS — Dividends from net investment income, if any, are declared and paid quarterly. Net realized capital gains, if any, are declared and paid annually. Income dividends and capital gain distributions are determined in accordance with U.S. federal income tax regulations which may differ from U.S. GAAP.
U.S. TAX STATUS — No provision is made for U.S. income taxes as it is the Fund’s intention to qualify for and elect the tax treatment applicable to regulated investment companies under Subchapter M of the Internal Revenue Code of 1986, as amended, and make the requisite distributions to its shareholders which will be sufficient to relieve it from U.S. income and excise taxes.
CASH AND CASH EQUIVALENTS — The Fund considers liquid assets deposited into a bank demand deposit account to be cash equivalents.These investments represent amounts held with financial institutions that are readily accessible to pay Fund expenses or purchase investments. Cash and cash equivalents are valued at cost plus accrued interest, which approximates market value.
14
PERIMETER
SMALL CAP GROWTH FUND
Notes to Financial Statements (Continued)
February 28, 2014
(Unaudited)
REDEMPTION FEES — The Fund retains a redemption fee of 2% on redemptions of Fund shares held less than seven days. The fees are reflected on the Statements of Changes in Net Assets. The Fund reserves the right to modify or eliminate the redemption fees or waivers at any time.
OTHER — In the normal course of business, the Fund may enter into contracts that provide general indemnifications. The Fund’s maximum exposure under these arrangements is dependent on claims that may be made against the Fund in the future, and, therefore, cannot be estimated; however, based on experience, the risk of material loss from such claims is considered remote.
2. Investment Adviser and Other Services
Perimeter Capital Management (the “Adviser”) serves as investment adviser to the Fund. For its services, the Adviser is entitled to receive a monthly fee, which is calculated daily and paid monthly, at an annual rate of 0.90% of the Fund’s average daily net assets. The Adviser has contractually agreed to waive its advisory fee and/or reimburse expenses in order to limit total annual Fund operating expenses (excluding certain items discussed below) to 1.35% and 1.10% of the Fund’s average daily net assets attributable to Investor Class Shares and I Shares, respectively. In determining theAdviser’s obligation to waive advisory fees and/or reimburse expenses, the following expenses are not taken into account: acquired fund fees and expenses, brokerage commissions, extraordinary items, interest or taxes. This contractual limitation is in effect until December 31, 2014 and may not be terminated without the approval of the Company’s Board of Directors. If at any time during the first three years the advisory agreement is in effect, the Fund’s total annual Fund operating expenses for that year are less than 1.35% and 1.10% of the Fund’s Investor Class Shares and I Shares average daily net assets, respectively, the Adviser may recoup any waived amount from the Fund if such reimbursement does not cause the Fund to exceed existing expense limitations. As of February 28, 2014, the total fees which were previously waived by the Adviser which may be subject to possible future reimbursement to the Adviser were $183,424, $275,981, $236,487 and $91,732 expiring in 2014, 2015, 2016 and 2017, respectively.
BNY Mellon Investment Servicing (US) Inc. (“BNY Mellon”) serves as administrator for the Fund. For providing administrative and accounting services, BNY Mellon is entitled to receive a monthly fee equal to an annual percentage rate of the Fund’s average daily net assets, subject to certain minimum monthly fees.
Included in the administration and accounting service fees, shown on the Statement of Operations, are fees for providing regulatory administration services to RBB. For providing these services, BNY Mellon is entitled to receive compensation as agreed to by the Company and BNY Mellon. This fee is allocated to each portfolio of the Company in proportion to its net assets of the Company.
In addition, BNY Mellon serves as the Fund’s transfer and dividend disbursing agent. For providing transfer agent services, BNY Mellon is entitled to receive a monthly fee equal to an annual percentage rate of the Fund’s average daily net assets, subject to certain minimum monthly fees.
The Bank of NewYork Mellon (the “Custodian”) provides certain custodian services to the Fund. The Custodian is entitled to receive a monthly fee equal to an annual percentage rate of the Fund’s average daily net assets, subject to certain minimum monthly fees.
Foreside Funds Distributors LLC serves as the principal underwriter and distributor of the Fund’s shares pursuant to a Distribution Agreement with RBB.
3. Director Compensation
The Directors of the Company receive an annual retainer and meeting fees for meetings attended. The remuneration paid to the Directors by the Fund during the six months ended February 28, 2014 was $5,426. Certain employees of BNY Mellon serve as an Officer or Director of the Company. They are not compensated by the Fund or the Company.
15
PERIMETER
SMALL CAP GROWTH FUND
Notes to Financial Statements (Concluded)
February 28, 2014
(Unaudited)
4. Investment in Securities
For the six months ended February 28, 2014, aggregate purchases and sales of investment securities (excluding short-term investments) of the Fund were as follows:
| | |
Purchases | | Sales |
$55,510,779 | | $82,571,579 |
5. Federal Income Tax Information
The Fund has followed the authoritative guidance on accounting for and disclosure of uncertainty in tax positions, which requires the Fund to determine whether a tax position is more likely than not to be sustained upon examination, including resolution of any related appeals or litigation processes, based on the technical merits of the position. The Fund has determined that there was no effect on the financial statements from following this authoritative guidance. In the normal course of business, the Fund is subject to examination by federal, state and local jurisdictions, where applicable, for tax years for which applicable statutes of limitations have not expired.
As of February 28, 2014, the federal tax cost, aggregate gross unrealized appreciation and depreciation of securities held by the Fund were as follows:
| | | | | | |
Federal Tax Cost | | Unrealized
Appreciation | | Unrealized
Depreciation | | Net
Unrealized
Appreciation |
$60,567,131 | | $19,265,685 | | $(948,680) | | $18,317,005 |
Distributions to shareholders from net investment income and realized gains are determined in accordance with federal income tax regulations, which may differ from net investment income and realized gains recognized for financial reporting purposes. Accordingly, the character of distributions and composition of net assets for tax purposes may differ from those reflected in the accompanying financial statements. To the extent these differences are permanent, such amounts are reclassified within the capital accounts based on the tax treatment; temporary differences do not require such reclassification.
As of August 31, 2013, the components of distributable earnings on a tax basis were as follows:
| | | | |
Undistributed
Ordinary Income | | Undistributed
Long-Term Gains | | Unrealized
Appreciation |
$13,836,407 | | $16,929,901 | | $16,786,121 |
The differences between the book and tax basis components of distributable earnings relate principally to the timing of recognition of income and gains for federal income tax purposes.
The tax character of dividends and distributions paid during the year ended August 31, 2013 was as follows:
| | | | |
Ordinary
Income | | Long-Term
Gains | | Total |
$— | | $24,867,936 | | $24,867,936 |
Dividends from net investment income and short-term capital gains are treated as ordinary income dividends for federal income tax purposes.
Under the Regulated Investment Company Modernization Act of 2010 (the “Modernization Act”), the Fund is permitted to carry forward capital losses incurred in taxable years beginning after December 22, 2010 for an unlimited period. Any losses incurred during those future taxable years will be required to be utilized prior to any losses incurred in pre-enactment taxable years.Additionally, post-enactment capital losses that are carried forward will retain their character as either short-term or long-term capital losses rather than being considered all short-term as under the previous law. The Fund’s first fiscal year-end subject to the Modernization Act was August 31, 2012. As of August 31, 2013, the Fund had no capital loss carryforwards.
6. Subsequent Events
Management has evaluated the impact of all subsequent events on the Fund through the date the financial statements were issued, and has determined that there was no subsequent event requiring recognition or disclosure in the financial statements.
16
PERIMETER
SMALL CAP GROWTH FUND
Other Information
(Unaudited)
Proxy Voting
Policies and procedures that the Fund uses to determine how to vote proxies relating to portfolio securities as well as information regarding how the Fund voted proxies relating to portfolio securities for the most recent 12-month period ended June 30 are available without charge, upon request, by calling (888) 968-4964 and on the Securities and Exchange Commission’s (“SEC”) website at http://www.sec.gov.
Quarterly Portfolio Schedules
The Company will file its complete schedule of portfolio holdings with the SEC for the first and third fiscal quarters of each fiscal year (quarters ended November 30 and May 31) on Form N-Q. The Company’s Forms N-Q will be available on the SEC’s website at http://www.sec.gov and may be reviewed and copied at the SEC’s Public Reference Room in Washington, D.C. Information on the operation of the SEC’s Public Reference Room may be obtained by calling (202) 551-8090.
17
Intentionally Left Blank
Investment Adviser
Perimeter Capital Management
Six Concourse Parkway
Suite 3300
Atlanta, GA 30328
Administrator
BNY Mellon Investment Servicing (US) Inc.
301 Bellevue Parkway
Wilmington, DE 19809
Transfer Agent
BNY Mellon Investment Servicing (US) Inc.
4400 Computer Drive
Westborough, MA 01581
Principal Underwriter
Foreside Funds Distributors LLC
400 Berwyn Park
899 Cassatt Road
Berwyn, PA 19312
Custodian
The Bank of New York Mellon
One Wall Street
New York, NY 10286
Independent Registered Public Accounting Firm
Ernst & Young LLP
One Commerce Square
2005 Market Street, Suite 700
Philadelphia, PA 19103
Legal Counsel
Drinker, Biddle & Reath LLP
One Logan Square, Ste. 2000
Philadelphia, PA 19103-6996
| | |
GENERAL MARKET COMMENTARY | | |
Dear Shareholder,
Equity markets around the world surged in 2013 as investors’ spirits were bolstered by the easy monetary policies of central banks around the world and the slow and steady 5-year recovery from the financial crisis. The S&P 500 returned an astounding 32.4% in 2013, its best annual gain since 1997. As of the February 28, 2014 close of the reporting period, investors have clearly gained confidence in the measured global expansion as well as the ongoing safety net being provided by central banks around the world.
The economic news in the U.S. was surprisingly solid through calendar year 2013 with existing home prices up 9%, employment increasing by 2.3 million, S&P 500 earnings growth of 8%, and real GDP up 2.5%. Meanwhile, the budget deficit narrowed by $400 billion and the consumer price index rose just 1.2%. Stock market sentiment improved considerably over the latter half of 2013 as well, which led to an increase of the market price-earnings multiple by roughly two points. This multiple expansion was a major driver behind the market’s increase. While balance sheets of central banks expanded around the world to aid the recovery, the U.S. stock market has taken the Federal Reserve’s tapering news in stride.
As 2014 unfolds, recent economic data has been mixed. There have been some negative issues such as poor weather that led to some disappointing news in January and February. Emerging markets remain a concern in 2014. China’s growth continues to disappoint as its soft landing has had difficulty reaccelerating. Ukraine/Russia/U.S. political tensions have also roiled investors. On the other hand, there have been some positive developments such as the improved employment picture in the United States. Housing prices have again accelerated after a six-month hiatus. Inflation around the world has remained extremely benign. Corporations appeared to be spending their cash hoards with a significant increase in transactions over the past several months. The last and perhaps most important missing piece to a self-sustaining economic recovery—bank loan growth—rebounded strongly during the first quarter of 2014.
We remain steadfast in our outlook for about 3% global growth in 2014 with low inflation. We expect central bankers and investors will continue to play a game of “cat and mouse” for the rest of this year as well, and that the Federal Reserve will continue to convey that economies are improving and that tapering will continue. As a result, investors need to remain patient with this wandering market. We have been somewhat spoiled by the almost steady upward trajectory of stock prices over the past two years. Consolidation phases are healthy as momentum players’ mettle is tested and value investors remain persistent scouring for opportunities. We expect the market to continue to grind higher this year as investor optimism is buoyed by steady growth, low inflation and solid earnings. Rather than trying to predict these variable outcomes, we will continue to do what we do best—identify stocks that we believe will outperform for your portfolio. By focusing on companies with low valuation, high and increasing returns on capital and improving business momentum, we believe we can create excess returns for you regardless of the investing environment.
Sincerely,
Robeco Investment Management
Portfolio composition is subject to change. The current and future portfolio holdings of the Funds are subject to investment risk.
| | | | |
| SEMI-ANNUAL REPORT 2014 | | | 1 | |
| | |
Total Returns for the Period Ended February 28, 2014 (unaudited) |
| | | | | | | | | | | | | | | | | | | | |
| | | | | | | | | Average Annual | |
| | | Six-Month* | | | 1 Year | | | 5 Year | | | 10 Year | | | Since
Inception | |
| | | | |
| Robeco Boston Partners Small Cap Value Fund II | | | | | | | | | | | | | | | | | |
Institutional Class | | | 15.54 | % | | | 27.29 | % | | | 29.28 | % | | | 8.88 | % | | | N/A | |
Investor Class | | | 15.41 | % | | | 27.04 | % | | | 28.98 | % | | | 8.61 | % | | | N/A | |
Russell 2000® Value Index | | | 16.23 | % | | | 26.19 | % | | | 25.13 | % | | | 8.09 | % | | | N/A | |
Russell 2000® Index1 | | | 17.75 | % | | | 31.56 | % | | | 26.63 | % | | | 8.71 | % | | | N/A | |
1 This is not a primary benchmark of the Fund. Results of the index performance are presented for general comparative purposes. | |
| | | | |
| Robeco Boston Partners Long/Short Equity Fund | | | | | | �� | | | | | | | | | | | |
Institutional Class | | | 0.64 | % | | | 1.17 | % | | | 25.85 | % | | | 12.44 | % | | | N/A | |
Investor Class | | | 0.52 | % | | | 0.93 | % | | | 25.42 | % | | | 12.10 | % | | | N/A | |
S&P 500® Index | | | 15.07 | % | | | 25.37 | % | | | 23.00 | % | | | 7.16 | % | | | N/A | |
| | | | |
| Robeco Boston Partners Long/Short Research Fund | | | | | | | | | | | | | | | | | |
Institutional Class1 | | | 9.29 | % | | | 15.18 | % | | | N/A | | | | N/A | | | | 12.19 | % |
S&P 500® Index | | | 15.07 | % | | | 25.37 | % | | | N/A | | | | N/A | | | | 17.90 | % |
| | | | | |
Investor Class2 | | | 9.13 | % | | | 14.87 | % | | | N/A | | | | N/A | | | | 11.21 | % |
S&P 500® Index | | | 15.07 | % | | | 25.37 | % | | | N/A | | | | N/A | | | | 17.76 | % |
1 Inception date September 30, 2010 | |
2 Inception date November 29, 2010 | |
| | | | |
| Robeco Boston Partners All-Cap Value Fund | | | | | | | | | | | | | | | | | |
Institutional Class | | | 15.05 | % | | | 29.87 | % | | | 23.53 | % | | | 9.99 | % | | | N/A | |
Investor Class | | | 14.95 | % | | | 29.67 | % | | | 23.30 | % | | | 9.74 | % | | | N/A | |
Russell 3000® Value Index | | | 13.68 | % | | | 23.65 | % | | | 23.34 | % | | | 7.30 | % | | | N/A | |
Russell 3000® Index2 | | | 15.84 | % | | | 26.74 | % | | | 23.86 | % | | | 7.67 | % | | | N/A | |
2 This is not a primary benchmark of the Fund. Results of the index performance are presented for general comparative purposes. | |
| | | | |
| Robeco WPG Small/Micro Cap Value Fund | | | | | | | | | | | | | | | | | |
Institutional Class1 | | | 12.80 | % | | | 26.24 | % | | | 25.67 | % | | | 7.51 | % | | | N/A | |
Russell 2000® Value Index | | | 16.23 | % | | | 26.19 | % | | | 25.13 | % | | | 8.09 | % | | | N/A | |
| | | | |
| Robeco Boston Partners Global Equity Fund | | | | | | | | | | | | | | | | | |
Institutional Class1 | | | 17.62 | % | | | 25.97 | % | | | N/A | | | | N/A | | | | 22.60 | % |
MSCI World Index | | | 14.91 | % | | | 22.34 | % | | | N/A | | | | N/A | | | | 20.90 | % |
1 Inception date December 30, 2011 | |
| | | | |
| Robeco Boston Partners International Equity Fund | | | | | | | | | | | | | | | | | |
Institutional Class1 | | | 18.09 | % | | | 25.39 | % | | | N/A | | | | N/A | | | | 22.38 | % |
MSCI EAFE | | | 15.12 | % | | | 19.78 | % | | | N/A | | | | N/A | | | | 20.34 | % |
1 Inception date December 30, 2011 | |
| | |
| 2 | | SEMI-ANNUAL REPORT 2014 |
The performance data quoted represents past performance. Past performance is not indicative of future results. Investment return and principal value will fluctuate so that an investor’s shares, when redeemed, may be worth more or less than their original cost. Robeco Investment Management, Inc. waived a portion of its advisory fee and agreed to reimburse a portion of each Fund’s operating expenses, if necessary, to maintain certain expense ratios as set forth in the notes to the financial statements. Total returns shown include fee waivers, expense reimbursements and expense recoupment, if any; total returns would have been lower had there been no assumption of fees and expenses in excess of expense limitations. Each Fund’s annual operating expense ratios below are as stated in the current prospectuses. These rates can fluctuate and may differ from the actual expenses incurred by a Fund for the period covered by this report. Returns shown include the reinvestment of all dividends and other distributions and do not reflect taxes that a shareholder would pay on Fund distributions or on the redemption of Fund shares. Current performance may be lower or higher than the performance data quoted. For performance data current to the most recent month-end, please call 1-888-261-4073 or visit our web site at www.robecoinvest.com.
Investors should note that the Funds are actively managed mutual funds while the indices are unmanaged, do not incur expense and are not available for investment.
Small company stocks are generally riskier than large company stocks due to greater volatility and less liquidity.
Value investing involves the risk that the Fund’s investment in companies whose securities are believed to be undervalued, relative to their underlying profitability, will not appreciate in value as anticipated.
A long/short strategy uses short sales which theoretically involve unlimited loss potential since the market price of securities sold short may continuously increase. Increased leverage may cause a fund’s NAV to be disproportionately volatile. The strategy also may generate high portfolio turnover which may result in higher costs and capital gains.
International investing is subject to special risks including, but not limited to, currency risk associated with securities denominated in other than the U.S. dollar, which may be affected by fluctuations in currency exchange rates, political, social or economic instability, and differences in taxation, auditing and other financial practices. Investment in emerging market securities may increase these risks.
The following are the Funds’ gross annual operating expense ratios as stated in the most recent prospectus:
| | | | |
| | | Institutional
Class | | Investor
Class |
Robeco Boston Partners Small Cap Value Fund II | | 1.29% | | 1.54% |
Robeco Boston Partners Long/Short Equity Fund | | 4.30%1 | | 4.55%1 |
Robeco Boston Partners Long/Short Research Fund | | 2.71%1 | | 2.96%1 |
Robeco Boston Partners All-Cap Value Fund | | 0.97% | | 1.22% |
Robeco WPG Small/Micro Cap Value Fund | | 1.54% | | N/A |
Robeco Boston Partners Global Equity Fund | | 3.05% | | N/A |
Robeco Boston Partners International Equity Fund | | 3.18% | | N/A |
Robeco Boston Partners Global Long/Short Fund | | 5.44%1 | | N/A |
| | |
1 Includes interest and dividend expense on short sales. | | | | |
| | | | |
| SEMI-ANNUAL REPORT 2014 | | | 3 | |
| | |
FUND EXPENSE EXAMPLES (unaudited) | | |
As a shareholder of the Fund(s), you incur two types of costs: (1) transaction costs, including redemption fees; and (2) ongoing costs, including management fees, distribution fees and other Fund expenses. The examples are intended to help you understand your ongoing costs (in dollars) of investing in the Fund(s) and to compare these costs with the ongoing costs of investing in other mutual funds.
The examples are based on an investment of $1,000 invested at the beginning of the six-month period from September 1, 2013 through February 28, 2014, and held for the entire period.
Actual Expenses
The first line of the accompanying tables provides information about actual account values and actual expenses. You may use the information in this line, together with the amount you invested, to estimate the expenses that you paid over the period. Simply divide your account value by $1,000 (for example, an $8,600 account value divided by $1,000 = 8.6), then multiply the result by the number in the first line under the heading entitled “Expenses Paid During Period” to estimate the expenses you paid on your account during this period.
Hypothetical Example for Comparison Purposes
The second line of the accompanying tables provides information about hypothetical account values and hypothetical expenses based on a Fund’s actual expense ratio and an assumed rate of return of 5% per year before expenses, which is not the Fund’s actual return. The hypothetical account values and expenses may not be used to estimate the actual ending account balance or expenses you paid for the period. You may use this information to compare the ongoing costs of investing in the Fund(s) and other funds. To do so, compare these 5% hypothetical examples with the 5% hypothetical examples that appear in the shareholder reports of other funds.
Please note that the expenses shown in the accompanying tables are meant to highlight your ongoing costs only and do not reflect any transactional costs, such as redemption fees. Therefore, the second line of the accompanying tables is useful in comparing ongoing costs only, and will not help you determine the relative total costs of owning different funds. In addition, if these transactional costs were included, your costs would have been higher.
Expense Table
| | | | | | | | | | | | | | | | |
| | | Beginning Account
Value
September 1, 2013 | | | Ending Account
Value
February 28, 2014 | | | Annualized
Expense
Ratio | | | Expenses
Paid During
Period* | |
| Robeco Boston Partners Small Cap Value Fund II | | | | | | | | | | | | | | | | |
Institutional | | | | | | | | | | | | | | | | |
Actual | | | $1,000.00 | | | | $1,155.40 | | | | 1.24 | % | | | $6.63 | |
Hypothetical | | | 1,000.00 | | | | 1,018.65 | | | | 1.24 | % | | | 6.21 | |
Investor | | | | | | | | | | | | | | | | |
Actual | | | $1,000.00 | | | | $1,154.10 | | | | 1.49 | % | | | $7.96 | |
Hypothetical | | | 1,000.00 | | | | 1,017.41 | | | | 1.49 | % | | | 7.45 | |
| Robeco Boston Partners Long/Short Equity Fund | | | | | | | | | | | | | | | | |
Institutional | | | | | | | | | | | | | | | | |
Actual | | | $1,000.00 | | | | $1,006.40 | | | | 4.10 | %(1) | | | $20.40 | |
Hypothetical | | | 1,000.00 | | | | 1,004.46 | | | | 4.10 | %(1) | | | 20.38 | |
Investor | | | | | | | | | | | | | | | | |
Actual | | | $1,000.00 | | | | $1,005.20 | | | | 4.35 | %(1) | | | $21.63 | |
Hypothetical | | | 1,000.00 | | | | 1,003.22 | | | | 4.35 | %(1) | | | 21.61 | |
| Robeco Boston Partners Long/Short Research Fund | | | | | | | | | | | | | | | | |
Institutional | | | | | | | | | | | | | | | | |
Actual | | | $1,000.00 | | | | $1,092.90 | | | | 2.31 | %(1) | | | $11.99 | |
Hypothetical | | | 1,000.00 | | | | 1,013.34 | | | | 2.31 | %(1) | | | 11.53 | |
Investor | | | | | | | | | | | | | | | | |
Actual | | | $1,000.00 | | | | $1,091.30 | | | | 2.56 | %(1) | | | $13.27 | |
Hypothetical | | | 1,000.00 | | | | 1,012.10 | | | | 2.56 | %(1) | | | 12.77 | |
| | |
| 4 | | SEMI-ANNUAL REPORT 2014 |
| | |
FUND EXPENSE EXAMPLES (unaudited) (concluded) | | |
| | | | | | | | | | | | | | | | |
| | | Beginning Account
Value
September 1, 2013 | | | Ending Account
Value
February 28, 2014 | | | Annualized
Expense
Ratio | | | Expenses
Paid During
Period* | |
| Robeco Boston Partners All-Cap Value Fund | | | | | | | | | | | | | | | | |
Institutional | | | | | | | | | | | | | | | | |
Actual | | | $1,000.00 | | | | $1,150.50 | | | | 0.70 | % | | | $3.73 | |
Hypothetical | | | 1,000.00 | | | | 1,021.32 | | | | 0.70 | % | | | 3.51 | |
Investor | | | | | | | | | | | | | | | | |
Actual | | | $1,000.00 | | | | $1,149.50 | | | | 0.95 | % | | | $5.06 | |
Hypothetical | | | 1,000.00 | | | | 1,020.08 | | | | 0.95 | % | | | 4.76 | |
| Robeco Boston Partners WPG Small/Micro Cap Value Fund | | | | | | | | | | | | | | | | |
Institutional | | | | | | | | | | | | | | | | |
Actual | | | $1,000.00 | | | | $1,128.00 | | | | 1.46 | % | | | $7.70 | |
Hypothetical | | | 1,000.00 | | | | 1,017.55 | | | | 1.46 | % | | | 7.30 | |
| Robeco Boston Partners Global Equity Fund | | | | | | | | | | | | | | | | |
Institutional | | | | | | | | | | | | | | | | |
Actual | | | $1,000.00 | | | | $1,176.20 | | | | 0.97 | % | | | $5.23 | |
Hypothetical | | | 1,000.00 | | | | 1,019.98 | | | | 0.97 | % | | | 4.86 | |
| Robeco Boston Partners International Equity Fund | | | | | | | | | | | | | | | | |
Institutional | | | | | | | | | | | | | | | | |
Actual | | | $1,000.00 | | | | $1,180.90 | | | | 1.01 | % | | | $5.46 | |
Hypothetical | | | 1,000.00 | | | | 1,019.79 | | | | 1.01 | % | | | 5.06 | |
| Robeco Boston Partners Global Long/Short Fund** | | | | | | | | | | | | | | | | |
Institutional | | | | | | | | | | | | | | | | |
Actual | | | $1,000.00 | | | | $997.00 | | | | 3.66 | %(1) | | | $5.71 | |
Hypothetical | | | 1,000.00 | | | | 1,006.44 | | | | 3.66 | %(1) | | | 18.21 | |
| * | Expenses are equal to the Fund’s annualized six-month expense ratios in the table above, which include waived fees or reimbursed expenses, multiplied by the average account value over the period, multiplied by the number of days (181) in the most recent fiscal half-year, then divided by 365 to reflect the one-half year period. The Fund’s ending account values on the first line in each table are based on the actual six-month total return of 15.54% and 15.41% for the Institutional Class and Investor Class, respectively, of the Robeco Boston Partners Small Cap Value Fund II; 0.64% and 0.52% for the Institutional Class and Investor Class, respectively, of the Robeco Boston Partners Long/Short Equity Fund; 9.29% and 9.13% for the Institutional Class and Investor Class, respectively, of the Robeco Boston Partners Long/Short Research Fund; 15.05% and 14.95% for the Institutional Class and Investor Class, respectively, of the Robeco Boston Partners All-Cap Value Fund; 12.80% for the Institutional Class of the WPG Small/Micro Cap Value Fund, 17.62% for the Institutional Class of the Robeco Boston Partners Global Equity Fund, 18.09% for the Institutional Class of the Robeco Boston Partners International Equity Fund and (0.30%) for the Institutional Class of the Robeco Boston Partners Global Long/Short Fund for the period beginning December 31, 2013 (commencement of operations) to February 28, 2014. |
| ** | Expenses are equal to the Fund’s annualized expense ratio for the period beginning December 31, 2013 (commencement of operations) to February 28, 2014 of 3.66%, multiplied by the average account value over the period, multiplied by the number of days in the most recent period (57) then divided by 365 days to reflect the days in the period. For comparison purposes, the hypothetical expenses are as if the Fund had been in existence from September 1, 2013 and are equal to the Fund’s annualized expense ratio, multiplied by the average account value over the period, multiplied by the number of days in the most recent six-month period (181), then divided by 365 to reflect the period. |
| (1) | These amounts include dividends paid on securities which the Funds have sold short (“short-sale dividends”) and related interest expense. The amount of short-sale dividends and related interest expense was 1.67% and 0.93% of average net assets for the six-month period ended February 28, 2014 for both the Institutional Class and Investor Class of the Robeco Boston Partners Long/Short Equity Fund and Robeco Boston Partners Long/Short Research Fund, respectively, and 1.66% of average net assets for the period beginning December 31, 2013 to February 28, 2014 for the Institutional Class of the Robeco Boston Partners Global Long/Short Fund. |
| | | | |
| SEMI-ANNUAL REPORT 2014 | | | 5 | |
| | |
| ROBECO INVESTMENT FUNDS | | FEBRUARY 28, 2014 (unaudited) |
| | |
PORTFOLIO HOLDINGS SUMMARY TABLES (unaudited) | | |
ROBECO BOSTON PARTNERS SMALL CAP VALUE FUND II
| | | | | | | | |
| Security Type/Sector Classification | | % of Net
Assets | | | Value | |
COMMON STOCK | | | | | | | | |
Consumer Services | | | 20.1 | % | | $ | 40,574,661 | |
Finance | | | 18.7 | | | | 37,624,880 | |
Capital Goods | | | 14.5 | | | | 29,240,489 | |
Technology | | | 10.5 | | | | 21,066,739 | |
Health Care | | | 9.9 | | | | 19,899,477 | |
Real Estate Investment Trusts | | | 9.0 | | | | 18,073,537 | |
Consumer Non-Durables | | | 3.5 | | | | 6,997,596 | |
Consumer Durables | | | 3.0 | | | | 6,061,606 | |
Basic Industries | | | 2.9 | | | | 5,821,082 | |
Energy | | | 2.5 | | | | 5,160,053 | |
Transportation | | | 1.1 | | | | 2,239,500 | |
Utilities | | | 0.9 | | | | 1,795,590 | |
RIGHTS | | | 0.1 | | | | 115,837 | |
SECURITIES LENDING COLLATERAL | | | 3.0 | | | | 6,139,754 | |
LIABILITIES IN EXCESS OF OTHER ASSETS | | | (0.3 | ) | | | (521,273 | ) |
| | | | | | | | |
NET ASSETS | | | 100.0 | % | | $ | 201,332,074 | |
| | | | | | | | |
Portfolio holdings are subject to change at any time.
ROBECO BOSTON PARTNERS LONG/SHORT EQUITY FUND
| | | | | | | | |
| Security Type/Sector Classification | | % of Net
Assets | | | Value | |
COMMON STOCK | | | | | | | | |
Technology | | | 16.8 | % | | $ | 126,650,646 | |
Consumer Services | | | 15.8 | | | | 119,196,998 | |
Finance | | | 12.4 | | | | 93,848,552 | |
Energy | | | 11.7 | | | | 88,067,460 | |
Health Care | | | 10.2 | | | | 77,279,003 | |
Capital Goods | | | 9.1 | | | | 68,526,247 | |
Basic Industries | | | 7.6 | | | | 57,285,811 | |
Consumer Non-Durables | | | 6.4 | | | | 48,017,704 | |
Communications | | | 4.1 | | | | 30,824,658 | |
Consumer Durables | | | 2.0 | | | | 15,295,447 | |
Real Estate Investment Trusts | | | 0.9 | | | | 6,823,014 | |
Transportation | | | 0.2 | | | | 1,598,375 | |
PREFERRED STOCK | | | 0.0 | | | | 158,371 | |
SECURITIES LENDING
COLLATERAL | | | 2.7 | | | | 20,006,304 | |
SECURITIES SOLD SHORT | | | (76.7 | ) | | | (578,585,710 | ) |
WRITTEN OPTIONS | | | 0.0 | | | | (309,405 | ) |
OTHER ASSETS IN EXCESS OF LIABILITIES | | | 76.8 | | | | 579,461,828 | |
| | | | | | | | |
NET ASSETS | | | 100.0 | % | | $ | 754,145,303 | |
| | | | | | | | |
Portfolio holdings are subject to change at any time.
ROBECO BOSTON PARTNERS LONG/SHORT RESEARCH FUND
| | | | | | | | |
| Security Type/Sector Classification | | % of Net
Assets | | | Value | |
COMMON STOCK | | | | | | | | |
Finance | | | 16.4 | % | | $ | 637,257,885 | |
Technology | | | 14.5 | | | | 563,959,704 | |
Health Care | | | 11.6 | | | | 452,449,457 | |
Energy | | | 11.1 | | | | 433,691,217 | |
Consumer Services | | | 10.3 | | | | 399,983,269 | |
Capital Goods | | | 10.3 | | | | 399,005,956 | |
Basic Industries | | | 5.6 | | | | 217,705,032 | |
Consumer Non-Durables | | | 4.9 | | | | 189,909,697 | |
Communications | | | 3.7 | | | | 143,783,385 | |
Consumer Durables | | | 3.2 | | | | 126,050,604 | |
Real Estate Investment Trusts | | | 1.5 | | | | 58,437,188 | |
Transportation | | | 0.3 | | | | 12,737,991 | |
SECURITIES SOLD SHORT | | | (44.6 | ) | | | (1,736,793,396 | ) |
WRITTEN OPTIONS | | | (0.1 | ) | | | (3,126,200 | ) |
OTHER ASSETS IN EXCESS OF LIABILITIES | | | 51.3 | | | | 1,996,428,131 | |
| | | | | | | | |
NET ASSETS | | | 100.0 | % | | $ | 3,891,479,920 | |
| | | | | | | | |
Portfolio holdings are subject to change at any time.
ROBECO BOSTON PARTNERS ALL-CAP VALUE FUND
| | | | | | | | |
| Security Type/Sector Classification | | % of Net
Assets | | | Value | |
COMMON STOCK | | | | | | | | |
Finance | | | 26.5 | % | | $ | 218,441,603 | |
Technology | | | 17.0 | | | | 140,089,421 | |
Health Care | | | 17.0 | | | | 139,841,080 | |
Consumer Services | | | 10.0 | | | | 82,305,536 | |
Energy | | | 8.6 | | | | 71,010,354 | |
Capital Goods | | | 5.5 | | | | 45,669,414 | |
Consumer Non-Durables | | | 4.9 | | | | 40,490,276 | |
Consumer Durables | | | 3.5 | | | | 28,724,808 | |
Communications | | | 1.7 | | | | 14,294,301 | |
Real Estate Investment Trusts | | | 0.2 | | | | 1,691,138 | |
Basic Industries | | | 0.9 | | | | 7,685,615 | |
PREFERRED STOCK | | | 0.0 | | | | 43,192 | |
SECURITIES LENDING COLLATERAL | | | 0.3 | | | | 2,725,161 | |
WRITTEN OPTIONS | | | 0.0 | | | | (91,692 | ) |
OTHER ASSETS IN EXCESS OF LIABILITIES | | | 3.9 | | | | 32,370,893 | |
| | | | | | | | |
NET ASSETS | | | 100.0 | % | | $ | 825,291,100 | |
| | | | | | | | |
Portfolio holdings are subject to change at any time.
THEACCOMPANYINGNOTESAREANINTEGRALPARTOFTHEFINANCIALSTATEMENTS.
| | |
| 6 | | SEMI-ANNUAL REPORT 2014 |
| | |
| ROBECO INVESTMENT FUNDS | | FEBRUARY 28, 2014 (unaudited) |
| | |
PORTFOLIO HOLDINGS SUMMARY TABLES (unaudited) (concluded) | | |
ROBECO WPG SMALL/MICRO CAP VALUE FUND
| | | | | | | | |
| Security Type/Sector Classification | | % of Net
Assets | | | Value | |
COMMON STOCK | | | | | | | | |
Finance | | | 22.6 | % | | $ | 10,333,260 | |
Real Estate Investment Trusts | | | 12.9 | | | | 5,870,743 | |
Energy | | | 11.3 | | | | 5,155,635 | |
Consumer Services | | | 8.8 | | | | 4,029,728 | |
Technology | | | 8.4 | | | | 3,851,349 | |
Capital Goods | | | 7.8 | | | | 3,559,051 | |
Transportation | | | 6.6 | | | | 3,001,719 | |
Health Care | | | 5.0 | | | | 2,284,512 | |
Utilities | | | 4.3 | | | | 1,970,973 | |
Consumer Non-Durables | | | 3.5 | | | | 1,611,397 | |
Consumer Durables | | | 2.5 | | | | 1,154,660 | |
Basic Industries | | | 1.6 | | | | 711,263 | |
SECURITIES LENDING COLLATERAL | | | 11.6 | | | | 5,306,318 | |
LIABILITIES IN EXCESS OF OTHER ASSETS | | | (6.9 | ) | | | (3,165,533 | ) |
| | | | | | | | |
NET ASSETS | | | 100.0 | % | | $ | 45,675,075 | |
| | | | | | | | |
Portfolio holdings are subject to change at any time.
ROBECO BOSTON PARTNERS GLOBAL EQUITY FUND
| | | | | | | | |
| Security Type/Sector Classification | | % of Net
Assets | | | Value | |
COMMON STOCK | | | | | | | | |
Finance | | | 16.7 | % | | $ | 11,610,395 | |
Health Care | | | 16.4 | | | | 11,405,911 | |
Consumer Discretionary | | | 14.6 | | | | 10,212,911 | |
Information Technology | | | 11.1 | | | | 7,743,946 | |
Industrials | | | 10.2 | | | | 7,092,298 | |
Consumer Staples | | | 9.9 | | | | 6,895,439 | |
Materials | | | 9.6 | | | | 6,670,641 | |
Energy | | | 6.4 | | | | 4,463,499 | |
Telecommunication Services | | | 0.6 | | | | 444,763 | |
OTHER ASSETS IN EXCESS OF LIABILITIES | | | 4.5 | | | | 3,160,025 | |
| | | | | | | | |
NET ASSETS | | | 100.0 | % | | $ | 69,699,828 | |
| | | | | | | | |
Portfolio holdings are subject to change at any time.
ROBECO BOSTON PARTNERS
INTERNATIONAL EQUITY FUND
| | | | | | | | |
| Security Type/Sector Classification | | % of Net
Assets | | | Value | |
COMMON STOCK | | | | | | | | |
Financials | | | 14.5 | % | | $ | 1,982,196 | |
Consumer Discretionary | | | 14.0 | | | | 1,908,739 | |
Industrials | | | 14.0 | | | | 1,906,685 | |
Health Care | | | 13.7 | | | | 1,864,721 | |
Information Technology | | | 11.3 | | | | 1,540,702 | |
Materials | | | 9.4 | | | | 1,274,866 | |
Energy | | | 8.1 | | | | 1,103,635 | |
Consumer Staples | | | 6.1 | | | | 835,453 | |
Telecommunication Services | | | 2.8 | | | | 386,790 | |
OTHER ASSETS IN EXCESS OF LIABILITIES | | | 6.1 | | | | 829,012 | |
| | | | | | | | |
NET ASSETS | | | 100.0 | % | | $ | 13,632,799 | |
| | | | | | | | |
Portfolio holdings are subject to change at any time.
ROBECO BOSTON PARTNERS GLOBAL LONG/SHORT FUND
| | | | | | | | |
| Security Type/Sector Classification | | % of Net
Assets | | | Value | |
COMMON STOCK | | | | | | | | |
Health Care | | | 7.4 | % | | $ | 586,506 | |
Finance | | | 6.6 | | | | 527,198 | |
Consumer Services | | | 4.1 | | | | 326,173 | |
Industrial | | | 3.5 | | | | 280,214 | |
Basic Industries | | | 3.5 | | | | 275,575 | |
Energy | | | 2.9 | | | | 231,327 | |
Consumer Staples | | | 2.6 | | | | 205,817 | |
Consumer Discretionary | | | 2.2 | | | | 173,210 | |
Information Technology | | | 2.2 | | | | 173,092 | |
Technology | | | 1.9 | | | | 149,802 | |
Communications | | | 1.3 | | | | 99,597 | |
Materials | | | 1.0 | | | | 80,855 | |
Capital Goods | | | 1.0 | | | | 78,334 | |
Consumer Durables | | | 0.7 | | | | 58,022 | |
Computer Software & Services | | | 0.6 | | | | 51,572 | |
Consumer Non-Durables | | | 0.6 | | | | 49,709 | |
Real Estate Investment Trusts | | | 0.3 | | | | 27,112 | |
Telecommunication Services | | | 0.3 | | | | 22,520 | |
SECURITIES SOLD SHORT | | | (23.4 | ) | | | (1,867,638 | ) |
OTHER ASSETS IN EXCESS OF LIABILITIES | | | 80.8 | | | | 6,435,146 | |
| | | | | | | | |
NET ASSETS | | | 100.0 | % | | $ | 7,964,143 | |
| | | | | | | | |
Portfolio holdings are subject to change at any time.
THEACCOMPANYINGNOTESAREANINTEGRALPARTOFTHEFINANCIALSTATEMENTS.
| | | | |
| SEMI-ANNUAL REPORT 2014 | | | 7 | |
| | |
| ROBECO INVESTMENT FUNDS | | FEBRUARY 28, 2014 (unaudited) |
| | |
ROBECO BOSTON PARTNERS SMALL CAP VALUE FUND II | | PORTFOLIOOF INVESTMENTS |
| | | | | | | | |
| | | Number of
Shares | | | Value | |
COMMON STOCK—96.6% | | | | | | | | |
Basic Industries—2.9% | | | | | | | | |
Graphic Packaging Holding Co. * | | | 318,145 | | | $ | 3,257,805 | |
PolyOne Corp. | | | 15,344 | | | | 575,400 | |
Schweitzer-Mauduit International, Inc. | | | 30,850 | | | | 1,484,811 | |
Sensient Technologies Corp. | | | 9,595 | | | | 503,066 | |
| | | | | | | | |
| | | | | | | 5,821,082 | |
| | | | | | | | |
Capital Goods—14.5% | | | | | | | | |
Actuant Corp., Class A | | | 52,645 | | | | 1,845,734 | |
Aegion Corp. * | | | 57,080 | | | | 1,321,402 | |
Ampco-Pittsburgh Corp. | | | 17,245 | | | | 352,660 | |
Brady Corp., Class A | | | 27,203 | | | | 727,680 | |
Cabot Corp. | | | 26,745 | | | | 1,447,974 | |
Curtiss-Wright Corp. | | | 18,695 | | | | 1,274,251 | |
Drew Industries, Inc. | | | 23,585 | | | | 1,161,325 | |
Globe Specialty Metals, Inc. | | | 82,320 | | | | 1,635,698 | |
Granite Construction, Inc. | | | 32,370 | | | | 1,189,921 | |
Hillenbrand, Inc. | | | 32,650 | | | | 975,582 | |
Huntington Ingalls Industries, Inc. | | | 17,040 | | | | 1,726,663 | |
LSB Industries, Inc. * | | | 28,925 | | | | 945,558 | |
MRC Global, Inc. * | | | 61,050 | | | | 1,570,206 | |
Mueller Industries, Inc. | | | 17,100 | | | | 1,068,408 | |
Orion Marine Group, Inc. * | | | 124,735 | | | | 1,408,258 | |
Rofin-Sinar Technologies, Inc. * | | | 7,000 | | | | 164,290 | |
Stock Building Supply Holdings, Inc. * | | | 65,570 | | | | 1,459,588 | |
Terex Corp. | | | 42,985 | | | | 1,914,122 | |
WESCO International, Inc. * | | | 31,255 | | | | 2,694,494 | |
World Fuel Services Corp. | | | 96,772 | | | | 4,356,675 | |
| | | | | | | | |
| | | | | | | 29,240,489 | |
| | | | | | | | |
Consumer Durables—3.0% | | | | | | | | |
Tempur Sealy International, Inc. * | | | 37,955 | | | | 1,968,726 | |
Thor Industries, Inc. | | | 44,540 | | | | 2,494,685 | |
Tower International, Inc. * | | | 62,235 | | | | 1,598,195 | |
| | | | | | | | |
| | | | | | | 6,061,606 | |
| | | | | | | | |
Consumer Non-Durables—3.5% | | | | | | | | |
Alliance One International, Inc. * | | | 92,050 | | | | 247,614 | |
Fresh Del Monte Produce, Inc. | | | 26,465 | | | | 700,264 | |
Matthews International Corp., Class A | | | 11,315 | | | | 464,254 | |
Nu Skin Enterprises, Inc., Class A | | | 10,075 | | | | 841,464 | |
Skechers U.S.A., Inc., Class A * | | | 31,895 | | | | 1,075,818 | |
Steven Madden Ltd. * | | | 39,277 | | | | 1,431,647 | |
Take-Two Interactive Software, Inc. * | | | 52,620 | | | | 1,040,297 | |
Universal Corp. | | | 20,750 | | | | 1,196,238 | |
| | | | | | | | |
| | | | | | | 6,997,596 | |
| | | | | | | | |
Consumer Services—20.1% | | | | | | | | |
Abercrombie & Fitch Co., Class A | | | 83,555 | | | | 3,311,285 | |
ABM Industries, Inc. | | | 22,920 | | | | 647,032 | |
Aeropostale, Inc. * (a) | | | 36,470 | | | | 267,690 | |
American Eagle Outfitters, Inc. | | | 62,870 | | | | 913,501 | |
Asbury Automotive Group, Inc. * | | | 56,480 | | | | 2,871,443 | |
Ascena Retail Group, Inc. * | | | 62,165 | | | | 1,136,998 | |
| | | | | | | | |
| | | Number of
Shares | | | Value | |
Consumer Services—(continued) | |
Booz Allen Hamilton Holding Corp. | | | 49,545 | | | $ | 1,041,931 | |
Brink’s Co., (The) | | | 42,485 | | | | 1,291,969 | |
CBIZ, Inc. * | | | 56,985 | | | | 520,273 | |
Ennis, Inc. | | | 22,725 | | | | 359,055 | |
Finish Line, Inc., (The), Class A | | | 119,995 | | | | 3,242,265 | |
FTI Consulting, Inc. * | | | 52,110 | | | | 1,521,091 | |
G&K Services, Inc., Class A | | | 19,182 | | | | 1,201,369 | |
Group 1 Automotive, Inc. | | | 19,065 | | | | 1,272,779 | |
Heidrick & Struggles International, Inc. | | | 41,320 | | | | 759,875 | |
ICF International, Inc. * | | | 15,730 | | | | 635,807 | |
International Speedway Corp., Class A | | | 42,598 | | | | 1,436,831 | |
KAR Auction Services, Inc. | | | 82,205 | | | | 2,561,508 | |
Knoll, Inc. | | | 49,943 | | | | 777,613 | |
Korn/Ferry International * | | | 19,595 | | | | 497,517 | |
Live Nation Entertainment, Inc. * | | | 49,890 | | | | 1,132,004 | |
MAXIMUS, Inc. | | | 39,145 | | | | 1,870,740 | |
Men’s Wearhouse, Inc., (The) | | | 56,600 | | | | 3,044,514 | |
Navigant Consulting, Inc. * | | | 128,885 | | | | 2,246,466 | |
Odyssey Marine Exploration, Inc. * (a) | | | 121,860 | | | | 266,873 | |
Rent-A-Center, Inc. | | | 33,035 | | | | 830,500 | |
Rite Aid Corp. * | | | 280,760 | | | | 1,850,208 | |
RPX Corp. * | | | 110,955 | | | | 1,777,499 | |
Steiner Leisure Ltd. * | | | 8,405 | | | | 371,669 | |
Viad Corp. | | | 15,570 | | | | 374,459 | |
XO Group, Inc. * | | | 45,385 | | | | 541,897 | |
| | | | | | | | |
| | | | | | | 40,574,661 | |
| | | | | | | | |
Energy—2.5% | |
Bristow Group, Inc. | | | 17,440 | | | | 1,353,344 | |
Contango Oil & Gas Co. * | | | 11,510 | | | | 545,804 | |
Forum Energy Technologies, Inc. * | | | 25,340 | | | | 656,306 | |
Helix Energy Solutions Group, Inc. * | | | 35,090 | | | | 829,528 | |
Rosetta Resources, Inc. * | | | 19,255 | | | | 854,344 | |
Western Refining, Inc. | | | 25,260 | | | | 920,727 | |
| | | | | | | | |
| | | | | | | 5,160,053 | |
| | | | | | | | |
Finance—18.7% | |
American Capital Mortgage Investment Corp. | | | 31,190 | | | | 629,102 | |
Ameris Bancorp * | | | 25,098 | | | | 528,062 | |
AMERISAFE, Inc. | | | 19,645 | | | | 855,343 | |
Apollo Investment Corp. | | | 39,395 | | | | 337,221 | |
BBCN Bancorp, Inc. | | | 142,025 | | | | 2,417,266 | |
Centerstate Banks, Inc. | | | 58,160 | | | | 635,689 | |
Columbia Banking System, Inc. | | | 30,065 | | | | 788,304 | |
Cowen Group, Inc., Class A * | | | 29,185 | | | | 124,912 | |
Federal Agricultural Mortgage Corp., Class C | | | 5,860 | | | | 184,356 | |
Fifth Street Finance Corp. | | | 98,295 | | | | 965,257 | |
First American Financial Corp. | | | 102,945 | | | | 2,773,338 | |
First Citizens Bancshares, Inc., Class A | | | 3,560 | | | | 798,828 | |
First NBC Bank Holding Co. * | | | 35,470 | | | | 1,183,634 | |
FirstMerit Corp. | | | 67,401 | | | | 1,399,245 | |
Flushing Financial Corp. | | | 28,520 | | | | 590,934 | |
THEACCOMPANYINGNOTESAREANINTEGRALPARTOFTHEFINANCIALSTATEMENTS.
| | |
| 8 | | SEMI-ANNUAL REPORT 2014 |
| | |
| ROBECO INVESTMENT FUNDS | | FEBRUARY 28, 2014 (unaudited) |
| | |
ROBECO BOSTON PARTNERS SMALL CAP VALUE FUND II (continued) | | PORTFOLIOOF INVESTMENTS |
| | | | | | | | |
| | | Numberof
Shares | | | Value | |
Finance—(continued) | |
Gladstone Capital Corp. | | | 16,670 | | | $ | 166,533 | |
Global Indemnity PLC * | | | 15,158 | | | | 395,321 | |
Heritage Financial Corp. | | | 36,690 | | | | 650,514 | |
Infinity Property & Casualty Corp. | | | 11,885 | | | | 876,519 | |
JMP Group, Inc. | | | 71,505 | | | | 525,562 | |
Maiden Holdings Ltd. | | | 170,765 | | | | 1,917,691 | |
Nationstar Mortgage Holdings, Inc. * (a) | | | 53,385 | | | | 1,539,090 | |
Navigators Group, Inc., (The) * | | | 9,470 | | | | 574,071 | |
Nelnet, Inc., Class A | | | 41,816 | | | | 1,677,658 | |
Park Sterling Corp. | | | 46,540 | | | | 305,302 | |
PHH Corp. * | | | 103,630 | | | | 2,697,489 | |
Platinum Underwriters Holdings Ltd. | | | 25,710 | | | | 1,507,120 | |
Safety Insurance Group, Inc. | | | 10,740 | | | | 599,614 | |
Stancorp Financial Group, Inc. | | | 14,860 | | | | 983,435 | |
Stewart Information Services Corp. | | | 69,855 | | | | 2,583,238 | |
SVB Financial Group * | | | 10,315 | | | | 1,298,762 | |
Symetra Financial Corp. | | | 82,505 | | | | 1,625,349 | |
Walker & Dunlop, Inc. * | | | 99,175 | | | | 1,669,115 | |
Walter Investment Management
Corp. * (a) | | | 44,535 | | | | 1,137,869 | |
Washington Federal, Inc. | | | 30,470 | | | | 683,137 | |
| | | | | | | | |
| | | | | | | 37,624,880 | |
| | | | | | | | |
Health Care—9.9% | |
Amsurg Corp. * | | | 22,475 | | | | 985,753 | |
Centene Corp. * | | | 15,100 | | | | 961,568 | |
Chemed Corp. (a) | | | 17,620 | | | | 1,490,652 | |
Hanger Orthopedic Group, Inc. * | | | 47,440 | | | | 1,681,748 | |
ICON PLC * | | | 24,220 | | | | 1,134,465 | |
Integra LifeSciences Holdings Corp. * | | | 31,500 | | | | 1,481,760 | |
Kindred Healthcare, Inc. | | | 88,187 | | | | 1,910,130 | |
LHC Group, Inc. * | | | 18,360 | | | | 432,562 | |
LifePoint Hospitals, Inc. * | | | 16,030 | | | | 869,628 | |
Omnicell, Inc. * | | | 27,255 | | | | 784,399 | |
Owens & Minor, Inc. | | | 28,302 | | | | 982,645 | |
PAREXEL International Corp. * | | | 23,735 | | | | 1,271,484 | |
Select Medical Holdings Corp. | | | 95,040 | | | | 1,065,398 | |
Symmetry Medical, Inc. * | | | 126,990 | | | | 1,343,554 | |
U.S. Physical Therapy, Inc. | | | 79,374 | | | | 2,633,629 | |
VCA Antech, Inc. * | | | 28,095 | | | | 870,102 | |
| | | | | | | | |
| | | | | | | 19,899,477 | |
| | | | | | | | |
Real Estate Investment Trusts—9.0% | |
Altisource Residential Corp.,
Class B (a) | | | 27,530 | | | | 786,807 | |
American Residential Properties,
Inc. * (a) | | | 61,105 | | | | 1,112,111 | |
Anworth Mortgage Asset Corp. | | | 130,887 | | | | 677,995 | |
Ares Commercial Real Estate Corp. | | | 99,515 | | | | 1,352,409 | |
Chatham Lodging Trust | | | 54,990 | | | | 1,147,641 | |
Colony Financial, Inc. | | | 23,745 | | | | 536,162 | |
CYS Investments, Inc. | | | 232,680 | | | | 2,047,584 | |
| | | | | | | | |
| | | Numberof
Shares | | | Value | |
Real Estate Investment Trusts—(continued) | |
Gladstone Commercial Corp. | | | 19,205 | | | $ | 334,167 | |
Hatteras Financial Corp. | | | 98,495 | | | | 1,942,321 | |
Javelin Mortgage Investment Corp. (a) | | | 66,035 | | | | 957,508 | |
MFA Financial, Inc. | | | 306,350 | | | | 2,407,911 | |
Monmouth Real Estate Investment Corp., Class A | | | 75,090 | | | | 726,871 | |
QTS Realty Trust, Inc. | | | 17,255 | | | | 441,038 | |
Silver Bay Realty Trust Corp. | | | 44,432 | | | | 696,249 | |
Two Harbors Investment Corp. | | | 280,035 | | | | 2,906,763 | |
| | | | | | | | |
| | | | | | | 18,073,537 | |
| | | | | | | | |
Technology—10.5% | |
Bel Fuse, Inc., Class B | | | 30,986 | | | | 588,734 | |
Belden, Inc. | | | 42,940 | | | | 3,097,262 | |
Brooks Automation, Inc. | | | 47,990 | | | | 497,656 | |
Coherent, Inc. * | | | 7,750 | | | | 528,163 | |
Electronics for Imaging, Inc. * | | | 30,150 | | | | 1,344,690 | |
EnerSys, Inc. | | | 50,710 | | | | 3,602,438 | |
Imation Corp. * | | | 32,590 | | | | 208,576 | |
Insight Enterprises, Inc. * | | | 20,805 | | | | 478,099 | |
Integrated Device Technology, Inc. * | | | 84,215 | | | | 992,895 | |
Lexmark International, Inc., Class A | | | 60,315 | | | | 2,541,674 | |
Magnachip Semiconductor Corp. * | | | 45,275 | | | | 667,354 | |
NETGEAR, Inc. * | | | 30,755 | | | | 1,051,206 | |
Sykes Enterprises, Inc. * | | | 87,435 | | | | 1,720,721 | |
SYNNEX Corp. * | | | 44,200 | | | | 2,629,016 | |
TeleTech Holdings, Inc. * | | | 21,645 | | | | 521,212 | |
Teradyne, Inc. * | | | 29,440 | | | | 597,043 | |
| | | | | | | | |
| | | | | | | 21,066,739 | |
| | | | | | | | |
Transportation—1.1% | |
Diana Shipping, Inc. * | | | 41,980 | | | | 546,580 | |
Landstar System, Inc. | | | 9,145 | | | | 527,758 | |
Quality Distribution, Inc. * | | | 46,280 | | | | 593,310 | |
| | | | | | | | |
UTi Worldwide, Inc. | | | 58,115 | | | | 571,852 | |
| | | | | | | | |
| | | | | | | 2,239,500 | |
| | | | | | | | |
Utilities—0.9% | |
PNM Resources, Inc. | | | 68,665 | | | | 1,795,590 | |
| | | | | | | | |
TOTAL COMMON STOCK (Cost $131,222,796) | | | | | | | 194,555,210 | |
| | | | | | | | |
RIGHTS—0.1% | | | | | | | | |
Edwards Group Ltd., Contingent Value Rights * | | | 113,566 | | | | 115,837 | |
| | | | | | | | |
TOTAL RIGHTS
(Cost $0) | | | | 115,837 | |
| | | | | | | | |
THEACCOMPANYINGNOTESAREANINTEGRALPARTOFTHEFINANCIALSTATEMENTS.
| | | | |
| SEMI-ANNUAL REPORT 2014 | | | 9 | |
| | |
| ROBECO INVESTMENT FUNDS | | FEBRUARY 28, 2014 (unaudited) |
| | |
ROBECO BOSTON PARTNERS SMALL CAP VALUE FUND II (concluded) | | PORTFOLIOOF INVESTMENTS |
| | | | | | | | |
| | | Number of
Shares | | | Value | |
SECURITIES LENDING COLLATERAL—3.0% | |
BlackRock Liquidity TempFund, Institutional Shares | | | 6,139,754 | | | $ | 6,139,754 | |
| | | | | | | | |
TOTAL SECURITIES LENDING COLLATERAL
(Cost $6,139,754) | | | | | | | 6,139,754 | |
| | | | | | | | |
TOTAL INVESTMENTS—99.7%
(Cost $137,362,550) | | | | | | | 200,810,801 | |
| | | | | | | | |
OTHER ASSETS IN EXCESS OF LIABILITIES—0.3% | | | | | | | 521,273 | |
| | | | | | | | |
NET ASSETS—100.0% | | | | | | $ | 201,332,074 | |
| | | | | | | | |
| | | | |
| PLC | | — | | Public Limited Company |
| * | | — | | Non-income producing. |
| (a) | | — | | All or a portion of the security is on loan (See Note 6 of the Notes to Financial Statements). |
A summary of the inputs used to value the Fund’s investments as of February 28, 2014 is as follows (see Note 1 in the Notes to Financial Statements):
| | | | | | | | | | | | | | | | |
| | | Total Value as of
February 28, 2014 | | | Level 1
Quoted
Price | | | Level 2
Significant
Observable
Inputs | | | Level 3
Significant
Unobservable
Inputs | |
| | | | | | | | | | | | | | | | |
Common Stock * | | $ | 194,555,210 | | | $ | 194,555,210 | | | $ | — | | | $ | — | |
Rights | | | 115,837 | | | | 115,837 | | | | — | | | | — | |
Securities Lending Collateral | | | 6,139,754 | | | | 6,139,754 | | | | — | | | | — | |
| | | | | | | | | | | | | | | | |
Total Assets | | $ | 200,810,801 | | | $ | 200,810,801 | | | $ | — | | | $ | — | |
| | | | | | | | | | | | | | | | |
| * | See Portfolio of Investments detail for industry and security type breakout. |
THEACCOMPANYINGNOTESAREANINTEGRALPARTOFTHEFINANCIALSTATEMENTS.
| | |
| 10 | | SEMI-ANNUAL REPORT 2014 |
| | |
| ROBECO INVESTMENT FUNDS | | FEBRUARY 28, 2014 (unaudited) |
| | |
ROBECO BOSTON PARTNERS LONG/SHORT EQUITY FUND | | PORTFOLIOOF INVESTMENTS |
| | | | | | | | |
| | | Number of
Shares | | | Value | |
LONG POSITIONS—99.9% | | | | | | | | |
COMMON STOCK—97.2% | | | | | | | | |
Basic Industries—7.6% | | | | | | | | |
AEP Industries, Inc. * † | | | 88,443 | | | $ | 3,769,440 | |
African Minerals Ltd. * | | | 717,854 | | | | 1,785,078 | |
Alcoa, Inc. † | | | 213,998 | | | | 2,512,337 | |
Barrick Gold Corp. (a) | | | 93,417 | | | | 1,903,838 | |
Berry Plastics Group, Inc. * † | | | 325,461 | | | | 7,918,466 | |
Crown Holdings, Inc. * † | | | 183,119 | | | | 8,244,017 | |
Eldorado Gold Corp. (a) | | | 215,846 | | | | 1,437,534 | |
Freeport-McMoRan Copper & Gold, Inc. † | | | 146,425 | | | | 4,776,384 | |
Goldcorp, Inc. | | | 74,304 | | | | 2,001,007 | |
Greif, Inc., Class B † | | | 43,250 | | | | 2,367,938 | |
Koppers Holdings, Inc. † | | | 113,962 | | | | 4,506,057 | |
Newmont Mining Corp. † | | | 68,085 | | | | 1,583,657 | |
Owens-Illinois, Inc. * † | | | 139,813 | | | | 4,742,457 | |
Pan American Silver Corp. † | | | 216,205 | | | | 3,046,328 | |
Royal Gold Inc. | | | 17,425 | | | | 1,197,272 | |
Steel Dynamics, Inc. † | | | 315,023 | | | | 5,494,001 | |
| | | | | | | | |
| | | | | | | 57,285,811 | |
| | | | | | | | |
Capital Goods—9.1% | | | | | | | | |
AECOM Technology Corp. * † | | | 180,866 | | | | 5,776,860 | |
Aggreko PLC | | | 94,804 | | | | 2,476,544 | |
Bombardier, Inc., Class B | | | 446,513 | | | | 1,451,167 | |
Cemex SAB de CV ADR * † | | | 330,970 | | | | 4,329,088 | |
Columbus McKinnon Corp. * † | | | 94,467 | | | | 2,405,130 | |
Cubic Corp. † | | | 82,371 | | | | 4,283,292 | |
Fluor Corp. † | | | 67,257 | | | | 5,225,196 | |
General Cable Corp. † | | | 123,375 | | | | 3,797,483 | |
Gibraltar Industries, Inc. * † | | | 81,938 | | | | 1,510,117 | |
Global Brass & Copper Holdings, Inc. † | | | 319,064 | | | | 5,401,754 | |
Global Power Equipment Group, Inc. † | | | 159,801 | | | | 2,927,554 | |
Joy Global, Inc. † | | | 93,509 | | | | 5,142,995 | |
Masonite International Corp. * † | | | 51,752 | | | | 2,986,090 | |
Orion Marine Group, Inc. * † | | | 365,490 | | | | 4,126,382 | |
Rofin-Sinar Technologies, Inc. * † | | | 168,241 | | | | 3,948,616 | |
Safran SA — ADR † | | | 201,474 | | | | 3,503,633 | |
Tecumseh Products Co.,
Class A * † | | | 48,586 | | | | 383,829 | |
URS Corp. † | | | 84,598 | | | | 3,933,807 | |
WaterFurnace Renewable Energy, Inc. † | | | 75,611 | | | | 1,554,751 | |
World Fuel Services Corp. † | | | 74,677 | | | | 3,361,959 | |
| | | | | | | | |
| | | | | | | 68,526,247 | |
| | | | | | | | |
Communications—4.1% | | | | | | | | |
Comcast Corp., Class A † | | | 121,112 | | | | 6,260,279 | |
DIRECTV * † | | | 71,416 | | | | 5,541,882 | |
Hawaiian Telcom Holdco, Inc. * † | | | 226,091 | | | | 6,511,421 | |
IAC/InterActiveCorp. † | | | 41,957 | | | | 3,252,926 | |
iPass, Inc. * | | | 612,056 | | | | 948,687 | |
Iridium Communications, Inc. * | | | 776,223 | | | | 5,060,974 | |
Time Warner Cable, Inc. | | | 7,116 | | | | 998,731 | |
Vonage Holdings Corp. * | | | 488,017 | | | | 2,249,758 | |
| | | | | | | | |
| | | | | | | 30,824,658 | |
| | | | | | | | |
| | | | | | | | |
| | | Number of
Shares | | | Value | |
Consumer Durables—2.0% | | | | | | | | |
AV Homes, Inc. * † | | | 123,802 | | | $ | 2,445,090 | |
Cooper-Standard Holding, Inc. * † | | | 26,574 | | | | 1,653,939 | |
Dorel Industries, Inc., Class B | | | 176,200 | | | | 5,966,132 | |
Helen of Troy Ltd. * † | | | 80,084 | | | | 5,230,286 | |
| | | | | | | | |
| | | | | | | 15,295,447 | |
| | | | | | | | |
Consumer Non-Durables—6.4% | | | | | | | | |
Anheuser-Busch InBev NV — Sponsored ADR † | | | 50,176 | | | | 5,248,911 | |
Archer-Daniels-Midland Co. † | | | 65,615 | | | | 2,663,969 | |
Central Garden and Pet Co., Class A��* | | | 663,647 | | | | 4,884,442 | |
Crimson Wine Group Ltd * † | | | 277,686 | | | | 2,227,042 | |
Dean Foods Co. * † | | | 254,546 | | | | 3,764,735 | |
Energizer Holdings, Inc. † | | | 37,241 | | | | 3,625,039 | |
Hanesbrands, Inc. † | | | 48,162 | | | | 3,529,311 | |
Leucadia National Corp. † | | | 216,681 | | | | 6,054,067 | |
Lorillard, Inc. † | | | 152,122 | | | | 7,463,105 | |
Philip Morris International, Inc. † | | | 38,487 | | | | 3,113,983 | |
Unilever NV † | | | 137,591 | | | | 5,443,100 | |
| | | | | | | | |
| | | | | | | 48,017,704 | |
| | | | | | | | |
Consumer Services—15.8% | | | | | | | | |
Advance Auto Parts, Inc. † | | | 22,604 | | | | 2,878,845 | |
Apollo Education Group, Inc. * † | | | 100,067 | | | | 3,335,233 | |
CRA International, Inc. * † | | | 143,132 | | | | 3,344,995 | |
CVS Caremark Corp. † | | | 79,916 | | | | 5,845,056 | |
DeVry Education Group, Inc. † | | | 50,907 | | | | 2,138,603 | |
eBay, Inc. * † | | | 158,288 | | | | 9,302,586 | |
Ennis, Inc. † | | | 293,328 | | | | 4,634,582 | |
Express, Inc. * † | | | 244,174 | | | | 4,465,942 | |
GNC Holdings, Inc., Class A † | | | 101,175 | | | | 4,706,661 | |
Harte-Hanks, Inc. † | | | 432,227 | | | | 3,453,494 | |
Insperity, Inc. † | | | 141,915 | | | | 4,142,499 | |
ITT Educational Services, Inc. * (a) | | | 149,909 | | | | 4,651,676 | |
K12, Inc. * (a) † | | | 122,215 | | | | 2,765,725 | |
Liberty Interactive Corp., Class A * † | | | 131,176 | | | | 3,830,339 | |
Macy’s, Inc. † | | | 147,676 | | | | 8,544,533 | |
Realogy Holdings Corp. * † | | | 53,463 | | | | 2,537,354 | |
Regis Corp. † | | | 233,897 | | | | 3,288,592 | |
Strayer Education, Inc. * † | | | 58,265 | | | | 2,783,319 | |
Systemax, Inc. * † | | | 403,086 | | | | 4,744,322 | |
Tesco PLC — Sponsored ADR † | | | 168,689 | | | | 2,798,551 | |
Tetra Tech, Inc. * † | | | 166,929 | | | | 4,820,910 | |
Titan Machinery, Inc. * (a) | | | 170,785 | | | | 2,701,819 | |
Viacom, Inc., Class B † | | | 45,581 | | | | 3,998,821 | |
Vitacost.com, Inc. * | | | 200,030 | | | | 1,490,224 | |
Walgreen Co. † | | | 94,631 | | | | 6,430,176 | |
Walt Disney Co., (The) † | | | 99,795 | | | | 8,064,434 | |
Wyndham Worldwide Corp. † | | | 43,130 | | | | 3,143,314 | |
Wynn Resorts Ltd. † | | | 17,957 | | | | 4,354,393 | |
| | | | | | | | |
| | | | | | | 119,196,998 | |
| | | | | | | | |
Energy—11.7% | | | | | | | | |
Apache Corp. † | | | 99,049 | | | | 7,853,595 | |
Canadian Natural Resources Ltd. † | | | 114,083 | | | | 4,177,719 | |
THEACCOMPANYINGNOTESAREANINTEGRALPARTOFTHEFINANCIALSTATEMENTS.
| | | | |
| SEMI-ANNUAL REPORT 2014 | | | 11 | |
| | |
| ROBECO INVESTMENT FUNDS | | FEBRUARY 28, 2014 (unaudited) |
| | |
ROBECO BOSTON PARTNERS LONG/SHORT EQUITY FUND (continued) | | PORTFOLIOOF INVESTMENTS |
| | | | | | | | |
| | | Number of
Shares | | | Value | |
Energy—(continued) | | | | | | | | |
Cenovus Energy, Inc. † | | | 88,877 | | | $ | 2,356,129 | |
Emerald Oil, Inc. * | | | 209,075 | | | | 1,601,515 | |
Ensco PLC, Class A † | | | 37,465 | | | | 1,972,907 | |
EOG Resources, Inc. † | | | 33,580 | | | | 6,360,724 | |
EQT Corp. † | | | 45,195 | | | | 4,622,997 | |
Halliburton Co. † | | | 66,188 | | | | 3,772,716 | |
Legacy Oil + Gas, Inc. * | | | 569,706 | | | | 3,224,650 | |
National Oilwell Varco, Inc. † | | | 48,850 | | | | 3,763,404 | |
Newfield Exploration Co. * † | | | 130,700 | | | | 3,684,433 | |
Occidental Petroleum Corp. † | | | 80,148 | | | | 7,735,885 | |
Phillips 66 † | | | 64,246 | | | | 4,809,456 | |
Rosetta Resources, Inc. * † | | | 69,898 | | | | 3,101,374 | |
Rowan Cos PLC, Class A * † | | | 69,917 | | | | 2,332,431 | |
Royal Dutch Shell PLC, Class A — ADR | | | 60,547 | | | | 4,412,060 | |
Schlumberger Ltd. † | | | 84,432 | | | | 7,852,176 | |
SEACOR Holdings, Inc. * † | | | 29,615 | | | | 2,619,743 | |
Suncor Energy, Inc. (a) | | | 162,340 | | | | 5,363,714 | |
Talisman Energy, Inc. † | | | 392,725 | | | | 4,048,995 | |
Tesoro Corp. † | | | 47,066 | | | | 2,400,837 | |
| | | | | | | | |
| | | | | | | 88,067,460 | |
| | | | | | | | |
Finance—12.4% | | | | | | | | |
ACE Ltd. † | | | 62,989 | | | | 6,164,733 | |
AerCap Holdings NV * † | | | 143,465 | | | | 6,168,995 | |
American International Group, Inc. † | | | 156,858 | | | | 7,806,823 | |
Axis Capital Holdings Ltd. † | | | 82,555 | | | | 3,629,943 | |
Berkshire Hathaway, Inc., Class B * † | | | 85,736 | | | | 9,926,514 | |
Century Bancorp, Inc., Class A † | | | 36,535 | | | | 1,311,607 | |
Citigroup, Inc. † | | | 101,087 | | | | 4,915,861 | |
Endurance Specialty Holdings Ltd. † | | | 91,301 | | | | 4,760,434 | |
Fairfax Financial Holdings Ltd. † | | | 4,453 | | | | 1,854,585 | |
First Southern Bancorp, Inc. Class B 144A * ‡ | | | 64,350 | | | | 398,970 | |
Flushing Financial Corp. † | | | 96,517 | | | | 1,999,832 | |
HF Financial Corp. † | | | 81,322 | | | | 1,079,956 | |
JPMorgan Chase & Co. † | | | 91,261 | | | | 5,185,450 | |
Loews Corp. † | | | 109,341 | | | | 4,754,147 | |
Maiden Holdings Ltd. † | | | 702,901 | | | | 7,893,578 | |
National Western Life Insurance Co., Class A † | | | 9,494 | | | | 2,146,119 | |
New Hampshire Thrift Bancshares, Inc. | | | 29,229 | | | | 435,512 | |
PartnerRe Ltd. † | | | 50,077 | | | | 4,951,614 | |
Primus Guaranty Ltd. * † | | | 116,221 | | | | 946,039 | |
Sprott, Inc. | | | 570,880 | | | | 1,799,306 | |
Steel Excel, Inc. * † | | | 219,697 | | | | 6,371,213 | |
Validus Holdings Ltd. † | | | 157,215 | | | | 5,787,084 | |
White Mountains Insurance Group Ltd. † | | | 6,143 | | | | 3,560,237 | |
| | | | | | | | |
| | | | | | | 93,848,552 | |
| | | | | | | | |
Health Care—10.2% | | | | | | | | |
Alpha PRO Tech Ltd. * | | | 307,051 | | | | 712,358 | |
Alphatec Holdings, Inc. * | | | 562,045 | | | | 792,483 | |
| | | | | | | | |
| | | Number of
Shares | | | Value | |
Health Care—(continued) | | | | | | | | |
Amgen, Inc. † | | | 40,470 | | | $ | 5,019,089 | |
Amsurg Corp. * † | | | 85,888 | | | | 3,767,048 | |
Becton, Dickinson & Co. † | | | 31,681 | | | | 3,650,285 | |
BioScrip, Inc. * † | | | 316,503 | | | | 2,256,666 | |
Charles River Laboratories International, Inc. * † | | | 40,238 | | | | 2,390,540 | |
DaVita HealthCare Partners, Inc. * † | | | 104,586 | | | | 7,188,196 | |
Fresenius Medical Care AG & Co. KGaA — ADR † | | | 196,496 | | | | 6,749,638 | |
Humana, Inc. † | | | 34,626 | | | | 3,894,040 | |
Laboratory Corp. of America Holdings * † | | | 68,451 | | | | 6,402,907 | |
MFC Industrial Ltd (a) | | | 212,512 | | | | 1,515,211 | |
Omnicare, Inc. † | | | 67,020 | | | | 3,947,478 | |
Organovo Holdings Inc. (a) | | | 58,982 | | | | 606,335 | |
Orthofix International NV * † | | | 53,487 | | | | 1,188,481 | |
Pfizer, Inc. † | | | 198,718 | | | | 6,380,835 | |
PharMerica Corp. * † | | | 87,660 | | | | 2,112,606 | |
Sanofi — ADR † | | | 145,248 | | | | 7,529,656 | |
Teva Pharmaceutical Industries Ltd. — Sponsored ADR † | | | 100,283 | | | | 5,003,119 | |
UnitedHealth Group, Inc. † | | | 50,795 | | | | 3,924,930 | |
WuXi PharmaTech Cayman, Inc., — ADR * † | | | 58,427 | | | | 2,247,102 | |
| | | | | | | | |
| | | | | | | 77,279,003 | |
| | | | | | | | |
Real Estate Investment Trusts—0.9% | |
Annaly Capital Management, Inc. † | | | 198,748 | | | | 2,222,003 | |
Hatteras Financial Corp. † | | | 119,297 | | | | 2,352,537 | |
Two Harbors Investment Corp. † | | | 216,616 | | | | 2,248,474 | |
| | | | | | | | |
| | | | | | | 6,823,014 | |
| | | | | | | | |
Technology—16.8% | |
Actuate Corp. * † | | | 534,074 | | | | 3,033,540 | |
Alpha & Omega Semiconductor Ltd. * | | | 399,060 | | | | 2,909,147 | |
Amkor Technology, Inc. * † | | | 537,731 | | | | 3,183,368 | |
Arrow Electronics, Inc. * † | | | 42,367 | | | | 2,399,243 | |
Avnet, Inc. † | | | 50,167 | | | | 2,183,770 | |
ChipMOS TECHNOLOGIES Bermuda Ltd. | | | 32,147 | | | | 732,952 | |
Clicksoftware Technologies Ltd. | | | 630,161 | | | | 6,301,610 | |
Comtech Telecommunications Corp. † | | | 80,927 | | | | 2,590,473 | |
Corning, Inc. † | | | 151,190 | | | | 2,913,431 | |
CSG Systems International, Inc. † | | | 255,256 | | | | 7,147,168 | |
EMC Corp. † | | | 262,015 | | | | 6,909,336 | |
Fiserv, Inc. * † | | | 59,370 | | | | 3,446,429 | |
Flextronics International Ltd. * | | | 491,962 | | | | 4,403,060 | |
GSI Group, Inc. * † | | | 305,951 | | | | 3,839,685 | |
Ingram Micro, Inc., Class A * † | | | 73,838 | | | | 2,174,529 | |
Intel Corp. † | | | 173,023 | | | | 4,284,049 | |
Jabil Circuit, Inc. † | | | 231,802 | | | | 4,290,655 | |
Kofax Ltd. * † | | | 200,000 | | | | 1,628,000 | |
Kulicke & Soffa Industries, Inc. * † | | | 189,348 | | | | 2,185,076 | |
Magnachip Semiconductor Corp. * † | | | 102,511 | | | | 1,511,012 | |
THEACCOMPANYINGNOTESAREANINTEGRALPARTOFTHEFINANCIALSTATEMENTS.
| | |
| 12 | | SEMI-ANNUAL REPORT 2014 |
| | |
| ROBECO INVESTMENT FUNDS | | FEBRUARY 28, 2014 (unaudited) |
| | |
ROBECO BOSTON PARTNERS LONG/SHORT EQUITY FUND (continued) | | PORTFOLIOOF INVESTMENTS |
| | | | | | | | |
| | | Number of
Shares | | | Value | |
Technology—(continued) | |
Mellanox Technologies Ltd. * (a) | | | 85,829 | | | $ | 3,134,475 | |
Microsoft Corp. † | | | 282,904 | | | | 10,838,052 | |
NCR Corp. * † | | | 125,450 | | | | 4,271,573 | |
NetApp, Inc. † | | | 97,128 | | | | 3,924,942 | |
O2Micro International Ltd — ADR * | | | 894,430 | | | | 3,354,113 | |
ON Semiconductor Corp. * † | | | 290,652 | | | | 2,714,690 | |
Oracle Corp. † | | | 180,276 | | | | 7,050,594 | |
QLogic Corp. * † | | | 290,125 | | | | 3,313,228 | |
Reis, Inc. * † | | | 121,853 | | | | 2,149,487 | |
Rovi Corp. * † | | | 99,388 | | | | 2,468,798 | |
TE Connectivity Ltd. † | | | 87,725 | | | | 5,138,931 | |
Teradata Corp. * † | | | 66,223 | | | | 3,040,960 | |
Travelsky Technology Ltd., Class H ‡ | | | 2,745,526 | | | | 2,770,236 | |
VASCO Data Security International, Inc. * | | | 9,610 | | | | 76,688 | |
Vishay Intertechnology, Inc. * † | | | 306,743 | | | | 4,337,346 | |
| | | | | | | | |
| | | | | | | 126,650,646 | |
| | | | | | | | |
Transportation—0.2% | |
Aurizon Holdings Ltd. ‡ | | | 352,065 | | | | 1,598,375 | |
| | | | | | | | |
| | | | | | | 1,598,375 | |
| | | | | | | | |
TOTAL COMMON STOCK
(Cost $571,256,856) | | | | | | | 733,413,915 | |
| | | | | | | | |
PREFERRED STOCK—0.0% | |
Finance—0.0% | |
First Southern Bancorp, Inc., 5.000% 144A ‡ | | | 110 | | | | 158,371 | |
| | | | | | | | |
TOTAL PREFERRED STOCK (Cost $110,000) | | | | | | | 158,371 | |
| | | | | | | | |
SECURITIES LENDING COLLATERAL—2.7% | |
BlackRock Liquidity TempFund, Institutional Shares | | | 20,006,304 | | | | 20,006,304 | |
| | | | | | | | |
TOTAL SECURITIES LENDING COLLATERAL
(Cost $20,006,304) | | | | | | | 20,006,304 | |
| | | | | | | | |
TOTAL INVESTMENTS—99.9%
(Cost $591,373,160) | | | | | | | 753,578,590 | |
| | | | | | | | |
SECURITIES SOLD SHORT—(76.7%) | |
COMMON STOCK—(76.7%) | | | | | |
Basic Industries—(1.3%) | | | | | | | | |
Ethanex Energy, Inc. * ‡ | | | (648 | ) | | | (517 | ) |
Kennady Diamonds, Inc. * | | | (45,900 | ) | | | (190,265 | ) |
Mountain Province Diamonds, Inc. * | | | (141,626 | ) | | | (702,464 | ) |
Orchids Paper Products Co. | | | (80,910 | ) | | | (2,724,239 | ) |
Tanzanian Royalty Exploration Corp. * | | | (171,865 | ) | | | (397,007 | ) |
Texas Industries, Inc. * | | | (44,275 | ) | | | (3,758,947 | ) |
United States Steel Corp. | | | (87,484 | ) | | | (2,118,861 | ) |
| | | | | | | | |
| | | | | | | (9,892,300 | ) |
| | | | | | | | |
Capital Goods—(7.5%) | | | | | | | | |
Applied Energetics, Inc. * | | | (238,070 | ) | | | (4,094 | ) |
Applied Nanotech Holdings, Inc. * | | | (8,285 | ) | | | (546 | ) |
| | | | | | | | |
| | | Number of
Shares | | | Value | |
Capital Goods—(continued) | | | | | | | | |
Armstrong World Industries, Inc. * | | | (81,292 | ) | | $ | (4,462,117 | ) |
Arrowhead Research Corp. * | | | (181,237 | ) | | | (3,523,247 | ) |
Builders FirstSource, Inc. * | | | (422,478 | ) | | | (3,637,536 | ) |
Carpenter Technology Corp. | | | (50,070 | ) | | | (2,961,641 | ) |
DynaMotive Energy Systems
Corp. * | | | (72,185 | ) | | | (7 | ) |
Interface, Inc. | | | (282,223 | ) | | | (5,435,615 | ) |
Lindsay Corp. | | | (45,753 | ) | | | (3,882,600 | ) |
Martin Marietta Materials, Inc. | | | (13,642 | ) | | | (1,664,051 | ) |
NN, Inc. | | | (118,827 | ) | | | (2,292,173 | ) |
Smith & Wesson Holding Corp. * | | | (402,003 | ) | | | (4,623,035 | ) |
Trex Co., Inc. * | | | (165,240 | ) | | | (12,925,073 | ) |
USG Corp. * | | | (66,142 | ) | | | (2,336,797 | ) |
Vulcan Materials Co. | | | (55,320 | ) | | | (3,757,888 | ) |
Wabash National Corp. * | | | (386,721 | ) | | | (5,224,601 | ) |
| | | | | | | | |
| | | | | | | (56,731,021 | ) |
| | | | | | | | |
Communications—(6.1%) | | | | | | | | |
Angie’s List, Inc. * | | | (95,696 | ) | | | (1,331,131 | ) |
Cogent Communications Group, Inc. | | | (60,629 | ) | | | (2,324,516 | ) |
Costar Group, Inc. * | | | (13,118 | ) | | | (2,637,243 | ) |
CTC Communications Group,
Inc. * | | | (98,900 | ) | | | (10 | ) |
eGain Communications Corp. * | | | (142,473 | ) | | | (1,193,924 | ) |
Equinix, Inc. * | | | (27,657 | ) | | | (5,253,724 | ) |
Facebook, Inc., Class A * | | | (41,627 | ) | | | (2,849,784 | ) |
Gogo, Inc. * | | | (63,804 | ) | | | (1,330,313 | ) |
Interliant, Inc. * | | | (600 | ) | | | 0 | |
LinkedIn Corp., Class A * | | | (20,445 | ) | | | (4,171,598 | ) |
LivePerson, Inc. * | | | (183,807 | ) | | | (2,404,196 | ) |
Marketo, Inc. * | | | (43,039 | ) | | | (1,764,599 | ) |
Meetme, Inc. * | | | (274,187 | ) | | | (729,337 | ) |
NTELOS Holdings Corp. | | | (141,817 | ) | | | (1,982,602 | ) |
Pandora Media, Inc. * | | | (45,020 | ) | | | (1,684,648 | ) |
Shutterfly, Inc. * | | | (34,801 | ) | | | (1,898,743 | ) |
Shutterstock, Inc. * | | | (26,205 | ) | | | (2,604,253 | ) |
Trulia, Inc. * | | | (45,854 | ) | | | (1,373,786 | ) |
Twitter, Inc. * | | | (97,372 | ) | | | (5,346,697 | ) |
WebMD Health Corp. * | | | (47,768 | ) | | | (2,121,377 | ) |
Yelp, Inc. * | | | (28,295 | ) | | | (2,671,614 | ) |
| | | | | | | | |
| | | | | | | (45,674,095 | ) |
| | | | | | | | |
Consumer Durables—(4.7%) | | | | | | | | |
American Axle & Manaufacturing Holdings, Inc. * | | | (222,756 | ) | | | (4,305,873 | ) |
Cavco Industries, Inc. * | | | (53,973 | ) | | | (4,234,182 | ) |
Ethan Allen Interiors, Inc. | | | (146,244 | ) | | | (3,675,112 | ) |
iRobot Corp. * | | | (146,979 | ) | | | (6,161,360 | ) |
KB Home | | | (166,534 | ) | | | (3,397,294 | ) |
Qsound Labs, Inc. * | | | (4,440 | ) | | | (18 | ) |
SodaStream International Ltd. * | | | (68,529 | ) | | | (2,705,525 | ) |
Standard Pacific Corp. * | | | (406,397 | ) | | | (3,702,277 | ) |
Tesla Motors, Inc. * | | | (29,170 | ) | | | (7,141,108 | ) |
| | | | | | | | |
| | | | | | | (35,322,749 | ) |
| | | | | | | | |
Consumer Non-Durables—(3.8%) | | | | | |
Amish Naturals, Inc. * | | | (25,959 | ) | | | (156 | ) |
Annie’s, Inc. * | | | (54,811 | ) | | | (2,054,316 | ) |
THEACCOMPANYINGNOTESAREANINTEGRALPARTOFTHEFINANCIALSTATEMENTS.
| | | | |
| SEMI-ANNUAL REPORT 2014 | | | 13 | |
| | |
| ROBECO INVESTMENT FUNDS | | FEBRUARY 28, 2014 (unaudited) |
| | |
ROBECO BOSTON PARTNERS LONG/SHORT EQUITY FUND (continued) | | PORTFOLIOOF INVESTMENTS |
| | | | | | | | |
| | | Number of
Shares | | | Value | |
Consumer Non-Durables—(continued) | |
Black Diamond, Inc. * | | | (164,600 | ) | | $ | (1,741,468 | ) |
Boulder Brands, Inc. * | | | (131,648 | ) | | | (1,979,986 | ) |
Columbia Sportswear Co. | | | (24,878 | ) | | | (2,067,113 | ) |
Deckers Outdoor Corp. * | | | (21,410 | ) | | | (1,591,834 | ) |
Female Health Co., (The) | | | (310,915 | ) | | | (2,148,423 | ) |
Green Mountain Coffee Roasters, Inc. | | | (26,668 | ) | | | (2,927,613 | ) |
Iconix Brand Group, Inc. * | | | (84,151 | ) | | | (3,386,236 | ) |
Monster Beverage Corp. * | | | (51,665 | ) | | | (3,823,210 | ) |
Quiksilver, Inc. * | | | (531,952 | ) | | | (4,149,226 | ) |
Senomyx, Inc. * | | | (296,601 | ) | | | (2,954,146 | ) |
Valence Technology, Inc. * | | | (27,585 | ) | | | (138 | ) |
| | | | | | | | |
| | | | | | | (28,823,865 | ) |
| | | | | | | | |
Consumer Services—(13.6%) | |
Acxiom Corp. * | | | (123,994 | ) | | | (4,616,297 | ) |
Arctic Cat, Inc. | | | (71,901 | ) | | | (3,366,405 | ) |
Bankrate, Inc. * | | | (218,159 | ) | | | (4,391,541 | ) |
Blue Nile, Inc. * | | | (3,018 | ) | | | (106,203 | ) |
Bravo Brio Restaurant Group, Inc. * | | | (121,649 | ) | | | (1,884,343 | ) |
Buffalo Wild Wings, Inc. * | | | (28,328 | ) | | | (4,107,560 | ) |
Care.Com, Inc. * | | | (76,031 | ) | | | (1,407,334 | ) |
Chefs’ Warehouse, Inc., (The) * | | | (94,578 | ) | | | (2,198,939 | ) |
Concur Technologies, Inc. * | | | (21,456 | ) | | | (2,648,743 | ) |
Constant Contact, Inc. * | | | (73,468 | ) | | | (2,025,513 | ) |
Container Store Group, Inc. (The) * | | | (96,229 | ) | | | (3,445,960 | ) |
Corporate Resource Services, Inc. * | | | (131,352 | ) | | | (342,829 | ) |
Cracker Barrel Old Country Store, Inc. | | | (20,956 | ) | | | (2,084,074 | ) |
Cumulus Media, Inc., Class A * | | | (523,263 | ) | | | (3,432,605 | ) |
Fresh Market, Inc., (The) * | | | (76,218 | ) | | | (2,553,303 | ) |
Imax Corp. * | | | (85,835 | ) | | | (2,296,086 | ) |
inContact, Inc. * | | | (229,260 | ) | | | (2,067,925 | ) |
Manchester United PLC, Class A * | | | (121,023 | ) | | | (1,866,175 | ) |
Mattress Firm Holding Corp. * | | | (28,300 | ) | | | (1,233,597 | ) |
Medidata Solutions, Inc. * | | | (38,740 | ) | | | (2,483,234 | ) |
Multimedia Games Holding Co., Inc. * | | | (102,648 | ) | | | (3,389,950 | ) |
Netflix, Inc. * | | | (26,140 | ) | | | (11,648,768 | ) |
Noodles & Co. * | | | (3,954 | ) | | | (157,409 | ) |
Nutrisystem, Inc. | | | (83,413 | ) | | | (1,227,839 | ) |
Potbelly Corp. * | | | (162,680 | ) | | | (3,482,979 | ) |
Red Robin Gourmet Burgers, Inc. * | | | (66,098 | ) | | | (5,151,017 | ) |
Sears Holdings Corp. * | | | (44,160 | ) | | | (1,976,160 | ) |
SFx Entertainment, Inc. * | | | (177,527 | ) | | | (1,524,957 | ) |
Sprouts Farmers Market, Inc. * | | | (54,262 | ) | | | (2,117,303 | ) |
Sturm Ruger & Co., Inc. | | | (28,542 | ) | | | (1,819,267 | ) |
Texas Roadhouse, Inc. | | | (167,656 | ) | | | (4,434,501 | ) |
Tuesday Morning Corp. * | | | (11,644 | ) | | | (185,271 | ) |
Ultimate Software Group, Inc., (The) * | | | (12,001 | ) | | | (1,992,166 | ) |
Viggle, Inc. * | | | (4,896 | ) | | | (2,695 | ) |
VistaPrint NV * | | | (55,652 | ) | | | (2,739,191 | ) |
Wendy’s Co., (The) | | | (684,862 | ) | | | (6,560,978 | ) |
| | | | | | | | |
| | | Number of
Shares | | | Value | |
Consumer Services—(continued) | |
World Wrestling Entertainment, Inc. | | | (63,655 | ) | | $ | (1,458,973 | ) |
Zillow, Inc., Class A * | | | (48,171 | ) | | | (4,027,096 | ) |
| | | | | | | | |
| | | | | | | (102,455,186 | ) |
| | | | | | | | |
Energy—(1.0%) | |
Beard Co. * | | | (9,710 | ) | | | (27 | ) |
CARBO Ceramics, Inc. | | | (17,364 | ) | | | (2,154,004 | ) |
Crescent Point Energy Corp. | | | (28,548 | ) | | | (1,001,749 | ) |
Goodrich Petroleum Corp. * | | | (64,163 | ) | | | (873,900 | ) |
Neste Oil OYJ | | | (149,322 | ) | | | (3,196,754 | ) |
| | | | | | | | |
| | | | | | | (7,226,434 | ) |
| | | | | | | | |
Finance—(1.3%) | |
Financial Engines, Inc. | | | (44,228 | ) | | | (2,499,324 | ) |
Green Dot Corp., Class A * | | | (129,237 | ) | | | (2,604,126 | ) |
WisdomTree Investments, Inc. * | | | (329,000 | ) | | | (5,125,820 | ) |
| | | | | | | | |
| | | | | | | (10,229,270 | ) |
| | | | | | | | |
Health Care—(18.7%) | |
ABIOMED, Inc. * | | | (132,079 | ) | | | (3,723,307 | ) |
Accelerate Diagnostics, Inc. * | | | (296,553 | ) | | | (4,383,053 | ) |
Accuray, Inc. * | | | (306,780 | ) | | | (2,877,596 | ) |
Advisory Board Co., (The) * | | | (57,905 | ) | | | (3,710,552 | ) |
Air Methods Corp. * | | | (49,780 | ) | | | (2,689,116 | ) |
Akorn, Inc. * | | | (68,945 | ) | | | (1,780,160 | ) |
Albany Molecular Research, Inc. * | | | (599,255 | ) | | | (9,348,378 | ) |
Align Technology, Inc. * | | | (43,217 | ) | | | (2,261,546 | ) |
Aratana Therapeutics, Inc. * | | | (69,454 | ) | | | (1,623,140 | ) |
Arena Pharmaceuticals, Inc. * | | | (248,768 | ) | | | (1,619,480 | ) |
athenahealth, Inc. * | | | (25,856 | ) | | | (5,012,703 | ) |
AVANIR Pharmaceuticals, Inc., Class A * | | | (473,390 | ) | | | (1,969,302 | ) |
Biotime, Inc. * | | | (93,456 | ) | | | (335,507 | ) |
BodyTel Scientific, Inc. * ‡ | | | (4,840 | ) | | | 0 | |
CareView Communications, Inc. * | | | (207,465 | ) | | | (103,733 | ) |
Cerner Corp. * | | | (117,721 | ) | | | (7,224,538 | ) |
Endologix, Inc. * | | | (194,086 | ) | | | (2,620,161 | ) |
Fluidigm Corp. * | | | (50,158 | ) | | | (2,349,902 | ) |
GenMark Diagnostics, Inc. * | | | (106,935 | ) | | | (1,332,410 | ) |
HealthStream, Inc. * | | | (69,235 | ) | | | (1,995,353 | ) |
HeartWare International, Inc. * | | | (49,524 | ) | | | (4,755,790 | ) |
Immunomedics, Inc. * | | | (251,684 | ) | | | (1,192,982 | ) |
Insulet Corp. * | | | (76,907 | ) | | | (3,646,161 | ) |
Insys Therapeutics, Inc. * | | | (59,289 | ) | | | (3,988,964 | ) |
Intuitive Surgical, Inc. * | | | (10,722 | ) | | | (4,769,467 | ) |
Keryx Biopharmaceuticals, Inc. * | | | (159,358 | ) | | | (2,557,696 | ) |
Lannett Co, Inc. * | | | (161,902 | ) | | | (6,943,977 | ) |
Ligand Pharmaceuticals, Inc. * | | | (30,554 | ) | | | (2,131,142 | ) |
MiMedx Group, Inc. * | | | (516,925 | ) | | | (3,696,014 | ) |
Mindray Medical International Ltd. — ADR | | | (71,299 | ) | | | (2,491,187 | ) |
Mirati Therapeutics, Inc. * | | | (72,629 | ) | | | (1,767,064 | ) |
NanoString Technologies Inc | | | (84,331 | ) | | | (1,593,856 | ) |
Neogen Corp. * | | | (48,072 | ) | | | (2,082,479 | ) |
THEACCOMPANYINGNOTESAREANINTEGRALPARTOFTHEFINANCIALSTATEMENTS.
| | |
| 14 | | SEMI-ANNUAL REPORT 2014 |
| | |
| ROBECO INVESTMENT FUNDS | | FEBRUARY 28, 2014 (unaudited) |
| | |
ROBECO BOSTON PARTNERS LONG/SHORT EQUITY FUND (continued) | | PORTFOLIOOF INVESTMENTS |
| | | | | | | | |
| | | Number of
Shares | | | Value | |
Health Care—(continued) | |
Neuralstem, Inc. * | | | (466,549 | ) | | $ | (1,665,580 | ) |
NewLink Genetics Corp. * | | | (44,444 | ) | | | (1,964,425 | ) |
Novavax, Inc. * | | | (471,820 | ) | | | (3,019,648 | ) |
Opko Health, Inc. * | | | (155,129 | ) | | | (1,476,828 | ) |
Organovo Holdings, Inc. * | | | (442,689 | ) | | | (4,550,843 | ) |
Osiris Therapeutics, Inc. * | | | (131,227 | ) | | | (2,003,836 | ) |
Quidel Corp. * | | | (122,596 | ) | | | (3,435,140 | ) |
Raptor Pharmaceutical Corp. * | | | (172,056 | ) | | | (2,723,646 | ) |
Seattle Genetics, Inc. * | | | (132,993 | ) | | | (6,994,102 | ) |
Spectrum Pharmaceuticals, Inc. * | | | (295,074 | ) | | | (2,463,868 | ) |
Staar Surgical Co. * | | | (139,991 | ) | | | (1,982,273 | ) |
TherapeuticsMD, Inc. * | | | (390,346 | ) | | | (2,681,677 | ) |
Utah Medical Products, Inc. | | | (11,917 | ) | | | (655,316 | ) |
Wright Medical Group, Inc. * | | | (142,956 | ) | | | (4,548,860 | ) |
Zogenix, Inc. * | | | (520,044 | ) | | | (2,262,191 | ) |
| | | | | | | | |
| | | | | | | (141,004,949 | ) |
| | | | | | | | |
Real Estate Investment Trusts—(0.2%) | |
St. Joe Co., (The) * | | | (87,393 | ) | | | (1,689,307 | ) |
| | | | | | | | |
| | | | | | | (1,689,307 | ) |
| | | | | | | | |
Technology—(15.6%) | | | | | | | | |
3D Systems Corp. * | | | (63,777 | ) | | | (4,844,501 | ) |
ANTs Software, Inc. * | | | (10,334 | ) | | | (98 | ) |
Applied Micro Circuits Corp. * | | | (183,026 | ) | | | (2,097,478 | ) |
Benefitfocus, Inc. * | | | (47,346 | ) | | | (3,067,074 | ) |
CalAmp Corp. * | | | (160,725 | ) | | | (5,149,629 | ) |
Cavium, Inc. * | | | (116,461 | ) | | | (4,906,502 | ) |
Ciena Corp. * | | | (182,367 | ) | | | (4,480,757 | ) |
CommVault Systems, Inc. * | | | (24,793 | ) | | | (1,707,742 | ) |
Consygen, Inc. * | | | (200 | ) | | | 0 | |
Cornerstone OnDemand, Inc. * | | | (38,559 | ) | | | (2,251,074 | ) |
Cray, Inc. * | | | (163,790 | ) | | | (5,681,875 | ) |
Cree, Inc. * | | | (30,473 | ) | | | (1,871,956 | ) |
Ener1, Inc. * | | | (102,820 | ) | | | (10 | ) |
Enphase Energy, Inc. * | | | (273,975 | ) | | | (2,210,978 | ) |
FireEye, Inc. * | | | (35,007 | ) | | | (2,997,999 | ) |
First Solar, Inc. * | | | (79,595 | ) | | | (4,542,487 | ) |
Generac Holdings, Inc. | | | (40,683 | ) | | | (2,317,711 | ) |
Himax Technologies, Inc. — ADR | | | (199,893 | ) | | | (2,760,522 | ) |
Imageware Systems, Inc. * | | | (388,259 | ) | | | (733,810 | ) |
Infinera Corp. * | | | (243,511 | ) | | | (2,026,012 | ) |
IntraLinks Holdings, Inc. * | | | (370,094 | ) | | | (4,296,791 | ) |
InvenSense, Inc. * | | | (109,729 | ) | | | (2,211,039 | ) |
IPG Photonics Corp. | | | (78,863 | ) | | | (5,659,998 | ) |
Methode Electronics, Inc. | | | (36,732 | ) | | | (1,245,215 | ) |
Neonode, Inc. * | | | (224,412 | ) | | | (1,620,255 | ) |
Nestor, Inc. * | | | (15,200 | ) | | | (306 | ) |
NetSuite, Inc. * | | | (18,947 | ) | | | (2,180,610 | ) |
Palo Alto Networks, Inc. * | | | (19,566 | ) | | | (1,392,121 | ) |
Parkervision, Inc. * | | | (142,151 | ) | | | (710,755 | ) |
Proofpoint, Inc. * | | | (98,660 | ) | | | (4,089,457 | ) |
Qlik Technologies, Inc. * | | | (148,957 | ) | | | (4,543,189 | ) |
QuickLogic Corp. * | | | (303,574 | ) | | | (1,545,192 | ) |
Salesforce.com, Inc. * | | | (43,803 | ) | | | (2,731,993 | ) |
SciQuest Inc * | | | (135,112 | ) | | | (3,988,506 | ) |
ServiceNow, Inc. * | | | (45,334 | ) | | | (3,085,432 | ) |
| | | | | | | | |
| | | Number of
Shares | | | Value | |
Technology—(continued) | | | | | | | | |
Sonus Networks, Inc. * | | | (877,799 | ) | | $ | (3,274,190 | ) |
Splunk, Inc. * | | | (53,040 | ) | | | (4,919,460 | ) |
Stratasys Ltd. * | | | (17,230 | ) | | | (2,190,450 | ) |
Tessco Technologies, Inc. | | | (30,985 | ) | | | (1,179,909 | ) |
Textura Corp. * | | | (70,732 | ) | | | (1,903,398 | ) |
Tiger Telematics, Inc. * | | | (6,510 | ) | | | (7 | ) |
TigerLogic Corp. * | | | (85,760 | ) | | | (144,077 | ) |
Uni-Pixel, Inc. * | | | (19,665 | ) | | | (193,897 | ) |
Veeva Systems, Inc., Class A * | | | (164,001 | ) | | | (5,789,235 | ) |
Vicor Corp. * | | | (49,006 | ) | | | (527,795 | ) |
Violin Memory, Inc. * | | | (267,703 | ) | | | (1,164,508 | ) |
Workday, Inc., Class A * | | | (32,833 | ) | | | (3,609,003 | ) |
WorldGate Communications, Inc. * | | | (582,655 | ) | | | (291 | ) |
Xybernaut Corp. * | | | (34,156 | ) | | | 0 | |
| | | | | | | | |
| | | | | | | (117,845,294 | ) |
| | | | | | | | |
Transportation—(2.1%) | |
American Railcar Industries, Inc. | | | (162,763 | ) | | | (11,271,338 | ) |
Student Transportation, Inc. | | | (753,053 | ) | | | (4,661,398 | ) |
| | | | | | | | |
| | | | | | | (15,932,736 | ) |
| | | | | | | | |
Utilities—(0.8%) | |
SolarCity Corp. * | | | (67,779 | ) | | | (5,758,504 | ) |
| | | | | | | | |
TOTAL COMMON STOCK (Proceeds $445,677,380) | | | | | | | (578,585,710 | ) |
| | | | | | | | |
TOTAL SECURITIES SOLD SHORT—(76.7%)
(Proceeds $445,677,380) | | | | | | | (578,585,710 | ) |
| | | | | | | | |
| | | Number of
Contracts | | | | |
OPTIONS WRITTEN ††—0.0% | | | | | | | | |
Gogo, Inc. Call Options
Expires 08/16/14
Strike Price $30.00 | | | (890 | ) | | | (160,200 | ) |
Sturm Ruger & Co., Inc. Call Options Expires 01/17/15
Strike Price $70.50 | | | (343 | ) | | | (149,205 | ) |
| | | | | | | | |
TOTAL OPTIONS WRITTEN
(Premiums received $900,455) | | | | | | | (309,405 | ) |
| | | | | | | | |
OTHER ASSETS IN EXCESS OF LIABILITIES—76.8% | | | | | | | 579,461,828 | |
| | | | | | | | |
NET ASSETS—100.0% | | | | | | $ | 754,145,303 | |
| | | | | | | | |
| | | | |
| ADR | | — | | American Depositary Receipt |
| PLC | | — | | Public Limited Company |
| 144A | | — | | Security was purchased pursuant to Rule 144A under the Securities Act of 1933 and may not be resold subject to that rule except to qualified institutional buyers. As of February 28, 2014, these securities amounted to $557,341 or 0.07% of net assets. These 144A securities have not been deemed illiquid. |
| * | | — | | Non-income producing. |
| (a) | | — | | All or a portion of the security is on loan (See Note 6 of the Notes to Financial Statements). |
THEACCOMPANYINGNOTESAREANINTEGRALPARTOFTHEFINANCIALSTATEMENTS.
| | | | |
| SEMI-ANNUAL REPORT 2014 | | | 15 | |
| | |
| ROBECO INVESTMENT FUNDS | | FEBRUARY 28, 2014 (unaudited) |
| | |
ROBECO BOSTON PARTNERS LONG/SHORT EQUITY FUND (concluded) | | PORTFOLIOOF INVESTMENTS |
| | | | |
| † | | — | | Security position is either entirely or partially held in a segregated account as collateral for securities sold short. |
| †† | | — | | Primary risk exposure is equity contracts. |
| ‡ | | — | | Security has been valued at fair market value as determined in good faith by or under the direction of The RBB Fund, Inc.‘s Board of Directors. As of February 28, 2014, long positions amounted to $4,925,952 and short positions amounted to ($517), or 0.65% and 0.0%, respectively, of net assets. |
A summary of the inputs used to value the Fund’s investments as of February 28, 2014 is as follows (see Note I in the Notes to Financial Statements):
| | | | | | | | | | | | | | | | |
| | | Total
Value as of
February 28, 2014 | | | Level 1
Quoted
Price | | | Level 2
Significant
Observable
Inputs | | | Level 3
Significant
Unobservable
Inputs | |
| | | | | | | | | | | | | | | | |
Common Stock | | | | | | | | | | | | | | | | |
Basic Industries | | $ | 57,285,811 | | | $ | 57,285,811 | | | $ | — | | | $ | — | |
Capital Goods | | | 68,526,247 | | | | 68,526,247 | | | | — | | | | — | |
Communications | | | 30,824,658 | | | | 30,824,658 | | | | — | | | | — | |
Consumer Durables | | | 15,295,447 | | | | 15,295,447 | | | | — | | | | — | |
Consumer Non-Durables | | | 48,017,704 | | | | 48,017,704 | | | | — | | | | — | |
Consumer Services | | | 119,196,998 | | | | 119,196,998 | | | | — | | | | — | |
Energy | | | 88,067,460 | | | | 88,067,460 | | | | — | | | | — | |
Finance | | | 93,848,552 | | | | 93,449,582 | | | | — | | | | 398,970 | |
Health Care | | | 77,279,003 | | | | 77,279,003 | | | | — | | | | — | |
Real Estate Investment Trusts | | | 6,823,014 | | | | 6,823,014 | | | | — | | | | — | |
Technology | | | 126,650,646 | | | | 126,650,646 | | | | — | | | | — | |
Transportation | | | 1,598,375 | | | | 1,598,375 | | | | — | | | | — | |
Preferred Stocks | | | | | | | | | | | | | | | | |
Finance | | | 158,371 | | | | — | | | | — | | | | 158,371 | |
Securities Lending Collateral | | | 20,006,304 | | | | 20,006,304 | | | | — | | | | — | |
| | | | | | | | | | | | | | | | |
Total Assets | | $ | 753,578,590 | | | $ | 753,021,249 | | | $ | — | | | $ | 557,341 | |
| | | | | | | | | | | | | | | | |
| | | | |
| | | Total
Value as of
February 28, 2014 | | | Level 1
Quoted
Price | | | Level 2
Significant
Observable
Inputs | | | Level 3
Significant
Unobservable
Inputs | |
Securities Sold Short | | | | | | | | | | | | | | | | |
Basic Industries | | $ | (9,892,300 | ) | | $ | (9,892,300 | ) | | $ | — | | | $ | — | |
Capital Goods | | | (56,731,021 | ) | | | (56,731,021 | ) | | | — | | | | — | |
Communications | | | (45,674,095 | ) | | | (45,674,085 | ) | | | — | | | | (10 | ) |
Consumer Durables | | | (35,322,749 | ) | | | (35,322,749 | ) | | | — | | | | — | |
Consumer Non-Durables | | | (28,823,865 | ) | | | (28,823,709 | ) | | | — | | | | (156 | ) |
Consumer Services | | | (102,455,186 | ) | | | (102,455,186 | ) | | | — | | | | — | |
Energy | | | (7,226,434 | ) | | | (7,226,434 | ) | | | — | | | | — | |
Finance | | | (10,229,270 | ) | | | (10,229,270 | ) | | | — | | | | — | |
Health Care | | | (141,004,949 | ) | | | (141,004,949 | ) | | | — | | | | — | |
Real Estate Investment Trusts | | | (1,689,307 | ) | | | (1,689,307 | ) | | | — | | | | — | |
Technology | | | (117,845,294 | ) | | | (117,844,873 | ) | | | — | | | | (421 | ) |
Transportation | | | (15,932,736 | ) | | | (15,932,736 | ) | | | — | | | | — | |
Utilities | | | (5,758,504 | ) | | | (5,758,504 | ) | | | — | | | | — | |
Options Written | | | | | | | | | | | | | | | | |
Equity Contracts | | | (309,405 | ) | | | — | | | | (309,405 | ) | | | — | |
| | | | | | | | | | | | | | | | |
Total Liabilities | | $ | (578,895,115 | ) | | $ | (578,585,133 | ) | | $ | (309,405 | ) | | $ | (587 | ) |
| | | | | | | | | | | | | | | | |
THEACCOMPANYINGNOTESAREANINTEGRALPARTOFTHEFINANCIALSTATEMENTS.
| | |
| 16 | | SEMI-ANNUAL REPORT 2014 |
| | |
| ROBECO INVESTMENT FUNDS | | FEBRUARY 28, 2014 (unaudited) |
| | |
ROBECO BOSTON PARTNERS LONG/SHORT RESEARCH FUND | | PORTFOLIOOF INVESTMENTS |
| | | | | | | | |
| | | Number of
Shares | | | Value | |
LONG POSITIONS—93.4% | | | | | | | | |
COMMON STOCK—93.4% | | | | | | | | |
Basic Industries—5.6% | | | | | | | | |
Albemarle Corp. † | | | 183,000 | | | $ | 12,076,170 | |
Berry Plastics Group, Inc. * † | | | 1,083,702 | | | | 26,366,470 | |
Crown Holdings, Inc. * † | | | 523,113 | | | | 23,550,547 | |
CVR Partners LP | | | 221,287 | | | | 4,392,547 | |
Graphic Packaging Holding Co. * † | | | 3,186,661 | | | | 32,631,409 | |
Huntsman Corp. † | | | 1,021,296 | | | | 24,878,771 | |
International Paper Co. † | | | 522,470 | | | | 25,543,558 | |
Lintec Corp. | | | 624,500 | | | | 12,156,624 | |
LyondellBasell Industries NV, Class A | | | 194,844 | | | | 17,161,860 | |
Owens-Illinois, Inc. * † | | | 436,885 | | | | 14,819,139 | |
Silgan Holdings, Inc. † | | | 264,803 | | | | 12,766,153 | |
Smurfit Kappa Group PLC * | | | 134,978 | | | | 3,758,522 | |
Yamana Gold, Inc. | | | 757,297 | | | | 7,603,262 | |
| | | | | | | | |
| | | | 217,705,032 | |
| | | | | | | | |
Capital Goods—10.3% | | | | | | | | |
Boeing Co. (The) † | | | 158,918 | | | | 20,487,709 | |
Carlisle Cos, Inc. † | | | 158,776 | | | | 12,594,112 | |
Crane Co. | | | 170,715 | | | | 12,192,465 | |
Cubic Corp. † | | | 298,079 | | | | 15,500,108 | |
Curtiss-Wright Corp. † | | | 81,408 | | | | 5,548,769 | |
Dover Corp. † | | | 60,743 | | | | 5,728,065 | |
Entertainment One Ltd. * | | | 2,421,890 | | | | 13,991,628 | |
Global Brass & Copper Holdings, Inc. † | | | 770,657 | | | | 13,047,223 | |
HB Fuller Co. † | | | 323,404 | | | | 15,678,626 | |
Honeywell International, Inc. † | | | 144,837 | | | | 13,678,406 | |
Hubbell, Inc., Class B † | | | 65,065 | | | | 7,777,870 | |
Huntington Ingalls Industries, Inc. † | | | 205,294 | | | | 20,802,441 | |
Hyundai Mobis Co. Ltd. | | | 33,578 | | | | 9,860,580 | |
Koninklijke Philips NV | | | 443,635 | | | | 15,460,680 | |
LISI | | | 7,000 | | | | 1,136,746 | |
Lockheed Martin Corp. † | | | 194,618 | | | | 31,586,501 | |
Masco Corp. † | | | 902,037 | | | | 21,062,564 | |
Minerals Technologies, Inc. † | | | 246,342 | | | | 13,179,297 | |
Northrop Grumman Corp. † | | | 121,295 | | | | 14,680,334 | |
Parker Hannifin Corp. † | | | 60,091 | | | | 7,243,970 | |
Raytheon Co. † | | | 170,006 | | | | 16,645,287 | |
Rexel SA | | | 167,947 | | | | 4,241,098 | |
Siemens AG — Sponsored ADR | | | 107,092 | | | | 14,257,158 | |
Smiths Group PLC | | | 640,810 | | | | 14,673,164 | |
Tarkett SA * | | | 224,332 | | | | 9,660,941 | |
Textron, Inc. † | | | 418,029 | | | | 16,595,751 | |
Timken Co., (The) † | | | 145,713 | | | | 8,795,237 | |
Triumph Group, Inc. † | | | 283,005 | | | | 18,451,926 | |
Tyco International Ltd. † | | | 259,690 | | | | 10,953,724 | |
United Technologies Corp. † | | | 115,310 | | | | 13,493,576 | |
| | | | | | | | |
| | | | 399,005,956 | |
| | | | | | | | |
Communications—3.7% | | | | | | | | |
Baidu, Inc. — Sponsored ADR * † | | | 51,137 | | | | 8,740,847 | |
Comcast Corp., Class A † | | | 512,712 | | | | 26,502,083 | |
Daum Communications Corp. | | | 53,741 | | | | 3,524,212 | |
| | | | | | | | |
| | | Number of
Shares | | | Value | |
Communications—(continued) | | | | | | | | |
Google, Inc., Class A * † | | | 7,358 | | | $ | 8,944,753 | |
Liberty Global PLC, Class A * | | | 100,635 | | | | 8,709,959 | |
Liberty Global PLC, Series C * † | | | 367,788 | | | | 31,136,932 | |
Millennial Media, Inc. * | | | 661,128 | | | | 3,993,213 | |
NetEase, Inc. — ADR † | | | 116,426 | | | | 8,053,186 | |
Perfect World Co. Ltd. — Sponsored ADR | | | 115,013 | | | | 2,601,594 | |
Sina Corp. * † | | | 76,257 | | | | 5,210,641 | |
Time Warner Cable, Inc. † | | | 93,902 | | | | 13,179,146 | |
Verizon Communications, Inc. | | | 1 | | | | 28 | |
Vodafone Group PLC — Sponsored ADR † | | | 202,489 | | | | 8,417,449 | |
Windstream Holdings, Inc. † | | | 744,493 | | | | 5,970,834 | |
Yahoo!, Inc. * † | | | 227,528 | | | | 8,798,508 | |
| | | | | | | | |
| | | | 143,783,385 | |
| | | | | | | | |
Consumer Durables—3.2% | | | | | | | | |
Ekornes ASA | | | 38,416 | | | | 576,048 | |
Lear Corp. † | | | 328,352 | | | | 26,662,182 | |
Newell Rubbermaid, Inc. † | | | 574,055 | | | | 18,432,906 | |
NVR, Inc. * | | | 9,184 | | | | 10,947,328 | |
Samsung Electronics Co. Ltd. | | | 9,517 | | | | 12,056,167 | |
Tenneco, Inc. * † | | | 214,955 | | | | 12,948,889 | |
Toyota Motor Corp. | | | 286,000 | | | | 16,460,192 | |
TRW Automotive Holdings Corp. * † | | | 225,389 | | | | 18,554,022 | |
TS Tech Co. Ltd. | | | 287,500 | | | | 9,412,870 | |
| | | | | | | | |
| | | | 126,050,604 | |
| | | | | | | | |
Consumer Non-Durables—4.9% | | | | | | | | |
Activision Blizzard, Inc. † | | | 490,462 | | | | 9,490,440 | |
Aryzta AG | | | 226,059 | | | | 18,851,444 | |
British American Tobacco PLC | | | 318,758 | | | | 17,375,812 | |
Britvic PLC | | | 1,071,057 | | | | 13,930,592 | |
Carlsberg A/S, Class B | | | 141,967 | | | | 14,956,578 | |
Constellation Brands, Inc.,
Class A * † | | | 237,849 | | | | 19,272,904 | |
Henkel AG & Co. KGaA | | | 279,756 | | | | 28,258,933 | |
Lorillard, Inc. † | | | 275,245 | | | | 13,503,520 | |
Stock Spirits Group PLC * | | | 2,867,990 | | | | 13,783,334 | |
Tyson Foods, Inc., Class A † | | | 715,310 | | | | 28,218,980 | |
Unilever NV † | | | 310,090 | | | | 12,267,160 | |
| | | | | | | | |
| | | | 189,909,697 | |
| | | | | | | | |
Consumer Services—10.3% | | | | | |
Apollo Education Group, Inc. * | | | 348,387 | | | | 11,611,739 | |
Bed Bath & Beyond, Inc. * † | | | 268,093 | | | | 18,182,067 | |
CBS Corp., Class B non-voting shares † | | | 234,140 | | | | 15,706,111 | |
Conversant, Inc. * | | | 213,756 | | | | 5,313,974 | |
CVS Caremark Corp. † | | | 333,021 | | | | 24,357,156 | |
eBay, Inc. * † | | | 153,479 | | | | 9,019,961 | |
Equifax, Inc. † | | | 220,373 | | | | 15,439,332 | |
Expedia, Inc. † | | | 113,072 | | | | 8,879,544 | |
Foot Locker, Inc. † | | | 299,462 | | | | 12,490,560 | |
FTI Consulting, Inc. * † | | | 191,975 | | | | 5,603,750 | |
Gannett Co., Inc. † | | | 514,095 | | | | 15,294,326 | |
Global Sources Ltd. * | | | 107,439 | | | | 729,511 | |
Liberty Media Corp., Class A * † | | | 107,310 | | | | 14,718,640 | |
THEACCOMPANYINGNOTESAREANINTEGRALPARTOFTHEFINANCIALSTATEMENTS.
| | | | |
| SEMI-ANNUAL REPORT 2014 | | | 17 | |
| | |
| ROBECO INVESTMENT FUNDS | | FEBRUARY 28, 2014 (unaudited) |
| | |
ROBECO BOSTON PARTNERS LONG/SHORT RESEARCH FUND (continued) | | PORTFOLIOOF INVESTMENTS |
| | | | | | | | |
| | | Number of
Shares | | | Value | |
Consumer Services—(continued) | | | | | |
Live Nation Entertainment,
Inc. * † | | | 575,398 | | | $ | 13,055,781 | |
Macy’s, Inc. † | | | 341,608 | | | | 19,765,439 | |
Manpowergroup, Inc. † | | | 281,386 | | | | 21,993,130 | |
Moody’s Corp. † | | | 180,480 | | | | 14,257,920 | |
News Corp., Class A * † | | | 995,075 | | | | 18,239,725 | |
Omnicom Group, Inc. † | | | 266,461 | | | | 20,165,768 | |
Phoenix New Media Ltd. —
ADR * | | | 701,315 | | | | 7,560,176 | |
Rite Aid Corp. * | | | 3,334,214 | | | | 21,972,470 | |
Robert Half International, Inc. † | | | 367,000 | | | | 15,024,980 | |
Six Flags Entertainment Corp. | | | 278,517 | | | | 11,363,494 | |
Target Corp. | | | 153,727 | | | | 9,614,087 | |
Time Warner, Inc. † | | | 211,835 | | | | 14,220,484 | |
Towers Watson & Co., Class A † | | | 90,861 | | | | 9,912,935 | |
Viacom, Inc., Class B † | | | 164,505 | | | | 14,432,024 | |
Walt Disney Co., (The) † | | | 194,345 | | | | 15,705,019 | |
WPP PLC | | | 700,990 | | | | 15,353,166 | |
| | | | | | | | |
| | | | 399,983,269 | |
| | | | | | | | |
Energy—11.1% | | | | | |
Canacol Energy Ltd. * | | | 1,531,718 | | | | 9,779,867 | |
Canadian Natural Resources Ltd. | | | 544,105 | | | | 19,925,125 | |
Diamondback Energy, Inc. * † | | | 454,703 | | | | 29,251,044 | |
Energen Corp. † | | | 334,488 | | | | 26,906,215 | |
EOG Resources, Inc. † | | | 186,487 | | | | 35,324,367 | |
EQT Corp. † | | | 238,419 | | | | 24,387,879 | |
Exxon Mobil Corp. † | | | 531,754 | | | | 51,191,958 | |
Gulfport Energy Corp. * † | | | 214,902 | | | | 14,205,022 | |
Halliburton Co. † | | | 275,650 | | | | 15,712,050 | |
Inpex Corp. | | | 680,600 | | | | 8,648,174 | |
Kosmos Energy Ltd. * † | | | 1,026,539 | | | | 11,271,398 | |
Noble Energy, Inc. | | | 291,493 | | | | 20,043,059 | |
Occidental Petroleum Corp. † | | | 334,528 | | | | 32,288,643 | |
Pacific Drilling SA * | | | 683,810 | | | | 7,426,177 | |
Phillips 66 † | | | 317,844 | | | | 23,793,802 | |
QEP Resources, Inc. | | | 572,662 | | | | 16,567,112 | |
Rice Energy, Inc. * † | | | 1,036,372 | | | | 24,872,928 | |
Rosetta Resources, Inc. * | | | 121,952 | | | | 5,411,010 | |
Schlumberger Ltd. † | | | 238,129 | | | | 22,145,997 | |
Valero Energy Corp. † | | | 478,708 | | | | 22,968,410 | |
Western Refining, Inc. † | | | 317,448 | | | | 11,570,980 | |
| | | | | | | | |
| | | | 433,691,217 | |
| | | | | | | | |
Finance—16.4% | | | | | |
ACE Ltd. † | | | 213,801 | | | | 20,924,704 | |
Allianz SE, Registered Shares | | | 86,214 | | | | 15,375,022 | |
Allstate Corp., (The) † | | | 394,501 | | | | 21,405,624 | |
Axis Capital Holdings Ltd. † | | | 308,008 | | | | 13,543,112 | |
Bangkok Bank PCL | | | 704,500 | | | | 3,721,400 | |
Bank of America Corp. † | | | 1,552,119 | | | | 25,656,527 | |
BB&T Corp. † | | | 653,728 | | | | 24,710,918 | |
Berkshire Hathaway, Inc.,
Class B * † | | | 183,789 | | | | 21,279,090 | |
Capital One Financial Corp. † | | | 409,664 | | | | 30,081,628 | |
Charles Schwab Corp., (The) † | | | 527,854 | | | | 13,993,410 | |
Citigroup, Inc. † | | | 616,337 | | | | 29,972,468 | |
Comerica, Inc. † | | | 93,810 | | | | 4,519,766 | |
Discover Financial Services † | | | 416,924 | | | | 23,923,099 | |
| | | | | | | | |
| | | Number of
Shares | | | Value | |
Finance—(continued) | | | | | |
Endurance Specialty Holdings
Ltd. † | | | 291,305 | | | $ | 15,188,643 | |
Fifth Third Bancorp † | | | 1,288,430 | | | | 27,952,489 | |
First NBC Bank Holding Co. * | | | 47,135 | | | | 1,572,895 | |
First Niagara Financial Group,
Inc. † | | | 723,934 | | | | 6,566,081 | |
Goldman Sachs Group, Inc.,
(The) † | | | 121,027 | | | | 20,144,944 | |
Huntington Bancshares, Inc. † | | | 1,919,855 | | | | 18,296,218 | |
JPMorgan Chase & Co. † | | | 559,101 | | | | 31,768,119 | |
MetLife, Inc. † | | | 267,867 | | | | 13,572,821 | |
Morgan Stanley † | | | 193,173 | | | | 5,949,728 | |
PNC Financial Services Group, Inc., (The) † | | | 240,750 | | | | 19,688,535 | |
Raymond James Financial, Inc. † | | | 247,853 | | | | 13,081,681 | |
Regions Financial Corp. † | | | 2,246,161 | | | | 23,899,153 | |
Reinsurance Group of America, Inc. † | | | 140,308 | | | | 10,802,313 | |
SLM Corp. | | | 523,813 | | | | 12,540,083 | |
Standard Chartered PLC | | | 440,409 | | | | 9,322,670 | |
State Street Corp. † | | | 357,041 | | | | 23,446,882 | |
SunTrust Banks, Inc. † | | | 356,400 | | | | 13,429,152 | |
TD Ameritrade Holding Corp. † | | | 416,860 | | | | 13,935,630 | |
Torchmark Corp. † | | | 134,310 | | | | 10,410,368 | |
Travelers Cos., Inc., (The) † | | | 249,234 | | | | 20,895,779 | |
US Bancorp † | | | 215,125 | | | | 8,850,243 | |
Validus Holdings Ltd. † | | | 537,439 | | | | 19,783,130 | |
Wells Fargo & Co. † | | | 623,671 | | | | 28,950,808 | |
WR Berkley Corp. † | | | 438,961 | | | | 18,102,752 | |
| | | | | | | | |
| | | | 637,257,885 | |
| | | | | | | | |
Health Care—11.6% | | | | | | | | |
AbbVie, Inc. † | | | 578,053 | | | | 29,428,678 | |
Amgen, Inc. † | | | 162,571 | | | | 20,162,055 | |
Bayer AG — Sponsored ADR | | | 95,768 | | | | 13,524,357 | |
Boston Scientific Corp. * † | | | 1,004,836 | | | | 13,163,352 | |
Cardinal Health, Inc. † | | | 286,759 | | | | 20,511,871 | |
CareFusion Corp. * † | | | 219,744 | | | | 8,906,224 | |
Covidien PLC † | | | 247,651 | | | | 17,818,489 | |
DaVita HealthCare Partners,
Inc. * † | | | 247,854 | | | | 17,035,005 | |
Endo Health Solutions, Inc. * † | | | 127,406 | | | | 10,169,547 | |
Express Scripts Holding Co. * † | | | 310,126 | | | | 23,355,589 | |
ICON PLC * | | | 245,688 | | | | 11,508,026 | |
Integra LifeSciences Holdings Corp. * † | | | 155,863 | | | | 7,331,795 | |
Johnson & Johnson † | | | 465,468 | | | | 42,878,912 | |
Laboratory Corp. of America Holdings * † | | | 202,458 | | | | 18,937,921 | |
McKesson Corp. † | | | 111,557 | | | | 19,751,167 | |
Medtronic, Inc. † | | | 178,427 | | | | 10,573,584 | |
Novartis AG — ADR † | | | 339,957 | | | | 28,277,623 | |
Omnicare, Inc. † | | | 316,647 | | | | 18,650,508 | |
Pfizer, Inc. † | | | 1,116,669 | | | | 35,856,242 | |
Quest Diagnostics, Inc. † | | | 320,539 | | | | 16,988,567 | |
Sanofi — ADR | | | 428,275 | | | | 22,201,776 | |
Select Medical Holdings Corp. † | | | 1,140,284 | | | | 12,782,584 | |
UnitedHealth Group, Inc. † | | | 191,872 | | | | 14,825,949 | |
THEACCOMPANYINGNOTESAREANINTEGRALPARTOFTHEFINANCIALSTATEMENTS.
| | |
| 18 | | SEMI-ANNUAL REPORT 2014 |
| | |
| ROBECO INVESTMENT FUNDS | | FEBRUARY 28, 2014 (unaudited) |
| | |
ROBECO BOSTON PARTNERS LONG/SHORT RESEARCH FUND (continued) | | PORTFOLIOOF INVESTMENTS |
| | | | | | | | |
| | | Number of
Shares | | | Value | |
Health Care—(continued) | | | | | | | | |
Universal Health Services, Inc.,
Class B † | | | 221,844 | | | $ | 17,809,636 | |
| | | | | | | | |
| | | | 452,449,457 | |
| | | | | | | | |
Real Estate Investment Trusts—1.5% | | | | | |
American Capital Agency Corp. | | | 470,881 | | | | 10,495,937 | |
American Homes 4 Rent, Class A | | | 519,267 | | | | 8,505,593 | |
American Residential Properties, Inc. * † | | | 410,150 | | | | 7,464,730 | |
Annaly Capital Management, Inc. † | | | 844,341 | | | | 9,439,732 | |
Boston Properties, Inc. † | | | 62,353 | | | | 7,010,348 | |
Equity Residential † | | | 111,051 | | | | 6,493,152 | |
Post Properties, Inc. † | | | 186,023 | | | | 9,027,696 | |
| | | | | | | | |
| | | | 58,437,188 | |
| | | | | | | | |
Technology—14.5% | | | | | | | | |
Agilent Technologies, Inc. † | | | 225,718 | | | | 12,850,126 | |
Alliance Data Systems Corp. * † | | | 18,902 | | | | 5,389,149 | |
Amdocs Ltd. † | | | 324,874 | | | | 14,450,396 | |
Analog Devices, Inc. | | | 63,111 | | | | 3,207,301 | |
Apple, Inc. † | | | 17,385 | | | | 9,148,682 | |
Arrow Electronics, Inc. * † | | | 498,757 | | | | 28,244,609 | |
Avago Technologies Ltd. | | | 488,155 | | | | 30,119,164 | |
Avnet, Inc. † | | | 549,580 | | | | 23,923,217 | |
Brocade Communications Systems, Inc. * | | | 3,217,397 | | | | 30,790,489 | |
CA, Inc. † | | | 288,935 | | | | 9,679,323 | |
CDW Corp. † | | | 596,480 | | | | 15,609,882 | |
Cisco Systems, Inc. † | | | 620,417 | | | | 13,525,091 | |
EMC Corp. † | | | 929,827 | | | | 24,519,538 | |
Fidelity National Information Services, Inc. † | | | 201,318 | | | | 11,195,294 | |
Flextronics International Ltd. * † | | | 2,767,458 | | | | 24,768,749 | |
Global Payments, Inc. | | | 156,546 | | | | 11,009,880 | |
Harris Corp. † | | | 190,216 | | | | 14,041,745 | |
Jabil Circuit, Inc. | | | 1,302,754 | | | | 24,113,977 | |
LSI Corp. † | | | 2,008,445 | | | | 22,273,655 | |
MediaTek, Inc. | | | 1,947,000 | | | | 28,702,209 | |
Microsoft Corp. † | | | 683,430 | | | | 26,182,203 | |
NetApp, Inc. † | | | 620,823 | | | | 25,087,457 | |
ON Semiconductor Corp. * | | | 2,124,931 | | | | 19,846,856 | |
QUALCOMM, Inc. † | | | 190,215 | | | | 14,321,287 | |
Seagate Technology PLC † | | | 459,122 | | | | 23,961,577 | |
Symantec Corp. † | | | 655,082 | | | | 14,071,161 | |
TE Connectivity Ltd. † | | | 168,175 | | | | 9,851,692 | |
Texas Instruments, Inc. † | | | 495,735 | | | | 22,288,246 | |
Total System Services, Inc. † | | | 342,443 | | | | 10,430,814 | |
Vantiv, Inc., Class A * † | | | 331,165 | | | | 10,540,982 | |
Western Digital Corp. † | | | 342,740 | | | | 29,814,953 | |
| | | | | | | | |
| | | | 563,959,704 | |
| | | | | | | | |
Transportation—0.3% | | | | | | | | |
Norfolk Southern Corp. † | | | 138,592 | | | | 12,737,991 | |
| | | | | | | | |
| | | | 12,737,991 | |
| | | | | | | | |
TOTAL COMMON STOCK—93.4%
(Cost $3,192,644,700) | | | | 3,634,971,385 | |
| | | | | | | | |
| | | | | | | | |
| | | Number of
Shares | | | Value | |
TOTAL INVESTMENTS—93.4%
(Cost $3,192,644,700) | | | | | | $ | 3,634,971,385 | |
| | | | | | | | |
SECURITIES SOLD SHORT—(44.6%) | | | | | |
COMMON STOCK—(44.6%) | | | | | | | | |
Basic Industries—(2.7%) | | | | | | | | |
Air Products & Chemicals, Inc. | | | (90,999 | ) | | | (11,039,999 | ) |
Aptargroup, Inc. | | | (158,060 | ) | | | (10,458,830 | ) |
Compass Minerals International, Inc. | | | (61,676 | ) | | | (5,264,047 | ) |
EI Du Pont de Nemours & Co. | | | (80,966 | ) | | | (5,393,955 | ) |
FMC Corp. | | | (48,467 | ) | | | (3,740,683 | ) |
Intrepid Potash, Inc. * | | | (747,497 | ) | | | (11,070,430 | ) |
K+S AG, Registered Shares | | | (339,708 | ) | | | (11,468,752 | ) |
LANXESS AG | | | (125,937 | ) | | | (9,338,191 | ) |
Resolute Forest Products, Inc. * | | | (453,540 | ) | | | (9,293,035 | ) |
Scotts Miracle-Gro Co. (The), Class A | | | (183,185 | ) | | | (10,461,695 | ) |
Solvay SA | | | (47,368 | ) | | | (7,329,940 | ) |
Wausau Paper Corp. | | | (795,512 | ) | | | (10,540,534 | ) |
| | | | | | | | |
| | | | (105,400,091 | ) |
| | | | | | | | |
Capital Goods—(3.5%) | | | | | | | | |
Briggs & Stratton Corp. | | | (191,360 | ) | | | (4,359,181 | ) |
Deere & Co. | | | (43,987 | ) | | | (3,779,803 | ) |
Fastenal Co. | | | (90,420 | ) | | | (4,266,920 | ) |
Kennametal, Inc. † | | | (64,138 | ) | | | (2,805,396 | ) |
Kubota Corp. | | | (164,000 | ) | | | (2,304,670 | ) |
Lafarge SA | | | (75,089 | ) | | | (5,629,902 | ) |
Manitex International, Inc. * | | | (34,382 | ) | | | (515,386 | ) |
Manitowoc Co., Inc., (The) | | | (109,310 | ) | | | (3,382,051 | ) |
Nordson Corp. | | | (24,917 | ) | | | (1,822,928 | ) |
Proto Labs, Inc. * | | | (153,640 | ) | | | (11,968,556 | ) |
Raven Industries, Inc. | | | (197,243 | ) | | | (7,213,177 | ) |
Regal-Beloit Corp. | | | (38,634 | ) | | | (2,846,939 | ) |
Roper Industries, Inc. | | | (80,823 | ) | | | (10,961,215 | ) |
SGL Carbon SE | | | (299,744 | ) | | | (12,100,220 | ) |
Simpson Manufacturing Co., Inc. | | | (159,890 | ) | | | (5,652,112 | ) |
Sun Hydraulics Corp. | | | (91,514 | ) | | | (3,871,042 | ) |
Toro Co., (The) | | | (65,620 | ) | | | (4,346,013 | ) |
Trex Co., Inc. * | | | (117,719 | ) | | | (9,207,980 | ) |
Trinity Industries, Inc. | | | (110,658 | ) | | | (7,946,351 | ) |
Vulcan Materials Co. | | | (140,474 | ) | | | (9,542,399 | ) |
WW Grainger, Inc. | | | (6,361 | ) | | | (1,622,182 | ) |
Zardoya Otis SA | | | (617,142 | ) | | | (10,672,553 | ) |
Zep, Inc. | | | (480,274 | ) | | | (8,452,822 | ) |
| | | | | | | | |
| | | | (135,269,798 | ) |
| | | | | | | | |
Communications—(3.9%) | | | | | | | | |
America Movil SAB de CV,
Series L — ADR | | | (492,739 | ) | | | (9,544,354 | ) |
AOL, Inc. * | | | (80,465 | ) | | | (3,522,758 | ) |
Belgacom SA | | | (362,541 | ) | | | (10,906,245 | ) |
Cogent Communications Group, Inc. | | | (252,200 | ) | | | (9,669,348 | ) |
Equinix, Inc. * | | | (65,897 | ) | | | (12,517,794 | ) |
Eutelsat Communications SA | | | (326,584 | ) | | | (10,642,140 | ) |
Internap Network Services Corp. * | | | (754,709 | ) | | | (5,750,882 | ) |
THEACCOMPANYINGNOTESAREANINTEGRALPARTOFTHEFINANCIALSTATEMENTS.
| | | | |
| SEMI-ANNUAL REPORT 2014 | | | 19 | |
| | |
| ROBECO INVESTMENT FUNDS | | FEBRUARY 28, 2014 (unaudited) |
| | |
ROBECO BOSTON PARTNERS LONG/SHORT RESEARCH FUND (continued) | | PORTFOLIOOF INVESTMENTS |
| | | | | | | | |
| | | Number of
Shares | | | Value | |
Communications—(continued) | | | | | | | | |
Level 3 Communications, Inc. * | | | (168,349 | ) | | $ | (6,198,610 | ) |
Millicom International Cellular SA — SDR | | | (116,179 | ) | | | (12,097,145 | ) |
NQ Mobile, Inc. — ADR * | | | (167,526 | ) | | | (3,251,680 | ) |
Orange SA | | | (890,844 | ) | | | (11,110,652 | ) |
Rackspace Hosting, Inc. * | | | (94,835 | ) | | | (3,487,083 | ) |
Shutterfly, Inc. * | | | (38,664 | ) | | | (2,109,508 | ) |
Shutterstock, Inc. * | | | (19,090 | ) | | | (1,897,164 | ) |
Sohu.com, Inc. * | | | (57,141 | ) | | | (4,856,414 | ) |
Sprint Corp. * | | | (1,206,681 | ) | | | (10,546,392 | ) |
Synchronoss Technologies, Inc. * | | | (320,607 | ) | | | (11,022,469 | ) |
Telefonica SA — Sponsored ADR | | | (641,615 | ) | | | (9,765,380 | ) |
Twitter, Inc. * | | | (35,348 | ) | | | (1,940,959 | ) |
Yelp, Inc. * | | | (36,585 | ) | | | (3,454,356 | ) |
Zynga, Inc., Class A * | | | (1,176,774 | ) | | | (5,954,476 | ) |
| | | | | | | | |
| | | | (150,245,809 | ) |
| | | | | | | | |
Consumer Durables—(0.7%) | | | | | | | | |
Dorman Products, Inc. * | | | (74,295 | ) | | | (4,280,878 | ) |
Federal-Mogul Corp. * | | | (210,762 | ) | | | (3,970,756 | ) |
iRobot Corp. * | | | (204,694 | ) | | | (8,580,772 | ) |
MDC Holdings, Inc. | | | (187,496 | ) | | | (5,848,000 | ) |
Seb SA | | | (66,199 | ) | | | (5,350,747 | ) |
| | | | | | | | |
| | | | (28,031,153 | ) |
| | | | | | | | |
Consumer Non-Durables—(3.6%) | | | | | |
Annie’s, Inc. * | | | (151,880 | ) | | | (5,692,462 | ) |
Beiersdorf AG | | | (126,975 | ) | | | (12,953,901 | ) |
C&C Group PLC | | | (1,879,371 | ) | | | (12,768,143 | ) |
Clorox Co., (The) | | | (133,800 | ) | | | (11,678,064 | ) |
Deckers Outdoor Corp. * | | | (67,262 | ) | | | (5,000,930 | ) |
Fossil Group, Inc. * | | | (81,348 | ) | | | (9,347,699 | ) |
Glu Mobile, Inc. * | | | (1,105,621 | ) | | | (5,561,274 | ) |
Green Mountain Coffee Roasters, Inc. | | | (106,969 | ) | | | (11,743,057 | ) |
Guess?, Inc. | | | (357,310 | ) | | | (10,840,785 | ) |
Hillshire Brands Co., (The) | | | (377,203 | ) | | | (14,163,973 | ) |
LeapFrog Enterprises, Inc. * | | | (215,699 | ) | | �� | (1,570,289 | ) |
Nintendo Co., Ltd. | | | (11,600 | ) | | | (1,433,751 | ) |
Prada SpA | | | (1,288,000 | ) | | | (9,707,073 | ) |
Remy Cointreau SA | | | (106,841 | ) | | | (9,050,781 | ) |
Snyders-Lance, Inc. | | | (345,851 | ) | | | (9,369,104 | ) |
Under Armour, Inc., Class A * | | | (93,658 | ) | | | (10,597,403 | ) |
| | | | | | | | |
| | | | (141,478,689 | ) |
| | | | | | | | |
Consumer Services—(6.4%) | | | | | |
Acxiom Corp. * | | | (80,229 | ) | | | (2,986,926 | ) |
Bankrate, Inc. * | | | (166,501 | ) | | | (3,351,665 | ) |
Buffalo Wild Wings, Inc. * | | | (98,870 | ) | | | (14,336,150 | ) |
Cabela’s, Inc. * | | | (173,986 | ) | | | (11,538,751 | ) |
Cheesecake Factory, Inc., (The) | | | (229,761 | ) | | | (10,918,243 | ) |
Concur Technologies, Inc. * | | | (108,920 | ) | | | (13,446,174 | ) |
E-Commerce China Dangdang, Inc. — Sponsored ADR * | | | (434,116 | ) | | | (6,103,671 | ) |
Hennes & Mauritz AB, Class B | | | (280,300 | ) | | | (12,622,065 | ) |
IHS, Inc., Class A * | | | (106,325 | ) | | | (12,746,241 | ) |
Iron Mountain, Inc. | | | (329,150 | ) | | | (8,952,880 | ) |
L Brands, Inc. | | | (223,337 | ) | | | (12,580,573 | ) |
| | | | | | | | |
| | | Number of
Shares | | | Value | |
Consumer Services—(continued) | | | | | |
Lululemon Athletica, Inc. * | | | (165,182 | ) | | $ | (8,310,306 | ) |
Monro Muffler Brake, Inc. | | | (272,880 | ) | | | (16,282,750 | ) |
Netflix, Inc. * | | | (29,829 | ) | | | (13,292,697 | ) |
Panera Bread Co., Class A * | | | (57,680 | ) | | | (10,458,538 | ) |
Ritchie Bros Auctioneers, Inc. | | | (505,465 | ) | | | (11,757,116 | ) |
Rollins, Inc. | | | (378,691 | ) | | | (11,307,713 | ) |
Sally Beauty Holdings, Inc. * | | | (329,331 | ) | | | (9,451,800 | ) |
Sonic Automotive, Inc., Class A | | | (164,581 | ) | | | (3,910,445 | ) |
Ultimate Software Group, Inc.,
(The) * | | | (74,990 | ) | | | (12,448,340 | ) |
United Natural Foods, Inc. * | | | (191,140 | ) | | | (13,834,713 | ) |
Whole Foods Market, Inc. | | | (229,696 | ) | | | (12,415,069 | ) |
Youku Tudou, Inc. — ADR * | | | (56,181 | ) | | | (1,864,647 | ) |
Zillow, Inc., Class A * | | | (153,874 | ) | | | (12,863,866 | ) |
| | | | | | | | |
| | | | (247,781,339 | ) |
| | | | | | | | |
Energy—(5.0%) | | | | | |
Approach Resources, Inc. * | | | (174,329 | ) | | | (3,882,307 | ) |
Atwood Oceanics, Inc. * | | | (105,830 | ) | | | (5,015,284 | ) |
Bill Barrett Corp. * | | | (363,170 | ) | | | (9,202,728 | ) |
Calfrac Well Services Ltd. | | | (170,010 | ) | | | (5,510,394 | ) |
Carrizo Oil & Gas, Inc. * | | | (256,340 | ) | | | (12,750,352 | ) |
Chesapeake Energy Corp. | | | (567,865 | ) | | | (14,713,382 | ) |
ConocoPhillips | | | (204,029 | ) | | | (13,567,929 | ) |
Continental Resources, Inc. * | | | (130,468 | ) | | | (15,593,535 | ) |
Crescent Point Energy Corp. | | | (281,933 | ) | | | (9,894,262 | ) |
Encana Corp. | | | (620,359 | ) | | | (11,774,414 | ) |
Energy XXI Bermuda Ltd. | | | (227,942 | ) | | | (5,279,137 | ) |
Fugro NV | | | (162,386 | ) | | | (9,416,431 | ) |
Goodrich Petroleum Corp. * | | | (316,488 | ) | | | (4,310,567 | ) |
HollyFrontier Corp. | | | (273,490 | ) | | | (12,462,939 | ) |
Matador Resources Co. * | | | (572,441 | ) | | | (13,887,419 | ) |
Oasis Petroleum, Inc. * | | | (240,869 | ) | | | (10,494,662 | ) |
Penn West Petroleum Ltd. | | | (1,112,609 | ) | | | (9,123,534 | ) |
RPC, Inc. | | | (329,396 | ) | | | (6,064,180 | ) |
ShawCor Ltd. | | | (203,678 | ) | | | (8,411,627 | ) |
Ultra Petroleum Corp. * | | | (498,515 | ) | | | (12,542,637 | ) |
| | | | | | | | |
| | | | (193,897,720 | ) |
| | | | | | | | |
Finance—(5.3%) | | | | | |
Aberdeen Asset Management PLC | | | (1,093,236 | ) | | | (7,132,626 | ) |
Astoria Financial Corp. | | | (521,187 | ) | | | (7,140,262 | ) |
Aviva PLC | | | (603,305 | ) | | | (4,796,564 | ) |
Bank of Hawaii Corp. | | | (122,147 | ) | | | (7,139,492 | ) |
Commonwealth Bank of Australia | | | (112,466 | ) | | | (7,511,649 | ) |
Community Bank System, Inc. | | | (327,115 | ) | | | (11,916,799 | ) |
CVB Financial Corp. | | | (693,124 | ) | | | (10,791,941 | ) |
Deutsche Bank AG, Registered Shares | | | (110,165 | ) | | | (5,328,072 | ) |
Eaton Vance Corp. | | | (258,324 | ) | | | (9,774,980 | ) |
First Financial Bankshares, Inc. | | | (187,575 | ) | | | (11,344,536 | ) |
Greenhill & Co., Inc. | | | (215,745 | ) | | | (11,492,736 | ) |
HDFC Bank Ltd. — ADR | | | (259,575 | ) | | | (8,719,124 | ) |
Northern Trust Corp. | | | (160,554 | ) | | | (9,930,265 | ) |
Siam Commercial Bank PCL, (The) — NVDR | | | (1,492,800 | ) | | | (6,947,989 | ) |
TCF Financial Corp. | | | (535,395 | ) | | | (8,630,567 | ) |
THEACCOMPANYINGNOTESAREANINTEGRALPARTOFTHEFINANCIALSTATEMENTS.
| | |
| 20 | | SEMI-ANNUAL REPORT 2014 |
| | |
| ROBECO INVESTMENT FUNDS | | FEBRUARY 28, 2014 (unaudited) |
| | |
ROBECO BOSTON PARTNERS LONG/SHORT RESEARCH FUND (continued) | | PORTFOLIOOF INVESTMENTS |
| | | | | | | | |
| | | Number of
Shares | | | Value | |
Finance—(continued) | | | | | |
Trustmark Corp. | | | (444,676 | ) | | $ | (10,730,032 | ) |
UMB Financial Corp. | | | (136,385 | ) | | | (8,502,241 | ) |
United Bankshares, Inc. | | | (414,584 | ) | | | (12,201,207 | ) |
United States Natural Gas Fund LP * | | | (304,395 | ) | | | (7,765,116 | ) |
United States Oil Fund LP * | | | (422,184 | ) | | | (15,511,040 | ) |
Valley National Bancorp | | | (1,080,679 | ) | | | (10,893,244 | ) |
Westamerica Bancorporation | | | (274,352 | ) | | | (13,794,419 | ) |
| | | | | | | | |
| | | | (207,994,901 | ) |
| | | | | | | | |
Health Care—(2.2%) | | | | | | | | |
athenahealth, Inc. * | | | (56,851 | ) | | | (11,021,703 | ) |
Elekta AB, B Shares | | | (869,765 | ) | | | (11,564,491 | ) |
Health Net, Inc. * | | | (305,907 | ) | | | (10,416,133 | ) |
Orion OYJ, Class B | | | (126,056 | ) | | | (4,145,668 | ) |
ResMed, Inc. | | | (340,066 | ) | | | (14,969,705 | ) |
Seattle Genetics, Inc. * | | | (309,069 | ) | | | (16,253,939 | ) |
William Demant Holding * | | | (196,023 | ) | | | (17,640,390 | ) |
| | | | | | | | |
| | | | (86,012,029 | ) |
| | | | | | | | |
Real Estate Investment Trusts—(1.7%) | | | | | |
FelCor Lodging Trust, Inc. | | | (884,107 | ) | | | (7,700,572 | ) |
HCP, Inc. | | | (283,488 | ) | | | (10,990,830 | ) |
Health Care REIT, Inc. | | | (176,833 | ) | | | (10,387,170 | ) |
Omega Healthcare Investors, Inc. | | | (329,262 | ) | | | (10,523,213 | ) |
Realty Income Corp. | | | (324,024 | ) | | | (14,393,146 | ) |
Rouse Properties, Inc. | | | (602,422 | ) | | | (11,277,340 | ) |
| | | | | | | | |
| | | | (65,272,271 | ) |
| | | | | | | | |
Technology—(7.1%) | | | | | | | | |
ADTRAN, Inc. | | | (247,282 | ) | | | (6,478,788 | ) |
Aspen Technology, Inc. * | | | (213,067 | ) | | | (10,003,496 | ) |
AZZ, Inc. | | | (303,773 | ) | | | (13,478,408 | ) |
Blackbaud, Inc. | | | (453,604 | ) | | | (14,206,877 | ) |
Ciena Corp. * | | | (355,727 | ) | | | (8,740,212 | ) |
Cirrus Logic, Inc. * | | | (250,933 | ) | | | (4,830,460 | ) |
Dassault Systemes SA | | | (131,806 | ) | | | (15,151,286 | ) |
Finisar Corp. * | | | (368,144 | ) | | | (8,725,013 | ) |
Hittite Microwave Corp. * | | | (277,925 | ) | | | (16,392,017 | ) |
Infinera Corp. * | | | (1,042,023 | ) | | | (8,669,631 | ) |
Infosys Technologies Ltd. — Sponsored ADR | | | (271,095 | ) | | | (16,718,429 | ) |
International Rectifier Corp. * | | | (535,952 | ) | | | (14,443,906 | ) |
Itron, Inc. * | | | (412,963 | ) | | | (14,453,705 | ) |
National Instruments Corp. | | | (583,142 | ) | | | (16,893,624 | ) |
NetSuite, Inc. * | | | (141,126 | ) | | | (16,242,191 | ) |
Red Hat, Inc. * | | | (213,047 | ) | | | (12,567,643 | ) |
Salesforce.com, Inc. * | | | (324,472 | ) | | | (20,237,319 | ) |
Skyworks Solutions, Inc. * | | | (224,357 | ) | | | (7,955,699 | ) |
Tyler Technologies, Inc. * | | | (113,440 | ) | | | (10,638,403 | ) |
ViaSat, Inc. * | | | (168,901 | ) | | | (11,267,386 | ) |
VMware, Inc., Class A * | | | (38,812 | ) | | | (3,727,893 | ) |
VTech Holdings Ltd. | | | (370,000 | ) | | | (4,181,276 | ) |
Wipro Ltd. — ADR | | | (1,375,808 | ) | | | (18,986,150 | ) |
| | | | | | | | |
| | | | (274,989,812 | ) |
| | | | | | | | |
| | | | | | | | |
| | | Number of
Shares | | | Value | |
Transportation—(1.3%) | | | | | | | | |
Hub Group, Inc., Class A * | | | (185,705 | ) | | $ | (7,255,494 | ) |
J.B. Hunt Transport Services, Inc. | | | (129,680 | ) | | | (9,320,102 | ) |
Kansas City Southern | | | (98,280 | ) | | | (9,230,458 | ) |
Keikyu Corp. | | | (737,220 | ) | | | (6,194,929 | ) |
Koninklijke Vopak NV | | | (164,051 | ) | | | (9,592,906 | ) |
Old Dominion Freight Line,
Inc. * | | | (99,400 | ) | | | (5,292,056 | ) |
Panalpina Welttransport Holding AG, Registered Shares | | | (34,525 | ) | | | (5,715,139 | ) |
| | | | | | | | |
| | | | (52,601,084 | ) |
| | | | | | | | |
Utilities—(1.2%) | | | | | | | | |
NextEra Energy, Inc. | | | (75,073 | ) | | | (6,860,921 | ) |
NiSource, Inc. | | | (426,835 | ) | | | (14,862,395 | ) |
Ormat Technologies, Inc. | | | (74,706 | ) | | | (2,073,091 | ) |
Pepco Holdings, Inc. | | | (525,259 | ) | | | (10,710,031 | ) |
TECO Energy, Inc. | | | (793,341 | ) | | | (13,312,262 | ) |
| | | | | | | | |
| | | | (47,818,700 | ) |
| | | | | | | | |
TOTAL COMMON STOCK
(Proceeds $1,597,981,589) | | | | (1,736,793,396 | ) |
| | | | | | | | |
TOTAL SECURITIES SOLD SHORT—(44.6%)
(Proceeds $1,597,981,589) | | | | (1,736,793,396 | ) |
| | | | | | | | |
| | | Number of
Contracts | | | | |
OPTIONS WRITTEN ††—(0.1%) | | | | | |
EOG Resources, Inc.
Call Options
Expires 04/19/14
Strike Price $170 | | | (580 | ) | | | (1,154,200 | ) |
Exxon Mobil Corp. Call Options
Expires 07/19/14
Strike Price $90 | | | (2,000 | ) | | | (1,530,000 | ) |
Exxon Mobil Corp. Call Options
Expires 07/19/14
Strike Price $97.50 | | | (1,700 | ) | | | (442,000 | ) |
| | | | | | | | |
TOTAL OPTIONS WRITTEN
(Premiums received $1,920,469) | | | | (3,126,200 | ) |
| | | | | | | | |
OTHER ASSETS IN EXCESS OF LIABILITIES—51.3% | | | | | | | 1,996,428,131 | |
| | | | | | | | |
NET ASSETS—100.0% | | | | | | $ | 3,891,479,920 | |
| | | | | | | | |
THEACCOMPANYINGNOTESAREANINTEGRALPARTOFTHEFINANCIALSTATEMENTS.
| | | | |
| SEMI-ANNUAL REPORT 2014 | | | 21 | |
| | |
| ROBECO INVESTMENT FUNDS | | FEBRUARY 28, 2014 (unaudited) |
| | |
ROBECO BOSTON PARTNERS LONG/SHORT RESEARCH FUND (concluded) | | PORTFOLIOOF INVESTMENTS |
| | | | |
| ADR | | — | | American Depositary Receipt |
| LP | | — | | Limited Partnership |
| NVDR | | — | | Non-Voting Depository Receipt |
| PCL | | — | | Public Company Limited |
| PLC | | — | | Public Limited Company |
| REIT | | — | | Real Estate Investment Trust |
| SDR | | — | | Swedish Depositary Receipt |
| * | | — | | Non-income producing. |
| † | | — | | Security position is either entirely or partially held in a segregated account as collateral for securities sold short. |
| †† | | — | | Primary risk exposure is equity contracts. |
A summary of the inputs used to value the Fund’s investments as of February 28, 2014 is as follows (see Note I in the Notes to Financial Statements):
| | | | | | | | | | | | | | | | |
| | | Total
Value as of
February 28, 2014 | | | Level 1
Quoted
Price | | | Level 2
Significant
Observable
Inputs | | | Level 3
Significant
Unobservable
Inputs | |
| | | | | | | | | | | | | | | | |
Common Stock | | | | | | | | | | | | | | | | |
Basic Industries | | $ | 217,705,032 | | | $ | 201,789,886 | | | $ | 15,915,146 | | | $ | — | |
Capital Goods | | | 399,005,956 | | | | 374,472,212 | | | | 24,533,744 | | | | — | |
Communications | | | 143,783,385 | | | | 140,259,173 | | | | 3,524,212 | | | | — | |
Consumer Durables | | | 126,050,604 | | | | 88,121,375 | | | | 37,929,229 | | | | — | |
Consumer Non-Durables | | | 189,909,697 | | | | 96,536,338 | | | | 93,373,359 | | | | — | |
Consumer Services | | | 399,983,269 | | | | 384,630,103 | | | | 15,353,166 | | | | — | |
Energy | | | 433,691,217 | | | | 425,043,043 | | | | 8,648,174 | | | | — | |
Finance | | | 637,257,885 | | | | 608,838,793 | | | | 28,419,092 | | | | — | |
Health Care | | | 452,449,457 | | | | 452,449,457 | | | | — | | | | — | |
Real Estate Investment Trusts | | | 58,437,188 | | | | 58,437,188 | | | | — | | | | — | |
Technology | | | 563,959,704 | | | | 535,257,495 | | | | 28,702,209 | | | | — | |
Transportation | | | 12,737,991 | | | | 12,737,991 | | | | — | | | | — | |
| | | | | | | | | | | | | | | | |
Total Assets | | $ | 3,634,971,385 | | | $ | 3,378,573,054 | | | $ | 256,398,331 | | | $ | — | |
| | | | | | | | | | | | | | | | |
| | | | |
| | | Total
Value as of
February 28, 2014 | | | Level 1
Quoted
Price | | | Level 2
Significant
Observable
Inputs | | | Level 3
Significant
Unobservable
Inputs | |
Securities Sold Short | | | | | | | | | | | | | | | | |
Basic Industries | | $ | (105,400,091 | ) | | $ | (77,263,208 | ) | | $ | (28,136,883 | ) | | $ | — | |
Capital Goods | | | (135,269,798 | ) | | | (104,562,453 | ) | | | (30,707,345 | ) | | | — | |
Communications | | | (150,245,809 | ) | | | (105,489,627 | ) | | | (44,756,182 | ) | | | — | |
Consumer Durables | | | (28,031,153 | ) | | | (22,680,406 | ) | | | (5,350,747 | ) | | | — | |
Consumer Non-Durables | | | (141,478,689 | ) | | | (108,333,183 | ) | | | (33,145,506 | ) | | | — | |
Consumer Services | | | (247,781,339 | ) | | | (235,159,274 | ) | | | (12,622,065 | ) | | | — | |
Energy | | | (193,897,720 | ) | | | (184,481,289 | ) | | | (9,416,431 | ) | | | — | |
Finance | | | (207,994,901 | ) | | | (176,278,001 | ) | | | (31,716,900 | ) | | | — | |
Health Care | | | (86,012,029 | ) | | | (64,225,971 | ) | | | (21,786,058 | ) | | | — | |
Real Estate Investment Trusts | | | (65,272,271 | ) | | | (65,272,271 | ) | | | — | | | | — | |
Technology | | | (274,989,812 | ) | | | (274,989,812 | ) | | | — | | | | — | |
Transportation | | | (52,601,084 | ) | | | (31,098,110 | ) | | | (21,502,974 | ) | | | — | |
Utilities | | | (47,818,700 | ) | | | (47,818,700 | ) | | | — | | | | — | |
Options Written | | | | | | | | | | | | | | | | |
Equity Contracts | | | (3,126,200 | ) | | | — | | | | (3,126,200 | ) | | | — | |
| | | | | | | | | | | | | | | | |
Total Liabilities | | $ | (1,739,919,596 | ) | | $ | (1,497,652,305 | ) | | $ | (242,267,291 | ) | | $ | — | |
| | | | | | | | | | | | | | | | |
THEACCOMPANYINGNOTESAREANINTEGRALPARTOFTHEFINANCIALSTATEMENTS.
| | |
| 22 | | SEMI-ANNUAL REPORT 2014 |
| | |
| ROBECO INVESTMENT FUNDS | | FEBRUARY 28, 2014 (unaudited) |
| | |
ROBECO BOSTON PARTNERS ALL-CAP VALUE FUND | | PORTFOLIOOF INVESTMENTS |
| | | | | | | | |
| | | Number of
Shares | | | Value | |
COMMON STOCK—95.8% | | | | | | | | |
Basic Industries—0.9% | | | | | | | | |
Graphic Packaging Holding Co. * | | | 271,265 | | | $ | 2,777,754 | |
Huntsman Corp. | | | 101,645 | | | | 2,476,072 | |
International Paper Co. | | | 49,740 | | | | 2,431,789 | |
| | | | | | | | |
| | | | | | | 7,685,615 | |
| | | | | | | | |
Capital Goods—5.5% | |
Cubic Corp. | | | 30,705 | | | | 1,596,660 | |
Dover Corp. | | | 81,600 | | | | 7,694,880 | |
Fluor Corp. | | | 28,978 | | | | 2,251,301 | |
Huntington Ingalls Industries, Inc. | | | 41,960 | | | | 4,251,807 | |
Illinois Tool Works, Inc. | | | 29,310 | | | | 2,418,075 | |
Masco Corp. | | | 168,325 | | | | 3,930,389 | |
MRC Global, Inc. * | | | 126,445 | | | | 3,252,165 | |
Parker Hannifin Corp. | | | 64,597 | | | | 7,787,168 | |
Raytheon Co. | | | 50,990 | | | | 4,992,431 | |
Stanley Black & Decker, Inc. | | | 30,265 | | | | 2,513,206 | |
Textron, Inc. | | | 64,605 | | | | 2,564,819 | �� |
Timken Co. | | | 40,035 | | | | 2,416,513 | |
| | | | | | | | |
| | | | | | | 45,669,414 | |
| | | | | | | | |
Communications—1.7% | |
DIRECTV * | | | 122,545 | | | | 9,509,492 | |
IAC/InterActiveCorp. | | | 33,465 | | | | 2,594,541 | |
NetEase, Inc. — ADR | | | 31,665 | | | | 2,190,268 | |
| | | | | | | | |
| | | | | | | 14,294,301 | |
| | | | | | | | |
Consumer Durables—3.5% | |
Brunswick Corp. | | | 104,955 | | | | 4,700,934 | |
Lear Corp. | | | 143,208 | | | | 11,628,490 | |
Newell Rubbermaid, Inc. | | | 143,795 | | | | 4,617,257 | |
Thor Industries, Inc. | | | 94,205 | | | | 5,276,422 | |
TRW Automotive Holdings Corp. * | | | 30,390 | | | | 2,501,705 | |
| | | | | | | | |
| | | | | | | 28,724,808 | |
| | | | | | | | |
Consumer Non-Durables—4.9% | |
Activision Blizzard, Inc. | | | 484,575 | | | | 9,376,526 | |
Electronic Arts, Inc. * | | | 275,903 | | | | 7,888,067 | |
Jones Group, Inc., (The) | | | 206,315 | | | | 3,082,346 | |
Lorillard, Inc. | | | 169,205 | | | | 8,301,197 | |
PepsiCo, Inc. | | | 80,450 | | | | 6,441,632 | |
Tyson Foods, Inc., Class A | | | 136,895 | | | | 5,400,508 | |
| | | | | | | | |
| | | | | | | 40,490,276 | |
| | | | | | | | |
Consumer Services—10.0% | |
Conversant, Inc. * | | | 176,840 | | | | 4,396,242 | |
CVS Caremark Corp. | | | 63,765 | | | | 4,663,772 | |
eBay, Inc. * | | | 113,210 | | | | 6,653,352 | |
Equifax, Inc. | | | 52,745 | | | | 3,695,315 | |
Foot Locker, Inc. | | | 96,830 | | | | 4,038,779 | |
Kohl’s Corp. | | | 174,836 | | | | 9,824,035 | |
Korn/Ferry International * | | | 81,996 | | | | 2,081,878 | |
Macy’s, Inc. | | | 126,820 | | | | 7,337,805 | |
Manpowergroup, Inc. | | | 68,425 | | | | 5,348,098 | |
Omnicom Group, Inc. | | | 105,700 | | | | 7,999,376 | |
Staples, Inc. | | | 111,345 | | | | 1,513,179 | |
Target Corp. | | | 168,490 | | | | 10,537,365 | |
| | | | | | | | |
| | | Number of
Shares | | | Value | |
Consumer Services—(continued) | |
Viacom, Inc., Class B | | | 64,555 | | | $ | 5,663,410 | |
Walt Disney Co., (The) | | | 105,840 | | | | 8,552,930 | |
| | | | | | | | |
| | | | | | | 82,305,536 | |
| | | | | | | | |
Energy—8.6% | |
Canadian Natural Resources Ltd. | | | 68,230 | | | | 2,498,583 | |
Energen Corp. | | | 104,965 | | | | 8,443,385 | |
EOG Resources, Inc. | | | 46,385 | | | | 8,786,247 | |
Exxon Mobil Corp. | | | 172,545 | | | | 16,610,907 | |
Occidental Petroleum Corp. | | | 183,205 | | | | 17,682,947 | |
Phillips 66 | | | 139,885 | | | | 10,471,791 | |
Rosetta Resources, Inc. * | | | 44,300 | | | | 1,965,591 | |
Valero Energy Corp. | | | 94,850 | | | | 4,550,903 | |
| | | | | | | | |
| | | | | | | 71,010,354 | |
| | | | | | | | |
Finance—26.5% | |
ACE Ltd. | | | 77,455 | | | | 7,580,520 | |
Alleghany Corp. * | | | 14,997 | | | | 5,781,343 | |
Allstate Corp., (The) | | | 75,305 | | | | 4,086,049 | |
American International Group, Inc. | | | 167,345 | | | | 8,328,760 | |
Axis Capital Holdings Ltd. | | | 133,995 | | | | 5,891,760 | |
BB&T Corp. | | | 292,165 | | | | 11,043,837 | |
Bond Street Holdings, Inc., Class A 144A * ‡ | | | 50,936 | | | | 835,350 | |
Bond Street Holdings, Inc., Class B 144A * ‡ | | | 12,734 | | | | 208,838 | |
Capital One Financial Corp. | | | 230,605 | | | | 16,933,325 | |
Citigroup, Inc. # | | | 289,232 | | | | 14,065,352 | |
Federated Investors, Inc., Class B (a) | | | 120,535 | | | | 3,302,659 | |
Fifth Third Bancorp | | | 306,595 | | | | 6,651,579 | |
First Southern Bancorp, Inc.
Class B * ‡ | | | 17,550 | | | | 108,810 | |
Goldman Sachs Group, Inc., (The) | | | 48,445 | | | | 8,063,670 | |
Huntington Bancshares, Inc. | | | 603,270 | | | | 5,749,163 | |
JPMorgan Chase & Co. | | | 465,365 | | | | 26,442,039 | |
Loews Corp. | | | 196,994 | | | | 8,565,299 | |
MetLife, Inc. | | | 196,300 | | | | 9,946,521 | |
National Bank Holdings Corp., Class A | | | 165,065 | | | | 3,240,226 | |
OneBeacon Insurance Group Ltd., Class A | | | 178,375 | | | | 2,925,350 | |
Peoples Choice Financial Corp. 144A * | | | 1,465 | | | | 0 | |
Prudential Financial, Inc. | | | 112,965 | | | | 9,554,580 | |
Raymond James Financial, Inc. | | | 84,300 | | | | 4,449,354 | |
SLM Corp. | | | 230,525 | | | | 5,518,769 | |
Solar Cayman Ltd. 144A * | | | 19,375 | | | | 0 | |
State Street Corp. | | | 109,625 | | | | 7,199,074 | |
Torchmark Corp. | | | 88,500 | | | | 6,859,635 | |
Travelers Cos., Inc., (The) | | | 92,510 | | | | 7,756,038 | |
Validus Holdings Ltd. | | | 156,204 | | | | 5,749,869 | |
Wells Fargo & Co. | | | 272,825 | | | | 12,664,537 | |
White Mountains Insurance Group Ltd. | | | 8,675 | | | | 5,027,683 | |
WR Berkley Corp. | | | 94,850 | | | | 3,911,614 | |
| | | | | | | | |
| | | | | | | 218,441,603 | |
| | | | | | | | |
THEACCOMPANYINGNOTESAREANINTEGRALPARTOFTHEFINANCIALSTATEMENTS.
| | | | |
| SEMI-ANNUAL REPORT 2014 | | | 23 | |
| | |
| ROBECO INVESTMENT FUNDS | | FEBRUARY 28, 2014 (unaudited) |
| | |
ROBECO BOSTON PARTNERS ALL-CAP VALUE FUND (continued) | | PORTFOLIOOF INVESTMENTS |
| | | | | | | | |
| | | Number of
Shares | | | Value | |
Health Care—17.0% | |
AbbVie, Inc. | | | 88,310 | | | $ | 4,495,862 | |
Allscripts Healthcare Solutions, Inc. * | | | 171,275 | | | | 3,180,576 | |
Amgen, Inc. | | | 195,200 | | | | 24,208,704 | |
Boston Scientific Corp. * | | | 202,800 | | | | 2,656,680 | |
Cardinal Health, Inc. | | | 83,660 | | | | 5,984,200 | |
Covidien PLC | | | 97,275 | | | | 6,998,936 | |
Endo Health Solutions, Inc. * | | | 36,355 | | | | 2,901,856 | |
Express Scripts Holding Co. * | | | 110,370 | | | | 8,311,965 | |
Integra LifeSciences Holdings Corp. * | | | 57,490 | | | | 2,704,330 | |
Johnson & Johnson | | | 164,725 | | | | 15,174,467 | |
McKesson Corp. | | | 22,660 | | | | 4,011,953 | |
Medtronic, Inc. | | | 133,640 | | | | 7,919,506 | |
Novartis AG — ADR | | | 149,660 | | | | 12,448,719 | |
Pfizer, Inc. | | | 449,741 | | | | 14,441,184 | |
Sanofi — ADR | | | 275,180 | | | | 14,265,331 | |
UnitedHealth Group, Inc. | | | 72,685 | | | | 5,616,370 | |
WellPoint, Inc. | | | 49,900 | | | | 4,520,441 | |
| | | | | | | | |
| | | | | | | 139,841,080 | |
| | | | | | | | |
Real Estate Investment Trusts—0.2% | |
Colony Financial, Inc. | | | 46,925 | | | | 1,059,567 | |
Terreno Realty Corp. | | | 33,810 | | | | 631,571 | |
TMST, Inc. ‡ | | | 191,097 | | | | 0 | |
| | | | | | | | |
| | | | | | | 1,691,138 | |
| | | | | | | | |
Technology—17.0% | | | | | | | | |
Amdocs Ltd. | | | 90,435 | | | | 4,022,548 | |
Arrow Electronics, Inc. * | | | 116,732 | | | | 6,610,533 | |
Avago Technologies Ltd. | | | 49,780 | | | | 3,071,426 | |
Avnet, Inc. | | | 144,222 | | | | 6,277,983 | |
BancTec, Inc. 144A * ‡ | | | 14,327 | | | | 28,941 | |
Brocade Communications Systems, Inc. * | | | 415,490 | | | | 3,976,239 | |
CA, Inc. | | | 244,960 | | | | 8,206,160 | |
Cisco Systems, Inc. | | | 559,535 | | | | 12,197,863 | |
EMC Corp. | | | 662,935 | | | | 17,481,596 | |
Fidelity National Information Services, Inc. | | | 119,235 | | | | 6,630,658 | |
Flextronics International Ltd. * | | | 1,462,501 | | | | 13,089,384 | |
Global Payments, Inc. | | | 44,600 | | | | 3,136,718 | |
Jabil Circuit, Inc. | | | 223,550 | | | | 4,137,911 | |
LSI Corp. | | | 411,585 | | | | 4,564,478 | |
Microsemi Corp. * | | | 77,615 | | | | 1,789,802 | |
Microsoft Corp. | | | 227,625 | | | | 8,720,314 | |
ON Semiconductor Corp. * | | | 548,945 | | | | 5,127,146 | |
Seagate Technology PLC | | | 46,125 | | | | 2,407,264 | |
TE Connectivity Ltd. | | | 213,185 | | | | 12,488,377 | |
Total System Services, Inc. | | | 142,070 | | | | 4,327,452 | |
Vantiv, Inc., Class A * | | | 73,990 | | | | 2,355,102 | |
Vishay Intertechnology, Inc. | | | 330,985 | | | | 4,680,128 | |
Western Digital Corp. | | | 54,735 | | | | 4,761,398 | |
| | | | | | | | |
| | | | | | | 140,089,421 | |
| | | | | | | | |
TOTAL COMMON STOCK (Cost $631,296,157) | | | | | | | 790,243,546 | |
| | | | | | | | |
| | | | | | | | |
| | | Number of
Shares | | | Value | |
PREFERRED STOCK—0.0% | | | | | | | | |
Finance—0.0% | | | | | | | | |
First Southern Bancorp, Inc., 5.000% ‡ | | | 30 | | | $ | 43,192 | |
| | | | | | | | |
TOTAL PREFERRED STOCK (Cost $30,000) | | | | | | | 43,192 | |
| | | | | | | | |
SECURITIES LENDING COLLATERAL—0.3% | |
BlackRock Liquidity TempFund, Institutional Shares | | | 2,725,161 | | | | 2,725,161 | |
| | | | | | | | |
TOTAL SECURITIES LENDING COLLATERAL
(Cost $2,725,161) | | | | | | | 2,725,161 | |
| | | | | | | | |
TOTAL INVESTMENTS—96.1% (Cost $634,051,318) | | | | | | | 793,011,899 | |
| | | | | | | | |
| | | Number of
Contracts | | | | |
OPTIONS WRITTEN ††—0.0% | | | | | | | | |
Citigroup Inc. Call Options
Expires 01/17/15
Strike Price $60 | | | (849 | ) | | | (91,692 | ) |
| | | | | | | | |
TOTAL OPTIONS WRITTEN (Premiums received $212,360) | | | | | | | (91,692 | ) |
| | | | | | | | |
OTHER ASSETS IN EXCESS OF LIABILITIES—3.9% | | | | | | | 32,370,893 | |
| | | | | | | | |
NET ASSETS—100.0% | | | | | | $ | 825,291,100 | |
| | | | | | | | |
| | | | |
| ADR | | — | | American Depositary Receipt |
| PLC | | — | | Public Limited Company |
| 144A | | — | | Security was purchased pursuant to Rule 144A under the Securities Act of 1933 and may not be resold subject to that rule except to qualified institutional buyers. As of February 28, 2014, these securities amounted to $1,073,129 or 0.1% of net assets. These 144A securities have not been deemed illiquid. |
| * | | — | | Non-income producing. |
| ‡ | | — | | Security has been valued at fair market value as determined in good faith by or under the direction of The RBB Fund, Inc.‘s Board of Directors. As of February 28, 2014, these securities amounted to $1,225,131 or 0.1% of net assets. |
| # | | — | | Security segregated as collateral for options written. |
| (a) | | — | | All or a portion of the security is on loan (See Note 6 of the Notes to Financial Statements). |
| †† | | — | | Primary risk exposure is equity contracts. |
THEACCOMPANYINGNOTESAREANINTEGRALPARTOFTHEFINANCIALSTATEMENTS.
| | |
| 24 | | SEMI-ANNUAL REPORT 2014 |
| | |
| ROBECO INVESTMENT FUNDS | | FEBRUARY 28, 2014 (unaudited) |
| | |
ROBECO BOSTON PARTNERS ALL-CAP VALUE FUND (concluded) | | PORTFOLIOOF INVESTMENTS |
A summary of the inputs used to value the Fund’s investments as of February 28, 2014 is as follows (see Note I in the Notes to Financial Statements):
| | | | | | | | | | | | | | | | |
| | | Total
Value as of
February 28, 2014 | | | Level 1
Quoted
Price | | | Level 2
Significant
Observable
Inputs | | | Level 3
Significant
Unobservable
Inputs | |
| | | | | | | | | | | | | | | | |
Common Stock | | | | | | | | | | | | | | | | |
Basic Industries | | $ | 7,685,615 | | | $ | 7,685,615 | | | $ | — | | | $ | — | |
Capital Goods | | | 45,669,414 | | | | 45,669,414 | | | | — | | | | — | |
Communications | | | 14,294,301 | | | | 14,294,301 | | | | — | | | | — | |
Consumer Durables | | | 28,724,808 | | | | 28,724,808 | | | | — | | | | — | |
Consumer Non-Durables | | | 40,490,276 | | | | 40,490,276 | | | | — | | | | — | |
Consumer Services | | | 82,305,536 | | | | 82,305,536 | | | | — | | | | — | |
Energy | | | 71,010,354 | | | | 71,010,354 | | | | — | | | | — | |
Finance | | | 218,441,603 | | | | 217,288,605 | | | | — | | | | 1,152,998 | |
Health Care | | | 139,841,080 | | | | 139,841,080 | | | | — | | | | — | |
Real Estate Investment Trusts | | | 1,691,138 | | | | 1,691,138 | | | | — | | | | — | |
Technology | | | 140,089,421 | | | | 140,060,480 | | | | — | | | | 28,941 | |
Preferred Stock | | | | | | | | | | | | | | | | |
Finance | | | 43,192 | | | | — | | | | — | | | | 43,192 | |
Securities Lending Collateral | | | 2,725,161 | | | | 2,725,161 | | | | — | | | | — | |
| | | | | | | | | | | | | | | | |
Total Assets | | $ | 793,011,899 | | | $ | 791,786,768 | | | $ | — | | | $ | 1,225,131 | |
| | | | | | | | | | | | | | | | |
| | | | |
| | | Total
Value as of
February 28, 2014 | | | Level 1
Quoted
Price | | | Level 2
Significant
Observable
Inputs | | | Level 3
Significant
Unobservable
Inputs | |
Options Written | | | | | | | | | | | | | | | | |
Equity Contracts | | $ | (91,692 | ) | | $ | — | | | $ | (91,692 | ) | | $ | — | |
| | | | | | | | | | | | | | | | |
Total Liabilities | | $ | (91,692 | ) | | $ | — | | | $ | (91,692 | ) | | $ | — | |
| | | | | | | | | | | | | | | | |
THEACCOMPANYINGNOTESAREANINTEGRALPARTOFTHEFINANCIALSTATEMENTS.
| | | | |
| SEMI-ANNUAL REPORT 2014 | | | 25 | |
| | |
| ROBECO INVESTMENT FUNDS | | FEBRUARY 28, 2014 (unaudited) |
| | |
ROBECO WPG SMALL/MICRO CAP VALUE FUND | | PORTFOLIOOF INVESTMENTS |
| | | | | | | | |
| | | Number of
Shares | | | Value | |
COMMON STOCK—95.3% | | | | | | | | |
Basic Industries—1.6% | | | | | | | | |
Cloud Peak Energy, Inc. * | | | 10,900 | | | $ | 211,460 | |
GrafTech International Ltd. * | | | 33,000 | | | | 320,100 | |
Novagold Resources, Inc. * | | | 48,700 | | | | 179,703 | |
| | | | | | | | |
| | | | 711,263 | |
| | | | | | | | |
Capital Goods—7.8% | | | | | | | | |
Aegion Corp. * | | | 16,400 | | | | 379,660 | |
FreightCar America, Inc. | | | 5,900 | | | | 150,804 | |
Global Power Equipment Group, Inc. | | | 19,000 | | | | 348,080 | |
Great Lakes Dredge & Dock Corp. | | | 76,500 | | | | 631,890 | |
Landec Corp. * | | | 13,700 | | | | 139,603 | |
LSB Industries, Inc. * | | | 12,000 | | | | 392,280 | |
MRC Global, Inc. * | | | 14,500 | | | | 372,940 | |
MYR Group, Inc. * | | | 16,800 | | | | 390,936 | |
Orion Marine Group, Inc. * | | | 25,200 | | | | 284,508 | |
Tutor Perini Corp. * | | | 19,000 | | | | 468,350 | |
| | | | | | | | |
| | | | 3,559,051 | |
| | | | | | | | |
Consumer Durables—2.5% | | | | | | | | |
ACCO Brands Corp. * | | | 42,400 | | | | 251,008 | |
Libbey, Inc. * | | | 38,800 | | | | 903,652 | |
| | | | | | | | |
| | | | 1,154,660 | |
| | | | | | | | |
Consumer Non-Durables—3.5% | | | | | | | | |
Chiquita Brands International, Inc. * | | | 40,600 | | | | 444,164 | |
Crocs, Inc. * | | | 19,300 | | | | 293,939 | |
Jones Group, Inc., (The) * | | | 6,600 | | | | 98,604 | |
Matthews International Corp., Class A | | | 7,500 | | | | 307,725 | |
Universal Corp. | | | 8,100 | | | | 466,965 | |
| | | | | | | | |
| | | | 1,611,397 | |
| | | | | | | | |
Consumer Services—8.8% | | | | | | | | |
Bravo Brio Restaurant Group, Inc. * | | | 8,900 | | | | 137,861 | |
Brink’s Co., (The) | | | 9,200 | | | | 279,772 | |
CST Brands, Inc. | | | 3,300 | | | | 107,349 | |
Destination XL Group, Inc. * | | | 34,900 | | | | 198,930 | |
FTI Consulting, Inc. * | | | 16,700 | | | | 487,473 | |
ICF International, Inc. * | | | 6,700 | | | | 270,814 | |
Ignite Restaurant Group, Inc. * | | | 5,300 | | | | 64,872 | |
K12, Inc. * | | | 21,200 | | | | 479,756 | |
KAR Auction Services, Inc. | | | 8,900 | | | | 277,324 | |
MDC Partners, Inc., Class A | | | 23,250 | | | | 522,893 | |
Office Depot, Inc. * | | | 46,200 | | | | 227,766 | |
PRGX Global, Inc. * | | | 70,000 | | | | 422,800 | |
Titan Machinery, Inc. *(a) | | | 34,900 | | | | 552,118 | |
| | | | | | | | |
| | | | 4,029,728 | |
| | | | | | | | |
Energy—11.3% | | | | | | | | |
Aegean Marine Petroleum Network, Inc. | | | 24,400 | | | | 247,172 | |
Approach Resources, Inc. *(a) | | | 62,700 | | | | 1,396,329 | |
Bill Barrett Corp. * | | | 9,500 | | | | 240,730 | |
EPL Oil & Gas, Inc. * | | | 22,100 | | | | 665,210 | |
McDermott International, Inc. * | | | 27,600 | | | | 229,908 | |
North Atlantic Drilling Ltd (a) | | | 38,800 | | | | 353,080 | |
| | | | | | | | |
| | | Number of
Shares | | | Value | |
Energy—(continued) | | | | | | | | |
Nuverra Environmental Solutions, Inc. *(a) | | | 45,090 | | | $ | 766,530 | |
Precision Drilling Corp. | | | 14,700 | | | | 162,582 | |
TETRA Technologies, Inc. * | | | 27,700 | | | | 332,400 | |
Triangle Petroleum Corp. * | | | 61,800 | | | | 553,728 | |
W&T Offshore, Inc. | | | 13,800 | | | | 207,966 | |
| | | | | | | | |
| | | | 5,155,635 | |
| | | | | | | | |
Finance—22.6% | | | | | | | | |
A.B. Watley Group, Inc. * ‡ | | | 93,855 | | | | 253 | |
American Equity Investment Life Holding Co. | | | 14,200 | | | | 310,412 | |
BancorpSouth, Inc. | | | 7,000 | | | | 167,510 | |
Central Pacific Financial Corp. | | | 46,200 | | | | 911,526 | |
CNO Financial Group, Inc. | | | 61,100 | | | | 1,115,686 | |
Customers Bancorp Inc * | | | 8,800 | | | | 173,976 | |
Employers Holdings, Inc. | | | 17,400 | | | | 342,258 | |
FBR & Co. * | | | 21,195 | | | | 551,070 | |
Fidelity & Guaranty Life * | | | 26,400 | | | | 571,824 | |
First Midwest Bancorp, Inc. | | | 17,300 | | | | 288,391 | |
Hanover Insurance Group, Inc., (The) | | | 4,800 | | | | 282,432 | |
Home Loan Servicing Solutions Ltd. | | | 3,600 | | | | 73,872 | |
Kennedy-Wilson Holdings, Inc. | | | 30,000 | | | | 759,000 | |
Maiden Holdings Ltd. | | | 54,900 | | | | 616,527 | |
Meadowbrook Insurance Group, Inc. | | | 83,400 | | | | 447,858 | |
Nelnet, Inc., Class A | | | 12,600 | | | | 505,512 | |
Northfield Bancorp, Inc. | | | 37,132 | | | | 470,091 | |
Ocwen Financial Corp. * | | | 12,100 | | | | 453,024 | |
OmniAmerican Bancorp, Inc. | | | 7,600 | | | | 165,452 | |
Popular Inc * | | | 13,100 | | | | 374,529 | |
THL Credit, Inc. | | | 14,700 | | | | 232,701 | |
United Community Banks, Inc. * | | | 22,100 | | | | 368,849 | |
ViewPoint Financial Group | | | 11,100 | | | | 277,500 | |
Walter Investment Management Corp. *(a) | | | 13,800 | | | | 352,590 | |
WSFS Financial Corp. | | | 7,300 | | | | 520,417 | |
| | | | | | | | |
| | | | 10,333,260 | |
| | | | | | | | |
Health Care—5.0% | | | | | | | | |
Accuray, Inc. *(a) | | | 99,300 | | | | 931,434 | |
Alere, Inc. * | | | 11,900 | | | | 437,206 | |
Cross Country Healthcare, Inc. * | | | 15,200 | | | | 158,080 | |
Medical Action Industries, Inc. * | | | 16,300 | | | | 119,316 | |
Natus Medical, Inc. * | | | 10,600 | | | | 266,060 | |
Symmetry Medical, Inc. * | | | 35,200 | | | | 372,416 | |
| | | | | | | | |
| | | | 2,284,512 | |
| | | | | | | | |
Real Estate Investment Trusts—12.9% | | | | | |
American Capital Mortgage Investment Corp. | | | 20,000 | | | | 403,400 | |
Campus Crest Communities, Inc. | | | 15,000 | | | | 124,200 | |
CYS Investments, Inc. | | | 46,400 | | | | 408,320 | |
FelCor Lodging Trust, Inc. | | | 65,700 | | | | 572,247 | |
Geo Group, Inc. (The) | | | 37,200 | | | | 1,198,956 | |
Government Properties Income Trust | | | 7,500 | | | | 186,825 | |
THEACCOMPANYINGNOTESAREANINTEGRALPARTOFTHEFINANCIALSTATEMENTS.
| | |
| 26 | | SEMI-ANNUAL REPORT 2014 |
| | |
| ROBECO INVESTMENT FUNDS | | FEBRUARY 28, 2014 (unaudited) |
| | |
ROBECO WPG SMALL/MICRO CAP VALUE FUND (concluded) | | PORTFOLIOOF INVESTMENTS |
| | | | | | | | |
| | | Number of
Shares | | | Value | |
Real Estate Investment Trusts—(continued) | | | | | |
Gramercy Property Trust Inc. * | | | 40,900 | | | $ | 237,220 | |
Hatteras Financial Corp. | | | 14,000 | | | | 276,080 | |
Highwoods Properties, Inc. | | | 4,010 | | | | 151,217 | |
Lexington Realty Trust | | | 37,000 | | | | 422,170 | |
Mack-Cali Realty Corp. | | | 15,800 | | | | 351,550 | |
Rouse Properties, Inc. (a) | | | 33,300 | | | | 623,376 | |
Starwood Property Trust, Inc. | | | 13,900 | | | | 333,878 | |
Two Harbors Investment Corp. | | | 21,800 | | | | 226,284 | |
Winthrop Realty Trust | | | 30,500 | | | | 355,020 | |
| | | | | | | | |
| | | | 5,870,743 | |
| | | | | | | | |
Technology—8.4% | | | | | | | | |
ChipMOS TECHNOLOGIES Bermuda Ltd. | | | 6,400 | | | | 145,920 | |
CIBER, Inc. * | | | 112,700 | | | | 538,706 | |
Computer Task Group, Inc. | | | 29,900 | | | | 485,875 | |
Digi International, Inc. * | | | 41,600 | | | | 397,280 | |
Diodes, Inc. * | | | 11,800 | | | | 280,958 | |
Exar Corp. * | | | 37,700 | | | | 431,665 | |
Extreme Networks, Inc. * | | | 18,700 | | | | 107,151 | |
Kulicke & Soffa Industries, Inc. * | | | 8,600 | | | | 99,244 | |
Plantronics, Inc. | | | 9,000 | | | | 399,420 | |
Saba Software, Inc. * | | | 39,600 | | | | 495,792 | |
Ultratech, Inc. * | | | 17,900 | | | | 469,338 | |
| | | | | | | | |
| | | | 3,851,349 | |
| | | | | | | | |
Transportation—6.6% | | | | | | | | |
Air Transport Services Group,
Inc. * | | | 43,900 | | | | 280,521 | |
JetBlue Airways Corp. * | | | 69,800 | | | | 616,334 | |
Navigator Holdings Ltd * | | | 13,800 | | | | 333,270 | |
Rand Logistics, Inc. * (a) | | | 29,000 | | | | 196,330 | |
Scorpio Bulkers Inc * (a) | | | 42,500 | | | | 401,625 | |
Scorpio Tankers, Inc. | | | 82,200 | | | | 804,738 | |
StealthGas, Inc. * | | | 35,100 | | | | 368,901 | |
| | | | | | | | |
| | | | 3,001,719 | |
| | | | | | | | |
| | | | | | | | |
| | | Number of
Shares | | | Value | |
Utilities—4.3% | | | | | | | | |
Cadiz, Inc. * (a) | | | 40,600 | | | $ | 302,876 | |
Empire District Electric Co. (The) | | | 8,900 | | | | 211,286 | |
Great Plains Energy, Inc. | | | 9,100 | | | | 239,057 | |
NorthWestern Corp. | | | 3,700 | | | | 169,978 | |
Piedmont Natural Gas Co., Inc. | | | 11,000 | | | | 372,020 | |
Portland General Electric Co. | | | 8,100 | | | | 257,580 | |
UIL Holdings Corp. | | | 10,800 | | | | 418,176 | |
| | | | | | | | |
| | | | 1,970,973 | |
| | | | | | | | |
TOTAL COMMON STOCK
(Cost $34,149,454) | | | | | | | 43,534,290 | |
| | | | | | | | |
SECURITIES LENDING COLLATERAL—11.6% | |
Commercial Services—11.6% | | | | | | | | |
BlackRock Liquidity TempFund, Institutional Shares | | | 5,306,318 | | | | 5,306,318 | |
| | | | | | | | |
TOTAL SECURITIES LENDING COLLATERAL
(Cost $5,306,318) | | | | | | | 5,306,318 | |
| | | | | | | | |
TOTAL INVESTMENTS—106.9%
(Cost $39,455,772) | | | | | | | 48,840,608 | |
| | | | | | | | |
LIABILITIES IN EXCESS OF OTHER ASSETS—(6.9)% | | | | | | | (3,165,533 | ) |
| | | | | | | | |
NET ASSETS—100.0% | | | | | | $ | 45,675,075 | |
| | | | | | | | |
| | | | |
| ADR | | — | | American Depositary Receipt |
| PLC | | — | | Public Limited Company |
| * | | — | | Non-income Producing |
| (a) | | — | | All or a portion of the security is on loan (See Note 6 of the Notes to Financial Statements). |
| ‡ | | — | | Security has been valued at fair market value as determined in good faith by or under the direction of the RBB Fund, Inc.’s Board of Directors. As of February 28, 2014, these securities amounted to $253 or 0.0% of net assets. |
A summary of the inputs used to value the Fund’s investments as of February 28, 2014 is as follows (see Note 1 in the Notes to Financial Statements):
| | | | | | | | | | | | | | | | |
| | | Total
Value as of
February 28, 2014 | | | Level 1
Quoted
Price | | | Level 2
Significant
Observable
Inputs | | | Level 3
Significant
Unobservable
Inputs | |
Common Stock * | | $ | 43,534,290 | | | $ | 43,534,290 | | | $ | — | | | $ | — | |
Securities Lending Collateral | | | 5,306,318 | | | | 5,306,318 | | | | — | | | | — | |
| | | | | | | | | | | | | | | | |
Total Assets | | $ | 48,840,608 | | | $ | 48,840,608 | | | $ | — | | | $ | — | |
| | | | | | | | | | | | | | | | |
| * | See Portfolio of Investments detail for industry and security type breakout. |
THEACCOMPANYINGNOTESAREANINTEGRALPARTOFTHEFINANCIALSTATEMENTS.
| | | | |
| SEMI-ANNUAL REPORT 2014 | | | 27 | |
| | |
| ROBECO INVESTMENT FUNDS | | FEBRUARY 28, 2014 (unaudited) |
| | |
ROBECO BOSTON PARTNERS GLOBAL EQUITY FUND | | PORTFOLIOOF INVESTMENTS |
| | | | | | | | |
| | | Number of
Shares | | | Value | |
COMMON STOCK—95.5% | | | | | | | | |
Bermuda—0.7% | | | | | | | | |
Validus Holdings Ltd. | | | 13,395 | | | $ | 493,070 | |
| | | | | | | | |
Canada—0.5% | | | | | | | | |
Canadian Natural Resources Ltd. | | | 8,700 | | | | 318,364 | |
| | | | | | | | |
Denmark—0.7% | | | | | | | | |
Carlsberg A/S, Class B | | | 4,750 | | | | 500,424 | |
| | | | | | | | |
France—4.3% | | | | | | | | |
Atos | | | 9,540 | | | | 925,045 | |
AXA SA | | | 13,160 | | | | 342,783 | |
LISI | | | 3,275 | | | | 531,835 | |
Sanofi | | | 4,130 | | | | 429,561 | |
Teleperformance SA | | | 12,020 | | | | 763,318 | |
| | | | | | | | |
| | | | | | | 2,992,542 | |
| | | | | | | | |
Germany—7.0% | | | | | | | | |
Allianz SE, Registered Shares | | | 3,490 | | | | 622,391 | |
Aurelius AG | | | 22,475 | | | | 885,618 | |
Bayer AG, Registered Shares | | | 5,685 | | | | 806,136 | |
Fresenius SE & Co. KGaA | | | 6,800 | | | | 1,055,238 | |
Henkel AG & Co. KGaA | | | 8,395 | | | | 848,002 | |
NORMA Group AG | | | 11,028 | | | | 632,096 | |
| | | | | | | | |
| | | | | | | 4,849,481 | |
| | | | | | | | |
Hong Kong—1.3% | | | | | | | | |
Cheung Kong Holdings Ltd. | | | 32,000 | | | | 502,477 | |
Hutchison Whampoa Ltd. | | | 28,000 | | | | 378,231 | |
| | | | | | | | |
| | | | | | | 880,708 | |
| | | | | | | | |
Ireland—2.9% | | | | | | | | |
Greencore Group PLC | | | 219,455 | | | | 979,863 | |
Smurfit Kappa Group PLC * | | | 38,555 | | | | 1,073,581 | |
| | | | | | | | |
| | | | | | | 2,053,444 | |
| | | | | | | | |
Japan—6.0% | | | | | | | | |
Inpex Corp. | | | 34,600 | | | | 439,652 | |
ITOCHU Corp. | | | 40,400 | | | | 503,461 | |
Lintec Corp. | | | 37,400 | | | | 728,035 | |
Nippon Telegraph & Telephone Corp. | | | 7,900 | | | | 444,763 | |
Seven & I Holdings Co. Ltd. | | | 9,900 | | | | 372,251 | |
Toho Holdings Co. Ltd. | | | 19,200 | | | | 396,409 | |
Toyota Motor Corp. | | | 14,800 | | | | 851,786 | |
TS Tech Co. Ltd. | | | 14,500 | | | | 474,736 | |
| | | | | | | | |
| | | | | | | 4,211,093 | |
| | | | | | | | |
South Korea—0.5% | | | | | | | | |
Samsung Electronics Co. Ltd. | | | 267 | | | | 338,236 | |
| | | | | | | | |
Switzerland—7.4% | | | | | | | | |
ACE Ltd. | | | 6,195 | | | | 606,304 | |
Aryzta AG | | | 11,740 | | | | 979,019 | |
Georg Fischer AG, Registered Shares | | | 1,165 | | | | 932,789 | |
Novartis AG, Registered Shares | | | 11,630 | | | | 967,966 | |
Roche Holding AG, Participation Certificate | | | 5,335 | | | | 1,642,647 | |
| | | | | | | | |
| | | | | | | 5,128,725 | |
| | | | | | | | |
| | | | | | | | |
| | | Number of
Shares | | | Value | |
Taiwan—0.5% | | | | | | | | |
MediaTek, Inc. | | | 25,000 | | | $ | 368,544 | |
| | | | | | | | |
United Kingdom—11.1% | | | | | | | | |
AstraZeneca PLC | | | 12,535 | | | | 852,088 | |
Berendsen PLC | | | 61,695 | | | | 1,081,958 | |
BHP Billiton PLC | | | 12,630 | | | | 407,022 | |
Entertainment One Ltd. | | | 131,545 | | | | 759,956 | |
HSBC Holdings PLC | | | 49,497 | | | | 522,388 | |
Inchcape PLC | | | 40,585 | | | | 426,203 | |
Meggitt PLC | | | 89,095 | | | | 750,528 | |
Melrose Industries PLC | | | 68,793 | | | | 377,783 | |
Rio Tinto PLC | | | 5,930 | | | | 340,028 | |
Standard Chartered PLC | | | 21,930 | | | | 464,219 | |
Stock Spirits Group PLC * | | | 183,959 | | | | 884,092 | |
WPP PLC | | | 38,335 | | | | 839,618 | |
| | | | | | | | |
| | | | | | | 7,705,883 | |
| | | | | | | | |
United States—52.6% | | | | | | | | |
AbbVie, Inc. | | | 12,860 | | | | 654,702 | |
Allstate Corp., (The) | | | 16,720 | | | | 907,227 | |
American Capital Agency Corp. REIT | | | 24,430 | | | | 544,545 | |
Amgen, Inc. | | | 8,025 | | | | 995,260 | |
Annaly Capital Management, Inc. | | | 48,210 | | | | 538,988 | |
Apple, Inc. | | | 1,910 | | | | 1,005,118 | |
Avnet, Inc. | | | 16,255 | | | | 707,580 | |
BB&T Corp. | | | 17,470 | | | | 660,366 | |
Berkshire Hathaway, Inc., Class B * | | | 6,830 | | | | 790,777 | |
Berry Plastics Group, Inc. * | | | 46,740 | | | | 1,137,184 | |
Brocade Communications Systems, Inc. | | | 72,150 | | | | 690,475 | |
Capital One Financial Corp. | | | 7,080 | | | | 519,884 | |
Cardinal Health, Inc. | | | 9,105 | | | | 651,280 | |
CBS Corp., Class B non-voting shares | | | 8,795 | | | | 589,968 | |
Cinemark Holdings, Inc. | | | 10,120 | | | | 297,730 | |
Citigroup, Inc. | | | 22,650 | | | | 1,101,469 | |
Comcast Corp., Class A | | | 30,810 | | | | 1,592,569 | |
Crown Holdings, Inc. * | | | 17,780 | | | | 800,456 | |
CVR Partners LP | | | 12,390 | | | | 245,942 | |
CVS Caremark Corp. | | | 25,300 | | | | 1,850,442 | |
DIRECTV * | | | 4,870 | | | | 377,912 | |
Dover Corp. | | | 3,830 | | | | 361,169 | |
EMC Corp. | | | 22,120 | | | | 583,304 | |
Energen Corp. | | | 6,025 | | | | 484,651 | |
Energizer Holdings, Inc. | | | 4,945 | | | | 481,346 | |
EOG Resources, Inc. | | | 2,960 | | | | 560,683 | |
EQT Corp. | | | 3,225 | | | | 329,885 | |
Exxon Mobil Corp. | | | 7,885 | | | | 759,089 | |
Fifth Third Bancorp | | | 25,375 | | | | 550,511 | |
Graphic Packaging Holding Co. * | | | 114,505 | | | | 1,172,531 | |
Honeywell International, Inc. | | | 8,250 | | | | 779,130 | |
International Paper Co. | | | 15,665 | | | | 765,862 | |
Jabil Circuit, Inc. | | | 29,260 | | | | 541,603 | |
Johnson & Johnson | | | 12,475 | | | | 1,149,197 | |
JPMorgan Chase & Co. | | | 13,590 | | | | 772,184 | |
Lear Corp. | | | 13,050 | | | | 1,059,660 | |
Liberty Global PLC, Series C * | | | 16,700 | | | | 1,413,822 | |
Macy’s, Inc. | | | 26,425 | | | | 1,528,951 | |
THEACCOMPANYINGNOTESAREANINTEGRALPARTOFTHEFINANCIALSTATEMENTS.
| | |
| 28 | | SEMI-ANNUAL REPORT 2014 |
| | |
| ROBECO INVESTMENT FUNDS | | FEBRUARY 28, 2014 (unaudited) |
| | |
ROBECO BOSTON PARTNERS GLOBAL EQUITY FUND (concluded) | | PORTFOLIOOF INVESTMENTS |
| | | | | | | | |
| | | Number of
Shares | | | Value | |
United States—(continued) | | | | | | | | |
McKesson Corp. | | | 7,670 | | | $ | 1,357,974 | |
Microsoft Corp. | | | 29,305 | | | | 1,122,675 | |
NetApp, Inc. | | | 14,755 | | | | 596,250 | |
Occidental Petroleum Corp. | | | 5,750 | | | | 554,990 | |
Pfizer, Inc. | | | 13,935 | | | | 447,453 | |
Phillips 66 | | | 5,800 | | | | 434,188 | |
Valero Energy Corp. | | | 12,130 | | | | 581,997 | |
Wells Fargo & Co. | | | 16,915 | | | | 785,194 | |
Western Digital Corp. | | | 9,945 | | | | 865,116 | |
| | | | | | | | |
| | | | | | | 36,699,289 | |
| | | | | | | | |
TOTAL COMMON STOCK
(Cost $61,593,781) | | | | | | | 66,539,803 | |
| | | | | | | | |
| | | | | | |
| | | | | Value | |
TOTAL INVESTMENTS—95.5%
(Cost $61,593,781) | | | | $ | 66,539,803 | |
| | | | | | |
OTHER ASSETS IN EXCESS OF LIABILITIES—4.5% | | | | | 3,160,025 | |
| | | | | | |
NET ASSETS—100.0% | | | | $ | 69,699,828 | |
| | | | | | |
| | | | |
| LP | | — | | Limited Partnership |
| PLC | | — | | Public Limited Company |
| REIT | | — | | Real Estate Investment Trust |
| * | | — | | Non-income producing. |
A summary of the inputs used to value the Fund’s investments as of February 28, 2014 is as follows (see Note I in the Notes to Financial Statements):
| | | | | | | | | | | | | | | | |
| | | Total
Value as of
February 28, 2014 | | | Level 1
Quoted
Price | | | Level 2
Significant
Observable
Inputs | | | Level 3
Significant
Unobservable
Inputs | |
| | | | | | | | | | | | | | | | |
Common Stock | | | | | | | | | | | | | | | | |
Bermuda | | $ | 493,070 | | | $ | 493,070 | | | $ | — | | | $ | — | |
Canada | | | 318,364 | | | | 318,364 | | | | — | | | | — | |
Denmark | | | 500,424 | | | | — | | | | 500,424 | | | | — | |
France | | | 2,992,542 | | | | 531,835 | | | | 2,460,707 | | | | — | |
Germany | | | 4,849,481 | | | | — | | | | 4,849,481 | | | | — | |
Hong Kong | | | 880,708 | | | | — | | | | 880,708 | | | | — | |
Ireland | | | 2,053,444 | | | | — | | | | 2,053,444 | | | | — | |
Japan | | | 4,211,093 | | | | — | | | | 4,211,093 | | | | — | |
South Korea | | | 338,236 | | | | — | | | | 338,236 | | | | — | |
Switzerland | | | 5,128,725 | | | | 606,304 | | | | 4,522,421 | | | | — | |
Taiwan | | | 368,544 | | | | — | | | | 368,544 | | | | — | |
United Kingdom | | | 7,705,883 | | | | 1,644,048 | | | | 6,061,835 | | | | — | |
United States | | | 36,699,289 | | | | 36,699,289 | | | | — | | | | — | |
| | | | | | | | | | | | | | | | |
Total Assets | | $ | 66,539,803 | | | $ | 40,292,910 | | | $ | 26,246,893 | | | $ | — | |
| | | | | | | | | | | | | | | | |
THEACCOMPANYINGNOTESAREANINTEGRALPARTOFTHEFINANCIALSTATEMENTS.
| | | | |
| SEMI-ANNUAL REPORT 2014 | | | 29 | |
| | |
| ROBECO INVESTMENT FUNDS | | FEBRUARY 28, 2014 (unaudited) |
| | |
ROBECO BOSTON PARTNERS INTERNATIONAL EQUITY FUND | | PORTFOLIOOF INVESTMENTS |
| | | | | | | | |
| | | Number of
Shares | | | Value | |
COMMON STOCK—93.9% | | | | | | | | |
Australia—0.5% | | | | | | | | |
Australia & New Zealand Banking Group Ltd. | | | 2,485 | | | $ | 71,445 | |
| | | | | | | | |
Belgium—1.3% | | | | | | | | |
Ageas | | | 3,935 | | | | 180,008 | |
| | | | | | | | |
Canada—1.4% | | | | | | | | |
Canadian Natural Resources Ltd. | | | 2,750 | | | | 100,632 | |
Suncor Energy, Inc. | | | 2,670 | | | | 88,084 | |
| | | | | | | | |
| | | | | | | 188,716 | |
| | | | | | | | |
China—0.6% | | | | | | | | |
Labixiaoxin Snacks Group Ltd. | | | 107,000 | | | | 81,485 | |
| | | | | | | | |
Denmark—1.0% | | | | | | | | |
Carlsberg A/S, Class B | | | 1,225 | | | | 129,057 | |
| | | | | | | | |
France—15.6% | | | | | | | | |
Atos | | | 3,070 | | | | 297,682 | |
AXA SA | | | 5,605 | | | | 145,995 | |
Cap Gemini SA | | | 3,405 | | | | 266,049 | |
Havas SA | | | 14,355 | | | | 121,131 | |
LISI | | | 1,305 | | | | 211,922 | |
Publicis Groupe SA | | | 2,245 | | | | 213,062 | |
Sanofi | | | 1,715 | | | | 178,377 | |
Tarkett SA * | | | 1,800 | | | | 77,518 | |
Teleperformance SA | | | 4,405 | | | | 279,735 | |
Total SA | | | 5,255 | | | | 340,940 | |
| | | | | | | | |
| | | | | | | 2,132,411 | |
| | | | | | | | |
Germany—12.5% | | | | | | | | |
Allianz SE, Registered Shares | | | 1,200 | | | | 214,003 | |
Aurelius AG | | | 6,395 | | | | 251,992 | |
Bayer AG, Registered Shares | | | 1,550 | | | | 219,791 | |
Bayerische Motoren Werke AG | | | 1,050 | | | | 121,829 | |
Fresenius SE & Co. KGaA | | | 2,440 | | | | 378,644 | |
Henkel AG & Co. KGaA | | | 2,630 | | | | 265,664 | |
Muenchener Rueckversicherungs AG, Registered Shares | | | 320 | | | | 69,965 | |
NORMA Group AG | | | 3,256 | | | | 186,625 | |
| | | | | | | | |
| | | | | | | 1,708,513 | |
| | | | | | | | |
Hong Kong—2.9% | | | | | | | | |
AMVIG Holdings Ltd. | | | 184,000 | | | | 74,678 | |
Cheung Kong Holdings Ltd. | | | 8,000 | | | | 125,619 | |
Hutchison Whampoa Ltd. | | | 10,000 | | | | 135,082 | |
Lenovo Group Ltd. | | | 58,000 | | | | 61,915 | |
| | | | | | | | |
| | | | | | | 397,294 | |
| | | | | | | | |
Ireland—4.3% | | | | | | | | |
Greencore Group PLC | | | 50,080 | | | | 223,606 | |
Smurfit Kappa Group PLC * | | | 12,805 | | | | 356,561 | |
| | | | | | | | |
| | | | | | | 580,167 | |
| | | | | | | | |
Japan—11.9% | | | | | | | | |
Aisin Seiki Co Ltd. | | | 1,900 | | | | 66,163 | |
Brother Industries Ltd. | | | 9,000 | | | | 129,145 | |
Inpex Corp. | | | 10,500 | | | | 133,420 | |
ITOCHU Corp. | | | 9,800 | | | | 122,127 | |
| | | | | | | | |
| | | Number of
Shares | | | Value | |
Japan—(continued) | | | | | | | | |
Kaken Pharmaceutical Co. Ltd. | | | 6,000 | | | $ | 92,528 | |
Lintec Corp. | | | 9,300 | | | | 181,035 | |
Nippon Telegraph & Telephone Corp. | | | 2,200 | | | | 123,858 | |
Nippon Television Holdings Inc | | | 4,200 | | | | 70,040 | |
Seven & I Holdings Co. Ltd. | | | 2,900 | | | | 109,043 | |
Softbank Corp. | | | 1,410 | | | | 106,854 | |
Toho Holdings Co. Ltd. | | | 6,200 | | | | 128,007 | |
Toyota Motor Corp. | | | 4,000 | | | | 230,212 | |
TS Tech Co. Ltd. | | | 4,100 | | | | 134,236 | |
| | | | | | | | |
| | | | | | | 1,626,668 | |
| | | | | | | | |
Netherlands—2.9% | | | | | | | | |
Aegon NV | | | 12,855 | | | | 115,882 | |
Koninklijke Ahold NV | | | 14,975 | | | | 279,145 | |
| | | | | | | | |
| | | | | | | 395,027 | |
| | | | | | | | |
Singapore—2.1% | | | | | | | | |
M1 Ltd. | | | 32,000 | | | | 85,875 | |
OSIM International Ltd. | | | 37,000 | | | | 70,673 | |
United Overseas Bank Ltd. | | | 8,000 | | | | 130,300 | |
| | | | | | | | |
| | | | | | | 286,848 | |
| | | | | | | | |
South Korea—2.2% | | | | | | | | |
Hyundai Motor Co. | | | 460 | | | | 105,686 | |
Samsung Electronics Co. Ltd. | | | 100 | | | | 126,680 | |
SK Telecom Co. Ltd. | | | 345 | | | | 70,203 | |
| | | | | | | | |
| | | | | | | 302,569 | |
| | | | | | | | |
Switzerland—10.9% | | | | | | | | |
Aryzta AG | | | 2,995 | | | | 249,758 | |
Georg Fischer AG, Registered Shares | | | 330 | | | | 264,224 | |
Novartis AG, Registered Shares | | | 3,725 | | | | 310,032 | |
Roche Holding AG, Participation Certificate | | | 1,430 | | | | 440,297 | |
Swiss Re AG | | | 1,475 | | | | 137,675 | |
Zurich Insurance Group AG | | | 255 | | | | 78,033 | |
| | | | | | | | |
| | | | | | | 1,480,019 | |
| | | | | | | | |
Taiwan—1.6% | | | | | | | | |
Delta Electronics, Inc. | | | 16,000 | | | | 89,488 | |
MediaTek, Inc. | | | 9,000 | | | | 132,676 | |
| | | | | | | | |
| | | | | | | 222,164 | |
| | | | | | | | |
United Kingdom—22.2% | | | | | | | | |
AstraZeneca PLC | | | 3,450 | | | | 234,520 | |
Berendsen PLC | | | 16,980 | | | | 297,782 | |
BHP Billiton PLC | | | 5,065 | | | | 163,228 | |
Daily Mail & General Trust PLC, Class A | | | 4,245 | | | | 74,747 | |
DS Smith PLC | | | 39,570 | | | | 233,633 | |
Entertainment One Ltd. * | | | 33,810 | | | | 195,326 | |
Firstgroup PLC * | | | 29,680 | | | | 70,141 | |
HSBC Holdings PLC | | | 18,300 | | | | 193,137 | |
Inchcape PLC | | | 11,815 | | | | 124,075 | |
Intercontinental Hotels Group PLC | | | 1,937 | | | | 62,998 | |
Meggitt PLC | | | 19,637 | | | | 165,420 | |
Melrose Industries PLC | | | 17,875 | | | | 98,163 | |
THEACCOMPANYINGNOTESAREANINTEGRALPARTOFTHEFINANCIALSTATEMENTS.
| | |
| 30 | | SEMI-ANNUAL REPORT 2014 |
| | |
| ROBECO INVESTMENT FUNDS | | FEBRUARY 28, 2014 (unaudited) |
| | |
ROBECO BOSTON PARTNERS INTERNATIONAL EQUITY FUND (concluded) | | PORTFOLIOOF INVESTMENTS |
| | | | | | | | |
| | | Number of
Shares | | | Value | |
United Kingdom—(continued) | | | | | | | | |
Rexam PLC | | | 18,765 | | | $ | 155,064 | |
Rio Tinto PLC | | | 1,930 | | | | 110,667 | |
Royal Dutch Shell PLC, Class A | | | 4,735 | | | | 172,377 | |
Standard Chartered PLC | | | 9,100 | | | | 192,631 | |
Stock Spirits Group PLC * | | | 42,228 | | | | 202,944 | |
WPP PLC | | | 12,535 | | | | 274,543 | |
| | | | | | | | |
| | | | | | | 3,021,396 | |
| | | | | | | | |
TOTAL COMMON STOCK (Cost $9,758,325) | | | | | | | 12,803,787 | |
| | | | | | | | |
| | | | | | |
| | | | | Value | |
TOTAL INVESTMENTS—93.9%
(Cost $9,758,325) | | | | $ | 12,803,787 | |
| | | | | | |
OTHER ASSETS IN EXCESS OF LIABILITIES—6.1% | | | | | 829,012 | |
| | | | | | |
NET ASSETS—100.0% | | | | $ | 13,632,799 | |
| | | | | | |
| | | | |
| PCL | | — | | Public Company Limited |
| PLC | | — | | Public Limited Company |
| * | | — | | Non-income producing. |
A summary of the inputs used to value the Fund’s investments as of February 28, 2014 is as follows (see Note I in the Notes to Financial Statements):
| | | | | | | | | | | | | | | | |
| | | Total
Value as of
February 28, 2014 | | | Level 1
Quoted
Price | | | Level 2
Significant
Observable
Inputs | | | Level 3
Significant
Unobservable
Inputs | |
| | | | | | | | | | | | | | | | |
Common Stock | | | | | | | | | | | | | | | | |
Australia | | $ | 71,445 | | | $ | — | | | $ | 71,445 | | | $ | — | |
Belgium | | | 180,008 | | | | — | | | | 180,008 | | | | — | |
Canada | | | 188,716 | | | | 188,716 | | | | — | | | | — | |
China | | | 81,485 | | | | — | | | | 81,485 | | | | — | |
Denmark | | | 129,057 | | | | — | | | | 129,057 | | | | — | |
France | | | 2,132,411 | | | | 289,440 | | | | 1,842,971 | | | | — | |
Germany | | | 1,708,513 | | | | — | | | | 1,708,513 | | | | — | |
Hong Kong | | | 397,294 | | | | — | | | | 397,294 | | | | — | |
Ireland | | | 580,167 | | | | — | | | | 580,167 | | | | — | |
Japan | | | 1,626,668 | | | | — | | | | 1,626,668 | | | | — | |
Netherlands | | | 395,027 | | | | — | | | | 395,027 | | | | — | |
Singapore | | | 286,848 | | | | — | | | | 286,848 | | | | — | |
South Korea | | | 302,569 | | | | — | | | | 302,569 | | | | — | |
Switzerland | | | 1,480,019 | | | | — | | | | 1,480,019 | | | | — | |
Taiwan | | | 222,164 | | | | — | | | | 222,164 | | | | — | |
United Kingdom | | | 3,021,396 | | | | 398,270 | | | | 2,623,126 | | | | — | |
| | | | | | | | | | | | | | | | |
Total Assets | | $ | 12,803,787 | | | $ | 876,426 | | | $ | 11,927,361 | | | $ | — | |
| | | | | | | | | | | | | | | | |
THEACCOMPANYINGNOTESAREANINTEGRALPARTOFTHEFINANCIALSTATEMENTS.
| | | | |
| SEMI-ANNUAL REPORT 2014 | | | 31 | |
| | |
| BOSTON PARTNERS FAMILY OF FUNDS | | FEBRUARY 28, 2014 (unaudited) |
| | |
ROBECO BOSTON PARTNERS GLOBAL LONG/SHORT FUND | | PORTFOLIOOF INVESTMENTS |
| | | | | | | | |
| | | Number of
Shares | | | Value | |
LONG POSITIONS—42.6% | | | | | | | | |
COMMON STOCK—42.6% | | | | | | | | |
Bermuda—0.3% | | | | | | | | |
Validus Holdings Ltd. † | | | 687 | | | $ | 25,288 | |
| | | | | | | | |
| | | | 25,288 | |
| | | | | | | | |
Canada—0.7% | | | | | | | | |
Canadian Natural Resources Ltd. † | | | 447 | | | | 16,357 | |
Entertainment One Ltd. * | | | 6,704 | | | | 38,730 | |
| | | | | | | | |
| | | | 55,087 | |
| | | | | | | | |
Denmark—0.3% | | | | | | | | |
Carlsberg A/S, Class B | | | 239 | | | | 25,179 | |
| | | | | | | | |
| | | | 25,179 | |
| | | | | | | | |
France—1.9% | | | | | | | | |
AtoS † | | | 486 | | | | 47,125 | |
AXA SA | | | 673 | | | | 17,530 | |
LISI † | | | 160 | | | | 25,983 | |
Sanofi | | | 214 | | | | 22,258 | |
Teleperformance † | | | 614 | | | | 38,991 | |
| | | | | | | | |
| | | | 151,887 | |
| | | | | | | | |
Germany—3.1% | | | | | | | | |
Allianz SE, Registered Shares † | | | 176 | | | | 31,387 | |
Aurelius AG † | | | 1,150 | | | | 45,315 | |
Bayer AG, Registered Shares † | | | 292 | | | | 41,406 | |
Fresenius SE & Co. KGaA † | | | 348 | | | | 54,003 | |
Henkel AG & Co. KGaA | | | 415 | | | | 41,920 | |
Norma Group SE † | | | 566 | | | | 32,442 | |
| | | | | | | | |
| | | | 246,473 | |
| | | | | | | | |
Hong Kong—0.4% | | | | | | | | |
Cheung Kong Holdings Ltd. | | | 1,000 | | | | 15,702 | |
Hutchison Whampoa Ltd. | | | 1,000 | | | | 13,508 | |
| | | | | | | | |
| | | | 29,210 | |
| | | | | | | | |
Ireland—1.3% | | | | | | | | |
Greencore Group PLC | | | 11,183 | | | | 49,932 | |
Smurfit Kappa Group PLC * | | | 1,973 | | | | 54,939 | |
| | | | | | | | |
| | | | 104,871 | |
| | | | | | | | |
Japan—2.8% | | | | | | | | |
Inpex Corp. | | | 2,000 | | | | 25,413 | |
ITOCHU Corp. | | | 2,200 | | | | 27,416 | |
Lintec Corp. | | | 2,000 | | | | 38,932 | |
Nippon Telegraph & Telephone Corp. | | | 400 | | | | 22,520 | |
Seven & I Holdings Co., Ltd. | | | 500 | | | | 18,801 | |
Toho Holdings Co., Ltd. | | | 1,100 | | | | 22,711 | |
Toyota Motor Corp. | | | 700 | | | | 40,287 | |
TS Tech Co., Ltd. | | | 800 | | | | 26,192 | |
| | | | | | | | |
| | | | 222,272 | |
| | | | | | | | |
South Korea—0.2% | | | | | | | | |
Samsung Electronics Co., Ltd. | | | 14 | | | | 17,735 | |
| | | | | | | | |
| | | | 17,735 | |
| | | | | | | | |
| | | | | | | | |
| | | Number of
Shares | | | Value | |
Switzerland—3.3% | | | | | | | | |
ACE Ltd. † | | | 312 | | | $ | 30,535 | |
Aryzta AG † | | | 601 | | | | 50,118 | |
Georg Fischer AG, Registered
Shares † | | | 61 | | | | 48,841 | |
Novartis AG, Registered Shares † | | | 601 | | | | 50,021 | |
Roche Holding AG, Participation Certificate † | | | 273 | | | | 84,057 | |
| | | | | | | | |
| | | | 263,572 | |
| | | | | | | | |
Taiwan—0.2% | | | | | | | | |
MediaTek, Inc. | | | 1,000 | | | | 14,742 | |
| | | | | | | | |
| | | | 14,742 | |
| | | | | | | | |
United Kingdom—5.1% | | | | | | | | |
AstraZeneca PLC | | | 630 | | | | 42,825 | |
Berendsen PLC † | | | 3,147 | | | | 55,190 | |
BHP Billiton PLC † | | | 646 | | | | 20,818 | |
HSBC Holdings PLC † | | | 2,534 | | | | 26,744 | |
Inchcape PLC † | | | 2,043 | | | | 21,455 | |
Liberty Global PLC, Series C * † | | | 853 | | | | 72,215 | |
Meggitt PLC † | | | 4,568 | | | | 38,480 | |
Melrose Industries PLC | | | 3,525 | | | | 19,360 | |
Standard Chartered PLC † | | | 1,123 | | | | 23,772 | |
Stock Spirits Group PLC * † | | | 9,373 | | | | 45,046 | |
WPP PLC † | | | 1,962 | | | | 42,972 | |
| | | | | | | | |
| | | | 408,877 | |
| | | | | | | | |
United States—23.0% | | | | | | | | |
AbbVie, Inc. † | | | 658 | | | | 33,500 | |
Allstate Corp., (The) † | | | 837 | | | | 45,416 | |
American Capital Agency Corp.,
REIT † | | | 1,229 | | | | 27,394 | |
Amgen, Inc. † | | | 412 | | | | 51,096 | |
Annaly Capital Management, Inc.,
REIT † | | | 2,425 | | | | 27,112 | |
Apple, Inc. † | | | 98 | | | | 51,572 | |
Avnet, Inc. † | | | 818 | | | | 35,608 | |
BB&T Corp. † | | | 894 | | | | 33,793 | |
Berkshire Hathaway, Inc.,
Class B * † | | | 349 | | | | 40,407 | |
Berry Plastics Group, Inc. * † | | | 2,389 | | | | 58,124 | |
Brocade Communications Systems, Inc. * | | | 3,691 | | | | 35,323 | |
Capital One Financial Corp. | | | 366 | | | | 26,875 | |
Cardinal Health, Inc. † | | | 465 | | | | 33,261 | |
CBS Corp., Class B non-voting shares † | | | 451 | | | | 30,253 | |
Cinemark Holdings, Inc. | | | 519 | | | | 15,270 | |
Citigroup, Inc. † | | | 1,158 | | | | 56,314 | |
Comcast Corp., Class A † | | | 1,553 | | | | 80,275 | |
Crown Holdings, Inc. * † | | | 909 | | | | 40,923 | |
CVR Partners LP | | | 2,174 | | | | 43,154 | |
CVS Caremark Corp. † | | | 1,276 | | | | 93,327 | |
DIRECTV * † | | | 249 | | | | 19,322 | |
Dover Corp. † | | | 196 | | | | 18,483 | |
EMC Corp. † | | | 1,131 | | | | 29,824 | |
Energen Corp. † | | | 309 | | | | 24,856 | |
Energizer Holdings, Inc. † | | | 252 | | | | 24,530 | |
EOG Resources, Inc. † | | | 152 | | | | 28,792 | |
THEACCOMPANYINGNOTESAREANINTEGRALPARTOFTHEFINANCIALSTATEMENTS.
| | |
| 32 | | SEMI-ANNUAL REPORT 2014 |
| | |
| BOSTON PARTNERS FAMILY OF FUNDS | | FEBRUARY 28, 2014 (unaudited) |
| | |
ROBECO BOSTON PARTNERS GLOBAL LONG/SHORT FUND (continued) | | PORTFOLIOOF INVESTMENTS |
| | | | | | | | |
| | | Number of
Shares | | | Value | |
United States—(continued) | | | | | | | | |
EQT Corp. | | | 179 | | | $ | 18,310 | |
Exxon Mobil Corp. † | | | 411 | | | | 39,567 | |
Fifth Third Bancorp † | | | 1,310 | | | | 28,420 | |
Graphic Packaging Holding Co. * † | | | 5,863 | | | | 60,037 | |
Honeywell International, Inc. † | | | 422 | | | | 39,854 | |
International Paper Co. | | | 808 | | | | 39,503 | |
Jabil Circuit, Inc. † | | | 1,471 | | | | 27,228 | |
Johnson & Johnson † | | | 640 | | | | 58,957 | |
JPMorgan Chase & Co. † | | | 696 | | | | 39,547 | |
Lear Corp. † | | | 657 | | | | 53,348 | |
Macy’s, Inc. † | | | 1,352 | | | | 78,227 | |
McKesson Corp. † | | | 393 | | | | 69,581 | |
Microsoft Corp. † | | | 1,499 | | | | 57,427 | |
NetApp, Inc. † | | | 754 | | | | 30,469 | |
Occidental Petroleum Corp. † | | | 273 | | | | 26,350 | |
Pfizer, Inc. † | | | 711 | | | | 22,830 | |
Phillips 66 † | | | 293 | | | | 21,934 | |
Valero Energy Corp. † | | | 620 | | | | 29,748 | |
Wells Fargo & Co. † | | | 865 | | | | 40,153 | |
Western Digital Corp. † | | | 519 | | | | 45,148 | |
| | | | | | | | |
| | | | 1,831,442 | |
| | | | | | | | |
TOTAL COMMON STOCK
(Cost $3,325,895) | | | | 3,396,635 | |
| | | | | | | | |
TOTAL INVESTMENTS—42.6%
(Cost $3,325,895) | | | | 3,396,635 | |
| | | | | | | | |
SECURITIES SOLD SHORT—(23.4%) | | | | | |
COMMON STOCK—(23.4%) | | | | | | | | |
Argentina—(0.2%) | | | | | | | | |
Mercadolibre, Inc. | | | (141 | ) | | | (14,689 | ) |
| | | | | | | | |
| | | | (14,689 | ) |
| | | | | | | | |
Australia—(0.3%) | | | | | | | | |
Commonwealth Bank of Australia | | | (211 | ) | | | (14,093 | ) |
Treasury Wine Estates Ltd. | | | (2,644 | ) | | | (9,178 | ) |
| | | | | | | | |
| | | | (23,271 | ) |
| | | | | | | | |
Austria—(0.2%) | | | | | | | | |
Andritz AG | | | (209 | ) | | | (13,108 | ) |
| | | | | | | | |
| | | | (13,108 | ) |
| | | | | | | | |
Belgium—(0.1%) | | | | | | | | |
Solvay SA | | | (54 | ) | | | (8,356 | ) |
| | | | | | | | |
| | | | (8,356 | ) |
| | | | | | | | |
Canada—(0.7%) | | | | | | | | |
Ritchie Bros Auctioneers, Inc. * | | | (753 | ) | | | (17,515 | ) |
ShawCor Ltd. | | | (381 | ) | | | (15,735 | ) |
Ultra Petroleum Corp. * | | | (763 | ) | | | (19,197 | ) |
| | | | | | | | |
| | | | (52,447 | ) |
| | | | | | | | |
China—(0.6%) | | | | | | | | |
AAC Technologies Holdings, Inc. | | | (3,000 | ) | | | (13,613 | ) |
ASM Pacific Technology, Ltd. | | | (1,500 | ) | | | (13,600 | ) |
Mindray Medical International Ltd. — ADR | | | (400 | ) | | | (13,976 | ) |
| | | | | | | | |
| | | Number of
Shares | | | Value | |
China—(continued) | | | | | | | | |
Zoomlion Heavy Industry Science and Technology Co., Ltd. | | | (10,200 | ) | | $ | (7,634 | ) |
| | | | | | | | |
| | | | (48,823 | ) |
| | | | | | | | |
Denmark—(0.2%) | | | | | | | | |
William Demant Holding A/S | | | (177 | ) | | | (15,928 | ) |
| | | | | | | | |
| | | | (15,928 | ) |
| | | | | | | | |
Finland—(0.4%) | | | | | | | | |
Kone OYJ | | | (452 | ) | | | (18,382 | ) |
Konecranes OYJ | | | (492 | ) | | | (17,425 | ) |
| | | | | | | | |
| | | | (35,807 | ) |
| | | | | | | | |
France—(1.7%) | | | | | | | | |
Bureau Veritas SA | | | (593 | ) | | | (16,321 | ) |
Dassault Systemes | | | (154 | ) | | | (17,703 | ) |
Essilor International SA | | | (140 | ) | | | (14,583 | ) |
Hermes International | | | (43 | ) | | | (13,817 | ) |
L’Oreal SA | | | (109 | ) | | | (18,466 | ) |
Lafarge SA | | | (200 | ) | | | (14,995 | ) |
LVMH Moet Hennessy Louis Vuitton SA — Unsponsored ADR | | | (294 | ) | | | (10,863 | ) |
PernodRicard SA | | | (98 | ) | | | (11,499 | ) |
Remy Cointreau SA | | | (129 | ) | | | (10,928 | ) |
SEB SA | | | (128 | ) | | | (10,346 | ) |
| | | | | | | | |
| | | | (139,521 | ) |
| | | | | | | | |
Germany—(1.7%) | | | | | | | | |
Adidas AG | | | (151 | ) | | | (17,557 | ) |
Beiersdorf AG | | | (176 | ) | | | (17,955 | ) |
Carl Zeiss Meditec AG | | | (617 | ) | | | (18,812 | ) |
Deutsche Bank AG, Registered Shares | | | (210 | ) | | | (10,157 | ) |
Hochtief AG | | | (150 | ) | | | (13,935 | ) |
K+S AG, Registered Shares | | | (353 | ) | | | (11,917 | ) |
LANXESS AG | | | (195 | ) | | | (14,459 | ) |
Pfeiffer Vacuum Technology AG | | | (130 | ) | | | (15,327 | ) |
SGL Carbon SE | | | (387 | ) | | | (15,623 | ) |
| | | | | | | | |
| | | | (135,742 | ) |
| | | | | | | | |
Hong Kong—(0.2%) | | | | | | | | |
Vtech Holdings Ltd. | | | (1,600 | ) | | | (18,081 | ) |
| | | | | | | | |
| | | | (18,081 | ) |
| | | | | | | | |
India—(0.4%) | | | | | | | | |
HDFC Bank Ltd. — ADR | | | (545 | ) | | | (18,307 | ) |
Infosys Ltd. — Sponsored ADR | | | (167 | ) | | | (10,299 | ) |
| | | | | | | | |
| | | | (28,606 | ) |
| | | | | | | | |
Indonesia—(0.2%) | | | | | | | | |
Semen Indonesia Persero Tbk PT | | | (524 | ) | | | (13,252 | ) |
| | | | | | | | |
| | | | (13,252 | ) |
| | | | | | | | |
Italy—(0.2%) | | | | | | | | |
Prada SpA | | | (1,700 | ) | | | (12,812 | ) |
| | | | | | | | |
| | | | (12,812 | ) |
| | | | | | | | |
THEACCOMPANYINGNOTESAREANINTEGRALPARTOFTHEFINANCIALSTATEMENTS.
| | | | |
| SEMI-ANNUAL REPORT 2014 | | | 33 | |
| | |
| BOSTON PARTNERS FAMILY OF FUNDS | | FEBRUARY 28, 2014 (unaudited) |
| | |
ROBECO BOSTON PARTNERS GLOBAL LONG/SHORT FUND (continued) | | PORTFOLIOOF INVESTMENTS |
| | | | | | | | |
| | | Number of
Shares | | | Value | |
Japan—(1.0%) | | | | | | | | |
Electric Power Development
Co., Ltd. | | | (200 | ) | | $ | (6,225 | ) |
Hisamitsu Pharmaceutical Co., Inc. | | | (200 | ) | | | (9,373 | ) |
J Front Retailing Co., Ltd. | | | (2,000 | ) | | | (12,712 | ) |
Keikyu Corp. | | | (1,000 | ) | | | (8,403 | ) |
Nikon Corp. | | | (900 | ) | | | (16,522 | ) |
Taiheiyo Cement Corp. | | | (2,000 | ) | | | (7,063 | ) |
Tohoku Electric Power Co., Inc. * | | | (1,600 | ) | | | (18,842 | ) |
| | | | | | | | |
| | | | (79,140 | ) |
| | | | | | | | |
Luxembourg—(0.1%) | | | | | | | | |
Millicom International Cellular
SA — SDR | | | (92 | ) | | | (9,580 | ) |
| | | | | | | | |
| | | | (9,580 | ) |
| | | | | | | | |
Netherlands—(0.1%) | | | | | | | | |
Koninklijke Vopak NV | | | (213 | ) | | | (12,455 | ) |
| | | | | | | | |
| | | | (12,455 | ) |
| | | | | | | | |
New Zealand—(0.1%) | | | | | | | | |
Ryman Healthcare Ltd. | | | (1,637 | ) | | | (10,839 | ) |
| | | | | | | | |
| | | | (10,839 | ) |
| | | | | | | | |
Portugal—(0.3%) | | | | | | | | |
Jeronimo Martins SGPS SA | | | (1,239 | ) | | | (21,007 | ) |
| | | | | | | | |
| | | | (21,007 | ) |
| | | | | | | | |
Spain—(0.1%) | | | | | | | | |
Banco Santander SA | | | (1,226 | ) | | | (11,067 | ) |
| | | | | | | | |
| | | | (11,067 | ) |
| | | | | | | | |
Sweden—(0.3%) | | | | | | | | |
Elekta AB, Class B | | | (1,219 | ) | | | (16,208 | ) |
Hennes & Mauritz AB, Class B | | | (274 | ) | | | (12,338 | ) |
| | | | | | | | |
| | | | (28,546 | ) |
| | | | | | | | |
Switzerland—(0.6%) | | | | | | | | |
Julius Baer Group Ltd. | | | (221 | ) | | | (10,342 | ) |
Panalpina Welttransport Holding AG, Registered Shares | | | (98 | ) | | | (16,223 | ) |
SGS SA | | | (8 | ) | | | (19,796 | ) |
| | | | | | | | |
| | | | (46,361 | ) |
| | | | | | | | |
Thailand—(0.5%) | | | | | | | | |
Siam Cement PCL, (The) | | | (1,600 | ) | | | (21,127 | ) |
Siam Commercial Bank PCL, (The) | | | (3,700 | ) | | | (17,221 | ) |
| | | | | | | | |
| | | | (38,348 | ) |
| | | | | | | | |
United Kingdom—(1.3%) | | | | | | | | |
Aberdeen Asset Management PLC | | | (1,567 | ) | | | (10,224 | ) |
Aviva PLC | | | (1,580 | ) | | | (12,562 | ) |
BG Group PLC | | | (490 | ) | | | (8,915 | ) |
Diageo PLC | | | (650 | ) | | | (20,411 | ) |
G4S PLC | | | (3,106 | ) | | | (12,351 | ) |
Michael Page International PLC | | | (1,887 | ) | | | (16,000 | ) |
Ocado Group PLC * | | | (971 | ) | | | (9,132 | ) |
Old Mutual PLC | | | (3,285 | ) | | | (10,827 | ) |
| | | | | | | | |
| | | | (100,422 | ) |
| | | | | | | | |
| | | | | | | | |
| | | Number of
Shares | | | Value | |
United States—(11.9%) | | | | | | | | |
3D Systems Corp. * | | | (189 | ) | | $ | (14,356 | ) |
ABIOMED, Inc. * | | | (444 | ) | | | (12,516 | ) |
Air Products & Chemicals, Inc. | | | (99 | ) | | | (12,011 | ) |
American Axle & Manaufacturing Holdings, Inc. * | | | (477 | ) | | | (9,220 | ) |
Angie’s List, Inc. * | | | (511 | ) | | | (7,108 | ) |
athenahealth, Inc. * | | | (46 | ) | | | (8,918 | ) |
AutoNation, Inc. * | | | (209 | ) | | | (11,002 | ) |
Blackbaud, Inc. | | | (203 | ) | | | (6,359 | ) |
Buffalo Wild Wings, Inc. * | | | (65 | ) | | | (9,425 | ) |
Cabela’s, Inc. * | | | (302 | ) | | | (20,029 | ) |
Carrizo Oil & Gas, Inc. * | | | (362 | ) | | | (18,006 | ) |
Caterpillar, Inc. | | | (87 | ) | | | (8,436 | ) |
Cheesecake Factory, Inc. (The) | | | (241 | ) | | | (11,452 | ) |
Chesapeake Energy Corp. | | | (532 | ) | | | (13,784 | ) |
Chico’s FAS, Inc. | | | (641 | ) | | | (10,474 | ) |
Chipotle Mexican Grill, Inc. * | | | (30 | ) | | | (16,956 | ) |
Clorox Co.(The) | | | (224 | ) | | | (19,551 | ) |
Community Bank System, Inc. | | | (323 | ) | | | (11,767 | ) |
Compass Minerals International, Inc. | | | (175 | ) | | | (14,936 | ) |
Concur Technologies, Inc. * | | | (102 | ) | | | (12,592 | ) |
Continental Resources, Inc. * | | | (150 | ) | | | (17,928 | ) |
Eaton Vance Corp. | | | (420 | ) | | | (15,893 | ) |
Elizabeth Arden, Inc. * | | | (356 | ) | | | (10,883 | ) |
FactSet Research Systems, Inc. | | | (154 | ) | | | (16,215 | ) |
Fastenal Co. | | | (359 | ) | | | (16,941 | ) |
First Financial Bankshares, Inc. | | | (157 | ) | | | (9,495 | ) |
Greenhill & Co., Inc. | | | (339 | ) | | | (18,059 | ) |
Health Net, Inc./CA * | | | (260 | ) | | | (8,853 | ) |
Hittite Microwave Corp. | | | (182 | ) | | | (10,734 | ) |
Interface, Inc. | | | (487 | ) | | | (9,380 | ) |
International Rectifier Corp. * | | | (475 | ) | | | (12,801 | ) |
Intrepid Potash, Inc. * | | | (922 | ) | | | (13,655 | ) |
Intuitive Surgical, Inc. * | | | (34 | ) | | | (15,124 | ) |
Itron, Inc. * | | | (256 | ) | | | (8,960 | ) |
J.B. Hunt Transport Services, Inc. | | | (174 | ) | | | (12,505 | ) |
Krispy Kreme Doughnuts Inc * | | | (501 | ) | | | (9,529 | ) |
L Brands, Inc. | | | (216 | ) | | | (12,167 | ) |
LinkedIn Corp., Class A * | | | (63 | ) | | | (12,855 | ) |
Lululemon Athletica, Inc. * | | | (331 | ) | | | (16,653 | ) |
Manitowoc Co., Inc., (The) | | | (624 | ) | | | (19,307 | ) |
Matador Resources Co. * | | | (494 | ) | | | (11,984 | ) |
Mattel, Inc. | | | (503 | ) | | | (18,767 | ) |
Mondelez International Inc | | | (422 | ) | | | (14,361 | ) |
Monro Muffler Brake, Inc. | | | (413 | ) | | | (24,644 | ) |
Monster Beverage Corp. * | | | (126 | ) | | | (9,324 | ) |
National Instruments Corp. | | | (595 | ) | | | (17,237 | ) |
Netflix, Inc. * | | | (52 | ) | | | (23,173 | ) |
NetSuite, Inc. * | | | (79 | ) | | | (9,092 | ) |
Pepco Holdings, Inc. | | | (675 | ) | | | (13,763 | ) |
Plum Creek Timber Co., Inc. | | | (314 | ) | | | (13,593 | ) |
Quiksilver, Inc. * | | | (1,169 | ) | | | (9,118 | ) |
ResMed, Inc. | | | (448 | ) | | | (19,721 | ) |
Rollins, Inc. | | | (547 | ) | | | (16,333 | ) |
Sally Beauty Holdings, Inc. * | | | (668 | ) | | | (19,172 | ) |
Seattle Genetics, Inc. * | | | (262 | ) | | | (13,779 | ) |
Simpson Manufacturing Co., Inc. | | | (242 | ) | | | (8,555 | ) |
Snyders-Lance, Inc. | | | (633 | ) | | | (17,148 | ) |
THEACCOMPANYINGNOTESAREANINTEGRALPARTOFTHEFINANCIALSTATEMENTS.
| | |
| 34 | | SEMI-ANNUAL REPORT 2014 |
| | |
| BOSTON PARTNERS FAMILY OF FUNDS | | FEBRUARY 28, 2014 (unaudited) |
| | |
ROBECO BOSTON PARTNERS GLOBAL LONG/SHORT FUND (continued) | | PORTFOLIOOF INVESTMENTS |
| | | | | | | | |
| | | Number of
Shares | | | Value | |
United States—(continued) | | | | | | | | |
Sonic Corp. * | | | (706 | ) | | $ | (14,388 | ) |
TCF Financial Corp. | | | (551 | ) | | | (8,882 | ) |
TECO Energy, Inc. | | | (790 | ) | | | (13,256 | ) |
Toll Brothers, Inc. * | | | (219 | ) | | | (8,543 | ) |
Trex Co., Inc. * | | | (111 | ) | | | (8,682 | ) |
Trustmark Corp. | | | (422 | ) | | | (10,183 | ) |
UMB Financial Corp. | | | (316 | ) | | | (19,699 | ) |
Under Armour, Inc., Class A * | | | (117 | ) | | | (13,239 | ) |
United Bankshares, Inc. | | | (551 | ) | | | (16,216 | ) |
Vulcan Materials Co. | | | (154 | ) | | | (10,461 | ) |
W.W. Grainger, Inc. | | | (54 | ) | | | (13,771 | ) |
Wausau Paper Corp. | | | (1,424 | ) | | | (18,868 | ) |
Westamerica Bancorporation | | | (331 | ) | | | (16,643 | ) |
| | | | | | | | |
| | | | (949,430 | ) |
| | | | | | | | |
TOTAL COMMON STOCK (Proceeds $1,845,645) | | | | | | | (1,867,638 | ) |
| | | | | | | | |
| | | | | | |
| | | | | Value | |
TOTAL SECURITIES SOLD SHORT —(23.4%)
(Proceeds $1,845,645) | | | | $ | (1,867,638 | ) |
| | | | | | |
OTHER ASSETS IN EXCESS OF LIABILITIES—80.8% | | | | | 6,435,146 | |
| | | | | | |
NET ASSETS—100.0% | | | | $ | 7,964,143 | |
| | | | | | |
| | | | |
| ADR | | — | | American Depositary Receipt |
| PLC | | — | | Public Limited Company |
| * | | — | | Non-income producing. |
| † | | — | | Security position is either entirely or partially held in a segregated account as collateral for securities sold short. |
Contracts For Difference held by the Fund at February 28, 2014, are as follows:
| | | | | | | | | | | | | | | | |
| Reference Company | | Counterparty | | | Number of
Contracts (Short) | | | Notional
Amount | | | Unrealized
(Depreciation) | |
Chailease Holding Co., Ltd. | | | Goldman Sachs | | | | (5,000.00 | ) | | $ | 372,500 | | | $ | (128 | ) |
A summary of the inputs used to value the Fund’s investments as of February 28, 2014 is as follows (see Note I in the Notes to Financial Statements):
| | | | | | | | | | | | | | | | |
| | | Total
Value as of
February 28, 2014 | | | Level 1
Quoted
Price | | | Level 2
Significant
Observable
Inputs | | | Level 3
Significant
Unobservable
Inputs | |
| | | | | | | | | | | | | | | | |
Common Stock | | | | | | | | | | | | | | | | |
Bermuda | | $ | 25,288 | | | | 25,288 | | | $ | — | | | $ | — | |
Canada | | | 55,087 | | | | 55,087 | | | | — | | | | — | |
Denmark | | | 25,179 | | | | — | | | | 25,179 | | | | — | |
France | | | 151,887 | | | | 25,983 | | | | 125,904 | | | | — | |
Germany | | | 246,473 | | | | 45,315 | | | | 201,158 | | | | — | |
Hong Kong | | | 29,210 | | | | — | | | | 29,210 | | | | — | |
Ireland | | | 104,871 | | | | — | | | | 104,871 | | | | — | |
Japan | | | 222,272 | | | | 53,608 | | | | 168,664 | | | | — | |
South Korea | | | 17,735 | | | | — | | | | 17,735 | | | | — | |
Switzerland | | | 263,572 | | | | 30,535 | | | | 233,037 | | | | — | |
Taiwan | | | 14,742 | | | | — | | | | 14,742 | | | | — | |
United Kingdom | | | 408,877 | | | | 183,858 | | | | 225,019 | | | | — | |
United States | | | 1,831,442 | | | | 1,831,442 | | | | — | | | | — | |
| | | | | | | | | | | | | | | | |
Total Assets | | $ | 3,396,635 | | | $ | 2,251,116 | | | $ | 1,145,519 | | | $ | — | |
| | | | | | | | | | | | | | | | |
THEACCOMPANYINGNOTESAREANINTEGRALPARTOFTHEFINANCIALSTATEMENTS.
| | | | |
| SEMI-ANNUAL REPORT 2014 | | | 35 | |
| | |
| BOSTON PARTNERS FAMILY OF FUNDS | | FEBRUARY 28, 2014 (unaudited) |
| | |
ROBECO BOSTON PARTNERS GLOBAL LONG/SHORT FUND (concluded) | | PORTFOLIOOF INVESTMENTS |
| | | | | | | | | | | | | | | | |
| | | Total
Value as of
February 28, 2014 | | | Level 1
Quoted
Price | | | Level 2
Significant
Observable
Inputs | | | Level 3
Significant
Unobservable
Inputs | |
Securities Sold Short | | | | | | | | | | | | | | | | |
Argentina | | $ | (14,689 | ) | | $ | (14,689 | ) | | $ | — | | | $ | — | |
Australia | | | (23,271 | ) | | | — | | | | (23,271 | ) | | | — | |
Austria | | | (13,108 | ) | | | — | | | | (13,108 | ) | | | — | |
Belgium | | | (8,356 | ) | | | — | | | | (8,356 | ) | | | — | |
Canada | | | (52,447 | ) | | | (52,447 | ) | | | — | | | | — | |
China | | | (48,823 | ) | | | (13,976 | ) | | | (34,847 | ) | | | — | |
Denmark | | | (15,928 | ) | | | — | | | | (15,928 | ) | | | — | |
Finland | | | (35,807 | ) | | | — | | | | (35,807 | ) | | | — | |
France | | | (139,521 | ) | | | (40,065 | ) | | | (99,456 | ) | | | — | |
Germany | | | (135,742 | ) | | | (10,157 | ) | | | (125,585 | ) | | | — | |
Hong Kong | | | (18,081 | ) | | | (18,081 | ) | | | — | | | | — | |
India | | | (28,606 | ) | | | (28,606 | ) | | | — | | | | — | |
Indonesia | | | (13,252 | ) | | | (13,252 | ) | | | — | | | | — | |
Italy | | | (12,812 | ) | | | (12,812 | ) | | | — | | | | — | |
Japan | | | (79,140 | ) | | | — | | | | (79,140 | ) | | | — | |
Luxembourg | | | (9,580 | ) | | | — | | | | (9,580 | ) | | | — | |
Netherlands | | | (12,455 | ) | | | — | | | | (12,455 | ) | | | — | |
New Zealand | | | (10,839 | ) | | | — | | | | (10,839 | ) | | | — | |
Portugal | | | (21,007 | ) | | | — | | | | (21,007 | ) | | | — | |
Spain | | | (11,067 | ) | | | (11,067 | ) | | | — | | | | — | |
Sweden | | | (28,546 | ) | | | (16,208 | ) | | | (12,338 | ) | | | — | |
Switzerland | | | (46,361 | ) | | | — | | | | (46,361 | ) | | | — | |
Thailand | | | (38,348 | ) | | | — | | | | (38,348 | ) | | | — | |
United Kingdom | | | (100,422 | ) | | | (8,915 | ) | | | (91,507 | ) | | | — | |
United States | | | (949,430 | ) | | | (929,709 | ) | | | (19,721 | ) | | | — | |
Contracts for difference | | | (128 | ) | | | — | | | | (128 | ) | | | — | |
| | | | | | | | | | | | | | | | |
Total Liabilities | | $ | (1,867,766 | ) | | $ | (1,169,984 | ) | | $ | (697,782 | ) | | $ | — | |
| | | | | | | | | | | | | | | | |
THEACCOMPANYINGNOTESAREANINTEGRALPARTOFTHEFINANCIALSTATEMENTS.
| | |
| 36 | | SEMI-ANNUAL REPORT 2014 |
| | |
| ROBECO INVESTMENT FUNDS | | FEBRUARY 28, 2014 (unaudited) |
| | |
STATEMENTS OF ASSETS AND LIABILITIES | | |
| | | | | | | | | | | | | | | | |
| | | Robeco Boston
Partners
Small Cap
Value Fund II | | | Robeco Boston
Partners
Long/Short
Equity Fund | | | Robeco Boston
Partners
Long/Short
Research Fund | | | Robeco Boston
Partners
All-Cap
Value Fund | |
ASSETS | | | | | | | | | | | | | | | | |
Investments in securities, at value † ^ | | $ | 200,810,801 | | | $ | 753,578,590 | | | $ | 3,634,971,385 | | | $ | 793,011,899 | |
Cash | | | 12,051,460 | | | | 130,533,749 | | | | 360,439,304 | | | | 32,725,237 | |
Foreign currency, at value # | | | — | | | | — | | | | 108,547,756 | | | | — | |
Receivables | | | | | | | | | | | | | | | | |
Investments sold | | | 235,494 | | | | 24,213,623 | | | | 42,326,727 | | | | 68,396 | |
Deposits with brokers for securities sold short | | | — | | | | 588,815,561 | | | | 1,784,054,553 | | | | — | |
Dividends and interest | | | 130,133 | | | | 1,004,415 | | | | 8,668,933 | | | | 1,847,665 | |
Capital shares sold | | | 621,842 | | | | 697,911 | | | | 58,633,353 | | | | 2,096,731 | |
Prepaid expenses and other assets | | | 21,056 | | | | 45,486 | | | | 489,324 | | | | 34,289 | |
| | | | | | | | | | | | | | | | |
Total assets | | | 213,870,786 | | | | 1,498,889,335 | | | | 5,998,131,335 | | | | 829,784,217 | |
| | | | | | | | | | | | | | | | |
LIABILITIES | | | | | | | | | | | | | | | | |
Securities sold short, at fair value ‡ | | | — | | | | 578,585,710 | | | | 1,736,793,396 | | | | — | |
Options written, at value * | | | — | | | | 309,405 | | | | 3,126,200 | | | | 91,692 | |
Due to Custodian, at value # | | | — | | | | 415,867 | | | | — | | | | — | |
Payables | | | | | | | | | | | | | | | | |
Securities lending collateral | | | 6,139,754 | | | | 20,006,304 | | | | — | | | | 2,725,161 | |
Investments purchased | | | 6,053,685 | | | | 6,992,672 | | | | 76,227,965 | | | | 1,023,237 | |
Capital shares redeemed | | | 123,200 | | | | 5,025,483 | | | | 2,806,763 | | | | 224,966 | |
Due to prime broker | | | — | | | | 131,668,296 | | | | 282,115,799 | | | | — | |
Investment advisory fees | | | 143,944 | | | | 1,359,471 | | | | 3,392,083 | | | | 325,464 | |
Administration and accounting fees | | | 12,393 | | | | 48,241 | | | | 108,687 | | | | 39,761 | |
Custodian fees | | | 6,748 | | | | 53,888 | | | | 149,274 | | | | 21,914 | |
Distribution and service fees | | | 20,229 | | | | 39,519 | | | | 39,069 | | | | 31,318 | |
Dividends on securities sold-short | | | — | | | | 144,238 | | | | 1,764,083 | | | | — | |
Printing and shareholder reporting fees | | | 13,755 | | | | 46,594 | | | | 49,898 | | | | 4,334 | |
Other accrued expenses and liabilities | | | 25,004 | | | | 48,344 | | | | 78,198 | | | | 5,270 | |
| | | | | | | | | | | | | | | | |
Total liabilities | | | 12,538,712 | | | | 744,744,032 | | | | 2,106,651,415 | | | | 4,493,117 | |
| | | | | | | | | | | | | | | | |
Net Assets | | $ | 201,332,074 | | | $ | 754,145,303 | | | $ | 3,891,479,920 | | | $ | 825,291,100 | |
| | | | | | | | | | | | | | | | |
NET ASSETS CONSIST OF | | | | | | | | | | | | | | | | |
Par value | | $ | 9,370 | | | $ | 38,549 | | | $ | 268,844 | | | $ | 38,870 | |
Paid-in capital | | | 142,377,293 | | | | 722,693,407 | | | | 3,594,693,722 | | | | 648,071,544 | |
Undistributed net investment income/(accumulated net investment loss) | | | (32,715 | ) | | | (12,623,241 | ) | | | (14,047,834 | ) | | | 1,423,256 | |
Accumulated net realized gain/(loss) from investments, securities sold short, written options and foreign currency translation | | | (4,470,125 | ) | | | 14,150,674 | | | | 6,919,453 | | | | 16,676,181 | |
Net unrealized appreciation on investments, securities sold short, written options and foreign currency translation | | | 63,448,251 | | | | 29,885,914 | | | | 303,645,735 | | | | 159,081,249 | |
| | | | | | | | | | | | | | | | |
Net Assets | | $ | 201,332,074 | | | $ | 754,145,303 | | | $ | 3,891,479,920 | | | $ | 825,291,100 | |
| | | | | | | | | | | | | | | | |
INSTITUTIONAL CLASS | | | | | | | | | | | | | | | | |
Net assets | | $ | 92,053,164 | | | $ | 560,462,468 | | | $ | 3,677,228,524 | | | $ | 654,140,779 | |
Shares outstanding | | | 4,197,009 | | | | 28,211,355 | | | | 253,927,097 | | | | 30,788,138 | |
| | | | | | | | | | | | | | | | |
Net asset value, offering and redemption price per share | | $ | 21.93 | | | $ | 19.87 | | | $ | 14.48 | | | $ | 21.25 | |
| | | | | | | | | | | | | | | | |
INVESTOR CLASS | | | | | | | | | | | | | | | | |
Net assets | | $ | 109,278,910 | | | $ | 193,682,835 | | | $ | 214,251,396 | | | $ | 171,150,321 | |
Shares outstanding | | | 5,172,706 | | | | 10,337,641 | | | | 14,917,085 | | | | 8,081,366 | |
| | | | | | | | | | | | | | | | |
Net asset value, offering and redemption price per share | | $ | 21.13 | | | $ | 18.74 | | | $ | 14.36 | | | $ | 21.18 | |
| | | | | | | | | | | | | | | | |
† Investment in securities, at cost | | $ | 137,362,550 | | | $ | 591,373,160 | | | $ | 3,192,644,700 | | | $ | 634,051,318 | |
^ Includes market value of securities on loan | | $ | 5,943,039 | | | $ | 19,329,522 | | | $ | — | | | $ | 2,690,790 | |
# Foreign currency, at cost | | $ | — | | | $ | (413,932 | ) | | $ | 107,254,081 | | | $ | — | |
‡ Proceeds received, securities sold short | | $ | — | | | $ | 445,677,380 | | | $ | 1,597,981,589 | | | $ | — | |
* Premiums received, options written | | $ | — | | | $ | 900,455 | | | $ | 1,920,469 | | | $ | 212,360 | |
THEACCOMPANYINGNOTESAREANINTEGRALPARTOFTHEFINANCIALSTATEMENTS.
| | | | |
| SEMI-ANNUAL REPORT 2014 | | | 37 | |
| | |
| ROBECO INVESTMENT FUNDS | | FEBRUARY 28, 2014 (unaudited) |
| | |
STATEMENTS OF ASSETS AND LIABILITIES (concluded) | | |
| | | | | | | | | | | | | | | | |
| | | Robeco WPG
Small/Micro Cap
Value Fund | | | Robeco Boston
Partners Global
Equity Fund | | | Robeco Boston
Partners
International
Equity Fund | | | Robeco Boston
Partners Global
Long/Short
Fund | |
ASSETS | | | | | | | | | | | | | | | | |
Investments in securities, at value † ^ | | $ | 48,840,608 | | | $ | 66,539,803 | | | $ | 12,803,787 | | | $ | 3,396,635 | |
Cash | | | 1,330,138 | | | | 1,909,683 | | | | 560,162 | | | | 273,915 | |
Foreign currency, at value # | | | — | | | | 47,916 | | | | 17,108 | | | | 7,209 | |
Receivables | | | | | | | | | | | | | | | | |
Investments sold | | | 1,021,297 | | | | 1,494,366 | | | | 208,040 | | | | 87,758 | |
Deposits with brokers for securities sold short | | | — | | | | — | | | | — | | | | 2,621,047 | |
Dividends and interest | | | 49,291 | | | | 204,017 | | | | 54,571 | | | | 9,771 | |
Capital shares sold | | | — | | | | — | | | | — | | | | 4,334,987 | |
Investment adviser | | | — | | | | — | | | | 15,127 | | | | 22,821 | |
Prepaid expenses and other assets | | | 15,047 | | | | 24,145 | | | | 22,653 | | | | 10,448 | |
| | | | | | | | | | | | | | | | |
Total assets | | | 51,256,381 | | | | 70,219,930 | | | | 13,681,448 | | | | 10,764,591 | |
| | | | | | | | | | | | | | | | |
LIABILITIES | | | | | | | | | | | | | | | | |
Securities sold short, at fair value ‡ | | | — | | | | — | | | | — | | | | 1,867,638 | |
Payables | | | | | | | | | | | | | | | | |
Securities lending collateral | | | 5,306,318 | | | | — | | | | — | | | | — | |
Investments purchased | | | 186,858 | | | | 456,715 | | | | — | | | | 100,494 | |
Capital shares redeemed | | | 15,000 | | | | — | | | | — | | | | — | |
Due to prime broker | | | — | | | | — | | | | — | | | | 805,659 | |
Investment advisory fees | | | 30,803 | | | | 28,014 | | | | — | | | | — | |
Audit Fees | | | 11,580 | | | | 13,980 | | | | 27,420 | | | | 8,210 | |
Custodian fees | | | 9,267 | | | | 9,176 | | | | 8,535 | | | | 5,600 | |
Administration and accounting fees | | | 5,695 | | | | 4,937 | | | | 6,634 | | | | 2,491 | |
Dividends on securities sold-short | | | — | | | | — | | | | — | | | | 2,682 | |
Prime broker interest payable | | | — | | | | — | | | | — | | | | 61 | |
Printing and shareholder reporting fees | | | 1,795 | | | | — | | | | 1,055 | | | | 3,050 | |
Unrealized loss on contracts for difference | | | — | | | | — | | | | — | | | | 128 | |
Other accrued expenses and liabilities | | | 13,990 | | | | 7,280 | | | | 5,005 | | | | 4,435 | |
| | | | | | | | | | | | | | | | |
Total liabilities | | | 5,581,306 | | | | 520,102 | | | | 48,649 | | | | 2,800,448 | |
| | | | | | | | | | | | | | | | |
Net Assets | | $ | 45,675,075 | | | $ | 69,699,828 | | | $ | 13,632,799 | | | $ | 7,964,143 | |
| | | | | | | | | | | | | | | | |
NET ASSETS CONSIST OF | | | | | | | | | | | | | | | | |
Par value | | $ | 2,330 | | | $ | 4,691 | | | $ | 1,008 | | | $ | 799 | |
Paid-in capital | | | 35,292,469 | | | | 64,042,238 | | | | 10,132,690 | | | | 7,964,201 | |
Undistributed net investment income/(accumulated net investment loss) | | | (56,191 | ) | | | 123,912 | | | | 15,046 | | | | (5,602 | ) |
Accumulated net realized gain/(loss) from investments, securities sold short, written options, contracts for difference and foreign currency translation | | | 1,051,631 | | | | 581,319 | | | | 436,346 | | | | (44,077 | ) |
Net unrealized appreciation on investments, securities sold short, written options, contracts for difference and foreign currency translation | | | 9,384,836 | | | | 4,947,668 | | | | 3,047,709 | | | | 48,822 | |
| | | | | | | | | | | | | | | | |
Net Assets | | $ | 45,675,075 | | | $ | 69,699,828 | | | $ | 13,632,799 | | | $ | 7,964,143 | |
| | | | | | | | | | | | | | | | |
INSTITUTIONAL CLASS | | | | | | | | | | | | | | | | |
Net assets | | $ | 45,675,075 | | | $ | 69,699,828 | | | $ | 13,632,799 | | | $ | 7,964,143 | |
Shares outstanding | | | 2,329,587 | | | | 4,690,902 | | | | 1,007,836 | | | | 798,646 | |
| | | | | | | | | | | | | | | | |
Net asset value, offering and redemption price per share | | $ | 19.61 | | | $ | 14.86 | | | $ | 13.53 | | | $ | 9.97 | |
| | | | | | | | | | | | | | | | |
† Investment in securities, at cost | | $ | 39,455,772 | | | $ | 61,593,781 | | | $ | 9,758,325 | | | $ | 3,325,895 | |
^ Includes market value of securities on loan | | $ | 5,171,323 | | | $ | — | | | $ | — | | | $ | — | |
# Foreign currency, at cost | | $ | — | | | $ | 48,669 | | | $ | 17,096 | | | $ | 7,164 | |
‡ Proceeds received, securities sold short | | $ | — | | | $ | — | | | $ | — | | | $ | 1,845,645 | |
THEACCOMPANYINGNOTESAREANINTEGRALPARTOFTHEFINANCIALSTATEMENTS.
| | |
| 38 | | SEMI-ANNUAL REPORT 2014 |
| | |
| ROBECO INVESTMENT FUNDS | | FEBRUARY 28, 2014 (unaudited) |
| | | | | | | | | | | | | | | | |
| | | Robeco Boston
Partners
Small Cap
Value Fund II | | | Robeco Boston
Partners
Long/Short
Equity Fund | | | Robeco Boston
Partners
Long/Short
Research Fund | | | Robeco Boston
Partners
All-Cap
Value Fund | |
| | | For the
Six Months Ended
February 28, 2014 | | | For the
Six Months Ended
February 28, 2014 | | | For the
Six Months Ended
February 28, 2014 | | | For the
Six Months Ended
February 28, 2014 | |
Investment Income | | | | | | | | | | | | | | | | |
Dividends † | | $ | 1,757,936 | | | $ | 5,306,490 | | | $ | 26,691,842 | | | $ | 6,060,979 | |
Interest | | | 268 | | | | 2,547 | | | | 5,027 | | | | 1,361 | |
Income from securities loaned (Note 6) | | | 62,381 | | | | 158,761 | | | | — | | | | 16,861 | |
| | | | | | | | | | | | | | | | |
Total investment income | | | 1,820,585 | | | | 5,467,798 | | | | 26,696,869 | | | | 6,079,201 | |
| | | | | | | | | | | | | | | | |
Expenses | | | | | | | | | | | | | | | | |
Advisory fees (Note 2) | | | 925,872 | | | | 9,442,794 | | | | 16,696,286 | | | | 2,613,818 | |
Distribution fees (Investor Class) (Note 2) | | | 130,106 | | | | 267,193 | | | | 203,067 | | | | 151,193 | |
Administration and accounting fees (Note 2) | | | 86,027 | | | | 313,873 | | | | 678,901 | | | | 247,587 | |
Transfer agent fees (Note 2) | | | 46,265 | | | | 104,819 | | | | 226,680 | | | | 39,029 | |
Printing and shareholder reporting fees | | | 23,905 | | | | 68,540 | | | | 100,645 | | | | 18,333 | |
Registration and filing fees | | | 19,709 | | | | 57,108 | | | | 196,047 | | | | 33,059 | |
Audit fees | | | 12,302 | | | | 17,259 | | | | 18,748 | | | | 13,879 | |
Directors’ and officers’ fees | | | 11,703 | | | | 25,044 | | | | 51,937 | | | | 18,517 | |
Legal fees | | | 10,337 | | | | 38,599 | | | | 135,558 | | | | 24,429 | |
Custodian fees (Note 2) | | | 9,399 | | | | 85,514 | | | | 216,387 | | | | 38,776 | |
Dividend expense on securities sold-short | | | — | | | | 1,284,539 | | | | 8,783,606 | | | | — | |
Prime broker interest expense | | | — | | | | 5,716,749 | | | | 3,665,027 | | | | — | |
Other expenses | | | 3,593 | | | | 28,549 | | | | 81,866 | | | | 12,744 | |
| | | | | | | | | | | | | | | | |
Total expenses before waivers and reimbursements | | | 1,279,218 | | | | 17,450,580 | | | | 31,054,755 | | | | 3,211,364 | |
Less: waivers and reimbursements | | | — | | | | — | | | | — | | | | (773,079 | ) |
| | | | | | | | | | | | | | | | |
Net expenses after waivers and reimbursements | | | 1,279,218 | | | | 17,450,580 | | | | 31,054,755 | | | | 2,438,285 | |
| | | | | | | | | | | | | | | | |
Net investment income/(loss) | | | 541,367 | | | | (11,982,782 | ) | | | (4,357,886 | ) | | | 3,640,916 | |
| | | | | | | | | | | | | | | | |
Net realized gain/(loss) from: | | | | | | | | | | | | | | | | |
Investments | | | 6,551,926 | | | | 102,702,186 | * | | | 95,524,343 | | | | 26,607,889 | |
Investments sold-short | | | — | | | | (71,747,065 | ) | | | (77,643,493 | ) | | | — | |
Foreign currency transactions | | | — | | | | 117,623 | | | | 1,827,545 | | | | — | |
Written options ** | | | — | | | | (3,516,325 | ) | | | 1,438,125 | | | | (89,043 | ) |
Net change in unrealized appreciation/(depreciation) on: | | | | | | | | | | | | | | | | |
Investments | | | 19,303,057 | | | | 31,999,951 | | | | 307,255,609 | | | | 59,029,285 | |
Investments sold short | | | — | | | | (41,543,121 | ) | | | (98,823,336 | ) | | | — | |
Foreign currency translation | | | — | | | | (2,232 | ) | | | 1,880,994 | | | | — | |
Written options ** | | | — | | | | (146,221 | ) | | | (1,951,688 | ) | | | 178,400 | |
| | | | | | | | | | | | | | | | |
Net realized and unrealized gain from investments | | | 25,854,983 | | | | 17,864,796 | | | | 229,508,099 | | | | 85,726,531 | |
| | | | | | | | | | | | | | | | |
Net increase in net assets resulting from operations | | $ | 26,396,350 | | | $ | 5,882,014 | | | $ | 225,150,213 | | | $ | 89,367,447 | |
| | | | | | | | | | | | | | | | |
† Net of foreign withholding taxes of | | $ | — | | | $ | (146,463 | ) | | $ | (294,782 | ) | | $ | (74,187 | ) |
| | | | | | | | | | | | | | | | |
| * | Includes realized loss on purchased options of $(1,316,595). Primary risk is equity contracts |
| ** | Primary risk is equity contracts |
THEACCOMPANYINGNOTESAREANINTEGRALPARTOFTHEFINANCIALSTATEMENTS.
| | | | |
| SEMI-ANNUAL REPORT 2014 | | | 39 | |
| | |
| ROBECO INVESTMENT FUNDS | | FEBRUARY 28, 2014 (unaudited) |
| | |
STATEMENTS OF OPERATIONS (concluded) | | |
| | | | | | | | | | | | | | | | |
| | | Robeco WPG
Small/Micro Cap
Value Fund | | | Robeco Boston
Partners Global
Equity Fund | | �� | Robeco Boston
Partners
International
Equity Fund | | | Robeco Boston
Partners Global
Long/Short
Fund | |
| | | For the
Six Months Ended
February 28, 2014 | | | For the
Six Months Ended
February 28, 2014 | | | For the
Six Months Ended
February 28, 2014 | | | For the
Period Ended
February 28, 2014* | |
Investment Income | | | | | | | | | | | | | | | | |
Dividends † | | $ | 403,161 | | | $ | 309,633 | | | $ | 96,443 | | | $ | 9,938 | |
Interest | | | 115 | | | | 115 | | | | 66 | | | | 3 | |
Income from securities loaned (Note 6) | | | 25,843 | | | | — | | | | — | | | | — | |
| | | | | | | | | | | | | | | | |
Total investment income | | | 429,119 | | | | 309,748 | | | | 96,509 | | | | 9,941 | |
| | | | | | | | | | | | | | | | |
Expenses | | | | | | | | | | | | | | | | |
Advisory fees (Note 2) | | | 198,417 | | | | 163,707 | | | | 56,188 | | | | 6,363 | |
Administration and accounting fees (Note 2) | | | 37,934 | | | | 39,275 | | | | 40,288 | | | | 11,892 | |
Transfer agent fees (Note 2) | | | 28,241 | | | | 16,020 | | | | 16,046 | | | | 6,302 | |
Custodian fees (Note 2) | | | 14,492 | | | | 9,069 | | | | 10,994 | | | | 5,600 | |
Audit fees | | | 12,081 | | | | 17,134 | | | | 22,344 | | | | 8,210 | |
Registration and filing fees | | | 11,484 | | | | 15,033 | | | | 16,163 | | | | 3,453 | |
Directors’ and officers’ fees | | | 9,517 | | | | 8,561 | | | | 8,467 | | | | 4,595 | |
Legal fees | | | 1,592 | | | | — | | | | 8 | | | | 2,828 | |
Printing and shareholder reporting fees | | | 433 | | | | — | | | | — | | | | 3,050 | |
Dividend expense on securities sold-short | | | — | | | | — | | | | — | | | | 3,620 | |
Prime broker interest expense | | | — | | | | — | | | | — | | | | 3,439 | |
Other expenses | | | 6,629 | | | | 2,467 | | | | 2,547 | | | | 821 | |
| | | | | | | | | | | | | | | | |
Total expenses before waivers and reimbursements | | | 320,820 | | | | 271,266 | | | | 173,045 | | | | 60,173 | |
Less: waivers and reimbursements | | | — | | | | (94,767 | ) | | | (110,109 | ) | | | (44,630 | ) |
| | | | | | | | | | | | | | | | |
Net expenses after waivers and reimbursements | | | 320,820 | | | | 176,499 | | | | 62,936 | | | | 15,543 | |
| | | | | | | | | | | | | | | | |
Net investment income/(loss) | | | 108,299 | | | | 133,249 | | | | 33,573 | | | | (5,602 | ) |
| | | | | | | | | | | | | | | | |
Net realized gain/(loss) from: | | | | | | | | | | | | | | | | |
Investments | | | 4,361,806 | | | | 785,987 | | | | 567,939 | | | | (19,831 | ) |
Investments sold-short | | | — | | | | — | | | | — | | | | (15,390 | ) |
Foreign currency transactions | | | — | | | | (45,968 | ) | | | (4,278 | ) | | | (8,856 | ) |
Net change in unrealized appreciation/(depreciation) on: | | | | | | | | | | | | | | | | |
Investments | | | 728,897 | | | | 3,296,665 | | | | 1,438,272 | | | | 70,740 | |
Investments sold short | | | — | | | | — | | | | — | | | | (21,993 | ) |
Foreign currency translation | | | — | | | | 3,363 | | | | 2,553 | | | | 203 | |
Contracts for difference | | | — | | | | — | | | | — | | | | (128 | ) |
| | | | | | | | | | | | | | | | |
Net realized and unrealized gain from investments | | | 5,090,703 | | | | 4,040,047 | | | | 2,004,486 | | | | 4,745 | |
| | | | | | | | | | | | | | | | |
Net increase/(decrease) in net assets resulting from operations | | $ | 5,199,002 | | | $ | 4,173,296 | | | $ | 2,038,059 | | | $ | (857 | ) |
| | | | | | | | | | | | | | | | |
† Net of foreign withholding taxes of | | $ | (2,343 | ) | | $ | (8,511 | ) | | $ | (8,132 | ) | | $ | (371 | ) |
| | | | | | | | | | | | | | | | |
| * | Inception Date for the Fund is December 31, 2013. |
THEACCOMPANYINGNOTESAREANINTEGRALPARTOFTHEFINANCIALSTATEMENTS.
| | |
| 40 | | SEMI-ANNUAL REPORT 2014 |
| | |
| ROBECO INVESTMENT FUNDS | | FEBRUARY 28, 2014 |
| | |
STATEMENTS OF CHANGES IN NET ASSETS | | |
| | | | | | | | | | | | | | | | |
| | | Robeco Boston Partners
Small Cap Value Fund II | | | Robeco Boston Partners
Long/Short Equity Fund | |
| | | For the
Six Months Ended
February 28, 2014
(unaudited) | | | For the
Year Ended
August 31, 2013 | | | For the
Six Months Ended
February 28, 2014
(unaudited) | | | For the
Year Ended
August 31, 2013 | |
Increase/(decrease) in net assets from operations: | | | | | | | | | | | | | | | | |
Net investment income/(loss) | | $ | 541,367 | | | $ | 568,706 | | | $ | (11,982,782 | ) | | $ | (20,622,645 | ) |
Net realized gain from investments, securities sold short, written options and foreign currency | | | 6,551,926 | | | | 7,727,178 | | | | 27,556,419 | | | | 64,972,332 | |
Net change in unrealized appreciation/(depreciation) from investments, securities sold short, written options and foreign currency | | | 19,303,057 | | | | 23,481,128 | | | | (9,691,623 | ) | | | 12,934,395 | |
| | | | | | | | | | | | | | | | |
Net increase in net assets resulting from operations | | | 26,396,350 | | | | 31,777,012 | | | | 5,882,014 | | | | 57,284,082 | |
| | | | | | | | | | | | | | | | |
Dividends and distributions to shareholders from: | | | | | | | | | | | | | | | | |
Net investment income | | | | | | | | | | | | | | | | |
Institutional Class | | | (345,221 | ) | | | (330,981 | ) | | | — | | | | — | |
Investor Class | | | (237,918 | ) | | | (239,393 | ) | | | — | | | | — | |
Net realized gains | | | | | | | | | | | | | | | | |
Institutional Class | | | — | | | | — | | | | (36,987,514 | ) | | | (31,483,030 | ) |
Investor Class | | | — | | | | — | | | | (13,170,067 | ) | | | (11,609,468 | ) |
| | | | | | | | | | | | | | | | |
Net decrease in net assets from dividends and distributions to shareholders | | | (583,139 | ) | | | (570,374 | ) | | | (50,157,581 | ) | | | (43,092,498 | ) |
| | | | | | | | | | | | | | | | |
Capital transactions: | | | | | | | | | | | | | | | | |
Institutional Class | | | | | | | | | | | | | | | | |
Proceeds from shares sold | | | 12,540,672 | | | | 19,307,982 | | | | 74,229,335 | | | | 194,729,408 | |
Reinvestment of distributions | | | 324,783 | | | | 315,205 | | | | 26,413,733 | | | | 22,073,849 | |
Shares redeemed | | | (8,595,954 | ) | | | (11,010,452 | ) | | | (128,980,644 | ) | | | (112,476,432 | ) |
Redemption fees (Note 8) | | | — | | | | — | | | | 248,808 | | | | 226,043 | |
Investor Class | | | | | | | | | | | | | | | | |
Proceeds from shares sold | | | 17,235,735 | | | | 22,599,993 | | | | 22,739,175 | | | | 74,413,011 | |
Reinvestment of distributions | | | 233,663 | | | | 236,002 | | | | 12,197,068 | | | | 11,016,840 | |
Shares redeemed | | | (9,899,404 | ) | | | (19,269,204 | ) | | | (49,623,839 | ) | | | (39,083,760 | ) |
Redemption fees (Note 8) | | | — | | | | — | | | | 85,694 | | | | 79,485 | |
| | | | | | | | | | | | | | | | |
Net increase/(decrease) in net assets from capital transactions | | | 11,839,495 | | | | 12,179,526 | | | | (42,690,670 | ) | | | 150,978,444 | |
| | | | | | | | | | | | | | | | |
Total increase/(decrease) in net assets | | | 37,652,706 | | | | 43,386,164 | | | | (86,966,237 | ) | | | 165,170,028 | |
Net assets | | | | | | | | | | | | | | | | |
Beginning of period | | | 163,679,368 | | | | 120,293,204 | | | | 841,111,540 | | | | 675,941,512 | |
| | | | | | | | | | | | | | | | |
End of period | | $ | 201,332,074 | | | $ | 163,679,368 | | | $ | 754,145,303 | | | $ | 841,111,540 | |
| | | | | | | | | | | | | | | | |
Undistributed net investment income/(loss),
end of period | | $ | (32,715 | ) | | $ | 9,057 | | | $ | (12,623,241 | ) | | $ | (640,459 | ) |
| | | | | | | | | | | | | | | | |
Share transactions: | | | | | | | | | | | | | | | | |
Institutional Class | | | | | | | | | | | | | | | | |
Shares sold | | | 588,182 | | | | 1,111,634 | | | | 3,553,546 | | | | 9,225,509 | |
Shares reinvested | | | 15,262 | | | | 19,314 | | | | 1,291,625 | | | | 1,094,171 | |
Shares redeemed | | | (416,249 | ) | | | (622,538 | ) | | | (6,278,332 | ) | | | (5,349,876 | ) |
| | | | | | | | | | | | | | | | |
Net increase/(decrease) | | | 187,195 | | | | 508,410 | | | | (1,433,161 | ) | | | 4,969,804 | |
| | | | | | | | | | | | | | | | |
Investor Class | | | | | | | | | | | | | | | | |
Shares sold | | | 897,316 | | | | 1,361,719 | | | | 1,145,143 | | | | 3,725,052 | |
Shares reinvested | | | 11,392 | | | | 15,003 | | | | 632,300 | | | | 575,283 | |
Shares redeemed | | | (490,203 | ) | | | (1,147,672 | ) | | | (2,542,187 | ) | | | (1,956,277 | ) |
| | | | | | | | | | | | | | | | |
Net increase/(decrease) | | | 418,505 | | | | 229,050 | | | | (764,744 | ) | | | 2,344,058 | |
| | | | | | | | | | | | | | | | |
THEACCOMPANYINGNOTESAREANINTEGRALPARTOFTHEFINANCIALSTATEMENTS.
| | | | |
| SEMI-ANNUAL REPORT 2014 | | | 41 | |
| | |
| ROBECO INVESTMENT FUNDS | | FEBRUARY 28, 2014 |
| | |
STATEMENTS OF CHANGES IN NET ASSETS (continued) | | |
| | | | | | | | | | | | | | | | |
| | | Robeco Boston Partners
Long/Short Research Fund | | | Robeco Boston Partners
All-Cap Value Fund | |
| | | For the
Six Months Ended
February 28, 2014
(unaudited) | | | For the
Year Ended
August 31, 2013 | | | For the
Six Months Ended
February 28, 2014
(unaudited) | | | For the
Year Ended
August 31, 2013 | |
Increase/(decrease) in net assets from operations: | | | | | | | | | | | | | | | | |
Net investment income/(loss) | | $ | (4,357,886 | ) | | $ | (8,746,108 | ) | | $ | 3,640,916 | | | $ | 5,540,050 | |
Net realized gain/(loss) from investments, securities sold short, written options and foreign currency | | | 21,146,520 | | | | (3,616,597 | ) | | | 26,518,846 | | | | 13,930,912 | |
Net change in unrealized appreciation/(depreciation) from investments, securities sold short, written options and foreign currency | | | 208,361,579 | | | | 84,166,780 | | | | 59,207,685 | | | | 71,276,589 | |
| | | | | | | | | | | | | | | | |
Net increase in net assets resulting from operations | | | 225,150,213 | | | | 71,804,075 | | | | 89,367,447 | | | | 90,747,551 | |
| | | | | | | | | | | | | | | | |
Dividends and distributions to shareholders from: | | | | | | | | | | | | | | | | |
Net investment income | | | | | | | | | | | | | | | | |
Institutional Class | | | — | | | | — | | | | (4,677,165 | ) | | | (5,354,408 | ) |
Investor Class | | | — | | | | — | | | | (911,496 | ) | | | (396,553 | ) |
Net realized capital gains | | | | | | | | | | | | | | | | |
Institutional Class | | | (10,191,255 | ) | | | (3,652,979 | ) | | | (15,951,494 | ) | | | (1,983,575 | ) |
Investor Class | | | (644,954 | ) | | | (626,444 | ) | | | (3,674,790 | ) | | | (170,547 | ) |
| | | | | | | | | | | | | | | | |
Net decrease in net assets from dividends and distributions to shareholders | | | (10,836,209 | ) | | | (4,279,423 | ) | | | (25,214,945 | ) | | | (7,905,083 | ) |
| | | | | | | | | | | | | | | | |
Capital transactions: | | | | | | | | | | | | | | | | |
Institutional Class | | | | | | | | | | | | | | | | |
Proceeds from shares sold | | | 1,884,510,296 | | | | 1,560,210,535 | | | | 176,702,767 | | | | 94,185,087 | |
Reinvestment of distributions | | | 5,470,231 | | | | 3,332,064 | | | | 18,483,816 | | | | 6,790,733 | |
Shares redeemed | | | (157,688,738 | ) | | | (134,081,253 | ) | | | (35,798,140 | ) | | | (78,414,413 | ) |
Redemption fees (Note 8) | | | 70,418 | | | | 69,975 | | | | — | | | | — | |
Investor Class | | | | | | | | | | | | | | | | |
Proceeds from shares sold | | | 88,819,543 | | | | 86,157,330 | | | | 91,696,965 | | | | 54,038,094 | |
Reinvestment of distributions | | | 626,724 | | | | 616,804 | | | | 4,474,110 | | | | 542,146 | |
Shares redeemed | | | (20,563,499 | ) | | | (10,387,646 | ) | | | (14,213,580 | ) | | | (9,265,249 | ) |
Redemption fees (Note 8) | | | 4,722 | | | | 7,497 | | | | — | | | | — | |
| | | | | | | | | | | | | | | | |
Net increase in net assets from capital transactions | | | 1,801,249,697 | | | | 1,505,925,306 | | | | 241,345,938 | | | | 67,876,398 | |
| | | | | | | | | | | | | | | | |
Total increase in net assets | | | 2,015,563,701 | | | | 1,573,449,958 | | | | 305,498,440 | | | | 150,718,866 | |
Net assets | | | | | | | | | | | | | | | | |
Beginning of period | | | 1,875,916,219 | | | | 302,466,261 | | | | 519,792,660 | | | | 369,073,794 | |
| | | | | | | | | | | | | | | | |
End of period | | $ | 3,891,479,920 | | | $ | 1,875,916,219 | | | $ | 825,291,100 | | | $ | 519,792,660 | |
| | | | | | | | | | | | | | | | |
Undistributed net investment income/(loss), end of period | | $ | (14,047,834 | ) | | $ | (9,689,948 | ) | | $ | 1,423,256 | | | $ | 3,371,001 | |
| | | | | | | | | | | | | | | | |
Share transactions: | | | | | | | | | | | | | | | | |
Institutional Class | | | | | | | | | | | | | | | | |
Shares sold | | | 133,605,688 | | | | 119,828,386 | | | | 8,603,594 | | | | 5,222,054 | |
Shares reinvested | | | 384,686 | | | | 269,806 | | | | 902,530 | | | | 427,359 | |
Shares redeemed | | | (11,150,456 | ) | | | (10,349,319 | ) | | | (1,741,878 | ) | | | (4,718,642 | ) |
| | | | | | | | | | | | | | | | |
Net increase | | | 122,839,918 | | | | 109,748,873 | | | | 7,764,246 | | | | 930,771 | |
| | | | | | | | | | | | | | | | |
Investor Class | | | | | | | | | | | | | | | | |
Shares sold | | | 6,332,426 | | | | 6,723,198 | | | | 4,481,160 | | | | 2,941,809 | |
Shares reinvested | | | 44,385 | | | | 50,187 | | | | 219,104 | | | | 34,205 | |
Shares redeemed | | | (1,492,330 | ) | | | (813,591 | ) | | | (694,888 | ) | | | (525,121 | ) |
| | | | | | | | | | | | | | | | |
Net increase | | | 4,884,481 | | | | 5,959,794 | | | | 4,005,376 | | | | 2,450,893 | |
| | | | | | | | | | | | | | | | |
THEACCOMPANYINGNOTESAREANINTEGRALPARTOFTHEFINANCIALSTATEMENTS.
| | |
| 42 | | SEMI-ANNUAL REPORT 2014 |
| | |
| ROBECO INVESTMENT FUNDS | | FEBRUARY 28, 2014 |
| | |
STATEMENTS OF CHANGES IN NET ASSETS (continued) | | |
| | | | | | | | | | | | | | | | |
| | | Robeco WPG
Small/Micro Cap Value Fund | | | Robeco Boston Partners
Global Equity Fund | |
| | | For the
Six Months Ended
February 28, 2014
(unaudited) | | | For the
Year Ended
August 31, 2013 | | | For the
Six Months Ended
February 28, 2014
(unaudited) | | | For the
Year Ended
August 31, 2013 | |
Increase/(decrease) in net assets from operations: | | | | | | | | | | | | | | | | |
Net investment income | | $ | 108,299 | | | $ | 166,781 | | | $ | 133,249 | | | $ | 115,056 | |
Net realized gain from investments and foreign currency | | | 4,361,806 | | | | 6,470,040 | | | | 740,019 | | | | 1,381,402 | |
Net change in unrealized appreciation/(depreciation) from investments and foreign currency | | | 728,897 | | | | 5,215,538 | | | | 3,300,028 | | | | 655,470 | |
| | | | | | | | | | | | | | | | |
Net increase in net assets resulting from operations | | | 5,199,002 | | | | 11,852,359 | | | | 4,173,296 | | | | 2,151,928 | |
| | | | | | | | | | | | | | | | |
Dividends and distributions to shareholders from: | | | | | | | | | | | | | | | | |
Net investment income | | | | | | | | | | | | | | | | |
Institutional Class | | | (50,359 | ) | | | (177,056 | ) | | | (91,861 | ) | | | (132,255 | ) |
Net realized capital gains | | | | | | | | | | | | | | | | |
Institutional Class | | | (3,952,860 | ) | | | — | | | | (1,411,673 | ) | | | (89,015 | ) |
| | | | | | | | | | | | | | | | |
Net decrease in net assets from dividends and distributions to shareholders | | | (4,003,219 | ) | | | (177,056 | ) | | | (1,503,534 | ) | | | (221,270 | ) |
| | | | | | | | | | | | | | | | |
Capital transactions: | | | | | | | | | | | | | | | | |
Institutional Class | | | | | | | | | | | | | | | | |
Proceeds from shares sold | | | 1,221,107 | | | | 1,279,852 | | | | 54,342,198 | | | | 10,533,433 | |
Reinvestment of distributions | | | 3,615,431 | | | | 164,540 | | | | 1,503,534 | | | | 221,270 | |
Shares redeemed | | | (1,111,496 | ) | | | (9,732,943 | ) | | | (311,952 | ) | | | (12,423,048 | ) |
| | | | | | | | | | | | | | | | |
Net increase/(decrease) in net assets from capital transactions | | | 3,725,042 | | | | (8,288,551 | ) | | | 55,533,780 | | | | (1,668,345 | ) |
| | | | | | | | | | | | | | | | |
Total increase in net assets | | | 4,920,825 | | | | 3,386,752 | | | | 58,203,542 | | | | 262,313 | |
Net assets | | | | | | | | | | | | | | | | |
Beginning of period | | | 40,754,250 | | | | 37,367,498 | | | | 11,496,286 | | | | 11,233,973 | |
| | | | | | | | | | | | | | | | |
End of period | | $ | 45,675,075 | | | $ | 40,754,250 | | | $ | 69,699,828 | | | $ | 11,496,286 | |
| | | | | | | | | | | | | | | | |
Undistributed net investment income/(loss), end of period | | $ | (56,191 | ) | | $ | (114,130 | ) | | $ | 123,912 | | | $ | 82,524 | |
| | | | | | | | | | | | | | | | |
Share transactions: | | | | | | | | | | | | | | | | |
Institutional Class | | | | | | | | | | | | | | | | |
Shares sold | | | 60,966 | | | | 69,365 | | | | 3,720,386 | | | | 864,742 | |
Shares reinvested | | | 185,502 | | | | 10,726 | | | | 105,585 | | | | 19,444 | |
Shares redeemed | | | (55,169 | ) | | | (551,765 | ) | | | (21,657 | ) | | | (1,018,952 | ) |
| | | | | | | | | | | | | | | | |
Net increase/(decrease) | | | 191,299 | | | | (471,674 | ) | | | 3,804,314 | | | | (134,766 | ) |
| | | | | | | | | | | | | | | | |
THEACCOMPANYINGNOTESAREANINTEGRALPARTOFTHEFINANCIALSTATEMENTS.
| | | | |
| SEMI-ANNUAL REPORT 2014 | | | 43 | |
| | |
| ROBECO INVESTMENT FUNDS | | FEBRUARY 28, 2014 |
| | |
STATEMENTS OF CHANGES IN NET ASSETS (concluded) | | |
| | | | | | | | | | | | |
| | | Robeco Boston Partners
International Equity Fund | | | Robeco Boston
Partners Global
Long/Short Fund | |
| | | For the
Six Months Ended
February 28, 2014
(unaudited) | | | For the
Year Ended
August 31, 2013 | | | For the
Period Ended
February 28, 2014*
(unaudited) | |
Increase/(decrease) in net assets from operations: | | | | | | | | | | | | |
Net investment income/(loss) | | $ | 33,573 | | | $ | 184,786 | | | $ | (5,602 | ) |
Net realized gain/(loss) from investments, securities sold short, and foreign currency | | | 563,661 | | | | 1,225,561 | | | | (44,077 | ) |
Net change in unrealized appreciation/(depreciation) from investments, securities sold short, contracts for difference and foreign currency | | | 1,440,825 | | | | 827,263 | | | | 48,822 | |
| | | | | | | | | | | | |
Net increase/(decrease) in net assets resulting from operations | | | 2,038,059 | | | | 2,237,610 | | | | (857 | ) |
| | | | | | | | | | | | |
Dividends and distributions to shareholders from: | | | | | | | | | | | | |
Net investment income | | | | | | | | | | | | |
Institutional Class | | | (180,952 | ) | | | (131,147 | ) | | | — | |
Net realized capital gains | | | | | | | | | | | | |
Institutional Class | | | (1,228,664 | ) | | | (78,542 | ) | | | — | |
| | | | | | | | | | | | |
Net decrease in net assets from dividends and distributions to shareholders | | | (1,409,616 | ) | | | (209,689 | ) | | | — | |
| | | | | | | | | | | | |
Capital transactions: | | | | | | | | | | | | |
Institutional Class | | | | | | | | | | | | |
Proceeds from shares sold | | | 492,321 | | | | 10,203,550 | | | | 7,965,000 | |
Reinvestment of distributions | | | 1,409,616 | | | | 209,689 | | | | — | |
Shares redeemed | | | (1,714 | ) | | | (12,232,244 | ) | | | — | |
| | | | | | | | | | | | |
Net increase/(decrease) in net assets from capital transactions | | | 1,900,223 | | | | (1,819,005 | ) | | | 7,965,000 | |
| | | | | | | | | | | | |
Total increase in net assets | | | 2,528,666 | | | | 208,916 | | | | 7,964,143 | |
Net assets | | | | | | | | | | | | |
Beginning of period | | | 11,104,133 | | | | 10,895,217 | | | | — | |
| | | | | | | | | | | | |
End of period | | $ | 13,632,799 | | | $ | 11,104,133 | | | $ | 7,964,143 | |
| | | | | | | | | | | | |
Undistributed net investment income/(loss),
end of period | | $ | 15,046 | | | $ | 162,425 | | | $ | (5,602 | ) |
| | | | | | | | | | | | |
Share transactions: | | | | | | | | | | | | |
Institutional Class | | | | | | | | | | | | |
Shares sold | | | 36,229 | | | | 852,881 | | | | 798,646 | |
Shares reinvested | | | 109,697 | | | | 18,218 | | | | — | |
Shares redeemed | | | (130 | ) | | | (1,018,530 | ) | | | — | |
| | | | | | | | | | | | |
Net increase/(decrease) | | | 145,796 | | | | (147,431 | ) | | | 798,646 | |
| | | | | | | | | | | | |
| * | Inception Date of the Fund was December 31, 2013. |
THEACCOMPANYINGNOTESAREANINTEGRALPARTOFTHEFINANCIALSTATEMENTS.
| | |
| 44 | | SEMI-ANNUAL REPORT 2014 |
| | |
| ROBECO INVESTMENT FUNDS | | FEBRUARY 28, 2014 (unaudited) |
| | |
STATEMENT OF CASH FLOWS(1) | | |
| | | | |
| | | Robeco Boston
Partners Global
Long/Short Fund | |
| | | For the Period
December 31, 2013* to
February 28, 2014 | |
Cash flows provided from (used in) operating activities: | | | | |
Net increase (decrease) in net assets from operations | | $ | (857 | ) |
| |
Adjustments to reconcile net increase in net assets resulting from operations to net cash provided by (used in) operating activities: | | | | |
Purchases of long-term portfolio investments | | | (3,870,903 | ) |
Proceeds from disposition of long-term portfolio investments | | | 537,913 | |
Purchase to cover short sales | | | (594,854 | ) |
Proceeds from short sales | | | 2,425,109 | |
Net realized gain on investments and investments sold short | | | 35,221 | |
Net change in unrealized appreciation (depreciation) on investments and investments sold short | | | (48,747 | ) |
Net unrealized depreciation on contracts for differences | | | 128 | |
Increase (decrease) in deposits with brokers for securities sold short | | | (2,621,047 | ) |
Increase (decrease) in dividend and interest receivable | | | (9,771 | ) |
Increase (decrease) in prepaid expenses and other assets | | | (33,269 | ) |
Increase in payable for custodian fees | | | 5,600 | |
Increase in payable for audit fees | | | — | |
Increase in payable for dividends on securities sold-short | | | 2,682 | |
Increase in prime broker interest payable | | | 61 | |
Increase in admin and accounting fees | | | 2,491 | |
Increase in accrued expenses | | | 15,695 | |
| | | | |
Net cash used in operating activities | | | (4,154,548 | ) |
| | | | |
Cash flows from financing activities | | | | |
Increase in payable to Prime Broker | | | 805,659 | |
Net payment for fund share activity | | | 3,630,013 | |
Distributions paid from realized capital gains | | | — | |
| | | | |
Net cash provided by financing activities | | | 4,435,672 | |
| | | | |
| |
Net increase in cash | | | 281,124 | |
| | | | |
Cash and foreign currency at beginning of the period | | | — | |
| | | | |
Cash and foreign currency at end of the period | | $ | 281,124 | |
| | | | |
Supplemental disclosure of cash flow information: | | | | |
Cash paid during the period for interest expense | | $ | 3,378 | |
| | | | |
| * | Commencement of operations |
| (1) | The Robeco Boston Partners Global Long/Short Fund has not met the exemption criteria under the Financial Accounting Standards Board Accounting Standards Codification Topic 230, Statement of Cash Flows, and therefore includes a Statement of Cash Flows. All other Funds have met the exemption criteria. |
THEACCOMPANYINGNOTESAREANINTEGRALPARTOFTHEFINANCIALSTATEMENTS.
| | | | |
| SEMI-ANNUAL REPORT 2014 | | | 45 | |
| | |
FINANCIAL HIGHLIGHTS | | PER SHARE OPERATING PERFORMANCE |
Contained below is per share operating performance data for each class of shares outstanding, total investment return, ratios to average net assets and other supplemental data for the respective periods. This information has been derived from information provided in the financial statements.
| | | | | | | | | | | | | | | | | | | | | | | | | | | | | | | | | | |
| | |
Net
Asset
Value,
Beginning
of Period | | | Net
Investment
Income/(Loss)* | | | Net Realized
and Unrealized
Gain/(Loss) on
Investments | | | Total From
Investment
Operations | | | Dividends to
Shareholders
from Net
Investment
Income | | | Distributions to
Shareholders
from Net
Realized Gains | | | Return
of Capital | | | Total
Distributions | | | |
| Robeco Boston Partners Small Cap Value Fund II | | | | | | | | | | | | | | | | | | | |
Institutional Class | | | | | | | | | | | | | | | | | | | | | | | | | | | | | | | |
9/1/13 through 2/28/14† | | $ | 19.06 | | | $ | 0.08 | | | $ | 2.88 | | | $ | 2.96 | | | $ | (0.09 | ) | | $ | — | | | $ | — | | | $ | (0.09 | ) | | |
8/31/13 | | | 15.31 | | | | 0.09 | | | | 3.75 | | | | 3.84 | | | | (0.09 | ) | | | — | | | | — | | | | (0.09 | ) | | |
8/31/12 | | | 12.92 | | | | 0.05 | | | | 2.39 | | | | 2.44 | | | | (0.05 | ) | | | — | | | | — | | | | (0.05 | ) | | |
8/31/11 | | | 11.02 | | | | 0.03 | | | | 1.91 | | | | 1.94 | | | | (0.04 | ) | | | — | | | | — | | | | (0.04 | ) | | |
8/31/10 | | | 10.49 | | | | 0.06 | | | | 0.52 | | | | 0.58 | | | | (0.05 | ) | | | — | | | | — | | | | (0.05 | ) | | |
8/31/09 | | | 11.87 | | | | 0.11 | | | | (1.26 | ) | | | (1.15 | ) | | | (0.14 | ) | | | (0.05 | ) | | | (0.04 | ) | | | (0.23 | ) | | |
Investor Class | | | | | | | | | | | | | | | | | | | | | | | | | | | | | | | | | | |
9/1/13 through 2/28/14† | | $ | 18.35 | | | $ | 0.05 | | | $ | 2.78 | | | $ | 2.83 | | | $ | (0.05 | ) | | $ | — | | | $ | — | | | $ | (0.05 | ) | | |
8/31/13 | | | 14.74 | | | | 0.05 | | | | 3.61 | | | | 3.66 | | | | (0.05 | ) | | | — | | | | — | | | | (0.05 | ) | | |
8/31/12 | | | 12.44 | | | | 0.02 | | | | 2.30 | | | | 2.32 | | | | (0.02 | ) | | | — | | | | — | | | | (0.02 | ) | | |
8/31/11 | | | 10.62 | | | | (— | )3 | | | 1.84 | | | | 1.84 | | | | (0.02 | ) | | | — | | | | — | | | | (0.02 | ) | | |
8/31/10 | | | 10.11 | | | | 0.03 | | | | 0.50 | | | | 0.53 | | | | (0.02 | ) | | | — | | | | — | | | | (0.02 | ) | | |
8/31/09 | | | 11.43 | | | | 0.07 | | | | (1.20 | ) | | | (1.13 | ) | | | (0.11 | ) | | | (0.05 | ) | | | (0.03 | ) | | | (0.19 | ) | | |
| Robeco Boston Partners Long/Short Equity Fund | | | | | | | | | | | | | | | | | | | |
Institutional Class | | | | | | | | | | | | | | | | | | | | | | | | | | | | | | | | | | |
9/1/13 through 2/28/14† | | $ | 20.94 | | | $ | (0.29 | ) | | $ | 0.45 | | | $ | 0.16 | | | $ | — | | | $ | (1.24 | ) | | $ | — | | | $ | (1.24 | ) | | |
8/31/13 | | | 20.47 | | | | (0.54 | ) | | | 2.24 | | | | 1.70 | | | | — | | | | (1.24 | ) | | | — | | | | (1.24 | ) | | |
8/31/12 | | | 19.88 | | | | (0.54 | ) | | | 3.15 | | | | 2.61 | | | | — | | | | (2.03 | ) | | | — | | | | (2.03 | ) | | |
8/31/11 | | | 17.41 | | | | (0.47 | ) | | | 4.55 | | | | 4.08 | | | | — | | | | (1.62 | ) | | | — | | | | (1.62 | ) | | |
8/31/10 | | | 15.75 | | | | (0.37 | ) | | | 1.98 | | | | 1.61 | | | | — | | | | — | | | | — | | | | — | | | |
8/31/09 | | | 15.47 | | | | (0.22 | ) | | | 2.98 | | | | 2.76 | | | | — | | | | (2.48 | ) | | | — | | | | (2.48 | ) | | |
Investor Class | | | | | | | | | | | | | | | | | | | | | | | | | | | | | | | | | | |
9/1/13 through 2/28/14† | | $ | 19.84 | | | $ | (0.30 | ) | | $ | 0.43 | | | $ | 0.13 | | | $ | — | | | $ | (1.24 | ) | | $ | — | | | $ | (1.24 | ) | | |
8/31/13 | | | 19.51 | | | | (0.57 | ) | | | 2.13 | | | | 1.56 | | | | — | | | | (1.24 | ) | | | — | | | | (1.24 | ) | | |
8/31/12 | | | 19.08 | | | | (0.56 | ) | | | 3.01 | | | | 2.45 | | | | — | | | | (2.03 | ) | | | — | | | | (2.03 | ) | | |
8/31/11 | | | 16.80 | | | | (0.50 | ) | | | 4.39 | | | | 3.89 | | | | — | | | | (1.62 | ) | | | — | | | | (1.62 | ) | | |
8/31/10 | | | 15.31 | | | | (0.40 | ) | | | 1.84 | | | | 1.44 | | | | — | | | | — | | | | — | | | | — | | | |
8/31/09 | | | 15.17 | | | | (0.25 | ) | | | 2.87 | | | | 2.62 | | | | — | | | | (2.48 | ) | | | — | | | | (2.48 | ) | | |
| Robeco Boston Partners Long/Short Research Fund | | | | | | | | | | | | | | | | | | | |
Institutional Class | | | | | | | | | | | | | | | | | | | | | | | | | | | | | | | | | | |
9/1/13 through 2/28/14† | | $ | 13.30 | | | $ | (0.02 | ) | | $ | 1.26 | | | $ | 1.24 | | | $ | — | | | $ | (0.06 | ) | | $ | — | | | $ | (0.06 | ) | | |
8/31/13 | | | 11.91 | | | | (0.14 | ) | | | 1.66 | | | | 1.52 | | | | — | | | | (0.13 | ) | | | — | | | | (0.13 | ) | | |
8/31/12 | | | 10.60 | | | | (0.13 | ) | | | 1.53 | | | | 1.40 | | | | — | | | | (0.09 | ) | | | — | | | | (0.09 | ) | | |
9/30/10** through 8/31/11 | | | 10.00 | | | | (0.12 | ) | | | 0.71 | | | | 0.59 | | | | — | | | | — | | | | — | | | | — | | | |
Investor Class | | | | | | | | | | | | | | | | | | | | | | | | | | | | | | | | | | |
9/1/13 through 2/28/14† | | $ | 13.21 | | | $ | (0.04 | ) | | $ | 1.25 | | | $ | 1.21 | | | $ | — | | | $ | (0.06 | ) | | $ | — | | | $ | (0.06 | ) | | |
8/31/13 | | | 11.86 | | | | (0.18 | ) | | | 1.66 | | | | 1.48 | | | | — | | | | (0.13 | ) | | | — | | | | (0.13 | ) | | |
8/31/12 | | | 10.58 | | | | (0.15 | ) | | | 1.52 | | | | 1.37 | | | | — | | | | (0.09 | ) | | | — | | | | (0.09 | ) | | |
11/29/10** through 8/31/11 | | | 10.40 | | | | (0.12 | ) | | | 0.29 | | | | 0.17 | | | | — | | | | — | | | | — | | | | — | | | |
| * | Calculated based on average shares outstanding for the period. |
| 1 | Total return is calculated by assuming a purchase of shares on the first day and a sale of shares on the last day of the period and is not annualized if period is less than one year. |
| 2 | Redemption fees, if any, are reflected in total return calculations. |
| 3 | Amount is less than $0.01 per share. |
| 4 | Portfolio turnover rate excludes securities received from processing a subscription-in-kind. |
THEACCOMPANYINGNOTESAREANINTEGRALPARTOFTHEFINANCIALSTATEMENTS.
| | |
| 46 | | SEMI-ANNUAL REPORT 2014 |
| | |
FINANCIAL HIGHLIGHTS (continued) | | PER SHARE OPERATING PERFORMANCE |
| | | | | | | | | | | | | | | | | | | | | | | | | | | | | | | | | | | | |
| | | Redemption
Fees | | | Net
Asset
Value,
End of
Period | | | Total
Investment
Return1,2 | | | Net
Assets,
End of
Period
(000) | | | Ratio of
Expenses to
Average Net
Assets With
Waivers,
Reimbursements
and Recoupments
if any | | | Ratio of
Expenses to
Average Net
Assets With
Waivers,
Reimbursements
and Recoupments
if any (Excluding
Dividend and
Interest Expense) | | | Ratio of
Expenses to
Average Net
Assets Without
Waivers,
Reimbursements
and Recoupments
if any | | | Ratio of Net
Investment
Income/(Loss)
to Average Net
Assets With
Waivers and
Reimbursements | | | Portfolio
Turnover
Rate | |
| | | | | | | | | | | | | | | | | | | | | | | | | | | | | | | | | | | | |
| | | | | | | | | | | | | | | | | | | | | | | | | | | | | | | | | | | | |
| | $ | — | | | $ | 21.93 | | | | 15.54 | % | | $ | 92,053 | | | | 1.24 | %5 | | | N/A | | | | 1.24 | %5 | | | 0.73 | %5 | | | 9 | %6 |
| | | — | | | | 19.06 | | | | 25.19 | | | | 76,442 | | | | 1.29 | | | | N/A | | | | 1.29 | | | | 0.53 | | | | 19 | |
| | | — | 3 | | | 15.31 | | | | 18.98 | | | | 53,604 | | | | 1.30 | | | | N/A | | | | 1.36 | | | | 0.37 | | | | 32 | |
| | | — | 3 | | | 12.92 | | | | 17.59 | | | | 30,172 | | | | 1.30 | | | | N/A | | | | 1.37 | | | | 0.22 | | | | 38 | |
| | | — | 3 | | | 11.02 | | | | 5.47 | | | | 25,736 | | | | 1.30 | | | | N/A | | | | 1.39 | | | | 0.51 | | | | 43 | |
| | | — | 3 | | | 10.49 | | | | (8.97 | ) | | | 21,466 | | | | 1.30 | | | | N/A | | | | 1.74 | | | | 1.29 | | | | 66 | |
| | | | | | | | | | | | | | | | | | | | | | | | | | | | | | | | | | | | |
| | $ | — | | | $ | 21.13 | | | | 15.41 | % | | $ | 109,279 | | | | 1.49 | %5 | | | N/A | | | | 1.49 | %5 | | | 0.48 | %5 | | | 9 | %6 |
| | | — | | | | 18.35 | | | | 24.90 | | | | 87,237 | | | | 1.54 | | | | N/A | | | | 1.54 | | | | 0.28 | | | | 19 | |
| | | — | 3 | | | 14.74 | | | | 18.67 | | | | 66,689 | | | | 1.55 | | | | N/A | | | | 1.61 | | | | 0.12 | | | | 32 | |
| | | — | 3 | | | 12.44 | | | | 17.28 | | | | 70,490 | | | | 1.55 | | | | N/A | | | | 1.62 | | | | (0.03 | ) | | | 38 | |
| | | — | 3 | | | 10.62 | | | | 5.26 | | | | 61,260 | | | | 1.55 | | | | N/A | | | | 1.63 | | | | 0.25 | | | | 43 | |
| | | | — | 3 | | | 10.11 | | | | (9.20 | ) | | | 43,408 | | | | 1.55 | | | | N/A | | | | 2.00 | | | | 0.90 | | | | 66 | |
| | | | | | | | | | | | | | | | | | | | | |
| | | | | | | | | | | | | | | | | | | | | | | | | | | | | | | | | | | | |
| | $ | 0.01 | | | $ | 19.87 | | | | 0.64 | % | | $ | 560,462 | | | | 4.10 | %5 | | | 2.43 | %5 | | | 4.10 | %5 | | | (2.79 | )%5 | | | 27 | %6 |
| | | 0.01 | | | | 20.94 | | | | 8.61 | | | | 620,804 | | | | 4.30 | | | | 2.43 | | | | 4.30 | | | | (2.58 | ) | | | 67 | |
| | | 0.01 | | | | 20.47 | | | | 14.16 | | | | 505,108 | | | | 4.29 | | | | 2.48 | | | | 4.29 | | | | (2.68 | ) | | | 71 | |
| | | 0.01 | | | | 19.88 | | | | 23.66 | | | | 344,935 | | | | 3.70 | | | | 2.47 | | | | 3.71 | | | | (2.35 | ) | | | 103 | |
| | | 0.05 | | | | 17.41 | | | | 10.54 | | | | 164,438 | | | | 3.40 | | | | 2.50 | | | | 3.46 | | | | (2.10 | ) | | | 81 | |
| | | — | 3 | | | 15.75 | | | | 30.02 | | | | 54,703 | | | | 3.35 | | | | 2.50 | | | | 4.04 | | | | (1.85 | ) | | | 172 | |
| | | | | | | | | | | | | | | | | | | | | | | | | | | | | | | | | | | | |
| | $ | 0.01 | | | $ | 18.74 | | | | 0.52 | % | | $ | 193,683 | | | | 4.35 | %5 | | | 2.68 | %5 | | | 4.35 | %5 | | | (3.04 | )%5 | | | 27 | %6 |
| | | 0.01 | | | | 19.84 | | | | 8.30 | | | | 220,307 | | | | 4.55 | | | | 2.68 | | | | 4.55 | | | | (2.83 | ) | | | 67 | |
| | | 0.01 | | | | 19.51 | | | | 13.90 | | | | 170,834 | | | | 4.54 | | | | 2.73 | | | | 4.54 | | | | (2.93 | ) | | | 71 | |
| | | 0.01 | | | | 19.08 | | | | 23.37 | | | | 128,184 | | | | 3.95 | | | | 2.72 | | | | 3.96 | | | | (2.60 | ) | | | 103 | |
| | | 0.05 | | | | 16.80 | | | | 9.73 | | | | 82,088 | | | | 3.65 | | | | 2.75 | | | | 3.70 | | | | (2.35 | ) | | | 81 | |
| | | | — | 3 | | | 15.31 | | | | 29.63 | | | | 30,980 | | | | 3.55 | | | | 2.75 | | | | 4.19 | | | | (2.09 | ) | | | 172 | |
| | | | | | | | | | | | | | | | | | | | | |
| | | | | | | | | | | | | | | | | | | | | | | | | | | | | | | | | | | | |
| | $ | — | 3 | | $ | 14.48 | | | | 9.29 | % | | $ | 3,677,229 | | | | 2.31 | %5 | | | 1.38 | %5 | | | 2.31 | %5 | | | (0.31 | )%5 | | | 38 | %6 |
| | | — | 3 | | | 13.30 | | | | 12.81 | | | | 1,743,406 | | | | 2.75 | | | | 1.48 | | | | 2.71 | | | | (1.09 | ) | | | 65 | |
| | | — | 3 | | | 11.91 | | | | 13.32 | | | | 254,170 | | | | 2.81 | | | | 1.54 | | | | 2.84 | | | | (1.12 | ) | | | 53 | 4 |
| | | 0.01 | | | | 10.60 | | | | 6.00 | | | | 37,237 | | | | 2.70 | 5 | | | 1.74 | 5 | | | 4.05 | 5 | | | (1.21 | )5 | | | 61 | 6 |
| | | | | | | | | | | | | | | | | | | | | | | | | | | | | | | | | | | | |
| | $ | — | 3 | | $ | 14.36 | | | | 9.13 | % | | $ | 214,251 | | | | 2.56 | %5 | | | 1.63 | %5 | | | 2.56 | %5 | | | (0.56 | )%5 | | | 38 | %6 |
| | | — | 3 | | | 13.21 | | | | 12.52 | | | | 132,511 | | | | 3.05 | | | | 1.73 | | | | 3.01 | | | | (1.39 | ) | | | 65 | |
| | | — | 3 | | | 11.86 | | | | 13.06 | | | | 48,296 | | | | 3.00 | | | | 1.79 | | | | 3.04 | | | | (1.31 | ) | | | 53 | 4 |
| | | | 0.01 | | | | 10.58 | | | | 1.73 | | | | 20,308 | | | | 2.99 | 5 | | | 1.98 | 5 | | | 4.08 | 5 | | | (1.47 | )5 | | | 61 | 6 |
THEACCOMPANYINGNOTESAREANINTEGRALPARTOFTHEFINANCIALSTATEMENTS.
| | | | |
| SEMI-ANNUAL REPORT 2014 | | | 47 | |
| | |
FINANCIAL HIGHLIGHTS (continued) | | PER SHARE OPERATING PERFORMANCE |
Contained below is per share operating performance data for each class of shares outstanding, total investment return, ratios to average net assets and other supplemental data for the respective periods. This information has been derived from information provided in the financial statements.
| | | | | | | | | | | | | | | | | | | | | | | | | | | | | | | | | | |
| | | Net Asset
Value,
Beginning
of Period | | | Net
Investment
Income/(Loss)* | | | Net Realized
and Unrealized
Gain/(Loss) on
Investments | | | Total From
Investment
Operations | | | Dividends to
Shareholders
from Net
Investment
Income | | | Distributions to
Shareholders
from Net
Realized Gains | | | Total Distributions | | | Redemption Fees | | | |
| Robeco Boston Partners All-Cap Value Fund | | | | | | | | | | | | | | | | | | | | | | | | | | | |
Institutional Class | | | | | | | | | | | | | | | | | | | | | | | | | | | | | | | | | | |
9/1/13 through 2/28/14† | | $ | 19.19 | | | $ | 0.12 | | | $ | 2.74 | | | $ | 2.86 | | | $ | (0.18 | ) | | $ | (0.62 | ) | | $ | (0.80 | ) | | | | | | |
8/31/13 | | | 15.57 | | | | 0.24 | | | | 3.75 | | | | 3.99 | | | | (0.27 | ) | | | (0.10 | ) | | | (0.37 | ) | | | — | | | |
8/31/12 | | | 14.34 | | | | 0.20 | | | | 2.04 | | | | 2.24 | | | | (0.12 | ) | | | (0.89 | ) | | | (1.01 | ) | | | — | | | |
8/31/11 | | | 12.85 | | | | 0.15 | | | | 1.63 | | | | 1.78 | | | | (0.10 | ) | | | (0.19 | ) | | | (0.29 | ) | | | — | | | |
8/31/10 | | | 12.56 | | | | 0.10 | | | | 0.32 | | | | 0.42 | | | | (0.13 | ) | | | — | | | | (0.13 | ) | | | — | | | |
8/31/09 | | | 13.61 | | | | 0.19 | | | | (1.03 | ) | | | (0.84 | ) | | | (0.12 | ) | | | (0.09 | ) | | | (0.21 | ) | | | — | | | |
Investor Class | | | | | | | | | | | | | | | | | | | | | | | | | | | | | | | | | | |
9/1/13 through 2/28/14† | | $ | 19.12 | | | $ | 0.09 | | | $ | 2.74 | | | $ | 2.83 | | | $ | (0.15 | ) | | $ | (0.62 | ) | | $ | (0.77 | ) | | | | | | |
8/31/13 | | | 15.50 | | | | 0.20 | | | | 3.75 | | | | 3.95 | | | | (0.23 | ) | | | (0.10 | ) | | | (0.33 | ) | | | — | | | |
8/31/12 | | | 14.28 | | | | 0.16 | | | | 2.03 | | | | 2.19 | | | | (0.08 | ) | | | (0.89 | ) | | | (0.97 | ) | | | — | | | |
8/31/11 | | | 12.79 | | | | 0.11 | | | | 1.63 | | | | 1.74 | | | | (0.06 | ) | | | (0.19 | ) | | | (0.25 | ) | | | — | | | |
8/31/10 | | | 12.52 | | | | 0.07 | | | | 0.31 | | | | 0.38 | | | | (0.11 | ) | | | — | | | | (0.11 | ) | | | — | | | |
8/31/09 | | | 13.56 | | | | 0.16 | | | | (1.03 | ) | | | (0.87 | ) | | | (0.08 | ) | | | (0.09 | ) | | | (0.17 | ) | | | — | | | |
| Robeco WPG Small/Micro Cap Value Fund | | | | | | | | | | | | | | | | | | | | | | | | | | | |
Institutional Class | | | | | | | | | | | | | | | | | | | | | | | | | | | | | | | | | | |
9/1/13 through 2/28/14† | | $ | 19.06 | | | $ | 0.05 | | | $ | 2.37 | | | $ | 2.42 | | | $ | (0.02 | ) | | $ | (1.85 | ) | | $ | (1.87 | ) | | | — | | | |
8/31/13 | | | 14.32 | | | | 0.07 | | | | 4.74 | | | | 4.81 | | | | (0.07 | ) | | | — | | | | (0.07 | ) | | | — | | | |
8/31/12 | | | 12.31 | | | | (0.05 | ) | | | 2.06 | | | | 2.01 | | | | — | | | | — | | | | — | | | | — | 3 | | |
8/31/11 | | | 11.65 | | | | (0.06 | ) | | | 0.72 | | | | 0.66 | | | | — | | | | — | | | | — | | | | — | | | |
8/31/10 | | | 10.57 | | | | (0.05 | ) | | | 1.16 | | | | 1.11 | | | | (0.03 | ) | | | — | | | | (0.03 | ) | | | — | 3 | | |
8/31/09 | | | 12.18 | | | | 0.03 | | | | (1.62 | ) | | | (1.59 | ) | | | (0.01 | ) | | | (0.01 | ) | | | (0.02 | ) | | | — | | | |
| Robeco Boston Partners Global Equity Fund | | | | | | | | | | | | | | | | | | | | | | | | | | | |
Institutional Class | | | | | | | | | | | | | | | | | | | | | | | | | | | | | | | | | | |
9/1/13 through 2/28/14† | | $ | 12.97 | | | $ | 0.05 | | | $ | 2.22 | | | $ | 2.27 | | | $ | (0.02 | ) | | $ | (0.36 | ) | | $ | (0.38 | ) | | | — | | | |
8/31/13 | | | 11.00 | | | | 0.12 | | | | 2.07 | | | | 2.19 | | | | (0.13 | ) | | | (0.09 | ) | | | (0.22 | ) | | | — | | | |
12/30/11** through 8/31/12 | | | 10.00 | | | | 0.10 | | | | 0.90 | | | | 1.00 | | | | — | | | | — | | | | — | | | | — | | | |
| Robeco Boston Partners International Equity Fund | | | | | | | | | | | | | | | | | | | | | | | | | | | |
Institutional Class | | | | | | | | | | | | | | | | | | | | | | | | | | | | | | | | | | |
9/1/13 through 2/28/14† | | $ | 12.88 | | | $ | 0.04 | | | $ | 2.20 | | | $ | 2.24 | | | $ | (0.20 | ) | | $ | (1.39 | ) | | $ | (1.59 | ) | | $ | — | | | |
8/31/13 | | | 10.79 | | | | 0.20 | | | | 2.10 | | | | 2.30 | | | | (0.13 | ) | | | (0.08 | ) | | | (0.21 | ) | | | — | | | |
12/30/11** through 8/31/12 | | | 10.00 | | | | 0.15 | | | | 0.64 | | | | 0.79 | | | | — | | | | — | | | | — | | | | — | | | |
| Robeco Boston Partners Global Long/Short Fund | | | | | | | | | | | | | | | | | | | | | | | | | | | |
Institutional Class | | | | | | | | | | | | | | | | | | | | | | | | | | | | | | | | | | |
12/31/13** through 2/28/14† | | $ | 10.00 | | | $ | (0.02 | ) | | $ | (0.01 | ) | | $ | (0.03 | ) | | $ | — | | | $ | — | | | $ | — | | | $ | — | | | |
| * | Calculated based on average shares outstanding, unless otherwise noted. |
| 1 | Total return is calculated by assuming a purchase of shares on the first day and a sale of shares on the last day of the period and is not annualized if period is less than one year. |
| 2 | Redemption fees are reflected in total return calculations. |
| 3 | Amount is less than $0.01. |
THEACCOMPANYINGNOTESAREANINTEGRALPARTOFTHEFINANCIALSTATEMENTS.
| | |
| 48 | | SEMI-ANNUAL REPORT 2014 |
| | |
FINANCIAL HIGHLIGHTS (concluded) | | PER SHARE OPERATING PERFORMANCE |
| | | | | | | | | | | | | | | | | | | | | | | | | | | | | | | | |
| | | Net
Asset
Value,
End of
Period | | | Total
Investment
Return1,2 | | | Net
Assets,
End of
Period
(000) | | | Ratio of
Expenses to
Average Net
Assets With
Waivers and
Reimbursements | | | Ratio of
Expenses to
Average Net
Assets With
Waivers,
Reimbursements
and Recoupments
if any (Excluding
Dividend and
Interest Expense) | | | Ratio of
Expenses to
Average Net
Assets Without
Waivers and Reimbursements | | | Ratio of Net
Investment
Income/(Loss)
to Average Net
Assets With
Waivers and
Reimbursements | | | Portfolio
Turnover
Rate | |
| | | | | | | | | | | | | | | | | | | | | | | | | | | | | | | | |
| | | | | | | | | | | | | | | | | | | | | | | | | | | | | | | | |
| | $ | 21.25 | | | | 15.05 | % | | $ | 654,141 | | | | 0.70 | %4 | | | N/A | | | | 0.94 | %4 | | | 1.16 | %4 | | | 37 | %5 |
| | | 19.19 | | | | 26.11 | | | | 441,856 | | | | 0.70 | | | | N/A | | | | 0.97 | | | | 1.37 | | | | 32 | |
| | | 15.57 | | | | 16.73 | | | | 343,885 | | | | 0.70 | | | | N/A | | | | 1.03 | | | | 1.38 | | | | 33 | |
| | | 14.34 | | | | 13.75 | | | | 210,113 | | | | 0.70 | | | | N/A | | | | 1.03 | | | | 1.00 | | | | 47 | |
| | | 12.85 | | | | 3.31 | | | | 112,437 | | | | 0.80 | | | | N/A | | | | 1.15 | | | | 0.75 | | | | 48 | |
| | | 12.56 | | | | (5.88 | ) | | | 63,085 | | | | 0.95 | | | | N/A | | | | 1.50 | | | | 1.79 | | | | 55 | |
| | | | | | | | | | | | | | | | | | | | | | | | | |
| | $ | 21.18 | | | | 14.95 | % | | $ | 171,150 | | | | 0.95 | %4 | | | N/A | | | | 1.19 | %4 | | | 0.91 | %4 | | | 37 | %5 |
| | | 19.12 | | | | 25.93 | | | | 77,936 | | | | 0.95 | | | | N/A | | | | 1.22 | | | | 1.12 | | | | 32 | |
| | | 15.50 | | | | 16.44 | | | | 25,189 | | | | 0.95 | | | | N/A | | | | 1.28 | | | | 1.13 | | | | 33 | |
| | | 14.28 | | | | 13.55 | | | | 26,436 | | | | 0.95 | | | | N/A | | | | 1.28 | | | | 0.75 | | | | 47 | |
| | | 12.79 | | | | 3.01 | | | | 13,016 | | | | 1.03 | | | | N/A | | | | 1.39 | | | | 0.55 | | | | 48 | |
| | | | 12.52 | | | | (6.15 | ) | | | 5,187 | | | | 1.20 | | | | N/A | | | | 1.75 | | | | 1.51 | | | | 55 | |
| | | | | | | | | | | | | | | | | | | | | | | | | | | | | | | | |
| | | | | | | | | | | | | | | | | | | | | | | | | | | | | | | | |
| | $ | 19.61 | | | | 12.80 | % | | $ | 45,675 | | | | 1.46 | %4 | | | N/A | | | | 1.46 | %4 | | | 0.49 | %4 | | | 86 | %5 |
| | | 19.06 | | | | 33.71 | | | | 40,754 | | | | 1.54 | | | | N/A | | | | 1.54 | | | | 0.41 | | | | 72 | |
| | | 14.32 | | | | 16.33 | | | | 37,367 | | | | 1.70 | | | | N/A | | | | 1.70 | | | | (0.34 | ) | | | 84 | |
| | | 12.31 | | | | 5.67 | | | | 33,238 | | | | 1.67 | | | | N/A | | | | 1.72 | | | | (0.43 | ) | | | 85 | |
| | | 11.65 | | | | 10.54 | | | | 32,394 | | | | 1.69 | | | | N/A | | | | 1.77 | | | | (0.39 | ) | | | 94 | |
| | | | 10.57 | | | | (12.93 | ) | | | 35,405 | | | | 1.61 | | | | N/A | | | | 1.95 | | | | 0.37 | | | | 137 | |
| | | | | | | | | | | | | | | | | | | | | | | | | | | | | | | | |
| | | | | | | | | | | | | | | | | | | | | | | | | | | | | | | | |
| | $ | 14.86 | | | | 17.62 | % | | $ | 69,700 | | | | 0.97 | %4 | | | N/A | | | | 1.49 | %4 | | | 0.21 | %4 | | | 94 | %5 |
| | | 12.97 | | | | 20.14 | | | | 11,496 | | | | 1.30 | | | | N/A | | | | 3.05 | | | | 1.00 | | | | 102 | |
| | | | 11.00 | | | | 10.00 | 5 | | | 11,234 | | | | 1.30 | 4 | | | N/A | | | | 3.56 | 4 | | | 1.39 | 4 | | | 83 | 5 |
| | | | | | | | | | | | | | | | | | | | | | | | | | | | | | | | |
| | | | | | | | | | | | | | | | | | | | | | | | | | | | | | | | |
| | $ | 13.53 | | | | 18.09 | % | | $ | 13,633 | | | | 1.01 | %4 | | | N/A | | | | 2.77 | %4 | | | 0.73 | %4 | | | 29 | %5 |
| | | 12.88 | | | | 21.52 | | | | 11,104 | | | | 1.30 | | | | N/A | | | | 3.18 | | | | 1.63 | | | | 87 | |
| | | | 10.79 | | | | 7.90 | 5 | | | 10,895 | | | | 1.30 | 4 | | | N/A | | | | 3.77 | 4 | | | 2.16 | 4 | | | 81 | 5 |
| | | | | | | | | | | | | | | | | | | | | | | | | | | | | | | | |
| | | | | | | | | | | | | | | | | | | | | | | | | | | | | | | | |
| | | $ | 9.97 | | | | (0.30 | )% | | $ | 7,964 | | | | 3.66 | %4 | | | 2.00 | %4 | | | 14.18 | %4 | | | (1.32 | )%4 | | | 22 | %5 |
THEACCOMPANYINGNOTESAREANINTEGRALPARTOFTHEFINANCIALSTATEMENTS.
| | | | |
| SEMI-ANNUAL REPORT 2014 | | | 49 | |
| | |
NOTES TO FINANCIAL STATEMENTS (unaudited) | | |
| 1. | Organization and Significant Accounting Policies |
The RBB Fund, Inc. (“RBB” or the “Company”) was incorporated under the laws of the State of Maryland on February 29, 1988 and is registered under the Investment Company Act of 1940, as amended (the “1940 Act”), as an open-end management investment company. RBB is a “series trust,” which is a mutual fund divided into separate portfolios. Each portfolio is treated as a separate entity for certain matters under the 1940 Act, and for other purposes, and a shareholder of one portfolio is not deemed to be a shareholder of any other portfolio. Currently, RBB has twenty-one active investment portfolios, including Robeco Boston Partners Small Cap Value Fund II (“BP Small Cap Value Fund II”), Robeco Boston Partners Long/Short Equity Fund (“BP Long/Short Equity Fund”), Robeco Boston Partners Long/Short Research Fund (“BP Long/Short Research Fund”), Robeco Boston Partners All-Cap Value Fund (“BP All-Cap Value Fund”), Robeco Boston Partners Global Equity Fund (“BP Global Equity Fund”), Robeco Boston Partners International Equity Fund (“BP International Equity Fund”), Robeco Boston Partners Global Long/Short Fund (“BP Global Long/Short Fund”) (collectively “BP Funds”), and Robeco WPG Small/Micro Cap Value Fund (“WPG Small/Micro Cap Value Fund” and, collectively with the BP Funds, the “Funds”). As of February 28, 2014, the BP Funds each offer two classes of shares, Institutional Class and Investor Class. As of February 28, 2014, Investor Class shares of the BP Global Equity Fund, BP International Equity Fund and BP Global Long/Short Fund have not been issued. The WPG Small/Micro Cap Value Fund is a single class fund, offering only the Institutional Class of shares.
RBB has authorized capital of one hundred billion shares of common stock of which 81.373 billion shares are currently classified into one hundred and forty eight classes of common stock. Each class represents an interest in an active or inactive RBB investment portfolio.
Portfolio Valuation — Each Fund’s net asset value (“NAV”) is calculated once daily at the close of regular trading hours on the New York Stock Exchange (“NYSE”) (generally 4:00 p.m. Eastern time) on each day the NYSE is open. Securities held by a Fund are valued using the closing price or the last sale price on a national securities exchange or the National Association of Securities Dealers Automatic Quotation System (“NASDAQ”) market system where they are primarily traded. Equity securities traded in the over-the-counter market are valued at their closing prices. If there were no transactions on that day, securities traded principally on an exchange or on NASDAQ will be valued at the mean of the last bid and ask prices prior to the market close. Fixed income securities having a remaining maturity of greater than 60 days are valued using an independent pricing service, which considers such factors as security prices, yields, maturities and ratings, and are deemed representative of market values at the close of the market. Fixed income securities having a remaining maturity of 60 days or less are valued at amortized cost which approximates market value. Foreign securities are valued based on prices from the primary market in which they are traded, and are translated from the local currency into U.S. dollars using current exchange rates. Investments in other open-end investment companies are valued based on the NAV of the investment companies (which may use fair value pricing as disclosed in their prospectuses). Options for which the primary market is a national securities exchange are valued at the last sale price on the exchange on which they are traded, or, in the absence of any sale, will be valued at the mean of the last bid and ask prices prior to the market close. Options not traded on a national securities exchange are valued at the last quoted bid price for long option positions and the closing ask price for short option positions. If market quotations are unavailable or deemed unreliable, securities will be valued in accordance with procedures adopted by the Company’s Board of Directors. Relying on prices supplied by pricing services or dealers or using fair valuation may result in values that are higher or lower than the values used by other investment companies and investors to price the same investments. Such procedures use fundamental valuation methods, which may include, but are not limited to, an analysis of the effect of any restrictions on the resale of the security, industry analysis and trends, significant changes in the issuer’s financial position, and any other event which could have a significant impact on the value of the security. Determination of fair value involves subjective judgment as the actual market value of a particular security can be established only by negotiations between the parties in a sales transaction, and the difference between the recorded fair value and the value that would be received in a sale could be significant. The Funds may use fair value pricing more frequently for securities traded primarily in non-U.S. markets because, among other things, most foreign markets close well before the Funds value their securities, generally as of 4:00 p.m. Eastern time. The earlier close of these foreign markets gives rise to the possibility that significant events, including broad market moves, government actions or pronouncements, aftermarket trading, or news events may have occurred in the interim. To account for this, the Funds may value foreign securities using fair value prices based on third-party vendor modeling tools (international fair value pricing).
| | |
| 50 | | SEMI-ANNUAL REPORT 2014 |
| | |
NOTES TO FINANCIAL STATEMENTS (unaudited) (continued) | | |
Fair Value Measurements — The inputs and valuation techniques used to measure fair value of the Funds’ investments are summarized into three levels as described in the hierarchy below:
| | |
| |
| • Level 1 — | | quoted prices in active markets for identical securities; |
| |
| • Level 2 — | | other significant observable inputs (including quoted prices for similar securities, interest rates, prepayment speeds, credit risk, etc.); and |
| |
| • Level 3 — | | significant unobservable inputs (including the Funds’ own assumptions in determining the fair value of investments). |
The inputs or methodology used for valuing securities are not necessarily an indication of the risk associated with investing in those securities.
A summary of the inputs used to value each Fund’s investments as of February 28, 2014 is included in each Fund’s Portfolio of Investments.
At the end of each fiscal quarter, management evaluates the classification of Levels 1, 2 and 3 assets and liabilities. Various factors are considered, such as changes in liquidity from the prior reporting period; whether or not a broker is willing to execute at the quoted price; the depth and consistency of prices from third party pricing services; and the existence of contemporaneous, observable trades in the market. Additionally, management evaluates the classification of Level 1 and Level 2 assets and liabilities on a quarterly basis for changes in listings or delistings on national exchanges.
Due to the inherent uncertainty of determining the fair value of investments that do not have a readily available market value, the fair value of the Funds’ investments may fluctuate from period to period. Additionally, the fair value of investments may differ significantly from the values that would have been used had a ready market existed for such investments and may differ materially from the values the Funds may ultimately realize. Further, such investments may be subject to legal and other restrictions on resale or otherwise less liquid than publicly traded securities.
For fair valuations using significant unobservable inputs, U.S. generally accepted accounting principles (“U.S. GAAP”) require the Fund to present a reconciliation of the beginning to ending balances for reported market values that presents changes attributable to total realized and unrealized gains or losses, purchase and sales, and transfers in and out of Level 3 during the period. Transfers in and out between Levels are based on values at the end of the period. U.S. GAAP also requires the Fund to disclose amounts and reasons for all transfers in and out of Level 1 and Level 2 fair value measurements. A reconciliation of Level 3 investments is presented only when the Fund had an amount of Level 3 investments at the end of the reporting period that was meaningful in relation to its net assets. The amounts and reasons for all transfers in and out of each Level within the three-tier hierarchy are disclosed when the Fund had an amount of total transfers during the reporting period that was meaningful in relation to its net assets as of the end of the reporting period.
Foreign securities that utilize international fair pricing are categorized as Level 2 in the hierarchy. For the BP Global Equity Fund, securities with an end of period value of $885,618 transferred from Level 1 into Level 2. For the BP International Equity Fund, securities with an end of period value of $326,671 transferred from Level 1 into Level 2. These transfers occurred as a result of these securities being valued utilizing the international fair value pricing at February 28, 2014.
Use of Estimates — The preparation of financial statements in conformity U.S. GAAP requires management to make estimates and assumptions that affect the reported amounts of assets and liabilities and disclosure of contingent assets and liabilities at the date of the financial statements and the reported amounts of revenues and expenses during the period. Actual results could differ from those estimates and those differences could be significant.
Investment Transactions, Investment Income and Expenses — The Funds record security transactions based on trade date for financial report purposes. The cost of investments sold is determined by use of the specific identification method for both financial reporting and income tax purposes in determining realized gains and losses on investments. Interest income is accrued when earned. Dividend income is recorded on the ex-dividend date. Distributions received on securities that represent a return of capital or capital gains are recorded as a reduction of cost of investments and/or as a realized gain. The Funds’ investment income, expenses (other than class specific distribution fees) and unrealized and realized gains and losses are allocated daily to each class of shares based upon the relative proportion of net assets of each class at the beginning of the day. Expenses incurred on behalf of a specific class, fund or fund family of the Company are charged directly to the class, fund or fund family (in proportion to net assets). Expenses incurred for all of the RBB funds (such as director or professional fees) are charged to all funds in proportion to their average net assets of RBB, or in such other manner as the
| | | | |
| SEMI-ANNUAL REPORT 2014 | | | 51 | |
| | |
NOTES TO FINANCIAL STATEMENTS (unaudited) (continued) | | |
Company’s Board of Directors deems fair or equitable. Expenses and fees, including investment advisory and administration fees, are accrued daily and taken into account for the purpose of determining the NAV of the Funds.
Dividends and Distributions to Shareholders — Dividends from net investment income and distributions from net realized capital gains, if any, are declared and paid at least annually to shareholders and recorded on ex-dividend date for all Funds. Income dividends and capital gain distributions are determined in accordance with U.S. federal income tax regulations which may differ from U.S. GAAP.
U.S. Tax Status — No provision is made for U.S. income taxes as it is each Fund’s intention to continue to qualify for and elect the tax treatment applicable to regulated investment companies under Subchapter M of the Internal Revenue Code of 1986, as amended, and make the requisite distributions to its shareholders which will be sufficient to relieve it from U.S. income and excise taxes.
Cash and Cash Equivalents — The Funds consider liquid assets deposited into a bank demand deposit account to be cash equivalents. These investments represent amounts held with financial institutions that are readily accessible to pay Fund expenses or purchase investments. Cash and cash equivalents are valued at cost plus accrued interest, which approximates market value.
Other — In the normal course of business, the Funds may enter into contracts that provide general indemnifications. The Funds’ maximum exposure under these arrangements is dependent on claims that may be made against the Funds in the future, and, therefore, cannot be estimated; however, based on experience, the risk of material loss from such claims is considered remote.
Foreign Currency Translation — Assets and liabilities initially expressed in non-U.S. currencies are translated into U.S. dollars based on the applicable exchange rates at the date of the last business day of the financial statement period. Purchases and sales of securities, interest income, dividends, variation margin received and expenses denominated in foreign currencies are translated into U.S. dollars at the exchange rates in effect on the transaction date.
The Funds do not separately report the effect of changes in foreign exchange rates from changes in market prices of securities held. Such changes are included with the net realized gain or loss and change in unrealized appreciation or depreciation on investment securities in the Statement of Operations. Other foreign currency transactions resulting in realized and unrealized gain or loss are reported separately as net realized gain or loss and change in unrealized appreciation or depreciation on foreign currencies in the Statement of Operations.
Currency Risk — The Funds invest in securities of foreign issuers, including American Depositary Receipts. These markets are subject to special risks associated with foreign investments not typically associated with investing in U.S. markets. Because the foreign securities in which the Funds may invest generally trade in currencies other than the U.S. dollar, changes in currency exchange rates will affect the Funds’ NAV, the value of dividends and interest earned and gains and losses realized on the sale of securities. Because the NAV for the Funds are determined on the basis of U.S. dollars, the Funds may lose money by investing in a foreign security if the local currency of a foreign market depreciates against the U.S. dollar, even if the local currency value of the Funds’ holdings goes up. Generally, a strong U.S. dollar relative to these other currencies will adversely affect the value of the Funds’ holdings in foreign securities.
Foreign Securities Market Risk — Securities of many non-U.S. companies may be less liquid and their prices more volatile than securities of comparable U.S. companies. Securities of companies traded in many countries outside the U.S., particularly emerging markets countries, may be subject to further risks due to the inexperience of local investment professionals and financial institutions, the possibility of permanent or temporary termination of trading and greater spreads between bid and asked prices of securities. In addition, non-U.S. stock exchanges and investment professionals are subject to less governmental regulation, and commissions may be higher than in the United States. Also, there may be delays in the settlement of non-U.S. stock exchange transactions.
Options Written — The Funds are subject to equity price risk in the normal course of pursuing their investment objectives and may enter into options written to hedge against changes in the value of equities. Such options may relate to particular securities or domestic stock indices, and may or may not be listed on a domestic securities exchange or issued by the Options Clearing Corporation. The risk in writing a call option is that a Fund gives up the opportunity for profit if the market price of the security increases. The risk in writing a put option is that a Fund may incur a loss if the market price of the security decreases and the option is exercised. A Fund also has the additional risk of being unable to enter into a closing transaction at an acceptable price if a liquid secondary market does not exist. A Fund also may write over-the-counter options where completing the obligation depends upon the credit standing of the other party. Option contracts also involve the risk that they may result in loss due to unanticipated developments in market conditions or other causes.
| | |
| 52 | | SEMI-ANNUAL REPORT 2014 |
| | |
NOTES TO FINANCIAL STATEMENTS (unaudited) (continued) | | |
Written options are initially recorded as liabilities to the extent of premiums received and subsequently marked to market to reflect the current value of the option written. Gains or losses are realized when the option transaction expires or closes. When an option is exercised, the proceeds on sales for a written call option or the purchase cost for a written put option is adjusted by the amount of the premium received.
The BP Long/Short Equity Fund, BP Long/Short Research Fund and the BP All-Cap Value Fund had transactions in options written during the six-month period ended February 28, 2014 as follows:
| | | | | | | | | | | | | | | | | | | | | | | | |
| | | BP Long/Short Equity Fund | | | BP Long/Short Research Fund | | | BP All-Cap Value Fund | |
| | | Number of
Contracts | | | Premiums
Received | | | Number of
Contracts | | | Premiums
Received | | | Number of
Contracts | | | Premiums
Received | |
Options outstanding at August 31, 2013 | | | 1,996 | | | $ | 2,046,646 | | | | 5,383 | | | $ | 2,971,577 | | | | 849 | | | $ | 143,481 | |
Options written | | | 1,466 | | | | 1,328,415 | | | | 4,965 | | | | 2,144,974 | | | | 849 | | | | 212,360 | |
Options closed | | | (1,089 | ) | | | (2,248,984 | ) | | | (4,004 | ) | | | (2,198,368 | ) | | | (849 | ) | | | (143,481 | ) |
Options expired | | | (1,140 | ) | | | (225,622 | ) | | | (291 | ) | | | (90,814 | ) | | | — | | | | — | |
Options exercised | | | — | | | | — | | | | (1,773 | ) | | | (906,900 | ) | | | — | | | | — | |
| | | | | | | | | | | | | | | | | | | | | | | | |
Options outstanding at February 28, 2014 | | | 1,233 | | | $ | 900,455 | | | | 4,280 | | | $ | 1,920,469 | | | | 849 | | | $ | 212,360 | |
| | | | | | | | | | | | | | | | | | | | | | | | |
Short Sales — When the investment adviser believes that a security is overvalued, the BP Long/Short Equity Fund, the BP Long/Short Research Fund and the BP Global Long/Short Fund may sell the security short by borrowing the same security from a broker or other institution and selling the security. A Fund will incur a loss as a result of a short sale if the price of the borrowed security increases between the date of the short sale and the date on which the Fund buys and replaces such borrowed security. A Fund will realize a gain if there is a decline in price of the security between those dates where the decline in price exceeds the costs of borrowing the security and other transaction costs. There can be no assurance that a Fund will be able to close out a short position at any particular time or at an acceptable price. Although a Fund’s gain is limited to the amount at which it sold a security short, its potential loss is unlimited. Until a Fund replaces a borrowed security, it will maintain at all times cash, U.S. Government securities, or other liquid securities in an amount which, when added to any amount deposited with a broker as collateral, will at least equal the current market value of the security sold short. Depending on arrangements made with brokers, a Fund may not receive any payments (including interest) on collateral deposited with them.
In accordance with the terms of its prime brokerage agreements, a Fund may receive rebate income or be charged a fee on borrowed securities. Such income or fee is calculated on a daily basis based upon the market value of each borrowed security and a variable rate that is dependent upon the availability of such security. The Funds record these prime broker charges on a net basis as interest income or interest expense. For the six-month period ended February 28, 2014, the BP Long/Short Equity Fund, the BP Long/Short Research Fund and the BP Global Long/Short Fund had net charges of $5,559,191, $3,184,840 and $3,294, respectively, on borrowed securities. Such amounts are included in prime broker interest expense on the statement of operations.
As of February 28, 2014, the BP Long/Short Equity Fund, the BP Long/Short Research Fund and the BP Global Long/Short Fund had securities sold short valued at $578,585,710, $1,736,793,396 and $1,867,638, respectively, for which securities of $600,221,809, $1,648,392,515 and $1,843,695 and cash deposits of $588,815,561, $1,784,054,553 and $2,621,047, respectively, were pledged as collateral.
In accordance with Special Custody and Pledge Agreements with Goldman Sachs & Co. (“Goldman Sachs”) (the Funds’ prime broker), the BP Long/Short Equity Fund, the BP Long/Short Research Fund and the BP Global Long/Short Fund may borrow from Goldman Sachs to the extent necessary to maintain required margin cash deposits on short positions. Interest on such borrowings is charged to the Fund based on the LIBOR rate plus an agreed upon spread.
| | | | |
| SEMI-ANNUAL REPORT 2014 | | | 53 | |
| | |
NOTES TO FINANCIAL STATEMENTS (unaudited) (continued) | | |
The BP Long/Short Equity Fund, the BP Long/Short Research Fund and BP Global Long/Short Fund utilized cash borrowings from Goldman Sachs to meet required margin cash deposits as follows during the six-month period ended February 28, 2014:
| | | | | | | | | | | | | | | | | | | | | | | | | | | | | | | | | | | | | | | | | | | |
| BP Long/Short Equity Fund | | BP Long/Short Research Fund | | BP Global Long/Short Fund |
Days
Utilized | | Average Daily
Borrowings | | Weighted Average
Interest Rate | | Days
Utilized | | Average Daily
Borrowings | | Weighted Average
Interest Rate | | Days
Utilized | | Average Daily
Borrowings | | Weighted Average
Interest Rate |
| | | 121 | | | | | CAD 1,485,948 | | | | | 1.46 | % | | | | 11 | | | | | AUD 11,194,404 | | | | | 2.97 | % | | | | 51 | | | | | AUD 24,628 | | | | | 2.96 | % |
| | | 67 | | | | | EUR 2,447,039 | | | | | 0.60 | % | | | | 7 | | | | | EUR 49,323 | | | | | 0.64 | % | | | | 44 | | | | | CAD 26,563 | | | | | 1.46 | % |
| | | 179 | | | | | USD 60,257,229 | | | | | 0.54 | % | | | | 38 | | | | | GBP 1,421,884 | | | | | 0.88 | % | | | | 43 | | | | | CHF 17,886 | | | | | 0.46 | % |
| | | | | | | | | | | | | | | | | | 19 | | | | | JPY 214,159,867 | | | | | 0.55 | % | | | | 46 | | | | | DKK 8,290 | | | | | 0.48 | % |
| | | | | | | | | | | | | | | | | | 102 | | | | | NOK 2,931,134 | | | | | 1.95 | % | | | | 45 | | | | | EUR 263,828 | | | | | 0.60 | % |
| | | | | | | | | | | | | | | | | | 181 | | | | | USD 177,494,373 | | | | | 0.54 | % | | | | 53 | | | | | GBP 33,749 | | | | | 0.88 | % |
| | | | | | | | | | | | | | | | | | | | | | | | | | | | | | | | | 54 | | | | | HKD 24,732 | | | | | 0.53 | % |
| | | | | | | | | | | | | | | | | | | | | | | | | | | | | | | | | 43 | | | | | JPY 28,967 | | | | | 0.55 | % |
| | | | | | | | | | | | | | | | | | | | | | | | | | | | | | | | | 8 | | | | | NOK 75 | | | | | 1.93 | % |
| | | | | | | | | | | | | | | | | | | | | | | | | | | | | | | | | 10 | | | | | NZD 2,161 | | | | | 2.97 | % |
| | | | | | | | | | | | | | | | | | | | | | | | | | | | | | | | | 43 | | | | | SEK 32,597 | | | | | 1.27 | % |
| | | | | | | | | | | | | | | | | | | | | | | | | | | | | | | | | 52 | | | | | THB 23,330 | | | | | 2.61 | % |
| | | | | | | | | | | | | | | | | | | | | | | | | | | | | | | | | 7 | | | | | USD 209,456 | | | | | 0.55 | % |
As of February 28, 2014, the BP Long/Short Equity Fund, the BP Long/Short Research Fund and BP Global Long/Short Fund had borrowings of $131,668,296, $282,115,799 and $805,659, respectively. Interest expenses for the six-month period ended February 28, 2014, totaled $157,558, $480,187 and $145, respectively.
Contracts for Difference — The BP Global Long/Short Fund and BP Long/Short Research Fund (for this section only, each a “Fund”) may enter into Contracts for Differences (“CFDs”). CFDs are leveraged derivative instruments that allow a Fund to take a position on the change in the market price of an underlying asset, such as a stock, or the value of an index or currency exchange rate. With a short CFD, a Fund is seeking to profit from falls in the market price of the asset. CFDs are subject to liquidity risk because the liquidity of CFDs is based on the liquidity of the underlying instrument, and are subject to counterparty risk, i.e., the risk that the counterparty to the CFD transaction may be unable or unwilling to make payments or to otherwise honor its financial obligations under the terms of the contract. It is also possible that the market price of the CFD will move between the time the order is placed by a Fund and when it is executed by the issuer, which can result in the trade being executed at a less favorable price. CFDs, like many other derivative instruments, involve the risk that, if the derivative security declines in value, additional margin would be required to maintain the margin level. The seller may require a Fund to deposit additional sums to cover this decline in value, and the margin call may be at short notice. If additional margin is not provided in time, the seller may liquidate the positions at a loss for which a Fund is liable. The potential for margin calls and large losses are much greater in CFDs than in other leveraged products. Most CFDs are traded over-the-counter. CFDs are not registered with the SEC or any U.S. regulator, and are not subject to U.S. regulation. In a short position, the Fund will receive or pay an amount based upon the amount, if any, by which the notional amount of the CFD would have decreased or increased in value had it sold the particular stocks short, less the dividends that would have been paid on those stocks, plus a floating rate of interest on the notional amount of the CFD. All of these components are reflected in the market value of the CFD.
CFDs are marked-to-market daily based upon quotations from market makers and the resulting changes in market values, if any, are recorded as an unrealized gain or loss in the Statement of Operations. Periodic payments made or received are recorded as realized gains or losses. Entering into CFDs involves, to varying degrees, elements of credit and market risk in excess of the amounts recognized on the Statement of Assets and Liabilities. Such risks involve the possibility that there will be no liquid market for these contracts, that the counterparty to the contract may default on its obligation to perform and that there may be unfavorable changes in market conditions. CFDs outstanding at period end, if any, are listed on the Schedule of Investments. In connection with CFDs, cash or securities may be segregated as collateral by the Funds’ custodian. As of February 28, 2014, the BP Global Long/Short Fund held CFDs.
| 2. | Transactions with Investment Advisers and Other Services |
Robeco Investment Management, Inc. (“Robeco”) provides investment advisory services to the BP Funds and the WPG Small/Micro Cap Value Fund. For its advisory services with respect to the BP Funds, Robeco is entitled to receive 1.00% of the BP Small Cap Value Fund II’s average daily net assets, 2.25% of the BP Long/Short Equity Fund’s average daily net assets,
| | |
| 54 | | SEMI-ANNUAL REPORT 2014 |
| | |
NOTES TO FINANCIAL STATEMENTS (unaudited) (continued) | | |
1.25% of the BP Long/Short Research Fund’s average daily net assets, 0.80% of the BP All-Cap Value Fund’s average daily net assets, 0.90% of BP Global Equity Fund’s average daily net assets, 0.90% of BP International Equity Fund’s average daily net assets and 1.50% of BP Global Long/Short Fund’s average daily net assets, each accrued daily and payable monthly.
Until December 31, 2014, Robeco has contractually agreed to limit the BP Small Cap Value Fund II, BP Long/Short Equity Fund and BP All-Cap Value Fund’s total annual operating expenses (excluding certain items discussed below) to the extent that such expenses exceed the ratios in the table below. This limit is calculated daily based on the BP Small Cap Value Fund II, BP Long/Short Equity Fund and BP All-Cap Value Fund’s average daily net assets. These limitations are effected in waivers of advisory fees and reimbursements of expenses exceeding the advisory fee as necessary. These contractual limitations are in effect until at least December 31, 2014 and may not be terminated without approval of the Company’s Board of Directors. Robeco may not recoup any of its waived investment advisory fees with respect to these Funds.
| | | | | | | | |
| | | Institutional | | | Investor | |
BP Small Cap Value Fund II | | | 1.30 | % | | | 1.55 | % |
BP Long/Short Equity Fund | | | 2.50 | % | | | 2.75 | % |
BP All-Cap Value Fund | | | 0.70 | % | | | 0.95 | % |
For the BP Long/Short Research Fund and BP Global Long/Short Fund, Robeco has contractually agreed to forgo all or a portion of its advisory fee and/or reimburse expenses in an aggregate amount equal to the amount by which the total annual Fund operating expenses (excluding certain items discussed below) exceeds 1.50% and 2.00%, respectively, of the average daily net assets attributable to the Funds’ Institutional Class shares and 1.75% and 2.25%, respectively, of the average daily net assets attributable to the Funds’ Investor Class. This contractual limitation is in effect until at least December 31, 2014 and may not be terminated without approval of the Company’s Board of Directors. If at any time during the first three years the Funds’ Advisory Agreement with Robeco is in effect, the Funds’ Total annual Fund operating expenses for that year are less than 1.50% for the Institutional Class and 1.75% for the Investor Class of the BP Long/Short Research Fund or 2.00% for the Institutional Class and 2.25% for the Investor Class of the BP Global Long/Short Fund, Robeco is entitled to reimbursement by the Funds of the advisory fees forgone and other payments remitted by Robeco to the Funds during such three-year period.
From September 1, 2013 through September 30, 2013, for the BP Global Equity Fund and BP International Equity Fund, Robeco had contractually agreed to waive all or a portion of its advisory fee and/or reimburse expenses in an aggregate amount equal to the amount by which each Fund’s total annual Fund operating expenses (excluding certain items discussed below) exceeds 1.30% of the average daily net assets attributable to each Fund’s Institutional Class shares and 1.55% of the average daily net assets attributable to each Fund’s Investor Class. Effective October 1, 2013, Robeco has contractually agreed to waive all or a portion of its advisory fee and/or reimburse expenses in an aggregate amount equal to the amount by which each Fund’s total annual Fund operating expenses (excluding certain items discussed below) exceeds 0.95% of the average daily net assets attributable to each Fund’s Institutional Class shares and 1.20% of the average daily net assets attributable to each Fund’s Investor Class. This contractual limitation is in effect until at least December 31, 2014 and may not be terminated without approval of the Company’s Board of Directors. If at any time during the first three years each Fund’s Advisory Agreement with Robeco is in effect, each Fund’s total annual Fund operating expenses for that year are less than 0.95% for the Institutional Class and 1.20% for the Investor Class, Robeco is entitled to reimbursement by each Fund of the advisory fees waived and other payments remitted by Robeco to each Fund during such three-year period.
At February 28, 2014, the amount of potential recoupment by the Adviser was as follows:
| | | | | | | | | | | | | | | | |
| | | Expiration
August 31, 2015 | | | Expiration
August 31, 2016 | | | Expiration
August 31, 2017 | | | Total | |
BP Global Equity Fund | | $ | 133,820 | | | $ | 202,243 | | | $ | 94,767 | | | $ | 430,830 | |
BP International Equity Fund | | | 144,610 | | | | 213,420 | | | | 110,109 | | | | 468,139 | |
BP Global Long/Short Fund | | | — | | | | — | | | | 29,184 | | | | 29,184 | |
For its advisory services with respect to the WPG Small/Micro Cap Value Fund, Robeco is entitled to receive advisory fees, accrued daily and paid monthly, as follows:
| | |
| WPG Small/Micro Cap Value Fund | | 0.90% of net assets up to $300 million |
| | 0.80% of net assets $300 million to $500 million |
| | 0.75% of net assets in excess of $500 million |
Until December 31, 2014, Robeco has contractually agreed to limit the WPG Small/Micro Cap Value Fund’s total annual Fund operating expenses (excluding certain items discussed below) to 1.70% as a percentage of the Fund’s average daily net assets. The contractual limitation is in effect until at least December 31, 2014 and may not be terminated without approval of
| | | | |
| SEMI-ANNUAL REPORT 2014 | | | 55 | |
| | |
NOTES TO FINANCIAL STATEMENTS (unaudited) (continued) | | |
the Company’s Board of Directors. Robeco may not recoup any of its waived investment advisory fees with respect to the WPG Small/Micro Cap Value Fund.
For the six months period ended February 28, 2014, Robeco has waived and reimbursed fees as follows:
| | | | | | | | |
Funds | | Investment Adviser
Expense Waived | | | Investment Adviser
Reimbursement | |
BP Small Cap Value Fund II | | $ | — | | | $ | — | |
BP Long/Short Equity Fund | | | — | | | | — | |
BP Long/Short Research Fund | | | — | | | | — | |
BP All-Cap Value Fund | | | 773,079 | | | | — | |
BP WPG Small/Micro Cap Value Fund | | | — | | | | — | |
BP Global Equity Fund | | | 94,767 | | | | — | |
BP International Equity Fund | | | 56,188 | | | | 53,921 | |
BP Global Long/Short Fund | | | 6,363 | | | | 22,821 | |
In determining Robeco’s obligation to waive advisory fees and/or reimburse expenses, the following expenses are not taken into account and could cause a Fund’s net annualized expense ratio to exceed the applicable expense limitation: acquired fund fees and expenses, short sale dividend expenses, brokerage commissions, extraordinary items, interest and taxes.
BNY Mellon Investment Servicing (US) Inc. (“BNY Mellon”), serves as administrator for the Funds. For providing administration and accounting services, BNY Mellon is entitled to receive a monthly fee equal to an annual percentage rate of each Fund’s average daily net assets, subject to certain minimum monthly fees.
Included in the administration and accounting service fees, shown on the Statement of Operations, are fees for providing regulatory administrative services to RBB. For providing these services, BNY Mellon is entitled to receive compensation as agreed to by the Company and BNY Mellon. This fee is allocated to each portfolio of the Company in proportion to its net assets of the Company. For the BP Global Long/Short Fund, BNY accrued administration and accounting fees totaling $11,892 and waived fees totaling $9,401 for the period ended February 28, 2014.
In addition, BNY Mellon serves as the Funds’ transfer and dividend disbursing agent. For providing transfer agency services, BNY Mellon is entitled to receive a monthly fee, subject to certain minimum. For the BP Global Long/Short Fund, BNY accrued transfer agent fees totaling $6,302 and waived transfer agent fees totaling $4,599 for the period ended February 28, 2014.
The Bank of New York Mellon (the “Custodian”) provides certain custodial services to the Funds. The Custodian is entitled to receive a monthly fee equal to an annual percentage rate of the Funds’ average daily net assets, subject to certain minimum monthly fees. For the BP Global Long/Short Fund, the Custodian accrued custody fees totaling $5,600 and waived custodian fees totaling $1,446 for the period ended February 28, 2014.
The Board of Directors of the Company has approved a Distribution Agreement for the Funds and adopted separate Plans of Distribution for the Investor Class of each BP Fund (the “Plans”) pursuant to Rule 12b-1 under the 1940 Act. Under the Plans, Foreside Funds Distributors LLC (the “Underwriter”) is entitled to receive from each Fund a distribution fee with respect to the Investor Class, which is accrued daily and paid monthly, of up to 0.25% on an annualized basis of the average daily net assets of the Investor Class. Amounts paid to the Distributor under the Plans may be used by the Distributor to cover expenses that are related to (i) the sale of the Investor Class Shares, (ii) ongoing servicing and/or maintenance of the accounts of shareholders, and (iii) sub-transfer agency services, subaccounting services or administrative services related to the sale of the Investor Class, all as set forth in the Plans.
The Directors of the Company receive an annual retainer and meeting fees for meetings attended. The aggregate remuneration paid to the Directors by the Funds during the six-month period ended February 28, 2014 was $104,755. Certain employees of BNY Mellon serve as an Officer or Director of the Company. They are not compensated by the Funds or the Company.
| | |
| 56 | | SEMI-ANNUAL REPORT 2014 |
| | |
NOTES TO FINANCIAL STATEMENTS (unaudited) (continued) | | |
| 4. | Investment in Securities |
For the six-month period ended February 28, 2014, aggregate purchases and sales of investment securities (excluding short-term investments and U.S. government obligations) were as follows:
| | | | | | | | |
Fund | | Purchases | | | Sales | |
BP Small Cap Value Fund II | | $ | 23,108,336 | | | $ | 15,392,401 | |
BP Long/Short Equity Fund | | | 229,014,803 | | | | 435,976,812 | |
BP Long/Short Research Fund | | | 2,467,242,527 | | | | 976,690,170 | |
BP All-Cap Value Fund | | | 329,193,789 | | | | 116,899,903 | |
WPG Small/Micro Cap Value Fund | | | 18,203,751 | | | | 18,031,786 | |
BP Global Equity Fund | | | 69,500,579 | | | | 18,291,550 | |
BP International Equity Fund | | | 3,741,375 | | | | 3,448,611 | |
BP Global Long/Short Fund | | | 3,971,397 | | | | 625,671 | |
| 5. | Capital Share Transactions |
As of February 28, 2014, each class of each Fund has 100,000,000 shares of $0.001 par value common stock authorized except for the Institutional Class of the WPG Small/Micro Cap Value Fund, which has 50,000,000 shares of $0.001 par value common stock authorized.
Securities may be loaned to financial institutions, such as broker-dealers, and are required to be secured continuously by collateral in cash, cash equivalents, letter of credit or U.S. Government securities maintained on a current basis at an amount at least equal to the market value of the securities loaned. Cash collateral received, pursuant to investment guidelines established by the Funds and approved by the Company’s Board of Directors, is invested in short-term investments. All such investments are made at the risk of the Funds and, as such, the Funds are liable for investment losses. Such loans would involve risks of delay in receiving additional collateral in the event the value of the collateral decreased below the value of the securities loaned or of delay in recovering the securities loaned or even loss of rights in the collateral should the borrower of the securities fail financially. However, loans will be made only to borrowers deemed by Robeco to be of good standing and only when, in Robeco’s judgment, the income to be earned from the loans justifies the attendant risks. Any loans of a Fund’s securities will be fully collateralized and marked to market daily. During the six-month period ended February 28, 2014, the Funds participated in securities lending. The market value of securities on loan and collateral as of February 28, 2014 and the income generated from the program during the six-month period ended February 28, 2014 with respect to such loans are as follows:
| | | | | | | | | | | | |
Fund | | Market Value
of Securities
Loaned | | | Market Value
of Collateral | | | Income Received
from Securities
Lending | |
BP Small Cap Value Fund II | | $ | 5,943,039 | | | $ | 6,139,754 | | | $ | 62,381 | |
BP Long/Short Equity Fund | | | 19,329,522 | | | | 20,006,304 | | | | 158,761 | |
BP All-Cap Value Fund | | | 2,690,790 | | | | 2,725,161 | | | | 16,861 | |
WPG Small/Micro Cap Value Fund | | | 5,171,323 | | | | 5,306,318 | | | | 25,843 | |
Securities lending transactions are entered into by the Funds under a Master Securities Lending Agreement (“MSLA”) which permits the Funds, under certain circumstances including an event of default (such as bankruptcy or insolvency), to offset amounts payable by the Funds to the same counterparty against amounts to be received and create one single net payment due to or from the Funds. The following table is a summary of the Funds’ open securities lending transactions which are subject to a MSLA as of February 28, 2014:
| | | | | | | | | | | | | | | | | | | | | | | | |
| | | | | | | | | | | | Gross Amount Not Offset in the
Statement of Assets and Liabilities | |
Fund | | Gross Amounts of
Recognized Assets | | | Gross Amounts
Offset in the
Statement of
Assets and Liabilities | | | Net Amounts of
Assets Presented in
the Statement of
Assets and Liabilities | | | Financial
Instruments 1 | | | Cash
Collateral
Received | | | Net
Amount | |
BP Small Cap Value Fund II | | $ | 5,943,039 | | | $ | — | | | $ | 5,943,039 | | | $ | (5,943,039 | ) | | $ | — | | | $ | — | |
BP Long/Short Equity Fund | | | 19,329,522 | | | | — | | | | 19,329,522 | | | | (19,329,522 | ) | | | — | | | | — | |
BP All-Cap Value Fund | | | 2,690,790 | | | | — | | | | 2,690,790 | | | | (2,690,790 | ) | | | — | | | | — | |
WPG Small/Micro Cap Value Fund | | | 5,171,323 | | | | — | | | | 5,171,323 | | | | (5,171,323 | ) | | | — | | | | — | |
| 1 | Amount disclosed is limited to the amount of assets presented in the Statement of Assets and Liabilities. Actual collateral received may be more than the amount shown. |
| | | | |
| SEMI-ANNUAL REPORT 2014 | | | 57 | |
| | |
NOTES TO FINANCIAL STATEMENTS (unaudited) (continued) | | |
A restricted security is a security which has been purchased through a private offering and cannot be resold to the general public without prior registration under the Securities Act of 1933 (the “1933 Act”) or pursuant to the resale limitations provided by Rule 144 under the 1933 Act, or an exemption from the registration requirements of the 1933 Act. Certain restricted securities may be resold in transactions exempt from registration, normally to qualified institutional buyers, and may be deemed liquid by Robeco as applicable, based on policies and procedures established by the Company’s Board of Directors. Therefore, not all restricted securities are considered illiquid.
At February 28, 2014, the following Fund held restricted securities that were illiquid:
| | | | | | | | | | | | | | | | | | |
| | | Acquisition Date | | Acquisition
Cost | | | Shares | | | Value | | | % of
Net Assets | |
BP All-Cap Value Fund | | | | | | | | | | | | | | | | | | |
| Common Stocks: | | | | | | | | | | | | | | | | | | |
Peoples Choice Financial Corp. 144A | | 12/21/04-01/23/06 | | | 14,293 | | | | 1,465 | | | | — | | | | 0.0 | |
Solar Cayman Ltd. 144A | | 03/24/10 | | | — | | | | 19,375 | | | | — | | | | 0.0 | |
| | | | | | | | | | | | | | | | | | |
| | | | $ | 14,293 | | | | | | | $ | — | | | | 0.0 | % |
| | | | | | | | | | | | | | | | | | |
There is a 1.00% redemption fee on shares redeemed which have been held 60 days or less on BP Small Cap Value Fund II, BP Long/Short Research Fund, BP Global Equity Fund and BP International Equity Fund. There is a 2.00% redemption fee on shares redeemed which have been held 365 days or less on the BP Long/Short Equity Fund. The WPG Small/Micro Cap Value Fund has a 2.00% redemption fee on shares redeemed within 60 days of purchase. The redemption fees are retained by the Funds for the benefit of the remaining shareholders and recorded as paid-in capital.
| 9. | Federal Income Tax Information |
The Funds have followed the authoritative guidance on accounting for and disclosure of uncertainty in tax positions, which requires the Funds to determine whether a tax position is more likely than not to be sustained upon examination, including resolution of any related appeals or litigation processes, based on the technical merits of the position. The Funds have determined that there was no effect on the financial statements from following this authoritative guidance. In the normal course of business, the Funds are subject to examination by federal, state and local jurisdictions, where applicable, for tax years for which applicable statutes of limitations have not expired.
As of February 28, 2014, federal tax cost and aggregate gross unrealized appreciation and depreciation of securities held by each Fund were as follows:
| | | | | | | | | | | | | | | | |
Fund | | Federal Tax
Cost | | | Unrealized
Appreciation | | | Unrealized
Depreciation | | | Net
Unrealized
Appreciation | |
BP Small Cap Value Fund II | | $ | 137,362,550 | | | $ | 66,782,566 | | | $ | (3,334,315 | ) | | $ | 63,448,251 | |
BP Long/Short Equity Fund | | | 591,373,160 | | | | 171,905,447 | | | | 19,700,017 | | | | 162,205,430 | |
BP Long/Short Research Fund | | | 3,192,644,700 | | | | 465,870,223 | | | | (23,543,538 | ) | | | 442,326,685 | |
BP All-Cap Value Fund | | | 634,051,318 | | | | 161,154,167 | | | | (2,193,586 | ) | | | 158,960,581 | |
WPG Small/Micro Cap Value Fund | | | 39,455,772 | | | | 10,151,362 | | | | (766,526 | ) | | | 9,384,836 | |
BP Global Equity Fund | | | 61,593,781 | | | | 5,424,255 | | | | (478,233 | ) | | | 4,946,022 | |
BP International Equity Fund | | | 9,758,325 | | | | 3,127,396 | | | | (81,934 | ) | | | 3,045,462 | |
BP Global Long/Short Fund | | | 3,325,895 | | | | 104,657 | | | | (33,917 | ) | | | 70,740 | |
Distributions to shareholders from net investment income and realized gains are determined in accordance with federal income tax regulations, which may differ from net investment income and realized gains recognized for financial reporting purposes. Accordingly, the character of distributions and composition of net assets for tax purposes may differ from those reflected in the accompanying financial statements. To the extent these differences are permanent, such amounts are reclassified within the capital accounts based on the tax treatment; temporary differences do not require such reclassification.
| | |
| 58 | | SEMI-ANNUAL REPORT 2014 |
| | |
NOTES TO FINANCIAL STATEMENTS (unaudited) (concluded) | | |
As of August 31, 2013, the components of distributable earnings on a tax basis were as follows:
| | | | | | | | | | | | | | | | | | | | | | | | |
Fund | | Undistributed
Ordinary
Income | | | Undistributed
Long-Term
Gains | | | Capital Loss
Carryforwards | | | Unrealized
Appreciation
(Depreciation) | | | Qualified
Late-year
Loss
Deferral | | | Other
Temporary
Differences | |
BP Small Cap Value Fund II | | $ | 22,625 | | | $ | — | | | $ | (10,128,234 | ) | | $ | 43,237,809 | | | $ | — | | | $ | — | |
BP Long/Short Equity Fund | | | 2,623,279 | | | | 37,550,810 | | | | (1,264,851 | ) | | | 37,504,659 | | | | — | | | | (724,983 | ) |
BP Long/Short Research Fund | | | — | | | | 4,241,723 | | | | — | | | | 87,335,240 | | | | (8,235,220 | ) | | | (1,138,395 | ) |
BP All-Cap Value Fund | | | 8,982,724 | | | | 6,248,547 | | | | — | | | | 97,796,913 | | | | — | | | | — | |
WPG Small/Micro Cap Value Fund | | | 11,591 | | | | 1,959,496 | | | | — | | | | 7,213,406 | | | | — | | | | — | |
BP Global Equity Fund | | | 967,681 | | | | 377,341 | | | | — | | | | 1,638,115 | | | | — | | | | — | |
BP International Equity Fund | | | 876,880 | | | | 399,184 | | | | — | | | | 1,594,594 | | | | — | | | | — | |
The differences between the book and tax basis components of distributable earnings relate principally to the timing of recognition of income and gains for federal income tax purposes.
The tax character of dividends and distributions paid during the fiscal year ended August 31, 2013 were as follows:
| | | | | | | | | | | | |
| | | 2013 | |
Fund | | Ordinary
Income | | | Long-Term
Gains | | | Total | |
BP Small Cap Value Fund II | | $ | 570,374 | | | $ | — | | | $ | 570,374 | |
BP Long/Short Equity Fund | | | 28,628,366 | | | | 14,464,132 | | | | 43,092,498 | |
BP Long/Short Research Fund | | | 4,279,421 | | | | 2 | | | | 4,279,423 | |
BP All-Cap Value Fund | | | 6,966,356 | | | | 938,727 | | | | 7,905,083 | |
WPG Small/Micro Cap Value Fund | | | 177,056 | | | | — | | | | 177,056 | |
BP Global Equity Fund | | | 221,270 | | | | — | | | | 221,270 | |
BP International Equity Fund | | | 209,689 | | | | — | | | | 209,689 | |
Dividends from net investment income and short-term capital gains are treated as ordinary income dividends for federal income tax purposes.
As of August 31, 2013, the Funds had the following pre-enactment net capital loss carryforwards to offset future net capital gains, if any, to the extent provided by Treasury regulations. To the extent that these carryforwards are used to offset future capital gains, it is probable that the gains that are offset will not be distributed to shareholders.
| | | | | | | | | | | | | | | | |
Fund | | August 31, 2016 | | | August 31, 2017 | | | August 31, 2018 | | | Total | |
BP Small Cap Value Fund II | | $ | — | | | $ | — | | | $ | 10,128,234 | | | $ | 10,128,234 | |
BP Long/Short Equity Fund | | | 1,264,851 | | | | — | | | | — | | | | 1,264,851 | |
BP Long/Short Research Fund | | | — | | | | — | | | | — | | | | — | |
BP All-Cap Value Fund | | | — | | | | — | | | | — | | | | — | |
WPG Small/Micro Cap Value Fund | | | — | | | | — | | | | — | | | | — | |
As of August 31, 2013, the Funds had no post-enactment capital loss carryforwards.
Management has evaluated the impact of all subsequent events on the Funds through the date the financial statements were issued, and has determined that there were no subsequent events requiring recognition or disclosure in the financial statements.
| | | | |
| SEMI-ANNUAL REPORT 2014 | | | 59 | |
| | |
OTHER INFORMATION (unaudited) | | |
Proxy Voting
Policies and procedures that the Funds use to determine how to vote proxies relating to portfolio securities as well as information regarding how the Funds voted proxies relating to portfolio securities for the most recent 12-month period ended June 30 are available without charge, upon request, by calling (888) 261-4073 and on the Securities and Exchange Commission’s (“SEC”) website at http://www.sec.gov.
Quarterly Portfolio Schedule
The Company files a complete schedule of portfolio holdings with the SEC for the first and third fiscal quarters of each fiscal year (quarters ended November 30 and May 31) on Form N-Q. The Company’s Form N-Q is available on the SEC website at http://www.sec.gov and may be reviewed and copied at the SEC Public Reference Room in Washington, D.C. Information on the operation of the SEC Public Reference Room may be obtained by calling (202) 551-8090.
| | |
| 60 | | SEMI-ANNUAL REPORT 2014 |
| | |
PRIVACY NOTICE (unaudited) | | |
| | |
| FACTS | | WHAT DO THE ROBECO INVESTMENT FUNDS DO WITH YOUR PERSONAL INFORMATION? |
| Why? | | Financial companies choose how they share your personal information. Federal law gives consumers the right to limit some but not all sharing. Federal law also requires us to tell you how we collect, share, and protect your personal information. Please read this notice carefully to understand what we do. |
| What? | | The types of personal information we collect and share depend on the product or service you have with us. This information can include: • Social Security number • account balances • account transactions • transaction history • wire transfer instructions • checking account information When you are no longer our customer, we continue to share your information as described in this notice. |
| How? | | All financial companies need to share customers’ personal information to run their everyday business. In the section below, we list the reasons financial companies can share their customers’ personal information; the reasons the Robeco Investment Funds chooses to share; and whether you can limit this sharing. |
| | | | |
| Reasons we can share your personal information | | Do the Robeco Investment Funds share? | | Can you limit this sharing? |
For our everyday business purposes – such as to process your transactions, maintain your account(s), respond to court orders and legal investigations, or report to credit bureaus | | Yes | | No |
For our marketing purposes – to offer our products and services to you | | Yes | | No |
| For joint marketing with other financial companies | | No | | We don’t share |
| For our affiliates’ everyday business purposes – information about your transactions and experiences | | Yes | | No |
| For our affiliates’ everyday business purposes – information about your creditworthiness | | No | | We don’t share |
| For our affiliates to market to you | | Yes | | Yes |
| For nonaffiliates to market to you | | No | | We don’t share |
| | |
| Questions? | | Call (888)-261-4073 or go to www.robecoinvest.com |
| | | | |
| SEMI-ANNUAL REPORT 2014 | | | 1 | |
| | |
PRIVACY NOTICE (unaudited) (concluded) | | |
| | |
What we do | | |
| | |
| How do the Robeco Investment Funds protect my personal information? | | To protect your personal information from unauthorized access and use, we use security measures that comply with federal law. These measures include computer safeguards and secured files and buildings. |
| How do the Robeco Investment Funds collect my personal information? | | We collect your personal information, for example, when you • open an account • provide account information • give us your contact information • make a wire transfer • tell us where to send the money We also collect your information from others, such as credit bureaus, affiliates, or other companies. |
| Why can’t I limit all sharing? | | Federal law gives you the right to limit only • sharing for affiliates’ everyday business purposes – information about your creditworthiness • affiliates from using your information to market to you • sharing for nonaffiliates to market to you State laws and individual companies may give you additional rights to limit sharing. |
Definitions |
| Affiliates | | Companies related by common ownership or control. They can be financial and nonfinancial companies. Our affiliates include: • Robeco Investment Management, Inc. • Robeco Securities, LLC |
| Nonaffiliates | | Companies not related by common ownership or control. They can be financial and nonfinancial companies. • The Robeco Investment Funds don’t share with nonaffiliates so they can market to you. The Robeco Investment Funds may share information with nonaffiliates that perform marketing services on our behalf. |
| Joint marketing | | A formal agreement between nonaffiliated financial companies that together market financial products or services to you. • The Robeco Investment Funds may share your information with other financial institutions with whom we have joint marketing arrangements who may suggest additional fund services or other investment products which may be of interest to you. |
| | |
| 2 | | SEMI-ANNUAL REPORT 2014 |
INVESTMENT ADVISER
Robeco Investment Management Inc.
909 Third Avenue, 32nd Floor
New York, NY 10022
ADMINISTRATOR
BNY Mellon Investment Servicing (US) Inc.
301 Bellevue Parkway
Wilmington, DE 19809
TRANSFER AGENT
BNY Mellon Investment Servicing (US) Inc.
4400 Computer Drive
Westborough, MA 01581
PRINCIPAL
UNDERWRITER
Foreside Funds Distributors LLC
400 Berwyn Park
899 Cassatt Road
Berwyn, PA 19312
CUSTODIAN
The Bank of New York Mellon
One Wall Street
New York, NY 10286
INDEPENDENT REGISTERED PUBLIC ACCOUNTING FIRM
Ernst & Young LLP
One Commerce Square
2005 Market Street, Suite 700
Philadelphia, PA 19103
COUNSEL
Drinker Biddle & Reath LLP
One Logan Square, Ste. 2000
Philadelphia, PA 19103-6996
S1 FUND
of THE RBB FUND, INC.
SEMI-ANNUAL REPORT
FEBRUARY 28, 2014
(UNAUDITED)
This report is submitted for the general information of the shareholders of the Fund. It is not authorized for distribution unless preceded or accompanied by a current prospectus for the Fund.
S1 FUND
SEMI-ANNUAL INVESTMENT ADVISER’S REPORT
(UNAUDITED)
Dear Fellow Investor,
We are pleased to enclose the February 28, 2014 semi-annual report for the S1 Fund (the “Fund”) for your information.
The Simple Alternatives team would like to take this opportunity to thank you for your continued support. We are grateful for the confidence you have placed in us since the Fund’s inception.
Our philosophy is simple. We believe that hedged equity is a vital part of any investment portfolio. We believe that investors are best served by diversifying across a team of skilled hedged equity managers and that those strategies and managers are best accessed through a simple-to-use mutual fund structure.
Comparision of Change in Value of $1000 Investment in
S1 Fund I Shares vs. Hedge Fund Research Equity Hedge Index (“HFRXEH”)
Past performance is not predictive of future results.
For the period from September 1, 2013 to February 28, 2014, the Fund returned 12.66%. This compares to a 13.87% return for the S&P 500® Index during the same period. The performance is notable considering the Fund achieved this return with less than half the volatility of the S&P 500® Index and with less than 40% net market exposure.* These strong risk adjusted returns were driven by the Fund having positive performance in every sector with gross returns in Technology (5.42%), Consumer Discretionary (3.08%), Financials (2.17%), and Industrial (2.02%) leading the way. Our decision in mid-2013 to bring in two new managers who have an edge in Technology, Consumer and Industrials, paid dividends and greatly complemented the work of our other managers.
The Fund earned a three-year track record in October of 2013 and was recently awarded a five-star rating from Morningstar for the Multialternative category**. We are grateful for those who believed early on in our model and are encouraged by the growing number of investors in the Fund.
Sincerely,
James K. Dilworth
Founder
Simple Alternatives
**About Morningstar Ratings™
As of 2/28/14, the Simple Alternatives S1 Fund was rated against 144 Multialternative Funds in the last three years and received a five star rating.
For each fund with at least a three-year history, Morningstar calculates a Morningstar Rating™ based on a Morningstar Risk-Adjusted Return measure that accounts for variation in a fund’s monthly performance (including the effects of sales charges, loads, and redemption fees), placing more emphasis on downward variations and rewarding consistent performance.
The top 10% of funds in each category receive 5 stars, the next 22.5% receive 4 stars, the next 35% receive 3 stars, the next 22.5% receive 2 stars and the bottom 10% receive 1 star. (Each share class is counted as a fraction of one fund within this scale and rated
1
separately, which may cause slight variations in the distribution percentages.) The Overall Morningstar Rating™ for a fund is derived from a weighted average of the performance figures associated with its three-, five- and ten-year (if applicable) Morningstar Rating metrics.
© 2014 Morningstar, Inc. All Rights Reserved. The information contained herein: (1) is proprietary to Morningstar and/or its content providers; (2) may not be copied or distributed; and (3) is not warranted to be accurate, complete or timely. Neither Morningstar nor its content providers are responsible for any damages or losses arising from any use of this information. Past performance is no guarantee of future results.
*Annualized Standard Deviation: Risk as measured by the variability of performance. The higher the standard deviation, the greater the variability (and therefore the risk) of the fund or index. Net exposure is calculated by subtracting the value of the short positions from the long positions.
The S&P 500 is a broad index of the U.S. stock market. The HFRX Global Hedge Fund Index data is sourced from Hedge Funds Research, Inc. and is designed to be representative of the overall composition of the hedge fund universe. It is comprised of all eligible hedge fund strategies; including but not limited to convertible arbitrage, distressed securities, equity hedge, equity market neutral, event driven, macro, merger arbitrage, and relative value arbitrage. The strategies are asset weighted based on the distribution of assets in the hedge fund industry. The S&P 500 Index and the HFRI Index are unmanaged, do not incur expenses and are not available for investment.
Portfolio composition is subject to change. The current and future portfolio holdings of the Fund are subject to investment risk.
2
S1 FUND
PERFORMANCE DATA
(UNAUDITED)
| | | | | | | | | | | | | | | | |
| Total Returns for the Periods Ended February 28, 2014 | |
| | | | | | Average Annual | |
| | | Six
Months* | | | One
Year | | | Three
Year | | | Since
Inception** | |
S1 Fund, I Shares | | | 12.66% | | | | 12.23% | | | | 5.19% | | | | 4.79% | |
S&P 500® Index*** | | | 13.87% | | | | 22.76% | | | | 11.92% | | | | 17.71% | |
HFRX Equity Hedge Index*** | | | 7.32% | | | | 8.76% | | | | -1.44% | | | | 0.83% | |
| ** | Inception date of the Fund is September 30, 2010. |
| *** | Benchmark performance is from the inception date of the Fund only and is not the inception date of the benchmark itself. |
Performance quoted is past performance and does not guarantee future results. Investment return and principal value will fluctuate so that shares, when redeemed, may be worth more or less than their original cost. Current performance may be lower or higher than the returns quoted above. Call Simple Alternatives at 1-866-882-1226 for returns current to the most recent month-end.
The performance quoted reflects fee waivers in effect and would have been less in their absence. The Fund’s gross annual operating expense ratio, as stated in the current prospectus, is 4.86% and the Fund’s net operating expense ratio is 4.48%. Net operating expense includes interest and dividends on short sales and acquired fund fees. The Fund’s investment adviser, Simple Alternatives, LLC, has contractually agreed until at least December 31, 2014 to forgo all or a portion of its advisory fee and/or reimburse expenses in an aggregate amount equal to the amount by which the total annual Fund operating expenses (other than acquired fund fees and expenses, short sale dividend expenses, brokerage commissions, litigation, extraordinary items, interest or taxes) exceeds 2.95% of the average daily net assets attributable to the Fund’s I Shares. This limitation can be discontinued at any time after December 31, 2014.
The Fund is non-diversified and may focus its investments in the securities of a comparatively small number of issuers. Concentration in securities of a limited number of issuers exposes a fund to greater market risk and potential monetary losses than if its assets were diversified among the securities of a greater number of issuers. The Fund may invest in small- and medium-sized companies which involve greater risk than investing in larger, more established companies, such as increased volatility of earnings and prospects, higher failure rates, and limited markets, product lines or financial resources.
The Fund may invest in foreign or emerging markets securities which involve special risks, including the volatility of currency exchange rates and, in some cases, limited geographic focus, political and economic instability, and relatively illiquid markets.
The Fund may invest in debt securities which are subject to interest rate risk. An increase in interest rates typically causes a fall in the value of the debt securities in which the Fund may invest. The Fund may also invest in high yield, lower rated (junk) bonds which involve a greater degree of risk and price fluctuation than investment grade bonds in return for higher yield potential. The Fund’s distressed debt strategy may involve a substantial degree of risk, including investments in sub-prime mortgage securities.
The Fund may purchase securities of companies in initial public offerings. Special risks associated with these securities may include a limited number of shares available for trading, unseasoned trading, lack of investor knowledge of the company and limited operating history. The Fund may leverage transactions which include selling short as well as borrowing for other than temporary or emergency purposes. Leverage creates the risk of magnified capital losses.
3
S1 FUND
PERFORMANCE DATA (CONCLUDED)
(UNAUDITED)
The Fund may also invest in derivatives which can be volatile and involve various types and degrees of risks, depending upon the characteristics of a particular derivative. The Fund may invest in options and futures which are subject to special risks and may not fully protect the Fund against declines in the value of its stocks. In addition, an option writing strategy limits the upside profit potential normally associated with stocks. Futures trading is very speculative, largely due to the traditional volatility of futures prices.
Portfolio composition is subject to change.
4
S1 FUND
FUND EXPENSE EXAMPLES
(UNAUDITED)
As a shareholder of the Fund, you incur two types of costs: (1) transaction costs and (2) ongoing costs, including management fees, shareholder servicing fees and other Fund expenses. These examples are intended to help you understand your ongoing costs (in dollars) of investing in the Fund and to compare these costs with the ongoing costs of investing in other mutual funds.
This example is based on an investment of $1,000 invested at the beginning of the six-month period from September 1, 2013 through February 28, 2014 and held for the entire period.
ACTUAL EXPENSES
The first line of the accompanying table provides information about actual account values and actual expenses. You may use the information in this line, together with the amount you invested, to estimate the expenses that you paid over the period. Simply divide your account value by $1,000 (for example, an $8,600 account value divided by $1,000 = 8.6), then multiply the result by the number in the first line under the heading entitled “Expenses Paid During Period” to estimate the expenses you paid on your account during this period.
HYPOTHETICAL EXAMPLEFOR COMPARISON PURPOSES
The second line of the accompanying table provides information about hypothetical account values and hypothetical expenses based on the Fund’s actual expense ratio and an assumed rate of return of 5% per year before expenses, which is not the Fund’s actual return. The hypothetical account values and expenses may not be used to estimate the actual ending account balance or expenses you paid for the period. You may use this information to compare the ongoing costs of investing in the Fund and other funds. To do so, compare these 5% hypothetical examples with the 5% hypothetical examples that appear in the shareholder reports of other funds.
Please note that the expenses shown in the accompanying table are meant to highlight your ongoing costs only and do not reflect any transactional costs, such as redemption fees. Therefore, the second line of the accompanying table is useful in comparing ongoing costs only, and will not help you determine the relative total costs of owning different funds. In addition, if these transactional costs were included, your costs would have been higher.
| | | | | | |
| | | I SHARES |
| | | BEGINNING ACCOUNT VALUE
SEPTEMBER 1, 2013 | | ENDING ACCOUNT VALUE
FEBRUARY 28, 2014 | | EXPENSES PAID
DURING PERIOD |
Actual* | | $1,000.00 | | $1,126.60 | | $21.88 |
Hypothetical (5% return before expenses) | | 1,000.00 | | 1,004.22 | | 20.62 |
| * | Expenses equal to an annualized expense ratio for the six-month period ended February 28, 2014 of 4.15% for the I Shares of the Fund, which includes waived fees or reimbursed expenses (including dividend and interest expense), multiplied by the average account value over the period, multiplied by the number of days in the most recent period (181) then divided by 365 days. The Fund’s ending account value on the first line in the table is based on the actual six-months total return for the I Shares of the Fund of 12.66%. These amounts include dividends paid on securities which the Fund has sold short (“short-sale dividends”) and related interest expense. The annualized amount of short-sale dividends and related interest expense was 1.20% of the Fund’s average net assets attributable to I Shares for the most recent fiscal year. |
5
S1 FUND
PORTFOLIO HOLDINGS SUMMARY TABLE
FEBRUARY 28, 2014
(UNAUDITED)
The following table presents a summary by sector of the portfolio holdings of the Fund.
| | | | | | | | |
| SECURITY TYPE/SECTOR CLASSIFICATION | | % OF NET
ASSETS | | | VALUE | |
COMMON STOCKS: | | | | | | | | |
Information Technology | | | 27.2 | % | | $ | 21,285,715 | |
Consumer Discretionary | | | 22.7 | | | | 17,794,829 | |
Real Estate Investment Trusts | | | 15.3 | | | | 12,020,217 | |
Industrials | | | 9.1 | | | | 7,150,318 | |
Financials | | | 6.6 | | | | 5,186,867 | |
Materials | | | 4.9 | | | | 3,866,961 | |
Telecommunication Services | | | 3.0 | | | | 2,341,403 | |
Consumer Staples | | | 2.3 | | | | 1,807,603 | |
Health Care | | | 0.3 | | | | 216,750 | |
Energy | | | 0.1 | | | | 69,500 | |
PURCHASED OPTIONS | | | 1.1 | | | | 827,473 | |
EXCHANGE TRADED FUNDS | | | 0.8 | | | | 611,011 | |
U.S TREASURY NOTE | | | 0.1 | | | | 104,797 | |
FOREIGN GOVERNMENT NOTE | | | 0.0 | | | | 9,341 | |
WRITTEN OPTIONS | | | (0.7 | ) | | | (545,812 | ) |
EXCHANGE TRADED FUNDS SOLD SHORT | | | (4.8 | ) | | | (3,780,232 | ) |
COMMON STOCKS SOLD SHORT | | | (46.6 | ) | | | (36,550,730 | ) |
OTHER ASSETS IN EXCESS OF LIABILITIES | | | 58.6 | | | | 45,945,274 | |
| | | | | | | | |
NET ASSETS | | | 100.0 | % | | $ | 78,361,285 | |
| | | | | | | | |
Portfolio holdings are subject to change at any time.
The accompanying notes are an integral part of the financial statements.
6
S1 FUND
PORTFOLIOOF INVESTMENTS
FEBRUARY 28, 2014
(UNAUDITED)
| | | | | | | | |
| | | NUMBER
OF SHARES | | | VALUE | |
COMMON STOCKS — 91.5% | | | | | |
CONSUMER DISCRETIONARY—22.7% | | | | | |
Advance Auto Parts, Inc.^ | | | 1,415 | | | $ | 180,214 | |
Aeropostale, Inc.*^ | | | 28,521 | | | | 209,344 | |
Ascena Retail Group, Inc.*^ | | | 7,930 | | | | 145,040 | |
Brookfield Residential Properties, Inc.*†^ | | | 28,474 | | | | 633,546 | |
Caesars Acquisition Co., Class A* | | | 47,000 | | | | 646,250 | |
Caesars Entertainment Corp.*^ | | | 32,400 | | | | 841,104 | |
Charter Communications, Inc., Class A*^ | | | 12,200 | | | | 1,546,594 | |
Childrens Place Retail Stores, Inc., (The)*^ | | | 2,110 | | | | 114,299 | |
Chipotle Mexican Grill, Inc.*^ | | | 474 | | | | 267,910 | |
ClubCorp Holdings, Inc. | | | 5,400 | | | | 94,068 | |
Francesca’s Holdings Corp.* | | | 6,090 | | | | 119,181 | |
GameStop Corp., Class A | | | 2,100 | | | | 78,351 | |
GNC Holdings, Inc., Class A | | | 390 | | | | 18,143 | |
HomeAway, Inc.*^ | | | 10,786 | | | | 494,754 | |
Interval Leisure Group, Inc. | | | 9,060 | | | | 246,341 | |
JC Penney Co., Inc.*^ | | | 31,313 | | | | 227,959 | |
Kate Spade & Co.* | | | 1,385 | | | | 47,395 | |
Lee Enterprises, Inc.*^ | | | 200,000 | | | | 1,028,000 | |
Lennar Corp., Class A^ | | | 22,512 | | | | 987,827 | |
Liberty Interactive Corp., Class A*^ | | | 17,000 | | | | 496,400 | |
Liberty Ventures,
Class A*^ | | | 17,400 | | | | 2,479,674 | |
Loral Space & Communications, Inc.*^ | | | 12,025 | | | | 950,216 | |
Melco Crown Entertainment Ltd. - ADR* | | | 805 | | | | 34,551 | |
Meritage Homes Corp.* | | | 10,800 | | | | 520,668 | |
Mothercare PLC (United Kingdom)* | | | 40,000 | | | | 166,784 | |
MTR Gaming Group, Inc.* | | | 39,000 | | | | 206,310 | |
Perry Ellis International, Inc.* | | | 1,200 | | | | 16,740 | |
Polaris Industries, Inc.^ | | | 2,018 | | | | 270,473 | |
Quiksilver, Inc.*^ | | | 39,516 | | | | 308,225 | |
Ralph Lauren Corp. | | | 130 | | | | 20,940 | |
Restoration Hardware Holdings, Inc.*^ | | | 4,148 | | | | 280,903 | |
Select Comfort Corp.* | | | 4,500 | | | | 81,270 | |
SFX Entertainment, Inc.*^ | | | 60,279 | | | | 517,797 | |
Sirius XM Canada Holdings, Inc. (Canada) | | | 130,000 | | | | 987,357 | |
Skechers U.S.A., Inc.,
Class A* | | | 1,600 | | | | 53,968 | |
Smith & Wesson Holding Corp.* | | | 14,340 | | | | 164,910 | |
Sony Corp. - Sponsored ADR^ | | | 7,882 | | | | 138,329 | |
Starbucks Corp.^ | | | 1,219 | | | | 86,500 | |
Starz, Class A* | | | 5,731 | | | | 183,277 | |
Tile Shop Holdings, Inc.* | | | 6,360 | | | | 98,071 | |
Time Warner, Inc. | | | 2,607 | | | | 175,008 | |
Urban Outfitters, Inc.* | | | 3,240 | | | | 121,306 | |
William Lyon Homes,
Class A*^ | | | 17,300 | | | | 535,089 | |
Wolverine World Wide, Inc.^ | | | 19,838 | | | | 522,930 | |
World Wrestling Entertainment, Inc., Class A | | | 19,669 | | | | 450,813 | |
| | | | | | | | |
| | | | | | | 17,794,829 | |
| | | | | | | | |
| | | | | | | | |
| | | NUMBER
OF SHARES | | | VALUE | |
CONSUMER STAPLES—2.3% | | | | | |
Coca-Cola Central Japan Co. Ltd. (Japan) | | | 29,400 | | | $ | 676,087 | |
Estee Lauder Cos., Inc. (The), Class A | | | 391 | | | | 26,916 | |
Tyson Foods, Inc., Class A^ | | | 28,000 | | | | 1,104,600 | |
| | | | | | | | |
| | | | | | | 1,807,603 | |
| | | | | | | | |
ENERGY—0.1% | | | | | | | | |
RSP Permian, Inc.* | | | 2,500 | | | | 69,500 | |
| | | | | | | | |
FINANCIALS—6.6% | | | | | | | | |
Altisource Portfolio Solutions SA*† | | | 552 | | | | 54,306 | |
American International Group, Inc.^ | | | 2,950 | | | | 146,822 | |
Bank Mutual Corp. | | | 21,670 | | | | 143,455 | |
Capital & Counties Properties, PLC (United Kingdom) | | | 66,405 | | | | 418,663 | |
Capital Bank Financial Corp., Class A*^ | | | 8,241 | | | | 189,543 | |
CBRE Group, Inc., Class A* | | | 10,450 | | | | 292,078 | |
Dream Unlimited Corp. - Class A (Canada)* | | | 28,311 | | | | 379,167 | |
Fox Chase Bancorp, Inc.^ | | | 4,718 | | | | 80,867 | |
Genworth Financial, Inc.,
Class A*^ | | | 9,800 | | | | 152,292 | |
Hampden Bancorp, Inc.^ | | | 9,850 | | | | 157,108 | |
Heritage Commerce Corp.^ | | | 22,690 | | | | 183,562 | |
Howard Hughes Corp.,
(The)*^ | | | 7,550 | | | | 1,042,127 | |
ICG Group, Inc.* | | | 40,429 | | | | 821,922 | |
Ocean Shore Holding Co.^ | | | 13,670 | | | | 190,150 | |
OmniAmerican Bancorp, Inc. | | | 4,610 | | | | 100,360 | |
Pacific Mercantile BanCorp.* | | | 32,149 | | | | 200,610 | |
Realogy Holdings Corp.* | | | 1,980 | | | | 93,971 | |
Santander Consumer USA Holdings, Inc.* | | | 2,900 | | | | 73,457 | |
Unite Group PLC (United Kingdom) | | | 42,788 | | | | 321,307 | |
ViewPoint Financial Group | | | 5,804 | | | | 145,100 | |
| | | | | | | | |
| | | | | | | 5,186,867 | |
| | | | | | | | |
HEALTH CARE—0.3% | | | | | | | | |
Angiotech Pharmaceuticals, Inc.†D | | | 14,450 | | | | 216,750 | |
| | | | | | | | |
INDUSTRIALS—9.1% | | | | | | | | |
3M Co. | | | 1,300 | | | | 175,149 | |
Ashtead Group PLC (United Kingdom) | | | 25,500 | | | | 373,621 | |
Baltic Trading Ltd.^ | | | 106,400 | | | | 728,840 | |
Danaher Corp. | | | 1,100 | | | | 84,139 | |
FedEx Corp.^ | | | 3,195 | | | | 425,989 | |
H&E Equipment Services, Inc.* | | | 8,100 | | | | 265,032 | |
HD Supply Holdings, Inc.*^ | | | 17,000 | | | | 395,590 | |
Hertz Global Holdings, Inc.*^ | | | 30,000 | | | | 840,300 | |
Nielsen Holdings NV*^ | | | 7,780 | | | | 368,305 | |
Paragon Shipping, Inc.,
Class A*† | | | 61,000 | | | | 436,150 | |
Pitney Bowes, Inc. | | | 1,389 | | | | 35,350 | |
RPX Corp.*^ | | | 34,177 | | | | 547,516 | |
Safe Bulkers, Inc. | | | 38,500 | | | | 394,240 | |
United Rentals, Inc.*^ | | | 8,674 | | | | 766,261 | |
The accompanying notes are an integral part of the financial statements.
7
S1 FUND
PORTFOLIOOF INVESTMENTS (CONTINUED)
FEBRUARY 28, 2014
(UNAUDITED)
| | | | | | | | |
| | | NUMBER
OF SHARES | | | VALUE | |
INDUSTRIALS—(CONTINUED) | | | | | |
URS Corp. | | | 1,890 | | | $ | 87,885 | |
USG Corp.*^ | | | 34,700 | | | | 1,225,951 | |
| | | | | | | | |
| | | | | | | 7,150,318 | |
| | | | | | | | |
INFORMATION TECHNOLOGY—27.2% | | | | | |
Apple, Inc.^ | | | 656 | | | | 345,213 | |
Attunity Ltd.*† | | | 9,400 | | | | 102,742 | |
BroadSoft, Inc.*^ | | | 19,989 | | | | 599,870 | |
Cavium, Inc.*^ | | | 14,869 | | | | 626,431 | |
Comverse, Inc.*^ | | | 6,123 | | | | 211,917 | |
Cvent, Inc.*^ | | | 21,218 | | | | 833,443 | |
eBay, Inc.* | | | 10,900 | | | | 640,593 | |
EchoStar Corp., Class A* | | | 27,300 | | | | 1,360,086 | |
Envestnet, Inc.*^ | | | 15,392 | | | | 644,001 | |
Extreme Networks, Inc.* | | | 16,570 | | | | 94,946 | |
Fleetmatics Group, PLC* | | | 13,329 | | | | 492,507 | |
Gigamon, Inc.*^ | | | 25,315 | | | | 798,941 | |
Guidewire Software, Inc.*^ | | | 12,327 | | | | 660,850 | |
Interactive Intelligence Group, Inc.* | | | 5,992 | | | | 477,143 | |
JinkoSolar Holding Co. Ltd. - ADR* | | | 14,438 | | | | 472,411 | |
LogMein, Inc.*^ | | | 16,820 | | | | 703,917 | |
LTX-Credence Corp.*^ | | | 132,170 | | | | 1,337,560 | |
Marketo, Inc.* | | | 12,736 | | | | 522,176 | |
NVIDIA Corp. | | | 3,790 | | | | 69,660 | |
NXP Semiconductor NV*† | | | 11,506 | | | | 646,982 | |
OpenTable, Inc.*^ | | | 1,258 | | | | 100,250 | |
Optimal Payments, PLC (United Kingdom)* | | | 152,000 | | | | 1,237,014 | |
Palo Alto Networks, Inc.* | | | 6,060 | | | | 431,169 | |
Pandora Media, Inc.*^ | | | 21,640 | | | | 809,769 | |
Rambus, Inc.*^ | | | 76,225 | | | | 702,794 | |
RealNetworks, Inc.* | | | 5,000 | | | | 37,550 | |
Rocket Fuel, Inc.* | | | 8,082 | | | | 453,077 | |
Salesforce.com, Inc.* | | | 9,390 | | | | 585,654 | |
ServiceNow, Inc.*^ | | | 14,335 | | | | 975,640 | |
Silicon Motion Technology Corp., ADR^ | | | 89,620 | | | | 1,495,758 | |
SINA Corp.* | | | 7,512 | | | | 513,295 | |
Splunk, Inc.* | | | 2,886 | | | | 267,676 | |
Tableau Software, Inc.,
Class A* | | | 3,468 | | | | 327,171 | |
Teradyne, Inc.*^ | | | 24,000 | | | | 486,720 | |
Yahoo!, Inc.* | | | 13,833 | | | | 534,922 | |
Yelp, Inc.*^ | | | 7,264 | | | | 685,867 | |
| | | | | | | | |
| | | | | | | 21,285,715 | |
| | | | | | | | |
MATERIALS—4.9% | | | | | |
Air Products & Chemicals, Inc. | | | 190 | | | | 23,051 | |
Constellium NV, Class A* | | | 32,800 | | | | 911,512 | |
Graphic Packaging Holding Co.*^ | | | 110,000 | | | | 1,126,400 | |
Noranda Aluminum Holding Corp. | | | 57,000 | | | | 245,670 | |
Owens-Illinois, Inc.*^ | | | 23,000 | | | | 780,160 | |
Silver Wheaton Corp. (Canada) | | | 9,500 | | | | 242,535 | |
Smurfit Kappa Group, PLC (Ireland)* | | | 17,900 | | | | 498,433 | |
Verso Paper Corp.* | | | 16,000 | | | | 39,200 | |
| | | | | | | | |
| | | | | | | 3,866,961 | |
| | | | | | | | |
| | | | | | | | |
| | | NUMBER
OF SHARES | | | VALUE | |
REAL ESTATE INVESTMENT TRUSTS—15.3% | |
Alexandria Real Estate Equities, Inc.^ | | | 11,054 | | | $ | 800,862 | |
American Campus Communities, Inc.^ | | | 10,683 | | | | 394,630 | |
American Capital Agency Corp. | | | 16,050 | | | | 357,754 | |
American Homes 4 Rent, Class A^ | | | 19,700 | | | | 322,686 | |
Avalonbay Communities, Inc.^ | | | 6,131 | | | | 790,715 | |
BRE Properties, Inc.^ | | | 11,507 | | | | 710,787 | |
Brookfield Canada Office Properties (Canada) | | | 11,981 | | | | 289,976 | |
Education Realty Trust, Inc. | | | 3,958 | | | | 37,324 | |
Equity Lifestyle Properties, Inc.^ | | | 12,837 | | | | 516,689 | |
General Growth Properties, Inc.^ | | | 37,125 | | | | 817,492 | |
Green REIT, PLC (Ireland)* | | | 123,656 | | | | 211,646 | |
Hibernia REIT, PLC (Ireland)* | | | 102,650 | | | | 151,606 | |
Host Hotels & Resorts, Inc.^ | | | 33,850 | | | | 665,830 | |
Klepierre (France) | | | 8,756 | | | | 398,781 | |
Lar Espana Real Estate Socim* | | | 30,800 | | | | 425,132 | |
Parkway Properties, Inc.^ | | | 64,154 | | | | 1,182,358 | |
Post Properties, Inc.^ | | | 22,786 | | | | 1,105,805 | |
Prologis, Inc.^ | | | 17,828 | | | | 734,335 | |
Retail Opportunity Investments Corp. | | | 34,646 | | | | 513,800 | |
RLJ Lodging Trust^ | | | 29,000 | | | | 753,710 | |
Rouse Properties^ | | | 22,728 | | | | 425,468 | |
Spirit Realty Capital, Inc.^ | | | 37,805 | | | | 412,831 | |
| | | | | | | | |
| | | | | | | 12,020,217 | |
| | | | | | | | |
TELECOMMUNICATION SERVICES—3.0% | |
8X8, Inc.*^. | | | 77,318 | | | | 818,024 | |
Globalstar, Inc.* | | | 76,000 | | | | 172,520 | |
inContact, Inc.*^ | | | 108,534 | | | | 978,977 | |
RingCentral, Inc.,
Class A* | | | 17,177 | | | | 371,882 | |
| | | | | | | | |
| | | | | | | 2,341,403 | |
| | | | | | | | |
TOTAL COMMON STOCKS
(Cost $58,549,877) | | | | 71,740,163 | |
| | | | | | | | |
| |
EXCHANGE TRADED FUNDS — 0.8% | | | | | |
CURRENCY—0.1% | | | | | |
ProShares UltraShort Yen* | | | 1,530 | | | | 100,766 | |
| | | | | | | | |
EQUITY—0.6% | | | | | |
ProShares UltraShort Russell 2000* | | | 1,200 | | | | 54,744 | |
ProShares UltraShort S&P 500* | | | 8,000 | | | | 231,280 | |
SPDR S&P Homebuilders ETF | | | 4,000 | | | | 136,120 | |
| | | | | | | | |
| | | | | | | 422,144 | |
| | | | | | | | |
OTHER—0.1% | | | | | |
AP Alternative Assets LP* | | | 2,788 | | | | 88,101 | |
| | | | | | | | |
TOTAL EXCHANGE TRADED FUNDS
(Cost $587,239) | | | | 611,011 | |
| | | | | | | | |
The accompanying notes are an integral part of the financial statements.
8
S1 FUND
PORTFOLIOOF INVESTMENTS (CONTINUED)
FEBRUARY 28, 2014
(UNAUDITED)
| | | | | | | | |
| | | PAR
(000’S) | | | VALUE | |
FOREIGN GOVERNMENT NOTE — 0.0% | |
Canadian Government Bond 3.000% 12/01/15 | | | CAD 10 | | | $ | 9,341 | |
| | | | | | | | |
TOTAL FOREIGN GOVERNMENT NOTE (Cost $10,122) | | | | 9,341 | |
| | | | | | | | |
U.S. TREASURY NOTE — 0.1% | | | | | |
2.625% 04/30/16^ | | $ | 100 | | | | 104,797 | |
| | | | | | | | |
TOTAL U.S. TREASURY NOTE (Cost $101,391) | | | | 104,797 | |
| | | | | | | | |
| | | NUMBER
OF
CONTRACTS | | | | |
PURCHASED OPTIONS — 1.1% | | | | | |
CALL OPTIONS PURCHASED — 0.8% | |
Constellium NV | |
Expires 05/17/14 | | | | | | | | |
Strike Price $25 | | | 320 | | | | 112,320 | |
Graphic Packaging Holding Co. | |
Expires 06/21/14 | | | | | | | | |
Strike Price $10 | | | 800 | | | | 60,000 | |
Hertz Global Holdings, Inc. | |
Expires 06/21/14 | | | | | | | | |
Strike Price $30 | | | 450 | | | | 65,250 | |
iShares Russell 2000 ETF | |
Expires 03/22/14 | | | | | | | | |
Strike Price $118 | | | 360 | | | | 61,200 | |
Loral Space & Communications, Inc. | |
Expires 04/19/14 | | | | | | | | |
Strike Price $85 | | | 77 | | | | 9,818 | |
Meritage Homes Corp. | |
Expires 03/22/14 | | | | | | | | |
Strike Price $50 | | | 190 | | | | 17,480 | |
Sprint Corp. | |
Expires 05/17/14 | | | | | | | | |
Strike Price $11 | | | 300 | | | | 6,600 | |
Time Warner Cable, Inc. | |
Expires 04/19/14 | | | | | | | | |
Strike Price $140 | | | 260 | | | | 109,200 | |
United Rentals, Inc. | |
Expires 03/22/14 | | | | | | | | |
Strike Price $85 | | | 70 | | | | 30,800 | |
USG Corp. | |
Expires 05/17/14 | | | | | | | | |
Strike Price $34 | | | 220 | | | | 69,300 | |
Vix | |
Expires 03/18/14 | | | | | | | | |
Strike Price $17 | | | 420 | | | | 29,400 | |
| | | | | | | | |
TOTAL CALL OPTIONS PURCHASED (Cost $366,001) | | | | 571,368 | |
| | | | | | | | |
PUT OPTIONS PURCHASED — 0.3% | |
AmTrust Financial Services, Inc. | |
Expires 06/21/14 | | | | | | | | |
Strike Price $25 | | | 170 | | | | 13,260 | |
| | | | | | | | |
| | | NUMBER
OF
CONTRACTS | | | VALUE | |
Energy Select Sector SPDR Fund | |
Expires 03/28/14 | | | | | | | | |
Strike Price $83.50 | | | 150 | | | $ | 6,375 | |
Flextronics International Ltd. | |
Expires 03/22/14 | | | | | | | | |
Strike Price $7 | | | 750 | | | | 1,500 | |
iShares MSCI Brazil Capped ETF | |
Expires 04/19/14 | | | | | | | | |
Strike Price $38 | | | 380 | | | | 24,700 | |
iShares Russell 2000 ETF | |
Expires 03/22/14 | | | | | | | | |
Strike Price $113 | | | 450 | | | | 31,950 | |
Lindsay Corp. | |
Expires 06/21/14 | | | | | | | | |
Strike Price $85 | | | 8 | | | | 4,680 | |
MercadoLibre, Inc. | |
Expires 03/22/14 | | | | | | | | |
Strike Price $85 | | | 88 | | | | 2,640 | |
NTELOS Holdings Corp. | |
Expires 03/22/14 | | | | | | | | |
Strike Price $12.50 | | | 280 | | | | 14,000 | |
NTELOS Holdings Corp. | |
Expires 03/22/14 | | | | | | | | |
Strike Price $15 | | | 150 | | | | 29,250 | |
NTELOS Holdings Corp. | |
Expires 06/21/14 | | | | | | | | |
Strike Price $10 | | | 100 | | | | 6,000 | |
RealPage, Inc. | |
Expires 07/19/14 | | | | | | | | |
Strike Price $17.50 | | | 160 | | | | 28,000 | |
SPDR Dow Jones Industrial | |
Average ETF Trust | | | | | | | | |
Expires 05/17/14 | | | | | | | | |
Strike Price $158 | | | 160 | | | | 39,840 | |
SPDR S&P 500 ETF Trust | |
Expires 04/19/14 | | | | | | | | |
Strike Price $178 | | | 170 | | | | 22,270 | |
Sprint Corp. | |
Expires 03/22/14 | | | | | | | | |
Strike Price $8 | | | 380 | | | | 8,360 | |
Sprint Nextel Corp. | |
Expires 05/17/14 | | | | | | | | |
Strike Price $8 | | | 300 | | | | 15,300 | |
Sturm, Ruger & Co., Inc. | |
Expires 04/19/14 | | | | | | | | |
Strike Price $65 | | | 19 | | | | 7,980 | |
| | | | | | | | |
TOTAL PUT OPTIONS PURCHASED (Cost $433,218) | | | | 256,105 | |
| | | | | | | | |
TOTAL PURCHASED OPTIONS — 1.1% | |
(Cost $799,219) | | | | | | | 827,473 | |
| | | | | | | | |
TOTAL INVESTMENTS — 93.5% | | | | | |
(Cost $60,047,848) | | | | | | | 73,292,785 | |
| | | | | | | | |
The accompanying notes are an integral part of the financial statements.
9
S1 FUND
PORTFOLIOOF INVESTMENTS (CONTINUED)
FEBRUARY 28, 2014
(UNAUDITED)
| | | | | | | | |
| | | NUMBER
OF SHARES | | | VALUE | |
SECURITIES SOLD SHORT — (51.4)% | |
COMMON STOCKS — (46.6)% | |
CONSUMER DISCRETIONARY—(7.1)% | |
Beazer Homes USA, Inc.* | | | (2,860 | ) | | $ | (66,323 | ) |
Brunswick Corp. | | | (515 | ) | | | (23,067 | ) |
Casio Computer Co. Ltd. (Japan) | | | (9,000 | ) | | | (102,009 | ) |
CST Brands, Inc. | | | (5,500 | ) | | | (178,915 | ) |
Dick’s Sporting Goods, Inc. | | | (424 | ) | | | (22,756 | ) |
Dunkin’ Brands Group, Inc. | | | (3,400 | ) | | | (175,678 | ) |
Francesca’s Holdings Corp.* | | | (8,190 | ) | | | (160,278 | ) |
GameStop Corp., Class A | | | (211 | ) | | | (7,872 | ) |
Gannett Co., Inc. | | | (341 | ) | | | (10,145 | ) |
Gap, Inc. (The) | | | (492 | ) | | | (21,525 | ) |
Hanesbrands, Inc. | | | (1,331 | ) | | | (97,536 | ) |
Hasbro, Inc. | | | (2,598 | ) | | | (143,306 | ) |
Jarden Corp.* | | | (439 | ) | | | (26,985 | ) |
John Wiley & Sons, Inc., Class A | | | (4,000 | ) | | | (232,120 | ) |
L Brands, Inc. | | | (850 | ) | | | (47,880 | ) |
LifeLock, Inc.* | | | (26,005 | ) | | | (517,760 | ) |
Macy’s, Inc. | | | (200 | ) | | | (11,572 | ) |
Marriott International, Inc., Class A | | | (16,144 | ) | | | (875,489 | ) |
McDonald’s Corp. | | | (1,380 | ) | | | (131,307 | ) |
Nikon Corp. (Japan) | | | (11,000 | ) | | | (201,933 | ) |
Panera Bread Co., Class A* | | | (84 | ) | | | (15,231 | ) |
Sally Beauty Holdings, Inc.* | | | (6,000 | ) | | | (172,200 | ) |
Scholastic Corp. | | | (5,200 | ) | | | (183,456 | ) |
Target Corp. | | | (3,030 | ) | | | (189,496 | ) |
Tile Shop Holdings, Inc.* | | | (6,360 | ) | | | (98,071 | ) |
TripAdvisor, Inc.* | | | (14,635 | ) | | | (1,467,012 | ) |
Tupperware Brands Corp. | | | (1,347 | ) | | | (105,874 | ) |
WH Smith PLC (United Kingdom) | | | (12,000 | ) | | | (234,794 | ) |
Yum! Brands, Inc. | | | (150 | ) | | | (11,112 | ) |
| | | | | | | | |
| | | | | | | (5,531,702 | ) |
| | | | | | | | |
CONSUMER STAPLES—(0.9)% | |
Colgate-Palmolive Co. | | | (258 | ) | | | (16,210 | ) |
ConAgra Foods, Inc. | | | (300 | ) | | | (8,520 | ) |
Energizer Holdings, Inc. | | | (778 | ) | | | (75,731 | ) |
General Mills, Inc. | | | (2,856 | ) | | | (142,886 | ) |
Kimberly-Clark Corp. | | | (1,939 | ) | | | (213,969 | ) |
Molson Coors Brewing Co., Class B | | | (203 | ) | | | (11,536 | ) |
PepsiCo, Inc. | | | (1,600 | ) | | | (128,112 | ) |
Philip Morris International, Inc. | | | (1,000 | ) | | | (80,910 | ) |
| | | | | | | | |
| | | | | | | (677,874 | ) |
| | | | | | | | |
FINANCIALS—(2.4)% | |
Altisource Asset Management Corp.*† | | | (100 | ) | | | (77,500 | ) |
Altisource Residential Corp.† | | | (5,314 | ) | | | (151,874 | ) |
Amtrust Financial Services, Inc. | | | (6,160 | ) | | | (232,848 | ) |
Cohen & Steers, Inc. | | | (1,970 | ) | | | (74,486 | ) |
Greenhill & Co., Inc. | | | (1,230 | ) | | | (65,522 | ) |
Home Capital Group, Inc. (Canada) | | | (238 | ) | | | (18,588 | ) |
Invesco Ltd. | | | (2,000 | ) | | | (68,600 | ) |
Jones Lang LaSalle, Inc. | | | (3,000 | ) | | | (369,600 | ) |
MSCI, Inc.* | | | (7,600 | ) | | | (332,196 | ) |
| | | | | | | | |
| | | NUMBER
OF SHARES | | | VALUE | |
FINANCIALS—(CONTINUED) | |
Portfolio Recovery Associates, Inc.* | | | (4,500 | ) | | $ | (244,035 | ) |
Regional Management Corp.* | | | (2,100 | ) | | | (63,378 | ) |
Springleaf Holdings, Inc.* | | | (2,800 | ) | | | (78,876 | ) |
US Bancorp | | | (1,950 | ) | | | (80,223 | ) |
WisdomTree Investments, Inc.* | | | (4,400 | ) | | | (68,552 | ) |
| | | | | | | | |
| | | | | | | (1,926,278 | ) |
| | | | | | | | |
HEALTH CARE—(0.6)% | |
Intuitive Surgical, Inc.* | | | (200 | ) | | | (88,966 | ) |
Masimo Corp.* | | | (13,500 | ) | | | (344,925 | ) |
Questcor Pharmaceuticals, Inc. | | | (980 | ) | | | (59,535 | ) |
| | | | | | | | |
| | | | | | | (493,426 | ) |
| | | | | | | | |
INDUSTRIALS—(1.0)% | |
Caterpillar, Inc. | | | (105 | ) | | | (10,182 | ) |
Healthcare Services Group, Inc. | | | (6,600 | ) | | | (177,738 | ) |
Nielsen Holdings NV | | | (2,896 | ) | | | (137,097 | ) |
Ritchie Bros Auctioneers, Inc.† | | | (10,000 | ) | | | (232,600 | ) |
Solarcity Corp.* | | | (570 | ) | | | (48,427 | ) |
Trex Co., Inc.* | | | (2,600 | ) | | | (203,372 | ) |
| | | | | | | | |
| | | | | | | (809,416 | ) |
| | | | | | | | |
INFORMATION TECHNOLOGY—(25.1)% | |
Activision Blizzard, Inc. | | | (6,986 | ) | | | (135,179 | ) |
Bankrate, Inc.* | | | (37,959 | ) | | | (764,115 | ) |
Bazaarvoice, Inc.* | | | (38,802 | ) | | | (262,302 | ) |
Blackbaud, Inc. | | | (13,565 | ) | | | (424,856 | ) |
Bottomline Technologies de, Inc.* . | | | (8,600 | ) | | | (306,934 | ) |
Canon, Inc. (Japan) | | | (5,500 | ) | | | (171,604 | ) |
Care.Com, Inc.* | | | (26,004 | ) | | | (481,334 | ) |
CommVault Systems, Inc.* | | | (10,494 | ) | | | (722,827 | ) |
Compuware Corp. | | | (36,352 | ) | | | (398,054 | ) |
Dassault Systemes SA (France) | | | (3,502 | ) | | | (402,560 | ) |
Dealertrack Technologies, Inc.* | | | (4,000 | ) | | | (216,280 | ) |
Digital River, Inc.* | | | (20,956 | ) | | | (372,388 | ) |
Ebix, Inc. | | | (3,120 | ) | | | (50,700 | ) |
Electronic Arts, Inc.* | | | (25,326 | ) | | | (724,070 | ) |
FactSet Research Systems, Inc. | | | (590 | ) | | | (62,121 | ) |
FireEye, Inc.* | | | (5,201 | ) | | | (445,414 | ) |
Flextronics International Ltd.* | | | (30,000 | ) | | | (268,500 | ) |
Fusion-io, Inc.* | | | (4,400 | ) | | | (48,268 | ) |
Hewlett-Packard Co. | | | (8,100 | ) | | | (242,028 | ) |
iGATE Corp.* | | | (24,360 | ) | | | (824,586 | ) |
Integrated Device Technology, Inc.* | | | (42,765 | ) | | | (504,199 | ) |
Intel Corp. | | | (12,761 | ) | | | (315,962 | ) |
International Business Machines Corp. | | | (4,511 | ) | | | (835,302 | ) |
International Rectifier Corp.* | | | (18,801 | ) | | | (506,687 | ) |
IPG Photonics Corp.* | | | (860 | ) | | | (61,722 | ) |
Juniper Networks, Inc.* | | | (16,847 | ) | | | (450,489 | ) |
Marketo, Inc.* | | | (1,870 | ) | | | (76,670 | ) |
Model N, Inc.* | | | (49,605 | ) | | | (545,159 | ) |
Monster Worldwide, Inc.* | | | (61,772 | ) | | | (492,323 | ) |
Motorola Solutions, Inc. | | | (12,492 | ) | | | (826,970 | ) |
NCR Corp.* | | | (2,600 | ) | | | (88,530 | ) |
Neopost SA (France) | | | (2,100 | ) | | | (192,733 | ) |
NETGEAR, Inc.* | | | (14,872 | ) | | | (508,325 | ) |
The accompanying notes are an integral part of the financial statements.
10
S1 FUND
PORTFOLIOOF INVESTMENTS (CONTINUED)
FEBRUARY 28, 2014
(UNAUDITED)
| | | | | | | | |
| | | NUMBER
OF SHARES | | | VALUE | |
INFORMATION TECHNOLOGY—(CONTINUED) | |
NVIDIA Corp. | | | (31,939 | ) | | $ | (587,039 | ) |
Oracle Corp. | | | (6,500 | ) | | | (254,215 | ) |
Plexus Corp.* | | | (16,361 | ) | | | (673,255 | ) |
RealPage, Inc.* | | | (37,998 | ) | | | (672,565 | ) |
Salesforce.com, Inc.* | | | (6,200 | ) | | | (386,694 | ) |
Seagate Technology., PLC | | | (199 | ) | | | (10,386 | ) |
Silicon Graphics International Corp.* | | | (5,310 | ) | | | (65,366 | ) |
Symantec Corp. | | | (38,139 | ) | | | (819,226 | ) |
Synchronoss Technologies, Inc.* | | | (6,800 | ) | | | (233,784 | ) |
Taiwan Semiconductor Manufacturing Co. Ltd. - Sponsored ADR | | | (17,000 | ) | | | (307,190 | ) |
Teradata Corp.* | | | (14,899 | ) | | | (684,162 | ) |
TIBCO Software, Inc.* | | | (13,183 | ) | | | (287,258 | ) |
Travelzoo, Inc.* | | | (20,791 | ) | | | (491,083 | ) |
Tyler Technologies, Inc.* | | | (7,509 | ) | | | (704,194 | ) |
United Microelectronics Corp. - Sponsored ADR | | | (49,000 | ) | | | (98,490 | ) |
Western Digital Corp. | | | (4,796 | ) | | | (417,204 | ) |
Zebra Technologies Corp., Class A* | | | (3,550 | ) | | | (244,914 | ) |
| | | | | | | | |
| | | | | | | (19,666,216 | ) |
| | | | | | | | |
REAL ESTATE INVESTMENT TRUSTS—(7.5)% | |
Acadia Realty Trust | | | (10,828 | ) | | | (286,401 | ) |
Brixmor Property Group, Inc. | | | (27,437 | ) | | | (605,809 | ) |
Camden Property Trust | | | (5,700 | ) | | | (380,190 | ) |
CBL & Associates Properties, Inc. | | | (17,550 | ) | | | (312,214 | ) |
Corrections Corp of America | | | (2,600 | ) | | | (86,710 | ) |
CubeSmart | | | (23,472 | ) | | | (410,995 | ) |
Duke Realty Corp. | | | (27,835 | ) | | | (467,628 | ) |
EastGroup Properties, Inc. | | | (4,006 | ) | | | (248,532 | ) |
HCP, Inc. | | | (5,550 | ) | | | (215,174 | ) |
Highwoods Properties, Inc. | | | (18,205 | ) | | | (686,511 | ) |
Kimco Realty Corp. | | | (19,967 | ) | | | (444,465 | ) |
Mack-Cali Realty Corp. | | | (7,983 | ) | | | (177,622 | ) |
Pebblebrook Hotel Trust | | | (16,728 | ) | | | (556,039 | ) |
Plum Creek Timber Co., Inc. | | | (2,258 | ) | | | (97,749 | ) |
Regency Centers Corp. | | | (1,300 | ) | | | (66,001 | ) |
Sun Communities, Inc. | | | (4,050 | ) | | | (186,543 | ) |
Weingarten Realty Investors | | | (20,344 | ) | | | (620,492 | ) |
| | | | | | | | |
| | | | | | | (5,849,075 | ) |
| | | | | | | | |
TELECOMMUNICATION SERVICES—(2.0)% | |
AT&T, Inc. | | | (4,585 | ) | | | (146,399 | ) |
Belgacom SA (Belgium) | | | (14,000 | ) | | | (421,159 | ) |
CenturyLink, Inc. | | | (4,100 | ) | | | (128,166 | ) |
Deutsche Telekom AG, Registered Shares (Germany) | | | (17,000 | ) | | | (287,594 | ) |
NTELOS Holdings Corp. | | | (9,500 | ) | | | (132,810 | ) |
Telefonica SA | | | (20,000 | ) | | | (305,806 | ) |
Verizon Communications, Inc. | | | (3,674 | ) | | | (174,809 | ) |
| | | | | | | | |
| | | | | | | (1,596,743 | ) |
| | | | | | | | |
TOTAL COMMON STOCKS SOLD SHORT
(Proceeds $34,669,097) | | | | (36,550,730 | ) |
| | | | | | | | |
| | | | | | | | |
| | | NUMBER
OF SHARES | | | VALUE | |
EXCHANGE TRADED-FUNDS SOLD SHORT — (4.8)% | |
EQUITY—(4.8)% | | | | | | | | |
Consumer Staples Select Sector SPDR Fund | | | (5,600 | ) | | $ | (237,160 | ) |
iShares MSCI Emerging Markets ETF | | | (2,620 | ) | | | (103,438 | ) |
iShares Silver Trust* | | | (21,200 | ) | | | (431,420 | ) |
SPDR S&P 500 ETF Trust | | | (7,268 | ) | | | (1,354,028 | ) |
SPDR S&P Regional Banking ETF | | | (1,500 | ) | | | (59,835 | ) |
Vanguard REIT ETF | | | (22,535 | ) | | | (1,594,351 | ) |
| | | | | | | | |
| | | | | | | (3,780,232 | ) |
| | | | | | | | |
TOTAL EXCHANGE TRADED FUNDS SOLD SHORT
(Proceeds $3,720,953) | | | | (3,780,232 | ) |
| | | | | | | | |
TOTAL SECURITIES SOLD SHORT
(Proceeds $38,390,050) | | | | | | | (40,330,962 | ) |
| | | | | | | | |
| | |
| | | NUMBER
OF
CONTRACTS | | | | |
WRITTEN OPTIONS — (0.7)% | |
CALL OPTIONS WRITTEN—(0.7)% | |
Constellium NV | | | | | | | | |
Expires 05/17/14 | | | | | | | | |
Strike Price $30 | | | (80 | ) | | | (7,400 | ) |
Energy Select Sector SPDR Fund | | | | | | | | |
Expires 03/28/14 | | | | | | | | |
Strike Price $88.50 | | | (150 | ) | | | (12,150 | ) |
Expedia, Inc. | | | | | | | | |
Expires 04/19/14 | | | | | | | | |
Strike Price $70 | | | (107 | ) | | | (99,510 | ) |
Hertz Global Holdings, Inc. | | | | | | | | |
Expires 06/21/14 | | | | | | | | |
Strike Price $35 | | | (450 | ) | | | (19,125 | ) |
iShares MSCI Brazil Capped ETF | | | | | | | | |
Expires 04/19/14 | | | | | | | | |
Strike Price $43 | | | (380 | ) | | | (27,740 | ) |
iShares Russell 2000 ETF | | | | | | | | |
Expires 03/22/14 | | | | | | | | |
Strike Price $115 | | | (450 | ) | | | (167,400 | ) |
Lindsay Corp. | | | | | | | | |
Expires 06/21/14 | | | | | | | | |
Strike Price $85 | | | (8 | ) | | | (3,200 | ) |
Loral Space & Communications, Inc. | | | | | |
Expires 04/19/14 | | | | | | | | |
Strike Price $90 | | | (154 | ) | | | (8,855 | ) |
Meritage Homes Corp. | | | | | | | | |
Expires 03/22/14 | | | | | | | | |
Strike Price $55 | | | (190 | ) | | | (2,375 | ) |
SPDR S&P 500 ETF Trust | | | | | | | | |
Expires 04/19/14 | | | | | | | | |
Strike Price $187 | | | (260 | ) | | | (66,300 | ) |
Sprint Nextel Corp. | | | | | | | | |
Expires 05/17/14 | | | | | | | | |
Strike Price $9 | | | (300 | ) | | | (20,700 | ) |
Sturm, Ruger & Co., Inc. | | | | | | | | |
Expires 04/19/14 | | | | | | | | |
Strike Price $70 | | | (19 | ) | | | (1,805 | ) |
The accompanying notes are an integral part of the financial statements.
11
S1 FUND
PORTFOLIOOF INVESTMENTS (CONTINUED)
FEBRUARY 28, 2014
(UNAUDITED)
| | | | | | | | |
| | | NUMBER
OF
CONTRACTS | | | VALUE | |
CALL OPTIONS WRITTEN—(CONTINUED) | |
Time Warner Cable, Inc. | | | | | | | | |
Expires 04/19/14 | | | | | | | | |
Strike Price $145 | | | (260 | ) | | $ | (55,900 | ) |
United Rentals, Inc. | | | | | | | | |
Expires 03/22/14 | | | | | | | | |
Strike Price $90 | | | (70 | ) | | | (11,900 | ) |
USG Corp. | | | | | | | | |
Expires 05/17/14 | | | | | | | | |
Strike Price $39 | | | (220 | ) | | | (22,000 | ) |
| | | | | | | | |
TOTAL CALL OPTIONS WRITTEN
(Premiums Received $309,674) | | | | (526,360 | ) |
| | | | | | | | |
PUT OPTIONS WRITTEN—0.0% | | | | | |
iShares Russell 2000 ETF | | | | | | | | |
Expires 03/22/14 | | | | | | | | |
Strike Price $106 | | | (450 | ) | | | (8,100 | ) |
MercadoLibre, Inc. | | | | | | | | |
Expires 03/22/14 | | | | | | | | |
Strike Price $70 | | | (88 | ) | | | (352 | ) |
SPDR Dow Jones Industrial | | | | | | | | |
Average ETF Trust | | | | | | | | |
Expires 05/17/14 | | | | | | | | |
Strike Price $145 | | | (80 | ) | | | (4,800 | ) |
SPDR S&P 500 ETF Trust | | | | | | | | |
Expires 04/19/14 | | | | | | | | |
Strike Price $163 | | | (200 | ) | | | (6,200 | ) |
| | | | | | | | |
TOTAL PUT OPTIONS WRITTEN
(Premiums Received $57,893) | | | | (19,452 | ) |
| | | | | | | | |
TOTAL WRITTEN OPTIONS — (0.7)%
(Premiums Received $367,567) | | | | (545,812 | ) |
| | | | | | | | |
| |
OTHER ASSETSIN EXCESSOF
LIABILITIES — 58.6% | | | | 45,945,274 | |
| | | | | | | | |
NET ASSETS — 100.0% | | | | | | $ | 78,361,285 | |
| | | | | | | | |
*Non-income producing.
| † | This company is domiciled outside of the United States. The security’s functional currency is the United States dollar. |
| D | Security has been valued at fair market value as determined in good faith by or under the direction of The RBB Fund, Inc.’s Board of Directors. As of February 28, 2014, fair valued positions amounted to $216,750 or 0.3% of net assets. |
| ^ | Security position is either entirely or partially held in a segregated account as collateral for securities sold short. |
| | |
| ADR | | American Depositary Receipt |
| CAD | | Canadian Dollar |
| ETF | | Exchange-traded Fund |
| MSCI | | Morgan Stanley Capital International |
| PLC | | Public Limited Company |
| REIT | | Real Estate Investment Trust |
| S&P | | Standard & Poors |
| SPDR | | Standard & Poors Depositary Receipt |
The accompanying notes are an integral part of the financial statements.
12
S1 FUND
STATEMENTOF ASSETSAND LIABILITIES
FEBRUARY 28, 2014
(UNAUDITED)
| | | | |
ASSETS | | | | |
Investments, at value (cost $60,047,848) | | $ | 73,292,785 | |
Cash | | | 24,504,380 | |
Foreign Cash (Cost $181,441) | | | 185,061 | |
Deposits held with prime broker for securities sold short and written options | | | 44,309,976 | |
Receivables for: | | | | |
Investments sold | | | 6,230,646 | |
Capital shares sold | | | 112,685 | |
Dividends and interest | | | 16,872 | |
Prepaid expenses and other assets | | | 16,798 | |
| | | | |
Total assets | | | 148,669,203 | |
| | | | |
LIABILITIES | | | | |
Securities sold short, at value (proceeds $38,390,050) | | | 40,330,962 | |
Options written, at value (premiums received $367,567) | | | 545,812 | |
Foreign currency due to prime broker for securities sold short and written options (cost $5,306,395) | | | 5,333,730 | |
Payables for: | | | | |
Investments purchased | | | 4,349,604 | |
Capital shares redeemed | | | 88,433 | |
Investment advisory fees | | | 127,696 | |
Dividends on securities sold short | | | 38,094 | |
Due to prime broker | | | 19,433,253 | |
Other accrued expenses and liabilities | | | 60,334 | |
| | | | |
Total liabilities | | | 70,307,918 | |
| | | | |
Net Assets | | $ | 78,361,285 | |
| | | | |
| |
NET ASSETS CONSIST OF | | | | |
Capital stock, $0.001 par value | | $ | 6,890 | |
Paid-in capital | | | 66,515,420 | |
Accumulated net investment loss | | | (2,600,038 | ) |
Accumulated net realized gain from investments, securities sold short, futures transactions and written options | | | 3,336,919 | |
Net unrealized appreciation on investments, securities sold short, futures transactions, foreign currency translations, forward currency contracts and written options | | | 11,102,094 | |
| | | | |
Net assets | | $ | 78,361,285 | |
| | | | |
I SHARES | | | | |
Net assets | | $ | 78,361,285 | |
| | | | |
Shares outstanding ($0.001 par value, 100,000,000 shares authorized) | | | 6,890,274 | |
| | | | |
Net asset value, offering and redemption price per share | | $ | 11.37 | |
| | | | |
The accompanying notes are an integral part of the financial statements.
13
S1 FUND
STATEMENTOF OPERATIONS
FOR THE SIX MONTHS ENDED
FEBRUARY 28, 2014
(UNAUDITED)
| | | | |
INVESTMENT INCOME | | | | |
Dividends (net of foreign withholding taxes of $10,134) | | $ | 471,945 | |
Interest | | | 1,856 | |
| | | | |
Total investment income | | | 473,801 | |
| | | | |
EXPENSES | | | | |
Advisory fees (Note 2) | | | 1,172,256 | |
Dividend expense on securities sold short | | | 289,641 | |
Prime broker interest expense | | | 220,426 | |
Administration and accounting fees (Note 2) | | | 116,589 | |
Transfer agent fees (Note 2) | | | 44,619 | |
Custodian fees (Note 2) | | | 26,033 | |
Printing and shareholder reporting fees | | | 25,415 | |
Audit fees | | | 18,663 | |
Registration and filing fees | | | 18,296 | |
Legal fees | | | 14,403 | |
Directors’ and officers’ fees | | | 9,913 | |
Insurance fees | | | 3,640 | |
Other expenses | | | 3,285 | |
| | | | |
Total expenses before waivers and reimbursements | | | 1,963,179 | |
Less: waivers and reimbursements (Note 2) | | | (195,539 | ) |
| | | | |
Net expenses after waivers and reimbursements | | | 1,767,640 | |
| | | | |
Net investment loss | | | (1,293,839 | ) |
| | | | |
NET REALIZED AND UNREALIZED GAIN/(LOSS) FROM INVESTMENTS | | | | |
Net realized gain/(loss) from: | | | | |
Investments | | | 9,137,449 | |
Securities sold short | | | (4,162,397 | ) |
Foreign currency transactions | | | (270,492 | ) |
Written options | | | 173,236 | |
Net change in unrealized appreciation/(depreciation) on: | | | | |
Investments | | | 7,999,141 | |
Securities sold short | | | (1,145,831 | ) |
Foreign currency translation | | | 64,845 | |
Written options | | | (138,778 | ) |
| | | | |
Net realized and unrealized gain from investments | | | 11,657,173 | |
| | | | |
NET INCREASE IN NET ASSETS RESULTING FROM OPERATIONS | | $ | 10,363,334 | |
| | | | |
The accompanying notes are an integral part of the financial statements.
14
S1 FUND
STATEMENTSOF CHANGESIN NET ASSETS
| | | | | | | | |
| | | FOR THE
SIX MONTHS ENDED
FEBRUARY 28, 2014
(UNAUDITED) | | | FOR THE
YEAR ENDED
AUGUST 31, 2013 | |
INCREASE/(DECREASE)IN NET ASSETS FROM | | | | | | | | |
OPERATIONS: | | | | | | | | |
Net investment loss | | $ | (1,293,839 | ) | | $ | (2,074,613 | ) |
Net realized gain from investments, securities sold short, futures transactions, foreign currency transactions, forward currency contracts and written options | | | 4,877,796 | | | | 2,022,462 | |
Net change in unrealized appreciation on investments, securities sold short, futures transactions, foreign currency translation, forward currency contracts and written options | | | 6,779,377 | | | | 2,230,135 | |
| | | | | | | | |
Net increase in net assets resulting from operations | | | 10,363,334 | | | | 2,177,984 | |
| | | | | | | | |
| | |
DISTRIBUTIONSTO SHAREHOLDERS FROM: | | | | | | | | |
Net realized gains | | | (2,667,365 | ) | | | (153,211 | ) |
| | | | | | | | |
Total distributions | | | (2,667,365 | ) | | | (153,211 | ) |
| | | | | | | | |
| | |
CAPITAL TRANSACTIONs: | | | | | | | | |
I Shares | | | | | | | | |
Proceeds from shares sold | | | 15,373,546 | | | | 36,986,724 | |
Proceeds from reinvestment of distributions | | | 2,611,352 | | | | 149,176 | |
Shares redeemed | | | (32,118,527 | ) | | | (18,650,974 | ) |
| | | | | | | | |
Net decrease in net assets from capital share transactions | | | (14,133,629 | ) | | | 18,484,926 | |
| | | | | | | | |
Total decrease in net assets | | | (6,437,660 | ) | | | 20,509,699 | |
| | | | | | | | |
| | |
NET ASSETS | | | | | | | | |
Beginning of period | | | 84,798,945 | | | | 64,289,246 | |
| | | | | | | | |
End of period | | $ | 78,361,285 | | | $ | 84,798,945 | |
| | | | | | | | |
Accumulated net investment loss, end of period | | $ | (2,600,038 | ) | | $ | (1,306,199 | ) |
| | | | | | | | |
| | |
SHARE TRANSACTIONS: | | | | | | | | |
I Shares | | | | | | | | |
Shares sold | | | 1,407,135 | | | | 3,558,619 | |
Shares reinvested | | | 239,354 | | | | 14,497 | |
Shares redeemed | | | (2,920,455 | ) | | | (1,799,971 | ) |
| | | | | | | | |
Net decrease in shares | | | (1,273,966 | ) | | | 1,773,145 | |
| | | | | | | | |
The accompanying notes are an integral part of the financial statements.
15
S1 FUND
STATEMENTOF CASH FLOWS
FORTHE PERIOD ENDED
FEBRUARY 28, 2014
(UNAUDITED)
| | | | |
CASHFLOWSPROVIDEDBYOPERATINGACTIVITIES: | | | | |
Net increase in net assets from operations | | $ | 10,363,334 | |
| |
Adjustments to reconcile net increase in net assets to net cash used in operating activities: | | | | |
Purchases of investments securities | | | (101,824,620 | ) |
Proceeds from disposition of long-term investments securities | | | 115,522,829 | |
Purchases to cover short sales | | | (66,322,647 | ) |
Proceeds from short sales | | | 66,741,946 | |
Net cost of purchased options | | | (634,411 | ) |
Proceeds from written options | | | 1,894,606 | |
Cost of closed and exercised options | | | (1,762,835 | ) |
Net amortization/(accretion) of premium/(discount) | | | 355 | |
Net realized gain on investments and investments sold short | | | (4,975,052 | ) |
Net unrealized appreciation, investments, investments sold short, futures, forward currency contracts and written options | | | (6,714,531 | ) |
Increase in deposits with brokers for securities sold short | | | (8,797,692 | ) |
Decrease in foreign currency deposits held with prime broker for securities sold short and written options | | | 1,170,385 | |
Increase in foreign currency due to prime broker for securities sold short and written options | | | (2,466,813 | ) |
Decrease in dividend and interest receivable | | | 23,425 | |
Decrease in prepaid expenses and other assets. | | | 964 | |
Increase in dividends payable on securities sold short | | | 4,575 | |
Decrease in payable to investment advisor | | | (35,037 | ) |
Decrease in accrued expenses | | | (39,903 | ) |
| | | | |
Net cash used in operating activities | | | 2,148,878 | |
| | | | |
| |
CASHFLOWSFROMFINANCINGACTIVITIES: | | | | |
Increase in due to prime broker payable | | | 13,179,071 | |
Net cost of fundshare activity | | | (16,853,567 | ) |
Distributions paid from realized capital gains | | | (56,013 | ) |
| | | | |
Net cash provided by financing activities | | | (3,730,509 | ) |
| | | | |
Net increase in cash and foreign currency | | | (1,581,631 | ) |
| |
CASH: | | | | |
Cash and foreign currency at beginning of the year | | | 26,271,072 | |
| | | | |
Cash and foreign currency at end of the period | | $ | 24,689,441 | |
| | | | |
| |
SUPPLEMENTALDISCLOSUREOFCASHFLOWINFORMATION: | | | | |
Cash paid during the period for interest expense | | $ | 220,742 | |
| | | | |
The accompanying notes are an integral part of the financial statements.
16
S1 FUND
FINANCIAL HIGHLIGHTS
Contained below is per share operating performance data for shares outstanding, total investment return, ratios to average net assets and other supplemental data for the respective periods. This information has been derived from information provided in the financial statements.
| | | | | | | | | | | | | | | | |
| | | I SHARES | |
| | | FOR THE
SIX MONTHS
ENDED
FEBRUARY 28, 2014
(UNAUDITED) | | | FOR THE
YEAR
ENDED
AUGUST 31, 2013 | | | FOR THE
YEAR
ENDED
AUGUST 31, 2012 | | | FOR THE
PERIOD
ENDED
AUGUST 31, 2011(1) | |
PER SHARE OPERATING PERFORMANCE | | | | | | | | | | | | | | | | |
Net asset value, beginning of period | | $ | 10.39 | | | $ | 10.06 | | | $ | 9.96 | | | $ | 10.00 | |
| | | | | | | | | | | | | | | | |
Net investment loss(2) | | | (0.16 | ) | | | (0.29 | ) | | | (0.32 | ) | | | (0.29 | ) |
Net realized and unrealized gain from investments | | | 1.46 | | | | 0.64 | | | | 0.42 | (3) | | | 0.25 | |
| | | | | | | | | | | | | | | | |
Total from operations | | | 1.30 | | | | 0.35 | | | | 0.10 | | | | (0.04 | ) |
| | | | | | | | | | | | | | | | |
Distributions to shareholders from: | | | | | | | | | | | | | | | | |
From net realized gains | | | (0.32 | ) | | | (0.02 | ) | | | — | | | | — | |
| | | | | | | | | | | | | | | | |
Total Distributions | | | (0.32 | ) | | | (0.02 | ) | | | — | | | | — | |
| | | | | | | | | | | | | | | | |
Net asset value, end of period | | $ | 11.37 | | | $ | 10.39 | | | $ | 10.06 | | | $ | 9.96 | |
| | | | | | | | | | | | | | | | |
Total investment return(4) | | | 12.66 | %(5) | | | 3.52 | % | | | 1.00 | % | | | (0.40 | )%(5) |
| | | | | | | | | | | | | | | | |
RATIOS/SUPPLEMENTAL DATA | | | | | | | | | | | | | |
Net assets, end of period (000’s omitted) | | $ | 78,361 | | | $ | 84,799 | | | $ | 64,289 | | | $ | 51,234 | |
Ratio of expenses to average net assets with waivers and reimbursements (including dividend and interest expense) | | | 4.15 | %(6) | | | 4.43 | % | | | 4.42 | % | | | 4.06 | %(6) |
Ratio of expenses to average net assets with waivers and reimbursements (excluding dividend and interest expense) | | | 2.95 | %(6) | | | 2.95 | % | | | 2.95 | % | | | 2.95 | %(6) |
Ratio of expenses to average net assets without waivers and reimbursements (including dividend and interest expense) | | | 4.61 | %(6) | | | 4.81 | % | | | 5.24 | % | | | 6.39 | %(6) |
Ratio of net investment loss to average net assets | | | (3.04 | )%(6) | | | (2.76 | )% | | | (3.24 | )% | | | (3.16 | )%(6) |
Portfolio turnover rate | | | 139.68 | %(5) | | | 310.41 | % | | | 249.27 | % | | | 440.88 | %(5) |
| (1) | The Fund commenced investment operations on September 30, 2010. |
| (2) | Calculated based on average shares outstanding for the period. |
| (3) | The amount shown may not correlate with the change in the aggregate gains and losses due to the timing of sales and purchases of the Fund’s shares in relation to fluctuating market values for the Fund’s portfolio. |
| (4) | Total investment return is calculated assuming a purchase of shares on the first day and a sale of shares on the last day of each period reported and includes reinvestments of dividends and distributions, if any. |
The accompanying notes are an integral part of the financial statements.
17
S1 FUND
NOTES TO FINANCIAL STATEMENTS
FEBRUARY 28, 2014 (UNAUDITED)
1. ORGANIZATIONAND SIGNIFICANT ACCOUNTING POLICIES
The RBB Fund, Inc. (“RBB” or the “Company”) was incorporated under the laws of the State of Maryland on February 29, 1988 and is registered under the Investment Company Act of 1940, as amended, (the “1940 Act”) as an open-end management investment company. RBB is a “series fund,” which is a mutual fund divided into separate portfolios. Each portfolio is treated as a separate entity for certain matters under the 1940 Act, and for other purposes, and a shareholder of one portfolio is not deemed to be a shareholder of any other portfolio. Currently, RBB has twenty-one active investment portfolios, including the S1 Fund (the “Fund”), which commenced investment operations on September 30, 2010. The Fund offers two classes of shares, I Shares and R Shares. As of February 28, 2014, Class R Shares have not been issued.
RBB has authorized capital of one hundred billion shares of common stock of which 81.373 billion shares are currently classified into one hundred and forty-eight classes of common stock. Each class represents an interest in an active or inactive RBB investment portfolio. The Fund has issued shares with a par value of $0.001.
PORTFOLIO VALUATION — The Fund’s net asset value (“NAV”) is calculated once daily at the close of regular trading hours on the New York Stock Exchange (“NYSE”) (generally 4:00 p.m. Eastern time) on each day the NYSE is open. Securities held by the Fund are valued using the closing price or the last sale price on a national securities exchange or the National Association of Securities Dealers Automatic Quotation System (“NASDAQ”) market system where they are primarily traded. Equity securities traded in the over-the-counter market are valued at their closing prices. If there were no transactions on that day, securities traded principally on an exchange or on NASDAQ will be valued at the mean of the last bid and ask prices prior to the market close. Fixed income securities having a remaining maturity of greater than 60 days are valued using an independent pricing service, which considers such factors as security prices, yields, maturities and ratings, and are deemed representative of market values at the close of the market. Fixed income securities having a remaining maturity of 60 days or less are valued at amortized cost, which approximates market value. Foreign securities are valued based on prices from the primary market in which they are traded, and are translated from the local currency into U.S. dollars using current exchange rates. Options for which the primary market is a national securities exchange are valued at the last sale price on the exchange on which they are traded, or, in the absence of any sale, will be valued at the mean of the last bid and ask prices prior to the market close. Options not traded on a national securities exchange are valued at the last quoted bid price for long option positions and the closing ask price for short option positions. If market quotations are unavailable or deemed unreliable, securities will be valued in accordance with procedures adopted by the Company’s Board of Directors. Relying on prices supplied by pricing services or dealers or using fair valuation may result in values that are higher or lower than the values used by other investment companies and investors to price the same investments. The Fund may use fair value pricing more frequently for securities traded primarily in non-U.S. markets because, among other things, most foreign markets close well before the Fund values its securities, generally as of 4:00 p.m. Eastern time. The earlier close of these foreign markets gives rise to the possibility that significant events, including broad market moves, government actions or pronouncements, aftermarket trading, or news events may have occurred in the interim. To account for this, the Fund may value foreign securities using fair value prices based on third-party vendor modeling tools (international fair value pricing).
FAIR VALUE MEASUREMENTS — The inputs and valuations techniques used to measure fair value of the Fund’s investments are summarized into three levels as described in the hierarchy below:
| | • | | Level 1 – quoted prices in active markets for identical securities; |
| | • | | Level 2 – other significant observable inputs (including quoted prices for similar securities, interest rates, prepayment speeds, credit risk, etc.); and |
18
S1 FUND
NOTES TO FINANCIAL STATEMENTS
FEBRUARY 28, 2014 (UNAUDITED) (CONTINUED)
| | • | | Level 3 – significant unobservable inputs (including the Fund’s own assumptions in determining the fair value of investments). |
The inputs or methodology used for valuing securities are not necessarily an indication of the risk associated with investing in those securities.
The following is a summary of the inputs used, as of February 28, 2014, in valuing the Fund’s investments carried at fair value:
| | | | | | | | | | | | | | | | |
| | | TOTAL FAIR VALUE AT
FEBRUARY 28, 2014 | | | LEVEL 1 QUOTED PRICE | | | LEVEL 2
SIGNIFICANT
OBSERVABLE
INPUTS | | | LEVEL 3
SIGNIFICANT
UNOBSERVABLE
INPUTS | |
| |
Common Stocks | | | | | | | | | | | | | | | | |
Consumer Discretionary | | $ | 17,794,829 | | | $ | 17,628,045 | | | $ | 166,784 | | | $ | — | |
Consumer Staples | | | 1,807,603 | | | | 1,131,516 | | | | 676,087 | | | | — | |
Energy | | | 69,500 | | | | 69,500 | | | | — | | | | — | |
Financials | | | 5,186,867 | | | | 4,446,897 | | | | 739,970 | | | | — | |
Health Care | | | 216,750 | | | | — | | | | 216,750 | | | | — | |
Industrials | | | 7,150,318 | | | | 6,776,697 | | | | 373,621 | | | | — | |
Information Technology | | | 21,285,715 | | | | 21,285,715 | | | | — | | | | — | |
Materials | | | 3,866,961 | | | | 3,368,528 | | | | 498,433 | | | | — | |
Real Estate Investment Trusts | | | 12,020,217 | | | | 11,621,436 | | | | 398,781 | | | | — | |
Telecommunication Services | | | 2,341,403 | | | | 2,341,403 | | | | — | | | | — | |
Exchange Traded Funds | | | 611,011 | | | | 611,011 | | | | — | | | | — | |
Foreign Government Note | | | 9,341 | | | | — | | | | 9,341 | | | | — | |
U.S. Treasury Note | | | 104,797 | | | | — | | | | 104,797 | | | | — | |
Asset Derivatives | | | | | | | | | | | | | | | | |
Equity Contracts | | | 827,473 | | | | 827,473 | | | | — | | | | — | |
| |
Total Assets | | $ | 73,292,785 | | | $ | 70,108,221 | | | $ | 3,184,564 | | | $ | — | |
| |
| | | | |
| | | TOTAL FAIR VALUE AT FEBRUARY 28, 2014 | | | LEVEL 1 QUOTED PRICE | | | LEVEL 2 SIGNIFICANT OBSERVABLE INPUTS | | | LEVEL 3 SIGNIFICANT UNOBSERVABLE INPUTS | |
| |
Common Stocks Sold Short | | | | | | | | | | | | | | | | |
Consumer Discretionary | | $ | (5,531,702 | ) | | $ | (4,992,966 | ) | | $ | (538,736 | ) | | $ | — | |
Consumer Staples | | | (677,874 | ) | | | (677,874 | ) | | | — | | | | — | |
Financials | | | (1,926,278 | ) | | | (1,926,278 | ) | | | — | | | | — | |
Health Care | | | (493,426 | ) | | | (493,426 | ) | | | — | | | | — | |
Industrials | | | (809,416 | ) | | | (809,416 | ) | | | — | | | | — | |
Information Technology | | | (19,666,216 | ) | | | (19,301,879 | ) | | | (364,337 | ) | | | — | |
Real Estate Investment Trusts | | | (5,849,075 | ) | | | (5,849,075 | ) | | | — | | | | — | |
Telecommunications Services | | | (1,596,743 | ) | | | (582,184 | ) | | | (1,014,559 | ) | | | — | |
Exchange Traded Funds | | | (3,780,232 | ) | | | (3,780,232 | ) | | | — | | | | — | |
Liability Derivatives | | | | | | | | | | | | | | | | |
Equity Contracts | | | (545,812 | ) | | | (545,812 | ) | | | — | | | | — | |
| |
Total Liabilities | | $ | (40,876,774 | ) | | $ | (38,959,142 | ) | | $ | (1,917,632 | ) | | $ | — | |
| |
At the end of each fiscal quarter, management evaluates the classification of Levels 1, 2 and 3 assets and liabilities. Various factors are considered, such as changes in liquidity from the prior reporting period; whether or not a broker is willing to execute at the quoted price; the depth and consistency of prices from third party pricing services; and the existence of contemporaneous, observable trades in the market. Additionally, management evaluates the classification of Level 1 and Level 2 assets and liabilities on a quarterly basis for changes in listings or delistings on national exchanges.
19
S1 FUND
NOTES TO FINANCIAL STATEMENTS
FEBRUARY 28, 2014 (UNAUDITED) (CONTINUED)
Due to the inherent uncertainty of determining the fair value of investments that do not have a readily available market value, the fair value of the Fund’s investments may fluctuate from period to period. Additionally, the fair value of investments may differ significantly from the values that would have been used had a ready market existed for such investments and may differ materially from the values the Fund may ultimately realize. Further, such investments may be subject to legal and other restrictions on resale or otherwise less liquid than publicly traded securities.
For fair valuations using significant unobservable inputs, U.S. generally accepted accounting principles (“U.S. GAAP”) require the Fund to present a reconciliation of the beginning to ending balances for reported market values that presents changes attributable to total realized and unrealized gains or losses, purchase and sales, and transfers in and out of Level 3 during the period. Transfers in and out between Levels are based on values at the end of the period. U.S. GAAP also requires the Fund to disclose amounts and reasons for all transfers in and out of Level 1 and Level 2 fair value measurements. A reconciliation of Level 3 investments is presented only when the Fund had an amount of Level 3 investments at the end of the reporting period that was meaningful in relation to its net assets. The amounts and reasons for all transfers in and out of each Level within the three-tier hierarchy are disclosed when the Fund had an amount of total transfers during the reporting period that was meaningful in relation to its net assets as of the end of the reporting period.
For the period ended February 28, 2014, the Fund had no significant transfers between level 1, 2 and 3.
DISCLOSURESABOUT DERIVATIVE INSTRUMENTSAND HEDGING ACTIVITIES
The following tables provide quantitative disclosures about fair value amounts of and gains and losses on the Fund’s derivative instruments as of February 28, 2014.
The following table lists the fair values of the Fund’s derivative holdings as of February 28, 2014 grouped by contract type and risk exposure category.
| | | | | | | | | | | | | | | | | | | | | | |
| DERIVATIVE TYPE | | BALANCE SHEET LOCATION | | EQUITY CONTRACTS | | | INTEREST RATE CONTRACTS | | | FOREIGN CURRENCY CONTRACTS | | | COMMODITY CONTRACTS | | | TOTAL | |
| |
| | | | | Asset Derivatives | | | | | | | | | | |
| |
Purchased Options | | Investments, at value | | $ | 827,473 | | | $ | — | | | $ | — | | | $ | — | | | $ | 827,473 | |
| |
Total Value - Assets | | | | $ | 827,473 | | | $ | — | | | $ | — | | | $ | — | | | $ | 827,473 | |
| |
| | | | | Liability Derivatives | | | | | | | | | | |
| |
Written Options | | Options written, at value | | $ | (545,812 | ) | | $ | — | | | $ | — | | | $ | — | | | $ | (545,812 | ) |
| |
Total Value - Liabilities | | | | $ | (545,812 | ) | | $ | — | | | $ | — | | | $ | — | | | $ | (545,812 | ) |
| |
The following table lists the amounts of realized gains or losses included in net increase in net assets resulting from operations for the period ended February 28, 2014, grouped by contract type and risk exposure.
| | | | | | | | | | | | | | | | | | | | | | |
| DERIVATIVE TYPE | | INCOME STATEMENT
LOCATION | | EQUITY
CONTRACTS | | | INTEREST
RATE
CONTRACTS | | | FOREIGN
CURRENCY
CONTRACTS | | | COMMODITY
CONTRACTS | | | TOTAL | |
| |
| | | | | Realized Gain (Loss) | | | | | | | | | | |
| |
Purchased Options | | Net realized gain (loss) from Investments | | $ | (710,813 | ) | | $ | — | | | $ | — | | | $ | — | | | $ | (710,813 | ) |
| |
20
S1 FUND
NOTES TO FINANCIAL STATEMENTS
FEBRUARY 28, 2014 (UNAUDITED) (CONTINUED)
| | | | | | | | | | | | | | | | | | | | | | |
| DERIVATIVE TYPE | | INCOME STATEMENT
LOCATION | | EQUITY
CONTRACTS | | | INTEREST
RATE
CONTRACTS | | | FOREIGN
CURRENCY
CONTRACTS | | | COMMODITY
CONTRACTS | | | TOTAL | |
| |
Written Options | | Net realized gain (loss) from Written Options | | | 173,236 | | | | — | | | | — | | | | — | | | | 173,236 | |
| |
Total Realized Gain (Loss) | | | | $ | (537,577 | ) | | $ | — | | | $ | — | | | $ | — | | | $ | (537,577 | ) |
| |
The following table lists the amounts of change in unrealized appreciation (depreciation) included in net increase in net assets resulting from operations for the period ended February 28, 2014, grouped by contract type and risk exposure.
| | | | | | | | | | | | | | | | | | | | | | |
| DERIVATIVE TYPE | | INCOME STATEMENT
LOCATION | | EQUITY
CONTRACTS | | | INTEREST
RATE
CONTRACTS | | | FOREIGN
CURRENCY
CONTRACTS | | | COMMODITY
CONTRACTS | | | TOTAL | |
| |
| | | | | Change in appreciation (depreciation) | | | | | | | |
| |
Purchased Options | | Net change in unrealized appreciation (depreciation) from Investments | | $ | (393,389 | ) | | $ | — | | | $ | — | | | $ | — | | | $ | (393,389 | ) |
| |
Written Options | | Net change in unrealized appreciation (depreciation) from Written Options | | | (138,778 | ) | | | — | | | | — | | | | — | | | | (138,778 | ) |
| |
| Total change in appreciation (depreciation) | | | | $ | (532,167 | ) | | $ | — | | | $ | — | | | $ | — | | | $ | (532,167 | ) |
| |
For the period ended February 28, 2014, the Fund’s average volume of derivatives is as follows:
| | |
PURCHASED
OPTIONS
(COST) | | WRITTEN
OPTIONS
(PROCEEDS) |
| $726,933 | | $300,164 |
USEOF ESTIMATES — The preparation of financial statements in conformity with U.S. GAAP requires management to make estimates and assumptions that affect the reported amounts of assets and liabilities and disclosure of contingent assets and liabilities at the date of the financial statements and the reported amounts of revenues and expenses during the period. Actual results could differ from those estimates and those differences could be significant.
INVESTMENT TRANSACTIONS, INVESTMENT INCOMEAND EXPENSES — The Fund records security transactions based on trade date for financial reporting purposes. The cost of investments sold is determined by use of the specific identification method for both financial reporting and income tax purposes in determining realized gains and losses on investments. Interest income is accrued when earned. Dividend income is recorded on the ex-dividend date. Distributions received on securities that represent a return of capital or capital gains are recorded as a reduction of cost of investments
21
S1 FUND
NOTES TO FINANCIAL STATEMENTS
FEBRUARY 28, 2014 (UNAUDITED) (CONTINUED)
and/or as a realized gain. Expenses incurred on behalf of a specific class, fund or fund family are charged directly to the class, fund or fund family to each class of shares based upon the relative proportion of net assets of each class at the beginning of the day. Expenses incurred for all the RBB funds (such as director or professional fees) are charged to all funds in proportion to their average net assets of RBB, or in such other manner as the Company’s Board of Directors deems fair or equitable. Expenses and fees, including investment advisory and administration fees, are accrued daily and taken into account for the purpose of determining the NAV of the Fund.
DIVIDENDSAND DISTRIBUTIONSTO SHAREHOLDERS — Dividends from net investment income and distributions from net realized capital gains, if any, are declared and paid at least annually to shareholders and recorded on ex-dividend date. Income dividends and capital gain distributions are determined in accordance with U.S. federal income tax regulations which may differ from U.S. GAAP.
U.S. TAX STATUS — No provision is made for U.S. income taxes as it is the Fund’s intention to qualify for and elect the tax treatment applicable to regulated investment companies under Subchapter M of the Internal Revenue Code of 1986, as amended, and make the requisite distributions to its shareholders which will be sufficient to relieve it from U.S. income and excise taxes.
FOREIGN CURRENCY TRANSLATION — Assets and liabilities initially expressed in non-U.S. currencies are translated into U.S. dollars based on the applicable exchange rates at the date of the last business day of the financial statement period. Purchases and sales of securities, interest income, dividends, variation margin received and expenses denominated in foreign currencies are translated into U.S. dollars at the exchange rates in effect on the transaction date.
The Fund does not seperately report the effect of changes in foreign exchange rates from changes in market prices of securities held. Such changes are included with the net realized gain or loss and change in unrealized appreciation or depreciation on investment securities in the Statement of Operations. Other foreign currency transactions resulting in realized and unrealized gain or loss are reported separately as net realized gain or loss and change in unrealized appreciation or depreciation on foreign currencies in the Statement of Operations.
CURRENCY RISK — The Fund invests in securities of foreign issuers, including American Depositary Receipts. These markets are subject to special risks associated with foreign investments not typically associated with investing in U.S. markets. Because the foreign securities in which the Fund may invest generally trade in currencies other than the U.S. dollar, changes in currency exchange rates will affect the Fund’s NAV, the value of dividends and interest earned and gains and losses realized on the sale of securities. Because the NAV for the Fund is determined on the basis of U.S. dollars, the Fund may lose money by investing in a foreign security if the local currency of a foreign market depreciates against the U.S. dollar, even if the local currency value of the Fund holdings goes up. Generally, a strong U.S. dollar relative to these other currencies will adversely affect the value of the Fund holdings in foreign securities.
FOREIGN SECURITIES — Securities of many non-U.S. companies may be less liquid and their prices more volatile than securities of comparable U.S. companies. Securities of companies traded in many countries outside the U.S., particularly emerging markets countries, may be subject to further risks due to the inexperience of local investment professionals and financial institutions, the possibility of permanent or temporary termination of trading and greater spreads between bid and asked prices of securities. In addition, non-U.S. stock exchanges and investment professionals are subject to less governmental regulation, and commissions may be higher than in the United States. Also, there may be delays in the settlement of non-U.S. stock exchange transactions.
PURCHASED OPTIONS — The Fund is subject to equity and other risk exposure in the normal course of pursuing its investment objectives. The Fund purchases option contracts. This transaction is used to hedge against changes in interest rates, foreign exchange rates and values of equities. The risk associated with purchasing an option is that the Fund pays a premium whether or not the option is exercised. Additionally, the Fund bears the risk of loss of premium and change in market value should the counterparty not perform under the contract. Put and call options are accounted
22
S1 FUND
NOTES TO FINANCIAL STATEMENTS
FEBRUARY 28, 2014 (UNAUDITED) (CONTINUED)
for in the same manner as other securities owned. The cost of securities acquired through the exercise of call options is increased by the premiums paid. The proceeds from securities sold through the exercise of put options are decreased by the premiums paid.
OPTIONS WRITTEN — The Fund is subject to equity and other risk exposure in the normal course of pursuing its investment objectives and may enter into options written to hedge against changes in interest rates, foreign exchange rates and values of equities. Such options may relate to particular securities or domestic stock indices, and may or may not be listed on a domestic securities exchange or issued by the Options Clearing Corporation. The risk in writing a call option is that the Fund gives up the opportunity for profit if the market price of the security increases. The risk in writing a put option is that the Fund may incur a loss if the market price of the security decreases and the option is exercised. The Fund also has the additional risk of being unable to enter into a closing transaction at an acceptable price if a liquid secondary market does not exist. The Fund also may write over-the-counter options where completing the obligation depends upon the credit standing of the other party. Option contracts also involve the risk that they may result in loss due to unanticipated developments in market conditions or other causes. Written options are initially recorded as liabilities to the extent of premiums received and subsequently marked to market to reflect the current value of the option written. Gains or losses are realized when the option transaction expires or closes. When an option is exercised, the proceeds on sales for a written call option or the purchase cost for a written put option is adjusted by the amount of the premium received.
As of February 28, 2014, the Fund had options written valued at ($545,812).
The Fund had transactions in options written during the period ended February 28, 2014 as follows:
| | | | | | | | |
| | | NUMBER OF
CONTRACTS | | | PREMIUMS
RECEIVED | |
Options outstanding at August 31, 2013 | | | 3,670 | | | $ | 343,283 | |
Options written | | | 22,537 | | | | 1,894,606 | |
Options closed | | | (19,070 | ) | | | (1,762,835 | ) |
Options expired | | | (3,221 | ) | | | (107,487 | ) |
Options exercised | | | — | | | | — | |
| | | | | | | | |
Options outstanding at February 28, 2014 | | | 3,916 | | | $ | 367,567 | |
| | | | | | | | |
SHORT SALES — When the investment adviser or a sub-adviser believes that a security is overvalued, the Fund may sell the security short by borrowing the same security from a broker or other institution and selling the security. The Fund will incur a loss as a result of a short sale if the price of the borrowed security increases between the date of the short sale and the date on which the Fund buys and replaces such borrowed security. The Fund will realize a gain if there is a decline in price of the security between those dates where the decline in price exceeds the costs of borrowing the security and other transaction costs. There can be no assurance that the Fund will be able to close out a short position at any particular time or at an acceptable price. Although the Fund’s gain is limited to the amount at which it sold a security short, its potential loss is unlimited. Until the Fund replaces a borrowed security, it will maintain at all times cash, U.S. Government securities, or other liquid securities in an amount which, when added to any amount deposited with a broker as collateral, will at least equal the current market value of the security sold short. Depending on arrangements made with brokers, the Fund may not receive any payments (including interest) on collateral deposited with them.
In accordance with the terms of its prime brokerage agreements, the Fund may receive rebate income or be charged a fee on borrowed securities. Such income or fee is calculated on a daily basis based upon the market value of each
23
S1 FUND
NOTES TO FINANCIAL STATEMENTS
FEBRUARY 28, 2014 (UNAUDITED) (CONTINUED)
borrowed security and a variable rate that is dependent upon the availability of such security. The Fund records these prime broker charges on a net basis as interest income or interest expense. For the period ended February 28, 2014, the Fund had net charges of $150,440 on borrowed securities. Such amounts are included in prime broker interest expense on the Statement of Operations.
As of February 28, 2014, the Fund had securities sold short valued at $40,330,962 for which securities of $32,152,725 and cash deposits of $38,976,246 were pledged as collateral for securities sold short and written options. In accordance with the Special Custody and Pledge Agreement with Goldman Sachs & Co. (“Goldman Sachs”) (the Fund’s prime broker), the Fund may borrow from Goldman Sachs to the extent necessary to maintain required margin cash deposits on short positions. Interest on such borrowings is charged to the Fund based on the LIBOR rate plus an agreed upon spread.
The Fund utilized cash borrowings from Goldman Sachs to meet required margin cash deposits as follows during the period ended February 28, 2014:
| | | | | | | | | | |
DAYS
UTILIZED | | AVERAGE DAILY
BORROWINGS | | | WEIGHTED AVERAGE
INTEREST RATE |
| 181 | | | CAD | | | | 1,712,842 | | | 1.56% |
| 152 | | | EUR | | | | 510,819 | | | 0.66% |
| 181 | | | GBP | | | | 2,223,644 | | | 0.99% |
| 17 | | | HKD | | | | 158,068 | | | 0.66% |
| 181 | | | JPY | | | | 107,005,422 | | | 0.64% |
| 163 | | | MXN | | | | 3,010,781 | | | 4.13% |
| 181 | | | USD | | | | 9,338,056 | | | 0.64% |
As of February 28, 2014, the Fund had borrowings of $19,433,253. Interest expense on cash borrowings for the period ended February 28, 2014 totaled $69,986.
FUTURES CONTRACTS — The Fund is subject to equity and other risk exposure in the normal course of pursuing its investment objectives. The Fund may use futures contracts for hedging or speculative purposes consistent with its investment objective. Upon entering into a futures contract, the Fund must deposit initial margin in addition to segregating cash or liquid assets sufficient to meet its obligation to purchase or provide securities, or to pay the amount owed at the expiration of an index-based futures contract. Such liquid assets may consist of cash, cash equivalents, liquid debt or equity securities or other acceptable assets. Pursuant to the futures contract, the Fund agrees to receive from, or pay to the broker, an amount of cash equal to the daily fluctuation in value of the contract. Such a receipt of payment is known as “variation margin” and is recorded by the Fund as an unrealized gain or loss. When the contract is closed, the Fund records a realized gain or loss equal to the difference between the proceeds from (or cost of) the closing transactions and the Fund’s basis in the contract. Futures contracts have market risks, including the risk that the change in the value of the contract may not correlate with changes in the value of the underlying securities. Use of long futures contracts subjects the Fund to risk of loss in excess of the amount shown on the Statement of Assets and Liabilities, up to the notional value of the futures contract. Use of short futures contracts subjects the Fund to unlimited risk of loss. As of February 28, 2014, the Fund had no futures contracts.
FORWARD FOREIGN CURRENCY CONTRACTS — In the normal course of pursuing its investment objectives, the Fund is subject to foreign investment and currency risk. The Fund may enter into forward foreign currency contracts (“forward contracts”) for purposes of hedging, duration management, as a substitute for securities, to increase returns, for currency hedging or risk management, or to otherwise help achieve the Fund’s investment goal. These contracts are marked-to-market daily at the applicable translation rates. The Fund records realized gains or losses at the time the forward contract is closed. A forward contract is extinguished through a closing transaction or upon delivery of the currency or entering an offsetting contract. Risks may arise upon entering these contracts from the potential inability
24
S1 FUND
NOTES TO FINANCIAL STATEMENTS
FEBRUARY 28, 2014 (UNAUDITED) (CONTINUED)
of a counterparty to meet the terms of their contracts and from unanticipated movements in the value of a foreign currency relative to the U.S. dollar or other currencies.
CASHAND CASH EQUIVALENTS — The Fund considers liquid assets deposited into bank demand deposit accounts to be cash equivalents. These investments represent amounts held with financial institutions that are readily accessible to pay Fund expense or purchase investments. Cash and cash equivalents are valued at cost plus accrued interest, which approximates market value.
OTHER — In the normal course of business, the Fund may enter into contracts that provide general indemnifications. The Fund’s maximum exposure under these arrangements is dependent on claims that may be made against the Fund in the future, and, therefore, cannot be estimated; however, based on experience, the risk of material loss from such claims is considered remote.
2. INVESTMENT ADVISERAND OTHER SERVICES
Simple Alternatives, LLC (“Simple Alternatives” or the “Adviser”) serves as the Fund’s investment adviser. For its advisory services, the Adviser is entitled to receive a monthly fee from the Fund calculated at an annual rate of 2.75% of the Fund’s average daily net assets.
The Adviser has contractually agreed to forgo all or a portion of its advisory fee and/or reimburse expenses in a aggregate amount equal to the amount by which the total annual Fund operating expenses (other than acquired fund fees and expenses, short sale dividend expenses, brokerage commissions, litigation, extraordinary items, interest or taxes) exceed 2.95% of the average daily net assets of the Fund’s I Shares and 3.20% of the average daily net assets of the Fund’s R Shares, respectively. This contractual limitation is in effect until at least December 31, 2014 and may not be terminated prior to December 31, 2014 without approval by the Company’s Board of Directors. If at any time during the first three years the Fund’s Advisory Agreement with the Adviser is in effect, the Fund’s total annual Fund operating expenses for that year are less than 2.95% or 3.20%, as applicable, the Adviser is entitled to reimbursement by the Fund of the advisory fees forgone and other payments remitted by the Adviser to the Fund during such three-year period if such reimbursement by the Fund does not cause the Fund to exceed existing expense limitations. For the period ended February 28, 2014, investment advisory fees accrued and waived were $1,172,256 and $195,539, respectively. At February 28, 2014, the amount of potential recovery by the Advisor was as follows:
| | | | | | |
| EXPIRATION |
| 2014 | | 2015 | | 2016 | | 2017 |
| $313,683 | | $472,047 | | $288,049 | | $195,539 |
Simple Alternatives has currently retained the services of Roaring Blue Lion Capital Management, LLC; Courage Capital Management, LLC; Garelick Capital Partners, L.P.; Maerisland Capital, LLC; Sonica Capital LLC; and Starwood Real Estate Securities, LLC as sub-advisers (each a “Sub-Adviser”) of the Fund. Pursuant to sub-advisory agreements between the Adviser and each Sub-Adviser, each Sub-Adviser manages the investment and reinvestment of the portion of the Fund’s portfolio allocated to it by the Adviser. The Fund is not required to invest with any minimum number of Sub-Advisers, and does not have minimum or maximum limitations with respect to allocations of assets to any Sub-Adviser. The Sub-Advisers are compensated by the Adviser and not by the Fund.
BNY Mellon Investment Servicing (US) Inc. (“BNY Mellon”) serves as administrator for the Fund. For providing administrative and accounting services, BNY Mellon is entitled to receive a monthly fee equal to an annual percentage rate of the Fund’s average daily net assets, subject to certain minimum monthly fees.
Included in the administration and accounting service fees, shown on the Statement of Operations, are fees for providing regulatory administration services to RBB. For providing these services, BNY Mellon is entitled to receive
25
S1 FUND
NOTES TO FINANCIAL STATEMENTS
FEBRUARY 28, 2014 (UNAUDITED) (CONTINUED)
compensation as agreed to by the Company and BNY Mellon. This fee is allocated to each portfolio in proportion to its net assets of the Company.
In addition, BNY Mellon serves as the Fund’s transfer and dividend disbursing agent. For providing transfer agent services, BNY Mellon is entitled to receive a monthly fee and out of pocket expenses.
The Bank of New York Mellon (the “Custodian”) provides certain custodial services to the Fund. The Custodian is entitled to receive a monthly fee equal to an annual percentage rate of the Fund’s average daily net assets subject to certain minimum monthly fees and may receive out of pocket expenses.
Foreside Funds Distributors LLC serves as the principal underwriter and distributor of the Fund’s shares pursuant to a Distribution Agreement with RBB.
3. DIRECTOR COMPENSATION
The Directors of the Company receive an annual retainer and meeting fees for meetings attended. The remuneration paid to the Directors by the Fund during the period ended February 28, 2014 was $5,456. Certain employees of BNY Mellon serve as an Officer or Director of the Company. They are not compensated by the Fund or the Company.
4. INVESTMENTIN SECURITIES
For the period ended February 28, 2014, aggregate purchases and sales of investment securities (excluding short-term investments) of the Fund were as follows:
| | | | | | | | |
| | | PURCHASES | | | SALES | |
Investments in Non-U.S. Government Securities | | $ | 104,229,850 | | | $ | 116,786,172 | |
Investments in U.S. Government Securities | | | — | | | | — | |
5. FEDERAL INCOME TAX INFORMATION
The Fund has followed the authoritative guidance on accounting for and disclosure of uncertainty in tax positions, which requires the Fund to determine whether a tax position is more likely than not to be sustained upon examination, including resolution of any related appeals or litigation processes, based on the technical merits of the position. The Fund has determined that there was no effect on the financial statements from following this authoritative guidance. In the normal course of business, the Fund is subject to examination by federal, state and local jurisdictions, where applicable, for tax years for which applicable statutes of limitations have not expired.
As of February 28, 2014, federal tax cost, aggregate gross unrealized appreciation and depreciation of securities held by the Fund were as follows:
| | | | | | |
FEDERAL TAX
COST | | UNREALIZED
APPRECIATION | | UNREALIZED
DEPRECIATION | | NET
UNREALIZED
APPRECIATION |
| $60,047,848 | | $14,002,790 | | $(757,853) | | $13,244,937 |
Distributions to shareholders from net investment income and realized gains are determined in accordance with federal income tax regulations, which may differ from net investment income and realized gains recognized for financial reporting purposes. Accordingly, the character of distributions and composition of net assets for tax purposes may differ from those reflected in the accompanying financial statements. To the extent these differences are permanent, such amounts are reclassified within the capital accounts based on the tax treatment; temporary differences do not require such reclassification.
26
S1 FUND
NOTES TO FINANCIAL STATEMENTS
FEBRUARY 28, 2014 (UNAUDITED) (CONTINUED)
As of August 31, 2013, the components of distributable earnings on a tax basis were as follows:
| | | | | | | | |
UNDISTRIBUTED
ORDINARY INCOME | | UNDISTRIBUTED
LONG-TERM GAINS | | UNREALIZED
APPRECIATION | | QUALIFIED
LATE-YEAR
LOSSES | | OTHER TEMPORARY
DIFFERENCES |
| $— | | $2,100,131 | | $3,399,419 | | $(1,311,746) | | $(44,798) |
The differences between the book and tax basis components of distributable earnings relate principally to the timing of recognition of income and gains for federal income tax purposes. Short-term and foreign currency gains are reported as ordinary income for federal income tax purposes.
Pursuant to federal income tax rules applicable to regulated investment companies, the Fund may elect to treat certain capital losses between November 1 and August 31 and late year ordinary losses ((i) ordinary losses between January 1 and August 31, and (ii) specified ordinary and currency losses between November 1 and August 31) as occurring on the first day of the following tax year. For the year ended August 31, 2013, any amount of losses elected within the tax return will not be recognized for federal income tax purposes until September 1, 2013.
Under the Regulated Investment Company Modernization Act of 2010 (the “Modernization Act”), the Fund is permitted to carry forward capital losses incurred in taxable years beginning after December 22, 2010 for an unlimited period. Any losses incurred during those future taxable years will be required to be utilized prior to any losses incurred in pre-enactment taxable years. Additionally, post-enactment capital losses that are carried forward will retain their character as either short-term or long-term capital losses rather than being considered all short-term as under the previous law. The Fund’s first fiscal year end subject to the Modernization Act was August 31, 2012. As of August 31, 2013, the Fund had no capital loss carryforwards.
6. SUBSEQUENT EVENTS
Management has evaluated the impact of all subsequent events on the Fund through the date the financial statements were issued, and has determined that there were no subsequent events.
27
S1 FUND
OTHER INFORMATION
(UNAUDITED)
PROXY VOTING
Policies and procedures that the Fund uses to determine how to vote proxies relating to portfolio securities as well as information regarding how the Fund voted proxies relating to portfolio securities for the most recent 12-month period ended June 30 are available without charge, upon request, by calling (866) 882-1226 and on the Securities and Exchange Commission’s (“SEC”) website at http://www.sec.gov.
QUARTERLY PORTFOLIO SCHEDULES
The Company files its complete schedule of portfolio holdings with the SEC for the first and third fiscal quarters of each fiscal year (quarters ended November 30 and May 31) on Form N-Q. The Company’s Form N-Q is available on the SEC website at http://www.sec.gov and may be reviewed and copied at the SEC Public Reference Room in Washington, D.C. Information on the operation of the SEC Public Reference Room may be obtained by calling (202) 551-8090.
28
[THIS PAGE INTENTIONALLY LEFT BLANK]
Investment Adviser
Simple Alternatives, LLC
90 Grove Street
Suite 205
Ridgefield, CT 06877
Administrator
BNY Mellon Investment Servicing (US) Inc.
301 Bellevue Parkway
Wilmington, DE 19809
Transfer Agent
BNY Mellon Investment Servicing (US) Inc.
4400 Computer Drive
Westborough, MA 01581
Principal Underwriter
Foreside Funds Distributors LLC
400 Berwyn Park
899 Cassatt Road
Berwyn, PA 19312
Custodian
The Bank of New York Mellon
One Wall Street
New York, NY 10286
Independent Registered Public Accounting Firm
Ernst & Young LLP
One Commerce Square
2005 Market Street, Suite 700
Philadelphia, PA 19103
Counsel
Drinker Biddle & Reath LLP
One Logan Square, Ste. 2000
Philadelphia, PA 19103-6996
of the RBB Fund, Inc.
Schneider Small Cap Value Fund
Schneider Value Fund
|
|
SEMI-ANNUAL REPORT February 28, 2014 (Unaudited) |

This report is submitted for the general information of the shareholders of the Funds. It is not authorized for distribution unless preceded or accompanied by a current prospectus for the Funds.
THE SCHNEIDER FUNDS
Semi-Annual Investment Adviser’s Report
February 28, 2014
(Unaudited)
Fellow Shareholder:
The semi-annual report for the Schneider Funds covers the six months ended February 28, 2014.
Investment Review
During the six-month period, the broad market Russell 3000 Index rose 15.83%. The economy continues to show signs of improvement in both gross domestic product growth and employment. After an extended period of anticipation, the Federal Reserve announced the initiation of the tapering of its quantitative easing (QE) program with a nominal decrease of $10 billion per month to its monthly purchases.
The Small Cap Value Fund returned 17.01% for the six-month period ended February 28, 2014 (see table on page 2). The Value Fund posted a 16.74% return during the same period (see table on page 3). Both of the funds outperformed their respective index.
We believe each Fund continues to have significant upside potential, even with an upward trending market. We are finding new opportunities and we continue to maintain high expectations for our holdings.
The domestic banking industry continues to heal and is in sound condition after five years of heightened regulatory scrutiny which imposed ever rising capital requirements. Banks’ fundamentals continue to improve at a steady pace. Net interest margin (loan and investment yields, less funding costs) is bottoming, and expected future increases in short-term interest rates should sharply boost results. Banks have also turned a keen eye towards expense control, and the reduction in head count, branch closures, and the elimination of weaker business units have helped enhance profitability. Loan growth, primarily concentrated in the commercial and industrial category in prior years, is becoming more broad-based as the economic recovery accelerates. Charge-offs related to banks’ loan portfolios are now at six year lows.
Overall, banks have too much capital, but the regulators have been reticent to allow them to use much of the excess to pay dividends or repurchase shares. Banks in general have capital ratios that are in compliance not only with current standards but the more restrictive levels that will be required in 2019. While loan demand is picking up, the average bank still has 15% of its assets in short-term securities, which provides plenty of dry powder for future loan growth.
The housing market continues to recover, but at a muted pace versus one year ago. Housing demand varies by geography: Texas is strongest and Florida continues to rebound, while the previously red hot market of Phoenix has cooled. Home price appreciation will likely decelerate to the mid-single digits in 2014 in the aftermath of last year’s double digit price increase, which still represents attractive growth.
While household formations are still at very low levels, consumers’ desire for ownership still remains high despite the drag on the entry-level market from a weak job landscape and large student loan burdens. The move-up market, where we are positioned in each Fund’s portfolio, remains strong. Lenders are continuing to prefer higher credit quality borrowers; in order to help boost home sales, credit access for a broader range of borrowers needs to improve demonstrably.
Our home builders are generally experiencing improved revenue, gross margins and earnings, but volumes remain the wild card. Poor first quarter weather had a negative influence on new home starts as well as demand but the overall inventory level remains low. We continue to have a very positive outlook for our homebuilders as new housing starts are two-thirds of normal levels.
Outlook
The U.S. economy continues to slowly improve and may achieve 3% growth in 2014, finally breaking out of the anemic 2.0% annual growth rate range of the past five years. The employment picture continues to brighten and there are currently only small hints of inflation.
The keys to continued economic growth are construction, capital expenditures and exports. The Federal Reserve remains committed to its tapering program and the current experiment in the QE program is expected to conclude before year end, thankfully.
The emerging markets, the world’s engine of growth of recent years, are facing widespread challenges. Many of the smaller countries are struggling with current account deficits and weakened currencies, while the largest of the emerging markets (Brazil, Russia, India and China) all are facing major issues. It is China, however, that is the most closely watched and is the key litmus test for other emerging markets. In addition to a housing and credit bubble, China’s labor costs advantage is dissipating. Also, the poor capital allocation decisions made for projects that cannot cover their cost of capital has created excess capacity in select industries. Many of these projects were financed via the “shadow” (non-regulated) banking system, and the impact of these projects not being able to service their debts may have wide-ranging effects on China’s credit markets. One silver lining is the cessation of credit to new projects in oversupplied industries. India will likely elect a new pro-business leader who may invigorate that economy.
We appreciate your support and the confidence you have placed in us.

Arnold C. Schneider III, CFA
Portfolio Manager
Schneider Capital Management
1
THE SCHNEIDER FUNDS
SCHNEIDER SMALL CAP VALUE FUND
Performance Data
February 28, 2014 (Unaudited)
| | | | | | | | | | | | | | | | | | | | |
| Total Returns for the Periods Ended February 28, 2014 | |
| | | | | | Average Annual | |
| | | Six
Months* | | | One Year | | | Five Years | | | Ten Years | | | Since
Inception** | |
Schneider Small Cap Value | | | 17.01% | | | | 24.70% | | | | 30.58% | | | | 7.03% | | | | 15.54% | |
Russell 2000® Value Index | | | 16.23% | | | | 26.19% | | | | 25.14% | | | | 8.09% | | | | 10.33% | |
* Not annualized | | | | | | | | | | | | | | | | | | | | |
** Inception date 9/2/98 | | | | | | | | | | | | | | | | | | | | |
The performance data quoted represents past performance. Past performance is not indicative of future results. Investment return and principal value will fluctuate so that an investor’s shares, when redeemed, may be worth more or less than their original cost. Current performance may be lower or higher. Schneider Capital Management Company, the Fund’s investment adviser, has contractually agreed to waive management fees and/or reimburse expenses through December 31, 2014, to the extent that total annual Fund operating expenses (excluding acquired fund fees and expenses, brokerage commissions, extraordinary items, interest and taxes) exceed 1.15%. Total returns shown include fee waivers and expense reimbursements, if any; total returns would have been lower had there been no waiver or reimbursement of fees and expenses in excess of expense limitations. Returns shown include the reinvestment of all dividends and other distributions and do not reflect taxes that a shareholder would pay on Fund distributions or on the redemption of Fund shares. For performance data current to the most recent month-end, please call 1-888-520-3277. The Fund’s gross and net annual operating expenses, as stated in the current prospectus, are 1.50% and 1.15%, respectively. Shares of the Fund not purchased through reinvested dividends or capital gains and held less than one year are subject to a 1.75% redemption fee.
Small company stocks are generally riskier than large company stocks due to greater volatility and less liquidity.
Value investing involves the risk that the Fund’s investment in companies whose securities are believed to be undervalued, relative to their underlying profitability, will not appreciate in value as anticipated.
2
THE SCHNEIDER FUNDS
SCHNEIDER VALUE FUND
Performance Data
February 28, 2014 (Unaudited)
| | | | | | | | | | | | | | | | | | | | |
| Total Returns for the Periods Ended February 28, 2014 | |
| | | | | | Average Annual | |
| | | Six
Months* | | | One Year | | | Five Years | | | Ten Years | | | Since
Inception** | |
Schneider Value | | | 16.74% | | | | 32.04% | | | | 22.38% | | | | 3.88% | | | | 9.34% | |
Russell 1000® Value Index | | | 13.46% | | | | 23.44% | | | | 23.18% | | | | 7.24% | | | | 10.00% | |
* Not annualized ** Inception date 9/30/02 | | | | | | | | | | | | | | | | | | | | |
The performance data quoted represents past performance. Past performance is not indicative of future results. Investment return and principal value will fluctuate so that an investor’s shares, when redeemed, may be worth more or less than their original cost. Current performance may be lower or higher. Schneider Capital Management Company, the Fund’s investment adviser, has contractually agreed to waive management fees and/or reimburse expenses through December 31, 2014, to the extent that total annual fund operating expenses (excluding acquired fund fees and expenses, brokerage commissions, extraordinary items, interest and taxes) exceed 0.90%. Total returns shown include fee waivers and expense reimbursements, if any; total returns would have been lower had there been no waiver or reimbursement of fees and expenses in excess of expense limitations. Returns shown include the reinvestment of all dividends and other distributions and do not reflect taxes that a shareholder would pay on Fund distributions or on the redemption of Fund shares. For performance data current to the most recent month-end, please call 1-888-520-3277. The Fund’s gross and net annual operating expenses, as stated in the current prospectus, are 1.55% and 0.90%, respectively. Shares of the Fund not purchased through reinvested dividends or capital gains and held less than 90 days are subject to a 1.00% redemption fee.
Value investing involves the risk that the Fund’s investment in companies whose securities are believed to be undervalued, relative to their underlying profitability, will not appreciate in value as anticipated.
3
THE SCHNEIDER FUNDS
Fund Expense Examples
(Unaudited)
As a shareholder of the Fund(s), you incur two types of costs: (1) transaction costs, including redemption fees; and (2) ongoing costs, including management fees and other Fund expenses. These examples are intended to help you understand your ongoing costs (in dollars) of investing in the Fund(s) and to compare these costs with the ongoing costs of investing in other mutual funds.
These examples are based on an investment of $1,000 invested at the beginning of the six months from September 1, 2013 through February 28, 2014, and held for the entire period.
Actual Expenses
The first line of the accompanying tables provides information about actual account values and actual expenses. You may use the information in this line, together with the amount you invested, to estimate the expenses that you paid over the period. Simply divide your account value by $1,000 (for example, an $8,600 account value divided by $1,000 = 8.6), then multiply the result by the number in the first line under the heading entitled “Expenses Paid During Period” to estimate the expenses you paid on your account during this period.
Hypothetical Example for Comparison Purposes
The second line of the accompanying table for each Fund provides information about hypothetical account values and hypothetical expenses based on the Fund’s actual expense ratio and an assumed rate of return of 5% per year before expenses, which is not your Fund’s actual return. The hypothetical account values and expenses may not be used to estimate the actual ending account balance or expenses you paid for the period. You may use this information to compare the ongoing costs of investing in the Fund and other funds. To do so, compare these 5% hypothetical examples with the 5% hypothetical examples that appear in the shareholder reports of other funds.
Please note that the expenses shown in the accompanying tables are meant to highlight your ongoing costs only and do not reflect any transactional costs, such as redemption fees. Therefore, the second line of the accompanying table for each Fund is useful in comparing ongoing costs only, and will not help you determine the relative total costs of owning different funds. In addition, if these transactional costs were included, your costs would have been higher.
| | | | | | | | | | | | |
| | | Schneider Small Cap Value Fund | |
| | | Beginning Account Value
September 1, 2013 | | | Ending Account Value
February 28, 2014 | | | Expenses Paid
During Period* | |
Actual | | $ | 1,000.00 | | | $ | 1,170.10 | | | $ | 6.19 | |
Hypothetical (5% return before expenses) | | | 1,000.00 | | | | 1,019.09 | | | | 5.76 | |
| |
| | | Schneider Value Fund | |
| | | Beginning Account Value
September 1, 2013 | | | Ending Account Value
February 28, 2014 | | | Expenses Paid
During Period* | |
Actual | | $ | 1,000.00 | | | $ | 1,167.40 | | | $ | 4.84 | |
Hypothetical (5% return before expenses) | | | 1,000.00 | | | | 1,020.33 | | | | 4.51 | |
| * | Expenses are equal to an annualized six-month expense ratio of 1.15% for the Schneider Small Cap Value Fund and 0.90% for the Schneider Value Fund, which includes waived fees or reimbursed expenses, multiplied by the average account value over the period, multiplied by the number of days in the most recent fiscal half-year (181), then divided by 365 to reflect the one-half year period. The Fund’s ending account values on the first line in each table are based on the actual six-month total return for each Fund of 17.01% for the Schneider Small Cap Value Fund and 16.74% for the Schneider Value Fund. |
4
THE SCHNEIDER FUNDS
SCHNEIDER SMALL CAP VALUE FUND
Portfolio Holdings Summary Table
February 28, 2014
(Unaudited)
The following table presents a summary by sector of the portfolio holdings of the Fund:
| | | | | | | | |
| | | % of Net
Assets | | | Value | |
Common Stocks: | | | | | | | | |
Savings & Loans | | | 10.0 | % | | $ | 6,944,924 | |
Home Builders | | | 9.9 | | | | 6,861,287 | |
Coal | | | 8.8 | | | | 6,135,169 | |
Banks | | | 8.6 | | | | 5,982,034 | |
Commercial Services | | | 6.1 | | | | 4,230,237 | |
Oil & Gas | | | 5.3 | | | | 3,706,285 | |
Healthcare — Services | | | 5.2 | | | | 3,620,429 | |
Real Estate Investment Trusts | | | 4.8 | | | | 3,376,219 | |
Telecommunications | | | 4.5 | | | | 3,151,809 | |
Retail | | | 4.2 | | | | 2,903,976 | |
Industrial | | | 3.1 | | | | 2,163,194 | |
Mining | | | 2.9 | | | | 2,043,018 | |
Semiconductors | | | 2.9 | | | | 2,012,995 | |
Insurance | | | 2.4 | | | | 1,695,384 | |
Software | | | 1.8 | | | | 1,261,181 | |
Electronics | | | 1.6 | | | | 1,131,448 | |
Machinery — Diversified | | | 1.6 | | | | 1,089,071 | |
Internet | | | 1.6 | | | | 1,083,867 | |
Miscellaneous Manfacturing | | | 1.2 | | | | 831,605 | |
Healthcare — Products | | | 0.9 | | | | 634,803 | |
Apparel | | | 0.9 | | | | 602,807 | |
Real Estate | | | 0.7 | | | | 512,615 | |
Computers | | | 0.7 | | | | 466,227 | |
Auto Parts | | | 0.4 | | | | 272,488 | |
Securities Lending Collateral | | | 13.4 | | | | 9,279,656 | |
Corporate Bonds | | | 2.4 | | | | 1,680,530 | |
Exchange Traded Fund | | | 1.7 | | | | 1,164,700 | |
Liabilities In Excess Of Other Assets | | | (7.6 | ) | | | (5,261,191 | ) |
| | | | | | | | |
NET ASSETS | | | 100.0 | % | | $ | 69,576,767 | |
| | | | | | | | |
Portfolio holdings are subject to change at any time.
The accompanying notes are an integral part of the financial statements.
5
THE SCHNEIDER FUNDS
SCHNEIDER VALUE FUND
Portfolio Holdings Summary Table
February 28, 2014
(Unaudited)
The following table presents a summary by sector of the portfolio holdings of the Fund:
| | | | | | | | |
| | | % of Net
Assets | | | Value | |
Common Stocks: | | | | | | | | |
Banks | | | 27.4 | % | | $ | 10,031,336 | |
Oil & Gas | | | 14.1 | | | | 5,142,067 | |
Insurance | | | 11.6 | | | | 4,227,631 | |
Coal | | | 10.2 | | | | 3,718,675 | |
Home Builders | | | 9.9 | | | | 3,630,332 | |
Lodging | | | 4.9 | | | | 1,794,083 | |
Leisure Time | | | 3.3 | | | | 1,217,165 | |
Health Care — Services | | | 2.2 | | | | 791,846 | |
Automobile Manufacturers | | | 1.6 | | | | 585,600 | |
Electronics | | | 1.3 | | | | 468,024 | |
Commercial Services | | | 1.3 | | | | 458,707 | |
Aircraft | | | 1.2 | | | | 456,972 | |
Automobile Parts & Equipment | | | 1.1 | | | | 419,755 | |
Aerospace & Defense | | | 0.9 | | | | 314,564 | |
Mining | | | 0.6 | | | | 236,033 | |
Real Estate Investment Trusts | | | 0.4 | | | | 147,191 | |
Electric | | | 0.4 | | | | 138,818 | |
Securities Lending Collateral | | | 6.9 | | | | 2,523,341 | |
Exchange Traded Fund | | | 0.6 | | | | 228,652 | |
Assets In Excess Of Other Liabilities | | | 0.1 | | | | 35,883 | |
| | | | | | | | |
NET ASSETS | | | 100.0 | % | | $ | 36,566,675 | |
| | | | | | | | |
Portfolio holdings are subject to change at any time.
The accompanying notes are an integral part of the financial statements.
6
THE SCHNEIDER FUNDS
SCHNEIDER SMALL CAP VALUE FUND
Portfolio of Investments
February 28, 2014
(Unaudited)
| | | | | | | | |
| | | Shares | | | Value | |
COMMON STOCKS — 90.1% | | | | | | | | |
Apparel — 0.9% | | | | | | | | |
Barry (R.G.) Corp. | | | 32,549 | | | $ | 602,807 | |
| | | | | | | | |
Auto Parts — 0.4% | | | | | | | | |
Commercial Vehicle Group, Inc. * | | | 14,357 | | | | 128,064 | |
Modine Manufacturing Co. * | | | 9,765 | | | | 144,424 | |
| | | | | | | | |
| | | | | | | 272,488 | |
| | | | | | | | |
Banks — 8.6% | | | | | | | | |
Dundee Corp., Class A * | | | 20,920 | | | | 319,783 | |
First Horizon National Corp. | | | 275,370 | | | | 3,296,179 | |
Intervest Bancshares Corp. * | | | 3,327 | | | | 24,653 | |
MainSource Financial Group, Inc. | | | 69,125 | | | | 1,193,789 | |
Regions Financial Corp. | | | 107,860 | | | | 1,147,630 | |
| | | | | | | | |
| | | | | | | 5,982,034 | |
| | | | | | | | |
Coal — 8.8% | | | | | | | | |
Arch Coal, Inc. (a) | | | 830,839 | | | | 3,788,626 | |
Peabody Energy Corp. | | | 133,630 | | | | 2,346,543 | |
| | | | | | | | |
| | | | | | | 6,135,169 | |
| | | | | | | | |
Commercial Services — 6.1% | | | | | | | | |
Aegean Marine Petroleum Network, Inc. (a) | | | 180,509 | | | | 1,828,556 | |
Ardmore Shipping Corp. | | | 65,529 | | | | 850,566 | |
Baltic Trading, Ltd. | | | 37,830 | | | | 259,136 | |
Hudson Global Inc * | | | 255,698 | | | | 915,399 | |
Insperity, Inc. | | | 12,901 | | | | 376,580 | |
| | | | | | | | |
| | | | | | | 4,230,237 | |
| | | | | | | | |
Computers — 0.7% | | | | | | | | |
Xyratex Ltd. | | | 35,347 | | | | 466,227 | |
| | | | | | | | |
Electronics — 1.6% | | | | | | | | |
AU Optronics Corp. SP ADR * | | | 205,882 | | | | 685,587 | |
Kemet Corp. * | | | 47,662 | | | | 270,720 | |
Pulse Electronics Corp. * (a) | | | 43,785 | | | | 175,141 | |
| | | | | | | | |
| | | | | | | 1,131,448 | |
| | | | | | | | |
Healthcare - Products — 0.9% | | | | | | | | |
Orthofix International NV * | | | 28,569 | | | | 634,803 | |
| | | | | | | | |
Healthcare - Services — 5.2% | | | | | | | | |
Five Star Quality Care, Inc. * | | | 625,290 | | | | 3,620,429 | |
| | | | | | | | |
Home Builders — 9.9% | | | | | | | | |
Meritage Homes Corp. * | | | 54,071 | | | | 2,606,763 | |
Taylor Morrison Home Corp., Class A * | | | 169,368 | | | | 4,254,524 | |
| | | | | | | | |
| | | | | | | 6,861,287 | |
| | | | | | | | |
Industrial — 3.1% | | | | | | | | |
FreightCar America, Inc. | | | 84,632 | | | | 2,163,194 | |
| | | | | | | | |
| | | | | | | | |
| | | Shares | | | Value | |
Insurance — 2.4% | | | | | | | | |
Assured Guaranty, Ltd. | | | 29,895 | | | $ | 733,922 | |
First American Financial Corp. | | | 35,689 | | | | 961,462 | |
| | | | | | | | |
| | | | | | | 1,695,384 | |
| | | | | | | | |
Internet — 1.6% | | | | | | | | |
ModusLink Global Solutions, Inc. * | | | 237,170 | | | | 1,083,867 | |
| | | | | | | | |
Machinery - Diversified — 1.6% | | | | | | | | |
Intevac, Inc. * | | | 144,631 | | | | 1,089,071 | |
| | | | | | | | |
Mining — 2.9% | | | | | | | | |
Alumina Ltd. SP ADR * | | | 119,542 | | | | 549,893 | |
Stillwater Mining Co. * | | | 9,180 | | | | 124,297 | |
Thompson Creek Metals Co., Inc. * (a) | | | 514,597 | | | | 1,368,828 | |
| | | | | | | | |
| | | | | | | 2,043,018 | |
| | | | | | | | |
Miscellaneous Manfacturing — 1.2% | | | | | |
Orbotech, Ltd. * | | | 58,605 | | | | 831,605 | |
| | | | | | | | |
Oil & Gas — 5.3% | | | | | | | | |
Swift Energy Co. * (a) | | | 207,730 | | | | 2,077,300 | |
Willbros Group, Inc * | | | 164,877 | | | | 1,628,985 | |
| | | | | | | | |
| | | | | | | 3,706,285 | |
| | | | | | | | |
Real Estate — 0.7% | | | | | | | | |
Forestar Group, Inc. * | | | 27,180 | | | | 512,615 | |
| | | | | | | | |
Real Estate Investment Trusts — 4.8% | | | | | |
NorthStar Realty Finance Corp. | | | 53,110 | | | | 823,736 | |
Piedmont Office Realty Trust Inc. (a) | | | 45,030 | | | | 778,118 | |
Redwood Trust, Inc. (a) | | | 28,875 | | | | 580,388 | |
Rexford Industrial Realty, Inc. | | | 4,572 | | | | 64,877 | |
Strategic Hotels & Resorts, Inc. * | | | 113,023 | | | | 1,129,100 | |
| | | | | | | | |
| | | | | | | 3,376,219 | |
| | | | | | | | |
Retail — 4.2% | | | | | | | | |
MarineMax, Inc. * | | | 80,826 | | | | 1,163,894 | |
Office Depot, Inc. * | | | 332,198 | | | | 1,637,735 | |
Wet Seal Inc./The Class A * | | | 53,867 | | | | 102,347 | |
| | | | | | | | |
| | | | | | | 2,903,976 | |
| | | | | | | | |
Savings & Loans — 10.0% | | | | | | | | |
Flagstar Bancorp, Inc. * | | | 247,325 | | | | 5,475,776 | |
HomeStreet, Inc. | | | 57,281 | | | | 1,079,174 | |
Pulaski Financial Corp. | | | 38,842 | | | | 389,974 | |
| | | | | | | | |
| | | | | | | 6,944,924 | |
| | | | | | | | |
Semiconductors — 2.9% | | | | | | | | |
Alpha & Omega Semiconductor Ltd * | | | 19,879 | | | | 144,918 | |
ATMI, Inc. * | | | 22,967 | | | | 781,108 | |
Axcelis Technologies, Inc. * | | | 487,430 | | | | 1,086,969 | |
| | | | | | | | |
| | | | | | | 2,012,995 | |
| | | | | | | | |
The accompanying notes are an integral part of the financial statements.
7
THE SCHNEIDER FUNDS
SCHNEIDER SMALL CAP VALUE FUND
Portfolio of Investments (Concluded)
February 28, 2014
(Unaudited)
| | | | | | | | |
| | | Shares | | | Value | |
Software — 1.8% | | | | | | | | |
Avid Technology, Inc. * | | | 96,237 | | | $ | 635,164 | |
Take-Two Interactive Software, Inc. * | | | 31,665 | | | | 626,017 | |
| | | | | | | | |
| | | | | | | 1,261,181 | |
| | | | | | | | |
Telecommunications — 4.5% | | | | | | | | |
Aviat Networks, Inc. * | | | 1,287,961 | | | | 2,511,524 | |
Comverse, Inc. * | | | 18,500 | | | | 640,285 | |
| | | | | | | | |
| | | | | | | 3,151,809 | |
| | | | | | | | |
TOTAL COMMON STOCKS
(Cost $44,947,522) | | | | | | | 62,713,072 | |
| | | | | | | | |
| | | Par
(000) | | | | |
CORPORATE BONDS — 2.4% | | | | | | | | |
LandAmerica Financial Group, Inc. CONV ‡
0.00%, 05/15/34 | | $ | 33 | | | | 8,068 | |
Northstar Realty Finance Corp. ^ CONV
7.50%, 03/15/31 | | | 358 | | | | 929,681 | |
Pulse Electronics Corp. CONV
7.00%, 12/15/14 | | | 172 | | | | 127,280 | |
RAIT Financial Trust CONV
7.00%, 04/01/31 | | | 463 | | | | 615,501 | |
| | | | | | | | |
TOTAL CORPORATE BONDS
(Cost $975,949) | | | | | | | 1,680,530 | |
| | | | | | | | |
| | | Shares | | | | |
EXCHANGE TRADED FUND — 1.7% | | | | | | | | |
Finance — 1.7% | | | | | | | | |
iShares Russell 2000 Value Index Fund (a) | | | 11,647 | | | | 1,164,700 | |
| | | | | | | | |
TOTAL EXCHANGE TRADED FUND
(Cost $1,125,915) | | | | | | | 1,164,700 | |
| | | | | | | | |
| | | | | | | | |
| | | Shares | | | Value | |
SECURITIES LENDING COLLATERAL — 13.4% | | | | | |
BlackRock Liquidity Fund, Institutional Shares | | | 9,279,656 | | | $ | 9,279,656 | |
| | | | | | | | |
TOTAL SECURITIES LENDING COLLATERAL
(Cost $9,279,656) | | | | | | | 9,279,656 | |
| | | | | | | | |
TOTAL INVESTMENTS — 107.6%
(Cost $56,329,042) | | | | | | | 74,837,958 | |
| | | | | | | | |
LIABILITIES IN EXCESS OF OTHER ASSETS — (7.6)% | | | | | | | (5,261,191 | ) |
| | | | | | | | |
NET ASSETS — 100.0% | | | | | | $ | 69,576,767 | |
| | | | | | | | |
| (a) | All or a portion of the security is on loan. At February 28, 2014, the market value of securities on loan was $8,932,792. |
| ‡ | Holding in default resolution. Value has been determined in good faith by or under the direction of The RBB Fund, Inc’s Board of Directors to be the estimated value of the future payouts under the default resolution. As of February 28, 2014, this holding amounted to $8,068 or 0.0% of net assets and is deemed illiquid by the portfolio manager pursuant to the Fund’s policies and procedures. |
| ^ | Security was purchased pursuant to Rule 144A under Securities Act of 1933 and may not be resold subject to that rule except to qualified institutional buyers. As of February 28, 2014, this security amounted to $929,681 or 1.3% of net assets. |
| SP ADR | Sponsored American Depository Receipt |
The accompanying notes are an integral part of the financial statements.
8
THE SCHNEIDER FUNDS
SCHNEIDER VALUE FUND
Portfolio of Investments
February 28, 2014
(Unaudited)
| | | | | | | | |
| | | Shares | | | Value | |
| | | | | | | | |
COMMON STOCKS — 92.4% | | | | | | | | |
Aerospace & Defense — 0.9% | | | | | | | | |
Boeing Co. (The) | | | 2,440 | | | $ | 314,564 | |
| | | | | | | | |
Aircraft — 1.2% | | | | | | | | |
Bombardier, Inc., Class B | | | 140,607 | | | | 456,972 | |
| | | | | | | | |
Automobile Manufacturers — 1.6% | | | | | | | | |
Navistar International Corp. *(a) | | | 15,616 | | | | 585,600 | |
| | | | | | | | |
Automobile Parts & Equipment — 1.1% | | | | | |
Magna International, Inc. | | | 4,710 | | | | 419,755 | |
| | | | | | | | |
Banks — 27.4% | | | | | | | | |
Bank of America Corp. | | | 122,110 | | | | 2,018,478 | |
Barclays PLC, SP ADR | | | 41,008 | | | | 697,136 | |
Citigroup, Inc. | | | 36,974 | | | | 1,798,046 | |
Huntington Bancshares, Inc. | | | 35,389 | | | | 337,257 | |
JPMorgan Chase & Co. | | | 20,075 | | | | 1,140,662 | |
KeyCorp | | | 28,775 | | | | 378,967 | |
Morgan Stanley | | | 5,180 | | | | 159,544 | |
Regions Financial Corp. | | | 75,755 | | | | 806,033 | |
SunTrust Banks, Inc. | | | 71,529 | | | | 2,695,213 | |
| | | | | | | | |
| | | | | | | 10,031,336 | |
| | | | | | | | |
Coal — 10.2% | | | | | | | | |
Arch Coal, Inc. (a) | | | 301,215 | | | | 1,373,540 | |
Consol Energy, Inc. | | | 18,335 | | | | 735,234 | |
Peabody Energy Corp. | | | 91,680 | | | | 1,609,901 | |
| | | | | | | | |
| | | | | | | 3,718,675 | |
| | | | | | | | |
Commercial Services — 1.3% | | | | | | | | |
Aegean Marine Petroleum Network, Inc. | | | 45,282 | | | | 458,707 | |
| | | | | | | | |
Electric — 0.4% | | | | | | | | |
FirstEnergy Corp. | | | 4,510 | | | | 138,818 | |
| | | | | | | | |
Electronics — 1.3% | | | | | | | | |
LG Display Co., Ltd., ADR *(a) | | | 41,272 | | | | 468,024 | |
| | | | | | | | |
Health Care - Services — 2.2% | | | | | | | | |
Brookdale Senior Living, Inc. * | | | 23,609 | | | | 791,846 | |
| | | | | | | | |
Home Builders — 9.9% | | | | | | | | |
Lennar Corp., Class A | | | 31,165 | | | | 1,367,520 | |
Taylor Morrison Home Corp., Class A * | | | 14,110 | | | | 354,443 | |
Toll Brothers, Inc. * | | | 48,920 | | | | 1,908,369 | |
| | | | | | | | |
| | | | | | | 3,630,332 | |
| | | | | | | | |
Insurance — 11.6% | | | | | | | | |
Allstate Corp., (The) | | | 16,291 | | | | 883,950 | |
American International Group, Inc. | | | 22,660 | | | | 1,127,788 | |
Assured Guaranty, Ltd. | | | 36,751 | | | | 902,237 | |
Genworth Financial, Inc., Class A * | | | 3,350 | | | | 52,059 | |
Hartford Financial Services Group, Inc. | | | 35,851 | | | | 1,261,597 | |
| | | | | | | | |
| | | | | | | 4,227,631 | |
| | | | | | | | |
| | | | | | | | |
| | | Shares | | | Value | |
Leisure Time — 3.3% | | | | | | | | |
Carnival Corp. | | | 30,690 | | | $ | 1,217,165 | |
| | | | | | | | |
Lodging — 4.9% | | | | | | | | |
Marriott International, Inc., Class A | | | 31,960 | | | | 1,733,191 | |
Orient-Express Hotels, Ltd., Class A * | | | 3,954 | | | | 60,892 | |
| | | | | | | | |
| | | | | | | 1,794,083 | |
| | | | | | | | |
Mining — 0.6% | | | | | | | | |
Alcoa, Inc. | | | 20,105 | | | | 236,033 | |
| | | | | | | | |
Oil & Gas — 14.1% | | | | | | | | |
Chesapeake Energy Corp. | | | 70,786 | | | | 1,834,065 | |
Devon Energy Corp. | | | 13,565 | | | | 873,857 | |
Weatherford International, Ltd. * | | | 123,513 | | | | 2,058,962 | |
WPX Energy, Inc. * | | | 21,293 | | | | 375,183 | |
| | | | | | | | |
| | | | | | | 5,142,067 | |
| | | | | | | | |
Real Estate Investment Trusts — 0.4% | | | | | | | | |
Columbia Property Trust, Inc. | | | 5,546 | | | | 147,191 | |
| | | | | | | | |
TOTAL COMMON STOCKS
(Cost $24,102,057) | | | | | | | 33,778,799 | |
| | | | | | | | |
EXCHANGE TRADED FUND — 0.6% | | | | | | | | |
Finance — 0.6% | | | | | | | | |
iShares Russell 1000 Value Index Fund | | | 2,415 | | | | 228,652 | |
| | | | | | | | |
TOTAL EXCHANGE TRADED FUND
(Cost $214,086) | | | | | | | 228,652 | |
| | | | | | | | |
SECURITIES LENDING COLLATERAL — 6.9% | | | | | |
BlackRock Liquidity Fund, Institutional Shares | | | 2,523,341 | | | | 2,523,341 | |
| | | | | | | | |
TOTAL SECURITIES LENDING COLLATERAL
(Cost $2,523,341) | | | | | | | 2,523,341 | |
| | | | | | | | |
TOTAL INVESTMENTS — 99.9%
(Cost $26,839,484) | | | | | | | 36,530,792 | |
| | | | | | | | |
ASSETS IN EXCESS OF OTHER LIABILITIES — 0.1% | | | | | | | 35,883 | |
| | | | | | | | |
NET ASSETS — 100.0% | | | | | | $ | 36,566,675 | |
| | | | | | | | |
| (a) | All or a portion of the security is on loan. At February 28, 2014, market value of securities on loan was $2,429,414. |
The accompanying notes are an integral part of the financial statements.
9
THE SCHNEIDER FUNDS
Statements of Assets & Liabilities
February 28, 2014
(Unaudited)
| | | | | | | | |
| | | Schneider
Small Cap
Value Fund | | | Schneider
Value Fund | |
| | |
ASSETS | | | | | | | | |
Investments, at value †^ | | $ | 74,837,958 | | | $ | 36,530,792 | |
Cash and cash equivalents | | | 4,143,070 | | | | 2,472,401 | |
Receivables | | | | | | | | |
Investment adviser | | | — | | | | 1,280 | |
Investments sold | | | 1,085,781 | | | | 283,818 | |
Dividends and interest | | | 66,348 | | | | 46,676 | |
Prepaid expenses and other assets | | | 16,572 | | | | 12,631 | |
| | | | | | | | |
Total assets | | | 80,149,729 | | | | 39,347,598 | |
| | | | | | | | |
| | |
LIABILITIES | | | | | | | | |
Payables | | | | | | | | |
Securities lending collateral | | | 9,279,656 | | | | 2,523,341 | |
Investments purchased | | | 1,090,494 | | | | 161,606 | |
Capital shares redeemed | | | 115,372 | | | | 42,088 | |
Investment adviser | | | 25,433 | | | | — | |
Other accrued expenses and liabilities | | | 62,007 | | | | 53,888 | |
| | | | | | | | |
Total liabilities | | | 10,572,962 | | | | 2,780,923 | |
| | | | | | | | |
Net Assets | | $ | 69,576,767 | | | $ | 36,566,675 | |
| | | | | | | | |
| | |
NET ASSETS CONSIST OF | | | | | | | | |
Par value | | $ | 3,321 | | | $ | 1,928 | |
Paid-in capital | | | 49,725,773 | | | | 156,622,685 | |
Undistributed/accumulated net investment income/(loss) | | | (76,569 | ) | | | 36,420 | |
Accumulated net realized gain/(loss) from investments | | | 1,415,326 | | | | (129,785,666 | ) |
Net unrealized appreciation on investments | | | 18,508,916 | | | | 9,691,308 | |
| | | | | | | | |
Net Assets | | $ | 69,576,767 | | | $ | 36,566,675 | |
| | | | | | | | |
Shares outstanding ($0.001 par value, 100,000,000 shares authorized) | | | 3,321,447 | | | | 1,928,079 | |
| | | | | | | | |
Net asset value, offering and redemption price per share | | $ | 20.95 | | | $ | 18.97 | |
| | | | | | | | |
† Investment in securities, at cost | | $ | 56,329,042 | | | $ | 26,839,484 | |
| | | | | | | | |
^ Includes market value of securities on loan | | $ | 8,932,792 | | | $ | 2,429,414 | |
| | | | | | | | |
The accompanying notes are an integral part of the financial statements.
10
THE SCHNEIDER FUNDS
Statements of Operations
For the Six Months Ended February 28, 2014
(Unaudited)
| | | | | | | | |
| | | Schneider
Small Cap
Value Fund | | | Schneider
Value Fund | |
Investment Income | | | | | | | | |
Dividends † | | $ | 248,614 | | | $ | 187,575 | |
Securities Lending Income | | | 33,362 | | | | 9,133 | |
Interest | | | 47,035 | | | | 120 | |
| | | | | | | | |
Total investment income | | | 329,011 | | | | 196,828 | |
| | | | | | | | |
| | |
Expenses | | | | | | | | |
Advisory fees | | | 352,679 | | | | 124,762 | |
Administration and accounting fees | | | 61,989 | | | | 56,179 | |
Transfer agent fees | | | 36,494 | | | | 32,670 | |
Professional fees | | | 26,464 | | | | 18,002 | |
Custodian fees | | | 15,225 | | | | 11,721 | |
Registration and filing fees | | | 14,790 | | | | 12,133 | |
Directors’ and officers’ fees | | | 9,709 | | | | 8,917 | |
Insurance fees | | | 4,655 | | | | 2,537 | |
Printing and shareholder reporting fees | | | 1,565 | | | | 2,473 | |
Other expenses | | | 1,589 | | | | 2,786 | |
| | | | | | | | |
Total expenses before waivers and reimbursements | | | 525,159 | | | | 272,180 | |
Less: waivers and reimbursements | | | (119,579 | ) | | | (111,772 | ) |
| | | | | | | | |
Net expenses after waivers and reimbursements | | | 405,580 | | | | 160,408 | |
| | | | | | | | |
Net investment income/(loss) | | | (76,569 | ) | | | 36,420 | |
| | | | | | | | |
| | |
Net realized and unrealized gain from investments | | | | | | | | |
Net realized gain from: | | | | | | | | |
Investments | | | 7,491,661 | | | | 2,690,309 | |
Net change in unrealized appreciation on: | | | | | | | | |
Investments | | | 3,754,693 | | | | 2,768,431 | |
| | | | | | | | |
Net realized and unrealized gain on investments | | | 11,246,354 | | | | 5,458,740 | |
| | | | | | | | |
Net increase in net assets resulting from operations | | $ | 11,169,785 | | | $ | 5,495,160 | |
| | | | | | | | |
† Net of foreign withholding taxes of | | $ | — | | | $ | (277 | ) |
| | | | | | | | |
The accompanying notes are an integral part of the financial statements.
11
THE SCHNEIDER FUNDS
SCHNEIDER SMALL CAP VALUE FUND
Statements of Changes in Net Assets
| | | | | | | | |
| | | For the Six Months
Ended
February 28, 2014
(Unaudited) | | | For the Year
Ended
August 31, 2013 | |
Increase in net assets from operations: | | | | | | | | |
Net investment income/(loss) | | $ | (76,569 | ) | | $ | 270,584 | |
Net realized gain from investments | | | 7,491,661 | | | | 11,809,927 | |
Net change in unrealized appreciation from investments | | | 3,754,693 | | | | 6,471,148 | |
| | | | | | | | |
Net increase in net assets resulting from operations | | | 11,169,785 | | | | 18,551,659 | |
| | | | | | | | |
| | |
Dividends and distributions to shareholders from: | | | | | | | | |
Net realized capital gains | | | (10,779,655 | ) | | | — | |
| | | | | | | | |
Net decrease in net assets from dividends and distributions to shareholders | | | (10,779,655 | ) | | | — | |
| | | | | | | | |
| | |
Capital transactions: | | | | | | | | |
Proceeds from shares sold | | | 598,764 | | | | 3,519,305 | |
Reinvestment of distributions | | | 9,110,476 | | | | — | |
Redemption fees * | | | 14,003 | | | | 13,608 | |
Shares redeemed | | | (11,092,716 | ) | | | (14,219,434 | ) |
| | | | | | | | |
Net decrease in net assets from capital share transactions | | | (1,369,473 | ) | | | (10,686,521 | ) |
| | | | | | | | |
Total increase/(decrease) in net assets | | | (979,343 | ) | | | 7,865,138 | |
| | | | | | | | |
| | |
Net assets: | | | | | | | | |
Beginning of period | | | 70,556,110 | | | | 62,690,972 | |
| | | | | | | | |
End of period | | $ | 69,576,767 | | | $ | 70,556,110 | |
| | | | | | | | |
Undistributed/accumulated net investment income/(loss), end of period | | $ | (76,569 | ) | | $ | — | |
| | | | | | | | |
| | |
Share transactions: | | | | | | | | |
Shares sold | | | 28,998 | | | | 176,906 | |
Shares reinvested | | | 466,248 | | | | — | |
Shares redeemed | | | (522,767 | ) | | | (723,734 | ) |
| | | | | | | | |
Total share transactions | | | (27,521 | ) | | | (546,828 | ) |
| | | | | | | | |
| * | There is a 1.75% redemption fee on shares redeemed which have been held less than one year in the Schneider Small Cap Value Fund. The redemption fees are retained by the Fund for the benefit of the remaining shareholders and recorded as paid-in capital. |
The accompanying notes are an integral part of the financial statements.
12
THE SCHNEIDER FUNDS
SCHNEIDER VALUE FUND
Statements of Changes in Net Assets
| | | | | | | | |
| | | For the Six Months
Ended
February 28, 2014
(Unaudited) | | | For the Year
Ended
August 31, 2013 | |
Increase in net assets from operations: | | | | | | | | |
Net investment income | | $ | 36,420 | | | $ | 132,642 | |
Net realized gain from investments | | | 2,690,309 | | | | 5,225,439 | |
Net change in unrealized appreciation from investments | | | 2,768,431 | | | | 3,779,711 | |
| | | | | | | | |
Net increase in net assets resulting from operations | | | 5,495,160 | | | | 9,137,792 | |
| | | | | | | | |
| | |
Dividends and distributions to shareholders from: | | | | | | | | |
Net investment income | | | (132,641 | ) | | | (339,819 | ) |
| | | | | | | | |
Net decrease in net assets from dividends and distributions to shareholders | | | (132,641 | ) | | | (339,819 | ) |
| | | | | | | | |
| | |
Capital transactions: | | | | | | | | |
Proceeds from shares sold | | | 156,658 | | | | 425,034 | |
Reinvestment of distributions | | | 126,471 | | | | 327,112 | |
Redemption fees * | | | — | | | | 332 | |
Shares redeemed | | | (2,951,414 | ) | | | (19,397,005 | ) |
| | | | | | | | |
Net decrease in net assets from capital share transactions | | | (2,668,285 | ) | | | (18,644,527 | ) |
| | | | | | | | |
Total increase/(decrease) in net assets | | | 2,694,234 | | | | (9,846,554 | ) |
| | | | | | | | |
| | |
Net assets: | | | | | | | | |
Beginning of period | | | 33,872,441 | | | | 43,718,995 | |
| | | | | | | | |
End of period | | $ | 36,566,675 | | | $ | 33,872,441 | |
| | | | | | | | |
Undistributed net investment income, end of period | | $ | 36,420 | | | $ | 132,641 | |
| | | | | | | | |
| | |
Share transactions: | | | | | | | | |
Shares sold | | | 8,715 | | | | 30,588 | |
Shares reinvested | | | 6,956 | | | | 24,503 | |
Shares redeemed | | | (163,851 | ) | | | (1,401,380 | ) |
| | | | | | | | |
Total share transactions | | | (148,180 | ) | | | (1,346,289 | ) |
| | | | | | | | |
| * | There is a 1.75% redemption fee on shares redeemed which have been held less than one year in the Schneider Small Cap Value Fund. The redemption fees are retained by the Fund for the benefit of the remaining shareholders and recorded as paid-in capital. |
The accompanying notes are an integral part of the financial statements.
13
THE SCHNEIDER FUNDS
SCHNEIDER SMALL CAP VALUE FUND
Financial Highlights
Contained below is per share operating performance data for a share outstanding during each period, total investment return, ratios to average net assets and other supplemental data for the respective periods. This information has been derived from information provided in the financial statements.
| | | | | | | | | | | | | | | | | | | | | | | | |
| | | For the
Six Months Ended
February 28, 2014
(Unaudited) | | | For the Years Ended August 31, | |
| | | | 2013 | | | 2012 | | | 2011 | | | 2010 | | | 2009 | |
Per Share Operating Performance | | | | | | | | | | | | | | | | | | | | | | | | |
Net asset value, beginning of period | | $ | 21.07 | | | $ | 16.09 | | | $ | 13.70 | | | $ | 13.19 | | | $ | 12.34 | | | $ | 14.54 | |
| | | | | | | | | | | | | | | | | | | | | | | | |
Net investment income/(loss) | | | (0.02 | ) | | | 0.08 | (1) | | | (0.11 | ) | | | (0.06 | ) | | | (0.11 | ) | | | 0.12 | |
Net realized and unrealized gain/(loss) on investments and foreign currency transactions | | | 3.35 | | | | 4.90 | | | | 2.49 | | | | 0.56 | | | | 1.01 | | | | (2.20 | ) |
| | | | | | | | | | | | | | | | | | | | | | | | |
Net increase/(decrease) in net assets resulting from operations | | | 3.33 | | | | 4.98 | | | | 2.38 | | | | 0.50 | | | | 0.90 | | | | (2.08 | ) |
| | | | | | | | | | | | | | | | | | | | | | | | |
Dividends and distributions to shareholders from: | | | | | | | | | | | | | | | | | | | | | | | | |
Net investment income | | | — | | | | — | | | | — | | | | — | | | | (0.07 | ) | | | (0.18 | ) |
Net realized gains | | | (3.45 | ) | | | — | | | | — | | | | — | | | | — | | | | — | |
| | | | | | | | | | | | | | | | | | | | | | | | |
Total dividends and distributions to shareholders | | | (3.45 | ) | | | — | | | | — | | | | — | | | | (0.07 | ) | | | (0.18 | ) |
| | | | | | | | | | | | | | | | | | | | | | | | |
Redemption fees | | | — | (2) | | | — | (2) | | | 0.01 | | | | 0.01 | | | | 0.02 | | | | 0.06 | |
| | | | | | | | | | | | | | | | | | | | | | | | |
Net asset value, end of period | | $ | 20.95 | | | $ | 21.07 | | | $ | 16.09 | | | $ | 13.70 | | | $ | 13.19 | | | $ | 12.34 | |
| | | | | | | | | | | | | | | | | | | | | | | | |
Total investment return(3) | | | 17.01 | %(4) | | | 30.95 | % | | | 17.45 | % | | | 3.87 | % | | | 7.48 | % | | | (13.20 | )% |
| | | | | | | | | | | | | | | | | | | | | | | | |
| | | | | | |
Ratio/Supplemental Data | | | | | | | | | | | | | | | | | | | | | | | | |
Net assets, end of period (000’s omitted) | | $ | 69,577 | | | $ | 70,556 | | | $ | 62,691 | | | $ | 69,698 | | | $ | 73,243 | | | $ | 98,283 | |
Ratio of expenses to average net assets(5) | | | 1.15 | %(6) | | | 1.15 | % | | | 1.15 | % | | | 1.15 | % | | | 1.15 | % | | | 1.14 | % |
Ratio of expenses to average net assets without waivers and expense reimbursements | | | 1.49 | %(6) | | | 1.50 | % | | | 1.52 | % | | | 1.40 | % | | | 1.43 | % | | | 1.42 | % |
Ratio of net investment income/(loss) to average net assets(5) | | | (0.22 | )%(6) | | | 0.38 | % | | | (0.64 | )% | | | (0.33 | )% | | | (0.65 | )% | | | 0.97 | % |
Portfolio turnover rate | | | 41.28 | %(4) | | | 63.87 | % | | | 67.85 | % | | | 59.18 | % | | | 83.39 | % | | | 122.36 | % |
| (1) | Calculated based on average shares outstanding for the period. |
| (2) | Amount is less than $0.005 per share. |
| (3) | Total investment return is calculated by assuming a purchase of shares on the first day and a sale of shares on the last day of each period reported and includes reinvestments of dividends and distributions, if any. |
| (5) | Reflects waivers and reimbursements. |
The accompanying notes are an integral part of the financial statements.
14
THE SCHNEIDER FUNDS
SCHNEIDER VALUE FUND
Financial Highlights
Contained below is per share operating performance data for a share outstanding during each period, total investment return, ratios to average net assets and other supplemental data for the respective periods. This information has been derived from information provided in the financial statements.
| | | | | | | | | | | | | | | | | | | | | | | | |
| | | For the
Six Months Ended
February 28, 2014
(Unaudited) | | | For the Years Ended August 31, | |
| | | | 2013 | | | 2012 | | | 2011 | | | 2010 | | | 2009 | |
Per Share Operating Performance | | | | | | | | | | | | | | | | | | | | | | | | |
Net asset value, beginning of period | | $ | 16.31 | | | $ | 12.77 | | | $ | 12.50 | | | $ | 11.72 | | | $ | 12.14 | | | $ | 16.37 | |
| | | | | | | | | | | | | | | | | | | | | | | | |
Net investment income | | | 0.02 | (1) | | | 0.10 | | | | 0.10 | | | | 0.07 | | | | 0.08 | | | | 0.34 | |
Net realized and unrealized gain/(loss) from investments and foreign currency transactions | | | 2.71 | | | | 3.58 | | | | 0.23 | | | | 0.80 | | | | (0.23 | ) | | | (4.14 | ) |
| | | | | | | | | | | | | | | | | | | | | | | | |
Net increase/(decrease) in net assets resulting from operations | | | 2.73 | | | | 3.68 | | | | 0.33 | | | | 0.87 | | | | (0.15 | ) | | | (3.80 | ) |
| | | | | | | | | | | | | | | | | | | | | | | | |
Dividends and distributions to shareholders from: | | | | | | | | | | | | | | | | | | | | | | | | |
Net investment income | | | (0.07 | ) | | | (0.14 | ) | | | (0.06 | ) | | | (0.09 | ) | | | (0.27 | ) | | | (0.43 | ) |
| | | | | | | | | | | | | | | | | | | | | | | | |
Total dividends and distributions to shareholders | | | (0.07 | ) | | | (0.14 | ) | | | (0.06 | ) | | | (0.09 | ) | | | (0.27 | ) | | | (0.43 | ) |
| | | | | | | | | | | | | | | | | | | | | | | | |
Redemption fees(2) | | | — | | | | — | | | | — | | | | — | | | | — | | | | — | |
| | | | | | | | | | | | | | | | | | | | | | | | |
Net asset value, end of period | | $ | 18.97 | | | $ | 16.31 | | | $ | 12.77 | | | $ | 12.50 | | | $ | 11.72 | | | $ | 12.14 | |
| | | | | | | | | | | | | | | | | | | | | | | | |
Total investment return(3) | | | 16.74 | %(4) | | | 29.08 | % | | | 2.67 | % | | | 7.35 | % | | | (1.30 | )% | | | (22.06 | )% |
| | | | | | | | | | | | | | | | | | | | | | | | |
| | | | | | |
Ratio/Supplemental Data | | | | | | | | | | | | | | | | | | | | | | | | |
Net assets, end of period (000’s omitted) | | $ | 36,567 | | | $ | 33,872 | | | $ | 43,719 | | | $ | 67,940 | | | $ | 98,953 | | | $ | 118,467 | |
Ratio of expenses to average net
assets(5) | | | 0.90 | %(6) | | | 0.90 | % | | | 0.90 | % | | | 0.90 | % | | | 0.90 | % | | | 0.88 | % |
Ratio of expenses to average net assets without waivers and expense reimbursements | | | 1.53 | %(6) | | | 1.55 | % | | | 1.28 | % | | | 1.07 | % | | | 1.03 | % | | | 1.14 | % |
Ratio of net investment income to average net assets(5) | | | 0.20 | %(6) | | | 0.39 | % | | | 0.63 | % | | | 0.31 | % | | | 0.52 | % | | | 2.24 | % |
Portfolio turnover rate | | | 24.13 | %(4) | | | 53.08 | % | | | 55.87 | % | | | 67.80 | % | | | 79.30 | % | | | 107.13 | % |
| (1) | Calculated based on average shares outstanding for the period. |
| (2) | Amount is less than $0.005 per share. |
| (3) | Total investment return is calculated by assuming a purchase of shares on the first day and a sale of shares on the last day of each period reported and includes reinvestments of dividends and distributions, if any. |
| (5) | Reflects waivers and reimbursements. |
The accompanying notes are an integral part of the financial statements.
15
THE SCHNEIDER FUNDS
Notes to Financial Statements
February 28, 2014 (Unaudited)
| 1. | Organization and Significant Accounting Policies |
The RBB Fund, Inc. (“RBB” or the “Company”) was incorporated under the laws of the State of Maryland on February 29, 1988 and is registered under the Investment Company Act of 1940, as amended (the “1940 Act”), as an open-end management investment company. RBB is a “series fund,” which is a mutual fund divided into separate portfolios. Each portfolio is treated as a separate entity for certain matters under the 1940 Act, and for other purposes, and a shareholder of one portfolio is not deemed to be a shareholder of any other portfolio. Currently, RBB has twenty-one active investment portfolios, including the Schneider Small Cap Value Fund (the “Small Cap Value Fund”) and the Schneider Value Fund (the “Value Fund”) (each a “Fund,” collectively the “Funds”), which commenced investment operations on September 2, 1998 and September 30, 2002, respectively. As of the date hereof, each Fund offers Institutional Class shares.
RBB has authorized capital of one hundred billion shares of common stock of which 81.373 billion shares are currently classified into one hundred and forty-eight classes of common stock. Each class represents an interest in an active or inactive RBB investment portfolio.
PORTFOLIO VALUATION — Each Fund’s net asset value (“NAV”) is calculated once daily at the close of regular trading hours on the New York Stock Exchange (“NYSE”) (generally 4:00 p.m. Eastern time) on each day the NYSE is open. Securities held by the Funds are valued using the closing price or the last sale price on a national securities exchange or the National Association of Securities Dealers Automatic Quotation System (“NASDAQ”) market system where they are primarily traded. Equity securities traded in the over-the-counter market are valued at their closing prices. If there were no transactions on that day, securities traded principally on an exchange or on NASDAQ will be valued at the mean of the last bid and ask prices prior to the market close. Fixed Income securities having a remaining maturity of greater than 60 days are valued using an independent pricing service. Fixed Income securities having a remaining maturity of 60 days or less are valued at amortized cost, which approximates market value. Foreign securities are valued based on prices from the primary market in which they are traded, and are translated from the local currency into U.S. dollars using current exchange rates. Investments in other open-end investment companies are valued based on the NAV of the investment companies (which may use Fair Value Pricing as discussed in their prospectuses). If market quotations are unavailable or deemed unreliable, securities will be valued in accordance with procedures adopted by the Company’s Board of Directors. Relying on prices supplied by pricing services or dealers or using fair valuation may result in values that are higher or lower than the values used by other investment companies and investors to price the same investments.
FAIR VALUE MEASUREMENT — The inputs and valuations techniques used to measure fair value of the Funds’ investments are summarized into three levels as described in the hierarchy below:
| | • Level 1 — | quoted prices in active markets for identical securities; |
| | • Level 2 — | other significant observable inputs (including quoted prices for similar securities, interest rates, prepayment speeds, credit risk, etc.); and |
| | • Level 3 — | significant unobservable inputs (including the Funds’ own assumptions in determining the fair value of investments). |
The inputs or methodology used for valuing securities are not necessarily an indication of the risk associated with investing in those securities.
16
THE SCHNEIDER FUNDS
Notes to Financial Statements (Continued)
February 28, 2014 (Unaudited)
The following summary of the inputs used, as of February 28, 2014, in valuing the Funds’ investments carried at fair value:
Small Cap Value Fund
| | | | | | | | | | | | | | | | |
| | | Total
Value as of
February 28, 2014 | | | Level 1
Quoted
Price | | | Level 2
Significant
Observable
Inputs | | | Level 3
Significant
Unobservable
Inputs | |
Common Stocks* | | $ | 62,713,072 | | | $ | 62,713,072 | | | $ | — | | | $ | — | |
Corporate Bonds | | | 1,680,530 | | | | — | | | | 1,672,462 | | | | 8,068 | |
Exchange Traded Fund | | | 1,164,700 | | | | 1,164,700 | | | | — | | | | — | |
Securities Lending Collateral | | | 9,279,656 | | | | 9,279,656 | | | | — | | | | — | |
| | | | | | | | | | | | | | | | |
Total | | $ | 74,837,958 | | | $ | 73,157,428 | | | $ | 1,672,462 | | | $ | 8,068 | |
| | | | | | | | | | | | | | | | |
Value Fund
| | | | | | | | | | | | | | | | |
| | | Total
Value as of
February 28, 2014 | | | Level 1
Quoted
Price | | | Level 2
Significant
Observable
Inputs | | | Level 3
Significant
Unobservable
Inputs | |
Common Stocks* | | $ | 33,778,799 | | | $ | 33,778,799 | | | $ | — | | | $ | — | |
Exchange Traded Fund | | | 228,652 | | | | 228,652 | | | | — | | | | — | |
Securities Lending Collateral | | | 2,523,341 | | | | 2,523,341 | | | | — | | | | — | |
| | | | | | | | | | | | | | | | |
Total | | $ | $36,530,792 | | | $ | 36,530,792 | | | $ | — | | | $ | — | |
| | | | | | | | | | | | | | | | |
* Please refer to the Portfolio of Investments for further details on portfolio holdings.
The fair value of a Fund’s bonds are generally based on quotes received from brokers of independent pricing services. Bonds with quotes that are based on actual trades with a sufficient level of activity on or near the measurement date are classified as Level 2 assets. Bonds that are priced using quotes derived from implied values, indicative bids, or a limited amount of actual trades are classified as Level 3 assets because the inputs used by the brokers and pricing services to derive the values are not readily observable.
Investments designated as Level 3 may include assets valued using quotes or indications furnished by brokers which are based on models or estimates and may not be executable prices. In light of the developing market conditions, Schneider Capital Management continues to search for observable data points and evaluate broker quotes and indications received for portfolio investments. Determination of fair values is uncertain because it involves subjective judgments and estimates not easily substantiated by auditing procedures.
At the end of each fiscal quarter, management evaluates the classification of Levels 1, 2 and 3 assets and liabilities. Various factors are considered, such as changes in liquidity from the prior reporting period; whether or not a broker is willing to execute at the quoted price; the depth and consistency of prices from third party pricing services; and the existence of contemporaneous, observable trades in the market. Additionally, management evaluates the classification of Level 1 and Level 2 assets and liabilities on a quarterly basis for changes in listings or delistings on national exchanges.
Due to the inherent uncertainty of determining the fair value of investments that do not have a readily available market value, the fair value of the Funds’ investments may fluctuate from period to period. Additionally, the fair value of investments may differ significantly from the values that would have been used had an active market existed for such investments and may differ materially from the values the Funds may ultimately realize. Further, such investments may be subject to legal and other restrictions on resale or otherwise less liquid than publicly traded securities.
For fair valuations using significant unobservable inputs, U.S. generally accepted accounting principles (“U.S. GAAP”) require each Fund to present a reconciliation of the beginning to ending balances for reported market values that presents
17
THE SCHNEIDER FUNDS
Notes to Financial Statements (Continued)
February 28, 2014 (Unaudited)
changes attributable to total realized and unrealized gains or losses, purchase and sales, and transfers in and out of Level 3 during the period. Transfers in and out between Levels are based on values at the end of the period. U.S. GAAP also requires a Fund to disclose amounts and reasons for all transfers in and out of Level 1 and Level 2 fair value measurements. A reconciliation of Level 3 investments is presented only when a Fund had an amount of Level 3 investments at the end of the reporting period that was meaningful in relation to its net assets. The amounts and reasons for all transfers in and out of each Level within the three-tier hierarchy are disclosed when a Fund had an amount of total transfers during the reporting period that was meaningful in relation to its net assets as of the end of the reporting period.
For the six months ended February 28, 2014, there were no transfers between Levels 1, 2 and 3 for the Small Cap Value Fund and the Value Fund.
USE OF ESTIMATES — The preparation of financial statements in conformity with U.S. GAAP requires management to make estimates and assumptions that affect the reported amounts of assets and liabilities and disclosure of contingent assets and liabilities at the date of the financial statements and the reported amounts of revenues and expenses during the period. Actual results could differ from those estimates and those differences could be significant.
INVESTMENT TRANSACTIONS, INVESTMENT INCOME, AND EXPENSES — The Funds record security transactions based on trade date for financial reporting purposes. The cost of investments sold is determined by use of the specific identification method for both financial reporting and income tax purposes in determining realized gains and losses on investments. Interest income is accrued as earned. Dividend income is recorded on the ex-dividend date. Distributions received on securities that represent a return of capital or capital gain are recorded as a reduction of cost of investments and/or as a realized gain. Each Fund estimates the components of distributions received that may be considered return of capital distributions or capital gain distributions. Expenses incurred on behalf of a specific class, fund or fund family of the Company are charged directly to the class, fund or fund family (in proportion to net assets). Expenses incurred for all of the RBB funds (such as director or professional fees) are charged to all funds in proportion to their average net assets of RBB, or in such other manner as the Board of Directors deems fair or equitable. Expenses and fees, including investment advisory and administration fees, are accrued daily and taken into account for the purpose of determining the NAV of the Funds.
FOREIGN CURRENCY TRANSLATION — Foreign securities and other foreign assets and liabilities are valued using the foreign currency exchange rate effective at the end of the reporting period. The books and records of the Funds are maintained in U.S. dollars. Cost of investments is translated at the currency exchange rate effective at the trade date. The gain or loss resulting from a change in currency exchange rates between the trade and settlement dates of a portfolio transaction is treated as a gain or loss on foreign currency. Likewise, the gain or loss resulting from a change in currency exchange rates, between the date income is accrued and paid, is treated as a gain or loss on foreign currency.
DIVIDENDS AND DISTRIBUTIONS TO SHAREHOLDERS — Dividends from net investment income and distributions from net realized capital gains, if any, are declared, recorded on the ex-dividend date and paid at least annually to shareholders. Income dividends and capital gain distributions are determined in accordance with U.S. federal income tax regulations, which may differ from U.S. GAAP.
U.S. TAX STATUS — No provision is made for U.S. income taxes as it is each Fund’s intention to qualify for and elect the tax treatment applicable to regulated investment companies under Subchapter M of the Internal Revenue Code of 1986, as amended, and make the requisite distributions to its shareholders which will be sufficient to relieve it from U.S. income and excise taxes.
CASH AND CASH EQUIVALENTS — The Funds consider liquid assets deposited into a bank demand deposit account to be cash equivalents. These investments represent amounts held with financial institutions that are readily accessible to pay Fund expenses or purchase investments. Cash and cash equivalents are valued at cost plus accrued interest, which approximates market value.
OTHER — In the normal course of business, the Funds may enter into contracts that provide general indemnifications. The Funds’ maximum exposure under these arrangements is dependent on claims that may be made against the Funds in
18
THE SCHNEIDER FUNDS
Notes to Financial Statements (Continued)
February 28, 2014 (Unaudited)
the future, and, therefore, cannot be estimated; however, based on experience, the risk of material loss for such claims is considered remote.
| 2. | Investment Adviser and Other Services |
Schneider Capital Management Company (“SCM” or the “Adviser”) serves as each Fund’s investment adviser. For its advisory services, SCM is entitled to receive 1.00% of the Small Cap Value Fund’s average daily net assets and 0.70% of the Value Fund’s average daily net assets, computed daily and payable monthly.
SCM has contractually agreed to waive its management fees and/or reimburse expenses to the extent that total annual operating expenses (excluding certain items discussed below) of the Small Cap Value Fund and the Value Fund exceed 1.15% and 0.90%, respectively. In determining SCM’s obligation to waive advisory fees and/or reimburse expenses, the following expenses are not taken into account: acquired fund fees and expenses, brokerage commissions, extraordinary items, interest and taxes. This contractual limitation is in effect until December 31, 2014 and may not be terminated without the approval of the Company’s Board of Directors.
For the six months ended February 28, 2014, investment advisory fees and waivers of advisory fees were as follows:
| | | | | | | | | | | | |
| | | Gross Advisory Fees | | | Waivers | | | Net Advisory Fees | |
Schneider Small Cap Value Fund | | $ | 352,679 | | | $ | (119,579 | ) | | $ | 233,100 | |
Schneider Value Fund | | | 124,762 | | | | (111,772 | ) | | | 12,990 | |
The Funds will not pay SCM at a later time for any amounts it may waive or any amounts that SCM has assumed.
BNY Mellon Investment Servicing (US) Inc. (“BNY Mellon”) serves as administrator for the Funds. For providing administration and accounting services, BNY Mellon is entitled to receive a monthly fee equal to an annual percentage rate of each Fund’s average daily net assets, subject to certain minimum monthly fees.
Included in the administration and accounting services fees, shown on the Statement of Operations, are fees for providing regulatory administration services to RBB. For providing these services, BNY Mellon is entitled to receive compensation as agreed to by the Company and BNY Mellon. This fee is allocated to each portfolio of the Company in proportion to its net assets of the Company.
In addition, BNY Mellon serves as the Funds’ transfer and dividend disbursing agent. For providing transfer agent services, BNY Mellon is entitled to receive a monthly fee equal to an annual percentage rate of each Fund’s average daily net assets, subject to certain minimum monthly fees.
The Bank of New York Mellon (the “Custodian”) provides certain custodial services to the Funds. The Custodian is entitled to receive a monthly fee equal to an annual percentage rate of the Funds’ average daily net assets, subject to certain minimum monthly fees.
Foreside Funds Distributors LLC serves as the principal underwriter and distributor of the Funds’ shares pursuant to a Distribution Agreement with RBB.
The Directors of the Company receive an annual retainer and meeting fees for meetings attended. The aggregate remuneration paid to the Directors by the Funds during the six months ended February 28, 2014 was $9,622. Certain employees of BNY Mellon serve as an Officer or Director of the Company. They are not compensated by the Funds or the Company.
19
THE SCHNEIDER FUNDS
Notes to Financial Statements (Continued)
February 28, 2014 (Unaudited)
| 4. | Investment in Securities |
For the six months ended February 28, 2014, aggregate purchases and sales of investment securities (excluding short-term investments) were as follows:
| | | | | | | | |
| | | Purchases | | | Sales | |
Small Cap Value Fund | | $ | 27,441,635 | | | $ | 38,243,090 | |
Value Fund | | | 8,037,702 | | | | 10,540,905 | |
| 5. | Federal Income Tax Information |
The Funds have followed the authoritative guidance on accounting for and disclosure of uncertainty in tax positions, which requires the Funds to determine whether a tax position is more likely than not to be sustained upon examination, including resolution of any related appeals or litigation processes, based on the technical merits of the position. Each Fund has determined that there was no effect on the financial statements from following this authoritative guidance. In the normal course of business, the Funds are subject to examination by federal, state and local jurisdictions, where applicable, for tax years for which applicable statutes of limitations have not expired.
As of February 28, 2014, federal tax cost, aggregate gross unrealized appreciation and depreciation of securities held by the Funds were as follows:
| | | | | | | | | | | | | | | | |
| | | Federal Tax
Cost | | | Unrealized
Appreciation | | | Unrealized
Depreciation | | | Net Unrealized
Appreciation | |
Small Cap Value Fund | | $ | 56,329,042 | | | $ | 20,782,146 | | | $ | (2,273,230 | ) | | $ | 18,508,916 | |
Value Fund | | | 26,839,484 | | | | 11,020,562 | | | | (1,329,254 | ) | | | 9,691,308 | |
Distributions to shareholders from net investment income and realized gains are determined in accordance with federal income tax regulations, which may differ from net investment income and realized gains recognized for financial reporting purposes. Accordingly, the character of distributions and composition of net assets for tax purposes may differ from those reflected in the accompanying financial statements. To the extent these differences are permanent, such amounts are reclassified within the capital accounts based on the tax treatment; temporary differences do not require such reclassification.
As of August 31, 2013, the components of distributable earnings on a tax basis were as follows:
| | | | | | | | | | | | | | | | |
| | | Capital Loss
Carryforwards | | | Undistributed
Ordinary
Income | | | Undistributed
Long-Term Gains | | | Unrealized
Appreciation | |
Small Cap Value Fund | | $ | — | | | $ | 2,519,287 | | | $ | 5,456,047 | | | $ | 11,482,209 | |
Value Fund | | | (127,662,241 | ) | | | 132,641 | | | | — | | | | 2,109,143 | |
The differences between the book and tax basis components of distributable earnings relate principally to the timing of recognition of income and gains for federal income tax purposes. Short-term and foreign currency gains are reportable as ordinary income for federal income tax purposes.
The tax character of dividends and distributions paid during the fiscal year ended August 31, 2013 was as follows:
| | | | | | | | | | | | |
| | | Ordinary
Income | | | Long-Term
Gains | | | Total | |
Small Cap Value Fund | | $ | — | | | $ | — | | | $ | — | |
Value Fund | | | 339,819 | | | | — | | | | 339,819 | |
Dividends from net investment income and short-term capital gains are treated as ordinary income dividends for federal income tax purposes.
Accumulated capital losses represent net capital loss carry forwards as of August 31, 2013 that may be available to offset future realized capital gains and thereby reduce future capital gains distributions. Under the Regulated Investment
20
THE SCHNEIDER FUNDS
Notes to Financial Statements (Continued)
February 28, 2014 (Unaudited)
Company Modernization Act of 2010 (the “Modernization Act”), the Funds are permitted to carry forward capital losses incurred in taxable years beginning after December 22, 2010 for an unlimited period. Any losses incurred during those future taxable years will be required to be utilized prior to any losses incurred in pre-enactment taxable years. Additionally, post-enactment capital losses that are carried forward will retain their character as either short-term or long-term capital losses rather than being considered all short-term as under the previous law. The Funds’ first fiscal year end subject to the Modernization Act was August 31, 2012.
As of August 31, 2013, the Funds had the following pre-enactment net capital loss carryforwards to offset future net capital gains, if any, to the extent provided by Treasury regulations. To the extent that these carryforwards are used to offset future capital gains, it is probable that the gains that are offset will not be distributed to shareholders.
| | | | | | | | | | | | | | | | | | | | |
| | | August 31, 2016 | | | August 31, 2017 | | | August 31, 2018 | | | August 31, 2019 | | | Total | |
Small Cap Value Fund | | $ | — | | | $ | — | | | $ | — | | | $ | — | | | $ | — | |
Value Fund | | | 6,608,253 | | | | 75,945,572 | | | | 42,948,995 | | | | 2,159,421 | | | | 127,662,241 | |
As of August 31, 2013, the Funds did not have any post-enactment capital loss carryforwards.
The Funds may make secured loans of their portfolio securities to brokers, dealers and other financial institutions to earn additional income and receive cash collateral equal to at least 102% of the current market value of the loaned securities, as marked to market each day that the NAV of the Funds is determined. When the collateral falls below specified amounts, the lending agent will use its best effort to obtain additional collateral on the next business day to meet required amounts under the security lending agreement. The Funds will pay administrative and custodial fees in connection with the loan of securities. Collateral is invested in short-term investments and the Funds will bear the risk of loss of the invested collateral. Securities lending will expose the Funds to the risk of loss should a borrower default on its obligation to return the borrowed securities. The market value of the securities on loan and collateral as of February 28, 2014 and the income received for the six months ended February 28, 2014 were as follows:
| | | | | | | | | | | | |
| | | Fair Value of
Securities Loaned | | | Fair Value
of Collateral | | | Income Received
from Securities
Lending | |
Small Cap Value Fund | | $ | 8,932,792 | | | $ | 9,279,656 | | | $ | 33,362 | |
Value Fund | | | 2,429,414 | | | | 2,523,341 | | | | 9,133 | |
Securities lending transactions are entered into by each Fund under a Master Securities Lending Agreement (“MSLA”) which permits the Funds, under certain circumstances including an event of default (such as bankruptcy or insolvency), to offset amounts payable by the Funds to the same counterparty against amounts to be received and create one single net payment due to or from the Funds. The following table is a summary of each Fund’s open securities lending transactions which are subject to a MSLA as of February 28, 2014:
| | | | | | | | | | | | | | | | | | | | | | | | |
Securities Lending | | Gross Amounts of
Recognized Assets | | | Gross Amounts
Offset in the
Statement of
Assets and
Liabilities | | | Net Amounts of
Assets Presented in
the Statement of
Assets and Liabilities | | | Gross Amount Not Offset in the
Statement of Assets and Liabilities | |
| | | | | Financial
Instruments1 | | | Cash
Collateral
Received | | | Net
Amount | |
Small Cap Value Fund | | $ | 8,932,792 | | | $ | — | | | $ | 8,932,792 | | | $ | (8,932,792 | ) | | $ | — | | | $ | — | |
Value Fund | | | 2,429,414 | | | | — | | | | 2,429,414 | | | | (2,429,414 | ) | | | — | | | | — | |
| 1 | Amount disclosed is limited to the amount of assets presented in the Statement of Assets and Liabilities. Actual collateral received may be more than the amount shown. |
21
THE SCHNEIDER FUNDS
Notes to Financial Statements (Concluded)
February 28, 2014 (Unaudited)
Management has evaluated the impact of all subsequent events on the Funds through the date the financial statements were issued and have determined that there were no subsequent events requiring recognition or disclosure in the financial statements.
22
THE SCHNEIDER FUNDS
Other Information
(Unaudited)
Proxy Voting
Policies and procedures that the Funds use to determine how to vote proxies relating to portfolio securities as well as information regarding how the Funds voted proxies relating to portfolio securities for the most recent 12-month period ended June 30 are available without charge, upon request, by calling (888) 520-3277 and on the Securities and Exchange Commission’s (“SEC”) website at http://www.sec.gov.
Quarterly Portfolio Schedules
The Company files a complete schedule of portfolio holdings with the SEC for the first and third fiscal quarters of each fiscal year (quarters ended November 30 and May 31) on Form N-Q. The Company’s Form N-Q is available on the SEC website at http://www.sec.gov and may be reviewed and copied at the SEC Public Reference Room in Washington, D.C. Information on the operation of the SEC Public Reference Room may be obtained by calling (202) 551-8090.
23
Investment Adviser
Schneider Capital Management
460 E. Swedesford Road
Suite 1080
Wayne, PA 19087
Administrator
BNY Mellon Investment Servicing (US) Inc.
301 Bellevue Parkway
Wilmington, DE 19809
Transfer Agent
BNY Mellon Investment Servicing (US) Inc.
4400 Computer Drive
Westborough, MA 01581
Principal Underwriter
Foreside Funds Distributors LLC
400 Berwyn Park
899 Cassatt Road
Berwyn, PA 19312
Custodian
The Bank of New York Mellon
One Wall Street
New York, NY 10286
Independent Registered Public Accounting Firm
PricewaterhouseCoopers LLP
Two Commerce Square, Suite 1700
2001 Market Street
Philadelphia, PA 19103-7042
Counsel
Drinker Biddle & Reath LLP
One Logan Square, Ste. 2000
Philadelphia, PA 19103-6996

SUMMIT GLOBAL INVESTMENTS
U.S. LOW VOLATILITY EQUITY FUND
of
The RBB Fund, Inc.
Class I Shares
SEMI-ANNUAL REPORT
February 28, 2014
(Unaudited)
This report is submitted for the general information of the shareholders of the Fund.
It is not authorized for distribution unless preceded or accompanied by a current prospectus for the Fund.
SUMMIT GLOBAL INVESTMENTS
U.S. LOW VOLATILITY EQUITY FUND
Semi-Annual Investment Adviser’s Report
February 28, 2014
(Unaudited)
Dear Shareholder:
We recognize the confidence you have placed in us and we are continually grateful. It enables us to do what we love and enjoy everyday. I was asked by my son if I could do anything in this world what would it be. After answering, “be your dad”, he wanted a serious answer and I told him, “I would be doing exactly what I do now,” which is managing risk and return in the markets.
We firmly believe that investing with a long-term, risk-return perspective is key to experiencing superior risk-adjusted returns. While staying the course with a low volatility portfolio doesn’t eliminate risk, it can considerably lessen the effect of market volatility.
We sincerely value and believe strongly that return and risk must coincide and be effectively managed together. Investing in risk-adjusted returns must become more common. Investing in cap-weighted indexes, higher risk products or markets just for exposure without regard for the return of such investments seems unwarranted.
Investing for return must be weighed against the risk of the investments. As such, we continually look to be efficient and effective in providing shareholders with superior risk-adjusted equity returns, returns that correlate with the productivity of the underlying assets, as hedges against unforeseen events.
During the later part of 2013 and first part of 2014, U.S. equities continued to experience gains. The volatility of the market continued especially in January and February. And though the markets have experienced record highs, they have done so amidst both debt issues and varied U.S. economic data.
For the calendar year ended December 31, 2013, the Summit Global Investments U.S. Low Volatility Equity Fund’s shares rose 27.71% vs. 32.41% for the S&P 500 Index®. Risk-adjusted1, the S&P 500 Index® rose 25.6%, for the calendar year ended December 31, 2013. Thus the Fund outperformed the risk-adjusted Index by 2.11%. For the month of January 2014, the Fund’s shares returned -3.30% vs. -3.46% for the S&P 500 Index®. For the month of February 2014, the Fund’s shares rose 0.84% vs. 1.81% for the S&P 500 Index®. The beta2 for the Fund, as of February 28, 2014, was 0.79.
We have said for several quarters that large market events are being driven more by world events than ever before. U.S. markets do not stand alone, isolated from the world. U.S. companies are global companies. Their revenues and profits, business plans and investments, and ultimately success or failure are more correlated to global events than ever in history. As such, companies must be as strong or stronger, balance sheet wise, than the country in which they are headquartered. We must keep an eye on such events and company strength throughout the coming months and years.
In addition to global and political events, companies are unique in how each prepares, responds and survives the impact of such macro events and economic cycles. While some cycles may vary in length and events differ in impact, we believe, for U.S. equity exposure, the Summit Global Investments U.S. Low Volatility Equity Fund approach is effective over full market cycles.
Our philosophy to navigate such markets is simple and consistent throughout up and down markets. We believe that being invested in a low volatility equity portfolio over full market cycles provides lower price fluctuations, more consistent and reliable returns with smaller drawdowns, and adds increased diversification when combined with other investment strategies. Our approach takes into account each underlying company’s stock volatility, expected market return and how it correlates with other stocks within the portfolio, ultimately seeking to maximize return with an overall lower risk than a cap-weighted benchmark. As stated in the prospectus, the Fund seeks to outperform the S&P 500 Index® over a full market cycle while reducing overall volatility.
Financial markets are always unpredictable but there are several time-tested investment principles that may help put the odds in your favor. It is our sincere effort to follow such principles and provide long-term, risk-adjusted returns.
1
SUMMIT GLOBAL INVESTMENTS
U.S. LOW VOLATILITY EQUITY FUND
Semi-Annual Investment Adviser’s Report (Continued)
February 28, 2014
(Unaudited)
While we remain optimistic about the opportunities within the U.S. equity market, we remain focused on monitoring the risk of individual companies and the overall portfolio. During these times of continued uncertainty, we believe, for U.S. equity exposure, the Summit Global Investments U.S. Low Volatility Equity Fund approach is warranted.
Sincerely,
Summit Global Investments, LLC
| 1 | Risk-adjusted returns are simply taking the return of the index and multiplying that index by the beta of the Fund. |
| 2 | Beta means a measure of a security’s or portfolio’s volatility. A beta of 1 means that the security or portfolio is neither more nor less volatile or risky than the wider market. A beta of more than 1 indicates greater volatility and beta of less than 1 indicates less volatility. |
2
SUMMIT GLOBAL INVESTMENTS
U.S. LOW VOLATILITY EQUITY FUND
Performance Data
February 28, 2014
(Unaudited)
| | | | | | | | | | | | |
| Total Returns For the Period Ended February 28, 2014 | |
| | | Six Months* | | | One Year | | | Since
Inception* | |
Summit Global Investments U.S. Low Volatility Equity Fund - Class I Shares | | | 10.10% | | | | 17.54% | | | | 14.89% | |
S&P 500® Index** | | | 13.87% | | | | 22.76% | | | | 16.35% | |
| * | Annualized. The Fund commenced operations on February 29, 2012. |
| ** | Benchmark performance is from inception date of the Fund only and is not the inception date of the benchmark itself. |
Performance quoted is past performance and does not guarantee future results. The investment return and principal value of an investment in the Fund will fluctuate so that an investor’s shares, when redeemed, may be worth more or less than their original cost. Current performance may be lower or higher. Returns shown do not reflect taxes that a shareholder would pay on Fund distributions or on the redemption of Fund shares. Performance data current to the most recent month-end may be obtained by calling (855) 744-8500.
The Fund applies a 1.50% fee to the value of shares redeemed within 60 days of purchase. This redemption fee is not reflected in the returns shown above. The performance quoted reflects fee waivers in effect and would have been less in their absence. The Fund’s total annual gross and net operating expenses, as stated in the current prospectus dated December 31, 2013, are 2.74% and 0.98%, respectively, of average daily net assets for Class I Shares. These rates may fluctuate and may differ from the actual expenses incurred by the Fund for the period covered by this report. The Fund’s investment adviser has contractually agreed to waive management fees and/or reimburse certain expenses of the Fund through December 31, 2014 to the extent necessary to ensure that the Fund’s total operating expenses (excluding acquired fund fees and expenses, brokerage commissions, extraordinary items, interest or taxes) do not exceed 0.98% (on an annual basis) of the Fund’s average daily net assets (the “Expense Limitation”). The Expense Limitation shall remain in effect until December 31, 2014, unless the Board of Directors of The RBB Fund, Inc. approves its earlier termination.
The Fund invests in common stock, preferred stocks, warrants to acquire common stock and securities convertible into common stock. Portfolio composition is subject to change.
The Fund evaluates performance as compared to that of the Standard & Poor’s 500® Index (“S&P 500®”). The S&P 500® is a widely recognized, unmanaged index of 500 common stocks which are generally representative of the U.S. stock market as a whole. It is impossible to invest directly in an index.
3
SUMMIT GLOBAL INVESTMENTS
U.S. LOW VOLATILITY EQUITY FUND
Fund Expense Examples
(Unaudited)
As a shareholder of the Fund, you incur two types of costs: (1) transaction costs and (2) ongoing costs, including management fees and other Fund expenses. These examples are intended to help you understand your ongoing costs (in dollars) of investing in the Fund and to compare these costs with the ongoing costs of investing in other mutual funds.
These examples are based on an investment of $1,000 invested at the beginning of the six-month period from September 1, 2013 through February 28, 2014 and held for the entire period.
Actual Expenses
The first line of the accompanying table provides information about actual account values and actual expenses. You may use the information in this line, together with the amount you invested, to estimate the expenses that you paid over the period. Simply divide your account value by $1,000 (for example, an $8,600 account value divided by $1,000 = 8.6), then multiply the result by the number in the first line under the heading entitled “Expenses Paid During Period” to estimate the expenses you paid on your account during this period.
Hypothetical Examples for Comparison Purposes
The second line of the accompanying table provides information about hypothetical account values and hypothetical expenses based on the Fund’s actual expense ratio and an assumed rate of return of 5% per year before expenses, which is not your Fund’s actual return. The hypothetical account values and expenses may not be used to estimate the actual ending account balance or expenses you paid for the period. You may use this information to compare the ongoing costs of investing in the Fund and other funds. To do so, compare these 5% hypothetical examples with the 5% hypothetical examples that appear in the shareholder reports of other funds.
Please note that the expenses shown in the accompanying table are meant to highlight your ongoing costs only and do not reflect any transactional costs, such as redemption fees. Therefore, the second line of the accompanying table is useful in comparing ongoing costs only and will not help you determine the relative total costs of owning different funds. In addition, if these transactional costs were included, your costs would have been higher.
| | | | | | | | | | | | | | | |
| | | Class I Shares |
| | | Beginning Account Value
September 1, 2013 | | Ending Account Value
February 28, 2014 | | Expenses Paid
During Period* |
Actual | | | | $1,000.00 | | | | | $1,101.00 | | | | | $5.11 | |
Hypothetical (5% return before expenses) | | | | 1,000.00 | | | | | 1,019.93 | | | | | 4.91 | |
| * | Expenses are equal to the Fund’s annualized six month expense ratio of 0.98% for Class I Shares which includes waived fees and reimbursed expenses, multiplied by the average account value over the period multiplied by the number of days (181) in the most recent fiscal half year, then divided by 365 to reflect the one half year period. The Fund’s ending account values on the first line in the table is based on the actual six month total investment return for the Fund of 10.10% for Class I Shares. |
4
SUMMIT GLOBAL INVESTMENTS
U.S. LOW VOLATILITY EQUITY FUND
Portfolio Holdings Summary Table
February 28, 2014
(Unaudited)
The following table presents a summary by sector of the portfolio holdings of the Fund.
| | | | | | | | |
Security Type/Sector Classification | | % of Net
Assets | | | Value | |
COMMON STOCKS: | | | | | | | | |
Pharmaceuticals | | | 15.2 | % | | $ | 7,346,581 | |
Electric | | | 9.5 | | | | 4,600,861 | |
Retail | | | 9.2 | | | | 4,455,830 | |
Insurance | | | 6.4 | | | | 3,115,516 | |
Chemicals | | | 6.1 | | | | 2,933,837 | |
Software | | | 5.9 | | | | 2,839,120 | |
Food | | | 5.4 | | | | 2,627,335 | |
Semiconductors | | | 4.6 | | | | 2,209,552 | |
Computers | | | 4.2 | | | | 2,011,229 | |
Telecommunications | | | 3.9 | | | | 1,872,377 | |
Healthcare-Services | | | 3.8 | | | | 1,846,097 | |
Pipelines | | | 3.8 | | | | 1,838,850 | |
Household Products/Wares | | | 3.2 | | | | 1,543,110 | |
Healthcare-Products | | | 3.0 | | | | 1,459,174 | |
Banks | | | 3.0 | | | | 1,439,490 | |
Oil & Gas | | | 2.9 | | | | 1,405,432 | |
Commercial Services | | | 2.8 | | | | 1,332,674 | |
Internet | | | 1.1 | | | | 518,585 | |
Biotechnology | | | 0.7 | | | | 349,736 | |
Airlines | | | 0.6 | | | | 312,814 | |
Miscellaneous Manufacturing | | | 0.5 | | | | 239,673 | |
Cosmetics/Personal Care | | | 0.4 | | | | 201,370 | |
Savings & Loans | | | 0.2 | | | | 116,619 | |
Machinery-Diversified | | | 0.2 | | | | 101,397 | |
Oil & Gas Services | | | 0.2 | | | | 90,907 | |
Environmental Control | | | 0.2 | | | | 81,750 | |
Lodging | | | 0.1 | | | | 63,991 | |
Electronics | | | 0.1 | | | | 46,788 | |
Real Estate Investment Trusts | | | 0.1 | | | | 44,022 | |
Media | | | 0.1 | | | | 43,076 | |
Apparel | | | 0.1 | | | | 41,599 | |
Diversified Financial Services | | | 0.1 | | | | 39,863 | |
Transportation | | | 0.1 | | | | 32,562 | |
Other Assets in Excess of Liabilities | | | 2.3 | | | | 1,112,329 | |
| | | | | | | | |
NET ASSETS | | | 100.0 | % | | $ | 48,314,146 | |
| | | | | | | | |
Portfolio holdings are subject to change at any time.
The accompanying notes are an integral part of the financial statements.
5
SUMMIT GLOBAL INVESTMENTS U.S. LOW VOLATILITY EQUITY FUND
Portfolio of Investments
February 28, 2014
(Unaudited)
| | | | | | | | |
| | | Number
of Shares | | | Value | |
COMMON STOCKS - 97.7% | | | | | | | | |
Airlines — 0.6% | | | | | | | | |
Southwest Airlines Co. | | | 13,940 | | | $ | 312,814 | |
| | | | | | | | |
| | | | | | | 312,814 | |
| | | | | | | | |
Apparel — 0.1% | | | | | | | | |
VF Corp. | | | 710 | | | | 41,599 | |
| | | | | | | | |
| | | | | | | 41,599 | |
| | | | | | | | |
Banks — 3.0% | | | | | | | | |
KeyCorp | | | 3,530 | | | | 46,490 | |
US Bancorp | | | 33,860 | | | | 1,393,000 | |
| | | | | | | | |
| | | | | | | 1,439,490 | |
| | | | | | | | |
Biotechnology — 0.7% | | | | | | | | |
Amgen, Inc. | | | 2,820 | | | | 349,736 | |
| | | | | | | | |
| | | | | | | 349,736 | |
| | | | | | | | |
Chemicals — 6.1% | | | | | | | | |
FMC Corp. | | | 14,980 | | | | 1,156,156 | |
International Flavors & Fragrances, Inc. | | | 1,180 | | | | 110,672 | |
Praxair, Inc. | | | 360 | | | | 46,933 | |
Sigma-Aldrich Corp. | | | 17,160 | | | | 1,620,076 | |
| | | | | | | | |
| | | | | | | 2,933,837 | |
| | | | | | | | |
Commercial Services — 2.8% | | | | | | | | |
Cintas Corp. | | | 3,250 | | | | 197,145 | |
Total System Services, Inc. | | | 36,060 | | | | 1,098,388 | |
Western Union Co., (The) | | | 2,220 | | | | 37,141 | |
| | | | | | | | |
| | | | | | | 1,332,674 | |
| | | | | | | | |
Computers — 4.2% | | | | | | | | |
EMC Corp. | | | 46,200 | | | | 1,218,294 | |
Hewlett-Packard Co. | | | 1,180 | | | | 35,258 | |
International Business Machines Corp. | | | 240 | | | | 44,441 | |
NetApp, Inc. | | | 17,650 | | | | 713,236 | |
| | | | | | | | |
| | | | | | | 2,011,229 | |
| | | | | | | | |
Cosmetics/Personal Care — 0.4% | | | | | |
Procter & Gamble Co., (The) | | | 2,560 | | | | 201,370 | |
| | | | | | | | |
| | | | | | | 201,370 | |
| | | | | | | | |
Diversified Financial Services — 0.1% | | | | | |
CME Group, Inc. | | | 540 | | | | 39,863 | |
| | | | | | | | |
| | | | | | | 39,863 | |
| | | | | | | | |
Electric — 9.5% | | | | | | | | |
CMS Energy Corp. | | | 1,590 | | | | 45,204 | |
Dominion Resources, Inc. | | | 680 | | | | 47,192 | |
DTE Energy Co. | | | 600 | | | | 43,056 | |
Duke Energy Corp. | | | 18,150 | | | | 1,286,472 | |
Edison International | | | 1,180 | | | | 61,797 | |
Exelon Corp. | | | 15,500 | | | | 471,355 | |
PG&E Corp. | | | 1,180 | | | | 51,991 | |
Pinnacle West Capital Corp. | | | 1,180 | | | | 65,667 | |
PPL Corp. | | | 1,330 | | | | 42,946 | |
| | | | | | | | |
| | | Number
of Shares | | | Value | |
Electric — (Continued) | | | | | | | | |
SCANA Corp. | | | 2,700 | | | $ | 133,650 | |
Wisconsin Energy Corp. | | | 14,500 | | | | 637,420 | |
Xcel Energy, Inc. | | | 56,590 | | | | 1,714,111 | |
| | | | | | | | |
| | | | | | | 4,600,861 | |
| | | | | | | | |
Electronics — 0.1% | | | | | | | | |
Waters Corp.* | | | 420 | | | | 46,788 | |
| | | | | | | | |
| | | | | | | 46,788 | |
| | | | | | | | |
Environmental Control — 0.2% | | | | | | | | |
Republic Services, Inc. | | | 1,180 | | | | 40,250 | |
Waste Management, Inc. | | | 1,000 | | | | 41,500 | |
| | | | | | | | |
| | | | | | | 81,750 | |
| | | | | | | | |
Food — 5.4% | | | | | | | | |
ConAgra Foods, Inc. | | | 1,050 | | | | 29,819 | |
General Mills, Inc. | | | 5,300 | | | | 265,159 | |
Hormel Foods Corp. | | | 20,470 | | | | 971,302 | |
Kellogg Co. | | | 12,760 | | | | 774,404 | |
McCormick & Co., Inc. | | | 1,170 | | | | 77,688 | |
Sysco Corp. | | | 14,130 | | | | 508,963 | |
| | | | | | | | |
| | | | | | | 2,627,335 | |
| | | | | | | | |
Healthcare-Products — 3.0% | | | | | | | | |
Carefusion Corp.* | | | 1,100 | | | | 44,583 | |
DENTSPLY International, Inc. | | | 23,530 | | | | 1,067,791 | |
Stryker Corp. | | | 580 | | | | 46,539 | |
Varian Medical Systems, Inc.* | | | 3,190 | | | | 267,418 | |
Zimmer Holdings, Inc. | | | 350 | | | | 32,843 | |
| | | | | | | | |
| | | | | | | 1,459,174 | |
| | | | | | | | |
Healthcare-Services — 3.8% | | | | | | | | |
Cigna Corp. | | | 510 | | | | 40,591 | |
Humana, Inc. | | | 400 | | | | 44,984 | |
Quest Diagnostics, Inc. | | | 4,710 | | | | 249,630 | |
UnitedHealth Group, Inc. | | | 18,170 | | | | 1,403,996 | |
Wellpoint, Inc. | | | 1,180 | | | | 106,896 | |
| | | | | | | | |
| | | | | | | 1,846,097 | |
| | | | | | | | |
Household Products/Wares — 3.2% | | | | | |
Clorox Co., (The) | | | 17,680 | | | | 1,543,110 | |
| | | | | | | | |
| | | | | | | 1,543,110 | |
| | | | | | | | |
Insurance — 6.4% | | | | | | | | |
Berkshire Hathaway, Inc., Class B* | | | 1,930 | | | | 223,455 | |
Loews Corp. | | | 18,360 | | | | 798,293 | |
Marsh & McLennan Cos., Inc. | | | 8,850 | | | | 426,216 | |
Progressive Corp., (The) | | | 1,590 | | | | 38,939 | |
Torchmark Corp. | | | 20,460 | | | | 1,585,855 | |
Travelers Cos, Inc., (The) | | | 510 | | | | 42,758 | |
| | | | | | | | |
| | | | | | | 3,115,516 | |
| | | | | | | | |
The accompanying notes are an integral part of the financial statements.
6
SUMMIT GLOBAL INVESTMENTS U.S. LOW VOLATILITY EQUITY FUND
Portfolio of Investments (Continued)
February 28, 2014
(Unaudited)
| | | | | | | | |
| | | Number
of Shares | | | Value | |
Internet — 1.1% | | | | | | | | |
VeriSign, Inc.* | | | 9,410 | | | $ | 518,585 | |
| | | | | | | | |
| | | | | | | 518,585 | |
| | | | | | | | |
Lodging — 0.1% | | | | | | | | |
Marriott International, Inc., Class A | | | 1,180 | | | | 63,991 | |
| | | | | | | | |
| | | | | | | 63,991 | |
| | | | | | | | |
Machinery-Diversified — 0.2% | | | | | | | | |
Deere & Co. | | | 1,180 | | | | 101,397 | |
| | | | | | | | |
| | | | | | | 101,397 | |
| | | | | | | | |
Media — 0.1% | | | | | | | | |
News Corp., Class A* | | | 2,350 | | | | 43,076 | |
| | | | | | | | |
| | | | | | | 43,076 | |
| | | | | | | | |
Miscellaneous Manufacturing — 0.5% | | | | | |
General Electric Co. | | | 9,410 | | | | 239,673 | |
| | | | | | | | |
| | | | | | | 239,673 | |
| | | | | | | | |
Oil & Gas — 2.9% | | | | | | | | |
Chevron Corp. | | | 360 | | | | 41,519 | |
ConocoPhillips | | | 750 | | | | 49,875 | |
Denbury Resources, Inc. | | | 2,350 | | | | 38,446 | |
Exxon Mobil Corp. | | | 11,160 | | | | 1,074,373 | |
Marathon Oil Corp. | | | 4,710 | | | | 157,785 | |
Occidental Petroleum Corp. | | | 450 | | | | 43,434 | |
| | | | | | | | |
| | | | | | | 1,405,432 | |
| | | | | | | | |
Oil & Gas Services — 0.2% | | | | | | | | |
National Oilwell Varco, Inc. | | | 1,180 | | | | 90,907 | |
| | | | | | | | |
| | | | | | | 90,907 | |
| | | | | | | | |
Pharmaceuticals — 15.2% | | | | | | | | |
AbbVie, Inc. | | | 5,300 | | | | 269,823 | |
Eli Lilly & Co. | | | 20,390 | | | | 1,215,448 | |
Express Scripts Holding Co.* | | | 11,240 | | | | 846,484 | |
Forest Laboratories, Inc.* | | | 1,010 | | | | 98,546 | |
Johnson & Johnson | | | 3,810 | | | | 350,977 | |
Merck & Co., Inc. | | | 32,820 | | | | 1,870,412 | |
Perrigo Co., Plc* | | | 4,710 | | | | 774,512 | |
Pfizer, Inc. | | | 35,510 | | | | 1,140,226 | |
Zoetis, Inc. | | | 25,150 | | | | 780,153 | |
| | | | | | | | |
| | | | | | | 7,346,581 | |
| | | | | | | | |
Pipelines — 3.8% | | | | | | | | |
Kinder Morgan, Inc. | | | 1,180 | | | | 37,583 | |
Spectra Energy Corp. | | | 47,010 | | | | 1,752,533 | |
Williams COS, Inc. (The) | | | 1,180 | | | | 48,734 | |
| | | | | | | | |
| | | | | | | 1,838,850 | |
| | | | | | | | |
Real Estate Investment Trusts — 0.1% | | | | | |
Crown Castle International Corp. | | | 580 | | | | 44,022 | |
| | | | | | | | |
| | | | | | | 44,022 | |
| | | | | | | | |
Retail — 9.2% | | | | | | | | |
Bed Bath & Beyond, Inc.* | | | 580 | | | | 39,336 | |
| | | | | | | | |
| | | Number
of Shares | | | Value | |
Retail — (Continued) | | | | | | | | |
Coach, Inc. | | | 1,180 | | | $ | 57,596 | |
Costco Wholesale Corp. | | | 12,430 | | | | 1,451,824 | |
Dollar Tree, Inc.* | | | 13,350 | | | | 731,180 | |
Kohl’s Corp. | | | 8,590 | | | | 482,672 | |
McDonald’s Corp. | | | 4,560 | | | | 433,884 | |
Nordstrom, Inc. | | | 1,180 | | | | 72,546 | |
O’Reilly Automotive, Inc.* | | | 310 | | | | 46,764 | |
Urban Outfitters, Inc.* | | | 1,180 | | | | 44,179 | |
Wal-Mart Stores, Inc. | | | 14,670 | | | | 1,095,849 | |
| | | | | | | | |
| | | | | | | 4,455,830 | |
| | | | | | | | |
Savings & Loans — 0.2% | | | | | | | | |
People’s United Financial, Inc. | | | 8,230 | | | | 116,619 | |
| | | | | | | | |
| | | | | | | 116,619 | |
| | | | | | | | |
Semiconductors — 4.6% | | | | | | | | |
Intel Corp. | | | 39,420 | | | | 976,039 | |
Linear Technology Corp. | | | 6,890 | | | | 322,728 | |
Microchip Technology, Inc. | | | 1,010 | | | | 46,006 | |
NVIDIA Corp. | | | 47,050 | | | | 864,779 | |
| | | | | | | | |
| | | | | | | 2,209,552 | |
| | | | | | | | |
Software — 5.9% | | | | | | | | |
Adobe Systems, Inc.* | | | 890 | | | | 61,063 | |
Fidelity National Information Services, Inc. | | | 7,630 | | | | 424,304 | |
Fiserv, Inc.* | | | 890 | | | | 51,664 | |
Intuit, Inc. | | | 18,760 | | | | 1,466,094 | |
Microsoft Corp. | | | 18,210 | | | | 697,625 | |
Oracle Corp. | | | 1,180 | | | | 46,150 | |
Paychex, Inc. | | | 1,050 | | | | 43,848 | |
Red Hat, Inc.* | | | 820 | | | | 48,372 | |
| | | | | | | | |
| | | | | | | 2,839,120 | |
| | | | | | | | |
Telecommunications — 3.9% | |
AT&T, Inc. | | | 25,880 | | | | 826,348 | |
Harris Corp. | | | 3,530 | | | | 260,585 | |
Motorola Solutions, Inc. | | | 710 | | | | 47,002 | |
Verizon Communications, Inc. | | | 15,520 | | | | 738,442 | |
| | | | | | | | |
| | | | | | | 1,872,377 | |
| | | | | | | | |
Transportation — 0.1% | | | | | | | | |
United Parcel Service, Inc., Class B | | | 340 | | | | 32,562 | |
| | | | | | | | |
| | | | | | | 32,562 | |
| | | | | | | | |
TOTAL COMMON STOCKS
(Cost $44,153,441) | | | | | | | 47,201,817 | |
| | | | | | | | |
The accompanying notes are an integral part of the financial statements.
7
SUMMIT GLOBAL INVESTMENTS U.S. LOW VOLATILITY EQUITY FUND
Portfolio of Investments (Concluded)
February 28, 2014
(Unaudited)
| | | | |
| | | Value | |
TOTAL INVESTMENTS - 97.7%
(Cost $44,153,441) | | $ | 47,201,817 | |
| | | | |
OTHER ASSETS IN EXCESS OF
LIABILITIES - 2.3% | | | 1,112,329 | |
| | | | |
NET ASSETS - 100.0% | | $ | 48,314,146 | |
| | | | |
| * | Non-income producing security. |
PLC Public Limited Company
The accompanying notes are an integral part of the financial statements.
8
SUMMIT GLOBAL INVESTMENTS
U.S. LOW VOLATILITY EQUITY FUND
Statement of Assets and Liabilities
February 28, 2014
(Unaudited)
| | | | |
ASSETS | | | | |
Investments, at value (Cost $44,153,441) | | $ | 47,201,817 | |
Cash | | | 1,045,438 | |
Receivables for: | | | | |
Capital shares sold | | | 11,750 | |
Dividends | | | 99,830 | |
Prepaid expenses and other assets | | | 22,329 | |
| | | | |
Total assets | | | 48,381,164 | |
| | | | |
| |
LIABILITIES | | | | |
Payables for: | | | | |
Capital shares redeemed | | | 5,000 | |
Transfer agent fees | | | 19,680 | |
Audit fees | | | 13,110 | |
Investment advisory fees | | | 11,733 | |
Administration and accounting services fees | | | 8,461 | |
Other accrued expenses and liabilities | | | 9,034 | |
| | | | |
Total liabilities | | | 67,018 | |
| | | | |
Net Assets | | $ | 48,314,146 | |
| | | | |
NET ASSETS CONSISTS OF | | | | |
Par value | | $ | 3,792 | |
Paid-in capital | | | 44,361,352 | |
Undistributed net investment income | | | 79,984 | |
Accumulated net realized gain from investments | | | 820,642 | |
Net unrealized appreciation on investments | | | 3,048,376 | |
| | | | |
Net Assets | | $ | 48,314,146 | |
| | | | |
| |
I SHARES: | | | | |
Net Assets applicable to Class I Shares | | $ | 48,314,146 | |
| | | | |
Shares outstanding ($0.001 par value, 100,000,000 shares authorized) | | | 3,791,504 | |
| | | | |
Net asset value, offering and redemption price per share | | $ | 12.74 | |
| | | | |
The accompanying notes are an integral part of the financial statements.
9
SUMMIT GLOBAL INVESTMENTS
U.S. LOW VOLATILITY EQUITY FUND
Statement of Operations
For the Six Months Ended February 28, 2014
(Unaudited)
| | | | |
INVESTMENT INCOME | | | | |
Dividends and interest | | $ | 370,659 | |
| | | | |
Total investment income | | | 370,659 | |
| | | | |
EXPENSES | | | | |
Advisory fees (Note 2) | | | 130,475 | |
Administration and accounting services fees (Note 2) | | | 56,281 | |
Transfer agent fees (Note 2) | | | 21,502 | |
Audit fees | | | 13,066 | |
Custodian fees (Note 2) | | | 11,878 | |
Registration and filing fees | | | 11,674 | |
Directors’ and officers’ fees | | | 9,750 | |
Legal fees | | | 5,959 | |
Printing and shareholder reporting fees | | | 830 | |
Other expenses | | | 2,888 | |
| | | | |
Total expenses before waivers and reimbursements | | | 264,303 | |
Less: waivers and reimbursements (Note 2) | | | (81,638 | ) |
| | | | |
Net expenses after waivers and reimbursements | | | 182,665 | |
| | | | |
Net investment income | | | 187,994 | |
| | | | |
NET REALIZED AND UNREALIZED GAIN FROM INVESTMENTS | | | | |
Net realized gain from: | | | | |
Investments | | | 984,536 | |
Net change in unrealized appreciation on: | | | | |
Investments | | | 2,162,880 | |
| | | | |
Net realized and unrealized gain from investments | | | 3,147,416 | |
| | | | |
NET INCREASE IN NET ASSETS RESULTING FROM OPERATIONS | | $ | 3,335,410 | |
| | | | |
The accompanying notes are an integral part of the financial statements.
10
SUMMIT GLOBAL INVESTMENTS
U.S. LOW VOLATILITY EQUITY FUND
Statements of Changes in Net Assets
| | | | | | | | |
| | | For the
Six Months Ended
February 28, 2014
(Unaudited) | | | For the
Year Ended
August 31, 2013 | |
INCREASE IN NET ASSETS FROM OPERATIONS: | | | | | | | | |
Net investment income | | $ | 187,994 | | | $ | 176,086 | |
Net realized gain from investments | | | 984,536 | | | | 540,905 | |
Net change in unrealized appreciation on investments | | | 2,162,880 | | | | 788,121 | |
| | | | | | | | |
Net increase in net assets resulting from operations | | | 3,335,410 | | | | 1,505,112 | |
| | | | | | | | |
| | |
DIVIDENDS AND DISTRIBUTIONS TO SHAREHOLDERS FROM: | | | | | | | | |
Class I Shares | | | | | | | | |
Net investment income | | | (250,235 | ) | | | (44,910 | ) |
Net realized gains | | | (668,384 | ) | | | (60,335 | ) |
| | | | | | | | |
Net decrease in net assets from dividends and distributions to shareholders | | | (918,619 | ) | | | (105,245 | ) |
| | | | | | | | |
CAPITAL TRANSACTIONS: | | | | | | | | |
Capital Transactions: | | | | | | | | |
Class I Shares | | | | | | | | |
Proceeds from shares sold | | | 20,945,170 | | | | 25,571,238 | |
Reinvestment of distributions | | | 918,422 | | | | 105,245 | |
Shares redeemed | | | (1,604,290 | ) | | | (5,040,783 | ) |
Redemption fees | | | 17 | | | | 21 | |
| | | | | | | | |
Net increase in net assets from capital share transactions | | | 20,259,319 | | | | 20,635,721 | |
| | | | | | | | |
Total increase in net assets | | | 22,676,110 | | | | 22,035,588 | |
| | | | | | | | |
NET ASSETS | | | | | | | | |
Beginning of period | | | 25,638,036 | | | | 3,602,448 | |
| | | | | | | | |
End of period | | $ | 48,314,146 | | | $ | 25,638,036 | |
| | | | | | | | |
Undistributed net investment income, end of period | | $ | 79,984 | | | $ | 142,225 | |
| | | | | | | | |
CAPITAL SHARE TRANSACTIONS: | | | | | | | | |
Class I Shares | | | | | | | | |
Shares sold | | | 1,683,319 | | | | 2,227,473 | |
Shares reinvested | | | 74,607 | | | | 10,248 | |
Shares redeemed | | | (129,318 | ) | | | (428,636 | ) |
| | | | | | | | |
Net increase in shares | | | 1,628,608 | | | | 1,809,085 | |
| | | | | | | | |
The accompanying notes are an integral part of the financial statements.
11
SUMMIT GLOBAL INVESTMENTS
U.S. LOW VOLATILITY EQUITY FUND
Financial Highlights
Contained below is per share operating performance data for shares outstanding, total investment return, ratios to average net assets and other supplemental data for the representative periods. This information has been derived from information provided in the financial statements.
| | | | | | | | | | | | | | | |
| | | Class I Shares |
| | | For the Six Months Ended
February 28, 2014
(Unaudited) | | For the
Year Ended
August 31, 2013 | | For the Period
February 29, 2012 to
August 31, 2012(1) |
Per Share Operating Performance | | | | | | | | | | | | | | | |
Net asset value, beginning of period | | | $ | 11.85 | | | | $ | 10.18 | | | | $ | 10.00 | |
| | | | | | | | | | | | | | | |
Net investment income(2) | | | | 0.06 | | | | | 0.15 | | | | | 0.08 | |
Net realized and unrealized gain from investments(3) | | | | 1.13 | | | | | 1.64 | | | | | 0.10 | |
| | | | | | | | | | | | | | | |
Total from operations | | | | 1.19 | | | | | 1.79 | | | | | 0.18 | |
| | | | | | | | | | | | | | | |
Distributions to shareholders from: | | | | | | | | | | | | | | | |
Net investment income | | | | (0.08 | ) | | | | (0.05 | ) | | | | — | |
Net realized gains | | | | (0.22 | ) | | | | (0.07 | ) | | | | — | |
| | | | | | | | | | | | | | | |
Total Distributions | | | | (0.30 | ) | | | | (0.12 | ) | | | | — | |
| | | | | | | | | | | | | | | |
Net asset value, end of period | | | $ | 12.74 | | | | $ | 11.85 | | | | $ | 10.18 | |
| | | | | | | | | | | | | | | |
Total investment return(4) | | | | 10.10 | %(5) | | | | 17.78 | % | | | | 1.80 | %(5) |
| | | | | | | | | | | | | | | |
Ratios/Supplemental Data | | | | | | | | | | | | | | | |
Net assets, end of period (000’s omitted) | | | $ | 48,314 | | | | $ | 25,638 | | | | $ | 3,602 | |
Ratio of expenses to average net assets with waivers and reimbursements | | | | 0.98 | %(6) | | | | 0.98 | % | | | | 0.98 | %(6) |
Ratio of expenses to average net assets without waivers and reimbursements | | | | 1.45 | %(6) | | | | 2.74 | % | | | | 20.03 | %(6) |
Ratio of net investment income to average net assets | | | | 1.01 | %(6) | | | | 1.34 | % | | | | 1.64 | %(6) |
Portfolio turnover rate | | | | 68 | %(5) | | | | 81 | % | | | | 95 | %(5) |
| (1) | The Fund commenced investment operations on February 29, 2012. |
| (2) | The selected per share data was calculated based on average shares outstanding method for the period. |
| (3) | The amount shown may not correlate with the change in the aggregate gains and losses due to the timing of sales and purchases of the Fund’s shares in relation to fluctuating market values for the Fund’s portfolio. |
| (4) | Total investment return is calculated assuming a purchase of shares on the first day and a sale of shares on the last day of each period reported and includes reinvestments of dividends and distributions, if any. |
The accompanying notes are an integral part of the financial statements.
12
SUMMIT GLOBAL INVESTMENTS U.S. LOW VOLATILITY EQUITY FUND
Notes to Financial Statements
February 28, 2014
(Unaudited)
1. Organization and Significant Accounting Policies
The RBB Fund, Inc. (“RBB” or the “Company”) was incorporated under the laws of the State of Maryland on February 29, 1988 and is registered under the Investment Company Act of 1940, as amended, (the “Investment Company Act”) as an open-end management investment company. RBB is a “series fund,” which is a mutual fund divided into separate portfolios. Each portfolio is treated as a separate entity for certain matters under the Investment Company Act, and for other purposes, and, a shareholder of one portfolio is not deemed to be a shareholder of any other portfolio. Currently, RBB has twenty-one active investment portfolios, including the Summit Global Investments U.S. Low Volatility Equity Fund (the “Fund”), which commenced investment operations on February 29, 2012. As of February 28, 2014, the Fund offers three classes of shares, Class A Shares, Retail Shares and Class I Shares. As of February 28, 2014, Class A Shares and Retail Shares have not been issued.
RBB has authorized capital of one hundred billion shares of common stock of which 81.373 billion shares are currently classified into one hundred and forty-eight classes of common stock. Each class represents an interest in an active or inactive RBB investment portfolio. The Fund has issued shares with a par value of $0.001.
Portfolio Valuation– The Fund’s net asset value (“NAV”) is calculated once daily at the close of regular trading hours on the New York Stock Exchange (“NYSE”) (typically 4:00 p.m. Eastern time) on each day the NYSE is open. Securities held by the Fund are valued using the closing price or the last sale price on a national securities exchange or the National Association of Securities Dealers Automatic Quotation System (“NASDAQ”) market system where they are primarily traded. Equity securities traded in the over-the-counter market are valued at their closing prices. If there were no transactions on that day, securities traded principally on an exchange or on NASDAQ will be valued at the mean of the last bid and ask prices prior to the market close. Investments in other open-end investment companies, if any, are valued based on the NAV of those investment companies (which may use fair value pricing as disclosed in their prospectuses). If market quotations are unavailable or deemed unreliable, securities will be valued in accordance with procedures adopted by the Company’s Board of Directors. Relying on prices supplied by pricing services or dealers or using fair valuation may result in values that are higher or lower than the values used by other investment companies and investors to price the same investments.
Fair Value Measurements – The inputs and valuation techniques used to measure fair value of the Fund’s investments are summarized into three levels as described in the hierarchy below:
| | | | | | | | |
| | — Level 1 | | | — | | | quoted prices in active markets for identical securities; |
| | | |
| | — Level 2 | | | — | | | other significant observable inputs (including quoted prices for similar securities, interest rates, prepayment speeds, credit risk, etc.); and |
| | | |
| | — Level 3 | | | — | | | significant unobservable inputs (including the Fund’s own assumptions in determining the fair value of investments). |
The inputs or methodology used for valuing securities are not necessarily an indication of the risk associated with investing in those securities.
13
SUMMIT GLOBAL INVESTMENTS U.S. LOW VOLATILITY EQUITY FUND
Notes to Financial Statements (Continued)
February 28, 2014
(Unaudited)
The following is a summary of the inputs used, as of February 28, 2014, in valuing the Fund’s investments carried at fair value:
| | | | | | | | | | | | | | | | |
| | | Total Value at
February 28,
2014 | | | Level 1
Quoted
Price | | | Level 2
Other
Significant
Observable
Inputs | | | Level 3
Significant
Unobservable
Inputs | |
Investments in Securities* | | $ | 47,201,817 | | | $ | 47,201,817 | | | | — | | | | — | |
| | | | | | | | | | | | | | | | |
|
* Please refer to Portfolio of Investments for further details. | |
At the end of each calendar quarter, management evaluates the classification of Levels 1, 2 and 3 assets and liabilities. Various factors are considered, such as changes in liquidity from the prior reporting period; whether or not a broker is willing to execute at the quoted price; the depth and consistency of prices from third party pricing services; and the existence of contemporaneous, observable trades in the market. Additionally, management evaluates the classification of Level 1 and Level 2 assets and liabilities on a quarterly basis for changes in listings or delistings on national exchanges.
For fair valuations using significant unobservable inputs, U.S. generally accepted accounting principles (“U.S. GAAP”) require the Fund to present a reconciliation of the beginning to ending balances for reported market values that presents changes attributable to total realized and unrealized gains or losses, purchase and sales, and transfers in and out of Level 3 during the period. Transfers in and out between Levels are based on values at the end of the period. U.S. GAAP also requires the Fund to disclose amounts and reasons for all transfers in and out of Level 1 and Level 2 fair value measurements. A reconciliation of Level 3 investments is presented only when the Fund had an amount of Level 3 investments at the end of the reporting period that was meaningful in relation to its net assets. The amounts and reasons for all transfers in and out of each Level within the three-tier hierarchy are disclosed when the Fund had an amount of total transfers during the reporting period that was meaningful in relation to its net assets as of the end of the reporting period.
For the six months ended February 28, 2014, there were no transfers between Levels 1, 2 and 3 for the Fund.
Use of Estimates — The preparation of financial statements in conformity with U.S. GAAP requires management to make estimates and assumptions that affect the reported amounts of assets and liabilities and disclosure of contingent assets and liabilities at the date of the financial statements and the reported amounts of revenues and expenses during the period. Actual results could differ from those estimates and those differences could be significant.
Investment Transactions, Investment Income and Expenses — The Fund records security transactions based on trade date for financial reporting purposes. The cost of investments sold is determined by use of the specific identification method for both financial reporting and income tax purposes in determining realized gains and losses on investments. Interest income is accrued when earned. Dividend income is recorded on the ex-dividend date. Distributions received on securities that represent a return of capital or capital gains are recorded as a reduction of cost of investments and/or as a realized gain. The Fund’s policy is to allocate investment income, expenses and unrealized and realized gains and losses among classes on a daily basis, when applicable. Expenses incurred on behalf of a specific class, fund or fund family are charged directly to the class, fund or fund family to each class of shares based upon the relative proportion of net assets of each class at the beginning of the day. Expenses incurred for all the RBB funds (such as director or professional fees) are charged to all funds in proportion to their average net assets of RBB, or in such other manner as the Company’s Board of Directors deems fair or equitable. Expenses and fees, including investment advisory and administration fees, are accrued daily and taken into account for the purpose of determining the NAV of the Fund.
14
SUMMIT GLOBAL INVESTMENTS U.S. LOW VOLATILITY EQUITY FUND
Notes to Financial Statements (Continued)
February 28, 2014
(Unaudited)
Dividends and Distributions to Shareholders — Dividends from net investment income, if any, are declared and paid quarterly. Net realized capital gains, if any, are declared and paid annually. Income dividends and capital gain distributions are determined in accordance with U.S. federal income tax regulations which may differ from U.S. GAAP.
U.S. Tax Status — No provision is made for U.S. income taxes as it is the Fund’s intention to qualify for and elect the tax treatment applicable to regulated investment companies under Subchapter M of the Internal Revenue Code of 1986, as amended, and make the requisite distributions to its shareholders which will be sufficient to relieve it from U.S. income and excise taxes.
Cash and Cash Equivalents — The Fund considers liquid assets deposited into a bank demand deposit account to be cash equivalents. These investments represent amounts held with financial institutions that are readily accessible to pay Fund expenses or purchase investments. Cash and cash equivalents are valued at cost plus accrued interest, which approximates market value.
Redemption Fees — The Fund retains a redemption fee of 1.50% on redemptions of Fund shares held less than 60 days. The fees are reflected on the Statements of Changes in Net Assets. The Fund reserves the right to modify or eliminate the redemption fees or waivers at any time.
Other — In the normal course of business, the Fund may enter into contracts that provide general indemnifications. The Fund’s maximum exposure under these arrangements is dependent on claims that may be made against the Fund in the future, and, therefore, cannot be estimated; however, based on experience, the risk of material loss from such claims is considered remote.
2. Investment Adviser and Other Services
Summit Global Investments, LLC (“Summit” or the “Adviser”) serves as the Fund’s investment adviser. For its advisory services, the Adviser is entitled to receive a monthly fee from the Fund calculated at an annual rate of 0.70% of the Fund’s average daily net assets.
Summit has contractually agreed to waive its management fees and/or reimburse expenses, to the extent that total annual operating expenses (excluding certain items discussed below) exceed 1.23% of the average daily net assets for Class A Shares and Retail Shares (Class A Shares and Retail Shares have not commenced operations as of February 28, 2014) and 0.98% of the average daily net assets for Class I Shares. In determining Summit’s obligation to waive advisory fees and/or reimburse expenses, the following expenses are not taken into account: acquired fund fees and expenses, brokerage commissions, extraordinary items, interest or taxes. This contractual limitation is in effect until December 31, 2014 and may not be terminated before December 31, 2014 without approval by the Company’s Board of Directors. If at any time during the three years from January 1, 2014 through December 31, 2016 in which the advisory agreement is in effect, the Fund’s Total Annual Fund Operating Expenses for that year are less than 1.23% of the average daily net assets attributable to the Fund’s Class A Shares or Retail Shares or less than 0.98% of the average daily net assets attributable to the Fund’s Class I Shares, the Adviser is entitled to reimbursement by the Fund of the advisory fees forgone and other payments remitted by the Adviser to the Fund during such three-year period. For the six months ended February 28, 2014, investment advisory fees accrued were $130,475, of which $81,638 were waived by the Adviser. As of February 28, 2014, the amounts available for recoupment were $151,293 and $81,638 expiring in 2016 and 2017, respectively.
BNY Mellon Investment Servicing (US) Inc. (“BNY Mellon”) serves as administrator for the Fund. For providing administrative and accounting services, BNY Mellon is entitled to receive a monthly fee equal to an annual percentage rate of the Fund’s average daily net assets, subject to certain minimum monthly fees.
15
SUMMIT GLOBAL INVESTMENTS U.S. LOW VOLATILITY EQUITY FUND
Notes to Financial Statements (Continued)
February 28, 2014
(Unaudited)
Included in the administration and accounting service fees, shown on the Statement of Operations, are fees for providing regulatory administration services to RBB. For providing these services, BNY Mellon is entitled to receive compensation as agreed to by the Company and BNY Mellon. This fee is allocated to each portfolio of the Company in proportion to its net assets of the Company.
In addition, BNY Mellon serves as the Fund’s transfer and dividend disbursing agent. For providing these transfer agent services, BNY Mellon is entitled to receive a monthly fee equal to an annual percentage rate of the Fund’s average daily net assets, subject to certain minimum monthly fees.
The Bank of New York Mellon (the “Custodian”) provides certain custodial services to the Fund. The Custodian is entitled to receive a monthly fee equal to an annual percentage rate of the Fund’s average daily net assets, subject to certain minimum monthly fees.
Foreside Funds Distributors LLC, serves as the principal underwriter and distributor of Fund’s shares pursuant to a Distribution Agreement with RBB.
3. Director Compensation
The Directors of the Company receive an annual retainer and meeting fees for meetings attended. The aggregate remuneration paid to the Directors by the Fund during the six months ended February 28, 2014 was $4,395. Certain employees of BNY Mellon serve as an Officer or Director of the Company. They are not compensated by the Fund or the Company.
4. Investment in Securities
For the six months ended February 28, 2014, aggregate purchases and sales of investment securities (excluding short-term investments) of the Fund were as follows:
| | | | | | | | |
| | | Purchases | | | Sales | |
Investment Securities | | $ | 44,192,893 | | | $ | 24,748,800 | |
5. Federal Income Tax Information
The Fund has followed the authoritative guidance on accounting for and disclosure of uncertainty in tax positions, which requires the Fund to determine whether a tax position is more likely than not to be sustained upon examination, including resolution of any related appeals or litigation processes, based on the technical merits of the position. The Fund has determined that there was no effect on the financial statements from following this authoritative guidance. In the normal course of business, the Fund is subject to examination by federal, state and local jurisdictions, where applicable, for tax years for which applicable statutes of limitations have not expired.
As of February 28, 2014, the federal tax cost, aggregate gross unrealized appreciation and depreciation of securities held by the Fund were as follows:
| | | | |
Federal tax cost | | $ | 44,153,441 | |
| | | | |
Gross unrealized appreciation | | $ | 3,307,954 | |
Gross unrealized depreciation | | | (259,578 | ) |
| | | | |
Net unrealized appreciation | | $ | 3,048,376 | |
| | | | |
16
SUMMIT GLOBAL INVESTMENTS U.S. LOW VOLATILITY EQUITY FUND
Notes to Financial Statements (Concluded)
February 28, 2014
(Unaudited)
Distributions to shareholders, if any, from net investment income and realized gains are determined in accordance with federal income tax regulations, which may differ from net investment income and realized gains recognized for financial reporting purposes. Accordingly, the character of distributions and composition of net assets for tax purposes may differ from those reflected in the accompanying financial statements. To the extent these differences are permanent, such amounts are reclassified within the capital accounts based on the tax treatment; temporary differences do not require such reclassification.
As of August 31, 2013, the components of distributable earnings on a tax basis were as follows:
| | | | | | | | | | |
Undistributed Ordinary Income | | Undistributed
Long-Term Gains | | Net Unrealized
Appreciation |
$643,787 | | | | $21,016 | | | | | $867,408 | |
The differences between the book and tax basis components of distributable earnings relate primarily to the timing of recognition of income and gains for federal income tax purposes. Short-term and foreign currency gains are reported as ordinary income for federal income tax purposes.
The tax character of dividends and distributions paid during the fiscal year ended August 31, 2013 was as follows:
| | | | | | | | | | |
Ordinary
Income | | Long-Term
Gains | | Total |
$105,245 | | | | $— | | | | | $105,245 | |
Under the Regulated Investment Company Modernization Act of 2010 (the “Modernization Act”), the Fund is permitted to carry forward capital losses incurred in taxable years beginning after December 22, 2010 for an unlimited period. Additionally, post-enactment capital losses that are carried forward will retain their character as either short-term or long-term capital losses rather than being considered all short-term as under the previous law. The Fund’s first fiscal year-end subject to the Modernization Act was August 31, 2012. As of August 31, 2013, the Fund did not have any capital loss carryforwards.
6. Subsequent Events
Management has evaluated the impact of all subsequent events on the Fund though the date the financial statements were issued, and has determined that there were subsequent events requiring recognition or disclosure in the financial statements.
17
SUMMIT GLOBAL INVESTMENTS
U.S. LOW VOLATILITY EQUITY FUND
Other Information
(Unaudited)
Proxy Voting
Policies and procedures that the Fund uses to determine how to vote proxies relating to portfolio securities as well as information regarding how the Fund voted proxies relating to portfolio securities for the most recent six-month period ended June 30 are available without charge, upon request, by calling (855) 744-8500 and on the Securities and Exchange Commission’s (“SEC”) website at http://www.sec.gov.
Quarterly Portfolio Schedules
The Company will file its complete schedule of portfolio holdings with the SEC for the first and third fiscal quarters of each fiscal year (quarters ended November 30 and May 31) on Form N-Q. The Company’s Forms N-Q will be available on the SEC’s website at http://www.sec.gov and may be reviewed and copied at the SEC’s Public Reference Room in Washington, D.C. Information on the operation of the SEC’s Public Reference Room may be obtained by calling (202) 551-8090.
18
[THIS PAGE INTENTIONALLY LEFT BLANK.]
[THIS PAGE INTENTIONALLY LEFT BLANK.]
[THIS PAGE INTENTIONALLY LEFT BLANK.]
[THIS PAGE INTENTIONALLY LEFT BLANK.]
Investment Adviser
Summit Global Investments, LLC
620 South Main Street
Bountiful, UT 84010
Administrator
BNY Mellon Investment Servicing (US) Inc.
301 Bellevue Parkway
Wilmington, DE 19809
Transfer Agent
BNY Mellon Investment Servicing (US) Inc.
4400 Computer Drive
Westborough, MA 01581
Principal Underwriter
Foreside Funds Distributors LLC
400 Berwyn Park
899 Cassatt Road
Berwyn, PA 19312
Custodian
The Bank of New York Mellon
One Wall Street
New York, NY 10286
Independent Registered Public Accounting Firm
Ernst & Young LLP
One Commerce Square
2005 Market Street, Suite 700
Philadelphia, PA 19103
Legal Counsel
Drinker, Biddle & Reath LLP
One Logan Square, Ste. 2000
Philadelphia, PA 19103
Item 2. Code of Ethics.
Not applicable.
Item 3. Audit Committee Financial Expert.
Not applicable.
Item 4. Principal Accountant Fees and Services.
Not applicable.
Item 5. Audit Committee of Listed Registrants.
Not applicable.
Item 6. Investments.
| (a) | Schedule of Investments in securities of unaffiliated issuers as of the close of the reporting period is included as part of the report to shareholders filed under Item 1 of this Form. |
Item 7. Disclosure of Proxy Voting Policies and Procedures for Closed-End Management Investment
Companies.
Not applicable.
Item 8. Portfolio Managers of Closed-End Management Investment Companies.
Not applicable.
Item 9. Purchases of Equity Securities by Closed-End Management Investment Company and
Affiliated Purchasers.
Not applicable.
Item 10. Submission of Matters to a Vote of Security Holders.
There have been no material changes to the procedures by which the shareholders may recommend nominees to the registrant’s board of directors, where those changes were implemented after the registrant last provided disclosure in response to the requirements of Item 407(c)(2)(iv) of Regulation S-K (17 CFR 229.407) (as required by Item 22(b)(15) of Schedule 14A (17 CFR 240.14a-101)), or this Item.
Item 11. Controls and Procedures.
| | (a) | The registrant’s principal executive and principal financial officers, or persons performing similar functions, have concluded that the registrant’s disclosure controls and procedures (as defined in Rule 30a-3(c) under the Investment Company Act of 1940, as amended (the “1940 Act”) (17 CFR 270.30a-3(c))) are effective, as of a date within 90 days of the filing date of the report that includes the disclosure required by this paragraph, based on their evaluation of these controls and procedures required by Rule 30a-3(b) under the 1940 Act (17 CFR 270.30a-3(b)) and Rules 13a-15(b) or 15d-15(b) under the Securities Exchange Act of 1934, as amended (17 CFR 240.13a-15(b) or 240.15d-15(b)). |
| | (b) | There were no changes in the registrant’s internal control over financial reporting (as defined in Rule 30a-3(d) under the 1940 Act (17 CFR 270.30a-3(d)) that occurred during the registrant’s second fiscal quarter of the period covered by this report that has materially affected, or is reasonably likely to materially affect, the registrant’s internal control over financial reporting. |
Item 12. Exhibits.
| | | | | | |
| | (a)(1) | | Not applicable. | | |
| | |
| | (a)(2) | | Certifications pursuant to Rule 30a-2(a) under the 1940 Act and Section 302 of the Sarbanes-Oxley Act of 2002 are attached hereto. |
| | | |
| | (a)(3) | | Not applicable. | | |
| | |
| | (b) | | Certifications pursuant to Rule 30a-2(b) under the 1940 Act and Section 906 of the Sarbanes-Oxley Act of 2002 are attached hereto. |
SIGNATURES
Pursuant to the requirements of the Securities Exchange Act of 1934 and the Investment Company Act of 1940, the registrant has duly caused this report to be signed on its behalf by the undersigned, thereunto duly authorized.
| | | | |
| (Registrant) | | The RBB Fund, Inc. | | |
| | | | |
| | |
By (Signature and Title)* | | /s/ Salvatore Faia | | |
| | Salvatore Faia, President | | |
| | (principal executive officer) | | |
Pursuant to the requirements of the Securities Exchange Act of 1934 and the Investment Company Act of 1940, this report has been signed below by the following persons on behalf of the registrant and in the capacities and on the dates indicated.
| | | | |
By (Signature and Title)* | | /s/ Salvatore Faia | | |
| | Salvatore Faia, President | | |
| | (principal executive officer) | | |
| | | | |
By (Signature and Title)* | | /s/ Joel Weiss | | |
| | Joel Weiss, Treasurer | | |
| | (principal financial officer) | | |
* Print the name and title of each signing officer under his or her signature.