UNITED STATES
SECURITIES AND EXCHANGE COMMISSION
Washington, D.C. 20549
FORM N-CSR
CERTIFIED SHAREHOLDER REPORT OF REGISTERED
MANAGEMENT INVESTMENT COMPANIES
Investment Company Act file number 811-05518
THE RBB FUND, INC.
(Exact name of registrant as specified in charter)
Bellevue Park Corporate Center
103 Bellevue Parkway
Wilmington, DE 19809
(Address of principal executive offices) (Zip code)
Salvatore Faia
BNY Mellon Investment Servicing (US) Inc.
103 Bellevue Parkway
Wilmington, DE 19809
(Name and address of agent for service)
Registrant’s telephone number, including area code: 302-791-1851
Date of fiscal year end: August 31
Date of reporting period: February 29, 2012
Form N-CSR is to be used by management investment companies to file reports with the Commission not later than 10 days after the transmission to stockholders of any report that is required to be transmitted to stockholders under Rule 30e-1 under the Investment Company Act of 1940 (17 CFR 270.30e-1). The Commission may use the information provided on Form N-CSR in its regulatory, disclosure review, inspection, and policymaking roles.
A registrant is required to disclose the information specified by Form N-CSR, and the Commission will make this information public. A registrant is not required to respond to the collection of information contained in Form N-CSR unless the Form displays a currently valid Office of Management and Budget (“OMB”) control number. Please direct comments concerning the accuracy of the information collection burden estimate and any suggestions for reducing the burden to Secretary, Securities and Exchange Commission, 100 F Street, NE, Washington, DC 20549. The OMB has reviewed this collection of information under the clearance requirements of 44 U.S.C. § 3507.
Item 1. Reports to Stockholders.
The Report to Shareholders is attached herewith.
|
BEAR STEARNS CUFS® MLP MORTGAGE PORTFOLIO of THE RBB FUND, INC.
SEMI-ANNUAL REPORT
February 29, 2012 (Unaudited)
This report is submitted for the general information of the shareholders of the Portfolio. It is not authorized for distribution unless preceded or accompanied by a current prospectus for the Portfolio. |

BEAR STEARNS CUFS® MLP
MORTGAGE PORTFOLIO
PERFORMANCE DATA
FEBRUARY 29, 2012
(UNAUDITED)
| TOTAL RETURNSASOF FEBRUARY 29, 2012
| ||||||||||||||||||||
| Six-Month* | 1 Year | Average Annual Total Returns 3 Year | Average Annual Total Returns 5 Year | Average Annual Total Returns Since Inception** | ||||||||||||||||
Bear Stearns CUFS® MLP Mortgage Portfolio 1 | 1.48 | % | 2.24 | % | 10.85 | % | 1.06 | % | 1.28 | % | ||||||||||
Barclay’s Capital U.S. Treasury Bills 1 to 3 Month Index 2 | 0.01 | % | 0.05 | % | 0.11 | % | 1.20 | % | 1.34 | % | ||||||||||
1 Month LIBOR 3 | 0.13 | % | 0.24 | % | 0.28 | % | 1.65 | % | 1.81 | % | ||||||||||
Performance quoted is past performance and does not guarantee future results. Investment return and principal value will fluctuate so that shares, when redeemed, may be worth more or less than their original cost. Current performance may be lower or higher than the returns quoted above. Call CUFS® at 1-800-519-CUFS (2837) for returns current to the most recent month-end. The Portfolio’s gross and net annual operating expense ratio, as stated in the most recent prospectus, is 0.88%. The performance data reflects fee waivers and expense reimbursements. The returns would have been lower if these waivers and expense reimbursements were not in effect.
Portfolio composition is subject to change and risk.
| * | Not annualized. |
| ** | The inception date of the Portfolio was December 19, 2006. |
| 1 | Net of fees and expenses. |
| 2 | The Barclay’s Capital U.S. Treasury Bills 1-3 Month Index includes all publicly issued zero-coupon U.S. Treasury Bills that have a remaining maturity of less than 3 months and more than 1 month, are rated investment grade, and have $250 million or more of outstanding face value. It is not possible to invest directly in an index. |
| 3 | The 1-Month LIBOR is a constant maturity index of the London Interbank Offering Rate established to reflect the total return of the 1-Month LIBOR rate. Source: Merrill Lynch. |
1
BEAR STEARNS CUFS® MLP
MORTGAGE PORTFOLIO
FUND EXPENSE EXAMPLE
(UNAUDITED)
As a shareholder of the Portfolio, you incur two types of costs: (1) transaction costs and (2) ongoing costs, including management fees and other Portfolio expenses. The example is intended to help you understand your ongoing costs (in dollars) of investing in the Portfolio and to compare these costs with the ongoing costs of investing in other mutual funds.
These examples are based on an investment of $1,000 that was invested at the beginning of the period from September 1, 2011 through February 29, 2012, and held for the entire period.
ACTUAL EXPENSES
The first line of the accompanying table provides information about actual account values and actual expenses. You may use the information in this line, together with the amount you invested, to estimate the expenses that you paid over the period. Simply divide your account value by $1,000 (for example, an $8,600 account value divided by $1,000 = 8.6), then multiply the result by the number in the first line under the heading entitled “Expenses Paid During Period” to estimate the expenses you paid on your account during this period.
HYPOTHETICAL EXAMPLEFOR COMPARISON PURPOSES
The second line of the accompanying table provides information about hypothetical account values and hypothetical expenses based on the Portfolio’s actual expense ratio and an assumed rate of return of 5% per year before expenses, which is not the Portfolio’s actual return. The hypothetical account values and expenses may not be used to estimate the actual ending account balance or expenses you paid for the period. You may use this information to compare the ongoing costs of investing in the Portfolio and other funds. To do so, compare these 5% hypothetical examples with the 5% hypothetical examples that appear in the shareholder reports of other funds.
Please note that the expenses shown in the accompanying table are meant to highlight your ongoing costs only and do not reflect any transactional costs. Therefore, the second line of the accompanying table is useful in comparing ongoing costs only, and will not help you determine the relative total costs of owning different funds. In addition, if any transactional costs were included, your costs would have been higher.
| BEGINNING ACCOUNT VALUE SEPTEMBER 1, 2011 | ENDING ACCOUNT VALUE FEBRUARY 29, 2012 | EXPENSES PAID DURING PERIOD* | ||||||||||
Actual | $ | 1,000.00 | $ | 1,014.76 | $ | 4.06 | ||||||
Hypothetical | 1,000.00 | 1,020.84 | 4.07 | |||||||||
| * | Expenses are equal to the Portfolio’s annualized six-month expense ratio of 0.81%, which includes waived fees or reimbursed expenses, multiplied by the number of days (182) in the most recent fiscal half-year, then divided by 366 to reflect the one-half year period. The Portfolio’s ending account value on the first line is based on the actual six-month total return of 1.48%. |
2
BEAR STEARNS CUFS® MLP
MORTGAGE PORTFOLIO
PORTFOLIO HOLDINGS SUMMARY TABLE
FEBRUARY 29, 2012
(UNAUDITED)
The following table presents a summary by security type of the portfolio holdings of the Fund:
SECURITY TYPE/INDUSTRY CLASSIFICATION | % OF NET ASSETS | VALUE | ||||||
GOVERNMENT AGENCY MORTGAGE-BACKED SECURITIES | 60.9 | % | $ | 75,070,238 | ||||
COLLATERALIZED MORTGAGE OBLIGATIONS | 31.4 | 38,661,257 | ||||||
MORTGAGE DERIVATIVES | 8.2 | 10,070,340 | ||||||
SHORT TERM OBLIGATIONS | 0.1 | 169,998 | ||||||
TBA SALE COMMITMENTS | (5.2 | ) | (6,392,813 | ) | ||||
OTHER ASSETS IN EXCESS OF LIABILITIES | 4.6 | 5,637,136 | ||||||
|
|
|
| |||||
NET ASSETS | 100.0 | % | $ | 123,216,156 | ||||
|
|
|
| |||||
Portfolio holdings are subject to change at any time.
The accompanying notes are an integral part of the financial statements.
3
BEAR STEARNS CUFS® MLP
MORTGAGE PORTFOLIO
PORTFOLIOOF INVESTMENTS
FEBRUARY 29, 2012 (UNAUDITED)
| MOODY’S/ S&P (b) | PAR (000’S) | MARKET VALUE | ||||||||||
GOVERNMENT AGENCY MORTGAGE-BACKED |
| |||||||||||
FEDERAL HOME LOAN MORTGAGE |
| |||||||||||
5.000% 05/01/18 | Aaa/AA+ | $ | 645 | $ | 690,929 | |||||||
5.000% 09/01/19 | Aaa/AA+ | 926 | 999,586 | |||||||||
5.000% 09/01/20 | Aaa/AA+ | 745 | 803,973 | |||||||||
4.500% 11/01/20 | Aaa/AA+ | 591 | 633,380 | |||||||||
4.500% 06/01/21 | Aaa/AA+ | 832 | 892,401 | |||||||||
4.500% 12/01/21 | Aaa/AA+ | 801 | 859,349 | |||||||||
4.500% 08/01/22 | Aaa/AA+ | 1,491 | 1,598,841 | |||||||||
4.500% 08/01/22 | Aaa/AA+ | 1,215 | 1,303,286 | |||||||||
5.000% 03/01/23 | Aaa/AA+ | 298 | 325,267 | |||||||||
5.000% 04/01/23 | Aaa/AA+ | 646 | 706,209 | |||||||||
5.000% 10/01/23 | Aaa/AA+ | 2,507 | 2,741,341 | |||||||||
5.000% 04/01/25 | Aaa/AA+ | 2,181 | 2,379,197 | |||||||||
5.000% 03/01/26 | Aaa/AA+ | 551 | 601,544 | |||||||||
2.521% 08/01/36 (a) | Aaa/AA+ | 1,543 | 1,644,820 | |||||||||
2.450% 09/01/36 (a) | Aaa/AA+ | 688 | 734,157 | |||||||||
2.480% 11/01/36 (a) | Aaa/AA+ | 1,243 | 1,313,276 | |||||||||
5.634% 08/01/37 (a) | Aaa/AA+ | 1,712 | 1,828,421 | |||||||||
|
| |||||||||||
| 20,055,977 | ||||||||||||
|
| |||||||||||
FEDERAL NATIONAL MORTGAGE |
| |||||||||||
5.000% 06/01/18 | Aaa/AA+ | 833 | 901,553 | |||||||||
5.000% 02/01/19 | Aaa/AA+ | 1,002 | 1,084,153 | |||||||||
5.000% 04/01/19 | Aaa/AA+ | 666 | 721,203 | |||||||||
5.000% 07/01/19 | Aaa/AA+ | 964 | 1,052,933 | |||||||||
4.500% 03/01/20 | Aaa/AA+ | 1,585 | 1,702,903 | |||||||||
5.000% 04/01/21 | Aaa/AA+ | 727 | 786,659 | |||||||||
5.000% 06/01/23 | Aaa/AA+ | 353 | 387,203 | |||||||||
4.500% 10/01/23 | Aaa/AA+ | 7,450 | 8,077,923 | |||||||||
5.000% 03/01/25 | Aaa/AA+ | 992 | 1,084,825 | |||||||||
5.000% 09/01/25 | Aaa/AA+ | 2,102 | 2,291,065 | |||||||||
5.000% 11/01/25 | Aaa/AA+ | 677 | 737,780 | |||||||||
5.000% 06/01/27 | Aaa/AA+ | 375 | 407,809 | |||||||||
2.064% 12/01/34 (a) | Aaa/AA+ | 2,882 | 3,027,707 | |||||||||
2.380% 10/01/36 (a) | Aaa/AA+ | 346 | 368,711 | |||||||||
2.535% 10/01/36 (a) | Aaa/AA+ | 639 | 684,411 | |||||||||
3.399% 12/01/36 (a) | Aaa/AA+ | 378 | 383,506 | |||||||||
5.500% 12/01/36 | Aaa/AA+ | 182 | 199,657 | |||||||||
5.534% 09/01/37 (a) | Aaa/AA+ | 1,046 | 1,117,448 | |||||||||
5.500% 07/01/39 | Aaa/AA+ | 4,899 | 5,369,260 | |||||||||
4.500% 04/01/40 | Aaa/AA+ | 7,151 | 7,626,570 | |||||||||
4.000% 03/01/42 TBA | Aaa/AA+ | 11,000 | 11,574,062 | |||||||||
|
| |||||||||||
| 49,587,341 | ||||||||||||
|
| |||||||||||
GOVERNMENT NATIONAL MORTGAGE |
| |||||||||||
4.000% 05/20/26 | Aaa/AA+ | 5,034 | 5,426,920 | |||||||||
|
| |||||||||||
TOTAL GOVERNMENT AGENCY |
| 75,070,238 | ||||||||||
|
| |||||||||||
| MOODY’S/ S&P (b) | PAR (000’S) | MARKET VALUE | ||||||||||
MORTGAGE DERIVATIVES—8.2% |
| |||||||||||
FANNIE MAE (IO)—6.4% |
| |||||||||||
4.500% 12/01/18 | Aaa/AA+ | $ | 2,604 | $ | 206,920 | |||||||
4.500% 01/01/19 | Aaa/AA+ | 2,562 | 202,396 | |||||||||
4.500% 03/01/20 | Aaa/AA+ | 1,062 | 92,018 | |||||||||
4.500% 03/01/20 | Aaa/AA+ | 1,097 | 96,128 | |||||||||
5.500% 05/25/23 | Aaa/AA+ | 739 | 89,489 | |||||||||
5.500% 12/25/24 | Aaa/AA+ | 2,417 | 202,505 | |||||||||
5.500% 10/25/31 | Aaa/AA+ | 7,715 | 524,404 | |||||||||
6.906% 02/25/32 (a) | Aaa/AA+ | 1,727 | 122,836 | |||||||||
7.606% 04/25/32 (a) | Aaa/AA+ | 1,577 | 254,535 | |||||||||
6.806% 09/25/32 (a) | Aaa/AA+ | 2,092 | 188,710 | |||||||||
5.000% 10/01/33 | Aaa/AA+ | 4,724 | 568,407 | |||||||||
5.000% 12/01/33 (a) | Aaa/AA+ | 905 | 118,072 | |||||||||
5.000% 12/01/33 | Aaa/AA+ | 1,480 | 173,282 | |||||||||
5.000% 07/25/34 | Aaa/AA+ | 1,373 | 193,709 | |||||||||
6.456% 01/25/35 (a) | Aaa/AA+ | 10,155 | 1,843,233 | |||||||||
5.500% 04/01/36 | Aaa/AA+ | 3,040 | 420,608 | |||||||||
5.500% 04/01/36 | Aaa/AA+ | 4,590 | 616,960 | |||||||||
7.056% 08/25/36 (a) | Aaa/AA+ | 2,872 | 531,081 | |||||||||
6.366% 09/25/36 (a) | Aaa/AA+ | 16,570 | 907,946 | |||||||||
5.000% 10/01/36 | Aaa/AA+ | 3,466 | 501,398 | |||||||||
|
| |||||||||||
| 7,854,637 | ||||||||||||
|
| |||||||||||
FREDDIE MAC (IO)—1.1% |
| |||||||||||
6.237% 06/15/36 (a) | Aaa/AA+ | 1,750 | 266,960 | |||||||||
6.332% 09/15/36 (a) | Aaa/AA+ | 3,308 | 547,851 | |||||||||
6.402% 11/15/36 (a) | Aaa/AA+ | 3,284 | 538,296 | |||||||||
|
| |||||||||||
| 1,353,107 | ||||||||||||
|
| |||||||||||
NON-AGENCY (IO)—0.7% |
| |||||||||||
CWALT Series 2006-43CB (b) |
| |||||||||||
6.000% 02/25/37 | C | (e) | 4,653 | 862,596 | ||||||||
|
| |||||||||||
TOTAL MORTGAGE DERIVATIVES |
| 10,070,340 | ||||||||||
|
| |||||||||||
COLLATERALIZED MORTGAGE |
| |||||||||||
Banc of America Mortgage | ||||||||||||
Series | ||||||||||||
2.755% 09/25/35 | CC/CCC | 2,000 | 1,460,216 | |||||||||
Banc of America Mortgage | ||||||||||||
Series 2006-B (a) | ||||||||||||
2.299% 10/20/46 | CCC | 2,139 | 990,081 | |||||||||
Banc of America Mortgage | ||||||||||||
Series 2007-3 (b) | ||||||||||||
6.000% 09/25/37 | C/CCC | 2,630 | 2,337,295 | |||||||||
Citigroup Mortgage | ||||||||||||
Series 2007-AR8 (a) | ||||||||||||
5.165% 07/25/37 | Caa3/D | 2,428 | 1,551,491 | |||||||||
The accompanying notes are an integral part of the financial statements.
4
BEAR STEARNS CUFS® MLP
MORTGAGE PORTFOLIO
PORTFOLIOOF INVESTMENTS (CONTINUED)
FEBRUARY 29, 2012 (UNAUDITED)
| MOODY’S/ S&P (b) | PAR (000’S) | MARKET VALUE | ||||||||||
COLLATERALIZED MORTGAGE OBLIGATIONS—(CONTINUED) |
| |||||||||||
Countrywide Asset-Backed Certificates |
| |||||||||||
Series 2004-AB2 (a) |
| |||||||||||
0.844% 05/25/36 | C/B- | $ | 500 | $ | 60,640 | |||||||
CWALT Series 2006-43CB (b) |
| |||||||||||
6.000% 02/25/37 | D/D | 509 | 346,699 | |||||||||
CWALT Series 2006-J2, A3 |
| |||||||||||
6.000% 04/25/36 | Caa3/D | 3,534 | 2,643,977 | |||||||||
CWALT Series 2007-2CB |
| |||||||||||
5.750% 03/25/37 | C/D | 1,037 | 15,486 | |||||||||
CWALT Series 2007-J2 (b) |
| |||||||||||
6.000% 07/25/37 | Caa3/C | 1,162 | 908,371 | |||||||||
Fannie Mae REMICS |
| |||||||||||
Series 2005-25 (a) |
| |||||||||||
0.594% 04/25/35 | Aaa/AA+ | 1,401 | 1,397,871 | |||||||||
First Horizon Asset Securities, Inc. |
| |||||||||||
Series 2006-AR1 (a) (b) |
| |||||||||||
2.604% 05/25/36 | C/CC | 2,367 | 479,378 | |||||||||
Freddie Mac REMICS |
| |||||||||||
Series 2590 |
| |||||||||||
5.000% 03/15/18 | Aaa/AA+ | 5,000 | 5,403,116 | |||||||||
Freddie Mac REMICS |
| |||||||||||
Series 2752 (a) |
| |||||||||||
0.599% 12/15/30 | Aaa/AA+ | 129 | 129,142 | |||||||||
Freddie Mac REMICS |
| |||||||||||
Series 2992, Class JP |
| |||||||||||
4.750% 06/15/35 | Aaa/AA+ | 2,294 | 2,455,339 | |||||||||
Ginnie Mae |
| |||||||||||
Series 2009-103 |
| |||||||||||
4.500% 02/20/36 | Aaa/AA+ | 3,714 | 3,901,111 | |||||||||
Ginnie Mae |
| |||||||||||
Series 2009-61 |
| |||||||||||
4.500% 03/20/34 | Aaa/AA+ | 4,955 | 5,143,653 | |||||||||
Ginnie Mae |
| |||||||||||
Series 2009-65 |
| |||||||||||
5.500% 07/20/39 | Aaa/AA+ | 2,001 | 2,186,989 | |||||||||
JPMorgan Mortgage Trust |
| |||||||||||
Series 2005-A4 (a) (c) |
| |||||||||||
5.062% 07/25/35 | Ba1/BBB- | 467 | 437,036 | |||||||||
JPMorgan Mortgage Trust |
| |||||||||||
Series 2005-A6 (a) (b) (c) |
| |||||||||||
2.766% 08/25/35 | B/B | 455 | 397,855 | |||||||||
Residential Asset Securitiation Trust |
| |||||||||||
Series 2007-A5 |
| |||||||||||
6.000% 05/25/37 | Caa2/CCC | 1,000 | 756,449 | |||||||||
Residential Funding Mortgage Securities I |
| |||||||||||
Series 2006-SA4 (a) |
| |||||||||||
3.707% 11/25/36 | Caa3/D | 3,691 | 2,571,810 | |||||||||
Washington Mutual, Inc. |
| |||||||||||
Series 2007-HY3 (a) (b) |
| |||||||||||
2.613% 03/25/37 | D/D | 668 | 12,531 | |||||||||
MOODY’S/ | PAR (000’S) | MARKET VALUE | ||||||||
COLLATERALIZED MORTGAGE OBLIGATIONS—(CONTINUED) |
| |||||||||
Washington Mutual, Inc. | ||||||||||
Series 2007-HY4 (a) (b) | ||||||||||
4.856% 04/25/37 | CCC/C | $ | 2,511 | $ | 1,720,350 | |||||
Wells Fargo Mortgage Backed Securities Trust |
| |||||||||
Series 2007-10 (b) |
| |||||||||
6.250% 07/25/37 | B2/CCC | 1,430 | 1,354,371 | |||||||
|
| |||||||||
TOTAL COLLATERALIZED MORTGAGE OBLIGATIONS |
| 38,661,257 | ||||||||
|
| |||||||||
SHORT TERM OBLIGATIONS—0.1% |
| |||||||||
U.S. TREASURY BILL—0.1% | ||||||||||
U.S. Treasury Bill (d) (f) | ||||||||||
0.005% 03/15/12 | Aaa/AA+ | 170 | 169,998 | |||||||
|
| |||||||||
TOTAL SHORT TERM OBLIGATIONS |
| 169,998 | ||||||||
|
| |||||||||
TOTAL INVESTMENTS—100.6% |
| 123,971,833 | ||||||||
|
| |||||||||
TBA SALE COMMITMENTS—(5.2)% |
| |||||||||
FANNIE MAE—(5.2)% | ||||||||||
4.500% 03/01/42 TBA | Aaa/AA+ | (6,000 | ) | (6,392,813 | ) | |||||
|
| |||||||||
TOTAL TBA SALE COMMITMENTS |
| (6,392,813 | ) | |||||||
|
| |||||||||
OTHER ASSETS IN EXCESS OF LIABILITIES (g)—4.6% |
| 5,637,136 | ||||||||
|
| |||||||||
NET ASSETS—100.0% |
| $ | 123,216,156 | |||||||
|
| |||||||||
CWALT Countrywide Alternative Loan Trust
| IO | Interest Only |
| TBA | To Be Announced |
| (a) | Adjustable rate security. Interest rate varies due to interest rate fluctuations, or, in the case of certain asset-backed securities, interest payment shortfalls. |
| (b) | Where Moody’s and S&P’s rating is not available, Fitch rating is substituted, if available. |
| (c) | Security was purchased prior to the Portfolio’s affiliation with JPMorgan Chase & Co. |
| (d) | Rate represents the yield at the time of purchase. |
| (e) | Not rated by Moody’s or S&P, Fitch rating is substituted. |
The accompanying notes are an integral part of the financial statements.
5
BEAR STEARNS CUFS® MLP
MORTGAGE PORTFOLIO
PORTFOLIOOF INVESTMENTS (CONCLUDED)
FEBRUARY 29, 2012 (UNAUDITED)
(f) All or a portion of the security held as collateral for the following Futures contracts open at February 29, 2012:
NUMBEROF CONTRACTS | TYPE | EXPIRATION MONTH | VALUE AT TRADE DATE | VALUE AT 02/29/2012 | UNREALIZED APPRECIATION (DEPRECIATION)* | |||||||||||||
Long Positions: | ||||||||||||||||||
| U.S. Treasury | ||||||||||||||||||
90 | 10 Year Note | 06/2012 | $ | 11,778,263 | $ | 11,785,781 | $ | 7,518 | ||||||||||
Short Positions: | ||||||||||||||||||
| U.S. Treasury | ||||||||||||||||||
26 | 2 Year Note | 06/2012 | 5,725,750 | 5,726,094 | 344 | |||||||||||||
| U.S. Treasury | ||||||||||||||||||
46 | 5 Year Note | 06/2012 | 5,667,454 | 5,665,906 | (1,548 | ) | ||||||||||||
|
| |||||||||||||||||
| $ | 6,314 | |||||||||||||||||
|
| |||||||||||||||||
(g) Assets in excess of other liabilities include interest rate swaps as follows:
COUNTERPARTY | TERMINATION DATE | NOTIONAL AMOUNT (000) | FIXED RATE | FLOATING RATE | VALUE AT 02/29/2012 | UNREALIZED EPRECIATION* | ||||||||||||||
Deutsche Bank** | 09/17/2013 | $ | 20,000 | 4.520 | % | 3 MONTH LIBOR | $ | (1,617,747 | ) | $ | (1,617,747 | ) | ||||||||
|
|
|
| |||||||||||||||||
| * | Primary risk exposure is interest rate contracts. |
| ** | Portfolio pays the fixed rate and receives the floating rate. |
The accompanying notes are an integral part of the financial statements.
6
BEAR STEARNS CUFS® MLP
MORTGAGE PORTFOLIO
STATEMENTOF ASSETSAND LIABILITIES
FEBRUARY 29, 2012
(UNAUDITED)
ASSETS | ||||
Investments, at value† | $ | 123,971,833 | ||
Cash | 10,695,722 | |||
Segregated cash | 1,751,492 | |||
Receivables | ||||
Investments sold | 6,401,572 | |||
Dividends and interest | 453,614 | |||
Prepaid expenses and other assets | 24,759 | |||
|
| |||
Total assets | 143,298,992 | |||
|
| |||
LIABILITIES | ||||
TBA sale commitments, at value†† | 6,392,813 | |||
Unrealized depreciation on swap agreements* | 1,617,747 | |||
Payables | ||||
Investments purchased | 11,598,672 | |||
Distributions to shareholders | 326,299 | |||
Investment adviser | 46,738 | |||
Variation margin due to broker | 27,688 | |||
Other accrued expenses and liabilities | 72,879 | |||
|
| |||
Total liabilities | 20,082,836 | |||
|
| |||
Net Assets | $ | 123,216,156 | ||
|
| |||
NET ASSETS CONSISTOF: | ||||
Par value | $ | 15,085 | ||
Paid-in capital | 150,314,189 | |||
Distributions in excess of net investment income | (101,596 | ) | ||
Accumulated net realized loss from investments, futures transactions, TBA sale commitments, and swap agreements | (16,965,766 | ) | ||
Net unrealized depreciation from investments, futures transactions, TBA sale commitments, and swap agreements | (10,045,756 | ) | ||
|
| |||
Net Assets | $ | 123,216,156 | ||
|
| |||
Shares outstanding ($0.001 par value, 100,000,000 shares authorized) | 15,085,138 | |||
|
| |||
Net asset value, offering and redemption price per share | $ | 8.17 | ||
|
| |||
†Investment in securities, at cost | $ | 132,409,906 | ||
†† TBA sale commitments, proceeds | $ | 6,396,563 | ||
|
|
| * | Primary risk exposure is interest rate contracts. |
The accompanying notes are an integral part of the financial statements.
7
BEAR STEARNS CUFS® MLP
MORTGAGE PORTFOLIO
STATEMENTOF OPERATIONS
FORTHE SIX MONTHS ENDED FEBRUARY 29, 2012
(UNAUDITED)
INVESTMENT INCOME | ||||
Interest | $ | 2,504,565 | ||
|
| |||
Total investment income | 2,504,565 | |||
|
| |||
EXPENSES | ||||
Advisory fees | 293,523 | |||
Administration and accounting fees | 89,981 | |||
Audit fees | 26,246 | |||
Transfer agent fees | 20,224 | |||
Legal fees | 20,219 | |||
Custodian fees | 13,298 | |||
Directors’ and officers’ fees | 11,048 | |||
Registration and filing fees | 7,394 | |||
Insurance | 5,227 | |||
Printing and shareholder reporting fees | 4,894 | |||
Other expenses | 3,296 | |||
|
| |||
Total expenses | 495,350 | |||
|
| |||
Net investment income | 2,009,215 | |||
|
| |||
NET REALIZEDAND UNREALIZED GAIN/(LOSS) FROM INVESTMENTS, FUTURES TRANSACTIONS, TBA SALE COMMITMENTS,AND SWAP AGREEMENTS | ||||
Net realized gain/(loss) from: | ||||
Investments | (5,351,633 | ) | ||
Futures* | 75,937 | |||
TBA sale commitments | (252,226 | ) | ||
Swap agreements* | (426,522 | ) | ||
|
| |||
Total realized gain/(loss) from investments, futures transactions, TBA sale commitments, and swap agreements | (5,954,444 | ) | ||
|
| |||
Net change in unrealized appreciation/(depreciation) on: | ||||
Investments | 5,303,538 | |||
Futures* | (6,082 | ) | ||
TBA sale commitments | 22,499 | |||
Swap agreements* | 424,368 | |||
|
| |||
Total net changes in unrealized appreciation/(depreciation) on investments, futures transactions, TBA sale commitments, and swap agreements | 5,744,323 | |||
|
| |||
Net realized and unrealized gain/(loss) on investments, futures transactions, TBA sale commitments, and swap agreements | (210,121 | ) | ||
|
| |||
NET INCREASEIN NET ASSETS RESULTING FROM OPERATIONS | $ | 1,799,094 | ||
|
|
| * | Primary risk exposure is interest rate contracts. |
The accompanying notes are an integral part of the financial statements.
8
BEAR STEARNS CUFS® MLP
MORTGAGE PORTFOLIO
STATEMENTSOF CHANGESIN NET ASSETS
| FOR THE SIX MONTHS ENDED FEBRUARY 29, 2012 (UNAUDITED) | FOR THE YEAR ENDED AUGUST 31, 2011 | |||||||
INCREASE/(DECREASE)IN NET ASSETS FROM OPERATIONS: | ||||||||
Net investment income | $ | 2,009,215 | $ | 4,536,381 | ||||
Net realized gain/(loss) from investments, futures transactions, TBA sale commitments, and swap agreements | (5,954,444 | ) | (9,503,292 | ) | ||||
Net change in unrealized appreciation from investments, futures transactions, TBA sale commitments, and swap agreements | 5,744,323 | 10,743,576 | ||||||
|
|
|
| |||||
Net increase in net assets resulting from operations | 1,799,094 | 5,776,665 | ||||||
|
|
|
| |||||
DIVIDENDSAND DISTRIBUTIONSTO SHAREHOLDERS FROM: | ||||||||
Net investment income | (2,108,451 | ) | (4,317,073 | ) | ||||
|
|
|
| |||||
Net decrease in net assets from dividends and distributions to shareholders | (2,108,451 | ) | (4,317,073 | ) | ||||
|
|
|
| |||||
Total increase/(decrease) in net assets | (309,357 | ) | 1,459,592 | |||||
NET ASSETS: | ||||||||
Beginning of period | 123,525,513 | 122,065,921 | ||||||
|
|
|
| |||||
End of period | $ | 123,216,156 | $ | 123,525,513 | ||||
|
|
|
| |||||
Distributions in excess of net investment income, end of period | $ | (101,596 | ) | $ | (2,360 | ) | ||
|
|
|
| |||||
The accompanying notes are an integral part of the financial statements.
9
BEAR STEARNS CUFS® MLP
MORTGAGE PORTFOLIO
FINANCIAL HIGHLIGHTS
Contained below is per share operating performance data for a share outstanding during each period, total investment return, ratios to average net assets and other supplemental data for the respective periods. This information has been derived from information provided in the financial statements.
| FORTHE SIX MONTHS ENDED FEBRUARY 29, 2012 (UNAUDITED) | FOR THE YEAR ENDED AUGUST 31, 2011 | FOR THE YEAR ENDED AUGUST 31, 2010 | FOR THE YEAR ENDED AUGUST 31, 2009 | FOR THE YEAR ENDED AUGUST 31, 2008 | FOR THE PERIOD DECEMBER 19, 2006*TO AUGUST 31, 2007 | |||||||||||||||||||
PER SHARE OPERATING PERFORMANCE |
| |||||||||||||||||||||||
Net asset value, beginning of period | $ | 8.19 | $ | 8.09 | $ | 7.67 | $ | 8.93 | $ | 9.92 | $ | 10.00 | ||||||||||||
|
|
|
|
|
|
|
|
|
|
|
| |||||||||||||
Net investment income | 0.13 | 0.30 | 0.29 | 0.54 | 0.54 | 0.38 | ||||||||||||||||||
Net realized and unrealized gain/ (loss) on investments, futures transactions, TBA sale commitments, swap agreements and options | (0.01 | ) | 0.09 | 0.54 | (1.28 | ) | (0.98 | ) | (0.08 | ) | ||||||||||||||
|
|
|
|
|
|
|
|
|
|
|
| |||||||||||||
Net increase/(decrease) in net assets resulting from operations | 0.12 | 0.39 | 0.83 | (0.74 | ) | (0.44 | ) | 0.30 | ||||||||||||||||
|
|
|
|
|
|
|
|
|
|
|
| |||||||||||||
Dividends to shareholders from: | ||||||||||||||||||||||||
Net investment income | (0.14 | ) | (0.29 | ) | (0.41 | ) | (0.52 | ) | (0.55 | ) | (0.38 | ) | ||||||||||||
|
|
|
|
|
|
|
|
|
|
|
| |||||||||||||
Net asset value, end of period | $ | 8.17 | $ | 8.19 | $ | 8.09 | $ | 7.67 | $ | 8.93 | $ | 9.92 | ||||||||||||
|
|
|
|
|
|
|
|
|
|
|
| |||||||||||||
Total investment return(1) | 1.48 | %(2) | 4.81 | % | 10.96 | % | (7.82 | )% | (4.76 | )% | 3.10 | %(2) | ||||||||||||
|
|
|
|
|
|
|
|
|
|
|
| |||||||||||||
RATIOS/SUPPLEMENTAL DATA |
| |||||||||||||||||||||||
Net assets, end of period (000’s omitted) | $ | 123,216 | $ | 123,526 | $ | 122,066 | $ | 114,440 | $ | 129,888 | $ | 161,278 | ||||||||||||
Ratio of expenses to average net assets with waivers and expense reimbursements (excluding interest expense) | 0.81 | %(3) | 0.87 | % | 0.78 | % | 0.60 | % | 0.60 | % | 0.60 | %(3) | ||||||||||||
Ratio of expenses to average net assets with waivers and expense reimbursements (including interest expense) | 0.81 | %(3) | 0.87 | % | 0.78 | % | 0.60 | % | 0.60 | % | 0.78 | %(3) | ||||||||||||
Ratio of expenses to average net assets without waivers and expense reimbursements (including interest expense) | 0.81 | %(3) | 0.87 | % | 0.86 | % | 0.88 | % | 0.80 | % | 0.95 | %(3) | ||||||||||||
Ratio of net investment income to average net assets | 3.29 | %(3) | 3.66 | % | 3.63 | % | 7.30 | % | 5.56 | % | 5.58 | %(3) | ||||||||||||
Portfolio turnover | 110.23 | %(2) | 113.51 | % | 180.05 | % | 410.52 | % | 190.88 | % | 259.47 | %(2) | ||||||||||||
| * | Commencement of operations. |
| (1) | Total investment return is calculated by assuming a purchase of shares on the first day and a sale of shares on the last day of each period reported and includes reinvestments of dividends and distributions, if any. |
| (2) | Not annualized. |
| (3) | Annualized. |
| (4) | The portfolio turnover rate excluding TBA transactions (see Note 1 in Notes to the Financial Statements) is 2.07% for the six months ended February 29, 2012, 22.94% for the year ended August 31, 2011, 42.09% for the year ended August 31, 2010, 35.58% for the year ended August 31, 2009, 32.83% for the year ended August 31, 2008 and 125.15% for the period December 19, 2006 to August 31, 2007, respectively. |
The accompanying notes are an integral part of the financial statements.
10
BEAR STEARNS CUFS® MLP
MORTGAGE PORTFOLIO
NOTESTO FINANCIAL STATEMENTS
FEBRUARY 29, 2012 (UNAUDITED)
| 1. | ORGANIZATIONAND SIGNIFICANT ACCOUNTING POLICIES |
The RBB Fund, Inc. (“RBB” or the “Company”) was incorporated under the laws of the State of Maryland on February 29, 1988 and is registered under the Investment Company Act of 1940, as amended (the “Investment Company Act”), as an open-end management investment company. RBB is a “series fund,” which is a mutual fund divided into separate portfolios. Each portfolio is treated as a separate entity for certain matters under the Investment Company Act, and for other purposes, and a shareholder of one portfolio is not deemed to be a shareholder of any other portfolio. Currently, RBB has nineteen active investment portfolios, including the Bear Stearns CUFS® MLP Mortgage Portfolio (the “Portfolio”), which commenced investment operations on December 19, 2006.
RBB has authorized capital of one hundred billion shares of common stock of which 80.373 billion shares are currently classified into one hundred and forty classes of common stock. Each class represents an interest in an active or inactive RBB investment portfolio.
On April 5, 2010, the Board of Directors of the Company (the “Board”) approved a plan of liquidation and termination providing for the liquidation of the Portfolio on or about April 30, 2010 (the “Liquidation”). Effective April 6, 2010, new account requests and purchase orders for the Portfolio’s shares were no longer permissible and daily dividends were suspended. Subsequently, at the unanimous request of the shareholders of the Portfolio, the Board postponed indefinitely the Liquidation of the Portfolio while other options with regards to the Portfolio are explored. Daily dividends have resumed; however, the Portfolio remains closed to new investments.
In the event that a shareholder of the Portfolio requests a redemption of all or any portion of the shares in the Portfolio held by it, the Board has approved the liquidation of the Portfolio within no more than seven (7) days after the date of such redemption request in order not to disadvantage the Portfolio’s remaining shareholders.
PORTFOLIO VALUATION — The Portfolio’s net asset value (“NAV”) is calculated once daily at the close of regular trading hours on the New York Stock Exchange (“NYSE”) (generally 4:00 p.m. Eastern time) on each day the NYSE is open. Fixed income securities having a remaining maturity of greater than 60 days are valued using an independent pricing service. These fixed income securities are valued by pricing services approved by the Board based upon market transactions for normal, institutional-size trading units of similar securities. The services may use various pricing techniques which take into account appropriate factors such as yield, quality, coupon rate, maturity, type of issue, trading characteristics and other data, as well as broker quotes. Debt securities for which quotations are readily available are valued at an over-the-counter or exchange bid quotation. Certain debt securities, which tend to be more thinly traded and of lesser quality, are priced based on fundamental analysis of the financial condition of the issuer and the estimated value of any collateral. Valuations developed through pricing techniques may materially vary from the actual amounts realized upon sale of the securities, and the potential material variation may be greater for those securities valued using fundamental analysis. Fixed income securities having a remaining maturity of 60 days or less are valued at amortized cost, which approximates market value. Investments in other open-end investment companies, if held, are valued based on the NAV of the investment companies (which may use fair value pricing as discussed in their prospectuses). If price quotes are unavailable or deemed unreliable, securities will be fair valued in accordance with procedures adopted by the Company’s Board. Relying on prices supplied by pricing services or dealers or using fair valuation may result in values that are higher or lower than the values used by other investment companies and investors to price the same investments.
Fair Value Measurements — The inputs and valuations techniques used to measure fair value of the Portfolio’s investments are summarized into three levels as described in the hierarchy below:
| • | Level 1 | — | quoted prices in active markets for identical securities; | |||
| • | Level 2 | — | other significant observable inputs (including quoted prices for similar securities, interest rates, prepayment speeds, credit risk, etc.); and | |||
| • | Level 3 | — | significant unobservable inputs (including the Portfolio’s own assumptions in determining the fair value of investments). | |||
11
BEAR STEARNS CUFS® MLP
MORTGAGE PORTFOLIO
NOTESTO FINANCIAL STATEMENTS (CONTINUED)
FEBRUARY 29, 2012 (UNAUDITED)
The following is a summary of the inputs used, as of February 29, 2012, in valuing the Portfolio’s investments carried at fair value:
| TOTAL MARKET VALUEAT FEBRUARY 29, 2012 | LEVEL 1 QUOTED PRICE | LEVEL 2 SIGNIFICANT OBSERVABLE INPUTS | LEVEL 3 SIGNIFICANT UNOBSERVABLE INPUTS | |||||||||||||
GOVERNMENT AGENCY MORTGAGE-BACKED SECURITIES | $ | 75,070,238 | $ | — | $ | 75,070,238 | $ | — | ||||||||
MORTGAGE DERIVATIVES | 10,070,340 | — | 10,070,340 | — | ||||||||||||
COLLATERALIZED MORTGAGE OBLIGATIONS | 38,661,257 | — | 38,661,257 | — | ||||||||||||
SHORT TERM OBLIGATIONS | 169,998 | — | 169,998 | — | ||||||||||||
ASSET DERIVATIVES | ||||||||||||||||
INTEREST RATE CONTRACTS*** | 7,862 | 7,862 | — | — | ||||||||||||
|
|
|
|
|
|
|
| |||||||||
TOTAL ASSETS | $ | 123,979,695 | $ | 7,862 | $ | 123,971,833 | $ | — | ||||||||
|
|
|
|
|
|
|
| |||||||||
| TOTAL MARKET VALUEAT FEBRUARY 29, 2012 | LEVEL 1 QUOTED PRICE | LEVEL 2 SIGNIFICANT OBSERVABLE INPUTS | LEVEL 3 SIGNIFICANT UNOBSERVABLE INPUTS | |||||||||||||
TBA SALE COMMITMENTS | $ | (6,392,813 | ) | $ | — | $ | (6,392,813 | ) | $ | — | ||||||
LIABILITY DERIVATIVES | ||||||||||||||||
INTEREST RATE CONTRACTS*** | (1,619,295 | ) | (1,548 | ) | (1,617,747 | ) | — | |||||||||
|
|
|
|
|
|
|
| |||||||||
TOTAL LIABILITIES | $ | (8,012,108 | ) | $ | (1,548 | ) | $ | (8,010,560 | ) | $ | — | |||||
|
|
|
|
|
|
|
| |||||||||
| *** | Interest rate contracts include open futures contracts and swap contracts. |
The inputs or methodology used for valuing securities are not necessarily an indication of the risk associated with investing in those securities.
At the end of each calendar quarter, management evaluates the classification of Levels 1, 2 and 3 assets and liabilities. Various factors are considered, such as changes in liquidity from the prior reporting period; whether or not a broker is willing to execute at the quoted price; the depth and consistency of prices from third party pricing services; and the existence of contemporaneous, observable trades in the market. Additionally, management evaluates the classification of Level 1 and Level 2 assets and liabilities on a quarterly basis for changes in listings or delistings on national exchanges.
Due to the inherent uncertainty of determining the fair value of investments that do not have a readily available market value, the fair value of the Portfolio’s investments may fluctuate from period to period. Additionally, the fair value of investments may differ significantly from the values that would have been used had a ready market existed for such investments and may differ materially from the values the Portfolio may ultimately realize. Further, such investments may be subject to legal and other restrictions on resale or otherwise less liquid than publicly traded securities.
For the six months ended February 29, 2012, there were no transfers between Levels 1, 2 and 3 for the Portfolio.
USEOF ESTIMATES — The preparation of financial statements in conformity with accounting principles generally accepted in the United States of America requires management to make estimates and assumptions that affect the reported amounts of assets and liabilities and disclosure of contingent assets and liabilities at the date of the financial statements and the reported amounts of revenues and expenses during the period. Actual results could differ from those estimates and these differences could be significant.
INVESTMENT TRANSACTIONS, INVESTMENT INCOMEAND EXPENSES — The Portfolio records security transactions based on trade date. The cost of investments sold is determined by use of the specific identification method for both financial reporting and income tax purposes in determining realized gains and losses on investments. Interest income is accrued when earned. Paydown gains and losses on mortgage and asset-backed securities are presented as an adjustment to interest income. Dividend income is recorded on the ex-dividend date. Distributions received on securities that represent a return of capital or capital gains are recorded as a reduction of cost of investments and/or as a realized gain. The Portfolio estimates the components of distributions received that may be considered return of capital distributions or capital gain distributions. The Portfolio’s investment income, expenses and unrealized and realized gains and losses are allocated daily. Expenses incurred for all of the RBB funds (such as director or professional fees) are charged to all funds in proportion to their average net assets of RBB, or in such other manner as the Board deems fair or equitable. Expenses and fees, including investment advisory and administration fees are accrued daily and taken into account for the purpose of determining the net asset value of the Portfolio.
12
BEAR STEARNS CUFS® MLP
MORTGAGE PORTFOLIO
NOTESTO FINANCIAL STATEMENTS (CONTINUED)
FEBRUARY 29, 2012 (UNAUDITED)
DIVIDENDSAND DISTRIBUTIONSTO SHAREHOLDERS — Dividends from net investment income are declared daily and paid monthly. Distributions from net realized capital gains, if any, are declared and paid at least annually to shareholders and recorded on ex-date for the Portfolio. Income dividends and capital gain distributions are determined in accordance with U.S. federal income tax regulations which may differ from generally accepted accounting principles in the United States of America (“U.S. GAAP”).
U.S. TAX STATUS — No provision is made for U.S. income taxes as it is the Portfolio’s intention to qualify for and elect the tax treatment applicable to regulated investment companies under Subchapter M of the Internal Revenue Code of 1986, as amended, and make the requisite distributions to its shareholders which will be sufficient to relieve it from U.S. income and excise taxes.
CASHAND CASH EQUIVALENTS — The Portfolio considers liquid assets deposited into a bank demand deposit account to be cash equivalents. These investments represent amounts held with financial institutions that are readily accessible to pay Portfolio expenses or purchase investments. Cash and cash equivalents are valued at cost plus accrued interest, which approximates market value.
OTHER — In the normal course of business, the Portfolio may enter into contracts that provide general indemnifications. The Portfolio’s maximum exposure under these arrangements is dependent on claims that may be made against the Portfolio in the future, and, therefore, cannot be estimated; however, based on experience, the risk of material loss from such claims is considered remote.
MORTGAGE-RELATED SECURITIES — The Portfolio may invest in mortgage pass-through securities and multiple-class pass-through securities, such as collateralized mortgage obligations (“CMOs”) and Real Estate Mortgage Investment Conduit (“REMIC”) pass-through or participation certificates as well as other securities collateralized by or representing a direct or indirect interest in mortgage-related securities or mortgage loans. The Portfolio may also invest in certain stripped mortgage-backed securities. Some of these securities may contain “embedded leverage” which can make them more sensitive to small movements in interest rates.
The types of mortgage-related securities in which the Portfolio may invest include: mortgage pass-through securities, including CMOs and REMICs, which may or may not be U.S. Government guaranteed, privately issued mortgage-related securities, stripped mortgage-backed securities, including interest only (“IO”) or principal only (“PO”) class securities, and floating rate and inverse floating rate securities. Stripped mortgage-backed securities represent a participation in, or are secured by and payable from, mortgage loans on real property, and may be structured in classes with rights to receive varying proportions of principal and interest. Payments received for IOs and POs are used to reduce the cost of the security. Payments in excess of cost are recognized as interest income on the Statement of Operations based on a security’s yield to maturity. If the underlying mortgage assets experience greater than anticipated payments of principal, the Portfolio may fail to recoup some or all of its initial investment in IO securities. For PO securities, accelerated payments of principal will cause a faster than anticipated return of the initial investment resulting in an increased yield to maturity for the security. The market value of these securities is highly sensitive to changes in interest rates.
The Portfolio is subject to risks associated with securities with contractual cash flows including mortgage related securities such as collateralized mortgage obligations, mortgage pass-through securities and commercial mortgage-backed securities, including some securities that are backed by sub-prime mortgages. The value, liquidity and related income of these securities are sensitive to changes in economic conditions, including real estate value, pre-payments, delinquencies and/or defaults, and may be adversely affected by shifts in the market’s perception of the issuers and changes in interest rates. A significant portion of the Portfolio’s investments are comprised of mortgage related securities, including some securities that are backed by sub-prime mortgages.
TBA COMMITMENTS — The Portfolio may purchase securities on a to-be-announced (“TBA”) basis, with payment and delivery scheduled for a future date. These transactions are subject to market fluctuations and are subject to the risk that their value at delivery may be more or less than the trade date purchase price. Although the Portfolio may purchase securities on a when-issued or forward commitment basis with the intention of acquiring the securities for its portfolio, the Portfolio may dispose of when-issued securities or forward commitments prior to settlement if the Adviser deems it appropriate.
MORTGAGE DOLLAR ROLLS – The Portfolio can enter into dollar roll transactions, pursuant to which it sells a mortgage-backed TBA or security and simultaneously purchases a similar, but not identical, TBA with the same issuer, rate and terms. The Portfolio may execute a “roll” to obtain better underlying mortgage securities or to increase yield. The Portfolio accounts for dollar roll transactions as purchases and sales, which has the effect of increasing its portfolio turnover rates. Risks associated with dollar rolls are that actual mortgages received by the Portfolio may be less favorable than those anticipated or that counterparties may fail to perform under the terms of the contracts. For the six months ended February 29, 2012, the Portfolio did not enter into any dollar roll transactions.
13
BEAR STEARNS CUFS® MLP
MORTGAGE PORTFOLIO
NOTESTO FINANCIAL STATEMENTS (CONTINUED)
FEBRUARY 29, 2012 (UNAUDITED)
FINANCIAL FUTURES CONTRACTS — The Portfolio is subject to interest rate risk exposure in the normal course of pursuing its investment objectives. The Portfolio may enter into futures contracts to hedge against changes in interest rates and securities prices, or to otherwise manage its term structure, sector selections and duration. Upon entering into a futures contract, the Portfolio is required to deposit with the broker an amount of cash or cash equivalents equal to a certain percentage of the contract amount. This is known as the “initial margin.” Subsequent payments (“variation margin”) are made or received by the Portfolio each day, depending on the daily fluctuation of the value of the contract. The daily changes in the contract are recorded as unrealized gain or loss. The Portfolio recognizes a realized gain or loss when the contract is closed.
The risks associated with entering into financial futures contracts include the possibility that a change in the value of the contract may not correlate with the changes in the value of the underlying instruments. In addition, investing in financial futures contracts involves the risk that the Portfolio could lose more than the original margin deposit and subsequent payments required for a futures transaction. Risks may also arise upon entering into these contracts from the potential inability of the counterparties to meet the terms of their contracts. For the six months ended February 29, 2012, the Portfolio’s average volume of futures contracts is 53 for long position contracts and 122 for short position contracts.
OPTIONS CONTRACTS — The Portfolio is subject to interest rate risk exposure in the normal course of pursuing its investment objectives. The Portfolio may write covered call and put options on futures, or securities it owns or in which it may invest. Writing put options tends to increase the Portfolio’s exposure to the underlying instrument. When the Portfolio writes a call or put option, an amount equal to the premium received is recorded as a liability and subsequently marked to market to reflect the current value of the option written. These liabilities are reflected as written options outstanding in the Statement of Assets and Liabilities. Payments received or made, if any, from writing options with premiums to be determined on a future date are reflected as such on the Statement of Assets and Liabilities. Premiums received from writing options that expire are treated as realized gains. Premiums received from writing options that are exercised or closed are added to the proceeds or offset against amounts paid on the underlying future or security transaction to determine the realized gain or loss. The Portfolio, as a writer of an option, has no control over whether the underlying future or security may be sold (call) or purchased (put), and as a result bears the market risk of an unfavorable change in the price of the future or security underlying the written option. The Portfolio may not be able to enter into a closing transaction because of an illiquid market.
The Portfolio may also purchase put and call options. Purchasing call options tends to increase the Portfolio’s exposure to the underlying instrument. Purchasing put options tends to decrease the Portfolio’s exposure to the underlying instrument. The Portfolio pays a premium which is included in the Portfolio’s Statement of Assets and Liabilities as an investment and subsequently marked to market to reflect the current value of the option. Premiums paid for purchasing options that expire are treated as realized losses. The risk associated with purchasing put and call options is limited to the premium paid. Premiums paid for purchasing options that are exercised or closed are added to the amounts paid or offset against the proceeds on the underlying future or security transaction to determine the realized gain or loss.
SWAP AGREEMENTS — The Portfolio is subject to interest rate risk exposure in the normal course of pursuing its investment objectives. The Portfolio may invest in swap agreements for the purpose of hedging against changes in interest rates. Swap agreements involve the exchange by the Portfolio with another party of their respective commitments to pay or receive interest with respect to a notional amount of principal. Swaps are marked to market daily based upon quotations from independent market makers and the change, if any, is recorded as unrealized gain or loss in the statement of operations. Net payments of interest are recorded as realized gain or loss. Cash in the amount of $1,751,492 held as collateral for swap agreements is classified as segregated cash on the Portfolio’s Statement of Assets and Liabilities.
The Portfolio is also subject to counterparty credit risk, which is the risk that a counterparty fails to perform on agreements with the Portfolio such as swap contracts, option contracts, and TBA securities.
The Portfolio is party to various derivative contracts governed by International Swaps and Derivatives Association Master Agreements (ISDA agreements). The Portfolio’s ISDA agreements, which are separately negotiated with each dealer counterparty, typically contain provisions allowing, absent other considerations, a counterparty to exercise rights, to the extent not otherwise waived, against the Portfolio in the event the Portfolio’s net assets decline over time by a pre-determined percentage or fall below a pre-determined floor. Such rights often include the ability to terminate (i.e., close out) open contracts at prices which may favor the counterparty, which could have an adverse impact on the Portfolio. For open swap contracts, see the Portfolio of Investments, which is also indicative of activity for the six months ended February 29, 2012.
REPURCHASE AGREEMENTS — Money market instruments may be purchased subject to the seller’s agreement to repurchase them at an agreed-upon date and price. The seller will be required on a daily basis to maintain the value of the securities as collateral, subject to the agreement at not less than the repurchase price plus accrued interest. If the value of the collateral falls below this amount, the Portfolio will require the seller to deposit additional collateral by the next Portfolio
14
BEAR STEARNS CUFS® MLP
MORTGAGE PORTFOLIO
NOTESTO FINANCIAL STATEMENTS (CONTINUED)
FEBRUARY 29, 2012 (UNAUDITED)
business day. In the event that the seller under the agreement defaults on its repurchase obligation or fails to deposit sufficient collateral, the Portfolio has the contractual right, subject to the requirements of applicable bankruptcy and insolvency laws, to sell the underlying securities and may claim any resulting loss from the seller. The agreements are conditioned upon the collateral being deposited under the Federal Reserve Book Entry System or with the Portfolio’s custodian or a third party sub-custodian.
| 2. | INVESTMENT ADVISERAND OTHER SERVICES |
Bear Stearns Asset Management Inc. (“BSAM” or the “Adviser”), an indirect wholly-owned subsidiary of JPMorgan Chase & Co., serves as investment adviser to the Portfolio pursuant to an investment advisory agreement with the Company (the “Advisory Agreement”). For its services, the Adviser is paid a monthly fee at the annual rate of 0.48% of the Portfolio’s average daily net assets. For the six months ended February 29, 2012, investment advisory fees were $293,523.
BNY Mellon Investment Servicing (US) Inc., (“BNY Mellon”) serves as administrator for the Portfolio. For providing administration and accounting services, BNY Mellon is entitled to receive a monthly fee equal to an annual percentage rate of the Portfolio’s average daily net assets, subject to certain minimum monthly fees.
Included in the administration and accounting fees, are fees for providing regulatory administration services to RBB. For providing these services, BNY Mellon is entitled to receive compensation as agreed to by the Company and BNY Mellon. This fee is allocated to each portfolio in proportion to its net assets of the Company.
For providing transfer agent services, BNY Mellon is entitled to receive a monthly fee equal to an annual percentage rate of the Portfolio’s average daily net assets, subject to certain minimum monthly fees.
The Bank of New York Mellon (the “Custodian”) provides certain custodial services to the Portfolio. The Custodian is entitled to receive a monthly fee equal to an annual percentage rate of the Portfolio’s average daily net assets, subject to certain minimum monthly fees.
BNY Mellon Distributors LLC (formerly known as BNY Mellon Distributors, Inc.) serves as the principal underwriter and distributor of the Portfolio’s shares pursuant to a Distribution Agreement with RBB.
| 3. | DIRECTOR COMPENSATION |
The Directors of the Company receive an annual retainer, meeting fees and reimbursement of out of pocket expenses for meetings attended. The remuneration paid to the Directors by the Portfolio during the six months ended February 29, 2012 was $7,975. Certain employees of BNY Mellon are Officers of the Company. They are not compensated by the Portfolio or the Company.
| 4. | INVESTMENTIN SECURITIES |
For the six months ended February 29, 2012, aggregate purchases and sales of investment securities (excluding short-term investments and including TBA securities) of the Portfolio were as follows:
| PURCHASES | SALES | |||||||
Investments in U.S. Government Securities | $ | 158,001,251 | $ | 187,869,053 | ||||
Investments in Non-U.S. Government Securities | — | 8,661,925 | ||||||
| 5. | CAPITAL STOCK TRANSACTIONS |
As of February 29, 2012, the Portfolio had individual shareholder accounts, which individually amounted to more than 10% of the total shares outstanding of the Portfolio as detailed below.
% OF SHARES OUTSTANDING | NUMBER OF ACCOUNTS | |
100 % | 5 |
Significant shareholder transactions, if any, may impact the Portfolio’s performance.
| 6. | FEDERAL INCOME TAX INFORMATION |
The Portfolio has followed the authoritative guidance on accounting for and disclosure of uncertainty in tax positions, which requires the Fund to determine whether a tax position is more likely than not to be sustained upon examination, including resolution of any related appeals or litigation processes, based on the technical merits of the position. The Portfolio has determined that there was no effect on the financial statements from following this authoritative guidance. In the normal course of business, the Portfolio is subject to examination by federal, state and local jurisdictions, where applicable, for tax years for which applicable statutes of limitations have not expired.
15
BEAR STEARNS CUFS® MLP
MORTGAGE PORTFOLIO
NOTESTO FINANCIAL STATEMENTS (CONTINUED)
FEBRUARY 29, 2012 (UNAUDITED)
As of February 29, 2012, federal tax cost, aggregate gross unrealized appreciation and depreciation of securities held by the Portfolio were as follows:
FEDERAL TAX COST | UNREALIZED APPRECIATION | UNREALIZED DEPRECIATION | NET UNREALIZED DEPRECIATION | |||||||||||
| $ 132,409,906 | $ | 4,567,333 | $ | (13,005,406 | ) | $ | (8,438,073 | ) | ||||||
Distributions to shareholders from net investment income and realized gains are determined in accordance with federal income tax regulations, which may differ from net investment income and realized gains recognized for financial reporting purposes. Accordingly, the character of distributions and composition of net assets for tax purposes may differ from those reflected in the accompanying financial statements. To the extent these differences are permanent, such amounts are reclassified within the capital accounts based on the tax treatment; temporary differences do not require such reclassification.
As of August 31, 2011, the components of distributable earnings on a tax basis were as follows:
UNDISTRIBUTED ORDINARY INCOME | UNDISTRIBUTED LONG-TERM GAINS | |||
| $ 445,413 | $ | — | ||
The difference between the book and tax basis components of distributable earnings relate principally to the timing of recognition of income and gains for federal income tax purposes. Short-term capital gains are reported as ordinary income dividends for federal income tax purposes.
The federal income tax character of dividends and distributions paid during the last fiscal year end was as follows:
| AUGUST 31, 2011 | ||||
Ordinary income | $ | 4,317,073 | ||
Long-term capital gains | — | |||
Dividends from net investment income and short-term capital gains are treated as ordinary income dividends for federal income tax purposes.
For federal income tax purposes, capital loss carryforwards are available to offset future capital gains. As of August 31, 2011, the Portfolio had a capital loss carryforward of $2,070,905 which will expire as follows:
August 31, 2019 | $ | 688,096 | ||
August 31, 2018 | $ | 67,305 | ||
August 31, 2016 | $ | 832,226 | ||
August 31, 2015 | $ | 483,278 |
Under federal tax law, foreign currency and capital losses realized after October 31 may be deferred and treated as having arisen on the first day of the following fiscal year. For the year ended August 31, 2011, the Portfolio deferred post-October capital losses of $8,911,146.
On December 22, 2010, President Obama signed into law the Regulated Investment Company Modernization Act of 2010 (the “Act”). The Act updates certain tax rules applicable to regulated investment companies (“RICs”). The various provisions of the Act will generally be effective for RICs with taxable years beginning after December 22, 2010. Additional information regarding the impact of the Act on the Portfolio, if any, will be contained within the relevant sections of the notes to the financial statements for the fiscal year ending August 31, 2012.
| 7. | SIGNIFICANT RISKS |
CREDIT/DEFAULT RISK – The risk that the credit rating of an issuer or guarantor of a security may be lowered or that an issuer or guarantor of a security or the counterparty to a derivative contract or repurchase agreement may default on its payment obligations.
MARKET RISK – The risk that the market price of securities owned by the Portfolio may go up or down, sometimes rapidly or unpredictably depending solely on the market conditions of supply and demand. In such a market, the value of such securities and the Portfolio’s share price may change dramatically. The value of a security may decline due to general market
16
BEAR STEARNS CUFS® MLP
MORTGAGE PORTFOLIO
NOTESTO FINANCIAL STATEMENTS (CONCLUDED)
FEBRUARY 29, 2012 (UNAUDITED)
conditions that are not specifically related to a particular issuer such as real or perceived adverse economic conditions, changes in the outlook for corporate earnings, changes in interest rates or adverse investor sentiment generally. The value of a security also may decline because of factors that affect a particular industry or industries, such as labor shortages or increased production costs and competitive conditions within an industry. The Portfolio’s share price or yield may be adversely impacted by market risk.
| 8. | NEW ACCOUNTING PRONOUNCEMENT |
In May 2011, the Financial Accounting Standards Board issued Accounting Standards Update (“ASU”) No. 2011-04 “Amendments to Achieve Common Fair Value Measurement and Disclosure Requirements in U.S. GAAP and IFRSs”. ASU 2011-04 includes common requirements for measurement of and disclosure about fair value between U.S. GAAP and IFRS. ASU 2011-04 will require reporting entities to disclose the following information for fair value measurements categorized within Level 3 of the fair value hierarchy: quantitative information about the unobservable inputs used in the fair value measurement, the valuation processes used by the reporting entity and a narrative description of the sensitivity of the fair value measurement to changes in unobservable inputs and the interrelationships between those unobservable inputs. In addition, ASU 2011-04 will require reporting entities to make disclosures about amounts and reasons for all transfers in and out of Level 1 and Level 2 fair value measurements. The new and revised disclosures are effective for interim and annual reporting periods beginning after December 15, 2011. Management is currently evaluating the implications of ASU No. 2011-04 and its impact on the financial statements.
In December 2011, FASB issued ASU No. 2011-11, “Disclosures about Offsetting Assets and Liabilities”. ASU No. 2011-11 requires disclosures to make financial statements that are prepared under U.S. GAAP more comparable to those prepared under IFRS’s. The new disclosure requirements mandate that entities disclose both gross and net information about instruments and transactions eligible for offset in the statement of assets and liabilities as well as instruments and transactions subject to an agreement similar to a master netting arrangement. In addition, ASU No. 2011-11 requires disclosure of collateral received and posted in connection with master netting agreements or similar arrangements. New disclosures are required for annual reporting periods beginning on or after January 1, 2013, and interim periods within those annual periods. Management is evaluating the impact of ASU No. 2011-11 on the financial statements and disclosures.
| 9. | SUBSEQUENT EVENT |
Management has evaluated the impact of all subsequent events on the Fund through the date the financial statements were issued, and has determined that there was the following subsequent events:
The Bank of New York Mellon Corporation announced on November 28, 2011 that it had agreed to sell BNY Mellon Distributors LLC (the “Distributor”) and its four subsidiaries to Foreside Distributors, LLC, a subsidiary of Foreside Financial Group, LLC (the “Transaction”). The Transaction closed on March 31, 2012. Upon the closing of the Transaction, the Distributor became an indirect, wholly owned subsidiary of Foreside Financial Group, LLC and was renamed Foreside Funds Distributors LLC effective April 1, 2012.
On April 10, 2012, the Board approved a new plan of liquidation and termination (the “Plan”) providing for the liquidation of the Portfolio on or about May 11, 2012 (or such earlier or later date as the officers of the Company upon the advice of counsel to the Company shall deem advisable), subject to approval of the Plan by the shareholders of the Portfolio. On April 11, 2012, shareholders of the Portfolio approved the Plan. Subsequently, the officers of the Company determined to liquidate the portfolio on or about May 30, 2012.
17
BEAR STEARNS CUFS® MLP
MORTGAGE PORTFOLIO
OTHER INFORMATION
(UNAUDITED)
PROXY VOTING
Policies and procedures that the Portfolio uses to determine how to vote proxies relating to portfolio securities as well as information regarding how the Portfolio voted proxies relating to portfolio securities for the most recent 12-month period ended June 30 are available without charge, upon request, by calling Bear Stearns CUFS® MLP Mortgage Portfolio at (800) 519-CUFS (2837) and on the Securities and Exchange Commission’s (“SEC”) website at http://www.sec.gov.
QUARTERLY PORTFOLIO SCHEDULES
The Company will file its complete schedule of portfolio holdings with the SEC for the first and third fiscal quarters of each fiscal year (quarters ended November 30 and May 31) on Form N-Q. The Company’s Form N-Q will be available on the SEC website at http://www.sec.gov and may be reviewed and copied at the SEC Public Reference Room in Washington, D.C. Information on the operation of the SEC Public Reference Room may be obtained by calling (202) 551-8090.
18
BEAR STEARNS CUFS® MLP
MORTGAGE PORTFOLIO
INVESTMENT ADVISER
Bear Stearns Asset Management
c/o J.P. Morgan Asset Management
270 Park Avenue
New York, NY 10017
ADMINISTRATOR
BNY Mellon Investment Servicing (US) Inc.
301 Bellevue Parkway
Wilmington, DE 19809
TRANSFER AGENT
BNY Mellon Investment Servicing (US) Inc.
4400 Computer Drive
Westborough, MA 01581
PRINCIPAL UNDERWRITER
Foreside Funds Distributors LLC
400 Berwyn Park
899 Cassatt Road
Berwyn, PA 19312
CUSTODIAN
The Bank of New York Mellon
One Wall Street
New York, NY 10286
INDEPENDENT REGISTERED PUBLIC ACCOUNTING FIRM
PricewaterhouseCoopers LLP
Two Commerce Square, Suite 1700
2001 Market Street
Philadelphia, PA 19103
LEGAL COUNSEL
Drinker Biddle & Reath LLP
One Logan Square, Suite 2000
Philadelphia, PA 19103-6996
THE RBB FUND, INC.
Money Market Portfolio
Fund Expense Examples
(Unaudited)
As a shareholder of the Money Market Portfolio (the “Portfolio”), you incur two types of costs: (1) transaction costs and (2) ongoing costs, including management fees, distribution fees, and other Portfolio expenses. These examples are intended to help you understand your ongoing costs (in dollars) of investing in the Portfolio and to compare these costs with the ongoing costs of investing in other mutual funds.
These examples are based on an investment of $1,000 invested at the beginning of the six-month period from September 1, 2011 through February 29, 2012 and held for the entire period.
Actual Expenses
The first line of the accompanying tables provides information about actual account values and actual expenses. You may use the information in this line, together with the amount you invested, to estimate the expenses that you paid over the period. Simply divide your account value by $1,000 (for example, an $8,600 account value divided by $1,000 = 8.6), then multiply the result by the number in the first line under the heading entitled “Expenses Paid During Period” to estimate the expenses you paid on your account during this period.
Hypothetical Example for Comparison Purposes
The second line of the accompanying tables provides information about hypothetical account values and hypothetical expenses based on the Portfolio’s actual expense ratio and an assumed rate of return of 5% per year before expenses, which is not the Portfolio’s actual return. The hypothetical account values and expenses may not be used to estimate the actual ending account balance or expenses you paid for the period. You may use this information to compare the ongoing costs of investing in the Portfolio and other funds. To do so, compare these 5% hypothetical examples with the 5% hypothetical examples that appear in the shareholder reports of other funds.
Please note that the expenses shown in the accompanying tables are meant to highlight your ongoing costs only and do not reflect any transactional costs, such as redemption fees that may be incurred by shareholders of other funds. Therefore, the second line of the accompanying tables is useful in comparing ongoing costs only, and will not help you determine the relative total costs of owning different funds.
| Money Market Portfolio – Bedford Class | ||||||||||||
| Beginning Account Value September 1, 2011 | Ending Account Value February 29, 2012 | Expenses Paid During Period* | ||||||||||
Actual | $ | 1,000.00 | $ | 1,000.16 | $ | 1.17 | ||||||
Hypothetical (5% return before expenses) | 1,000.00 | 1,023.69 | 1.19 | |||||||||
| Money Market Portfolio – Sansom Street Class | ||||||||||||
| Beginning Account Value September 1, 2011 | Ending Account Value February 29, 2012 | Expenses Paid During Period* | ||||||||||
Actual | $ | 1,000.00 | $ | 1,000.26 | $ | 1.07 | ||||||
Hypothetical (5% return before expenses) | 1,000.00 | 1,023.79 | 1.08 | |||||||||
| * | Expenses are equal to the Portfolio’s annualized six month expense ratio of 0.24% for the Bedford Class shares and 0.22% for the Sansom Street Class shares, which includes waived fees or reimbursed expenses, multiplied by the average account value over the period, multiplied by the number of days (182) in the most recent fiscal half-year, then divided by 366 to reflect the one-half year period. The Portfolio’s ending account value on the first line in each table is based on the actual six-month total return of 0.02% for the Bedford Class shares and 0.03% for the Sansom Street Class shares. |
1
THE RBB FUND, INC.
Money Market Portfolio
Portfolio Holdings Summary Table
February 29, 2012
(Unaudited)
The following table presents a summary by security type of the portfolio holdings of the Fund:
Security Type | % of Net Assets | Value | ||||||
Short Term Investments: | ||||||||
Commercial Paper | 43.4 | % | $ | 339,021,042 | ||||
Certificates of Deposit | 20.2 | 157,810,011 | ||||||
U.S. Treasury Obligations | 10.9 | 84,836,961 | ||||||
Agency Obligations | 9.3 | 72,497,021 | ||||||
Repurchase Agreement | 8.9 | 69,229,000 | ||||||
Municipal Bonds | 8.1 | 63,645,000 | ||||||
Variable Rate Obligations | 1.1 | 8,600,000 | ||||||
Liabilities in Excess of Other Assets | (1.9 | ) | (14,990,426 | ) | ||||
|
|
|
| |||||
NET ASSETS | 100.0 | % | $ | 780,648,609 | ||||
|
|
|
| |||||
Portfolio holdings are subject to change at any time.
2
THE RBB FUND, INC.
Money Market Portfolio
Schedule of Investments
February 29, 2012
(Unaudited)
| Par (000) | Value | |||||||
CERTIFICATES OF DEPOSIT—20.2% |
| |||||||
Yankee Dollar Certificates of Deposit—20.2% (a) |
| |||||||
Bank of Montreal, Chicago | ||||||||
0.230%, 03/01/12 | $ | 15,000 | $ | 15,000,000 | ||||
Bank of Nova Scotia, New York | ||||||||
0.350%, 07/17/12 | 10,000 | 10,000,000 | ||||||
Barclays Bank PLC, New York | ||||||||
0.500%, 05/16/12 | 8,000 | 8,000,000 | ||||||
Canadian Imperial Bank | ||||||||
0.170%, 05/14/12 | 5,000 | 5,000,000 | ||||||
Credit Suisse, New York | ||||||||
0.380%, 04/26/12 | 5,000 | 5,000,000 | ||||||
Deutsche Bank AG, New York | ||||||||
0.480%, 04/30/12 | 8,000 | 8,000,000 | ||||||
National Australia Bank Ltd, | ||||||||
0.490%, 06/18/12 | 3,500 | 3,500,000 | ||||||
National Bank of Canada, | ||||||||
0.350%, 08/27/12 | 5,000 | 5,000,000 | ||||||
Nordea Bank Finland PLC, | ||||||||
0.300%, 05/21/12 | 6,500 | 6,500,000 | ||||||
Norinchukin Bank, New York | ||||||||
0.170%, 03/06/12 | 6,000 | 6,000,000 | ||||||
0.170%, 03/07/12 | 15,000 | 15,000,000 | ||||||
Rabobank Nederland NV, | ||||||||
0.430%, 03/01/12 | 11,500 | 11,500,000 | ||||||
0.470%, 04/23/12 | 6,500 | 6,500,000 | ||||||
Royal Bank of Canada, | ||||||||
0.508%, 05/16/12 | 5,000 | 5,000,000 | ||||||
Sumitomo Mitsui Banking Corp., New York | ||||||||
0.300%, 03/12/12 | 10,000 | 10,000,000 | ||||||
0.180%, 03/14/12 | 10,000 | 10,000,000 | ||||||
0.250%, 04/10/12 | 8,000 | 8,000,000 | ||||||
0.370%, 05/09/12 | 5,000 | 5,000,000 | ||||||
Sumitomo Trust & Banking Co. Ltd, New York | ||||||||
0.280%, 04/09/12 | 12,000 | 12,000,000 | ||||||
Svenska Handelsbanken AB, | ||||||||
0.510%, 03/29/12 | 2,810 | 2,810,011 | ||||||
|
| |||||||
| 157,810,011 | ||||||||
TOTAL CERTIFICATES OF DEPOSIT (Cost $157,810,011) | 157,810,011 | |||||||
|
| |||||||
| Par (000) | Value | |||||||
COMMERCIAL PAPER—43.4% |
| |||||||
Asset Backed—20.9% |
| |||||||
Atlantis One Funding Corp.(c) | ||||||||
0.360%, 04/11/12 | $ | 8,000 | $ | 7,996,720 | ||||
0.400%, 05/08/12 | 8,000 | 7,993,956 | ||||||
Bryant Park Funding LLC(c) | ||||||||
0.180%, 03/08/12 | 8,000 | 7,999,720 | ||||||
0.160%, 03/26/12 | 5,000 | 4,999,444 | ||||||
CAFCO LLC(c) | ||||||||
0.280%, 04/09/12 | 7,000 | 6,997,877 | ||||||
Ciesco LLC(c) | ||||||||
0.290%, 04/23/12 | 12,950 | 12,944,471 | ||||||
CRC Funding LLC(c) | ||||||||
0.260%, 04/11/12 | 7,000 | 6,997,927 | ||||||
0.280%, 04/24/12 | 10,000 | 9,995,800 | ||||||
Fairway Finance Co. LLC(b) | ||||||||
0.301%, 06/07/12 | 15,000 | 15,000,000 | ||||||
0.293%, 06/11/12 | 5,000 | 5,000,000 | ||||||
Grampian Funding LLC(c) | ||||||||
0.200%, 03/07/12 | 15,000 | 14,999,500 | ||||||
Manhattan Asset Funding Co. LLC(c) | ||||||||
0.200%, 03/19/12 | 4,000 | 3,999,600 | ||||||
Metlife Short Term Funding LLC(c) | ||||||||
0.280%, 04/09/12 | 7,000 | 6,997,877 | ||||||
0.360%, 05/01/12 | 1,750 | 1,748,933 | ||||||
0.340%, 05/29/12 | 10,000 | 9,991,594 | ||||||
Nieuw Amsterdam Receivables Corp.(c) | ||||||||
0.320%, 03/29/12 | 10,000 | 9,997,511 | ||||||
0.400%, 05/02/12 | 8,000 | 7,994,489 | ||||||
Old Line Funding LLC(c) | ||||||||
0.210%, 04/18/12 | 7,000 | 6,998,040 | ||||||
Thunder Bay Funding LLC(c) | ||||||||
0.130%, 03/20/12 | 10,000 | 9,999,314 | ||||||
Victory Receivables Corp.(c) | ||||||||
0.250%, 03/05/12 | 5,000 | 4,999,861 | ||||||
|
| |||||||
| 163,652,634 | ||||||||
|
| |||||||
Banks—22.5% |
| |||||||
ANZ National International, | ||||||||
0.560%, 07/10/12 | 12,000 | 11,975,547 | ||||||
0.530%, 07/30/12 | 5,000 | 4,988,885 | ||||||
Barclays US Funding Corp.(c) | ||||||||
0.120%, 03/01/12 | 10,000 | 10,000,000 | ||||||
The accompanying notes are an integral part of the financial statements.
3
THE RBB FUND, INC.
Money Market Portfolio
Schedule of Investments (Continued)
February 29, 2012
(Unaudited)
| Par (000) | Value | |||||||
COMMERCIAL PAPER—(Continued) |
| |||||||
Banks—(Continued) |
| |||||||
Deutsche Bank Financial LLC(c) | ||||||||
0.440%, 05/08/12 | $ | 5,000 | $ | 4,995,844 | ||||
ING US Funding LLC(c) | ||||||||
0.490%, 05/18/12 | 22,500 | 22,476,112 | ||||||
JPMorgan Chase & Co. | ||||||||
0.278%, 03/16/12 (b) | 5,000 | 5,000,000 | ||||||
0.180%, 05/02/12(c) | 15,000 | 14,995,350 | ||||||
Mizuho Funding LLC(c) | ||||||||
0.270%, 04/13/12 | 15,000 | 14,995,163 | ||||||
National Australia Funding, Delaware(c) | ||||||||
0.470%, 07/03/12 | 6,000 | 5,990,287 | ||||||
Nordea North America(c) | ||||||||
0.305%, 04/17/12 | 15,000 | 14,994,027 | ||||||
0.400%, 05/23/12 | 4,000 | 3,996,311 | ||||||
RBS Holdings USA, Inc.(c) | ||||||||
0.200%, 03/12/12 | 5,000 | 4,999,694 | ||||||
0.200%, 03/13/12 | 10,000 | 9,999,333 | ||||||
State Street Corp.(c) | ||||||||
0.250%, 03/02/12 | 10,000 | 9,999,931 | ||||||
0.220%, 03/05/12 | 15,000 | 14,999,633 | ||||||
0.250%, 03/08/12 | 3,000 | 2,999,854 | ||||||
Westpac Banking Corp.(c) | ||||||||
0.500%, 07/09/12 | 6,500 | 6,488,264 | ||||||
0.490%, 08/13/12 | 11,500 | 11,474,173 | ||||||
|
| |||||||
| 175,368,408 | ||||||||
|
| |||||||
TOTAL COMMERCIAL PAPER (Cost $339,021,042) | 339,021,042 | |||||||
|
| |||||||
MUNICIPAL BONDS—8.1% |
| |||||||
California—3.5% |
| |||||||
California Bay Area Toll Authority, Toll Bridge Revenue, RB (LOC: Bank of America)(b)(d) | ||||||||
0.120%, 03/07/12 | 5,000 | 5,000,000 | ||||||
California Housing Finance Agency Revenue, Series A, RB (LOC: Fannie Mae, Freddie Mac)(b)(d) | ||||||||
0.130%, 03/07/12 | 3,100 | 3,100,000 | ||||||
| Par (000) | Value | |||||||
MUNICIPAL BONDS—(Continued) |
| |||||||
California—(Continued) |
| |||||||
Metropolitan Water District of Southern California, Series A, RB (SPA: Bank of America)(b)(d) | ||||||||
0.130%, 03/07/12 | $ | 15,000 | $ | 15,000,000 | ||||
San Francisco, City & County Redevelopment Agency, Multifamily Revenue, Series A, RB (LOC: Fannie Mae)(b)(d) | ||||||||
0.120%, 03/07/12 | 4,000 | 4,000,000 | ||||||
|
| |||||||
| 27,100,000 | ||||||||
|
| |||||||
Colorado—0.8% |
| |||||||
Colorado State, Housing Finance Authority, Class I, Series A-3, RB (LOC: Fannie Mae, Freddie | ||||||||
0.140%, 03/07/12 | 6,500 | 6,500,000 | ||||||
|
| |||||||
Connecticut—0.7% |
| |||||||
Connecticut State, Health & Educational Facilities Authority Revenue, New Haven Hospital, Series K-2, RB (LOC: JPMorgan Chase Bank)(b)(d) | ||||||||
0.110%, 03/07/12 | 5,600 | 5,600,000 | ||||||
|
| |||||||
New York—2.6% |
| |||||||
New York City, Housing Development Corp., Multifamily Rent Housing Revenue, Series A, RB (LOC: Fannie Mae)(b)(d) | ||||||||
0.130%, 03/07/12 | 6,000 | 6,000,000 | ||||||
New York City, Industrial Development Agency Civic Facility Revenue, New York Law School Project, Series A, RB (LOC: JPMorgan Chase | ||||||||
0.130%, 03/07/12 | 4,345 | 4,345,000 | ||||||
New York State, Housing Finance Agency Revenue, RB (LOC: Freddie Mac)(b)(d) | ||||||||
0.100%, 03/07/12 | 5,200 | 5,200,000 | ||||||
Westchester County, Health Care Revenue, RB (LOC: TD Bank NA)(b)(d) | ||||||||
0.160%, 03/07/12 | 5,000 | 5,000,000 | ||||||
|
| |||||||
| 20,545,000 | ||||||||
|
| |||||||
The accompanying notes are an integral part of the financial statements.
4
THE RBB FUND, INC.
Money Market Portfolio
Schedule of Investments (Continued)
February 29, 2012
(Unaudited)
| Par (000) | Value | |||||||
MUNICIPAL BONDS—(Continued) |
| |||||||
Texas—0.5% |
| |||||||
Texas State, Veterans Housing Assessment Project, Series A-2, GO (Liquidity Facility: JPMorgan Chase & Co.)(b)(d) | ||||||||
0.150%, 03/07/12 | $ | 3,900 | $ | 3,900,000 | ||||
|
| |||||||
TOTAL MUNICIPAL BONDS (Cost $63,645,000) | 63,645,000 | |||||||
|
| |||||||
VARIABLE RATE OBLIGATIONS—1.1% |
| |||||||
Banks—1.1% |
| |||||||
JPMorgan Chase Bank NA(b) | ||||||||
0.595%, 02/15/13 | 8,600 | 8,600,000 | ||||||
|
| |||||||
TOTAL VARIABLE | 8,600,000 | |||||||
|
| |||||||
AGENCY OBLIGATIONS—9.3% |
| |||||||
Fannie Mae | ||||||||
0.234%, 07/26/12 (b) | 6,500 | 6,499,477 | ||||||
0.110%, 09/10/12(c) | 3,453 | 3,450,964 | ||||||
0.276%, 09/17/12(b) | 6,000 | 5,999,335 | ||||||
0.276%, 12/20/12(b) | 3,500 | 3,499,429 | ||||||
Federal Farm Credit Bank(c) | ||||||||
0.170%, 08/24/12 | 5,000 | 4,995,844 | ||||||
Freddie Mac | ||||||||
0.234%, 04/03/12 (b) | 6,000 | 5,999,780 | ||||||
0.125%, 06/05/12(c) | 3,880 | 3,878,707 | ||||||
0.205%, 11/02/12(b) | 7,000 | 6,997,143 | ||||||
0.270%, 01/24/13(b) | 4,000 | 3,998,548 | ||||||
0.330%, 09/03/13(b) | 5,000 | 4,998,477 | ||||||
0.194%, 09/13/13(b) | 22,200 | 22,179,317 | ||||||
|
| |||||||
TOTAL AGENCY OBLIGATIONS (Cost $72,497,021) | 72,497,021 | |||||||
|
| |||||||
U.S. TREASURY OBLIGATIONS—10.9% |
| |||||||
U.S. Treasury Bills | ||||||||
0.095%, 05/31/12 | 15,500 | 15,496,278 | ||||||
0.100%, 08/09/12 | 12,000 | 11,994,633 | ||||||
U.S. Treasury Notes | ||||||||
4.625%, 07/31/12 | 8,000 | 8,151,057 | ||||||
0.375%, 08/31/12 | 7,500 | 7,508,879 | ||||||
4.125%, 08/31/12 | 9,000 | 9,180,076 | ||||||
0.375%, 09/30/12 | 12,000 | 12,015,429 | ||||||
4.250%, 09/30/12 | 10,000 | 10,240,731 | ||||||
| Par (000) | Value | |||||||
U.S. TREASURY OBLIGATIONS—(Continued) |
| |||||||
3.875%, 10/31/12 | $ | 10,000 | $ | 10,249,878 | ||||
|
| |||||||
TOTAL U.S. TREASURY OBLIGATIONS (COST $84,836,961) | 84,836,961 | |||||||
|
| |||||||
REPURCHASE AGREEMENTS—8.9% |
| |||||||
Deutsche Bank Securities Inc. (Tri-Party Agreement dated 02/29/12 to be repurchased at $39,229,196, collateralized by $38,531,000 par value, Federal National Mortgage Association Structured Notes, 0.50% to 2.00%, due 09/06/2013 to 08/18/2015, Fair Value of the collateral is $40,014,193) | ||||||||
0.180%, 03/01/12 | 39,229 | 39,229,000 | ||||||
Morgan Stanley & Co. LLC | ||||||||
0.200%, 03/01/12 | 30,000 | 30,000,000 | ||||||
|
| |||||||
TOTAL REPURCHASE AGREEMENTS (Cost $69,229,000) | 69,229,000 | |||||||
|
| |||||||
TOTAL INVESTMENTS AT |
| 795,639,035 | ||||||
|
| |||||||
LIABILITIES IN EXCESS OF |
| (14,990,426 | ) | |||||
|
| |||||||
NET ASSETS (APPLICABLE TO 780,319,864 BEDFORD SHARES AND 325,516 SANSOM STREET SHARES )—100.0% |
| $ | 780,648,609 | |||||
|
| |||||||
| * | Aggregate cost is the same for financial reporting and Federal tax purposes. |
| (a) | Issuer is a US branch of a foreign domiciled bank. |
| (b) | Variable Rate Security. Rate shown is as of report date. |
The accompanying notes are an integral part of the financial statements.
5
THE RBB FUND, INC.
Money Market Portfolio
Schedule of Investments (Concluded)
February 29, 2012
(Unaudited)
| (c) | Rate disclosed represents the discount rate at the time of purchase. |
| (d) | Rate shown is as of report date and the date shown is date on which principal and accrued interest may be recovered through demand. |
| GO | General Obligation | |
| LOC | Line of Credit | |
| PLC | Public Liability Company | |
| RB | Revenue Bond | |
| SPA | Standby Purchase Agreement |
The accompanying notes are an integral part of the financial statements.
6
THE RBB FUND, INC.
Money Market Portfolio
Statement of Assets and Liabilities
February 29, 2012
(Unaudited)
ASSETS | ||||
Investments, at value (Cost $726,410,035) | $ | 726,410,035 | ||
Repurchase agreement, at value (Cost $69,229,000) | 69,229,000 | |||
Cash | 199,787 | |||
Receivables | ||||
Interest receivable | 453,065 | |||
Prepaid expenses and other assets | 50,153 | |||
|
| |||
Total assets | 796,342,040 | |||
|
| |||
LIABILITIES | ||||
Payables | ||||
Investments purchased | 15,496,278 | |||
Distribution to shareholders | 233 | |||
Investment advisory and administration fees | 92,665 | |||
Custodian fees | 33,356 | |||
Transfer agent fees | 14,969 | |||
Professional fees | 13,204 | |||
Distribution fees | 12,231 | |||
Regulatory administration fees | 3,762 | |||
Service organization fees (Sansom Street Class) | 1,405 | |||
Directors’ and officers’ fees | 424 | |||
Other accrued expenses and liabilities | 24,904 | |||
|
| |||
Total liabilities | 15,693,431 | |||
|
| |||
Net Assets | $ | 780,648,609 | ||
|
| |||
NET ASSETS CONSIST OF | ||||
Par Value | 780,645 | |||
Paid-in Capital | 779,864,711 | |||
Accumulated net realized gain from investments | 3,253 | |||
|
| |||
Net Assets | $ | 780,648,609 | ||
|
| |||
BEDFORD CLASS | ||||
Net assets | $ | 780,323,109 | ||
|
| |||
Shares outstanding ($0.001 par value, 1,500,000,000 shares authorized) | 780,319,864 | |||
|
| |||
Net asset value, offering and redemption price per share | $ | 1.00 | ||
|
| |||
SANSOM STREET CLASS | ||||
Net assets | $ | 325,500 | ||
|
| |||
Shares outstanding ($0.001 par value, 1,500,000,000 shares authorized) | 325,516 | |||
|
| |||
Net asset value, offering and redemption price per share | $ | 1.00 | ||
|
|
The accompanying notes are an integral part of the financial statements.
7
THE RBB FUND, INC.
Money Market Portfolio
Statement of Operations
For the Six Months Ended February 29, 2012
(Unaudited)
Investment Income | ||||
Interest | $ | 961,582 | ||
|
| |||
Total investment income | 961,582 | |||
|
| |||
Expenses | ||||
Distribution fees (Bedford Class)(1) | 2,364,372 | |||
Investment advisory and administration fees | 1,467,472 | |||
Custodian fees | 68,228 | |||
Professional fees | 53,564 | |||
Directors’ and officers’ fees | 42,489 | |||
Regulatory administration fees | 31,389 | |||
Transfer agent fees | 25,988 | |||
Printing and shareholder reporting fees | 16,521 | |||
Insurance fees | 15,653 | |||
Registration and filing fees | 14,998 | |||
Other expenses | 9,123 | |||
|
| |||
Total expenses before waivers | 4,109,797 | |||
Less: Advisory and administration waivers | (956,256 | ) | ||
Less: Distribution fee waivers | (2,291,622 | ) | ||
|
| |||
Net expenses after waivers | 861,919 | |||
|
| |||
Net investment income | 99,663 | |||
|
| |||
Net realized gain from investments | 3,253 | |||
|
| |||
Net increase in net assets resulting from operations | $ | 102,916 | ||
|
|
| (1) | See Note 2 in Notes to Financial Statements |
The accompanying notes are an integral part of the financial statements.
8
THE RBB FUND, INC.
Money Market Portfolio
Statements of Changes in Net Assets
| For the Six Months Ended February 29, 2012 (Unaudited) | For the Year Ended August 31, 2011 | |||||||
Increase (decrease) in net assets: | ||||||||
From operations: | ||||||||
Net investment income | $ | 99,663 | $ | 146,050 | ||||
Net realized gain from investments | 3,253 | 18,236 | ||||||
|
|
|
| |||||
Net increase in net assets resulting from operations | 102,916 | 164,286 | ||||||
|
|
|
| |||||
Dividends to shareholders from: | ||||||||
Net investment income: | ||||||||
Bedford Class | (116,632 | ) | (142,022 | ) | ||||
Sansom Street Class | (1,267 | ) | (15,841 | ) | ||||
|
|
|
| |||||
Net decrease in net assets from dividends to shareholders | (117,899 | ) | (157,863 | ) | ||||
|
|
|
| |||||
Capital transactions (at $1.00 per share): | ||||||||
Proceeds from shares sold: | ||||||||
Bedford Class | 418,732,634 | 981,059,807 | ||||||
Sansom Street Class | 4,143,556 | 111,311,969 | ||||||
Shares issued on reinvestment of distributions: | ||||||||
Bedford Class | 114,579 | 139,263 | ||||||
Sansom Street Class | 89 | 316 | ||||||
Shares repurchased: | ||||||||
Bedford Class | (359,654,080 | ) | (853,630,447 | ) | ||||
Sansom Street Class | (23,338,210 | ) | (129,500,272 | ) | ||||
|
|
|
| |||||
Net increase in net assets derived from capital transactions | 39,998,568 | 109,380,636 | ||||||
|
|
|
| |||||
Total increase in net assets | 39,983,585 | 109,387,059 | ||||||
Net assets: | ||||||||
Beginning of period | 740,665,024 | 631,277,965 | ||||||
|
|
|
| |||||
End of period | $ | 780,648,609 | $ | 740,665,024 | ||||
|
|
|
| |||||
Undistributed net investment income, end of period | $ | — | $ | 18,236 | ||||
|
|
|
| |||||
Share Transactions: | ||||||||
Shares sold | ||||||||
Bedford Class | 418,732,634 | 981,059,807 | ||||||
Sansom Street Class | 4,143,556 | 111,311,969 | ||||||
Shares reinvested | ||||||||
Bedford Class | 114,579 | 139,263 | ||||||
Sansom Street Class | 89 | 316 | ||||||
Shares repurchased | ||||||||
Bedford Class | (359,654,080 | ) | (853,630,447 | ) | ||||
Sansom Street Class | (23,338,210 | ) | (129,500,272 | ) | ||||
|
|
|
| |||||
Total Share Activity | 39,998,568 | 109,380,636 | ||||||
|
|
|
| |||||
The accompanying notes are an integral part of the financial statements.
9
THE RBB FUND, INC.
Money Market Portfolio
Financial Highlights
(For a Share Outstanding Throughout each Period)
| The Bedford Class | ||||||||||||||||||||||||
| For the Six Months Ended February 29, 2012 (Unaudited) | For the Year Ended August 31, 2011 | For the Year Ended August 31, 2010 | For the Year Ended August 31, 2009 | For the Year Ended August 31, 2008 | For the Year Ended August 31, 2007 | |||||||||||||||||||
Net asset value, beginning of period | $ | 1.00 | $ | 1.00 | $ | 1.00 | $ | 1.00 | $ | 1.00 | $ | 1.00 | ||||||||||||
|
|
|
|
|
|
|
|
|
|
|
| |||||||||||||
Income from investment operations: | ||||||||||||||||||||||||
Net investment income | 0.0002 | 0.0002 | 0.0003 | 0.0074 | 0.0307 | 0.0447 | ||||||||||||||||||
Net gains (losses) on securities | — | (b) | — | (b) | — | (b) | — | (b) | — | (b) | — | (b) | ||||||||||||
|
|
|
|
|
|
|
|
|
|
|
| |||||||||||||
Total net income from investment operations | 0.0002 | 0.0002 | 0.0003 | 0.0074 | 0.0307 | 0.0447 | ||||||||||||||||||
|
|
|
|
|
|
|
|
|
|
|
| |||||||||||||
Less dividends and distributions: | ||||||||||||||||||||||||
Dividends (from net investment income) | (0.0002 | ) | (0.0002 | ) | (0.0003 | ) | (0.0074 | ) | (0.0307 | ) | (0.0447 | ) | ||||||||||||
|
|
|
|
|
|
|
|
|
|
|
| |||||||||||||
Net asset value, end of period | $ | 1.00 | $ | 1.00 | $ | 1.00 | $ | 1.00 | $ | 1.00 | $ | 1.00 | ||||||||||||
|
|
|
|
|
|
|
|
|
|
|
| |||||||||||||
Total Return | 0.02 | %(c) | 0.02 | % | 0.03 | % | 0.74 | % | 3.12 | % | 4.56 | % | ||||||||||||
Ratios/Supplemental Data | ||||||||||||||||||||||||
Net assets, end of period (000’s omitted) | $ | 780,323 | $ | 721,145 | $ | 593,570 | $ | 545,194 | $ | 319,387 | $ | 218,914 | ||||||||||||
Ratios of expenses to average net assets(a) | 0.24 | %(d) | 0.27 | % | 0.31 | % | 0.69 | % | 0.90 | % | 0.90 | % | ||||||||||||
Ratios of net investment income to average net assets | 0.03 | %(d) | 0.02 | % | 0.02 | % | 0.65 | % | 2.94 | % | 4.47 | % | ||||||||||||
| (a) | Without the waiver of advisory fees, distribution fees, and/or reimbursement of certain operating expenses, the ratios of expenses to average net assets for the Bedford Class of the Money Market Portfolio would have been 1.13% (annualized) for the six months ended February 29, 2012 and 1.12%, 1.18%, 1.24%, 1.23% and 1.29% for the years ended August 31, 2011, 2010, 2009, 2008 and 2007, respectively. |
| (b) | Amount is less than $0.00005 per share. |
| (c) | Not annualized. |
| (d) | Annualized. |
The accompanying notes are an integral part of the financial statements.
10
THE RBB FUND, INC.
Money Market Portfolio
Financial Highlights (Concluded)
(For a Share Outstanding Throughout each Period)
| The Sansom Street Class | ||||||||||||||||||||||||
| For the Six Months Ended February 29, 2012 (Unaudited) | For the Year Ended August 31, 2011 | For the Year Ended August 31, 2010 | For the Year Ended August 31, 2009 | For the Year Ended August 31, 2008 | For the Year Ended August 31, 2007 | |||||||||||||||||||
Net asset value, beginning of period | $ | 1.00 | $ | 1.00 | $ | 1.00 | $ | 1.00 | $ | 1.00 | $ | 1.00 | ||||||||||||
|
|
|
|
|
|
|
|
|
|
|
| |||||||||||||
Income from investment operations: | ||||||||||||||||||||||||
Net investment income | 0.0003 | 0.0006 | 0.0010 | 0.0121 | 0.0365 | 0.0502 | ||||||||||||||||||
Net gains (losses) on securities | — | (b) | — | (b) | — | (b) | — | (b) | — | (b) | — | (b) | ||||||||||||
|
|
|
|
|
|
|
|
|
|
|
| |||||||||||||
Total net income from investment operations | 0.0003 | 0.0006 | 0.0010 | 0.0121 | 0.0365 | 0.0502 | ||||||||||||||||||
|
|
|
|
|
|
|
|
|
|
|
| |||||||||||||
Less dividends and distributions: | ||||||||||||||||||||||||
Dividends (from net investment income) | (0.0003 | ) | (0.0006 | ) | (0.0010 | ) | (0.0121 | ) | (0.0365 | ) | (0.0502 | ) | ||||||||||||
|
|
|
|
|
|
|
|
|
|
|
| |||||||||||||
Net asset value, end of period | $ | 1.00 | $ | 1.00 | $ | 1.00 | $ | 1.00 | $ | 1.00 | $ | 1.00 | ||||||||||||
|
|
|
|
|
|
|
|
|
|
|
| |||||||||||||
Total Return | 0.03 | %(c) | 0.06 | % | 0.10 | % | 1.21 | % | 3.71 | % | 5.14 | % | ||||||||||||
Ratios/Supplemental Data | ||||||||||||||||||||||||
Net assets, end of period (000’s omitted) | $ | 326 | $ | 19,520 | $ | 37,708 | $ | 32,496 | $ | 28,749 | $ | 15,352 | ||||||||||||
Ratios of expenses to average net assets(a) | 0.22 | %(d) | 0.23 | % | 0.24 | % | 0.25 | % | 0.31 | % | 0.35 | % | ||||||||||||
Ratios of net investment income to average net assets | 0.05 | %(d) | 0.06 | % | 0.09 | % | 0.93 | % | 3.64 | % | 5.02 | % | ||||||||||||
| (a) | Without the waiver of advisory fees and reimbursement of certain operating expenses, the ratios of expenses to average net assets for the Sansom Street Class of the Money Market Portfolio would have been 0.50% (annualized) for the six months ended February 29, 2012 and 0.47%, 0.54%, 0.60%, 0.60% and 0.69% for the years ended August 31, 2011, 2010, 2009, 2008 and 2007, respectively. |
| (b) | Amount is less than $0.00005 per share. |
| (c) | Not annualized. |
| (d) | Annualized. |
The accompanying notes are an integral part of the financial statements.
11
THE RBB FUND, INC.
Money Market Portfolio
Notes to Financial Statements
February 29, 2012
(Unaudited)
1. Summary of Significant Accounting Policies
The RBB Fund, Inc. (“RBB” or the “Company”) was incorporated under the laws of the State of Maryland on February 29, 1988, and is registered under the Investment Company Act of 1940, as amended (the “1940 Act”), as an open-end management investment company. RBB is a “series fund,” which is a mutual fund divided into separate portfolios. Each portfolio is treated as a separate entity for certain matters under the 1940 Act, and for other purposes, and a shareholder of one portfolio is not deemed to be a shareholder of any other portfolio. Currently, RBB has nineteen active investment portfolios, including the Money Market Portfolio (“Portfolio”).
RBB has authorized capital of one hundred billion shares of common stock of which 80.373 billion shares are currently classified into one hundred and forty classes of common stock. Each class represents an interest in an active or inactive RBB investment portfolio. The Portfolio has issued shares with a par value of $0.001.
SECURITY VALUATION — Securities held in the Portfolio are valued under the amortized cost method, which approximates fair value. Under this method, securities are valued at cost when purchased and thereafter a constant accretion of discount or amortization of premium is recorded until maturity of the security. Regular review and monitoring of the valuation is performed to ensure that cost continues to approximate fair value and to avoid dilution or other unfair results to shareholders. The Portfolio seeks to maintain net asset value (“NAV”) per share at $1.00.
Fair Value Measurements — The inputs and valuations techniques used to measure fair value of the Portfolio’s investments are summarized into three levels as described in the hierarchy below:
| • | Level 1 — unadjusted quoted prices in active markets for identical securities; |
| • | Level 2 — other significant observable inputs (including quoted prices for similar securities, interest rates, prepayment |
speeds, credit risk, etc.); and
| • | Level 3 — significant unobservable inputs (including the Portfolio’s own assumptions in determining the fair value of |
investments).
The inputs or methodology used for valuing securities are not necessarily an indication of the risk associated with investing in those securities.
The following is a summary of the inputs used, as of February 29, 2012, in valuing the Portfolio’s investments carried at fair value:
| Total Value at February 29, 2012 | Level 1 Quoted Price | Level 2 Significant Observable Inputs | Level 3 Significant Unobservable Inputs | |||||||||||||
Investments in Securities* | $ | 795,639,035 | $ | — | $ | 795,639,035 | $ | — | ||||||||
|
|
|
|
|
|
|
| |||||||||
| * | Please refer to the Schedule of Investments for industry and security type breakouts. |
At the end of each calendar quarter, management evaluates the classification of Levels 1, 2 and 3 assets and liabilities. Various factors are considered, such as changes in liquidity from the prior reporting period; whether or not a broker is willing to execute at the quoted price; the depth and consistency of prices from third party pricing services; and the existence of contemporaneous, observable trades in the market. Additionally, management evaluates the classification of Level 1 and Level 2 assets and liabilities on a quarterly basis for changes in listings or delistings on national exchanges.
12
THE RBB FUND, INC.
Money Market Portfolio
Notes to Financial Statements (Continued)
February 29, 2012
(Unaudited)
Due to the inherent uncertainty of determining the fair value of investments that do not have a readily available market value, the fair value of the Portfolio’s investments may fluctuate from period to period. Additionally, the fair value of investments may differ significantly from the values that would have been used had a ready market existed for such investments and may differ materially from the values the Portfolio may ultimately realize. Further, such investments may be subject to legal and other restrictions on resale or otherwise less liquid than publicly traded securities.
For the six months ended February 29, 2012, there were no transfers between Levels 1, 2 and 3 for the Portfolio.
SECURITY TRANSACTIONS, INVESTMENT INCOME, AND EXPENSES — Security transactions are accounted for on the trade date. The cost of investments sold is determined by use of the specific identification method for both financial reporting and income tax purposes. Interest income is accrued when earned. Certain expenses, such as distribution fee and service organization fees, are class specific expenses and vary by class. Expenses not directly attributable to a specific portfolio or class are allocated based on relative net assets of each portfolio and class. Expenses incurred on behalf of a specific class, fund or fund family of the Company are charged directly to the class, fund or fund family (in proportion to net assets). Expenses incurred for all portfolios within the Company (such as director or professional fees) are charged to all portfolios in proportion to their average net assets of RBB, or in such other manner as the Company’s Board of Directors deems fair or equitable. Expenses and fees, including investment advisory and administration fees, are accrued daily and taken into account for the purpose of determining the NAV of the Portfolio.
DIVIDENDS AND DISTRIBUTIONS TO SHAREHOLDERS — Dividends from net investment income are declared daily, recorded on the ex-date and paid monthly. All dividends from net investment income are taxed as ordinary income. Any net realized capital gains are distributed at least annually. Income subject to dividends and capital gain subject to distributions are determined in accordance with U.S. federal income tax regulations, which may differ from accounting principles generally accepted in the United States of America (“U.S. GAAP”).
FEDERAL INCOME TAXES — No provision is made for federal income taxes. It is the Company’s intention to have the Portfolio continue to qualify for and elect the tax treatment applicable to regulated investment companies under Subchapter M of the Internal Revenue Code of 1986, as amended and make the requisite distributions to its shareholders which will be sufficient to relieve it from federal income and excise taxes.
REPURCHASE AGREEMENTS — Money market instruments may be purchased from financial institutions, such as banks and non-bank dealers, subject to the seller’s agreement to repurchase them at an agreed upon date and price. Collateral for repurchase agreements may have longer maturities than the maximum permissible remaining maturity of portfolio investments, provided the repurchase agreements themselves mature in 13 months or less. The seller is required on a daily basis to maintain the value of the securities subject to the agreement at no less than the repurchase price. The agreements are conditioned upon the collateral being deposited under the Federal Reserve book entry system or held in a separate account by the Portfolio’s custodian or an authorized securities depository. In the event the counterparty defaults and the fair value of the collateral declines, the Portfolio could experience losses, delays and costs in liquidating the collateral.
USE OF ESTIMATES — The preparation of financial statements in conformity with accounting principles generally accepted in the United States of America requires management to make estimates and assumptions. These estimates and
13
THE RBB FUND, INC.
Money Market Portfolio
Notes to Financial Statements (Continued)
February 29, 2012
(Unaudited)
assumptions affect the reported amounts of assets and liabilities and disclosure of contingent assets and liabilities at the date of the financial statements and the reported amounts of revenues and expenses during the reporting period. Actual results could differ from those estimates and those differences could be significant.
OTHER — In the normal course of business, the Portfolio may enter into contracts that provide general indemnifications. The Portfolio’s maximum exposure under these arrangements is dependent on claims that may be made against the Portfolio in the future and therefore, cannot be estimated; however, based on experience, the risk of material loss for such claims is considered remote.
2. Investment Adviser and Other Services
Pursuant to an Investment Advisory and Administration Agreement, BlackRock Advisors LLC. (the “Adviser” or “BALLC”), an indirect wholly owned subsidiary of BlackRock, Inc., serves as investment adviser and administrator for the Portfolio.
BALLC (assignee of BlackRock Institutional Management Corporation) and BNY Mellon Investment Servicing (US) Inc, (“BNY Mellon”), have entered into a delegation agreement on behalf of the Portfolio, wherein BNY Mellon has agreed to perform administration and accounting services for an annual fee of 0.10% of the average net assets of the Portfolio, paid out of the advisory fee paid to BALLC.
For its advisory services, BALLC is entitled to receive the following fees, computed daily and payable monthly, and based on the Portfolio’s average daily net assets:
| Annual Rate |
| 0.45% of first $250 million of net assets; |
| 0.40% of next $250 million of net assets; and |
| 0.35% of net assets in excess of $500 million. |
Effective December 20, 2011 the Adviser has contractually agreed to waive fees and/or reimburse expenses for the Portfolio such that total annual Portfolio operating expenses after fee waivers and/or expense reimbursements (excluding certain Portfolio expenses) do not exceed 0.25%. The following expenses are excluded from the contractual limitation: (i) interest, taxes, dividends tied to short sales, brokerage commissions, and other expenditures which are capitalized in accordance with generally accepted accounting principles; (ii) expenses incurred directly or indirectly by the Portfolio as a result of investments in other investment companies and pooled investment vehicles; (iii) other expenses attributable to, and incurred as a result of, the Portfolio’s investments; (iv) distribution and servicing (12b-1) Fees; and (v) other extraordinary expenses (including litigation expenses) not incurred in the ordinary course of the Portfolio’s business, if any, of the Bedford Shares and the Sansom Street Shares of the Portfolio. This contractual limitation is in effect until January 1, 2013 and may not be terminated without the approval of the Company’s Board of Directors. The Adviser may terminate this arrangement at any time after January 1, 2013. Prior to December 20, 2011, the Adviser voluntarily waived a portion of its management fees and/or reimbursed expenses for the Portfolio.
14
THE RBB FUND, INC.
Money Market Portfolio
Notes to Financial Statements (Continued)
February 29, 2012
(Unaudited)
For each class of shares within the Portfolio, the net advisory fee charged to each class is the same on a relative basis. For the six months ended February 29, 2012, advisory fees and waivers were as follows:
| Gross Advisory and Administration Fee | Waiver | Net Advisory and Administration Fee | ||||||||
| $ | 1,467,472 | $ | (956,256 | ) | $ | 511,216 | ||||
As of February 29, 2012, the Portfolio owed BALLC $92,665 in advisory and administration fees.
BNY Mellon and BNY Mellon Distributors LLC, formerly known as BNY Mellon Distributors, Inc. (“BNY Mellon Distributors”), may also voluntarily waive a portion of their fees and/or reimburse expenses.
The Portfolio will not pay BALLC, BNY Mellon or BNY Mellon Distributors at a later time for any amounts waived or assumed.
For providing regulatory administration services to RBB, BNY Mellon is entitled to receive compensation as agreed to by the Company and BNY Mellon. This fee is allocated to each portfolio in proportion to its net assets of the Company.
In addition, BNY Mellon serves as the Portfolio’s transfer and dividend disbursing agent. For providing transfer agent services, BNY Mellon is entitled to receive a monthly fee equal to an annual percentage rate of the Portfolio’s average daily net assets and is subject to certain minimum monthly fees.
The Bank of New York Mellon provides custodian services to the Portfolio and is entitled to receive out of pocket expenses.
The Portfolio, on behalf of the Bedford Class of shares of the Portfolio, has adopted a Distribution Plan pursuant to Rule 12b-1 under the 1940 Act (the “Plan”). The Portfolio has entered into a Distribution Agreement with BNY Mellon Distributors.
The Plan provides for the Bedford Class to make monthly payments, based on average net assets, to BNY Mellon Distributors of up to 0.65% on an annualized basis. BNY Mellon Distributors may voluntarily waive these fees at its discretion. For the six months ended February 29, 2012, distribution fees paid to BNY Mellon Distributors for the Bedford Class were as follows:
| Gross Distribution Fee | Waiver | Net Distribution Fee | ||||||||||
Bedford Class | $ | 2,364,372 | $ | (2,291,622 | ) | $ | 72,750 | |||||
The Portfolio has entered into service agreements with BNY Mellon which render support services to customers who are the beneficial owners of the Sansom Street Class in consideration of the payment of 0.10% of the daily net asset value of such shares.
3. Director Compensation
The Directors of the Company receive an annual retainer, meeting fees and reimbursement of out of pocket expenses for meetings attended. The remuneration paid to the Directors by the Portfolio during the six months ended February 29, 2012 was $29,559. Certain employees of BNY Mellon are Officers of the Company. They are not compensated by the Portfolio or the Company.
15
THE RBB FUND, INC.
Money Market Portfolio
Notes to Financial Statements (Continued)
February 29, 2012
(Unaudited)
4. Federal Income Tax Information
The Portfolio intends to continue to qualify as a regulated investment company and distribute all of its taxable income. Therefore, no federal tax provision is required.
The Portfolio has followed the authoritative guidance on accounting for and disclosure of uncertainty in tax positions, which requires the Portfolio to determine whether a tax position is more likely than not to be sustained upon examination, including resolution of any related appeals or litigation processes, based on the technical merits of the position. The Portfolio has determined that there was no effect on the financial statements from following this authoritative guidance. In the normal course of business, the Portfolio is subject to examination by federal, state and local jurisdictions, where applicable, for tax years for which applicable statutes of limitations have not expired.
Distributions to shareholders from net investment income and realized gains are determined in accordance with federal income tax regulations, which may differ from net investment income and realized gains recognized for financial reporting purposes. Accordingly, the character of distributions and composition of net assets for tax purposes may differ from those reflected in the accompanying financial statements. To the extent these differences are permanent, such amounts are reclassified within the capital accounts based on the tax treatment; temporary differences do not require such reclassification.
As of August 31, 2011 the Portfolio had $19,365 of undistributed ordinary income for federal tax purposes.
The difference between the book and tax basis components of distributable earnings relate principally to the timing of recognition of income and gains for Federal income tax purposes. Short-term capital gains are reported as ordinary income dividends for Federal income tax purposes.
The tax character of dividends and distributions paid during the last fiscal year was as follows:
| Ordinary Income | ||||
2011 | $ | 157,863 | ||
Dividends paid from net investment income and short-term capital gains are treated as ordinary income distributions for federal income tax purposes.
For federal income tax purposes, realized capital losses may be carried forward and applied against future realized gains. As of August 31, 2011, the Portfolio had no capital loss carryforwards.
Under federal tax law, foreign currency and capital losses realized after October 31 may be deferred and treated as having arisen on the first day of the following fiscal year. For the year ended August 31, 2011, the Portfolio did not incur a net post-October capital loss.
On December 22, 2010, President Obama signed into law the Regulated Investment Company Modernization Act of 2010 (the “Act”). The Act updates certain tax rules applicable to regulated investment companies (“RICs”). The various provisions of the Act will generally be effective for RICs with taxable years beginning after December 22, 2010. Additional information regarding the impact of the Act on the Portfolio, if any, will be contained within the relevant sections of the notes to the financial statements for the fiscal year ending August 31, 2012.
16
THE RBB FUND, INC.
Money Market Portfolio
Notes to Financial Statements (Concluded)
February 29, 2012
(Unaudited)
5. New Accounting Pronouncement
In May 2011, the Financial Accounting Standards Board issued Accounting Standards Update (“ASU”) No. 2011-04 “Amendments to Achieve Common Fair Value Measurement and Disclosure Requirements in U.S. GAAP and International Financial Reporting Standards (“IFRS”).” ASU 2011-04 includes common requirements for measurement of and disclosure about fair value between U.S. GAAP and IFRS. ASU 2011-04 will require reporting entities to disclose the following information for fair value measurements categorized within Level 3 of the fair value hierarchy: quantitative information about the unobservable inputs used in the fair value measurement, the valuation processes used by the reporting entity and a narrative description of the sensitivity of the fair value measurement to changes in unobservable inputs and the interrelationships between those unobservable inputs. In addition, ASU 2011-04 will require reporting entities to make disclosures about amounts and reasons for all transfers in and out of Level 1 and Level 2 fair value measurements. The new and revised disclosures are effective for interim and annual reporting periods beginning after December 15, 2011. Management is currently evaluating the implications of ASU No. 2011-04 and its impact on the financial statements.
In December 2011, FASB issued ASU No. 2011-11, “Disclosures about Offsetting Assets and Liabilities”. ASU No. 2011-11 requires disclosures to make financial statements that are prepared under U.S. GAAP more comparable to those prepared under IFRS’s. The new disclosure requirements mandate that entities disclose both gross and net information about instruments and transactions eligible for offset in the statement of assets and liabilities as well as instruments and transactions subject to an agreement similar to a master netting arrangement. In addition, ASU No. 2011-11 requires disclosure of collateral received and posted in connection with master netting agreements or similar arrangements. New disclosures are required for annual reporting periods beginning on or after January 1, 2013, and interim periods within those annual periods. Management is evaluating the impact of ASU No. 2011-11 on the financial statements and disclosures.
6. Subsequent Event
Management has evaluated the impact of all subsequent events on the Fund through the date the financial statements were issued, and has determined that there was the following subsequent event:
The Bank of New York Mellon Corporation announced on November 28, 2011 that it had agreed to sell BNY Mellon Distributors LLC (the “Distributor”) and its four subsidiaries to Foreside Distributors, LLC, a subsidiary of Foreside Financial Group, LLC (the “Transaction”). The Transaction closed on March 31, 2012. Upon the closing of the Transaction, the Distributor became an indirect, wholly owned subsidiary of Foreside Financial Group, LLC and was renamed Foreside Funds Distributors LLC effective April 1, 2012.
17
THE RBB FUND, INC.
Money Market Portfolio
Additional Information
(Unaudited)
Proxy Voting
Policies and procedures that the Portfolio uses to determine how to vote proxies relating to portfolio securities as well as information regarding how the Portfolio voted proxies relating to portfolio securities for the most recent 12-month period ended June 30 are available without charge, upon request, by calling the number shown below and on the Securities and Exchange Commission’s (“SEC”) website at http://www.sec.gov.
Bedford Sansom Street | (800) 888-9723 (800) 430-9618 |
Quarterly Portfolio Schedules
The Company files its complete schedule of portfolio holdings with the SEC for the first and third fiscal quarter of each fiscal year (quarters ended November 30 and May 31) on Form N-Q. The Company’s Form N-Q is available on the SEC website at http://www.sec.gov and may be reviewed and copied at the SEC Public Reference Room in Washington, D.C. Information on the operation of the SEC Public Reference Room may be obtained by calling (202) 551-8090.
18
[THIS PAGE INTENTIONALLY LEFT BLANK.]
Investment Adviser
BlackRock Advisors LLC
100 Bellevue Parkway
Wilmington, DE 19809
Transfer Agent
BNY Mellon Investment Servicing (US) Inc.
4400 Computer Drive
Westborough, MA 01581
Principal Underwriter
Foreside Funds Distributors LLC
400 Berwyn Park
899 Cassatt Road
Berwyn, PA 19312
Custodian
The Bank of New York Mellon
One Wall Street
New York, NY 10286
Independent Registered Public Accounting Firm
PricewaterhouseCoopers LLP
Two Commerce Square, Suite 1700
2001 Market Street
Philadelphia, PA 19103-7042
Counsel
Drinker Biddle & Reath LLP
One Logan Square, Ste. 2000
Philadelphia, PA 19103-6996
The Bedford
Class
of
The RBB Fund, Inc.
Money Market
Portfolio
Semi-Annual Report
February 29, 2012
(Unaudited)
An investment in the Portfolio is not insured or guaranteed by the Federal Deposit Insurance Corporation or any other government agency. Although the Portfolio seeks to preserve the value of your investment at $1.00 per share, it’s possible to lose money by investing in the Portfolio.
This report is submitted for the general information of the shareholders of the Portfolio. It is not authorized for distribution unless preceded or accompanied by a prospectus for the Portfolio.
BOGLE INVESTMENT MANAGEMENT
SMALL CAP GROWTH FUND
SEMI-ANNUAL REPORTFORTHE SIX-MONTH PERIOD ENDED FEBRUARY 29, 2012
(UNAUDITED)
Fellow Shareholder:
The Bogle Small Cap Growth Fund (the “Fund”) and the benchmark Russell 2000® posted similarly positive performance in the latest semiannual reporting period. The first month of the period (September 2011) saw U.S. equity markets decline sharply in an accelerated extension of the market downturn that began in May of last year. Equity markets bounced back strongly in October and, for the first time in the calendar year 2011, investors showed a distinct preference for speculative and beaten down stocks. Following mixed performance in November and early December, a turning point occurred on December 20th and markets advanced steadily for the balance of the semiannual period (through February 29, 2012). For the full semiannual period, the Fund’s Investor shares advanced +12.25% net of all fees and Institutional shares gained +12.28% net of all fees, while the Russell 2000® benchmark returned +12.40%. The Fund lagged its small cap benchmark Russell 2000® in September, November and December, rebounded in January and February, and ended the period about even with the benchmark. The market environment is discussed further in the next section of this letter, followed by a more detailed semiannual performance evaluation, including investment model performance, performance attribution, and a few stock-specific examples of companies in which we have invested. We then present the fundamental characteristics of the Fund and benchmark, highlighting the Fund’s above-benchmark median expected growth rate and below-benchmark price-based ratios. Finally, we close with an update on developments at Bogle Investment Management, L.P.
INVESTMENT PERFORMANCE - PERIODS ENDING FEBRUARY 29, 2012
BOGLE FUNDVS. RUSSELL 2000® BENCHMARK
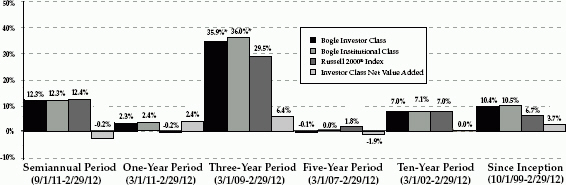
| * | Due to market conditions, the Fund has experienced relatively high three-year performance which may not be repeated in the future. |
All Fund returns are presented net of fees and include the reinvestment of all dividends and other earnings. Multi-year period returns are annualized.
Returns shown represent past performance and do not guarantee future results. Current performance may be lower or higher than the returns shown above. The investment return and principal value of an investment in the Fund will fluctuate so that an investor’s shares, when redeemed, may be worth more or less than their original cost. Returns current to
1
the most recent month-end may be obtained at 1-877-264-5346. The table does not reflect the deduction of taxes that a shareholder would pay on Fund distributions or the redemption of Fund shares.
The performance quoted reflects fee waivers in effect and would have been less in their absence. The Fund’s annual operating expenses, as stated in the current prospectus, are 1.44% for the Institutional Class and 1.54% for the Investor Class, prior to fee waivers.
The Fund’s investment adviser, Bogle Investment Management, L.P., has contractually agreed to waive management fees and reimburse expenses through December 31, 2012 to the extent that total annual Fund operating expenses exceed 1.25% and 1.35% for the Institutional Class and Investor Class, respectively. The Adviser, in its discretion, has the right to extend this waiver. The Russell 2000® is an index of stocks 1001 through 3000 in the Russell 3000® Index as ranked by total market capitalization. A direct investment in the index is not possible. Investing in small companies can involve more volatility, less liquidity and less available information than investing in large companies.
Market Environment. As mentioned in our introduction, U.S. equity market performance was generally positive in the semiannual reporting period. According to Russell benchmarks, large cap stocks outperformed small cap stocks in September and February, small caps outperformed large caps in October and January, and the two capitalization segments posted similar performance for the six months overall (Russell 1000® up +13.31%, Russell 2000® up +12.40%). The equal-weighted Russell 2000® index was up +13.51% for the six months, earning most of its performance advantage relative to the cap-weighted index in January. Small cap growth modestly outperformed small cap value during the period as investors generally favored small growth stocks over small value stocks during the months when markets advanced (October, January and February). For the semiannual period, the Russell 2000® Growth Index gained +12.99%, while the Russell 2000® Value Index returned +11.81%. Market volatility was elevated at the start of the semiannual period but then declined steadily to end February around long-term average levels. Among small cap stocks (categorized using our eight proprietary sectors), the consumer cyclical and industrial sectors were the strongest performers, while basic industry, energy and utilities were the weakest.
Investment Philosophy and Process. While our investment process has evolved over time as new insights have been added, our core investment principles have not changed since we began managing the Fund more than twelve years ago. Our philosophy continues to rest on the belief that, in the long run, companies that offer the most attractive combination of good earnings prospects, reasonable share price, and conservative financial reporting will be rewarded by investors; however, over the short-term, valuations can become more distorted due to increased participation by investors that, for various reasons, make investment decisions that are based on other criteria such as irrational fears or optimism. In general, behavioral biases, whether by Wall Street analysts, company management, and/or traders in the marketplace, create opportunities to earn excess returns. We believe that because these opportunities are behavioral and thus repetitive, they can be exploited with quantitative tools. We also recognize that there are limits to the size and frequency with which we discover these opportunities so we attempt to preserve our ability to add value for our clients by limiting the amount of capital we’re willing to manage. Finally, we believe that process evolution through continuous research is the only way to maintain a competitive advantage and add value through time. To that end, while our investment process today is conceptually similar to what it was twelve years ago, the details have changed over time as we’ve learned new things about how investor behaviors influence security valuations. For example, in some cases we’ve adapted our approach based on observations of how the influence of technology has changed the ways in which many investors behave. Our objective in all of this is to manage an investment process that can add value in a variety of market environments, as well as over time.
Performance Attribution. In the latest semiannual period, the Fund’s return was similar to its benchmark’s return as our composite investment model produced mixed stock picking performance during the period, with months where stock picking was negative offsetting positive months. Our attribution analysis shows that our modest factor and sector exposures (relative to the benchmark) had no meaningful impact on per-
2
formance. On a standalone basis, within our small cap investable universe, all of our sub-models that combine to form our composite investment model, except the earnings expectations sub-model, posted modestly positive returns during the semiannual period. Financial quality sub-model performance was the most consistently positive, while relative valuation sub-model returns turned positive in December as market sentiment started to shift. Similarly, short-term sub-model performance started to improve in January. The earnings expectations sub-model, which is most effective in stable markets, struggled in October and January, as markets were quite volatile during these months. Stock selection was strongest in industrial, technology, and consumer sectors, but losses in financials, energy and basic industry stocks offset these gains.
We continue to maintain a diversified portfolio of 120 to 200 stocks; this diversification helps us to minimize the impact any single stock can have on total Fund performance. At the end of the semiannual period, the Fund held 148 stocks and the largest holding represented 1.5% of portfolio assets. Approximately 80% of the Fund was invested in about 80 positions. In the stock examples that follow, we illustrate how our models led us to two stocks that outperformed the benchmark and one where our investment underperformed. Liquidity Services, Inc. operates various online auction marketplaces for surplus goods.
We stared to buy the stock last fall based on attractive growth prospects, low levels of poor sentiment, and recent price weakness. We closed out of the position toward the end of the semiannual period, as the price had risen dramatically and both the short-term mean reversion and the longer-term relative valuation signals deteriorated. Brocade Communications Systems, Inc. provides networking and storage solutions allowing businesses in different locations to connect virtually. Although the company’s earnings expectations signal was weak when we first purchased the stock for the Fund in May 2011, the company appeared to have conservative accounting and relatively low levels of shares held short. Over the semiannual period the company’s earnings score improved dramatically, while the other longer-term fundamental measures also remained positive. Turning to an investment that negatively impacted performance, True Religion Apparel Company was experiencing strong earnings growth until its most recent earnings report, which proved a disappointment to investors and battered the stock. The company designs, manufactures and sells high end jeans and other apparel. At the end of the semiannual period, with most of the component model signals turning negative, we began to close out of the position.
FUNDAMENTAL CHARACTERISTICS
FEBRUARY 29, 2012
Median | BOGLX* | Russell 2000® | ||||||
Market Cap. ($mil.) | $ | 867 | $ | 1,195 | ||||
Estimated Long-Term Earnings Growth Rate** | 15.9 | % | 13.6 | % | ||||
Price/Historical Earnings | 15.1x | 18.0x | ||||||
Price/Forward Earnings | 12.9x | 15.6x | ||||||
Price/Sales | 1.2x | 1.8x | ||||||
| * | The Bogle Small Cap Growth Fund Investor Shares. Median characteristics refer to the Fund’s holdings, not the Fund itself. |
| ** | The Estimated Long-Term Earnings Growth Rate is calcu- lated for the Fund’s portfolio of companies and the bench- mark companies from First Call analysts’ median estimated earnings growth rate over the next 3 to 5 years. This figure is not indicative of future performance of the Fund; the port- folio and benchmark companies’ actual earnings growth rate will vary from this figure. |
Investment Positioning. As of the end of February, the Fund’s median market capitalization was below that of the bench-mark, as we have continued to take advantage of our small size in pursuit of these smaller opportunities. The Fund continues to have a higher median analysts’ expected long-term earnings growth rate than the benchmark, due to our tendency to avoid stocks that are expected to have very slow long-term earnings growth. We find that we do not have as much of an edge in selecting low growth companies, so we explicitly leave many of them out of the investment process. The Fund also has maintained its attractive valuation exposure,
3
with price-to-earnings and price-to-sales ratios below the benchmark. Note that small deviations from benchmark reflected in the fundamental characteristics (and sector exposures) of the Fund arise purely from the bottom up stock selection process and do not reflect attempts to actively time the overall market, style preferences, or sector rotation. Selected risk statistics for the Fund and benchmark are presented in the table to the right. Total Fund volatility, as measured by the annualized standard deviation of daily returns, was elevated in the last four months of 2011, although it declined in the first two months of 2012. Fund volatility was below that of the benchmark for the semiannual period. Active volatility, or the variability of the difference between the Fund and benchmark daily returns, also declined during the period, from almost 7% in December to about 3% in February.
RISK STATISTICS*
SEMI ANNUAL PERIOD
Measurement | BOGLX | Russell 2000® | ||||||
Standard Deviation | 33.2 | % | 34.1 | % | ||||
Active Volatility | 5.5 | % | ||||||
Beta with Russell 2000® | 0.96 | |||||||
Average Cash | 0.7 | % | ||||||
| * | Risk statistics apply to the Fund and benchmark. Standard deviation is a statistical measure of the range of performance. Active volatility is the standard deviation of the difference between the Fund and benchmark performance. Beta is a meas- ure of a portfolio’s sensitivity to market movement. |
Progress at Bogle Investment Management, L.P. At the end of February 2012, assets in the Fund were $105 million. As we have been reporting for several years, the Fund remains open to new shareholders and we currently have capacity for some additional asset growth. To assist in this area of the business, we recently brought on board our first marketing professional. But, while we expect the Fund to grow somewhat over the next year, we remain committed to monitoring its growth, growth in overall firm assets, and market liquidity conditions to determine when it is appropriate to reclose our investment strategies. We anticipate that if and when we reclose the Fund we will be able to remain open for existing shareholders and financial advisers, as we did when we closed in 2002. Finally, there have been no changes to the investment team, and the team members have now been together for a minimum of eight years.
As a reminder, information about the Fund, including historical net asset values (“NAVs”), sector allocation, fundamental characteristics, and top ten holdings, can be viewed on our website, www.boglefunds.com. The NAVs are updated daily while the other Fund information is updated quarterly.
As always, please let us know if there is any way we can improve your investment experience with us.
Respectfully,
Bogle Investment Management, L.P.
Management Office: 781-283-5000
Shareholder Services Toll Free: 1-877-BOGLEIM (264-5346)
The performance data quoted represents past performance and does not guarantee future results. Current performance may be lower or higher. Performance data current to the most recent month end may be obtained at 1-877-264-5346. The investment return and principal value of an investment will fluctuate so that shares, when redeemed, may be worth more or less than their original cost. The performance quoted reflects fee waivers in effect and would have been less in their absence.
Portfolio composition is subject to change. The current and future portfolio holdings of the Fund are subject to investment risk.
This material must be preceded or accompanied by a current prospectus.
4
BOGLE INVESTMENT MANAGEMENT
SMALL CAP GROWTH FUND
FUND EXPENSE EXAMPLES
(UNAUDITED)
As a shareholder of the Fund, you incur two types of costs: (1) transaction costs and (2) ongoing costs, including management fees, shareholder servicing fees and other Fund expenses. These examples are intended to help you understand your ongoing costs (in dollars) of investing in the Fund and to compare these costs with the ongoing costs of investing in other mutual funds.
These examples are based on an investment of $1,000 invested at the beginning of the six-month period from September 1, 2011 through February 29, 2012, and held for the entire period.
ACTUAL EXPENSES
The first line of the accompanying tables provides information about actual account values and actual expenses. You may use the information in this line, together with the amount you invested, to estimate the expenses that you paid over the period. Simply divide your account value by $1,000 (for example, an $8,600 account value divided by $1,000 = 8.6), then multiply the result by the number in the first line under the heading entitled “Expenses Paid During Period” to estimate the expenses you paid on your account during this period.
HYPOTHETICAL EXAMPLEFOR COMPARISON PURPOSES
The second line of the accompanying tables provides information about hypothetical account values and hypothetical expenses based on the Fund’s actual expense ratio and an assumed rate of return of 5% per year before expenses, which is not the Fund’s actual return. The hypothetical account values and expenses may not be used to estimate the actual ending account balance or expenses you paid for the period. You may use this information to compare the ongoing costs of investing in the Fund and other funds. To do so, compare these 5% hypothetical examples with the 5% hypothetical examples that appear in the shareholder reports of other funds.
Please note that the expenses shown in the accompanying tables are meant to highlight your ongoing costs only and do not reflect any transactional costs, such as redemption fees. Therefore, the second line of the accompanying tables is useful in comparing ongoing costs only, and will not help you determine the relative total costs of owning different funds. In addition, if these transactional costs were included, your costs would have been higher.
| INSTITUTIONAL CLASS | ||||||||||||
| BEGINNING ACCOUNT VALUE SEPTEMBER 1, 2011 | ENDING ACCOUNT VALUE FEBRUARY 29, 2012 | EXPENSES PAID DURING PERIOD* | ||||||||||
Actual | $ | 1,000.00 | $ | 1,122.80 | $ | 6.60 | ||||||
Hypothetical | ||||||||||||
(5% return before expenses) | 1,000.00 | 1,018.65 | 6.27 | |||||||||
5
BOGLE INVESTMENT MANAGEMENT
SMALL CAP GROWTH FUND
FUND EXPENSE EXAMPLES (CONCLUDED)
(UNAUDITED)
| INVESTOR CLASS | ||||||||||||
| BEGINNING ACCOUNT VALUE | ENDING ACCOUNT VALUE | EXPENSES PAID DURING | ||||||||||
| SEPTEMBER 1, 2011 | FEBRUARY 29, 2012 | PERIOD* | ||||||||||
Actual | $ | 1,000.00 | $ | 1,122.50 | $ | 7.12 | ||||||
Hypothetical (5% return before expenses) | 1,000.00 | 1,018.15 | 6.77 | |||||||||
| * | Expenses are equal to the Fund’s annualized six-month expense ratio of 1.25% for the Institutional Class and 1.35% for the Investor Class, which includes waived fees or reimbursed expenses, multiplied by the average account value over the period, multiplied by the number of days (182) in the most recent fiscal half-year, then divided by 366 to reflect the one-half year period. The Fund’s ending account values on the first line in each table are based on the actual six-month total investment return for each class of 12.28% for the Institutional Class and 12.25% for the Investor Class. |
6
BOGLE INVESTMENT MANAGEMENT
SMALL CAP GROWTH FUND
PORTFOLIO HOLDINGS SUMMARY TABLE
FEBRUARY 29, 2012
(UNAUDITED)
The following table presents a summary by security type of the portfolio holdings of the Fund:
SECURITY TYPE & SECTOR CLASSIFICATION | % OF NET ASSETS | VALUE | ||||||
COMMON STOCKS: | ||||||||
Consumer Growth | 20.2 | % | $ | 21,331,740 | ||||
Technology | 18.3 | 19,257,376 | ||||||
Financial | 17.0 | 17,877,577 | ||||||
Industrial | 16.3 | 17,217,935 | ||||||
Consumer Cyclical | 15.2 | 16,075,876 | ||||||
Energy | 6.5 | 6,852,216 | ||||||
Basic Industry | 3.8 | 4,058,226 | ||||||
Utility | 1.6 | 1,650,143 | ||||||
SHORT-TERM INVESTMENTS | 1.0 | 1,057,027 | ||||||
OTHER ASSETS IN EXCESSOF LIABILITIES | 0.1 | 58,254 | ||||||
|
|
|
| |||||
NET ASSETS | 100.0 | % | $ | 105,436,370 | ||||
|
|
|
| |||||
Portfolio holdings are subject to change at any time.
The accompanying notes are an integral part of the financial statements.
7
BOGLE INVESTMENT MANAGEMENT
SMALL CAP GROWTH FUND
PORTFOLIOOF INVESTMENTS
FEBRUARY 29, 2012 (UNAUDITED)
| NUMBER OF SHARES | VALUE | |||||||
COMMON STOCKS—98.9% | ||||||||
BASIC INDUSTRY—3.8% | ||||||||
Aurizon Mines Ltd. * | 42,660 | $ | 226,951 | |||||
Coeur d’Alene Mines Corp. * | 34,992 | 995,172 | ||||||
Huntsman Corp. | 90,827 | 1,240,697 | ||||||
Nevsun Resources Ltd. | 168,924 | 692,588 | ||||||
Steel Dynamics, Inc. | 60,960 | 902,818 | ||||||
|
| |||||||
| 4,058,226 | ||||||||
|
| |||||||
CONSUMER CYCLICAL—15.2% |
| |||||||
AFC Enterprises, Inc. * | 653 | 10,441 | ||||||
Arctic Cat, Inc. * | 42,776 | 1,573,301 | ||||||
Asbury Automotive Group, Inc. * | 14,447 | 374,611 | ||||||
Avis Budget Group, Inc. * | 31,824 | 410,530 | ||||||
Cost Plus, Inc. * | 34,724 | 456,273 | ||||||
Domino’s Pizza, Inc. * | 2,133 | 82,035 | ||||||
Goodyear Tire & Rubber Co., (The) * | 68,988 | 887,186 | ||||||
Group 1 Automotive, Inc. | 8,288 | 427,412 | ||||||
Kona Grill, Inc. * | 46,500 | 250,170 | ||||||
Leapfrog Enterprises, | 168,970 | 1,187,859 | ||||||
Movado Group, Inc. | 49,170 | 1,052,238 | ||||||
Multimedia Games, Inc. * | 100,306 | 1,026,130 | ||||||
Overstock.com, Inc. * | 27,081 | 172,235 | ||||||
Pantry, Inc., (The) * | 32,191 | 400,134 | ||||||
Papa John’s International, Inc. * | 26,622 | 989,274 | ||||||
Shuffle Master, Inc. * | 74,768 | 1,091,613 | ||||||
Smith & Wesson Holding Corp. * | 101,020 | 528,335 | ||||||
Standard Motor Products, Inc. | 46,060 | 1,046,483 | ||||||
Susser Holdings Corp. * | 22,108 | 560,217 | ||||||
Town Sports International Holdings, Inc. * | 41,701 | 429,520 | ||||||
True Religion Apparel, Inc. * | 34,558 | 911,294 | ||||||
Ulta Salon, Cosmetics & Fragrance, Inc. * | 15,060 | 1,253,594 | ||||||
VOXX International Corp. * | 74,667 | 954,991 | ||||||
|
| |||||||
| 16,075,876 | ||||||||
|
| |||||||
| NUMBER OF SHARES | VALUE | |||||||
CONSUMER GROWTH—20.2% |
| |||||||
ABIOMED, Inc. * | 44,945 | $ | 938,451 | |||||
Anika Therapeutics, | 20,753 | 235,754 | ||||||
Arqule, Inc. * | 51,201 | 363,527 | ||||||
Cambrex Corp. * | 140,723 | 937,215 | ||||||
Charles River Laboratories International, Inc. * | 30,230 | 1,061,980 | ||||||
CONMED Corp. * | 1,934 | 57,711 | ||||||
Constellation Brands, Inc., Class A * | 38,692 | 845,033 | ||||||
Cooper Cos, Inc., (The) | 11,648 | 925,783 | ||||||
Cosan Ltd., Class A | 85,772 | 1,275,430 | ||||||
Dean Foods Co. * | 121,967 | 1,495,315 | ||||||
Elizabeth Arden, Inc. * | 37,091 | 1,377,931 | ||||||
Grand Canyon Education, Inc. * | 2,521 | 43,134 | ||||||
Health Net, Inc. * | 26,128 | 986,071 | ||||||
Herbalife Ltd. | 13,102 | 867,483 | ||||||
Hi-Tech Pharmacal Co., Inc. * | 25,739 | 1,027,501 | ||||||
Hill-Rom Holdings, Inc. | 16,850 | 572,395 | ||||||
Jazz Pharmaceuticals | 30,010 | 1,574,625 | ||||||
Neurocrine Biosciences, Inc. * | 122,018 | 960,282 | ||||||
Omnicare, Inc. | 26,344 | 926,782 | ||||||
Progenics Pharmaceuticals, | 85,880 | 837,330 | ||||||
RTI Biologics, Inc. * | 154,763 | 572,623 | ||||||
Spectrum Pharmaceuticals, | 74,281 | 1,054,047 | ||||||
Sun Healthcare Group, Inc. * | 29,091 | 129,746 | ||||||
SXC Health Solutions Corp. * | 11,392 | 806,554 | ||||||
Syneron Medical Ltd. * | 5,536 | 61,782 | ||||||
Trius Therapeutics, Inc. * | 104,592 | 529,236 | ||||||
Warner Chilcott PLC, Class A * | 51,884 | 868,019 | ||||||
|
| |||||||
| 21,331,740 | ||||||||
|
| |||||||
ENERGY—6.5% | ||||||||
Advantage Oil & Gas | 47,136 | 181,473 | ||||||
Cheniere Energy, Inc. * | 74,035 | 1,113,486 | ||||||
Exterran Holdings, Inc. * | 41,133 | 592,315 | ||||||
Flotek Industries, Inc. * | 98,887 | 1,106,546 | ||||||
Helix Energy Solutions Group, Inc. * | 49,928 | 960,615 | ||||||
Mitcham Industries, Inc. * | 43,012 | 1,005,190 | ||||||
The accompanying notes are an integral part of the financial statements.
8
BOGLE INVESTMENT MANAGEMENT
SMALL CAP GROWTH FUND
PORTFOLIOOF INVESTMENTS (CONTINUED)
FEBRUARY 29, 2012 (UNAUDITED)
| NUMBER OF SHARES | VALUE | |||||||
ENERGY—(CONTINUED) | ||||||||
REX American Resources Corp. * | 2,816 | $ | 86,367 | |||||
Rosetta Resources, Inc. * | 21,547 | 1,099,759 | ||||||
TGC Industries, Inc. * | 66,915 | 678,518 | ||||||
Warren Resources, Inc. * | 7,166 | 27,947 | ||||||
|
| |||||||
| 6,852,216 | ||||||||
|
| |||||||
FINANCIAL—17.0% | ||||||||
1st Source Corp. | 4,894 | 120,147 | ||||||
Advance America Cash Advance Centers, Inc. | 118,859 | 1,232,568 | ||||||
Artio Global Investors, Inc. | 173,982 | 833,374 | ||||||
Aspen Insurance Holdings Ltd. | 28,974 | 768,680 | ||||||
Assurant, Inc. | 173 | 7,347 | ||||||
Banco Latinoamericano de Comercio Exterior SA, Class E | 31,855 | 621,491 | ||||||
Banco Macro SA, ADR | 47,250 | 953,033 | ||||||
BBVA Banco Frances SA, ADR | 6,782 | 41,167 | ||||||
Calamos Asset Management, Inc., Class A | 76,558 | 938,601 | ||||||
Epoch Holding Corp. | 36,447 | 909,353 | ||||||
Erie Indemnity Co., Class A | 8,624 | 656,373 | ||||||
FBL Financial Group, Inc., Class A | 907 | 30,811 | ||||||
Genworth Financial, Inc., Class A * | 148,902 | 1,353,519 | ||||||
Hanmi Financial Corp * | 13,516 | 117,184 | ||||||
HFF, Inc., Class A * | 600 | 8,646 | ||||||
Hudson City Bancorp, Inc. | 79,666 | 545,712 | ||||||
Interactive Brokers Group, Inc., Class A | 83,115 | 1,318,204 | ||||||
INTL. FCStone, Inc. * | 20,939 | 474,268 | ||||||
Janus Capital Group, Inc. | 157,945 | 1,393,075 | ||||||
Lakeland Financial Corp. | 2,159 | 54,450 | ||||||
MarketAxess Holdings, Inc. | 31,191 | 1,033,046 | ||||||
MoneyGram International, Inc. * | 7,986 | 143,109 | ||||||
NASDAQ OMX Group, Inc., (The) * | 2,924 | 77,018 | ||||||
Nelnet, Inc., Class A | 44,210 | 1,168,028 | ||||||
Reinsurance Group of America, Inc. | 14,492 | 835,754 | ||||||
| NUMBER OF SHARES | VALUE | |||||||
FINANCIAL—(CONTINUED) | ||||||||
State Bank Financial Corp. * | 49,617 | $ | 805,780 | |||||
SWS Group, Inc. | 119,621 | 668,681 | ||||||
United Fire Group, Inc. | 13,448 | 270,170 | ||||||
Washington Federal, Inc. | 30,740 | 497,988 | ||||||
|
| |||||||
| 17,877,577 | ||||||||
|
| |||||||
INDUSTRIAL—16.3% | ||||||||
AerCap Holdings N.V. * | 52,020 | 680,422 | ||||||
American Railcar Industries, Inc. * | 32,031 | 944,915 | ||||||
Consolidated Graphics, Inc. * | 500 | 23,345 | ||||||
Eagle Materials, Inc. | 10,145 | 318,350 | ||||||
Elster Group SE, ADR * | 22,386 | 322,582 | ||||||
Fair Isaac Corp. | 33,550 | 1,358,104 | ||||||
Flow International | 51,207 | 204,828 | ||||||
FreightCar America, Inc. | 37,450 | 1,035,493 | ||||||
Generac Holdings, Inc. * | 38,428 | 977,608 | ||||||
H&E Equipment Services, Inc. * | 1,955 | 33,802 | ||||||
Huron Consulting Group, Inc. * | 25,320 | 966,718 | ||||||
ITT Corp. * | 44,767 | 1,116,937 | ||||||
Landstar System, Inc. | 18,475 | 998,759 | ||||||
McGrath Rentcorp | 9,776 | 310,388 | ||||||
NACCO Industries, Inc., Class A | 10,021 | 980,054 | ||||||
Navigant Consulting, | 35,217 | 475,782 | ||||||
Navistar International Corp. * | 26,995 | 1,127,851 | ||||||
NCI Building Systems, Inc. * | 65,545 | 793,095 | ||||||
Park-Ohio Holdings | 22,669 | 425,044 | ||||||
Patterson-UTI Energy, Inc. | 56,321 | 1,093,754 | ||||||
Ryder System, Inc. | 5,220 | 277,861 | ||||||
Sauer-Danfoss, Inc. * | 27,973 | 1,514,458 | ||||||
Textron, Inc. | 44,994 | 1,237,785 | ||||||
|
| |||||||
| 17,217,935 | ||||||||
|
| |||||||
TECHNOLOGY—18.3% | ||||||||
Actuate Corp. * | 23,393 | 141,294 | ||||||
Allot Communications Ltd. * | 59,492 | 1,061,932 | ||||||
American Software, Inc., Class A | 32,489 | 269,984 | ||||||
ATMI, Inc. * | 44,758 | 986,019 | ||||||
The accompanying notes are an integral part of the financial statements.
9
BOGLE INVESTMENT MANAGEMENT
SMALL CAP GROWTH FUND
PORTFOLIOOF INVESTMENTS (CONCLUDED)
FEBRUARY 29, 2012 (UNAUDITED)
| NUMBER OF SHARES | VALUE | |||||||
TECHNOLOGY—(CONTINUED) |
| |||||||
Brocade Communications Systems, Inc. * | 220,882 | $ | 1,276,698 | |||||
Clicksoftware Technologies Ltd. | 41,762 | 458,129 | ||||||
Comverse Technology, | 156,242 | 1,003,074 | ||||||
Digitalglobe, Inc. * | 3,861 | 59,382 | ||||||
Echelon Corp. * | 52,761 | 259,584 | ||||||
Emulex Corp. * | 95,923 | 1,003,355 | ||||||
Guidance Software, | 27,282 | 311,288 | ||||||
IDT Corp., Class B | 69,144 | 625,753 | ||||||
Insight Enterprises, | 44,848 | 937,323 | ||||||
Kulicke & Soffa Industries, | 131,647 | 1,482,345 | ||||||
Magnachip Semiconductor | 90,765 | 1,051,059 | ||||||
Manhattan Associates, | 24,762 | 1,147,966 | ||||||
Marchex, Inc., Class B | 24,510 | 105,148 | ||||||
MKS Instruments, Inc. | 14,265 | 427,237 | ||||||
Move, Inc. * | 5,841 | 51,167 | ||||||
Omnicell, Inc. * | 19,676 | 293,566 | ||||||
PROS Holdings, Inc. * | 8,326 | 145,955 | ||||||
ReachLocal, Inc. * | 3,203 | 24,983 | ||||||
ShoreTel, Inc. * | 97,523 | 523,699 | ||||||
Sierra Wireless, Inc. * | 49,502 | 381,660 | ||||||
Silicon Motion Technology Corp., ADR * | 61,988 | 1,103,386 | ||||||
Unisys Corp. * | 58,107 | 1,085,439 | ||||||
United Online, Inc. | 197,111 | 997,382 | ||||||
Xyratex Ltd. | 75,335 | 1,289,735 | ||||||
Zygo Corp. * | 39,251 | 752,834 | ||||||
|
| |||||||
| 19,257,376 | ||||||||
|
| |||||||
UTILITY—1.6% | ||||||||
PNM Resources, Inc. | 49,137 | 883,481 | ||||||
Telecom Argentina S.A., SP ADR | 41,531 | 766,662 | ||||||
|
| |||||||
| 1,650,143 | ||||||||
|
| |||||||
TOTAL COMMON STOCKS | 104,321,089 | |||||||
|
| |||||||
| NUMBER OF SHARES | VALUE | |||||||
SHORT-TERM INVESTMENTS—1.0% |
| |||||||
BofA Cash Reserves Fund | 1,057,027 | $ | 1,057,027 | |||||
|
| |||||||
TOTAL SHORT-TERM INVESTMENTS |
| 1,057,027 | ||||||
|
| |||||||
TOTAL INVESTMENTS—99.9% |
| 105,378,116 | ||||||
|
| |||||||
OTHER ASSETSIN EXCESSOF LIABILITIES—0.1% |
| 58,254 | ||||||
|
| |||||||
NET ASSETS—100.0% | $ | 105,436,370 | ||||||
|
| |||||||
| * | Non-income producing. |
ADR — American Depositary Receipt.
SP ADR — Sponsored American Depositary Receipt.
The accompanying notes are an integral part of the financial statements.
10 |
BOGLE INVESTMENT MANAGEMENT
SMALL CAP GROWTH FUND
STATEMENTOF ASSETSAND LIABILITIES
FEBRUARY 29, 2012
(UNAUDITED)
ASSETS | ||||
Investments, at value (cost $96,151,063) | $ | 105,378,116 | ||
Receivables for: | ||||
Investments sold | 7,507,933 | |||
Capital shares sold | 66,503 | |||
Dividends and interest | 94,893 | |||
Prepaid expenses and other assets | 30,044 | |||
|
| |||
Total assets | 113,077,489 | |||
|
| |||
LIABILITIES | ||||
Payables for: | ||||
Investments purchased | 7,468,531 | |||
Investment advisory fees and shareholder servicing fees | 71,041 | |||
Capital shares redeemed | 33,370 | |||
Directors’ and officers’ fees | 803 | |||
Other accrued expenses and liabilities | �� | 67,374 | ||
|
| |||
Total liabilities | 7,641,119 | |||
|
| |||
Net assets | $ | 105,436,370 | ||
|
| |||
NET ASSETS CONSIST OF | ||||
Capital stock, $0.001 par value | $ | 4,887 | ||
Paid-in capital | 137,126,657 | |||
Accumulated net investment loss | (264,807 | ) | ||
Accumulated net realized loss from investments | (40,657,420 | ) | ||
Net unrealized appreciation on investments | 9,227,053 | |||
|
| |||
Net assets | $ | 105,436,370 | ||
|
| |||
INSTITUTIONAL CLASS | ||||
Net assets | $ | 44,402,081 | ||
|
| |||
Shares outstanding ($0.001 par value, 100,000,000 shares authorized) | 2,040,280 | |||
|
| |||
Net asset value, offering and redemption price per share | $ | 21.76 | ||
|
| |||
INVESTOR CLASS | ||||
Net assets | $ | 61,034,289 | ||
|
| |||
Shares outstanding ($0.001 par value, 100,000,000 shares authorized) | 2,846,681 | |||
|
| |||
Net asset value, offering and redemption price per share | $ | 21.44 | ||
|
|
The accompanying notes are an integral part of the financial statements.
11
BOGLE INVESTMENT MANAGEMENT
SMALL CAP GROWTH FUND
STATEMENTOF OPERATIONS
FORTHE SIX MONTHS ENDED FEBRUARY 29, 2012
(UNAUDITED)
INVESTMENT INCOME | ||||
Dividends and interest (net of foreign withholding taxes of $1,902) | $ | 389,234 | ||
|
| |||
Total investment income | 389,234 | |||
|
| |||
EXPENSES | ||||
Advisory fees | 498,837 | |||
Administration and accounting fees | 83,495 | |||
Transfer agent fees | 66,756 | |||
Shareholder servicing fees | 30,495 | |||
Professional fees | 23,094 | |||
Custodian fees | 16,170 | |||
Registration and filing fees | 14,785 | |||
Printing and shareholder reporting fees | 14,002 | |||
Directors’ and officers’ fees | 12,594 | |||
Insurance fees | 4,072 | |||
Other expenses | 2,007 | |||
|
| |||
Total expenses before waivers | 766,307 | |||
Less: waivers | (112,266 | ) | ||
|
| |||
Net expenses after waivers | 654,041 | |||
|
| |||
Net investment loss | (264,807 | ) | ||
|
| |||
NET REALIZED AND UNREALIZED GAIN/(LOSS) FROM INVESTMENTS | ||||
Net realized loss from investments | (309,883 | ) | ||
Net change in unrealized appreciation/(depreciation) on investments | 11,864,493 | |||
|
| |||
Net realized and unrealized gain from investments | 11,554,610 | |||
|
| |||
NET INCREASE IN NET ASSETS RESULTING FROM OPERATIONS | $ | 11,289,803 | ||
|
|
The accompanying notes are an integral part of the financial statements.
12
BOGLE INVESTMENT MANAGEMENT
SMALL CAP GROWTH FUND
STATEMENTSOF CHANGESIN NET ASSETS
| FOR THE SIX MONTHS ENDED FEBRUARY 29, 2012 (UNAUDITED) | FOR THE YEAR ENDED AUGUST 31, 2011 | |||||||
INCREASE/(DECREASE)IN NET ASSETS FROM OPERATIONS: | ||||||||
Net investment loss | $ | (264,807 | ) | $ | (625,238 | ) | ||
Net realized gain/(loss) from investments | (309,883 | ) | 26,119,149 | |||||
Net change in unrealized appreciation/(depreciation) on investments | 11,864,493 | (2,182,920 | ) | |||||
|
|
|
| |||||
Net increase in net assets resulting from operations | 11,289,803 | 23,310,991 | ||||||
|
|
|
| |||||
INCREASE/(DECREASE) IN NET ASSETS DERIVED FROM CAPITAL TRANSACTIONS: | ||||||||
Institutional Class | ||||||||
Proceeds from shares sold | 4,215,973 | 12,173,186 | ||||||
Distributions for shares redeemed | (2,993,589 | ) | (15,808,392 | ) | ||||
|
|
|
| |||||
Total Institutional Class | 1,222,384 | (3,635,206 | ) | |||||
Investor Class | ||||||||
Proceeds from shares sold | 1,291,254 | 34,121,969 | ||||||
Distributions for shares redeemed | (20,795,838 | ) | (21,529,000 | ) | ||||
|
|
|
| |||||
Total Investor Class | (19,504,584 | ) | 12,592,969 | |||||
|
|
|
| |||||
Net increase/(decrease) in net assets from capital share transactions | (18,282,200 | ) | 8,957,763 | |||||
|
|
|
| |||||
Total increase/(decrease) in net assets | (6,992,397 | ) | 32,268,754 | |||||
|
|
|
| |||||
NET ASSETS | ||||||||
Beginning of period | 112,428,767 | 80,160,013 | ||||||
|
|
|
| |||||
End of period | $ | 105,436,370 | $ | 112,428,767 | ||||
|
|
|
| |||||
Accumulated net investment loss, end of period | $ | (264,807 | ) | $ | — | |||
|
|
|
| |||||
The accompanying notes are an integral part of the financial statements.
13
BOGLE INVESTMENT MANAGEMENT
SMALL CAP GROWTH FUND
STATEMENTSOF CHANGESIN NET ASSETS (CONCLUDED)
| FOR THE SIX MONTHS ENDED FEBRUARY 29, 2012 (UNAUDITED) | FOR THE YEAR ENDED AUGUST 31, 2011 | |||||||
INCREASE/(DECREASE) IN SHARES OUTSTANDING DERIVED FROM SHARE TRANSACTIONS: | ||||||||
Institutional Class | ||||||||
Shares sold | 219,252 | 593,748 | ||||||
Shares redeemed | (153,497 | ) | (760,717 | ) | ||||
|
|
|
| |||||
Total Institutional Class | 65,755 | (166,969 | ) | |||||
|
|
|
| |||||
Investor Class | ||||||||
Shares sold | 66,538 | 1,643,437 | ||||||
Shares redeemed | (1,101,623 | ) | (1,077,424 | ) | ||||
|
|
|
| |||||
Total Investor Class | (1,035,085 | ) | 566,013 | |||||
|
|
|
| |||||
Total increase/(decrease) in shares outstanding derived fromshare transactions | (969,330 | ) | 399,044 | |||||
|
|
|
| |||||
The accompanying notes are an integral part of the financial statements.
14
BOGLE INVESTMENT MANAGEMENT
SMALL CAP GROWTH FUND
FINANCIAL HIGHLIGHTS
Contained below is per share operating performance data for each class of shares outstanding, total investment return, ratios to average net assets and other supplemental data for the respective periods. This information has been derived from information provided in the financial statements.
| INSTITUTIONAL CLASS | ||||||||||||||||||||||||
| FOR THE SIX MONTHS ENDED 2/29/12 | FOR THE YEAR ENDED 8/31/11 | FOR THE YEAR ENDED 8/31/10 | FOR THE YEAR ENDED 8/31/09 | FOR THE YEAR ENDED 8/31/08 | FOR THE YEAR ENDED 8/31/07 | |||||||||||||||||||
| (UNAUDITED) | ||||||||||||||||||||||||
PER SHARE OPERATING PERFORMANCE | ||||||||||||||||||||||||
Net asset value, beginning of period | $ | 19.38 | $ | 14.81 | $ | 14.03 | $ | 17.35 | $ | 24.61 | $ | 27.74 | ||||||||||||
|
|
|
|
|
|
|
|
|
|
|
| |||||||||||||
Net investment loss* | (0.05 | ) | (0.10 | ) | (0.07 | ) | (0.05 | ) | (0.13 | ) | (0.08 | ) | ||||||||||||
Net realized and unrealized gain/(loss)from investments | 2.43 | 4.67 | 0.85 | (3.27 | ) | (3.99 | ) | 2.74 | ||||||||||||||||
|
|
|
|
|
|
|
|
|
|
|
| |||||||||||||
Net increase/(decrease) in net assets resulting from operations | 2.38 | 4.57 | 0.78 | (3.32 | ) | (4.12 | ) | 2.66 | ||||||||||||||||
|
|
|
|
|
|
|
|
|
|
|
| |||||||||||||
Distributions to shareholders from: | ||||||||||||||||||||||||
Net realized capital gains | — | — | — | — | (3.14 | ) | (5.79 | ) | ||||||||||||||||
|
|
|
|
|
|
|
|
|
|
|
| |||||||||||||
Net asset value, end of period | $ | 21.76 | $ | 19.38 | $ | 14.81 | $ | 14.03 | $ | 17.35 | $ | 24.61 | ||||||||||||
|
|
|
|
|
|
|
|
|
|
|
| |||||||||||||
Total investment return(1) | 12.28 | %(2) | 30.86 | % | 5.56 | % | (19.08 | )% | (19.33 | )% | 10.29 | % | ||||||||||||
|
|
|
|
|
|
|
|
|
|
|
| |||||||||||||
RATIOS/SUPPLEMENTAL DATA | ||||||||||||||||||||||||
Net assets, end of period (000’s omitted) | $ | 44,402 | $ | 38,274 | $ | 31,714 | $ | 35,571 | $ | 84,546 | $ | 197,415 | ||||||||||||
Ratio of expenses to average net assets with waivers and reimbursements | 1.25 | %(3) | 1.25 | % | 1.25 | % | 1.25 | % | 1.25 | % | 1.25 | % | ||||||||||||
Ratio of expenses to average net assets without waivers and reimbursements | 1.48 | %(3) | 1.44 | % | 1.51 | % | 1.57 | % | 1.44 | % | 1.43 | % | ||||||||||||
Ratio of net investment loss to average net assets | (0.47 | )%(3) | (0.48 | )% | (0.48 | )% | (0.44 | )% | (0.64 | )% | (0.30 | )% | ||||||||||||
Portfolio turnover rate | 133.90 | %(2) | 302.71 | % | 196.03 | % | 159.14 | % | 162.10 | % | 142.45 | % | ||||||||||||
| * | Calculated based on average shares outstanding for the period. |
| (1) | Total investment return is calculated assuming a purchase of shares on the first day and a sale of shares on the last day of each period reported and includes reinvestments of dividends and distributions, if any. |
| (2) | Not annualized |
| (3) | Annualized |
The accompanying notes are an integral part of the financial statements.
15
BOGLE INVESTMENT MANAGEMENT
SMALL CAP GROWTH FUND
FINANCIAL HIGHLIGHTS
Contained below is per share operating performance data for each class of shares outstanding, total investment return, ratios to average net assets and other supplemental data for the respective periods. This information has been derived from information provided in the financial statements.
| INVESTOR CLASS | ||||||||||||||||||||||||
| FOR THE SIX MONTHS ENDED 2/29/12 | FOR THE YEAR ENDED 8/31/11 | FOR THE YEAR ENDED 8/31/10 | FOR THE YEAR ENDED 8/31/09 | FOR THE YEAR ENDED 8/31/08 | FOR THE YEAR ENDED 8/31/07 | |||||||||||||||||||
| (UNAUDITED) | ||||||||||||||||||||||||
PER SHARE OPERATING PERFORMANCE | ||||||||||||||||||||||||
Net asset value, beginning of period | $ | 19.10 | $ | 14.61 | $ | 13.86 | $ | 17.14 | $ | 24.38 | $ | 27.56 | ||||||||||||
|
|
|
|
|
|
|
|
|
|
|
| |||||||||||||
Net investment loss* | (0.05 | ) | (0.12 | ) | (0.09 | ) | (0.06 | ) | (0.14 | ) | (0.10 | ) | ||||||||||||
Net realized and unrealized gain/(loss)from investments | 2.39 | 4.61 | 0.84 | (3.22 | ) | (3.96 | ) | 2.71 | ||||||||||||||||
|
|
|
|
|
|
|
|
|
|
|
| |||||||||||||
Net increase/(decrease) in net assets resulting from operations | 2.34 | 4.49 | 0.75 | (3.28 | ) | (4.10 | ) | 2.61 | ||||||||||||||||
|
|
|
|
|
|
|
|
|
|
|
| |||||||||||||
Distributions to shareholders from: | ||||||||||||||||||||||||
Net realized capital gains | — | — | — | — | (3.14 | ) | (5.79 | ) | ||||||||||||||||
|
|
|
|
|
|
|
|
|
|
|
| |||||||||||||
Net asset value, end of period | $ | 21.44 | $ | 19.10 | $ | 14.61 | $ | 13.86 | $ | 17.14 | $ | 24.38 | ||||||||||||
|
|
|
|
|
|
|
|
|
|
|
| |||||||||||||
Total investment return(1) | 12.25 | %(2) | 30.73 | % | 5.41 | % | (19.14 | )% | (19.45 | )% | 10.15 | % | ||||||||||||
|
|
|
|
|
|
|
|
|
|
|
| |||||||||||||
RATIOS/SUPPLEMENTAL DATA | ||||||||||||||||||||||||
Net assets, end of period (000’s omitted) | $ | 61,034 | $ | 74,155 | $ | 48,446 | $ | 53,379 | $ | 82,477 | $ | 135,752 | ||||||||||||
Ratio of expenses to average net assets with waivers and reimbursements | 1.35 | %(3) | 1.35 | % | 1.35 | % | 1.35 | % | 1.35 | % | 1.35 | % | ||||||||||||
Ratio of expenses to average net assets without waivers and reimbursements | 1.57 | %(3) | 1.54 | % | 1.62 | % | 1.67 | % | 1.54 | % | 1.53 | % | ||||||||||||
Ratio of net investment loss to average net assets | (0.57 | )%(3) | (0.58 | )% | (0.58 | )% | (0.56 | )% | (0.74 | )% | (0.40 | )% | ||||||||||||
Portfolio turnover rate | 133.90 | %(2) | 302.71 | % | 196.03 | % | 159.14 | % | 162.10 | % | 142.45 | % | ||||||||||||
| * | Calculated based on average shares outstanding for the period. |
| (1) | Total investment return is calculated assuming a purchase of shares on the first day and a sale of shares on the last day of each period reported and includes reinvestments of dividends and distributions, if any. |
| (2) | Not annualized |
| (3) | Annualized |
The accompanying notes are an integral part of the financial statements.
16
BOGLE INVESTMENT MANAGEMENT
SMALL CAP GROWTH FUND
NOTESTO FINANCIAL STATEMENTS
(UNAUDITED)
| 1. | ORGANIZATIONAND SIGNIFICANT ACCOUNTING POLICIES |
The RBB Fund, Inc. (“RBB” or the “Company”) was incorporated under the laws of the State of Maryland on February 29, 1988 and is registered under the Investment Company Act of 1940, as amended, (the “Investment Company Act”) as an open-end management investment company. RBB is a “series fund,” which is a mutual fund divided into separate portfolios. Each portfolio is treated as a separate entity for certain matters under the Investment Company Act, and for other purposes, and a shareholder of one portfolio is not deemed to be a shareholder of any other portfolio. Currently, RBB has nineteen active investment portfolios, including the Bogle Investment Management Small Cap Growth Fund (the “Fund”), which commenced investment operations on October 1, 1999. As of the date hereof, the Fund offers two classes of shares, Institutional Class and Investor Class.
RBB has authorized capital of one hundred billion shares of common stock of which 80.373 billion shares are currently classified into one hundred and forty classes of common stock. Each class represents an interest in an active or inactive RBB investment portfolio.
PORTFOLIO VALUATION — The Fund’s net asset value (“NAV”) is calculated once daily at the close of regular trading hours on the New York Stock Exchange (“NYSE”) (generally 4:00 p.m. Eastern time) on each day the NYSE is open. Securities held by the Fund are valued using the closing price or the last sale price on a national securities exchange or the National Association of Securities Dealers Automatic Quotation System (“NASDAQ”) market system where they are primarily traded. Equity securities traded in the over-the-counter market are valued at their closing prices. If there were no transactions on that day, securities traded principally on an exchange or on NASDAQ will be valued at the mean of the last bid and ask prices prior to the market close. Fixed income securities having a remaining maturity of greater than 60 days are valued using an independent pricing service. Fixed income securities having a remaining maturity of 60 days or less are valued at amortized cost, which approximates market value. Investments in other open-end investment companies are valued based on the NAV of those investment companies (which may use fair value pricing as discussed in their prospectuses). If market quotations are unavailable or deemed unreliable, securities will be valued in accordance with procedures adopted by RBB’s Board of Directors (the “Board”). Relying on prices supplied by pricing services or dealers or using fair valuation may result in values that are higher or lower than the values used by other investment companies and investors to price the same investments.
FAIR VALUE MEASUREMENTS — The inputs and valuation techniques used to measure fair value of the Fund’s investments are summarized into three levels as described in the hierarchy below:
| • | Level 1 – | quoted prices in active markets for identical securities; | ||
| • | Level 2 – | other significant observable inputs (including quoted prices for similar securities, interest rates, prepayment speeds, credit risk, etc.); and | ||
| • | Level 3 – | significant unobservable inputs (including the Fund’s own assumptions in determining the fair value of investments). | ||
17
BOGLE INVESTMENT MANAGEMENT
SMALL CAP GROWTH FUND
NOTESTO FINANCIAL STATEMENTS (CONTINUED)
(UNAUDITED)
The inputs or methodology used for valuing securities are not necessarily an indication of the risk associated with investing in those securities.
The following is a summary of the inputs used, as of February 29, 2012, in valuing the Fund’s investments carried at fair value:
| TOTAL VALUE AT FEBRUARY 29, 2012 | LEVEL 1 QUOTED PRICE | LEVEL 2 SIGNIFICANT OBSERVABLE INPUTS | LEVEL 3 SIGNIFICANT UNOBSERVABLE INPUTS | |||||||||||||
Total Investments* | $ | 105,378,116 | $ | 105,378,116 | $ | — | $ | — | ||||||||
|
|
|
|
|
|
|
| |||||||||
| * | See Portfolio of Investments detail for security type and sector classification breakout. |
At the end of each calendar quarter, management evaluates the classification of Levels 1, 2 and 3 assets and liabilities. Various factors are considered, such as changes in liquidity from the prior reporting period; whether or not a broker is willing to execute at the quoted price; the depth and consistency of prices from third party pricing services; and the existence of contemporaneous, observable trades in the market. Additionally, management evaluates the classification of Level 1 and Level 2 assets and liabilities on a quarterly basis for changes in listings or delistings on national exchanges.
Due to the inherent uncertainty of determining the fair value of investments that do not have a readily available market value, the fair value of the Fund’s investments may fluctuate from period to period. Additionally, the fair value of investments may differ significantly from the values that would have been used had a ready market existed for such investments and may differ materially from the values the Fund may ultimately realize. Further, such investments may be subject to legal and other restrictions on resale or otherwise less liquid than publicly traded securities.
For the six months ended February 29, 2012, there were no transfers between Levels 1, 2 and 3 for the Fund.
USEOF ESTIMATES — The preparation of financial statements in conformity with accounting principles generally accepted in the United States of America requires management to make estimates and assumptions that affect the reported amounts of assets and liabilities and disclosure of contingent assets and liabilities at the date of the financial statements and the reported amounts of revenues and expenses during the period. Actual results could differ from those estimates and those differences could be significant.
INVESTMENT TRANSACTIONS, INVESTMENT INCOMEAND EXPENSES — The Fund records security transactions based on trade date. The cost of investments sold is determined by use of the specific identification method for both financial reporting and income tax purposes in determining realized gains and losses on investments. Interest income is accrued when earned. Dividend income is recorded on the ex-dividend date. The Fund’s net investment income (other than class specific shareholder servicing fees) and unrealized and realized gains and losses are allocated daily to each class of shares based upon the relative proportion of net
18
BOGLE INVESTMENT MANAGEMENT
SMALL CAP GROWTH FUND
NOTES TO FINANCIAL STATEMENTS (CONTINUED)
(UNAUDITED)
assets of each class at the beginning of the day. Expenses incurred on behalf of a specific class, fund or fund family of the Company are charged directly to the class, fund or fund family (in proportion to net assets). Expenses incurred for all of the RBB funds (such as director or professional fees) are charged to all funds in proportion to their average net assets of RBB, or in such other manner as the Company’s Board deems fair or equitable. Expenses and fees, including investment advisory and administration fees, are accrued daily for the purpose of determining the NAV of the Fund.
DIVIDENDSAND DISTRIBUTIONSTO SHAREHOLDERS — Dividends from net investment income and distributions from net realized capital gains, if any, will be declared and paid at least annually to shareholders and recorded on the ex-dividend date. Income dividends and capital gain distributions are determined in accordance with U.S. federal income tax regulations which may differ from accounting principles generally accepted in the United States (“U.S. GAAP”).
U.S. TAX STATUS — No provision is made for U.S. income taxes as it is the Fund’s intention to qualify for and elect the tax treatment applicable to regulated investment companies under Subchapter M of the Internal Revenue Code of 1986, as amended, and make the requisite distributions to its shareholders which will be sufficient to relieve it from U.S. income and excise taxes.
CASHAND CASH EQUIVALENTS — The Fund considers liquid assets deposited into bank demand deposit accounts to be cash equivalents. These investments represent amounts held with financial institutions that are readily accessible to pay Fund expenses or purchase investments. Cash and cash equivalents are valued at cost plus accrued interest, which approximates market value.
OTHER — In the normal course of business, the Fund may enter into contracts that provide general indemnifications. The Fund’s maximum exposure under these arrangements is dependent on claims that may be made against the Fund in the future, and, therefore, cannot be estimated; however, based on experience, the risk of material loss from such claims is considered remote.
| 2. | INVESTMENT ADVISERAND OTHER SERVICES |
Bogle Investment Management, L.P. (the “Adviser” or “Bogle”) serves as the Fund’s investment adviser. For its advisory services, the Adviser is entitled to receive a monthly fee from the Fund calculated at an annual rate of 1.00% of the Fund’s average daily net assets.
The Adviser has contractually agreed to waive management fees and reimburse expenses to the extent that total annual Fund operating expenses (excluding certain items discussed below) exceed 1.25% and 1.35% for the Institutional Class and Investor Class, respectively. In determining the Adviser’s obligation to waive advisory fees and/or reimburse expenses, the following expenses are not taken into account: acquired fund fees and expenses, brokerage commissions, extraordinary items, interest or taxes. This contractual limitation is in effect until December 31, 2012 and may not be terminated without the approval of the Board. The Adviser may discontinue these arrangements at any time after December 31, 2012.
19
BOGLE INVESTMENT MANAGEMENT
SMALL CAP GROWTH FUND
NOTESTO FINANCIAL STATEMENTS (CONTINUED)
(UNAUDITED)
The contractual fee waiver does not provide for recoupment of fees that were waived or expenses that were reimbursed. For the six months ended February 29, 2012, investment advisory fees and waivers of the Fund were as follows:
GROSS ADVISORY | WAIVERS | NET ADVISORY FEES | ||||||||
| $ | 498,837 | $ | (106,031 | ) | $ | 392,806 | ||||
The Fund will not pay the Adviser at a later time for any amounts waived or any amounts assumed.
In addition to serving as the Fund’s investment adviser, Bogle provides certain shareholder services to the Investor Class of the Fund. As compensation for such services, the Adviser receives a monthly fee equal to an annual rate of 0.10% of the average daily net assets of the Fund’s Investor Class.
BNY Mellon Investment Servicing (US) Inc. (“BNY Mellon”) serves as administrator for the Fund. For providing administrative and accounting services, BNY Mellon is entitled to receive a monthly fee equal to an annual percentage rate of the Fund’s average daily net assets, subject to certain minimum monthly fees.
BNY Mellon has voluntarily agreed to waive a portion of its administration and accounting fees for the Fund. For the six months ended February 29, 2012, administration and accounting fees and waivers of the Fund were as follows:
GROSS ADMINISTRATION | WAIVERS | NET ADMINISTRATION AND ACCOUNTING FEES | ||||||||
| $ | 83,495 | $ | (6,235 | ) | $ | 77,260 | ||||
For providing regulatory administration services to RBB, BNY Mellon is entitled to receive compensation as agreed to by the Company and BNY Mellon. This fee is allocated to each portfolio in proportion to its net assets of the Company.
In addition, BNY Mellon serves as the Fund’s transfer and dividend disbursing agent. For providing transfer agent services, BNY Mellon is entitled to receive a monthly fee equal to an annual percentage rate of the Fund’s average daily net assets and is subject to certain minimum monthly fees.
The Bank of New York Mellon (the “Custodian”) provides certain custodial services to the Fund. The Custodian is entitled to receive a monthly fee equal to an annual percentage rate of the Fund’s average daily net assets, subject to certain minimum monthly fees.
BNY Mellon Distributors LLC, formerly known as BNY Mellon Distributors Inc., a member of BNY Mellon, serves as the principal underwriter and distributor of the Fund’s shares pursuant to a Distribution Agreement with RBB.
The Fund will not pay The Bank of New York Mellon Corporation or any of its members or BNY Mellon’s affiliates at a later time for any amounts waived or any amounts assumed.
20
BOGLE INVESTMENT MANAGEMENT
SMALL CAP GROWTH FUND
NOTESTO FINANCIAL STATEMENTS (CONTINUED)
(UNAUDITED)
| 3. | DIRECTOR COMPENSATION |
The Directors of the Company receive an annual retainer, meeting fees and reimbursement of out of pocket expenses for meetings attended. The remuneration paid to the Directors by the Fund during the six months ended February 29, 2012 was $7,502. Certain employees of BNY Mellon are Officers of the Company. They are not compensated by the Fund or the Company.
| 4. | INVESTMENTIN SECURITIES |
For the six months ended February 29, 2012, aggregate purchases and sales of investment securities (excluding short-term investments) of the Fund were as follows:
| INVESTMENT SECURITIES | ||||||
| PURCHASES | SALES | |||||
| $ | 134,497,156 | $ | 153,665,297 | |||
| 5. | CAPITAL SHARE TRANSACTIONS |
As of February 29, 2012, the Fund has 100,000,000 shares of $0.001 par value common stock authorized for the Institutional Class and 100,000,000 shares of $0.001 par value common stock authorized for the Investor Class.
| 6. | FEDERAL INCOME TAX INFORMATION |
The Fund has followed the authoritative guidance on accounting for and disclosure of uncertainty in tax positions, which requires the Fund to determine whether a tax position is more likely than not to be sustained upon examination, including resolution of any related appeals or litigation processes, based on the technical merits of the position. The Fund has determined that there was no effect on the financial statements from following this authoritative guidance. In the normal course of business, the Fund is subject to examination by federal, state and local jurisdictions, where applicable, for tax years for which applicable statutes of limitations have not expired.
As of February 29, 2012, federal tax cost, aggregate gross unrealized appreciation and depreciation of securities held by the Fund were as follows:
FEDERAL TAX COST | UNREALIZED APPRECIATION | UNREALIZED DEPRECIATION | NET UNREALIZED APPRECIATION | |||||||||||
| $ | 96,151,063 | $ | 12,014,451 | $ | (2,787,398 | ) | $ | 9,227,053 | ||||||
Distributions to shareholders from net investment income and realized gains are determined in accordance with federal income tax regulations, which may differ from net investment income and realized gains recognized for financial reporting purposes. Accordingly, the character of distributions and composition of net assets for tax purposes may differ from those reflected in the accompanying financial statements. To the extent these differences are permanent, such amounts are reclassified within the capital accounts based on the tax treatment; temporary differences do not require such reclassification.
21
BOGLE INVESTMENT MANAGEMENT
SMALL CAP GROWTH FUND
NOTESTO FINANCIAL STATEMENTS (CONTINUED)
(UNAUDITED)
There were no dividends or distributions paid during the fiscal year ended August 31, 2011. Dividends from net investment income and short-term capital gains are treated as ordinary income dividends for federal income tax purposes.
As of August 31, 2011, the Fund had a capital loss carryforward of $39,206,234 available to offset future capital gains. This capital loss carryforward will expire as follows:
August 31, 2018 | $ | 26,317,731 | ||
August 31, 2017 | $ | 12,888,503 |
Under federal tax law, foreign currency and capital losses realized after October 31 may be deferred and treated as having arisen on the first day of the following fiscal year. For the year ended August 31, 2011, the Fund did not incur a net post-October capital loss.
On December 22, 2010, President Obama signed into law the Regulated Investment Company Modernization Act of 2010 (the “Act”). The Act updates certain tax rules applicable to regulated investment companies (“RICs”). The various provisions of the Act will generally be effective for RICs with taxable years beginning after December 22, 2010. Additional information regarding the impact of the Act on the Fund, if any, will be contained within the relevant sections of the notes to the financial statements for the fiscal year ending August 31, 2012.
| 7. | NEW ACCOUNTING PRONOUNCEMENT |
In May 2011, the Financial Accounting Standards Board issued Accounting Standards Update (“ASU”) No. 2011-04 “Amendments to Achieve Common Fair Value Measurement and Disclosure Requirements in U.S. GAAP and International Financial Reporting Standards (“IFRSs”)”. ASU No. 2011-04 includes common requirements for measurement of and disclosure about fair value between U.S. GAAP and IFRSs. ASU No. 2011-04 will require reporting entities to disclose the following information for fair value measurements categorized within Level 3 of the fair value hierarchy: quantitative information about the unobservable inputs used in the fair value measurement, the valuation processes used by the reporting entity and a narrative description of the sensitivity of the fair value measurement to changes in unobservable inputs and the interrelationships between those unobservable inputs. In addition, ASU No. 2011-04 will require reporting entities to make disclosures about amounts and reasons for all transfers in and out of Level 1 and Level 2 fair value measurements. The new and revised disclosures are effective for interim and annual reporting periods beginning after December 15, 2011. Management is currently evaluating the implications of ASU No. 2011-04 and its impact on the financial statements.
22
BOGLE INVESTMENT MANAGEMENT
SMALL CAP GROWTH FUND
NOTESTO FINANCIAL STATEMENTS (CONCLUDED)
(UNAUDITED)
| 8. | SUBSEQUENT EVENT |
Management has evaluated the impact of all subsequent events on the Fund through the date the financial statements were issued, and has determined that there was the following subsequent event:
The Bank of New York Mellon Corporation announced on November 28, 2011 that it had agreed to sell BNY Mellon Distributors LLC (the “Distributor”) and its four subsidiaries to Foreside Distributors LLC, a subsidiary of Foreside Financial Group, LLC (the “Transaction”). The Transaction closed on March 31, 2012. Upon the closing of the Transaction, the Distributor became an indirect, wholly owned subsidiary of Foreside Financial Group, LLC and was renamed Foreside Funds Distributors, LLC effective April 1, 2012.
23
BOGLE INVESTMENT MANAGEMENT
SMALL CAP GROWTH FUND
OTHER INFORMATION
(UNAUDITED)
PROXY VOTING
Policies and procedures that the Fund uses to determine how to vote proxies relating to portfolio securities as well as information regarding how the Fund voted proxies relating to portfolio securities for the most recent 12-month period ended June 30 are available without charge, upon request, by calling (877) 264-5346 and on the Securities and Exchange Commission’s (“SEC”) website at http://www.sec.gov.
QUARTERLY PORTFOLIO SCHEDULES
The Company files its complete schedule of portfolio holdings with the SEC for the first and third fiscal quarters of each fiscal year (quarters ended November 30 and May 31) on Form N-Q. The Company’s Form N-Q is available on the SEC website at http://www.sec.gov and may be reviewed and copied at the SEC Public Reference Room in Washington, D.C. Information on the operation of the SEC Public Reference Room may be obtained by calling (202) 551-8090.
24
[THIS PAGE INTENTIONALLY LEFT BLANK]
[THIS PAGE INTENTIONALLY LEFT BLANK]
[THIS PAGE INTENTIONALLY LEFT BLANK]
Investment Adviser
Bogle Investment Management, L.P.
2310 Washington Street
Suite 310
Newton Lower Falls, MA 02462
Administrator
BNY Mellon Investment Servicing (US) Inc.
301 Bellevue Parkway
Wilmington, DE 19809
Transfer Agent
BNY Mellon Investment Servicing (US) Inc.
4400 Computer Drive
Westborough, MA 01581
Principal Underwriter
Foreside Funds Distributors LLC
400 Berwyn Park
899 Cassatt Road
Berwyn, PA 19312
Custodian
The Bank of New York Mellon
One Wall Street
New York, NY 10286
Independent Registered Public Accounting Firm
PricewaterhouseCoopers LLP
Two Commerce Square, Suite 1700
2001 Market Street
Philadelphia, PA 19103-7042
Counsel
Drinker Biddle & Reath LLP
One Logan Square
Suite 2000
Philadelphia, PA 19103-6996
BOGLE
INVESTMENT
MANAGEMENT
SMALL CAP
GROWTH FUND
of THE RBB FUND, INC.
SEMI-ANNUAL REPORT
FEBRUARY 29, 2012
(UNAUDITED)
This report is submitted for the general information of the shareholders of the Fund. It is not authorized for distribution unless preceded or accompanied by a current prospectus for the Fund.
FREE MARKET FUNDS
Semi-Annual Investment Adviser’s Report
February 29, 2012
(Unaudited)
Dear Fellow Shareholder,
The Free Market Funds (the “Funds”) have steadily gained assets since their start and have surpassed the $2 billion mark. We would like to extend a warm and grateful thank you to all investors who have embraced our Free Market Portfolio Strategies.
Over the past six months, investors who remained invested have continued to experience the gains from the upward rally that started at the end of 2011. Global equity markets over the past six months have risen 8.12% as measured by the MSCI All Country World Index. Furthermore, U.S. stocks led the way with double digit returns over the past half a year. The Barclays Capital US Government/Credit Intermediate Bond Index was also in the positive with a return of 1.71% for the last six months.
Matson Money, Inc. (“Matson Money”) strives to deliver the performance of capital markets and add value through Free Market Investment strategies and Structured Market Portfolios. Grounded in the conviction that Free Markets work, Matson Money avoids the cost-generating activity of stock picking and market timing. Instead, we focus on the dimensions of capital markets that we believe reward investors as intelligently and effectively as possible. Our disciplined approach to life-long investing provides both the individual investor and the financial professional with the academic foundation upon which to help achieve investment goals.
Sound economic and financial research has documented that, over the long term, small cap stocks outperform large cap stocks, and value stocks outperform growth stocks. These returns seem to be compensation for risk. In fixed income, risk is well described by bond maturity and credit quality. Matson Money’s vehicles deliberately target specific risk and return trade offs. The Funds are broadly diversified and designed to work together in your total investment plan.
We invite you to contact your financial professional or explore our website, www.MatsonMoney.com, to learn more about the concepts and strategies of Matson Money’s investing.
We appreciate your support and confidence in our firm’s investment philosophy, process and people.

Daniel J List
Chief Compliance Officer and
Director of Portfolio Management
Matson Money, Inc.
Portfolio composition is subject to change. The current and future portfolio holdings of the Funds are subject to investment risks.
1
FREE MARKET FUNDS
Performance Data
(Unaudited)
Free Market U.S. Equity Fund
| Total Returns for the Periods Ended February 29, 2012 | ||||||||||||||||
| Average Annual | ||||||||||||||||
| Six Months* | One Year | Three Year | Since Inception** | |||||||||||||
Free Market U.S. Equity Fund | 12.71 | % | -0.82 | % | 30.62 | % | 4.31 | % | ||||||||
Russell 2500® Index | 12.98 | % | 1.45 | % | 31.28 | % | 3.64 | % | ||||||||
Composite Index*** | 12.56 | % | 0.91 | % | 26.98 | % | 1.06 | % | ||||||||
| * | Not annualized. |
| ** | The Fund commenced operations on December 31, 2007. |
| *** | The Composite Index is comprised of the S&P 500® Index, Russell 1000® Value Index, Russell 2000® Index and Russell 2000® Value Index, each weighted 25%, 25%, 25% and 25%, respectively. |
The performance data quoted represents past performance. Past performance is not indicative of future results. Investment return and principal value will fluctuate so that an investor’s shares, when redeemed, may be worth more or less than their original cost. Current performance may be lower or higher. Returns shown include the reinvestment of all dividends and other distributions and do not reflect taxes that a shareholder would pay on Fund distributions or on the redemption of Fund shares. For performance data current to the most recent month-end, please call 1-866-780-0357 ext. 3863. The Fund’s annual operating expenses, as stated in the current prospectus, is 0.96% (included in the ratio is 0.32%, attributable to acquired fund fees and expenses).
The Fund’s aggregate total return since inception is based on an increase in net asset value from $10.00 per share on December 31, 2007 (commencement of operations) to $11.49 per share on February 29, 2012.
The Free Market U.S. Equity Fund’s underlying funds invest in small-cap and micro-cap stocks, large-cap stocks and other equity securities. In addition to the ordinary risks of equity investing, small companies entail special risk. Small companies tend to have more risk than large companies. An investor in the Fund will incur the expenses of the underlying funds in addition to the Fund expenses.
Free Market International Equity Fund
| Total Returns for the Periods Ended February 29, 2012 | ||||||||||||||||
| Average Annual | ||||||||||||||||
| Six Months* | One Year | Three Year | Since Inception** | |||||||||||||
Free Market International Equity Fund | 3.18 | % | -9.14 | % | 25.61 | % | -1.26 | % | ||||||||
MSCI World (excluding U.S.) Index | 3.54 | % | -7.86 | % | 20.38 | % | -5.15 | % | ||||||||
Composite Index*** | 4.08 | % | -5.70 | % | 24.76 | % | -3.66 | % | ||||||||
| * | Not annualized. |
| ** | The Fund commenced operations on December 31, 2007. |
| *** | The Composite Index is comprised of the MSCI EAFE Index, MSCI EAFE Value Index, MSCI EAFE Small Company Index, and MSCI Emerging Markets Free Index, each weighted 25%, 25%, 25% and 25%, respectively. |
The performance data quoted represents past performance. Past performance is not indicative of future results. Investment return and principal value will fluctuate so that an investor’s shares, when redeemed, may be worth more or less than their original cost. Current performance may be lower or higher. Returns shown include the reinvestment of all dividends and other distributions and do not reflect taxes that a shareholder would pay on Fund distributions or on the redemption of Fund shares. For performance data current to the most recent month-end, please call 1-866-780-0357 ext. 3863. The Fund’s annual operating expenses, as stated in the current prospectus, is 1.18% (included in the ratio is 0.52%, attributable to acquired fund fees and expenses).
The Fund’s aggregate total return since inception is based on a decrease in net asset value from $10.00 per share on December 31, 2007 (commencement of operations) to $8.73 per share on February 29, 2012.
2
FREE MARKET FUNDS
Performance Data
(Unaudited)
The Free Market International Equity Fund’s underlying funds invest in common stock, preferred stock, securities convertible into stocks and other equity securities issued by foreign companies. In addition to the ordinary risks of equity investing, foreign and small companies entail special risk. The return on foreign equities may be adversely affected by currency fluctuations. Emerging markets may be subject to social instability and lack of market liquidity. Small companies tend to have more risk than large companies. An investor in the Fund will incur the expenses of the underlying funds in addition to the Fund expenses.
Free Market Fixed Income Fund
| Total Returns for the Periods Ended February 29, 2012 | ||||||||||||||||
| Average Annual | ||||||||||||||||
| Six Months* | One Year | Three Year | Since Inception** | |||||||||||||
Free Market Fixed Income Fund | 0.60 | % | 3.43 | % | 2.83 | % | 2.84 | % | ||||||||
Citigroup World Govt. Bond 1–5 Year Currency Hedged U.S. Dollar Index | 1.06 | % | 3.09 | % | 2.32 | % | 3.29 | % | ||||||||
Composite Index*** | 1.11 | % | 4.25 | % | 3.74 | % | 3.86 | % | ||||||||
| * | Not annualized. |
| ** | The Fund commenced operations on December 31, 2007. |
| *** | The Composite Index is comprised of the Three-Month Treasury Bill Index, Barclays Capital Intermediate Government Bond Index, B of A Merrill Lynch 1-3 Year US Government/Corporate Index and Barclays Capital Aggregate Bond Index, each weighted 25%, 25%, 25% and 25%, respectively. |
The performance data quoted represents past performance. Past performance is not indicative of future results. Investment return and principal value will fluctuate so that an investor’s shares, when redeemed, may be worth more or less than their original cost. Current performance may be lower or higher. Returns shown include the reinvestment of all dividends and other distributions and do not reflect taxes that a shareholder would pay on Fund distributions or on the redemption of Fund shares. For performance data current to the most recent month-end, please call 1-866-780-0357 ext. 3863. The Fund’s annual operating expenses, as stated in the current prospectus, is 0.85% (included in the ratio is 0.20%, attributable to acquired fund fees and expenses).
The Fund’s aggregate total return since inception is based on an increase in net asset value from $10.00 per share on December 31, 2007 (commencement of operations) to $10.41 per share on February 29, 2012.
The Free Market Fixed Income Fund’s underlying funds invest in fixed income securities. The underlying funds may invest their assets in bonds and other debt securities issued by domestic and foreign governments and companies. Debt instruments involve the risk that their prices will fall when interest rates rise, and they are subject to the risk that the borrower may default. In addition, the return on foreign debt securities may be adversely affected by currency fluctuations. An investor in the Fund will incur the expenses of the underlying funds in addition to the Fund expenses.
3
FREE MARKET FUNDS
Fund Expense Examples
(Unaudited)
As a shareholder of the Fund(s), you incur two types of costs: (1) transaction costs, including redemption fees; and (2) ongoing costs, including management fees and other Fund expenses. These examples are intended to help you understand your ongoing costs (in dollars) of investing in the Fund(s) and to compare these costs with the ongoing costs of investing in other mutual funds.
These examples are based on an investment of $1,000 invested at the beginning of the six-month period from September 1, 2011 through February 29, 2012, and held for the entire period.
Actual Expenses
The first line of the accompanying tables provides information about actual account values and actual expenses. You may use the information in this line, together with the amount you invested, to estimate the expenses that you paid over the period. Simply divide your account value by $1,000 (for example, an $8,600 account value divided by $1,000 = 8.6), then multiply the result by the number in the first line under the heading entitled “Expenses Paid During Period” to estimate the expenses you paid on your account during this period.
Hypothetical Example for Comparison Purposes
The second line of the accompanying tables provides information about hypothetical account values and hypothetical expenses based on the Fund’s actual expense ratio and an assumed rate of return of 5% per year before expenses, which is not your Fund’s actual return. The hypothetical account values and expenses may not be used to estimate the actual ending account balance or expenses you paid for the period. You may use this information to compare the ongoing costs of investing in the Fund and other funds. To do so, compare these 5% hypothetical examples with the 5% hypothetical examples that appear in the shareholder reports of other funds.
Please note that the expenses shown in the accompanying tables are meant to highlight your ongoing costs only and do not reflect any transactional costs, such as redemption fees. Therefore, the second line of the accompanying tables is useful in comparing ongoing costs only, and will not help you determine the relative total costs of owning different funds. In addition, if these transactional costs were included, your costs would have been higher.
| Free Market U.S. Equity Fund | ||||||||||||
| Beginning Account Value September 1, 2011 | Ending Account Value February 29, 2012 | Expenses Paid During Period* | ||||||||||
Actual | $ | 1,000.00 | $ | 1,127.12 | $ | 3.37 | ||||||
Hypothetical (5% return before expenses) | 1,000.00 | 1,021.69 | 3.20 | |||||||||
| Free Market International Equity Fund | ||||||||||||
| Beginning Account Value September 1, 2011 | Ending Account Value February 29, 2012 | Expenses Paid During Period* | ||||||||||
Actual | $ | 1,000.00 | $ | 1,031.75 | $ | 3.30 | ||||||
Hypothetical (5% return before expenses) | 1,000.00 | 1,021.61 | 3.29 | |||||||||
4
FREE MARKET FUNDS
Fund Expense Examples (Concluded)
(Unaudited)
| Free Market Fixed Income Fund | ||||||||||||
| Beginning Account Value September 1, 2011 | Ending Account Value February 29, 2012 | Expenses Paid During Period* | ||||||||||
Actual | $ | 1,000.00 | $ | 1,005.95 | $ | 3.15 | ||||||
Hypothetical (5% return before expenses) | 1,000.00 | 1,021.72 | 3.18 | |||||||||
| * | Expenses are equal to an annualized six-month expense ratio of 0.64% for the Free Market U.S. Equity Fund, 0.65% for the Free Market International Equity Fund and 0.63% for the Free Market Fixed Income Fund, multiplied by the average account value over the period, multiplied by the number of days in the most recent fiscal half-year (182), then divided by 366 to reflect the one-half year period. The annualized expense ratios do not reflect fees and expenses associated with the underlying funds. If such fees and expenses had been included, the expenses would have been higher. The range of weighted expense ratios of the underlying funds held by the Funds, as stated in their current prospectuses, were as follows: |
| Free Market U.S. September Fund | Free Market International Equity Fund | Free Market Fixed Income Fund | ||||||||||
| 0.02 | %-0.13% | 0.01 | %-0.28% | 0.01 | %-0.07% | |||||||
Each Fund’s ending account values on the first line in each table are based on the actual six-month total return for each Fund of 12.71% for the Free Market U.S. Equity Fund, 3.18% for the Free Market International Equity Fund and 0.60% for the Free Market Fixed Income Fund.
5
FREE MARKET FUNDS
FREE MARKET U.S. EQUITY FUND
Portfolio of Investments
February 29, 2012 (Unaudited)
| Number of Shares | Value | |||||||
EQUITY FUNDS — 99.9% |
| |||||||
U.S. Large Cap Value Portfolio III(a) | 15,822,349 | $ | 257,429,619 | |||||
U.S. Large Company Portfolio(a) | 11,869,468 | 127,952,859 | ||||||
U.S. Micro Cap | 8,669,841 | 124,932,407 | ||||||
U.S. Small Cap | 5,577,202 | 125,654,365 | ||||||
U.S. Small Cap Value Portfolio(b) | 8,176,907 | 209,901,215 | ||||||
|
| |||||||
TOTAL EQUITY FUNDS |
| 845,870,465 | ||||||
|
| |||||||
TOTAL INVESTMENTS — 99.9% |
| 845,870,465 | ||||||
|
| |||||||
OTHER ASSETS IN EXCESS OF LIABILITIES — 0.1% |
| 715,310 | ||||||
|
| |||||||
NET ASSETS — 100.0% | $ | 846,585,775 | ||||||
|
| |||||||
Portfolio Holdings Summary Table
| % of Net Assets | Value | |||||||
Equity Funds | 99.9 | % | $ | 845,870,465 | ||||
Other Assets In Excess of Liabilities | 0.1 | % | 715,310 | |||||
|
|
|
| |||||
NET ASSETS | 100.0 | % | $ | 846,585,775 | ||||
|
|
|
| |||||
| (a) | A portfolio of Dimensional Investment Group Inc. |
| (b) | A portfolio of DFA Investment Dimensions Group Inc. |
Portfolio holdings are subject to change at any time.
The accompanying notes are an integral part of the financial statements.
6
FREE MARKET FUNDS
FREE MARKET INTERNATIONAL EQUITY FUND
Portfolio of Investments
February 29, 2012 (Unaudited)
| Number of Shares | Value | |||||||
INTERNATIONAL EQUITY FUNDS — 99.9% |
| |||||||
Asia Pacific Small Company Portfolio(a) | 509,818 | $ | 12,261,132 | |||||
Continental Small Company Portfolio(a) | 1,774,461 | 27,060,525 | ||||||
DFA International Small | 15,399,904 | 243,780,481 | ||||||
DFA International Value Portfolio III(b) | 11,781,729 | 182,145,534 | ||||||
Emerging Markets Portfolio(a) | 1,167,200 | 32,378,132 | ||||||
Emerging Markets Small Cap Portfolio(a) | 1,387,658 | 29,779,131 | ||||||
Emerging Markets Value Portfolio(a) | 949,461 | 29,775,095 | ||||||
Japanese Small Company Portfolio(a) | 739,883 | 12,030,496 | ||||||
Large Cap International Portfolio(a) | 1,606,619 | 30,188,371 | ||||||
United Kingdom Small Company Portfolio(a) | 341,677 | 8,688,852 | ||||||
|
| |||||||
TOTAL INTERNATIONAL EQUITY FUNDS |
| 608,087,749 | ||||||
|
| |||||||
TOTAL INVESTMENTS — 99.9% |
| 608,087,749 | ||||||
|
| |||||||
OTHER ASSETS IN EXCESS OF LIABILITIES — 0.1% |
| 623,983 | ||||||
|
| |||||||
NET ASSETS — 100.0% |
| $ | 608,711,732 | |||||
|
| |||||||
Portfolio Holdings Summary Table
| % of Net Assets | Value | |||||||
International Equity Funds | 99.9 | % | $ | 608,087,749 | ||||
Other Assets In Excess of Liabilities | 0.1 | % | 623,983 | |||||
|
|
|
| |||||
NET ASSETS | 100.0 | % | $ | 608,711,732 | ||||
|
|
|
| |||||
| (a) | A portfolio of DFA Investment Dimensions Group Inc. |
| (b) | A portfolio of Dimensional Investment Group Inc. |
Portfolio holdings are subject to change at any time.
The accompanying notes are an integral part of the financial statements.
7
FREE MARKET FUNDS
FREE MARKET FIXED INCOME FUND
Portfolio of Investments
February 29, 2012 (Unaudited)
| Number of Shares | Value | |||||||
FIXED INCOME FUNDS — 99.4% |
| |||||||
DFA Five-Year Global | 19,262,655 | $ | 212,659,712 | |||||
DFA Inflation-Protected Securities Portfolio(a) | 3,405,576 | 42,467,528 | ||||||
DFA Intermediate Government Fixed Income Portfolio(a) | 7,874,863 | 101,979,470 | ||||||
DFA One-Year Fixed Income Portfolio(a) | 20,193,146 | 208,595,200 | ||||||
DFA Short-Term | 6,283,483 | 67,987,289 | ||||||
DFA Two-Year Global | 21,053,634 | 212,852,240 | ||||||
|
| |||||||
TOTAL FIXED INCOME FUNDS |
| 846,541,439 | ||||||
|
| |||||||
TOTAL INVESTMENTS — 99.4% |
| 846,541,439 | ||||||
|
| |||||||
OTHER ASSETS IN EXCESS OF LIABILITIES — 0.6% |
| 4,687,799 | ||||||
|
| |||||||
NET ASSETS — 100.0% |
| $ | 851,229,238 | |||||
|
| |||||||
Portfolio Holdings Summary Table
| % of Net Assets | Value | |||||||
Fixed Income Funds | 99.4 | % | $ | 846,541,439 | ||||
Other Assets In Excess of Liabilities | 0.6 | % | 4,687,799 | |||||
|
|
|
| |||||
NET ASSETS | 100.0 | % | $ | 851,229,238 | ||||
|
|
|
| |||||
| (a) | A portfolio of DFA Investment Dimensions Group Inc. |
Portfolio holdings are subject to change at any time.
The accompanying notes are an integral part of the financial statements.
8
FREE MARKET FUNDS
Statements of Assets and Liabilities
February 29, 2012 (Unaudited)
| Free Market U.S. Equity Fund | Free Market International Equity Fund | Free Market Fixed Income Fund | ||||||||||
ASSETS | ||||||||||||
Investments in non-affiliated funds, at value † | $ | 845,870,465 | $ | 608,087,749 | $ | 846,541,439 | ||||||
Cash and cash equivalents | 622,552 | 583,812 | 4,660,642 | |||||||||
Receivables | ||||||||||||
Receivable for capital shares sold | 1,233,828 | 896,182 | 1,394,999 | |||||||||
Dividends and interest receivable | 250 | 174 | — | |||||||||
Prepaid expenses and other assets | 47,384 | 39,089 | 51,428 | |||||||||
|
|
|
|
|
| |||||||
Total assets | 847,774,479 | 609,607,006 | 852,648,508 | |||||||||
|
|
|
|
|
| |||||||
LIABILITIES | ||||||||||||
Payables | ||||||||||||
Investments purchased | — | — | 458,377 | |||||||||
Capital shares redeemed | 689,479 | 520,371 | 468,934 | |||||||||
Investment adviser | 335,323 | 236,933 | 333,660 | |||||||||
Administration and accounting fees | 92,542 | 71,783 | 90,040 | |||||||||
Other accrued expenses and liabilities | 71,360 | 66,187 | 68,259 | |||||||||
|
|
|
|
|
| |||||||
Total liabilities | 1,188,704 | 895,274 | 1,419,270 | |||||||||
|
|
|
|
|
| |||||||
Net Assets | $ | 846,585,775 | $ | 608,711,732 | $ | 851,229,238 | ||||||
|
|
|
|
|
| |||||||
NET ASSETS CONSISTS OF | ||||||||||||
Par value | $ | 73,710 | $ | 69,739 | $ | 81,803 | ||||||
Paid-in capital | 676,524,369 | 575,991,880 | 840,901,370 | |||||||||
Accumulated net investment loss | (848,522 | ) | (943,099 | ) | (2,349,285 | ) | ||||||
Accumulated net realized gain/(loss) from investments | (1,132,726 | ) | (1,959,123 | ) | 7,119,633 | |||||||
Net unrealized appreciation on investments | 171,968,944 | 35,552,335 | 5,475,717 | |||||||||
|
|
|
|
|
| |||||||
Net Assets | $ | 846,585,775 | $ | 608,711,732 | $ | 851,229,238 | ||||||
|
|
|
|
|
| |||||||
Shares outstanding ($0.001 par value, 200,000,000 shares authorized) | 73,709,740 | 69,739,279 | 81,802,700 | |||||||||
|
|
|
|
|
| |||||||
Net asset value, offering and redemption price per share | $ | 11.49 | $ | 8.73 | $ | 10.41 | ||||||
|
|
|
|
|
| |||||||
† Investment in non-affiliated funds, at cost | $ | 673,901,521 | $ | 572,535,414 | $ | 841,065,722 | ||||||
|
|
|
|
|
| |||||||
The accompanying notes are an integral part of the financial statements.
9
FREE MARKET FUNDS
Statements of Operations
For the Six Months Ended February 29, 2012
(Unaudited)
| Free Market U.S. Equity Fund | Free Market International Equity Fund | Free Market Fixed Income Fund | ||||||||||
Investment Income | ||||||||||||
Dividends from non-affiliated funds | $ | 6,149,704 | $ | 7,259,093 | $ | 10,349,761 | ||||||
Interest from non-affiliated funds | 42 | 26 | 177 | |||||||||
|
|
|
|
|
| |||||||
Total investment income | 6,149,746 | 7,259,119 | 10,349,938 | |||||||||
|
|
|
|
|
| |||||||
Expenses | ||||||||||||
Advisory fees (Note 2) | 1,845,526 | 1,302,626 | 2,007,154 | |||||||||
Administration and accounting fees (Note 2) | 226,877 | 177,906 | 237,330 | |||||||||
Transfer agent fees (Note 2) | 115,083 | 88,990 | 121,613 | |||||||||
Professional fees | 47,922 | 37,287 | 50,492 | |||||||||
Directors’ and officers’ fees | 36,608 | 27,844 | 34,637 | |||||||||
Custodian fees (Note 2) | 31,345 | 27,715 | 34,208 | |||||||||
Printing and shareholder reporting fees | 18,901 | 16,184 | 19,754 | |||||||||
Other expenses | 30,408 | 25,579 | 31,147 | |||||||||
|
|
|
|
|
| |||||||
Total expenses | 2,352,670 | 1,704,131 | 2,536,335 | |||||||||
|
|
|
|
|
| |||||||
Net investment income | 3,797,076 | 5,554,988 | 7,813,603 | |||||||||
|
|
|
|
|
| |||||||
Net realized and unrealized gain/(loss) from investments | ||||||||||||
Net realized gain/(loss) from: | ||||||||||||
Non-affiliated funds | 203,336 | (1,975,523 | ) | 3,530 | ||||||||
Capital gain distributions from non-affiliated fund investments | 2,642,178 | 6,630,089 | 7,252,808 | |||||||||
Net change in unrealized appreciation/(depreciation) on: | ||||||||||||
Non-affiliated funds | 90,099,502 | 14,192,599 | (10,791,680 | ) | ||||||||
|
|
|
|
|
| |||||||
Net realized and unrealized gain/(loss) on investments | 92,945,016 | 18,847,165 | (3,535,342 | ) | ||||||||
|
|
|
|
|
| |||||||
Net increase in net assets resulting from operations | $ | 96,742,092 | $ | 24,402,153 | $ | 4,278,261 | ||||||
|
|
|
|
|
| |||||||
The accompanying notes are an integral part of the financial statements.
10
FREE MARKET U.S. EQUITY FUND
Statements of Changes in Net Assets
| For the Six Months Ended February 29, 2012 (Unaudited) | For the Year Ended August 31, 2011 | |||||||
Increase in net assets from operations: | ||||||||
Net investment income | $ | 3,797,076 | $ | 3,674,349 | ||||
Net realized gain from investments | 2,845,514 | 4,874,845 | ||||||
Net change in unrealized appreciation from investments | 90,099,502 | 87,491,919 | ||||||
|
|
|
| |||||
Net increase in net assets resulting from operations | 96,742,092 | 96,041,113 | ||||||
|
|
|
| |||||
Dividends and distributions to shareholders from: | ||||||||
Net investment income | (4,645,598 | ) | (3,793,406 | ) | ||||
Net realized capital gains | (5,493,112 | ) | (18,737 | ) | ||||
|
|
|
| |||||
Net decrease in net assets from dividends and distributions to shareholders | (10,138,710 | ) | (3,812,143 | ) | ||||
|
|
|
| |||||
Capital share transactions: | ||||||||
Proceeds from shares sold | 121,622,984 | 244,842,046 | ||||||
Reinvestment of distributions | 10,138,710 | 3,812,143 | ||||||
Shares redeemed | (50,926,567 | ) | (146,926,884 | ) | ||||
|
|
|
| |||||
Net increase in net assets from capital shares | 80,835,127 | 101,727,305 | ||||||
|
|
|
| |||||
Total increase in net assets | 167,438,509 | 193,956,275 | ||||||
|
|
|
| |||||
Net assets: | ||||||||
Beginning of period | 679,147,266 | 485,190,991 | ||||||
|
|
|
| |||||
End of period | $ | 846,585,775 | $ | 679,147,266 | ||||
|
|
|
| |||||
Undistributed/accumulated net investment income/(loss), end of period | $ | (848,522 | ) | $ | — | |||
|
|
|
| |||||
Capital share transactions: | ||||||||
Shares sold | 11,757,434 | 22,421,680 | ||||||
Shares reinvested | 967,434 | 345,930 | ||||||
Shares redeemed | (4,770,332 | ) | (13,118,352 | ) | ||||
|
|
|
| |||||
Total share transactions | 7,954,536 | 9,649,258 | ||||||
|
|
|
| |||||
The accompanying notes are an integral part of the financial statements.
11
FREE MARKET INTERNATIONAL EQUITY FUND
Statements of Changes in Net Assets
| For the Six Months Ended February 29, 2012 (Unaudited) | For the Year Ended August 31, 2011 | |||||||
Increase in net assets from operations: | ||||||||
Net investment income | $ | 5,554,988 | $ | 8,164,141 | ||||
Net realized gain from investments | 4,654,566 | 6,150,944 | ||||||
Net change in unrealized appreciation from investments | 14,192,599 | 20,204,625 | ||||||
|
|
|
| |||||
Net increase in net assets resulting from operations | 24,402,153 | 34,519,710 | ||||||
|
|
|
| |||||
Dividends and distributions to shareholders from: | ||||||||
Net investment income | (11,517,635 | ) | (6,163,601 | ) | ||||
Net realized capital gains | (7,200,541 | ) | — | |||||
|
|
|
| |||||
Net decrease in net assets from dividends and distributions to shareholders | (18,718,176 | ) | (6,163,601 | ) | ||||
|
|
|
| |||||
Capital share transactions: | ||||||||
Proceeds from shares sold | 97,324,615 | 190,010,433 | ||||||
Reinvestment of distributions | 18,718,176 | 6,163,601 | ||||||
Shares redeemed | (29,087,555 | ) | (73,922,823 | ) | ||||
|
|
|
| |||||
Net increase in net assets from capital shares | 86,955,236 | 122,251,211 | ||||||
|
|
|
| |||||
Total increase in net assets | 92,639,213 | 150,607,320 | ||||||
|
|
|
| |||||
Net assets: | ||||||||
Beginning of period | 516,072,519 | 365,465,199 | ||||||
|
|
|
| |||||
End of period | $ | 608,711,732 | $ | 516,072,519 | ||||
|
|
|
| |||||
Undistributed/accumulated net investment income/(loss), end of period | $ | (943,099 | ) | $ | 5,019,548 | |||
|
|
|
| |||||
Capital share transactions: | ||||||||
Shares sold | 12,048,865 | 20,004,784 | ||||||
Shares reinvested | 2,482,517 | 643,382 | ||||||
Shares redeemed | (3,566,532 | ) | (7,712,072 | ) | ||||
|
|
|
| |||||
Total share transactions | 10,964,850 | 12,936,094 | ||||||
|
|
|
| |||||
The accompanying notes are an integral part of the financial statements.
12
FREE MARKET FIXED INCOME FUND
Statements of Changes in Net Assets
| For the Six Months Ended February 29, 2012 (Unaudited) | For the Year Ended August 31, 2011 | |||||||
Increase in net assets from operations: | ||||||||
Net investment income | $ | 7,813,603 | $ | 6,478,944 | ||||
Net realized gain from investments | 7,256,338 | 4,709,778 | ||||||
Net change in unrealized appreciation/(depreciation) from investments | (10,791,680 | ) | 3,845,111 | |||||
|
|
|
| |||||
Net increase in net assets resulting from operations | 4,278,261 | 15,033,833 | ||||||
|
|
|
| |||||
Dividends and distributions to shareholders from: | ||||||||
Net investment income | (10,162,888 | ) | (11,170,911 | ) | ||||
Net realized capital gains | (3,877 | ) | (232,406 | ) | ||||
Return of capital | — | (611,392 | ) | |||||
|
|
|
| |||||
Net decrease in net assets from dividends and distributions to shareholders | (10,166,765 | ) | (12,014,709 | ) | ||||
|
|
|
| |||||
Capital share transactions: | ||||||||
Proceeds from shares sold | 155,809,748 | 368,657,981 | ||||||
Reinvestment of distributions | 10,166,640 | 12,014,709 | ||||||
Shares redeemed | (70,541,510 | ) | (81,290,712 | ) | ||||
|
|
|
| |||||
Net increase in net assets from capital shares | 95,434,878 | 299,381,978 | ||||||
|
|
|
| |||||
Total increase in net assets | 89,546,374 | 302,401,102 | ||||||
|
|
|
| |||||
Net assets: | ||||||||
Beginning of period | 761,682,864 | 459,281,762 | ||||||
|
|
|
| |||||
End of period | $ | 851,229,238 | $ | 761,682,864 | ||||
|
|
|
| |||||
Undistributed/accumulated net investment income/(loss), end of period | $ | (2,349,285 | ) | $ | — | |||
|
|
|
| |||||
Capital share transactions: | ||||||||
Shares sold | 14,943,677 | 35,572,514 | ||||||
Shares reinvested | 979,764 | 1,164,681 | ||||||
Shares redeemed | (6,770,589 | ) | (7,835,973 | ) | ||||
|
|
|
| |||||
Total share transactions | 9,152,852 | 28,901,222 | ||||||
|
|
|
| |||||
The accompanying notes are an integral part of the financial statements.
13
FREE MARKET FUNDS
FREE MARKET U.S. EQUITY FUND
Financial Highlights
Contained below is per share operating performance data for each share outstanding, total investment return, ratios to average net assets and other supplemental data for the respective periods. This information has been derived from information provided in the financial statements.
| For the Six Months Ended February 29, 2012 (Unaudited) | For the Year Ended August 31, 2011 | For the Year Ended August 31, 2010 | For the Year Ended August 31, 2009 | For the Period December 31, 2007(1) Through August 31, 2008 | ||||||||||||||||
Per Share Operating Performance | ||||||||||||||||||||
Net asset value, beginning of period | $ | 10.33 | $ | 8.65 | $ | 8.21 | $ | 10.29 | $ | 10.00 | ||||||||||
|
|
|
|
|
|
|
|
|
| |||||||||||
Net investment income. | 0.05 | (2) | 0.06 | (2) | 0.02 | (2) | 0.10 | (2) | — | (3) | ||||||||||
Net realized and unrealized gain/(loss) on investments | 1.25 | 1.68 | 0.46 | (2.09 | ) | 0.29 | ||||||||||||||
|
|
|
|
|
|
|
|
|
| |||||||||||
Net increase/(decrease) in net assets resulting from operations | 1.30 | 1.74 | 0.48 | (1.99 | ) | 0.29 | ||||||||||||||
|
|
|
|
|
|
|
|
|
| |||||||||||
Dividends and distributions to shareholders from: | ||||||||||||||||||||
Net investment income. | (0.06 | ) | (0.06 | ) | (0.03 | ) | (0.09 | ) | — | |||||||||||
Net realized capital gains | (0.08 | ) | — | (4) | — | — | — | |||||||||||||
Tax return of capital | — | — | (0.01 | ) | — | — | ||||||||||||||
|
|
|
|
|
|
|
|
|
| |||||||||||
Total dividends and distributions to shareholders | (0.14 | ) | (0.06 | ) | (0.04 | ) | (0.09 | ) | — | |||||||||||
|
|
|
|
|
|
|
|
|
| |||||||||||
Net asset value, end of period | $ | 11.49 | $ | 10.33 | $ | 8.65 | $ | 8.21 | $ | 10.29 | ||||||||||
|
|
|
|
|
|
|
|
|
| |||||||||||
Total investment return(5) | 12.71 | %(6) | 20.11 | % | 5.88 | % | (19.19 | )% | 2.90 | %(6) | ||||||||||
|
|
|
|
|
|
|
|
|
| |||||||||||
Ratio/Supplemental Data | ||||||||||||||||||||
Net assets, end of period (000’s omitted) | $ | 846,586 | $ | 679,147 | $ | 485,191 | $ | 312,104 | $ | 187,039 | ||||||||||
Ratio of expenses to average net assets(7) | 0.64 | %(8) | 0.64 | % | 0.67 | % | 0.72 | % | 0.84 | %(8) | ||||||||||
Ratio of net investment income to average net assets(7) | 1.03 | %(8) | 0.55 | % | 0.22 | % | 1.37 | % | 0.02 | %(8) | ||||||||||
Portfolio turnover rate | 2 | %(6) | 9 | % | 3 | % | 1 | % | 0 | %(6) | ||||||||||
| (1) | Commencement of operations. |
| (2) | The selected per share data was calculated using the average shares outstanding method for the period. |
| (3) | Amount less than $0.005 per share. |
| (4) | Amount less than $(0.005) per share. |
| (5) | Total investment return is calculated by assuming a purchase of shares on the first day and a sale of shares on the last day of each period reported and includes reinvestments of dividends and distributions, if any. |
| (6) | Not annualized. |
| (7) | The Fund also will indirectly bear its prorated share of expenses of the underlying funds. Such expenses are not included in the calculation of this ratio. |
| (8) | Annualized. |
The accompanying notes are an integral part of the financial statements.
14
FREE MARKET FUNDS
FREE MARKET INTERNATIONAL EQUITY FUND
Financial Highlights
Contained below is per share operating performance data for each share outstanding, total investment return, ratios to average net assets and other supplemental data for the respective periods. This information has been derived from information provided in the financial statements.
| For the Six Months Ended February 29, 2012 (Unaudited) | For the Year Ended August 31, 2011 | For the Year Ended August 31, 2010 | For the Year Ended August 31, 2009 | For the Period December 31, 2007(1) Through August 31, 2008 | ||||||||||||||||
Per Share Operating Performance | ||||||||||||||||||||
Net asset value, beginning of period | $ | 8.78 | $ | 7.97 | $ | 8.02 | $ | 8.85 | $ | 10.00 | ||||||||||
|
|
|
|
|
|
|
|
|
| |||||||||||
Net investment income. | 0.09 | (2) | 0.16 | (2) | 0.11 | (2) | 0.13 | (2) | 0.08 | |||||||||||
Net realized and unrealized gain/(loss) on investments | 0.14 | 0.78 | (0.04 | ) | (0.85 | ) | (1.23 | ) | ||||||||||||
|
|
|
|
|
|
|
|
|
| |||||||||||
Net increase/(decrease) in net assets resulting from operations. | 0.23 | 0.94 | 0.07 | (0.72 | ) | (1.15 | ) | |||||||||||||
|
|
|
|
|
|
|
|
|
| |||||||||||
Dividends and distributions to shareholders from: | ||||||||||||||||||||
Net investment income. | (0.17 | ) | (0.13 | ) | (0.09 | ) | (0.11 | ) | — | |||||||||||
Net realized capital gains | (0.11 | ) | — | (0.03 | ) | — | — | |||||||||||||
|
|
|
|
|
|
|
|
|
| |||||||||||
Total dividends and distributions to shareholders | (0.28 | ) | (0.13 | ) | (0.12 | ) | (0.11 | ) | — | |||||||||||
|
|
|
|
|
|
|
|
|
| |||||||||||
Net asset value, end of period | $ | 8.73 | $ | 8.78 | $ | 7.97 | $ | 8.02 | $ | 8.85 | ||||||||||
|
|
|
|
|
|
|
|
|
| |||||||||||
Total investment return(3) | 3.18 | %(4) | 11.60 | % | 0.86 | % | (7.71 | )% | (11.50 | )%(4) | ||||||||||
|
|
|
|
|
|
|
|
|
| |||||||||||
Ratio/Supplemental Data | ||||||||||||||||||||
Net assets, end of period (000’s omitted) | $ | 608,712 | $ | 516,073 | $ | 365,465 | $ | 258,632 | $ | 130,821 | ||||||||||
Ratio of expenses to average net assets(5) | 0.65 | %(6) | 0.66 | % | 0.68 | % | 0.73 | % | 0.92 | %(6) | ||||||||||
Ratio of net investment income to average net assets(5) | 2.13 | %(6) | 1.66 | % | 1.29 | % | 2.01 | % | 2.94 | %(6) | ||||||||||
Portfolio turnover rate | 2 | %(4) | 4 | % | 8 | % | 2 | % | 0 | %(4) | ||||||||||
| (1) | Commencement of operations. |
| (2) | The selected per share data was calculated using the average shares outstanding method for the period. |
| (3) | Total investment return is calculated by assuming a purchase of shares on the first day and a sale of shares on the last day of each period reported and includes reinvestments of dividends and distributions, if any. |
| (4) | Not annualized. |
| (5) | The Fund also will indirectly bear its prorated share of expenses of the underlying funds. Such expenses are not included in the calculation of this ratio. |
| (6) | Annualized. |
The accompanying notes are an integral part of the financial statements.
15
FREE MARKET FUNDS
FREE MARKET FIXED INCOME FUND
Financial Highlights
Contained below is per share operating performance data for each share outstanding, total investment return, ratios to average net assets and other supplemental data for the respective periods. This information has been derived from information provided in the financial statements.
| For the Six Months Ended February 29, 2012 (Unaudited) | For the Year Ended August 31, 2011 | For the Year Ended August 31, 2010 | For the Year Ended August 31, 2009 | For the Period December 31, 2007(1) Through August 31, 2008 | ||||||||||||||||
Per Share Operating Performance | ||||||||||||||||||||
Net asset value, beginning of period | $ | 10.48 | $ | 10.50 | $ | 10.35 | $ | 10.04 | $ | 10.00 | ||||||||||
|
|
|
|
|
|
|
|
|
| |||||||||||
Net investment income. | 0.10 | (2) | 0.12 | (2) | 0.13 | (2) | 0.21 | (2) | 0.02 | |||||||||||
Net realized and unrealized gain/(loss) on investments | (0.04 | ) | 0.09 | 0.27 | 0.25 | 0.04 | ||||||||||||||
|
|
|
|
|
|
|
|
|
| |||||||||||
Net increase in net assets resulting from operations | 0.06 | 0.21 | 0.40 | 0.46 | 0.06 | |||||||||||||||
|
|
|
|
|
|
|
|
|
| |||||||||||
Dividends and distributions to shareholders from: | ||||||||||||||||||||
Net investment income. | (0.13 | ) | (0.22 | ) | (0.21 | ) | (0.15 | ) | (0.02 | ) | ||||||||||
Net realized capital gains | — | (3) | — | (3) | (0.04 | ) | — | — | ||||||||||||
Tax return of capital | — | (0.01 | ) | — | — | — | (3) | |||||||||||||
|
|
|
|
|
|
|
|
|
| |||||||||||
Total dividends and distributions to shareholders | (0.13 | ) | (0.23 | ) | (0.25 | ) | (0.15 | ) | (0.02 | ) | ||||||||||
|
|
|
|
|
|
|
|
|
| |||||||||||
Net asset value, end of period | $ | 10.41 | $ | 10.48 | $ | 10.50 | $ | 10.35 | $ | 10.04 | ||||||||||
|
|
|
|
|
|
|
|
|
| |||||||||||
Total investment return(4) | 0.60 | %(5) | 2.06 | % | 3.96 | % | 4.62 | % | 0.61 | %(5) | ||||||||||
|
|
|
|
|
|
|
|
|
| |||||||||||
Ratio/Supplemental Data | ||||||||||||||||||||
Net assets, end of period (000’s omitted) | $ | 851,229 | $ | 761,683 | $ | 459,282 | $ | 210,107 | $ | 128,982 | ||||||||||
Ratio of expenses to average net assets(6) | 0.63 | %(7) | 0.65 | % | 0.68 | % | 0.75 | % | 0.97 | %(7) | ||||||||||
Ratio of net investment income to average net assets(6) | 1.95 | %(7) | 1.12 | % | 1.31 | % | 2.06 | % | 0.26 | %(7) | ||||||||||
Portfolio turnover rate | 0 | %(5) | 0 | % | 1 | % | 84 | % | 0 | %(5) | ||||||||||
| (1) | Commencement of operations. |
| (2) | The selected per share data was calculated using the average shares outstanding method for the period. |
| (3) | Amount less than $(0.005) per share. |
| (4) | Total investment return is calculated by assuming a purchase of shares on the first day and a sale of shares on the last day of each period reported and includes reinvestments of dividends and distributions, if any. |
| (5) | Not annualized. |
| (6) | The Fund also will indirectly bear its prorated share of expenses of the underlying funds. Such expenses are not included in the calculation of this ratio. |
| (7) | Annualized. |
The accompanying notes are an integral part of the financial statements.
16
FREE MARKET FUNDS
Notes to Financial Statements
February 29, 2012
(Unaudited)
| 1. | Organization and Significant Accounting Policies |
The RBB Fund, Inc. (“RBB” or the “Company”) was incorporated under the laws of the State of Maryland on February 29, 1988 and is registered under the Investment Company Act of 1940, as amended (the “1940 Act”), as an open-end management investment company. RBB is a “series fund,” which is a mutual fund divided into separate portfolios. Each portfolio is treated as a separate entity for certain matters under the 1940 Act, and for other purposes, and a shareholder of one portfolio is not deemed to be a shareholder of any other portfolio. Currently, RBB has nineteen active investment portfolios, including the Free Market U.S. Equity Fund, Free Market International Equity Fund, and the Free Market Fixed Income Fund (each a “Fund,” collectively the “Funds”). Each Fund operates as a “Fund of Funds” and commenced investment operations on December 31, 2007.
RBB has authorized capital of one hundred billion shares of common stock of which 80.373 billion shares are currently classified into one hundred and forty classes of common stock. Each class represents an interest in an active or inactive RBB investment portfolio.
PORTFOLIO VALUATION — Investments in the underlying funds are valued at each fund’s net asset value determined as of the close of business on the New York Stock Exchange (generally 4:00 p.m. Eastern time). As required, some securities and assets may be valued at fair value as determined in good faith by the Company’s Board of Directors. Direct investments in fixed income securities having a remaining maturity of 60 days or less are valued at amortized cost, which approximates market value.
Fair Value Measurements — The inputs and valuations techniques used to measure fair value of the Funds’ investments are summarized into three levels as described in the hierarchy below:
• Level 1 — | quoted prices in active markets for identical securities; | |
• Level 2 — | other significant observable inputs (including quoted prices for similar securities, interest rates, prepayment speeds, credit risk, etc.); and | |
• Level 3 — | significant unobservable inputs (including the Funds’ own assumptions in determining the fair value of investments). | |
The inputs or methodology used for valuing securities are not necessarily an indication of the risk associated with investing in those securities.
The following is a summary of the inputs used, as of February 29, 2012, in valuing the Funds’ investments carried at fair value:
FREE MARKET U.S. EQUITY FUND
| Total Value at February 29, 2012 | Level 1 Quoted Price | Level 2 Significant Observable Input | Level 3 Significant Unobservable Input | |||||||||||||
Investments in Securities* | $ | 845,870,465 | $ | 845,870,465 | $ | — | $ | — | ||||||||
|
|
|
|
|
|
|
| |||||||||
| * | Please refer to the Portfolio of Investments for further details. |
17
FREE MARKET FUNDS
Notes to Financial Statements (Continued)
February 29, 2012
(Unaudited)
FREE MARKET INTERNATIONAL EQUITY FUND
| Total Value at February 29, 2012 | Level 1 Quoted Price | Level 2 Significant Observable Input | Level 3 Significant Unobservable Input | |||||||||||||
Investments in Securities* | $ | 608,087,749 | $ | 608,087,749 | $ | — | $ | — | ||||||||
|
|
|
|
|
|
|
| |||||||||
| * | Please refer to the Portfolio of Investments for further details. |
FREE MARKET FIXED INCOME FUND
| Total Value at February 29, 2012 | Level 1 Quoted Price | Level 2 Significant Observable Input | Level 3 Significant Unobservable Input | |||||||||||||
Investments in Securities* | $ | 846,541,439 | $ | 846,541,439 | $ | — | $ | — | ||||||||
|
|
|
|
|
|
|
| |||||||||
| * | Please refer to the Portfolio of Investments for further details. |
At the end of each calendar quarter, management evaluates the classification of Levels 1, 2 and 3 assets and liabilities. Various factors are considered, such as changes in liquidity from the prior reporting period; whether or not a broker is willing to execute at the quoted price; the depth and consistency of prices from third party pricing services; and the existence of contemporaneous, observable trades in the market. Additionally, management evaluates the classification of Level 1 and Level 2 assets and liabilities on a quarterly basis for changes in listings or delistings on national exchanges.
Due to the inherent uncertainty of determining the fair value of investments that do not have a readily available market value, the fair value of the Funds’ investments may fluctuate from period to period. Additionally, the fair value of investments may differ significantly from the values that would have been used had a ready market existed for such investments and may differ materially from the values the Funds may ultimately realize. Further, such investments may be subject to legal and other restrictions on resale or otherwise less liquid than publicly traded securities.
For the six months ended February 29, 2012, there were no transfers between Levels 1, 2 and 3 for the Funds.
USE OF ESTIMATES — The preparation of financial statements in conformity with accounting principles generally accepted in the United States of America requires management to make estimates and assumptions that affect the reported amounts of assets and liabilities and disclosure of contingent assets and liabilities at the date of the financial statements and the reported amounts of revenues and expenses during the period. Actual results could differ from those estimates and those differences could be significant.
INVESTMENT TRANSACTIONS, INVESTMENT INCOME AND EXPENSES — Transactions are accounted for on the trade date. The cost of investments sold is determined by use of the specific identification method for both financial reporting and income tax purposes in determining realized gains and losses on investments. Interest income is accrued when earned. Dividend income is recorded on the ex-dividend date. Distributions received on securities that represent a return of capital or capital gain are recorded as a reduction of cost of investments and/or as a realized gain. The Funds estimate the components of distributions received that may be considered return of capital distributions or capital gain distributions. Each Fund’s investment income, expenses and unrealized and realized gains and losses are allocated daily. Expenses incurred on behalf of a specific class, fund or fund family of the Company are charged directly to the class, fund or fund family (in proportion to net assets). Expenses incurred for all of the RBB funds (such as director or professional fees) are charged to all funds in
18
FREE MARKET FUNDS
Notes to Financial Statements (Continued)
February 29, 2012
(Unaudited)
proportion to their average net assets of RBB, or in such other manner as the Board of Directors deems fair or equitable. Expenses and fees, including investment advisory and administration fees, are accrued daily and taken into account for the purpose of determining the net asset value of the Funds. In addition to the net annual operating expenses that the Funds bear directly, the shareholders indirectly bear the Funds’ pro-rata expenses of the underlying mutual funds in which each Fund invests.
DIVIDENDS AND DISTRIBUTIONS TO SHAREHOLDERS — Dividends from net investment income and distributions from net realized capital gains, if any, are declared and paid at least annually to shareholders and recorded on ex-dividend date for all Funds with the exception of the Free Market Fixed Income Fund which declares and pays quarterly dividends from net investment income. Income dividends and capital gain distributions are determined in accordance with U.S. federal income tax regulations which may differ from U.S. generally accepted accounting principles (“U.S. GAAP”).
U.S. TAX STATUS — No provision is made for U.S. income taxes as it is each Fund’s intention to qualify for and elect the tax treatment applicable to regulated investment companies under Subchapter M of the Internal Revenue Code of 1986, as amended, and make the requisite distributions to its shareholders which will be sufficient to relieve it from U.S. income and excise taxes.
CASH AND CASH EQUIVALENTS — The Funds consider liquid assets deposited with a bank demand deposit account to be cash equivalents. These investments represent amounts held with financial institutions that are readily accessible to pay Fund expenses or purchase investments. Cash and cash equivalents are valued at cost plus accrued interest, which approximates market value.
OTHER — In the normal course of business, the Funds may enter into contracts that provide general indemnifications. The Funds’ maximum exposure under these arrangements is dependent on claims that may be made against the Funds in the future, and, therefore, cannot be estimated; however, based on experience, the risk of material loss for such claims is considered remote.
| 2. | Investment Adviser and Other Services |
Matson Money, Inc. (“Matson Money” or the “Adviser”), serves as each Fund’s investment adviser. For its advisory services, Matson Money is entitled to receive 0.50% of each Fund’s average daily net assets, computed daily and payable monthly. The Adviser has voluntarily agreed to waive its advisory fee and/or reimburse certain expenses in order to limit total annual fund operating expenses of Free Market U.S. Equity Fund, Free Market International Equity Fund and the Free Market Fixed Income Fund to 1.13%, 1.35% and 1.00%, respectively, of the particular Fund’s average daily net assets. The expense limitations include expenses incurred as a result of investing in other investment companies. The Adviser may discontinue these arrangements at any time. The Funds will not pay Matson Money at a later time for any amounts they may waive or any amounts that Matson Money has assumed.
BNY Mellon Investment Servicing (US) Inc. (“BNY Mellon”), serves as administrator for the Funds. Administration and accounting fees accrued also include transfer agent, custodian fees and administrative service fees. For providing administrative and accounting services, BNY Mellon is entitled to receive a monthly fee equal to an annual percentage rate of the Fund’s average daily net assets and is subject to certain minimum monthly fees.
19
FREE MARKET FUNDS
Notes to Financial Statements (Continued)
February 29, 2012
(Unaudited)
Included in the administration and accounting fees are fees for providing regulatory administration services to RBB. For providing these services, BNY Mellon is entitled to receive compensation as agreed to by the Company and BNY Mellon. This fee is allocated to each portfolio in proportion to its assets of the Company.
For providing transfer agent services, BNY Mellon is entitled to receive out-of-pocket expenses.
The Bank of New York Mellon provides custodian services to the Funds and is entitled to receive out of pocket expenses.
BNY Mellon Distributors LLC, formerly known as BNY Mellon Distributors Inc., serves as the principal underwriter and distributor of the Funds’ shares pursuant to a Distribution Agreement with RBB.
| 3. | Director Compensation |
The Directors of the Company receive an annual retainer, meeting fees and reimbursement of out of pocket expenses for meetings attended. The aggregate remuneration paid to the Directors by the Funds during the six months ended February 29, 2012 was $80,257. Certain employees of BNY Mellon are Officers of the Company. They are not compensated by the Funds or the Company.
| 4. | Investment in Securities |
For the six months ended February 29, 2012, aggregate purchases and sales of investment securities (excluding short-term investments) of the Funds were as follows:
| Purchases | Sales | |||||||
Free Market U.S. Equity Fund | $ | 91,064,076 | $ | 13,630,452 | ||||
Free Market International Equity Fund | 92,867,718 | 12,186,515 | ||||||
Free Market Fixed Income Fund | 102,831,921 | 2,760,928 | ||||||
| 5. | Capital Share Transaction |
As of February 29, 2012, each Fund has 200,000,000 shares of $0.001 per value common stock authorized.
| 6. | Federal Income Tax Information |
The Funds have followed the authoritative guidance on accounting for and disclosure of uncertainty in tax positions, which requires the Funds to determine whether a tax position is more likely than not to be sustained upon examination, including resolution of any related appeals or litigation processes, based on the technical merits of the position. The Funds have determined that there was no effect on the financial statements from following this authoritative guidance. In the normal course of business, the Funds are subject to examination by federal, state and local jurisdictions, where applicable, for tax years for which applicable statutes of limitations have not expired.
20
FREE MARKET FUNDS
Notes to Financial Statements (Continued)
February 29, 2012
(Unaudited)
As of February 29, 2012, the federal tax cost, aggregate gross unrealized appreciation and depreciation of securities held by each Fund were as follows:
| Federal Tax Cost | Unrealized Appreciation | Unrealized Depreciation | Net Unrealized Appreciation | |||||||||||||
Free Market U.S. Equity Fund | $ | 673,901,521 | $ | 171,968,944 | $ | — | $ | 171,968,944 | ||||||||
Free Market International Equity Fund | 572,535,414 | 35,552,335 | — | 35,552,335 | ||||||||||||
Free Market Fixed Income Fund | 841,065,722 | 9,162,242 | (3,686,525 | ) | 5,475,717 | |||||||||||
Distributions to shareholders from net investment income and realized gains are determined in accordance with federal income tax regulations, which may differ from net investment income and realized gains recognized for financial reporting purposes. Accordingly, the character of distributions and composition of net assets for tax purposes may differ from those reflected in the accompanying financial statements. To the extent these differences are permanent, such amounts are reclassified within the capital accounts based on the tax treatment; temporary differences do not require such reclassification.
As of August 31, 2011, the components of distributable earnings on a tax basis were as follows:
| Undistributed Ordinary Income | Undistributed Long-Term Gains | |||||||
Free Market U.S. Equity Fund | $ | — | $ | 5,493,067 | ||||
Free Market International Equity Fund | 5,019,548 | 6,938,263 | ||||||
Free Market Fixed Income Fund | — | — | ||||||
The differences between the book and tax basis components of distributable earnings relate primarily to the timing of recognition of income and gains for federal income tax purposes. Short-term and foreign currency gains are reported as ordinary income for federal income tax purposes.
The tax characters of distributions paid during the fiscal year ended August 31, 2011 were as follows:
| Ordinary Income | Long-Term Gains | Return of Capital | Total | |||||||||||||
Free Market U.S. Equity Fund | $ | 3,674,349 | $ | 137,794 | $ | — | $ | 3,812,143 | ||||||||
Free Market International Equity Fund | 6,163,601 | — | — | 6,163,601 | ||||||||||||
Free Market Fixed Income Fund | 8,085,652 | 3,317,665 | 611,392 | 12,014,709 | ||||||||||||
Distributions from net investment income and short term capital gains are treated as ordinary income for federal income tax purposes.
For federal income tax purposes, realized capital losses may be carried forward and applied against future realized gains. As of August 31, 2011, the Funds had no capital loss carryforwards.
Under federal tax law, foreign currency and capital losses realized after October 31 may be deferred and treated as having arisen on the first day of the following fiscal year. For the year ended August 31, 2011, the Funds did not incur any net post-October capital losses.
21
FREE MARKET FUNDS
Notes to Financial Statements (Concluded)
February 29, 2012
(Unaudited)
On December 22, 2010, President Obama signed into law the Regulated Investment Company Modernization Act of 2010 (the “Act”). The Act updates certain tax rules applicable to regulated investment companies (“RICs”). The various provisions of the Act will generally be effective for RICs with taxable years beginning after December 22, 2010. Additional information regarding the impact of the Act on the Fund, if any, will be contained within the relevant sections of the notes to financial statements for the fiscal year ending August 31, 2012.
| 7. | New Accounting Pronouncement |
In May 2011, Financial Accounting Standards Board (“FASB”) issued Accounting Standards Update (“ASU”) No. 2011-04 “Amendments to Achieve Common Fair Value Measurement and Disclosure Requirements in U.S. GAAP and International Financial Reporting Standards (“IFRS”). ASU 2011-04 includes common requirements for measurement of and disclosure about fair value between U.S. GAAP and IFRS. ASU 2011-04 will require reporting entities to disclose the following information for fair value measurements categorized within Level 3 of the fair value hierarchy: quantitative information about the unobservable inputs used in the fair value measurement, the valuation processes used by the reporting entity and a narrative description of the sensitivity of the fair value measurement to changes in unobservable inputs and the interrelationships between those unobservable inputs. In addition, ASU 2011-04 will require reporting entities to make disclosures about amounts and reasons for all transfers in and out of Level 1 and Level 2 fair value measurements. The new and revised disclosures are effective for interim and annual reporting periods beginning after December 15, 2011. Management is currently evaluating the implications of ASU No. 2011-04 and its impact on the financial statements.
| 8. | Subsequent Event |
Management has evaluated the impact of all subsequent events on the Funds through the date the financial statements were issued, and has determined that there was the following subsequent event:
The Bank of New York Mellon Corporation announced on November 28, 2011 that it had agreed to sell BNY Mellon Distributors LLC (the “Distributor”) and its four subsidiaries to Foreside Distributors, LLC, a subsidiary of Foreside Financial Group, LLC (the “Transaction”). The Transaction closed on March 31, 2012. Upon the closing of the Transaction, the Distributor became an indirect, wholly owned subsidiary of Foreside Financial Group, LLC and was renamed Foreside Funds Distributors LLC effective April 1, 2012.
22
FREE MARKET FUNDS
Other Information
(Unaudited)
Proxy Voting
Policies and procedures that the Funds use to determine how to vote proxies relating to portfolio securities as well as information regarding how the Funds voted proxies relating to portfolio securities for the most recent 12-month period ended June 30 are available without charge, upon request, by calling Free Market Funds at (866) 780-0357, ext. 3863 and on the Securities and Exchange Commission’s (“SEC”) website at http://www.sec.gov.
Quarterly Portfolio Schedules
The Company files a complete schedule of portfolio holdings with the SEC for the first and third fiscal quarters of each fiscal year (quarters ended November 30 and May 31) on Form N-Q. The Company’s Form N-Q is available on the SEC website at http://www.sec.gov and may be reviewed and copied at the SEC Public Reference Room in Washington, D.C. Information on the operation of the SEC Public Reference Room may be obtained by calling (202) 551-8090.
23
Investment Adviser MATSON MONEY, INC. 5955 Deerfield Blvd. Mason, OH 45040
Administrator BNY Mellon Investment Servicing (US) Inc. 301 Bellevue Parkway Wilmington, DE 19809
Transfer Agent BNY Mellon Investment Servicing (US) Inc. 4400 Computer Drive Westborough, MA 01581
Principal Underwriter Foreside Funds Distributors LLC 400 Berwyn Park 899 Cassatt Road Berwyn, PA 19312
Custodian The Bank of New York Mellon One Wall Street New York, NY 10286
Independent Registered Public Accounting Firm PricewaterhouseCoopers LLP Two Commerce Square, Suite 1700 2001 Market Street Philadelphia, PA 19103-7042
Counsel Drinker Biddle & Reath LLP One Logan Square, Ste. 2000 Philadelphia, PA 19103-6996 | FREE MARKET U.S. EQUITY FUND
FREE MARKET INTERNATIONAL EQUITY FUND
FREE MARKET FIXED INCOME FUND
of
THE RBB FUND, INC.
SEMI-ANNUAL REPORT
February 29, 2012
(Unaudited) | |
This report is submitted for the general information of the shareholders of the Funds. It is not authorized for distribution unless preceded or accompanied by a current prospectus for the Funds. |
Marvin & Palmer
LARGE CAP GROWTH FUND
Semi-Annual Investment Adviser’s Report
February 29, 2012
(Unaudited)
Dear Fellow Shareholder:
During the period from September 1, 2011 through February 29, 2012 the Fund returned 7.3%. It underperformed the Russell 1000 Growth Index which was up 13.8% for the same period.
Investment Climate and Outlook
The period began under pressure during September as stocks reflected investor concerns about a possible debt default in Greece as well as a potentially sharp slowdown in China. After discounting these concerns, the market began a rally that continued through the first two months of 2012. The likelihood of an agreement between creditors, Greece and the European Central Bank has reduced market tensions. In China’s case, a soft landing scenario seems to be developing. As a result, investors are gradually building their exposure to stocks. Because so many investors are at minimum levels of equity participation, we believe the possibility of continued stock appreciation is significant as macro concerns dissipate.
U.S. economic data has been trending more positively, leading us to a more constructive view for 2012. We remain dedicated to investing in leading companies that exhibit superior franchise, management and balance sheet quality. Our experience has shown us that these stocks outperform on a historic basis despite periods of fear and uncertainty.
Investment Review and Portfolio Strategy
The Fund’s underperformance was driven primarily by stock selection, although sector allocation was also negative. Stock selection in the information technology, consumer discretionary and energy sectors was particularly challenging. Health care was the only positively contributing sector for the period. The Fund’s best performing stocks were Alexion Pharmaceuticals, Inc., Biogen Idec, Inc. and Intuitive Surgical, Inc. The worst contributing stocks were Exxon Mobil Corp., Microsoft Corp. and Apple, Inc. primarily due to our underweight positions.
The Fund has been emphasizing high-quality growth stocks in the health care and industrials sectors. We favor global companies with substantial exposure to the growth in the emerging markets. We believe this approach should serve us well in this market environment.
David F. Marvin, CFA
Chairman
Marvin & Palmer Associates, Inc.
Portfolio composition is subject to change. The current and future portfolio holdings of the Fund are subject to investment risks.
1
Marvin & Palmer
LARGE CAP GROWTH FUND
Semi-Annual Report
February 29, 2012
(Unaudited)
Total Returns for the Period Ended February 29, 2012 |
| |||||||||||||||
| Average Annual | ||||||||||||||||
| Six Months* | One Year | Three Year | Since Inception** | |||||||||||||
Large Cap Growth Fund | 7.31 | % | 0.41 | % | 20.32 | % | -1.62 | % | ||||||||
Russell 1000® Growth Index | 13.76 | % | 7.62 | % | 27.51 | % | 3.22 | % | ||||||||
* Not Annualized | ||||||||||||||||
** Inception date June 29, 2007. | ||||||||||||||||
The performance data quoted represents past performance and does not guarantee future results. Current performance may be lower or higher. Performance data current to the most recent month-end may be obtained by calling (877) 821-2117. The investment return and principal value of an investment will fluctuate so that shares, when redeemed, may be worth more or less than their original cost. The table does not reflect the deduction of taxes that a shareholder would pay on Fund distributions or the redemption of Fund shares. The performance quoted reflects fee waivers in effect and would have been less in their absence. The Fund’s gross annual operating expense ratio, as stated in the current prospectus, is 3.22% and the Fund’s net operating expense ratio is 0.80%. The Fund’s investment adviser has contractually agreed to limit total annual Fund operating expenses (excluding acquired fund fees and expenses, brokerage commissions, extraordinary items, interest or taxes) to 0.80% of the Fund’s average daily net assets through December 31, 2012. This limitation can be discontinued at any time after December 31, 2012.
The Fund’s total returns since inception are based on a change in net asset value from $10.00 per share on June 29, 2007 (inception) to $9.20 per share on February 29, 2012.
2
Marvin & Palmer
LARGE CAP GROWTH FUND
Fund Expense Disclosure
February 29, 2012
(Unaudited)
As a shareholder of the Fund, you incur two types of costs: (1) transaction costs, including redemption fees; and (2) ongoing costs, including management fees and other Fund expenses. This example is intended to help you understand your ongoing costs (in dollars) of investing in the Fund and to compare these costs with the ongoing costs of investing in other mutual funds.
The example is based on an investment of $1,000 invested at the beginning of the six-month period from September 1, 2011 through February 29, 2012, and held for the entire period.
Actual Expenses
The first line of the accompanying table below provides information about actual account values and actual expenses. You may use the information in this line, together with the amount you invested, to estimate the expenses that you paid over the period. Simply divide your account value by $1,000 (for example, an $8,600 account value divided by $1,000 = 8.6), then multiply the result by the number in the first line under the heading entitled “Expenses Paid During Period” to estimate the expenses you paid on your account during this period.
Hypothetical Example for Comparison Purposes
The second line of the accompanying table below provides information about hypothetical account values and hypothetical expenses based on the Fund’s actual expense ratio and an assumed rate of return of 5% per year before expenses, which is not your Fund’s actual return. The hypothetical account values and expenses may not be used to estimate the actual ending account balance or expenses you paid for the period. You may use this information to compare the ongoing costs of investing in the Fund and other funds. To do so, compare these 5% hypothetical examples with the 5% hypothetical examples that appear in the shareholder reports of other funds.
Please note that the expenses shown in the accompanying tables are meant to highlight your ongoing costs only and do not reflect any transactional costs, such as redemption fees. Therefore, the second line of the accompanying table is useful in comparing ongoing costs only, and will not help you determine the relative total costs of owning different funds. In addition, if these transactional costs were included, your costs would have been higher.
| Large Cap Growth Fund | ||||||||||||
| Beginning Account Value September 1, 2011 | Ending Account Value February 29, 2012 | Expenses Paid During Period* | ||||||||||
Actual | $ | 1,000.00 | $ | 1,073.06 | $ | 4.12 | ||||||
Hypothetical (5% return before expenses) | 1,000.00 | 1,020.89 | 4.02 | |||||||||
| * | Expenses are equal to an annualized six-month expense ratio of 0.80% for the Fund which includes waived fees or reimbursed expenses, multiplied by the average account value over the period, multiplied by the number of days in the most recent period (182), then divided by 366 to reflect the one-half year period. The Fund’s ending account values are based on the actual six-month total return for the Fund of 7.31%. |
3
Marvin & Palmer
LARGE CAP GROWTH FUND
Portfolio Holdings Summary Table
February 29, 2012
(Unaudited)
The following table presents a summary by sector of the portfolio holdings of the Fund:
| % of Net Assets | Value | |||||||
Common Stocks: | ||||||||
Software & Services | 16.8 | % | $ | 1,082,281 | ||||
Capital Goods | 15.0 | 961,024 | ||||||
Technology Hardware & Equipment | 13.2 | 850,983 | ||||||
Energy | 8.2 | 523,739 | ||||||
Pharmaceuticals, Biotechnology & Life Sciences | 7.8 | 500,886 | ||||||
Consumer Services | 6.3 | 403,820 | ||||||
Consumer Durables & Apparel | 6.1 | 388,840 | ||||||
Health Care Equipment & Services | 5.8 | 375,607 | ||||||
Food & Staples Retailing | 5.0 | 320,448 | ||||||
Food, Beverages & Tobacco | 3.9 | 250,090 | ||||||
Transportation | 2.6 | 165,375 | ||||||
Materials | 2.1 | 136,304 | ||||||
Semiconductors & Semiconductors Equipment | 1.4 | 91,392 | ||||||
Retailing | 1.0 | 62,891 | ||||||
Diversified Financials | 1.0 | 61,590 | ||||||
Media | 0.9 | 57,144 | ||||||
Other Assets in Excess of Liabilities | 2.9 | 189,094 | ||||||
|
|
|
| |||||
NET ASSETS | 100.0 | % | $ | 6,421,508 | ||||
|
|
|
| |||||
Portfolio holdings are subject to change at any time.
The accompanying notes are an integral part of the financial statements.
4
Marvin & Palmer
LARGE CAP GROWTH FUND
Portfolio of Investments
February 29, 2012
(Unaudited)
| Shares | Value | |||||||
COMMON STOCKS — 97.1% |
| |||||||
Capital Goods — 15.0% | ||||||||
AMETEK, Inc. | 1,100 | $ | 52,360 | |||||
Boeing Co., (The) | 800 | 59,960 | ||||||
Caterpillar, Inc. | 1,900 | 216,999 | ||||||
Cummins, Inc. | 1,400 | 168,798 | ||||||
Deere & Co. | 700 | 58,051 | ||||||
Joy Global, Inc. | 500 | 43,480 | ||||||
Precision Castparts Corp. | 1,375 | 230,216 | ||||||
Roper Industries, Inc. | 700 | 64,064 | ||||||
United Technologies Corp. | 800 | 67,096 | ||||||
|
| |||||||
| 961,024 | ||||||||
|
| |||||||
Consumer Durables & Apparel — 6.1% |
| |||||||
Coach, Inc. | 2,600 | 194,584 | ||||||
NIKE, Inc., Class B | 1,800 | 194,256 | ||||||
|
| |||||||
| 388,840 | ||||||||
|
| |||||||
Consumer Services — 6.3% | ||||||||
McDonald’s Corp. | 1,350 | 134,028 | ||||||
Starbucks Corp. | 1,600 | 77,696 | ||||||
Yum! Brands, Inc. | 2,900 | 192,096 | ||||||
|
| |||||||
| 403,820 | ||||||||
|
| |||||||
Diversified Financials — 1.0% |
| |||||||
T. Rowe Price Group, Inc. | 1,000 | 61,590 | ||||||
|
| |||||||
Energy — 8.2% | ||||||||
Cameron International Corp.* | 1,300 | 72,423 | ||||||
Chevron Corp. | 700 | 76,384 | ||||||
Exxon Mobil Corp. | 700 | 60,550 | ||||||
FMC Technologies, Inc.* | 1,100 | 55,473 | ||||||
National Oilwell Varco, Inc. | 1,100 | 90,783 | ||||||
Occidental Petroleum Corp. | 600 | 62,622 | ||||||
Oceaneering International, Inc. | 800 | 43,416 | ||||||
Schlumberger Ltd. | 800 | 62,088 | ||||||
|
| |||||||
| 523,739 | ||||||||
|
| |||||||
Food & Staples Retailing — 5.0% |
| |||||||
Costco Wholesale Corp. | 1,600 | 137,696 | ||||||
Wal-Mart Stores, Inc. | 2,000 | 118,160 | ||||||
Whole Foods Market, Inc. | 800 | 64,592 | ||||||
|
| |||||||
| 320,448 | ||||||||
|
| |||||||
Food, Beverages & Tobacco — 3.9% |
| |||||||
Altria Group, Inc. | 4,000 | 120,400 | ||||||
Coca-Cola Co., (The) | 900 | 62,874 | ||||||
Philip Morris International, Inc. | 800 | 66,816 | ||||||
|
| |||||||
| 250,090 | ||||||||
|
| |||||||
Health Care Equipment & Services — 5.8% |
| |||||||
Humana, Inc. | 1,600 | 139,360 | ||||||
Intuitive Surgical, Inc * | 350 | 179,067 | ||||||
Medtronic, Inc. | 1,500 | 57,180 | ||||||
|
| |||||||
| 375,607 | ||||||||
|
| |||||||
| Shares | Value | |||||||
Materials — 2.1% |
| |||||||
CF Industries Holdings, Inc. | 400 | $ | 74,400 | |||||
Monsanto Co. | 800 | 61,904 | ||||||
|
| |||||||
| 136,304 | ||||||||
|
| |||||||
Media — 0.9% | ||||||||
Viacom, Inc., Class B | 1,200 | 57,144 | ||||||
|
| |||||||
Pharmaceuticals, Biotechnology & Life Sciences — 7.8% |
| |||||||
Abbott Laboratories | 1,100 | 62,271 | ||||||
Alexion Pharmaceuticals, Inc.* | 1,900 | 159,087 | ||||||
Biogen Idec, Inc.* | 2,400 | 279,528 | ||||||
|
| |||||||
| 500,886 | ||||||||
|
| |||||||
Retailing — 1.0% | ||||||||
Amazon.com, Inc.* | 350 | 62,891 | ||||||
|
| |||||||
Semiconductors & Semiconductor Equipment — 1.4% |
| |||||||
Intel Corp. | 3,400 | 91,392 | ||||||
|
| |||||||
Software & Services — 16.8% |
| |||||||
Google, Inc., Class A* | 425 | 262,756 | ||||||
International Business Machines Corp. | 1,450 | 285,259 | ||||||
Intuit, Inc. | 1,200 | 69,408 | ||||||
Mastercard, Inc., Class A | 525 | 220,500 | ||||||
Microsoft Corp. | 4,200 | 133,308 | ||||||
Nuance Communications, Inc.* | 1,800 | 46,656 | ||||||
Oracle Corp. | 2,200 | 64,394 | ||||||
|
| |||||||
| 1,082,281 | ||||||||
|
| |||||||
Technology Hardware & Equipment — 13.2% |
| |||||||
Amphenol Corp., Class A | 1,000 | 55,960 | ||||||
Apple, Inc.* | 575 | 311,903 | ||||||
F5 Networks, Inc.* | 400 | 49,984 | ||||||
Qualcomm, Inc. | 4,500 | 279,810 | ||||||
SanDisk Corp.* | 3,100 | 153,326 | ||||||
|
| |||||||
| 850,983 | ||||||||
|
| |||||||
Transportation — 2.6% |
| |||||||
Union Pacific Corp. | 1,500 | 165,375 | ||||||
|
| |||||||
TOTAL COMMON STOCKS |
| 6,232,414 | ||||||
|
| |||||||
TOTAL INVESTMENTS — 97.1% |
| 6,232,414 | ||||||
|
| |||||||
OTHER ASSETS IN EXCESS OF |
| 189,094 | ||||||
|
| |||||||
NET ASSETS — 100.0% |
| $ | 6,421,508 | |||||
|
| |||||||
| * | Non-income producing. |
| PLC | —Public Limited Company. |
The accompanying notes are an integral part of the financial statements.
5
Marvin & Palmer
LARGE CAP GROWTH FUND
Statement of Assets and Liabilities
February 29, 2012
(Unaudited)
ASSETS | ||||
Investments, at value (Cost $4,873,943) | $ | 6,232,414 | ||
Cash and cash equivalents | 291,138 | |||
Receivables | ||||
Investments sold | 65,595 | |||
Investment adviser | 34,922 | |||
Dividends and interest | 7,848 | |||
Prepaid expenses and other assets | 18,105 | |||
|
| |||
Total assets | 6,650,022 | |||
|
| |||
LIABILITIES | ||||
Payables for investments purchased | 177,849 | |||
Other accrued expenses and liabilities | 50,665 | |||
|
| |||
Total liabilities | 228,514 | |||
|
| |||
Net Assets | $ | 6,421,508 | ||
|
| |||
NET ASSETS CONSIST OF | ||||
Par value | $ | 698 | ||
Paid-in capital | 13,709,009 | |||
Accumulated net investment loss | (3,642 | ) | ||
Accumulated net realized loss from investments | (8,643,028 | ) | ||
Net unrealized appreciation on investments | 1,358,471 | |||
|
| |||
Net Assets | $ | 6,421,508 | ||
|
| |||
Shares outstanding ($0.001 par value, 100,000,000 shares authorized) | 697,675 | |||
|
| |||
Net asset value, offering and redemption price per share | $ | 9.20 | ||
|
|
The accompanying notes are an integral part of the financial statements.
6
Marvin & Palmer
LARGE CAP GROWTH FUND
Statement of Operations
Six Months Ended February 29, 2012
(Unaudited)
Investment Income | ||||
Dividends | $ | 48,040 | ||
Interest | 86 | |||
|
| |||
Total investment income | 48,126 | |||
|
| |||
Expenses | ||||
Administration and accounting fees | 75,509 | |||
Advisory fees | 31,005 | |||
Transfer agent fees | 13,889 | |||
Audit fees | 13,315 | |||
Directors’ and officers’ fees | 9,390 | |||
Printing and shareholder reporting fees | 8,676 | |||
Registration and filing fees | 7,920 | |||
Legal fees | 5,643 | |||
Insurance | 2,570 | |||
Custodian fees | 1,553 | |||
Other expenses | 1,241 | |||
|
| |||
Total expenses before waivers and reimbursements | 170,711 | |||
|
| |||
Less: waivers and reimbursements | (132,550 | ) | ||
|
| |||
Net expenses after waivers and reimbursements | 38,161 | |||
|
| |||
Net investment income | 9,965 | |||
|
| |||
Net realized and unrealized gain/(loss) from investments | ||||
Net realized gain/(loss) from: | ||||
Investments | 976,050 | |||
Net change in unrealized appreciation/(depreciation) on: | ||||
Investments | (445,098 | ) | ||
|
| |||
Net realized and unrealized gain from investments | 530,952 | |||
|
| |||
Net increase in net assets resulting from operations | $ | 540,917 | ||
|
|
The accompanying notes are an integral part of the financial statements.
7
Marvin & Palmer
LARGE CAP GROWTH FUND
Statements of Changes in Net Assets
| For the Six Months Ended February 29, 2012 (Unaudited) | For the Year Ended August 31, 2011 | |||||||
Increase/(decrease) in net assets from operations: | ||||||||
Net investment income | $ | 9,965 | $ | 5,258 | ||||
Net realized gain from investments | 976,050 | 1,459,918 | ||||||
Net change in unrealized appreciation/(depreciation) from investments | (445,098 | ) | 596,680 | |||||
|
|
|
| |||||
Net increase in net assets resulting from operations | 540,917 | 2,061,856 | ||||||
|
|
|
| |||||
Dividends and distributions to shareholders from: | ||||||||
Net investment income | (19,259 | ) | — | |||||
|
|
|
| |||||
Net decrease in net assets from dividends and distributions to shareholders | (19,259 | ) | — | |||||
|
|
|
| |||||
Capital transactions: | ||||||||
Proceeds from shares sold | 14,900 | 236,650 | ||||||
Reinvestment of distributions | 18,361 | — | ||||||
Shares redeemed | (4,617,930 | ) | (794,276 | ) | ||||
|
|
|
| |||||
Net decrease in net assets from capital transactions | (4,584,669 | ) | (557,626 | ) | ||||
|
|
|
| |||||
Total increase/(decrease) in net assets | (4,063,011 | ) | 1,504,230 | |||||
Net assets | ||||||||
Beginning of period | 10,484,519 | 8,980,289 | ||||||
|
|
|
| |||||
End of period | $ | 6,421,508 | $ | 10,484,519 | ||||
|
|
|
| |||||
Undistributed net investment income/(loss), end of period | $ | (3,642 | ) | $5,652 | ||||
|
|
|
| |||||
Share transactions: | ||||||||
Shares sold | 1,714 | 25,164 | ||||||
Shares reinvested | 2,186 | — | ||||||
Shares redeemed | (526,867 | ) | (90,475 | ) | ||||
|
|
|
| |||||
Total share transactions | (522,967 | ) | (65,311 | ) | ||||
|
|
|
| |||||
The accompanying notes are an integral part of the financial statements.
8
Marvin & Palmer
LARGE CAP GROWTH FUND
Financial Highlights
| Contained below is per share operating performance data for each share outstanding, total investment return, ratios to average net assets and other supplemental data for the respective periods. This information has been derived from information provided in the financial statements. |
| For the Six Months Ended February 29, 2012 (Unaudited) | For the Year Ended August 31, 2011 | For the Year Ended August 31, 2010 | For the Year Ended August 31, 2009 | For the Year Ended August 31, 2008 | For the Period June 29, 2007* to August 31, 2007 | |||||||||||||||||||
Per Share Operating Performance | ||||||||||||||||||||||||
Net asset value, beginning of period | $ | 8.59 | $ | 6.98 | $ | 6.64 | $ | 9.32 | $ | 10.20 | $ | 10.00 | ||||||||||||
|
|
|
|
|
|
|
|
|
|
|
| |||||||||||||
Net investment income/(loss) | 0.01 | — | (1) | — | (1) | 0.02 | 0.01 | — | (1) | |||||||||||||||
Net realized and unrealized gain/(loss) on investments | 0.62 | 1.61 | 0.35 | (2.68 | ) | (0.89 | ) | 0.20 | ||||||||||||||||
|
|
|
|
|
|
|
|
|
|
|
| |||||||||||||
Net increase/(decrease) in net assets resulting from operations | 0.63 | 1.61 | 0.35 | (2.66 | ) | (0.88 | ) | 0.20 | ||||||||||||||||
|
|
|
|
|
|
|
|
|
|
|
| |||||||||||||
Dividends to shareholders from: | ||||||||||||||||||||||||
Net investment income | (0.02 | ) | — | (0.01 | ) | (0.02 | ) | — | (1) | — | ||||||||||||||
|
|
|
|
|
|
|
|
|
|
|
| |||||||||||||
Net asset value, end of period | $ | 9.20 | $ | 8.59 | $ | 6.98 | $ | 6.64 | $ | 9.32 | $ | 10.20 | ||||||||||||
|
|
|
|
|
|
|
|
|
|
|
| |||||||||||||
Total investment return(2) | 7.31 | %(3) | 23.07 | % | 5.28 | % | (28.51 | )% | (8.61 | )% | 2.00 | %(3) | ||||||||||||
Ratio/Supplemental Data | ||||||||||||||||||||||||
Net assets, end of period (000’s omitted) | $ | 6,422 | $ | 10,485 | $ | 8,980 | $ | 19,343 | $ | 28,780 | $ | 15,283 | ||||||||||||
Ratio of expenses to average net assets | 0.80 | %(4) | 0.80 | % | 0.80 | % | 0.80 | % | 0.80 | % | 0.80 | %(4) | ||||||||||||
Ratio of expenses to average net assets without waivers and expense reimbursements | 3.58 | %(4) | 3.22 | % | 2.62 | % | 2.27 | % | 2.09 | % | 3.93 | %(4) | ||||||||||||
Ratio of net investment income/(loss) to average net assets | 0.21 | %(4) | 0.05 | % | (0.01 | )% | 0.37 | % | 0.12 | % | 0.21 | %(4) | ||||||||||||
Portfolio turnover rate | 72.37 | %(3) | 95.16 | % | 138.68 | % | 237.91 | % | 252.37 | % | 28.70 | %(3) | ||||||||||||
| * | Commencement of Operations. |
| (1) | Less than $0.005 per share. |
| (2) | Total investment return is calculated by assuming a purchase of shares on the first day and a sale of shares on the last day of each period reported and includes reinvestments of dividends and distributions, if any. |
| (3) | Not Annualized. |
| (4) | Annualized. |
The accompanying notes are an integral part of the financial statements.
9
Marvin & Palmer
LARGE CAP GROWTH FUND
February 29, 2012
(Unaudited)
| 1. | Organization and Significant Accounting Policies |
The RBB Fund, Inc. (“RBB” or the “Company”) was incorporated under the laws of the State of Maryland on February 29, 1988 and is registered under the Investment Company Act of 1940, as amended (the “Investment Company Act”), as an open-end management investment company. RBB is a “series fund,” which is a mutual fund divided into separate portfolios. Each portfolio is treated as a separate entity for certain matters under the Investment Company Act, and for other purposes, and a shareholder of one portfolio is not deemed to be a shareholder of any other portfolio. Currently, RBB has nineteen active investment portfolios, including the Marvin & Palmer Large Cap Growth Fund (the “Fund”), which commenced investment operations on June 29, 2007.
RBB has authorized capital of one hundred billion shares of common stock of which 80.373 billion shares are currently classified into one hundred and forty classes of common stock. Each class represents an interest in an active or inactive RBB investment portfolio. The Fund has issued shares with a par value of $0.001.
PORTFOLIO VALUATION — The Fund’s net asset value (“NAV”) is calculated once daily at the close of regular trading hours on the New York Stock Exchange (“NYSE”) (generally 4:00 p.m. Eastern time) on each day the NYSE is open. Securities held by the Fund are valued using the closing price or the last sale price on a national securities exchange or the National Association of Securities Dealers Automatic Quotation System (“NASDAQ”) market system where they are primarily traded. Equity securities traded in the over-the-counter market are valued at their closing prices. If there were no transactions on that day, securities traded principally on an exchange or on NASDAQ will be valued at the mean of the last bid and ask prices prior to the market close. Fixed income securities having a remaining maturity of greater than 60 days are valued using an independent pricing service. Fixed income securities having a remaining maturity of 60 days or less are valued at amortized cost, which approximates market value. Foreign securities are valued based on prices from the primary market in which they are traded, and are translated from the local currency into U.S. dollars using current exchange rates. Investments in other open-end investment companies are valued based on the NAV of the investment companies (which may use fair value pricing as discussed in their prospectuses). If market quotations are unavailable or deemed unreliable, securities will be valued in accordance with procedures adopted by the Company’s Board of Directors. Relying on prices supplied by pricing services or dealers or using fair valuation may result in values that are higher or lower than the values used by other investment companies and investors to price the same investments.
Fair Value Measurements — The inputs and valuation techniques used to measure fair value of the Fund’s investments are summarized into three levels as described in the hierarchy below:
• Level 1 — | quoted prices in active markets for identical securities; | |
• Level 2 — | other significant observable inputs (including quoted prices for similar securities, interest rates, prepayment speeds, credit risk, etc.); and | |
• Level 3 — | significant unobservable inputs (including the Fund’s own assumptions in determining the fair value of investments) | |
The inputs or methodology used for valuing securities are not necessarily an indication of the risk associated with investing in those securities.
The following is a summary of the inputs used, as of February 29, 2012, in valuing the Fund’s investments carried at fair value:
| Total Value at February 29, 2012 | Level 1 Quoted Price | Level 2 Significant Observable Inputs | Level 3 Significant Unobservable Inputs | |||||||||||||
Investments in Securities* | $ | 6,232,414 | $ | 6,232,414 | $ | — | $ | — | ||||||||
|
|
|
|
|
|
|
| |||||||||
| * | Please refer to the Portfolio of Investments for industry and security type breakouts. |
At the end of each calendar quarter, management evaluates the classification of Levels 1, 2 and 3 assets and liabilities. Various factors are considered, such as changes in liquidity from the prior reporting period; whether or not a broker is willing to execute at the quoted price; the depth and consistency of prices from third party pricing services; and the existence of contemporaneous, observable trades in the market. Additionally, management evaluates the classification of Level 1 and Level 2 assets and liabilities on a quarterly basis for changes in listings or delistings on national exchanges.
10
Marvin & Palmer
LARGE CAP GROWTH FUND
Notes to Financial Statements (Continued)
February 29, 2012
(Unaudited)
Due to the inherent uncertainty of determining the fair value of investments that do not have a readily available market value, the fair value of the Fund’s investments may fluctuate from period to period. Additionally, the fair value of investments may differ significantly from the values that would have been used had a ready market existed for such investments and may differ materially from the values the Fund may ultimately realize. Further, such investments may be subject to legal and other restrictions on resale or otherwise less liquid than publicly traded securities.
For the six months ended February 29, 2012, there were no transfers between Levels 1, 2 and 3 for the Fund.
USE OF ESTIMATES — The preparation of financial statements in conformity with accounting principles generally accepted in the United States of America, requires management to make estimates and assumptions that affect the reported amounts of assets and liabilities and disclosure of contingent assets and liabilities at the date of the financial statements and the reported amounts of revenues and expenses during the period. Actual results could differ from those estimates and those differences could be significant.
INVESTMENT TRANSACTIONS, INVESTMENT INCOME AND EXPENSES — The Fund records security transactions based on trade date. The cost of investments sold is determined by use of the specific identification method for both financial reporting and income tax purposes in determining realized gains and losses on investments. Interest income is accrued when earned. Dividend income is recorded on the ex-dividend date. Distributions received on securities that represent a return of capital or capital gains are recorded as a reduction of cost of investments and/or as a realized gain. The Fund estimates the components of distributions received that may be considered return of capital distributions or capital gain distributions. The Fund’s investment income, expenses and unrealized and realized gains and losses are allocated daily. Expenses incurred on behalf of a specific class, fund or fund family of the Company are charged directly to the class, fund or fund family (in proportion to net assets). Expenses incurred for all the RBB funds (such as director or professional fees) are charged to all funds in proportion to their average net assets of RBB, or in such other manner as the Company’s Board of Directors deems fair or equitable. Expenses and fees, including investment advisory and administration fees, are accrued daily and taken into account for the purpose of determining the NAV of the Fund.
DIVIDENDS AND DISTRIBUTIONS TO SHAREHOLDERS — Dividends from net investment income and distributions from net realized capital gains, if any, are declared, recorded on the ex-dividend date and paid at least annually to shareholders. Income dividends and capital gain distributions are determined in accordance with U.S. federal income tax regulations, which may differ from U.S. generally accepted accounting principles (“U.S. GAAP”).
U.S. TAX STATUS — No provision is made for U.S. income taxes as it is the Fund’s intention to qualify for and elect the tax treatment applicable to regulated investment companies under Subchapter M of the Internal Revenue Code of 1986, as amended, and make the requisite distributions to its shareholders which will be sufficient to relieve it from U.S. income and excise taxes.
CASH AND CASH EQUIVALENTS — The Fund considers liquid assets deposited into a bank demand deposit account to be cash equivalents. These investments represent amounts held with financial institutions that are readily accessible to pay Fund expenses or purchase investments. Cash and cash equivalents are valued at cost plus accrued interest, which approximates market value.
OTHER — In the normal course of business, the Fund may enter into contracts that provide general indemnifications. The Fund’s maximum exposure under these arrangements is dependent on claims that may be made against the Fund in the future, and, therefore, cannot be estimated; however, based on experience, the risk of material loss from such claims is considered remote.
| 2. | Investment Adviser and Other Services |
Marvin & Palmer Associates, Inc. (“Marvin & Palmer” or the “Adviser”) serves as investment adviser to the Fund pursuant to an investment advisory agreement with the Company (the “Advisory Agreement”). For its services, the Adviser is paid a monthly fee at the annual rate of 0.65% of the Fund’s average daily net assets. The Adviser has contractually agreed to waive its advisory fees and/or reimburse expenses to the extent that total annual Fund operating expenses (excluding certain items discussed below) exceed 0.80% of the Fund’s average daily net assets. In determining the Adviser’s obligation to waive advisory fees and/or reimburse expenses, the following expenses are not taken into account and could cause net total annual Fund operating expenses to exceed 0.80%: acquired fund fees and expenses, brokerage commissions, extraordinary items, interest or taxes. This contractual limitation is in effect until December 31, 2012 and may not be terminated without the approval of the Company’s Board of Directors. The Adviser may discontinue these arrangements at any time after December 31, 2012. If at any time during the three years ending March 4, 2015 in which the advisory agreement is in effect, the Fund’s total annual operating expenses for that year are less than 0.80% of the Fund’s average daily net assets, the Adviser is entitled to reimbursement by the Fund, in whole or in part, of the advisory fees waived and other payments remitted by the Adviser to the Fund during such three-year period. For the six months ended February 29, 2012, investment advisory fees accrued and waived were $31,005 and expenses reimbursed or to be reimbursed by the Adviser were $101,545.
11
Marvin & Palmer
LARGE CAP GROWTH FUND
Notes to Financial Statements (Continued)
February 29, 2012
(Unaudited)
As of February 29, 2012, the total fees which were previously waived by the Advisor which may be subject to possible future reimbursements to the Adviser were as follows:
| Expiration | ||||||||||||||
| August 31, 2012 | August 31, 2013 | August 31, 2014 | Februay 28, 2015 | |||||||||||
| $ | 268,864 | $ | 251,254 | $ | 261,943 | $ | 132,550 | |||||||
BNY Mellon Investment Servicing (US), Inc. (“BNY Mellon”) serves as administrator for the Fund. Administration and accounting fees accrued also include certain Transfer Agent and custodian fees. For providing administrative and accounting services, BNY Mellon is entitled to receive a monthly fee equal to an annual percentage rate of the Fund’s average daily net assets, subject to certain minimum monthly fees.
Included in the administration and accounting fees are fees for providing regulatory administration services to RBB. For providing these services, BNY Mellon is entitled to receive compensation as agreed to by the Company and BNY Mellon. This fee is allocated to each portfolio in proportion to its net assets of the Company.
In addition, BNY Mellon serves as the Fund’s transfer and dividend disbursing agent. For providing transfer agent services, BNY Mellon is entitled to receive out of pocket expenses.
The Bank of New York Mellon (the “Custodian”) provides certain custodial services to the Fund. The Custodian is entitled to receive a monthly fee equal to an annual percentage rate of the Portfolio’s average daily net assets subject to certain minimum monthly fees and may receive out of pocket expenses.
BNY Mellon Distributors LLC, formerly known as BNY Mellon Distributors Inc., serves as the principal underwriter and distributor of the Fund’s shares pursuant to a Distribution Agreement with RBB.
| 3. | Director Compensation |
The Directors of the Company receive an annual retainer, meeting fees and reimbursement of out of pocket expenses for meetings attended. The remuneration paid to the Directors by the Fund during the six months ended February 29, 2012 was $4,110. Certain employees of BNY Mellon are Officers of the Company. They are not compensated by the Fund or the Company.
| 4. | Investment in Securities |
For the six months ended February 29, 2012, aggregate purchases and sales of investment securities (excluding short-term investments) of the Fund were as follows:
| Purchases | Sales | |||||||
Investment Securities | $ | 6,763,998 | $ | 11,173,799 | ||||
| 5. | Federal Income Tax Information |
The Fund has followed the authoritative guidance on accounting for and disclosure of uncertainty in tax positions, which requires the Fund to determine whether a tax position is more likely than not to be sustained upon examination, including resolution of any related appeals or litigation processes, based on the technical merits of the position. The Fund has determined that there was no effect on the financial statements from following this authoritative guidance. In the normal course of business, the Fund is subject to examination by federal, state and local jurisdictions, where applicable, for tax years for which applicable statutes of limitations have not expired.
As of February 29, 2012, federal tax cost, aggregate gross unrealized appreciation and depreciation of securities held by the Fund were as follows:
Federal Tax Cost | Unrealized Appreciation | Unrealized Depreciation | Net Unrealized Appreciation | |||||||||||
| $ | 4,873,943 | $ | 1,367,858 | $ | (9,387 | ) | $ | 1,358,471 | ||||||
12
Marvin & Palmer
LARGE CAP GROWTH FUND
Notes to Financial Statements (Concluded)
February 29, 2012
(Unaudited)
Distributions to shareholders from net investment income and realized gains are determined in accordance with federal income tax regulations, which may differ from net investment income and realized gains recognized for financial reporting purposes. Accordingly, the character of distributions and composition of net assets for tax purposes may differ from those reflected in the accompanying financial statements. To the extent these differences are permanent, such amounts are reclassified within the capital accounts based on the tax treatment; temporary differences do not require such reclassification.
As of February 29, 2012, the Fund had no tax-basis distributable earnings.
The difference between the book and tax basis components of distributable earnings relate principally to the timing of recognition of income and gains for federal income tax purposes. Short-term and foreign currency gains are reportable as ordinary income for federal income tax purposes.
There were no distributions paid during the fiscal year ended August 31, 2011.
For federal income tax purposes, capital loss carryforwards are available to offset future capital gains. As of August 31, 2011, the Fund had a capital loss carryforward of $9,618,197 which will expire as follows:
August 31, 2018 | $ | 3,287,157 | ||
August 31, 2017 | $ | 6,331,040 |
On December 22, 2010, President Obama signed into law the Regulated Investment Company Modernization Act of 2010 (the “Act”). The Act updates certain tax rules applicable to regulated investment companies (“RICs”). The various provisions of the Act will generally be effective for RICs with taxable years beginning after December 22, 2010. Additional information regarding the impact of the Act on the Fund, if any, will be contained within the relevant sections of the notes to financial statements for the fiscal year ending August 31, 2012.
| 6. | New Accounting Pronouncement |
In May 2011, the Financial Accounting Standards Board issued Accounting Standards Update (“ASU”) No. 2011-04 “Amendments to Achieve Common Fair Value Measurement and Disclosure Requirements in U.S. GAAP and International Financial Reporting Standards (“IFRS”)”. ASU 2011-04 includes common requirements for measurement of and disclosure about fair value between U.S. GAAP and IFRS. ASU 2011-04 will require reporting entities to disclose the following information for fair value measurements categorized within Level 3 of the fair value hierarchy: quantitative information about the unobservable inputs used in the fair value measurement, the valuation processes used by the reporting entity and a narrative description of the sensitivity of the fair value measurement to changes in unobservable inputs and the interrelationships between those unobservable inputs. In addition, ASU 2011-04 will require reporting entities to make disclosures about amounts and reasons for all transfers in and out of Level 1 and Level 2 fair value measurements. The new and revised disclosures are effective for interim and annual reporting periods beginning after December 15, 2011. Management is currently evaluating the implications of ASU No. 2011-04 and its impact on the financial statements.
| 7. | Subsequent Event |
Management has evaluated the impact of all subsequent events on the Fund through the date the financial statements were issued, and has determined that there was the following subsequent event:
The Bank of New York Mellon Corporation announced on November 28, 2011 that it had agreed to sell BNY Mellon Distributors LLC (together, the “Distributor”) and its four subsidiaries to Foreside Distributors, LLC, a subsidiary of Foreside Financial Group, LLC (the “Transaction”). The Transaction closed on March 31, 2012. Upon the closing of the Transaction, the Distributor became an indirect, wholly owned subsidiary of Foreside Financial Group, LLC and was renamed Foreside Funds Distributors LLC effective April 1, 2012.
For the period March 1, 2012 through April 26, 2012, there were net redemptions of $3,420,077, which represented 53% of the Fund’s net assets.
13
Marvin & Palmer
LARGE CAP GROWTH FUND
Other Information
(Unaudited)
Proxy Voting
Policies and procedures that the Fund uses to determine how to vote proxies relating to portfolio securities as well as information regarding how the Fund voted proxies relating to portfolio securities for the most recent 12-month period ended June 30 are available without charge, upon request, by calling Marvin & Palmer at (877) 821-2117 and on the Securities and Exchange Commission’s (“SEC”) website at http://www.sec.gov.
Quarterly Portfolio Schedules
The Company files a complete schedule of portfolio holdings with the SEC for the first and third fiscal quarters of each fiscal year (quarters ended November 30 and May 31) on Form N-Q. The Company’s Form N-Q is available on the SEC website at http://www.sec.gov and may be reviewed and copied at the SEC Public Reference Room in Washington, D.C. Information on the operation of the SEC Public Reference Room may be obtained by calling (202) 551-8090.
14
[THIS PAGE INTENTIONALLY LEFT BLANK.]
[THIS PAGE INTENTIONALLY LEFT BLANK.]
[THIS PAGE INTENTIONALLY LEFT BLANK.]
Investment Adviser
Marvin & Palmer Associates, Inc.
1201 N. Market Street
Suite 2300
Wilmington, DE 19801-1165
Administrator
BNY Mellon Investment Servicing (US) Inc.
301 Bellevue Parkway
Wilmington, DE 19809
Transfer Agent
BNY Mellon Investment Servicing (US) Inc.
4400 Computer Drive
Westborough, MA 01581
Principal Underwriter
Foreside Funds Distributors LLC
400 Berwyn Park
899 Cassatt Road
Berwyn, PA 19312
Custodian
The Bank of New York Mellon
One Wall Street
New York, NY 10286
Independent Registered Public Accounting Firm
PricewaterhouseCoopers LLP
Two Commerce Square, Suite 1700
2001 Market Street
Philadelphia, PA 19103-7042
Counsel
Drinker Biddle & Reath LLP
One Logan Square, Ste. 2000
Philadelphia, PA 19103-6996

PERIMETER
SMALL CAP GROWTH FUND
Semi-Annual Investment Adviser’s Report
February 29, 2012
(Unaudited)
Dear Shareholders:
The Perimeter Small Cap Growth Fund (the “Fund”) returned 10.38% (I Shares) and 10.16% (Investor Shares) versus the 12.99% return of the Russell 2000 Growth Index during the six-month period ended February 29, 2012. Following a sharp market downturn in August, the fiscal year began on shaky footing as economic data in the US and abroad prompted fears of a double-dip recession. These fears were more perception than reality, however, as the job market began to heal, Congress and the Administration reached a compromise on the debt ceiling debate, and various manufacturing indices improved. While global concerns remained at the start of calendar 2012, including the European Union (EU) crisis and slowing growth in China, US economic data continued to show improvement, suggesting a self-sustaining recovery. The market kicked off the new year with a strong January Effect where lower-priced stocks surged, although by February, falling stock correlations began to reward quality fundamental stock-picking. Overall, higher beta sectors like Technology and Consumer Discretionary, continued to lead the market given high exposure to the economic cycle.
The Financials sector was a top contributor to Perimeter’s performance given strong stock selection across several industries and with particular strength from SVB Financial Group (SIVB) and Umpqua Holdings (UMPQ) in the Banking industry. Maintaining an underweight position in weaker performing Consumer Staples, along with strong performance from Hain Celestial Group (HAIN) in the Food Products area, also contributed to the Fund’s performance.
Although performance from Technology and Consumer Discretionary improved by the end of the period, both sectors presented overall headwinds during the first half of the fiscal year. Within Technology, Cavium Networks (CAVM) and Interactive Intelligence (ININ) detracted from performance after reporting disappointing news relative to estimated growth. Likewise, in Consumer Discretionary, Shutterfly (SFLY) and Crocs (CROX) experienced earnings missteps that led to significant setbacks in the stocks during the period.
Given our quality-focused stock selection process, we are encouraged by the recent decline in historically high stock correlations, which has presented a headwind to fundamental stock-picking in recent years. At the same time, volatility levels have fallen, reflecting a more stable environment, one in which the Fund has historically excelled.
Looking forward, we have seen encouraging signs from our domestic economy such as steady gains in employment, strong manufacturing production, stabilizing home prices, and a resilient consumer. That being said, despite an accommodative fiscal environment, global risks from the European Union and China that remain (along with the risk that rising oil prices) could dampen US consumer spending. As we look forward, we feel confident that our bottom-up, fundamental process will lead us to companies that we believe can generate strong fundamental momentum and accelerating growth.
Sincerely,
Perimeter Capital Management
This represents the manager’s assessment of the Fund and the market environment at a specific point in time and should not be relied upon by the reader as research or investment advice.
Portfolio composition is subject to change. The current and future portfolio holdings of the Fund are subject to investment risk.
The Russell 2000® Index is a widely-recognized, capitalization-weighted index that measures the performance of the smallest 2,000 companies in the Russell 3000® Index. The Russell 2000® Growth Index measures the performance of those Russell 2000 companies with higher price-to-book ratios and higher forecasted growth values. Direct investment into an index is not possible.
1
PERIMETER
SMALL CAP GROWTH FUND
Semi-Annual Report
February 29, 2012
(Unaudited)
| Average Annual Total Returns For The Periods Ended February 29, 2012 | ||||||||||||||||||||
| Six Months* | One Year | Three Year | Five Year | Since Inception**** | ||||||||||||||||
Perimeter Small Cap Growth Fund, Investor Class Shares** | 10.16 | % | –0.57 | % | 26.14 | % | 1.69 | % | 3.38 | % | ||||||||||
Perimeter Small Cap Growth Fund, I Shares*** | 10.38 | % | –0.30 | % | 26.39 | % | 1.89 | % | 0.87 | % | ||||||||||
Russell 2000® Growth Index | 12.99 | % | 2.38 | % | 31.21 | % | 3.93 | % | 5.54 | % | ||||||||||
| * | Not Annualized |
| ** | Investor Class Shares were offered beginning September 29, 2006. |
| *** | I Shares were offered beginning December 31, 2007. The performance shown for the I Shares prior to December 31, 2007 is based on the performance and expenses of the Investor Class Shares, and has not been adjusted for the shareholder servicing fee charged specifically to the Investor Class Shares. |
| **** | The Fund commenced operations on September 29, 2006 as a separate portfolio (the “Predecessor Fund”) of The Advisors’ Inner Circle Fund II. The performance shown for periods prior to February 8, 2010 represents the performance of the Predecessor Fund. |
The performance data quoted herein represents past performance. Past performance does not guarantee future results. Investment return and principal value will fluctuate so that an investor’s shares, when redeemed, may be worth more or less than its original cost. Current performance may be higher or lower than the performance quoted. For performance current to the most recent month-end, please call 1-888-968-4964. Performance assumes reinvestment of dividends and capital gains. Unlike a mutual fund, index returns do not reflect taxes, fees or expenses. The Fund’s gross total expense ratio as stated in the prospectus is 1.39% for Investor Shares and 1.14% for I Shares. The performance quoted reflects fee waivers in effect and would have been lower in their absence. The Fund charges a 2.00% redemption fee if redeemed within 7 days. The Adviser has contractually agreed to limit the total expenses of the Investor Class Shares and I Shares of the Fund (excluding acquired fund fees and expenses, brokerage commissions, extraordinary items, interest and taxes) to 1.35% and 1.10% of the average daily net assets of the Fund’s Investor Class Shares and I Shares, respectively, through December 31, 2012.
Returns shown do not reflect the deduction of taxes that a shareholder would pay on Fund distributions or the redemption of Fund shares. Mutual fund investing involves risk including the possible loss of principal. The Fund invests in small cap stocks which generally involve more risk than large cap stocks due to potentially greater volatility and less market liquidity.
2
PERIMETER
SMALL CAP GROWTH FUND
Fund Expense Disclosure
February 29, 2012
(Unaudited)
As a shareholder of the Fund, you incur two types of costs: (1) transaction costs, including redemption fees; and (2) ongoing costs, including management fees, distribution fees and other Fund expenses. These examples are intended to help you understand your ongoing costs (in dollars) of investing in the Fund and to compare these costs with the ongoing costs of investing in other mutual funds.
This example is based on an investment of $1,000 invested at the beginning of the six-month period from August 1, 2011 through February 29, 2012, and held for the entire period.
Actual Expenses
The first line of the accompanying tables provides information about actual account values and actual expenses. You may use the information in this line, together with the amount you invested, to estimate the expenses that you paid over the period. Simply divide your account value by $1,000 (for example, an $8,600 account value divided by $1,000 = 8.6), then multiply the result by the number in the first line under the heading entitled “Expenses Paid During Period” to estimate the expenses you paid on your account during this period.
Hypothetical Example for Comparison Purposes
The second line of the accompanying tables provides information about hypothetical account values and hypothetical expenses based on the Fund’s actual expense ratio and an assumed rate of return of 5% per year before expenses, which is not your Fund’s actual return. The hypothetical account values and expenses may not be used to estimate the actual ending account balance or expenses you paid for the period. You may use this information to compare the ongoing costs of investing in the Fund and other funds. To do so, compare these 5% hypothetical examples with the 5% hypothetical examples that appear in the shareholder reports of other funds.
Please note that the expenses shown in the accompanying tables are meant to highlight your ongoing costs only and do not reflect any transactional costs, such as redemption fees. Therefore, the second line of the accompanying tables is useful in comparing ongoing costs only, and will not help you determine the relative total costs of owning different funds. In addition, if these transactional costs were included, your costs would have been higher.
| Perimeter Small Cap Growth Fund —Investor Class | ||||||||||||
| Beginning Account Value September 1, 2011 | Ending Account Value February 29, 2012 | Expenses Paid During Period* | ||||||||||
Actual | $ | 1,000.00 | $ | 1,101.56 | $ | 7.05 | ||||||
Hypothetical — (5% return before expenses) | 1,000.00 | 1,018.15 | 6.77 | |||||||||
| Perimeter Small Cap Growth Fund — I Shares | ||||||||||||
| Beginning Account Value September 1, 2011 | Ending Account Value February 29, 2012 | Expenses Paid During Period* | ||||||||||
Actual | $ | 1,000.00 | $ | 1,103.75 | $ | 5.77 | ||||||
Hypothetical — (5% return before expenses) | 1,000.00 | 1,019.38 | 5.53 | |||||||||
| * | Expenses are equal to an annualized six-month expense ratio of 1.35% for the Investor Class and 1.10% for the I Shares which includes waived fees, reimbursed expenses or recoupment, multiplied by the average account value over the period, multiplied by the number of days in the most recent period 182, then divided by 366 to reflect the six-month period. The Fund’s ending account values on the first line in each table are based on the actual six-month total return for the Fund of 10.16% for the Investor Class and 10.38% for the I Shares. |
3
PERIMETER
SMALL CAP GROWTH FUND
Portfolio Holdings Summary Table
February 29, 2012
(Unaudited)
The following table presents a summary by sector of the portfolio holdings of the Fund:
| % of Net Assets | Value | |||||||
Domestic Common Stocks: | ||||||||
Consumer Non-cyclical | 23.8 | % | $ | 76,599,303 | ||||
Technology | 17.7 | 56,876,060 | ||||||
Consumer Cyclical | 14.8 | 47,463,017 | ||||||
Industrial | 13.8 | 44,407,756 | ||||||
Communications | 11.3 | 36,278,442 | ||||||
Energy | 8.1 | 25,937,672 | ||||||
Financial | 6.5 | 20,886,686 | ||||||
Basic Materials | 3.9 | 12,608,727 | ||||||
Other Assets In Excess of Liabilities | 0.1 | 349,271 | ||||||
|
|
|
| |||||
| 100 | % | $ | 321,406,934 | |||||
|
|
|
| |||||
Portfolio holdings are subject to change at any time.
The accompanying notes are an integral part of the financial statements.
4
PERIMETER
SMALL CAP GROWTH FUND
Portfolio of Investments
February 29, 2012
(Unaudited)
| Shares | Value | |||||||
COMMON STOCK† — 99.9% |
| |||||||
Basic Materials — 3.9% |
| |||||||
Balchem | 35,311 | $ | 962,225 | |||||
Buckeye Technologies | 52,770 | 1,802,623 | ||||||
Coeur D’alene Mines* | 54,070 | 1,537,751 | ||||||
Hecla Mining | 58,570 | 297,536 | ||||||
KapStone Paper and Packaging* | 92,440 | 1,858,044 | ||||||
Kraton Performance Polymers* | 76,625 | 2,129,409 | ||||||
Kronos Worldwide | 104,170 | 2,434,453 | ||||||
Sensient Technologies | 42,895 | 1,586,686 | ||||||
|
| |||||||
| 12,608,727 | ||||||||
|
| |||||||
Communications — 11.3% |
| |||||||
AboveNet* | 34,080 | 2,370,605 | ||||||
ADTRAN | 9,294 | 327,613 | ||||||
Allot Communications* | 92,717 | 1,654,998 | ||||||
BroadSoft* | 62,927 | 2,288,655 | ||||||
Cbeyond* | 164,555 | 1,263,782 | ||||||
ClickSoftware Technologies | 190,536 | 2,090,180 | ||||||
DealerTrack Holdings* | 87,640 | 2,440,774 | ||||||
DigitalGlobe* | 112,730 | 1,733,787 | ||||||
Dolan* | 49,623 | 445,614 | ||||||
EZchip Semiconductor* | 62,770 | 2,537,163 | ||||||
Finisar* | 116,940 | 2,372,713 | ||||||
HealthStream* | 65,493 | 1,338,022 | ||||||
InterDigital | 28,190 | 1,066,991 | ||||||
NIC | 81,771 | 988,611 | ||||||
NICE Systems, ADR* | 56,099 | 1,918,025 | ||||||
Procera Networks* | 60,171 | 1,170,928 | ||||||
Shutterfly* | 91,013 | 2,490,116 | ||||||
Sonus Networks* | 626,108 | 1,828,235 | ||||||
SPS Commerce* | 6,710 | 166,744 | ||||||
US Auto Parts Network* | 140,050 | 679,243 | ||||||
ValueClick* | 145,776 | 3,032,141 | ||||||
Websense* | 15,304 | 275,625 | ||||||
Zix* | 613,610 | 1,797,877 | ||||||
|
| |||||||
| 36,278,442 | ||||||||
|
| |||||||
Consumer Cyclical — 14.8% |
| |||||||
Allegiant Travel* | 22,670 | 1,133,047 | ||||||
Ascena Retail Group* | 24,996 | 964,846 | ||||||
Beacon Roofing Supply* | 67,645 | 1,595,069 | ||||||
Bebe Stores | 187,600 | 1,680,896 | ||||||
Body Central* | 54,975 | 1,530,504 | ||||||
Buckle | 36,490 | 1,639,131 | ||||||
Buffalo Wild Wings* | 13,267 | 1,147,463 | ||||||
Caribou Coffee* | 37,195 | 616,693 | ||||||
Casual Male Retail Group* | 383,538 | 1,208,145 | ||||||
Chico’s FAS | 140,430 | 2,107,854 | ||||||
Domino’s Pizza* | 32,930 | 1,266,488 | ||||||
Ethan Allen Interiors | 64,210 | 1,621,302 | ||||||
Express* | 117,567 | 2,798,095 | ||||||
Ezcorp, Cl A* | 57,215 | 1,802,272 | ||||||
| Shares | Value | |||||||
Consumer Cyclical — (Continued) |
| |||||||
Finish Line, Cl A | 85,190 | $ | 1,958,518 | |||||
First Cash Financial Services* | 53,988 | 2,281,533 | ||||||
Genesco* | 30,111 | 2,051,763 | ||||||
Iconix Brand Group* | 120,640 | 2,190,822 | ||||||
La-Z-Boy* | 95,800 | 1,368,982 | ||||||
Lithia Motors, Cl A | 76,263 | 1,800,569 | ||||||
Maidenform Brands* | 70,429 | 1,479,009 | ||||||
Pier 1 Imports* | 106,300 | 1,825,171 | ||||||
Rush Enterprises, Cl A* | 70,099 | 1,669,758 | ||||||
Select Comfort* | 56,550 | 1,673,315 | ||||||
Steven Madden* | 65,490 | 2,827,858 | ||||||
Vitamin Shoppe* | 59,527 | 2,525,731 | ||||||
Wabash National* | 104,429 | 1,102,770 | ||||||
WMS Industries* | 72,420 | 1,595,413 | ||||||
|
| |||||||
| 47,463,017 | ||||||||
|
| |||||||
Consumer Non-cyclical — 23.8% |
| |||||||
Akorn* | 193,005 | 2,418,353 | ||||||
American Public Education* | 55,241 | 2,163,237 | ||||||
ArthroCare* | 16,050 | 418,905 | ||||||
Astex Pharmaceuticals* | 665,004 | 1,216,957 | ||||||
Atrion | 2,251 | 463,706 | ||||||
Bruker* | 95,349 | 1,528,444 | ||||||
Cardiome Pharma* | 206,034 | 459,456 | ||||||
Centene* | 39,660 | 1,935,408 | ||||||
Consolidated Graphics* | 49,295 | 2,301,583 | ||||||
Corporate Executive Board | 23,673 | 981,009 | ||||||
Corrections Corp of America* | 82,780 | 2,074,467 | ||||||
Depomed* | 202,970 | 1,276,681 | ||||||
DFC Global* | 89,825 | 1,608,766 | ||||||
Euronet Worldwide* | 101,570 | 1,959,285 | ||||||
FTI Consulting* | 55,360 | 2,218,275 | ||||||
Grand Canyon Education* | 120,850 | 2,067,743 | ||||||
Haemonetics* | 33,905 | 2,272,652 | ||||||
Hain Celestial Group* | 44,534 | 1,818,768 | ||||||
Huron Consulting Group* | 64,670 | 2,469,101 | ||||||
ICON ADR* | 129,397 | 2,740,628 | ||||||
ICU Medical* | 41,285 | 1,894,156 | ||||||
Impax Laboratories* | 121,384 | 2,834,316 | ||||||
Integra LifeSciences Holdings* | 44,980 | 1,421,368 | ||||||
Inter Parfums | 99,024 | 1,670,535 | ||||||
Jazz Pharmaceuticals* | 54,050 | 2,836,003 | ||||||
Metropolitan Health Networks* | 118,730 | 992,583 | ||||||
Myriad Genetics* | 120,970 | 2,927,474 | ||||||
Onyx Pharmaceuticals* | 50,910 | 1,950,871 | ||||||
PAREXEL International* | 61,558 | 1,506,940 | ||||||
Rent-A-Center | 58,150 | 2,059,673 | ||||||
Ruddick | 38,510 | 1,577,370 | ||||||
Salix Pharmaceuticals* | 41,520 | 2,047,766 | ||||||
Sanderson Farms | 41,580 | 2,045,736 | ||||||
Seattle Genetics* | 125,110 | 2,309,531 | ||||||
The accompanying notes are an integral part of the financial statements.
5
PERIMETER
SMALL CAP GROWTH FUND
Portfolio of Investments (Continued)
February 29, 2012
(Unaudited)
| Shares | Value | |||||||
Consumer Non-cyclical — (Continued) |
| |||||||
Sotheby’s | 20,436 | $ | 803,952 | |||||
Spectrum Brands Holdings* | 71,020 | 2,018,388 | ||||||
Spectrum Pharmaceuticals* | 67,590 | 959,102 | ||||||
Thoratec* | 49,115 | 1,694,468 | ||||||
TNS* | 63,749 | 1,168,519 | ||||||
Transcend Services* | 44,740 | 961,910 | ||||||
TrueBlue* | 59,020 | 977,371 | ||||||
United Therapeutics* | 16,493 | 787,211 | ||||||
VistaPrint* | 77,060 | 3,134,801 | ||||||
Wright Express* | 26,274 | 1,625,835 | ||||||
|
| |||||||
| 76,599,303 | ||||||||
|
| |||||||
Energy — 8.1% |
| |||||||
CARBO Ceramics | 23,690 | 2,171,188 | ||||||
Dawson Geophysical* | 46,455 | 1,760,180 | ||||||
Energy XXI Bermuda* | 51,700 | 1,935,131 | ||||||
Georesources* | 77,766 | 2,491,623 | ||||||
Gulfport Energy* | 58,798 | 1,976,789 | ||||||
Helix Energy Solutions Group* | 106,104 | 2,041,441 | ||||||
Key Energy Services* | 106,901 | 1,823,731 | ||||||
Kodiak Oil & Gas* | 201,610 | 1,953,601 | ||||||
North American Energy Partners* | 162,341 | 946,448 | ||||||
OYO Geospace* | 30,723 | 3,381,066 | ||||||
Rex Energy* | 134,885 | 1,551,178 | ||||||
Rosetta Resources* | 36,141 | 1,844,637 | ||||||
Swift Energy* | 68,620 | 2,060,659 | ||||||
|
| |||||||
| 25,937,672 | ||||||||
|
| |||||||
Financial — 6.5% |
| |||||||
Altisource Portfolio Solutions SA* | 17,970 | 1,157,987 | ||||||
Boston Private Financial Holdings | 154,910 | 1,476,292 | ||||||
Endurance Specialty Holdings* | 41,920 | 1,612,243 | ||||||
First Citizens BancShares, Cl A | 5,096 | 897,660 | ||||||
Hanover Capital Mortgage Holdings* | 112,749 | 2,297,825 | ||||||
KBW | 72,965 | 1,206,111 | ||||||
Maiden Holdings | 163,782 | 1,416,714 | ||||||
Platinum Underwriters Holdings | 69,320 | 2,465,019 | ||||||
ProAssurance | 16,258 | 1,426,802 | ||||||
SVB Financial Group* | 47,031 | 2,787,998 | ||||||
Texas Capital Bancshares* | 25,230 | 855,045 | ||||||
Umpqua Holdings | 77,806 | 958,570 | ||||||
WisdomTree Investments* | 188,420 | 1,334,014 | ||||||
World Acceptance* | 15,655 | 994,406 | ||||||
|
| |||||||
| 20,886,686 | ||||||||
|
| |||||||
Industrial — 13.8% |
| |||||||
A.O. Smith | 59,966 | 2,708,065 | ||||||
Actuant, Cl A | 16,750 | 471,847 | ||||||
Atlas Air Worldwide Holdings* | 46,084 | 1,964,100 | ||||||
Chart Industries* | 35,243 | 2,410,269 | ||||||
Curtiss-Wright | 59,980 | 2,228,257 | ||||||
DXP Enterprises* | 3,511 | 129,907 | ||||||
| Shares | Value | |||||||
Industrial — (Continued) |
| |||||||
EnerSys* | 49,548 | $ | 1,663,822 | |||||
EnPro Industries* | 63,395 | 2,396,965 | ||||||
General Cable* | 34,779 | 1,077,106 | ||||||
Gulfmark Offshore, Cl A* | 37,190 | 1,868,426 | ||||||
Hexcel* | 89,540 | 2,262,676 | ||||||
HUB Group, Cl A* | 33,062 | 1,177,999 | ||||||
II-VI* | 72,286 | 1,690,769 | ||||||
Landstar System | 30,090 | 1,626,665 | ||||||
Marten Transport | 56,003 | 1,168,783 | ||||||
MasTec* | 141,480 | 2,488,633 | ||||||
Mistras Group* | 87,340 | 1,956,416 | ||||||
MYR Group* | 82,860 | 1,659,686 | ||||||
Newport* | 51,966 | 868,872 | ||||||
NVE* | 27,463 | 1,469,271 | ||||||
Old Dominion Freight Line* | 49,184 | 2,139,996 | ||||||
OSI Systems* | 41,065 | 2,422,835 | ||||||
Silgan Holdings | 40,210 | 1,709,729 | ||||||
TriMas* | 98,416 | 2,384,620 | ||||||
Triumph Group | 38,590 | 2,462,042 | ||||||
|
| |||||||
| 44,407,756 | ||||||||
|
| |||||||
Technology — 17.7% |
| |||||||
ACI Worldwide* | 86,942 | 3,284,669 | ||||||
ATMI* | 46,969 | 1,034,727 | ||||||
Cavium* | 82,040 | 2,931,289 | ||||||
CommVault Systems* | 30,374 | 1,566,387 | ||||||
Computer Programs & Systems | 28,460 | 1,731,506 | ||||||
Diodes* | 90,167 | 2,239,748 | ||||||
Emulex* | 82,050 | 858,243 | ||||||
inContact* | 268,411 | 1,430,631 | ||||||
Interactive Intelligence Group* | 69,632 | 1,949,696 | ||||||
Kulicke & Soffa Industries* | 134,780 | 1,517,623 | ||||||
Lattice Semiconductor* | 249,172 | 1,642,043 | ||||||
LivePerson* | 201,289 | 3,035,438 | ||||||
LTX-Credence* | 178,350 | 1,203,863 | ||||||
Maxwell Technologies* | 70,633 | 1,284,814 | ||||||
MedAssets* | 101,750 | 1,452,990 | ||||||
Mellanox Technologies* | 58,840 | 2,245,923 | ||||||
Mentor Graphics* | 150,850 | 2,286,886 | ||||||
MIPS Technologies* | 307,110 | 1,768,954 | ||||||
Mitek Systems* | 87,180 | 906,672 | ||||||
Monotype Imaging Holdings* | 55,440 | 777,823 | ||||||
NetScout Systems* | 117,010 | 2,484,122 | ||||||
Nova Measuring Instruments* | 212,280 | 1,566,626 | ||||||
Omnicell* | 126,230 | 1,883,352 | ||||||
Open Text* | 36,890 | 2,254,717 | ||||||
Opnet Technologies | 61,964 | 1,769,072 | ||||||
Parametric Technology* | 113,940 | 3,042,198 | ||||||
RADWARE* | 53,715 | 1,788,172 | ||||||
Silicon Image* | 197,510 | 1,021,127 | ||||||
SolarWinds* | 29,860 | 1,112,584 | ||||||
The accompanying notes are an integral part of the financial statements.
6
PERIMETER
SMALL CAP GROWTH FUND
Portfolio of Investments (Concluded)
February 29, 2012
(Unaudited)
| Shares | Value | |||||||
Technology — (Continued) | ||||||||
TriQuint Semiconductor* | 408,790 | $ | 2,632,608 | |||||
Ultimate Software Group* | 17,040 | 1,189,733 | ||||||
Volterra Semiconductor* | 31,950 | 981,824 | ||||||
|
| |||||||
| 56,876,060 | ||||||||
|
| |||||||
TOTAL COMMON STOCK | 321,057,663 | |||||||
|
| |||||||
Warrants — 0.0% | ||||||||
Energy — 0.0% | ||||||||
Magnum Hunter Resources, | 31,749 | 0 | ||||||
|
| |||||||
TOTAL WARRANTS | 0 | |||||||
|
| |||||||
TOTAL INVESTMENTS — 99.9% |
| 321,057,663 | ||||||
|
| |||||||
OTHER ASSETS IN EXCESS OF LIABILITIES — 0.1% | 349,271 | |||||||
|
| |||||||
NET ASSETS — 100.0% | $ | 321,406,934 | ||||||
|
| |||||||
| † | More narrow industries are utilized for compliance purposes, whereas broad sectors are utilized for reporting purposes. |
| * | Non-income producing security. |
| ADR | American Depositary Receipt |
| Cl | Class |
The accompanying notes are an integral part of the financial statements.
7
PERIMETER
SMALL CAP GROWTH FUND
Statement of Assets & Liabilities
February 29, 2012
(Unaudited)
ASSETS | ||||
Investments, at value (Cost $264,619,516) | $ | 321,057,663 | ||
Cash | 2,815,391 | |||
Receivables | ||||
Investments sold | 3,579,832 | |||
Capital shares sold | 416,090 | |||
Dividends and interest | 44,965 | |||
Prepaid expenses and other assets | 40,142 | |||
|
| |||
Total assets | 327,954,083 | |||
|
| |||
LIABILITIES | ||||
Payable for investments purchased | 5,862,232 | |||
Capital shares redeemed | 323,356 | |||
Investment advisory fees | 216,333 | |||
Administration and accounting fees | 26,624 | |||
Directors’ and officers’ fees | 852 | |||
Other accrued expenses and liabilities | 117,752 | |||
|
| |||
Total liabilities | 6,547,149 | |||
|
| |||
Net Assets | $ | 321,406,934 | ||
|
| |||
NET ASSETS CONSIST OF | ||||
Par value | $ | 33,618 | ||
Paid-in capital | 265,118,906 | |||
Accumulated net investment loss | (1,241,387 | ) | ||
Accumulated net realized gain from investments | 1,057,650 | |||
Net unrealized appreciation on investments | 56,438,147 | |||
|
| |||
Net Assets | $ | 321,406,934 | ||
|
| |||
Investor Class | ||||
Net Assets | $ | 87,047,163 | ||
|
| |||
Shares outstanding ($0.001 par value, 100,000,000 shares authorized) | 9,179,148 | |||
|
| |||
Net asset value, offering and redemption price per share | $ | 9.48 | ||
|
| |||
I Shares | ||||
Net Assets | $ | 234,359,771 | ||
|
| |||
Shares outstanding ($0.001 par value, 100,000,000 shares authorized) | 24,439,085 | |||
|
| |||
Net asset value, offering and redemption price per share | $ | 9.59 | ||
|
|
The accompanying notes are an integral part of the financial statements.
8
PERIMETER
SMALL CAP GROWTH FUND
Statement of Operations
Six Months Ended February 29, 2012
(Unaudited)
Investment Income | ||||
Dividends (net of foreign taxes withheld of $13,368) | $ | 618,612 | ||
Interest | 976 | |||
|
| |||
Total investment income | 619,588 | |||
|
| |||
Expenses | ||||
Advisory fees | 1,417,738 | |||
Distribution fees(1) | 126,184 | |||
Transfer agent fees | 154,393 | |||
Administration and accounting fees | 143,976 | |||
Printing and shareholder reporting fees | 66,410 | |||
Professional fees | 37,563 | |||
Directors’ and officers’ fees | 22,968 | |||
Registration and filing fees | 20,172 | |||
Insurance fees | 10,707 | |||
Custodian fees | 6,741 | |||
Other expenses | 3,490 | |||
|
| |||
Total expenses before waivers and recoupment | 2,010,342 | |||
Less: waiver of Advisory fees | (149,367 | ) | ||
|
| |||
Net expenses after waivers and recoupment | 1,860,975 | |||
|
| |||
Net investment loss | (1,241,387 | ) | ||
|
| |||
Net realized and unrealized gain/(loss) from investments | ||||
Net realized gain/(loss) from: | ||||
Investments | 5,420,364 | |||
Net change in unrealized appreciation/(depreciation) on: | ||||
Investments | 26,407,723 | |||
|
| |||
Net realized and unrealized gain from investments | 31,828,087 | |||
|
| |||
Net increase in net assets resulting from operations | $ | 30,586,700 | ||
|
|
| (1) | Attributable to Investor Class Shares. |
The accompanying notes are an integral part of the financial statements.
9
PERIMETER
SMALL CAP GROWTH FUND
Statement of Changes in Net Assets
| For the Six Months Ended February 29, 2012 (Unaudited) | For the Year Ended August 31, 2011 | |||||||
Increase/(decrease) in net assets from operations: | ||||||||
Net investment loss | $ | (1,241,387 | ) | $ | (3,261,788 | ) | ||
Net realized gain from investments | 5,420,364 | 70,401,044 | ||||||
Net change in unrealized appreciation from investments | 26,407,723 | 17,115,011 | ||||||
|
|
|
| |||||
Net increase in net assets resulting from operations | 30,586,700 | 84,254,267 | ||||||
|
|
|
| |||||
Dividends and distributions to shareholders from: | ||||||||
Net realized capital gains | ||||||||
Investor Class | (19,965,000 | ) | — | |||||
I Shares | (40,427,651 | ) | — | |||||
|
|
|
| |||||
Net decrease in net assets from dividends and distributions to shareholders | (60,392,651 | ) | — | |||||
|
|
|
| |||||
Capital transactions: | ||||||||
Investor Class | ||||||||
Proceeds from shares sold | 10,086,023 | 33,689,670 | ||||||
Reinvestment of distributions | 19,950,107 | — | ||||||
Shares redeemed | (51,826,359 | ) | (116,312,148 | ) | ||||
|
|
|
| |||||
Total Investor Class | (21,790,229 | ) | (82,622,478 | ) | ||||
|
|
|
| |||||
I Shares | ||||||||
Proceeds from shares sold | 32,404,230 | 85,807,601 | ||||||
Reinvestment of distributions | 40,118,933 | — | ||||||
Shares redeemed | (35,853,113 | ) | (76,944,076 | ) | ||||
|
|
|
| |||||
Total I Shares | 36,670,050 | 8,863,525 | ||||||
|
|
|
| |||||
Redemption fees | 947 | 6,660 | ||||||
|
|
|
| |||||
Net increase/(decrease) in net assets from capital transactions | 14,880,768 | (73,752,293 | ) | |||||
|
|
|
| |||||
Total increase/(decrease) in net assets | (14,925,183 | ) | 10,501,974 | |||||
Net assets | ||||||||
Beginning of period | 336,332,117 | 325,830,143 | ||||||
|
|
|
| |||||
End of period | $ | 321,406,934 | $ | 336,332,117 | ||||
|
|
|
| |||||
Undistributed/accumulated net investment income/(loss), end of period | $ | (1,241,387 | ) | $ | — | |||
|
|
|
| |||||
Increase/(decrease) in shares outstanding derived from share transactions: | ||||||||
Investor Class | ||||||||
Shares sold | 1,070,769 | 2,982,297 | ||||||
Shares reinvested | 2,403,627 | — | ||||||
Shares redeemed | (5,509,903 | ) | (10,019,851 | ) | ||||
|
|
|
| |||||
Total Investor Class | (2,035,507 | ) | (7,037,554 | ) | ||||
|
|
|
| |||||
I Shares | ||||||||
Shares sold | 3,471,934 | 7,769,516 | ||||||
Shares reinvested | 4,781,756 | — | ||||||
Shares redeemed | (3,733,799 | ) | (6,555,944 | ) | ||||
|
|
|
| |||||
Total I Shares | 4,519,891 | 1,213,572 | ||||||
|
|
|
| |||||
Net increase/(decrease) in shares outstanding from share transactions | 2,484,384 | (5,823,982 | ) | |||||
|
|
|
| |||||
The accompanying notes are an integral part of the financial statements.
10
PERIMETER
SMALL CAP GROWTH FUND
Financial Highlights
Contained below is per share operating performance data for each share outstanding, total investment return, ratios to average net assets and other supplemental data for the respective periods. This information has been derived from information provided in the financial statements.
| Investor Class Shares | ||||||||||||||||||||||||||||
| Six Months Period Ended February 29, 2012 (Unaudited) | Year Ended August 31, 2011 | One Month Period Ended August 31, 2010* | Year Ended July 31, 2010 | Year Ended July 31, 2009 | Year Ended July 31, 2008 | Period Ended July 31, 2007** | ||||||||||||||||||||||
Net asset value, Beginning of Period | $ | 10.75 | $ | 8.79 | $ | 9.53 | $ | 8.45 | $ | 10.40 | $ | 11.49 | $ | 10.00 | ||||||||||||||
|
|
|
|
|
|
|
|
|
|
|
|
|
| |||||||||||||||
Income (Loss) from Operations: | ||||||||||||||||||||||||||||
Net Investment Loss(1) | (0.05 | ) | (0.11 | ) | (0.01 | ) | (0.09 | ) | (0.05 | ) | (0.08 | ) | (0.08 | )(2) | ||||||||||||||
Net Realized and Unrealized Gains | 0.84 | 2.07 | (0.73 | ) | 1.17 | (1.90 | ) | (0.88 | ) | 1.57 | (2) | |||||||||||||||||
|
|
|
|
|
|
|
|
|
|
|
|
|
| |||||||||||||||
Total from Operations | 0.79 | 1.96 | (0.74 | ) | 1.08 | (1.95 | ) | (0.96 | ) | 1.49 | ||||||||||||||||||
|
|
|
|
|
|
|
|
|
|
|
|
|
| |||||||||||||||
Dividends and Distributions from: | ||||||||||||||||||||||||||||
Net Realized Gains | (2.06 | ) | — | — | — | — | (0.13 | ) | — | |||||||||||||||||||
|
|
|
|
|
|
|
|
|
|
|
|
|
| |||||||||||||||
Total Dividends and Distributions | (2.06 | ) | — | — | — | — | (0.13 | ) | — | |||||||||||||||||||
|
|
|
|
|
|
|
|
|
|
|
|
|
| |||||||||||||||
Redemption Fees | — | (3) | — | (3) | — | (3) | — | (3) | — | (3) | — | — | ||||||||||||||||
|
|
|
|
|
|
|
|
|
|
|
|
|
| |||||||||||||||
Net Asset Value, End of Period | $ | 9.48 | $ | 10.75 | $ | 8.79 | $ | 9.53 | $ | 8.45 | $ | 10.40 | $ | 11.49 | ||||||||||||||
|
|
|
|
|
|
|
|
|
|
|
|
|
| |||||||||||||||
Total Return† | 10.16 | % | 22.30 | % | (7.77 | )% | 12.78 | % | (18.75 | )% | (8.47 | )% | 14.90 | % | ||||||||||||||
|
|
|
|
|
|
|
|
|
|
|
|
|
| |||||||||||||||
Ratios and Supplemental Data |
| |||||||||||||||||||||||||||
Net Assets, End of Period (Thousands) | $ | 87,047 | $ | 120,543 | $ | 160,496 | $ | 174,434 | $ | 138,929 | $ | 122,353 | $ | 53,100 | ||||||||||||||
Ratio of Expenses to Average Net Assets (including waivers and recoupment, excluding fees paid indirectly) | 1.35 | %*** | 1.35 | % | 1.35 | %*** | 1.29 | % | 1.11 | % | 1.20 | % | 1.38 | %*** | ||||||||||||||
Ratio of Expenses to Average Net Assets (including waivers, recoupment and fees paid indirectly) | 1.35 | %*** | 1.35 | % | 1.35 | %*** | 1.29 | % | 1.09 | % | 1.16 | % | 1.29 | %*** | ||||||||||||||
Ratio of Expenses to Average Net Assets (excluding waivers, recoupment and fees paid indirectly) | 1.44 | %*** | 1.38 | % | 1.47 | %*** | 1.34 | % | 1.41 | % | 1.51 | % | 2.11 | %*** | ||||||||||||||
Ratio of Net Investment Loss to Average Net Assets | (0.96 | )%*** | (0.93 | )% | (0.97 | )%*** | (0.93 | )% | (0.66 | )% | (0.74 | )% | (0.79 | )%*** | ||||||||||||||
Portfolio Turnover Rate‡ | 58 | % | 122 | % | 7 | % | 97 | % | 126 | % | 147 | % | 88 | % | ||||||||||||||
| † | Total return has not been annualized for periods less than one year. Total return would have been lower had certain expenses not been waived by the Adviser during the period. The return shown does not reflect the deduction of taxes that a shareholder would pay on Fund distributions or the redemption of Fund shares. |
| ‡ | Portfolio turnover rate has not been annualized for periods less than one year. |
| * | The Fund changed its fiscal year end to August 31. |
| ** | Commenced operations on September 29, 2006. |
| *** | Annualized |
| (1) | Per share data calculated using average shares method. |
| (2) | This amount is inconsistent with the Fund’s aggregate net income, gains and losses because of the timing of sales and redemption of Fund shares in relation to fluctuating market values for the investment portfolio. |
| (3) | Amount is less than $0.01 per share. |
The accompanying notes are an integral part of the financial statements.
11
PERIMETER
SMALL CAP GROWTH FUND
Financial Highlights
Contained below is per share operating performance data for each share outstanding, total investment return, ratios to average net assets and other supplemental data for the respective periods. This information has been derived from information provided in the financial statements.
| I Shares | ||||||||||||||||||||||||
| Six Months Period Ended February 29, 2012 (Unaudited) | Year Ended August 31, 2011 | One Month Period Ended August 31, 2010* | Year Ended July 31, 2010 | Year Ended July 31, 2009 | Period Ended July 31, 2008** | |||||||||||||||||||
Net asset value, Beginning of Period | $ | 10.83 | $ | 8.84 | $ | 9.58 | $ | 8.48 | $ | 10.42 | $ | 11.53 | ||||||||||||
|
|
|
|
|
|
|
|
|
|
|
| |||||||||||||
Income (Loss) from Operations: | ||||||||||||||||||||||||
Net Investment Loss(1) | (0.03 | ) | (0.08 | ) | (0.01 | ) | (0.07 | ) | (0.05 | ) | (0.04 | ) | ||||||||||||
Net Realized and Unrealized Gains (Loss) on Investments | 0.85 | 2.07 | (0.73 | ) | 1.17 | (1.89 | ) | (1.07 | ) | |||||||||||||||
|
|
|
|
|
|
|
|
|
|
|
| |||||||||||||
Total from Operations | 0.82 | 1.99 | (0.74 | ) | 1.10 | (1.94 | ) | (1.11 | ) | |||||||||||||||
|
|
|
|
|
|
|
|
|
|
|
| |||||||||||||
Dividends and Distributions from: | ||||||||||||||||||||||||
Net realized Gains | (2.06 | ) | — | — | — | — | — | |||||||||||||||||
|
|
|
|
|
|
|
|
|
|
|
| |||||||||||||
Total Dividend and Distributions | (2.06 | ) | — | — | — | — | — | |||||||||||||||||
|
|
|
|
|
|
|
|
|
|
|
| |||||||||||||
Redemption Fees | — | (2) | — | (2) | — | (2) | — | (2) | — | (2) | — | |||||||||||||
|
|
|
|
|
|
|
|
|
|
|
| |||||||||||||
Net Asset Value, End of Period | $ | 9.59 | $ | 10.83 | $ | 8.84 | $ | 9.58 | $ | 8.48 | $ | 10.42 | ||||||||||||
|
|
|
|
|
|
|
|
|
|
|
| |||||||||||||
Total Return† | 10.38 | % | 22.51 | % | (7.73 | )% | 12.97 | % | (18.62 | )% | (9.63 | )% | ||||||||||||
|
|
|
|
|
|
|
|
|
|
|
| |||||||||||||
Ratios and Supplemental Data | ||||||||||||||||||||||||
Net Assets, End of Period (Thousands) | $ | 234,360 | $ | 215,789 | $ | 165,334 | $ | 179,290 | $ | 154,905 | $ | 26,616 | ||||||||||||
Ratio of Expenses to Average Net Assets (including waivers and recoupment, excluding fees paid indirectly) | 1.10 | %*** | 1.10 | % | 1.10 | %*** | 1.10 | % | 1.04 | % | 1.03 | %*** | ||||||||||||
Ratio of Expenses to Average Net Assets (including waivers, recoupment and fees paid indirectly) | 1.10 | %*** | 1.10 | % | 1.10 | %*** | 1.10 | % | 1.03 | % | 1.00 | %*** | ||||||||||||
Ratio of Expenses to Average Net Assets (excluding waivers, recoupment and fees paid indirectly) | 1.20 | %*** | 1.14 | % | 1.22 | %*** | 1.16 | % | 1.36 | % | 1.37 | %*** | ||||||||||||
Ratio of Net Investment Loss to Average Net Assets | (0.71 | )%*** | (0.69 | )% | (0.72 | )%*** | (0.74 | )% | (0.64 | )% | (0.58 | )%*** | ||||||||||||
Portfolio Turnover Rate‡ | 58 | % | 122 | % | 7 | % | 97 | % | 126 | % | 147 | %‡‡ | ||||||||||||
| † | Total return has not been annualized for periods less than one year. Total return would have been lower had certain expenses not been waived by the Adviser during the period. The return shown does not reflect the deduction of taxes that a shareholder would pay on Fund distributions or the redemption of Fund shares. |
| ‡ | Portfolio turnover rate has not been annualized for periods less than one year. |
| ‡‡ | Portfolio turnover rate is for the Fund for the year ended July 31, 2008. |
| * | The Fund changed its fiscal year end to August 31. |
| ** | Commenced operations on December 31, 2007. |
| *** | Annualized |
| (1) | Per share data calculated using average shares method. |
| (2) | Amount is less than $0.01 per share. |
The accompanying notes are an integral part of the financial statements.
12
PERIMETER
SMALL CAP GROWTH FUND
Notes to Financial Statements
February 29, 2012
(Unaudited)
| 1. | Organization and Significant Accounting Policies |
The RBB Fund, Inc. (“RBB” or the “Company”) was incorporated under the laws of the State of Maryland on February 29, 1988 and is registered under the Investment Company Act of 1940, as amended (the “Investment Company Act”), as an open-end management investment company. RBB is a “series fund,” which is a mutual fund divided into separate portfolios. Each portfolio is treated as a separate entity for certain matters under the Investment Company Act, and for other purposes, and a shareholder of one portfolio is not deemed to be a shareholder of any other portfolio. Currently, RBB has nineteen active investment portfolios, including the Perimeter Small Cap Growth Fund (the “Fund”).
RBB has authorized capital of one hundred billion shares of common stock of which 80.373 billion shares are currently classified into one hundred and forty classes of common stock. Each class represents an interest in an active or inactive RBB investment portfolio.
The Fund commenced operations on September 29, 2006 as a separate portfolio (the “Predecessor Fund”) of The Advisors’ Inner Circle Fund II. Immediately prior to the opening of business on February 8, 2010, pursuant to an Agreement and Plan of Reorganization (the “Reorganization”) approved at a Meeting of Shareholders held on January 14, 2010, the Fund received substantially all of the assets and liabilities of the Predecessor Fund. The shareholders of the Predecessor Fund received Investor Class Shares and I Shares of the Fund with an aggregate net asset value equal to the aggregate net asset value of their shares in the Predecessor Fund immediately prior to the Reorganization. The Reorganization was treated as a tax-free reorganization for federal income tax purposes and, accordingly, the basis of the assets of the Fund reflected the historical basis of the assets of the Predecessor Fund as of the date of the Reorganization. The Predecessor Fund and the Fund had identical investment objectives and substantially similar investment policies and principal risks. For financial reporting purposes, the Predecessor Fund’s financial and performance history prior to the Reorganization is carried forward and reflected in the Fund’s financial statements and financial highlights.
The investment objective of the Fund is to seek long-term capital appreciation. The Fund invests primarily (at least 80% of its net assets) in small-cap equity securities. The assets of each fund of the Company are segregated, and a shareholder’s interest is limited to the fund in which shares are held.
The Fund is registered to offer Investor Class Shares and I Shares.
PORTFOLIO VALUATION — The Fund’s net asset value (“NAV”) is calculated once daily at the close of regular trading hours on the New York Stock Exchange (“NYSE”) (generally 4:00 p.m. Eastern time) on each day the NYSE is open. Securities held by the Fund are valued using the closing price or the last sale price on a national securities exchange or the National Association of Securities Dealers Automatic Quotation System (“NASDAQ”) market system where they are primarily traded. Equity securities traded in the over-the-counter market are valued at their closing prices. If there were no transactions on that day, securities traded principally on an exchange or on NASDAQ will be valued at the mean of the last bid and ask prices prior to the market close. Fixed income securities having a remaining maturity of greater than 60 days are valued using an independent pricing service. Fixed income securities having a remaining maturity of 60 days or less are amortized to maturity based on their cost. Investments in other open-end investment companies are valued based on the NAV of the investment companies (which may use fair value pricing as discussed in their prospectuses). If market quotations are unavailable or deemed unreliable, securities will be valued in accordance with procedures adopted by the Company’s Board of Directors. Relying on prices supplied by pricing services or dealers or using fair valuation may result in values that are higher or lower than the values used by other investment companies and investors to price the same investments. As of February 29, 2012, there were no fair valued securities.
Fair Value Measurements — The inputs and valuation techniques used to measure fair value of the Fund’s investments are summarized into three levels as described in the hierarchy below:
| • | Level 1 | — | quoted prices in active markets for identical securities; | |||
| • | Level 2 | — | other significant observable inputs (including quoted prices for similar securities, interest rates, prepayment speeds, credit risk, etc.); and | |||
| • | Level 3 | — | significant unobservable inputs (including the Fund’s own assumptions in determining the fair value of investments). | |||
The inputs or methodology used for valuing securities are not necessarily an indication of the risk associated with investing in those securities.
13
PERIMETER
SMALL CAP GROWTH FUND
Notes to Financial Statements (Continued)
February 29, 2012
(Unaudited)
The following is a summary of the inputs used, as of February 29, 2012, in valuing the Fund’s investments carried at fair value:
| Total Value at February 29, 2012 | Level 1 Quoted Price | Level 2 Significant Observable Inputs | Level 3 Significant Unobservable Inputs | |||||||||||||
Investments in Securities* | $ | 321,057,663 | $ | 321,057,663 | $ | — | $ | — | ||||||||
|
|
|
|
|
|
|
| |||||||||
| * | Please refer to the Portfolio of Investments for industry and security type breakouts. |
At the end of each calendar quarter, management evaluates the classification of Levels 1, 2 and 3 assets and liabilities. Various factors are considered, such as changes in liquidity from the prior reporting period; whether or not a broker is willing to execute at the quoted price; the depth and consistency of prices from third party pricing services; and the existence of contemporaneous, observable trades in the market. Additionally, management evaluates the classification of Level 1 and Level 2 assets and liabilities on a quarterly basis for changes in listings or delistings on national exchanges.
Due to the inherent uncertainty of determining the fair value of investments that do not have a readily available market value, the fair value of the Fund’s investments may fluctuate from period to period. Additionally, the fair value of investments may differ significantly from the values that would have been used had a ready market existed for such investments and may differ materially from the values the Fund may ultimately realize. Further, such investments may be subject to legal and other restrictions on resale or otherwise less liquid than publicly traded securities.
For the period ended February 29, 2012, there were no transfers between Levels 1, 2 and 3 for the Fund.
USE OF ESTIMATES — The preparation of financial statements in conformity with U.S. generally accepted accounting principles (“U.S. GAAP”) requires management to make estimates and assumptions that affect the reported amounts of assets and liabilities and disclosure of contingent assets and liabilities at the date of the financial statements and the reported amounts of revenues and expenses during the period. Actual results could differ from those estimates and those differences could be significant.
INVESTMENT TRANSACTIONS, INVESTMENT INCOME AND EXPENSES — The Fund records security transactions based on trade date. The cost of investments sold is determined by use of the specific identification method for both financial reporting and income tax purposes in determining realized gains and losses on investments. Interest income is accrued when earned. Dividend income is recorded on the ex-dividend date. Distributions received on securities that represent a return of capital or capital gains are recorded as a reduction of cost of investments and/or as a realized gain. The Fund estimates the components of distributions received that may be considered return of capital distributions or capital gain distributions. The Fund’s investment income, expenses and unrealized and realized gains and losses are allocated daily. Expenses incurred on behalf of a specific class, fund or fund family of the Company are charged directly to the class, fund or fund family to each class of shares based upon the relative proportion of net assets of each class at the beginning of the day. Expenses incurred for all the RBB funds (such as director or professional fees) are charged to all funds in proportion to their average net assets of RBB, or in such other manner as the Company’s Board of Directors deems fair or equitable. Expenses and fees, including investment advisory and administration fees, are accrued daily and taken into account for the purpose of determining the NAV of the Fund.
DIVIDENDS AND DISTRIBUTIONS TO SHAREHOLDERS — Dividends from net investment income and distributions from net realized capital gains, if any, are declared, recorded on the ex-dividend date and paid at least annually to shareholders. Income dividends and capital gain distributions are determined in accordance with U.S. federal income tax regulations, which may differ from U.S. generally accepted accounting principles.
U.S. TAX STATUS — No provision is made for U.S. income taxes as it is the Fund’s intention to qualify for and elect the tax treatment applicable to regulated investment companies under Subchapter M of the Internal Revenue Code of 1986, as amended, and make the requisite distributions to its shareholders which will be sufficient to relieve it from U.S. income and excise taxes.
CASH AND CASH EQUIVALENTS — The Fund considers liquid assets deposited into a bank demand deposit account to be cash equivalents. These investments represent amounts held with financial institutions that are readily accessible to pay Fund expenses or purchase investments. Cash and cash equivalents are valued at cost plus accrued interest, which approximates market value.
14
PERIMETER
SMALL CAP GROWTH FUND
Notes to Financial Statements (Continued)
February 29, 2012
(Unaudited)
REDEMPTION FEES — The Fund retains a redemption fee of 2% on redemptions of Fund shares held less than seven days. The fees are reflected on the Statement of Changes in Net Assets. The Fund reserves the right to modify or eliminate the redemption fees or waivers at any time.
OTHER — In the normal course of business, the Fund may enter into contracts that provide general indemnifications. The Fund’s maximum exposure under these arrangements is dependent on claims that may be made against the Fund in the future, and, therefore, cannot be estimated; however, based on experience, the risk of material loss from such claims is considered remote.
| 2. | Investment Adviser and Other Services |
Perimeter Capital Management (the “Adviser”) serves as investment adviser to the Fund. For its services, the Adviser is entitled to a fee, which is calculated daily and paid monthly, at an annual rate of 0.90% of the Fund’s average daily net assets. The Adviser has contractually agreed to waive its advisory fee and/or reimburse expenses in order to limit total annual Fund operating expenses (excluding certain items discussed below) to 1.35% and 1.10% of the Fund’s average daily net assets attributable to Investor Class Shares and I Shares, respectively. In determining the Adviser’s obligation to waive advisory fees and/or reimburse expenses, the following expenses are not taken into account: acquired fund fees and expenses, brokerage commissions, extraordinary items, interest or taxes. This contractual limitation is in effect until December 31, 2012 and may not be terminated without the approval of the Company’s Board of Directors. If at any time during the first three years the advisory agreement is in effect, the Fund’s total annual Fund operating expenses for that year are less than 1.35% and 1.10% of the Fund’s Investor Class Shares and I Shares, respectively, the Adviser may recoup any waived amount from the Fund if such reimbursement does not cause the Fund to exceed existing expense limitations. As of February 29, 2012, the total fees which were previously waived by the Adviser which may be subject to possible future reimbursement to the Adviser were $183,424 and $149,367, expiring in 2013 and 2014, respectively.
BNY Mellon Investment Servicing (US) Inc. (“BNY Mellon”), serves as administrator for the Fund. For providing administrative and accounting services, BNY Mellon is entitled to receive a monthly fee equal to an annual percentage rate of the Fund’s average daily net assets, subject to certain minimum monthly fees.
Included in the administration and accounting service fees, shown on the Statement of Operations, are fees for providing regulatory administration services to RBB. For providing these services, BNY Mellon is entitled to receive compensation as agreed to by the Company and BNY Mellon. This fee is allocated to each portfolio in proportion to its net assets of the Company.
BNY Mellon serves as the Fund’s transfer and dividend disbursing agent. For providing transfer agency services, BNY Mellon is entitled to a monthly fee, subject to certain minimums.
The Bank of New York Mellon (the “Custodian”) serves as the Funds’ Custodian providing certain custodial services to the Funds. The Custodian is entitled to receive a monthly fee equal to an annual percentage rate of the Funds’ average daily net assets, subject to certain minimum monthly fees. The Custodian is entitled to receive a monthly fee equal to an annual percentage rate of the Fund’s average daily net assets, subject to certain minimum monthly fees.
BNY Mellon Distributors LLC, formerly known as BNY Mellon Distributors Inc., serves as the principal underwriter and distributor of the Funds’ shares pursuant to a Distribution Agreement with RBB.
| 3. | Director Compensation |
The Directors of the Company receive an annual retainer, meeting fees and reimbursement of out of pocket expenses for meetings attended. The remuneration paid to the Directors by the Fund during the six months ended February 29, 2012 was $15,392. Certain employees of BNY Mellon are Officers of the Company. They are not compensated by the Fund or the Company.
| 4. | Investment in Securities |
For the six months ended February 29, 2012, aggregate purchases and sales of investment securities (excluding short-term investments) of the Fund were as follows:
Purchases | Sales | |||
$183,250,565 | $ | 222,362,042 | ||
15
PERIMETER
SMALL CAP GROWTH FUND
Notes to Financial Statements (Continued)
February 29, 2012
(Unaudited)
| 5. | Federal Tax Information |
The Fund has followed the authoritative guidance on accounting for and disclosure of uncertainty in tax positions, which requires the Fund to determine whether a tax position is more likely than not to be sustained upon examination, including resolution of any related appeals or litigation processes, based on the technical merits of the position. The Fund has determined that there was no effect on the financial statements from following this authoritative guidance. In the normal course of business, the Fund is subject to examination by federal, state and local jurisdictions, where applicable, for tax years for which applicable statutes of limitations have not expired.
As of February 29, 2012, federal tax cost, aggregate gross unrealized appreciation and depreciation of securities held by the Fund were as follows:
| Federal Tax Cost | Unrealized Appreciation | Unrealized Depreciation | Net Unrealized Appreciation/ (Depreciation) | |||||||||||
| $ | 246,619,516 | $ | 65,236,748 | $ | (8,798,601 | ) | $ | 56,438,147 | ||||||
Distributions to shareholders from net investment income and realized gains are determined in accordance with federal income tax regulations, which may differ from net investment income and realized gains recognized for financial reporting purposes. Accordingly, the character of distributions and composition of net assets for tax purposes may differ from those reflected in the accompanying financial statements. To the extent these differences are permanent, such amounts are reclassified within the capital accounts based on the tax treatment; temporary differences do not require such reclassification.
As of August 31, 2011, the components of distributable earnings on a tax basis were as follows:
| Undistributed Ordinary Income | Undistributed Long-Term Gains | |||||||||
| $ | 9,096,108 | $ | 50,281,737 | |||||||
The differences between the book and tax basis components of distributable earnings relate principally to the timing of recognition of income and gains for federal income tax purposes. Short-term gains are reported as ordinary income for federal income tax purposes.
There were no dividends or distributions paid during the year ended August 31, 2011. Dividends from net investment income and short-term capital gains are treated as ordinary income dividends for federal income tax purposes.
For federal income tax purposes, capital loss carryforwards are available to offset future capital gains. As of August 31, 2011, the Fund had no capital loss carryforwards.
Under federal tax law, foreign currency and capital losses realized after October 31 may be deferred and treated as having arisen on the first day of the following fiscal year. For the fiscal year ended August 31, 2011, the Fund did not incur a net post-October capital loss.
On December 22, 2010, President Obama signed into law the Regulated Investment Company Modernization Act of 2010 (the “Act”). The Act updates certain tax rules applicable to regulated investment companies (“RICs”). The various provisions of the Act will generally be effective for RICs with taxable years beginning after December 22, 2010. Additional information regarding the impact of the Act on the Fund, if any, will be contained within the relevant sections of the notes to financial statements for the fiscal year ending August 31, 2012.
| 6. | New Accounting Pronouncement |
In May 2011, Financial Accounting Standards Board (“FASB”) issued Accounting Standards Update (“ASU”) No. 2011-04 “Amendments to Achieve Common Fair Value Measurement and Disclosure Requirements in U.S. GAAP and International Financial Reporting Standards (“IFRS”).” ASU 2011-04 includes common requirements for measurement of and disclosure about fair value between U.S. GAAP and IFRS. ASU 2011-04 will require reporting entities to disclose the following information for fair value measurements categorized within Level 3 of the fair value hierarchy: quantitative information about the unobservable inputs used in the fair value measurement, the valuation processes used by the reporting entity and a narrative description of the sensitivity of the fair value measurement to changes in unobservable inputs and the interrelationships between those unobservable inputs. In addition, ASU 2011-04
16
PERIMETER
SMALL CAP GROWTH FUND
Notes to Financial Statements (Concluded)
February 29, 2012
(Unaudited)
will require reporting entities to make disclosures about amounts and reasons for all transfers in and out of Level 1 and Level 2 fair value measurements. The new and revised disclosures are effective for interim and annual reporting periods beginning after December 15, 2011. Management is currently evaluating the implications of ASU No. 2011-04 and its impact on the financial statements.
| 7. | Subsequent Event |
Management has evaluated the impact of all subsequent events on the Fund through the date the financial statements were issued, and has determined that there was the following subsequent event:
The Bank of New York Mellon Corporation announced on November 28, 2011 that it had agreed to sell BNY Mellon Distributors LLC (the “Distributor”) and its four subsidiaries to Foreside Distributors, LLC, a subsidiary of Foreside Financial Group, LLC (the “Transaction”). The Transaction closed on March 31, 2012. Upon the closing of the Transaction, the Distributor became an indirect, wholly owned subsidiary of Foreside Financial Group, LLC and was renamed Foreside Funds Distributors LLC effective April 1, 2012.
17
PERIMETER
SMALL CAP GROWTH FUND
Other Information
(Unaudited)
Proxy Voting
Policies and procedures that the Fund uses to determine how to vote proxies relating to portfolio securities as well as information regarding how the Fund voted proxies relating to portfolio securities for the most recent 12-month period ended June 30 are available without charge, upon request, by calling Perimeter at (888) 968-4964 and on the Securities and Exchange Commission’s (“SEC”) website at http://www.sec.gov.
Quarterly Portfolio Schedules
The Company files a complete schedule of portfolio holdings with the SEC for the first and third fiscal quarters of each fiscal year (quarters ended November 30 and May 31) on Form N-Q. The Company’s Form N-Q is available on the SEC website at http://www.sec.gov and may be reviewed and copied at the SEC Public Reference Room in Washington, D.C. Information on the operation of the SEC Public Reference Room may be obtained by calling (202) 551-8090.
18
Investment Advisor
Perimeter Capital Management
Six Concourse Parkway
Suite 3300
Atlanta, GA 30328
Administrator
BNY Mellon Investment Servicing (US) Inc.
301 Bellevue Parkway
Wilmington, DE 19809
Transfer Agent
BNY Mellon Investment Servicing (US) Inc.
4400 Computer Drive
Westborough, MA 01581
Principal Underwriter
Foreside Funds Distributors LLC
400 Berwyn Park
899 Cassatt Road
Berwyn, PA 19312
Custodian
The Bank of New York Mellon
One Wall Street
New York, NY 10286
Independent Registered Public Accounting Firm
Ernst & Young, LLP
Two Commerce Square
2001 Market Street
Suite 4000
Philadelphia, PA 19103
Legal Counsel
Drinker Biddle & Reath LLP
One Logan Square, Ste. 2000
Philadelphia, PA 19103-6996
| ROBECO INVESTMENT FUNDS | ||
| GENERAL MARKET COMMENTARY | ||
Dear Shareholder,
The US equity market demonstrated solid performance for the six-month period ended February 29th, 2012 with the S&P 500 returning 13.31% and the NASDAQ returning 15.64%.
During the last four months of the calendar year 2011, US equity returns increased by double digits among all styles and capitalizations as investors witnessed stronger US economic growth during the second half of last year. Following on the heels of a strong year-end close, investors have continued to seek out risky assets during early 2012 as fears of another financial collapse have faded away.
Within the global arena, Europe appears to be getting serious about fixing its fiscal woes through debt restructurings and budget austerity plans. While Northern European nations may be able to skirt a recession, some southern European countries still appear to have a difficult road ahead. China, though slowing from previous expectations, seems to be successfully orchestrating an economic soft landing.
Here at home, the US economy continues to track better than expected. Employment and the housing market – two important signals for a self-sustaining US economy – have shown clear signs of moving in the right direction. The economic pickup seems to be fairly broad-based with encouraging auto sales, airline bookings and trucking activity. Corporate profits, after reined-in expectations at the end of 2011, are due for a positive surprise in the second quarter of 2012 as low natural gas prices have been a nice tailwind for US manufacturers and global economic activity has not been as weak as what was feared at the end of 2011.
During 2010 and 2011, we also had strong stock market returns in the first quarter as investors anticipated a strong and sustainable recovery. However, summer slowdowns, coinciding with less easing from global monetary authorities, caused investors to sell stocks and seek out safety. Will “sell in May and go away” be the correct decision again this year? Some indicators are pointing that way – notably global steel production and some manufacturing indices are beginning to decline. Gasoline prices surged in the first two months of 2012, putting additional pressure on consumers’ wallets. The Eurozone, while tracking better than dire expectations six months ago, has many obstacles to overcome prior to declaring victory. The fiscal mess in Washington is largely being ignored by politicians and investors. The current complacency of stock investors, as measured by declining stock market volatility, is sure to be rattled as the election season heats up and politicians repeatedly remind investors of our country’s problems.
We would not be surprised to see increased market volatility and a market correction over the coming months as election rhetoric intensifies. However, we may not have seen the market highs for the year. Compared to 2010 and 2011, housing has improved and overall economic activity and employment gains have been more widespread. Global monetary authorities understand that continued stimulus is necessary if economic activity weakens. Once the election outcome is more certain, we believe investors will once again focus on the slow but steady recovery. We will focus our efforts on providing you with a diversified portfolio of high quality stocks with attractive valuations and improving business momentum which we would expect to outperform regardless of the election results.
Sincerely,
Robeco Investment Funds
Portfolio composition is subject to change. The current and future portfolio holdings of the Funds are subject to investment risk. | ||
| SEMI-ANNUAL REPORT 2012 | 1 | ||
| ROBECO INVESTMENT FUNDS |
| Total Returns for the Period Ended February 29, 2012 (unaudited) |
| Average Annual | ||||||||||||||||||||
| Six-Month | 1 Year | 5 Year | 10 Year | Since Inception | ||||||||||||||||
Robeco Boston Partners Small Cap Value Fund II | ||||||||||||||||||||
Institutional Class | 14.01 | % | 0.00 | % | 2.41 | % | 8.28 | % | N/A | |||||||||||
Investor Class | 13.84 | % | -0.20 | % | 2.15 | % | 8.00 | % | N/A | |||||||||||
Russell 2000® Value Index | 11.81 | % | -2.72 | % | -0.36 | % | 7.03 | % | N/A | |||||||||||
Russell 2000® Index1 | 12.40 | % | -0.15 | % | 1.83 | % | 7.00 | % | N/A | |||||||||||
1 This is not a primary benchmark of the Fund. Results of the index performance are presented for general comparative purposes. |
| |||||||||||||||||||
Robeco Boston Partners Long/Short Equity Fund | ||||||||||||||||||||
Institutional Class | 10.76 | % | 7.25 | % | 13.65 | % | 10.89 | % | N/A | |||||||||||
Investor Class | 10.57 | % | 6.93 | % | 13.24 | % | 10.56 | % | N/A | |||||||||||
S&P 500® Index | 13.31 | % | 5.12 | % | 1.58 | % | 4.16 | % | N/A | |||||||||||
Robeco Boston Partners Long/Short Research Fund | ||||||||||||||||||||
Institutional Class1 | 10.56 | % | 5.30 | % | N/A | N/A | 11.88 | % | ||||||||||||
S&P 500® Index | 13.31 | % | 5.12 | % | N/A | N/A | 15.92 | % | ||||||||||||
Investor Class2 | 10.49 | % | 5.12 | % | N/A | N/A | 9.81 | % | ||||||||||||
S&P 500® Index | 13.31 | % | 5.12 | % | N/A | N/A | 15.11 | % | ||||||||||||
1 Inception date September 30, 2010 |
| |||||||||||||||||||
2 Inception date November 29, 2010 |
| |||||||||||||||||||
Robeco Boston Partners All-Cap Value Fund | ||||||||||||||||||||
Institutional Class1 | 13.43 | % | 1.98 | % | 3.45 | % | N/A | 9.11 | % | |||||||||||
Investor Class1 | 13.28 | % | 1.74 | % | 3.18 | % | N/A | 8.84 | % | |||||||||||
Russell 3000® Value Index | 12.76 | % | 1.77 | % | -1.03 | % | N/A | 6.73 | % | |||||||||||
Russell 3000® Index2 | 13.24 | % | 4.45 | % | 1.77 | % | N/A | 6.04 | % | |||||||||||
1 Inception date July 1, 2002 |
| |||||||||||||||||||
2 This is not a primary benchmark of the Fund. Results of the index performance are presented for general comparative purposes. |
| |||||||||||||||||||
Robeco WPG Small/Micro Cap Value Fund | ||||||||||||||||||||
Institutional Class1 | 16.82 | % | -5.02 | % | 0.06 | % | 6.22 | % | N/A | |||||||||||
Russell 2000® Value Index | 11.81 | % | -2.72 | % | -0.36 | % | 7.03 | % | N/A | |||||||||||
Robeco Boston Partners Global Equity Fund | ||||||||||||||||||||
Institutional Class1 | N/A | N/A | N/A | N/A | 9.20 | % | ||||||||||||||
MSCI World Index | N/A | N/A | N/A | N/A | 10.24 | % | ||||||||||||||
1 Inception date December 30, 2011 |
| |||||||||||||||||||
Robeco Boston Partners International Equity Fund | ||||||||||||||||||||
Institutional Class1 | N/A | N/A | N/A | N/A | 8.80 | % | ||||||||||||||
MSCI World Index | N/A | N/A | N/A | N/A | 10.24 | % | ||||||||||||||
1 Inception date December 30, 2011 |
| |||||||||||||||||||
| 2 | SEMI-ANNUAL REPORT 2012 | ||
| ROBECO INVESTMENT FUNDS |
The performance data quoted represents past performance. Past performance is not indicative of future results. Investment return and principal value will fluctuate so that an investor’s shares, when redeemed, may be worth more or less than their original cost. Robeco Investment Management, Inc. waived a portion of its advisory fee and agreed to reimburse a portion of each Fund’s operating expenses, if necessary, to maintain certain expense ratios as set forth in the notes to the financial statements. Total returns shown include fee waivers and expense reimbursements, if any; total returns would have been lower had there been no assumption of fees and expenses in excess of expense limitations. Each Fund’s annual operating expense ratios below are as stated in the current prospectuses.These rates can fluctuate and may differ from the actual expenses incurred by a Fund for the period covered by this report. Returns shown include the reinvestment of all dividends and other distributions and do not reflect taxes that a shareholder would pay on Fund distributions or on the redemption of Fund shares. Current performance may be lower or higher than the performance data quoted. For performance data current to the most recent month-end, please call 1-888-261-4073 or visit our web site at www.robecoinvest.com.
Investors should note that the Funds are actively managed mutual funds while the indices are unmanaged, do not incur expense and are not available for investment.
Small company stocks are generally riskier than large company stocks due to greater volatility and less liquidity.
Value investing involves the risk that the Fund’s investment in companies whose securities are believed to be undervalued, relative to their underlying profitability, will not appreciate in value as anticipated.
The following are the Funds’ gross annual operating expense ratios as stated in the most recent prospectus:
| Institutional Class | Investor Class | |||||||
Robeco Boston Partners Small Cap Value Fund II | 1.37 | % | 1.62 | % | ||||
Robeco Boston Partners Long/Short Equity Fund | 3.71 | %1 | 3.96 | %1 | ||||
Robeco Boston Partners Long/Short Research Fund | 4.20 | %1 | 4.45 | %1 | ||||
Robeco Boston Partners All-Cap Value Fund | 1.03 | % | 1.28 | % | ||||
Robeco WPG Small/Micro Cap Value Fund | 1.72 | % | N/A | |||||
Robeco Boston Partners Global Equity Fund | 2.05 | % | N/A | |||||
Robeco Boston Partners International Equity Fund | 2.06 | % | N/A | |||||
| 1 | Includes interest and dividend expense on short sales. |
| SEMI-ANNUAL REPORT 2012 | 3 | ||
| ROBECO INVESTMENT FUNDS |
| FUND EXPENSE EXAMPLES (unaudited) |
As a shareholder of the Fund(s), you incur two types of costs: (1) transaction costs, including redemption fees; and (2) ongoing costs, including management fees, distribution fees and other Fund expenses. The examples are intended to help you understand your ongoing costs (in dollars) of investing in the Fund(s) and to compare these costs with the ongoing costs of investing in other mutual funds.
The examples are based on an investment of $1,000 invested at the beginning of the six-month period from September 1, 2011 through February 29, 2012, and held for the entire period.
Actual Expenses
The first line of the accompanying tables provides information about actual account values and actual expenses. You may use the information in this line, together with the amount you invested, to estimate the expenses that you paid over the period. Simply divide your account value by $1,000 (for example, an $8,600 account value divided by $1,000 = 8.6), then multiply the result by the number in the first line under the heading entitled “Expenses Paid During Period” to estimate the expenses you paid on your account during this period.
Hypothetical Example for Comparison Purposes
The second line of the accompanying tables provides information about hypothetical account values and hypothetical expenses based on a Fund’s actual expense ratio and an assumed rate of return of 5% per year before expenses, which is not the Fund’s actual return. The hypothetical account values and expenses may not be used to estimate the actual ending account balance or expenses you paid for the period. You may use this information to compare the ongoing costs of investing in the Fund(s) and other funds. To do so, compare these 5% hypothetical examples with the 5% hypothetical examples that appear in the shareholder reports of other funds.
Please note that the expenses shown in the accompanying tables are meant to highlight your ongoing costs only and do not reflect any transactional costs, such as redemption fees. Therefore, the second line of the accompanying tables is useful in comparing ongoing costs only, and will not help you determine the relative total costs of owning different funds. In addition, if these transactional costs were included, your costs would have been higher.
Expense Table
| Beginning Account Value September 1, 2011 | Ending Account Value February 29, 2012 | Annualized Expense Ratio | Expenses Paid During Period* | |||||||||||||
Robeco Boston Partners Small Cap Value Fund II |
| |||||||||||||||
Institutional | ||||||||||||||||
Actual | $ | 1,000.00 | $ | 1,140.05 | 1.30 | % | $ | 6.92 | ||||||||
Hypothetical | 1,000.00 | 1,018.40 | 1.30 | % | 6.52 | |||||||||||
Investor | ||||||||||||||||
Actual | $ | 1,000.00 | $ | 1,138.35 | 1.55 | % | $ | 8.24 | ||||||||
Hypothetical | 1,000.00 | 1,017.16 | 1.55 | % | 7.77 | |||||||||||
Robeco Boston Partners Long/Short Equity Fund |
| |||||||||||||||
Institutional | ||||||||||||||||
Actual | $ | 1,000.00 | $ | 1,107.60 | 4.13 | %(1) | $ | 21.64 | ||||||||
Hypothetical | 1,000.00 | 1,004.33 | 4.13 | %(1) | 20.58 | |||||||||||
Investor | ||||||||||||||||
Actual | $ | 1,000.00 | $ | 1,105.70 | 4.38 | %(1) | $ | 22.93 | ||||||||
Hypothetical | 1,000.00 | 1,003.08 | 4.38 | %(1) | 21.81 | |||||||||||
Robeco Boston Partners Long/Short Research Fund |
| |||||||||||||||
Institutional | ||||||||||||||||
Actual | $ | 1,000.00 | $ | 1,105.60 | 2.58 | %(1) | $ | 13.51 | ||||||||
Hypothetical | 1,000.00 | 1,012.03 | 2.58 | %(1) | 12.91 | |||||||||||
Investor |
| |||||||||||||||
Actual | $ | 1,000.00 | $ | 1,104.90 | 2.83 | %(1) | $ | 14.81 | ||||||||
Hypothetical | 1,000.00 | 1,010.79 | 2.83 | %(1) | 14.15 | |||||||||||
| 4 | SEMI-ANNUAL REPORT 2012 | ||
| ROBECO INVESTMENT FUNDS |
| FUND EXPENSE EXAMPLES (unaudited) (concluded) |
| Beginning Account Value September 1, 2011 | Ending Account Value February 29, 2012 | Annualized Expense Ratio | Expenses Paid During Period* | |||||||||||||
Robeco Boston Partners All-Cap Value Fund |
| |||||||||||||||
Institutional | ||||||||||||||||
Actual | $ | 1,000.00 | $ | 1,134.33 | 0.70 | % | $ | 3.72 | ||||||||
Hypothetical | 1,000.00 | 1,021.38 | 0.70 | % | 3.52 | |||||||||||
Investor | ||||||||||||||||
Actual | $ | 1,000.00 | $ | 1,132.84 | 0.95 | % | $ | 5.05 | ||||||||
Hypothetical | 1,000.00 | 1,020.13 | 0.95 | % | 4.78 | |||||||||||
Robeco Boston Partners WPG Small/Micro Cap Value Fund |
| |||||||||||||||
Institutional | ||||||||||||||||
Actual | $ | 1,000.00 | $ | 1,168.16 | 1.70 | % | $ | 9.16 | ||||||||
Hypothetical | 1,000.00 | 1,016.41 | 1.70 | % | 8.52 | |||||||||||
Robeco Boston Partners Global Equity Fund(2) |
| |||||||||||||||
Institutional | ||||||||||||||||
Actual(3) | $ | 1,000.00 | $ | 1,092.00 | 1.30 | % | $ | 2.15 | ||||||||
Hypothetical(4) | 1,000.00 | 1,018.40 | 1.30 | % | 6.52 | |||||||||||
Robeco Boston Partners International Equity Fund(2) |
| |||||||||||||||
Institutional | ||||||||||||||||
Actual(3) | $ | 1,000.00 | $ | 1,088.00 | 1.30 | % | $ | 2.15 | ||||||||
Hypothetical(4) | 1,000.00 | 1,018.40 | 1.30 | % | 6.52 | |||||||||||
| * | Expenses are equal to the Fund’s annualized six-month expense ratios in the table above, which include waived fees or reimbursed expenses, multiplied by the average account value over the period, multiplied by the number of days (182) in the most recent fiscal half-year, then divided by 366 to reflect the one-half year period. |
| (1) | These amounts include dividends paid on securities which the Funds have sold short (“short-sale dividends”) and related interest expense.The annualized amount of short-sale dividends and related interest expense was 1.68% and 0.93% of average net assets for the six month period for the Robeco Boston Partners Long/Short Equity Fund and for the Robeco Boston Partners Long/Short Research Fund, respectively. |
| (2) | Inception date December 30, 2011. |
| (3) | Expenses are equal to an annualized expense ratio for the period beginning December 30, 2011 to February 29, 2012 of 1.30%, multiplied by the average account value over the period, multiplied by the number of days in the most recent period (58) then divided by 366 days. |
| (4) | Expenses (hypothetical expenses if the Fund had been in existence from September 1, 2011) are equal to the Fund’s annualized expense ratio, multiplied by the average account value over the period, multiplied by the number of days in the most recent six-month period (182), then divided by 366. |
| SEMI-ANNUAL REPORT 2012 | 5 | ||
| ROBECO INVESTMENT FUNDS | FEBRUARY 29, 2012 (UNAUDITED) | |
| PORTFOLIO HOLDINGS SUMMARY TABLES | ||
ROBECO BOSTON PARTNERS | ||||
SMALL CAP VALUE FUND II | ||||
Security Type/Sector Classification | % of Net Assets | Value | ||||||
COMMON STOCK | ||||||||
Consumer Services | 20.8 | % | $ | 23,419,786 | ||||
Finance | 20.0 | 22,487,473 | ||||||
Capital Goods | 13.8 | 15,493,167 | ||||||
Health Care | 10.9 | 12,312,657 | ||||||
Technology | 9.5 | 10,678,303 | ||||||
Real Estate Investment Trusts | 6.4 | 7,249,043 | ||||||
Consumer Non-Durables | 5.5 | 6,218,585 | ||||||
Energy | 2.9 | 3,296,977 | ||||||
Consumer Durables | 2.2 | 2,509,700 | ||||||
Utilities | 2.1 | 2,410,722 | ||||||
Basic Industries | 2.0 | 2,277,824 | ||||||
Transportation | 2.0 | 2,207,061 | ||||||
Communications | 0.5 | 582,539 | ||||||
SECURITIES LENDING COLLATERAL | 4.5 | 5,109,294 | ||||||
LIABILITIES IN EXCESS OF OTHER ASSETS | (3.1 | ) | (3,504,844 | ) | ||||
|
|
|
| |||||
NET ASSETS | 100.0 | % | $ | 112,748,287 | ||||
|
|
|
| |||||
Portfolio holdings are subject to change at any time.
ROBECO BOSTON PARTNERS | ||||
LONG/SHORT EQUITY FUND | ||||
Security Type/Sector Classification | % of Net Assets | Value | ||||||
COMMON STOCK | ||||||||
Technology | 22.8 | % | $ | 133,143,958 | ||||
Finance | 17.4 | 101,341,364 | ||||||
Health Care | 16.9 | 98,462,734 | ||||||
Consumer Services | 11.9 | 69,346,933 | ||||||
Consumer Non-Durables | 6.8 | 39,889,934 | ||||||
Capital Goods | 4.5 | 26,311,810 | ||||||
Energy | 4.2 | 24,390,443 | ||||||
Communications | 4.0 | 23,570,217 | ||||||
Basic Industries | 1.6 | 9,480,424 | ||||||
Utilities | 0.4 | 2,478,829 | ||||||
Consumer Durables | 0.4 | 2,378,372 | ||||||
Real Estate Investment Trusts | 0.3 | 1,606,943 | ||||||
PREFERRED STOCK | 0.7 | 4,158,517 | ||||||
SECURITIES LENDING COLLATERAL | 2.6 | 15,088,513 | ||||||
SECURITIES SOLD SHORT | (58.8 | ) | (343,473,575 | ) | ||||
OPTIONS WRITTEN | (0.1 | ) | (571,277 | ) | ||||
OTHER ASSETS IN EXCESS | ||||||||
OF LIABILITIES | 64.4 | 375,924,638 | ||||||
|
|
|
| |||||
NET ASSETS | 100.0 | % | $ | 583,528,777 | ||||
|
|
|
| |||||
Portfolio holdings are subject to change at any time.
ROBECO BOSTON PARTNERS | ||||
LONG/SHORT RESEARCH FUND | ||||
Security Type/Sector Classification | % of Net Assets | Value | ||||||
COMMON STOCK | ||||||||
Finance | 16.6 | % | $ | 20,981,575 | ||||
Technology | 16.1 | 20,338,919 | ||||||
Consumer Services | 16.1 | 20,335,077 | ||||||
Capital Goods | 11.3 | 14,229,859 | ||||||
Health Care | 8.9 | 11,244,620 | ||||||
Communications | 5.8 | 7,357,369 | ||||||
Consumer Non-Durables | 5.3 | 6,659,110 | ||||||
Energy | 5.1 | 6,442,074 | ||||||
Basic Industries | 3.9 | 4,964,621 | ||||||
Consumer Durables | 1.7 | 2,136,271 | ||||||
Utilities | 0.5 | 658,093 | ||||||
Transportation | 0.4 | 520,031 | ||||||
WRITTEN OPTIONS | 0.0 | (28,203 | ) | |||||
SECURITIES SOLD SHORT | (35.4 | ) | (44,729,171 | ) | ||||
OTHER ASSETS IN EXCESS OF LIABILITIES | 43.7 | 55,186,456 | ||||||
|
|
|
| |||||
NET ASSETS | 100.0 | % | $ | 126,296,701 | ||||
|
|
|
| |||||
Portfolio holdings are subject to change at any time.
ROBECO BOSTON PARTNERS | ||||
ALL-CAP VALUE FUND | ||||
Security Type/Sector Classification | % of Net Assets | Value | ||||||
COMMON STOCK | ||||||||
Finance | 25.4 | % | $ | 64,913,036 | ||||
Consumer Services | 17.8 | 45,514,735 | ||||||
Health Care | 15.9 | 40,753,690 | ||||||
Technology | 14.1 | 36,121,713 | ||||||
Energy | 9.5 | 24,396,158 | ||||||
Capital Goods | 5.7 | 14,693,455 | ||||||
Consumer Non-Durables | 4.6 | 11,840,823 | ||||||
Communications | 3.2 | 8,086,537 | ||||||
Consumer Durables | 1.4 | 3,518,076 | ||||||
Real Estate Investment Trusts | 0.7 | 1,827,634 | ||||||
Utilities | 0.3 | 826,418 | ||||||
PREFERRED STOCK | 0.0 | 56,141 | ||||||
CORPORATE BONDS | 0.0 | 97,395 | ||||||
SECURITIES LENDING COLLATERAL | 1.5 | 3,920,093 | ||||||
WRITTEN OPTIONS | (0.2 | ) | (614,017 | ) | ||||
OTHER ASSETS IN EXCESS OF LIABILITIES | 0.1 | 204,706 | ||||||
|
|
|
| |||||
NET ASSETS | 100.0 | % | $ | 256,156,593 | ||||
|
|
|
| |||||
Portfolio holdings are subject to change at any time.
| THEACCOMPANYINGNOTESAREANINTEGRALPARTOFTHEFINANCIALSTATEMENTS. | ||
| 6 | SEMI-ANNUAL REPORT 2012 | ||
| ROBECO INVESTMENT FUNDS | FEBRUARY 29, 2012 (UNAUDITED) | |
| PORTFOLIO HOLDINGS SUMMARY TABLES | ||
| ROBECO WPG SMALL/MICRO CAP VALUE FUND | ||||||||
Security Type/Sector Classification | % of Net Assets | Value | ||||||
COMMON STOCK | ||||||||
Finance | 26.0 | % | $ | 10,170,796 | ||||
Consumer Services | 14.4 | 5,660,968 | ||||||
Real Estate Investment Trusts | 10.5 | 4,103,892 | ||||||
Capital Goods | 9.7 | 3,811,655 | ||||||
Transportation | 7.1 | 2,793,628 | ||||||
Technology | 6.6 | 2,580,096 | ||||||
Health Care | 5.4 | 2,124,294 | ||||||
Utilities | 3.9 | 1,537,995 | ||||||
Consumer Non-Durables | 2.6 | 998,661 | ||||||
Communications | 2.4 | 957,852 | ||||||
Energy | 2.2 | 879,534 | ||||||
Basic Industries | 2.0 | 764,497 | ||||||
Consumer Durables | 1.9 | 724,135 | ||||||
PREFFERED STOCK | 0.2 | 80,613 | ||||||
SECURITIES LENDING COLLATERAL | 3.1 | 1,211,496 | ||||||
OTHER ASSETS IN EXCESS OF LIABILITIES | 2.0 | 790,846 | ||||||
|
|
|
| |||||
NET ASSETS | 100.0 | % | $ | 39,190,958 | ||||
|
|
|
| |||||
Portfolio holdings are subject to change at any time. |
| |||||||
ROBECO BOSTON PARTNERS GLOBAL EQUITY FUND | ||||||||
Security Type/Sector Classification | % of Net Assets | Value | ||||||
COMMON STOCK | ||||||||
Technology | 16.7 | % | $ | 1,821,155 | ||||
Finance | 14.7 | 1,604,027 | ||||||
Capital Goods | 13.5 | 1,474,284 | ||||||
Health Care | 10.5 | 1,149,250 | ||||||
Consumer Non-Durables | 10.0 | 1,087,575 | ||||||
Energy | 10.0 | 1,094,694 | ||||||
Basic Industries | 6.6 | 714,817 | ||||||
Consumer Services | 6.1 | 669,169 | ||||||
Communications | 5.3 | 575,236 | ||||||
Consumer Durables | 5.1 | 561,747 | ||||||
OTHER ASSETS IN EXCESS OF LIABILITIES | 1.5 | 164,333 | ||||||
|
|
|
| |||||
NET ASSETS | 100.0 | % | $ | 10,916,287 | ||||
|
|
|
| |||||
Portfolio holdings are subject to change at any time. |
| |||||||
ROBECO BOSTON PARTNERS INTERNATIONAL EQUITY FUND | ||||||||
Security Type/Sector Classification | % of Net Assets | Value | ||||||
COMMON STOCK | ||||||||
Industrials | 15.5 | % | $ | 1,684,939 | ||||
Consumer Staples | 14.3 | 1,555,394 | ||||||
Financials | 13.3 | 1,449,102 | ||||||
Materials | 10.9 | 1,184,788 | ||||||
Consumer Discretionary | 9.8 | 1,071,101 | ||||||
Health Care | 9.3 | 1,012,058 | ||||||
Information Technology | 9.0 | 978,937 | ||||||
Energy | 8.7 | 941,672 | ||||||
Telecommunication Services | 5.9 | 641,073 | ||||||
Utilities | 0.7 | 76,542 | ||||||
OTHER ASSETS IN EXCESS OF LIABILITIES | 2.6 | 287,711 | ||||||
|
|
|
| |||||
NET ASSETS | 100.0 | % | $ | 10,883,317 | ||||
|
|
|
| |||||
Portfolio holdings are subject to change at any time. |
| |||||||
| THEACCOMPANYINGNOTESAREANINTEGRALPARTOFTHEFINANCIALSTATEMENTS. | ||
| SEMI-ANNUAL REPORT 2012 | 7 | ||
| ROBECO INVESTMENT FUNDS | FEBRUARY 29, 2012 (UNAUDITED) | |
| ROBECO BOSTON PARTNERS SMALL CAP VALUE FUND II | PORTFOLIOOF INVESTMENTS | |
| Number of Shares | Value | |||||||
COMMON STOCK—98.6% |
| |||||||
Basic Industries—2.0% |
| |||||||
Graphic Packaging Holding Co.* | 149,755 | $ | 790,706 | |||||
Schweitzer-Mauduit International, Inc. | 13,365 | 936,218 | ||||||
Sensient Technologies Corp. | 8,310 | 307,387 | ||||||
Spartech Corp. * | 41,985 | 243,513 | ||||||
|
| |||||||
| 2,277,824 | ||||||||
|
| |||||||
Capital Goods—13.8% | ||||||||
Actuant Corp., Class A | 45,630 | 1,285,397 | ||||||
Aegion Corp. * | 49,465 | 871,079 | ||||||
Ampco-Pittsburgh Corp. | 14,945 | 316,983 | ||||||
Beacon Roofing Supply, Inc. * | 52,830 | 1,245,731 | ||||||
Brady Corp., Class A | 23,573 | 753,157 | ||||||
Curtiss-Wright Corp. | 16,200 | 601,830 | ||||||
Drew Industries, Inc. * | 20,445 | 560,193 | ||||||
Globe Specialty Metals, Inc. | 79,955 | 1,136,960 | ||||||
Granite Construction, Inc. | 19,495 | 557,557 | ||||||
Griffon Corp. | 74,600 | 797,474 | ||||||
Hillenbrand, Inc. | 28,295 | 649,936 | ||||||
Huntington Ingalls Industries, Inc. * | 14,765 | 529,768 | ||||||
Mueller Industries, Inc. | 14,815 | 681,490 | ||||||
Mueller Water Products, Inc., Class A | 89,905 | 267,018 | ||||||
Orion Marine Group, Inc. * | 108,100 | 789,130 | ||||||
Rofin-Sinar Technologies, Inc. * | 6,065 | 142,285 | ||||||
Terex Corp. * | 32,520 | 825,683 | ||||||
Tutor Perini Corp. * | 34,545 | 545,120 | ||||||
WESCO International, | 28,360 | 1,783,560 | ||||||
World Fuel Services Corp. | 27,672 | 1,152,816 | ||||||
|
| |||||||
| 15,493,167 | ||||||||
|
| |||||||
Communications—0.5% | ||||||||
EarthLink, Inc. | 47,065 | 351,576 | ||||||
Monster Worldwide, Inc. * | 33,280 | 230,963 | ||||||
|
| |||||||
| 582,539 | ||||||||
|
| |||||||
Consumer Durables—2.2% | ||||||||
Exide Technologies * | 47,110 | 139,917 | ||||||
Sealy Corp. * | 131,560 | 226,283 | ||||||
Thor Industries, Inc. (a) | 44,715 | 1,456,368 | ||||||
Tower International, Inc. * | 53,935 | 687,132 | ||||||
|
| |||||||
| 2,509,700 | ||||||||
|
| |||||||
Consumer Non-Durables—5.5% |
| |||||||
Alliance One International, Inc. * . | 79,770 | 294,351 | ||||||
Callaway Golf Co. (a) | 78,520 | 514,306 | ||||||
Dole Food Co., Inc. * | 87,900 | 842,082 | ||||||
Fresh Del Monte Produce, Inc. | 22,940 | 515,232 | ||||||
Matthews International Corp., Class A | 9,800 | 303,996 | ||||||
Nu Skin Enterprises, Inc., Class A (a) | 15,325 | 885,172 | ||||||
Skechers U.S.A., Inc., Class A * | 27,645 | 353,027 | ||||||
Steven Madden Ltd. * | 22,688 | 979,668 | ||||||
Take-Two Interactive Software, Inc. * | 45,600 | 704,520 | ||||||
Universal Corp. | 17,985 | 826,231 | ||||||
|
| |||||||
| 6,218,585 | ||||||||
|
| |||||||
Consumer Services—20.8% | ||||||||
ABM Industries, Inc. | 19,865 | 450,936 | ||||||
Aeropostale, Inc. * | 31,605 | 567,942 | ||||||
| Number of Shares | Value | |||||||
Consumer Services—(continued) |
| |||||||
American Eagle Outfitters, Inc. | 79,125 | $ | 1,150,478 | |||||
Asbury Automotive Group, Inc. * | 48,945 | 1,269,144 | ||||||
Ascena Retail Group, Inc. * | 42,160 | 1,627,376 | ||||||
Brink’s Co., (The) | 36,815 | 929,579 | ||||||
Cato Corp., (The), Class A | 13,105 | 355,277 | ||||||
CBIZ, Inc. * (a) | 49,380 | 320,970 | ||||||
Charming Shoppes, Inc. * | 131,235 | 741,478 | ||||||
Children’s Place Retail Stores, Inc., (The) * | 18,050 | 916,038 | ||||||
Ennis, Inc. | 19,690 | 330,004 | ||||||
Finish Line, Inc., (The), Class A | 52,620 | 1,209,734 | ||||||
FTI Consulting, Inc. * | 21,035 | 842,872 | ||||||
G&K Services, Inc., Class A | 16,622 | 554,011 | ||||||
Geo Group, Inc. (The) * | 19,180 | 337,760 | ||||||
Group 1 Automotive, Inc. | 16,530 | 852,452 | ||||||
Heidrick & Struggles International, Inc. | 35,800 | 727,456 | ||||||
International Speedway Corp., Class A | 36,918 | 928,857 | ||||||
KAR Auction Services, | 49,800 | 800,286 | ||||||
Knoll, Inc. | 43,278 | 667,347 | ||||||
Korn/Ferry International * | 16,985 | 271,250 | ||||||
Live Nation Entertainment, Inc. * | 66,245 | 617,403 | ||||||
MAXIMUS, Inc. | 21,505 | 896,974 | ||||||
Men’s Wearhouse, Inc., (The) | 23,395 | 906,088 | ||||||
Navigant Consulting, Inc. * | 111,685 | 1,508,864 | ||||||
Odyssey Marine Exploration, Inc. * (a) | 111,095 | 338,840 | ||||||
Rent-A-Center, Inc. | 28,615 | 1,013,543 | ||||||
RPX Corp. * | 13,910 | 234,384 | ||||||
Service Corp. International | 55,850 | 633,339 | ||||||
Steiner Leisure Ltd. * | 7,280 | 364,291 | ||||||
Steinway Musical Instruments * | 17,500 | 436,800 | ||||||
Viad Corp. | 13,490 | 262,515 | ||||||
XO Group, Inc. * | 39,325 | 355,498 | ||||||
|
| |||||||
| 23,419,786 | ||||||||
|
| |||||||
Energy—2.9% | ||||||||
Bristow Group, Inc. | 15,110 | 713,343 | ||||||
Helix Energy Solutions Group, Inc. * | 30,405 | 584,992 | ||||||
Rosetta Resources, Inc. * | 26,335 | 1,344,138 | ||||||
Swift Energy Co. * | 21,795 | 654,504 | ||||||
|
| |||||||
| 3,296,977 | ||||||||
|
| |||||||
Finance—20.0% | ||||||||
Ameris Bancorp * | 21,748 | 250,537 | ||||||
AMERISAFE, Inc. * | 17,020 | 383,971 | ||||||
Apollo Investment Corp. | 34,135 | 239,628 | ||||||
BBCN Bancorp, Inc. * | 123,065 | 1,261,416 | ||||||
Centerstate Banks, Inc. | �� | 50,400 | 352,800 | |||||
Citizens Republic Bancorp, Inc. * | 42,635 | 583,673 | ||||||
Columbia Banking System, Inc. | 26,050 | 550,958 | ||||||
Cowen Group, Inc., | 25,285 | 70,798 | ||||||
Fifth Street Finance Corp. (a) | 85,175 | 843,233 | ||||||
First American Financial Corp. | 42,650 | 656,810 | ||||||
First Citizens Bancshares, Inc., Class A | 3,085 | 543,423 | ||||||
Flagstone Reinsurance Holdings S.A. | 21,860 | 173,131 | ||||||
Flushing Financial Corp. | 24,715 | 320,059 | ||||||
FX Alliance, Inc. * | 39,650 | 536,465 | ||||||
| THEACCOMPANYINGNOTESAREANINTEGRALPARTOFTHEFINANCIALSTATEMENTS. | ||
| 8 | SEMI-ANNUAL REPORT 2012 | ||
| ROBECO INVESTMENT FUNDS | FEBRUARY 29, 2012 (UNAUDITED) | |
| ROBECO BOSTON PARTNERS SMALL CAP VALUE FUND II (continued) | PORTFOLIOOF INVESTMENTS | |
| Number of Shares | Value | |||||||
Finance—(continued) | ||||||||
Gladstone Capital Corp. | 14,440 | $ | 123,173 | |||||
Global Indemnity PLC * | 13,128 | 251,139 | ||||||
Heritage Financial Corp. | 31,795 | 426,053 | ||||||
Infinity Property & Casualty Corp. | 10,295 | 564,475 | ||||||
Janus Capital Group, Inc. | 81,575 | 719,492 | ||||||
JMP Group, Inc. | 61,965 | 441,191 | ||||||
Knight Capital Group, Inc., | 88,150 | 1,167,988 | ||||||
Maiden Holdings Ltd. | 147,975 | 1,279,984 | ||||||
MGIC Investment | 119,260 | 537,863 | ||||||
Navigators Group, Inc., (The) * | 8,205 | 385,717 | ||||||
Nelnet, Inc., Class A | 36,236 | 957,355 | ||||||
Ocwen Financial Corp. * | 113,960 | 1,835,896 | ||||||
Park Sterling Corp. * | 40,335 | 183,524 | ||||||
PHH Corp. * (a) | 67,670 | 921,665 | ||||||
Platinum Underwriters Holdings Ltd. | 22,285 | 792,455 | ||||||
Safety Insurance Group, Inc. | 9,305 | 397,137 | ||||||
Stancorp Financial Group Inc. | 12,680 | 504,157 | ||||||
Stewart Information Services Corp. (a) | 83,895 | 1,102,380 | ||||||
SVB Financial Group * | 24,955 | 1,479,332 | ||||||
Symetra Financial Corp. | 71,500 | 710,710 | ||||||
United Rentals, Inc. * (a) | 12,265 | 511,205 | ||||||
Washington Federal, Inc. | 26,400 | 427,680 | ||||||
|
| |||||||
| 22,487,473 | ||||||||
|
| |||||||
Health Care—10.9% | ||||||||
Addus HomeCare Corp. * | 47,106 | 169,582 | ||||||
Amsurg Corp. * | 19,480 | 509,012 | ||||||
Centene Corp. * | 16,630 | 811,544 | ||||||
Chemed Corp. | 10,015 | 619,127 | ||||||
Hanger Orthopedic Group, Inc.* | 41,110 | 850,566 | ||||||
ICON PLC, Sponsored ADR * | 48,120 | 1,019,182 | ||||||
Integra Lifesciences Holdings Corp. * | 12,235 | 386,626 | ||||||
Kindred Healthcare, Inc. * | 75,402 | 775,887 | ||||||
LHC Group, Inc. * | 15,905 | 270,703 | ||||||
LifePoint Hospitals, Inc. * | 13,890 | 541,293 | ||||||
Lincare Holdings, Inc. | 21,530 | 578,296 | ||||||
Omnicell, Inc. * | 23,610 | 352,261 | ||||||
Owens & Minor, Inc. | 24,522 | 734,679 | ||||||
PAREXEL International Corp. * | 27,435 | 671,609 | ||||||
Select Medical Holdings Corp. * | 82,355 | 693,429 | ||||||
Symmetry Medical, Inc. * | 110,040 | 796,690 | ||||||
U.S. Physical Therapy, Inc. | 87,244 | 1,658,508 | ||||||
VCA Antech, Inc. * | 39,730 | 873,663 | ||||||
|
| |||||||
| 12,312,657 | ||||||||
|
| |||||||
Real Estate Investment Trusts—6.4% |
| |||||||
Anworth Mortgage Asset Corp. | 113,427 | 737,276 | ||||||
Capstead Mortgage Corp. | 28,700 | 381,710 | ||||||
Chatham Lodging Trust | 47,655 | 574,719 | ||||||
Colony Financial, Inc. | 20,580 | 343,274 | ||||||
CYS Investments, Inc. (a) | 113,055 | 1,534,156 | ||||||
Gladstone Commercial Corp. | 16,645 | 297,446 | ||||||
Hatteras Financial Corp. | 38,605 | 1,099,470 | ||||||
MFA Financial, Inc. | 85,055 | 620,902 | ||||||
Monmouth Real Estate Investment Corp., Class A | 65,070 | 609,055 | ||||||
| Number of Shares | Value | |||||||
Real Estate Investment Trusts—(continued) |
| |||||||
Redwood Trust, Inc. | 42,720 | $ | 494,270 | |||||
Two Harbors Investment Corp. | 54,160 | 556,765 | ||||||
|
| |||||||
| 7,249,043 | ||||||||
|
| |||||||
Technology—9.5% | ||||||||
Bel Fuse, Inc., Class B | 14,735 | 257,568 | ||||||
Belden, Inc. | 37,205 | 1,468,481 | ||||||
Brooks Automation, Inc. | 41,585 | 496,941 | ||||||
Coherent, Inc. * | 6,720 | 372,826 | ||||||
Dolan Co., (The) * | 23,200 | 208,336 | ||||||
Electronics for Imaging, Inc. * | 26,130 | 417,035 | ||||||
EnerSys * | 53,535 | 1,797,705 | ||||||
Generac Holdings, Inc. * | 10,690 | 271,954 | ||||||
Imation Corp. * | 28,240 | 176,500 | ||||||
Insight Enterprises, Inc. * | 18,030 | 376,827 | ||||||
Integrated Device Technology, Inc. * | 72,975 | 504,257 | ||||||
NETGEAR, Inc. * | 26,650 | 1,001,240 | ||||||
Sykes Enterprises, Inc. * | 75,775 | 1,044,179 | ||||||
SYNNEX Corp. * | 38,300 | 1,579,109 | ||||||
TeleTech Holdings, Inc. * | 18,755 | 286,389 | ||||||
Teradyne, Inc. * | 25,515 | 418,956 | ||||||
|
| |||||||
| 10,678,303 | ||||||||
|
| |||||||
Transportation—2.0% | ||||||||
Diana Shipping, Inc. * | 36,380 | 332,513 | ||||||
Landstar System, Inc. | 13,430 | 726,026 | ||||||
UTi Worldwide, Inc. | 71,160 | 1,148,522 | ||||||
|
| |||||||
| 2,207,061 | ||||||||
|
| |||||||
Utilities—2.1% | ||||||||
PNM Resources, Inc. | 65,575 | 1,179,038 | ||||||
SemGroup Corp., | 43,415 | 1,231,684 | ||||||
|
| |||||||
| 2,410,722 | ||||||||
|
| |||||||
TOTAL COMMON STOCK | 111,143,837 | |||||||
|
| |||||||
SECURITIES LENDING COLLATERAL—4.5% |
| |||||||
BlackRock Liquidity Fund | 5,109,294 | 5,109,294 | ||||||
|
| |||||||
TOTAL SECURITIES LENDING COLLATERAL (Cost $5,109,294) | 5,109,294 | |||||||
|
| |||||||
TOTAL INVESTMENTS—103.1% |
| 116,253,131 | ||||||
|
| |||||||
LIABILITIES IN EXCESS OF OTHER ASSETS—(3.1)% |
| (3,504,844 | ) | |||||
|
| |||||||
NET ASSETS—100.0% | $ | 112,748,287 | ||||||
|
| |||||||
| ADR | —American Depositary Receipt |
| PLC | —Public Limited Company |
| * | —Non-income producing. |
| (a) | —All or a portion of the security is on loan. (See Note 6 of the Notes to Financial Statements) |
| THEACCOMPANYINGNOTESAREANINTEGRALPARTOFTHEFINANCIALSTATEMENTS. | ||
| SEMI-ANNUAL REPORT 2012 | 9 | ||
| ROBECO INVESTMENT FUNDS | FEBRUARY 29, 2012 (UNAUDITED) | |
| ROBECO BOSTON PARTNERS SMALL CAP VALUE FUND II (concluded) | PORTFOLIOOF INVESTMENTS | |
A summary of the inputs used to value the Fund’s investments as of February 29, 2012 is as follows (see Note I in the Notes to Financial Statements):
| Total Value as of 02/29/12 | Level 1 Quoted Price | Level 2 Significant Observable Inputs | Level 3 Significant Unobservable Inputs | |||||||||||||
Common Stock * | $ | 111,143,837 | $ | 111,143,837 | $ | — | $ | — | ||||||||
Securities Lending Collateral | 5,109,294 | 5,109,294 | — | — | ||||||||||||
|
|
|
|
|
|
|
| |||||||||
Total Assets | $ | 116,253,131 | $ | 116,253,131 | $ | — | $ | — | ||||||||
|
|
|
|
|
|
|
| |||||||||
| * | See Portfolio of Investments detail for industry and security type breakout. |
| THEACCOMPANYINGNOTESAREANINTEGRALPARTOFTHEFINANCIALSTATEMENTS. | ||
| 10 | SEMI-ANNUAL REPORT 2012 | ||
| ROBECO INVESTMENT FUNDS | FEBRUARY 29, 2012 (UNAUDITED) | |
| ROBECO BOSTON PARTNERS LONG/SHORT EQUITY FUND | PORTFOLIOOF INVESTMENTS | |
| Number of Shares | Value | |||||||
LONG POSITIONS—94.5% |
| |||||||
COMMON STOCK—91.2% |
| |||||||
Basic Industries—1.6% | ||||||||
AEP Industries, Inc. * † | 50,749 | $ | 1,770,633 | |||||
Sealed Air Corp. † | 223,025 | 4,377,981 | ||||||
Spartech Corp. * † | 574,450 | 3,331,810 | ||||||
|
| |||||||
| 9,480,424 | ||||||||
|
| |||||||
Capital Goods—4.5% | ||||||||
American Woodmark Corp. | 77,526 | 1,101,645 | ||||||
Chase Corp. (a) † | 67,400 | 977,300 | ||||||
Foster Wheeler AG * | 73,220 | 1,803,409 | ||||||
General Cable Corp. * | 62,040 | 1,921,379 | ||||||
Hardinge, Inc. | 98,040 | 963,733 | ||||||
Innovative Solutions and Support, Inc. * | 361,611 | 1,544,079 | ||||||
Lakeland Industries, Inc. * | 53,115 | 528,494 | ||||||
LMI Aerospace, Inc. * | 112,846 | 2,296,416 | ||||||
Michael Baker Corp. * † | 172,357 | 4,158,974 | ||||||
NACCO Industries, Inc., Class A † | 34,705 | 3,394,149 | ||||||
Tyco International, Ltd. † | 90,160 | 4,672,091 | ||||||
WaterFurnace Renewable Energy, Inc. | 152,770 | 2,950,141 | ||||||
|
| |||||||
| 26,311,810 | ||||||||
|
| |||||||
Communications—4.0% | ||||||||
Comcast Corp., Class A † | 218,910 | 6,431,576 | ||||||
DISH Network Corp., Class A † | 93,375 | 2,723,749 | ||||||
iPass, Inc. * | 1,078,240 | 2,328,998 | ||||||
SureWest | 312,175 | 6,995,842 | ||||||
Telephone & Data Systems, Inc. † | 143,100 | 3,616,137 | ||||||
TNS, Inc. * | 80,410 | 1,473,915 | ||||||
|
| |||||||
| 23,570,217 | ||||||||
|
| |||||||
Consumer Durables—0.4% | ||||||||
AV Homes, Inc. * | 37,000 | 387,390 | ||||||
Hooker Furniture Corp. † | 88,199 | 1,059,270 | ||||||
Libbey, Inc. † * | 74,240 | 931,712 | ||||||
|
| |||||||
| 2,378,372 | ||||||||
|
| |||||||
Consumer Non-Durables—6.8% |
| |||||||
Activision Blizzard, Inc. † | 289,420 | 3,458,569 | ||||||
Anheuser-Busch InBev | 126,945 | 8,537,051 | ||||||
Coca-Cola Femsa S.A. de C.V. - Sponsored | 42,930 | 4,247,924 | ||||||
Hanesbrands, Inc. * † | 156,585 | 4,498,687 | ||||||
Kenneth Cole Productions, Inc., Class A * † | 265,234 | 4,161,522 | ||||||
Lorillard, Inc. † | 45,505 | 5,964,795 | ||||||
Matthews International Corp., Class A † | 69,140 | 2,144,723 | ||||||
TESCO PLC - Sponsored ADR | 188,255 | 2,861,476 | ||||||
Unilever NV | 120,540 | 4,015,187 | ||||||
|
| |||||||
| 39,889,934 | ||||||||
|
| |||||||
Consumer Services—11.9% | ||||||||
AFC Enterprises, Inc. * † | 230,686 | 3,688,669 | ||||||
Barrett Business Services, Inc. | 29,598 | 503,758 | ||||||
Century Casinos, Inc. * † | 831,881 | 2,329,267 | ||||||
CRA International, Inc. * | 2,550 | 60,715 | ||||||
| Number of Shares | Value | |||||||
Consumer Services—(continued) |
| |||||||
CVS Caremark Corp. † | 141,310 | $ | 6,373,081 | |||||
DreamWorks Animation SKG, Inc., Class A * (a) | 179,365 | 3,095,840 | ||||||
Ediets.Com, Inc. * | 342,052 | 177,867 | ||||||
Ennis, Inc. † | 204,600 | 3,429,096 | ||||||
Geo Group, Inc. (The) * | 164,110 | 2,889,977 | ||||||
Groupon, Inc. * (a) | 146,455 | 2,887,360 | ||||||
Heidrick & Struggles International, Inc. † | 29,640 | 602,285 | ||||||
Hudson Highland Group, Inc. * † | 285,033 | 1,274,097 | ||||||
ICF International, Inc. * † | 98,425 | 2,552,160 | ||||||
International Game Technology | 179,215 | 2,691,809 | ||||||
International Speedway Corp., Class A † | 141,915 | 3,570,581 | ||||||
Midas, Inc. * † | 388,262 | 3,544,832 | ||||||
Multi-Color Corp. (a) † | 136,316 | 2,981,231 | ||||||
Nash Finch Co. † | 152,037 | 4,076,112 | ||||||
Navigant Consulting, | 85,915 | 1,160,712 | ||||||
Republic Services, Inc. † | 72,895 | 2,174,458 | ||||||
Saga Communications, Inc., Class A † * | 66,546 | 2,496,806 | ||||||
Towers Watson & Co., Class A † | 38,455 | 2,458,813 | ||||||
Viad Corp. † | 142,670 | 2,776,358 | ||||||
Wal-Mart Stores, Inc. † | 62,360 | 3,684,229 | ||||||
Walt Disney Co. (The) † | 126,960 | 5,331,050 | ||||||
Western Union Co., (The) † | 145,150 | 2,535,770 | ||||||
|
| |||||||
| 69,346,933 | ||||||||
|
| |||||||
Energy—4.2% | ||||||||
Canadian Natural Resources Ltd. † | 87,675 | 3,253,619 | ||||||
Cenovus Energy, Inc. † | 99,185 | 3,848,378 | ||||||
Ensco PLC - Sponsored ADR † | 41,810 | 2,437,523 | ||||||
EOG Resources, Inc. † | 37,475 | 4,266,903 | ||||||
Royal Dutch Shell PLC-ADR † | 97,855 | 7,152,222 | ||||||
SM Energy Co. † | 43,595 | 3,431,798 | ||||||
|
| |||||||
| 24,390,443 | ||||||||
|
| |||||||
Finance—17.4% | ||||||||
ACE Ltd. † | 78,400 | 5,622,064 | ||||||
Alterra Capital Holdings Ltd. † | 84,805 | 1,947,123 | ||||||
Aon Corp. † | 69,465 | 3,251,657 | ||||||
Axis Capital Holdings Ltd. † | 92,130 | 2,842,211 | ||||||
Berkshire Hathaway, Inc., Class B * † | 92,105 | 7,225,637 | ||||||
Capitol Federal Financial, Inc. † | 84,520 | 988,039 | ||||||
CBRE Group, Inc., | 99,065 | 1,815,862 | ||||||
Century Bancorp, Inc., Class A † | 38,003 | 940,954 | ||||||
Charles Schwab Corp., (The) | 126,515 | 1,756,028 | ||||||
Citigroup, Inc. † | 135,228 | 4,505,797 | ||||||
Citizens Republic Bancorp, Inc. * | 85,444 | 1,169,728 | ||||||
Cowen Group, Inc., | 775,320 | 2,170,896 | ||||||
Endurance Specialty Holdings Ltd. † | 106,925 | 4,112,335 | ||||||
Fairfax Financial Holdings Ltd. † | 4,970 | 2,064,293 | ||||||
First Southern Bancorp, Inc. Class B 144A * ‡ | 64,350 | 529,601 | ||||||
Flushing Financial Corp. † | 107,711 | 1,394,857 | ||||||
Goldman Sachs Group, Inc., (The) | 25,473 | 2,932,961 | ||||||
HF Financial Corp. | 83,779 | 964,296 | ||||||
Investors Title Co. † | 6,765 | 305,643 | ||||||
JPMorgan Chase & Co. † | 120,091 | 4,712,371 | ||||||
Loews Corp. † | 83,730 | 3,277,192 | ||||||
| THEACCOMPANYINGNOTESAREANINTEGRALPARTOFTHEFINANCIALSTATEMENTS. | ||
| SEMI-ANNUAL REPORT 2012 | 11 | ||
| ROBECO INVESTMENT FUNDS | FEBRUARY 29, 2012 (UNAUDITED) | |
| ROBECO BOSTON PARTNERS LONG/SHORT EQUITY FUND (continued) | PORTFOLIOOF INVESTMENTS | |
| Number of Shares | Value | |||||||
Finance—(continued) |
| |||||||
Maiden Holdings Ltd. † | 793,837 | $ | 6,866,690 | |||||
NBH Holdings Corp., | 79,735 | 1,367,455 | ||||||
New Hampshire Thrift Bancshares, Inc. | 29,529 | 353,167 | ||||||
Nicholas Financial, | 122,637 | 1,590,602 | ||||||
OceanFirst Financial Corp. † | 36,680 | 503,616 | ||||||
Och-Ziff Capital Management Group LLC, Class A † | 233,455 | 2,201,481 | ||||||
PartnerRe Ltd. | 39,010 | 2,474,794 | ||||||
Primus Guaranty | 129,701 | 804,146 | ||||||
Protective Life Corp. † | 17,590 | 488,474 | ||||||
RenaissanceRe Holdings | 22,755 | 1,637,450 | ||||||
State Street Corp. † | 68,635 | 2,898,456 | ||||||
Stewart Information Services | 109,940 | 1,444,612 | ||||||
TD Ameritrade Holding Corp. | 84,805 | 1,583,309 | ||||||
TFS Financial | 99,535 | 930,652 | ||||||
Torchmark Corp. † | 60,235 | 2,917,783 | ||||||
Tower Group, Inc. † | 188,395 | 4,342,505 | ||||||
Travelers Cos., Inc., (The) | 46,295 | 2,683,721 | ||||||
Validus Holdings Ltd. † | 139,217 | 4,244,726 | ||||||
Verisk Analytics, Inc., | 69,290 | 3,014,115 | ||||||
West Coast Bancorp * | 61,952 | 1,062,477 | ||||||
White Mountains Insurance | 6,855 | 3,401,588 | ||||||
|
| |||||||
| 101,341,364 | ||||||||
|
| |||||||
Health Care—16.9% |
| |||||||
Accuray, Inc. * † | 286,475 | 1,942,301 | ||||||
Almost Family, Inc. * | 70,140 | 1,604,803 | ||||||
Alpha PRO Tech Ltd. * | 485,210 | 713,259 | ||||||
Amgen, Inc. † | 66,605 | 4,525,810 | ||||||
Amsurg Corp. * † | 138,990 | 3,631,809 | ||||||
Anika Therapeutics, | 215,460 | 2,447,626 | ||||||
Baxter International, | 97,990 | 5,696,159 | ||||||
Becton, Dickinson | 35,355 | 2,694,758 | ||||||
BioClinica, Inc. * † | 327,186 | 1,851,873 | ||||||
CardioNet, Inc. * | 503,651 | 1,606,647 | ||||||
Charles River Laboratories International, Inc. * | 44,905 | 1,577,513 | ||||||
Covidien PLC | 82,562 | 4,313,865 | ||||||
Cross Country Healthcare, | 479,007 | 2,711,180 | ||||||
Hooper Holmes, Inc. * | 860,703 | 601,287 | ||||||
ICON PLC, Sponsored ADR * † | 194,880 | 4,127,558 | ||||||
IRIS International, | 358,230 | 4,001,429 | ||||||
Johnson & Johnson † | 122,880 | 7,997,030 | ||||||
Laboratory Corp. of America Holdings * † | 51,280 | 4,609,559 | ||||||
Lincare Holdings, Inc. † | 136,674 | 3,671,064 | ||||||
Medical Action Industries, | 302,865 | 1,641,528 | ||||||
Myriad Genetics, Inc. * | 95,180 | 2,303,356 | ||||||
Pfizer, Inc. † | 401,045 | 8,462,049 | ||||||
Rochester Medical | 125,651 | 1,178,606 | ||||||
Rotech Healthcare, Inc. * | 1,151,331 | 1,784,563 | ||||||
Sanofi - ADR - ADR | 162,095 | 6,002,378 | ||||||
Teva Pharmaceutical Industries Ltd. - Sponsored ADR † | 127,450 | 5,711,034 | ||||||
Theragenics Corp. * | 510,450 | 811,616 | ||||||
Thermo Fisher Scientific, | 116,955 | 6,621,992 | ||||||
| Number of Shares | Value | |||||||
Health Care—(continued) |
| |||||||
United Therapeutics | 75,845 | $ | 3,620,082 | |||||
|
| |||||||
| 98,462,734 | ||||||||
|
| |||||||
Real Estate Investment Trusts—0.3% |
| |||||||
Reis, Inc. * | 157,698 | 1,606,943 | ||||||
|
| |||||||
Technology—22.8% | ||||||||
Actuate Corp. * | 474,405 | 2,865,406 | ||||||
Alpha & Omega Semiconductor | 190,535 | 1,888,202 | ||||||
Amdocs Ltd. * † | 116,445 | 3,571,368 | ||||||
Amkor Technology, | 600,100 | 3,834,639 | ||||||
AVX Corp. | 114,740 | 1,519,158 | ||||||
BMC Software, Inc. * † | 74,160 | 2,776,550 | ||||||
Booz Allen Hamilton Holding | 151,659 | 2,792,042 | ||||||
CA, Inc. † | 228,285 | 6,170,544 | ||||||
Carbonite, | 190,245 | 1,843,474 | ||||||
Cisco Systems, | 233,895 | 4,649,833 | ||||||
Coleman Cable, | 384,103 | 4,367,251 | ||||||
Compuware | 273,975 | 2,468,515 | ||||||
Concurrent Computer | 301,962 | 1,123,299 | ||||||
Corning, Inc. | 148,130 | 1,931,615 | ||||||
CSG Systems International, | 310,380 | 4,969,184 | ||||||
DragonWave, | 192,920 | 846,919 | ||||||
Flextronics International | 411,295 | 2,899,630 | ||||||
GSI Group, Inc. * † | 461,235 | 5,299,590 | ||||||
Guidance Software, Inc * † | 303,175 | 3,459,227 | ||||||
Hawaiian Telcom Holdco, | 318,005 | 4,999,039 | ||||||
Hemisphere GPS, Inc. * | 839,675 | 839,675 | ||||||
Lexmark International, Inc., | 130,075 | 4,797,166 | ||||||
Lionbridge Technologies, | 461,210 | 1,194,534 | ||||||
LSI Corp. * | 239,760 | 2,061,936 | ||||||
Marvell Technology Group | 98,420 | 1,476,300 | ||||||
Microsoft Corp. † | 296,170 | 9,400,436 | ||||||
MRV Communications, Inc. | 1,059,385 | 1,069,979 | ||||||
Net 1 UEPS Technologies, | 112,620 | 1,111,559 | ||||||
Oracle Corp. † | 205,879 | 6,026,078 | ||||||
Pericom Semiconductor | 81,252 | 624,828 | ||||||
Plug Power, | 1,379,920 | 3,063,422 | ||||||
Pulse Electronics Corp. | 626,418 | 1,929,368 | ||||||
QLogic Corp. * † | 323,775 | 5,565,692 | ||||||
Quest Software, Inc. * | 177,570 | 3,554,951 | ||||||
Steel Excel, | 229,697 | 6,420,031 | ||||||
TeleTech Holdings, Inc. * † | 388,130 | 5,926,745 | ||||||
Telular Corp. | 138,195 | 1,039,226 | ||||||
Veeco Instruments, | 105,495 | 2,852,585 | ||||||
Vishay Intertechnology, | 426,260 | 5,225,948 | ||||||
Xerox Corp. † | 569,625 | 4,688,014 | ||||||
|
| |||||||
| 133,143,958 | ||||||||
|
| |||||||
Utilities—0.4% |
| |||||||
SemGroup Corp., | 87,375 | 2,478,829 | ||||||
|
| |||||||
TOTAL COMMON STOCK |
| 532,401,961 | ||||||
|
| |||||||
PREFERRED STOCK—0.7% |
| |||||||
Finance—0.7% | ||||||||
BAC Capital Trust IV 5.875% * (a) | 56,497 | 1,309,601 | ||||||
Citigroup Capital XVI | 107,050 | 2,643,065 | ||||||
| THEACCOMPANYINGNOTESAREANINTEGRALPARTOFTHEFINANCIALSTATEMENTS. | ||
| 12 | SEMI-ANNUAL REPORT 2012 | ||
| ROBECO INVESTMENT FUNDS | FEBRUARY 29, 2012 (UNAUDITED) | |
| ROBECO BOSTON PARTNERS LONG/SHORT EQUITY FUND (continued) | PORTFOLIOOF INVESTMENTS | |
| Number of Shares | Value | |||||||
Finance—(continued) |
| |||||||
First Southern Bancorp, Inc. 144A 5.000% 144A * ‡ D | 110 | $ | 205,851 | |||||
|
| |||||||
TOTAL PREFERRED STOCK |
| 4,158,517 | ||||||
|
| |||||||
SECURITIES LENDING COLLATERAL—2.6% |
| |||||||
BlackRock Liquidity Fund | 15,088,513 | 15,088,513 | ||||||
|
| |||||||
TOTAL SECURITIES LENDING COLLATERAL |
| 15,088,513 | ||||||
|
| |||||||
TOTAL LONG POSITIONS—94.5% |
| 551,648,991 | ||||||
|
| |||||||
SECURITIES SOLD SHORT—(58.8%) |
| |||||||
COMMON STOCK—(58.8%) |
| |||||||
Basic Industries—(1.8%) |
| |||||||
Cliffs Natural Resources, | (36,955 | ) | (2,345,903 | ) | ||||
Ethanex Energy, Inc. * | (648 | ) | (343 | ) | ||||
Gold Resource | (67,830 | ) | (1,658,443 | ) | ||||
Intrepid Potash, | (87,500 | ) | (2,212,875 | ) | ||||
MAG Silver | (83,345 | ) | (801,779 | ) | ||||
Molycorp, Inc. * | (22,405 | ) | (553,404 | ) | ||||
Seabridge Gold, Inc. * | (76,310 | ) | (1,805,495 | ) | ||||
Tanzanian Royalty Exploration | (193,370 | ) | (814,088 | ) | ||||
Uranerz Energy Corp. * | (83,070 | ) | (207,675 | ) | ||||
|
| |||||||
| (10,400,005 | ) | |||||||
|
| |||||||
Capital Goods—(5.9%) |
| |||||||
ADA-ES, Inc. * | (68,138 | ) | (1,531,061 | ) | ||||
Ameresco, Inc., | (121,020 | ) | (1,705,172 | ) | ||||
Applied Energetics, | (238,070 | ) | (26,188 | ) | ||||
Applied Nanotech Holdings, | (8,285 | ) | (2,237 | ) | ||||
Cavco Industries, Inc. * | (35,330 | ) | (1,593,030 | ) | ||||
DynaMotive Energy Systems | (72,185 | ) | (10,106 | ) | ||||
EDAC Technologies | (98,241 | ) | (1,021,697 | ) | ||||
Lindsay Corp. | (45,280 | ) | (2,969,915 | ) | ||||
Middleby Corp., (The) * | (16,040 | ) | (1,567,750 | ) | ||||
National Presto Industries, | (40,949 | ) | (3,545,774 | ) | ||||
Stericycle, Inc. * | (19,785 | ) | (1,716,744 | ) | ||||
Titan International, Inc. | (135,975 | ) | (3,350,424 | ) | ||||
Tredegar Corp. | (98,120 | ) | (2,280,309 | ) | ||||
Trex Co., Inc. * | (207,215 | ) | (5,580,300 | ) | ||||
Twin Disc, Inc. | (106,848 | ) | (3,414,862 | ) | ||||
Vulcan Materials Co. | (94,985 | ) | (4,232,532 | ) | ||||
|
| |||||||
| (34,548,101 | ) | |||||||
|
| |||||||
Communications—(4.6%) |
| |||||||
Aruba Networks, Inc. * | (104,245 | ) | (2,250,649 | ) | ||||
Cogent Communications | (157,680 | ) | (2,904,466 | ) | ||||
Consolidated Communications Holdings, Inc. | (90,875 | ) | (1,723,899 | ) | ||||
CTC Communications Group, | (98,900 | ) | (10 | ) | ||||
Digital Domain Media Group, Inc. * | (123,359 | ) | (692,044 | ) | ||||
| Number of Shares | Value | |||||||
Communications—(continued) |
| |||||||
Elephant Talk Communications, | (239,001 | ) | $ | (511,462 | ) | |||
Equinix, Inc. * | (22,140 | ) | (3,103,585 | ) | ||||
Interliant, Inc. * ‡ D | (600 | ) | 0 | |||||
j2 Global Communications, | (71,770 | ) | (2,122,239 | ) | ||||
LinkedIn Corp., | (32,650 | ) | (2,836,305 | ) | ||||
LivePerson, Inc. * | (206,805 | ) | (3,118,619 | ) | ||||
MicroStrategy, Inc., | (22,375 | ) | (3,033,826 | ) | ||||
OpenTable, Inc. * | (32,700 | ) | (1,585,950 | ) | ||||
Rackspace Hosting, | (57,880 | ) | (3,023,651 | ) | ||||
|
| |||||||
| (26,906,705 | ) | |||||||
|
| |||||||
Consumer Durables—(3.8%) |
| |||||||
American Axle & Manaufacturing | (175,562 | ) | (2,080,410 | ) | ||||
Conn’s, Inc. * | (141,865 | ) | (1,881,130 | ) | ||||
Deckers Outdoor Corp. * | (43,730 | ) | (3,269,255 | ) | ||||
Garmin Ltd | (55,115 | ) | (2,600,877 | ) | ||||
Gentex Corp. | (97,880 | ) | (2,314,862 | ) | ||||
iRobot Corp. * | (42,460 | ) | (1,083,579 | ) | ||||
Qsound Labs, Inc. * | (4,440 | ) | (133 | ) | ||||
SodaStream International | (72,570 | ) | (2,957,228 | ) | ||||
Tesla Motors, Inc. * | (92,880 | ) | (3,103,121 | ) | ||||
Universal Display | (64,665 | ) | (2,671,311 | ) | ||||
|
| |||||||
| (21,961,906 | ) | |||||||
|
| |||||||
Consumer Non-Durables—(2.9%) |
| |||||||
Amazon.com, Inc. * | (9,335 | ) | (1,677,406 | ) | ||||
Amish Naturals, Inc. * D | (25,959 | ) | (156 | ) | ||||
Blyth, Inc. | (21,545 | ) | (1,374,571 | ) | ||||
Cal-Maine Foods, Inc. | (117,935 | ) | (4,540,497 | ) | ||||
Peet’s Coffee & Tea, | (28,899 | ) | (1,860,807 | ) | ||||
Schiff Nutrition International, | (91,632 | ) | (1,022,613 | ) | ||||
Smart Balance, Inc. * | (209,240 | ) | (1,253,348 | ) | ||||
Swisher Hygiene, Inc. * | (487,696 | ) | (1,438,703 | ) | ||||
Under Armour, Inc., | (38,310 | ) | (3,418,784 | ) | ||||
Valence Technology, | (27,585 | ) | (25,654 | ) | ||||
|
| |||||||
| (16,612,539 | ) | |||||||
|
| |||||||
Consumer Services—(13.5%) |
| |||||||
Arbitron, Inc. | (88,025 | ) | (2,943,556 | ) | ||||
BJ’s Restaurants, Inc. * | (26,290 | ) | (1,305,298 | ) | ||||
Blue Nile, Inc. * | (157,430 | ) | (5,612,379 | ) | ||||
Cheesecake Factory, Inc. | (58,020 | ) | (1,719,713 | ) | ||||
Constant Contact, Inc. * | (90,575 | ) | (2,738,988 | ) | ||||
Fresh Market, Inc., | (19,280 | ) | (867,986 | ) | ||||
GameStop Corp., Class A | (46,400 | ) | (1,056,992 | ) | ||||
Groupon, Inc * | (259,285 | ) | (5,111,804 | ) | ||||
Imax Corp. * | (103,880 | ) | (2,651,018 | ) | ||||
Intersections, Inc. | (60,369 | ) | (704,506 | ) | ||||
JC Penney Co., Inc. | (68,345 | ) | (2,706,462 | ) | ||||
Life Time Fitness, Inc. * | (78,730 | ) | (3,894,773 | ) | ||||
Liquidity Services, Inc. * | (53,790 | ) | (2,326,417 | ) | ||||
Lululemon Athletica, | (36,735 | ) | (2,461,980 | ) | ||||
Lumber Liquidators Holdings, | (87,710 | ) | �� | (1,919,972 | ) | |||
Mattress Firm Holding | (90,297 | ) | (3,001,472 | ) | ||||
Medifast, Inc. * | (136,690 | ) | (2,218,479 | ) | ||||
Netflix, Inc. * | (45,110 | ) | (4,995,030 | ) | ||||
Red Robin Gourmet Burgers, | (79,540 | ) | (2,736,971 | ) | ||||
| THEACCOMPANYINGNOTESAREANINTEGRALPARTOFTHEFINANCIALSTATEMENTS. | ||
| SEMI-ANNUAL REPORT 2012 | 13 | ||
| ROBECO INVESTMENT FUNDS | FEBRUARY 29, 2012 (UNAUDITED) | |
| ROBECO BOSTON PARTNERS LONG/SHORT EQUITY FUND (continued) | PORTFOLIOOF INVESTMENTS | |
| Number of Shares | Value | |||||||
Consumer Services—(continued) |
| |||||||
Ritchie Bros.Auctioneers, Inc. | (236,595 | ) | $ | (5,777,650 | ) | |||
Sturm Ruger & Co., Inc. | (140,270 | ) | (5,860,481 | ) | ||||
Teavana Holdings, | (48,930 | ) | (1,147,409 | ) | ||||
Texas Roadhouse, Inc. | (190,555 | ) | (3,187,985 | ) | ||||
Urban Outfitters, | (100,445 | ) | (2,851,634 | ) | ||||
VistaPrint NV * | (62,615 | ) | (2,547,178 | ) | ||||
VOXX International | (317,741 | ) | (4,063,907 | ) | ||||
Zynga, Inc., Class A * | (192,640 | ) | (2,537,069 | ) | ||||
|
| |||||||
| (78,947,109 | ) | |||||||
|
| |||||||
Energy—(2.9%) |
| |||||||
Apco Oil and Gas International , Inc. | (63,423 | ) | (4,768,141 | ) | ||||
Basic Energy Services, Inc. * | (109,040 | ) | (2,165,534 | ) | ||||
Beard Co. * | (9,710 | ) | (777 | ) | ||||
C&J Energy Services, Inc. * | (52,530 | ) | (1,067,410 | ) | ||||
CARBO Ceramics, Inc. | (18,500 | ) | (1,695,525 | ) | ||||
Crescent Point Energy Corp | (32,120 | ) | (1,517,349 | ) | ||||
Goodrich Petroleum Corp. * | (109,055 | ) | (1,737,246 | ) | ||||
Houston American Energy | (116,735 | ) | (1,265,407 | ) | ||||
Hyperdynamics Corp. * | (201,215 | ) | (273,652 | ) | ||||
InterOil Corp. * | (21,570 | ) | (1,296,357 | ) | ||||
Miller Energy Resources | (253,560 | ) | (1,064,952 | ) | ||||
|
| |||||||
| (16,852,350 | ) | |||||||
|
| |||||||
Finance—(1.0%) |
| |||||||
First Cash Financial Services, | (29,130 | ) | (1,231,034 | ) | ||||
Higher One Holdings | (206,955 | ) | (3,042,238 | ) | ||||
Value Line, Inc. | (78,574 | ) | (901,244 | ) | ||||
World Acceptance | (11,600 | ) | (736,832 | ) | ||||
|
| |||||||
| (5,911,348 | ) | |||||||
|
| |||||||
Health Care—(6.6%) |
| |||||||
ABIOMED, Inc. * | (88,280 | ) | (1,843,286 | ) | ||||
Accretive Health, | (106,050 | ) | (2,756,239 | ) | ||||
Align Technology, | (72,220 | ) | (1,849,554 | ) | ||||
Ariad Pharmaceuticals, | (120,765 | ) | (1,786,114 | ) | ||||
athenahealth, Inc. * | (40,365 | ) | (2,852,594 | ) | ||||
Auxilium Pharmaceuticals, | (80,265 | ) | (1,586,036 | ) | ||||
Biotime, Inc. * | (105,150 | ) | (524,699 | ) | ||||
BodyTel Scientific, Inc. * | (4,840 | ) | (29 | ) | ||||
CareView Communications, | (207,465 | ) | (352,690 | ) | ||||
Conceptus, Inc. * | (126,440 | ) | (1,703,147 | ) | ||||
Curis, Inc. * | (228,155 | ) | (1,028,979 | ) | ||||
HeartWare International, | (15,860 | ) | (1,161,904 | ) | ||||
Hi-Tech Pharmacal Co., | (60,975 | ) | (2,434,122 | ) | ||||
Idenix Pharmaceuticals, | (125,280 | ) | (1,474,546 | ) | ||||
IDEXX Laboratories, | (15,145 | ) | (1,298,684 | ) | ||||
Immunomedics, Inc. * | (388,750 | ) | (1,383,950 | ) | ||||
Insulet Corp. * | (86,530 | ) | (1,706,372 | ) | ||||
MAKO Surgical Corp. * | (49,505 | ) | (1,935,645 | ) | ||||
Mindray Medical International | (80,220 | ) | (2,455,534 | ) | ||||
NxStage Medical, Inc. * | (103,765 | ) | (2,075,300 | ) | ||||
Rockwell Medical Technologies, | (61,980 | ) | (588,190 | ) | ||||
Seattle Genetics, Inc. * | (94,825 | ) | (1,750,470 | ) | ||||
Spectrum Pharmaceuticals, | (156,010 | ) | (2,213,782 | ) | ||||
SXC Health Solutions | (28,520 | ) | (2,019,216 | ) | ||||
|
| |||||||
| (38,781,082 | ) | |||||||
|
| |||||||
| Number of Shares | Value | |||||||
Real Estate Investment Trusts—(0.9%) |
| |||||||
DuPont Fabros Technology, | (105,940 | ) | $ | (2,426,026 | ) | |||
Simon Property Group, | (20,370 | ) | (2,759,728 | ) | ||||
|
| |||||||
| (5,185,754 | ) | |||||||
|
| |||||||
Technology—(14.4%) |
| |||||||
3D Systems Corp. * | (156,460 | ) | (3,504,704 | ) | ||||
Acme Packet, Inc. * | (42,005 | ) | (1,280,312 | ) | ||||
Advent Software, Inc. * | (84,204 | ) | (2,166,569 | ) | ||||
ANTs Software, Inc. * | (10,334 | ) | (83 | ) | ||||
ARM Holdings PLC - Sponsored | (193,425 | ) | (5,257,291 | ) | ||||
Aspen Technology, Inc. * | (197,535 | ) | (4,061,320 | ) | ||||
Blackbaud, Inc. | (56,320 | ) | (1,776,896 | ) | ||||
BroadSoft, Inc. * | (69,625 | ) | (2,532,261 | ) | ||||
Cavium, Inc. * | (65,660 | ) | (2,346,032 | ) | ||||
Ciena Corp. * | (266,805 | ) | (3,980,731 | ) | ||||
Cirrus Logic, Inc. * | (135,870 | ) | (3,203,815 | ) | ||||
Citrix Systems, Inc. * | (11,210 | ) | (837,835 | ) | ||||
CommVault Systems, | (43,450 | ) | (2,240,716 | ) | ||||
Computer Programs & Systems, | (29,575 | ) | (1,799,343 | ) | ||||
Consygen, Inc. * ‡ D | (200 | ) | 0 | |||||
Cypress Semiconductor | (300,880 | ) | (5,190,180 | ) | ||||
eGain Communications | (160,300 | ) | (835,163 | ) | ||||
Ener1, Inc. * | (102,820 | ) | (1,234 | ) | ||||
Entegris, Inc. * | (448,840 | ) | (4,057,514 | ) | ||||
EZchip Semiconductor | (29,020 | ) | (1,172,988 | ) | ||||
F5 Networks, Inc. * | (15,365 | ) | (1,920,010 | ) | ||||
Finisar Corp. * | (104,020 | ) | (2,110,566 | ) | ||||
First Solar, Inc. * | (65,160 | ) | (2,104,668 | ) | ||||
Function X, Inc. * | (9,792 | ) | (67,565 | ) | ||||
Infinera Corp. * | (177,235 | ) | (1,410,791 | ) | ||||
Keynote Systems, Inc. | (82,415 | ) | (1,639,234 | ) | ||||
Maxwell Technologies, Inc. * | (48,745 | ) | (886,672 | ) | ||||
Measurement Specialties, | (105,310 | ) | (3,424,681 | ) | ||||
Mitek Systems, Inc. * | (126,695 | ) | (1,317,628 | ) | ||||
MoSys, Inc. * | (153,340 | ) | (585,759 | ) | ||||
Nanometrics, Inc. * | (123,700 | ) | (2,170,935 | ) | ||||
Nestor, Inc. * | (15,200 | ) | (23 | ) | ||||
NetSuite, Inc. * | (62,220 | ) | (2,967,894 | ) | ||||
Power Integrations, Inc. | (59,220 | ) | (2,208,906 | ) | ||||
QLIK Technologies, | (76,390 | ) | (2,312,325 | ) | ||||
Red Hat, Inc. * | (45,625 | ) | (2,256,613 | ) | ||||
Riverbed Technology, Inc. * | (70,010 | ) | (1,993,185 | ) | ||||
Salesforce.com, Inc. * | (19,925 | ) | (2,852,463 | ) | ||||
Tiger Telematics, Inc. * D | (6,510 | ) | (7 | ) | ||||
TigerLogic Corp. * | (96,490 | ) | (218,067 | ) | ||||
Tower Semiconductor Ltd. * | (514,365 | ) | (363,399 | ) | ||||
Viasat, Inc. * | (74,380 | ) | (3,431,149 | ) | ||||
Wipro Ltd. - ADR | (152,595 | ) | (1,675,493 | ) | ||||
WorldGate Communications, | (582,655 | ) | (19,228 | ) | ||||
Xybernaut Corp. * ‡ D | (34,156 | ) | 0 | |||||
|
| |||||||
| (84,182,248 | ) | |||||||
|
| |||||||
| THEACCOMPANYINGNOTESAREANINTEGRALPARTOFTHEFINANCIALSTATEMENTS. | ||
| 14 | SEMI-ANNUAL REPORT 2012 | ||
| ROBECO INVESTMENT FUNDS | FEBRUARY 29, 2012 (UNAUDITED) | |
| ROBECO BOSTON PARTNERS LONG/SHORT EQUITY FUND (continued) | PORTFOLIOOF INVESTMENTS | |
| Number of Shares | Value | |||||||
Utilities—(0.5%) | ||||||||
Cadiz, Inc. * | (72,010 | ) | $ | (764,746 | ) | |||
Clean Energy Fuels Corp. * | (128,775 | ) | (2,419,682 | ) | ||||
|
| |||||||
| (3,184,428 | ) | |||||||
|
| |||||||
TOTAL COMMON STOCK | (343,473,575 | ) | ||||||
|
| |||||||
TOTAL SECURITIES SOLD | (343,473,575 | ) | ||||||
|
| |||||||
| Number of Contracts | ||||||||
OPTIONS WRITTEN††—(0.1%) |
| |||||||
Goldman Sachs Group, Inc., (The) Put Options Expires 01/19/13 Strike Price $105 | (157 | ) | (160,925 | ) | ||||
Groupon, Inc. Call Options Expires 01/19/13 Strike Price $20 | (552 | ) | (149,592 | ) | ||||
Invensense, Inc. Call Options Expires 09/22/12 Strike Price $10 | (424 | ) | (260,760 | ) | ||||
TOTAL OPTIONS WRITTEN | (571,277 | ) | ||||
|
| |||||
OTHER ASSETS IN EXCESS OF LIABILITIES—64.4% | 375,924,638 | |||||
|
| |||||
NET ASSETS—100.0% | $ | 583,528,777 | ||||
|
|
| ADR | — | American Depositary Receipt | ||
| PLC | — | Public Limited Company | ||
| 144A | — | Security was purchased pursuant to Rule 144A under the Securities Act of 1933 and may not be resold subject to that rule except to qualified institutional buyers. As of February 29, 2012, these securities amounted to $2,102,907 or 0.4% of net assets. Unless otherwise noted, these 144A securities have not been deemed illiquid. | ||
| * | — | Non-income producing. | ||
| (a) | — | All or a portion of the security is on loan. (See Note 6 of the Notes to Financial Statements) | ||
| † | — | Security position is either entirely or partially held in a segregated account as collateral for securities sold short. | ||
| †† | — | Primary risk exposure is equity contracts. | ||
| ‡ | — | Security has been valued at fair market value as determined in good faith by or under the direction of The RBB Fund, Inc.’s Board of Directors. As of February 29, 2012 long positions amounted to $2,102,907 or 0.4% of net assets. | ||
| D | — | Security has been deemed illiquid. Less then 0.1% of the Fund’s net assets were reported illiquid by the portfolio manager under the Fund’s policies and procedures. |
| THEACCOMPANYINGNOTESAREANINTEGRALPARTOFTHEFINANCIALSTATEMENTS. | ||
| SEMI-ANNUAL REPORT 2012 | 15 | ||
| ROBECO INVESTMENT FUNDS | FEBRUARY 29, 2012 (UNAUDITED) | |
| ROBECO BOSTON PARTNERS LONG/SHORT EQUITY FUND (continued) | PORTFOLIOOF INVESTMENTS | |
A summary of the inputs used to value the Fund’s investments as of February 29, 2012 is as follows (see Note I in the Notes to Financial Statements):
| Total Value as of 02/29/12 | Level 1 Quoted Price | Level 2 Significant Observable Inputs | Level 3 Significant Unobservable Inputs | |||||||||||||
Common Stock | ||||||||||||||||
Basic Industries | $ | 9,480,424 | $ | 9,480,424 | $ | — | $ | — | ||||||||
Capital Goods | 26,311,810 | 26,311,810 | — | — | ||||||||||||
Communications | 23,570,217 | 23,570,217 | — | — | ||||||||||||
Consumer Durables | 2,378,372 | 2,378,372 | — | — | ||||||||||||
Consumer Non-Durables | 39,889,934 | 39,889,934 | — | — | ||||||||||||
Consumer Services | 69,346,933 | 69,346,933 | — | — | ||||||||||||
Energy | 24,390,443 | 24,390,443 | — | — | ||||||||||||
Finance | 101,341,364 | 99,444,308 | — | 1,897,056 | ||||||||||||
Health Care | 98,462,734 | 98,462,734 | — | — | ||||||||||||
Real Estate Investment Trusts | 1,606,943 | 1,606,943 | — | — | ||||||||||||
Technology | 133,143,958 | 133,143,958 | — | — | ||||||||||||
Utilities | 2,478,829 | 2,478,829 | — | — | ||||||||||||
Preferred Stocks | ||||||||||||||||
Finance | 4,158,517 | 3,952,666 | — | 205,851 | ||||||||||||
Securities Lending Collateral | 15,088,513 | 15,088,513 | — | — | ||||||||||||
|
|
|
|
|
|
|
| |||||||||
Total Assets | $ | 551,648,991 | $ | 549,546,084 | $ | — | $ | 2,102,907 | ||||||||
|
|
|
|
|
|
|
| |||||||||
| Total Value as of 02/29/12 | Level 1 Quoted Price | Level 2 Significant Observable Inputs | Level 3 Significant Unobservable Inputs | |||||||||||||
Securities Sold Short | ||||||||||||||||
Basic Industries | $ | (10,400,005 | ) | $ | (10,400,005 | ) | $ | — | $ | — | ||||||
Capital Goods | (34,548,101 | ) | (34,548,101 | ) | — | — | ||||||||||
Communications | (26,906,705 | ) | (26,906,695 | ) | — | (10 | ) | |||||||||
Consumer Durables | (21,961,906 | ) | (21,961,906 | ) | — | — | ||||||||||
Consumer Non-Durables | (16,612,539 | ) | (16,612,383 | ) | — | (156 | ) | |||||||||
Consumer Services | (78,947,109 | ) | (78,947,109 | ) | — | — | ||||||||||
Energy | (16,852,350 | ) | (16,852,350 | ) | — | — | ||||||||||
Finance | (5,911,348 | ) | (5,911,348 | ) | — | — | ||||||||||
Health Care | (38,781,082 | ) | (38,781,082 | ) | — | — | ||||||||||
Real Estate Investment Trusts | (5,185,754 | ) | (5,185,754 | ) | — | — | ||||||||||
Technology | (84,182,248 | ) | (84,182,248 | ) | — | — | ||||||||||
Utilities | (3,184,428 | ) | (3,184,428 | ) | — | — | ||||||||||
Options Written | ||||||||||||||||
Equity Contracts | (571,277 | ) | — | (571,277 | ) | — | ||||||||||
|
|
|
|
|
|
|
| |||||||||
Total Liabilities | $ | (344,044,852 | ) | $ | (343,473,409 | ) | $ | (571,277 | ) | $ | (166 | ) | ||||
|
|
|
|
|
|
|
| |||||||||
| THEACCOMPANYINGNOTESAREANINTEGRALPARTOFTHEFINANCIALSTATEMENTS. | ||
| 16 | SEMI-ANNUAL REPORT 2012 | ||
| ROBECO INVESTMENT FUNDS | FEBRUARY 29, 2012 (UNAUDITED) | |
| ROBECO BOSTON PARTNERS LONG/SHORT EQUITY FUND (concluded) | PORTFOLIOOF INVESTMENTS | |
The following is a reconciliation of the Fund’s Level 3 investments for which significant unobservable inputs were used to determine fair value.
| Common Stock | Preferred Stock | |||||||||||
| Total Investments | Finance | Finance | ||||||||||
Balance as of August 31, 2011 | $ | 2,369,486 | $ | 2,103,885 | $ | 265,601 | ||||||
Net realized gain/(loss) | — | — | — | |||||||||
Change in unrealized appreciation/(depreciation) | (266,579 | ) | (206,829 | ) | (59,750 | ) | ||||||
Purchases | — | — | — | |||||||||
Sales | — | — | — | |||||||||
Transfers in * | — | — | — | |||||||||
Transfers out * | — | — | — | |||||||||
|
|
|
|
|
| |||||||
Balance as of February 29, 2012 | $ | 2,102,907 | $ | 1,897,056 | $ | 205,851 | ||||||
|
|
|
|
|
| |||||||
Securities Sold Short | ||||||||||||
| Total Investments | Communications | Consumer Non-Durables | ||||||||||
Balance as of August 31, 2011 | $ | (10 | ) | $ | (10 | ) | $ | — | ||||
Net realized gain/(loss) | — | — | — | |||||||||
Change in unrealized appreciation/(depreciation) | — | — | — | |||||||||
Purchases | — | — | — | |||||||||
Sales | — | — | — | |||||||||
Transfers in * | (156 | ) | — | (156 | ) | |||||||
Transfers out * | — | — | — | |||||||||
|
|
|
|
|
| |||||||
Balance as of February 29, 2012 | $ | (166 | ) | $ | (10 | ) | $ | (156 | ) | |||
|
|
|
|
|
| |||||||
| * | Transfers in and/or (out) of Level 3 are recognized at the end of each reporting period. The transfer in occurred because of lack of observable market data due to decrease in market activity for this security. The change in unrealized appreciation/(depreciation) related to investments still held at February 29, 2012 was $(266,579). |
| THEACCOMPANYINGNOTESAREANINTEGRALPARTOFTHEFINANCIALSTATEMENTS. | ||
| SEMI-ANNUAL REPORT 2012 | 17 | ||
| ROBECO INVESTMENT FUNDS | FEBRUARY 29, 2012 (UNAUDITED) | |
| ROBECO BOSTON PARTNERS LONG/SHORT RESEARCH FUND | PORTFOLIOOF INVESTMENTS | |
| Number of Shares | Value | |||||||
LONG POSITIONS—91.7% | ||||||||
COMMON STOCK—91.7% | ||||||||
Basic Industries—3.9% | ||||||||
Ashland, Inc. | 5,196 | $ | 330,258 | |||||
AuRico Gold, Inc. * | 43,040 | 421,939 | ||||||
Ball Corp. † | 4,667 | 187,053 | ||||||
Barrick Gold Corp. † | 9,795 | 467,515 | ||||||
Crown Holdings, Inc. * | 8,152 | 301,379 | ||||||
Cytec Industries, Inc. † | 4,198 | 249,613 | ||||||
FP Corp. | 2,600 | 161,520 | ||||||
Globe Specialty Metals, | 23,232 | 330,359 | ||||||
Graphic Packaging Holding Co. * † | 83,908 | 443,034 | ||||||
Minerals Technologies, Inc. † | 4,014 | 259,184 | ||||||
Newmont Mining Corp. † # | 6,460 | 383,724 | ||||||
Osisko Mining Corp. * | 25,000 | 316,843 | ||||||
Rock-Tenn Co., Class A | 8,012 | 564,766 | ||||||
Spartech Corp. * † | 41,079 | 238,258 | ||||||
St Barbara Ltd. * | 124,800 | 309,176 | ||||||
|
| |||||||
| 4,964,621 | ||||||||
|
| |||||||
Capital Goods—11.3% | ||||||||
ABB Ltd. - Sponsored ADR * | 21,490 | 440,330 | ||||||
Briggs & Stratton Corp. | 11,600 | 196,504 | ||||||
CIRCOR International, Inc. † | 5,735 | 189,886 | ||||||
CNH Global NV * | 8,830 | 378,895 | ||||||
Cubic Corp. | 4,590 | 219,402 | ||||||
Curtiss-Wright Corp. | 13,754 | 510,961 | ||||||
Dover Corp. † | 4,540 | 290,651 | ||||||
Emerson Electric Co. | 6,880 | 346,133 | ||||||
EnPro Industries, Inc. * † | 9,944 | 375,983 | ||||||
Exelon Corp. | 8,780 | 343,035 | ||||||
Fluor Corp. | 5,066 | 306,392 | ||||||
Honeywell International, | 15,880 | 945,972 | ||||||
Hubbell, Inc., Class B | 4,557 | 342,778 | ||||||
Hyundai Mobis | 706 | 179,857 | ||||||
Illinois Tool Works, Inc. † | 5,865 | 326,622 | ||||||
JTEKT Corp. | 15,800 | 178,428 | ||||||
Kennametal, Inc. † | 8,265 | 380,769 | ||||||
Lockheed Martin Corp. | 8,465 | 748,391 | ||||||
Makita Corp. | 10,600 | 440,743 | ||||||
Meggitt PLC | 49,869 | 306,554 | ||||||
Northrop Grumman Corp. | 5,490 | 328,357 | ||||||
PACCAR, Inc. | 9,270 | 426,513 | ||||||
Parker-Hannifin Corp. | 3,835 | 344,421 | ||||||
Precision Castparts Corp. † | 2,970 | 497,267 | ||||||
Raytheon Co. | 6,680 | 337,474 | ||||||
Siemens AG - Sponsored ADR † | 4,805 | 479,107 | ||||||
Smiths Group PLC | 25,623 | 443,505 | ||||||
SPX Corp. | 3,242 | 237,120 | ||||||
Standex International Corp. | 12,216 | 466,773 | ||||||
Stanley Black & Decker, Inc. | 6,490 | 498,432 | ||||||
Textron, Inc. | 8,980 | 247,040 | ||||||
TriMas Corp. * † | 9,205 | 223,037 | ||||||
Tyco International, Ltd. † | 17,735 | 919,028 | ||||||
Volvo AB - Sponsored ADR | 37,347 | 542,278 | ||||||
WABCO Holdings, Inc. * | 5,345 | 317,974 | ||||||
WESCO International, Inc. * † | 7,525 | 473,247 | ||||||
|
| |||||||
| 14,229,859 | ||||||||
|
| |||||||
| Number of Shares | Value | |||||||
Communications—5.8% | ||||||||
Comcast Corp., Class A † | 29,195 | $ | 857,749 | |||||
Deutsche Telekom AG | 24,040 | 280,570 | ||||||
Expedia, Inc. | 14,475 | 492,874 | ||||||
Google, Inc., Class A * # | 795 | 491,509 | ||||||
Liberty Media Corp., Inc - Liberty Capital, Class A * † | 9,165 | 823,842 | ||||||
Monster Worldwide, Inc. * † | 26,665 | 185,055 | ||||||
Netease.com, Inc. - ADR * † | 4,910 | 257,382 | ||||||
RigNet, Inc. * † | 29,755 | 505,835 | ||||||
Shenandoah Telecommunications Co. † | 8,905 | 88,961 | ||||||
Sohu.Com, Inc. * | 8,815 | 434,932 | ||||||
Time Warner Cable, Inc. † | 8,810 | 698,985 | ||||||
Vodafone Group PLC - Sponsored ADR † | 25,740 | 697,297 | ||||||
Walt Disney Co. (The) | 15,025 | 630,900 | ||||||
Windstream Corp. † | 47,015 | 567,941 | ||||||
Yahoo!, Inc. * | 23,165 | 343,537 | ||||||
|
| |||||||
| 7,357,369 | ||||||||
|
| |||||||
Consumer Durables—1.7% | ||||||||
Hoshizaki Electric Co. Ltd. | 9,175 | 195,712 | ||||||
Johnson Controls, Inc. † | 15,949 | 520,416 | ||||||
Lear Corp. | 12,278 | 555,088 | ||||||
LISI | 2,814 | 234,319 | ||||||
Swatch Group AG (The), Bearer Shares | 1,050 | 476,080 | ||||||
Unipres Corp. | 5,600 | 154,656 | ||||||
|
| |||||||
| 2,136,271 | ||||||||
|
| |||||||
Consumer Non-Durables—5.3% |
| |||||||
Anheuser-Busch InBev NV - Sponsored ADR † | 13,451 | 904,580 | ||||||
Coca-Cola Enterprises, Inc. † | 28,445 | 822,060 | ||||||
ConAgra Foods, Inc. † | 24,230 | 636,037 | ||||||
Cott Corp. * † | 103,045 | 675,975 | ||||||
Electronic Arts, Inc. * † | 29,140 | 475,856 | ||||||
Guess?, Inc. † | 14,455 | 500,866 | ||||||
Henkel AG & Co. KGaA | 6,340 | 346,023 | ||||||
Kerry Group PLC, Class A | 7,262 | 309,606 | ||||||
Lorillard, Inc. † | 4,850 | 635,738 | ||||||
Tyson Foods, Inc., Class A | 33,450 | 632,540 | ||||||
Unilever NV † | 21,610 | 719,829 | ||||||
|
| |||||||
| 6,659,110 | ||||||||
|
| |||||||
Consumer Services—16.1% | ||||||||
ANN, Inc. * † | 14,720 | 351,661 | ||||||
CBS Corp., Class B non-voting shares † | 28,980 | 866,502 | ||||||
Century Casinos, Inc. * † | 40,628 | 113,758 | ||||||
Cinemark Holdings, Inc. † | 28,035 | 586,492 | ||||||
Covanta Holding Corp. | 15,430 | 251,972 | ||||||
Ctrip.Com International Ltd- ADR * | 10,925 | 299,017 | ||||||
CVS Caremark Corp. † | 14,479 | 653,003 | ||||||
Dun & Bradstreet Corp., (The) | 8,605 | 711,203 | ||||||
eBay, Inc. * † | 17,575 | 628,130 | ||||||
eLong, Inc. - Sponsored ADR | 23,140 | 365,843 | ||||||
Equifax, Inc. † | 14,880 | 625,555 | ||||||
| THEACCOMPANYINGNOTESAREANINTEGRALPARTOFTHEFINANCIALSTATEMENTS. | ||
| 18 | SEMI-ANNUAL REPORT 2012 | ||
| ROBECO INVESTMENT FUNDS | FEBRUARY 29, 2012 (UNAUDITED) | |
| ROBECO BOSTON PARTNERS LONG/SHORT RESEARCH FUND (continued) | PORTFOLIOOF INVESTMENTS | |
| Number of Shares | Value | |||||||
Consumer Services—(continued) |
| |||||||
Finish Line, Inc., (The), Class A | 14,706 | $ | 338,091 | |||||
FTI Consulting, Inc. * † | 18,975 | 760,328 | ||||||
Home Depot, Inc. (The) † | 12,395 | 589,630 | ||||||
IAC/InterActiveCorp | 6,735 | 307,116 | ||||||
Kohl’s Corp. † | 13,213 | 656,422 | ||||||
Lowe’s Cos., Inc. | 19,895 | 564,620 | ||||||
Macy’s, Inc. † | 18,513 | 702,939 | ||||||
Manpower, Inc. † | 12,883 | 554,871 | ||||||
McGraw-Hill Cos., Inc., (The) † | 18,965 | 882,631 | ||||||
Mecox Lane Ltd. - ADR * † | 78,470 | 98,872 | ||||||
Moody’s Corp. † | 18,560 | 716,602 | ||||||
Nordstrom, Inc. † | 9,345 | 501,079 | ||||||
Odyssey Marine Exploration, Inc. * † | 190,070 | 579,714 | ||||||
Omnicom Group, Inc. † | 15,240 | 753,466 | ||||||
Republic Services, Inc. | 16,515 | 492,642 | ||||||
Robert Half International, Inc. † | 23,643 | 672,170 | ||||||
Staples, Inc. | 7,327 | 107,414 | ||||||
Target Corp. † | 11,942 | 676,992 | ||||||
Time Warner, Inc. † | 13,580 | 505,312 | ||||||
Towers Watson & Co., Class A † | 11,508 | 735,822 | ||||||
Viacom, Inc., Class B † | 13,135 | 625,489 | ||||||
Wal-Mart Stores, Inc. † | 7,745 | 457,575 | ||||||
Walgreen Co. | 15,170 | 503,037 | ||||||
WPP PLC | 64,175 | 820,335 | ||||||
Wright Express Corp. * | 13,795 | 853,635 | ||||||
Xylem Inc | 16,364 | 425,137 | ||||||
|
| |||||||
| 20,335,077 | ||||||||
|
| |||||||
Energy—5.1% | ||||||||
Canadian Natural Resources Ltd. † | 12,340 | 457,937 | ||||||
Devon Energy Corp. | 5,800 | 425,198 | ||||||
EnerSys * | 12,708 | 426,735 | ||||||
EOG Resources, Inc. † | 11,098 | 1,263,618 | ||||||
Exxon Mobil Corp. | 7,875 | 681,187 | ||||||
Noble Energy, Inc. † # | 5,445 | 531,704 | ||||||
Occidental Petroleum Corp. † | 5,990 | 625,176 | ||||||
Rosetta Resources, Inc. * † | 8,459 | 431,747 | ||||||
Royal Dutch Shell PLC-ADR | 10,991 | 803,332 | ||||||
SM Energy Co. | 4,605 | 362,506 | ||||||
WPX Energy, Inc. * | 23,840 | 432,934 | ||||||
|
| |||||||
| 6,442,074 | ||||||||
|
| |||||||
Finance—16.6% | ||||||||
ACE Ltd. † | 6,210 | 445,319 | ||||||
American Express Co. † | 8,120 | 429,467 | ||||||
Barclays PLC - Sponsored ADR † | 34,619 | 539,018 | ||||||
Berkshire Hathaway, Inc., Class B * † | 8,130 | 637,798 | ||||||
Capital One Financial Corp. † | 22,735 | 1,150,391 | ||||||
Catlin Group Ltd. | 59,250 | 392,405 | ||||||
Citigroup, Inc. † | 33,021 | 1,100,260 | ||||||
Comerica, Inc. † | 28,415 | 843,641 | ||||||
Discover Financial Services † | 31,103 | 933,401 | ||||||
East West Bancorp, Inc. † | 20,245 | 447,819 | ||||||
Fifth Third Bancorp † | 78,325 | 1,066,003 | ||||||
First Niagara Financial Group, Inc. | 45,000 | 430,200 | ||||||
Goldman Sachs Group, Inc., (The) † | 4,125 | 474,952 | ||||||
Huntington Bancshares, Inc. | 132,555 | 774,784 | ||||||
JPMorgan Chase & Co. † | 28,962 | 1,136,469 | ||||||
| Number of Shares | Value | |||||||
Finance—(continued) | ||||||||
M&T Bank Corp. | 5,425 | $ | 442,789 | |||||
Marsh & McLennan Cos., | 19,030 | 593,736 | ||||||
MetLife, Inc. † | 9,250 | 356,588 | ||||||
Morgan Stanley | 11,805 | 218,865 | ||||||
PNC Financial Services Group, Inc. † | 16,050 | 955,296 | ||||||
Raymond James Financial, Inc. † | 26,605 | 941,019 | ||||||
SLM Corp. † | 58,863 | 927,681 | ||||||
Steel Excel, Inc. * | 10,500 | 293,475 | ||||||
SunTrust Banks, Inc. † | 37,435 | 859,508 | ||||||
TD Ameritrade Holding | 43,010 | 802,997 | ||||||
Torchmark Corp. † | 11,640 | 563,842 | ||||||
Travelers Cos., Inc., (The) | 7,410 | 429,558 | ||||||
US Bancorp † | 32,555 | 957,117 | ||||||
Validus Holdings Ltd. † | 16,955 | 516,958 | ||||||
Wells Fargo & Co. † | 42,193 | 1,320,219 | ||||||
|
| |||||||
| 20,981,575 | ||||||||
|
| |||||||
Health Care—8.9% | ||||||||
AmerisourceBergen Corp. † | 14,960 | 558,756 | ||||||
Amgen, Inc. † | 5,777 | 392,547 | ||||||
Bayer AG - Sponsored ADR † | 3,305 | 244,388 | ||||||
CareFusion Corp. * † | 14,423 | 372,258 | ||||||
Chemed Corp. | 10,000 | 618,200 | ||||||
CIGNA Corp. | 13,610 | 600,337 | ||||||
Covidien PLC † | 11,252 | 587,917 | ||||||
DaVita, Inc. * † | 6,910 | 598,060 | ||||||
Exactech, Inc. * | 14,469 | 229,912 | ||||||
Express Scripts, Inc. * † | 8,750 | 466,637 | ||||||
Hologic, Inc. * † | 16,055 | 332,820 | ||||||
Humana, Inc. † | 6,240 | 543,504 | ||||||
ICON PLC, Sponsored ADR * | 15,374 | 325,621 | ||||||
Johnson & Johnson † | 6,600 | 429,528 | ||||||
McKesson Corp. † | 8,230 | 687,287 | ||||||
Medco Health Solutions, | 5,500 | 371,745 | ||||||
Omnicare, Inc. † | 16,915 | 595,070 | ||||||
PAREXEL International | 9,877 | 241,789 | ||||||
Pfizer, Inc. † | 22,680 | 478,548 | ||||||
Quest Diagnostics, Inc. † | 7,395 | 429,280 | ||||||
Roche Holding AG - Sponsored ADR † | 8,230 | 358,663 | ||||||
Sanofi - ADR | 8,785 | 325,309 | ||||||
Stryker Corp. † | 6,913 | 370,813 | ||||||
UnitedHealth Group, Inc. | 11,680 | 651,160 | ||||||
WellPoint, Inc. | 6,620 | 434,471 | ||||||
|
| |||||||
| 11,244,620 | ||||||||
|
| |||||||
Technology—16.1% | ||||||||
Accenture PLC, Class A † | 10,697 | 636,899 | ||||||
Alliance Data Systems | 2,890 | 350,730 | ||||||
Amdocs Ltd. * † | 24,480 | 750,802 | ||||||
Analog Devices, Inc. † | 13,866 | 543,686 | ||||||
Apple, Inc. * † | 2,275 | 1,234,051 | ||||||
Arrow Electronics, Inc. * † | 19,067 | 765,540 | ||||||
Avnet, Inc. * † | 17,510 | 625,807 | ||||||
BMC Software, Inc. * † | 15,500 | 580,320 | ||||||
CA, Inc. † | 26,763 | 723,404 | ||||||
CACI International, Inc., Class A * † | 9,055 | 535,513 | ||||||
| THEACCOMPANYINGNOTESAREANINTEGRALPARTOFTHEFINANCIALSTATEMENTS. | ||
| SEMI-ANNUAL REPORT 2012 | 19 | ||
| ROBECO INVESTMENT FUNDS | FEBRUARY 29, 2012 (UNAUDITED) | |
| ROBECO BOSTON PARTNERS LONG/SHORT RESEARCH FUND (continued) | PORTFOLIOOF INVESTMENTS | |
| Number of Shares | Value | |||||||
Technology—(continued) |
| |||||||
CDC Software Corp. - ADR * | 54,213 | $ | 504,181 | |||||
CGI Group, Inc., Class A * † | 25,030 | 536,643 | ||||||
Cisco Systems, Inc. † | 40,605 | 807,227 | ||||||
EMC Corp. * † | 32,727 | 906,211 | ||||||
Flextronics International | 109,639 | 772,955 | ||||||
Harris Corp. † | 23,605 | 1,029,886 | ||||||
Hewlett-Packard | 16,827 | 425,891 | ||||||
Ingram Micro, Inc., Class A * † | 42,265 | 808,529 | ||||||
International Business Machines Corp. | 1,718 | 337,982 | ||||||
Microsoft Corp. † | 31,945 | 1,013,934 | ||||||
Oracle Corp. † | 20,432 | 598,045 | ||||||
Seagate Technology PLC | 34,920 | 916,999 | ||||||
STMicroelectronics NV † | 62,823 | 466,147 | ||||||
Symantec Corp. * † | 32,983 | 588,417 | ||||||
TE Connectivity Ltd. † | 13,450 | 491,598 | ||||||
TeleTech Holdings, Inc. * | 13,567 | 207,168 | ||||||
Texas Instruments, Inc. † | 21,190 | 706,687 | ||||||
United Technologies Corp. | 4,510 | 378,254 | ||||||
Western Digital | 22,720 | 891,760 | ||||||
Western Union Co., | 26,310 | 459,636 | ||||||
Xerox Corp. † | 90,403 | 744,017 | ||||||
|
| |||||||
| 20,338,919 | ||||||||
|
| |||||||
Transportation—0.4% |
| |||||||
UTi Worldwide, Inc. | 32,220 | 520,031 | ||||||
|
| |||||||
| 520,031 | ||||||||
|
| |||||||
Utilities—0.5% | ||||||||
AES Corp., (The) * | 18,970 | 257,233 | ||||||
PG&E Corp. † | 6,170 | 257,166 | ||||||
SemGroup Corp., Class A * † | 5,065 | 143,694 | ||||||
|
| |||||||
| 658,093 | ||||||||
|
| |||||||
TOTAL COMMON STOCK—91.7% |
| 115,867,619 | ||||||
|
| |||||||
TOTAL LONG |
| 115,867,619 | ||||||
|
| |||||||
SECURITIES SOLD SHORT—(35.4%) |
| |||||||
COMMON STOCK—(35.4%) |
| |||||||
Basic Industries—(1.1%) |
| |||||||
Air Liquide SA - ADR | (7,994 | ) | (207,484 | ) | ||||
AMETEK, Inc. | (4,125 | ) | (196,350 | ) | ||||
Bemis Co., Inc. | (4,599 | ) | (144,271 | ) | ||||
Haynes International, Inc. | (2,550 | ) | (161,389 | ) | ||||
Seabridge Gold, Inc. * | (5,029 | ) | (118,986 | ) | ||||
Sun Hydraulics Corp. | (5,010 | ) | (164,629 | ) | ||||
Tennant CO | (3,560 | ) | (146,102 | ) | ||||
Texas Industries, Inc. | (6,799 | ) | (230,010 | ) | ||||
|
| |||||||
| (1,369,221 | ) | |||||||
|
| |||||||
Capital Goods—(3.8%) |
| |||||||
AAON, Inc. | (7,350 | ) | (136,342 | ) | ||||
Acuity Brands, Inc. | (5,631 | ) | (350,192 | ) | ||||
Donaldson Co., Inc. | (1,985 | ) | (145,759 | ) | ||||
Eaton Corp. | (8,230 | ) | (429,524 | ) | ||||
Fastenal Co. | (10,440 | ) | (549,979 | ) | ||||
| Number of Shares | Value | |||||||
Capital Goods—(continued) | ||||||||
Graco, Inc. | (3,177 | ) | $ | (162,599 | ) | |||
KEYW Holding Corp., (The) * | (22,487 | ) | (159,658 | ) | ||||
Kubota Corp. - Sponsored ADR | (3,710 | ) | (182,198 | ) | ||||
Manitex International, Inc. * | (18,990 | ) | (124,954 | ) | ||||
Middleby Corp., (The) * | (3,366 | ) | (328,993 | ) | ||||
National Presto Industries, Inc. | (1,620 | ) | (140,276 | ) | ||||
Nordson Corp. | (2,485 | ) | (136,600 | ) | ||||
Otter Tail Corp. | (3,070 | ) | (65,207 | ) | ||||
Pfeiffer Vacuum Technology AG | (2,201 | ) | (238,375 | ) | ||||
RTI International Metals, Inc. * | (3,720 | ) | (83,849 | ) | ||||
Shanghai Electric Group Co. Ltd. | (457,117 | ) | (246,941 | ) | ||||
Simpson Manufacturing Co., Inc. | (9,242 | ) | (275,596 | ) | ||||
Titan Machinery, Inc. * | (5,390 | ) | (141,164 | ) | ||||
Trex Co., Inc. * | (5,565 | ) | (149,865 | ) | ||||
Twin Disc, Inc. | (9,795 | ) | (313,048 | ) | ||||
Vulcan Materials Co. | (5,102 | ) | (227,345 | ) | ||||
Watsco, Inc. | (2,663 | ) | (190,112 | ) | ||||
|
| |||||||
| (4,778,576 | ) | |||||||
|
| |||||||
Communications—(3.9%) | ||||||||
AMC Networks, Inc. * | (6,080 | ) | (275,971 | ) | ||||
Ancestry.com, Inc. * | (3,015 | ) | (68,682 | ) | ||||
Calix, Inc. * | (34,490 | ) | (311,790 | ) | ||||
Cbeyond, Inc. * | (24,945 | ) | (191,578 | ) | ||||
Cincinnati Bell, Inc. * | (86,855 | ) | (325,706 | ) | ||||
Cogent Communications Group, Inc. * | (7,385 | ) | (136,032 | ) | ||||
Consolidated Communications Holdings, Inc. | (7,960 | ) | (151,001 | ) | ||||
Equinix, Inc. * | (3,900 | ) | (546,702 | ) | ||||
Frontier Communications Corp | (23,170 | ) | (106,350 | ) | ||||
Koninklijke KPN NV | (31,060 | ) | (336,637 | ) | ||||
Level 3 Communications, | (12,880 | ) | (313,113 | ) | ||||
LinkedIn Corp., Class A * | (2,395 | ) | (208,054 | ) | ||||
Lumos Networks Corp. | (10,930 | ) | (139,904 | ) | ||||
NII Holdings, Inc. * | (11,160 | ) | (199,541 | ) | ||||
Oclaro, Inc. * | (44,030 | ) | (190,210 | ) | ||||
OpenTable, Inc. * | (9,325 | ) | (452,262 | ) | ||||
Rackspace Hosting, Inc. * | (7,754 | ) | (405,069 | ) | ||||
Sprint Nextel Corp. * | (51,950 | ) | (128,316 | ) | ||||
Telefonica SA - Sponsored ADR | (10,970 | ) | (187,477 | ) | ||||
tw telecom, Inc. * | (12,105 | ) | (261,468 | ) | ||||
|
| |||||||
| (4,935,863 | ) | |||||||
|
| |||||||
Consumer Durables—(1.8%) |
| |||||||
American Axle & Manaufacturing Holdings, Inc. * | (23,901 | ) | (272,232 | ) | ||||
Elekta AB, B Shares | (4,245 | ) | (198,880 | ) | ||||
KB Home | (25,114 | ) | (286,802 | ) | ||||
Meritage Homes Corp. * | (7,914 | ) | (204,893 | ) | ||||
Sherwin-Williams Co., (The) | (1,754 | ) | (180,925 | ) | ||||
Toll Brothers, Inc. * | (13,980 | ) | (327,971 | ) | ||||
Under Armour, Inc., Class A * | (5,740 | ) | (512,238 | ) | ||||
Whirlpool Corp. | (4,458 | ) | (336,891 | ) | ||||
|
| |||||||
| (2,320,832 | ) | |||||||
|
| |||||||
| THEACCOMPANYINGNOTESAREANINTEGRALPARTOFTHEFINANCIALSTATEMENTS. | ||
| 20 | SEMI-ANNUAL REPORT 2012 | ||
| ROBECO INVESTMENT FUNDS | FEBRUARY 29, 2012 (UNAUDITED) | |
| ROBECO BOSTON PARTNERS LONG/SHORT RESEARCH FUND (continued) | PORTFOLIOOF INVESTMENTS | |
| Number of Shares | Value | |||||||
Consumer Non-Durables—(2.2%) |
| |||||||
Clorox Co., (The) | (5,670 | ) | $ | (383,349 | ) | |||
Flowers Foods, Inc. | (18,319 | ) | (350,626 | ) | ||||
Green Mountain Coffee Roasters, Inc. * | (5,115 | ) | (332,322 | ) | ||||
Hershey Co., (The) | (6,440 | ) | (390,908 | ) | ||||
Luxottica Group SPA - Sponsored ADR | (10,134 | ) | (361,986 | ) | ||||
Monster Beverage Corp. * | (7,870 | ) | (450,085 | ) | ||||
Tootsie Roll Industries, Inc. | (17,370 | ) | (403,852 | ) | ||||
WMS Industries, Inc. * | (6,102 | ) | (134,427 | ) | ||||
|
| |||||||
| (2,807,555 | ) | |||||||
|
| |||||||
Consumer Services—(6.8%) |
| |||||||
Amazon.com, Inc. * | (745 | ) | (133,869 | ) | ||||
AutoNation, Inc. * | (4,964 | ) | (169,173 | ) | ||||
Blue Nile, Inc. * | (11,105 | ) | (395,893 | ) | ||||
Buffalo Wild Wings, Inc. * | (6,040 | ) | (522,400 | ) | ||||
Cenveo, Inc. * | (78,860 | ) | (307,554 | ) | ||||
Clean Harbors, Inc. * | (1,077 | ) | (72,331 | ) | ||||
Concur Technologies, Inc. * | (6,344 | ) | (373,979 | ) | ||||
Fresh Market, Inc., (The) * | (10,165 | ) | (457,628 | ) | ||||
Iron Mountain, Inc. | (8,622 | ) | (267,713 | ) | ||||
Jack in the Box, Inc. * | (17,210 | ) | (410,458 | ) | ||||
JC Penney Co., Inc. | (10,620 | ) | (420,552 | ) | ||||
Monro Muffler Brake, Inc. | (9,200 | ) | (422,004 | ) | ||||
Old Dominion Freight Line, | (6,900 | ) | (300,219 | ) | ||||
Pegasystems, Inc. | (8,884 | ) | (249,463 | ) | ||||
Pool Corp. | (4,145 | ) | (150,878 | ) | ||||
priceline.com, Inc. * | (370 | ) | (231,997 | ) | ||||
Red Robin Gourmet Burgers, Inc. * | (13,515 | ) | (465,051 | ) | ||||
Regal Entertainment Group, Class A | (29,785 | ) | (411,629 | ) | ||||
Ritchie Bros.Auctioneers, Inc. | (18,141 | ) | (443,003 | ) | ||||
Rollins, Inc. | (20,246 | ) | (410,184 | ) | ||||
Shutterfly, Inc. * | (3,660 | ) | (100,138 | ) | ||||
Sinclair Broadcasting Group, Inc., Class A | (26,250 | ) | (299,775 | ) | ||||
Sonic Corp. * | (48,098 | ) | (397,289 | ) | ||||
Sturm Ruger & Co., Inc. | (3,486 | ) | (145,645 | ) | ||||
Sysco Corp. | (14,230 | ) | (418,647 | ) | ||||
Vail Resorts, Inc. | (2,528 | ) | (106,429 | ) | ||||
Youku.com, Inc. - ADR * | (22,825 | ) | (573,821 | ) | ||||
|
| |||||||
| (8,657,722 | ) | |||||||
|
| |||||||
Energy—(2.6%) | ||||||||
Apco Oil and Gas International , Inc. | (4,250 | ) | (319,515 | ) | ||||
Baytex Energy Corp. | (1,760 | ) | (101,781 | ) | ||||
Chesapeake Energy Corp. | (18,950 | ) | (473,750 | ) | ||||
Concho Resources, Inc. * | (3,920 | ) | (418,813 | ) | ||||
Continental Resources, | (4,984 | ) | (451,949 | ) | ||||
Crescent Point Energy Corp. | (9,175 | ) | (434,432 | ) | ||||
Forest Oil Corp. * | (18,945 | ) | (244,959 | ) | ||||
Gasfrac Energy Services, Inc. * | (10,185 | ) | (85,437 | ) | ||||
Goodrich Petroleum Corp. * | (16,040 | ) | (255,517 | ) | ||||
Petroleum Development Corp. * | (2,540 | ) | (82,652 | ) | ||||
Petroquest Energy, Inc. * | (25,305 | ) | (154,360 | ) | ||||
Whiting Petroleum Corp. * | (3,545 | ) | (207,879 | ) | ||||
|
| |||||||
| (3,231,044 | ) | |||||||
|
| |||||||
| Number of Shares | Value | |||||||
ExchangeTraded Funds—(0.5%) |
| |||||||
iPath Dow Jones-UBS Copper Subindex Total Return ETN * | (2,465 | ) | $ | (122,584 | ) | |||
SPDR Gold Shares * | (1,250 | ) | (205,362 | ) | ||||
United States Oil Fund LP * | (7,400 | ) | (302,808 | ) | ||||
|
| |||||||
| (630,754 | ) | |||||||
|
| |||||||
Finance—(4.5%) | ||||||||
City National Corp. | (4,550 | ) | (213,850 | ) | ||||
Commonwealth Bank of Australia | (4,675 | ) | (247,829 | ) | ||||
CVB Financial Corp. | (29,459 | ) | (317,273 | ) | ||||
E*Trade Financial Corp. * | (15,045 | ) | (144,883 | ) | ||||
Eaton Vance Corp. | (5,070 | ) | (146,067 | ) | ||||
First Cash Financial Services, Inc. * | (6,910 | ) | (292,017 | ) | ||||
FirstMerit Corp. | (7,175 | ) | (115,159 | ) | ||||
Gain Capital Holdings, Inc. | (35,965 | ) | (188,457 | ) | ||||
Glacier Bancorp, Inc. | (16,725 | ) | (230,805 | ) | ||||
Greenhill & Co., Inc. | (2,615 | ) | (114,955 | ) | ||||
Hancock Holding Co. | (7,648 | ) | (259,650 | ) | ||||
Iberiabank Corp. | (6,537 | ) | (346,722 | ) | ||||
KBW, Inc. | (9,990 | ) | (165,135 | ) | ||||
MB Financial, Inc. | (10,563 | ) | (210,204 | ) | ||||
Royal Bank of Canada | (3,846 | ) | (216,222 | ) | ||||
TCF Financial Corp. | (31,470 | ) | (339,247 | ) | ||||
Textainer Group Holdings Ltd. | (11,535 | ) | (383,193 | ) | ||||
Tompkins Financial Corp. | (7,238 | ) | (297,482 | ) | ||||
Toronto-Dominion Bank, (The) | (2,380 | ) | (194,018 | ) | ||||
UMB Financial Corp. | (7,076 | ) | (294,715 | ) | ||||
Valley National Bancorp | (26,163 | ) | (327,299 | ) | ||||
Westamerica Bancorporation | (7,169 | ) | (339,524 | ) | ||||
World Acceptance Corp. * | (4,630 | ) | (294,098 | ) | ||||
|
| |||||||
| (5,678,804 | ) | |||||||
|
| |||||||
Health Care—(1.6%) | ||||||||
ABIOMED, Inc. * | (10,521 | ) | (219,678 | ) | ||||
AstraZeneca PLC - Sponsored ADR | (1,639 | ) | (73,575 | ) | ||||
athenahealth, Inc. * | (6,360 | ) | (449,461 | ) | ||||
Biotime, Inc. * | (25,414 | ) | (126,816 | ) | ||||
IDEXX Laboratories, Inc. * | (2,079 | ) | (178,274 | ) | ||||
Lundbeck (H.) A/S | (5,646 | ) | (119,387 | ) | ||||
Orion OYJ, Class B | (5,465 | ) | (117,734 | ) | ||||
Perrigo Co. | (2,295 | ) | (236,523 | ) | ||||
Spectrum Pharmaceuticals, | (11,747 | ) | (166,690 | ) | ||||
Stericycle, Inc. * | (3,867 | ) | (335,540 | ) | ||||
|
| |||||||
| (2,023,678 | ) | |||||||
|
| |||||||
Technology—(5.8%) | ||||||||
Alvarion Ltd. * | (135,704 | ) | (138,418 | ) | ||||
AOL, Inc. * | (26,155 | ) | (469,744 | ) | ||||
Aspen Technology, Inc. * | (19,012 | ) | (390,887 | ) | ||||
Aviat Networks, Inc. * | (65,815 | ) | (173,093 | ) | ||||
Ciena Corp. * | (15,120 | ) | (225,590 | ) | ||||
Cirrus Logic, Inc. * | (21,688 | ) | (511,403 | ) | ||||
Dassault Systemes SA | (3,986 | ) | (330,954 | ) | ||||
Finisar Corp. * | (6,580 | ) | (133,508 | ) | ||||
First Solar, Inc. * | (3,773 | ) | (121,868 | ) | ||||
Infinera Corp. * | (30,375 | ) | (241,785 | ) | ||||
Itron, Inc. * | (8,028 | ) | (356,604 | ) | ||||
Logitech International SA * | (27,176 | ) | (229,909 | ) | ||||
| THEACCOMPANYINGNOTESAREANINTEGRALPARTOFTHEFINANCIALSTATEMENTS. | ||
| SEMI-ANNUAL REPORT 2012 | 21 | ||
| ROBECO INVESTMENT FUNDS | FEBRUARY 29, 2012 (UNAUDITED) | |
| ROBECO BOSTON PARTNERS LONG/SHORT RESEARCH FUND (continued) | PORTFOLIOOF INVESTMENTS | |
| Number of Shares | Value | |||||||
Technology—(continued) |
| |||||||
Marchex, Inc., Class B | (18,395 | ) | $ | (78,915 | ) | |||
National Instruments Corp. | (13,790 | ) | (366,814 | ) | ||||
NetSuite, Inc. * | (9,296 | ) | (443,419 | ) | ||||
Red Hat, Inc. * | (8,542 | ) | (422,487 | ) | ||||
Renren, Inc. - ADR * | (46,070 | ) | (251,081 | ) | ||||
Salesforce.com, Inc. * | (2,688 | ) | (384,814 | ) | ||||
Skyworks Solutions, | (19,012 | ) | (512,754 | ) | ||||
SMA Solar Technology AG | (4,037 | ) | (206,535 | ) | ||||
Syntel, Inc. | (7,178 | ) | (367,514 | ) | ||||
Total Systems Services, Inc. | (4,675 | ) | (102,289 | ) | ||||
Tri-Tech Holding, Inc. * | (21,880 | ) | (183,573 | ) | ||||
VMware, Inc., Class A * | (3,292 | ) | (325,546 | ) | ||||
Wipro Ltd. - ADR | (28,063 | ) | (308,132 | ) | ||||
|
| |||||||
| (7,277,636 | ) | |||||||
|
| |||||||
Transportation—(0.3%) |
| |||||||
CH Robinson Worldwide, Inc. | (3,419 | ) | (226,235 | ) | ||||
Genco Shipping & Trading Ltd. * | (24,050 | ) | (164,742 | ) | ||||
|
| |||||||
| (390,977 | ) | |||||||
|
| |||||||
Utilities—(0.5%) |
| |||||||
Aqua America, Inc. | (3,903 | ) | (86,686 | ) | ||||
Calpine Corp. * | (15,130 | ) | (231,640 | ) | ||||
Clean Energy Fuels Corp. * | (11,550 | ) | (217,024 | ) | ||||
Consolidated Edison, Inc. | (1,569 | ) | (91,159 | ) | ||||
|
| |||||||
| (626,509 | ) | |||||||
|
| |||||||
TOTAL COMMON STOCK |
| (44,729,171 | ) | |||||
|
| |||||||
TOTAL SECURITIES |
| (44,729,171 | ) | |||||
|
| |||||||
| Number of Contracts | ||||||||
OPTIONS WRITTEN††—0.0% |
| |||||||
Google, Inc. Call Options Expires 06/16/12 Strike Price $700 | (4 | ) | (2,600 | ) | ||||
Newmont Mining Corp. Call Options Expires 06/16/12 Strike Price $65 | (49 | ) | (7,203 | ) | ||||
Noble Energy, Inc. Call Options Expires 05/19/12 Strike Price $100 | (40 | ) | (18,400 | ) | ||||
|
| |||||||
TOTAL OPTIONS WRITTEN |
| (28,203 | ) | |||||
|
| |||||||
OTHER ASSETS IN EXCESS OF LIABILITIES—43.7% |
| 55,186,456 | ||||||
|
| |||||||
NET ASSETS—100.0% |
| $ | 126,296,701 | |||||
|
| |||||||
| ADR | — American Depositary Receipt |
| PLC | — Public Limited Company |
| * | — Non-income producing. |
| † | — | Security position is either entirely or partially held in a segregated account as collateral for securities sold short. |
| # | — | Security segregated as collateral for options written. | ||
| †† | — | Primary risk exposure is equity contracts. |
| THEACCOMPANYINGNOTESAREANINTEGRALPARTOFTHEFINANCIALSTATEMENTS. | ||
| 22 | SEMI-ANNUAL REPORT 2012 | ||
| ROBECO INVESTMENT FUNDS | FEBRUARY 29, 2012 (UNAUDITED) | |
| ROBECO BOSTON PARTNERS LONG/SHORT RESEARCH FUND (concluded) | PORTFOLIOOF INVESTMENTS | |
A summary of the inputs used to value the Fund’s investments as of February 29, 2012 is as follows (see Note I in the Notes to Financial Statements):
| Total Value as of 02/29/12 | Level 1 Quoted Price | Level 2 Significant Observable Inputs | Level 3 Significant Unobservable Inputs | |||||||||||||
Investment in securities * | $ | 115,867,619 | $ | 115,867,619 | $ | — | $ | — | ||||||||
|
|
|
|
|
|
|
| |||||||||
Total Assets | $ | 115,867,619 | $ | 115,867,619 | $ | — | $ | — | ||||||||
|
|
|
|
|
|
|
| |||||||||
| Total Value as of 02/29/12 | Level 1 Quoted Price | Level 2 Significant Observable Inputs | Level 3 Significant Unobservable Inputs | |||||||||||||
Investment in securities sold short * | $ | (44,729,171 | ) | $ | (44,729,171 | ) | $ | — | $ | — | ||||||
Options Written | ||||||||||||||||
Equity Contracts * | (28,203 | ) | — | (28,203 | ) | — | ||||||||||
|
|
|
|
|
|
|
| |||||||||
Total Liabilities | $ | (44,757,374 | ) | $ | (44,729,171 | ) | $ | (28,203 | ) | $ | — | |||||
|
|
|
|
|
|
|
| |||||||||
| * | See Portfolio of Investments detail for country and security type breakout |
The following is a reconciliation of the Fund’s Level 3 investments for which significant unobservable inputs were used to determine fair value.
| Securities Sold Short | ||||||||
| Total Investments | Consumer Durables | |||||||
| — | — | |||||||
Balance as of August 31, 2011 | $ | (13,020 | ) | $ | (13,020 | ) | ||
Net realized gain/(loss) | 7,064 | 7,064 | ||||||
Change in unrealized appreciation/(depreciation) | — | — | ||||||
Purchases to cover short | 5,956 | 5,956 | ||||||
Securities sold short | — | — | ||||||
Transfers in ** | — | — | ||||||
Transfers out ** | — | — | ||||||
|
|
|
| |||||
Balance as of February 29, 2012 | $ | — | $ | — | ||||
|
|
|
| |||||
| ** | Transfers in and/or (out) of Level 3 are recognized at the end of each reporting period. As of February 29, 2012, there were no transfers in and/or (out) of Level 3. |
| THEACCOMPANYINGNOTESAREANINTEGRALPARTOFTHEFINANCIALSTATEMENTS. | ||
| SEMI-ANNUAL REPORT 2012 | 23 | ||
| ROBECO INVESTMENT FUNDS | FEBRUARY 29, 2012 (UNAUDITED) | |
| ROBECO BOSTON PARTNERS ALL-CAP VALUE FUND | PORTFOLIOOF INVESTMENTS | |
| Number of Shares | Value | |||||||
COMMON STOCK—98.6% |
| |||||||
Capital Goods—5.7% |
| |||||||
Actuant Corp., Class A | 38,335 | $ | 1,079,897 | |||||
AGCO Corp. * | 16,670 | 860,672 | ||||||
Dover Corp. | 48,075 | 3,077,762 | ||||||
Illinois Tool Works, Inc. | 43,015 | 2,395,505 | ||||||
Parker-Hannifin Corp. | 29,902 | 2,685,499 | ||||||
Stanley Black & Decker, Inc. | 18,845 | 1,447,296 | ||||||
Tyco International, Ltd. | 31,630 | 1,639,067 | ||||||
Volvo AB - Sponsored ADR | 103,840 | 1,507,757 | ||||||
|
| |||||||
| 14,693,455 | ||||||||
|
| |||||||
Communications—3.2% |
| |||||||
Google, Inc., Class A * # | 4,785 | 2,958,326 | ||||||
Monster Worldwide, Inc. * | 51,915 | 360,290 | ||||||
Vodafone Group PLC - Sponsored ADR | 176,003 | 4,767,921 | ||||||
|
| |||||||
| 8,086,537 | ||||||||
|
| |||||||
Consumer Durables—1.4% |
| |||||||
Lear Corp. | 44,245 | 2,000,316 | ||||||
Thor Industries, Inc. | 33,885 | 1,103,634 | ||||||
Tower International, Inc. * | 32,506 | 414,126 | ||||||
|
| |||||||
| 3,518,076 | ||||||||
|
| |||||||
Consumer Non-Durables—4.6% |
| |||||||
Electronic Arts, Inc. * # | 164,470 | 2,685,795 | ||||||
Jones Group, Inc., (The) | 110,995 | 1,093,301 | ||||||
Mattel, Inc. | 78,465 | 2,545,405 | ||||||
Matthews International Corp., Class A | 17,135 | 531,528 | ||||||
PepsiCo, Inc. | 37,260 | 2,345,144 | ||||||
Philip Morris International, Inc. | 31,605 | 2,639,650 | ||||||
|
| |||||||
| 11,840,823 | ||||||||
|
| |||||||
Consumer Services—17.8% |
| |||||||
CBS Corp., Class B non-voting shares | 94,618 | 2,829,078 | ||||||
CEC Entertainment, Inc. | 13,355 | 509,627 | ||||||
eBay, Inc. * | 95,915 | 3,428,002 | ||||||
Equifax, Inc. | 58,540 | 2,461,022 | ||||||
Expedia, Inc. (a) | 56,709 | 1,930,941 | ||||||
HSN, Inc. | 20,075 | 745,987 | ||||||
IAC/InterActiveCorp | 38,620 | 1,761,072 | ||||||
Kohl’s Corp. | 80,951 | 4,021,646 | ||||||
Manpower, Inc. | 69,945 | 3,012,531 | ||||||
Men’s Wearhouse, Inc., (The) | 23,815 | 922,355 | ||||||
Omnicom Group, Inc. | 68,020 | 3,362,909 | ||||||
Pantry, Inc., (The) * | 14,930 | 185,580 | ||||||
Regis Corp. | 111,390 | 1,928,161 | ||||||
Rent-A-Center, Inc. | 52,495 | 1,859,373 | ||||||
Staples, Inc. | 19,095 | 279,933 | ||||||
Target Corp. | 78,005 | 4,422,103 | ||||||
Towers Watson & Co., Class A | 33,680 | 2,153,499 | ||||||
Viacom, Inc., Class B | 52,890 | 2,518,622 | ||||||
Wal-Mart Stores, Inc. | 23,905 | 1,412,307 | ||||||
Walt Disney Co. (The) | 61,005 | 2,561,600 | ||||||
Wright Express Corp. * | 29,395 | 1,818,963 | ||||||
Wyndham Worldwide Corp. | 31,585 | 1,389,424 | ||||||
|
| |||||||
| 45,514,735 | ||||||||
|
| |||||||
| Number of Shares | Value | |||||||
Energy—9.5% |
| |||||||
Apache Corp. | 11,030 | $ | 1,190,468 | |||||
Canadian Natural Resources Ltd. | 31,595 | 1,172,490 | ||||||
Chevron Corp. | 28,255 | 3,083,186 | ||||||
EOG Resources, Inc. | 49,460 | 5,631,516 | ||||||
Exxon Mobil Corp. | 46,975 | 4,063,338 | ||||||
Occidental Petroleum Corp. # | 46,545 | 4,857,902 | ||||||
Royal Dutch Shell PLC-ADR | 53,000 | 3,873,770 | ||||||
SM Energy Co. | 6,650 | 523,488 | ||||||
|
| |||||||
| 24,396,158 | ||||||||
|
| |||||||
Finance—25.4% |
| |||||||
ACE Ltd. | 35,290 | 2,530,646 | ||||||
Alleghany Corp. * (a) | 6,657 | 2,161,128 | ||||||
Axis Capital Holdings Ltd. | 55,190 | 1,702,611 | ||||||
BB&T Corp. | 123,945 | 3,625,391 | ||||||
Bond Street Holdings, Inc. Class A 144A * ‡ | 63,670 | 1,538,267 | ||||||
Capital One Financial Corp. | 97,445 | 4,930,717 | ||||||
Citigroup, Inc. # | 104,947 | 3,496,834 | ||||||
Federated Investors, Inc., | 55,815 | 1,143,649 | ||||||
Fifth Third Bancorp | 141,955 | 1,932,008 | ||||||
First Southern Bancorp, Inc. Class B 144A * ‡ | 17,550 | 144,436 | ||||||
Flagstone Reinsurance Holdings S.A. | 76,355 | 604,732 | ||||||
Hanover Insurance Group, Inc., (The) | 26,035 | 1,062,749 | ||||||
Hercules Technology Growth Capital, Inc. | 71,720 | 740,150 | ||||||
Huntington Bancshares, Inc. | 279,335 | 1,632,713 | ||||||
J.G.Wentworth, Inc. * ± D | — | 0 | ||||||
JPMorgan Chase & Co. | 192,625 | 7,558,605 | ||||||
Loews Corp. | 91,214 | 3,570,116 | ||||||
Maiden Holdings Ltd. | 31,245 | 270,269 | ||||||
MetLife, Inc. | 90,890 | 3,503,810 | ||||||
NBH Holdings Corp., Class A 144A * ‡ | 40,025 | 686,429 | ||||||
Peoples Choice Financial Corp. 144A * D | 1,465 | 0 | ||||||
Raymond James Financial, Inc. | 39,035 | 1,380,668 | ||||||
SLM Corp. | 163,690 | 2,579,754 | ||||||
Solar Cayman Ltd. 144A * | 19,375 | 0 | ||||||
State Street Corp. | 76,045 | 3,211,380 | ||||||
THL Credit, Inc. | 23,960 | 305,730 | ||||||
Torchmark Corp. | 29,325 | 1,420,503 | ||||||
Travelers Cos., Inc., (The) | 42,820 | 2,482,275 | ||||||
Unum Group | 58,566 | 1,349,946 | ||||||
Validus Holdings Ltd. | 77,204 | 2,353,950 | ||||||
Wells Fargo & Co. | 142,470 | 4,457,886 | ||||||
White Mountains Insurance Group Ltd. | 5,110 | 2,535,684 | ||||||
|
| |||||||
| 64,913,036 | ||||||||
|
| |||||||
Health Care—15.9% |
| |||||||
AmerisourceBergen Corp. | 43,725 | 1,633,129 | ||||||
Amgen, Inc. | 90,380 | 6,141,321 | ||||||
Cardinal Health, Inc. | 38,735 | 1,609,439 | ||||||
CareFusion Corp. * | 48,025 | 1,239,525 | ||||||
Covidien PLC | 61,950 | 3,236,887 | ||||||
| THEACCOMPANYINGNOTESAREANINTEGRALPARTOFTHEFINANCIALSTATEMENTS. | ||
| 24 | SEMI-ANNUAL REPORT 2012 | ||
| ROBECO INVESTMENT FUNDS | FEBRUARY 29, 2012 (UNAUDITED) | |
ROBECO BOSTON PARTNERS ALL-CAP VALUE FUND (continued) | PORTFOLIOOF INVESTMENTS | |
| Number of Shares | Value | |||||||
Health Care—(continued) |
| |||||||
Hologic, Inc. * | 67,920 | $ | 1,407,982 | |||||
Humana, Inc. | 35,860 | 3,123,406 | ||||||
Johnson & Johnson | 64,305 | 4,184,969 | ||||||
McKesson Corp. | 36,690 | 3,063,982 | ||||||
Medtronic, Inc. | 34,155 | 1,301,989 | ||||||
Pfizer, Inc. | 422,336 | 8,911,290 | ||||||
Sanofi - ADR | 34,240 | 1,267,907 | ||||||
UnitedHealth Group, Inc. | 37,940 | 2,115,155 | ||||||
WellPoint, Inc. | 23,110 | 1,516,709 | ||||||
|
| |||||||
| 40,753,690 | ||||||||
|
| |||||||
Real Estate Investment Trusts—0.7% |
| |||||||
Ashford Hospitality Trust, Inc. (a) . | 47,975 | 404,909 | ||||||
Colony Financial, Inc. | 50,585 | 843,758 | ||||||
Terreno Realty Corp. | 40,715 | 578,967 | ||||||
TMST, Inc. * D | 191,097 | 0 | ||||||
|
| |||||||
| 1,827,634 | ||||||||
|
| |||||||
Technology—14.1% |
| |||||||
Amdocs Ltd. * | 56,575 | 1,735,155 | ||||||
Arrow Electronics, Inc. * | 32,779 | 1,316,077 | ||||||
Avnet, Inc. * | 49,650 | 1,774,491 | ||||||
BancTec, Inc. 144A * ‡ (a) | 15,732 | 50,185 | ||||||
CA, Inc. | 113,420 | 3,065,743 | ||||||
Cisco Systems, Inc. | 126,845 | 2,521,679 | ||||||
Dun & Bradstreet Corp., (The) | 17,610 | 1,455,466 | ||||||
Flextronics International Ltd. * | 413,661 | 2,916,310 | ||||||
International Business Machines Corp. | 19,670 | 3,869,679 | ||||||
Lexmark International, Inc., Class A | 36,095 | 1,331,184 | ||||||
Microsemi Corp. * | 35,940 | 751,865 | ||||||
Microsoft Corp. | 165,485 | 5,252,494 | ||||||
Seagate Technology PLC | 76,860 | 2,018,344 | ||||||
TE Connectivity Ltd. | 120,145 | 4,391,300 | ||||||
Texas Instruments, Inc. | 39,620 | 1,321,327 | ||||||
Western Union Co., (The) | 134,540 | 2,350,414 | ||||||
|
| |||||||
| 36,121,713 | ||||||||
|
| |||||||
Utilities—0.3% | ||||||||
SemGroup Corp., Class A * | 29,130 | 826,418 | ||||||
|
| |||||||
TOTAL COMMON STOCK |
| 252,492,275 | ||||||
|
| |||||||
PREFERRED STOCK—0.0% |
| |||||||
Finance—0.0% | ||||||||
First Southern Bancorp, Inc. 144A 5.000% ‡ | 30 | 56,141 | ||||||
|
| |||||||
TOTAL PREFERRED STOCK |
| 56,141 | ||||||
|
| |||||||
| Par (000) | ||||||||
CORPORATE BONDS—0.0% |
| |||||||
MBIA Insurance | $ | 151 | 97,395 | |||||
|
| |||||||
TOTAL CORPORATE BONDS |
| 97,395 | ||||||
|
| |||||||
| Number of Shares | Value | |||||||
SECURITIES LENDING COLLATERAL—1.5% |
| |||||||
BlackRock Liquidity Fund | 3,920,093 | $ | 3,920,093 | |||||
|
| |||||||
TOTAL SECURITIES LENDING COLLATERAL |
| 3,920,093 | ||||||
|
| |||||||
TOTAL INVESTMENTS—100.2% |
| 256,565,904 | ||||||
|
| |||||||
| Number of Contracts | ||||||||
OPTIONS WRITTEN††—(0.2%) |
| |||||||
Citigroup, Inc. Call Options | ||||||||
Expires 01/19/13 Strike Price $40 | (849 | ) | (169,800 | ) | ||||
Electronic Arts, Inc. Call Options | ||||||||
Expires 01/19/13 Strike Price $25 | (501 | ) | (17,535 | ) | ||||
Electronic Arts, Inc. Call Options | ||||||||
Expires 01/19/13 Strike Price $30 | (501 | ) | (4,509 | ) | ||||
Google, Inc. Call Options | ||||||||
Expires 01/19/13 Strike Price $600 | (14 | ) | (101,346 | ) | ||||
Google, Inc. Call Options | ||||||||
Expires 01/19/13 Strike Price $600 | (33 | ) | (238,887 | ) | ||||
Occidental Petroleum Corp. Call Options | ||||||||
Expires 08/18/12 Strike Price $115 | (241 | ) | (81,940 | ) | ||||
|
| |||||||
TOTAL OPTIONS WRITTEN |
| (614,017 | ) | |||||
|
| |||||||
OTHER ASSETS IN EXCESS OF LIABILITIES—0.1% |
| 204,706 | ||||||
|
| |||||||
NET ASSETS—100.0% | $ | 256,156,593 | ||||||
|
| |||||||
| ADR | — | American Depositary Receipt | ||
| PLC | — | Public Limited Company | ||
| 144A | — | Security was purchased pursuant to Rule 144A under the Securities Act of 1933 and may not be resold subject to that rule except to qualified institutional buyers. As of February 29, 2012, these securities amounted to $2,475,458 or 1.0% of net assets. Unless otherwise noted, these 144A securities have not been deemed illiquid. | ||
| * | — | Non-income producing. | ||
| ‡ | — | Security has been valued at fair market value as determined in good faith by or under the direction of The RBB Fund, Inc.’s Board of Directors. As of February 29, 2012, these securities amounted to $2,475,458 or 1.0% of net assets. | ||
| ± | — | Total shares owned by the Fund as of February 29, 2012 were less than one share. | ||
| † | — | Adjustable rate security. | ||
| # | — | Security segregated as collateral for options written. | ||
| ## | — | Callable security. |
| THEACCOMPANYINGNOTESAREANINTEGRALPARTOFTHEFINANCIALSTATEMENTS. | ||
| SEMI-ANNUAL REPORT 2012 | 25 | ||
| ROBECO INVESTMENT FUNDS | FEBRUARY 29, 2012 (UNAUDITED) | |
ROBECO BOSTON PARTNERS ALL-CAP VALUE FUND (concluded) | PORTFOLIOOF INVESTMENTS | |
| (a) | — | All or a portion of the security is on loan (See Note 6 of the Notes to Financial Statements). | ||
| D | — | Security has been deemed illiquid. Less than 0.1% of the Fund’s net assets were reported illiquid by the portfolio manager under the Funds’ policies and procedures. | ||
| †† | — | Primary risk exposure is equity contracts. |
A summary of the inputs used to value the Fund’s investments as of February 29, 2012 is as follows (see Note I in the Notes to Financial Statements):
| Total Value as of 02/29/12 | Level 1 Quoted Price | Level 2 Significant Observable Inputs | Level 3 Significant Unobservable Inputs | |||||||||||||
Common Stock | ||||||||||||||||
Capital Goods | $ | 14,693,455 | $ | 14,693,455 | $ | — | $ | — | ||||||||
Communications | 8,086,537 | 8,086,537 | — | — | ||||||||||||
Consumer Durables | 3,518,076 | 3,518,076 | — | — | ||||||||||||
Consumer Non-Durables | 11,840,823 | 11,840,823 | — | — | ||||||||||||
Consumer Services | 45,514,735 | 45,514,735 | — | — | ||||||||||||
Energy | 24,396,158 | 24,396,158 | — | — | ||||||||||||
Finance | 64,913,036 | 62,543,904 | — | 2,369,132 | ||||||||||||
Health Care | 40,753,690 | 40,753,690 | — | — | ||||||||||||
Real Estate Investment Trusts | 1,827,634 | 1,827,634 | — | — | ||||||||||||
Technology | 36,121,713 | 36,071,528 | — | 50,185 | ||||||||||||
Utilities | 826,418 | 826,418 | — | — | ||||||||||||
Preferred Stocks | 56,141 | — | — | 56,141 | ||||||||||||
Corporate Bonds | 97,395 | — | 97,395 | — | ||||||||||||
Securities Lending Collateral | 3,920,093 | 3,920,093 | — | — | ||||||||||||
|
|
|
|
|
|
|
| |||||||||
Total Assets | $ | 256,565,904 | $ | 253,993,051 | $ | 97,395 | $ | 2,475,458 | ||||||||
|
|
|
|
|
|
|
| |||||||||
| Total Value as of 02/29/12 | Level 1 Quoted Price | Level 2 Significant Observable Inputs | Level 3 Significant Unobservable Inputs | |||||||||||||
Options Written | ||||||||||||||||
Equity Contracts | $ | (614,017 | ) | $ | — | $ | (614,017 | ) | $ | — | ||||||
|
|
|
|
|
|
|
| |||||||||
Total Liabilities | $ | (614,017 | ) | $ | — | $ | (614,017 | ) | $ | — | ||||||
|
|
|
|
|
|
|
| |||||||||
The following is a reconciliation of the Fund’s Level 3 investments for which significant unobservable inputs were used to determine fair value.
| Common Stock | Preferred Stock | |||||||||||||||||||
| Total Investments | Finance | Technology | Finance | Corporate Bonds | ||||||||||||||||
Balance as of August 31, 2011 | $ | 2,262,890 | $ | 2,140,740 | $ | 49,713 | $ | 72,437 | $ | 0 | ||||||||||
Net realized gain/(loss) | (830,064 | ) | — | — | — | (830,064 | ) | |||||||||||||
Change in unrealized appreciation/(depreciation) | 1,044,877 | 228,392 | 472 | (16,296 | ) | 832,309 | ||||||||||||||
Purchases | — | — | — | — | — | |||||||||||||||
Sales | (2,245 | ) | — | — | — | (2,245 | ) | |||||||||||||
Transfers in * | — | — | — | — | — | |||||||||||||||
Transfers out * | — | — | — | — | — | |||||||||||||||
|
|
|
|
|
|
|
|
|
| |||||||||||
Balance as of February 29, 2012 | $ | 2,475,458 | $ | 2,369,132 | $ | 50,185 | $ | 56,141 | $ | — | ||||||||||
|
|
|
|
|
|
|
|
|
| |||||||||||
| * | Transfers in and/or (out) of Level 3 are recognized at the end of each reporting period.As of February 29, 2012, there were no transfers in and/or (out) of level 3. The change in unrealized appreciation/(depreciation) related to investments still held at February 29, 2012 was $212,568. |
| THEACCOMPANYINGNOTESAREANINTEGRALPARTOFTHEFINANCIALSTATEMENTS. | ||
| 26 | SEMI-ANNUAL REPORT 2012 | ||
| ROBECO INVESTMENT FUNDS | FEBRUARY 29, 2012 (UNAUDITED) | |
| ROBECO WPG SMALL/MICRO CAP VALUE FUND | PORTFOLIOOF INVESTMENTS | |
| Number of Shares | Value | |||||||
COMMON STOCK—94.7% |
| |||||||
Basic Industries—2.0% |
| |||||||
GrafTech International Ltd. * | 12,200 | $ | 155,062 | |||||
Schweitzer-Mauduit International, Inc. | 8,700 | 609,435 | ||||||
|
| |||||||
| 764,497 | ||||||||
|
| |||||||
Capital Goods—9.7% |
| |||||||
Columbus McKinnon Corp. * | 19,200 | 319,680 | ||||||
Flow International Corp. * | 39,500 | 158,000 | ||||||
Global Power Equipment Group, Inc. * | 8,900 | 215,825 | ||||||
Globe Specialty Metals, Inc. | 13,800 | 196,236 | ||||||
Horsehead Holding Corp. * | 23,900 | 272,460 | ||||||
ICF International, Inc. * | 11,400 | 295,602 | ||||||
Matrix Service Co. * | 19,200 | 254,208 | ||||||
Orion Marine Group, Inc. * | 44,700 | 326,310 | ||||||
RTI International Metals, Inc. * | 8,700 | 196,098 | ||||||
Trinity Industries, Inc. | 7,700 | 267,652 | ||||||
Tutor Perini Corp. * | 32,800 | 517,584 | ||||||
Wabash National Corp. * | 75,000 | 792,000 | ||||||
|
| |||||||
| 3,811,655 | ||||||||
|
| |||||||
Communications—2.4% |
| |||||||
Digital River, Inc. * | 9,500 | 167,675 | ||||||
Fairpoint Communications, | 24,680 | 92,797 | ||||||
Neutral Tandem, Inc. * | 37,600 | 419,616 | ||||||
Saba Software, Inc. * | 23,700 | 277,764 | ||||||
|
| |||||||
| 957,852 | ||||||||
|
| |||||||
Consumer Durables—1.9% |
| |||||||
Libbey, Inc. *(a) | 57,700 | 724,135 | ||||||
|
| |||||||
Consumer Non-Durables—2.6% |
| |||||||
Brown Shoe Co., Inc. (a) | 10,700 | 115,346 | ||||||
Chiquita Brands International, | 40,000 | 383,600 | ||||||
Dole Food Co., Inc. * | 28,000 | 268,240 | ||||||
Jones Group, Inc., (The) | 23,500 | 231,475 | ||||||
|
| |||||||
| 998,661 | ||||||||
|
| |||||||
Consumer Services—14.4% |
| |||||||
ABM Industries, Inc. | 12,100 | 274,670 | ||||||
Body Central Corp. * | 4,000 | 111,360 | ||||||
Brink’s Co., (The) | 17,700 | 446,925 | ||||||
Casual Male Retail Group, Inc. * | 67,180 | 211,617 | ||||||
Corrections Corp. of America * | 9,600 | 240,576 | ||||||
Cross Country Healthcare, Inc. * . | 11,200 | 63,392 | ||||||
FTI Consulting, Inc. * | 7,000 | 280,490 | ||||||
Geo Group, Inc. (The) * | 62,800 | 1,105,908 | ||||||
Hackett Group, Inc. (The) * | 78,800 | 379,816 | ||||||
MDC Partners, Inc., Class A | 54,400 | 702,848 | ||||||
Navigant Consulting, Inc. * | 37,000 | 499,870 | ||||||
Nutrisystem, Inc. | 8,700 | 98,049 | ||||||
Penske Automotive Group, Inc. | 11,400 | 274,512 | ||||||
Providence Service Corp. * | 28,300 | 425,915 | ||||||
TMS International Corp.,Class A * | 45,800 | 545,020 | ||||||
|
| |||||||
| 5,660,968 | ||||||||
|
| |||||||
| Number of Shares | Value | |||||||
Energy—2.2% |
| |||||||
Energy Partners Ltd. * | 21,100 | $ | 359,544 | |||||
GeoMet, Inc. * | 64,070 | 43,568 | ||||||
GSE Holding, Inc. * | 31,400 | 381,510 | ||||||
Newpark Resources, Inc. * | 12,060 | 94,912 | ||||||
|
| |||||||
| 879,534 | ||||||||
|
| |||||||
Finance—26.0% |
| |||||||
A.B.Watley Group, Inc. * | 93,855 | 502 | ||||||
Alterra Capital Holdings Ltd. | 19,700 | 452,312 | ||||||
American Equity Investment Life Holding Co. | 25,100 | 303,710 | ||||||
Boston Private Financial Holdings, Inc. | 78,700 | 750,011 | ||||||
CNO Financial Group, Inc. * | 91,200 | 676,704 | ||||||
Encore Bancshares, Inc. *(a) | 21,260 | 308,270 | ||||||
FBR & Co. * | 123,830 | 312,052 | ||||||
First Midwest Bancorp, Inc. | 22,700 | 262,412 | ||||||
Global Indemnity PLC * | 20,730 | 396,565 | ||||||
Great American Group, Inc. * | 76,190 | 13,581 | ||||||
Hanmi Financial Corp. * | 22,400 | 194,208 | ||||||
Home Bancshares, Inc. | 17,600 | 443,520 | ||||||
Home Loan Servicing Solutions Ltd * | 14,700 | 199,332 | ||||||
HomeStreet, Inc. * | 5,600 | 295,400 | ||||||
Maiden Holdings Ltd. | 74,900 | 647,885 | ||||||
Meadowbrook Insurance Group, Inc. | 72,700 | 692,104 | ||||||
Nelnet, Inc., Class A | 15,030 | 397,092 | ||||||
Ocwen Financial Corp. * | 42,400 | 683,064 | ||||||
OmniAmerican Bancorp, Inc. * | 11,200 | 200,368 | ||||||
PrivateBancorp, Inc. | 14,000 | 203,000 | ||||||
SCBT Financial Corp. | 5,700 | 176,529 | ||||||
Simmons First National Corp., Class A | 12,200 | 320,738 | ||||||
THL Credit, Inc. | 18,400 | 234,784 | ||||||
United Financial Bancorp, Inc. | 10,280 | 162,938 | ||||||
Validus Holdings Ltd. | 12,000 | 365,880 | ||||||
ViewPoint Financial Group | 29,410 | 440,856 | ||||||
Western Alliance Bancorp * | 80,770 | 657,468 | ||||||
WSFS Financial Corp. | 9,860 | 379,511 | ||||||
|
| |||||||
| 10,170,796 | ||||||||
|
| |||||||
Health Care—5.4% |
| |||||||
Accuray, Inc. * | 21,900 | 148,482 | ||||||
Alere, Inc. * | 18,800 | 478,084 | ||||||
eResearch Technology, Inc. * | 50,000 | 319,000 | ||||||
ICU Medical, Inc. * | 2,350 | 107,818 | ||||||
Medical Action Industries, Inc. * | 58,000 | 314,360 | ||||||
Natus Medical, Inc. * | 24,700 | 258,609 | ||||||
Symmetry Medical, Inc. * | 30,300 | 219,372 | ||||||
Teleflex, Inc. | 4,700 | 278,569 | ||||||
|
| |||||||
| 2,124,294 | ||||||||
|
| |||||||
Real Estate Investment Trusts—10.5% |
| |||||||
American Campus Communities, Inc. | 3,300 | 135,795 | ||||||
Campus Crest Communities, Inc. (a) | 57,300 | 606,807 | ||||||
Chatham Lodging Trust | 8,700 | 104,922 | ||||||
CreXus Investment Corp. | 40,200 | 448,230 | ||||||
CYS Investments, Inc. | 16,900 | 229,333 | ||||||
| THEACCOMPANYINGNOTESAREANINTEGRALPARTOFTHEFINANCIALSTATEMENTS. | ||
| SEMI-ANNUAL REPORT 2012 | 27 | ||
| ROBECO INVESTMENT FUNDS | FEBRUARY 29, 2012 (UNAUDITED) | |
| ROBECO WPG SMALL/MICRO CAP VALUE FUND (concluded) | PORTFOLIOOF INVESTMENTS | |
| Number of Shares | Value | |||||||
Real Estate Investment Trusts—(continued) |
| |||||||
Government Properties Income Trust | 12,000 | $ | 279,960 | |||||
Highwoods Properties, Inc. | 10,810 | 345,920 | ||||||
Kennedy-Wilson Holdings, Inc. | 51,100 | 690,872 | ||||||
Lexington Realty Trust (a) | 45,190 | 390,893 | ||||||
Mack-Cali Realty Corp. | 13,600 | 388,960 | ||||||
Starwood Property Trust, Inc. | 11,200 | 221,088 | ||||||
Two Harbors Investment Corp. | 25,400 | 261,112 | ||||||
|
| |||||||
| 4,103,892 | ||||||||
|
| |||||||
Technology—6.6% | ||||||||
Aeroflex Holding Corp. * | 20,800 | 228,176 | ||||||
CDC Software Corp. - | 48,000 | 446,400 | ||||||
CIBER, Inc. * | 150,900 | 660,942 | ||||||
Computer Task Group, | 16,200 | 238,302 | ||||||
Digi International, Inc. * | 35,700 | 401,268 | ||||||
Diodes, Inc. * | 5,500 | 136,620 | ||||||
Plantronics, Inc. | 7,300 | 272,290 | ||||||
Spectrum Brands Holdings, Inc. * . | 6,900 | 196,098 | ||||||
|
| |||||||
| 2,580,096 | ||||||||
|
| |||||||
Transportation—7.1% | ||||||||
Air Transport Services Group, Inc. * | 50,300 | 273,129 | ||||||
Alaska Air Group, Inc. * | 2,900 | 198,853 | ||||||
Hawaiian Holdings, Inc. * | 18,000 | 95,580 | ||||||
Rand Logistics, Inc. * | 14,600 | 125,998 | ||||||
Scorpio Tankers, Inc. * | 121,000 | 770,770 | ||||||
Spirit Airlines, Inc. *(a) | 35,400 | 691,362 | ||||||
Swift Transportation Co. * | 28,100 | 329,332 | ||||||
US Airways Group, | 28,400 | 210,444 | ||||||
USA Truck, Inc. * | 12,000 | 98,160 | ||||||
|
| |||||||
| 2,793,628 | ||||||||
|
| |||||||
Utilities—3.9% | ||||||||
Aegean Marine Petroleum | ||||||||
Network, Inc. | 53,300 | 375,232 | ||||||
Cadiz, Inc. *(a) | 25,310 | 268,792 | ||||||
Empire District Electric Co. | 14,600 | 291,270 | ||||||
Portland General Electric Co. | 9,400 | 231,616 | ||||||
StealthGas, Inc. * | 23,700 | 113,760 | ||||||
UIL Holdings Corp. | 7,300 | 257,325 | ||||||
|
| |||||||
| 1,537,995 | ||||||||
|
| |||||||
TOTAL COMMON STOCK | 37,108,003 | |||||||
|
| |||||||
| Number of Shares | Value | |||||||
PREFERRED STOCK—0.2% |
| |||||||
Energy—0.2% | ||||||||
GeoMet, Inc., Series A * | 9,078 | $ | 80,613 | |||||
|
| |||||||
TOTAL PREFERRED STOCK | 80,613 | |||||||
| �� |
|
| ||||||
SECURITIES LENDING COLLATERAL—3.1% |
| |||||||
BlackRock Liquidity Fund | 1,211,496 | 1,211,496 | ||||||
|
| |||||||
TOTAL SECURITIES LENDING COLLATERAL | 1,211,496 | |||||||
|
| |||||||
TOTAL INVESTMENTS—98.0% | 38,400,112 | |||||||
|
| |||||||
OTHER ASSETS IN EXCESS OF LIABILITIES—2.0% | 790,846 | |||||||
|
| |||||||
NET ASSETS—100.0% | $ | 39,190,958 | ||||||
|
| |||||||
| ADR | — | American Depositary Receipt | ||
| PLC | — | Public Limited Company | ||
| * | — | Non-income Producing | ||
| ‡ | — | Security has been valued at fair market value as determined in good faith by or under the direction of The RBB Fund, Inc.’s Board of Directors. As of February 29, 2012, this security amounted to $446,400 or 1.1% of net assets. | ||
| (a) | — | All or a portion of the security is on loan. (See Note 6 of the Notes to Financial Statements) | ||
| D | — | Security has been deemed illiquid. Less than 0.1% of the Fund’s net assets were reported illiquid by the portfolio manager under the Fund’s policies and procedures. |
A summary of the inputs used to value the Fund’s investments as of February 29, 2012 is as follows (see Note I in the Notes to Financial Statements):
| Total Value as of 02/29/12 | Level 1 Quoted Price | Level 2 Significant Observable Inputs | Level 3 Significant Unobservable Inputs | |||||||||||||
Common Stock * | $ | 37,108,003 | $ | 37,108,003 | $ | — | $ | — | ||||||||
Preferred Stock | 80,613 | 80,613 | ||||||||||||||
Securities Lending Collateral | 1,211,496 | 1,211,496 | — | — | ||||||||||||
|
|
|
|
|
|
|
| |||||||||
Total Assets | $ | 38,400,112 | $ | 38,400,112 | $ | — | $ | — | ||||||||
|
|
|
|
|
|
|
| |||||||||
| * | See Portfolio of Investments detail for industry and security type breakout. |
| THEACCOMPANYINGNOTESAREANINTEGRALPARTOFTHEFINANCIALSTATEMENTS. | ||
| 28 | SEMI-ANNUAL REPORT 2012 | ||
| ROBECO INVESTMENT FUNDS | FEBRUARY 29, 2012 (UNAUDITED) | |
| ROBECO BOSTON PARTNERS GLOBAL EQUITY FUND | PORTFOLIOOF INVESTMENTS | |
| Number of Shares | Value | |||||||
COMMON STOCK—98.5% | ||||||||
Australia—1.8% | ||||||||
Australia & New Zealand Banking Group Ltd. | 2,710 | $ | 63,794 | |||||
Coca-Cola Amatil Ltd. | 4,260 | 54,824 | ||||||
St Barbara Ltd. * | 29,220 | 72,389 | ||||||
|
| |||||||
| 191,007 | ||||||||
|
| |||||||
Belgium—1.0% | ||||||||
Barco NV | 1,675 | 109,974 | ||||||
|
| |||||||
Bermuda—1.7% | ||||||||
Axis Capital Holdings Ltd. | 2,975 | 91,779 | ||||||
Validus Holdings Ltd. | 3,185 | 97,111 | ||||||
|
| |||||||
| 188,890 | ||||||||
|
| |||||||
Canada—1.7% | ||||||||
AuRico Gold, Inc. * | 8,040 | 78,820 | ||||||
Barrick Gold Corp. | 1,225 | 58,610 | ||||||
Canadian Natural Resources Ltd. . | 1,385 | 51,397 | ||||||
|
| |||||||
| 188,827 | ||||||||
|
| |||||||
France—5.9% | ||||||||
Alstom SA | 2,740 | 118,058 | ||||||
Atos | 2,340 | 133,183 | ||||||
Havas SA | 16,760 | 85,231 | ||||||
LISI | 1,270 | 105,752 | ||||||
Nexity SA | 2,145 | 60,257 | ||||||
Sanofi | 1,105 | 81,722 | ||||||
Teleperformance SA | 2,010 | 53,813 | ||||||
|
| |||||||
| 638,016 | ||||||||
|
| |||||||
Germany—4.5% | ||||||||
Bayer AG, Registered Shares | 1,025 | 75,791 | ||||||
Brenntag AG | 695 | 81,021 | ||||||
Henkel AG & Co. KGaA | 3,515 | 191,841 | ||||||
Muenchener Rueckversicherungs AG, Registered Shares | 490 | 71,452 | ||||||
Rheinmetall AG | 1,250 | 75,816 | ||||||
|
| |||||||
| 495,921 | ||||||||
|
| |||||||
Ireland—2.3% | ||||||||
Covidien PLC | 2,795 | 146,039 | ||||||
Kerry Group PLC, Class A | 2,465 | 105,092 | ||||||
|
| |||||||
| 251,131 | ||||||||
|
| |||||||
Japan—6.5% | ||||||||
Autobacs Seven Co. Ltd. | 1,100 | 52,503 | ||||||
Dena Co. Ltd. | 2,000 | 65,076 | ||||||
FCC Co. Ltd. | 3,500 | 81,634 | ||||||
Hoshizaki Electric Co. Ltd. | 4,300 | 91,723 | ||||||
Inpex Corp. | 10 | 70,980 | ||||||
ITOCHU Corp. | 6,900 | 78,515 | ||||||
Makita Corp. | 2,600 | 108,107 | ||||||
NTT DoCoMo, Inc. | 25 | 42,687 | ||||||
Sumitomo Mitsui Trust Holdings, Inc. | 15,000 | 52,036 | ||||||
Unipres Corp. | 2,300 | 63,519 | ||||||
|
| |||||||
| 706,780 | ||||||||
|
| |||||||
| Number of Shares | Value | |||||||
Netherlands—4.0% | ||||||||
Imtech NV | 3,070 | $ | 102,847 | |||||
Koninklijke Ahold NV | 7,640 | 105,656 | ||||||
Unilever NV-CVA | 1,960 | 65,100 | ||||||
Unit 4 NV | 3,675 | 104,167 | ||||||
Wolters Kluwer NV | 2,925 | 54,460 | ||||||
|
| |||||||
| 432,230 | ||||||||
|
| |||||||
Singapore—0.9% | ||||||||
M1 Ltd. | 26,000 | 51,973 | ||||||
Oversea-Chinese Banking Corp. Ltd. | 7,000 | 50,262 | ||||||
|
| |||||||
| 102,235 | ||||||||
|
| |||||||
South Korea—0.8% | ||||||||
NongShim Co. Ltd. | 398 | 86,272 | ||||||
|
| |||||||
Switzerland—5.2% | ||||||||
Credit Suisse Group AG, | 2,945 | 79,134 | ||||||
Novartis AG, Registered Shares | 1,940 | 105,695 | ||||||
Roche Holding AG, Participation Certificate | 865 | 150,589 | ||||||
Swatch Group AG (The), | ||||||||
Bearer Shares | 220 | 99,750 | ||||||
Tyco International, Ltd. | 1,475 | 76,435 | ||||||
Zurich Financial Services AG | 235 | 59,172 | ||||||
|
| |||||||
| 570,775 | ||||||||
|
| |||||||
United Kingdom—14.3% | ||||||||
AMEC PLC | 3,050 | 53,665 | ||||||
Amlin PLC | 9,630 | 53,835 | ||||||
Barclays PLC | 21,020 | 81,929 | ||||||
BHP Billiton PLC | 3,330 | 107,940 | ||||||
Britvic PLC | 9,035 | 54,591 | ||||||
Filtrona PLC | 18,310 | 131,081 | ||||||
HSBC Holdings PLC | 11,360 | 100,356 | ||||||
Imperial Tobacco Group PLC | 4,350 | 172,386 | ||||||
Meggitt PLC | 15,215 | 93,529 | ||||||
Rexam PLC | 12,415 | 81,986 | ||||||
Royal Dutch Shell PLC, Class A | 7,100 | 258,267 | ||||||
Smiths Group PLC | 4,810 | 83,256 | ||||||
Standard Chartered PLC | 3,080 | 79,256 | ||||||
Victrex PLC | 2,445 | 51,578 | ||||||
Vodafone Group PLC | 57,375 | 154,578 | ||||||
|
| |||||||
| 1,558,233 | ||||||||
|
| |||||||
United States—47.9% | ||||||||
AmerisourceBergen Corp. | 2,660 | 99,351 | ||||||
Amgen, Inc. | 1,150 | 78,142 | ||||||
Apple, Inc. * | 780 | 423,103 | ||||||
CACI International, Inc., Class A * | 2,275 | 134,543 | ||||||
Capital One Financial Corp. | 3,070 | 155,342 | ||||||
CBS Corp., Class B non-voting shares | 1,810 | 54,119 | ||||||
Chevron Corp. | 800 | 87,296 | ||||||
Cisco Systems, Inc. | 11,020 | 219,078 | ||||||
Crown Holdings, Inc. * | 2,170 | 80,225 | ||||||
| THEACCOMPANYINGNOTESAREANINTEGRALPARTOFTHEFINANCIALSTATEMENTS. | ||
| SEMI-ANNUAL REPORT 2012 | 29 | ||
| ROBECO INVESTMENT FUNDS | FEBRUARY 29, 2012 (UNAUDITED) | |
| ROBECO BOSTON PARTNERS GLOBAL EQUITY FUND (concluded) | PORTFOLIOOF INVESTMENTS | |
| Number of Shares | Value | |||||||
United States—(continued) | ||||||||
CVS Caremark Corp. | 3,575 | $ | 161,232 | |||||
DIRECTV, Class A * | 1,765 | 81,755 | ||||||
Dover Corp. | 1,755 | 112,355 | ||||||
EOG Resources, Inc. | 1,980 | 225,443 | ||||||
Exxon Mobil Corp. | 2,915 | 252,147 | ||||||
Fifth Third Bancorp | 10,355 | 140,932 | ||||||
Fluor Corp. | 1,675 | 101,304 | ||||||
Graphic Packaging Holding Co. * | 14,795 | 78,118 | ||||||
Honeywell International, Inc. | 1,890 | 112,587 | ||||||
Illinois Tool Works, Inc. | 1,960 | 109,152 | ||||||
Johnson & Johnson | 1,530 | 99,572 | ||||||
JPMorgan Chase & Co. | 1,845 | 72,398 | ||||||
Lear Corp. | 2,175 | 98,332 | ||||||
Macy’s, Inc. | 4,390 | 166,688 | ||||||
McKesson Corp. | 1,565 | 130,693 | ||||||
Microsoft Corp. | 9,490 | 301,213 | ||||||
Newmont Mining Corp. | 815 | 48,411 | ||||||
Nordstrom, Inc. | 1,075 | 57,642 | ||||||
Occidental Petroleum Corp. | 915 | 95,499 | ||||||
Oracle Corp. | 5,850 | 171,230 | ||||||
Pfizer, Inc. | 4,395 | 92,735 | ||||||
Philip Morris International, Inc. | 3,015 | 251,813 | ||||||
Rock-Tenn Co., Class A | 895 | 63,089 | ||||||
SunTrust Banks, Inc. | 5,450 | 125,132 | ||||||
Target Corp. | 2,065 | 117,065 | ||||||
United Technologies Corp. | 1,545 | 129,579 | ||||||
UnitedHealth Group, Inc. | 1,595 | 88,921 | ||||||
Wells Fargo & Co. | 4,835 | 151,287 | ||||||
Western Union Co., (The) | 9,135 | 159,588 | ||||||
Windstream Corp. | 8,655 | 104,552 | ||||||
|
| |||||||
| 5,231,663 | ||||||||
|
| |||||||
TOTAL COMMON STOCK | 10,751,954 | |||||||
|
| |||||||
TOTAL INVESTMENTS—98.5% | 10,751,954 | |||||||
|
| |||||||
OTHER ASSETS IN EXCESS OF LIABILITIES—1.5% | 164,333 | |||||||
|
| |||||||
NET ASSETS—100.0% | $ | 10,916,287 | ||||||
|
| |||||||
| PLC | — | Public Limited Company | ||
| * | — | Non-income producing. |
A summary of the inputs used to value the Fund’s investments as of February 29, 2012 is as follows (see Note I in the Notes to Financial Statements):
| Total Value as of 02/29/12 | Level 1 Quoted Price | Level 2 Significant Observable Inputs | Level 3 Significant Unobservable Inputs | |||||||||||||
Investment in Securities * | $ | 10,751,954 | $ | 10,751,954 | $ | — | $ | — | ||||||||
|
|
|
|
|
|
|
| |||||||||
Total Assets | $ | 10,751,954 | $ | 10,751,954 | $ | — | $ | — | ||||||||
|
|
|
|
|
|
|
| |||||||||
| * | See Portfolio of Investments detail for country and security type breakout. |
| THEACCOMPANYINGNOTESAREANINTEGRALPARTOFTHEFINANCIALSTATEMENTS. | ||
| 30 | SEMI-ANNUAL REPORT 2012 | ||
| ROBECO INVESTMENT FUNDS | FEBRUARY 29, 2012 (UNAUDITED) | |
| ROBECO BOSTON PARTNERS INTERNATIONAL EQUITY FUND | PORTFOLIOOF INVESTMENTS | |
| Number of Shares | Value | |||||||
COMMON STOCK—97.4% | ||||||||
Australia—2.4% | ||||||||
Australia & New Zealand Banking Group Ltd. | 3,465 | $ | 81,567 | |||||
Coca-Cola Amatil Ltd. | 6,805 | 87,577 | ||||||
St Barbara Ltd. * | 37,505 | 92,914 | ||||||
|
| |||||||
| 262,058 | ||||||||
|
| |||||||
Belgium—1.5% | ||||||||
Barco NV | 2,560 | 168,079 | ||||||
|
| |||||||
Bermuda—0.5% | ||||||||
Catlin Group Ltd. | 8,005 | 53,016 | ||||||
|
| |||||||
Canada—3.3% | ||||||||
AuRico Gold, Inc. * | 9,660 | 94,701 | ||||||
Barrick Gold Corp. | 1,455 | 69,614 | ||||||
Canadian Natural Resources Ltd. | 2,515 | 93,332 | ||||||
CGI Group, Inc., Class A * | 4,760 | 101,892 | ||||||
|
| |||||||
| 359,539 | ||||||||
|
| |||||||
France—11.6% | ||||||||
Accor SA | 1,560 | 54,870 | ||||||
Alstom SA | 4,485 | 193,244 | ||||||
Atos | 3,745 | 213,150 | ||||||
Havas SA | 26,495 | 134,738 | ||||||
LISI | 1,670 | 139,059 | ||||||
Nexity SA | 2,880 | 80,904 | ||||||
Sanofi | 1,775 | 131,272 | ||||||
Teleperformance SA | 4,095 | 109,634 | ||||||
Total SA | 3,655 | 204,473 | ||||||
|
| |||||||
| 1,261,344 | ||||||||
|
| |||||||
Germany—8.6% | ||||||||
Bayer AG, Registered Shares | 1,850 | 136,794 | ||||||
Brenntag AG | 1,255 | 146,304 | ||||||
Fresenius Medical Care AG & Co. KGaA | 890 | 62,347 | ||||||
Henkel AG & Co. KGaA | 5,065 | 276,437 | ||||||
Muenchener Rueckversicherungs AG, Registered Shares | 695 | 101,345 | ||||||
Rheinmetall AG | 1,695 | 102,807 | ||||||
SAP AG | 900 | 60,733 | ||||||
Siemens AG, Registered Shares | 535 | 53,359 | ||||||
|
| |||||||
| 940,126 | ||||||||
|
| |||||||
Ireland—4.3% | ||||||||
Beazley PLC | 34,305 | 78,152 | ||||||
Kerry Group PLC, Class A | 5,150 | 219,564 | ||||||
WPP PLC | 13,255 | 169,436 | ||||||
|
| |||||||
| 467,152 | ||||||||
|
| |||||||
Italy—0.6% | ||||||||
Marr SpA | 5,390 | 59,316 | ||||||
|
| |||||||
| Number of Shares | Value | |||||||
Japan—15.1% | ||||||||
Autobacs Seven Co. Ltd. | 2,000 | $ | 95,461 | |||||
Brother Industries Ltd. | 3,900 | 50,423 | ||||||
Dena Co. Ltd. | 2,700 | 87,852 | ||||||
FCC Co. Ltd. | 4,200 | 97,960 | ||||||
FP Corp. | 800 | 49,699 | ||||||
Hoshizaki Electric Co. Ltd. | 5,800 | 123,720 | ||||||
Inpex Corp. | 17 | 120,667 | ||||||
ITOCHU Corp. | 10,700 | 121,755 | ||||||
Kaken Pharmaceutical Co. Ltd. | 4,000 | 50,633 | ||||||
Kamigumi Co. Ltd. | 8,000 | 68,692 | ||||||
Makita Corp. | 3,100 | 128,896 | ||||||
Nichii Gakkan Co. | 4,400 | 51,312 | ||||||
Nissan Chemical Industries Ltd. | 12,800 | 127,543 | ||||||
NTT DoCoMo, Inc. | 57 | 97,326 | ||||||
Omron Corp. | 2,600 | 57,572 | ||||||
Shinsei Bank Ltd. | 47,000 | 60,709 | ||||||
Sugi Holdings Co. Ltd. | 3,300 | 89,513 | ||||||
Sumitomo Mitsui Trust Holdings, Inc. | 16,000 | 55,505 | ||||||
Unipres Corp. | 3,700 | 102,183 | ||||||
|
| |||||||
| 1,637,421 | ||||||||
|
| |||||||
Netherlands—6.7% | ||||||||
Imtech NV | 4,255 | 142,546 | ||||||
Koninklijke Ahold NV | 11,675 | 161,457 | ||||||
Mediq NV | 5,910 | 95,944 | ||||||
Unilever NV-CVA | 2,445 | 81,209 | ||||||
Unit 4 NV | 5,500 | 155,896 | ||||||
Wolters Kluwer NV | 4,920 | 91,605 | ||||||
|
| |||||||
| 728,657 | ||||||||
|
| |||||||
Singapore—3.0% | ||||||||
M1 Ltd. | 58,000 | 115,940 | ||||||
Oversea-Chinese Banking Corp. Ltd. | 9,000 | 64,622 | ||||||
Singapore Telecommunications Ltd. | 35,000 | 88,714 | ||||||
United Overseas Bank Ltd. | 4,000 | 57,730 | ||||||
|
| |||||||
| 327,006 | ||||||||
|
| |||||||
South Korea—1.9% | ||||||||
NongShim Co. Ltd. | 720 | 156,070 | ||||||
SK Telecom Co. Ltd. | 390 | 50,723 | ||||||
|
| |||||||
| 206,793 | ||||||||
|
| |||||||
Switzerland—8.8% | ||||||||
Credit Suisse Group AG, Registered Shares | 4,420 | 118,769 | ||||||
Julius Baer Group Ltd. | 1,440 | 56,425 | ||||||
Novartis AG, Registered Shares | 3,490 | 190,143 | ||||||
Roche Holding AG, Participation Certificate | 1,280 | 222,836 | ||||||
Swatch Group AG (The), Bearer Shares | 415 | 188,165 | ||||||
Tecan Group AG | 870 | 70,777 | ||||||
Zurich Financial Services AG | 430 | 108,272 | ||||||
|
| |||||||
| 955,387 | ||||||||
|
| |||||||
| THEACCOMPANYINGNOTESAREANINTEGRALPARTOFTHEFINANCIALSTATEMENTS. | ||
| SEMI-ANNUAL REPORT 2012 | 31 | ||
| ROBECO INVESTMENT FUNDS | FEBRUARY 29, 2012 (UNAUDITED) | |
| ROBECO BOSTON PARTNERS INTERNATIONAL EQUITY FUND (concluded) | PORTFOLIOOF INVESTMENTS | |
| Number of Shares | Value | |||||||
United Kingdom—29.1% | ||||||||
AMEC PLC | 3,070 | $ | 54,017 | |||||
Amlin PLC | 11,525 | 64,429 | ||||||
Barclays PLC | 34,945 | 136,204 | ||||||
BG Group PLC | 2,250 | 54,319 | ||||||
BHP Billiton PLC | 6,820 | 221,066 | ||||||
Britvic PLC | 9,015 | 54,470 | ||||||
Filtrona PLC | 28,885 | 206,787 | ||||||
HSBC Holdings PLC | 27,875 | 246,253 | ||||||
Imperial Tobacco Group PLC | 8,005 | 317,230 | ||||||
Intercontinental Hotels Group PLC | 2,445 | 55,779 | ||||||
Mears Group PLC | 18,970 | 71,902 | ||||||
Meggitt PLC | 28,020 | 172,244 | ||||||
National Grid PLC | 7,500 | 76,542 | ||||||
Rexam PLC | 24,785 | 163,674 | ||||||
Rio Tinto PLC | 1,860 | 106,052 | ||||||
Royal Dutch Shell PLC, Class A | 11,405 | 414,864 | ||||||
Sage Group PLC (The) | 16,866 | 83,340 | ||||||
Smiths Group PLC | 6,400 | 110,777 | ||||||
Standard Chartered PLC | 6,455 | 166,104 | ||||||
TESCO PLC | 10,450 | 52,551 | ||||||
Victrex PLC | 2,500 | 52,738 | ||||||
Vodafone Group PLC | 107,035 | 288,370 | ||||||
|
| |||||||
| 3,169,712 | ||||||||
|
| |||||||
TOTAL COMMON STOCK | 10,595,606 | |||||||
|
| |||||||
TOTAL INVESTMENTS—97.4% | 10,595,606 | |||||||
|
| |||||||
OTHER ASSETS IN EXCESS OF LIABILITIES—2.6% | 287,711 | |||||||
|
| |||||||
NET ASSETS—100.0% | $ | 10,883,317 | ||||||
|
| |||||||
| PLC | — | Public Limited Company | ||
| * | — | Non-income producing. |
A summary of the inputs used to value the Fund’s investments as of February 29, 2012 is as follows (see Note I in the Notes to Financial Statements):
| Total Value as of 02/29/12 | Level 1 Quoted Price | Level 2 Significant Observable Inputs | Level 3 Significant Unobservable Inputs | |||||||||||||
Investment in Securities * | $ | 10,595,606 | $ | 10,595,606 | $ | — | $ | — | ||||||||
|
|
|
|
|
|
|
| |||||||||
Total Assets | $ | 10,595,606 | $ | 10,595,606 | $ | — | $ | — | ||||||||
|
|
|
|
|
|
|
| |||||||||
| * | See Portfolio of Investments detail for country and security type breakout. |
| THEACCOMPANYINGNOTESAREANINTEGRALPARTOFTHEFINANCIALSTATEMENTS. | ||
| 32 | SEMI-ANNUAL REPORT 2012 | ||
| ROBECO INVESTMENT FUNDS | FEBRUARY 29, 2012 (UNAUDITED) | |
| STATEMENTS OF ASSETS AND LIABILITIES | ||
| Robeco Boston Partners Small Cap Value Fund II | Robeco Boston Partners Long/ Short Equity Fund | Robeco Boston Partners Long/ Short Research Fund | Robeco Boston Partners All-Cap Value Fund | |||||||||||||
ASSETS | ||||||||||||||||
Investments in securities, at value † ^ | $ | 116,253,131 | $ | 551,648,991 | $ | 115,867,619 | $ | 256,565,904 | ||||||||
Cash | 1,809,823 | 87,441,417 | 16,352,964 | 127,624 | ||||||||||||
Foreign currency, at value # | — | — | 2,085,490 | — | ||||||||||||
Receivables | ||||||||||||||||
Investments sold | — | 17,084,041 | 426,087 | 6,444,876 | ||||||||||||
Deposits with brokers for securities sold short | — | 344,425,586 | 45,135,248 | — | ||||||||||||
Dividends and interest | 55,952 | 771,449 | 194,919 | 564,968 | ||||||||||||
Capital shares sold | 79,312 | 500,580 | 1,323,909 | 45,684 | ||||||||||||
Prepaid expenses and other assets | 17,149 | 60,605 | 32,203 | 28,768 | ||||||||||||
|
|
|
|
|
|
|
| |||||||||
Total assets | 118,215,367 | 1,001,932,669 | 181,418,439 | 263,777,824 | ||||||||||||
|
|
|
|
|
|
|
| |||||||||
LIABILITIES | ||||||||||||||||
Securities sold short, at fair value‡ | — | 343,473,575 | 44,729,171 | — | ||||||||||||
Options written, at value* | — | 571,277 | 28,203 | 614,017 | ||||||||||||
Payables | ||||||||||||||||
Securities lending collateral | 5,109,294 | 15,088,513 | — | 3,920,093 | ||||||||||||
Investments purchased | — | 8,521,007 | 2,690,855 | 2,876,230 | ||||||||||||
Capital shares redeemed | 209,369 | 551,697 | 164,838 | 48,090 | ||||||||||||
Due to prime broker | — | 48,704,897 | 7,263,245 | — | ||||||||||||
Investment advisory fees | 86,111 | 1,024,838 | 119,510 | 100,324 | ||||||||||||
Distribution and service fees | 15,980 | 29,563 | 4,969 | 5,311 | ||||||||||||
Dividends on securities sold-short | — | 342,629 | 51,226 | — | ||||||||||||
Prime broker interest payable | — | 22,613 | 122 | — | ||||||||||||
Other accrued expenses and liabilities | 46,326 | 73,283 | 69,599 | 57,166 | ||||||||||||
|
|
|
|
|
|
|
| |||||||||
Total liabilities | 5,467,080 | 418,403,892 | 55,121,738 | 7,621,231 | ||||||||||||
|
|
|
|
|
|
|
| |||||||||
Net Assets | $ | 112,748,287 | $ | 583,528,777 | $ | 126,296,701 | $ | 256,156,593 | ||||||||
|
|
|
|
|
|
|
| |||||||||
NET ASSETS CONSIST OF | ||||||||||||||||
Par value | $ | 7,886 | $ | 29,758 | $ | 10,871 | $ | 16,936 | ||||||||
Paid-in capital | 115,457,581 | 540,904,912 | 119,378,524 | 238,401,647 | ||||||||||||
Undistributed net investment income/(accumulated net investment loss) | (35,642 | ) | (6,805,144 | ) | (483,501 | ) | 1,624,928 | |||||||||
Accumulated net realized gain/(loss) from investments | (18,418,844 | ) | 10,866,208 | 105,537 | (5,462,766 | ) | ||||||||||
Net unrealized appreciation on investments, securities sold short, written options and foreign currency translation | 15,737,306 | 38,533,043 | 7,285,270 | 21,575,848 | ||||||||||||
|
|
|
|
|
|
|
| |||||||||
Net Assets | $ | 112,748,287 | $ | 583,528,777 | $ | 126,296,701 | $ | 256,156,593 | ||||||||
|
|
|
|
|
|
|
| |||||||||
INSTITUTIONAL CLASS | ||||||||||||||||
Net assets | $ | 33,562,452 | $ | 433,176,479 | $ | 100,641,401 | $ | 232,124,729 | ||||||||
Shares outstanding | 2,287,425 | 21,819,378 | 8,657,178 | 15,343,013 | ||||||||||||
|
|
|
|
|
|
|
| |||||||||
Net asset value, offering and redemption price per share | $ | 14.67 | $ | 19.85 | $ | 11.63 | $ | 15.13 | ||||||||
|
|
|
|
|
|
|
| |||||||||
INVESTOR CLASS | ||||||||||||||||
Net assets | $ | 79,185,835 | $ | 150,352,298 | $ | 25,655,300 | $ | 24,031,864 | ||||||||
Shares outstanding | 5,598,715 | 7,938,191 | 2,214,249 | 1,593,299 | ||||||||||||
|
|
|
|
|
|
|
| |||||||||
Net asset value, offering and redemption price per share | $ | 14.14 | $ | 18.94 | $ | 11.59 | $ | 15.08 | ||||||||
|
|
|
|
|
|
|
| |||||||||
† Investment in securities, at cost | $ | 100,515,825 | $ | 504,910,526 | $ | 105,376,122 | $ | 234,970,955 | ||||||||
^ Includes market value of securities on loan | $ | 4,923,143 | $ | 13,871,732 | $ | — | $ | 3,876,454 | ||||||||
# Foreign currency, at cost | $ | — | $ | — | $ | 2,048,489 | $ | — | ||||||||
‡ Proceeds received, securities sold short | $ | — | $ | 334,992,463 | $ | 41,467,221 | $ | — | ||||||||
* Premiums received, options written | $ | — | $ | 846,967 | $ | 50,350 | $ | 594,916 | ||||||||
| THEACCOMPANYINGNOTESAREANINTEGRALPARTOFTHEFINANCIALSTATEMENTS. | ||
| SEMI-ANNUAL REPORT 2012 | 33 | ||
| ROBECO INVESTMENT FUNDS | FEBRUARY 29, 2012 (UNAUDITED) | |
| STATEMENTS OF ASSETS AND LIABILITIES (concluded) | ||
| Robeco WPG Small/Micro Cap Value Fund | Robecco Boston Partners Global Equity Fund | Robecco Boston Partners International Equity Fund | ||||||||||
ASSETS | ||||||||||||
Investments in securities, at value † ^ | $ | 38,400,112 | $ | 10,751,954 | $ | 10,595,606 | ||||||
Cash | 2,609,961 | 117,660 | 283,824 | |||||||||
Foreign currency, at value # | — | 74,195 | — | |||||||||
Receivables | ||||||||||||
Investments sold | 273,129 | 14,755 | 82,138 | |||||||||
Dividends and interest | 20,422 | 21,985 | 29,247 | |||||||||
Investment adviser | — | 10,642 | 10,780 | |||||||||
Prepaid expenses and other assets | 12,192 | 34,573 | 34,573 | |||||||||
|
|
|
|
|
| |||||||
Total assets | 41,315,816 | 11,025,764 | 11,036,168 | |||||||||
|
|
|
|
|
| |||||||
LIABILITIES | ||||||||||||
Due to Custodian, at value # | — | — | 18,605 | |||||||||
Payables | ||||||||||||
Securities lending collateral | 1,211,496 | — | — | |||||||||
Investments purchased | 832,102 | 95,758 | 120,513 | |||||||||
Capital shares redeemed | 126 | — | — | |||||||||
Investment advisory fees | 32,269 | — | — | |||||||||
Other accrued expenses and liabilities | 48,865 | 13,719 | 13,733 | |||||||||
|
|
|
|
|
| |||||||
Total liabilities | 2,124,858 | 109,477 | 152,851 | |||||||||
|
|
|
|
|
| |||||||
Net Assets | $ | 39,190,958 | $ | 10,916,287 | $ | 10,883,317 | ||||||
|
|
|
|
|
| |||||||
NET ASSETS CONSIST OF | ||||||||||||
Par value | $ | 2,727 | $ | 1,000 | $ | 1,000 | ||||||
Paid-in capital | 41,594,063 | 9,999,000 | 9,999,000 | |||||||||
Undistributed net investment income/(accumulated net investment loss) | (26,986 | ) | 9,853 | 18,508 | ||||||||
Accumulated net realized gain/(loss) from investments | (6,873,347 | ) | 26,429 | (22,744 | ) | |||||||
Net unrealized appreciation on investments, securities sold short, written options and foreign currency translation | 4,494,501 | 880,005 | 887,553 | |||||||||
|
|
|
|
|
| |||||||
Net Assets | $ | 39,190,958 | $ | 10,916,287 | $ | 10,883,317 | ||||||
|
|
|
|
|
| |||||||
INSTITUTIONAL CLASS | ||||||||||||
Net assets | $ | 39,190,958 | $ | 10,916,287 | $ | 10,883,317 | ||||||
Shares outstanding | 2,726,597 | 1,000,000 | 1,000,000 | |||||||||
|
|
|
|
|
| |||||||
Net asset value, offering and redemption price per share | $ | 14.37 | $ | 10.92 | $ | 10.88 | ||||||
|
|
|
|
|
| |||||||
† Investment in securities, at cost | $ | 33,905,611 | $ | 9,872,769 | $ | 9,709,165 | ||||||
^ Includes market value of securities on loan | $ | 1,159,601 | $ | — | $ | — | ||||||
# Foreign currency, at cost | $ | — | $ | 73,273 | $ | (17,295 | ) | |||||
| THEACCOMPANYINGNOTESAREANINTEGRALPARTOFTHEFINANCIALSTATEMENTS. | ||
| 34 | SEMI-ANNUAL REPORT 2012 | ||
| ROBECO INVESTMENT FUNDS | FEBRUARY 29, 2012 (UNAUDITED) | |
| STATEMENTS OF OPERATIONS | ||
| Robeco Boston Partners Small Cap Value Fund II | Robeco Boston Partners Long/ Short Equity Fund | Robeco Boston Partners Long/ Short Research Fund | Robeco Boston Partners All-Cap Value Funds | |||||||||||||
| For the Six Months Ended February 29, 2012 | For the Six Months Ended February 29, 2012 | For the Six Months Ended February 29, 2012 | For the Six Months Ended February 29, 2012 | |||||||||||||
Investment Income | ||||||||||||||||
Dividends † | $ | 918,128 | $ | 3,774,303 | $ | 646,188 | $ | 2,445,375 | ||||||||
Interest | 2,267 | 6,649 | 1,745 | 12,276 | ||||||||||||
Income from securities loaned (Note 6) | 18,793 | 212,407 | — | 32,066 | ||||||||||||
|
|
|
|
|
|
|
| |||||||||
Total investment income | 939,188 | 3,993,359 | 647,933 | 2,489,717 | ||||||||||||
|
|
|
|
|
|
|
| |||||||||
Expenses | ||||||||||||||||
Advisory fees (Note 2) | 508,902 | 5,775,292 | 527,452 | 950,851 | ||||||||||||
Distribution fees (Investor Class) (Note 2) | 89,625 | 167,619 | 28,376 | 31,923 | ||||||||||||
Administration and accounting fees (Note 2) | 52,659 | 218,859 | 52,006 | 112,689 | ||||||||||||
Transfer agent fees (Note 2) | 52,596 | 78,281 | 41,179 | 44,313 | ||||||||||||
Registration and filing fees | 19,005 | 52,803 | 22,645 | 25,266 | ||||||||||||
Printing and shareholder reporting fees | 18,986 | 59,922 | 6,757 | 16,005 | ||||||||||||
Directors’ and officers’ fees | 13,191 | 28,081 | 11,290 | 19,243 | ||||||||||||
Audit fees | 12,757 | 6,944 | 16,327 | 13,280 | ||||||||||||
Custodian fees (Note 2) | 11,441 | 35,860 | 40,363 | 18,979 | ||||||||||||
Legal fees | 7,757 | 52,522 | 6,526 | 19,739 | ||||||||||||
Dividend expense on securities sold-short | — | 980,183 | 193,764 | — | ||||||||||||
Prime broker interest expense | — | 3,321,903 | 199,870 | — | ||||||||||||
Other expenses | 2,130 | 1,460 | 2,098 | 3,147 | ||||||||||||
|
|
|
|
|
|
|
| |||||||||
Total expenses before waivers and reimbursements | 789,049 | 10,779,729 | 1,148,653 | 1,255,435 | ||||||||||||
Less: waivers and reimbursements | (37,851 | ) | — | (30,823 | ) | (390,652 | ) | |||||||||
|
|
|
|
|
|
|
| |||||||||
Net expenses after waivers and reimbursements | 751,198 | 10,779,729 | 1,117,830 | 864,783 | ||||||||||||
|
|
|
|
|
|
|
| |||||||||
Net investment income/(loss) | 187,990 | (6,786,370 | ) | (469,897 | ) | 1,624,934 | ||||||||||
|
|
|
|
|
|
|
| |||||||||
Net realized gain/(loss) from: | ||||||||||||||||
Investments | (498,674 | ) | 16,264,444 | (459,171 | ) | (4,428,199 | ) | |||||||||
Investments sold-short | — | 118,902 | 1,139,662 | — | ||||||||||||
Foreign currency transactions | — | — | (41,852 | ) | — | |||||||||||
Written options* | — | 2,252,100 | 24,197 | 515,942 | ||||||||||||
Net change in unrealized appreciation/(depreciation) on: | ||||||||||||||||
Investments | 13,878,014 | 59,860,413 | 14,141,943 | 32,981,690 | ||||||||||||
Investments sold short | — | (18,193,358 | ) | (4,826,127 | ) | — | ||||||||||
Foreign currency translation | — | — | 33,034 | — | ||||||||||||
Written options* | — | (299,933 | ) | 18,003 | (312,660 | ) | ||||||||||
|
|
|
|
|
|
|
| |||||||||
Net realized and unrealized gain from investments | 13,379,340 | 60,002,568 | 10,029,689 | 28,756,773 | ||||||||||||
|
|
|
|
|
|
|
| |||||||||
Net increase in net assets resulting from operations | $ | 13,567,330 | $ | 53,216,198 | $ | 9,559,792 | $ | 30,381,707 | ||||||||
|
|
|
|
|
|
|
| |||||||||
† Net of foreign witholding taxes of | $ | — | $ | (72,948 | ) | $ | (8,182 | ) | $ | (16,842 | ) | |||||
|
|
|
|
|
|
|
| |||||||||
| * | Primary risk is equity contracts |
| THEACCOMPANYINGNOTESAREANINTEGRALPARTOFTHEFINANCIALSTATEMENTS. | ||
| SEMI-ANNUAL REPORT 2012 | 35 | ||
| ROBECO INVESTMENT FUNDS | FEBRUARY 29, 2012 (UNAUDITED) | |
| STATEMENTS OF OPERATIONS (concluded) | ||
| Robeco WPG Small/Micro Cap Value Fund | Robecco Boston Partners Global Equity Fund | Robecco Boston Partners International Equity Fund | ||||||||||
| For the Six Months Ended February 29, 2012 | For the Period Ended February 29, 2012* | For the Period Ended February 29, 2012* | ||||||||||
Investment Income | ||||||||||||
Dividends † | $ | 251,905 | $ | 31,086 | $ | 39,610 | ||||||
Interest | 216 | 9 | 11 | |||||||||
Income from securities loaned (Note 6) | 13,845 | — | — | |||||||||
|
|
|
|
|
| |||||||
Total investment income | 265,966 | 31,095 | 39,621 | |||||||||
|
|
|
|
|
| |||||||
Expenses | ||||||||||||
Advisory fees (Note 2) | 155,094 | 13,072 | 12,988 | |||||||||
Transfer agent fees (Note 2) | 44,055 | 10,260 | 10,360 | |||||||||
Administration and accounting fees (Note 2) | 38,820 | 14,463 | 14,463 | |||||||||
Custodian fees (Note 2) | 17,949 | 2,963 | 2,972 | |||||||||
Audit fees | 12,310 | 3,062 | 3,062 | |||||||||
Registration and filing fees | 11,031 | 5,629 | 5,629 | |||||||||
Directors’ and officers’ fees | 9,992 | 909 | 809 | |||||||||
Printing and shareholder reporting fees | 2,755 | 1,571 | 1,571 | |||||||||
Legal fees | 1,992 | 9,972 | 9,972 | |||||||||
Other expenses | 2,905 | 1,667 | 1,667 | |||||||||
|
|
|
|
|
| |||||||
Total expenses before waivers and reimbursements | 296,903 | 63,568 | 63,493 | |||||||||
Less: waivers and reimbursements | (3,951 | ) | (42,326 | ) | (42,380 | ) | ||||||
|
|
|
|
|
| |||||||
Net expenses after waivers and reimbursements | 292,952 | 21,242 | 21,113 | |||||||||
|
|
|
|
|
| |||||||
Net investment income/(loss) | (26,986 | ) | 9,853 | 18,508 | ||||||||
|
|
|
|
|
| |||||||
Net realized gain/(loss) from: | ||||||||||||
Investments | (202,855 | ) | 58,925 | 53,711 | ||||||||
Foreign currency transactions | — | (32,496 | ) | (76,455 | ) | |||||||
Net change in unrealized appreciation/(depreciation) on: | ||||||||||||
Investments | 5,936,663 | 879,185 | 886,441 | |||||||||
Foreign currency translation | — | 820 | 1,112 | |||||||||
|
|
|
|
|
| |||||||
Net realized and unrealized gain from investments | 5,733,808 | 906,434 | 864,809 | |||||||||
|
|
|
|
|
| |||||||
Net increase in net assets resulting from operations | $ | 5,706,822 | $ | 916,287 | $ | 883,317 | ||||||
|
|
|
|
|
| |||||||
† Net of foreign witholding taxes of | $ | (1,757 | ) | $ | (755 | ) | $ | (1,791 | ) | |||
|
|
|
|
|
| |||||||
| * | Inception date of the Fund was December 30, 2011. |
| THEACCOMPANYINGNOTESAREANINTEGRALPARTOFTHEFINANCIALSTATEMENTS. | ||
| 36 | SEMI-ANNUAL REPORT 2012 | ||
| ROBECO INVESTMENT FUNDS | FEBRUARY 29, 2012 | |
| STATEMENTS OF CHANGES IN NET ASSETS | ||
| Robeco Boston Partners Small Cap Value Fund II | Robeco Boston Partners Long/ Short Equity Fund | |||||||||||||||
| For the Six Months Ended February 29, 2012 (unaudited) | For the Year Ended August 31, 2011 | For the Six Months Ended February 29, 2012 (unaudited) | For the Year Ended August 31, 2011 | |||||||||||||
Increase/(decrease) in net assets from operations: | ||||||||||||||||
Net investment income/(loss) | $ | 187,990 | $ | 43,951 | $ | (6,786,370 | ) | $ | (9,760,178 | ) | ||||||
Net realized gain/(loss) from investments, securities sold short and written options | (498,674 | ) | 12,742,824 | 18,635,446 | 65,774,073 | |||||||||||
Net change in unrealized appreciation/(depreciation) from investments, securities sold short and written options | 13,878,014 | 2,875,002 | 41,367,122 | 3,535,503 | ||||||||||||
|
|
|
|
|
|
|
| |||||||||
Net increase in net assets resulting from operations | 13,567,330 | 15,661,777 | 53,216,198 | 59,549,398 | ||||||||||||
|
|
|
|
|
|
|
| |||||||||
Dividends and distributions to shareholders from: | ||||||||||||||||
Net investment income | ||||||||||||||||
Institutional Class | (119,144 | ) | (100,184 | ) | — | — | ||||||||||
Investor Class | (104,488 | ) | (95,484 | ) | — | — | ||||||||||
Net realized capital gains | ||||||||||||||||
Institutional Class | — | — | (38,698,442 | ) | (17,894,655 | ) | ||||||||||
Investor Class | — | — | (14,040,805 | ) | (8,626,259 | ) | ||||||||||
|
|
|
|
|
|
|
| |||||||||
Net decrease in net assets from dividends and distributions to shareholders | (223,632 | ) | (195,668 | ) | (52,739,247 | ) | (26,520,914 | ) | ||||||||
|
|
|
|
|
|
|
| |||||||||
Capital transactions: | ||||||||||||||||
Institutional Class | ||||||||||||||||
Proceeds from shares sold | 1,694,844 | 3,909,043 | 98,013,556 | 201,360,557 | ||||||||||||
Reinvestment of distributions | 109,724 | 93,662 | 24,911,474 | 14,385,081 | ||||||||||||
Shares redeemed | (2,243,636 | ) | (4,024,153 | ) | (35,653,560 | ) | (57,419,040 | ) | ||||||||
Redemption fees (Note 8) | 858 | 2,581 | 138,148 | 179,582 | ||||||||||||
Investor Class | ||||||||||||||||
Proceeds from shares sold | 6,447,798 | 15,435,654 | 25,100,159 | 56,183,987 | ||||||||||||
Reinvestment of distributions | 103,165 | 94,378 | 13,855,744 | 8,458,921 | ||||||||||||
Shares redeemed | (7,372,434 | ) | (17,318,122 | ) | (16,481,636 | ) | (29,659,739 | ) | ||||||||
Redemption fees (Note 8) | 2,025 | 6,126 | 48,791 | 75,682 | ||||||||||||
|
|
|
|
|
|
|
| |||||||||
Net increase/(decrease) in net assets from capital transactions | (1,257,656 | ) | (1,800,831 | ) | 109,932,676 | 193,565,031 | ||||||||||
|
|
|
|
|
|
|
| |||||||||
Total increase in net assets | 12,086,042 | 13,665,278 | 110,409,627 | 226,593,515 | ||||||||||||
Net assets | ||||||||||||||||
Beginning of period | 100,662,245 | 86,996,967 | 473,119,150 | 246,525,635 | ||||||||||||
|
|
|
|
|
|
|
| |||||||||
End of period | $ | 112,748,287 | $ | 100,662,245 | $ | 583,528,777 | $ | 473,119,150 | ||||||||
|
|
|
|
|
|
|
| |||||||||
Undistributed net investment income/(loss), end of period | $ | (35,642 | ) | $ | — | $ | (6,805,144 | ) | $ | (18,774 | ) | |||||
|
|
|
|
|
|
|
| |||||||||
Share transactions: | ||||||||||||||||
Institutional Class | ||||||||||||||||
Shares sold | 127,523 | 295,829 | 4,949,211 | 10,027,275 | ||||||||||||
Shares reinvested | 8,480 | 6,807 | 1,331,452 | 734,681 | ||||||||||||
Shares redeemed | (183,370 | ) | (302,635 | ) | (1,810,968 | ) | (2,859,105 | ) | ||||||||
|
|
|
|
|
|
|
| |||||||||
Net increase/(decrease) | (47,367 | ) | 1 | 4,469,695 | 7,902,851 | |||||||||||
|
|
|
|
|
|
|
| |||||||||
Investor Class | ||||||||||||||||
Shares sold | 495,381 | 1,194,306 | 1,320,945 | 2,912,953 | ||||||||||||
Shares reinvested | 8,267 | 7,112 | 775,798 | 449,464 | ||||||||||||
Shares redeemed | (571,404 | ) | (1,304,155 | ) | (876,509 | ) | (1,530,960 | ) | ||||||||
|
|
|
|
|
|
|
| |||||||||
Net increase/(decrease) | (67,756 | ) | (102,737 | ) | 1,220,234 | 1,831,457 | ||||||||||
|
|
|
|
|
|
|
| |||||||||
| THEACCOMPANYINGNOTESAREANINTEGRALPARTOFTHEFINANCIALSTATEMENTS. | ||
| SEMI-ANNUAL REPORT 2012 | 37 | ||
| ROBECO INVESTMENT FUNDS | FEBRUARY 29, 2012 | |
| STATEMENTS OF CHANGES IN NET ASSETS (continued) | ||
| Robeco Boston Partners Long/Short Research Fund | Robeco Boston Partners All-Cap Value Fund | |||||||||||||||
| For the Six Months Ended February 29, 2012 (unaudited) | For the Period Ended August 31, 2011* | For the Six Months Ended February 29, 2012 (unaudited) | For the Year Ended August 31, 2011 | |||||||||||||
Increase/(decrease) in net assets from operations: | ||||||||||||||||
Net investment income/(loss) | $ | (469,897 | ) | $ | (264,322 | ) | $ | 1,624,934 | $ | 2,252,938 | ||||||
Net realized gain/(loss) from investments, securities sold short, written options and foreign currency | 662,836 | 346,533 | (3,912,257 | ) | 16,113,884 | |||||||||||
Net change in unrealized appreciation/(depreciation) from investments, securities sold short, written options and foreign currency | 9,366,853 | (2,081,583 | ) | 32,669,030 | (6,104,213 | ) | ||||||||||
|
|
|
|
|
|
|
| |||||||||
Net increase/(decrease) in net assets resulting from operations | 9,559,792 | (1,999,372 | ) | 30,381,707 | 12,262,609 | |||||||||||
|
|
|
|
|
|
|
| |||||||||
Dividends and distributions to shareholders from: | ||||||||||||||||
Net investment income | ||||||||||||||||
Institutional Class | — | — | (1,665,830 | ) | (1,101,905 | ) | ||||||||||
Investor Class | — | — | (146,798 | ) | (63,061 | ) | ||||||||||
Net realized capital gains | ||||||||||||||||
Institutional Class | (496,066 | ) | — | (12,924,039 | ) | (2,218,532 | ) | |||||||||
Investor Class | (186,172 | ) | — | (1,628,060 | ) | (201,331 | ) | |||||||||
|
|
|
|
|
|
|
| |||||||||
Net decrease in net assets from dividends and distributions to shareholders | (682,238 | ) | — | (16,364,727 | ) | (3,584,829 | ) | |||||||||
|
|
|
|
|
|
|
| |||||||||
Capital transactions: | ||||||||||||||||
Institutional Class | ||||||||||||||||
Proceeds from shares sold | 58,530,827 | 38,930,061 | 26,641,752 | 148,246,242 | ||||||||||||
Reinvestment of distributions | 442,615 | — | 13,713,736 | 3,267,204 | ||||||||||||
Shares redeemed | (2,277,309 | ) | (506,901 | ) | (30,896,396 | ) | (62,354,127 | ) | ||||||||
Redemption fees (Note 8) | 2,541 | 10,669 | — | — | ||||||||||||
Investor Class | ||||||||||||||||
Proceeds from shares sold | 8,089,100 | 23,466,226 | 3,414,948 | 20,853,224 | ||||||||||||
Reinvestment of distributions | 186,154 | — | 1,722,851 | 252,790 | ||||||||||||
Shares redeemed | (5,100,721 | ) | (2,361,571 | ) | (9,006,217 | ) | (7,847,340 | ) | ||||||||
Redemption fees (Note 8) | 1,079 | 5,749 | — | — | ||||||||||||
|
|
|
|
|
|
|
| |||||||||
Net increase in net assets from capital transactions | 59,874,286 | 59,544,233 | 5,590,674 | 102,417,993 | ||||||||||||
|
|
|
|
|
|
|
| |||||||||
Total increase in net assets | 68,751,840 | 57,544,861 | 19,607,654 | 111,095,773 | ||||||||||||
Net assets | ||||||||||||||||
Beginning of period | 57,544,861 | — | 236,548,939 | 125,453,166 | ||||||||||||
|
|
|
|
|
|
|
| |||||||||
End of period | $ | 126,296,701 | $ | 57,544,861 | $ | 256,156,593 | $ | 236,548,939 | ||||||||
|
|
|
|
|
|
|
| |||||||||
Undistributed net investment income/(loss), end of period | $ | (483,501 | ) | $ | (13,604 | ) | $ | 1,624,928 | $ | 1,812,622 | ||||||
|
|
|
|
|
|
|
| |||||||||
Share transactions: | ||||||||||||||||
Institutional Class | ||||||||||||||||
Shares sold | 5,307,784 | 3,560,031 | 1,859,651 | 9,707,857 | ||||||||||||
Shares reinvested | 41,327 | — | 1,020,367 | 218,688 | ||||||||||||
Shares redeemed | (204,858 | ) | (47,106 | ) | (2,185,509 | ) | (4,025,430 | ) | ||||||||
|
|
|
|
|
|
|
| |||||||||
Net increase | 5,144,253 | 3,512,925 | 694,509 | 5,901,115 | ||||||||||||
|
|
|
|
|
|
|
| |||||||||
Investor Class | ||||||||||||||||
Shares sold | 746,440 | 2,137,441 | 237,554 | 1,345,568 | ||||||||||||
Shares reinvested | 17,430 | — | 128,571 | 16,966 | ||||||||||||
Shares redeemed | (469,589 | ) | (217,473 | ) | (623,914 | ) | (528,995 | ) | ||||||||
|
|
|
|
|
|
|
| |||||||||
Net increase/(decrease) | 294,281 | 1,919,968 | (257,789 | ) | 833,539 | |||||||||||
|
|
|
|
|
|
|
| |||||||||
| * | Inception date of the Fund was September 30, 2010. |
| THEACCOMPANYINGNOTESAREANINTEGRALPARTOFTHEFINANCIALSTATEMENTS. | ||
| 38 | SEMI-ANNUAL REPORT 2012 | ||
| ROBECO INVESTMENT FUNDS | FEBRUARY 29, 2012 | |
| STATEMENTS OF CHANGES IN NET ASSETS (concluded) | ||
| Robeco WPG Small/Micro Cap Value Fund | Robecco Boston Partners Global Equity Fund | Robecco Boston Partners International Equity Fund | ||||||||||||||
| For the Six Months Ended February 29, 2012 (unaudited) | For the Year Ended August 31, 2011 | For the Period Ended February 29, 2012* (unaudited) | For the Period Ended February 29, 2012* (unaudited) | |||||||||||||
Increase/(decrease) in net assets from operations: | ||||||||||||||||
Net investment income/(loss) | $ | (26,986 | ) | $ | (161,396 | ) | $ | 9,853 | $ | 18,508 | ||||||
Net realized gain/(loss) from investments and foreign currency | (202,855 | ) | 5,344,276 | 26,429 | (22,744 | ) | ||||||||||
Net change in unrealized appreciation/(depreciation) from investments and foreign currency | 5,936,663 | (2,923,039 | ) | 880,005 | 887,553 | |||||||||||
|
|
|
|
|
|
|
| |||||||||
Net increase in net assets resulting from operations | 5,706,822 | 2,259,841 | 916,287 | 883,317 | ||||||||||||
|
|
|
|
|
|
|
| |||||||||
Capital transactions: | ||||||||||||||||
Institutional Class | ||||||||||||||||
Proceeds from shares sold | 2,541,116 | 3,836,370 | 10,000,000 | 10,000,000 | ||||||||||||
Shares redeemed | (2,294,581 | ) | (5,252,156 | ) | — | — | ||||||||||
|
|
|
|
|
|
|
| |||||||||
Net increase/(decrease) in net assets from capital transactions | 246,535 | (1,415,786 | ) | 10,000,000 | 10,000,000 | |||||||||||
|
|
|
|
|
|
|
| |||||||||
Total increase in net assets | 5,953,357 | 844,055 | 10,916,287 | 10,883,317 | ||||||||||||
Net assets | ||||||||||||||||
Beginning of period | 33,237,601 | 32,393,546 | — | — | ||||||||||||
|
|
|
|
|
|
|
| |||||||||
End of period | $ | 39,190,958 | $ | 33,237,601 | $ | 10,916,287 | $ | 10,883,317 | ||||||||
|
|
|
|
|
|
|
| |||||||||
Undistributed net investment income/(loss),end of period | $ | (26,986 | ) | $ | — | $ | 9,853 | $ | 18,508 | |||||||
|
|
|
|
|
|
|
| |||||||||
Share transactions: | ||||||||||||||||
Institutional Class | ||||||||||||||||
Shares sold | 206,301 | 312,889 | 1,000,000 | 1,000,000 | ||||||||||||
Shares redeemed | (180,357 | ) | (393,955 | ) | — | — | ||||||||||
|
|
|
|
|
|
|
| |||||||||
Net increase/(decrease) | 25,944 | (81,066 | ) | 1,000,000 | 1,000,000 | |||||||||||
|
|
|
|
|
|
|
| |||||||||
| * | Inception date of the Fund was December 30, 2011. |
| THEACCOMPANYINGNOTESAREANINTEGRALPARTOFTHEFINANCIALSTATEMENTS. | ||
| SEMI-ANNUAL REPORT 2012 | 39 | ||
| ROBECO INVESTMENT FUNDS | FEBRUARY 29, 2012 (UNAUDITED) | |
| STATEMENT OF CASH FLOWS | ||
| Robeco Boston Partners Long/Short Equity Fund | Robeco Boston Partners Long/Short Research Fund | |||||||
| For the Six Months Ended February 29, 2012 | For the Six Months Ended February 29, 2012 | |||||||
Cash flows provided from operating activities: | ||||||||
Net increase in net assets resulting from operations | $ | 53,216,198 | $ | 9,559,792 | ||||
Adjustments to reconcile net increase in net assets resulting from operations to net cash provided by operating activities: | ||||||||
Purchases of long-term portfolio investments | (232,528,795 | ) | (62,020,406 | ) | ||||
Proceeds from disposition of long-term portfolio investments | 216,220,092 | 16,519,445 | ||||||
Purchases to cover short sales | (109,667,214 | ) | (16,377,197 | ) | ||||
Proceeds from short sales | 213,568,495 | 34,721,095 | ||||||
Proceeds for written options | 5,296,105 | 50,350 | ||||||
Cost of closed expired and exercised options | (6,756,171 | ) | (20,979 | ) | ||||
Proceeds from litigation | 3,176 | — | ||||||
Net realized gain on investments and investments sold short | (16,383,346 | ) | (680,491 | ) | ||||
Net change in unrealized appreciation on investments, investments sold short and written options | (41,367,122 | ) | (9,333,819 | ) | ||||
Increase in securities lending collateral | (9,894,680 | ) | — | |||||
Increase in deposits with brokers for securities sold short | (122,412,672 | ) | (22,253,690 | ) | ||||
Increase in dividend and interest receivable | (147,701 | ) | (92,210 | ) | ||||
Decrease in receivable from investment adviser | — | 51,416 | ||||||
Increase in prepaid expenses and other assets | (34,983 | ) | (22,091 | ) | ||||
Increase in payable for securities lending collateral | 9,894,680 | — | ||||||
Increase in payable for dividends on securities sold short | 263,371 | 30,867 | ||||||
Decrease in prime broker interest payable | (532,354 | ) | (30,159 | ) | ||||
Increase in payable for investment advisory fee | 150,671 | 119,510 | ||||||
Increase/(decrease) in accrued expenses and other liabilities | (25,343 | ) | 6,799 | |||||
|
|
|
| |||||
Net cash used in operating activities | (41,137,593 | ) | (49,771,768 | ) | ||||
|
|
|
| |||||
Cash flows from financing activities: | ||||||||
Increase in payable to Prime Broker | 37,291,179 | 6,027,036 | ||||||
Net proceeds for fund share activity | 72,083,206 | 58,346,143 | ||||||
Distributions paid from realized capital gains | (13,972,029 | ) | (53,469 | ) | ||||
|
|
|
| |||||
Net cash provided by financing activities | 95,402,356 | 64,319,710 | ||||||
|
|
|
| |||||
Net increase in cash | 54,264,763 | 14,547,942 | ||||||
|
|
|
| |||||
Cash and foreign currency at beginning of year | 33,176,654 | 3,890,512 | ||||||
|
|
|
| |||||
Cash and foreign currency at end of period | $ | 87,441,417 | $ | 18,438,454 | ||||
|
|
|
| |||||
Supplemental disclosure of cash flow information: | ||||||||
Cash paid during the period for interest expense | $ | 3,854,257 | $ | 230,029 | ||||
|
|
|
| |||||
| THEACCOMPANYINGNOTESAREANINTEGRALPARTOFTHEFINANCIALSTATEMENTS. | ||
| 40 | SEMI-ANNUAL REPORT 2012 | ||
[THIS PAGE INTENTIONALLY LEFT BLANK]
ROBECO INVESTMENT FUNDS
| ||
| FINANCIAL HIGHLIGHTS | PER SHARE OPERATING PERFORMANCE | |
Contained below is per share operating performance data for each class of shares outstanding, total investment return, ratios to average net assets and other supplemental data for the respective periods. This information has been derived from information provided in the financial statements.
| Net Asset Value, Beginning of Period | Net Investment Income/(Loss)* | Net Realized and Unrealized Gain/(Loss) on Investments | Total From Investment Operations | Dividends to Shareholders from Net Investment Income | Distributions to Shareholders from Net Realized Gains | Return of Capital | Total Distributions | |||||||||||||||||||||||||
Robeco Boston Partners Small Cap Value Fund II |
| |||||||||||||||||||||||||||||||
Institutional Class | ||||||||||||||||||||||||||||||||
9/1/11 through 2/29/12† | $ | 12.92 | $ | 0.04 | $ | 1.76 | $ | 1.80 | $ | (0.05 | ) | $ | — | $ | — | $ | (0.05 | ) | ||||||||||||||
8/31/11 | 11.02 | 0.03 | 1.91 | 1.94 | (0.04 | ) | — | — | (0.04 | ) | ||||||||||||||||||||||
8/31/10 | 10.49 | 0.06 | 0.52 | 0.58 | (0.05 | ) | — | — | (0.05 | ) | ||||||||||||||||||||||
8/31/09 | 11.87 | 0.11 | (1.26 | ) | (1.15 | ) | (0.14 | ) | (0.05 | ) | (0.04 | ) | (0.23 | ) | ||||||||||||||||||
8/31/08 | 21.47 | 0.07 | (1.97 | ) | (1.90 | ) | — | (7.70 | ) | — | (7.70 | ) | ||||||||||||||||||||
8/31/07 | 22.82 | (0.01 | ) | 2.41 | 2.40 | (0.09 | ) | (3.67 | ) | — | (3.76 | ) | ||||||||||||||||||||
Investor Class | ||||||||||||||||||||||||||||||||
9/1/11 through 2/29/12† | $ | 12.44 | $ | 0.02 | $ | 1.70 | $ | 1.72 | $ | (0.02 | ) | $ | — | $ | — | $ | (0.02 | ) | ||||||||||||||
8/31/11 | 10.62 | (— | )3 | 1.84 | 1.84 | (0.02 | ) | — | — | (0.02 | ) | |||||||||||||||||||||
8/31/10 | 10.11 | 0.03 | 0.50 | 0.53 | (0.02 | ) | — | — | (0.02 | ) | ||||||||||||||||||||||
8/31/09 | 11.43 | 0.07 | (1.20 | ) | (1.13 | ) | (0.11 | ) | (0.05 | ) | (0.03 | ) | (0.19 | ) | ||||||||||||||||||
8/31/08 | 21.02 | 0.03 | (1.92 | ) | (1.89 | ) | — | (7.70 | ) | — | (7.70 | ) | ||||||||||||||||||||
8/31/07 | 22.40 | (0.07 | ) | 2.37 | 2.30 | (0.02 | ) | (3.67 | ) | — | (3.69 | ) | ||||||||||||||||||||
Robeco Boston Partners Long/Short Equity Fund |
| |||||||||||||||||||||||||||||||
Institutional Class | ||||||||||||||||||||||||||||||||
9/1/11 through 2/29/12† | $ | 19.88 | $ | (0.25 | ) | $ | 2.24 | $ | 1.99 | $ | — | $ | (2.03 | ) | $ | — | $ | (2.03 | ) | |||||||||||||
8/31/11 | 17.41 | (0.47 | ) | 4.55 | 4.08 | — | (1.62 | ) | — | (1.62 | ) | |||||||||||||||||||||
8/31/10 | 15.75 | (0.37 | ) | 1.98 | 1.61 | — | — | — | — | |||||||||||||||||||||||
8/31/09 | 15.47 | (0.22 | ) | 2.98 | 2.76 | — | (2.48 | ) | — | (2.48 | ) | |||||||||||||||||||||
8/31/08 | 17.23 | (0.36 | ) | 0.50 | 0.14 | — | (1.90 | ) | — | (1.90 | ) | |||||||||||||||||||||
8/31/07 | 18.57 | (0.21 | ) | 0.73 | 0.52 | — | (1.86 | ) | — | (1.86 | ) | |||||||||||||||||||||
Investor Class | ||||||||||||||||||||||||||||||||
9/1/11 through 2/29/12† | $ | 19.08 | $ | (0.27 | ) | $ | 2.15 | $ | 1.88 | $ | — | $ | (2.03 | ) | $ | — | $ | (2.03 | ) | |||||||||||||
8/31/11 | 16.80 | (0.50 | ) | 4.39 | 3.89 | — | (1.62 | ) | — | (1.62 | ) | |||||||||||||||||||||
8/31/10 | 15.31 | (0.40 | ) | 1.84 | 1.44 | — | — | — | — | |||||||||||||||||||||||
8/31/09 | 15.17 | (0.25 | ) | 2.87 | 2.62 | — | (2.48 | ) | — | (2.48 | ) | |||||||||||||||||||||
8/31/08 | 16.97 | (0.39 | ) | 0.49 | 0.10 | — | (1.90 | ) | — | (1.90 | ) | |||||||||||||||||||||
8/31/07 | 18.36 | (0.26 | ) | 0.73 | 0.47 | — | (1.86 | ) | — | (1.86 | ) | |||||||||||||||||||||
Robeco Boston Partners Long/Short Research Fund |
| |||||||||||||||||||||||||||||||
Institutional Class | ||||||||||||||||||||||||||||||||
9/1/11 through 2/29/12† | $ | 10.60 | $ | (0.06 | ) | $ | 1.18 | $ | 1.12 | $ | — | $ | (0.09 | ) | $ | — | $ | (0.09 | ) | |||||||||||||
9/30/10** through 8/31/11 | 10.00 | (0.12 | ) | 0.71 | 0.59 | — | — | — | — | |||||||||||||||||||||||
Investor Class | ||||||||||||||||||||||||||||||||
9/1/11 through 2/29/12† | $ | 10.58 | $ | (0.07 | ) | $ | 1.17 | $ | 1.10 | $ | — | $ | (0.09 | ) | $ | — | $ | (0.09 | ) | |||||||||||||
11/29/10** through 8/31/11 | 10.40 | (0.12 | ) | 0.29 | 0.17 | — | — | — | — | |||||||||||||||||||||||
| † | Unaudited. |
| * | Calculated based on average shares outstanding for the period. |
| ** | Inception date. |
| 1 | Total return is calculated by assuming a purchase of shares on the first day and a sale of shares on the last day of the period and is not annualized if period is less than one year. |
| 2 | Redemption fees are reflected in total return calculations. |
| 3 | Amount is less than $0.01 per share. |
| 4 | Annualized. |
| 5 | Not Annualized. |
| THEACCOMPANYINGNOTESAREANINTEGRALPARTOFTHEFINANCIALSTATEMENTS. | ||
| 42 | SEMI-ANNUAL REPORT 2012 | ||
ROBECO INVESTMENT FUNDS
| ||
| FINANCIAL HIGHLIGHTS (continued) | PER SHARE OPERATING PERFORMANCE | |
| Redemption Fees | Net Asset Value, End of Period | Total Investment Return1,2 | Net Assets, End of Period (000) | Ratio of Expenses to Average Net Assets With Waivers and Reimbursements | Ratio of Expenses to Average Net Assets With Waivers and Reimbursements (Excluding Dividend and Interest Expense) | Ratio of Expenses to Average Net Assets Without Waivers and Reimbursements | Ratio of Net Investment Income/(Loss) to Average Net Assets With Waivers and Reimbursements | Portfolio Turnover Rate | ||||||||||||||||||||||||||
| $ | — | 3 | $ | 14.67 | 14.01 | % | $ | 33,562 | 1.30 | %4 | N/A | 1.37 | %4 | 0.55 | %4 | 6 | %5 | |||||||||||||||||
| — | 3 | 12.92 | 17.59 | 30,172 | 1.30 | N/A | 1.37 | 0.22 | 38 | |||||||||||||||||||||||||
| — | 3 | 11.02 | 5.47 | 25,736 | 1.30 | N/A | 1.39 | 0.51 | 43 | |||||||||||||||||||||||||
| — | 3 | 10.49 | (8.97 | ) | 21,466 | 1.30 | N/A | 1.74 | 1.29 | 66 | ||||||||||||||||||||||||
| — | 3 | 11.87 | (10.15 | ) | 56,652 | 1.39 | N/A | 1.54 | 0.47 | 54 | ||||||||||||||||||||||||
| 0.01 | 21.47 | 10.53 | 94,337 | 1.55 | N/A | 1.56 | (0.09 | ) | 46 | |||||||||||||||||||||||||
| $ | — | 3 | $ | 14.14 | 13.84 | % | $ | 79,186 | 1.55 | %4 | N/A | 1.62 | %4 | 0.30 | %4 | 6 | %5 | |||||||||||||||||
| — | 3 | 12.44 | 17.28 | 70,490 | 1.55 | N/A | 1.62 | (0.03 | ) | 38 | ||||||||||||||||||||||||
| — | 3 | 10.62 | 5.26 | 61,260 | 1.55 | N/A | 1.63 | 0.25 | 43 | |||||||||||||||||||||||||
| — | 3 | 10.11 | (9.20 | ) | 43,408 | 1.55 | N/A | 2.00 | 0.90 | 66 | ||||||||||||||||||||||||
| — | 3 | 11.43 | (10.40 | ) | 65,370 | 1.64 | N/A | 1.79 | 0.19 | 54 | ||||||||||||||||||||||||
| 0.01 | 21.02 | 10.26 | 154,546 | 1.80 | N/A | 1.81 | (0.32 | ) | 46 | |||||||||||||||||||||||||
| $ | 0.01 | �� | $ | 19.85 | 10.76 | % | $ | 433,176 | 4.13 | %4 | 2.45 | %4 | 4.13 | %4 | (2.58 | )%4 | 46 | %5 | ||||||||||||||||
| 0.01 | 19.88 | 23.66 | 344,935 | 3.70 | 2.47 | 3.71 | (2.35 | ) | 103 | |||||||||||||||||||||||||
| 0.05 | 17.41 | 10.54 | 164,438 | 3.40 | 2.50 | 3.46 | (2.10 | ) | 81 | |||||||||||||||||||||||||
| — | 3 | 15.75 | 30.02 | 54,703 | 3.35 | 2.50 | 4.04 | (1.85 | ) | 172 | ||||||||||||||||||||||||
| — | 3 | 15.47 | 1.12 | 36,423 | 3.98 | 2.50 | 4.36 | (2.27 | ) | 124 | ||||||||||||||||||||||||
| — | 3 | 17.23 | 2.61 | 73,770 | 3.44 | 2.50 | 3.60 | (1.17 | ) | 93 | ||||||||||||||||||||||||
| $ | 0.01 | $ | 18.94 | 10.57 | % | $ | 150,352 | 4.38 | %4 | 2.70 | %4 | 4.38 | %4 | (2.82 | )%4 | 46 | %5 | |||||||||||||||||
| 0.01 | 19.08 | 23.37 | 128,184 | 3.95 | 2.72 | 3.96 | (2.60 | ) | 103 | |||||||||||||||||||||||||
| 0.05 | 16.80 | 9.73 | 82,088 | 3.65 | 2.75 | 3.70 | (2.35 | ) | 81 | |||||||||||||||||||||||||
| — | 3 | 15.31 | 29.63 | 30,980 | 3.55 | 2.75 | 4.19 | (2.09 | ) | 172 | ||||||||||||||||||||||||
| — | 3 | 15.17 | 0.88 | 7,728 | 4.23 | 2.75 | 4.61 | (2.51 | ) | 124 | ||||||||||||||||||||||||
| — | 3 | 16.97 | 2.35 | 14,664 | 3.69 | 2.75 | 3.85 | (1.42 | ) | 93 | ||||||||||||||||||||||||
| $ | — | 3 | $ | 11.63 | 10.56 | % | $ | 100,641 | 2.58 | %4 | 1.65 | %4 | 2.65 | %4 | (1.05 | )%4 | 21 | %5 | ||||||||||||||||
| 0.01 | 10.60 | 6.00 | 37,237 | 2.70 | 4 | 1.74 | 4 | 4.20 | 4 | (1.21 | )4 | 61 | 5 | |||||||||||||||||||||
| $ | — | 3 | $ | 11.59 | 10.49 | % | $ | 25,655 | 2.83 | %4 | 1.90 | %4 | 2.90 | %4 | (1.30 | )%4 | 21 | %5 | ||||||||||||||||
| 0.01 | 10.58 | 1.73 | 20,308 | 2.99 | 4 | 1.98 | 4 | 4.25 | 4 | (1.47 | )4 | 61 | 5 | |||||||||||||||||||||
| THEACCOMPANYINGNOTESAREANINTEGRALPARTOFTHEFINANCIALSTATEMENTS. | ||
| SEMI-ANNUAL REPORT 2012 | 43 | ||
ROBECO INVESTMENT FUNDS
| ||
| FINANCIAL HIGHLIGHTS (continued) | PER SHARE OPERATING PERFORMANCE | |
Contained below is per share operating performance data for each class of shares outstanding, total investment return, ratios to average net assets and other supplemental data for the respective periods. This information has been derived from information provided in the financial statements.
| Net Asset Value, Beginning of Period | Net Investment Income/(Loss)* | Net Realized and Unrealized Gain/(Loss) on Investments | Total From Investment Operations | Dividends to Shareholders from Net Investment Income | Distributions to Shareholders from Net Realized Gains | Total Distributions | Redemption Fees | |||||||||||||||||||||||||
Robeco Boston Partners All-Cap Value Fund |
| |||||||||||||||||||||||||||||||
Institutional Class | ||||||||||||||||||||||||||||||||
9/1/11 through 2/29/12† | $ | 14.34 | $ | 0.10 | $ | 1.70 | $ | 1.80 | $ | (0.12 | ) | $ | (0.89 | ) | $ | (1.01 | ) | $ | — | |||||||||||||
8/31/11 | 12.85 | 0.15 | 1.63 | 1.78 | (0.10 | ) | (0.19 | ) | (0.29 | ) | — | |||||||||||||||||||||
8/31/10 | 12.56 | 0.10 | 0.32 | 0.42 | (0.13 | ) | — | (0.13 | ) | — | ||||||||||||||||||||||
8/31/09 | 13.61 | 0.19 | (1.03 | ) | (0.84 | ) | (0.12 | ) | (0.09 | ) | (0.21 | ) | — | |||||||||||||||||||
8/31/08 | 16.47 | 0.23 | (1.54 | ) | (1.31 | ) | (0.16 | ) | (1.39 | ) | (1.55 | ) | — | |||||||||||||||||||
8/31/07 | 15.69 | 0.16 | 2.05 | 2.21 | (0.13 | ) | (1.30 | ) | (1.43 | ) | — | |||||||||||||||||||||
Investor Class | ||||||||||||||||||||||||||||||||
9/1/11 through 2/29/12† | $ | 14.28 | $ | 0.08 | $ | 1.69 | $ | 1.77 | $ | (0.08 | ) | $ | (0.89 | ) | $ | (0.97 | ) | $ | — | |||||||||||||
8/31/11 | 12.79 | 0.11 | 1.63 | 1.74 | (0.06 | ) | (0.19 | ) | (0.25 | ) | — | |||||||||||||||||||||
8/31/10 | 12.52 | 0.07 | 0.31 | 0.38 | (0.11 | ) | — | (0.11 | ) | — | ||||||||||||||||||||||
8/31/09 | 13.56 | 0.16 | (1.03 | ) | (0.87 | ) | (0.08 | ) | (0.09 | ) | (0.17 | ) | — | |||||||||||||||||||
8/31/08 | 16.41 | 0.16 | (1.51 | ) | (1.35 | ) | (0.11 | ) | (1.39 | ) | (1.50 | ) | — | |||||||||||||||||||
8/31/07 | 15.63 | 0.11 | 2.06 | 2.17 | (0.09 | ) | (1.30 | ) | (1.39 | ) | — | |||||||||||||||||||||
Robeco WPG Small/Micro Cap Value Fund |
| |||||||||||||||||||||||||||||||
Institutional Class | ||||||||||||||||||||||||||||||||
9/1/11 through 2/29/12† | $ | 12.31 | $ | (0.01 | ) | $ | 2.07 | $ | 2.06 | $ | — | $ | — | $ | — | $ | — | |||||||||||||||
8/31/11 | 11.65 | (0.06 | ) | 0.72 | 0.66 | — | — | — | — | |||||||||||||||||||||||
8/31/10 | 10.57 | (0.05 | ) | 1.16 | 1.11 | (0.03 | ) | — | (0.03 | ) | — | 3 | ||||||||||||||||||||
8/31/09 | 12.18 | 0.03 | (1.62 | ) | (1.59 | ) | (0.01 | ) | (0.01 | ) | (0.02 | ) | — | |||||||||||||||||||
8/31/08 | 17.05 | 0.05 | 5 | (2.46 | ) | (2.41 | ) | (0.01 | ) | (2.45 | ) | (2.46 | ) | — | ||||||||||||||||||
8/31/07 | 16.54 | 0.01 | 5 | 2.31 | 2.32 | — | (1.81 | ) | (1.81 | ) | — | |||||||||||||||||||||
Robeco Boston Partners Global Equity Fund |
| |||||||||||||||||||||||||||||||
Institutional Class | ||||||||||||||||||||||||||||||||
12/30/11** through 2/29/12†$10.00 |
| $ | 0.01 | $ | 0.91 | $ | 0.92 | $ | — | $ | — | $ | — | $ | — | |||||||||||||||||
Robeco Boston Partners International Equity Fund |
| |||||||||||||||||||||||||||||||
Institutional Class | ||||||||||||||||||||||||||||||||
12/30/11** through 2/29/12†$10.00 |
| $ | 0.02 | $ | 0.86 | $ | 0.88 | $ | — | $ | — | $ | — | $ | — | |||||||||||||||||
| † | Unaudited |
| * | Calculated based on average shares outstanding, unless otherwise noted. |
| ** | Inception date. |
| 1 | Total return is calculated by assuming a purchase of shares on the first day and a sale of shares on the last day of the period and is not annualized if period is less than one year. |
| 2 | Redemption fees are reflected in total return calculations. |
| 3 | Amount is less than $0.01. |
| 4 | Annualized. |
| 5 | Not Annualized. |
| 6 | Calculated using the SEC’s undistributed net investment income method. |
| THEACCOMPANYINGNOTESAREANINTEGRALPARTOFTHEFINANCIALSTATEMENTS. | ||
| 44 | SEMI-ANNUAL REPORT 2012 | ||
| ROBECO INVESTMENT FUNDS | ||
| FINANCIAL HIGHLIGHTS (continued) | PER SHARE OPERATING PERFORMANCE | |
| Net Asset Value, End of Period | Total Investment Return1,2 | Net Assets, End of Period (000) | Ratio of Expenses to Average Net Assets With Waivers and Reimbursements | Ratio of Expenses to Average Net Assets Without Waivers and Reimbursements | Ratio of Net Investment Income/(Loss) to Average Net Assets With Waivers and Reimbursements | Portfolio Turnover Rate | ||||||||||||||||||||
| $ | 15.13 | 13.43 | % | $ | 232,125 | 0.70 | %4 | 1.03 | %4 | 1.06 | %4 | 22 | %5 | |||||||||||||
| 14.34 | 13.75 | 210,113 | 0.70 | 1.03 | 1.00 | 47 | ||||||||||||||||||||
| 12.85 | 3.31 | 112,437 | 0.80 | 1.15 | 0.75 | 48 | ||||||||||||||||||||
| 12.56 | (5.88 | ) | 63,085 | 0.95 | 1.50 | 1.79 | 55 | |||||||||||||||||||
| 13.61 | (8.55 | ) | 51,850 | 0.95 | 1.70 | 1.59 | 44 | |||||||||||||||||||
| 16.47 | 14.38 | 13,720 | 0.95 | 2.24 | 0.92 | 45 | ||||||||||||||||||||
| $ | 15.08 | 13.28 | % | $ | 24,032 | 0.95 | %4 | 1.28 | %4 | 0.81 | %4 | 22 | %5 | |||||||||||||
| 14.28 | 13.55 | 26,436 | 0.95 | 1.28 | 0.75 | 47 | ||||||||||||||||||||
| 12.79 | 3.01 | 13,016 | 1.03 | 1.39 | 0.55 | 48 | ||||||||||||||||||||
| 12.52 | (6.15 | ) | 5,187 | 1.20 | 1.75 | 1.51 | 55 | |||||||||||||||||||
| 13.56 | (8.82 | ) | 3,164 | 1.20 | 1.95 | 1.10 | 44 | |||||||||||||||||||
| 16.41 | 14.16 | 4,021 | 1.20 | 2.49 | 0.67 | 45 | ||||||||||||||||||||
| $ | 14.37 | 16.82 | % | $ | 39,191 | 1.70 | %4 | 1.72 | %4 | (0.16 | )%4 | 42 | %5 | |||||||||||||
| 12.31 | 5.67 | 33,238 | 1.67 | 1.72 | (0.43 | ) | 85 | |||||||||||||||||||
| 11.65 | 10.54 | 32,394 | 1.69 | 1.77 | (0.39 | ) | 94 | |||||||||||||||||||
| 10.57 | (12.93 | ) | 35,405 | 1.61 | 1.95 | 0.37 | 137 | |||||||||||||||||||
| 12.18 | (15.12 | ) | 43,133 | 1.61 | 1.65 | 0.11 | 131 | |||||||||||||||||||
| 17.05 | 14.28 | 53,962 | 1.47 | 1.47 | 0.09 | 138 | ||||||||||||||||||||
| $ | 10.92 | 9.20 | % | $ | 10,916 | 1.30 | %4 | 3.89 | %4 | 0.60 | %4 | 28 | %5 | |||||||||||||
| $ | 10.88 | 8.80 | % | $ | 10,883 | 1.30 | %4 | 3.91 | %4 | 1.14 | %4 | 29 | %5 | |||||||||||||
| THEACCOMPANYINGNOTESAREANINTEGRALPARTOFTHEFINANCIALSTATEMENTS. | ||
| SEMI-ANNUAL REPORT 2012 | 45 | ||
ROBECO INVESTMENT FUNDS
|
| NOTES TO FINANCIAL STATEMENTS (unaudited) |
| 1. | Organization and Significant Accounting Policies |
The RBB Fund, Inc. (“RBB” or the “Company”) was incorporated under the laws of the State of Maryland on February 29, 1988 and is registered under the Investment Company Act of 1940, as amended (the “1940 Act”), as an open-end management investment company. RBB is a “series trust,” which is a mutual fund divided into separate portfolios. Each portfolio is treated as a separate entity for certain matters under the 1940 Act, and for other purposes, and a shareholder of one portfolio is not deemed to be a shareholder of any other portfolio. Currently, RBB has nineteen active investment portfolios, including Robeco Boston Partners Small Cap Value Fund II (“BP Small Cap Value Fund II”), Robeco Boston Partners Long/Short Equity Fund (“BP Long/Short Equity Fund”), Robeco Boston Partners Long/Short Research Fund (“BP Long/Short Research Fund”) Robeco Boston Partners All-Cap Value Funds (“BP All-Cap Value Fund”) Robeco Boston Partners Global Equity Fund (“BP Global Equity Fund”), Robeco Boston Partners International Equity Fund (“BP International Equity Fund”) (collectively “BP Funds”), and Robeco WPG Small/Micro Cap Value Fund (“WPG Small/Micro Cap Value Fund” and, collectively with the BP Funds, the “Funds”). As of February 29, 2012, the BP Funds each offer two classes of shares, Institutional Class and Investor Class. As of February 29, 2012, Investor Class shares of the BP Global Equity Fund and BP International Equity Fund have not been issued. The WPG Small/Micro Cap Value Fund is a single class fund, offering only the Institutional Class of shares.
RBB has authorized capital of one hundred billion shares of common stock of which 80.373 billion shares are currently classified into one hundred and forty classes of common stock. Each class represents an interest in an active or inactive RBB investment portfolio.
Portfolio Valuation — Each Fund’s net asset value (“NAV”) is calculated once daily at the close of regular trading hours on the New York Stock Exchange (“NYSE”) (generally 4:00 p.m. Eastern time) on each day the NYSE is open. Securities held by a Fund are valued using the closing price or the last sale price on a national securities exchange or the National Association of Securities Dealers Automatic Quotation System (“NASDAQ”) market system where they are primarily traded. Equity securities traded in the over-the-counter market are valued at their closing prices. If there were no transactions on that day, securities traded principally on an exchange or on NASDAQ will be valued at the mean of the last bid and ask prices prior to the market close. Fixed income securities having a remaining maturity of greater than 60 days are valued using an independent pricing service, which considers such factors as security prices, yields, maturities and ratings, and are deemed representative of market values at the close of the market. Fixed income securities having a remaining maturity of 60 days or less are valued at amortized cost which approximates market value. Foreign securities are valued based on prices from the primary market in which they are traded, and are translated from the local currency into U.S. dollars using current exchange rates. Investments in other open-end investment companies are valued based on the NAV of the investment companies (which may use fair value pricing as discussed in their prospectuses). If market quotations are unavailable or deemed unreliable, securities will be valued in accordance with procedures adopted by the Company’s Board of Directors. Relying on prices supplied by pricing services or dealers or using fair valuation may result in values that are higher or lower than the values used by other investment companies and investors to price the same investments. Such procedures use fundamental valuation methods, which may include, but are not limited to, an analysis of the effect of any restrictions on the resale of the security, industry analysis and trends, significant changes in the issuer’s financial position, and any other event which could have a significant impact on the value of the security. Determination of fair value involves subjective judgment as the actual market value of a particular security can be established only by negotiations between the parties in a sales transaction, and the difference between the recorded fair value and the value that would be received in a sale could be significant.
Fair Value Measurements — The inputs and valuation techniques used to measure fair value of the Funds’ investments are summarized into three levels as described in the hierarchy below:
• Level 1 | — | quoted prices in active markets for identical securities; | ||||
• Level 2 | — | other significant observable inputs (including quoted prices for similar securities, interest rates, prepayment speeds, credit risk, etc.); and | ||||
• Level 3 | — | significant unobservable inputs (including the Funds’ own assumptions in determining the fair value of investments). | ||||
The inputs or methodology used for valuing securities are not necessarily an indication of the risk associated with investing in those securities.
| 46 | SEMI-ANNUAL REPORT 2012 | ||
ROBECO INVESTMENT FUNDS
|
| NOTES TO FINANCIAL STATEMENTS (unaudited) (continued) |
| 1. | Organization and Significant Accounting Policies (continued) |
A summary of the inputs used to value each Fund’s investments as of February 29, 2012 is included in each Fund’s Portfolio of Investments.
At the end of each calendar quarter, management evaluates the classification of Levels 1, 2 and 3 assets and liabilities. Various factors are considered, such as changes in liquidity from the prior reporting period; whether or not a broker is willing to execute at the quoted price; the depth and consistency of prices from third party pricing services; and the existence of contemporaneous, observable trades in the market. Additionally, management evaluates the classification of Level 1 and Level 2 assets and liabilities on a quarterly basis for changes in listings or delistings on national exchanges.
Due to the inherent uncertainty of determining the fair value of investments that do not have a readily available market value, the fair value of the Funds’ investments may fluctuate from period to period. Additionally, the fair value of investments may differ significantly from the values that would have been used had a ready market existed for such investments and may differ materially from the values the Funds may ultimately realize. Further, such investments may be subject to legal and other restrictions on resale or otherwise less liquid than publicly traded securities.
For the period ended February 29, 2012, there were no transfers between Levels 1, 2, and 3 for BP Small Cap Value Fund II, BP Long/Short Research Fund, BP All-Cap Value Fund, WPG Small/Micro Cap Value Fund, BP Global Equity Fund and BP International Equity Fund. For details of transfers in and out of Level 3 for the BP Long/Short Equity Fund, please refer to page 17.
Use of Estimates — The preparation of financial statements in conformity with U.S. generally accepted accounting principles requires management to make estimates and assumptions that affect the reported amounts of assets and liabilities and disclosure of contingent assets and liabilities at the date of the financial statements and the reported amounts of revenues and expenses during the period. Actual results could differ from those estimates and those differences could be significant.
Investment Transactions, Investment Income and Expenses — The Funds record security transactions based on trade date. The cost of investments sold is determined by use of the specific identification method for both financial reporting and income tax purposes in determining realized gains and losses on investments. Interest income is accrued when earned. Dividend income is recorded on the ex-dividend date. Distributions received on securities that represent a return of capital or capital gains are recorded as a reduction of cost of investments and/or as a realized gain. The Funds estimate the components of distributions received from Real Estate Investment Trusts that may be considered return of capital distributions or capital gain distributions. The Funds’ investment income, expenses (other than class specific distribution fees) and unrealized and realized gains and losses are allocated daily to each class of shares based upon the relative proportion of net assets of each class at the beginning of the day. Expenses incurred on behalf of a specific class, fund or fund family of the Company are charged directly to the class, fund or fund family (in proportion to net assets). Expenses incurred for all of the RBB funds (such as director or professional fees) are charged to all funds in proportion to their average net assets of RBB, or in such other manner as the Company’s Board of Directors deems fair or equitable. Expenses and fees, including investment advisory and administration fees are accrued daily and taken into account for the purpose of determining the NAV of the Funds.
Dividends and Distributions to Shareholders — Dividends from net investment income and distributions from net realized capital gains, if any, are declared and paid at least annually to shareholders and recorded on ex-dividend date for all Funds. Income dividends and capital gain distributions are determined in accordance with U.S. federal income tax regulations which may differ from U.S. generally accepted accounting principles (“U.S. GAAP”).
U.S.Tax Status — No provision is made for U.S. income taxes as it is each Fund’s intention to qualify or continue to qualify for and elect the tax treatment applicable to regulated investment companies under Subchapter M of the Internal Revenue Code of 1986, as amended, and make the requisite distributions to its shareholders which will be sufficient to relieve it from U.S. income and excise taxes.
Cash and Cash Equivalents — The Funds consider liquid assets deposited into a bank demand deposit account to be cash equivalents. These investments represent amounts held with financial institutions that are readily accessible to pay Fund expenses or purchase investments. Cash and cash equivalents are valued at cost plus accrued interest, which approximates market value.
| SEMI-ANNUAL REPORT 2012 | 47 | ||
ROBECO INVESTMENT FUNDS
|
| NOTES TO FINANCIAL STATEMENTS (unaudited) (continued) |
| 1. | Organization and Significant Accounting Policies (continued) |
Other — In the normal course of business, the Funds may enter into contracts that provide general indemnifications. The Funds’ maximum exposure under these arrangements is dependent on claims that may be made against the Funds in the future, and, therefore, cannot be estimated; however, based on experience, the risk of material loss from such claims is considered remote.
Foreign Currency Translation — Assets and liabilities initially expressed in non-U.S. currencies are translated into U.S. dollars based on the applicable exchange rates at the date of the last business day of the financial statement period. Purchases and sales of securities, interest income, dividends, variation margin received and expenses denominated in foreign currencies are translated into U.S. dollars at the exchange rates in effect on the transaction date.
The Funds do not separately report the effect of changes in foreign exchange rates from changes in market prices of securities held. Such changes are included with the net realized gain or loss and change in unrealized appreciation or depreciation on investment securities in the Statement of Operations. Other foreign currency transactions resulting in realized and unrealized gain or loss are reported separately as net realized gain or loss and change in unrealized appreciation or depreciation on foreign currencies in the Statement of Operations.
Currency Risk — The Funds invest in securities of foreign issuers, including American Depositary Receipts. These markets are subject to special risks associated with foreign investments not typically associated with investing in U.S. markets. Because the foreign securities in which the Funds may invest generally trade in currencies other than the U.S. dollar, changes in currency exchange rates will affect the Funds” NAV, the value of dividends and interest earned and gains and losses realized on the sale of securities. Because the NAV for the Funds are determined on the basis of U.S. dollars, the Funds may lose money by investing in a foreign security if the local currency of a foreign market depreciates against the U.S. dollar, even if the local currency value of the Funds’ holdings goes up. Generally, a strong U.S. dollar relative to these other currencies will adversely affect the value of the Funds holdings in foreign securities.
Foreign Securities Market Risk — Securities of many non-U.S. companies may be less liquid and their prices more volatile than securities of comparable U.S. companies. Securities of companies traded in many countries outside the U.S., particularly emerging markets countries, may be subject to further risks due to the inexperience of local investment professionals and financial institutions, the possibility of permanent or temporary termination of trading and greater spreads between bid and asked prices of securities. In addition, non-U.S. stock exchanges and investment professionals are subject to less governmental regulation, and commissions may be higher than in the United States. Also, there may be delays in the settlement of non-U.S. stock exchange transactions.
Options Written —The Funds are subject to equity price risk in the normal course of pursuing their investment objectives and may enter into options written to hedge against changes in the value of equities. Such options may relate to particular securities or domestic stock indices, and may or may not be listed on a domestic securities exchange or issued by the Options Clearing Corporation. The risk in writing a call option is that a Fund gives up the opportunity for profit if the market price of the security increases. The risk in writing a put option is that a Fund may incur a loss if the market price of the security decreases and the option is exercised. A Fund also has the additional risk of being unable to enter into a closing transaction at an acceptable price if a liquid secondary market does not exist. A Fund also may write over-the-counter options where completing the obligation depends upon the credit standing of the other party. Option contracts also involve the risk that they may result in loss due to unanticipated developments in market conditions or other causes.
Written options are recorded as liabilities to the extent of premiums received. Gains or losses are realized when the option transaction expires or closes. When an option is exercised, the proceeds on sales for a written call option or the purchase cost for a written put option is adjusted by the amount of the premium received or paid.
| 48 | SEMI-ANNUAL REPORT 2012 | ||
ROBECO INVESTMENT FUNDS
|
| NOTES TO FINANCIAL STATEMENTS (unaudited) (continued) |
| 1. | Organization and Significant Accounting Policies (continued) |
The BP Long/Short Equity Fund, BP Long/Short Research Fund and the BP All-Cap Value Fund had transactions in options written during the six-month period ended February 29, 2012 as follows:
| BP Long/Short Equity Fund | BP Long/Short Research Fund | BP All-Cap Value Fund | ||||||||||||||||||||||
| Number of Contracts | Premiums Received | Number of Contracts | Premiums Received | Number of Contracts | Premiums Received | |||||||||||||||||||
Options outstanding at August 31, 2011 | 9,636 | $ | 2,307,033 | 37 | $ | 20,979 | 6,021 | $ | 520,322 | |||||||||||||||
Options written | 15,393 | 5,296,105 | 93 | 50,350 | 3,321 | 691,660 | ||||||||||||||||||
Options closed | (21,714 | ) | (4,859,693 | ) | (37 | ) | (20,979 | ) | (3,750 | ) | (259,539 | ) | ||||||||||||
Options expired | — | — | — | — | (3,089 | ) | (265,249 | ) | ||||||||||||||||
Options exercised | (2,182 | ) | (1,896,478 | ) | — | — | (364 | ) | (92,278 | ) | ||||||||||||||
|
|
|
|
|
|
|
|
|
|
|
| |||||||||||||
Options outstanding at February 29, 2012 | 1,133 | $ | 846,967 | 93 | $ | 50,350 | 2,139 | $ | 594,916 | |||||||||||||||
|
|
|
|
|
|
|
|
|
|
|
| |||||||||||||
Short Sales — When the investment adviser believes that a security is overvalued, the BP Long/Short Equity Fund, the BP Long/Short Research Fund and the BP All-Cap Value Fund may sell the security short by borrowing the same security from a broker or other institution and selling the security. A Fund will incur a loss as a result of a short sale if the price of the borrowed security increases between the date of the short sale and the date on which the Fund buys and replaces such borrowed security. A Fund will realize a gain if there is a decline in price of the security between those dates where the decline in price exceeds the costs of borrowing the security and other transaction costs. There can be no assurance that a Fund will be able to close out a short position at any particular time or at an acceptable price. Although a Fund’s gain is limited to the amount at which it sold a security short, its potential loss is unlimited. Until a Fund replaces a borrowed security, it will maintain at all times cash, U.S. Government securities, or other liquid securities in an amount which, when added to any amount deposited with a broker as collateral, will at least equal the current market value of the security sold short. Depending on arrangements made with brokers, a Fund may not receive any payments (including interest) on collateral deposited with them.
In accordance with the terms of its prime brokerage agreements, a Fund may receive rebate income or be charged a fee on borrowed securities. Such income or fee is calculated on a daily basis based upon the market value of each borrowed security and a variable rate that is dependent upon the availability of such security. The Funds record these prime broker charges on a net basis as interest income or interest expense. For the six-month period ended February 29, 2012, the BP Long/Short Equity Fund and the BP Long/Short Research Fund had net charges of $3,289,259 and $195,647, respectively, on borrowed securities. Such amounts are included in prime broker interest expense on the statement of operations.
As of February 29, 2012, the BP Long/Short Equity Fund and the BP Long/Short Research Fund had securities sold short valued at $343,473,575 and $44,729,171, respectively, for which securities of $349,287,637 and $41,938,349 and cash deposits of $344,425,586 and $45,135,248, respectively, were pledged as collateral.
In accordance with Special Custody and Pledge Agreements with Goldman Sachs & Co. (“Goldman Sachs”) (the Funds’ prime broker), the BP Long/Short Equity Fund and the BP Long/Short Research Fund may borrow from Goldman Sachs to the extent necessary to maintain required margin cash deposits on short positions. Interest on such borrowings is charged a the Fund based on the LIBOR rate plus an agreed upon spread.
The BP Long/Short Equity Fund and the BP Long/Short Research Fund utilized cash borrowings from Goldman Sachs to meet required margin cash deposits as follows during the six-month period ended February 29, 2012:
| Days Utilized | Average Daily Borrowings | Weighted Average Interest Rate | ||||||||
BP Long/Short Equity Fund | 127 | $ | 19,489,571 | 0.60 | % | |||||
BP Long/Short Research Fund | 142 | 2,028,038 | 0.60 | % | ||||||
As of February 29, 2012, the BP Long/Short Equity Fund and the BP Long/Short Research Fund had borrowings of $48,704,897 and $7,263,245, respectively. Interest expenses for the six month period ended February 29, 2012, totaled $32,644 and $4,223, respectively.
| SEMI-ANNUAL REPORT 2012 | 49 | ||
ROBECO INVESTMENT FUNDS
|
| NOTES TO FINANCIAL STATEMENTS (unaudited) (continued) |
| 2. | Transactions with Investment Advisers and Other Services |
Robeco Investment Management, Inc. (“Robeco”) provides investment advisory services to the BP Funds and the WPG Small/Micro Cap Value Fund. For its advisory services with respect to the BP Funds, Robeco is entitled to receive 1.00% of the BP Small Cap Value Fund II’s average daily net assets, 2.25% of the BP Long/Short Equity Fund’s average daily net assets, 1.25% of the BP Long/Short Research Fund’s average daily net assets, 0.80% of the BP All-Cap Value Fund’s average daily net assets, 0.90% of BP Global Equity Fund’s average daily net assets, and 0.90% of BP International Equity Fund’s average daily net assets, each accrued daily and payable monthly.
Until December 31, 2012, Robeco has contractually agreed to limit the BP Small Cap Value Fund II, BP Long/Short Equity Fund and BP All-Cap Value Fund’s total annual operating expenses (excluding certain items discussed below) to the extent that such expenses exceed the ratios in the table below. This limit is calculated daily based the BP Small Cap Value Fund II, BP Long/Short Equity Fund and BP All-Cap Value Fund’s average daily net assets. These limitations are effected in waivers of advisory fees and reimbursements of expenses exceeding the advisory fee as necessary. These contractual limitations are in effect until at least December 31, 2012 and may not be terminated without approval of the Company’s Board of Directors. Robeco may not recoup any of its waived investment advisory fees with respect to these Funds.
| Institutional | Investor | |||||||
BP Small Cap Value Fund II | 1.30 | % | 1.55 | % | ||||
BP Long/Short Equity Fund | 2.50 | % | 2.75 | % | ||||
BP All-Cap Value Fund | 0.70 | % | 0.95 | % | ||||
For the BP Long/Short Research Fund, for the period from September 1, 2011 to December 31, 2011, Robeco had contractually agreed to forgo all or a portion of its advisory fee and/or reimburse expenses in an aggregate amount equal to the amount by which the total annual Fund operating expenses (other than acquired fund fees and expenses, short sale dividend expenses, brokerage commissions, extraordinary items or taxes) exceeded 2.25% of the average daily net assets attributable to the Fund’s Institutional Class shares and 2.50% of the average daily net assets attributable to the Fund’s Investor Class. Effective January 1, 2012, Robeco has contractually agreed to forgo all or a portion of its advisory fee and/or reimburse expenses in an aggregate amount equal to the amount by which the total annual Fund operating expenses (excluding certain items discussed below) exceeds 1.50% of the average daily net assets attributable to the Fund’s Institutional Class shares and 1.75% of the average daily net assets attributable to the Fund’s Investor Class. This contractual limitation is in effect until at least December 31, 2012 and may not be terminated without approval of the Company’s Board of Directors. If at any time during the first three years the Fund’s Advisory Agreement with Robeco is in effect, the Fund’s Total annual Fund operating expenses for that year are less than 1.50% for the Institutional Class and 1.75% for the Investor Class, Robeco is entitled to reimbursement by the Fund of the advisory fees forgone and other payments remitted by Robeco to the Fund during such three-year period. As of February 29, 2012, the total fees waived and reimbursed which may be subject to possible future reimbursement to Robeco totaled $286,851, of which, $256,028 expires in 2014 and $30,823 expires in 2015.
For the BP Global Equity Fund and BP International Equity Fund, Robeco has contractually agreed to forgo all or a portion of its advisory fee and/or reimburse expenses in an aggregate amount equal to the amount by which each Fund’s total annual Fund operating expenses (excluding certain items discussed below) exceeds 1.30% of the average daily net assets attributable to each Fund’s Institutional Class shares and 1.55% of the average daily net assets attributable to each Fund’s Investor Class. This contractual limitation is in effect until at least December 31, 2012 and may not be terminated without approval of the Company’s Board of Directors. If at any time during the first three years each Fund’s Advisory Agreement with Robeco is in effect, each Fund’s Total annual Fund operating expenses for that year are less than 1.30% for the Institutional Class and 1.55% for the Investor Class, Robeco is entitled to reimbursement by each Fund of the advisory fees forgone and other payments remitted by Robeco to each Fund during such three-year period. As of February 29, 2012, the total fees waived and reimbursed which may be subject to possible future reimbursement to Robeco totaled $23,714 and $23,768 for the BP Global Equity Fund and BP International Equity Fund, respectively, which expires in 2015.
For its advisory services with respect to the WPG Small/Micro Cap Value Fund, Robeco is entitled to receive advisory fees, accrued daily and paid monthly, as follows:
WPG Small/Micro Cap Value Fund | 0.90% of net assets up to $300 million | |
| 0.80% of net assets $300 million to $500 million | ||
| 0.75% of net assets in excess of $500 million |
| 50 | SEMI-ANNUAL REPORT 2012 | ||
ROBECO INVESTMENT FUNDS
|
| NOTES TO FINANCIAL STATEMENTS (unaudited) (continued) |
| 2. | Transactions with Investment Advisers and Other Services (continued) |
Until December 31, 2012, Robeco has contractually agreed to limit the WPG Small/Micro Cap Value Fund’s total annual Fund operating expenses (excluding certain items discussed below) to 1.70% as a percentage of the Fund’s average daily net assets. The contractual limitation is in effect until at least December 31, 2012 and may not be terminated without approval of the Company’s Board of Directors. Robeco may not recoup any of its waived investment advisory fees with respect to the WPG Small/Micro Cap Value Fund.
For the period ended February 29, 2012, Robeco has waived and reimbursed fees as follows:
Funds | Investment Adviser Expense Waived | Investment Adviser Reimbursement | ||||||
BP Small Cap Value Fund II | $ | 37,851 | $ | — | ||||
BP Long/Short Equity Fund | — | — | ||||||
BP Long/Short Research Fund | 30,823 | — | ||||||
BP All-Cap Value Fund | 390,652 | — | ||||||
BP WPG Small/Micro Cap Value Fund | 3,951 | — | ||||||
BP Global Equity Fund | 13,072 | 10,642 | ||||||
BP International Equity Fund | 12,988 | 10,780 | ||||||
In determining Robeco’s obligation to waive advisory fees and/or reimburse expenses, the following expenses are not taken into account and could cause a Fund’s net annualized expense ratio to exceed the applicable expense limitation: acquired fund fees and expenses, short sale dividend expenses, brokerage commissions, extraordinary items, interest and taxes.
BNY Mellon Investment Servicing (US) Inc. (“BNY”), a member of The Bank of New York Mellon Corporation, serves as administrator for the Funds. For providing administration and accounting services, BNY is entitled to receive a monthly fee equal to an annual percentage rate of each Fund’s average daily net assets, subject to certain minimum monthly fees. For the BP Global Equity Fund and BP International Equity Fund, BNY accrued administration and accounting fees totaling $14,463 and $14,463 and waived fees totaling $9,226 and $9,226, respectively, for the period ended February 29, 2012.
Included in the administration and accounting service fees, shown on the Statement of Operations, are fees for providing regulatory administrative services to RBB. For providing these services, BNY is entitled to receive compensation as agreed to by the Company and BNY. This fee is allocated to each Fund in proportion to its net assets of the Company.
In addition, BNY serves as the Funds’ transfer, custodian and dividend disbursing agent. For providing transfer agency services, BNY is entitled to receive a monthly fee, subject to certain minimum. For the BP Global Equity Fund and BP International Equity Fund, BNY accrued transfer agent fees totaling $10,260 and $10,360 and waived fees totaling $7,967 and $7,967, respectively, for the period ended February 29, 2012. The Bank of New York Mellon (the “Custodian”) serves as the Funds’ Custodian providing certain custodial services to the Funds. The Custodian is entitled to receive a monthly fee equal to an annual percentage rate of the Funds’ average daily net assets, subject to certain minimum monthly fees. For the BP Global Equity Fund and BP International Equity Fund, the Custodian accrued custody fees totaling $2,963 and $2,972 and waived fees totaling $1,419 and $1,419, respectively, for the period ended February 29, 2012.
The Board of Directors of the Company has approved a Distribution Agreement for the Funds and adopted separate Plans of Distribution for the Investor Class of each BP Fund (the “Plans”) pursuant to Rule 12b-1 under the 1940 Act. Under the Plans, BNY Distributors Inc. (the “Distributor”) is entitled to receive from each Fund a distribution fee with respect to the Investor Class, which is accrued daily and paid monthly, of up to 0.25% on an annualized basis of the average daily net assets of the Investor Class. Amounts paid to the Distributor under the Plans may be used by the Distributor to cover expenses that are related to (i) the sale of the Investor Class Shares, (ii) ongoing servicing and/or maintenance of the accounts of shareholders, and (iii) sub-transfer agency services, subaccounting services or administrative services related to the sale of the Investor Class, all as set forth in the Plans.
| 3. | Directors/Compensation |
The Directors of the Company receive an annual retainer, meeting fees and reimbursement of out of pocket expenses for meetings attended. The aggregate remuneration paid to the Directors by the Funds during the six-month period ended February 29, 2012 was $55,274. Certain employees of BNY are Officers of the Company. They are not compensated by the Funds or the Company.
| SEMI-ANNUAL REPORT 2012 | 51 | ||
ROBECO INVESTMENT FUNDS
|
| NOTES TO FINANCIAL STATEMENTS (unaudited) (continued) |
| 4. | Investment in Securities |
For the six-month period ended February 29, 2012 aggregate purchases and sales of investment securities (excluding short-term investments and U.S. government obligations) were as follows:
Fund | Purchases | Sales | ||||||
BP Small Cap Value Fund II | $ | 5,689,827 | $ | 7,103,679 | ||||
BP Long/Short Equity Fund | 238,395,813 | 229,577,631 | ||||||
BP Long/Short Research Fund | 64,323,543 | 16,791,488 | ||||||
BP All-Cap Value Fund | 51,494,615 | 60,102,952 | ||||||
WPG Small/Micro Cap Value Fund | 14,270,970 | 15,959,766 | ||||||
BP Global Equity Fund | 12,774,237 | 2,960,393 | ||||||
BP International Equity Fund | 12,708,528 | 3,053,074 | ||||||
| 5. | Capital Share Transactions |
As of February 29, 2012, each class of each Fund has 100,000,000 shares of $0.001 par value common stock authorized except for the Institutional Class of the WPG Small/Micro Cap Value Fund, which has 50,000,000 shares of $0.001 par value common stock authorized.
As of February 29, 2012, the following Funds had shareholders that held 10% or more of the outstanding shares of the Funds.
BP Long/Short Research Fund (Robeco and its affiliates) | 11% | |
BP All-Cap Value Fund (2 shareholders) | 27% | |
BP Global Equity Fund (Robecco and its affiliates) | 100% | |
BP International Equity Fund (Robecco and its affiliates) | 100% |
| 6. | Securities Lending |
Securities may be loaned to financial institutions, such as broker-dealers, and are required to be secured continuously by collateral in cash, cash equivalents, letter of credit or U.S. Government securities maintained on a current basis at an amount at least equal to the market value of the securities loaned. Cash collateral received, pursuant to investment guidelines established by the Funds and approved by the Board of Directors, is invested in short-term investments. All such investments are made at the risk of the Funds and, as such, the Funds are liable for investment losses. Such loans would involve risks of delay in receiving additional collateral in the event the value of the collateral decreased below the value of the securities loaned or of delay in recovering the securities loaned or even loss of rights in the collateral should the borrower of the securities fail financially. However, loans will be made only to borrowers deemed by Robeco to be of good standing and only when, in the Robeco’s judgment, the income to be earned from the loans justifies the attendant risks. Any loans of a Fund’s securities will be fully collateralized and marked to market daily. During the six-month period ended February 29, 2012, the Funds participated in securities lending. The market value of securities on loan and collateral as of February 29, 2012 and the income generated from the program during the six month period ended February 29, 2012 with respect to such loans are as follows:
Fund | Market Value of Securities Loaned | Market Value of Collateral | Income Received from Securities Lending | |||||||||
BP Small Cap Value Fund II | $ | 4,923,143 | $ | 5,109,294 | $ | 18,793 | ||||||
BP Long/Short Equity Fund | 13,871,732 | 15,088,513 | 212,407 | |||||||||
BP All-Cap Value Fund | 3,876,454 | 3,920,093 | 32,066 | |||||||||
WPG Small/Micro Cap Value Fund | 1,159,601 | 1,211,496 | 13,845 | |||||||||
| 7. | Restricted Securities |
A restricted security is a security which has been purchased through a private offering and cannot be resold to the general public without prior registration under the Securities Act of 1933 (the “1933 Act”) or pursuant to the resale limitations provided by Rule 144 under the 1933 Act, or an exemption from the registration requirements of the 1933 Act. Certain restricted securities may be resold in transactions exempt from registration, normally to qualified institutional buyers, and may be deemed liquid by Robeco as applicable, based on policies and procedures established by the Board of Directors. Therefore, not all restricted securities are considered illiquid.
| 52 | SEMI-ANNUAL REPORT 2012 | ||
ROBECO INVESTMENT FUNDS
|
| NOTES TO FINANCIAL STATEMENTS (unaudited) (continued) |
| 7. | Restricted Securities (continued) |
At February 29, 2012, the following Fund held restricted securities that were illiquid:
| Acquisition Date | Acquisition Cost | Shares/ Par | Value | % of Net Assets | ||||||||||||||
BP All-Cap Value Fund | ||||||||||||||||||
Common Stocks: | ||||||||||||||||||
J.G.Wentworth, Inc. | 08/02/07-03/26/08 | $ | 181,980 | — | — | 0.0 | % | |||||||||||
Peoples Choice Financial Corp. 144A | 12/21/04-01/23/06 | 14,293 | 1,465 | — | 0.0 | |||||||||||||
Solar Cayman Ltd. 144A | 03/24/10 | — | 19,375 | — | 0.0 | |||||||||||||
|
|
|
|
|
|
|
| |||||||||||
| $ | 196,273 | 20,840 | $ | — | 0.0 | % | ||||||||||||
|
|
|
|
|
|
|
| |||||||||||
| 8. | Redemption Fees |
There is a 1.00% redemption fee on shares redeemed which have been held 60 days or less on BP Small Cap Value Fund II, BP Long/Short Research Fund, BP Global Equity Fund and BP International Equity Fund. There is a 2.00% redemption fee on shares redeemed which have been held 365 days or less on the BP Long/Short Equity Fund. The WPG Small/Micro Cap Value Fund has a 2.00% redemption fee on shares redeemed within 60 days of purchase. The redemption fees are retained by the Funds for the benefit of the remaining shareholders and recorded as paid-in capital.
| 9. | Federal Income Tax Information |
The Funds have followed the authoritative guidance on accounting for and disclosure of uncertainty in tax positions, which requires the Funds to determine whether a tax position is more likely than not to be sustained upon examination, including resolution of any related appeals or litigation processes, based on the technical merits of the position. The Funds have determined that there was no effect on the financial statements from following this authoritative guidance. In the normal course of business, the Funds are subject to examination by federal, state and local jurisdictions, where applicable, for tax years for which applicable statutes of limitations have not expired.
As of February 29, 2012, federal tax cost, aggregate gross unrealized appreciation and depreciation of securities held by each Fund were as follows:
Fund | Federal Tax Cost | Unrealized Appreciation | Unrealized (Depreciation) | Net Unrealized Appreciation | ||||||||||||
BP Small Cap Value Fund II | $ | 100,515,825 | $ | 23,936,216 | $ | (8,198,910 | ) | $ | 15,737,306 | |||||||
BP Long/Short Equity Fund | 504,910,526 | 65,326,589 | (18,588,124 | ) | 46,738,465 | |||||||||||
BP Long/Short Research Fund | 105,376,122 | 11,757,128 | (1,265,631 | ) | 10,491,497 | |||||||||||
BP All-Cap Value Fund | 234,970,955 | 27,375,146 | (5,780,197 | ) | 21,594,949 | |||||||||||
WPG Small/Micro Cap Value Fund | 33,905,611 | 6,101,032 | (1,606,531 | ) | 4,494,501 | |||||||||||
BP Global Equity Fund | 9,872,769 | 938,126 | (58,941 | ) | 879,185 | |||||||||||
BP International Equity Fund | 9,709,165 | 968,647 | (82,206 | ) | 886,441 | |||||||||||
Distributions to shareholders from net investment income and realized gains are determined in accordance with federal income tax regulations, which may differ from net investment income and realized gains recognized for financial reporting purposes. Accordingly, the character of distributions and composition of net assets for tax purposes may differ from those reflected in the accompanying financial statements. To the extent these differences are permanent, such amounts are reclassified within the capital accounts based on the tax treatment; temporary differences do not require such reclassification.
As of August 31, 2011, the components of distributable earnings on a tax basis were as follows:
Fund | Undistributed Ordinary Income | Undistributed Long-Term Gains | Accumulated Losses | Unrealized Appreciation/ (Depreciation) | ||||||||||||
BP Small Cap Value Fund II | $ | — | $ | — | $ | (16,637,853 | ) | $ | 576,975 | |||||||
BP Long/Short Equity Fund | 33,686,891 | 14,889,156 | (2,108,085 | ) | (4,350,806 | ) | ||||||||||
BP Long/Short Research Fund | 537,279 | — | (13,604 | ) | (2,493,923 | ) | ||||||||||
BP All-Cap Value Fund | 3,635,245 | 12,729,460 | — | (12,643,675 | ) | |||||||||||
WPG Small/Micro Cap Value Fund | — | — | (5,267,825 | ) | (2,844,829 | ) | ||||||||||
| SEMI-ANNUAL REPORT 2012 | 53 | ||
ROBECO INVESTMENT FUNDS
|
| NOTES TO FINANCIAL STATEMENTS (unaudited) (continued) |
| 9. | Federal Income Tax Information (continued) |
The differences between the book and tax basis components of distributable earnings relate principally to the timing of recognition of income and gains for federal income tax purposes. Short-term and foreign currency gains are reportable as ordinary income for federal income tax purposes.
The tax character of dividends and distributions paid during the fiscal year ended August 31, 2011 and 2010 were as follows:
| 2011 | ||||||||||||
Fund | Ordinary Income | Long-Term Gains | Total | |||||||||
BP Small Cap Value Fund II | $ | 195,668 | $ | — | $ | 195,668 | ||||||
BP Long/Short Equity Fund | 24,904,689 | 1,616,225 | 26,520,914 | |||||||||
BP Long/Short Research Fund | — | — | — | |||||||||
BP All-Cap Value Fund | 2,998,868 | 585,961 | 3,584,829 | |||||||||
WPG Small/Micro Cap Value Fund | — | — | — | |||||||||
Dividends from net investment income and short-term capital gains are treated as ordinary income dividends for federal income tax purposes.
For federal income tax purposes, capital loss carryforwards represent net realized capital losses of a Fund that may be carried forward for a maximum of eight years and applied against future net capital gains. As of August 31, 2011, the following Funds had capital loss carryforwards available to offset future realized capital gains through the expiration dates indicated below:
Fund | August 31, 2016 | August 31, 2017 | August 31, 2018 | Total | ||||||||||||
BP Small Cap Value Fund II | $ | — | $ | 3,787,452 | $ | 12,850,401 | $ | 16,637,853 | ||||||||
BP Long/Short Equity Fund | 2,108,085 | — | — | 2,108,085 | ||||||||||||
BP Long/Short Research Fund | — | — | — | — | ||||||||||||
BP All-Cap Value Fund | — | — | — | — | ||||||||||||
WPG Small/Micro Cap Value Fund | — | 1,849,282 | 3,418,543 | 5,267,825 | ||||||||||||
Due to limitations imposed by the Internal Revenue Code and the regulations thereunder, the capital losses from the BP Long/Short Equity Fund that were acquired in its reorganization with the WPG 130/30 Large Cap Core Fund on April 17, 2009, could not be fully used against its current year capital gains. The remaining loss of $2,108,085 is carried forward and $421,617 can be utilized annually against the BP Long/Short Equity Fund’s realized capital gains through August 31, 2016.
Under federal tax law, foreign currency and capital losses realized after October 31 may be deferred and treated as having arisen on the first day of the following fiscal year. For the fiscal year ended August 31, 2011, the following Funds will defer post-October capital and foreign currency losses to the fiscal year ending August 31, 2012.
Fund | Capital | Foreign Currency | ||||||
BP Long/Short Research Fund | $ | — | $ | 13,604 | ||||
On December 22, 2010, President Obama signed into law the Regulated Investment Company Modernization Act of 2010 (the “Act”). The Act updates certain tax rules applicable to regulated investment companies (“RICs”). The various provisions of the Act will generally be effective for RICs with taxable years beginning after December 22, 2010. Additional information regarding the impact of the Act on the Funds, if any, will be contained within the relevant sections of the notes to financial statements for the fiscal year ending August 31, 2012.
| 10. | New Accounting Pronouncements |
In May 2011, the Financial Accounting Standards Board (“FASB”) issued Accounting Standards Update (“ASU”) No. 2011-04 “Amendments to Achieve Common Fair Value Measurement and Disclosure Requirements in U.S. GAAP and IFRSs”. ASU 2011-04 includes common requirements for measurement of and disclosure about fair value between U.S. GAAP and International Financial Reporting Standards (“IFRS”). ASU 2011-04 will require reporting entities to disclose the following information for fair value measurements categorized within Level 3 of the fair value hierarchy: quantitative information about the unobservable inputs used in
| 54 | SEMI-ANNUAL REPORT 2012 | ||
ROBECO INVESTMENT FUNDS
|
| NOTES TO FINANCIAL STATEMENTS (unaudited) (continued) |
the fair value measurement, the valuation processes used by the reporting entity and a narrative description of the sensitivity of the fair value measurement to changes in unobservable inputs and the interrelationships between those unobservable inputs. In addition, ASU 2011-04 will require reporting entities to make disclosures about amounts and reasons for all transfers in and out of Level 1 and Level 2 fair value measurements. The new and revised disclosures are effective for interim and annual reporting periods beginning after December 15, 2011. Management is currently evaluating the implications of ASU No. 2011-04 and its impact on the financial statements.
In December 2011, FASB issued ASU No. 2011-11, “Disclosures about Offsetting Assets and Liabilities”. ASU 2011-11 requires disclosures to make financial statements that are prepared under U.S. GAAP more comparable to those prepared under IFRS. The new disclosure requirements mandate that entities disclose both gross and net information about instruments and transactions eligible for offset in the statement of assets and liabilities as well as instruments and transactions subject to an agreement similar to a master netting arrangement. In addition, ASU 2011-11 requires disclosure of collateral received and posted in connection with master netting agreements or similar arrangements. New disclosures are required for annual reporting periods beginning on or after January 1, 2013, and interim periods within those annual periods. Management is evaluating the impact of ASU 2011-11 on the financial statements and disclosures.
| 11. | Subsequent Events |
Management has evaluated the impact of all subsequent events on the Fund(s) through the date the financial statements were issued, and has determined that there was the following subsequent event:
The Bank of New York Mellon Corporation announced on November 28, 2011 that it had agreed to sell BNY Mellon Distributors LLC (the “Distributor”) and its four subsidiaries to Foreside Distributors, LLC, a subsidiary of Foreside Financial Group, LLC (the “Transaction”). The Transaction closed on March 31, 2012. Upon the closing of the Transaction, the Distributor became an indirect, wholly owned subsidiary of Foreside Financial Group, LLC and was renamed Foreside Funds Distributors LLC effective April 1, 2012.
| SEMI-ANNUAL REPORT 2012 | 55 | ||
ROBECO INVESTMENT FUNDS
|
| OTHER INFORMATION (unaudited) |
Proxy Voting
Policies and procedures that the Funds use to determine how to vote proxies relating to portfolio securities as well as information regarding how the Funds voted proxies relating to portfolio securities for the most recent 12-month period ended June 30 are available without charge, upon request, by calling (888) 261-4073 and on the Securities and Exchange Commission’s (“SEC”) website at http://www.sec.gov.
Quarterly Portfolio Schedule
The Company files a complete schedule of portfolio holdings with the SEC for the first and third fiscal quarters of each fiscal year (quarters ended November 30 and May 31) on Form N-Q. The Company’s Form N-Q is available on the SEC website at http://www.sec.gov and may be reviewed and copied at the SEC Public Reference Room in Washington, D.C. Information on the operation of the SEC Public Reference Room may be obtained by calling (202) 551-8090.
Approval of Investment Advisory Agreements
As required by the 1940 Act, the Board of Directors of the Company (the “Board”), including all of the Directors who are not “interested persons” of the Company, as that term is defined in the 1940 Act (the “Independent Directors”), considered the approval of the investment advisory agreements between Robeco and the Company (the “Advisory Agreements”) on behalf of the BP Global Equity Fund and BP International Equity Fund (the “New BP Funds”) at a meeting of the Board held on September 13, 2011 (the “Meeting”). At the Meeting, the Board, including all the Independent Directors, approved the Advisory Agreements for an initial term ending on August 16, 2013. The Board’s decision to approve the Advisory Agreements reflects the exercise of its business judgment to engage Robeco to provide advisory services to the New BP Funds pursuant to the terms of the Advisory Agreements. In approving the Advisory Agreements, the Board considered information provided by Robeco with the assistance and advice of counsel to the Independent Directors and the Company.
In considering the approval of the advisory agreement with Robeco, the Board took into account all materials provided prior to and during the Meeting, the presentations made during the Meeting, and the discussions during the Meeting. Among other things, the Board considered (i) the nature, extent, and quality of Robeco’s services to be provided to the New BP Funds; (ii) descriptions of the experience and qualifications of Robeco’s personnel providing those services; (iii) Robeco’s investment philosophies and processes; (iv) Robeco’s assets under management and client descriptions; (v) Robeco’s soft dollar commission and trade allocation policies, including information on the types of research and services obtained in connection with soft dollar commissions; (vi) Robeco’s current and proposed advisory fee arrangements for the New BP Funds, with the other Funds and with other similarly managed clients; (vii) Robeco’s compliance procedures; (viii) Robeco’s financial information and insurance coverage; and (ix) the extent to which economies of scale are relevant to the New BP Funds.
As part of their review, the Board considered the nature, extent and quality of the services to be provided by Robeco. The Board concluded that Robeco had substantial resources to provide services to the New BP Funds and that Robeco’s services to the other Funds had been acceptable.
The Board also considered the prior investment performance of each New BP Fund’s strategy. The Board concluded that the investment performance of each New BP Fund’s strategy as compared to the MSCI EAFE Index was acceptable.
The Board also considered the advisory fee rate payable by the New BP Funds under the proposed Advisory Agreements. In this regard, the Board noted that Robeco had offered to contractually agree to waive management fees and reimburse expenses through December 31, 2012 to limit total annual operating expenses to agreed upon levels for the New BP Funds.
After reviewing the information regarding Robeco’s costs and economies of scale, and after considering Robeco’s services, the Board concluded that the investment advisory fees to be paid by the New BP Funds were fair and reasonable and that the Advisory Agreements should be approved for an initial period ending August 16, 2013.
| 56 | SEMI-ANNUAL REPORT 2012 | ||

INVESTMENT ADVISER Robeco Investment Management Inc. 909 Third Avenue, 32nd Floor New York, NY 10022 ADMINISTRATOR BNY Mellon Investment Servicing (US) Inc. 301 Bellevue Parkway Wilmington, DE 19809 TRANSFER AGENT BNY Mellon Investment Servicing (US) Inc. 4400 Computer Drive Westborough, MA 01581 PRINCIPAL UNDERWRITER Foreside Funds Distributors LLC 400 Berwyn Park 899 Cassatt Road Berwyn, PA 19312 CUSTODIAN The Bank of New York Mellon One Wall Street New York, NY 10286 INDEPENDENT REGISTERED PUBLIC ACCOUNTING FIRM Ernst & Young LLP Two Commerce Square 2001 Market Street, Suite 4000 Philadelphia, PA 19103 COUNSEL Drinker Biddle & Reath LLP One Logan Square, Ste. 2000 Philadelphia, PA 19103-6996
S1 FUND
SEMI-ANNUAL INVESTMENT ADVISER’S REPORT
(UNAUDITED)
Dear Fellow Investor,
We are pleased to enclose the February 29, 2012 semi-annual report for the S1 Fund (the “Fund) for your information.
The Simple Alternatives team would like to take this opportunity to thank you for your support. We are grateful for the confidence you have placed in us since the Fund’s inception.
Our philosophy is simple. We believe that hedged equity may be a vital part of any investment portfolio. We believe that investors are best served by diversifying across a team of skilled hedged equity managers and that those strategies and managers can now be accessed through a simple-to-use mutual fund structure.
One of our goals in creating the Fund was to offer a liquid, transparent alternative to traditional hedge fund investment vehicles that would be competitive in every aspect, including structure, communication and, most importantly, performance.
We are pleased that the Fund’s performance had not just been competitive with traditional hedge funds, but outperformed for this report period the broader hedge fund universe as measured by the Hedge Fund Research, Inc (“HFRI”) Fund of Funds Composite Indexi. For the year ended December 31, 2011, the Fund returned -1.21% which compared quite favorably with the HFRI Fund of Funds Composite Index’s return of -5.51% for the year. While the Fund and HFRI Fund of Funds Composite Index lagged the S&P 500® return of 0.00% for the year, both the Fund and HFRI Fund of Funds Composite Index were significantly less volatile. The S&P 500® delivered annualized standard deviationii of 23.2% which was far more volatile than the Fund’s 4.6% and HFRI Fund of Funds Composite Index’s 4.3%. We take great satisfaction in being able to accomplish this strong relative performance in a mutual fund structure versus the traditional limited partnership hedge fund investment structure.
In February, we added our newest sub-advisor Maerisland Capital, LLC. Mark Beder, Founder and Chief Investment Officer, brings remarkable stock picking acumen, excellent short-selling experience, and exceptional portfolio management skills. We are excited to have him managing a portion of the Fund and welcome his contribution of unique ideas to the portfolio.
While we are optimistic about the opportunities our sub-advisors are uncovering in early 2012, we remain diligent in our efforts to monitor risk in the portfolio. During times of volatility, it may be especially important for investors to allocate capital to managers that aim to preserve capital while seeking to generate positive returns in a variety of market conditions.
Our careful selection of sub-advisors has resulted in a diverse and talented team of experienced hedged equity managers who are skilled at finding undiscovered opportunities to invest in while at the same time to strive to protect capital.
We are grateful for your support and participation.
Sincerely,
James K. Dilworth
Founder
Simple Alternatives
1
| i | The HFRI Fund of Funds Composite Index data is sourced from Hedge Fund Research, Inc and is an equal weighted index of over 650 constituent hedge fund of funds that invest over a broad range of strategies. |
| ii | Annualized Standard Deviation: Risk as measured by the variability of performance. The higher the standard deviation, the greater the variability (and therefore the risk) of the fund or index. |
Portfolio composition is subject to change. The current and future portfolio holdings of the Fund are subject to investment risks.
2
S1 FUND
PERFORMANCE DATA
(UNAUDITED)
TOTAL RETURNS AS OF FEBRUARY 29, 2012 |
| |||||||||||
| Six Months* | One Year | Since Inception** | ||||||||||
S1 Fund, I Shares | 0.00 | % | -1.19 | % | -0.28 | % | ||||||
S&P 500® Index*** | 12.04 | % | 2.90 | % | 13.51 | % | ||||||
| * | Not annualized. |
| ** | Inception date of the Fund is September 30, 2010. |
| *** | Benchmark performance is from the inception date of the Fund only and is not the inception date of the benchmark itself. |
Performance quoted is past performance and does not guarantee future results. Investment return and principal value will fluctuate so that shares, when redeemed, may be worth more or less than their original cost. Current performance may be lower or higher than the returns quoted above. Call Simple Alternatives at 1-866-882-1226 for returns current to the most recent month-end.
The performance quoted reflects fee waivers in effect and would have been less in their absence. The Fund’s gross annual operating expense ratio, as stated in the current prospectus, is 6.41% and the Fund’s net operating expense ratio is 4.08%. Net operating expense includes interest and dividends on short sales and acquired fund fees. The Fund’s investment adviser, Simple Alternatives, LLC, has contractually agreed until at least December 31, 2012 to forgo all or a portion of its advisory fee and/or reimburse expenses in an aggregate amount equal to the amount by which the total annual Fund operating expenses (other than acquired fund fees and expenses, short sale dividend expenses, brokerage commissions, litigation, extraordinary items, interest or taxes) exceeds 2.95% of the average daily net assets attributable to the Fund’s I Shares.This limitation can be discontinued at any time after December 31, 2012.
The Fund is non-diversified and may focus its investments in the securities of a comparatively small number of issuers. Concentration in securities of a limited number of issuers exposes a fund to greater market risk and potential monetary losses than if its assets were diversified among the securities of a greater number of issuers. The Fund may invest in small- and medium-sized companies which involve greater risk than investing in larger, more established companies, such as increased volatility of earnings and prospects, higher failure rates, and limited markets, product lines or financial resources.
The Fund may invest in foreign or emerging markets securities which involve special risks, including the volatility of currency exchange rates and, in some cases, limited geographic focus, political and economic instability, and relatively illiquid markets.
The Fund may invest in debt securities which are subject to interest rate risk. An increase in interest rates typically causes a fall in the value of the debt securities in which the Fund may invest. The Fund may also invest in high yield,
3
S1 FUND
PERFORMANCE DATA (CONCLUDED)
(UNAUDITED)
lower rated (junk) bonds which involve a greater degree of risk and price fluctuation than investment grade bonds in return for higher yield potential. The Fund’s distressed debt strategy may involve a substantial degree of risk, including investments in sub-prime mortgage securities.
The Fund may purchase securities of companies in initial public offerings. Special risks associated with these securities may include a limited number of shares available for trading, unseasoned trading, lack of investor knowledge of the company and limited operating history. The Fund may leverage transactions which include selling short as well as borrowing for other than temporary or emergency purposes. Leverage creates the risk of magnified capital losses.
The Fund may also invest in derivatives which can be volatile and involve various types and degrees of risks, depending upon the characteristics of a particular derivative. The Fund may invest in options and futures which are subject to special risks and my not fully protect the Fund against declines in the value of its stocks. In addition, an option writing strategy limits the upside profit potentially normally associated with stocks. Futures trading is very speculative, largely due to the traditional volatility of future prices.
Portfolio composition is subject to change.
4
S1 FUND
FUND EXPENSE EXAMPLES
(UNAUDITED)
As a shareholder of the Fund, you incur two types of costs: (1) transaction costs and (2) ongoing costs, including management fees, shareholder servicing fees and other Fund expenses. These examples are intended to help you understand your ongoing costs (in dollars) of investing in the Fund and to compare these costs with the ongoing costs of investing in other mutual funds.
This example is based on an investment of $1,000 invested at the beginning of the six-month period from September 1, 2011 through February 29, 2012 and held for the entire period.
ACTUAL EXPENSES
The first line of the accompanying tables provides information about actual account values and actual expenses. You may use the information in this line, together with the amount you invested, to estimate the expenses that you paid over the period. Simply divide your account value by $1,000 (for example, an $8,600 account value divided by $1,000 = 8.6), then multiply the result by the number in the first line under the heading entitled “Expenses Paid During Period” to estimate the expenses you paid on your account during this period.
HYPOTHETICAL EXAMPLEFOR COMPARISON PURPOSES
The second line of the accompanying tables provides information about hypothetical account values and hypothetical expenses based on the Fund’s actual expense ratio and an assumed rate of return of 5% per year before expenses, which is not the Fund’s actual return. The hypothetical account values and expenses may not be used to estimate the actual ending account balance or expenses you paid for the period. You may use this information to compare the ongoing costs of investing in the Fund and other funds. To do so, compare these 5% hypothetical examples with the 5% hypothetical examples that appear in the shareholder reports of other funds.
Please note that the expenses shown in the accompanying tables are meant to highlight your ongoing costs only and do not reflect any transactional costs, such as redemption fees. Therefore, the second line of the accompanying tables is useful in comparing ongoing costs only, and will not help you determine the relative total costs of owning different funds. In addition, if these transactional costs were included, your costs would have been higher.
5
S1 FUND
FUND EXPENSE EXAMPLES (CONCLUDED)
(UNAUDITED)
| I SHARES | ||||||||||||
| BEGINNING ACCOUNT VALUE SEPTEMBER 1, 2011 | ENDING ACCOUNT VALUE FEBRUARY 29, 2012 | EXPENSES PAID DURING PERIOD | ||||||||||
Actual* | $ | 1,000.00 | $ | 1,000.00 | $ | 21.36 | ||||||
Hypothetical (5% return before expenses) | 1,000.00 | 1,003.50 | 21.40 | |||||||||
| * | Expenses equal to an annualized expense ratio for the six-month period ended February 29, 2012 of 4.30% for the I Shares of the Fund, which includes waived fees or reimbursed expenses (including dividend and interest expense), multiplied by the average account value over the period, multiplied by the number of days in the most recent period (182) then divided by 366 days. The Fund’s ending account value on the first line in the table is based on the actual six-months total return for the I Shares of the Fund of 0.00%. These amounts include dividends paid on securities which the Fund has sold short (“short-sale dividends”) and related interest expense. The annualized amount of short-sale dividends and related interest expense was 1.35% of the Fund’s average net assets attributable to I Shares for the most recent fiscal year. |
6
S1 FUND
PORTFOLIO HOLDINGS SUMMARY TABLE
FEBRUARY 29, 2012
(UNAUDITED)
The following table presents a summary by sector of the portfolio holdings of the Fund.
SECURITY TYPE/SECTOR CLASSIFICATION | % OF NET ASSETS | VALUE | ||||||
COMMON STOCKS: | ||||||||
Consumer Discretionary | 15.9 | % | $ | 9,353,127 | ||||
Financials | 8.5 | 5,004,029 | ||||||
Information Technology | 9.7 | 5,735,537 | ||||||
Real Estate Investment Trusts | 7.3 | 4,309,286 | ||||||
Energy | 4.1 | 2,435,988 | ||||||
Materials | 3.9 | 2,285,601 | ||||||
Health Care | 2.3 | 1,353,838 | ||||||
Consumer Staples | 2.2 | 1,312,202 | ||||||
Industrials | 1.8 | 1,063,729 | ||||||
Telecommunication Services | 1.6 | 919,660 | ||||||
Utilities | 0.1 | 37,948 | ||||||
EXCHANGE TRADED FUNDS | 15.2 | 8,966,803 | ||||||
U.S. GOVERNMENT AGENCY | 8.5 | 4,984,073 | ||||||
SHORT-TERM INVESTMENTS | 2.7 | 1,599,943 | ||||||
CORPORATE BOND | 1.7 | 1,005,770 | ||||||
U.S TREASURY NOTES | 0.2 | 107,906 | ||||||
PURCHASED OPTIONS | 0.2 | 76,810 | ||||||
FOREIGN GOVERNMENT NOTE | 0.0 | 10,735 | ||||||
COMMON STOCKS SOLD SHORT | (22.0 | ) | (12,980,698 | ) | ||||
EXCHANGE TRADED FUNDS SOLD SHORT | (14.1 | ) | (8,289,687 | ) | ||||
WRITTEN OPTIONS | (0.1 | ) | (53,831 | ) | ||||
OTHER ASSETS IN EXCESS OF LIABILITIES | 50.3 | 29,646,840 | ||||||
|
|
|
| |||||
NET ASSETS | 100.0 | % | $ | 58,885,609 | ||||
|
|
|
| |||||
Portfolio holdings are subject to change at any time.
The accompanying notes are an integral part of the financial statements.
7
S1 FUND
PORTFOLIOOF INVESTMENTS
FEBRUARY 29, 2012
(UNAUDITED)
| NUMBER OF SHARES | VALUE | |||||||
COMMON STOCKS — 57.4% |
| |||||||
CONSUMER DISCRETIONARY—15.9% |
| |||||||
Amazon.com, Inc.* | 1,227 | $ | 220,480 | |||||
AMC Networks, Inc., Class A* | 9,288 | 421,582 | ||||||
America’s Car-Mart, Inc.*^ | 8,649 | 385,832 | ||||||
Apollo Group, Inc., Class A* | 2,260 | 96,366 | ||||||
Arcos Dorados Holdings, Inc., Class A† | 5,360 | 112,667 | ||||||
Ascent Capital Group, Inc., Class A* | 1,000 | 49,240 | ||||||
Black Diamond, Inc.*^ | 16,791 | 139,029 | ||||||
Charter Communications, Inc., Class A* | 9,815 | 622,369 | ||||||
Cie Financiere Richemont SA, Class A (Switzerland) | 1,640 | 100,699 | ||||||
CROCS, Inc.*^ | 13,400 | 263,310 | ||||||
DIRECTV, Class A* | 7,545 | 349,484 | ||||||
DR Horton, Inc. | 7,270 | 104,252 | ||||||
Family Dollar Stores, Inc. | 2,000 | 107,980 | ||||||
Foot Locker, Inc.^ | 10,115 | 295,055 | ||||||
Gentex Corp.^ | 4,400 | 104,060 | ||||||
Heelys, Inc.*^ | 33,718 | 74,854 | ||||||
Hovnanian Enterprises, Inc., Class A* | 21,600 | 59,832 | ||||||
Hyatt Hotels Corp., Class A*^ | 3,435 | 142,243 | ||||||
Iconix Brand Group, Inc.*^ | 14,860 | 269,858 | ||||||
JOS A Bank Clothiers, Inc.*^ | 5,000 | 257,450 | ||||||
Lear Corp.^ | 10,750 | 486,008 | ||||||
Lennar Corp., Class A | 5,461 | 127,678 | ||||||
Li & Fung Ltd. (Hong Kong) | 56,800 | 130,352 | ||||||
Liberty Interactive Corp., Class A* | 21,267 | 398,969 | ||||||
Liberty Media Corp. - Liberty Capital, Class A* | 7,243 | 651,073 | ||||||
Melco Crown Entertainment Ltd. - ADR* | 23,640 | 298,573 | ||||||
MGM Resorts International* | 25,327 | 348,753 | ||||||
Michael Kors Holdings Ltd.*† | 1,100 | 47,575 | ||||||
Morgans Hotel Group Co.* | 5,600 | 28,728 | ||||||
New Oriental Education & Technology Group Sponsored ADR* | 3,400 | 90,134 | ||||||
| NUMBER OF SHARES | VALUE | |||||||
CONSUMER DISCRETIONARY—(CONTINUED) |
| |||||||
Panasonic Corp. - Sponsored ADR | 8,860 | $ | 82,398 | |||||
Priceline.com, Inc.* | 509 | 319,153 | ||||||
PulteGroup, Inc.* | 53,734 | 473,934 | ||||||
RadioShack Corp. | 22,210 | 157,469 | ||||||
Sirius XM Radio, Inc.* | 100,000 | 226,000 | ||||||
Super Group Ltd. (South Africa)* | 12,400 | 23,869 | ||||||
Tiffany & Co. | 2,500 | 162,525 | ||||||
Toll Brothers, Inc.* | 2,147 | 50,369 | ||||||
True Religion Apparel, Inc.*^ | 21,785 | 574,470 | ||||||
Tupperware Brands Corp. | 300 | 18,807 | ||||||
Urban Outfitters, Inc.*^ | 8,900 | 252,671 | ||||||
Viacom, Inc., Class B | 2,850 | 135,717 | ||||||
Wendy’s Co. (The) | 18,000 | 91,260 | ||||||
|
| |||||||
| 9,353,127 | ||||||||
|
| |||||||
CONSUMER STAPLES—2.2% |
| |||||||
Bunge Ltd. | 1,465 | 98,624 | ||||||
Green Mountain Coffee Roasters, Inc.* | 1,100 | 71,467 | ||||||
Loblaw Cos. Ltd. (Canada) | 2,350 | 82,462 | ||||||
Nestle SA - Sponsored ADR | 1,425 | 87,338 | ||||||
Reckitt Benckiser Group PLC (United Kingdom) | 1,270 | 70,311 | ||||||
Safeway, Inc. | 4,750 | 101,888 | ||||||
Sysco Corp. | 1,400 | 41,188 | ||||||
Tesco PLC (United Kingdom) | 15,106 | 75,965 | ||||||
Tyson Foods, Inc., Class A | 5,610 | 106,085 | ||||||
Viterra, Inc. (Canada) | 7,840 | 84,782 | ||||||
Walgreen Co.^ | 11,820 | 391,951 | ||||||
Wal-Mart Stores, Inc. | 1,695 | 100,141 | ||||||
|
| |||||||
| 1,312,202 | ||||||||
|
| |||||||
ENERGY—4.1% |
| |||||||
Alpha Natural Resources, Inc.* | 5,100 | 94,656 | ||||||
Apache Corp. | 1,000 | 107,930 | ||||||
Baker Hughes, Inc.^ | 5,300 | 266,484 | ||||||
Bowood Energy, Inc. (Canada)* | 17,380 | 3,162 | ||||||
BP PLC - Sponsored ADR^ | 1,300 | 61,308 | ||||||
The accompanying notes are an integral part of the Portfolio of Investments.
8
S1 FUND
PORTFOLIOOF INVESTMENTS (CONTINUED)
FEBRUARY 29, 2012
(UNAUDITED)
| NUMBER OF SHARES | VALUE | |||||||
ENERGY—(CONTINUED) | ||||||||
Canacol Energy Ltd. (Canada)* | 11,000 | $ | 11,006 | |||||
Cloud Peak Energy, Inc.* | 4,990 | 88,423 | ||||||
Enerplus Corp. (Canada) | 4,000 | 96,000 | ||||||
Exxon Mobil Corp. | 1,435 | 124,127 | ||||||
Golar LNG Ltd. | 2,450 | 104,052 | ||||||
Green Plains Renewable Energy, Inc.* | 10,000 | 113,500 | ||||||
Hess Corp. | 1,700 | 110,364 | ||||||
HollyFrontier Corp. | 3,000 | 97,890 | ||||||
Murphy Oil Corp. | 1,670 | 106,780 | ||||||
Overseas Shipholding Group, Inc. | 800 | 7,080 | ||||||
Petroamerica Oil Corp. (Canada)* | 10,000 | 1,920 | ||||||
Petrodorado Energy Ltd. (Canada)* | 24,506 | 5,820 | ||||||
QEP Resources, Inc.^ | 10,430 | 356,080 | ||||||
Sasol Ltd. - Sponsored ADR | 2,320 | 123,818 | ||||||
Statoil ASA - Sponsored ADR | 5,815 | 165,611 | ||||||
Suncor Energy, Inc.† | 1,600 | 57,504 | ||||||
Transocean Ltd.† | 1,705 | 90,945 | ||||||
WPX Energy, Inc.* | 13,300 | 241,528 | ||||||
|
| |||||||
| 2,435,988 | ||||||||
|
| |||||||
FINANCIALS—8.5% | ||||||||
Altisource Portfolio Solutions SA*† | 3,626 | 233,659 | ||||||
American International Group, Inc.* | 3,000 | 87,660 | ||||||
Berkshire Hathaway, Inc., Class B* | 1,200 | 94,140 | ||||||
Brookfield Office Properties, Inc.^ | 20,491 | 357,568 | ||||||
CBRE Group, Inc., Class A* | 6,900 | 126,477 | ||||||
China Life Insurance Co. Ltd. - ADR | 2,705 | 125,377 | ||||||
CME Group, Inc.^ | 1,144 | 331,177 | ||||||
Cohen & Steers, Inc. | 1,250 | 41,175 | ||||||
Fairfax Financial Holdings Ltd. (Canada) | 240 | 99,202 | ||||||
First California Financial Group, Inc.*^ | 92,749 | 428,500 | ||||||
| NUMBER OF SHARES | VALUE | |||||||
FINANCIALS—(CONTINUED) | ||||||||
Forest City Enterprises, Inc., Class A*^ | 19,587 | $ | 286,362 | |||||
Fox Chase Bancorp, Inc.^ | 28,580 | 357,536 | ||||||
Hampden Bancorp, Inc. | 15,280 | 186,416 | ||||||
Heritage Commerce Corp.*^ | 60,000 | 315,000 | ||||||
HFF, Inc., Class A*^ | 5,610 | 80,840 | ||||||
Hilltop Holdings, Inc.*^ | 27,360 | 225,446 | ||||||
HomeStreet, Inc.*^ | 6,610 | 348,678 | ||||||
ICICI Bank Ltd., Sponsored ADR | 400 | 14,520 | ||||||
JPMorgan Chase & Co. | 300 | 11,772 | ||||||
KKR Financial Holdings, LLC, LP | 1,100 | 10,285 | ||||||
OmniAmerican Bancorp, Inc.*^ | 37,639 | 673,362 | ||||||
Safestore Holdings PLC (United Kingdom) | 29,807 | 56,429 | ||||||
ViewPoint Financial Group^ | 34,186 | 512,448 | ||||||
|
| |||||||
| 5,004,029 | ||||||||
|
| |||||||
HEALTH CARE—2.3% | ||||||||
Brookdale Senior Living, Inc.*^ | 9,050 | 168,692 | ||||||
ExamWorks Group, Inc.*^ | 21,020 | 216,926 | ||||||
HCA Holdings, Inc.^ | 16,270 | 433,921 | ||||||
Johnson & Johnson | 1,500 | 97,620 | ||||||
Masimo Corp.* | 4,800 | 104,640 | ||||||
Medicines Co., (The)* | 1,700 | 36,431 | ||||||
Merck & Co., Inc. | 2,680 | 102,296 | ||||||
Santarus, Inc.* | 6,982 | 31,559 | ||||||
Teva Pharmaceutical Industries Ltd. - Sponsored ADR^ | 1,300 | 58,253 | ||||||
Thoratec Corp.* | 3,000 | 103,500 | ||||||
|
| |||||||
| 1,353,838 | ||||||||
|
| |||||||
INDUSTRIALS—1.8% | ||||||||
Acacia Research - Acacia Technologies*^ | 5,802 | 229,179 | ||||||
Alexco Resource Corp. (Canada)* | 1,300 | 10,261 | ||||||
CSX Corp. | 4,000 | 84,040 | ||||||
Electrovaya, Inc. (Canada)* | 1,856 | 1,857 | ||||||
G4S PLC (United Kingdom) | 11,484 | 52,836 | ||||||
The accompanying notes are an integral part of the Portfolio of Investments.
9
S1 FUND
PORTFOLIOOF INVESTMENTS (CONTINUED)
FEBRUARY 29, 2012
(UNAUDITED)
| NUMBER OF SHARES | VALUE | |||||||
INDUSTRIALS—(CONTINUED) |
| |||||||
Gol Linhas Aereas Inteligentes SA - ADR | 2,800 | $ | 24,612 | |||||
Grupo Aeroportuario del Sureste SAB de CV - ADR | 1,711 | 117,768 | ||||||
Pitney Bowes, Inc. | 4,425 | 80,225 | ||||||
Shaw Group, Inc., (The)* | 3,170 | 91,740 | ||||||
Snap-On, Inc. | 210 | 12,837 | ||||||
Stanley Black & Decker, Inc. | 700 | 53,760 | ||||||
Taser International, Inc.* | 700 | 2,821 | ||||||
United Continental Holdings, Inc.* | 13,529 | 279,374 | ||||||
Wabtec Corp. | 300 | 22,419 | ||||||
|
| |||||||
| 1,063,729 | ||||||||
|
| |||||||
INFORMATION TECHNOLOGY—9.7% |
| |||||||
Apple, Inc.* | 1,618 | 877,668 | ||||||
AU Optronics Corp. - Sponsored ADR | 16,800 | 89,208 | ||||||
Cree, Inc.* | 3,500 | 106,015 | ||||||
EchoStar Corp., Class A*^ | 5,000 | 149,850 | ||||||
Equinix, Inc.* | 1,925 | 269,846 | ||||||
Genpact Ltd.*† | 6,500 | 104,130 | ||||||
Global Cash Access Holdings, Inc.* | 54,460 | 302,798 | ||||||
Google, Inc., Class A*^ | 1,000 | 618,250 | ||||||
Hewlett-Packard Co. | 2,500 | 63,275 | ||||||
Intel Corp. | 4,450 | 119,616 | ||||||
KIT Digital, Inc.* | 25,798 | 261,076 | ||||||
LTX-Credence Corp.* | 60,129 | 405,871 | ||||||
Microsoft Corp.^ | 15,502 | 492,034 | ||||||
MIPS Technologies, Inc.* | 18,000 | 103,680 | ||||||
NCR Corp.* | 3,702 | 80,407 | ||||||
Oracle Corp.^ | 4,000 | 117,080 | ||||||
Polycom, Inc.* | 3,000 | 61,950 | ||||||
Rovi Corp.* | 1,100 | 39,028 | ||||||
SanDisk Corp.* | 10,074 | 498,260 | ||||||
Sapient Corp. | 8,600 | 107,414 | ||||||
Silicon Graphics International Corp.* | 11,500 | 111,435 | ||||||
Skyworks Solutions, Inc.* | 700 | 18,879 | ||||||
Stamps.com, Inc.* | 7,701 | 199,071 | ||||||
Teradyne, Inc.* | 12,187 | 200,111 | ||||||
Unisys Corp.* | 300 | 5,604 | ||||||
| NUMBER OF SHARES | VALUE | |||||||
INFORMATION TECHNOLOGY—(CONTINUED) |
| |||||||
VanceInfo Technologies, Inc. - ADR* | 21,377 | $ | 238,781 | |||||
Western Digital Corp.* | 2,400 | 94,200 | ||||||
|
| |||||||
| 5,735,537 | ||||||||
|
| |||||||
MATERIALS—3.9% |
| |||||||
Agrium, Inc.† | 1,240 | 105,598 | ||||||
Allegheny Technologies, Inc. | 2,300 | 100,901 | ||||||
Brigus Gold Corp. (Canada)* | 350 | 329 | ||||||
Crown Holdings, Inc.* | 16,781 | 620,394 | ||||||
Geomega Resources, Inc. (Canada)* | 1,188 | 840 | ||||||
Goldcorp, Inc. (Canada)^ | 5,290 | 256,565 | ||||||
Griffin Mining Ltd. (United Kingdom)* | 65,200 | 48,492 | ||||||
Griffin Mining Ltd. (United Kingdom)*† | 14,800 | 11,027 | ||||||
International Northair Mines (Canada)* | 13,699 | 3,669 | ||||||
Lion One Metals Ltd. (Canada)* | 1,700 | 1,924 | ||||||
LSB Industries, Inc.* | 200 | 8,044 | ||||||
Minera IRL Ltd. (United Kingdom)* | 5,795 | 6,852 | ||||||
Neo Material Technologies, Inc. (Canada)* | 11,500 | 101,233 | ||||||
Northern Tiger Resources, Inc. (Canada)* | 22,000 | 4,336 | ||||||
Oro Mining Ltd. (Canada)* | 2,179 | 264 | ||||||
Orvana Minerals Corp. (Canada)* | 8,454 | 8,117 | ||||||
PNG Gold Corp. (Canada)* | 3,600 | 1,237 | ||||||
POSCO - ADR | 1,040 | 96,200 | ||||||
Potash Corp. of Saskatchewan, Inc.† | 4,700 | 218,785 | ||||||
PPG Industries, Inc. | 1,000 | 91,250 | ||||||
Schweitzer-Mauduit International, Inc.^ | 3,540 | 247,977 | ||||||
Sealed Air Corp. | 5,400 | 106,002 | ||||||
Silver Standard Resources, Inc. (Canada)*^ | 11,300 | 193,795 | ||||||
Trelawney Mining and Exploration, Inc. (Canada)* | 1,400 | 3,325 | ||||||
The accompanying notes are an integral part of the Portfolio of Investments.
10
S1 FUND
PORTFOLIOOF INVESTMENTS (CONTINUED)
FEBRUARY 29, 2012
(UNAUDITED)
| NUMBER OF SHARES | VALUE | |||||||
MATERIALS—(CONTINUED) |
| |||||||
Vale SA - Sponsored ADR | 1,927 | $ | 48,445 | |||||
|
| |||||||
| 2,285,601 | ||||||||
|
| |||||||
REAL ESTATE INVESTMENT TRUSTS—7.3% |
| |||||||
American Campus Communities, Inc. | 5,100 | 209,865 | ||||||
Camden Property Trust^ | 2,600 | 161,200 | ||||||
Chatham Lodging Trust^ | 11,873 | 143,188 | ||||||
Colonial Properties Trust^ | 4,315 | 88,544 | ||||||
Duke Realty Corp. | 10,750 | 149,210 | ||||||
Dundee Real Estate Investment Trust (Canada) | 6,100 | 212,077 | ||||||
DuPont Fabros Technology, Inc. | 6,750 | 154,575 | ||||||
Equity Lifestyle Properties, Inc.^ | 6,726 | 447,346 | ||||||
First Industrial Realty Trust, Inc.*^ | 11,880 | 140,422 | ||||||
Glimcher Realty Trust | 12,500 | 123,750 | ||||||
Gramercy Capital Corp.* | 41,800 | 121,220 | ||||||
Hammerson PLC (United Kingdom) | 25,900 | 161,437 | ||||||
HCP, Inc. | 4,300 | 169,850 | ||||||
Home Properties, Inc. | 1,900 | 109,497 | ||||||
Kilroy Realty Corp. | 2,046 | 89,697 | ||||||
Medical Properties Trust, Inc. | 8,200 | 79,704 | ||||||
Mid-America Apartment Communities, Inc. | 2,850 | 177,754 | ||||||
Northern Property Real Estate Investment Trust (Canada) | 1,200 | 40,265 | ||||||
Parkway Properties, Inc. | 3,300 | 32,967 | ||||||
Ramco-Gershenson Properties Trust^ | 30,043 | 332,576 | ||||||
Senior Housing Properties Trust | 3,750 | 80,250 | ||||||
Simon Property Group, Inc. | 1,350 | 182,898 | ||||||
Strategic Hotels & Resorts, Inc.* | 16,650 | 103,730 | ||||||
Sunstone Hotel Investors, Inc.* | 6,600 | 59,268 | ||||||
Tanger Factory Outlet Centers^ | 9,850 | 288,408 | ||||||
| NUMBER OF SHARES | VALUE | |||||||
REAL ESTATE INVESTMENT TRUSTS—(CONTINUED) |
| |||||||
Transglobe Apartment Real Estate Investment Trust (Canada) | 2,800 | $ | 35,062 | |||||
Vornado Realty Trust | 1,900 | 155,287 | ||||||
Westfield Group (Australia) | 27,500 | 259,239 | ||||||
|
| |||||||
| 4,309,286 | ||||||||
|
| |||||||
TELECOMMUNICATION SERVICES—1.6% |
| |||||||
China Mobile Ltd. - Sponsored ADR | 2,055 | 108,936 | ||||||
Leap Wireless International, Inc.* | 21,178 | 221,098 | ||||||
MetroPCS Communications, Inc.* | 27,269 | 280,871 | ||||||
Multiband Corp.*^ | 13,571 | 48,584 | ||||||
Oi S.A. - ADR | 5,500 | 110,000 | ||||||
Sprint Nextel Corp.* | 60,798 | 150,171 | ||||||
|
| |||||||
| 919,660 | ||||||||
|
| |||||||
UTILITIES—0.1% |
| |||||||
American Water Works Co., Inc. | 1,107 | 37,948 | ||||||
|
| |||||||
TOTAL COMMON STOCKS | 33,810,945 | |||||||
|
| |||||||
EXCHANGE TRADED FUNDS — 15.2% |
| |||||||
COMMODITY—1.6% |
| |||||||
ELEMENTS Rogers Agriculture Total Return ETN* | 298 | 2,742 | ||||||
SPDR Gold Shares*^ | 5,799 | 952,718 | ||||||
|
| |||||||
| 955,460 | ||||||||
|
| |||||||
CURRENCY—0.4% |
| |||||||
ProShares UltraShort Euro* | 6,410 | 122,303 | ||||||
Proshares Ultrashort Yen* | 3,100 | 141,019 | ||||||
|
| |||||||
| 263,322 | ||||||||
|
| |||||||
EQUITY—12.5% |
| |||||||
Consumer Staples Select Sector SPDR Fund^ | 35,102 | 1,166,439 | ||||||
Industrial Select Sector SPDR Fund^ | 38,000 | 1,413,980 | ||||||
iShares MSCI EAFE Index Fund | 300 | 16,410 | ||||||
The accompanying notes are an integral part of the Portfolio of Investments.
11
S1 FUND
PORTFOLIOOF INVESTMENTS (CONTINUED)
FEBRUARY 29, 2012
(UNAUDITED)
| NUMBER OF SHARES | VALUE | |||||||
EQUITY—(CONTINUED) |
| |||||||
iShares MSCI Emerging Markets Index Fund | 30,700 | $ | 1,360,317 | |||||
Market Vectors Gold Miners ETF | 6,150 | 340,710 | ||||||
Market Vectors Indonesia Index ETF^ | 8,000 | 235,200 | ||||||
Powershares S&P 500 High Quality Portfolio^ | 11,981 | 179,355 | ||||||
Technology Select Sector SPDR Fund^ | 47,000 | 1,359,240 | ||||||
Vanguard MSCI European ETF^ | 28,000 | 1,289,680 | ||||||
|
| |||||||
| 7,361,331 | ||||||||
|
| |||||||
FIXED INCOME—0.6% |
| |||||||
iShares iBoxx $ High Yield Corporate Bond Fund | 1,500 | 138,195 | ||||||
ProShares UltraShort 20+ Year Treasury*^ | 10,200 | 192,678 | ||||||
|
| |||||||
| 330,873 | ||||||||
|
| |||||||
OTHER—0.1% |
| |||||||
Morgan Stanley China A Share Fund, Inc.* | 190 | 4,292 | ||||||
Templeton Dragon Fund, Inc. | 1,770 | 51,525 | ||||||
|
| |||||||
| 55,817 | ||||||||
|
| |||||||
TOTAL EXCHANGE TRADED FUNDS (Cost $8,462,709) | 8,966,803 | |||||||
|
| |||||||
| PAR (000’S) | VALUE | |||||||
CORPORATE BOND — 1.7% |
| |||||||
FINANCIAL—1.7% |
| |||||||
Ally Financial, Inc.^ | $ | 1,000 | $ | 1,005,770 | ||||
|
| |||||||
TOTAL CORPORATE BOND | 1,005,770 | |||||||
|
| |||||||
FOREIGN GOVERNMENT NOTE — 0.0% |
| |||||||
Canadian Government Bond 3.000% 12/01/15 | CAD 10 | 10,735 | ||||||
|
| |||||||
TOTAL FOREIGN GOVERNMENT NOTE | 10,735 | |||||||
|
| |||||||
U.S. TREASURY NOTES — 0.2% |
| |||||||
2.625% 04/30/16 | 100 | 107,906 | ||||||
|
| |||||||
TOTAL U.S. TREASURY NOTES | 107,906 | |||||||
|
| |||||||
U.S. GOVERNMENT AGENCY — 8.5% |
| |||||||
FEDERAL HOME LOAN BANK—5.1% |
| |||||||
1.000% 02/24/27^ | 1,000 | 995,767 | ||||||
1.000% 02/22/27^ | 1,000 | 990,160 | ||||||
1.250% 02/22/27^ | 1,000 | 1,001,108 | ||||||
|
| |||||||
| 2,987,035 | ||||||||
|
| |||||||
FEDERAL NATIONAL MORTGAGE ASSOCIATION—3.4% |
| |||||||
1.000% 11/23/26^ | 1,000 | 999,320 | ||||||
1.500% 11/30/26^ | 1,000 | 997,718 | ||||||
|
| |||||||
| 1,997,038 | ||||||||
|
| |||||||
TOTAL U.S. GOVERNMENT AGENCY | 4,984,073 | |||||||
|
| |||||||
SHORT-TERM INVESTMENTS — 2.7% |
| |||||||
U.S. TREASURY BILL—2.7% |
| |||||||
0.010% 03/29/12^ | 1,600 | 1,599,943 | ||||||
|
| |||||||
TOTAL SHORT-TERM INVESTMENTS | 1,599,943 | |||||||
|
| |||||||
The accompanying notes are an integral part of the Portfolio of Investments.
12
S1 FUND
PORTFOLIOOF INVESTMENTS (CONTINUED)
FEBRUARY 29, 2012
(UNAUDITED)
| NUMBER OF CONTRACTS | VALUE | |||||||
PURCHASED OPTIONS — 0.2% |
| |||||||
CALL OPTIONS PURCHASED—0.1% |
| |||||||
iShares Barclays 20+ Year Treasury Bond Fund Expires 05/19/12 Strike Price $127 | 200 | $ | 10,400 | |||||
Taser International, Inc. Expires 06/16/12 Strike Price $7.5 | 23 | 115 | ||||||
|
| |||||||
TOTAL CALL OPTIONS PURCHASED | 10,515 | |||||||
|
| |||||||
PUT OPTIONS PURCHASED—0.1% |
| |||||||
AsiaInfo-Linkage, Inc. Expires 07/21/12 Strike Price $12 | 100 | 15,750 | ||||||
iShares FTSE China 25 Index Fund Expires 05/19/12 Strike Price $32 | 250 | 5,250 | ||||||
S&P 500 Index Expires 03/17/12 Strike Price $850 | 12 | 60 | ||||||
S&P 500 Index Expires 03/17/12 Strike Price $950 | 12 | 60 | ||||||
SPDR Gold Shares Expires 05/19/12 Strike Price $130 | 200 | 6,400 | ||||||
SPDR S&P 500 ETF Trust Expires 05/19/12 Strike Price $110 | 550 | 29,150 | ||||||
WisdomTree Dreyfus Chinese Yuan Fund Expires 04/21/12 Strike Price $25 | 450 | 4,500 | ||||||
WisdomTree Dreyfus Chinese Yuan Fund Expires 07/21/12 Strike Price $24 | 410 | 5,125 | ||||||
|
| |||||||
TOTAL PUT OPTIONS PURCHASED | 66,295 | |||||||
|
| |||||||
| NUMBER OF CONTRACTS | VALUE | |||||||
PUT OPTIONS PURCHASED—(CONTINUED) |
| |||||||
TOTAL PURCHASED OPTIONS — 0.2% | $ | 76,810 | ||||||
|
| |||||||
TOTAL LONG POSITIONS — 85.9% | 50,562,985 | |||||||
|
| |||||||
| NUMBER OF SHARES | ||||||||
SECURITIES SOLD SHORT — (31.6)% |
| |||||||
COMMON STOCKS — (22.0)% |
| |||||||
CONSUMER DISCRETIONARY—(5.5)% |
| |||||||
Amazon.com, Inc.* | (610 | ) | $ | (109,611 | ) | |||
American Axle & Manufacturing Holdings, Inc.* | (1,845 | ) | (21,015 | ) | ||||
Blue Nile, Inc.* | (3,252 | ) | (115,934 | ) | ||||
Buckle, Inc. (The) | (2,669 | ) | (119,891 | ) | ||||
Carter’s, Inc.* | (1,300 | ) | (63,141 | ) | ||||
Coach, Inc. | (2,200 | ) | (164,648 | ) | ||||
Columbia Sportswear Co. | (3,100 | ) | (154,783 | ) | ||||
Discovery Communications, Inc., Class A* | (2,585 | ) | (120,590 | ) | ||||
Dollar Tree, Inc.* | (1,200 | ) | (106,212 | ) | ||||
Focus Media Holding Ltd. - ADR* | (7,770 | ) | (188,500 | ) | ||||
Fred’s, Inc., Class A | (10,000 | ) | (138,500 | ) | ||||
Garmin Ltd. | (2,541 | ) | (119,910 | ) | ||||
Hanesbrands, Inc.* | (4,158 | ) | (119,459 | ) | ||||
Hovnanian Enterprises, Inc., Class A* | (48,300 | ) | (133,791 | ) | ||||
JC Penney Co., Inc. | (3,980 | ) | (157,608 | ) | ||||
Life Time Fitness, Inc.* | (1,211 | ) | (59,908 | ) | ||||
Meredith Corp. | (3,647 | ) | (119,986 | ) | ||||
Netflix, Inc.* | (2,606 | ) | (288,563 | ) | ||||
Sodastream International Ltd.* | (2,600 | ) | (105,950 | ) | ||||
Tempur-Pedic International, Inc.* | (1,518 | ) | (119,922 | ) | ||||
Tesla Motors, Inc.* | (5,680 | ) | (189,769 | ) | ||||
Thor Industries, Inc. | (6,783 | ) | (220,922 | ) | ||||
Valassis Communications, Inc.* | (5,156 | ) | (128,797 | ) | ||||
The accompanying notes are an integral part of the Portfolio of Investments.
13
S1 FUND
PORTFOLIOOF INVESTMENTS (CONTINUED)
FEBRUARY 29, 2012
(UNAUDITED)
| NUMBER OF SHARES | VALUE | |||||||
CONSUMER DISCRETIONARY—(CONTINUED) |
| |||||||
Verizon Communications, Inc. | (3,674 | ) | $ | (140,016 | ) | |||
|
| |||||||
| (3,207,426 | ) | |||||||
|
| |||||||
CONSUMER STAPLES—(0.2)% |
| |||||||
Boston Beer Co., Inc. (The), Class A* | (1,368 | ) | (129,303 | ) | ||||
|
| |||||||
ENERGY—0.0% |
| |||||||
Calumet Specialty Products Partners LP | (53 | ) | (1,261 | ) | ||||
Enterprise Products Partners LP | (100 | ) | (5,188 | ) | ||||
Penn Virginia Corp. | (410 | ) | (2,005 | ) | ||||
|
| |||||||
| (8,454 | ) | |||||||
|
| |||||||
FINANCIALS—(5.8)% |
| |||||||
American Capital Agency Corp. | (11,900 | ) | (365,449 | ) | ||||
American Capital Mortgage Investment Corp. | (6,290 | ) | (135,612 | ) | ||||
Annaly Capital Management, Inc. | (11,200 | ) | (186,144 | ) | ||||
BankUnited, Inc. | (5,300 | ) | (122,059 | ) | ||||
Cedar Realty Trust, Inc. | (32,750 | ) | (155,890 | ) | ||||
Chimera Investment Corp. | (15,238 | ) | (46,781 | ) | ||||
CNinsure, Inc. - ADR* | (9,530 | ) | (69,378 | ) | ||||
Commonwealth Bank of Australia (Australia) | (2,900 | ) | (153,733 | ) | ||||
Credit Agricole SA (France) | (8,112 | ) | (51,952 | ) | ||||
DiamondRock Hospitality Co | (4,200 | ) | (41,832 | ) | ||||
Equity One, Inc. | (6,293 | ) | (119,693 | ) | ||||
Federated Investors, Inc., Class B | (5,500 | ) | (112,695 | ) | ||||
First Cash Financial Services, Inc.* | (4,200 | ) | (177,492 | ) | ||||
General Growth Properties, Inc. | (7,500 | ) | (122,025 | ) | ||||
Hatteras Financial Corp. | (6,320 | ) | (179,994 | ) | ||||
Legg Mason, Inc. | (5,685 | ) | (155,712 | ) | ||||
NorthStar Realty Finance Corp. | (8,700 | ) | (46,458 | ) | ||||
Omega Healthcare Investors, Inc. | (10,400 | ) | (211,848 | ) | ||||
| NUMBER OF SHARES | VALUE | |||||||
FINANCIALS—(CONTINUED) |
| |||||||
Plum Creek Timber Co., Inc. | (3,058 | ) | $ | (119,751 | ) | |||
Prospect Capital Corp. | (200 | ) | (2,162 | ) | ||||
Prosperity Bancshares, Inc. | (3,310 | ) | (144,779 | ) | ||||
Realty Income Corp. | (4,000 | ) | (147,560 | ) | ||||
Rouse Properties, Inc.* | (4,850 | ) | (70,956 | ) | ||||
Texas Capital Bancshares, Inc.* | (5,850 | ) | (198,257 | ) | ||||
United Community Banks, Inc.* | (13,600 | ) | (121,992 | ) | ||||
Westpac Banking Corp. (Australia) | (6,590 | ) | (147,710 | ) | ||||
|
| |||||||
| (3,407,914 | ) | |||||||
|
| |||||||
HEALTH CARE—(0.4)% | (1,724 | ) | (121,835 | ) | ||||
MWI Veterinary Supply, Inc.* | (1,374 | ) | (118,947 | ) | ||||
Sun Healthcare Group, Inc.* | (3,629 | ) | (16,185 | ) | ||||
|
| |||||||
| (256,967 | ) | |||||||
|
| |||||||
INDUSTRIALS—(0.8)% |
| |||||||
Masco Corp. | (2,300 | ) | (27,324 | ) | ||||
Nielsen Holdings NV | (4,096 | ) | (120,791 | ) | ||||
Pitney Bowes, Inc. | (7,705 | ) | (139,692 | ) | ||||
TAM SA - Sponsored ADR | (1,500 | ) | (35,265 | ) | ||||
Universal Forest Products, Inc. | (200 | ) | (6,428 | ) | ||||
Watsco, Inc. | (1,670 | ) | (119,221 | ) | ||||
|
| |||||||
| (448,721 | ) | |||||||
|
| |||||||
INFORMATION TECHNOLOGY—(2.6)% |
| |||||||
Broadridge Financial Solutions, Inc. | (5,395 | ) | (131,314 | ) | ||||
DTS, Inc.* | (4,227 | ) | (118,694 | ) | ||||
eBay, Inc.* | (3,362 | ) | (120,158 | ) | ||||
Qihoo 360 Technology Co. Ltd. - ADR* | (7,000 | ) | (147,980 | ) | ||||
Rambus, Inc.+* | (18,101 | ) | (128,155 | ) | ||||
RealPage, Inc.* | (460 | ) | (9,122 | ) | ||||
Salesforce.com, Inc.* | (1,881 | ) | (269,284 | ) | ||||
SAP AG - Sponsored ADR. | (2,870 | ) | (194,041 | ) | ||||
STEC, Inc.* | (2,400 | ) | (23,256 | ) | ||||
Trimble Navigation Ltd.* | (2,383 | ) | (119,841 | ) | ||||
ValueClick, Inc.* | (6,198 | ) | (128,918 | ) | ||||
The accompanying notes are an integral part of the Portfolio of Investments.
14
S1 FUND
PORTFOLIOOF INVESTMENTS (CONTINUED)
FEBRUARY 29, 2012
(UNAUDITED)
| NUMBER OF SHARES | VALUE | |||||||
INFORMATION TECHNOLOGY—(CONTINUED) |
| |||||||
VanceInfo Technologies, Inc. - ADR* | (4,000 | ) | $ | (44,680 | ) | |||
VMware, Inc., Class A* | (1,211 | ) | (119,756 | ) | ||||
|
| |||||||
| (1,555,199 | ) | |||||||
|
| |||||||
MATERIALS—(0.9)% |
| |||||||
Agrium, Inc.† | (2,550 | ) | (217,158 | ) | ||||
Gold Resource Corp. | (5,950 | ) | (145,478 | ) | ||||
Vale SA - Sponsored ADR | (1,830 | ) | (44,981 | ) | ||||
Valspar Corp. | (2,000 | ) | (92,700 | ) | ||||
|
| |||||||
| (500,317 | ) | |||||||
|
| |||||||
REAL ESTATE INVESTMENT TRUSTS—(5.6)% |
| |||||||
Acadia Realty Trust | (9,267 | ) | (196,368 | ) | ||||
AvalonBay Communities, Inc.* | (1,600 | ) | (207,472 | ) | ||||
Boston Properties, Inc. | (1,700 | ) | (172,635 | ) | ||||
Capital Shopping Centres Group PLC (United Kingdom) | (14,600 | ) | (77,276 | ) | ||||
CBL & Associates Properties, Inc. | (13,750 | ) | (242,413 | ) | ||||
CubeSmart | (15,850 | ) | (178,788 | ) | ||||
EastGroup Properties, Inc. | (6,356 | ) | (306,296 | ) | ||||
Equity Residential | (3,300 | ) | (187,737 | ) | ||||
Essex Property Trust, Inc. | (600 | ) | (83,994 | ) | ||||
Federal Realty Investment Trust | (1,650 | ) | (157,328 | ) | ||||
Health Care REIT, Inc. | (3,100 | ) | (168,764 | ) | ||||
Highwoods Properties, Inc. | (5,550 | ) | (177,600 | ) | ||||
Host Hotels & Resorts, Inc. | (7,800 | ) | (123,084 | ) | ||||
LaSalle Hotel Properties | (4,950 | ) | (132,066 | ) | ||||
RioCan Real Estate Investment Trust (Canada) | (2,550 | ) | (69,893 | ) | ||||
SL Green Realty Corp. | (4,430 | ) | (336,902 | ) | ||||
Taubman Centers, Inc. | (3,750 | ) | (259,013 | ) | ||||
Unibail-Rodamco SE (France) | (550 | ) | (106,251 | ) | ||||
Ventas, Inc. | (2,471 | ) | (138,178 | ) | ||||
|
| |||||||
| (3,322,058 | ) | |||||||
|
| |||||||
TELECOMMUNICATION SERVICES—(0.2)% |
| |||||||
AT&T, Inc. | (4,585 | ) | (140,255 | ) | ||||
|
| |||||||
| NUMBER OF SHARES | VALUE | |||||||
UTILITIES—0.0% | ||||||||
China Natural Gas, Inc.*†D | (2,116 | ) | $ | (4,084 | ) | |||
|
| |||||||
TOTAL COMMON STOCKS SOLD SHORT (Proceeds $12,452,877) | (12,980,698 | ) | ||||||
|
| |||||||
EXCHANGE TRADED FUNDS SOLD SHORT — (14.1)% |
| |||||||
CURRENCY—(1.1)% |
| |||||||
CurrencyShares Euro Trust | (990 | ) | (131,294 | ) | ||||
CurrencyShares Japanese Yen Trust* | (4,000 | ) | (484,120 | ) | ||||
|
| |||||||
| (615,414 | ) | |||||||
|
| |||||||
EQUITY—(12.8)% |
| |||||||
Industrial Select Sector SPDR Fund | (400 | ) | (14,884 | ) | ||||
iShares Dow Jones US Home Construction Index Fund | (10,000 | ) | (139,400 | ) | ||||
iShares FTSE China 25 Index Fund | (86,000 | ) | (3,463,220 | ) | ||||
iShares MSCI Brazil Index Fund | (600 | ) | (41,496 | ) | ||||
iShares MSCI Hong Kong | ||||||||
Index Fund | (32,500 | ) | (593,125 | ) | ||||
iShares MSCI Japan Index Fund | (5,000 | ) | (49,950 | ) | ||||
iShares Russell 2000 Index Fund | (29,056 | ) | (2,353,245 | ) | ||||
Market Vectors Russia ETF | (1,000 | ) | (33,030 | ) | ||||
Powershares QQQ Trust Series 1 | (1,300 | ) | (83,733 | ) | ||||
SPDR S&P 500 ETF Trust | (5,100 | ) | (698,037 | ) | ||||
SPDR S&P Homebuilders ETF | (600 | ) | (12,075 | ) | ||||
SPDR S&P Regional Banking ETF | (2,000 | ) | (53,780 | ) | ||||
|
| |||||||
| (7,535,975 | ) | |||||||
|
| |||||||
The accompanying notes are an integral part of the Portfolio of Investments.
15
S1 FUND
PORTFOLIOOF INVESTMENTS (CONTINUED)
FEBRUARY 29, 2012
(UNAUDITED)
| NUMBER OF SHARES | VALUE | |||||||
FIXED INCOME—(0.2)% |
| |||||||
iShares iBoxx Investment Grade Corporate Bond Fund | (1,175 | ) | $ | (138,298 | ) | |||
|
| |||||||
| (138,298 | ) | |||||||
|
| |||||||
TOTAL EXCHANGE TRADED FUNDS SOLD SHORT (Proceeds $7,732,026) | (8,289,687 | ) | ||||||
|
| |||||||
TOTAL SECURITIES SOLD SHORT — (36.1)% | (21,270,385 | ) | ||||||
|
| |||||||
| NUMBER OF CONTRACTS | ||||||||
WRITTEN OPTIONS — (0.1)% |
| |||||||
CALL OPTIONS WRITTEN—(0.1)% |
| |||||||
American International Group, Inc. Expires 03/17/12 Strike Price $29 | (12 | ) | (1,164 | ) | ||||
AsiaInfo-Linkage, Inc. Expires 07/21/12 Strike Price $12 | (100 | ) | (17,250 | ) | ||||
AsiaInfo-Linkage, Inc. Expires 07/21/12 Strike Price $15 | (100 | ) | (4,000 | ) | ||||
Lennar Corp. Expires 04/21/12 Strike Price $25 | (12 | ) | (804 | ) | ||||
NCR Corp. Expires 03/17/12 Strike Price $22 | (14 | ) | (560 | ) | ||||
New Oriental Education & Technology Group -ADR Expires 03/17/12 Strike Price $28 | (20 | ) | (800 | ) | ||||
Snap-on, Inc. Expires 06/16/12 Strike Price $65 | (4 | ) | (720 | ) | ||||
Stanley Black & Decker, Inc. Expires 03/17/12 Strike Price $77.5 | (9 | ) | (765 | ) | ||||
| NUMBER OF CONTRACTS | VALUE | |||||||
CALL OPTIONS WRITTEN—(CONTINUED) |
| |||||||
Statoil ASA - Sponsored ADR | (5 | ) | $ | (600 | ) | |||
Suncor Energy, Inc. | (11 | ) | (935 | ) | ||||
Target Corp. | (5 | ) | (2,070 | ) | ||||
Tesla Motors, Inc. | (5 | ) | (440 | ) | ||||
Tupperware Brands Corp. | (3 | ) | (68 | ) | ||||
|
| |||||||
TOTAL CALL OPTIONS WRITTEN (Premiums Received $24,282) | (30,176 | ) | ||||||
|
| |||||||
PUT OPTIONS WRITTEN—0.0% |
| |||||||
American Tower Corp. - REIT | (11 | ) | (440 | ) | ||||
AT&T, Inc. | (11 | ) | (99 | ) | ||||
CH Robinson Worldwide, Inc. | (7 | ) | (262 | ) | ||||
Citrix Systems, Inc. | (2 | ) | (210 | ) | ||||
Crown Castle International Corp. | (7 | ) | (52 | ) | ||||
Express Scripts, Inc. | (7 | ) | (252 | ) | ||||
Gentex Corp. | (7 | ) | (1,225 | ) | ||||
The accompanying notes are an integral part of the Portfolio of Investments.
16
S1 FUND
PORTFOLIOOF INVESTMENTS (CONTINUED)
FEBRUARY 29, 2012
(UNAUDITED)
| NUMBER OF CONTRACTS | VALUE | |||||||
PUT OPTIONS WRITTEN—(CONTINUED) |
| |||||||
iPATH S&P 500 VIX Short-Term Futures ETN | (7 | ) | $ | (588 | ) | |||
National Oilwell Varco, Inc. | (2 | ) | (218 | ) | ||||
Netflix, Inc. | (2 | ) | (160 | ) | ||||
Philip Morris International, Inc. | (6 | ) | (96 | ) | ||||
Polypore International, Inc. | (5 | ) | (400 | ) | ||||
Rovi Corp. | (5 | ) | (375 | ) | ||||
S&P 500 Index | (2 | ) | (1,200 | ) | ||||
Salesforce.com, Inc. | (2 | ) | (140 | ) | ||||
SBA Communications Corp. | (2 | ) | (30 | ) | ||||
Taser International, Inc. | (23 | ) | (2,300 | ) | ||||
Thoratec Corp. | (10 | ) | (350 | ) | ||||
Thoratec Corp. | (10 | ) | (600 | ) | ||||
Viacom, Inc. | (7 | ) | (350 | ) | ||||
| NUMBER OF CONTRACTS | VALUE | |||||||
PUT OPTIONS WRITTEN—(CONTINUED) |
| |||||||
Vornado Realty Trust - REIT | (7 | ) | $ | (508 | ) | |||
Wal-Mart Stores, Inc. | (100 | ) | (13,800 | ) | ||||
|
| |||||||
TOTAL PUT OPTIONS WRITTEN (Premiums Received $48,372) | (23,655 | ) | ||||||
|
| |||||||
TOTAL WRITTEN OPTIONS — (0.1)% | (53,831 | ) | ||||||
|
| |||||||
OTHER ASSETSIN EXCESSOF LIABILITIES — 50.3% | 29,646,840 | |||||||
|
| |||||||
NET ASSETS — 100.0% | $ | 58,885,609 | ||||||
|
| |||||||
| * | Non-income producing. |
| † | This company is domiciled outside of the United States. The security’s functional currency is the United States dollar. |
| D | Security has been valued at fair market value as determined in good faith by or under the direction of The RBB Fund, Inc.’s Board of Directors. As of February 29, 2012, fair valued short positions amounted to ($4,084) or 0.0% of net assets. |
| ^ | Security position is either entirely or partially held in a segregated account as collateral for securities sold short or written options. |
| ADR | American Depositary Receipt |
| CAD | Canadian Dollar |
| ETF | Exchange-traded Fund |
| ETN | Exchange-traded Note |
| LP | Limited Partnership |
| MSCI | Morgan Stanley Capital International |
| PLC | Public Limited Company |
| REIT | Real Estate Investment Trust |
| S&P | Standard & Poors |
| SPDR | Standard & Poors Depositary Receipt |
| VIX | Volatility Index |
The accompanying notes are an integral part of the Portfolio of Investments.
17
S1 FUND
PORTFOLIOOF INVESTMENTS (CONTINUED)
FEBRUARY 29, 2012
(UNAUDITED)
The Fund had the following futures contract open at February 29, 2012:
NUMBER OF CONTRACTS | TYPE | EXPIRATION MONTH | VALUE AT TRADE DATE | VALUE AT 02/29/2012 | UNREALIZED APPRECIATION (DEPRECIATION) | |||||||||||
Short Positions: | ||||||||||||||||
5 | Australian Dollar Futures | 03/2012 | AUD 500,000 | $ | 537,000 | $ | 533 | |||||||||
|
| |||||||||||||||
| $ | 533 | |||||||||||||||
|
| |||||||||||||||
The accompanying notes are an integral part of the Portfolio of Investments.
18
S1 FUND
STATEMENTOF ASSETSAND LIABILITIES
FEBRUARY 29, 2012
(UNAUDITED)
ASSETS | ||||
Investments, at value (cost $48,502,514) | $ | 50,562,985 | ||
Cash | 18,392,181 | |||
Deposits with brokers for securities sold short and written options | 16,274,461 | |||
Foreign currency (cost $275,553) | 290,421 | |||
Receivables for: | ||||
Investments sold | 5,646,833 | |||
Capital shares sold | 120,828 | |||
Dividends and interest | 52,044 | |||
Variation margin | 533 | |||
Prepaid expenses and other assets | 25,106 | |||
|
| |||
Total assets | 91,365,392 | |||
|
| |||
LIABILITIES | ||||
Securities sold short, at value (proceeds $20,184,903) | 21,270,385 | |||
Options written, at value (premiums received $72,654) | 53,831 | |||
Payables for: | ||||
Investments purchased | 10,907,950 | |||
Capital shares redeemed | 59,519 | |||
Investment advisory fees | 84,941 | |||
Directors’ and officers’ fees | 602 | |||
Dividends on securities sold short | 10,198 | |||
Due to prime broker | 21,044 | |||
Other accrued expenses and liabilities | 71,313 | |||
|
| |||
Total liabilities | 32,479,783 | |||
|
| |||
Net Assets | $ | 58,885,609 | ||
|
| |||
NET ASSETS CONSIST OF | ||||
Capital stock, $0.001 par value | $ | 5,912 | ||
Paid-in capital | 59,470,957 | |||
Accumulated net investment loss | (900,300 | ) | ||
Accumulated net realized loss from investments, securities sold short, foreign currency transactions and written options | (700,011 | ) | ||
Net unrealized appreciation on investments, securities sold short, foreign currency transactions, written options and futures transactions | 1,009,051 | |||
|
| |||
Net assets | $ | 58,885,609 | ||
|
| |||
I SHARES | ||||
Net assets | $ | 58,885,609 | ||
|
| |||
Shares outstanding ($0.001 par value, 100,000,000 shares authorized) | 5,911,823 | |||
|
| |||
Net asset value, offering and redemption price per share | $ | 9.96 | ||
|
|
The accompanying notes are an integral part of the financial statements.
19
S1 FUND
STATEMENTOF OPERATIONS
FORTHE PERIOD ENDED FEBRUARY 29, 2012
(UNAUDITED)
INVESTMENT INCOME | ||||
Dividends (net of foreign withholding taxes of $3,186) | $ | 215,837 | ||
Interest | 59,244 | |||
|
| |||
Total investment income | 275,081 | |||
|
| |||
EXPENSES | ||||
Advisory fees (Note 2) | 752,552 | |||
Dividend expense on securities sold short | 238,069 | |||
Prime broker interest expense | 130,096 | |||
Administration and accounting fees (Note 2) | 93,372 | |||
Legal fees | 45,495 | |||
Custodian fees (Note 2) | 45,089 | |||
Transfer agent fees (Note 2) | 42,727 | |||
Audit fees | 23,714 | |||
Printing and shareholder reporting fees | 13,753 | |||
Directors’ and officers’ fees | 10,050 | |||
Registration and filing fees | 7,289 | |||
Insurance fees | 3,778 | |||
Other expenses | 1,401 | |||
|
| |||
Total expenses before waivers and reimbursements | 1,407,385 | |||
Less: waivers and reimbursements (Note 2) | (232,004 | ) | ||
|
| |||
Net expenses after waivers and reimbursements | 1,175,381 | |||
|
| |||
Net investment loss | (900,300 | ) | ||
|
| |||
NET REALIZED AND UNREALIZED GAIN/(LOSS) FROM INVESTMENTS | ||||
Net realized gain/(loss) from: | ||||
Investments | (320,302 | ) | ||
Securities sold short | 129,163 | |||
Foreign currency transactions | (2,428 | ) | ||
Written options | 131,753 | |||
Net change in unrealized appreciation/(depreciation) on: | ||||
Investments | 2,754,201 | |||
Investments sold short | (1,721,963 | ) | ||
Futures | 533 | |||
Foreign currency translation | 7,798 | |||
Written options | 23,158 | |||
|
| |||
Net realized and unrealized gain from investments | 1,001,913 | |||
|
| |||
NET INCREASE IN NET ASSETS RESULTING FROM OPERATIONS | $ | 101,613 | ||
|
|
The accompanying notes are an integral part of the financial statements.
20
S1 FUND
STATEMENTSOF CHANGESIN NET ASSETS
(UNAUDITED)
| FORTHE PERIOD ENDED FEBRUARY 28, 2012 (UNAUDITED) | FORTHE PERIOD ENDED AUGUST 31, 2011(1) | |||||||
INCREASE/(DECREASE)IN NET ASSETS FROM OPERATIONS: | ||||||||
Net investment loss | $ | (900,300 | ) | $ | (467,866 | ) | ||
Net realized loss from investments, securities sold short, foreign currency transactions and written options | (61,814 | ) | (267,662 | ) | ||||
Net change in unrealized appreciation/(depreciation) on investments, securities sold short, foreign currency transactions, written options and futures transactions | 1,063,727 | (54,676 | ) | |||||
|
|
|
| |||||
Net increase/(decrease) in net assets resulting from operations | 101,613 | (790,204 | ) | |||||
|
|
|
| |||||
CAPITAL TRANSACTIONS: | ||||||||
I Shares | ||||||||
Proceeds from shares sold | 14,337,581 | 53,338,698 | ||||||
Shares redeemed | (6,787,954 | ) | (1,314,125 | ) | ||||
|
|
|
| |||||
Net increase in net assets from capital share transactions | 7,549,627 | 52,024,573 | ||||||
|
|
|
| |||||
Total increase in net assets | 7,651,240 | 51,234,369 | ||||||
|
|
|
| |||||
NET ASSETS | ||||||||
Beginning of period | 51,234,369 | — | ||||||
|
|
|
| |||||
End of period | $ | 58,885,609 | $ | 51,234,369 | ||||
|
|
|
| |||||
Accumulated net investment loss, end of period | $ | (900,300 | ) | $ | — | |||
|
|
|
| |||||
SHARE TRANSACTIONS: | ||||||||
I Shares | ||||||||
Shares sold | 1,455,705 | 5,274,677 | ||||||
Shares redeemed | (687,943 | ) | (130,616 | ) | ||||
|
|
|
| |||||
Net increase in shares | 767,762 | 5,144,061 | ||||||
|
|
|
| |||||
| (1) | The Fund commenced investment operations on September 30, 2010. |
The accompanying notes are an integral part of the financial statements.
21
S1 FUND
FINANCIAL HIGHLIGHTS
Contained below is per share operating performance data for shares outstanding, total investment return, ratios to average net assets and other supplemental data for the respective periods. This information has been derived from information provided in the financial statements.
| I SHARES | ||||||||
| FOR THE PERIOD ENDED FEBRUARY 29, 2012 (UNAUDITED) | FOR THE PERIOD ENDED AUGUST 31, 2011(1) | |||||||
PER SHARE OPERATING PERFORMANCE | ||||||||
Net asset value, beginning of period | $ | 9.96 | $ | 10.00 | ||||
|
|
|
| |||||
Net investment loss | (0.16 | )(2) | (0.29 | )(2) | ||||
Net realized and unrealized gain from investments | 0.16 | 0.25 | (3) | |||||
|
|
|
| |||||
Net decrease in net assets resulting from operations | — | (0.04 | ) | |||||
|
|
|
| |||||
Net asset value, end of period | $ | 9.96 | $ | 9.96 | ||||
|
|
|
| |||||
Total investment return(4) | 0.00 | %(5) | (0.40 | )%(5) | ||||
|
|
|
| |||||
RATIOS/SUPPLEMENTAL DATA | ||||||||
Net assets, end of period (000’s omitted) | $ | 58,886 | $ | 51,234 | ||||
Ratio of expenses to average net assets with waivers and reimbursements (including dividend and interest expense) | 4.30 | %(6) | 4.05 | %(6) | ||||
Ratio of expenses to average net assets with waivers and reimbursements (excluding dividend and interest expense) | 2.95 | %(6) | 2.95 | %(6) | ||||
Ratio of expenses to average net assets without waivers and reimbursements (including dividend and interest expense) | 5.10 | %(6) | 6.39 | %(6) | ||||
Ratio of net investment loss to average net assets | (3.29 | )%(6) | (3.16 | )%(6) | ||||
Portfolio turnover rate | 151.50 | %(5) | 440.88 | %(5) | ||||
| (1) | The Fund commenced investment operations on September 30, 2010. |
| (2) | Calculated based on average shares outstanding for the period. |
| (3) | The amount shown may not correlate with the change in the aggregate gains and losses presented on the Statement of Operations due to the timing of sales and purchases of the Fund’s shares in relation to fluctuating market values for the Fund’s portfolio. |
| (4) | Total investment return is calculated assuming a purchase of shares on the first day and a sale of shares on the last day of each period reported and includes reinvestments of dividends and distributions, if any. |
| (5) | Not annualized. |
| (6) | Annualized. |
The accompanying notes are an integral part of the financial statements.
22
S1 FUND
NOTES TO FINANCIAL STATEMENTS
FEBRUARY 29, 2012 (UNAUDITED)
1. ORGANIZATIONAND SIGNIFICANT ACCOUNTING POLICIES
The RBB Fund, Inc. (“RBB” or the “Company”) was incorporated under the laws of the State of Maryland on February 29, 1988 and is registered under the Investment Company Act of 1940, as amended, (the “Investment Company Act”) as an open-end management investment company. RBB is a “series fund,” which is a mutual fund divided into separate portfolios. Each portfolio is treated as a separate entity for certain matters under the Investment Company Act, and for other purposes, and a shareholder of one portfolio is not deemed to be a shareholder of any other portfolio. Currently, RBB has nineteen active investment portfolios, including the S1 Fund (the “Fund”), which commenced investment operations on September 30, 2010. As of the date hereof, the Fund offers two classes of shares, I Shares and R Shares. As of February 29, 2012, Class R Shares have not been issued.
RBB has authorized capital of one hundred billion shares of common stock of which 80.373 billion shares are currently classified into one hundred and forty classes of common stock. Each class represents an interest in an active or inactive RBB investment portfolio. The Fund has issued shares with a par value of $0.001.
PORTFOLIO VALUATION — The Fund’s net asset value (“NAV”) is calculated once daily at the close of regular trading hours on the New York Stock Exchange (“NYSE”) (generally 4:00 p.m. Eastern time) on each day the NYSE is open. Securities held by the Fund are valued using the closing price or the last sale price on a national securities exchange or the National Association of Securities Dealers Automatic Quotation System (“NASDAQ”) market system where they are primarily traded. Equity securities traded in the over-the-counter market are valued at their closing prices. If there were no transactions on that day, securities traded principally on an exchange or on NASDAQ will be valued at the mean of the last bid and ask prices prior to the market close. Fixed income securities having a remaining maturity of greater than 60 days are valued using an independent pricing service. Fixed income securities having a remaining maturity of 60 days or less are valued at amortized cost, which approximates market value. Investments in other open-end investment companies are valued based on the NAV of those investment companies (which may use fair value pricing as discussed in their prospectuses). If market quotations are unavailable or deemed unreliable, securities will be valued in accordance with procedures adopted by the Company’s Board of Directors. Relying on prices supplied by pricing services or dealers or using fair valuation may result in values that are higher or lower than the values used by other investment companies and investors to price the same investments.
23
S1 FUND
NOTES TO FINANCIAL STATEMENTS
FEBRUARY 29, 2012 (UNAUDITED) (CONTINUED)
FAIR VALUE MEASUREMENTS — The inputs and valuations techniques used to measure fair value of the Fund’s investments are summarized into three levels as described in the hierarchy below:
• Level 1 – | quoted prices in active markets for identical securities; | |
• Level 2 – | other significant observable inputs (including quoted prices for similar securities, interest rates, prepayment speeds, credit risk, etc.); and | |
• Level 3 – | significant unobservable inputs (including the Fund’s own assumptions in determining the fair value of investments). | |
The inputs or methodology used for valuing securities are not necessarily an indication of the risk associated with investing in those securities.
The following is a summary of the inputs used, as of February 29, 2012, in valuing the Fund’s investments carried at fair value:
| TOTAL FAIR VALUE AT FEBRUARY 29, 2012 | LEVEL 1 QUOTED PRICE | LEVEL 2 SIGNIFICANT OBSERVABLE INPUTS | LEVEL 3 SIGNIFICANT UNOBSERVABLE INPUTS | |||||||||||||
Common Stocks | ||||||||||||||||
Consumer Discretionary | $ | 9,353,127 | $ | 9,353,127 | $ | — | $ | — | ||||||||
Consumer Staples | 1,312,202 | 1,312,202 | — | — | ||||||||||||
Energy | 2,435,988 | 2,435,988 | — | — | ||||||||||||
Financials | 5,004,029 | 5,004,029 | — | — | ||||||||||||
Health Care | 1,353,838 | 1,353,838 | — | — | ||||||||||||
Industrials | 1,063,729 | 1,063,729 | — | — | ||||||||||||
Information Technology | 5,735,537 | 5,735,537 | — | — | ||||||||||||
Materials | 2,285,601 | 2,285,601 | — | — | ||||||||||||
Real Estate Investment Trusts | 4,309,286 | 4,309,286 | — | — | ||||||||||||
Telecommunication Services | 919,660 | 919,660 | — | — | ||||||||||||
Utilities | 37,948 | 37,948 | — | — | ||||||||||||
Exchange Traded Funds | 8,966,803 | 8,966,803 | — | — | ||||||||||||
Corporate Bond | 1,005,770 | 1,005,770 | — | |||||||||||||
Foreign Government Note | 10,735 | 10,735 | — | |||||||||||||
U.S. Treasury Notes | 107,906 | 107,906 | — | |||||||||||||
U.S. Government Agency | 4,984,073 | 4,984,073 | — | |||||||||||||
Short-Term Investments | 1,599,943 | 1,599,943 | — | |||||||||||||
Asset Derivatives | ||||||||||||||||
Commodity Contracts | 6,400 | 6,400 | — | — | ||||||||||||
Equity Contracts | 50,385 | 50,385 | — | — | ||||||||||||
Foreign Currency Contracts | 10,158 | 10,158 | — | — | ||||||||||||
Interest Rate Contracts | 10,400 | 10,400 | — | — | ||||||||||||
|
|
|
|
|
|
|
| |||||||||
Total Assets | $ | 50,563,518 | $ | 42,855,091 | $ | 7,708,427 | $ | — | ||||||||
|
|
|
|
|
|
|
| |||||||||
24
S1 FUND
NOTES TO FINANCIAL STATEMENTS
FEBRUARY 29, 2012 (UNAUDITED) (CONTINUED)
| TOTAL FAIR VALUEAT FEBRUARY 29, 2012 | LEVEL 1 QUOTED PRICE | LEVEL 2 SIGNIFICANT OBSERVABLE INPUTS | LEVEL 3 SIGNIFICANT UNOBSERVABLE INPUTS | |||||||||||||
Common Stocks Sold Short | ||||||||||||||||
Consumer Discretionary | $ | (3,207,426 | ) | $ | (3,207,426 | ) | $ | — | $ | — | ||||||
Consumer Staples | (129,303 | ) | (129,303 | ) | — | — | ||||||||||
Energy | (8,454 | ) | (8,454 | ) | — | — | ||||||||||
Financials | (3,407,914 | ) | (3,407,914 | ) | — | — | ||||||||||
Health Care | (256,967 | ) | (256,967 | ) | — | — | ||||||||||
Industrials | (448,721 | ) | (448,721 | ) | — | — | ||||||||||
Information Technology | (1,555,199 | ) | (1,555,199 | ) | — | — | ||||||||||
Materials | (500,317 | ) | (500,317 | ) | — | — | ||||||||||
Real Estate Investment Trusts | (3,322,058 | ) | (3,322,058 | ) | — | — | ||||||||||
Telecommunication Services | (140,255 | ) | (140,255 | ) | — | — | ||||||||||
Utilities | (4,084 | ) | — | — | (4,084 | ) | ||||||||||
Exchange Traded Funds Sold Short | (8,289,687 | ) | (8,289,687 | ) | — | — | ||||||||||
Liability Derivatives | ||||||||||||||||
Equity Contracts | (53,831 | ) | (53,831 | ) | — | — | ||||||||||
|
|
|
|
|
|
|
| |||||||||
Total Liabilities | $ | (21,324,216 | ) | $ | (21,320,132 | ) | $ | — | $ | (4,084 | ) | |||||
|
|
|
|
|
|
|
| |||||||||
The following is a reconciliation of the Fund’s Level 3 investments for which significant unobservable inputs were used to determine fair value.
| TOTAL INVESTMENTS | CONSUMER DISCRETIONARY | MATERIALS | UTILITIES | WRITTEN OPTIONS | ||||||||||||||||
Balance as of August 31, 2011. | $ | (18,465 | ) | $ | (7,588 | ) | $ | (1,712 | ) | $ | — | $ | (9,165 | ) | ||||||
Accrued discounts/premiums. | — | — | — | — | — | |||||||||||||||
Net realized gain/(loss) | 7,207 | 7,682 | 4,298 | — | 7,207 | |||||||||||||||
Change in unrealized appreciation/(depreciation) | 1,958 | 1,404 | 3,296 | — | 1,958 | |||||||||||||||
Purchases | — | — | — | — | — | |||||||||||||||
Sales* | 9,300 | (1,498 | ) | (5,882 | ) | — | — | |||||||||||||
Transfer in* | (4,084 | ) | — | — | (4,084 | ) | — | |||||||||||||
Transfer out | — | — | — | — | — | |||||||||||||||
|
|
|
|
|
|
|
|
|
| |||||||||||
Balance as of February 29, 2012 | $ | (4,084 | ) | $ | — | $ | — | $ | (4,084 | ) | $ | — | ||||||||
|
|
|
|
|
|
|
|
|
| |||||||||||
| * | Included were securities purchased as a short sale. The change in unrealized appreciation/(depreciation) related to investments still held at February 29, 2012 was $1,100. |
At the end of each calendar quarter, management evaluates the classification of Levels 1, 2 and 3 assets and liabilities. Various factors are considered, such as changes in liquidity from the prior reporting period;
25
S1 FUND
NOTES TO FINANCIAL STATEMENTS
FEBRUARY 29, 2012 (UNAUDITED) (CONTINUED)
whether or not a broker is willing to execute at the quoted price; the depth and consistency of prices from third party pricing services; and the existence of contemporaneous, observable trades in the market. Additionally, management evaluates the classification of Level 1 and Level 2 assets and liabilities on a quarterly basis for changes in listings or delistings on national exchanges.
Due to the inherent uncertainty of determining the fair value of investments that do not have a readily available market value, the fair value of the Fund’s investments may fluctuate from period to period. Additionally, the fair value of investments may differ significantly from the values that would have been used had a ready market existed for such investments and may differ materially from the values the Fund may ultimately realize. Further, such investments may be subject to legal and other restrictions on resale or otherwise less liquid than publicly traded securities.
Transfers in and out of Levels 1, 2 and 3 are recognized at the end of the period. For the period ended February 29, 2012, the Fund had a transfer from Level 1 into Level 3. For details on this transfer, please refer to page 25.
DISCLOSURESABOUT DERIVATIVE INSTRUMENTSAND HEDGING ACTIVITIES
The following is a summary of the location of derivatives on the Fund’s Statement of Assets and Liabilities as of February 29, 2012:
LOCATIONONTHE STATEMENTOF ASSETSAND LIABILITIES | ||||
DERIVATIVE INVESTMENTS TYPE | ASSET DERIVATIVES | LIABILITY DERIVATIVES | ||
Equity contracts | Investments, at value | Options written, at value | ||
Foreign currency contracts | ||||
Commodity contracts | ||||
Other contracts | Payable: Variation margin | |||
The following is a summary of the Fund’s derivative instrument holdings categorized by primary risk exposure as of February 29, 2012:
| ASSET DERIVATIVE INVESTMENTS VALUE | ||||||||||
TOTAL VALUE AT | EQUITY CONTRACTS | INTEREST RATE CONTRACTS | CREDIT CONTRACTS | FOREIGN CURRENCY CONTRACTS | COMMODITY CONTRACTS | |||||
| $77,343 | $50,385 | $10,400 | $— | $10,158 | $6,400 | |||||
| LIABILITY DERIVATIVE INVESTMENTS VALUE | ||||||||||
TOTAL VALUEAT | EQUITY CONTRACTS | INTEREST RATE CONTRACTS | CREDIT CONTRACTS | FOREIGN CURRENCY CONTRACTS | COMMODITY CONTRACTS | |||||
| $(53,831) | $(53,831) | $— | $— | $— | $— | |||||
26
S1 FUND
NOTES TO FINANCIAL STATEMENTS
FEBRUARY 29, 2012 (UNAUDITED) (CONTINUED)
The following is a summary of the location of derivative investments on the Fund’s Statement of Operations for the period ended February 29, 2012:
DERIVATIVE INVESTMENTS TYPE | TYPE LOCATIONOF GAIN (LOSS)ON DERIVATIVES RECOGNIZEDINTHE STATEMENTSOF OPERATIONS | |
| Equity contracts | Net realized gain (loss) from investments | |
| Foreign currency contracts | Net realized gain (loss) from written options | |
| Commodity contracts | Net change in unrealized appreciation/ | |
| Interest rate contracts | (depreciation) on investments | |
| Net change in unrealized appreciation/ | ||
| (depreciation) on written options | ||
| Net change in unrealized appreciation/ | ||
| (depreciation) on futures |
The following is a summary of the Fund’s realized gain or loss and change in unrealized appreciation or depreciation on derivative investments recognized in the Statement of Operations categorized by primary risk exposure for the period ended February 29, 2012:
REALIZED GAIN/(LOSS)ON DERIVATIVE INVESTMENTS RECOGNIZEDINTHE STATEMENTOF OPERATIONS | ||||||||||
TOTAL VALUE AT | EQUITY CONTRACTS | INTEREST RATE CONTRACTS | CREDIT CONTRACTS | FOREIGN CURRENCY CONTRACTS | COMMODITY | |||||
$(279,040) | $(120,113) | $— | $— | $(117,853) | $(41,074) | |||||
CHANGEIN UNREALIZED APPRECIATION/(DEPRECIATION)ON DERIVATIVE INVESTMENTS RECOGNIZEDINTHE STATEMENTOF OPERATIONS | ||||||||||
TOTAL VALUEAT | EQUITY CONTRACTS | INTEREST RATE CONTRACTS | CREDIT CONTRACTS | FOREIGN CURRENCY CONTRACTS | COMMODITY | |||||
$(33,660) | $(50,725) | $10,400 | $— | $5,243 | $1,422 | |||||
27
S1 FUND
NOTES TO FINANCIAL STATEMENTS
FEBRUARY 29, 2012 (UNAUDITED) (CONTINUED)
For the period ended February 29, 2012, the Fund’s average volume of derivatives is as follows:
PURCHASED | WRITTEN OPTIONS (PROCEEDS) | |
| $223,713 | $149,736 |
USEOF ESTIMATES — The preparation of financial statements in conformity with U.S. generally accepted accounting principles (“U.S. GAAP”) requires management to make estimates and assumptions that affect the reported amounts of assets and liabilities and disclosure of contingent assets and liabilities at the date of the financial statements and the reported amounts of revenues and expenses during the period. Actual results could differ from those estimates and those differences could be significant.
INVESTMENT TRANSACTIONS, INVESTMENT INCOMEAND EXPENSES — The Fund records security transactions based on trade date. The cost of investments sold is determined by use of the specific identification method for both financial reporting and income tax purposes in determining realized gains and losses on investments. Interest income is accrued when earned. Dividend income is recorded on the ex-dividend date. Distributions received on securities that represent a return of capital or capital gains are recorded as a reduction of cost of investments and/or as a realized gain. The Fund estimates the components of distributions received that may be considered return of capital distributions or capital gain distributions. The Fund’s investment income, expenses and unrealized and realized gains and losses are allocated daily. Expenses incurred on behalf of a specific class, fund or fund family are charged directly to the class, fund or fund family to each class of shares based upon the relative proportion of net assets of each class at the beginning of the day. Expenses incurred for all the RBB funds (such as director or professional fees) are charged to all funds in proportion to their average net assets of RBB, or in such other manner as the Company’s Board of Directors deems fair or equitable. Expenses and fees, including investment advisory and administration fees, are accrued daily and taken into account for the purpose of determining the NAV of the Fund.
DIVIDENDSAND DISTRIBUTIONSTO SHAREHOLDERS — Dividends from net investment income and distributions from net realized capital gains, if any, are declared and paid at least annually to shareholders and recorded on ex-dividend date. Income dividends and capital gain distributions are determined in accordance with U.S. federal income tax regulations which may differ from U.S. GAAP.
U.S. TAX STATUS — No provision is made for U.S. income taxes as it is the Fund’s intention to qualify for and elect the tax treatment applicable to regulated investment companies under Subchapter M of the Internal Revenue Code of 1986, as amended, and make the requisite distributions to its shareholders which will be sufficient to relieve it from U.S. income and excise taxes.
FOREIGN CURRENCY TRANSLATION — Assets and liabilities initially expressed in non-U.S. currencies are translated into U.S. dollars based on the applicable exchange rates at the date of the last business day of the financial statement period. Purchases and sales of securities, interest income, dividends, variation margin received and expenses denominated in foreign currencies are translated into U.S. dollars at the exchange rates in effect on the transaction date.
28
S1 FUND
NOTES TO FINANCIAL STATEMENTS
FEBRUARY 29, 2012 (UNAUDITED) (CONTINUED)
The Fund does not seperately report the effect of changes in foreign exchange rates from changes in market prices of securities held. Such changes are included with the net realized gain or loss and change in unrealized appreciation or depreciation on investment securities in the Statement of Operations. Other foreign currency transactions resulting in realized and unrealized gain or loss are reported separately as net realized gain or loss and change in unrealized appreciation or depreciation on foreign currencies in the Statement of Operations.
FOREIGN CURRENCY CONTRACTS — The Fund invests in securities of foreign issuers, including American Depositary Receipts. These markets are subject to special risks associated with foreign investments not typically associated with investing in U.S. markets. Because the foreign securities in which the Fund may invest generally trade in currencies other than the U.S. dollar, changes in currency exchange rates will affect the Fund’s NAV, the value of dividends and interest earned and gains and losses realized on the sale of securities. Because the NAV for the Fund is determined on the basis of U.S. dollars, the Fund may lose money by investing in a foreign security if the local currency of a foreign market depreciates against the U.S. dollar, even if the local currency value of the Fund holdings goes up. Generally, a strong U.S. dollar relative to these other currencies will adversely affect the value of the Fund holdings in foreign securities.
FOREIGN SECURITIES — Securities of many non-U.S. companies may be less liquid and their prices more volatile than securities of comparable U.S. companies. Securities of companies traded in many countries outside the U.S., particularly emerging markets countries, may be subject to further risks due to the inexperience of local investment professionals and financial institutions, the possibility of permanent or temporary termination of trading and greater spreads between bid and asked prices of securities. In addition, non-U.S. stock exchanges and investment professionals are subject to less governmental regulation, and commissions may be higher than in the United States. Also, there may be delays in the settlement of non-U.S. stock exchange transactions.
PURCHASED OPTIONS — The Fund is subject to equity and other risk exposure in the normal course of pursuing its investment objectives. The Fund purchases option contracts. This transaction is used to hedge against changes in interest rates, foreign exchange rates and values of equities. The risk associated with purchasing an option is that the Fund pays a premium whether or not the option is exercised. Additionally, the Fund bears the risk of loss of premium and change in market value should the counterparty not perform under the contract. Put and call options are accounted for in the same manner as other securities owned. The cost of securities acquired through the exercise of call options is increased by the premiums paid. The proceeds from securities sold through the exercise of put options are decreased by the premiums paid.
OPTIONS WRITTEN — The Fund is subject to equity and other risk exposure in the normal course of pursuing its investment objectives and may enter into options written to hedge against changes in interest rates, foreign exchange rates and values of equities. Such options may relate to particular securities or domestic stock indices, and may or may not be listed on a domestic securities exchange or issued by the Options
29
S1 FUND
NOTES TO FINANCIAL STATEMENTS
FEBRUARY 29, 2012 (UNAUDITED) (CONTINUED)
Clearing Corporation. The risk in writing a call option is that the Fund gives up the opportunity for profit if the market price of the security increases. The risk in writing a put option is that the Fund may incur a loss if the market price of the security decreases and the option is exercised. The Fund also has the additional risk of being unable to enter into a closing transaction at an acceptable price if a liquid secondary market does not exist. The Fund also may write over-the-counter options where completing the obligation depends upon the credit standing of the other party. Option contracts also involve the risk that they may result in loss due to unanticipated developments in market conditions or other causes. Written options are recorded as liabilities to the extent of premiums received. Gains or losses are realized when the option transaction expires or closes. When an option is exercised, the proceeds on sales for a written call option or the purchase cost for a written put option is adjusted by the amount of the premium received or paid.
As of February 29, 2012, the Fund had options written valued at ($53,831) for which securities of $75,328 were pledged as collateral.
The Fund had transactions in options written during the period ended February 29, 2012 as follows:
| NUMBEROF CONTRACTS | PREMIUMS RECEIVED | |||||||
Options outstanding at August 31, 2011 | 1,408 | $ | 218,398 | |||||
Options written | 4,908 | 552,721 | ||||||
Options closed | (4,373 | ) | (539,412 | ) | ||||
Options expired | (1,329 | ) | (155,776 | ) | ||||
Options exercised | (72 | ) | (3,277 | ) | ||||
|
|
|
| |||||
Options outstanding at February 29, 2012 | 542 | $ | 72,654 | |||||
|
|
|
| |||||
SHORT SALES — When the investment adviser or a sub-adviser believes that a security is overvalued, the Fund may sell the security short by borrowing the same security from a broker or other institution and selling the security. The Fund will incur a loss as a result of a short sale if the price of the borrowed security increases between the date of the short sale and the date on which the Fund buys and replaces such borrowed security. The Fund will realize a gain if there is a decline in price of the security between those dates where the decline in price exceeds the costs of borrowing the security and other transaction costs. There can be no assurance that a Fund will be able to close out a short position at any particular time or at an acceptable price. Although a Fund’s gain is limited to the amount at which it sold a security short, its potential loss is unlimited. Until a Fund replaces a borrowed security, it will maintain at all times cash, U.S. Government securities, or other liquid securities in an amount which, when added to any amount deposited with a broker as collateral, will at least equal the current market value of the security sold short. Depending on arrangements made with brokers, the Fund may not receive any payments (including interest) on collateral deposited with them.
30
S1 FUND
NOTES TO FINANCIAL STATEMENTS
FEBRUARY 29, 2012 (UNAUDITED) (CONTINUED)
In accordance with the terms of its prime brokerage agreements, the Fund may receive rebate income or be charged a fee on borrowed securities. Such income or fee is calculated on a daily basis based upon the market value of each borrowed security and a variable rate that is dependent upon the availability of such security. The Fund records these prime broker charges on a net basis as interest income or interest expense. For the period ended February 29, 2012, the Fund had net charges of $117,201 on borrowed securities. Such amounts are included in prime broker interest expense on the Statement of Operations.
As of February 29, 2012, the Fund had securities sold short valued at $21,271,385 for which securities of $22,430,454 were pledged as collateral. In accordance with the Special Custody and Pledge Agreement with Goldman Sachs & Co. (“Goldman Sachs”) (the Fund’s prime broker), the Fund may borrow from Goldman Sachs to the extent necessary to maintain required margin cash deposits on short positions. Interest on such borrowings is charged to the Fund based on the LIBOR rate plus an agreed upon spread.
The Fund utilized cash borrowings from Goldman Sachs to meet required margin cash deposits as follows during the period ended February 29, 2012:
DAYS | AVERAGE DAILY BORROWINGS | WEIGHTED AVERAGE INTEREST RATE | ||||
| 301 | AUD | 87,575 | 5.02% | |||
| 275 | CAD | 13,850 | 1.52% | |||
| 212 | EUR | 42,950 | 1.41% | |||
| 131 | GBP | 21,619 | 1.04% | |||
| 88 | HKD | 66,689 | 0.75% | |||
| 48 | USD | 156,904 | 0.61% | |||
As of February 29, 2012, the Fund had no borrowings. Interest expense for the period ended February 29, 2012 totaled $12,895.
OTHER — In the normal course of business, the Fund may enter into contracts that provide general indemnifications. The Fund’s maximum exposure under these arrangements is dependent on claims that may be made against the Fund in the future, and, therefore, cannot be estimated; however, based on experience, the risk of material loss from such claims is considered remote.
2. INVESTMENT ADVISERAND OTHER SERVICES
Simple Alternatives, LLC (“Simple Alternatives” or the “Adviser”) serves as the Fund’s investment adviser. For its advisory services, the Adviser is entitled to receive a monthly fee from the Fund calculated at an annual rate of 2.75% of the Fund’s average daily net assets.
The Adviser has contractually agreed to forgo all or a portion of its advisory fee and/or reimburse expenses in a aggregate amount equal to the amount by which the total annual Fund operating expenses (other than acquired fund fees and expenses, short sale dividend expenses, brokerage commissions, litigation, extraordinary
31
S1 FUND
NOTES TO FINANCIAL STATEMENTS
FEBRUARY 29, 2012 (UNAUDITED) (CONTINUED)
items, interest or taxes) exceed 2.95% of the average daily net assets of the Fund’s I Shares and 3.20% of the average daily net assets of the Fund’s R Shares, respectively. This contractual limitation is in effect until at least December 31, 2012 and may not be terminated prior to December 31, 2012 without approval by the Company’s Board of Directors. If at any time during the first three years the Fund’s Advisory Agreement with the Adviser is in effect, the Fund’s total annual Fund operating expenses for that year are less than 2.95% or 3.20%, as applicable, the Adviser is entitled to reimbursement by the Fund of the advisory fees forgone and other payments remitted by the Adviser to the Fund during such three-year period if such reimbursement by the Fund does not cause the Fund to exceed existing expense limitations. For the period ended February 29, 2012, investment advisory fees accrued and waived were $752,552 and $220,004, respectively. At February 29, 2012, the amount of potential recovery by the Advisor was as follows:
| EXPIRATION | ||
2014 | 2015 | |
| $313,683 | $220,004 | |
Simple Alternatives has currently retained the services of Roaring Blue Lion Capital Management, LLC; Courage Capital Management, LLC; Cramer Rosenthal McGlynn, LLC; Lauren Templeton Capital Management, LLC; Maerisland Capital, LLC ; Starwood Real Estate Securities, LLC; and Trellus Management Co., LLC as sub-advisers (each a “Sub-Adviser”) of the Fund. Pursuant to sub-advisory agreements between the Adviser and each Sub-Adviser, each Sub-Adviser manages the investment and reinvestment of the portion of the Fund’s portfolio allocated to it by the Adviser. The Fund is not required to invest with any minimum number of Sub-Advisers, and does not have minimum or maximum limitations with respect to allocations of assets to any Sub-Adviser. The Sub-Advisers are compensated by the Adviser and not by the Fund.
BNY Mellon Investment Servicing (US) Inc. (“BNY Mellon”) serves as administrator for the Fund. For providing administrative and accounting services, BNY Mellon is entitled to receive a monthly fee equal to an annual percentage rate of the Fund’s average daily net assets, subject to certain minimum monthly fees.
Included in the administration and accounting service fees, shown on the Statement of Operations, are fees for providing regulatory administration services to RBB. For providing these services, BNY Mellon is entitled to receive compensation as agreed to by the Company and BNY Mellon. This fee is allocated to each portfolio in proportion to its net assets of the Company. For the period ended February 29, 2012, BNY Mellon accrued administration and accounting fees totaling $93,372 and waived fees totaling $12,000.
In addition, BNY Mellon serves as the Fund’s transfer and dividend disbursing agent. For providing transfer agent services, BNY Mellon is entitled to receive out of pocket expenses.
The Bank of New York Mellon (the “Custodian”) succeeded PFPC Trust Company as the Fund’s custodian providing certain custodial services to the Fund. The Custodian is entitled to receive a monthly fee equal to an annual percentage rate of the Portfolio’s average daily net assets subject to certain minimum monthly fees and may receive out of pocket expenses.
32
S1 FUND
NOTES TO FINANCIAL STATEMENTS
FEBRUARY 29, 2012 (UNAUDITED) (CONTINUED)
BNY Mellon Distributors, LLC, formerly known as BNY Mellon Distributors, Inc., a member of BNY Mellon, serves as the principal underwriter and distributor of the Fund’s shares pursuant to a Distribution Agreement with RBB.
The Fund will not pay The Bank of New York Mellon Corporation or any of its members or BNY Mellon’s affiliates at a later time for any amounts waived or any amounts assumed.
3. DIRECTOR COMPENSATION
The Directors of the Company receive an annual retainer, meeting fees and reimbursement of out of pocket expenses for meetings attended. The remuneration paid to the Directors by the Fund during the period ended February 29, 2012 was $5,484. Certain employees of BNY Mellon are Officers of the Company. They are not compensated by the Fund or the Company.
4. INVESTMENTIN SECURITIES
For the period ended February 29, 2012, aggregate purchases and sales of investment securities (excluding short-term investments) of the Fund were as follows:
| PURCHASES | SALES | |||||||
Investments in Non-U.S. Government Securities | $ | — | $ | 193,882,249 | ||||
Investments in U.S. Government Securities | 155,908,962 | 1,279,480 | ||||||
5. CAPITAL SHARE TRANSACTIONS
As of February 29, 2012, the Fund has 100,000,000 shares of $0.001 par value common stock authorized for I Shares and 100,000,000 shares of $0.001 par value common stock authorized for R Shares.
6. FEDERAL INCOME TAX INFORMATION
The Fund has followed the authoritative guidance on accounting for and disclosure of uncertainty in tax positions, which requires the Fund to determine whether a tax position is more likely than not to be sustained upon examination, including resolution of any related appeals or litigation processes, based on the technical merits of the position. The Fund has determined that there was no effect on the financial statements from following this authoritative guidance. In the normal course of business, the Fund is subject to examination by federal, state and local jurisdictions, where applicable, for tax years for which applicable statutes of limitations have not expired.
33
S1 FUND
NOTES TO FINANCIAL STATEMENTS
FEBRUARY 29, 2012 (UNAUDITED) (CONTINUED)
As of February 29, 2012, federal tax cost, aggregate gross unrealized appreciation and depreciation of securities held by the Fund were as follows:
FEDERAL TAX COST | UNREALIZED APPRECIATION | UNREALIZED DEPRECIATION | NET UNREALIZED APPRECIATION | |||
$48,502,514 | $2,844,229 | $(783,758) | $2,060,471 |
Distributions to shareholders from net investment income and realized gains are determined in accordance with federal income tax regulations, which may differ from net investment income and realized gains recognized for financial reporting purposes. Accordingly, the character of distributions and composition of net assets for tax purposes may differ from those reflected in the accompanying financial statements. To the extent these differences are permanent, such amounts are reclassified within the capital accounts based on the tax treatment; temporary differences do not require such reclassification.
As of August 31, 2011 the components of distributable earnings on a tax basis were as follows:
UNDISTRIBUTED ORDINARY INCOME | UNDISTRIBUTED LONG-TERM GAINS | UNREALIZED DEPRECIATION | ||
$— | $72 | $(692,945) |
The differences between the book and tax basis components of distributable earnings relate principally to the timing of recognition of income and gains for federal income tax purposes. Short-term and foreign currency gains are reported as ordinary income for federal income tax purposes.
There were no dividends or distributions paid during the fiscal period ended August 31, 2011. Dividends from net investment income and short-term capital gains are treated as ordinary income dividends for federal income tax purposes.
Under federal tax law, foreign currency and capital losses realized after October 31 may be deferred and treated as having arisen on the first day of the following fiscal year. For the fiscal period ended August 31, 2011, the Fund did not incur a net post-October loss.
As of August 31, 2011, the Fund had no capital loss carryforwards.
On December 22, 2010, President Obama signed into law the Regulated Investment Company Modernization Act of 2010 (the “Act”). The Act updates certain tax rules applicable to regulated investment companies (“RICs”). The various provisions of the Act will generally be effective for RICs with taxable years beginning after December 22, 2010. Additional information regarding the impact of the Act on the Fund, if any, will be contained within the relevant sections of the notes to the financial statements for the fiscal year ending August 31, 2012.
7. NEW ACCOUNTING PRONOUNCEMENT
In May 2011, Financial Accounting Standards Board (“FASB”) issued Accounting Standards Update (“ASU”) No. 2011-04 “Amendments to Achieve Common Fair Value Measurement and Disclosure Requirements in U.S. GAAP and International Financial Reporting Standards (“IFRS”).” ASU 2011-04 includes common requirements
34
S1 FUND
NOTES TO FINANCIAL STATEMENTS
FEBRUARY 29, 2012 (UNAUDITED) (CONCLUDED)
for measurement of and disclosure about fair value between U.S. GAAP and IFRS . ASU 2011-04 will require reporting entities to disclose the following information for fair value measurements categorized within Level 3 of the fair value hierarchy: quantitative information about the unobservable inputs used in the fair value measurement, the valuation processes used by the reporting entity and a narrative description of the sensitivity of the fair value measurement to changes in unobservable inputs and the interrelationships between those unobservable inputs. In addition, ASU 2011-04 will require reporting entities to make disclosures about amounts and reasons for all transfers in and out of Level 1 and Level 2 fair value measurements. The new and revised disclosures are effective for interim and annual reporting periods beginning after December 15, 2011. Management is currently evaluating the implications of ASU No. 2011-04 and its impact on the financial statements.
In December 2011, FASB issued ASU No. 2011-11, “Disclosures about Offsetting Assets and Liabilities”. ASU 2011-11 requires disclosures to make financial statements that are prepared under U.S. GAAP more comparable to those prepared under IFRS. The new disclosure requirements mandate that entities disclose both gross and net information about instruments and transactions eligible for offset in the statement of assets and liabilities as well as instruments and transactions subject to an agreement similar to a master netting arrangement. In addition, ASU 2011-11 requires disclosure of collateral received and posted in connection with master netting agreements or similar arrangements. New disclosures are required for annual reporting periods beginning on or after January 1, 2013, and interim periods within those annual periods. Management is evaluating the impact of ASU 2011-11 on the financial statements and disclosures.
8. SUBSEQUENT EVENTS
Management has evaluated the impact of all subsequent events on the Fund though the date the financial statements were issued, and has determined that there was the following subsequent events:
The Bank of New York Mellon Corporation announced on November 28, 2011 that it had agreed to sell BNY Mellon Distributors LLC (the “Distributor”) and its four subsidiaries to Foreside Distributors, LLC, a subsidiary of Foreside Financial Group, LLC (the “Transaction”). The Transaction closed on March 31, 2012. Upon the closing of the Transaction, the Distributor became an indirect, wholly owned subsidiary of Foreside Financial Group, LLC and was renamed Foreside Funds Distributors LLC effective April 1, 2012.
35
S1 FUND
OTHER INFORMATION
(UNAUDITED)
PROXY VOTING
Policies and procedures that the Fund uses to determine how to vote proxies relating to portfolio securities as well as information regarding how the Fund voted proxies relating to portfolio securities for the most recent 12-month period ended June 30 are available without charge, upon request, by calling (866) 882-1226 and on the Securities and Exchange Commission’s (“SEC”) website at http://www.sec.gov.
QUARTERLY PORTFOLIO SCHEDULES
The Company files its complete schedule of portfolio holdings with the SEC for the first and third fiscal quarters of each fiscal year (quarters ended November 30 and May 31) on Form N-Q. The Company’s Form N-Q is available on the SEC website at http://www.sec.gov and may be reviewed and copied at the SEC Public Reference Room in Washington, D.C. Information on the operation of the SEC Public Reference Room may be obtained by calling (202) 551-8090.
APPROVAL OF INVESTMENT ADVISORY AGREEMENT
Sub-Advisory Agreement with Maerisland Capital, LLC
As required by the Investment Company Act, the Board of Directors (the “Board”) of the Company, including all of the Directors who are not “interested persons” of the Company, as that term is defined in the Investment Company Act (the “Independent Directors”), considered the initial approval of the investment sub-advisory agreement between Simple Alternatives, LLC and Maerisland Capital, LLC (“Maerisland”)(the “Sub-Advisory Agreement”) with respect to the Fund at a meeting of the Board held on December 8, 2011. At the meeting, the Board, including all of the Independent Directors, approved the Sub-Advisory Agreement for an initial two-year term. The Board’s decision to approve the Sub-Advisory Agreement reflects the exercise of its business judgment with respect to Simple Alternative’s engagement of Maerisland to provide sub-advisory services to the Fund. In approving the Sub-Advisory Agreement, the Board considered information provided by Simple Alternatives and Maerisland with the assistance and advice of counsel to the Independent Directors and the Company.
In considering the approval of the Sub-Advisory Agreement between Simple Alternatives and Maerisland, the Board took into account all materials provided prior to and during the Meeting, the presentations made during the Meeting, and the discussions during the Meeting. Among other things, the Board considered (i) the nature, extent, and quality of services to be provided to the Fund by Maerisland; (ii) descriptions of the experience and qualifications of the personnel providing those services; (iii) Maerisland’s investment philosophies and processes; (iv) Maerisland’s assets under management and client descriptions; (v) Maerisland’s soft dollar commission and trade allocation policies, including information on the types of research and services obtained in connection with soft dollar commissions; (vi) Maerisland’s proposed advisory fee arrangements with the Advisor and other similarly managed clients; (vii) Maerisland’s compliance procedures; (viii) Maerisland’s financial information and insurance coverage; (ix) the extent to which economies of scale are relevant to the Fund; (x) the expected impact on the profitability of the Simple Alternatives; and (xi) performance information provided by Maerisland’s regarding similarly managed accounts.
36
S1 FUND
OTHER INFORMATION (CONCLUDED)
(UNAUDITED)
As part of their review, the Board considered the nature, extent and quality of the services to be provided by Maerisland. The Board concluded that Maerisland has substantial resources to provide services to the Fund. The Board also considered the sub-advisory fees payable to Maerisland under the proposed sub-advisory agreement. In this regard, the Board noted that the fees for Maerisland were payable by Simple Alternatives.
After reviewing the information regarding Maerisland’s costs, profitability and economies of scale, and after considering the services to be provided by Maerisland, the Board concluded that the investment advisory fees to be paid by Simple Alternatives to Maerisland were fair and reasonable, and that the Sub-Advisory Agreement should be approved for an initial period ending August 16, 2013.
37
[THIS PAGE INTENTIONALLY LEFT BLANK]
[THIS PAGE INTENTIONALLY LEFT BLANK]
Investment Adviser
Simple Alternatives, LLC
90 Grove Street
Suite 205
Ridgefield, CT 06877
Administrator
BNY Mellon Investment Servicing (US) Inc.
301 Bellevue Parkway
Wilmington, DE 19809
Transfer Agent
BNY Mellon Investment Servicing (US) Inc.
4400 Computer Drive
Westborough, MA 01581
Principal Underwriter
Foreside Funds Distributors LLC
400 Berwyn Park
899 Cassatt Road
Berwyn, PA 19312
Custodian
The Bank of New York Mellon
One Wall Street
New York, NY 10286
Independent Registered Public Accounting Firm
Ernst & Young LLP
Two Commerce Square
2001 Market Street, Suite 4000
Philadelphia, PA 19103
Counsel
Drinker Biddle & Reath LLP
One Logan Square, Ste. 2000
Philadelphia, PA 19103-6996
S1 FUND
of THE RBB FUND, INC.
SEMI-ANNUAL REPORT
FEBRUARY 29, 2012
(UNAUDITED)
This report is submitted for the general information of the shareholders of the Fund. It is not authorized for distribution unless preceded or accompanied by a current prospectus for the Fund.
THE SCHNEIDER FUNDS
Semi-Annual Investment Adviser’s Report
February 29, 2012
(Unaudited)
Fellow Shareholder:
The semi-annual report for the Schneider Funds covers the six months ended February 29, 2012.
Investment Review
During the six-month period, the broad market Russell 3000 Index rose 13.2%. Improving macroeconomic data provided confirming evidence of durable, if modest, U.S. economic expansion. After a slow initial response by euro area policymakers to their challenges, it appears that actions in recent months have helped to stabilize Europe for the time being.
The Small Cap Value Fund returned 17.23% for the six-month period ended February 29, 2012. The Value Fund posted a 6.93% return during same period.
We believe the holdings in both Funds are very cheaply valued relative to the broad market and offer great potential for future earnings growth, compared to corporate America that in our opinion has already hit its full earnings power. We take a longer-term perspective and will continue to hold convictions that sometimes challenge consensus views but we believe should eventually be rewarded for their uncommon value.
The homebuilding industry is improving, in our view. Public homebuilders should mark 2012 as the beginning of their fundamental recovery as the necessary backdrop is beginning to be set for a housing rebound. Prices for non-distressed homes have stabilized and new home inventories are down over 70% from the 2006 peak. In addition, encouraging data relating to job creation, mortgage delinquencies, existing home inventories, homebuyer traffic, and consumer sentiment signal that the pieces are falling into place. We believe that record affordability, historic pent-up demand and improved confidence will entice consumers to come back into the market. The public homebuilders have tremendous operating leverage to any sustained uptick in demand. Despite a rally in the stocks during the period, valuations are cheap relative to medium-term earnings power.
Lagging performance for coal stocks has not diminished our enthusiasm or confidence in the investment case. Thermal coal demand and pricing will continue to face temporary headwinds from the fourth-warmest winter in the U.S. since recordkeeping began. The exceptionally mild weather contributed to unsustainably low natural gas prices, which in turn encouraged substantial coal-to-gas switching by electric utilities. At current valuations, we believe the stocks exhibit a compelling risk/reward profile. Global demand trends should continue to be favorable for thermal coal and we expect higher-cost coal miners in the U.S. to accelerate production cuts that should help inventories return to normal levels.
Bank valuations are very attractive. In three years, the banking system has gone from low capital ratios to near record highs. We expect the industry in 2012 to experience a third consecutive year of improving credit quality, and we look for loan growth to build momentum this year. Expense control will boost incremental earnings, and negative impacts associated with regulatory reform have been largely passed through to consumers. However, the zero-rate environment will continue to weigh on net margins and near-term earnings power.
Outlook
We believe the U.S. can have a decent year of economic growth as long as Europe muddles through in addressing their problems and does not erupt in a full-blown crisis. The euro area could begin to recover from recession late in the year in response to interest rate cuts and increased liquidity from the European Central Bank’s Long Term Refinancing Operation. New leaders in Italy, Spain and the European Central Bank should provide some momentum to decisively tackle this mess.
The U.S. private sector is fundamentally sound and should continue to demonstrate its natural resilience over the next several years. Many of the imbalances or excesses which led to the 2008 recession, such as consumer leverage and housing prices, have dissipated. The U.S. also entered 2012 with some favorable momentum. Most encouraging has been the modest improvement in labor and employment trends, as well as gains in consumer confidence and a stabilizing housing market. The investment case for the holdings in the Funds assumes a slow but sustained economic recovery.
On a cautious note, United States taxpayers face eight major tax increases in 2013, totaling a massive 3% of GDP. These levies include the temporary payroll tax holiday, four from the expiring 2001/2003 tax cuts and three scheduled Obamacare-related tax increases, one on income and two on investments. We hope the Supreme Court will throw out the entire health care bill and this entitlement the U.S.
1
THE SCHNEIDER FUNDS
Semi-Annual Investment Adviser’s Report (Continued)
February 29, 2012
(Unaudited)
cannot afford, in addition to the three tax hikes. Either five or all eight sizeable tax hikes next year would have a crippling effect on economic growth. The uncertainty surrounding tax policy would also erode consumer confidence once the breadth and size become more widely recognized later this year.
The U.S. faces a critical need to reduce future deficits, but the negative economic impact of austerity measures can be moderated if done properly. We saw successful examples of sound policy in both Canada and Southeast Asia in the 1990s, which focused on government spending cuts rather than tax increases.
Thank you for your interest and the confidence you have placed in us.

Arnold C. Schneider III, CFA
Portfolio Manager
Schneider Capital Management
Portfolio composition is subject to change. The current and future portfolio holdings of the Funds are subject to investment risks.
2
THE SCHNEIDER FUNDS
SCHNEIDER SMALL CAP VALUE FUND
Performance Data
February 29, 2012 (Unaudited)
Total Returns for the Periods Ended February 29, 2012
| ||||||||||||||||||||
| Average Annual | ||||||||||||||||||||
| Six Months* | One Year | Five Years | Ten Years | Since Inception** | ||||||||||||||||
Schneider Small Cap Value | 17.23 | % | -12.77 | % | -5.05 | % | 9.16 | % | 14.35 | % | ||||||||||
Russell 2000® Value Index | 11.81 | % | -2.72 | % | -0.36 | % | 7.04 | % | 8.77 | % | ||||||||||
* Not annualized | ||||||||||||||||||||
** Inception date 9/2/98
| ||||||||||||||||||||
The performance data quoted represents past performance. Past performance is not indicative of future results. Investment return and principal value will fluctuate so that an investor’s shares, when redeemed, may be worth more or less than their original cost. Current performance may be lower or higher. Schneider Capital Management Company, the Fund’s investment adviser has contractually agreed to waive management fees and/or reimburse expenses through December 31, 2012, to the extent that total annual Fund operating expenses (excluding acquired fund fees and expenses, brokerage commissions, extraordinary items, interest and taxes) exceed 1.15%. Total returns shown include fee waivers and expense reimbursements, if any; total returns would have been lower had there been no waiver or reimbursement of fees and expenses in excess of expense limitations. Returns shown include the reinvestment of all dividends and other distributions and do not reflect taxes that a shareholder would pay on Fund distributions or on the redemption of Fund shares. For performance data current to the most recent month-end, please call 1-888-520-3277. The Fund’s gross and net annual operating expenses, as stated in the current prospectus, are 1.40% and 1.15%, respectively. Shares of the Fund not purchased through reinvested dividends or capital gains and held less than one year are subject to a 1.75% redemption fee.
The Fund’s annualized total return since inception is based on an increase in net asset value from $10.00 per share on September 2, 1998 (inception) to $16.06 per share on February 29, 2012, adjusted for dividends and distributions totaling $29.52 per share paid from net investment income and realized gains.
Small company stocks are generally riskier than large company stocks due to greater volatility and less liquidity.
Value investing involves the risk that the Fund’s investment in companies whose securities are believed to be undervalued, relative to their underlying profitability, will not appreciate in value as anticipated.
3
THE SCHNEIDER FUNDS
SCHNEIDER VALUE FUND
Performance Data
February 29, 2012 (Unaudited)
Total Returns for the Periods Ended February 29, 2012
| ||||||||||||||||
| Average Annual | ||||||||||||||||
| Six Months* | One Year | Five Years | Since Inception** | |||||||||||||
Schneider Value | 6.93 | % | -14.10 | % | -7.95 | % | 7.14 | % | ||||||||
Russell 1000® Value Index | 12.84 | % | 2.18 | % | -1.08 | % | 7.89 | % | ||||||||
* Not annualized |
| |||||||||||||||
** Inception date 9/30/02 |
| |||||||||||||||
The performance data quoted represents past performance. Past performance is not indicative of future results. Investment return and principal value will fluctuate so that an investor’s shares, when redeemed, may be worth more or less than their original cost. Current performance may be lower or higher. Schneider Capital Management Company, the Fund’s investment adviser, has contractually agreed to waive management fees and/or reimburse expenses through December 31, 2012, to the extent that total annual fund operating expenses (excluding acquired fund fees and expenses, brokerage commissions, extraordinary items, interest and taxes) exceed 0.90%. Total returns shown include fee waivers and expense reimbursements, if any; total returns would have been lower had there been no waiver or reimbursement of fees and expenses in excess of expense limitations. Returns shown include the reinvestment of all dividends and other distributions and do not reflect taxes that a shareholder would pay on Fund distributions or on the redemption of Fund shares. For performance data current to the most recent month-end, please call 1-888-520-3277. The Fund’s gross and net annual operating expenses, as stated in the current prospectus, are 1.07% and 0.90%, respectively. Shares of the Fund not purchased through reinvested dividends or capital gains and held less than 90 days are subject to a 1.00% redemption fee.
The Fund’s aggregate total return since inception is based on an increase in net asset value from $10.00 per share on September 30, 2002 (inception) to $13.30 per share on February 29, 2012, adjusted for dividends and distributions totaling $6.53 per share paid from net investment income and realized gains.
Value investing involves the risk that the Fund’s investment in companies whose securities are believed to be undervalued, relative to their underlying profitability, will not appreciate in value as anticipated.
4
THE SCHNEIDER FUNDS
Fund Expense Examples
(Unaudited)
As a shareholder of the Fund(s), you incur two types of costs: (1) transaction costs, including redemption fees; and (2) ongoing costs, including management fees and other Fund expenses. These examples are intended to help you understand your ongoing costs (in dollars) of investing in the Fund(s) and to compare these costs with the ongoing costs of investing in other mutual funds.
These examples are based on an investment of $1,000 invested at the beginning of the six months from September 1, 2011 through February 29, 2012, and held for the entire period.
Actual Expenses
The first line of the accompanying tables provides information about actual account values and actual expenses. You may use the information in this line, together with the amount you invested, to estimate the expenses that you paid over the period. Simply divide your account value by $1,000 (for example, an $8,600 account value divided by $1,000 = 8.6), then multiply the result by the number in the first line under the heading entitled “Expenses Paid During Period” to estimate the expenses you paid on your account during this period.
Hypothetical Example for Comparison Purposes
The second line of the accompanying tables provides information about hypothetical account values and hypothetical expenses based on the Fund’s actual expense ratio and an assumed rate of return of 5% per year before expenses, which is not your Fund’s actual return. The hypothetical account values and expenses may not be used to estimate the actual ending account balance or expenses you paid for the period. You may use this information to compare the ongoing costs of investing in the Fund and other funds. To do so, compare these 5% hypothetical examples with the 5% hypothetical examples that appear in the shareholder reports of other funds.
Please note that the expenses shown in the accompanying tables are meant to highlight your ongoing costs only and do not reflect any transactional costs, such as redemption fees. Therefore, the second line of the accompanying tables is useful in comparing ongoing costs only, and will not help you determine the relative total costs of owning different funds. In addition, if these transactional costs were included, your costs would have been higher.
| Schneider Small Cap Value Fund | ||||||||||||
| Beginning Account Value September 1, 2011 | Ending Account Value February 29, 2012 | Expenses Paid During Period* | ||||||||||
Actual | $ | 1,000.00 | $ | 1,172.27 | $ | 6.21 | ||||||
Hypothetical (5% return before expenses) | 1,000.00 | 1,019.14 | 5.77 | |||||||||
| Schneider Value Fund | ||||||||||||
| Beginning Account Value September 1, 2011 | Ending Account Value February 29, 2012 | Expenses Paid During Period* | ||||||||||
Actual | $ | 1,000.00 | $ | 1,069.32 | $ | 4.63 | ||||||
Hypothetical (5% return before expenses) | 1,000.00 | 1,020.39 | 4.52 | |||||||||
| * | Expenses are equal to an annualized six-month expense ratio of 1.15% for the Schneider Small Cap Value Fund and 0.90% for the Schneider Value Fund, which includes waived fees or reimbursed expenses, multiplied by the average account value over the period, multiplied by the number of days in the most recent fiscal half-year (182), then divided by 366 to reflect the one-half year period. The Fund’s ending account values on the first line in each table are based on the actual six-month total return for each Fund of 17.23% for the Schneider Small Cap Value Fund and 6.93% for the Schneider Value Fund. |
5
THE SCHNEIDER FUNDS
SCHNEIDER SMALL CAP VALUE FUND
Portfolio Holdings Summary Table
February 29, 2012
(Unaudited)
The following table presents a summary by sector of the portfolio holdings of the Fund:
| % of Net Assets | Value | |||||||
Common Stocks: | ||||||||
Banks | 20.5 | % | $ | 15,094,740 | ||||
Home Builders | 9.8 | 7,249,418 | ||||||
Coal | 9.8 | 7,190,559 | ||||||
Commercial Services | 6.2 | 4,533,882 | ||||||
Savings & Loans | 5.5 | 4,061,135 | ||||||
Real Estate Investment Trusts | 5.4 | 3,971,531 | ||||||
Semiconductors | 4.0 | 2,975,623 | ||||||
Insurance | 3.3 | 2,428,265 | ||||||
Healthcare - Services | 2.9 | 2,113,580 | ||||||
Retail | 2.7 | 1,996,697 | ||||||
Industrial | 2.4 | 1,794,264 | ||||||
Real Estate | 2.4 | 1,769,985 | ||||||
Chemicals | 2.4 | 1,728,189 | ||||||
Internet | 2.1 | 1,553,366 | ||||||
Computers | 1.9 | 1,396,688 | ||||||
Oil & Gas | 1.8 | 1,316,755 | ||||||
Software | 1.5 | 1,088,916 | ||||||
Telecommunications | 1.5 | 1,083,788 | ||||||
Apparel | 1.4 | 1,042,894 | ||||||
Machinery - Diversified | 1.4 | 1,017,218 | ||||||
Auto Manufacturers | 1.2 | 902,448 | ||||||
Building Materials | 1.1 | 816,705 | ||||||
Office Products | 1.1 | 770,106 | ||||||
Electronics | 0.9 | 668,425 | ||||||
Aerospace & Defense | 0.8 | 620,201 | ||||||
Food | 0.5 | 357,192 | ||||||
Electric | 0.4 | 298,204 | ||||||
Metals Fabricating | 0.1 | 104,788 | ||||||
Securities Lending Collateral | 11.0 | 8,130,117 | ||||||
Corporate Bonds | 1.2 | 896,379 | ||||||
Exchange Traded Fund | 0.6 | 409,647 | ||||||
Liabilities In Excess of Other Assets | (7.8 | ) | (5,739,639 | ) | ||||
|
|
|
| |||||
NET ASSETS | 100.0 | % | $ | 73,642,066 | ||||
|
|
|
| |||||
Portfolio holdings are subject to change at any time.
The accompanying notes are an integral part of the financial statements.
6
THE SCHNEIDER FUNDS
SCHNEIDER VALUE FUND
Portfolio Holdings Summary Table
February 29, 2012
(Unaudited)
The following table presents a summary by sector of the portfolio holdings of the Fund:
| % of Net Assets | Value | |||||||
Common Stocks: | ||||||||
Banks | 22.8 | % | $ | 14,174,387 | ||||
Coal | 12.3 | 7,684,526 | ||||||
Insurance | 11.7 | 7,259,161 | ||||||
Home Builders | 9.4 | 5,880,806 | ||||||
Telecommunications | 6.5 | 4,021,426 | ||||||
Oil & Gas | 6.2 | 3,838,210 | ||||||
Electric | 3.3 | 2,043,697 | ||||||
Automobile Parts & Equipment | 3.0 | 1,872,273 | ||||||
Health Care - Services | 3.0 | 1,852,350 | ||||||
Automobile Manufacturers | 2.9 | 1,834,392 | ||||||
Lodging | 2.5 | 1,566,884 | ||||||
Computers | 2.5 | 1,541,534 | ||||||
Aerospace & Defense | 2.4 | 1,482,885 | ||||||
Electronics | 2.0 | 1,276,454 | ||||||
Leisure Time | 1.9 | 1,208,874 | ||||||
Real Estate Investment Trusts | 1.8 | 1,146,683 | ||||||
Commercial Services | 1.7 | 1,061,713 | ||||||
Semiconductors | 0.9 | 593,332 | ||||||
Retail | 0.7 | 413,662 | ||||||
Chemicals | 0.2 | 103,200 | ||||||
Securities Lending Collateral | 7.0 | 4,388,531 | ||||||
Exchange Traded Fund | 1.0 | 611,431 | ||||||
Liabilities In Excess of Other Assets | (5.7 | ) | (3,575,227 | ) | ||||
|
|
|
| |||||
NET ASSETS | 100.0 | % | $ | 62,281,184 | ||||
|
|
|
| |||||
Portfolio holdings are subject to change at any time.
The accompanying notes are an integral part of the financial statements.
7
THE SCHNEIDER FUNDS
SCHNEIDER SMALL CAP VALUE FUND
Portfolio of Investments
February 29, 2012
(Unaudited)
| Shares | Value | |||||||
COMMON STOCKS — 95.0% |
| |||||||
Aerospace & Defense — 0.8% | ||||||||
AAR Corp. | 20,300 | $ | 447,614 | |||||
BE Aerospace, Inc. * | 3,765 | 172,587 | ||||||
|
| |||||||
| 620,201 | ||||||||
|
| |||||||
Apparel — 1.4% | ||||||||
Barry (R.G.) Corp. | 74,599 | 1,042,894 | ||||||
|
| |||||||
Auto Manufacturers — 1.2% | ||||||||
Navistar International Corp. * | 21,600 | 902,448 | ||||||
|
| |||||||
Banks — 20.5% | ||||||||
Citizens Republic Bancorp, Inc. * | 109,196 | 1,494,893 | ||||||
First Bancorp * | 466,824 | 1,806,609 | ||||||
First Horizon National Corp. | 358,465 | 3,369,571 | ||||||
Hanmi Financial Corp. * | 83,312 | 722,315 | ||||||
MainSource Financial Group, Inc. | 150,217 | 1,523,200 | ||||||
Popular Inc. * | 652,185 | 1,239,152 | ||||||
Regions Financial Corp. | 805,895 | 4,641,955 | ||||||
Southwest Bancorp, Inc. * | 10,275 | 87,954 | ||||||
Yadkin Valley Financial Corp. | 101,010 | 209,091 | ||||||
|
| |||||||
| 15,094,740 | ||||||||
|
| |||||||
Building Materials — 1.1% | ||||||||
Builders FirstSource, Inc. * | 89,719 | 271,849 | ||||||
Norbord, Inc. * | 51,450 | 544,856 | ||||||
|
| |||||||
| 816,705 | ||||||||
|
| |||||||
Chemicals — 2.4% | ||||||||
A. Schulman, Inc. | 37,520 | 969,517 | ||||||
Ferro Corp. * | 32,585 | 180,847 | ||||||
Spartech Corp. * | 99,625 | 577,825 | ||||||
|
| |||||||
| 1,728,189 | ||||||||
|
| |||||||
Coal — 9.8% | ||||||||
Arch Coal, Inc. (a) | 277,099 | 3,760,233 | ||||||
Cloud Peak Energy, Inc. * | 193,585 | 3,430,326 | ||||||
|
| |||||||
| 7,190,559 | ||||||||
|
| |||||||
Commercial Services — 6.2% | ||||||||
Aegean Marine Petroleum Network, Inc. | 102,835 | 723,958 | ||||||
Hudson Highland Group, Inc. * | 471,140 | 2,105,996 | ||||||
Insperity, Inc. | 23,121 | 696,636 | ||||||
| Shares | Value | |||||||
Commercial Services — (Continued) |
| |||||||
Monster Worldwide, Inc. * | 83,372 | $ | 578,602 | |||||
PHH Corp. * | 31,475 | 428,690 | ||||||
|
| |||||||
| 4,533,882 | ||||||||
|
| |||||||
Computers — 1.9% | ||||||||
Insight Enterprises, Inc. * | 34,105 | 712,795 | ||||||
Xyratex Ltd. | 39,947 | 683,893 | ||||||
|
| |||||||
| 1,396,688 | ||||||||
|
| |||||||
Electric — 0.4% | ||||||||
GenOn Energy, Inc. * | 121,221 | 298,204 | ||||||
|
| |||||||
Electronics — 0.9% | ||||||||
Pulse Electronics, Inc. | 217,021 | 668,425 | ||||||
|
| |||||||
Food — 0.5% | ||||||||
Sanderson Farms, Inc. (a) | 7,260 | 357,192 | ||||||
|
| |||||||
Healthcare - Services — 2.9% | ||||||||
Emeritus Corp. * | 88,111 | 1,626,529 | ||||||
Five Star Quality Care, Inc. * | 137,585 | 487,051 | ||||||
|
| |||||||
| 2,113,580 | ||||||||
|
| |||||||
Home Builders — 9.8% | ||||||||
KB Home (a) | 241,780 | 2,761,128 | ||||||
Meritage Homes Corp. * | 173,360 | 4,488,290 | ||||||
|
| |||||||
| 7,249,418 | ||||||||
|
| |||||||
Industrial — 2.4% | ||||||||
FreightCar America, Inc. | 64,892 | 1,794,264 | ||||||
|
| |||||||
Insurance — 3.3% | ||||||||
Assured Guaranty Ltd. | 39,365 | 661,332 | ||||||
Axis Capital Holdings Ltd. | 57,275 | 1,766,933 | ||||||
|
| |||||||
| 2,428,265 | ||||||||
|
| |||||||
Internet — 2.1% | ||||||||
ICG Group, Inc. * | 54,476 | 472,307 | ||||||
ModusLink Global Solutions, Inc. | 194,435 | 1,081,059 | ||||||
|
| |||||||
| 1,553,366 | ||||||||
|
| |||||||
Machinery - Diversified — 1.4% | ||||||||
Flow International Corp. * | 75,178 | 300,712 | ||||||
Terex Corp. * | 28,220 | 716,506 | ||||||
|
| |||||||
| 1,017,218 | ||||||||
|
| |||||||
The accompanying notes are an integral part of the financial statements.
8
THE SCHNEIDER FUNDS
SCHNEIDER SMALL CAP VALUE FUND
Portfolio of Investments (Continued)
February 29, 2012
(Unaudited)
| Shares | Value | |||||||
Metals Fabricating — 0.1% |
| |||||||
RTI International Metals, Inc. * | 4,649 | $ | 104,788 | |||||
|
| |||||||
Office Products — 1.1% |
| |||||||
OfficeMax, Inc. * | 137,519 | 770,106 | ||||||
|
| |||||||
Oil & Gas — 1.8% |
| |||||||
Penn Virginia Corp. | 123,450 | 603,671 | ||||||
Willbros Group, Inc * | 169,782 | 713,084 | ||||||
|
| |||||||
| 1,316,755 | ||||||||
|
| |||||||
Real Estate — 2.4% |
| |||||||
Forestar Group, Inc. * | 68,238 | 1,070,654 | ||||||
Thomas Properties Group, Inc. | 162,635 | 699,331 | ||||||
|
| |||||||
| 1,769,985 | ||||||||
|
| |||||||
Real Estate Investment Trusts — 5.4% |
| |||||||
FelCor Lodging Trust, Inc. * | 264,281 | 1,014,839 | ||||||
NorthStar Realty Finance Corp. (a) | 270,205 | 1,442,895 | ||||||
Redwood Trust, Inc. | 51,190 | 592,268 | ||||||
Strategic Hotels & Resorts, Inc. * | 147,918 | 921,529 | ||||||
|
| |||||||
| 3,971,531 | ||||||||
|
| |||||||
Retail — 2.7% |
| |||||||
Brown Shoe Co., Inc. (a) | 78,675 | 848,117 | ||||||
MarineMax, Inc. * | 142,151 | 1,148,580 | ||||||
|
| |||||||
| 1,996,697 | ||||||||
|
| |||||||
Savings & Loans — 5.5% |
| |||||||
First Financial Holdings, Inc. | 128,965 | 1,258,698 | ||||||
Flagstar Bancorp, Inc. * | 3,000,199 | 2,162,843 | ||||||
HomeStreet, Inc. * | 12,125 | 639,594 | ||||||
|
| |||||||
| 4,061,135 | ||||||||
|
| |||||||
Semiconductors — 4.0% |
| |||||||
ATMI , Inc. * | 57,869 | 1,274,854 | ||||||
Axcelis Technologies, Inc. * | 244,648 | 406,115 | ||||||
Magnachip Semiconductor Corp. * | 82,465 | 954,945 | ||||||
MEMC Electronic Materials, Inc. * | 86,440 | 339,709 | ||||||
|
| |||||||
| 2,975,623 | ||||||||
|
| |||||||
Software — 1.5% | ||||||||
Take-Two Interactive Software, Inc. * | 70,480 | 1,088,916 | ||||||
|
| |||||||
| Shares | Value | |||||||
Telecommunications — 1.5% |
| |||||||
Aviat Networks, Inc. * | 412,087 | $ | 1,083,788 | |||||
|
| |||||||
TOTAL COMMON STOCKS | 69,945,562 | |||||||
|
| |||||||
| Par (000) | ||||||||
CORPORATE BONDS — 1.2% |
| |||||||
LandAmerica Financial Group, Inc. CONV ‡ | ||||||||
3.25%, 05/15/34 | 74 | 16,751 | ||||||
Northstar Realty Finance Corp. ^ CONV | ||||||||
7.50%, 03/15/31 | 358 | 348,155 | ||||||
RAIT Financial Trust CONV | ||||||||
7.00%, 04/01/31 | 598 | 531,473 | ||||||
|
| |||||||
TOTAL CORPORATE BONDS | 896,379 | |||||||
|
| |||||||
| Shares | ||||||||
EXCHANGE TRADED FUND — 0.6% |
| |||||||
Finance — 0.6% |
| |||||||
iShares Russell 2000 Value Index Fund | 5,764 | 409,647 | ||||||
|
| |||||||
TOTAL EXCHANGE TRADED FUND | 409,647 | |||||||
|
| |||||||
SECURITIES LENDING COLLATERAL — 11.0% |
| |||||||
BlackRock Liquidity Fund | 8,130,117 | 8,130,117 | ||||||
|
| |||||||
TOTAL SECURITIES LENDING COLLATERAL | 8,130,117 | |||||||
|
| |||||||
TOTAL INVESTMENTS — 107.8% | $ | 79,381,705 | ||||||
|
| |||||||
LIABILITIES IN EXCESS OF OTHER ASSETS — (7.8)% | (5,739,639 | ) | ||||||
|
| |||||||
NET ASSETS — 100.0% | $ | 73,642,066 | ||||||
|
| |||||||
| * | Non-income producing. |
| (a) | All or a portion of the security is on loan. At February 29, 2012, the market value of securities on loan was $7,774,587. |
The accompanying notes are an integral part of the financial statements.
9
THE SCHNEIDER FUNDS
SCHNEIDER SMALL CAP VALUE FUND
Portfolio of Investments (Concluded)
February 29, 2012
(Unaudited)
| ‡ | Holding in default resolution. Value has been determined in good faith by or under the direction of The RBB Fund, Inc’s Board of Directors to be the estimated value of the future payouts under the default resolution. As of February 29, 2012, this holding amounted to $16,751 or 0.0% of net assets and is deemed illiquid by the portfolio manager pursuant to the Fund’s policies and procedures. |
| ^ | Security was purchased pursuant to Rule 144A under Securities Act of 1933 and may not be resold subject to that rule except to qualified institutional buyers. As of February 29, 2012, this security amounted to $348,155 or 0.5% of net assets. |
| CONV | Convertible |
The accompanying notes are an integral part of the financial statements.
10
THE SCHNEIDER FUNDS
SCHNEIDER VALUE FUND
Portfolio of Investments
February 29, 2012
(Unaudited)
| Shares | Value | |||||||
COMMON STOCKS — 97.7% |
| |||||||
Aerospace & Defense — 2.4% |
| |||||||
Boeing Co. (The) | 19,785 | $ | 1,482,885 | |||||
|
| |||||||
Automobile Manufacturers — 2.9% |
| |||||||
Navistar International Corp. * | 43,906 | 1,834,392 | ||||||
|
| |||||||
Automobile Parts & Equipment — 3.0% |
| |||||||
Magna International, Inc. | 39,350 | 1,872,273 | ||||||
|
| |||||||
Banks — 22.8% |
| |||||||
Huntington Bancshares, Inc. | 122,755 | 717,503 | ||||||
JPMorgan Chase & Co. | 82,225 | 3,226,509 | ||||||
PNC Financial Services Group, Inc. | 26,873 | 1,599,481 | ||||||
Regions Financial Corp. | 279,835 | 1,611,850 | ||||||
SunTrust Banks, Inc. | 167,669 | 3,849,680 | ||||||
Wells Fargo & Co. | 101,290 | 3,169,364 | ||||||
|
| |||||||
| 14,174,387 | ||||||||
|
| |||||||
Chemicals — 0.2% |
| |||||||
LyondellBasell Industries NV | 2,390 | 103,200 | ||||||
|
| |||||||
Coal — 12.3% |
| |||||||
Arch Coal, Inc. (a) | 231,845 | 3,146,137 | ||||||
Consol Energy, Inc. | 46,360 | 1,660,615 | ||||||
Peabody Energy Corp. | 82,505 | 2,877,774 | ||||||
|
| |||||||
| 7,684,526 | ||||||||
|
| |||||||
Commercial Services — 1.7% |
| |||||||
Aegean Marine Petroleum Network, Inc. | 78,952 | 555,822 | ||||||
Monster Worldwide, Inc. * | 72,895 | 505,891 | ||||||
|
| |||||||
| 1,061,713 | ||||||||
|
| |||||||
Computers — 2.5% |
| |||||||
Dell, Inc. * | 89,106 | 1,541,534 | ||||||
|
| |||||||
Electric — 3.3% | ||||||||
FirstEnergy Corp. | 20,696 | 916,626 | ||||||
GenOn Energy, Inc. * | 458,159 | 1,127,071 | ||||||
|
| |||||||
| 2,043,697 | ||||||||
|
| |||||||
Electronics — 2.0% |
| |||||||
Avnet, Inc. * | 35,715 | 1,276,454 | ||||||
|
| |||||||
Health Care - Services — 3.0% |
| |||||||
Brookdale Senior Living, Inc. * | 99,375 | 1,852,350 | ||||||
|
| |||||||
| Shares | Value | |||||||
Home Builders — 9.4% |
| |||||||
KB Home (a) | 90,395 | $ | 1,032,311 | |||||
NVR, Inc. * | 4,124 | 2,853,808 | ||||||
Toll Brothers, Inc. * | 85,025 | 1,994,687 | ||||||
|
| |||||||
| 5,880,806 | ||||||||
|
| |||||||
Insurance — 11.7% |
| |||||||
ACE Ltd. | 33,225 | 2,382,565 | ||||||
Allstate Corp., (The) | 45,800 | 1,439,494 | ||||||
Assured Guaranty Ltd. | 87,776 | 1,474,637 | ||||||
Brown & Brown, Inc. | 10,002 | 236,347 | ||||||
Genworth Financial, Inc., Class A * | 29,585 | 268,928 | ||||||
RenaissanceRe Holdings, Ltd. | 20,250 | 1,457,190 | ||||||
|
| |||||||
| 7,259,161 | ||||||||
|
| |||||||
Leisure Time — 1.9% |
| |||||||
Carnival Corp. | 39,910 | 1,208,874 | ||||||
|
| |||||||
Lodging — 2.5% |
| |||||||
Marriott International, Inc., Class A | 23,775 | 838,782 | ||||||
Orient-Express Hotels, Ltd., Class A * | 73,620 | 728,102 | ||||||
|
| |||||||
| 1,566,884 | ||||||||
|
| |||||||
Oil & Gas — 6.2% |
| |||||||
BP PLC, SP ADR | 29,550 | 1,393,578 | ||||||
Chesapeake Energy Corp. | 37,341 | 933,525 | ||||||
EQT Corp. | 12,221 | 647,957 | ||||||
Valero Energy Corp. | 35,245 | 863,150 | ||||||
|
| |||||||
| 3,838,210 | ||||||||
|
| |||||||
Real Estate Investment Trusts — 1.8% |
| |||||||
Sunstone Hotel Investors, Inc. * | 127,693 | 1,146,683 | ||||||
|
| |||||||
Retail — 0.7% |
| |||||||
J.C. Penney Co., Inc. | 10,446 | 413,662 | ||||||
|
| |||||||
Semiconductors — 0.9% |
| |||||||
MEMC Electronic Materials, Inc. * | 150,975 | 593,332 | ||||||
|
| |||||||
Telecommunications — 6.5% |
| |||||||
Cisco Systems, Inc. | 202,285 | 4,021,426 | ||||||
|
| |||||||
TOTAL COMMON STOCKS | 60,856,449 | |||||||
|
| |||||||
The accompanying notes are an integral part of the financial statements.
11
THE SCHNEIDER FUNDS
SCHNEIDER VALUE FUND
Portfolio of Investments (Concluded)
February 29, 2012
(Unaudited)
| Shares | Value | |||||||
EXCHANGE TRADED FUND — 1.0% |
| |||||||
Finance — 1.0% | ||||||||
iShares Russell 1000 Value Index Fund | 8,926 | $ | 611,431 | |||||
|
| |||||||
TOTAL EXCHANGE TRADED FUND | 611,431 | |||||||
|
| |||||||
SECURITIES LENDING COLLATERAL — 7.0% |
| |||||||
BlackRock Liquidity Fund | 4,388,531 | 4,388,531 | ||||||
|
| |||||||
TOTAL SECURITIES LENDING COLLATERAL | 4,388,531 | |||||||
|
| |||||||
TOTAL INVESTMENTS — 105.7% | 65,856,411 | |||||||
|
| |||||||
LIABILITIES IN EXCESS OF OTHER | (3,575,227 | ) | ||||||
|
| |||||||
NET ASSETS — 100.0% | $ | 62,281,184 | ||||||
|
| |||||||
| * | Non-income producing. |
| (a) | All or a portion of the security is on loan. At February 29, 2012, market value of securities on loan was $4,178,448. |
| PLC | Public Liability Company |
| SP ADR | Sponsored American Depositary Receipt |
The accompanying notes are an integral part of the financial statements.
12
THE SCHNEIDER FUNDS
Statements of Assets & Liabilities
February 29, 2012
(Unaudited)
| Schneider Small Cap Value Fund | Schneider Value Fund | |||||||
ASSETS | ||||||||
Investments, at value †^ | $ | 79,381,705 | $ | 65,856,411 | ||||
Cash and cash equivalents | 801,220 | 530,674 | ||||||
Receivables | ||||||||
Investments sold | 2,670,883 | 339,653 | ||||||
Capital shares sold | 30,500 | — | ||||||
Dividends and interest | 91,210 | 92,207 | ||||||
Prepaid expenses and other assets | 16,236 | 19,542 | ||||||
|
|
|
| |||||
Total assets | 82,991,754 | 66,838,487 | ||||||
|
|
|
| |||||
LIABILITIES | ||||||||
Payables | ||||||||
Securities lending collateral | 8,130,117 | 4,388,531 | ||||||
Investments purchased | 973,344 | 43,635 | ||||||
Capital shares redeemed | 124,061 | 22,435 | ||||||
Investment adviser | 42,375 | 19,888 | ||||||
Other accrued expenses and liabilities | 79,791 | 82,814 | ||||||
|
|
|
| |||||
Total liabilities | 9,349,688 | 4,557,303 | ||||||
|
|
|
| |||||
Net Assets | $ | 73,642,066 | $ | 62,281,184 | ||||
|
|
|
| |||||
NET ASSETS CONSIST OF | ||||||||
Par value | $ | 4,585 | $ | 4,684 | ||||
Paid-in capital | 72,455,556 | 194,648,323 | ||||||
Undistributed/accumulated net investment income(loss) | (224,636 | ) | 169,466 | |||||
Accumulated net realized loss from investments | (9,521,602 | ) | (140,439,346 | ) | ||||
Net unrealized appreciation on investments | 10,928,163 | 7,898,057 | ||||||
|
|
|
| |||||
Net Assets | $ | 73,642,066 | $ | 62,281,184 | ||||
|
|
|
| |||||
Shares outstanding ($0.001 par value, 100,000,000 shares authorized) | 4,585,400 | 4,683,766 | ||||||
|
|
|
| |||||
Net asset value, offering and redemption price per share | $ | 16.06 | $ | 13.30 | ||||
|
|
|
| |||||
†Investment in securities, at cost | $ | 68,453,542 | $ | 57,958,354 | ||||
|
|
|
| |||||
^Includes market value of securities on loan | $ | 7,774,587 | $ | 4,178,448 | ||||
|
|
|
| |||||
The accompanying notes are an integral part of the financial statements.
13
THE SCHNEIDER FUNDS
Statements of Operations
For the Six Months Ended February 29, 2012
(Unaudited)
| Schneider Small Cap Value Fund | Schneider Value Fund | |||||||
Investment Income | ||||||||
Dividends† | $ | 119,534 | $ | 438,066 | ||||
Securities Lending Income | 6,966 | 3,607 | ||||||
Interest | 34,592 | 195 | ||||||
|
|
|
| |||||
Total investment income | 161,092 | 441,868 | ||||||
|
|
|
| |||||
Expenses | ||||||||
Advisory fees | 335,321 | 211,781 | ||||||
Administration and accounting fees | 61,479 | 60,245 | ||||||
Transfer agent fees | 30,793 | 27,668 | ||||||
Professional fees | 21,819 | 22,010 | ||||||
Custodian fees | 16,571 | 14,839 | ||||||
Directors’ and officers’ fees | 12,515 | 11,810 | ||||||
Registration and filing fees | 10,382 | 7,205 | ||||||
Printing and shareholder reporting fees | 9,561 | 8,963 | ||||||
Insurance fees | 4,028 | 3,972 | ||||||
Other expenses | 1,573 | 1,670 | ||||||
|
|
|
| |||||
Total expenses before waivers and reimbursements | 504,042 | 370,163 | ||||||
Less: waivers and reimbursements | (118,314 | ) | (97,764 | ) | ||||
|
|
|
| |||||
Net expenses after waivers and reimbursements | 385,728 | 272,399 | ||||||
|
|
|
| |||||
Net investment income/(loss) | (224,636 | ) | 169,469 | |||||
|
|
|
| |||||
Net realized and unrealized gain/(loss) from investments | ||||||||
Net realized gain from: | ||||||||
Investments | 229,032 | (551,914 | ) | |||||
Net change in unrealized appreciation/(depreciation) on: | ||||||||
Investments | 11,088,505 | 3,936,654 | ||||||
|
|
|
| |||||
Net realized and unrealized gain/(loss) on investments | 11,317,537 | 3,384,740 | ||||||
|
|
|
| |||||
Net increase in net assets resulting from operations | $ | 11,092,901 | $ | 3,554,209 | ||||
|
|
|
| |||||
†Net of foreign withholding taxes of | $ | — | $ | (1,592 | ) | |||
|
|
|
| |||||
The accompanying notes are an integral part of the financial statements.
14
THE SCHNEIDER FUNDS
SCHNEIDER SMALL CAP VALUE FUND
Statement of Changes in Net Assets
| For the Six Months Ended February 29, 2012 (Unaudited) | For the Year Ended August 31, 2011 | |||||||
Increase/(decrease) in net assets from operations: | ||||||||
Net investment loss | $ | (224,636 | ) | $ | (295,329 | ) | ||
Net realized gain from investments | 229,032 | 14,670,146 | ||||||
Net change in unrealized appreciation/(depreciation) from investments | 11,088,505 | (10,168,324 | ) | |||||
|
|
|
| |||||
Net increase in net assets resulting from operations | 11,092,901 | 4,206,493 | ||||||
|
|
|
| |||||
Capital transactions: | ||||||||
Proceeds from shares sold | 1,994,153 | 10,426,285 | ||||||
Redemption fees * | 11,363 | 38,347 | ||||||
Shares redeemed | (9,154,754 | ) | (18,215,631 | ) | ||||
|
|
|
| |||||
Net decrease in net assets from capital share transactions | (7,149,238 | ) | (7,750,999 | ) | ||||
|
|
|
| |||||
Total increase/(decrease) in net assets | 3,943,663 | (3,544,506 | ) | |||||
|
|
|
| |||||
Net assets: | ||||||||
Beginning of period | 69,698,403 | 73,242,909 | ||||||
|
|
|
| |||||
End of period | $ | 73,642,066 | $ | 69,698,403 | ||||
|
|
|
| |||||
Undistributed net investment loss, end of period | $ | (224,636 | ) | $ | — | |||
|
|
|
| |||||
Share transactions: | ||||||||
Shares sold | 145,219 | 611,631 | ||||||
Shares redeemed | (646,732 | ) | (1,078,301 | ) | ||||
|
|
|
| |||||
Total share transactions | (501,513 | ) | (466,670 | ) | ||||
|
|
|
| |||||
| * | There is a 1.75% redemption fee on shares redeemed which have been held less than one year in the Schneider Small Cap Value Fund. The redemption fees are retained by the Fund for the benefit of the remaining shareholders and recorded as paid-in capital. |
The accompanying notes are an integral part of the financial statements.
15
THE SCHNEIDER FUNDS
SCHNEIDER VALUE FUND
Statement of Changes in Net Assets
| For the Six Months Ended February 29, 2012 (Unaudited) | For the Year Ended August 31, 2011 | |||||||
Increase/(decrease) in net assets from operations: | ||||||||
Net investment income | $ | 169,469 | $ | 296,013 | ||||
Net realized gain/(loss) from investments | (551,914 | ) | 6,786,123 | |||||
Net change in unrealized appreciation from investments | 3,936,654 | 4,076,106 | ||||||
|
|
|
| |||||
Net increase in net assets resulting from operations | 3,554,209 | 11,158,242 | ||||||
|
|
|
| |||||
Dividends and distributions to shareholders from: | ||||||||
Net investment income | (296,010 | ) | (632,891 | ) | ||||
|
|
|
| |||||
Net decrease in net assets from dividends and distributions to shareholders | (296,010 | ) | (632,891 | ) | ||||
|
|
|
| |||||
Capital transactions: | ||||||||
Proceeds from shares sold | 962,405 | 6,780,726 | ||||||
Reinvestment of distributions | 286,585 | 547,560 | ||||||
Redemption fees * | — | 694 | ||||||
Shares redeemed | (10,165,733 | ) | (48,867,458 | ) | ||||
|
|
|
| |||||
Net decrease in net assets from capital share transactions | (8,916,743 | ) | (41,538,478 | ) | ||||
|
|
|
| |||||
Total decrease in net assets | (5,658,544 | ) | (31,013,127 | ) | ||||
|
|
|
| |||||
Net assets: | ||||||||
Beginning of period | 67,939,728 | 98,952,855 | ||||||
|
|
|
| |||||
End of period | $ | 62,281,184 | $ | 67,939,728 | ||||
|
|
|
| |||||
Undistributed net investment income, end of period | $ | 169,466 | $ | 296,007 | ||||
|
|
|
| |||||
Share transactions: | ||||||||
Shares sold | 77,083 | 469,105 | ||||||
Shares reinvested | 24,042 | 38,807 | ||||||
Shares redeemed | (852,643 | ) | (3,514,120 | ) | ||||
|
|
|
| |||||
Total share transactions | (751,518 | ) | (3,006,208 | ) | ||||
|
|
|
| |||||
| * | There is a 1.00% redemption fee on shares redeemed which have been held less than 90 days in the Schneider Value Fund. The redemption fees are retained by the Fund for the benefit of the remaining shareholders and recorded as paid-in capital. |
The accompanying notes are an integral part of the financial statements.
16
THE SCHNEIDER FUNDS
SCHNEIDER SMALL CAP VALUE FUND
Financial Highlights
Contained below is per share operating performance data for a share outstanding during each period, total investment return, ratios to average net assets and other supplemental data for the respective periods. This information has been derived from information provided in the financial statements.
| For the Six Months Ended February 29, 2012 (Unaudited) | ||||||||||||||||||||||||
| For the Years Ended August 31, | ||||||||||||||||||||||||
| 2011 | 2010 | 2009 | 2008 | 2007 | ||||||||||||||||||||
Per Share Operating Performance | ||||||||||||||||||||||||
Net asset value, beginning of period | $ | 13.70 | $ | 13.19 | $ | 12.34 | $ | 14.54 | $ | 19.06 | $ | 21.96 | ||||||||||||
|
|
|
|
|
|
|
|
|
|
|
| |||||||||||||
Net investment income/(loss) | (0.05 | ) | (0.06 | ) | (0.11 | ) | 0.12 | 0.16 | 0.43 | |||||||||||||||
Net realized and unrealized gain/(loss) on investments and foreign currency transactions | 2.41 | 0.56 | 1.01 | (2.20 | ) | (3.81 | ) | 0.15 | ||||||||||||||||
|
|
|
|
|
|
|
|
|
|
|
| |||||||||||||
Net increase/(decrease) in net assets resulting from operations | 2.36 | 0.50 | 0.90 | (2.08 | ) | (3.65 | ) | 0.58 | ||||||||||||||||
|
|
|
|
|
|
|
|
|
|
|
| |||||||||||||
Dividends and distributions to shareholders from: | ||||||||||||||||||||||||
Net investment income | — | — | (0.07 | ) | (0.18 | ) | (0.32 | ) | (0.20 | ) | ||||||||||||||
Net realized capital gains | — | — | — | — | † | (0.55 | ) | (3.28 | ) | |||||||||||||||
|
|
|
|
|
|
|
|
|
|
|
| |||||||||||||
Total dividends and distributions to shareholders | — | — | (0.07 | ) | (0.18 | ) | (0.87 | ) | (3.48 | ) | ||||||||||||||
|
|
|
|
|
|
|
|
|
|
|
| |||||||||||||
Redemption fees | — | † | 0.01 | 0.02 | 0.06 | — | † | — | † | |||||||||||||||
|
|
|
|
|
|
|
|
|
|
|
| |||||||||||||
Net asset value, end of period | $ | 16.06 | $ | 13.70 | $ | 13.19 | $ | 12.34 | $ | 14.54 | $ | 19.06 | ||||||||||||
|
|
|
|
|
|
|
|
|
|
|
| |||||||||||||
Total investment return(1) | 17.23 | %(2) | 3.87 | % | 7.48 | % | (13.20 | )% | (19.78 | )% | 0.72 | % | ||||||||||||
|
|
|
|
|
|
|
|
|
|
|
| |||||||||||||
Ratio/Supplemental Data | ||||||||||||||||||||||||
Net assets, end of period (000’s omitted) | $ | 73,642 | $ | 69,698 | $ | 73,243 | $ | 98,283 | $ | 91,691 | $ | 101,052 | ||||||||||||
Ratio of expenses to average net assets(3) | 1.15 | %(4) | 1.15 | % | 1.15 | % | 1.14 | % | 1.10 | % | 1.10 | % | ||||||||||||
Ratio of expenses to average net assets without waivers and expense reimbursements | 1.50 | %(4) | 1.40 | % | 1.43 | % | 1.42 | % | 1.49 | % | 1.50 | % | ||||||||||||
Ratio of net investment income/(loss) to average net assets(3) | (0.67 | )%(4) | (0.33 | )% | (0.65 | )% | 0.97 | % | 0.92 | % | 1.81 | % | ||||||||||||
Portfolio turnover rate | 33.18 | %(2) | 59.18 | % | 83.39 | % | 122.36 | % | 116.34 | % | 75.21 | % | ||||||||||||
| † | Amount is less than $0.005 per share. |
| (1) | Total investment return is calculated by assuming a purchase of shares on the first day and a sale of shares on the last day of each period reported and includes reinvestments of dividends and distributions, if any. |
| (2) | Not annualized. |
| (3) | Reflects waivers and reimbursements. |
| (4) | Annualized. |
The accompanying notes are an integral part of the financial statements.
17
THE SCHNEIDER FUNDS
SCHNEIDER VALUE FUND
Financial Highlights
Contained below is per share operating performance data for a share outstanding during each period, total investment return, ratios to average net assets and other supplemental data for the respective periods. This information has been derived from information provided in the financial statements.
| For the Six Months Ended February 29, 2012 (Unaudited) | ||||||||||||||||||||||||
| For the Years Ended August 31, | ||||||||||||||||||||||||
| 2011 | 2010 | 2009 | 2008 | 2007 | ||||||||||||||||||||
Per Share Operating Performance | ||||||||||||||||||||||||
Net asset value, beginning of period | $ | 12.50 | $ | 11.72 | $ | 12.14 | $ | 16.37 | $ | 23.13 | $ | 21.16 | ||||||||||||
|
|
|
|
|
|
|
|
|
|
|
| |||||||||||||
Net investment income | 0.04 | 0.07 | 0.08 | 0.34 | 0.37 | 0.14 | ||||||||||||||||||
Net realized and unrealized gain/(loss) from investments and foreign currency transactions | 0.82 | 0.80 | (0.23 | ) | (4.14 | ) | (5.89 | ) | 2.99 | |||||||||||||||
|
|
|
|
|
|
|
|
|
|
|
| |||||||||||||
Net increase/(decrease) in net assets resulting from operations | 0.86 | 0.87 | (0.15 | ) | (3.80 | ) | (5.52 | ) | 3.13 | |||||||||||||||
|
|
|
|
|
|
|
|
|
|
|
| |||||||||||||
Dividends and distributions to shareholders from: | ||||||||||||||||||||||||
Net investment income | (0.06 | ) | (0.09 | ) | (0.27 | ) | (0.43 | ) | (0.14 | ) | (0.08 | ) | ||||||||||||
Net realized capital gains | — | — | — | — | (1.10 | ) | (1.08 | ) | ||||||||||||||||
|
|
|
|
|
|
|
|
|
|
|
| |||||||||||||
Total dividends and distributions to shareholders | (0.06 | ) | (0.09 | ) | (0.27 | ) | (0.43 | ) | (1.24 | ) | (1.16 | ) | ||||||||||||
|
|
|
|
|
|
|
|
|
|
|
| |||||||||||||
Redemption fees | — | — | † | — | † | — | † | — | † | — | † | |||||||||||||
|
|
|
|
|
|
|
|
|
|
|
| |||||||||||||
Net asset value, end of period | $ | 13.30 | $ | 12.50 | $ | 11.72 | $ | 12.14 | $ | 16.37 | $ | 23.13 | ||||||||||||
|
|
|
|
|
|
|
|
|
|
|
| |||||||||||||
Total investment return(1) | 6.93 | %(2) | 7.35 | % | (1.30 | )% | (22.06 | )% | (25.05 | )% | 14.88 | % | ||||||||||||
|
|
|
|
|
|
|
|
|
|
|
| |||||||||||||
Ratio/Supplemental Data | ||||||||||||||||||||||||
Net assets, end of period (000’s omitted) | $ | 62,281 | $ | 67,940 | $ | 98,953 | $ | 118,467 | $ | 225,036 | $ | 364,793 | ||||||||||||
Ratio of expenses to average net assets(3) | 0.90 | %(4) | 0.90 | % | 0.90 | % | 0.88 | % | 0.85 | % | 0.85 | % | ||||||||||||
Ratio of expenses to average net assets without waivers and expense reimbursements | 1.22 | %(4) | 1.07 | % | 1.03 | % | 1.14 | % | 1.09 | % | 1.12 | % | ||||||||||||
Ratio of net investment income to average net assets(3) | 0.56 | %(4) | 0.31 | % | 0.52 | % | 2.24 | % | 1.61 | % | 0.77 | % | ||||||||||||
Portfolio turnover rate | 24.71 | %(2) | 67.80 | % | 79.30 | % | 107.13 | % | 101.98 | % | 131.75 | % | ||||||||||||
| † | Amount is less than $0.005 per share. |
| (1) | Total investment return is calculated by assuming a purchase of shares on the first day and a sale of shares on the last day of each period reported and includes reinvestments of dividends and distributions, if any. |
| (2) | Not annualized. |
| (3) | Reflects waivers and reimbursements. |
| (4) | Annualized. |
The accompanying notes are an integral part of the financial statements.
18
THE SCHNEIDER FUNDS
Notes to Financial Statements
February 29, 2012 (Unaudited)
| 1. | Organization and Significant Accounting Policies |
The RBB Fund, Inc. (“RBB” or the “Company”) was incorporated under the laws of the State of Maryland on February 29, 1988 and is registered under the Investment Company Act of 1940, as amended (the “1940 Act”), as an open-end management investment company. RBB is a “series fund,” which is a mutual fund divided into separate portfolios. Each portfolio is treated as a separate entity for certain matters under the 1940 Act, and for other purposes, and a shareholder of one portfolio is not deemed to be a shareholder of any other portfolio. Currently, RBB has nineteen active investment portfolios, including the Schneider Small Cap Value Fund (the “Small Cap Value Fund”) and the Schneider Value Fund (the “Value Fund”) (each a “Fund,” collectively the “Funds”), which commenced investment operations on September 2, 1998 and September 30, 2002, respectively. As of the date hereof, each Fund offers Institutional Class shares.
RBB has authorized capital of one hundred billion shares of common stock of which 80.373 billion shares are currently classified into one hundred and forty classes of common stock. Each class represents an interest in an active or inactive RBB investment portfolio.
PORTFOLIO VALUATION — Each Fund’s net asset value (“NAV”) is calculated once daily at the close of regular trading hours on the New York Stock Exchange (“NYSE”) (generally 4:00 p.m. Eastern time) on each day the NYSE is open. Securities held by the Funds are valued using the closing price or the last sale price on a national securities exchange or the National Association of Securities Dealers Automatic Quotation System (“NASDAQ”) market system where they are primarily traded. Equity securities traded in the over-the-counter market are valued at their closing prices. If there were no transactions on that day, securities traded principally on an exchange or on NASDAQ will be valued at the mean of the last bid and ask prices prior to the market close. Fixed Income securities having a remaining maturity of greater than 60 days are valued using an independent pricing service. Fixed Income securities having a remaining maturity of 60 days or less are valued at amortized cost, which approximates market value. Foreign securities are valued based on prices from the primary market in which they are traded, and are translated from the local currency into U.S. dollars using current exchange rates. Investments in other open-end investment companies are valued based on the NAV of the investment companies (which may use Fair Value Pricing as discussed in their prospectuses). If market quotations are unavailable or deemed unreliable, securities will be valued in accordance with procedures adopted by the Company’s Board of Directors. Relying on prices supplied by pricing services or dealers or using fair valuation may result in values that are higher or lower than the values used by other investment companies and investors to price the same investments.
FAIR VALUE MEASUREMENT — The inputs and valuations techniques used to measure fair value of the Funds’ investments are summarized into three levels as described in the hierarchy below:
• Level 1 – | quoted prices in active markets for identical securities; | |
• Level 2 – | other significant observable inputs (including quoted prices for similar securities, interest rates, prepayment speeds, credit risk, etc.); and | |
• Level 3 – | significant unobservable inputs (including the Funds’ own assumptions in determining the fair value of investments). | |
The inputs or methodology used for valuing securities are not necessarily an indication of the risk associated with investing in those securities.
19
THE SCHNEIDER FUNDS
Notes to Financial Statements (Continued)
February 29, 2012 (Unaudited)
The following summary of the inputs used, as of February 29, 2012, in valuing the Small Cap Value Funds’ investments carried at fair value:
Schneider Small Cap Value Fund
| Total Value as of February 29, 2012 | Level 1 Quoted Price | Level 2 Significant Observable Inputs | Level 3 Significant Unobservable Inputs | |||||||||||||
Common Stocks* | $ | 69,945,562 | $ | 69,945,562 | $ | — | $ | — | ||||||||
Corporate Bonds | 896,379 | — | 879,628 | 16,751 | ||||||||||||
Exchange Traded Fund | 409,647 | 409,647 | — | — | ||||||||||||
Securities Lending Collateral | 8,130,117 | — | 8,130,117 | — | ||||||||||||
|
|
|
|
|
|
|
| |||||||||
Total | $ | 79,381,705 | $ | 70,355,209 | $ | 9,009,745 | $ | 16,751 | ||||||||
|
|
|
|
|
|
|
| |||||||||
| * | Please refer to the Portfolio of Investments for industry and security type breakouts. |
The following is a summary of the inputs used, as of February 29, 2012, in valuing the Value Fund’s net assets carried at fair value:
Schneider Value Fund
| Total Value as of February 29, 2012 | Level 1 Quoted Price | Level 2 Significant Observable Inputs | Level 3 Significant Unobservable Inputs | |||||||||||||
Common Stocks* | $ | 60,856,449 | $ | 60,856,449 | $ | — | $ | — | ||||||||
Exchange Traded Fund | 611,431 | 611,431 | �� | — | ||||||||||||
Securities Lending Collateral | 4,388,531 | — | 4,388,531 | — | ||||||||||||
|
|
|
|
|
|
|
| |||||||||
Total | $ | 65,856,411 | $ | 61,467,880 | $ | 4,388,531 | $ | — | ||||||||
|
|
|
|
|
|
|
| |||||||||
| * | Please refer to the Portfolio of Investments for industry and security type breakouts. |
The following is a reconciliation of the Small Cap Value Funds’ Level 3 investments for which significant unobservable inputs were used to determine fair value.
Schneider Small Cap Value Fund
| Total Investments | Common Stock | Preferred Stock | Corporate Bonds | |||||||||||||
Balance as of August 31, 2011 | $ | 9,624 | $ | — | $ | — | $ | 9,624 | ||||||||
Accrued discounts/premiums realized gain/(loss) | 45,812 | — | — | 45,812 | ||||||||||||
Change in unrealized appreciation (depreciation) | 7,366 | — | — | 7,366 | ||||||||||||
Purchases | — | — | — | — | ||||||||||||
20
THE SCHNEIDER FUNDS
Notes to Financial Statements (Continued)
February 29, 2012 (Unaudited)
Schneider Small Cap Value Fund (Continued)
| Total Investments | Common Stock | Preferred Stock | Corporate Bonds | |||||||||||||
Sales | $ | (46,051 | ) | $ | — | $ | — | $ | (46,051 | ) | ||||||
Transfers into Level 3 | — | — | — | — | ||||||||||||
Transfers out of Level 3 | — | — | — | — | ||||||||||||
|
|
|
|
|
|
|
| |||||||||
Balance as of February 29, 2012 | $ | 16,751 | $ | — | $ | — | $ | 16,751 | ||||||||
|
|
|
|
|
|
|
| |||||||||
The change in unrealized appreciation (depreciation) related to investments still held at February 29, 2012 for the Small Cap Value Fund was $7,366.
Bonds that are priced using quotes derived from implied values, indicative bids, or a limited amount of actual trades are classified as Level 3 assets because the inputs used by the brokers and pricing services to derive the values are not readily observable.
Investments designated as Level 3 may include assets valued using quotes or indications furnished by brokers which are based on models or estimates and may not be executable prices. In light of the developing market conditions, Schneider Capital Management Company continues to search for observable data points and evaluate broker quotes and indications received for portfolio investments. Determination of fair values is uncertain because it involves subjective judgments and estimates not easily substantiated by auditing procedures.
At the end of each calendar quarter, management evaluates the classification of Levels 1, 2 and 3 assets and liabilities. Various factors are considered, such as changes in liquidity from the prior reporting period; whether or not a broker is willing to execute at the quoted price; the depth and consistency of prices from third party pricing services; and the existence of contemporaneous, observable trades in the market. Additionally, management evaluates the classification of Level 1 and Level 2 assets and liabilities on a quarterly basis for changes in listings or delistings on national exchanges.
Due to the inherent uncertainty of determining the fair value of investments that do not have a readily available market value, the fair value of the Funds’ investments may fluctuate from period to period. Additionally, the fair value of investments may differ significantly from the values that would have been used had a ready market existed for such investments and may differ materially from the values the Funds may ultimately realize. Further, such investments may be subject to legal and other restrictions on resale or otherwise less liquid than publicly traded securities.
For the six months ended February 29, 2012, there were no transfers between Levels 1, 2 and 3 for the Small Cap Value Fund. There were no transfers between Levels 1, 2 and 3 for the Value Fund.
USE OF ESTIMATES — The preparation of financial statements in conformity with accounting principles generally accepted in the United States of America, requires management to make estimates and assumptions that affect the reported amounts of assets and liabilities and disclosure of contingent assets and liabilities at the date of the financial statements and the reported amounts of revenues and expenses during the period. Actual results could differ from those estimates and those differences could be significant.
21
THE SCHNEIDER FUNDS
Notes to Financial Statements (Continued)
February 29, 2012 (Unaudited)
INVESTMENT TRANSACTIONS, INVESTMENT INCOME, AND EXPENSES — Transactions are accounted for on the trade date. The cost of investments sold is determined by use of the specific identification method for both financial reporting and income tax purposes in determining realized gains and losses on investments. Interest income is accrued as earned. Dividend income is recorded on the ex-dividend date. Distributions received on securities that represent a return of capital or capital gain are recorded as a reduction of cost of investments and/or as a realized gain. Each Fund estimates the components of distributions received that may be considered return of capital distributions or capital gain distributions. Expenses incurred on behalf of a specific class, fund or fund family of the Company are charged directly to the class, fund or fund family (in proportion to net assets). Expenses incurred for all of the RBB funds (such as director or professional fees) are charged to all funds in proportion to their average net assets of RBB, or in such other manner as the Board of Directors deems fair or equitable. Expenses and fees, including investment advisory and administration fees, are accrued daily and taken into account for the purpose of determining the NAV of the Funds.
FOREIGN CURRENCY TRANSLATION — Foreign securities and other foreign assets and liabilities are valued using the foreign currency exchange rate effective at the end of the reporting period. The books and records of the Funds are maintained in U.S. dollars. Cost of investments is translated at the currency exchange rate effective at the trade date. The gain or loss resulting from a change in currency exchange rates between the trade and settlement dates of a portfolio transaction is treated as a gain or loss on foreign currency. Likewise, the gain or loss resulting from a change in currency exchange rates, between the date income is accrued and paid, is treated as a gain or loss on foreign currency.
DIVIDENDS AND DISTRIBUTIONS TO SHAREHOLDERS — Dividends from net investment income and distributions from net realized capital gains, if any, are declared, recorded on the ex-dividend date and paid at least annually to shareholders. Income dividends and capital gain distributions are determined in accordance with U.S. federal income tax regulations, which may differ from U.S. generally accepted accounting principles (“U.S. GAAP”).
U.S. TAX STATUS — No provision is made for U.S. income taxes as it is each Fund’s intention to qualify for and elect the tax treatment applicable to regulated investment companies under Subchapter M of the Internal Revenue Code of 1986, as amended, and make the requisite distributions to its shareholders which will be sufficient to relieve it from U.S. income and excise taxes.
CASH AND CASH EQUIVALENTS — The Funds consider liquid assets deposited into a bank demand deposit account to be cash equivalents. These investments represent amounts held with financial institutions that are readily accessible to pay Fund expenses or purchase investments. Cash and cash equivalents are valued at cost plus accrued interest, which approximates market value.
OTHER — In the normal course of business, the Funds may enter into contracts that provide general indemnifications. The Funds’ maximum exposure under these arrangements is dependent on claims that may be made against the Funds in the future, and, therefore, cannot be estimated; however, based on experience, the risk of material loss for such claims is considered remote.
| 2. | Investment Adviser and Other Services |
Schneider Capital Management Company (“SCM” or the “Adviser”) serves as each Fund’s investment adviser. For its advisory services, SCM is entitled to receive 1.00% of the Small Cap Value Fund’s average daily net assets and 0.70% of the Value Fund’s average daily net assets, computed daily and payable monthly.
22
THE SCHNEIDER FUNDS
Notes to Financial Statements (Continued)
February 29, 2012 (Unaudited)
SCM has contractually agreed to waive its management fees and/or reimburse expenses to the extent that total annual operating expenses (excluding certain items discussed below) of the Small Cap Value Fund and the Value Fund exceed 1.15% and 0.90%, respectively. In determining SCM’s obligation to waive advisory fees and/or reimburse expenses, the following expenses are not taken into account: acquired fund fees and expenses, brokerage commissions, extraordinary items, interest and taxes. This contractual limitation is in effect until December 31, 2012 and may not be terminated without the approval of the Company’s Board of Directors. For the year ended February 29, 2012, investment advisory fees and waivers of expenses were as follows:
| Gross Advisory Fees | Waivers | Net Advisory Fees | ||||||||||
Schneider Small Cap Value Fund | $ | 335,321 | $ | (118,314 | ) | $ | 217,007 | |||||
Schneider Value Fund | 211,781 | (97,764 | ) | 114,017 | ||||||||
The Funds will not pay SCM at a later time for any amounts it may waive or any amounts that SCM has assumed.
BNY Mellon Investment Servicing (US) Inc. (“BNY Mellon”) serves as administrator for the Funds. For providing administration and accounting services, BNY Mellon is entitled to receive a monthly fee equal to an annual percentage rate of each Fund’s average daily net assets, and is subject to certain minimum monthly fees.
Included in the administration and accounting services fees and expenses, are fees for providing regulatory administration services to RBB. For providing these services, BNY Mellon is entitled to receive compensation as agreed to by the Company and BNY Mellon. This fee is allocated to each portfolio of the Company in proportion to its net assets of the Company.
In addition, BNY Mellon serves as the Funds’ transfer and dividend disbursing agent. For providing transfer agent services, BNY Mellon is entitled to receive a monthly fee equal to an annual percentage rate of each Fund’s average daily net assets, subject to certain minimum monthly fees.
The Bank of New York Mellon (the “Custodian”) serves as the Funds’ Custodian providing certain custodial services to the Funds. The Custodian is entitled to receive a monthly fee equal to an annual percentage rate of the Funds’ average daily net assets, subject to certain minimum monthly fees.
BNY Mellon Distributors LLC, formerly BNY Mellon Distributors Inc., serves as the principal underwriter and distributor of the Funds’ shares pursuant to a Distribution Agreement with RBB.
| 3. | Director Compensation |
The Directors of the Company receive an annual retainer, meeting fees and reimbursement of out of pocket expenses for meetings attended. The aggregate remuneration paid to the Directors by the Funds during the six months ended February 29, 2012 was $12,288. Certain employees of BNY Mellon are Officers of the Company. They are not compensated by the Funds or the Company.
23
THE SCHNEIDER FUNDS
Notes to Financial Statements (Continued)
February 29, 2012 (Unaudited)
| 4. | Investment in Securities |
For the six months ended February 29, 2012, aggregate purchases and sales of investment securities (excluding short-term investments) were as follows:
| Purchases | Sales | |||||||
Schneider Small Cap Value Fund | $ | 22,337,451 | $ | 31,354,285 | ||||
Schneider Value Fund | 15,023,277 | 24,633,764 | ||||||
| 5. | Federal Income Tax Information |
The Funds have followed the authoritative guidance on accounting for and disclosure of uncertainty in tax positions, which requires the Funds to determine whether a tax position is more likely than not to be sustained upon examination, including resolution of any related appeals or litigation processes, based on the technical merits of the position. Each Fund has determined that there was no effect on the financial statements from following this authoritative guidance. In the normal course of business, the Funds are subject to examination by federal, state and local jurisdictions, where applicable, for tax years for which applicable statutes of limitations have not expired.
As of February 29, 2012, federal tax cost, aggregate gross unrealized appreciation and depreciation of securities held by the Funds were as follows:
| Federal Tax Cost | Unrealized Appreciation | Unrealized Depreciation | Net Unrealized Appreciation | |||||||||||||
Schneider Small Cap Value Fund | $ | 68,453,542 | $ | 15,089,506 | $ | (4,161,343 | ) | $ | 10,928,163 | |||||||
Schneider Value Fund | 57,958,354 | 13,038,672 | (5,140,615 | ) | 7,898,057 | |||||||||||
Distributions to shareholders from net investment income and realized gains are determined in accordance with federal income tax regulations, which may differ from net investment income and realized gains recognized for financial reporting purposes. Accordingly, the character of distributions and composition of net assets for tax purposes may differ from those reflected in the accompanying financial statements. To the extent these differences are permanent, such amounts are reclassified within the capital accounts based on the tax treatment; temporary differences do not require such reclassification.
As of August 31, 2011, the components of distributable earnings on a tax basis were as follows:
| Undistributed Ordinary Income | Undistributed Long-Term Gains | |||||||
Schneider Small Cap Value Fund | $ | — | $ | — | ||||
Schneider Value Fund | 296,007 | — | ||||||
The differences between the book and tax basis components of distributable earnings relate principally to the timing of recognition of income and gains for federal income tax purposes. Short-term and foreign currency gains are reportable as ordinary income for federal income tax purposes.
24
THE SCHNEIDER FUNDS
Notes to Financial Statements (Continued)
February 29, 2012 (Unaudited)
The tax character of dividends and distributions paid during the last two fiscal years were as follows:
| Ordinary Income | Long-Term Gains | Total | ||||||||||||||
Schneider Small Cap Value Fund | 2011 | $ | — | $ | — | $ | — | |||||||||
| 2010 | 543,270 | — | 543,270 | |||||||||||||
Schneider Value Fund | 2011 | 632,891 | — | 632,891 | ||||||||||||
| 2010 | 2,533,672 | — | 2,533,672 | |||||||||||||
Dividends from net investment income and short-term capital gains are treated as ordinary income dividends for federal income tax purposes.
For federal income tax purposes, capital loss carryforwards are available to offset future capital gains. As of August 31, 2011, the Small Cap Value Fund and the Value Fund had capital loss carryforwards of $7,743,102 and $132,864,385, respectively, that will expire as follows:
| August 31, 2016 | August 31, 2017 | August 31, 2018 | August 31, 2019 | Total | ||||||||||||||||
Schneider Small Cap Value Fund | $ | — | $ | — | $ | 7,743,102 | $ | — | $ | 7,743,102 | ||||||||||
Schneider Value Fund | 11,810,397 | 75,945,572 | 42,948,995 | 2,159,421 | 132,864,385 | |||||||||||||||
Under federal tax law, foreign currency and capital losses realized after October 31 may be deferred and treated as having arisen on the first day of the following fiscal year. For the year ended August 31, 2011, the Value Fund incurred post-October capital losses of $735,212.
On December 22, 2010, President Obama signed into law the Regulated Investment Company Modernization Act of 2010 (the “Act”). The Act updates certain tax rules applicable to regulated investment companies (“RICs”). The various provisions of the Act will generally be effective for RICs with taxable years beginning after December 22, 2010. Additional information regarding the impact of the Act on the Funds, if any, will be contained within the relevant sections of the notes to the financial statements for the fiscal year ending August 31, 2012.
| 6. | Securities Lending |
The Funds may make secured loans of their portfolio securities to brokers, dealers and other financial institutions to earn additional income and receive cash collateral equal to at least 102% of the current market value of the loaned securities, as marked to market each day that the NAV of the Funds is determined. The Funds will pay administrative and custodial fees in connection with the loan of securities. Collateral is invested in short-term investments and the Funds will bear the risk of loss of the invested collateral. Securities lending will expose the Funds to the risk of loss should a borrower default on its obligation to return the borrowed securities. The market value of the securities on loan and collateral as of February 29, 2012 and the income received for the year ended February 29, 2012 were as follows:
| Market Value of Securities Loaned | Market Value of Collateral | Income Received from Securities Lending | ||||||||||
Schneider Small Cap Value Fund | $ | 7,774,587 | $ | 8,130,117 | $ | 6,966 | ||||||
Schneider Value Fund | 4,178,448 | 4,388,531 | 3,607 | |||||||||
25
THE SCHNEIDER FUNDS
Notes to Financial Statements (Continued)
February 29, 2012 (Unaudited)
| 7. | New Accounting Pronouncement |
In May 2011, the Financial Accounting Standards Board issued Accounting Standards Update (“ASU”) No. 2011-04 “Amendments to Achieve Common Fair Value Measurement and Disclosure Requirements in U.S. GAAP and International Financial Reporting Standards (“IFRS”)”. ASU 2011-04 includes common requirements for measurement of and disclosure about fair value between U.S. GAAP and IFRS. ASU 2011-04 will require reporting entities to disclose the following information for fair value measurements categorized within Level 3 of the fair value hierarchy: quantitative information about the unobservable inputs used in the fair value measurement, the valuation processes used by the reporting entity and a narrative description of the sensitivity of the fair value measurement to changes in unobservable inputs and the interrelationships between those unobservable inputs. In addition, ASU 2011-04 will require reporting entities to make disclosures about amounts and reasons for all transfers in and out of Level 1 and Level 2 fair value measurements. The new and revised disclosures are effective for interim and annual reporting periods beginning after December 15, 2011. Management is currently evaluating the implications of ASU No. 2011-04 and its impact on the financial statements.
In December 2011, FASB issued ASU No. 2011-11, “Disclosures about Offsetting Assets and Liabilities”. ASU No. 2011-11 requires disclosures to make financial statements that are prepared under U.S. GAAP more comparable to those prepared under IFRS’s. The new disclosure requirements mandate that entities disclose both gross and net information about instruments and transactions eligible for offset in the statement of assets and liabilities as well as instruments and transactions subject to an agreement similar to a master netting arrangement. In addition, ASU No. 2011-11 requires disclosure of collateral received and posted in connection with master netting agreements or similar arrangements. New disclosures are required for annual reporting periods beginning on or after January 1, 2013, and interim periods within those annual periods. Management is evaluating the impact of ASU No. 2011-11 on the financial statements and disclosures.
| 8. | Subsequent Event |
Management has evaluated the impact of all subsequent events on the Funds through the date the financial statements were issued and have determined that there was the following subsequent event:
The Bank of New York Mellon Corporation announced on November 28, 2011 that it had agreed to sell BNY Mellon Distributors LLC (the “Distributor”) and its four subsidiaries to Foreside Distributors, LLC, a subsidiary of Foreside Financial Group, LLC (the “Transaction”). The Transaction closed on March 31, 2012. Upon the closing of the Transaction, the Distributor became an indirect, wholly owned subsidiary of Foreside Financial Group, LLC and was renamed Foreside Funds Distributors LLC effective April 1, 2012.
26
THE SCHNEIDER FUNDS
Other Information
(Unaudited)
Proxy Voting
Policies and procedures that the Funds use to determine how to vote proxies relating to portfolio securities as well as information regarding how the Funds voted proxies relating to portfolio securities for the most recent 12-month period ended June 30 are available without charge, upon request, by calling (888) 520-3277 and on the Securities and Exchange Commission’s (“SEC”) website at http://www.sec.gov.
Quarterly Portfolio Schedules
The Company files a complete schedule of portfolio holdings with the SEC for the first and third fiscal quarters of each fiscal year (quarters ended November 30 and May 31) on Form N-Q. The Company’s Form N-Q is available on the SEC website at http://www.sec.gov and may be reviewed and copied at the SEC Public Reference Room in Washington, D.C. Information on the operation of the SEC Public Reference Room may be obtained by calling (202) 551-8090.
27
Investment Adviser
Schneider Capital Management Company
460 E. Swedesford Road
Suite 1080
Wayne, PA 19087
Administrator
BNY Mellon Investment Servicing (US) Inc.
301 Bellevue Parkway
Wilmington, DE 19809
Transfer Agent
BNY Mellon Investment Servicing (US) Inc.
4400 Computer Drive
Westborough, MA 01581
Principal Underwriter
Foreside Funds Distributors LLC
400 Berwyn Park
899 Cassatt Road
Berwyn, PA 19312
Custodian
The Bank of New York Mellon
One Wall Street
New York, NY 10286
Independent Registered Public Accounting Firm
PricewaterhouseCoopers LLP
Two Commerce Square, Suite 1700
2001 Market Street
Philadelphia, PA 19103-7042
Counsel
Drinker Biddle & Reath LLP
One Logan Square, Suite 2000
Philadelphia, PA 19103-6996

of The RBB Fund, Inc.
Schneider Small Cap Value Fund
Schneider Value Fund

This report is submitted for the general information of the shareholders of the Funds. It is not authorized for distribution unless preceded or accompanied by a current prospectus for the Funds.
Item 2. Code of Ethics.
Not applicable.
Item 3. Audit Committee Financial Expert.
Not applicable.
Item 4. Principal Accountant Fees and Services.
Not applicable.
Item 5. Audit Committee of Listed Registrants.
Not applicable.
Item 6. Investments.
| (a) | Schedule of Investments in securities of unaffiliated issuers as of the close of the reporting period is included as part of the report to shareholders filed under Item 1 of this Form. |
| (b) | Not applicable. |
Item 7. Disclosure of Proxy Voting Policies and Procedures for Closed-End Management Investment Companies.
Not applicable.
Item 8. Portfolio Managers of Closed-End Management Investment Companies.
Not applicable.
Item 9. Purchases of Equity Securities by Closed-End Management Investment Company and Affiliated Purchasers.
Not applicable.
Item 10. Submission of Matters to a Vote of Security Holders.
There have been no material changes to the procedures by which the shareholders may recommend nominees to the registrant’s board of directors, where those changes were implemented after the registrant last provided disclosure in response to the requirements of Item 407(c)(2)(iv) of Regulation S-K (17 CFR 229.407) (as required by Item 22(b)(15) of Schedule 14A (17 CFR 240.14a-101)), or this Item.
Item 11. Controls and Procedures.
| (a) | The registrant’s principal executive and principal financial officers, or persons performing similar functions, have concluded that the registrant’s disclosure controls and procedures (as defined in Rule 30a-3(c) under the Investment Company Act of 1940, as amended (the “1940 Act”) (17 CFR 270.30a-3(c))) are effective, as of a date within 90 days of the filing date of the report that includes the disclosure required by this paragraph, based on their evaluation of these controls and procedures required by Rule 30a-3(b) under the 1940 Act (17 CFR 270.30a-3(b)) and Rules 13a-15(b) or 15d-15(b) under the Securities Exchange Act of 1934, as amended (17 CFR 240.13a-15(b) or 240.15d-15(b)). |
| (b) | There were no changes in the registrant’s internal control over financial reporting (as defined in Rule 30a-3(d) under the 1940 Act (17 CFR 270.30a-3(d)) that occurred during the registrant’s second fiscal quarter of the period covered by this report that has materially affected, or is reasonably likely to materially affect, the registrant’s internal control over financial reporting. |
Item 12. Exhibits.
| (a)(1) | Not applicable. |
| (a)(2) | Certifications pursuant to Rule 30a-2(a) under the 1940 Act and Section 302 of the Sarbanes-Oxley Act of 2002 are attached hereto. |
| (a)(3) | Not applicable. |
| (b) | Certifications pursuant to Rule 30a-2(b) under the 1940 Act and Section 906 of the Sarbanes-Oxley Act of 2002 are attached hereto. |
SIGNATURES
Pursuant to the requirements of the Securities Exchange Act of 1934 and the Investment Company Act of 1940, the registrant has duly caused this report to be signed on its behalf by the undersigned, thereunto duly authorized.
| (Registrant) | The RBB Fund, Inc. |
| By (Signature and Title)* | /s/ Salvatore Faia | |||
| Salvatore Faia, President | ||||
| (principal executive officer) | ||||
Date April 27, 2012
Pursuant to the requirements of the Securities Exchange Act of 1934 and the Investment Company Act of 1940, this report has been signed below by the following persons on behalf of the registrant and in the capacities and on the dates indicated.
| By (Signature and Title)* | /s/ Salvatore Faia | |||
| Salvatore Faia, President | ||||
| (principal executive officer) |
Date April 27, 2012
| By (Signature and Title)* | /s/ Joel Weiss | |||
| Joel Weiss, Treasurer | ||||
| (principal financial officer) |
Date April 27, 2012
| * | Print the name and title of each signing officer under his or her signature. |