UNITED STATES
SECURITIES AND EXCHANGE COMMISSION
Washington, D.C. 20549
FORM N-CSR
CERTIFIED SHAREHOLDER REPORT OF REGISTERED MANAGEMENT
INVESTMENT COMPANIES
Investment Company Act file number 811-05518
The RBB Fund, Inc.
(Exact name of registrant as specified in charter)
Bellevue Park Corporate Center
103 Bellevue Parkway
Wilmington, DE 19809
(Address of principal executive offices) (Zip code)
Salvatore Faia
BNY Mellon Investment Servicing (US) Inc.
103 Bellevue Parkway
Wilmington, DE 19809
(Name and address of agent for service)
Registrant’s telephone number, including area code: 302-791-1851
Date of fiscal year end: August 31
Date of reporting period: February 28, 2013
Form N-CSR is to be used by management investment companies to file reports with the Commission not later than 10 days after the transmission to stockholders of any report that is required to be transmitted to stockholders under Rule 30e-1 under the Investment Company Act of 1940 (17 CFR 270.30e-1). The Commission may use the information provided on Form N-CSR in its regulatory, disclosure review, inspection, and policymaking roles.
A registrant is required to disclose the information specified by Form N-CSR, and the Commission will make this information public. A registrant is not required to respond to the collection of information contained in Form N-CSR unless the Form displays a currently valid Office of Management and Budget (“OMB”) control number. Please direct comments concerning the accuracy of the information collection burden estimate and any suggestions for reducing the burden to Secretary, Securities and Exchange Commission, 100 F Street, NE, Washington, DC 20549. The OMB has reviewed this collection of information under the clearance requirements of 44 U.S.C. § 3507.
Item 1. Reports to Stockholders.
The Report to Shareholders is attached herewith.
THE RBB FUND, INC.
Money Market Portfolio
Fund Expense Examples
(Unaudited)
As a shareholder of the Money Market Portfolio (the “Portfolio”), you incur two types of costs: (1) transaction costs and (2) ongoing costs, including management fees, distribution fees, and other Portfolio expenses. These examples are intended to help you understand your ongoing costs (in dollars) of investing in the Portfolio and to compare these costs with the ongoing costs of investing in other mutual funds.
These examples are based on an investment of $1,000 invested at the beginning of the six-month period from September 1, 2012 through February 28, 2013 and held for the entire period.
Actual Expenses
The first line of the accompanying tables provides information about actual account values and actual expenses. You may use the information in this line, together with the amount you invested, to estimate the expenses that you paid over the period. Simply divide your account value by $1,000 (for example, an $8,600 account value divided by $1,000 = 8.6), then multiply the result by the number in the first line under the heading entitled “Expenses Paid During Period” to estimate the expenses you paid on your account during this period.
Hypothetical Example for Comparison Purposes
The second line of the accompanying tables provides information about hypothetical account values and hypothetical expenses based on the Portfolio’s actual expense ratio and an assumed rate of return of 5% per year before expenses, which is not the Portfolio’s actual return. The hypothetical account values and expenses may not be used to estimate the actual ending account balance or expenses you paid for the period. You may use this information to compare the ongoing costs of investing in the Portfolio and other funds. To do so, compare these 5% hypothetical examples with the 5% hypothetical examples that appear in the shareholder reports of other funds.
Please note that the expenses shown in the accompanying tables are meant to highlight your ongoing costs only and do not reflect any transactional costs, such as redemption fees that may be incurred by shareholders of other funds. Therefore, the second line of the accompanying tables is useful in comparing ongoing costs only, and will not help you determine the relative total costs of owning different funds.
| | | | | | | | | | | | |
| | | Money Market Portfolio – Bedford Class | |
| | | Beginning
Account Value
September 1, 2012 | | | Ending
Account Value
February 28, 2013 | | | Expenses Paid
During
Period* | |
Actual | | $ | 1,000.00 | | | $ | 1,000.10 | | | $ | 1.29 | |
Hypothetical (5% return before expenses) | | | 1,000.00 | | | | 1,023.51 | | | | 1.30 | |
| |
| | | Money Market Portfolio – Sansom Street Class | |
| | | Beginning
Account Value
September 1, 2012 | | | Ending
Account Value
February 28, 2013 | | | Expenses Paid
During
Period* | |
Actual | | $ | 1,000.00 | | | $ | 1,000.20 | | | $ | 1.19 | |
Hypothetical (5% return before expenses) | | | 1,000.00 | | | | 1,023.60 | | | | 1.20 | |
| * | Expenses are equal to the Portfolio’s annualized six month expense ratio of 0.26% for the Bedford Class shares and 0.24% for the Sansom Street Class shares, which includes waived fees or reimbursed expenses, multiplied by the average account value over the period, multiplied by the number of days (181) in the most recent fiscal half-year, then divided by 365 to reflect the one-half year period. The Portfolio’s ending account value on the first line in each table is based on the actual six-month total return of 0.01% for the Bedford Class shares and 0.02% for the Sansom Street Class shares. |
1
THE RBB FUND, INC.
Money Market Portfolio
Portfolio Holdings Summary Table
February 28, 2013
(Unaudited)
| | | | | | | | |
Security
Type | | % of Net
Assets | | | Value | |
| | |
Short Term Investments: | | | | | | | | |
Commercial Paper | | | 35.4 | % | | $ | 238,861,825 | |
Certificates of Deposit | | | 31.8 | | | | 214,803,000 | |
U.S. Treasury Obligations | | | 10.7 | | | | 72,035,866 | |
Municipal Bonds | | | 8.5 | | | | 57,635,000 | |
Repurchase Agreements | | | 8.1 | | | | 54,764,000 | |
Agency Obligations | | | 5.7 | | | | 38,183,026 | |
Variable Rate Obligations | | | 1.3 | | | | 8,600,000 | |
Liabilities in Excess of Other Assets | | | (1.5 | ) | | | (9,834,821 | ) |
| | | | | | | | |
NET ASSETS | | | 100.0 | % | | $ | 675,047,896 | |
| | | | | | | | |
Portfolio holdings are subject to change at any time.
2
THE RBB FUND, INC.
Money Market Portfolio
Schedule of Investments
February 28, 2013
(Unaudited)
| | | | | | | | |
| | | Par
(000) | | | Value | |
CERTIFICATES OF DEPOSIT—31.8% | |
Euro Dollar Certificates Of Deposit(a)—2.4% | |
National Australia Bank Ltd.,London | | | | | | | | |
0.429%, 04/10/13 | | $ | 10,000 | | | $ | 10,000,000 | |
0.302%, 10/21/13 | | | 6,000 | | | | 6,000,000 | |
| | | | | | | | |
| | | | | | | 16,000,000 | |
| | | | | | | | |
Yankee Dollar Certificates Of Deposit(b)—29.4% | |
Australia & New Zealand Banking Group Ltd., New York(a) | | | | | | | | |
0.284%, 04/30/13 | | | 5,000 | | | | 5,000,674 | |
Bank of Montreal,
Chicago(a) | | | | | | | | |
0.200%, 05/17/13 | | | 5,000 | | | | 5,000,000 | |
0.422%, 07/17/13 | | | 5,000 | | | | 5,000,000 | |
0.365%, 01/10/14 | | | 4,000 | | | | 4,000,000 | |
Bank of Nova Scotia, Houston(a) | | | | | | | | |
0.263%, 11/26/13 | | | 5,000 | | | | 5,000,000 | |
0.358%, 01/02/14 | | | 5,000 | | | | 5,000,000 | |
Bank of Tokyo Mitsubishi UFJ, Ltd., New York | | | | | | | | |
0.260%, 04/08/13 | | | 5,000 | | | | 4,999,947 | |
0.340%, 04/22/13 | | | 6,000 | | | | 6,000,000 | |
0.250%, 05/30/13 | | | 10,000 | | | | 10,000,000 | |
Canadian Imperial Bank of Commerce, New
York(a) | | | | | | | | |
0.330%, 02/04/14 | | | 5,000 | | | | 5,000,000 | |
0.330%, 03/03/14 | | | 10,000 | | | | 10,000,000 | |
Credit Suisse, New York | | | | | | | | |
0.280%, 06/06/13 | | | 7,000 | | | | 7,000,000 | |
Deutsche Bank AG, New York | | | | | | | | |
0.410%, 08/08/13 | | | 5,000 | | | | 5,000,000 | |
DNB Bank ASA, New York | | | | | | | | |
0.280%, 07/19/13 | | | 2,000 | | | | 2,000,000 | |
Mitsubishi UFJ Trust and Banking Corp., New York(a) | | | | | | | | |
0.322%, 05/15/13 | | | 7,000 | | | | 7,000,000 | |
Mizuho Corporate Bank, New York | | | | | | | | |
0.270%, 04/03/13 | | | 15,000 | | | | 15,000,000 | |
Nordea Bank Finland PLC, New York | | | | | | | | |
0.260%, 06/03/13 | | | 4,000 | | | | 4,000,052 | |
0.275%, 07/17/13 | | | 1,945 | | | | 1,944,963 | |
Rabobank Nederland NV, New York | | | | | | | | |
0.482%, 04/24/13 | | | 6,300 | | | | 6,300,000 | |
0.420%, 10/29/13(a) | | | 12,000 | | | | 12,000,000 | |
0.405%, 01/08/14 | | | 6,000 | | | | 6,000,000 | |
| | | | | | | | |
| | | Par
(000) | | | Value | |
CERTIFICATES OF DEPOSIT—(Continued) | |
Yankee Dollar Certificates Of Deposit—(Continued) | |
Royal Bank of Canada, New
York(a) | | | | | | | | |
0.442%, 05/16/13 | | $ | 6,500 | | | $ | 6,500,000 | |
Skandinaviska Enskilda Banken, New York | | | | | | | | |
0.310%, 03/28/13 | | | 7,000 | | | | 7,000,000 | |
0.300%, 04/08/13 | | | 2,040 | | | | 2,040,000 | |
Sumitomo Mitsui Banking Corp., New York | | | | | | | | |
0.230%, 05/02/13 | | | 10,000 | | | | 10,000,000 | |
Sumitomo Mitsui Trust Bank Ltd., New York | | | | | | | | |
0.230%, 05/13/13 | | | 7,500 | | | | 7,500,000 | |
0.270%, 05/22/13 | | | 7,000 | | | | 7,000,000 | |
Svenska Handelsbanken, New York | | | | | | | | |
0.230%, 06/05/13 | | | 6,000 | | | | 5,999,840 | |
0.260%, 06/10/13 | | | 4,000 | | | | 4,000,112 | |
Toronto Dominion Bank, New York | | | | | | | | |
0.320%, 03/18/13 | | | 7,000 | | | | 7,000,000 | |
0.300%, 07/22/13 | | | 3,000 | | | | 3,000,000 | |
Westpac Banking Corp., New York(a) | | | | | | | | |
0.338%, 11/01/13 | | | 7,520 | | | | 7,517,412 | |
| | | | | | | | |
| | | | | | | 198,803,000 | |
| | | | | | | | |
TOTAL CERTIFICATES OF DEPOSIT | | | | | |
(Cost $214,803,000) | | | | | | | 214,803,000 | |
| | | | | | | | |
COMMERCIAL PAPER—35.4% | | | | | |
Asset Backed—15.7% | | | | | | | | |
Aspen Funding
Corp.(c) | | | | | | | | |
0.300%, 03/04/13 | | | 10,000 | | | | 9,999,750 | |
Atlantis One Funding
Corp.(c) | | | | | | | | |
0.471%, 03/07/13 | | | 10,000 | | | | 9,999,217 | |
Cancara Asset Securitization LLC(c) | | | | | | | | |
0.240%, 05/03/13 | | | 4,000 | | | | 3,998,320 | |
0.230%, 05/23/13 | | | 3,000 | | | | 2,998,409 | |
Chariot Funding LLC(c) | | | | | | | | |
0.190%, 04/29/13 | | | 7,000 | | | | 6,997,820 | |
Gotham Funding Corp.(c) | | | | | | | | |
0.180%, 03/11/13 | | | 4,000 | | | | 3,999,800 | |
Jupiter Securitization Company LLC(c) | | | | | | | | |
0.210%, 03/04/13 | | | 5,000 | | | | 4,999,913 | |
Liberty Street Funding
LLC(c) | | | | | | | | |
0.160%, 03/08/13 | | | 7,050 | | | | 7,049,781 | |
The accompanying notes are an integral part of these financial statements.
3
THE RBB FUND, INC.
Money Market Portfolio
Schedule of Investments (Continued)
February 28, 2013
(Unaudited)
| | | | | | | | |
| | | Par
(000) | | | Value | |
COMMERCIAL PAPER—(Continued) | | | | | | | | |
Asset Backed—(Continued) | | | | | | | | |
Manhattan Asset Funding Co. LLC(c) | | | | | | | | |
0.200%, 03/12/13 | | $ | 7,000 | | | $ | 6,999,572 | |
Metlife Short Term Funding LLC(c) | | | | | | | | |
0.250%, 07/22/13 | | | 5,000 | | | | 4,995,034 | |
Mont Blanc Capital Corp.(c) | | | | | | | | |
0.350%, 03/04/13 | | | 5,000 | | | | 4,999,854 | |
0.190%, 03/20/13 | | | 3,000 | | | | 2,999,699 | |
Nieuw Amsterdam Receivables Corp.(c) | | | | | | | | |
0.170%, 03/07/13 | | | 6,000 | | | | 5,999,830 | |
0.190%, 04/18/13 | | | 15,000 | | | | 14,996,200 | |
Surrey Funding Corp.(c) | | | | | | | | |
0.230%, 04/03/13 | | | 14,995 | | | | 14,991,839 | |
| | | | | | | | |
| | | | | | | 106,025,038 | |
| | | | | | | | |
Banks—19.7% | | | | | | | | |
Australia & New Zealand Banking Ltd. | | | | | | | | |
0.373%, 01/17/14 | | | 4,000 | | | | 4,000,000 | |
Collateralized Commercial Paper Co. LLC(c) | | | | | | | | |
0.310%, 05/15/13 | | | 7,000 | | | | 6,995,479 | |
Commonwealth Bank of Australia(a) | | | | | | | | |
0.340%, 11/14/13 | | | 4,500 | | | | 4,499,678 | |
DNB Bank ASA(c) | | | | | | | | |
0.270%, 07/30/13 | | | 7,500 | | | | 7,491,506 | |
0.270%, 08/05/13 | | | 7,000 | | | | 6,991,757 | |
General Electric Capital Corp.(c) | | | | | | | | |
0.240%, 08/12/13 | | | 1,000 | | | | 998,907 | |
0.240%, 08/26/13 | | | 5,000 | | | | 4,994,067 | |
ING US Funding LLC(c) | | | | | | | | |
0.220%, 05/09/13 | | | 15,000 | | | | 14,993,675 | |
0.230%, 05/09/13 | | | 6,500 | | | | 6,497,135 | |
La Caisse Centrale Desjardins Du Quebec(c) | | | | | | | | |
0.250%, 03/04/13 | | | 10,000 | | | | 9,999,792 | |
Lloyds TSB Bank PLC(c) | | | | | | | | |
0.240%, 04/23/13 | | | 5,000 | | | | 4,998,233 | |
0.235%, 04/24/13 | | | 5,000 | | | | 4,998,237 | |
Nordea North America, Inc., Delaware(c) | | | | | | | | |
0.300%, 05/16/13 | | | 6,000 | | | | 5,996,200 | |
0.280%, 07/15/13(c) | | | 1,945 | | | | 1,942,943 | |
0.280%, 07/16/13(c) | | | 1,945 | | | | 1,942,927 | |
| | | | | | | | |
| | | Par
(000) | | | Value | |
COMMERCIAL PAPER—(Continued) | | | | | | | | |
Banks—(Continued) | | | | | | | | |
NRW.Bank(c) | | | | | | | | |
0.175%, 03/05/13 | | $ | 10,000 | | | $ | 9,999,806 | |
UBS Finance LLC, Delaware(c) | | | | | | | | |
0.200%, 03/11/13 | | | 20,000 | | | | 19,998,889 | |
Westpac Banking Corp. | | | | | | | | |
0.500%, 04/02/13(c) | | | 5,500 | | | | 5,497,556 | |
0.289%, 10/08/13(a) | | | 10,000 | | | | 10,000,000 | |
| | | | | | | | |
| | | | | | | 132,836,787 | |
| | | | | | | | |
TOTAL COMMERCIAL PAPER (Cost $238,861,825) | | | | | | | 238,861,825 | |
| | | | | | | | |
MUNICIPAL BONDS—8.5% | | | | | | | | |
California—1.0% | | | | | | | | |
California Housing Finance Agency Revenue, Series A, RB (LOC: Fannie Mae, Freddie Mac)(a)(d) | | | | | | | | |
0.110%, 03/07/13 | | | 3,000 | | | | 3,000,000 | |
San Francisco, City & County Redevelopment Agency, Multifamily Revenue, Series A, RB (LOC: Fannie Mae)(a)(d) | | | | | | | | |
0.090%, 03/07/13 | | | 3,900 | | | | 3,900,000 | |
| | | | | | | | |
| | | | | | | 6,900,000 | |
| | | | | | | | |
Connecticut—0.8% | | | | | | | | |
Connecticut State, Health & Educational Facilities Authority Revenue, New Haven Hospital, Series K-2, RB (LOC: JPMorgan Chase Bank)(a)(d) | | | | | | | | |
0.100%, 03/07/13 | | | 5,400 | | | | 5,400,000 | |
| | | | | | | | |
Michigan—1.1% | | | | | | | | |
Michigan State Housing Development Authority, Series D, RB (LOC: Fannie Mae)(a)(d) | | | | | | | | |
0.110%, 03/07/13 | | | 7,900 | | | | 7,900,000 | |
| | | | | | | | |
New York—3.8% | | | | | | | | |
New York City, Housing Development Corp., Multifamily Rent Housing Revenue, Series A, RB (LOC: Fannie Mae)(a)(d) | | | | | | | | |
0.100%, 03/07/13 | | | 6,000 | | | | 6,000,000 | |
The accompanying notes are an integral part of these financial statements.
4
THE RBB FUND, INC.
Money Market Portfolio
Schedule of Investments (Continued)
February 28, 2013
(Unaudited)
| | | | | | | | |
| | | Par
(000) | | | Value | |
MUNICIPAL BONDS—(Continued) | | | | | | | | |
New York—(Continued) | | | | | | | | |
New York City, Industrial Development Agency Civic Facility Revenue, New York Law School Project, Series A, RB (LOC: JPMorgan Chase Bank)(a)(d) | | | | | | | | |
0.110%, 03/07/13 | | $ | 4,335 | | | $ | 4,335,000 | |
New York State Dormitory Authority, City University, Series D, RB (LOC: TD Bank NA)(a)(d) | | | | | | | | |
0.100%, 03/07/13 | | | 5,000 | | | | 5,000,000 | |
New York State, Housing Finance Agency Revenue, RB (LOC: Freddie Mac)(a)(d) | | | | | | | | |
0.080%, 03/07/13 | | | 5,200 | | | | 5,200,000 | |
Westchester County, Health Care Revenue, RB (LOC: TD Bank NA)(a)(d) | | | | | | | | |
0.150%, 03/07/13 | | | 5,000 | | | | 5,000,000 | |
| | | | | | | | |
| | | | | | | 25,535,000 | |
| | | | | | | | |
Tennessee—1.2% | | | | | | | | |
Eclipse Funding Trust, Various 2007-0005-Solar Eclipse-Blount, RB (LOC: U.S. Bank NA)(a)(d) | | | | | | | | |
0.110%, 03/07/13 | | | 8,000 | | | | 8,000,000 | |
| | | | | | | | |
Texas—0.6% | | | | | | | | |
Texas State, Veterans Housing Assessment Project, Series A-2, GO (Liquidity Facility: JPMorgan Chase & Co.)(a)(d) | | | | | | | | |
0.160%, 03/07/13 | | | 3,900 | | | | 3,900,000 | |
| | | | | | | | |
TOTAL MUNICIPAL BONDS | | | | | | | | |
(Cost $57,635,000) | | | | | | | 57,635,000 | |
| | | | | | | | |
VARIABLE RATE OBLIGATIONS—1.3% | | | | | |
Banks—1.3% | | | | | | | | |
JPMorgan Chase Bank NA(a) | | | | | | | | |
0.373%, 05/17/13 | | | 8,600 | | | | 8,600,000 | |
| | | | | | | | |
TOTAL VARIABLE RATE OBLIGATIONS | | | | | |
(Cost $8,600,000) | | | | | | | 8,600,000 | |
| | | | | | | | |
AGENCY OBLIGATIONS—5.7% | | | | | | | | |
Fannie Mae | | | | | | | | |
0.173%, 02/27/15(a) | | | 6,000 | | | | 5,996,991 | |
| | | | | | | | |
| | | Par
(000) | | | Value | |
AGENCY OBLIGATIONS—(Continued) | | | | | | | | |
Freddie Mac | | | | | | | | |
0.390%, 09/03/13(a) | | $ | 5,000 | | | $ | 4,999,486 | |
0.142%, 09/13/13(a) | | | 22,200 | | | | 22,192,774 | |
0.180%, 11/05/13(c) | | | 5,000 | | | | 4,993,775 | |
| | | | | | | | |
TOTAL AGENCY OBLIGATIONS | | | | | | | | |
(Cost $38,183,026) | | | | | | | 38,183,026 | |
| | | | | | | | |
U.S. TREASURY OBLIGATIONS—10.7% | | | | | |
U.S. Treasury Notes | | | | | | | | |
0.625%, 04/30/13 | | | 17,000 | | | | 17,011,744 | |
0.500%, 05/31/13 | | | 10,000 | | | | 10,008,051 | |
3.500%, 05/31/13 | | | 6,000 | | | | 6,049,818 | |
0.375%, 06/30/13 | | | 7,500 | | | | 7,503,386 | |
3.375%, 06/30/13 | | | 7,000 | | | | 7,074,415 | |
0.125%, 08/31/13 | | | 4,000 | | | | 3,998,505 | |
0.750%, 09/15/13 | | | 7,785 | | | | 7,809,972 | |
0.125%, 09/30/13 | | | 6,500 | | | | 6,498,435 | |
2.000%, 11/30/13 | | | 6,000 | | | | 6,081,540 | |
| | | | | | | | |
TOTAL U.S. TREASURY OBLIGATIONS | | | | | |
(Cost $72,035,866) | | | | | | | 72,035,866 | |
| | | | | | | | |
REPURCHASE AGREEMENTS—8.1% | | | | | | | | |
Deutsche Bank Securities, Inc. (Tri-Party Agreement dated 02/28/13 to be repurchased at $34,764,183, collateralized by $35,191,000 par value, Federal National Mortgage Backed Securities, 0.000%-1.2500%, due 07/01/2013 to 02/27/2014, Fair Value of the collateral is $35,459,538) | | | | | | | | |
0.190%, 03/01/13 | | | 34,764 | | | | 34,764,000 | |
Morgan Stanley & Co. LLC (Tri-Party Agreement dated 02/28/13 to be repurchased at $20,000,111, collateralized by $20,034,480, par value, Federal National Mortgage Backed Security, 2.500%, due 12/01/2027, Fair Value of the collateral is $20,600,000) | | | | | | | | |
0.200%, 03/01/13 | | | 20,000 | | | | 20,000,000 | |
| | | | | | | | |
TOTAL REPURCHASE AGREEMENTS | | | | | |
(Cost $54,764,000) | | | | | | | 54,764,000 | |
| | | | | | | | |
The accompanying notes are an integral part of these financial statements.
5
THE RBB FUND, INC.
Money Market Portfolio
Schedule of Investments (Concluded)
February 28, 2013
(Unaudited)
| | | | | | |
| | | | | Value | |
TOTAL INVESTMENTS AT VALUE—101.5% | |
(Cost $684,882,717)* | | | | $ | 684,882,717 | |
| | | | | | |
LIABILITIES IN EXCESS OF
OTHER ASSETS—(1.5)% | | | (9,834,821 | ) |
| | | | | | |
NET ASSETS (APPLICABLE TO 674,380,542 BEDFORD SHARES AND 661,999 SANSOM STREET SHARES)—100.0% | | | | $ | 675,047,896 | |
| | | | | | |
| * | Aggregate cost is the same for financial reporting and Federal tax purposes. |
| (a) | Variable Rate Security. Rate shown is as of report date. |
| (b) | Issuer is a US branch of a foreign domiciled bank. |
| (c) | Rate disclosed represents the discount rate at the time of purchase. |
| (d) | Rate shown is as of report date and the date shown is date on which principal and accrued interest may be recovered through demand. |
| LLC | Limited Liability Company |
| PLC | Public Liability Company |
The accompanying notes are an integral part of these financial statements.
6
THE RBB FUND, INC.
Money Market Portfolio
Statement of Assets and Liabilities
February 28, 2013
(Unaudited)
| | | | |
ASSETS | | | | |
Investments, at value (Cost $630,118,717) | | $ | 630,118,717 | |
Repurchase agreements, at value (Cost $54,764,000) | | | 54,764,000 | |
Cash | | | 4,565 | |
Receivables | | | | |
Interest receivable | | | 308,804 | |
Prepaid expenses and other assets | | | 91,361 | |
| | | | |
Total assets | | | 685,287,447 | |
| | | | |
| |
LIABILITIES | | | | |
Payables | | | | |
Investments purchased | | | 10,000,000 | |
Distribution to shareholders | | | 110 | |
Investment advisory and administration fees | | | 99,515 | |
Printing fees | | | 56,414 | |
Professional fees | | | 30,712 | |
Transfer agent fees | | | 14,593 | |
Distribution fees (Bedford Class) | | | 10,151 | |
Regulatory administration fees | | | 8,130 | |
Directors’ and officers’ fees | | | 6,101 | |
Custodian fees | | | 1,561 | |
Other accrued expenses and liabilities | | | 12,264 | |
| | | | |
Total liabilities | | | 10,239,551 | |
| | | | |
Net Assets | | $ | 675,047,896 | |
| | | | |
| |
NET ASSETS CONSIST OF | | | | |
Par Value | | $ | 675,043 | |
Paid-in Capital | | | 674,367,474 | |
Accumulated net investment loss | | | (16,215 | ) |
Accumulated net realized gain from investments | | | 21,594 | |
| | | | |
Net Assets | | $ | 675,047,896 | |
| | | | |
| |
BEDFORD CLASS | | | | |
Net assets | | $ | 674,385,918 | |
| | | | |
Shares outstanding ($0.001 par value, 1,500,000,000 shares authorized) | | | 674,380,542 | |
| | | | |
Net asset value, offering and redemption price per share | | $ | 1.00 | |
| | | | |
| |
SANSOM STREET CLASS | | | | |
Net assets | | $ | 661,978 | |
| | | | |
Shares outstanding ($0.001 par value, 1,500,000,000 shares authorized) | | | 661,999 | |
| | | | |
Net asset value, offering and redemption price per share | | $ | 1.00 | |
| | | | |
The accompanying notes are an integral part of the financial statements.
7
THE RBB FUND, INC.
Money Market Portfolio
Statement of Operations
For the Six Months Ended February 28, 2013
(Unaudited)
| | | | | | |
Investment Income | | | | | | |
Interest | | | | $ | 882,147 | |
| | | | | | |
Total investment income | | | | | 882,147 | |
| | | | | | |
| | |
Expenses | | | | | | |
Distribution fees (Bedford Class)(1) | | | | | 2,062,087 | |
Investment advisory and administration fees | | | | | 1,297,178 | |
Printing and shareholder reporting fees | | | | | 135,467 | |
Custodian fees | | | | | 75,226 | |
Professional fees | | | | | 46,263 | |
Directors’ and officers’ fees | | | | | 26,811 | |
Regulatory administration fees | | | | | 24,299 | |
Transfer agent fees | | | | | 22,797 | |
Insurance fees | | | | | 17,048 | |
Registration and filing fees | | | | | 15,438 | |
Other expenses | | | | | 9,202 | |
| | | | | | |
Total expenses before waivers | | | | | 3,731,816 | |
Less: Advisory and administration waivers | | | (898,136 | ) |
Less: Distribution fee waivers (Bedford Class)(1) | | | (1,985,850 | ) |
| | | | | | |
Net expenses after waivers | | | | | 847,830 | |
| | | | | | |
Net investment income | | | | | 34,317 | |
| | | | | | |
Net realized gain from investments | | | | | 11,082 | |
| | | | | | |
Net increase in net assets resulting from operations | | | | $ | 45,399 | |
| | | | | | |
| (1) | See Note 2 in Notes to Financial Statements |
The accompanying notes are an integral part of the financial statements.
8
THE RBB FUND, INC.
Money Market Portfolio
Statements of Changes in Net Assets
| | | | | | | | |
| | | For the
Six Months Ended
February 28,2013
(Unaudited) | | | For the
Year Ended
August 31, 2012 | |
Increase in net assets: | | | | | |
From operations: | | | | | |
Net investment income | | $ | 34,317 | | | $ | 164,652 | |
Net realized gain from investments | | | 11,082 | | | | 10,512 | |
| | | | | | | | |
Net increase in net assets resulting from operations | | | 45,399 | | | | 175,164 | |
| | | | | | | | |
Dividends to shareholders from: | | | | | | | | |
Net investment income: | | | | | | | | |
Bedford Class | | | (50,434 | ) | | | (181,565 | ) |
Sansom Street Class | | | (98 | ) | | | (1,323 | ) |
| | | | | | | | |
Net decrease in net assets from dividends to shareholders | | | (50,532 | ) | | | (182,888 | ) |
| | | | | | | | |
Capital transactions (at $1.00 per share): | | | | | | | | |
Proceeds from shares sold: | | | | | | | | |
Bedford Class | | | 248,287,092 | | | | 717,471,265 | |
Sansom Street Class | | | 778,420 | | | | 4,334,284 | |
Shares issued on reinvestment of distributions: | | | | | | | | |
Bedford Class | | | 49,464 | | | | 178,351 | |
Sansom Street Class | | | 79 | | | | 138 | |
Shares repurchased: | | | | | | | | |
Bedford Class | | | (215,656,688 | ) | | | (797,075,673 | ) |
Sansom Street Class | | | (356,547 | ) | | | (23,614,456 | ) |
| | | | | | | | |
Increase/(decrease) in net assets derived from capital transactions | | | 33,101,820 | | | | (98,706,091 | ) |
| | | | | | | | |
Total increase/(decrease) in net assets | | | 33,096,687 | | | | (98,713,815 | ) |
Net assets: | | | | | | | | |
Beginning of period | | | 641,951,209 | | | | 740,665,024 | |
| | | | | | | | |
End of period | | $ | 675,047,896 | | | $ | 641,951,209 | |
| | | | | | | | |
Accumulated net investment loss, end of period | | $ | (16,215 | ) | | $ | — | |
| | | | | | | | |
Share Transactions: | | | | | | | | |
Shares sold | | | | | | | | |
Bedford Class | | | 248,287,092 | | | | 717,471,265 | |
Sansom Street Class | | | 778,420 | | | | 4,334,284 | |
Shares reinvested | | | | | | | | |
Bedford Class | | | 49,464 | | | | 178,351 | |
Sansom Street Class | | | 79 | | | | 138 | |
Shares repurchased | | | | | | | | |
Bedford Class | | | (215,656,688 | ) | | | (797,075,673 | ) |
Sansom Street Class | | | (356,547 | ) | | | (23,614,456 | ) |
| | | | | | | | |
Total Share Activity | | | 33,101,820 | | | | (98,706,091 | ) |
| | | | | | | | |
The accompanying notes are an integral part of the financial statements.
9
THE RBB FUND, INC.
Money Market Portfolio
Financial Highlights
(For a Share Outstanding Throughout each Year)
| | | | | | | | | | | | | | | | | | | | | | | | |
| | | The Bedford Class | |
| | | | | | |
| | | For the
Six Months
Ended
February 28, 2013
(Unaudited) | | | For the
Year
Ended
August 31, 2012 | | | For the
Year
Ended
August 31, 2011 | | | For the
Year
Ended
August 31, 2010 | | | For the
Year
Ended
August 31, 2009 | | | For the
Year
Ended
August 31, 2008 | |
| | | | | | |
Net asset value, beginning of period | | $ | 1.00 | | | $ | 1.00 | | | $ | 1.00 | | | $ | 1.00 | | | $ | 1.00 | | | $ | 1.00 | |
| | | | | | | | | | | | | | | | | | | | | | | | |
Income from investment operations: | | | | | | | | | | | | | | | | | | | | | | | | |
Net investment income | | | 0.0001 | | | | 0.0003 | | | | 0.0002 | | | | 0.0003 | | | | 0.0074 | | | | 0.0307 | |
Net gains (losses) on securities | | | —(a | ) | | | —(a | ) | | | —(a | ) | | | —(a | ) | | | —(a | ) | | | —(a | ) |
| | | | | | | | | | | | | | | | | | | | | | | | |
Total net income from investment operations | | | 0.0001 | | | | 0.0003 | | | | 0.0002 | | | | 0.0003 | | | | 0.0074 | | | | 0.0307 | |
| | | | | | | | | | | | | | | | | | | | | | | | |
Less dividends and distributions: | | | | | | | | | | | | | | | | | | | | | | | | |
Dividends (from net investment
income) | | | (0.0001 | ) | | | (0.0003 | ) | | | (0.0002 | ) | | | (0.0003 | ) | | | (0.0074 | ) | | | (0.0307 | ) |
| | | | | | | | | | | | | | | | | | | | | | | | |
Net asset value, end of period | | $ | 1.00 | | | $ | 1.00 | | | $ | 1.00 | | | $ | 1.00 | | | $ | 1.00 | | | $ | 1.00 | |
| | | | | | | | | | | | | | | | | | | | | | | | |
Total Return | | | 0.01%(b | ) | | | 0.03% | | | | 0.02% | | | | 0.03% | | | | 0.74% | | | | 3.12% | |
| | | | | | |
Ratios/Supplemental Data | | | | | | | | | | | | | | | | | | | | | | | | |
Net assets, end of period
(000’s omitted) | | $ | 674,386 | | | $ | 641,711 | | | $ | 721,145 | | | $ | 593,570 | | | $ | 545,194 | | | $ | 319,387 | |
Ratios of expenses to average
net assets(c) | | | 0.26%(d | ) | | | 0.25% | | | | 0.27% | | | | 0.31% | | | | 0.69% | | | | 0.90% | |
Ratios of net investment income
to average net assets | | | 0.01%(d | ) | | | 0.02% | | | | 0.02% | | | | 0.02% | | | | 0.65% | | | | 2.94% | |
| (a) | Amount is less than $0.00005 per share. |
| (c) | Without the waiver of advisory fees, distribution fees, and/or reimbursement of certain operating expenses, the ratios of expenses to average net assets for the Bedford Class of the Money Market Portfolio would have been 1.18% (annualized) for the six months ended February 28, 2013 and 1.15%, 1.12%, 1.18%, 1.24% and 1.23% for the years ended August 31, 2012, 2011, 2010, 2009 and 2008, respectively. |
The accompanying notes are an integral part of the financial statements.
10
THE RBB FUND, INC.
Money Market Portfolio
Financial Highlights (Concluded)
(For a Share Outstanding Throughout each Year)
| | | | | | | | | | | | | | | | | | | | | | | | |
| | | The Sansom Street Class | |
| | | | | | |
| | | For the
Six Months
Ended
February 28, 2013
(Unaudited) | | | For the
Year
Ended
August 31, 2012 | | | For the
Year
Ended
August 31, 2011 | | | For the
Year
Ended
August 31, 2010 | | | For the
Year
Ended
August 31, 2009 | | | For the
Year
Ended
August 31, 2008 | |
| | | | | | |
Net asset value, beginning of period | | $ | 1.00 | | | $ | 1.00 | | | $ | 1.00 | | | $ | 1.00 | | | $ | 1.00 | | | $ | 1.00 | |
| | | | | | | | | | | | | | | | | | | | | | | | |
Income from investment operations: | | | | | | | | | | | | | | | | | | | | | | | | |
Net investment income | | | 0.0002 | | | | 0.0004 | | | | 0.0006 | | | | 0.0010 | | | | 0.0121 | | | | 0.0365 | |
Net gains (losses) on securities | | | —(a | ) | | | —(a | ) | | | —(a | ) | | | —(a | ) | | | —(a | ) | | | —(a | ) |
| | | | | | | | | | | | | | | | | | | | | | | | |
Total net income from investment operations | | | 0.0002 | | | | 0.0004 | | | | 0.0006 | | | | 0.0010 | | | | 0.0121 | | | | 0.0365 | |
| | | | | | | | | | | | | | | | | | | | | | | | |
Less dividends and distributions: | | | | | | | | | | | | | | | | | | | | | | | | |
Dividends (from net investment
income) | | | (0.0002 | ) | | | (0.0004 | ) | | | (0.0006 | ) | | | (0.0010 | ) | | | (0.0121 | ) | | | (0.0365 | ) |
| | | | | | | | | | | | | | | | | | | | | | | | |
Net asset value, end of period | | $ | 1.00 | | | $ | 1.00 | | | $ | 1.00 | | | $ | 1.00 | | | $ | 1.00 | | | $ | 1.00 | |
| | | | | | | | | | | | | | | | | | | | | | | | |
Total Return | | | 0.02%(b | ) | | | 0.05% | | | | 0.06% | | | | 0.10% | | | | 1.21% | | | | 3.71% | |
| | | | | | |
Ratios/Supplemental Data | | | | | | | | | | | | | | | | | | | | | | | | |
Net assets, end of period
(000’s omitted) | | $ | 662 | | | $ | 240 | | | $ | 19,520 | | | $ | 37,708 | | | $ | 32,496 | | | $ | 28,749 | |
Ratios of expenses to average
net assets(c) | | | 0.24%(d | ) | | | 0.23% | | | | 0.23% | | | | 0.24% | | | | 0.25% | | | | 0.31% | |
Ratios of net investment income
to average net assets | | | 0.03%(d | ) | | | 0.04% | | | | 0.06% | | | | 0.09% | | | | 0.93% | | | | 3.64% | |
| (a) | Amount is less than $0.00005 per share. |
| (c) | Without the waiver of advisory fees and reimbursement of certain operating expenses, the ratios of expenses to average net assets for the Sansom Street Class of the Money Market Portfolio would have been 0.53% (annualized) for the six months ended February 28, 2013 and 0.50%, 0.47%, 0.54%, 0.60% and 0.60% for the years ended August 31, 2012, 2011, 2010, 2009 and 2008, respectively. |
The accompanying notes are an integral part of the financial statements.
11
THE RBB FUND, INC.
Money Market Portfolio
Notes to Financial Statements
February 28, 2013
(Unaudited)
1. Summary of Significant Accounting Policies
The RBB Fund, Inc. (“RBB” or the “Company”) was incorporated under the laws of the State of Maryland on February 29, 1988, and is registered under the Investment Company Act of 1940, as amended (the “1940 Act”), as an open-end management investment company. RBB is a “series fund,” which is a mutual fund divided into separate portfolios. Each portfolio is treated as a separate entity for certain matters under the 1940 Act, and for other purposes, and a shareholder of one portfolio is not deemed to be a shareholder of any other portfolio. Currently, RBB has seventeen active investment portfolios, including the Money Market Portfolio (“Portfolio”).
RBB has authorized capital of one hundred billion shares of common stock of which 80.573 billion shares are currently classified into one hundred and forty-two classes of common stock. Each class represents an interest in an active or inactive RBB investment portfolio. The Portfolio has issued shares with a par value of $0.001.
SECURITY VALUATION — Securities held in the Portfolio are valued under the amortized cost method, which approximates fair value. Under this method, securities are valued at cost when purchased and thereafter a constant accretion of discount or amortization of premium is recorded until maturity of the security. Regular review and monitoring of the valuation is performed to ensure that cost continues to approximate fair value and to avoid dilution or other unfair results to shareholders. The Portfolio seeks to maintain net asset value (“NAV”) per share at $1.00.
Fair Value Measurements — The inputs and valuations techniques used to measure fair value of the Portfolio’s investments are summarized into three levels as described in the hierarchy below:
| | • | | Level 1 — quoted prices in active markets for identical securities; |
| | • | | Level 2 — other significant observable inputs (including quoted prices for similar securities, interest rates, prepayment speeds, credit risk, etc.); and |
| | • | | Level 3 — significant unobservable inputs (including the Portfolio’s own assumptions in determining the fair value of net assets). |
The inputs or methodology used for valuing securities are not necessarily an indication of the risk associated with investing in those securities.
The following is a summary of the inputs used, as of February 28, 2013, in valuing the Portfolio’s net assets carried at fair value:
| | | | | | | | | | | | | | | | |
| | | Total
Value at
February 28, 2013 | | | Level 1
Quoted
Price | | | Level 2
Significant
Observable
Inputs | | | Level 3
Significant
Unobservable
Inputs | |
Investments in Securities* | | $ | 684,882,717 | | | $ | — | | | $ | 684,882,717 | | | $ | — | |
| | | | | | | | | | | | | | | | |
| * | Please refer to the Schedule of Investments for industry and security type breakouts. |
Securities held in the Portfolio are valued at amortized cost, in accordance with rules under the 1940 Act. Generally, amortized cost approximates the current fair value of a security, but since the value is not obtained from a quoted price in an active market, such securities are reflected as Level 2.
12
THE RBB FUND, INC.
Money Market Portfolio
Notes to Financial Statements (Continued)
February 28, 2013
(Unaudited)
At the end of each fiscal quarter, management evaluates the classification of Levels 1, 2 and 3 assets and liabilities. Various factors are considered, such as changes in liquidity from the prior reporting period; whether or not a broker is willing to execute at the quoted price; the depth and consistency of prices from third party pricing services; and the existence of contemporaneous, observable trades in the market. Additionally, management evaluates the classification of Level 1 and Level 2 assets and liabilities on a quarterly basis for changes in listings or delistings on national exchanges.
Due to the inherent uncertainty of determining the fair value of investments that do not have a readily available market value, the fair value of the Portfolio’s investments may fluctuate from period to period. Additionally, the fair value of investments may differ significantly from the values that would have been used had a ready market existed for such investments and may differ materially from the values the Portfolio may ultimately realize. Further, such investments may be subject to legal and other restrictions on resale or otherwise less liquid than publicly traded securities.
For fair valuations using significant unobservable inputs, U.S. generally accepted accounting principles (“U.S. GAAP”) require the Fund to present a reconciliation of the beginning to ending balances for reported market values that presents changes attributable to total realized and unrealized gains or losses, purchase and sales, and transfers in and out of Level 3 during the period. Transfers in and out between Levels are based on values at the end of the period. U.S. GAAP also requires the Fund to disclose amounts and reasons for all transfers in and out of Level 1 and Level 2 fair value measurements. A reconciliation of Level 3 investments is presented only when the Fund had an amount of Level 3 investments at the end of the reporting period that was meaningful in relation to its net assets. The amounts and reasons for all transfers in and out of each Level within the three-tier hierarchy are disclosed when the Fund had an amount of total transfers during the reporting period that was meaningful in relation to its net assets as of the end of the reporting period.
For the six months ended February 28, 2013, there were no transfers between Levels 1, 2 and 3 for the Portfolio.
SECURITY TRANSACTIONS, INVESTMENT INCOME, AND EXPENSES — The Fund records security transactions based on the trade date for financial reporting purposes. The cost of investments sold is determined by use of the specific identification method for both financial reporting and income tax purposes. Interest income is accrued when earned. Certain expenses, such as distribution fee and service organization fees, are class specific expenses and vary by class. Expenses not directly attributable to a specific portfolio or class are allocated based on relative net assets of each portfolio and class. Expenses incurred on behalf of a specific class, fund or fund family of the Company are charged directly to the class, fund or fund family (in proportion to net assets). Expenses incurred for all portfolios within the Company (such as director or professional fees) are charged to all portfolios in proportion to their average net assets of RBB, or in such other manner as the Company’s Board of Directors deems fair or equitable. Expenses and fees, including investment advisory and administration fees, are accrued daily and taken into account for the purpose of determining the NAV of the Portfolio.
DIVIDENDS AND DISTRIBUTIONS TO SHAREHOLDERS — Dividends from net investment income are declared daily, recorded on the ex-dividend date and paid monthly. All dividends from net investment income are taxed as ordinary income. Any net realized capital gains are distributed at least annually. Income subject to dividends and capital gain subject to distributions are determined in accordance with U.S. federal income tax regulations, which may differ from U.S. GAAP.
FEDERAL INCOME TAXES — No provision is made for federal income taxes. It is the Company’s intention to have the Portfolio continue to qualify for and elect the tax treatment applicable to regulated investment companies under Subchapter M of the Internal Revenue Code of 1986, as amended and make the requisite distributions to its shareholders which will be sufficient to relieve it from federal income and excise taxes.
13
THE RBB FUND, INC.
Money Market Portfolio
Notes to Financial Statements (Continued)
February 28, 2013
(Unaudited)
REPURCHASE AGREEMENTS — Money market instruments may be purchased from financial institutions, such as banks and non-bank dealers, subject to the seller’s agreement to repurchase them at an agreed upon date and price. Collateral for repurchase agreements may have longer maturities than the maximum permissible remaining maturity of portfolio investments, provided the repurchase agreements themselves mature in 13 months or less. The seller is required on a daily basis to maintain the value of the securities subject to the agreement at no less than the repurchase price. The agreements are conditioned upon the collateral being deposited under the Federal Reserve book entry system or held in a separate account by the Portfolio’s custodian or an authorized securities depository. In the event the counterparty defaults and the fair value of the collateral declines, the Portfolio could experience losses, delays and costs in liquidating the collateral.
USE OF ESTIMATES — The preparation of financial statements in conformity with U.S. GAAP requires management to make estimates and assumptions. These estimates and assumptions affect the reported amounts of assets and liabilities and disclosure of contingent assets and liabilities at the date of the financial statements and the reported amounts of revenues and expenses during the reporting period. Actual results could differ from those estimates and those differences could be significant.
CASH AND CASH EQUIVALENTS — The Funds consider liquid assets deposited with a bank demand deposit account to be cash equivalents. These investments represent amounts held with financial institutions that are readily accessible to pay Fund expenses or purchase investments. Cash and cash equivalents are valued at cost plus accrued interest, which approximates market value.
OTHER — In the normal course of business, the Portfolio may enter into contracts that provide general indemnifications. The Portfolio’s maximum exposure under these arrangements is dependent on claims that may be made against the Portfolio in the future and therefore, cannot be estimated; however, based on experience, the risk of material loss for such claims is considered remote.
2. Investment Adviser and Other Services
Pursuant to an Investment Advisory and Administration Agreement, BlackRock Advisors LLC (the “Adviser” or “BALLC”), an indirect wholly owned subsidiary of BlackRock, Inc., serves as investment adviser and administrator for the Portfolio.
BALLC (assignee of BlackRock Institutional Management Corporation) and BNY Mellon Investment Servicing (US) Inc, (“BNY Mellon”), have entered into a delegation agreement on behalf of the Portfolio, wherein BNY Mellon has agreed to perform administration and accounting services for an annual fee of 0.10% of the average net assets of the Portfolio, paid out of the fee paid to BALLC.
For its advisory services, BALLC is entitled to receive the following fees, computed daily and payable monthly, and based on the Portfolio’s average daily net assets:
|
Annual Rate |
0.45% of first $250 million of net assets; |
0.40% of next $250 million of net assets; and |
0.35% of net assets in excess of $500 million. |
The Adviser has contractually agreed to waive fees and/or reimburse expenses for the Portfolio such that total annual Portfolio operating expenses after fee waivers and/or expense reimbursements (excluding certain Portfolio expenses) do not exceed 0.25%. The following expenses are excluded from the contractual limitation: (i) interest, taxes, dividends tied to short sales, brokerage commissions, and other expenditures which are capitalized in accordance with U.S. GAAP; (ii) expenses
14
THE RBB FUND, INC.
Money Market Portfolio
Notes to Financial Statements (Continued)
February 28, 2013
(Unaudited)
incurred directly or indirectly by the Portfolio as a result of investments in other investment companies and pooled investment vehicles; (iii) other expenses attributable to, and incurred as a result of, the Portfolio’s investments; (iv) distribution and servicing (12b-1) fees; and (v) other extraordinary expenses (including litigation expenses) not incurred in the ordinary course of the Portfolio’s business, if any, of the Bedford Shares and the Sansom Street Shares of the Portfolio. This contractual limitation is in effect through December 31, 2013 and may not be terminated without the approval of the Company’s Board of Directors. The Adviser may terminate this arrangement at any time after December 31, 2013. Prior to December 20, 2011, the Adviser voluntarily waived a portion of its management fees and/or reimbursed expenses for the Portfolio.
For each class of shares within the Portfolio, the net advisory fee charged to each class is the same on a relative basis. For the six months ended February 28, 2013, advisory fees and waivers were as follows:
| | | | | | | | | | |
Gross Advisory
and
Administration
Fee | | | Waiver | | | Net Advisory
and
Administration
Fee | |
| | $1,297,178 | | | $ | (898,136 | ) | | $ | 399,042 | |
As of February 28, 2013, the Portfolio owed BALLC $99,515 in advisory and administration fees.
For providing regulatory administration services to RBB, BNY Mellon is entitled to receive compensation as agreed to by the Company and BNY Mellon. This fee is allocated to each portfolio of the Company in proportion to its net assets of the Company.
In addition, BNY Mellon serves as the Portfolio’s transfer and dividend disbursing agent. For providing transfer agent services, BNY Mellon is entitled to receive a monthly fee equal to an annual percentage rate of the Portfolio’s average daily net assets, subject to certain minimum monthly fees.
The Bank of New York Mellon provides certain custodian services to the Portfolio and is entitled to receive out of pocket expenses.
BNY Mellon may also voluntarily waive a portion of their fees and/or reimburse expenses.
The Portfolio, on behalf of the Bedford Class of shares of the Portfolio, has adopted a Distribution Plan pursuant to Rule 12b-1 under the 1940 Act (the “Plan”). The Portfolio has entered into a Distribution Agreement with Foreside Funds Distributors LLC (“Foreside Distributors”).
The Plan provides for the Bedford Class to make monthly payments, based on average net assets, to Foreside Distributors of up to 0.65% on an annualized basis. Foreside Distributors may voluntarily waive these fees at its discretion. For the six months ended February 28, 2013, distribution fees paid to Foreside Distributors for the Bedford Class were as follows:
| | | | | | | | | | | | |
| | | Gross
Distribution
Fee | | | Waiver | | | Net
Distribution
Fee | |
Bedford Class | | $ | 2,062,087 | | | $ | (1,985,850 | ) | | $ | 76,237 | |
The Portfolio will not pay BALLC, BNY Mellon or Foreside Distributors at a later time for any amounts waived or assumed.
15
THE RBB FUND, INC.
Money Market Portfolio
Notes to Financial Statements (Continued)
February 28, 2013
(Unaudited)
The Portfolio has entered into service agreements with BNY Mellon which render support services to customers who are the beneficial owners of the Sansom Street Class in consideration of the payment of 0.10% of the daily net asset value of such shares.
3. Director Compensation
The Directors of the Company receive an annual retainer and meeting fees for meetings attended. The remuneration paid to the Directors by the Portfolio during the six months ended February 28, 2013 was $26,352. Certain employees of BNY Mellon serve as an Officer or Director of the Company. They are not compensated by the Portfolio or the Company.
4. Federal Income Tax Information
The Portfolio intends to continue to qualify as a regulated investment company and distribute all of its taxable income. Therefore, no federal tax provision is required.
The Portfolio has followed the authoritative guidance on accounting for and disclosure of uncertainty in tax positions, which requires the Portfolio to determine whether a tax position is more likely than not to be sustained upon examination, including resolution of any related appeals or litigation processes, based on the technical merits of the position. The Portfolio has determined that there was no effect on the financial statements from following this authoritative guidance. In the normal course of business, the Portfolio is subject to examination by federal, state and local jurisdictions, where applicable, for tax years for which applicable statutes of limitations have not expired.
Distributions to shareholders from net investment income and realized gains are determined in accordance with federal income tax regulations, which may differ from net investment income and realized gains recognized for financial reporting purposes. Accordingly, the character of distributions and composition of net assets for tax purposes may differ from those reflected in the accompanying financial statements. To the extent these differences are permanent, such amounts are reclassified within the capital accounts based on the tax treatment; temporary differences do not require such reclassification.
As of August 31, 2012, the Portfolio had $10,676 of undistributed ordinary income for federal tax purposes.
The difference between the book and tax basis components of distributable earnings relate principally to the timing of recognition of income and gains for Federal income tax purposes. Short-term capital gains are reported as ordinary income dividends for Federal income tax purposes.
The tax character of dividends and distributions paid during the last fiscal year was as follows:
| | | | |
| | | Ordinary
Income | |
2012 | | $ | 182,888 | |
Dividends paid from net investment income and short-term capital gains are treated as ordinary income distributions for federal income tax purposes.
Accumulated capital losses represent net capital loss carry forwards as of August 31, 2012 that may be available to offset future realized capital gains and thereby reduce future capital gains distributions. Under the Regulated Investment Company Modernization Act of 2010 (the “Modernization Act”), the Portfolio is permitted to carry forward capital losses
16
THE RBB FUND, INC.
Money Market Portfolio
Notes to Financial Statements (Concluded)
February 28, 2013
(Unaudited)
incurred in taxable years beginning after December 22, 2010 for an unlimited period. Any losses incurred during those future taxable years will be required to be utilized prior to any losses incurred in pre-enactment taxable years. Additionally, post-enactment capital losses that are carried forward will retain their character as either short-term or long-term capital losses rather than being considered all short-term as under the previous law. The Portfolio’s first fiscal year end subject to the Modernization Act was August 31, 2012. During the fiscal year ended August 31, 2012, the Fund did not utilize any prior year capital loss carry forwards. As of August 31, 2012, the Portfolio had no pre- or post-enactment capital loss carry forwards.
5. Subsequent Event
Management has evaluated the impact of all subsequent events on the Portfolio through the date the financial statements were issued, and has determined that there were no subsequent events requiring recognition or disclosure in the financial statements.
17
THE RBB FUND, INC.
Money Market Portfolio
Additional Information
(Unaudited)
Proxy Voting
Policies and procedures that the Portfolio uses to determine how to vote proxies relating to portfolio securities as well as information regarding how the Portfolio voted proxies relating to portfolio securities for the most recent 12-month period ended June 30 are available without charge, upon request, by calling the number shown below and on the Securities and Exchange Commission’s (“SEC”) website at http://www.sec.gov.
| | |
Bedford | | (800) 888-9723 |
Sansom Street | | (800) 430-9618 |
Quarterly Portfolio Schedules
The Company files its complete schedule of portfolio holdings with the SEC for the first and third fiscal quarter of each fiscal year (quarters ended November 30 and May 31) on Form N-Q. The Company’s Form N-Q is available on the SEC website at http://www.sec.gov and may be reviewed and copied at the SEC Public Reference Room in Washington, D.C. Information on the operation of the SEC Public Reference Room may be obtained by calling (202) 551-8090.
18
[THIS PAGE INTENTIONALLY LEFT BLANK.]
Investment Adviser
BlackRock Advisors LLC
100 Bellevue Parkway
Wilmington, DE 19809
Transfer Agent
BNY Mellon Investment Servicing (US) Inc.
4400 Computer Drive
Westborough, MA 01581
Principal Underwriter
Foreside Funds Distributors LLC
400 Berwyn Park
899 Cassatt Road
Berwyn, PA 19312
Custodian
The Bank of New York Mellon
One Wall Street
New York, NY 10286
Independent Registered Public Accounting Firm
PricewaterhouseCoopers LLP
Two Commerce Square, Suite 1700
2001 Market Street
Philadelphia, PA 19103-7042
Counsel
Drinker Biddle & Reath LLP
One Logan Square, Ste. 2000
Philadelphia, PA 19103-6996
The Bedford Class
of
The RBB Fund, Inc.
Money Market
Portfolio
Semi-Annual Report
February 28, 2013
(Unaudited)
An investment in the Portfolio is not insured or guaranteed by the Federal Deposit Insurance Corporation or any other government agency. Although the Portfolio seeks to preserve the value of your investment at $1.00 per share, it’s possible to lose money by investing in the Portfolio.
This report is submitted for the general information of the shareholders of the Portfolio. It is not authorized for distribution unless preceded or accompanied by a current prospectus for the Portfolio.
BOGLE INVESTMENT MANAGEMENT
SMALL CAP GROWTH FUND
SEMI-ANNUAL REPORTFORTHE SIX-MONTH PERIOD ENDED FEBRUARY 28, 2013
(UNAUDITED)
Fellow Shareholder:
During the most recent semiannual reporting period ended February 28, 2013, the Bogle Small Cap Growth Fund (the “Fund”) outperformed its benchmark by +4.95%, returning +17.97% for both the Investor and Institutional shares net of fees, while the unmanaged Russell 2000® index of smaller companies gained +13.02%. Equity markets posted robust gains over the last six months, advancing steadily from the middle of November through the middle of February. Concerns about European sovereign debt issues, which affected global markets in 2011 and early 2012, seemed to fade, while U.S. economic indicators continued to strengthen. U.S. investors appeared optimistic about corporate earnings growth, employment and the housing market. Limits on government spending increases due to budget triggers seemed to be perceived positively by investors as a means to rein in spendthrift politicians, as opposed to a significant threat to economic growth. The Federal Reserve remained highly accommodative, providing additional support to U.S. equity markets. As investors became less concerned about the general risks of equity investing, the extremely high correlations of stock price movements of the previous two years dropped significantly. A more moderate correlation environment tends to provide a more favorable backdrop for our investment strategy, confirmed by the Fund’s nearly five percentage point advantage over its benchmark for the period. The market environment is discussed further in the next section of this letter, followed by more detailed semiannual performance evaluation, including investment model performance and performance attribution. We then present the fundamental characteristics of the Fund and its benchmark, highlighting the Fund’s above-benchmark median expected growth rate and below-benchmark price-based ratios (as has been the case for almost four years). Finally, we close with an update on developments at Bogle Investment Management, L.P.
INVESTMENT PERFORMANCE — PERIODS ENDING FEBRUARY 28, 2013
BOGLE FUNDVS. RUSSELL 2000® BENCHMARK
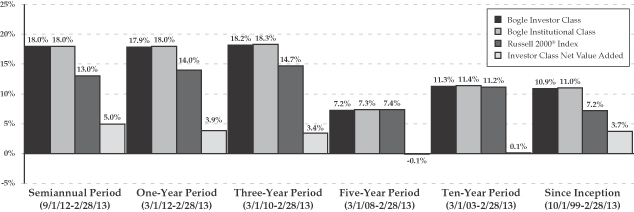
All Fund returns are presented net of fees and include the reinvestment of all dividends and other earnings. Multi-year period returns are annualized. Returns shown represent past performance and do not guarantee future results. Current performance may be lower or higher than the returns shown above. The investment return and principal value of an investment in the Fund will fluctuate so that an investor’s shares, when redeemed, may be worth more or less than their original cost. Returns current to the most recent month-end may be obtained at 1-877-264-5346. The figures do not reflect the deduction of taxes that a shareholder would pay on Fund distributions or the redemption of Fund shares. The performance quoted reflects fee waivers in effect and would have been less in their absence. The Fund’s annual operating expenses, as stated in the current prospectus, are 1.51% for the Institutional Class and 1.60% for the Investor Class, prior to fee waivers.
1
Market Environment. As mentioned in our introduction, U.S. equity market performance was generally positive in the semiannual reporting period. According to Russell benchmarks, small cap stocks outperformed large cap stocks, with most of the advantage occurring in December and January, and cumulating to more than three percentage points for the period overall (Russell 2000® up +13.02%, Russell 1000® up +9.72%). The Russell 2000® Value Index started to outperform the Russell 2000® Growth Index on September 13th, which was also the date that the Federal Reserve announced round three of its bond purchase program, known as quantitative easing, or QE3. Small cap value stocks held onto their performance advantage for the balance of the semiannual period, and the Value Index gained +14.56%, while the Growth Index returned +11.44%. Among small cap stocks (categorized using our eight proprietary sectors), the industrial sector was the strongest performer, while energy and consumer growth were the weakest. Market volatility was low throughout the semiannual period, with the CBOE Volatility Index® (VIX®) level of implied, expected volatility averaging 15.5. Two small spikes in volatility occurred, one in late-December and another in late-February, but these increases proved to be temporary.
Investment Philosophy and Process. While our investment process has evolved over time as new insights have been added, our core investment principles have not changed since we began managing the Fund more than thirteen years ago. Our philosophy continues to rest on the belief that, in the long run, companies that offer the most attractive combination of good earnings prospects, reasonable share price, and conservative financial reporting will be rewarded by investors; however, over the short-term, valuations can become distorted due to fads or fears that allow stocks to become disconnected from fundamental values. In general, predictable behavioral biases, whether by Wall Street analysts, corporate managers, and/or traders in the marketplace, can create opportunities to earn excess returns. We believe that because these opportunities are behavioral and thus very slow to change, they can be exploited with carefully designed quantitative tools. We also recognize that there are limits to the amount of capital that can be employed to harvest these opportunities and the frequency with which we discover them, so we attempt to preserve our ability to add value for our clients by strictly controlling the asset base we are willing to manage (a marked contrast, we believe, to the asset gatherers that dominate this industry, who seem to want to take your money, with little regard for the impact on their ability to effectively manage it). Finally, we believe that process evolution through continuous research is the only way to maintain a competitive advantage and add value through time. To that end, while our investment process today is conceptually the same as it was thirteen years ago, much of the underlying data have changed over time as we’ve learned new things about how investor behaviors influence security valuations. Our objective, as always, is an investment process that can add value over time, and in a variety of market environments.
Performance Attribution. In the latest semiannual period, the Fund outperformed its benchmark as our composite investment model produced positive stock picking performance. Attribution analysis shows that our modest factor and sector exposures (relative to the benchmark) had no meaningful impact on performance. On a standalone basis, within our small cap investable universe, all the sub-models that combine to form our composite investment model added value during the semiannual period. Our shorter-term, non-fundamental sub-models produced the most consistently positive performance, while relative valuation sub-model returns turned positive in October. Earnings expectations and financial quality model performance was mixed, with recent positive contributions boosting value added for the semiannual period. Stock selection was positive in all sectors except consumer cyclical and technology stocks, with selection in consumer growth stocks contributing the most to relative performance. The dichotomy between the good performance of our composite model and the mixed performance of the sub-models that combine to form it is not unusual, and is also an affirmation of our conviction that the contextual nature of each sub-model’s information is much more important than the standalone information it provides. We continue to maintain a
2
diversified portfolio of 150 to 200 stocks; this diversification helps us to minimize the impact any single stock can have on total Fund performance. At the end of the semiannual period, the Fund held 161 stocks and the largest holding represented 1.4% of portfolio assets. Approximately 80% of the Fund was invested in about 80 positions.
Investment Positioning. As of the end of February 2013, the Fund’s median market capitalization was below that of the benchmark, as we have continued to take advantage of our small size in pursuit of these smaller, generally more rewarding opportunities. The Fund continues to have a higher median analysts’ expected long-term earnings growth rate than the benchmark, due to our tendency to avoid stocks that are expected to have very slow long-term earnings growth. We find that we do not get rewarded as much with successful investments in low growth companies, so we explicitly leave many of them out of the investment process. The Fund also has maintained its attractive valuation exposure, with price-to-earnings and price-to-sales ratios below the benchmark. Note that small deviations from the benchmark reflected in the fundamental characteristics (and sector exposures) of the Fund arise from the bottom up stock selection process and do not reflect attempts to actively time styles or sectors.
Selected risk statistics for the Fund and benchmark are presented in the second half of the table to the right. Total Fund volatility, as measured by the annualized standard deviation of daily returns, was below long-term levels in the semiannual period, averaging 14.4% versus 25.8% since the Fund’s inception. Fund volatility was in line with that of the benchmark. Active volatility, or the variability of the difference between the Fund and benchmark daily returns, was also below long-term levels, at 4.1% versus 6.6% since Fund inception.
| | | | | | | | |
FUNDAMENTAL CHARACTERISTICS
FEBRUARY 28, 2013 | |
Median | | BOGLX* | | | Russell
2000® | |
Market Cap. ($mil.) | | | $969 | | | | $1,300 | |
Estimated Long-Term Earnings Growth Rate** | | | 14.7% | | | | 13.4% | |
Price/Historical Earnings | | | 18.2x | | | | 18.9x | |
Price/Forward Earnings | | | 14.6x | | | | 16.0x | |
Price/Sales | | | 0.9x | | | | 1.9x | |
* The Bogle Small Cap Growth Fund Investor Shares. Median characteristics refer to the Fund’s holdings, not the Fund itself. ** The Estimated Long-Term Earnings Growth Rate is calculated for the Fund’s portfolio of companies and the benchmark companies from First Call analysts’ median estimated earnings growth rate over the next 3 to 5 years. This figure is not indicative of future performance of the Fund; the portfolio and benchmark companies’ actual earnings growth rate will vary from this figure. | |
| | | | | | | | |
RISK STATISTICS*
SEMI ANNUAL PERIOD | |
Measurement | | BOGLX | | | Russell
2000® | |
Standard Deviation | | | 14.4% | | | | 14.0% | |
Active Volatility | | | 4.1% | | | | | |
Beta with Russell 2000® | | | 0.98 | | | | | |
Average Cash | | | 1.1% | | | | | |
* Risk statistics apply to the Fund and benchmark. Standard deviation is a statistical measure of the range of performance. Active volatility is the standard deviation of the difference between the Fund and benchmark performance. Beta is a measure of a portfolio’s sensitivity to market movement. | |
Progress at Bogle Investment Management, L.P. At the end of February 2013, assets in the Fund were $137 million, up $32 million from a year ago, representing $20 million in appreciation and $12 million in net investor inflows. The Fund is open to new shareholders and we continue to have capacity for some additional asset growth. We remain committed to monitoring Fund growth, growth in overall firm assets, and
3
market liquidity conditions to determine when it is appropriate to reclose our investment strategies. We anticipate that if and when we reclose the Fund we will be able to remain open for existing shareholders and financial advisers, as we did when we closed in 2002. Finally, there have been no changes to the investment team, and the team members have now been together for eight years or more.
As a reminder, information about the Fund, including historical NAVs, sector allocation, fundamental characteristics, and top ten holdings, can be viewed on our website, www.boglefunds.com. The NAVs are updated daily while the other Fund information is updated quarterly.
As always, please let us know if there is any way we can improve your investment experience with us.
Respectfully,
Bogle Investment Management, L.P.
Management Office: 781-283-5000
Shareholder Services Toll Free: 1-877-BOGLEIM (264-5346)
The Fund’s investment adviser, Bogle Investment Management, L.P., has contractually agreed to waive management fees and reimburse expenses through December 31, 2013 to the extent that total annual Fund operating expenses exceed 1.25% and 1.35% for the Institutional Class and Investor Class, respectively. The Adviser, in its discretion, has the right to extend this waiver.
The Russell 2000® is an index of stocks 1001 through 3000 in the Russell 3000® Index as ranked by total market capitalization. A direct investment in the index is not possible. The Russell ® Indexes are a trademark of the Frank Russell Company (“FRC”). FRC is the owner of the copyrights relating to the Russell Indexes and is the source of the Performance Values for the Russell Indexes.
Investing in small companies can involve more volatility, less liquidity and less available information than investing in large companies.
Portfolio composition is subject to change. The current and future portfolio holdings of the Fund are subject to investment risk.
4
BOGLE INVESTMENT MANAGEMENT
SMALL CAP GROWTH FUND
FUND EXPENSE EXAMPLES
(UNAUDITED)
As a shareholder of the Fund, you incur two types of costs: (1) transaction costs and (2) ongoing costs, including management fees, shareholder servicing fees and other Fund expenses. These examples are intended to help you understand your ongoing costs (in dollars) of investing in the Fund and to compare these costs with the ongoing costs of investing in other mutual funds.
These examples are based on an investment of $1,000 invested at the beginning of the six-month period from September 1, 2012 through February 28, 2013, and held for the entire period.
ACTUAL EXPENSES
The first line of the accompanying tables provides information about actual account values and actual expenses. You may use the information in this line, together with the amount you invested, to estimate the expenses that you paid over the period. Simply divide your account value by $1,000 (for example, an $8,600 account value divided by $1,000 = 8.6), then multiply the result by the number in the first line under the heading entitled “Expenses Paid During Period” to estimate the expenses you paid on your account during this period.
HYPOTHETICAL EXAMPLEFOR COMPARISON PURPOSES
The second line of the accompanying tables provides information about hypothetical account values and hypothetical expenses based on the Fund’s actual expense ratio and an assumed rate of return of 5% per year before expenses, which is not the Fund’s actual return. The hypothetical account values and expenses may not be used to estimate the actual ending account balance or expenses you paid for the period. You may use this information to compare the ongoing costs of investing in the Fund and other funds. To do so, compare these 5% hypothetical examples with the 5% hypothetical examples that appear in the shareholder reports of other funds.
Please note that the expenses shown in the accompanying tables are meant to highlight your ongoing costs only and do not reflect any transactional costs, such as redemption fees. Therefore, the second line of the accompanying tables is useful in comparing ongoing costs only, and will not help you determine the relative total costs of owning different funds. In addition, if these transactional costs were included, your costs would have been higher.
| | | | | | | | | | | | |
| | | INSTITUTIONAL CLASS | |
| | | BEGINNING ACCOUNT VALUE
SEPTEMBER 1, 2012 | | | ENDING ACCOUNT VALUE
FEBRUARY 28, 2013 | | | EXPENSES PAID DURING
PERIOD* | |
Actual | | $ | 1,000.00 | | | $ | 1,179.70 | | | $ | 6.76 | |
Hypothetical
(5% return before expenses) | | | 1,000.00 | | | | 1,018.60 | | | | 6.26 | |
5
BOGLE INVESTMENT MANAGEMENT
SMALL CAP GROWTH FUND
FUND EXPENSE EXAMPLES (CONCLUDED)
(UNAUDITED)
| | | | | | | | | | | | |
| | | INVESTOR CLASS | |
| | | BEGINNING ACCOUNT VALUE
SEPTEMBER 1, 2012 | | | ENDING ACCOUNT VALUE
FEBRUARY 28, 2013 | | | EXPENSES PAID DURING
PERIOD* | |
Actual | | $ | 1,000.00 | | | $ | 1,179.70 | | | $ | 7.30 | |
Hypothetical
(5% return before expenses) | | | 1,000.00 | | | | 1,018.10 | | | | 6.76 | |
| *Expenses | are equal to the Fund’s annualized six-month expense ratio of 1.25% for the Institutional Class and 1.35% for the Investor Class, which includes waived fees or reimbursed expenses, multiplied by the average account value over the period, multiplied by the number of days (181) in the most recent fiscal half-year, then divided by 365 to reflect the one-half year period. The Fund’s ending account values on the first line in each table are based on the actual six-month total investment return for each class of 17.97% for the Institutional Class and 17.97% for the Investor Class. |
6
BOGLE INVESTMENT MANAGEMENT
SMALL CAP GROWTH FUND
PORTFOLIO HOLDINGS SUMMARY TABLE
FEBRUARY 28, 2013
(UNAUDITED)
The following table presents a summary by security type of the portfolio holdings of the Fund:
| | | | | | | | |
| SECURITY TYPE & SECTOR CLASSIFICATION | | % OF NET
ASSETS | | | VALUE | |
| | |
COMMON STOCKS: | | | | | | | | |
Consumer Growth | | | 22.6% | | | $ | 30,916,977 | |
Industrial | | | 18.6 | | | | 25,550,731 | |
Financial | | | 17.8 | | | | 24,366,034 | |
Consumer Cyclical | | | 16.0 | | | | 21,965,760 | |
Technology | | | 14.2 | | | | 19,411,987 | |
Energy | | | 5.6 | | | | 7,630,721 | |
Basic Industry | | | 3.3 | | | | 4,478,714 | |
Utility | | | 0.4 | | | | 566,520 | |
SHORT-TERM INVESTMENTS | | | 1.6 | | | | 2,191,722 | |
LIABILITIESIN EXCESSOF OTHER ASSETS | | | (0.1) | | | | (136,682) | |
| | | | | | | | |
NET ASSETS | | | 100.0% | | | $ | 136,942,484 | |
| | | | | | | | |
Portfolio holdings are subject to change at any time.
The accompanying notes are an integral part of the financial statements.
7
BOGLE INVESTMENT MANAGEMENT
SMALL CAP GROWTH FUND
PORTFOLIOOF INVESTMENTS
FEBRUARY 28, 2013 (UNAUDITED)
| | | | | | | | |
| | | NUMBER
OF SHARES | | | VALUE | |
| | | | | | | | |
COMMON STOCKS—98.5% | |
BASIC INDUSTRY—3.3% | |
Eagle Materials, Inc. | | | 17,731 | | | $ | 1,140,280 | |
Gibraltar Industries, Inc. * | | | 13,028 | | | | 223,430 | |
Headwaters, Inc. * | | | 142,217 | | | | 1,338,261 | |
Huntsman Corp. | | | 81,705 | | | | 1,407,777 | |
Methanex Corp. | | | 500 | | | | 18,290 | |
Steel Dynamics, Inc. | | | 22,965 | | | | 350,676 | |
| | | | | | | | |
| | | | 4,478,714 | |
| | | | | | | | |
CONSUMER CYCLICAL—16.0% | |
ANN, Inc. * | | | 40,314 | | | | 1,140,482 | |
Ascent Capital Group, Inc., Class A * | | | 14,608 | | | | 1,001,962 | |
Big 5 Sporting Goods Corp. | | | 20,998 | | | | 327,359 | |
Brown Shoe Co., Inc. | | | 68,562 | | | | 1,124,417 | |
Central Garden and Pet Co.,Class A * | | | 1,100 | | | | 9,603 | |
Core-Mark Holding Co., Inc. | | | 20,726 | | | | 993,190 | |
Einstein Noah Restaurant Group, Inc. | | | 23,287 | | | | 312,977 | |
Goodyear Tire & Rubber Co., (The) * | | | 92,429 | | | | 1,199,728 | |
Harry Winston Diamond Corp. (CA) * | | | 86,700 | | | | 1,353,387 | |
Haverty Furniture Co., Inc. | | | 18,798 | | | | 344,943 | |
Hot Topic, Inc. | | | 116,533 | | | | 1,258,556 | |
Journal Communications, Inc., Class A * | | | 1,300 | | | | 7,111 | |
Kimball International, Inc., Class B | | | 60,217 | | | | 554,599 | |
Krispy Kreme Doughnuts, Inc. * | | | 114,620 | | | | 1,512,984 | |
MarineMax, Inc. * | | | 3,794 | | | | 49,132 | |
Multimedia Games Holding Co., Inc. * | | | 95,502 | | | | 1,785,887 | |
Nautilus, Inc. * | | | 215,437 | | | | 1,232,300 | |
Nexstar Broadcasting Group, Inc., Class A | | | 101,561 | | | | 1,509,196 | |
Perry Ellis International, Inc. | | | 1,899 | | | | 30,802 | |
Pool Corp. | | | 26,215 | | | | 1,198,550 | |
PulteGroup, Inc. * | | | 54,194 | | | | 1,039,441 | |
| | | | | | | | |
| | | NUMBER
OF SHARES | | | VALUE | |
| | | | | | | | |
CONSUMER CYCLICAL—(CONTINUED) | |
Republic Airways Holdings, Inc. * | | | 141,481 | | | $ | 1,331,336 | |
Stage Stores, Inc. | | | 50,525 | | | | 1,247,462 | |
Town Sports International Holdings, Inc. | | | 15,612 | | | | 144,723 | |
United Stationers, Inc. * | | | 34,686 | | | | 1,255,633 | |
| | | | | | | | |
| | | | 21,965,760 | |
| | | | | | | | |
CONSUMER GROWTH—22.6% | |
Accuray, Inc. * | | | 90,955 | | | | 388,379 | |
Albany Molecular Research, Inc. * | | | 154,670 | | | | 1,249,733 | |
Allscripts Healthcare Solutions, Inc. * | | | 119,623 | | | | 1,521,605 | |
AMAG Pharmaceuticals, Inc. * | | | 19,233 | | | | 318,306 | |
AMN Healthcare Services, Inc. * | | | 119,696 | | | | 1,687,714 | |
Anika Therapeutics, Inc. * | | | 9,997 | | | | 124,463 | |
Charles River Laboratories International, Inc. * | | | 31,601 | | | | 1,287,425 | |
Cott Corp. | | | 132,715 | | | | 1,267,428 | |
Cyberonics, Inc. * | | | 26,547 | | | | 1,214,525 | |
Cynosure, Inc., Class A * | | | 46,587 | | | | 1,319,810 | |
Dean Foods Co. * | | | 77,535 | | | | 1,287,081 | |
Emergent Biosolutions, Inc. * | | | 80,130 | | | | 1,241,214 | |
Enzon Pharmaceuticals, Inc. | | | 68,346 | | | | 289,104 | |
Farmer Bros Co. * | | | 8,403 | | | | 106,634 | |
Gentiva Health Services, Inc. * | | | 99,793 | | | | 1,049,822 | |
Hillshire Brands Co. | | | 37,365 | | | | 1,210,626 | |
ICON PLC, ADR* | | | 42,596 | | | | 1,327,291 | |
Ingredion, Inc. | | | 18,216 | | | | 1,205,899 | |
John B. Sanfilippo & Son, Inc. | | | 1,612 | | | | 30,725 | |
Lannett Co., Inc. * | | | 9,378 | | | | 77,462 | |
Medifast, Inc. * | | | 54,482 | | | | 1,262,893 | |
Molina Healthcare, Inc. * | | | 41,979 | | | | 1,339,550 | |
Myriad Genetics, Inc. * | | | 45,199 | | | | 1,148,959 | |
PAREXEL International Corp. * | | | 37,385 | | | | 1,296,886 | |
The accompanying notes are an integral part of the financial statements.
8
BOGLE INVESTMENT MANAGEMENT
SMALL CAP GROWTH FUND
PORTFOLIOOF INVESTMENTS (CONTINUED)
FEBRUARY 28, 2013 (UNAUDITED)
| | | | | | | | |
| | | NUMBER
OF SHARES | | | VALUE | |
| | | | | | | | |
CONSUMER GROWTH—(CONTINUED) | |
Providence Service Corp., (The) * | | | 42,633 | | | $ | 728,172 | |
Santarus, Inc. * | | | 7,343 | | | | 97,442 | |
Select Medical Holdings Corp. | | | 144,533 | | | | 1,335,485 | |
SurModics, Inc. * | | | 53,097 | | | | 1,346,540 | |
Syneron Medical Ltd. * | | | 35,700 | | | | 366,639 | |
Thoratec Corp. * | | | 36,514 | | | | 1,285,658 | |
Vascular Solutions, Inc. * | | | 31,956 | | | | 485,092 | |
Warner Chilcott PLC, Class A | | | 91,486 | | | | 1,235,976 | |
West Pharmaceutical Services, Inc. | | | 12,950 | | | | 782,439 | |
| | | | | | | | |
| | | | 30,916,977 | |
| | | | | | | | |
ENERGY—5.6% | |
Advanced Energy Industries, Inc. * | | | 85,317 | | | | 1,539,119 | |
Alon USA Energy, Inc. | | | 83,154 | | | | 1,620,671 | |
Cosan Ltd., Class A | | | 53,110 | | | | 1,091,942 | |
Global Geophysical Services, Inc. * | | | 12,582 | | | | 29,442 | |
Green Plains Renewable Energy, Inc. * | | | 12,283 | | | | 116,320 | |
Matrix Service Co. * | | | 100 | | | | 1,556 | |
Penn Virginia Corp. | | | 330 | | | | 1,343 | |
Petrobras Argentina SA, ADR * | | | 27,436 | | | | 127,303 | |
Tesoro Corp. | | | 23,240 | | | | 1,307,018 | |
Western Refining, Inc. | | | 50,042 | | | | 1,796,007 | |
| | | | | | | | |
| | | | 7,630,721 | |
| | | | | | | | |
FINANCIAL—17.8% | |
Altisource Asset Management Corp. * | | | 854 | | | | 110,807 | |
Artio Global Investors, Inc. | | | 34,532 | | | | 93,927 | |
Axis Capital Holdings Ltd. | | | 26,509 | | | | 1,079,712 | |
BBVA Banco Frances SA, ADR * | | | 16,746 | | | | 67,654 | |
Calamos Asset Management, Inc., Class A | | | 119,843 | | | | 1,339,845 | |
Cardinal Financial Corp. | | | 9,632 | | | | 153,438 | |
Consumer Portfolio Services, Inc. * | | | 154,031 | | | | 1,270,756 | |
| | | | | | | | |
| | | NUMBER
OF SHARES | | | VALUE | |
| | | | | | | | |
FINANCIAL—(CONTINUED) | |
Ellie Mae, Inc. * | | | 43,085 | | | $ | 874,626 | |
Erie Indemnity Co., Class A | | | 14,887 | | | | 1,089,728 | |
Euronet Worldwide, Inc. * | | | 53,266 | | | | 1,285,841 | |
First American Financial Corp. | | | 52,089 | | | | 1,265,242 | |
Genworth Financial, Inc., Class A * | | | 220,200 | | | | 1,880,508 | |
Interactive Brokers Group, Inc., Class A | | | 84,405 | | | | 1,241,598 | |
Investment Technology Group, Inc. * | | | 103,555 | | | | 1,254,051 | |
LPL Financial Holdings, Inc. | | | 22,132 | | | | 697,822 | |
MCG Capital Corp. | | | 13,066 | | | | 58,797 | |
Meadowbrook Insurance Group, Inc. | | | 68,642 | | | | 482,553 | |
Nelnet, Inc., Class A * | | | 39,023 | | | | 1,294,783 | |
Ocwen Financial Corp. | | | 28,669 | | | | 1,130,132 | |
Old Republic International Corp. | | | 104,020 | | | | 1,249,280 | |
Phoenix Cos, Inc. (The) * | | | 15,547 | | | | 390,230 | |
Piper Jaffray Cos., Inc. * | | | 32,870 | | | | 1,267,796 | |
Provident Financial Holdings, Inc. | | | 60,132 | | | | 1,028,257 | |
Safety Insurance Group, Inc. | | | 10,233 | | | | 480,951 | |
Stewart Information Services Corp. | | | 49,653 | | | | 1,149,467 | |
SWS Group, Inc. * | | | 11,605 | | | | 74,388 | |
Tree.com, Inc. | | | 17,050 | | | | 297,182 | |
United Fire Group, Inc. | | | 25,618 | | | | 629,690 | |
Washington Federal, Inc. | | | 64,215 | | | | 1,126,973 | |
| | | | | | | | |
| | | | 24,366,034 | |
| | | | | | | | |
INDUSTRIAL—18.6% | |
AAON, Inc. | | | 9,367 | | | | 225,370 | |
AECOM Technology, Corp. * | | | 12,785 | | | | 387,512 | |
AerCap Holdings N.V. * | | | 83,347 | | | | 1,293,545 | |
AGCO Corp. | | | 1,849 | | | | 95,187 | |
AMERCO, Inc. | | | 9,255 | | | | 1,394,821 | |
American Railcar Industries, Inc. | | | 32,344 | | | | 1,411,492 | |
Argan, Inc. | | | 23,002 | | | | 384,823 | |
The accompanying notes are an integral part of the financial statements.
9
BOGLE INVESTMENT MANAGEMENT
SMALL CAP GROWTH FUND
PORTFOLIOOF INVESTMENTS (CONCLUDED)
FEBRUARY 28, 2013 (UNAUDITED)
| | | | | | | | |
| | | NUMBER
OF SHARES | | | VALUE | |
| | | | | | | | |
INDUSTRIAL—(CONTINUED) | | | | | | | | |
Barrett Business Services, Inc. | | | 28,568 | | | $ | 1,247,850 | |
Corelogic, Inc. * | | | 49,759 | | | | 1,289,256 | |
Crane Co. | | | 8,434 | | | | 453,581 | |
EnerNOC, Inc. * | | | 1,200 | | | | 19,788 | |
Exelis, Inc. | | | 9,500 | | | | 98,040 | |
Graphic Packaging Holding Co. * | | | 167,604 | | | | 1,243,622 | |
Insteel Industries, Inc. | | | 30,120 | | | | 478,607 | |
LB Foster Co., Class A | | | 21,714 | | | | 958,890 | |
Manitowoc Co., Inc. (The) | | | 77,339 | | | | 1,432,318 | |
Mueller Water Products, Inc., Class A | | | 227,636 | | | | 1,279,314 | |
MYR Group, Inc. * | | | 53,065 | | | | 1,231,639 | |
NACCO Industries, Inc., Class A | | | 6,333 | | | | 367,884 | |
Perceptron, Inc. | | | 19,868 | | | | 122,784 | |
Ryder System, Inc. | | | 23,734 | | | | 1,333,851 | |
Spirit Aerosystems Holdings, Inc., Class A * | | | 43,517 | | | | 757,631 | |
Stealthgas, Inc. * | | | 111,674 | | | | 1,169,227 | |
Steelcase, Inc., Class A | | | 115,067 | | | | 1,628,198 | |
Swift Transportation Co. * | | | 99,954 | | | | 1,352,378 | |
Taser International, Inc. * | | | 181,593 | | | | 1,352,868 | |
UniFirst Corp. | | | 15,162 | | | | 1,266,633 | |
Viad Corp. | | | 46,381 | | | | 1,273,622 | |
| | | | | | | | |
| | | | 25,550,731 | |
| | | | | | | | |
TECHNOLOGY—14.2% | | | | | | | | |
Aspen Technology, Inc. * | | | 42,624 | | | | 1,311,113 | |
Benchmark Electronics, Inc. * | | | 7,095 | | | | 123,595 | |
Brightcove, Inc. * | | | 114,158 | | | | 719,195 | |
Brocade Communications Systems, Inc. * | | | 219,236 | | | | 1,229,914 | |
Cbeyond, Inc. * | | | 14,393 | | | | 101,039 | |
Concurrent Computer Corp. | | | 128,015 | | | | 894,825 | |
Cray, Inc. * | | | 72,730 | | | | 1,407,326 | |
Daktronics, Inc. | | | 120,885 | | | | 1,234,236 | |
EarthLink, Inc. | | | 215,210 | | | | 1,250,370 | |
Giant Interactive Group, Inc., ADR | | | 42,758 | | | | 265,100 | |
IDT Corp., Class B | | | 24,990 | | | | 252,649 | |
Infoblox, Inc. * | | | 59,925 | | | | 1,263,818 | |
| | | | | | | | |
| | | NUMBER
OF SHARES | | | VALUE | |
| | | | | | | | |
TECHNOLOGY—(CONTINUED) | | | | | | | | |
Kulicke & Soffa Industries, Inc. * | | | 115,018 | | | $ | 1,244,495 | |
LSI Corp. * | | | 159,934 | | | | 1,113,141 | |
Magnachip Semiconductor Corp. * | | | 88,057 | | | | 1,386,898 | |
Manhattan Associates, Inc. * | | | 2,285 | | | | 159,630 | |
Move, Inc. * | | | 51,917 | | | | 506,710 | |
NetSol Technologies, Inc. * | | | 13,873 | | | | 160,649 | |
ReachLocal, Inc. * | | | 36,834 | | | | 461,530 | |
RF Micro Devices, Inc. * | | | 147,769 | | | | 681,215 | |
Sierra Wireless, Inc. (CA) * | | | 14,034 | | | | 158,444 | |
Spansion, Inc., Class A * | | | 1,700 | | | | 19,992 | |
support.com, Inc. * | | | 4,040 | | | | 15,756 | |
Telenav, Inc. * | | | 123,287 | | | | 876,571 | |
Unisys Corp. * | | | 56,391 | | | | 1,295,865 | |
United Online, Inc. | | | 216,595 | | | | 1,277,911 | |
| | | | | | | | |
| | | | | | | 19,411,987 | |
| | | | | | | | |
UTILITY—0.4% | | | | | | | | |
Atlantic Tele-Network, Inc. | | | 1,460 | | | | 68,619 | |
Just Energy Group, Inc. (CA) | | | 58,230 | | | | 437,890 | |
NV Energy, Inc. | | | 2,089 | | | | 41,279 | |
PNM Resources, Inc. | | | 834 | | | | 18,732 | |
| | | | | | | | |
| | | | | | | 566,520 | |
| | | | | | | | |
TOTAL COMMON STOCKS
(Cost $119,178,116) | | | | 134,887,444 | |
| | | | | | | | |
SHORT-TERM INVESTMENTS—1.6% | |
BofA Cash Reserves Fund | | | 2,191,722 | | | | 2,191,722 | |
| | | | | | | | |
TOTAL SHORT-TERM INVESTMENTS
(Cost $2,191,722) | | | | 2,191,722 | |
| | | | | | | | |
TOTAL INVESTMENTS—100.1%
(Cost $121,369,838) | | | | 137,079,166 | |
| | | | | | | | |
LIABILITIESIN EXCESSOF OTHER ASSETS—(0.1)% | | | | (136,682 | ) |
| | | | | | | | |
NET ASSETS—100.0% | | | $ | 136,942,484 | |
| | | | | | | | |
* Non-income producing.
ADR — American Depositary Receipt.
SP ADR — Sponsored American Depositary Receipt.
The accompanying notes are an integral part of the financial statements.
10
BOGLE INVESTMENT MANAGEMENT
SMALL CAP GROWTH FUND
STATEMENTOF ASSETSAND LIABILITIES
FEBRUARY 28, 2013
(UNAUDITED)
| | | | |
ASSETS | |
Investments, at value (cost $121,369,838) | | $ | 137,079,166 | |
Receivables for: | | | | |
Investments sold | | | 4,128,103 | |
Capital shares sold | | | 178,371 | |
Dividends and interest | | | 93,235 | |
Prepaid expenses and other assets | | | 26,170 | |
| | | | |
Total assets | | | 141,505,045 | |
| | | | |
LIABILITIES | | | | |
Payables for: | | | | |
Investments purchased | | | 4,221,847 | |
Capital shares redeemed | | | 146,535 | |
Investment advisory fees and shareholder servicing fees | | | 94,042 | |
Directors’ and officers’ fees | | | 964 | |
Other accrued expenses and liabilities | | | 99,173 | |
| | | | |
Total liabilities | | | 4,562,561 | |
| | | | |
Net assets | | $ | 136,942,484 | |
| | | | |
NET ASSETS CONSIST OF | | | | |
Capital stock, $0.001 par value | | $ | 5,376 | |
Paid-in capital | | | 149,329,738 | |
Undistributed net investment income | | | 495,323 | |
Accumulated net realized loss from investments | | | (28,597,281 | ) |
Net unrealized appreciation on investments | | | 15,709,328 | |
| | | | |
Net assets | | $ | 136,942,484 | |
| | | | |
INSTITUTIONAL CLASS | | | | |
Net assets | | $ | 70,671,173 | |
| | | | |
Shares outstanding ($0.001 par value, 100,000,000 shares authorized) | | | 2,752,879 | |
| | | | |
Net asset value, offering and redemption price per share | | $ | 25.67 | |
| | | | |
INVESTOR CLASS | | | | |
Net assets | | $ | 66,271,311 | |
| | | | |
Shares outstanding ($0.001 par value, 100,000,000 shares authorized) | | | 2,622,642 | |
| | | | |
Net asset value, offering and redemption price per share | | $ | 25.27 | |
| | | | |
The accompanying notes are an integral part of the financial statements.
11
BOGLE INVESTMENT MANAGEMENT
SMALL CAP GROWTH FUND
STATEMENTOF OPERATIONS
FORTHE SIX MONTHS ENDED FEBRUARY 28, 2013
(UNAUDITED)
| | | | |
INVESTMENT INCOME | | | | |
Dividends Interest (net of foreign withholding taxes of $6,986) | | $ | 1,392,036 | |
| | | | |
Total investment income | | | 1,392,036 | |
| | | | |
EXPENSES | | | | |
Advisory fees | | | 580,499 | |
Administration and accounting fees | | | 91,261 | |
Transfer agent fees | | | 75,946 | |
Shareholder servicing fees (Investor Class) | | | 30,316 | |
Professional fees | | | 24,091 | |
Custodian fees | | | 20,165 | |
Registration and filing fees | | | 16,009 | |
Printing and shareholder reporting fees | | | 15,046 | |
Directors’ and officers’ fees | | | 14,864 | |
Insurance fees | | | 5,283 | |
Other expenses | | | 2,222 | |
| | | | |
Total expenses before waivers | | | 875,702 | |
Less: waivers | | | (119,762 | ) |
| | | | |
Net expenses after waivers | | | 755,940 | |
| | | | |
Net investment income | | | 636,096 | |
| | | | |
NET REALIZED AND UNREALIZED GAIN FROM INVESTMENTS | | | | |
Net realized gain from investments | | | 9,849,095 | |
Net change in unrealized appreciation on investments | | | 8,653,028 | |
| | | | |
Net realized and unrealized gain from investments | | | 18,502,123 | |
| | | | |
NET INCREASE IN NET ASSETS RESULTING FROM OPERATIONS | | $ | 19,138,219 | |
| | | | |
The accompanying notes are an integral part of the financial statements.
12
BOGLE INVESTMENT MANAGEMENT
SMALL CAP GROWTH FUND
STATEMENTOF CHANGESIN NET ASSETS
| | | | | | | | |
| | | FOR THE
SIX MONTHS ENDED
FEBRUARY 28, 2013
(UNAUDITED) | | | FOR THE
YEAR ENDED
AUGUST 31, 2012 | |
INCREASE/(DECREASE)IN NET ASSETS FROM OPERATIONS: | | | | | | | | |
Net investment income/(loss) | | $ | 636,096 | | | $ | (299,764 | ) |
Net realized gain from investments | | | 9,849,095 | | | | 1,901,161 | |
Net change in unrealized appreciation on investments | | | 8,653,028 | | | | 9,693,740 | |
| | | | | | | | |
Net increase in net assets resulting from operations | | | 19,138,219 | | | | 11,295,137 | |
| | | | | | | | |
INCREASE/(DECREASE)IN NET ASSETS DERIVED
FROM CAPITAL TRANSACTIONS: | | | | | | | | |
Institutional Class | | | | | | | | |
Proceeds from shares sold | | | 18,943,987 | | | | 11,052,767 | |
Distributions for shares redeemed | | | (5,903,849 | ) | | | (5,824,270 | ) |
| | | | | | | | |
Total Institutional Class | | | 13,040,138 | | | | 5,228,497 | |
Investor Class | | | | | | | | |
Proceeds from shares sold | | | 4,684,344 | | | | 2,489,549 | |
Distributions for shares redeemed | | | (6,457,563 | ) | | | (24,904,604 | ) |
| | | | | | | | |
Total Investor Class | | | (1,773,219 | ) | | | (22,415,055 | ) |
| | | | | | | | |
Net increase/(decrease) in net assets from capital share transactions | | | 11,266,919 | | | | (17,186,558 | ) |
| | | | | | | | |
Total increase/(decrease) in net assets | | | 30,405,138 | | | | (5,891,421 | ) |
NET ASSETS | | | | | | | | |
Beginning of period | | | 106,537,346 | | | | 112,428,767 | |
| | | | | | | | |
End of period | | $ | 136,942,484 | | | $ | 106,537,346 | |
| | | | | | | | |
Undistributed accumulated net investment income/(loss), end of period | | $ | 495,323 | | | $ | (140,773 | ) |
| | | | | | | | |
The accompanying notes are an integral part of the financial statements.
13
BOGLE INVESTMENT MANAGEMENT
SMALL CAP GROWTH FUND
STATEMENTOF CHANGESIN NET ASSETS (CONCLUDED)
| | | | | | | | |
| | | FOR THE
SIX MONTHS ENDED
FEBRUARY 28, 2013
(UNAUDITED) | | | FOR THE
YEAR ENDED
AUGUST 31, 2012 | |
INCREASE/(DECREASE)IN SHARES OUTSTANDING
DERIVED FROM SHARE TRANSACTIONS: | | | | | | | | |
Institutional Class | | | | | | | | |
Shares sold | | | 765,916 | | | | 542,636 | |
Shares redeemed | | | (243,289 | ) | | | (286,909 | ) |
| | | | | | | | |
Total Institutional Class | | | 522,627 | | | | 255,727 | |
Investor Class | | | | | | | | |
Shares sold | | | 192,570 | | | | 123,453 | |
Shares redeemed | | | (277,625 | ) | | | (1,297,522 | ) |
| | | | | | | | |
Total Investor Class | | | (85,055 | ) | | | (1,174,069 | ) |
| | | | | | | | |
Total increase/(decrease) in shares outstanding derived from share transactions | | | 437,572 | | | | (918,342 | ) |
| | | | | | | | |
The accompanying notes are an integral part of the financial statements.
14
BOGLE INVESTMENT MANAGEMENT
SMALL CAP GROWTH FUND
FINANCIAL HIGHLIGHTS
Contained below is per share operating performance data for each class of shares outstanding, total investment return, ratios to average net assets and other supplemental data for the respective periods. This information has been derived from information provided in the financial statements.
| | | | | | | | | | | | | | | | | | | | | | | | |
| | | INSTITUTIONAL CLASS | |
| | | FOR THE
SIX MONTHS
ENDED
2/28/13 | | | FOR THE
YEAR
ENDED
8/31/12 | | | FOR THE
YEAR
ENDED
8/31/11 | | | FOR THE
YEAR
ENDED
8/31/10 | | | FOR THE
YEAR
ENDED
8/31/09 | | | FOR THE
YEAR
ENDED
8/31/08 | |
| | | (UNAUDITED) | | | | | | | | | | | | | | | | |
PER SHARE OPERATING PERFORMANCE | | | | | | | | | | | | | | | | | | | | | | | | |
Net asset value, beginning of period | | $ | 21.76 | | | $ | 19.38 | | | $ | 14.81 | | | $ | 14.03 | | | $ | 17.35 | | | $ | 24.61 | |
| | | | | | | | | | | | | | | | | | | | | | | | |
Net investment gain/(loss)* | | | 0.13 | | | | (0.04 | ) | | | (0.10 | ) | | | (0.07 | ) | | | (0.05 | ) | | | (0.13 | ) |
Net realized and unrealized gain/(loss) from investments | | | 3.78 | | | | 2.42 | | | | 4.67 | | | | 0.85 | | | | (3.27 | ) | | | (3.99 | ) |
| | | | | | | | | | | | | | | | | | | | | | | | |
Net increase/(decrease) in net assets
resulting from operations | | | 3.91 | | | | 2.38 | | | | 4.57 | | | | 0.78 | | | | (3.32 | ) | | | (4.12 | ) |
| | | | | | | | | | | | | | | | | | | | | | | | |
Distributions to shareholders from: | | | | | | | | | | | | | | | | | | | | | | | | |
| | | | | | |
Net realized capital gains | | | — | | | | — | | | | — | | | | — | | | | — | | | | (3.14 | ) |
| | | | | | | | | | | | | | | | | | | | | | | | |
Net asset value, end of period | | $ | 25.67 | | | $ | 21.76 | | | $ | 19.38 | | | $ | 14.81 | | | $ | 14.03 | | | $ | 17.35 | |
| | | | | | | | | | | | | | | | | | | | | | | | |
Total investment return(1) | | | 17.97 | %(2) | | | 12.28 | % | | | 30.86 | % | | | 5.56 | % | | | (19.08 | )% | | | (19.33 | )% |
| | | | | | | | | | | | | | | | | | | | | | | | |
RATIOS/SUPPLEMENTAL DATA | | | | | | | | | | | | | | | | | | | | | | | | |
Net assets, end of period
(000’s omitted) | | $ | 70,671 | | | $ | 48,526 | | | $ | 38,274 | | | $ | 31,714 | | | $ | 35,571 | | | $ | 84,546 | |
Ratio of expenses to average net assets
with waivers and reimbursements | | | 1.25 | %(3) | | | 1.25 | % | | | 1.25 | % | | | 1.25 | % | | | 1.25 | % | | | 1.25 | % |
Ratio of expenses to average net assets
without waivers and reimbursements | | | 1.45 | %(3) | | | 1.51 | % | | | 1.44 | % | | | 1.51 | % | | | 1.57 | % | | | 1.44 | % |
Ratio of net investment gain/(loss) to average net assets | | | 1.15 | %(3) | | | (0.21 | )% | | | (0.48 | )% | | | (0.48 | )% | | | (0.44 | )% | | | (0.64 | )% |
Portfolio turnover rate | | | 119.44 | %(2) | | | 288.88 | % | | | 302.71 | % | | | 196.03 | % | | | 159.14 | % | | | 162.10 | % |
| * | Calculated based on average shares outstanding for the period. |
| (1) | Total investment return is calculated assuming a purchase of shares on the first day and a sale of shares on the last day of each period reported and includes reinvestments of dividends and distributions, if any. |
The accompanying notes are an integral part of the financial statements.
15
BOGLE INVESTMENT MANAGEMENT
SMALL CAP GROWTH FUND
FINANCIAL HIGHLIGHTS
Contained below is per share operating performance data for each class of shares outstanding, total investment return, ratios to average net assets and other supplemental data for the respective periods. This information has been derived from information provided in the financial statements.
| | | | | | | | | | | | | | | | | | | | | | | | |
| | | INVESTOR CLASS | |
| | | FOR THE
SIX MONTHS
ENDED
2/28/13 | | | FOR THE
YEAR
ENDED
8/31/12 | | | FOR THE
YEAR
ENDED
8/31/11 | | | FOR THE
YEAR
ENDED
8/31/10 | | | FOR THE
YEAR
ENDED
8/31/09 | | | FOR THE
YEAR
ENDED
8/31/08 | |
| | | (UNAUDITED) | | | | | | | | | | | | | | | | |
PER SHARE OPERATING PERFORMANCE | | | | | | | | | | | | | | | | | | | | | | | | |
Net asset value, beginning of period | | $ | 21.42 | | | $ | 19.10 | | | $ | 14.61 | | | $ | 13.86 | | | $ | 17.14 | | | $ | 24.38 | |
| | | | | | | | | | | | | | | | | | | | | | | | |
Net investment gain/(loss)* | | | 0.12 | | | | (0.07 | ) | | | (0.12 | ) | | | (0.09 | ) | | | (0.06 | ) | | | (0.14 | ) |
Net realized and unrealized gain/(loss)
from investments | | | 3.73 | | | | 2.39 | | | | 4.61 | | | | 0.84 | | | | (3.22 | ) | | | (3.96 | ) |
| | | | | | | | | | | | | | | | | | | | | | | | |
Net increase/(decrease) in net assets
resulting from operations | | | 3.85 | | | | 2.32 | | | | 4.49 | | | | 0.75 | | | | (3.28 | ) | | | (4.10 | ) |
| | | | | | | | | | | | | | | | | | | | | | | | |
Distributions to shareholders from: | | | | | | | | | | | | | | | | | | | | | | | | |
| | | | | | |
Net realized capital gains | | | — | | | | — | | | | — | | | | — | | | | — | | | | (3.14 | ) |
| | | | | | | | | | | | | | | | | | | | | | | | |
Net asset value, end of period | | $ | 25.27 | | | $ | 21.42 | | | $ | 19.10 | | | $ | 14.61 | | | $ | 13.86 | | | $ | 17.14 | |
| | | | | | | | | | | | | | | | | | | | | | | | |
Total investment return(1) | | | 17.97 | %(2) | | | 12.15 | % | | | 30.73 | % | | | 5.41 | % | | | (19.14 | )% | | | (19.45 | )% |
| | | | | | | | | | | | | | | | | | | | | | | | |
RATIOS/SUPPLEMENTAL DATA | | | | | | | | | | | | | | | | | | | | | | | | |
Net assets, end of period (000’s omitted) | | $ | 66,271 | | | $ | 58,011 | | | $ | 74,155 | | | $ | 48,446 | | | $ | 53,379 | | | $ | 82,477 | |
Ratio of expenses to average net assets
with waivers and reimbursements | | | 1.35 | %(3) | | | 1.35 | % | | | 1.35 | % | | | 1.35 | % | | | 1.35 | % | | | 1.35 | % |
Ratio of expenses to average net assets
without waivers and reimbursements | | | 1.55 | %(3) | | | 1.60 | % | | | 1.54 | % | | | 1.62 | % | | | 1.67 | % | | | 1.54 | % |
Ratio of net investment gain/(loss) to average net assets | | | 1.05 | %(3) | | | (0.36 | )% | | | (0.58 | )% | | | (0.58 | )% | | | (0.56 | )% | | | (0.74 | )% |
Portfolio turnover rate | | | 119.44 | %(2) | | | 288.88 | % | | | 302.71 | % | | | 196.03 | % | | | 159.14 | % | | | 162.10 | % |
| * | Calculated based on average shares outstanding for the period. |
| (1) | Total investment return is calculated assuming a purchase of shares on the first day and a sale of shares on the last day of each period reported and includes reinvestments of dividends and distributions, if any. |
The accompanying notes are an integral part of the financial statements.
16
BOGLE INVESTMENT MANAGEMENT
SMALL CAP GROWTH FUND
NOTESTO FINANCIAL STATEMENTS
(UNAUDITED)
| 1. | ORGANIZATIONAND SIGNIFICANT ACCOUNTING POLICIES |
The RBB Fund, Inc. (“RBB” or the “Company”) was incorporated under the laws of the State of Maryland on February 29, 1988 and is registered under the Investment Company Act of 1940, as amended, (the “1940 Act”) as an open-end management investment company. RBB is a “series fund,” which is a mutual fund divided into separate portfolios. Each portfolio is treated as a separate entity for certain matters under the 1940 Act, and for other purposes, and a shareholder of one portfolio is not deemed to be a shareholder of any other portfolio. Currently, RBB has seventeen active investment portfolios, including the Bogle Investment Management Small Cap Growth Fund (the “Fund”), which commenced investment operations on October 1, 1999. As of the date hereof, the Fund offers two classes of shares, Institutional Class and Investor Class.
RBB has authorized capital of one hundred billion shares of common stock of which 8.573 billion shares are currently classified into one hundred and forty-two classes of common stock. Each class represents an interest in an active or inactive RBB investment portfolio.
PORTFOLIO VALUATION — The Fund’s net asset value (“NAV”) is calculated once daily at the close of regular trading hours on the New York Stock Exchange (“NYSE”) (generally 4:00 p.m. Eastern time) on each day the NYSE is open. Securities held by the Fund are valued using the closing price or the last sale price on a national securities exchange or the National Association of Securities Dealers Automatic Quotation System (“NASDAQ”) market system where they are primarily traded. Equity securities traded in the over-the-counter market are valued at their closing prices. If there were no transactions on that day, securities traded principally on an exchange or on NASDAQ will be valued at the mean of the last bid and ask prices prior to the market close. Fixed income securities having a remaining maturity of greater than 60 days are valued using an independent pricing service. Fixed income securities having a remaining maturity of 60 days or less are valued at amortized cost, which approximates market value. Investments in other open-end investment companies are valued based on the NAV of those investment companies (which may use fair value pricing as discussed in their prospectuses). If market quotations are unavailable or deemed unreliable, securities will be valued in accordance with procedures adopted by RBB’s Board of Directors (the “Board”). Relying on prices supplied by pricing services or dealers or using fair valuation may result in values that are higher or lower than the values used by other investment companies and investors to price the same investments.
FAIR VALUE MEASUREMENTS — The inputs and valuation techniques used to measure fair value of the Fund’s investments are summarized into three levels as described in the hierarchy below:
| | • Level 1 – | quoted prices in active markets for identical securities; |
| | • Level 2 – | other significant observable inputs (including quoted prices for similar securities, interest rates, prepayment speeds, credit risk, etc.); and |
| | • Level 3 – | significant unobservable inputs (including the Fund’s own assumptions in determining the fair value of investments). |
17
BOGLE INVESTMENT MANAGEMENT
SMALL CAP GROWTH FUND
NOTESTO FINANCIAL STATEMENTS (CONTINUED)
(UNAUDITED)
The inputs or methodology used for valuing securities are not necessarily an indication of the risk associated with investing in those securities.
The following is a summary of the inputs used, as of February 28, 2013, in valuing the Fund’s investments carried at fair value:
| | | | | | | | | | | | | | | | |
| | | Total
Value at
February 28, 2013 | | | Level 1
Quoted
Price | | | Level 2
Significant
Observable
Inputs | | | Level 3
Significant
Unobservable
Inputs | |
TOTAL INVESTMENTS* | | | $137,079,166 | | | | $137,079,166 | | | | $ — | | | | $ — | |
| | | | | | | | | | | | | | | | |
| * | See Portfolio of Investments detail for security type and sector classification breakout. |
At the end of each fiscal quarter, management evaluates the classification of Levels 1, 2 and 3 assets and liabilities. Various factors are considered, such as changes in liquidity from the prior reporting period; whether or not a broker is willing to execute at the quoted price; the depth and consistency of prices from third party pricing services; and the existence of contemporaneous, observable trades in the market. Additionally, management evaluates the classification of Level 1 and Level 2 assets and liabilities on a quarterly basis for changes in listings or delistings on national exchanges.
Due to the inherent uncertainty of determining the fair value of investments that do not have a readily available market value, the fair value of the Fund’s investments may fluctuate from period to period. Additionally, the fair value of investments may differ significantly from the values that would have been used had a ready market existed for such investments and may differ materially from the values the Fund may ultimately realize. Further, such investments may be subject to legal and other restrictions on resale or otherwise less liquid than publicly traded securities.
For fair valuations using significant unobservable inputs, U.S. generally accepted accounting principles (“U.S. GAAP”) require the Fund to present a reconciliation of the beginning to ending balances for reported market values that presents changes attributable to total realized and unrealized gains or losses, purchase and sales, and transfers in and out of Level 3 during the period. Transfers in and out between Levels are based on values at the end of the period. U.S. GAAP also requires the Fund to disclose amounts and reasons for all transfers in and out of Level 1 and Level 2 fair value measurements. A reconciliation of Level 3 investments is presented only when the Fund had an amount of Level 3 investments at the end of the reporting period that was meaningful in relation to its net assets. The amounts and reasons for all transfers in and out of each Level within the three-tier hierarchy are disclosed when the Fund had an amount of total transfers during the reporting period that was meaningful in relation to its net assets as of the end of the reporting period.
For the six months ended February 28, 2013, there were no transfers between Levels 1, 2 and 3 for the Fund.
18
BOGLE INVESTMENT MANAGEMENT
SMALL CAP GROWTH FUND
NOTESTO FINANCIAL STATEMENTS (CONTINUED)
(UNAUDITED)
USEOF ESTIMATES — The preparation of financial statements in conformity with U.S. GAAP requires management to make estimates and assumptions that affect the reported amounts of assets and liabilities and disclosure of contingent assets and liabilities at the date of the financial statements and the reported amounts of revenues and expenses during the period. Actual results could differ from those estimates and those differences could be significant.
INVESTMENT TRANSACTIONS, INVESTMENT INCOMEAND EXPENSES — The Fund records security transactions based on trade date for financial reporting purposes. The cost of investments sold is determined by use of the specific identification method for both financial reporting and income tax purposes in determining realized gains and losses on investments. Interest income is accrued when earned. Dividend income is recorded on the ex-dividend date. The Fund’s net investment income (other than class specific shareholder servicing fees) and unrealized and realized gains and losses are allocated daily to each class of shares based upon the relative proportion of net assets of each class at the beginning of the day. Expenses incurred on behalf of a specific class, fund or fund family of the Company are charged directly to the class, fund or fund family (in proportion to net assets). Expenses incurred for all of the RBB funds (such as director or professional fees) are charged to all funds in proportion to their average net assets of RBB, or in such other manner as the Company’s Board deems fair or equitable. Expenses and fees, including investment advisory and administration fees, are accrued daily for the purpose of determining the NAV of the Fund.
DIVIDENDSAND DISTRIBUTIONSTO SHAREHOLDERS — Dividends from net investment income and distributions from net realized capital gains, if any, will be declared and paid at least annually to shareholders and recorded on the ex-dividend date. Income dividends and capital gain distributions are determined in accordance with U.S. federal income tax regulations which may differ from U.S. GAAP.
U.S. TAX STATUS — No provision is made for U.S. income taxes as it is the Fund’s intention to qualify for and elect the tax treatment applicable to regulated investment companies under Subchapter M of the Internal Revenue Code of 1986, as amended, and make the requisite distributions to its shareholders which will be sufficient to relieve it from U.S. income and excise taxes.
CASHAND CASH EQUIVALENTS — The Fund considers liquid assets deposited into bank demand deposit accounts to be cash equivalents. These investments represent amounts held with financial institutions that are readily accessible to pay Fund expenses or purchase investments. Cash and cash equivalents are valued at cost plus accrued interest, which approximates market value.
OTHER — In the normal course of business, the Fund may enter into contracts that provide general indemnifications. The Fund’s maximum exposure under these arrangements is dependent on claims that may be made against the Fund in the future, and, therefore, cannot be estimated; however, based on experience, the risk of material loss from such claims is considered remote.
19
BOGLE INVESTMENT MANAGEMENT
SMALL CAP GROWTH FUND
NOTESTO FINANCIAL STATEMENTS (CONTINUED)
(UNAUDITED)
| 2. | INVESTMENT ADVISERAND OTHER SERVICES |
Bogle Investment Management, L.P. (the “Adviser” or “Bogle”) serves as the Fund’s investment adviser. For its advisory services, the Adviser is entitled to receive a monthly fee from the Fund calculated at an annual rate of 1.00% of the Fund’s average daily net assets.
The Adviser has contractually agreed to waive management fees and reimburse expenses to the extent that total annual Fund operating expenses (excluding certain items discussed below) exceed 1.25% and 1.35% for the Institutional Class and Investor Class, respectively. In determining the Adviser’s obligation to waive advisory fees and/or reimburse expenses, the following expenses are not taken into account: acquired fund fees and expenses, brokerage commissions, extraordinary items, interest or taxes. This contractual limitation is in effect until December 31, 2013 and may not be terminated without the approval of the Board. The Adviser may discontinue these arrangements at any time after December 31, 2013.
The contractual fee waiver does not provide for recoupment of fees that were waived or expenses that were reimbursed. For the six months ended February 28, 2013, investment advisory fees and waivers of the Fund were as follows:
| | | | | | | | | | |
GROSS
ADVISORY FEES | | | WAIVERS | | | NET
ADVISORY FEES | |
| $ | 580,499 | | | $ | (112,506 | ) | | $ | 467,993 | |
The Fund will not pay the Adviser at a later time for any amounts waived or any amounts assumed.
In addition to serving as the Fund’s investment adviser, the Adviser provides certain shareholder services to the Investor Class of the Fund. As compensation for such services, the Adviser receives a monthly fee equal to an annual rate of 0.10% of the average daily net assets of the Fund’s Investor Class.
BNY Mellon Investment Servicing (US) Inc. (“BNY Mellon”) serves as administrator for the Fund. For providing administrative and accounting services, BNY Mellon is entitled to receive a monthly fee equal to an annual percentage rate of the Fund’s average daily net assets, subject to certain minimum monthly fees.
BNY Mellon has voluntarily agreed to waive a portion of its administration and accounting fees for the Fund. For the six months ended February 28, 2013, administration and accounting fees and waivers of the Fund were as follows:
| | | | | | | | | | |
GROSS ADMINISTRATION
AND ACCOUNTING
FEES | | | WAIVERS | | | NET ADMINISTRATION
AND ACCOUNTING
FEES | |
| $ | 91,261 | | | $ | (7,256 | ) | | $ | 84,005 | |
Included in the administration and accounting services fees, shown on the Statement of Operations, are fees for providing regulatory administration services to RBB. For providing these services, BNY Mellon is entitled to receive compensation as agreed to by the Company and BNY Mellon. This fee is allocated to each portfolio of the Company in proportion to its net assets of the Company.
20
BOGLE INVESTMENT MANAGEMENT
SMALL CAP GROWTH FUND
NOTESTO FINANCIAL STATEMENTS (CONTINUED)
(UNAUDITED)
In addition, BNY Mellon serves as the Fund’s transfer and dividend disbursing agent. For providing transfer agent services, BNY Mellon is entitled to receive a monthly fee equal to an annual percentage rate of the Fund’s average daily net assets, subject to certain minimum monthly fees.
The Bank of New York Mellon (the “Custodian”) provides certain custodial services to the Fund. The Custodian is entitled to receive a monthly fee equal to an annual percentage rate of the Fund’s average daily net assets, subject to certain minimum monthly fees.
The Fund will not pay The Bank of New York Mellon Corporation or any of its members or BNY Mellon’s affiliates at a later time for any amounts waived or any amounts assumed.
Foreside Funds Distributors LLC serves as the principal underwriter and distributor of the Fund’s shares pursuant to a Distribution Agreement with RBB.
The Directors of the Company receive an annual retainer and meeting fees for meetings attended. The remuneration paid to the Directors by the Fund during the six months ended February 28, 2013 was $7,668. Certain employees of BNY Mellon serve as an Officer or Director of the Company. They are not compensated by the Fund or the Company.
| 4. | INVESTMENTIN SECURITIES |
For the six months ended February 28, 2013, aggregate purchases and sales of investment securities (excluding short-term investments) of the Fund were as follows:
| | | | | | |
| INVESTMENT SECURITIES | |
| PURCHASES | | | SALES | |
| $ | 150,090,050 | | | $ | 138,479,849 | |
| 5. | FEDERAL INCOME TAX INFORMATION |
The Fund has followed the authoritative guidance on accounting for and disclosure of uncertainty in tax positions, which requires the Fund to determine whether a tax position is more likely than not to be sustained upon examination, including resolution of any related appeals or litigation processes, based on the technical merits of the position. The Fund has determined that there was no effect on the financial statements from following this authoritative guidance. In the normal course of business, the Fund is subject to examination by federal, state and local jurisdictions, where applicable, for tax years for which applicable statutes of limitations have not expired.
21
BOGLE INVESTMENT MANAGEMENT
SMALL CAP GROWTH FUND
NOTESTO FINANCIAL STATEMENTS (CONTINUED)
(UNAUDITED)
As of February 28, 2013, federal tax cost, aggregate gross unrealized appreciation and depreciation of securities held by the Fund were as follows:
| | | | | | | | | | | | | | |
FEDERAL TAX
COST | | | UNREALIZED
APPRECIATION | | | UNREALIZED
DEPRECIATION | | | NET UNREALIZED
APPRECIATION | |
| $ | 121,369,838 | | | $ | 18,131,278 | | | $ | (2,421,950 | ) | | $ | 15,709,328 | |
Distributions to shareholders from net investment income and realized gains are determined in accordance with federal income tax regulations, which may differ from net investment income and realized gains recognized for financial reporting purposes. Accordingly, the character of distributions and composition of net assets for tax purposes may differ from those reflected in the accompanying financial statements. To the extent these differences are permanent, such amounts are reclassified within the capital accounts based on the tax treatment; temporary differences do not require such reclassification.
As of August 31, 2012, the components of distributable earnings on a tax basis were as follows:
| | | | | | | | | | | | | | |
CAPITAL LOSS
CARRYFORWARD | | | UNDISTRIBUTED
ORDINARY INCOME | | | UNDISTRIBUTED
LONG-TERM GAINS | | | UNREALIZED
APPRECIATION | |
| $ | (37,834,958 | ) | | $ | — | | | $ | — | | | $ | 6,444,882 | |
The differences between the book and tax basis components of distributable earnings relate principally to the timing of recognition of income and gains for federal income tax purposes. Short-term and foreign currency gains are reported as ordinary income for federal income tax purposes.
Accumulated capital losses represent net capital loss carryforwards as of August 31, 2012 that may be available to offset future realized capital gains and thereby reduce future capital gains distributions. Under the Regulated Investment Company Modernization Act of 2010 (the “Modernization Act”), the Funds are permitted to carry forward capital losses incurred in taxable years beginning after December 22, 2010 for an unlimited period. Any losses incurred during those future taxable years will be required to be utilized prior to any losses incurred in pre-enactment taxable years. Additionally, post-enactment capital losses that are carried forward will retain their character as either short-term or long-term capital losses rather than being considered all short-term as under the previous law. The Funds’ first fiscal year end subject to the Modernization Act was August 31, 2012.
As of August 31, 2012, the Fund had the following pre-enactment net capital loss carryforwards to offset future net capital gains, if any, to the extent provided by Treasury regulations. To the extent that these carryforwards are used to offset future capital gains, it is probable that the gains that are offset will not be distributed to shareholders.
| | | | | | | | | | |
| AUGUST 31, 2017 | | | AUGUST 31, 2018 | | | TOTAL | |
| $ | 11,517,227 | | | $ | 26,317,731 | | | $ | 37,834,958 | |
22
BOGLE INVESTMENT MANAGEMENT
SMALL CAP GROWTH FUND
NOTESTO FINANCIAL STATEMENTS (CONCLUDED)
(UNAUDITED)
As of August 31, 2012, the Fund did not have any post-enactment capital loss carryforwards.
Management has evaluated the impact of all subsequent events on the Fund through the date the financial statements were issued, and has determined that there were no subsequent events requiring recognition or disclosure in the financial statements.
23
BOGLE INVESTMENT MANAGEMENT
SMALL CAP GROWTH FUND
OTHER INFORMATION
(UNAUDITED)
PROXY VOTING
Policies and procedures that the Fund uses to determine how to vote proxies relating to portfolio securities as well as information regarding how the Fund voted proxies relating to portfolio securities for the most recent 12-month period ended June 30 are available without charge, upon request, by calling (877) 264-5346 and on the Securities and Exchange Commission’s (“SEC”) website at http://www.sec.gov.
QUARTERLY PORTFOLIO SCHEDULES
The Company files its complete schedule of portfolio holdings with the SEC for the first and third fiscal quarters of each fiscal year (quarters ended November 30 and May 31) on Form N-Q. The Company’s Form N-Q is available on the SEC website at http://www.sec.gov and may be reviewed and copied at the SEC Public Reference Room in Washington, D.C. Information on the operation of the SEC Public Reference Room may be obtained by calling (202) 551-8090.
24
Investment Adviser
Bogle Investment Management, L.P.
2310 Washington Street
Suite 310
Newton Lower Falls, MA 02462
Administrator
BNY Mellon Investment Servicing (US) Inc.
301 Bellevue Parkway
Wilmington, DE 19809
Transfer Agent
BNY Mellon Investment Servicing (US) Inc.
4400 Computer Drive
Westborough, MA 01581
Principal Underwriter
Foreside Funds Distributors LLC
400 Berwyn Park
899 Cassatt Road
Berwyn, PA 19312
Custodian
The Bank of New York Mellon
One Wall Street
New York, NY 10286
Independent Registered Public Accounting Firm
PricewaterhouseCoopers LLP
Two Commerce Square, Suite 1700
2001 Market Street
Philadelphia, PA 19103-7042
Counsel
Drinker Biddle & Reath LLP
One Logan Square
Suite 2000
Philadelphia, PA 19103-6996
BOGLE INVESTMENT MANAGEMENT
SMALL CAP
GROWTH FUND
of THE RBB FUND, INC.
SEMI-ANNUAL REPORT
FEBRUARY 28, 2013
(UNAUDITED)
This report is submitted for the general information of the shareholders of the Fund. It is not authorized for distribution unless preceded or accompanied by a current prospectus for the Fund.
FREE MARKET FUNDS
Semi-Annual Investment Adviser’s Report
February 28, 2013
(Unaudited)
Dear Fellow Shareholder,
The Free Market Funds (the “Funds”) have continued to gain assets and have surpassed the $3 billion mark. We would like to extend a warm and grateful thank you to all investors who have embraced our Free Market Portfolio Strategies.
For the six months ended February 28 ,2013, investors who remained invested and diversified have continued to experience the gains from the upward rally (despite a few bumps along the way) that started at the end of 2011. Global equity markets for over the six-month period have risen 11.25% as measured by the MSCI All Country World Index. Furthermore, U.S. stocks also performed well but did trail international markets slightly over the reporting period. The Barclays Capital US Government/Credit Intermediate Bond Index was also in the positive with a return of 0.70% for the reporting period.
Matson Money, Inc. (“Matson Money”) strives to deliver the performance of capital markets and add value through Free Market Investment strategies and Structured Market Portfolios. Grounded in the conviction that Free Markets work, Matson Money avoids the cost-generating activity of stock picking and market timing. Instead, we focus on the dimensions of capital markets that we believe reward investors as intelligently and effectively as possible. Our disciplined approach to life-long investing provides both the individual investor and the financial professional with the academic foundation upon which to help achieve investment goals.
Sound economic and financial research has documented that, over the long term, small cap stocks outperform large cap stocks, and value stocks outperform growth stocks. These returns seem to be compensation for risk. In fixed income, risk is well described by bond maturity and credit quality. Matson Money’s vehicles deliberately target specific risk and return trade offs. The Funds are broadly diversified and designed to work together in your total investment plan.
We invite you to contact your financial professional or explore our website, www.MatsonMoney.com, to learn more about the concepts and strategies of Matson Money’s investing.
We appreciate your support and confidence in our firm’s investment philosophy, process and people.

Daniel J List
Chief Compliance Officer and
Director of Portfolio Management
Matson Money, Inc.
1
FREE MARKET FUNDS
Performance Data
(Unaudited)
Free Market U.S. Equity Fund
| | | | | | | | | | | | | | | | | | | | | | |
| Total Returns for the Period Ended February 28, 2013 | | | | | | | |
| | | | | | Average Annual | | | |
| | | Six
Months* | | | 1 Year | | | 3 Years | | | 5 Years | | | Since
Inception** | | | |
Free Market U.S. Equity Fund | | | 14.38% | | | | 16.47% | | | | 14.69% | | | | 6.25% | | | | 6.56% | | | |
Russell 2500® Index | | | 14.32% | | | | 15.17% | | | | 15.75% | | | | 7.92% | | | | 5.78% | | | |
Composite Index*** | | | 12.44% | | | | 15.45% | | | | 13.88% | | | | 5.76% | | | | 3.70% | | | |
| ** | Annualized — The Fund commenced operations on December 31, 2007. |
| *** | The Composite Index is comprised of the S&P 500® Index, Russell 1000® Index and Russell 2000® Value Index, each weighted 25%, 25% and 25%, respectively. |
The performance data quoted represents past performance. Past performance is not indicative of future results. Investment return and principal value will fluctuate so that an investor’s shares, when redeemed, may be worth more or less than their original cost. Current performance may be lower or higher. Returns shown include the reinvestment of all dividends and other distributions and do not reflect taxes that a shareholder would pay on Fund distributions or on the redemption of Fund shares. For performance data current to the most recent month-end, please call 1-866-780-0357 ext. 3863. The Fund’s annual operating expense ratio, as stated in the current prospectus, is 0.96% (included in the ratio is 0.32% attributable to acquired fund fees and expenses).
The Fund’s aggregate total return since inception is based on a increase in net asset value from $10.00 per share on December 31, 2007 (commencement of operations) to $13.14 per share on February 28, 2013.
The Free Market U.S. Equity Fund’s underlying fund’s invest in small-cap and micro-cap stocks, large-cap and other equity securities. In addition to the ordinary risks of equity investing, small companies entail special risk. Small companies tend to have more risk than large companies. An investor in the Fund will incur the expenses of the underlying funds in addition to the Fund expenses.
Free Market International Equity Fund
| | | | | | | | | | | | | | | | | | | | |
| Total Returns for the Period Ended February 28, 2013 | | | | | |
| | | | | | Average Annual | |
| | | Six
Months* | | | 1 Year | | | 3 Years | | | 5 Years | | | Since
Inception** | |
Free Market International Equity Fund | | | 16.12% | | | | 6.95% | | | | 6.87% | | | | 0.17% | | | | 0.28% | |
MSCI World (excluding U.S.) Index | | | 13.37% | | | | 8.75% | | | | 6.70% | | | | -1.19% | | | | -2.60% | |
Composite Index*** | | | 14.88% | | | | 7.63% | | | | 7.46% | | | | -0.13% | | | | -1.57% | |
| ** | Annualized — The Fund commenced operations on December 31, 2007. |
| *** | The Composite Index is comprised of the MSCI EAFE Index, MSCI EAFE Value Index, MSCI EAFE Small Company Index, and MSCI Emerging Markets Free Index, each weighted 25%, 25%, 25% and 25%, respectively. |
The performance data quoted represents past performance. Past performance is not indicative of future results. Investment return and principal value will fluctuate so that an investor’s shares, when redeemed, may be worth more or less than their original cost. Current performance may be lower or higher. Returns shown include the reinvestment of all dividends and other distributions and do not reflect taxes that a shareholder would pay on Fund distributions or on the redemption of Fund shares. For performance data current to the most recent month-end, please call 1-866-780-0357 ext. 3863. The Fund’s annual operating expense ratio, as stated in the current prospectus, is 1.17% (included in the ratio is 0.52% attributable to acquired fund fees and expenses).
The Fund’s aggregate total return since inception is based on a decrease in net asset value from $10.00 per share on December 31, 2007 (commencement of operations) to $9.10 per share on February 28, 2013.
Portfolio composition is subject to change.
The Free Market International Equity Fund’s underlying funds invest in common stock, preferred stock, securities convertible into stocks and other equity securities issued by foreign companies. In addition to the ordinary risks of equity investing, foreign and small companies entail special risk. The return on foreign equities may be adversely affected by currency fluctuations. Emerging markets may be subject to social instability and lack of market liquidity. Small companies tend to have more risk than large companies. An investor in the Fund will incur the expenses of the underlying funds in addition to the Fund expenses.
2
FREE MARKET FUNDS
Performance Data
(Unaudited)
Free Market Fixed Income Fund
| | | | | | | | | | | | | | | | | | | | |
| Total Returns for the Period Ended February 28, 2013 | |
| | | | | | Average Annual | |
| | | Six
Months* | | | 1 Year | | | 3 Years | | | 5 Years | | | Since
Inception** | |
Free Market Fixed Income Fund | | | 0.14% | | | | 1.43% | | | | 2.23% | | | | 2.57% | | | | 2.56% | |
Citigroup World Govt. Bond 1-5 Year Currency Hedged U.S. Dollar Index | | | 0.73% | | | | 1.64% | | | | 1.91% | | | | 2.63% | | | | 2.97% | |
Composite Index*** | | | 0.18% | | | | 1.63% | | | | 2.83% | | | | 3.10% | | | | 3.42% | |
| ** | Annualized — The Fund commenced operations on December 31, 2007. |
| *** | The Composite Index is comprised of the Three-Month Treasury Bill Index, Barclays Capital Intermediate Government Bond Index, BofA Merrill Lynch 1-3 Year US Government/Corporate Index and Barclays Capital Aggregate Bond Index, each weighted 25%, 25% and 25%, respectively. |
The performance data quoted represents past performance. Past performance is not indicative of future results. Investment return and principal value will fluctuate so that an investor’s shares, when redeemed, may be worth more or less than their original cost. Current performance may be lower or higher. Returns shown include the reinvestment of all dividends and other distributions and do not reflect taxes that a shareholder would pay on Fund distributions or on the redemption of Fund shares. For performance data current to the most recent month-end, please call 1-866-780-0357 ext. 3863. The Fund’s annual operating expense ratio, as stated in the current prospectus, is 0.82% (included in the ratio is 0.19% attributable to acquired fund fees and expenses).
The Fund’s aggregate total return since inception is based on an increase in net asset value from $10.00 per share on December 31, 2007 (commencement of operations) to $10.41 per share on February 28, 2013.
Portfolio composition is subject to change.
The Free Market Fixed Income Fund’s underlying funds invest in fixed income securities. The underlying funds may invest their assets and bonds and other debt securities issued by domestic and foreign governments and companies. Debt instruments involve the risk that their prices will fall when interest rates rise, and they are subject to the risk that the borrower may default. In addition, the return on foreign debt securities may be adversely affected by currency fluctuations. An investor in the Fund will incur expenses of the underlying funds in addition to the Fund expenses.
3
FREE MARKET FUNDS
Fund Expense Examples
(Unaudited)
As a shareholder of the Fund(s), you incur two types of costs: (1) transaction costs, including redemption fees; and (2) ongoing costs, including management fees and other Fund expenses. These examples are intended to help you understand your ongoing costs (in dollars) of investing in the Fund(s) and to compare these costs with the ongoing costs of investing in other mutual funds.
These examples are based on an investment of $1,000 invested at the beginning of the six-month period from September 1, 2012 through February 28, 2013, and held for the entire period.
Actual Expenses
The first line of the accompanying tables provides information about actual account values and actual expenses. You may use the information in this line, together with the amount you invested, to estimate the expenses that you paid over the period. Simply divide your account value by $1,000 (for example, an $8,600 account value divided by $1,000 = 8.6), then multiply the result by the number in the first line under the heading entitled “Expenses Paid During Period” to estimate the expenses you paid on your account during this period.
Hypothetical Example for Comparison Purposes
The second line of the accompanying tables provides information about hypothetical account values and hypothetical expenses based on the Fund’s actual expense ratio and an assumed rate of return of 5% per year before expenses, which is not your Fund’s actual return. The hypothetical account values and expenses may not be used to estimate the actual ending account balance or expenses you paid for the period. You may use this information to compare the ongoing costs of investing in the Fund and other funds. To do so, compare these 5% hypothetical examples with the 5% hypothetical examples that appear in the shareholder reports of other funds.
Please note that the expenses shown in the accompanying tables are meant to highlight your ongoing costs only and do not reflect any transactional costs, such as redemption fees. Therefore, the second line of the accompanying tables is useful in comparing ongoing costs only, and will not help you determine the relative total costs of owning different funds. In addition, if these transactional costs were included, your costs would have been higher.
| | | | | | | | | | | | |
| | | Free Market U.S. Equity Fund | |
| | | Beginning Account Value
September 1, 2012 | | | Ending Account Value
February 28, 2013 | | | Expenses Paid
During Period* | |
Actual | | $ | 1,000.00 | | | $ | 1,143.80 | | | $ | 3.35 | |
Hypothetical (5% return before expenses) | | | 1,000.00 | | | | 1,021.67 | | | | 3.16 | |
| |
| | | Free Market International Equity Fund | |
| | | Beginning Account Value
September 1, 2012 | | | Ending Account Value
February 28, 2013 | | | Expenses Paid
During Period* | |
Actual | | $ | 1,000.00 | | | $ | 1,161.20 | | | $ | 3.43 | |
Hypothetical (5% return before expenses) | | | 1,000.00 | | | | 1,021.62 | | | | 3.21 | |
4
FREE MARKET FUNDS
Fund Expense Examples (Concluded)
(Unaudited)
| | | | | | | | | | | | |
| | | Free Market Fixed Income Fund | |
| | | Beginning Account Value
September 1, 2012 | | | Ending Account Value
February 28, 2013 | | | Expenses Paid
During Period* | |
Actual | | $ | 1,000.00 | | | $ | 1,001.40 | | | $ | 3.13 | |
Hypothetical (5% return before expenses) | | | 1,000.00 | | | | 1,021.67 | | | | 3.16 | |
| * | Expenses are equal to an annualized six-month expense ratio of 0.63% for the Free Market U.S. Equity Fund, 0.64% for the Free Market International Equity Fund and 0.63% for the Free Market Fixed Income Fund, multiplied by the average account value over the period, multiplied by the number of days in the most recent fiscal half-year (181), then divided by 365 to reflect the one-half year period. The annualized expense ratios do not reflect fees and expenses associated with the underlying funds. If such fees and expenses had been included, the expenses would have been higher. The range of weighted expense ratios of the underlying funds held by the Funds, as stated in their current prospectuses, were as follows: |
| | | | |
Free Market U.S.
Equity Fund | | Free Market International
Equity Fund | | Free Market Fixed
Income Fund |
| 0.01%-0.13% | | 0.01%-0.28% | | 0.01%-0.07% |
Each Fund’s ending account values on the first line in each table are based on the actual six-month total return for each Fund of 14.38% for the Free Market U.S. Equity Fund, 16.12% for the Free Market International Equity Fund and 0.14% for the Free Market Fixed Income Fund.
5
FREE MARKET FUNDS
FREE MARKET U.S. EQUITY FUND
Portfolio of Investments
February 28, 2013 (Unaudited)
| | | | | | | | |
| | | Number of
Shares | | | Value | |
| | |
EQUITY FUNDS — 99.8% | | | | | | | | |
U.S. Large Cap Value
Portfolio III(a) | | | 18,023,214 | | | $ | 342,260,829 | |
U.S. Large Company Portfolio(a) | | | 14,243,354 | | | | 170,350,512 | |
U.S. Micro Cap Portfolio(b) | | | 10,921,930 | | | | 170,382,103 | |
U.S. Small Cap Portfolio(b) | | | 7,013,723 | | | | 170,643,891 | |
U.S. Small Cap Value
Portfolio(b) | | | 10,025,655 | | | | 284,929,122 | |
| | | | | | | | |
TOTAL EQUITY FUNDS (Cost $855,443,461) | | | | | | | 1,138,566,457 | |
| | | | | | | | |
TOTAL INVESTMENTS — 99.8% | | | | | |
(Cost $855,443,461) | | | | | | | 1,138,566,457 | |
| | | | | | | | |
OTHER ASSETS IN EXCESS OF LIABILITIES — 0.2% | | | | | | | 1,932,382 | |
| | | | | | | | |
NET ASSETS — 100.0% | | | | | | $ | 1,140,498,839 | |
| | | | | | | | |
Portfolio Holdings Summary Table
| | | | | | | | |
| | | % of
Net Assets | | | Value | |
Equity Funds | | | 99.8% | | | $ | 1,138,566,457 | |
Other Assets In Excess of Liabilities | | | 0.2% | | | | 1,932,382 | |
| | | | | | | | |
NET ASSETS | | | 100.0% | | | $ | 1,140,498,839 | |
| | | | | | | | |
| (a) | A portfolio of Dimensional Investment Group Inc. |
| (b) | A portfolio of DFA Investment Dimensions Group Inc. |
Portfolio holdings are subject to change at any time.
The accompanying notes are an integral part of the financial statements.
6
FREE MARKET FUNDS
FREE MARKET INTERNATIONAL EQUITY FUND
Portfolio of Investments
February 28, 2013 (Unaudited)
| | | | | | | | |
| | | Number of
Shares | | | Value | |
| |
INTERNATIONAL EQUITY FUNDS — 99.8% | | | | | |
Asia Pacific Small Company Portfolio(a) | | | 430,037 | | | $ | 10,806,823 | |
Canadian Small Company Series(c) | | | 948,569 | | | | 10,148,156 | |
Continental Small Company Portfolio(a) | | | 1,514,824 | | | | 24,994,600 | |
Continental Small Company
Series(c) | | | 25,888 | | | | 1,273,257 | |
DFA International Small Cap Value Portfolio(a) | | | 19,676,946 | | | | 332,540,390 | |
DFA International Value
Portfolio III(b) | | | 16,095,314 | | | | 248,511,641 | |
Emerging Markets
Portfolio(a) | | | 1,595,686 | | | | 43,642,022 | |
Emerging Markets Small Cap Portfolio(a) | | | 1,887,376 | | | | 41,107,050 | |
Emerging Markets Value
Portfolio(a) | | | 1,359,946 | | | | 40,539,981 | |
Japanese Small Company
Portfolio(a) | | | 1,168,989 | | | | 19,288,318 | |
Large Cap International Portfolio(a) | | | 2,103,910 | | | | 41,552,225 | |
United Kingdom Small Company Portfolio(a) | | | 267,400 | | | | 8,000,609 | |
United Kingdom Small Company Series(c) | | | 156,027 | | | | 7,203,758 | |
| | | | | | | | |
TOTAL INTERNATIONAL EQUITY FUNDS | | | | | |
(Cost $755,395,242) | | | | | | | 829,608,830 | |
| | | | | | | | |
TOTAL INVESTMENTS — 99.8% | | | | | |
(Cost $755,395,242) | | | | | | | 829,608,830 | |
| | | | | | | | |
OTHER ASSETS IN EXCESS OF LIABILITIES — 0.2% | | | | | | | 1,329,915 | |
| | | | | | | | |
NET ASSETS — 100.0% | | | | | | $ | 830,938,745 | |
| | | | | | | | |
Portfolio Holdings Summary Table
| | | | | | | | |
| | | % of
Net Assets | | | Value | |
International Equity Funds | | | 99.8% | | | $ | 829,608,830 | |
Other Assets In Excess of Liabilities | | | 0.2% | | | | 1,329,915 | |
| | | | | | | | |
NET ASSETS | | | 100.0% | | | $ | 830,938,745 | |
| | | | | | | | |
| (a) | A portfolio of DFA Investment Dimensions Group Inc. |
| (b) | A portfolio of Dimensional Investment Group Inc. |
| (c) | A portfolio of DFA Investment Trust Company. |
Portfolio holdings are subject to change at any time.
The accompanying notes are an integral part of the financial statements.
7
FREE MARKET FUNDS
FREE MARKET FIXED INCOME FUND
Portfolio of Investments
February 28, 2013 (Unaudited)
| | | | | | | | |
| | | Number of
Shares | | | Value | |
| |
FIXED INCOME FUNDS — 99.5% | | | | | |
DFA Five-Year Global
Fixed Income Portfolio(a) | | | 24,498,839 | | | $ | 273,652,032 | |
DFA Inflation-Protected
Securities Portfolio(a) | | | 4,309,435 | | | | 54,859,106 | |
DFA Intermediate Government
Fixed Income Portfolio(a) | | | 10,096,285 | | | | 131,453,630 | |
DFA One-Year Fixed Income
Portfolio(a) | | | 25,961,180 | | | | 268,178,992 | |
DFA Short-Term
Government Portfolio(a) | | | 8,104,614 | | | | 87,367,736 | |
DFA Two-Year Global
Fixed Income Portfolio(a) | | | 27,229,058 | | | | 273,652,032 | |
| | | | | | | | |
TOTAL FIXED INCOME FUNDS (Cost $1,081,650,183) | | | | | | | 1,089,163,528 | |
| | | | | | | | |
TOTAL INVESTMENTS — 99.5% | | | | | |
(Cost $1,081,650,183) | | | | | | | 1,089,163,528 | |
| | | | | | | | |
OTHER ASSETS IN EXCESS OF LIABILITIES — 0.5% | | | | | | | 5,986,398 | |
| | | | | | | | |
NET ASSETS — 100.0% | | | | | | $ | 1,095,149,926 | |
| | | | | | | | |
Portfolio Holdings Summary Table
| | | | | | | | |
| | | % of
Net Assets | | | Value | |
Fixed Income Funds | | | 99.5% | | | $ | 1,089,163,528 | |
Other Assets In Excess of Liabilities | | | 0.5% | | | | 5,986,398 | |
| | | | | | | | |
NET ASSETS | | | 100.0% | | | $ | 1,095,149,926 | |
| | | | | | | | |
| (a) | A portfolio of DFA Investment Dimensions Group Inc. |
Portfolio holdings are subject to change at any time.
The accompanying notes are an integral part of the financial statements.
8
FREE MARKET FUNDS
Statements of Assets and Liabilities
February 28, 2013 (Unaudited)
| | | | | | | | | | | | |
| | | Free Market
U.S. Equity
Fund | | | Free Market
International
Equity Fund | | | Free Market
Fixed Income
Fund | |
ASSETS | | | | | | | | | | | | |
Investments in non-affiliated funds, at value † | | $ | 1,138,566,457 | | | $ | 829,608,830 | | | $ | 1,089,163,528 | |
Cash and cash equivalents | | | 2,682,732 | | | | 1,930,442 | | | | 7,951,103 | |
Receivables | | | | | | | | | | | | |
Receivable for capital shares sold | | | 1,249,207 | | | | 957,457 | | | | 1,340,539 | |
Prepaid expenses and other assets | | | 60,173 | | | | 51,422 | | | | 58,874 | |
| | | | | | | | | | | | |
Total assets | | | 1,142,558,569 | | | | 832,548,151 | | | | 1,098,514,044 | |
| | | | | | | | | | | | |
LIABILITIES | | | | | | | | | | | | |
Payables | | | | | | | | | | | | |
Investments purchased | | | 1,000,000 | | | | 883,754 | | | | 2,277,091 | |
Capital shares redeemed | | | 414,768 | | | | 242,524 | | | | 478,397 | |
Investment adviser | | | 434,321 | | | | 317,545 | | | | 410,233 | |
Administration and accounting fees | | | 97,559 | | | | 78,143 | | | | 95,282 | |
Other accrued expenses and liabilities | | | 113,082 | | | | 87,440 | | | | 103,115 | |
| | | | | | | | | | | | |
Total liabilities | | | 2,059,730 | | | | 1,609,406 | | | | 3,364,118 | |
| | | | | | | | | | | | |
Net assets | | $ | 1,140,498,839 | | | $ | 830,938,745 | | | $ | 1,095,149,926 | |
| | | | | | | | | | | | |
NET ASSETS CONSISTS OF | | | | | | | | | | | | |
Par value | | $ | 86,827 | | | $ | 91,318 | | | $ | 105,228 | |
Paid-in capital | | | 832,788,441 | | | | 755,635,295 | | | | 1,085,606,124 | |
Accumulated net investment loss | | | (1,917,285 | ) | | | (850,594 | ) | | | (2,522,964 | ) |
Accumulated net realized gain from investments | | | 26,417,860 | | | | 1,849,138 | | | | 4,448,193 | |
Net unrealized appreciation on investments | | | 283,122,996 | | | | 74,213,588 | | | | 7,513,345 | |
| | | | | | | | | | | | |
Net assets | | $ | 1,140,498,839 | | | $ | 830,938,745 | | | $ | 1,095,149,926 | |
| | | | | | | | | | | | |
Shares outstanding ($0.001 par value, 200,000,000 shares authorized) | | | 86,826,767 | | | | 91,317,915 | | | | 105,228,388 | |
| | | | | | | | | | | | |
Net asset value, offering and redemption price per share | | $ | 13.14 | | | $ | 9.10 | | | $ | 10.41 | |
| | | | | | | | | | | | |
† Investment in non-affiliated funds, at cost | | $ | 855,443,461 | | | $ | 755,395,242 | | | $ | 1,081,650,183 | |
| | | | | | | | | | | | |
The accompanying notes are an integral part of the financial statements.
9
FREE MARKET FUNDS
Statements of Operations
For the Six Months Ended February 28, 2013
(Unaudited)
| | | | | | | | | | | | |
| | | Free Market
U.S. Equity
Fund | | | Free Market
International
Equity Fund | | | Free Market
Fixed Income
Fund | |
Investment Income | | | | | | | | | | | | |
Dividends from non-affiliated funds | | $ | 12,023,368 | | | $ | 8,554,685 | | | $ | 8,150,375 | |
Interest from non-affiliated funds | | | 42 | | | | 37 | | | | 247 | |
| | | | | | | | | | | | |
Total investment income | | | 12,023,410 | | | | 8,554,722 | | | | 8,150,622 | |
| | | | | | | | | | | | |
| | | |
Expenses | | | | | | | | | | | | |
Advisory fees (Note 2) | | | 2,523,837 | | | | 1,849,219 | | | | 2,484,179 | |
Administration and accounting fees (Note 2) | | | 275,868 | | | | 223,788 | | | | 274,310 | |
Transfer agent fees (Note 2) | | | 143,495 | | | | 116,317 | | | | 141,863 | |
Professional fees | | | 66,006 | | | | 42,173 | | | | 64,209 | |
Directors’ and officers’ fees | | | 44,229 | | | | 38,952 | | | | 44,752 | |
Custodian fees (Note 2) | | | 37,669 | | | | 30,547 | | | | 37,311 | |
Printing and shareholder reporting fees | | | 36,400 | | | | 33,598 | | | | 36,106 | |
Other expenses | | | 32,702 | | | | 51,597 | | | | 33,197 | |
| | | | | | | | | | | | |
Total expenses | | | 3,160,206 | | | | 2,386,191 | | | | 3,115,927 | |
| | | | | | | | | | | | |
Net investment income | | | 8,863,204 | | | | 6,168,531 | | | | 5,034,695 | |
| | | | | | | | | | | | |
| | | |
Net realized and unrealized gain/(loss) from investments | | | | | | | | | | | | |
Net realized gain/(loss) from: | | | | | | | | | | | | |
Non-affiliated funds | | | 4,574,201 | | | | 1,117,524 | | | | — | |
Capital gain distributions from non-affiliated fund investments | | | 29,023,726 | | | | 11,042,893 | | | | 4,618,659 | |
Net change in unrealized appreciation/(depreciation) on: | | | | | | | | | | | | |
Non-affiliated funds | | | 95,869,795 | | | | 91,047,733 | | | | (8,878,493 | ) |
| | | | | | | | | | | | |
Net realized and unrealized gain/(loss) on investments | | | 129,467,722 | | | | 103,208,150 | | | | (4,259,834 | ) |
| | | | | | | | | | | | |
Net increase in net assets resulting from operations | | $ | 138,330,926 | | | $ | 109,376,681 | | | $ | 774,861 | |
| | | | | | | | | | | | |
The accompanying notes are an integral part of the financial statements.
10
FREE MARKET U.S. EQUITY FUND
Statements of Changes in Net Assets
| | | | | | | | |
| | | For the
Six Months Ended
February 28, 2013
(Unaudited) | | | For the
Year Ended
August 31, 2012 | |
Increase in net assets from operations: | | | | | | | | |
Net investment income | | $ | 8,863,204 | | | $ | 5,924,569 | |
Net realized gain from investments | | | 33,597,927 | | | | 3,410,649 | |
Net change in unrealized appreciation from investments | | | 95,869,795 | | | | 105,383,759 | |
| | | | | | | | |
Net increase in net assets resulting from operations | | | 138,330,926 | | | | 114,718,977 | |
| | | | | | | | |
| | |
Dividends and distributions to shareholders from: | | | | | | | | |
Net investment income | | | (12,059,460 | ) | | | (4,645,598 | ) |
Net realized capital gains | | | (6,612,476 | ) | | | (5,493,112 | ) |
| | | | | | | | |
Net decrease in net assets from dividends and distributions to shareholders | | | (18,671,936 | ) | | | (10,138,710 | ) |
| | | | | | | | |
| | |
Capital share transactions: | | | | | | | | |
Proceeds from shares sold | | | 158,991,230 | | | | 258,102,377 | |
Reinvestment of distributions | | | 18,671,936 | | | | 10,138,710 | |
Shares redeemed | | | (90,337,807 | ) | | | (118,454,130 | ) |
| | | | | | | | |
Net increase in net assets from capital shares | | | 87,325,359 | | | | 149,786,957 | |
| | | | | | | | |
Total increase in net assets | | | 206,984,349 | | | | 254,367,224 | |
| | | | | | | | |
| | |
Net assets: | | | | | | | | |
Beginning of period | | | 933,514,490 | | | | 679,147,266 | |
| | | | | | | | |
End of period | | $ | 1,140,498,839 | | | $ | 933,514,490 | |
| | | | | | | | |
Accumulated/Undistributed net investment income/(loss), end of period | | $ | (1,917,285 | ) | | $ | 1,278,971 | |
| | | | | | | | |
| | |
Capital share transactions: | | | | | | | | |
Shares sold | | | 12,821,825 | | | | 23,791,485 | |
Dividends and distributions reinvested | | | 1,519,279 | | | | 967,434 | |
Shares redeemed | | | (7,315,719 | ) | | | (10,712,741 | ) |
| | | | | | | | |
Total share transactions | | | 7,025,385 | | | | 14,046,178 | |
| | | | | | | | |
The accompanying notes are an integral part of the financial statements.
11
FREE MARKET INTERNATIONAL EQUITY FUND
Statements of Changes in Net Assets
| | | | | | | | |
| | | For the
Six Months Ended
February 28, 2013
(Unaudited) | | | For the
Year Ended
August 31, 2012 | |
Increase/(decrease) in net assets from operations: | | | | | | | | |
Net investment income | | $ | 6,168,531 | | | $ | 12,401,565 | |
Net realized gain from investments | | | 12,160,417 | | | | 3,089,680 | |
Net change in unrealized appreciation (depreciation) from investments | | | 91,047,733 | | | | (38,193,881 | ) |
| | | | | | | | |
Net increase/(decrease) in net assets resulting from operations | | | 109,376,681 | | | | (22,702,636 | ) |
| | | | | | | | |
| | |
Dividends and distributions to shareholders from: | | | | | | | | |
Net investment income | | | (13,261,063 | ) | | | (11,517,635 | ) |
Net realized capital gains | | | (6,448,810 | ) | | | (7,200,541 | ) |
| | | | | | | | |
Net decrease in net assets from dividends and distributions to shareholders | | | (19,709,873 | ) | | | (18,718,176 | ) |
| | | | | | | | |
| | |
Capital share transactions: | | | | | | | | |
Proceeds from shares sold | | | 128,054,532 | | | | 218,473,669 | |
Reinvestment of distributions | | | 19,709,873 | | | | 18,718,176 | |
Shares redeemed | | | (55,202,851 | ) | | | (63,133,169 | ) |
| | | | | | | | |
Net increase in net assets from capital shares | | | 92,561,554 | | | | 174,058,676 | |
| | | | | | | | |
Total increase in net assets | | | 182,228,362 | | | | 132,637,864 | |
| | | | | | | | |
| | |
Net assets: | | | | | | | | |
Beginning of period | | | 648,710,383 | | | | 516,072,519 | |
| | | | | | | | |
End of period | | $ | 830,938,745 | | | $ | 648,710,383 | |
| | | | | | | | |
Accumulated/Undistributed net investment income/(loss), end of period | | $ | (850,594 | ) | | $ | 6,241,938 | |
| | | | | | | | |
| | |
Capital share transactions: | | | | | | | | |
Shares sold | | | 14,688,339 | | | | 27,183,866 | |
Dividends and distributions reinvested | | | 2,234,680 | | | | 2,482,517 | |
Shares redeemed | | | (6,303,442 | ) | | | (7,742,474 | ) |
| | | | | | | | |
Total share transactions | | | 10,619,577 | | | | 21,923,909 | |
| | | | | | | | |
The accompanying notes are an integral part of the financial statements.
12
FREE MARKET FIXED INCOME FUND
Statements of Changes in Net Assets
| | | | | | | | |
| | | For the
Six Months Ended
February 28, 2013
(Unaudited) | | | For the
Year Ended
August 31, 2012 | |
Increase in net assets from operations: | | | | | | | | |
Net investment income | | $ | 5,034,695 | | | $ | 9,215,805 | |
Net realized gain from investments | | | 4,618,659 | | | | 7,488,327 | |
Net change in unrealized appreciation (depreciation) from investments | | | (8,878,493 | ) | | | 124,441 | |
| | | | | | | | |
Net increase in net assets resulting from operations | | | 774,861 | | | | 16,828,573 | |
| | | | | | | | |
| | |
Dividends and distributions to shareholders from: | | | | | | | | |
Net investment income | | | (7,743,898 | ) | | | (10,592,495 | ) |
Net realized capital gains | | | (5,959,159 | ) | | | (3,877 | ) |
| | | | | | | | |
Net decrease in net assets from dividends and distributions to shareholders | | | (13,703,057 | ) | | | (10,596,372 | ) |
| | | | | | | | |
| | |
Capital share transactions: | | | | | | | | |
Proceeds from shares sold | | | 211,159,204 | | | | 315,318,641 | |
Reinvestment of distributions | | | 13,703,057 | | | | 10,596,247 | |
Shares redeemed | | | (63,758,861 | ) | | | (146,855,231 | ) |
| | | | | | | | |
Net increase in net assets from capital shares | | | 161,103,400 | | | | 179,059,657 | |
| | | | | | | | |
Total increase in net assets | | | 148,175,204 | | | | 185,291,858 | |
| | | | | | | | |
| | |
Net assets: | | | | | | | | |
Beginning of period | | | 946,974,722 | | | | 761,682,864 | |
| | | | | | | | |
End of period | | $ | 1,095,149,926 | | | $ | 946,974,722 | |
| | | | | | | | |
Accumulated/Undistributed net investment income/(loss), end of period | | $ | (2,522,964 | ) | | $ | 186,239 | |
| | | | | | | | |
| | |
Capital share transactions: | | | | | | | | |
Shares sold | | | 20,186,960 | | | | 30,200,012 | |
Dividends and distributions reinvested | | | 1,315,154 | | | | 1,020,796 | |
Shares redeemed | | | (6,081,007 | ) | | | (14,063,375 | ) |
| | | | | | | | |
Total share transactions | | | 15,421,107 | | | | 17,157,433 | |
| | | | | | | | |
The accompanying notes are an integral part of the financial statements.
13
FREE MARKET FUNDS
FREE MARKET U.S. EQUITY FUND
Financial Highlights
Contained below is per share operating performance data for each share outstanding, total investment return, ratios to average net assets and other supplemental data for the respective periods. This information has been derived from information provided in the financial statements.
| | | | | | | | | | | | | | | | | | | | | | | | |
| | | For the
Six Months Ended
February 28, 2013
(Unaudited) | | | For the
Year Ended
August 31, 2012 | | | For the
Year Ended
August 31, 2011 | | | For the
Year Ended
August 31, 2010 | | | For the
Year Ended
August 31, 2009 | | | For the Period
December 31, 2007(1)
Through
August 31, 2008 | |
Per Share Operating Performance | | | | | | | | | | | | | | | | | | | | | | | | |
Net asset value, beginning of period | | $ | 11.70 | | | $ | 10.33 | | | $ | 8.65 | | | $ | 8.21 | | | $ | 10.29 | | | $ | 10.00 | |
| | | | | | | | | | | | | | | | | | | | | | | | |
Net investment income | | | 0.11 | (2) | | | 0.08 | (2) | | | 0.06 | (2) | | | 0.02 | (2) | | | 0.10 | (2) | | | — | (3) |
Net realized and unrealized gain/(loss) on investments | | | 1.56 | | | | 1.43 | | | | 1.68 | | | | 0.46 | | | | (2.09 | ) | | | 0.29 | |
| | | | | | | | | | | | | | | | | | | | | | | | |
Net increase/(decrease) in net assets resulting from operations | | | 1.67 | | | | 1.51 | | | | 1.74 | | | | 0.48 | | | | (1.99 | ) | | | 0.29 | |
| | | | | | | | | | | | | | | | | | | | | | | | |
Dividends and distributions to shareholders from: | | | | | | | | | | | | | | | | | | | | | | | | |
Net investment income | | | (0.15 | ) | | | (0.06 | ) | | | (0.06 | ) | | | (0.03 | ) | | | (0.09 | ) | | | — | |
Net realized capital gains | | | (0.08 | ) | | | (0.08 | ) | | | — | (4) | | | — | | | | — | | | | — | |
Tax return of capital | | | — | | | | — | | | | — | | | | (0.01 | ) | | | — | | | | — | |
| | | | | | | | | | | | | | | | | | | | | | | | |
Total dividends and distributions to shareholders | | | (0.23 | ) | | | (0.14 | ) | | | (0.06 | ) | | | (0.04 | ) | | | (0.09 | ) | | | — | |
| | | | | | | | | | | | | | | | | | | | | | | | |
Net asset value, end of period | | $ | 13.14 | | | $ | 11.70 | | | $ | 10.33 | | | $ | 8.65 | | | $ | 8.21 | | | $ | 10.29 | |
| | | | | | | | | | | | | | | | | | | | | | | | |
Total investment return(5) | | | 14.38 | %(6) | | | 14.77 | % | | | 20.11 | % | | | 5.88 | % | | | (19.19 | )% | | | 2.90 | %(6) |
| | | | | | | | | | | | | | | | | | | | | | | | |
| | | | | | |
Ratio/Supplemental Data | | | | | | | | | | | | | | | | | | | | | | | | |
Net assets, end of period (000’s omitted) | | $ | 1,140,499 | | | $ | 933,514 | | | $ | 679,147 | | | $ | 485,191 | | | $ | 312,104 | | | $ | 187,039 | |
Ratio of expenses to average net assets(7) | | | 0.63 | %(8) | | | 0.64 | % | | | 0.64 | % | | | 0.67 | % | | | 0.72 | % | | | 0.84 | %(8) |
Ratio of net investment income to average net assets(7) | | | 1.75 | %(8) | | | 0.73 | % | | | 0.55 | % | | | 0.22 | % | | | 1.37 | % | | | 0.02 | %(8) |
Portfolio turnover rate | | | 3 | %(6) | | | 4 | % | | | 9 | % | | | 3 | % | | | 1 | % | | | 0 | %(6) |
| (1) | Commencement of operations. |
| (2) | The selected per share data was calculated using the average shares outstanding method for the period. |
| (3) | Amount less than $0.005 per share. |
| (4) | Amount less than $(0.005) per share. |
| (5) | Total investment return is calculated by assuming a purchase of shares on the first day and a sale of shares on the last day of each period reported and includes reinvestments of dividends and distributions, if any. |
| (7) | The Fund also will indirectly bear its prorated share of expenses of the underlying funds. Such expenses are not included in the calculation of this ratio. |
The accompanying notes are an integral part of the financial statements.
14
FREE MARKET FUNDS
FREE MARKET INTERNATIONAL EQUITY FUND
Financial Highlights
Contained below is per share operating performance data for each share outstanding, total investment return, ratios to average net assets and other supplemental data for the respective periods. This information has been derived from information provided in the financial statements.
| | | | | | | | | | | | | | | | | | | | | | | | |
| | | For the
Six Months Ended
February 28, 2013
(Unaudited) | | | For the
Year Ended
August 31, 2012 | | | For the
Year Ended
August 31, 2011 | | | For the
Year Ended
August 31, 2010 | | | For the
Year Ended
August 31, 2009 | | | For the Period
December 31, 2007(1)
Through
August 31, 2008 | |
Per Share Operating Performance | |
Net asset value, beginning of period | | $ | 8.04 | | | $ | 8.78 | | | $ | 7.97 | | | $ | 8.02 | | | $ | 8.85 | | | $ | 10.00 | |
| | | | | | | | | | | | | | | | | | | | | | | | |
Net investment income | | | 0.07 | (2) | | | 0.18 | (2) | | | 0.16 | (2) | | | 0.11 | (2) | | | 0.13 | (2) | | | 0.08 | |
Net realized and unrealized gain/(loss) on investments | | | 1.21 | | | | (0.64 | ) | | | 0.78 | | | | (0.04 | ) | | | (0.85 | ) | | | (1.23 | ) |
| | | | | | | | | | | | | | | | | | | | | | | | |
Net increase/(decrease) in net assets resulting from operations | | | 1.28 | | | | (0.46 | ) | | | 0.94 | | | | 0.07 | | | | (0.72 | ) | | | (1.15 | ) |
| | | | | | | | | | | | | | | | | | | | | | | | |
Dividends and distributions to shareholders from: | | | | | | | | | | | | | | | | | | | | | | | | |
Net investment income | | | (0.15 | ) | | | (0.17 | ) | | | (0.13 | ) | | | (0.09 | ) | | | (0.11 | ) | | | — | |
Net realized capital gains | | | (0.07 | ) | | | (0.11 | ) | | | — | | | | (0.03 | ) | | | — | | | | — | |
| | | | | | | | | | | | | | | | | | | | | | | | |
Total dividends and distributions to shareholders | | | (0.22 | ) | | | (0.28 | ) | | | (0.13 | ) | | | (0.12 | ) | | | (0.11 | ) | | | — | |
| | | | | | | | | | | | | | | | | | | | | | | | |
Net asset value, end of period | | $ | 9.10 | | | $ | 8.04 | | | $ | 8.78 | | | $ | 7.97 | | | $ | 8.02 | | | $ | 8.85 | |
| | | | | | | | | | | | | | | | | | | | | | | | |
Total investment return(3) | | | 16.12 | %(4) | | | (4.98 | )% | | | 11.60 | % | | | 0.86 | % | | | (7.71 | )% | | | (11.50 | )%(4) |
| | | | | | | | | | | | | | | | | | | | | | | | |
| | | | | | |
Ratio/Supplemental Data | | | | | | | | | | | | | | | | | | | | | | | | |
Net assets, end of period
(000’s omitted) | | $ | 830,939 | | | $ | 648,710 | | | $ | 516,073 | | | $ | 365,465 | | | $ | 258,632 | | | $ | 130,821 | |
Ratio of expenses to average
net assets(5) | | | 0.64 | %(6) | | | 0.65 | % | | | 0.66 | % | | | 0.68 | % | | | 0.73 | % | | | 0.92 | %(6) |
Ratio of net investment income to average net assets(5) | | | 1.67 | %(6) | | | 2.21 | % | | | 1.66 | % | | | 1.29 | % | | | 2.01 | % | | | 2.94 | %(6) |
Portfolio turnover rate | | | 3 | %(4) | | | 3 | % | | | 4 | % | | | 8 | % | | | 2 | % | | | 0 | %(4) |
| (1) | Commencement of operations. |
| (2) | The selected per share data was calculated using the average shares outstanding method for the period. |
| (3) | Total investment return is calculated by assuming a purchase of shares on the first day and a sale of shares on the last day of each period reported and includes reinvestments of dividends and distributions, if any. |
| (5) | The Fund also will indirectly bear its prorated share of expenses of the underlying funds. Such expenses are not included in the calculation of this ratio. |
The accompanying notes are an integral part of the financial statements.
15
FREE MARKET FUNDS
FREE MARKET FIXED INCOME FUND
Financial Highlights
Contained below is per share operating performance data for each share outstanding, total investment return, ratios to average net assets and other supplemental data for the respective periods. This information has been derived from information provided in the financial statements.
| | | | | | | | | | | | | | | | | | | | | | | | |
| | | For the
Six Months Ended
February 28, 2013
(Unaudited) | | | For the
Year Ended
August 31, 2012 | | | For the
Year Ended
August 31, 2011 | | | For the
Year Ended
August 31, 2010 | | | For the
Year Ended
August 31, 2009 | | | For the Period
December 31, 2007(1)
Through
August 31, 2008 | |
Per Share Operating Performance | | | | | |
Net asset value, beginning of period | | $ | 10.54 | | | $ | 10.48 | | | $ | 10.50 | | | $ | 10.35 | | | $ | 10.04 | | | $ | 10.00 | |
| | | | | | | | | | | | | | | | | | | | | | | | |
Net investment income | | | 0.05 | (2) | | | 0.11 | (2) | | | 0.12 | (2) | | | 0.13 | (2) | | | 0.21 | (2) | | | 0.02 | |
Net realized and unrealized gain/(loss) on investments | | | (0.04 | ) | | | 0.09 | | | | 0.09 | | | | 0.27 | | | | 0.25 | | | | 0.04 | |
| | | | | | | | | | | | | | | | | | | | | | | | |
Net increase in net assets resulting from operations | | | 0.01 | | | | 0.20 | | | | 0.21 | | | | 0.40 | | | | 0.46 | | | | 0.06 | |
| | | | | | | | | | | | | | | | | | | | | | | | |
Dividends and distributions to shareholders from: | | | | | | | | | | | | | | | | | | | | | | | | |
Net investment income | | | (0.08 | ) | | | (0.14 | ) | | | (0.22 | ) | | | (0.21 | ) | | | (0.15 | ) | | | (0.02 | ) |
Net realized capital gains | | | (0.06 | ) | | | — | (3) | | | — | (3) | | | (0.04 | ) | | | — | | | | — | |
Tax return of capital | | | — | | | | — | | | | (0.01 | ) | | | — | | | | — | | | | — | (3) |
| | | | | | | | | | | | | | | | | | | | | | | | |
Total dividends and distributions to shareholders | | | (0.14 | ) | | | (0.14 | ) | | | (0.23 | ) | | | (0.25 | ) | | | (0.15 | ) | | | (0.02 | ) |
| | | | | | | | | | | | | | | | | | | | | | | | |
Net asset value, end of period | | $ | 10.41 | | | $ | 10.54 | | | $ | 10.48 | | | $ | 10.50 | | | $ | 10.35 | | | $ | 10.04 | |
| | | | | | | | | | | | | | | | | | | | | | | | |
Total investment return(4) | | | 0.14 | %(5) | | | 1.90 | % | | | 2.06 | % | | | 3.96 | % | | | 4.62 | % | | | 0.61 | %(5) |
| | | | | | | | | | | | | | | | | | | | | | | | |
| | | | | | |
Ratio/Supplemental Data | | | | | | | | | | | | | | | | | | | | | | | | |
Net assets, end of period
(000’s omitted) | | $ | 1,095,150 | | | $ | 946,975 | | | $ | 761,683 | | | $ | 459,282 | | | $ | 210,107 | | | $ | 128,982 | |
Ratio of expenses to average
net assets(6) | | | 0.63 | %(7) | | | 0.63 | % | | | 0.65 | % | | | 0.68 | % | | | 0.75 | % | | | 0.97 | %(7) |
Ratio of net investment income to average net assets(6) | | | 1.01 | %(7) | | | 1.08 | % | | | 1.12 | % | | | 1.31 | % | | | 2.06 | % | | | 0.26 | %(7) |
Portfolio turnover rate | | | 0 | %(5) | | | 1 | % | | | 0 | % | | | 1 | % | | | 84 | % | | | 0 | %(5) |
| (1) | Commencement of operations. |
| (2) | The selected per share data was calculated using the average shares outstanding method for the period. |
| (3) | Amount less than $(0.005) per share. |
| (4) | Total investment return is calculated by assuming a purchase of shares on the first day and a sale of shares on the last day of each period reported and includes reinvestments of dividends and distributions, if any. |
| (6) | The Fund also will indirectly bear its prorated share of expenses of the underlying funds. Such expenses are not included in the calculation of this ratio. |
The accompanying notes are an integral part of the financial statements.
16
FREE MARKET FUNDS
Notes to Financial Statements
February 28, 2013
(Unaudited)
| 1. | Organization and Significant Accounting Policies |
The RBB Fund, Inc. (“RBB” or the “Company”) was incorporated under the laws of the State of Maryland on February 29, 1988 and is registered under the Investment Company Act of 1940, as amended (the “1940 Act”), as an open-end management investment company. RBB is a “series fund,” which is a mutual fund divided into separate portfolios. Each portfolio is treated as a separate entity for certain matters under the 1940 Act, and for other purposes, and a shareholder of one portfolio is not deemed to be a shareholder of any other portfolio. Currently, RBB has seventeen active investment portfolios, including the Free Market U.S. Equity Fund, the Free Market International Equity Fund, and the Free Market Fixed Income Fund (each a “Fund,” collectively the “Funds”). Each Fund operates as a “Fund of Funds” and commenced investment operations on December 31, 2007.
RBB has authorized capital of one hundred billion shares of common stock of which 80.573 billion shares are currently classified into one hundred and forty-two classes of common stock. Each class represents an interest in an active or inactive RBB investment portfolio.
PORTFOLIO VALUATION — Investments in the underlying funds are valued at each fund’s net asset value determined as of the close of business on the New York Stock Exchange (generally 4:00 p.m. Eastern time). As required, some securities and assets may be valued at fair value as determined in good faith by the Company’s Board of Directors. Direct investments in fixed income securities having a remaining maturity of 60 days or less are valued at amortized cost, which approximates market value.
Fair Value Measurements — The inputs and valuations techniques used to measure fair value of the Funds’ investments are summarized into three levels as described in the hierarchy below:
| | • Level 1 — | quoted prices in active markets for identical securities; |
| | • Level 2 — | other significant observable inputs (including quoted prices for similar securities, interest rates, prepayment speeds, credit risk, etc.); and |
| | • Level 3 — | significant unobservable inputs (including the Funds’ own assumptions in determining the fair value of investments). |
The inputs or methodology used for valuing securities are not necessarily an indication of the risk associated with investing in those securities.
The following is a summary of the inputs used, as of February 28, 2013, in valuing the Funds’ investments carried at fair value:
FREE MARKET U.S. EQUITY FUND
| | | | | | | | | | | | | | | | |
| | | Total Value at
February 28, 2013 | | | Level 1
Quoted
Price | | | Level 2
Significant
Observable
Input | | | Level 3
Significant
Unobservable
Input | |
Investments in Securities* | | $ | 1,138,566,457 | | | $ | 1,138,566,457 | | | $ | — | | | $ | — | |
| | | | | | | | | | | | | | | | |
*Please refer to the Portfolio of Investments for further details.
17
FREE MARKET FUNDS
Notes to Financial Statements (Continued)
February 28, 2013
(Unaudited)
FREE MARKET INTERNATIONAL EQUITY FUND
| | | | | | | | | | | | | | | | |
| | | Total Value at
February 28, 2013 | | | Level 1
Quoted
Price | | | Level 2
Significant
Observable
Input | | | Level 3
Significant
Unobservable
Input | |
Investments in Securities* | | $ | 829,608,830 | | | $ | 829,608,830 | | | $ | — | | | $ | — | |
| | | | | | | | | | | | | | | | |
*Please refer to the Portfolio of Investments for further details.
FREE MARKET FIXED INCOME FUND
| | | | | | | | | | | | | | | | |
| | | Total Value at
February 28, 2013 | | | Level 1
Quoted
Price | | | Level 2
Significant
Observable
Input | | | Level 3
Significant
Unobservable
Input | |
Investments in Securities* | | $ | 1,089,163,528 | | | $ | 1,089,163,528 | | | $ | — | | | $ | — | |
| | | | | | | | | | | | | | | | |
*Please refer to the Portfolio of Investments for further details.
At the end of each fiscal quarter, management evaluates the classification of Levels 1, 2 and 3 assets and liabilities. Various factors are considered, such as changes in liquidity from the prior reporting period; whether or not a broker is willing to execute at the quoted price; the depth and consistency of prices from third party pricing services; and the existence of contemporaneous, observable trades in the market. Additionally, management evaluates the classification of Level 1 and Level 2 assets and liabilities on a quarterly basis for changes in listings or delistings on national exchanges.
Due to the inherent uncertainty of determining the fair value of investments that do not have a readily available market value, the fair value of the Funds’ investments may fluctuate from period to period. Additionally, the fair value of investments may differ significantly from the values that would have been used had a ready market existed for such investments and may differ materially from the values the Funds may ultimately realize. Further, such investments may be subject to legal and other restrictions on resale or otherwise less liquid than publicly traded securities.
For fair valuations using significant unobservable inputs, U.S. generally accepted accounting principles (“U.S. GAAP”) require each Fund to present a reconciliation of the beginning to ending balances for reported market values that presents changes attributable to total realized and unrealized gains or losses, purchase and sales, and transfers in and out of Level 3 during the period. Transfers in and out between Levels are based on values at the end of the period. U.S. GAAP also requires a Fund to disclose amounts and reasons for all transfers in and out of Level 1 and Level 2 fair value measurements. A reconciliation of Level 3 investments is presented only when a Fund had an amount of Level 3 investments at the end of the reporting period that was meaningful in relation to its net assets. The amounts and reasons for all transfers in and out of each Level within the three-tier hierarchy are disclosed when a Fund had an amount of total transfers during the reporting period that was meaningful in relation to its net assets as of the end of the reporting period.
For the six months ended February 28, 2013, there were no transfers between Levels 1, 2 and 3 for the Funds.
USE OF ESTIMATES — The preparation of financial statements in conformity with U.S. GAAP requires management to make estimates and assumptions that affect the reported amounts of assets and liabilities and disclosure of contingent
18
FREE MARKET FUNDS
Notes to Financial Statements (Continued)
February 28, 2013
(Unaudited)
assets and liabilities at the date of the financial statements and the reported amounts of revenues and expenses during the period. Actual results could differ from those estimates and those differences could be significant.
INVESTMENT TRANSACTIONS, INVESTMENT INCOME AND EXPENSES — Transactions are accounted for on the trade date for financial reporting purposes. The cost of investments sold is determined by use of the specific identification method for both financial reporting and income tax purposes in determining realized gains and losses on investments. Interest income is accrued when earned. Dividend income is recorded on the ex-dividend date. Distributions received on securities that represent a return of capital or capital gain are recorded as a reduction of cost of investments and/or as a realized gain. The Funds estimate the components of distributions received that may be considered return of capital distributions or capital gain distributions. Each Fund’s investment income, expenses and unrealized and realized gains and losses are allocated daily. Expenses incurred on behalf of a specific class, fund or fund family of the Company are charged directly to the class, fund or fund family (in proportion to net assets). Expenses incurred for all of the RBB funds (such as director or professional fees) are charged to all funds in proportion to their average net assets of RBB, or in such other manner as the Board of Directors deems fair or equitable. Expenses and fees, including investment advisory and administration fees, are accrued daily and taken into account for the purpose of determining the net asset value of the Funds. In addition to the net annual operating expenses that the Funds bear directly, the shareholders indirectly bear the Funds’ pro-rata expenses of the underlying mutual funds in which each Fund invests.
DIVIDENDS AND DISTRIBUTIONS TO SHAREHOLDERS — Dividends from net investment income and distributions from net realized capital gains, if any, are declared and paid at least annually to shareholders and recorded on ex-dividend date for all Funds with the exception of the Free Market Fixed Income Fund which declares and pays quarterly dividends from net investment income. Income dividends and capital gain distributions are determined in accordance with U.S. federal income tax regulations which may differ from U.S. GAAP.
U.S. TAX STATUS — No provision is made for U.S. income taxes as it is each Fund’s intention to qualify for and elect the tax treatment applicable to regulated investment companies under Subchapter M of the Internal Revenue Code of 1986, as amended, and make the requisite distributions to its shareholders which will be sufficient to relieve it from U.S. income and excise taxes.
CASH AND CASH EQUIVALENTS — The Funds consider liquid assets deposited with a bank demand deposit account to be cash equivalents. These investments represent amounts held with financial institutions that are readily accessible to pay Fund expenses or purchase investments. Cash and cash equivalents are valued at cost plus accrued interest, which approximates market value.
OTHER — In the normal course of business, the Funds may enter into contracts that provide general indemnifications. The Funds’ maximum exposure under these arrangements is dependent on claims that may be made against the Funds in the future, and, therefore, cannot be estimated; however, based on experience, the risk of material loss for such claims is considered remote.
19
FREE MARKET FUNDS
Notes to Financial Statements (Continued)
February 28, 2013
(Unaudited)
| 2. | Investment Adviser and Other Services |
Matson Money, Inc. (“Matson Money” or the “Adviser”), serves as each Fund’s investment adviser. For its advisory services, Matson Money is entitled to receive 0.50% of the first $1 billion of each Fund’s average daily net assets, 0.49% of each Fund’s average daily net assets over $1 billion to $5 billion and 0.47% of each Fund’s average daily net assets over $5 billion, computed daily and payable monthly. Prior to January 1, 2013, the Adviser received 0.50% of each Fund’s average daily net assets computed daily and payable monthly. The Adviser has voluntarily agreed to waive its advisory fee and/or reimburse certain expenses in order to limit total annual fund operating expenses of the Free Market U.S. Equity Fund, the Free Market International Equity Fund and the Free Market Fixed Income Fund to 1.13%, 1.35% and 1.00%, respectively, of the particular Fund’s average daily net assets. The expense limitations include expenses incurred as a result of investing in other investment companies. The Adviser may discontinue these arrangements at any time. The Funds will not pay Matson Money at a later time for any amounts they may waive or any amounts that Matson Money has assumed.
BNY Mellon Investment Servicing (US) Inc. (“BNY Mellon”), serves as administrator for the Funds. For providing administrative and accounting services, BNY Mellon is entitled to receive a monthly fee equal to an annual percentage rate of the Funds’ average daily net assets and is subject to certain minimum monthly fees.
Included in the administration and accounting service fees, shown on the Statement of Operations, are fees for providing regulatory administration services to RBB. For providing these services, BNY Mellon is entitled to receive compensation as agreed to by the Company and BNY Mellon. This fee is allocated to each portfolio of the Company in proportion to its net assets of the Company.
In addition, BNY Mellon serves as the Funds’ transfer and dividend disbursing agent. For providing transfer agent services, BNY Mellon is entitled to receive a monthly fee equal to an annual percentage rate of each Fund’s average daily net assets, subject to certain minimum monthly fees.
The Bank of New York Mellon (the “Custodian”) provides custodian services to the Funds. The Custodian is entitled to receive a monthly fee equal to an annual percentage rate of the Funds’ average daily net assets, subject to certain minimum monthly fees.
Foreside Funds Distributors LLC serves as the principal underwriter and distributor of the Funds’ shares pursuant to a Distribution Agreement with RBB.
The Directors of the Company receive an annual retainer and meeting fees for meetings attended. The aggregate remuneration paid to the Directors by the Funds during the six months ended February 28, 2013 was $104,616. Certain employees of BNY Mellon serve as an Officer or Director of the Company. They are not compensated by the Funds or the Company.
20
FREE MARKET FUNDS
Notes to Financial Statements (Continued)
February 28, 2013
(Unaudited)
| 4. | Investment in Securities |
For the six months ended February 28, 2013, aggregate purchases and sales of investment securities (excluding short-term investments) of the Funds were as follows:
| | | | | | | | |
| | | Purchases | | | Sales | |
Free Market U.S. Equity Fund | | $ | 132,355,197 | | | $ | 27,156,555 | |
Free Market International Equity Fund | | | 111,758,079 | | | | 25,519,374 | |
Free Market Fixed Income Fund | | | 155,892,451 | | | | — | |
| 5. | Federal Income Tax Information |
The Funds have followed the authoritative guidance on accounting for and disclosure of uncertainty in tax positions, which requires the Funds to determine whether a tax position is more likely than not to be sustained upon examination, including resolution of any related appeals or litigation processes, based on the technical merits of the position. The Funds have determined that there was no effect on the financial statements from following this authoritative guidance. In the normal course of business, the Funds are subject to examination by federal, state and local jurisdictions, where applicable, for tax years for which applicable statutes of limitations have not expired.
As of February 28, 2013, the federal tax cost, aggregate gross unrealized appreciation and depreciation of securities held by each Fund were as follows:
| | | | | | | | | | | | | | | | |
| | | Federal Tax
Cost | | | Unrealized
Appreciation | | | Unrealized
Depreciation | | | Net
Unrealized
Appreciation | |
Free Market U.S. Equity Fund | | $ | 855,443,461 | | | $ | 283,122,996 | | | $ | — | | | $ | 283,122,996 | |
Free Market International Equity Fund | | | 755,395,242 | | | | 74,213,588 | | | | — | | | | 74,213,588 | |
Free Market Fixed Income Fund | | | 1,081,650,183 | | | | 11,511,299 | | | | (3,997,954 | ) | | | 7,513,345 | |
Distributions to shareholders from net investment income and realized gains are determined in accordance with federal income tax regulations, which may differ from net investment income and realized gains recognized for financial reporting purposes. Accordingly, the character of distributions and composition of net assets for tax purposes may differ from those reflected in the accompanying financial statements. To the extent these differences are permanent, such amounts are reclassified within the capital accounts based on the tax treatment; temporary differences do not require such reclassification.
As of August 31, 2012, the components of distributable earnings on a tax basis were as follows:
| | | | | | | | | | | | |
| | | Undistributed
Ordinary Income | | | Undistributed
Long-Term
Capital Gains | | | Unrealized
Appreciation/
(Depreciation) | |
Free Market U.S. Equity Fund | | $ | 1,278,971 | | | $ | 4,786,356 | | | $ | 181,899,254 | |
Free Market International Equity Fund | | | 6,241,938 | | | | 6,448,729 | | | | (27,145,343 | ) |
Free Market Fixed Income Fund | | | 186,239 | | | | 5,959,067 | | | | 16,221,464 | |
21
FREE MARKET FUNDS
Notes to Financial Statements (Concluded)
February 28, 2013
(Unaudited)
The differences between the book and tax basis components of distributable earnings relate primarily to the timing of recognition of income and gains for federal income tax purposes. Short-term and foreign currency gains are reported as ordinary income for federal income tax purposes.
The tax characters of distributions paid during the fiscal year ended August 31, 2012 were as follows:
| | | | | | | | | | | | | | | | | | |
| | | | | Ordinary
Income | | | Long-Term
Gains | | | Return of
Capital | | | Total | |
Free Market U.S. Equity Fund | | | | $ | 4,645,598 | | | $ | 5,493,112 | | | $ | — | | | $ | 10,138,710 | |
Free Market International Equity Fund | | | | | 11,517,635 | | | | 7,200,541 | | | | — | | | | 18,718,176 | |
Free Market Fixed Income Fund | | | | | 10,592,495 | | | | 3,877 | | | | — | | | | 10,596,372 | |
Distributions from net investment income and short term capital gains are treated as ordinary income for federal income tax purposes.
Accumulated capital losses represent net capital loss carryforwards as of August 31, 2012 that may be available to offset future realized capital gains and thereby reduce future capital gains distributions. Under the Regulated Investment Company Modernization Act of 2010 (the “Modernization Act”), the Funds are permitted to carry forward capital losses incurred in taxable years beginning after December 22, 2010 for an unlimited period. Any losses incurred during those future taxable years will be required to be utilized prior to any losses incurred in pre-enactment taxable years. Additionally, post-enactment capital losses that are carried forward will retain their character as either short-term or long-term capital losses rather than being considered all short-term as under the previous law. The Funds’ first fiscal year end subject to the Modernization Act was August 31, 2012. As of August 31, 2012, the Funds had no pre- or post-enactment capital loss carryforwards.
Management has evaluated the impact of all subsequent events on the Funds through the date the financial statements were issued, and has determined that there were no subsequent events requiring recognition or disclosure in the financial statements.
22
FREE MARKET FUNDS
Other Information
(Unaudited)
Proxy Voting
Policies and procedures that the Funds use to determine how to vote proxies relating to portfolio securities as well as information regarding how the Funds voted proxies relating to portfolio securities for the most recent 12-month period ended June 30 are available without charge, upon request, by calling Free Market Funds at (866) 780-0357, ext. 3863 and on the Securities and Exchange Commission’s (“SEC”) website at http://www.sec.gov.
Quarterly Portfolio Schedules
The Company files a complete schedule of portfolio holdings with the SEC for the first and third fiscal quarters of each fiscal year (quarters ended November 30 and May 31) on Form N-Q. The Company’s Form N-Q is available on the SEC website at http://www.sec.gov and may be reviewed and copied at the SEC Public Reference Room in Washington, D.C. Information on the operation of the SEC Public Reference Room may be obtained by calling (202) 551-8090.
23
Investment Adviser
MATSON MONEY, INC.
5955 Deerfield Blvd.
Mason, OH 45040
Administrator
BNY Mellon Investment Servicing (US) Inc.
301 Bellevue Parkway
Wilmington, DE 19809
Transfer Agent
BNY Mellon Investment Servicing (US) Inc.
4400 Computer Drive
Westborough, MA 01581
Principal Underwriter
Foreside Funds Distributors LLC
400 Berwyn Park
899 Cassatt Road
Berwyn, PA 19312
Custodian
The Bank of New York Mellon
One Wall Street
New York, NY 10286
Independent Registered Public Accounting Firm
PricewaterhouseCoopers LLP
Two Commerce Square, Suite 1700
2001 Market Street
Philadelphia, PA 19103-7042
Counsel
Drinker Biddle & Reath LLP
One Logan Square, Ste. 2000
Philadelphia, PA 19103-6996
FREE MARKET
U.S. EQUITY FUND
FREE MARKET
INTERNATIONAL EQUITY FUND
FREE MARKET
FIXED INCOME FUND
of
THE RBB FUND, INC.
SEMI-ANNUAL
REPORT
February 28, 2013
(Unaudited)
This report is submitted for the general information of the shareholders of the Funds. It is not authorized for distribution unless preceded or accompanied by a current prospectus for the Funds.
Perimeter Small Cap Growth Fund
of The RBB Fund, Inc.
| | |
Semi-Annual Report | | February 28, 2013 |
| | (Unaudited) |

PERIMETER
SMALL CAP GROWTH FUND
Semi-Annual Investment Adviser’s Report
February 28, 2013
(Unaudited)
Dear Shareholder:
The Perimeter Small Cap Growth Fund (the “Fund”) returned 11.51% (I Shares) and 11.43% (Investor Shares) versus the 11.44% return of the Russell 2000 Growth Index during the six-month period ended February 28, 2013. Stocks saw modest gains in the first four (4) months of the period as the economic drag from Hurricane Sandy and uncertainty surrounding the Fiscal Cliff were offset by a rebound in Chinese growth, positive U.S. housing data and strong corporate profits. Similar to last year, the market kicked off the new year with a strong January Effect where lower-priced stocks surged. However, by February, falling stock correlations began to reward quality fundamental stock-picking.
The Consumer Staples sector was a top contributor to Perimeter’s performance given strong performance from Spectrum Brands Holdings (SPB) and Inter Parfums Inc. (IPAR), up 48% and 52%, respectively. Strong selection within Energy was led by top-performing positions in oilfield services companies Geospace Technologies (GEOS) and Helix Energy Solutions (HLX). Geospace is the leading provider of instruments and equipment used by the oil and gas industry in the capture and processing of seismic data. Perimeter had owned this company since December 2009, with an initial cost basis that is roughly a fifth of the current stock price. Within Technology, stock selection lagged given weakness from holdings such as LivePerson (LPSN) and Allot Communications (ALLT). In the case of Allot Communications, after strong growth over the last two years, operating leverage stalled on acquisitions and the market’s fear of a slowdown in its business resulted in negative performance.
While the U.S. economy has yet to gain full traction, signals continue to emerge that economic growth could potentially accelerate into 2013 - lower unemployment claims, higher productivity driving corporate profits, new highs in consumer confidence, expanding credit, improving capital equipment orders and a generally improving global economic outlook. However, headwinds still remain for the market and economy including the second coming of the debt ceiling debate and fiscal budget discussions, along with higher taxes for Americans across the board. Given the rise in taxes, a general theme we expect to emerge within the economy is a shift from consumer spending to business spending and investment. The outlook for growth in capital expenditures (CAPEX) appears favorable in 2013, given the extension of the R&D investment tax credit and expansion of bonus depreciation, combined with the improved global economic outlook. Lastly, support for the equity markets could also come from equity inflows from bond funds, which have been moving in the opposite direction over the last couple of years as bond yields came down.
While we continue to maintain our strong quality bias, we have already been incorporating the aforementioned environment into our bottom-up stock selection process. Despite the recent underperformance, we are pleased to see the initial signs of an improving economic outlook both domestically and globally. While certain headwinds remain, removal of some of the uncertainties is healthy for the overall market and conducive for Perimeter’s bottom-up fundamental stock picking.
Sincerely,
Perimeter Capital Management
This represents the manager’s assessment of the Funds and the market environment at a specific point in time and should not be relied upon by the reader as research or investment advice.
Portfolio composition is subject to change. The current and future portfolio holdings of the Fund are subject to investment risk.
The Russell 2000® Index is a widely-recognized, capitalization-weighted index that measures the performance of the smallest 2,000 companies in the Russell 3000® Index. The Russell 2000® Growth Index measures the performance of those Russell 2000 companies with higher price-to-book ratios and higher forecasted growth values. Direct investment into an index is not possible.
2
PERIMETER
SMALL CAP GROWTH FUND
Semi-Annual Investment Adviser’s Report
February 28, 2013
(Unaudited)
Average Annual Total Returns For The Periods Ended February 28, 2013
| | | | | | | | | | | | | | | | | | | | |
| | | Six
Months* | | | One Year | | | Three Year | | | Five Year | | | Since
Inception**** | |
Perimeter Small Cap Growth Fund, Investor Class Shares** | | | 11.43% | | | | 7.79% | | | | 11.41% | | | | 4.55% | | | | 4.06% | |
Perimeter Small Cap Growth Fund, I Shares*** | | | 11.51% | | | | 8.02% | | | | 11.72% | | | | 4.75% | | | | 4.25% | |
Russell 2000® Index | | | 11.44% | | | | 11.17% | | | | 15.73% | | | | 7.83% | | | | 3.79% | |
| ** | Investor Class Shares were offered beginning September 29, 2006. |
| *** | I Shares were offered beginning December 31, 2007. The performance shown for the I Shares prior to December 31, 2007 is based on the performance and expenses of the Investor Class Shares, and has not been adjusted for the shareholder servicing fee charged specifically to the Investor Class Shares. |
| **** | The Fund commenced operations on September 29, 2006 as a separate portfolio ( the “Predecessor Fund”) of the The Advisors’ Inner Circle Fund II. The performance shown for periods prior to February 8, 2010 represents the performance of the Predecessor Fund. |
The performance data quoted herein represents past performance. Past performance does not guarantee future results. Investment return and principal value will fluctuate so that an investor’s shares, when redeemed, may be worth more or less than its original cost. Current performance may be higher or lower than the performance quoted. For performance current to the most recent month-end, please call 1-888-968-4964. Performance assumes reinvestment of dividends and capital gains. Unlike a mutual fund, index returns do not reflect taxes, fees or expenses. The Fund’s gross total expense ratio as stated in the prospectus is 1.45% for Investor Shares and 1.20% for I Shares. The performance quoted reflects fee waivers in effect and would have been lower in their absence. The Fund charges a 2.00% redemption fee if redeemed within 7 days. The Adviser has contractually agreed to limit the total expenses of the Investor Class Shares and I Shares of the Fund (excluding acquired fund fees and expenses, brokerage commissions, extraordinary items, interest and taxes) to 1.35% and 1.10% of the average daily net assets of the Fund’s Investor Class Shares and I Shares, respectively, through December 31, 2013.
Returns shown do not reflect the deduction of taxes that a shareholder would pay on Fund distributions or the redemption of Fund shares.
Mutual fund investing involves risk including the possible loss of principal. The Fund invests in small cap stocks which generally involve more risk than large cap stocks due to potentially greater volatility and less market liquidity.
3
PERIMETER
SMALL CAP GROWTH FUND
Fund Expense Disclosure
February 28, 2013
(Unaudited)
As a shareholder of the Fund, you incur two types of costs: (1) transaction costs, including redemption fees; and (2) ongoing costs, including management fees, distribution fees and other Fund expenses. These examples are intended to help you understand your ongoing costs (in dollars) of investing in the Fund and to compare these costs with the ongoing costs of investing in other mutual funds.
These examples are based on an investment of $1,000 invested at the beginning of the six-month period from September 1, 2012 through February 28, 2013, and held for the entire period.
Actual Expenses
The first line of the accompanying table provides information about actual account values and actual expenses. You may use the information in this line, together with the amount you invested, to estimate the expenses that you paid over the period. Simply divide your account value by $1,000 (for example, an $8,600 account value divided by $1,000 = 8.6), then multiply the result by the number in the first line under the heading entitled “Expenses Paid During Period” to estimate the expenses you paid on your account during this period.
Hypothetical Examples for Comparison Purposes
The second line of the accompanying table provides information about hypothetical account values and hypothetical expenses based on the Fund’s actual expense ratio and an assumed rate of return of 5% per year before expenses, which is not your Fund’s actual return. The hypothetical account values and expenses may not be used to estimate the actual ending account balance or expenses you paid for the period. You may use this information to compare the ongoing costs of investing in the Fund and other funds. To do so, compare these 5% hypothetical examples with the 5% hypothetical examples that appear in the shareholder reports of other funds.
Please note that the expenses shown in the accompanying table are meant to highlight your ongoing costs only and do not reflect any transactional costs, such as redemption fees. Therefore, the second line of the accompanying table is useful in comparing ongoing costs only and will not help you determine the relative total costs of owning different funds. In addition, if these transactional costs were included, your costs would have been higher.
| | | | | | |
| | | Perimeter Small Cap Growth Fund — Investor Class Shares |
| | | Beginning Account Value
September 1, 2012 | | Ending Account Value
February 28, 2013 | | Expenses Paid
During Period* |
Actual | | $1,000.00 | | $1,114.30 | | $7.08 |
Hypothetical - (5% return before expenses) | | 1,000.00 | | 1,018.10 | | 6.76 |
| | | | | | |
| | | Perimeter Small Cap Growth Fund — I Shares |
| | | Beginning Account Value
September 1, 2012 | | Ending Account Value
February 28, 2013 | | Expenses Paid
During Period* |
Actual | | $1,000.00 | | $1,115.10 | | $5.77 |
Hypothetical - (5% return before expenses) | | 1,000.00 | | 1,019.34 | | 5.51 |
| | * | Expenses are equal to an annualized six-month expense ratio of 1.35% for the Investor Class Shares and 1.10% for the I Shares which includes waived fees, reimbursed expenses or recoupment, multiplied by the average account value over the period, multiplied by the number of days in the most recent period (181), then divided by 365 to reflect the six-month period. The Fund’s ending account values on the first line in each table are based on the actual six-month total return for the Fund of 11.43% for the Investor Class Shares and 11.51% for the I Shares. |
4
PERIMETER
SMALL CAP GROWTH FUND
Portfolio Holdings Summary Table
February 28, 2013
(Unaudited)
The following table presents a summary by sector of the portfolio holdings of the Fund.
| | | | | | | | |
| | | % of Net
Assets | | | Value | |
Domestic Common Stocks: | | | | | | | | |
| | |
Consumer Non-cyclical | | | 25.1 | % | | $ | 50,729,361 | |
Technology | | | 14.2 | | | | 28,722,053 | |
Consumer Cyclical | | | 14.1 | | | | 28,454,314 | |
Industrial | | | 14.1 | | | | 28,330,840 | |
Financial | | | 9.7 | | | | 19,590,355 | |
Communications | | | 7.0 | | | | 14,188,257 | |
Energy | | | 5.0 | | | | 10,035,511 | |
Basic Materials | | | 4.5 | | | | 9,151,533 | |
Warrants | | | 0.0 | | | | 4,207 | |
Other Assets in Excess of Liabilities | | | 6.3 | | | | 12,678,244 | |
| | | | | | | | |
| | | 100.0 | % | | $ | 201,884,675 | |
| | | | | | | | |
Portfolio holdings are subject to change at any time.
|
The accompanying notes are an integral part of the financial statements. |
|
5 |
PERIMETER
SMALL CAP GROWTH FUND
Portfolio of Investments
February 28, 2013
(Unaudited)
| | | | | | | | |
| | | Shares | | | Value | |
COMMON STOCKS† - 93.7% | | | | | | | | |
Basic Materials — 4.5% | | | | | | | | |
American Vanguard | | | 62,570 | | | $ | 1,941,547 | |
Balchem | | | 40,294 | | | | 1,625,057 | |
Buckeye Technologies | | | 59,150 | | | | 1,640,230 | |
Chemtura* | | | 43,120 | | | | 867,574 | |
Kapstone Paper and Packaging* | | | 57,230 | | | | 1,524,607 | |
NewMarket | | | 3,250 | | | | 817,928 | |
Polyone | | | 32,233 | | | | 734,590 | |
| | | | | | | | |
| | | | | | | 9,151,533 | |
| | | | | | | | |
Communications — 7.0% | | | | | | | | |
Acme Packet* | | | 61,390 | | | | 1,791,360 | |
ADTRAN | | | 43,880 | | | | 980,279 | |
Allot Communications* | | | 96,734 | | | | 1,328,158 | |
Aruba Networks* | | | 36,450 | | | | 908,334 | |
ClickSoftware Technologies | | | 107,201 | | | | 884,408 | |
HealthStream* | | | 26,232 | | | | 561,103 | |
Ixia* | | | 70,600 | | | | 1,431,768 | |
NIC | | | 73,331 | | | | 1,299,425 | |
NICE Systems, SP ADR* | | | 16,245 | | | | 573,611 | |
Shutterfly* | | | 24,213 | | | | 1,047,939 | |
SPS Commerce* | | | 24,548 | | | | 917,850 | |
Tyler Technologies* | | | 28,890 | | | | 1,629,396 | |
Zix* | | | 221,975 | | | | 834,626 | |
| | | | | | | | |
| | | | | | | 14,188,257 | |
| | | | | | | | |
Consumer Cyclical — 14.1% | | | | | | | | |
AFC Enterprises* | | | 40,520 | | | | 1,215,600 | |
Allegiant Travel | | | 23,560 | | | | 1,891,632 | |
Arctic Cat* | | | 38,560 | | | | 1,400,885 | |
Ascena Retail Group* | | | 47,620 | | | | 799,540 | |
Casey’s General Stores | | | 27,560 | | | | 1,559,620 | |
Chico’s FAS | | | 92,610 | | | | 1,572,518 | |
Coinstar* | | | 28,508 | | | | 1,459,325 | |
Destination XL Group* | | | 132,984 | | | | 603,747 | |
First Cash Financial Services* | | | 24,884 | | | | 1,316,612 | |
Francesca’s Holdings* | | | 48,680 | | | | 1,238,906 | |
HSN | | | 11,950 | | | | 639,325 | |
Nu Skin Enterprises | | | 17,690 | | | | 728,828 | |
Pier 1 Imports | | | 88,650 | | | | 1,991,966 | |
Pool | | | 35,400 | | | | 1,618,488 | |
Six Flags Entertainment | | | 22,730 | | | | 1,518,591 | |
Spirit Airlines* | | | 85,080 | | | | 1,722,870 | |
Stage Stores | | | 62,070 | | | | 1,532,508 | |
Susser Holdings* | | | 16,320 | | | | 722,650 | |
Tenneco* | | | 27,080 | | | | 959,444 | |
Toro | | | 26,360 | | | | 1,188,836 | |
UniFirst | | | 19,034 | | | | 1,590,100 | |
Vitamin Shoppe* | | | 22,499 | | | | 1,182,323 | |
| | | | | | | | |
| | | | | | | 28,454,314 | |
| | | | | | | | |
Consumer Non-cyclical — 25.1% | | | | | | | | |
Array Biopharma* | | | 405,960 | | | | 1,579,184 | |
| | | | | | | | |
| | | Shares | | | Value | |
Consumer Non-cyclical — (Continued) | | | | | | | | |
Astex Pharmaceuticals* | | | 218,243 | | | $ | 711,472 | |
Cardtronics* | | | 55,130 | | | | 1,453,227 | |
Charles River Laboratories International* | | | 37,210 | | | | 1,515,935 | |
Chemed | | | 23,830 | | | | 1,839,438 | |
CoreLogic* | | | 55,740 | | | | 1,444,223 | |
Corporate Executive Board | | | 27,150 | | | | 1,469,901 | |
Corrections Corp. of America | | | 21,090 | | | | 808,802 | |
CoStar Group* | | | 12,620 | | | | 1,271,339 | |
Cubist Pharmaceuticals* | | | 42,060 | | | | 1,784,606 | |
Cynosure, Cl A* | | | 28,550 | | | | 808,822 | |
Depomed* | | | 151,890 | | | | 982,728 | |
Dynavax Technologies* | | | 507,710 | | | | 1,035,728 | |
Grand Canyon Education* | | | 77,097 | | | | 1,846,473 | |
Haemonetics* | | | 42,640 | | | | 1,758,900 | |
HealthSouth* | | | 72,200 | | | | 1,741,464 | |
Heartland Payment Systems | | | 37,230 | | | | 1,157,853 | |
HMS Holdings* | | | 35,260 | | | | 1,022,187 | |
Huron Consulting Group* | | | 36,920 | | | | 1,446,895 | |
ICON, PLC* | | | 78,857 | | | | 2,457,184 | |
Infinity Pharmaceuticals* | | | 29,322 | | | | 1,210,705 | |
Inter Parfums | | | 65,814 | | | | 1,649,299 | |
J&J Snack Foods | | | 18,360 | | | | 1,270,879 | |
Jazz Pharmaceuticals, PLC* | | | 30,170 | | | | 1,755,291 | |
KAR Auction Services | | | 69,640 | | | | 1,477,761 | |
MAXIMUS | | | 14,449 | | | | 1,051,598 | |
Myriad Genetics* | | | 52,920 | | | | 1,345,226 | |
Neogen* | | | 37,790 | | | | 1,769,328 | |
Quad Graphics | | | 35,227 | | | | 766,187 | |
Rollins | | | 63,300 | | | | 1,551,483 | |
Salix Pharmaceuticals* | | | 37,970 | | | | 1,854,835 | |
Seattle Genetics* | | | 26,287 | | | | 739,716 | |
Spectrum Brands Holdings | | | 33,790 | | | | 1,827,701 | |
Team Health Holdings* | | | 60,430 | | | | 2,023,801 | |
Thoratec* | | | 32,185 | | | | 1,133,234 | |
WEX* | | | 15,544 | | | | 1,165,956 | |
| | | | | | | | |
| | | | | | | 50,729,361 | |
| | | | | | | | |
Energy — 5.0% | | | | | | | | |
Basic Energy Services* | | | 104,780 | | | | 1,532,931 | |
Flotek Industries* | | | 99,720 | | | | 1,400,069 | |
Geospace Technologies* | | | 10,714 | | | | 1,042,687 | |
Halcon Resources* | | | 163,890 | | | | 1,163,619 | |
Helix Energy Solutions Group* | | | 33,064 | | | | 774,028 | |
Kodiak Oil & Gas* | | | 132,910 | | | | 1,182,899 | |
Rex Energy* | | | 96,456 | | | | 1,300,227 | |
Rosetta Resources* | | | 18,330 | | | | 892,304 | |
Walter Energy | | | 23,490 | | | | 746,747 | |
| | | | | | | | |
| | | | | | | 10,035,511 | |
| | | | | | | | |
Financial — 9.7% | | | | | | | | |
Boston Private Financial Holdings | | | 99,330 | | | | 906,883 | |
Campus Crest Communities, REIT | | | 108,362 | | | | 1,358,860 | |
|
The accompanying notes are an integral part of the financial statements. |
|
6 |
PERIMETER
SMALL CAP GROWTH FUND
Portfolio of Investments (Concluded)
February 28, 2013
(Unaudited)
| | | | | | | | |
| | | Shares | | | Value | |
| | |
Financial — (Continued) | | | | | | | | |
Cubesmart, REIT | | | 95,000 | | | $ | 1,400,300 | |
Education Realty Trust, REIT | | | 160,190 | | | | 1,747,673 | |
Endurance Specialty Holdings | | | 43,370 | | | | 1,910,015 | |
Horace Mann Educators | | | 82,510 | | | | 1,688,155 | |
Iberiabank | | | 29,212 | | | | 1,466,442 | |
Nationstar Mortgage Holdings* | | | 51,240 | | | | 1,974,277 | |
Pinnacle Financial Partners* | | | 66,260 | | | | 1,438,505 | |
Platinum Underwriters Holdings | | | 39,880 | | | | 2,108,854 | |
ProAssurance | | | 38,006 | | | | 1,782,101 | |
WageWorks* | | | 76,590 | | | | 1,808,290 | |
| | | | | | | | |
| | | | | | | 19,590,355 | |
| | | | | | | | |
Industrial — 14.1% | | | | | | | | |
A.O. Smith | | | 8,746 | | | | 625,601 | |
AZZ | | | 33,950 | | | | 1,516,207 | |
Belden | | | 18,280 | | | | 920,581 | |
Celadon Group | | | 49,570 | | | | 987,930 | |
Chart Industries* | | | 12,357 | | | | 896,624 | |
Covanta Holding | | | 113,410 | | | | 2,218,300 | |
Darling International* | | | 34,960 | | | | 583,482 | |
DXP Enterprises* | | | 16,080 | | | | 1,000,176 | |
EMCOR Group | | | 40,210 | | | | 1,550,900 | |
EnPro Industries* | | | 26,620 | | | | 1,238,629 | |
Exponent* | | | 19,756 | | | | 993,134 | |
Gulfmark Offshore, Cl A | | | 38,570 | | | | 1,377,720 | |
Hexcel* | | | 64,580 | | | | 1,759,805 | |
Middleby* | | | 7,910 | | | | 1,181,042 | |
Newport* | | | 42,860 | | | | 700,761 | |
NVE* | | | 7,373 | | | | 390,474 | |
Old Dominion Freight Line* | | | 38,046 | | | | 1,367,754 | |
OSI Systems* | | | 39,007 | | | | 2,247,973 | |
Proto Labs* | | | 22,280 | | | | 1,035,797 | |
Regal-Beloit | | | 19,190 | | | | 1,483,003 | |
Tetra Tech* | | | 59,710 | | | | 1,723,231 | |
TriMas* | | | 45,206 | | | | 1,296,960 | |
Triumph Group | | | 16,820 | | | | 1,234,756 | |
| | | | | | | | |
| | | | | | | 28,330,840 | |
| | | | | | | | |
Technology — 14.2% | | | | | | | | |
Aspen Technology* | | | 47,580 | | | | 1,463,561 | |
AVG Technologies NV* | | | 117,220 | | | | 1,840,354 | |
Cavium* | | | 36,410 | | | | 1,344,257 | |
CommVault Systems* | | | 13,274 | | | | 981,612 | |
| | | | | | | | |
| | | Shares | | | Value | |
| | |
Technology — (Continued) | | | | | | | | |
Cypress Semiconductor | | | 151,960 | | | $ | 1,600,139 | |
Diodes* | | | 80,653 | | | | 1,607,414 | |
Fortinet* | | | 72,000 | | | | 1,740,960 | |
inContact* | | | 170,831 | | | | 1,159,942 | |
InnerWorkings* | | | 82,026 | | | | 1,211,524 | |
InterXion Holding NV* | | | 51,270 | | | | 1,267,907 | |
LivePerson* | | | 70,127 | | | | 1,014,738 | |
MedAssets* | | | 91,897 | | | | 1,697,338 | |
Mentor Graphics* | | | 96,030 | | | | 1,700,691 | |
NetScout Systems* | | | 43,040 | | | | 1,094,507 | |
Omnicell* | | | 24,490 | | | | 441,310 | |
RADWARE* | | | 56,945 | | | | 2,071,659 | |
Rovi* | | | 110,020 | | | | 1,957,256 | |
SS&C Technologies Holdings* | | | 65,930 | | | | 1,668,688 | |
Ultimate Software Group* | | | 12,110 | | | | 1,190,050 | |
Volterra Semiconductor* | | | 108,674 | | | | 1,668,146 | |
| | | | | | | | |
| | | | | | | 28,722,053 | |
| | | | | | | | |
TOTAL COMMON STOCKS
(Cost $153,154,010) | | | | 189,202,224 | |
| | | | | | | | |
WARRANTS - 0.0% | | | | | | | | |
Energy — 0.0% | | | | | | | | |
Magnum Hunter Resources
Exercise Price $10.50, Expires 10/14/13 | | | 31,749 | | | | 4,207 | |
| | | | | | | | |
TOTAL WARRANTS
(Cost $0) | | | | | | | 4,207 | |
| | | | | | | | |
TOTAL INVESTMENTS - 93.7%
(Cost $153,154,010) | | | | 189,206,431 | |
| | | | | | | | |
OTHER ASSETS IN EXCESS OF
LIABILITIES - 6.3% | | | | 12,678,244 | |
| | | | | | | | |
NET ASSETS - 100.0% | | | | | | $ | 201,884,675 | |
| | | | | | | | |
| † | More narrow industries are utilized for compliance purposes, whereas broad sectors are utilized for reporting purposes. |
| * | Non-income producing security. |
| | |
Cl | | Class |
PLC | | Public Limited Company |
REIT | | Real Estate Investment Trusts |
SP ADR | | Sponsored American Depositary Receipt |
|
The accompanying notes are an integral part of the financial statements. |
|
7 |
PERIMETER
SMALL CAP GROWTH FUND
Statement of Assets and Liabilities
February 28, 2013
(Unaudited)
| | | | |
ASSETS | | | | |
Investments, at value (Cost $153,154,010) | | $ | 189,206,431 | |
Cash | | | 9,271,807 | |
Receivables | | | | |
Investments sold | | | 4,936,570 | |
Capital shares sold | | | 439,769 | |
Dividends and Interest | | | 69,832 | |
Prepaid expenses and other assets | | | 41,391 | |
| | | | |
Total assets | | | 203,965,800 | |
| | | | |
| |
LIABILITIES | | | | |
Payable for investments purchased | | | 1,593,967 | |
Capital shares redeemed | | | 228,961 | |
Investment advisory fees | | | 119,209 | |
Administration and accounting fees | | | 32,662 | |
Directors’ and officers’ fees | | | 125 | |
Other accrued expenses and liabilities | | | 106,201 | |
| | | | |
Total liabilities | | | 2,081,125 | |
| | | | |
Net Assets | | $ | 201,884,675 | |
| | | | |
NET ASSETS CONSISTS OF | | | | |
Par Value | | $ | 22,384 | |
Paid-in capital | | | 157,057,959 | |
Accumulated net investment loss | | | (1,300,996 | ) |
Accumulated net realized gain from investments | | | 10,052,907 | |
Net unrealized appreciation on investments | | | 36,052,421 | |
| | | | |
Net Assets | | $ | 201,884,675 | |
| | | | |
| |
Investor Class Shares: | | | | |
Net Assets | | $ | 9,857,730 | |
| | | | |
Shares outstanding ($0.001 par value, 100,000,000 shares authorized) | | | 1,109,192 | |
| | | | |
Net asset value, offering and redemption price per share | | $ | 8.89 | |
| | | | |
| |
I Shares: | | | | |
Net Assets | | $ | 192,026,945 | |
| | | | |
Shares outstanding ($0.001 par value, 100,000,000 shares authorized) | | | 21,274,551 | |
| | | | |
Net asset value, offering and redemption price per share | | $ | 9.03 | |
| | | | |
|
The accompanying notes are an integral part of the financial statements. |
|
8 |
PERIMETER
SMALL CAP GROWTH FUND
Statement of Operations
Six Months Ended February 28, 2013
(Unaudited)
| | | | |
Investment Income | | | | |
Dividends (net of foreign taxes withheld of $4,618) | | $ | 1,285,096 | |
Interest | | | 1,287 | |
| | | | |
Total investment income | | | 1,286,383 | |
| | | | |
Expenses | | | | |
Advisory fees | | | 912,743 | |
Transfer agent fees | | | 114,699 | |
Administration and accounting fees | | | 96,853 | |
Printing and shareholder reporting fees | | | 55,356 | |
Professional fees | | | 26,531 | |
Distribution fees(1) | | | 19,838 | |
Registration and filing fees | | | 16,133 | |
Directors’ and officers’ fees | | | 16,124 | |
Insurance fees | | | 8,407 | |
Custodian fees | | | 4,729 | |
Other expenses | | | 2,500 | |
| | | | |
Total expenses before waivers | | | 1,273,913 | |
Less: waivers of Advisory fees | | | (138,500 | ) |
| | | | |
Net expenses after waivers | | | 1,135,413 | |
| | | | |
Net investment income | | | 150,970 | |
| | | | |
Net realized and unrealized gain from investments | | | | |
Net realized gain from: | | | | |
Investments | | | 19,063,726 | |
Net change in unrealized appreciation on: | | | | |
Investments | | | 2,803,039 | |
| | | | |
Net realized and unrealized gain from investments | | | 21,866,765 | |
| | | | |
Net increase in net assets resulting from operations | | $ | 22,017,735 | |
| | | | |
| (1) | Attributable to Investor Class Shares |
|
The accompanying notes are an integral part of the financial statements. |
|
9 |
PERIMETER
SMALL CAP GROWTH FUND
Statement of Changes in Net Assets
| | | | | | | | |
| | | For the
Six Months
Ended
February 28, 2013
(Unaudited) | | | For the Year
Ended
August 31, 2012 | |
Increase/(decrease) in net assets from operations: | | | | | | | | |
Net investment income/(loss) | | $ | 150,970 | | | $ | (2,126,769 | ) |
Net realized gain from investments | | | 19,063,726 | | | | 20,219,831 | |
Net change in unrealized appreciation on investments | | | 2,803,039 | | | | 3,218,958 | |
| | | | | | | | |
Net increase in net assets resulting from operations | | | 22,017,735 | | | | 21,312,020 | |
| | | | | | | | |
Dividends and Distributions to shareholders from: | | | | | | | | |
Net Realized capital gains | | | | | | | | |
Investor Class Shares | | | (2,127,625 | ) | | | (19,965,000 | ) |
I Shares | | | (22,740,311 | ) | | | (40,427,651 | ) |
| | | | | | | | |
Net decrease in net assets from dividends and distributions to shareholders | | | (24,867,936 | ) | | | (60,392,651 | ) |
| | | | | | | | |
Increase/(decrease) in net assets in capital transactions: | | | | | | | | |
Investor Class Shares | | | | | | | | |
Proceeds from shares sold | | | 1,403,283 | | | | 13,504,662 | |
Reinvestment of distribution | | | 2,117,679 | | | | 19,950,107 | |
Shares redeemed | | | (13,990,944 | ) | | | (119,410,959 | ) |
| | | | | | | | |
Total Investor Class Shares | | | (10,469,982 | ) | | | (85,956,190 | ) |
| | | | | | | | |
I Shares | | | | | | | | |
Proceeds from shares sold | | | 19,841,045 | | | | 61,528,257 | |
Reinvestment of distributions | | | 22,371,805 | | | | 40,118,934 | |
Shares redeemed | | | (39,450,355 | ) | | | (100,504,504 | ) |
| | | | | | | | |
Total I Shares | | | 2,762,495 | | | | 1,142,687 | |
| | | | | | | | |
Redemption fees | | | 2,532 | | | | 1,848 | |
| | | | | | | | |
Net decrease in net assets from capital share transactions | | | (7,704,955 | ) | | | (84,811,655 | ) |
| | | | | | | | |
Total decrease in net assets | | | (10,555,156 | ) | | | (123,892,286 | ) |
Net assets | | | | | | | | |
Beginning of period | | | 212,439,831 | | | | 336,332,117 | |
| | | | | | | | |
End of period | | $ | 201,884,675 | | | $ | 212,439,831 | |
| | | | | | | | |
Accumulated net investment loss, end of period | | $ | (1,300,996 | ) | | $ | (1,451,966 | ) |
| | | | | | | | |
Increase/(decrease) in shares outstanding derived from share transactions: | | | | | | | | |
Investor Class Shares | | | | | | | | |
Shares sold | | | 156,390 | | | | 1,438,758 | |
Dividends and distributions reinvested | | | 263,066 | | | | 2,403,628 | |
Shares redeemed | | | (1,589,391 | ) | | | (12,777,914 | ) |
| | | | | | | | |
Total Invetor Class Shares | | | (1,169,935 | ) | | | (8,935,528 | ) |
| | | | | | | | |
I Shares | | | | | | | | |
Shares sold | | | 2,222,940 | | | | 6,653,884 | |
Dividends and distributions reinvested | | | 2,738,287 | | | | 4,781,756 | |
Shares redeemed | | | (4,283,090 | ) | | | (10,758,420 | ) |
| | | | | | | | |
Total I Shares | | | 678,137 | | | | 677,220 | |
| | | | | | | | |
Net decrease in shares outstanding from share transactions | | | (491,798 | ) | | | (8,258,308 | ) |
| | | | | | | | |
The accompanying notes are an integral part of the financial statements.
10
PERIMETER
SMALL CAP GROWTH FUND
Financial Highlights
Contained below is per share operating performance data for shares outstanding, total investment return, ratios to average net assets and other supplemental data for the respective periods. This information has been derived from information provided in the financial statements.
| | | | | | | | | | | | | | | | | | | | | | | | | | | | |
| |
| | | Investor Class Shares | |
| | | Six Month
Period Ended
February 28,
2013
(Unaudited) | | | Year
Ended
August 31,
2012 | | | Year
Ended
August 31,
2011 | | | One Month
Period Ended
August 31,
2010(1)(2) | | | Year
Ended
July 31,
2010(2) | | | Year
Ended
July 31,
2009(2) | | | Year
Ended
July 31,
2008(2) | |
Net asset value, Beginning of Period | | $ | 9.18 | | | $ | 10.75 | | | $ | 8.79 | | | $ | 9.53 | | | $ | 8.45 | | | $ | 10.40 | | | $ | 11.49 | |
| | | | | | | | | | | | | | | | | | | | | | | | | | | | |
Income/(Loss) from Operations: | | | | | | | | | | | | | | | | | | | | | | | | | | | | |
Net Investment Income/(Loss)(3) | | | — | (4) | | | (0.09 | ) | | | (0.11 | ) | | | (0.01 | ) | | | (0.09 | ) | | | (0.05 | ) | | | (0.08 | ) |
Net Realized and Unrealized Gains (Loss) on Investments | | | 0.92 | | | | 0.58 | | | | 2.07 | | | | (0.73 | ) | | | 1.17 | | | | (1.90 | ) | | | (0.88 | ) |
| | | | | | | | | | | | | | | | | | | | | | | | | | | | |
Total from Operations | | | 0.92 | | | | 0.49 | | | | 1.96 | | | | (0.74 | ) | | | 1.08 | | | | (1.95 | ) | | | (0.96 | ) |
| | | | | | | | | | | | | | | | | | | | | | | | | | | | |
Dividends and Distributions from: | | | | | | | | | | | | | | | | | | | | | | | | | | | | |
Net Realized Gains | | | (1.21 | ) | | | (2.06 | ) | | | — | | | | — | | | | — | | | | — | | | | (0.13 | ) |
| | | | | | | | | | | | | | | | | | | | | | | | | | | | |
Total Dividends and Distributions | | | (1.21 | ) | | | (2.06 | ) | | | — | | | | — | | | | — | | | | — | | | | (0.13 | ) |
| | | | | | | | | | | | | | | | | | | | | | | | | | | | |
Redemption Fees | | | — | (4) | | | — | (4) | | | — | (4) | | | — | (4) | | | — | (4) | | | — | (4) | | | — | |
| | | | | | | | | | | | | | | | | | | | | | | | | | | | |
Net asset value, End of Period | | $ | 8.89 | | | $ | 9.18 | | | $ | 10.75 | | | $ | 8.79 | | | $ | 9.53 | | | $ | 8.45 | | | $ | 10.40 | |
| | | | | | | | | | | | | | | | | | | | | | | | | | | | |
Total Return(5) | | | 11.43 | % | | | 6.56 | % | | | 22.30 | % | | | (7.77 | )% | | | 12.78 | % | | | (18.75 | )% | | | (8.47 | )% |
| | | | | | | | | | | | | | | | | | | | | | | | | | | | |
Ratios/Supplemental Data | | | | | | | | | | | | | | | | | | | | | | | | | | | | |
Net assets, End of Period (Thousands) | | $ | 9,858 | | | $ | 20,930 | | | $ | 120,543 | | | $ | 160,496 | | | $ | 174,434 | | | $ | 138,929 | | | $ | 122,353 | |
Ratio of Expenses to Average Net Assets (including waivers and recoupment, excluding fees paid indirectly) | | | 1.35 | %(6) | | | 1.35 | % | | | 1.35 | % | | | 1.35 | %(6) | | | 1.29 | % | | | 1.11 | % | | | 1.20 | % |
Ratio of Expenses to Average Net Assets (including waivers and recoupment and fees paid indirectly) | | | 1.35 | %(6) | | | 1.35 | % | | | 1.35 | % | | | 1.35 | %(6) | | | 1.29 | % | | | 1.09 | % | | | 1.16 | % |
Ratio of Expenses to Average Net Assets (excluding waivers and recoupment and fees paid indirectly) | | | 1.48 | %(6) | | | 1.45 | % | | | 1.38 | % | | | 1.47 | %(6) | | | 1.34 | % | | | 1.41 | % | | | 1.51 | % |
Ratio of Net Investment Income/(Loss) to Average Net Assets | | | 0.02 | %(6) | | | (0.93 | )% | | | (0.93 | )% | | | (0.97 | )%(6) | | | (0.93 | )% | | | (0.66 | )% | | | (0.74 | )% |
Portfolio Turnover Rate(7) | | | 55 | % | | | 138 | % | | | 122 | % | | | 7 | % | | | 97 | % | | | 126 | % | | | 147 | % |
| (1) | The Fund changed its fiscal year end to August 31. |
| (2) | Effective February 8, 2010, the Fund acquired all the assets and liabilities of the Perimeter Small Cap Growth Fund, a series of The Advisors’ Inner Circle Fund II (the “Predecessor Fund”). The financial highlights for the period to that date reflect the performance of the Pedecessor Fund. |
| (3) | Per share data calculated using average share method. |
| (4) | Amount is less than $0.01 per share. |
| (5) | Total return has not been annualized for periods less than one year. Total return would have been lower had certain expenses not been waived by the Adviser during the period. The return shown does not reflect the deduction of taxes that a shareholder would pay on Fund distributions or the redemptions of Fund shares. |
| (7) | Portfolio turnover rate has not been annualized for periods less than one year. |
The accompanying notes are an integral part of the financial statements.
11
PERIMETER
SMALL CAP GROWTH FUND
Financial Highlights
Contained below is per share operating performance data for shares outstanding, total investment return, ratios to average net assets and other supplemental data for the respective period. This information has been derived from information provided in the financial statements.
| | | | | | | | | | | | | | | | | | | | | | | | | | | | |
| | | I Shares | |
| | | Six Month
Period Ended
February 28,
2013
(Unaudited) | | | Year
Ended
August 31,
2012 | | | Year
Ended
August 31,
2011 | | | One Month
Period Ended
August 31,
2010(1)(2) | | | Year
Ended
July 31,
2010(2) | | | Year
Ended
July 31,
2009(2) | | | Period
Ended
July 31,
2008(3) | |
Net asset value, Beginning of Period | | $ | 9.30 | | | $ | 10.83 | | | $ | 8.84 | | | $ | 9.58 | | | $ | 8.48 | | | $ | 10.42 | | | $ | 11.53 | |
| | | | | | | | | | | | | | | | | | | | | | | | | | | | |
Income/(Loss) from Operations: | | | | | | | | | | | | | | | | | | | | | | | | | | | | |
Net Investment Income/(Loss)(4) | | | 0.01 | | | | (0.07 | ) | | | (0.08 | ) | | | (0.01 | ) | | | (0.07 | ) | | | (0.05 | ) | | | (0.04 | ) |
Net Realized and Unrealized Gains (Loss) on Investments | | | 0.93 | | | | 0.60 | | | | 2.07 | | | | (0.73 | ) | | | 1.17 | | | | (1.89 | ) | | | (1.07 | ) |
| | | | | | | | | | | | | | | | | | | | | | | | | | | | |
Total from Operations | | | 0.94 | | | | 0.53 | | | | 1.99 | | | | (0.74 | ) | | | 1.10 | | | | (1.94 | ) | | | (1.11 | ) |
| | | | | | | | | | | | | | | | | | | | | | | | | | | | |
Dividends and Distributions from: | | | | | | | | | | | | | | | | | | | | | | | | | | | | |
Net Realized Gains | | | (1.21 | ) | | | (2.06 | ) | | | — | | | | — | | | | — | | | | — | | | | — | |
| | | | | | | | | | | | | | | | | | | | | | | | | | | | |
Total Dividends and Distributions | | | (1.21 | ) | | | (2.06 | ) | | | — | | | | — | | | | — | | | | — | | | | — | |
| | | | | | | | | | | | | | | | | | | | | | | | | | | | |
Redemption Fees | | | — | (5) | | | — | (5) | | | — | (5) | | | — | (5) | | | — | (5) | | | — | (5) | | | — | |
| | | | | | | | | | | | | | | | | | | | | | | | | | | | |
Net asset value, End of Period | | $ | 9.03 | | | $ | 9.30 | | | $ | 10.83 | | | $ | 8.84 | | | $ | 9.58 | | | $ | 8.48 | | | $ | 10.42 | |
| | | | | | | | | | | | | | | | | | | | | | | | | | | | |
Total Return(6) | | | 11.51 | % | | | 6.93 | % | | | 22.51 | % | | | (7.73 | )% | | | 12.97 | % | | | (18.62 | )% | | | (9.63 | )% |
| | | | | | | | | | | | | | | | | | | | | | | | | | | | |
Ratios/Supplemental Data | | | | | | | | | | | | | | | | | | | | | | | | | | | | |
Net assets, End of Period (Thousands) | | $ | 192,027 | | | $ | 191,510 | | | $ | 215,789 | | | $ | 165,334 | | | $ | 179,290 | | | $ | 154,905 | | | $ | 26,616 | |
Ratio of Expenses to Average Net Assets (including waivers and recoupment, excluding fees paid indirectly) | | | 1.10 | %(7) | | | 1.10 | % | | | 1.10 | % | | | 1.10 | %(7) | | | 1.10 | % | | | 1.04 | % | | | 1.03 | %(7) |
Ratio of Expenses to Average Net Assets (including waivers and recoupment and fees paid indirectly) | | | 1.10 | %(7) | | | 1.10 | % | | | 1.10 | % | | | 1.10 | %(7) | | | 1.10 | % | | | 1.03 | % | | | 1.00 | %(7) |
Ratio of Expenses to Average Net Assets (excluding waivers and recoupment and fees paid indirectly) | | | 1.24 | %(7) | | | 1.20 | % | | | 1.14 | % | | | 1.22 | %(7) | | | 1.16 | % | | | 1.36 | % | | | 1.37 | %(7) |
Ratio of Net Investment Income/(Loss) to Average Net Assets | | | 0.16 | %(7) | | | (0.68 | )% | | | (0.69 | )% | | | (0.72 | )%(7) | | | (0.74 | )% | | | (0.64 | )% | | | (0.58 | )%(7) |
Portfolio Turnover Rate(8) | | | 55 | % | | | 138 | % | | | 122 | % | | | 7 | % | | | 97 | % | | | 126 | % | | | 147 | %(9) |
| (1) | The Fund changed its fiscal year end to August 31. |
| (2) | Effective February 8, 2010, the Fund acquired all the assets and liabilities of the Perimeter Small Cap Growth Fund, a series of The Advisors’ Inner Circle Fund II (the “Predecessor Fund”). The financial highlights for the period to that date reflect the performance of the Pedecessor Fund. |
| (3) | Commenced operations on December 31, 2007. |
| (4) | Per share data calculated using average share method. |
| (5) | Amount is less than $0.01 per share. |
| (6) | Total return has not been annualized for periods less than one year. Total return would have been lower had certain expenses not been waived by the Adviser during the period. The return shown does not reflect the deduction of taxes that a shareholder would pay on Fund distributions or the redemptions of Fund shares. |
| (8) | Portfolio turnover rate has not been annualized for periods less than one year. |
| (9) | Portfolio turnover rate is for the Fund for the year ended July 31, 2008. |
The accompanying notes are an integral part of the financial statements.
12
PERIMETER
SMALL CAP GROWTH FUND
Notes to Financial Statements
February 28, 2013
(Unaudited)
1. Organization and Significant Accounting Policies
The RBB Fund, Inc. (“RBB” or the “Company”) was incorporated under the laws of the State of Maryland on February 29, 1988 and is registered under the Investment Company Act of 1940, as amended, (the “1940 Act”) as an open-end management investment company. RBB is a “series fund,” which is a mutual fund divided into separate portfolios. Each portfolio is treated as a separate entity for certain matters under the 1940 Act, and for other purposes, and a shareholder of one portfolio is not deemed to be a shareholder of any other portfolio. Currently, RBB has seventeen active investment portfolios, including the Perimeter Small Cap Growth Fund (the “Fund”).
RBB has authorized capital of one hundred billion shares of common stock of which 80.573 billion shares are currently classified into one hundred and forty-two classes of common stock. Each class represents an interest in an active or inactive RBB investment portfolio.
The investment objective of the Fund is to seek long-term capital appreciation. The Fund invests primarily (at least 80% of its net assets) in small-cap equity securities. The assets of each fund of the Company are segregated, and a shareholder’s interest is limited to the fund in which shares are held.
The Fund is registered to offer Investment Class Shares and I Shares.
PORTFOLIO VALUATION – The Fund’s net asset value (“NAV”) is calculated once daily at the close of regular trading hours on the New York Stock Exchange (“NYSE”) (generally 4:00 p.m. Eastern time) on each day the NYSE is open. Securities held by the Fund are valued using the closing price or the last sale price on a national securities exchange or the National Association of Securities Dealers Automatic Quotation System (“NASDAQ”) market system where they are primarily traded. Equity securities traded in the over-the-counter market are valued at their closing prices. If there were no transactions on that day, securities traded principally on an exchange or on NASDAQ will be valued at the mean of the last bid and ask prices prior to the market close. If market quotations are unavailable or deemed unreliable, securities will be valued in accordance with procedures adopted by the Company’s Board of Directors. Relying on prices supplied by pricing services or dealers or using fair valuation may result in values that are higher or lower than the values used by other investment companies and investors to price the same investments.
Fair Value Measurements – The inputs and valuation techniques used to measure fair value of the Fund’s investments are summarized into three levels as described in the hierarchy below:
| | • | | Level 1 — quoted prices in active markets for identical securities; |
| | • | | Level 2 — other significant observable inputs (including quoted prices for similar securities, interest rates, prepayment |
speeds, credit risk, etc.); and
| | • | | Level 3 — significant unobservable inputs (including the Fund’s own assumptions in determining the fair value of |
investments).
The inputs or methodology used for valuing securities are not necessarily an indication of the risk associated with investing in those securities.
The following is a summary of the inputs used, as of February 28, 2013, in valuing the Fund’s investments carried at fair value:
| | | | | | | | | | | | | | | | |
| | | Total
Value at
February 28,
2013 | | | Level 1
Quoted
Price | | | Level 2
Other
Significant
Observable
Inputs | | | Level 3
Significant
Unobservable
Inputs | |
Common Stocks* | | | $189,202,224 | | | | $189,202,224 | | | | $— | | | | $— | |
Warrants | | | 4,207 | | | | 4,207 | | | | — | | | | — | |
| | | | | | | | | | | | | | | | |
Total | | | $189,206,431 | | | | $189,206,431 | | | | $— | | | | $— | |
| | | | | | | | | | | | | | | | |
| * | Please refer to Portfolio of Investments for industry and sector type breakouts. |
At the end of each fiscal quarter, management evaluates the classification of Levels 1, 2 and 3 assets and liabilities. Various factors are considered, such as changes in liquidity from the prior reporting period; whether or not a broker is willing to execute at the quoted price; the depth and consistency of prices from third party pricing services; and the existence of contemporaneous, observable trades in the market. Additionally, management evaluates the classification of Level 1 and Level 2 assets and liabilities on a quarterly basis for changes in listings or delistings on national exchanges.
13
PERIMETER
SMALL CAP GROWTH FUND
Notes to Financial Statements (Continued)
February 28, 2013
(Unaudited)
Due to the inherent uncertainty of determining the fair value of investments that do not have a readily available market value, the fair value of the Fund’s investments may fluctuate from period to period. Additionally, the fair value of investments may differ significantly from the values that would have been used had a ready market existed for such investments and may differ materially from the values the Fund may ultimately realize. Furthermore, such investments may be subject to legal and other restrictions on resale or otherwise less liquid than publicly traded securities.
For fair valuations using significant unobservable inputs, U.S. generally accepted accounting principles (“U.S. GAAP”) require the Fund to present a reconciliation of the beginning to ending balances for reported market values that presents changes attributable to total realized and unrealized gains or losses, purchase and sales, and transfers in and out of Level 3 during the period. Transfers in and out between Levels are based on values at the end of the period. U.S. GAAP also requires the Fund to disclose amounts and reasons for all transfers in and out of Level 1 and Level 2 fair value measurements. A reconciliation of Level 3 investments is presented only when the Fund had an amount of Level 3 investments at the end of the reporting period that was meaningful in relation to its net assets. The amounts and reasons for all transfers in and out of each Level within the three-tier hierarchy are disclosed when the Fund had an amount of total transfers during the reporting period that was meaningful in relation to its net assets as of the end of the reporting period.
For the period ended February 28, 2013, there were no transfers between Levels 1, 2 and 3 for the Fund.
USE OF ESTIMATES — The preparation of financial statements in conformity with U.S. GAAP requires management to make estimates and assumptions that affect the reported amounts of assets and liabilities and disclosure of contingent assets and liabilities at the date of the financial statements and the reported amounts of revenues and expenses during the period. Actual results could differ from those estimates and those differences could be significant.
INVESTMENT TRANSACTIONS, INVESTMENT INCOME AND EXPENSES — The Fund records security transactions based on trade date for financial reporting purposes. The cost of investments sold is determined by use of the specific identification method for both financial reporting and income tax purposes in determining realized gains and losses on investments. Interest income is accrued when earned. Dividend income is recorded on the ex-dividend date. Distributions received on securities that represent a return of capital or capital gains are recorded as a reduction of cost of investments and/or as a realized gain. The Fund’s investment income, expenses and unrealized and realized gains and losses are allocated daily. Expenses incurred on behalf of a specific class, fund or fund family of the Company are charged directly to the class, fund or fund family to each class of shares based upon the relative proportion of net assets of each class at the beginning of the day. Expenses incurred for all the RBB funds (such as director or professional fees) are charged to all funds in proportion to their average net assets of RBB, or in such other manner as the Company’s Board of Directors deems fair or equitable. Expenses and fees, including investment advisory and administration fees, are accrued daily and taken into account for the purpose of determining the NAV of the Fund.
DIVIDENDS AND DISTRIBUTIONS TO SHAREHOLDERS — Dividends from net investment income, if any, are declared and paid quarterly. Net realized capital gains, if any, are declared and paid annually. Income dividends and capital gain distributions are determined in accordance with U.S. federal income tax regulations which may differ from U.S. GAAP.
U.S. TAX STATUS — No provision is made for U.S. income taxes as it is the Fund’s intention to qualify for and elect the tax treatment applicable to regulated investment companies under Subchapter M of the Internal Revenue Code of 1986, as amended, and make the requisite distributions to its shareholders which will be sufficient to relieve it from U.S. income and excise taxes.
CASH AND CASH EQUIVALENTS — The Funds consider liquid assets deposited into a bank demand deposit account to be cash equivalents. These investments represent amounts held with financial institutions that are readily accessible to pay Fund expenses or purchase investments. Cash and cash equivalents are valued at cost plus accrued interest, which approximates market value.
REDEMPTION FEES — The Fund retains a redemption fee of 2% on redemptions of Fund shares held less than seven days. The fees are reflected on the Statements of Changes in Net Assets. The Fund reserves the right to modify or eliminate the redemption fees or waivers at any time.
OTHER — In the normal course of business, the Fund may enter into contracts that provide general indemnifications. The Fund’s maximum exposure under these arrangements is dependent on claims that may be made against the Fund in the future, and, therefore, cannot be estimated; however, based on experience, the risk of material loss from such claims is considered remote.
14
PERIMETER
SMALL CAP GROWTH FUND
Notes to Financial Statements (Continued)
February 28, 2013
(Unaudited)
2. Investment Adviser and Other Services
Perimeter Capital Management (the “Adviser”) serves as investment adviser to the Fund. For its services, the Adviser is entitled to receive a monthly fee, which is calculated daily and paid monthly, at an annual rate of 0.90% of the Fund’s average daily net assets. The Adviser has contractually agreed to waive its advisory fee and/or reimburse expenses in order to limit total annual Fund operating expenses (excluding certain items discussed below) to 1.35% and 1.10% of the Fund’s average daily net assets attrbutable to Ivestor Class Shares and I Shares, respectively. In determining the Adviser’s obligation to waive advisory fees and/or reimburse expenses, the following expenses are not taken into account: acquired fund fees and expenses, brokerage commissions, extraordinary items, interest or taxes. This contractual limitation is in effect until December 31, 2013 and may not be terminated without the approval of the Company’s Board of Directors. If at any time during the first three years the advisory agreement is in effect, the Fund’s total annual Fund operating expenses for that year are less than 1.35% and 1.10% of the Fund’s Investor Class Shares and I Shares average daily net assets, respectively, the Adviser may recoup any waived amount from the Fund if such reimbursement does not cause the Fund to exceed existing expense limitations. As of February 28, 2013, the total fees which were previously waived by the Adviser which may be subject to possible future reimbursement to the Adviser were $183,424, $275,981 and $138,500, expiring in 2014, 2015 and 2016, respectively.
BNY Mellon Investment Servicing (US) Inc. (“BNY Mellon”) serves as administrator for the Fund. For providing administrative and accounting services, BNY Mellon is entitled to receive a monthly fee equal to an annual percentage rate of the Fund’s average daily net assets, subject to certain minimum monthly fees.
Included in the administration and accounting service fees, shown on the Statement of Operations, are fees for providing regulatory administration services to RBB. For providing these services, BNY Mellon is entitled to receive compensation as agreed to by the Company and BNY Mellon. This fee is allocated to each portfolio of the Company in proportion to its net assets of the Company.
In addition, BNY Mellon serves as the Fund’s transfer and dividend disbursing agent. For providing transfer agent services, BNY Mellon is entitled to receive a monthly fee equal to an annual percentage rate of the Fund’s average daily net assets, subject to certain minimum monthly fees.
The Bank of NewYork Mellon (the “Custodian”) provides certain custodian services to the Fund. The Custodian is entitled to receive a monthly fee equal to an annual percentage rate of the Fund’s average daily net assets, subject to certain minimum monthly fees.
Foreside Funds Distributors LLC serves as the principal underwriter and distributor of the Fund’s shares pursuant to a Distribution Agreement with RBB.
3. Director Compensation
The Directors of the Company receive an annual retainer and meeting fees for meetings attended. The remuneration paid to the Directors by the Fund during the six months ended February 28, 2013 was $11,014. Certain employees of BNY serve as an Officer or Director of the Company. They are not compensated by the Fund or the Company.
4. Investment in Securities
For the six months ended February 28, 2013, aggregate purchases and sales of investment securities (excluding short-term investments) of the Fund were as follows:
| | |
Purchases | | Sales |
$109,070,004 | | $148,588,508 |
15
PERIMETER
SMALL CAP GROWTH FUND
Notes to Financial Statements (Concluded)
February 28, 2013
(Unaudited)
5. Federal Income Tax Information
The Fund has followed the authoritative guidance on accounting for and disclosure of uncertainty in tax positions, which requires the Fund to determine whether a tax position is more likely than not to be sustained upon examination, including resolution of any related appeals or litigation processes, based on the technical merits of the position. The Fund has determined that there was no effect on the financial statements from following this authoritative guidance. In the normal course of business, the Fund is subject to examination by federal, state and local jurisdictions, where applicable, for tax years for which applicable statutes of limitations have not expired.
As of February 28, 2013, the federal tax cost, aggregate gross unrealized appreciation and depreciation of securities held by the Fund were as follows:
| | | | | | |
| | | | | | | Net |
| Federal Tax | | Unrealized | | Unrealized | | Unrealized |
Cost | | Appreciation | | Depreciation | | Appreciation |
$153,154,010 | | $38,654,314 | | $(2,601,893) | | $36,052,421 |
Distributions to shareholders from net investment income and realized gains are determined in accordance with federal income tax regulations, which may differ from net investment income and realized gains recognized for financial reporting purposes. Accordingly, the character of distributions and composition of net assets for tax purposes may differ from those reflected in the accompanying financial statements. To the extent these differences are permanent, such amounts are reclassified within the capital accounts based on the tax treatment; temporary differences do not require such reclassification.
As of August 31, 2012, the components of distributable earnings on a tax basis were as follows:
| | | | | | |
| | | | | | | Qualified |
| Undistributed | | Undistributed | | Unrealized | | Late-Year |
Ordinary Income | | Long-Term Gains | | Appreciation | | Loss Deferral |
$ — | | $19,471,521 | | $29,634,978 | | $(1,451,966) |
The differences between the book and tax basis components of distributable earnings relate principally to the timing of recognition of income and gains for federal income tax purposes.
The tax character of dividends and distributions paid during the year ended August 31, 2012 was as follows:
| | | | |
| Ordinary | | Long-Term | | |
Income | | Gains | | Total |
$9,096,108 | | $51,296,543 | | $60,392,651 |
Dividends from net investment income and short-term capital gains are treated as ordinary income dividends for federal income tax purposes.
Accumulated capital losses represent net capital loss carry forwards as of August 31, 2012 that may be available to offset future realized capital gains and thereby reduce future capital gains distributions. Under the Regulated Investment Company Modernization Act of 2010 (the “Modernization Act”), the Fund is permitted to carry forward capital losses incurred in taxable years beginning after December 22, 2010 for an unlimited period. Any losses incurred during those future taxable years will be required to be utilized prior to any losses incurred in pre-enactment taxable years. Additionally, post-enactment capital losses that are carried forward will retain their character as either short-term or long-term capital losses rather than being considered all short-term as under the previous law. The Fund’s first fiscal year end subject to the Modernization Act was August 31, 2012. There were no capital loss carryforwards as of August 31, 2012.
6. Subsequent Events
Management has evaluated the impact of all subsequent events on the Fund through the date the financial statements were issued, and has determined that there was the following subsequent event:
For the period March 1, 2013 through April 19, 2013, there were net redemptions of $123,157,785, which represented 61% of the Fund’s net assets.
16
PERIMETER
SMALL CAP GROWTH FUND
Other Information
(Unaudited)
Proxy Voting
Policies and procedures that the Fund uses to determine how to vote proxies relating to portfolio securities as well as information regarding how the Fund voted proxies relating to portfolio securities for the most recent six-month period ended June 30 are available without charge, upon request, by calling (888) 968-4964 and on the Securities and Exchange Commission’s (“SEC”) website at http://www.sec.gov.
Quarterly Portfolio Schedules
The Company will file its complete schedule of portfolio holdings with the SEC for the first and third fiscal quarters of each fiscal year (quarters ended November 30 and May 31) on Form N-Q. The Company’s Forms N-Q will be available on the SEC’s website at http://www.sec.gov and may be reviewed and copied at the SEC’s Public Reference Room in Washington, D.C. Information on the operation of the SEC’s Public Reference Room may be obtained by calling (202) 551-8090.
17
Intentionally Left Blank
Intentionally Left Blank
Investment Adviser
Perimeter Capital Management
Six Concourse Parkway
Suite 3300
Atlanta, Ga 30328
Administrator
BNY Mellon Investment Servicing (US) Inc.
301 Bellevue Parkway
Wilmington, DE 19809
Transfer Agent
BNY Mellon Investment Servicing (US) Inc.
4400 Computer Drive
Westborough, MA 01581
Principal Underwriter
Foreside Funds Distributors LLC
400 Berwyn Park
899 Cassatt Road
Berwyn, PA 19312
Custodian
The Bank of New York Mellon
One Wall Street
New York, NY 10286
Independent Registered Public Accounting Firm
Ernst & Young LLP
One Commerce Square
2005 Market Street, Suite 700
Philadelphia, PA 19103
Legal Counsel
Drinker, Biddle & Reath LLP
One Logan Square, Ste. 2000
Philadelphia, PA 19103-6996
| | |
GENERAL MARKET COMMENTARY | | |
Dear Shareholder,
The U.S. Equity markets performed remarkably well throughout the six months ended February 2013, with most major indices returning better than 10% over the period. As of the end of February, the Federal Reserve’s (the “Fed”) monetary policy had trumped fiscal policy as their monthly $85 billion bond purchases more than compensated for the bickering in Congress over spending and budget legislation. Investors, dissatisfied with returns from near record low bond yields, began pouring billions into equity mutual funds during the first quarter of 2013, reversing a negative outflow trend that has been occurring for almost two years.
The lackluster stock market returns observed during the fourth quarter of 2012 were due to a host of well-documented worries. Investors faced expected downward earnings growth revisions resulting from Europe’s ongoing recession, which had caused collateral slowdowns in the emerging markets. Investors were also faced with the impact of the fiscal tightening and new tax increases coming out of the fiscal cliff deal that were expected to trim U.S. Gross Domestic Product (“GDP”) by 1% to 1.5% in 2013, and there also remained the ever present debt ceiling and further budget cuts looming into early 2013. Capital spending had also stalled as companies adopted a wait-and-see approach to those budget negotiations.
While these issues dominated headlines during the fourth quarter of 2012, the strong market performance of late has been the result of a number of positive developments that started to take affect late in the fourth quarter and into the first quarter of 2013. Some of the positive developments include the Fed’s ongoing near zero interest rate policy that has pushed mortgage rates to all-time lows, resulting in a surge of mortgage refinancings and increased disposable personal income. The long awaited housing recovery finally took root during the fourth quarter of 2012 resulting in reduced inventory, increasing existing home sales, increasing housing prices and rebounding housing starts. The slowly improving employment outlook also received a major boost after the Fed indicated that easy monetary policies will persist until the unemployment rate is below 6.5% in a low inflation environment.
Other nations have taken notice of the Fed’s bond purchases and seem to be emulating this easy monetary policy. The Bank of England, the Swiss National Bank and the European Central Bank have stepped up government bond purchases in their respective regions to stimulate global demand. Japan recently joined the “easy money club” as the Bank of Japan has significantly expanded its balance sheet and bond yields have plunged. Investors and global monetary authorities are gaining confidence that bond purchases will lead to lower interest rates which will encourage more borrowing, spending and hiring without reigniting inflation. Global trade authorities are beginning to understand that lower interest rates are intended to boost domestic demand rather than depress currency valuations to make exports more attractive.
While investors have become more optimistic, global economic news is still mixed. Europe continues to be mired in a recession and hope that growth will emerge in the second half of the year appears to be fading. China’s economy has had fits and starts and the Shanghai stock market has lagged this year. The U.S. economy may be tracking better than previously expected but even the most optimistic GDP forecasts call for less than 3% growth in 2013. On the other hand, if U.S. growth continues to pick up steam, then the Fed is likely to discontinue easy monetary policies and rising interest rates may choke off the recovery.
During each of the past three years, investors became hopeful about a recovery only to see the optimism fade throughout the year. In fact, over 70% of the S&P 500’s return has occurred during the first quarter of the year since 2010. Should we expect the same pattern this year? While we do not believe investors should expect double digit returns every quarter, we do not believe the market is due for a correction. The housing recovery appears to be on firm footing as home prices have been steadily climbing for the past year while inventories are at record lows. Easy monetary policies around the world should stimulate local borrowing and demand. With stock prices near all-time highs, home prices moving in the right direction and employment improving modestly, we would expect to see an increase in consumer spending. Finally, investors are more comfortable investing in equities as returns have gone up, volatility has come down and flows into equities have increased. We believe we are well on our way to a sustainable economic and equity market recovery.
As noted before, there are many moving parts in the global economic and political landscape. Rather than trying to predict these variable outcomes, we will continue to do what we do best—identify stocks that we believe will outperform for your portfolio. By focusing on companies with low valuation, high and increasing returns on capital and improving business momentum, we believe we can create excess returns for you regardless of the investing environment.
Sincerely,
Robeco Investment Management
Portfolio composition is subject to change. The current and future portfolio holdings of the Funds are subject to investment risk.
| | | | |
| SEMI-ANNUAL REPORT 2013 | | | 1 | |
| | |
Total Returns for the Period Ended February 28, 2013 (unaudited) |
| | | | | | | | | | | | | | | | | | | | |
| | | | | | | | | Average Annual | |
| | | Six-Month* | | | 1 Year | | | 5 Year | | | 10 Year | | | Since
Inception | |
| | | | |
| Robeco Boston Partners Small Cap Value Fund II | | | | | | | | | | | | | | | | | |
Institutional Class | | | 13.63 | % | | | 18.59 | % | | | 9.40 | % | | | 12.59 | % | | | N/A | |
Investor Class | | | 13.46 | % | | | 18.27 | % | | | 9.12 | % | | | 12.30 | % | | | N/A | |
Russell 2000® Value Index | | | 14.56 | % | | | 16.89 | % | | | 6.73 | % | | | 10.95 | % | | | N/A | |
Russell 2000® Index1 | | | 13.02 | % | | | 14.02 | % | | | 7.35 | % | | | 11.16 | % | | | N/A | |
1 This is not a primary benchmark of the Fund. Results of the index performance are presented for general comparative purposes. | |
| | | | |
| Robeco Boston Partners Long/Short Equity Fund | | | | | | | | | | | | | | | | | |
Institutional Class | | | 8.04 | % | | | 11.36 | % | | | 18.21 | % | | | 12.27 | % | | | N/A | |
Investor Class | | | 7.87 | % | | | 11.11 | % | | | 17.80 | % | | | 11.94 | % | | | N/A | |
S&P 500® Index | | | 8.94 | % | | | 13.46 | % | | | 4.94 | % | | | 8.24 | % | | | N/A | |
| | | | |
| Robeco Boston Partners Long/Short Research Fund | | | | | | | | | | | | | | | | | |
Institutional Class1 | | | 7.04 | % | | | 9.71 | % | | | N/A | | | | N/A | | | | 10.98 | % |
S&P 500® Index | | | 8.94 | % | | | 13.46 | % | | | N/A | | | | N/A | | | | 14.89 | % |
| | | | | |
Investor Class2 | | | 6.90 | % | | | 9.39 | % | | | N/A | | | | N/A | | | | 9.62 | % |
S&P 500® Index | | | 8.94 | % | | | 13.46 | % | | | N/A | | | | N/A | | | | 14.51 | % |
1 Inception date September 30, 2010 | |
2 Inception date November 29, 2010 | |
| | | | |
| Robeco Boston Partners All-Cap Value Fund | | | | | | | | | | | | | | | | | |
Institutional Class | | | 11.72 | % | | | 14.96 | % | | | 7.32 | % | | | 11.91 | % | | | N/A | |
Investor Class | | | 11.64 | % | | | 14.75 | % | | | 7.07 | % | | | 11.66 | % | | | N/A | |
Russell 3000® Value Index | | | 13.25 | % | | | 17.57 | % | | | 4.11 | % | | | 8.93 | % | | | N/A | |
Russell 3000® Index1 | | | 9.97 | % | | | 13.65 | % | | | 5.38 | % | | | 8.85 | % | | | N/A | |
1This is not a primary benchmark of the Fund. Results of the index performance are presented for general comparative purposes. | |
| | | | |
| Robeco WPG Small/Micro Cap Value Fund | | | | | | | | | | | | | | | | | |
Institutional Class1 | | | 19.47 | % | | | 18.97 | % | | | 7.01 | % | | | 10.34 | % | | | N/A | |
Russell 2000® Value Index | | | 14.56 | % | | | 16.89 | % | | | 6.73 | % | | | 10.95 | % | | | N/A | |
| | | | |
| Robeco Boston Partners Global Equity Fund | | | | | | | | | | | | | | | | | |
Institutional Class1 | | | 12.17 | % | | | 12.99 | % | | | N/A | | | | N/A | | | | 19.78 | % |
MSCI World Index | | | 11.12 | % | | | 11.37 | % | | | N/A | | | | N/A | | | | 20.50 | % |
1 Inception date December 30, 2011 | |
| | | | |
| Robeco Boston Partners International Equity Fund | | | | | | | | | | | | | | | | | |
Institutional Class1 | | | 14.44 | % | | | 13.49 | % | | | N/A | | | | N/A | | | | 19.86 | % |
MSCI EAFE | | | 14.54 | % | | | 10.37 | % | | | N/A | | | | N/A | | | | 21.34 | % |
1 Inception date December 30, 2011 | |
| | |
| 2 | | SEMI-ANNUAL REPORT 2013 |
The performance data quoted represents past performance. Past performance is not indicative of future results. Investment return and principal value will fluctuate so that an investor’s shares, when redeemed, may be worth more or less than their original cost. Robeco Investment Management, Inc. waived a portion of its advisory fee and agreed to reimburse a portion of each Fund’s operating expenses, if necessary, to maintain certain expense ratios as set forth in the notes to the financial statements. Total returns shown include fee waivers, expense reimbursements and expense recoupment, if any; total returns would have been lower had there been no assumption of fees and expenses in excess of expense limitations. Each Fund’s annual operating expense ratios below are as stated in the current prospectuses.These rates can fluctuate and may differ from the actual expenses incurred by a Fund for the period covered by this report. Returns shown include the reinvestment of all dividends and other distributions and do not reflect taxes that a shareholder would pay on Fund distributions or on the redemption of Fund shares. Current performance may be lower or higher than the performance data quoted. For performance data current to the most recent month-end, please call 1-888-261-4073 or visit our web site at www.robecoinvest.com.
Investors should note that the Funds are actively managed mutual funds while the indices are unmanaged, do not incur expense and are not available for investment.
Small company stocks are generally riskier than large company stocks due to greater volatility and less liquidity.
Value investing involves the risk that the Fund’s investment in companies whose securities are believed to be undervalued, relative to their underlying profitability, will not appreciate in value as anticipated.
A long/short strategy uses short sales which theoretically involve unlimited loss potential since the market price of securities sold short may continuously increase. Increased leverage may cause a fund’s NAV to be disproportionately volatile. The strategy also may generate high portfolio turnover which may result in higher costs and capital gains.
International investing is subject to special risks including, but not limited to, currency risk associated with securities denominated in other than the U.S. dollar, which may be affected by fluctuations in currency exchange rates, political, social or economic instability, and differences in taxation, auditing and other financial practices. Investment in emerging market securities may increase these risks.
The following are the Funds’ gross annual operating expense ratios as stated in the most recent prospectus:
| | | | |
| | | Institutional
Class | | Investor
Class |
Robeco Boston Partners Small Cap Value Fund II | | 1.36% | | 1.61% |
Robeco Boston Partners Long/Short Equity Fund | | 4.29%1 | | 4.54%1 |
Robeco Boston Partners Long/Short Research Fund | | 2.84%1 | | 3.04%1 |
Robeco Boston Partners All-Cap Value Fund | | 1.03% | | 1.28% |
Robeco WPG Small/Micro Cap Value Fund | | 1.70% | | N/A |
Robeco Boston Partners Global Equity Fund | | 3.56% | | N/A |
Robeco Boston Partners International Equity Fund | | 3.77% | | N/A |
| | |
1 Includes interest and dividend expense on short sales. | | | | |
| | | | |
| SEMI-ANNUAL REPORT 2013 | | | 3 | |
| | |
FUND EXPENSE EXAMPLES (unaudited) | | |
As a shareholder of the Fund(s), you incur two types of costs: (1) transaction costs, including redemption fees; and (2) ongoing costs, including management fees, distribution fees and other Fund expenses. The examples are intended to help you understand your ongoing costs (in dollars) of investing in the Fund(s) and to compare these costs with the ongoing costs of investing in other mutual funds.
The examples are based on an investment of $1,000 invested at the beginning of the six-month period from September 1, 2012 through February 28, 2013, and held for the entire period.
Actual Expenses
The first line of the accompanying tables provides information about actual account values and actual expenses. You may use the information in this line, together with the amount you invested, to estimate the expenses that you paid over the period. Simply divide your account value by $1,000 (for example, an $8,600 account value divided by $1,000 = 8.6), then multiply the result by the number in the first line under the heading entitled “Expenses Paid During Period” to estimate the expenses you paid on your account during this period.
Hypothetical Example for Comparison Purposes
The second line of the accompanying tables provides information about hypothetical account values and hypothetical expenses based on a Fund’s actual expense ratio and an assumed rate of return of 5% per year before expenses, which is not the Fund’s actual return. The hypothetical account values and expenses may not be used to estimate the actual ending account balance or expenses you paid for the period. You may use this information to compare the ongoing costs of investing in the Fund(s) and other funds. To do so, compare these 5% hypothetical examples with the 5% hypothetical examples that appear in the shareholder reports of other funds.
Please note that the expenses shown in the accompanying tables are meant to highlight your ongoing costs only and do not reflect any transactional costs, such as redemption fees. Therefore, the second line of the accompanying tables is useful in comparing ongoing costs only, and will not help you determine the relative total costs of owning different funds. In addition, if these transactional costs were included, your costs would have been higher.
Expense Table
| | | | | | | | | | | | | | | | |
| | | Beginning Account
Value
September 1, 2012 | | | Ending Account
Value
February 28, 2013 | | | Annualized
Expense
Ratio | | | Expenses
Paid During
Period* | |
| Robeco Boston Partners Small Cap Value Fund II | | | | | | | | | | | | | | | | |
Institutional | | | | | | | | | | | | | | | | |
Actual | | | $1,000.00 | | | | $1,136.30 | | | | 1.30 | % | | | $6.89 | |
Hypothetical | | | 1,000.00 | | | | 1,018.35 | | | | 1.30 | % | | | 6.51 | |
Investor | | | | | | | | | | | | | | | | |
Actual | | | $1,000.00 | | | | $1,134.60 | | | | 1.55 | % | | | $8.20 | |
Hypothetical | | | 1,000.00 | | | | 1,017.11 | | | | 1.55 | % | | | 7.75 | |
| Robeco Boston Partners Long/Short Equity Fund | | | | | | | | | | | | | | | | |
Institutional | | | | | | | | | | | | | | | | |
Actual | | | $1,000.00 | | | | $1,080.40 | | | | 4.62 | %(1) | | | $23.83 | |
Hypothetical | | | 1,000.00 | | | | 1,001.88 | | | | 4.62 | %(1) | | | 22.93 | |
Investor | | | | | | | | | | | | | | | | |
Actual | | | $1,000.00 | | | | $1,078.70 | | | | 4.87 | %(1) | | | $25.10 | |
Hypothetical | | | 1,000.00 | | | | 1,000.64 | | | | 4.87 | %(1) | | | 24.16 | |
| Robeco Boston Partners Long/Short Research Fund | | | | | | | | | | | | | | | | |
Institutional | | | | | | | | | | | | | | | | |
Actual | | | $1,000.00 | | | | $1,070.40 | | | | 2.90 | %(1) | | | $14.89 | |
Hypothetical | | | 1,000.00 | | | | 1,010.41 | | | | 2.90 | %(1) | | | 14.46 | |
Investor | | | | | | | | | | | | | | | | |
Actual | | | $1,000.00 | | | | $1,069.00 | | | | 3.15 | %(1) | | | $16.16 | |
Hypothetical | | | 1,000.00 | | | | 1,009.17 | | | | 3.15 | %(1) | | | 15.69 | |
| | |
| 4 | | SEMI-ANNUAL REPORT 2013 |
| | |
FUND EXPENSE EXAMPLES (unaudited) (concluded) | | |
| | | | | | | | | | | | | | | | |
| | | Beginning Account
Value
September 1, 2012 | | | Ending Account
Value
February 28, 2013 | | | Annualized
Expense
Ratio | | | Expenses
Paid During
Period* | |
| Robeco Boston Partners All-Cap Value Fund | | | | | | | | | | | | | | | | |
Institutional | | | | | | | | | | | | | | | | |
Actual | | | $1,000.00 | | | | $1,117.20 | | | | 0.70 | % | | | $3.67 | |
Hypothetical | | | 1,000.00 | | | | 1,021.32 | | | | 0.70 | % | | | 3.51 | |
Investor | | | | | | | | | | | | | | | | |
Actual | | | $1,000.00 | | | | $1,116.40 | | | | 0.95 | % | | | $4.99 | |
Hypothetical | | | 1,000.00 | | | | 1,020.08 | | | | 0.95 | % | | | 4.76 | |
| Robeco Boston Partners WPG Small/Micro Cap Value Fund | | | | | | | | | | | | | | | | |
Institutional | | | | | | | | | | | | | | | | |
Actual | | | $1,000.00 | | | | $1,194.70 | | | | 1.65 | % | | | $8.98 | |
Hypothetical | | | 1,000.00 | | | | 1,016.61 | | | | 1.65 | % | | | 8.25 | |
| Robeco Boston Partners Global Equity Fund | | | | | | | | | | | | | | | | |
Institutional | | | | | | | | | | | | | | | | |
Actual | | | $1,000.00 | | | | $1,121.70 | | | | 1.30 | % | | | $6.84 | |
Hypothetical | | | 1,000.00 | | | | 1,018.35 | | | | 1.30 | % | | | 6.51 | |
| Robeco Boston Partners International Equity Fund | | | | | | | | | | | | | | | | |
Institutional | | | | | | | | | | | | | | | | |
Actual | | | $1,000.00 | | | | $1,144.40 | | | | 1.30 | % | | | $6.91 | |
Hypothetical | | | 1,000.00 | | | | 1,018.35 | | | | 1.30 | % | | | 6.51 | |
| * | Expenses are equal to the Fund’s annualized six-month expense ratios in the table above, which include waived fees or reimbursed expenses and expense recoupment, if any, multiplied by the average account value over the period, multiplied by the number of days (181) in the most recent fiscal half-year, then divided by 365 to reflect the one-half year period. The Fund’s ending account values on the first line in each table are based on the actual six-month total return of 13.63% and 13.46% for the Institutional Class and Investor Class, respectively, of the Robeco Boston Partners Small Cap Value Fund II; 8.04% and 7.87% for the Institutional Class and Investor Class, respectively, of the Robeco Boston Partners Long/Short Equity Fund; 7.04% and 8.94% for the Institutional Class and Investor Class, respectively, of the Robeco Boston Partners Long/Short Research Fund; 11.72% and 11.64% for the Institutional Class and Investor Class, respectively, of the Robeco Boston Partners All-Cap Value Fund; 19.47% for the Institutional Class of the WPG Small/Micro Cap Value Fund, 12.17% for the Institutional Class of the Robeco Boston Partners Global Equity Fund and 14.44% for the Institutional Class of the Robeco Boston Partners International Equity Fund. |
| (1) | These amounts include dividends paid on securities which the Funds have sold short (“short-sale dividends”) and related interest expense. The annualized amount of short-sale dividends and related interest expense was 2.18% of average net assets for the year for both the Institutional Class and Investor Class of the Robeco Boston Partners Long/Short Equity Fund and 1.40% for both the Institutional Class and Investor Class of the Robeco Boston Partners Long/Short Research Fund. |
| | | | |
| SEMI-ANNUAL REPORT 2013 | | | 5 | |
| | |
| ROBECO INVESTMENT FUNDS | | FEBRUARY 28, 2013 (unaudited) |
| | |
PORTFOLIO HOLDINGS SUMMARY TABLES (unaudited) | | |
ROBECO BOSTON PARTNERS SMALL CAP VALUE FUND II
| | | | | | | | |
| Security Type/Sector Classification | | % of Net
Assets | | | Value | |
COMMON STOCK | | | | | | | | |
Finance | | | 22.3 | % | | $ | 32,677,148 | |
Consumer Services | | | 18.0 | | | | 26,438,813 | |
Capital Goods | | | 13.4 | | | | 19,652,903 | |
Health Care | | | 9.7 | | | | 14,184,950 | |
Technology | | | 9.0 | | | | 13,218,344 | |
Real Estate Investment Trusts | | | 6.8 | | | | 10,014,717 | |
Consumer Non-Durables | | | 6.1 | | | | 8,999,869 | |
Consumer Durables | | | 2.9 | | | | 4,308,883 | |
Energy | | | 2.7 | | | | 3,877,668 | |
Basic Industries | | | 2.0 | | | | 2,975,873 | |
Transportation | | | 1.6 | | | | 2,276,282 | |
Utilities | | | 1.5 | | | | 2,224,757 | |
SECURITIES LENDING COLLATERAL | | | 12.1 | | | | 17,809,719 | |
LIABILITIES IN EXCESS OF OTHER ASSETS | | | (8.1 | ) | | | (11,838,707 | ) |
| | | | | | | | |
NET ASSETS | | | 100.0 | % | | $ | 146,821,219 | |
| | | | | | | | |
Portfolio holdings are subject to change at any time.
ROBECO BOSTON PARTNERS LONG/SHORT EQUITY FUND
| | | | | | | | |
| Security Type/Sector Classification | | % of Net
Assets | | | Value | |
COMMON STOCK | | | | | | | | |
Finance | | | 18.7 | % | | $ | 145,359,670 | |
Health Care | | | 15.6 | | | | 121,261,551 | |
Technology | | | 15.4 | | | | 119,595,947 | |
Consumer Services | | | 11.8 | | | | 92,005,217 | |
Energy | | | 10.2 | | | | 79,593,222 | |
Capital Goods | | | 7.8 | | | | 60,342,621 | |
Communications | | | 5.8 | | | | 44,919,219 | |
Consumer Non-Durables | | | 5.2 | | | | 40,601,530 | |
Basic Industries | | | 2.4 | | | | 18,864,784 | |
Transportation | | | 1.0 | | | | 7,911,471 | |
Consumer Durables | | | 1.0 | | | | 7,517,216 | |
Real Estate Investment Trusts | | | 0.9 | | | | 7,359,866 | |
PREFERRED STOCK | | | 0.0 | | | | 151,152 | |
EXCHANGE TRADED FUND | | | 0.6 | | | | 4,497,186 | |
SECURITIES LENDING COLLATERAL | | | 1.4 | | | | 10,859,274 | |
SECURITIES SOLD SHORT | | | (62.0 | ) | | | (482,598,214 | ) |
WRITTEN OPTIONS | | | (0.0 | ) | | | (181,260 | ) |
OTHER ASSETS IN EXCESS OF LIABILITIES | | | 64.2 | | | | 499,632,016 | |
| | | | | | | | |
NET ASSETS | | | 100.0 | % | | $ | 777,692,468 | |
| | | | | | | | |
Portfolio holdings are subject to change at any time.
ROBECO BOSTON PARTNERS LONG/SHORT RESEARCH FUND
| | | | | | | | |
| Security Type/Sector Classification | | % of Net
Assets | | | Value | |
COMMON STOCK | | | | | | | | |
Capital Goods | | | 16.7 | % | | $ | 116,691,021 | |
Finance | | | 14.2 | | | | 98,974,133 | |
Technology | | | 12.5 | | | | 87,045,655 | |
Consumer Services | | | 12.2 | | | | 85,417,368 | |
Energy | | | 9.2 | | | | 64,495,996 | |
Health Care | | | 8.9 | | | | 62,320,291 | |
Communications | | | 4.9 | | | | 34,056,585 | |
Basic Industries | | | 4.8 | | | | 33,286,739 | |
Consumer Non-Durables | | | 3.7 | | | | 25,687,451 | |
Consumer Durables | | | 3.5 | | | | 24,537,567 | |
Transportation | | | 1.1 | | | | 7,817,588 | |
Utilities | | | 0.7 | | | | 4,521,901 | |
SECURITIES SOLD SHORT | | | (44.4 | ) | | | (309,527,634 | ) |
OTHER ASSETS IN EXCESS OF LIABILITIES | | | 52.0 | | | | 362,831,399 | |
| | | | | | | | |
NET ASSETS | | | 100.0 | % | | $ | 698,156,060 | |
| | | | | | | | |
Portfolio holdings are subject to change at any time.
ROBECO BOSTON PARTNERS ALL-CAP VALUE FUND
| | | | | | | | |
| Security Type/Sector Classification | | % of Net
Assets | | | Value | |
COMMON STOCK | | | | | | | | |
Finance | | | 26.1 | % | | $ | 101,997,977 | |
Health Care | | | 17.5 | | | | 68,365,237 | |
Technology | | | 13.7 | | | | 53,401,336 | |
Consumer Services | | | 13.0 | | | | 50,704,662 | |
Energy | | | 9.8 | | | | 38,156,700 | |
Capital Goods | | | 6.4 | | | | 25,110,215 | |
Consumer Non-Durables | | | 4.2 | | | | 16,397,111 | |
Consumer Durables | | | 2.5 | | | | 9,831,700 | |
Communications | | | 1.6 | | | | 6,478,968 | |
Real Estate Investment Trusts | | | 0.6 | | | | 2,214,060 | |
PREFERRED STOCK | | | 0.0 | | | | 41,223 | |
CORPORATE BONDS | | | 0.0 | | | | 45,300 | |
SECURITIES LENDING COLLATERAL | | | 0.7 | | | | 2,833,760 | |
WRITTEN OPTIONS | | | (0.0 | ) | | | (148,575 | ) |
OTHER ASSETS IN EXCESS OF LIABILITIES | | | 3.9 | | | | 15,384,386 | |
| | | | | | | | |
NET ASSETS | | | 100.0 | % | | $ | 390,814,060 | |
| | | | | | | | |
Portfolio holdings are subject to change at any time.
THEACCOMPANYINGNOTESAREANINTEGRALPARTOFTHEFINANCIALSTATEMENTS.
| | |
| 6 | | SEMI-ANNUAL REPORT 2013 |
| | |
| ROBECO INVESTMENT FUNDS | | FEBRUARY 28, 2013 (unaudited) |
| | |
PORTFOLIO HOLDINGS SUMMARY TABLES (unaudited) (concluded) | | |
ROBECO WPG SMALL/MICRO CAP VALUE FUND
| | | | | | | | |
| Security Type/Sector Classification | | % of Net
Assets | | | Value | |
COMMON STOCK | | | | | | | | |
Finance | | | 28.5 | % | | $ | 12,127,181 | |
Consumer Services | | | 13.6 | | | | 5,765,430 | |
Real Estate Investment Trusts | | | 9.8 | | | | 4,151,821 | |
Technology | | | 7.8 | | | | 3,314,893 | |
Utilities | | | 6.0 | | | | 2,557,721 | |
Capital Goods | | | 5.8 | | | | 2,483,269 | |
Health Care | | | 5.7 | | | | 2,427,658 | |
Transportation | | | 4.3 | | | | 1,826,033 | |
Basic Industries | | | 4.1 | | | | 1,750,223 | |
Consumer Non-Durables | | | 3.1 | | | | 1,299,291 | |
Consumer Durables | | | 2.5 | | | | 1,044,115 | |
Energy | | | 2.3 | | | | 973,206 | |
SECURITIES LENDING COLLATERAL | | | 8.7 | | | | 3,712,413 | |
LIABILITIES IN EXCESS OF OTHER ASSETS | | | (2.2 | ) | | | (939,014 | ) |
| | | | | | | | |
NET ASSETS | | | 100.0 | % | | $ | 42,494,240 | |
| | | | | | | | |
Portfolio holdings are subject to change at any time.
ROBECO BOSTON PARTNERS GLOBAL EQUITY FUND
| | | | | | | | |
| Security Type/Sector Classification | | % of Net
Assets | | | Value | |
COMMON STOCK | | | | | | | | |
Finance | | | 17.1 | % | | $ | 2,173,554 | |
Health Care | | | 13.9 | | | | 1,772,000 | |
Industrials | | | 13.7 | | | | 1,741,516 | |
Consumer Discretionary | | | 13.0 | | | | 1,648,088 | |
Information Technology | | | 10.7 | | | | 1,362,952 | |
Energy | | | 9.6 | | | | 1,213,446 | |
Materials | | | 7.0 | | | | 890,502 | |
Consumer Staples | | | 4.1 | | | | 522,749 | |
Telecommunication Services | | | 0.7 | | | | 90,053 | |
OTHER ASSETS IN EXCESS OF LIABILITIES | | | 10.2 | | | | 1,300,059 | |
| | | | | | | | |
NET ASSETS | | | 100.0 | % | | $ | 12,714,919 | |
| | | | | | | | |
Portfolio holdings are subject to change at any time.
ROBECO BOSTON PARTNERS INTERNATIONAL EQUITY FUND
| | | | | | | | |
| Security Type/Sector Classification | | % of Net
Assets | | | Value | |
COMMON STOCK% | | | | | | | | |
Financials | | | 18.9 | % | | $ | 2,379,536 | |
Industrials | | | 15.1 | | | | 1,905,889 | |
Consumer Discretionary | | | 14.9 | | | | 1,883,457 | |
Health Care | | | 13.7 | | | | 1,727,253 | |
Information Technology | | | 8.4 | | | | 1,058,418 | |
Energy | | | 7.9 | | | | 991,563 | |
Materials | | | 6.3 | | | | 799,547 | |
Consumer Staples | | | 6.0 | | | | 750,388 | |
Telecommunication Services | | | 3.1 | | | | 395,108 | |
Utilities | | | 0.7 | | | | 83,002 | |
OTHER ASSETS IN EXCESS OF LIABILITIES | | | 5.0 | | | | 636,331 | |
| | | | | | | | |
NET ASSETS | | | 100.0 | % | | $ | 12,610,492 | |
| | | | | | | | |
Portfolio holdings are subject to change at any time.
THEACCOMPANYINGNOTESAREANINTEGRALPARTOFTHEFINANCIALSTATEMENTS.
| | | | |
| SEMI-ANNUAL REPORT 2013 | | | 7 | |
| | |
| ROBECO INVESTMENT FUNDS | | FEBRUARY 28, 2013 (unaudited) |
| | |
ROBECO BOSTON PARTNERS SMALL CAP VALUE FUND II | | PORTFOLIOOF INVESTMENTS |
| | | | | | | | |
| | | Number of
Shares | | | Value | |
COMMON STOCK—96.0% | | | | | | | | |
Basic Industries—2.0% | | | | | | | | |
Graphic Packaging Holding Co. * | | | 158,175 | | | $ | 1,173,658 | |
Schweitzer-Mauduit International, Inc. | | | 28,235 | | | | 1,040,460 | |
Sensient Technologies Corp. | | | 8,780 | | | | 324,070 | |
Spartech Corp. * | | | 44,345 | | | | 437,685 | |
| | | | | | | | |
| | | | | | | 2,975,873 | |
| | | | | | | | |
Capital Goods—13.4% | | | | | | | | |
Actuant Corp., Class A | | | 48,190 | | | | 1,465,458 | |
Aegion Corp. * | | | 52,245 | | | | 1,255,447 | |
Ampco-Pittsburgh Corp. | | | 15,780 | | | | 295,244 | |
Beacon Roofing Supply, Inc. * (a) | | | 22,760 | | | | 839,844 | |
Brady Corp., Class A | | | 24,898 | | | | 847,777 | |
Cabot Corp. | | | 24,480 | | | | 900,374 | |
Curtiss-Wright Corp. | | | 17,110 | | | | 593,888 | |
Drew Industries, Inc. | | | 21,585 | | | | 785,262 | |
Edwards Group Ltd., Sponsored ADR * | | | 107,291 | | | | 769,276 | |
Globe Specialty Metals, Inc. | | | 75,345 | | | | 1,076,680 | |
Granite Construction, Inc. | | | 20,595 | | | | 640,298 | |
Griffon Corp. | | | 65,565 | | | | 738,917 | |
Hillenbrand, Inc. | | | 29,885 | | | | 737,861 | |
Huntington Ingalls Industries, Inc. | | | 15,595 | | | | 749,184 | |
MRC Global, Inc. * | | | 55,880 | | | | 1,716,634 | |
Mueller Industries, Inc. | | | 15,650 | | | | 832,267 | |
Orion Marine Group, Inc. * | | | 114,170 | | | | 1,086,898 | |
Rofin-Sinar Technologies, Inc. * | | | 6,405 | | | | 170,181 | |
Terex Corp. * | | | 39,345 | | | | 1,290,909 | |
WESCO International, Inc. * | | | 28,610 | | | | 2,114,279 | |
World Fuel Services Corp. | | | 19,622 | | | | 746,225 | |
| | | | | | | | |
| | | | | | | 19,652,903 | |
| | | | | | | | |
Consumer Durables—2.9% | | | | | | | | |
Tempur-Pedic International, Inc. * | | | 50,905 | | | | 2,090,668 | |
Thor Industries, Inc. | | | 40,765 | | | | 1,532,356 | |
Tower International, Inc. * | | | 56,965 | | | | 685,859 | |
| | | | | | | | |
| | | | | | | 4,308,883 | |
| | | | | | | | |
Consumer Non-Durables—6.1% | | | | | | | | |
Alliance One International, Inc. * | | | 84,255 | | | | 314,271 | |
Dole Food Co., Inc. * (a) | | | 193,158 | | | | 2,163,370 | |
Fresh Del Monte Produce, Inc. | | | 24,225 | | | | 632,030 | |
Matthews International Corp., Class A | | | 10,350 | | | | 341,550 | |
Nu Skin Enterprises, Inc., Class A (a) | | | 51,380 | | | | 2,116,856 | |
Skechers U.S.A., Inc., Class A * | | | 29,195 | | | | 610,176 | |
Steven Madden Ltd. * | | | 23,968 | | | | 1,056,749 | |
Take-Two Interactive Software, Inc. * | | | 48,165 | | | | 705,136 | |
Universal Corp. (a) | | | 18,995 | | | | 1,059,731 | |
| | | | | | | | |
| | | | | | | 8,999,869 | |
| | | | | | | | |
Consumer Services—18.0% | | | | | | | | |
ABM Industries, Inc. | | | 20,975 | | | | 476,132 | |
Aeropostale, Inc. * | | | 33,380 | | | | 434,608 | |
Asbury Automotive Group, Inc. * | | | 51,695 | | | | 1,745,223 | |
Ascena Retail Group, Inc. * | | | 56,900 | | | | 955,351 | |
Brink’s Co., (The) | | | 38,885 | | | | 1,028,508 | |
Cato Corp., (The), Class A | | | 13,850 | | | | 355,391 | |
CBIZ, Inc. * (a) | | | 52,160 | | | | 331,738 | |
Children’s Place Retail Stores, Inc., (The) * | | | 11,315 | | | | 514,380 | |
| | | | | | | | |
| | | Number of
Shares | | | Value | |
Consumer Services—(continued) | | | | | | | | |
Ennis, Inc. | | | 20,800 | | | $ | 325,728 | |
Finish Line, Inc., (The), Class A (a) | | | 109,830 | | | | 1,989,021 | |
FTI Consulting, Inc. * | | | 68,065 | | | | 2,364,578 | |
G&K Services, Inc., Class A | | | 17,557 | | | | 731,600 | |
Group 1 Automotive, Inc. | | | 17,450 | | | | 1,007,563 | |
Heidrick & Struggles International, Inc. | | | 37,820 | | | | 514,352 | |
ICF International, Inc. * | | | 14,400 | | | | 356,256 | |
International Speedway Corp., Class A | | | 38,988 | | | | 1,175,098 | |
KAR Auction Services, Inc. | | | 75,240 | | | | 1,596,593 | |
Knoll, Inc. | | | 45,713 | | | | 778,035 | |
Korn/Ferry International * | | | 17,935 | | | | 331,977 | |
Live Nation Entertainment, Inc. * | | | 69,970 | | | | 740,982 | |
MAXIMUS, Inc. | | | 22,710 | | | | 1,652,834 | |
Men’s Wearhouse, Inc., (The) | | | 51,805 | | | | 1,456,757 | |
Navigant Consulting, Inc. * | | | 117,965 | | | | 1,501,694 | |
Odyssey Marine Exploration, Inc. * (a) | | | 111,540 | | | | 390,390 | |
Rent-A-Center, Inc. | | | 30,235 | | | | 1,096,926 | |
RPX Corp. * | | | 14,685 | | | | 174,017 | |
Service Corp. International | | | 55,585 | | | | 863,791 | |
Steiner Leisure Ltd. * | | | 7,690 | | | | 362,584 | |
Steinway Musical Instruments * | | | 18,485 | | | | 415,173 | |
Viad Corp. | | | 14,255 | | | | 391,442 | |
XO Group, Inc. * | | | 41,540 | | | | 380,091 | |
| | | | | | | | |
| | | | | | | 26,438,813 | |
| | | | | | | | |
Energy—2.7% | | | | | | | | |
Bristow Group, Inc. | | | 15,960 | | | | 929,830 | |
Contango Oil & Gas Co. | | | 10,530 | | | | 408,143 | |
Forum Energy Technologies, Inc. * (a) | | | 23,195 | | | | 618,843 | |
Helix Energy Solutions Group, Inc. * | | | 32,115 | | | | 751,812 | |
Rosetta Resources, Inc. * | | | 17,620 | | | | 857,742 | |
Swift Energy Co. * | | | 23,025 | | | | 311,298 | |
| | | | | | | | |
| | | | | | | 3,877,668 | |
| | | | | | | | |
Finance—22.3% | | | | | | | | |
American Capital Mortgage Investment Corp. | | | 28,545 | | | | 733,607 | |
Ameris Bancorp * | | | 22,973 | | | | 318,865 | |
AMERISAFE, Inc. * | | | 17,980 | | | | 586,508 | |
Apollo Investment Corp. | | | 36,055 | | | | 313,318 | |
BBCN Bancorp, Inc. | | | 129,990 | | | | 1,609,276 | |
Centerstate Banks, Inc. | | | 53,235 | | | | 450,900 | |
Citizens Republic Bancorp, Inc. * | | | 45,030 | | | | 927,618 | |
Columbia Banking System, Inc. | | | 27,515 | | | | 550,300 | |
Cowen Group, Inc., Class A * | | | 26,710 | | | | 69,713 | |
Fifth Street Finance Corp. | | | 89,965 | | | | 962,626 | |
First American Financial Corp. | | | 66,355 | | | | 1,611,763 | |
First Citizens Bancshares, Inc., Class A | | | 3,255 | | | | 584,435 | |
Flushing Financial Corp. | | | 26,105 | | | | 412,459 | |
Gladstone Capital Corp. | | | 15,255 | | | | 138,821 | |
Global Indemnity PLC * | | | 13,868 | | | | 320,351 | |
Heritage Financial Corp. | | | 33,580 | | | | 465,083 | |
Infinity Property & Casualty Corp. | | | 10,880 | | | | 611,347 | |
Janus Capital Group, Inc. (a) | | | 86,170 | | | | 797,934 | |
JMP Group, Inc. | | | 65,450 | | | | 389,427 | |
Maiden Holdings Ltd. | | | 156,300 | | | | 1,575,504 | |
Nationstar Mortgage Holdings, Inc. * (a) | | | 59,755 | | | | 2,302,360 | |
Navigators Group, Inc., (The) * | | | 8,665 | | | | 486,626 | |
Nelnet, Inc., Class A | | | 38,271 | | | | 1,269,832 | |
THEACCOMPANYINGNOTESAREANINTEGRALPARTOFTHEFINANCIALSTATEMENTS.
| | |
| 8 | | SEMI-ANNUAL REPORT 2013 |
| | |
| ROBECO INVESTMENT FUNDS | | FEBRUARY 28, 2013 (unaudited) |
| | |
ROBECO BOSTON PARTNERS SMALL CAP VALUE FUND II (continued) | | PORTFOLIOOF INVESTMENTS |
| | | | | | | | |
| | | Number of
Shares | | | Value | |
Finance—(continued) | | | | | | | | |
Ocwen Financial Corp. * | | | 81,865 | | | $ | 3,227,118 | |
Park Sterling Corp. * | | | 42,600 | | | | 241,968 | |
PHH Corp. * (a) | | | 71,465 | | | | 1,501,480 | |
Platinum Underwriters Holdings Ltd. | | | 23,535 | | | | 1,244,531 | |
Safety Insurance Group, Inc. | | | 9,830 | | | | 462,010 | |
Stancorp Financial Group Inc | | | 13,600 | | | | 541,416 | |
Stewart Information Services Corp. | | | 63,935 | | | | 1,480,095 | |
SVB Financial Group * | | | 20,375 | | | | 1,366,348 | |
Symetra Financial Corp. | | | 75,515 | | | | 994,533 | |
United Rentals, Inc. * | | | 12,950 | | | | 691,660 | |
Validus Holdings Ltd. | | | 4,466 | | | | 159,124 | |
Walter Investment Management Corp. * | | | 60,730 | | | | 2,788,722 | |
Washington Federal, Inc. | | | 27,890 | | | | 489,470 | |
| | | | | | | | |
| | | | | | | 32,677,148 | |
| | | | | | | | |
Health Care—9.7% | | | | | | | | |
Addus HomeCare Corp. * | | | 49,756 | | | | 438,350 | |
Amsurg Corp. * | | | 20,570 | | | | 621,214 | |
Centene Corp. * | | | 13,825 | | | | 622,402 | |
Chemed Corp. | | | 16,130 | | | | 1,245,075 | |
Hanger Orthopedic Group, Inc. * | | | 43,420 | | | | 1,287,837 | |
ICON PLC, ADR * | | | 38,025 | | | | 1,184,859 | |
Integra Lifesciences Holdings Corp. * | | | 12,925 | | | | 526,564 | |
Kindred Healthcare, Inc. * | | | 79,642 | | | | 897,565 | |
LHC Group, Inc. * | | | 16,800 | | | | 341,376 | |
LifePoint Hospitals, Inc. * | | | 14,675 | | | | 647,021 | |
Omnicell, Inc. * | | | 24,945 | | | | 449,509 | |
Owens & Minor, Inc. (a) | | | 25,902 | | | | 788,716 | |
PAREXEL International Corp. * | | | 21,725 | | | | 753,640 | |
Select Medical Holdings Corp. | | | 86,990 | | | | 803,788 | |
Symmetry Medical, Inc. * | | | 116,230 | | | | 1,212,279 | |
U.S. Physical Therapy, Inc. | | | 73,109 | | | | 1,799,944 | |
VCA Antech, Inc. * | | | 25,720 | | | | 564,811 | |
| | | | | | | | |
| | | | | | | 14,184,950 | |
| | | | | | | | |
Real Estate Investment Trusts—6.8% | | | | | |
Altisource Residential Corp., Class B * (a) | | | 25,195 | | | | 479,713 | |
Anworth Mortgage Asset Corp. | | | 119,802 | | | | 730,792 | |
Chatham Lodging Trust | | | 50,330 | | | | 828,432 | |
Colony Financial, Inc. | | | 21,735 | | | | 481,430 | |
CYS Investments, Inc. (a) | | | 157,070 | | | | 1,862,850 | |
Gladstone Commercial Corp. (a) | | | 17,580 | | | | 333,317 | |
Hatteras Financial Corp. | | | 40,770 | | | | 1,088,151 | |
Javelin Mortgage Investment Corp (a) | | | 46,710 | | | | 895,898 | |
MFA Financial, Inc. | | | 89,840 | | | | 797,779 | |
Monmouth Real Estate Investment Corp., Class A | | | 68,730 | | | | 767,027 | |
Silver Bay Realty Trust Corp. * (a) | | | 36,885 | | | | 753,192 | |
Two Harbors Investment Corp. | | | 77,460 | | | | 996,136 | |
| | | | | | | | |
| | | | | | | 10,014,717 | |
| | | | | | | | |
Technology—9.0% | | | | | | | | |
Bel Fuse, Inc., Class B | | | 28,731 | | | | 478,658 | |
Belden, Inc. | | | 39,300 | | | | 1,979,148 | |
Brooks Automation, Inc. | | | 43,925 | | | | 444,082 | |
Coherent, Inc. | | | 7,095 | | | | 409,807 | |
Electronics for Imaging, Inc. * | | | 27,600 | | | | 636,456 | |
EnerSys, Inc. * | | | 46,415 | | | | 1,897,445 | |
| | | | | | | | |
| | | Number of
Shares | | | Value | |
Technology—(continued) | | | | | | | | |
Imation Corp. * | | | 29,830 | | | $ | 101,720 | |
Insight Enterprises, Inc. * | | | 19,045 | | | | 366,045 | |
Integrated Device Technology, Inc. * | | | 77,080 | | | | 524,144 | |
Lexmark International, Inc., Class A (a) | | | 55,205 | | | | 1,215,614 | |
Magnachip Semiconductor Corp. * | | | 41,440 | | | | 652,680 | |
NETGEAR, Inc. * (a) | | | 28,150 | | | | 958,507 | |
Sykes Enterprises, Inc. * | | | 80,030 | | | | 1,189,246 | |
SYNNEX Corp. * | | | 40,455 | | | | 1,542,549 | |
TeleTech Holdings, Inc. * | | | 19,810 | | | | 370,645 | |
Teradyne, Inc. * | | | 26,945 | | | | 451,598 | |
| | | | | | | | |
| | | | | | | 13,218,344 | |
| | | | | | | | |
Transportation—1.6% | | | | | | | | |
Diana Shipping, Inc. * | | | 38,425 | | | | 326,228 | |
Landstar System, Inc. | | | 8,370 | | | | 471,147 | |
Quality Distribution, Inc. * | | | 42,360 | | | | 334,220 | |
UTi Worldwide, Inc. | | | 75,160 | | | | 1,144,687 | |
| | | | | | | | |
| | | | | | | 2,276,282 | |
| | | | | | | | |
Utilities—1.5% | | | | | | | | |
PNM Resources, Inc. | | | 62,845 | | | | 1,411,499 | |
SemGroup Corp., Class A * | | | 17,645 | | | | 813,258 | |
| | | | | | | | |
| | | | | | | 2,224,757 | |
| | | | | | | | |
TOTAL COMMON STOCK (Cost $105,903,655) | | | | | | | 140,850,207 | |
| | | | | | | | |
SECURITIES LENDING COLLATERAL—12.1% | |
BlackRock Liquidity Fund | | | 17,809,719 | | | | 17,809,719 | |
| | | | | | | | |
TOTAL SECURITIES LENDING COLLATERAL
(Cost $17,809,719) | | | | | | | 17,809,719 | |
| | | | | | | | |
TOTAL INVESTMENTS—108.1%
(Cost $123,713,374) | | | | | | | 158,659,926 | |
| | | | | | | | |
LIABILITIES IN EXCESS OF OTHER ASSETS—(8.1)% | | | | | | | (11,838,707 | ) |
| | | | | | | | |
NET ASSETS—100.0% | | | | | | $ | 146,821,219 | |
| | | | | | | | |
| | | | |
| ADR | | — | | American Depositary Receipt |
| PLC | | — | | Public Limited Company |
| * | | — | | Non-income producing. |
| (a) | | — | | All or a portion of the security is on loan. (See Note 6 of the Notes to Financial Statements) |
THEACCOMPANYINGNOTESAREANINTEGRALPARTOFTHEFINANCIALSTATEMENTS.
| | | | |
| SEMI-ANNUAL REPORT 2013 | | | 9 | |
| | |
| ROBECO INVESTMENT FUNDS | | FEBRUARY 28, 2013 (unaudited) |
| | |
ROBECO BOSTON PARTNERS SMALL CAP VALUE FUND II (concluded) | | PORTFOLIOOF INVESTMENTS |
A summary of the inputs used to value the Fund’s investments as of February 28, 2013 is as follows (see Note I in the Notes to Financial Statements):
| | | | | | | | | | | | | | | | |
| | | Total
Value as of
February 28, 2013 | | | Level 1
Quoted
Price | | | Level 2
Significant
Observable
Inputs | | | Level 3
Significant
Unobservable
Inputs | |
| | | | | | | | | | | | | | | | |
Common Stock * | | $ | 140,850,207 | | | $ | 140,850,207 | | | $ | — | | | $ | — | |
Securities Lending Collateral | | | 17,809,719 | | | | 17,809,719 | | | | — | | | | — | |
| | | | | | | | | | | | | | | | |
Total Assets | | $ | 158,659,926 | | | $ | 158,659,926 | | | $ | — | | | $ | — | |
| | | | | | | | | | | | | | | | |
| * | See Portfolio of Investments detail for industry and security type breakout. |
THEACCOMPANYINGNOTESAREANINTEGRALPARTOFTHEFINANCIALSTATEMENTS.
| | |
| 10 | | SEMI-ANNUAL REPORT 2013 |
| | |
| ROBECO INVESTMENT FUNDS | | FEBRUARY 28, 2013 (unaudited) |
| | |
ROBECO BOSTON PARTNERS LONG/SHORT EQUITY FUND | | PORTFOLIOOF INVESTMENTS |
| | | | | | | | |
| | | Number of
Shares | | | Value | |
LONG POSITIONS—97.8% | |
COMMON STOCK—95.8% | |
Basic Industries—2.4% | | | | | | | | |
Greif, Inc., Class B (a) | | | 43,300 | | | $ | 2,320,880 | |
KapStone Paper and Packaging Corp. † | | | 117,970 | | | | 3,142,721 | |
Owens-Illinois, Inc. * † | | | 248,380 | | | | 6,333,690 | |
Sealed Air Corp. † | | | 211,965 | | | | 4,707,743 | |
Steel Dynamics, Inc. | | | 154,535 | | | | 2,359,750 | |
| | | | | | | | |
| | | | | | | 18,864,784 | |
| | | | | | | | |
Capital Goods—7.8% | |
Actuant Corp., Class A † | | | 118,360 | | | | 3,599,328 | |
Babcock & Wilcox Co., (The) | | | 232,170 | | | | 6,273,233 | |
Columbus McKinnon Corp. * | | | 92,500 | | | | 1,814,850 | |
Crane Co. † | | | 43,430 | | | | 2,335,665 | |
EnPro Industries, Inc. * † | | | 97,280 | | | | 4,526,438 | |
Foster Wheeler AG * | | | 162,090 | | | | 3,899,885 | |
General Cable Corp. * † | | | 137,685 | | | | 4,535,344 | |
Gibraltar Industries, Inc. * † | | | 137,593 | | | | 2,359,720 | |
Global Power Equipment Group, Inc. † | | | 164,045 | | | | 2,752,675 | |
Hardinge, Inc. | | | 98,040 | | | | 1,282,363 | |
Masonite Worldwide Holdings, Inc. * | | | 62,760 | | | | 2,784,975 | |
Michael Baker Corp. † | | | 93,032 | | | | 2,255,096 | |
Moog, Inc., Class A * † | | | 83,780 | | | | 3,766,749 | |
NCI Building Systems, Inc. * | | | 127,055 | | | | 2,077,349 | |
Orion Marine Group, Inc. * | | | 198,495 | | | | 1,889,672 | |
Safran SA - ADR | | | 75,840 | | | | 3,474,989 | |
Spirit Aerosystems Holdings, Inc., Class A * † | | | 359,035 | | | | 6,250,799 | |
WaterFurnace Renewable Energy, Inc. † | | | 136,945 | | | | 2,230,560 | |
World Fuel Services Corp. † | | | 58,715 | | | | 2,232,931 | |
| | | | | | | | |
| | | | | | | 60,342,621 | |
| | | | | | | | |
Communications—5.8% | |
Comcast Corp., Class A † | | | 145,815 | | | | 5,801,979 | |
Dice Holdings, Inc. * | | | 284,830 | | | | 2,745,761 | |
DIRECTV * † | | | 188,150 | | | | 9,063,186 | |
Hawaiian Telcom Holdco, Inc. * † | | | 438,914 | | | | 8,457,873 | |
IAC/InterActive Corp. † | | | 89,535 | | | | 3,648,551 | |
iPass, Inc. * | | | 653,655 | | | | 1,313,847 | |
Lionbridge Technologies, Inc. * | | | 612,555 | | | | 2,339,960 | |
Time Warner Cable, Inc. † | | | 79,090 | | | | 6,832,585 | |
Yahoo!, Inc. * † | | | 221,280 | | | | 4,715,477 | |
| | | | | | | | |
| | | | | | | 44,919,219 | |
| | | | | | | | |
Consumer Durables—1.0% | |
Cooper-Standard Holding, Inc. * | | | 28,760 | | | | 1,085,690 | |
Helen of Troy Ltd. † | | | 173,450 | | | | 6,431,526 | |
| | | | | | | | |
| | | | | | | 7,517,216 | |
| | | | | | | | |
Consumer Non-Durables—5.2% | |
Anheuser-Busch InBev NV - Sponsored ADR † | | | 82,370 | | | | 7,741,956 | |
Archer-Daniels-Midland Co. | | | 73,225 | | | | 2,332,949 | |
Crimson Wine Group Ltd * | | | 38,832 | | | | 312,594 | |
Crocs, Inc. * | | | 201,005 | | | | 3,047,236 | |
Energizer Holdings, Inc. † | | | 47,700 | | | | 4,385,061 | |
Hanesbrands, Inc. * † | | | 100,095 | | | | 3,967,766 | |
Lorillard, Inc. † | | | 105,495 | | | | 4,065,777 | |
| | | | | | | | |
| | | Number of
Shares | | | Value | |
Consumer Non-Durables—(continued) | |
Molson Coors Brewing Co., Class B † | | | 103,120 | | | $ | 4,558,935 | |
Philip Morris International, Inc. | | | 42,950 | | | | 3,940,663 | |
Revlon, Inc., Class A * | | | 12,081 | | | | 272,427 | |
Unilever NV | | | 153,550 | | | | 5,976,166 | |
| | | | | | | | |
| | | | | | | 40,601,530 | |
| | | | | | | | |
Consumer Services—11.8% | |
Acacia Research Corp. * | | | 78,676 | | | | 2,199,781 | |
Barrett Business Services, Inc. | | | 11,512 | | | | 502,844 | |
Century Casinos, Inc. * † | | | 831,881 | | | | 2,454,049 | |
CRA International, Inc. * | | | 204,800 | | | | 4,528,128 | |
CVS Caremark Corp. † | | | 127,115 | | | | 6,498,119 | |
DreamWorks Animation SKG, Inc., Class A * (a) | | | 179,365 | | | | 2,977,459 | |
Ennis, Inc. † | | | 327,350 | | | | 5,126,301 | |
Express, Inc. * | | | 161,405 | | | | 2,985,993 | |
GNC Holdings, Inc., Class A † | | | 112,910 | | | | 4,629,310 | |
Hudson Global, Inc. * † | | | 200,865 | | | | 739,183 | |
ICF International, Inc. * † | | | 264,180 | | | | 6,535,813 | |
Insperity, Inc. † | | | 158,375 | | | | 4,489,931 | |
International Speedway Corp., Class A † | | | 206,165 | | | | 6,213,813 | |
Kelly Services, Inc., Class A | | | 60,520 | | | | 1,068,783 | |
Liberty Interactive Corp., Class A * † | | | 146,390 | | | | 3,056,623 | |
Liberty Ventures, Series A * † | | | 9,759 | | | | 704,600 | |
Nash Finch Co. † | | | 207,797 | | | | 3,983,469 | |
TESCO PLC - Sponsored ADR † | | | 188,255 | | | | 3,179,627 | |
Towers Watson & Co., Class A † | | | 77,610 | | | | 5,166,498 | |
Valuevision Media, Inc., Class A * | | | 633,045 | | | | 1,658,578 | |
Viacom, Inc., Class B † | | | 64,405 | | | | 3,765,116 | |
Wal-Mart Stores, Inc. † | | | 62,360 | | | | 4,413,841 | |
Walgreen Co. † | | | 185,065 | | | | 7,576,561 | |
Walt Disney Co., (The) † | | | 126,960 | | | | 6,930,747 | |
XO Group, Inc. * | | | 67,765 | | | | 620,050 | |
| | | | | | | | |
| | | | | | | 92,005,217 | |
| | | | | | | | |
Energy—10.2% | |
Apache Corp. † | | | 84,390 | | | | 6,267,645 | |
Calfrac Well Services Ltd. | | | 141,980 | | | | 3,333,676 | |
Canadian Natural Resources Ltd. † | | | 127,315 | | | | 3,881,834 | |
Cenovus Energy, Inc. † | | | 99,185 | | | | 3,204,667 | |
Diamond Offshore Drilling, Inc. (a) | | | 44,925 | | | | 3,130,374 | |
Ensco PLC, Class A † | | | 41,810 | | | | 2,514,453 | |
EOG Resources, Inc. † | | | 37,475 | | | | 4,710,982 | |
EQT Corp. † | | | 84,670 | | | | 5,341,830 | |
Halliburton Co. † | | | 151,035 | | | | 6,269,463 | |
Legacy Oil + Gas, Inc. * | | | 331,595 | | | | 2,052,573 | |
National Oilwell Varco, Inc. † | | | 54,515 | | | | 3,714,107 | |
Occidental Petroleum Corp. † | | | 117,645 | | | | 9,685,713 | |
Rosetta Resources, Inc. * † | | | 78,005 | | | | 3,797,283 | |
Royal Dutch Shell PLC - ADR † | | | 151,360 | | | | 9,936,784 | |
Schlumberger Ltd. † | | | 29,955 | | | | 2,331,997 | |
SM Energy Co. † | | | 43,595 | | | | 2,523,279 | |
Tesoro Corp. † | | | 52,525 | | | | 2,954,006 | |
Weatherford International Ltd. * | | | 331,865 | | | | 3,942,556 | |
| | | | | | | | |
| | | | | | | 79,593,222 | |
| | | | | | | | |
Finance—18.7% | |
ACE Ltd. † | | | 78,400 | | | | 6,694,576 | |
AerCap Holdings NV * | | | 160,105 | | | | 2,484,830 | |
THEACCOMPANYINGNOTESAREANINTEGRALPARTOFTHEFINANCIALSTATEMENTS.
| | | | |
| SEMI-ANNUAL REPORT 2013 | | | 11 | |
| | |
| ROBECO INVESTMENT FUNDS | | FEBRUARY 28, 2013 (unaudited) |
| | |
ROBECO BOSTON PARTNERS LONG/SHORT EQUITY FUND (continued) | | PORTFOLIOOF INVESTMENTS |
| | | | | | | | |
| | | Number of
Shares | | | Value | |
Finance—(continued) | |
Alterra Capital Holdings Ltd. | | | 25,350 | | | $ | 776,724 | |
American International Group, Inc. * † | | | 250,350 | | | | 9,515,804 | |
AON PLC † | | | 102,205 | | | | 6,243,703 | |
Axis Capital Holdings Ltd. † | | | 92,130 | | | | 3,752,455 | |
Berkshire Hathaway, Inc., Class B * † | | | 105,720 | | | | 10,800,355 | |
Century Bancorp, Inc., Class A † | | | 38,003 | | | | 1,254,099 | |
Charles Schwab Corp., (The) † | | | 135,320 | | | | 2,197,597 | |
Citigroup, Inc. † | | | 135,718 | | | | 5,696,084 | |
Cowen Group, Inc., Class A * | | | 775,320 | | | | 2,023,585 | |
Endurance Specialty Holdings Ltd. † | | | 142,510 | | | | 6,276,140 | |
Fairfax Financial Holdings Ltd. † | | | 4,970 | | | | 1,883,630 | |
First Southern Bancorp, Inc. Class B 144A ‡ | | | 64,350 | | | | 388,674 | |
Flushing Financial Corp. † | | | 107,711 | | | | 1,701,834 | |
HF Financial Corp. | | | 83,779 | | | | 1,125,990 | |
JPMorgan Chase & Co. † | | | 101,846 | | | | 4,982,306 | |
Leucadia National Corp. † | | | 388,315 | | | | 10,445,674 | |
Loews Corp. † | | | 83,730 | | | | 3,609,600 | |
Maiden Holdings Ltd. † | | | 887,322 | | | | 8,944,206 | |
Morgan Stanley † | | | 171,375 | | | | 3,864,506 | |
NASDAQ OMX Group, Inc., (The) † | | | 32,815 | | | | 1,038,923 | |
National Western Life Insurance Co., Class A † | | | 12,845 | | | | 2,091,937 | |
NBH Holdings Corp., Class A 144A ‡ | | | 79,735 | | | | 1,153,765 | |
New Hampshire Thrift Bancshares, Inc. | | | 29,529 | | | | 393,031 | |
Nicholas Financial, Inc. | | | 122,637 | | | | 1,661,731 | |
OceanFirst Financial Corp. † | | | 36,680 | | | | 511,319 | |
PartnerRe Ltd. † | | | 55,885 | | | | 4,987,177 | |
Primus Guaranty Ltd. * (a) | | | 129,701 | | | | 1,258,100 | |
RenaissanceRe Holdings Ltd. † | | | 46,300 | | | | 4,048,472 | |
State Street Corp. † | | | 69,055 | | | | 3,907,823 | |
Steel Excel, Inc. * † | | | 229,697 | | | | 5,799,849 | |
TD Ameritrade Holding Corp. † | | | 153,070 | | | | 2,909,861 | |
Torchmark Corp. † | | | 60,235 | | | | 3,384,605 | |
Tower Group, Inc. † | | | 267,790 | | | | 4,994,284 | |
Travelers Cos., Inc., (The) † | | | 46,295 | | | | 3,723,044 | |
Validus Holdings Ltd. † | | | 139,217 | | | | 4,960,302 | |
White Mountains Insurance Group Ltd. † | | | 6,855 | | | | 3,873,075 | |
| | | | | | | | |
| | | | | | | 145,359,670 | |
| | | | | | | | |
Health Care—15.6% | |
Allscripts Healthcare Solutions, Inc. * † | | | 793,835 | | | | 10,097,581 | |
Alpha PRO Tech Ltd. * | | | 485,210 | | | | 786,040 | |
AmerisourceBergen Corp. † | | | 123,395 | | | | 5,824,244 | |
Amgen, Inc. † | | | 62,505 | | | | 5,713,582 | |
Amsurg Corp. * † | | | 180,695 | | | | 5,456,989 | |
Baxter International, Inc. † | | | 57,600 | | | | 3,893,760 | |
Becton, Dickinson & Co. † | | | 35,355 | | | | 3,113,361 | |
BioClinica, Inc. * † | | | 327,186 | | | | 2,368,827 | |
CardioNet, Inc. * | | | 505,851 | | | | 1,259,569 | |
Charles River Laboratories International, Inc. * † | | | 44,905 | | | | 1,829,430 | |
Cross Country Healthcare, Inc. * † | | | 456,352 | | | | 2,601,206 | |
Express Scripts Holding Co. * † | | | 83,990 | | | | 4,779,871 | |
Humana, Inc. † | | | 86,485 | | | | 5,903,466 | |
Invacare Corp. † | | | 139,975 | | | | 2,031,037 | |
Johnson & Johnson † | | | 81,585 | | | | 6,209,434 | |
| | | | | | | | |
| | | Number of
Shares | | | Value | |
Health Care—(continued) | | | | | | | | |
Laboratory Corp. of America Holdings * † | | | 76,390 | | | $ | 6,768,154 | |
Masimo Corp. † | | | 108,385 | | | | 2,151,442 | |
MFC Industrial Ltd | | | 237,160 | | | | 2,369,228 | |
Myriad Genetics, Inc. * † | | | 95,180 | | | | 2,419,476 | |
Omnicare, Inc. † | | | 101,980 | | | | 3,799,775 | |
Orthofix International NV * | | | 59,690 | | | | 2,224,049 | |
Pfizer, Inc. † | | | 366,480 | | | | 10,030,558 | |
Sanofi - ADR † | | | 162,095 | | | | 7,652,505 | |
Teva Pharmaceutical Industries Ltd. - Sponsored ADR † | | | 182,225 | | | | 6,815,215 | |
UnitedHealth Group, Inc. † | | | 91,500 | | | | 4,890,675 | |
Universal Health Services, Inc., Class B † | | | 107,870 | | | | 6,244,594 | |
WuXi PharmaTech Cayman, Inc., - ADR * | | | 246,480 | | | | 4,027,483 | |
| | | | | | | | |
| | | | | | | 121,261,551 | |
| | | | | | | | |
Real Estate Investment Trusts—0.9% | |
CBRE Group, Inc., Class A * † | | | 205,005 | | | | 4,954,971 | |
Reis, Inc. * † | | | 157,698 | | | | 2,404,895 | |
| | | | | | | | |
| | | | | | | 7,359,866 | |
| | | | | | | | |
Technology—15.4% | |
Active Network, Inc., (The) * (a) | | | 479,125 | | | | 2,247,096 | |
Actuate Corp. * † | | | 1,008,755 | | | | 6,062,618 | |
Alpha & Omega Semiconductor Ltd * | | | 543,538 | | | | 4,380,916 | |
Amdocs Ltd. † | | | 116,445 | | | | 4,246,749 | |
Amkor Technology, Inc. * (a) † | | | 600,100 | | | | 2,430,405 | |
Anixter International, Inc. † | | | 56,535 | | | | 3,896,392 | |
Arrow Electronics, Inc. * † | | | 47,280 | | | | 1,898,292 | |
Avnet, Inc. * † | | | 55,985 | | | | 1,976,830 | |
Celestica, Inc. * | | | 614,130 | | | | 4,992,877 | |
Coleman Cable, Inc. | | | 736,458 | | | | 7,298,299 | |
CSG Systems International, Inc. * † | | | 225,595 | | | | 4,378,799 | |
EMC Corp. * † | | | 233,045 | | | | 5,362,366 | |
Fiserv, Inc. * † | | | 37,550 | | | | 3,083,231 | |
Flextronics International Ltd. * | | | 411,295 | | | | 2,735,112 | |
GSI Group, Inc. * | | | 526,764 | | | | 5,056,934 | |
Hemisphere GPS, Inc. * | | | 159,850 | | | | 126,921 | |
Ingram Micro, Inc., Class A * † | | | 258,890 | | | | 4,882,665 | |
LSI Corp. * | | | 436,745 | | | | 3,039,745 | |
Microsoft Corp. † | | | 229,260 | | | | 6,373,428 | |
Molex, Inc., Class A | | | 99,545 | | | | 2,261,662 | |
O2Micro International Ltd - ADR * | | | 911,730 | | | | 2,926,653 | |
ON Semiconductor Corp. * | | | 417,155 | | | | 3,337,240 | |
Oplink Communications, Inc. * † | | | 205,670 | | | | 3,159,091 | |
Oracle Corp. † | | | 172,449 | | | | 5,908,103 | |
QLogic Corp. * † | | | 323,775 | | | | 3,684,560 | |
Rovi Corp. * † | | | 159,535 | | | | 2,838,128 | |
SAIC, Inc. † | | | 281,020 | | | | 3,321,656 | |
TE Connectivity Ltd. | | | 138,095 | | | | 5,541,752 | |
Thermo Fisher Scientific, Inc. † | | | 72,140 | | | | 5,323,932 | |
Travelsky Technology Ltd, Class H | | | 7,037,185 | | | | 4,609,356 | |
Vishay Intertechnology, Inc. * † | | | 167,865 | | | | 2,214,139 | |
| | | | | | | | |
| | | | | | | 119,595,947 | |
| | | | | | | | |
THEACCOMPANYINGNOTESAREANINTEGRALPARTOFTHEFINANCIALSTATEMENTS.
| | |
| 12 | | SEMI-ANNUAL REPORT 2013 |
| | |
| ROBECO INVESTMENT FUNDS | | FEBRUARY 28, 2013 (unaudited) |
| | |
ROBECO BOSTON PARTNERS LONG/SHORT EQUITY FUND (continued) | | PORTFOLIOOF INVESTMENTS |
| | | | | | | | |
| | | Number of
Shares | | | Value | |
Transportation—1.0% | |
Aurizon Holdings Ltd | | | 392,900 | | | $ | 1,618,748 | |
Con-way, Inc. † | | | 65,905 | | | | 2,316,561 | |
Diana Shipping, Inc. | | | 295,510 | | | | 2,508,880 | |
Vitran Corp., Inc. * | | | 238,971 | | | | 1,467,282 | |
| | | | | | | | |
| | | | | | | 7,911,471 | |
| | | | | | | | |
TOTAL COMMON STOCK
(Cost $646,671,875) | | | | | | | 745,332,314 | |
| | | | | | | | |
PREFERRED STOCK—0.0% | |
Finance—0.0% | | | | | | | | |
First Southern Bancorp, Inc., 5.000% 144A ‡ | | | 110 | | | | 151,152 | |
| | | | | | | | |
TOTAL PREFERRED STOCK
(Cost $110,000) | | | | | | | 151,152 | |
| | | | | | | | |
EXCHANGE TRADED FUND—0.6% | |
ProShares Short 20+ Year Treasury * | | | 150,710 | | | | 4,497,186 | |
| | | | | | | | |
TOTAL EXCHANGE TRADED FUND
(Cost $4,348,303) | | | | | | | 4,497,186 | |
| | | | | | | | |
SECURITIES LENDING COLLATERAL—1.4% | |
BlackRock Liquidity Fund | | | 10,859,274 | | | | 10,859,274 | |
| | | | | | | | |
TOTAL SECURITIES LENDING COLLATERAL
(Cost $10,859,274) | | | | | | | 10,859,274 | |
| | | | | | | | |
TOTAL LONG POSITIONS—97.8%
(Cost $661,989,452) | | | | | | | 760,839,926 | |
| | | | | | | | |
SECURITIES SOLD SHORT—(62.0%) | | | | | |
COMMON STOCK—(62.0%) | | | | | | | | |
Basic Industries—(1.0%) | | | | | | | | |
AEP Industries, Inc. * | | | (53,675 | ) | | | (3,785,698 | ) |
American Vanguard Corp. | | | (49,650 | ) | | | (1,540,639 | ) |
Ethanex Energy, Inc. * | | | (648 | ) | | | (259 | ) |
Kennady Diamonds, Inc. * | | | (46,500 | ) | | | (55,462 | ) |
MAG Silver Corp. * | | | (83,345 | ) | | | (791,778 | ) |
Mountain Province Diamonds, Inc. * | | | (277,767 | ) | | | (1,102,735 | ) |
Tanzanian Royalty Exploration Corp. * | | | (193,370 | ) | | | (680,662 | ) |
| | | | | | | | |
| | | | | | | (7,957,233 | ) |
| | | | | | | | |
Capital Goods—(6.8%) | | | | | | | | |
Applied Energetics, Inc. * | | | (238,070 | ) | | | (6,333 | ) |
Applied Nanotech Holdings, Inc. * | | | (8,285 | ) | | | (1,152 | ) |
Builders FirstSource, Inc. * | | | (475,340 | ) | | | (2,875,807 | ) |
Cummins, Inc. | | | (32,120 | ) | | | (3,721,744 | ) |
DynaMotive Energy Systems Corp. * ‡ | | | (72,185 | ) | | | (7 | ) |
EDAC Technologies Corp. * | | | (98,240 | ) | | | (1,503,072 | ) |
Interface, Inc. | | | (250,260 | ) | | | (4,582,261 | ) |
Kimball International, Inc., Class B | | | (134,432 | ) | | | (1,238,119 | ) |
Lindsay Corp. | | | (72,390 | ) | | | (6,185,726 | ) |
Middleby Corp. * | | | (16,040 | ) | | | (2,394,932 | ) |
Polypore International, Inc. * | | | (84,250 | ) | | | (3,225,090 | ) |
Smith & Wesson Holding Corp. * | | | (431,120 | ) | | | (4,117,196 | ) |
Titan International, Inc. | | | (168,412 | ) | | | (3,555,177 | ) |
TransDigm Group, Inc. | | | (27,920 | ) | | | (3,974,133 | ) |
| | | | | | | | |
| | | Number of
Shares | | | Value | |
Capital Goods—(continued) | | | | | | | | |
Trex Co., Inc. * | | | (207,215 | ) | | $ | (9,788,837 | ) |
USG Corp. * | | | (118,280 | ) | | | (3,337,862 | ) |
Vulcan Materials Co. | | | (47,020 | ) | | | (2,394,729 | ) |
| | | | | | | | |
| | | | | | | (52,902,177 | ) |
| | | | | | | | |
Communications—(3.2%) | | | | | | | | |
Cogent Communications Group, Inc. | | | (157,680 | ) | | | (3,965,652 | ) |
CTC Communications Group, Inc. * ‡ | | | (98,900 | ) | | | (10 | ) |
eGain Communications Corp. * | | | (160,300 | ) | | | (1,280,797 | ) |
Elephant Talk Communications, Inc. * | | | (239,001 | ) | | | (286,801 | ) |
Equinix, Inc. * | | | (22,140 | ) | | | (4,683,717 | ) |
Interliant, Inc. * ‡ | | | (600 | ) | | | 0 | |
j2 Global Communications, Inc. | | | (15,284 | ) | | | (545,333 | ) |
LivePerson, Inc. * | | | (206,805 | ) | | | (2,992,468 | ) |
MicroStrategy, Inc., Class A * | | | (22,375 | ) | | | (2,279,565 | ) |
Pandora Media, Inc. * | | | (186,590 | ) | | | (2,276,398 | ) |
Rackspace Hosting, Inc. * | | | (81,073 | ) | | | (4,528,738 | ) |
Shutterfly, Inc. * | | | (44,560 | ) | | | (1,928,557 | ) |
| | | | | | | | |
| | | | | | | (24,768,036 | ) |
| | | | | | | | |
Consumer Durables—(2.9%) | | | | | | | | |
American Axle & Manaufacturing Holdings, Inc. * | | | (191,770 | ) | | | (2,425,890 | ) |
Cavco Industries, Inc. * | | | (35,330 | ) | | | (1,593,736 | ) |
Dorman Products, Inc. | | | (63,755 | ) | | | (2,228,875 | ) |
National Presto Industries, Inc. | | | (27,995 | ) | | | (2,127,340 | ) |
Qsound Labs, Inc. * | | | (4,440 | ) | | | (2,221 | ) |
SodaStream International Ltd. * | | | (72,570 | ) | | | (3,453,606 | ) |
Standard Pacific Corp. * | | | (257,555 | ) | | | (2,096,498 | ) |
Tesla Motors, Inc. * | | | (92,880 | ) | | | (3,235,010 | ) |
Toll Brothers, Inc. * | | | (95,015 | ) | | | (3,241,912 | ) |
Whirlpool Corp. | | | (20,440 | ) | | | (2,308,698 | ) |
| | | | | | | | |
| | | | | | | (22,713,786 | ) |
| | | | | | | | |
Consumer Non-Durables—(4.9%) | | | | | | | | |
Amish Naturals, Inc. * ‡ | | | (25,959 | ) | | | (156 | ) |
Annie’s, Inc. * | | | (81,790 | ) | | | (3,431,908 | ) |
Boston Beer Co., Inc., (The) Class A * | | | (12,680 | ) | | | (1,970,852 | ) |
Boulder Brands, Inc. * | | | (319,105 | ) | | | (2,718,775 | ) |
Cal-Maine Foods, Inc. | | | (47,665 | ) | | | (1,929,956 | ) |
Female Health Co., (The) | | | (336,400 | ) | | | (2,388,440 | ) |
Fifth & Pacific Cos, Inc. * | | | (233,900 | ) | | | (4,231,251 | ) |
Glu Mobile, Inc. * | | | (345,780 | ) | | | (784,921 | ) |
Green Mountain Coffee Roasters, Inc. * | | | (102,765 | ) | | | (4,908,056 | ) |
Mead Johnson Nutrition Co | | | (37,320 | ) | | | (2,795,641 | ) |
Monster Beverage Corp. * | | | (62,465 | ) | | | (3,150,110 | ) |
Post Holdings, Inc. * | | | (93,805 | ) | | | (3,626,501 | ) |
Quiksilver, Inc. * | | | (343,350 | ) | | | (2,145,938 | ) |
Tumi Holdings, Inc. * | | | (164,690 | ) | | | (3,893,272 | ) |
Valence Technology, Inc. * | | | (27,585 | ) | | | (472 | ) |
| | | | | | | | |
| | | | | | | (37,976,249 | ) |
| | | | | | | | |
Consumer Services—(13.4%) | | | | | | | | |
Acxiom Corp. * | | | (151,370 | ) | | | (2,756,448 | ) |
Amazon.com, Inc. * | | | (12,445 | ) | | | (3,288,840 | ) |
Arctic Cat, Inc. * | | | (91,900 | ) | | | (3,338,727 | ) |
Barnes & Noble, Inc. * | | | (108,840 | ) | | | (1,713,142 | ) |
Best Buy Co., Inc. | | | (115,675 | ) | | | (1,898,227 | ) |
BJ’s Restaurants, Inc. * | | | (195 | ) | | | (6,004 | ) |
Blue Nile, Inc. * | | | (112,363 | ) | | | (3,812,477 | ) |
THEACCOMPANYINGNOTESAREANINTEGRALPARTOFTHEFINANCIALSTATEMENTS.
| | | | |
| SEMI-ANNUAL REPORT 2013 | | | 13 | |
| | |
| ROBECO INVESTMENT FUNDS | | FEBRUARY 28, 2013 (unaudited) |
| | |
ROBECO BOSTON PARTNERS LONG/SHORT EQUITY FUND (continued) | | PORTFOLIOOF INVESTMENTS |
| | | | | | | | |
| | | Number of
Shares | | | Value | |
Consumer Services—(continued) | | | | | | | | |
Buffalo Wild Wings, Inc. * | | | (52,825 | ) | | $ | (4,156,799 | ) |
Chipotle Mexican Grill, Inc. * | | | (12,135 | ) | | | (3,844,247 | ) |
Conn’s, Inc. * | | | (87,180 | ) | | | (2,793,247 | ) |
Cumulus Media, Inc., Class A * | | | (588,735 | ) | | | (1,925,163 | ) |
Fresh Market, Inc., (The) * | | | (41,545 | ) | | | (1,936,828 | ) |
GameStop Corp., Class A | | | (46,400 | ) | | | (1,162,784 | ) |
Higher One Holdings Inc * | | | (282,725 | ) | | | (2,527,561 | ) |
Ignite Restaurant Group, Inc. * | | | (169,120 | ) | | | (2,374,445 | ) |
Imax Corp. * | | | (103,880 | ) | | | (2,669,716 | ) |
InnerWorkings, Inc. * | | | (150,215 | ) | | | (2,218,676 | ) |
Iron Mountain, Inc. | | | (68,811 | ) | | | (2,373,980 | ) |
Landauer, Inc. | | | (23,629 | ) | | | (1,387,259 | ) |
Lululemon Athletica, Inc. * | | | (87,285 | ) | | | (5,852,459 | ) |
Manchester United PLC, Class A * | | | (136,165 | ) | | | (2,386,972 | ) |
Mattress Firm Holding Corp. * | | | (90,297 | ) | | | (2,514,771 | ) |
Medidata Solutions, Inc. * | | | (38,425 | ) | | | (2,002,711 | ) |
Netflix, Inc. * | | | (45,110 | ) | | | (8,484,289 | ) |
New Oriental Education & Technology Group. - Sponsored ADR | | | (111,430 | ) | | | (1,693,736 | ) |
Polaris Industries, Inc. | | | (25,910 | ) | | | (2,263,757 | ) |
RadioShack Corp. | | | (455,615 | ) | | | (1,366,845 | ) |
Red Robin Gourmet Burgers, Inc. * | | | (79,540 | ) | | | (3,410,675 | ) |
Ritchie Bros. Auctioneers, Inc. | | | (207,415 | ) | | | (4,724,914 | ) |
Sears Holdings Corp. * | | | (43,590 | ) | | | (1,961,550 | ) |
Sturm Ruger & Co., Inc. | | | (81,315 | ) | | | (4,440,612 | ) |
Texas Roadhouse, Inc. | | | (190,555 | ) | | | (3,685,334 | ) |
Tractor Supply Co. | | | (26,945 | ) | | | (2,802,011 | ) |
Ulta Salon Cosmetics & Fragrance, Inc. | | | (16,646 | ) | | | (1,474,170 | ) |
Urban Outfitters, Inc. * | | | (100,445 | ) | | | (4,070,031 | ) |
Viggle, Inc. * | | | (4,896 | ) | | | (3,868 | ) |
VistaPrint NV * | | | (62,615 | ) | | | (2,191,525 | ) |
Yum! Brands, Inc. | | | (43,310 | ) | | | (2,835,939 | ) |
| | | | | | | | |
| | | | | | | (104,350,739 | ) |
| | | | | | | | |
Energy—(0.7%) | | | | | | | | |
Beard Co. * | | | (9,710 | ) | | | (131 | ) |
Crescent Point Energy Corp. | | | (32,120 | ) | | | (1,215,421 | ) |
InterOil Corp. * | | | (21,570 | ) | | | (1,504,939 | ) |
Miller Energy Resources, Inc. * | | | (253,560 | ) | | | (993,955 | ) |
Petroleo Brasileiro SA - ADR | | | (115,180 | ) | | | (1,689,691 | ) |
| | | | | | | | |
| | | | | | | (5,404,137 | ) |
| | | | | | | | |
Finance—(0.7%) | | | | | | | | |
African Bank Investments Ltd. - ADR | | | (121,955 | ) | | | (1,951,280 | ) |
DFC Global Corp. * | | | (152,585 | ) | | | (2,850,288 | ) |
Value Line, Inc. | | | (78,574 | ) | | | (756,668 | ) |
| | | | | | | | |
| | | | | | | (5,558,236 | ) |
| | | | | | | | |
Health Care—(13.0%) | | | | | | | | |
ABIOMED, Inc. * | | | (148,605 | ) | | | (2,383,624 | ) |
Advisory Board Co., (The) * | | | (65,150 | ) | | | (3,310,271 | ) |
Agenus, Inc. * | | | (175,605 | ) | | | (751,589 | ) |
Air Methods Corp. | | | (71,640 | ) | | | (3,208,756 | ) |
Align Technology, Inc. * | | | (99,260 | ) | | | (3,120,734 | ) |
Alnylam Pharmaceuticals, Inc. * | | | (85,300 | ) | | | (2,020,757 | ) |
Arena Pharmaceuticals, Inc. * | | | (279,895 | ) | | | (2,348,319 | ) |
Ariad Pharmaceuticals, Inc. * | | | (199,610 | ) | | | (4,197,798 | ) |
| | | | | | | | |
| | | Number of
Shares | | | Value | |
Health Care—(continued) | | | | | | | | |
athenahealth, Inc. * | | | (32,520 | ) | | $ | (3,050,051 | ) |
AVANIR Pharmaceuticals, Inc., Class A * | | | (702,330 | ) | | | (1,917,361 | ) |
Biotime, Inc. * | | | (105,150 | ) | | | (442,681 | ) |
BodyTel Scientific, Inc. * | | | (4,840 | ) | | | 0 | |
CareView Communications, Inc. * | | | (207,465 | ) | | | (165,972 | ) |
Cerner Corp. * | | | (66,225 | ) | | | (5,792,038 | ) |
Conceptus, Inc. * | | | (183,910 | ) | | | (4,106,710 | ) |
Curis, Inc. * | | | (228,155 | ) | | | (613,737 | ) |
DexCom, Inc. * | | | (156,995 | ) | | | (2,343,935 | ) |
Edwards Lifesciences Corp. * | | | (39,390 | ) | | | (3,384,783 | ) |
Endologix, Inc. * | | | (218,370 | ) | | | (3,288,652 | ) |
Fluidigm Corp. * | | | (125,015 | ) | | | (2,157,759 | ) |
Forest Laboratories, Inc. * | | | (100,480 | ) | | | (3,697,664 | ) |
HealthStream, Inc. * | | | (79,135 | ) | | | (1,692,698 | ) |
HeartWare International, Inc. * | | | (55,720 | ) | | | (4,759,602 | ) |
Hi-Tech Pharmacal Co., Inc. | | | (82,945 | ) | | | (3,069,794 | ) |
HMS Holdings Corp. * | | | (208,085 | ) | | | (6,032,384 | ) |
ICU Medical, Inc. * | | | (44,295 | ) | | | (2,514,184 | ) |
IDEXX Laboratories, Inc. * | | | (42,760 | ) | | | (3,939,051 | ) |
Incyte Corp. Ltd. * | | | (140,595 | ) | | | (3,121,209 | ) |
Insulet Corp. * | | | (86,530 | ) | | | (1,952,982 | ) |
Mindray Medical International Ltd. - ADR | | | (80,220 | ) | | | (3,017,074 | ) |
Quidel Corp. * | | | (137,935 | ) | | | (3,264,921 | ) |
ResMed, Inc. | | | (69,265 | ) | | | (3,081,600 | ) |
Seattle Genetics, Inc. * | | | (228,502 | ) | | | (6,430,046 | ) |
Sequenom, Inc. * | | | (424,760 | ) | | | (1,745,764 | ) |
Spectrum Pharmaceuticals, Inc. | | | (331,995 | ) | | | (3,784,743 | ) |
| | | | | | | | |
| | | | | | | (100,709,243 | ) |
| | | | | | | | |
Technology—(13.9%) | | | | | | | | |
3D Systems Corp. * | | | (125,760 | ) | | | (4,648,090 | ) |
ANTs Software, Inc. * | | | (10,334 | ) | | | (1 | ) |
Aspen Technology, Inc. * | | | (197,535 | ) | | | (6,076,177 | ) |
Cavium, Inc. * | | | (63,710 | ) | | | (2,352,173 | ) |
Ciena Corp. * | | | (266,805 | ) | | | (4,066,108 | ) |
Cirrus Logic, Inc. * | | | (199,055 | ) | | | (4,785,282 | ) |
CommVault Systems, Inc. * | | | (36,110 | ) | | | (2,670,334 | ) |
Consygen, Inc. * ‡ | | | (200 | ) | | | 0 | |
Cornerstone OnDemand, Inc. * | | | (56,850 | ) | | | (1,924,941 | ) |
Cray, Inc. * | | | (123,305 | ) | | | (2,385,952 | ) |
Demandware, Inc. * | | | (117,650 | ) | | | (3,111,842 | ) |
E2open, Inc. * | | | (127,780 | ) | | | (2,524,933 | ) |
Ellie Mae, Inc. * | | | (118,885 | ) | | | (2,413,365 | ) |
Ener1, Inc. * ‡ | | | (102,820 | ) | | | (10 | ) |
EZchip Semiconductor Ltd. * | | | (53,455 | ) | | | (1,296,818 | ) |
First Solar, Inc. * | | | (115,830 | ) | | | (2,994,205 | ) |
Fusion-io, Inc. * | | | (178,385 | ) | | | (3,011,139 | ) |
Garmin Ltd | | | (55,115 | ) | | | (1,892,649 | ) |
Generac Holdings, Inc. | | | (42,345 | ) | | | (1,458,785 | ) |
Infinera Corp. * | | | (273,980 | ) | | | (1,778,130 | ) |
IntraLinks Holdings, Inc. * | | | (354,203 | ) | | | (2,082,714 | ) |
IPG Photonics Corp. | | | (88,730 | ) | | | (5,260,802 | ) |
Ixia * | | | (114,425 | ) | | | (2,320,539 | ) |
Jive Software, Inc. * | | | (105,490 | ) | | | (1,749,024 | ) |
MoSys, Inc. * | | | (153,340 | ) | | | (532,090 | ) |
NAM TAI Electronics, Inc. | | | (137,204 | ) | | | (1,871,463 | ) |
Nestor, Inc. * | | | (15,200 | ) | | | (15 | ) |
THEACCOMPANYINGNOTESAREANINTEGRALPARTOFTHEFINANCIALSTATEMENTS.
| | |
| 14 | | SEMI-ANNUAL REPORT 2013 |
| | |
| ROBECO INVESTMENT FUNDS | | FEBRUARY 28, 2013 (unaudited) |
| | |
ROBECO BOSTON PARTNERS LONG/SHORT EQUITY FUND (continued) | | PORTFOLIOOF INVESTMENTS |
| | | | | | | | |
| | | Number of
Shares | | | Value | |
Technology—(continued) | | | | | | | | |
NetSuite, Inc. * | | | (30,725 | ) | | $ | (2,144,298 | ) |
Nokia OYJ - ADR | | | (663,175 | ) | | | (2,420,589 | ) |
Power Integrations, Inc. | | | (59,220 | ) | | | (2,475,988 | ) |
QLIK Technologies, Inc. * | | | (167,595 | ) | | | (4,357,470 | ) |
RealPage, Inc. * | | | (79,600 | ) | | | (1,724,136 | ) |
Research In Motion Ltd. * | | | (231,695 | ) | | | (3,093,128 | ) |
Ruckus Wireless, Inc. | | | (99,415 | ) | | | (2,123,504 | ) |
Salesforce.com, Inc. * | | | (19,925 | ) | | | (3,371,709 | ) |
ServiceNow, Inc. | | | (58,060 | ) | | | (1,885,208 | ) |
Tessco Technologies, Inc. | | | (315,766 | ) | | | (7,189,992 | ) |
TIBCO Software, Inc. * | | | (89,900 | ) | | | (1,928,355 | ) |
Tiger Telematics, Inc. * ‡ | | | (6,510 | ) | | | (7 | ) |
TigerLogic Corp. * | | | (96,490 | ) | | | (178,507 | ) |
Tower Semiconductor Ltd. * | | | (34,291 | ) | | | (233,179 | ) |
Ultratech, Inc. * | | | (91,265 | ) | | | (3,740,040 | ) |
Uni-Pixel, Inc. * | | | (22,125 | ) | | | (522,150 | ) |
Universal Display Corp. * | | | (75,960 | ) | | | (2,383,625 | ) |
ViaSat, Inc. * | | | (116,970 | ) | | | (5,492,911 | ) |
WorldGate Communications, Inc. * | | | (582,655 | ) | | | (1,165 | ) |
Xybernaut Corp. * ‡ | | | (34,156 | ) | | | 0 | |
| | | | | | | | |
| | | | | | | (108,473,542 | ) |
| | | | | | | | |
Transportation—(1.3%) | | | | | | | | |
American Railcar Industries, Inc. | | | (144,201 | ) | | | (6,292,932 | ) |
Student Transportation, Inc. | | | (569,485 | ) | | | (3,656,094 | ) |
| | | | | | | | |
| | | | | | | (9,949,026 | ) |
| | | | | | | | |
Utilities—(0.2%) | | | | | | | | |
Cadiz, Inc. * | | | (72,010 | ) | | | (485,347 | ) |
Solarcity Corp. * | | | (74,570 | ) | | | (1,350,463 | ) |
| | | | | | | | |
| | | | | | | (1,835,810 | ) |
| | | | | | | | |
TOTAL COMMON STOCK (Proceeds $436,021,953) | | | | | | | (482,598,214 | ) |
| | | | | | | | |
TOTAL SECURITIES SOLD SHORT—(62.0%)
(Proceeds $436,021,953) | | | | | | | (482,598,214 | ) |
| | | | | | | | |
| | | Number of
Contracts | | | | |
OPTIONS WRITTEN ††—0.0% | | | | | | | | |
Arena Pharmaceuticals, Inc.
Call Options
Expires 01/18/14
Strike Price $10 | | | (1,140 | ) | | | (181,260 | ) |
| | | | | | | | |
TOTAL OPTIONS WRITTEN (Premiums received $225,622) | | | | | | | (181,260 | ) |
| | | | | | | | |
OTHER ASSETS IN EXCESS OF LIABILITIES—64.2% | | | | | | | 499,632,016 | |
| | | | | | | | |
NET ASSETS—100.0% | | | | | | $ | 777,692,468 | |
| | | | | | | | |
| | | | |
| ADR | | — | | American Depositary Receipt |
| PLC | | — | | Public Limited Company |
| 144A | | — | | Security was purchased pursuant to Rule 144A under the Securities Act of 1933 and may not be resold subject to that rule except to qualified institutional buyers. As of February 28, 2013, these securities amounted to $1,693,591 or 0.2% of net assets. These 144A securities have not been deemed illiquid. |
| * | | — | | Non-income producing. |
| (a) | | — | | All or a portion of the security is on loan. (See Note 6 of the Notes to Financial Statements) |
| † | | — | | Security position is either entirely or partially held in a segregated account as collateral for securities sold short. |
| †† | | — | | Primary risk exposure is equity contracts. |
| ‡ | | — | | Security has been valued at fair market value as determined in good faith by or under the direction of The RBB Fund, Inc.‘s Board of Directors. As of February 28, 2013 long positions amounted to $1,693,591 and short positions amounted to ($190), or 0.2% and (0.0)%, respectively, of net assets. |
THEACCOMPANYINGNOTESAREANINTEGRALPARTOFTHEFINANCIALSTATEMENTS.
| | | | |
| SEMI-ANNUAL REPORT 2013 | | | 15 | |
| | |
| ROBECO INVESTMENT FUNDS | | FEBRUARY 28, 2013 (unaudited) |
| | |
ROBECO BOSTON PARTNERS LONG/SHORT EQUITY FUND (concluded) | | PORTFOLIOOF INVESTMENTS |
A summary of the inputs used to value the Fund’s investments as of February 28, 2013 is as follows (see Note I in the Notes to Financial Statements):
| | | | | | | | | | | | | | | | |
| | | Total
Value as of
February 28, 2013 | | | Level 1
Quoted
Price | | | Level 2
Significant
Observable
Inputs | | | Level 3
Significant
Unobservable
Inputs | |
| | | | | | | | | | | | | | | | |
Common Stock | | | | | | | | | | | | | | | | |
Basic Industries | | $ | 18,864,784 | | | | 18,864,784 | | | $ | — | | | $ | — | |
Capital Goods | | | 60,342,621 | | | | 60,342,621 | | | | — | | | | — | |
Communications | | | 44,919,219 | | | | 44,919,219 | | | | — | | | | — | |
Consumer Durables | | | 7,517,216 | | | | 7,517,216 | | | | — | | | | — | |
Consumer Non-Durables | | | 40,601,530 | | | | 40,601,530 | | | | — | | | | — | |
Consumer Services | | | 92,005,217 | | | | 92,005,217 | | | | — | | | | — | |
Energy | | | 79,593,222 | | | | 79,593,222 | | | | — | | | | — | |
Finance | | | 145,359,670 | | | | 143,817,231 | | | | — | | | | 1,542,439 | |
Health Care | | | 121,261,551 | | | | 121,261,551 | | | | — | | | | — | |
Real Estate Investment Trusts | | | 7,359,866 | | | | 7,359,866 | | | | — | | | | — | |
Technology | | | 119,595,947 | | | | 119,595,947 | | | | — | | | | — | |
Transportation | | | 7,911,471 | | | | 7,911,471 | | | | — | | | | — | |
Preferred Stocks | | | | | | | | | | | | | | | | |
Finance | | | 151,152 | | | | — | | | | — | | | | 151,152 | |
Exchange Traded Fund | | | 4,497,186 | | | | 4,497,186 | | | | — | | | | — | |
Securities Lending Collateral | | | 10,859,274 | | | | 10,859,274 | | | | — | | | | — | |
| | | | | | | | | | | | | | | | |
Total Assets | | $ | 760,839,926 | | | $ | 759,146,335 | | | $ | — | | | $ | 1,693,591 | |
| | | | | | | | | | | | | | | | |
| | | | | | | | | | | | | | | | |
| | | | |
| | | Total
Value as of
February 28, 2013 | | | Level 1
Quoted
Price | | | Level 2
Significant
Observable
Inputs | | | Level 3
Significant
Unobservable
Inputs | |
| | | | | | | | | | | | | | | | |
Securities Sold Short | | | | | | | | | | | | | | | | |
Basic Industries | | $ | (7,957,233 | ) | | $ | (7,957,233 | ) | | $ | — | | | $ | — | |
Capital Goods | | | (52,902,177 | ) | | | (52,902,170 | ) | | | — | | | | (7 | ) |
Communications | | | (24,768,036 | ) | | | (24,768,026 | ) | | | — | | | | (10 | ) |
Consumer Durables | | | (22,713,786 | ) | | | (22,713,786 | ) | | | — | | | | — | |
Consumer Non-Durables | | | (37,976,249 | ) | | | (37,976,093 | ) | | | — | | | | (156 | ) |
Consumer Services | | | (104,350,739 | ) | | | (104,350,739 | ) | | | — | | | | — | |
Energy | | | (5,404,137 | ) | | | (5,404,137 | ) | | | — | | | | — | |
Finance | | | (5,558,236 | ) | | | (5,558,236 | ) | | | — | | | | — | |
Health Care | | | (100,709,243 | ) | | | (100,709,243 | ) | | | — | | | | — | |
Technology | | | (108,473,542 | ) | | | (108,473,525 | ) | | | — | | | | (17 | ) |
Transportation | | | (9,949,026 | ) | | | (9,949,026 | ) | | | — | | | | — | |
Utilities | | | (1,835,810 | ) | | | (1,835,810 | ) | | | — | | | | — | |
Options Written | | | | | | | | | | | | | | | | |
Equity Contracts | | | (181,260 | ) | | | — | | | | (181,260 | ) | | | — | |
| | | | | | | | | | | | | | | | |
Total Liabilities | | $ | (482,779,474 | ) | | $ | (482,598,024 | ) | | $ | (181,260 | ) | | $ | (190 | ) |
| | | | | | | | | | | | | | | | |
THEACCOMPANYINGNOTESAREANINTEGRALPARTOFTHEFINANCIALSTATEMENTS.
| | |
| 16 | | SEMI-ANNUAL REPORT 2013 |
| | |
| ROBECO INVESTMENT FUNDS | | FEBRUARY 28, 2013 (unaudited) |
| | |
ROBECO BOSTON PARTNERS LONG/SHORT RESEARCH FUND | | PORTFOLIOOF INVESTMENTS |
| | | | | | | | |
| | | Number of
Shares | | | Value | |
LONG POSITIONS—92.4% | |
COMMON STOCK—92.4% | |
Basic Industries—4.8% | |
AuRico Gold, Inc. * | | | 129,645 | | | $ | 810,870 | |
CaesarStone Sdot-Yam Ltd. * | | | 85,173 | | | | 1,980,272 | |
Cambrex Corp. * | | | 125,480 | | | | 1,444,275 | |
Chemtura Corp. * | | | 60,330 | | | | 1,213,840 | |
Crown Holdings, Inc. * † | | | 83,442 | | | | 3,243,390 | |
Fuji Seal International, Inc. | | | 134,400 | | | | 3,078,338 | |
Graphic Packaging Holding Co. * † | | | 713,345 | | | | 5,293,020 | |
International Paper Co. † | | | 66,540 | | | | 2,928,425 | |
Owens-Illinois, Inc. * | | | 134,525 | | | | 3,430,387 | |
PH Glatfelter Co. | | | 150,875 | | | | 2,738,381 | |
Sensient Technologies Corp. † | | | 66,635 | | | | 2,459,498 | |
Smurfit Kappa Group PLC | | | 219,565 | | | | 3,418,341 | |
Yamana Gold, Inc. | | | 84,820 | | | | 1,247,702 | |
| | | | | | | | |
| | | | | | | 33,286,739 | |
| | | | | | | | |
Capital Goods—16.7% | |
3M Co. † | | | 32,896 | | | | 3,421,184 | |
ABB Ltd. - Sponsored ADR | | | 102,053 | | | | 2,318,644 | |
AGCO Corp. † | | | 70,700 | | | | 3,639,636 | |
Babcock & Wilcox Co., (The) † | | | 70,100 | | | | 1,894,102 | |
Carlisle Cos, Inc. † | | | 36,244 | | | | 2,459,880 | |
CIRCOR International, Inc. † | | | 71,117 | | | | 2,964,156 | |
CNH Global NV † | | | 41,250 | | | | 1,827,375 | |
Cubic Corp. † | | | 57,085 | | | | 2,382,728 | |
Curtiss-Wright Corp. † | | | 44,118 | | | | 1,531,336 | |
Dover Corp. † | | | 34,510 | | | | 2,531,308 | |
Emerson Electric Co. † | | | 36,370 | | | | 2,062,179 | |
EnPro Industries, Inc. * † | | | 48,827 | | | | 2,271,920 | |
Flowserve Corp. † | | | 13,111 | | | | 2,104,315 | |
Fluor Corp. † | | | 52,486 | | | | 3,248,883 | |
Foster Wheeler AG * | | | 121,435 | | | | 2,921,726 | |
General Electric Co. † | | | 191,388 | | | | 4,444,029 | |
Gibraltar Industries, Inc. * | | | 154,830 | | | | 2,655,334 | |
HB Fuller Co. † | | | 75,590 | | | | 3,089,363 | |
Honeywell International, Inc. † | | | 46,335 | | | | 3,248,083 | |
Hubbell, Inc., Class B † | | | 23,470 | | | | 2,180,598 | |
Huntington Ingalls Industries, Inc. † | | | 54,345 | | | | 2,610,734 | |
Illinois Tool Works, Inc. † | | | 22,100 | | | | 1,359,150 | |
Joy Global, Inc. † | | | 40,860 | | | | 2,588,072 | |
LB Foster Co., Class A | | | 56,485 | | | | 2,494,378 | |
Lockheed Martin Corp. † | | | 25,150 | | | | 2,213,200 | |
Meggitt PLC | | | 190,190 | | | | 1,311,655 | |
Metso OYJ | | | 29,504 | | | | 1,267,275 | |
Minerals Technologies, Inc. † | | | 48,312 | | | | 1,944,075 | |
MYR Group, Inc. * | | | 141,008 | | | | 3,272,796 | |
Northrop Grumman Corp. † | | | 30,740 | | | | 2,019,003 | |
PACCAR, Inc. † | | | 53,590 | | | | 2,541,774 | |
Parker Hannifin Corp. † | | | 29,880 | | | | 2,823,062 | |
Precision Castparts Corp. † | | | 12,690 | | | | 2,367,827 | |
Raytheon Co. † | | | 34,920 | | | | 1,905,584 | |
Rheinmetall AG | | | 54,449 | | | | 2,996,273 | |
Smiths Group PLC | | | 130,322 | | | | 2,493,075 | |
Stanley Black & Decker, Inc. † | | | 52,400 | | | | 4,123,880 | |
Textron, Inc. † | | | 116,335 | | | | 3,356,265 | |
Triumph Group, Inc. † | | | 45,210 | | | | 3,318,866 | |
Tyco International Ltd. † | | | 86,060 | | | | 2,754,781 | |
| | | | | | | | |
| | | Number of
Shares | | | Value | |
Capital Goods—(continued) | |
United Technologies Corp. † | | | 26,570 | | | $ | 2,405,914 | |
URS Corp. † | | | 55,250 | | | | 2,334,865 | |
Valmont Industries, Inc. † | | | 19,286 | | | | 3,038,509 | |
WESCO International, Inc. * † | | | 56,490 | | | | 4,174,611 | |
Xylem, Inc. † | | | 64,677 | | | | 1,778,618 | |
| | | | | | | | |
| | | | | | | 116,691,021 | |
| | | | | | | | |
Communications—4.9% | |
Baidu, Inc. - Sponsored ADR * † | | | 30,340 | | | | 2,753,658 | |
Comcast Corp., Class A † | | | 88,740 | | | | 3,530,965 | |
Google, Inc., Class A * † | | | 6,470 | | | | 5,183,764 | |
IAC/InterActive Corp. † | | | 127,190 | | | | 5,182,993 | |
Liberty Global, Inc., Class A * † | | | 36,915 | | | | 2,543,074 | |
Liberty Global, Inc., Class C * | | | 10,000 | | | | 638,600 | |
RigNet, Inc. * † | | | 65,954 | | | | 1,294,017 | |
Sina Corp. * | | | 37,640 | | | | 1,945,235 | |
Time Warner Cable, Inc. † | | | 33,810 | | | | 2,920,846 | |
Vodafone Group PLC - Sponsored ADR † | | | 71,325 | | | | 1,793,111 | |
Windstream Corp. † | | | 194,330 | | | | 1,669,295 | |
Yahoo Japan Corp. | | | 8,000 | | | | 3,387,636 | |
Yahoo!, Inc. * | | | 56,940 | | | | 1,213,391 | |
| | | | | | | | |
| | | | | | | 34,056,585 | |
| | | | | | | | |
Consumer Durables—3.5% | |
Cie Generale des Etablissements Michelin | | | 29,616 | | | | 2,646,247 | |
Harman International Industries, Inc. | | | 63,845 | | | | 2,710,220 | |
Lear Corp. † | | | 78,888 | | | | 4,214,197 | |
LISI | | | 13,735 | | | | 1,289,651 | |
Newell Rubbermaid, Inc. † | | | 150,470 | | | | 3,511,970 | |
NVR, Inc. * | | | 2,610 | | | | 2,634,012 | |
Samsung Electronics Co. Ltd. | | | 2,855 | | | | 4,070,944 | |
Tower International, Inc. * | | | 38,862 | | | | 467,898 | |
TS Tech Co. Ltd. | | | 122,675 | | | | 2,992,428 | |
| | | | | | | | |
| | | | | | | 24,537,567 | |
| | | | | | | | |
Consumer Non-Durables—3.7% | | | | | |
Activision Blizzard, Inc. | | | 109,000 | | | | 1,558,700 | |
British American Tobacco PLC | | | 85,095 | | | | 4,433,738 | |
Coca-Cola Enterprises, Inc. † | | | 65,970 | | | | 2,360,407 | |
Cott Corp. † | | | 277,720 | | | | 2,652,226 | |
Electronic Arts, Inc. * † | | | 195,800 | | | | 3,432,374 | |
Henkel AG & Co. KGaA | | | 34,638 | | | | 2,562,713 | |
Ingredion, Inc. † | | | 38,385 | | | | 2,541,087 | |
Kerry Group PLC, Class A | | | 19,067 | | | | 1,069,401 | |
Perfect World Co. Ltd. - Sponsored ADR † | | | 239,300 | | | | 2,718,448 | |
Unilever NV † | | | 60,595 | | | | 2,358,357 | |
| | | | | | | | |
| | | | | | | 25,687,451 | |
| | | | | | | | |
Consumer Services—12.2% | |
ANN, Inc. * † | | | 55,445 | | | | 1,568,539 | |
Bed Bath & Beyond, Inc. * † | | | 32,585 | | | | 1,849,199 | |
Berendsen PLC | | | 244,280 | | | | 2,529,257 | |
CBS Corp., Class B non-voting shares † | | | 49,915 | | | | 2,165,812 | |
Ctrip.com International Ltd. - ADR * † | | | 139,730 | | | | 2,695,392 | |
CVS Caremark Corp. † | | | 49,170 | | | | 2,513,570 | |
THEACCOMPANYINGNOTESAREANINTEGRALPARTOFTHEFINANCIALSTATEMENTS.
| | | | |
| SEMI-ANNUAL REPORT 2013 | | | 17 | |
| | |
| ROBECO INVESTMENT FUNDS | | FEBRUARY 28, 2013 (unaudited) |
| | |
ROBECO BOSTON PARTNERS LONG/SHORT RESEARCH FUND (continued) | | PORTFOLIOOF INVESTMENTS |
| | | | | | | | |
| | | Number of
Shares | | | Value | |
Consumer Services—(continued) | |
Daily Mail & General Trust PLC | | | 458,890 | | | $ | 4,942,759 | |
eBay, Inc. * † | | | 47,820 | | | | 2,614,798 | |
Equifax, Inc. † | | | 36,985 | | | | 2,038,613 | |
FTI Consulting, Inc. * † | | | 94,585 | | | | 3,285,883 | |
Gannett Co., Inc. | | | 98,940 | | | | 1,985,726 | |
Global Sources Ltd. * | | | 196,820 | | | | 1,525,355 | |
Interpublic Group of Cos., Inc., (The) † | | | 178,075 | | | | 2,275,799 | |
ITV PLC | | | 1,244,765 | | | | 2,345,370 | |
Liberty Media Corp. * † | | | 27,270 | | | | 2,945,160 | |
Macy’s, Inc. † | | | 69,950 | | | | 2,874,945 | |
Manpower, Inc. † | | | 52,050 | | | | 2,841,930 | |
McGraw-Hill Cos., Inc., (The) † | | | 35,050 | | | | 1,631,578 | |
Moody’s Corp. † | | | 44,955 | | | | 2,160,537 | |
News Corp., Class A † | | | 97,435 | | | | 2,806,128 | |
Nordstrom, Inc. † | | | 40,035 | | | | 2,170,698 | |
Odyssey Marine Exploration, Inc. * † | | | 490,365 | | | | 1,716,278 | |
Omnicom Group, Inc. † | | | 40,665 | | | | 2,339,457 | |
Rent-A-Center, Inc. † | | | 76,895 | | | | 2,789,751 | |
Robert Half International, Inc. † | | | 79,920 | | | | 2,841,156 | |
Stage Stores, Inc. † | | | 94,440 | | | | 2,331,724 | |
Staples, Inc. † | | | 104,235 | | | | 1,373,817 | |
Target Corp. † | | | 45,415 | | | | 2,859,328 | |
Time Warner, Inc. † | | | 61,990 | | | | 3,296,008 | |
Towers Watson & Co., Class A † | | | 50,165 | | | | 3,339,484 | |
Travelzoo, Inc. * | | | 34,890 | | | | 735,132 | |
Viacom, Inc., Class B † | | | 44,935 | | | | 2,626,900 | |
Walt Disney Co., (The) † | | | 54,755 | | | | 2,989,075 | |
Williams-Sonoma, Inc. | | | 32,180 | | | | 1,460,972 | |
WPP PLC | | | 184,570 | | | | 2,951,238 | |
| | | | | | | | |
| | | | | | | 85,417,368 | |
| | | | | | | | |
Energy—9.2% | |
Awilco Drilling PLC * | | | 52,712 | | | | 762,119 | |
Cameron International Corp. * † | | | 53,750 | | | | 3,424,950 | |
Canacol Energy Ltd. * | | | 251,515 | | | | 829,237 | |
Canadian Natural Resources Ltd. | | | 95,010 | | | | 2,896,855 | |
Contango Oil & Gas Co. | | | 17,295 | | | | 670,354 | |
Ensco PLC, Class A | | | 55,635 | | | | 3,345,889 | |
EOG Resources, Inc. † | | | 36,163 | | | | 4,546,051 | |
EQT Corp. | | | 20,010 | | | | 1,262,431 | |
Exxon Mobil Corp. † | | | 53,685 | | | | 4,807,492 | |
Halliburton Co. † | | | 164,025 | | | | 6,808,678 | |
Kosmos Energy Ltd. * | | | 170,750 | | | | 1,866,298 | |
LyondellBasell Industries NV, Class A | | | 25,000 | | | | 1,465,500 | |
Occidental Petroleum Corp. † | | | 61,095 | | | | 5,029,951 | |
Petrofac Ltd. | | | 123,890 | | | | 2,732,770 | |
Phillips 66 † | | | 52,330 | | | | 3,294,697 | |
Royal Dutch Shell PLC - ADR | | | 67,090 | | | | 4,404,459 | |
Schlumberger Ltd. † | | | 79,550 | | | | 6,192,968 | |
SM Energy Co. † | | | 52,035 | | | | 3,011,786 | |
Southwestern Energy Co. * † | | | 77,655 | | | | 2,661,237 | |
Valero Energy Corp. † | | | 46,315 | | | | 2,111,501 | |
Weatherford International Ltd. * | | | 199,560 | | | | 2,370,773 | |
| | | | | | | | |
| | | | | | | 64,495,996 | |
| | | | | | | | |
Finance—14.2% | |
ACE Ltd. † | | | 34,840 | | | | 2,974,988 | |
Axis Capital Holdings Ltd. † | | | 73,290 | | | | 2,985,102 | |
BB&T Corp. † | | | 108,755 | | | | 3,301,802 | |
| | | | | | | | |
| | | Number of
Shares | | | Value | |
Finance—(continued) | |
Berkshire Hathaway, Inc., Class B * † | | | 27,595 | | | $ | 2,819,105 | |
Capital One Financial Corp. † | | | 68,400 | | | | 3,490,452 | |
CapitalSource, Inc. | | | 265,170 | | | | 2,386,530 | |
Catlin Group Ltd. | | | 232,280 | | | | 1,779,531 | |
Charles Schwab Corp., (The) † | | | 178,345 | | | | 2,896,323 | |
Citigroup, Inc. † | | | 125,666 | | | | 5,274,202 | |
Comerica, Inc. † | | | 92,130 | | | | 3,167,429 | |
Discover Financial Services † | | | 71,138 | | | | 2,740,947 | |
East West Bancorp, Inc. † | | | 99,439 | | | | 2,446,199 | |
Everest Re Group Ltd. † | | | 22,255 | | | | 2,773,196 | |
Fifth Third Bancorp † | | | 276,770 | | | | 4,384,037 | |
First Niagara Financial Group, Inc. | | | 247,035 | | | | 2,020,746 | |
Goldman Sachs Group, Inc., (The) † | | | 16,450 | | | | 2,463,552 | |
Huntington Bancshares, Inc. † | | | 437,165 | | | | 3,073,270 | |
JPMorgan Chase & Co. † | | | 102,137 | | | | 4,996,542 | |
Marsh & McLennan Cos., Inc. † | | | 69,560 | | | | 2,583,458 | |
MetLife, Inc. † | | | 74,040 | | | | 2,623,978 | |
Morgan Stanley † | | | 89,810 | | | | 2,025,216 | |
PNC Financial Services Group, Inc. † | | | 43,700 | | | | 2,726,443 | |
Raymond James Financial, Inc. † | | | 67,985 | | | | 2,983,182 | |
Regions Financial Corp. | | | 313,900 | | | | 2,401,335 | |
Reinsurance Group of America, Inc. | | | 23,000 | | | | 1,322,500 | |
SLM Corp. † | | | 66,698 | | | | 1,265,261 | |
State Street Corp. † | | | 49,125 | | | | 2,779,984 | |
Steel Excel, Inc. * † | | | 29,325 | | | | 740,456 | |
SunTrust Banks, Inc. † | | | 120,725 | | | | 3,330,803 | |
TD Ameritrade Holding Corp. † | | | 147,315 | | | | 2,800,458 | |
Torchmark Corp. † | | | 50,450 | | | | 2,834,786 | |
Travelers Cos., Inc., (The) | | | 33,135 | | | | 2,664,717 | |
US Bancorp † | | | 81,805 | | | | 2,779,734 | |
Validus Holdings Ltd. † | | | 74,690 | | | | 2,661,205 | |
Wells Fargo & Co. † | | | 127,613 | | | | 4,476,664 | |
| | | | | | | | |
| | | | | | | 98,974,133 | |
| | | | | | | | |
Health Care—8.9% | |
Abbott Laboratories | | | 58,369 | | | | 1,972,289 | |
AbbVie, Inc. | | | 60,851 | | | | 2,246,619 | |
AmerisourceBergen Corp. † | | | 58,265 | | | | 2,750,108 | |
Amgen, Inc. † | | | 15,447 | | | | 1,412,010 | |
Cardinal Health, Inc. † | | | 59,840 | | | | 2,765,206 | |
CareFusion Corp. * † | | | 83,678 | | | | 2,739,618 | |
Chemed Corp. † | | | 25,465 | | | | 1,965,643 | |
CIGNA Corp. † | | | 44,830 | | | | 2,620,762 | |
Covidien PLC † | | | 33,608 | | | | 2,136,461 | |
DaVita HealthCare Partners, Inc. * † | | | 17,440 | | | | 2,086,173 | |
Endo Health Solutions, Inc. * † | | | 71,597 | | | | 2,219,507 | |
Express Scripts Holding Co. * † | | | 42,545 | | | | 2,421,236 | |
Hologic, Inc. * † | | | 88,827 | | | | 1,939,093 | |
Humana, Inc. † | | | 38,230 | | | | 2,609,580 | |
ICON PLC, ADR * | | | 45,506 | | | | 1,417,967 | |
Johnson & Johnson † | | | 27,530 | | | | 2,095,308 | |
McKesson Corp. † | | | 28,765 | | | | 3,052,829 | |
Omnicare, Inc. † | | | 70,320 | | | | 2,620,123 | |
Omnicell, Inc. * † | | | 107,172 | | | | 1,931,239 | |
Orthofix International NV * | | | 33,682 | | | | 1,254,991 | |
Pfizer, Inc. † | | | 91,813 | | | | 2,512,922 | |
Quest Diagnostics, Inc. † | | | 38,825 | | | | 2,180,800 | |
Roche Holding AG - Sponsored ADR † | | | 30,102 | | | | 1,726,952 | |
Sanofi - ADR | | | 62,162 | | | | 2,934,668 | |
THEACCOMPANYINGNOTESAREANINTEGRALPARTOFTHEFINANCIALSTATEMENTS.
| | |
| 18 | | SEMI-ANNUAL REPORT 2013 |
| | |
| ROBECO INVESTMENT FUNDS | | FEBRUARY 28, 2013 (unaudited) |
| | |
ROBECO BOSTON PARTNERS LONG/SHORT RESEARCH FUND (continued) | | PORTFOLIOOF INVESTMENTS |
| | | | | | | | |
| | | Number of
Shares | | | Value | |
Health Care—(continued) | |
Stryker Corp. † | | | 33,191 | | | $ | 2,120,241 | |
Teleflex, Inc. | | | 16,874 | | | | 1,349,245 | |
UnitedHealth Group, Inc. † | | | 48,645 | | | | 2,600,075 | |
Universal Health Services, Inc., Class B † | | | 45,580 | | | | 2,638,626 | |
| | | | | | | | |
| | | | | | | 62,320,291 | |
| | | | | | | | |
Technology—12.5% | |
Accenture PLC, Class A † | | | 16,487 | | | | 1,225,973 | |
Alliance Data Systems Corp. * † | | | 8,140 | | | | 1,291,737 | |
Amdocs Ltd. † | | | 74,145 | | | | 2,704,068 | |
Analog Devices, Inc. † | | | 48,681 | | | | 2,201,355 | |
Apple, Inc. † | | | 5,295 | | | | 2,337,213 | |
Arrow Electronics, Inc. * † | | | 84,182 | | | | 3,379,907 | |
Avnet, Inc. * † | | | 103,860 | | | | 3,667,297 | |
BMC Software, Inc. * † | | | 67,310 | | | | 2,697,112 | |
CA, Inc. † | | | 137,338 | | | | 3,363,408 | |
CACI International, Inc., Class A * † | | | 30,485 | | | | 1,547,114 | |
Cisco Systems, Inc. † | | | 138,155 | | | | 2,880,532 | |
EMC Corp. * † | | | 180,502 | | | | 4,153,351 | |
Fiserv, Inc. * † | | | 29,736 | | | | 2,441,623 | |
Flextronics International Ltd. * † | | | 527,459 | | | | 3,507,602 | |
Harris Corp. † | | | 56,610 | | | | 2,721,243 | |
Ingram Micro, Inc., Class A * † | | | 157,790 | | | | 2,975,919 | |
International Business Machines Corp. | | | 5,178 | | | | 1,039,898 | |
LSI Corp. * † | | | 453,070 | | | | 3,153,367 | |
Microsoft Corp. † | | | 122,470 | | | | 3,404,666 | |
NVIDIA Corp. † | | | 262,620 | | | | 3,324,769 | |
ON Semiconductor Corp. * | | | 474,430 | | | | 3,795,440 | |
Oracle Corp. † | | | 113,317 | | | | 3,882,240 | |
QUALCOMM, Inc. | | | 20,000 | | | | 1,312,600 | |
Seagate Technology PLC † | | | 124,210 | | | | 3,994,594 | |
STMicroelectronics NV † | | | 55,998 | | | | 445,184 | |
Symantec Corp. * † | | | 180,213 | | | | 4,224,193 | |
TE Connectivity Ltd. † | | | 55,300 | | | | 2,219,189 | |
Texas Instruments, Inc. † | | | 71,630 | | | | 2,461,923 | |
VeriFone Systems, Inc. * † | | | 111,860 | | | | 2,121,984 | |
Western Digital Corp. † | | | 88,300 | | | | 4,164,228 | |
WEX, Inc. * † | | | 37,550 | | | | 2,816,626 | |
Xerox Corp. † | | | 195,968 | | | | 1,589,300 | |
| | | | | | | | |
| | | | | | | 87,045,655 | |
| | | | | | | | |
Transportation—1.1% | | | | | | | | |
Con-way, Inc. † | | | 53,100 | | | | 1,866,465 | |
Norfolk Southern Corp. † | | | 30,620 | | | | 2,236,791 | |
United Parcel Service, Inc., Class B † | | | 27,830 | | | | 2,300,150 | |
UTi Worldwide, Inc. | | | 92,855 | | | | 1,414,182 | |
| | | | | | | | |
| | | | | | | 7,817,588 | |
| | | | | | | | |
Utilities—0.7% | | | | | | | | |
AES Corp. † | | | 135,030 | | | | 1,569,049 | |
National Fuel Gas Co. † | | | 50,745 | | | | 2,952,852 | |
| | | | | | | | |
| | | | | | | 4,521,901 | |
| | | | | | | | |
TOTAL COMMON STOCK—92.4%
(Cost $582,789,842) | | | | 644,852,295 | |
| | | | | | | | |
TOTAL LONG POSITIONS—92.4%
(Cost $582,789,842) | | | | 644,852,295 | |
| | | | | | | | |
| | | | | | | | |
| | | Number of
Shares | | | Value | |
SECURITIES SOLD SHORT—(44.4%) | | | | | |
COMMON STOCK—(44.4%) | | | | | | | | |
Basic Industries—(1.8%) | | | | | | | | |
Antofagasta PLC | | | (78,175 | ) | | $ | (1,296,255 | ) |
EI Du Pont de Nemours & Co. | | | (31,560 | ) | | | (1,511,724 | ) |
Fortescue Metals Group Ltd. | | | (175,000 | ) | | | (843,718 | ) |
Greif, Inc., Class A | | | (38,605 | ) | | | (1,963,836 | ) |
Resolute Forest Products * | | | (86,635 | ) | | | (1,195,563 | ) |
Solvay SA | | | (14,840 | ) | | | (2,120,526 | ) |
Texas Industries, Inc. * | | | (17,654 | ) | | | (1,024,815 | ) |
Wausau Paper Corp. | | | (169,395 | ) | | | (1,671,929 | ) |
Westlake Chemical Corp. | | | (8,755 | ) | | | (754,856 | ) |
| | | | | | | | |
| | | | | | | (12,383,222 | ) |
| | | | | | | | |
Capital Goods—(4.5%) | | | | | | | | |
AAON, Inc. | | | (20,775 | ) | | | (499,846 | ) |
Acuity Brands, Inc. | | | (21,919 | ) | | | (1,493,341 | ) |
Alstom SA | | | (29,645 | ) | | | (1,308,164 | ) |
Altra Holdings, Inc. | | | (47,915 | ) | | | (1,233,332 | ) |
Builders FirstSource, Inc. * | | | (251,900 | ) | | | (1,523,995 | ) |
Caterpillar, Inc. | | | (26,305 | ) | | | (2,429,793 | ) |
Federal Signal Corp. * | | | (151,280 | ) | | | (1,179,984 | ) |
Graco, Inc. | | | (16,318 | ) | | | (948,076 | ) |
Interface, Inc. | | | (88,180 | ) | | | (1,614,576 | ) |
James Hardie Industries PLC - Sponsored ADR | | | (23,035 | ) | | | (1,156,127 | ) |
Lennox International, Inc. | | | (32,770 | ) | | | (1,935,724 | ) |
Manitex International, Inc. * | | | (87,630 | ) | | | (839,495 | ) |
Manitowoc Co., Inc., (The) | | | (112,245 | ) | | | (2,078,777 | ) |
Olin Corp. | | | (73,975 | ) | | | (1,713,261 | ) |
Polypore International Inc. * | | | (25,095 | ) | | | (960,637 | ) |
Roper Industries, Inc. | | | (10,712 | ) | | | (1,334,822 | ) |
Simpson Manufacturing Co., Inc. | | | (47,090 | ) | | | (1,370,319 | ) |
Sun Hydraulics Corp. | | | (58,720 | ) | | | (1,637,701 | ) |
Taiheiyo Cement Corp. | | | (537,570 | ) | | | (1,328,121 | ) |
Trex Co., Inc. * | | | (45,555 | ) | | | (2,152,018 | ) |
USG Corp. * | | | (45,095 | ) | | | (1,272,581 | ) |
Vulcan Materials Co. | | | (24,057 | ) | | | (1,225,223 | ) |
| | | | | | | | |
| | | | | | | (31,235,913 | ) |
| | | | | | | | |
Communications—(5.0%) | | | | | | | | |
America Movil SAB de CV,
Series L - ADR | | | (45,000 | ) | | | (940,050 | ) |
Angie’s List, Inc. * | | | (100,920 | ) | | | (1,721,695 | ) |
AOL, Inc. | | | (54,300 | ) | | | (2,003,670 | ) |
CenturyLink, Inc. | | | (34,220 | ) | | | (1,186,407 | ) |
Cogent Communications Group, Inc. | | | (78,040 | ) | | | (1,962,706 | ) |
Equinix, Inc. * | | | (8,240 | ) | | | (1,743,172 | ) |
France Telecom SA | | | (114,120 | ) | | | (1,105,353 | ) |
Internap Network Services Corp. * | | | (102,940 | ) | | | (893,519 | ) |
KDDI Corp. | | | (17,510 | ) | | | (1,314,808 | ) |
Level 3 Communications, Inc. * | | | (59,455 | ) | | | (1,187,911 | ) |
LinkedIn Corp., Class A * | | | (22,370 | ) | | | (3,762,187 | ) |
Lumos Networks Corp. | | | (62,660 | ) | | | (715,577 | ) |
Millicom International Cellular SA - SDR | | | (65,317 | ) | | | (5,125,456 | ) |
NII Holdings, Inc. * | | | (125,095 | ) | | | (602,958 | ) |
Rackspace Hosting, Inc. * | | | (34,875 | ) | | | (1,948,117 | ) |
Shutterfly, Inc. * | | | (33,260 | ) | | | (1,439,493 | ) |
Shutterstock, Inc. * | | | (73,315 | ) | | | (2,390,069 | ) |
THEACCOMPANYINGNOTESAREANINTEGRALPARTOFTHEFINANCIALSTATEMENTS.
| | | | |
| SEMI-ANNUAL REPORT 2013 | | | 19 | |
| | |
| ROBECO INVESTMENT FUNDS | | FEBRUARY 28, 2013 (unaudited) |
| | |
ROBECO BOSTON PARTNERS LONG/SHORT RESEARCH FUND (continued) | | PORTFOLIOOF INVESTMENTS |
| | | | | | | | |
| | | Number of
Shares | | | Value | |
Communications—(continued) | | | | | | | | |
Telefonica SA - Sponsored ADR | | | (93,230 | ) | | $ | (1,213,855 | ) |
Verizon Communications, Inc. | | | (35,835 | ) | | | (1,667,402 | ) |
YY, Inc. ADR * | | | (123,000 | ) | | | (2,269,965 | ) |
| | | | | | | | |
| | | | | | | (35,194,370 | ) |
| | | | | | | | |
Consumer Durables—(1.9%) | | | | | | | | |
American Axle & Manaufacturing Holdings, Inc. * | | | (185,787 | ) | | | (2,350,205 | ) |
Autoneum Holding AG * | | | (11,373 | ) | | | (746,835 | ) |
Cooper Tire & Rubber Co. | | | (38,616 | ) | | | (976,212 | ) |
D.R. Horton, Inc. | | | (43,205 | ) | | | (963,471 | ) |
Electrolux AB - Series B | | | (68,615 | ) | | | (1,751,606 | ) |
Exide Technologies * | | | (761,884 | ) | | | (2,041,849 | ) |
Faurecia | | | (48,525 | ) | | | (867,604 | ) |
Goodyear Tire & Rubber Co., (The) * | | | (110,699 | ) | | | (1,436,873 | ) |
Modine Manufacturing Co. * | | | (238,804 | ) | | | (1,967,745 | ) |
| | | | | | | | |
| | | | | | | (13,102,400 | ) |
| | | | | | | | |
Consumer Non-Durables—(2.7%) | | | | | | | | |
Annie’s, Inc. * | | | (37,415 | ) | | | (1,569,933 | ) |
Clorox Co., (The) | | | (24,475 | ) | | | (2,056,145 | ) |
Fossil, Inc. * | | | (23,350 | ) | | | (2,399,679 | ) |
Giant Interactive Group, Inc. | | | (425,370 | ) | | | (2,637,294 | ) |
Huabao International Holdings Ltd. | | | (2,914,000 | ) | | | (1,626,904 | ) |
Luxottica Group SpA - Sponsored ADR | | | (55,180 | ) | | | (2,572,492 | ) |
Snyders-Lance, Inc. | | | (70,255 | ) | | | (1,739,514 | ) |
Tootsie Roll Industries, Inc. | | | (51,925 | ) | | | (1,458,054 | ) |
Under Armour, Inc., Class A * | | | (51,890 | ) | | | (2,557,139 | ) |
| | | | | | | | |
| | | | | | | (18,617,154 | ) |
| | | | | | | | |
Consumer Services—(7.9%) | | | | | | | | |
Acxiom Corp. * | | | (112,055 | ) | | | (2,040,521 | ) |
ADT Corp., (The) | | | (37,465 | ) | | | (1,794,199 | ) |
Amazon.com, Inc. * | | | (4,025 | ) | | | (1,063,687 | ) |
AMC Networks, Inc., Class A * | | | (30,025 | ) | | | (1,723,435 | ) |
BJ’s Restaurants, Inc. * | | | (65,020 | ) | | | (2,001,966 | ) |
Blue Nile, Inc. * | | | (68,345 | ) | | | (2,318,946 | ) |
Bureau Veritas SA | | | (12,590 | ) | | | (1,623,800 | ) |
Caesars Entertainment Corp. * | | | (90,050 | ) | | | (1,125,625 | ) |
Concur Technologies, Inc. * | | | (24,325 | ) | | | (1,707,615 | ) |
Darden Restaurants, Inc. | | | (51,635 | ) | | | (2,389,151 | ) |
FactSet Research Systems, Inc. | | | (18,880 | ) | | | (1,836,835 | ) |
Family Dollar Stores, Inc. | | | (36,370 | ) | | | (2,093,093 | ) |
IHS, Inc., Class A * | | | (16,030 | ) | | | (1,703,187 | ) |
Lululemon Athletica, Inc. * | | | (34,540 | ) | | | (2,315,907 | ) |
Mediaset SpA | | | (775,185 | ) | | | (1,718,450 | ) |
Monro Muffler Brake, Inc. | | | (42,135 | ) | | | (1,561,102 | ) |
Morningstar, Inc. | | | (23,765 | ) | | | (1,629,804 | ) |
Mothercare PLC * | | | (355,125 | ) | | | (1,466,735 | ) |
MSCI, Inc. * | | | (44,885 | ) | | | (1,487,040 | ) |
Netflix, Inc. * | | | (11,985 | ) | | | (2,254,139 | ) |
Penske Automotive Group, Inc. | | | (51,450 | ) | | | (1,531,152 | ) |
Pool Corp. | | | (22,289 | ) | | | (1,019,053 | ) |
Ritchie Bros. Auctioneers, Inc. | | | (82,675 | ) | | | (1,883,336 | ) |
Rollins, Inc. | | | (73,555 | ) | | | (1,802,833 | ) |
Sysco Corp. | | | (79,715 | ) | | | (2,563,634 | ) |
Titan Machinery, Inc. * | | | (35,700 | ) | | | (1,008,525 | ) |
Ultimate Software Group, Inc., (The) * | | | (17,315 | ) | | | (1,701,545 | ) |
| | | | | | | | |
| | | Number of
Shares | | | Value | |
Consumer Services—(continued) | | | | | |
Vail Resorts, Inc. | | | (15,978 | ) | | $ | (882,625 | ) |
Vitacost.com, Inc. * | | | (139,657 | ) | | | (1,032,065 | ) |
Wendy’s Co., (The) | | | (525,610 | ) | | | (2,990,721 | ) |
Youku.com, Inc. - ADR * | | | (93,330 | ) | | | (1,902,999 | ) |
Zillow, Inc., Class A * | | | (24,455 | ) | | | (1,050,587 | ) |
| | | | | | | | |
| | | | | | | (55,224,312 | ) |
| | | | | | | | |
Energy—(3.3%) | | | | | | | | |
Approach Resources, Inc. * | | | (21,555 | ) | | | (533,486 | ) |
Atwood Oceanics, Inc. * | | | (34,980 | ) | | | (1,789,227 | ) |
Aurora Oil and Gas Ltd. * | | | (247,965 | ) | | | (978,635 | ) |
Birchcliff Energy Ltd. * | | | (2,385 | ) | | | (18,132 | ) |
Carrizo Oil & Gas, Inc. * | | | (47,180 | ) | | | (1,108,258 | ) |
Chesapeake Energy Corp. | | | (18,365 | ) | | | (370,238 | ) |
ConocoPhillips | | | (40,615 | ) | | | (2,353,639 | ) |
Continental Resources, Inc. * | | | (8,665 | ) | | | (762,520 | ) |
Crescent Point Energy Corp. | | | (34,140 | ) | | | (1,299,389 | ) |
Denbury Resources, Inc. * | | | (78,265 | ) | | | (1,418,162 | ) |
Dresser-Rand Group, Inc. * | | | (12,975 | ) | | | (800,038 | ) |
FMC Technologies, Inc. * | | | (26,500 | ) | | | (1,375,615 | ) |
Goodrich Petroleum Corp. * | | | (75,365 | ) | | | (971,455 | ) |
Lufkin Industries, Inc. | | | (19,060 | ) | | | (1,234,707 | ) |
Magnum Hunter Resources Corp. * | | | (110,000 | ) | | | (425,700 | ) |
Neste Oil OYJ | | | (121,610 | ) | | | (1,830,596 | ) |
Patterson-UTI Energy, Inc. | | | (34,080 | ) | | | (795,427 | ) |
PDC Energy, Inc. * | | | (23,880 | ) | | | (1,113,763 | ) |
Range Resources Corp. | | | (8,170 | ) | | | (627,456 | ) |
RPC, Inc. | | | (89,550 | ) | | | (1,448,919 | ) |
Sanchez Energy Corp. * | | | (48,000 | ) | | | (888,480 | ) |
Subsea 7 SA | | | (35,065 | ) | | | (828,875 | ) |
Whiting Petroleum Corp. * | | | (9,055 | ) | | | (440,978 | ) |
| | | | | | | | |
| | | | | | | (23,413,695 | ) |
| | | | | | | | |
Exchange Traded Funds—(0.4%) | | | | | | | | |
United States Oil Fund LP * | | | (80,817 | ) | | | (2,671,810 | ) |
| | | | | | | | |
| | | | | | | (2,671,810 | ) |
| | | | | | | | |
Finance—(4.1%) | | | | | | | | |
1st United Bancorp, Inc. | | | (181,210 | ) | | | (1,101,757 | ) |
Aviva PLC | | | (124,440 | ) | | | (673,577 | ) |
Commonwealth Bank of Australia | | | (18,311 | ) | | | (1,258,203 | ) |
Community Bank System, Inc. | | | (52,635 | ) | | | (1,519,572 | ) |
CVB Financial Corp. | | | (112,859 | ) | | | (1,196,305 | ) |
First Cash Financial Services, Inc. * | | | (16,365 | ) | | | (865,872 | ) |
First Financial Bankshares, Inc. | | | (41,420 | ) | | | (1,847,332 | ) |
Gain Capital Holdings, Inc. | | | (76,995 | ) | | | (341,858 | ) |
Glacier Bancorp, Inc. | | | (64,870 | ) | | | (1,131,333 | ) |
Greenhill & Co., Inc. | | | (27,550 | ) | | | (1,674,489 | ) |
Iberiabank Corp. | | | (17,127 | ) | | | (859,775 | ) |
Northern Trust Corp. | | | (26,290 | ) | | | (1,397,839 | ) |
Signature Bank * | | | (21,640 | ) | | | (1,607,203 | ) |
TCF Financial Corp. | | | (117,915 | ) | | | (1,620,152 | ) |
Tompkins Financial Corp. | | | (30,869 | ) | | | (1,278,903 | ) |
TrustCo Bank Corp. | | | (281,480 | ) | | | (1,466,511 | ) |
Trustmark Corp. | | | (48,680 | ) | | | (1,114,772 | ) |
UMB Financial Corp. | | | (31,576 | ) | | | (1,439,550 | ) |
United Bankshares, Inc. | | | (62,975 | ) | | | (1,637,350 | ) |
Valley National Bancorp | | | (166,159 | ) | | | (1,666,575 | ) |
Westamerica Bancorporation | | | (44,924 | ) | | | (1,987,887 | ) |
THEACCOMPANYINGNOTESAREANINTEGRALPARTOFTHEFINANCIALSTATEMENTS.
| | |
| 20 | | SEMI-ANNUAL REPORT 2013 |
| | |
| ROBECO INVESTMENT FUNDS | | FEBRUARY 28, 2013 (unaudited) |
| | |
ROBECO BOSTON PARTNERS LONG/SHORT RESEARCH FUND (continued) | | PORTFOLIOOF INVESTMENTS |
| | | | | | | | |
| | | Number of
Shares | | | Value | |
Finance—(continued) | | | | | | | | |
World Acceptance Corp. * | | | (15,605 | ) | | $ | (1,228,114 | ) |
| | | | | | | | |
| | | | | | | (28,914,929 | ) |
| | | | | | | | |
Health Care—(3.2%) | | | | | | | | |
ABIOMED, Inc. * | | | (68,264 | ) | | | (1,094,955 | ) |
Acadia Healthcare Co., Inc. * | | | (81,250 | ) | | | (2,211,625 | ) |
Ariad Pharmaceuticals, Inc. * | | | (41,394 | ) | | | (870,516 | ) |
athenahealth, Inc. * | | | (29,190 | ) | | | (2,737,730 | ) |
DexCom, Inc. * | | | (73,428 | ) | | | (1,096,280 | ) |
Edwards Lifesciences Corp. * | | | (13,484 | ) | | | (1,158,680 | ) |
Elekta AB, B Shares | | | (87,799 | ) | | | (1,316,836 | ) |
H Lundbeck A/S | | | (20,121 | ) | | | (341,183 | ) |
HeartWare International, Inc. * | | | (7,271 | ) | | | (621,089 | ) |
IDEXX Laboratories, Inc. * | | | (13,294 | ) | | | (1,224,643 | ) |
Incyte Corp. Ltd. * | | | (30,675 | ) | | | (680,985 | ) |
Navidea Biopharmaceuticals, Inc. * | | | (183,200 | ) | | | (562,424 | ) |
Orion OYJ, Class B | | | (20,840 | ) | | | (617,614 | ) |
Perrigo Co. | | | (11,705 | ) | | | (1,324,655 | ) |
ResMed, Inc. | | | (25,119 | ) | | | (1,117,544 | ) |
Seattle Genetics, Inc. * | | | (23,072 | ) | | | (649,246 | ) |
Spectrum Pharmaceuticals, Inc. | | | (92,178 | ) | | | (1,050,829 | ) |
Stericycle, Inc. * | | | (21,890 | ) | | | (2,099,689 | ) |
Straumann Holding AG, Registered Shares | | | (4,641 | ) | | | (641,709 | ) |
Vivus, Inc. * | | | (59,908 | ) | | | (642,214 | ) |
| | | | | | | | |
| | | | | | | (22,060,446 | ) |
| | | | | | | | |
Real Estate Investment Trusts—(0.3%) | | | | | |
Apartment Investment & Management Co., Class A | | | (64,245 | ) | | | (1,902,937 | ) |
| | | | | | | | |
Technology—(7.5%) | | | | | |
ADTRAN, Inc. | | | (86,025 | ) | | | (1,921,799 | ) |
Aspen Technology, Inc. * | | | (47,992 | ) | | | (1,476,234 | ) |
Aviat Networks, Inc. * | | | (295,905 | ) | | | (1,053,422 | ) |
AZZ, Inc. | | | (48,701 | ) | | | (2,174,987 | ) |
Blackbaud, Inc. | | | (76,250 | ) | | | (2,119,750 | ) |
Calix, Inc. * | | | (54,970 | ) | | | (471,093 | ) |
Ciena Corp. * | | | (91,330 | ) | | | (1,391,869 | ) |
Cirrus Logic, Inc. * | | | (35,738 | ) | | | (859,142 | ) |
Cypress Semiconductor Corp. | | | (111,360 | ) | | | (1,172,621 | ) |
Dassault Systemes SA | | | (14,906 | ) | | | (1,691,900 | ) |
Eaton Corp. PLC | | | (29,405 | ) | | | (1,822,228 | ) |
Finisar Corp. * | | | (95,340 | ) | | | (1,396,731 | ) |
First Solar, Inc. * | | | (18,648 | ) | | | (482,051 | ) |
Gamesa Corp. Tecnologica SA | | | (488,097 | ) | | | (1,468,828 | ) |
Generac Holdings, Inc. | | | (64,704 | ) | | | (2,229,053 | ) |
Hittite Microwave Corp. * | | | (30,240 | ) | | | (1,960,157 | ) |
Infinera Corp. * | | | (105,030 | ) | | | (681,645 | ) |
Infosys Technologies Ltd. - Sponsored ADR | | | (33,405 | ) | | | (1,801,532 | ) |
Itron, Inc. * | | | (34,508 | ) | | | (1,451,752 | ) |
Jive Software, Inc. * | | | (83,410 | ) | | | (1,382,938 | ) |
Logitech International SA | | | (57,391 | ) | | | (387,963 | ) |
Methode Electronics, Inc. | | | (97,860 | ) | | | (1,282,945 | ) |
National Instruments Corp. | | | (71,095 | ) | | | (2,138,538 | ) |
NetSuite, Inc. * | | | (22,261 | ) | | | (1,553,595 | ) |
Nokia OYJ | | | (300,000 | ) | | | (1,095,000 | ) |
Oclaro, Inc. * | | | (529,300 | ) | | | (703,969 | ) |
| | | | | | | | |
| | | Number of
Shares | | | Value | |
Technology—(continued) | | | | | |
Pegasystems, Inc. | | | (37,284 | ) | | $ | (1,021,209 | ) |
Red Hat, Inc. * | | | (29,632 | ) | | | (1,505,602 | ) |
Research In Motion Ltd. * | | | (67,240 | ) | | | (897,654 | ) |
Salesforce.com, Inc. * | | | (11,068 | ) | | | (1,872,927 | ) |
ServiceSource International, Inc. * | | | (178,855 | ) | | | (1,130,364 | ) |
Skyworks Solutions, Inc. * | | | (49,817 | ) | | | (1,061,102 | ) |
Tri-Tech Holding, Inc. * | | | (81,005 | ) | | | (164,440 | ) |
Tyler Technologies, Inc. * | | | (31,000 | ) | | | (1,748,400 | ) |
Vestas Wind Systems A/S * | | | (197,922 | ) | | | (1,413,815 | ) |
ViaSat, Inc. * | | | (47,235 | ) | | | (2,218,156 | ) |
VMware, Inc., Class A * | | | (11,187 | ) | | | (803,562 | ) |
Wipro Ltd. - ADR | | | (216,108 | ) | | | (2,074,637 | ) |
| | | | | | | | |
| | | | | | | (52,083,610 | ) |
| | | | | | | | |
Transportation—(1.3%) | |
Hub Group, Inc., Class A * | | | (40,620 | ) | | | (1,532,593 | ) |
J.B. Hunt Transport Services, Inc. | | | (25,050 | ) | | | (1,741,476 | ) |
Kansas City Southern | | | (16,865 | ) | | | (1,736,589 | ) |
Keikyu Corp. | | | (151,000 | ) | | | (1,334,222 | ) |
Old Dominion Freight Line, Inc. * | | | (44,855 | ) | | | (1,612,537 | ) |
Panalpina Welttransport Holding AG, Registered Shares | | | (12,680 | ) | | | (1,337,941 | ) |
| | | | | | | | |
| | | | | | | (9,295,358 | ) |
| | | | | | | | |
Utilities—(0.5%) | |
Aqua America, Inc. | | | (47,235 | ) | | | (1,375,956 | ) |
Oneok, Inc. | | | (26,000 | ) | | | (1,169,740 | ) |
Ormat Technologies, Inc. | | | (43,140 | ) | | | (881,782 | ) |
| | | | | | | | |
| | | | | | | (3,427,478 | ) |
| | | | | | | | |
TOTAL COMMON STOCK—(44.4%)
(Proceeds $285,124,928) | | | | | | | (309,527,634 | ) |
| | | | | | | | |
TOTAL SECURITIES SOLD SHORT—(44.4%)
(Proceeds $285,124,928) | | | | | | | (309,527,634 | ) |
| | | | | | | | |
OTHER ASSETS IN EXCESS OF LIABILITIES—52.0% | | | | | | | 362,831,399 | |
| | | | | | | | |
NET ASSETS—100.0% | | | | | | $ | 698,156,060 | |
| | | | | | | | |
| | | | |
| ADR | | — | | American Depositary Receipt |
| PLC | | — | | Public Limited Company |
| SDR | | — | | Swedish Depositary Receipt |
| * | | — | | Non-income producing. |
| † | | — | | Security position is either entirely or partially held in a segregated account as collateral for securities sold short. |
THEACCOMPANYINGNOTESAREANINTEGRALPARTOFTHEFINANCIALSTATEMENTS.
| | | | |
| SEMI-ANNUAL REPORT 2013 | | | 21 | |
| | |
| ROBECO INVESTMENT FUNDS | | FEBRUARY 28, 2013 (unaudited) |
| | |
ROBECO BOSTON PARTNERS LONG/SHORT RESEARCH FUND (concluded) | | PORTFOLIOOF INVESTMENTS |
A summary of the inputs used to value the Fund’s investments as of February 28, 2013 is as follows (see Note I in the Notes to Financial Statements):
| | | | | | | | | | | | | | | | |
| | | Total
Value as of
February 28, 2013 | | | Level 1
Quoted
Price | | | Level 2
Significant
Observable
Inputs | | | Level 3
Significant
Unobservable
Inputs | |
| | | | | | | | | | | | | | | | |
Investment in securities * | | $ | 644,852,295 | | | $ | 644,852,295 | | | $ | — | | | $ | — | |
| | | | | | | | | | | | | | | | |
Total Assets | | $ | 644,852,295 | | | $ | 644,852,295 | | | $ | — | | | $ | — | |
| | | | | | | | | | | | | | | | |
| | | | |
| | | Total
Value as of
February 28, 2013 | | | Level 1
Quoted
Price | | | Level 2
Significant
Observable
Inputs | | | Level 3
Significant
Unobservable
Inputs | |
| | | | | | | | | | | | | | | | |
Investments in Securities Sold Short * | | $ | (309,527,634 | ) | | $ | (309,527,634 | ) | | $ | — | | | $ | — | |
| | | | | | | | | | | | | | | | |
Total Liabilities | | $ | (309,527,634 | ) | | $ | (309,527,634 | ) | | $ | — | | | $ | — | |
| | | | | | | | | | | | | | | | |
| * | See Portfolio of Investments detail for country and security type breakout. |
THEACCOMPANYINGNOTESAREANINTEGRALPARTOFTHEFINANCIALSTATEMENTS.
| | |
| 22 | | SEMI-ANNUAL REPORT 2013 |
| | |
| ROBECO INVESTMENT FUNDS | | FEBRUARY 28, 2013 (unaudited) |
| | |
ROBECO BOSTON PARTNERS ALL-CAP VALUE FUND | | PORTFOLIOOF INVESTMENTS |
| | | | | | | | |
| | | Number of
Shares | | | Value | |
COMMON STOCK—95.4% | | | | | | | | |
Capital Goods—6.4% | |
Actuant Corp., Class A | | | 51,340 | | | $ | 1,561,249 | |
Dover Corp. | | | 78,465 | | | | 5,755,408 | |
Fluor Corp. | | | 28,203 | | | | 1,745,766 | |
Foster Wheeler AG * | | | 42,530 | | | | 1,023,272 | |
Huntington Ingalls Industries, Inc. | | | 26,020 | | | | 1,250,001 | |
Illinois Tool Works, Inc. | | | 46,855 | | | | 2,881,583 | |
Masco Corp. | | | 104,370 | | | | 2,010,166 | |
Parker Hannifin Corp. | | | 40,052 | | | | 3,784,113 | |
Stanley Black & Decker, Inc. | | | 25,235 | | | | 1,985,995 | |
Textron, Inc. | | | 40,060 | | | | 1,155,731 | |
Tyco International Ltd. | | | 61,135 | | | | 1,956,931 | |
| | | | | | | | |
| | | | | | | 25,110,215 | |
| | | | | | | | |
Communications—1.6% | |
Google, Inc., Class A * | | | 155 | | | | 124,186 | |
IAC/InterActive Corp. | | | 35,050 | | | | 1,428,287 | |
Monster Worldwide, Inc. * (a) | | | 69,525 | | | | 355,968 | |
Vodafone Group PLC - Sponsored ADR | | | 181,803 | | | | 4,570,527 | |
| | | | | | | | |
| | | | | | | 6,478,968 | |
| | | | | | | | |
Consumer Durables—2.5% | |
Lear Corp. | | | 88,788 | | | | 4,743,055 | |
Newell Rubbermaid, Inc. | | | 89,180 | | | | 2,081,461 | |
Thor Industries, Inc. | | | 70,480 | | | | 2,649,343 | |
Tower International, Inc. * | | | 29,721 | | | | 357,841 | |
| | | | | | | | |
| | | | | | | 9,831,700 | |
| | | | | | | | |
Consumer Non-Durables—4.2% | |
Brunswick Corp. | | | 96,160 | | | | 3,504,070 | |
Electronic Arts, Inc. * | | | 263,198 | | | | 4,613,861 | |
Jones Group, Inc., (The) | | | 148,660 | | | | 1,715,536 | |
Mattel, Inc. | | | 49,725 | | | | 2,026,294 | |
Matthews International Corp., Class A | | | 22,945 | | | | 757,185 | |
PepsiCo, Inc. | | | 49,890 | | | | 3,780,165 | |
| | | | | | | | |
| | | | | | | 16,397,111 | |
| | | | | | | | |
Consumer Services—13.0% | |
CBS Corp., Class B non-voting shares | | | 53,373 | | | | 2,315,854 | |
CEC Entertainment, Inc. | | | 12,210 | | | | 369,352 | |
eBay, Inc. * | | | 55,280 | | | | 3,022,710 | |
Equifax, Inc. | | | 32,700 | | | | 1,802,424 | |
FTI Consulting, Inc. * | | | 37,299 | | | | 1,295,767 | |
Interpublic Group of Cos., Inc., (The) | | | 224,400 | | | | 2,867,832 | |
Kohl’s Corp. | | | 108,411 | | | | 4,997,747 | |
Korn/Ferry International * | | | 50,841 | | | | 941,067 | |
Manpower, Inc. | | | 93,670 | | | | 5,114,382 | |
Men’s Wearhouse, Inc., (The) | | | 31,890 | | | | 896,747 | |
Omnicom Group, Inc. | | | 106,820 | | | | 6,145,355 | |
Pantry, Inc., (The) * | | | 8,670 | | | | 107,855 | |
Rent-A-Center, Inc. | | | 47,852 | | | | 1,736,071 | |
Staples, Inc. | | | 69,045 | | | | 910,013 | |
Target Corp. | | | 104,480 | | | | 6,578,061 | |
Towers Watson & Co., Class A | | | 45,110 | | | | 3,002,973 | |
Viacom, Inc., Class B | | | 70,830 | | | | 4,140,722 | |
Walt Disney Co., (The) | | | 81,695 | | | | 4,459,730 | |
| | | | | | | | |
| | | | | | | 50,704,662 | |
| | | | | | | | |
| | | | | | | | |
| | | Number of
Shares | | | Value | |
Energy—9.8% | |
Cameron International Corp. * | | | 19,175 | | | $ | 1,221,831 | |
Canadian Natural Resources Ltd. | | | 42,320 | | | | 1,290,337 | |
Chevron Corp. | | | 37,835 | | | | 4,432,370 | |
EOG Resources, Inc. | | | 30,085 | | | | 3,781,985 | |
Exxon Mobil Corp. | | | 77,925 | | | | 6,978,184 | |
Halliburton Co. | | | 80,470 | | | | 3,340,310 | |
Occidental Petroleum Corp. | | | 78,245 | | | | 6,441,911 | |
Phillips 66 | | | 41,940 | | | | 2,640,542 | |
Royal Dutch Shell PLC - ADR | | | 70,980 | | | | 4,659,837 | |
Valero Energy Corp. | | | 37,370 | | | | 1,703,698 | |
Weatherford International Ltd. (Switzerland) * | | | 140,210 | | | | 1,665,695 | |
| | | | | | | | |
| | | | | | | 38,156,700 | |
| | | | | | | | |
Finance—26.1% | |
ACE Ltd. | | | 27,270 | | | | 2,328,585 | |
Alleghany Corp. * | | | 6,087 | | | | 2,300,095 | |
American International Group, Inc. * | | | 103,775 | | | | 3,944,488 | |
Axis Capital Holdings Ltd. | | | 89,145 | | | | 3,630,876 | |
BB&T Corp. | | | 181,165 | | | | 5,500,169 | |
Bond Street Holdings, Inc.,
Class B 144A * ‡ | | | 12,734 | | | | 357,316 | |
Bond Street Holdings, Inc.,
Class A 144A * ‡ | | | 50,936 | | | | 1,429,264 | |
Capital One Financial Corp. | | | 130,505 | | | | 6,659,670 | |
Citigroup, Inc. # | | | 179,357 | | | | 7,527,613 | |
Federated Investors, Inc., Class B (a) | | | 74,745 | | | | 1,735,579 | |
Fifth Third Bancorp | | | 190,115 | | | | 3,011,422 | |
First Southern Bancorp, Inc. Class B ‡ | | | 17,550 | | | | 106,002 | |
Hanover Insurance Group, Inc., (The) | | | 34,860 | | | | 1,487,825 | |
Huntington Bancshares, Inc. | | | 374,100 | | | | 2,629,923 | |
J.G. Wentworth, Inc. * ‡ ± | | | — | | | | 0 | |
JPMorgan Chase & Co. | | | 288,560 | | | | 14,116,355 | |
Loews Corp. | | | 122,159 | | | | 5,266,274 | |
MetLife, Inc. | | | 121,725 | | | | 4,313,934 | |
NBH Holdings Corp., Class A | | | 62,698 | | | | 1,134,207 | |
NBH Holdings Corp., Class A 144A ‡ | | | 40,025 | | | | 579,162 | |
Peoples Choice Financial Corp. 144A * ‡ | | | 1,465 | | | | 0 | |
Raymond James Financial, Inc. | | | 52,275 | | | | 2,293,827 | |
SLM Corp. | | | 219,225 | | | | 4,158,698 | |
Solar Cayman Ltd. 144A * ‡ | | | 19,375 | | | | 0 | |
State Street Corp. | | | 101,840 | | | | 5,763,126 | |
THL Credit, Inc. | | | 21,910 | | | | 336,538 | |
Torchmark Corp. | | | 54,875 | | | | 3,083,426 | |
Travelers Cos., Inc., (The) | | | 57,355 | | | | 4,612,489 | |
Unum Group | | | 78,431 | | | | 1,919,207 | |
Validus Holdings Ltd. | | | 126,639 | | | | 4,512,148 | |
Wells Fargo & Co. | | | 169,180 | | | | 5,934,834 | |
White Mountains Insurance Group Ltd. | | | 2,345 | | | | 1,324,925 | |
| | | | | | | | |
| | | | | | | 101,997,977 | |
| | | | | | | | |
Health Care—17.5% | |
AbbVie, Inc. | | | 54,760 | | | | 2,021,739 | |
Allscripts Healthcare Solutions, Inc. * | | | 106,205 | | | | 1,350,928 | |
AmerisourceBergen Corp. | | | 58,550 | | | | 2,763,560 | |
Amgen, Inc. | | | 121,040 | | | | 11,064,266 | |
Cardinal Health, Inc. | | | 51,870 | | | | 2,396,913 | |
THEACCOMPANYINGNOTESAREANINTEGRALPARTOFTHEFINANCIALSTATEMENTS.
| | | | |
| SEMI-ANNUAL REPORT 2013 | | | 23 | |
| | |
| ROBECO INVESTMENT FUNDS | | FEBRUARY 28, 2013 (unaudited) |
| | |
ROBECO BOSTON PARTNERS ALL-CAP VALUE FUND (continued) | | PORTFOLIOOF INVESTMENTS |
| | | | | | | | |
| | | Number of
Shares | | | Value | |
Health Care—(continued) | |
CareFusion Corp. * | | | 64,330 | | | $ | 2,106,164 | |
Covidien PLC | | | 82,970 | | | | 5,274,403 | |
Endo Health Solutions, Inc. * | | | 57,295 | | | | 1,776,145 | |
Johnson & Johnson | | | 102,160 | | | | 7,775,398 | |
McKesson Corp. | | | 49,135 | | | | 5,214,698 | |
Medtronic, Inc. | | | 45,750 | | | | 2,056,920 | |
Pfizer, Inc. | | | 565,631 | | | | 15,481,320 | |
Sanofi - ADR | | | 63,160 | | | | 2,981,784 | |
St Jude Medical, Inc. | | | 16,315 | | | | 668,915 | |
UnitedHealth Group, Inc. | | | 65,630 | | | | 3,507,924 | |
WellPoint, Inc. | | | 30,945 | | | | 1,924,160 | |
| | | | | | | | |
| | | | | | | 68,365,237 | |
| | | | | | | | |
Real Estate Investment Trusts—0.6% | |
Ashford Hospitality Trust, Inc. | | | 44,460 | | | | 523,294 | |
Colony Financial, Inc. | | | 46,250 | | | | 1,024,438 | |
Terreno Realty Corp. | | | 37,225 | | | | 666,328 | |
TMST, Inc. * ‡ | | | 191,097 | | | | 0 | |
| | | | | | | | |
| | | | | | | 2,214,060 | |
| | | | | | | | |
Technology—13.7% | |
Amdocs Ltd. | | | 75,770 | | | | 2,763,332 | |
Arrow Electronics, Inc. * | | | 72,382 | | | | 2,906,137 | |
Avnet, Inc. * | | | 89,432 | | | | 3,157,844 | |
BancTec, Inc. 144A * ‡ | | | 14,327 | | | | 24,499 | |
CA, Inc. | | | 151,895 | | | | 3,719,908 | |
Cisco Systems, Inc. | | | 346,960 | | | | 7,234,116 | |
Flextronics International Ltd. * | | | 650,931 | | | | 4,328,691 | |
International Business Machines Corp. | | | 17,325 | | | | 3,479,380 | |
Lexmark International, Inc., Class A (a) | | | 48,345 | | | | 1,064,557 | |
LSI Corp. * | | | 157,440 | | | | 1,095,782 | |
Microsemi Corp. * | | | 48,130 | | | | 992,922 | |
Microsoft Corp. | | | 256,155 | | | | 7,121,109 | |
NVIDIA Corp. | | | 79,790 | | | | 1,010,141 | |
ON Semiconductor Corp. * | | | 340,430 | | | | 2,723,440 | |
Seagate Technology PLC | | | 55,750 | | | | 1,792,920 | |
TE Connectivity Ltd. | | | 108,030 | | | | 4,335,244 | |
Texas Instruments, Inc. | | | 33,620 | | | | 1,155,519 | |
Vishay Intertechnology, Inc. * | | | 205,245 | | | | 2,707,182 | |
WEX, Inc. * | | | 23,845 | | | | 1,788,613 | |
| | | | | | | | |
| | | | | | | 53,401,336 | |
| | | | | | | | |
TOTAL COMMON STOCK
(Cost $311,003,825) | | | | | | | 372,657,966 | |
| | | | | | | | |
PREFERRED STOCK—0.0% | |
Finance—0.0% | |
First Southern Bancorp, Inc., 144A 5.000% ‡ | | | 30 | | | | 41,223 | |
| | | | | | | | |
TOTAL PREFERRED STOCK
(Cost $30,000) | | | | | | | 41,223 | |
| | | | | | | | |
| | | Par
(000) | | | | |
CORPORATE BONDS—0.0% | |
MBIA Insurance Corp.144A † ## 11.56% 01/15/33 | | $ | 151 | | | | 45,300 | |
| | | | | | | | |
TOTAL CORPORATE BONDS
(Cost $149,017) | | | | | | | 45,300 | |
| | | | | | | | |
| | | | | | | | |
| | | Number of
Shares | | | Value | |
SECURITIES LENDING COLLATERAL—0.7% | |
BlackRock Liquidity Fund | | | 2,833,760 | | | $ | 2,833,760 | |
| | | | | | | | |
TOTAL SECURITIES LENDING COLLATERAL
(Cost $2,833,760) | | | | | | | 2,833,760 | |
| | | | | | | | |
TOTAL INVESTMENTS—96.1%
(Cost $314,016,602) | | | | | | | 375,578,249 | |
| | | | | | | | |
| | | Number of
Contracts | | | | |
OPTIONS WRITTEN ††—0.0% | |
Citigroup, Inc. Call Options
Expires 01/18/14
Strike Price $50 | | | (849 | ) | | | (148,575 | ) |
| | | | | | | | |
TOTAL OPTIONS WRITTEN
(Premiums received $143,481) | | | | | | | (148,575 | ) |
| | | | | | | | |
OTHER ASSETS IN EXCESS OF LIABILITIES—3.9% | | | | | | | 15,384,386 | |
| | | | | | | | |
NET ASSETS—100.0% | | | | | | $ | 390,814,060 | |
| | | | | | | | |
| | | | |
| ADR | | — | | American Depositary Receipt |
| PLC | | — | | Public Limited Company |
| 144A | | — | | Security was purchased pursuant to Rule 144A under the Securities Act of 1933 and may not be resold subject to that rule except to qualified institutional buyers. As of February 28, 2013, these securities amounted to $2,476,764 or 0.6% of net assets. These 144A securities have not been deemed illiquid. |
| * | | — | | Non-income producing. |
| ‡ | | — | | Security has been valued at fair market value as determined in good faith by or under the direction of The RBB Fund, Inc.‘s Board of Directors. As of February 28, 2013, these securities amounted to $2,537,466 or 0.6% of net assets. |
| ± | | — | | Total shares owned by the Fund as of February 28, 2013 were less than one share. |
| † | | — | | Adjustable rate security. |
| # | | — | | Security segregated as collateral for options written. |
| ## | | — | | Callable security. |
| (a) | | — | | All or a portion of the security is on loan. (See Note 6 of the Notes to Financial Statements) |
| †† | | — | | Primary risk exposure is equity contracts. |
THEACCOMPANYINGNOTESAREANINTEGRALPARTOFTHEFINANCIALSTATEMENTS.
| | |
| 24 | | SEMI-ANNUAL REPORT 2013 |
| | |
| ROBECO INVESTMENT FUNDS | | FEBRUARY 28, 2013 (unaudited) |
| | |
ROBECO BOSTON PARTNERS ALL-CAP VALUE FUND (concluded) | | PORTFOLIOOF INVESTMENTS |
A summary of the inputs used to value the Fund’s investments as of February 28, 2013 is as follows (see Note I in the Notes to Financial Statements):
| | | | | | | | | | | | | | | | |
| | | Total
Value as of
February 28, 2013 | | | Level 1
Quoted
Price | | | Level 2
Significant
Observable
Inputs | | | Level 3
Significant
Unobservable
Inputs | |
| | | | | | | | | | | | | | | | |
Common Stock | | | | | | | | | | | | | | | | |
Capital Goods | | $ | 25,110,215 | | | $ | 25,110,215 | | | $ | — | | | $ | — | |
Communications | | | 6,478,968 | | | | 6,478,968 | | | | — | | | | — | |
Consumer Durables | | | 9,831,700 | | | | 9,831,700 | | | | — | | | | — | |
Consumer Non-Durables | | | 16,397,111 | | | | 16,397,111 | | | | — | | | | — | |
Consumer Services | | | 50,704,662 | | | | 50,704,662 | | | | — | | | | — | |
Energy | | | 38,156,700 | | | | 38,156,700 | | | | — | | | | — | |
Finance | | | 101,997,977 | | | | 99,526,233 | | | | — | | | | 2,471,744 | |
Health Care | | | 68,365,237 | | | | 68,365,237 | | | | — | | | | — | |
Real Estate Investment Trusts | | | 2,214,060 | | | | 2,214,060 | | | | — | | | | — | |
Technology | | | 53,401,336 | | | | 53,376,837 | | | | — | | | | 24,499 | |
Preferred Stocks | | | 41,223 | | | | — | | | | — | | | | 41,223 | |
Corporate Bonds | | | 45,300 | | | | — | | | | 45,300 | | | | — | |
Securities Lending Collateral | | | 2,833,760 | | | | 2,833,760 | | | | — | | | | — | |
| | | | | | | | | | | | | | | | |
Total Assets | | $ | 375,578,249 | | | $ | 372,995,483 | | | $ | 45,300 | | | $ | 2,537,466 | |
| | | | | | | | | | | | | | | | |
| | | | | | | | | | | | | | | | |
| | | Total
Value as of
February 28, 2013 | | | Level 1
Quoted
Price | | | Level 2
Significant
Observable
Inputs | | | Level 3
Significant
Unobservable
Inputs | |
| | | | | | | | | | | | | | | | |
Options Written | | | | | | | | | | | | | | | | |
Equity Contracts | | $ | (148,575 | ) | | $ | — | | | $ | (148,575 | ) | | $ | — | |
| | | | | | | | | | | | | | | | |
Total Liabilities | | $ | (148,575 | ) | | $ | — | | | $ | (148,575 | ) | | $ | — | |
| | | | | | | | | | | | | | | | |
THEACCOMPANYINGNOTESAREANINTEGRALPARTOFTHEFINANCIALSTATEMENTS.
| | | | |
| SEMI-ANNUAL REPORT 2013 | | | 25 | |
| | |
| ROBECO INVESTMENT FUNDS | | FEBRUARY 28, 2013 (unaudited) |
| | |
ROBECO WPG SMALL/MICRO CAP VALUE FUND | | PORTFOLIOOF INVESTMENTS |
| | | | | | | | |
| | | Number of
Shares | | | Value | |
COMMON STOCK—93.5% | | | | | | | | |
Basic Industries—4.1% | | | | | | | | |
Alpha Natural Resources Inc * (a) | | | 17,100 | | | $ | 136,458 | |
GrafTech International Ltd. * (a) | | | 32,900 | | | | 243,131 | |
GSE Holding, Inc. * | | | 81,400 | | | | 585,266 | |
Horsehead Holding Corp. * | | | 17,200 | | | | 181,804 | |
TMS International Corp.,Class A * | | | 43,800 | | | | 603,564 | |
| | | | | | | | |
| | | | | | | 1,750,223 | |
| | | | | | | | |
Capital Goods—5.8% | | | | | | | | |
Blount International, Inc * | | | 8,300 | | | | 125,081 | |
Columbus McKinnon Corp. * | | | 8,100 | | | | 158,922 | |
Flow International Corp. * | | | 60,900 | | | | 225,939 | |
Global Power Equipment Group, Inc. | | | 25,200 | | | | 422,856 | |
Globe Specialty Metals, Inc. | | | 11,800 | | | | 168,622 | |
Orion Marine Group, Inc. * | | | 46,000 | | | | 437,920 | |
Tutor Perini Corp. * | | | 33,900 | | | | 576,639 | |
Wabash National Corp. * | | | 38,500 | | | | 367,290 | |
| | | | | | | | |
| | | | | | | 2,483,269 | |
| | | | | | | | |
Consumer Durables—2.5% | | | | | | | | |
Libbey, Inc. * | | | 56,900 | | | | 1,044,115 | |
| | | | | | | | |
Consumer Non-Durables—3.1% | | | | | | | | |
Chiquita Brands International, Inc. * | | | 85,500 | | | | 530,955 | |
Dole Food Co., Inc. * (a) | | | 27,400 | | | | 306,880 | |
Jones Group, Inc., (The) (a) | | | 21,400 | | | | 246,956 | |
Matthews International Corp., Class A | | | 6,500 | | | | 214,500 | |
| | | | | | | | |
| | | | | | | 1,299,291 | |
| | | | | | | | |
Consumer Services—13.6% | | | | | | | | |
ABM Industries, Inc. | | | 14,000 | | | | 317,800 | |
ACCO Brands Corp. * | | | 27,300 | | | | 204,750 | |
America’s Car-Mart, Inc. * | | | 4,300 | | | | 205,368 | |
Big Lots, Inc. * | | | 6,300 | | | | 209,790 | |
Bravo Brio Restaurant Group Inc * | | | 20,600 | | | | 310,648 | |
Brink’s Co., (The) | | | 24,100 | | | | 637,445 | |
Carmike Cinemas, Inc. * | | | 13,900 | | | | 217,674 | |
Destination XL Group, Inc. * (a) | | | 75,400 | | | | 342,316 | |
FTI Consulting, Inc. * | | | 16,200 | | | | 562,788 | |
ICF International, Inc. * | | | 24,100 | | | | 596,234 | |
Ignite Restaurant Group, Inc. * | | | 23,100 | | | | 324,324 | |
K12, Inc. * | | | 300 | | | | 6,249 | |
MDC Partners, Inc., Class A | | | 81,800 | | | | 1,124,750 | |
Navigant Consulting, Inc. * | | | 20,200 | | | | 257,146 | |
PRGX Global, Inc. * | | | 30,000 | | | | 195,000 | |
Providence Service Corp. * | | | 8,900 | | | | 152,012 | |
Wet Seal, Inc. (The), Class A * | | | 34,400 | | | | 101,136 | |
| | | | | | | | |
| | | | | | | 5,765,430 | |
| | | | | | | | |
Energy—2.3% | | | | | | | | |
Diamondback Energy, Inc. * | | | 14,700 | | | | 333,837 | |
EPL Oil & Gas, Inc. * | | | 16,700 | | | | 429,691 | |
Newpark Resources, Inc. * | | | 23,800 | | | | 209,678 | |
| | | | | | | | |
| | | | | | | 973,206 | |
| | | | | | | | |
Finance—28.5% | | | | | | | | |
A.B. Watley Group, Inc. * | | | 93,855 | | | | 291 | |
American Capital Mortgage Investment Corp. | | | 4,300 | | | | 110,510 | |
| | | | | | | | |
| | | Number of
Shares | | | Value | |
Finance—(continued) | | | | | | | | |
American Equity Investment Life Holding Co. | | | 38,000 | | | $ | 527,440 | |
BancorpSouth, Inc. | | | 28,800 | | | | 440,640 | |
Central Pacific Financial Corp. * | | | 29,400 | | | | 455,406 | |
CNO Financial Group, Inc. | | | 108,400 | | | | 1,185,896 | |
Employers Holdings, Inc. | | | 16,500 | | | | 346,665 | |
FBR & Co. * | | | 32,995 | | | | 582,691 | |
First Midwest Bancorp, Inc. | | | 24,300 | | | | 303,750 | |
FXCM, Inc., Class A (a) | | | 24,500 | | | | 322,175 | |
Global Indemnity PLC * | | | 7,400 | | | | 170,940 | |
Great American Group, Inc. * | | | 60,590 | | | | 19,171 | |
Home Loan Servicing Solutions Ltd | | | 17,000 | | | | 383,520 | |
LiqTech International, Inc. * | | | 45,320 | | | | 97,438 | |
Maiden Holdings Ltd. | | | 70,900 | | | | 714,672 | |
Meadowbrook Insurance Group, Inc. | | | 124,300 | | | | 873,829 | |
Nationstar Mortgage Holdings, Inc. * (a) | | | 12,400 | | | | 477,772 | |
Nelnet, Inc., Class A | | | 18,200 | | | | 603,876 | |
Northfield Bancorp, Inc. (a) | | | 44,232 | | | | 503,360 | |
Ocwen Financial Corp. * | | | 20,300 | | | | 800,226 | |
OmniAmerican Bancorp, Inc. * | | | 9,000 | | | | 234,540 | |
PrivateBancorp, Inc. | | | 18,600 | | | | 333,126 | |
SCBT Financial Corp. (a) | | | 5,300 | | | | 252,386 | |
THL Credit, Inc. | | | 17,900 | | | | 274,944 | |
Tower Group, Inc. | | | 900 | | | | 16,785 | |
United Community Banks, Inc. * | | | 28,400 | | | | 305,868 | |
United Financial Bancorp, Inc. | | | 9,080 | | | | 135,746 | |
Validus Holdings Ltd. | | | 9,600 | | | | 342,048 | |
ViewPoint Financial Group | | | 21,000 | | | | 437,850 | |
Western Alliance Bancorp * | | | 28,900 | | | | 384,370 | |
WSFS Financial Corp. | | | 10,300 | | | | 489,250 | |
| | | | | | | | |
| | | | | | | 12,127,181 | |
| | | | | | | | |
Health Care—5.7% | | | | | | | | |
Accuray, Inc. * (a) | | | 165,700 | | | | 707,539 | |
Alere, Inc. * | | | 32,700 | | | | 744,252 | |
Invacare Corp. | | | 23,400 | | | | 339,534 | |
Medical Action Industries, Inc. * | | | 51,000 | | | | 301,920 | |
Symmetry Medical, Inc. * | | | 19,100 | | | | 199,213 | |
Trinity Biotech PLC - Sponsored ADR | | | 8,000 | | | | 135,200 | |
| | | | | | | | |
| | | | | | | 2,427,658 | |
| | | | | | | | |
Real Estate Investment Trusts—9.8% | | | | | |
Campus Crest Communities, Inc. | | | 51,400 | | | | 644,556 | |
CYS Investments, Inc. (a) | | | 14,500 | | | | 171,970 | |
Geo Group, Inc. (The) | | | 9,200 | | | | 317,768 | |
Government Properties Income Trust (a) | | | 9,200 | | | | 243,432 | |
Highwoods Properties, Inc. | | | 5,810 | | | | 212,065 | |
Kennedy-Wilson Holdings, Inc. | | | 64,200 | | | | 1,031,694 | |
Lexington Realty Trust | | | 33,700 | | | | 386,202 | |
Mack-Cali Realty Corp. | | | 10,500 | | | | 297,990 | |
Starwood Property Trust, Inc. | | | 16,600 | | | | 463,970 | |
Two Harbors Investment Corp. | | | 26,400 | | | | 339,504 | |
Winthrop Realty Trust | | | 3,400 | | | | 42,670 | |
| | | | | | | | |
| | | | | | | 4,151,821 | |
| | | | | | | | |
Technology—7.8% | | | | | | | | |
CIBER, Inc. * | | | 157,800 | | | | 702,210 | |
Computer Task Group, Inc. * | | | 10,700 | | | | 212,930 | |
THEACCOMPANYINGNOTESAREANINTEGRALPARTOFTHEFINANCIALSTATEMENTS.
| | |
| 26 | | SEMI-ANNUAL REPORT 2013 |
| | |
| ROBECO INVESTMENT FUNDS | | FEBRUARY 28, 2013 (unaudited) |
| | |
ROBECO WPG SMALL/MICRO CAP VALUE FUND (concluded) | | PORTFOLIOOF INVESTMENTS |
| | | | | | | | |
| | | Number of
Shares | | | Value | |
Technology—(continued) | | | | | | | | |
Digi International, Inc. * | | | 45,900 | | | $ | 452,574 | |
Diodes, Inc. * | | | 14,000 | | | | 279,020 | |
Exar Corp. * | | | 67,500 | | | | 793,125 | |
Plantronics, Inc. | | | 5,300 | | | | 213,908 | |
Saba Software, Inc. * | | | 53,500 | | | | 467,590 | |
SeaChange International, Inc. * | | | 16,800 | | | | 193,536 | |
| | | | | | | | |
| | | | | | | 3,314,893 | |
| | | | | | | | |
Transportation—4.3% | | | | | | | | |
Air Transport Services Group, Inc. * | | | 61,100 | | | | 337,272 | |
Rand Logistics, Inc. * | | | 13,600 | | | | 77,520 | |
Scorpio Tankers, Inc. * | | | 91,100 | | | | 774,350 | |
Spirit Airlines, Inc. * | | | 23,300 | | | | 471,825 | |
Swift Transportation Co. * | | | 12,200 | | | | 165,066 | |
| | | | | | | | |
| | | | | | | 1,826,033 | |
| | | | | | | | |
Utilities—6.0% | | | | | | | | |
Aegean Marine Petroleum Network, Inc. | | | 37,600 | | | | 244,776 | |
Cadiz, Inc. * (a) | | | 35,200 | | | | 237,248 | |
Dynegy, Inc. * (a) | | | 5,000 | | | | 97,850 | |
Empire District Electric Co. (The) (a) | | | 13,600 | | | | 291,176 | |
Heckmann Corp. * (a) | | | 41,900 | | | | 149,164 | |
NorthWestern Corp. | | | 7,900 | | | | 307,942 | |
Piedmont Natural Gas Co., Inc. | | | 13,300 | | | | 428,792 | |
Portland General Electric Co. | | | 9,100 | | | | 270,179 | |
| | | | | | | | |
| | | Number of
Shares | | | Value | |
Utilities—(continued) | | | | | | | | |
StealthGas, Inc. * | | | 23,000 | | | $ | 240,810 | |
UIL Holdings Corp. | | | 7,400 | | | | 289,784 | |
| | | | | | | | |
| | | | | | | 2,557,721 | |
| | | | | | | | |
TOTAL COMMON STOCK
(Cost $31,439,363) | | | | | | | 39,720,841 | |
| | | | | | | | |
SECURITIES LENDING COLLATERAL—8.7% | |
BlackRock Liquidity Fund | | | 3,712,413 | | | | 3,712,413 | |
| | | | | | | | |
TOTAL SECURITIES LENDING COLLATERAL
(Cost $3,712,413) | | | | | | | 3,712,413 | |
| | | | | | | | |
TOTAL INVESTMENTS—102.2%
(Cost $35,151,776) | | | | | | | 43,433,254 | |
| | | | | | | | |
LIABILITIES IN EXCESS OF OTHER ASSETS—(2.2)% | | | | | | | (939,014 | ) |
| | | | | | | | |
NET ASSETS—100.0% | | | | | | $ | 42,494,240 | |
| | | | | | | | |
| | | | |
| ADR | | — | | American Depositary Receipt |
| PLC | | — | | Public Limited Company |
| * | | — | | Non-income Producing |
| (a) | | — | | All or a portion of the security is on loan. (see Note 6 of the Notes to Financial Statements) |
A summary of the inputs used to value the Fund’s investments as of February 28, 2013 is as follows (see Notes I in the Notes to Financial Statements):
| | | | | | | | | | | | | | | | |
| | | Total
Value as of
February 28, 2013 | | | Level 1
Quoted
Price | | | Level 2
Significant
Observable
Inputs | | | Level 3
Significant
Unobservable
Inputs | |
Common Stock * | | $ | 39,720,841 | | | $ | 39,720,841 | | | $ | — | | | $ | — | |
Securities Lending Collateral | | | 3,712,413 | | | | 3,712,413 | | | | — | | | | — | |
| | | | | | | | | | | | | | | | |
Total Assets | | $ | 43,433,254 | | | $ | 43,433,254 | | | $ | — | | | $ | — | |
| | | | | | | | | | | | | | | | |
| * | See Portfolio of Investments detail for industry and security type breakout. |
THEACCOMPANYINGNOTESAREANINTEGRALPARTOFTHEFINANCIALSTATEMENTS.
| | | | |
| SEMI-ANNUAL REPORT 2013 | | | 27 | |
| | |
| ROBECO INVESTMENT FUNDS | | FEBRUARY 28, 2013 (unaudited) |
| | |
ROBECO BOSTON PARTNERS GLOBAL EQUITY FUND | | PORTFOLIOOF INVESTMENTS |
| | | | | | | | |
| | | Number of
Shares | | | Value | |
COMMON STOCK—89.8% | | | | | | | | |
Austria—0.6% | | | | | | | | |
Zumtobel AG | | | 4,860 | | | $ | 72,745 | |
| | | | | | | | |
Bermuda—2.4% | | | | | | | | |
Axis Capital Holdings Ltd. | | | 2,910 | | | | 118,524 | |
Catlin Group Ltd. | | | 11,985 | | | | 91,819 | |
Validus Holdings Ltd. | | | 2,755 | | | | 98,161 | |
| | | | | | | | |
| | | | | | | 308,504 | |
| | | | | | | | |
Canada—0.3% | | | | | | | | |
Barrick Gold Corp. | | | 1,400 | | | | 42,451 | |
| | | | | | | | |
France—6.3% | | | | | | | | |
Atos | | | 3,055 | | | | 226,903 | |
Cie Generale des Etablissements Michelin | | | 2,200 | | | | 196,574 | |
Havas SA | | | 10,290 | | | | 64,793 | |
LISI | | | 830 | | | | 77,933 | |
Sanofi | | | 1,250 | | | | 118,446 | |
Teleperformance SA | | | 2,820 | | | | 116,083 | |
| | | | | | | | |
| | | | | | | 800,732 | |
| | | | | | | | |
Germany—7.1% | | | | | | | | |
Brenntag AG | | | 655 | | | | 93,381 | |
CompuGroup Medical AG | | | 3,070 | | | | 68,578 | |
Fresenius SE & Co. KGaA | | | 1,340 | | | | 164,692 | |
Henkel AG & Co. KGaA | | | 3,060 | | | | 226,396 | |
Muenchener Rueckversicherungs AG, Registered Shares | | | 865 | | | | 155,505 | |
NORMA Group AG | | | 3,023 | | | | 105,179 | |
Rheinmetall AG | | | 1,690 | | | | 92,999 | |
| | | | | | | | |
| | | | | | | 906,730 | |
| | | | | | | | |
Hong Kong—1.7% | | | | | | | | |
Cheung Kong Holdings Ltd. | | | 10,000 | | | | 155,501 | |
Hutchison Whampoa Ltd. | | | 6,000 | | | | 64,637 | |
| | | | | | | | |
| | | | | | | 220,138 | |
| | | | | | | | |
Ireland—2.4% | | | | | | | | |
Beazley PLC | | | 28,300 | | | | 87,068 | |
Covidien PLC | | | 2,465 | | | | 156,700 | |
Smurfit Kappa Group PLC * | | | 4,050 | | | | 63,053 | |
| | | | | | | | |
| | | | | | | 306,821 | |
| | | | | | | | |
Japan—8.6% | | | | | | | | |
Aisin Seiki Co. Ltd. | | | 2,300 | | | | 83,251 | |
Anritsu Corp. | | | 4,000 | | | | 59,165 | |
Fuji Seal International, Inc. | | | 5,400 | | | | 123,683 | |
Inpex Corp. | | | 17 | | | | 90,420 | |
ITOCHU Corp. | | | 5,600 | | | | 64,646 | |
Nihon Kohden Corp. | | | 2,900 | | | | 100,744 | |
Nissan Chemical Industries Ltd. | | | 7,100 | | | | 90,387 | |
Otsuka Corp. | | | 700 | | | | 71,065 | |
Softbank Corp. | | | 2,430 | | | | 90,053 | |
Toho Holdings Co. Ltd. | | | 5,800 | | | | 119,892 | |
Toyoda Gosei Co. Ltd. | | | 3,300 | | | | 76,225 | |
TS Tech Co. Ltd. | | | 4,900 | | | | 119,526 | |
| | | | | | | | |
| | | | | | | 1,089,057 | |
| | | | | | | | |
| | | | | | | | |
| | | Number of
Shares | | | Value | |
Netherlands—0.9% | | | | | | | | |
Aegon NV | | | 18,435 | | | $ | 110,279 | |
| | | | | | | | |
South Korea—1.5% | | | | | | | | |
Dongyang Mechatronics Corp. | | | 5,880 | | | | 63,805 | |
Samsung Electronics Co. Ltd. | | | 87 | | | | 124,053 | |
| | | | | | | | |
| | | | | | | 187,858 | |
| | | | | | | | |
Switzerland—5.7% | | | | | | | | |
ACE Ltd. | | | 1,350 | | | | 115,276 | |
Novartis AG, Registered Shares | | | 1,920 | | | | 130,383 | |
Roche Holding AG, Participation Certificate | | | 925 | | | | 211,883 | |
Swiss Re AG | | | 2,135 | | | | 170,723 | |
Zurich Insurance Group AG | | | 335 | | | | 91,676 | |
| | | | | | | | |
| | | | | | | 719,941 | |
| | | | | | | | |
Thailand—1.4% | | | | | | | | |
Bangkok Bank PCL | | | 24,200 | | | | 178,145 | |
| | | | | | | | |
United Kingdom—15.0% | | | | | | | | |
Babcock International Group PLC | | | 3,645 | | | | 59,333 | |
Berendsen PLC | | | 10,030 | | | | 103,850 | |
BHP Billiton PLC | | | 2,225 | | | | 70,513 | |
Daily Mail & General Trust PLC, Class A | | | 30,890 | | | | 332,720 | |
HSBC Holdings PLC | | | 9,264 | | | | 102,791 | |
Imperial Tobacco Group PLC | | | 1,695 | | | | 61,457 | |
ITV PLC | | | 45,430 | | | | 85,599 | |
Mears Group PLC | | | 18,050 | | | | 101,317 | |
Meggitt PLC | | | 22,580 | | | | 155,724 | |
Petrofac Ltd. | | | 4,315 | | | | 95,180 | |
Rexam PLC | | | 7,430 | | | | 57,993 | |
Rio Tinto PLC | | | 1,540 | | | | 82,727 | |
Royal Dutch Shell PLC, Class A | | | 7,375 | | | | 242,786 | |
RSA Insurance Group PLC | | | 36,115 | | | | 66,130 | |
Serco Group PLC | | | 12,701 | | | | 109,925 | |
Standard Chartered PLC | | | 2,940 | | | | 80,104 | |
WPP PLC | | | 6,545 | | | | 104,653 | |
| | | | | | | | |
| | | | | | | 1,912,802 | |
| | | | | | | | |
United States—35.9% | | | | | | | | |
AmerisourceBergen Corp. | | | 1,375 | | | | 64,900 | |
Amgen, Inc. | | | 1,250 | | | | 114,262 | |
Apple, Inc. | | | 205 | | | | 90,487 | |
BB&T Corp. | | | 3,030 | | | | 91,991 | |
Cameron International Corp. * | | | 840 | | | | 53,525 | |
Capital One Financial Corp. | | | 955 | | | | 48,734 | |
CareFusion Corp. * | | | 5,100 | | | | 166,974 | |
CBS Corp., Class B non-voting shares | | | 2,210 | | | | 95,892 | |
Chevron Corp. | | | 450 | | | | 52,717 | |
Cisco Systems, Inc. | | | 3,685 | | | | 76,832 | |
Crown Holdings, Inc. * | | | 2,710 | | | | 105,338 | |
CVS Caremark Corp. | | | 4,595 | | | | 234,896 | |
DIRECTV * | | | 2,145 | | | | 103,325 | |
Dover Corp. | | | 790 | | | | 57,946 | |
EMC Corp. * | | | 2,950 | | | | 67,879 | |
EOG Resources, Inc. | | | 480 | | | | 60,341 | |
Everest Re Group Ltd. | | | 1,055 | | | | 131,464 | |
Exxon Mobil Corp. | | | 1,100 | | | | 98,505 | |
THEACCOMPANYINGNOTESAREANINTEGRALPARTOFTHEFINANCIALSTATEMENTS.
| | |
| 28 | | SEMI-ANNUAL REPORT 2013 |
| | |
| ROBECO INVESTMENT FUNDS | | FEBRUARY 28, 2013 (unaudited) |
| | |
ROBECO BOSTON PARTNERS GLOBAL EQUITY FUND (concluded) | | PORTFOLIOOF INVESTMENTS |
| | | | | | | | |
| | | Number of
Shares | | | Value | |
United States—(continued) | | | | | | | | |
Fifth Third Bancorp | | | 8,055 | | | $ | 127,591 | |
Fluor Corp. | | | 1,570 | | | | 97,183 | |
Graphic Packaging Holding Co. * | | | 26,135 | | | | 193,922 | |
Halliburton Co. | | | 3,940 | | | | 163,549 | |
Honeywell International, Inc. | | | 1,365 | | | | 95,686 | |
Humana, Inc. | | | 1,340 | | | | 91,468 | |
Lear Corp. | | | 1,490 | | | | 79,596 | |
Macy’s, Inc. | | | 2,565 | | | | 105,422 | |
McKesson Corp. | | | 2,390 | | | | 253,651 | |
Microsoft Corp. | | | 4,880 | | | | 135,664 | |
Newmont Mining Corp. | | | 1,500 | | | | 60,435 | |
NVIDIA Corp. | | | 6,160 | | | | 77,986 | |
Occidental Petroleum Corp. | | | 1,225 | | | | 100,854 | |
ON Semiconductor Corp. * | | | 9,370 | | | | 74,960 | |
Oracle Corp. | | | 2,915 | | | | 99,868 | |
Pfizer, Inc. | | | 2,850 | | | | 78,005 | |
Phillips 66 | | | 945 | | | | 59,497 | |
Schlumberger Ltd. | | | 1,645 | | | | 128,063 | |
SM Energy Co. | | | 1,175 | | | | 68,009 | |
Symantec Corp. * | | | 8,085 | | | | 189,512 | |
| | | | | | | | |
| | | Number of
Shares | | | Value | |
United States—(continued) | | | | | | | | |
Target Corp. | | | 1,005 | | | $ | 63,275 | |
Textron, Inc. | | | 3,900 | | | | 112,515 | |
Time Warner Cable, Inc. | | | 850 | | | | 73,432 | |
Towers Watson & Co., Class A | | | 2,410 | | | | 160,434 | |
Wells Fargo & Co. | | | 4,335 | | | | 152,072 | |
| | | | | | | | |
| | | | | | | 4,558,657 | |
| | | | | | | | |
TOTAL COMMON STOCK
(Cost $9,753,727) | | | | | | | 11,414,860 | |
| | | | | | | | |
TOTAL INVESTMENTS—89.8%
(Cost $9,753,727) | | | | | | | 11,414,860 | |
| | | | | | | | |
OTHER ASSETS IN EXCESS OF LIABILITIES—10.2% | | | | | | | 1,300,059 | |
| | | | | | | | |
NET ASSETS—100.0% | | | | | | $ | 12,714,919 | |
| | | | | | | | |
| | | | |
| PCL | | — | | Public Company Limited |
| PLC | | — | | Public Limited Company |
| * | | — | | Non-income producing. |
A summary of the inputs used to value the Fund’s investments as of February 28, 2013 is as follows (see Note I in the Notes to Financial Statements):
| | | | | | | | | | | | | | | | |
| | | Total
Value as of
February 28, 2013 | | | Level 1
Quoted
Price | | | Level 2
Significant
Observable
Inputs | | | Level 3
Significant
Unobservable
Inputs | |
Investment in Securities * | | $ | 11,414,860 | | | $ | 11,414,860 | | | $ | — | | | $ | — | |
| | | | | | | | | | | | | | | | |
Total Assets | | $ | 11,414,860 | | | $ | 11,414,860 | | | $ | — | | | $ | — | |
| | | | | | | | | | | | | | | | |
| * | See Portfolio of Investments detail for country and security type breakout |
THEACCOMPANYINGNOTESAREANINTEGRALPARTOFTHEFINANCIALSTATEMENTS.
| | | | |
| SEMI-ANNUAL REPORT 2013 | | | 29 | |
| | |
| ROBECO INVESTMENT FUNDS | | FEBRUARY 28, 2013 (unaudited) |
| | |
ROBECO BOSTON PARTNERS INTERNATIONAL EQUITY FUND | | PORTFOLIOOF INVESTMENTS |
| | | | | | | | |
| | | Number of
Shares | | | Value | |
COMMON STOCK—95.0% | | | | | | | | |
Australia—0.7% | | | | | | | | |
Australia & New Zealand Banking Group Ltd. | | | 2,890 | | | $ | 84,781 | |
| | | | | | | | |
Austria—0.6% | | | | | | | | |
Zumtobel AG | | | 4,850 | | | | 72,596 | |
| | | | | | | | |
Belgium—1.0% | | | | | | | | |
Ageas | | | 3,835 | | | | 130,602 | |
| | | | | | | | |
Bermuda—1.3% | | | | | | | | |
Catlin Group Ltd. | | | 21,980 | | | | 168,392 | |
| | | | | | | | |
Canada—1.3% | | | | | | | | |
Barrick Gold Corp. | | | 1,715 | | | | 52,003 | |
Canadian Natural Resources Ltd. | | | 1,365 | | | | 41,619 | |
CGI Group, Inc., Class A * | | | 2,670 | | | | 70,553 | |
| | | | | | | | |
| | | | | | | 164,175 | |
| | | | | | | | |
France—11.2% | | | | | | | | |
Atos | | | 4,460 | | | | 331,257 | |
Cie Generale des Etablissements Michelin | | | 2,830 | | | | 252,866 | |
Havas SA | | | 18,340 | | | | 115,481 | |
LISI | | | 1,370 | | | | 128,636 | |
Publicis Groupe SA | | | 1,060 | | | | 70,052 | |
Sanofi | | | 2,580 | | | | 244,473 | |
Teleperformance SA | | | 4,340 | | | | 178,652 | |
Total SA | | | 1,760 | | | | 87,993 | |
| | | | | | | | |
| | | | | | | 1,409,410 | |
| | | | | | | | |
Germany—11.8% | | | | | | | | |
Bayer AG, Registered Shares | | | 660 | | | | 65,366 | |
Brenntag AG | | | 1,255 | | | | 178,920 | |
CompuGroup Medical AG | | | 4,610 | | | | 102,978 | |
Fresenius SE & Co. KGaA | | | 2,485 | | | | 305,418 | |
Henkel AG & Co. KGaA | | | 4,940 | | | | 365,489 | |
Muenchener Rueckversicherungs AG, Registered Shares | | | 1,080 | | | | 194,156 | |
NORMA Group AG | | | 4,276 | | | | 148,775 | |
Rheinmetall AG | | | 2,230 | | | | 122,715 | |
| | | | | | | | |
| | | | | | | 1,483,817 | |
| | | | | | | | |
Hong Kong—2.4% | | | | | | | | |
Cheung Kong Holdings Ltd. | | | 13,000 | | | | 202,151 | |
Hutchison Whampoa Ltd. | | | 9,000 | | | | 96,956 | |
| | | | | | | | |
| | | | | | | 299,107 | |
| | | | | | | | |
Ireland—1.5% | | | | | | | | |
Beazley PLC | | | 34,300 | | | | 105,527 | |
Smurfit Kappa Group PLC * | | | 5,570 | | | | 86,718 | |
| | | | | | | | |
| | | | | | | 192,245 | |
| | | | | | | | |
Japan—16.4% | | | | | | | | |
Aisin Seiki Co. Ltd. | | | 3,100 | | | | 112,207 | |
Anritsu Corp. | | | 8,000 | | | | 118,330 | |
Brother Industries Ltd. | | | 7,500 | | | | 78,487 | |
Fuji Seal International Inc. | | | 7,100 | | | | 162,620 | |
Inpex Corp. | | | 24 | | | | 127,651 | |
ITOCHU Corp. | | | 11,000 | | | | 126,982 | |
| | | | | | | | |
| | | Number of
Shares | | | Value | |
Japan—(continued) | | | | | | | | |
Kaken Pharmaceutical Co. Ltd. | | | 7,000 | | | $ | 121,815 | |
Megane TOP Co. Ltd. | | | 7,000 | | | | 79,750 | |
Nihon Kohden Corp. | | | 3,600 | | | | 125,062 | |
Nissan Chemical Industries Ltd. | | | 9,600 | | | | 122,214 | |
NTT DoCoMo, Inc. | | | 39 | | | | 60,337 | |
Otsuka Corp. | | | 1,200 | | | | 121,825 | |
Softbank Corp. | | | 3,510 | | | | 130,077 | |
Sugi Holdings Co. Ltd. | | | 3,500 | | | | 115,169 | |
Sumitomo Mitsui Trust Holdings, Inc. | | | 16,000 | | | | 62,143 | |
Toho Holdings Co. Ltd. | | | 7,900 | | | | 163,301 | |
Toyoda Gosei Co. Ltd. | | | 4,400 | | | | 101,633 | |
TS Tech Co. Ltd. | | | 5,900 | | | | 143,920 | |
| | | | | | | | |
| | | | | | | 2,073,523 | |
| | | | | | | | |
Netherlands—2.5% | | | | | | | | |
Aegon NV | | | 22,905 | | | | 137,019 | |
Koninklijke Ahold NV | | | 12,445 | | | | 178,723 | |
| | | | | | | | |
| | | | | | | 315,742 | |
| | | | | | | | |
Singapore—1.2% | | | | | | | | |
M1 Ltd. | | | 38,000 | | | | 85,917 | |
United Overseas Bank Ltd. | | | 4,000 | | | | 61,628 | |
| | | | | | | | |
| | | | | | | 147,545 | |
| | | | | | | | |
South Korea—3.3% | | | | | | | | |
Dongyang Mechatronics Corp. | | | 7,550 | | | | 81,927 | |
Samsung Electronics Co. Ltd. | | | 190 | | | | 270,921 | |
SK Telecom Co. Ltd. | | | 390 | | | | 64,290 | |
| | | | | | | | |
| | | | | | | 417,138 | |
| | | | | | | | |
Switzerland—7.4% | | | | | | | | |
Novartis AG, Registered Shares | | | 3,155 | | | | 214,249 | |
Roche Holding AG, Participation Certificate | | | 1,430 | | | | 327,559 | |
Swiss Re AG | | | 3,050 | | | | 243,889 | |
Zurich Insurance Group AG | | | 545 | | | | 149,144 | |
| | | | | | | | |
| | | | | | | 934,841 | |
| | | | | | | | |
Taiwan—0.5% | | | | | | | | |
Delta Electronics, Inc. | | | 18,000 | | | | 67,045 | |
| | | | | | | | |
Thailand—1.9% | | | | | | | | |
Bangkok Bank PCL | | | 31,800 | | | | 234,091 | |
| | | | | | | | |
United Kingdom—30.0% | | | | | | | | |
AstraZeneca PLC | | | 1,255 | | | | 57,032 | |
Babcock International Group PLC | | | 3,735 | | | | 60,798 | |
Berendsen PLC | | | 13,745 | | | | 142,315 | |
BG Group PLC | | | 4,775 | | | | 84,428 | |
BHP Billiton PLC | | | 4,960 | | | | 157,189 | |
BP PLC | | | 16,757 | | | | 113,303 | |
Daily Mail & General Trust PLC | | | 38,120 | | | | 410,595 | |
Howden Joinery Group PLC | | | 21,615 | | | | 70,173 | |
HSBC Holdings PLC | | | 25,478 | | | | 282,698 | |
Imperial Tobacco Group PLC | | | 2,510 | | | | 91,007 | |
Inchcape PLC | | | 9,400 | | | | 72,086 | |
Intercontinental Hotels Group PLC | | | 2,907 | | | | 84,409 | |
ITV PLC | | | 61,940 | | | | 116,707 | |
THEACCOMPANYINGNOTESAREANINTEGRALPARTOFTHEFINANCIALSTATEMENTS.
| | |
| 30 | | SEMI-ANNUAL REPORT 2013 |
| | |
| ROBECO INVESTMENT FUNDS | | FEBRUARY 28, 2013 (unaudited) |
| | |
ROBECO BOSTON PARTNERS INTERNATIONAL EQUITY FUND (concluded) | | PORTFOLIOOF INVESTMENTS |
| | | | | | | | |
| | | Number of
Shares | | | Value | |
United Kingdom—(continued) | | | | | | | | |
Mears Group PLC | | | 30,535 | | | $ | 171,397 | |
Meggitt PLC | | | 43,687 | | | | 301,290 | |
National Grid PLC | | | 7,500 | | | | 83,002 | |
Petrofac Ltd. | | | 5,655 | | | | 124,738 | |
Rexam PLC | | | 14,440 | | | | 112,708 | |
Rio Tinto PLC | | | 1,975 | | | | 106,095 | |
Royal Dutch Shell PLC, Class A | | | 12,510 | | | | 411,831 | |
RSA Insurance Group PLC | | | 53,290 | | | | 97,579 | |
Serco Group PLC | | | 20,319 | | | | 175,857 | |
Standard Chartered PLC | | | 8,285 | | | | 225,736 | |
Vodafone Group PLC | | | 21,695 | | | | 54,487 | |
WPP PLC | | | 10,735 | | | | 171,651 | |
| | | | | | | | |
| | | | | | | 3,779,111 | |
| | | | | | | | |
TOTAL COMMON STOCK
(Cost $10,134,450) | | | | | | | 11,974,161 | |
| | | | | | | | |
TOTAL INVESTMENTS—95.0%
(Cost $10,134,450) | | | | | | | 11,974,161 | |
| | | | | | | | |
OTHER ASSETS IN EXCESS OF LIABILITIES—5.0% | | | | | | | 636,331 | |
| | | | | | | | |
NET ASSETS—100.0% | | | | | | $ | 12,610,492 | |
| | | | | | | | |
| | | | |
| PCL | | — | | Public Company Limited |
| PLC | | — | | Public Limited Company |
| * | | — | | Non-income producing. |
A summary of the inputs used to value the Fund’s investments as of February 28, 2013 is as follows (see Note I in the Notes to Financial Statements):
| | | | | | | | | | | | | | | | |
| | | Total
Value as of
February 28, 2013 | | | Level 1
Quoted
Price | | | Level 2
Significant
Observable
Inputs | | | Level 3
Significant
Unobservable
Inputs | |
Investment in Securities * | | $ | 11,974,161 | | | $ | 11,974,161 | | | $ | — | | | $ | — | |
| | | | | | | | | | | | | | | | |
Total Assets | | $ | 11,974,161 | | | $ | 11,974,161 | | | $ | — | | | $ | — | |
| | | | | | | | | | | | | | | | |
| * | See Portfolio of Investments detail for country and security type breakout |
THEACCOMPANYINGNOTESAREANINTEGRALPARTOFTHEFINANCIALSTATEMENTS.
| | | | |
| SEMI-ANNUAL REPORT 2013 | | | 31 | |
| | |
| ROBECO INVESTMENT FUNDS | | FEBRUARY 28, 2013 (unaudited) |
| | |
STATEMENTS OF ASSETS AND LIABILITIES | | |
| | | | | | | | | | | | | | | | |
| | | Robeco Boston
Partners
Small Cap
Value Fund II | | | Robeco Boston
Partners
Long/Short
Equity Fund | | | Robeco Boston
Partners
Long/Short
Research Fund | | | Robeco Boston
Partners
All-Cap
Value Fund | |
ASSETS | | | | | | | | | | | | | | | | |
Investments in securities, at value † ^ | | $ | 158,659,926 | | | $ | 760,839,926 | | | $ | 644,852,295 | | | $ | 375,578,249 | |
Cash | | | 6,134,653 | | | | 85,493,713 | | | | 68,238,736 | | | | 17,409,177 | |
Foreign currency, at value # | | | — | | | | 63 | | | | 28,415,835 | | | | — | |
Receivables | | | | | | | | | | | | | | | | |
Investments sold | | | — | | | | 26,206,748 | | | | 6,914,706 | | | | 10,918 | |
Deposits with brokers for securities sold short | | | — | | | | 479,518,538 | | | | 312,247,561 | | | | — | |
Dividends and interest | | | 100,326 | | | | 930,676 | | | | 977,989 | | | | 910,639 | |
Capital shares sold | | | 125,101 | | | | 3,218,433 | | | | 22,191,258 | | | | 291,305 | |
Prepaid expenses and other assets | | | 26,350 | | | | 74,587 | | | | 74,533 | | | | 35,036 | |
| | | | | | | | | | | | | | | | |
Total assets | | | 165,046,356 | | | | 1,356,282,684 | | | | 1,083,912,913 | | | | 394,235,324 | |
| | | | | | | | | | | | | | | | |
LIABILITIES | | | | | | | | | | | | | | | | |
Securities sold short, at fair value ‡ | | $ | — | | | $ | 482,598,214 | | | $ | 309,527,634 | | | $ | — | |
Options written, at value * | | | — | | | | 181,260 | | | | — | | | | 148,575 | |
Payables | | | | | | | | | | | | | | | | |
Securities lending collateral | | | 17,809,719 | | | | 10,859,274 | | | | — | | | | 2,833,760 | |
Investments purchased | | | — | | | | 23,577,672 | | | | 15,943,667 | | | | 4,822 | |
Capital shares redeemed | | | 198,163 | | | | 245,912 | | | | 698,678 | | | | 146,113 | |
Due to prime broker | | | — | | | | 59,359,622 | | | | 58,578,926 | | | | — | |
Investment advisory fees | | | 112,462 | | | | 1,324,509 | | | | 603,201 | | | | 152,801 | |
Administration and accounting fees | | | 22,375 | | | | 95,406 | | | | 68,426 | | | | 51,846 | |
Custodian fees | | | 1,194 | | | | 10,029 | | | | 8,472 | | | | 5,245 | |
Distribution and service fees | | | 15,405 | | | | 39,604 | | | | 15,184 | | | | 6,222 | |
Dividends on securities sold-short | | | — | | | | 158,830 | | | | 238,590 | | | | — | |
Prime broker interest payable | | | — | | | | 27,893 | | | | 21,682 | | | | — | |
Printing and shareholder reporting fees | | | 20,844 | | | | 46,867 | | | | 10,966 | | | | 26,996 | |
Other accrued expenses and liabilities | | | 44,975 | | | | 65,124 | | | | 41,427 | | | | 44,884 | |
| | | | | | | | | | | | | | | | |
Total liabilities | | | 18,225,137 | | | | 578,590,216 | | | | 385,756,853 | | | | 3,421,264 | |
| | | | | | | | | | | | | | | | |
Net Assets | | $ | 146,821,219 | | | $ | 777,692,468 | | | $ | 698,156,060 | | | $ | 390,814,060 | |
| | | | | | | | | | | | | | | | |
NET ASSETS CONSIST OF | | | | | | | | | | | | | | | | |
Par value | | $ | 8,663 | | | $ | 37,888 | | | $ | 55,349 | | | $ | 23,001 | |
Paid-in capital | | | 128,739,700 | | | | 704,228,320 | | | | 661,843,666 | | | | 328,686,870 | |
Undistributed net investment income/(accumulated net investment loss) | | | (18,092 | ) | | | (9,027,344 | ) | | | (2,456,188 | ) | | | 916,083 | |
Accumulated net realized gain/(loss) from investments | | | (16,855,604 | ) | | | 30,135,032 | | | | 1,310,992 | | | | (368,447 | ) |
Net unrealized appreciation on investments, securities sold short, written options and foreign currency translation | | | 34,946,552 | | | | 52,318,572 | | | | 37,402,241 | | | | 61,556,553 | |
| | | | | | | | | | | | | | | | |
Net Assets | | $ | 146,821,219 | | | $ | 777,692,468 | | | $ | 698,156,060 | | | $ | 390,814,060 | |
| | | | | | | | | | | | | | | | |
INSTITUTIONAL CLASS | | | | | | | | | | | | | | | | |
Net assets | | $ | 66,521,252 | | | $ | 568,024,865 | | | $ | 614,377,029 | | | $ | 357,054,263 | |
Shares outstanding | | | 3,845,972 | | | | 27,275,761 | | | | 48,673,857 | | | | 21,008,882 | |
| | | | | | | | | | | | | | | | |
Net asset value, offering and redemption price per share | | $ | 17.30 | | | $ | 20.83 | | | $ | 12.62 | | | $ | 17.00 | |
| | | | | | | | | | | | | | | | |
INVESTOR CLASS | | | | | | | | | | | | | | | | |
Net assets | | $ | 80,299,967 | | | $ | 209,667,603 | | | $ | 83,779,031 | | | $ | 33,759,797 | |
Shares outstanding | | | 4,817,250 | | | | 10,611,993 | | | | 6,675,523 | | | | 1,991,860 | |
| | | | | | | | | | | | | | | | |
Net asset value, offering and redemption price per share | | $ | 16.67 | | | $ | 19.76 | | | $ | 12.55 | | | $ | 16.95 | |
| | | | | | | | | | | | | | | | |
† Investment in securities, at cost | | $ | 123,713,374 | | | $ | 661,989,452 | | | $ | 582,789,842 | | | $ | 314,016,602 | |
^ Includes market value of securities on loan | | $ | 17,400,880 | | | $ | 10,414,234 | | | $ | — | | | $ | 2,740,249 | |
# Foreign currency, at cost | | $ | — | | | $ | 66 | | | $ | 28,677,122 | | | $ | — | |
‡ Proceeds received, securities sold short | | $ | — | | | $ | 436,021,953 | | | $ | 285,124,928 | | | $ | — | |
* Premiums received, options written | | $ | — | | | $ | 225,622 | | | $ | — | | | $ | 143,481 | |
THEACCOMPANYINGNOTESAREANINTEGRALPARTOFTHEFINANCIALSTATEMENTS.
| | |
| 32 | | SEMI-ANNUAL REPORT 2013 |
| | |
| ROBECO INVESTMENT FUNDS | | FEBRUARY 28, 2013 (unaudited) |
| | |
STATEMENTS OF ASSETS AND LIABILITIES (concluded) | | |
| | | | | | | | | | | | |
| | | Robeco WPG
Small/Micro Cap
Value Fund | | | Robeco Boston
Partners Global
Equity Fund | | | Robeco Boston
Partners
International
Equity Fund | |
ASSETS | | | | | | | | | | | | |
Investments in securities, at value † ^ | | $ | 43,433,254 | | | $ | 11,414,860 | | | $ | 11,974,161 | |
Cash | | | 2,880,565 | | | | 290,430 | | | | 678,828 | |
Foreign currency, at value # | | | — | | | | 24,440 | | | | 224 | |
Receivables | | | | | | | | | | | | |
Investments sold | | | 287,502 | | | | 1,104,989 | | | | 109,569 | |
Deposits with brokers for securities sold short | | | — | | | | — | | | | — | |
Dividends and interest | | | 21,882 | | | | 37,875 | | | | 46,536 | |
Capital shares sold | | | 908 | | | | 240 | | | | 64,122 | |
Investment adviser | | | — | | | | 9,911 | | | | 11,012 | |
Prepaid expenses and other assets | | | 15,005 | | | | 27,408 | | | | 27,816 | |
| | | | | | | | | | | | |
Total assets | | | 46,639,116 | | | | 12,910,153 | | | | 12,912,268 | |
| | | | | | | | | | | | |
LIABILITIES | | | | | | | | | | | | |
Payables | | | | | | | | | | | | |
Securities lending collateral | | | 3,712,413 | | | | — | | | | — | |
Investments purchased | | | 334,010 | | | | 127,383 | | | | 231,641 | |
Investment advisory fees | | | 30,564 | | | | — | | | | — | |
Administration and accounting fees | | | 12,271 | | | | 11,079 | | | | 11,146 | |
Custodian fees | | | 7,821 | | | | 20,653 | | | | 22,484 | |
Printing and shareholder reporting fees | | | 5,069 | | | | 6,673 | | | | 6,681 | |
Other accrued expenses and liabilities | | | 42,728 | | | | 29,446 | | | | 29,824 | |
| | | | | | | | | | | | |
Total liabilities | | | 4,144,876 | | | | 195,234 | | | | 301,776 | |
| | | | | | | | | | | | |
Net Assets | | $ | 42,494,240 | | | $ | 12,714,919 | | | $ | 12,610,492 | |
| | | | | | | | | | | | |
NET ASSETS CONSIST OF | | | | | | | | | | | | |
Par value | | $ | 2,496 | | | $ | 1,050 | | | $ | 1,039 | |
Paid-in capital | | | 38,144,398 | | | | 10,510,479 | | | | 10,406,344 | |
Undistributed net investment income/(accumulated net investment loss) | | | (106,044 | ) | | | 9,665 | | | | 21,251 | |
Accumulated net realized gain/(loss) from investments | | | (3,828,088 | ) | | | 533,317 | | | | 342,921 | |
Net unrealized appreciation on investments, securities sold short, written options and foreign currency translation | | | 8,281,478 | | | | 1,660,408 | | | | 1,838,937 | |
| | | | | | | | | | | | |
Net Assets | | $ | 42,494,240 | | | $ | 12,714,919 | | | $ | 12,610,492 | |
| | | | | | | | | | | | |
INSTITUTIONAL CLASS | | | | | | | | | | | | |
Net assets | | $ | 42,494,240 | | | $ | 12,714,919 | | | $ | 12,610,492 | |
Shares outstanding | | | 2,495,572 | | | | 1,049,551 | | | | 1,039,213 | |
| | | | | | | | | | | | |
Net asset value, offering and redemption price per share | | $ | 17.03 | | | $ | 12.11 | | | $ | 12.13 | |
| | | | | | | | | | | | |
† Investment in securities, at cost | | $ | 35,151,776 | | | $ | 9,753,727 | | | $ | 10,134,450 | |
^ Includes market value of securities on loan | | $ | 3,592,008 | | | $ | — | | | $ | — | |
# Foreign currency, at cost | | $ | — | | | $ | 24,701 | | | $ | 226 | |
THEACCOMPANYINGNOTESAREANINTEGRALPARTOFTHEFINANCIALSTATEMENTS.
| | | | |
| SEMI-ANNUAL REPORT 2013 | | | 33 | |
| | |
| ROBECO INVESTMENT FUNDS | | FEBRUARY 28, 2013 (unaudited) |
| | | | | | | | | | | | | | | | |
| | | Robeco Boston
Partners
Small Cap
Value Fund II | | | Robeco Boston
Partners
Long/Short Equity
Fund | | | Robeco Boston
Partners
Long/Short
Research Fund | | | Robeco Boston
Partners
All-Cap
Value Fund | |
| | | For the
Six Months
Ended
February 28, 2013 | | | For the
Six Months
Ended
February 28, 2013 | | | For the
Six Months
Ended
February 28, 2013 | | | For the
Six Months
Ended
February 28, 2013 | |
Investment Income | | | | | | | | | | | | | | | | |
Dividends † | | $ | 1,456,926 | | | $ | 7,946,109 | | | $ | 3,861,324 | | | $ | 4,360,946 | |
Interest | | | 1,248 | | | | 16,431 | | | | 8,768 | | | | — | |
Income from securities loaned (Note 6) | | | 16,398 | | | | 110,517 | | | | — | | | | 28,848 | |
| | | | | | | | | | | | | | | | |
Total investment income | | | 1,474,572 | | | | 8,073,057 | | | | 3,870,092 | | | | 4,389,794 | |
| | | | | | | | | | | | | | | | |
Expenses | | | | | | | | | | | | | | | | |
Advisory fees (Note 2) | | | 651,029 | | | | 8,043,937 | | | | 2,685,951 | | | | 1,452,855 | |
Distribution fees (Investor Class) (Note 2) | | | 89,783 | | | | 230,665 | | | | 75,548 | | | | 34,506 | |
Administration and accounting fees (Note 2) | | | 65,777 | | | | 287,187 | | | | 187,751 | | | | 160,660 | |
Transfer agent fees (Note 2) | | | 49,308 | | | | 111,769 | | | | 93,042 | | | | 41,306 | |
Printing and shareholder reporting fees | | | 28,351 | | | | 54,148 | | | | 19,291 | | | | 20,770 | |
Registration and filing fees | | | 17,861 | | | | 49,798 | | | | 37,682 | | | | 25,839 | |
Directors’ and officers’ fees | | | 15,061 | | | | 42,722 | | | | 25,246 | | | | 24,720 | |
Custodian fees (Note 2) | | | 13,476 | | | | 55,050 | | | | 47,550 | | | | 22,183 | |
Audit fees | | | 12,931 | | | | 18,007 | | | | 18,064 | | | | 13,540 | |
Legal fees | | | 9,563 | | | | 51,248 | | | | 34,708 | | | | 28,188 | |
Dividend expense on securities sold-short | | | — | | | | 2,935,843 | | | | 1,836,212 | | | | — | |
Prime broker interest expense | | | — | | | | 4,851,058 | | | | 1,161,547 | | | | — | |
Other expenses | | | 3,633 | | | | 7,367 | | | | 9,646 | | | | 7,040 | |
| | | | | | | | | | | | | | | | |
Total expenses before waivers and reimbursements | | | 956,773 | | | | 16,738,799 | | | | 6,232,238 | | | | 1,831,607 | |
Less: waivers and reimbursements | | | (24,319 | ) | | | — | | | | — | | | | (525,853 | ) |
| | | | | | | | | | | | | | | | |
Plus: expenses recouped by Adviser (Note 2) | | | — | | | | — | | | | 64,210 | | | | — | |
Net expenses after waivers and reimbursements | | | 932,454 | | | | 16,738,799 | | | | 6,296,448 | | | | 1,305,754 | |
| | | | | | | | | | | | | | | | |
Net investment income/(loss) | | | 542,118 | | | | (8,665,742 | ) | | | (2,426,356 | ) | | | 3,084,040 | |
| | | | | | | | | | | | | | | | |
Net realized gain/(loss) from: | | | | | | | | | | | | | | | | |
Investments | | | 1,893,063 | | | | 27,823,498 | | | | 9,202,538 | | | | 3,538,202 | |
Investments sold-short | | | — | | | | 9,154,456 | | | | (5,346,371 | ) | | | — | |
Foreign currency transactions | | | — | | | | 2,337 | | | | (574,355 | ) | | | — | |
Written options * | | | — | | | | 1,031,448 | | | | 31,835 | | | | 241,738 | |
Net change in unrealized appreciation/(depreciation) on: | | | | | | | | | | | | | | | | |
Investments | | | 14,282,486 | | | | 64,711,433 | | | | 47,084,611 | | | | 32,469,738 | |
Investments sold short | | | — | | | | (37,894,014 | ) | | | (20,350,275 | ) | | | — | |
Foreign currency translation | | | — | | | | (3 | ) | | | (397,298 | ) | | | — | |
Written options * | | | — | | | | (1,141,986 | ) | | | (52,173 | ) | | | 489,840 | |
| | | | | | | | | | | | | | | | |
Net realized and unrealized gain from investments | | | 16,175,549 | | | | 63,687,169 | | | | 29,598,512 | | | | 36,739,518 | |
| | | | | | | | | | | | | | | | |
Net increase in net assets resulting from operations | | $ | 16,717,667 | | | $ | 55,021,427 | | | $ | 27,172,156 | | | $ | 39,823,558 | |
| | | | | | | | | | | | | | | | |
† Net of foreign withholding taxes of | | $ | — | | | $ | (169,094 | ) | | $ | (70,648 | ) | | $ | (15,370 | ) |
| | | | | | | | | | | | | | | | |
| * | Primary risk is equity contracts |
THEACCOMPANYINGNOTESAREANINTEGRALPARTOFTHEFINANCIALSTATEMENTS.
| | |
| 34 | | SEMI-ANNUAL REPORT 2013 |
| | |
ROBECO INVESTMENT FUNDS | | FEBRUARY 28, 2013 (unaudited) |
| | |
STATEMENTS OF OPERATIONS (concluded) | | |
| | | | | | | | | | | | |
| | | Robeco WPG
Small/Micro Cap
Value Fund | | | Robeco Boston
Partners Global
Equity Fund | | | Robeco Boston
Partners
International
Equity Fund | |
| | | For the
Six Months
Ended
February 28, 2013 | | | For the
Six Months
Ended
February 28, 2013 | | | For the
Six Months
Ended
February 28, 2013 | |
Investment Income | | | | | | | | | | | | |
Dividends † | | $ | 499,614 | | | $ | 113,603 | | | $ | 111,200 | |
Interest | | | 552 | | | | 10 | | | | 21 | |
Income from securities loaned (Note 6) | | | 12,285 | | | | — | | | | — | |
| | | | | | | | | | | | |
Total investment income | | | 512,451 | | | | 113,613 | | | | 111,221 | |
| | | | | | | | | | | | |
Expenses | | | | | | | | | | | | |
Advisory fees (Note 2) | | | 173,761 | | | | 52,909 | | | | 52,156 | |
Administration and accounting fees (Note 2) | | | 39,332 | | | | 41,375 | | | | 43,299 | |
Transfer agent fees (Note 2) | | | 38,866 | | | | 16,112 | | | | 16,112 | |
Custodian fees (Note 2) | | | 19,718 | | | | 28,065 | | | | 29,185 | |
Directors’ and officers’ fees | | | 12,378 | | | | 11,107 | | | | 11,143 | |
Audit fees | | | 12,258 | | | | 14,666 | | | | 14,614 | |
Registration and filing fees | | | 10,179 | | | | 19,138 | | | | 18,715 | |
Legal fees | | | 7,623 | | | | 8,742 | | | | 6,740 | |
Printing and shareholder reporting fees | | | 3,594 | | | | 4,232 | | | | 4,230 | |
Other expenses | | | 1,663 | | | | 3,337 | | | | 3,260 | |
| | | | | | | | | | | | |
Total expenses before waivers and reimbursements | | | 319,372 | | | | 199,683 | | | | 199,454 | |
Less: waivers and reimbursements | | | — | | | | (123,258 | ) | | | (124,119 | ) |
| | | | | | | | | | | | |
Net expenses after waivers and reimbursements | | | 319,372 | | | | 76,425 | | | | 75,335 | |
| | | | | | | | | | | | |
Net investment income/(loss) | | | 193,079 | | | | 37,188 | | | | 35,886 | |
| | | | | | | | | | | | |
Net realized gain/(loss) from: | | | | | | | | | | | | |
Investments | | | 1,981,056 | | | | 680,687 | | | | 491,252 | |
Foreign currency transactions | | | — | | | | (5,533 | ) | | | (7,994 | ) |
Net change in unrealized appreciation/(depreciation) on: | | | | | | | | | | | | |
Investments | | | 4,841,077 | | | | 669,167 | | | | 1,060,099 | |
Foreign currency translation | | | — | | | | (929 | ) | | | (783 | ) |
| | | | | | | | | | | | |
Net realized and unrealized gain from investments | | | 6,822,133 | | | | 1,343,392 | | | | 1,542,574 | |
| | | | | | | | | | | | |
Net increase in net assets resulting from operations | | $ | 7,015,212 | | | $ | 1,380,580 | | | $ | 1,578,460 | |
| | | | | | | | | | | | |
† Net of foreign withholding taxes of | | $ | (3,503 | ) | | $ | (3,463 | ) | | $ | (8,048 | ) |
| | | | | | | | | | | | |
THEACCOMPANYINGNOTESAREANINTEGRALPARTOFTHEFINANCIALSTATEMENTS.
| | | | |
| SEMI-ANNUAL REPORT 2013 | | | 35 | |
| | |
| ROBECO INVESTMENT FUNDS | | FEBRUARY 28, 2013 |
| | |
STATEMENTS OF CHANGES IN NET ASSETS | | |
| | | | | | | | | | | | | | | | |
| | | Robeco Boston Partners
Small Cap Value Fund II | | | Robeco Boston Partners
Long/Short Equity Fund | |
| | | For the
Six Months Ended
February 28, 2013
(unaudited) | | | For the
Year Ended
August 31, 2012 | | | For the
Six Months Ended
February 28, 2013
(unaudited) | | | For the
Year Ended
August 31, 2012 | |
Increase/(decrease) in net assets from operations: | | | | | | | | | | | | | | | | |
Net investment income/(loss) | | $ | 542,118 | | | $ | 233,722 | | | $ | (8,665,742 | ) | | $ | (15,770,719 | ) |
Net realized gain/(loss) from investments, securities sold short, written options and foreign currency | | | 1,893,063 | | | | (828,497 | ) | | | 38,011,739 | | | | 58,412,920 | |
Net change in unrealized appreciation/(depreciation) from investments, securities sold short, written options and foreign currency | | | 14,282,486 | | | | 18,804,774 | | | | 25,675,430 | | | | 29,477,221 | |
| | | | | | | | | | | | | | | | |
Net increase in net assets resulting from operations | | | 16,717,667 | | | | 18,209,999 | | | | 55,021,427 | | | | 72,119,422 | |
| | | | | | | | | | | | | | | | |
Dividends and distributions to shareholders from: | | | | | | | | | | | | | | | | |
Net investment income | | | | | | | | | | | | | | | | |
Institutional Class | | | (330,980 | ) | | | (119,144 | ) | | | — | | | | — | |
Investor Class | | | (239,393 | ) | | | (104,488 | ) | | | — | | | | — | |
Net realized capital gains | | | | | | | | | | | | | | | | |
Institutional Class | | | — | | | | — | | | | (31,483,030 | ) | | | (38,698,443 | ) |
Investor Class | | | — | | | | — | | | | (11,609,467 | ) | | | (14,040,805 | ) |
| | | | | | | | | | | | | | | | |
Net decrease in net assets from dividends and distributions to shareholders | | | (570,373 | ) | | | (223,632 | ) | | | (43,092,497 | ) | | | (52,739,248 | ) |
| | | | | | | | | | | | | | | | |
Capital transactions: | | | | | | | | | | | | | | | | |
Institutional Class | | | | | | | | | | | | | | | | |
Proceeds from shares sold | | | 9,581,864 | | | | 24,118,444 | | | | 76,469,680 | | | | 188,461,565 | |
Reinvestment of distributions | | | 315,205 | | | | 109,724 | | | | 22,072,058 | | | | 24,911,474 | |
Shares redeemed | | | (4,181,995 | ) | | | (6,282,691 | ) | | | (45,274,464 | ) | | | (68,565,103 | ) |
Redemption fees (Note 8) | | | 1,154 | | | | 1,412 | | | | 142,821 | | | | 279,385 | |
Investor Class | | | | | | | | | | | | | | | | |
Proceeds from shares sold | | | 13,735,991 | | | | 11,673,749 | | | | 43,816,850 | | | | 50,975,538 | |
Reinvestment of distributions | | | 236,002 | | | | 103,165 | | | | 11,016,675 | | | | 13,855,744 | |
Shares redeemed | | | (9,308,899 | ) | | | (28,082,121 | ) | | | (18,471,310 | ) | | | (26,573,638 | ) |
Redemption fees (Note 8) | | | 1,399 | | | | 2,910 | | | | 49,716 | | | | 97,223 | |
| | | | | | | | | | | | | | | | |
Net increase in net assets from capital transactions | | | 10,380,721 | | | | 1,644,592 | | | | 89,822,026 | | | | 183,442,188 | |
| | | | | | | | | | | | | | | | |
Total increase in net assets | | | 26,528,015 | | | | 19,630,959 | | | | 101,750,956 | | | | 202,822,362 | |
Net assets | | | | | | | | | | | | | | | | |
Beginning of period | | | 120,293,204 | | | | 100,662,245 | | | | 675,941,512 | | | | 473,119,150 | |
| | | | | | | | | | | | | | | | |
End of period | | $ | 146,821,219 | | | $ | 120,293,204 | | | $ | 777,692,468 | | | $ | 675,941,512 | |
| | | | | | | | | | | | | | | | |
Undistributed net investment income/(loss), end of period | | $ | (18,092 | ) | | $ | 10,163 | | | $ | (9,027,344 | ) | | $ | (361,602 | ) |
| | | | | | | | | | | | | | | | |
Share transactions: | | | | | | | | | | | | | | | | |
Institutional Class | | | | | | | | | | | | | | | | |
Shares sold | | | 579,639 | | | | 1,618,535 | | | | 3,697,481 | | | | 9,437,817 | |
Shares reinvested | | | 19,314 | | | | 8,480 | | | | 1,094,171 | | | | 1,331,452 | |
Shares redeemed | | | (254,385 | ) | | | (460,403 | ) | | | (2,190,603 | ) | | | (3,444,240 | ) |
| | | | | | | | | | | | | | | | |
Net increase | | | 344,568 | | | | 1,166,612 | | | | 2,601,049 | | | | 7,325,029 | |
| | | | | | | | | | | | | | | | |
Investor Class | | | | | | | | | | | | | | | | |
Shares sold | | | 864,357 | | | | 863,982 | | | | 2,216,281 | | | | 2,664,682 | |
Shares reinvested | | | 15,003 | | | | 8,267 | | | | 575,283 | | | | 775,797 | |
Shares redeemed | | | (587,261 | ) | | | (2,013,569 | ) | | | (937,898 | ) | | | (1,400,109 | ) |
| | | | | | | | | | | | | | | | |
Net increase/(decrease) | | | 292,099 | | | | (1,141,320 | ) | | | 1,853,666 | | | | 2,040,370 | |
| | | | | | | | | | | | | | | | |
THEACCOMPANYINGNOTESAREANINTEGRALPARTOFTHEFINANCIALSTATEMENTS.
| | |
| 36 | | SEMI-ANNUAL REPORT 2013 |
| | |
ROBECO INVESTMENT FUNDS | | FEBRUARY 28, 2013 |
| | |
STATEMENTS OF CHANGES IN NET ASSETS (continued) | | |
| | | | | | | | | | | | | | | | |
| | | Robeco Boston Partners
Long/Short Research Fund | | | Robeco Boston Partners
All-Cap Value Fund | |
| | | For the
Six Months Ended
February 28, 2013
(unaudited) | | | For the
Year Ended
August 31, 2012 | | | For the
Six Months Ended
February 28, 2013
(unaudited) | | | For the
Year Ended
August 31, 2012 | |
Increase/(decrease) in net assets from operations: | | | | | | | | | | | | | | | | |
Net investment income/(loss) | | $ | (2,426,356 | ) | | $ | (1,848,189 | ) | | $ | 3,084,040 | | | $ | 3,584,312 | |
Net realized gain/(loss) from investments, securities sold short, written options and foreign currency | | | 3,313,647 | | | | 4,665,974 | | | | 3,779,940 | | | | (445,056 | ) |
Net change in unrealized appreciation/(depreciation) from investments, securities sold short, written options and foreign currency | | | 26,284,865 | | | | 13,198,959 | | | | 32,959,578 | | | | 39,690,157 | |
| | | | | | | | | | | | | | | | |
Net increase in net assets resulting from operations | | | 27,172,156 | | | | 16,016,744 | | | | 39,823,558 | | | | 42,829,413 | |
| | | | | | | | | | | | | | | | |
Dividends and distributions to shareholders from: | | | | | | | | | | | | | | | | |
Net investment income | | | | | | | | | | | | | | | | |
Institutional Class | | | — | | | | — | | | | (5,354,408 | ) | | | (1,665,830 | ) |
Investor Class | | | — | | | | — | | | | (396,553 | ) | | | (146,798 | ) |
Net realized capital gains | | | | | | | | | | | | | | | | |
Institutional Class | | | (3,652,979 | ) | | | (496,066 | ) | | | (1,983,576 | ) | | | (12,924,039 | ) |
Investor Class | | | (626,444 | ) | | | (186,172 | ) | | | (170,548 | ) | | | (1,628,060 | ) |
| | | | | | | | | | | | | | | | |
Net decrease in net assets from dividends and distributions to shareholders | | | (4,279,423 | ) | | | (682,238 | ) | | | (7,905,085 | ) | | | (16,364,727 | ) |
| | | | | | | | | | | | | | | | |
Capital transactions: | | | | | | | | | | | | | | | | |
Institutional Class | | | | | | | | | | | | | | | | |
Proceeds from shares sold | | | 358,301,353 | | | | 237,705,311 | | | | 30,050,843 | | | | 140,521,621 | |
Reinvestment of distributions | | | 3,332,064 | | | | 442,616 | | | | 6,790,733 | | | | 13,713,736 | |
Shares redeemed | | | (21,104,129 | ) | | | (33,289,835 | ) | | | (53,051,419 | ) | | | (44,807,044 | ) |
Redemption fees (Note 8) | | | 6,955 | | | | 19,341 | | | | — | | | | — | |
Investor Class | | | | | | | | | | | | | | | | |
Proceeds from shares sold | | | 34,690,888 | | | | 35,745,671 | | | | 9,002,411 | | | | 7,344,224 | |
Reinvestment of distributions | | | 616,804 | | | | 186,154 | | | | 542,146 | | | | 1,722,851 | |
Shares redeemed | | | (3,047,975 | ) | | | (11,227,285 | ) | | | (3,512,921 | ) | | | (12,435,219 | ) |
Redemption fees (Note 8) | | | 1,106 | | | | 4,921 | | | | — | | | | — | |
| | | | | | | | | | | | | | | | |
Net increase/(decrease) in net assets from capital transactions | | | 372,797,066 | | | | 229,586,894 | | | | (10,178,207 | ) | | | 106,060,169 | |
| | | | | | | | | | | | | | | | |
Total increase in net assets | | | 395,689,799 | | | | 244,921,400 | | | | 21,740,266 | | | | 132,524,855 | |
Net assets | | | | | | | | | | | | | | | | |
Beginning of period | | | 302,466,261 | | | | 57,544,861 | | | | 369,073,794 | | | | 236,548,939 | |
| | | | | | | | | | | | | | | | |
End of period | | $ | 698,156,060 | | | $ | 302,466,261 | | | $ | 390,814,060 | | | $ | 369,073,794 | |
| | | | | | | | | | | | | | | | |
Undistributed net investment income/(loss), end of period | | $ | (2,456,188 | ) | | $ | (29,832 | ) | | $ | 916,083 | | | $ | 3,583,004 | |
| | | | | | | | | | | | | | | | |
Share transactions: | | | | | | | | | | | | | | | | |
Institutional Class | | | | | | | | | | | | | | | | |
Shares sold | | | 28,780,786 | | | | 20,665,614 | | | | 1,844,494 | | | | 9,519,203 | |
Shares reinvested | | | 269,805 | | | | 41,327 | | | | 427,359 | | | | 1,020,367 | |
Shares redeemed | | | (1,715,040 | ) | | | (2,881,560 | ) | | | (3,356,092 | ) | | | (3,094,953 | ) |
| | | | | | | | | | | | | | | | |
Net increase/(decrease) | | | 27,335,551 | | | | 17,825,381 | | | | (1,084,239 | ) | | | 7,444,617 | |
| | | | | | | | | | | | | | | | |
Investor Class | | | | | | | | | | | | | | | | |
Shares sold | | | 2,801,718 | | | | 3,133,404 | | | | 553,265 | | | | 498,216 | |
Shares reinvested | | | 50,187 | | | | 17,430 | | | | 34,205 | | | | 128,571 | |
Shares redeemed | | | (249,192 | ) | | | (997,992 | ) | | | (220,707 | ) | | | (852,778 | ) |
| | | | | | | | | | | | | | | | |
Net increase/(decrease) | | | 2,602,713 | | | | 2,152,842 | | | | 366,763 | | | | (225,991 | ) |
| | | | | | | | | | | | | | | | |
THEACCOMPANYINGNOTESAREANINTEGRALPARTOFTHEFINANCIALSTATEMENTS.
| | | | |
| SEMI-ANNUAL REPORT 2013 | | | 37 | |
| | |
ROBECO INVESTMENT FUNDS | | FEBRUARY 28, 2013 |
| | |
STATEMENTS OF CHANGES IN NET ASSETS (continued) | | |
| | | | | | | | | | | | | | | | |
| | | Robeco WPG
Small/Micro Cap Value Fund | | | Robeco Boston Partners
Global Equity Fund | |
| | | For the
Six Months
Ended
February 28, 2013
(unaudited) | | | For the
Year Ended
August 31, 2012 | | | For the
Six Months
Ended
February 28, 2013
(unaudited) | | | For the
Period Ended
August 31, 2012* | |
Increase/(decrease) in net assets from operations: | | | | | | | | | | | | | | | | |
Net investment income/(loss) | | $ | 193,079 | | | $ | (121,160 | ) | | $ | 37,188 | | | $ | 98,281 | |
Net realized gain/(loss) from investments and foreign currency | | | 1,981,056 | | | | 860,441 | | | | 675,154 | | | | (86,127 | ) |
Net change in unrealized appreciation/(depreciation) from investments and foreign currency | | | 4,841,077 | | | | 4,882,563 | | | | 668,238 | | | | 992,170 | |
| | | | | | | | | | | | | | | | |
Net increase in net assets resulting from operations | | | 7,015,212 | | | | 5,621,844 | | | | 1,380,580 | | | | 1,004,324 | |
| | | | | | | | | | | | | | | | |
Dividends and distributions to shareholders from: | | | | | | | | | | | | | | | | |
Net investment income | | | | | | | | | | | | | | | | |
Institutional Class | | | (177,056 | ) | | | — | | | | (132,255 | ) | | | — | |
Net realized capital gains | | | | | | | | | | | | | | | | |
Institutional Class | | | — | | | | — | | | | (89,015 | ) | | | — | |
| | | | | | | | | | | | | | | | |
Net decrease in net assets from dividends and distributions to shareholders | | | (177,056 | ) | | | — | | | | (221,270 | ) | | | — | |
| | | | | | | | | | | | | | | | |
Capital transactions: | | | | | | | | | | | | | | | | |
Institutional Class | | | | | | | | | | | | | | | | |
Proceeds from shares sold | | | 348,751 | | | | 4,572,368 | | | | 100,552 | | | | 10,229,759 | |
Reinvestment of distributions | | | 164,541 | | | | — | | | | 221,270 | | | | — | |
Shares redeemed | | | (2,224,706 | ) | | | (6,064,647 | ) | | | (186 | ) | | | (110 | ) |
Redemption fees (Note 8) | | | — | | | | 332 | | | | — | | | | — | |
| | | | | | | | | | | | | | | | |
Net increase/(decrease) in net assets from capital transactions | | | (1,711,414 | ) | | | (1,491,947 | ) | | | 321,636 | | | | 10,229,649 | |
| | | | | | | | | | | | | | | | |
Total increase in net assets | | | 5,126,742 | | | | 4,129,897 | | | | 1,480,946 | | | | 11,233,973 | |
Net assets | | | | | | | | | | | | | | | | |
Beginning of period | | | 37,367,498 | | | | 33,237,601 | | | | 11,233,973 | | | | — | |
| | | | | | | | | | | | | | | | |
End of period | | $ | 42,494,240 | | | $ | 37,367,498 | | | $ | 12,714,919 | | | $ | 11,233,973 | |
| | | | | | | | | | | | | | | | |
Undistributed net investment income/(loss), end of period | | $ | (106,044 | ) | | $ | (122,067 | ) | | $ | 9,665 | | | $ | 104,732 | |
| | | | | | | | | | | | | | | | |
Share transactions: | | | | | | | | | | | | | | | | |
Institutional Class | | | | | | | | | | | | | | | | |
Shares sold | | | 21,707 | | | | 351,635 | | | | 8,769 | | | | 1,021,365 | |
Shares reinvested | | | 10,726 | | | | — | | | | 19,444 | | | | — | |
Shares redeemed | | | (146,823 | ) | | | (442,326 | ) | | | (16 | ) | | | (11 | ) |
| | | | | | | | | | | | | | | | |
Net increase/(decrease) | | | (114,390 | ) | | | (90,691 | ) | | | 28,197 | | | | 1,021,354 | |
| | | | | | | | | | | | | | | | |
| * | Inception Date of the Fund was December 30, 2011. |
THEACCOMPANYINGNOTESAREANINTEGRALPARTOFTHEFINANCIALSTATEMENTS.
| | |
| 38 | | SEMI-ANNUAL REPORT 2013 |
| | |
ROBECO INVESTMENT FUNDS | | FEBRUARY 28, 2013 |
| | |
STATEMENTS OF CHANGES IN NET ASSETS (concluded) | | |
| | | | | | | | |
| | | Robeco Boston Partners
International Equity Fund | |
| | | For the
Six Months
Ended
February 28, 2013
(unaudited) | | | For the
Period Ended
August 31, 2012* | |
Increase/(decrease) in net assets from operations: | | | | | | | | |
Net investment income | | $ | 35,886 | | | $ | 149,856 | |
Net realized gain/(loss) from investments and foreign currency | | | 483,258 | | | | (134,895 | ) |
Net change in unrealized appreciation/(depreciation) from investments and foreign currency | | | 1,059,316 | | | | 779,621 | |
| | | | | | | | |
Net increase in net assets resulting from operations | | | 1,578,460 | | | | 794,582 | |
| | | | | | | | |
Dividends and distributions to shareholders from: | | | | | | | | |
Net investment income | | | | | | | | |
Institutional Class | | | (131,147 | ) | | | — | |
Net realized capital gains | | | | | | | | |
Institutional Class | | | (78,542 | ) | | | — | |
| | | | | | | | |
Net decrease in net assets from dividends and distributions to shareholders | | | (209,689 | ) | | | — | |
| | | | | | | | |
Capital transactions: | | | | | | | | |
Institutional Class | | | | | | | | |
Proceeds from shares sold | | | 142,299 | | | | 10,100,676 | |
Reinvestment of distributions | | | 209,689 | | | | — | |
Shares redeemed | | | (5,484 | ) | | | (41 | ) |
| | | | | | | | |
Net increase in net assets from capital transactions | | | 346,504 | | | | 10,100,635 | |
| | | | | | | | |
Total increase in net assets | | | 1,715,275 | | | | 10,895,217 | |
Net assets | | | | | | | | |
Beginning of period | | | 10,895,217 | | | | — | |
| | | | | | | | |
End of period | | $ | 12,610,492 | | | $ | 10,895,217 | |
| | | | | | | | |
Undistributed net investment income/(loss), end of period | | $ | 21,251 | | | $ | 116,512 | |
| | | | | | | | |
Share transactions: | | | | | | | | |
Institutional Class | | | | | | | | |
Shares sold | | | 11,974 | | | | 1,009,475 | |
Shares reinvested | | | 18,218 | | | | — | |
Shares redeemed | | | (450 | ) | | | (4 | ) |
| | | | | | | | |
Net increase | | | 29,742 | | | | 1,009,471 | |
| | | | | | | | |
| * | Inception Date of the Fund was December 30, 2011. |
THEACCOMPANYINGNOTESAREANINTEGRALPARTOFTHEFINANCIALSTATEMENTS.
| | | | |
| SEMI-ANNUAL REPORT 2013 | | | 39 | |
| | |
FINANCIAL HIGHLIGHTS | | PER SHARE OPERATING PERFORMANCE |
Contained below is per share operating performance data for each class of shares outstanding, total investment return, ratios to average net assets and other supplemental data for the respective periods. This information has been derived from information provided in the financial statements.
| | | | | | | | | | | | | | | | | | | | | | | | | | | | | | | | | | |
| | |
Net
Asset
Value,
Beginning
of Period | | | Net
Investment
Income/(Loss)* | | | Net Realized
and Unrealized
Gain/(Loss) on
Investments | | | Total From
Investment
Operations | | | Dividends to
Shareholders
from Net
Investment
Income | | | Distributions to
Shareholders
from Net
Realized Gains | | | Return
of Capital | | | Total
Distributions | | | |
| Robeco Boston Partners Small Cap Value Fund II | | | | | | | | | | | | | | | | | | | |
Institutional Class | | | | | | | | | | | | | | | | | | | | | | | | | | | | | | | |
9/1/12 through 2/28/13† | | $ | 15.31 | | | $ | 0.08 | | | $ | 2.00 | | | $ | 2.08 | | | $ | (0.09 | ) | | $ | — | | | $ | — | | | $ | (0.09 | ) | | |
8/31/12 | | | 12.92 | | | | 0.05 | | | | 2.390 | | | | 2.44 | | | | (0.05 | ) | | | — | | | | — | | | | (0.05 | ) | | |
8/31/11 | | | 11.02 | | | | 0.03 | | | | 1.91 | | | | 1.94 | | | | (0.04 | ) | | | — | | | | — | | | | (0.04 | ) | | |
8/31/10 | | | 10.49 | | | | 0.06 | | | | 0.52 | | | | 0.58 | | | | (0.05 | ) | | | — | | | | — | | | | (0.05 | ) | | |
8/31/09 | | | 11.87 | | | | 0.11 | | | | (1.26 | ) | | | (1.15 | ) | | | (0.14 | ) | | | (0.05 | ) | | | (0.04 | ) | | | (0.23 | ) | | |
8/31/08 | | | 21.47 | | | | 0.07 | | | | (1.97 | ) | | | (1.90 | ) | | | — | | | | (7.70 | ) | | | — | | | | (7.70 | ) | | |
Investor Class | | | | | | | | | | | | | | | | | | | | | | | | | | | | | | | | | | |
9/1/12 through 2/28/13† | | $ | 14.74 | | | $ | 0.06 | | | $ | 1.92 | | | $ | 1.98 | | | $ | (0.05 | ) | | $ | — | | | $ | — | | | $ | (0.05 | ) | | |
8/31/12 | | | 12.44 | | | | 0.02 | | | | 2.30 | | | | 2.32 | | | | (0.02 | ) | | | — | | | | — | | | | (0.02 | ) | | |
8/31/11 | | | 10.62 | | | | (— | )3 | | | 1.84 | | | | 1.84 | | | | (0.02 | ) | | | — | | | | — | | | | (0.02 | ) | | |
8/31/10 | | | 10.11 | | | | 0.03 | | | | 0.50 | | | | 0.53 | | | | (0.02 | ) | | | — | | | | — | | | | (0.02 | ) | | |
8/31/09 | | | 11.43 | | | | 0.07 | | | | (1.20 | ) | | | (1.13 | ) | | | (0.11 | ) | | | (0.05 | ) | | | (0.03 | ) | | | (0.19 | ) | | |
8/31/08 | | | 21.02 | | | | 0.03 | | | | (1.92 | ) | | | (1.89 | ) | | | — | | | | (7.70 | ) | | | — | | | | (7.70 | ) | | |
| Robeco Boston Partners Long/Short Equity Fund | | | | | | | | | | | | | | | | | | | |
Institutional Class | | | | | | | | | | | | | | | | | | | | | | | | | | | | | | | | | | |
9/1/12 through 2/28/13† | | $ | 20.47 | | | $ | (0.24 | ) | | $ | 1.83 | | | $ | 1.59 | | | $ | — | | | $ | (1.24 | ) | | $ | — | | | $ | (1.24 | ) | | |
8/31/12 | | | 19.88 | | | | (0.54 | ) | | | 3.15 | | | | 2.61 | | | | — | | | | (2.03 | ) | | | — | | | | (2.03 | ) | | |
8/31/11 | | | 17.41 | | | | (0.47 | ) | | | 4.55 | | | | 4.08 | | | | — | | | | (1.62 | ) | | | — | | | | (1.62 | ) | | |
8/31/10 | | | 15.75 | | | | (0.37 | ) | | | 1.98 | | | | 1.61 | | | | — | | | | — | | | | — | | | | — | | | |
8/31/09 | | | 15.47 | | | | (0.22 | ) | | | 2.98 | | | | 2.76 | | | | — | | | | (2.48 | ) | | | — | | | | (2.48 | ) | | |
8/31/08 | | | 17.23 | | | | (0.36 | ) | | | 0.50 | | | | 0.14 | | | | — | | | | (1.90 | ) | | | — | | | | (1.90 | ) | | |
Investor Class | | | | | | | | | | | | | | | | | | | | | | | | | | | | | | | | | | |
9/1/12 through 2/28/13† | | $ | 19.51 | | | $ | (0.25 | ) | | $ | 1.73 | | | $ | 1.48 | | | $ | — | | | $ | (1.24 | ) | | $ | — | | | $ | (1.24 | ) | | |
8/31/12 | | | 19.08 | | | | (0.56 | ) | | | 3.01 | | | | 2.45 | | | | — | | | | (2.03 | ) | | | — | | | | (2.03 | ) | | |
8/31/11 | | | 16.80 | | | | (0.50 | ) | | | 4.39 | | | | 3.89 | | | | — | | | | (1.62 | ) | | | — | | | | (1.62 | ) | | |
8/31/10 | | | 15.31 | | | | (0.40 | ) | | | 1.84 | | | | 1.44 | | | | — | | | | — | | | | — | | | | — | | | |
8/31/09 | | | 15.17 | | | | (0.25 | ) | | | 2.87 | | | | 2.62 | | | | — | | | | (2.48 | ) | | | — | | | | (2.48 | ) | | |
8/31/08 | | | 16.97 | | | | (0.39 | ) | | | 0.49 | | | | 0.10 | | | | — | | | | (1.90 | ) | | | — | | | | (1.90 | ) | | |
| Robeco Boston Partners Long/Short Research Fund | | | | | | | | | | | | | | | | | | | |
Institutional Class | | | | | | | | | | | | | | | | | | | | | | | | | | | | | | | | | | |
9/1/12 through 2/28/13† | | $ | 11.91 | | | $ | (0.07 | ) | | $ | 0.91 | | | $ | 0.84 | | | $ | — | | | $ | (0.13 | ) | | $ | — | | | $ | (0.13 | ) | | |
8/31/12 | | | 10.60 | | | | (0.13 | ) | | | 1.53 | | | | 1.40 | | | | — | | | | (0.09 | ) | | | — | | | | (0.09 | ) | | |
9/30/10** through 8/31/11 | | | 10.00 | | | | (0.12 | ) | | | 0.71 | | | | 0.59 | | | | — | | | | — | | | | — | | | | — | | | |
Investor Class | | | | | | | | | | | | | | | | | | | | | | | | | | | | | | | | | | |
9/1/12 through 2/28/13† | | $ | 11.86 | | | $ | (0.08 | ) | | $ | 0.90 | | | $ | 0.82 | | | $ | — | | | $ | (0.13 | ) | | $ | — | | | $ | (0.13 | ) | | |
8/31/12 | | | 10.58 | | | | (0.15 | ) | | | 1.52 | | | | 1.37 | | | | — | | | | (0.09 | ) | | | — | | | | (0.09 | ) | | |
11/29/10** through 8/31/11 | | | 10.40 | | | | (0.12 | ) | | | 0.29 | | | | 0.17 | | | | — | | | | — | | | | — | | | | — | | | |
| * | Calculated based on average shares outstanding for the period. |
| 1 | Total return is calculated by assuming a purchase of shares on the first day and a sale of shares on the last day of the period and is not annualized if period is less than one year. |
| 2 | Redemption fees, if any, are reflected in total return calculations. |
| 3 | Amount is less than $0.01 per share. |
| 4 | Portfolio turnover rate excludes securities received from processing a subscription-in-kind. |
THEACCOMPANYINGNOTESAREANINTEGRALPARTOFTHEFINANCIALSTATEMENTS.
| | |
| 40 | | SEMI-ANNUAL REPORT 2013 |
| | |
FINANCIAL HIGHLIGHTS (continued) | | PER SHARE OPERATING PERFORMANCE |
| | | | | | | | | | | | | | | | | | | | | | | | | | | | | | | | | | | | |
| | | Redemption
Fees | | | Net
Asset
Value,
End of
Period | | | Total
Investment
Return1,2 | | | Net
Assets,
End of
Period
(000) | | | Ratio of
Expenses to
Average Net
Assets With
Waivers and
Reimbursements
and/or Recoupment,
if any | | | Ratio of
Expenses to
Average Net
Assets With
Waivers and
Reimbursements
and/or Recoupment,
if any
(Excluding
Dividend and
Interest Expense) | | | Ratio of
Expenses to
Average Net
Assets Without
Waivers and
Reimbursements
and/or Recoupment,
if any | | | Ratio of Net
Investment
Income/(Loss)
to Average Net
Assets With
Waivers and
Reimbursements
and/or Recoupment,
if any | | | Portfolio
Turnover
Rate | |
| | | | | | | | | | | | | | | | | | | | | | | | | | | | | | | | | | | | |
| | | | | | | | | | | | | | | | | | | | | | | | | | | | | | | | | | | | |
| | $ | — | 3 | | $ | 17.30 | | | | 13.63 | % | | $ | 66,521 | | | | 1.30 | %5 | | | N/A | | | | 1.33 | %5 | | | 0.97 | %5 | | | 9 | %6 |
| | | — | 3 | | | 15.31 | | | | 18.98 | | | | 53,604 | | | | 1.30 | | | | N/A | | | | 1.36 | | | | 0.37 | | | | 32 | |
| | | — | 3 | | | 12.92 | | | | 17.59 | | | | 30,172 | | | | 1.30 | | | | N/A | | | | 1.37 | | | | 0.22 | | | | 38 | |
| | | — | 3 | | | 11.02 | | | | 5.47 | | | | 25,736 | | | | 1.30 | | | | N/A | | | | 1.39 | | | | 0.51 | | | | 43 | |
| | | — | 3 | | | 10.49 | | | | (8.97 | ) | | | 21,466 | | | | 1.30 | | | | N/A | | | | 1.74 | | | | 1.29 | | | | 66 | |
| | | — | 3 | | | 11.87 | | | | (10.15 | ) | | | 56,652 | | | | 1.39 | | | | N/A | | | | 1.54 | | | | 0.47 | | | | 54 | |
| | | | | | | | | | | | | | | | | | | | | | | | | | | | | | | | | | | | |
| | $ | — | 3 | | $ | 16.67 | | | | 13.46 | % | | $ | 80,300 | | | | 1.55 | %5 | | | N/A | | | | 1.58 | %5 | | | 0.72 | %5 | | | 9 | %6 |
| | | — | 3 | | | 14.74 | | | | 18.67 | | | | 66,689 | | | | 1.55 | | | | N/A | | | | 1.61 | | | | 0.12 | | | | 32 | |
| | | — | 3 | | | 12.44 | | | | 17.28 | | | | 70,490 | | | | 1.55 | | | | N/A | | | | 1.62 | | | | (0.03 | ) | | | 38 | |
| | | — | 3 | | | 10.62 | | | | 5.26 | | | | 61,260 | | | | 1.55 | | | | N/A | | | | 1.63 | | | | 0.25 | | | | 43 | |
| | | — | 3 | | | 10.11 | | | | (9.20 | ) | | | 43,408 | | | | 1.55 | | | | N/A | | | | 2.00 | | | | 0.90 | | | | 66 | |
| | | | — | 3 | | | 11.43 | | | | (10.40 | ) | | | 65,370 | | | | 1.64 | | | | N/A | | | | 1.79 | | | | 0.19 | | | | 54 | |
| | | | | | | | | | | | | | | | | | | | | |
| | | | | | | | | | | | | | | | | | | | | | | | | | | | | | | | | | | | |
| | $ | 0.01 | | | $ | 20.83 | | | | 8.04 | % | | $ | 568,025 | | | | 4.62 | %5 | | | 2.44 | %5 | | | 4.62 | %5 | | | (2.36 | )%5 | | | 33 | %6 |
| | | 0.01 | | | | 20.47 | | | | 14.16 | | | | 505,108 | | | | 4.29 | | | | 2.48 | | | | 4.29 | | | | (2.68 | ) | | | 71 | |
| | | 0.01 | | | | 19.88 | | | | 23.66 | | | | 344,935 | | | | 3.70 | | | | 2.47 | | | | 3.71 | | | | (2.35 | ) | | | 103 | |
| | | 0.05 | | | | 17.41 | | | | 10.54 | | | | 164,438 | | | | 3.40 | | | | 2.50 | | | | 3.46 | | | | (2.10 | ) | | | 81 | |
| | | — | 3 | | | 15.75 | | | | 30.02 | | | | 54,703 | | | | 3.35 | | | | 2.50 | | | | 4.04 | | | | (1.85 | ) | | | 172 | |
| | | — | 3 | | | 15.47 | | | | 1.12 | | | | 36,423 | | | | 3.98 | | | | 2.50 | | | | 4.36 | | | | (2.27 | ) | | | 124 | |
| | | | | | | | | | | | | | | | | | | | | | | | | | | | | | | | | | | | |
| | $ | 0.01 | | | $ | 19.76 | | | | 7.87 | % | | $ | 209,668 | | | | 4.87 | %5 | | | 2.69 | %5 | | | 4.87 | %5 | | | (2.61 | )%5 | | | 33 | %6 |
| | | 0.01 | | | | 19.51 | | | | 13.90 | | | | 170,834 | | | | 4.54 | | | | 2.73 | | | | 4.54 | | | | (2.93 | ) | | | 71 | |
| | | 0.01 | | | | 19.08 | | | | 23.37 | | | | 128,184 | | | | 3.95 | | | | 2.72 | | | | 3.96 | | | | (2.60 | ) | | | 103 | |
| | | 0.05 | | | | 16.80 | | | | 9.73 | | | | 82,088 | | | | 3.65 | | | | 2.75 | | | | 3.70 | | | | (2.35 | ) | | | 81 | |
| | | — | 3 | | | 15.31 | | | | 29.63 | | | | 30,980 | | | | 3.55 | | | | 2.75 | | | | 4.19 | | | | (2.09 | ) | | | 172 | |
| | | | — | 3 | | | 15.17 | | | | 0.88 | | | | 7,728 | | | | 4.23 | | | | 2.75 | | | | 4.61 | | | | (2.51 | ) | | | 124 | |
| | | | | | | | | | | | | | | | | | | | | |
| | | | | | | | | | | | | | | | | | | | | | | | | | | | | | | | | | | | |
| | $ | — | 3 | | $ | 12.62 | | | | 7.04 | % | | $ | 614,377 | | | | 2.90 | %5 | | | 1.50 | %5 | | | 2.87 | %5 | | | (1.09 | )%5 | | | 31 | %6 |
| | | — | 3 | | | 11.91 | | | | 13.32 | | | | 254,170 | | | | 2.81 | | | | 1.54 | | | | 2.84 | | | | (1.12 | ) | | | 53 | 4 |
| | | 0.01 | | | | 10.60 | | | | 6.00 | | | | 37,237 | | | | 2.70 | 5 | | | 1.74 | 5 | | | 4.05 | 5 | | | (1.21 | )5 | | | 61 | 6 |
| | | | | | | | | | | | | | | | | | | | | | | | | | | | | | | | | | | | |
| | $ | — | 3 | | $ | 12.55 | | | | 6.90 | % | | $ | 83,779 | | | | 3.15 | %5 | | | 1.75 | %5 | | | 3.12 | %5 | | | (1.34 | )%5 | | | 31 | %6 |
| | | — | 3 | | | 11.86 | | | | 13.06 | | | | 48,296 | | | | 3.00 | | | | 1.79 | | | | 3.04 | | | | (1.31 | ) | | | 53 | 4 |
| | | | 0.01 | | | | 10.58 | | | | 1.73 | | | | 20,308 | | | | 2.99 | 5 | | | 1.98 | 5 | | | 4.08 | 5 | | | (1.47 | )5 | | | 61 | 6 |
THEACCOMPANYINGNOTESAREANINTEGRALPARTOFTHEFINANCIALSTATEMENTS.
| | | | |
| SEMI-ANNUAL REPORT 2013 | | | 41 | |
| | |
FINANCIAL HIGHLIGHTS (continued) | | PER SHARE OPERATING PERFORMANCE |
Contained below is per share operating performance data for each class of shares outstanding, total investment return, ratios to average net assets and other supplemental data for the respective periods. This information has been derived from information provided in the financial statements.
| | | | | | | | | | | | | | | | | | | | | | | | | | | | | | | | | | |
| | | Net Asset
Value,
Beginning
of Period | | | Net
Investment
Income/(Loss)* | | | Net Realized
and Unrealized
Gain/(Loss) on
Investments | | | Total From
Investment
Operations | | | Dividends to
Shareholders
from Net
Investment
Income | | | Distributions to
Shareholders
from Net
Realized Gains | | | Total Distributions | | | Redemption Fees | | | |
| Robeco Boston Partners All-Cap Value Fund | | | | | | | | | | | | | | | | | | | | | | | | | | | |
Institutional Class | | | | | | | | | | | | | | | | | | | | | | | | | | | | | | | | | | |
9/1/12 through 2/28/13† | | $ | 15.57 | | | $ | 0.14 | | | $ | 1.66 | | | $ | 1.80 | | | $ | (0.27 | ) | | $ | (0.10 | ) | | $ | (0.37 | ) | | $ | — | | | |
8/31/12 | | | 14.34 | | | | 0.20 | | | | 2.04 | | | | 2.24 | | | | (0.12 | ) | | | (0.89 | ) | | | (1.01 | ) | | | — | | | |
8/31/11 | | | 12.85 | | | | 0.15 | | | | 1.63 | | | | 1.78 | | | | (0.10 | ) | | | (0.19 | ) | | | (0.29 | ) | | | — | | | |
8/31/10 | | | 12.56 | | | | 0.10 | | | | 0.32 | | | | 0.42 | | | | (0.13 | ) | | | — | | | | (0.13 | ) | | | — | | | |
8/31/09 | | | 13.61 | | | | 0.19 | | | | (1.03 | ) | | | (0.84 | ) | | | (0.12 | ) | | | (0.09 | ) | | | (0.21 | ) | | | — | | | |
8/31/08 | | | 16.47 | | | | 0.23 | | | | (1.54 | ) | | | (1.31 | ) | | | (0.16 | ) | | | (1.39 | ) | | | (1.55 | ) | | | — | | | |
Investor Class | | | | | | | | | | | | | | | | | | | | | | | | | | | | | | | | | | |
9/1/12 through 2/28/13† | | $ | 15.50 | | | $ | 0.12 | | | $ | 1.66 | | | $ | 1.78 | | | $ | (0.23 | ) | | $ | (0.10 | ) | | $ | (0.33 | ) | | $ | — | | | |
8/31/12 | | | 14.28 | | | | 0.16 | | | | 2.03 | | | | 2.19 | | | | (0.08 | ) | | | (0.89 | ) | | | (0.97 | ) | | | — | | | |
8/31/11 | | | 12.79 | | | | 0.11 | | | | 1.63 | | | | 1.74 | | | | (0.06 | ) | | | (0.19 | ) | | | (0.25 | ) | | | — | | | |
8/31/10 | | | 12.52 | | | | 0.07 | | | | 0.31 | | | | 0.38 | | | | (0.11 | ) | | | — | | | | (0.11 | ) | | | — | | | |
8/31/09 | | | 13.56 | | | | 0.16 | | | | (1.03 | ) | | | (0.87 | ) | | | (0.08 | ) | | | (0.09 | ) | | | (0.17 | ) | | | — | | | |
8/31/08 | | | 16.41 | | | | 0.16 | | | | (1.51 | ) | | | (1.35 | ) | | | (0.11 | ) | | | (1.39 | ) | | | (1.50 | ) | | | — | | | |
| Robeco WPG Small/Micro Cap Value Fund | | | | | | | | | | | | | | | | | | | | | | | | | | | |
Institutional Class | | | | | | | | | | | | | | | | | | | | | | | | | | | | | | | | | | |
9/1/12 through 2/28/13† | | $ | 14.32 | | | $ | 0.08 | | | $ | 2.70 | | | $ | 2.78 | | | $ | (0.07 | ) | | $ | — | | | $ | (0.07 | ) | | $ | — | 3 | | |
8/31/12 | | | 12.31 | | | | (0.05 | ) | | | 2.06 | | | | 2.01 | | | | — | | | | — | | | | — | | | | — | 3 | | |
8/31/11 | | | 11.65 | | | | (0.06 | ) | | | 0.72 | | | | 0.66 | | | | — | | | | — | | | | — | | | | — | | | |
8/31/10 | | | 10.57 | | | | (0.05 | ) | | | 1.16 | | | | 1.11 | | | | (0.03 | ) | | | — | | | | (0.03 | ) | | | — | 3 | | |
8/31/09 | | | 12.18 | | | | 0.03 | | | | (1.62 | ) | | | (1.59 | ) | | | (0.01 | ) | | | (0.01 | ) | | | (0.02 | ) | | | — | | | |
8/31/08 | | | 17.05 | | | | 0.05 | 6 | | | (2.46 | ) | | | (2.41 | ) | | | (0.01 | ) | | | (2.45 | ) | | | (2.46 | ) | | | — | | | |
| Robeco Boston Partners Global Equity Fund | | | | | | | | | | | | | | | | | | | | | | | | | | | |
Institutional Class | | | | | | | | | | | | | | | | | | | | | | | | | | | | | | | | | | |
9/1/12 through 2/28/13† | | $ | 11.00 | | | $ | 0.04 | | | $ | 1.29 | | | $ | 1.33 | | | $ | (0.13 | ) | | $ | (0.09 | ) | | $ | (0.22 | ) | | $ | — | | | |
12/30/11** through 8/31/12 | | | 10.00 | | | | 0.10 | | | | 0.90 | | | | 1.00 | | | | — | | | | — | | | | — | | | | — | | | |
| Robeco Boston Partners International Equity Fund | | | | | | | | | | | | | | | | | | | | | | | | | | | |
Institutional Class | | | | | | | | | | | | | | | | | | | | | | | | | | | | | | | | | | |
9/1/12 through 2/28/13† | | $ | 10.79 | | | $ | 0.04 | | | $ | 1.51 | | | $ | 1.55 | | | $ | (0.13 | ) | | $ | (0.08 | ) | | $ | (0.21 | ) | | $ | — | | | |
12/30/11** through 8/31/12 | | | 10.00 | | | | 0.15 | | | | 0.64 | | | | 0.79 | | | | — | | | | — | | | | — | | | | — | | | |
| * | Calculated based on average shares outstanding, unless otherwise noted. |
| 1 | Total return is calculated by assuming a purchase of shares on the first day and a sale of shares on the last day of the period and is not annualized if period is less than one year. |
| 2 | Redemption fees are reflected in total return calculations. |
| 3 | Amount is less than $0.01. |
| 6 | Calculated using the SEC’s undistributed net investment income method. |
THEACCOMPANYINGNOTESAREANINTEGRALPARTOFTHEFINANCIALSTATEMENTS.
| | |
| 42 | | SEMI-ANNUAL REPORT 2013 |
| | |
FINANCIAL HIGHLIGHTS (concluded) | | PER SHARE OPERATING PERFORMANCE |
| | | | | | | | | | | | | | | | | | | | | | | | | | | | |
| | | Net
Asset
Value,
End of
Period | | | Total
Investment
Return1,2 | | | Net
Assets,
End of
Period
(000) | | | Ratio of
Expenses to
Average Net
Assets With
Waivers and
Reimbursements | | | Ratio of
Expenses to
Average Net
Assets Without
Waivers and Reimbursements | | | Ratio of Net
Investment
Income/(Loss)
to Average Net
Assets With
Waivers and
Reimbursements | | | Portfolio
Turnover
Rate | |
| | | | | | | | | | | | | | | | | | | | | | | | | | | | |
| | | | | | | | | | | | | | | | | | | | | | | | | | | | |
| | $ | 17.00 | | | | 11.72 | % | | $ | 357,054 | | | | 0.70 | %4 | | | 0.99 | %4 | | | 1.72 | %4 | | | 15 | %5 |
| | | 15.57 | | | | 16.73 | | | | 343,885 | | | | 0.70 | | | | 1.03 | | | | 1.38 | | | | 33 | |
| | | 14.34 | | | | 13.75 | | | | 210,113 | | | | 0.70 | | | | 1.03 | | | | 1.00 | | | | 47 | |
| | | 12.85 | | | | 3.31 | | | | 112,437 | | | | 0.80 | | | | 1.15 | | | | 0.75 | | | | 48 | |
| | | 12.56 | | | | (5.88 | ) | | | 63,085 | | | | 0.95 | | | | 1.50 | | | | 1.79 | | | | 55 | |
| | | 13.61 | | | | (8.55 | ) | | | 51,850 | | | | 0.95 | | | | 1.70 | | | | 1.59 | | | | 44 | |
| | | | | | | | | | | | | | | | | | | | | |
| | $ | 16.95 | | | | 11.64 | % | | $ | 33,760 | | | | 0.95 | %4 | | | 1.24 | %4 | | | 1.46 | %4 | | | 15 | %5 |
| | | 15.50 | | | | 16.44 | | | | 25,189 | | | | 0.95 | | | | 1.28 | | | | 1.13 | | | | 33 | |
| | | 14.28 | | | | 13.55 | | | | 26,436 | | | | 0.95 | | | | 1.28 | | | | 0.75 | | | | 47 | |
| | | 12.79 | | | | 3.01 | | | | 13,016 | | | | 1.03 | | | | 1.39 | | | | 0.55 | | | | 48 | |
| | | 12.52 | | | | (6.15 | ) | | | 5,187 | | | | 1.20 | | | | 1.75 | | | | 1.51 | | | | 55 | |
| | | | 13.56 | | | | (8.82 | ) | | | 3,164 | | | | 1.20 | | | | 1.95 | | | | 1.10 | | | | 44 | |
| | | | | | | | | | | | | | | | | | | | | | | | | | | | |
| | | | | | | | | | | | | | | | | | | | | | | | | | | | |
| | $ | 17.03 | | | | 19.47 | % | | $ | 42,494 | | | | 1.65 | %4 | | | 1.65 | %4 | | | 1.00 | %4 | | | 32 | %5 |
| | | 14.32 | | | | 16.33 | | | | 37,367 | | | | 1.70 | | | | 1.70 | | | | (0.34 | ) | | | 84 | |
| | | 12.31 | | | | 5.67 | | | | 33,238 | | | | 1.67 | | | | 1.72 | | | | (0.43 | ) | | | 85 | |
| | | 11.65 | | | | 10.54 | | | | 32,394 | | | | 1.69 | | | | 1.77 | | | | (0.39 | ) | | | 94 | |
| | | 10.57 | | | | (12.93 | ) | | | 35,405 | | | | 1.61 | | | | 1.95 | | | | 0.37 | | | | 137 | |
| | | | 12.18 | | | | (15.12 | ) | | | 43,133 | | | | 1.61 | | | | 1.65 | | | | 0.11 | | | | 131 | |
| | | | | | | | | | | | | | | | | | | | | | | | | | | | |
| | | | | | | | | | | | | | | | | | | | | | | | | | | | |
| | $ | 12.11 | | | | 12.17 | % | | $ | 12,715 | | | | 1.30 | %4 | | | 3.40 | %4 | | | 0.63 | %4 | | | 50 | %5 |
| | | | 11.00 | | | | 10.00 | 5 | | | 11,234 | | | | 1.30 | 4 | | | 3.56 | 4 | | | 1.39 | 4 | | | 83 | 5 |
| | | | | | | | | | | | | | | | | | | | | | | | | | | | |
| | | | | | | | | | | | | | | | | | | | | | | | | | | | |
| | $ | 12.13 | | | | 14.44 | % | | $ | 12,610 | | | | 1.30 | %4 | | | 3.44 | %4 | | | 0.62 | %4 | | | 43 | %5 |
| | | | 10.79 | | | | 7.90 | 5 | | | 10,895 | | | | 1.30 | 4 | | | 3.77 | 4 | | | 2.16 | 4 | | | 81 | 5 |
THEACCOMPANYINGNOTESAREANINTEGRALPARTOFTHEFINANCIALSTATEMENTS.
| | | | |
| SEMI-ANNUAL REPORT 2013 | | | 43 | |
| | |
NOTES TO FINANCIAL STATEMENTS | | |
| 1. | Organization and Significant Accounting Policies |
The RBB Fund, Inc. (“RBB” or the “Company”) was incorporated under the laws of the State of Maryland on February 29, 1988 and is registered under the Investment Company Act of 1940, as amended (the “1940 Act”), as an open-end management investment company. RBB is a “series trust,” which is a mutual fund divided into separate portfolios. Each portfolio is treated as a separate entity for certain matters under the 1940 Act, and for other purposes, and a shareholder of one portfolio is not deemed to be a shareholder of any other portfolio. Currently, RBB has seventeen active investment portfolios, including Robeco Boston Partners Small Cap Value Fund II (“BP Small Cap Value Fund II”), Robeco Boston Partners Long/Short Equity Fund (“BP Long/Short Equity Fund”), Robeco Boston Partners Long/Short Research Fund (“BP Long/Short Research Fund”), Robeco Boston Partners All-Cap Value Fund (“BP All-Cap Value Fund”), Robeco Boston Partners Global Equity Fund (“BP Global Equity Fund”), Robeco Boston Partners International Equity Fund (“BP International Equity Fund”) (collectively “BP Funds”), and Robeco WPG Small/Micro Cap Value Fund (“WPG Small/Micro Cap Value Fund” and, collectively with the BP Funds, the “Funds”). As of February 28, 2013, the BP Funds each offer two classes of shares, Institutional Class and Investor Class. As of February 28, 2013, Investor Class shares of the BP Global Equity Fund and BP International Equity Fund have not been issued. The WPG Small/Micro Cap Value Fund is a single class fund, offering only the Institutional Class of shares.
RBB has authorized capital of one hundred billion shares of common stock of which 80.573 billion shares are currently classified into one hundred and forty-two classes of common stock. Each class represents an interest in an active or inactive RBB investment portfolio.
Portfolio Valuation — Each Fund’s net asset value (“NAV”) is calculated once daily at the close of regular trading hours on the New York Stock Exchange (“NYSE”) (generally 4:00 p.m. Eastern time) on each day the NYSE is open. Securities held by a Fund are valued using the closing price or the last sale price on a national securities exchange or the National Association of Securities Dealers Automatic Quotation System (“NASDAQ”) market system where they are primarily traded. Equity securities traded in the over-the-counter market are valued at their closing prices. If there were no transactions on that day, securities traded principally on an exchange or on NASDAQ will be valued at the mean of the last bid and ask prices prior to the market close. Fixed income securities having a remaining maturity of greater than 60 days are valued using an independent pricing service, which considers such factors as security prices, yields, maturities and ratings, and are deemed representative of market values at the close of the market. Fixed income securities having a remaining maturity of 60 days or less are valued at amortized cost which approximates market value. Foreign securities are valued based on prices from the primary market in which they are traded, and are translated from the local currency into U.S. dollars using current exchange rates. Investments in other open-end investment companies are valued based on the NAV of the investment companies (which may use fair value pricing as discussed in their prospectuses). Options for which the primary market is a national securities exchange are valued at the last sale price on the exchange on which they are traded, or, in the absence of any sale, will be valued at the mean of the last bid and ask prices prior to the market close. Options not traded on a national securities exchange are valued at the last quoted bid price for long option positions and the closing ask price for short option positions. If market quotations are unavailable or deemed unreliable, securities will be valued in accordance with procedures adopted by the Company’s Board of Directors. Relying on prices supplied by pricing services or dealers or using fair valuation may result in values that are higher or lower than the values used by other investment companies and investors to price the same investments. Such procedures use fundamental valuation methods, which may include, but are not limited to, an analysis of the effect of any restrictions on the resale of the security, industry analysis and trends, significant changes in the issuer’s financial position, and any other event which could have a significant impact on the value of the security. Determination of fair value involves subjective judgment as the actual market value of a particular security can be established only by negotiations between the parties in a sales transaction, and the difference between the recorded fair value and the value that would be received in a sale could be significant.
Fair Value Measurements — The inputs and valuation techniques used to measure fair value of the Funds’ investments are summarized into three levels as described in the hierarchy below:
| | |
| |
| • Level 1 — | | quoted prices in active markets for identical securities; |
| |
| • Level 2 — | | other significant observable inputs (including quoted prices for similar securities, interest rates, prepayment speeds, credit risk, etc.); and |
| |
| • Level 3 — | | significant unobservable inputs (including the Funds’ own assumptions in determining the fair value of investments). |
| | |
| 44 | | SEMI-ANNUAL REPORT 2013 |
| | |
NOTES TO FINANCIAL STATEMENTS (continued) | | |
The inputs or methodology used for valuing securities are not necessarily an indication of the risk associated with investing in those securities.
A summary of the inputs used to value each Fund’s investments as of February 28, 2013 is included in each Fund’s Portfolio of Investments.
At the end of each fiscal quarter, management evaluates the classification of Levels 1, 2 and 3 assets and liabilities. Various factors are considered, such as changes in liquidity from the prior reporting period; whether or not a broker is willing to execute at the quoted price; the depth and consistency of prices from third party pricing services; and the existence of contemporaneous, observable trades in the market. Additionally, management evaluates the classification of Level 1 and Level 2 assets and liabilities on a quarterly basis for changes in listings or delistings on national exchanges.
Due to the inherent uncertainty of determining the fair value of investments that do not have a readily available market value, the fair value of the Funds’ investments may fluctuate from period to period. Additionally, the fair value of investments may differ significantly from the values that would have been used had a ready market existed for such investments and may differ materially from the values the Funds may ultimately realize. Further, such investments may be subject to legal and other restrictions on resale or otherwise less liquid than publicly traded securities.
For fair valuations using significant unobservable inputs, U.S. generally accepted accounting principles (“U.S. GAAP”) require each Fund to present a reconciliation of the beginning to ending balances for reported market values that presents changes attributable to total realized and unrealized gains or losses, purchase and sales, and transfers in and out of Level 3 during the period. Transfers in and out between Levels are based on values at the end of the period. U.S. GAAP also requires a Fund to disclose amounts and reasons for all transfers in and out of Level 1 and Level 2 fair value measurements. A reconciliation of Level 3 investments is presented only when a Fund had an amount of Level 3 investments at the end of the reporting period that was meaningful in relation to its net assets. The amounts and reasons for all transfers in and out of each Level within the three-tier hierarchy are disclosed when a Fund had an amount of total transfers during the reporting period that was meaningful in relation to its net assets as of the end of the reporting period.
For the six months ended February 28, 2013, there were no material transfers between Levels 1, 2, and 3 for any of the Funds.
Use of Estimates — The preparation of financial statements in conformity with U.S. GAAP requires management to make estimates and assumptions that affect the reported amounts of assets and liabilities and disclosure of contingent assets and liabilities at the date of the financial statements and the reported amounts of revenues and expenses during the period. Actual results could differ from those estimates and those differences could be significant.
Investment Transactions, Investment Income and Expenses — The Funds record security transactions based on trade date for financial report purposes. The cost of investments sold is determined by use of the specific identification method for both financial reporting and income tax purposes in determining realized gains and losses on investments. Interest income is accrued when earned. Dividend income is recorded on the ex-dividend date. Distributions received on securities that represent a return of capital or capital gains are recorded as a reduction of cost of investments and/or as a realized gain. The Funds’ investment income, expenses (other than class specific distribution fees) and unrealized and realized gains and losses are allocated daily to each class of shares based upon the relative proportion of net assets of each class at the beginning of the day. Expenses incurred on behalf of a specific class, fund or fund family of the Company are charged directly to the class, fund or fund family (in proportion to net assets). Expenses incurred for all of the RBB funds (such as director or professional fees) are charged to all funds in proportion to their average net assets of RBB, or in such other manner as the Company’s Board of Directors deems fair or equitable. Expenses and fees, including investment advisory and administration fees, are accrued daily and taken into account for the purpose of determining the NAV of the Funds.
Dividends and Distributions to Shareholders — Dividends from net investment income and distributions from net realized capital gains, if any, are declared and paid at least annually to shareholders and recorded on ex-dividend date for all Funds. Income dividends and capital gain distributions are determined in accordance with U.S. federal income tax regulations which may differ from U.S. GAAP.
U.S. Tax Status — No provision is made for U.S. income taxes as it is each Fund’s intention to qualify or continue to qualify for and elect the tax treatment applicable to regulated investment companies under Subchapter M of the Internal Revenue Code of 1986, as amended, and make the requisite distributions to its shareholders which will be sufficient to relieve it from U.S. income and excise taxes.
| | | | |
| SEMI-ANNUAL REPORT 2013 | | | 45 | |
| | |
NOTES TO FINANCIAL STATEMENTS (continued) | | |
Other — In the normal course of business, the Funds may enter into contracts that provide general indemnifications. The Funds’ maximum exposure under these arrangements is dependent on claims that may be made against the Funds in the future, and, therefore, cannot be estimated; however, based on experience, the risk of material loss from such claims is considered remote.
Foreign Currency Translation — Assets and liabilities initially expressed in non-U.S. currencies are translated into U.S. dollars based on the applicable exchange rates at the date of the last business day of the financial statement period. Purchases and sales of securities, interest income, dividends, variation margin received and expenses denominated in foreign currencies are translated into U.S. dollars at the exchange rates in effect on the transaction date.
The Funds do not separately report the effect of changes in foreign exchange rates from changes in market prices of securities held. Such changes are included with the net realized gain or loss and change in unrealized appreciation or depreciation on investment securities in the Statement of Operations. Other foreign currency transactions resulting in realized and unrealized gain or loss are reported separately as net realized gain or loss and change in unrealized appreciation or depreciation on foreign currencies in the Statement of Operations.
Currency Risk — The Funds invest in securities of foreign issuers, including American Depositary Receipts. These markets are subject to special risks associated with foreign investments not typically associated with investing in U.S. markets. Because the foreign securities in which the Funds may invest generally trade in currencies other than the U.S. dollar, changes in currency exchange rates will affect the Funds” NAV, the value of dividends and interest earned and gains and losses realized on the sale of securities. Because the NAV for the Funds are determined on the basis of U.S. dollars, the Funds may lose money by investing in a foreign security if the local currency of a foreign market depreciates against the U.S. dollar, even if the local currency value of the Funds’ holdings goes up. Generally, a strong U.S. dollar relative to these other currencies will adversely affect the value of the Funds’ holdings in foreign securities.
Foreign Securities Market Risk — Securities of many non-U.S. companies may be less liquid and their prices more volatile than securities of comparable U.S. companies. Securities of companies traded in many countries outside the U.S., particularly emerging markets countries, may be subject to further risks due to the inexperience of local investment professionals and financial institutions, the possibility of permanent or temporary termination of trading and greater spreads between bid and asked prices of securities. In addition, non-U.S. stock exchanges and investment professionals are subject to less governmental regulation, and commissions may be higher than in the United States. Also, there may be delays in the settlement of non-U.S. stock exchange transactions.
Options Written — The Funds are subject to equity price risk in the normal course of pursuing their investment objectives and may enter into options written to hedge against changes in the value of equities. Such options may relate to particular securities or domestic stock indices, and may or may not be listed on a domestic securities exchange or issued by the Options Clearing Corporation. The risk in writing a call option is that a Fund gives up the opportunity for profit if the market price of the security increases. The risk in writing a put option is that a Fund may incur a loss if the market price of the security decreases and the option is exercised. A Fund also has the additional risk of being unable to enter into a closing transaction at an acceptable price if a liquid secondary market does not exist. A Fund also may write over-the-counter options where completing the obligation depends upon the credit standing of the other party. Option contracts also involve the risk that they may result in loss due to unanticipated developments in market conditions or other causes.
Written options are recorded as liabilities to the extent of premiums received. Gains or losses are realized when the option transaction expires or closes. When an option is exercised, the proceeds on sales for a written call option or the purchase cost for a written put option is adjusted by the amount of the premium received.
| | |
| 46 | | SEMI-ANNUAL REPORT 2013 |
| | |
NOTES TO FINANCIAL STATEMENTS (continued) | | |
The BP Long/Short Equity Fund, BP Long/Short Research Fund and the BP All-Cap Value Fund had transactions in options written during the six-month period ended February 28, 2013 as follows:
| | | | | | | | | | | | | | | | | | | | | | | | |
| | | BP Long/Short Equity Fund | | | BP Long/Short Research Fund | | | BP All-Cap Value Fund | |
| | | Number of
Contracts | | | Premiums
Received | | | Number of
Contracts | | | Premiums
Received | | | Number of
Contracts | | | Premiums
Received | |
Options outstanding at August 31, 2012 | | | 5,124 | | | $ | 2,513,645 | | | | 340 | | | $ | 174,573 | | | | 3,460 | | | $ | 762,800 | |
Options written | | | 1,140 | | | | 225,622 | | | | — | | | | — | | | | 849 | | | | 143,481 | |
Options closed | | | (3,819 | ) | | | (1,642,431 | ) | | | (240 | ) | | | (143,263 | ) | | | (849 | ) | | | (148,091 | ) |
Options expired | | | (552 | ) | | | (273,581 | ) | | | — | | | | — | | | | (1,625 | ) | | | (186,188 | ) |
Options exercised | | | (753 | ) | | | (597,633 | ) | | | (100 | ) | | | (31,310 | ) | | | (986 | ) | | | (428,521 | ) |
| | | | | | | | | | | | | | | | | | | | | | | | |
Options outstanding at February 28, 2013 | | | 1,140 | | | $ | 225,622 | | | | — | | | $ | — | | | | 849 | | | $ | 143,481 | |
| | | | | | | | | | | | | | | | | | | | | | | | |
Short Sales — When the investment adviser believes that a security is overvalued, the BP Long/Short Equity Fund, the BP Long/Short Research Fund and the BP All-Cap Value Fund may sell the security short by borrowing the same security from a broker or other institution and selling the security. A Fund will incur a loss as a result of a short sale if the price of the borrowed security increases between the date of the short sale and the date on which the Fund buys and replaces such borrowed security. A Fund will realize a gain if there is a decline in price of the security between those dates where the decline in price exceeds the costs of borrowing the security and other transaction costs. There can be no assurance that a Fund will be able to close out a short position at any particular time or at an acceptable price. Although a Fund’s gain is limited to the amount at which it sold a security short, its potential loss is unlimited. Until a Fund replaces a borrowed security, it will maintain at all times cash, U.S. Government securities, or other liquid securities in an amount which, when added to any amount deposited with a broker as collateral, will at least equal the current market value of the security sold short. Depending on arrangements made with brokers, a Fund may not receive any payments (including interest) on collateral deposited with them.
In accordance with the terms of its prime brokerage agreements, a Fund may receive rebate income or be charged a fee on borrowed securities. Such income or fee is calculated on a daily basis based upon the market value of each borrowed security and a variable rate that is dependent upon the availability of such security. The Funds record these prime broker charges on a net basis as interest income or interest expense. For the six-month period ended February 28, 2013, the BP Long/Short Equity Fund and the BP Long/Short Research Fund had net charges of $4,756,752 and $1,092,827, respectively, on borrowed securities. Such amounts are included in prime broker interest expense on the statement of operations.
As of February 28, 2013, the BP Long/Short Equity Fund and the BP Long/Short Research Fund had securities sold short valued at $482,598,214 and $309,527,634, respectively, for which securities of $500,289,743 and $295,670,603 and cash deposits of $479,518,538 and $312,247,561, respectively, were pledged as collateral.
In accordance with Special Custody and Pledge Agreements with Goldman Sachs & Co. (“Goldman Sachs”) (the Funds’ prime broker), the BP Long/Short Equity Fund and the BP Long/Short Research Fund may borrow from Goldman Sachs to the extent necessary to maintain required margin cash deposits on short positions. Interest on such borrowings is charged to the Fund based on the LIBOR rate plus an agreed upon spread.
The BP Long/Short Equity Fund and the BP Long/Short Research Fund utilized cash borrowings from Goldman Sachs to meet required margin cash deposits as follows during the six-month period ended February 28, 2013:
| | | | | | | | | | | | |
| | | Days Utilized | | | Average Daily
Borrowings | | | Weighted Average
Interest Rate | |
BP Long/Short Equity Fund | | | 176 | | | $ | 33,438,303 | | | | 0.60 | % |
BP Long/Short Research Fund | | | 181 | | | | 22,875,832 | | | | 0.60 | % |
As of February 28, 2013, the BP Long/Short Equity Fund and the BP Long/Short Research Fund had borrowings of $59,359,622 and $58,578,926, respectively. Interest expenses for the six-month period ended February 28, 2013, totaled $94,306 and $68,720, respectively.
| 2. | Transactions with Investment Advisers and Other Services |
Robeco Investment Management, Inc. (“Robeco”) provides investment advisory services to the BP Funds and the WPG Small/Micro Cap Value Fund. For its advisory services with respect to the BP Funds, Robeco is entitled to receive 1.00% of the BP Small Cap Value Fund II’s average daily net assets, 2.25% of the BP Long/Short Equity Fund’s average daily net assets, 1.25% of the BP Long/Short Research Fund’s average daily net assets, 0.80% of the BP All-Cap Value Fund’s average daily net
| | | | |
| SEMI-ANNUAL REPORT 2013 | | | 47 | |
| | |
NOTES TO FINANCIAL STATEMENTS (continued) | | |
assets, 0.90% of BP Global Equity Fund’s average daily net assets, and 0.90% of BP International Equity Fund’s average daily net assets, each accrued daily and payable monthly.
Until December 31, 2013, Robeco has contractually agreed to limit the BP Small Cap Value Fund II, BP Long/Short Equity Fund and BP All-Cap Value Fund’s total annual operating expenses (excluding certain items discussed below) to the extent that such expenses exceed the ratios in the table below. This limit is calculated daily based on the BP Small Cap Value Fund II, BP Long/Short Equity Fund and BP All-Cap Value Fund’s average daily net assets. These limitations are effected in waivers of advisory fees and reimbursements of expenses exceeding the advisory fee as necessary. These contractual limitations are in effect until at least December 31, 2013 and may not be terminated without approval of the Company’s Board of Directors. Robeco may not recoup any of its waived investment advisory fees with respect to these Funds.
| | | | | | | | |
| | | Institutional | | | Investor | |
BP Small Cap Value Fund II | | | 1.30 | % | | | 1.55 | % |
BP Long/Short Equity Fund | | | 2.50 | % | | | 2.75 | % |
BP All-Cap Value Fund | | | 0.70 | % | | | 0.95 | % |
For the BP Long/Short Research Fund, Robeco has contractually agreed to forgo all or a portion of its advisory fee and/or reimburse expenses in an aggregate amount equal to the amount by which the total annual Fund operating expenses (excluding certain items discussed below) exceeds 1.50% of the average daily net assets attributable to the Fund’s Institutional Class shares and 1.75% of the average daily net assets attributable to the Fund’s Investor Class. This contractual limitation is in effect until at least December 31, 2013 and may not be terminated without approval of the Company’s Board of Directors. If at any time during the first three years the Fund’s Advisory Agreement with Robeco is in effect, the Fund’s Total annual Fund operating expenses for that year are less than 1.50% for the Institutional Class and 1.75% for the Investor Class, Robeco is entitled to reimbursement by the Fund of the advisory fees forgone and other payments remitted by Robeco to the Fund during such three-year period. As of February 28, 2013, the total fees waived and reimbursed which may be subject to possible future reimbursement to Robeco totaled $248,830, of which, $191,818 expires in 2014 and $57,012 expires in 2015. During the six month period ended February 28, 2013, Robeco was reimbursed by the Fund $64,210 of advisory fee forgone in fiscal year 2011.
For the BP Global Equity Fund and BP International Equity Fund, Robeco has contractually agreed to waive all or a portion of its advisory fee and/or reimburse expenses in an aggregate amount equal to the amount by which each Fund’s total annual Fund operating expenses (excluding certain items discussed below) exceeds 1.30% of the average daily net assets attributable to each Fund’s Institutional Class shares and 1.55% of the average daily net assets attributable to each Fund’s Investor Class. This contractual limitation is in effect until at least December 31, 2013 and may not be terminated without approval of the Company’s Board of Directors. If at any time during the first three years each Fund’s Advisory Agreement with Robeco is in effect, each Fund’s total annual Fund operating expenses for that year are less than 1.30% for the Institutional Class and 1.55% for the Investor Class, Robeco is entitled to reimbursement by each Fund of the advisory fees waived and other payments remitted by Robeco to each Fund during such three-year period. As of February 28, 2013, the total fees waived and reimbursed which may be subject to possible future reimbursement to Robeco totaled $257,078 and $268,729 for the BP Global Equity Fund and BP International Equity Fund, respectively, of which $133,820 and $144,610, respectively, expires in 2015 and $123,258 and $124,119, respectively, expires in 2016.
For its advisory services with respect to the WPG Small/Micro Cap Value Fund, Robeco is entitled to receive advisory fees, accrued daily and paid monthly, as follows:
| | |
| WPG Small/Micro Cap Value Fund | | 0.90% of net assets up to $300 million |
| | 0.80% of net assets $300 million to $500 million |
| | 0.75% of net assets in excess of $500 million |
Until December 31, 2013, Robeco has contractually agreed to limit the WPG Small/Micro Cap Value Fund’s total annual Fund operating expenses (excluding certain items discussed below) to 1.70% as a percentage of the Fund’s average daily net assets. The contractual limitation is in effect until at least December 31, 2013 and may not be terminated without approval of the Company’s Board of Directors. Robeco may not recoup any of its waived investment advisory fees with respect to the WPG Small/Micro Cap Value Fund.
For the six months ended February 28, 2013, Robeco has waived and reimbursed fees as follows:
| | | | | | | | |
Funds | | Investment Adviser
Expense Waived | | | Investment Adviser
Reimbursement | |
BP Small Cap Value Fund II | | $ | 24,319 | | | $ | — | |
BP Long/Short Equity Fund | | | — | | | | — | |
BP Long/Short Research Fund | | | — | | | | — | |
BP All-Cap Value Fund | | | 525,853 | | | | — | |
BP WPG Small/Micro Cap Value Fund | | | — | | | | — | |
BP Global Equity Fund | | | 52,909 | | | | 70,349 | |
BP International Equity Fund | | | 52,156 | | | | 71,963 | |
| | |
| 48 | | SEMI-ANNUAL REPORT 2013 |
| | |
NOTES TO FINANCIAL STATEMENTS (continued) | | |
In determining Robeco’s obligation to waive advisory fees and/or reimburse expenses, the following expenses are not taken into account and could cause a Fund’s net annualized expense ratio to exceed the applicable expense limitation: acquired fund fees and expenses, short sale dividend expenses, brokerage commissions, extraordinary items, interest and taxes.
BNY Mellon Investment Servicing (US) Inc. (“BNY Mellon”), serves as administrator for the Funds. For providing administration and accounting services, BNY Mellon is entitled to receive a monthly fee equal to an annual percentage rate of each Fund’s average daily net assets, subject to certain minimum monthly fees.
Included in the administration and accounting service fees, shown on the Statement of Operations, are fees for providing regulatory administrative services to RBB. For providing these services, BNY Mellon is entitled to receive compensation as agreed to by the Company and BNY Mellon. This fee is allocated to each portfolio of the Company in proportion to its net assets of the Company.
In addition, BNY Mellon serves as the Funds’ transfer and dividend disbursing agent. For providing transfer agency services, BNY Mellon is entitled to receive a monthly fee, subject to certain minimum.
The Bank of New York Mellon (the “Custodian”) provides certain custodial services to the Funds. The Custodian is entitled to receive a monthly fee equal to an annual percentage rate of the Funds’ average daily net assets, subject to certain minimum monthly fees.
The Board of Directors of the Company has approved a Distribution Agreement for the Funds and adopted separate Plans of Distribution for the Investor Class of each BP Fund (the “Plans”) pursuant to Rule 12b-1 under the 1940 Act. Under the Plans, Foreside Funds Distributors LLC (“the Underwriter”) is entitled to receive from each Fund a distribution fee with respect to the Investor Class, which is accrued daily and paid monthly, of up to 0.25% on an annualized basis of the average daily net assets of the Investor Class. Amounts paid to the Distributor under the Plans may be used by the Distributor to cover expenses that are related to (i) the sale of the Investor Class Shares, (ii) ongoing servicing and/or maintenance of the accounts of shareholders, and (iii) sub-transfer agency services, subaccounting services or administrative services related to the sale of the Investor Class, all as set forth in the Plans.
The Directors of the Company receive an annual retainer and meeting fees for meetings attended. The aggregate remuneration paid to the Directors by the Funds during the six-month period ended February 28, 2013, was $83,259. Certain employees of BNY Mellon serve as an Officer or Director of the Company. They are not compensated by the Funds or the Company.
| 4. | Investment in Securities |
For the six-month period ended February 28, 2013, aggregate purchases and sales of investment securities (excluding short-term investments and U.S. government obligations) were as follows:
| | | | | | | | |
Fund | | Purchases | | | Sales | |
BP Small Cap Value Fund II | | $ | 20,133,725 | | | $ | 11,939,907 | |
BP Long/Short Equity Fund | | | 281,131,698 | | | | 229,014,883 | |
BP Long/Short Research Fund | | | 429,969,868 | | | | 129,799,179 | |
BP All-Cap Value Fund | | | 54,585,218 | | | | 71,460,476 | |
WPG Small/Micro Cap Value Fund | | | 11,975,665 | | | | 15,023,087 | |
BP Global Equity Fund | | | 5,751,142 | | | | 6,552,786 | |
BP International Equity Fund | | | 4,789,216 | | | | 4,839,168 | |
| 5. | Capital Share Transactions |
As of February 28, 2013, each class of each Fund has 100,000,000 shares of $0.001 par value common stock authorized except for the Institutional Class of the WPG Small/Micro Cap Value Fund, which has 50,000,000 shares of $0.001 par value common stock authorized.
Securities may be loaned to financial institutions, such as broker-dealers, and are required to be secured continuously by collateral in cash, cash equivalents, letter of credit or U.S. Government securities maintained on a current basis at an amount at
| | | | |
| SEMI-ANNUAL REPORT 2013 | | | 49 | |
| | |
NOTES TO FINANCIAL STATEMENTS (continued) | | |
least equal to the market value of the securities loaned. Cash collateral received, pursuant to investment guidelines established by the Funds and approved by the Board of Directors, is invested in short-term investments. All such investments are made at the risk of the Funds and, as such, the Funds are liable for investment losses. Such loans would involve risks of delay in receiving additional collateral in the event the value of the collateral decreased below the value of the securities loaned or of delay in recovering the securities loaned or even loss of rights in the collateral should the borrower of the securities fail financially. However, loans will be made only to borrowers deemed by Robeco to be of good standing and only when, in the Robeco’s judgment, the income to be earned from the loans justifies the attendant risks. Any loans of a Fund’s securities will be fully collateralized and marked to market daily. During the six-month period ended February 28, 2013, the Funds participated in securities lending. The market value of securities on loan and collateral as of February 28, 2013 and the income generated from the program during the six-month period ended February 28, 2013, with respect to such loans are as follows:
| | | | | | | | | | | | |
Fund | | Market Value
of Securities
Loaned | | | Market Value
of Collateral | | | Income Received
from Securities
Lending | |
BP Small Cap Value Fund II | | $ | 17,400,880 | | | $ | 17,809,719 | | | $ | 16,398 | |
BP Long/Short Equity Fund | | | 10,414,234 | | | | 10,859,274 | | | | 110,517 | |
BP All-Cap Value Fund | | | 2,740,249 | | | | 2,833,760 | | | | 28,848 | |
WPG Small/Micro Cap Value Fund | | | 3,592,008 | | | | 3,712,413 | | | | 12,285 | |
A restricted security is a security which has been purchased through a private offering and cannot be resold to the general public without prior registration under the Securities Act of 1933 (the “1933 Act”) or pursuant to the resale limitations provided by Rule 144 under the 1933 Act, or an exemption from the registration requirements of the 1933 Act. Certain restricted securities may be resold in transactions exempt from registration, normally to qualified institutional buyers, and may be deemed liquid by Robeco as applicable, based on policies and procedures established by the Board of Directors. Therefore, not all restricted securities are considered illiquid.
At February 28, 2013, the following Fund held restricted securities that were illiquid:
| | | | | | | | | | | | | | | | | | |
| | | Acquisition Date | | Acquisition
Cost | | | Shares | | | Value | | | % of
Net Assets | |
BP All-Cap Value Fund | | | | | | | | | | | | | | | | | | |
| Common Stocks: | | | | | | | | | | | | | | | | | | |
J.G.Wentworth, Inc. 144A | | 08/02/07-03/26/08 | | $ | 181,980 | | | | — | | | | — | | | | 0.0 | |
Peoples Choice Financial Corp. 144A | | 12/21/04-01/23/06 | | | 14,293 | | | | 1,465 | | | | — | | | | 0.0 | |
Solar Cayman Ltd. 144A | | 03/24/10 | | | — | | | | 19,375 | | | | — | | | | 0.0 | |
| | | | | | | | | | | | | | | | | | |
| | | | $ | 196,273 | | | | | | | $ | — | | | | 0.0 | % |
| | | | | | | | | | | | | | | | | | |
There is a 1.00% redemption fee on shares redeemed which have been held 60 days or less on BP Small Cap Value Fund II, BP Long/Short Research Fund, BP Global Equity Fund and BP International Equity Fund. There is a 2.00% redemption fee on shares redeemed which have been held 365 days or less on the BP Long/Short Equity Fund. The WPG Small/Micro Cap Value Fund has a 2.00% redemption fee on shares redeemed within 60 days of purchase. The redemption fees are retained by the Funds for the benefit of the remaining shareholders and recorded as paid-in capital.
| 9. | Federal Income Tax Information |
The Funds have followed the authoritative guidance on accounting for and disclosure of uncertainty in tax positions, which requires the Funds to determine whether a tax position is more likely than not to be sustained upon examination, including resolution of any related appeals or litigation processes, based on the technical merits of the position. The Funds have determined that there was no effect on the financial statements from following this authoritative guidance. In the normal course of business, the Funds are subject to examination by federal, state and local jurisdictions, where applicable, for tax years for which applicable statutes of limitations have not expired.
| | |
| 50 | | SEMI-ANNUAL REPORT 2013 |
| | |
NOTES TO FINANCIAL STATEMENTS (continued) | | |
As of February 28, 2013, federal tax cost and aggregate gross unrealized appreciation and depreciation of securities held by each Fund were as follows:
| | | | | | | | | | | | | | | | |
Fund | | Federal Tax
Cost | | | Unrealized
Appreciation | | | Unrealized
Depreciation | | | Net
Unrealized
Appreciation | |
BP Small Cap Value Fund II | | $ | 123,713,374 | | | $ | 38,509,731 | | | $ | (3,563,179 | ) | | $ | 34,946,552 | |
BP Long/Short Equity Fund | | | 661,989,452 | | | | 118,880,971 | | | | (20,030,497 | ) | | | 98,850,474 | |
BP Long/Short Research Fund | | | 582,789,842 | | | | 68,786,635 | | | | (6,724,182 | ) | | | 62,062,453 | |
BP All-Cap Value Fund | | | 314,016,602 | | | | 65,628,287 | | | | (4,066,640 | ) | | | 61,561,647 | |
WPG Small/Micro Cap Value Fund | | | 35,151,776 | | | | 9,102,814 | | | | (821,336 | ) | | | 8,281,478 | |
BP Global Equity Fund | | | 9,753,727 | | | | 1,793,256 | | | | (132,123 | ) | | | 1,661,133 | |
BP International Equity Fund | | | 10,134,450 | | | | 2,022,685 | | | | (182,974 | ) | | | 1,839,711 | |
Distributions to shareholders from net investment income and realized gains are determined in accordance with federal income tax regulations, which may differ from net investment income and realized gains recognized for financial reporting purposes. Accordingly, the character of distributions and composition of net assets for tax purposes may differ from those reflected in the accompanying financial statements. To the extent these differences are permanent, such amounts are reclassified within the capital accounts based on the tax treatment; temporary differences do not require such reclassification.
As of August 31, 2012, the components of distributable earnings on a tax basis were as follows:
| | | | | | | | | | | | | | | | | | | | | | | | |
Fund | | Undistributed
Ordinary
Income | | | Undistributed
Long-Term
Gains | | | Capital Loss
Carryforwards | | | Unrealized
Appreciation
(Depreciation) | | | Qualified
Late-year
Loss
Deferral | | | Other
Temporary
Differences | |
BP Small Cap Value Fund II | | $ | 10,163 | | | $ | — | | | $ | (16,071,197 | ) | | $ | 19,694,781 | | | $ | (1,708,185 | ) | | $ | — | |
BP Long/Short Equity Fund | | | 28,431,871 | | | | 10,071,484 | | | | (1,686,468 | ) | | | 25,196,547 | | | | — | | | | (516,104 | ) |
BP Long/Short Research Fund | | | 4,279,421 | | | | — | | | | — | | | | 9,116,718 | | | | — | | | | (31,827 | ) |
BP All-Cap Value Fund | | | 3,583,004 | | | | 118,755 | | | | — | | | | 26,483,957 | | | | — | | | | — | |
WPG Small/Micro Cap Value Fund | | | — | | | | — | | | | (4,435,716 | ) | | | 2,042,273 | | | | (97,367 | ) | | | — | |
BP Global Equity Fund | |
| 104,732
|
| | | — | | | | (41,732 | ) | | | 981,080 | | | | — | | | | — | |
BP International Equity Fund | |
| 116,512
|
| |
| —
|
| |
| (44,041
| )
| | | 761,867 | | | | — | | | | — | |
The differences between the book and tax basis components of distributable earnings relate principally to the timing of recognition of income and gains for federal income tax purposes.
The tax character of dividends and distributions paid during the fiscal year ended August 31, 2012 were as follows:
| | | | | | | | | | | | |
| | | 2012 | |
Fund | | Ordinary
Income | | | Long-Term
Gains | | | Total | |
BP Small Cap Value Fund II | | $ | 223,632 | | | $ | — | | | $ | 223,632 | |
BP Long/Short Equity Fund | | | 36,839,762 | | | | 15,899,486 | | | | 52,739,248 | |
BP Long/Short Research Fund | | | 682,238 | | | | — | | | | 682,238 | |
BP All-Cap Value Fund | | | 3,635,264 | | | | 12,729,463 | | | | 16,364,727 | |
WPG Small/Micro Cap Value Fund | | | — | | | | — | | | | — | |
BP Global Equity Fund | | | — | | | | — | | | | — | |
BP International Equity Fund | | | — | | | | — | | | | — | |
Dividends from net investment income and short-term capital gains are treated as ordinary income dividends for federal income tax purposes.
Accumulated capital losses represent net capital loss carryforwards as of August 31, 2012 that may be available to offset future realized capital gains and thereby reduce future capital gains distributions. Under the Regulated Investment Company Modernization Act of 2010 (the “Modernization Act”), the Funds are permitted to carry forward capital losses incurred in taxable years beginning after December 22, 2010 for an unlimited period. Any losses incurred during those future taxable years will be required to be utilized prior to any losses incurred in pre-enactment taxable years. Additionally, post-enactment capital losses that are carried forward will retain their character as either short-term or long-term capital losses rather than being considered all short-term as under the previous law. The Funds’ first fiscal year end subject to the Modernization Act was August 31, 2012.
| | | | |
| SEMI-ANNUAL REPORT 2013 | | | 51 | |
| | |
NOTES TO FINANCIAL STATEMENTS (concluded) | | |
As of August 31, 2012, the Funds had the following pre-enactment net capital loss carryforwards to offset future net capital gains, if any, to the extent provided by Treasury regulations. To the extent that these carryforwards are used to offset future capital gains, it is probable that the gains that are offset will not be distributed to shareholders.
| | | | | | | | | | | | | | | | |
Fund | | August 31, 2016 | | | August 31, 2017 | | | August 31, 2018 | | | Total | |
BP Small Cap Value Fund II | | $ | — | | | $ | 3,220,796 | | | $ | 12,850,401 | | | $ | 16,071,197 | |
BP Long/Short Equity Fund | | | 1,686,468 | | | | — | | | | — | | | | 1,686,468 | |
BP Long/Short Research Fund | | | — | | | | — | | | | — | | | | — | |
BP All-Cap Value Fund | | | — | | | | — | | | | — | | | | — | |
WPG Small/Micro Cap Value Fund | | | — | | | | 1,017,173 | | | | 3,418,543 | | | | 4,435,716 | |
As of August 31, 2012, the following Funds had post-enactment capital loss carryforwards which have an unlimited period of capital loss carryover:
| | | | |
| | | Short-Term | |
BP Global Equity Fund | | $ | 41,732 | |
BP International Equity Fund | | | 44,041 | |
| 10. | New Accounting Pronouncement |
In December 2011, the Financial Accounting Standards Board (“FASB”) issued Accounting Standards Update (“ASU”) No. 2011-11, “Disclosures about Offsetting Assets and Liabilities”. ASU 2011-11 requires disclosures to make financial statements that are prepared under U.S. GAAP more comparable to those prepared under International Financial Reporting Standards. The new disclosure requirements mandate that entities disclose both gross and net information about instruments and transactions eligible for offset in the statement of assets and liabilities as well as instruments and transactions subject to an agreement similar to a master netting arrangement. In addition, ASU 2011-11 requires disclosure of collateral received and posted in connection with master netting agreements or similar arrangements. New disclosures are required for annual reporting periods beginning on or after January 1, 2013, and interim periods within those annual periods. Management is evaluating the impact of ASU 2011-11 on the financial statements and disclosures.
Management has evaluated the impact of all subsequent events on the Funds through the date the financial statements were issued, and has determined that there were no subsequent events requiring recognition or disclosure in the financial statements.
| | |
| 52 | | SEMI-ANNUAL REPORT 2013 |
| | |
OTHER INFORMATION (unaudited) | | |
Proxy Voting
Policies and procedures that the Funds use to determine how to vote proxies relating to portfolio securities as well as information regarding how the Funds voted proxies relating to portfolio securities for the most recent 12-month period ended June 30 are available without charge, upon request, by calling (888) 261-4073 and on the Securities and Exchange Commission’s (“SEC”) website at http://www.sec.gov.
Quarterly Portfolio Schedule
The Company files a complete schedule of portfolio holdings with the SEC for the first and third fiscal quarters of each fiscal year (quarters ended November 30 and May 31) on Form N-Q. The Company’s Form N-Q is available on the SEC website at http://www.sec.gov and may be reviewed and copied at the SEC Public Reference Room in Washington, D.C. Information on the operation of the SEC Public Reference Room may be obtained by calling (202) 551-8090.
Other Matters
ORIX Corporation, an integrated financial services group based in Tokyo, Japan, is expected to acquire a majority of the equity interest of Robeco Groep N.V., the parent company of Robeco, in the second or third quarter of 2013.
Pursuant to the terms of the current investment advisory agreements between Robeco and the Company, on behalf of each of the Funds, the proposed transaction would be considered an assignment of the Funds’ current investment advisory agreements with Robeco, resulting in their automatic termination. On April 15, 2013, the Board of Directors of the Company approved a new investment advisory agreement with Robeco, on behalf of each of the Funds. The new investment advisory agreement contains substantially similar terms as the current investment advisory agreements with Robeco, including identical advisory fees. Upon consummation of the proposed transaction, Robeco will continue to provide investment advisory services to each Fund pursuant to the new advisory agreement, provided that such advisory agreement has been approved by Fund shareholders.
A special meeting of shareholders of the Funds will be held at which shareholders will be asked to consider and approve the new investment advisory agreement.
| | | | |
| SEMI-ANNUAL REPORT 2013 | | | 53 | |
INVESTMENT ADVISER
Robeco Investment Management Inc.
909 Third Avenue, 32nd Floor
New York, NY 10022
ADMINISTRATOR
BNY Mellon Investment Servicing (US) Inc.
301 Bellevue Parkway
Wilmington, DE 19809
TRANSFER AGENT
BNY Mellon Investment Servicing (US) Inc.
4400 Computer Drive
Westborough, MA 01581
PRINCIPAL
UNDERWRITER
Foreside Funds Distributors LLC
400 Berwyn Park
899 Cassatt Road
Berwyn, PA 19312
CUSTODIAN
The Bank of New York Mellon
One Wall Street
New York, NY 10286
INDEPENDENT REGISTERED PUBLIC ACCOUNTING FIRM
Ernst & Young LLP
One Commerce Square
2005 Market Street, Suite 700
Philadelphia, PA 19103
COUNSEL
Drinker Biddle & Reath LLP
One Logan Square, Ste. 2000
Philadelphia, PA 19103-6996
S1 FUND
SEMI-ANNUAL INVESTMENT ADVISER’S REPORT
(UNAUDITED)
Dear Fellow Investor,
We are pleased to enclose the February 28, 2013 semi-annual report for the S1 Fund (the “Fund”) for your information.
The Simple Alternatives team would like to take this opportunity to thank you for your continued support. We are grateful for the confidence you have placed in us since the Fund’s inception.
Our philosophy is simple. We believe that hedged equity is a vital part of any investment portfolio. We believe that investors are best served by diversifying across a team of skilled hedged equity managers and that those strategies and managers are best accessed through a simple-to-use mutual fund structure.
One of our goals of including hedged equity strategies in the Fund portfolio is to aim to reduce market volatility that can be found in an investment portfolio of equities and bonds. While equity and bond returns were generally positive during the past year, the Fund was able to provide meaningful ballast during high volatility moments while still delivering positive returns.
For the period from September 1, 2012 to February 28, 2013, the Fund returned 3.92%. This compares to a 7.69% return for the S&P 500®. The Fund achieved this return while only taking approximately one-third the risk of the S&P 500 during the same period. While the Fund’s conservative risk exposure made the frothy market rally of early 2013 challenging, we were encouraged by the Fund’s strong relative return in the fourth quarter of 2012. During the fourth quarter of 2012 the Fund delivered a 2.10% return while the S&P 500 lost 0.40%. This outperformance is a good example of how the Fund can deliver returns driven by strong stock selection and not market timing or overall broad equity market performance.
Our careful selection of sub-advisors has resulted in a diverse and talented team of experienced hedged equity managers who are skilled at finding undiscovered opportunities to invest in while at the same time striving to protect capital.
We are grateful for those who believed early on in our model and are encouraged by the continued growth in assets for the Fund.
Sincerely,
James K. Dilworth
Founder
Simple Alternatives
Portfolio composition is subject to change. The current and future portfolio holdings of the Fund are subject to investment risks.
1
S1 FUND
PERFORMANCE DATA
(UNAUDITED)
| | | | | | | | | | |
Total Returns for the Periods Ended February 28, 2013 | |
| | | | | | Average Annual | |
| | | Six
Months* | | | One
Year | | Since
Inception** | |
S1 Fund, I Shares | | | 3.92% | | | 4.96% | | | 1.86% | |
S&P 500® Index*** | | | 7.69% | | | 10.91% | | | 12.47% | |
| ** | Inception date of the Fund is September 30, 2010. |
| *** | Benchmark performance is from the inception date of the Fund only and is not the inception date of the benchmark itself. |
Performance quoted is past performance and does not guarantee future results. Investment return and principal value will fluctuate so that shares, when redeemed, may be worth more or less than their original cost. Current performance may be lower or higher than the returns quoted above. Call Simple Alternatives at 1-866-882-1226 for returns current to the most recent month-end.
The performance quoted reflects fee waivers in effect and would have been less in their absence. The Fund’s gross annual operating expense ratio, as stated in the current prospectus, is 5.29% and the Fund’s net operating expense ratio is 4.47%. Net operating expense includes interest and dividends on short sales and acquired fund fees. The Fund’s investment adviser, Simple Alternatives, LLC, has contractually agreed until at least December 31, 2014 to forgo all or a portion of its advisory fee and/or reimburse expenses in an aggregate amount equal to the amount by which the total annual Fund operating expenses (other than acquired fund fees and expenses, short sale dividend expenses, brokerage commissions, litigation, extraordinary items, interest or taxes) exceeds 2.95% of the average daily net assets attributable to the Fund’s I Shares. This limitation can be discontinued at any time after December 31, 2014.
The Fund is non-diversified and may focus its investments in the securities of a comparatively small number of issuers. Concentration in securities of a limited number of issuers exposes a fund to greater market risk and potential monetary losses than if its assets were diversified among the securities of a greater number of issuers. The Fund may invest in small- and medium-sized companies which involve greater risk than investing in larger, more established companies, such as increased volatility of earnings and prospects, higher failure rates, and limited markets, product lines or financial resources.
The Fund may invest in foreign or emerging markets securities which involve special risks, including the volatility of currency exchange rates and, in some cases, limited geographic focus, political and economic instability, and relatively illiquid markets.
The Fund may invest in debt securities which are subject to interest rate risk. An increase in interest rates typically causes a fall in the value of the debt securities in which the Fund may invest. The Fund may also invest in high yield,
2
S1 FUND
PERFORMANCE DATA (CONCLUDED)
(UNAUDITED)
lower rated (junk) bonds which involve a greater degree of risk and price fluctuation than investment grade bonds in return for higher yield potential. The Fund’s distressed debt strategy may involve a substantial degree of risk, including investments in sub-prime mortgage securities.
The Fund may purchase securities of companies in initial public offerings. Special risks associated with these securities may include a limited number of shares available for trading, unseasoned trading, lack of investor knowledge of the company and limited operating history. The Fund may leverage transactions which include selling short as well as borrowing for other than temporary or emergency purposes. Leverage creates the risk of magnified capital losses.
The Fund may also invest in derivatives which can be volatile and involve various types and degrees of risks, depending upon the characteristics of a particular derivative. The Fund may invest in options and futures which are subject to special risks and may not fully protect the Fund against declines in the value of its stocks. In addition, an option writing strategy limits the upside profit potential normally associated with stocks. Futures trading is very speculative, largely due to the traditional volatility of futures prices.
Portfolio composition is subject to change.
3
S1 FUND
FUND EXPENSE EXAMPLES
(UNAUDITED)
As a shareholder of the Fund, you incur two types of costs: (1) transaction costs and (2) ongoing costs, including management fees, shareholder servicing fees and other Fund expenses. These examples are intended to help you understand your ongoing costs (in dollars) of investing in the Fund and to compare these costs with the ongoing costs of investing in other mutual funds.
This example is based on an investment of $1,000 invested at the beginning of the six-month period from September 1, 2012 through February 28, 2013 and held for the entire period.
ACTUAL EXPENSES
The first line of the accompanying tables provides information about actual account values and actual expenses. You may use the information in this line, together with the amount you invested, to estimate the expenses that you paid over the period. Simply divide your account value by $1,000 (for example, an $8,600 account value divided by $1,000 = 8.6), then multiply the result by the number in the first line under the heading entitled “Expenses Paid During Period” to estimate the expenses you paid on your account during this period.
HYPOTHETICAL EXAMPLE FOR COMPARISON PURPOSES
The second line of the accompanying tables provides information about hypothetical account values and hypothetical expenses based on the Fund’s actual expense ratio and an assumed rate of return of 5% per year before expenses, which is not the Fund’s actual return. The hypothetical account values and expenses may not be used to estimate the actual ending account balance or expenses you paid for the period. You may use this information to compare the ongoing costs of investing in the Fund and other funds. To do so, compare these 5% hypothetical examples with the 5% hypothetical examples that appear in the shareholder reports of other funds.
Please note that the expenses shown in the accompanying tables are meant to highlight your ongoing costs only and do not reflect any transactional costs, such as redemption fees. Therefore, the second line of the accompanying tables is useful in comparing ongoing costs only, and will not help you determine the relative total costs of owning different funds. In addition, if these transactional costs were included, your costs would have been higher.
4
S1 FUND
FUND EXPENSE EXAMPLES (CONCLUDED)
(UNAUDITED)
| | | | | | | | | | | | | | | |
| | | I SHARES |
| | | BEGINNING ACCOUNT VALUE
SEPTEMBER 1, 2012 | | ENDING ACCOUNT VALUE
FEBRUARY 28, 2013 | | EXPENSES PAID
DURING PERIOD |
Actual* | | | $ | 1,000.00 | | | | $ | 1,039.20 | | | | $ | 21.69 | |
Hypothetical | | | | | | | | | | | | | | | |
(5% return before expenses) | | | | 1,000.00 | | | | | 1,003.52 | | | | | 21.31 | |
| * | Expenses equal to an annualized expense ratio for the six-month period ended February 28, 2013 of 4.29% for the I Shares of the Fund, which includes waived fees or reimbursed expenses (including dividend and interest expense), multiplied by the average account value over the period, multiplied by the number of days in the most recent period (181) then divided by 365 days. The Fund’s ending account value on the first line in the table is based on the actual six-months total return for the I Shares of the Fund of 3.92%. These amounts include dividends paid on securities which the Fund has sold short (“short-sale dividends”) and related interest expense. The annualized amount of short-sale dividends and related interest expense was 1.34% of the Fund’s average net assets attributable to I Shares for the most recent fiscal year. |
5
S1 FUND
PORTFOLIO HOLDINGS SUMMARY TABLE
FEBRUARY 28, 2013
(UNAUDITED)
The following table presents a summary by sector of the portfolio holdings of the Fund.
| | | | | | | | |
| SECURITY TYPE/SECTOR CLASSIFICATION | | % OF NET
ASSETS | | | VALUE | |
COMMON STOCKS: | | | | | | | | |
Consumer Discretionary | | | 17.8 | % | | $ | 13,347,721 | |
Real Estate Investment Trusts | | | 12.5 | | | | 9,380,890 | |
Financials | | | 10.3 | | | | 7,732,463 | |
Information Technology | | | 9.9 | | | | 7,433,053 | |
Industrials | | | 5.1 | | | | 3,818,079 | |
Health Care | | | 3.5 | | | | 2,590,609 | |
Telecommunication Services | | | 3.0 | | | | 2,261,080 | |
Materials | | | 2.6 | | | | 1,946,854 | |
Consumer Staples | | | 2.5 | | | | 1,855,606 | |
Energy | | | 1.9 | | | | 1,418,028 | |
U.S. GOVERNMENT AGENCY | | | 8.0 | | | | 6,004,016 | |
EXCHANGE TRADED FUNDS | | | 1.8 | | | | 1,332,546 | |
CORPORATE BONDS | | | 1.0 | | | | 730,250 | |
PURCHASED OPTIONS | | | 0.5 | | | | 380,655 | |
U.S TREASURY NOTE | | | 0.2 | | | | 107,000 | |
FOREIGN GOVERNMENT NOTE | | | 0.0 | | | | 10,196 | |
WRITTEN OPTIONS | | | (0.5 | ) | | | (392,886 | ) |
EXCHANGE TRADED FUNDS SOLD SHORT | | | (7.0 | ) | | | (5,228,660 | ) |
COMMON STOCKS SOLD SHORT | | | (29.2 | ) | | | (21,866,058 | ) |
OTHER ASSETS IN EXCESS OF LIABILITIES | | | 56.1 | | | | 42,067,383 | |
| | | | | | | | |
NET ASSETS | | | 100.0 | % | | $ | 74,928,825 | |
| | | | | | | | |
Portfolio holdings are subject to change at any time.
The accompanying notes are an integral part of the financial statements.
6
S1 FUND
PORTFOLIOOF INVESTMENTS
FEBRUARY 28, 2013
(UNAUDITED)
| | | | | | | | |
| | | NUMBER
OF SHARES | | | VALUE | |
COMMON STOCKS — 69.1% | | | | | |
CONSUMER DISCRETIONARY—17.8% | | | | | |
AMC Networks, Inc., Class A*^ | | | 10,798 | | | $ | 619,805 | |
America’s Car-Mart, Inc.*^ | | | 12,503 | | | | 597,144 | |
Ascent Capital Group, Inc., Class A* | | | 5,000 | | | | 342,950 | |
Beazer Homes USA, Inc.* | | | 6,000 | | | | 93,420 | |
Bravo Brio Restaurant Group, Inc.* | | | 28,390 | | | | 428,121 | |
Brookfield Residential Properties, Inc.*† | | | 21,539 | | | | 477,304 | |
Charter Communications, Inc.,
Class A*^ | | | 11,690 | | | | 1,009,899 | |
Childrens Place Retail Stores,
Inc., (The)*^ | | | 10,090 | | | | 458,691 | |
Cie Financiere Richemont SA,
Class A (Switzerland) | | | 1,640 | | | | 131,840 | |
Desarrolladora Homex SAB de
CV - ADR* | | | 6,090 | | | | 72,471 | |
Express, Inc.* | | | 24,960 | | | | 461,760 | |
Foot Locker, Inc.^ | | | 13,785 | | | | 471,309 | |
Hot Topic, Inc. | | | 39,750 | | | | 429,300 | |
Hyatt Hotels Corp., Class A*^ | | | 12,735 | | | | 523,282 | |
Interval Leisure Group, Inc. | | | 33,500 | | | | 699,145 | |
Li & Fung Ltd. (Hong Kong) | | | 56,800 | | | | 76,167 | |
Liberty Interactive Corp., Class A*^ | | | 20,386 | | | | 425,660 | |
Liberty Ventures, Class A*^ | | | 2,404 | | | | 173,569 | |
M/I Homes, Inc.* | | | 37,852 | | | | 866,811 | |
Melco Crown Entertainment
Ltd. - ADR*^ | | | 19,000 | | | | 364,990 | |
MGM Resorts International, Inc.* | | | 32,827 | | | | 410,009 | |
NVR, Inc.* | | | 160 | | | | 161,472 | |
Select Comfort Corp.* | | | 16,100 | | | | 330,533 | |
Sirius XM Canada Holdings, Inc. (Canada) | | | 112,000 | | | | 705,939 | |
Sirius XM Radio, Inc.^ | | | 175,700 | | | | 544,670 | |
Standard Pacific Corp.* | | | 12,000 | | | | 97,680 | |
Super Group Ltd. (South Africa) | | | 39,979 | | | | 94,022 | |
True Religion Apparel, Inc.^ | | | 34,913 | | | | 931,828 | |
| | | | | | | | |
| | | NUMBER
OF SHARES | | | VALUE | |
CONSUMER DISCRETIONARY—(CONTINUED) | |
Universal Entertainment Corp. (Japan) | | | 15,000 | | | $ | 256,177 | |
Vail Resorts, Inc. | | | 7,700 | | | | 425,348 | |
Whirlpool Corp.^ | | | 5,900 | | | | 666,405 | |
| | | | | | | | |
| | | | | | | 13,347,721 | |
| | | | | | | | |
CONSUMER STAPLES—2.5% | | | | | | | | |
Cermaq ASA (Norway) | | | 6,096 | | | | 104,596 | |
Loblaw Cos. Ltd. (Canada) | | | 3,850 | | | | 154,821 | |
Minerva SA (Brazil) | | | 18,100 | | | | 117,960 | |
Nestle SA - Sponsored ADR | | | 1,425 | | | | 99,707 | |
Reckitt Benckiser Group PLC
(United Kingdom) | | | 1,270 | | | | 85,332 | |
Safeway, Inc. | | | 7,250 | | | | 172,985 | |
Smithfield Foods, Inc.* | | | 6,400 | | | | 142,336 | |
Susser Holdings Corp.* | | | 8,539 | | | | 378,107 | |
Tesco PLC (United Kingdom) | | | 15,106 | | | | 84,700 | |
Tyson Foods, Inc., Class A^ | | | 22,720 | | | | 515,062 | |
| | | | | | | | |
| | | | | | | 1,855,606 | |
| | | | | | | | |
ENERGY—1.9% | | | | | | | | |
Baker Hughes, Inc. | | | 500 | | | | 22,410 | |
Cloud Peak Energy, Inc.* | | | 5,620 | | | | 96,327 | |
Exxon Mobil Corp. | | | 1,435 | | | | 128,504 | |
Murphy Oil Corp. | | | 1,670 | | | | 101,670 | |
Peabody Energy Corp. | | | 2,740 | | | | 59,074 | |
QEP Resources, Inc.^ | | | 23,690 | | | | 721,597 | |
Sasol Ltd. - Sponsored ADR | | | 2,320 | | | | 99,180 | |
Statoil ASA - Sponsored ADR | | | 4,015 | | | | 100,094 | |
Transocean Ltd.*† | | | 1,705 | | | | 89,172 | |
| | | | | | | | |
| | | | | | | 1,418,028 | |
| | | | | | | | |
FINANCIALS—10.3% | | | | | | | | |
Altisource Portfolio Solutions SA*† | | | 2,362 | | | | 192,597 | |
Capital Bank Financial Corp., Class A* | | | 19,931 | | | | 368,724 | |
China Life Insurance Co. Ltd. - ADR | | | 2,705 | | | | 119,209 | |
Fairfax Financial Holdings
Ltd. (Canada) | | | 350 | | | | 132,988 | |
Forest City Enterprises, Inc., Class A*^ | | | 61,087 | | | | 979,835 | |
The accompanying notes are an integral part of the financial statements.
7
S1 FUND
PORTFOLIOOF INVESTMENTS (CONTINUED)
FEBRUARY 28, 2013
(UNAUDITED)
| | | | | | | | |
| | | NUMBER
OF SHARES | | | VALUE | |
FINANCIALS—(CONTINUED) | | | | | | | | |
Fox Chase Bancorp, Inc.^ | | | 36,934 | | | $ | 617,536 | |
Hampden Bancorp, Inc. | | | 35,530 | | | | 562,085 | |
Heritage Commerce Corp.*^ | | | 96,700 | | | | 653,692 | |
HFF, Inc., Class A^ | | | 13,710 | | | | 251,716 | |
Hilltop Holdings, Inc.* | | | 37,673 | | | | 483,721 | |
Home Loan Sevicing Solutions Ltd.*†^ | | | 17,987 | | | | 405,786 | |
Howard Hughes Corp., (The)* | | | 4,400 | | | | 337,876 | |
Invesco Ltd. | | | 2,270 | | | | 60,813 | |
MetroCorp Bancshares, Inc.* | | | 54,130 | | | | 559,704 | |
Ocwen Financial Corp.* | | | 11,420 | | | | 450,176 | |
OmniAmerican Bancorp, Inc.*^ | | | 31,289 | | | | 815,391 | |
Safestore Holdings PLC
(United Kingdom) | | | 87,957 | | | | 168,129 | |
St. Joe Co. (The)* | | | 8,100 | | | | 180,630 | |
ViewPoint Financial Group^ | | | 18,794 | | | | 391,855 | |
| | | | | | | | |
| | | | | | | 7,732,463 | |
| | | | | | | | |
HEALTH CARE—3.5% | | | | | | | | |
Almost Family, Inc. | | | 7,988 | | | | 164,473 | |
Angiotech Pharmaceuticals, Inc.*†D | | | 14,450 | | | | 368,475 | |
Capital Senior Living Corp.* | | | 5,400 | | | | 124,200 | |
Emeritus Corp.* | | | 6,550 | | | | 186,610 | |
Johnson & Johnson^ | | | 8,300 | | | | 631,713 | |
LHC Group, Inc.* | | | 5,136 | | | | 104,364 | |
Pfizer, Inc.^ | | | 36,930 | | | | 1,010,774 | |
| | | | | | | | |
| | | | | | | 2,590,609 | |
| | | | | | | | |
INDUSTRIALS—5.1% | | | | | | | | |
ADT Corp. (The) | | | 3,150 | | | | 150,854 | |
All America Latina Logistica SA (Brazil) | | | 17,400 | | | | 86,147 | |
Ashtead Group PLC
(United Kingdom) | | | 45,000 | | | | 351,579 | |
Brink’s Co. (The) | | | 5,330 | | | | 140,979 | |
G4S PLC (United Kingdom) | | | 28,959 | | | | 127,448 | |
Gencorp, Inc.* | | | 75,500 | | | | 909,775 | |
Invensys PLC (United Kingdom) | | | 60,000 | | | | 325,955 | |
Manitowoc Co., Inc. (The) | | | 30,300 | | | | 561,156 | |
Tata Motors Ltd. - Sponsored ADR | | | 2,600 | | | | 70,564 | |
| | | | | | | | |
| | | NUMBER
OF SHARES | | | VALUE | |
INDUSTRIALS—(CONTINUED) | | | | | | | | |
United Continental Holdings, Inc.*^ | | | 15,749 | | | $ | 420,656 | |
United Rentals, Inc.* | | | 12,600 | | | | 672,966 | |
| | | | | | | | |
| | | | | | | 3,818,079 | |
| | | | | | | | |
INFORMATION TECHNOLOGY—9.9% | |
Comverse, Inc.* | | | 19,810 | | | | 545,171 | |
EchoStar Corp., Class A*^ | | | 24,529 | | | | 928,177 | |
Ellie Mae, Inc.* | | | 16,000 | | | | 324,800 | |
Global Cash Access Holdings, Inc.*^ | | | 70,000 | | | | 497,000 | |
Google, Inc., Class A*^ | | | 975 | | | | 781,170 | |
Hewlett-Packard Co. | | | 8,250 | | | | 166,155 | |
Intel Corp. | | | 4,450 | | | | 92,783 | |
Kulicke & Soffa Industries, Inc.* | | | 24,000 | | | | 259,680 | |
LTX-Credence Corp.* | | | 106,100 | | | | 615,380 | |
Micron Technology, Inc.* | | | 92,000 | | | | 771,880 | |
Microsoft Corp. | | | 3,990 | | | | 110,922 | |
ON Semiconductor Corp.* | | | 28,000 | | | | 224,000 | |
Optimal Payments, PLC
(United Kingdom)* | | | 160,518 | | | | 394,495 | |
Oracle Corp.^ | | | 12,500 | | | | 428,250 | |
Progress Software Corp.* | | | 29,890 | | | | 673,123 | |
Teradyne, Inc.* | | | 34,000 | | | | 569,840 | |
Western Union Co. (The) | | | 3,580 | | | | 50,227 | |
| | | | | | | | |
| | | | | | | 7,433,053 | |
| | | | | | | | |
MATERIALS—2.6% | | | | | | | | |
Agrium, Inc.† | | | 1,240 | | | | 128,278 | |
ArcelorMittal† | | | 6,240 | | | | 93,475 | |
Barrick Gold Corp. (Canada) | | | 4,500 | | | | 136,080 | |
Crown Holdings, Inc.*^ | | | 21,900 | | | | 851,253 | |
Northern Dynasty Minerals Ltd. (Canada)* | | | 67,464 | | | | 213,861 | |
POSCO - ADR | | | 1,040 | | | | 83,918 | |
Schweitzer-Mauduit International, Inc.^ | | | 11,940 | | | | 439,989 | |
| | | | | | | | |
| | | | | | | 1,946,854 | |
| | | | | | | | |
REAL ESTATE INVESTMENT TRUSTS—12.5% | |
American Capital Agency Corp. | | | 7,600 | | | | 240,958 | |
AvalonBay Communities, Inc. | | | 2,850 | | | | 355,766 | |
The accompanying notes are an integral part of the financial statements.
8
S1 FUND
PORTFOLIOOF INVESTMENTS (CONTINUED)
FEBRUARY 28, 2013
(UNAUDITED)
| | | | | | | | |
| | | NUMBER
OF SHARES | | | VALUE | |
REAL ESTATE INVESTMENT TRUSTS—(CONTINUED) | |
BRE Properties, Inc. | | | 9,450 | | | $ | 459,365 | |
Brookfield Office Properties, Inc.^ | | | 51,800 | | | | 864,542 | |
Colonial Properties Trust^ | | | 40,815 | | | | 879,971 | |
Colony Financial, Inc. | | | 8,600 | | | | 190,490 | |
Dundee Real Estate Investment Trust (Canada)*D 144A | | | 2,300 | | | | 82,120 | |
Dundee Real Estate Investment Trust, Class A (Canada) | | | 2,900 | | | | 103,542 | |
Education Realty Trust, Inc.^. | | | 45,050 | | | | 491,496 | |
Equity Lifestyle Properties, Inc.^ | | | 17,576 | | | | 1,295,175 | |
First Industrial Realty Trust, Inc.* | | | 20,300 | | | | 322,161 | |
General Growth Properties, Inc. | | | 29,700 | | | | 568,458 | |
Home Properties, Inc. | | | 7,900 | | | | 493,118 | |
Hudson Pacific Properties, Inc. | | | 18,850 | | | | 425,445 | |
Macerich Co., (The) | | | 10,900 | | | | 655,199 | |
Medical Properties Trust, Inc. | | | 10,150 | | | | 147,378 | |
Parkway Properties, Inc.^ | | | 19,000 | | | | 321,290 | |
Public Storage | | | 2,050 | | | | 309,981 | |
Ramco-Gershenson Properties Trust^ | | | 26,993 | | | | 426,489 | |
Silver Bay Realty Trust Corp.* | | | 1,850 | | | | 37,777 | |
Spirit Realty Capital, Inc. | | | 10,650 | | | | 212,148 | |
Strategic Hotels & Resorts, Inc.* | | | 50,400 | | | | 366,912 | |
Vastned Retail NV (Netherlands) | | | 3,100 | | | | 131,109 | |
| | | | | | | | |
| | | | | | | 9,380,890 | |
| | | | | | | | |
TELECOMMUNICATION SERVICES—3.0% | |
China Mobile Ltd. - Sponsored ADR | | | 2,505 | | | | 137,274 | |
Chorus Ltd. - ADR | | | 2,206 | | | | 26,384 | |
MegaFon OAO - GDR (United Kingdom)* | | | 4,350 | | | | 122,813 | |
Sprint Nextel Corp.*^ | | | 130,000 | | | | 754,000 | |
| | | | | | | | |
| | | NUMBER
OF SHARES | | | VALUE | |
TELECOMMUNICATION SERVICES—(CONTINUED) | |
Vodafone Group, PLC - Sponsored ADR | | | 36,000 | | | $ | 905,040 | |
Vodafone Group, PLC (United Kingdom) | | | 125,650 | | | | 315,569 | |
| | | | | | | | |
| | | | | | | 2,261,080 | |
| | | | | | | | |
TOTAL COMMON STOCKS (Cost $44,786,758) | | | | 51,784,383 | |
| | | | | | | | |
|
EXCHANGE TRADED FUNDS — 1.8% | |
COMMODITY—0.6% | | | | | | | | |
SPDR Gold Shares*^ | | | 2,899 | | | | 443,431 | |
| | | | | | | | |
CURRENCY—0.6% | | | | | | | | |
ProShares UltraShort Euro* | | | 9,470 | | | | 183,150 | |
ProShares UltraShort Yen* | | | 4,770 | | | | 273,655 | |
| | | | | | | | |
| | | | | | | 456,805 | |
| | | | | | | | |
DEBT—0.2% | | | | | | | | |
Proshares Ultrashort 20+ Year Treasury* | | | 2,585 | | | | 169,266 | |
| | | | | | | | |
EQUITY—0.3% | | | | | | | | |
Market Vectors Gold Miners ETF^ | | | 5,675 | | | | 212,245 | |
| | | | | | | | |
OTHER—0.1% | | | | | | | | |
Templeton Dragon Fund, Inc. | | | 1,770 | | | | 50,799 | |
| | | | | | | | |
TOTAL EXCHANGE TRADED FUNDS (Cost $1,308,089) | | | | 1,332,546 | |
| | | | | | | | |
| | |
| | | PAR
(000’S) | | | | |
CORPORATE BONDS — 1.0% | | | | | |
CONSUMER STAPLES—0.7% | | | | | |
North Atlantic Trading Co. 144A | | | | | | | | |
11.500% 07/15/16 | | $ | 500 | | | | 526,250 | |
| | | | | | | | |
FINANCIALS—0.3% | | | | | | | | |
MGIC Investment Corp. | | | | | | | | |
5.375% 11/01/15 | | | 240 | | | | 204,000 | |
| | | | | | | | |
TOTAL CORPORATE BONDS (Cost $701,388) | | | | 730,250 | |
| | | | | | | | |
The accompanying notes are an integral part of the financial statements.
9
S1 FUND
PORTFOLIOOF INVESTMENTS (CONTINUED)
FEBRUARY 28, 2013
(UNAUDITED)
| | | | | | | | |
| | | PAR
(000’S) | | | VALUE | |
FOREIGN GOVERNMENT NOTE — 0.0% | | | | | |
Canadian Government Bond
3.000% 12/01/15 | | CAD | 10 | | | $ | 10,196 | |
| | | | | | | | |
TOTAL FOREIGN GOVERNMENT NOTE (Cost $10,212) | | | | 10,196 | |
| | | | | | | | |
U.S. TREASURY NOTE — 0.2% | |
2.625% 04/30/16 | | $ | 100 | | | | 107,000 | |
| | | | | | | | |
TOTAL U.S. TREASURY NOTE (Cost $102,014) | | | | 107,000 | |
| | | | | | | | |
| |
U.S. GOVERNMENT AGENCY — 8.0% | | | | | |
FEDERAL NATIONAL MORTGAGE ASSOCIATION—8.0% | | | | | |
2.700% 03/28/22^ | | | 2,000 | | | | 2,003,126 | |
1.500% 03/29/27^# | | | 2,000 | | | | 2,002,092 | |
1.000% 04/30/27^# | | | 2,000 | | | | 1,998,798 | |
| | | | | | | | |
| | | | | | | 6,004,016 | |
| | | | | | | | |
TOTAL U.S. GOVERNMENT AGENCY (Cost $5,991,697) | | | | 6,004,016 | |
| | | | | | | | |
| | |
| | | NUMBER
OF
CONTRACTS | | | | |
PURCHASED OPTIONS — 0.5% | | | | | |
CALL OPTIONS PURCHASED — 0.1% | | | | | |
Vodafone Group, PLC - Sponsored ADR Expires 01/18/14 Strike Price $30 | | | 1,900 | | | | 72,200 | |
Whirlpool Corp. Expires 04/20/13 Strike Price $115 | | | 24 | | | | 8,880 | |
| | | | | | | | |
TOTAL CALL OPTIONS PURCHASED (Cost $100,000) | | | | 81,080 | |
| | | | | | | | |
| | | | | | | | |
| | | NUMBER
OF
CONTRACTS | | | VALUE | |
PUT OPTIONS PURCHASED — 0.4% | | | | | |
Amedisys, Inc. Expires 03/16/13 Strike Price $10 | | | 200 | | | $ | 4,800 | |
iShares Dow Jones U.S. Real Estate Expires 03/16/13 Strike Price $67 | | | 100 | | | | 2,100 | |
iShares Russell 2000 Index Fund 03/01/13 Strike Price $89 | | | 125 | | | | 1,375 | |
iShares Russell 2000 Index Fund Expires 04/20/13 Strike Price $87 | | | 960 | | | | 123,840 | |
iShares Russell 2000 Index Fund Expires 04/20/13 Strike Price $89 | | | 200 | | | | 37,600 | |
Manitowoc Co., Inc. (The) Expires 03/16/13 Strike Price $19 | | | 272 | | | | 23,120 | |
Melco Crown Entertainment, Ltd. Expires 04/20/13 Strike Price $18 | | | 76 | | | | 7,220 | |
MGM Resorts International Expires 03/16/13 Strike Price $12 | | | 90 | | | | 900 | |
SPDR S&P 500 ETF Trust Expires 03/16/13 Strike Price $146 | | | 260 | | | | 13,000 | |
SPDR S&P 500 ETF Trust Expires 03/16/13 Strike Price $149 | | | 260 | | | | 25,480 | |
SPDR S&P 500 ETF Trust Expires 03/28/13 Strike Price $148 | | | 150 | | | | 19,200 | |
Tesla Motors, Inc. Expires 03/16/13 Strike Price $29 | | | 52 | | | | 390 | |
The accompanying notes are an integral part of the financial statements.
10
S1 FUND
PORTFOLIOOF INVESTMENTS (CONTINUED)
FEBRUARY 28, 2013
(UNAUDITED)
| | | | | | | | |
| | | NUMBER
OF
CONTRACTS | | | VALUE | |
United Rentals, Inc. Expires 04/20/13 Strike Price $52.50 | | | 69 | | | $ | 20,010 | |
Whirlpool Corp. Expires 04/20/13 Strike Price $100 | | | 30 | | | | 2,790 | |
WisdomTree Dreyfus Chinese Yuan Fund Expires 04/20/13 Strike Price $24 | | | 350 | | | | 3,500 | |
WisdomTree Dreyfus Chinese Yuan Fund Expires 04/20/13 Strike Price $25 | | | 600 | | | | 9,000 | |
Zillow, Inc., Class A Expires 05/18/13 Strike Price $30 | | | 70 | | | | 5,250 | |
| | | | | | | | |
TOTAL PUT OPTIONS PURCHASED (Cost $426,122) | | | | 299,575 | |
| | | | | | | | |
TOTAL PURCHASED OPTIONS — 0.5% (Cost $526,122) | | | | 380,655 | |
| | | | | | | | |
TOTAL LONG POSITIONS — 80.6% (Cost $53,426,280) | | | | 60,349,046 | |
| | | | | | | | |
| | |
| | | NUMBER
OF SHARES | | | | |
SECURITIES SOLD SHORT — (36.2)% | | | | | |
COMMON STOCKS — (29.2)% | | | | | |
COMMUNICATIONS—(0.2)% | | | | | |
Verizon Communication, Inc. | | | (3,674 | ) | | | (170,951 | ) |
| | | | | | | | |
CONSUMER DISCRETIONARY—(5.2)% | |
Brinker International, Inc. | | | (7,000 | ) | | | (233,660 | ) |
Casio Computer Co. Ltd. (Japan) | | | (15,000 | ) | | | (118,783 | ) |
Conn’s, Inc.* | | | (6,300 | ) | | | (201,852 | ) |
Dick’s Sporting Goods, Inc. | | | (2,700 | ) | | | (135,000 | ) |
Francesca’s Holdings Corp.* | | | (4,600 | ) | | | (117,070 | ) |
Hanesbrands, Inc.* | | | (1,838 | ) | | | (72,858 | ) |
JC Penney Co., Inc. | | | (9,000 | ) | | | (158,130 | ) |
John Wiley & Sons, Inc., Class A | | | (9,300 | ) | | | (340,194 | ) |
LeapFrog Enterprises, Inc.* | | | (20,000 | ) | | | (171,400 | ) |
| | | | | | | | |
| | | NUMBER
OF SHARES | | | VALUE | |
CONSUMER DISCRETIONARY—(CONTINUED) | | | | | |
Lululemon Athletica, Inc.*† | | | (2,100 | ) | | $ | (140,805 | ) |
Marriott International, Inc., Class A | | | (10,900 | ) | | | (430,005 | ) |
Netflix, Inc.* | | | (250 | ) | | | (47,020 | ) |
NVR, Inc.* | | | (312 | ) | | | (314,870 | ) |
O’reilly Automotive, Inc.* | | | (1,575 | ) | | | (160,240 | ) |
Pandora Media, Inc.* | | | (22,540 | ) | | | (274,988 | ) |
Pearson, PLC (United Kingdom) | | | (10,000 | ) | | | (175,220 | ) |
Polaris Industries, Inc. | | | (1,100 | ) | | | (96,107 | ) |
PulteGroup, Inc.* | | | (8,700 | ) | | | (166,866 | ) |
Scholastic Corp. | | | (5,200 | ) | | | (156,520 | ) |
Thor Industries, Inc. | | | (4,900 | ) | | | (184,191 | ) |
TRI Pointe Homes, Inc.* | | | (9,900 | ) | | | (182,160 | ) |
| | | | | | | | |
| | | | | | | (3,877,939 | ) |
| | | | | | | | |
CONSUMER STAPLES—(0.8)% | | | | | |
Boulder Brands, Inc.* | | | (18,000 | ) | | | (153,360 | ) |
Hain Celestial Group, Inc. The* | | | (3,430 | ) | | | (187,793 | ) |
NU Skin Enterprises, Inc., Class A | | | (5,700 | ) | | | (234,840 | ) |
| | | | | | | | |
| | | | | | | (575,993 | ) |
| | | | | | | | |
FINANCIALS—(4.5)% | | | | | |
American Campus Communities, Inc. | | | (4,700 | ) | | | (212,440 | ) |
Bank of The Ozarks, Inc. | | | (8,730 | ) | | | (335,145 | ) |
BankUnited, Inc. | | | (9,480 | ) | | | (268,853 | ) |
Charles Schwab Corp. (The) | | | (13,500 | ) | | | (219,240 | ) |
Eaton Vance Corp. | | | (8,170 | ) | | | (312,012 | ) |
Federated Investors, Inc., Class B | | | (13,960 | ) | | | (324,151 | ) |
Greenhill & Co., Inc. | | | (5,660 | ) | | | (344,015 | ) |
Home Capital Group, Inc. (Canada) | | | (4,350 | ) | | | (241,871 | ) |
Legg Mason, Inc. | | | (10,345 | ) | | | (294,833 | ) |
MSCI, Inc.* | | | (2,800 | ) | | | (92,764 | ) |
Prosperity Bancshares, Inc. | | | (5,760 | ) | | | (265,767 | ) |
SVB Financial Group* | | | (3,300 | ) | | | (221,298 | ) |
Wisdomtree Investments, Inc.* | | | (23,900 | ) | | | (217,490 | ) |
Zillow, Inc., Class A* | | | (1,500 | ) | | | (64,440 | ) |
| | | | | | | | |
| | | | | | | (3,414,319 | ) |
| | | | | | | | |
The accompanying notes are an integral part of the financial statements.
11
S1 FUND
PORTFOLIOOF INVESTMENTS (CONTINUED)
FEBRUARY 28, 2013
(UNAUDITED)
| | | | | | | | |
| | | NUMBER
OF SHARES | | | VALUE | |
HEALTH CARE—(0.8)% | | | | | | | | |
Amedisys, Inc.* | | | (20,000 | ) | | $ | (226,000 | ) |
Masimo Corp. | | | (8,500 | ) | | | (168,725 | ) |
Questcor Pharmaceuticals, Inc. | | | (5,700 | ) | | | (185,820 | ) |
| | | | | | | | |
| | | | | | | (580,545 | ) |
| | | | | | | | |
INDUSTRIALS—(1.4)% | | | | | | | | |
Acorn Energy, Inc. | | | (28,530 | ) | | | (185,730 | ) |
Bouygues SA (France) | | | (5,300 | ) | | | (149,736 | ) |
Healthcare Services Group, Inc. | | | (6,600 | ) | | | (159,060 | ) |
Meyer Burger Tech. AG (Switzerland) | | | (4,500 | ) | | | (38,984 | ) |
Nielsen Holdings NV* | | | (2,896 | ) | | | (97,566 | ) |
Ritchie Bros Auctioneers, Inc.† | | | (11,700 | ) | | | (266,526 | ) |
Robert Half International, Inc. | | | (3,850 | ) | | | (136,867 | ) |
| | | | | | | | |
| | | | | | | (1,034,469 | ) |
| | | | | | | | |
INFORMATION TECHNOLOGY—(5.2)% | | | | | |
Broadridge Financial Solutions, Inc. | | | (12,125 | ) | | | (278,269 | ) |
Demand Media, Inc.* | | | (11,000 | ) | | | (89,100 | ) |
Dena Co. Ltd. (Japan) | | | (3,000 | ) | | | (84,151 | ) |
F5 Networks, Inc.* | | | (2,000 | ) | | | (188,860 | ) |
FactSet Research Systems, Inc. | | | (3,230 | ) | | | (314,247 | ) |
Fusion-io, Inc.* | | | (8,700 | ) | | | (146,856 | ) |
Gree, Inc. (Japan) | | | (5,500 | ) | | | (66,933 | ) |
Intel Corp. | | | (5,850 | ) | | | (121,972 | ) |
MercadoLibre, Inc.† | | | (2,700 | ) | | | (231,147 | ) |
Meru Networks, Inc.* | | | (12,686 | ) | | | (56,707 | ) |
Microsoft Corp. | | | (3,150 | ) | | | (87,570 | ) |
Neopost SA (France) | | | (1,577 | ) | | | (91,197 | ) |
Nintendo Co. Ltd. (Japan) | | | (1,100 | ) | | | (106,333 | ) |
OmniVision Technologies, Inc.* | | | (18,300 | ) | | | (282,003 | ) |
RealPage, Inc.* | | | (9,060 | ) | | | (196,240 | ) |
Salesforce.com, Inc.* | | | (786 | ) | | | (133,007 | ) |
Seagate Technology., PLC* | | | (8,550 | ) | | | (274,968 | ) |
Silicon Graphics International Corp.* | | | (28,520 | ) | | | (429,226 | ) |
SunPower Corp.* | | | (21,700 | ) | | | (254,758 | ) |
| | | | | | | | |
| | | NUMBER
OF SHARES | | | VALUE | |
INFORMATION TECHNOLOGY—(CONTINUED) | | | | | |
Taiwan Semiconductor Manufacturing Co. Ltd. - Sponsored ADR | | | (8,400 | ) | | $ | (153,300 | ) |
Trina Solar Ltd. - Sponsored ADR* | | | (50,000 | ) | | | (200,000 | ) |
United Microelectronics Corp. - Sponsored ADR | | | (49,000 | ) | | | (90,650 | ) |
| | | | | | | | |
| | | | | | | (3,877,494 | ) |
| | | | | | | | |
REAL ESTATE INVESTMENT TRUSTS—(10.0)% | |
Acadia Realty Trust | | | (7,467 | ) | | | (201,012 | ) |
Ashford Hospitality Trust, Inc. | | | (20,700 | ) | | | (243,639 | ) |
AvalonBay Communities, Inc. | | | (2,330 | ) | | | (290,854 | ) |
Boardwalk Real Estate Investment Trust (Canada) | | | (1,950 | ) | | | (122,228 | ) |
Cofinimmo (Belgium) | | | (1,300 | ) | | | (153,938 | ) |
Commonwealth REIT | | | (1,550 | ) | | | (39,137 | ) |
CubeSmart | | | (29,150 | ) | | | (429,671 | ) |
DCT Industrial Trust, Inc. | | | (24,600 | ) | | | (178,596 | ) |
EastGroup Properties, Inc. | | | (9,206 | ) | | | (522,993 | ) |
Essex Property Trust, Inc. | | | (2,750 | ) | | | (409,722 | ) |
Getty Realty Corp. | | | (10,550 | ) | | | (209,734 | ) |
Glimcher Realty Trust | | | (31,850 | ) | | | (358,631 | ) |
HCP, Inc. | | | (350 | ) | | | (17,108 | ) |
Kimco Realty Corp. | | | (28,450 | ) | | | (619,357 | ) |
Mack-Cali Realty Corp. | | | (11,750 | ) | | | (333,465 | ) |
Medical Properties Trust, Inc. | | | (18,800 | ) | | | (272,976 | ) |
National Health Investors, Inc. | | | (3,300 | ) | | | (213,840 | ) |
Pebblebrook Hotel Trust | | | (15,000 | ) | | | (358,650 | ) |
Plum Creek Timber Co., Inc. | | | (2,258 | ) | | | (109,513 | ) |
Post Properties, Inc. | | | (4,000 | ) | | | (190,960 | ) |
Prologis, Inc. | | | (10,950 | ) | | | (426,393 | ) |
RAIT Financial Trust | | | (24,900 | ) | | | (180,276 | ) |
Realty Income Corp. | | | (5,500 | ) | | | (251,075 | ) |
Retail Properties of America, Inc., Class A | | | (3,100 | ) | | | (45,880 | ) |
Sabra Health Care REIT, Inc. | | | (17,350 | ) | | | (458,561 | ) |
SL Green Realty Corp. | | | (8,410 | ) | | | (686,424 | ) |
Vornado Realty Trust | | | (1,750 | ) | | | (140,368 | ) |
| | | | | | | | |
| | | | | | | (7,465,001 | ) |
| | | | | | | | |
The accompanying notes are an integral part of the financial statements.
12
S1 FUND
PORTFOLIOOF INVESTMENTS (CONTINUED)
FEBRUARY 28, 2013
(UNAUDITED)
| | | | | | | | |
| | | NUMBER
OF SHARES | | | VALUE | |
TELECOMMUNICATION SERVICES—(1.1)% | |
AT&T, Inc. | | | (4,585 | ) | | $ | (164,647 | ) |
Deutsche Telekom AG, Registered Shares (Germany) | | | (28,000 | ) | | | (300,742 | ) |
France Telecom SA (France) | | | (12,400 | ) | | | (120,105 | ) |
Iliad SA (France) | | | (1,100 | ) | | | (210,533 | ) |
Iridium Communications, Inc.* | | | (12,000 | ) | | | (73,320 | ) |
| | | | | | | | |
| | | | | | | (869,347 | ) |
| | | | | | | | |
TOTAL COMMON STOCKS SOLD SHORT (Proceeds $20,422,329) | | | | (21,866,058 | ) |
| | | | | | | | |
EXCHANGE TRADED FUNDS SOLD SHORT — (7.0)% | | | | | |
EQUITY—(7.0)% | | | | | | | | |
iShares Dow Jones U.S. Home Construction Index Fund | | | (11,000 | ) | | | (247,390 | ) |
iShares Russell 2000 Index Fund | | | (55,066 | ) | | | (4,981,270 | ) |
| | | | | | | | |
| | | | | | | (5,228,660 | ) |
| | | | | | | | |
TOTAL EXCHANGE TRADED FUNDS SOLD SHORT (Proceeds $4,332,157) | | | | (5,228,660 | ) |
| | | | | | | | |
TOTAL SECURITIES SOLD SHORT (Proceeds $24,754,486) | | | | (27,094,718 | ) |
| | | | | | | | |
| | | NUMBER
OF
CONTRACTS | | | | |
WRITTEN OPTIONS — (0.5)% | | | | | |
CALL OPTIONS WRITTEN—(0.4)% | | | | | |
iShares Russell 2000 Index Fund Expires 04/20/13 Strike Price $93 | | | (440 | ) | | | (36,520 | ) |
Manitowoc Co., Inc. (The) Expires 03/16/13 Strike Price $19 | | | (90 | ) | | | (3,150 | ) |
| | | | | | | | |
| | | NUMBER
OF
CONTRACTS | | | VALUE | |
CALL OPTIONS WRITTEN—(CONTINUED) | |
Melco Crown Entertainment, Ltd. Expires 04/20/13 Strike Price $21 | | | (76 | ) | | $ | (4,940 | ) |
Micron Technology, Inc. Expires 04/20/13 Strike Price $8 | | | (230 | ) | | | (17,250 | ) |
Micron Technology, Inc. Expires 04/20/13 Strike Price $9 | | | (460 | ) | | | (11,960 | ) |
SPDR S&P 500 ETF Trust Expires 03/16/13 Strike Price $152 | | | (260 | ) | | | (33,800 | ) |
SPDR S&P 500 ETF Trust Expires 03/28/13 Strike Price $154 | | | (100 | ) | | | (8,000 | ) |
Tesla Motors, Inc. Expires 03/16/13 Strike Price $30 | | | (52 | ) | | | (26,520 | ) |
Tesla Motors, Inc. Expires 03/16/13 Strike Price $35 | | | (52 | ) | | | (4,940 | ) |
United Rentals, Inc. Expires 04/20/13 Strike Price $55 | | | (46 | ) | | | (11,730 | ) |
Whirlpool Corp.
Expires 04/20/13
Strike Price $120 | | | (48 | ) | | | (9,696 | ) |
Zillow, Inc., Class A Expires 05/18/13 Strike Price $30 | | | (55 | ) | | | (69,850 | ) |
Zillow, Inc., Class A Expires 05/18/13 Strike Price $35 | | | (70 | ) | | | (59,150 | ) |
| | | | | | | | |
TOTAL CALL OPTIONS WRITTEN (Premiums Received $184,970) | | | | (297,506 | ) |
| | | | | | | | |
PUT OPTIONS WRITTEN—(0.1)% | | | | | |
iShares Russell 2000 Index Fund Expires 04/20/13 Strike Price $84 | | | (250 | ) | | | (18,500 | ) |
The accompanying notes are an integral part of the financial statements.
13
S1 FUND
PORTFOLIOOF INVESTMENTS (CONTINUED)
FEBRUARY 28, 2013
(UNAUDITED)
| | | | | | | | |
| | | NUMBER
OF
CONTRACTS | | | VALUE | |
PUT OPTIONS WRITTEN—(CONTINUED) | | | | | |
iShares Russell 2000 Index Fund Expires 06/28/13 Strike Price $77 | | | (780 | ) | | $ | (56,940 | ) |
Manitowoc Co., Inc. (The) Expires 03/16/13 Strike Price $18 | | | (136 | ) | | | (4,420 | ) |
MGM Resorts International Expires 05/18/13 Strike Price $11 | | | (90 | ) | | | (2,520 | ) |
SPDR S&P 500 ETF Trust Expires 03/16/13 Strike Price $146 | | | (260 | ) | | | (13,000 | ) |
| | | | | | | | |
TOTAL PUT OPTIONS WRITTEN (Premiums Received $87,806) | | | | (95,380 | ) |
| | | | | | | | |
TOTAL WRITTEN OPTIONS — (0.5)% (Premiums Received $272,776) | | | | (392,886 | ) |
| | | | | | | | |
| |
OTHER ASSETSIN EXCESSOF LIABILITIES — 56.1% | | | | 42,067,383 | |
| | | | | | | | |
NET ASSETS — 100.0% | | | $ | 74,928,825 | |
| | | | | | | | |
* Non-income producing.
| † | This company is domiciled outside of the United States. The security’s functional currency is the United States dollar. |
| D | Security has been valued at fair market value as determined in good faith by or under the direction of The RBB Fund, Inc.’s Board of Directors. As of February 28, 2013, fair valued positions amounted to $450,595 or 0.6% of net assets. |
| ^ | Security position is either entirely or partially held in a segregated account as collateral for securities sold short. |
| | |
144A | | Security was purchased pursuant to Rule 144A under the Securities Act of 1933 and may not be resold subject to that rule except to qualified institutional buyers. As of February 28, 2013, these securities amounted to $608,370 or 0.8% of net assets. Unless otherwise noted, these 144A securities have not been deemed illiquid. |
# | | Step Bond. A bond that pays an initial interest rate for the first period and then a higher interest rate for the following periods until maturity. The interest rate shown reflects the rate in effect at February 28, 2013. |
| | |
ADR | | American Depositary Receipt |
AUD | | Australian Dollar |
CAD | | Canadian Dollar |
ETF | | Exchange-traded Fund |
GDR | | Global Depositary Receipt |
JPY | | Japanese Yen |
MSCI | | Morgan Stanley Capital International |
PLC | | Public Limited Company |
REIT | | Real Estate Investment Trust |
S&P | | Standard & Poors |
SPDR | | Standard & Poors Depositary Receipt |
The accompanying notes are an integral part of the financial statements.
14
S1 FUND
PORTFOLIOOF INVESTMENTS (CONCLUDED)
FEBRUARY 28, 2013
(UNAUDITED)
| | | | | | | | | | | | | | | | | | | | | | |
FORWARDFOREIGNCURRENCYCONTRACTSOUSTANDINGASOF FEBRUARY 28, 2013WEREASFOLLOWS: |
CONTRACTS TO BUYOR TO SELL | | CURRENCY | | PRINCIPAL AMOUNT COVEREDBY CONTRACTS | | EXPIRATION | | COUNTERPARTY | | UNREALIZED
APPRECIATION
(DEPRECIATION) |
Sell | | CAD | | CAD 666,400 | | 03/13 | | Goldman Sachs | | | $ | 14,497 | |
Buy | | EUR | | EUR 518,103 | | 03/13 | | Goldman Sachs | | | | (16,956 | ) |
Buy | | GBP | | GBP 400,000 | | 03/13 | | Goldman Sachs | | | | (10,598 | ) |
Sell | | GBP | | GBP 2,208,270 | | 03/13 | | Goldman Sachs | | | | 136,745 | |
Buy | | JPY | | JPY 21,332,502 | | 03/13 | | Goldman Sachs | | | | (4,224 | ) |
| | | | | | | | | | | | | | | | |
| | | | | | | | | | | $ | 119,464 | |
| | | | | | | | | | | | | | | | |
The accompanying notes are an integral part of the financial statements.
15
S1 FUND
STATEMENTOF ASSETSAND LIABILITIES
FEBRUARY 28, 2013
(UNAUDITED)
| | | | |
ASSETS | | | | |
Investments, at value (cost $53,426,280) | | $ | 60,349,046 | |
Cash | | | 21,527,355 | |
Deposits held with prime broker for securities sold short and written options | | | 26,997,143 | |
Foreign currency deposits held with prime broker for securities sold short and written
options(cost $1,072,728) | | | 1,030,777 | |
Receivables for: | | | | |
Investments sold | | | 2,348,831 | |
Capital shares sold | | | 749,577 | |
Dividends and interest | | | 110,714 | |
Forward foreign currency contracts appreciation | | | 151,242 | |
Prepaid expenses and other assets | | | 23,765 | |
| | | | |
Total assets | | | 113,288,450 | |
| | | | |
LIABILITIES | | | | |
Securities sold short, at value (proceeds $24,754,486) | | | 27,094,718 | |
Options written, at value (premiums received $272,776) | | | 392,886 | |
Payables for: | | | | |
Investments purchased | | | 2,252,112 | |
Capital shares redeemed | | | 34,477 | |
Investment advisory fees | | | 135,779 | |
Directors’ and officers’ fees | | | 438 | |
Dividends on securities sold short | | | 14,627 | |
Due to prime broker | | | 8,265,655 | |
Forward foreign currency contracts depreciation | | | 31,778 | |
Other accrued expenses and liabilities | | | 137,155 | |
| | | | |
Total liabilities | | | 38,359,625 | |
| | | | |
Net Assets | | $ | 74,928,825 | |
| | | | |
The accompanying notes are an integral part of the financial statements.
16
S1 FUND
STATEMENTOF ASSETSAND LIABILITIES (CONCLUDED)
FEBRUARY 28, 2013
(UNAUDITED)
| | | | |
NET ASSETS CONSIST OF | | | | |
Par value | | $ | 7,186 | |
Paid-in capital | | | 72,179,291 | |
Accumulated net investment loss | | | (2,215,929 | ) |
Accumulated net realized gain from investments, securities sold short, foreign currency
transactions, forward currency contracts, futures transactions and written options | | | 418,288 | |
Net unrealized appreciation on investments, securities sold short, futures transactions,
foreign currency translations, forward currency contracts and written options | | | 4,539,989 | |
| | | | |
Net assets | | $ | 74,928,825 | |
| | | | |
I SHARES | | | | |
Net assets | | $ | 74,928,825 | |
| | | | |
Shares outstanding ($ 0.001 par value, 100,000,000 shares authorized) | | | 7,186,028 | |
| | | | |
Net asset value, offering and redemption price per share | | $ | 10.43 | |
| | | | |
The accompanying notes are an integral part of the financial statements.
17
S1 FUND
STATEMENTOF OPERATIONS
FORTHE PERIOD ENDED FEBRUARY 28, 2013
(UNAUDITED)
| | | | |
INVESTMENT INCOME | | | | |
Dividends (net of foreign withholding taxes of $ 15,190) | | $ | 384,357 | |
Interest | | | 95,563 | |
| | | | |
Total investment income | | | 479,920 | |
| | | | |
EXPENSES | | | | |
Advisory fees (Note 2) | | | 924,564 | |
Dividend expense on securities sold short | | | 303,610 | |
Prime broker interest expense | | | 146,999 | |
Administration and accounting fees (Note 2) | | | 69,703 | |
Transfer agent fees (Note 2) | | | 43,214 | |
Custodian fees (Note 2) | | | 27,665 | |
Audit fees. | | | 22,356 | |
Legal fees | | | 20,034 | |
Printing and shareholder reporting fees | | | 16,586 | |
Registration and filing fees | | | 13,087 | |
Directors’ and officers’ fees | | | 12,655 | |
Insurance fees | | | 4,377 | |
Other expenses | | | 3,435 | |
| | | | |
Total expenses before waivers and reimbursements | | | 1,608,285 | |
Less: waivers and reimbursements (Note 2) | | | (165,870 | ) |
| | | | |
Net expenses after waivers and reimbursements. | | | 1,442,415 | |
| | | | |
Net investment loss | | | (962,495 | ) |
| | | | |
NET REALIZED AND UNREALIZED GAIN/(LOSS) FROM INVESTMENTS | | | | |
Net realized gain/(loss) from: | | | | |
Investments | | | 2,837,347 | |
Securities sold short | | | (1,810,562 | ) |
Futures | | | (64,690 | ) |
Foreign currency transactions | | | 3,877 | |
Forward currency contracts | | | 12,494 | |
Written options | | | 54,934 | |
Net change in unrealized appreciation/(depreciation) on: | | | | |
Investments | | | 3,593,553 | |
Securities sold short | | | (1,127,414 | ) |
Futures | | | 49,765 | |
Foreign currency translation. | | | (49,893 | ) |
Forward currency contracts | | | 120,247 | |
Written options | | | (138,851 | ) |
| | | | |
Net realized and unrealized gain from investments | | | 3,480,807 | |
| | | | |
NET INCREASE IN NET ASSETS RESULTING FROM OPERATIONS | | $ | 2,518,312 | |
| | | | |
The accompanying notes are an integral part of the financial statements.
18
S1 FUND
STATEMENTOF CHANGESIN NET ASSETS
| | | | | | | | |
| | | FORTHE
SIX MONTHS ENDED
FEBRUARY 28, 2013
(UNAUDITED) | | | FORTHE
YEAR ENDED
AUGUST 31, 2012 | |
INCREASE/(DECREASE)IN NET ASSETS FROM OPERATIONS: | | | | | | | | |
Net investment loss | | $ | (962,495 | ) | | $ | (1,905,303 | ) |
Net realized gain from investments, securities sold short, futures transactions, foreign currency transactions, forward currency contracts and written options | | | 1,033,400 | | | | 459,494 | |
Net change in unrealized appreciation on investments, securities sold short, futures transactions, foreign currency translation, forward currency contracts and written options | | | 2,447,407 | | | | 2,147,258 | |
| | | | | | | | |
Net increase in net assets resulting from operations | | | 2,518,312 | | | | 701,449 | |
| | | | | | | | |
| | |
DISTRIBUTIONSTO SHAREHOLDERS FROM: | | | | | | | | |
Net realized gain | | | (153,211 | ) | | | — | |
| | | | | | | | |
Total distributions | | | (153,211 | ) | | | — | |
| | | | | | | | |
| | |
CAPITAL TRANSACTIONS: | | | | | | | | |
I Shares | | | | | | | | |
Proceeds from shares sold | | | 17,135,997 | | | | 29,018,574 | |
Proceeds from reinvestment of distributions | | | 149,176 | | | | — | |
Shares redeemed | | | (9,010,695 | ) | | | (16,665,146 | ) |
| | | | | | | | |
Net increase in net assets from capital share transactions | | | 8,274,478 | | | | 12,353,428 | |
| | | | | | | | |
Total increase in net assets | | | 10,639,579 | | | | 13,054,877 | |
| | | | | | | | |
| | |
NET ASSETS | | | | | | | | |
Beginning of period | | | 64,289,246 | | | | 51,234,369 | |
| | | | | | | | |
End of period | | $ | 74,928,825 | | | $ | 64,289,246 | |
| | | | | | | | |
Accumulated net investment loss, end of period | | $ | (2,215,929 | ) | | $ | (1,253,434 | ) |
| | | | | | | | |
| | |
SHARE TRANSACTIONS: | | | | | | | | |
I Shares | | | | | | | | |
Shares sold | | | 1,659,997 | | | | 2,928,197 | |
Shares reinvested | | | 14,497 | | | | — | |
Shares redeemed | | | (879,561 | ) | | | (1,681,163 | ) |
| | | | | | | | |
Net increase in shares | | | 794,933 | | | | 1,247,034 | |
| | | | | | | | |
The accompanying notes are an integral part of the financial statements.
19
S1 FUND
STATEMENTOF CASH FLOWS
FORTHE SIX MONTHS ENDED FEBRUARY 28, 2013
(UNAUDITED)
| | | | |
CASHFLOWSPROVIDEDBYOPERATINGACTIVITIES: | | | | |
Net increase in net assets from operations | | $ | 2,518,312 | |
ADJUSTMENTSTORECONCILENETINVESTMENTLOSS
TONETCASHPROVIDEDBY
OPERATINGACTIVITIES: | | | | |
Purchases of investments securities | | | (61,031,481 | ) |
Proceeds from disposition of long-term investments securities | | | 61,232,796 | |
Purchases to cover short sales | | | (30,094,777 | ) |
Proceeds from short sales | | | 34,011,021 | |
Net cost of purchased options | | | (1,114,577 | ) |
Proceeds from written options | | | 1,227,600 | |
Cost of closed and exercised options | | | (976,405 | ) |
Net amortization/(accretion) of premium/(discount) | | | 4,186 | |
Net realized gain on investments and investments sold short | | | (1,026,785 | ) |
Net unrealized appreciation, investments, investments sold short, futures, forward
currency contracts and written options | | | (2,497,300 | ) |
Increase in deposits with brokers for securities sold short | | | (7,872,687 | ) |
Increase in dividend and interest receivable | | | (27,945 | ) |
Decrease in prepaid expenses and other assets | | | 4,936 | |
Decrease in due to custodian | | | (19,040 | ) |
Decrease in variation margin payable | | | (9,640 | ) |
Decrease in dividends on securities sold short | | | (1,252 | ) |
Increase in payable to investment advisor | | | 18,142 | |
Increase in accrued expenses | | | 17,349 | |
| | | | |
Net cash used in operating activities | | | (5,637,547 | ) |
| | | | |
CASHFLOWSFROMFINANCINGACTIVITIES: | | | | |
Increase in due to prime broker payable | | | 5,612,009 | |
Net proceeds from fundshare activity | | | 7,396,320 | |
Distributions paid from realized capital gains | | | (4,035 | ) |
| | | | |
Net cash provided by financing activities | | | 13,004,294 | |
| | | | |
Net increase in cash and foreign currency | | | 7,366,747 | |
CASH: | | | | |
Cash and foreign currency at beginning of the year | | $ | 15,191,385 | |
| | | | |
Cash and foreign currency at end of the period | | $ | 22,558,132 | |
| | | | |
SUPPLEMENTALDISCLOSUREOFCASHFLOWINFORMATION: | | | | |
Cash paid during the period for interest expense | | $ | 146,879 | |
| | | | |
The accompanying notes are an integral part of the financial statements.
20
S1 FUND
FINANCIAL HIGHLIGHTS
Contained below is per share operating performance data for shares outstanding, total investment return, ratios to average net assets and other supplemental data for the respective periods. This information has been derived from information provided in the financial statements.
| | | | | | | | | | | | |
| | | I SHARES | |
| | | FORTHE
SIX MONTHS
ENDED
FEBRUARY 28, 2013
(UNAUDITED) | | | FORTHE
YEAR
ENDED
AUGUST 31, 2012 | | | FORTHE
PERIOD
ENDED
AUGUST 31, 2011(1) | |
PER SHARE OPERATING PERFORMANCE | | | | | | | | | | | | |
Net asset value, beginning of period | | $ | 10.06 | | | $ | 9.96 | | | $ | 10.00 | |
| | | | | | | | | | | | |
Net investment loss(2) | | | (0.15 | ) | | | (0.32 | ) | | | (0.29 | ) |
Net realized and unrealized gain from investments | | | 0.54 | | | | 0.42 | | | | 0.25 | (3) |
| | | | | | | | | | | | |
Total from operations | | | 0.39 | | | | 0.10 | | | | (0.04 | ) |
| | | | | | | | | | | | |
Distributions to shareholders from: | | | | | | | | | | | | |
From net realized capital gains | | | (0.02 | ) | | | — | | | | — | |
| | | | | | | | | | | | |
Total Distributions | | | (0.02 | ) | | | — | | | | — | |
| | | | | | | | | | | | |
Net asset value, end of period | | $ | 10.43 | | | $ | 10.06 | | | $ | 9.96 | |
| | | | | | | | | | | | |
Total investment return(4) | | | 3.92 | %(5) | | | 1.00 | % | | | (0.40 | )%(5) |
| | | | | | | | | | | | |
RATIOS/SUPPLEMENTAL DATA | | | | | | | | | | | | |
Net assets, end of period (000’s omitted) | | $ | 74,929 | | | $ | 64,289 | | | $ | 51,234 | |
Ratio of expenses to average net assets with waivers and reimbursements (including dividend and interest expense) | | | 4.29 | %(6) | | | 4.42 | % | | | 4.06 | %(6) |
Ratio of expenses to average net assets with waivers and reimbursements (excluding dividend and interest expense) | | | 2.95 | %(6) | | | 2.95 | % | | | 2.95 | %(6) |
Ratio of expenses to average net assets without waivers and reimbursements (including dividend and interest expense) | | | 4.78 | %(6) | | | 5.24 | % | | | 6.39 | %(6) |
Ratio of net investment loss to average net assets | | | (2.86 | )%(6) | | | (3.24 | )% | | | (3.16 | )%(6) |
Portfolio turnover rate | | | 103.75 | %(5) | | | 249.27 | % | | | 440.88 | %(5) |
| (1) | The Fund commenced investment operations on September 30, 2010. |
| (2) | Calculated based on average shares outstanding for the period. |
| (3) | The amount shown may not correlate with the change in the aggregate gains and losses due to the timing of sales and purchases of the Fund’s shares in relation to fluctuating market values for the Fund’s portfolio. |
| (4) | Total investment return is calculated assuming a purchase of shares on the first day and a sale of shares on the last day of each period reported and includes reinvestments of dividends and distributions, if any. |
The accompanying notes are an integral part of the financial statements.
21
S1 FUND
NOTES TO FINANCIAL STATEMENTS
FEBRUARY 28, 2013 (UNAUDITED)
1. ORGANIZATIONAND SIGNIFICANT ACCOUNTING POLICIES
The RBB Fund, Inc. (“RBB” or the “Company”) was incorporated under the laws of the State of Maryland on February 29, 1988 and is registered under the Investment Company Act of 1940, as amended, (the “1940 Act”) as an open-end management investment company. RBB is a “series fund,” which is a mutual fund divided into seventeen separate portfolios. Each portfolio is treated as a separate entity for certain matters under the 1940 Act, and for other purposes, and a shareholder of one portfolio is not deemed to be a shareholder of any other portfolio. Currently, RBB has seventeen active investment portfolios, including the S1 Fund (the “Fund”), which commenced investment operations on September 30, 2010. As of the date hereof, the Fund offers two classes of shares, I Shares and R Shares. As of February 28, 2013, Class R Shares have not been issued.
RBB has authorized capital of one hundred billion shares of common stock of which 80.573 billion shares are currently classified into one hundred and forty-two classes of common stock. Each class represents an interest in an active or inactive RBB investment portfolio. The Fund has issued shares with a par value of $0.001.
PORTFOLIO VALUATION — The Fund’s net asset value (“NAV”) is calculated once daily at the close of regular trading hours on the New York Stock Exchange (“NYSE”) (generally 4:00 p.m. Eastern time) on each day the NYSE is open. Securities held by the Fund are valued using the closing price or the last sale price on a national securities exchange or the National Association of Securities Dealers Automatic Quotation System (“NASDAQ”) market system where they are primarily traded. Equity securities traded in the over-the-counter market are valued at their closing prices. If there were no transactions on that day, securities traded principally on an exchange or on NASDAQ will be valued at the mean of the last bid and ask prices prior to the market close. Fixed income securities having a remaining maturity of greater than 60 days are valued using an independent pricing service. Fixed income securities having a remaining maturity of 60 days or less are valued at amortized cost, which approximates market value. If market quotations are unavailable or deemed unreliable, securities will be valued in accordance with procedures adopted by the Company’s Board of Directors. Options for which the primary market is a national securities exchange are valued at the last sale price on the exchange on which they are traded, or, in the absence of any sale, will be valued at the mean of the last bid and ask prices prior to the market close. Options not traded on a national securities exchange are valued at the last quoted bid price for long option positions and the closing ask price for short option positions. Relying on prices supplied by pricing services or dealers or using fair valuation may result in values that are higher or lower than the values used by other investment companies and investors to price the same investments.
22
S1 FUND
NOTES TO FINANCIAL STATEMENTS
FEBRUARY 28, 2013 (UNAUDITED) (CONTINUED)
FAIR VALUE MEASUREMENTS — The inputs and valuations techniques used to measure fair value of the Fund’s investments are summarized into three levels as described in the hierarchy below:
| | |
| • Level 1 – | | quoted prices in active markets for identical securities; |
| • Level 2 – | | other significant observable inputs (including quoted prices for similar securities, interest rates, prepayment speeds, credit risk, etc.); and |
| • Level 3 – | | significant unobservable inputs (including the Fund’s own assumptions in determining the fair value of investments). |
The inputs or methodology used for valuing securities are not necessarily an indication of the risk associated with investing in those securities.
The following is a summary of the inputs used, as of February 28, 2013, in valuing the Fund’s investments carried at fair value:
| | | | | | | | | | | | | | | | |
| | | TOTAL FAIR
VALUE AT
FEBRUATY 28, 2013 | | | LEVEL 1
QUOTED
PRICE | | | LEVEL 2
SIGNIFICANT
OBSERVABLE
INPUTS | | | LEVEL 3
SIGNIFICANT
UNOBSERVABLE
INPUTS | |
| | | | |
Common Stocks | | | | | | | | | | | | | | | | |
Consumer Discretionary | | $ | 13,347,721 | | | $ | 13,347,721 | | | $ | — | | | $ | — | |
Consumer Staples | | | 1,855,606 | | | | 1,855,606 | | | | — | | | | — | |
Energy | | | 1,418,028 | | | | 1,418,028 | | | | — | | | | — | |
Financials | | | 7,732,463 | | | | 7,732,463 | | | | — | | | | — | |
Health Care | | | 2,590,609 | | | | 2,222,134 | | | | — | | | | 368,475 | |
Industrials | | | 3,818,079 | | | | 3,818,079 | | | | — | | | | — | |
Information Technology | | | 7,433,053 | | | | 7,433,053 | | | | — | | | | — | |
Materials | | | 1,946,854 | | | | 1,946,854 | | | | — | | | | — | |
Real Estate Investment Trusts | | | 9,380,890 | | | | 9,298,770 | | | | 82,120 | | | | — | |
Telecommunication Services | | | 2,261,080 | | | | 2,261,080 | | | | — | | | | — | |
Exchange Traded Funds | | | 1,332,546 | | | | 1,332,546 | | | | — | | | | — | |
Corporate Bonds | | | 730,250 | | | | — | | | | 730,250 | | | | — | |
Foreign Government Note | | | 10,196 | | | | — | | �� | | 10,196 | | | | — | |
U.S. Treasury Note | | | 107,000 | | | | — | | | | 107,000 | | | | — | |
U.S. Government Agency | | | 6,004,016 | | | | — | | | | 6,004,016 | | | | — | |
Asset Derivatives | | | | | | | | | | | | | | | | |
Equity Contracts | | | 368,155 | | | | — | | | | 368,155 | | | | — | |
Foreign Currency Contracts | | | 163,742 | | | | — | | | | 163,742 | | | | — | |
Total Assets | | $ | 60,500,288 | | | $ | 52,666,334 | | | $ | 7,465,479 | | | $ | 368,475 | |
23
S1 FUND
NOTES TO FINANCIAL STATEMENTS
FEBRUARY 28, 2013 (UNAUDITED) (CONTINUED)
| | | | | | | | | | | | | | | | |
| | | TOTAL FAIR
VALUE AT
FEBRUARY 28, 2013 | | | LEVEL 1
QUOTED
PRICE | | | LEVEL 2
SIGNIFICANT
OBSERVABLE
INPUTS | | | LEVEL 3
SIGNIFICANT
UNOBSERVABLE
INPUTS | |
| | | | |
Common Stocks Sold Short | | | | | | | | | | | | | | | | |
Communications | | $ | (170,951 | ) | | $ | (170,951 | ) | | $ | — | | | $ | — | |
Consumer Discretionary | | | (3,877,939 | ) | | | (3,877,939 | ) | | | — | | | | — | |
Consumer Staples | | | (575,993 | ) | | | (575,993 | ) | | | — | | | | — | |
Financials | | | (3,414,319 | ) | | | (3,414,319 | ) | | | — | | | | — | |
Health Care | | | (580,545 | ) | | | (580,545 | ) | | | — | | | | — | |
Industrials | | | (1,034,469 | ) | | | (1,034,469 | ) | | | — | | | | — | |
Information Technology | | | (3,877,494 | ) | | | (3,877,494 | ) | | | — | | | | — | |
Real Estate Investment Trusts | | | (7,465,001 | ) | | | (7,465,001 | ) | | | — | | | | — | |
Telecommunication Services | | | (869,347 | ) | | | (869,347 | ) | | | — | | | | — | |
Exchange Traded Funds | | | (5,228,660 | ) | | | (5,228,660 | ) | | | — | | | | — | |
Liability Derivatives | | | | | | | | | | | | | | | | |
Equity Contracts | | | (392,886 | ) | | | — | | | | (392,886 | ) | | | — | |
Foreign Currency Contracts | | | (31,778 | ) | | | — | | | | (31,778 | ) | | | — | |
Total Liabilities | | $ | (27,519,382 | ) | | $ | (27,094,718 | ) | | $ | (424,664 | ) | | $ | — | |
At the end of each fiscal quarter, management evaluates the classification of Levels 1, 2 and 3 assets and liabilities. Various factors are considered, such as changes in liquidity from the prior reporting period; whether or not a broker is willing to execute at the quoted price; the depth and consistency of prices from third party pricing services; and the existence of contemporaneous, observable trades in the market. Additionally, management evaluates the classification of Level 1 and Level 2 assets and liabilities on a quarterly basis for changes in listings or delistings on national exchanges.
Due to the inherent uncertainty of determining the fair value of investments that do not have a readily available market value, the fair value of the Fund’s investments may fluctuate from period to period. Additionally, the fair value of investments may differ significantly from the values that would have been used had a ready market existed for such investments and may differ materially from the values the Fund may ultimately realize. Further, such investments may be subject to legal and other restrictions on resale or otherwise less liquid than publicly traded securities.
For fair valuations using significant unobservable inputs, U.S. generally accepted accounting principles (“U.S. GAAP”) require the Fund to present a reconciliation of the beginning to ending balances for reported market values that presents changes attributable to total realized and unrealized gains or losses, purchase and sales, and transfers in and out of Level 3 during the period. Transfers in and out between Levels are based on values at the end of the period. U.S. GAAP also requires the Fund to disclose amounts and reasons for all transfers in and out of Level 1 and Level 2 fair value measurements. A reconciliation of Level 3 investments is presented only when the Fund had an amount of Level 3 investments at the end of the reporting period that was meaningful in relation to its net assets. The amounts and reasons for all transfers in and
24
S1 FUND
NOTES TO FINANCIAL STATEMENTS
FEBRUARY 28, 2013 (UNAUDITED) (CONTINUED)
out of each Level within the three-tier hierarchy are disclosed when the Fund had an amount of total transfers during the reporting period that was meaningful in relation to its net assets as of the end of the reporting period.
For the period ended February 28, 2013, the Fund had no significant transfers between Levels 1, 2 and 3.
DISCLOSURES ABOUT DERIVATIVE INSTRUMENTS AND HEDGING ACTIVITIES
The following tables provide quantitative disclosures about fair value amounts of and gains and losses on the Fund’s derivative instruments as of February 28, 2013.
The following table lists the fair values of the Fund’s derivative holdings as of February 28, 2013 grouped by contract type and risk exposure category.
| | | | | | | | | | | | | | | | | | | | | | |
DERIVATIVE TYPE | | BALANCE
SHEET
LOCATION | | EQUITY
CONTRACTS | | | INTEREST RATE
CONTRACTS | | | FOREIGN
CURRENCY
CONTRACTS | | | COMMODITY
CONTRACTS | | | TOTAL | |
| Asset Derivatives | |
Purchased Options | | Investments, at value | | $ | 368,155 | | | $ | — | | | $ | 12,500 | | | $ | — | | | $ | 380,655 | |
Forward Contracts | | Foreign currency contract appreciation | | | — | | | | — | | | | 151,242 | | | | — | | | | 151,242 | |
Total Value - Assets | | | | $ | 368,155 | | | $ | — | | | $ | 163,742 | | | $ | — | | | $ | 531,897 | |
| Liability Derivatives | |
Written Options | | Options written, at value | | $ | (392,886 | ) | | $ | — | | | $ | — | | | $ | — | | | $ | (392,886 | ) |
Forward Contracts | | Foreign currency contract depreciation | | | — | | | | — | | | | (31,778 | ) | | | — | | | | (31,778 | ) |
Total Value - Liabilities | | | | $ | (392,886 | ) | | $ | — | | | $ | (31,778 | ) | | $
|
— |
| | $ | (424,664 | ) |
25
S1 FUND
NOTES TO FINANCIAL STATEMENTS
FEBRUARY 28, 2013 (UNAUDITED) (CONTINUED)
The following table lists the amounts of realized gains or losses included in net increase in net assets resulting from operations for the period ended February 28, 2013, grouped by contract type and risk exposure.
| | | | | | | | | | | | | | | | | | | | | | |
DERIVATIVE
TYPE | | INCOME
STATEMENT
LOCATION | | EQUITY
CONTRACTS | | | INTEREST
RATE
CONTRACTS | | | FOREIGN
CURRENCY
CONTRACTS | | | COMMODITY
CONTRACTS | | | TOTAL | |
| Realized Gain (Loss) | |
Purchased Options | | Net realized
gain (loss) from Investments | | $ | (835,144 | ) | | $ | — | | | $ | (20,538 | ) | | $ | — | | | $ | (855,682 | ) |
Futures Contracts | | Net realized
gain (loss) from Futures | | | — | | | | — | | | | (64,690 | ) | | | — | | | | (64,690 | ) |
Forward Contracts | | Net realized
gain (loss) from Forward Currency
Contracts | | | — | | | | — | | | | 12,494 | | | | — | | | | 12,494 | |
Written Options | | Net realized
gain (loss) from Written
Options | | | 54,934 | | | | — | | | | — | | | | — | | | | 54,934 | |
Total Realized Gain (Loss ) | | | | $ | (780,210 | ) | | $ | — | | | $ | (72,734 | ) | | $ | — | | | $ | (852,944 | ) |
The following table lists the amounts of change in unrealized appreciation (depreciation) included in net increase in net assets resulting from operations for the period ended February 28, 2013, grouped by contract type and risk exposure.
| | | | | | | | | | | | | | | | | | | | | | |
DERIVATIVE
TYPE | | INCOME
STATEMENT
LOCATION | | EQUITY
CONTRACTS | | | INTEREST
RATE
CONTRACTS | | | FOREIGN
CURRENCY
CONTRACTS | | | COMMODITY
CONTRACTS | | | TOTAL | |
| Change in appreciation (depreciation) | |
Purchased Options | | Net change in
unrealized appreciation (depreciation) from Investments | | $ | (103,641 | ) | | $ | (34,896 | ) | | $ | (26,963 | ) | | $ | 9,032 | | | $ | (156,468 | ) |
The accompanying notes are an integral part of the financial statements.
26
S1 FUND
NOTES TO FINANCIAL STATEMENTS
FEBRUARY 28, 2013 (UNAUDITED)(CONTINUED)
| | | | | | | | | | | | | | | | | | | | | | |
DERIVATIVE TYPE | | INCOME STATEMENT LOCATION | | EQUITY CONTRACTS | | | INTEREST RATE CONTRACTS | | | FOREIGN CURRENCY CONTRACTS | | | COMMODITY CONTRACTS | | | TOTAL | |
Futures Contracts | | Net change in unrealized appreciation (depreciation) from Futures | | $ | — | | | $ | — | | | $ | 49,765 | | | $ | — | | | $ | 49,765 | |
Forward Contracts | | Net change in unrealized appreciation (depreciation) from Forward Currency Contracts | | | — | | | | — | | | | 120,247 | | | | — | | | | 120,247 | |
Written Options | | Net change in unrealized appreciation (depreciation) from Written Options | | | (138,851 | ) | | | — | | | | — | | | | — | | | | (138,851 | ) |
Total change in appreciation (depreciation) | | | | $ | (242,492 | ) | | $ | (34,896 | ) | | $ | 143,049 | | | $ | 9,032 | | | $ | (125,307 | ) |
For the period ended February 28, 2013, the Fund’s average volume of derivatives is as follows:
| | | | | | |
PURCHASED OPTIONS (COST) | | FORWARD FOREIGN
CURRENCY CONTRACTS
(APPRECIATION/(DEPRECIATION)) | | FUTURES
(APPRECIATION/(DEPRECIATION)) | | WRITTEN
OPTIONS
(PROCEEDS) |
| $368,573 | | $36,598 | | $(16,588) | | $172,525 |
USEOF ESTIMATES — The preparation of financial statements in conformity with U.S. GAAP requires management to make estimates and assumptions that affect the reported amounts of assets and liabilities and disclosure of contingent assets and liabilities at the date of the financial statements and the reported amounts of revenues and expenses during the period. Actual results could differ from those estimates and those differences could be significant.
INVESTMENT TRANSACTIONS, INVESTMENT INCOMEAND EXPENSES — The Fund records security transactions based on trade date for financial reporting purposes. The cost of investments sold is determined by use of the specific identification method for both financial reporting and income tax purposes in determining realized gains and losses on investments. Interest income is accrued when earned. Dividend income is recorded on
27
S1 FUND
NOTES TO FINANCIAL STATEMENTS
FEBRUARY 28, 2013 (UNAUDITED)(CONTINUED)
the ex-dividend date. Distributions received on securities that represent a return of capital or capital gains are recorded as a reduction of cost of investments and/or as a realized gain. Expenses incurred on behalf of a specific class, fund or fund family are charged directly to the class, fund or fund family to each class of shares based upon the relative proportion of net assets of each class at the beginning of the day. Expenses incurred for all the RBB funds (such as director or professional fees) are charged to all funds in proportion to their average net assets of RBB, or in such other manner as the Company’s Board of Directors deems fair or equitable. Expenses and fees, including investment advisory and administration fees, are accrued daily and taken into account for the purpose of determining the NAV of the Fund.
DIVIDENDSAND DISTRIBUTIONSTO SHAREHOLDERS — Dividends from net investment income and distributions from net realized capital gains, if any, are declared and paid at least annually to shareholders and recorded on ex-dividend date. Income dividends and capital gain distributions are determined in accordance with U.S. federal income tax regulations which may differ from U.S. GAAP.
U.S. TAX STATUS — No provision is made for U.S. income taxes as it is the Fund’s intention to qualify for and elect the tax treatment applicable to regulated investment companies under Subchapter M of the Internal Revenue Code of 1986, as amended, and make the requisite distributions to its shareholders which will be sufficient to relieve it from U.S. income and excise taxes.
FOREIGN CURRENCY TRANSLATION — Assets and liabilities initially expressed in non-U.S. currencies are translated into U.S. dollars based on the applicable exchange rates at the date of the last business day of the financial statement period. Purchases and sales of securities, interest income, dividends, variation margin received and expenses denominated in foreign currencies are translated into U.S. dollars at the exchange rates in effect on the transaction date.
The Fund does not seperately report the effect of changes in foreign exchange rates from changes in market prices of securities held. Such changes are included with the net realized gain or loss and change in unrealized appreciation or depreciation on investment securities in the Statement of Operations. Other foreign currency transactions resulting in realized and unrealized gain or loss are reported separately as net realized gain or loss and change in unrealized appreciation or depreciation on foreign currencies in the Statement of Operations.
CURRENCY RISK — The Fund invests in securities of foreign issuers, including American Depositary Receipts. These markets are subject to special risks associated with foreign investments not typically associated with investing in U.S. markets. Because the foreign securities in which the Fund may invest generally trade in currencies other than the U.S. dollar, changes in currency exchange rates will affect the Fund’s NAV, the value of dividends and interest earned and gains and losses realized on the sale of securities. Because the NAV for the Fund is determined on the basis of U.S. dollars, the Fund may lose money by investing in a foreign security if the local currency of a foreign market depreciates against the U.S. dollar, even if the local currency value of the Fund holdings goes up. Generally, a strong U.S. dollar relative to these other currencies will adversely affect the value of the Fund holdings in foreign securities.
28
S1 FUND
NOTES TO FINANCIAL STATEMENTS
FEBRUARY 28, 2013 (UNAUDITED) (CONTINUED)
FOREIGN SECURITIES — Securities of many non-U.S. companies may be less liquid and their prices more volatile than securities of comparable U.S. companies. Securities of companies traded in many countries outside the U.S., particularly emerging markets countries, may be subject to further risks due to the inexperience of local investment professionals and financial institutions, the possibility of permanent or temporary termination of trading and greater spreads between bid and asked prices of securities. In addition, non-U.S. stock exchanges and investment professionals are subject to less governmental regulation, and commissions may be higher than in the United States. Also, there may be delays in the settlement of non-U.S. stock exchange transactions.
PURCHASED OPTIONS — The Fund is subject to equity and other risk exposure in the normal course of pursuing its investment objectives. The Fund purchases option contracts. This transaction is used to hedge against changes in interest rates, foreign exchange rates and values of equities. The risk associated with purchasing an option is that the Fund pays a premium whether or not the option is exercised. Additionally, the Fund bears the risk of loss of premium and change in market value should the counterparty not perform under the contract. Put and call options are accounted for in the same manner as other securities owned. The cost of securities acquired through the exercise of call options is increased by the premiums paid. The proceeds from securities sold through the exercise of put options are decreased by the premiums paid.
OPTIONS WRITTEN — The Fund is subject to equity and other risk exposure in the normal course of pursuing its investment objectives and may enter into options written to hedge against changes in interest rates, foreign exchange rates and values of equities. Such options may relate to particular securities or domestic stock indices, and may or may not be listed on a domestic securities exchange or issued by the Options Clearing Corporation. The risk in writing a call option is that the Fund gives up the opportunity for profit if the market price of the security increases. The risk in writing a put option is that the Fund may incur a loss if the market price of the security decreases and the option is exercised. The Fund also has the additional risk of being unable to enter into a closing transaction at an acceptable price if a liquid secondary market does not exist. The Fund also may write over-the-counter options where completing the obligation depends upon the credit standing of the other party. Option contracts also involve the risk that they may result in loss due to unanticipated developments in market conditions or other causes. Written options are recorded as liabilities to the extent of premiums received. Gains or losses are realized when the option transaction expires or closes. When an option is exercised, the proceeds on sales for a written call option or the purchase cost for a written put option is adjusted by the amount of the premium received.
As of February 28, 2013, the Fund had options written valued at ($392,886).
29
S1 FUND
NOTES TO FINANCIAL STATEMENTS
FEBRUARY 28, 2013 (UNAUDITED) (CONTINUED)
The Fund had transactions in options written during the period ended February 28, 2013 as follows:
| | | | | | | | |
| | | NUMBER OF
CONTRACTS | | | PREMIUMS
RECEIVED | |
Options outstanding at August 31, 2012 | | | 963 | | | $ | 112,519 | |
Options written | | | 16,829 | | | | 1,227,600 | |
Options closed | | | (12,617 | ) | | | (965,120 | ) |
Options expired | | | (1,080 | ) | | | (90,938 | ) |
Options exercised | | | (600 | ) | | | (11,285 | ) |
| | | | | | | | |
Options outstanding at February 28, 2013 | | | 3,495 | | | $ | 272,776 | |
| | | | | | | | |
SHORT SALES — When the investment adviser or a sub-adviser believes that a security is overvalued, the Fund may sell the security short by borrowing the same security from a broker or other institution and selling the security. The Fund will incur a loss as a result of a short sale if the price of the borrowed security increases between the date of the short sale and the date on which the Fund buys and replaces such borrowed security. The Fund will realize a gain if there is a decline in price of the security between those dates where the decline in price exceeds the costs of borrowing the security and other transaction costs. There can be no assurance that a Fund will be able to close out a short position at any particular time or at an acceptable price. Although a Fund’s gain is limited to the amount at which it sold a security short, its potential loss is unlimited. Until a Fund replaces a borrowed security, it will maintain at all times cash, U.S. Government securities, or other liquid securities in an amount which, when added to any amount deposited with a broker as collateral, will at least equal the current market value of the security sold short. Depending on arrangements made with brokers, the Fund may not receive any payments (including interest) on collateral deposited with them.
In accordance with the terms of its prime brokerage agreements, the Fund may receive rebate income or be charged a fee on borrowed securities. Such income or fee is calculated on a daily basis based upon the market value of each borrowed security and a variable rate that is dependent upon the availability of such security. The Fund records these prime broker charges on a net basis as interest income or interest expense. For the period ended February 28, 2013, the Fund had net charges of $127,846 on borrowed securities. Such amounts are included in prime broker interest expense on the Statement of Operations.
As of February 28, 2013, the Fund had securities sold short valued at $27,094,718 for which securities of $19,256,540 and cash deposits of $28,027,920 were pledged as collateral for securities sold short and written options. In accordance with the Special Custody and Pledge Agreement with Goldman Sachs & Co. (“Goldman Sachs”) (the Fund’s prime broker), the Fund may borrow from Goldman Sachs to the extent necessary to maintain required margin cash deposits on short positions. Interest on such borrowings is charged to the Fund based on the LIBOR rate plus an agreed upon spread.
30
S1 FUND
NOTES TO FINANCIAL STATEMENTS
FEBRUARY 28, 2013 (UNAUDITED) (CONTINUED)
The Fund utilized cash borrowings from Goldman Sachs to meet required margin cash deposits as follows during the period ended February 28, 2013:
| | | | | | | | | | | | | | | | | | | | |
DAYS UTILIZED | | | | AVERAGE DAILY
BORROWINGS | | WEIGHTED AVERAGE
INTEREST RATE |
| | | 136 | | | | | | | AUD | | | | | 83,716 | | | 3.78% |
| | | 6 | | | | | | | CAD | | | | | 249,636 | | | 1.57% |
| | | 131 | | | | | | | EUR | | | | | 146,746 | | | 0.59% |
| | | 43 | | | | | | | GBP | | | | | 110,451 | | | 1.00% |
| | | 136 | | | | | | | HKD | | | | | 748,992 | | | 0.65% |
| | | 123 | | | | | | | JPY | | | | | 2,497,987 | | | 0.63% |
| | | 71 | | | | | | | MXN | | | | | 2,669,508 | | | 4.63% |
| | | 181 | | | | | | | USD | | | | | 4,404,350 | | | 0.70% |
As of February 28, 2013, the Fund had borrowings of $8,265,655. Interest expense on cash borrowings for the period ended February 28, 2013 totaled $146,999.
FUTURES CONTRACTS — The Fund is subject to equity and other risk exposure in the normal course of pursuing its investment objectives. The Fund may use futures contracts for hedging or speculative purposes consistent with its investment objective. Upon entering into a futures contract, the Fund must deposit initial margin in addition to segregating cash or liquid assets sufficient to meet its obligation to purchase or provide securities, or to pay the amount owed at the expiration of an index-based futures contract. Such liquid assets may consist of cash, cash equivalents, liquid debt or equity securities or other acceptable assets. Pursuant to the futures contract, the Fund agrees to receive from, or pay to the broker, an amount of cash equal to the daily fluctuation in value of the contract. Such a receipt of payment is known as a “variation margin” and is recorded by the Fund as an unrealized gain or loss. When the contract is closed, the Fund records a realized gain or loss equal to the difference between the proceeds from (or cost of) the closing transactions and the Fund’s basis in the contract. Futures contracts have market risks, including the risk that the change in the value of the contract may not correlate with changes in the value of the underlying securities. Use of long futures contracts subjects the Fund to risk of loss in excess of the amount shown on the Statement of Assets and Liabilities, up to the notional value of the futures contract. Use of short futures contracts subjects the Fund to unlimited risk of loss. As of February 28, 2013, the Fund had no futures contracts.
FORWARD FOREIGN CURRENCY CONTRACTS — In the normal course of pursuing their investment objectives, the Fund is subject to foreign investment and currency risk. The Fund may enter into forward foreign currency contracts (“forward contracts”) for purposes of hedging, duration management, as a substitute for securities, to increase returns, for currency hedging or risk management, or to otherwise help achieve the Fund’s investment goal. These contracts are marked-to-market daily at the applicable translation rates. The Fund records realized gains or losses at the time the forward contract is closed. A forward contract is extinguished through a closing transaction or upon delivery of the currency or entering an offsetting contract. Risks may arise upon
31
S1 FUND
NOTES TO FINANCIAL STATEMENTS
FEBRUARY 28, 2013 (UNAUDITED) (CONTINUED)
entering these contracts from the potential inability of a counterparty to meet the terms of their contracts and from unanticipated movements in the value of a foreign currency relative to the U.S. dollar or other currencies.
OTHER — In the normal course of business, the Fund may enter into contracts that provide general indemnifications. The Fund’s maximum exposure under these arrangements is dependent on claims that may be made against the Fund in the future, and, therefore, cannot be estimated; however, based on experience, the risk of material loss from such claims is considered remote.
2. INVESTMENT ADVISER AND OTHER SERVICES
Simple Alternatives, LLC (“Simple Alternatives” or the “Adviser”) serves as the Fund’s investment adviser. For its advisory services, the Adviser is entitled to receive a monthly fee from the Fund calculated at an annual rate of 2.75% of the Fund’s average daily net assets.
The Adviser has contractually agreed to forgo all or a portion of its advisory fee and/or reimburse expenses in a aggregate amount equal to the amount by which the total annual Fund operating expenses (other than acquired fund fees and expenses, short sale dividend expenses, brokerage commissions, litigation, extraordinary items, interest or taxes) exceed 2.95% of the average daily net assets of the Fund’s I Shares and 3.20% of the average daily net assets of the Fund’s R Shares, respectively. This contractual limitation is in effect until at least December 31, 2014 and may not be terminated prior to December 31, 2014 without approval by the Company’s Board of Directors. If at any time during the first three years the Fund’s Advisory Agreement with the Adviser is in effect, the Fund’s total annual Fund operating expenses for that year are less than 2.95% or 3.20%, as applicable, the Adviser is entitled to reimbursement by the Fund of the advisory fees forgone and other payments remitted by the Adviser to the Fund during such three-year period if such reimbursement by the Fund does not cause the Fund to exceed existing expense limitations. For the period ended February 28, 2013, investment advisory fees accrued and waived were $924,564 and $165,870, respectively. At February 28, 2013, the amount of potential recovery by the Advisor was as follows:
| | | | | | | | | | |
| EXPIRATION |
2014 | | 2015 | | 2016 |
$313,683 | | | $ | 472,047 | | | | $ | 165,870 | |
Simple Alternatives has currently retained the services of Roaring Blue Lion Capital Management, LLC; Courage Capital Management, LLC; Lauren Templeton Capital Management, LLC; Maerisland Capital, LLC ; and Starwood Real Estate Securities, LLC as sub-advisers (each a “Sub-Adviser”) of the Fund. Pursuant to sub-advisory agreements between the Adviser and each Sub-Adviser, each Sub-Adviser manages the investment and reinvestment of the portion of the Fund’s portfolio allocated to it by the Adviser. The Fund is not required to invest with any minimum number of Sub-Advisers, and does not have minimum or maximum limitations with respect to allocations of assets to any Sub-Adviser. The Sub-Advisers are compensated by the Adviser and not by the Fund.
32
S1 FUND
NOTES TO FINANCIAL STATEMENTS
FEBRUARY 28, 2013 (UNAUDITED) (CONTINUED)
BNY Mellon Investment Servicing (US) Inc. (“BNY Mellon”) serves as administrator for the Fund. For providing administrative and accounting services, BNY Mellon is entitled to receive a monthly fee equal to an annual percentage rate of the Fund’s average daily net assets, subject to certain minimum monthly fees.
Included in the administration and accounting service fees, shown on the Statement of Operations, are fees for providing regulatory administration services to RBB. For providing these services, BNY Mellon is entitled to receive compensation as agreed to by the Company and BNY Mellon. This fee is allocated to each portfolio in proportion to its net assets of the Company.
In addition, BNY Mellon serves as the Fund’s transfer and dividend disbursing agent. For providing transfer agent services, BNY Mellon is entitled to receive a monthly fee and out of pocket expenses.
The Bank of New York Mellon (the “Custodian”) provides certain custodial services to the Fund. The Custodian is entitled to receive a monthly fee equal to an annual percentage rate of the Fund’s average daily net assets subject to certain minimum monthly fees and may receive out of pocket expenses.
Foreside Funds Distributors LLC serves as the principal underwriter and distributor of the Fund’s shares pursuant to a Distribution Agreement with RBB.
The Fund will not pay The Bank of New York Mellon Corporation or any of its members or BNY Mellon’s affiliates at a later time for any amounts waived or any amounts assumed.
3. DIRECTOR COMPENSATION
The Directors of the Company receive an annual retainer and meeting fees for meetings attended. The remuneration paid to the Directors by the Fund during the period ended February 28, 2013 was $6,072. Certain employees of BNY Mellon serve as an Officer or Director of the Company. They are not compensated by the Fund or the Company.
4. INVESTMENT IN SECURITIES
For the period ended February 28, 2013, aggregate purchases and sales of investment securities (excluding short-term investments) of the Fund were as follows:
| | | | | | | | |
| | | PURCHASES | | | SALES | |
Investments in Non-U.S. Government Securities | | $ | 62,143,657 | | | $ | 60,368,941 | |
Investments in U.S. Government Securities | | | — | | | | 2,000,000 | |
5. FEDERAL INCOME TAX INFORMATION
The Fund has followed the authoritative guidance on accounting for and disclosure of uncertainty in tax positions, which requires the Fund to determine whether a tax position is more likely than not to be sustained upon examination, including resolution of any related appeals or litigation processes, based on the technical merits of the position. The Fund has determined that there was no effect on the financial statements from
33
S1 FUND
NOTES TO FINANCIAL STATEMENTS
FEBRUARY 28, 2013 (UNAUDITED) (CONTINUED)
following this authoritative guidance. In the normal course of business, the Fund is subject to examination by federal, state and local jurisdictions, where applicable, for tax years for which applicable statutes of limitations have not expired.
As of February 28, 2013, federal tax cost, aggregate gross unrealized appreciation and depreciation of securities held by the Fund were as follows:
| | | | | | | | | | | | | | | |
FEDERAL TAX COST | | UNREALIZED
APPRECIATION | | UNREALIZED
DEPRECIATION | | NET
UNREALIZED
APPRECIATION |
$53,426,280 | | | $ | 7,911,497 | | | | $ | (988,731 | ) | | | $ | 6,922,766 | |
Distributions to shareholders from net investment income and realized gains are determined in accordance with federal income tax regulations, which may differ from net investment income and realized gains recognized for financial reporting purposes. Accordingly, the character of distributions and composition of net assets for tax purposes may differ from those reflected in the accompanying financial statements. To the extent these differences are permanent, such amounts are reclassified within the capital accounts based on the tax treatment; temporary differences do not require such reclassification.
As of August 31, 2012, the components of distributable earnings on a tax basis were as follows:
| | | | | | | | |
UNDISTRIBUTED
ORDINARY INCOME | | UNDISTRIBUTED
LONG-TERM GAINS | | UNREALIZED
APPRECIATION | | QUALIFIED
LATE-YEAR LOSSES | | OTHER TEMPORARY
DIFFERENCES |
$— | | $— | | $1,607,639 | | $(1,245,488) | | $15,097 |
The differences between the book and tax basis components of distributable earnings relate principally to the timing of recognition of income and gains for federal income tax purposes. Short-term and foreign currency gains are reported as ordinary income for federal income tax purposes.
There were no dividends or distributions paid during the fiscal year ended August 31, 2012. Dividends from net investment income and short-term capital gains are treated as ordinary income dividends for federal income tax purposes.
Pursuant to federal income tax rules applicable to regulated investment companies, the Funds may elect to treat certain capital losses between November 1 and August 31 and late year ordinary losses ((i) ordinary losses between January 1 and August 31, and (ii) specified ordinary and currency losses between November 1 and August 31) as occurring on the first day of the following tax year. For the year ended August 31, 2012, any amount of losses elected within the tax return will not be recognized for federal income tax purposes until September 1, 2012.
Accumulated capital losses represent net capital loss carryforwards as of August 31, 2012 that may be available to offset future realized capital gains and thereby reduce future capital gains distributions. Under the Regulated Investment Company Modernization Act of 2010 (the “Modernization Act”), the Funds are
34
S1 FUND
NOTES TO FINANCIAL STATEMENTS
FEBRUARY 28, 2013 (UNAUDITED) (CONCLUDED)
permitted to carry forward capital losses incurred in taxable years beginning after December 22, 2010 for an unlimited period. Any losses incurred during those future taxable years will be required to be utilized prior to any losses incurred in pre- enactment taxable years. Additionally, post-enactment capital losses that are carried forward will retain their character as either short-term or long-term capital losses rather than being considered all short-term as under the previous law. The Funds’ first fiscal year end subject to the Modernization Act was August 31, 2012.
As of August 31, 2012, the Fund had no pre- or post-enactment capital loss carryforwards.
6. NEW ACCOUNTING PRONOUNCEMENT
In December 2011, the Financial Accounting Standards Board (“FASB”) issued Accounting Standards Update (“ASU”) No. 2011-11, “Disclosures about Offsetting Assets and Liabilities”. ASU 2011-11 requires disclosures to make financial statements that are prepared under U.S. GAAP more comparable to those prepared under International Financial Reporting Standards. The new disclosure requirements mandate that entities disclose both gross and net information about instruments and transactions eligible for offset in the statement of assets and liabilities as well as instruments and transactions subject to an agreement similar to a master netting arrangement. In addition, ASU 2011-11 requires disclosure of collateral received and posted in connection with master netting agreements or similar arrangements. New disclosures are required for annual reporting periods beginning on or after January 1, 2013, and interim periods within those annual periods. Management is evaluating the impact of ASU 2011-11 on the financial statements and disclosures.
7. SUBSEQUENT EVENTS
Management has evaluated the impact of all subsequent events on the Fund through the date the financial statements were issued, and has determined that there were no subsequent events.
35
S1 FUND
OTHER INFORMATION
PROXY VOTING
Policies and procedures that the Fund uses to determine how to vote proxies relating to portfolio securities as well as information regarding how the Fund voted proxies relating to portfolio securities for the most recent 12-month period ended June 30 are available without charge, upon request, by calling (866) 882-1226 and on the Securities and Exchange Commission’s (“SEC”) website at http://www.sec.gov.
QUARTERLY PORTFOLIO SCHEDULES
The Company files its complete schedule of portfolio holdings with the SEC for the first and third fiscal quarters of each fiscal year (quarters ended November 30 and May 31) on Form N-Q. The Company’s Form N-Q is available on the SEC website at http://www.sec.gov and may be reviewed and copied at the SEC Public Reference Room in Washington, D.C. Information on the operation of the SEC Public Reference Room may be obtained by calling (202) 551-8090.
36
[THIS PAGE INTENTIONALLY LEFT BLANK]
[THIS PAGE INTENTIONALLY LEFT BLANK]
[THIS PAGE INTENTIONALLY LEFT BLANK]
Investment Adviser
Simple Alternatives, LLC
90 Grove Street
Suite 205
Ridgefield, CT 06877
Administrator
BNY Mellon Investment Servicing (US) Inc.
301 Bellevue Parkway
Wilmington, DE 19809
Transfer Agent
BNY Mellon Investment Servicing (US) Inc.
4400 Computer Drive
Westborough, MA 01581
Principal Underwriter
Foreside Funds Distributors LLC
400 Berwyn Park
899 Cassatt Road
Berwyn, PA 19312
Custodian
The Bank of New York Mellon
One Wall Street
New York, NY 10286
Independent Registered Public Accounting Firm
Ernst & Young LLP
One Commerce Square
2005 Market Street, Suite 700
Philadelphia, PA 19103
Counsel
Drinker Biddle & Reath LLP
One Logan Square, Ste. 2000
Philadelphia, PA 19103-6996
S1 FUND
of THE RBB FUND, INC.
SEMI-ANNUAL REPORT
FEBRUARY 28, 2013
(UNAUDITED)
This report is submitted for the general information of the shareholders of the Fund. It is not authorized for distribution unless preceded or accompanied by a current prospectus for the Fund.
THE SCHNEIDER FUNDS
Semi-Annual Investment Adviser’s Report
February 28, 2013
(Unaudited)
Fellow Shareholder:
The semi-annual report for the Schneider Funds covers the six months ended February 28, 2013.
Investment Review
During the six-month period, the broad market Russell 3000 Index rose 13.26%. The economy demonstrated continuing signs of expansion, most notably in the housing, banking and auto sectors. The announced continuation of the Fed’s bond buying program that injects $1 trillion of liquidity annually into the market provides further support for the slowly expanding economy. The slowdown in China’s economy appears to have waned, resting at a still-robust 7.5% expected growth rate for 2013 which should provide support for many other economies and markets. Across the Atlantic, the European Union appears to be finding success in addressing the sovereign debt issues of its weaker members.
The Small Cap Value Fund returned 22.81% for the six-month period ended February 28, 2013 (see table on page 3). We are pleased to report that the Small Cap Value Fund was recently ranked the #1 small cap value fund by the Wall Street Journal for all of 2012. (Based on 1-year total return as of 12/31/2012 among 293 Small-Cap Value Equity Funds. See footnote disclosure below.)
The Value Fund posted a 14.12% return during the same period (see table on page 4).
The expected return potential for our holdings in both Funds remains at elevated levels versus the long-term average and we continue our view that the financial services sector and housing industry are areas of the market that possess tremendous opportunity.
Banks are realizing improved operating and financial results as expense reductions positively impact earnings and credit losses continue to decline. The majority of the banking stocks we hold are over-capitalized, which provides the opportunity for dividend increases and/or share repurchases.
We increased exposure to the property and casualty (P&C) insurance industry during the period. We believe that P&C pricing is exiting a cyclical bottom and is poised for an extended rebound from very depressed levels. With rate increases exceeding claims trends, the companies we own should see improved earnings and increased capital levels which we expect will generate renewed interest from investors.
We believe that the housing industry recovery will continue. Rising demand is being met with a limited supply of new and existing homes for sale. We expect new supply will stay constrained until land developers rebuild the depleted lot inventory. Investors are also purchasing homes to convert to rentals in many markets, further eroding supply. Home price appreciation exceeded consensus expectations in 2012 and the momentum should continue based on the supply/demand picture and low mortgage rates driving very favorable affordability. Our homebuilder stocks have delivered solid performance but there remains a long runway for continued volumetric and margin improvement.
We maintain a positive view on the coal industry as rising natural gas prices, signs of a nascent gas production decline, and the return to normal storage levels have all but eliminated the near term threat of utility switching from coal produced in the low cost Powder River Basin to natural gas. In addition, demand for U.S. coal is projected to increase 7% in 2013. Coal companies have made the prudent business decisions to lower or cancel capital expenditures programs which should help them strengthen their balance sheets.
Outlook
The US equity market continues to climb the “wall-of-worry” while individual investors shun stocks. The long-discussed “Great Rotation” from fixed income to equities in the US market has yet to commence as bond funds inflows continue to exceed those of equity funds, and cash holdings continue to grow.
With the world awash in liquidity, the support for equities remains in place. The slowly improving US economy, the apparent stabilization of the Euro economies, and the still-vibrant economic growth in China should create an environment where stocks may continue to generate positive returns.
1
THE SCHNEIDER FUNDS
Semi-Annual Investment Adviser’s Report (Continued)
February 28, 2013
(Unaudited)
Within the US market, there are signs that economic expansion can continue through 2013 and beyond. These signs include:
| | • | | The housing market continues to improve as demand increases, inventories of existing homes decline and home prices have risen year-over-year, increasing consumer wealth. |
| | • | | The banking industry continues to improve earnings and better manage its expenses, and capital levels are generally well above required levels which may provide the opportunity for dividend increases or share repurchases. |
| | • | | Unemployment is declining, albeit slowly. |
On the global stage, there is a delicate balance between the rewards and risks of various economic situations:
| | • | | In Japan, the new government is aggressively looking to use monetary policy to break the decades-long deflationary cycle. This program has boosted equity returns in the short term and interest rates remain low, but there is considerable risk to their deficits if interest rates rise. |
| | • | | While the weaker economies within the Eurozone have shown some economic improvement and have seen their labor costs decline, their strong dependence on the EU to provide continuing financial support is a constant concern for investors. |
| | • | | Within the US, the continuation of Fed-manufactured low interest rate environment raises the question of how to exit this program without forcing interest rates and inflation to spike. |
There is a sense that investors’ preoccupation with Washington is waning, and with it some of the fear that has kept investors from acting. With the passage of the continuing resolution to fund the US government through September 2013, there are signs that there may be room for negotiations and compromise regarding the troublesome budget deficit and high government spending. Any positive moves by the government to address these long-term issues will be received enthusiastically and may be the catalyst to entice many sideline-sitting equity investors to return to the market.
We expect the US economy to continue to grow in 2013, but initially at a subdued pace. It is important to note that in general our holdings continue to have very attractive valuations and improving business fundamentals, which we believe will help us better weather the investment landscape in 2013. As we look forward, we see improvements across wide parts of the economy, and we believe that growth can begin to accelerate as we move through 2013.
Thank you for your interest and the confidence you have placed in us.

Arnold C. Schneider III, CFA
Portfolio Manager
Schneider Capital Management
Footnote Disclosure: The Wall Street Journal ranked the Schneider Small Cap Value Fund first among 293 Small-Cap Value Equity Funds based on 1-year total return (not including sales charges) as of December 31, 2012, using data supplied by Lipper. The Wall Street Journal updates its rankings quarterly. Past performance does not guarantee future results.
2
THE SCHNEIDER FUNDS
SCHNEIDER SMALL CAP VALUE FUND
Performance Data
February 28, 2013 (Unaudited)
| | | | | | | | | | | | | | | | | | | | |
| Total Returns for the Periods Ended February 28, 2013 | |
| | | | | | Average Annual | |
| | | Six
Months* | | | One Year | | | Five Years | | | Ten Years | | | Since
Inception** | |
Schneider Small Cap Value | | | 22.81% | | | | 23.04% | | | | 3.94% | | | | 13.99% | | | | 14.93% | |
Russell 2000® Value Index | | | 14.56% | | | | 16.89% | | | | 6.74% | | | | 10.96% | | | | 9.32% | |
* Not annualized ** Inception date 9/2/98 | | | | | | | | | | | | | | | | | | | | |
The performance data quoted represents past performance. Past performance is not indicative of future results. Investment return and principal value will fluctuate so that an investor’s shares, when redeemed, may be worth more or less than their original cost. Current performance may be lower or higher. Schneider Capital Management Company, the Fund’s investment adviser has contractually agreed to waive management fees and/or reimburse expenses through December 31, 2013, to the extent that total annual Fund operating expenses (excluding acquired fund fees and expenses, brokerage commissions, extraordinary items, interest and taxes) exceed 1.15%. Total returns shown include fee waivers and expense reimbursements, if any; total returns would have been lower had there been no waiver or reimbursement of fees and expenses in excess of expense limitations. Returns shown include the reinvestment of all dividends and other distributions and do not reflect taxes that a shareholder would pay on Fund distributions or on the redemption of Fund shares. For performance data current to the most recent month-end, please call 1-888-520-3277. The Fund’s gross and net annual operating expenses, as stated in the current prospectus, are 1.52% and 1.15%, respectively. Shares of the Fund not purchased through reinvested dividends or capital gains and held less than one year are subject to a 1.75% redemption fee.
Small company stocks are generally riskier than large company stocks due to greater volatility and less liquidity.
Value investing involves the risk that the Fund’s investment in companies whose securities are believed to be undervalued, relative to their underlying profitability, will not appreciate in value as anticipated.
3
THE SCHNEIDER FUNDS
SCHNEIDER VALUE FUND
Performance Data
February 28, 2013 (Unaudited)
| | | | | | | | | | | | | | | | | | | | |
| Total Returns for the Periods Ended February 28, 2013 | |
| | | | | | Average Annual | |
| | | Six
Months* | | | One Year | | | Five Years | | | Ten Years | | | Since
Inception** | |
Schneider Value | | | 14.12% | | | | 9.58% | | | | -5.02% | | | | 7.10% | | | | 7.38% | |
Russell 1000® Value Index | | | 13.15% | | | | 17.63% | | | | 3.88% | | |
| 8.77%
|
| | | 8.79% | |
* Not annualized ** Inception date 9/30/02 | | | | | | | | | | | | | | | | | | | | |
The performance data quoted represents past performance. Past performance is not indicative of future results. Investment return and principal value will fluctuate so that an investor’s shares, when redeemed, may be worth more or less than their original cost. Current performance may be lower or higher. Schneider Capital Management Company, the Fund’s investment adviser, has contractually agreed to waive management fees and/or reimburse expenses through December 31, 2013, to the extent that total annual fund operating expenses (excluding acquired fund fees and expenses, brokerage commissions, extraordinary items, interest and taxes) exceed 0.90%. Total returns shown include fee waivers and expense reimbursements, if any; total returns would have been lower had there been no waiver or reimbursement of fees and expenses in excess of expense limitations. Returns shown include the reinvestment of all dividends and other distributions and do not reflect taxes that a shareholder would pay on Fund distributions or on the redemption of Fund shares. For performance data current to the most recent month-end, please call 1-888-520-3277. The Fund’s gross and net annual operating expenses, as stated in the current prospectus, are 1.28% and 0.90%, respectively. Shares of the Fund not purchased through reinvested dividends or capital gains and held less than 90 days are subject to a 1.00% redemption fee.
Value investing involves the risk that the Fund’s investment in companies whose securities are believed to be undervalued, relative to their underlying profitability, will not appreciate in value as anticipated.
4
THE SCHNEIDER FUNDS
Fund Expense Examples
(Unaudited)
As a shareholder of the Fund(s), you incur two types of costs: (1) transaction costs, including redemption fees; and (2) ongoing costs, including management fees and other Fund expenses. These examples are intended to help you understand your ongoing costs (in dollars) of investing in the Fund(s) and to compare these costs with the ongoing costs of investing in other mutual funds.
These examples are based on an investment of $1,000 invested at the beginning of the six months from September 1, 2012 through February 28, 2013, and held for the entire period.
Actual Expenses
The first line of the accompanying tables provides information about actual account values and actual expenses. You may use the information in this line, together with the amount you invested, to estimate the expenses that you paid over the period. Simply divide your account value by $1,000 (for example, an $8,600 account value divided by $1,000 = 8.6), then multiply the result by the number in the first line under the heading entitled “Expenses Paid During Period” to estimate the expenses you paid on your account during this period.
Hypothetical Example for Comparison Purposes
The second line of the accompanying tables provides information about hypothetical account values and hypothetical expenses based on the Fund’s actual expense ratio and an assumed rate of return of 5% per year before expenses, which is not your Fund’s actual return. The hypothetical account values and expenses may not be used to estimate the actual ending account balance or expenses you paid for the period. You may use this information to compare the ongoing costs of investing in the Fund and other funds. To do so, compare these 5% hypothetical examples with the 5% hypothetical examples that appear in the shareholder reports of other funds.
Please note that the expenses shown in the accompanying tables are meant to highlight your ongoing costs only and do not reflect any transactional costs, such as redemption fees. Therefore, the second line of the accompanying tables is useful in comparing ongoing costs only, and will not help you determine the relative total costs of owning different funds. In addition, if these transactional costs were included, your costs would have been higher.
| | | | | | | | | | | | |
| | | Schneider Small Cap Value Fund | |
| | | Beginning Account Value
September 1, 2012 | | | Ending Account Value
February 28, 2013 | | | Expenses Paid
During Period* | |
Actual | | $ | 1,000.00 | | | $ | 1,228.10 | | | $ | 6.35 | |
Hypothetical (5% return before expenses) | | | 1,000.00 | | | | 1,019.09 | | | | 5.76 | |
| |
| | | Schneider Value Fund | |
| | | Beginning Account Value
September 1, 2012 | | | Ending Account Value
February 28, 2013 | | | Expenses Paid
During Period* | |
Actual | | $ | 1,000.00 | | | $ | 1,141.20 | | | $ | 4.78 | |
Hypothetical (5% return before expenses) | | | 1,000.00 | | | | 1,020.33 | | | | 4.51 | |
| * | Expenses are equal to an annualized six-month expense ratio of 1.15% for the Schneider Small Cap Value Fund and 0.90% for the Schneider Value Fund, which includes waived fees or reimbursed expenses, multiplied by the average account value over the period, multiplied by the number of days in the most recent fiscal half-year (181), then divided by 365 to reflect the one-half year period. The Fund’s ending account values on the first line in each table are based on the actual six-month total return for each Fund of 22.81% for the Schneider Small Cap Value Fund and 14.12% for the Schneider Value Fund. |
5
THE SCHNEIDER FUNDS
SCHNEIDER SMALL CAP VALUE FUND
Portfolio Holdings Summary Table
February 28, 2013
(Unaudited)
The following table presents a summary by sector of the portfolio holdings of the Fund:
| | | | | | | | |
| | | % of Net
Assets | | | Value | |
Common Stocks: | | | | | | | | |
Banks | | | 14.4 | % | | $ | 10,413,321 | |
Home Builders | | | 9.9 | | | | 7,163,064 | |
Coal | | | 8.5 | | | | 6,145,293 | |
Insurance | | | 6.2 | | | | 4,451,221 | |
Real Estate Investment Trusts | | | 5.2 | | | | 3,747,165 | |
Oil & Gas | | | 4.3 | | | | 3,118,824 | |
Semiconductors | | | 4.3 | | | | 3,078,280 | |
Savings & Loans | | | 4.2 | | | | 3,027,061 | |
Healthcare — Services | | | 4.2 | | | | 3,014,840 | |
Commercial Services | | | 4.0 | | | | 2,882,434 | |
Office Products | | | 2.7 | | | | 1,944,993 | |
Real Estate | | | 2.6 | | | | 1,913,699 | |
Telecommunications | | | 2.6 | | | | 1,853,055 | |
Retail | | | 2.2 | | | | 1,588,568 | |
Mining | | | 1.8 | | | | 1,316,484 | |
Software | | | 1.6 | | | | 1,171,127 | |
Industrial | | | 1.5 | | | | 1,060,900 | |
Chemicals | | | 1.4 | | | | 1,031,823 | |
Internet | | | 1.4 | | | | 1,013,953 | |
Auto Manufacturers | | | 1.4 | | | | 1,000,028 | |
Miscellaneous Manfacturing | | | 1.0 | | | | 723,504 | |
Apparel | | | 0.9 | | | | 670,481 | |
Machinery — Diversified | | | 0.7 | | | | 512,086 | |
Electronics | | | 0.7 | | | | 489,530 | |
Household Durables | | | 0.7 | | | | 472,527 | |
Diversified Financial Services | | | 0.6 | | | | 453,493 | |
Airlines | | | 0.6 | | | | 451,920 | |
Computers | | | 0.6 | | | | 438,028 | |
Auto Parts | | | 0.4 | | | | 327,169 | |
Food | | | 0.4 | | | | 297,024 | |
Aerospace & Defense | | | 0.2 | | | | 146,095 | |
Securities Lending Collateral | | | 16.3 | | | | 11,746,233 | |
Corporate Bonds | | | 1.8 | | | | 1,316,953 | |
Exchange Traded Fund | | | 1.2 | | | | 863,045 | |
Liabilities In Excess of Other Assets | | | (10.5 | ) | | | (7,591,651 | ) |
| | | | | | | | |
NET ASSETS | | | 100.0 | % | | $ | 72,252,570 | |
| | | | | | | | |
Portfolio holdings are subject to change at any time.
The accompanying notes are an integral part of the financial statements.
6
THE SCHNEIDER FUNDS
SCHNEIDER VALUE FUND
Portfolio of Investments
February 28, 2013
(Unaudited)
The following table presents a summary by sector of the portfolio holdings of the Fund:
| | | | | | | | |
| | | % of Net
Assets | | | Value | |
Common Stocks: | | | | | | | | |
Banks | | | 27.3 | % | | $ | 8,828,289 | |
Oil & Gas | | | 12.8 | | | | 4,136,507 | |
Insurance | | | 12.5 | | | | 4,028,402 | |
Home Builders | | | 10.5 | | | | 3,388,673 | |
Coal | | | 8.7 | | | | 2,798,635 | |
Lodging | | | 4.4 | | | | 1,426,363 | |
Health Care — Services | | | 3.6 | | | | 1,148,305 | |
Automobile Manufacturers | | | 2.7 | | | | 864,730 | |
Electric | | | 2.2 | | | | 701,221 | |
Leisure Time | | | 2.0 | | | | 633,666 | |
Automobile Parts & Equipment | | | 1.6 | | | | 533,797 | |
Computers | | | 1.4 | | | | 450,529 | |
Aerospace & Defense | | | 1.3 | | | | 409,493 | |
Airlines | | | 1.2 | | | | 397,931 | |
Semiconductors | | | 1.0 | | | | 332,838 | |
Commercial Services | | | 1.0 | | | | 320,175 | |
Telecommunications | | | 0.7 | | | | 234,980 | |
Electronics | | | 0.1 | | | | 35,487 | |
Securities Lending Collateral | | | 12.1 | | | | 3,922,281 | |
Exchange Traded Fund | | | 0.8 | | | | 250,912 | |
Liabilities In Excess of Other Assets | | | (7.9 | ) | | | (2,556,716 | ) |
| | | | | | | | |
NET ASSETS | | | 100.0 | % | | $ | 32,286,498 | |
| | | | | | | | |
Portfolio holdings are subject to change at any time.
The accompanying notes are an integral part of the financial statements.
7
THE SCHNEIDER FUNDS
SCHNEIDER SMALL CAP VALUE FUND
Portfolio of Investments
February 28, 2013
(Unaudited)
| | | | | | | | |
| | | Shares | | | Value | |
| | | | | | | | |
COMMON STOCKS — 91.2% | | | | | | | | |
Aerospace & Defense — 0.2% | | | | | | | | |
AAR Corp. | | | 8,315 | | | $ | 146,095 | |
| | | | | | | | |
Airlines — 0.6% | | | | | | | | |
US Airways Group, Inc. * (a) | | | 33,650 | | | | 451,920 | |
| | | | | | | | |
Apparel — 0.9% | | | | | | | | |
Barry (R.G.) Corp. | | | 54,334 | | | | 670,481 | |
| | | | | | | | |
Auto Manufacturers — 1.4% | | | | | | | | |
Navistar International Corp. * (a) | | | 40,275 | | | | 1,000,028 | |
| | | | | | | | |
Auto Parts — 0.4% | | | | | | | | |
Modine Manufacturing Co. * | | | 39,705 | | | | 327,169 | |
| | | | | | | | |
Banks — 14.4% | | | | | | | | |
First BanCorp/Puerto Rico * (a) | | | 229,379 | | | | 1,254,703 | |
First Horizon National Corp. | | | 345,620 | | | | 3,673,941 | |
MainSource Financial Group, Inc. | | | 103,343 | | | | 1,446,802 | |
Popular Inc. * | | | 1 | | | | 14 | |
Regions Financial Corp. | | | 527,825 | | | | 4,037,861 | |
| | | | | | | | |
| | | | | | | 10,413,321 | |
| | | | | | | | |
Chemicals — 1.4% | | | | | | | | |
Ferro Corp. * | | | 201,135 | | | | 1,031,823 | |
| | | | | | | | |
Coal — 8.5% | | | | | | | | |
Arch Coal, Inc. (a) | | | 691,254 | | | | 3,615,258 | |
Cloud Peak Energy, Inc. * | | | 147,610 | | | | 2,530,035 | |
| | | | | | | | |
| | | | | | | 6,145,293 | |
| | | | | | | | |
Commercial Services — 4.0% | | | | | | | | |
Aegean Marine Petroleum Network, Inc. | | | 127,420 | | | | 829,504 | |
Hudson Global Inc * | | | 355,425 | | | | 1,307,964 | |
Insperity, Inc. | | | 17,276 | | | | 489,775 | |
Monster Worldwide, Inc. * (a) | | | 49,842 | | | | 255,191 | |
| | | | | | | | |
| | | | | | | 2,882,434 | |
| | | | | | | | |
Computers — 0.6% | | | | | | | | |
Xyratex Ltd. (a) | | | 47,457 | | | | 438,028 | |
| | | | | | | | |
Diversified Financial Services — 0.6% | | | | | |
Doral Financial Corp. * | | | 796,301 | | | | 453,493 | |
| | | | | | | | |
Electronics — 0.7% | | | | | | | | |
Kemet Corp. * | | | 52,520 | | | | 339,804 | |
Pulse Electronics, Inc. * | | | 385,893 | | | | 149,726 | |
| | | | | | | | |
| | | | | | | 489,530 | |
| | | | | | | | |
| | | | | | | | |
| | | Shares | | | Value | |
| | | | | | | | |
Food — 0.4% | | | | | | | | |
Sanderson Farms, Inc. | | | 5,855 | | | $ | 297,024 | |
| | | | | | | | |
Healthcare - Services — 4.2% | | | | | | | | |
Emeritus Corp. * | | | 61,046 | | | | 1,739,200 | |
Five Star Quality Care, Inc. * | | | 201,205 | | | | 1,275,640 | |
| | | | | | | | |
| | | | | | | 3,014,840 | |
| | | | | | | | |
Home Builders — 9.9% | | | | | | | | |
M/ I Homes, Inc. * (a) | | | 22,305 | | | | 510,785 | |
Meritage Homes Corp. * | | | 91,290 | | | | 3,696,332 | |
NVR, Inc. * | | | 2,929 | | | | 2,955,947 | |
| | | | | | | | |
| | | | | | | 7,163,064 | |
| | | | | | | | |
Household Durables — 0.7% | | | | | | | | |
Standard Pacific Corp. * (a) | | | 58,050 | | | | 472,527 | |
| | | | | | | | |
Industrial — 1.5% | | | | | | | | |
FreightCar America, Inc. | | | 50,447 | | | | 1,060,900 | |
| | | | | | | | |
Insurance — 6.2% | | | | | | | | |
Aspen Insurance Holdings, Ltd. | | | 80,840 | | | | 2,898,922 | |
Assured Guaranty, Ltd. | | | 40,145 | | | | 749,507 | |
Employers Holdings, Inc. | | | 38,210 | | | | 802,792 | |
| | | | | | | | |
| | | | | | | 4,451,221 | |
| | | | | | | | |
Internet — 1.4% | | | | | | | | |
ICG Group, Inc. * | | | 34,220 | | | | 445,887 | |
ModusLink Global Solutions, Inc. * | | | 197,245 | | | | 568,066 | |
| | | | | | | | |
| | | | | | | 1,013,953 | |
| | | | | | | | |
Machinery - Diversified — 0.7% | | | | | | | | |
Flow International Corp. * | | | 26,317 | | | | 97,636 | |
Intevac, Inc. * | | | 86,705 | | | | 414,450 | |
| | | | | | | | |
| | | | | | | 512,086 | |
| | | | | | | | |
Mining — 1.8% | | | | | | | | |
Alumina Ltd. SP ADR | | | 128,859 | | | | 632,698 | |
Golden Star Resources Ltd. * | | | 30,780 | | | | 48,632 | |
Thompson Creek Metals Co., Inc. * (a) | | | 186,810 | | | | 635,154 | |
| | | | | | | | |
| | | | | | | 1,316,484 | |
| | | | | | | | |
Miscellaneous Manfacturing — 1.0% | | | | | |
Orbotech, Ltd. * | | | 75,365 | | | | 723,504 | |
| | | | | | | | |
Office Products — 2.7% | | | | | | | | |
OfficeMax, Inc. | | | 162,489 | | | | 1,944,993 | |
| | | | | | | | |
Oil & Gas — 4.3% | | | | | | | | |
Willbros Group, Inc * | | | 217,877 | | | | 1,470,670 | |
WPX Energy, Inc. * | | | 116,149 | | | | 1,648,154 | |
| | | | | | | | |
| | | | | | | 3,118,824 | |
| | | | | | | | |
The accompanying notes are an integral part of the financial statements.
8
THE SCHNEIDER FUNDS
SCHNEIDER SMALL CAP VALUE FUND
Portfolio of Investments (Continued)
February 28, 2013
(Unaudited)
| | | | | | | | | | |
| | | |
| | | Shares | | | | | Value | |
| | | | | | | | | | |
Real Estate — 2.6% | | | | | | | | | | |
Forestar Group, Inc. * | | | 65,543 | | | | | $ | 1,141,759 | |
Thomas Properties Group, Inc. | | | 148,165 | | | | | | 771,940 | |
| | | | | | | | | | |
| | | | | | | | | 1,913,699 | |
| | | | | | | | | | |
Real Estate Investment Trusts — 5.2% | | | | | | | |
NorthStar Realty Finance Corp. (a) | | | 206,305 | | | | | | 1,846,430 | |
Redwood Trust, Inc. | | | 38,810 | | | | | | 786,291 | |
Strategic Hotels & Resorts, Inc. * | | | 153,083 | | | | | | 1,114,444 | |
| | | | | | | | | | |
| | | | | | | | | 3,747,165 | |
| | | | | | | | | | |
Retail — 2.2% | | | | | | | | | | |
MarineMax, Inc. * | | | 118,206 | | | | | | 1,530,768 | |
Wet Seal Inc./The Class A * | | | 19,660 | | | | | | 57,800 | |
| | | | | | | | | | |
| | | | | | | | | 1,588,568 | |
| | | | | | | | | | |
Savings & Loans — 4.2% | | | | | | | | | | |
First Financial Holdings, Inc. | | | 19,704 | | | | | | 393,292 | |
Flagstar Bancorp, Inc. * (a) | | | 193,802 | | | | | | 2,633,769 | |
| | | | | | | | | | |
| | | | | | | | | 3,027,061 | |
| | | | | | | | | | |
Semiconductors — 4.3% | | | | | | | | | | |
ATMI, Inc. * | | | 37,444 | | | | | | 820,024 | |
Axcelis Technologies, Inc. * | | | 523,478 | | | | | | 596,765 | |
International Rectifier Corp. * | | | 5,930 | | | | | | 124,649 | |
Magnachip Semiconductor Corp. * | | | 50,535 | | | | | | 795,926 | |
MEMC Electronic Materials, Inc. * | | | 149,680 | | | | | | 740,916 | |
| | | | | | | | | | |
| | | | | | | | | 3,078,280 | |
| | | | | | | | | | |
Software — 1.6% | | | | | | | | | | |
Take-Two Interactive Software, Inc. * | | | 79,995 | | | | | | 1,171,127 | |
| | | | | | | | | | |
Telecommunications — 2.6% | | | | | | | | | | |
Aviat Networks, Inc. * | | | 520,521 | | | | | | 1,853,055 | |
| | | | | | | | | | |
TOTAL COMMON STOCKS
(Cost $50,119,410) | | | | | | | | | 65,917,990 | |
| | | | | | | | | | |
| | | Par
(000) | | | | | | |
| | | | | | | | | | |
CORPORATE BONDS — 1.8% | | | | | | | | | | |
LandAmerica Financial Group, Inc. CONV ‡ 3.25%, 05/15/34 | | $ | 59 | | | | | | 8,554 | |
Northstar Realty Finance Corp. ^ CONV 7.50%, 03/15/31 | | | 358 | | | | | | 532,749 | |
Pulse Electronics Corp. CONV
7.00%, 12/15/14 | | | 172 | | | | | | 119,755 | |
| | | | | | | | | | |
| | | Par
(000) | | | | | Value | |
RAIT Financial Trust CONV
7.00%, 04/01/31 | | $ | 563 | | | | | $ | 655,895 | |
| | | | | | | | | | |
TOTAL CORPORATE BONDS
(Cost $1,057,818) | | | | | | | | | 1,316,953 | |
| | | | | | | | | | |
| | | Shares | | | | | | |
EXCHANGE TRADED FUND — 1.2% | | | | | | | |
Finance — 1.2% | | | | | | | | | | |
iShares Russell 2000 Value Index Fund (a) | | | 10,672 | | | | | | 863,045 | |
| | | | | | | | | | |
TOTAL EXCHANGE TRADED FUND
(Cost $856,945) | | | | | | | | | 863,045 | |
| | | | | | | | | | |
SECURITIES LENDING COLLATERAL — 16.3% | | | | | | | |
BlackRock Liquidity Fund | | | 11,746,233 | | | | | | 11,746,233 | |
| | | | | | | | | | |
TOTAL SECURITIES LENDING COLLATERAL
(Cost $11,746,233) | | | | | | | | | 11,746,233 | |
| | | | | | | | | | |
TOTAL INVESTMENTS — 110.5% (Cost $63,780,406) | | | | | | | | | 79,844,221 | |
| | | | | | | | | | |
LIABILITIES IN EXCESS OF OTHER ASSETS — (10.5)% | | | | | | | | | (7,591,651 | ) |
| | | | | | | | | | |
NET ASSETS — 100.0% | | | | | | | | $ | 72,252,570 | |
| | | | | | | | | | |
| (a) | All or a portion of the security is on loan. At February 28, 2013, the market value of securities on loan was $11,124,332. |
| ‡ | Holding in default resolution. Value has been determined in good faith by or under the direction of The RBB Fund, Inc’s Board of Directors to be the estimated value of the future payouts under the default resolution. As of February 28, 2013, this holding amounted to $8,554 or 0.0% of net assets and is deemed illiquid by the portfolio manager pursuant to the Fund’s policies and procedures. |
| ^ | Security was purchased pursuant to Rule 144A under Securities Act of 1933 and may not be resold subject to that rule except to qualified institutional buyers. As of February 28, 2013, this security amounted to $532,749 or 0.7% of net assets. |
| SP ADR | Sponsored American Depositary Receipt |
The accompanying notes are an integral part of the financial statements.
9
THE SCHNEIDER FUNDS
SCHNEIDER VALUE FUND
Portfolio of Investments
February 28, 2013
(Unaudited)
| | | | | | | | | | |
| | | Shares | | | | | Value | |
| | | | | | | | | | |
COMMON STOCKS — 95.0% | | | | | | | | | | |
Aerospace & Defense — 1.3% | | | | | | | | | | |
Boeing Co. (The) | | | 5,325 | | | | | $ | 409,493 | |
| | | | | | | | | | |
Airlines — 1.2% | | | | | | | | | | |
US Airways Group, Inc. * | | | 29,630 | | | | | | 397,931 | |
| | | | | | | | | | |
Automobile Manufacturers — 2.7% | | | | | | | | | | |
Navistar International Corp. *(a) | | | 34,826 | | | | | | 864,730 | |
| | | | | | | | | | |
Automobile Parts & Equipment — 1.6% | | | | | | | |
Magna International, Inc. | | | 10,030 | | | | | | 533,797 | |
| | | | | | | | | | |
Banks — 27.3% | | | | | | | | | | |
Bank of America Corp. | | | 96,550 | | | | | | 1,084,257 | |
Citigroup, Inc. | | | 40,124 | | | | | | 1,684,004 | |
Huntington Bancshares, Inc. | | | 48,305 | | | | | | 339,584 | |
JPMorgan Chase & Co. | | | 37,545 | | | | | | 1,836,701 | |
KeyCorp | | | 38,180 | | | | | | 358,510 | |
PNC Financial Services Group, Inc. | | | 4,835 | | | | | | 301,656 | |
Regions Financial Corp. | | | 114,700 | | | | | | 877,455 | |
SunTrust Banks, Inc. | | | 78,004 | | | | | | 2,152,130 | |
Wells Fargo & Co. | | | 5,530 | | | | | | 193,992 | |
| | | | | | | | | | |
| | | | | | | | | 8,828,289 | |
| | | | | | | | | | |
Coal — 8.7% | | | | | | | | | | |
Arch Coal, Inc. (a) | | | 212,725 | | | | | | 1,112,552 | |
Consol Energy, Inc. | | | 10,300 | | | | | | 331,145 | |
Peabody Energy Corp. | | | 62,845 | | | | | | 1,354,938 | |
| | | | | | | | | | |
| | | | | | | | | 2,798,635 | |
| | | | | | | | | | |
Commercial Services — 1.0% | | | | | | | | | | |
Aegean Marine Petroleum Network, Inc. | | | 49,182 | | | | | | 320,175 | |
| | | | | | | | | | |
Computers — 1.4% | | | | | | | | | | |
Dell, Inc. | | | 32,296 | | | | | | 450,529 | |
| | | | | | | | | | |
Electric — 2.2% | | | | | | | | | | |
FirstEnergy Corp. | | | 4,021 | | | | | | 158,749 | |
NRG Energy, Inc. | | | 22,603 | | | | | | 542,472 | |
| | | | | | | | | | |
| | | | | | | | | 701,221 | |
| | | | | | | | | | |
Electronics — 0.1% | | | | | | | | | | |
Avnet, Inc. * | | | 1,005 | | | | | | 35,487 | |
| | | | | | | | | | |
Health Care - Services — 3.6% | | | | | | | | | | |
Brookdale Senior Living, Inc. * | | | 41,485 | | | | | | 1,148,305 | |
| | | | | | | | | | |
| | | | | | | | | | |
| | | Shares | | | | | Value | |
| | | | | | | | | | |
Home Builders — 10.5% | | | | | | | | | | |
Meritage Homes Corp. * | | | 12,380 | | | | | $ | 501,266 | |
NVR, Inc. * | | | 1,078 | | | | | | 1,087,918 | |
Toll Brothers, Inc. * | | | 52,740 | | | | | | 1,799,489 | |
| | | | | | | | | | |
| | | | | | | | | 3,388,673 | |
| | | | | | | | | | |
Insurance — 12.5% | | | | | | | | | | |
ACE Ltd. | | | 15,115 | | | | | | 1,290,669 | |
Allstate Corp., (The) | | | 21,290 | | | | | | 979,766 | |
Assured Guaranty, Ltd. | | | 40,881 | | | | | | 763,248 | |
Axis Capital Holdings, Ltd. | | | 9,825 | | | | | | 400,172 | |
Genworth Financial, Inc., Class A * | | | 31,545 | | | | | | 269,394 | |
WR Berkley Corp. | | | 7,835 | | | | | | 325,153 | |
| | | | | | | | | | |
| | | | | | | | | 4,028,402 | |
| | | | | | | | | | |
Leisure Time — 2.0% | | | | | | | | | | |
Carnival Corp. | | | 17,715 | | | | | | 633,666 | |
| | | | | | | | | | |
Lodging — 4.4% | | | | | | | | | | |
Marriott International, Inc., Class A | | | 29,445 | | | | | | 1,161,605 | |
Orient-Express Hotels, Ltd., Class A * | | | 25,630 | | | | | | 264,758 | |
| | | | | | | | | | |
| | | | | | | | | 1,426,363 | |
| | | | | | | | | | |
Oil & Gas — 12.8% | | | | | | | | | | |
Chesapeake Energy Corp. (a) | | | 88,271 | | | | | | 1,779,543 | |
Devon Energy Corp. | | | 14,740 | | | | | | 799,792 | |
Weatherford International, Ltd. * | | | 66,390 | | | | | | 788,713 | |
WPX Energy, Inc. * | | | 54,155 | | | | | | 768,459 | |
| | | | | | | | | | |
| | | | | | | | | 4,136,507 | |
| | | | | | | | | | |
Semiconductors — 1.0% | | | | | | | | | | |
MEMC Electronic Materials, Inc. * | | | 67,240 | | | | | | 332,838 | |
| | | | | | | | | | |
Telecommunications — 0.7% | | | | | | | | | | |
Cisco Systems, Inc. | | | 11,270 | | | | | | 234,980 | |
| | | | | | | | | | |
TOTAL COMMON STOCKS
(Cost $24,978,881) | | | | | | | | | 30,670,021 | |
| | | | | | | | | | |
EXCHANGE TRADED FUND — 0.8% | | | | | | | | | | |
Finance — 0.8% | | | | | | | | | | |
iShares Russell 1000 Value Index Fund | | | 3,200 | | | | | | 250,912 | |
| | | | | | | | | | |
TOTAL EXCHANGE TRADED FUND
(Cost $236,070) | | | | | | | | | 250,912 | |
| | | | | | | | | | |
The accompanying notes are an integral part of the financial statements.
10
THE SCHNEIDER FUNDS
SCHNEIDER VALUE FUND
Portfolio of Investments (Concluded)
February 28, 2013
(Unaudited)
| | | | | | | | |
| | | Shares | | | Value | |
SECURITIES LENDING COLLATERAL — 12.1% | | | | | |
BlackRock Liquidity Fund | | | 3,922,281 | | | $ | 3,922,281 | |
| | | | | | | | |
TOTAL SECURITIES LENDING COLLATERAL
(Cost $3,922,281) | | | | | | | 3,922,281 | |
| | | | | | | | |
TOTAL INVESTMENTS — 107.9%
(Cost $29,137,232) | | | | | | | 34,843,214 | |
| | | | | | | | |
LIABILITIES IN EXCESS OF OTHER ASSETS — (7.9)% | | | | | | | (2,556,716 | ) |
| | | | | | | | |
NET ASSETS — 100.0% | | | | | | $ | 32,286,498 | |
| | | | | | | | |
| (a) | All or a portion of the security is on loan. At February 28, 2013, market value of securities on loan was $3,756,825. |
The accompanying notes are an integral part of the financial statements.
11
THE SCHNEIDER FUNDS
Statements of Assets & Liabilities
February 28, 2013
(Unaudited)
| | | | | | | | | | |
| | | Schneider
Small Cap
Value Fund | | | Schneider
Value Fund | | | |
ASSETS | | | | | | | | | | |
Investments, at value †^ | | $ | 79,844,221 | | | $ | 34,843,214 | | | |
Cash and cash equivalents | | | 4,611,896 | | | | 1,476,538 | | | |
Receivables | | | | | | | | | | |
Investments sold | | | 1,263,173 | | | | 73,380 | | | |
Dividends and interest | | | 114,247 | | | | 35,516 | | | |
Prepaid expenses and other assets | | | 23,853 | | | | 15,228 | | | |
| | | | | | | | | | |
Total assets | | | 85,857,390 | | | | 36,443,876 | | | |
| | | | | | | | | | |
| | | |
LIABILITIES | | | | | | | | | | |
Payables | | | | | | | | | | |
Securities lending collateral | | | 11,746,233 | | | | 3,922,281 | | | |
Investments purchased | | | 1,633,105 | | | | 124,819 | | | |
Capital shares redeemed | | | 113,981 | | | | 46,094 | | | |
Investment adviser | | | 37,878 | | | | 933 | | | |
Other accrued expenses and liabilities | | | 73,623 | | | | 63,251 | | | |
| | | | | | | | | | |
Total liabilities | | | 13,604,820 | | | | 4,157,378 | | | |
| | | | | | | | | | |
Net Assets | | $ | 72,252,570 | | | $ | 32,286,498 | | | |
| | | | | | | | | | |
| | | |
NET ASSETS CONSIST OF | | | | | | | | | | |
Par value | | $ | 3,656 | | | $ | 2,239 | | | |
Paid-in capital | | | 57,556,450 | | | | 161,865,465 | | | |
Undistributed/accumulated net investment income/(loss) | | | (423,904 | ) | | | 84,935 | | | |
Accumulated net realized loss from investments | | | (947,447 | ) | | | (135,372,123 | ) | | |
Net unrealized appreciation on investments | | | 16,063,815 | | | | 5,705,982 | | | |
| | | | | | | | | | |
Net Assets | | $ | 72,252,570 | | | $ | 32,286,498 | | | |
| | | | | | | | | | |
Shares outstanding ($0.001 par value, 100,000,000 shares authorized) | | | 3,655,618 | | | | 2,239,231 | | | |
| | | | | | | | | | |
Net asset value, offering and redemption price per share | | $ | 19.76 | | | $ | 14.42 | | | |
| | | | | | | | | | |
† Investment in securities, at cost | | $ | 63,780,406 | | | $ | 29,137,232 | | | |
| | | | | | | | | | |
^ Includes market value of securities on loan | | $ | 11,124,332 | | | $ | 3,756,825 | | | |
| | | | | | | | | | |
The accompanying notes are an integral part of the financial statements.
12
THE SCHNEIDER FUNDS
Statements of Operations
For the Six Months Ended February 28, 2013
(Unaudited)
| | | | | | | | |
| | | Schneider
Small Cap
Value Fund | | | Schneider
Value Fund | |
Investment Income | | | | | | | | |
Dividends † | | $ | 339,448 | | | $ | 233,327 | |
Securities Lending Income | | | 5,792 | | | | 5,269 | |
Interest | | | 46,878 | | | | 229 | |
| | | | | | | | |
Total investment income | | | 392,118 | | | | 238,825 | |
| | | | | | | | |
| | |
Expenses | | | | | | | | |
Advisory fees | | | 337,369 | | | | 119,577 | |
Administration and accounting fees | | | 61,409 | | | | 55,545 | |
Transfer agent fees | | | 31,135 | | | | 27,261 | |
Custodian fees | | | 25,515 | | | | 11,555 | |
Professional fees | | | 24,149 | | | | 20,462 | |
Directors’ and officers’ fees | | | 12,708 | | | | 11,882 | |
Printing and shareholder reporting fees | | | 7,589 | | | | 4,867 | |
Registration and filing fees | | | 7,057 | | | | 12,843 | |
Insurance fees | | | 3,728 | | | | 2,498 | |
Other expenses | | | 1,115 | | | | 526 | |
| | | | | | | | |
Total expenses before waivers and reimbursements | | | 511,774 | | | | 267,016 | |
Less: waivers and reimbursements | | | (123,800 | ) | | | (113,127 | ) |
| | | | | | | | |
Net expenses after waivers and reimbursements | | | 387,974 | | | | 153,889 | |
| | | | | | | | |
Net investment income | | | 4,144 | | | | 84,936 | |
| | | | | | | | |
| | |
Net realized and unrealized gain from investments | | | | | | | | |
Net realized gain from: | | | | | | | | |
Investments | | | 6,001,696 | | | | 2,329,291 | |
Net change in unrealized appreciation on: | | | | | | | | |
Investments | | | 7,780,740 | | | | 2,562,816 | |
| | | | | | | | |
Net realized and unrealized gain on investments | | | 13,782,436 | | | | 4,892,107 | |
| | | | | | | | |
Net increase in net assets resulting from operations | | $ | 13,786,580 | | | $ | 4,977,043 | |
| | | | | | | | |
† Net of foreign withholding taxes of | | $ | — | | | $ | (498 | ) |
| | | | | | | | |
The accompanying notes are an integral part of the financial statements.
13
THE SCHNEIDER FUNDS
SCHNEIDER SMALL CAP VALUE FUND
Statement of Changes in Net Assets
| | | | | | | | |
| | | For the Six Months
Ended
February 28, 2013
(Unaudited) | | | For the Year
Ended
August 31, 2012 | |
Increase/(decrease) in net assets from operations: | | | | | | | | |
Net investment income/(loss) | | $ | 4,144 | | �� | $ | (428,048 | ) |
Net realized gain from investments | | | 6,001,696 | | | | 2,801,491 | |
Net change in unrealized appreciation from investments | | | 7,780,740 | | | | 8,443,417 | |
| | | | | | | | |
Net increase in net assets resulting from operations | | | 13,786,580 | | | | 10,816,860 | |
| | | | | | | | |
| | |
Capital transactions: | | | | | | | | |
Proceeds from shares sold | | | 2,173,112 | | | | 2,521,948 | |
Redemption fees * | | | 2,503 | | | | 29,495 | |
Shares redeemed | | | (6,400,597 | ) | | | (20,375,734 | ) |
| | | | | | | | |
Net decrease in net assets from capital share transactions | | | (4,224,982 | ) | | | (17,824,291 | ) |
| | | | | | | | |
Total increase/(decrease) in net assets | | | 9,561,598 | | | | (7,007,431 | ) |
| | | | | | | | |
| | |
Net assets: | | | | | | | | |
Beginning of period | | | 62,690,972 | | | | 69,698,403 | |
| | | | | | | | |
End of period | | $ | 72,252,570 | | | $ | 62,690,972 | |
| | | | | | | | |
Accumulated net investment loss, end of period | | $ | (423,904 | ) | | $ | (428,048 | ) |
| | |
Share transactions: | | | | | | | | |
Shares sold | | | 113,461 | | | | 177,643 | |
Shares redeemed | | | (353,639 | ) | | | (1,368,760 | ) |
| | | | | | | | |
Total share transactions | | | (240,178 | ) | | | (1,191,117 | ) |
| | | | | | | | |
| * | There is a 1.75% redemption fee on shares redeemed which have been held less than one year in the Schneider Small Cap Value Fund. The redemption fees are retained by the Fund for the benefit of the remaining shareholders and recorded as paid-in capital. |
The accompanying notes are an integral part of the financial statements.
14
THE SCHNEIDER FUNDS
SCHNEIDER VALUE FUND
Statement of Changes in Net Assets
| | | | | | | | |
| | | For the Six Months
Ended
February 28, 2013
(Unaudited) | | | For the Year
Ended
August 31, 2012 | |
| | |
Increase/(decrease) in net assets from operations: | | | | | | | | |
Net investment income | | $ | 84,936 | | | $ | 339,821 | |
Net realized gain from investments | | | 2,329,291 | | | | 2,186,018 | |
Net change in unrealized appreciation/(depreciation) from investments | | | 2,562,816 | | | | (818,237 | ) |
| | | | | | | | |
Net increase in net assets resulting from operations | | | 4,977,043 | | | | 1,707,602 | |
| | | | | | | | |
| | |
Dividends and distributions to shareholders from: | | | | | | | | |
Net investment income | | | (339,819 | ) | | | (296,010 | ) |
| | | | | | | | |
Net decrease in net assets from dividends and distributions to shareholders | | | (339,819 | ) | | | (296,010 | ) |
| | | | | | | | |
| | |
Capital transactions: | | | | | | | | |
Proceeds from shares sold | | | 412,995 | | | | 1,030,485 | |
Reinvestment of distributions | | | 327,112 | | | | 286,585 | |
Redemption fees * | | | — | | | | 249 | |
Shares redeemed | | | (16,809,828 | ) | | | (26,949,644 | ) |
| | | | | | | | |
Net decrease in net assets from capital share transactions | | | (16,069,721 | ) | | | (25,632,325 | ) |
| | | | | | | | |
Total decrease in net assets | | | (11,432,497 | ) | | | (24,220,733 | ) |
| | | | | | | | |
| | |
Net assets: | | | | | | | | |
Beginning of period | | | 43,718,995 | | | | 67,939,728 | |
| | | | | | | | |
End of period | | $ | 32,286,498 | | | $ | 43,718,995 | |
| | | | | | | | |
Undistributed net investment income, end of period | | $ | 84,935 | | | $ | 339,818 | |
| | |
Share transactions: | | | | | | | | |
Shares sold | | | 29,775 | | | | 82,574 | |
Dividends and distributions reinvested | | | 24,503 | | | | 24,042 | |
Shares redeemed | | | (1,237,595 | ) | | | (2,119,352 | ) |
| | | | | | | | |
Total share transactions | | | (1,183,317 | ) | | | (2,012,736 | ) |
| | | | | | | | |
| * | There is a 1.00% redemption fee on shares redeemed which have been held less than 90 days in the Schneider Value Fund. The redemption fees are retained by the Fund for the benefit of the remaining shareholders and recorded as paid-in capital. |
The accompanying notes are an integral part of the financial statements.
15
THE SCHNEIDER FUNDS
SCHNEIDER SMALL CAP VALUE FUND
Financial Highlights
Contained below is per share operating performance data for a share outstanding during each period, total investment return, ratios to average net assets and other supplemental data for the respective periods. This information has been derived from information provided in the financial statements.
| | | | | | | | | | | | | | | | | | | | | | | | |
| | | For the
Six Months Ended
February 28, 2013
(Unaudited) | | | For the Years Ended August 31, | |
| | | | 2012 | | | 2011 | | | 2010 | | | 2009 | | | 2008 | |
Per Share Operating Performance | | | | | | | | | | | | | | | | | | | | | | | | |
Net asset value, beginning of period | | $ | 16.09 | | | $ | 13.70 | | | $ | 13.19 | | | $ | 12.34 | | | $ | 14.54 | | | $ | 19.06 | |
| | | | | | | | | | | | | | | | | | | | | | | | |
Net investment income/(loss) | | | 0.02 | | | | (0.11 | ) | | | (0.06 | ) | | | (0.11 | ) | | | 0.12 | | | | 0.16 | |
Net realized and unrealized gain/(loss) on investments and foreign currency transactions | | | 3.65 | | | | 2.49 | | | | 0.56 | | | | 1.01 | | | | (2.20 | ) | | | (3.81 | ) |
| | | | | | | | | | | | | | | | | | | | | | | | |
Net increase/(decrease) in net assets resulting from operations | | | 3.67 | | | | 2.38 | | | | 0.50 | | | | 0.90 | | | | (2.08 | ) | | | (3.65 | ) |
| | | | | | | | | | | | | | | | | | | | | | | | |
Dividends and distributions to shareholders from: | | | | | | | | | | | | | | | | | | | | | | | | |
Net investment income | | | — | | | | — | | | | — | | | | (0.07 | ) | | | (0.18 | ) | | | (0.32 | ) |
Net realized capital gains | | | — | | | | — | | | | — | | | | — | | | | — | (1) | | | (0.55 | ) |
| | | | | | | | | | | | | | | | | | | | | | | | |
Total dividends and distributions to shareholders | | | — | | | | — | | | | — | | | | (0.07 | ) | | | (0.18 | ) | | | (0.87 | ) |
| | | | | | | | | | | | | | | | | | | | | | | | |
Redemption fees | | | — | (1) | | | 0.01 | | | | 0.01 | | | | 0.02 | | | | 0.06 | | | | — | (1) |
| | | | | | | | | | | | | | | | | | | | | | | | |
Net asset value, end of period | | $ | 19.76 | | | $ | 16.09 | | | $ | 13.70 | | | $ | 13.19 | | | $ | 12.34 | | | $ | 14.54 | |
| | | | | | | | | | | | | | | | | | | | | | | | |
Total investment return(2) | | | 22.81 | %(3) | | | 17.45 | % | | | 3.87 | % | | | 7.48 | % | | | (13.20 | )% | | | (19.78 | )% |
| | | | | | | | | | | | | | | | | | | | | | | | |
| | | | | | |
Ratio/Supplemental Data | | | | | | | | | | | | | | | | | | | | | | | | |
Net assets, end of period (000’s omitted) | | $ | 72,253 | | | $ | 62,691 | | | $ | 69,698 | | | $ | 73,243 | | | $ | 98,283 | | | $ | 91,691 | |
Ratio of expenses to average net assets(4) | | | 1.15 | %(5) | | | 1.15 | % | | | 1.15 | % | | | 1.15 | % | | | 1.14 | % | | | 1.10 | % |
Ratio of expenses to average net assets without waivers and expense reimbursements | | | 1.52 | %(5) | | | 1.52 | % | | | 1.40 | % | | | 1.43 | % | | | 1.42 | % | | | 1.49 | % |
Ratio of net investment income/(loss) to average net assets(4) | | | 0.01 | %(5) | | | (0.64 | )% | | | (0.33 | )% | | | (0.65 | )% | | | 0.97 | % | | | 0.92 | % |
Portfolio turnover rate | | | 32.20 | %(3) | | | 67.85 | % | | | 59.18 | % | | | 83.39 | % | | | 122.36 | % | | | 116.34 | % |
| (1) | Amount is less than $0.005 per share. |
| (2) | Total investment return is calculated by assuming a purchase of shares on the first day and a sale of shares on the last day of each period reported and includes reinvestments of dividends and distributions, if any. |
| (4) | Reflects waivers and reimbursements. |
The accompanying notes are an integral part of the financial statements.
16
THE SCHNEIDER FUNDS
SCHNEIDER VALUE FUND
Financial Highlights
Contained below is per share operating performance data for a share outstanding during each period, total investment return, ratios to average net assets and other supplemental data for the respective periods. This information has been derived from information provided in the financial statements.
| | | | | | | | | | | | | | | | | | | | | | | | |
| | | For the
Six Months Ended
February 28, 2013
(Unaudited) | | | For the Years Ended August 31, | |
| | | | 2012 | | | 2011 | | | 2010 | | | 2009 | | | 2008 | |
Per Share Operating Performance | | | | | | | | | | | | | | | | | | | | | | | | |
Net asset value, beginning of period | | $ | 12.77 | | | $ | 12.50 | | | $ | 11.72 | | | $ | 12.14 | | | $ | 16.37 | | | $ | 23.13 | |
| | | | | | | | | | | | | | | | | | | | | | | | |
Net investment income | | | 0.08 | | | | 0.10 | | | | 0.07 | | | | 0.08 | | | | 0.34 | | | | 0.37 | |
Net realized and unrealized gain/(loss) from investments and foreign currency transactions | | | 1.71 | | | | 0.23 | | | | 0.80 | | | | (0.23 | ) | | | (4.14 | ) | | | (5.89 | ) |
| | | | | | | | | | | | | | | | | | | | | | | | |
Net increase/(decrease) in net assets resulting from operations | | | 1.79 | | | | 0.33 | | | | 0.87 | | | | (0.15 | ) | | | (3.80 | ) | | | (5.52 | ) |
| | | | | | | | | | | | | | | | | | | | | | | | |
Dividends and distributions to shareholders from: | | | | | | | | | | | | | | | | | | | | | | | | |
Net investment income | | | (0.14 | ) | | | (0.06 | ) | | | (0.09 | ) | | | (0.27 | ) | | | (0.43 | ) | | | (0.14 | ) |
Net realized capital gains | | | — | | | | — | | | | — | | | | — | | | | — | | | | (1.10 | ) |
| | | | | | | | | | | | | | | | | | | | | | | | |
Total dividends and distributions to shareholders | | | (0.14 | ) | | | (0.06 | ) | | | (0.09 | ) | | | (0.27 | ) | | | (0.43 | ) | | | (1.24 | ) |
| | | | | | | | | | | | | | | | | | | | | | | | |
Redemption fees | | | — | | | | — | (1) | | | — | (1) | | | — | (1) | | | — | (1) | | | — | (1) |
| | | | | | | | | | | | | | | | | | | | | | | | |
Net asset value, end of period | | $ | 14.42 | | | $ | 12.77 | | | $ | 12.50 | | | $ | 11.72 | | | $ | 12.14 | | | $ | 16.37 | |
| | | | | | | | | | | | | | | | | | | | | | | | |
Total investment return(2) | | | 14.12 | %(3) | | | 2.67 | % | | | 7.35 | % | | | (1.30 | )% | | | (22.06 | )% | | | (25.05 | )% |
| | | | | | | | | | | | | | | | | | | | | | | | |
| | | | | | |
Ratio/Supplemental Data | | | | | | | | | | | | | | | | | | | | | | | | |
Net assets, end of period (000’s omitted) | | $ | 32,286 | | | $ | 43,719 | | | $ | 67,940 | | | $ | 98,953 | | | $ | 118,467 | | | $ | 225,036 | |
Ratio of expenses to average net assets(4) | | | 0.90 | %(5) | | | 0.90 | % | | | 0.90 | % | | | 0.90 | % | | | 0.88 | % | | | 0.85 | % |
Ratio of expenses to average net assets without waivers and expense reimbursements | | | 1.56 | %(5) | | | 1.28 | % | | | 1.07 | % | | | 1.03 | % | | | 1.14 | % | | | 1.09 | % |
Ratio of net investment income to average net assets(4) | | | 0.50 | %(5) | | | 0.63 | % | | | 0.31 | % | | | 0.52 | % | | | 2.24 | % | | | 1.61 | % |
Portfolio turnover rate | | | 27.93 | %(3) | | | 55.87 | % | | | 67.80 | % | | | 79.30 | % | | | 107.13 | % | | | 101.98 | % |
| (1) | Amount is less than $0.005 per share. |
| (2) | Total investment return is calculated by assuming a purchase of shares on the first day and a sale of shares on the last day of each period reported and includes reinvestments of dividends and distributions, if any. |
| (4) | Reflects waivers and reimbursements. |
The accompanying notes are an integral part of the financial statements.
17
THE SCHNEIDER FUNDS
Notes to Financial Statements
February 28, 2013 (Unaudited)
| 1. | Organization and Significant Accounting Policies |
The RBB Fund, Inc. (“RBB” or the “Company”) was incorporated under the laws of the State of Maryland on February 29, 1988 and is registered under the Investment Company Act of 1940, as amended (the “1940 Act”), as an open-end management investment company. RBB is a “series fund,” which is a mutual fund divided into separate portfolios. Each portfolio is treated as a separate entity for certain matters under the 1940 Act, and for other purposes, and a shareholder of one portfolio is not deemed to be a shareholder of any other portfolio. Currently, RBB has seventeen active investment portfolios, including the Schneider Small Cap Value Fund (the “Small Cap Value Fund”) and the Schneider Value Fund (the “Value Fund”) (each a “Fund,” collectively the “Funds”), which commenced investment operations on September 2, 1998 and September 30, 2002, respectively. As of the date hereof, each Fund offers Institutional Class shares.
RBB has authorized capital of one hundred billion shares of common stock of which 80.573 billion shares are currently classified into one hundred and forty-two classes of common stock. Each class represents an interest in an active or inactive RBB investment portfolio.
PORTFOLIO VALUATION — Each Fund’s net asset value (“NAV”) is calculated once daily at the close of regular trading hours on the New York Stock Exchange (“NYSE”) (generally 4:00 p.m. Eastern time) on each day the NYSE is open. Securities held by the Funds are valued using the closing price or the last sale price on a national securities exchange or the National Association of Securities Dealers Automatic Quotation System (“NASDAQ”) market system where they are primarily traded. Equity securities traded in the over-the-counter market are valued at their closing prices. If there were no transactions on that day, securities traded principally on an exchange or on NASDAQ will be valued at the mean of the last bid and ask prices prior to the market close. Fixed Income securities having a remaining maturity of greater than 60 days are valued using an independent pricing service. Fixed Income securities having a remaining maturity of 60 days or less are valued at amortized cost, which approximates market value. Foreign securities are valued based on prices from the primary market in which they are traded, and are translated from the local currency into U.S. dollars using current exchange rates. Investments in other open-end investment companies are valued based on the NAV of the investment companies (which may use Fair Value Pricing as discussed in their prospectuses). If market quotations are unavailable or deemed unreliable, securities will be valued in accordance with procedures adopted by the Company’s Board of Directors. Relying on prices supplied by pricing services or dealers or using fair valuation may result in values that are higher or lower than the values used by other investment companies and investors to price the same investments.
FAIR VALUE MEASUREMENT — The inputs and valuations techniques used to measure fair value of the Funds’ investments are summarized into three levels as described in the hierarchy below:
| | • Level 1 — | quoted prices in active markets for identical securities; |
| | • Level 2 — | other significant observable inputs (including quoted prices for similar securities, interest rates, prepayment speeds, credit risk, etc.); and |
| | • Level 3 — | significant unobservable inputs (including the Funds’ own assumptions in determining the fair value of investments). |
The inputs or methodology used for valuing securities are not necessarily an indication of the risk associated with investing in those securities.
18
THE SCHNEIDER FUNDS
Notes to Financial Statements (Continued)
February 28, 2013 (Unaudited)
The following summary of the inputs used, as of February 28, 2013, in valuing the Funds’ investments carried at fair value:
Small Cap Value Fund
| | | | | | | | | | | | | | | | |
| | | Total
Value as of
February 28, 2013 | | | Level 1
Quoted
Price | | | Level 2
Significant
Observable
Inputs | | | Level 3
Significant
Unobservable
Inputs | |
Common Stocks * | | $ | 65,917,990 | | | $ | 65,917,990 | | | $ | — | | | $ | — | |
Corporate Bonds | | | 1,316,953 | | | | — | | | | 1,308,399 | | | | 8,554 | |
Exchange Traded Fund | | | 863,045 | | | | 863,045 | | | | — | | | | — | |
Securities Lending Collateral | | | 11,746,233 | | | | — | | | | 11,746,233 | | | | — | |
| | | | | | | | | | | | | | | | |
Total | | $ | 79,844,221 | | | $ | 66,781,035 | | | $ | 13,054,632 | | | $ | 8,554 | |
| | | | | | | | | | | | | | | | |
Value Fund
| | | | | | | | | | | | | | | | |
| | | Total
Value as of
February 28, 2013 | | | Level 1
Quoted
Price | | | Level 2
Significant
Observable
Inputs | | | Level 3
Significant
Unobservable
Inputs | |
Common Stocks* | | $ | 30,670,021 | | | $ | 30,670,021 | | | $ | — | | | $ | — | |
Exchange Traded Fund | | | 250,912 | | | | 250,912 | | | | — | | | | — | |
Securities Lending Collateral | | | 3,922,281 | | | | — | | | | 3,922,281 | | | | — | |
| | | | | | | | | | | | | | | | |
Total | | $ | 34,843,214 | | | $ | 30,920,933 | | | $ | 3,922,281 | | | $ | — | |
| | | | | | | | | | | | | | | | |
* Please refer to the Portfolio of Investments for industry and security type breakouts.
Bonds that are priced using quotes derived from implied values, indicative bids, or a limited amount of actual trades are classified as Level 3 assets because the inputs used by the brokers and pricing services to derive the values are not readily observable.
Investments designated as Level 3 may include assets valued using quotes or indications furnished by brokers which are based on models or estimates and may not be executable prices. In light of the developing market conditions, Schneider Capital Management continues to search for observable data points and evaluate broker quotes and indications received for portfolio investments. Determination of fair values is uncertain because it involves subjective judgments and estimates not easily substantiated by auditing procedures.
At the end of each fiscal quarter, management evaluates the classification of Levels 1, 2 and 3 assets and liabilities. Various factors are considered, such as changes in liquidity from the prior reporting period; whether or not a broker is willing to execute at the quoted price; the depth and consistency of prices from third party pricing services; and the existence of contemporaneous, observable trades in the market. Additionally, management evaluates the classification of Level 1 and Level 2 assets and liabilities on a quarterly basis for changes in listings or delistings on national exchanges.
Due to the inherent uncertainty of determining the fair value of investments that do not have a readily available market value, the fair value of the Funds’ investments may fluctuate from period to period. Additionally, the fair value of investments may differ significantly from the values that would have been used had an active market existed for such investments and may differ materially from the values the Funds may ultimately realize. Further, such investments may be subject to legal and other restrictions on resale or otherwise less liquid than publicly traded securities.
19
THE SCHNEIDER FUNDS
Notes to Financial Statements (Continued)
February 28, 2013 (Unaudited)
For fair valuations using significant unobservable inputs, U.S. generally accepted accounting principles (“U.S. GAAP”) require each Fund to present a reconciliation of the beginning to ending balances for reported market values that presents changes attributable to total realized and unrealized gains or losses, purchase and sales, and transfers in and out of Level 3 during the period. Transfers in and out between Levels are based on values at the end of the period. U.S. GAAP also requires a Fund to disclose amounts and reasons for all transfers in and out of Level 1 and Level 2 fair value measurements. A reconciliation of Level 3 investments is presented only when a Fund had an amount of Level 3 investments at the end of the reporting period that was meaningful in relation to its net assets. The amounts and reasons for all transfers in and out of each Level within the three-tier hierarchy are disclosed when a Fund had an amount of total transfers during the reporting period that was meaningful in relation to its net assets as of the end of the reporting period.
For the six months ended February 28, 2013, there were no transfers between Levels 1, 2 and 3 for the Small Cap Value Fund and the Value Fund.
USE OF ESTIMATES — The preparation of financial statements in conformity with U.S. GAAP requires management to make estimates and assumptions that affect the reported amounts of assets and liabilities and disclosure of contingent assets and liabilities at the date of the financial statements and the reported amounts of revenues and expenses during the period. Actual results could differ from those estimates and those differences could be significant.
INVESTMENT TRANSACTIONS, INVESTMENT INCOME, AND EXPENSES — The Funds record security transactions based on trade date for financial reporting purposes. The cost of investments sold is determined by use of the specific identification method for both financial reporting and income tax purposes in determining realized gains and losses on investments. Interest income is accrued as earned. Dividend income is recorded on the ex-dividend date. Distributions received on securities that represent a return of capital or capital gain are recorded as a reduction of cost of investments and/or as a realized gain. Each Fund estimates the components of distributions received that may be considered return of capital distributions or capital gain distributions. Expenses incurred on behalf of a specific class, fund or fund family of the Company are charged directly to the class, fund or fund family (in proportion to net assets). Expenses incurred for all of the RBB funds (such as director or professional fees) are charged to all funds in proportion to their average net assets of RBB, or in such other manner as the Board of Directors deems fair or equitable. Expenses and fees, including investment advisory and administration fees, are accrued daily and taken into account for the purpose of determining the NAV of the Funds.
FOREIGN CURRENCY TRANSLATION — Foreign securities and other foreign assets and liabilities are valued using the foreign currency exchange rate effective at the end of the reporting period. The books and records of the Funds are maintained in U.S. dollars. Cost of investments is translated at the currency exchange rate effective at the trade date. The gain or loss resulting from a change in currency exchange rates between the trade and settlement dates of a portfolio transaction is treated as a gain or loss on foreign currency. Likewise, the gain or loss resulting from a change in currency exchange rates, between the date income is accrued and paid, is treated as a gain or loss on foreign currency.
DIVIDENDS AND DISTRIBUTIONS TO SHAREHOLDERS — Dividends from net investment income and distributions from net realized capital gains, if any, are declared, recorded on the ex-dividend date and paid at least annually to shareholders. Income dividends and capital gain distributions are determined in accordance with U.S. federal income tax regulations, which may differ from U.S. GAAP.
U.S. TAX STATUS — No provision is made for U.S. income taxes as it is each Fund’s intention to qualify for and elect the tax treatment applicable to regulated investment companies under Subchapter M of the Internal Revenue Code of 1986, as amended, and make the requisite distributions to its shareholders which will be sufficient to relieve it from U.S. income and excise taxes.
20
THE SCHNEIDER FUNDS
Notes to Financial Statements (Continued)
February 28, 2013 (Unaudited)
CASH AND CASH EQUIVALENTS — The Funds consider liquid assets deposited into a bank demand deposit account to be cash equivalents. These investments represent amounts held with financial institutions that are readily accessible to pay Fund expenses or purchase investments. Cash and cash equivalents are valued at cost plus accrued interest, which approximates market value.
OTHER — In the normal course of business, the Funds may enter into contracts that provide general indemnifications. The Funds’ maximum exposure under these arrangements is dependent on claims that may be made against the Funds in the future, and, therefore, cannot be estimated; however, based on experience, the risk of material loss for such claims is considered remote.
| 2. | Investment Adviser and Other Services |
Schneider Capital Management Company (“SCM” or the “Adviser”) serves as each Fund’s investment adviser. For its advisory services, SCM is entitled to receive 1.00% of the Small Cap Value Fund’s average daily net assets and 0.70% of the Value Fund’s average daily net assets, computed daily and payable monthly.
SCM has contractually agreed to waive its management fees and/or reimburse expenses to the extent that total annual operating expenses (excluding certain items discussed below) of the Small Cap Value Fund and the Value Fund exceed 1.15% and 0.90%, respectively. In determining SCM’s obligation to waive advisory fees and/or reimburse expenses, the following expenses are not taken into account: acquired fund fees and expenses, brokerage commissions, extraordinary items, interest and taxes. This contractual limitation is in effect until December 31, 2013 and may not be terminated without the approval of the Company’s Board of Directors. For the six months ended February 28, 2013, investment advisory fees and waivers of expenses were as follows:
| | | | | | | | | | | | |
| | | Gross Advisory Fees | | | Waivers | | | Net Advisory Fees | |
Schneider Small Cap Value Fund | | $ | 337,369 | | | $ | (123,800 | ) | | $ | 213,569 | |
Schneider Value Fund | | | 119,577 | | | | (113,127 | ) | | | 6,450 | |
The Funds will not pay SCM at a later time for any amounts it may waive or any amounts that SCM has assumed.
BNY Mellon Investment Servicing (US) Inc. (“BNY Mellon”) serves as administrator for the Funds. For providing administration and accounting services, BNY Mellon is entitled to receive a monthly fee equal to an annual percentage rate of each Fund’s average daily net assets, subject to certain minimum monthly fees.
Included in the administration and accounting services fees, shown on the Statement of Operations, are fees for providing regulatory administration services to RBB. For providing these services, BNY Mellon is entitled to receive compensation as agreed to by the Company and BNY Mellon. This fee is allocated to each portfolio of the Company in proportion to its net assets of the Company.
In addition, BNY Mellon serves as the Funds’ transfer and dividend disbursing agent. For providing transfer agent services, BNY Mellon is entitled to receive a monthly fee equal to an annual percentage rate of each Fund’s average daily net assets, subject to certain minimum monthly fees.
The Bank of New York Mellon (the “Custodian”) provides certain custodial services to the Funds. The Custodian is entitled to receive a monthly fee equal to an annual percentage rate of the Funds’ average daily net assets, subject to certain minimum monthly fees.
21
THE SCHNEIDER FUNDS
Notes to Financial Statements (Continued)
February 28, 2013 (Unaudited)
Foreside Funds Distributors LLC serves as the principal underwriter and distributor of the Funds’ shares pursuant to a Distribution Agreement with RBB.
The Directors of the Company receive an annual retainer and meeting fees for meetings attended. The aggregate remuneration paid to the Directors by the Funds during the six months ended February 28, 2013 was $11,124. Certain employees of BNY Mellon serve as an Officer or Director of the Company. They are not compensated by the Funds or the Company.
| 4. | Investment in Securities |
For the six months ended February 28, 2013, aggregate purchases and sales of investment securities (excluding short-term investments) were as follows:
| | | | | | | | |
| | | Purchases | | | Sales | |
Small Cap Value Fund | | $ | 20,950,141 | | | $ | 27,729,912 | |
Value Fund | | | 9,447,141 | | | | 26,113,775 | |
| 5. | Federal Income Tax Information |
The Funds have followed the authoritative guidance on accounting for and disclosure of uncertainty in tax positions, which requires the Funds to determine whether a tax position is more likely than not to be sustained upon examination, including resolution of any related appeals or litigation processes, based on the technical merits of the position. Each Fund has determined that there was no effect on the financial statements from following this authoritative guidance. In the normal course of business, the Funds are subject to examination by federal, state and local jurisdictions, where applicable, for tax years for which applicable statutes of limitations have not expired.
As of February 28, 2013, federal tax cost, aggregate gross unrealized appreciation and depreciation of securities held by the Funds were as follows:
| | | | | | | | | | | | | | | | |
| | | Federal Tax
Cost | | | Unrealized
Appreciation | | | Unrealized
Depreciation | | | Net Unrealized
Appreciation | |
Small Cap Value Fund | | $ | 63,780,406 | | | $ | 19,919,087 | | | $ | (3,855,272 | ) | | $ | 16,063,815 | |
Value Fund | | | 29,137,232 | | | | 7,843,127 | | | | (2,137,145 | ) | | | 5,705,982 | |
Distributions to shareholders from net investment income and realized gains are determined in accordance with federal income tax regulations, which may differ from net investment income and realized gains recognized for financial reporting purposes. Accordingly, the character of distributions and composition of net assets for tax purposes may differ from those reflected in the accompanying financial statements. To the extent these differences are permanent, such amounts are reclassified within the capital accounts based on the tax treatment; temporary differences do not require such reclassification.
22
THE SCHNEIDER FUNDS
Notes to Financial Statements (Continued)
February 28, 2013 (Unaudited)
As of August 31, 2012, the components of distributable earnings on a tax basis were as follows:
| | | | | | | | |
| | | Undistributed
Ordinary
Income | | | Undistributed
Long-Term Gains | |
Small Cap Value Fund | | $ | — | | | $ | — | |
Value Fund | | | 339,818 | | | | — | |
The differences between the book and tax basis components of distributable earnings relate principally to the timing of recognition of income and gains for federal income tax purposes. Short-term and foreign currency gains are reportable as ordinary income for federal income tax purposes.
The tax character of dividends and distributions paid during the fiscal year ended August 31, 2012 was as follows:
| | | | | | | | | | | | |
| | | Ordinary
Income | | | Long-Term
Gains | | | Total | |
Small Cap Value Fund | | | $ — | | | $ | — | | | $ | — | |
Value Fund | | | 296,010 | | | | — | | | | 296,010 | |
Dividends from net investment income and short-term capital gains are treated as ordinary income dividends for federal income tax purposes.
Accumulated capital losses represent net capital loss carry forwards as of August 31, 2012 that may be available to offset future realized capital gains and thereby reduce future capital gains distributions. Under the Regulated Investment Company Modernization Act of 2010 (the “Modernization Act”), the Funds are permitted to carry forward capital losses incurred in taxable years beginning after December 22, 2010 for an unlimited period. Any losses incurred during those future taxable years will be required to be utilized prior to any losses incurred in pre-enactment taxable years. Additionally, post-enactment capital losses that are carried forward will retain their character as either short-term or long-term capital losses rather than being considered all short-term as under the previous law. The Funds’ first fiscal year end subject to the Modernization Act was August 31, 2012.
As of August 31, 2012, the Funds had the following pre-enactment net capital loss carryforwards to offset future net capital gains, if any, to the extent provided by Treasury regulations. To the extent that these carryforwards are used to offset future capital gains, it is probable that the gains that are offset will not be distributed to shareholders.
| | | | | | | | | | | | | | | | | | | | |
| | | August 31, 2016 | | | August 31, 2017 | | | August 31, 2018 | | | August 31, 2019 | | | Total | |
Small Cap Value Fund | | $ | — | | | $ | — | | | $ | 3,715,556 | | | $ | — | | | $ | 3,715,556 | |
Value Fund | | | 11,248,795 | | | | 75,945,572 | | | | 42,948,995 | | | | 2,159,421 | | | | 132,302,783 | |
As of August 31, 2012, the Funds did not have any post-enactment capital loss carryforwards.
23
THE SCHNEIDER FUNDS
Notes to Financial Statements (Concluded)
February 28, 2013 (Unaudited)
The Funds may make secured loans of their portfolio securities to brokers, dealers and other financial institutions to earn additional income and receive cash collateral equal to at least 102% of the current market value of the loaned securities, as marked to market each day that the NAV of the Funds is determined. When the collateral falls below specified amounts, the lending agent will use its best effort to obtain additional collateral on the next business day to meet required amounts under the security lending agreement. The Funds will pay administrative and custodial fees in connection with the loan of securities. Collateral is invested in short-term investments and the Funds will bear the risk of loss of the invested collateral. Securities lending will expose the Funds to the risk of loss should a borrower default on its obligation to return the borrowed securities. The market value of the securities on loan and collateral as of February 28, 2013 and the income received for the six months ended February 28, 2013 were as follows:
| | | | | | | | | | | | |
| | | Fair Value of
Securities Loaned | | | Fair Value
of Collateral | | | Income Received
from Securities
Lending | |
Small Cap Value Fund | | $ | 11,124,332 | | | $ | 11,746,233 | | | $ | 5,792 | |
Value Fund | | | 3,756,825 | | | | 3,922,281 | | | | 5,269 | |
Management has evaluated the impact of all subsequent events on the Funds through the date the financial statements were issued and have determined that there were no subsequent events requiring recognition or disclosure in the financial statements.
24
THE SCHNEIDER FUNDS
Other Information
(Unaudited)
Proxy Voting
Policies and procedures that the Funds use to determine how to vote proxies relating to portfolio securities as well as information regarding how the Funds voted proxies relating to portfolio securities for the most recent 12-month period ended June 30 are available without charge, upon request, by calling (888) 520-3277 and on the Securities and Exchange Commission’s (“SEC”) website at http://www.sec.gov.
Quarterly Portfolio Schedules
The Company files a complete schedule of portfolio holdings with the SEC for the first and third fiscal quarters of each fiscal year (quarters ended November 30 and May 31) on Form N-Q. The Company’s Form N-Q is available on the SEC website at http://www.sec.gov and may be reviewed and copied at the SEC Public Reference Room in Washington, D.C. Information on the operation of the SEC Public Reference Room may be obtained by calling (202) 551-8090.
25
[THIS PAGE INTENTIONALLY LEFT BLANK.]
[THIS PAGE INTENTIONALLY LEFT BLANK.]
Investment Adviser
Schneider Capital Management
460 E. Swedesford Road
Suite 1080
Wayne, PA 19087
Administrator
BNY Mellon Investment Servicing (US) Inc.
301 Bellevue Parkway
Wilmington, DE 19809
Transfer Agent
BNY Mellon Investment Servicing (US) Inc.
4400 Computer Drive
Westborough, MA 01581
Principal Underwriter
Foreside Funds Distributors LLC
400 Berwyn Park
899 Cassatt Road
Berwyn, PA 19312
Custodian
The Bank of New York Mellon
One Wall Street
New York, NY 10286
Independent Registered Public Accounting Firm
PricewaterhouseCoopers LLP
Two Commerce Square, Suite 1700
2001 Market Street
Philadelphia, PA 19103-7042
Counsel
Drinker Biddle & Reath LLP
One Logan Square, Ste. 2000
Philadelphia, PA 19103-6996
of the RBB Fund, Inc.
Schneider Small Cap Value Fund
Schneider Value Fund
|
|
SEMI-ANNUAL REPORT February 28, 2013 (Unaudited) |

This report is submitted for the general information of the shareholders of the Funds. It is not authorized for distribution unless preceded or accompanied by a current prospectus for the Funds.
SUMMIT GLOBAL INVESTMENTS
U.S. LOW VOLATILITY EQUITY FUND
Semi-Annual Investment Adviser’s Report
February 28, 2013
(Unaudited)
Dear Shareholder:
We are continually grateful for and cognitive of the confidence you have placed in us.
During the first quarter of 2013, U.S. equities experience significant gains. The volatility of the market also increased considerably in February. These record highs have come amidst both global debt issues and varied U.S. economic data.
For the six month period ended February 28, 2013, the Fund’s shares rose 10.33% vs. 7.69% for the S&P 500 Index®. For the past one year (February 29, 2012 to February 28, 2013) the total return for the Fund’s shares rose 12.31% vs. 10.91% for the S&P 500 Index®. The beta of the Fund on February 28, 2013 was 0.60.
As we consider recent events and ponder what may lay ahead, we know with more clarity that world events certainly affect the U.S. markets. We do not stand alone, isolated from the world. U.S. companies are global companies. Their revenue and sales, business plans and investments and ultimately success or failure is more correlated to global events than ever in history. As such, we must keep an eye on such events throughout the coming months and years. In addition to these global and political drivers, companies are unique in how each prepares, responds and survives the impact of world events and economic cycles. While some cycles may vary in length and events differ in impact, we believe, for U.S. equity exposure, the Summit Global Investments U.S. Low Volatility Equity Fund approach is effective over full market cycles.
Our philosophy to navigate such markets is simple and consistent throughout up and down markets. We believe that being invested in a low volatility equity portfolio over full market cycles provides lower price fluctuations, more consistent and reliable returns with smaller drawdowns and adds increased diversification when combined with other investment strategies. Our approach takes into account each underlying company’s stock volatility, expected market return and how it correlates with other stocks within the portfolio, ultimately seeking to maximize return with an overall lower risk than the cap-weighted benchmark. As stated in the prospectus, the Fund seeks to outperform the S&P 500® Index over a market cycle while reducing overall volatility.
Financial markets are always unpredictable but there are several time-tested investment principles that may help put the odds in your favor. We firmly believe that investing with a long-term, risk-return perspective is key to experiencing superior risk-adjusted returns. While staying the course with a low volatility portfolio doesn’t eliminate risk, it can considerably lessen the effect of market volatility.
While we are optimistic about the opportunities within the U.S. equity market, we remain laser focused on monitoring the risk of individual companies and the overall portfolio. During these times of uncertainty and volatility, we believe, for U.S. equity exposure the Summit Global Investments U.S. Low Volatility Equity Fund approach is warranted.
Sincerely,
Summit Global Investments, LLC
1
SUMMIT GLOBAL INVESTMENTS
U.S. LOW VOLATILITY EQUITY FUND
Performance Data
February 28, 2013
(Unaudited)
| | | | | | | | | | | | | | |
| | | Total Returns For the Period Ended February 28, 2013* | |
| | | | Average Annual | |
| | | | Six Months* | | | One Year | | | Since
Inception** | |
| | Summit Global Investments U.S. Low Volatility Equity Fund - Class I Shares | | | 10.33% | | | | 12.31% | | | | 12.31% | |
| | S&P 500® Index*** | | | 7.69% | | | | 10.91% | | | | 10.91% | |
| ** | Inception date of the Fund is February 29, 2012. |
| *** | Benchmark performance is from inception date of the Fund only and is not the inception date of the benchmark itself. |
Performance quoted is past performance and does not guarantee future results. The investment return and principal value of an investment in the Fund will fluctuate so that an investor’s shares, when redeemed, may be worth more or less than their original cost. Current performance may be lower or higher. Returns shown do not reflect taxes that a shareholder would pay on Fund distributions or on the redemption of Fund shares. Performance data current to the most recent month-end may be obtained by calling (855) 744-8500.
The Fund applies a 1.50% fee to the value of shares redeemed within 60 days of purchase. This redemption fee is not reflected in the returns shown above. The performance quoted reflects fees waived in effect and would have been less in their absence. The Fund’s total annual gross and net operating expenses, as stated in the current prospectus dated December 31, 2012, are 20.03% and 0.98% of average daily net assets for Class I Shares. These rates may fluctuate and may differ from the actual expenses incurred by the Fund for the period covered by this report. The Fund’s investment adviser has contractually agreed to waive management fees and/or reimburse certain expenses of the Fund through December 31, 2013 to the extent necessary to ensure that the Fund’s total operating expenses (excluding acquired fund fees and expenses, brokerage commissions, extraordinary items, interest or taxes) do not exceed 0.98% (on an annual basis) of the Fund’s average daily net assets (the “Expense Limitation”). The Expense Limitation shall remain in effect until December 31, 2013, unless the Board of Directors of The RBB Fund, Inc. approves its earlier termination.
The Fund invests in common stock, preferred stocks, warrants to acquire common stock and securities convertible into common stock. Portfolio composition is subject to change.
The Fund evaluates performance as compared to that of the Standard & Poor’s 500® Index (“S&P 500®”). The S&P 500® is a widely recognized, unmanaged index of 500 common stocks which are generally representative of the U.S. stock market as a whole. It is impossible to invest directly in an index.
2
SUMMIT GLOBAL INVESTMENTS
U.S. LOW VOLATILITY EQUITY FUND
Fund Expense Examples
(Unaudited)
As a shareholder of the Fund, you incur two types of costs: (1) transaction costs and (2) ongoing costs, including management fees and other Fund expenses. These examples are intended to help you understand your ongoing costs (in dollars) of investing in the Fund and to compare these costs with the ongoing costs of investing in other mutual funds.
These examples are based on an investment of $1,000 invested at the beginning of the six-month period from September 1, 2012 through February 28, 2013 and held for the entire period.
Actual Expenses
The first line of the accompanying table provides information about actual account values and actual expenses. You may use the information in this line, together with the amount you invested, to estimate the expenses that you paid over the period. Simply divide your account value by $1,000 (for example, an $8,600 account value divided by $1,000 = 8.6), then multiply the result by the number in the first line under the heading entitled “Expenses Paid During Period” to estimate the expenses you paid on your account during this period.
Hypothetical Examples for Comparison Purposes
The second line of the accompanying table provides information about hypothetical account values and hypothetical expenses based on the Fund’s actual expense ratio and an assumed rate of return of 5% per year before expenses, which is not your Fund’s actual return. The hypothetical account values and expenses may not be used to estimate the actual ending account balance or expenses you paid for the period. You may use this information to compare the ongoing costs of investing in the Fund and other funds. To do so, compare these 5% hypothetical examples with the 5% hypothetical examples that appear in the shareholder reports of other funds.
Please note that the expenses shown in the accompanying table are meant to highlight your ongoing costs only and do not reflect any transactional costs, such as redemption fees. Therefore, the second line of the accompanying table is useful in comparing ongoing costs only and will not help you determine the relative total costs of owning different funds. In addition, if these transactional costs were included, your costs would have been higher.
3
SUMMIT GLOBAL INVESTMENTS
U.S. LOW VOLATILITY EQUITY FUND
Fund Expense Examples (Concluded)
(Unaudited)
| | | | | | |
| | | Class I Shares |
| | | Beginning Account Value
September 1, 2012 | | Ending Account Value
February 28, 2013 | | Expenses Paid
During Period* |
Actual | | $1,000.00 | | $1,103.30 | | $5.11 |
Hypothetical (5% return before expenses) | | 1,000.00 | | 1,019.93 | | 4.91 |
| * | Expenses are equal to the Fund’s annualized six month expense ratio of 0.98% for Class I Shares which includes waived fees or reimbursed expenses, multiplied by the average account value over the period multiplied by the number of days (181) in the most recent fiscal half year, then divided by 365 to reflect the one half year period. The Fund’s ending account values on the first line in the table is based on the actual six month total investment return for the Fund of 10.33% for Class I Shares. |
4
SUMMIT GLOBAL INVESTMENTS
U.S. LOW VOLATILITY EQUITY FUND
Portfolio Holdings Summary Table
February 28, 2013
(Unaudited)
The following table presents a summary by sector of the portfolio holdings of the Fund.
| | | | | | | | |
Security Type/Sector Classification | | % of Net
Assets | | | Value | |
COMMON STOCKS: | | | | | | | | |
Pharmaceuticals | | | 12.9% | | | | $ 1,515,998 | |
Food Products | | | 11.1 | | | | 1,300,865 | |
Electric Utilities | | | 8.9 | | | | 1,045,310 | |
Real Estate Investment Trusts | | | 6.3 | | | | 743,739 | |
Multiline Retail | | | 5.5 | | | | 642,655 | |
IT Services | | | 5.4 | | | | 640,275 | |
Household Products | | | 5.0 | | | | 591,109 | |
Health Care Providers & Services | | | 4.8 | | | | 568,506 | |
Diversified Telecommunication | | | 3.7 | | | | 435,294 | |
Commercial Services & Supplies | | | 3.5 | | | | 414,847 | |
Information Technology | | | 3.2 | | | | 371,805 | |
Energy | | | 2.7 | | | | 317,310 | |
Health Care Equipment & Supplies | | | 2.7 | | | | 315,907 | |
Distributors | | | 2.5 | | | | 297,616 | |
Food & Staples Retailing | | | 2.3 | | | | 271,232 | |
Specialty Retail | | | 2.1 | | | | 243,770 | |
Financials | | | 1.5 | | | | 170,487 | |
Hotels Restaurants & Leisure | | | 1.1 | | | | 134,260 | |
Multi-Utilities | | | 1.1 | | | | 131,210 | |
Air Freight & Logistics | | | 0.9 | | | | 100,833 | |
Containers & Packaging | | | 0.7 | | | | 81,089 | |
Thrifts & Mortgage Finance | | | 0.6 | | | | 74,015 | |
Environmental Control | | | 0.5 | | | | 63,194 | |
Electronic Equip. & Instruments | | | 0.4 | | | | 52,153 | |
Airlines | | | 0.4 | | | | 49,725 | |
Insurance | | | 0.4 | | | | 48,082 | |
Internet Software & Services | | | 0.4 | | | | 42,744 | |
Media | | | 0.1 | | | | 10,918 | |
Other Assets in Excess of Liabilities | | | 9.3 | | | | 1,096,278 | |
NET ASSETS | | | 100.0% | | | | $ 11,771,226 | |
| | | | | | | | |
Portfolio holdings are subject to change at any time.
The accompanying notes are an integral part of the financial statements.
5
SUMMIT GLOBAL INVESTMENTS U.S. LOW VOLATILITY EQUITY FUND
Portfolio of Investments
February 28, 2013
(Unaudited)
| | | | | | | | |
| | | Number
of Shares | | | Value | |
| |
COMMON STOCKS - 90.7% | | | | | |
Air Freight & Logistics — 0.9% | | | | | |
United Parcel Service, Inc.,
Class B | | | 1,220 | | | $ | 100,833 | |
| | | | | | | | |
| | | | | | | 100,833 | |
| | | | | | | | |
Airlines — 0.4% | | | | | | | | |
Southwest Airlines Co. | | | 4,250 | | | | 49,725 | |
| | | | | | | | |
| | | | | | | 49,725 | |
| | | | | | | | |
Commercial Services & Supplies — 3.5% | |
Automatic Data Processing, Inc. | | | 160 | | | | 9,818 | |
Equifax, Inc. | | | 170 | | | | 9,371 | |
Paychex, Inc. | | | 3,370 | | | | 111,547 | |
Waste Management, Inc. | | | 7,470 | | | | 278,780 | |
Western Union Co., (The) | | | 380 | | | | 5,331 | |
| | | | | | | | |
| | | | | | | 414,847 | |
| | | | | | | | |
Containers & Packaging — 0.7% | | | | | |
Ball Corp. | | | 220 | | | | 9,770 | |
Bemis Co., Inc. | | | 1,910 | | | | 71,319 | |
| | | | | | | | |
| | | | | | | 81,089 | |
| | | | | | | | |
Distributors — 2.5% | | | | | | | | |
Genuine Parts Co. | | | 4,190 | | | | 297,616 | |
| | | | | | | | |
| | | | | | | 297,616 | |
| | | | | | | | |
Diversified Telecommunication — 3.7% | |
AT&T, Inc. | | | 5,980 | | | | 214,742 | |
Verizon Communications, Inc. | | | 4,740 | | | | 220,552 | |
| | | | | | | | |
| | | | | | | 435,294 | |
| | | | | | | | |
Electric Utilities — 8.9% | | | | | | | | |
American Electric Power
Co., Inc. | | | 220 | | | | 10,294 | |
CMS Energy Corp. | | | 400 | | | | 10,644 | |
Consolidated Edison, Inc. | | | 170 | | | | 10,030 | |
Dominion Resources, Inc. | | | 190 | | | | 10,640 | |
| | | | | | | | |
| | | Number
of Shares | | | Value | |
| | | | | | | | |
| | | | | | | | |
Electric Utilities — (Continued) | | | | | |
DTE Energy Co. | | | 160 | | | $ | 10,688 | |
Northeast Utilities | | | 7,280 | | | | 302,193 | |
Pinnacle West Capital Corp. | | | 2,830 | | | | 158,310 | |
PPL Corp. | | | 340 | | | | 10,479 | |
Southern Co., (The) | | | 5,700 | | | | 256,557 | |
Xcel Energy, Inc. | | | 9,250 | | | | 265,475 | |
| | | | | | | | |
| | | | | | | 1,045,310 | |
| | | | | | | | |
Electronic Equip. & Instruments — 0.4% | |
FLIR Systems, Inc. | | | 1,980 | | | | 52,153 | |
| | | | | | | | |
| | | | | | | 52,153 | |
| | | | | | | | |
Energy — 2.7% | | | | | | | | |
Cabot Oil & Gas Corp. | | | 210 | | | | 13,014 | |
ConocoPhillips | | | 160 | | | | 9,272 | |
Exxon Mobil Corp. | | | 110 | | | | 9,851 | |
Spectra Energy Corp. | | | 9,820 | | | | 285,173 | |
| | | | | | | | |
| | | | | | | 317,310 | |
| | | | | | | | |
Environmental Control — 0.5% | | | | | |
Republic Services, Inc. | | | 2,010 | | | | 63,194 | |
| | | | | | | | |
| | | | | | | 63,194 | |
| | | | | | | | |
Financials — 1.5% | | | | | |
American Express Co. | | | 110 | | | | 6,837 | |
Berkshire Hathaway, Inc.,
Class B* | | | 110 | | | | 11,238 | |
CHUBB Corp. (The) | | | 130 | | | | 10,924 | |
Cincinnati Financial Corp. | | | 240 | | | | 10,802 | |
CME Group, Inc. | | | 170 | | | | 10,169 | |
M&T Bank Corp. | | | 90 | | | | 9,188 | |
Marsh & McLennan Cos., Inc. | | | 2,730 | | | | 101,392 | |
Mastercard, Inc., Class A | | | 10 | | | | 5,178 | |
Visa, Inc., Class A | | | 30 | | | | 4,759 | |
| | | | | | | | |
| | | | | | | 170,487 | |
| | | | | | | | |
The accompanying notes are an integral part of the financial statements.
6
SUMMIT GLOBAL INVESTMENTS U.S. LOW VOLATILITY EQUITY FUND
Portfolio of Investments (Continued)
February 28, 2013
(Unaudited)
| | | | | | | | |
| | | Number
of Shares | | | Value | |
| | | | | | | | |
| | | | | | | | |
Food & Staples Retailing — 2.3% | |
CVS Caremark Corp. | | | 210 | | | $ | 10,735 | |
Walgreen Co. | | | 260 | | | | 10,644 | |
Wal-Mart Stores, Inc. | | | 3,530 | | | | 249,853 | |
| | | | | | | | |
| | | | | | | 271,232 | |
| | | | | | | | |
|
Food Products — 11.1% | |
Campbell Soup Co. | | | 260 | | | | 10,702 | |
ConAgra Foods, Inc. | | | 330 | | | | 11,256 | |
General Mills, Inc. | | | 1,640 | | | | 75,850 | |
Hershey Co., (The) | | | 2,450 | | | | 204,183 | |
HJ Heinz Co. | | | 4,610 | | | | 333,902 | |
Hormel Foods Corp. | | | 8,970 | | | | 335,568 | |
Kellogg Co. | | | 5,100 | | | | 308,550 | |
McCormick & Co., Inc. | | | 310 | | | | 20,854 | |
| | | | | | | | |
| | | | | | | 1,300,865 | |
| | | | | | | | |
|
Health Care Equipment & Supplies — 2.7% | |
Baxter International, Inc. | | | 150 | | | | 10,140 | |
Becton Dickinson and Co. | | | 3,360 | | | | 295,882 | |
CR Bard, Inc. | | | 100 | | | | 9,885 | |
| | | | | | | | |
| | | | | | | 315,907 | |
| | | | | | | | |
|
Health Care Providers & Services — 4.8% | |
Aetna, Inc. | | | 860 | | | | 40,583 | |
Cardinal Health, Inc. | | | 4,370 | | | | 201,938 | |
Cigna Corp. | | | 1,180 | | | | 68,983 | |
Coventry Health Care, Inc. | | | 5,040 | | | | 228,614 | |
Humana, Inc. | | | 140 | | | | 9,556 | |
Laboratory Corp. of America Holdings* | | | 110 | | | | 9,746 | |
UnitedHealth Group, Inc. | | | 170 | | | | 9,086 | |
| | | | | | | | |
| | | | | | | 568,506 | |
| | | | | | | | |
|
Hotels Restaurants & Leisure — 1.1% | |
McDonald’s Corp. | | | 1,400 | | | | 134,260 | |
| | | | | | | | |
| | | | | | | 134,260 | |
| | | | | | | | |
| | | | | | | | |
| | | Number
of Shares | | | Value | |
| | | | | | | | |
| | | | | | | | |
Household Products — 5.0% | |
Clorox Co., (The) | | | 3,550 | | | $ | 298,236 | |
Colgate-Palmolive Co. | | | 30 | | | | 3,433 | |
Kimberly-Clark Corp. | | | 3,070 | | | | 289,440 | |
| | | | | | | | |
| | | | | | | 591,109 | |
| | | | | | | | |
|
Information Technology — 3.2% | |
Google, Inc., Class A* | | | 320 | | | | 256,384 | |
Motorola Solutions, Inc. | | | 170 | | | | 10,576 | |
Yahoo!, Inc.* | | | 4,920 | | | | 104,845 | |
| | | | | | | | |
| | | | | | | 371,805 | |
| | | | | | | | |
|
Insurance — 0.4% | |
AON PLC (United Kingdom) | | | 170 | | | | 10,385 | |
Loews Corp. | | | 130 | | | | 5,604 | |
Progressive Corp., (The) | | | 450 | | | | 10,962 | |
Torchmark Corp. | | | 190 | | | | 10,676 | |
Travelers Cos, Inc., (The) | | | 130 | | | | 10,455 | |
| | | | | | | | |
| | | | | | | 48,082 | |
| | | | | | | | |
|
Internet Software & Services — 0.4% | |
Adobe Systems, Inc.* | | | 280 | | | | 11,004 | |
Fiserv, Inc.* | | | 120 | | | | 9,853 | |
Intel Corp. | | | 490 | | | | 10,217 | |
Microchip Technology, Inc. | | | 320 | | | | 11,670 | |
| | | | | | | | |
| | | | | | | 42,744 | |
| | | | | | | | |
|
IT Services — 5.4% | |
Fidelity National Information Services, Inc. | | | 8,200 | | | | 308,730 | |
International Business Machines Corp. | | | 60 | | | | 12,050 | |
Linear Technology Corp. | | | 290 | | | | 11,090 | |
Total System Services, Inc. | | | 12,980 | | | | 308,405 | |
| | | | | | | | |
| | | | | | | 640,275 | |
| | | | | | | | |
The accompanying notes are an integral part of the financial statements.
7
SUMMIT GLOBAL INVESTMENTS U.S. LOW VOLATILITY EQUITY FUND
Portfolio of Investments (Concluded)
February 28, 2013
(Unaudited)
| | | | | | | | |
Media — 0.1% | | | | | |
Walt Disney Co., (The) | | | 200 | | | $ | 10,918 | |
| | | | | | | | |
| | | | | | | 10,918 | |
| | | | | | | | |
Multiline Retail — 5.5% | | | | | |
Dollar General Corp.* | | | 300 | | | | 13,902 | |
Family Dollar Stores, Inc. | | | 3,450 | | | | 198,548 | |
Kohl’s Corp. | | | 110 | | | | 5,071 | |
Procter & Gamble Co., (The) | | | 2,250 | | | | 171,405 | |
Target Corp. | | | 4,030 | | | | 253,729 | |
| | | | | | | | |
| | | | | | | 642,655 | |
| | | | | | | | |
Multi-Utilities — 1.1% | | | | | |
SCANA Corp. | | | 860 | | | | 42,002 | |
Wisconsin Energy Corp. | | | 2,160 | | | | 89,208 | |
| | | | | | | | |
| | | | | | | 131,210 | |
| | | | | | | | |
Pharmaceuticals — 12.9% | | | | | |
Abbott Laboratories | | | 7,860 | | | | 265,589 | |
AmerisourceBergen Corp. | | | 6,790 | | | | 320,488 | |
Forest Laboratories, Inc.* | | | 260 | | | | 9,568 | |
Johnson & Johnson | | | 3,830 | | | | 291,501 | |
McKesson Corp. | | | 3,000 | | | | 318,390 | |
Mead Johnson Nutrition Co. | | | 140 | | | | 10,487 | |
Pfizer, Inc. | | | 10,960 | | | | 299,975 | |
| | | | | | | | |
| | | | | | | 1,515,998 | |
| | | | | | | | |
Real Estate Investment Trusts — 6.3% | |
American Tower Corp. | | | 130 | | | | 10,088 | |
Apartment Investment & Management Co., Class A | | | 7,560 | | | | 223,927 | |
Boston Properties, Inc. | | | 20 | | | | 2,078 | |
Equity Residential | | | 100 | | | | 5,504 | |
HCP, Inc. | | | 3,350 | | | | 163,748 | |
Health Care REIT, Inc. | | | 4,520 | | | | 289,913 | |
| | | | | | | | |
Real Estate Investment Trusts — (Continued) | |
Kimco Realty Corp. | | | 510 | | | $ | 11,103 | |
Plum Creek Timber Co., Inc. | | | 240 | | | | 11,640 | |
Public Storage | | | 100 | | | | 15,121 | |
Ventas, Inc. | | | 150 | | | | 10,617 | |
| | | | | | | | |
| | | | | | | 743,739 | |
| | | | | | | | |
Specialty Retail — 2.1% | | | | | |
AutoZone, Inc.* | | | 570 | | | | 216,686 | |
Cintas Corp. | | | 230 | | | | 10,097 | |
O’Reilly Automotive, Inc.* | | | 110 | | | | 11,191 | |
Ross Stores, Inc. | | | 100 | | | | 5,796 | |
| | | | | | | | |
| | | | | | | 243,770 | |
| | | | | | | | |
Thrifts & Mortgage Finance — 0.6% | | | | | |
People’s United Financial, Inc. | | | 5,650 | | | | 74,015 | |
| | | | | | | | |
| | | | | | | 74,015 | |
| | | | | | | | |
TOTAL COMMON STOCKS
(Cost $9,697,930) | | | | | | | 10,674,948 | |
| | | | | | | | |
TOTAL INVESTMENTS - 90.7%
(Cost $9,697,930) | | | | | | | 10,674,948 | |
| | | | | | | | |
OTHER ASSETS IN EXCESS
OF LIABILITIES - 9.3% | | | | | | | 1,096,278 | |
| | | | | | | | |
NET ASSETS - 100.0% | | | | | | $ | 11,771,226 | |
| | | | | | | | |
PCL Public Company Limited
REIT Real Estate Investment Trusts
The accompanying notes are an integral part of the financial statements.
8
SUMMIT GLOBAL INVESTMENTS
U.S. LOW VOLATILITY EQUITY FUND
Statement of Assets and Liabilities
February 28, 2013
(Unaudited)
| | | | |
ASSETS | | | | |
Investments, at value (Cost $9,697,930) | | $ | 10,674,948 | |
Cash | | | 1,051,728 | |
Receivables for: | | | | |
Capital shares sold | | | 21,467 | |
Dividends | | | 26,142 | |
Receivable from Investment Adviser (See Note 2) | | | 22,998 | |
Prepaid expenses and other assets | | | 18,412 | |
| | | | |
Total assets | | | 11,815,695 | |
| | | | |
| |
LIABILITIES | | | | |
Payables for: | | | | |
Administration and accounting services fees | | | 14,258 | |
Audit fees | | | 10,574 | |
Legal fees | | | 9,911 | |
Transfer agent fees | | | 4,441 | |
Other accrued expenses and liabilities | | | 5,285 | |
| | | | |
Total liabilities | | | 44,469 | |
| | | | |
Net Assets | | $ | 11,771,226 | |
| | | | |
NET ASSETS CONSISTS OF | | | | |
Par Value | | $ | 1,061 | |
Paid-in capital | | | 10,796,956 | |
Undistributed net investment income | | | 33,035 | |
Accumulated net realized loss from investments | | | (36,844 | ) |
Net unrealized appreciation on investments | | | 977,018 | |
| | | | |
Net Assets | | $ | 11,771,226 | |
| | | | |
| |
I SHARES: | | | | |
Net Assets applicable to Class I Shares | | $ | 11,771,226 | |
| | | | |
Shares outstanding ($0.001 par value, 100,000,000 shares authorized) | | | 1,060,882 | |
| | | | |
Net asset value, offering and redemption price per share | | $ | 11.10 | |
| | | | |
The accompanying notes are an integral part of the financial statements.
9
SUMMIT GLOBAL INVESTMENTS
U.S. LOW VOLATILITY EQUITY FUND
Statement of Operations
For the Six Months Ended February 28, 2013
(Unaudited)
| | | | |
INVESTMENT INCOME | | | | |
Dividends and interest | | $ | 103,602 | |
| | | | |
Total investment income | | | 103,602 | |
| | | | |
EXPENSES | | | | |
Administration and accounting services fees (Note 2) | | | 42,656 | |
Transfer agent fees (Note 2) | | | 35,006 | |
Advisory fees (Note 2) | | | 27,105 | |
Custodian fees (Note 2) | | | 13,013 | |
Audit fees | | | 11,353 | |
Directors’ and officers’ fees | | | 8,064 | |
Registration and filing fees | | | 5,067 | |
Other expenses | | | 11,873 | |
| | | | |
Total expenses before waivers and reimbursements | | | 154,137 | |
Less: waivers and reimbursements (Note 2) | | | (116,190 | ) |
| | | | |
Net expenses after waivers and reimbursements | | | 37,947 | |
| | | | |
Net investment income | | | 65,655 | |
| | | | |
NET REALIZED AND UNREALIZED GAIN FROM INVESTMENTS | | | | |
Net realized gain from: | | | | |
Investments | | | 842 | |
Net change in unrealized appreciation on: | | | | |
Investments | | | 879,643 | |
| | | | |
Net realized and unrealized gain from investments | | | 880,485 | |
| | | | |
NET INCREASE IN NET ASSETS RESULTING FROM OPERATIONS | | $ | 946,140 | |
| | | | |
The accompanying notes are an integral part of the financial statements.
10
SUMMIT GLOBAL INVESTMENTS
U.S. LOW VOLATILITY EQUITY FUND
Statement of Changes in Net Assets
| | | | | | | | |
| | | For the
Six Months Ended
February 28, 2013
(Unaudited) | | | For the
Period Ended
August 31, 2012(1) | |
INCREASE/(DECREASE) IN NET ASSETS FROM
OPERATIONS: | | | | | | | | |
Net investment income | | $ | 65,655 | | | $ | 12,290 | |
Net realized gain from investments | | | 842 | | | | 22,649 | |
Net change in unrealized appreciation on investments | | | 879,643 | | | | 97,375 | |
| | | | | | | | |
Net increase in net assets resulting from operations | | | 946,140 | | | | 132,314 | |
| | | | | | | | |
DIVIDENDS AND DISTRIBUTIONS TO SHAREHOLDERS
FROM: | | | | | | | | |
Class I Shares | | | | | | | | |
Net investment income | | | (44,910 | ) | | | — | |
Net realized capital gains | | | (60,335 | ) | | | — | |
| | | | | | | | |
Net decrease in net assets from dividends and distributions
to shareholders | | | (105,245 | ) | | | — | |
| | | | | | | | |
CAPITAL TRANSACTIONS: | | | | | | | | |
Class I Shares | | | | | | | | |
Proceeds from shares sold | | | 7,717,139 | | | | 3,597,193 | |
Reinvestment of distribution | | | 105,245 | | | | — | |
Shares redeemed | | | (494,501 | ) | | | (127,059 | ) |
| | | | | | | | |
Net increase in net assets from capital share transactions | | | 7,327,883 | | | | 3,470,134 | |
| | | | | | | | |
Total increase in net assets | | | 8,168,778 | | | | 3,602,448 | |
| | | | | | | | |
NET ASSETS | | | | | | | | |
Beginning of period | | | 3,602,448 | | | | — | |
| | | | | | | | |
End of period | | $ | 11,771,226 | | | $ | 3,602,448 | |
| | | | | | | | |
Undistributed net investment income, end of period | | $ | 33,035 | | | $ | 12,290 | |
| | | | | | | | |
CAPITAL SHARE TRANSACTIONS: | | | | | | | | |
Class I Shares | | | | | | | | |
Shares sold | | | 744,333 | | | | 366,392 | |
Shares reinvested | | | 10,248 | | | | — | |
Shares redeemed | | | (47,510 | ) | | | (12,581 | ) |
| | | | | | | | |
Net increase in shares | | | 707,071 | | | | 353,811 | |
| | | | | | | | |
| (1) | The Fund commenced investment operations on February 29, 2012. |
The accompanying notes are an integral part of the financial statements.
11
SUMMIT GLOBAL INVESTMENTS
U.S. LOW VOLATILITY EQUITY FUND
Financial Highlights
| | | | |
Contained below is per share operating performance data for shares outstanding, total investment return, ratios to average net assets and other supplemental data for the representative periods. This information has been derived from information provided in the financial statements. |
| | | Class I Shares |
| | | For the Six Months Ended
February 28, 2013
(Unaudited) | | For the Period
Ended
August 31, 2012(1) |
Per Share Operating Performance | | | | |
Net asset value, beginning of period | | $ 10.18 | | $10.00 |
Net investment income(2) | | 0.09 | | 0.08 |
Net realized and unrealized gain from investments(3) | | 0.95 | | 0.10 |
Total from operations | | 1.04 | | 0.18 |
Distributions to shareholders from: | | | | |
From net investment income | | (0.05) | | — |
From net realized capital gains | | (0.07) | | — |
Total Distributions | | (0.12) | | — |
Net asset value, end of period | | $ 11.10 | | $10.18 |
Total investment return(4) | | 10.33%(5) | | 1.80%(5) |
Ratios/Supplemental Data | | | | |
Net assets, end of period (000’s omitted) | | $11,771 | | $3,602 |
Ratio of expenses to average net assets with waivers and reimbursements | | 0.98%(6) | | 0.98%(6) |
Ratio of expenses to average net assets without waivers and reimbursements | | 3.98%(6) | | 20.03%(6) |
Ratio of net investment income to average net assets | | 1.70%(6) | | 1.64%(6) |
Portfolio turnover rate | | 41%(5) | | 95%(5) |
| (1) | The Fund commenced investment operations on February 29, 2012. |
| (2) | The selected per share data was calculated based on average shares outstanding method for the period. |
| (3) | The amount shown may not correlate with the change in the aggregate gains and losses due to the timing of sales and purchases of the Fund’s shares in relation to fluctuating market values for the Fund’s portfolio. |
| (4) | Total investment return is calculated assuming a purchase of shares on the first day and a sale of shares on the last day of each period reported and includes reinvestments of dividends and distributions, if any. |
The accompanying notes are an integral part of the financial statements.
12
SUMMIT GLOBAL INVESTMENTS U.S. LOW VOLATILITY EQUITY FUND
Notes to Financial Statements
February 28, 2013
(Unaudited)
1. Organization and Significant Accounting Policies
The RBB Fund, Inc. (“RBB” or the “Company”) was incorporated under the laws of the State of Maryland on February 29, 1988 and is registered under the Investment Company Act of 1940, as amended, (the “Investment Company Act”) as an open-end management investment company. RBB is a “series fund,” which is a mutual fund divided into separate portfolios. Each portfolio is treated as a separate entity for certain matters under the Investment Company Act, and for other purposes, and a shareholder of one portfolio is not deemed to be a shareholder of any other portfolio. Currently, RBB has seventeen active investment portfolios, including the Summit Global Investments U.S. Low Volatility Equity Fund (the “Fund”), which commenced investment operations on February 29, 2012. As of the date hereof, the Fund offers three classes of shares, Class A Shares, Retail Shares and Class I Shares. As of February 28, 2013, Class A Shares and Retail Shares have not been issued.
RBB has authorized capital of one hundred billion shares of common stock of which 80.573 billion shares are currently classified into one hundred and forty-two classes of common stock. Each class represents an interest in an active or inactive RBB investment portfolio. The Fund has issued shares with a par value of $0.001.
Portfolio Valuation– The Fund’s net asset value (“NAV”) is calculated once daily at the close of regular trading hours on the New York Stock Exchange (“NYSE”) (typically 4:00 p.m. Eastern time) on each day the NYSE is open. Securities held by the Fund are valued using the closing price or the last sale price on a national securities exchange or the National Association of Securities Dealers Automatic Quotation System (“NASDAQ”) market system where they are primarily traded. Equity securities traded in the over-the-counter market are valued at their closing prices. If there were no transactions on that day, securities traded principally on an exchange or on NASDAQ will be valued at the mean of the last bid and ask prices prior to the market close. Investments in other open-end investment companies, if any, are valued based on the NAV of those investment companies (which may use fair value pricing as discussed in their prospectuses). If market quotations are unavailable or deemed unreliable, securities will be valued in accordance with procedures adopted by the Company’s Board of Directors. Relying on prices supplied by pricing services or dealers or using fair valuation may result in values that are higher or lower than the values used by other investment companies and investors to price the same investments.
13
SUMMIT GLOBAL INVESTMENTS U.S. LOW VOLATILITY EQUITY FUND
Notes to Financial Statements (Continued)
February 28, 2013
(Unaudited)
Fair Value Measurements – The inputs and valuation techniques used to measure fair value of the Fund’s investments are summarized into three levels as described in the hierarchy below:
| | | | |
— | | Level 1 — | | quoted prices in active markets for identical securities; |
| | |
— | | Level 2 — | | other significant observable inputs (including quoted prices for similar securities, interest rates, prepayment speeds, credit risk, etc.); and |
| | |
— | | Level 3 — | | significant unobservable inputs (including the Fund’s own assumptions in determining the fair value of investments). |
The inputs or methodology used for valuing securities are not necessarily an indication of the risk associated with investing in those securities.
The following is a summary of the inputs used, as of February 28, 2013, in valuing the Fund’s investments carried at fair value:
| | | | | | | | | | | | | | | | |
| | | Total Value at
February 28,
2013 | | | Level 1
Quoted
Price | | | Level 2
Other
Significant
Observable
Inputs | | | Level 3
Significant
Unobservable
Inputs | |
Investments in Securities* | | $ | 10,674,948 | | | $ | 10,674,948 | | | | — | | | | — | |
| | | | | | | | | | | | | | | | |
* Please refer to Portfolio of Investments for further details.
At the end of each calendar quarter, management evaluates the classification of Levels 1, 2 and 3 assets and liabilities. Various factors are considered, such as changes in liquidity from the prior reporting period; whether or not a broker is willing to execute at the quoted price; the depth and consistency of prices from third party pricing services; and the existence of contemporaneous, observable trades in the market. Additionally, management evaluates the classification of Level 1 and Level 2 assets and liabilities on a quarterly basis for changes in listings or delistings on national exchanges.
For fair valuations using significant unobservable inputs, U.S. generally accepted accounting principles (“U.S. GAAP”) require the Fund to present a reconciliation of the beginning to ending balances for reported market values that presents changes attributable to total realized and unrealized gains or losses, purchase and sales, and transfers in and out of Level 3 during the period. Transfers in and out between Levels are based on values at the end of the period. U.S. GAAP also requires the Fund to disclose amounts and reasons for all transfers in and out of Level 1 and Level 2 fair value measurements. A reconciliation of Level 3 investments is presented only when the Fund had an amount of Level 3 investments at the end of the reporting period that was meaningful in relation to its net assets. The amounts and reasons for all transfers in and out of each Level within the three-tier hierarchy are disclosed when the Fund had
14
SUMMIT GLOBAL INVESTMENTS U.S. LOW VOLATILITY EQUITY FUND
Notes to Financial Statements (Continued)
February 28, 2013
(Unaudited)
an amount of total transfers during the reporting period that was meaningful in relation to its net assets as of the end of the reporting period.
For the six months ended February 28, 2013, there were no transfers between Levels 1, 2 and 3 for the Fund.
Use of Estimates — The preparation of financial statements in conformity with U.S. GAAP requires management to make estimates and assumptions that affect the reported amounts of assets and liabilities and disclosure of contingent assets and liabilities at the date of the financial statements and the reported amounts of revenues and expenses during the period. Actual results could differ from those estimates and those differences could be significant.
Investment Transactions, Investment Income and Expenses — The Fund records security transactions based on trade date for financial reporting purposes. The cost of investments sold is determined by use of the specific identification method for both financial reporting and income tax purposes in determining realized gains and losses on investments. Interest income is accrued when earned. Dividend income is recorded on the ex-dividend date. Distributions received on securities that represent a return of capital or capital gains are recorded as a reduction of cost of investments and/or as a realized gain. The Fund’s policy is to allocate investment income, expenses and unrealized and realized gains and losses among classes on a daily basis, when applicable. Expenses incurred on behalf of a specific class, fund or fund family are charged directly to the class, fund or fund family to each class of shares based upon the relative proportion of net assets of each class at the beginning of the day. Expenses incurred for all the RBB funds (such as director or professional fees) are charged to all funds in proportion to their average net assets of RBB, or in such other manner as the Company’s Board of Directors deems fair or equitable. Expenses and fees, including investment advisory and administration fees, are accrued daily and taken into account for the purpose of determining the NAV of the Fund.
Dividends and Distributions to Shareholders — Dividends from net investment income, if any, are declared and paid quarterly. Net realized capital gains, if any, are declared and paid annually. Income dividends and capital gain distributions are determined in accordance with U.S. federal income tax regulations which may differ from U.S. GAAP.
U.S. Tax Status — No provision is made for U.S. income taxes as it is the Fund’s intention to qualify for and elect the tax treatment applicable to regulated investment companies under Subchapter M of the Internal Revenue Code of 1986, as amended, and make the requisite distributions to its shareholders which will be sufficient to relieve it from U.S. income and excise taxes.
15
SUMMIT GLOBAL INVESTMENTS U.S. LOW VOLATILITY EQUITY FUND
Notes to Financial Statements (Continued)
February 28, 2013
(Unaudited)
Cash and Cash Equivalents — The Funds consider liquid assets deposited into a bank demand deposit account to be cash equivalents. These investments represent amounts held with financial institutions that are readily accessible to pay Fund expenses or purchase investments. Cash and cash equivalents are valued at cost plus accrued interest, which approximates market value.
Other — In the normal course of business, the Fund may enter into contracts that provide general indemnifications. The Fund’s maximum exposure under these arrangements is dependent on claims that may be made against the Fund in the future, and, therefore, cannot be estimated; however, based on experience, the risk of material loss from such claims is considered remote.
2. Investment Adviser and Other Services
Summit Global Investments, LLC (“Summit” or the “Adviser”) serves as the Fund’s investment adviser. For its advisory services, the Adviser is entitled to receive a monthly fee from the Fund calculated at an annual rate of 0.70% of the Fund’s average daily net assets.
Summit has contractually agreed to waive its management fees and/or reimburse expenses, to the extent that total annual operating expenses (excluding certain items discussed below) exceed 1.23% of the average daily net assets for Class A Shares and Retail Shares (Class A Shares and Retail Shares have not commenced operations as of February 28, 2013) and 0.98% of the average daily net assets for Class I Shares. In determining Summit’s obligation to waive advisory fees and/or reimburse expenses, the following expenses are not taken into account: acquired fund fees and expenses, brokerage commissions, extraordinary items, interest or taxes. This contractual limitation is in effect until December 31, 2015 and may not be terminated before December 31, 2013 without approval by the Company’s Board of Directors. For the six months ended February 28, 2013, investment advisory fees accrued were $27,105 and expenses waived and reimbursed by the Adviser were $116,190.
BNY Mellon Investment Servicing (US) Inc. (“BNY Mellon”) serves as administrator for the Fund. For providing administrative and accounting services, BNY Mellon is entitled to receive a monthly fee equal to an annual percentage rate of the Fund’s average daily net assets, subject to certain minimum monthly fees.
Included in the administration and accounting service fees, shown on the Statement of Operations, are fees for providing regulatory administration services to RBB. For providing these services, BNY Mellon is entitled to receive compensation as agreed to by the Company and BNY Mellon. This fee is allocated to each portfolio of the Company in proportion to its net assets of the Company.
In addition, BNY Mellon serves as the Fund’s transfer and dividend disbursing agent. For providing
16
SUMMIT GLOBAL INVESTMENTS U.S. LOW VOLATILITY EQUITY FUND
Notes to Financial Statements (Continued)
February 28, 2013
(Unaudited)
these transfer agent services, BNY Mellon is entitled to receive a monthly fee equal to an annual percentage rate of the Fund’s average daily net assets, subject to certain minimum monthly fees.
The Bank of New York Mellon (the “Custodian”) provides certain custodial services to the Fund. The Custodian is entitled to receive a monthly fee equal to an annual percentage rate of the Fund’s average daily net assets, subject to certain minimum monthly fees.
Foreside Funds Distributors LLC, serves as the principal underwriter and distributor of Fund’s shares pursuant to a Distribution Agreement with RBB.
3. Director Compensation
The Directors of the Company receive an annual retainer and meeting fees for meetings attended. The aggregate remuneration paid to the Directors by the Fund during the six months ended February 28, 2013 was $3,972. Certain employees of BNY serve as an Officer or Director of the Company. They are not compensated by the Fund or the Company.
4. Investment in Securities
For the six months ended February 28, 2013, aggregate purchases and sales of investment securities (excluding short-term investments) of the Fund were as follows:
| | | | | | | | |
| | | Purchases | | | Sales | |
Investment Securities | | $ | 9,509,987 | | | $ | 3,052,740 | |
5. Federal Income Tax Information
The Fund has followed the authoritative guidance on accounting for and disclosure of uncertainty in tax positions, which requires the Fund to determine whether a tax position is more likely than not to be sustained upon examination, including resolution of any related appeals or litigation processes, based on the technical merits of the position. The Fund has determined that there was no effect on the financial statements from following this authoritative guidance. In the normal course of business, the Fund is subject to examination by federal, state and local jurisdictions, where applicable, for tax years for which applicable statutes of limitations have not expired.
As of February 28, 2013, the federal tax cost, aggregate gross unrealized appreciation and depreciation of securities held by the Fund were as follows:
17
SUMMIT GLOBAL INVESTMENTS U.S. LOW VOLATILITY EQUITY FUND
Notes to Financial Statements (Concluded)
February 28, 2013
(Unaudited)
| | | | | | |
| | | | | | |
Federal tax cost | | $ | 9,697,930 | | |
| | | | | |
Gross unrealized appreciation | | $ | 1,009,872 | | |
Gross unrealized depreciation | | | (32,854 | ) | |
| | | | | |
Net unrealized appreciation | | $ | 977,018 | | |
| | | | | |
Distributions to shareholders, if any, from net investment income and realized gains are determined in accordance with federal income tax regulations, which may differ from net investment income and realized gains recognized for financial reporting purposes. Accordingly, the character of distributions and composition of net assets for tax purposes may differ from those reflected in the accompanying financial statements. To the extent these differences are permanent, such amounts are reclassified within the capital accounts based on the tax treatment; temporary differences do not require such reclassification.
As of August 31, 2012, the components of distributable earnings on a tax basis were as follows:
| | | | |
Undistributed
Ordinary Income | | Undistributed
Long-Term Gains | | Unrealized
Appreciation |
| $34,939 | | $— | | $97,375 |
There were no differences between the book and tax basis components of distributable earnings. Short-term and foreign currency gains are reported as ordinary income for federal income tax purposes.
Accumulated capital losses represent net capital loss carry forwards as of August 31, 2012 that may be available to offset future realized capital gains and thereby reduce future capital gains distributions. Under the Regulated Investment Company Modernization Act of 2010 (the “Modernization Act”), the Fund is permitted to carry forward capital losses incurred in taxable years beginning after December 22, 2010 for an unlimited period. Additionally, post-enactment capital losses that are carried forward will retain their character as either short-term or long-term capital losses rather than being considered all short-term as under the previous law. The Fund’s first fiscal year end subject to the Modernization Act was August 31, 2012. As of August 31, 2012, the Fund did not have any capital loss carry forwards.
6. Subsequent Events
Management has evaluated the impact of all subsequent events on the Fund though the date the financial statements were issued, and has determined that there were no subsequent events requiring recognition or disclosure in the financial statements.
18
SUMMIT GLOBAL INVESTMENTS
U.S. LOW VOLATILITY EQUITY FUND
Other Information
(Unaudited)
Proxy Voting
Policies and procedures that the Fund uses to determine how to vote proxies relating to portfolio securities as well as information regarding how the Fund voted proxies relating to portfolio securities for the most recent six-month period ended June 30 are available without charge, upon request, by calling (855) 744-8500 and on the Securities and Exchange Commission’s (“SEC”) website at http://www.sec.gov.
Quarterly Portfolio Schedules
The Company will file its complete schedule of portfolio holdings with the SEC for the first and third fiscal quarters of each fiscal year (quarters ended November 30 and May 31) on Form N-Q. The Company’s Forms N-Q will be available on the SEC’s website at http://www.sec.gov and may be reviewed and copied at the SEC’s Public Reference Room in Washington, D.C. Information on the operation of the SEC’s Public Reference Room may be obtained by calling (202) 551-8090.
19
Investment Adviser
Summit Global Investments, LLC
620 South Main Street
Bountiful, UT 84010
Administrator
BNY Mellon Investment Servicing (US) Inc.
301 Bellevue Parkway
Wilmington, DE 19809
Transfer Agent
BNY Mellon Investment Servicing (US) Inc.
4400 Computer Drive
Westborough, MA 01581
Principal Underwriter
Foreside Funds Distributors LLC
400 Berwyn Park
899 Cassatt Road
Berwyn, PA 19312
Custodian
The Bank of New York Mellon
One Wall Street
New York, NY 10286
Independent Registered Public Accounting Firm
Ernst & Young LLP
One Commerce Square
2005 Market Street, Suite 700
Philadelphia, PA 19103
Legal Counsel
Drinker, Biddle & Reath LLP
One Logan Square, Ste. 2000
Philadelphia, PA 19103-6996

SUMMIT GLOBAL
INVESTMENTS
U.S. LOW VOLATILITY
EQUITY FUND
of
The RBB Fund, Inc.
Class I Shares
SEMI-ANNUAL REPORT
February 28, 2013
(Unaudited)
This report is submitted for the general information of the shareholders of the Fund. It is not authorized for distribution unless preceded or accompanied by a current prospectus for the Fund.
Item 2. Code of Ethics.
Not applicable.
Item 3. Audit Committee Financial Expert.
Not applicable.
Item 4. Principal Accountant Fees and Services.
Not applicable.
Item 5. Audit Committee of Listed Registrants.
Not applicable.
Item 6. Investments.
| (a) | Schedule of Investments in securities of unaffiliated issuers as of the close of the reporting period is included as part of the report to shareholders filed under Item 1 of this Form. |
Item 7. Disclosure of Proxy Voting Policies and Procedures for Closed-End Management Investment Companies.
Not applicable.
Item 8. Portfolio Managers of Closed-End Management Investment Companies.
Not applicable.
Item 9. Purchases of Equity Securities by Closed-End Management Investment Company and Affiliated Purchasers.
Not applicable.
Item 10. Submission of Matters to a Vote of Security Holders.
There have been no material changes to the procedures by which the shareholders may recommend nominees to the registrant’s board of directors, where those changes were implemented after the registrant last provided disclosure in response to the requirements of Item 407(c)(2)(iv) of Regulation S-K (17 CFR 229.407) (as required by Item 22(b)(15) of Schedule 14A (17 CFR 240.14a-101)), or this Item.
Item 11. Controls and Procedures.
| | (a) | The registrant’s principal executive and principal financial officers, or persons performing similar functions, have concluded that the registrant’s disclosure controls and procedures (as defined in Rule 30a-3(c) under the Investment Company Act of 1940, as amended (the “1940 Act”) (17 CFR 270.30a-3(c))) are effective, as of a date within 90 days of the filing date of the report that includes the disclosure required by this paragraph, based on their evaluation of these controls and procedures required by Rule 30a-3(b) under the 1940 Act (17 CFR 270.30a-3(b)) and Rules 13a-15(b) or 15d-15(b) under the Securities Exchange Act of 1934, as amended (17 CFR 240.13a-15(b) or 240.15d-15(b)). |
| | (b) | There were no changes in the registrant’s internal control over financial reporting (as defined in Rule 30a-3(d) under the 1940 Act (17 CFR 270.30a-3(d)) that occurred during the registrant’s second fiscal quarter of the period covered by this report that has materially affected, or is reasonably likely to materially affect, the registrant’s internal control over financial reporting. |
Item 12. Exhibits.
| | (a)(2) | Certifications pursuant to Rule 30a-2(a) under the 1940 Act and Section 302 of the Sarbanes-Oxley Act of 2002 are attached hereto. |
| | (b) | Certifications pursuant to Rule 30a-2(b) under the 1940 Act and Section 906 of the Sarbanes-Oxley Act of 2002 are attached hereto. |
SIGNATURES
Pursuant to the requirements of the Securities Exchange Act of 1934 and the Investment Company Act of 1940, the registrant has duly caused this report to be signed on its behalf by the undersigned, thereunto duly authorized.
| | |
| (Registrant) The RBB Fund, Inc. |
|
| By (Signature and Title)* /s/ Salvatore Faia |
| | Salvatore Faia, President |
| | (principal executive officer) |
|
| Date April 26, 2013 |
Pursuant to the requirements of the Securities Exchange Act of 1934 and the Investment Company Act of 1940, this report has been signed below by the following persons on behalf of the registrant and in the capacities and on the dates indicated.
| | |
| By (Signature and Title)* /s/ Salvatore Faia |
| | Salvatore Faia, President |
| | (principal executive officer) |
|
| Date April 26, 2013 |
|
| By (Signature and Title)* /s/ Joel Weiss |
| | Joel Weiss, Treasurer |
| | (principal financial officer) |
|
| Date April 26, 2013 |
| * | Print the name and title of each signing officer under his or her signature. |