| |
| |
UNITED STATES |
SECURITIES AND EXCHANGE COMMISSION |
Washington, D.C. 20549 |
| |
FORM 10-Q |
| |
(Mark One) |
[X] | QUARTERLY REPORT PURSUANT TO SECTION 13 OR 15(d) OF THE |
SECURITIES EXCHANGE ACT OF 1934 |
For the quarterly period ended June 30, 2005 |
OR |
[ ] | TRANSITION REPORT PURSUANT TO SECTION 13 OR 15(d) OF THE |
SECURITIES EXCHANGE ACT OF 1934 |
For the transition period from | | to |
Commission File Number: 1-9916 |
| |
|
| |
Freeport-McMoRan Copper & Gold Inc. |
| (Exact name of registrant as specified in its charter) |
Delaware | 74-2480931 |
(State or other jurisdiction of incorporation or organization) | (IRS Employer Identification No.) |
| | |
1615 Poydras Street | |
New Orleans, Louisiana | 70112 |
| (Address of principal executive offices) | (Zip Code) |
| |
| |
(504) 582-4000 |
| (Registrant's telephone number, including area code) |
| |
Indicate by check mark whether the registrant (1) has filed all reports required to be filed by Section 13 or 15(d) of the Securities Exchange Act of 1934 during the preceding 12 months (or for such shorter period that the registrant was required to file such reports), and (2) has been subject to such filing requirements for the past 90 days. Yes X No __
Indicate by check mark whether the registrant is an accelerated filer (as defined in Rule 12b-2 of the Securities Exchange Act of 1934). Yes X No __
On June 30, 2005, there were issued and outstanding 177,342,552 shares of the registrant’s Class B Common Stock, par value $0.10 per share.
FREEPORT-McMoRan COPPER & GOLD INC.
| | |
| | Page |
| 3 |
| | |
| |
| | |
| 3 |
| | |
| 4 |
| | |
| 5 |
| | |
| 6 |
| | |
| 11 |
| | |
| 12 |
| | |
| |
| 13 |
| | |
| 36 |
| | |
| 36 |
| | |
| 36 |
| | |
| 36 |
| | |
| 37 |
| | |
| 37 |
| | |
| 37 |
| | |
| 38 |
| | |
| E-1 |
| | |
FREEPORT-McMoRan COPPER & GOLD INC.
FREEPORT-McMoRan COPPER & GOLD INC.
| | | June 30, | | | December 31, | |
| | | 2005 | | | 2004 | |
| | | (In Thousands) | |
| ASSETS | | | | | | | | |
| Current assets: | | | | | | | | |
| Cash and cash equivalents | | $ | 585,434 | | | $ | 551,450 | |
| Restricted cash | | | 500 | | | | 500 | |
| Accounts receivable | | | 302,184 | | | | 435,062 | |
| Inventories | | | 435,248 | | | | 466,712 | |
| Prepaid expenses and other | | | 9,975 | | | | 6,223 | |
| Total current assets | | | 1,333,341 | | | | 1,459,947 | |
| Property, plant, equipment and development costs, net | | | 3,146,065 | | | | 3,199,292 | |
| Deferred mining costs | | | 273,225 | | | | 220,415 | |
| Other assets | | | 152,697 | | | | 159,539 | |
| Investment in PT Smelting | | | 52,936 | | | | 47,802 | |
| Total assets | | $ | 4,958,264 | | | $ | 5,086,995 | |
| | | | | | | | | |
| LIABILITIES AND STOCKHOLDERS’ EQUITY | | | | | | | | |
| Current liabilities: | | | | | | | | |
| Accounts payable and accrued liabilities | | $ | 346,862 | | | $ | 386,590 | |
| Current portion of long-term debt and short-term borrowings | | | 193,706 | | | | 78,214 | |
| Accrued income taxes | | | 110,165 | | | | 92,346 | |
| Rio Tinto share of joint venture cash flows | | | 59,890 | | | | 60,224 | |
| Unearned customer receipts | | | 52,981 | | | | 33,021 | |
| Accrued interest payable | | | 46,981 | | | | 47,167 | |
| Total current liabilities | | | 810,585 | | | | 697,562 | |
| Long-term debt, less current portion: | | | | | | | | |
| Senior notes | | | 900,386 | | | | 911,336 | |
| Convertible senior notes | | | 575,000 | | | | 575,000 | |
| Equipment and other loans | | | 61,303 | | | | 67,624 | |
| Atlantic Copper debt | | | 39,210 | | | | 4,426 | |
| Redeemable preferred stock | | | 12,501 | | | | 179,880 | |
| PT Puncakjaya Power bank debt | | | - | | | | 135,426 | |
| Total long-term debt, less current portion | | | 1,588,400 | | | | 1,873,692 | |
| Accrued postretirement benefits and other liabilities | | | 203,949 | | | | 200,228 | |
| Deferred income taxes | | | 938,210 | | | | 932,416 | |
| Minority interests | | | 196,134 | | | | 219,448 | |
| Stockholders' equity: | | | | | | | | |
| Convertible perpetual preferred stock | | | 1,100,000 | | | | 1,100,000 | |
| Class B common stock | | | 28,621 | | | | 28,496 | |
| Capital in excess of par value of common stock | | | 1,886,486 | | | | 1,852,816 | |
| Retained earnings | | | 730,528 | | | | 604,680 | |
| Accumulated other comprehensive income | | | 9,588 | | | | 11,342 | |
| Common stock held in treasury | | | (2,534,237 | ) | | | (2,433,685 | ) |
| Total stockholders’ equity | | | 1,220,986 | | | | 1,163,649 | |
| Total liabilities and stockholders’ equity | | $ | 4,958,264 | | | $ | 5,086,995 | |
The accompanying notes are an integral part of these financial statements.
FREEPORT-McMoRan COPPER & GOLD INC.
| | | Three Months Ended | | | Six Months Ended | |
| | | June 30, | | | June 30, | |
| | | 2005 | | | 2004 | | | 2005 | | | 2004 | |
| | | (In Thousands, Except Per Share Amounts) | |
| Revenues | $ | 902,909 | | $ | 486,334 | | $ | 1,705,974 | | $ | 846,519 | |
| Cost of sales: | | | | | | | | | | | | |
| Production and delivery | | 390,586 | | | 371,679 | | | 755,592 | | | 647,291 | |
| Depreciation and amortization | | 54,159 | | | 42,590 | | | 111,085 | | | 68,000 | |
| Total cost of sales | | 444,745 | | | 414,269 | | | 866,677 | | | 715,291 | |
| Exploration expenses | | 2,342 | | | 2,787 | | | 4,262 | | | 5,014 | |
| General and administrative expenses | | 25,379 | | | 22,576 | | | 46,993 | | | 38,136 | |
| Total costs and expenses | | 472,466 | | | 439,632 | | | 917,932 | | | 758,441 | |
| Operating income | | 430,443 | | | 46,702 | | | 788,042 | | | 88,078 | |
| Equity in PT Smelting earnings (losses) | | 2,562 | | | (2,548 | ) | | 5,158 | | | (2,906 | ) |
| Interest expense, net | | (35,292 | ) | | (39,339 | ) | | (72,840 | ) | | (72,729 | ) |
| Gains (losses) on early extinguishment and | | | | | | | | | | | | |
| conversion of debt | | - | | | 643 | | | 37 | | | (14,000 | ) |
| Other income (expense), net | | 8,143 | | | (368 | ) | | 16,095 | | | 3,174 | |
| Income before income taxes and minority | | | | | | | | | | | | |
| interests | | 405,856 | | | 5,090 | | | 736,492 | | | 1,617 | |
| Provision for income taxes | | (188,684 | ) | | (38,210 | ) | | (352,712 | ) | | (56,551 | ) |
| Minority interests in net income of | | | | | | | | | | | | |
| consolidated subsidiaries | | (26,800 | ) | | (5,118 | ) | | (47,888 | ) | | (2,687 | ) |
| Net income (loss) | | 190,372 | | | (38,238 | ) | | 335,892 | | | (57,621 | ) |
| Preferred dividends | | (15,125 | ) | | (15,073 | ) | | (30,250 | ) | | (15,241 | ) |
| Net income (loss) applicable to common stock | $ | 175,247 | | $ | (53,311 | ) | $ | 305,642 | | $ | (72,862 | ) |
| | | | | | | | | | | | | |
| Net income (loss) per share of common stock: | | | | | | | | | | | | |
| Basic | | $0.98 | | | $(0.30 | ) | | $1.71 | | | $(0.39 | ) |
| Diluted | | $0.91 | | | $(0.30 | ) | | $1.62 | | | $(0.39 | ) |
| Average common shares outstanding: | | | | | | | | | | | | |
| Basic | | 178,324 | | | 175,202 | | | 178,822 | | | 186,570 | |
| Diluted | | 219,990 | | | 175,202 | | | 220,516 | | | 186,570 | |
| | | | | | | | | | | | | |
| Dividends paid per share of common stock | | $0.25 | | | $0.20 | | | $1.00 | | | $0.40 | |
The accompanying notes are an integral part of these financial statements.
FREEPORT-McMoRan COPPER & GOLD INC.
| | | Six Months Ended June 30, | |
| | | 2005 | | | 2004 | |
| | | (In Thousands) | |
| Cash flow from operating activities: | | | | | | | | |
| Net income (loss) | | $ | 335,892 | | | $ | (57,621 | ) |
| Adjustments to reconcile net income (loss) to net cash provided by | | | |
| (used in) operating activities: | | | | | | | | |
| Depreciation and amortization | | | 111,085 | | | | 68,000 | |
| (Gains) losses on early extinguishment and conversion of debt | | | (37 | ) | | | 14,000 | |
| Deferred income taxes | | | 5,327 | | | | 69,564 | |
| Equity in PT Smelting (earnings) losses | | | (5,158 | ) | | | 2,906 | |
| Minority interests' share of net income | | | 47,888 | | | | 2,687 | |
| Increase in deferred mining costs | | | (52,810 | ) | | | (57,707 | ) |
| Amortization of deferred financing costs | | | 4,010 | | | | 4,460 | |
| Currency translation gains | | | (6,252 | ) | | | (1,847 | ) |
| Elimination of profit on PT Freeport Indonesia sales to | | | | | | | | |
| PT Smelting | | | 25 | | | | 1,956 | |
| Provision for inventory obsolescence | | | 3,000 | | | | 4,025 | |
| Other | | | 14,937 | | | | 5,986 | |
| (Increases) decreases in working capital: | | | | | | | | |
| Accounts receivable | | | 123,278 | | | | (47,949 | ) |
| Inventories | | | 25,155 | | | | (33,007 | ) |
| Prepaid expenses and other | | | (2,406 | ) | | | (63,766 | ) |
| Accounts payable and accrued liabilities | | | (8,100 | ) | | | (28,286 | ) |
| Rio Tinto share of joint venture cash flows | | | (334 | ) | | | (30,484 | ) |
| Accrued income taxes | | | 25,011 | | | | (41,868 | ) |
| (Increase) decrease in working capital | | | 162,604 | | | | (245,360 | ) |
| Net cash provided by (used in) operating activities | | | 620,511 | | | | (188,951 | ) |
| Cash flow from investing activities: | | | | | | | | |
| PT Freeport Indonesia capital expenditures | | | (53,428 | ) | | | (59,583 | ) |
| Atlantic Copper capital expenditures | | | (5,863 | ) | | | (15,257 | ) |
| Proceeds from insurance settlement | | | 2,016 | | | | - | |
| Investment in PT Smelting and other | | | 131 | | | | (1,219 | ) |
| Sale of restricted investments | | | - | | | | 19,346 | |
| Decrease in Atlantic Copper restricted cash | | | - | | | | 11,000 | |
| Net cash used in investing activities | | | (57,144 | ) | | | (45,713 | ) |
| Cash flow from financing activities: | | | | | | | | |
| Net proceeds from sale of senior notes | | | - | | | | 344,354 | |
| Proceeds from other debt | | | 65,647 | | | | 57,708 | |
| Repayments of debt | | | (235,249 | ) | | | (337,184 | ) |
| Redemption of preferred stock | | | (215 | ) | | | (1,110 | ) |
| Net proceeds from sale of convertible perpetual preferred stock | | | - | | | | 1,067,000 | |
| Purchase of FCX common shares from Rio Tinto | | | - | | | | (881,868 | ) |
| Purchases of FCX common shares | | | (80,227 | ) | | | (99,477 | ) |
| Cash dividends paid: | | | | | | | | |
| Common stock | | | (179,658 | ) | | | (74,655 | ) |
| Preferred stock | | | (30,251 | ) | | | (5,219 | ) |
| Minority interests | | | (71,425 | ) | | | (929 | ) |
| Net proceeds from exercised stock options | | | 2,016 | | | | 4,030 | |
| Bank credit facilities fees and other | | | (21 | ) | | | (1,886 | ) |
| Net cash (used in) provided by financing activities | | | (529,383 | ) | | | 70,764 | |
| Net increase (decrease) in cash and cash equivalents | | | 33,984 | | | | (163,900 | ) |
| Cash and cash equivalents at beginning of year | | | 551,450 | | | | 463,652 | |
| Cash and cash equivalents at end of period | | $ | 585,434 | | | $ | 299,752 | |
The accompanying notes are an integral part of these financial statements.
FREEPORT-McMoRan COPPER & GOLD INC.
| 1. | NEW ACCOUNTING STANDARDS |
Deferred Mining Costs. In the mining industry, the costs of removing overburden and waste material to access mineral deposits are referred to as “stripping costs.” Currently, Freeport-McMoRan Copper & Gold Inc. (FCX) applies the deferred mining cost method in accounting for its post-production stripping costs, which FCX refers to as overburden removal costs. The deferred mining cost method is used by some companies in the metals mining industry; however, industry practice varies. The deferred mining cost method matches the cost of production with the sale of the related metal from the open pit by assigning each metric ton of ore removed an equivalent amount of overburden tonnage, thereby averaging overburden removal costs over the life of the mine. The mining cost capitalized in inventory and the amounts charged to cost of goods sold do not represent the actual costs incurred to mine the ore in any given period. The application of the deferred mining cost method has resulted in an asset on FCX’s balance sheets (“Deferred Mining Costs”) totaling $273.2 million at June 30, 2005, and $220.4 million at December 31, 2004. For further information, see Note 1 in FCX’s 2004 Annual Report on Form 10-K.
In March 2005, the Financial Accounting Standards Board (FASB) ratified Emerging Issues Task Force (EITF) Issue No. 04-6, “Accounting for Stripping Costs Incurred during Production in the Mining Industry,” which requires that stripping costs be considered costs of the extracted minerals and recognized as a component of inventory to be recognized in cost of sales in the same period as the revenue from the sale of inventory. As a result, capitalization of stripping costs is appropriate only to the extent product inventory exists at the end of a reporting period. The guidance in EITF Issue No. 04-6 is effective for financial statements issued for fiscal years beginning after December 15, 2005, with early adoption permitted. Companies may apply this guidance either by recognition of a cumulative effect adjustment to beginning retained earnings in the period of adoption or by restating prior period financial statements. FCX expects to adopt the guidance on January 1, 2006, with the most significant impacts of adoption being the deferred mining costs asset on FCX’s balance sheet on that date will be charged, net of taxes and minority interest share, as a cumulative effect adjustment to beginning retained earnings and future stripping costs will effectively be charged to cost of sales as incurred. Adoption of the new guidance will have no impact on FCX’s cash flows. The pro forma impact of applying EITF Issue No. 04-6 to the periods reported in this quarterly report on Form 10-Q would be to reduce net income by $12.1 million or $0.06 per diluted share for the second quarter of 2005 and $28.1 million or $0.13 per diluted share for the 2005 six-month period, and to increase net losses by $12.8 million or $0.07 per share for the second quarter of 2004 and $28.0 million or $0.15 per share for the 2004 six-month period.
Stock-Based Payments. Refer to Note 1 in FCX’s 2004 Annual Report on Form 10-K for FCX’s accounting for share-based payments, including stock options. Through June 30, 2005, FCX has accounted for grants of employee stock options under the recognition principles of Accounting Principles Board (APB) Opinion No. 25, “Accounting for Stock Issued to Employees,” and related interpretations, which require compensation costs for stock-based employee compensation plans to be recognized based on the difference on the date of grant, if any, between the quoted market price of the stock and the amount an employee must pay to acquire the stock. If FCX had applied the fair value recognition provisions of Statement of Financial Accounting Standards (SFAS) No. 123, “Accounting for Stock-Based Compensation,” which requires stock-based compensation to be recognized based on the use of a fair value method, FCX’s net income would have been reduced by $3.4 million, $0.02 per diluted share, for the second quarter of 2005 and $6.3 million, $0.06 per diluted share, for the first six months of 2005. In 2004, FCX’s net loss would have been increased by $1.1 million, $0.01 per diluted share, for the second quarter of 2004 and $2.2 million, $0.01 per diluted share, for the first six months of 2004.
In December 2004, the FASB issued SFAS No. 123 (revised 2004), “Share-Based Payment” (SFAS No. 123R). SFAS No. 123R requires all share-based payments to employees, including grants of employee stock options, to be recognized in the financial statements based on their fair values. SFAS No. 123R’s effective date is interim periods beginning after June 15, 2005. However, in April 2005 the Securities and Exchange Commission provided for a deferral of the effective date to fiscal periods beginning after June 15, 2005. FCX is still reviewing the provisions of SFAS No. 123R and has not yet determined if it will adopt SFAS No. 123R before January 1, 2006. Based on currently outstanding employee stock options, FCX estimates the pro forma charge to earnings before taxes and minority interest sharing for the full year 2005 would total approximately $22 million, and the pro forma reduction in net income would be approximately $13 million, $0.07 per share using average basic shares outstanding for the second quarter of 2005.
FCX basic net income (loss) per share of common stock was calculated by dividing net income (loss) applicable to common stock by the weighted average number of common shares outstanding during the period. The following is a reconciliation of net income (loss) and weighted average common shares outstanding for purposes of calculating diluted net income (loss) per share (in thousands, except per share amounts):
| | | Three Months Ended | | Six Months Ended | |
| | | June 30, | | June 30, | |
| | | 2005 | | 2004 | | 2005 | | 2004 | |
| Net income (loss) before preferred dividends | | $ | 190,372 | | $ | (38,238 | ) | $ | 335,892 | | $ | (57,621 | ) |
| Preferred dividends | | | (15,125 | ) | | (15,073 | ) | | (30,250 | ) | | (15,241 | ) |
| Net income (loss) applicable to common stock | | | 175,247 | | | (53,311 | ) | | 305,642 | | | (72,862 | ) |
| Plus income impact of assumed conversion of: | | | | | | | | | | | | | |
| 5½% Convertible Perpetual Preferred Stock | | | 15,125 | | | - | | | 30,250 | | | - | |
| 7% Convertible Senior Notes | | | 10,287 | | | - | | | 20,609 | | | - | |
| Diluted net income (loss) applicable to common stock | | $ | 200,659 | | $ | (53,311 | ) | $ | 356,501 | | $ | (72,862 | ) |
| | | | | | | | | | | | | | |
| Weighted average common shares outstanding | | | 178,324 | | | 175,202 | | | 178,822 | | | 186,570 | |
Add: Shares issuable upon conversion of: | | | | | | | | | | | | | |
| 5½% Convertible Perpetual Preferred Stock | | | 21,152 | | | - | | | 21,034 | | | - | |
| 7% Convertible Senior Notes | | | 18,625 | | | - | | | 18,625 | | | - | |
| Dilutive stock options | | | 1,408 | | | - | | | 1,555 | | | - | |
| Restricted stock | | | 481 | | | - | | | 480 | | | - | |
| Weighted average common shares outstanding for | | | | | | | | | | | | | |
| purposes of calculating diluted net income (loss) | | | | | | | | | | | | | |
| per share | | | 219,990 | | | 175,202 | | | 220,516 | | | 186,570 | |
| | | | | | | | | | | | | | |
| Diluted net income (loss) per share of common stock | | $ | 0.91 | | $ | (0.30 | ) | $ | 1.62 | | $ | (0.39 | ) |
| | | | | | | | | | | | | | |
Outstanding stock options with exercise prices greater than the average market price of the common stock during the period are excluded from the computation of diluted net income per share of common stock. FCX’s convertible instruments are also excluded when including the conversion of these instruments increases reported diluted net income per share or when FCX reports a net loss for the period. A recap of the excluded amounts follows (in thousands, except exercise prices):
| | Three Months Ended | | Six Months Ended | |
| | June 30, | | June 30, | |
| | 2005 | | 2004 | | 2005 | | 2004 | |
| Weighted average outstanding options | 5,463 | | 2,346 | | 2,732 | | - | |
| Weighted average exercise price | $36.98 | | $36.13 | | $36.98 | | - | |
| | | | | | | | | |
| Dividends on 5½% Convertible Perpetual Preferred Stock | - | | $15,125 | | - | | $15,293 | a |
| Weighted average shares issuable upon conversion | - | | 20,682 | | - | | 10,563 | a |
| | | | | | | | | |
| Interest on 7% Convertible Senior Notes | - | | $10,357 | b | - | | $20,715 | b |
| Weighted average shares issuable upon conversion | - | | 18,625 | | - | | 18,625 | |
| | | | | | | | | |
| Interest on 8¼% Convertible Senior Notes | N/A | | $1,399 | b | N/A | | $3,363 | b |
| Weighted average shares issuable upon conversion | N/A | | 4,653 | | N/A | | 5,464 | |
| | | | | | | | | |
| a. | FCX’s 5½% Convertible Perpetual Preferred Stock was issued on March 30, 2004. |
| b. | Amounts are net of the effective United States federal alternative minimum tax rate of two percent. |
Stock-Based Compensation Plans. As of June 30, 2005, FCX has four stock-based employee compensation plans and two stock-based director compensation plans, which are more fully described in Note 7 of FCX’s 2004 Annual Report on Form 10-K. FCX accounts for options granted under all of its plans using the recognition and measurement principles of APB Opinion No. 25 and related interpretations, which require compensation cost for stock-based employee compensation plans to be recognized based on the difference on the date of grant, if any, between the quoted market price of the stock and the amount an employee must pay to acquire the stock. Because all the plans require that the option exercise price be at least the market price on the date of grant, FCX recognizes no compensation expense on the grant or exercise of its employees’ options. The following table illustrates the effect on net income and earnings per share if FCX had applied the fair value recognition provisions of SFAS No. 123 which requires compensation cost for all stock-based employee compensation plans to be recognized based on a fair value method (in thousands, except per share amounts).
| | | Three Months Ended | | Six Months Ended | |
| | | June 30, | | June 30, | |
| | | 2005 | | 2004 | | 2005 | | 2004 | |
| Net income (loss) applicable to common stock, as reported | | $ | 175,247 | | $ | (53,311 | ) | $ | 305,642 | | $ | (72,862 | ) |
| Add: Stock-based employee compensation expense | | | | | | | | | | | | | |
| included in reported net income (loss) for stock option | | | | | | | | | | | | | |
| conversions, stock appreciation rights (SARs) and | | | | | | | | | | | | | |
| restricted stock units, net of taxes and minority interests | | | 1,898 | | | (16 | ) | | 4,457 | | | 374 | |
| Deduct: Total stock-based employee compensation | | | | | | | | | | | | | |
| expense determined under fair value-based method for | | | | | | | | | | | | | |
| all awards, net of taxes and minority interests | | | (5,339 | ) | | (1,041 | ) | | (10,754 | ) | | (2,583 | ) |
| Pro forma net income (loss) applicable to common stock | | $ | 171,806 | | $ | (54,368 | ) | $ | 299,345 | | $ | (75,071 | ) |
| | | | | | | | | | | | | | |
| Earnings (loss) per share: | | | | | | | | | | | | | |
| Basic - as reported | | $ | 0.98 | | $ | (0.30 | ) | $ | 1.71 | | $ | (0.39 | ) |
| Basic - pro forma | | $ | 0.96 | | $ | (0.31 | ) | $ | 1.67 | | $ | (0.40 | ) |
| | | | | | | | | | | | | | |
| Diluted - as reported | | $ | 0.91 | | $ | (0.30 | ) | $ | 1.62 | | $ | (0.39 | ) |
| Diluted - pro forma | | $ | 0.89 | | $ | (0.31 | ) | $ | 1.56 | | $ | (0.40 | ) |
| | | | | | | | | | | | | | |
For the pro forma computations, the values of option grants were calculated on the dates of grant using the Black-Scholes option pricing model. No other discounts or restrictions related to vesting or the likelihood of vesting of stock options were applied. The following table summarizes the calculated average fair values and weighted-average assumptions used to determine the fair value of FCX’s stock option grants under SFAS No. 123 during the periods presented.
| | Three Months Ended | | Six Months Ended | |
| | June 30, | | June 30, | |
| | 2005 | | 2004 | | 2005 | | 2004 | |
| Fair value per stock option | $ | 12.90 | | $ | 13.73 | | $ | 13.97 | | $ | 15.00 | |
| Risk-free interest rate | | 3.7 | % | | 4.3 | % | | 3.9 | % | | 3.7 | % |
| Expected volatility rate | | 45 | % | | 48 | % | | 46 | % | | 49 | % |
| Expected life of options (in years) | | 6 | | | 6 | | | 6 | | | 6 | |
| Assumed annual dividend | $ | 1.00 | | $ | 0.80 | | $ | 1.00 | | $ | 0.80 | |
See Note 1 above and Note 1 in FCX’s Annual Report on Form 10-K for a discussion of the requirements of SFAS No. 123R.
FCX has two operating segments: “mining and exploration” and “smelting and refining.” The mining and exploration segment consists of FCX’s Indonesian activities including PT Freeport Indonesia’s copper and gold mining operations, PT Puncakjaya Power’s power-generating operations (after eliminations with PT Freeport Indonesia) and FCX’s Indonesian exploration activities. The smelting and refining segment includes Atlantic Copper’s operations in Spain and PT Freeport Indonesia’s equity investment in PT Smelting in Gresik, Indonesia. The segment data presented below were prepared on the same basis as FCX’s consolidated financial statements.
| | | Mining and Exploration | | Smelting and Refining | | Eliminations and Other | | FCX Total | |
| | | (In Thousands) | |
| Three months ended June 30, 2005: | | | | | | | | | | | | | |
| Revenues | | $ | 678,386 | a | $ | 331,897 | | $ | (107,374 | ) | $ | 902,909 | |
| Production and delivery | | | 223,355 | | | 321,909 | | | (154,678 | )b | | 390,586 | |
| Depreciation and amortization | | | 44,217 | | | 7,141 | | | 2,801 | | | 54,159 | |
| Exploration expenses | | | 2,272 | | | - | | | 70 | | | 2,342 | |
| General and administrative expenses | | | 18,425 | c | | 2,901 | | | 4,053 | c | | 25,379 | |
| Operating income (loss) | | $ | 390,117 | | $ | (54 | ) | $ | 40,380 | | $ | 430,443 | |
| Equity in PT Smelting earnings | | $ | - | | $ | 2,562 | | $ | - | | $ | 2,562 | |
| Interest expense, net | | $ | 5,897 | | $ | 4,387 | | $ | 25,008 | | $ | 35,292 | |
| Provision for income taxes | | $ | 138,007 | | $ | - | | $ | 50,677 | | $ | 188,684 | |
| Capital expenditures | | $ | 29,939 | | $ | 3,139 | | $ | (33 | ) | $ | 33,045 | |
| Total assets | | $ | 3,870,969 | d | $ | 717,707 | e | $ | 369,588 | | $ | 4,958,264 | |
| | | | | | | | | | | | | | |
| Three months ended June 30, 2004: | | | | | | | | | | | | | |
| Revenues | | $ | 330,841 | a | $ | 171,736 | | $ | (16,243 | ) | $ | 486,334 | |
| Production and delivery | | | 175,243 | | | 201,542 | | | (5,106 | )b | | 371,679 | |
| Depreciation and amortization | | | 33,417 | | | 7,028 | | | 2,145 | | | 42,590 | |
| Exploration expenses | | | 2,679 | | | - | | | 108 | | | 2,787 | |
| General and administrative expenses | | | 16,339 | c | | 3,114 | | | 3,123 | c | | 22,576 | |
| Operating income (loss) | | $ | 103,163 | | $ | (39,948 | ) | $ | (16,513 | ) | $ | 46,702 | |
| Equity in PT Smelting losses | | $ | - | | $ | 2,548 | | $ | - | | $ | 2,548 | |
| Interest expense, net | | $ | 5,494 | | $ | 2,919 | | $ | 30,926 | | $ | 39,339 | |
| Provision for income taxes | | $ | 37,522 | | $ | - | | $ | 688 | | $ | 38,210 | |
| Capital expenditures | | $ | 34,002 | | $ | 6,491 | | $ | 6 | | $ | 40,499 | |
| Total assets | | $ | 3,561,840 | d | $ | 681,039 | e | $ | 482,635 | | $ | 4,725,514 | |
| | | | | | | | | | | | | | |
| Six months ended June 30, 2005: | | | | | | | | | | | | | |
| Revenues | | $ | 1,365,784 | a | $ | 604,013 | | $ | (263,823 | ) | $ | 1,705,974 | |
| Production and delivery | | | 417,233 | | | 585,486 | | | (247,127 | ) | | 755,592 | |
| Depreciation and amortization | | | 91,142 | | | 14,230 | | | 5,713 | | | 111,085 | |
| Exploration expenses | | | 4,164 | | | - | | | 98 | | | 4,262 | |
| General and administrative expenses | | | 51,607 | c | | 5,905 | | | (10,519 | )c | | 46,993 | |
| Operating income (loss) | | $ | 801,638 | | $ | (1,608 | ) | $ | (11,988 | ) | $ | 788,042 | |
| Equity in PT Smelting earnings | | $ | - | | $ | 5,158 | | $ | - | | $ | 5,158 | |
| Interest expense, net | | $ | 11,624 | | $ | 8,192 | | $ | 53,024 | | $ | 72,840 | |
| Provision for income taxes | | $ | 283,326 | | $ | - | | $ | 69,386 | | $ | 352,712 | |
| Capital expenditures | | $ | 53,508 | | $ | 5,863 | | $ | (80 | ) | $ | 59,291 | |
| | | | | | | | | | | | | | |
| Six months ended June 30, 2004: | | | | | | | | | | | | | |
| Revenues | | $ | 518,025 | a | $ | 382,953 | | $ | (54,459 | ) | $ | 846,519 | |
| Production and delivery | | | 326,515 | | | 413,658 | | | (92,882 | )b | | 647,291 | |
| Depreciation and amortization | | | 50,603 | | | 14,095 | | | 3,302 | | | 68,000 | |
| Exploration expenses | | | 4,868 | | | - | | | 146 | | | 5,014 | |
| General and administrative expenses | | | 93,351 | c | | 6,096 | | | (61,311 | )c | | 38,136 | |
| Operating income (loss) | | $ | 42,688 | | $ | (50,896 | ) | $ | 96,286 | | $ | 88,078 | |
| Equity in PT Smelting losses | | $ | - | | $ | 2,906 | | $ | - | | $ | 2,906 | |
| Interest expense, net | | $ | 11,213 | | $ | 6,771 | | $ | 54,745 | | $ | 72,729 | |
| Provision for income taxes | | $ | 17,943 | | $ | - | | $ | 38,608 | | $ | 56,551 | |
| Capital expenditures | | $ | 59,703 | | $ | 15,257 | | $ | (120 | ) | $ | 74,840 | |
| a. | Includes PT Freeport Indonesia’s sales to PT Smelting totaling $194.9 million in the 2005 quarter, $166.2 million in the 2004 quarter, $429.0 million in the 2005 six-month period and $293.2 million in the 2004 six-month period. |
| b. | Includes deferral (recognition) of intercompany profits on 25 percent of PT Freeport Indonesia’s sales to PT Smelting, for which the final sale to third parties must occur for profit recognition, totaling $(2.6) million in the 2005 quarter, $10.3 million in the 2004 quarter and $2.0 million in the 2004 six-month period. |
| c. | Includes charges to the mining and exploration segment for FCX stock option exercises which are eliminated in consolidation totaling $0.7 million in the 2005 quarter, $2.2 million in the 2004 quarter, $17.4 million in the 2005 six-month period and $66.8 million in the 2004 six-month period. |
| d. | Includes PT Freeport Indonesia’s trade receivables with PT Smelting totaling $71.9 million at June 30, 2005, and $71.8 million at June 30, 2004. |
| e. | Includes PT Freeport Indonesia’s equity investment in PT Smelting totaling $52.9 million at June 30, 2005, and $54.4 million at June 30, 2004. |
The components of inventories follow (in thousands):
| | | | June 30, | | December 31, | |
| | | | 2005 | | 2004 | |
| PT Freeport Indonesia: | Concentrates - Average cost | | $ | 9,501 | | $ | 11,830 | |
| Atlantic Copper: | Concentrates - First in, first out (FIFO) | | | 70,442 | | | 148,246 | |
| | Work in process - FIFO | | | 120,337 | | | 86,710 | |
| | Finished goods - FIFO | | | 1,051 | | | 6,479 | |
| Total product inventories | | | 201,331 | | | 253,265 | |
| Total materials and supplies, net | | | 233,917 | | | 213,447 | |
| Total inventories | | $ | 435,248 | | $ | 466,712 | |
The average cost method was used to determine the cost of essentially all materials and supplies inventory. Materials and supplies inventory is net of obsolescence reserves totaling $17.1 million at June 30, 2005 and December 31, 2004.
The components of net periodic pension benefit cost for the three months ended June 30, 2005 and 2004 follow (in thousands):
| | FCX | | PT Freeport Indonesia | | Atlantic Copper | |
| | 2005 | | 2004 | | 2005 | | 2004 | | 2005 | | 2004 | |
| Service cost | $ | 165 | | $ | 213 | | $ | 900 | | $ | 821 | | $ | - | | $ | - | |
| Interest cost | | 596 | | | 610 | | | 940 | | | 824 | | | 1,239 | | | 1,248 | |
| Expected return on plan assets | | (234 | ) | | 253 | | | (353 | ) | | (448 | ) | | - | | | - | |
| Amortization of prior service cost | | 1,019 | | | 944 | | | 225 | | | 237 | | | - | | | - | |
| Amortization of net actuarial loss | | - | | | - | | | 178 | | | 70 | | | 231 | | | 219 | |
| Net periodic benefit cost | $ | 1,546 | | $ | 2,020 | | $ | 1,890 | | $ | 1,504 | | $ | 1,470 | | $ | 1,467 | |
The components of net periodic pension benefit cost for the six months ended June 30, 2005 and 2004 follow (in thousands):
| | FCX | | PT Freeport Indonesia | | Atlantic Copper | |
| | 2005 | | 2004 | | 2005 | | 2004 | | 2005 | | 2004 | |
| Service cost | $ | 344 | | $ | 284 | | $ | 1,831 | | $ | 1,702 | | $ | - | | $ | - | |
| Interest cost | | 1,114 | | | 993 | | | 1,912 | | | 1,707 | | | 2,528 | | | 2,543 | |
| Expected return on plan assets | | (256 | ) | | (69 | ) | | (718 | ) | | (928 | ) | | - | | | - | |
| Amortization of prior service cost | | 1,963 | | | 1,888 | | | 457 | | | 491 | | | - | | | - | |
| Amortization of net actuarial loss | | - | | | - | | | 362 | | | 146 | | | 472 | | | 449 | |
| Net periodic benefit cost | $ | 3,165 | | $ | 3,096 | | $ | 3,844 | | $ | 3,118 | | $ | 3,000 | | $ | 2,992 | |
Interest expense excludes capitalized interest of $1.0 million in the second quarter of 2005, $0.7 million in the second quarter of 2004, $1.9 million in the first six months of 2005 and $1.1 million in the first six months of 2004.
A summary of FCX’s comprehensive income is shown below (in thousands).
| | | Three Months Ended | | Six Months Ended | |
| | | June 30, | | June 30, | |
| | | 2005 | | 2004 | | 2005 | | 2004 | |
| Net income (loss) | | $ | 190,372 | | $ | (38,238 | ) | $ | 335,892 | | $ | (57,621 | ) |
| Other comprehensive income (loss): | | | | | | | | | | | | | |
| Change in unrealized derivatives’ fair value, net of taxes | | | | | | | | | | | | | |
| of $0.8 million for the three months ended | | | | | | | | | | | | | |
| June 30, 2005, $1.0 million for the six months ended | | | | | | | | | | | | | |
| June 30, 2005 and $0.1 million for the 2004 periods | | | (1,047 | ) | | 32 | | | (1,345 | ) | | (114 | ) |
| Reclass to earnings, net of taxes of $0.1 million | | | | | | | | | | | | | |
| for the 2005 periods and none for the 2004 periods | | | (192 | ) | | 476 | | | (95 | ) | | 982 | |
| Total comprehensive income (loss) | | $ | 189,133 | | $ | (37,730 | ) | $ | 334,452 | | $ | (56,753 | ) |
| | | | | | | | | | | | | | |
| 8. | RATIO OF EARNINGS TO FIXED CHARGES |
The ratio of earnings to fixed charges for the first six months of 2005 and 2004 was 10.7 to 1 and 1.0 to 1, respectively. For this calculation, earnings consist of income from continuing operations before income taxes, minority interests and fixed charges. Fixed charges include interest and that portion of rent deemed representative of interest.
----------------------
The information furnished herein should be read in conjunction with FCX's financial statements contained in its 2004 Annual Report on Form 10-K. The information furnished herein reflects all adjustments which are, in the opinion of management, necessary for a fair statement of the results for the periods. All such adjustments are, in the opinion of management, of a normal recurring nature.
TO THE BOARD OF DIRECTORS AND STOCKHOLDERS OF
FREEPORT-McMoRan COPPER & GOLD INC.
We have reviewed the condensed consolidated balance sheet of Freeport-McMoRan Copper & Gold Inc. (a Delaware Corporation) and subsidiaries as of June 30, 2005 and the related consolidated statements of operations for the three-month and six-month periods ended June 30, 2005 and 2004, and the consolidated statements of cash flows for the six-month periods ended June 30, 2005 and 2004. These financial statements are the responsibility of the Company’s management.
We conducted our review in accordance with the standards of the Public Company Accounting Oversight Board (United States). A review of interim financial information consists principally of applying analytical procedures to financial data, and making inquiries of persons responsible for financial and accounting matters. It is substantially less in scope than an audit conducted in accordance with the standards of the Public Company Accounting Oversight Board (United States), the objective of which is the expression of an opinion regarding the financial statements taken as a whole. Accordingly, we do not express such an opinion.
Based on our review, we are not aware of any material modifications that should be made to the condensed consolidated financial statements referred to above for them to be in conformity with United States generally accepted accounting principles.
We have previously audited, in accordance with the standards of the Public Company Accounting Oversight Board (United States), the consolidated balance sheet of Freeport-McMoRan Copper & Gold Inc. as of December 31, 2004, and the related consolidated statements of income, stockholder’s equity, and cash flows for the year then ended (not presented herein), and in our report dated March 9, 2005, we expressed an unqualified opinion on those consolidated financial statements. In our opinion, the information set forth in the accompanying condensed consolidated balance sheet as of December 31, 2004, is fairly stated, in all material respects, in relation to the consolidated balance sheet from which it has been derived.
ERNST & YOUNG LLP
New Orleans, Louisiana
July 25, 2005
OVERVIEW
In management’s discussion and analysis, “we,”“us” and “our” refer to Freeport-McMoRan Copper & Gold Inc. (FCX) and its consolidated subsidiaries. References to “aggregate” amounts mean the total of our share and Rio Tinto plc’s share as our joint venture partner. You should read this discussion in conjunction with our financial statements, the related discussion and analysis of financial condition and results of operations and the discussion of our “Business and Properties” in our Form 10-K for the year ended December 31, 2004, filed with the Securities and Exchange Commission. The results of operations reported and summarized below are not necessarily indicative of future operating results.
We operate through our majority-owned subsidiaries, PT Freeport Indonesia and PT Puncakjaya Power (Puncakjaya Power), and through Atlantic Copper, S.A. (Atlantic Copper) and PT Irja Eastern Minerals (Eastern Minerals), our principal wholly owned subsidiaries. PT Freeport Indonesia, our principal operating subsidiary, conducts exploration, mining and production activities in a 24,700-acre area called Block A located in Papua, Indonesia. PT Freeport Indonesia also conducts exploration activities (which are currently suspended, but are under review for resumption) in an approximate 500,000-acre area called Block B in Papua. Puncakjaya Power’s sole business is to supply power to PT Freeport Indonesia’s operations. Our principal asset is the Grasberg minerals district, which contains the largest single gold reserve and the second-largest copper reserve of any mine in the world.
Atlantic Copper’s operations are in Spain and involve the smelting and refining of copper concentrates and the marketing of refined copper and precious metals in slimes. PT Freeport Indonesia owns a 25 percent interest in PT Smelting, an Indonesian company which operates a copper smelter and refinery in Gresik, Indonesia. Eastern Minerals conducts mineral exploration activities (which are currently suspended) in Papua, Indonesia.
We own 90.64 percent of PT Freeport Indonesia, of which 9.36 percent is owned through our wholly owned subsidiary, PT Indocopper Investama. The Government of Indonesia owns the remaining 9.36 percent of PT Freeport Indonesia. In July 2004, we received a request from the Indonesian Department of Energy and Mineral Resources that we offer to sell to Indonesian nationals shares in PT Indocopper Investama at fair market value. In response to this request and in view of the potential benefits of having additional Indonesian ownership in our project, we have agreed to consider a potential sale of an interest in PT Indocopper Investama at fair market value. Neither our Contract of Work nor Indonesian law requires us to divest any portion of our ownership interest in PT Freeport Indonesia or PT Indocopper Investama.
Outlook
Annual sales are expected to approximate 1.47 billion pounds of copper and 2.8 million ounces of gold in 2005, increases of nearly 50 percent for copper and nearly 100 percent for gold compared with 2004. Using estimated sales volumes for the remainder of 2005 and assuming prices of $1.40 per pound of copper and $420 per ounce of gold for the remainder of 2005, FCX estimates that it would generate operating cash flows in excess of $1.2 billion in 2005, with over $600 million in the second half of the year. Each $0.10 per pound change in copper prices in the balance of the year would affect 2005 cash flows by approximately $40 million and each $25 per ounce change in gold prices would affect cash flows by approximately $20 million.
PT Freeport Indonesia’s share of sales for 2006 are estimated to approximate 1.4 billion pounds of copper and 1.9 million ounces of gold. Average annual sales volumes over the next five years (2005 to 2009) are expected to approximate 1.35 billion pounds of copper and 2.2 million ounces of gold. Annual and quarterly sales volumes may vary from these estimates depending on the areas being mined within the Grasberg open pit. Based on these estimates of average annual sales volumes over the next five years and copper prices of approximately $1.40 per pound and gold prices of approximately $420 per ounce, the impact on our annual cash flow for each $0.10 per pound change in copper prices would approximate $69 million, including the effects of price changes on related royalty costs, and for each $25 per ounce change in gold prices would approximate $28 million.
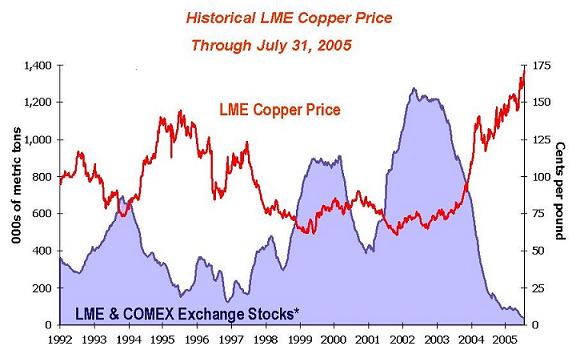
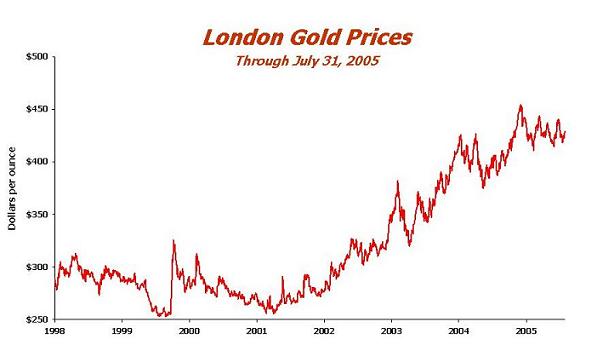
As shown in the graphs below, world metal prices for copper have fluctuated during the period from 1992 through July 2005 from a low of approximately $0.60 per pound in 2001 to a high of $1.71 per pound on July 29, 2005, and world gold prices have fluctuated during the period from 1998 through July 2005 from a low of approximately $250 per ounce in 1999 to a high of approximately $456 per ounce in 2004. Copper and gold prices are affected by numerous factors beyond our control as described further in our Form 10-K for the year ended December 31, 2004.
* Excludes Shanghai stocks, producer, consumer and merchant stocks.
The graph above presents London Metal Exchange (LME) copper prices and reported stocks of copper at the LME and New York Commodity Exchange (COMEX) through July 31, 2005. Market fundamentals for copper continued to be very positive in the first half of 2005. LME and COMEX inventories are at very low levels of less than 50,000 metric tons. Copper prices averaged $1.54 per pound in the second quarter of 2005, with prices ranging from $1.41 per pound to $1.66 per pound. The LME spot copper price closed at $1.71 per pound on July 29, 2005. As a result of continued low inventory levels, expectations of continued strong demand and limited supplies, the outlook for copper markets in 2005 is positive. Global demand in the first half of 2005 remained sufficiently strong to absorb increasing global production volumes. Most market analysts expect copper supplies to increase in the second half of 2005 as smelter capacity is projected to increase, and many project lower than current prices during the second half of 2005. Future copper prices will be determined by demand from China, economic performance in the United States (U.S.) and other industrialized countries, the timing of the development of new supplies of copper, production levels of mines and copper smelters and other factors. We consider the underlying supply and demand conditions in the global copper markets to be positive for our company.
Gold prices continue to be supported by a weak U.S. dollar, ongoing geopolitical tensions, growing investment demand for gold and actions by gold producers to reduce hedge positions. Gold prices averaged $427 per ounce in the second quarter of 2005, with prices ranging from $414 per ounce to $443 per ounce. The London gold price closed at approximately $429 per ounce on July 29, 2005.
CONSOLIDATED RESULTS
Summary comparative results for the second-quarter and six-month periods follow (in millions, except per share amounts):
| | Second Quarter | | Six Months | |
| | 2005 | | 2004 | | 2005 | | 2004 | |
| Revenues | $ | 902.9 | | $ | 486.3 | | $ | 1,706.0 | | $ | 846.5 | |
| Operating income | | 430.4 | | | 46.7 | | | 788.0 | | | 88.1 | |
| Net income (loss) applicable to common stock | | 175.2 | | | (53.3 | ) | | 305.6 | | | (72.9 | ) |
| Diluted net income (loss) per share of common stock | | 0.91 | | | (0.30 | ) | | 1.62 | | | (0.39 | ) |
Consolidated revenues include PT Freeport Indonesia’s sale of copper concentrates, which also contain significant quantities of gold and silver, and the sale by Atlantic Copper of copper anodes, copper cathodes, and gold in anodes and slimes. Consolidated revenues for the second quarter of 2005 and the first six months of 2005 were significantly higher than consolidated revenues for the 2004 periods, primarily reflecting substantially higher copper and gold sales volumes and prices than the 2004 periods. Second-quarter and six-month 2004 results were adversely affected by lower ore grades and reduced mill throughput as PT Freeport Indonesia completed its efforts to restore safe access to the higher-grade ore areas in its Grasberg open-pit mine following the fourth-quarter 2003 slippage and debris flow events. In addition, Atlantic Copper’s scheduled major maintenance turnaround adversely affected its 2004 revenues.
At June 30, 2005, we had consolidated embedded derivatives on copper sales totaling 272.5 million pounds recorded at an average price of $1.54 per pound. We expect final prices on these sales over the next several months. We estimate that a two-cent change in the average price used for these embedded derivatives and realized prices for these sales would have an approximate $5.5 million impact on our 2005 consolidated revenues and an approximate $3 million impact on our 2005 consolidated net income.
Second-quarter 2005 consolidated revenues included net additions of $12.6 million ($6.7 million to net income or $0.03 per share) primarily for final pricing of concentrates sold in prior quarters, compared with a net decrease of $5.6 million ($2.9 million to net income or $0.02 per share) to second-quarter 2004 revenues. Six-month 2005 consolidated revenues included net additions of $8.7 million ($4.6 million to net income or $0.02 per share) compared with $7.2 million ($3.7 million to net income or $0.02 per share), primarily for final pricing of concentrates sold in prior years.
Consolidated revenues and net income vary significantly with fluctuations in the market prices of copper and gold and other factors. Based on PT Freeport Indonesia’s projected share of copper sales for the remainder of 2005 (830 million pounds) and assuming an average price of $1.40 per pound of copper, each $0.01 per pound change in the average price realized in the balance of the year would have an approximate $8 million impact on our annual revenues and an approximate $4 million impact on our annual net income. A $5 per ounce change in the average price realized in the balance of the year on PT Freeport Indonesia’s projected share of gold sales for the remainder of 2005 (1.6 million ounces) would have an approximate $8 million impact on our annual revenues and an approximate $4 million impact on our annual net income.
On limited past occasions, in response to market conditions, we have entered into copper and gold price protection contracts for a portion of our expected future mine production to mitigate the risk of adverse price fluctuations. We currently have no copper or gold price protection contracts relating to our mine production. We have outstanding gold-denominated and silver-denominated preferred stock with dividends and redemption amounts determined by commodity prices.
Consolidated production and delivery costs were higher for the 2005 periods than the 2004 periods primarily because of higher production costs at PT Freeport Indonesia and higher costs of concentrate purchases at Atlantic Copper caused by increased production volumes and higher metals prices. Consolidated depreciation and amortization expense increased to $54.2 million in the second quarter of 2005 and $111.1 million in the first six months of 2005, compared with $42.6 million in the second quarter of 2004 and $68.0 million in the first six months of 2004, primarily because of higher copper sales volumes at PT Freeport Indonesia during the 2005 periods. Exploration expenses decreased to $2.3 million in the second quarter of 2005 and $4.3 million in the first six months of 2005 from $2.8 million in the second quarter of 2004 and $5.0 million in the first six months of 2004 (see “Mining and Exploration - Exploration Activities”). Consolidated general and administrative expenses increased to $25.4 million in the second quarter of 2005 and $47.0 million in the first six months of 2005 from $22.6 million in the second quarter of 2004 and $38.1 million in the first six months of 2004 (see “Other Financial Results”).
Net interest expense decreased to $35.3 million in the second quarter of 2005 from $39.3 million in the second quarter of 2004 primarily because we reduced average debt levels. Losses on early extinguishment and conversion of debt totaled $14.0 million ($13.7 million to net income or $0.07 per share) for the first six months of 2004 resulting primarily from the early conversions of our 8¼% Convertible Senior Notes (see “Capital Resources and Liquidity - Financing Activities”).
Other income (expense) includes the impact of translating into U.S. dollars Atlantic Copper’s net euro-denominated liabilities, primarily its retiree pension obligations. Changes in the U.S. dollar/euro exchange rate require us to adjust the dollar value of our net euro-denominated liabilities and record the adjustment in earnings. The exchange rate was $1.36 per euro at December 31, 2004, $1.30 per euro at March 31, 2005 and $1.21 per euro at June 30, 2005. Exchange rate effects on our net income from euro-denominated liabilities were gains (losses) of $3.4 million in the second quarter of 2005, $(0.2) million in the second quarter of 2004, $6.3 million in the first six months of 2005 and $1.8 million in the first six months of 2004. Other income also included interest income of $3.3 million in the second quarter of 2005, $1.8 million in the second quarter of 2004, $7.0 million in the first six months of 2005 and $3.2 million in the first six months of 2004.
PT Freeport Indonesia’s Contract of Work provides for a 35 percent corporate income tax rate. PT Indocopper Investama pays a 30 percent corporate income tax on dividends it receives from its 9.36 percent ownership in PT Freeport Indonesia. In addition, the tax treaty between Indonesia and the U.S. provides for a withholding tax rate of 10 percent on dividends and interest that PT Freeport Indonesia and PT Indocopper Investama pay to their parent company, FCX. Prior to 2005, we also incurred a U.S. alternative minimum tax at an effective rate of two percent based primarily on consolidated income, net of smelting and refining results. As a result of the enactment of the American Jobs Creation Act of 2004, the 90 percent limitation on the use of foreign tax credits to offset the U.S. federal alternative minimum tax liability has been repealed effective January 1, 2005. Based on current projections, we expect that the removal of this limitation will reduce our U.S. federal taxes beginning in 2005. In 2004, our U.S. federal alternative minimum tax liability totaled $8.2 million. We currently record no income taxes at Atlantic Copper, which is subject to taxation in Spain, because it has not generated significant taxable income in recent years and has substantial tax loss carryforwards for which we have provided no financial statement benefit. We receive no consolidated tax benefit from these losses because they cannot be used to offset PT Freeport Indonesia’s profits in Indonesia.
Parent company costs consist primarily of interest, depreciation and amortization, and general and administrative expenses. We receive minimal tax benefit from these costs, including interest expense, primarily because our parent company generates no taxable income from U.S. sources. As a result, our provision for income taxes as a percentage of our consolidated income before income taxes and minority interests will vary as PT Freeport Indonesia’s income changes, absent changes in Atlantic Copper and parent company costs. Summaries of the approximate significant components of the calculation of our consolidated provision for income taxes are shown below (in thousands, except percentages).
| | Three Months Ended | | Six Months Ended | |
| | June 30, | | June 30, | |
| | 2005 | | 2004 | | 2005 | | 2004 | |
Mining and exploration segment operating incomea | $ | 390,780 | | $ | 105,399 | | $ | 819,087 | | $ | 109,531 | |
| Mining and exploration segment interest expense, net | | (5,897 | ) | | (5,494 | ) | | (11,624 | ) | | (11,213 | ) |
| Intercompany operating profit (deferred) recognized | | 48,350 | | | (9,561 | ) | | (15,220 | ) | | 38,619 | |
| Income before taxes | | 433,233 | | | 90,344 | | | 792,243 | | | 136,937 | |
| Indonesian corporate income tax rate (35%) plus U.S. | | | | | | | | | | | | |
| alternative minimum tax rate (2%) for 2004 | | 35 | % | | 37 | % | | 35 | % | | 37 | % |
| Corporate income taxes | | 151,632 | | | 33,427 | | | 277,285 | | | 50,667 | |
| | | | | | | | | | | | | |
| Approximate PT Freeport Indonesia net income | | 281,601 | | | 56,917 | | | 514,958 | | | 86,270 | |
| Withholding tax on FCX’s equity share | | 9.064 | % | | 9.064 | % | | 9.064 | % | | 9.064 | % |
| Withholding taxes | | 25,524 | | | 5,159 | | | 46,676 | | | 7,820 | |
| | | | | | | | | | | | | |
| PT Indocopper Investama corporate income tax | | 6,957 | | | - | | | 21,081 | | | - | |
| Other, net | | 4,571 | | | (376 | ) | | 7,670 | | | (1,936 | ) |
| FCX consolidated provision for income taxes | $ | 188,684 | | $ | 38,210 | | $ | 352,712 | | $ | 56,551 | |
| | | | | | | | | | | | | |
| FCX consolidated effective tax rate | | 46 | % | | b | | | 48 | % | | b | |
| | | | | | | | | | | | | |
| a. | Excludes charges for FCX stock option exercises, which are eliminated in consolidation, totaling $0.7 million for the 2005 quarter, $2.2 million for the 2004 quarter, $17.4 million for the 2005 six-month period and $66.8 million for the 2004 six-month period. |
| b. | Rates are not meaningful given the small amounts of consolidated income before taxes and minority interests for the 2004 periods. |
RESULTS OF OPERATIONS
We have two operating segments: “mining and exploration” and “smelting and refining.” The mining and exploration segment consists of our Indonesian activities including PT Freeport Indonesia’s copper and gold mining operations, Puncakjaya Power’s power generating operations (after eliminations with PT Freeport Indonesia) and our Indonesian exploration activities, including those of Eastern Minerals. The smelting and refining segment includes Atlantic Copper’s operations in Spain and PT Freeport Indonesia’s equity investment in PT Smelting. Summary comparative operating income (loss) data by segment follow (in millions):
| | Second Quarter | | Six Months | |
| | 2005 | | 2004 | | 2005 | | 2004 | |
Mining and explorationa | $ | 390.1 | | $ | 103.2 | | $ | 801.6 | | $ | 42.7 | |
| Smelting and refining | | (0.1 | ) | | (40.0 | ) | | (1.6 | ) | | (50.9 | ) |
Intercompany eliminations and othera, b | | 40.4 | | | (16.5 | ) | | (12.0 | ) | | 96.3 | |
| FCX operating income | $ | 430.4 | | $ | 46.7 | | $ | 788.0 | | $ | 88.1 | |
| | | | | | | | | | | | | |
| a. | Includes charges to the mining and exploration segment for FCX stock option exercises, which are eliminated in consolidation, totaling $0.7 million in the 2005 quarter, $2.2 million in the 2004 quarter, $17.4 million for the 2005 six-month period and $66.8 million for the 2004 six-month period. |
| b. | We defer recognizing profits on PT Freeport Indonesia’s sales to Atlantic Copper and on 25 percent of PT Freeport Indonesia’s sales to PT Smelting until their sales of final products to third parties. Changes in the amount of these deferred profits impacted operating income by $48.3 million in the second quarter of 2005, $(9.6) million in the second quarter of 2004, $(15.2) million in the first six months of 2005 and $38.6 million in the first six months of 2004. Our consolidated earnings can fluctuate materially depending on the timing and prices of these sales. At June 30, 2005, our deferred profits to be recognized in future periods’ operating income totaled $96.1 million, $50.5 million to net income, after taxes and minority interest sharing. |
MINING AND EXPLORATION
PT Freeport Indonesia Operating Results
| | | | Second Quarter | | Six Months | |
| | | | 2005 | | 2004 | | 2005 | | 2004 | |
PT Freeport Indonesia Operating Data, Net of Rio Tinto’s Interest | | | | | | |
| Copper (recoverable) | | | | | | | | | | |
| Production (000s of pounds) | | | 302,300 | | 209,300 | | 637,900 | | 316,400 | |
| Production (metric tons) | | | 137,100 | | 94,900 | | 289,300 | | 143,500 | |
| Sales (000s of pounds) | | | 313,700 | | 205,100 | | 641,800 | | 310,500 | |
| Sales (metric tons) | | | 142,300 | | 93,000 | | 291,100 | | 140,800 | |
| Average realized price per pound | | | $1.53 | | $1.22 | | $1.54 | | $1.24 | |
| Gold (recoverable ounces) | | | | | | | | | | |
| Production | | | 591,300 | | 364,900 | | 1,200,700 | | 490,200 | |
| Sales | | | 616,400 | | 351,100 | | 1,211,700 | | 474,900 | |
| Average realized price per ounce | | | $428.23 | | $389.97 | | $427.54 | | $393.80 | |
| | | | | | | | | | | |
PT Freeport Indonesia, 100% Aggregate Operating Data | | | | | | | | |
| Ore milled (metric tons per day) | | | 211,800 | | 164,200 | | 205,600 | | 158,000 | |
| Average ore grade | | | | | | | | | | |
| Copper (percent) | | | .98 | | .82 | | 1.06 | | .67 | |
| Gold (grams per metric ton) | | | 1.43 | | .95 | | 1.52 | | .69 | |
| Recovery rates (percent) | | | | | | | | | | |
| Copper | | | 87.4 | | 88.2 | | 88.5 | | 86.6 | |
| Gold | | | 83.8 | | 84.6 | | 83.3 | | 81.5 | |
| Copper (recoverable) | | | | | | | | | | |
| Production (000s of pounds) | | | 349,200 | | 229,000 | | 739,500 | | 347,900 | |
| Production (metric tons) | | | 158,400 | | 103,900 | | 335,400 | | 157,800 | |
| Sales (000s of pounds) | | | 362,500 | | 224,100 | | 743,900 | | 340,900 | |
| Sales (metric tons) | | | 164,400 | | 101,600 | | 337,400 | | 154,600 | |
| Gold (recoverable ounces) | | | | | | | | | | |
| Production | | | 727,400 | | 383,600 | | 1,491,300 | | 514,900 | |
| Sales | | | 758,600 | | 369,600 | | 1,501,800 | | 499,700 | |
Mill throughput, which varies depending on ore types being processed, averaged 211,800 metric tons of ore per day in the second quarter of 2005, 164,200 metric tons of ore in the second quarter of 2004, 205,600 metric tons of ore in the first six months of 2005 and 158,000 metric tons of ore in the first six months of 2004. Mill rates in the second quarter of 2005 were impacted by unplanned downtime for mill maintenance activities during late June and the processing of hard ore. Mill rates are projected to average in excess of 220,000 metric tons of ore per day during the remainder of 2005. Approximate average daily throughput processed at our mill facilities from each of our producing mines follows (metric tons of ore per day):
| | Second Quarter | | Six Months | |
| | 2005 | | 2004 | | 2005 | | 2004 | |
| Grasberg open pit | 169,500 | | 118,700 | | 163,400 | | 112,600 | |
| Deep Ore Zone underground mine | 42,300 | | 45,500 | | 42,200 | | 45,400 | |
| Total mill throughput | 211,800 | | 164,200 | | 205,600 | | 158,000 | |
| | | | | | | | | |
Second-quarter 2005 copper ore grades averaged 0.98 percent, compared with 0.82 percent for the second quarter of 2004. Second-quarter copper recovery rates were 87.4 percent, compared with 88.2 percent for the second quarter of 2004. For the second quarter of 2005, gold ore grades averaged 1.43 grams per metric ton (g/t), compared with 0.95 g/t for the second quarter of 2004. Gold recovery rates averaged 83.8 percent for the second quarter of 2005, compared with 84.6 percent for the second quarter of 2004. The 2005 grades reflect the return to normal mining operations at Grasberg, including accessing higher grade material.
Production from the Deep Ore Zone (DOZ) underground mine averaged 42,300 metric tons of ore per day in the second quarter of 2005, representing 20 percent of mill throughput as it continued to perform above design capacity of 35,000 metric tons of ore per day. PT Freeport Indonesia is expanding the capacity of the DOZ underground operation to a sustained rate of 50,000 metric tons per day with the installation of a second crusher and additional ventilation, which are expected to be completed by 2007. PT Freeport Indonesia’s share of capital expenditures for the DOZ expansion totaled $5.5 million in the first half of 2005 and are expected to approximate $37 million through the projected 2007 ramp-up, with approximately $12 million estimated for the remainder of 2005. The DOZ mine, a block cave operation, is one of the world’s largest underground mines.
In 2004, PT Freeport Indonesia commenced its “Common Infrastructure” project, which will provide access to its large undeveloped underground ore bodies located in the Grasberg minerals district through a tunnel system located approximately 400 meters deeper than its existing underground tunnel system. PT Freeport Indonesia’s share of capital expenditures for its Common Infrastructure project totaled $8.9 million in the first half of 2005 and is estimated to total approximately $8 million for the remainder of 2005. The Common Infrastructure project is progressing according to plan.
PT Freeport Indonesia is also proceeding with plans to develop Big Gossan, a high-grade deposit located near the existing milling complex. Our Board of Directors has approved this project and aggregate capital expenditures from 2006 to 2009 for Big Gossan are expected to total approximately $225 million ($195 million net to PT Freeport Indonesia, with approximately $50 million in 2006). Production is expected to ramp up to 7,000 metric tons per day by 2010 (average annual aggregate incremental production of 135 million pounds of copper and 65,000 ounces of gold, with PT Freeport Indonesia receiving 60 percent of these amounts). The Big Gossan mine is expected to be an open-stope mine with cemented backfill, which is a higher-cost mining method than the block-cave method used at the DOZ mine.
PT Freeport Indonesia Revenues
A summary of changes in PT Freeport Indonesia revenues between the periods follows (in millions):
| | Second | | Six | |
| | Quarter | | Months | |
| PT Freeport Indonesia revenues - prior year period | $ | 330.8 | | $ | 518.0 | |
| Sales volumes: | | | | | | |
| Copper | | 132.5 | | | 409.5 | |
| Gold | | 103.5 | | | 290.2 | |
| Price realizations: | | | | | | |
| Copper | | 98.5 | | | 196.4 | |
| Gold | | 23.6 | | | 40.9 | |
| Adjustments, primarily for copper pricing on prior period open sales | | 22.7 | | | (1.4 | ) |
| Treatment charges, royalties and other | | (33.2 | ) | | (87.8 | ) |
| PT Freeport Indonesia revenues - current year period | $ | 678.4 | | $ | 1,365.8 | |
| | | | | | | |
PT Freeport Indonesia achieved significantly higher production and sales in the 2005 periods compared with the 2004 periods, reflecting higher ore grades and milling rates than the 2004 periods. Copper sales volumes totaled 313.7 million pounds in the second quarter of 2005, 53 percent higher than the 205.1 million pounds reported in the second quarter of 2004. Second-quarter 2005 copper price realizations of $1.53 per pound were $0.31 per pound higher than the second-quarter 2004 realizations of $1.22 per pound. Gold sales volumes totaled 616,400 ounces in the second quarter of 2005, 76 percent higher than the 351,100 ounces reported in the second quarter of 2004. Gold price realizations of $428.23 per ounce in the second quarter of 2005 were over $38 an ounce higher than second-quarter 2004 realizations of $389.97 per ounce. For the six-month periods, copper sales volumes totaled 641.8 million pounds in 2005, more than double the 310.5 million pounds in 2004, and gold sales volumes totaled 1,211,700 ounces, more than two and one half times higher than the 474,900 ounces in 2004. Copper price realizations of $1.54 per pound in the first six months of 2005 were $0.30 per pound higher than the 2004 period realizations of $1.24 per pound. Gold price realizations of $427.54 per ounce in the first six months of 2005 were almost $34 an ounce higher than 2004 period realizations of $393.80 per ounce.
Treatment charges vary with the volume of metals sold and the price of copper, and royalties vary with the volume of metals sold and the prices of copper and gold. In addition, treatment charges vary based on PT Freeport Indonesia’s customer mix as sales to PT Smelting are subject to a minimum rate (see below). Market rates for treatment and refining charge rates began to increase significantly in late 2004; however, PT Freeport Indonesia expects its 2005 rates to approximate its 2004 rates because of its customer mix.
Royalties totaled $17.7 million in the second quarter of 2005 and $36.5 million in the first six months of 2005 compared with $7.9 million in the second quarter of 2004 and $12.7 million in the first six months of 2004, reflecting higher sales volumes and metal prices.
Substantially all of PT Freeport Indonesia’s concentrate sales contracts provide final copper pricing in a specified future period based on prices quoted on the LME. PT Freeport Indonesia records revenues and invoices its customers based on LME prices at the time of shipment. Under accounting rules, these terms create an “embedded derivative” in our concentrate sales contracts which must be adjusted to fair value through earnings each period until the date of final copper pricing. PT Freeport Indonesia’s second-quarter 2005 revenues include net additions of $13.7 million for adjustments to the fair value of embedded copper derivatives in concentrate sales contracts, compared with net reductions of $15.8 million in the second quarter of 2004. PT Freeport Indonesia’s six-month 2005 revenues included net additions of $22.2 million for adjustments to the fair value of embedded derivatives in concentrate sales contracts, compared with net reductions of $0.8 million in the 2004 period.
PT Freeport Indonesia has revised its mine plans to incorporate second-quarter results and to reflect updated sequencing plans in the Grasberg open pit. PT Freeport Indonesia expects its share of sales to approximate 1.47 billion pounds of copper and 2.8 million ounces of gold for 2005. At the Grasberg mine, the sequencing in mining areas with varying ore grades causes fluctuations in the timing of ore production, which impacts sales volumes, particularly for gold. Second-half 2005 sales volumes are expected to be 29 percent higher for copper and 32 percent higher for gold than during the first half of the year. PT Freeport Indonesia expects its sales for the third quarter of 2005 to approximate 380 million pounds of copper and 575 thousand ounces of gold, with sales of 450 million pounds of copper and 1,025 thousand ounces of gold for the fourth quarter of 2005. PT Freeport Indonesia estimates its share of sales for 2006 to approximate 1.4 billion pounds of copper and 1.9 million ounces of gold, and average annual sales for the period 2005 - 2009 to approximate 1.35 billion pounds of copper and 2.2 million ounces of gold.
PT Freeport Indonesia has long-term contracts to provide approximately 60 percent of Atlantic Copper’s copper concentrate requirements at market prices and nearly all of PT Smelting’s copper concentrate requirements. Under the PT Smelting contract, for the first 15 years of PT Smelting’s operations beginning December 1998, the treatment and refining charges on the majority of the concentrate PT Freeport Indonesia provides will not fall below specified minimum rates, subject to renegotiation in 2008. The rate was $0.23 per pound during the period from the commencement of PT Smelting’s operations in 1998 until April 2004, when it declined to a minimum of $0.21 per pound. Market rates for 2005, excluding price participation, under long-term contracts settled in late 2004 approximate $0.21 per pound. Including price participation at current copper prices of approximately $1.70 per pound, PT Smelting’s rates exceed the minimum $0.21 per pound. Taking into account taxes and minority interest, an equivalent change in smelting and refining charge rates would essentially offset in our consolidated operating results.
PT Freeport Indonesia Costs
Gross profit per pound of copper (¢)/per ounce of gold and silver ($): | | | | |
Three Months Ended June 30, 2005 | | | | | | | | | | | | |
| Pounds of copper sold (000s) | | 313,700 | | | 313,700 | | | | | | | |
| Ounces of gold sold | | | | | | | | 616,400 | | | | |
| Ounces of silver sold | | | | | | | | | | | 1,057,700 | |
| | | | | | | | | | | | | |
| | | By-Product | | | Co-Product Method | |
| | | Method | | | Copper | | | Gold | | | Silver | |
| Revenues, after adjustments shown below | | 153.4 | ¢ | | 153.4 | ¢ | | $428.23 | | | $7.04 | |
| | | | | | | | | | | | | |
| Site production and delivery, before net non- | | | | | | | | | | | | |
| cash and nonrecurring costs shown below | | 70.5 | a | | 45.0 | b | | 126.01 | b | | 2.06 | b |
| Gold and silver credits | | (86.5 | ) | | - | | | - | | | - | |
| Treatment charges | | 21.6 | | | 13.8 | | | 38.68 | | | 0.63 | |
| Royalty on metals | | 5.7 | | | 3.6 | | | 10.11 | | | 0.17 | |
Unit net cash costsc | | 11.3 | | | 62.4 | | | 174.80 | | | 2.86 | |
| Depreciation and amortization | | 14.1 | | | 9.0 | | | 25.20 | | | 0.41 | |
| Noncash and nonrecurring costs, net | | 0.7 | | | 0.5 | | | 1.30 | | | 0.02 | |
| Total unit costs | | 26.1 | | | 71.9 | | | 201.30 | | | 3.29 | |
| Revenue adjustments, primarily for pricing | | | | | | | | | | | | |
| on prior period open sales | | 3.7 | | | 3.6 | | | 0.12 | | | (0.03 | ) |
| PT Smelting intercompany profit elimination | | 0.8 | | | 0.5 | | | 1.45 | | | 0.02 | |
| Gross profit per pound/ounce | | 131.8 | ¢ | | 85.6 | ¢ | | $228.50 | | | $3.74 | |
| | | | | | | | | | | | | |
Three Months Ended June 30, 2004 | | | | | | | | | | | | |
| Pounds of copper sold (000s) | | 205,100 | | | 205,100 | | | | | | | |
| Ounces of gold sold | | | | | | | | 351,100 | | | | |
| Ounces of silver sold | | | | | | | | | | | 824,900 | |
| | | | | | | | | | | | | |
| | | By-Product | | | Co-Product Method | |
| | | Method | | | Copper | | | Gold | | | Silver | |
| Revenues, after adjustments shown below | | 122.0 | ¢ | | 122.0 | ¢ | | $389.97 | | | $6.15 | |
| | | | | | | | | | | | | |
| Site production and delivery, before net non- | | | | | | | | | | | | |
| cash and nonrecurring costs shown below | | 84.0 | d | | 53.8 | e | | 170.37 | e | | 2.64 | e |
| Gold and silver credits | | (68.8 | ) | | - | | | - | | | - | |
| Treatment charges | | 21.2 | | | 13.6 | | | 42.90 | | | 0.66 | |
| Royalty on metals | | 3.8 | | | 2.5 | | | 7.78 | | | 0.12 | |
Unit net cash costsc | | 40.2 | | | 69.9 | | | 221.05 | | | 3.42 | |
| Depreciation and amortization | | 16.3 | | | 10.4 | | | 33.03 | | | 0.51 | |
| Noncash and nonrecurring costs, net | | 1.4 | | | 0.9 | | | 2.84 | | | 0.04 | |
| Total unit costs | | 57.9 | | | 81.2 | | | 256.92 | | | 3.97 | |
| Revenue adjustments, primarily for pricing | | | | | | | | | | | | |
| on prior period open sales | | (4.5 | ) | | (4.4 | ) | | (2.29 | ) | | (0.15 | ) |
| PT Smelting intercompany profit elimination | | (5.0 | ) | | (3.2 | ) | | (10.15 | ) | | (0.16 | ) |
| Gross profit per pound/ounce | | 54.6 | ¢ | | 33.2 | ¢ | | $120.61 | | | $1.87 | |
| | | | | | | | | | | | | |
| a. | Net of deferred mining costs totaling $20.6 million or 6.6¢ per pound. Upon adoption of Emerging Issues Task Force (EITF) Issue No. 04-6 (see Note 1 of Notes to Consolidated Financial Statements), mining costs will no longer be deferred. |
| b. | Net of deferred mining costs totaling $13.2 million or 4.2¢ per pound for copper, $7.2 million or $11.74 per ounce for gold and $0.2 million or $0.19 per ounce for silver. See Note a above. |
| c. | For a reconciliation of unit net cash costs to production and delivery costs applicable to sales reported in FCX’s consolidated financial statements refer to “Product Revenues and Production Costs” below. |
| d. | Net of deferred mining costs totaling $31.5 million or 15.4¢ per pound. See Note a above. |
| e. | Net of deferred mining costs totaling $20.2 million or 9.8¢ per pound for copper, $10.9 million or $31.14 per ounce for gold and $0.4 million or $0.48 per ounce for silver. See Note a above. |
Gross profit per pound of copper (¢)/per ounce of gold and silver ($): | | | | |
Six Months Ended June 30, 2005 | | | | | | | | | | | | |
| Pounds of copper sold (000s) | | 641,800 | | | 641,800 | | | | | | | |
| Ounces of gold sold | | | | | | | | 1,211,700 | | | | |
| Ounces of silver sold | | | | | | | | | | | 2,328,000 | |
| | | | | | | | | | | | | |
| | | By-Product | | | Co-Product Method | |
| | | Method | | | Copper | | | Gold | | | Silver | |
| Revenues, after adjustments shown below | | 154.2 | ¢ | | 154.2 | ¢ | | $427.54 | | | $7.02 | |
| | | | | | | | | | | | | |
| Site production and delivery, before net non- | | | | | | | | | | | | |
| cash and nonrecurring costs shown below | | 64.6 | a | | 42.1 | b | | 115.39 | b | | 1.92 | b |
| Gold and silver credits | | (82.8 | ) | | - | | | - | | | - | |
| Treatment charges | | 21.7 | | | 14.2 | | | 38.80 | | | 0.65 | |
| Royalty on metals | | 5.7 | | | 3.7 | | | 10.17 | | | 0.17 | |
Unit net cash costsc | | 9.2 | | | 60.0 | | | 164.36 | | | 2.74 | |
| Depreciation and amortization | | 14.2 | | | 9.3 | | | 25.38 | | | 0.42 | |
| Noncash and nonrecurring costs, net | | 0.4 | | | 0.3 | | | 0.78 | | | 0.01 | |
| Total unit costs | | 23.8 | | | 69.6 | | | 190.52 | | | 3.17 | |
| Revenue adjustments, primarily for pricing | | | | | | | | | | | | |
| on prior period open sales | | 3.2 | | | 3.3 | | | (2.47 | ) | | 0.06 | |
| PT Smelting intercompany profit elimination | | - | | | - | | | (0.01 | ) | | - | |
| Gross profit per pound/ounce | | 133.6 | ¢ | | 87.9 | ¢ | | $234.54 | | | $3.91 | |
| | | | | | | | | | | | | |
Six Months Ended June 30, 2004 | | | | | | | | | | | | |
| Pounds of copper sold (000s) | | 310,500 | | | 310,500 | | | | | | | |
| Ounces of gold sold | | | | | | | | 474,900 | | | | |
| Ounces of silver sold | | | | | | | | | | | 1,378,200 | |
| | | | | | | | | | | | | |
| | | By-Product | | | Co-Product Method | |
| | | Method | | | Copper | | | Gold | | | Silver | |
| Revenues, after adjustments shown below | | 123.6 | ¢ | | 123.6 | ¢ | | $393.80 | | | $6.14 | |
| | | | | | | | | | | | | |
| Site production and delivery, before net non- | | | | | | | | | | | | |
| cash and nonrecurring costs shown below | | 104.2 | d | | 69.3 | e | | 218.23 | e | | 3.51 | e |
| Gold and silver credits | | (63.1 | ) | | - | | | - | | | - | |
| Treatment charges | | 21.7 | | | 14.4 | | | 45.46 | | | 0.73 | |
| Royalty on metals | | 4.1 | | | 2.7 | | | 8.58 | | | 0.14 | |
Unit net cash costsc | | 66.9 | | | 86.4 | | | 272.27 | | | 4.38 | |
| Depreciation and amortization | | 16.3 | | | 10.8 | | | 34.13 | | | 0.55 | |
| Noncash and nonrecurring costs, net | | 1.0 | | | 0.6 | | | 2.00 | | | 0.03 | |
| Total unit costs | | 84.2 | | | 97.8 | | | 308.40 | | | 4.96 | |
| Revenue adjustments, primarily for pricing | | | | | | | | | | | | |
| on prior period open sales | | 6.0 | | | 5.8 | | | 0.62 | | | 0.20 | |
| PT Smelting intercompany profit elimination | | (0.6 | ) | | (0.4 | ) | | (1.32 | ) | | (0.02 | ) |
| Gross profit per pound/ounce | | 44.8 | ¢ | | 31.2 | ¢ | | $84.70 | | | $1.36 | |
| | | | | | | | | | | | | |
| a. | Net of deferred mining costs totaling $52.8 million or 8.2¢ per pound. Upon adoption of EITF Issue No. 04-6 (see Note 1 of Notes to Consolidated Financial Statements), mining costs will no longer be deferred. |
| b. | Net of deferred mining costs totaling $34.4 million or 5.4¢ per pound for copper, $17.8 million or $14.70 per ounce for gold and $0.6 million or $0.25 per ounce for silver. See Note a above. |
| c. | For a reconciliation of unit net cash costs to production and delivery costs applicable to sales reported in FCX’s consolidated financial statements refer to “Product Revenues and Production Costs” below. |
| d. | Net of deferred mining costs totaling $57.7 million or 18.6¢ per pound. See Note a above. |
| e. | Net of deferred mining costs totaling $38.4 million or 12.4¢ per pound for copper, $18.5 million or $38.92 per ounce for gold and $0.9 million or $0.63 per ounce for silver. See Note a above. |
We present gross profit per pound of copper using both a “by-product” method and a “co-product” method. We use the by-product method in our presentation of gross profit per pound of copper because (1) the majority of our revenues are copper revenues, (2) we produce and sell one product, concentrates, which contains all three metals, (3) it is not possible to specifically assign our costs to revenues from the copper, gold and silver we produce in concentrates, (4) it is the method used to compare mining operations in certain industry publications and (5) it is the method used by our management and our Board to monitor our operations. In the co-product method presentation, costs are allocated to the different products based on their relative revenue values, which will vary to the extent our metals sales volumes and realized prices change.
Because of the fixed nature of a large portion of our costs, unit costs vary significantly from period to period depending on volumes of copper and gold sold during the period. In addition, we have experienced significant increases in our production costs in recent years primarily as a result of higher energy costs and costs of other consumables, changes in currency exchange rates, higher mining costs and milling rates, labor costs and other factors. Our energy costs, which approximate 20 percent of PT Freeport Indonesia’s production costs, primarily include 100 million gallons per year of diesel and 650,000 metric tons per year of coal. Diesel prices have risen by more than 100 percent since 2002 and our coal costs are approximately 40 percent higher. The costs of other consumables, including steel and reagents also have increased. Our costs have been affected by the stronger Australian dollar against the U.S. dollar (approximately 40 percent increase since the beginning of 2003), which comprise approximately 18 percent of PT Freeport Indonesia’s production costs. We are pursuing cost reduction initiatives to mitigate the impacts of these increases.
Lower unit site production and delivery costs in the 2005 periods reflected significantly higher sales volumes resulting from higher ore grades and the primarily fixed nature of a large portion of PT Freeport Indonesia’s cost structure. Unit site production and delivery costs are net of deferred mining costs, which will no longer be deferred and are expected to be charged to cost of sales as incurred upon adoption of EITF Issue No. 04-6 (see Note 1 of Notes to Consolidated Financial Statements and “New Accounting Standards” below). PT Freeport Indonesia’s second-quarter 2005 overburden-to-ore ratio averaged 3.3 to 1, compared with a life-of-mine average ratio of 2.4 to 1. PT Freeport Indonesia’s overburden-to-ore ratio is expected to average approximately 2.9 to 1 in the balance of the year.
Unit treatment charges vary with the price of copper, and royalty rates vary with prices of copper and gold. In addition, treatment charges vary based on PT Freeport Indonesia’s customer mix. The copper royalty rate payable by PT Freeport Indonesia under its Contract of Work varies from 1.5 percent of copper net revenue at a copper price of $0.90 or less per pound to 3.5 percent at a copper price of $1.10 or more per pound. The Contract of Work royalty rate for gold and silver sales is 1.0 percent.
In connection with our fourth concentrator mill expansion completed in 1998, PT Freeport Indonesia agreed to pay the Government of Indonesia additional royalties (royalties not required by the Contract of Work) to provide further support to the local governments and the people of the Indonesian province of Papua (see Note 1 in FCX’s 2004 Annual Report on Form 10-K). The additional royalties are paid on metal from production from PT Freeport Indonesia’s milling facilities above 200,000 metric tons of ore per day. PT Freeport Indonesia’s royalty rate on copper net revenues from production above 200,000 metric tons of ore per day is double the Contract of Work royalty rate, and the royalty rates on gold and silver sales from production above 200,000 metric tons of ore per day are triple the Contract of Work royalty rates.
As a result of higher projected copper and gold sales volumes, we expect our total 2005 royalty costs to increase compared with 2004 royalty costs of $43.5 million. If copper prices average $1.40 per pound and gold prices average $420 per ounce during the remainder of 2005, we would expect royalty costs to total approximately $90 million ($0.06 per pound of copper) for 2005, including approximately $18 million for the additional royalties. These estimates assume 2005 sales volumes of 1.47 billion pounds of copper and 2.8 million ounces of gold.
As a result of the higher copper and gold production and sales volumes in the 2005 periods, PT Freeport Indonesia’s unit depreciation rate decreased compared with the 2004 periods. Because certain assets are depreciated on a straight-line basis, the unit rate will vary with the level of copper and gold production and sales.
PT Freeport Indonesia has a labor agreement covering its hourly paid Indonesian employees, the key provisions of which are renegotiated biannually. The labor agreement was schedule to expire on September 30, 2005. In June 2005, PT Freeport Indonesia and its workers agreed to terms for a new labor agreement that expires in September 2007. PT Freeport Indonesia’s relations with the workers’ union have generally been satisfactory.
Unit Net Cash Cost: By-Product Method
Unit net cash costs per pound of copper is a measure intended to provide investors with information about the cash generating capacity of our mining operations expressed on a basis relating to our primary metal product, copper. PT Freeport Indonesia uses this measure for the same purpose and for monitoring operating performance by its mining operations. This information differs from measures of performance determined in accordance with generally accepted accounting principles and should not be considered in isolation or as a substitute for measures of performance determined in accordance with generally accepted accounting principles. This measure is presented by other copper and gold mining companies, although our measures may not be comparable to similarly titled measures reported by other companies.
Unit site production and delivery costs in the second quarter of 2005 averaged $0.71 per pound of copper, $0.13 per pound lower than the $0.84 reported in the second quarter of 2004. Unit site production and delivery costs in the first six months of 2005 averaged $0.65 per pound of copper, $0.39 per pound lower than the $1.04 reported in the second quarter of 2004. Lower unit site production and delivery costs in the 2005 periods reflected significantly higher copper sales volumes resulting from higher ore grades and the primarily fixed nature of a large portion of PT Freeport Indonesia’s cost structure, partly offset by higher energy costs and costs of other consumables, changes in currency exchange rates, higher mining costs and milling rates, labor costs and other factors
Gold and silver credits averaged $0.87 per pound in the second quarter of 2005 and $0.83 per pound in the first six months of 2005, compared with $0.69 per pound in the second quarter of 2004 and $0.63 per pound in the first six months of 2004. The increases reflect higher gold sales volumes and average realized prices. Royalties of $0.06 per pound in the 2005 periods were $0.02 per pound above the year-ago periods primarily because of higher copper and gold prices and higher gold sales volumes.
Assuming 2005 average prices of $1.40 per pound for copper and $420 per ounce for gold, and copper and gold sales of 1.47 billion pounds and 2.8 million ounces for 2005, PT Freeport Indonesia estimates that its annual 2005 unit net cash costs, including gold and silver credits, would approximate $0.05 per pound, net of deferred mining costs of $0.05 per pound. Forecasted unit net cash costs are calculated on the same basis as the historical unit costs. Unit net cash costs for 2005 would change by approximately $0.03 per pound for each $25 per ounce change in the average price of gold for the balance of the year. Estimated unit cash costs for 2005 are projected to be significantly lower than the 2004 average, primarily because of higher 2005 sales volumes, partially offset by increases in energy costs and costs of other consumables, currency exchange rates, higher mining costs and milling rates, labor costs and other factors.
Unit Net Cash Cost: Co-Product Method
Unit site production and delivery costs in the second quarter of 2005 averaged $0.45 per pound of copper, $0.09 per pound lower than the $0.54 reported in the second quarter of 2004. Unit site production and delivery costs in the first six months of 2005 averaged $0.42 per pound of copper, $0.27 per pound lower than the $0.69 reported in the second quarter of 2004. For gold, unit site production and delivery costs in the second quarter of 2005 averaged $126 per ounce, $44 per ounce lower than the $170 reported in the second quarter of 2004. For gold, unit site production and delivery costs in the first six months of 2005 averaged $115 per ounce, $103 per ounce lower than the $218 reported in the first six months of 2004. Lower unit site production and delivery costs in the 2005 periods reflected significantly higher sales volumes resulting from higher ore grades and the primarily fixed nature of a large portion of PT Freeport Indonesia’s cost structure. Royalties per pound and per ounce were higher in the 2005 periods because of higher sales volumes and realized prices compared with the 2004 periods.
Foreign Currency Exchange Risk
The functional currency for our operations in Indonesia and Spain is the U.S. dollar. All of our revenues and a significant portion of our costs are denominated in U.S. dollars; however, some costs and certain asset and liability accounts are denominated in Indonesian rupiah, Australian dollars or euros. Generally, our results are positively affected when the U.S. dollar strengthens in relation to those foreign currencies and adversely affected when the U.S. dollar weakens in relation to those foreign currencies.
PT Freeport Indonesia recorded gains totaling $0.4 million in both the second quarters of 2005 and 2004, $0.1 million in the first six months of 2005 and $0.9 million in the first six months of 2004 related to its rupiah-denominated net monetary assets and liabilities. PT Freeport Indonesia’s labor costs are mostly rupiah denominated. At estimated aggregate annual rupiah payments of 1.4 trillion for operating costs and an exchange rate of 9,755 rupiah to one U.S. dollar, the exchange rate as of June 30, 2005, a one-thousand-rupiah increase in the exchange rate would result in an approximate $13 million decrease in aggregate annual operating costs. A one-thousand-rupiah decrease in the exchange rate would result in an approximate $16 million increase in aggregate annual operating costs.
PT Freeport Indonesia purchases certain materials and supplies denominated in Australian dollars. At estimated annual aggregate Australian dollar payments of 225 million, a $0.01 increase or decrease in the exchange rate would result in an approximate $2 million change in aggregate annual costs. The exchange rate at June 30, 2005 was $0.76 to one Australian dollar.
At times, PT Freeport Indonesia has entered into foreign currency forward contracts to hedge a portion of its aggregate anticipated Indonesian rupiah and Australian dollar payments. As of June 30, 2005, PT Freeport Indonesia had foreign currency contracts to hedge 330.0 billion in rupiah payments, including costs for capital expenditures, or approximately 43 percent of aggregate projected rupiah payments from July 2005 through December 2005, at an average exchange rate of 10,122 rupiah to one U.S. dollar. In the second quarter of 2005 and through July 2005, PT Freeport Indonesia entered into foreign currency contracts to hedge 735.0 billion in rupiah payments, including certain rupiah-based capital expenditures, or approximately 47 percent of aggregate projected rupiah payments for 2006, at an average exchange rate of 10,085 rupiah to one U.S. dollar. PT Freeport Indonesia accounts for these contracts as cash flow hedges.
Exploration Activities
PT Freeport Indonesia’s exploration efforts in 2005 are focused on potential extensions of the Mill Level Zone (MLZ) and Deep MLZ deposits to the northwest, expansion of the Deep Grasberg resource and testing downward extensions of the Dom deposit, which are expected to result in approximately $15 million ($10 million for our share) of exploration costs during 2005. We are continuing to assess the timing of resumption of exploration activities in areas outside the existing producing area of the Grasberg mining district.
The Indonesian government previously approved suspensions of our field exploration activities outside of our current mining operations area, which have been in suspension in recent years due to safety and security issues and regulatory uncertainty relating to a possible conflict between our mining and exploration rights in certain forest areas and an Indonesian Forestry law enacted in 1999 prohibiting open-pit mining in forest preservation areas. The current suspensions were granted for one-year periods ending February 26, 2006, for Block B; March 31, 2006, for PT Nabire Bakti Mining; and November 15, 2005, for Eastern Minerals. Recent Indonesian legislation permits open-pit mining in PT Freeport Indonesia’s Block B area, subject to certain requirements. We are currently assessing these requirements and security issues. The timing for our resumption of exploration activities in our Contract of Work areas outside of Block A depends on the resolution of these matters.
SMELTING AND REFINING
Our investment in smelters serves an important role in our concentrate marketing strategy. PT Freeport Indonesia generally sells approximately one-half of its concentrate production to its affiliated smelters, Atlantic Copper and PT Smelting, and the remainder to other customers. Treatment charges for smelting and refining copper concentrates represent a cost to PT Freeport Indonesia and income to Atlantic Copper and PT Smelting. Through downstream integration, we are assured placement of a significant portion of our concentrate production. While low smelting and refining charges in recent years adversely affected the operating results of Atlantic Copper, they benefited the operating results of PT Freeport Indonesia’s mining operations, effectively achieving a hedge for these charges. Market rates for treatment and refining charges began to increase significantly in late 2004 as worldwide smelter availability was insufficient to accommodate increased mine production. Higher treatment and refining charges will benefit our smelter operations and adversely affect our mining operations. Taking into account taxes and minority ownership interests, an equivalent change in smelting and refining charge rates would essentially offset in our consolidated operating results.
Atlantic Copper Operating Results | | | | |
| (In Millions) | Second Quarter | | Six Months | |
| | 2005 | | 2004 | | 2005 | | 2004 | |
| Gross profit (loss) | $2.8 | | $(36.8 | )a | $4.3 | | $(44.8 | )a |
| Add depreciation and amortization expense | 7.1 | | 7.0 | | 14.2 | | 14.1 | |
| Other | 1.1 | | 3.5 | | 2.1 | | 4.0 | |
| Cash margin (deficit) | $11.0 | | $(26.3 | )a | $20.6 | | $(26.7 | )a |
| | | | | | | | | |
| Operating loss (in millions) | $(0.1 | ) | $(39.9 | ) | $(1.6 | ) | $(50.9 | ) |
| Concentrate and scrap treated (metric tons) | 246,900 | | 129,500 | | 462,700 | | 316,600 | |
| Anodes production (000s of pounds) | 159,400 | | 80,200 | | 306,800 | | 206,900 | |
| Cathodes, wire rod and wire sales (000s of pounds) | 140,800 | | 102,400 | | 273,400 | | 214,400 | |
Cathode cash unit cost per poundb | $0.18 | | $0.57 | | $0.18 | | $0.36 | |
| Gold sales in anodes and slimes (ounces) | 178,900 | | 49,000 | | 246,200 | | 176,800 | |
| | |
| a. | Includes costs related to Atlantic Copper’s 51-day major maintenance turnaround totaling $23.5 million for the second quarter of 2004 and $27.5 million for the first six months of 2004. |
| b. | For a reconciliation of cathode cash unit costs per pound to production costs applicable to sales reported in FCX’s consolidated financial statements refer to “Product Revenues and Production Costs” below. |
Atlantic Copper’s operating cash margin was $11.0 million in the second quarter of 2005, compared with a deficit of $26.3 million in the 2004 quarter, and $20.6 million in the first six months of 2005, compared with a $26.7 million deficit in the first six months of 2004. The deficits in the 2004 periods were primarily because of Atlantic Copper’s major maintenance turnaround, which began in March 2004 and was completed in May 2004. Atlantic Copper reported nearly breakeven operating results for the second quarter of 2005, compared with $39.9 million of operating losses for the 2004 period. Atlantic Copper reported operating losses of $1.6 million for the first six months of 2005, compared with $50.9 million for the first six months of 2004. The maintenance turnaround adversely affected costs and volumes in the 2004 periods resulting in impacts of approximately $35 million, including an approximate $11.5 million impact from lower volumes, on second-quarter operating results and net income and approximately $40 million, including an approximate $12 million impact from lower volumes, on the six-month period operating results and net income.
Atlantic Copper treated 246,900 metric tons of concentrate and scrap in the second quarter of 2005, compared with 129,500 metric tons in the 2004 period. For the six-month periods, concentrate and scrap treated totaled 462,700 metric tons in 2005 and 316,600 metric tons in 2004. Cathode production totaled 137.8 million pounds and sales totaled 140.8 million pounds during the second quarter of 2005, compared with cathode production of 67.5 million pounds and sales of 102.4 million pounds during the second quarter of 2004. For the six-month periods, cathode production totaled 269.5 million pounds and sales totaled 273.4 million pounds during 2005, compared with cathode production of 196.3 million pounds and sales of 214.4 million pounds during 2004. Atlantic Copper’s cathode cash production costs per pound of copper averaged $0.18 in the second quarter of 2005, $0.57 in the second quarter of 2004, $0.18 in the first six months of 2005 and $0.36 in the first six months of 2004. Unit costs in 2004 were adversely affected by lower production and higher costs from the scheduled maintenance turnaround. Atlantic Copper’s treatment charges (including price participation), which are what PT Freeport Indonesia and third parties pay Atlantic Copper to smelt and refine concentrates, averaged $0.21 per pound during the second quarter of 2005 and $0.19 per pound during the first six months of 2005, compared with $0.15 per pound during the 2004 periods. Excess smelter capacity, combined with limited copper concentrate availability, resulted in historically low long-term treatment and refining rates for the past several years. However, as discussed above, treatment charge rates began to increase in late 2004 as worldwide smelter availability was insufficient to accommodate increased mine production. Atlantic Copper expects these higher rates to benefit its 2005 operations with its average rates projected to approximate $0.23 per pound in the balance of the year at current copper prices.
We defer recognizing profits on PT Freeport Indonesia’s sales to Atlantic Copper and on 25 percent of PT Freeport Indonesia’s sales to PT Smelting until the final sales to third parties occur. Changes in these net deferrals resulted in an addition to our operating income totaling $48.3 million ($25.7 million to net income or $0.12 per share) in the second quarter of 2005 and a reduction of $15.2 million ($8.5 million to net income or $0.04 per share) in the first six months of 2005. Changes in these net deferrals decreased operating income by $9.6 million ($4.9 million to net income or $0.03 per share) in the second quarter of 2004 and increased operating income by $38.6 million ($19.8 million to net income or $0.11 per share) in
the first six months of 2004. At June 30, 2005, our net deferred profits on PT Freeport Indonesia concentrate inventories at Atlantic Copper and PT Smelting to be recognized in future periods’ net income after taxes and minority interest sharing totaled $50.5 million. Based on copper prices of $1.40 per pound and gold prices of $420 per ounce for the remainder of 2005 and current shipping schedules, we expect that the net change in deferred profits on intercompany sales will result in an increase to net income of approximately $5 million in the third quarter of 2005 and a decrease to net income of approximately $35 million in the fourth quarter. The periodic change in deferred intercompany profits may differ substantially because of changes in the timing of shipments to affiliated smelters and metal prices.
The majority of Atlantic Copper’s revenues are denominated in U.S. dollars; however, operating costs, other than concentrate purchases, and certain asset and liability accounts are denominated in euros. Atlantic Copper’s estimated annual euro payments total approximately 100 million euros. A $0.05 increase or decrease in the exchange rate would result in an approximate $5 million change in annual costs. The exchange rate on June 30, 2005 was $1.21 per euro.
As of June 30, 2005, FCX’s net investment in Atlantic Copper totaled approximately $91 million, FCX had a $189.5 million loan outstanding to Atlantic Copper and Atlantic Copper’s debt to third parties under nonrecourse financing arrangements totaled $43.3 million. In March 2004, we used a portion of the proceeds from the sale of our 6⅞% Senior Notes to fund Atlantic Copper’s repayment of $162.4 million of its borrowings (see “Capital Resources and Liquidity - Financing Activities”). Atlantic Copper recorded a $3.7 million ($0.02 per share) accounting charge for losses on early extinguishment of debt in the first quarter of 2004 related to these debt repayments.
Atlantic Copper had euro-denominated net monetary liabilities at June 30, 2005, totaling $58.7 million recorded at an exchange rate of $1.21 per euro. The exchange rate was $1.30 per euro at March 31, 2005, and $1.36 per euro at December 31, 2004. Adjustments to Atlantic Copper’s euro-denominated net monetary liabilities to reflect changes in the exchange rate are recorded in other income (expense) and totaled $3.4 million in the second quarter of 2005, $(0.2) million in the second quarter of 2004, $6.3 million in the first six months of 2005 and $1.8 million in the first six months of 2004.
PT Smelting Operating Results
| | Second Quarter | | Six Months | |
| (In Millions) | 2005 | | 2004 | | 2005 | | 2004 | |
| PT Freeport Indonesia sales to PT Smelting | $194.9 | | $166.2 | | $429.0 | | $293.2 | |
| Equity in PT Smelting earnings (losses) | 2.6 | | (2.5 | ) | 5.2 | | (2.9 | ) |
| PT Freeport Indonesia operating profits recognized (deferred) | 2.6 | | (10.3 | ) | - | | (2.0 | ) |
| | | | | | | | | |
PT Freeport Indonesia accounts for its 25 percent interest in PT Smelting using the equity method and provides PT Smelting with substantially all of its concentrate requirements. During the second quarter of 2004, PT Smelting completed a 31-day maintenance turnaround and resumed normal operations. Major maintenance turnarounds of this duration typically occur approximately every four years for PT Smelting, with significantly shorter term maintenance turnarounds in the interim. PT Smelting also completed a refinery expansion during the maintenance turnaround, increasing its production capacity to approximately 250,000 metric tons of copper metal per year.
In the second quarter of 2005, PT Smelting set quarterly records for concentrate treated, production and sales. PT Smelting treated 230,700 metric tons of concentrate in the second quarter of 2005, 135,400 metric tons in the 2004 quarter, 457,100 metric tons in the first six months of 2005 and 302,700 metric tons in the first six months of 2004. Higher concentrate tonnage from PT Freeport Indonesia in 2005 resulted in higher production compared with 2004 when PT Freeport Indonesia’s production was much lower. PT Smelting reported production of 146.1 million pounds of cathodes and sales of 145.5 million pounds of cathodes in the second quarter of 2005, compared with production of 86.9 million pounds and sales of 89.7 million pounds in the year-ago period. For the first six months of 2005, cathode production totaled 289.6 million pounds and sales totaled 289.2 million pounds, compared with cathode production of 183.9 million pounds and sales of 181.7 million pounds for the first six months of 2004. PT Smelting’s cathode cash unit costs averaged $0.10 per pound in both of the 2005 periods, compared with $0.22 per pound in the second quarter of 2004 and $0.17 per pound in the first six months of 2004, reflecting the benefit of higher volumes in the 2005 periods (see “Product Revenues and Production Costs”). PT Smelting expects its cathode cash unit costs for the second half of 2005 to be higher than the first half of 2005 because of higher fuel costs.
OTHER FINANCIAL RESULTS
The FCX/Rio Tinto joint ventures incurred $3.7 million of aggregate exploration costs in the second quarter of 2005, $4.3 million in the second quarter of 2004, $6.7 million in the first six months of 2005 and $7.9 million in the first six months of 2004. As discussed above in “Exploration Activities,” our exploration program for 2005 is focused on potential extensions of the MLZ and Deep MLZ deposits to the northwest, expansion of the Deep Grasberg resource and testing downward extensions of the Dom deposit. Our share of these exploration costs, which are charged to expense, totaled $2.3 million in the second quarter of 2005, $2.8 million in the second quarter of 2004, $4.3 million in the first six months of 2005 and $5.0 million in the first six months of 2004.
Consolidated general and administrative expenses increased to $25.4 million in the second quarter of 2005, compared with $22.6 million in the year-ago period. For the first six months of 2005, general and administrative expenses totaled $47.0 million, compared with $38.1 million for the first six months of 2004. The increase in 2005 was primarily caused by higher incentive compensation costs associated with stronger financial performance and pursuant to established plans. Compensation costs are higher in 2005 because certain compensation plans are based on annual operating cash flow results, which are projected to be significantly higher in 2005 compared with 2004.
Our parent company charges PT Freeport Indonesia for the in-the-money value of exercised employee stock options. These charges are eliminated in consolidation; however, PT Freeport Indonesia shares a portion of these charges with Rio Tinto and Rio Tinto’s reimbursements reduce our consolidated general and administrative expenses. General and administrative expenses are net of Rio Tinto’s share of joint venture reimbursements for employee stock option exercises, which increased (decreased) general and administrative expenses by $(0.1) million in the second quarter of 2005, $0.8 million in the second quarter of 2004, $(3.0) million in the first six months of 2005 and $(4.9) million in the first six months of 2004. The cost of our outstanding stock appreciation rights varies with the price of our common stock, resulting in decreases in general and administrative expenses totaling $0.9 million in the second quarter of 2005, $1.1 million in the second quarter of 2004, $0.4 million in the first six months of 2005 and $1.4 million in the first six months of 2004. In accordance with our joint venture agreement, Rio Tinto’s percentage share of PT Freeport Indonesia’s general and administrative expenses varies with metal sales volumes and prices and totaled 16 percent in the first six months of 2005 compared with 7 percent in the first six months of 2004.
Total interest cost (before capitalization) was $36.3 million in the second quarter of 2005, $40.0 million in the second quarter of 2004, $74.7 million in the first six months of 2005 and $73.8 million in the first six months of 2004. First-quarter 2004 conversions of 8¼% Convertible Senior Notes resulted in a $6.4 million reduction of interest expense for previously accrued amounts that were reclassified to losses on early extinguishment and conversion of debt. Capitalized interest costs totaled $1.0 million in the second quarter of 2005, $0.7 million in the second quarter of 2004, $1.9 million in the first six months of 2005 and $1.1 million in the first six months of 2004.
CAPITAL RESOURCES AND LIQUIDITY
Based on current mine plans and subject to future copper and gold prices, we expect to generate cash flows significantly greater than our budgeted capital expenditures and scheduled debt maturities, providing opportunities to reduce debt further and return cash to shareholders through dividends and share purchases. Our current regular common stock dividend is $1.00 per share, which is payable quarterly at a rate of $0.25 per share. In July 2005, our Board of Directors authorized an additional supplemental dividend of $0.50 per share to be paid on September 30, 2005 to shareholders of record on September 15, 2005. In addition, we recently paid two supplemental common stock dividends totaling $0.75 per share, $0.25 per share on December 29, 2004 and $0.50 per share on March 31, 2005. Our Board of Directors will continue to review our dividend policy.
During the second quarter, we purchased 2.4 million shares of our common stock for $80.2 million, an average of $33.83 per share. As of July 29, 2005, 14.2 million shares remain available under the Board authorized 20-million share open market purchase program. The timing of future purchases of our common stock is dependent upon a number of factors including the price of our common shares, our cash flows and financial position, copper and gold prices and general economic and market conditions.
We generated operating cash flows totaling $620.5 million, including $162.6 million from working capital sources, during the first six months of 2005, compared with net cash used in operating activities totaling $189.0 million, including $245.4 million for working capital, during the first six months of 2004. The significant improvement in 2005 compared with the prior year period primarily reflects significantly higher production and sales and higher copper and gold prices. Using estimated sales volumes for the remainder of 2005 and assuming prices of $1.40 per pound of copper and $420 per ounce of gold were realized for the remainder of 2005, we would generate operating cash flows in excess of $1.2 billion in 2005, with over $600 million in the second half of the year.
Investing Activities
Capital expenditures for PT Freeport Indonesia and Atlantic Copper of $59.3 million in the first six months of 2005 were lower than the $74.8 million reported in the 2004 period. Our capital expenditures for 2005 are expected to total approximately $180 million, including approximately $17 million for the DOZ expansion and $17 million for the Common Infrastructure project. We expect to fund our 2005 capital expenditures with operating cash flows and available cash.
In the first quarter of 2005, PT Freeport Indonesia received the $23.2 million balance of its share of insurance settlement proceeds related to its open-pit slippage claim, $2.0 million of which represented a recovery of property losses. We sold $4.2 million of our restricted investments in the first six months of 2004 to pay scheduled semiannual interest due on 8¼% Convertible Senior Notes. Conversions of 8¼% Convertible Senior Notes during the first quarter of 2004 allowed us to sell an additional $15.1 million of our restricted investments. In the first quarter of 2004, Atlantic Copper repaid its working capital revolving credit facility that was secured by certain copper concentrate inventory resulting in the release of $11.0 million of previously restricted cash.
Financing Activities
As of June 30, 2005, we had total unrestricted cash and cash equivalents of $585.4 million and total outstanding debt of $1.78 billion. Debt was reduced by $169.8 million during the first six months of 2005, primarily reflecting a prepayment of $187.0 million of bank debt associated with PT Puncakjaya Power’s power-generating facilities at PT Freeport Indonesia’s mining operations and repurchases of $11.0 million of our 7.50% Senior Notes due 2006 and 7.20% Senior Notes due 2026, net of changes in other borrowings.
In February and May 2005, we paid our regular quarterly dividends ($0.25 per share each quarter) and our Board of Directors authorized a supplemental common stock dividend of $0.50 per share, which was paid on March 31, 2005, for total first-half 2005 dividends on common stock of $179.7 million. The declaration and payment of dividends is at the discretion of our Board of Directors. The amount of our current quarterly cash dividend on our common stock and the possible payment of additional future supplemental cash dividends will depend on our financial results, cash requirements, future prospects and other factors deemed relevant by our Board of Directors. In the first half of 2004, we paid two regular quarterly dividends ($0.20 per share each quarter) for a total of $74.7 million. Cash dividends on preferred stock, $30.3 million in 2005 and $5.2 million in 2004, represent dividends on our 5½% Convertible Perpetual Preferred Stock we sold in March 2004 (see below). Cash dividends to minority interests represent dividends paid to the minority interest owners of PT Freeport Indonesia and Puncakjaya Power. Pursuant to the restricted payment covenants in our 10⅛% Senior Notes and 6⅞% Senior Notes, the amount available for dividend payments, purchases of our common stock and other restricted payments as of June 30, 2005, was approximately $435 million.
In 2003, our Board of Directors approved a new open market share purchase program for up to 20 million shares, which replaced our previous program. Through July 31, 2005, under this new program, we acquired 2.4 million shares in the second quarter of 2005 for $80.2 million, $33.83 per share average, and 3.4 million shares during the second quarter of 2004 for $99.5 million, $29.39 per share average, and 14.2 million shares remain available. The timing of future purchases of our common stock is dependent on many factors including the price of our common shares, our cash flow and financial position, and general economic and market conditions.
We completed several financing transactions during the first six months of 2004 to continue to improve our financial position and debt maturity profile. We completed a tender offer and privately negotiated transactions for a portion of our remaining 8¼% Convertible Senior Notes due 2006 resulting in the early conversion of $226.1 million of notes into 15.8 million shares of our common stock. We recorded a $10.9 million charge to losses on early extinguishment and conversion of debt in the first quarter of 2004 in connection with these conversions. The $10.9 million charge included $6.4 million of previously accrued
interest costs, resulting in an equivalent reduction of interest expense. Of the $603.8 million of 8¼% Convertible Senior Notes issued in 2001, a total of $537.3 million had been converted into 37.6 million shares of our common stock through June 30, 2004. In June 2004, we called for redemption on July 31, 2004 the remaining $66.5 million of 8¼% Convertible Senior Notes. During July 2004, all $66.5 million of the notes were converted into 4.7 million shares of our common stock.
On February 3, 2004, we sold $350 million of 6⅞% Senior Notes due 2014 for net proceeds of $344.4 million. We used a portion of the proceeds from the sale to fund the repayment of $162.4 million of Atlantic Copper borrowings and to refinance other FCX 2004 debt maturities. Atlantic Copper recorded a $3.7 million charge to losses on early extinguishment of debt to accelerate amortization of deferred financing costs. During the second quarter of 2004, we purchased in the open market $9.7 million of the 6⅞% Senior Notes due 2014 for $8.8 million, which resulted in a gain of $0.8 million recorded as a reduction to losses on early extinguishment and conversion of debt, including related deferred financing cost.
On March 30, 2004, we sold 1.1 million shares of 5½% Convertible Perpetual Preferred Stock for $1.1 billion, with net proceeds totaling $1.067 billion. The conversion rate is adjustable upon the occurrence of certain events, including an increase in the common stock dividend rate. We used a portion of the proceeds from the sale to purchase 23.9 million shares of FCX common stock owned by Rio Tinto for $881.9 million (approximately $36.85 per share) and used the remainder for general corporate purposes.
We took steps to improve Atlantic Copper’s liquidity and financial position during the first six months of 2004 and repaid $162.4 million of Atlantic Copper’s debt. In April 2004, we prepaid $66.2 million of our vendor equipment financing.
Below is a summary (in millions) of our total debt maturities based on loan balances as of June 30, 2005, and original issue amounts for mandatorily redeemable preferred stock.
| | 2005 | | 2006 | | 2007 | | 2008 | | 2009 | | Thereafter |
| Redeemable preferred stock | $ | 12.5 | | $ | 179.9 | | $ | - | | $ | - | | $ | - | | $ | - |
| Atlantic Copper debt | | 4.0 | | | - | | | 39.2 | | | - | | | - | | | - |
| Equipment loans and other | | 3.5 | | | 13.1 | | | 13.6 | | | 13.5 | | | 13.5 | | | 13.9 |
| 7.50% Senior Notes due 2006 | | - | | | 59.9 | | | - | | | - | | | - | | | - |
| 10⅛% Senior Notes due 2010 | | - | | | - | | | - | | | - | | | - | | | 500.0 |
7% Convertible Senior Notes due 2011a | | - | | | - | | | - | | | - | | | - | | | 575.0 |
| 6⅞% Senior Notes due 2014 | | - | | | - | | | - | | | - | | | - | | | 340.3 |
| 7.20% Senior Notes due 2026 | | - | | | - | | | - | | | - | | | - | | | 0.2 |
| Total debt maturities | $ | 20.0 | | $ | 252.9 | | $ | 52.8 | | $ | 13.5 | | $ | 13.5 | | $ | 1,429.4 |
Pro forma adjustmentb | | 5.0 | | | 25.2 | | | - | | | - | | | - | | | - |
| Pro forma debt maturities | $ | 25.0 | | $ | 278.1 | | $ | 52.8 | | $ | 13.5 | | $ | 13.5 | | $ | 1,429.4 |
| a. | Conversion price is $30.87 per share. |
| b. | Represents additional amounts due above the original issue amounts based on the price of silver and gold, totaling $5.0 million in 2005 and $4.4 million in 2006 for our Silver-Denominated Preferred Stock and $20.8 million in February 2006 for our Gold-Denominated Preferred Stock, Series II. The adjustment for 2005 is based on the calculated August 2005 redemption amount and we calculated the 2006 amount using the June 30, 2005, London gold fixing price for one ounce of gold ($437.10) and the London silver fixing price for one ounce of silver ($7.10) in the London bullion market (which determine the preferred stock redemption amounts). |
In the mining industry, the costs of removing overburden and waste material to access mineral deposits are referred to as “stripping costs.” Currently, we apply the deferred mining cost method in accounting for PT Freeport Indonesia’s post-production stripping costs, which we refer to as overburden removal costs. The deferred mining cost method is used by some companies in the metals mining industry; however, industry practice varies. The deferred mining cost method matches the cost of production with the sale of the related metal from the open pit by assigning each metric ton of ore removed an equivalent amount of overburden tonnage, thereby averaging overburden removal costs over the life of the mine. The mining cost capitalized in inventory and the amounts charged to cost of goods sold do not represent the actual costs incurred to mine the ore in any given period. The application of the deferred mining cost method has resulted in an asset on our balance sheets (“Deferred Mining Costs”) totaling $273.2 million at June 30, 2005, and $220.4 million at December 31, 2004. For further information, see Note 1 in FCX’s 2004 Annual Report on Form 10-K.
In March 2005, the Financial Accounting Standards Board (FASB) ratified EITF Issue No. 04-6, “Accounting for Stripping Costs Incurred during Production in the Mining Industry,” which requires that stripping costs be considered costs of the extracted minerals and recognized as a component of inventory to be recognized in cost of sales in the same period as the revenue from the sale of inventory. As a result, capitalization of stripping costs is appropriate only to the extent product inventory exists at the end of a reporting period. The guidance in EITF Issue No. 04-6 is effective for financial statements issued for fiscal years beginning after December 15, 2005, with early adoption permitted. Companies may apply this guidance either by recognition of a cumulative effect adjustment to beginning retained earnings in the period of adoption or by restating prior period financial statements. We expect to adopt the guidance on January 1, 2006, with the most significant impacts of adoption being the deferred mining costs asset on our balance sheet on that date will be charged, net of taxes and minority interest share, as a cumulative effect adjustment to beginning retained earnings and future stripping costs will effectively be charged to cost of sales as incurred. Adoption of the new guidance will have no impact on our cash flows. Had we adopted EITF 04-6 on January 1, 2004, we estimate operating income would have been reduced by approximately $22.9 million ($12.1 million to net income or $0.06 per diluted share) for the second quarter of 2005, $24.1 million ($12.8 million to net loss or $0.07 per share) for the second quarter of 2004, $53.1 million ($28.1 million to net income of $0.13 per diluted share) for the first six months of 2005 and $52.8 million ($28.0 million to net loss or $0.15 per share) for the first six months of 2004.
Refer to Note 1 in FCX’s 2004 Annual Report on Form 10-K for our accounting for share-based payments, including stock options. Through June 30, 2005, we have accounted for grants of employee stock options under the recognition principles of Accounting Principles Board (APB) Opinion No. 25, “Accounting for Stock Issued to Employees,” and related interpretations, which require compensation costs for stock-based employee compensation plans to be recognized based on the difference on the date of grant, if any, between the quoted market price of the stock and the amount an employee must pay to acquire the stock. If we had applied the fair value recognition provisions of Statement of Financial Accounting Standards (SFAS) No. 123, “Accounting for Stock-Based Compensation,” which requires stock-based compensation to be recognized based on the use of a fair value method, our net income would have been reduced by $3.4 million, $0.02 per diluted share, for the second quarter of 2005 and $6.3 million, $0.06 per diluted share, for the first six months of 2005. In 2004, our net loss would have been increased by $1.1 million, $0.01 per diluted share, for the second quarter of 2004 and $2.2 million, $0.01 per diluted share, for the first six months of 2004 (see Note 2 of Notes to the Consolidated Financial Statements).
In December 2004, the FASB issued SFAS No. 123 (revised 2004), “Share-Based Payment” (SFAS No. 123R). SFAS No. 123R requires all share-based payments to employees, including grants of employee stock options, to be recognized in the financial statements based on their fair values. SFAS No. 123R’s effective date is interim periods beginning after June 15, 2005. However, in April 2005 the Securities and Exchange Commission provided for a deferral of the effective date to fiscal periods beginning after June 15, 2005. We are still reviewing the provisions of SFAS No. 123R and have not yet determined if we will adopt SFAS No. 123R before January 1, 2006. Based on currently outstanding employee stock options, we estimate the pro forma charge to earnings before taxes and minority interest sharing for the full year 2005 would total approximately $22 million, and the pro forma reduction in net income would be approximately $13 million, $0.07 per share using average basic shares outstanding for the second quarter of 2005.
PRODUCT REVENUES AND PRODUCTION COSTS
PT Freeport Indonesia Product Revenues and Unit Net Cash Costs
All amounts used in both the by-product and co-product method presentations are included in our recorded results under generally accepted accounting principles. We separately identify certain of these amounts as shown in the following reconciliation to amounts reported in our consolidated financial statements and as explained below.
| 1. | We show adjustments to revenues for prior period open sales as separate line items. Because such copper pricing adjustments do not result from current period sales, we have reflected these separately from revenues on current period sales. |
| 2. | Noncash and nonrecurring costs, which consist of items such as write-offs of equipment or unusual charges, have not been material. They are removed from site production and delivery costs in the calculation of unit net cash costs. |
| 3. | Gold and silver revenues are reflected as credits against site production and delivery costs in the by-product method. |
Three Months Ended June 30, 2005 | | | | |
| | By-Product | | Co-Product Method | |
| (In Thousands) | Method | | Copper | | Gold | | Silver | | Total | |
| Revenues, after adjustments shown below | $ | 480,076 | | $ | 480,076 | | $ | 264,040 | | $ | 7,406 | | $ | 751,522 | |
| | | | | | | | | | | | | | | | |
| Site production and delivery, before net noncash | | | | | | | | | | | | | | | |
| and nonrecurring costs shown below | | 221,071 | a | | 141,221 | b | | 77,671 | b | | 2,179 | b | | 221,071 | |
| Gold and silver credits | | (271,446 | ) | | - | | | - | | | - | | | - | |
| Treatment charges | | 67,867 | | | 43,354 | | | 23,844 | | | 669 | | | 67,867 | |
| Royalty on metals | | 17,741 | | | 11,333 | | | 6,233 | | | 175 | | | 17,741 | |
| Unit net cash costs | | 35,233 | | | 195,908 | | | 107,748 | | | 3,023 | | | 306,679 | |
| Depreciation and amortization | | 44,217 | | | 28,246 | | | 15,535 | | | 436 | | | 44,217 | |
| Noncash and nonrecurring costs, net | | 2,284 | | | 1,459 | | | 802 | | | 23 | | | 2,284 | |
| Total unit costs | | 81,734 | | | 225,613 | | | 124,085 | | | 3,482 | | | 353,180 | |
| Revenue adjustments, primarily for pricing on | | | | | | | | | | | | | | | |
| prior period open sales | | 12,472 | | | 12,472 | | | - | | | - | | | 12,472 | |
| PT Smelting intercompany profit elimination | | 2,552 | | | 1,630 | | | 897 | | | 25 | | | 2,552 | |
| Gross profit | $ | 413,366 | | $ | 268,565 | | $ | 140,852 | | $ | 3,949 | | $ | 413,366 | |
| | | | | | | | | | | | | | | | |
Reconciliation to Amounts Reported | | | | | | | | | | | | | | | |
| (In Thousands) | Revenues | | Production and Delivery | | Depreciation and Amortization | | | | | | | |
| Totals presented above | $ | 751,522 | | $ | 221,071 | | $ | 44,217 | | | | | | | |
| Net noncash and nonrecurring costs per above | | N/A | | | 2,284 | | | N/A | | | | | | | |
| Less: Treatment charges per above | | (67,867 | ) | | N/A | | | N/A | | | | | | | |
| Royalty per above | | (17,741 | ) | | N/A | | | N/A | | | | | | | |
| Revenue adjustments, primarily for pricing on | | | | | | | | | | | | | | | |
| prior period open sales per above | | 12,472 | | | N/A | | | N/A | | | | | | | |
| Mining and exploration segment | | 678,386 | | | 223,355 | | | 44,217 | | | | | | | |
| Smelting and refining segment | | 331,897 | | | 321,909 | | | 7,141 | | | | | | | |
| Eliminations and other | | (107,374 | ) | | (154,678 | ) | | 2,801 | | | | | | | |
| As reported in FCX’s consolidated financial | | | | | | | | | | | | | | | |
| statements | $ | 902,909 | | $ | 390,586 | | $ | 54,159 | | | | | | | |
| a. | Net of deferred mining costs totaling $20.6 million or 6.6¢ per pound. Upon adoption of EITF Issue No. 04-6, mining costs will no longer be deferred. See Note 1 of Notes to Consolidated Financial Statements. |
| b. | Net of deferred mining costs totaling $13.2 million or 4.2¢ per pound for copper, $7.2 million or $11.74 per ounce for gold and $0.2 million or $0.19 per ounce for silver. See Note a above. |
Three Months Ended June 30, 2004 | | | | |
| | By-Product | | Co-Product Method | |
| (In Thousands) | Method | | Copper | | Gold | | Silver | | Total | |
| Revenues, after adjustments shown below | $ | 251,178 | | $ | 251,178 | | $ | 136,115 | | $ | 4,951 | | $ | 392,244 | |
| | | | | | | | | | | | | | | | |
| Site production and delivery, before net noncash | | | | | | | | | | | | | | | |
| and nonrecurring costs shown below | | 172,371 | a | | 110,380 | b | | 59,815 | b | | 2,176 | b | | 172,371 | |
| Gold and silver credits | | (141,066 | ) | | - | | | - | | | - | | | - | |
| Treatment charges | | 43,407 | | | 27,796 | | | 15,063 | | | 548 | | | 43,407 | |
| Royalty on metals | | 7,875 | | | 5,043 | | | 2,733 | | | 99 | | | 7,875 | |
| Unit net cash costs | | 82,587 | | | 143,219 | | | 77,611 | | | 2,823 | | | 223,653 | |
| Depreciation and amortization | | 33,417 | | | 21,399 | | | 11,596 | | | 422 | | | 33,417 | |
| Noncash and nonrecurring costs, net | | 2,872 | | | 1,839 | | | 997 | | | 36 | | | 2,872 | |
| Total unit costs | | 118,876 | | | 166,457 | | | 90,204 | | | 3,281 | | | 259,942 | |
| Revenue adjustments, primarily for pricing on | | | | | | | | | | | | | | | |
| prior period open sales | | (10,121 | ) | | (10,121 | ) | | - | | | - | | | (10,121 | ) |
| PT Smelting intercompany profit elimination | | (10,273 | ) | | (6,578 | ) | | (3,565 | ) | | (130 | ) | | (10,273 | ) |
| Gross profit | $ | 111,908 | | $ | 68,022 | | $ | 42,346 | | $ | 1,540 | | $ | 111,908 | |
| | | | | | | | | | | | | | | | |
Reconciliation to Amounts Reported | | | | | | | | | | | | | | | |
| (In Thousands) | Revenues | | Production and Delivery | | Depreciation and Amortization | | | | | | | |
| Totals presented above | $ | 392,244 | | $ | 172,371 | | $ | 33,417 | | | | | | | |
| Net noncash and nonrecurring costs per above | | N/A | | | 2,872 | | | N/A | | | | | | | |
| Less: Treatment charges per above | | (43,407 | ) | | N/A | | | N/A | | | | | | | |
| Royalty per above | | (7,875 | ) | | N/A | | | N/A | | | | | | | |
| Revenue adjustments, primarily for pricing on | | | | | | | | | | | | | | | |
| prior period open sales per above | | (10,121 | ) | | N/A | | | N/A | | | | | | | |
| Mining and exploration segment | | 330,841 | | | 175,243 | | | 33,417 | | | | | | | |
| Smelting and refining segment | | 171,736 | | | 201,542 | | | 7,028 | | | | | | | |
| Eliminations and other | | (16,243 | ) | | (5,106 | ) | | 2,145 | | | | | | | |
| As reported in FCX’s consolidated financial | | | | | | | | | | | | | | | |
| statements | $ | 486,334 | | $ | 371,679 | | $ | 42,590 | | | | | | | |
| a. | Net of deferred mining costs totaling $31.5 million or 15.4¢ per pound. Upon adoption of EITF Issue No. 04-6, mining costs will no longer be deferred. See Note 1 of Notes to Consolidated Financial Statements. |
| b. | Net of deferred mining costs totaling $20.2 million or 9.8¢ per pound for copper, $10.9 million or $31.14 per ounce for gold and $0.4 million or $0.48 per ounce for silver. See Note a above. |
Six Months Ended June 30, 2005 | | | | |
| | By-Product | | Co-Product Method | |
| (In Thousands) | Method | | Copper | | Gold | | Silver | | Total | |
| Revenues, after adjustments shown below | $ | 995,096 | | $ | 995,096 | | $ | 515,038 | | $ | 16,506 | | $ | 1,526,640 | |
| | | | | | | | | | | | | | | | |
| Site production and delivery, before net noncash | | | | | | | | | | | | | | | |
| and nonrecurring costs shown below | | 414,425 | a | | 270,131 | b | | 139,813 | b | | 4,481 | b | | 414,425 | |
| Gold and silver credits | | (531,544 | ) | | - | | | - | | | - | | | - | |
| Treatment charges | | 139,353 | | | 90,833 | | | 47,013 | | | 1,507 | | | 139,353 | |
| Royalty on metals | | 36,519 | | | 23,804 | | | 12,320 | | | 395 | | | 36,519 | |
| Unit net cash costs | | 58,753 | | | 384,768 | | | 199,146 | | | 6,383 | | | 590,297 | |
| Depreciation and amortization | | 91,142 | | | 59,408 | | | 30,749 | | | 985 | | | 91,142 | |
| Noncash and nonrecurring costs, net | | 2,808 | | | 1,831 | | | 947 | | | 30 | | | 2,808 | |
| Total unit costs | | 152,703 | | | 446,007 | | | 230,842 | | | 7,398 | | | 684,247 | |
| Revenue adjustments, primarily for pricing on | | | | | | | | | | | | | | | |
| prior period open sales | | 15,016 | | | 15,016 | | | - | | | - | | | 15,016 | |
| PT Smelting intercompany profit elimination | | (25 | ) | | (16 | ) | | (9 | ) | | - | | | (25 | ) |
| Gross profit | $ | 857,384 | | $ | 564,089 | | $ | 284,187 | | $ | 9,108 | | $ | 857,384 | |
| | | | | | | | | | | | | | | | |
Reconciliation to Amounts Reported | | | | | | | | | | | | | | | |
| (In Thousands) | Revenues | | Production and Delivery | | Depreciation and Amortization | | | | | | | |
| Totals presented above | $ | 1,526,640 | | $ | 414,425 | | $ | 91,142 | | | | | | | |
| Net noncash and nonrecurring costs per above | | N/A | | | 2,808 | | | N/A | | | | | | | |
| Less: Treatment charges per above | | (139,353 | ) | | N/A | | | N/A | | | | | | | |
| Royalty per above | | (36,519 | ) | | N/A | | | N/A | | | | | | | |
| Revenue adjustments, primarily for pricing on | | | | | | | | | | | | | | | |
| prior period open sales per above | | 15,016 | | | N/A | | | N/A | | | | | | | |
| Mining and exploration segment | | 1,365,784 | | | 417,233 | | | 91,142 | | | | | | | |
| Smelting and refining segment | | 604,013 | | | 585,486 | | | 14,230 | | | | | | | |
| Eliminations and other | | (263,823 | ) | | (247,127 | ) | | 5,713 | | | | | | | |
| As reported in FCX’s consolidated financial | | | | | | | | | | | | | | | |
| statements | $ | 1,705,974 | | $ | 755,592 | | $ | 111,085 | | | | | | | |
| a. | Net of deferred mining costs totaling $52.8 million or 8.2¢ per pound. Upon adoption of EITF Issue No. 04-6, mining costs will no longer be deferred. See Note 1 of Notes to Consolidated Financial Statements. |
| b. | Net of deferred mining costs totaling $34.4 million or 5.4¢ per pound for copper, $17.8 million or $14.70 per ounce for gold and $0.6 million or $0.25 per ounce for silver. See Note a above. |
Six Months Ended June 30, 2004 | | | | |
| | By-Product | | Co-Product Method | |
| (In Thousands) | Method | | Copper | | Gold | | Silver | | Total | |
| Revenues, after adjustments shown below | $ | 388,717 | | $ | 388,717 | | $ | 187,310 | | $ | 8,743 | | $ | 584,770 | |
| | | | | | | | | | | | | | | | |
| Site production and delivery, before net noncash | | | | | | | | | | | | | | | |
| and nonrecurring costs shown below | | 323,546 | a | | 215,073 | b | | 103,636 | b | | 4,837 | b | | 323,546 | |
| Gold and silver credits | | (196,053 | ) | | - | | | - | | | - | | | - | |
| Treatment charges | | 67,393 | | | 44,798 | | | 21,587 | | | 1,008 | | | 67,393 | |
| Royalty on metals | | 12,722 | | | 8,457 | | | 4,075 | | | 190 | | | 12,722 | |
| Unit net cash costs | | 207,608 | | | 268,328 | | | 129,298 | | | 6,035 | | | 403,661 | |
| Depreciation and amortization | | 50,603 | | | 33,637 | | | 16,209 | | | 757 | | | 50,603 | |
| Noncash and nonrecurring costs, net | | 2,969 | | | 1,974 | | | 951 | | | 44 | | | 2,969 | |
| Total unit costs | | 261,180 | | | 303,939 | | | 146,458 | | | 6,836 | | | 457,233 | |
| Revenue adjustments, primarily for pricing on | | | | | | | | | | | | | | | |
| prior period open sales | | 13,370 | | | 13,370 | | | - | | | - | | | 13,370 | |
| PT Smelting intercompany profit elimination | | (1,956 | ) | | (1,300 | ) | | (627 | ) | | (29 | ) | | (1,956 | ) |
| Gross profit | $ | 138,951 | | $ | 96,848 | | $ | 40,225 | | $ | 1,878 | | $ | 138,951 | |
| | | | | | | | | | | | | | | | |
Reconciliation to Amounts Reported | | | | | | | | | | | | | | | |
| (In Thousands) | Revenues | | Production and Delivery | | Depreciation and Amortization | | | | | | | |
| Totals presented above | $ | 584,770 | | $ | 323,546 | | $ | 50,603 | | | | | | | |
| Net noncash and nonrecurring costs per above | | N/A | | | 2,969 | | | N/A | | | | | | | |
| Less: Treatment charges per above | | (67,393 | ) | | N/A | | | N/A | | | | | | | |
| Royalty per above | | (12,722 | ) | | N/A | | | N/A | | | | | | | |
| Revenue adjustments, primarily for pricing on | | | | | | | | | | | | | | | |
| prior period open sales per above | | 13,370 | | | N/A | | | N/A | | | | | | | |
| Mining and exploration segment | | 518,025 | | | 326,515 | | | 50,603 | | | | | | | |
| Smelting and refining segment | | 382,953 | | | 413,658 | | | 14,095 | | | | | | | |
| Eliminations and other | | (54,459 | ) | | (92,882 | ) | | 3,302 | | | | | | | |
| As reported in FCX’s consolidated financial | | | | | | | | | | | | | | | |
| statements | $ | 846,519 | | $ | 647,291 | | $ | 68,000 | | | | | | | |
| a. | Net of deferred mining costs totaling $57.7 million or 18.6¢ per pound. Upon adoption of EITF Issue No. 04-6, mining costs will no longer be deferred. See Note 1 of Notes to Consolidated Financial Statements. |
| b. | Net of deferred mining costs totaling $38.4 million or 12.4¢ per pound for copper, $18.5 million or $38.92 per ounce for gold and $0.9 million or $0.63 per ounce for silver. See Note a above. |
Atlantic Copper Cathode Cash Unit Cost Per Pound Of Copper
Atlantic Copper cathode cash unit cost per pound of copper is a measure intended to provide investors with information about the costs it incurs to produce cathodes at its smelting operations in Spain. We use this measure for the same purpose and for monitoring operating performance at Atlantic Copper’s smelting operations. This information differs from measures of performance determined in accordance with generally accepted accounting principles and should not be considered in isolation or as a substitute for measures of performance determined in accordance with generally accepted accounting principles. Other smelting companies present this measure, although Atlantic Copper’s measure may not be comparable to similarly titled measures reported by other companies. The reconciliation below presents reported production costs for our smelting and refining segment (Atlantic Copper) and subtracts or adds components of those costs that do not directly relate to the process of converting copper concentrates to cathodes. The adjusted production costs amounts are used to calculate Atlantic Copper’s cathode cash unit cost per pound of copper (in thousands, except per pound amounts):
| | Three Months Ended | | Six Months Ended | |
| | June 30, | | June 30, | |
| | 2005 | | 2004 | | 2005 | | 2004 | |
| Smelting and refining segment production costs reported | | | | | | | | | | | | |
| in FCX’s consolidated financial statements | $ | 321,909 | | $ | 201,542 | a | $ | 585,486 | | $ | 413,658 | a |
| Less: | | | | | | | | | | | | |
| Raw material purchase costs | | (209,199 | ) | | (70,935 | ) | | (406,470 | ) | | (167,878 | ) |
| Production costs of wire rod and wire | | - | b | | (55,561 | ) | | - | b | | (84,291 | ) |
| Production costs of anodes sold | | (2,368 | ) | | (612 | ) | | (5,766 | ) | | (1,108 | ) |
| Other | | 179 | | | (8,099 | ) | | (1,034 | ) | | (3,359 | ) |
| Credits: | | | | | | | | | | | | |
| Gold and silver revenues | | (78,473 | ) | | (21,265 | ) | | (110,421 | ) | | (74,023 | ) |
| Acid and other by-product revenues | | (7,291 | ) | | (6,607 | ) | | (14,591 | ) | | (12,371 | ) |
| Production costs used in calculating cathode cash unit | | | | | | | | | | | | |
| cost per pound | $ | 24,757 | | $ | 38,463 | | $ | 47,204 | | $ | 70,628 | |
| Pounds of cathode produced | | 137,800 | | | 67,500 | | | 269,500 | | | 196,300 | |
| Cathode cash unit cost per pound | $ | 0.18 | | $ | 0.57 | | $ | 0.18 | | $ | 0.36 | |
| a. | Includes $23.5 million, $0.35 per pound, in the 2004 quarter and $27.5 million, $0.14 per pound, in the 2004 six-month period for costs related to Atlantic Copper’s major maintenance turnaround. |
| b. | Atlantic Copper sold its wire rod and wire assets in December 2004. |
PT Smelting Cathode Cash Unit Cost Per Pound Of Copper
PT Smelting cathode cash unit cost per pound of copper is a measure intended to provide investors with information about the costs it incurs to produce cathodes at its smelting operations in Indonesia. We use this measure for the same purpose and for monitoring operating performance at PT Smelting’s smelting operations. This information differs from measures of performance determined in accordance with generally accepted accounting principles and should not be considered in isolation or as a substitute for measures of performance determined in accordance with generally accepted accounting principles. Other smelting companies present this measure, although PT Smelting’s measure may not be comparable to similarly titled measures reported by other companies. The calculation below presents PT Smelting’s reported operating costs and subtracts or adds components of those costs that do not directly relate to the process of converting copper concentrates to cathodes. PT Smelting’s operating costs are then reconciled to PT Freeport Indonesia’s equity in PT Smelting earnings (losses) reported in our consolidated financial statements (in thousands, except per pound amounts):
| | Three Months Ended | | Six Months Ended | |
| | June 30, | | June 30, | |
| | 2005 | | 2004 | | 2005 | | 2004 | |
| Operating costs - PT Smelting (100%) | $ | 17,623 | | $ | 18,821 | | $ | 36,074 | | $ | 33,760 | |
| Add: Gold and silver refining charges | | 1,119 | | | 552 | | | 2,075 | | | 1,712 | |
| Less: Acid and other by-product revenues | | (3,641 | ) | | (2,829 | ) | | (7,502 | ) | | (5,482 | ) |
| Production cost of anodes sold | | - | | | - | | | (12 | ) | | (12 | ) |
| Other | | (400 | ) | | 2,315 | | | (886 | ) | | 1,585 | |
| Production costs used in calculating cathode cash unit | | | | | | | | | | | | |
| cost per pound | $ | 14,701 | | $ | 18,859 | | $ | 29,749 | | $ | 31,563 | |
| Pounds of cathode produced | | 146,100 | | | 86,900 | | | 289,600 | | | 183,900 | |
| Cathode cash unit cost per pound | $ | 0.10 | | $ | 0.22 | | $ | 0.10 | | $ | 0.17 | |
| | | | | | | | | | | | | |
| | Three Months Ended | | Six Months Ended | |
| | June 30, | | June 30, | |
| | 2005 | | 2004 | | 2005 | | 2004 | |
| Reconciliation to Amounts Reported | | | | | | | | | | | | |
| Operating costs per above | $ | (17,623 | ) | $ | (18,821 | ) | $ | (36,074 | ) | $ | (33,760 | ) |
| Other costs | | (312,792 | ) | | (154,611 | ) | | (590,943 | ) | | (334,906 | ) |
| Revenue and other income | | 340,904 | | | 163,482 | | | 648,130 | | | 357,524 | |
| PT Smelting net income (loss) | | 10,489 | | | (9,950 | ) | | 21,113 | | | (11,142 | ) |
| | | | | | | | | | | | | |
| PT Freeport Indonesia’s 25% equity interest | | 2,622 | | | (2,488 | ) | | 5,278 | | | (2,786 | ) |
| Amortization of excess investment cost | | (60 | ) | | (60 | ) | | (120 | ) | | (120 | ) |
| Equity in PT Smelting earnings (losses) reported in | | | | | | | | | | | | |
| FCX’s consolidated financial statements | $ | 2,562 | | $ | (2,548 | ) | $ | 5,158 | | $ | (2,906 | ) |
CAUTIONARY STATEMENT
Our discussion and analysis contains forward-looking statements in which we discuss our expectations regarding future performance. Forward-looking statements are all statements other than historical facts, such as those regarding anticipated sales volumes, ore grades, commodity prices, general and administrative expenses, unit cash costs, operating cash flows, royalty costs, capital expenditures, debt repayments and refinancing, debt maturities, treatment charge rates, depreciation rates, exploration efforts and results, dividend payments, liquidity and other financial commitments. We caution you that these statements are not guarantees of future performance, and our actual results may differ materially from those projected, anticipated or assumed in the forward-looking statements. Important factors that can cause our actual results to differ materially from those anticipated in the forward-looking statements include unanticipated mining, milling and other processing problems, accidents that lead to personal injury or property damage, persistent commodity price reductions, changes in political, social or economic circumstances in our area of operations, variances in ore grades, labor relations, adverse weather conditions, the speculative nature of mineral exploration, fluctuations in interest rates and other adverse financial market conditions, and other factors described in more detail under the heading “Risk Factors” in our Form 10-K for the year ended December 31, 2004.
Item 3.Quantitative and Qualitative Disclosures about Market Risk. There have been no significant changes in our market risks since the year ended December 31, 2004. For more information, please read the consolidated financial statements and notes thereto included in our Annual Report on Form 10-K for the year ended December 31, 2004.
(a) Evaluation of disclosure controls and procedures. Our chief executive officer and chief financial officer, with the participation of management, have evaluated the effectiveness of our “disclosure controls and procedures” (as defined in Rules 13a-14(c) and 15d-14(c) under the Securities Exchange Act of 1934) as of the end of the period covered by this quarterly report on Form 10-Q. Based on their evaluation, they have concluded that our disclosure controls and procedures are effective in timely alerting them to material information relating to FCX (including our consolidated subsidiaries) required to be disclosed in our periodic Securities and Exchange Commission filings.
(b) Changes in internal controls. There has been no change in our internal control over financial reporting that occurred during the second quarter that has materially affected, or is reasonably likely to materially affect our internal control over financial reporting.
We are involved from time to time in various legal proceedings of a character normally incident to the ordinary course of our business. We believe that potential liability in such proceedings would not have a material adverse effect on our financial condition or results of operations. We maintain liability insurance to cover some, but not all, potential liabilities normally incident to the ordinary course of our business as well as other insurance coverage customary in our business, with coverage limits that we deem prudent.
Item 2. Unregistered Sales of Equity Securities and Use of Proceeds. The following table sets forth common shares we repurchased during the three-month period ended June 30, 2005.
| | | | | | | Current Programa |
| Period | | Total Shares Purchased | | Average Price Paid Per Share | | Shares Purchased | | Shares Available for Purchase |
| | | | | | | | | | |
| April 1 to 30, 2005 | | 1,349,200 | | $ | 34.57 | | 1,349,200 | | 15,266,200 |
| | | | | | | | | | |
| May 1 to 31, 2005 | | 1,022,000 | | | 32.87 | | 1,022,000 | | 14,244,200 |
| | | | | | | | | | |
| June 1 to 30, 2005 | | - | | | - | | - | | 14,244,200 |
| | | | | | | | | | |
| Total | | 2,371,200 | | | 33.83 | | 2,371,200 | | |
| | | | | | | | | | |
| a. | In October 2003, our Board of Directors approved a new open market share purchase program for up to 20 million shares, which replaced our previous program. The program does not have an expiration date. |
Item 4. Submission of Matters to a Vote of Security Holders. Our annual meeting of stockholders was held on May 5, 2005 (the “Annual Meeting”). Proxies were solicited pursuant to Regulation 14A under the Securities Exchange Act of 1934, as amended. The following matters were submitted to a vote of security holders during our Annual Meeting:
| | Votes Cast For | Authority Withheld |
| 1. Election of Directors: | | |
| Robert J. Allison, Jr. | 152,377,020 | 10,156,619 |
| Robert A. Day | 160,601,371 | 1,932,268 |
| H. Devon Graham, Jr. | 155,461,400 | 7,072,239 |
| Bobby Lee Lackey | 155,410,168 | 7,123,471 |
| Gabrielle K. McDonald | 156,386,530 | 6,147,109 |
| James R. Moffett | 159,491,805 | 3,041,834 |
| B. M. Rankin, Jr. | 156,320,889 | 6,212,750 |
| J. Stapleton Roy | 156,390,264 | 6,143,735 |
| J. Taylor Wharton | 155,465,455 | 7,068,184 |
There were no abstentions with respect to the election of directors. In addition to the directors elected at the Annual Meeting, the terms of the following directors continued after the Annual Meeting: Gerald J. Ford and J. Bennett Johnston.
| | For | Against | Abstentions | Broker Non-Votes |
| 2. Ratification of Ernst & Young LLP as | | | | |
| independent auditors | 161,140,536 | 212,899 | 981,657 | - |
| 3. Proposal to adopt 2005 Annual Incentive | | | | |
| Plan | 146,707,677 | 14,409,593 | 1,217,822 | - |
| 4. Stockholder proposal regarding a | | | | |
| majority vote requirement to elect | | | | |
| directors | 70,173,503 | 63,573,342 | 1,415,383 | 27,172,864 |
| 5. Stockholder proposal urging | | | | |
| management review its policies | | | | |
| relating to financial support of the | | | | |
| Indonesian Government security | | | | |
| personnel | 8,956,505 | 116,455,414 | 9,750,309 | 27,172,864 |
The exhibits to this report are listed in the Exhibit Index beginning on page E-1 hereof.
FREEPORT-McMoRan COPPER & GOLD INC.
Pursuant to the requirements of the Securities Exchange Act of 1934, the registrant has duly caused this report to be signed on its behalf by the undersigned hereunto duly authorized.
FREEPORT-McMoRan COPPER & GOLD INC.
By: /s/ C. Donald Whitmire, Jr.
C. Donald Whitmire, Jr.
Vice President and
Controller-Financial Reporting
(authorized signatory and
Principal Accounting Officer)
Date: August 3, 2005
Freeport-McMoRan Copper & Gold Inc.
Exhibit
Number Description
| 3.1 | | Amended and Restated Certificate of Incorporation of Freeport-McMoRan Copper & Gold Inc. (FCX). Incorporated by reference to Exhibit 3.1 to the Quarterly Report on Form 10-Q of FCX for the quarter ended March 31, 2002 (the FCX 2002 First Quarter Form 10-Q). |
| | | |
| 3.2 | | Certificate of Amendment to Amended and Restated Certificate of Incorporation of FCX. Incorporated by reference to Exhibit 3.1 to the Quarterly Report on Form 10-Q of FCX for the quarter ended March 31, 2003 (the FCX 2003 First Quarter Form 10-Q). |
| | | |
| 3.3 | | Amended By-Laws of FCX dated as of February 3, 2004. Incorporated by reference to Exhibit 3.3 to the Annual Report on Form 10-K of FCX for the fiscal year ended December 31, 2003 (the FCX 2003 Form 10-K). |
| | | |
| 4.1 | | Deposit Agreement dated as of January 15, 1994, among FCX, Mellon, as Depositary, and holders of depositary receipts (Gold-Denominated II Depositary Receipts) evidencing certain Depositary Shares, each of which, in turn, represented 0.05 shares of Gold-Denominated Preferred Stock II. Incorporated by reference to Exhibit 4.5 to the Quarterly Report on Form 10-Q of FCX for the quarter ended June 30, 2002 (the FCX 2002 Second Quarter Form 10-Q). |
| | | |
| 4.2 | | Form of Gold-Denominated II Depositary Receipt. Incorporated by reference to Exhibit 4.6 to the FCX 2002 Second Quarter Form 10-Q. |
| | | |
| 4.3 | | Deposit Agreement dated as of July 25, 1994, among FCX, Mellon, as Depositary, and holders of depositary receipts (Silver-Denominated Depositary Receipts) evidencing certain Depositary Shares, each of which, in turn, initially represented 0.025 shares of Silver-Denominated Preferred Stock. Incorporated by reference to Exhibit 4.7 to the FCX 2002 Second Quarter Form 10-Q. |
| | | |
| 4.4 | | Form of Silver-Denominated Depositary Receipt. Incorporated by reference to Exhibit 4.8 to the FCX 2002 Second Quarter Form 10-Q. |
| | | |
| 4.5 | | Certificate of Designations of 5½% Convertible Perpetual Preferred Stock of FCX. Incorporated by reference to Exhibit 4.1 to the Current Report on Form 8-K of FCX dated March 30, 2004 and filed March 31, 2004. |
| | | |
| 4.6 | | Amended and Restated Credit Agreement dated as of September 30, 2003, but effective as of October 2, 2003, among FCX, PT Freeport Indonesia, the several financial institutions that are parties thereto, U.S. Bank Trust National Association, as PT Freeport Indonesia Trustee, J.P. Morgan Securities Inc., as Arranger, and JPMorgan Chase Manhattan Bank as Administrative Agent, Issuing Bank, Security Agent, JAA Security Agent and Documentation Agent. Incorporated by reference to Exhibit 4.7 to the Quarterly Report on Form 10-Q of FCX for the quarter ended September 30, 2003. |
| | | |
| 4.7 | | Senior Indenture dated as of November 15, 1996, from FCX to The Chase Manhattan Bank, as Trustee. Incorporated by reference to Exhibit 4.4 to the Registration Statement on Form S-3 of FCX filed November 5, 2001 (the FCX November 5, 2001 Form S-3). |
| 4.8 | | First Supplemental Indenture dated as of November 18, 1996, from FCX to The Chase Manhattan Bank, as Trustee, providing for the issuance of the Senior Notes and supplementing the Senior Indenture dated November 15, 1996, from FCX to such Trustee, providing for the issuance of the 7.50% Senior Notes due 2006 and the 7.20% Senior Notes due 2026. Incorporated by reference to Exhibit 4.5 to the FCX November 5, 2001 Form S-3. |
| | | |
| 4.9 | | Indenture dated as of January 29, 2003, from FCX to The Bank of New York, as Trustee, with respect to the 10⅛% Senior Notes due 2010. Incorporated by reference to Exhibit 4.1 to the Current Report on Form 8-K of FCX dated February 6, 2003. |
| 4.10 | | Indenture dated as of February 11, 2003, from FCX to The Bank of New York, as Trustee, with respect to the 7% Convertible Senior Notes due 2011. Incorporated by reference to Exhibit 4.1 to the Current Report on Form 8-K of FCX dated February 11, 2003 and filed February 25, 2003. |
| | | |
| 4.11 | | Indenture dated as of February 3, 2004, from FCX to The Bank of New York, as Trustee, with respect to the 6⅞% Senior Notes due 2014. Incorporated by reference to Exhibit 4.12 to the FCX 2003 Form 10-K. |
| | | |
| 4.12 | | Rights Agreement dated as of May 3, 2000, between FCX and ChaseMellon Shareholder Services, L.L.C., as Rights Agent. Incorporated by reference to Exhibit 4.26 to the Quarterly Report on Form 10-Q of FCX for the quarter ended March 31, 2000. |
| | | |
| 4.13 | | Amendment No. 1 to Rights Agreement dated as of February 26, 2002, between FCX and Mellon Investor Services. Incorporated by reference to Exhibit 4.16 to the FCX 2002 First Quarter Form 10-Q. |
| | | |
| 10.1 | | Contract of Work dated December 30, 1991, between the Government of the Republic of Indonesia and PT Freeport Indonesia. Incorporated by reference to Exhibit 10.1 to the FCX November 5, 2001 Form S-3. |
| | | |
| 10.2 | | Contract of Work dated August 15, 1994, between the Government of the Republic of Indonesia and PT Irja Eastern Minerals Corporation. Incorporated by reference to Exhibit 10.2 to the FCX November 5, 2001 Form S-3. |
| | | |
| 10.3 | | Participation Agreement dated as of October 11, 1996, between PT Freeport Indonesia and P.T. RTZ-CRA Indonesia with respect to a certain contract of work. Incorporated by reference to Exhibit 10.4 to the FCX November 5, 2001 Form S-3. |
| | | |
| 10.4 | | Agreement dated as of October 11, 1996, to Amend and Restate Trust Agreement among PT Freeport Indonesia, FCX, the RTZ Corporation PLC, P.T. RTZ-CRA Indonesia, RTZ Indonesian Finance Limited and First Trust of New York, National Association, and The Chase Manhattan Bank, as Administrative Agent, JAA Security Agent and Security Agent. Incorporated by reference to Exhibit 10.3 to the Current Report on Form 8-K of FCX dated November 13, 1996 and filed November 15, 1996. |
| | | |
| 10.5 | | Concentrate Purchase and Sales Agreement dated effective December 11, 1996, between PT Freeport Indonesia and PT Smelting. Incorporated by reference to Exhibit 10.3 to the FCX November 5, 2001 Form S-3. |
| | | |
| 10.6 | | Second Amended and Restated Joint Venture and Shareholders’ Agreement dated as of December 11, 1996, among Mitsubishi Materials Corporation, Nippon Mining and Metals Company, Limited and PT Freeport Indonesia. Incorporated by reference to Exhibit 10.5 to the FCX November 5, 2001 Form S-3. |
| | | |
| 10.7 | | Settlement Agreement dated December 17, 2004, between Underwriters Subscribing to Certain Policies Reinsuring the Original Policy, Freeport-McMoRan Insurance Company Limited, FM Services Company (FMS) and FCX. Incorporated by reference to Exhibit 10.7 to the Annual Report on Form 10-K of FCX for the fiscal year ended December 31, 2004 (the FCX 2004 Form 10-K). |
| | | |
| | | Executive Compensation Plans and Arrangements (Exhibits 10.8 through 10.55) |
| | | |
| 10.8 | | Annual Incentive Plan of FCX as amended effective February 2, 1999. Incorporated by reference to Exhibit 10.11 to the Annual Report on Form 10-K of FCX for the fiscal year ended December 31, 1998 (the FCX 1998 Form 10-K). |
| | | |
| 10.9 | | FCX Performance Incentive Awards Program as amended effective February 2, 1999. Incorporated by reference to Exhibit 10.13 to the FCX 1998 Form 10-K. |
| | | |
| 10.10 | | FCX President’s Award Program. Incorporated by reference to Exhibit 10.7 to the FCX November 5, 2001 Form S-3. |
| 10.11 | | FCX Adjusted Stock Award Plan. Incorporated by reference to Exhibit 10.12 to the FCX 2003 Form 10-K. |
| | | |
| 10.12 | | FCX 1995 Stock Option Plan. Incorporated by reference to Exhibit 10.13 to the FCX 2003 Form 10-K. |
| | | |
| | |
| | | |
| | |
| | | |
| | |
| | | |
| | |
| | | |
| 10.17 | | FCX 1999 Long-Term Performance Incentive Plan. Incorporated by reference to Exhibit 10.19 to the Annual Report of FCX on Form 10-K for the year ended December 31, 1999 (the FCX 1999 Form 10-K). |
| | | |
| 10.18 | | FCX Stock Appreciation Rights Plan dated May 2, 2000. Incorporated by reference to Exhibit 10.20 to the Quarterly Report on Form 10-Q of FCX for the quarter ended June 30, 2001 (the FCX 2001 Second Quarter Form 10-Q). |
| | | |
| | |
| | | |
| | |
| | | |
| | |
| | | |
| | |
| | | |
| | |
| | | |
| | |
| | | |
| 10.25 | | FCX Director Compensation. Incorporated by reference to Exhibit 10.25 to the FCX 2004 Form 10-K. |
| | | |
| 10.26 | | FCX Supplemental Executive Retirement Plan dated February 26, 2004. Incorporated by reference to Exhibit 10.26 to the FCX 2004 Form 10-K. |
| | | |
| 10.27 | | Amendment No. 1 to FCX Supplemental Executive Retirement Plan. Incorporated by reference to Exhibit 10.1 to the Current Report on Form 8-K of FCX dated May 3, 2005. |
| | | |
| 10.28 | | FCX 2005 Annual Incentive Plan. Incorporated by reference to Exhibit 10.1 to the Current Report on Form 8-K of FCX dated May 5, 2005. |
| | | |
| 10.29 | | Amended Financial Counseling and Tax Return Preparation and Certification Program of FCX. Incorporated by reference to Exhibit 10.18 to the FCX 2003 First Quarter Form 10-Q. |
| | | |
| 10.30 | | FM Services Company Performance Incentive Awards Program as amended effective February 2, 1999. Incorporated by reference to Exhibit 10.19 to the FCX 1998 Form 10-K. |
| | | |
| 10.31 | | Amended FM Services Company Financial Counseling and Tax Return Preparation and Certification Program. Incorporated by reference to Exhibit 10.20 to the FCX 2003 First Quarter Form 10-Q. |
| | | |
| 10.32 | | Consulting Agreement dated as of December 22, 1988, with Kissinger Associates, Inc. (Kissinger Associates). Incorporated by reference to Exhibit 10.21 to the Annual Report on Form 10-K of FCX for the fiscal year ended December 31, 1997 (the FCX 1997 Form 10-K). |
| | | |
| 10.33 | | Letter Agreement dated May 1, 1989, with Kent Associates, Inc. (Kent Associates, predecessor in interest to Kissinger Associates). Incorporated by reference to Exhibit 10.22 to the FCX 1997 Form 10-K. |
| 10.34 | | Letter Agreement dated January 27, 1997, among Kissinger Associates, Kent Associates, FCX, Freeport-McMoRan Inc., and FMS. Incorporated by reference to Exhibit 10.26 to the Annual Report on Form 10-K of FCX for the fiscal year ended December 31, 2001 (the FCX 2001 Form 10-K). |
| | | |
| 10.35 | | Supplemental Consulting Agreement with Kissinger Associates and Kent Associates, effective as of January 1, 2005. Incorporated by reference to Exhibit 10.2 to the Current Report on Form 8-K of FCX filed on December 30, 2004 (the FCX December 30, 2004 Form 8-K). |
| | | |
| 10.36 | | Agreement for Consulting Services between FTX and B. M. Rankin, Jr. effective as of January 1, 1990 (assigned to FMS as of January 1, 1996). Incorporated by reference to Exhibit 10.24 to the FCX 1997 Form 10-K. |
| | | |
| 10.37 | | Supplemental Agreement between FMS and B. M. Rankin, Jr. dated December 15, 1997. Incorporated by reference to Exhibit 10.25 to the FCX 1997 Form 10-K. |
| | | |
| 10.38 | | Supplemental Letter Agreement between FMS and B. M. Rankin, Jr., effective as of January 1, 2005. Incorporated by reference to Exhibit 10.36 to the FCX 2004 Form 10-K. |
| | | |
| 10.39 | | Letter Agreement effective as of January 7, 1997, between Senator J. Bennett Johnston, Jr. and FMS. Incorporated by reference to Exhibit 10.31 to the FCX 2001 Form 10-K. |
| | | |
| 10.40 | | Supplemental Letter Agreement dated July 14, 2003, between J. Bennett Johnston, Jr. and FMS. Incorporated by reference to Exhibit 10.28 to the Quarterly Report on Form 10-Q of FCX for the quarter ended June 30, 2003. |
| | | |
| 10.41 | | Supplemental Consulting Agreement between FMS and J. Bennett Johnston, Jr., effective as of January 1, 2005. Incorporated by reference to Exhibit 10.1 to the FCX December 30, 2004 Form 8-K. |
| | | |
| 10.42 | | Supplemental Letter Agreement between FMS and J. Bennett Johnston, Jr., dated January 18, 2005. Incorporated by reference to Exhibit 10.40 to the FCX 2004 Form 10-K. |
| | | |
| 10.43 | | Letter Agreement dated November 1, 1999, between FMS and Gabrielle K. McDonald. Incorporated by reference to Exhibit 10.33 to the FCX 1999 Form 10-K. |
| | | |
| 10.44 | | Supplemental Letter Agreement, between FMS and Gabrielle K. McDonald, effective as of January 1, 2005. Incorporated by reference to Exhibit 10.3 to the FCX December 30, 2004 Form 8-K. |
| | | |
| 10.45 | | Executive Employment Agreement dated April 30, 2001, between FCX and James R. Moffett. Incorporated by reference to Exhibit 10.35 to the FCX 2001 Second Quarter Form 10-Q. |
| | | |
| 10.46 | | Executive Employment Agreement dated April 30, 2001, between FCX and Richard C. Adkerson. Incorporated by reference to Exhibit 10.36 to the FCX 2001 Second Quarter Form 10-Q. |
| | | |
| 10.47 | | Change of Control Agreement dated April 30, 2001, between FCX and James R. Moffett. Incorporated by reference to Exhibit 10.37 to the FCX 2001 Second Quarter Form 10-Q. |
| | | |
| 10.48 | | Change of Control Agreement dated April 30, 2001, between FCX and Richard C. Adkerson. Incorporated by reference to Exhibit 10.38 to the FCX 2001 Second Quarter Form 10-Q. |
| | | |
| 10.49 | | First Amendment to Executive Employment Agreement dated December 10, 2003, between FCX and James R. Moffett. Incorporated by reference to Exhibit 10.36 to the FCX 2003 Form 10-K. |
| | | |
| 10.50 | | First Amendment to Executive Employment Agreement dated December 10, 2003, between FCX and Richard C. Adkerson. Incorporated by reference to Exhibit 10.37 to the FCX 2003 Form 10-K. |
| | | |
| 10.51 | | First Amendment to Change of Control Agreement dated December 10, 2003, between FCX and James R. Moffett. Incorporated by reference to Exhibit 10.38 to the FCX 2003 Form 10-K. |
| | | |
| 10.52 | | First Amendment to Change of Control Agreement dated December 10, 2003, between FCX and Richard C. Adkerson. Incorporated by reference to Exhibit 10.39 to the FCX 2003 Form 10-K. |
| 10.53 | | Change of Control Agreement dated February 3, 2004, between FCX and Michael J. Arnold. Incorporated by reference to Exhibit 10.40 to the FCX 2003 Form 10-K. |
| | | |
| 10.54 | | Change of Control Agreement dated February 3, 2004, between FCX and Mark J. Johnson. Incorporated by reference to Exhibit 10.41 to the FCX 2003 Form 10-K. |
| | | |
| 10.55 | | Change of Control Agreement dated February 3, 2004, between FCX and Kathleen L. Quirk. Incorporated by reference to Exhibit 10.42 to the FCX 2003 Form 10-K. |