| |
| |
UNITED STATES |
SECURITIES AND EXCHANGE COMMISSION |
Washington, D.C. 20549 |
| |
FORM 10-Q |
| |
(Mark One) |
[X] QUARTERLY REPORT PURSUANT TO SECTION 13 OR 15(d) OF THE SECURITIES EXCHANGE ACT OF 1934 |
For the quarterly period ended June 30, 2006 |
OR |
[ ] TRANSITION REPORT PURSUANT TO SECTION 13 OR 15(d) OF THE SECURITIES EXCHANGE ACT OF 1934 |
For the transition period from | | To |
Commission File Number: 1-9916 |
| |
|
| |
Freeport-McMoRan Copper & Gold Inc. |
| (Exact name of registrant as specified in its charter) |
Delaware | 74-2480931 |
| (State or other jurisdiction of | (IRS Employer Identification No.) |
| incorporation or organization) | |
| | |
1615 Poydras Street | |
New Orleans, Louisiana | 70112 |
| (Address of principal executive offices) | (Zip Code) |
| |
| |
(504) 582-4000 |
| (Registrant's telephone number, including area code) |
| |
Indicate by check mark whether the registrant (1) has filed all reports required to be filed by Section 13 or 15(d) of the Securities Exchange Act of 1934 during the preceding 12 months (or for such shorter period that the registrant was required to file such reports), and (2) has been subject to such filing requirements for the past 90 days. R Yes ÿ No
Indicate by check mark whether the registrant is a large accelerated filer, an accelerated filer, or a non-accelerated filer. See definition of “accelerated filer and large accelerated filer” in Rule 12b-2 of the Exchange Act (Check one): Large accelerated filer R Accelerated filer ÿ Non-accelerated filer ÿ
Indicate by check mark whether the registrant is a shell company (as defined in Rule 12b-2 of the Exchange Act). ÿ Yes R No
On June 30, 2006, there were issued and outstanding 187,159,910 shares of the registrant’s Class B Common Stock, par value $0.10 per share.
FREEPORT-McMoRan COPPER & GOLD INC.
| | |
| | Page |
| 3 |
| | |
| |
| | |
| 3 |
| | |
| 4 |
| | |
| 5 |
| | |
| 6 |
| | |
| 16 |
| | |
| |
| 17 |
| | |
| 45 |
| | |
| 45 |
| | |
| 45 |
| | |
| 45 |
| | |
| 45 |
| | |
| 47 |
| | |
| 47 |
| | |
| 48 |
| | |
| 48 |
| | |
| E-1 |
| | |
FREEPORT-McMoRan COPPER & GOLD INC.
FREEPORT-McMoRan COPPER & GOLD INC.
| | | June 30, | | | December 31, | |
| | | 2006 | | | 2005 | |
| | | (In Thousands) | |
| ASSETS | | | | | | | | |
| Current assets: | | | | | | | | |
| Cash and cash equivalents | | $ | 357,751 | | | $ | 763,599 | |
| Accounts receivable | | | 685,275 | | | | 687,969 | |
| Inventories | | | 790,942 | | | | 565,019 | |
| Prepaid expenses and other | | | 18,534 | | | | 5,795 | |
| Total current assets | | | 1,852,502 | | | | 2,022,382 | |
| Property, plant, equipment and development costs, net | | | 3,104,806 | | | | 3,088,931 | |
| Deferred mining costs | | | - | | | | 285,355 | |
| Other assets | | | 111,661 | | | | 119,999 | |
| Investment in PT Smelting | | | 40,570 | | | | 33,539 | |
| Total assets | | $ | 5,109,539 | | | $ | 5,550,206 | |
| | | | | | | | | |
| LIABILITIES AND STOCKHOLDERS’ EQUITY | | | | | | | | |
| Current liabilities: | | | | | | | | |
| Accounts payable and accrued liabilities | | $ | 581,022 | | | $ | 573,560 | |
| Accrued income taxes | | | 94,563 | | | | 327,041 | |
| Current portion of long-term debt and short-term borrowings | | | 89,683 | | | | 253,350 | |
| Unearned customer receipts | | | 56,900 | | | | 57,184 | |
| Accrued interest payable | | | 29,828 | | | | 32,034 | |
| Rio Tinto share of joint venture cash flows | | | 26,251 | | | | 125,809 | |
| Total current liabilities | | | 878,247 | | | | 1,368,978 | |
| Long-term debt, less current portion: | | | | | | | | |
| Senior notes | | | 612,900 | | | | 624,365 | |
| Convertible senior notes | | | 307,663 | | | | 323,667 | |
| Equipment and other loans | | | 47,764 | | | | 54,529 | |
| Atlantic Copper debt | | | 13,841 | | | | 37 | |
| Total long-term debt, less current portion | | | 982,168 | | | | 1,002,598 | |
| Accrued postretirement benefits and other liabilities | | | 236,710 | | | | 210,259 | |
| Deferred income taxes | | | 852,209 | | | | 902,386 | |
| Minority interests | | | 218,849 | | | | 222,991 | |
| Stockholders' equity: | | | | | | | | |
| Convertible perpetual preferred stock | | | 1,100,000 | | | | 1,100,000 | |
| Class B common stock | | | 30,011 | | | | 29,696 | |
| Capital in excess of par value of common stock | | | 2,357,782 | | | | 2,212,246 | |
| Retained earnings | | | 1,202,295 | | | | 1,086,191 | |
| Accumulated other comprehensive income | | | 199 | | | | 10,749 | |
| Common stock held in treasury | | | (2,748,931 | ) | | | (2,595,888 | ) |
| Total stockholders’ equity | | | 1,941,356 | | | | 1,842,994 | |
| Total liabilities and stockholders’ equity | | $ | 5,109,539 | | | $ | 5,550,206 | |
| | | | | | | | | |
The accompanying notes are an integral part of these financial statements.
FREEPORT-McMoRan COPPER & GOLD INC.
| | | Three Months Ended | | | Six Months Ended | |
| | | June 30, | | | June 30, | |
| | | 2006 | | | 2005 | | | 2006 | | | 2005 | |
| | | (In Thousands, Except Per Share Amounts) | |
| Revenues | $ | 1,426,202 | | $ | 902,909 | | $ | 2,512,324 | | $ | 1,705,974 | |
| Cost of sales: | | | | | | | | | | | | |
| Production and delivery | | 605,607 | | | 390,586 | | | 1,083,522 | | | 755,592 | |
| Depreciation and amortization | | 43,355 | | | 54,159 | | | 86,605 | | | 111,085 | |
| Total cost of sales | | 648,962 | | | 444,745 | | | 1,170,127 | | | 866,677 | |
| Exploration expenses | | 2,778 | | | 2,342 | | | 5,354 | | | 4,262 | |
| General and administrative expenses | | 35,135 | | | 25,379 | | | 65,766 | | | 46,993 | |
| Total costs and expenses | | 686,875 | | | 472,466 | | | 1,241,247 | | | 917,932 | |
| Operating income | | 739,327 | | | 430,443 | | | 1,271,077 | | | 788,042 | |
| Equity in PT Smelting earnings | | 2,006 | | | 2,562 | | | 5,565 | | | 5,158 | |
| Interest expense, net | | (21,024 | ) | | (35,292 | ) | | (43,695 | ) | | (72,840 | ) |
| (Losses) gains on early extinguishment and | | | | | | | | | | | | |
| conversion of debt | | (267 | ) | | - | | | (2,240 | ) | | 37 | |
| Other income, net | | 14,616 | | | 8,143 | | | 19,574 | | | 16,095 | |
| Income before income taxes and minority | | | | | | | | | | | | |
| interests | | 734,658 | | | 405,856 | | | 1,250,281 | | | 736,492 | |
| Provision for income taxes | | (310,244 | ) | | (188,684 | ) | | (531,966 | ) | | (352,712 | ) |
| Minority interests in net income of | | | | | | | | | | | | |
| consolidated subsidiaries | | (42,034 | ) | | (26,800 | ) | | (69,160 | ) | | (47,888 | ) |
| Net income | | 382,380 | | | 190,372 | | | 649,155 | | | 335,892 | |
| Preferred dividends | | (15,125 | ) | | (15,125 | ) | | (30,250 | ) | | (30,250 | ) |
| Net income applicable to common stock | $ | 367,255 | | $ | 175,247 | | $ | 618,905 | | $ | 305,642 | |
| | | | | | | | | | | | | |
| Net income per share of common stock: | | | | | | | | | | | | |
| Basic | | $1.95 | | | $0.98 | | | $3.29 | | | $1.71 | |
| Diluted | | $1.74 | | | $0.91 | | | $2.97 | | | $1.62 | |
| | | | | | | | | | | | | |
| Average common shares outstanding: | | | | | | | | | | | | |
| Basic | | 188,506 | | | 178,324 | | | 188,211 | | | 178,822 | |
| Diluted | | 222,111 | | | 219,990 | | | 221,794 | | | 220,516 | |
| | | | | | | | | | | | | |
| Dividends paid per share of common stock | | $1.0625 | | | $0.25 | | | $1.875 | | | $1.00 | |
| | | | | | | | | | | | | |
The accompanying notes are an integral part of these financial statements.
FREEPORT-McMoRan COPPER & GOLD INC.
| | | Six Months Ended June 30, | |
| | | 2006 | | | 2005 | |
| | | (In Thousands) | |
| Cash flow from operating activities: | | | | | | | | |
| Net income | | $ | 649,155 | | | $ | 335,892 | |
| Adjustments to reconcile net income to net cash provided by | | | |
| operating activities: | | | | | | | | |
| Depreciation and amortization | | | 86,605 | | | | 111,085 | |
| Minority interests' share of net income | | | 69,160 | | | | 47,888 | |
| Deferred income taxes | | | 63,295 | | | | 5,327 | |
| Stock-based compensation | | | 24,824 | | | | 1,826 | |
| Long-term compensation and postretirement benefits | | | 10,590 | | | | 9,802 | |
| Losses (gains) on early extinguishment and conversion of debt | | | 2,240 | | | | (37 | ) |
| Equity in PT Smelting earnings | | | (5,565 | ) | | | (5,158 | ) |
| Increase in deferred mining costs | | | - | | | | (52,810 | ) |
| (Recognition) elimination of profit on PT Freeport Indonesia | | | | | | | | |
| sales to PT Smelting | | | (12,979 | ) | | | 25 | |
| Provision for inventory obsolescence | | | 3,000 | | | | 3,000 | |
| Other | | | 4,806 | | | | 1,067 | |
| (Increases) decreases in working capital: | | | | | | | | |
| Accounts receivable | | | (1,790 | ) | | | 123,278 | |
| Inventories | | | (218,373 | ) | | | 25,155 | |
| Prepaid expenses and other | | | (2,845 | ) | | | (2,406 | ) |
| Accounts payable and accrued liabilities | | | 29,655 | | | | (8,100 | ) |
| Rio Tinto share of joint venture cash flows | | | (99,558 | ) | | | (334 | ) |
| Accrued income taxes | | | (226,292 | ) | | | 25,011 | |
| (Increase) decrease in working capital | | | (519,203 | ) | | | 162,604 | |
| Net cash provided by operating activities | | | 375,928 | | | | 620,511 | |
| | | | | | | | | |
| Cash flow from investing activities: | | | | | | | | |
| PT Freeport Indonesia capital expenditures | | | (104,163 | ) | | | (53,428 | ) |
| Atlantic Copper and other capital expenditures | | | (6,182 | ) | | | (5,863 | ) |
| Sale of assets | | | 2,887 | | | | - | |
| Investment in PT Smelting and other | | | (1,152 | ) | | | 131 | |
| Proceeds from insurance settlement | | | - | | | | 2,016 | |
| Net cash used in investing activities | | | (108,610 | ) | | | (57,144 | ) |
| | | | | | | | | |
| Cash flow from financing activities: | | | | | | | | |
| Proceeds from debt | | | 53,135 | | | | 65,647 | |
| Repayments of debt | | | (223,303 | ) | | | (235,249 | ) |
| Redemption of step-up preferred stock | | | - | | | | (215 | ) |
| Purchases of FCX common shares | | | (99,783 | ) | | | (80,227 | ) |
| Cash dividends paid: | | | | | | | | |
| Common stock | | | (352,493 | ) | | | (179,658 | ) |
| Preferred stock | | | (30,250 | ) | | | (30,251 | ) |
| Minority interests | | | (56,802 | ) | | | (71,425 | ) |
| Net proceeds from exercised stock options | | | 13,830 | | | | 2,016 | |
| Excess tax benefit from exercised stock options | | | 22,522 | | | | - | |
| Other | | | (22 | ) | | | (21 | ) |
| Net cash used in financing activities | | | (673,166 | ) | | | (529,383 | ) |
| Net (decrease) increase in cash and cash equivalents | | | (405,848 | ) | | | 33,984 | |
| Cash and cash equivalents at beginning of year | | | 763,599 | | | | 551,450 | |
| Cash and cash equivalents at end of period | | $ | 357,751 | | | $ | 585,434 | |
| | | | | | | | | |
The accompanying notes are an integral part of these financial statements.
FREEPORT-McMoRan COPPER & GOLD INC.
The accompanying unaudited consolidated financial statements should be read in conjunction with Freeport-McMoRan Copper & Gold Inc.’s (FCX) consolidated financial statements and notes contained in its 2005 Annual Report on Form 10-K. The information furnished herein reflects all adjustments which are, in the opinion of management, necessary for a fair statement of the results for the periods. All such adjustments are, in the opinion of management, of a normal recurring nature. Operating results for the six-month period ended June 30, 2006, are not necessarily indicative of the results that may be expected for the year ending December 31, 2006. All significant intercompany transactions have been eliminated. Certain prior year amounts have been reclassified to conform to the 2006 presentation. Changes in the accounting principles applied during 2006 are discussed below in Notes 2 and 3.
| 2. | STOCK-BASED COMPENSATION |
Accounting for Stock-Based Compensation. As of June 30, 2006, FCX has four stock-based employee compensation plans and two stock-based director compensation plans. Prior to January 1, 2006, FCX accounted for options granted under all of its plans under the recognition and measurement principles of Accounting Principles Board (APB) Opinion No. 25, “Accounting for Stock Issued to Employees,” and related interpretations, as permitted by Statement of Financial Accounting Standards (SFAS) No. 123, “Accounting for Stock-Based Compensation.” APB Opinion No. 25 required compensation cost for stock options to be recognized based on the difference on the date of grant, if any, between the quoted market price of the stock and the amount an employee must pay to acquire the stock (i.e., the intrinsic value). Because all the plans require that the option exercise price be at least the market price on the date of grant, FCX recognized no compensation cost on the grant or exercise of its employees’ options through December 31, 2005. Other awards under the plans did result in compensation costs being recognized in earnings based on the intrinsic value on the date of grant for restricted stock units and the intrinsic value on the reporting or exercise date for cash-settled stock appreciation rights (SARs).
Effective January 1, 2006, FCX adopted the fair value recognition provisions of SFAS No. 123 (revised 2004), “Share-Based Payment” or “SFAS No. 123R,” using the modified prospective transition method. Under that transition method, compensation cost recognized in 2006 includes: (a) compensation costs for all stock option awards granted to employees prior to, but not yet vested as of January 1, 2006, based on the grant-date fair value estimated in accordance with the original provisions of SFAS No. 123, and (b) compensation cost for all stock option awards granted subsequent to January 1, 2006, based on the grant-date fair value estimated in accordance with the provisions of SFAS No. 123R. In addition, other stock-based awards charged to expense under SFAS No. 123 continue to be charged to expense under SFAS No. 123R. These include restricted stock units and SARs. Results for prior periods have not been restated. FCX has elected to recognize compensation costs for awards that vest over several years on a straight-line basis over the vesting period. FCX’s stock option awards provide for employees to receive an additional year of vesting after an employee retires. For awards granted after January 1, 2006, to retirement-eligible employees, FCX records one year of amortization of the awards’ value on the date of grant. Certain restricted stock units are performance based awards with accelerated vesting upon retirement. Therefore, in accordance with SFAS No. 123R and consistent with prior years’ accounting, FCX recognizes the compensation cost for restricted stock units granted to retirement-eligible employees in the period during which the employee performs the service related to the grant. The services are performed in the calendar year preceding the date of grant. In addition, prior to adoption of SFAS No. 123R, FCX recognized forfeitures as they occurred in its SFAS No. 123 pro forma disclosures. Beginning January 1, 2006, FCX includes estimated forfeitures in its compensation cost and updates the estimated forfeiture rate through the final vesting date of the awards.
As a result of adopting SFAS No. 123R on January 1, 2006, FCX’s income before income taxes and minority interests for the three months ended June 30, 2006, was $6.8 million lower and net income was $4.0 million ($0.02 per basic and diluted share) lower, and FCX’s income before income taxes and minority interests for the six months ended June 30, 2006, was $15.9 million lower and net income was
$9.3 million ($0.05 per basic share and $0.04 per diluted share) lower than if it had continued to account for share-based compensation under APB Opinion No. 25.
Prior to the adoption of SFAS No. 123R, FCX presented all tax benefits resulting from the exercise of stock options as operating cash flows in its Consolidated Statements of Cash Flows. SFAS No. 123R requires the cash flows generated by tax benefits resulting from tax deductions in excess of the compensation cost recognized for those options (excess tax benefits) to be classified as financing cash flows. The $22.5 million excess tax benefit classified as a financing cash inflow in the Consolidated Statements of Cash Flows for the six months ended June 30, 2006, would have been classified as an operating cash inflow if FCX had not adopted SFAS No. 123R.
Stock-Based Compensation Plans. As discussed above, FCX currently has six stock-based compensation plans and all are shareholder approved. As of June 30, 2006, only four of the plans, which are discussed below, have awards available for grant.
FCX’s 1999 Stock Incentive Plan (the 1999 Plan) and 2003 Stock Incentive Plan (the 2003 Plan) provide for the issuance of stock options, SARs, restricted stock units and other stock-based awards. Each plan allows FCX to grant awards for up to 8.0 million common shares to eligible participants. In May 2004, FCX’s shareholders approved the 2004 Director Compensation Plan (the 2004 Plan). The 2004 Plan authorizes awards of options and restricted stock units for up to 1.0 million shares and the one-time grant of 66,882 SARs. In May 2006, FCX’s shareholders approved the 2006 Stock Incentive Plan (the 2006 Plan). The 2006 Plan provides for the issuance of stock options, SARs, restricted stock units and other stock-based awards. The 2006 Plan allows FCX to grant awards for up to 12.0 million common shares to eligible participants.
Awards granted under all of the plans generally expire 10 years after the date of grant and vest in 25 percent annual increments beginning one year from the date of grant. The plans provide for employees to receive the following year’s vesting after retirement and provide for accelerated vesting if there is a change in control (as defined in the plans). Awards for 12.0 million shares under the 2006 Plan, 0.5 million shares under the 2004 Plan, 1.1 million shares under the 2003 Plan and 0.1 million shares under the 1999 Plan were available for new grants as of June 30, 2006.
FCX also has a restricted stock program that allows FCX senior executives to elect to receive restricted stock units under each plan in place of all or part of their cash incentive compensation. Restricted stock unit grants vest over three years and are valued on the date of grant at 50 percent above the cash incentive compensation that the employee elects to replace. Dividends on restricted stock units accrue and are subject to the awards vesting. Stock option and SAR awards do not receive dividends.
Stock-Based Compensation Cost. Compensation cost charged against earnings for stock-based awards is shown below (in thousands). FCX did not capitalize any stock-based compensation costs to fixed assets during the periods presented.
| | | Three Months Ended | | Six Months Ended | |
| | | June 30, | | June 30, | |
| | | 2006 | | 2005 | | 2006 | | 2005 | |
| Stock options awarded to employees (including directors) | | $ | 6,849 | | $ | 526 | a | $ | 15,877 | | $ | 1,034 | a |
| Stock options awarded to nonemployees | | | 372 | | | 268 | | | 859 | | | 587 | |
| Restricted stock units in lieu of cash awards | | | 4,351 | | | 3,042 | | | 6,829 | | | 6,063 | |
| Restricted stock units awarded to directors | | | 870 | | | 57 | | | 956 | | | 99 | |
| Stock appreciation rights | | | (327 | ) | | (430 | ) | | 952 | | | 99 | |
Total stock-based compensation costb | | | 12,115 | | | 3,463 | | | 25,473 | | | 7,882 | |
| Tax benefit | | | (4,038 | ) | | (918 | ) | | (8,955 | ) | | (2,220 | ) |
| Minority interest share | | | (595 | ) | | (136 | ) | | (1,319 | ) | | (330 | ) |
| Impact on net income | | $ | 7,482 | | $ | 2,409 | | $ | 15,199 | | $ | 5,332 | |
| | | | | | | | | | | | | | |
| a. | Represents amortization of the intrinsic value of FCX’s Class A stock options that were converted to Class B stock options in 2002. |
| b. | Amounts are before Rio Tinto’s share of joint venture reimbursements for employee exercises of in-the-money stock options which reduced general and administrative expenses by $2.6 million in the 2006 quarter, $0.1 million in the 2005 quarter, $7.1 million in the 2006 six-month period and $3.0 million in the 2005 six-month period. |
The following table illustrates the effect on net income and earnings per share for the three months ended June 30, 2005 and the six months ended June 30, 2005, if FCX had applied the fair value recognition provisions of SFAS No. 123 to stock-based awards granted under FCX’s stock-based compensation plans (in thousands, except per share amounts):
| | | Three Months | | | Six Months | |
| | | Ended | | | Ended | |
| | | June 30, 2005 | | | June 30, 2005 | |
| Net income applicable to common stock, as reported | | $ | 175,247 | | | $ | 305,642 | |
| Add: Stock-based employee compensation expense | | | | | | | | |
| included in reported net income for stock option | | | | | | | | |
| conversions, SARs and restricted stock units, | | | | | | | | |
| net of taxes and minority interests | | | 1,898 | | | | 4,457 | |
| Deduct: Total stock-based employee compensation | | | | | | | | |
| expense determined under fair value-based method | | | | | | | | |
| for all awards, net of taxes and minority interests | | | (5,339 | ) | | | (10,754 | ) |
| Pro forma net income applicable to common stock | | $ | 171,806 | | | $ | 299,345 | |
| | | | | | | | | |
| Earnings per share: | | | | | | | | |
| Basic - as reported | | $ | 0.98 | | | $ | 1.71 | |
| Basic - pro forma | | $ | 0.96 | | | $ | 1.67 | |
| | | | | | | | | |
| Diluted - as reported | | $ | 0.91 | | | $ | 1.62 | |
| Diluted - pro forma | | $ | 0.89 | | | $ | 1.56 | |
| | | | | | | | | |
For the pro forma computations, the values of option grants were calculated on the dates of grant using the Black-Scholes-Merton option pricing model and amortized to expense on a straight-line basis over the options’ vesting periods. No other discounts or restrictions related to vesting or the likelihood of vesting of stock options were applied. The following table summarizes the calculated average fair values and weighted-average assumptions used to determine the fair value of FCX’s stock option grants under SFAS No. 123 during the 2005 periods presented.
| | Three Months | | | Six Months | |
| | Ended | | | Ended | |
| | June 30, 2005 | | | June 30, 2005 | |
| Fair value per stock option | $ | 12.90 | | | $ | 13.97 | |
| Risk-free interest rate | | 3.7 | % | | | 3.9 | % |
| Expected volatility rate | | 45 | % | | | 46 | % |
| Expected life of options (in years) | | 6 | | | | 6 | |
| Assumed annual dividend | $ | 1.00 | | | $ | 1.00 | |
Options and SARs. A summary of options outstanding as of June 30, 2006, including 145,871 SARs, and changes during the six months ended June 30, 2006 follow:
Table of Contents
| | | | | | Weighted | | | |
| | | | | | Average | | Aggregate | |
| | | | Weighted | | Remaining | | Intrinsic | |
| | Number of | | Average | | Contractual | | Value | |
| | Options | | Option Price | | Term (years) | | ($000) | |
| Balance at January 1 | 7,355,612 | | $ | 31.43 | | | | | | |
| Granted | 1,116,250 | | | 62.96 | | | | | | |
| Exercised | (2,545,133 | ) | | 26.62 | | | | | | |
| Expired/Forfeited | (61,574 | ) | | 38.99 | | | | | | |
| Balance at June 30 | 5,865,155 | | | 39.47 | | 8.13 | | $ | 101,904 | |
| | | | | | | | | | | |
| Vested and exercisable at June 30 | 567,860 | | | 22.10 | | 7.10 | | $ | 18,918 | |
| | | | | | | | | | | |
The fair value of each option award is estimated on the date of grant using a Black-Scholes-Merton option valuation model. The assumptions used to value stock option awards during the six months ended June 30, 2006, are noted in the following table. Expected volatility is based on implied volatilities from traded options on FCX’s stock and historical volatility of FCX’s stock. FCX uses historical data to estimate future option exercises, forfeitures and expected life of the options. When appropriate, separate groups of employees that have similar historical exercise behavior are considered separately for valuation purposes. The expected dividend rate is calculated as the annual dividend (excludes supplemental dividends) at the date of grant divided by the average stock price for the one-year period preceding the grant date. The risk-free interest rate is based on Federal Reserve rates in effect for bonds with maturity dates equal to the expected term of the option at the grant date.
| Expected volatility | | 33.3%-42.2 | % | |
| Weighted average volatility | | 37.7 | % | |
| Expected life of options (in years) | | 4.0 | | |
| Expected dividend rate | | 2.9 | % | |
| Risk-free interest rate | | 4.4 | % | |
The grant-date fair value of options granted during the three months ended March 31, 2006, was $17.93 per option and during the three months ended June 30, 2006, was $15.25 per option. The total intrinsic value of options exercised during the three months ended June 30, 2006, was $32.2 million and during the six months ended June 30, 2006, was $93.8 million. As of June 30, 2006, FCX had $60.9 million of total unrecognized compensation cost related to unvested stock options expected to be recognized over a weighted average period of 1.3 years.
The following table includes amounts related to exercises of stock options and SARs and vesting of restricted stock units during the periods presented (in millions, except shares tendered for taxes):
| | Three Months Ended | | Six Months Ended | |
| | June 30, | | June 30, | |
| | 2006 | | 2005 | | 2006 | | 2005 | |
| FCX shares tendered to pay the exercise price | | | | | | | | | | | | |
and/or the minimum required taxesa | | 451,743 | | | - | | | 809,634 | | | 524,907 | |
| Cash received from stock option exercises | $ | 10.1 | | $ | 0.5 | | $ | 35.3 | | $ | 7.7 | |
| Actual tax benefit realized for the tax deductions | | | | | | | | | | | | |
| from stock option exercises | $ | 10.3 | | $ | 0.2 | | $ | 29.9 | | $ | 6.1 | |
| Amounts FCX paid for employee taxes related | | | | | | | | | | | | |
| to stock option exercises | $ | 7.5 | | $ | - | | $ | 21.5 | | $ | 5.7 | |
| Amounts FCX paid for exercised SARs | $ | 0.2 | | $ | 0.1 | | $ | 2.0 | | $ | 0.1 | |
| a. | Under terms of the related plans, upon exercise of stock options and vesting of restricted stock units, employees may tender FCX shares to FCX to pay the exercise price and/or the minimum required taxes. |
Restricted Stock Units. As discussed above, FCX has a restricted stock program that allows FCX senior executives to elect to receive restricted stock units in place of all or part of their annual cash incentive compensation. The annual cash incentive is a function of FCX’s consolidated operating cash flows for the preceding year. These awards of restricted stock units are considered performance-based awards. To compensate for certain restrictions and the risk of forfeiture, the restricted stock units are awarded at a 50 percent premium to the market value on the date of grant. The awards vest ratably over three years and vesting accelerates upon retirement. For retirement-eligible executives, the fair value of the restricted stock units is estimated based on projected operating cash flows for the year and is charged to expense ratably over the year the cash flows are generated.
FCX grants restricted stock units to its directors under the 2004 Plan. The restricted stock units vest over four years and are valued on the date of grant based on the average high and low price of FCX common stock. The fair value of the restricted stock units is amortized over the four-year vesting period or the period until the director becomes retirement-eligible, whichever is shorter. Upon a director’s retirement, all unvested restricted stock units immediately vest. For retirement-eligible directors, the fair value of restricted stock units is recognized on the date of grant.
FCX granted 20,000 restricted stock units in the three months ended June 30, 2006, 20,000 restricted stock units in the three months ended June 30, 2005, 352,677 restricted stock units in the six months ended June 30, 2006 and 143,044 restricted stock units in the six months ended June 30, 2005. A summary of outstanding unvested restricted stock units as of June 30, 2006, and activity during the six months ended June 30, 2006 is presented below:
| | | | Weighted | | | |
| | | | Average | | Aggregate | |
| | Number of | | Remaining | | Intrinsic | |
| | Restricted | | Contractual | | Value | |
| | Stock Units | | Term (years) | | ($000) | |
| Balance at January 1 | 317,258 | | | | | | |
| Granted | 352,677 | | | | | | |
| Vested | (139,350 | ) | | | | | |
| Forfeited | - | | | | | | |
| Balance at June 30 | 530,585 | | 2.55 | | $ | 29,400 | |
| | | | | | | | |
The grant-date fair value of restricted stock units granted during the three months ended March 31, 2006, was $21.2 million. Because this is a performance-based award and the requisite service period under SFAS No. 123R is considered to be the calendar year prior to the grant date, the entire value of this award on the date of grant was charged to expense during the calendar year prior to the date of grant.
The grant-date fair value of restricted stock units granted during the three months ended June 30, 2006, was $1.1 million. The total intrinsic value of restricted stock units vesting during the three months ended June 30, 2006, was $0.4 million and during the six months ended June 30, 2006, was $8.7 million. As of June 30, 2006, FCX had $1.2 million of total unrecognized compensation cost related to unvested restricted stock units expected to be recognized over a weighted average period of 1.3 years.
On January 1, 2006, FCX adopted Emerging Issues Task Force Issue No. 04-6, “Accounting for Stripping Costs Incurred during Production in the Mining Industry” (EITF 04-6), which requires that stripping costs incurred during production be considered costs of the extracted minerals and included as a component of inventory to be recognized in cost of sales in the same period as the revenue from the sale of inventory. Upon adoption of EITF 04-6, FCX recorded its deferred mining costs asset ($285.4 million) at December 31, 2005, net of taxes, minority interest share and inventory effects ($135.9 million), as a cumulative effect adjustment to reduce its retained earnings on January 1, 2006. In addition, stripping costs incurred in 2006 and later periods are now charged to cost of sales as incurred. As a result of adopting EITF 04-6 on January 1, 2006, FCX’s income before income taxes and minority interests for the three months ended
June 30, 2006, was $5.9 million lower and net income was $3.2 million ($0.02 per basic share and $0.01 per diluted share) lower, and FCX’s income before income taxes and minority interests for the six months ended June 30, 2006, was $38.7 million lower and net income was $20.6 million ($0.11 per basic share and $0.09 per diluted share) lower than if it had not adopted EITF 04-6 and continued to defer stripping costs. Adoption of the new guidance has no impact on FCX’s cash flows.
FCX’s basic net income per share of common stock was calculated by dividing net income applicable to common stock by the weighted-average number of common shares outstanding during the year. The following is a reconciliation of net income and weighted-average common shares outstanding for purposes of calculating diluted net income per share (in thousands, except per share amounts):
| | | Three Months Ended | | Six Months Ended | |
| | | June 30, | | June 30, | |
| | | 2006 | | 2005 | | 2006 | | 2005 | |
| Net income before preferred dividends | | $ | 382,380 | | $ | 190,372 | | $ | 649,155 | | $ | 335,892 | |
| Preferred dividends | | | (15,125 | ) | | (15,125 | ) | | (30,250 | ) | | (30,250 | ) |
| Net income applicable to common stock | | | 367,255 | | | 175,247 | | | 618,905 | | | 305,642 | |
| Plus income impact of assumed conversion of: | | | | | | | | | | | | | |
| 5½% Convertible Perpetual Preferred Stock | | | 15,125 | | | 15,125 | | | 30,250 | | | 30,250 | |
| 7% Convertible Senior Notes | | | 5,070 | | | 10,287 | | | 10,175 | | | 20,609 | |
| Diluted net income applicable to common stock | | $ | 387,450 | | $ | 200,659 | | $ | 659,330 | | $ | 356,501 | |
| | | | | | | | | | | | | | |
| Weighted average common shares outstanding | | | 188,506 | | | 178,324 | | | 188,211 | | | 178,822 | |
| Add: | | | | | | | | | | | | | |
| Shares issuable upon conversion, exercise or vesting of: | | | | | | | | | | | | | |
| 5½% Convertible Perpetual Preferred Stock | | | 22,004 | | | 21,152 | | | 21,868 | | | 21,034 | |
| 7% Convertible Senior Notes | | | 9,995 | | | 18,625 | | | 10,077 | | | 18,625 | |
| Dilutive stock options | | | 881 | | | 1,408 | | | 966 | | | 1,555 | |
| Restricted stock | | | 725 | | | 481 | | | 672 | | | 480 | |
| Weighted average common shares outstanding for | | | | | | | | | | | | | |
| purposes of calculating diluted net income per share | | | 222,111 | | | 219,990 | | | 221,794 | | | 220,516 | |
| | | | | | | | | | | | | | |
| Diluted net income per share of common stock | | $ | 1.74 | | $ | 0.91 | | $ | 2.97 | | $ | 1.62 | |
| | | | | | | | | | | | | | |
Outstanding stock options with exercise prices greater than the average market price of FCX’s common stock during the period are excluded from the computation of diluted net income per share of common stock. FCX’s convertible instruments are also excluded when including the conversion of these instruments increases reported diluted net income per share. A recap of the excluded amounts follows (in thousands, except exercise prices):
| | Three Months Ended | | Six Months Ended | |
| | June 30, | | June 30, | |
| | 2006 | | 2005 | | 2006 | | 2005 | |
| Weighted average options | 1,006 | | 5,463 | | 842 | | 2,732 | |
| Weighted average exercise price | $63.77 | | $36.98 | | $63.77 | | $36.98 | |
| | | | | | | | | |
The components of inventories follow (in thousands):
| | | | June 30, | | December 31, | |
| | | | 2006 | | 2005 | |
| PT Freeport Indonesia: | Concentrates and stockpiles - | | | | | | | |
| | Average cost | | $ | 30,706 | | $ | 14,723 | |
| Atlantic Copper: | Concentrates - First in, first out (FIFO) | | | 245,708 | | | 137,740 | |
| | Work in process - FIFO | | | 197,892 | | | 144,951 | |
| | Finished goods - FIFO | | | 4,602 | | | 2,975 | |
| Total product inventories | | | 478,908 | | | 300,389 | |
| Total materials and supplies, net | | | 312,034 | | | 264,630 | |
| Total inventories | | $ | 790,942 | | $ | 565,019 | |
| | | | | | | | |
The average cost method was used to determine the cost of essentially all materials and supplies inventory. Materials and supplies inventory is net of obsolescence reserves totaling $17.2 million at June 30, 2006, and $16.6 million at December 31, 2005.
| 6. | DEBT AND EQUITY TRANSACTIONS |
As of June 30, 2006, FCX had total outstanding debt of $1.1 billion. Total debt was reduced by a net $184.1 million during the first six months of 2006, including $167.4 million for the mandatory redemption of FCX’s Gold-Denominated Preferred Stock, Series II in February 2006. The mandatory redemption was based on average gold prices at the time of redemption ($548.92 per ounce) and totaled $236.4 million, resulting in a $69.0 million loss recognized in revenues ($36.6 million to net income or $0.17 per share). Other debt reductions during the first six months of 2006 included:
| · | privately negotiated transactions to induce conversion of $16.0 million of 7% Convertible Senior Notes due 2011 into 0.5 million shares of FCX common stock and |
| · | purchases in open-market transactions of $11.5 million of 10⅛% Senior Notes due 2010 for $12.6 million. |
As a result of the induced conversions and open-market transactions, FCX recorded charges of $2.2 million ($1.5 million to net income, net of related reduction of interest expense, or $0.01 per share) in the first six months of 2006. In July 2006, FCX induced conversion of an additional $14.5 million of 7% Convertible Senior Notes due 2011 into 0.5 million shares of FCX common stock.
In July 2006, FCX and PT Freeport Indonesia entered into an amended credit agreement for a $465 million revolving credit facility compared with its previous $195 million facility that was scheduled to mature in September 2006. The new facility, which can be expanded to up to $500 million with additional lender commitments, matures in 2009 and no amounts are outstanding under the facility.
On August 1, 2006, FCX funded the final scheduled annual redemption payment on its Silver-Denominated Preferred Stock for $25.8 million. The mandatory redemption will result in a $12.5 million decrease in debt and a reduction of revenues of $13.3 million, $7.0 million to net income, in the third quarter of 2006.
Interest expense excludes capitalized interest of $2.3 million in the second quarter of 2006, $1.0 million in the second quarter of 2005, $4.1 million in the first six months of 2006 and $1.9 million in the first six months of 2005.
Table of Contents
The components of net periodic pension benefit cost for the three months ended June 30, 2006 and 2005 follow (in thousands):
| | FCX | | PT Freeport Indonesia | | Atlantic Copper | |
| | 2006 | | 2005 | | 2006 | | 2005 | | 2006 | | 2005 | |
| Service cost | $ | (17 | ) | $ | 165 | | $ | 958 | | $ | 900 | | $ | - | | $ | - | |
| Interest cost | | 463 | | | 596 | | | 1,240 | | | 940 | | | 1,164 | | | 1,239 | |
| Expected return on plan assets | | 39 | | | (234 | ) | | (617 | ) | | (353 | ) | | - | | | - | |
| Amortization of prior service cost | | 1,051 | | | 1,019 | | | 238 | | | 225 | | | - | | | - | |
| Amortization of net actuarial loss | | 14 | | | - | | | 136 | | | 178 | | | 230 | | | 231 | |
| Net periodic benefit cost | $ | 1,550 | | $ | 1,546 | | $ | 1,955 | | $ | 1,890 | | $ | 1,394 | | $ | 1,470 | |
| | | | | | | | | | | | | | | | | | | |
The components of net periodic pension benefit cost for the six months ended June 30, 2006 and 2005 follow (in thousands):
| | FCX | | PT Freeport Indonesia | | Atlantic Copper | |
| | 2006 | | 2005 | | 2006 | | 2005 | | 2006 | | 2005 | |
| Service cost | $ | 92 | | $ | 344 | | $ | 1,904 | | $ | 1,831 | | $ | - | | $ | - | |
| Interest cost | | 861 | | | 1,114 | | | 2,466 | | | 1,912 | | | 2,278 | | | 2,528 | |
| Expected return on plan assets | | 379 | | | (256 | ) | | (1,226 | ) | | (718 | ) | | - | | | - | |
| Amortization of prior service cost | | 2,102 | | | 1,963 | | | 472 | | | 457 | | | - | | | - | |
| Amortization of net actuarial loss | | 28 | | | - | | | 270 | | | 362 | | | 451 | | | 472 | |
| Net periodic benefit cost | $ | 3,462 | | $ | 3,165 | | $ | 3,886 | | $ | 3,844 | | $ | 2,729 | | $ | 3,000 | |
| | | | | | | | | | | | | | | | | | | |
FCX has two operating segments: “mining and exploration” and “smelting and refining.” The mining and exploration segment consists of FCX’s Indonesian activities including PT Freeport Indonesia’s copper and gold mining operations, PT Puncakjaya Power’s power-generating operations (after eliminations with PT Freeport Indonesia) and FCX’s Indonesian exploration activities. The smelting and refining segment includes Atlantic Copper’s operations in Spain and PT Freeport Indonesia’s equity investment in PT Smelting in Gresik, Indonesia. The segment data presented below were prepared on the same basis as FCX’s consolidated financial statements.
| | | Mining and Exploration | | Smelting and Refining | | Eliminations and Other | | FCX Total | |
| | | (In Thousands) | |
| Three months ended June 30, 2006: | | | | | | | | | | | | | |
| Revenues | | $ | 1,035,168 | a | $ | 593,134 | | $ | (202,100 | ) | $ | 1,426,202 | |
| Production and delivery | | | 281,308 | | | 560,375 | | | (236,076 | )b | | 605,607 | |
| Depreciation and amortization | | | 33,910 | | | 7,410 | | | 2,035 | | | 43,355 | |
| Exploration expenses | | | 2,709 | | | - | | | 69 | | | 2,778 | |
| General and administrative expenses | | | 55,689 | c | | 3,529 | | | (24,083 | )c | | 35,135 | |
| Operating income | | $ | 661,552 | | $ | 21,820 | | $ | 55,955 | | $ | 739,327 | |
| Equity in PT Smelting earnings | | $ | - | | $ | 2,006 | | $ | - | | $ | 2,006 | |
| Interest expense, net | | $ | 1,608 | | $ | 4,824 | | $ | 14,592 | | $ | 21,024 | |
| Provision for income taxes | | $ | 237,001 | | $ | - | | $ | 73,243 | | $ | 310,244 | |
| Capital expenditures | | $ | 56,392 | | $ | 2,669 | | $ | (838 | ) | $ | 58,223 | |
| Total assets | | $ | 3,890,148 | d | $ | 1,035,415 | e | $ | 183,976 | | $ | 5,109,539 | |
| | | | | | | | | | | | | | |
| | | Mining and Exploration | | Smelting and Refining | | Eliminations and Other | | FCX Total | |
| | | (In Thousands) | |
| Three months ended June 30, 2005: | | | | | | | | | | | | | |
| Revenues | | $ | 678,386 | a | $ | 331,897 | | $ | (107,374 | ) | $ | 902,909 | |
| Production and delivery | | | 223,355 | | | 321,909 | | | (154,678 | )b | | 390,586 | |
| Depreciation and amortization | | | 44,217 | | | 7,141 | | | 2,801 | | | 54,159 | |
| Exploration expenses | | | 2,272 | | | - | | | 70 | | | 2,342 | |
| General and administrative expenses | | | 18,425 | c | | 2,901 | | | 4,053 | c | | 25,379 | |
| Operating income (loss) | | $ | 390,117 | | $ | (54 | ) | $ | 40,380 | | $ | 430,443 | |
| Equity in PT Smelting earnings | | $ | - | | $ | 2,562 | | $ | - | | $ | 2,562 | |
| Interest expense, net | | $ | 5,897 | | $ | 4,387 | | $ | 25,008 | | $ | 35,292 | |
| Provision for income taxes | | $ | 138,007 | | $ | - | | $ | 50,677 | | $ | 188,684 | |
| Capital expenditures | | $ | 29,939 | | $ | 3,139 | | $ | (33 | ) | $ | 33,045 | |
| Total assets | | $ | 3,870,969 | d | $ | 717,707 | e | $ | 369,588 | | $ | 4,958,264 | |
| | | | | | | | | | | | | | |
| Six months ended June 30, 2006: | | | | | | | | | | | | | |
| Revenues | | $ | 1,831,951 | a | $ | 1,109,238 | | $ | (428,865 | ) | $ | 2,512,324 | |
| Production and delivery | | | 567,985 | | | 1,051,812 | | | (536,275 | )b | | 1,083,522 | |
| Depreciation and amortization | | | 67,683 | | | 14,816 | | | 4,106 | | | 86,605 | |
| Exploration expenses | | | 5,246 | | | - | | | 108 | | | 5,354 | |
| General and administrative expenses | | | 137,995 | c | | 7,304 | | | (79,533 | )c | | 65,766 | |
| Operating income | | $ | 1,053,042 | | $ | 35,306 | | $ | 182,729 | | $ | 1,271,077 | |
| Equity in PT Smelting earnings | | $ | - | | $ | 5,565 | | $ | - | | $ | 5,565 | |
| Interest expense, net | | $ | 4,881 | | $ | 10,271 | | $ | 28,543 | | $ | 43,695 | |
| Provision for income taxes | | $ | 381,692 | | $ | - | | $ | 150,274 | | $ | 531,966 | |
| Capital expenditures | | $ | 105,332 | | $ | 6,182 | | $ | (1,169 | ) | $ | 110,345 | |
| | | | | | | | | | | | | | |
| Six months ended June 30, 2005: | | | | | | | | | | | | | |
| Revenues | | $ | 1,365,784 | a | $ | 604,013 | | $ | (263,823 | ) | $ | 1,705,974 | |
| Production and delivery | | | 417,233 | | | 585,486 | | | (247,127 | ) | | 755,592 | |
| Depreciation and amortization | | | 91,142 | | | 14,230 | | | 5,713 | | | 111,085 | |
| Exploration expenses | | | 4,164 | | | - | | | 98 | | | 4,262 | |
| General and administrative expenses | | | 51,607 | c | | 5,905 | | | (10,519 | )c | | 46,993 | |
| Operating income (loss) | | $ | 801,638 | | $ | (1,608 | ) | $ | (11,988 | ) | $ | 788,042 | |
| Equity in PT Smelting earnings | | $ | - | | $ | 5,158 | | $ | - | | $ | 5,158 | |
| Interest expense, net | | $ | 11,624 | | $ | 8,192 | | $ | 53,024 | | $ | 72,840 | |
| Provision for income taxes | | $ | 283,326 | | $ | - | | $ | 69,386 | | $ | 352,712 | |
| Capital expenditures | | $ | 53,508 | | $ | 5,863 | | $ | (80 | ) | $ | 59,291 | |
| | | | | | | | | | | | | | |
| a. | Includes PT Freeport Indonesia’s sales to PT Smelting totaling $325.4 million in the 2006 quarter, $194.9 million in the 2005 quarter, $607.9 million in the 2006 six-month period and $429.0 million in the 2005 six-month period. |
| b. | Includes deferral (recognition) of intercompany profits on 25 percent of PT Freeport Indonesia’s sales to PT Smelting, for which the final sale to third parties has not occurred, totaling $7.8 million in the 2006 quarter, $(2.6) million in the 2005 quarter and $(13.0) million in the 2006 six-month period. |
| c. | Includes charges to the mining and exploration segment for the in-the-money value of FCX stock option exercises which are eliminated in consolidation totaling $29.4 million in the 2006 quarter, $0.7 million in the 2005 quarter, $85.5 million in the 2006 six-month period and $17.4 million in the 2005 six-month period. |
| d. | Includes PT Freeport Indonesia’s trade receivables with PT Smelting totaling $257.6 million at June 30, 2006, and $71.9 million at June 30, 2005. |
| e. | Includes PT Freeport Indonesia’s equity investment in PT Smelting totaling $40.6 million at June 30, 2006, and $52.9 million at June 30, 2005. |
A summary of FCX’s comprehensive income is shown below (in thousands).
| | | Three Months Ended | | Six Months Ended | |
| | | June 30, | | June 30, | |
| | | 2006 | | 2005 | | 2006 | | 2005 | |
| Net income | | $ | 382,380 | | $ | 190,372 | | $ | 649,155 | | $ | 335,892 | |
| Other comprehensive income (loss): | | | | | | | | | | | | | |
| Change in unrealized derivatives’ fair value, net of taxes | | | | | | | | | | | | | |
| of $1.4 million for the three months ended June 30, | | | | | | | | | | | | | |
| 2006, $0.8 million for the three months ended June 30, | | | | | | | | | | | | | |
| 2005, $(0.1) million for the six months ended June 30, | | | | | | | | | | | | | |
| 2006 and $1.0 million for the six months ended June 30, | | | | | | | | | | | | | |
| 2005 | | | (12,846 | )a | | (1,047 | ) | | (10,805 | ) | | (1,345 | ) |
| Reclass to earnings, net of taxes of $0.5 million | | | | | | | | | | | | | |
| for the three months ended June 30, 2006, $1.0 million | | | | | | | | | | | | | |
| for the six months ended June 30, 2006 and $0.1 million | | | | | | | | | | | | | |
| for the 2005 periods | | | 1,055 | | | (192 | ) | | 340 | | | (95 | ) |
| Total comprehensive income | | $ | 370,589 | | $ | 189,133 | | $ | 638,690 | | $ | 334,452 | |
| | | | | | | | | | | | | | |
| a. | Relates to unrealized losses on PT Smelting’s hedging contracts to fix a portion of its revenues through 2007. At June 30, 2006, FCX had $10.9 million in accumulated other comprehensive income related to these contracts. |
| 11. | RATIO OF EARNINGS TO FIXED CHARGES |
The ratio of earnings to fixed charges for the first six months of 2006 was 26.5 to 1 compared with 10.7 to 1 for the 2005 period. For this calculation, earnings consist of income from continuing operations before income taxes, minority interests and fixed charges. Fixed charges include interest and that portion of rent deemed representative of interest.
TO THE BOARD OF DIRECTORS AND STOCKHOLDERS OF
FREEPORT-McMoRan COPPER & GOLD INC.
We have reviewed the condensed consolidated balance sheet of Freeport-McMoRan Copper & Gold Inc. and its subsidiaries as of June 30, 2006 and the related consolidated statements of income for the three-month and six-month periods ended June 30, 2006 and 2005, and the consolidated statements of cash flows for the six-month periods ended June 30, 2006 and 2005. These financial statements are the responsibility of the Company’s management.
We conducted our review in accordance with the standards of the Public Company Accounting Oversight Board (United States). A review of interim financial information consists principally of applying analytical procedures and making inquiries of persons responsible for financial and accounting matters. It is substantially less in scope than an audit conducted in accordance with the standards of the Public Company Accounting Oversight Board, the objective of which is the expression of an opinion regarding the financial statements taken as a whole. Accordingly, we do not express such an opinion.
Based on our review, we are not aware of any material modifications that should be made to the condensed consolidated financial statements referred to above for them to be in conformity with U.S. generally accepted accounting principles.
We have previously audited, in accordance with the standards of the Public Company Accounting Oversight Board (United States), the consolidated balance sheet of Freeport-McMoRan Copper & Gold Inc. as of December 31, 2005, and the related consolidated statements of income, stockholder’s equity, and cash flows for the year then ended (not presented herein), and in our report dated February 24, 2006, we expressed an unqualified opinion on those consolidated financial statements. In our opinion, the information set forth in the accompanying condensed consolidated balance sheet as of December 31, 2005, is fairly stated, in all material respects, in relation to the consolidated balance sheet from which it has been derived.
ERNST & YOUNG LLP
New Orleans, Louisiana
August 1, 2006
OVERVIEW
In management’s discussion and analysis, “we,” “us” and “our” refer to Freeport-McMoRan Copper & Gold Inc. (FCX) and its consolidated subsidiaries. References to “aggregate” amounts mean the total of our share and Rio Tinto plc’s share as our joint venture partner. You should read this discussion in conjunction with our financial statements, the related discussion and analysis of financial condition and results of operations and the discussion of our “Business and Properties” in our Form 10-K for the year ended December 31, 2005, filed with the Securities and Exchange Commission. The results of operations reported and summarized below are not necessarily indicative of future operating results. References to “Notes” are Notes included in our “Notes to Consolidated Financial Statements.” Per share amounts are on a diluted basis unless otherwise noted.
Through our majority-owned subsidiary, PT Freeport Indonesia, we have one of the world’s largest copper and gold mining and production operations in terms of reserves and production. Our principal asset is a majority ownership interest in the Grasberg minerals district, which, based on the latest available data, contains the largest single copper reserve and the largest single gold reserve of any mine in the world.
PT Freeport Indonesia, our principal operating subsidiary, operates under an agreement, called a Contract of Work, with the Government of Indonesia. The Contract of Work allows us to conduct exploration, mining and production activities in a 24,700-acre area called Block A located in Papua, Indonesia. Under the Contract of Work, PT Freeport Indonesia also conducts exploration activities (which are currently suspended, but are under review for resumption) in an approximate 500,000-acre area called Block B in Papua. All of our proven and probable mineral reserves and current mining operations are located in Block A.
We own 90.64 percent of PT Freeport Indonesia, including 9.36 percent owned through our wholly owned subsidiary, PT Indocopper Investama. The Government of Indonesia owns the remaining 9.36 percent of PT Freeport Indonesia. In July 2004, we received a request from the Indonesian Department of Energy and Mineral Resources that we offer to sell shares in PT Indocopper Investama to Indonesian nationals at fair market value. In response to this request and in view of the potential benefits of having additional Indonesian ownership in our project, we have agreed to consider a potential sale of an interest in PT Indocopper Investama at fair market value. Neither our Contract of Work nor Indonesian law requires us to divest any portion of our ownership interest in PT Freeport Indonesia or PT Indocopper Investama.
We also operate through a majority-owned subsidiary, PT Puncakjaya Power (Puncakjaya Power), and through Atlantic Copper, S.A. (Atlantic Copper) and PT Irja Eastern Minerals (Eastern Minerals), our other principal wholly owned subsidiaries. Puncakjaya Power’s sole business is to supply power to PT Freeport Indonesia’s operations. Atlantic Copper’s operations are in Spain and involve the smelting and refining of copper concentrates and the marketing of refined copper and precious metals in slimes. Eastern Minerals conducts mineral exploration activities (which are currently suspended) in Papua, Indonesia. PT Freeport Indonesia owns a 25 percent interest in PT Smelting, an Indonesian company which operates a copper smelter and refinery in Gresik, Indonesia.
In 1996, we established joint ventures with Rio Tinto, an international mining company with headquarters in London, England. One joint venture covers PT Freeport Indonesia’s mining operations in Block A and gives Rio Tinto, through 2021, a 40 percent interest in certain assets and future production exceeding specified annual amounts of copper, gold and silver in Block A, and, after 2021, a 40 percent interest in all production from Block A. Operating, nonexpansion capital and administrative costs are shared proportionately between PT Freeport Indonesia and Rio Tinto based on the ratio of (a) the incremental revenues from production from our expansion completed in 1998 to (b) total revenues from Block A, including production from PT Freeport Indonesia’s previously existing reserves. PT Freeport Indonesia receives 100 percent of the cash flow from specified annual amounts of copper, gold and silver through 2021, calculated by reference to its proven and probable reserves as of December 31, 1994, and 60 percent of all remaining cash flow.
Outlook
PT Freeport Indonesia’s share of annual sales in 2006 is currently projected to approximate 1.2 billion pounds of copper and 1.7 million ounces of gold, compared with previous estimates of 1.3 billion pounds and 1.7 million ounces. The reduction in estimated copper sales primarily reflects operational issues experienced in the second quarter and the impact of mine plan revisions to incorporate geotechnical data. Efforts are under way to improve productivity of mining activities, which would increase mining rates and advance timing of metal production. At the Grasberg open-pit mine, the sequencing in mining areas with varying ore grades causes fluctuations in the timing of ore production, resulting in varying quarterly and annual copper and gold sales. During 2006, approximately 63 percent of copper and 55 percent of gold sales are expected in the second half of the year, including 280.0 million pounds of copper and 320,000 ounces of gold in the third quarter and 475.0 million pounds of copper and 610,000 ounces of gold in the fourth quarter of 2006. The achievement of PT Freeport Indonesia’s sales estimates will be dependent, among other factors, on the achievement of targeted mining rates, the successful operation of PT Freeport Indonesia’s production facilities and the impact of weather conditions at the end of fiscal periods on concentrate loading activities.
Our mine plans are based on latest available data and studies, which take into account factors such as mining and milling rates, ore grades and recoveries, economic conditions and geologic/geotechnical considerations. We update these plans to incorporate new data and conditions, with the objective of operating safely, managing risks and maximizing economic values. While ongoing analyses may alter current expectations, we have revised in July 2006 our five-year mine plan as follows:
| | | PT Freeport Indonesia’s Share of Sales | |
| | | Previous Estimate | | Current Estimate | |
| Year | | Copper | | Gold | | Copper | | Gold | |
| | | (Billion Lbs.) | | (Million Ozs.) | | (Billion Lbs.) | | (Million Ozs.) | |
| 2006 | | 1.3 | | 1.7 | | 1.2 | | 1.7 | |
| 2007 | | 1.2 | | 2.0 | | 1.1 | | 1.8 | |
| 2008 | | 1.5 | | 2.4 | | 1.4 | | 1.9 | |
| 2009 | | 1.2 | | 1.6 | | 1.2 | | 1.8 | |
| 2010 | | 1.3 | | 1.9 | | 1.3 | | 2.1 | |
| Total | | 6.5 | | 9.6 | | 6.2 | | 9.3 | |
| | | | | | | | | | |
| 5-Year Average | | 1.3 | | 1.9 | | 1.24 | | 1.9 | |
| | | | | | | | | | |
| Percent Change | | | | | | (4.6 | )% | (3.1 | )% |
| | | | | | | | | | |
These revisions include updated estimates for 2006 and design changes to incorporate recent geotechnical data, resulting in deferral of production of certain high-grade ore from 2007 and 2008 into future periods. The revised mine plans also incorporate an anticipated expansion of the Deep Ore Zone (DOZ) underground mine to 80,000 metric tons of ore per day. The preliminary economics of this project appear highly attractive. The mine plan changes affect the timing of metal production and do not impact ultimate recoverable reserves. PT Freeport Indonesia’s initiatives to improve productivity and mining rates are an important factor in the ability to meet or potentially to exceed these plans.
We are also continuing to analyze our longer range mine plans to assess the optimal design of the Grasberg open pit, which may affect the timing of our development of the Grasberg underground block cave ore body. Our previous plan included the transition from the Grasberg open pit to the Grasberg underground block cave ore body in 2015. We expect to complete the current studies on longer range plans by year-end 2006.
Sales volumes may vary from these estimates depending on the areas being mined within the Grasberg open pit. Quarterly variations in sales volumes are expected to be significant. Based on current estimated sales volumes for the remainder of 2006 and copper prices of approximately $3.00 per pound and gold prices of approximately $600 per ounce, we expect to generate operating cash flows approximating $1.6
billion in 2006, with over $1.2 billion in the second half of the year. The impact on our projected 2006 cash flows for each $0.10 per pound change in copper prices in the balance of the year would approximate $38 million, including the effects of price changes on related royalty costs, and for each $25 per ounce change in gold prices in the balance of the year would approximate $12 million.
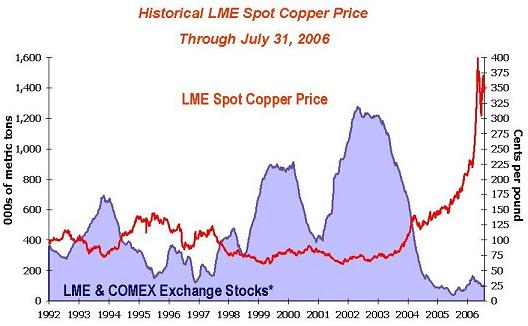
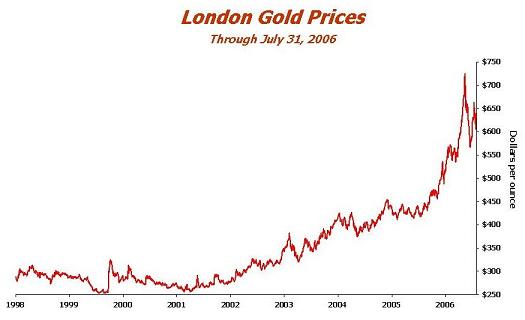
Copper and Gold Markets
As shown in the graphs below, world metal prices for copper have fluctuated during the period from 1992 through July 2006 with the London Metal Exchange (LME) spot copper price varying from a low of approximately $0.60 per pound in 2001 to a record high of approximately $3.99 per pound on May 12, 2006, and world gold prices have fluctuated during the period from 1998 through July 2006 from a low of approximately $250 per ounce in 1999 to a high of approximately $726 per ounce on May 12, 2006. Current copper and gold prices reflect significantly higher levels of direct investment by commodity investors. This high level of activity can be expected to result in higher levels of volatility in copper and gold prices and in the share prices of FCX and other commodity producers. Copper and gold prices are affected by numerous factors beyond our control as described further in our Form 10-K for the year ended December 31, 2005.
* Excludes Shanghai stocks, producer, consumer and merchant stocks.
The graph above presents LME spot copper prices and reported stocks of copper at the LME and New York Commodity Exchange (COMEX) through July 31, 2006. Since 2003 and through 2005, global demand has exceeded supply, evidenced by the decline in warehouse inventories. LME and COMEX inventories have risen from the 2005 lows in recent months but combined stocks of approximately 100,000 metric tons at June 30, 2006 represent less than two days of global consumption. Copper prices averaged $3.29 per pound in the second quarter of 2006, with prices ranging from $2.52 per pound to a record high of $3.99 per pound. Copper prices have remained strong in July 2006 and the LME spot price closed at $3.56 per pound on July 31, 2006. Disruptions associated with strikes, unrest and other operational issues have resulted in a continuation of low levels of inventory. Future copper prices are expected to continue to be influenced by demand from China, economic performance in the United States (U.S.) and other industrialized countries, the timing of the development of new supplies of copper,
production levels of mines and copper smelters and the level of direct participation by investors. We consider the current underlying supply and demand conditions in the global copper markets to be positive for our company.
The environment for gold continues to be positive with gold prices recently reaching new 25-year highs above $700 per ounce before declining to $600 per ounce. Gold prices continue to be supported by increased investment demand for gold, ongoing geopolitical tensions, a weak U.S. dollar, inflationary pressures, falling production from older mines, limited development of new mines and actions by gold producers to reduce hedge positions. Gold prices averaged $628 per ounce in the second quarter of 2006, with prices ranging from $567 per ounce to $726 per ounce. The London gold price closed at $633 per ounce on July 31, 2006.
CONSOLIDATED RESULTS
Summary comparative results for the second-quarter and six-month periods follow (in millions, except per share amounts):
| | Second Quarter | | Six Months | |
| | 2006 | | 2005 | | 2006 | | 2005 | |
| Revenues | $ | 1,426.2 | | $ | 902.9 | | $ | 2,512.3 | | $ | 1,706.0 | |
| Operating income | | 739.3 | | | 430.4 | | | 1,271.1 | | | 788.0 | |
| Net income applicable to common stock | | 367.3 | | | 175.2 | | | 618.9 | | | 305.6 | |
| Diluted net income per share of common stock | | 1.74 | | | 0.91 | | | 2.97 | | | 1.62 | |
Consolidated revenues include PT Freeport Indonesia’s sale of copper concentrates, which also contain significant quantities of gold and silver, and the sale by Atlantic Copper of copper anodes, copper cathodes, and gold in anodes and slimes. Consolidated revenues for the second quarter of 2006 and the first six months of 2006 were higher than consolidated revenues for the 2005 periods, reflecting substantially higher copper and gold prices than the 2005 periods, partly offset by lower PT Freeport Indonesia sales volumes. PT Freeport Indonesia mined lower grade ore and reported lower production and sales in the second quarter of 2006 and the first six months of 2006, compared with the 2005 periods.
At June 30, 2006, we had consolidated embedded derivatives on copper sales totaling 185.1 million pounds recorded at an average price of $3.34 per pound. Final prices on these sales will be established over the next several months pursuant to terms of sales contracts. We estimate that a five-cent change in the average price used for these embedded derivatives and realized prices for these sales would have an approximate $9 million impact on our 2006 consolidated revenues and an approximate $5 million impact on our 2006 consolidated net income.
Second-quarter 2006 consolidated revenues included net additions of $146.6 million ($77.7 million to net income or $0.35 per share) primarily for final pricing of concentrates sold in prior quarters, compared with $12.6 million ($6.7 million to net income or $0.03 per share) to second-quarter 2005 revenues. Six-month 2006 consolidated revenues included net additions of $137.9 million ($73.1 million to net income or $0.33 per share) compared with $8.7 million ($4.6 million to net income or $0.02 per share) for the six-month 2005 period, primarily for final pricing of concentrates sold in prior years.
Consolidated revenues and net income vary significantly with fluctuations in the market prices of copper and gold, sales volumes and other factors. Based on PT Freeport Indonesia’s projected share of copper sales for the remainder of 2006 (755.0 million pounds) and assuming an average price of $3.00 per pound of copper, each $0.10 per pound change in the average price realized in the balance of the year would have an approximate $76 million impact on our annual revenues and an approximate $38 million impact on our annual net income. A $25 per ounce change in the average price realized in the balance of the year on PT Freeport Indonesia’s projected share of gold sales for the remainder of 2006 (930,000 ounces) would have an approximate $23 million impact on our annual revenues and an approximate $12 million impact on our annual net income.
We currently have no copper or gold price protection contracts relating to our mine production. We had outstanding gold-denominated and silver-denominated preferred stock with dividends and redemption amounts determined by commodity prices. Our Gold-Denominated Preferred Stock, Series II was redeemed in February 2006, resulting in a $69.0 million reduction in revenues ($36.6 million to net income or $0.17 per share), and the final scheduled redemption of our Silver-Denominated Preferred Stock occurred on August 1, 2006 (see “Capital Resources and Liquidity - Financing Activities”).
Consolidated production and delivery costs were higher for the 2006 periods than the 2005 periods. The increases were primarily because of higher costs of concentrate purchases at Atlantic Copper caused by higher metals prices and higher production costs at PT Freeport Indonesia primarily caused by the adoption of Emerging Issues Task Force Issue No. 04-6, “Accounting for Stripping Costs Incurred during Production in the Mining Industry” (EITF 04-6). See Note 3 and “New Accounting Standards.”
Consolidated depreciation and amortization expense decreased to $43.4 million in the second quarter of 2006 and $86.6 million in the first six months of 2006, compared with $54.2 million in the second quarter of 2005 and $111.1 million in the first six months of 2005, primarily because of lower copper sales volumes at PT Freeport Indonesia during the 2006 periods. Exploration expenses increased to $2.8 million in the second quarter of 2006 and $5.4 million in the first six months of 2006 from $2.3 million in the second quarter of 2005 and $4.3 million in the first six months of 2005 (see “Mining and Exploration - PT Freeport Indonesia Exploration Activities”). Consolidated general and administrative expenses increased to $35.1 million in the second quarter of 2006 and $65.8 million in the first six months of 2006 from $25.4 million in the second quarter of 2005 and $47.0 million in the first six months of 2005 (see “Other Financial Results”).
Net interest expense decreased to $21.0 million in the second quarter of 2006 and $43.7 million in the first six months of 2006 from $35.3 million in the second quarter of 2005 and $72.8 million in the first six months of 2005 primarily because of lower debt levels. In the first six months of 2006, we induced conversion of $16.0 million of 7% Convertible Senior Notes due 2011 into 0.5 million shares of FCX common stock and purchased in open market transactions $11.5 million of 10⅛% Senior Notes due 2010 for $12.6 million. As a result of the induced conversions and open market transactions, we recorded losses on early extinguishment and conversion of debt totaling $2.2 million ($1.5 million to net income, net of related reduction of interest expense, or $0.01 per share) in the first six months of 2006 (see “Capital
Resources and Liquidity - Financing Activities”). We are continuing to assess opportunities to repay debt in advance of scheduled maturities.
Other income includes interest income of $4.8 million in the second quarter of 2006, $3.3 million in the second quarter of 2005, $11.8 million in the first six months of 2006 and $7.0 million in the first six months of 2005. Other income also includes the impact of translating into U.S. dollars Atlantic Copper’s net euro-denominated liabilities, primarily its retiree pension obligations. Changes in the U.S. dollar/euro exchange rate require us to adjust the dollar value of our net euro-denominated liabilities and record the adjustment in earnings. The exchange rate was $1.18 per euro at December 31, 2005, $1.21 per euro at March 31, 2006 and $1.27 per euro at June 30, 2006. Exchange rate effects on our net income from euro-denominated liabilities were gains (losses) of $(0.4) million in the second quarter of 2006, $3.4 million in the second quarter of 2005, $(1.6) million in the first six months of 2006 and $6.3 million in the first six months of 2005. In the second quarter of 2006, Atlantic Copper recorded an $8.6 million ($8.6 million to net income or $0.04 per share) gain to other income for the disposition of land in a transaction with the local Spanish government. In the transaction, the provincial government granted Atlantic Copper development rights estimated to be worth $8.6 million in exchange for property owned by Atlantic Copper. Atlantic Copper expects to sell these development rights and certain non-operating properties in the third quarter of 2006 for an amount in excess of its book value.
PT Freeport Indonesia’s Contract of Work provides for a 35 percent corporate income tax rate. PT Indocopper Investama pays a 30 percent corporate income tax on dividends it receives from its 9.36 percent ownership in PT Freeport Indonesia. In addition, the tax treaty between Indonesia and the U.S. provides for a withholding tax rate of 10 percent on dividends and interest that PT Freeport Indonesia and PT Indocopper Investama pay to their parent company, FCX. We currently record no income taxes at Atlantic Copper, which is subject to taxation in Spain, because it has not generated significant taxable income in recent years and has substantial tax loss carryforwards for which we have provided no net financial statement benefit. We receive no consolidated tax benefit from these losses because they cannot be used to offset PT Freeport Indonesia’s profits in Indonesia, but can be utilized to offset Atlantic Copper’s future profits.
Parent company costs consist primarily of interest, depreciation and amortization, and general and administrative expenses. We receive minimal, if any, tax benefit from these costs, including interest expense, primarily because our parent company normally generates no taxable income from U.S. sources. As a result, our provision for income taxes as a percentage of our consolidated income before income taxes and minority interests will vary as PT Freeport Indonesia’s income changes, absent changes in Atlantic Copper and parent company costs. Summaries of the approximate significant components of the calculation of our consolidated provision for income taxes are shown below (in thousands, except percentages).
Table of Contents
| | Three Months Ended | | Six Months Ended | |
| | June 30, | | June 30, | |
| | 2006 | | 2005 | | 2006 | | 2005 | |
Mining and exploration segment operating incomea | $ | 690,977 | | $ | 390,780 | | $ | 1,138,504 | | $ | 819,087 | |
| Mining and exploration segment interest expense, net | | (1,608 | ) | | (5,897 | ) | | (4,881 | ) | | (11,624 | ) |
| Intercompany operating profit recognized (deferred) | | 34,208 | | | 48,350 | | | 108,419 | | | (15,220 | ) |
| Income before taxes | | 723,577 | | | 433,233 | | | 1,242,042 | | | 792,243 | |
| Indonesian corporate income tax rate | | 35 | % | | 35 | % | | 35 | % | | 35 | % |
| Corporate income taxes | | 253,252 | | | 151,632 | | | 434,715 | | | 277,285 | |
| | | | | | | | | | | | | |
| Approximate PT Freeport Indonesia net income | | 470,325 | | | 281,601 | | | 807,327 | | | 514,958 | |
| Withholding tax on FCX’s equity share | | 9.064 | % | | 9.064 | % | | 9.064 | % | | 9.064 | % |
| Withholding taxes | | 42,630 | | | 25,524 | | | 73,176 | | | 46,676 | |
| | | | | | | | | | | | | |
| PT Indocopper Investama corporate income tax | | 11,247 | | | 6,957 | | | 16,870 | | | 21,081 | |
| Other, net | | 3,115 | | | 4,571 | | | 7,205 | | | 7,670 | |
| FCX consolidated provision for income taxes | $ | 310,244 | | $ | 188,684 | | $ | 531,966 | | $ | 352,712 | |
| | | | | | | | | | | | | |
| FCX consolidated effective tax rate | | 42 | % | | 46 | % | | 43 | % | | 48 | % |
| | | | | | | | | | | | | |
| a. | Excludes charges for the in-the-money value of FCX stock option exercises, which are eliminated in consolidation, totaling $29.4 million for the 2006 quarter, $0.7 million for the 2005 quarter, $85.5 million for the 2006 six-month period and $17.4 million for the 2005 six-month period. |
RESULTS OF OPERATIONS
We have two operating segments: “mining and exploration” and “smelting and refining.” The mining and exploration segment consists of our Indonesian activities including PT Freeport Indonesia’s copper and gold mining operations, Puncakjaya Power’s power generating operations (after eliminations with PT Freeport Indonesia) and our Indonesian exploration activities, including those of Eastern Minerals. The smelting and refining segment includes Atlantic Copper’s operations in Spain and PT Freeport Indonesia’s equity investment in PT Smelting. Summary comparative operating income (loss) data by segment follow (in millions):
| | Second Quarter | | Six Months | |
| | 2006 | | 2005 | | 2006 | | 2005 | |
Mining and explorationa | $ | 661.5 | | $ | 390.1 | | $ | 1,053.0 | | $ | 801.6 | |
| Smelting and refining | | 21.8 | | | (0.1 | ) | | 35.3 | | | (1.6 | ) |
Intercompany eliminations and othera, b | | 56.0 | | | 40.4 | | | 182.8 | | | (12.0 | ) |
| FCX operating income | $ | 739.3 | | $ | 430.4 | | $ | 1,271.1 | | $ | 788.0 | |
| | | | | | | | | | | | | |
| a. | Includes charges to the mining and exploration segment for the in-the-money value of FCX stock option exercises, which are eliminated in consolidation, totaling $29.4 million in the 2006 quarter, $0.7 million in the 2005 quarter, $85.5 million for the 2006 six-month period and $17.4 million for the 2005 six-month period. |
| b. | We defer recognizing profits on PT Freeport Indonesia’s sales to Atlantic Copper and on 25 percent of PT Freeport Indonesia’s sales to PT Smelting until their sales of final products to third parties. Changes in the amount of these deferred profits impacted operating income by $34.2 million in the second quarter of 2006, $48.3 million in the second quarter of 2005, $108.4 million in the first six months of 2006 and $(15.2) million in the first six months of 2005. Our consolidated earnings can fluctuate materially depending on the timing and prices of these sales. At June 30, 2006, our deferred profits to be recognized in future periods’ operating income totaled $114.2 million, $60.5 million to net income, after taxes and minority interest sharing. |
MINING AND EXPLORATION
PT Freeport Indonesia Operating Results
| | | | Second Quarter | | Six Months | |
| | | | 2006 | | 2005 | | 2006 | | 2005 | |
PT Freeport Indonesia Operating Data, Net of Rio Tinto’s Interest | | | | | | |
| Copper (recoverable) | | | | | | | | | | |
| Production (000s of pounds) | | | 237,100 | | 302,300 | | 458,400 | | 637,900 | |
| Production (metric tons) | | | 107,500 | | 137,100 | | 207,900 | | 289,300 | |
| Sales (000s of pounds) | | | 220,100 | | 313,700 | | 445,300 | | 641,800 | |
| Sales (metric tons) | | | 99,900 | | 142,300 | | 202,000 | | 291,100 | |
| Average realized price per pound | | | $3.33 | | $1.53 | | $3.27 | | $1.54 | |
| Gold (recoverable ounces) | | | | | | | | | | |
| Production | | | 307,300 | | 591,300 | | 769,100 | | 1,200,700 | |
| Sales | | | 278,000 | | 616,400 | | 750,500 | | 1,211,700 | |
| Average realized price per ounce | | | $613.77 | | $428.23 | | $492.73 | a | $427.54 | |
| | | | | | | | | | | |
PT Freeport Indonesia, 100% Aggregate Operating Data | | | | | | | | |
| Ore milled (metric tons per day) | | | 223,700 | | 211,800 | | 220,200 | | 205,600 | |
| Average ore grade | | | | | | | | | | |
| Copper (percent) | | | 0.72 | | 0.98 | | 0.72 | | 1.06 | |
| Gold (grams per metric ton) | | | 0.67 | | 1.43 | | 0.79 | | 1.52 | |
| Recovery rates (percent) | | | | | | | | | | |
| Copper | | | 84.1 | | 87.4 | | 83.3 | | 88.5 | |
| Gold | | | 76.4 | | 83.8 | | 78.8 | | 83.3 | |
| Copper (recoverable) | | | | | | | | | | |
| Production (000s of pounds) | | | 258,800 | | 349,200 | | 505,400 | | 739,500 | |
| Production (metric tons) | | | 117,300 | | 158,400 | | 229,200 | | 335,400 | |
| Sales (000s of pounds) | | | 239,900 | | 362,500 | | 491,200 | | 743,900 | |
| Sales (metric tons) | | | 108,800 | | 164,400 | | 222,800 | | 337,400 | |
| Gold (recoverable ounces) | | | | | | | | | | |
| Production | | | 325,700 | | 727,400 | | 796,400 | | 1,491,300 | |
| Sales | | | 293,800 | | 758,600 | | 780,100 | | 1,501,800 | |
| a. | Amount was $585.34 before a loss resulting from redemption of FCX’s Gold-Denominated Preferred Stock, Series II. |
PT Freeport Indonesia mined lower grade ore and reported lower production and sales in the second quarter of 2006 and the first six months of 2006, compared with the 2005 periods. PT Freeport Indonesia’s share of second-quarter 2006 production totaled 237.1 million pounds of copper and 307,300 ounces of gold. PT Freeport Indonesia experienced weather-related shipping delays at the end of June, resulting in PT Freeport Indonesia’s share of second-quarter 2006 copper sales of 220.1 million pounds being lower than the previous estimate of 235.0 million pounds announced on June 5, 2006. PT Freeport Indonesia’s share of second-quarter 2006 gold sales of 278,000 ounces slightly exceeded the previous estimate of 275,000 ounces. In May 2006, PT Freeport Indonesia encountered a relatively small section of ore in the “6 North” pushback with abnormally high clay content, which adversely affected ore flow, mill recoveries and concentrate grades. Operations improved during June as PT Freeport Indonesia gained access to better ore types. For the six-month periods, copper and gold sales volumes totaled 445.3 million pounds of copper and 750,500 ounces of gold in 2006, compared with sales of 641.8 million pounds of copper and 1,211,700 ounces of gold in 2005.
Mill throughput, which varies depending on ore types being processed, averaged 223,700 metric tons of ore per day in the second quarter of 2006, 211,800 metric tons in the second quarter of 2005, 220,200 metric tons in the first six months of 2006 and 205,600 metric tons in the first six months of 2005. Mill rates are expected to average over 220,000 metric tons per day during the second half of 2006. Operations were temporarily suspended for an approximate four-day period in February 2006 when illegal miners (“gold panners”) blocked a road leading to our mill. While this situation was resolved peacefully by Indonesian government authorities, we continue to work with the government to resolve the legal and security concerns presented by the increased presence of gold panners in our area of operations. Approximate average daily throughput processed at our mill facilities from each of our producing mines follows (metric tons of ore per day):
| | Second Quarter | | Six Months | |
| | 2006 | | 2005 | | 2006 | | 2005 | |
| Grasberg open pit | 176,500 | | 169,500 | | 174,700 | | 163,400 | |
| Deep Ore Zone underground mine | 47,200 | | 42,300 | | 45,500 | | 42,200 | |
| Total mill throughput | 223,700 | | 211,800 | | 220,200 | | 205,600 | |
| | | | | | | | | |
In the second quarter of 2006, copper ore grades averaged 0.72 percent and recovery rates averaged 84.1 percent, compared with 0.98 percent and 87.4 percent for the second quarter of 2005. Gold ore grades averaged 0.67 grams per metric ton (g/t) and recovery rates averaged 76.4 percent in the second quarter of 2006, compared with 1.43 g/t and 83.8 percent for the second quarter of 2005. The 2006 ore grades and recoveries for copper and gold reflect the mining of lower grade material compared with the extraordinarily high grades mined in 2005 and abnormally high clay content associated with mining a relatively small section of ore in the “6 North” pushback. Average ore grades are expected to improve in the second half of 2006 with the highest grades expected to be mined in the fourth quarter.
Production from the DOZ underground mine averaged 47,200 metric tons of ore per day in the second quarter of 2006, representing 21 percent of mill throughput. DOZ continues to perform above design capacity of 35,000 metric tons of ore per day. PT Freeport Indonesia is expanding the capacity of the DOZ underground operation to a sustained rate of 50,000 metric tons of ore per day with the installation of a second crusher and additional ventilation, expected to be completed by mid-2007. PT Freeport Indonesia’s share of capital expenditures for the DOZ expansion totaled approximately $8 million in the first six months of 2006 (approximately $27 million incurred through June 30, 2006) and is expected to approximate $37 million through the projected 2007 ramp-up, with approximately $16 million estimated for 2006. PT Freeport Indonesia is completing plans that are anticipated to expand the capacity of the DOZ mine to 80,000 metric tons of ore per day. The DOZ mine, a block cave operation, is one of the world’s largest underground mines.
In 2004, PT Freeport Indonesia commenced its “Common Infrastructure” project, which will provide access to its large undeveloped underground ore bodies located in the Grasberg minerals district through a tunnel system located approximately 400 meters deeper than its existing underground tunnel system. In addition to providing access to our underground ore bodies, the tunnel system will enable PT Freeport Indonesia to conduct future exploration in prospective areas associated with currently identified ore bodies. PT Freeport Indonesia’s share of capital expenditures for its Common Infrastructure project totaled approximately $7 million in the first six months of 2006 and is estimated to total approximately $8 million in 2006. The Common Infrastructure project is progressing according to plan. Work on the Grasberg underground ore body has begun with PT Freeport Indonesia’s share of capital expenditures totaling approximately $3 million in the first six months of 2006. Projected 2006 capital expenditures for the Grasberg underground ore body approximate $23 million.
PT Freeport Indonesia is also proceeding with plans to develop Big Gossan, a high-grade deposit located near the existing milling complex. Our Board of Directors has approved this project and aggregate capital expenditures from 2005 to 2009 for Big Gossan are expected to total approximately $225 million ($195 million net to PT Freeport Indonesia, with approximately $50 million in 2006). PT Freeport Indonesia’s share of capital expenditures for Big Gossan totaled approximately $29 million in the first six months of 2006. Production is expected to ramp up to 7,000 metric tons per day by 2010 (average annual aggregate
incremental production of 135 million pounds of copper and 65,000 ounces of gold, with PT Freeport Indonesia receiving 60 percent of these amounts). The Big Gossan mine is being developed as an open-stope mine with cemented backfill, an established mining methodology expected to be higher-cost than the block-cave method used at the DOZ mine.
PT Freeport Indonesia Revenues
A summary of changes in PT Freeport Indonesia revenues between the periods follows (in millions):
| | Second | | Six | |
| | Quarter | | Months | |
| PT Freeport Indonesia revenues - prior year period | $ | 678.4 | | $ | 1,365.8 | |
| Price realizations: | | | | | | |
| Copper | | 395.7 | | | 767.3 | |
| Gold | | 51.6 | | | 48.9 | |
| Sales volumes: | | | | | | |
| Copper | | (143.6 | ) | | (303.0 | ) |
| Gold | | (144.9 | ) | | (197.2 | ) |
| Adjustments, primarily for copper pricing on prior year open sales | | 237.2 | | | 196.2 | |
| Treatment charges, royalties and other | | (39.2 | ) | | (46.0 | ) |
| PT Freeport Indonesia revenues - current year period | $ | 1,035.2 | | $ | 1,832.0 | |
| | | | | | | |
Realized copper prices more than doubled to an average of $3.33 per pound in the second quarter of 2006 from $1.53 in the second quarter of 2005. Realized gold prices improved by 43 percent to an average of $613.77 per ounce from $428.23 in the second quarter of 2005. Realized copper prices also more than doubled to an average of $3.27 per pound in the first six months of 2006 from $1.54 in the 2005 period. Realized gold prices in the first six months of 2006 averaged $492.73 per ounce; including a reduction of $92.61 per ounce for revenue adjustments associated with the first-quarter 2006 redemption of our Gold-Denominated Preferred Stock, Series II; compared to $427.54 in the first six months of 2005.
As discussed above, PT Freeport Indonesia’s share of second-quarter 2006 copper sales of 220.1 million pounds and gold sales of 278,000 ounces were lower than second-quarter 2005 sales of 313.7 million pounds of copper and 616,400 ounces of gold. For the six-month periods, copper and gold sales volumes totaled 445.3 million pounds of copper and 750,500 ounces of gold in 2006, compared with sales of 641.8 million pounds of copper and 1,211,700 ounces of gold in 2005.
Treatment charges vary with the volume of metals sold and the price of copper, and royalties vary with the volume of metals sold and the prices of copper and gold. Market rates for treatment and refining charge rates began to increase significantly in late 2004. A large part of the increase relates to the price participation component of our concentrate sales agreements. Royalties totaled $22.9 million in the second quarter of 2006 and $42.9 million in the first six months of 2006 compared with $17.7 million in the second quarter of 2005 and $36.5 million in the first six months of 2005, reflecting higher metal prices partly offset by lower sales volumes.
Substantially all of PT Freeport Indonesia’s concentrate sales contracts provide final copper pricing in a specified future period based on prices quoted on the LME. PT Freeport Indonesia records revenues and invoices its customers based on LME prices at the time of shipment. Under accounting rules, these terms create an “embedded derivative” in our concentrate sales contracts which must be adjusted to fair value through earnings each period until the date of final copper pricing. PT Freeport Indonesia’s second-quarter 2006 revenues include net additions of $269.2 million for adjustments to the fair value of embedded copper derivatives in concentrate sales contracts, compared with $11.5 million in the second quarter of 2005. PT Freeport Indonesia’s six-month 2006 revenues included net additions of $452.1 million for adjustments to the fair value of embedded derivatives in concentrate sales contracts, compared with $37.2 million in the 2005 period.
PT Freeport Indonesia has long-term contracts to provide approximately 60 percent of Atlantic Copper’s copper concentrate requirements at market prices and nearly all of PT Smelting’s copper concentrate requirements. Under the PT Smelting contract, for the first 15 years of PT Smelting’s operations beginning December 1998, the treatment and refining charges on the majority of the concentrate PT Freeport Indonesia provides will not fall below specified minimum rates, subject to renegotiation in 2008. The rate was $0.23 per pound during the period from the commencement of PT Smelting’s operations in 1998 until April 2004, when it declined to a minimum of $0.21 per pound. PT Smelting’s rates for 2006 are expected to exceed the minimum $0.21 per pound (see “Smelting and Refining”). Current rates are substantially higher than the minimum rate.
PT Freeport Indonesia Costs
| Gross Profit per Pound of Copper/per Ounce of Gold and Silver | |
| | |
Three Months Ended June 30, 2006 | | | | | | | | | | | | |
| Pounds of copper sold (000s) | | 220,100 | | | 220,100 | | | | | | | |
| Ounces of gold sold | | | | | | | | 278,000 | | | | |
| Ounces of silver sold | | | | | | | | | | | 835,200 | |
| | | | | | | |
| | | By-Product | | | Co-Product Method | |
| | | Method | | | Copper | | | Gold | | | Silver | |
| Revenues, after adjustments shown below | | $3.33 | | | $3.33 | | | $613.77 | | | $11.74 | |
| | | | | | | | | | | | | |
| Site production and delivery, before net non- | | | | | | | | | | | | |
| cash and nonrecurring costs shown below | | 1.23 | | | 0.98 | | | 184.56 | | | 3.76 | |
| Gold and silver credits | | (0.85 | ) | | - | | | - | | | - | |
| Treatment charges | | 0.49 | a | | 0.39 | b | | 73.03 | b | | 1.49 | b |
| Royalty on metals | | 0.11 | | | 0.09 | | | 15.62 | | | 0.32 | |
Unit net cash costsc | | 0.98 | | | 1.46 | | | 273.21 | | | 5.57 | |
| Depreciation and amortization | | 0.15 | | | 0.12 | | | 23.10 | | | 0.47 | |
| Noncash and nonrecurring costs, net | | 0.05 | | | 0.04 | | | 7.09 | | | 0.14 | |
| Total unit costs | | 1.18 | | | 1.62 | | | 303.40 | | | 6.18 | |
| Revenue adjustments, primarily for pricing on | | | | | | | | | | | | |
| prior period open sales | | 1.12 | | | 1.12 | | | 18.47 | | | 1.14 | |
| PT Smelting intercompany profit elimination | | (0.03 | ) | | (0.03 | ) | | (5.35 | ) | | (0.11 | ) |
| Gross profit per pound/ounce | | $3.24 | | | $2.80 | | | $323.49 | | | $6.59 | |
| | | | | | | | | | | | | |
| a. | Includes $14.4 million or $0.07 per pound for adjustments to prior quarters’ concentrate sales subject to final pricing to reflect the impact on treatment charges resulting from the increase in copper prices since March 31, 2006. |
| b. | Includes $11.5 million or $0.05 per pound for copper, $2.7 million or $9.84 per ounce for gold and $0.2 million or $0.20 per ounce for silver for adjustments to prior quarters’ concentrate sales subject to final pricing to reflect the impact on treatment charges resulting from the increase in copper prices since March 31, 2006. |
| c. | For a reconciliation of unit net cash costs to production and delivery costs applicable to sales reported in FCX’s consolidated financial statements refer to “Product Revenues and Production Costs.” |
Three Months Ended June 30, 2005 | | | | | | | | | | | | |
| Pounds of copper sold (000s) | | 313,700 | | | 313,700 | | | | | | | |
| Ounces of gold sold | | | | | | | | 616,400 | | | | |
| Ounces of silver sold | | | | | | | | | | | 1,057,700 | |
| | | | | | | |
| | | By-Product | | | Co-Product Method | |
| | | Method | | | Copper | | | Gold | | | Silver | |
| Revenues, after adjustments shown below | | $1.53 | | | $1.53 | | | $428.23 | | | $7.04 | |
| | | | | | | | | | | | | |
| Site production and delivery, before net non- | | | | | | | | | | | | |
| cash and nonrecurring costs shown below | | 0.71 | a | | 0.45 | b | | 126.01 | b | | 2.06 | b |
| Gold and silver credits | | (0.87 | ) | | - | | | - | | | - | |
| Treatment charges | | 0.21 | | | 0.14 | | | 38.68 | | | 0.63 | |
| Royalty on metals | | 0.06 | | | 0.03 | | | 10.11 | | | 0.17 | |
Unit net cash costsc | | 0.11 | | | 0.62 | | | 174.80 | | | 2.86 | |
| Depreciation and amortization | | 0.14 | | | 0.09 | | | 25.20 | | | 0.41 | |
| Noncash and nonrecurring costs, net | | 0.01 | | | 0.01 | | | 1.30 | | | 0.02 | |
| Total unit costs | | 0.26 | | | 0.72 | | | 201.30 | | | 3.29 | |
| Revenue adjustments, primarily for pricing on | | | | | | | | | | | | |
| prior period open sales | | 0.04 | | | 0.04 | | | 0.12 | | | (0.03 | ) |
| PT Smelting intercompany profit recognized | | 0.01 | | | 0.01 | | | 1.45 | | | 0.02 | |
| Gross profit per pound/ounce | | $1.32 | | | $0.86 | | | $228.50 | | | $3.74 | |
| | | | | | | | | | | | | |
| a. | Net of deferred mining costs totaling $20.6 million or $0.07 per pound. Following adoption of EITF 04-6 on January 1, 2006 (see Note 3 and “New Accounting Standards”), stripping costs are no longer deferred. |
| b. | Net of deferred mining costs totaling $13.2 million or $0.04 per pound for copper, $7.2 million or $11.74 per ounce for gold and $0.2 million or $0.19 per ounce for silver (see Note a above). |
Six Months Ended June 30, 2006 | | | | | | | | | | | | |
| Pounds of copper sold (000s) | | 445,300 | | | 445,300 | | | | | | | |
| Ounces of gold sold | | | | | | | | 750,500 | | | | |
| Ounces of silver sold | | | | | | | | | | | 1,542,300 | |
| | | | | | | |
| | | By-Product | | | Co-Product Method | |
| | | Method | | | Copper | | | Gold | | | Silver | |
| Revenues, after adjustments shown below | | $3.27 | | | $3.27 | | | $492.73 | a | | $11.19 | |
| | | | | | | | | | | | | |
| Site production and delivery, before net non- | | | | | | | | | | | | |
| cash and nonrecurring costs shown below | | 1.23 | | | 0.93 | | | 172.18 | | | 3.38 | |
| Gold and silver credits | | (1.07 | ) | | - | | | - | | | - | |
| Treatment charges | | 0.43 | b | | 0.32 | c | | 60.19 | c | | 1.18 | c |
| Royalty on metals | | 0.09 | | | 0.07 | | | 13.52 | | | 0.27 | |
Unit net cash costsd | | 0.68 | | | 1.32 | | | 245.89 | | | 4.83 | |
| Depreciation and amortization | | 0.15 | | | 0.11 | | | 21.35 | | | 0.42 | |
| Noncash and nonrecurring costs, net | | 0.05 | | | 0.04 | | | 6.96 | | | 0.14 | |
| Total unit costs | | 0.88 | | | 1.47 | | | 274.20 | | | 5.39 | |
| Revenue adjustments, primarily for pricing on | | | | | | | | | | | | |
| prior period open sales | | 0.30 | e | | 0.45 | | | 26.40 | | | 0.82 | |
| PT Smelting intercompany profit recognized | | 0.03 | | | 0.02 | | | 4.09 | | | 0.08 | |
| Gross profit per pound/ounce | | $2.72 | | | $2.27 | | | $249.02 | | | $6.70 | |
| | | | | | | | | | | | | |
| a. | Amount was $585.34 before a loss resulting from redemption of FCX’s Gold-Denominated Preferred Stock, Series II. |
| b. | Includes $12.4 million or $0.03 per pound for adjustments to 2005 concentrate sales subject to final pricing to reflect the impact on treatment charges resulting from the increase in copper prices since December 31, 2005. |
| c. | Includes $9.3 million or $0.02 per pound for copper, $2.9 million or $3.91 per ounce for gold and $0.1 million or $0.08 per ounce for silver for adjustments to 2005 concentrate sales subject to final pricing to reflect the impact on treatment charges resulting from the increase in copper prices since December 31, 2005. |
| d. | For a reconciliation of unit net cash costs to production and delivery costs applicable to sales reported in FCX’s consolidated financial statements refer to “Product Revenues and Production Costs.” |
| e. | Includes a $69.0 million or $0.16 per pound loss on the redemption of FCX’s Gold-Denominated Preferred Stock, Series II. |
Six Months Ended June 30, 2005 | | | | | | | | | | | | |
| Pounds of copper sold (000s) | | 641,800 | | | 641,800 | | | | | | | |
| Ounces of gold sold | | | | | | | | 1,211,700 | | | | |
| Ounces of silver sold | | | | | | | | | | | 2,328,000 | |
| | | | | | | |
| | | By-Product | | | Co-Product Method | |
| | | Method | | | Copper | | | Gold | | | Silver | |
| Revenues, after adjustments shown below | | $1.54 | | | $1.54 | | | $427.54 | | | $7.02 | |
| | | | | | | | | | | | | |
| Site production and delivery, before net non- | | | | | | | | | | | | |
| cash and nonrecurring costs shown below | | 0.65 | a | | 0.42 | b | | 115.39 | b | | 1.92 | b |
| Gold and silver credits | | (0.83 | ) | | - | | | - | | | - | |
| Treatment charges | | 0.21 | | | 0.14 | | | 38.80 | | | 0.65 | |
| Royalty on metals | | 0.06 | | | 0.04 | | | 10.17 | | | 0.17 | |
Unit net cash costsc | | 0.09 | | | 0.60 | | | 164.36 | | | 2.74 | |
| Depreciation and amortization | | 0.14 | | | 0.09 | | | 25.38 | | | 0.42 | |
| Noncash and nonrecurring costs, net | | 0.01 | | | 0.01 | | | 0.78 | | | 0.01 | |
| Total unit costs | | 0.24 | | | 0.70 | | | 190.52 | | | 3.17 | |
| Revenue adjustments, primarily for pricing on | | | | | | | | | | | | |
| prior period open sales | | 0.04 | | | 0.04 | | | (2.47 | ) | | 0.06 | |
| PT Smelting intercompany profit elimination | | - | | | - | | | (0.01 | ) | | - | |
| Gross profit per pound/ounce | | $1.34 | | | $0.88 | | | $234.54 | | | $3.91 | |
| | | | | | | | | | | | | |
| a. | Net of deferred mining costs totaling $52.8 million or $0.08 per pound. Following adoption of EITF 04-6 on January 1, 2006 (see Note 3 and “New Accounting Standards”), stripping costs are no longer deferred. |
| b. | Net of deferred mining costs totaling $34.4 million or $0.05 per pound for copper, $17.8 million or $14.70 per ounce for gold and $0.6 million or $0.25 per ounce for silver (see Note a above). |
We present gross profit per pound of copper using both a “by-product” method and a “co-product” method. We use the by-product method in our presentation of gross profit per pound of copper because (1) the majority of our revenues are copper revenues, (2) we produce and sell one product, concentrates, which contains copper, gold and silver, (3) it is not possible to specifically assign our costs to revenues from the copper, gold and silver we produce in concentrates, (4) it is the method used to compare mining operations in certain industry publications and (5) it is the method used by our management and our Board of Directors to monitor our operations. In the co-product method presentation, costs are allocated to the different products based on their relative revenue values, which will vary to the extent our metals sales volumes and realized prices change.
Because of the fixed nature of a large portion of our costs, unit costs vary significantly from period to period depending on volumes of copper and gold sold during the period. Higher unit site production and
delivery costs in the 2006 periods, compared with the 2005 periods, primarily reflected lower sales volumes resulting from mine sequencing in the Grasberg open pit, the impact of adopting EITF 04-6 (see Note a above, Note 3 and “New Accounting Standards”) and higher input costs, including energy.
While lower volumes constitute the largest component of variance on a unit basis, we have experienced significant increases in our production costs in recent years primarily as a result of higher energy costs and costs of other consumables, higher mining costs and milling rates, labor costs and other factors. Our energy costs, which approximate 22 percent of PT Freeport Indonesia’s production costs, primarily include purchases of 100 million gallons of diesel per year and 650,000 metric tons of coal per year. Diesel prices have risen by more than 120 percent since 2002 and our coal costs are approximately 40 percent higher. The costs of other consumables, including steel and reagents, also have increased. Our costs have been affected by the stronger Australian dollar against the U.S. dollar (approximate 40 percent increase since the beginning of 2003), which comprise approximately 15 percent of PT Freeport Indonesia’s production costs. We are pursuing cost reduction initiatives to mitigate the impacts of these increases.
Unit treatment charges vary with the price of copper, and unit royalty costs vary with prices of copper and gold. In addition, market rates for treatment charges have increased significantly since 2004 and will vary based on PT Freeport Indonesia’s customer mix. The copper royalty rate payable by PT Freeport Indonesia under its Contract of Work varies from 1.5 percent of copper net revenue at a copper price of $0.90 or less per pound to 3.5 percent at a copper price of $1.10 or more per pound. The Contract of Work royalty rate for gold and silver sales is 1.0 percent.
In connection with our fourth concentrator mill expansion completed in 1998, PT Freeport Indonesia agreed to pay the Government of Indonesia additional royalties (royalties not required by the Contract of Work) to provide further support to the local governments and the people of the Indonesian province of Papua (see Note 1 in our 2005 Annual Report on Form 10-K). The additional royalties are paid on metal from production from PT Freeport Indonesia’s milling facilities above 200,000 metric tons of ore per day. PT Freeport Indonesia’s royalty rate on copper net revenues from production above 200,000 metric tons of ore per day is double the Contract of Work royalty rate, and the royalty rates on gold and silver sales from production above 200,000 metric tons of ore per day are triple the Contract of Work royalty rates.
Second-quarter 2006 royalty costs totaled $22.9 million, compared with $17.7 million in the second quarter of 2005. Additional royalties, discussed above, totaled $1.4 million in the 2005 quarter and none in the 2006 quarter. Royalty costs totaled $42.9 million, including a $1.4 million final adjustment related to 2005 sales, in the first six months of 2006, compared with $36.5 million in the 2005 period. Additional royalties, discussed above, totaled $3.2 million in the first six months of 2005 and none in 2006. If copper prices average $3.00 per pound and gold prices average $600 per ounce during the remainder of 2006, we would expect royalty costs to total approximately $116 million ($0.10 per pound of copper) in 2006. These estimates assume 2006 sales volumes of 1.2 billion pounds of copper and 1.7 million ounces of gold.
As a result of the lower copper production and sales volumes in the 2006 periods, PT Freeport Indonesia’s unit depreciation rate increased compared with the 2005 periods. Because certain assets are depreciated on a straight-line basis, the unit rate will vary with the level of copper production and sales. In addition, changes to the long-range mine plan discussed above that impact the timing of transitioning from the Grasberg open pit to the Grasberg underground block cave will impact unit rates.
Unit Net Cash Costs: By-Product Method - Unit net cash costs per pound of copper calculated using a by-product method is a measure intended to provide investors with information about the cash generating capacity of our mining operations expressed on a basis relating to our primary metal product, copper. PT Freeport Indonesia uses this measure for the same purpose and for monitoring operating performance by its mining operations. This information differs from measures of performance determined in accordance with generally accepted accounting principles and should not be considered in isolation or as a substitute for measures of performance determined in accordance with generally accepted accounting principles. This measure is presented by other copper and gold mining companies, although our measures may not be comparable to similarly titled measures reported by other companies.
Unit site production and delivery costs in the second quarter and first six months of 2006 averaged $1.23 per pound of copper, $0.52 per pound higher than the $0.71 reported in the second quarter of 2005 and $0.58 per pound higher than the $0.65 reported in the first six months of 2005. Unit site production and delivery costs in the 2006 periods were adversely affected by lower copper sales volumes. In addition, PT Freeport Indonesia adopted EITF 04-6 and no longer defers stripping costs. For 2005, unit costs benefited from the deferral of stripping costs totaling $0.07 per pound in the second quarter and $0.08 per pound in the first six months.
Gold and silver credits averaged $0.85 per pound in the second quarter of 2006 and $1.07 per pound in the first six months of 2006, compared with $0.87 per pound in the second quarter of 2005 and $0.83 per pound in the first six months of 2005. The increase for the first six months of 2006 compared with the first six months of 2005 reflects lower copper sales volumes and higher average realized gold prices. Treatment charges increased to $0.49 per pound in the second quarter of 2006 and to $0.43 per pound in the first six months of 2006 from $0.21 per pound in the 2005 periods primarily because of higher market rates and higher copper prices, including the effects of price participation under our concentrate sales agreements. In addition, unit treatment charges include adjustments to prior period concentrate sales subject to final pricing to reflect the impact on treatment charges resulting from the increase in copper prices totaling $0.07 per pound in the second quarter of 2006 and $0.03 per pound in the first six months of 2006. Royalties of $0.11 per pound in the 2006 quarter and $0.09 per pound in the 2006 six-month period were higher than the year-ago periods ($0.06 per pound) because of higher copper and gold prices.
Assuming average copper prices of $3.00 per pound and average gold prices of $600 per ounce for the remainder of 2006 and achievement of current 2006 sales estimates, PT Freeport Indonesia estimates that its annual 2006 unit net cash costs, including gold and silver credits, would approximate $0.66 per pound. Estimated unit net cash costs for 2006 are projected to be higher than the 2005 average, primarily because of lower 2006 copper and gold sales volumes, higher treatment charges and royalties attributable to increased copper prices and the change in the accounting treatment of stripping costs. Because the majority of PT Freeport Indonesia’s costs are fixed, unit costs vary with the volumes sold and will therefore be lower during the third and fourth quarters of 2006 compared to the projected annual average. Estimated average 2006 unit net cash costs are higher than previous estimates of $0.54 per pound, primarily reflecting the impact of higher copper prices on treatment charges and royalties, lower copper volumes and higher energy costs. Unit net cash costs for 2006 would change by approximately $0.02 per pound for each $25 per ounce change in the average price of gold for the balance of the year.
Unit Net Cash Costs: Co-Product Method - Using the co-product method, unit site production and delivery costs in the second quarter of 2006 averaged $0.98 per pound of copper, compared with $0.45 in the 2005 quarter. Unit site production and delivery costs in the first six months of 2006 averaged $0.93 per pound of copper, compared with $0.42 in the 2005 period. For gold, unit site production and delivery costs in the second quarter of 2006 averaged $185 per ounce, compared with $126 in the 2005 quarter. Unit site production and delivery costs in the first six months of 2006 averaged $172 per ounce, compared with $115 in the 2005 period. As discussed above, unit site production and delivery costs in the 2006 periods were impacted by the lower sales volumes resulting from lower ore grades and the adoption of EITF 04-6. Treatment charges per pound and per ounce were higher in the 2006 periods primarily because of higher market rates and copper prices. In addition, unit treatment charges include adjustments to prior period concentrate sales subject to final pricing to reflect the impact of the increase in copper prices totaling $0.05 per pound for copper and $9.84 per ounce for gold in the second quarter of 2006 and $0.02 per pound for copper and $3.91 per ounce for gold in the first six months of 2006. Royalties per pound and per ounce were also higher in the 2006 periods because of higher copper and gold prices compared with the 2005 periods.
PT Freeport Indonesia Exploration Activities
PT Freeport Indonesia’s exploration efforts in 2006 are focused on testing extensions of the Deep Grasberg and Kucing Liar mine complex, the resource potential below the previously mined Ertsberg deposit and other targets in Block A, the existing producing area of the Grasberg minerals district. We continue to assess the timing of resumption of suspended exploration activities in areas outside Block A.
The Indonesian government previously approved suspensions of our field exploration activities outside of our current mining operations area, which have been in suspension in recent years due to safety and security issues and regulatory uncertainty relating to a possible conflict between our mining and exploration rights in certain forest areas and an Indonesian Forestry law enacted in 1999 prohibiting open-pit mining in forest preservation areas. The current suspensions were granted for one-year periods ending November 15, 2006, for Eastern Minerals; February 26, 2007, for Block B; and March 30, 2007, for PT Nabire Bakti Mining. Recent Indonesian legislation permits open-pit mining in PT Freeport Indonesia’s Block B area, subject to certain requirements. We continue to assess these requirements and security issues. The timing for our resumption of exploration activities in our Contract of Work areas outside of Block A depends on the resolution of these matters.
SMELTING AND REFINING
Our investment in smelters serves an important role in our concentrate marketing strategy. PT Freeport Indonesia generally sells approximately one-half of its concentrate production to its affiliated smelters, Atlantic Copper and PT Smelting, and the remainder to other customers. Treatment charges for smelting and refining copper concentrates represent a cost to PT Freeport Indonesia and income to Atlantic Copper and PT Smelting. Through downstream integration, we are assured placement of a significant portion of our concentrate production. Low smelter treatment and refining charges in recent years adversely affected the operating results of Atlantic Copper and benefited the operating results of PT Freeport Indonesia’s mining operations. Market rates for treatment and refining charges have increased significantly since late 2004 as worldwide smelter availability was insufficient to accommodate increased mine production. Higher treatment and refining charges benefit our smelter operations and adversely affect our mining operations. Taking into account taxes and minority ownership interests, an equivalent change in smelting and refining charge rates essentially offsets in our consolidated operating results.
Atlantic Copper Operating Results | | | | |
| (In Millions) | Second Quarter | | Six Months | |
| | 2006 | | 2005 | | 2006 | | 2005 | |
| Gross profit | $25.3 | | $2.8 | | $42.6 | | $4.3 | |
| Add depreciation and amortization expense | 7.4 | | 7.1 | | 14.8 | | 14.2 | |
| Other | 0.5 | | 1.1 | | 0.1 | | 2.1 | |
| Cash margin | $33.2 | | $11.0 | | $57.5 | | $20.6 | |
| | | | | | | | | |
| Operating income (loss) (in millions) | $21.8 | | $(0.1 | ) | $35.3 | | $(1.6 | ) |
| Concentrate and scrap treated (metric tons) | 228,900 | | 246,900 | | 479,600 | | 462,700 | |
| Anodes production (000s of pounds) | 138,700 | | 159,400 | | 295,800 | | 306,800 | |
| Treatment rates per pound | $0.34 | | $0.21 | | $0.32 | | $0.19 | |
| Cathodes sales (000s of pounds) | 131,100 | | 140,800 | | 267,700 | | 273,400 | |
Cathode cash unit cost per pounda | $0.21 | | $0.18 | | $0.20 | | $0.18 | |
| Gold sales in anodes and slimes (ounces) | 199,000 | | 178,900 | | 444,600 | | 246,200 | |
| | |
| a. | For a reconciliation of cathode cash unit cost per pound to production costs applicable to sales reported in FCX’s consolidated financial statements refer to “Product Revenues and Production Costs” below. |
Atlantic Copper’s operating cash margin was $33.2 million in the second quarter of 2006, compared with $11.0 million in the 2005 quarter, and $57.5 million in the first six months of 2006, compared with $20.6 million in the 2005 period. Atlantic Copper reported operating income of $21.8 million in the second quarter of 2006 and $35.3 million for the first six months of 2006, compared with operating losses of $0.1 million in the 2005 quarter and $1.6 million in the 2005 six-month period. The positive results in the 2006 periods primarily reflect higher treatment charges. The next major maintenance activity at Atlantic Copper is a 22-day maintenance turnaround currently scheduled for 2007.
Atlantic Copper treated 228,900 metric tons of concentrate and scrap in the second quarter of 2006, compared with 246,900 metric tons in the 2005 quarter. For the six-month periods, concentrate and scrap
treated totaled 479,600 metric tons in 2006 and 462,700 metric tons in 2005. Cathode production totaled 131.5 million pounds and sales totaled 131.1 million pounds during the second quarter of 2006, compared with cathode production of 137.8 million pounds and sales of 140.8 million pounds during the second quarter of 2005. For the six-month periods, cathode production totaled 260.9 million pounds and sales totaled 267.7 million pounds during 2006, compared with cathode production of 269.5 million pounds and sales of 273.4 million pounds during 2005.
Atlantic Copper’s treatment charges (including price participation), which reflect charges paid by PT Freeport Indonesia and third parties to Atlantic Copper to smelt and refine concentrates, averaged $0.34 per pound during the second quarter of 2006, $0.21 per pound during the second quarter of 2005, $0.32 per pound during the first six months of 2006 and $0.19 per pound during the first six months of 2005. The significant increase in treatment charges in the 2006 periods reflects higher market rates and price participation under the terms of Atlantic Copper’s concentrate purchase and sales agreements. Price participation totaled $0.09 per pound in the second quarter of 2006 and $0.08 per pound in the first six months of 2006 (compared with $0.03 per pound in the 2005 periods). Treatment charge rates have increased significantly since late 2004 with increased mine production and higher copper prices. Assuming copper prices of $3.00 per pound for the remainder of 2006, Atlantic Copper expects these rates to average approximately $0.32 per pound in 2006. Atlantic Copper’s cathode cash unit cost per pound of copper averaged $0.21 in the second quarter of 2006, $0.18 in the second quarter of 2005, $0.20 in the first six months of 2006 and $0.18 in the first six months of 2005. Higher unit costs in the 2006 periods primarily reflect the impact of lower volumes.
We defer recognizing profits on PT Freeport Indonesia’s sales to Atlantic Copper and on 25 percent of PT Freeport Indonesia’s sales to PT Smelting until the final sales to third parties occur. Changes in these net deferrals resulted in additions to our operating income totaling $34.2 million ($18.1 million to net income or $0.08 per share) in the second quarter of 2006 and $108.4 million ($57.4 million to net income or $0.26 per share) in the first six months of 2006. For the 2005 periods, changes in these net deferrals resulted in an addition to our operating income totaling $48.3 million ($25.7 million to net income or $0.12 per share) in the second quarter and a reduction of $15.2 million ($8.5 million to net income or $0.04 per share) in the first six months. At June 30, 2006, our net deferred profits on PT Freeport Indonesia concentrate inventories at Atlantic Copper and PT Smelting to be recognized in future periods’ net income after taxes and minority interest sharing totaled $60.5 million. Based on copper prices of $3.00 per pound and gold prices of $600 per ounce for the third quarter of 2006 and current shipping schedules, we estimate the net change in deferred profits on intercompany sales will result in a decrease to net income of approximately $10 million in the third quarter of 2006. The actual change in deferred intercompany profits may differ substantially from this estimate because of changes in the timing of shipments to affiliated smelters and metal prices.
The majority of Atlantic Copper’s revenues are denominated in U.S. dollars; however, operating costs, other than concentrate purchases, and certain asset and liability accounts are denominated in euros. Atlantic Copper’s estimated annual euro payments total approximately 100 million euros. A $0.05 increase or decrease in the exchange rate would result in an approximate $5 million change in annual costs. The exchange rate on June 30, 2006, was $1.27 per euro.
As of June 30, 2006, FCX’s net investment in Atlantic Copper totaled approximately $144 million, FCX had a $189.5 million loan outstanding to Atlantic Copper and Atlantic Copper’s debt to third parties under nonrecourse financing arrangements totaled $22.1 million.
Atlantic Copper had euro-denominated net monetary liabilities at June 30, 2006, totaling $15.0 million recorded at an exchange rate of $1.27 per euro. The exchange rate was $1.18 per euro at December 31, 2005 and $1.21 per euro at March 31, 2006. Adjustments to Atlantic Copper’s euro-denominated net monetary liabilities to reflect changes in the exchange rate are recorded in other income (expense) and totaled $(0.4) million in the second quarter of 2006, $3.4 million in the second quarter of 2005, $(1.6) million in the first six months of 2006 and $6.3 million in the first six months of 2005.
Table of Contents
PT Smelting Operating Results
| | Second Quarter | | Six Months | |
| (In Millions) | 2006 | | 2005 | | 2006 | | 2005 | |
| PT Freeport Indonesia sales to PT Smelting | $325.4 | �� | $194.9 | | $607.9 | | $429.0 | |
| Equity in PT Smelting earnings | 2.0 | | 2.6 | | 5.6 | | 5.2 | |
| PT Freeport Indonesia operating profits (deferred) recognized | (7.8 | ) | 2.6 | | 13.0 | | - | |
| | | | | | | | | |
PT Freeport Indonesia accounts for its 25 percent interest in PT Smelting using the equity method and provides PT Smelting with substantially all of its concentrate requirements. PT Smelting treated 187,500 metric tons of concentrate in the second quarter of 2006, 230,700 metric tons in the second quarter of 2005, 421,900 metric tons in the first six months of 2006 and 457,100 metric tons in the first six months of 2005. PT Smelting completed a 22-day maintenance turnaround in the second quarter of 2006 which resulted in lower production during the period, and the next major maintenance turnaround is scheduled for 2008. PT Smelting is currently expanding its production capacity from 250,000 metric tons of copper metal per year to 270,000 metric tons of copper metal per year. PT Smelting produced 127.3 million pounds of cathodes and sold 129.6 million pounds of cathodes in the second quarter of 2006, compared with production of 146.1 million pounds and sales of 145.5 million pounds in the second quarter of 2005. For the first six months of 2006, cathode production totaled 269.7 million pounds and sales totaled 270.3 million pounds, compared with cathode production of 289.6 million pounds and sales of 289.2 million pounds for the first six months of 2005. PT Smelting’s cathode cash unit costs averaged $0.25 per pound in the second quarter of 2006 and $0.19 per pound in the first six months of 2006, compared with $0.10 per pound in both of the 2005 periods, primarily reflecting the impact of the maintenance turnaround discussed above and higher energy costs in the 2006 periods (see “Product Revenues and Production Costs”).
In late 2005 and early 2006, PT Smelting entered into hedging contracts to fix a portion of its revenues through 2007. FCX’s share of the unrealized losses on these contracts totaled $10.9 million as of June 30, 2006, and is recorded in accumulated other comprehensive income in stockholders’ equity.
OTHER FINANCIAL RESULTS
The FCX/Rio Tinto joint ventures incurred $3.9 million of aggregate exploration costs in the second quarter of 2006, $3.7 million in the second quarter of 2005, $7.8 million in the first six months of 2006 and $6.7 million in the first six months of 2005. As discussed above in “PT Freeport Indonesia Exploration Activities,” our exploration program for 2006 is focused on testing extensions of the Deep Grasberg and Kucing Liar mine complex, the resource potential below the previously mined Ertsberg deposit and other targets in Block A. Our share of these exploration costs, which are charged to expense, totaled $2.8 million in the second quarter of 2006, $2.3 million in the second quarter of 2005, $5.4 million in the first six months of 2006 and $4.3 million in the first six months of 2005.
Consolidated general and administrative expenses increased to $35.1 million in the second quarter of 2006, compared with $25.4 million in the year-ago period. For the first six months of 2006, general and administrative expenses increased to $65.8 million, compared with $47.0 million for the first six months of 2005. The increases in the 2006 periods primarily relate to increased incentive compensation, including stock-based compensation, and charitable contributions. On January 1, 2006, we adopted Statement of Financial Accounting Standards No. 123 (revised 2004), “Share-Based Payment” or “SFAS No. 123R.” Stock-based compensation costs totaled $12.1 million in the second quarter of 2006, including $6.3 million charged to general and administrative expenses, $3.5 million in the second quarter of 2005, including $2.2 million charged to general and administrative expenses, $25.5 million in the first six months of 2006, including $13.2 million charged to general and administrative expenses, and $7.9 million in the first six months of 2005, including $5.3 million charged to general and administrative expenses.
Our parent company charges PT Freeport Indonesia for the in-the-money value of exercised employee stock options. These charges are eliminated in consolidation; however, PT Freeport Indonesia shares a
portion of these charges with Rio Tinto and Rio Tinto’s reimbursements reduce our consolidated general and administrative expenses. General and administrative expenses are net of Rio Tinto’s share of joint venture reimbursements for employee stock option exercises, which decreased general and administrative expenses by $2.6 million in the second quarter of 2006, $0.1 million in the second quarter of 2005, $7.1 million in the first six months of 2006 and $3.0 million in the first six months of 2005. In accordance with our joint venture agreement, Rio Tinto’s percentage share of PT Freeport Indonesia’s general and administrative expenses varies with metal sales volumes and prices and totaled approximately 8 percent in the first six months of 2006, compared with 16 percent in the first six months of 2005.
Total consolidated interest cost (before capitalization) was $23.3 million in the second quarter of 2006, $36.3 million in the second quarter of 2005, $47.8 million in the first six months of 2006 and $74.7 million in the first six months of 2005. Interest costs decreased primarily because we reduced average debt levels, with significant reductions in 2005. Our interest cost for 2006 is expected to be lower compared to 2005 primarily because of the 2005 debt reductions. See “Capital Resources and Liquidity - Financing Activities” for further discussion. Capitalized interest totaled $2.3 million in the second quarter of 2006, $1.0 million in the second quarter of 2005, $4.1 million in the first six months of 2006 and $1.9 million in the first six months of 2005.
Foreign Currency Exchange Risk
The functional currency for our operations in Indonesia and Spain is the U.S. dollar. All of our revenues and a significant portion of our costs are denominated in U.S. dollars; however, some costs and certain asset and liability accounts are denominated in Indonesian rupiah, Australian dollars or euros. Generally, our results are positively affected when the U.S. dollar strengthens in relation to those foreign currencies and adversely affected when the U.S. dollar weakens in relation to those foreign currencies.
One U.S. dollar was equivalent to 9,825 rupiah at December 31, 2005, 9,066 rupiah at March 31, 2006, and 9,288 rupiah at June 30, 2006. PT Freeport Indonesia recorded gains (losses) to production costs totaling $(0.2) million in the second quarter of 2006, $0.4 million in the second quarter of 2005, $(0.1) million in the first six months of 2006 and $0.1 million in the first six months of 2005 related to its rupiah-denominated net monetary assets and liabilities. PT Freeport Indonesia’s labor costs are mostly rupiah denominated. At estimated aggregate annual rupiah payments of 1.6 trillion for operating costs and an exchange rate of 9,288 rupiah to one U.S. dollar, the exchange rate as of June 30, 2006, a one-thousand-rupiah increase in the exchange rate would result in an approximate $16 million decrease in aggregate annual operating costs. A one-thousand-rupiah decrease in the exchange rate would result in an approximate $20 million increase in aggregate annual operating costs.
Approximately 15 percent of PT Freeport Indonesia’s total purchases of materials, supplies and services are denominated in Australian dollars. The exchange rate was $0.73 to one Australian dollar at December 31, 2005, $0.72 to one Australian dollar at March 31, 2006, and $0.74 to one Australian dollar at June 30, 2006. At estimated annual aggregate Australian dollar payments of 225 million and an exchange rate of $0.74 to one Australian dollar, the exchange rate as of June 30, 2006, a $0.01 increase or decrease in the exchange rate would result in an approximate $2 million change in aggregate annual operating costs.
At times, PT Freeport Indonesia has entered into foreign currency forward contracts to hedge a portion of its aggregate anticipated Indonesian rupiah and/or Australian dollar payments. As of June 30, 2006, PT Freeport Indonesia had foreign currency contracts to hedge 375.0 billion in rupiah payments, including certain rupiah-based capital expenditures, or approximately 47 percent of aggregate projected rupiah payments for the remainder of 2006, at an average exchange rate of 10,111 rupiah to one U.S. dollar. PT Freeport Indonesia accounts for these contracts as cash flow hedges.
CAPITAL RESOURCES AND LIQUIDITY
Our operating cash flows vary with prices realized for copper and gold sales, our production levels, production costs, cash payments for income taxes and interest, other working capital changes and other factors. Based on current mine plans and subject to future copper and gold prices, we expect to generate cash flows significantly greater than our budgeted capital expenditures and scheduled debt maturities, providing opportunities to reduce debt further and return cash to shareholders through dividends and share purchases. Common stock dividends totaled $352.5 million in the first six months of 2006, including $94.2 million ($0.50 per share) for a supplemental dividend paid on March 31, 2006 and $140.4 million ($0.75 per share) for a supplemental dividend paid on June 30, 2006. Our current regular annual common stock dividend, which is declared by our Board, is $1.25 per share, paid at a quarterly rate of $0.3125 per share. On August 1, 2006, our Board declared a supplemental dividend of $0.75 per share payable September 29, 2006 to shareholders of record on September 14, 2006.
We purchased 2.0 million shares of our common stock for $99.8 million ($49.94 per share average) during the second quarter of 2006 and have purchased a total of 7.8 million shares for $279.5 million ($36.05 per share average) under the Board authorized 20-million share open market purchase program. As of July 31, 2006, 12.2 million shares remain available under the Board authorized 20-million share open market purchase program.
The potential payment of future regular and supplemental dividends will be determined by our Board of Directors and will be dependent upon many factors, including our cash flows and financial position, copper and gold prices, and general economic and market conditions. The timing of future purchases of our common stock is dependent upon a number of factors including the price of our common shares, our cash flows and financial position, copper and gold prices and general economic and market conditions.
Operating Activities
We generated operating cash flows totaling $375.9 million, net of $519.2 million that we used for working capital, during the first six months of 2006, compared with $620.5 million, including $162.6 million from working capital sources, during the first six months of 2005. Using estimated sales volumes for the remainder of 2006 and assuming average prices of $3.00 per pound of copper and $600 per ounce of gold for the remainder of 2006, we would generate operating cash flows approximating $1.6 billion in 2006, with over $1.2 billion in the second half of the year.
Investing Activities
Total capital expenditures of $110.3 million in the first six months of 2006 were nearly double the $59.3 million reported in the 2005 period. Our capital expenditures for the 2006 period included approximately $8 million for the DOZ expansion, $7 million for the Common Infrastructure project and $29 million for Big Gossan. Capital expenditures, including approximately $120 million for long-term projects, are estimated to total $250 million for 2006. In the first quarter of 2005, PT Freeport Indonesia received the $23.2 million balance of its share of insurance settlement proceeds related to its open-pit slippage claim, $2.0 million of which represented a recovery of property losses.
Financing Activities
As of June 30, 2006, we had total unrestricted cash and cash equivalents of $357.8 million and total outstanding debt of approximately $1.1 billion. Total debt was reduced by a net $184.1 million during the first six months of 2006, including $167.4 million for the mandatory redemption of FCX’s Gold-Denominated Preferred Stock, Series II. The mandatory redemption was based on average gold prices at the time of redemption ($548.92 per ounce) and totaled $236.4 million, resulting in a $69.0 million loss recognized in revenues ($36.6 million to net income or $0.17 per share). Other debt reductions in the first half of 2006 included:
| · | privately negotiated transactions to induce conversion of $16.0 million of 7% Convertible Senior Notes due 2011 into 0.5 million shares of FCX common stock and |
Table of Contents| · | purchases in open-market transactions of $11.5 million of 10⅛% Senior Notes due 2010 for $12.6 million. |
As a result of the induced conversions and open-market transactions, we recorded charges of $2.2 million ($1.5 million to net income, net of related reduction of interest expense, or $0.01 per share) in the first six months of 2006. In July 2006, we induced conversion of an additional $14.5 million of 7% Convertible Senior Notes due 2011 into 0.5 million shares of FCX common stock.
Following the debt repayments and redemption during the first six months of 2006, we have $92.1 million, including $25.8 million for the final redemption of our Silver-Denominated Preferred Stock, in debt maturities for the remainder of 2006, which can be funded with the $357.8 million of cash on hand. Debt maturities total $58.5 million for the three-year period of 2007 through 2009.
In July 2006, FCX and PT Freeport Indonesia entered into an amended credit agreement for a $465 million revolving credit facility compared with its previous $195 million facility that was scheduled to mature in September 2006. The new facility, which can be expanded to up to $500 million with additional lender commitments, matures in 2009 and no amounts are outstanding under the facility.
On August 1, 2006, we funded the final scheduled annual redemption payment on our Silver-Denominated Preferred Stock for $25.8 million. The mandatory redemption will result in a $12.5 million decrease in debt and a reduction of revenues of $13.3 million, $7.0 million to net income, in the third quarter of 2006.
During the first six months of 2005, total debt was reduced by $169.8 million, primarily reflecting a prepayment of $187.0 million of bank debt associated with Puncakjaya Power’s power-generating facilities at PT Freeport Indonesia’s mining operations and repurchases of $11.0 million of our 7.50% Senior Notes due 2006 and 7.20% Senior Notes due 2026, net of changes in other borrowings.
In the first six months of 2006, total common stock dividends were $352.5 million ($1.88 per share), including two supplemental dividends of $0.50 per share on March 31, 2006, and $0.75 per share on June 30, 2006. Since December 2004, we have paid six supplemental dividends totaling $551.7 million ($3.00 per share). In the first six months of 2005, we paid our regular quarterly dividend ($0.25 per share) in February and May and a supplemental common stock dividend of $0.50 per share in March, for total common stock dividends of $179.7 million for the 2005 period. The declaration and payment of dividends is at the discretion of our Board of Directors. The amount of our current quarterly cash dividend ($0.3125 per share) on our common stock and the possible payment of additional future supplemental cash dividends will depend on our financial results, cash requirements, future prospects and other factors deemed relevant by our Board of Directors.
During the first six months of 2006 and 2005, cash dividends on preferred stock of $30.3 million represent dividends on our 5½% Convertible Perpetual Preferred Stock. Each share of preferred stock was initially convertible into 18.8019 shares of our common stock, equivalent to an initial conversion price of approximately $53.19 per common share. The conversion rate is adjustable upon the occurrence of certain events, including any quarter that our common stock dividend exceeds $0.20 per share. As a result of the quarterly and supplemental common stock dividends paid through June 2006 discussed above, each share of preferred stock is now convertible into 20.2481 shares of FCX common stock, equivalent to a conversion price of approximately $49.39 per common share. Cash dividends to minority interests represent dividends paid to the minority interest owners of PT Freeport Indonesia and Puncakjaya Power. Pursuant to the restricted payment covenants in our 10⅛% Senior Notes and 6⅞% Senior Notes, the amount available for dividend payments, purchases of our common stock and other restricted payments as of June 30, 2006, was approximately $625 million.
In 2003, our Board of Directors approved a new open market share purchase program for up to 20 million shares, which replaced our previous program. Through July 31, 2006, we acquired 7.8 million shares for $279.5 million ($36.05 per share average), including 2.0 million shares in the second quarter of 2006 for $99.8 million ($49.94 per share average), and 12.2 million shares remain available. The timing of future purchases of our common stock is dependent on many factors including the price of our common shares,
our cash flows and financial position, copper and gold prices and general economic and market conditions.
Debt Maturities. Below is a summary (in millions) of our total debt maturities based on loan balances as of June 30, 2006, and the original issue amount for mandatorily redeemable preferred stock.
| | 2006 | | 2007 | | 2008 | | 2009 | | 2010 | | Thereafter | |
| Equipment loans and other | $ | 6.8 | | $ | 13.5 | | $ | 13.5 | | $ | 13.5 | | $ | 10.2 | | $ | 3.8 | |
| 7.50% Senior Notes due 2006 | | 55.4 | | | - | | | - | | | - | | | - | | | - | |
| Atlantic Copper debt | | 4.1 | | | 18.0 | | | - | | | - | | | - | | | - | |
| Redeemable preferred stock | | 12.5 | | | - | | | - | | | - | | | - | | | - | |
| 10⅛% Senior Notes due 2010 | | - | | | - | | | - | | | - | | | 272.4 | | | - | |
7% Convertible Senior Notes due 2011a | | - | | | - | | | - | | | - | | | - | | | 307.7 | |
| 6⅞% Senior Notes due 2014 | | - | | | - | | | - | | | - | | | - | | | 340.3 | |
| 7.20% Senior Notes due 2026 | | - | | | - | | | - | | | - | | | - | | | 0.2 | |
| Total debt maturities | $ | 78.8 | | $ | 31.5 | | $ | 13.5 | | $ | 13.5 | | $ | 282.6 | | $ | 652.0 | |
| Pro forma adjustments | | 13.3 | b | | - | | | - | | | - | | | - | | | (14.5 | )c |
| Pro forma debt maturities | $ | 92.1 | | $ | 31.5 | | $ | 13.5 | | $ | 13.5 | | $ | 282.6 | | $ | 637.5 | |
| | | | | | | | | | | | | | | | | | | |
| a. | Conversion price is $30.87 per share. |
| b. | Represents the additional amount due above the original issue amount of our Silver-Denominated Preferred Stock. The adjustment is based on the August 2006 redemption amount. |
| c. | Represents the amount of 7% Convertible Senior Notes due 2011 that we induced conversion of in July 2006 (see above). |
NEW ACCOUNTING STANDARDS
Accounting for Stock-Based Compensation. As of June 30, 2006, we had four stock-based employee compensation plans and two stock-based director compensation plans. Prior to January 1, 2006, we accounted for options granted under all of our plans under the recognition and measurement principles of Accounting Principles Board (APB) Opinion No. 25, “Accounting for Stock Issued to Employees,” and related interpretations, as permitted by SFAS No. 123, “Accounting for Stock-Based Compensation.” APB Opinion No. 25 required compensation cost for stock options to be recognized based on the difference on the date of grant, if any, between the quoted market price of the stock and the amount an employee must pay to acquire the stock (i.e., the intrinsic value). Because all the plans require that the option exercise price be at least the market price on the date of grant, we recognized no compensation cost on the grant or exercise of our employees’ options through December 31, 2005. Other awards under the plans did result in compensation costs being recognized in earnings based on the projected intrinsic value for restricted stock units to be granted in lieu of cash compensation and the intrinsic value on the reporting or exercise date for cash-settled stock appreciation rights (SARs).
Effective January 1, 2006, we adopted the fair value recognition provisions of SFAS No. 123R using the modified prospective transition method. Under that transition method, compensation cost recognized in 2006 includes: (a) compensation costs for all stock option awards granted to employees prior to, but not yet vested as of January 1, 2006, based on the grant-date fair value estimated in accordance with the original provisions of SFAS No. 123, and (b) compensation cost for all stock option awards granted subsequent to January 1, 2006, based on the grant-date fair value estimated in accordance with the provisions of SFAS No. 123R. Fair value of stock option awards granted to employees was calculated using the Black-Scholes-Merton option-pricing model before and after adoption of SFAS No. 123R. Other stock-based awards charged to expense under SFAS No. 123 continue to be charged to expense under SFAS No. 123R (see Note 2). These include restricted stock units granted in lieu of certain cash compensation and SARs, which are settled in cash. Results for prior periods have not been restated.
As a result of adopting SFAS No. 123R on January 1, 2006, our income before income taxes and minority interests for the three months ended June 30, 2006, was $6.8 million lower and net income was $4.0 million ($0.02 per basic and diluted share) lower, and our income before income taxes and minority
interests for the six months ended June 30, 2006, was $15.9 million lower and net income was $9.3 million ($0.05 per basic share and $0.04 per diluted share) lower than if we had continued to account for share-based compensation under APB Opinion No. 25.
Prior to the adoption of SFAS No. 123R, we presented all tax benefits resulting from the exercise of stock options as operating cash flows in the Consolidated Statements of Cash Flows. SFAS No. 123R requires the cash flows generated by tax benefits resulting from tax deductions in excess of the compensation cost recognized for those options (excess tax benefits) to be classified as financing cash flows. The $22.5 million excess tax benefit classified as a financing cash inflow in the Consolidated Statements of Cash Flows for the six months ended June 30, 2006 would have been classified as an operating cash inflow if we had not adopted SFAS No. 123R.
Compensation cost charged against earnings for stock-based awards is shown below (in thousands). We did not capitalize any stock-based compensation costs to fixed assets during the periods presented.
| | | Three Months Ended | | Six Months Ended | |
| | | June 30, | | June 30, | |
| | | 2006 | | 2005 | | 2006 | | 2005 | |
| Production and delivery costs | | $ | 5,505 | | $ | 1,288 | | $ | 11,584 | | $ | 2,582 | |
| General and administrative expenses | | | 6,294 | a | | 2,175 | a, b | | 13,146 | a | | 5,300 | a, b |
| Exploration expenses | | | 316 | | | - | | | 743 | | | - | |
| Total stock-based compensation cost | | $ | 12,115 | | $ | 3,463 | | $ | 25,473 | | $ | 7,882 | |
| | | | | | | | | | | | | | |
| a. | Amounts are before Rio Tinto’s share of joint venture reimbursements for employee exercises of in-the-money stock options which reduced general and administrative expenses by $2.6 million in the 2006 quarter, $0.1 million in the 2005 quarter, $7.1 million in the 2006 six-month period and $3.0 million in the 2005 six-month period. |
| b. | Includes amortization of the intrinsic value of FCX’s Class A stock options that were converted to Class B stock options in 2002 totaling $0.5 million for the 2005 quarter and $1.0 million for the 2005 six-month period. |
As of June 30, 2006, total compensation cost related to nonvested stock option awards not yet recognized in earnings was $60.9 million.
Deferred Mining Costs. On January 1, 2006, we adopted EITF 04-6, which requires that stripping costs incurred during production be considered costs of the extracted minerals and included as a component of inventory to be recognized in cost of sales in the same period as the revenue from the sale of inventory. Upon adoption of EITF 04-6, we recorded our deferred mining costs asset ($285.4 million) at December 31, 2005, net of taxes, minority interest share and inventory effects ($135.9 million), as a cumulative effect adjustment to reduce our retained earnings on January 1, 2006. In addition, stripping costs incurred in 2006 and later periods are now charged to cost of sales as incurred. As a result of adopting EITF 04-6 on January 1, 2006, our income before income taxes and minority interests for the three months ended June 30, 2006, was $5.9 million lower and net income was $3.2 million ($0.02 per basic share and $0.01 per diluted share) lower, and our income before income taxes and minority interests for the six months ended June 30, 2006, was $38.7 million lower and net income was $20.6 million ($0.11 per basic share and $0.09 per diluted share) lower than if we had not adopted EITF 04-6 and continued to defer stripping costs. Adoption of the new guidance has no impact on our cash flows.
Accounting for Uncertainty in Income Taxes. In June 2006, the Financial Accounting Standards Board issued Interpretation No. 48, “Accounting for Uncertainty in Income Taxes,” (FIN 48). FIN 48 clarifies the accounting for income taxes by prescribing the minimum recognition threshold a tax position is required to meet before being recognized in the financial statements. FIN 48 also provides guidance on derecognition, measurement, classification, interest and penalties, accounting in interim periods, disclosure and transition. FIN 48 is effective for the first fiscal year beginning after December 15, 2006. We are reviewing the provisions of FIN 48 and have not yet determined the impact of adoption.
Table of Contents
PRODUCT REVENUES AND PRODUCTION COSTS
PT Freeport Indonesia Product Revenues and Unit Net Cash Costs
All amounts used in both the by-product and co-product method presentations are included in our recorded results under generally accepted accounting principles. We separately identify certain of these amounts as shown in the following reconciliation to amounts reported in our consolidated financial statements and as explained here.
| 1. | We show adjustments to copper revenues for prior period open sales as separate line items. Because such copper pricing adjustments do not result from current period sales, we have reflected these separately from revenues on current period sales. |
| 2. | Noncash and nonrecurring costs consist of items such as stock-based compensation costs starting January 1, 2006 (see “New Accounting Standards”), write-offs of equipment or unusual charges. They are removed from site production and delivery costs in the calculation of unit net cash costs. |
| 3. | Gold and silver revenues, excluding any impacts from redemption of our gold-and silver-denominated preferred stocks, are reflected as credits against site production and delivery costs in the by-product method. |
Three Months Ended June 30, 2006 | | | | |
| | By-Product | | Co-Product Method | |
| (In Thousands) | Method | | Copper | | Gold | | Silver | | Total | |
| Revenues, after adjustments shown below | $ | 741,511 | | $ | 741,511 | | $ | 175,763 | | $ | 10,750 | | $ | 928,024 | |
| | | | | | | | | | | | | | | | |
| Site production and delivery, before net noncash | | | | | | | | | | | | | | | |
| and nonrecurring costs shown below | | 270,904 | | | 216,458 | | | 51,308 | | | 3,138 | | | 270,904 | |
| Gold and silver credits | | (186,513 | ) | | - | | | - | | | - | | | - | |
| Treatment charges | | 107,196 | a | | 85,652 | b | | 20,302 | b | | 1,242 | b | | 107,196 | |
| Royalty on metals | | 22,934 | | | 18,325 | | | 4,344 | | | 265 | | | 22,934 | |
| Unit net cash costs | | 214,521 | | | 320,435 | | | 75,954 | | | 4,645 | | | 401,034 | |
| Depreciation and amortization | | 33,910 | | | 27,095 | | | 6,422 | | | 393 | | | 33,910 | |
| Noncash and nonrecurring costs, net | | 10,404 | | | 8,313 | | | 1,970 | | | 121 | | | 10,404 | |
| Total unit costs | | 258,835 | | | 355,843 | | | 84,346 | | | 5,159 | | | 445,348 | |
| Revenue adjustments, primarily for pricing on | | | | | | | | | | | | | | | |
| prior period open sales | | 237,274 | | | 237,274 | | | - | | | - | | | 237,274 | |
| PT Smelting intercompany profit elimination | | (7,849 | ) | | (6,271 | ) | | (1,487 | ) | | (91 | ) | | (7,849 | ) |
| Gross profit | $ | 712,101 | | $ | 616,671 | | $ | 89,930 | | $ | 5,500 | | $ | 712,101 | |
| | | | | | | | | | | | | | | | |
Reconciliation to Amounts Reported | | | | | | | | | | | | | | | |
| (In Thousands) | Revenues | | Production and Delivery | | Depreciation and Amortization | | | | | | | |
| Totals presented above | $ | 928,024 | | $ | 270,904 | | $ | 33,910 | | | | | | | |
| Net noncash and nonrecurring costs per above | | N/A | | | 10,404 | | | N/A | | | | | | | |
| Less: Treatment charges per above | | (107,196 | ) | | N/A | | | N/A | | | | | | | |
| Royalty per above | | (22,934 | ) | | N/A | | | N/A | | | | | | | |
| Revenue adjustments, primarily for pricing on | | | | | | | | | | | | | | | |
| prior period open sales per above | | 237,274 | | | N/A | | | N/A | | | | | | | |
| Mining and exploration segment | | 1,035,168 | | | 281,308 | | | 33,910 | | | | | | | |
| Smelting and refining segment | | 593,134 | | | 560,375 | | | 7,410 | | | | | | | |
| Eliminations and other | | (202,100 | ) | | (236,076 | ) | | 2,035 | | | | | | | |
| As reported in FCX’s consolidated financial | | | | | | | | | | | | | | | |
| statements | $ | 1,426,202 | | $ | 605,607 | | $ | 43,355 | | | | | | | |
| | | | | | | | | | | | | | | | |
Three Months Ended June 30, 2005 | | | | |
| | By-Product | | Co-Product Method | |
| (In Thousands) | Method | | Copper | | Gold | | Silver | | Total | |
| Revenues, after adjustments shown below | $ | 480,076 | | $ | 480,076 | | $ | 264,040 | | $ | 7,406 | | $ | 751,522 | |
| | | | | | | | | | | | | | | | |
| Site production and delivery, before net noncash | | | | | | | | | | | | | | | |
| and nonrecurring costs shown below | | 221,071 | c | | 141,221 | d | | 77,671 | d | | 2,179 | d | | 221,071 | |
| Gold and silver credits | | (271,446 | ) | | - | | | - | | | - | | | - | |
| Treatment charges | | 67,867 | | | 43,354 | | | 23,844 | | | 669 | | | 67,867 | |
| Royalty on metals | | 17,741 | | | 11,333 | | | 6,233 | | | 175 | | | 17,741 | |
| Unit net cash costs | | 35,233 | | | 195,908 | | | 107,748 | | | 3,023 | | | 306,679 | |
| Depreciation and amortization | | 44,217 | | | 28,246 | | | 15,535 | | | 436 | | | 44,217 | |
| Noncash and nonrecurring costs, net | | 2,284 | | | 1,459 | | | 802 | | | 23 | | | 2,284 | |
| Total unit costs | | 81,734 | | | 225,613 | | | 124,085 | | | 3,482 | | | 353,180 | |
| Revenue adjustments, primarily for pricing on | | | | | | | | | | | | | | | |
| prior period open sales | | 12,472 | | | 12,472 | | | - | | | - | | | 12,472 | |
| PT Smelting intercompany profit recognized | | 2,552 | | | 1,630 | | | 897 | | | 25 | | | 2,552 | |
| Gross profit | $ | 413,366 | | $ | 268,565 | | $ | 140,852 | | $ | 3,949 | | $ | 413,366 | |
| | | | | | | | | | | | | | | | |
Reconciliation to Amounts Reported | | | | | | | | | | | | | | | |
| (In Thousands) | Revenues | | Production and Delivery | | Depreciation and Amortization | | | | | | | |
| Totals presented above | $ | 751,522 | | $ | 221,071 | | $ | 44,217 | | | | | | | |
| Net noncash and nonrecurring costs per above | | N/A | | | 2,284 | | | N/A | | | | | | | |
| Less: Treatment charges per above | | (67,867 | ) | | N/A | | | N/A | | | | | | | |
| Royalty per above | | (17,741 | ) | | N/A | | | N/A | | | | | | | |
| Revenue adjustments, primarily for pricing on | | | | | | | | | | | | | | | |
| prior period open sales per above | | 12,472 | | | N/A | | | N/A | | | | | | | |
| Mining and exploration segment | | 678,386 | | | 223,355 | | | 44,217 | | | | | | | |
| Smelting and refining segment | | 331,897 | | | 321,909 | | | 7,141 | | | | | | | |
| Eliminations and other | | (107,374 | ) | | (154,678 | ) | | 2,801 | | | | | | | |
| As reported in FCX’s consolidated financial | | | | | | | | | | | | | | | |
| statements | $ | 902,909 | | $ | 390,586 | | $ | 54,159 | | | | | | | |
| | | | | | | | | | | | | | | | |
| a. | Includes $14.4 million or $0.07 per pound for adjustments to prior quarters’ concentrate sales subject to final pricing to reflect the impact on treatment charges resulting from the increase in copper prices since March 31, 2006. |
| b. | Includes $11.5 million or $0.05 per pound for copper, $2.7 million or $9.84 per ounce for gold and $0.2 million or $0.20 per ounce for silver for adjustments to prior quarters’ concentrate sales subject to final pricing to reflect the impact on treatment charges resulting from the increase in copper prices since March 31, 2006. |
| c. | Net of deferred mining costs totaling $20.6 million or $0.07 per pound. Following adoption of EITF 04-6 on January 1, 2006 (see Note 3 and New Accounting Standards), stripping costs are no longer deferred. |
| d. | Net of deferred mining costs totaling $13.2 million or $0.04 per pound for copper, $7.2 million or $11.74 per ounce for gold and $0.2 million or $0.19 per ounce for silver (see Note c above). |
Six Months Ended June 30, 2006 | | | | |
| | By-Product | | Co-Product Method | |
| (In Thousands) | Method | | Copper | | Gold | | Silver | | Total | |
| Revenues, after adjustments shown below | $ | 1,460,234 | | $ | 1,460,234 | | $ | 458,561 | | $ | 18,507 | | $ | 1,937,302 | |
| | | | | | | | | | | | | | | | |
| Site production and delivery, before net noncash | | | | | | | | | | | | | | | |
| and nonrecurring costs shown below | | 545,913 | | | 411,480 | | | 129,218 | | | 5,215 | | | 545,913 | |
| Gold and silver credits | | (477,068 | ) | | - | | | - | | | - | | | - | |
| Treatment charges | | 190,839 | a | | 143,844 | b | | 45,172 | b | | 1,823 | b | | 190,839 | |
| Royalty on metals | | 42,869 | | | 32,312 | | | 10,147 | | | 410 | | | 42,869 | |
| Unit net cash costs | | 302,553 | | | 587,636 | | | 184,537 | | | 7,448 | | | 779,621 | |
| Depreciation and amortization | | 67,683 | | | 51,016 | | | 16,021 | | | 646 | | | 67,683 | |
| Noncash and nonrecurring costs, net | | 22,072 | | | 16,637 | | | 5,224 | | | 211 | | | 22,072 | |
| Total unit costs | | 392,308 | | | 655,289 | | | 205,782 | | | 8,305 | | | 869,376 | |
| Revenue adjustments, primarily for pricing on | | | | | | | | | | | | | | | |
| prior period open sales and gold hedging | | 128,357 | c | | 197,319 | | | (68,962 | ) | | - | | | 128,357 | |
| PT Smelting intercompany profit recognized | | 12,979 | | | 9,783 | | | 3,072 | | | 124 | | | 12,979 | |
| Gross profit | $ | 1,209,262 | | $ | 1,012,047 | | $ | 186,889 | | $ | 10,326 | | $ | 1,209,262 | |
| | | | | | | | | | | | | | | | |
Reconciliation to Amounts Reported | | | | | | | | | | | | | | | |
| (In Thousands) | Revenues | | Production and Delivery | | Depreciation and Amortization | | | | | | | |
| Totals presented above | $ | 1,937,302 | | $ | 545,913 | | $ | 67,683 | | | | | | | |
| Net noncash and nonrecurring costs per above | | N/A | | | 22,072 | | | N/A | | | | | | | |
| Less: Treatment charges per above | | (190,839 | ) | | N/A | | | N/A | | | | | | | |
| Royalty per above | | (42,869 | ) | | N/A | | | N/A | | | | | | | |
| Revenue adjustments, primarily for pricing on | | | | | | | | | | | | | | | |
| prior period open sales and hedging per above | | 128,357 | | | N/A | | | N/A | | | | | | | |
| Mining and exploration segment | | 1,831,951 | | | 567,985 | | | 67,683 | | | | | | | |
| Smelting and refining segment | | 1,109,238 | | | 1,051,812 | | | 14,816 | | | | | | | |
| Eliminations and other | | (428,865 | ) | | (536,275 | ) | | 4,106 | | | | | | | |
| As reported in FCX’s consolidated financial | | | | | | | | | | | | | | | |
| statements | $ | 2,512,324 | | $ | 1,083,522 | | $ | 86,605 | | | | | | | |
| | | | | | | | | | | | | | | | |
Six Months Ended June 30, 2005 | | | | |
| | By-Product | | Co-Product Method | |
| (In Thousands) | Method | | Copper | | Gold | | Silver | | Total | |
| Revenues, after adjustments shown below | $ | 995,096 | | $ | 995,096 | | $ | 515,038 | | $ | 16,506 | | $ | 1,526,640 | |
| | | | | | | | | | | | | | | | |
| Site production and delivery, before net noncash | | | | | | | | | | | | | | | |
| and nonrecurring costs shown below | | 414,425 | d | | 270,131 | e | | 139,813 | e | | 4,481 | e | | 414,425 | |
| Gold and silver credits | | (531,544 | ) | | - | | | - | | | - | | | - | |
| Treatment charges | | 139,353 | | | 90,833 | | | 47,013 | | | 1,507 | | | 139,353 | |
| Royalty on metals | | 36,519 | | | 23,804 | | | 12,320 | | | 395 | | | 36,519 | |
| Unit net cash costs | | 58,753 | | | 384,768 | | | 199,146 | | | 6,383 | | | 590,297 | |
| Depreciation and amortization | | 91,142 | | | 59,408 | | | 30,749 | | | 985 | | | 91,142 | |
| Noncash and nonrecurring costs, net | | 2,808 | | | 1,831 | | | 947 | | | 30 | | | 2,808 | |
| Total unit costs | | 152,703 | | | 446,007 | | | 230,842 | | | 7,398 | | | 684,247 | |
| Revenue adjustments, primarily for pricing on | | | | | | | | | | | | | | | |
| prior period open sales | | 15,016 | | | 15,016 | | | - | | | - | | | 15,016 | |
| PT Smelting intercompany profit elimination | | (25 | ) | | (16 | ) | | (9 | ) | | - | | | (25 | ) |
| Gross profit | $ | 857,384 | | $ | 564,089 | | $ | 284,187 | | $ | 9,108 | | $ | 857,384 | |
| | | | | | | | | | | | | | | | |
Reconciliation to Amounts Reported | | | | | | | | | | | | | | | |
| (In Thousands) | Revenues | | Production and Delivery | | Depreciation and Amortization | | | | | | | |
| Totals presented above | $ | 1,526,640 | | $ | 414,425 | | $ | 91,142 | | | | | | | |
| Net noncash and nonrecurring costs per above | | N/A | | | 2,808 | | | N/A | | | | | | | |
| Less: Treatment charges per above | | (139,353 | ) | | N/A | | | N/A | | | | | | | |
| Royalty per above | | (36,519 | ) | | N/A | | | N/A | | | | | | | |
| Revenue adjustments, primarily for pricing on | | | | | | | | | | | | | | | |
| prior period open sales per above | | 15,016 | | | N/A | | | N/A | | | | | | | |
| Mining and exploration segment | | 1,365,784 | | | 417,233 | | | 91,142 | | | | | | | |
| Smelting and refining segment | | 604,013 | | | 585,486 | | | 14,230 | | | | | | | |
| Eliminations and other | | (263,823 | ) | | (247,127 | ) | | 5,713 | | | | | | | |
| As reported in FCX’s consolidated financial | | | | | | | | | | | | | | | |
| statements | $ | 1,705,974 | | $ | 755,592 | | $ | 111,085 | | | | | | | |
| | | | | | | | | | | | | | | | |
| a. | Includes $12.4 million or $0.03 per pound for adjustments to 2005 concentrate sales subject to final pricing to reflect the impact on treatment charges resulting from the increase in copper prices since December 31, 2005. |
| b. | Includes $9.3 million or $0.02 per pound for copper, $2.9 million or $3.91 per ounce for gold and $0.1 million or $0.08 per ounce for silver for adjustments to 2005 concentrate sales subject to final pricing to reflect the impact on treatment charges resulting from the increase in copper prices since December 31, 2005. |
| c. | Includes a $69.0 million or $0.16 per pound loss on the redemption of FCX’s Gold-Denominated Preferred Stock, Series II. |
| d. | Net of deferred mining costs totaling $52.8 million or $0.08 per pound. Following adoption of EITF 04-6 on January 1, 2006 (see Note 3 and New Accounting Standards), stripping costs are no longer deferred. |
| e. | Net of deferred mining costs totaling $34.4 million or $0.05 per pound for copper, $17.8 million or $14.70 per ounce for gold and $0.6 million or $0.25 per ounce for silver (see Note d above). |
CATHODE CASH UNIT COST
Cathode cash unit cost per pound of copper is a measure intended to provide investors with information about the costs incurred to produce cathodes at our smelting operations in Spain and Indonesia. We use this measure for the same purpose and for monitoring operating performance at our smelting operations. This information differs from measures of performance determined in accordance with generally accepted accounting principles and should not be considered in isolation or as a substitute for measures of performance determined in accordance with generally accepted accounting principles. Other smelting companies present this measure, although Atlantic Copper’s and PT Smelting’s measures may not be comparable to similarly titled measures reported by other companies.
Atlantic Copper Cathode Cash Unit Cost Per Pound Of Copper
The reconciliation below presents reported production costs for our smelting and refining segment (Atlantic Copper) and subtracts or adds components of those costs that do not directly relate to the process of converting copper concentrates to cathodes. The adjusted production costs amounts are used to calculate Atlantic Copper’s cathode cash unit cost per pound of copper (in thousands, except per pound amounts):
Table of Contents
| | Three Months Ended | | Six Months Ended | |
| | June 30, | | June 30, | |
| | 2006 | | 2005 | | 2006 | | 2005 | |
| Smelting and refining segment production costs reported | | | | | | | | | | | | |
| in FCX’s consolidated financial statements | $ | 560,375 | | $ | 321,909 | | $ | 1,051,812 | | $ | 585,486 | |
| Less: | | | | | | | | | | | | |
| Raw material purchase costs | | (409,477 | ) | | (209,199 | ) | | (735,418 | ) | | (406,470 | ) |
| Production costs of anodes sold | | (1,524 | ) | | (2,368 | ) | | (6,049 | ) | | (5,766 | ) |
| Other | | 3,335 | | | 179 | | | 4,447 | | | (1,034 | ) |
| Credits: | | | | | | | | | | | | |
| Gold and silver revenues | | (118,816 | ) | | (78,473 | ) | | (248,859 | ) | | (110,421 | ) |
| Acid and other by-product revenues | | (6,279 | ) | | (7,291 | ) | | (12,938 | ) | | (14,591 | ) |
| Production costs used in calculating cathode cash unit | | | | | | | | | | | | |
| cost per pound | $ | 27,614 | | $ | 24,757 | | $ | 52,995 | | $ | 47,204 | |
| | | | | | | | | | | | | |
| Pounds of cathode produced | | 131,500 | | | 137,800 | | | 260,900 | | | 269,500 | |
| | | | | | | | | | | | | |
| Cathode cash unit cost per pound | $ | 0.21 | | $ | 0.18 | | $ | 0.20 | | $ | 0.18 | |
| | | | | | | | | | | | | |
PT Smelting Cathode Cash Unit Cost Per Pound of Copper
The calculation below presents PT Smelting’s reported operating costs and subtracts or adds components of those costs that do not directly relate to the process of converting copper concentrates to cathodes. PT Smelting’s operating costs are then reconciled to PT Freeport Indonesia’s equity in PT Smelting earnings reported in FCX’s consolidated financial statements (in thousands, except per pound amounts):
| | Three Months Ended | | Six Months Ended | |
| | June 30, | | June 30, | |
| | 2006 | | 2005 | | 2006 | | 2005 | |
| Operating costs - PT Smelting (100%) | $ | 31,438 | | $ | 17,623 | | $ | 55,404 | | $ | 36,074 | |
| Add: Gold and silver refining charges | | 1,039 | | | 1,119 | | | 2,505 | | | 2,075 | |
| Less: Acid and other by-product revenues | | (3,666 | ) | | (3,641 | ) | | (7,402 | ) | | (7,502 | ) |
| Other | | 3,522 | | | (400 | ) | | 1,922 | | | (898 | ) |
| Production costs used in calculating cathode cash unit | | | | | | | | | | | | |
| cost per pound | $ | 32,333 | | $ | 14,701 | | $ | 52,429 | | $ | 29,749 | |
| | | | | | | | | | | | | |
| Pounds of cathode produced | | 127,300 | | | 146,100 | | | 269,700 | | | 289,600 | |
| | | | | | | | | | | | | |
| Cathode cash unit cost per pound | $ | 0.25 | | $ | 0.10 | | $ | 0.19 | | $ | 0.10 | |
| | | | | | | | | | | | | |
Reconciliation to Amounts Reported | | | | | | | | | | | | |
| Operating costs per above | $ | (31,438 | ) | $ | (17,623 | ) | $ | (55,404 | ) | $ | (36,074 | ) |
| Other costs | | (528,549 | ) | | (312,792 | ) | | (1,000,584 | ) | | (590,943 | ) |
| Revenue and other income | | 568,252 | | | 340,904 | | | 1,078,729 | | | 648,130 | |
| PT Smelting net income | | 8,265 | | | 10,489 | | | 22,741 | | | 21,113 | |
| �� | | | | | | | | | | | | |
| PT Freeport Indonesia’s 25% equity interest | | 2,066 | | | 2,622 | | | 5,685 | | | 5,278 | |
| Amortization of excess investment cost | | (60 | ) | | (60 | ) | | (120 | ) | | (120 | ) |
| Equity in PT Smelting earnings reported in FCX’s | | | | | | | | | | | | |
| consolidated financial statements | $ | 2,006 | | $ | 2,562 | | $ | 5,565 | | $ | 5,158 | |
| | | | | | | | | | | | | |
CAUTIONARY STATEMENT
Our discussion and analysis contains forward-looking statements in which we discuss our expectations regarding future performance. Forward-looking statements are all statements other than historical facts, such as those regarding anticipated sales volumes, ore grades, commodity prices, general and administrative expenses, unit net cash costs, operating cash flows, royalty costs, capital expenditures, debt repayments and refinancing, debt maturities, treatment charge rates, depreciation rates, exploration
efforts and results, dividend payments, liquidity and other financial commitments. We caution you that these statements are not guarantees of future performance, and our actual results may differ materially from those projected, anticipated or assumed in the forward-looking statements. Important factors that can cause our actual results to differ materially from those anticipated in the forward-looking statements include unanticipated mining, milling and other processing problems, accidents that lead to personal injury or property damage, persistent commodity price reductions, changes in political, social or economic circumstances in our area of operations, variances in ore grades, labor relations, adverse weather conditions, the speculative nature of mineral exploration, fluctuations in interest rates and other adverse financial market conditions, and other factors described in more detail under the heading “Risk Factors” in our Form 10-K for the year ended December 31, 2005.
There have been no significant changes in our market risks since the year ended December 31, 2005. For more information, please read the consolidated financial statements and notes thereto included in our Annual Report on Form 10-K for the year ended December 31, 2005.
(a) Evaluation of disclosure controls and procedures. Our chief executive officer and chief financial officer, with the participation of management, have evaluated the effectiveness of our “disclosure controls and procedures” (as defined in Rules 13a-14(c) and 15d-14(c) under the Securities Exchange Act of 1934) as of the end of the period covered by this quarterly report on Form 10-Q. Based on their evaluation, they have concluded that our disclosure controls and procedures are effective in timely alerting them to material information relating to FCX (including our consolidated subsidiaries) required to be disclosed in our periodic Securities and Exchange Commission filings.
(b) Changes in internal controls. There has been no change in our internal control over financial reporting that occurred during the second quarter that has materially affected, or is reasonably likely to materially affect our internal control over financial reporting.
We are involved from time to time in various legal proceedings of a character normally incident to the ordinary course of our business. We believe that potential liability in such proceedings would not have a material adverse effect on our financial condition or results of operations. We maintain liability insurance to cover some, but not all, potential liabilities normally incident to the ordinary course of our business as well as other insurance coverage customary in our business, with coverage limits that we deem prudent.
As reported in January 2006, we are responding to requests from governmental authorities in the United States and Indonesia for information about PT Freeport Indonesia, primarily relating to PT Freeport Indonesia’s support of Indonesian security institutions. As described in our Form 10-K for the year ended December 31, 2005, we provide support to assist security institutions deployed and directed by the Government of Indonesia with infrastructure, logistics and the hardship elements of posting in Papua and our practices adhere to the joint U.S. State Department-British Foreign Office Voluntary Principles on Security and Human Rights. We are cooperating with these requests.
The risk factors included in our Annual Report on Form 10-K for the year ended December 31, 2005, have not materially changed other than the updates set forth below, which should be read in conjunction with our 2005 Form 10-K.
Our Contracts of Work are subject to termination if we do not comply with our contractual obligations, and if a dispute arises, we may have to submit to the jurisdiction of a foreign court or arbitration panel.
PT Freeport Indonesia’s Contracts of Work and other Contracts of Work in which we have an interest were entered into under Indonesia’s 1967 Foreign Capital Investment Law, which provides guarantees of remittance rights and protection against nationalization. Our Contracts of Work can be terminated by the Government of Indonesia if we do not satisfy our contractual obligations, which include the payment of royalties and taxes to the government and the satisfaction of certain mining, environmental, safety and health requirements.
At times, certain government officials and others in Indonesia have questioned the validity of contracts entered into by the Government of Indonesia prior to May 1998 (i.e., during the Suharto regime), including PT Freeport Indonesia’s Contract of Work, which was signed in December 1991. We cannot assure you that the validity of, or our compliance with the Contracts of Work will not be challenged for political or other reasons. PT Freeport Indonesia’s Contracts of Work and our other Contracts of Work require that disputes with the Indonesian government be submitted to international arbitration. Notwithstanding that provision, if a dispute arises under the Contracts of Work, we face the risk of having to submit to the jurisdiction of a foreign court or arbitration panel, and if we prevail in such a dispute, we will face the additional risk of having to enforce the judgment of a foreign court or arbitration panel against Indonesia within its own territory.
Indonesian government officials have periodically raised questions regarding our compliance with Indonesian environmental laws and regulations and the terms of the Contracts of Work. In 2006, the Government of Indonesia created a joint team for “Periodic Evaluation on Implementation of the PT-FI Contract of Work (COW)” to conduct a periodic evaluation every five years. The team consists of five working groups, whose members are from relevant ministries or agencies, covering production, state revenues, community development, environmental issues and security issues. We have conducted numerous working meetings with these groups. The joint team has indicated that it will issue its report shortly. We cannot assure you that the report will conclude that we are complying with all of the provisions of PT Freeport Indonesia’s Contract of Work. Separately, the Indonesian House of Representatives created a working committee on PT Freeport Indonesia. Members of this group have also visited our operations and held a number of hearings in Jakarta. We will continue to work with these groups to respond to their questions about our operations and our compliance with PT Freeport Indonesia’s COW.
Our mining operations create difficult and costly environmental challenges, and future changes in environmental laws, or unanticipated environmental impacts from our operations, could require us to incur increased costs.
Mining operations on the scale of our operations in Papua involve significant environmental risks and challenges. Our primary challenge is to dispose of the large amount of crushed and ground rock material, called tailings, that results from the process by which we physically separate the copper-, gold- and silver-bearing materials from the ore that we mine. Our tailings management plan uses the river system near our mine to transport the tailings to the lowlands where the tailings and natural sediments are deposited in a controlled area contained within a levee system that will be revegetated. We incurred aggregate costs relating to tailings management of $8.7 million in 2005, $11.8 million in 2004 and $8.3 million in 2003.
Another major environmental challenge is managing overburden, which is the rock that must be moved aside in the mining process in order to reach the ore. In the presence of air, water and naturally occurring bacteria, some overburden can cause acid rock drainage, or acidic water containing dissolved metals which, if not properly managed, can have a negative impact on the environment.
Certain Indonesian governmental officials have from time to time raised issues with respect to our tailings and overburden management plans, including a suggestion that we implement a pipeline system rather than our river deposition system for tailings disposal. Because our mining operations are remotely located in steep mountainous terrain and in an active seismic area, a pipeline system would be costly, difficult to construct and maintain, more prone to catastrophic failure and involve environmental issues. An external panel of qualified experts, as directed in our 300K ANDAL (the Environmental Impact Assessment document submitted to the Indonesian government), conducted detailed reviews and analyses of a number of technical studies. They concluded that all significant impacts identified were in line with the
300K ANDAL predictions, and that the current system of riverine tailings management was appropriate considering all site-specific factors. For these reasons, we do not believe that a pipeline system is necessary or practical.
In March 2006, the Indonesian Ministry of Environment announced the preliminary results of its PROPER environmental management audit, acknowledging the effectiveness of PT Freeport Indonesia’s environmental management practices in some areas while making several suggestions for improvement in others. We are working with the Ministry of Environment to address the issues raised as we complete the audit process.
We anticipate that we will continue to spend significant financial and managerial resources on environmental compliance. In addition, changes in Indonesian environmental laws or unanticipated environmental impacts from our operations could require us to incur significant unanticipated costs.
(a) In July 2006, we privately negotiated transactions with holders to induce conversion of $14.5 million of our $575 million 7% Convertible Senior Notes due 2011 into 0.5 million shares of our common stock. This transaction is in reliance on the exemption from registration provided under Section 3(a)(9) of the Securities Act of 1933.
(c) The following table sets forth common shares we repurchased during the three-month period ended June 30, 2006.
| | | | | | | Current Programa |
| Period | | Total Shares Purchased | | Average Price Paid Per Share | | Shares Purchased | | Shares Available for Purchase |
| | | | | | | | | | |
| April 1 to 30, 2006 | | - | | $ | - | | - | | 14,244,200 |
| | | | | | | | | | |
| May 1 to 31, 2006 | | - | | | - | | - | | 14,244,200 |
| | | | | | | | | | |
| June 1 to 30, 2006 | | 1,997,900 | | | 49.94 | | 1,997,900 | | 12,246,300 |
| | | | | | | | | | |
| Total | | 1,997,900 | | | 49.94 | | 1,997,900 | | |
| | | | | | | | | | |
| a. | In October 2003, our Board of Directors approved an open market share purchase program for up to 20 million shares, which replaced our previous program. The program does not have an expiration date. |
Our annual meeting of stockholders was held on May 4, 2006 (the “Annual Meeting”). Proxies were solicited pursuant to Regulation 14A under the Securities Exchange Act of 1934, as amended. The following matters were submitted to a vote of security holders during our Annual Meeting:
| | | Votes Cast For | | Authority Withheld |
| 1. Election of Directors: | | | | |
| Robert J. Allison, Jr. | | 146,967,385 | | 15,793,239 |
| Robert A. Day | | 158,967,066 | | 3,793,558 |
| Gerald J. Ford | | 161,144,159 | | 1,616,465 |
| H. Devon Graham, Jr. | | 149,795,985 | | 12,964,639 |
| J. Bennett Johnston | | 151,476,785 | | 11,283,839 |
| Bobby Lee Lackey | | 147,930,403 | | 14,830,221 |
| Gabrielle K. McDonald | | 151,498,577 | | 11,262,047 |
| James R. Moffett | | 158,787,892 | | 3,972,732 |
| B. M. Rankin, Jr. | | 151,510,240 | | 11,250,384 |
| J. Stapleton Roy | | 151,536,776 | | 11,223,848 |
| J. Taylor Wharton | | 147,946,553 | | 14,814,071 |
There were no abstentions with respect to the election of directors.
| | | | | | | | | Broker |
| | | For | | Against | | Abstentions | | Non-Votes |
| 2. Ratification of Ernst & Young LLP | | | | | | | | |
| as independent auditors | | 161,510,837 | | 225,729 | | 1,010,479 | | - |
| 3. Proposal to adopt 2006 Stock | | | | | | | | |
| Incentive Plan | | 93,317,417 | | 48,580,101 | | 1,335,262 | | - |
| 4. Stockholder proposal urging | | | | | | | | |
| management review its | | | | | | | | |
| policies relating to financial | | | | | | | | |
| support of the Indonesian | | | | | | | | |
| Government security personnel | | 8,828,837 | | 115,848,160 | | 18,555,783 | | 19,514,265 |
The exhibits to this report are listed in the Exhibit Index beginning on Page E-1 hereof.
FREEPORT-McMoRan COPPER & GOLD INC.
Pursuant to the requirements of the Securities Exchange Act of 1934, the registrant has duly caused this report to be signed on its behalf by the undersigned hereunto duly authorized.
FREEPORT-McMoRan COPPER & GOLD INC.
By: /s/ C. Donald Whitmire, Jr.
C. Donald Whitmire, Jr.
Vice President and
Controller-Financial Reporting
(authorized signatory and
Principal Accounting Officer)
Date: August 3, 2006
Freeport-McMoRan Copper & Gold Inc.
Exhibit
Number Description
| 3.1 | | Amended and Restated Certificate of Incorporation of Freeport-McMoRan Copper & Gold Inc. (FCX). Incorporated by reference to Exhibit 3.1 to the Quarterly Report on Form 10-Q of FCX for the quarter ended March 31, 2002 (the FCX 2002 First Quarter Form 10-Q). |
| | | |
| 3.2 | | Certificate of Amendment to Amended and Restated Certificate of Incorporation of FCX. Incorporated by reference to Exhibit 3.1 to the Quarterly Report on Form 10-Q of FCX for the quarter ended March 31, 2003 (the FCX 2003 First Quarter Form 10-Q). |
| | | |
| 3.3 | | Amended and Restated By-Laws of FCX as amended, effective January 31, 2006. Incorporated by reference to Exhibit 3.3 to the Current Report on Form 8-K of FCX dated January 31, 2006. |
| | | |
| 4.1 | | Certificate of Designations of 5½% Convertible Perpetual Preferred Stock of FCX. Incorporated by reference to Exhibit 4.1 to the Current Report on Form 8-K of FCX dated March 30, 2004 and filed March 31, 2004. |
| | | |
| 4.2 | | Amended and Restated Credit Agreement dated as of July 25, 2006, by and among FCX, PT Freeport Indonesia, JPMorgan Chase Bank, N.A. as Administrative Agent, Issuing Bank, Security Agent, JAA Security Agent and Syndication Agent, Citibank, N.A., Merrill Lynch, Pierce, Fenner & Smith Incorporated and The Bank of Nova Scotia, as Co-Documentation Agents, U.S. Bank National Association, as FI Trustee, J.P. Morgan Securities Inc., as Sole Lead Arranger and Sole Bookrunner, and the several financial institutions that are parties thereto. Incorporated by reference to Exhibit 10.1 to the Current Report on Form 8-K of FCX dated July 25, 2006 and filed July 26, 2006. |
| | | |
| 4.3 | | Senior Indenture dated as of November 15, 1996, from FCX to The Chase Manhattan Bank, as Trustee. Incorporated by reference to Exhibit 4.4 to the Registration Statement on Form S-3 of FCX filed November 5, 2001 (the FCX November 5, 2001 Form S-3). |
| 4.4 | | First Supplemental Indenture dated as of November 18, 1996, from FCX to The Chase Manhattan Bank, as Trustee, providing for the issuance of the Senior Notes and supplementing the Senior Indenture dated November 15, 1996, from FCX to such Trustee, providing for the issuance of the 7.50% Senior Notes due 2006 and the 7.20% Senior Notes due 2026. Incorporated by reference to Exhibit 4.5 to the FCX November 5, 2001 Form S-3. |
| | | |
| 4.5 | | Indenture dated as of January 29, 2003, from FCX to The Bank of New York, as Trustee, with respect to the 10⅛% Senior Notes due 2010. Incorporated by reference to Exhibit 4.1 to the Current Report on Form 8-K of FCX dated February 6, 2003. |
| | | |
| 4.6 | | Indenture dated as of February 11, 2003, from FCX to The Bank of New York, as Trustee, with respect to the 7% Convertible Senior Notes due 2011. Incorporated by reference to Exhibit 4.1 to the Current Report on Form 8-K of FCX dated February 11, 2003 and filed February 25, 2003. |
| | | |
| 4.7 | | Indenture dated as of February 3, 2004, from FCX to The Bank of New York, as Trustee, with respect to the 6⅞% Senior Notes due 2014. Incorporated by reference to Exhibit 4.12 to the Annual Report on Form 10-K of FCX for the fiscal year ended December 31, 2003 (the FCX 2003 Form 10-K). |
| 4.8 | | Rights Agreement dated as of May 3, 2000, between FCX and ChaseMellon Shareholder Services, L.L.C., as Rights Agent. Incorporated by reference to Exhibit 4.26 to the Quarterly Report on Form 10-Q of FCX for the quarter ended March 31, 2000. |
| | | |
| 4.9 | | Amendment No. 1 to Rights Agreement dated as of February 26, 2002, between FCX and Mellon Investor Services. Incorporated by reference to Exhibit 4.16 to the FCX 2002 First Quarter Form 10-Q. |
| 10.1 | | Contract of Work dated December 30, 1991, between the Government of the Republic of Indonesia and PT Freeport Indonesia. Incorporated by reference to Exhibit 10.1 to the FCX November 5, 2001 Form S-3. |
| | | |
| 10.2 | | Contract of Work dated August 15, 1994, between the Government of the Republic of Indonesia and PT Irja Eastern Minerals Corporation. Incorporated by reference to Exhibit 10.2 to the FCX November 5, 2001 Form S-3. |
| | | |
| 10.3 | | Participation Agreement dated as of October 11, 1996, between PT Freeport Indonesia and P.T. RTZ-CRA Indonesia with respect to a certain contract of work. Incorporated by reference to Exhibit 10.4 to the FCX November 5, 2001 Form S-3. |
| | | |
| 10.4 | | Agreement dated as of October 11, 1996, to Amend and Restate Trust Agreement among PT Freeport Indonesia, FCX, the RTZ Corporation PLC, P.T. RTZ-CRA Indonesia, RTZ Indonesian Finance Limited and First Trust of New York, National Association, and The Chase Manhattan Bank, as Administrative Agent, JAA Security Agent and Security Agent. Incorporated by reference to Exhibit 10.3 to the Current Report on Form 8-K of FCX dated November 13, 1996 and filed November 15, 1996. |
| | | |
| 10.5 | | Concentrate Purchase and Sales Agreement dated effective December 11, 1996, between PT Freeport Indonesia and PT Smelting. Incorporated by reference to Exhibit 10.3 to the FCX November 5, 2001 Form S-3. |
| | | |
| 10.6 | | Second Amended and Restated Joint Venture and Shareholders’ Agreement dated as of December 11, 1996, among Mitsubishi Materials Corporation, Nippon Mining and Metals Company, Limited and PT Freeport Indonesia. Incorporated by reference to Exhibit 10.5 to the FCX November 5, 2001 Form S-3. |
| | | |
| 10.7 | | Settlement Agreement dated December 17, 2004, between Underwriters Subscribing to Certain Policies Reinsuring the Original Policy, Freeport-McMoRan Insurance Company Limited, FM Services Company (FMS) and FCX. Incorporated by reference to Exhibit 10.7 to the Annual Report on Form 10-K of FCX for the fiscal year ended December 31, 2004 (the FCX 2004 Form 10-K). |
| | | |
| | | Executive Compensation Plans and Arrangements (Exhibits 10.8 through 10.58) |
| | | |
| 10.8 | | Annual Incentive Plan of FCX as amended effective February 2, 1999. Incorporated by reference to Exhibit 10.11 to the Annual Report on Form 10-K of FCX for the fiscal year ended December 31, 1998 (the FCX 1998 Form 10-K). |
| | | |
| 10.9 | | FCX Performance Incentive Awards Program as amended effective February 2, 1999. Incorporated by reference to Exhibit 10.13 to the FCX 1998 Form 10-K. |
| | | |
| 10.10 | | FCX President’s Award Program. Incorporated by reference to Exhibit 10.7 to the FCX November 5, 2001 Form S-3. |
| | | |
| 10.11 | | FCX 1995 Stock Option Plan, as amended and restated. Incorporated by reference to Exhibit 10.3 to the Current Report on Form 8-K of FCX dated May 2, 2006 (the FCX May 2, 2006 Form 8-K). |
| | | |
| 10.12 | | FCX Amended and Restated 1999 Stock Incentive Plan, as amended and restated. Incorporated by reference to Exhibit 10.2 to the FCX May 2, 2006 Form 8-K. |
| 10.13 | | Form of Notice of Grant of Nonqualified Stock Options under the 1999 Stock Incentive Plan. Incorporated by reference to Exhibit 10.14 to the FCX 2005 Second Quarter Form 10-Q. |
| | | |
| 10.14 | | Form of Restricted Stock Unit Agreement under the 1999 Stock Incentive Plan. Incorporated by reference to Exhibit 10.15 to the FCX 2005 Second Quarter Form 10-Q. |
| | | |
| 10.15 | | Form of Performance-Based Restricted Stock Unit Agreement under the 1999 Stock Incentive Plan. Incorporated by reference to Exhibit 10.16 to the FCX 2005 Second Quarter Form 10-Q. |
| | | |
| 10.16 | | FCX 1999 Long-Term Performance Incentive Plan. Incorporated by reference to Exhibit 10.19 to the Annual Report of FCX on Form 10-K for the year ended December 31, 1999 (the FCX 1999 Form 10-K). |
| | | |
| 10.17 | | FCX Stock Appreciation Rights Plan dated May 2, 2000. Incorporated by reference to Exhibit 10.20 to the Quarterly Report on Form 10-Q of FCX for the quarter ended June 30, 2001 (the FCX 2001 Second Quarter Form 10-Q). |
| | | |
| 10.18 | | FCX 2003 Stock Incentive Plan, as amended and restated. Incorporated by reference to Exhibit 10.1 to the FCX May 2, 2006 Form 8-K. |
| | | |
| 10.19 | | Form of Notice of Grant of Nonqualified Stock Options under the 2003 Stock Incentive Plan. Incorporated by reference to Exhibit 10.20 to the FCX 2005 Second Quarter Form 10-Q. |
| | | |
| 10.20 | | Form of Restricted Stock Unit Agreement under the 2003 Stock Incentive Plan. Incorporated by reference to Exhibit 10.21 to the FCX 2005 Second Quarter Form 10-Q. |
| | | |
| 10.21 | | Form of Performance-Based Restricted Stock Unit Agreement under the 2003 Stock Incentive Plan. Incorporated by reference to Exhibit 10.22 to the FCX 2005 Second Quarter Form 10-Q. |
| | | |
| 10.22 | | FCX 1995 Stock Option Plan for Non-Employee Directors. Incorporated by reference to Exhibit 10.23 to the FCX 2005 Second Quarter Form 10-Q. |
| | | |
| 10.23 | | FCX 2004 Director Compensation Plan. Incorporated by reference to Exhibit 10.24 to the FCX 2005 Second Quarter Form 10-Q. |
| | | |
| 10.24 | | Form of Amendment No. 1 to Notice of Grant of Nonqualified Stock Options and Stock Appreciation Rights under the 2004 Director Compensation Plan. Incorporated by reference to Exhibit 10.4 to the FCX May 2, 2006 Form 8-K. |
| | | |
| 10.25 | | FCX 2006 Stock Incentive Plan. Incorporated by reference to Exhibit 10.6 to the FCX May 2, 2006 Form 8-K. |
| | | |
| 10.26 | | Form of Notice of Grant of Nonqualified Stock Options under the 2006 Stock Incentive Plan. Incorporated by reference to Exhibit 10.7 to the FCX May 2, 2006 Form 8-K. |
| | | |
| 10.27 | | Form of Restricted Stock Unit Agreement under the 2006 Stock Incentive Plan. Incorporated by reference to Exhibit 10.8 to the FCX May 2, 2006 Form 8-K. |
| | | |
| 10.28 | | Form of Performance-Based Restricted Stock Unit Agreement under the 2006 Stock Incentive Plan. Incorporated by reference to Exhibit 10.9 to the FCX May 2, 2006 Form 8-K. |
| | | |
| 10.29 | | FCX Director Compensation. Incorporated by reference to Exhibit 10.25 to the FCX 2004 Form 10-K. |
| | | |
| 10.30 | | FCX Supplemental Executive Retirement Plan dated February 26, 2004. Incorporated by reference to Exhibit 10.26 to the FCX 2004 Form 10-K. |
| | | |
| 10.31 | | Amendment No. 1 to FCX Supplemental Executive Retirement Plan. Incorporated by reference to Exhibit 10.1 to the Current Report on Form 8-K of FCX dated May 3, 2005. |
| | | |
| 10.32 | | FCX 2005 Annual Incentive Plan. Incorporated by reference to Exhibit 10.1 to the Current Report on Form 8-K of FCX dated May 5, 2005. |
| | | |
| 10.33 | | FCX Executive Services Program. Incorporated by reference to Exhibit 10.5 to the FCX May 2, 2006 Form 8-K. |
| | | |
| 10.34 | | FM Services Company Performance Incentive Awards Program as amended effective February 2, 1999. Incorporated by reference to Exhibit 10.19 to the FCX 1998 Form 10-K. |
| | | |
| 10.35 | | Consulting Agreement dated as of December 22, 1988, with Kissinger Associates, Inc. (Kissinger Associates). Incorporated by reference to Exhibit 10.21 to the Annual Report on Form 10-K of FCX for the fiscal year ended December 31, 1997 (the FCX 1997 Form 10-K). |
| | | |
| 10.36 | | Letter Agreement dated May 1, 1989, with Kent Associates, Inc. (Kent Associates, predecessor in interest to Kissinger Associates). Incorporated by reference to Exhibit 10.22 to the FCX 1997 Form 10-K. |
| | | |
| 10.37 | | Letter Agreement dated January 27, 1997, among Kissinger Associates, Kent Associates, FCX, Freeport-McMoRan Inc., and FMS. Incorporated by reference to Exhibit 10.26 to the Annual Report on Form 10-K of FCX for the fiscal year ended December 31, 2001 (the FCX 2001 Form 10-K). |
| | | |
| 10.38 | | Supplemental Consulting Agreement with Kissinger Associates and Kent Associates, effective as of January 1, 2006. Incorporated by reference to Exhibit 10.35 to the Annual Report on Form 10-K of FCX for the fiscal year ended December 31, 2005 (the FCX 2005 Form 10-K). |
| | | |
| 10.39 | | Agreement for Consulting Services between FTX and B. M. Rankin, Jr. effective as of January 1, 1990 (assigned to FMS as of January 1, 1996). Incorporated by reference to Exhibit 10.24 to the FCX 1997 Form 10-K. |
| | | |
| 10.40 | | Supplemental Agreement between FMS and B. M. Rankin, Jr. dated December 15, 1997. Incorporated by reference to Exhibit 10.25 to the FCX 1997 Form 10-K. |
| | | |
| 10.41 | | Supplemental Letter Agreement between FMS and B. M. Rankin, Jr., effective as of January 1, 2006. Incorporated by reference to Exhibit 10.38 to the FCX 2005 Form 10-K. |
| | | |
| 10.42 | | Letter Agreement effective as of January 7, 1997, between Senator J. Bennett Johnston, Jr. and FMS. Incorporated by reference to Exhibit 10.31 to the FCX 2001 Form 10-K. |
| | | |
| 10.43 | | Supplemental Letter Agreement dated July 14, 2003, between J. Bennett Johnston, Jr. and FMS. Incorporated by reference to Exhibit 10.28 to the Quarterly Report on Form 10-Q of FCX for the quarter ended June 30, 2003. |
| | | |
| 10.44 | | Supplemental Letter Agreement between FMS and J. Bennett Johnston, Jr., dated January 18, 2005. Incorporated by reference to Exhibit 10.40 to the FCX 2004 Form 10-K. |
| | | |
| 10.45 | | Supplemental Consulting Agreement between FMS and J. Bennett Johnston, Jr., effective as of January 1, 2006. Incorporated by reference to Exhibit 10.42 to the FCX 2005 Form 10-K. |
| | | |
| 10.46 | | Letter Agreement dated November 1, 1999, between FMS and Gabrielle K. McDonald. Incorporated by reference to Exhibit 10.33 to the FCX 1999 Form 10-K. |
| | | |
| 10.47 | | Supplemental Letter Agreement, between FMS and Gabrielle K. McDonald, effective as of January 1, 2006. Incorporated by reference to Exhibit 10.44 to the FCX 2005 Form 10-K. |
| | | |
| 10.48 | | Executive Employment Agreement dated April 30, 2001, between FCX and James R. Moffett. Incorporated by reference to Exhibit 10.35 to the FCX 2001 Second Quarter Form 10-Q. |
| | | |
| 10.49 | | Executive Employment Agreement dated April 30, 2001, between FCX and Richard C. Adkerson. Incorporated by reference to Exhibit 10.36 to the FCX 2001 Second Quarter Form 10-Q. |
| | | |
| 10.50 | | Change of Control Agreement dated April 30, 2001, between FCX and James R. Moffett. Incorporated by reference to Exhibit 10.37 to the FCX 2001 Second Quarter Form 10-Q. |
| | | |
| 10.51 | | Change of Control Agreement dated April 30, 2001, between FCX and Richard C. Adkerson. Incorporated by reference to Exhibit 10.38 to the FCX 2001 Second Quarter Form 10-Q. |
| | | |
| 10.52 | | First Amendment to Executive Employment Agreement dated December 10, 2003, between FCX and James R. Moffett. Incorporated by reference to Exhibit 10.36 to the FCX 2003 Form 10-K. |
| | | |
| 10.53 | | First Amendment to Executive Employment Agreement dated December 10, 2003, between FCX and Richard C. Adkerson. Incorporated by reference to Exhibit 10.37 to the FCX 2003 Form 10-K. |
| | | |
| 10.54 | | First Amendment to Change of Control Agreement dated December 10, 2003, between FCX and James R. Moffett. Incorporated by reference to Exhibit 10.38 to the FCX 2003 Form 10-K. |
| | | |
| 10.55 | | First Amendment to Change of Control Agreement dated December 10, 2003, between FCX and Richard C. Adkerson. Incorporated by reference to Exhibit 10.39 to the FCX 2003 Form 10-K. |
| | | |
| 10.56 | | Change of Control Agreement dated February 3, 2004, between FCX and Michael J. Arnold. Incorporated by reference to Exhibit 10.40 to the FCX 2003 Form 10-K. |
| | | |
| 10.57 | | Change of Control Agreement dated February 3, 2004, between FCX and Mark J. Johnson. Incorporated by reference to Exhibit 10.41 to the FCX 2003 Form 10-K. |
| | | |
| 10.58 | | Change of Control Agreement dated February 3, 2004, between FCX and Kathleen L. Quirk. Incorporated by reference to Exhibit 10.42 to the FCX 2003 Form 10-K. |
| | Letter from Ernst & Young LLP regarding unaudited interim financial statements. |
| | | |
| | Certification of Principal Executive Officer pursuant to Rule 13a-14(a)/15d - 14(a). |
| | | |
| | Certification of Principal Financial Officer pursuant to Rule 13a-14(a)/15d - 14(a). |
| | | |
| | Certification of Principal Executive Officer pursuant to 18 U.S.C. Section 1350. |
| | | |
| | Certification of Principal Financial Officer pursuant to 18 U.S.C Section 1350. |