| UNITED STATES |
| SECURITIES AND EXCHANGE COMMISSION |
| Washington, D.C. 20549 |
| |
| FORM 10-Q |
| |
| (Mark One) |
| [X] QUARTERLY REPORT PURSUANT TO SECTION 13 OR 15(d) OF THE SECURITIES EXCHANGE ACT OF 1934 |
| For the quarterly period ended March 31, 2009 |
| OR |
| [ ] TRANSITION REPORT PURSUANT TO SECTION 13 OR 15(d) OF THE SECURITIES EXCHANGE ACT OF 1934 |
| For the transition period from | | To |
| Commission File Number: 1-9916 |
| |
|
| |
| Freeport-McMoRan Copper & Gold Inc. |
| (Exact name of registrant as specified in its charter) |
| Delaware | 74-2480931 |
| (State or other jurisdiction of | (I.R.S. Employer Identification No.) |
| incorporation or organization) | |
| | |
| One North Central Avenue | |
| Phoenix, AZ | 85004-4414 |
| (Address of principal executive offices) | (Zip Code) |
| |
| (602) 366-8100 |
| (Registrant's telephone number, including area code) |
| |
Indicate by check mark whether the registrant (1) has filed all reports required to be filed by Section 13 or 15(d) of the Securities Exchange Act of 1934 during the preceding 12 months (or for such shorter period that the registrant was required to file such reports), and (2) has been subject to such filing requirements for the past 90 days.
Indicate by check mark whether the registrant is a large accelerated filer, an accelerated filer, a non-accelerated filer or a smaller reporting company. See the definitions of “large accelerated filer,” “accelerated filer” and “smaller reporting company” in Rule 12b-2 of the Exchange Act.
Large accelerated filer R Accelerated filer oÿ Non-accelerated filer o Smaller reporting company oÿ
Indicate by check mark whether the registrant is a shell company (as defined in Rule 12b-2 of the Exchange Act). ÿ0 Yes R No
Indicate by check mark whether the registrant has submitted electronically and posted on its corporate Web site, if any, every Interactive Data File required to be submitted and posted pursuant to Rule 405 of Regulation S-T (§ 232.405 of this chapter) during the preceding 12 months (or for such shorter period that the registrant was required to submit and post such files). ÿo Yes ÿo No
On April 30, 2009, there were issued and outstanding 411,754,522 shares of the registrant’s common stock, par value $0.10 per share.
FREEPORT-McMoRan COPPER & GOLD INC.
TABLE OF CONTENTS
| | |
| | Page |
| 3 |
| | |
| |
| | |
| 3 |
| | |
| 4 |
| | |
| 5 |
| | |
| 6 |
| | |
| 7 |
| | |
| 19 |
| | |
| |
| 20 |
| | |
| 49 |
| | |
| 49 |
| | |
| 50 |
| | |
| 50 |
| | |
| 50 |
| | |
| 50 |
| | |
| 50 |
| | |
| 51 |
| | |
| E-1 |
| | |
FREEPORT-McMoRan COPPER & GOLD INC.
FREEPORT-McMoRan COPPER & GOLD INC. CONDENSED CONSOLIDATED BALANCE SHEETS (Unaudited)
| | | March 31, | | | December 31, | |
| | | 2009 | | | 2008 | |
| | | (In Millions) | |
| | | | | | | | | |
| ASSETS | | | | | | | | |
| Current assets: | | | | | | | | |
| Cash and cash equivalents | | $ | 644 | | | $ | 872 | |
| Trade accounts receivable | | | 880 | | | | 374 | |
| Other accounts receivable | | | 830 | | | | 838 | |
| Product inventories and materials and supplies, net | | | 2,195 | | | | 2,192 | |
| Mill and leach stockpiles | | | 571 | | | | 571 | |
| Other current assets | | | 280 | | | | 386 | |
| Total current assets | | | 5,400 | | | | 5,233 | |
| Property, plant, equipment and development costs, net | | | 16,211 | | | | 16,002 | |
| Long-term mill and leach stockpiles | | | 1,147 | | | | 1,145 | |
| Intangible assets, net | | | 359 | | | | 364 | |
| Trust assets | | | 139 | | | | 142 | |
| Other assets | | | 452 | | | | 467 | |
| Total assets | | $ | 23,708 | | | $ | 23,353 | |
| | | | | | | | | |
| LIABILITIES AND EQUITY | | | | | | | | |
| Current liabilities: | | | | | | | | |
| Accounts payable and accrued liabilities | | $ | 1,941 | | | $ | 2,766 | |
| Accrued income taxes | | | 442 | | | | 163 | |
| Current portion of reclamation and environmental liabilities | | | 178 | | | | 162 | |
| Current portion of long-term debt and short-term borrowings | | | 87 | | | | 67 | |
| Total current liabilities | | | 2,648 | | | | 3,158 | |
| Long-term debt, less current portion: | | | | | | | | |
| Senior notes | | | 6,883 | | | | 6,884 | |
| Project financing, equipment loans and other | | | 257 | | | | 250 | |
| Revolving credit facility | | | – | | | | 150 | |
| Total long-term debt, less current portion | | | 7,140 | | | | 7,284 | |
| Deferred income taxes | | | 2,471 | | | | 2,339 | |
| Reclamation and environmental liabilities, less current portion | | | 1,967 | | | | 1,951 | |
| Other liabilities | | | 1,400 | | | | 1,520 | |
| Total liabilities | | | 15,626 | | | | 16,252 | |
| Equity: | | | | | | | | |
| FCX stockholders’ equity: | | | | | | | | |
| 5½% Convertible Perpetual Preferred Stock | | | 832 | | | | 832 | |
| 6¾% Mandatory Convertible Preferred Stock | | | 2,875 | | | | 2,875 | |
| Common stock | | | 53 | | | | 51 | |
| Capital in excess of par value | | | 14,760 | | | | 13,989 | |
| Accumulated deficit | | | (8,224 | ) | | | (8,267 | ) |
| Accumulated other comprehensive loss | | | (237 | ) | | | (305 | ) |
| Common stock held in treasury | | | (3,409 | ) | | | (3,402 | ) |
| Total FCX stockholders’ equity | | | 6,650 | | | | 5,773 | |
| Noncontrolling interests in subsidiaries | | | 1,432 | | | | 1,328 | |
| Total equity | | | 8,082 | | | | 7,101 | |
| Total liabilities and equity | | $ | 23,708 | | | $ | 23,353 | |
| | | | | | | | | |
The accompanying notes are an integral part of these consolidated financial statements.
FREEPORT-McMoRan COPPER & GOLD INC. CONSOLIDATED STATEMENTS OF INCOME (Unaudited)
| | | | | | | | | | | | | |
| | | | Three Months Ended | |
| | | | March 31, | |
| | | | | | 2009 | | 2008 | |
| | | | | | (In Millions, Except Per | |
| | | | | | Share Amounts) | |
| | | | | | | | | | | | | |
| Revenues | | | | | | | $ | 2,602 | | $ | 5,672 | |
| Cost of sales: | | | | | | | | | | | | |
| Production and delivery | | | | | | | | 1,562 | | | 2,721 | |
| Depreciation, depletion and amortization | | | | | | | | 232 | | | 418 | |
| Lower of cost or market inventory adjustments | | | | | | | | 19 | | | 1 | |
| Total cost of sales | | | | | | | | 1,813 | | | 3,140 | |
| Selling, general and administrative expenses | | | | | | | | 62 | | | 84 | |
| Exploration and research expenses | | | | | | | | 30 | | | 52 | |
| Restructuring and other charges | | | | | | | | 25 | | | – | |
| Total costs and expenses | | | | | | | | 1,930 | | | 3,276 | |
| Operating income | | | | | | | | 672 | | | 2,396 | |
| Interest expense, net | | | | | | | | (131 | ) | | (165 | ) |
| Losses on early extinguishment of debt | | | | | | | | – | | | (6 | ) |
| Other income and expense, net | | | | | | | | (14 | ) | | 2 | |
| Income before income taxes and equity in affiliated companies’ | | | | | | | | |
| net earnings | | | | | | | | 527 | | | 2,227 | |
| Provision for income taxes | | | | | | | | (331 | ) | | (729 | ) |
| Equity in affiliated companies’ net earnings | | | | | | | | 11 | | | 7 | |
| Net income | | | | | | | | 207 | | | 1,505 | |
| Net income attributable to noncontrolling interests in subsidiaries | | | | | | (104 | ) | | (319 | ) |
| Preferred dividends | | | | | | | | (60 | ) | | (64 | ) |
| Net income applicable to common stock | | | | | | | $ | 43 | | $ | 1,122 | |
| | | | | | | | | | | | | |
| Net income per share of common stock attributable to FCX common | | | | | | | | |
| stockholders: | | | | | | | | | | | | |
| Basic | | | | | | | $ | 0.11 | | $ | 2.93 | |
| Diluted | | | | | | | $ | 0.11 | | $ | 2.64 | |
| | | | | | | | | | | | | |
| Average common shares outstanding: | | | | | | | | | | | | |
| Basic | | | | | | | | 400 | | | 383 | |
| Diluted | | | | | | | | 401 | | | 449 | |
| | | | | | | | | | | | | |
| Dividends declared per share of common stock | | | | | | | $ | – | | $ | 0.4375 | |
The accompanying notes are an integral part of these consolidated financial statements.
FREEPORT-McMoRan COPPER & GOLD INC. CONSOLIDATED STATEMENTS OF CASH FLOWS (Unaudited)
| | | Three Months Ended | |
| | | March 31, | |
| | | 2009 | | | 2008 | |
| | | (In Millions) | |
| | | | | | | | | |
| Cash flow from operating activities: | | | | | | | | |
| Net income | | $ | 207 | | | $ | 1,505 | |
| Adjustments to reconcile net income to net cash (used in) provided by | | | | | | | | |
| operating activities: | | | | | | | | |
| Depreciation, depletion and amortization | | | 232 | | | | 418 | |
| Lower of cost or market inventory adjustments | | | 19 | | | | 1 | |
| Stock-based compensation | | | 33 | | | | 47 | |
| Charges for reclamation and environmental liabilities, including accretion | | | 67 | | | | 41 | |
| Losses on early extinguishment of debt | | | – | | | | 6 | |
| Deferred income taxes | | | 73 | | | | (48 | ) |
| Increase in long-term mill and leach stockpiles | | | (3 | ) | | | (47 | ) |
| Amortization of intangible assets/liabilities and other, net | | | 33 | | | | 48 | |
| (Increases) decreases in working capital: | | | | | | | | |
| Accounts receivable | | | (455 | ) | | | (950 | ) |
| Inventories | | | (35 | ) | | | (81 | ) |
| Other current assets | | | 77 | | | | 1 | |
| Accounts payable and accrued liabilities | | | (731 | ) | | | (505 | ) |
| Accrued income and other taxes | | | 249 | | | | 216 | |
| Settlement of reclamation and environmental liabilities | | | (24 | ) | | | (37 | ) |
| Net cash (used in) provided by operating activities | | | (258 | ) | | | 615 | |
| | | | | | | | | |
| Cash flow from investing activities: | | | | | | | | |
| Capital expenditures: | | | | | | | | |
| North America copper mines | | | (72 | ) | | | (151 | ) |
| South America copper mines | | | (74 | ) | | | (63 | ) |
| Indonesia | | | (55 | ) | | | (115 | ) |
| Africa | | | (251 | ) | | | (143 | ) |
| Other | | | (67 | ) | | | (36 | ) |
| Proceeds from the sale of assets and other, net | | | 3 | | | | 21 | |
| Net cash used in investing activities | | | (516 | ) | | | (487 | ) |
| | | | | | | | | |
| Cash flow from financing activities: | | | | | | | | |
| Net proceeds from sale of common stock | | | 740 | | | | – | |
| Proceeds from debt | | | 101 | | | | 473 | |
| Repayments of revolving credit facility and other debt | | | (225 | ) | | | (118 | ) |
| Cash dividends paid: | | | | | | | | |
| Common stock | | | – | | | | (169 | ) |
| Preferred stock | | | (60 | ) | | | (64 | ) |
| Noncontrolling interests | | | – | | | | (49 | ) |
| Net payments for stock-based awards | | | (7 | ) | | | (8 | ) |
| Excess tax benefit from stock-based awards | | | – | | | | 12 | |
| Bank fees and other | | | (3 | ) | | | – | |
| Net cash provided by financing activities | | | 546 | | | | 77 | |
| | | | | | | | | |
| Net (decrease) increase in cash and cash equivalents | | | (228 | ) | | | 205 | |
| Cash and cash equivalents at beginning of year | | | 872 | | | | 1,626 | |
| Cash and cash equivalents at end of period | | $ | 644 | | | $ | 1,831 | |
The accompanying notes are an integral part of these consolidated financial statements.
FREEPORT-McMoRan COPPER & GOLD INC. CONSOLIDATED STATEMENT OF EQUITY (Unaudited)
| | | Freeport-McMoRan Copper & Gold Inc. Stockholders’ Equity | | | | | | |
| | | Convertible Perpetual | | Mandatory Convertible | | | | | | | | | | Common Stock | | | | | | |
| | | Preferred Stock | | Preferred Stock | | Common Stock | | | | | | Accumulated | | Held in Treasury | | Noncontrolling | | | | |
| | | Number | | | | Number | | | | Number | | | | Capital in | | Accumu- | | Other | | Number | | | | Interests | | | | |
| | | of | | At Par | | of | | At Par | | of | | At Par | | Excess of | | lated | | Comprehensive | | of | | At | | in | | Total | |
| | | Shares | | Value | | Shares | | Value | | Shares | | Value | | Par Value | | Deficit | | Loss | | Shares | | Cost | | Subsidiaries | | Equity | |
| | | (In Millions) | |
| | | | | | | | | | | | | | | | | | | | | | | | | | | | | | | | | | | | | | | | |
| Balance at December 31, 2008 | | 1 | | $ | 832 | | | 29 | | $ | 2,875 | | | 505 | | $ | 51 | | $ | 13,989 | | $ | (8,267 | ) | $ | (305 | ) | | 121 | | $ | (3,402 | ) | $ | 1,328 | | $ | 7,101 | |
| Sale of common stock | | – | | | – | | | – | | | – | | | 27 | | | 2 | | | 738 | | | – | | | – | | | – | | | – | | | – | | | 740 | |
| Exercised and issued stock-based awards | | – | | | – | | | – | | | – | | | 1 | | | – | | | – | | | – | | | – | | | – | | | – | | | – | | | – | |
| Stock-based compensation costs | | – | | | – | | | – | | | – | | | – | | | – | | | 33 | | | – | | | – | | | – | | | – | | | – | | | 33 | |
| Tender of shares for stock-based awards | | – | | | – | | | – | | | – | | | – | | | – | | | – | | | – | | | – | | | – | | | (7 | ) | | – | | | (7 | ) |
| Dividends on preferred stock | | – | | | – | | | – | | | – | | | – | | | – | | | – | | | (60 | ) | | – | | | – | | | – | | | – | | | (60 | ) |
| Comprehensive income: | | | | | | | | | | | | | | | | | | | | | | | | | | | | | | | | | | | | | | | |
| Net income | | – | | | – | | | – | | | – | | | – | | | – | | | – | | | 103 | | | – | | | – | | | – | | | 104 | | | 207 | |
| Other comprehensive income, | | | | | | | | | | | | | | | | | | | | | | | | | | | | | | | | | | | | | | | |
| net of taxes: | | | | | | | | | | | | | | | | | | | | | | | | | | | | | | | | | | | | | | | |
| Unrealized gains on securities | | – | | | – | | | – | | | – | | | – | | | – | | | – | | | – | | | 1 | | | – | | | – | | | – | | | 1 | |
| Defined benefit plans: | | | | | | | | | | | | | | | | | | | | | | | | | | | | | | | | | | | | | | | |
| Net gain during period, net of | | | | | | | | | | | | | | | | | | | | | | | | | | | | | | | | | | | | | | | |
| taxes of $40 million | | – | | | – | | | – | | | – | | | – | | | – | | | – | | | – | | | 62 | | | – | | | – | | | – | | | 62 | |
| Amortization of unrecognized amounts | | – | | | – | | | – | | | – | | | – | | | – | | | – | | | – | | | 5 | | | – | | | – | | | – | | | 5 | |
| Other comprehensive income | | – | | | – | | | – | | | – | | | – | | | – | | | – | | | – | | | 68 | | | – | | | – | | | – | | | 68 | |
| Total comprehensive income | | – | | | – | | | – | | | – | | | – | | | – | | | – | | | – | | | – | | | – | | | – | | | – | | | 275 | |
| Balance at March 31, 2009 | | 1 | | $ | 832 | | | 29 | | $ | 2,875 | | | 533 | | $ | 53 | | $ | 14,760 | | $ | (8,224 | ) | $ | (237 | ) | | 121 | | $ | (3,409 | ) | $ | 1,432 | | $ | 8,082 | |
| | | | | | | | | | | | | | | | | | | | | | | | | | | | | | | | | | | | | | | | |
The accompanying notes are an integral part of these consolidated financial statements.
FREEPORT-McMoRan COPPER & GOLD INC. NOTES TO CONSOLIDATED FINANCIAL STATEMENTS (Unaudited)
The accompanying unaudited consolidated financial statements have been prepared in accordance with the instructions to Form 10-Q and do not include all information and disclosures required by generally accepted accounting principles (GAAP) in the United States (U.S.). Therefore, this information should be read in conjunction with Freeport-McMoRan Copper & Gold Inc.’s (FCX) consolidated financial statements and notes contained in its 2008 Annual Report on Form 10-K. The information furnished herein reflects all adjustments which are, in the opinion of management, necessary for a fair statement of the results for the interim periods reported. All such adjustments are, in the opinion of management, of a normal recurring nature. Operating results for the three-month period ended March 31, 2009, are not necessarily indicative of the results that may be expected for the year ending December 31, 2009. FCX changed Phelps Dodge Corporation’s (Phelps Dodge) legal name to Freeport-McMoRan Corporation (FMC) in 2008.
| 2. | RESTRUCTURING AND OTHER CHARGES |
During the fourth quarter of 2008, there was a dramatic decline in copper and molybdenum prices. After averaging $3.05 per pound in 2006, $3.23 per pound in 2007 and $3.61 per pound for the first nine months of 2008, London Metal Exchange (LME) spot copper prices declined to a four-year low of $1.26 per pound in December 2008, averaged $1.78 per pound in the fourth quarter of 2008 and closed at $1.32 per pound on December 31, 2008. Additionally, while molybdenum markets have been strong in recent years with prices averaging approximately $25 per pound in 2006, $30 per pound in 2007 and $33 per pound for the first nine months of 2008, molybdenum prices declined significantly to a four-year low of $8.75 per pound in November 2008, averaged approximately $16 per pound in the fourth quarter of 2008 and closed at $9.50 per pound on December 31, 2008.
While FCX’s long-term strategy of developing its resources to their full potential remains in place, the decline in copper and molybdenum prices in the fourth quarter of 2008 and the deterioration of the economic and credit environment have limited FCX’s ability to invest in growth projects and required FCX to make adjustments to its near-term operating plans. FCX responded to the sudden downturn and uncertain near-term outlook by revising its near-term strategy to protect liquidity while preserving its mineral resources and growth options for the longer term. Accordingly, operating plans were revised in the fourth quarter of 2008 and January 2009 to reflect: (i) curtailment of copper production at higher-cost North America operations and of molybdenum production at the Henderson molybdenum mine; (ii) capital cost reductions; (iii) aggressive cost control, including workforce reductions, reduced equipment purchases that were planned to support expansion projects, a reduction in material and supplies inventory and reductions in exploration, research and administrative costs; and (iv) suspension of FCX’s annual common stock dividend.
Charges recognized in first-quarter 2009 in connection with FCX’s revised operating plans in the fourth quarter of 2008 and January 2009 include restructuring charges of $34 million ($31 million to net income applicable to common stock or $0.07 per diluted share) for contract termination costs, other project cancellation costs, employee severance and benefit costs; partially offset by pension and postretirement gains of $9 million ($9 million to net income applicable to common stock or $0.02 per diluted share) for special retirement benefits and curtailments. The restructuring charge reflects workforce reductions (approximately 3,000 employees related to fourth-quarter 2008 revised operating plans and approximately 1,500 employees related to January 2009 revised operating plans) and other charges that reflect an approximate 50 percent total reduction in mining and crushed-leach rates at the Morenci mine in Arizona, an approximate 50 percent reduction in mining and stacking rates at the Safford mine in Arizona, an approximate 50 percent reduction in the mining rate at the Tyrone mine in New Mexico, suspension of mining and milling activities at the Chino mine in New Mexico (with limited residual copper production from leach operations), and an approximate 40 percent reduction in annual production (an approximate 25 percent reduction began in the fourth quarter of 2008) at the Henderson molybdenum mine in Colorado. In addition, the revised operating plans included decisions to defer certain capital projects, including the (i) incremental expansion projects at the Sierrita and Bagdad mines in Arizona, the Cerro Verde mine in Peru and the sulfide project at the El Abra mine in Chile, (ii) the restart of the Miami mine in Arizona and (iii) the restart of the Climax molybdenum mine in Colorado.
The following table reflects first-quarter 2009 activities associated with the liabilities (included in accounts payable and accrued liabilities) incurred in connection with the fourth quarter of 2008 restructuring (in millions):
| | December 31, | | Additions/ | | | | March 31, | |
| | 2008 | | Adjustments | | Payments | | 2009 | |
| North America Copper Mines | | | | | | | | | | | | |
| Morenci | | | | | | | | | | | | |
| Employee severance and benefit costs | $ | 2 | | $ | – | | $ | (1 | ) | $ | 1 | |
| Contract cancellation and other costs | | – | | | 5 | a | | (5 | ) | | – | |
| Other mines | | | | | | | | | | | | |
| Employee severance and benefit costs | | 12 | | | (2 | ) | | (7 | ) | | 3 | |
| Contract cancellation and other costs | | 1 | | | 6 | | | (2 | ) | | 5 | |
| | | 15 | | | 9 | a | | (15 | ) | | 9 | |
| | | | | | | | | | | | | |
| South America Copper Mines | | | | | | | | | | | | |
| Cerro Verde | | | | | | | | | | | | |
| Contract cancellation and other costs | | 1 | | | – | | | (1 | ) | | – | |
| Other mines | | | | | | | | | | | | |
| Employee severance and benefit costs | | 6 | | | – | | | (3 | ) | | 3 | |
| Contract cancellation and other costs | | – | | | 6 | | | (3 | ) | | 3 | |
| | | 7 | | | 6 | | | (7 | ) | | 6 | |
| | | | | | | | | | | | | |
| Africa | | | | | | | | | | | | |
| Employee severance and benefit costs | | 2 | | | – | | | – | | | 2 | |
| | | | | | | | | | | | | |
| Molybdenum | | | | | | | | | | | | |
| Employee severance and benefit costs | | 1 | | | 1 | | | (2 | ) | | – | |
| | | | | | | | | | | | | |
| Rod & Refining | | | | | | | | | | | | |
| Employee severance and benefit costs | | 4 | | | – | | | (3 | ) | | 1 | |
| | | | | | | | | | | | | |
| Corporate & Other | | | | | | | | | | | | |
| Employee severance and benefit costs | | 6 | | | – | | | (5 | ) | | 1 | |
| Contract cancellation and other costs | | 3 | | | – | | | (3 | ) | | – | |
| | | 9 | | | – | | | (8 | ) | | 1 | |
| | | | | | | | | | | | | |
| Total | $ | 38 | | $ | 16 | a | $ | (35 | ) | $ | 19 | |
| a. | Excludes $3 million for the write off of other current assets in connection with a lease cancellation. |
The following table reflects first-quarter 2009 activities associated with the liabilities (included in accounts payable and accrued liabilities) incurred in connection with the January 2009 restructuring (in millions):
| | 2009 | | | | March 31, | |
| | Additions | | Payments | | 2009 | |
| North America Copper Mines | | | | | | | | | |
| Morenci | | | | | | | | | |
| Employee severance and benefit costs | $ | 12 | | $ | (2 | ) | $ | 10 | |
| Contract cancellation and other costs | | 3 | | | (1 | ) | | 2 | |
| Total | $ | 15 | | $ | (3 | ) | $ | 12 | |
| | | | | | | | | | |
| 3. | PENSION AND POSTRETIREMENT BENEFITS |
During the first quarter of 2009, FCX remeasured its plan assets and benefit obligations for the FMC Retirement Plan and the FMC Retiree Medical Plan as a result of employee reductions caused by FCX’s revised operating plans.
Information as of and for the three months ended March 31, 2009, on the FMC Retirement Plan and the FMC Retiree Medical Plan follows (in millions):
| | | FMC | | FMC | |
| | | Retirement | | Retiree | |
| | | Plan | | Medical Plan | |
| Change in benefit obligation: | | | | | | | |
| Benefit obligation at beginning of period | | $ | 1,289 | | $ | 222 | |
| Service cost | | | 6 | | | – | |
| Interest cost | | | 19 | | | 3 | |
| Actuarial gains | | | (165 | ) | | (9 | ) |
Special retirement benefits and curtailmentsa | | | (9 | ) | | (3 | ) |
| Benefits paid, net of employee contributions and | | | | | | | |
| Medicare Part D subsidy (retiree medical plan) | | | (29 | ) | | (6 | ) |
| Benefit obligation at end of period | | | 1,111 | | | 207 | |
| | | | | | | | |
| Change in plan assets: | | | | | | | |
| Fair value of plan assets at beginning of period | | | 924 | | | – | |
| Actual return on plan assets | | | (57 | ) | | – | |
| Employer contributions | | | – | | | 6 | |
| Benefits paid, net of employee contributions | | | (29 | ) | | (6 | ) |
| Fair value of plan assets at end of period | | | 838 | | | – | |
| | | | | | | | |
| Funded status | | $ | (273 | ) | $ | (207 | ) |
| | | | | | | | |
| Discount rate assumption | | | 7.30 | % | | 6.90 | % |
| a. | Resulted from reductions in the workforce caused by the revised mine operating plans (see Note 2 for further discussion). |
Following is a reconciliation of the benefit obligation, fair value of plan assets and funded status as of December 31, 2008, for FCX’s pension plans (as reported in FCX’s 2008 Annual Report on Form 10-K) to the FMC Retirement Plan beginning balances shown above (in millions):
| | | | | Fair Value | | | |
| | | Benefit | | of Plan | | Funded | |
| | | Obligation | | Assets | | Status | |
| FCX’s pension plans as reported | | $ | 1,412 | | $ | 959 | | $ | (453 | ) |
| Less: FMC plans other than the FMC Retirement Plan, | | | | | | | | | | |
| and FCX’s SERP, director and excess benefit plans | | | (123 | ) | | (35 | ) | | 88 | |
| FMC Retirement Plan | | $ | 1,289 | | $ | 924 | | $ | (365 | ) |
| | | | | | | | | | | |
Following is a reconciliation of the benefit obligation, fair value of plan assets and funded status as of December 31, 2008, for FCX’s postretirement medical and life insurance benefit plans (as reported in FCX’s 2008 Annual Report on Form 10-K) to the FMC Retiree Medical Plan beginning balances shown above (in millions):
| | | | | Fair Value | | | |
| | | Benefit | | of Plan | | Funded | |
| | | Obligation | | Assets | | Status | |
| FCX’s postretirement medical and life insurance | | | | | | | | | | |
| benefit plans as reported | | $ | 257 | | $ | – | | $ | (257 | ) |
| Less: FCX’s medical and life insurance benefit plans | | | | | | | | | | |
| other than the FMC Retiree Medical Plan | | | (35 | ) | | – | | | 35 | |
| FMC Retiree Medical Plan | | $ | 222 | | $ | – | | $ | (222 | ) |
| | | | | | | | | | | |
The components of net periodic benefit cost for pension and postretirement benefits for the three-month periods ended March 31, 2009 and 2008, follow (in millions):
| | | | | Three Months Ended | |
| | | | | March 31, | |
| | | | | | | 2009 | | 2008 | |
| Service cost | | | | | | | | $ | 9 | | $ | 9 | |
| Interest cost | | | | | | | | | 27 | | | 27 | |
| Expected return on plan assets | | | | | | | | | (20 | ) | | (32 | ) |
| Amortization of prior service cost | | | | | | | | | – | | | 2 | |
| Amortization of net actuarial loss | | | | | | | | | 8 | | | – | |
| Curtailments | | | | | | | | | (4 | ) | | – | |
| Special retirement benefits | | | | | | | | | (5 | ) | | – | |
| Net periodic benefit costs | | | | | | | | $ | 15 | | $ | 6 | |
| | | | | | | | | | | | | | |
Net periodic benefit costs increased as a result of a decrease in the expected return on plan assets ($12 million) and amortization of actuarial losses ($8 million) primarily in connection with the losses on plan assets, partially offset by gains on special retirement benefits and curtailments ($9 million) resulting from workforce reductions caused by the revised mine operating plans.
FCX’s basic net income per share of common stock was calculated by dividing net income applicable to common stock by the weighted-average shares of common stock outstanding during the period. The following is a reconciliation of net income and weighted-average shares of common stock outstanding for purposes of calculating diluted net income per share for the three months ended March 31, 2009 and 2008 (in millions, except per share amounts):
| | | | | | | | | | | | | | |
| | | | | Three Months Ended | |
| | | | | March 31, | |
| | | | | | | 2009 | | 2008 | |
| Net income | | | | | | | | $ | 207 | | $ | 1,505 | |
| Net income attributable to noncontrolling interests in | | | | | | | | | | | | | |
| subsidiaries | | | | | | | | | (104 | ) | | (319 | ) |
| Preferred dividends | | | | | | | | | (60 | ) | | (64 | ) |
| Net income applicable to common stock | | | | | | | | | 43 | | | 1,122 | |
| Plus income impact of assumed conversion of: | | | | | | | | | | | | | |
| 6¾% Mandatory Convertible Preferred Stock | | | | | | | | | – | | | 49 | |
| 5½% Convertible Perpetual Preferred Stock | | | | | | | | | – | | | 15 | |
| Diluted net income applicable to common stock | | | | | | | | $ | 43 | | $ | 1,186 | |
| | | | | | | | | | | | | | |
| Weighted-average shares of common stock outstanding: | | | | | | | | | 400 | | | 383 | |
| Add stock issuable upon conversion, exercise or | | | | | | | | | | | | | |
| vesting of: | | | | | | | | | | | | | |
6¾% Mandatory Convertible Preferred Stocka | | | | | | | | | – | b | | 39 | |
| 5½% Convertible Perpetual Preferred Stock | | | | | | | | | – | b | | 23 | |
| Dilutive stock options | | | | | | | | | – | | | 2 | |
| Restricted stock | | | | | | | | | 1 | | | 2 | |
| Weighted-average shares of common stock outstanding | | | | | | | | | | | | | |
| for purposes of calculating diluted net income per share | | | | | | | | | 401 | | | 449 | |
| | | | | | | | | | | | | | |
| Diluted net income per share of common stock | | | | | | | | | | | | | |
| attributable to FCX stockholders | | | | | | | | $ | 0.11 | | $ | 2.64 | |
| a. | Preferred stock will automatically convert on May 1, 2010, into between approximately 39 million and 47 million shares of FCX common stock at a conversion rate that will be determined based on FCX’s common stock price. Prior to May 1, 2010, holders may convert at a conversion rate of 1.3654 or approximately 39 million shares. |
| b. | Potential additional shares of common stock of approximately 39 million shares for the 6¾% Mandatory Convertible Preferred Stock and 18 million shares for the 5½% Convertible Perpetual Preferred Stock were excluded for the three months ended March 31, 2009, because they were anti-dilutive. |
FCX’s convertible instruments are excluded from the computation of diluted net income per share of common stock when including the conversion of these instruments results in an anti-dilutive effect on earnings per share (see footnote b above). The quarterly dilution threshold for the 5½% Convertible Perpetual Preferred Stock is $0.64 per share and for the 6¾% Mandatory Convertible Preferred Stock is $1.24 per share. Outstanding stock options with exercise prices greater than the average market price of FCX’s common stock during the period are also excluded from the computation of diluted net income per share of common stock. Excluded amounts were approximately nine million stock options with a weighted-average exercise price of $67.00 for first-quarter 2009. No stock options were excluded for first-quarter 2008.
| 5. | INVENTORIES, AND MILL AND LEACH STOCKPILES |
The components of inventories follow (in millions):
| | | March 31, | | December 31, | |
| | | 2009 | | 2008 | |
| Mining Operations: | | | | | | | |
| Raw materials | | $ | 1 | | $ | 1 | |
| Work-in-process | | | 145 | | | 128 | |
Finished goodsa | | | 700 | | | 703 | |
| Atlantic Copper: | | | | | | | |
| Raw materials (concentrates) | | | 134 | | | 164 | |
| Work-in-process | | | 132 | | | 71 | |
| Finished goods | | | 5 | | | 1 | |
| Total product inventories | | | 1,117 | | | 1,068 | |
Total materials and supplies, netb | | | 1,078 | | | 1,124 | |
| Total inventories | | $ | 2,195 | | $ | 2,192 | |
| a. | Primarily includes copper concentrates, anodes, cathodes and rod, and molybdenum. |
| b.�� | Materials and supplies inventory is net of obsolescence reserves totaling $21 million at March 31, 2009, and $22 million at December 31, 2008. |
The following summarizes mill and leach stockpiles (in millions):
| | | March 31, | | December 31, | |
| | | 2009 | | 2008 | |
| Current: | | | | | | | |
| Mill stockpiles | | $ | 22 | | $ | 10 | |
| Leach stockpiles | | | 549 | | | 561 | |
| Total current mill and leach stockpiles | | $ | 571 | | $ | 571 | |
| | | | | | | | |
Long-terma: | | | | | | | |
| Mill stockpiles | | $ | 333 | | $ | 340 | |
| Leach stockpiles | | | 814 | | | 805 | |
| Total long-term mill and leach stockpiles | | $ | 1,147 | | $ | 1,145 | |
| a. | Metals in stockpiles not expected to be recovered within the next 12 months. |
FCX recorded charges for lower of cost or market (LCM) molybdenum inventory adjustments of $19 million ($19 million to net income applicable to common stock or $0.05 per diluted share) in first-quarter 2009 resulting from lower molybdenum prices.
FCX’s first-quarter 2009 income tax provision resulted from taxes on international operations ($330 million) and U.S. operations ($1 million). FCX’s effective tax rate for 2009 is expected to be highly sensitive to changes in commodity prices and the mix of income between U.S. and international operations. Taxes provided on income generated from FCX’s South America and Indonesia operations are recorded at the applicable statutory rates. However, at certain commodity prices, FCX does not record a tax benefit for losses generated in the U.S., and these losses cannot be used to offset income generated from international operations. These factors have caused FCX’s consolidated effective tax rate of 63 percent to be substantially higher than the U.S. federal statutory rate of 35 percent.
FCX’s first-quarter 2008 income tax provision resulted from taxes on international operations ($579 million) and U.S. operations ($150 million). The difference between FCX’s consolidated effective income tax rate of approximately 33 percent for first-quarter 2008 and the U.S. federal statutory rate of 35 percent primarily was attributable to a U.S. benefit for percentage depletion, partially offset by withholding taxes and incremental U.S. income tax accrued on foreign earnings.
Capitalized interest totaled $45 million in first-quarter 2009 and $22 million in first-quarter 2008.
| 8. | DERIVATIVE FINANCIAL INSTRUMENTS AND FAIR VALUE MEASUREMENT |
Derivative Financial Instruments. FCX and its subsidiaries do not purchase, hold or sell derivative financial instruments unless there is an existing asset or obligation or if FCX anticipates a future activity that is likely to occur and will result in exposure to market risks. FCX does not enter into any derivative financial instruments for speculative purposes. FCX and its subsidiaries have entered into derivative financial instruments in limited instances to achieve specific objectives. These objectives principally relate to managing risks associated with commodity price, foreign currency and interest rate risks. The fair values of FCX’s derivative financial instruments are based on widely published market prices.
Summarized below are unrealized gains/losses on derivative financial instruments that are designated and qualify as fair value hedge transactions under Statement of Financial Accounting Standards (SFAS) No. 133, “Accounting for Derivative Instruments and Hedging Activities,” as amended, for the three months ended March 31, 2009, along with the unrealized gains (losses) on the related hedged item (in millions):
| | | Derivative | | Hedged Item | |
| Commodity contracts: | | | | | | | |
Copper futures and swap contractsa | | $ | 5 | | $ | (5 | ) |
| a. | Gains (losses) on derivative financial instruments as well as the offsetting gains (losses) on the hedged items (unrecognized firm commitments) are recorded in revenues. Additionally, FCX realized gains of $3 million during first-quarter 2009 from matured derivative financial instruments that qualify for hedge accounting. |
Summarized below are the realized and unrealized gains recognized in income before income taxes and equity in affiliated companies’ net earnings for derivative financial instruments, including embedded derivatives, which do not qualify for hedge accounting under SFAS No. 133, as amended, for the three months ended March 31, 2009 (in millions):
| Commodity contracts: | | | | |
Embedded derivatives in provisional sales contractsa | | $ | 313 | |
Embedded derivatives in provisional purchase contractsb | | | 1 | |
Copper forward contractsb | | | 4 | |
Copper futures and swap contractsa | | | 32 | |
| a. | Amounts recorded in revenues. |
| b. | Amounts recorded in cost of sales as production and delivery costs. |
Summarized below are the fair values of unsettled derivative financial instruments recorded on the consolidated balance sheet at March 31, 2009 (in millions):
| Derivatives designated as hedging instruments under | | | | | | | |
| SFAS No. 133, as amended | | | | | | | |
| Commodity contracts: | | | | | | | |
| Copper futures and swap contracts: | | | | | | | |
Asset positiona | | | | | $ | 5 | |
| | | | | | | | |
| Derivatives not designated as hedging instruments under | | | | | | | |
| SFAS No. 133, as amended | | | | | | | |
| Commodity contracts: | | | | | | | |
Embedded derivatives in provisional sales/purchases contracts:b | | | | | | | |
| Asset position | | | | | $ | 220 | |
| Liability position | | | | | | (10 | ) |
| Copper forward contracts: | | | | | | | |
Liability positionc | | | | | | (1 | ) |
Copper futures and swap contracts:d | | | | | | | |
Asset positiona | | | | | | 5 | |
Liability positione | | | | | | (25 | ) |
| a. | Amounts recorded in other current assets. |
| b. | Amounts recorded either as a net accounts receivable or a net accounts payable except for Atlantic Copper’s copper purchases, which are recorded to product inventories ($(7) million). |
| c. | Amounts recorded in accounts payable and accrued liabilities. |
| d. | At March 31, 2009, FCX had paid $26 million to brokers for margin requirements, which is recorded in other current assets. |
| e. | Amounts recorded in accounts payable and accrued liabilities ($23 million) and long-term liabilities ($2 million). |
Commodity Contracts. From time to time, FCX has entered into forward, futures and swap contracts to hedge the market risk associated with fluctuations in the prices of commodities it purchases and sells. Derivative financial instruments used by FCX to manage its risks do not contain credit risk-related contingent provisions. As of March 31, 2009, FCX had no price protection contracts relating to its future mine production. A discussion of FCX’s derivative commodity contracts and programs follows.
Fair Value Hedges
Copper Futures and Swap Contracts. Some of FCX’s U.S. copper rod customers request a fixed market price instead of the New York Mercantile Exchange (COMEX) average price in the month of shipment. FCX hedges this price exposure in a manner that allows it to receive the COMEX average price in the month of shipment while the customers pay the fixed price they requested. FCX accomplishes this by entering into copper futures and swap contracts and then liquidating the copper futures contracts and settling the copper swap contracts during the month of shipment, which generally results in FCX receiving the COMEX average price in the month of shipment. Hedge gains or losses from these copper futures and swap contracts are recorded in revenues. FCX did not have any significant gains or losses during the three months ended March 31, 2009, resulting from ineffectiveness. At March 31, 2009, FCX held copper futures and swap contracts for 34 million pounds at an average price of $1.69 per pound, with maturities through January 2011.
Other Derivative Financial Instruments
Derivative financial instruments that do not meet the criteria to qualify under FSAS No. 133, as amended, for hedge accounting are discussed below.
Embedded Derivatives. As described in Note 1 to FCX’s 2008 Annual Report on Form 10-K under “Revenue Recognition,” certain FCX copper concentrate, copper cathode and gold sales contracts provide for provisional pricing primarily based on LME or COMEX prices at the time of shipment as specified in the contract. Similarly, FCX purchases copper and molybdenum under contracts that provide for provisional pricing. FCX applies the normal purchase and sale exception under SFAS No. 133, as amended, to the host sales agreements since the contracts do not allow for net settlement and always result in physical delivery. Under SFAS No. 133, as amended,
sales and purchases with a provisional sales price contain an embedded derivative (i.e., the price settlement mechanism that is settled after the time of delivery) that is required to be bifurcated from the host contract. The host contract is the sale or purchase of the metals contained in the concentrates or cathodes at the then-current LME or COMEX price. Mark-to-market price fluctuations recorded through the settlement date are reflected in revenues for sales contracts and in cost of sales as production and delivery costs for purchase contracts. At March 31, 2009, FCX had embedded derivatives on 407 million pounds of copper sales (net of noncontrolling interests), with maturities through August 2009 and 57 million pounds of copper purchases, with maturities through July 2009.
In order to reduce short-term price volatility in earnings and cash flows, FCX entered into copper forward sales contracts (not included in the table above) in early April 2009 to lock in prices at an average of $1.86 per pound on 355 million pounds of PT Freeport Indonesia’s provisionally priced copper sales at March 31, 2009. These economic hedge transactions are scheduled to final price from April 2009 through July 2009. From time to time, FCX may enter into similar transactions to lock in pricing on provisionally priced sales, but FCX does not intend to change its long-standing policy of not hedging future copper production.
Copper Forward Contracts. Atlantic Copper enters into forward copper contracts designed to hedge its copper price risk whenever its physical purchases and sales pricing periods do not match. These economic hedge transactions are intended to hedge against changes in copper prices, with the mark-to-market hedging gains or losses recorded in cost of sales. At March 31, 2009, Atlantic Copper held forward copper purchase contracts for 8 million pounds at an average price of $1.69 per pound, with maturities through May 2009.
Copper Futures and Swap Contracts. In addition to the contracts that qualify for fair value hedge accounting that are discussed above, FCX also has similar contracts with its U.S. copper rod customers that do not qualify for hedge accounting because of certain terms in the sales contracts. Gains and losses for these economic hedge transactions are recorded in revenues. At March 31, 2009, FCX held copper futures and swap contracts for 49 million pounds at an average price of $2.27 per pound, with maturities through December 2010.
From time to time, FCX or its subsidiaries may enter into foreign currency exchange contracts to lock in or minimize the effects of fluctuations in exchange rates or interest rate swaps to manage its exposure to interest rate changes on a portion of its debt. FCX had no outstanding foreign currency exchange contracts or interest rate swaps at March 31, 2009. Refer to Note 17 in FCX’s 2008 Annual Report on Form 10-K for further discussion.
Fair Value Measurement. In September 2006, the Financial Accounting Standards Board (FASB) issued SFAS No. 157, “Fair Value Measurements,” which provides enhanced guidance for using fair value to measure assets and liabilities. SFAS No. 157 does not require any new fair value measurements under U.S. GAAP; rather this statement establishes a common definition of fair value, provides a framework for measuring fair value under U.S. GAAP and expands disclosure requirements about fair value measurements. In February 2008, FASB issued FASB Staff Position (FSP) No. FAS 157-2, which delayed the effective date of SFAS No. 157 for nonfinancial assets or liabilities that are not required or permitted to be measured at fair value on a recurring basis to fiscal years beginning after November 15, 2008, and interim periods within those years. FCX adopted SFAS No. 157 for financial assets and liabilities recognized at fair value on a recurring basis effective January 1, 2008. This partial adoption of SFAS No. 157 did not have a material impact on FCX’s financial reporting and disclosures as its financial assets are measured using quoted market prices, or Level 1 inputs. FCX adopted SFAS No. 157 for nonfinancial assets or liabilities not valued on a recurring basis (at least annually) effective January 1, 2009, with no material impact on its financial reporting and disclosures.
SFAS No. 157 establishes a fair value hierarchy that prioritizes the inputs to valuation techniques used to measure fair value. The hierarchy gives the highest priority to unadjusted quoted prices in active markets for identical assets or liabilities (Level 1 inputs) and the lowest priority to unobservable inputs (Level 3 inputs). The three levels of the fair value hierarchy under SFAS No. 157 are described below:
| Level 1 | Unadjusted quoted prices in active markets that are accessible at the measurement date for identical, unrestricted assets or liabilities; |
| Level 2 | Quoted prices in markets that are not active, quoted prices for similar assets or liabilities in active markets, inputs other than quoted prices that are observable for the asset or liability, or inputs that are derived principally from or corroborated by observable market data by correlation or other means; |
| Level 3 | Prices or valuation techniques that require inputs that are both significant to the fair value measurement and unobservable (supported by little or no market activity). |
The following table sets forth FCX’s financial assets and liabilities measured at fair value on a recurring basis (in millions):
| | | Fair Value at March 31, 2009 | |
| | | Total | | Level 1 | | Level 2 | | Level 3 | |
| Cash equivalents | | $ | 612 | | $ | 612 | | $ | – | | $ | – | |
| Trust assets (current and long-term) | | | 230 | | | 230 | | | – | | | – | |
| Available-for-sale securities | | | 68 | | | 68 | | | – | | | – | |
| Embedded derivatives in provisional sales/purchases | | | | | | | | | | | | | |
| contracts | | | 210 | | | 210 | | | – | | | – | |
| Other derivative financial instruments, net | | | (16 | ) | | (16 | ) | | – | | | – | |
| | | $ | 1,104 | | $ | 1,104 | | $ | – | | $ | – | |
| | | | | | | | | | | | | | |
| 9. | NEW ACCOUNTING STANDARDS |
Noncontrolling Interests in Consolidated Financial Statements. In December 2007, FASB issued SFAS No. 160, “Noncontrolling Interests in Consolidated Financial Statements – an amendment of ARB No. 51,” which clarifies that noncontrolling interests (minority interests) are to be treated as a separate component of equity and any changes in the ownership interest (in which control is retained) are to be accounted for as capital transactions. However, a change in ownership of a consolidated subsidiary that results in a loss of control is considered a significant event that triggers gain or loss recognition, with the establishment of a new fair value basis in any remaining ownership interests. SFAS No. 160 also provides additional disclosure requirements for each reporting period. SFAS No. 160 applies to fiscal years beginning on or after December 15, 2008, with early adoption prohibited. This statement is required to be adopted prospectively, except for the following provisions, which are to be applied retrospectively: (i) the reclassification of noncontrolling interests to equity in the consolidated balance sheets and (ii) the adjustment to consolidated net income to include net income attributable to both the controlling and noncontrolling interests. FCX adopted SFAS No. 160 effective January 1, 2009.
Accounting for Convertible Debt Instruments That May Be Settled in Cash upon Conversion. In May 2008, FASB issued FSP No. APB 14-1, “Accounting for Convertible Debt Instruments That May Be Settled in Cash upon Conversion (Including Partial Cash Settlement),” which changes the accounting treatment for convertible debt securities that the issuer may settle fully or partially in cash. FSP No. APB 14-1 requires bifurcation of convertible debt instruments into a debt component that is initially recorded at fair value and an equity component that represents the difference between the initial proceeds from issuance of the instrument and the fair value allocated to the debt component. The debt component is subsequently accreted (as a component of interest expense) to par value over its expected life. FSP No. APB 14-1 is effective for fiscal years and interim periods beginning after December 15, 2008, and must be retrospectively applied to all prior periods presented, even if an instrument has matured, converted, or otherwise been extinguished as of the FSP’s effective date. FSP No. APB 14-1 did not have an impact on FCX’s financial reporting.
Employers’ Disclosures about Postretirement Benefit Plan Assets. In December 2008, FASB issued FSP No. FAS 132(R)-1, “Employers’ Disclosures about Postretirement Benefit Plan Assets,” which provides enhanced guidance on an employer’s disclosures about plan assets of a defined benefit pension or other postretirement plan. FSP FAS 132(R)-1 revises disclosure requirements on pension and postretirement plan assets from those required in the original SFAS No. 132 after the FASB decided disclosures about fair value measurements for postretirement plan assets were not within the scope of SFAS No. 157. The disclosures about plan assets required by FSP FAS 132(R)-1 are effective for fiscal years ending after December 15, 2009, with early application permitted. Upon initial application, disclosures are not required for earlier periods that are presented for comparative purposes. FCX is currently evaluating the impact that the adoption of FSP No. FAS 132(R)-1 will have on its financial disclosures.
FCX has organized its operations into five primary divisions – North America copper mines, South America copper mines, Indonesia mining, Africa mining and Molybdenum operations. Notwithstanding this structure, FCX internally reports information on a mine-by-mine basis. Therefore, in accordance with SFAS No. 131, “Disclosures about Segments of an Enterprise and Related Information,” FCX concluded that its operating segments include individual mines. Operating segments that meet certain SFAS No. 131 thresholds are reportable segments. In accordance with this guidance, beginning in first-quarter 2009, Sierrita is no longer a reportable segment.
In third-quarter 2008, FCX revised its presentation of the operating divisions to better reflect management’s view of the consolidated FCX operations. Accordingly, FCX has revised its segment disclosures for the three months ended March 31, 2008, to conform with the current period presentation.
Further discussion of the reportable segments included in FCX’s primary operating divisions, as well as FCX’s other reportable segments – Rod & Refining and Atlantic Copper Smelting & Refining – follows.
North America Copper Mines. FCX has five operating copper mines in North America – Morenci, Sierrita, Bagdad and Safford in Arizona and Tyrone in New Mexico. The North America copper mines include open-pit mining, sulfide ore concentrating, leaching, and solution extraction and electrowinning (SX/EW) operations. A majority of the copper produced at the North America copper mines is cast into copper rod by FCX’s Rod & Refining operations. The North America mines division includes the Morenci copper mine as a reportable segment.
Morenci. The Morenci open-pit mine, located in southeastern Arizona, primarily produces copper cathodes. FCX owns an 85 percent undivided interest in Morenci through an unincorporated joint venture.
Other Mines. Other mines include FCX’s other operating southwestern U.S. copper mines – Sierrita, Bagdad, Safford and Tyrone. In addition to copper, the Sierrita and Bagdad mines produce molybdenum concentrates as a by-product. Other mines also include FCX’s southwestern U.S. copper mines that are currently on care-and-maintenance status.
South America Copper Mines. FCX has four operating copper mines in South America – Cerro Verde in Peru, and Candelaria, Ojos del Salado and El Abra in Chile. These operations include open-pit and underground mining, sulfide ore concentrating, leaching and SX/EW operations. The South America mines division includes the Cerro Verde copper mine as a reportable segment.
Cerro Verde. The Cerro Verde open-pit copper mine, located near Arequipa, Peru, produces copper cathodes and copper concentrates. In addition to copper, the Cerro Verde mine produces molybdenum concentrates as a by-product. FCX owns a 53.56 percent interest in Cerro Verde.
Other Mines. Other mines include FCX’s Chilean copper mines – Candelaria, Ojos del Salado and El Abra – which include open-pit and underground mining, sulfide ore concentrating, leaching and SX/EW operations. In addition to copper, the Candelaria and Ojos del Salado mines produce gold and silver as by-products. FCX owns an 80 percent interest in both the Candelaria and Ojos del Salado mines, and owns a 51 percent interest in the El Abra mine.
Indonesia. Indonesia mining includes PT Freeport Indonesia’s Grasberg minerals district. PT Freeport Indonesia produces copper concentrates, which contain significant quantities of gold and silver. FCX owns 90.64 percent of PT Freeport Indonesia, including 9.36 percent owned through PT Indocopper Investama. In 1996, FCX established an unincorporated joint venture with Rio Tinto, which covers PT Freeport Indonesia’s mining operations in Block A and gives Rio Tinto, through 2021, a 40 percent interest in certain assets and future production exceeding specified annual amounts of copper, gold and silver. After 2021, Rio Tinto will have a 40 percent interest in all production from Block A.
Africa. Africa mining includes the Tenke Fungurume copper and cobalt mining concessions in the Katanga province of the Democratic Republic of Congo. Construction progressed during first-quarter 2009, and the first copper cathode was produced in late March 2009 as the project entered the commissioning and start-up phase. FCX owns an effective 57.75 percent interest in Tenke Fungurume.
Molybdenum. The Molybdenum segment is an integrated producer of molybdenum, with mining, sulfide ore concentrating, roasting and processing facilities that produce high-purity, molybdenum-based chemicals, molybdenum metal powder and metallurgical products, which are sold to customers around the world, and includes the wholly owned Henderson molybdenum mine in Colorado and related conversion facilities. The Henderson underground mine produces high-purity, chemical-grade molybdenum concentrates, which are typically further processed into value-added molybdenum chemical products. This segment also includes a sales company that purchases and sells molybdenum from the Henderson mine as well as from FCX’s North and South America copper mines that produce molybdenum as a by-product. In addition, at times this segment roasts and/or processes material on a toll basis. Toll arrangements require the tolling customer to deliver appropriate molybdenum-bearing material to FCX’s facilities for processing into a product that is returned to the customer, who pays FCX for processing its material into the specified products. The Molybdenum segment also includes FCX’s wholly owned Climax molybdenum mine in Colorado, which has been on care-and-maintenance status since 1995.
Rod & Refining. The Rod & Refining segment consists of copper conversion facilities located in North America, and includes a refinery, three rod mills and a specialty copper products facility. These operations process copper produced at the North America mines and purchased copper into copper cathode, rod and custom copper shapes. At times these operations refine copper and produce copper rod and shapes for customers on a toll basis. Toll arrangements require the tolling customer to deliver appropriate copper-bearing material to FCX’s facilities for processing into a product that is returned to the customer, who pays FCX for processing its material into the specified products.
Atlantic Copper Smelting & Refining. Atlantic Copper, S.A. (Atlantic Copper), FCX’s wholly owned smelting unit in Spain, smelts and refines copper concentrates and markets refined copper and precious metals in slimes. PT Freeport Indonesia and the South America copper mines generally sell a portion of their concentrate and cathode (South America) production to Atlantic Copper.
Intersegment Sales. Intersegment sales between FCX’s operations are based on similar arms-length transactions with third parties at the time of the sale. Intersegment sales may not be reflective of the actual prices ultimately realized because of a variety of factors, including additional processing, timing of sales to unaffiliated customers and transportation premiums.
Allocations. FCX allocates certain operating costs, expenses and capital to the operating divisions and individual segments. However, not all costs and expenses applicable to a mine or operation are allocated. All U.S. federal and state income taxes are recorded and managed at the corporate level, whereas foreign income taxes are recorded and managed at the applicable mine or operation. In addition, most exploration and research activities are managed at the corporate level, and those costs along with some selling, general and administrative costs are not allocated to the operating divisions or segments. Accordingly, the following segment information reflects management determinations that may not be indicative of what the actual financial performance of each operating division or segment would be if it was an independent entity.
Business Segments
| (In Millions) | North America Copper Mines | | South America Copper Mines | | Indonesia | | Africa | | | | | | | | | | | |
| | | | | | | | | | | | | | | | | | | | | | Atlantic | | | | | |
| | | | | | | | | | | | | | | | | | | | | | Copper | | | | | |
| | | | | | | | | | | | | | | | | | | | | | Smelting | | | | | |
| | Morenci | | | | Total | | | | | | Total | | Grasberg | | Tenke | | | | | | & Refining | | | | | |
| First-Quarter 2009 | | | | | | | | | | | | | | | | | | | | | | | | | | | |
| Revenues: | | | | | | | | | | | | | | | | | | | | | | | | | | | |
| Unaffiliated customers | $ | 21 | | $ | 23 | | $ | 44 | | $ | 246 | | $ | 338 | | $ | 584 | | $ | 920 | a | $ | – | | $ | 146 | | $ | 613 | | $ | 292 | | $ | 3 | | $ | 2,602 | |
| Intersegment | | 212 | | 362 | | 574 | | 77 | | 41 | | 118 | | 202 | | – | | – | | 6 | | – | | (900 | ) | – | |
| Production and delivery | | 190 | | 363 | | 553 | | 149 | | 218 | | 367 | | 350 | | 16 | | 119 | | 614 | | 293 | | (750 | ) | 1,562 | |
| Depreciation, depletion and amortization | | 36 | | 39 | | 75 | | 35 | | 30 | | 65 | | 65 | | 3 | | 9 | | 2 | | 8 | | 5 | | 232 | |
| LCM inventory adjustments | | – | | – | | – | | – | | – | | – | | – | | – | | 19 | | – | | – | | – | | 19 | |
| Selling, general and administrative expenses | | – | | – | | – | | – | | – | | – | | 18 | | – | | 4 | | – | | 2 | | 38 | | 62 | |
| Exploration and research expenses | | – | | – | | – | | – | | – | | – | | – | | – | | – | | – | | – | | 30 | | 30 | |
Restructuring and other chargesb | | 24 | | (2 | ) | 22 | | – | | 6 | | 6 | | – | | – | | (1 | ) | (2 | ) | – | | – | | 25 | |
| Operating income (loss) | | (17 | ) | (15 | ) | (32 | ) | 139 | | 125 | | 264 | | 689 | | (19 | ) | (4 | ) | 5 | | (11 | ) | (220 | ) | 672 | |
| | | | | | | | | | | | | | | | | | | | | | | | | | | | |
| Interest expense, net | | 1 | | 2 | | 3 | | – | | 1 | | 1 | | 1 | | (24 | ) | – | | – | | 1 | | 149 | | 131 | |
| Provision for (benefit from) income taxes | | – | | – | | – | | 47 | | 37 | | 84 | | 288 | | (1 | ) | – | | – | | – | | (40 | ) | 331 | |
| Total assets at March 31, 2009 | | 2,079 | | 4,072 | | 6,151 | | 4,002 | | 2,401 | | 6,403 | | 4,765 | | 3,013 | | 1,755 | | 268 | | 875 | | 478 | | 23,708 | |
| Capital expenditures | | 29 | | 43 | | 72 | | 37 | | 37 | | 74 | | 55 | | 251 | | 44 | | 3 | | 6 | | 14 | | 519 | |
| | | | | | | | | | | | | | | | | | | | | | | | | | | | |
| | | | | | | | | | | | | | | | | | | | | | | | | | | | |
| First-Quarter 2008 | | | | | | | | | | | | | | | | | | | | | | | | | | | |
| Revenues: | | | | | | | | | | | | | | | | | | | | | | | | | | | |
| Unaffiliated customers | $ | 134 | | $ | 111 | | $ | 245 | | $ | 612 | | $ | 861 | | $ | 1,473 | | $ | 887 | a | $ | – | | $ | 719 | | $ | 1,680 | | $ | 665 | | $ | 3 | | $ | 5,672 | |
| Intersegment | | 464 | | 787 | | 1,251 | | 117 | | 17 | | 134 | | 165 | | – | | – | | 8 | | – | | (1,558 | ) | – | |
| Production and delivery | | 279 | | 366 | | 645 | | 162 | | 270 | | 432 | | 399 | | 3 | | 460 | | 1,676 | | 651 | | (1,545 | ) | 2,721 | |
| Depreciation, depletion and amortization | | 81 | | 103 | | 184 | | 43 | | 87 | | 130 | | 45 | | 1 | | 39 | | 2 | | 9 | | 8 | | 418 | |
| LCM inventory adjustments | | – | | 1 | | 1 | | – | | – | | – | | – | | – | | – | | – | | – | | – | | 1 | |
| Selling, general and administrative expenses | | – | | – | | – | | – | | – | | – | | 37 | | – | | 6 | | – | | 8 | | 33 | | 84 | |
| Exploration and research expenses | | – | | – | | – | | – | | – | | – | | – | | – | | – | | – | | – | | 52 | | 52 | |
| Operating income (loss) | | 238 | | 428 | | 666 | | 524 | | 521 | | 1,045 | | 571 | | (4 | ) | 214 | | 10 | | (3 | ) | (103 | ) | 2,396 | |
| | | | | | | | | | | | | | | | | | | | | | | | | | | | |
| Interest expense, net | | 1 | | 3 | | 4 | | 1 | | – | | 1 | | 1 | | (9 | ) | – | | 1 | | 4 | | 163 | | 165 | |
| Provision for income taxes | | – | | – | | – | | 173 | | 160 | | 333 | | 239 | | – | | – | | – | | – | | 157 | | 729 | |
| Goodwill at March 31, 2008 | | 1,912 | | 2,299 | | 4,211 | | 763 | | 366 | | 1,129 | | – | | 2 | | 703 | | – | | – | | 3 | | 6,048 | |
| Total assets at March 31, 2008 | | 6,960 | | 11,922 | | 18,882 | | 5,464 | | 4,833 | | 10,297 | | 3,932 | | 1,666 | | 4,179 | | 604 | | 994 | | 1,274 | | 41,828 | |
| Capital expenditures | | 77 | | 74 | | 151 | | 17 | | 46 | | 63 | | 115 | | 143 | | 12 | | 3 | | 5 | | 16 | | 508 | |
| | | | | | | | | | | | | | | | | | | | | | | | | | | | |
| a. | Includes PT Freeport Indonesia’s sales to PT Smelting totaling $263 million in first-quarter 2009 and $464 million in first-quarter 2008. |
| | |
| b. | The following table summarizes restructuring and other charges: |
| | |
| | Restructuring charges | $ | 23 | | $ | 4 | | $ | 27 | | $ | – | | $ | 6 | | $ | 6 | | $ | – | | $ | – | | $ | 1 | | $ | – | | $ | – | | $ | – | | $ | 34 | |
| | Special retirement benefits and curtailments | | 1 | | (6 | ) | (5 | ) | – | | – | | – | | – | | – | | (2 | ) | (2 | ) | – | | – | | (9 | ) |
| | Restructuring and other charges | $ | 24 | | $ | (2 | ) | $ | 22 | | $ | – | | $ | 6 | | $ | 6 | | $ | – | | $ | – | | $ | (1 | ) | $ | (2 | ) | $ | – | | $ | – | | $ | 25 | |
| | | | | | | | | | | | | | | | | | | | | | | | | | | | |
REPORT OF INDEPENDENT REGISTERED PUBLIC ACCOUNTING FIRM
TO THE BOARD OF DIRECTORS AND STOCKHOLDERS OF
FREEPORT-McMoRan COPPER & GOLD INC.
We have reviewed the condensed consolidated balance sheet of Freeport-McMoRan Copper & Gold Inc. as of March 31, 2009, and the related consolidated statements of income and cash flows for the three-month periods ended March 31, 2009 and 2008, and the consolidated statement of equity for the three-month period ended March 31, 2009. These financial statements are the responsibility of the Company’s management.
We conducted our review in accordance with the standards of the Public Company Accounting Oversight Board (United States). A review of interim financial information consists principally of applying analytical procedures and making inquiries of persons responsible for financial and accounting matters. It is substantially less in scope than an audit conducted in accordance with the standards of the Public Company Accounting Oversight Board, the objective of which is the expression of an opinion regarding the financial statements taken as a whole. Accordingly, we do not express such an opinion.
Based on our review, we are not aware of any material modifications that should be made to the condensed consolidated financial statements referred to above for them to be in conformity with U.S. generally accepted accounting principles.
We have previously audited, in accordance with the standards of the Public Company Accounting Oversight Board (United States), the consolidated balance sheet of Freeport-McMoRan Copper & Gold Inc. as of December 31, 2008, and the related consolidated statements of income, cash flows, and stockholders’ equity for the year then ended (not presented herein), and in our report dated February 18, 2009, we expressed an unqualified opinion on those consolidated financial statements and which report included an explanatory paragraph for the Company’s adoption of FASB Interpretation No. 48, “Accounting for Uncertainty in Income Taxes – an interpretation of FASB Statement No. 109,” effective January 1, 2007; and SFAS No. 158, “Employers’ Accounting for Defined Benefit Pension and Other Postretirement Plans, an amendment of FASB Statements No. 87, 88, 106 and 132R,” effective December 31, 2006. As described in Note 9, on January 1, 2009, Freeport-McMoRan Copper & Gold Inc. adopted SFAS No. 160, “Noncontrolling Interests in Consolidated Financial Statements,” on a retrospective basis resulting in revisions of the December 31, 2008, consolidated balance sheet. We have not audited and reported on the revised balance sheet reflecting the adoption of SFAS No. 160.
ERNST & YOUNG LLP
Phoenix, Arizona
May 4, 2009
Item 2. Management's Discussion and Analysis of Financial Condition and Results of Operations.
OVERVIEW and OUTLOOK
In Management’s Discussion and Analysis of Financial Condition and Results of Operations, “we,” “us” and “our” refer to Freeport-McMoRan Copper & Gold Inc. (FCX) and its consolidated subsidiaries, including, except as otherwise stated, Phelps Dodge Corporation (Phelps Dodge) and its subsidiaries, which we acquired on March 19, 2007. You should read this discussion in conjunction with our financial statements, the related Management’s Discussion and Analysis of Financial Condition and Results of Operations and the discussion of our “Business and Properties” in our Form 10-K for the year ended December 31, 2008, filed with the U.S. Securities and Exchange Commission (SEC). The results of operations reported and summarized below are not necessarily indicative of future operating results. References to “Notes” are Notes included in our “Notes to Consolidated Financial Statements.” Throughout Management's Discussion and Analysis of Financial Condition and Results of Operations all references to earnings or losses per share are on a diluted basis, unless otherwise noted. FCX changed Phelps Dodge’s legal name to Freeport-McMoRan Corporation (FMC) in 2008; therefore, references to FMC and Phelps Dodge represent the same entity.
We are one of the world’s largest copper, gold and molybdenum mining companies in terms of reserves and production. Our portfolio of assets includes the Grasberg minerals district in Indonesia, which contains the largest single recoverable copper reserve and the largest single gold reserve of any mine in the world based on the latest available reserve data provided by third-party industry consultants; significant mining operations in North and South America; and the Tenke Fungurume minerals district in the Democratic Republic of Congo (DRC), which we believe is one of the world’s highest potential copper and cobalt concessions. We also operate Atlantic Copper, our wholly owned copper smelting and refining operation in Spain. Refer to “Operations” for further discussion.
Our mining revenues for first-quarter 2009 include sales of copper (approximately 71 percent), gold (approximately 17 percent) and molybdenum (approximately 5 percent). We currently have five operating copper mines in North America, four in South America, the Grasberg minerals district in Indonesia, and in late March 2009, the first copper cathode was produced at the Tenke Fungurume minerals district in the DRC as the project entered the commissioning and start-up phase. We also have one operating primary molybdenum mine in North America. During first-quarter 2009, approximately 66 percent of our consolidated copper production was from our Grasberg, Cerro Verde and Morenci mines, and approximately 57 percent of our mined copper was sold in concentrate, approximately 23 percent as rod (principally from our North America operations) and approximately 20 percent as cathodes. We produce gold as a by-product at our copper mines, primarily at the Grasberg minerals district in Indonesia, which accounted for approximately 96 percent of our consolidated gold production in first-quarter 2009. During first-quarter 2009, approximately half of our consolidated molybdenum production was from our Henderson molybdenum mine and half was produced as a by-product primarily at our North America copper mines. Refer to “Operations” for further discussion of our mining operations.
Because of the significant reduction in debt following our March 2007 acquisition of Phelps Dodge and historically high prices for copper, molybdenum and gold, our financial policy during most of 2008 was designed to use our cash flow to invest in growth projects with anticipated high rates of return and to return excess cash flows to shareholders in the form of dividends and share purchases. However, the dramatic declines in copper and molybdenum prices and the deterioration of the economic and credit environment have limited our ability to invest in growth projects and required us to make adjustments to our near-term plans. Our near-term strategy has been designed to protect liquidity while preserving our large mineral resources and growth options for the longer term. Revisions made to our operating and financial plans in late 2008 and early 2009 include:
| · | Curtailment of copper production at higher cost North America operations and of molybdenum production at the Henderson molybdenum mine (refer to “Operations” for further discussion); |
| · | Capital cost reductions, including deferral of most of our project development activities and also reduced capital spending on the remaining development projects in the Grasberg minerals district and at Tenke Fungurume (refer to “Development Projects” for further discussion); |
| · | Aggressive cost control, including workforce reductions, reduced equipment purchases that were planned to support expansion projects, a reduction in material and supplies inventory and reductions in exploration, research and administrative costs; and |
| · | The suspension of our annual common stock dividend. |
The completion in February 2009 of a public offering of 26.8 million shares of FCX common stock at an average price of $28.00 per share generated total proceeds of $750 million (net proceeds of $740 million after fees and expenses). Refer to “Capital Resources and Liquidity – Financing Activities” for further discussion.
While we view the long-term outlook for our business positively, supported by limitations on supplies of copper and by the requirements for copper in the world’s economy, we have responded to the sudden downturn and uncertain near-term outlook and will continue to adjust our operating strategy as market conditions change.
At March 31, 2009, we had $644 million in consolidated cash ($445 million of which was available to our parent company). We also had no borrowings and $74 million of letters of credit issued under our $1.5 billion revolving credit facilities, resulting in availability of approximately $1.4 billion. From time to time we may use the facilities for working capital and short-term funding requirements.
The sharp declines in copper and molybdenum prices have significantly impacted our consolidated financial results in first-quarter 2009, compared to first-quarter 2008. Refer to “Consolidated Results” for further discussion of our consolidated financial results for the three month periods ended March 31, 2009 and 2008.
Outlook
Consolidated sales from mines are expected to approximate 3.9 billion pounds of copper, 2.3 million ounces of gold and 50 million pounds of molybdenum for 2009, including 955 million pounds of copper, 650 thousand ounces of gold and 11 million pounds of molybdenum for second-quarter 2009. Achievement of these sales volume estimates is dependent on the achievement of targeted mining rates, the successful operation of production facilities, the impact of weather conditions and other factors.
Consolidated revenues, operating cash flows and net income vary significantly with fluctuations in the market prices of copper, gold and molybdenum, sales volumes and other factors. Based on the above projected consolidated sales volumes for 2009 and assuming average prices of $2.00 per pound of copper, $900 per ounce of gold and $8 per pound of molybdenum for the remainder of 2009, our consolidated operating cash flows would approximate $2.5 billion in 2009, net of an estimated $0.6 billion for working capital requirements principally reflecting settlements with customers in first-quarter 2009 of prior year provisionally priced sales. Operating cash flows for 2009 would be impacted by approximately $240 million for each $0.10 per pound change in copper prices, $75 million for each $50 per ounce change in gold prices and $30 million for each $1 per pound change in molybdenum prices.
Assuming average prices of $2.00 per pound of copper, $900 per ounce of gold and $8.00 per pound of molybdenum for the remainder of 2009, and using recent prices for commodity-based input costs, we estimate our consolidated unit net cash costs related to our copper mining operations (after by-product credits) would average approximately $0.70 per pound of copper in 2009, compared with $1.16 per pound of copper in 2008. Estimated consolidated unit net cash costs for 2009 are lower when compared to 2008 primarily because of the effects of lower operating rates and reduced energy prices and other commodity-based input costs. Refer to “Consolidated Results – Production and Delivery Costs” for further discussion of consolidated unit net cash costs.
COPPER, GOLD AND MOLYBDENUM MARKETS
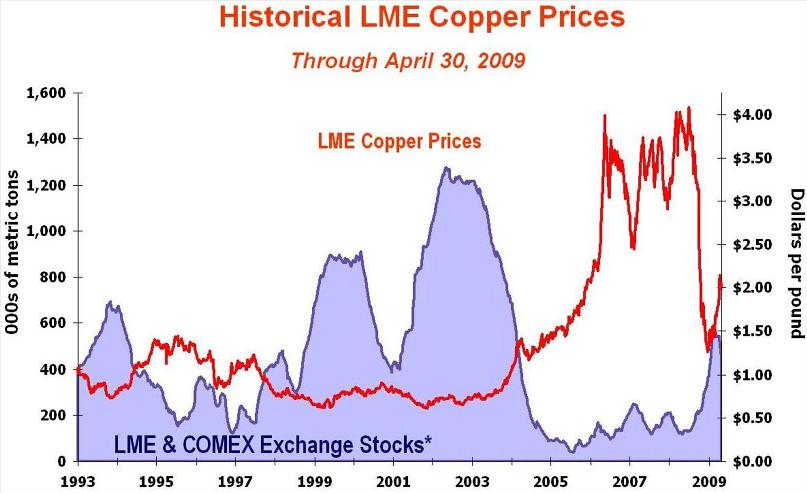
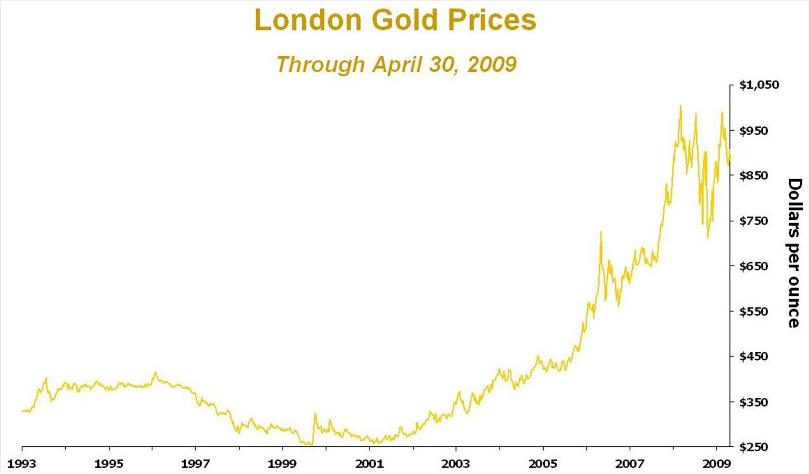
The graphs below illustrate the movements in metals prices from January 1993 through April 2009. World prices for copper, gold and molybdenum have fluctuated significantly during this period. The London Metal Exchange (LME) spot copper price varied from a low of $0.60 per pound in 2001 to a high of $4.08 per pound in July 2008, the London gold price fluctuated from a low of approximately $250 per ounce in 1999 to a high of $1,011 per ounce in March 2008, and the average weekly Metals Week Molybdenum Dealer Oxide price ranged from $1.87 per pound in January 1993 to a high of $39.25 per pound in June 2005. Copper, gold and molybdenum prices are affected by numerous factors beyond our control as described further in our “Risk Factors” contained in Part I, Item 1A of our Form 10-K for the year ended December 31, 2008.
* Excludes Shanghai stocks, producer, consumer and merchant stocks.
The graph above presents LME spot copper prices and reported stocks of copper at the LME and the New York Mercantile Exchange (COMEX) from January 1993 through April 2009. During the period 2003 to 2006, global consumption exceeded production, evidenced by the decline in exchange warehouse inventories. Disruptions associated with strikes and other operational issues, combined with growing demand from China and other emerging economies resulted in low levels of inventory from 2006 through most of 2008. However, slowing consumption has led to increases in inventory levels, with combined LME and COMEX stocks rising to approximately 540 thousand metric tons at March 31, 2009.
During first-quarter 2009, LME spot copper prices ranged from $1.38 per pound to $1.85 per pound and averaged $1.56 per pound. Turmoil in the United States (U.S.) financial markets and concerns about the global economy negatively impacted copper prices in fourth-quarter 2008; however, copper prices have improved in 2009 because of increased Chinese buying activity, less bearish economic sentiment and production and supply issues. While the near-term outlook is uncertain, we believe the underlying fundamentals of the copper business remain positive, supported by supply side constraints and the absence of significant new development projects. Future copper prices may continue to be volatile and are expected to be influenced by demand from China, economic activity in the U.S. and other industrialized countries, the timing of the development of new supplies of copper and production levels of mines and copper smelters. During April 2009, copper prices rose as declines in inventory levels signaled an increase in demand; the LME spot copper price closed at $2.05 per pound on April 30, 2009.
The graph above presents London gold prices from January 1993 through April 2009. During first-quarter 2009, the environment for gold was positive, but volatile, with gold prices ranging from approximately $810 per ounce to $989 per ounce and averaging approximately $908 per ounce. Growing investment demand, economic uncertainty and a weak U.S. dollar are continuing to support gold prices. London gold prices closed at approximately $883 per ounce on April 30, 2009.
The graph above presents the Metals Week Molybdenum Dealer Oxide price from January 1993 through April 2009. Molybdenum prices have declined significantly as a result of the financial market turmoil and a decline in demand. During first-quarter 2009, the weekly average price of molybdenum ranged from approximately $8.13 per pound to approximately $9.50 per pound and averaged $8.91 per pound. The weekly average Metals Week Molybdenum Dealer Oxide price was $8.00 per pound on April 30, 2009.
CONSOLIDATED RESULTS
| | First-Quarter | |
| | 2009 | | 2008 | |
Financial Data (in millions, except per share amounts) | | | | | | |
| Revenues | $ | 2,602 | a,b,c | $ | 5,672 | a,b,c |
| Operating income | $ | 672 | a,b,c,d,e | $ | 2,396 | a,b,c,e |
| Net income | $ | 207 | b,c,d,e | $ | 1,505 | b,c,e |
Net income applicable to common stockf | $ | 43 | b,c,d,e | $ | 1,122 | b,c,e |
| Diluted net income per share of common stock | $ | 0.11 | b,c,d,e | $ | 2.64 | b,c,e |
Diluted average common shares outstanding g | | 401 | | | 449 | |
| | | | | | | |
| FCX Mining Operating Data | | | | | | |
Copper (millions of recoverable pounds) | | | | | | |
| Production | | 1,041 | | | 880 | |
| Sales, excluding purchases | | 1,020 | | | 911 | |
| Average realized price per pound | $ | 1.72 | | $ | 3.69 | |
Site production and delivery costs per poundh | $ | 1.07 | | $ | 1.47 | |
Unit net cash costs per poundh | $ | 0.66 | | $ | 1.06 | |
Gold (thousands of recoverable ounces) | | | | | | |
| Production | | 595 | | | 275 | |
| Sales, excluding purchases | | 545 | | | 280 | |
| Average realized price per ounce | $ | 904 | | $ | 933 | |
Molybdenum (millions of recoverable pounds) | | | | | | |
| Production | | 14 | | | 18 | |
| Sales, excluding purchases | | 10 | | | 20 | |
| Average realized price per pound | $ | 11.52 | | $ | 31.67 | |
| a. | As discussed in Note 10, during 2008 we revised the presentation of our operating divisions to better reflect management’s view of our consolidated operations, and have also reclassified amounts for first-quarter 2008 to conform to the current period presentation. Following is a summary of revenues and operating income (loss) by operating division (in millions): |
| | First-Quarter 2009 | | First-Quarter 2008 | |
| | | | | | Operating | | | | | | Operating | |
| | | | | | Income | | | | | | Income | |
| | | Revenues | | | (Loss) | | | Revenues | | | (Loss) | |
| North America copper mines | $ | 618 | | $ | (32 | ) | $ | 1,496 | | $ | 666 | |
| South America copper mines | | 702 | | | 264 | | | 1,607 | | | 1,045 | |
| Indonesia mining | | 1,122 | | | 689 | | | 1,052 | | | 571 | |
| Africa mining | | – | | | (19 | ) | | – | | | (4 | ) |
| Molybdenum | | 146 | | | (4 | ) | | 719 | | | 214 | |
| Rod & Refining | | 619 | | | 5 | | | 1,688 | | | 10 | |
| Atlantic Copper Smelting & Refining | | 292 | | | (11 | ) | | 665 | | | (3 | ) |
| Corporate, other & eliminations | | (897 | ) | | (220 | ) | | (1,555 | ) | | (103 | ) |
| Total | $ | 2,602 | | $ | 672 | | $ | 5,672 | | $ | 2,396 | |
| b. | Includes impacts of adjustments to provisionally priced prior year copper sales. Refer to “Revenues” for further discussion. |
| c. | Includes unrealized gains on copper derivative contracts entered into in connection with certain of our sales contracts with U.S. copper rod customers totaling $19 million ($19 million to net income applicable to common stock or $0.05 per share) in first-quarter 2009 and $19 million ($12 million to net income applicable to common stock or $0.03 per share) in first-quarter 2008. These contracts allow us to receive market prices in the month of shipment while the customer pays the fixed price they requested. Refer to Note 8 for further discussion. |
| d. | First-quarter 2009 includes charges totaling $25 million to operating income ($22 million to net income applicable to common stock or $0.05 per share) for restructuring and other charges associated with our revised operating plans. Refer to Note 2 for further discussion. |
| e. | First-quarter 2009 includes charges of $31 million ($31 million to net income applicable to common stock or $0.08 per share) associated with adjustments to environmental obligations, and $19 million ($19 million to net income applicable to common stock or $0.05 per share) for lower of cost or market (LCM) molybdenum inventory adjustments. |
Also includes a reduction in compensation expense attributable to the prior years’ financial results totaling $33 million ($29 million to net income applicable to common stock or $0.07 per share) for first-quarter 2009 and $40 million ($23 million to net income applicable to common stock or $0.05 per share) for first-quarter 2008.
| f. | After net income attributable to noncontrolling interests in subsidiaries and preferred dividends. |
| g. | Reflects assumed conversion of our 5½% Convertible Perpetual Preferred Stock and 6¾% Mandatory Convertible Preferred Stock in first-quarter 2008. These securities were not dilutive in first-quarter 2009. |
| h. | Reflects per pound weighted average production and delivery costs and unit net cash costs (net of by-product credits) for all copper mines. For reconciliations of the per pound costs by operating division to production and delivery costs applicable to sales reported in our consolidated financial statements, refer to “Operations – Unit Net Cash Costs” and to “Product Revenues and Production Costs.” |
Revenues
Consolidated revenues include the sale of copper rod, copper cathodes, copper concentrates, molybdenum, gold and other metals by our North and South America copper mines, the sale of copper concentrates (which also contain significant quantities of gold and silver) by our Indonesia mining operation, the sale of molybdenum in various forms by our Molybdenum operations, and the sale of copper anodes, copper cathodes, and gold in anodes and slimes by Atlantic Copper. Consolidated revenues totaled $2.6 billion in first-quarter 2009, compared with $5.7 billion in first-quarter 2008, primarily because of the sharp declines in the price of copper. Following is a summary of changes in our consolidated revenues between periods (in millions):
| First-quarter 2008 consolidated revenues | $ | 5,672 | |
| Price realizations: | | | |
| Copper | | (2,009 | ) |
| Gold | | (16 | ) |
| Molybdenum | | (198 | ) |
| Sales volumes: | | | |
| Copper | | 403 | |
| Gold | | 247 | |
| Molybdenum | | (337 | ) |
| Purchased copper and molybdenum | | (590 | ) |
| Adjustments, primarily for copper pricing on prior year open sales | | (137 | ) |
| Atlantic Copper revenues | | (372 | ) |
| Other, net | | (61 | ) |
| First-quarter 2009 consolidated revenues | $ | 2,602 | |
Realized copper prices decreased to an average of $1.72 per pound in first-quarter 2009, compared with $3.69 per pound in first-quarter 2008; realized gold prices decreased to an average of $904 per ounce in first-quarter 2009, compared with $933 per ounce in first-quarter 2008; and realized molybdenum prices decreased to an average of $11.52 per pound in first-quarter 2009, compared with $31.67 per pound in first-quarter 2008.
Consolidated sales volumes in first-quarter 2009 totaled 1.0 billion pounds of copper, 545 thousand ounces of gold and 10 million pounds of molybdenum, compared with 911 million pounds of copper, 280 thousand ounces of gold and 20 million pounds of molybdenum in first-quarter 2008. Higher first-quarter 2009 copper and gold sales volumes primarily reflect expected increased production at Grasberg because of higher ore grades. The increase in copper sales volumes was partly offset by lower sales volumes at our North America copper mines as a result of planned curtailed production rates at these operations to reduce production of higher cost volumes. Lower molybdenum sales volumes in first-quarter 2009 reflect the effects of declines in demand, principally in the metallurgical sector. Refer to “Operations” for further discussion.
During first-quarter 2009, approximately 57 percent of our mined copper was sold in concentrate, approximately 23 percent as rod (principally from our North America operations) and approximately 20 percent as cathodes. Substantially all of our concentrate sales contracts and some of our cathode sales contracts provide final copper pricing in a specified future period (generally one to four months from the shipment date) based primarily on quoted LME prices. We receive market prices based on prices in the specified future period, and the accounting rules applied to these sales result in changes recorded to revenues until the specified future period. We record revenues and invoice customers at the time of shipment based on then-current LME prices, which results in an embedded derivative on our provisional priced concentrate and cathode sales that is adjusted to fair value through earnings each period until the date of final pricing. To the extent final prices are higher or lower than what was recorded on a provisional basis, an increase or decrease to revenues is recorded each reporting period until the date of final pricing.
At December 31, 2008, we had provisionally priced copper sales of 508 million pounds of copper (net of noncontrolling interests) recorded at an average of $1.39 per pound. Higher prices during first-quarter 2009 resulted in adjustments to these prior year copper sales and increased consolidated revenues by $128 million ($60 million to net income applicable to common stock or $0.15 per share) in first-quarter 2009, compared with an increase of $263 million ($111 million to net income applicable to common stock or $0.25 per share) in first-quarter 2008.
LME spot copper prices averaged $1.56 per pound in first-quarter 2009, compared with our average recorded price of $1.72 per pound. Approximately 70 percent of our first-quarter 2009 consolidated copper sales were provisionally priced at the time of shipment and are subject to final pricing during the remainder of 2009. At March 31, 2009, we had provisionally priced copper sales totaling 407 million pounds of copper (net of noncontrolling interests) recorded at an average of $1.83 per pound, subject to final pricing over the next several months.
In early April 2009, we entered into forward copper sales contracts to lock in prices at an average of $1.86 per pound on 355 million pounds of PT Freeport Indonesia’s provisionally priced copper sales at March 31, 2009, which are scheduled to final price from April 2009 through July 2009. From time to time, we may enter into future transactions to lock in pricing on provisionally priced sales to reduce short-term volatility in earnings and cash flows, but we do not intend to change our long standing policy of not hedging future copper production.
After taking into account the forward sales contracts on PT Freeport Indonesia’s provisionally priced copper sales, we estimate that each $0.05 change in the price realized from the March 31, 2009, provisional price recorded would have a net impact on our 2009 consolidated revenues of approximately $8 million ($4 million to net income applicable to common stock). The LME spot copper price closed at $2.05 per pound on April 30, 2009.
Production and Delivery Costs
Consolidated production and delivery costs totaled $1.6 billion in first-quarter 2009 compared with $2.7 billion in first-quarter 2008. Lower production and delivery costs in first-quarter 2009 primarily reflected the effects of lower operating rates at our North America copper mines and declining commodity-based input costs. Energy costs are expected to approximate 20 percent of our consolidated copper production costs in 2009, compared with approximately 25 percent in 2008, and include purchases of approximately 190 million gallons of diesel fuel, 800 thousand metric tons of coal, 5,700 gigawatt hours of electricity and 1 million MMBTU (million british thermal units) of natural gas.
Consolidated unit net cash costs, net of by-product credits, related to our copper mining operations totaled $0.66 per pound of copper in first-quarter 2009 compared with $1.06 per pound of copper in first-quarter 2008. The decrease in unit net cash costs in first-quarter 2009 reflected the effects of lower operating rates following production curtailments at our North America copper mines, higher copper ore grades at Grasberg and decreases in energy prices and other commodity-based input costs. Refer to “Operations – Unit Net Cash Costs” for further discussion of unit net cash costs associated with our operating divisions, and to “Product Revenues and Production Costs” for reconciliations of per pound costs by operating division to production and delivery costs applicable to sales reported in our consolidated financial statements.
Depreciation, Depletion and Amortization
Consolidated depreciation, depletion and amortization expense totaled $232 million in first-quarter 2009 compared with $418 million in first-quarter 2008. The decrease in depreciation, depletion and amortization expense reflects the impact of the long-lived asset impairment charges recognized in fourth-quarter 2008, partly offset by higher expense under the unit-of-production method primarily resulting from higher production at PT Freeport Indonesia in first-quarter 2009.
LCM Inventory Adjustments
Inventories are required to be recorded at the lower of cost or market. As a result of lower molybdenum prices we recognized charges of $19 million ($19 million to net income applicable to common stock or $0.05 per share) for LCM inventory adjustments in first-quarter 2009.
Selling, General and Administrative Expenses
Consolidated selling, general and administrative expenses totaled $62 million in first-quarter 2009 compared with $84 million in first-quarter 2008. Lower selling, general and administrative expenses primarily reflected lower incentive compensation costs because of weaker financial results in 2009 compared with 2008, lower stock-based compensation costs related to a lower FCX common stock price, and changes to certain benefit plans.
Exploration and Research Expenses
Consolidated exploration and research expenses totaled $30 million in first-quarter 2009 compared with $52 million in first-quarter 2008. Exploration activities are being conducted near our existing mines with a focus on opportunities to expand reserves that will support additional future production capacity in the large mineral districts where we currently operate. Drilling activities were significantly expanded in 2008 and were successful in providing significant reserve additions and in identifying potential additional ore adjacent to existing ore bodies. Results indicate opportunities for significant future potential reserve additions at Morenci, Sierrita and Bagdad in North America, at Cerro Verde in South America and in the high potential Tenke Fungurume minerals district.
During 2009, we will focus on analyzing exploratory data gained through the core drilling previously undertaken. For 2009, exploration expenditures are expected to approximate $75 million.
Restructuring and Other Charges
Net charges of $25 million ($22 million to net income applicable to common stock or $0.05 per share) were recognized in first-quarter 2009 associated with our revised operating plans, including contract termination costs, other project cancellation costs and charges for employee severance and benefits, partially offset by pension and postretirement gains for special retirement benefits and curtailments. Refer to Note 2 for further discussion.
Interest Expense, Net
Consolidated interest expense (before capitalization) totaled $176 million in first-quarter 2009 and $187 million in first-quarter 2008. Capitalized interest totaled $45 million in first-quarter 2009 compared with $22 million in first-quarter 2008. Capitalized interest is primarily related to our Tenke Fungurume development project (refer to “Development Projects” for further discussion), which entered the commissioning and start-up phase in late March 2009. As a result, we expect to recognize significantly less capitalized interest beginning in second-quarter 2009.
Provision for Income Taxes
Our first-quarter 2009 income tax provision resulted from taxes on international operations ($330 million) and U.S. operations ($1 million). Our effective tax rate for 2009 is expected to be highly sensitive to changes in commodity prices and the mix of income between U.S. and international operations. Taxes provided on income generated from our South America and Indonesia operations are recorded at the applicable statutory rates. However, at certain commodity prices, we do not record a tax benefit for losses generated in the U.S., and those losses cannot be used to offset income generated from international operations. These factors have caused our consolidated effective tax rate of 63 percent to be substantially higher than the U.S. federal statutory rate of 35 percent.
Our first-quarter 2008 income tax provision resulted from taxes on international operations ($579 million) and U.S. operations ($150 million). The difference between our consolidated effective income tax rate of approximately 33 percent for first-quarter 2008 and the U.S. federal statutory rate of 35 percent primarily was attributable to a U.S. benefit for percentage depletion, partly offset by withholding taxes and incremental U.S. income tax accrued on foreign earnings.
A summary of the approximate amounts in the calculation of our consolidated provision for income taxes for first-quarter 2009 and first-quarter 2008 follows (in millions, except percentages):
| | | First-Quarter 2009 | | First-Quarter 2008 | |
| | | | | | | | Income Tax | | | | | | | Income Tax | |
| | | Income | | | Effective | | Provision | | Income | | | Effective | | Provision | |
| | | (Loss)a | | | Tax Rate | | (Benefit) | | (Loss)a | | | Tax Rate | | (Benefit) | |
| U.S. | | $ | (288 | ) | | – | | $ | 1 | | $ | 778 | | | 19% | | $ | 150 | |
| South America | | | 253 | | | 33% | | | 84 | | | 1,024 | | | 33% | | | 333 | |
| Indonesia | | | 689 | | | 42% | | | 288 | | | 570 | | | 42% | | | 239 | |
| Africa | | | (2 | ) | | 30% | | | (1 | ) | | - | | | 30% | | | - | |
| Eliminations and other | | | (125 | ) | | N/A | | | (41 | ) | | (145 | ) | | N/A | | | (3 | ) |
Annualized rate adjustmentb | | | N/A | | | N/A | | | – | | | N/A | | | N/A | | | 10 | |
| Consolidated FCX | | $ | 527 | | | 63%c | | $ | 331 | | $ | 2,227 | | | 33% | | $ | 729 | |
| a. | Represents income (loss) before income taxes and equity in affiliated companies’ net earnings. |
| b. | In accordance with applicable accounting rules, we adjust our interim provision for income taxes to equal our estimated annualized tax rate. |
| c. | Our estimated consolidated effective tax rate for 2009 will vary with commodity price changes and the mix of income from international and U.S. operations. Following is a summary of our estimated annual consolidated effective tax rate using currently projected sales volumes for 2009 and based on various commodity price assumptions for the remainder of 2009: |
| | | | | | | | | | Estimated |
| | Copper | | | Gold | | | Molybdenum | | Effective |
| | (per pound) | | | (per ounce) | | | (per pound) | | Tax Rate(1) |
| $ | 1.50 | | $ | 900 | | $ | 8.00 | | 72% |
| $ | 2.00 | | $ | 900 | | $ | 8.00 | | 48% |
| $ | 2.50 | | $ | 900 | | $ | 8.00 | | 42% |
(1) Quarterly effective tax rates may vary depending on the mix of income for the quarterly period.
OPERATIONS
North America Copper Mines
We currently have five operating open-pit copper mines in North America – Morenci, Sierrita, Bagdad and Safford in Arizona, and Tyrone in New Mexico. In addition to copper, the Sierrita and Bagdad mines produce molybdenum as a by-product. All of these mining operations are wholly owned, except for Morenci, an unincorporated joint venture, in which we own an 85 percent undivided interest.
The North America copper mines include open-pit mining, sulfide ore concentrating, leaching and solution extraction/electrowinning (SX/EW) operations. A majority of the copper produced at our North America copper mines is cast into copper rod by our Rod & Refining operations. The remainder of our North America copper sales is primarily in the form of copper cathode or copper concentrate.
In response to weak market conditions, we revised operating plans at our North America copper mines at the end of 2008 and in early 2009, which included an approximate 50 percent reduction in mining and crushed-leach rates at Morenci; an approximate 50 percent reduction in mining and stacking rates at the Safford mine; an approximate 50 percent reduction in the mining rate at the Tyrone mine; and the suspension of mining and milling activities at the Chino mine (with limited residual copper production from leach operations). Operating plans for the North America copper mines will continue to be reviewed and additional adjustments may be made as market conditions warrant.
Operating Data. Following is summary operating data for the North America copper mines for the first quarters of 2009 and 2008.
| | | First-Quarter | |
| | | 2009 | | 2008 | |
| Operating Data, Net of Joint Venture Interest | | | | | | | |
Copper (millions of recoverable pounds) | | | | | | | |
| Production | | | 289 | | | 327 | |
| Sales, excluding purchases | | | 301 | | | 339 | |
| Average realized price per pound | | $ | 1.59 | | $ | 3.50 | |
| | | | | | | | |
Molybdenum (millions of recoverable pounds) | | | | | | | |
Production (by-product)a | | | 6 | | | 8 | |
| | | | | | | | |
| 100% Operating Data, Including Joint Venture Interest | | | | | | | |
| SX/EW operations | | | | | | | |
| Leach ore placed in stockpiles (metric tons per day) | | | 669,200 | | | 1,134,900 | |
| Average copper ore grade (percent) | | | 0.30 | | | 0.19 | |
| Copper production (millions of recoverable pounds) | | | 222 | | | 217 | |
| | | | | | | | |
| Mill operations | | | | | | | |
| Ore milled (metric tons per day) | | | 180,800 | | | 244,000 | |
| Average ore grade (percent): | | | | | | | |
| Copper | | | 0.35 | | | 0.39 | |
| Molybdenum | | | 0.02 | | | 0.02 | |
| Copper recovery rate (percent) | | | 85.2 | | | 81.2 | |
| Production (millions of recoverable pounds): | | | | | | | |
| Copper | | | 88 | | | 136 | |
| Molybdenum (by-product) | | | 6 | | | 8 | |
| a. | Reflects by-product molybdenum production from the North America copper mines. Sales of by-product molybdenum are reflected in the Molybdenum division. |
Copper sales from the North America mines totaled 301 million pounds in first-quarter 2009 compared with 339 million pounds in first-quarter 2008. The decrease in copper sales volumes in first-quarter 2009 primarily reflected planned curtailed production rates to reduce production of higher cost volumes, partly offset by higher production at the Safford copper mine. Production commenced at Safford in December 2007 and was ramped up to design capacity during 2008 before we revised operating plans to curtail production in fourth-quarter 2008.
For 2009, copper sales volumes from our North America copper mines are expected to approximate 1.1 billion pounds and by-product molybdenum production is expected to approximate 27 million pounds, compared with 1.4 billion pounds of copper and 30 million pounds of by-product molybdenum production in 2008. Production from the North America copper mines in 2010 is currently expected to decline by approximately an additional 200 million pounds because of impacts of 2009 mining activities on 2010 leaching operations.
Unit Net Cash Costs. Unit net cash costs per pound of copper is a measure intended to provide investors with information about the cash-generating capacity of our mining operations expressed on a basis relating to the primary metal product for our respective operations. We use this measure for the same purpose and for monitoring operating performance by our mining operations. This information differs from measures of performance determined in accordance with generally accepted accounting principles (GAAP) in the U.S. and should not be considered in isolation or as a substitute for measures of performance determined in accordance with U.S. GAAP. This measure is presented by other mining companies, although our measure may not be comparable to similarly titled measures reported by other companies.
Gross Profit per Pound of Copper and Molybdenum
The following tables summarize unit net cash costs and gross profit at the North America copper mines for the first quarters of 2009 and 2008. Refer to “Product Revenues and Production Costs” for an explanation of the “by-product” and “co-product” methods and a reconciliation of unit net cash costs per pound to production and delivery costs applicable to sales reported in our consolidated financial statements.
| | First-Quarter 2009 | | First-Quarter 2008 | |
| | By- | | Co-Product Method | | By- | | Co-Product Method | |
| | Product | | | | | Molyb- | | Product | | | | | Molyb- | |
| | Method | | Copper | | denuma | | Method | | Copper | | denuma | |
| Revenues, excluding adjustments shown below | $ | 1.59 | | $ | 1.59 | | $ | 9.71 | | $ | 3.50 | | $ | 3.50 | | $ | 32.75 | |
| | | | | | | | | | | | | | | | | | | |
| Site production and delivery, before net noncash | | | | | | | | | | | | | | | | | | |
| and nonrecurring costs shown below | | 1.32 | | | 1.26 | | | 4.28 | | | 1.64 | | | 1.43 | | | 9.75 | |
By-product creditsa | | (0.18 | ) | | – | | | – | | | (0.77 | ) | | – | | | – | |
| Treatment charges | | 0.08 | | | 0.08 | | | – | | | 0.09 | | | 0.09 | | | – | |
| Unit net cash costs | | 1.22 | | | 1.34 | | | 4.28 | | | 0.96 | | | 1.52 | | | 9.75 | |
| Depreciation, depletion and amortization | | 0.24 | | | 0.23 | | | 0.21 | | | 0.53 | | | 0.47 | | | 2.47 | |
| Noncash and nonrecurring costs, net | | 0.15 | | | 0.15 | | | 0.15 | | | 0.09 | | | 0.09 | | | 0.11 | |
| Total unit costs | | 1.61 | | | 1.72 | | | 4.64 | | | 1.58 | | | 2.08 | | | 12.33 | |
| Revenue adjustments, primarily for hedging | | 0.24 | | | 0.24 | | | – | | | 0.13 | | | 0.13 | | | – | |
| Idle facility and other non-inventoriable costs | | (0.13 | ) | | (0.13 | ) | | – | | | (0.04 | ) | | (0.04 | ) | �� | (0.02 | ) |
| Gross profit (loss) | $ | 0.09 | | $ | (0.02 | ) | $ | 5.07 | | $ | 2.01 | | $ | 1.51 | | $ | 20.40 | |
| | | | | | | | | | | | | | | | | | | |
| Copper sales (millions of recoverable pounds) | | 301 | | | 301 | | | | | | 337 | | | 337 | | | | |
Molybdenum sales (millions of recoverable pounds)b | | | | | | | | 6 | | | | | | | | | 8 | |
| a. | Molybdenum by-product credits and revenues reflect volumes produced at market-based pricing and also include tolling revenues at Sierrita. |
| b. | Reflects molybdenum produced by the North America copper mines. |
Unit net cash costs, after by-product credits, for our North America copper mines increased to $1.22 per pound of copper in first-quarter 2009, compared with $0.96 per pound of copper in first-quarter 2008, primarily reflecting lower molybdenum credits ($0.59 per pound decrease) resulting from lower molybdenum prices and volumes, partly offset by a decrease in site production and delivery costs ($0.32 per pound decrease, including $0.48 per pound associated with lower operating rates and $0.17 per pound for reduced energy costs, partly offset by increases of $0.25 per pound related to draw downs of inventory with higher average costs).
Our five operating North America copper mines have varying cost structures because of differences in ore grades and ore characteristics, processing costs, by-products and other factors. During first-quarter 2009, the Morenci mine, which accounts for approximately 40 percent of North America’s production, had unit net cash costs of $1.18 per pound. Based on current operating plans and assuming average prices of $2.00 per pound of copper and $8.00 per pound of molybdenum for the remainder of 2009, we estimate that average unit net cash costs, including molybdenum credits, for our North America copper mines would approximate $1.22 per pound of copper for the year 2009, compared with $1.33 per pound in 2008. Each $1 per pound change in the molybdenum price during the remainder of 2009 would have an approximate $0.015 per pound impact on the North America copper mines’ 2009 unit net cash costs.
The decrease in depreciation, depletion and amortization in first-quarter 2009, compared with first-quarter 2008, reflects the impact of the long-lived asset impairment charges recognized in fourth-quarter 2008.
South America Copper Mines
We have four operating copper mines in South America – Cerro Verde in Peru, and Candelaria, Ojos del Salado and El Abra in Chile. We own a 53.56 percent interest in Cerro Verde, an 80 percent interest in both Candelaria and Ojos del Salado and a 51 percent interest in El Abra.
The South America copper mines include open-pit and underground mining, sulfide ore concentrating, leaching and SX/EW operations. In addition to copper, the Cerro Verde mine produces molybdenum concentrates as a by-product, and the Candelaria and Ojos del Salado mines produce gold and silver as by-products. Production from our South America copper mines is sold as copper concentrate or copper cathode under long-term contracts.
In response to weak market conditions, we revised operating plans at our South America copper mines at the end of 2008 and in early 2009. The revised operating plans for 2009 principally reflect the incorporation of reduced input costs; a significant reduction in capital spending plans, including deferral of the planned incremental expansion project at the Cerro Verde mine and a delay in the sulfide project at El Abra; and reduced spending for discretionary items. In addition, we have temporarily curtailed the molybdenum circuit at Cerro Verde. Operating plans for the South America copper mines will continue to be reviewed and additional adjustments may be made as market conditions warrant.
Operating Data. Following is summary operating data for the South America copper mines for the first quarters of 2009 and 2008.
| | | First-Quarter | |
| | | 2009 | | 2008 | |
Copper (millions of recoverable pounds) | | | | | | | |
| Production | | | 348 | | | 353 | |
| Sales | | | 350 | | | 365 | |
| Average realized price per pound | | $ | 1.76 | | $ | 3.78 | |
| | | | | | | | |
Gold (thousands of recoverable ounces) | | | | | | | |
| Production | | | 23 | | | 26 | |
| Sales | | | 23 | | | 27 | |
| Average realized price per ounce | | $ | 902 | | $ | 936 | |
| | | | | | | | |
Molybdenum (millions of recoverable pounds) | | | | | | | |
Production (by-product)a | | | 1 | | | 1 | |
| | | | | | | | |
| SX/EW operations | | | | | | | |
| Leach ore placed in stockpiles (metric tons per day) | | | 250,500 | | | 274,100 | |
| Average copper ore grade (percent) | | | 0.45 | | | 0.39 | |
| Copper production (millions of recoverable pounds) | | | 137 | | | 135 | |
| | | | | | | | |
| Mill operations | | | | | | | |
| Ore milled (metric tons per day) | | | 182,400 | | | 170,700 | |
| Average copper ore grade (percent): | | | | | | | |
| Copper | | | 0.68 | | | 0.74 | |
| Molybdenum | | | 0.02 | | | 0.02 | |
| Copper recovery rate (percent) | | | 88.9 | | | 90.6 | |
| Production (millions of recoverable pounds): | | | | | | | |
| Copper | | | 211 | | | 218 | |
| Molybdenum | | | 1 | | | 1 | |
| a. | Reflects by-product molybdenum production from our Cerro Verde copper mine. Sales of by-product molybdenum are reflected in the Molybdenum segment. |
Copper sales from the South America mines totaled 350 million pounds in first-quarter 2009, compared with 365 million pounds in first-quarter 2008. Lower sales volumes in first-quarter 2009 primarily reflect the mining of lower ore grades at El Abra and Candelaria.
For 2009, consolidated sales volumes from our South America mines are expected to approximate 1.4 billion pounds of copper and 100 thousand ounces of gold, compared with 1.5 billion pounds of copper and 116 thousand ounces of gold in 2008. Lower copper volumes in 2009, compared with 2008, reflect the impact of previously expected mining of lower ore grades at Candelaria. While the revised operating plans for our South America copper mines do not have a significant effect on 2009 production volumes, they are expected to result in lower 2010 production by approximately 100 million pounds of copper.
Unit Net Cash Costs. Unit net cash costs per pound of copper is a measure intended to provide investors with information about the cash-generating capacity of our mining operations expressed on a basis relating to the primary metal product for our respective operations. We use this measure for the same purpose and for monitoring operating performance by our mining operations. This information differs from measures of performance determined in accordance with U.S. GAAP and should not be considered in isolation or as a substitute for measures of performance determined in accordance with U.S. GAAP. This measure is presented by other mining companies, although our measure may not be comparable to similarly titled measures reported by other companies.
Gross Profit per Pound of Copper
The following tables summarize unit net cash costs and gross profit at the South America copper mines for the first quarters of 2009 and 2008. The below tables reflect unit net cash costs per pound of copper under the by-product and co-product methods as the South America copper mines also had small amounts of molybdenum, gold and silver sales. Refer to “Product Revenues and Production Costs” for an explanation of the “by-product” and “co-product” methods and a reconciliation of unit net cash costs per pound to production and delivery costs applicable to sales reported in our consolidated financial statements.
| | First-Quarter 2009 | | First-Quarter 2008 | |
| | By-Product | | Co-Product | | By-Product | | Co-Product | |
| | Method | | Method | | Method | | Method | |
| Revenues, excluding adjustments shown below | $ | 1.76 | | $ | 1.76 | | $ | 3.78 | | $ | 3.78 | |
| | | | | | | | | | | | | |
| Site production and delivery, before net noncash | | | | | | | | | | | | |
| and nonrecurring costs shown below | | 1.00 | | | 0.92 | | | 1.08 | | | 1.05 | |
| By-product credits | | (0.11 | ) | | – | | | (0.14 | ) | | – | |
| Treatment charges | | 0.14 | | | 0.14 | | | 0.21 | | | 0.21 | |
| Unit net cash costs | | 1.03 | | | 1.06 | | | 1.15 | | | 1.26 | |
| Depreciation, depletion and amortization | | 0.18 | | | 0.17 | | | 0.35 | | | 0.34 | |
| Noncash and nonrecurring costs, net | | 0.02 | | | 0.02 | | | 0.07 | | | 0.07 | |
| Total unit costs | | 1.23 | | | 1.25 | | | 1.57 | | | 1.67 | |
| Revenue adjustments, primarily for pricing on | | | | | | | | | | | | |
| prior period open sales | | 0.25 | | | 0.25 | | | 0.63 | | | 0.63 | |
| Idle facility and other non-inventoriable costs | | (0.02 | ) | | (0.02 | ) | | (0.02 | ) | | (0.01 | ) |
| Gross profit | $ | 0.76 | | $ | 0.74 | | $ | 2.82 | | $ | 2.73 | |
| | | | | | | | | | | | | |
| Copper sales (millions of recoverable pounds) | | 350 | | | 350 | | | 365 | | | 365 | |
Unit net cash costs, after by-product credits, for our South America copper mines decreased to $1.03 per pound of copper in first-quarter 2009, compared with $1.15 per pound in first-quarter 2008, primarily reflecting lower site production and delivery costs ($0.08 per pound decrease, including $0.15 per pound for lower operating costs reflecting the impacts of revised operating plans and $0.07 per pound for lower energy costs, partly offset by an increase of $0.12 per pound for draw downs of inventory with higher average costs). In addition, lower treatment charges ($0.07 per pound decrease) associated with lower price participation because of lower copper prices contributed to lower unit net cash costs for our South America copper mines.
Our South America copper mines have varying cost structures because of differences in ore grades and ore characteristics, processing costs, by-products and other factors. During first-quarter 2009, the Cerro Verde mine, which accounts for almost half of South America’s production had unit net cash costs for of $0.97 per pound. Assuming average prices of $2.00 per pound of copper for the remainder of 2009 and achievement of current 2009 sales, we estimate that average unit net cash costs, after by-product credits, for our South America copper mines would approximate $1.05 per pound of copper in 2009, compared with $1.14 per pound in 2008.
The decrease in depreciation, depletion and amortization in first-quarter 2009, compared with first-quarter 2008, reflects the impact of the long-lived asset impairment charges recognized in fourth-quarter 2008.
Indonesia Mining
We own 90.64 percent of PT Freeport Indonesia, including 9.36 percent owned through our wholly owned subsidiary, PT Indocopper Investama. The Government of Indonesia owns the remaining 9.36 percent of PT Freeport Indonesia. PT Freeport Indonesia operates under an agreement, called a Contract of Work, with the Government of Indonesia that allows us to conduct exploration, mining and production activities in a 24,700-acre area called Block A located in Papua, Indonesia. Under the Contract of Work, PT Freeport Indonesia also conducts exploration activities in an approximate 500,000-acre area called Block B in Papua. All of PT Freeport Indonesia’s proven and probable mineral reserves and current mining operations, including the Grasberg minerals district, are located in Block A.
PT Freeport Indonesia produces copper concentrates, which contain significant quantities of gold and silver. Substantially all of PT Freeport Indonesia’s copper concentrates are sold under long-term contracts.
We have established certain unincorporated joint ventures with Rio Tinto plc (Rio Tinto), an international mining company with headquarters in London, England. Pursuant to the joint venture agreement, Rio Tinto has a 40
percent interest in certain assets and future production exceeding specified annual amounts of copper, gold and silver through 2021 in Block A of PT Freeport Indonesia’s Contract of Work, and, after 2021, a 40 percent interest in all production from Block A.
As reported in January 2006, we received and responded to requests from U.S. governmental authorities related to PT Freeport Indonesia’s support of Indonesian security institutions. In May 2009, we were notified by the SEC that the U.S. government's investigation has been completed and no action has been recommended.
Operating Data. Following is summary operating data for our Indonesia mining operations for the first quarters of 2009 and 2008.
| | | First-Quarter | |
| | | 2009 | | 2008 | |
| Consolidated Operating Data, Net of Joint Venture Interest | | | | | | | |
Copper (millions of recoverable pounds) | | | | | | | |
| Production | | | 404 | | | 200 | |
| Sales | | | 369 | | | 207 | |
| Average realized price per pound | | $ | 1.80 | | $ | 3.82 | |
| | | | | | | | |
Gold (thousands of recoverable ounces) | | | | | | | |
| Production | | | 570 | | | 246 | |
| Sales | | | 521 | | | 251 | |
| Average realized price per ounce | | $ | 904 | | $ | 932 | |
| | | | | | | | |
| 100% Operating Data, Including Joint Venture Interest | | | | | | | |
| Ore milled (metric tons per day): | | | | | | | |
Grasberg open pita | | | 165,000 | | | 118,600 | |
Deep Ore Zone (DOZ) underground minea | | | 72,400 | | | 61,200 | |
| Total | | | 237,400 | | | 179,800 | |
| Average ore grade: | | | | | | | |
| Copper (percent) | | | 1.12 | | | 0.70 | |
| Gold (grams per metric ton) | | | 1.13 | | | 0.61 | |
| Recovery rates (percent): | | | | | | | |
| Copper | | | 90.7 | | | 89.7 | |
| Gold | | | 81.9 | | | 79.0 | |
| Production (recoverable): | | | | | | | |
| Copper (millions of pounds) | | | 456 | | | 214 | |
| Gold (thousands of ounces) | | | 619 | | | 246 | |
| a. | Amounts represent the approximate average daily throughput processed at PT Freeport Indonesia’s mill facilities from each producing mine. |
At the Grasberg mine, the sequencing in mining areas with varying ore grades causes fluctuations in the timing of ore production resulting in varying quarterly and annual sales of copper and gold. PT Freeport Indonesia’s share of sales totaled 369 million pounds of copper and 521 thousand ounces of gold in first-quarter 2009, compared with 207 million pounds of copper and 251 thousand ounces of gold in first-quarter 2008. Higher copper and gold sales volumes in first-quarter 2009 resulted from mining in a higher-grade section of the Grasberg open pit, which is expected to continue in 2009 and 2010.
For 2009, PT Freeport Indonesia’s sales are expected to approximate 1.3 billion pounds of copper and 2.2 million ounces of gold, compared with 1.1 billion pounds of copper and 1.2 million ounces of gold in 2008.
Unit Net Cash Costs. Unit net cash costs per pound of copper is a measure intended to provide investors with information about the cash-generating capacity of our mining operations expressed on a basis relating to the primary metal product for our respective operations. We use this measure for the same purpose and for monitoring operating performance by our mining operations. This information differs from measures of performance determined in accordance with U.S. GAAP and should not be considered in isolation or as a substitute for measures of performance determined in accordance with U.S. GAAP. This measure is presented by other mining companies, although our measure may not be comparable to similarly titled measures reported by other companies.
Gross Profit per Pound of Copper/per Ounce of Gold
The following tables summarize the unit net cash (credits) costs and gross profit at our Indonesia mining operations. Refer to “Production Revenues and Production Costs” for an explanation of “by-product” and “co-product” methods and a reconciliation of unit net cash costs per pound to production and delivery costs applicable to sales reported in our consolidated financial statements.
| | First-Quarter 2009 | | First-Quarter 2008 | |
| | By-Product | | Co-Product Method | | By-Product | | Co-Product Method | |
| | Method | | Copper | | Gold | | Method | | Copper | | Gold | |
| Revenues, after adjustments shown below | $ | 1.80 | | $ | 1.80 | | $ | 904.18 | | $ | 3.82 | | $ | 3.82 | | $ | 931.71 | |
| | | | | | | | | | | | | | | | | | | |
| Site production and delivery, before net noncash | | | | | | | | | | | | | | | | | | |
| and nonrecurring costs shown below | | 0.92 | | | 0.53 | | | 268.28 | | | 1.86 | | | 1.41 | | | 349.08 | |
| Gold and silver credits | | (1.34 | ) | | – | | | – | | | (1.23 | ) | | – | | | – | |
| Treatment charges | | 0.20 | | | 0.11 | | | 59.27 | | | 0.33 | | | 0.25 | | | 61.71 | |
| Royalty on metals | | 0.07 | | | 0.04 | | | 19.48 | | | 0.12 | | | 0.09 | | | 22.69 | |
| Unit net cash (credits) costs | | (0.15 | ) | | 0.68 | | | 347.03 | | | 1.08 | | | 1.75 | | | 433.48 | |
| Depreciation and amortization | | 0.18 | | | 0.10 | | | 51.27 | | | 0.22 | | | 0.17 | | | 40.82 | |
| Noncash and nonrecurring costs, net | | 0.03 | | | 0.02 | | | 8.69 | | | 0.07 | | | 0.05 | | | 12.76 | |
| Total unit costs | | 0.06 | | | 0.80 | | | 406.99 | | | 1.37 | | | 1.97 | | | 487.06 | |
| Revenue adjustments, primarily for pricing on | | | | | | | | | | | | | | | | | | |
| prior period open sales | | 0.17 | | | 0.17 | | | 11.85 | | | 0.48 | | | 0.48 | | | 27.32 | |
| PT Smelting intercompany profit | | (0.01 | ) | | (0.01 | ) | | (5.46 | ) | | (0.02 | ) | | (0.02 | ) | | (4.27 | ) |
| Gross profit | $ | 1.90 | | $ | 1.16 | | $ | 503.58 | | $ | 2.91 | | $ | 2.31 | | $ | 467.70 | |
| | | | | | | | | | | | | | | | | | | |
| Consolidated sales | | | | | | | | | | | | | | | | | | |
| Copper (millions of recoverable pounds) | | 369 | | | 369 | | | | | | 207 | | | 207 | | | | |
| Gold (thousands of recoverable ounces) | | | | | | | | 521 | | | | | | | | | 251 | |
Because of the fixed nature of a large portion of PT Freeport Indonesia’s costs, unit costs vary significantly from period to period depending on volumes of copper and gold sold during the period. Unit net cash costs, after gold and silver credits, decreased to a net credit of $0.15 per pound of copper in first-quarter 2009, compared with $1.08 per pound in first-quarter 2008, primarily reflecting lower site production and delivery costs ($0.94 per pound decrease, including $0.70 per pound associated with higher copper sales volumes and $0.19 per pound related to changes in inventory) and higher gold credits ($0.11 per pound increase) resulting from higher gold sales volumes in first-quarter 2009.
The decrease in unit net cash costs also reflected lower treatment charges ($0.13 per pound decrease), which vary with the volume of metals sold and the price of copper, and lower royalties on metals ($0.05 per pound decrease), which vary with the volume of metals sold and the prices of copper and gold.
Because certain assets are depreciated on a straight-line basis, PT Freeport Indonesia’s unit depreciation rate varies with the level of copper production and sales.
Assuming average copper prices of $2.00 per pound and average gold prices of $900 per ounce for the remainder of 2009 and achievement of current 2009 sales estimates, we estimate that average unit net cash costs for PT Freeport Indonesia, including gold and silver credits, would approximate a net credit of $0.13 per pound of copper in 2009, compared with $0.96 per pound in 2008. Each $50 per ounce change in gold prices during the remainder of 2009 would have an approximate $0.06 per pound impact on PT Freeport Indonesia’s 2009 unit net cash costs.
Africa Mining
We hold an effective 57.75 percent interest in the Tenke Fungurume copper and cobalt mining concessions in the Katanga province of the DRC and are the operator of the project. Significant progress on the construction of the project was achieved during first-quarter 2009, and the first copper cathode was produced in late March 2009 as the project entered the commissioning and start-up phase. Construction activities for the initial development project are nearing completion, and production is expected to ramp up to full annual capacity in the second half of 2009. Annual production in the initial years is expected to approximate 250 million pounds of copper and 18 million pounds of cobalt in the second half of 2009. The initial project at Tenke Fungurume is based on mining and processing ore reserves approximating 119 million metric tons with average ore grades of 2.6 percent copper and 0.35 percent cobalt. Refer to “Development Projects” for further discussion.
Molybdenum
Our Molybdenum operation is an integrated producer of molybdenum, with mining, sulfide ore concentrating, roasting and processing facilities that produce high-purity, molybdenum-based chemicals, molybdenum metal powder and metallurgical products, which are sold to customers around the world, and includes the wholly owned Henderson molybdenum mine in Colorado and related conversion facilities. The Henderson underground mine produces high-purity, chemical-grade molybdenum concentrates, which are typically further processed into value-added molybdenum chemical products. The Molybdenum operation also includes the wholly owned Climax molybdenum mine in Colorado, which has been on care-and-maintenance status since 1995; a sales company that purchases and sells molybdenum from our Henderson mine and from our North and South America copper mines that produce molybdenum as a by-product; and related conversion facilities that, at times, roast and/or process material on a toll basis. Toll arrangements require the tolling customer to deliver appropriate molybdenum-bearing material to our facilities for processing into a product that is returned to the customer, who pays us for processing their material into the specified products.
Molybdenum markets have been significantly affected by the downturn in economic conditions, which began in fourth-quarter 2008, and demand for molybdenum, principally in the metallurgical sector, remains very weak. During fourth-quarter 2008, the Henderson molybdenum mine began operating at a curtailed rate, reflecting an approximate 25 percent reduction in annual production. In response to further weakness in market conditions, we have taken additional steps to adjust molybdenum production and further revised Henderson’s operating plans to reflect an approximate 40 percent reduction in Henderson’s annual production, which totaled 40 million pounds in 2008. In addition, we have made adjustments to molybdenum production plans at certain by-product mines, including the suspension of molybdenum processing at our Cerro Verde mine. We are continuing to monitor market conditions and may make further adjustments to our molybdenum production and sales plans.
Operating Data. Following is summary operating data for the Molybdenum operations for the first quarters of 2009 and 2008.
| | | First-Quarter | |
| | | 2009 | | 2008 | |
Molybdenum (millions of recoverable pounds) | | | | | | | |
| Production | | | 7 | | | 9 | |
Sales, excluding purchasesa | | | 10 | | | 20 | |
| Average realized price per pound | | $ | 11.52 | | $ | 31.67 | |
| | | | | | | | |
| Henderson molybdenum mine | | | | | | | |
| Ore milled (metric tons per day) | | | 15,200 | | | 25,000 | |
| Average molybdenum ore grade (percent) | | | 0.25 | | | 0.22 | |
| Molybdenum production (millions of recoverable pounds) | | | 7 | | | 9 | |
| a. | Includes sales of molybdenum produced as a by-product at our North and South America copper mines. |
Molybdenum sales volumes decreased to 10 million pounds in first-quarter 2009, compared with 20 million pounds in first-quarter 2008, primarily reflecting curtailed production in response to lower demand, principally in the metallurgical sector. For 2009, molybdenum sales volumes are expected to approximate 50 million pounds, compared with 71 million pounds in 2008. For 2009, approximately 85 percent of our molybdenum sales are expected to be priced at prevailing market prices.
Unit Net Cash Costs. Unit net cash costs per pound of molybdenum is a measure intended to provide investors with information about the cash-generating capacity of our mining operations expressed on a basis relating to the primary metal product for our respective operations. We use this measure for the same purpose and for monitoring operating performance by our mining operations. This information differs from measures of performance determined in accordance with U.S. GAAP and should not be considered in isolation or as a substitute for measures of performance determined in accordance with U.S. GAAP. This measure is presented by other mining companies, although our measure may not be comparable to similarly titled measures reported by other companies.
Gross Profit per Pound of Molybdenum
The following tables summarize the unit net cash costs and gross profit at our Henderson molybdenum mine for the first quarters of 2009 and 2008. Refer to “Product Revenues and Production Costs” for a reconciliation of unit net cash costs per pound to production and delivery costs applicable to sales reported in our consolidated financial statements.
| | First-Quarter | |
| | 2009 | | 2008 | |
| Revenues | $ | 10.55 | | $ | 29.45 | |
| | | | | | | |
| Site production and delivery, before net noncash | | | | | | |
| and nonrecurring costs shown below | | 5.61 | | | 5.14 | |
| Unit net cash costs | | 5.61 | | | 5.14 | |
| Depreciation, depletion and amortization | | 0.93 | | | 4.26 | |
| Noncash and nonrecurring costs, net | | 0.03 | | | 0.06 | |
| Total unit costs | | 6.57 | | | 9.46 | |
Gross profita | $ | 3.98 | | $ | 19.99 | |
| | | | | | | |
Molybdenum sales (millions of recoverable pounds)b | | 7 | | | 9 | |
| a. | Gross profit reflects sales of Henderson products based on volumes produced at market-based pricing. On a consolidated basis, the Molybdenum segment includes profits on sales as they are made to third parties and realizations based on actual contract terms. As a result, the actual gross profit realized will differ from the amounts reported in this table. |
| b. | Reflects molybdenum produced by the Henderson molybdenum mine. |
Henderson’s unit net cash costs were $5.61 per pound of molybdenum in first-quarter 2009, compared with $5.14 per pound of molybdenum in first-quarter 2008. The increase in Henderson’s unit net cash costs primarily reflects lower molybdenum production. Assuming achievement of current 2009 sales estimates, we estimate that the 2009 average unit net cash costs for Henderson would approximate $6.00 per pound of molybdenum, compared with $5.36 per pound in 2008.
The decrease in Henderson’s depreciation, depletion and amortization reflects the impact of the long-lived asset impairment charges recognized in fourth-quarter 2008.
Rod & Refining
The Rod & Refining operations consist of copper conversion facilities located in North America, including a refinery, three rod mills and a specialty copper products facility. These operations process copper produced at our North America mines and purchased copper into copper cathode, rod and custom copper shapes. At times these operations refine copper and produce copper rod and shapes for customers on a toll basis. Toll arrangements require the tolling customer to deliver appropriate copper-bearing material to our facilities for processing into a product that is returned to the customer, who pays us for processing their material into the specified products.
Atlantic Copper Smelting & Refining
Atlantic Copper is our wholly owned subsidiary located in Spain. Atlantic Copper’s operations involve the smelting and refining of copper concentrates and the marketing of refined copper and precious metals in slimes. Our investment in smelters serves an important role in our concentrate marketing strategy. PT Freeport Indonesia generally sells, under long-term contracts, approximately one-half of its concentrate production to its affiliated smelters, Atlantic Copper and PT Smelting, and the remainder to other customers. Additionally, certain of our South America mining operations sell a portion of their copper concentrate and cathode inventories to Atlantic Copper. Treatment charges for smelting and refining copper concentrates represent a cost to PT Freeport Indonesia and our South America mining operations and income to Atlantic Copper and PT Smelting. Through downstream integration, we are assured placement of a significant portion of our concentrate production. Smelting and refining charges consist of a base rate and, in certain contracts, price participation based on copper prices. Higher treatment and refining charges benefit our smelter operations at Atlantic Copper and adversely affect our mining operations in Indonesia and South America. Our North America copper mines are not significantly affected by changes in treatment and refining charges because these operations are fully integrated with our Miami smelter located in Arizona.
Atlantic Copper has a labor contract covering certain employees, which expired in December 2007. During March 2009, we successfully negotiated a new four-year labor contract, retroactive to January 1, 2008.
We defer recognizing profits on PT Freeport Indonesia’s and our South America copper mines’ sales to Atlantic Copper and on 25 percent of PT Freeport Indonesia’s sales to PT Smelting (PT Freeport Indonesia’s 25-percent owned copper smelter and refinery in Indonesia) until final sales to third parties occur. Changes in these net deferrals resulted in net reductions to net income applicable to common stock totaling $62 million ($0.15 per share) in first-quarter 2009 and net additions of $6 million ($0.01 per share) in first-quarter 2008. At March 31, 2009, our net deferred profits on PT Freeport Indonesia’s and the South America copper mines’ inventories at Atlantic Copper and PT Smelting to be recognized in future periods’ net income after taxes and noncontrolling interests totaled $90 million.
DEVELOPMENT PROJECTS
We have several projects and potential opportunities to expand our production volumes, extend our mine lives and develop large-scale underground ore bodies. In response to the declines in copper and molybdenum prices and the weak economic environment, we have deferred most of our project development activities, including incremental expansion projects at the Sierrita and Bagdad mines in North America and at the Cerro Verde concentrator in South America; the planned restart of the Miami mine; development of the El Abra sulfide project; and the restart of the Climax molybdenum mine. Current major development projects include underground development in the Grasberg minerals district and the Tenke Fungurume project in the DRC, although we have also reduced capital spending on these projects. Capital spending plans continue to be reviewed and may be revised based on market conditions.
Indonesia. We have several projects in progress in the Grasberg minerals district, including developing the large-scale, high-grade underground ore bodies located beneath and adjacent to the Grasberg open pit. Following provides additional discussion of these current projects, including the continued development of the Common Infrastructure project, the Grasberg Block Cave and Big Gossan underground mines and a further expansion of the DOZ underground mine.
| · | Common Infrastructure. In 2004, PT Freeport Indonesia commenced its Common Infrastructure project to provide access to its large undeveloped underground ore bodies located in the Grasberg minerals district through a tunnel system located approximately 400 meters deeper than its existing underground tunnel system. In addition to providing access to our underground ore bodies, the tunnel system will enable PT Freeport Indonesia to conduct future exploration in prospective areas associated with currently identified ore bodies. The tunnel system has reached the Big Gossan terminal and we are proceeding with development of the lower Big Gossan infrastructure. We have also advanced development of the Grasberg spur, and as of December 31, 2008, we completed the tunneling required to reach the Grasberg underground ore body. During first-quarter 2009, we continued development of the Grasberg Block Cave terminal infrastructure and mine access. |
| · | Grasberg Block Cave. In 2008, we completed the feasibility study for the development of the Grasberg Block Cave, which accounts for over one-third of our reserves in Indonesia. Production at the Grasberg Block Cave is currently scheduled to commence at the end of mining the Grasberg open pit, which is expected to continue until the end of 2015. The timing of the underground Grasberg Block Cave development will continue to be assessed. |
Based on the 2008 feasibility study, aggregate mine development capital for the Grasberg Block Cave and associated Common Infrastructure is expected to approximate $3.1 billion to be incurred between 2008 and 2021, with PT Freeport Indonesia’s share totaling approximately $2.8 billion. Aggregate project costs incurred through March 31, 2009, total $222 million.
| · | Big Gossan. The Big Gossan underground mine is a high-grade deposit located near PT Freeport Indonesia’s existing milling complex. The Big Gossan mine is being developed as an open-stope mine with backfill consisting of mill tailings and cement, an established mining methodology expected to be higher cost than the block-cave method used at the DOZ mine. Production is designed to ramp up to 7,000 metric tons per day by late 2012 (equal to average annual aggregate incremental production of 125 million pounds of copper and 65,000 ounces of gold, with PT Freeport Indonesia receiving 60 percent of these amounts). The total capital investment for this project is currently estimated at approximately $480 million, of which $345 million has been incurred through March 31, 2009. |
| · | DOZ Expansion. In mid-2007, PT Freeport Indonesia completed the expansion of the capacity of the DOZ underground operation to allow a sustained rate of 50,000 metric tons per day. PT Freeport Indonesia’s further expansion of the DOZ mine to 80,000 metric tons of ore per day is under way with completion targeted by 2010. The capital cost for this expansion is expected to approximate $100 million, with PT Freeport Indonesia’s 60 percent share totaling approximately $60 million. The success of the development of the DOZ mine, one of the world’s largest underground mines, provides confidence in the future development of PT Freeport Indonesia’s large-scale undeveloped underground ore bodies. |
Tenke Fungurume. Significant progress on the construction of the project was achieved during first-quarter 2009, and the first copper cathode was produced in late March 2009 as the project entered the commissioning and start-up phase. Construction activities for the initial development project are nearing completion and production is expected to ramp up to full annual capacity in the second half of 2009. Annual production in the initial years is expected to approximate 250 million pounds of copper and 18 million pounds of cobalt. The initial project is based on mining and processing ore reserves approximating 119 million metric tons with average ore grades of 2.6 percent copper and 0.35 percent cobalt. We also continue to engage in drilling activities, exploration analyses and metallurgical testing to evaluate the potential of this highly prospective district. As a result, we expect its ore reserves to increase significantly over time, enabling future expansions of the initial production facilities. The timing of these expansions will depend on a number of factors, including general economic and market conditions.
Approximately $1.6 billion of the budgeted $1.75 billion in aggregate project costs have been incurred through March 31, 2009. We are responsible for funding 70 percent of project development costs and are also responsible for financing our partner’s share of certain project overruns on the initial project. In response to current market conditions, we have deferred spending on certain expenditures not required for the initial project.
The project has been designed and constructed in a world-class fashion, using modern technology and following international standards for environmental management, occupational safety and social responsibility. The facilities include impermeable lined tailing storage and waste-water treatment ponds, and we are making significant investments in infrastructure in the region, including a national road and improvements in power generation and transmission systems. Our social programs continue to expand, including local micro-enterprise businesses, agricultural capacity building initiatives, malaria abatement, potable drinking water wells, new medical facilities and several new schools. The project will continue to provide important benefits to the Congolese through employment and the provision of local services and to the DRC government through substantial tax, royalty and dividend revenues.
In February 2008, the Ministry of Mines, Government of the DRC, sent a letter seeking comment on proposed material modifications to the mining contracts for the Tenke Fungurume concession. FCX responded to this letter indicating that its mining contracts were negotiated transparently and approved by the Government of the DRC following extended negotiations, and that FCX believes they are fair and equitable, comply with Congolese law and are enforceable without modifications. We are continuing to work cooperatively with the Government of the DRC to resolve these matters. This review process has not affected the development schedule or production plans associated with the Tenke Fungurume project.
CAPITAL RESOURCES AND LIQUIDITY
Our operating cash flows vary with prices realized from copper, gold and molybdenum sales, our production levels, production costs, cash payments for income taxes and interest, other working capital changes and other factors. As a result of weak economic conditions, there is significant uncertainty about the near-term price outlook for our principal products. While we view the long-term outlook for our business positively, supported by limitations on supplies of copper and by the requirements for copper in the world’s economy, we have responded to the uncertain near-term outlook and will continue to adjust our operating strategy as market conditions change. Operating plans were revised at the end of 2008 and in early 2009 to curtail production at higher cost operations, defer or eliminate capital projects and target reductions in costs, including reduced exploration, research and administrative costs. We also suspended our annual common stock dividend.
Based on current mine plans and subject to future copper, gold and molybdenum prices, we expect estimated operating cash flows combined with net proceeds from the first-quarter 2009 equity offering (refer to “Financing Activities” for further discussion) to be greater than our budgeted capital expenditures, scheduled debt maturities, preferred dividends, noncontrolling interest distributions and other cash requirements. From time to time we may use our credit facilities for working capital and short-term funding requirements.
Cash and Cash Equivalents
At March 31, 2009, we had consolidated cash and cash equivalents of $644 million. The following table reflects the U.S. and international components of consolidated cash and cash equivalents at March 31, 2009, and December 31, 2008 (in millions):
| | March 31, | | December 31, | |
| | 2009 | | 2008 | |
Cash at domestic companiesa | $ | 261 | | $ | 95 | |
| Cash at international operations | | 383 | | | 777 | |
| Total consolidated cash and cash equivalents | | 644 | | | 872 | |
| Less: Noncontrolling interests’ share | | (126 | ) | | (267 | ) |
| Cash, net of noncontrolling interests’ share | | 518 | | | 605 | |
| Taxes and other costs if distributed | | (73 | ) | | (151 | ) |
| Net cash available to FCX parent | $ | 445 | | $ | 454 | |
| a. | Includes cash at our parent company and North America operations. |
Operating Activities
Net cash used for operating activities totaled $258 million in first-quarter 2009, including $919 million used for working capital requirements, which primarily related to settlement of final pricing with customers on 2008 provisionally priced copper sales ($573 million). Operating cash flows provided in first-quarter 2008 totaled $615 million, net of $1.4 billion used for working capital requirements, including $598 million to settle the 2007 copper price protection program contract. Consolidated revenues, operating cash flows and net income vary significantly with fluctuations in the market prices of copper, gold and molybdenum, sales volumes and other factors.
Refer to “Overview and Outlook” for further discussion of projected 2009 operating cash flows.
Investing Activities
Capital expenditures, including capitalized interest, totaled $519 million in first-quarter 2009, compared with $508 million in first-quarter 2008. First-quarter 2009 capital expenditures, compared to first-quarter 2008, include an increase associated with spending on the Tenke Fungurume development project in Africa, partly offset by decreases associated with the effects of the decision to defer capital spending for most of our project development activities and also reduced spending for sustaining capital. Refer to “Development Projects” for further discussion.
Capital expenditures are expected to approximate $1.3 billion for 2009, including $0.6 billion for sustaining capital and $0.7 billion for the Tenke Fungurume development project and development projects in Indonesia, compared with $2.7 billion in 2008. Capital spending plans continue to be reviewed and may be revised based on market conditions.
Financing Activities
Total debt approximated $7.2 billion at March 31, 2009, and $7.4 billion at December 31, 2008. We have no significant debt maturities in the near term; however, we may consider opportunities to prepay debt in advance of scheduled maturities.
We have revolving credit facilities available through March 2012, which are composed of a (i) $1.0 billion revolving credit facility available to FCX and (ii) $0.5 billion revolving credit facility available to both FCX and PT Freeport Indonesia. At March 31, 2009, we had no borrowings and $74 million of letters of credit issued under the facilities, resulting in availability of approximately $1.4 billion. The revolving credit facilities contain restrictions on the amount available for dividend payments, purchases of our common stock and certain debt prepayments. However, these restrictions do not apply as long as availability under the revolvers plus domestic cash exceeds $750 million. As of March 31, 2009, we had availability under the revolvers plus available domestic cash totaling approximately $1.7 billion.
In April 2008, Standard & Poor’s Rating Services and Fitch Ratings raised our corporate credit rating and the ratings on our unsecured debt to BBB- (investment grade). As a result of the upgrade of our unsecured notes to investment grade, the restricted payment covenants contained in our $6.0 billion in senior notes used to finance the acquisition of Phelps Dodge and in our 6⅞% Senior Notes were suspended. To the extent the rating is downgraded below investment grade, the covenants would again become effective.
In February 2009, we completed a public offering of 26.8 million shares of our common stock at an average price of $28.00 per share, which generated gross proceeds of $750 million (net proceeds of $740 million after fees and expenses). Net proceeds were used for general corporate purposes, including the repayment of amounts outstanding under our revolving credit facilities, working capital and capital expenditures. As of March 31, 2009, we had 412 million common shares outstanding. Assuming conversion of our 5½% Convertible Perpetual Preferred Stock and 6¾% Mandatory Convertible Preferred Stock prior to May 1, 2010, we would have approximately 469 million common shares outstanding; assuming the 6¾% Mandatory Convertible Preferred Stock automatically converts on May 1, 2010, we would have between 469 million and 477 million common shares outstanding (depending on the applicable market price of our common stock).
In February 2008, we purchased, in an open market transaction, $33 million of our 9½% Senior Notes for $46 million.
Because of financial market turmoil and declines in copper and molybdenum prices, in September 2008 we suspended purchases of shares under the open-market share purchase program. There are 23.7 million shares remaining under this program. The timing of future purchases of our common stock is dependent on many factors, including our operating results; cash flows and financial position; copper, gold and molybdenum prices; the price of our common shares; and general economic and market conditions.
The declaration and payment of dividends is at the discretion of our Board of Directors (the Board). The amount of our cash dividend on our common stock is dependent upon our financial results, cash requirements, future prospects and other factors deemed relevant by the Board. Because of the deterioration in copper and molybdenum prices and in general economic conditions, in December 2008 the Board suspended the cash dividend on our common stock; accordingly, there were no common dividends paid in first-quarter 2009, compared to $169 million paid in first-quarter 2008. The Board will continue to review our financial policy on an ongoing basis.
Preferred stock dividends paid totaled $60 million in first-quarter 2009 and $64 million in first-quarter 2008 representing dividends on our 5½% Convertible Perpetual Preferred Stock and 6¾% Mandatory Convertible Preferred Stock. On March 26, 2009, FCX declared a regular quarterly dividend of $1.6875 per share on our 6¾% Mandatory Convertible Preferred Stock and a regular quarterly dividend of $13.75 per share on our 5½% Convertible Perpetual Preferred Stock, which were paid on May 1, 2009, to shareholders of record at the close of business on April 15, 2009.
Cash dividends paid to noncontrolling interests totaled less than $1 million in first-quarter 2009 and $49 million in first-quarter 2008, which reflected dividends paid to the noncontrolling interest owners of PT Freeport Indonesia and of our South America copper mines.
CONTRACTUAL OBLIGATIONS
There have been no material changes in our contractual obligations since year-end 2008. Refer to Item 7 in our report on Form 10-K for the year ended December 31, 2008, for further information regarding our contractual obligations.
ENVIRONMENTAL AND RECLAMATION MATTERS
Our mining, exploration, production and historical operating activities are subject to stringent laws and regulations governing the protection of the environment. There have been no material changes to our environmental and reclamation obligations since year-end 2008. Refer to Note 15 in our report on Form 10-K for the year ended December 31, 2008, for further information regarding our environmental and reclamation obligations.
Refer to Note 9 for information on new accounting standards.
PRODUCT REVENUES AND PRODUCTION COSTS
Unit net cash costs per pound of copper and molybdenum are measures intended to provide investors with information about the cash-generating capacity of our mining operations expressed on a basis relating to the primary metal product for the respective operations. We use this measure for the same purpose and for monitoring operating performance by our mining operations. This information differs from measures of performance determined in accordance with U.S. GAAP and should not be considered in isolation or as a substitute for measures of performance determined in accordance with U.S. GAAP. This measure is presented by other mining companies, although our measure may not be comparable to similarly titled measures reported by other companies.
We present gross profit per pound of copper using both a “by-product” method and a “co-product” method. We use the by-product method in our presentation of gross profit per pound of copper because (i) the majority of our revenues are copper revenues, (ii) we mine ore, which contains copper, gold, molybdenum and other metals, (iii) it is not possible to specifically assign all of our costs to revenues from the copper, gold, molybdenum and other metals we produce, (iv) it is the method used to compare mining operations in certain industry publications and (v) it is the method used by our management and Board of Directors to monitor operations. In the co-product method presentation below, costs are allocated to the different products based on their relative revenue values, which will vary to the extent our metals sales volumes and realized prices change.
In both the by-product and the co-product method calculations, we show adjustments to copper revenues for prior period open sales as separate line items. Because the copper pricing adjustments do not result from current period sales, we have reflected these separately from revenues on current period sales. Noncash and nonrecurring costs consist of items such as LCM inventory adjustments, stock-based compensation costs and/or unusual charges. They are removed from site production and delivery costs in the calculation of unit net cash costs. As discussed above, gold, molybdenum and other metal revenues at copper mines are reflected as credits against site production and delivery costs in the by-product method. Presentations under both the by-product and co-product methods are shown below together with reconciliations to amounts reported in our consolidated financial statements.
North America Copper Mines Product Revenues and Production Costs
| Three Months Ended March 31, 2009 | | | | |
| | By-Product | | Co-Product Method | |
| (In millions) | Method | | Copper | | Molybdenuma | | Otherb | | Total | |
| Revenues, excluding adjustments shown below | $ | 480 | | $ | 480 | | $ | 59 | | $ | 6 | | $ | 545 | |
| | | | | | | | | | | | | | | | |
| Site production and delivery, before net noncash | | | | | | | | | | | | | | | |
| and nonrecurring costs shown below | | 396 | | | 378 | | | 26 | | | 2 | | | 406 | |
By-product creditsa | | (55 | ) | | – | | | – | | | – | | | – | |
| Treatment charges | | 25 | | | 25 | | | – | | | – | | | 25 | |
| Net cash costs | | 366 | | | 403 | | | 26 | | | 2 | | | 431 | |
| Depreciation, depletion and amortization | | 71 | | | 69 | | | 1 | | | 1 | | | 71 | |
| Noncash and nonrecurring costs, net | | 46 | | | 45 | | | 1 | | | – | | | 46 | |
| Total costs | | 483 | | | 517 | | | 28 | | | 3 | | | 548 | |
| Revenue adjustments, primarily for hedging | | 69 | | | 69 | | | – | | | – | | | 69 | |
| Idle facility and other non-inventoriable costs | | (38 | ) | | (38 | ) | | – | | | – | | | (38 | ) |
| Gross profit (loss) | $ | 28 | | $ | (6 | ) | $ | 31 | | $ | 3 | | $ | 28 | |
| | | | | | | | | | | | | | | | |
| Reconciliation to Amounts Reported | | | | | | | | | | | | | | | |
| (In millions) | | | | | | | Depreciation, | | | | | | | |
| | | | | Production | | | Depletion and | | | | | | | |
| | Revenues | | and Delivery | | | Amortization | | | | | | | |
| Totals presented above | $ | 545 | | $ | 406 | | $ | 71 | | | | | | | |
| Net noncash and nonrecurring costs per above | | N/A | | | 46 | | | N/A | | | | | | | |
| Treatment charges per above | | N/A | | | 25 | | | N/A | | | | | | | |
| Revenue adjustments, primarily for hedging per above | | 69 | | | N/A | | | N/A | | | | | | | |
| Eliminations and other | | 4 | | | 76 | | | 4 | | | | | | | |
| North America copper mines | | 618 | | | 553 | | | 75 | | | | | | | |
| South America copper mines | | 702 | | | 367 | | | 65 | | | | | | | |
| Indonesia mining | | 1,122 | | | 350 | | | 65 | | | | | | | |
| Africa mining | | – | | | 16 | | | 3 | | | | | | | |
| Molybdenum | | 146 | | | 138 | c | | 9 | | | | | | | |
| Rod & Refining | | 619 | | | 614 | | | 2 | | | | | | | |
| Atlantic Copper Smelting & Refining | | 292 | | | 293 | | | 8 | | | | | | | |
| Corporate, other & eliminations | | (897 | ) | | (750 | ) | | 5 | | | | | | | |
| As reported in FCX’s consolidated financial statements | $ | 2,602 | | $ | 1,581 | c | $ | 232 | | | | | | | |
| a. | Molybdenum by-product credits and revenues reflect volumes produced at market-based pricing and also include tolling revenues at Sierrita. |
| b. | Includes gold and silver product revenues and production costs. |
| c. | Includes LCM molybdenum inventory adjustments totaling $19 million. |
North America Copper Mines Product Revenues and Production Costs (continued)
| Three Months Ended March 31, 2008 | | | | |
| | By-Product | | Co-Product Method | |
| (In millions) | Method | | Copper | | Molybdenuma | | Otherb | | Total | |
| Revenues, excluding adjustments shown below | $ | 1,179 | | $ | 1,179 | | $ | 256 | | $ | 16 | | $ | 1,451 | |
| | | | | | | | | | | | | | | | |
| Site production and delivery, before net noncash | | | | | | | | | | | | | | | |
| and nonrecurring costs shown below | | 553 | | | 481 | | | 76 | | | 7 | | | 564 | |
By-product creditsa | | (261 | ) | | – | | | – | | | – | | | – | |
| Treatment charges | | 31 | | | 31 | | | – | | | – | | | 31 | |
| Net cash costs | | 323 | | | 512 | | | 76 | | | 7 | | | 595 | |
| Depreciation, depletion and amortization | | 180 | | | 159 | | | 19 | | | 2 | | | 180 | |
| Noncash and nonrecurring costs, net | | 30 | | | 29 | | | 1 | | | – | | | 30 | |
| Total costs | | 533 | | | 700 | | | 96 | | | 9 | | | 805 | |
| Revenue adjustments, primarily for hedging | | 42 | | | 42 | | | – | | | – | | | 42 | |
| Idle facility and other non-inventoriable costs | | (13 | ) | | (13 | ) | | – | | | – | | | (13 | ) |
| Gross profit | $ | 675 | | $ | 508 | | $ | 160 | | $ | 7 | | $ | 675 | |
| | | | | | | | | | | | | | | | |
| Reconciliation to Amounts Reported | | | | | | | | | | | | | | | |
| (In millions) | | | | | | | Depreciation, | | | | | | | |
| | | | | Production | | | Depletion and | | | | | | | |
| | Revenues | | and Delivery | | | Amortization | | | | | | | |
| Totals presented above | $ | 1,451 | | $ | 564 | | $ | 180 | | | | | | | |
| Net noncash and nonrecurring costs per above | | N/A | | | 30 | | | N/A | | | | | | | |
| Treatment charges per above | | N/A | | | 31 | | | N/A | | | | | | | |
| Revenue adjustments, primarily for hedging per above | | 42 | | | N/A | | | N/A | | | | | | | |
| Eliminations and other | | 3 | | | 21 | | | 4 | | | | | | | |
| North America copper mines | | 1,496 | | | 646 | | | 184 | | | | | | | |
| South America copper mines | | 1,607 | | | 432 | | | 130 | | | | | | | |
| Indonesia mining | | 1,052 | | | 399 | | | 45 | | | | | | | |
| Africa mining | | – | | | 3 | | | 1 | | | | | | | |
| Molybdenum | | 719 | | | 460 | | | 39 | | | | | | | |
| Rod & Refining | | 1,688 | | | 1,676 | | | 2 | | | | | | | |
| Atlantic Copper Smelting & Refining | | 665 | | | 651 | | | 9 | | | | | | | |
| Corporate, other & eliminations | | (1,555 | ) | | (1,545 | ) | | 8 | | | | | | | |
| As reported in FCX’s consolidated financial statements | $ | 5,672 | | $ | 2,722 | c | $ | 418 | | | | | | | |
| a. | Molybdenum by-product credits and revenues reflect volumes produced at market-based pricing and also include tolling revenues at Sierrita. |
| b. | Includes gold and silver product revenues and production costs. |
| c. | Includes LCM inventory adjustments of $1 million. |
South America Copper Mines Product Revenues and Production Costs
| Three Months Ended March 31, 2009 | | | | | | | | |
| | By-Product | | Co-Product Method | |
| (In millions) | Method | | Copper | | Other a | | Total | |
| Revenues, excluding adjustments shown below | $ | 617 | | $ | 617 | | $ | 44 | | $ | 661 | |
| | | | | | | | | | | | | |
| Site production and delivery, before net noncash | | | | | | | | | | | | |
| nonrecurring costs shown below | | 352 | | | 323 | | | 34 | | | 357 | |
| By-product credits | | (39 | ) | | – | | | – | | | – | |
| Treatment charges | | 48 | | | 48 | | | – | | | 48 | |
| Net cash costs | | 361 | | | 371 | | | 34 | | | 405 | |
| Depreciation, depletion and amortization | | 65 | | | 62 | | | 3 | | | 65 | |
| Noncash and nonrecurring costs, net | | 5 | | | 5 | | | – | | | 5 | |
| Total costs | | 431 | | | 438 | | | 37 | | | 475 | |
| Revenue adjustments, primarily for pricing on prior | | | | | | | | | | | | |
| period open sales | | 88 | | | 88 | | | – | | | 88 | |
| Other non-inventoriable costs | | (9 | ) | | (8 | ) | | (1 | ) | | (9 | ) |
| Gross profit | $ | 265 | | $ | 259 | | $ | 6 | | $ | 265 | |
| | | | | | | | | | | | | |
| Reconciliation to Amounts Reported | | | | | | | | | | | | |
| (In millions) | | | | | | Depreciation, | | | | |
| | | | | Production | | Depletion and | | | | |
| | Revenues | | and Delivery | | Amortization | | | | |
| Totals presented above | $ | 661 | | $ | 357 | | $ | 65 | | | | |
| Net noncash and nonrecurring costs per above | | N/A | | | 5 | | | N/A | | | | |
| Less: Treatment charges per above | | (48 | ) | | N/A | | | N/A | | | | |
| Revenue adjustments, primarily for pricing on prior | | | | | | | | | | | | |
| period open sales per above | | 88 | | | N/A | | | N/A | | | | |
| Eliminations and other | | 1 | | | 5 | | | – | | | | |
| South America copper mines | | 702 | | | 367 | | | 65 | | | | |
| North America copper mines | | 618 | | | 553 | | | 75 | | | | |
| Indonesia mining | | 1,122 | | | 350 | | | 65 | | | | |
| Africa mining | | – | | | 16 | | | 3 | | | | |
| Molybdenum | | 146 | | | 138 | b | | 9 | | | | |
| Rod & Refining | | 619 | | | 614 | | | 2 | | | | |
| Atlantic Copper Smelting & Refining | | 292 | | | 293 | | | 8 | | | | |
| Corporate, other & eliminations | | (897 | ) | | (750 | ) | | 5 | | | | |
| As reported in FCX’s consolidated financial statements | $ | 2,602 | | $ | 1,581 | b | $ | 232 | | | | |
| a. | Includes molybdenum, gold and silver product revenues and production costs. |
| b. | Includes LCM molybdenum inventory adjustments totaling $19 million. |
South America Copper Mines Product Revenues and Production Costs (continued)
| Three Months Ended March 31, 2008 | | | | | | | | |
| | By-Product | | Co-Product Method | |
| (In millions) | Method | | Copper | | Other a | | Total | |
| Revenues, excluding adjustments shown below | $ | 1,380 | | $ | 1,380 | | $ | 59 | | $ | 1,439 | |
| | | | | | | | | | | | | |
| Site production and delivery, before net noncash | | | | | | | | | | | | |
| nonrecurring costs shown below | | 395 | | | 381 | | | 20 | | | 401 | |
| By-product credits | | (53 | ) | | – | | | – | | | – | |
| Treatment charges | | 76 | | | 76 | | | – | | | 76 | |
| Net cash costs | | 418 | | | 457 | | | 20 | | | 477 | |
| Depreciation, depletion and amortization | | 130 | | | 126 | | | 4 | | | 130 | |
| Noncash and nonrecurring costs, net | | 25 | | | 25 | | | – | | | 25 | |
| Total costs | | 573 | | | 608 | | | 24 | | | 632 | |
| Revenue adjustments, primarily for pricing on prior | | | | | | | | | | | | |
| period open sales | | 230 | | | 230 | | | – | | | 230 | |
| Other non-inventoriable costs | | (9 | ) | | (8 | ) | | (1 | ) | | (9 | ) |
| Gross profit | $ | 1,028 | | $ | 994 | | $ | 34 | | $ | 1,028 | |
| | | | | | | | | | | | | |
| Reconciliation to Amounts Reported | | | | | | | | | | | | |
| (In millions) | | | | | | Depreciation, | | | | |
| | | | | Production | | Depletion and | | | | |
| | Revenues | | and Delivery | | Amortization | | | | |
| Totals presented above | $ | 1,439 | | $ | 401 | | $ | 130 | | | | |
| Net noncash and nonrecurring costs per above | | N/A | | | 25 | | | N/A | | | | |
| Less: Treatment charges per above | | (76 | ) | | N/A | | | N/A | | | | |
| Revenue adjustments, primarily for pricing on prior | | | | | | | | | | | | |
| period open sales per above | | 230 | | | N/A | | | N/A | | | | |
| Eliminations and other | | 14 | | | 6 | | | – | | | | |
| South America copper mines | | 1,607 | | | 432 | | | 130 | | | | |
| North America copper mines | | 1,496 | | | 646 | | | 184 | | | | |
| Indonesia mining | | 1,052 | | | 399 | | | 45 | | | | |
| Africa mining | | – | | | 3 | | | 1 | | | | |
| Molybdenum | | 719 | | | 460 | | | 39 | | | | |
| Rod & Refining | | 1,688 | | | 1,676 | | | 2 | | | | |
| Atlantic Copper Smelting & Refining | | 665 | | | 651 | | | 9 | | | | |
| Corporate, other & eliminations | | (1,555 | ) | | (1,545 | ) | | 8 | | | | |
| As reported in FCX’s consolidated financial statements | $ | 5,672 | | $ | 2,722 | b | $ | 418 | | | | |
| a. | Includes molybdenum, gold and silver product revenues and production costs. |
| b. | Includes LCM inventory adjustments totaling $1 million. |
Indonesia Mining Product Revenues and Production Costs
| Three Months Ended March 31, 2009 | | | | |
| | By-Product | | Co-Product Method | |
| (In millions) | Method | | Copper | | Gold | | Silver | | Total | |
| Revenues, after adjustments shown below | $ | 665 | | $ | 665 | | $ | 477 | | $ | 17 | | $ | 1,159 | |
| | | | | | | | | | | | | | | | |
| Site production and delivery, before net noncash | | | | | | | | | | | | | | | |
| and nonrecurring costs shown below | | 339 | | | 195 | | | 140 | | | 4 | | | 339 | |
| Gold and silver credits | | (494 | ) | | – | | | – | | | – | | | – | |
| Treatment charges | | 75 | | | 43 | | | 31 | | | 1 | | | 75 | |
| Royalty on metals | | 25 | | | 14 | | | 10 | | | 1 | | | 25 | |
| Net cash (credits) costs | | (55 | ) | | 252 | | | 181 | | | 6 | | | 439 | |
| Depreciation and amortization | | 65 | | | 37 | | | 27 | | | 1 | | | 65 | |
| Noncash and nonrecurring costs, net | | 11 | | | 7 | | | 4 | | | – | | | 11 | |
| Total costs | | 21 | | | 296 | | | 212 | | | 7 | | | 515 | |
| Revenue adjustments, primarily for pricing on prior | | | | | | | | | | | | | | | |
| period open sales | | 63 | | | 63 | | | – | | | – | | | 63 | |
| PT Smelting intercompany loss | | (7 | ) | | (4 | ) | | (3 | ) | | – | | | (7 | ) |
| Gross profit | $ | 700 | | $ | 428 | | $ | 262 | | $ | 10 | | $ | 700 | |
| | | | | | | | | | | | | | | | |
| Reconciliation to Amounts Reported | | | | | | | | | | | | | | | |
| (In millions) | | | | | Depreciation, | | | | | | | |
| | | | Production | | Depletion and | | | | | | | |
| | Revenues | | and Delivery | | Amortization | | | | | | | |
| Totals presented above | $ | 1,159 | | $ | 339 | | $ | 65 | | | | | | | |
| Net noncash and nonrecurring costs per above | | N/A | | | 11 | | | N/A | | | | | | | |
| Less: Treatment charges per above | | (75 | ) | | N/A | | | N/A | | | | | | | |
| Less: Royalty per above | | (25 | ) | | N/A | | | N/A | | | | | | | |
| Revenue adjustments, primarily for pricing on prior | | | | | | | | | | | | | | | |
| period open sales per above | | 63 | | | N/A | | | N/A | | | | | | | |
| Indonesia mining | | 1,122 | | | 350 | | | 65 | | | | | | | |
| North America copper mines | | 618 | | | 553 | | | 75 | | | | | | | |
| South America copper mines | | 702 | | | 367 | | | 65 | | | | | | | |
| Africa mining | | – | | | 16 | | | 3 | | | | | | | |
| Molybdenum | | 146 | | | 138 | a | | 9 | | | | | | | |
| Rod & Refining | | 619 | | | 614 | | | 2 | | | | | | | |
| Atlantic Copper Smelting & Refining | | 292 | | | 293 | | | 8 | | | | | | | |
| Corporate, other & eliminations | | (897 | ) | | (750 | ) | | 5 | | | | | | | |
| As reported in FCX’s consolidated financial statements | $ | 2,602 | | $ | 1,581 | a | $ | 232 | | | | | | | |
| a. | Includes total LCM molybdenum inventory adjustments totaling $19 million. |
Indonesia Mining Product Revenues and Production Costs (continued)
| Three Months Ended March 31, 2008 | | | | |
| | By-Product | | Co-Product Method | |
| (In millions) | Method | | Copper | | Gold | | Silver | | Total | |
| Revenues, after adjustments shown below | $ | 802 | | $ | 802 | | $ | 241 | | $ | 15 | | $ | 1,058 | |
| | | | | | | | | | | | | | | | |
| Site production and delivery, before net noncash | | | | | | | | | | | | | | | |
| and nonrecurring costs shown below | | 385 | | | 292 | | | 88 | | | 5 | | | 385 | |
| Gold and silver credits | | (256 | ) | | – | | | – | | | – | | | – | |
| Treatment charges | | 68 | | | 52 | | | 15 | | | 1 | | | 68 | |
| Royalty on metals | | 25 | | | 19 | | | 6 | | | – | | | 25 | |
| Net cash costs | | 222 | | | 363 | | | 109 | | | 6 | | | 478 | |
| Depreciation and amortization | | 45 | | | 34 | | | 10 | | | 1 | | | 45 | |
| Noncash and nonrecurring costs, net | | 14 | | | 11 | | | 3 | | | – | | | 14 | |
| Total costs | | 281 | | | 408 | | | 122 | | | 7 | | | 537 | |
| Revenue adjustments, primarily for pricing on prior | | | | | | | | | | | | | | | |
| period open sales | | 87 | | | 87 | | | – | | | – | | | 87 | |
| PT Smelting intercompany loss | | (5 | ) | | (3 | ) | | (2 | ) | | – | | | (5 | ) |
| Gross profit | $ | 603 | | $ | 478 | | $ | 117 | | $ | 8 | | $ | 603 | |
| | | | | | | | | | | | | | | | |
| Reconciliation to Amounts Reported | | | | | | | | | | | | | | | |
| (In millions) | | | | | Depreciation, | | | | | | | |
| | | | Production | | Depletion and | | | | | | | |
| | Revenues | | and Delivery | | Amortization | | | | | | | |
| Totals presented above | $ | 1,058 | | $ | 385 | | $ | 45 | | | | | | | |
| Net noncash and nonrecurring costs per above | | N/A | | | 14 | | | N/A | | | | | | | |
| Less: Treatment charges per above | | (68 | ) | | N/A | | | N/A | | | | | | | |
| Less: Royalty per above | | (25 | ) | | N/A | | | N/A | | | | | | | |
| Revenue adjustments, primarily for pricing on prior | | | | | | | | | | | | | | | |
| period open sales per above | | 87 | | | N/A | | | N/A | | | | | | | |
| Indonesia mining | | 1,052 | | | 399 | | | 45 | | | | | | | |
| North America copper mines | | 1,496 | | | 646 | | | 184 | | | | | | | |
| South America copper mines | | 1,607 | | | 432 | | | 130 | | | | | | | |
| Africa mining | | – | | | 3 | | | 1 | | | | | | | |
| Molybdenum | | 719 | | | 460 | | | 39 | | | | | | | |
| Rod & Refining | | 1,688 | | | 1,676 | | | 2 | | | | | | | |
| Atlantic Copper Smelting & Refining | | 665 | | | 651 | | | 9 | | | | | | | |
| Corporate, other & eliminations | | (1,555 | ) | | (1,545 | ) | | 8 | | | | | | | |
| As reported in FCX’s consolidated financial statements | $ | 5,672 | | $ | 2,722 | a | $ | 418 | | | | | | | |
| a. | Includes LCM inventory adjustments totaling $1 million. |
Henderson Molybdenum Mine Product Revenues and Production Costs
| | Three Months Ended March 31, | | | | |
| (In millions) | 2009 | | 2008 | | | | |
| Revenues | $ | 70 | | $ | 282 | | | | |
| | | | | | | | | | |
| Site production and delivery, before net noncash | | | | | | | | | |
| and nonrecurring costs shown below | | 37 | | | 49 | | | | |
| Net cash costs | | 37 | | | 49 | | | | |
| Depreciation, depletion and amortization | | 6 | | | 41 | | | | |
| Noncash and nonrecurring costs, net | | – | | | 1 | | | | |
| Total costs | | 43 | | | 91 | | | | |
Gross profita | $ | 27 | | $ | 191 | | | | |
| | | | | | | | | | |
Reconciliation to Amounts Reported | | | | Production | | Depreciation, | |
| (In millions) | | | | and | | Depletion and | |
| | | Revenues | | Delivery | | Amortization | |
| Three Months Ended March 31, 2009 | | | | | | | | | |
| Totals presented above | $ | 70 | | $ | 37 | | $ | 6 | |
| Net noncash and nonrecurring costs per above | | N/A | | | – | | | N/A | |
| Henderson mine | | 70 | | | 37 | | | 6 | |
Other molybdenum operations and eliminationsb | | 76 | | | 101 | c | | 3 | |
| Molybdenum | | 146 | | | 138 | | | 9 | |
| North America copper mines | | 618 | | | 553 | | | 75 | |
| South America copper mines | | 702 | | | 367 | | | 65 | |
| Indonesia mining | | 1,122 | | | 350 | | | 65 | |
| Africa mining | | – | | | 16 | | | 3 | |
| Rod & Refining | | 619 | | | 614 | | | 2 | |
| Atlantic Copper Smelting & Refining | | 292 | | | 293 | | | 8 | |
| Corporate, other & eliminations | | (897 | ) | | (750 | ) | | 5 | |
| As reported in FCX’s consolidated financial statements | $ | 2,602 | | $ | 1,581 | c | $ | 232 | |
| | | | | | | | | | |
| Three Months Ended March 31, 2008 | | | | | | | | | |
| Totals presented above | $ | 282 | | $ | 49 | | $ | 41 | |
| Net noncash and nonrecurring costs per above | | N/A | | | 1 | | | N/A | |
| Henderson mine | | 282 | | | 50 | | | 41 | |
Other molybdenum operations and eliminationsb | | 437 | | | 410 | | | (2 | ) |
| Molybdenum | | 719 | | | 460 | | | 39 | |
| North America copper mines | | 1,496 | | | 646 | | | 184 | |
| South America copper mines | | 1,607 | | | 432 | | | 130 | |
| Indonesia mining | | 1,052 | | | 399 | | | 45 | |
| Africa mining | | – | | | 3 | | | 1 | |
| Rod & Refining | | 1,688 | | | 1,676 | | | 2 | |
| Atlantic Copper Smelting & Refining | | 665 | | | 651 | | | 9 | |
| Corporate, other & eliminations | | (1,555 | ) | | (1,545 | ) | | 8 | |
| As reported in FCX’s consolidated financial statements | $ | 5,672 | | $ | 2,722 | d | $ | 418 | |
a. | Gross profit reflects sales of Henderson products based on volumes produced at market-based pricing. On a consolidated basis, the Molybdenum segment includes profits on sales as they are made to third parties and realizations based on actual contract terms. As a result, the actual gross profit realized will differ from the amounts reported in this table. |
b. | Primarily includes amounts associated with the molybdenum sales company, which includes sales of molybdenum produced as a by-product at our North and South America copper mines. |
c. | First-quarter 2009 includes LCM inventory molybdenum adjustments totaling $19 million. |
d. | First-quarter 2008 includes LCM inventory adjustments totaling $1 million. |
CAUTIONARY STATEMENT
Our discussion and analysis contains forward-looking statements in which we discuss our expectations regarding future performance. Forward-looking statements are all statements other than statements of historical facts, such as those statements regarding anticipated production volumes, sales volumes, unit net cash costs, ore grades, milling rates, commodity prices, development and other capital expenditures, mine production and development plans, environmental liabilities, potential future dividend payments, reserve estimates, projected exploration efforts and results, operating cash flows, the impact of copper, gold and molybdenum price changes, the impact of deferred intercompany profits on earnings, liquidity, other financial commitments and tax rates. The words “anticipates,” “may,” “can,” “plans,” “believes,” “estimates,” “expects,” “projects,” “intends,” “likely,” “will,” “should,” “to be” and any similar expressions and/or statements that are not historical facts, in each case as they relate to us or our management, are intended to identify those assertions as forward-looking statements.
In making any of those statements, the person making them believes that the expectations are based on reasonable assumptions. We caution readers that those statements are not guarantees of future performance, and our actual results may differ materially from those anticipated, projected or assumed in the forward-looking statements. Important factors that can cause our actual results to differ materially from those anticipated in the forward-looking statements include commodity prices, mine sequencing, production rates, industry risks, regulatory changes, political risks, weather-related risks, labor relations, environmental risks, litigation results, currency translation risks and other factors described in more detail under the heading “Risk Factors” in our Form 10-K for the year ended December 31, 2008.
Accordingly, no assurances can be given that any of the events anticipated by the forward-looking statements will transpire or occur, or if any of them do so, what impact they will have on our results of operations or financial condition. Except for our ongoing obligations under the federal securities laws, we do not intend and undertake no obligation to update or revise any forward-looking statements.
Item 3. Quantitative and Qualitative Disclosures About Market Risk.
In early April 2009, we entered into forward copper sales contracts to lock in prices at an average of $1.86 per pound on 355 million pounds of PT Freeport Indonesia’s provisionally priced copper sales at March 31, 2009, which are scheduled to final price from April 2009 through July 2009. From time to time, we may enter into future transactions to lock in pricing on provisionally priced sales to reduce short-term volatility in earnings and cash flows, but we do not intend to change our long standing policy of not hedging future copper production.
For additional information on market risks, refer to “Disclosures About Market Risks” included in Part II, Item 7A of our report on Form 10-K for the year ended December 31, 2008.
Item 4. Controls and Procedures.
| (a) | Evaluation of disclosure controls and procedures. Our chief executive officer and chief financial officer, with the participation of management, have evaluated the effectiveness of our “disclosure controls and procedures” (as defined in Rules 13a-15(e) and 15(d)-15(e) under the Securities Exchange Act of 1934) as of the end of the period covered by this quarterly report on Form 10-Q. Based on their evaluation, they have concluded that our disclosure controls and procedures are effective as of the end of the period covered by this report. |
| (b) | Changes in internal control. There has been no change in our internal control over financial reporting that occurred during the three months ended March 31, 2009, that has materially affected, or is reasonably likely to materially affect our internal control over financial reporting. |
Environmental Proceedings
Arizona Notice of Violation (NOV) – Sierrita operations. Information regarding this legal proceeding is incorporated by reference to Item 3. Legal Proceedings of Part I of the FCX Form 10-K for the year ended December 31, 2008.
In January 2009, Phelps Dodge Sierrita, Inc. (Sierrita) and the Arizona Department of Environmental Quality (ADEQ) entered into a consent decree relating to two NOVs associated with dust emissions from Sierrita’s tailing facility. The consent decree, which obligates Sierrita to pay a $45,000 fine and $60,000 for a supplemental environmental project, was entered by the court in April 2009. It will be terminated after the payment of the required sums and filing of a report with ADEQ.
New Mexico Environment Department – Chino Mines. Information regarding this legal proceeding is incorporated by reference to Item 3. Legal Proceedings of Part I of the FCX Form 10-K for the year ended December 31, 2008.
In 2007, Chino Mines Co. (Chino) notified New Mexico Environmental Department (NMED) that heavy rains led to a release of diluted leach solutions through a storm water outfall to an ephemeral stream on Chino’s property; Chino also identified the interim corrective actions taken as a result of the discharge. In April 2009, Chino and NMED entered a Settlement Agreement and Stipulated Final Order obligating Chino to pay a $276,000 penalty and to implement a corrective action plan.
There have been no material changes to our risk factors during the three months ended March 31, 2009. For additional information on risk factors, refer to “Risk Factors” included in Part I, Item 1A of our report on Form 10-K for the year ended December 31, 2008.
Item 2. Unregistered Sales of Equity Securities and Use of Proceeds.
| (c) | The following table sets forth information with respect to shares of common stock of FCX purchased by FCX during the three months ended March 31, 2009: |
| | | | | | | | (c) Total Number of | | (d) Maximum Number |
| | | (a) Total Number | | (b) Average | | Shares Purchased as Part | | of Shares That May |
| | | of Shares | | Price Paid | | of Publicly Announced | | Yet Be Purchased Under |
| Period | | Purchaseda | | Per Share | | Plans or Programsb | | the Plans or Programsb |
| January 1-31, 2009 | | 935 | | $ | 27.42 | | – | | 23,685,500 |
| February 1-28, 2009 | | 273 | | $ | 29.00 | | – | | 23,685,500 |
| March 1-31, 2009 | | 498 | | $ | 33.98 | | – | | 23,685,500 |
| Total | | 1,706 | | $ | 29.59 | | – | | 23,685,500 |
| | | | | | | | | | |
| a. | Consists of shares repurchased under FCX’s applicable stock incentive plans, which were repurchased to satisfy tax obligations on restricted stock awards and to cover the cost of option exercises. |
| b. | On July 21, 2008, FCX’s Board of Directors approved an increase in FCX’s open-market share purchase program for up to 30 million shares. This program does not have an expiration date. |
The exhibits to this report are listed in the Exhibit Index beginning on Page E-1 hereof.
FREEPORT-McMoRan COPPER & GOLD INC.
SIGNATURE
Pursuant to the requirements of the Securities Exchange Act of 1934, the registrant has duly caused this report to be signed on its behalf by the undersigned hereunto duly authorized.
FREEPORT-McMoRan COPPER & GOLD INC.
By: /s/ Kathleen L. Quirk
Kathleen L. Quirk
Executive Vice President,
Chief Financial Officer and
Treasurer
(authorized signatory and
Principal Financial Officer)
Date: May 11, 2009
FREEPORT-McMoRan COPPER & GOLD INC. |
| EXHIBIT INDEX |
| | | Filed | |
| Exhibit | | with this | Incorporated by Reference |
| | | | | |
| 3.1 | Composite Certificate of Incorporation of FCX. | | 8-A/A | 001-11307-01 | 01/26/2009 |
| 3.2 | Amended and Restated By-Laws of FCX, as amended through May 1, 2007. | | 8-K | 001-11307-01 | 05/04/2007 |
| FCX Director Compensation. | X | | | |
| Letter from Ernst & Young LLP regarding unaudited interim financial statements. | X | | | |
| Certification of Principal Executive Officer pursuant to Rule 13a-14(a)/15d – 14(a). | X | | | |
| Certification of Principal Financial Officer pursuant to Rule 13a-14(a)/15d – 14(a). | X | | | |
| Certification of Principal Executive Officer pursuant to 18 U.S.C. Section 1350. | X | | | |
| Certification of Principal Financial Officer pursuant to 18 U.S.C Section 1350. | X | | | |
| 101.INS | XBRL Instance Document. | X | | | |
| 101.SCH | XBRL Taxonomy Extension Schema. | X | | | |
| 101.CAL | XBRL Taxonomy Extension Calculation Linkbase. | X | | | |
| 101.DEF | XBRL Taxonomy Extension Definition Linkbase. | X | | | |
| 101.LAB | XBRL Taxonomy Extension Label Linkbase. | X | | | |
| 101.PRE | XBRL Taxonomy Extension Presentation Linkbase. | X | | | |
| 101.REF | XBRL Taxonomy Extension Reference Linkbase. | X | | | |
* Indicates management contract or compensatory plan or arrangement.