UNITED STATES
SECURITIES AND EXCHANGE COMMISSION
WASHINGTON, D.C. 20549
FORM N-CSR
CERTIFIED SHAREHOLDER REPORT OF REGISTERED MANAGEMENT
INVESTMENT COMPANIES
Investment Company Act file number 811-5531
| Barings Participation Investors | |
| (Exact name of registrant as specified in charter) | |
| | |
| 1500 Main Street, P.O. Box 15189, Springfield, MA 01115-5189 | |
| (Address of principal executive offices) (Zip code) | |
| | |
| Janice M. Bishop, Vice President, Secretary and Chief Legal Officer Indepence Wharf, 470 Atlantic Ave., Boston, MA 02210 | |
| (Name and address of agent for service) | |
Registrant's telephone number, including area code: 413-226-1000
Date of fiscal year end: 12/31
Date of reporting period: 12/31/16
Form N-CSR is to be used by management investment companies to file reports with the Commission not later than 10 days after the transmission to stockholders of any report that is required to be transmitted to stockholders under Rule 30e-1 under the Investment Company Act of 1940 (17 CFR 270.30e-1). The Commission may use the information provided on Form N-CSR in its regulatory, disclosure review, inspection and policymaking roles.
A registrant is required to disclose the information specified by Form N-CSR, and the Commission will make this information public. A registrant is not required to respond to the collection of information contained in Form N-CSR unless the Form displays a currently valid Office of Management and Budget ("OMB") control number. Please direct comments concerning the accuracy of the information collection burden estimate and any suggestions for reducing the burden to Secretary, Securities and Exchange Commission, 110 F Street NE, Washington, DC 20549. The OMB has reviewed this collection of information under the clearance requirements of 44 U.S.C. ss. 3507.
ITEM 1. REPORT TO STOCKHOLDERS.
Attached hereto is the annual shareholder report transmitted to shareholders pursuant to Rule 30e-1 of the Investment Company Act of 1940, as amended.
BARINGS PARTICIPATION INVESTORS
Barings Participation Investors is a closed-end investment company, first offered to the public in 1988, whose shares are traded on the New York Stock Exchange.
INVESTMENT OBJECTIVE & POLICY
Barings Participation Investors (the "Trust") is a closed-end management investment company, first offered to the public in 1988, whose shares are traded on the New York Stock Exchange under the trading symbol "MPV". The Trust's share price can be found in the financial section of newspapers under either the New York Stock Exchange listings or Closed-End Fund listings.
The Trust's investment objective is to maximize total return by providing a high level of current income, the potential for growth of income, and capital appreciation. The Trust's principal investments are privately placed, below-investment grade, long-term debt obligations purchased directly from their issuers, which tend to be smaller companies. The Trust will also invest in publicly traded debt securities (including high yield securities) again with an emphasis on those with equity features, and in convertible preferred stocks and, subject to certain limitations, readily marketable equity securities. Below-investment grade or high yield securities have predominantly speculative characteristics with respect to the capacity of the issuer to pay interest and repay principal. The Trust is prohibited from purchasing below-investment grade securities if, after giving effect to the purchase, more than 75% of the Trust's total assets would be invested in below-investment grade securities, which are securities that are rated, at the time of purchase, BB or B by S&P or Ba or B by Moody's, or, if unrated, are believed by Barings LLC ("Barings") to be of an equivalent quality. In addition, the Trust will not invest in any debt security that is rated, at the time of acquisition, below B by S&P or Moody's, or if unrated, is believed by Barings to be of an equivalent quality. In addition, the Trust may invest in high quality, readily marketable securities.
Barings manages the Trust on a total return basis. The Trust distributes substantially all of its net income to
shareholders each year. Accordingly, the Trust pays dividends to shareholders four times a year in January, May, August, and November. All registered shareholders are automatically enrolled in the Dividend Reinvestment and Cash Purchase Plan unless cash distributions are requested.
In this report, you will find a complete listing of the Trust's holdings. We encourage you to read this section carefully for a better understanding of the Trust. We cordially invite all shareholders to attend the Trust's Annual Meeting of Shareholders, which will be held on April 21, 2017 at 1:00 P.M. in Springfield, Massachusetts.
PROXY VOTING POLICIES & PROCEDURES: PROXY VOTING RECORD
The Trustees of the Trust have delegated proxy voting responsibilities relating to the voting of securities held by the Trust to Barings. A description of Barings' proxy voting policies and procedures is available (1) without charge, upon request, by calling, toll-free 1-866-399-1516; (2) on the Trust's website at http://www.barings.com/mpv and (3) on the U.S. Securities and Exchange Commission's ("SEC") website at http://www.sec.gov. Information regarding how the Trust voted proxies relating to portfolio securities during the most recent 12-month period ended June 30, 2016 is available (1) on the Trust's website at http://www.barings.com/mpv and (2) on the SEC's website at http://www.sec.gov.
FORM N-Q
The Trust files its complete schedule of portfolio holdings with the SEC for the first and third quarters of each fiscal year on Form N-Q. This information is available (i) on the SEC's website at http://www.sec.gov; and (ii) at the SEC's Public Reference Room in Washington, DC (which information on their operation may be obtained by calling 1-800-SEC-0330). A complete schedule of portfolio holdings as of each quarter-end is available on the Trust's website at http://www.barings.com/mpv or upon request by calling, toll-free, 1-866-399-1516.
BARINGS PARTICIPATION INVESTORS c / o Barings LLC 1500 Main Street P.O. Box 15189 Springfield, Massachusetts 01115-5189 (413) 226-1516 http://www.barings.com/mpv ADVISER Barings LLC 1500 Main Street, P.O. Box 15189 Springfield, Massachusetts 01115-5189 INDEPENDENT REGISTERED PUBLIC ACCOUNTING FIRM KPMG LLP Boston, Massachusetts 02111 | | COUNSEL TO THE TRUST Ropes & Gray LLP Boston, Massachusetts 02110 CUSTODIAN State Street Bank and Trust Company Boston, MA 02110 TRANSFER AGENT & REGISTRAR DST Systems, Inc. P.O. Box 219086 Kansas City, MO 64121-9086 1-800-647-7374 |
2016 Annual Report
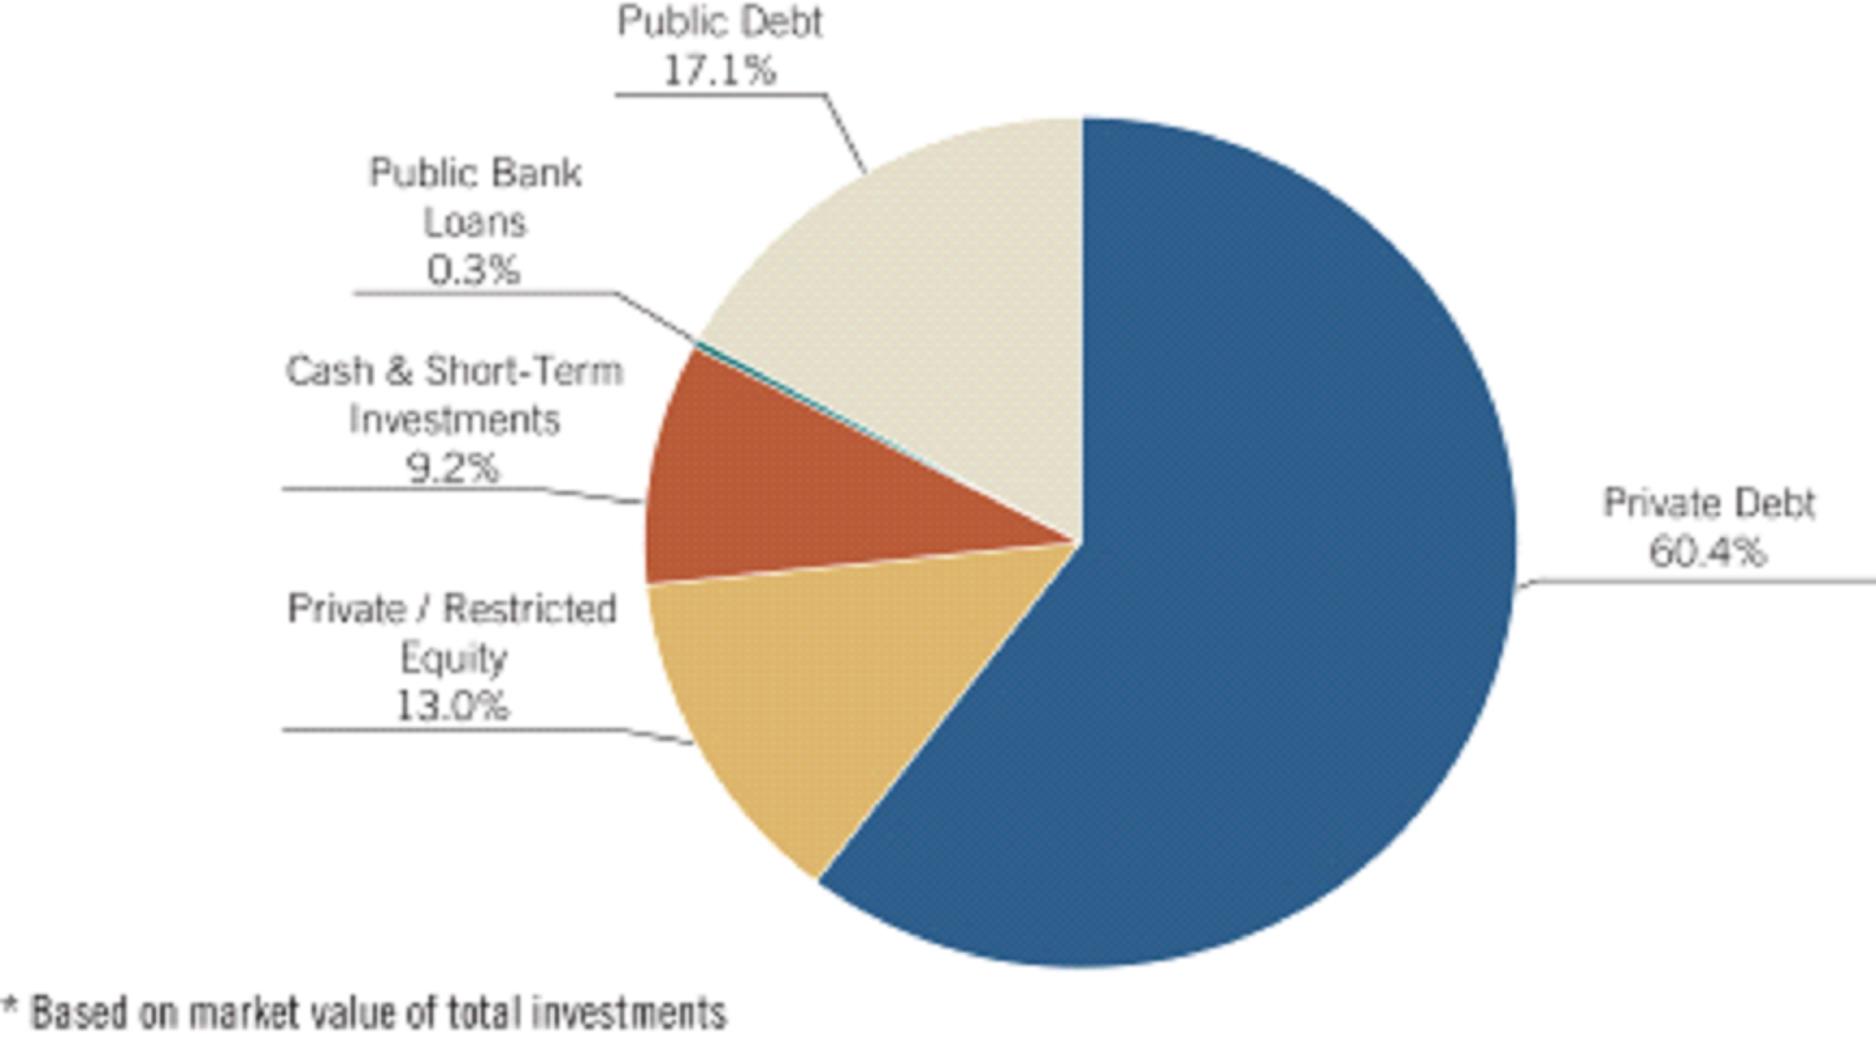
PORTFOLIO COMPOSITION AS OF 12/31/16*
TOTAL ANNUAL PORTFOLIO RETURN (AS OF 12/31 EACH YEAR)*
| * | Data for Barings Participation Investors (the "Trust") represents portfolio returns based on change in the Trust's net asset value (net of all fees and expenses) assuming the reinvestment of all dividends and distributions. These returns differ from the total investment return based on market value of the Trust's shares due to the difference between the Trust's net asset value and the market value of its shares outstanding (see page 12 for total investment return based on market value). Past performance is no guarantee of future results. |
1
Barings Participation Investors (formerly known as Babson Capital Participation Investors)
TO OUR SHAREHOLDERS
I am pleased to share with you the Trust's Annual Report for the year ended December 31, 2016.
PORTFOLIO PERFORMANCE
The Trust's net total portfolio rate of return for 2016 was 8.8%, as measured by the change in net asset value assuming the reinvestment of all dividends and distributions. The Trust's total net assets were $136,606,731 or $13.15 per share, as of December 31, 2016. This compares to $135,349,634 or $13.10 per share, as of December 31, 2015. The Trust paid a quarterly dividend of $0.27 per share for each of the four quarters of 2016, for a total annual dividend of $1.08 per share. In 2015, the Trust also paid four quarterly dividends of $0.27 per share, for a total annual dividend of $1.08 per share. Net taxable investment income for 2016 was $1.08 per share, including approximately $0.15 per share of non-recurring income, compared to 2015 net taxable investment income of $1.11 per share, which included approximately $0.25 per share of non-recurring income.
The Trust's stock price increased 3.3% during 2016, from $13.75 as of December 31, 2015 to $14.20 as of December 31, 2016. The Trust's stock price of $14.20 as of December 31, 2016 equates to an 8.0% premium over the December 31, 2016 net asset value per share of $13.15. The Trust's average quarter-end premium for the 3-, 5-, and 10-year periods ended December 31, 2016 was 0.7%, 7.0% and 7.1%, respectively.
The table below lists the average annual net returns of the Trust's portfolio, based on the change in net assets and assuming the reinvestment of all dividends and distributions. Average annual returns of the Barclays Capital U.S. Corporate High Yield Index and the Russell 2000 Index for the 1-, 3-, 5-, 10- and 25-year periods ended December 31, 2016 are provided for comparison purposes only.
| | | | |
| | The Trust | Barclays Capital U.S. Corporate High Yield Index | Russell
2000 Index |
| | | | |
| 1 Year | 8.75% | 17.13% | 21.32% |
| | | | |
| 3 Years | 9.49% | 4.66% | 6.74% |
| | | | |
| 5 Years | 11.04% | 7.36% | 14.46% |
| | | | |
| 10 Years | 9.43% | 7.45% | 7.07% |
| | | | |
| 25 Years | 12.21% | 8.04% | 9.69% |
Past performance is no guarantee of future results.
2016 Annual Report
In 2016, the Trust closed 15 new private placement investments, as well as 10 "add-on" investments in existing portfolio companies. The 15 new investments were in AM Conservation Holding Corp; API Technologies Corp.; CORA Health Services, Inc.; Del Real LLC; Dunn Paper; Elite Sportswear Holding, LLC; Glynlyon Holding Companies, Inc.; Happy Floors Acquisition, Inc.; Midwest Industrial Rubber, Inc.; Money Mailer Equity LLC; NSi Industries Holdings, Inc.; PANOS Brands LLC; Software Paradigms International Group, LLC; Veritext Corporation and Wolf-Gordon, Inc. In addition, the Trust added to existing private placement investments in Church Services Holding Company; Clarion Brands Holding Corp.; CTM Holding, Inc.; ERG Holding Company LLC; Hollandia Produce LLC; HVAC Holdings, Inc.; JMH Investors LLC; Merex Holding Corporation; Petroplex Inv Holdings LLC and PPC Event Services. A brief description of these investments can be found in the Consolidated Schedule of Investments. The total amount invested by the Trust in these transactions was $27,190,494, which was only slightly less than the $27,511,179 of new private placement investments made by the Trust in 2015, and the fourth highest dollar volume over the past ten years. We are pleased to have generated strong new investment volume for the Trust three years in a row.
The Trust's level of new investment activity in 2016 benefited from larger average transaction sizes as compared to 2015, a steady flow of investment opportunities from an established network of private equity sponsors, and several follow-on investments in companies which the Trust had an existing investment. After spending most of 2016 at levels below prior year, middle market buyout volume ended the year flat compared to 2015, due to strong fourth quarter activity, particularly at the upper end of the middle market. Competition for new investment opportunities remains intense, as there continues to be an ever increasing abundance of private debt and equity capital looking to be invested. As a result, attractive companies are being aggressively pursued by both buyers and lenders alike. As a result, high purchase multiples and leverage levels continue to be prevalent in the market. In 2016, average purchase price multiples for middle market companies decreased modestly (approximately 3%) but remain higher than any year since 2000 (other than 2015). Average leverage multiples also remained elevated in 2016, albeit modestly lower than 2015. However, the average leverage multiple steadily increased each quarter during 2016 resulting in the fourth quarter average being the fourth highest since 2003.
Though we remained very active investors on behalf of the Trust in 2016, we did so, and will continue to do so, cautiously and with discipline, consistent with our longstanding investment philosophy of seeking to take prudent levels of risk and getting paid appropriately for the risk taken. In 2016, in the face of these aggressive market conditions, we continued our history of investing in companies at lower than market leverage levels. The average leverage of the Trust's new private placement investments in 2016 was 4.9 times EBITDA, compared to the average market multiple of 5.3 times EBITDA. This approach has served us well over the long term and through all kinds of market cycles.
In addition to strong new investment activity, the condition of the Trust's existing portfolio remained solid throughout the year. Sales and earnings for the Trust's portfolio companies as a whole continued their upward momentum. In addition, the number of companies on our watch list or in default remained at acceptable levels in 2016.
We had 19 companies exit from the Trust's portfolio during 2016. This level of exit activity remains relatively high for the Trust's portfolio, especially after the unprecedented 32 exits experienced in 2014 and 21 exits in 2015, and is another indicator of how active and aggressive the markets continued to be in 2016. In all but four of these exits, the Trust realized a positive return on its investment. Of note, 14 of
Barings Participation Investors (formerly known as Babson Capital Participation Investors)
the 19 exits in 2016 were the realization of stub equity holdings in companies where the interest bearing debt securities had previously been prepaid.
During 2016, the Trust had five portfolio companies fully or partially prepay their debt obligations. The level of refinancing activity in the portfolio in 2016 was notably lower than in each of the prior three years when prepayments numbered 15, 20, and 32 in 2015, 2014, and 2013, respectively. These transactions, in which the debt instruments held by the Trust were fully or partially prepaid, are generally driven by performing companies seeking to take advantage of lower interest rates and the abundant availability of debt capital. Unless replaced by new private debt investments, these prepayments reduce net investment income.
As a result of the level of new investment activity, combined with the composition of the realizations (majority being the sale of non-cash pay equity securities) and lower level of prepayments, the Trust's recurring net investment income, increased over 9% to $0.94 per share as compared to $0.86 per share in 2015.
OUTLOOK FOR 2017
As we enter 2017, the pipeline of investment opportunities remains relatively healthy. The market appears optimistic that the new Presidential administration will result in a favorable economic environment, particularly for middle market companies, the very type of companies in which we focus our investment activities. Various surveys of middle market investment banks and capital providers would suggest the same. However, as previously mentioned, the market dynamics have, and are expected to continue to remain aggressive. And while there is much economic optimism, there is also a level of uncertainty that always comes with changes in governmental leadership. Rest assured that despite constantly changing market conditions, we will continue to employ on behalf of the Trust the same investment philosophy that has served it well since its inception: investing in companies which we believe have a strong business proposition, solid cash flow, and experienced, ethical management. We believe this philosophy, along with Barings' seasoned investment management team, positions the Trust well to meet its long-term investment objectives.
The Trust was able to maintain its $0.27 per share quarterly dividend in 2016 for a total annual dividend of $1.08 per share. However, it was once again necessary to supplement recurring investment income in each quarter of 2016 with non-recurring income and earnings carry forward in order to maintain the $1.08 per share annual dividend. As has been discussed in prior reports, recurring investment income alone has not been sufficient, and while improving, is not projected to be sufficient in the near term, to fully fund the current dividend rate. Net investment income has been below the dividend rate since 2013 due principally to the considerable reduction in the number of private debt securities in the portfolio resulting from the high level of exits and prepayment activity that occurred from 2013 through 2015, combined with generally lower investment returns available due to market and competitive dynamics over the past several years. As mentioned above, we made good progress in growing recurring investment income in 2016, but it remains below the dividend rate and will continue to require supplementation from non-recurring income in the near term. The level of expected recurring investment income generated by the Trust in 2017, combined with the availability of earnings carry forwards and other non-recurring income, maintenance of the current dividend rate over the next several quarters is expected. But over time, the Trust's dividend paying ability tends to be correlated with its recurring earnings capacity. As such, until recurring investment income reaches a level equal to the current dividend rate, there is the risk that the dividend may need to be reduced in the future.
2016 Annual Report
As always, I would like to thank you for your continued interest in and support of Barings Participation Investors. I look forward to seeing you at the Trust's annual shareholder meeting in Springfield on April 21, 2017.
Robert M. Shettle
President
Barings Participation Investors (formerly known as Babson Capital Participation Investors)
| | | | | | |
2016
Dividends | Record
Date | Total
Paid | Ordinary
Income | Short-Term
Gains | Long-Term
Gains |
| Regular | 5/2/2016 | 0.2700 | 0.2700 | — | — |
| Regular | 8/1/2016 | 0.2700 | 0.2700 | — | — |
| Regular | 11/7/2016 | 0.2700 | 0.2700 | — | — |
| Regular | 12/30/2016 | 0.2700 | 0.2700 | — | — |
| | | 1.0800 | 1.0800 | 0.0000 | 0.0000 |
| | | | | | | |
Annual
Dividend | Qualified for Dividend Received Deduction*** | Qualified Dividends**** | Interest Earned on U.S. Gov't. Obligations |
Amount per
Share | Percent | Amount per
Share | Percent | Amount per
Share | Percent | Amount per
Share |
| $1.08 | 13.4585% | 0.1321 | 13.4585% | 0.1321 | 0% | 0.0000 |
| *** | Not available to individual shareholders |
| **** | Qualified dividends are reported in Box 1b on IRS Form 1099-Div for 2016 |
BARINGS PARTICIPATION INVESTORS | | |
| | | |
| Financial Report | | |
| | | |
| | | |
| Consolidated Statement of Assets and Liabilities | 8 | |
| | | |
| Consolidated Statement of Operations | 9 | |
| | | |
| Consolidated Statement of Cash Flows | 10 | |
| | | |
| Consolidated Statements of Changes in Net Assets | 11 | |
| | | |
| Consolidated Selected Financial Highlights | 12 | |
| | | |
| Consolidated Schedule of Investments | 13-41 | |
| | | |
| Notes to Consolidated Financial Statements | 42-49 | |
| | | |
| Report of Independent Registered Public Accounting Firm | 50 | |
| | | |
| Interested Trustees | 51-52 | |
| | | |
| Independent Trustees | 53-54 | |
| | | |
| Officers of the Trust | 55 | |
Barings Participation Investors (formerly known as Babson Capital Participation Investors)
CONSOLIDATED STATEMENT OF ASSETS AND LIABILITIES
December 31, 2016
| | | | |
| Assets: | | | |
| Investments | | | |
| (See Consolidated Schedule of Investments) | | | |
| Corporate restricted securities at fair value | | | |
| (Cost - $97,075,180 ) | | $ | 94,771,586 | |
| Corporate restricted securities at market value | | | | |
| (Cost - $18,139,062 ) | | | 18,191,653 | |
| Corporate public securities at market value | | | | |
| (Cost - $26,042,529 ) | | | 26,734,649 | |
| Short-term securities at amortized cost | | | 9,999,142 | |
| | | | | |
| Total investments (Cost - $151,255,913 ) | | | 149,697,030 | |
| | | | | |
| Cash | | | 4,199,021 | |
| Interest receivable | | | 1,748,514 | |
| Receivable for investments sold | | | 152,188 | |
| Other assets | | | 26,783 | |
| | | | | |
| Total assets | | | 155,823,536 | |
| | | | | |
| Liabilities: | | | | |
| Note payable | | | 15,000,000 | |
| Dividend payable | | | 2,804,267 | |
| Tax payable | | | 504,303 | |
| Deferred tax liability | | | 415,014 | |
| Investment advisory fee payable | | | 307,365 | |
| Interest payable | | | 27,267 | |
| Accrued expenses | | | 158,589 | |
| | | | | |
| Total liabilities | | | 19,216,805 | |
| | | | | |
| Total net assets | | $ | 136,606,731 | |
| | | | | |
| Net Assets: | | | | |
| Common shares, par value $.01 per share | | $ | 103,861 | |
| Additional paid-in capital | | | 94,909,097 | |
| Retained net realized gain on investments, prior years | | | 40,511,310 | |
| Undistributed net investment income | | | 568,739 | |
| Accumulated net realized gain on investments | | | 2,487,621 | |
| Net unrealized depreciation of investments | | | (1,973,897 | ) |
| | | | | |
| Total net assets | | $ | 136,606,731 | |
| | | | | |
| Common shares issued and outstanding (14,787,750 authorized) | | | 10,386,173 | |
| | | | | |
| Net asset value per share | | $ | 13.15 | |
| | | | | |
See Notes to Consolidated Financial Statements
CONSOLIDATED STATEMENT OF OPERATIONS
For the year ended December 31, 2016
| | | | |
| Investment Income: | | | |
| Interest | | $ | 12,108,459 | |
| Dividends | | | 427,016 | |
| Other | | | 278,283 | |
| | | | | |
| Total investment income | | | 12,813,758 | |
| | | | | |
| Expenses: | | | | |
| Investment advisory fees | | | 1,250,835 | |
| Interest | | | 613,500 | |
| Trustees' fees and expenses | | | 225,000 | |
| Professional fees | | | 165,146 | |
| Reports to shareholders | | | 71,000 | |
| Custodian fees | | | 16,171 | |
| Other | | | 147,864 | |
| | | | | |
| Total expenses | | | 2,489,516 | |
| | | | | |
| Investment income - net | | | 10,324,242 | |
| Net realized and unrealized gain on investments: | | | | |
| Net realized gain on investments before taxes | | | 1,931,283 | |
| Income tax expense | | | (651,292 | ) |
| | | | | |
| Net realized gain on investments after taxes | | | 1,279,991 | |
| | | | | |
| Net increase (decrease) in unrealized appreciation (depreciation) of investments before taxes | | | (55,675 | ) |
| Net (increase) decrease in deferred income tax expense | | | 94,074 | |
| | | | | |
| Net increase (decrease) in unrealized appreciation (depreciation) of investments after taxes | | | 38,399 | |
| | | | | |
| Net gain on investments | | | 1,318,390 | |
| | | | | |
| Net increase in net assets resulting from operations | | $ | 11,642,632 | |
| | | | | |
See Notes to Consolidated Financial Statements
Barings Participation Investors (formerly known as Babson Capital Participation Investors)
CONSOLIDATED STATEMENT OF CASH FLOWS
For the year ended December 31, 2016
| | | | |
| Net decrease in cash: | | | |
| Cash flows from operating activities: | | | |
| Purchases/Proceeds/Maturities from short-term portfolio securities, net | | $ | (5,948,810 | ) |
| Purchases of portfolio securities | | | (43,862,303 | ) |
| Proceeds from disposition of portfolio securities | | | 49,663,363 | |
| Interest, dividends and other income received | | | 11,244,327 | |
| Interest expense paid | | | (613,500 | ) |
| Operating expenses paid | | | (1,974,948 | ) |
| Income taxes paid | | | (621,436 | ) |
| | | | | |
| Net cash provided by operating activities | | | 7,886,693 | |
| | | | | |
| Cash flows from financing activities: | | | | |
| Cash dividends paid from net investment income | | | (11,176,907 | ) |
| Receipts for shares issued on reinvestment of dividends | | | 806,973 | |
| Net cash used for financing activities | | | (10,369,934 | ) |
| Net decrease in cash | | | (2,483,241 | ) |
| Cash - beginning of year | | | 6,682,262 | |
| | | | | |
| Cash - end of year | | $ | 4,199,021 | |
| | | | | |
Reconciliation of net increase in net assets to net
cash provided by operating activities: | | | | |
| Net increase in net assets resulting from operations | | $ | 11,642,632 | |
| | | | | |
| Increase in investments | | | (3,305,349 | ) |
| Increase in interest receivable | | | (135,252 | ) |
| Increase in receivable for investments sold | | | (152,188 | ) |
| Increase in tax payable | | | 29,856 | |
| Decrease in deferred tax liability | | | (94,074 | ) |
| Increase in investment advisory fee payable | | | 2,828 | |
| Decrease in accrued expenses | | | (101,760 | ) |
| | | | | |
| Total adjustments to net assets from operations | | | (3,755,939 | ) |
| | | | | |
| Net cash provided by operating activities | | $ | 7,886,693 | |
| | | | | |
See Notes to Consolidated Financial Statements
2016 Annual Report
CONSOLIDATED STATEMENTS OF CHANGES IN NET ASSETS
For the years ended December 31, 2016 and 2015
| | | | | | | |
| | | 2016 | | | 2015 | |
| Increase/(decrease) in net assets: | | | | | | |
| Operations: | | | | | | |
| Investment income - net | | $ | 10,324,242 | | | $ | 9,762,813 | |
| Net realized gain on investments after taxes | | | 1,279,991 | | | | 161,395 | |
| Net change in unrealized appreciation/(depreciation) of investments after taxes | | | 38,399 | | | | (1,368,494 | ) |
| | | | | | | | | |
| Net increase in net assets resulting from operations | | | 11,642,632 | | | | 8,555,714 | |
| | | | | | | | | |
| Increase from common shares issued on reinvestment of dividends | | | | | | | | |
| Common shares issued (2016 - 57,782; 2015 - 27,306) | | | 806,973 | | | | 368,734 | |
| | | | | | | | | |
| Dividends to shareholders from: | | | | | | | | |
| Net investment income (2016 - $1.08 per share; 2015 - $1.08 per share) | | | (11,192,508 | ) | | | (11,143,733 | ) |
| | | | | | | | | |
| Total increase/(decrease) in net assets | | | 1,257,097 | | | | (2,219,285 | ) |
| | | | | | | | | |
| Net assets, beginning of year | | | 135,349,634 | | | | 137,568,919 | |
| | | | | | | | | |
| Net assets, end of year (including undistributed net investment income of $568,739 and $1,404,388, respectively) | | $ | 136,606,731 | | | $ | 135,349,634 | |
| | | | | | | | | |
See Notes to Consolidated Financial Statements
Barings Participation Investors (formerly known as Babson Capital Participation Investors)
CONSOLIDATED SELECTED FINANCIAL HIGHLIGHTS
Selected data for each share of beneficial interest outstanding:
| | | For the years ended December 31, | |
| | | 2016 | | | 2015 | | | 2014 | | | 2013 | | | 2012 | |
| | | | |
| Net asset value: | | | | | | | | | | | | | | | |
| Beginning of year | | $ | 13.10 | | | $ | 13.35 | | | $ | 12.83 | | | $ | 12.56 | | | $ | 11.90 | |
| Net investment income (a) | | | 1.00 | | | | 0.95 | | | | 1.04 | | | | 1.00 | | | | 1.08 | |
Net realized and unrealized gain (loss) on investments | | | 0.13 | | | | (0.12 | ) | | | 0.57 | | | | 0.35 | | | | 0.64 | |
| | | | | | | | | | | | | | | | | | | | | |
| Total from investment operations | | | 1.13 | | | | 0.83 | | | | 1.61 | | | | 1.35 | | | | 1.72 | |
| | | | | | | | | | | | | | | | | | | | | |
Dividends from net investment income to common shareholders | | | (1.08 | ) | | | (1.08 | ) | | | (0.96 | ) | | | (1.08 | ) | | | (1.04 | ) |
Dividends from realized gain on investments to common shareholders | | | — | | | | — | | | | (0.12 | ) | | | — | | | | (0.04 | ) |
| Increase from dividends reinvested | | | (0.00 | )(b) | | | (0.00 | )(b) | | | (0.01 | ) | | | (0.00 | )(b) | | | 0.02 | |
| | | | | | | | | | | | | | | | | | | | | |
| Total dividends | | | (1.08 | ) | | | (1.08 | ) | | | (1.09 | ) | | | (1.08 | ) | | | (1.06 | ) |
| | | | | | | | | | | | | | | | | | | | | |
| Net asset value: End of year | | $ | 13.15 | | | $ | 13.10 | | | $ | 13.35 | | | $ | 12.83 | | | $ | 12.56 | |
| | | | | | | | | | | | | | | | | | | | | |
| Per share market value: End of year | | $ | 14.20 | | | $ | 13.75 | | | $ | 13.23 | | | $ | 12.88 | | | $ | 13.91 | |
| | | | | | | | | | | | | | | | | | | | | |
| Total investment return | | | | | | | | | | | | | | | | | | | | |
| Net asset value (c) | | | 8.75% | | | | 6.23% | | | | 13.61% | | | | 10.97% | | | | 15.89% | |
| Market value (c) | | | 11.45% | | | | 12.66% | | | | 12.54% | | | | 0.47% | | | | (4.54% | ) |
| Net assets (in millions): | | | | | | | | | | | | | | | | | | | | |
| End of year | | $ | 136.61 | | | $ | 135.35 | | | $ | 137.57 | | | $ | 131.42 | | | $ | 127.87 | |
Ratio of total expenses to average net assets | | | 2.26% | | | | 2.17% | | | | 2.84% | | | | 2.15% | | | | 2.83% | |
Ratio of operating expenses to average net assets | | | 1.35% | | | | 1.49% | | | | 1.49% | | | | 1.51% | | | | 1.51% | |
Ratio of interest expense to average net assets | | | 0.44% | | | | 0.44% | | | | 0.45% | | | | 0.47% | | | | 0.49% | |
Ratio of income tax expense to average net assets (d) | | | 0.47% | | | | 0.24% | | | | 0.90% | | | | 0.17% | | | | 0.83% | |
Ratio of net investment income to average net assets | | | 7.45% | | | | 6.95% | | | | 7.82% | | | | 7.77% | | | | 8.82% | |
| Portfolio turnover | | | 31% | | | | 30% | | | | 32% | | | | 30% | | | | 34% | |
| (a) | Calculated using average shares. |
| (b) | Rounds to less than $0.01 per share. |
| (c) | Net asset value return represents portfolio returns based on change in the Trust's net asset value assuming the reinvestment of all dividends and distributions which differs from the total investment return based on the Trust's market value due to the difference between the Trust's net asset value and the market value of its shares outstanding; past performance is no guarantee of future results. |
| (d) | As additional information, this ratio is included to reflect the taxes paid on retained long-term gains. These taxes paid are netted against realized capital gains in the Statement of Operations. The taxes paid are treated as deemed distributions and a credit for the taxes paid is passed on to shareholders. |
| Senior borrowings: | | | | | | | | | | | | | | | | | | | | |
| Total principal amount (in millions) | | $ | 15 | | | $ | 15 | | | $ | 15 | | | $ | 15 | | | $ | 15 | |
Asset coverage per $1,000 of indebtedness | | $ | 10,107 | | | $ | 10,023 | | | $ | 10,171 | | | $ | 9,761 | | | $ | 9,525 | |
See Notes to Consolidated Financial Statements
2016 Annual Report
CONSOLIDATED SCHEDULE OF INVESTMENTS
December 31, 2016
| | | | | | | | | | | | | |
| Corporate Restricted Securities - 82.69%: (A) | | Principal Amount,
Shares, Units or
Ownership Percentage | | | Acquisition
Date | | | Cost | | | Fair Value | |
| | |
| Private Placement Investments - 69.38%: (C) | |
| | | | | | | | | | | | | |
| 1492 Acquisition LLC | | | | | | | | | | | | |
| A leading producer of premium Italian cured meats and deli meats in the U.S. | |
Limited Liability Company Unit Class A Preferred (B) | | 102 uts. | | | 10/17/12 | | | $ | 102,270 | | | $ | 139,857 | |
Limited Liability Company Unit Class A Common (B) | | 11,364 uts. | | | 10/17/12 | | | | 11,364 | | | | 153,737 | |
| | | | | | | | | | | | | | | |
| | | | | | | | | | 113,634 | | | | 293,594 | |
| | | | | | | | | | | | | | | |
| | | | | | | | | | | | | | | |
| ABC Industries, Inc. | | | | | | | | | | | | | | |
| A manufacturer of mine and tunneling ventilation products in the U.S. | |
| 13% Senior Subordinated Note due 07/31/2019 | | $ | 139,205 | | | 08/01/12 | | | | 131,977 | | | | 137,087 | |
| Preferred Stock Series A (B) | | 125,000 shs. | | | 08/01/12 | | | | 125,000 | | | | 197,584 | |
Warrant, exercisable until 2022, to purchase common stock at $.02 per share (B) | | 22,414 shs. | | | 08/01/12 | | | | 42,446 | | | | 32,955 | |
| | | | | | | | | | | | | | | | |
| | | | | | | | | | | 299,423 | | | | 367,626 | |
| | | | | | | | | | | | | | | | |
| | |
| Advanced Manufacturing Enterprises LLC | |
| A designer and manufacturer of large, custom gearing products for a number of critical customer applications. | |
| Limited Liability Company Unit (B) | | 1,945 uts. | | | | * | | | | 207,910 | | | | — | |
| | | | | | | | | | | | | | | | | |
| * 12/07/12, 07/11/13 and 06/30/15. | | | | | | | | | | | | | | | | |
| | |
| | |
| AFC - Dell Holding Corporation | |
| A distributor and provider of inventory management services for "C-Parts" used by OEMs in their manufacturing and production facilities. | |
12.5% (1% PIK) Senior Subordinated Note due 09/27/2020 | | $ | 1,203,330 | | | 03/27/15 | | | | 1,185,568 | | | | 1,227,396 | |
| Preferred Stock (B) | | 1,122 shs. | | | 03/27/15 | | | | 112,154 | | | | 112,506 | |
| Common Stock (B) | | 346 shs. | | | 03/27/15 | | | | 346 | | | | — | |
| | | | | | | | | | | | | | | | | |
| | | | | | | | | | | | 1,298,068 | | | | 1,339,902 | |
| | | | | | | | | | | | | | | | | |
| | | | | | | | | | | | | | | | | |
| Airxcel Holdings | | | | | | | | | | | | | | | | |
| A leading manufacturer of a broad range of climate control solutions, including air-conditioners, heat pumps, cooking appliances, furnaces, powered vents, and water heaters. | |
12.5% (1.5% PIK) Senior Subordinated Note due 11/18/2020 | | $ | 1,483,333 | | | 11/18/14 | | | | 1,462,362 | | | | 1,483,333 | |
| Limited Liability Company Unit | | 288 uts. | | | 11/18/14 | | | | 288,000 | | | | 509,686 | |
| | | | | | | | | | | | | | | | | |
| | | | | | | | | | | | 1,750,362 | | | | 1,993,019 | |
| | | | | | | | | | | | | | | | | |
See Notes to Consolidated Financial Statements
Barings Participation Investors (formerly known as Babson Capital Participation Investors)
CONSOLIDATED SCHEDULE OF INVESTMENTS (CONTINUED)
December 31, 2016
| | | | | | | | | | | | | |
Corporate Restricted Securities: (A)
(Continued) | | Principal Amount,
Shares, Units or
Ownership Percentage | | | Acquisition
Date | | | Cost | | | Fair Value | |
| | | | | | | | | | | |
| AM Conservation Holding Corp. | | | | | | | | | | |
| A supplier of energy efficiency ("EE") products, including lighting, shower heads and aerators, and weatherization products such as door seals and weather stripping. | |
11.75% (1.5% PIK) Senior Subordinated Note due 04/30/2023 | | $ | 1,572,233 | | | 10/31/16 | | | $ | 1,541,418 | | | $ | 1,555,661 | |
| Common Stock (B) | | 156,818 shs. | | | 10/31/16 | | | | 156,818 | | | | 156,818 | |
| | | | | | | | | | | | | | | | |
| | | | | | | | | | | 1,698,236 | | | | 1,712,479 | |
| | | | | | | | | | | | | | | | |
| | | | | | | | | | | | | | | | |
| AMS Holding LLC | | | | | | | | | | | | | | | |
| A leading multi-channel direct marketer of high-value collectible coins and proprietary-branded jewelry and watches. | |
Limited Liability Company Unit Class A Preferred (B)(F) | | 114 uts. | | | 10/04/12 | | | | 113,636 | | | | 254,622 | |
| | | | | | | | | | | | | | | | |
| | | | | | | | | | | | | | | | |
| API Technologies Corp. | | | | | | | | | | | | | | | |
| A designer, developer and manufacturer of electronic systems, subsystems, modules and secure communications for technically demanding defense, aerospace and commercial applications in the U.S. and internationally. | |
12% (1% PIK) Senior Subordinated Note due 04/22/2023 | | $ | 1,389,522 | | | 04/22/16 | | | | 1,369,530 | | | | 1,392,570 | |
| Limited Liability Company Unit (B) | | 0.40% int. | | | 04/20/16 | | | | 345,000 | | | | 265,650 | |
| | | | | | | | | | | | | | | | |
| | | | | | | | | | | 1,714,530 | | | | 1,658,220 | |
| | | | | | | | | | | | | | | | |
| | | | | | | | | | | | | | | | |
| ARI Holding Corporation | | | | | | | | | | | | | | | |
| A leading national supplier of products used primarily by specialty contractors. | |
11.5% (0.5% PIK) Senior Subordinated Note due 02/01/2020 | | $ | 1,713,112 | | | | * | | | | 1,695,985 | | | | 1,713,112 | |
| Limited Partnership Interest | | 524 uts. | | | 08/01/14 | | | | 523,950 | | | | 649,257 | |
| | | | | | | | | | | | | | | | | |
| * 05/21/13 and 08/01/14. | | | | | | | | | | | 2,219,935 | | | | 2,362,369 | |
| | | | | | | | | | | | | | | | | |
| | | | | | | | | | | | | | | | | |
| ASC Holdings, Inc. | | | | | | | | | | | | | | | | |
| A manufacturer of capital equipment used by corrugated box manufacturers. | |
13% (1% PIK) Senior Subordinated Note due 05/18/2021 | | $ | 748,684 | | | 11/19/15 | | | | 736,084 | | | | 738,396 | |
| Limited Liability Company Unit (B) | | 111,100 uts. | | | 11/18/15 | | | | 111,100 | | | | 34,663 | |
| | | | | | | �� | | | | | | | | | | |
| | | | | | | | | | | | 847,184 | | | | 773,059 | |
| | | | | | | | | | | | | | | | | |
See Notes to Consolidated Financial Statements
2016 Annual Report
CONSOLIDATED SCHEDULE OF INVESTMENTS (CONTINUED)
December 31, 2016
| | | | | | | | | | | | | |
Corporate Restricted Securities: (A)
(Continued) | | Principal Amount,
Shares, Units or
Ownership Percentage | | | Acquisition
Date | | | Cost | | | Fair Value | |
| | |
| Aurora Parts & Accessories LLC | |
| A distributor of aftermarket over-the-road semi-trailer parts and accessories sold to customers across North America. | |
11% Senior Subordinated Note due 02/17/2022 | | $ | 1,515,400 | | | 08/17/15 | | | $ | 1,490,834 | | | $ | 1,535,559 | |
| Preferred Stock (B) | | 210 shs. | | | 08/17/15 | | | | 209,390 | | | | 174,632 | |
| Common Stock (B) | | 210 shs. | | | 08/17/15 | | | | 210 | | | | — | |
| | | | | | | | | | | | | | | | |
| | | | | | | | | | | 1,700,434 | | | | 1,710,191 | |
| | | | | | | | | | | | | | | | |
| | |
| Avantech Testing Services LLC | |
| A manufacturer of custom Non-Destructive Testing ("NDT") systems and provider of NDT and inspections services primarily to the oil country tubular goods market. | |
15% (3.75% PIK) Senior Subordinated Note due 01/31/2021 (D) | | $ | 500,587 | | | 07/31/14 | | | | 491,228 | | | | — | |
| Limited Liability Company Unit (B)(F) | | 45,504 uts. | | | | * | | | | — | | | | — | |
| | | | | | | | | | | | | | | | | |
| * 07/31/14 and 10/14/15. | | | | | | | | | | | 491,228 | | | | — | |
| | | | | | | | | | | | | | | | | |
| | |
| Blue Wave Products, Inc. | |
| A distributor of pool supplies. | |
10% Senior Secured Term Note due 09/30/2018 | | $ | 139,007 | | | 10/12/12 | | | | 138,017 | | | | 139,007 | |
13% (1% PIK) Senior Subordinated Note due 09/30/2019 | | $ | 331,416 | | | 10/12/12 | | | | 319,314 | | | | 331,416 | |
| Common Stock (B) | | 51,064 shs. | | | 10/12/12 | | | | 51,064 | | | | 232,189 | |
Warrant, exercisable until 2022, to purchase common stock at $.01 per share (B) | | 20,216 shs. | | | 10/12/12 | | | | 20,216 | | | | 91,923 | |
| | | | | | | | | | | | | | | | | |
| | | | | | | | | | | | 528,611 | | | | 794,535 | |
| | | | | | | | | | | | | | | | | |
| | |
| BlueSpire Holding, Inc. | |
| A marketing services firm that integrates strategy, technology, and content to deliver customized marketing solutions for clients in the senior living, financial services and healthcare end markets. | |
12.5% (1.5% PIK) Senior Subordinated Note due 06/30/2021 | | $ | 1,603,816 | | | 06/30/15 | | | | 1,578,222 | | | | — | |
| Common Stock (B) | | 1,417 shs. | | | 06/30/15 | | | | 156,800 | | | | — | |
| | | | | | | | | | | | | | | | | |
| | | | | | | | | | | | 1,735,022 | | | | — | |
| | | | | | | | | | | | | | | | | |
| | |
| BP SCI LLC | |
| A leading value-added distributor of branded pipes, valves, and fittings (PVF) to diversified end markets. | |
Limited Liability Company Unit Class A (B)(F) | | 417 uts. | | | 10/17/12 | | | | 41,667 | | | | 77,385 | |
Limited Liability Company Unit Class B (B)(F) | | 167 uts. | | | 10/17/12 | | | | 166,666 | | | | 267,799 | |
| | | | | | | | | | | | | | | | | |
| | | | | | | | | | | | 208,333 | | | | 345,184 | |
| | | | | | | | | | | | | | | | | |
See Notes to Consolidated Financial Statements
Barings Participation Investors (formerly known as Babson Capital Participation Investors)
CONSOLIDATED SCHEDULE OF INVESTMENTS (CONTINUED)
December 31, 2016
| | | | | | | | | | | | | |
Corporate Restricted Securities: (A)
(Continued) | | Principal Amount,
Shares, Units or
Ownership Percentage | | | Acquisition
Date | | | Cost | | | Fair Value | |
| | |
| CG Holdings Manufacturing Company | |
| A coating provider serving the automotive, agricultural, heavy truck and other end markets. | |
13% Senior Subordinated Note due 11/01/2019 | | $ | 1,412,605 | | | | * | | | $ | 1,362,085 | | | $ | 1,412,605 | |
| Preferred Stock (B) | | 1,350 shs. | | | | * | | | | 134,972 | | | | 169,355 | |
| Preferred Stock (B) | | 489 shs. | | | | * | | | | 48,721 | | | | 61,382 | |
| Common Stock (B) | | 140 shs. | | | | * | | | | 14,864 | | | | 131,712 | |
Warrant, exercisable until 2023, to purchase common stock at $.01 per share (B) | | 58 shs. | | | | * | | | | 5,430 | | | | 54,709 | |
| | | | | | | | | | | | | | | | | |
| * 05/09/13 and 11/01/13. | | | | | | | | | | | 1,566,072 | | | | 1,829,763 | |
| | | | | | | | | | | | | | | | | |
| | |
| CHG Alternative Education Holding Company | |
| A leading provider of publicly-funded, for profit pre-K-12 education services targeting special needs children at therapeutic day schools and "at risk" youth through alternative education programs. | |
13.5% (1.5% PIK) Senior Subordinated Note due 01/19/2018 | | $ | 779,888 | | | 01/19/11 | | | | 770,565 | | | | 779,888 | |
14% (2% PIK) Senior Subordinated Note due 08/03/2019 | | $ | 205,009 | | | 08/03/12 | | | | 203,185 | | | | 205,009 | |
| Common Stock (B) | | 375 shs. | | | 01/19/11 | | | | 37,500 | | | | 43,372 | |
Warrant, exercisable until 2021, to purchase common stock at $.01 per share (B) | | 295 shs. | | | 01/19/11 | | | | 29,250 | | | | 34,093 | |
| | | | | | | | | | | | | | | | | |
| | | | | | | | | | | | 1,040,500 | | | | 1,062,362 | |
| | | | | | | | | | | | | | | | | |
| | |
| Church Services Holding Company | |
| A provider of diversified residential services to homeowners in the Houston, Dallas, and Austin markets. | |
14.5% (2% PIK) Senior Subordinated Note due 03/26/2018 (D) | | $ | 191,888 | | | 03/26/12 | | | | 189,978 | | | | — | |
| Preferred Stock Series A (B) | | 65 shs. | | | 09/22/16 | | | | 6,465 | | | | — | |
| Preferred Stock (B) | | 548 shs. | | | 04/11/16 | | | | 54,762 | | | | — | |
| Common Stock (B) | | 1,327 shs. | | | | * | | | | 132,700 | | | | — | |
Warrant, exercisable until 2022, to purchase common stock at $.01 per share (B) | | 57 shs. | | | 03/26/12 | | | | 5,740 | | | | — | |
| | | | | | | | | | | | | | | | | |
| * 03/26/12, 05/25/12 and 06/19/12. | | | | | | | | | | | 389,645 | | | | — | |
| | | | | | | | | | | | | | | | | |
| | |
| Clarion Brands Holding Corp. | |
| A portfolio of six over-the-counter (OTC) pharmaceutical brands whose products are used to treat tinnitus or ringing of the ear, excessive sweating, urinary tract infections, muscle pain, and skin conditions. | |
12.5% (1.5% PIK) Senior Subordinated Note due 04/01/2021 | | $ | 2,023,440 | | | | * | | | | 1,991,934 | | | | 1,994,682 | |
| Limited Liability Company Unit | | 1,853 uts. | | | 07/18/16 | | | | 189,267 | | | | 155,383 | |
| | | | | | | | | | | | | | | | | |
| * 10/01/14, 01/07/16 and 07/18/16. | | | | | | | | | | | 2,181,201 | | | | 2,150,065 | |
| | | | | | | | | | | | | | | | | |
See Notes to Consolidated Financial Statements
2016 Annual Report
CONSOLIDATED SCHEDULE OF INVESTMENTS (CONTINUED)
December 31, 2016
| | | | | | | | | | | | | |
Corporate Restricted Securities: (A)
(Continued) | | Principal Amount,
Shares, Units or
Ownership Percentage | | | Acquisition
Date | | | Cost | | | Fair Value | |
| | |
| Clough, Harbour and Associates | |
| An engineering service firm that is located in Albany, NY. | |
| Preferred Stock (B) | | 147 shs. | | | 12/02/08 | | | $ | 146,594 | | | $ | 623,893 | |
| | | | | | | | | | | | | | | |
| | |
| Compass Chemical International LLC | |
| A manufacturer and supplier of standard and specialty formulated chemicals, primarily phosphoric acid derivatives called phosphonates. | |
| Limited Liability Company Unit (B)(F) | | 230 uts. | | | 03/04/15 | | | | 147,304 | | | | 117,908 | |
| | | | | | | | | | | | | | | |
| | | | | | | | | | | | | | | |
| Connecticut Electric, Inc. | | | | | | | | | | | | | | |
| A supplier and distributor of electrical products sold into the retail and wholesale markets. | |
| Limited Liability Company Unit Class A (B) | | 82,613 uts. | | | 01/12/07 | | | | 82,613 | | | | 110,660 | |
| Limited Liability Company Unit Class C (B) | | 59,756 uts. | | | 01/12/07 | | | | 59,756 | | | | 86,349 | |
| Limited Liability Company Unit Class D (B) | | 671,525 uts. | | | 05/03/10 | | | | — | | | | 915,651 | |
| Limited Liability Company Unit Class E (B) | | 1,102 uts. | | | 05/03/10 | | | | — | | | | 157,741 | |
| | | | | | | | | | | | | | | |
| | | | | | | | | | 142,369 | | | | 1,270,401 | |
| | | | | | | | | | | | | | | |
| | | | | | | | | | | | | | | |
| CORA Health Services, Inc. | | | | | | | | | | | | | | |
| A provider of outpatient rehabilitation therapy services. | |
12.75% (1.75% PIK) Senior Subordinated Note due 06/30/2023 | | $ | 764,929 | | | 06/30/16 | | | | 750,861 | | | | 771,653 | |
| Common Stock Class A (B) | | 3,791 shs. | | | 06/30/16 | | | | 3,791 | | | | 2,692 | |
| Preferred Stock Series A (B) | | 758 shs. | | | 06/30/16 | | | | 72,033 | | | | 74,285 | |
| | | | | | | | | | | | | | | | |
| | | | | | | | | | | 826,685 | | | | 848,630 | |
| | | | | | | | | | | | | | | | |
| | | | | | | | | | | | | | | | |
| CTM Holding, Inc. | | | | | | | | | | | | | | | |
| A leading owner and operator of coin-operated children's rides, penny presses and candy kiosks in the U.S. | |
15% (3% PIK) Senior Subordinated Note due 11/22/2019 | | $ | 1,296,882 | | | 11/22/13 | | | | 1,282,840 | | | | 1,290,310 | |
| Common Stock (B) | | 90 shs. | | | | * | | | | 514,284 | | | | 377,036 | |
| | | | | | | | | | | | | | | | | |
| * 11/22/13 and 09/16/16. | | | | | | | | | | | 1,797,124 | | | | 1,667,346 | |
| | | | | | | | | | | | | | | | | |
| | | | | | | | | | | | | | | | | |
| Del Real LLC | | | | | | | | | | | | | | | | |
| A manufacturer and distributor of fully-prepared fresh refrigerated Hispanic entrees as well as side dishes that are typically sold on a heat-and-serve basis at retail grocers. | |
11% Senior Subordinated Note due 04/06/2023 | | $ | 1,420,588 | | | 10/07/16 | | | | 1,392,885 | | | | 1,397,274 | |
| Limited Liability Company Unit (B)(F) | | 304,412 uts. | | | 10/07/16 | | | | 304,412 | | | | 304,412 | |
| | | | | | | | | | | | | | | | | |
| | | | | | | | | | | | 1,697,297 | | | | 1,701,686 | |
| | | | | | | | | | | | | | | | | |
See Notes to Consolidated Financial Statements
Barings Participation Investors (formerly known as Babson Capital Participation Investors)
CONSOLIDATED SCHEDULE OF INVESTMENTS (CONTINUED)
December 31, 2016
| | | | | | | | | | | |
Corporate Restricted Securities: (A)
(Continued) | | Principal Amount,
Shares, Units or
Ownership Percentage | | Acquisition
Date | | Cost | | | Fair Value | |
| | | | | | | | | | | |
| DPL Holding Corporation | | | | | | | | | | |
| A distributor and manufacturer of aftermarket undercarriage parts for medium and heavy duty trucks and trailers. | |
| 14% (2% PIK) Senior Subordinated Note due 11/04/2020 | | $ | 1,403,960 | | 05/04/12 | | $ | 1,392,283 | | | $ | 1,359,968 | |
| Preferred Stock (B) | | 25 shs. | | 05/04/12 | | | 252,434 | | | | 195,418 | |
| Common Stock (B) | | 25 shs. | | 05/04/12 | | | 28,048 | | | | — | |
| | | | | | | | | | | | | | |
| | | | | | | | | 1,672,765 | | | | 1,555,386 | |
| | | | | | | | | | | | | | |
| | | | | | | | | | | | | | |
| Dunn Paper | | | | | | | | | | | | | |
| A provider of specialty paper for niche product applications. | |
| 9.75% Second Lien Term Loan due 08/31/2023 | | $ | 1,725,000 | | 09/28/16 | | | 1,691,587 | | | | 1,690,500 | |
| | | | | | | | | | | | | | |
| | | | | | | | | | | | | | |
| Eagle Family Foods, Inc. | | | | | | | | | | | | | |
| A producer of low-cost branded and private label canned milk. | |
| 10.05% Last Out Term Loan due 12/31/2021 | | $ | 1,725,000 | | 12/22/15 | | | 1,703,457 | | | | 1,717,390 | |
| | | | | | | | | | | | | | |
| | | | | | | | | | | | | | |
| ECG Consulting Group | | | | | | | | | | | | | |
| A healthcare management consulting company who provides strategic, financial, operational, and technology related consulting services to healthcare providers. | |
| 11.75% (0.75% PIK) Senior Subordinated Note due 11/21/2020 | | $ | 1,314,351 | | 11/21/14 | | | 1,292,935 | | | | 1,327,495 | |
| Limited Liability Company Unit (B)(F) | | 230 uts. | | 11/19/14 | | | 71,875 | | | | 88,980 | |
| | | | | | | | | | | | | | |
| | | | | | | | | 1,364,810 | | | | 1,416,475 | |
| | | | | | | | | | | | | | |
| | |
| Elite Sportwear Holding, LLC | |
| A designer and manufacturer of gymnastics, competitive cheerleading and swimwear apparel in the U.S. and internationally. | |
| 11.5% (1% PIK) Senior Subordinated Note due 10/13/2021 | | $ | 1,568,713 | | 10/14/16 | | | 1,542,205 | | | | 1,551,115 | |
| Limited Liability Company Unit (B)(F) | | 101 uts. | | 10/14/16 | | | 159,722 | | | | 159,726 | |
| | | | | | | | | | | | | | |
| | | | | | | | | 1,701,927 | | | | 1,710,841 | |
| | | | | | | | | | | | | | |
| | |
| ERG Holding Company LLC | |
| A provider of inpatient and outpatient clinical trial services to pharmaceutical companies and contract research organizations. | |
| 13.5% (1.5% PIK) Senior Subordinated Note due 10/04/2019 | | $ | 969,346 | | 04/04/14 | | | 958,270 | | | | 979,039 | |
| 14% (2% PIK) Senior Subordinated Note due 10/04/2019 | | $ | 254,509 | | 07/01/16 | | | 250,098 | | | | 262,144 | |
| Common Stock (B) | | 0.31% int. | | 04/04/14 | | | 77,533 | | | | 87,124 | |
| | | | | | | | | | | | | | |
| | | | | | | | | 1,285,901 | | | | 1,328,307 | |
| | | | | | | | | | | | | | |
See Notes to Consolidated Financial Statements
2016 Annual Report
CONSOLIDATED SCHEDULE OF INVESTMENTS (CONTINUED)
December 31, 2016
| | | | | | | | | | | | |
Corporate Restricted Securities: (A)
(Continued) | | | Principal Amount,
Shares, Units or
Ownership Percentage | | Acquisition
Date | | Cost | | | Fair Value | |
| | | | | | | | | | | | |
| F F C Holding Corporation | | | | | | | | | | | |
| A leading U.S. manufacturer of private label frozen novelty and ice cream products. | |
Limited Liability Company Unit
Preferred (B) | | | 171 uts. | | 09/27/10 | | $ | 58,345 | | | $ | 80,306 | |
| Limited Liability Company Unit Common (B) | | | 171 uts. | | 09/27/10 | | | 17,073 | | | | 232,843 | |
| | | | | | | | | | | | | | |
| | | | | | | | | 75,418 | | | | 313,149 | |
| | | | | | | | | | | | | | |
| | | | | | | | | | | | | | |
| F G I Equity LLC | | | | | | | | | | | | | |
| A manufacturer of a broad range of filters and related products that are used in commercial, light industrial, healthcare, gas turbine, nuclear, laboratory, clean room, hotel, educational system, and food processing settings. | |
Limited Liability Company Unit
Preferred (B) | | | 80,559 uts. | | 04/15/14 | | | — | | | | 80,559 | |
Limited Liability Company Unit
Class B-1 (B) | | | 65,789 uts. | | 12/15/10 | | | 65,789 | | | | 167,831 | |
Limited Liability Company Unit
Class B-2 (B) | | | 8,248 uts. | | 12/15/10 | | | 8,248 | | | | 21,041 | |
Limited Liability Company Unit
Class B-3 (B) | | | 6,522 uts. | | 08/30/12 | | | 15,000 | | | | 18,333 | |
Limited Liability Company Unit
Class C (B) | | | 1,575 uts. | | 12/20/10 | | | 16,009 | | | | 32,637 | |
| | | | | | | | | | | | | | |
| | | | | | | | | 105,046 | | | | 320,401 | |
| | | | | | | | | | | | | | |
| | | | | | | | | | | | | | |
| FMH Holdings Corporation | | | | | | | | | | | | | |
| A designer and manufacturer of highly engineered components for the aerospace, defense and space industries. | |
| Common Stock (B) | | | 148 shs. | | 05/01/15 | | | 148,096 | | | | 209,178 | |
| | | | | | | | | | | | | | |
| | | | | | | | | | | | | | |
| GD Dental Services LLC | | | | | | | | | | | | | |
| A provider of convenient "onestop" general, specialty, and cosmetic dental services with 21 offices located throughout South and Central Florida. | |
Limited Liability Company Unit
Preferred (B) | | | 76 uts. | | 10/05/12 | | | 75,920 | | | | 102,792 | |
Limited Liability Company Unit Common (B) | | | 767 uts. | | 10/05/12 | | | 767 | | | | 15,704 | |
| | | | | | | | | | | | | | |
| | | | | | | | | 76,687 | | | | 118,496 | |
| | | | | | | | | | | | | | |
| | | | | | | | | | | | | | |
| GenNx Novel Holding, Inc. | | | | | | | | | | | | | |
| A manufacturer and distributor of nutraceutical ingredients. | |
15% (1% PIK) Senior Subordinated Note due 03/27/2020 | | | $1,609,919 | | 03/27/14 | | | 1,589,862 | | | | 1,028,738 | |
| Common Stock (B) | | | 15,500 shs. | | 03/27/14 | | | 155,000 | | | | — | |
| | | | | | | | | | | | | | |
| | | | | | | | | 1,744,862 | | | | 1,028,738 | |
| | | | | | | | | | | | | | |
See Notes to Consolidated Financial Statements
Barings Participation Investors (formerly known as Babson Capital Participation Investors)
CONSOLIDATED SCHEDULE OF INVESTMENTS (CONTINUED)
December 31, 2016
| | | | | | | | | | | |
Corporate Restricted Securities: (A)
(Continued) | | Principal Amount,
Shares, Units or
Ownership Percentage | | Acquisition
Date | | Cost | | | Fair Value | |
| | |
| gloProfessional Holdings, Inc. | |
| A marketer and distributor of premium mineral-based cosmetics, cosmeceuticals and professional hair care products to the professional spa and physician's office channels. | |
14% (2% PIK) Senior Subordinated Note due 03/27/2019 | | $ | 1,220,021 | | 03/27/13 | | $ | 1,209,282 | | | $ | 1,220,021 | |
| Common Stock (B) | | 1,181 shs. | | 03/27/13 | | | 118,110 | | | | 122,911 | |
| | | | | | | | | | | | | | |
| | | | | | | | | 1,327,392 | | | | 1,342,932 | |
| | | | | | | | | | | | | | |
| | |
| Glynlyon Holding Companies, Inc. | |
| A technology-enabled curriculum provider of K-12 and support services predominantly to small and medium public school districts. | |
12% (1% PIK) Senior Subordinated Note due 01/05/2022 | | $ | 1,592,781 | | 01/15/16 | | | 1,564,860 | | | | 1,631,491 | |
| Common Stock (B) | | 147 shs. | | 01/15/16 | | | 147,436 | | | | 165,693 | |
| | | | | | | | | | | | | | |
| | | | | | | | | 1,712,296 | | | | 1,797,184 | |
| | | | | | | | | | | | | | |
| | |
| GlynnDevins Acquisition Corporation | |
| A marketing communications agency that services senior living facilities. | |
| Preferred Stock Series A (B) | | 342 shs. | | 06/19/15 | | | 70,683 | | | | 78,062 | |
| Common Stock (B) | | 342 shs. | | 06/19/15 | | | 2,945 | | | | 28,444 | |
| | | | | | | | | | | | | | |
| | | | | | | | | 73,628 | | | | 106,506 | |
| | | | | | | | | | | | | | |
| | |
| Grakon Parent | |
| The leading designer and manufacturer of highly-engineered and customized LED and incandescent lighting systems for transportation-based markets. | |
| Common Stock (B) | | 175 shs. | | 10/31/14 | | | 174,831 | | | | 148,841 | |
| | | | | | | | | | | | | | |
| | |
| GTI Holding Company | |
| A designer, developer, and marketer of precision specialty hand tools and handheld test instruments. | |
12% Senior Subordinated Note due 02/05/2020 | | $ | 727,865 | | 02/05/14 | | | 696,212 | | | | 712,430 | |
| Common Stock (B) | | 846 shs. | | 02/05/14 | | | 84,636 | | | | 90,272 | |
Warrant, exercisable until 2024, to purchase common stock at $.01 per share (B) | | 397 shs. | | 02/05/14 | | | 36,816 | | | | 42,362 | |
| | | | | | | | | | | | | | |
| | | | | | | | | 817,664 | | | | 845,064 | |
| | | | | | | | | | | | | | |
See Notes to Consolidated Financial Statements
2016 Annual Report
CONSOLIDATED SCHEDULE OF INVESTMENTS (CONTINUED)
December 31, 2016
| | | | | | | | | | | | | |
Corporate Restricted Securities: (A)
(Continued) | | Principal Amount,
Shares, Units or
Ownership Percentage | | | Acquisition
Date | | | Cost | | | Fair Value | |
| | |
| Handi Quilter Holding Company (Premier Needle Arts) | |
| A designer and manufacturer of long-arm quilting machines and related components for the consumer quilting market. | |
12% (1% PIK) Senior Subordinated Note due 06/19/2021 | | $ | 1,437,500 | | | 12/19/14 | | | $ | 1,415,428 | | | $ | 1,459,840 | |
Limited Liability Company Unit Preferred (B) | | 359 uts. | | | | * | | | | 359,375 | | | | 324,132 | |
Limited Liability Company Unit Common Class A (B) | | 3,594 uts. | | | 12/19/14 | | | | — | | | | — | |
| | | | | | | | | | | | | | | | | |
| * 12/19/14 and 04/29/16. | | | | | | | | | | | 1,774,803 | | | | 1,783,972 | |
| | | | | | | | | | | | | | | | | |
| | |
| Happy Floors Acquisition, Inc. | |
| A wholesale importer and value-added distributor of premium European flooring tile to residential and commercial end markets. | |
12.5% (1% PIK) Senior Subordinated Note due 07/01/2022 | | $ | 1,583,387 | | | 07/01/16 | | | | 1,554,519 | | | | 1,592,682 | |
| Common Stock (B) | | 150 shs. | | | 07/01/16 | | | | 149,500 | | | | 132,063 | |
| | | | | | | | | | | | | | | | | |
| | | | | | | | | | | | 1,704,019 | | | | 1,724,745 | |
| | | | | | | | | | | | | | | | | |
| | |
| Hartland Controls Holding Corporation | |
| A manufacturer and distributor of electronic and electromechanical components. | |
14% (2% PIK) Senior Subordinated Note due 08/14/2019 | | $ | 1,106,379 | | | 02/14/14 | | | | 1,093,856 | | | | 1,117,443 | |
12% Senior Subordinated Note due 08/14/2019 | | $ | 431,250 | | | 06/22/15 | | | | 428,306 | | | | 439,875 | |
| Preferred Stock Series A (B) | | 1,140 shs. | | | 02/14/14 | | | | 114,011 | | | | 129,337 | |
| Common Stock (B) | | 821 shs. | | | 02/14/14 | | | | 822 | | | | 267,857 | |
| | | | | | | | | | | | | | | | | |
| | | | | | | | | | | | 1,636,995 | | | | 1,954,512 | |
| | | | | | | | | | | | | | | | | |
| | |
| Healthcare Direct Holding Company | |
| A direct-to-customer marketer of discount dental plans. | |
| Common Stock (B) | | 517 shs. | | | 03/09/12 | | | | 21,419 | | | | 84,602 | |
| | | | | | | | | | | | | | | | | |
| | | | | | | | | | | | | | | | | |
| HHI Group, LLC | | | | | | | | | | | | | | | | |
| A developer, marketer, and distributor of hobby-grade radio control products. | |
14% (2% PIK) Senior Subordinated Note due 01/17/2020 | | $ | 1,714,377 | | | 01/17/14 | | | | 1,696,404 | | | | 942,907 | |
| Limited Liability Company Unit (B)(F) | | 102 uts. | | | 01/17/14 | | | | 101,563 | | | | — | |
| | | | | | | | | | | | | | | | | |
| | | | | | | | | | | | 1,797,967 | | | | 942,907 | |
| | | | | | | | | | | | | | | | | |
See Notes to Consolidated Financial Statements
Barings Participation Investors (formerly known as Babson Capital Participation Investors)
CONSOLIDATED SCHEDULE OF INVESTMENTS (CONTINUED)
December 31, 2016
| | | | | | | | | | | | | |
Corporate Restricted Securities: (A)
(Continued) | | Principal Amount,
Shares, Units or
Ownership Percentage | | | Acquisition
Date | | | Cost | | | Fair Value | |
| | |
| Hollandia Produce LLC | |
| A hydroponic greenhouse producer of branded root vegetables. | |
14.25% (2.75% PIK) Senior Subordinated Note due 12/11/2020 | | $ | 1,355,622 | | | | * | | | $ | 1,333,186 | | | $ | 1,292,672 | |
| | | | | | | | | | | | | | | | | |
| * 12/30/15 and 12/23/16 | | | | | | | | | | | | | | | | |
| | |
| | |
| HOP Entertainment LLC | |
| A provider of post production equipment and services to producers of television shows and motion pictures. | |
Limited Liability Company Unit
Class F (B)(F) | | 47 uts. | | | 10/14/11 | | | | — | | | | — | |
Limited Liability Company Unit
Class G (B)(F) | | 114 uts. | | | 10/14/11 | | | | — | | | | — | |
Limited Liability Company Unit
Class H (B)(F) | | 47 uts. | | | 10/14/11 | | | | — | | | | — | |
Limited Liability Company Unit
Class I (B)(F) | | 47 uts. | | | 10/14/11 | | | | — | | | | — | |
| | | | | | | | | | | | | | | | | |
| | | | | | | | | | | | — | | | | — | |
| | |
| | |
| Hospitality Mints Holding Company | |
| A manufacturer of individually-wrapped imprinted promotional mints. | |
12% Senior Subordinated Note due 10/01/2018 | | $ | 1,098,837 | | | 08/19/08 | | | | 1,094,933 | | | | 1,029,240 | |
| Common Stock (B) | | 251 shs. | | | 08/19/08 | | | | 251,163 | | | | 20,012 | |
Warrant, exercisable until 2018, to purchase common stock at $.01 per share (B) | | 65 shs. | | | 08/19/08 | | | | 60,233 | | | | 5,173 | |
| | | | | | | | | | | | | | | | | |
| | | | | | | | | | | | 1,406,329 | | | | 1,054,425 | |
| | | | | | | | | | | | | | | | | |
| | |
| HVAC Holdings, Inc. | |
| A provider of integrated energy efficiency services and maintenance programs for HVAC systems. | |
12% (1% PIK) Senior Subordinated Note due 07/19/2022 | | $ | 1,128,821 | | | | * | | | | 1,116,749 | | | | 1,130,185 | |
Limited Liability Company Unit Class A Preferred (B) | | 1,127 uts. | | | 09/27/12 | | | | 112,726 | | | | 169,495 | |
Limited Liability Company Unit Class A Common (B) | | 910 uts. | | | 09/27/12 | | | | 910 | | | | 92,165 | |
| | | | | | | | | | | | | | | | | |
| * 7/19/16 and 9/6/16 | | | | | | | | | | | 1,230,385 | | | | 1,391,845 | |
| | | | | | | | | | | | | | | | | |
| | |
| Ideal Tridon Holdings, Inc. | |
| A designer and manufacturer of clamps and couplings used in automotive and industrial end markets. | |
| Common Stock | | 93 shs. | | | 10/27/11 | | | | 77,462 | | | | 173,292 | |
| | | | | | | | | | | | | | | | | |
See Notes to Consolidated Financial Statements
2016 Annual Report
CONSOLIDATED SCHEDULE OF INVESTMENTS (CONTINUED)
December 31, 2016
| | | | | | | | | | | |
Corporate Restricted Securities: (A)
(Continued) | | Principal Amount,
Shares, Units or
Ownership Percentage | | Acquisition
Date | | Cost | | | Fair Value | |
| | |
| Impact Confections | |
An independent manufacturer and marketer of confectionery products including Warheads® brand sour candies, Melster® brand classic candies, and co-manufactured/private label classic candies. | |
13% (1% PIK) Senior Subordinated Note due 11/10/2020 | | $ | 1,086,749 | | 11/10/14 | | $ | 1,071,229 | | | $ | 1,080,905 | |
| Common Stock (B) | | 2,300 shs. | | 11/10/14 | | | 230,000 | | | | 208,926 | |
| | | | | | | | | | | | | | |
| | | | | | | | | 1,301,229 | | | | 1,289,831 | |
| | | | | | | | | | | | | | |
| | |
| Insurance Claims Management, Inc. | |
| A third party administrator providing auto and property claim administration services for insurance companies. | |
| Common Stock (B) | | 47 shs. | | 02/27/07 | | | 1,424 | | | | 142,344 | |
| | | | | | | | | | | | | | |
| | |
| Janus Group Holdings LLC | |
| A manufacturer of roll-up doors and hallway systems that are primarily used in self-storage facilities. | |
13.5% (1.5% PIK) Senior Subordinated Note due 06/10/2019 | | $ | 577,581 | | 12/11/13 | | | 571,372 | | | | 577,581 | |
Limited Liability Company Unit
Class A (B)(F) | | 283 uts. | | 12/11/13 | | | 379,581 | | | | 1,556,776 | |
| | | | | | | | | | | | | | |
| | | | | | | | | 950,953 | | | | 2,134,357 | |
| | | | | | | | | | | | | | |
| | |
| JMH Investors LLC | |
| A developer and manufacturer of custom formulations for a wide variety of foods. | |
| Limited Liability Company Unit (B)(F) | | 1,038,805 uts. | | 12/05/12 | | | 232,207 | | | | — | |
Limited Liability Company Unit
Class A-1 (B)(F) | | 163,043 uts. | | 10/31/16 | | | 163,043 | | | | 163,043 | |
Limited Liability Company Unit
Class A-2 (B)(F) | | 1,032,609 uts. | | 10/31/16 | | | — | | | | — | |
| | | | | | | | | | | | | | |
| | | | | | | | | 395,250 | | | | 163,043 | |
| | | | | | | | | | | | | | |
| | | | | | | | | | | | | | |
| K N B Holdings Corporation | | | | | | | | | | | | | |
| A designer, manufacturer and marketer of products for the custom framing market. | |
| Common Stock (B) | | 71,053 shs. | | 05/24/06 | | | 71,053 | | | | 87,415 | |
Warrant, exercisable until 2018, to purchase common stock at $.01 per share (B) | | 43,600 shs. | | 05/25/06 | | | 37,871 | | | | 53,640 | |
| | | | | | | | | | | | | | |
| | | | | | | | | 108,924 | | | | 141,055 | |
| | | | | | | | | | | | | | |
| | | | | | | | | | | | | | |
| K P I Holdings, Inc. | | | | | | | | | | | | | |
| The largest player in the U.S. non-automotive, non-ferrous die casting segment. | |
Limited Liability Company Unit Class C Preferred (B) | | 40 uts. | | 06/30/15 | | | — | | | | 77,840 | |
| Common Stock (B) | | 353 shs. | | 07/15/08 | | | 285,619 | | | | 216,200 | |
| | | | | | | | | | | | | | |
| | | | | | | | | 285,619 | | | | 294,040 | |
| | | | | | | | | | | | | | |
See Notes to Consolidated Financial Statements
Barings Participation Investors (formerly known as Babson Capital Participation Investors)
CONSOLIDATED SCHEDULE OF INVESTMENTS (CONTINUED)
December 31, 2016
| | | | | | | | | | | | | |
Corporate Restricted Securities: (A)
(Continued) | | Principal Amount,
Shares, Units or
Ownership Percentage | | | Acquisition
Date | | | Cost | | | Fair Value | |
| | | | | | | | | | | | | |
| Kyjen Company | | | | | | | | | | | | |
| A designer and distributor of branded and private label dog toys and accessories primarily in the US. | |
13% (1% PIK) Senior Subordinated Note due 10/14/2021 | | $ | 1,309,495 | | | 10/14/15 | | | $ | 1,287,347 | | | $ | 1,328,589 | |
| | | | | | | | | | | | | | | | |
| | |
| Mail Communications Group, Inc. | |
| A provider of mail processing and handling services, lettershop services, and commercial printing services. | |
| Limited Liability Company Unit | | 12,764 uts. | | | | * | | | | 166,481 | | | | 191,885 | |
Warrant, exercisable until 2017, to purchase common stock at $.01 per share (B)(F) | | 1,787 shs. | | | 05/04/07 | | | | 22,781 | | | | 26,866 | |
| | | | | | | | | | | | | | | | | |
| * 05/04/07 and 01/02/08. | | | | | | | | | | | 189,262 | | | | 218,751 | |
| | | | | | | | | | | | | | | | | |
| | |
| Manhattan Beachwear Holding Company | |
| A designer and distributor of women's swimwear. | |
12.5% Senior Subordinated Note due 01/15/2018 (D) | | $ | 419,971 | | | 01/15/10 | | | | 404,121 | | | | — | |
15% (2.5% PIK) Senior Subordinated Note due 01/15/2018 (D) | | $ | 115,253 | | | 10/05/10 | | | | 114,604 | | | | — | |
| Common Stock (B) | | 35 shs. | | | 10/05/10 | | | | 35,400 | | | | — | |
| Common Stock Class B (B) | | 118 shs. | | | 01/15/10 | | | | 117,647 | | | | — | |
Warrant, exercisable until 2019, to purchase common stock at $.01 per share (B) | | 104 shs. | | | 10/05/10 | | | | 94,579 | | | | — | |
| | | | | | | | | | | | | | | | | |
| | | | | | | | | | | | 766,351 | | | | — | |
| | | | | | | | | | | | | | | | | |
| | | | | | | | | | | | | | | | | |
| Master Cutlery LLC | | | | | | | | | | | | | | | | |
| A designer and marketer of a wide assortment of knives and swords. | |
13% Senior Subordinated Note due 04/17/2020 | | $ | 872,543 | | | 04/17/15 | | | | 865,307 | | | | 820,770 | |
| Limited Liability Company Unit | | 5 uts. | | | 04/17/15 | | | | 678,329 | | | | 183,327 | |
| | | | | | | | | | | | | | | | | |
| | | | | | | | | | | | 1,543,636 | | | | 1,004,097 | |
| | | | | | | | | | | | | | | | | |
| | | | | | | | | | | | | | | | | |
| MC Sign Holdings LLC | | | | | | | | | | | | | | | | |
| A provider of sign and lighting services nationwide. | |
11.75% (0.75% PIK) Senior Subordinated Note due 09/15/2021 | | $ | 768,305 | | | 09/22/15 | | | | 755,493 | | | | 775,988 | |
| Limited Liability Company Unit Class B (B) | | 101,500 uts. | | | 09/22/15 | | | | 101,500 | | | | 175,057 | |
| | | | | | | | | | | | | | | | | |
| | | | | | | | | | | | 856,993 | | | | 951,045 | |
| | | | | | | | | | | | | | | | | |
See Notes to Consolidated Financial Statements
2016 Annual Report
CONSOLIDATED SCHEDULE OF INVESTMENTS (CONTINUED)
December 31, 2016
| | | | | | | | | | | |
Corporate Restricted Securities: (A)
(Continued) | | Principal Amount,
Shares, Units or
Ownership Percentage | | Acquisition
Date | | Cost | | | Fair Value | |
| | | | | | | | | | | |
| Merex Holding Corporation | | | | | | | | | | |
| A provider of after-market spare parts and components, as well as maintenance, repair and overhaul services for "out of production" or "legacy" aerospace and defense systems that are no longer effectively supported by the original equipment manufacturers. | |
16% Senior Subordinated Note due 10/30/2019 (D) | | $ | 454,295 | | 09/22/11 | | $ | 449,013 | | | $ | 340,721 | |
15% PIK Senior Subordinated Note due 04/30/2022 (D) | | $ | 23,839 | | 08/18/15 | | | 23,839 | | | | — | |
14% PIK Senior Subordinated Note due 06/30/2019 | | $ | 31,492 | | 10/21/16 | | | 31,492 | | | | 31,245 | |
| Common Stock Class A (B) | | 77,118 shs. | | 08/18/15 | | | 170,705 | | | | — | |
| | | | | | | | | | | | | | |
| | | | | | | | | 675,049 | | | | 371,966 | |
| | | | | | | | | | | | | | |
| | | | | | | | | | | | | | |
| MES Partners, Inc. | | | | | | | | | | | | | |
| An industrial service business offering an array of cleaning and environmental services to the Gulf Coast region of the U.S. | |
12% (1% PIK) Senior Subordinated Note due 09/30/2021 | | $ | 1,106,636 | | 09/30/14 | | | 1,090,069 | | | | 1,078,937 | |
| Common Stock Class B (B) | | 219,545 shs. | | 09/30/14 | | | 219,545 | | | | 90,843 | |
| | | | | | | | | | | | | | |
| | | | | | | | | 1,309,614 | | | | 1,169,780 | |
| | | | | | | | | | | | | | |
| | |
| Midwest Industrial Rubber, Inc. | |
| A supplier of industrial maintenance, repair, and operations ("MRO") products, specializing in the fabrication and distribution of lightweight conveyor belting and related conveyor components and accessories. | |
12% (1% PIK) Senior Subordinated Note due 12/02/2022 | | $ | 1,554,894 | | 12/02/16 | | | 1,524,112 | | | | 1,561,434 | |
| Preferred Stock (B) | | 1,711 shs. | | 12/02/16 | | | 171,116 | | | | 171,116 | |
| Common Stock (B) | | 242 shs. | | 12/02/16 | | | 242 | | | | 242 | |
| | | | | | | | | | | | | | |
| | | | | | | | | 1,695,470 | | | | 1,732,792 | |
| | | | | | | | | | | | | | |
| | | | | | | | | | | | | | |
| MNX Holding Company | | | | | | | | | | | | | |
| An international third party logistics company providing customized logistics services to customers across the globe. | |
14% (2% PIK) Senior Subordinated Note due 11/02/2019 | | $ | 1,309,766 | | 11/02/12 | | | 1,297,100 | | | | 1,309,766 | |
| Common Stock (B) | | 45 shs. | | 11/02/12 | | | 44,643 | | | | 34,163 | |
| | | | | | | | | | | | | | |
| | | | | | | | | 1,341,743 | | | | 1,343,929 | |
| | | | | | | | | | | | | | |
See Notes to Consolidated Financial Statements
Barings Participation Investors (formerly known as Babson Capital Participation Investors)
CONSOLIDATED SCHEDULE OF INVESTMENTS (CONTINUED)
December 31, 2016
| | | | | | | | | | | | | |
Corporate Restricted Securities: (A)
(Continued) | | Principal Amount,
Shares, Units or
Ownership Percentage | | | Acquisition
Date | | | Cost | | | Fair Value | |
| | | | | | | | | | | | | |
| Money Mailer Equity LLC | | | | | | | | | | | | |
| A leading provider of hyperlocal shared direct mail advertising as well as interactive and online advertising solutions through its nationwide production and distribution network. | |
12% (1% PIK) Senior Subordinated Note due 10/29/2021 | | $ | 1,735,179 | | | 04/29/16 | | | $ | 1,704,360 | | | $ | 1,702,229 | |
| | | | | | | | | | | | | | | | |
| | |
| Motion Controls Holdings | |
| A manufacturer of high performance mechanical motion control and linkage products. | |
14.25% (1.75% PIK) Senior Subordinated Note due 08/15/2020 | | $ | 1,009,479 | | | 11/30/10 | | | | 1,002,523 | | | | 1,009,479 | |
Limited Liability Company Unit
Class B-1 (B)(F) | | 75,000 uts. | | | 11/30/10 | | | | — | | | | 47,619 | |
Limited Liability Company Unit
Class B-2 (B)(F) | | 6,801 uts. | | | 11/30/10 | | | | — | | | | 4,318 | |
| | | | | | | | | | | | | | | | |
| | | | | | | | | | | 1,002,523 | | | | 1,061,416 | |
| | | | | | | | | | | | | | | | |
| | |
| NetShape Technologies, Inc. | |
| A manufacturer of powder metal and metal injection molded precision components used in industrial, consumer, and other applications. | |
12% Senior Subordinated Note due 06/10/2020 (D) | | $ | 810,000 | | | 02/02/07 | | | | 809,408 | | | | — | |
| Limited Partnership Interest of Saw Mill PCG Partners LLC (B) | | 1.46% int. | | | 02/01/07 | | | | 588,077 | | | | — | |
Limited Liability Company Unit Class D of Saw Mill PCG Partners LLC (B) | | 9 uts. | | | | * | | | | 8,873 | | | | — | |
Limited Liability Company Unit Class D-1 of Saw Mill PCG Partners LLC (B) | | 121 uts. | | | 09/30/09 | | | | 121,160 | | | | — | |
Limited Liability Company Unit Class D-2 of Saw Mill PCG Partners LLC (B) | | 68 uts. | | | 04/29/11 | | | | 34,547 | | | | — | |
Limited Liability Company Unit Class D-3 of Saw Mill PCG Partners LLC (B) | | 104 uts. | | | 12/10/14 | | | | 103,904 | | | | — | |
| | | | | | | | | | | | | | | | | |
| * 12/18/08 and 09/30/09. | | | | | | | | | | | 1,665,969 | | | | — | |
| | | | | | | | | | | | | | | | | |
| | |
| NSi Industries Holdings, Inc. | |
| A manufacturer and distributor of electrical components and accessories to small to mid-sized electrical wholesalers. | |
12.75% (1.75% PIK) Senior Subordinated Note due 05/17/2023 | | $ | 1,527,814 | | | 06/30/16 | | | | 1,500,242 | | | | 1,533,103 | |
| Common Stock (B) | | 207 shs. | | | 05/17/16 | | | | 207,000 | | | | 250,814 | |
| | | | | | | | | | | | | | | | | |
| | | | | | | | | | | | 1,707,242 | | | | 1,783,917 | |
| | | | | | | | | | | | | | | | | |
See Notes to Consolidated Financial Statements
2016 Annual Report
CONSOLIDATED SCHEDULE OF INVESTMENTS (CONTINUED)
December 31, 2016
| | | | | | | | | | | | | |
Corporate Restricted Securities: (A)
(Continued) | | Principal Amount,
Shares, Units or
Ownership Percentage | | | Acquisition
Date | | | Cost | | | Fair Value | |
| | |
| O E C Holding Corporation | |
| A provider of elevator maintenance, repair and modernization services. | |
| Preferred Stock Series A (B) | | 554 shs. | | | 06/04/10 | | | $ | 55,354 | | | $ | 71,791 | |
| Preferred Stock Series B (B) | | 311 shs. | | | 06/04/10 | | | | 31,125 | | | | 55,532 | |
| Common Stock (B) | | 344 shs. | | | 06/04/10 | | | | 344 | | | | 69,811 | |
| | | | | | | | | | | | | | | |
| | | | | | | | | | 86,823 | | | | 197,134 | |
| | | | | | | | | | | | | | | |
| | |
| PANOS Brands LLC | |
| A marketer and distributor of branded consumer foods in the specialty, natural, better-for-you, "free from" healthy and gluten-free categories. | |
12% (1% PIK) Senior Subordinated Note due 07/29/2021 | | $ | 1,449,000 | | | 01/29/16 | | | | 1,423,626 | | | | 1,484,300 | |
| Common Stock Class A (B) | | 276,000 shs. | | | 01/29/16 | | | | 276,000 | | | | 323,388 | |
| | | | | | | | | | | | | | | | |
| | | | | | | | | | | 1,699,626 | | | | 1,807,688 | |
| | | | | | | | | | | | | | | | |
| | |
| Pearlman Enterprises, Inc. | |
| A developer and distributor of tools, equipment and supplies to the natural and engineered stone industry. | |
| Preferred Stock Series A (B) | | 1,236 shs. | | | 05/22/09 | | | | 59,034 | | | | 1,235,800 | |
| Preferred Stock Series B (B) | | 7,059 shs. | | | 05/22/09 | | | | 290,050 | | | | 243,168 | |
| Common Stock (B) | | 21,462 shs. | | | 05/22/09 | | | | 993,816 | | | | — | |
| | | | | | | | | | | | | | | | |
| | | | | | | | | | | 1,342,900 | | | | 1,478,968 | |
| | | | | | | | | | | | | | | | |
| | |
| Petroplex Inv Holdings LLC | |
| A leading provider of acidizing services to E&P customers in the Permian Basin. | |
| Limited Liability Company | | 0.40% int. | | | | * | | | | 175,339 | | | | 19,089 | |
| | | | | | | | | | | | | | | | | |
| * 11/29/12 and 12/20/16 | | | | | | | | | | | | | | | | |
| | | | | | | | | | | | | | | | | |
| | |
| Polytex Holdings LLC | |
| A manufacturer of water based inks and related products serving primarily the wall covering market. | |
13% (1% PIK) Senior Subordinated Note due 01/31/2020 | | $ | 1,062,000 | | | 07/31/14 | | | | 1,048,573 | | | | 1,036,310 | |
| Limited Liability Company Unit | | 148,096 uts. | | | 07/31/14 | | | | 148,096 | | | | 48,102 | |
| | | | | | | | | | | | | | | | | |
| | | | | | | | | | | | 1,196,669 | | | | 1,084,412 | |
| | | | | | | | | | | | | | | | | |
| | |
| Power Stop Holdings LLC | |
| A supplier of performance upgrade aftermarket brake products. | |
11% Senior Subordinated Note due 05/29/2022 | | $ | 1,610,100 | | | 05/29/15 | | | | 1,584,654 | | | | 1,642,302 | |
Limited Liability Company Unit Preferred (B)(F) | | 1,149 uts. | | | 05/29/15 | | | | 114,900 | | | | 131,223 | |
Limited Liability Company Unit Common (B)(F) | | 1,149 uts. | | | 05/29/15 | | | | — | | | | 79,165 | |
| | | | | | | | | | | | | | | | | |
| | | | | | | | | | | | 1,699,554 | | | | 1,852,690 | |
| | | | | | | | | | | | | | | | | |
See Notes to Consolidated Financial Statements
Barings Participation Investors (formerly known as Babson Capital Participation Investors)
CONSOLIDATED SCHEDULE OF INVESTMENTS (CONTINUED)
December 31, 2016
| | | | | | | | | | | |
Corporate Restricted Securities: (A)
(Continued) | | Principal Amount,
Shares, Units or
Ownership Percentage | | Acquisition
Date | | Cost | | | Fair Value | |
| | |
| PPC Event Services | |
| A special event equipment rental business. | |
14% (2% PIK) Senior Subordinated Note due 05/20/2020 | | $ | 1,166,893 | | 11/20/14 | | $ | 1,151,233 | | | $ | 1,166,893 | |
| Limited Liability Company Unit (B) | | 3,450 uts. | | 11/20/14 | | | 172,500 | | | | 471,636 | |
Limited Liability Company Unit Series A-1 (B) | | 339 uts. | | 03/16/16 | | | 42,419 | | | | 53,747 | |
| | | | | | | | | | | | | | |
| | | | | | | | | 1,366,152 | | | | 1,692,276 | |
| | | | | | | | | | | | | | |
| | |
| Randy's Worldwide Automotive | |
| A designer and distributor of automotive aftermarket parts. | |
11.5% Senior Subordinated Note due 05/12/2021 | | $ | 1,135,898 | | 05/12/15 | | | 1,119,043 | | | | 1,158,616 | |
| Common Stock (B) | | 118 shs. | | 05/12/15 | | | 118,476 | | | | 179,520 | |
| | | | | | | | | | | | | | |
| | | | | | | | | 1,237,519 | | | | 1,338,136 | |
| | | | | | | | | | | | | | |
| | |
| Safety Infrastructure Solutions | |
| A provider of trench safety equipment to a diverse customer base across multiple end markets in Texas and the Southwestern United States. | |
| Preferred Stock (B) | | 2,098 shs. | | 03/30/12 | | | 83,920 | | | | 126,487 | |
| Common Stock (B) | | 983 shs. | | 03/30/12 | | | 9,830 | | | | 193,855 | |
| | | | | | | | | | | | | | |
| | | | | | | | | 93,750 | | | | 320,342 | |
| | | | | | | | | | | | | | |
| | |
| Signature Systems Holding Company | |
| A seller and installer of a variety of modular surfaces, industrial matting and related products used for ground protection. | |
| Common Stock (B) | | 76 shs. | | 03/15/13 | | | 75,509 | | | | 34,749 | |
Warrant, exercisable until 2023, to purchase common stock A at $.01 per share (B) | | 31 shs. | | 03/15/13 | | | 28,316 | | | | 14,197 | |
| | | | | | | | | | | | | | |
| | | | | | | | | 103,825 | | | | 48,946 | |
| | | | | | | | | | | | | | |
| | |
| Smart Source Holdings LLC | |
| A short-term computer rental company. | |
| Limited Liability Company Unit (B) | | 328 uts. | | * | | | 261,262 | | | | 415,349 | |
Warrant, exercisable until 2020, to purchase common stock at $.01 per share (B) | | 83 shs. | | * | | | 67,467 | | | | 105,208 | |
| | | | | | | | | | | | | | |
| * 08/31/07 and 03/06/08. | | | | | | | | 328,729 | | | | 520,557 | |
| | | | | | | | | | | | | | |
See Notes to Consolidated Financial Statements
2016 Annual Report
CONSOLIDATED SCHEDULE OF INVESTMENTS (CONTINUED)
December 31, 2016
| | | | | | | | | | | | | |
Corporate Restricted Securities: (A)
(Continued) | | Principal Amount,
Shares, Units or
Ownership Percentage | | | Acquisition
Date | | | Cost | | | Fair Value | |
| | |
| SMB Machinery Holdings, Inc. | |
| A reseller of used, rebuilt and refurbished packaging and processing equipment, primarily serving the bottling and food manufacturing industries. | |
14% (2% PIK) Senior Subordinated Note due 10/18/2019 (D) | | $ | 738,694 | | | 10/18/13 | | | $ | 726,147 | | | $ | — | |
| Common Stock (B) | | 841 shs. | | | 10/18/13 | | | | 84,100 | | | | — | |
| | | | | | | | | | | | | | | | |
| | | | | | | | | | | 810,247 | | | | — | |
| | | | | | | | | | | | | | | | |
| | |
| Software Paradigms International Group, LLC | |
| An outsourced IT services provider focused on the retail industry. | |
12.5% (1.5% PIK) Senior Subordinated Note due 11/23/2021 | | $ | 1,725,000 | | | 05/23/16 | | | | 1,693,237 | | | | 1,728,129 | |
| | | | | | | | | | | | | | | | |
| | | | | | | | | | | | | | | | |
| Strahman Holdings Inc | | | | | | | | | | | | | | | |
| A manufacturer of industrial valves and wash down equipment for a variety of industries, including chemical, petrochemical, polymer, pharmaceutical, food processing, beverage and mining. | |
14% (2% PIK) Senior Subordinated Note due 06/13/2019 | | $ | 1,059,783 | | | 12/13/13 | | | | 1,045,337 | | | | 1,042,835 | |
| Preferred Stock Series A (B) | | 158,967 shs. | | | 12/13/13 | | | | 158,967 | | | | 135,122 | |
| Preferred Stock Series A-2 (B) | | 26,543 shs. | | | 09/10/15 | | | | 29,994 | | | | 22,562 | |
| | | | | | | | | | | | | | | | |
| | | | | | | | | | | 1,234,298 | | | | 1,200,519 | |
| | | | | | | | | | | | | | | | |
| | |
| Sunrise Windows Holding Company | |
| A manufacturer and marketer of premium vinyl windows exclusively selling to the residential remodeling and replacement market. | |
16% Senior Subordinated Note due 12/14/2017 (D) | | $ | 1,372,356 | | | | * | | | | 1,358,229 | | | | 960,649 | |
| Common Stock (B) | | 38 shs. | | | 12/14/10 | | | | 38,168 | | | | — | |
Warrant, exercisable until 2020, to purchase common stock at $.01 per share (B) | | 37 shs. | | | 12/14/10 | | | | 37,249 | | | | — | |
| | | | | | | | | | | | | | | | | |
| * 12/14/10, 08/17/12 and 03/31/16. | | | | | | | | | | | 1,433,646 | | | | 960,649 | |
| | | | | | | | | | | | | | | | | |
| | |
| Sunvair Aerospace Group Inc. | |
| An aerospace maintenance, repair, and overhaul provider servicing landing gears on narrow body aircraft. | |
12% (1% PIK) Senior Subordinated Note due 07/31/2021 | | $ | 1,218,639 | | | 07/31/15 | | | | 1,199,559 | | | | 1,191,831 | |
| Common Stock (B) | | 68 shs. | | | 07/31/15 | | | | 78,150 | | | | 37,434 | |
| | | | | | | | | | | | | | | | | |
| | | | | | | | | | | | 1,277,709 | | | | 1,229,265 | |
| | | | | | | | | | | | | | | | | |
See Notes to Consolidated Financial Statements
Barings Participation Investors (formerly known as Babson Capital Participation Investors)
CONSOLIDATED SCHEDULE OF INVESTMENTS (CONTINUED)
December 31, 2016
| | | | | | | | | | | |
Corporate Restricted Securities: (A)
(Continued) | | Principal Amount,
Shares, Units or
Ownership Percentage | | Acquisition
Date | | Cost | | | Fair Value | |
| | |
| Team Drive-Away Holdings LLC | |
| An asset-light provider of over the road driveaway services for class 8 trucks and specialized equipment. | |
12.5% (1.5% PIK) Senior Subordinated Note due 04/15/2021 | | $ | 766,700 | | 10/15/15 | | $ | 753,889 | | | $ | 778,127 | |
| Limited Liability Company Unit (B) | | 95,800 uts. | | 10/15/15 | | | 95,800 | | | | 107,392 | |
| | | | | | | | | | | | | | |
| | | | | | | | | 849,689 | | | | 885,519 | |
| | | | | | | | | | | | | | |
| | |
| Torrent Group Holdings, Inc. | |
| A contractor specializing in the sales and installation of engineered drywells for the retention and filtration of stormwater and nuisance water flow. | |
15% (7.5% PIK) Senior Subordinated Note due 12/05/2020 (D) | | $ | 67,125 | | 12/05/13 | | | 219,203 | | | | 67,125 | |
Warrant, exercisable until 2023, to purchase common stock at $.01 per share (B) | | 28,079 shs. | | 12/05/13 | | | — | | | | 11,512 | |
| | | | | | | | | | | | | | |
| | | | | | | | | 219,203 | | | | 78,637 | |
| | | | | | | | | | | | | | |
| | | | | | | | | | | | | | |
| Tranzonic Holdings LLC | | | | | | | | | | | | | |
| A producer of commercial and industrial supplies, such as safety products, janitorial supplies, work apparel, washroom and restroom supplies and sanitary care products. | |
Limited Liability Company Unit Preferred Class A (B) | | 147,727 shs. | | 07/05/13 | | | 147,727 | | | | 218,582 | |
| | | | | | | | | | | | | | |
| | |
| Tristar Global Energy Solutions, Inc. | |
| A hydrocarbon and decontamination services provider serving refineries worldwide. | |
12.5% (1.5% PIK) Senior Subordinated Note due 07/31/2020 | | $ | 1,143,391 | | 01/23/15 | | | 1,127,539 | | | | 1,166,258 | |
| | | | | | | | | | | | | | |
| | | | | | | | | | | | | | |
| Veritext Corporation | | | | | | | | | | | | | |
| A provider of stenographic staffing and other services used during the legal deposition process. | |
10.75% Second Lien Term Loan due 01/29/2023 | | $ | 1,725,000 | | 01/21/16 | | | 1,695,060 | | | | 1,725,000 | |
| | | | | | | | | | | | | | |
| | | | | | | | | | | | | | |
| VP Holding Company | | | | | | | | | | | | | |
| A provider of school transportation services for special-needs and homeless children in Massachusetts. | |
| Common Stock (B) | | 3,632 shs. | | 03/31/14 | | | 363,158 | | | | 401,147 | |
| | | | | | | | | | | | | | |
See Notes to Consolidated Financial Statements
2016 Annual Report
CONSOLIDATED SCHEDULE OF INVESTMENTS (CONTINUED)
December 31, 2016
| | | | | | | | | | | |
Corporate Restricted Securities: (A)
(Continued) | | Principal Amount,
Shares, Units or
Ownership Percentage | | Acquisition
Date | | Cost | | | Fair Value | |
| | |
| Wellborn Forest Holding Company | |
| A manufacturer of semi-custom kitchen and bath cabinetry. | |
8% Senior Subordinated Note due 09/30/2017 (D) | | $ | 1,680,931 | | 11/30/06 | | $ | 867,531 | | | $ | 1,512,838 | |
| Common Stock) (B) | | 101 shs. | | 11/30/06 | | | 101,250 | | | | — | |
Warrant, exercisable until 2017, to purchase common stock at $.01 per share (B) | | 51 shs. | | 11/30/06 | | | 45,790 | | | | — | |
| | | | | | | | | | | | | | |
| | | | | | | | | 1,014,571 | | | | 1,512,838 | |
| | | | | | | | | | | | | | |
| | |
| Westminster Acquisition LLC | |
| A manufacturer of premium, all-natural oyster cracker products sold under the Westminster and Olde Cape Cod brands. | |
12% (1% PIK) Senior Subordinated Note due 02/03/2021 | | $ | 375,486 | | 08/03/15 | | | 369,829 | | | | 378,985 | |
| Limited Liability Company Unit (B)(F) | | 370,241 uts. | | 08/03/15 | | | 370,241 | | | | 456,225 | |
| | | | | | | | | | | | | | |
| | | | | | | | | 740,070 | | | | 835,210 | |
| | | | | | | | | | | | | | |
| | | | | | | | | | | | | | |
| Whitcraft Holdings, Inc. | | | | | | | | | | | | | |
| A leading independent manufacturer of precision formed, machined, and fabricated flight-critical aerospace components. | |
| Common Stock (B) | | 205 shs. | | 12/16/10 | | | 205,480 | | | | 292,372 | |
Warrant, exercisable until 2018, to purchase common stock at $.01 per share (B) | | 55 shs. | | 12/16/10 | | | 49,334 | | | | 78,571 | |
| | | | | | | | | | | | | | |
| | | | | | | | | 254,814 | | | | 370,943 | |
| | | | | | | | | | | | | | |
| | | | | | | | | | | | | | |
| Wolf-Gordon, Inc. | | | | | | | | | | | | | |
| A designer and specialty distributor of wallcoverings and related building products, including textiles, paint, and writeable surfaces. | |
12.5% (1.5% PIK) Senior Subordinated Note due 07/22/2021 | | $ | 1,590,450 | | 01/22/16 | | | 1,563,022 | | | | 1,616,394 | |
| Common Stock (B) | | 157 shs. | | 01/22/16 | | | 156,818 | | | | 172,197 | |
| | | | | | | | | | | | | | |
| | | | | | | | | 1,719,840 | | | | 1,788,591 | |
| | | | | | | | | | | | | | |
| | |
| WP Supply Holding Corporation | |
| A distributor of fresh fruits and vegetables to grocery wholesalers and foodservice distributors in the upper Midwest. | |
14.5% (2.5% PIK) Senior Subordinated Note due 06/12/2020 | | $ | 966,680 | | 11/03/11 | | | 960,404 | | | | 966,680 | |
| Common Stock (B) | | 1,500 shs. | | 11/03/11 | | | 150,000 | | | | 145,020 | |
| | | | | | | | | | | | | | |
| | | | | | | | | 1,110,404 | | | | 1,111,700 | |
| | | | | | | | | | | | | | |
See Notes to Consolidated Financial Statements
Barings Participation Investors (formerly known as Babson Capital Participation Investors)
CONSOLIDATED SCHEDULE OF INVESTMENTS (CONTINUED)
December 31, 2016
| | | | | | | �� | | | | |
Corporate Restricted Securities: (A)
(Continued) | | Principal Amount,
Shares, Units or
Ownership Percentage | | Acquisition
Date | | Cost | | | Fair Value | |
| | |
| York Wall Holding Company | |
| A designer, manufacturer and marketer of wall covering products for both residential and commercial wall coverings. | |
12.5% (1.5% PIK) Senior Subordinated Note due 03/04/2021 | | $ | 1,584,137 | | 03/04/15 | | $ | 1,560,355 | | | $ | 1,369,132 | |
| Common Stock (B) | | 1,835 shs. | | 03/04/15 | | | 183,500 | | | | 66,834 | |
| | | | | | | | | | | | | | |
| | | | | | | | | 1,743,855 | | | | 1,435,966 | |
| | | | | | | | | | | | | | |
| | | | | | | | | | | | | | |
Total Private Placement Investments (E) | | | | | | | $ | 97,075,180 | | | $ | 94,771,586 | |
| | | | | | | | | | | | | | |
See Notes to Consolidated Financial Statements
2016 Annual Report
CONSOLIDATED SCHEDULE OF INVESTMENTS (CONTINUED)
December 31, 2016
| | | | | | | | | | | | | | |
Corporate Restricted Securities: (A)
(Continued) | | Interest
Rate | | Maturity
Date | | Principal
Amount | | | Cost | | | Market Value | |
| | |
| Rule 144A Securities - 13.31%: | |
| | |
| Bonds - 13.31% | |
| | | | | | | | | | | | | | |
| Altice Financing S.A. | | | 7.500 | % | 05/15/26 | | $ | 400,000 | | | $ | 400,000 | | | $ | 416,000 | |
| Amsted Industries | | | 5.375 | | 09/15/24 | | | 240,000 | | | | 240,000 | | | | 235,800 | |
| A. Schulman Inc. | | | 6.875 | | 06/01/23 | | | 500,000 | | | | 506,088 | | | | 522,500 | |
| Beazer Homes USA, Inc. | | | 8.750 | | 03/15/22 | | | 160,000 | | | | 160,000 | | | | 172,800 | |
| Belden Inc. | | | 5.250 | | 07/15/24 | | | 210,000 | | | | 210,000 | | | | 211,050 | |
| Boise Cascade Company | | | 5.625 | | 09/01/24 | | | 130,000 | | | | 130,000 | | | | 129,025 | |
| CITGO Petroleum Corporation | | | 6.250 | | 08/15/22 | | | 425,000 | | | | 425,000 | | | | 442,000 | |
| Consolidated Energy Finance S.A. | | | 6.750 | | 10/15/19 | | | 500,000 | | | | 495,038 | | | | 500,000 | |
| Constellium N.V. | | | 7.875 | | 04/01/21 | | | 373,000 | | | | 373,000 | | | | 400,974 | |
| Cornerstone Chemical Company | | | 9.375 | | 03/15/18 | | | 500,000 | | | | 503,745 | | | | 501,250 | |
| CTP Transportation Products, LLC | | | 8.250 | | 12/15/19 | | | 310,000 | | | | 310,000 | | | | 267,375 | |
| CVR Partners, LP. | | | 9.250 | | 06/15/23 | | | 500,000 | | | | 488,220 | | | | 515,000 | |
| Dean Foods | | | 6.500 | | 03/15/23 | | | 329,000 | | | | 329,000 | | | | 346,272 | |
| Dell Inc. | | | 4.420 | | 06/15/21 | | | 600,000 | | | | 626,826 | | | | 620,847 | |
| Digicel Group Limited | | | 6.000 | | 04/15/21 | | | 500,000 | | | | 459,222 | | | | 452,235 | |
| First Data Corporation | | | 5.000 | | 01/15/24 | | | 406,000 | | | | 406,000 | | | | 408,160 | |
| HD Supply, Inc. | | | 5.250 | | 12/15/21 | | | 127,000 | | | | 127,000 | | | | 133,984 | |
| Hilcorp Energy Company | | | 5.000 | | 12/01/24 | | | 335,000 | | | | 335,000 | | | | 332,488 | |
| Hughes Satellite Systems Corporation | | | 6.625 | | 08/01/26 | | | 500,000 | | | | 496,577 | | | | 502,500 | |
| J.B. Poindexter Co., Inc. | | | 9.000 | | 04/01/22 | | | 500,000 | | | | 500,000 | | | | 525,000 | |
| Jupiter Resources Inc. | | | 8.500 | | 10/01/22 | | | 500,000 | | | | 472,924 | | | | 431,250 | |
| OPE KAG Finance Sub | | | 7.875 | | 07/31/23 | | | 500,000 | | | | 520,954 | | | | 505,000 | |
| LBC Tank Terminals Holding Netherlands B.V. | | | 6.875 | | 05/15/23 | | | 663,000 | | | | 678,637 | | | | 677,918 | |
| Mallinckrodt PLC | | | 5.750 | | 08/01/22 | | | 500,000 | | | | 500,000 | | | | 481,250 | |
| MEG Energy Corporation | | | 6.375 | | 01/30/23 | | | 500,000 | | | | 500,000 | | | | 445,000 | |
| Micron Technology, Inc. | | | 5.250 | | 08/01/23 | | | 494,000 | | | | 494,000 | | | | 495,853 | |
| Micron Technology, Inc. | | | 7.500 | | 09/15/23 | | | 203,000 | | | | 203,000 | | | | 224,823 | |
| Moog Inc. | | | 5.250 | | 12/01/22 | | | 500,000 | | | | 503,281 | | | | 510,000 | |
| Nielsen Finance LLC | | | 5.000 | | 04/15/22 | | | 271,000 | | | | 272,565 | | | | 276,081 | |
| Penske Corporation | | | 4.875 | | 07/11/22 | | | 500,000 | | | | 498,616 | | | | 536,556 | |
| Prime Security Services Borrower | | | 9.250 | | 05/15/23 | | | 500,000 | | | | 500,000 | | | | 544,375 | |
| Sabre GLBL, Inc. | | | 5.250 | | 11/15/23 | | | 122,000 | | | | 122,000 | | | | 125,278 | |
| Sinclair Broadcast Group, Inc. | | | 5.875 | | 03/15/26 | | | 204,000 | | | | 204,000 | | | | 204,510 | |
| Sinclair Television Group, Inc. | | | 5.125 | | 02/15/27 | | | 500,000 | | | | 500,000 | | | | 475,000 | |
See Notes to Consolidated Financial Statements
Barings Participation Investors (formerly known as Babson Capital Participation Investors)
CONSOLIDATED SCHEDULE OF INVESTMENTS (CONTINUED)
December 31, 2016
| | | | | | | | | | | | | | |
Corporate Restricted Securities: (A)
(Continued) | | Interest
Rate | | Maturity
Date | | Principal
Amount | | | Cost | | | Market Value | |
| | | | | | | | | | | | | | |
| Suncoke Energy | | | 7.375 | % | 02/01/20 | | $ | 500,000 | | | $ | 472,952 | | | $ | 497,500 | |
| Tallgrass Operations LLC | | | 5.500 | | 09/15/24 | | | 304,000 | | | | 304,000 | | | | 301,720 | |
| TeamHealth Holdings Inc | | | 7.250 | | 12/15/23 | | | 115,000 | | | | 115,000 | | | | 130,813 | |
| Topaz Marine S.A. | | | 8.625 | | 11/01/18 | | | 500,000 | | | | 500,000 | | | | 485,000 | |
| Unitymedia KabelBW GmbH | | | 6.125 | | 01/15/25 | | | 500,000 | | | | 500,000 | | | | 513,750 | |
| Univision Communications, Inc. | | | 5.125 | | 05/15/23 | | | 160,000 | | | | 160,000 | | | | 157,600 | |
| UPCB Finance IV Limited | | | 5.375 | | 01/15/25 | | | 208,000 | | | | 208,000 | | | | 209,560 | |
| Valeant Pharmaceuticals International | | | 7.000 | | 10/01/20 | | | 250,000 | | | | 250,435 | | | | 215,469 | |
| Virgin Media Secured Finance PLC | | | 5.250 | | 01/15/26 | | | 500,000 | | | | 503,259 | | | | 493,749 | |
| VRX Escrow Corp. | | | 6.125 | | 04/15/25 | | | 182,000 | | | | 182,000 | | | | 136,728 | |
| Welltec A/S | | | 8.000 | | 02/01/19 | | | 375,000 | | | | 372,140 | | | | 376,875 | |
| West Corporation | | | 5.375 | | 07/15/22 | | | 500,000 | | | | 492,583 | | | | 483,124 | |
| Western Digital Corporation | | | 10.500 | | 04/01/24 | | | 253,000 | | | | 253,000 | | | | 299,173 | |
| Wolverine World Wide, Inc. | | | 5.000 | | 09/01/26 | | | 335,000 | | | | 335,000 | | | | 322,438 | |
| | | | | | | | | | | | | | | | | | |
| Total Bonds | | | | | | | | | | | | 18,139,062 | | | | 18,191,653 | |
| | | | | | | | | | | | | | | | | | |
| | | | | | | | | | | | | | | | | | |
| Common Stock - 0.00% | | | | | | | | | | | | | | | | | |
| | | | | | | | | | | | | | | | | | |
| TherOX, Inc. (B) | | | | | | | | 2 | | | | — | | | | — | |
| Touchstone Health Partnership (B) | | | | | | | | 292 | | | | — | | | | — | |
| | | | | | | | | | | | | | | | | | |
| Total Common Stock | | | | | | | | | | | | — | | | | — | |
| | | | | | | | | | | | | | | | | | |
| | | | | | | | | | | | | | | | | | |
| Total Rule 144A Securities | | | | | | | | | | | | 18,139,062 | | | | 18,191,653 | |
| | | | | | | | | | | | | | | | | | |
| | | | | | | | | | | | | | | | | | |
| Total Corporate Restricted Securities | | | | | | | | | | | $ | 115,214,242 | | | $ | 112,963,239 | |
| | | | | | | | | | | | | | | | | | |
See Notes to Consolidated Financial Statements
2016 Annual Report
CONSOLIDATED SCHEDULE OF INVESTMENTS (CONTINUED)
December 31, 2016
| | | | | | | | | | | | | | |
Corporate Public Securities -
19.57%: (A) | | Interest
Rate | | Maturity
Date | | Principal
Amount | | | Cost | | | Market Value | |
| | | | | |
| Bank Loans - 0.36% | | | | |
| | | | | | | | | | | | | | |
| Aquilex Holdings LLC | | | 5.000 | % | 12/31/20 | | $ | 157,303 | | | $ | 157,077 | | | $ | 153,173 | |
| Seadrill Partners Finco, LLC | | | 4.000 | | 02/21/21 | | | 494,898 | | | | 238,437 | | | | 337,026 | |
| | | | | | | | | | | | | | | | | | |
| Total Bank Loans | | | | | | | | | | | | 395,514 | | | | 490,199 | |
| | | | | | | | | | | | | | | | | | |
| | | | | | | | | | | | | | | | | | |
| Bonds - 19.21% | | | | | | | | | | | | | | | | | |
| | | | | | | | | | | | | | | | | | |
| ADT Security Services Corporation | | | 4.125 | | 06/15/23 | | | 500,000 | | | | 440,305 | | | | 477,500 | |
| Air Lease Corp. | | | 3.000 | | 09/15/23 | | | 600,000 | | | | 594,612 | | | | 573,232 | |
| Alcoa, Inc. | | | 6.150 | | 08/15/20 | | | 600,000 | | | | 615,591 | | | | 652,500 | |
| Anglogold Holdings PLC | | | 5.375 | | 04/15/20 | | | 600,000 | | | | 602,613 | | | | 616,500 | |
| Anixter, Inc. | | | 5.125 | | 10/01/21 | | | 165,000 | | | | 165,000 | | | | 171,600 | |
| Antero Resources Corporation | | | 5.375 | | 11/01/21 | | | 395,000 | | | | 395,000 | | | | 403,888 | |
| Bank of America Corporation | | | 4.000 | | 04/01/24 | | | 500,000 | | | | 498,569 | | | | 515,670 | |
| Brunswick Corporation | | | 7.125 | | 08/01/27 | | | 500,000 | | | | 504,007 | | | | 583,750 | |
| Bunge Limited Finance Corp. | | | 3.250 | | 08/15/26 | | | 600,000 | | | | 602,135 | | | | 576,165 | |
| Clearwater Paper Corporation | | | 4.500 | | 02/01/23 | | | 500,000 | | | | 496,640 | | | | 490,000 | |
| Commercial Metals Company | | | 4.875 | | 05/15/23 | | | 750,000 | | | | 751,091 | | | | 753,750 | |
| Crown Castle International Corp | | | 5.250 | | 01/15/23 | | | 600,000 | | | | 671,906 | | | | 645,750 | |
| CVR Refining LLC | | | 6.500 | | 11/01/22 | | | 350,000 | | | | 341,324 | | | | 347,375 | |
| Discovery Communications | | | 4.900 | | 03/11/26 | | | 600,000 | | | | 653,571 | | | | 631,811 | |
| Duke Realty Limited Partnership | | | 3.875 | | 10/15/22 | | | 500,000 | | | | 501,271 | | | | 520,063 | |
| EP Energy Corporation | | | 9.375 | | 05/01/20 | | | 406,000 | | | | 198,984 | | | | 374,279 | |
| Expedia Inc. | | | 4.500 | | 08/15/24 | | | 600,000 | | | | 627,457 | | | | 609,736 | |
| Ferrellgas Partners, L.P. | | | 8.625 | | 06/15/20 | | | 650,000 | | | | 650,582 | | | | 640,250 | |
| Ford Motor Credit Co. LLC | | | 4.375 | | 08/06/23 | | | 600,000 | | | | 647,970 | | | | 619,200 | |
| Forum Energy Technologies | | | 6.250 | | 10/01/21 | | | 160,000 | | | | 160,000 | | | | 160,000 | |
| Frontier Communications Corporation | | | 6.875 | | 01/15/25 | | | 500,000 | | | | 490,730 | | | | 423,750 | |
| General Motors Financial Co. Inc. | | | 4.000 | | 01/15/25 | | | 500,000 | | | | 508,649 | | | | 487,821 | |
| GEO Group, Inc. | | | 5.875 | | 01/15/22 | | | 500,000 | | | | 475,066 | | | | 506,250 | |
| HealthSouth Corporation | | | 5.125 | | 03/15/23 | | | 421,000 | | | | 412,647 | | | | 416,789 | |
| Hertz Corporation | | | 6.750 | | 04/15/19 | | | 79,000 | | | | 78,541 | | | | 79,000 | |
| Hornbeck Offshore Services, Inc. | | | 1.500 | | 09/01/19 | | | 500,000 | | | | 257,500 | | | | 354,688 | |
| Hospital Corporation of America | | | 5.375 | | 02/01/25 | | | 100,000 | | | | 101,574 | | | | 100,250 | |
| Hospital Corporation of America | | | 5.250 | | 06/15/26 | | | 174,000 | | | | 174,000 | | | | 179,873 | |
| Hewlett Packard Enterprise Company | | | 4.900 | | 10/15/25 | | | 500,000 | | | | 498,571 | | | | 514,407 | |
| Icahn Enterprises L.P. | | | 6.000 | | 08/01/20 | | | 600,000 | | | | 607,084 | | | | 612,750 | |
See Notes to Consolidated Financial Statements
Barings Participation Investors (formerly known as Babson Capital Participation Investors)
CONSOLIDATED SCHEDULE OF INVESTMENTS (CONTINUED)
December 31, 2016
| | | | | | | | | | | | | | |
| Corporate Public Securities: (A) (Continued) | | Interest
Rate | | Maturity
Date | | Principal
Amount | | | Cost | | | Market Value | |
| | | | | | | | | | | | | | |
| Jabil Circuit, Inc. | | | 4.700 | % | 09/15/22 | | $ | 500,000 | | | $ | 499,988 | | | $ | 510,000 | |
| Laboratory Corporation of America Holdings | | | 3.600 | | 02/01/25 | | | 500,000 | | | | 499,343 | | | | 497,810 | |
| Lamar Media Corp. | | | 5.375 | | 01/15/24 | | | 160,000 | | | | 160,000 | | | | 165,600 | |
| Laredo Petroleum, Inc. | | | 5.625 | | 01/15/22 | | | 500,000 | | | | 473,387 | | | | 503,750 | |
| Lazard Group LLC | | | 4.250 | | 11/14/20 | | | 500,000 | | | | 499,030 | | | | 523,378 | |
| Lifepoint Hospitals, Inc. | | | 5.500 | | 12/01/21 | | | 350,000 | | | | 357,240 | | | | 364,000 | |
| LyondellBasell Industries N.V. | | | 5.750 | | 04/15/24 | | | 500,000 | | | | 593,852 | | | | 572,213 | |
| MasTec, Inc. | | | 4.875 | | 03/15/23 | | | 500,000 | | | | 492,649 | | | | 488,750 | |
| Meritor, Inc. | | | 6.750 | | 06/15/21 | | | 1,000,000 | | | | 1,000,000 | | | | 1,022,500 | |
| MPLX LP | | | 4.875 | | 12/01/24 | | | 500,000 | | | | 500,000 | | | | 514,847 | |
| Netflix, Inc. | | | 5.500 | | 02/15/22 | | | 299,000 | | | | 299,000 | | | | 322,173 | |
| Owens Corning | | | 4.200 | | 12/01/24 | | | 600,000 | | | | 636,839 | | | | 614,628 | |
| Perry Ellis International, Inc. | | | 7.875 | | 04/01/19 | | | 125,000 | | | | 124,487 | | | | 125,000 | |
| Pitney Bowes Inc. | | | 3.375 | | 10/01/21 | | | 500,000 | | | | 499,622 | | | | 485,442 | |
| Precision Drilling Corporation | | | 6.625 | | 11/15/20 | | | 149,477 | | | | 151,932 | | | | 151,720 | |
| Reinsurance Group of America | | | 3.950 | | 09/15/26 | | | 500,000 | | | | 503,150 | | | | 494,665 | |
| R.R. Donnelley & Sons Company | | | 6.000 | | 04/01/24 | | | 500,000 | | | | 500,000 | | | | 471,250 | |
| Sanchez Energy Corporation | | | 6.125 | | 01/15/23 | | | 500,000 | | | | 361,364 | | | | 475,000 | |
| Sprint Corporation | | | 7.125 | | 06/15/24 | | | 155,000 | | | | 155,000 | | | | 159,650 | |
| Steelcase, Inc. | | | 6.375 | | 02/15/21 | | | 500,000 | | | | 504,225 | | | | 558,858 | |
| Suburban Propane Partners, L.P. | | | 5.750 | | 03/01/25 | | | 500,000 | | | | 500,000 | | | | 507,500 | |
| Summit Midstream Holdings, LLC | | | 5.500 | | 08/15/22 | | | 92,000 | | | | 67,493 | | | | 89,700 | |
| Time Warner Cable, Inc. | | | 5.000 | | 02/01/20 | | | 500,000 | | | | 496,262 | | | | 530,665 | |
| Tyson Foods, Inc. | | | 4.500 | | 06/15/22 | | | 500,000 | | | | 510,045 | | | | 532,063 | |
| William Lyon Homes | | | 7.000 | | 08/15/22 | | | 500,000 | | | | 500,000 | | | | 517,500 | |
| WPX Energy, Inc. | | | 5.250 | | 09/15/24 | | | 425,000 | | | | 425,000 | | | | 412,250 | |
| Xlit Ltd | | | 4.450 | | 03/31/25 | | | 600,000 | | | | 614,117 | | | | 594,941 | |
| | | | | | | | | | | | | | | | | | |
| Total Bonds | | | | | | | | | | | | 25,647,015 | | | | 26,244,450 | |
| | | | | | | | | | | | | | | | | | |
| | | | | | | | | | | | | | | | | | |
| Total Corporate Public Securities | | | | | | | | | | | $ | 26,042,529 | | | $ | 26,734,649 | |
| | | | | | | | | | | | | | | | | | |
See Notes to Consolidated Financial Statements
2016 Annual Report
CONSOLIDATED SCHEDULE OF INVESTMENTS (CONTINUED)
December 31, 2016
| | | | | | | | | | | | | | |
| Short-Term Security: | | Interest
Rate/Yield^ | | Maturity
Date | | Principal
Amount | | | Cost | | | Market Value | |
| | | | | | | | | | | | | | |
| Commercial Paper - 7.32% | | | | | | | | | | | | | |
| | | | | | | | | | | | | | |
| Avangrid, Inc. | | | 0.850 | % | 01/05/17 | | $ | 2,000,000 | | | $ | 1,999,811 | | | $ | 1,999,811 | |
| Kroger Co. | | | 0.900 | | 01/04/17 | | | 2,000,000 | | | | 1,999,850 | | | | 1,999,850 | |
| Kroger Co. | | | 0.850 | | 01/03/17 | | | 2,000,000 | | | | 1,999,906 | | | | 1,999,906 | |
| Southern Co. | | | 0.900 | | 01/06/17 | | | 2,000,000 | | | | 1,999,750 | | | | 1,999,750 | |
| Tate & Lyle International | | | 1.050 | | 01/04/17 | | | 2,000,000 | | | | 1,999,825 | | | | 1,999,825 | |
| | | | | | | | | | | | | | | | | | |
| Total Short-Term Security | | | | | | | | | | | $ | 9,999,142 | | | $ | 9,999,142 | |
| | | | | | | | | | | | | | | | | | |
| Total Investments | | | 109.58 | % | | | | | | | $ | 151,255,913 | | | $ | 149,697,030 | |
| | | | | | | | | | | | | | | | | | |
| Other Assets | | | 4.49 | | | | | | | | | | | | | 6,126,506 | |
| Liabilities | | | (14.07 | ) | | | | | | | | | | | | (19,216,805 | ) |
| | | | | | | | | | | | | | | | | | |
| | | | | | | | | | | | | | | | | | |
| Total Net Assets | | | 100.00 | % | | | | | | | | | | | $ | 136,606,731 | |
| | | | | | | | | | | | | | | | | | |
| (A) | In each of the convertible note, warrant, and common stock investments, the issuer has agreed to provide certain registration rights. |
| (B) | Non-income producing security. |
| (C) | Security valued at fair value using methods determined in good faith by or under the direction of the Board of Trustees. |
| (D) | Defaulted security; interest not accrued. |
| (E) | Illiquid security. As of December 31, 2016 the values of these securities amounted to $94,771,586 or 69.38% of net assets. |
| (F) | Held in CI Subsidiary Trust |
PIK - Payment-in-kind
See Notes to Consolidated Financial Statements
Barings Participation Investors (formerly known as Babson Capital Participation Investors)
CONSOLIDATED SCHEDULE OF INVESTMENTS (CONTINUED)
December 31, 2016
| Industry Classification: | | Fair Value/
Market Value | |
| | | | |
| AEROSPACE & DEFENSE - 2.81% | | | |
| API Technologies Corp. | | $ | 1,658,220 | |
| FMH Holdings Corporation | | | 209,178 | |
| Merex Holding Corporation | | | 371,966 | |
| Sunvair Aerospace Group Inc. | | | 1,229,265 | |
| Whitcraft Holdings, Inc. | | | 370,943 | |
| | | | 3,839,572 | |
| | | | | |
| AUTOMOTIVE - 8.49% | | | | |
| Aurora Parts & Accessories LLC | | | 1,710,191 | |
| CG Holdings Manufacturing Company | | | 1,829,763 | |
| DPL Holding Corporation | | | 1,555,386 | |
| Ford Motor Credit Co. LLC | | | 619,200 | |
| General Motors Financial Co. Inc. | | | 487,821 | |
| Grakon Parent | | | 148,841 | |
| J.B. Poindexter Co., Inc. | | | 525,000 | |
| Meritor, Inc. | | | 1,022,500 | |
| Moog Inc. | | | 510,000 | |
| Power Stop Holdings LLC | | | 1,852,690 | |
| Randy's Worldwide Automotive | | | 1,338,136 | |
| | | | 11,599,528 | |
| | | | | |
| BANKING - 0.38% | | | | |
| Bank of America Corporation | | | 515,670 | |
| | | | | |
BROKERAGE, ASSET MANAGERS &
EXCHANGES - 0.83% | |
| Icahn Enterprises L.P. | | | 612,750 | |
| Lazard Group LLC | | | 523,378 | |
| | | | 1,136,128 | |
| | | | | |
| BUILDING MATERIALS - 10.70% | | | | |
| ARI Holding Corporation | | | 2,362,369 | |
| Boise Cascade Company | | | 129,025 | |
| Janus Group Holdings LLC | | | 2,134,357 | |
| Happy Floors Acquisition, Inc. | | | 1,724,745 | |
| NSi Industries Holdings, Inc. | | | 1,783,917 | |
| Owens Corning | | | 614,628 | |
| Pearlman Enterprises, Inc. | | | 1,478,968 | |
| | | Fair Value/
Market Value | |
| Signature Systems Holding Company | | $ | 48,946 | |
| Sunrise Windows Holding Company | | | 960,649 | |
| Torrent Group Holdings, Inc. | | | 78,637 | |
| Wellborn Forest Holding Company | | | 1,512,838 | |
| Wolf-Gordon, Inc. | | | 1,788,591 | |
| | | | 14,617,670 | |
| | | | | |
| CABLE & SATELLITE - 1.65% | |
| Hughes Satellite Systems Corporation | | | 502,500 | |
| Time Warner Cable, Inc. | | | 530,665 | |
| Unitymedia KabelBW GmbH | | | 513,750 | |
| UPCB Finance IV Limited | | | 209,560 | |
| Virgin Media Secured Finance PLC | | | 493,749 | |
| | | | 2,250,224 | |
| | | | | |
| CHEMICALS - 3.29% | |
| A. Schulman Inc. | | | 522,500 | |
| Compass Chemical International LLC | | | 117,908 | |
| Consolidated Energy Finance S.A. | | | 500,000 | |
| Cornerstone Chemical Company | | | 501,250 | |
| CVR Partners, LP. | | | 515,000 | |
LBC Tank Terminals Holding Netherlands B.V. | | | 677,918 | |
| LyondellBasell Industries N.V. | | | 572,213 | |
| Polytex Holdings LLC | | | 1,084,412 | |
| | | | 4,491,201 | |
| | | | | |
| CONSTRUCTION MACHINERY - 0.23% | |
| Safety Infrastructure Solutions | | | 320,342 | |
| | | | | |
| CONSUMER CYCLICAL SERVICES - 3.49% | |
| ADT Security Services Corporation | | | 477,500 | |
CHG Alternative Education Holding Company | | | 1,062,362 | |
| Church Services Holding Company | | | — | |
| GEO Group, Inc. | | | 506,250 | |
| PPC Event Services | | | 1,692,276 | |
| Prime Security Services Borrower | | | 544,375 | |
| West Corporation | | | 483,124 | |
| | | | 4,765,887 | |
| | | | | |
See Notes to Consolidated Financial Statements
2016 Annual Report
CONSOLIDATED SCHEDULE OF INVESTMENTS (CONTINUED)
December 31, 2016
| Industry Classification: (Continued) | | Fair Value/
Market Value | |
| | |
| CONSUMER PRODUCTS - 8.93% | |
| AMS Holding LLC | | $ | 254,622 | |
| Blue Wave Products, Inc. | | | 794,535 | |
| Elite Sportwear Holding, LLC | | | 1,710,841 | |
| gloProfessional Holdings, Inc. | | | 1,342,932 | |
| GTI Holding Company | | | 845,064 | |
| Handi Quilter Holding Company | | | 1,783,972 | |
| HHI Group, LLC | | | 942,907 | |
| K N B Holdings Corporation | | | 141,055 | |
| Kyjen Company | | | 1,328,589 | |
| Manhattan Beachwear Holding Company | | | — | |
| MasTec, Inc. | | | 488,750 | |
| Master Cutlery LLC | | | 1,004,097 | |
| Perry Ellis International, Inc. | | | 125,000 | |
| York Wall Holding Company | | | 1,435,966 | |
| | | | 12,198,330 | |
| | | | | |
| DIVERSIFIED MANUFACTURING - 4.85% | |
| ABC Industries, Inc. | | | 367,626 | |
| Advanced Manufacturing Enterprises LLC | | | — | |
| Airxcel Holdings | | | 1,993,019 | |
| Amsted Industries | | | 235,800 | |
| Belden Inc. | | | 211,050 | |
| BP SCI LLC | | | 345,184 | |
| CTP Transportation Products, LLC | | | 267,375 | |
| F G I Equity LLC | | | 320,401 | |
| Forum Energy Technologies | | | 160,000 | |
| Ideal Tridon Holdings, Inc. | | | 173,292 | |
| K P I Holdings, Inc. | | | 294,040 | |
| Motion Controls Holdings | | | 1,061,416 | |
| NetShape Technologies, Inc. | | | — | |
| Strahman Holdings Inc | | | 1,200,519 | |
| | | | 6,629,722 | |
| | | | | |
| ELECTRIC - 2.72% | |
| AM Conservation Holding Corp. | | | 1,712,479 | |
| Avangrid, Inc. | | | 1,999,811 | |
| | | | 3,712,290 | |
| | | Fair Value/
Market Value | |
| |
| FINANCE COMPANIES - 0.42% | |
| Air Lease Corp. | | $ | 573,232 | |
| | |
| FINANCIAL OTHER - 0.10% | |
| Insurance Claims Management, Inc. | | | 142,344 | |
| | |
| FOOD & BEVERAGE - 11.76% | |
| 1492 Acquisition LLC | | | 293,594 | |
| Bunge Limited Finance Corp. | | | 576,165 | |
| Dean Foods | | | 346,272 | |
| Del Real LLC | | | 1,701,686 | |
| Eagle Family Foods, Inc. | | | 1,717,390 | |
| F F C Holding Corporation | | | 313,149 | |
| GenNx Novel Holding, Inc. | | | 1,028,738 | |
| Hollandia Produce LLC | | | 1,292,672 | |
| Hospitality Mints Holding Company | | | 1,054,425 | |
| Impact Confections | | | 1,289,831 | |
| JMH Investors LLC | | | 163,043 | |
| PANOS Brands LLC | | | 1,807,688 | |
| Tate & Lyle International | | | 1,999,825 | |
| Tyson Foods, Inc. | | | 532,063 | |
| Westminster Acquisition LLC | | | 835,210 | |
| WP Supply Holding Corporation | | | 1,111,700 | |
| | | | 16,063,451 | |
| | | | |
| GAMING - 1.22% | |
| CTM Holding, Inc. | | | 1,667,346 | |
| | |
| HEALTHCARE - 3.30% | |
| CORA Health Services, Inc. | | | 848,630 | |
| ECG Consulting Group | | | 1,416,475 | |
| GD Dental Services LLC | | | 118,496 | |
| Healthcare Direct Holding Company | | | 84,602 | |
| HealthSouth Corporation | | | 416,789 | |
| Hospital Corporation of America | | | 280,123 | |
| Laboratory Corporation of America Holdings | | | 497,810 | |
| Lifepoint Hospitals, Inc. | | | 364,000 | |
| TeamHealth Holdings Inc | | | 130,813 | |
| TherOX, Inc. | | | — | |
See Notes to Consolidated Financial Statements
Barings Participation Investors (formerly known as Babson Capital Participation Investors)
CONSOLIDATED SCHEDULE OF INVESTMENTS (CONTINUED)
December 31, 2016
| Industry Classification: (Continued) | | Fair Value/
Market Value | |
| | | | |
| Touchstone Health Partnership | | $ | — | |
| Valeant Pharmaceuticals International | | | 215,469 | |
| VRX Escrow Corp. | | | 136,728 | |
| | | | 4,509,935 | |
| | | | | |
| HEALTH INSURANCE - 0.36% | |
| Reinsurance Group of America | | | 494,665 | |
| | | | | |
| HOME CONSTRUCTION - 0.51% | |
| Beazer Homes USA, Inc. | | | 172,800 | |
| William Lyon Homes | | | 517,500 | |
| | | | 690,300 | |
| | | | | |
| INDEPENDENT - 2.04% | |
| Antero Resources Corporation | | | 403,888 | |
| EP Energy Corporation | | | 374,279 | |
| Jupiter Resources Inc. | | | 431,250 | |
| Laredo Petroleum, Inc. | | | 503,750 | |
| MEG Energy Corporation | | | 445,000 | |
| Precision Drilling Corporation | | | 151,720 | |
| Sanchez Energy Corporation | | | 475,000 | |
| | | | 2,784,887 | |
| | | | | |
| INDUSTRIAL OTHER - 8.78% | |
| AFC - Dell Holding Corporation | | | 1,339,902 | |
| Aquilex Holdings LLC | | | 153,173 | |
| Brunswick Corporation | | | 583,750 | |
| Clough, Harbour and Associates | | | 623,893 | |
| Connecticut Electric, Inc. | | | 1,270,401 | |
| Hartland Controls Holding Corporation | | | 1,954,512 | |
| HVAC Holdings, Inc. | | | 1,391,845 | |
| Mail Communications Group, Inc. | | | 218,751 | |
| MC Sign Holdings LLC | | | 951,045 | |
| Midwest Industrial Rubber, Inc. | | | 1,732,792 | |
| Nielsen Finance LLC | | | 276,081 | |
| O E C Holding Corporation | | | 197,134 | |
| Smart Source Holdings LLC | | | 520,557 | |
| SMB Machinery Holdings, Inc. | | | — | |
| | | | | |
| | | Fair Value/
Market Value | |
| | | | |
| Steelcase, Inc. | | $ | 558,858 | |
| Tranzonic Holdings LLC | | | 218,582 | |
| | | | 11,991,276 | |
| | | | | |
| | | | | |
| MEDIA & ENTERTAINMENT - 3.10% | |
| BlueSpire Holding, Inc. | | | — | |
| Discovery Communications | | | 631,811 | |
| GlynnDevins Acquisition Corporation | | | 106,506 | |
| HOP Entertainment LLC | | | — | |
| Lamar Media Corp. | | | 165,600 | |
| Money Mailer Equity LLC | | | 1,702,229 | |
| Netflix, Inc. | | | 322,173 | |
| R.R. Donnelley & Sons Company | | | 471,250 | |
| Sinclair Broadcast Group, Inc. | | | 204,510 | |
| Sinclair Television Group, Inc. | | | 475,000 | |
| Univision Communications, Inc. | | | 157,600 | |
| | | | 4,236,679 | |
| | | | | |
| METALS & MINING - 2.14% | |
| Alcoa, Inc. | | | 652,500 | |
| Anglogold Holdings PLC | | | 616,500 | |
| Commercial Metals Company | | | 753,750 | |
| Constellium N.V. | | | 400,974 | |
| Suncoke Energy | | | 497,500 | |
| | | | 2,921,224 | |
| | | | | |
| MIDSTREAM - 1.38% | |
| CVR Refining LLC | | | 347,375 | |
| Ferrellgas Partners, L.P. | | | 640,250 | |
| Suburban Propane Partners, L.P. | | | 507,500 | |
| Summit Midstream Holdings, LLC | | | 89,700 | |
| Tallgrass Operations LLC | | | 301,720 | |
| | | | 1,886,545 | |
| | | | | |
| NATURAL GAS - 1.46% | |
| Southern Co. | | | 1,999,750 | |
| | | | | |
| OIL FIELD SERVICES - 1.70% | |
| Avantech Testing Services LLC | | | — | |
| Hilcorp Energy Company | | | 332,488 | |
See Notes to Consolidated Financial Statements
2016 Annual Report
CONSOLIDATED SCHEDULE OF INVESTMENTS (CONTINUED)
December 31, 2016
| Industry Classification: (Continued) | | Fair Value/
Market Value | |
| | | | |
| Hornbeck Offshore Services, Inc. | | $ | 354,688 | |
| Petroplex Inv Holdings LLC | | | 19,089 | |
| Seadrill Partners Finco, LLC | | | 337,026 | |
| Topaz Marine S.A. | | | 485,000 | |
| Welltec A/S | | | 376,875 | |
| WPX Energy, Inc. | | | 412,250 | |
| | | | 2,317,416 | |
| | | | | |
| OTHER - REITS - 0.38% | |
| Duke Realty Limited Partnership | | | 520,063 | |
| | | | | |
| PACKAGING - 0.57% | |
| ASC Holdings, Inc. | | | 773,059 | |
| | | | | |
| PAPER - 1.60% | |
| Clearwater Paper Corporation | | | 490,000 | |
| Dunn Paper | | | 1,690,500 | |
| | | | 2,180,500 | |
| | | | | |
| PHARMACEUTICALS - 2.90% | |
| Clarion Brands Holding Corp. | | | 2,150,065 | |
| ERG Holding Company LLC | | | 1,328,307 | |
| Mallinckrodt PLC | | | 481,250 | |
| | | | 3,959,622 | |
| | | | | |
| PROPERTY & CASUALTY - 0.44% | |
| Xlit Ltd | | | 594,941 | |
| | | | | |
| REFINING - 2.41% | |
| CITGO Petroleum Corporation | | | 442,000 | |
| MES Partners, Inc. | | | 1,169,780 | |
| MPLX LP | | | 514,847 | |
| Tristar Global Energy Solutions, Inc. | | | 1,166,258 | |
| | | | 3,292,885 | |
| | | | | |
| RETAILERS - 0.33% | |
| HD Supply, Inc. | | | 133,984 | |
| Wolverine World Wide, Inc. | | | 322,438 | |
| | | | 456,422 | |
| | | | | |
| SUPERMARKET - 2.93% | |
| Kroger Co. | | | 3,999,756 | |
| | | | | |
| | | Fair Value/
Market Value | |
| | | | | |
| TECHNOLOGY - 7.11% | | | | |
| Anixter, Inc. | | $ | 171,600 | |
| Dell Inc. | | | 620,847 | |
| Expedia Inc. | | | 609,736 | |
| First Data Corporation | | | 408,160 | |
| Glynlyon Holding Companies, Inc. | | | 1,797,184 | |
| Hewlett Packard Enterprise Company | | | 514,407 | |
| Jabil Circuit, Inc. | | | 510,000 | |
| Micron Technology, Inc. | | | 720,676 | |
| Pitney Bowes Inc. | | | 485,442 | |
| Sabre GLBL, Inc. | | | 125,278 | |
Software Paradigms International
Group, LLC | | | 1,728,129 | |
| Veritext Corporation | | | 1,725,000 | |
| Western Digital Corporation | | | 299,173 | |
| | | | 9,715,632 | |
| | | | | |
| TELECOMMUNICATIONS - 0.29% | |
| Altice Financing S.A. | | | 416,000 | |
| | | | | |
| TRANSPORTATION SERVICES - 2.75% | |
| Hertz Corporation | | | 79,000 | |
| MNX Holding Company | | | 1,343,929 | |
| OPE KAG Finance Sub | | | 505,000 | |
| Penske Corporation | | | 536,556 | |
| Team Drive-Away Holdings LLC | | | 885,519 | |
| VP Holding Company | | | 401,147 | |
| | | | 3,751,151 | |
| | | | | |
| WIRELESS - 0.92% | |
| Crown Castle International Corp | | | 645,750 | |
| Digicel Group Limited | | | 452,235 | |
| Sprint Corporation | | | 159,650 | |
| | | | 1,257,635 | |
| | | | | |
| WIRELINES - 0.31% | |
| Frontier Communications Corporation | | | 423,750 | |
| | | | | |
Total Investments - 109.58%
(Cost - $151,255,913) | | $ | 149,697,030 | |
See Notes to Consolidated Financial Statements
Barings Participation Investors (formerly known as Babson Capital Participation Investors)
NOTES TO CONSOLIDATED FINANCIAL STATEMENTS
Barings Participation Investors (formerly known as Babson Capital Participation Investors) (the "Trust") was organized as a Massachusetts business trust under the laws of the Commonwealth of Massachusetts pursuant to a Declaration of Trust dated April 7, 1988. In order to clarify the Trust's relationship to Barings LLC (formerly known as Babson Capital Management LLC), as of September 12, 2016, the Trust's name was changed to replace "Babson Capital Participation Investors" with "Barings Participation Investors".
The Trust is a diversified closed-end management investment company. Barings LLC ("Barings"), a wholly-owned indirect subsidiary of Massachusetts Mutual Life Insurance Company ("MassMutual"), acts as its investment adviser. The Trust's investment objective is to maximize total return by providing a high level of current income, the potential for growth of income, and capital appreciation. The Trust's principal investments are privately placed, below-investment grade, long-term debt obligations purchased directly from their issuers, which tend to be smaller companies. The Trust will also invest in publicly traded debt securities (including high yield securities), and in convertible preferred stocks and, subject to certain limitations, readily marketable equity securities. Below-investment grade or high yield securities have predominantly speculative characteristics with respect to the capacity of the issuer to pay interest and repay capital. In addition, the Trust may invest in high quality, readily marketable securities.
On January 27, 1998, the Board of Trustees authorized the formation of a wholly-owned subsidiary of the Trust ("PI Subsidiary Trust") for the purpose of holding certain investments. The results of the PI Subsidiary Trust are consolidated in the accompanying financial statements. Footnote 2.D below discusses the Federal tax consequences of the PI Subsidiary Trust.
| 2. | Significant Accounting Policies |
The following is a summary of significant accounting policies followed consistently by the Trust in the preparation of its consolidated financial statements in conformity with accounting principles generally accepted in the United States of America ("U.S. GAAP").
The Trustees have determined that the Trust is an investment company in accordance with Accounting Standards Codification ("ASC") 946, Financial Services - Investment Companies, for the purpose of financial reporting.
A. Fair Value Measurements:
Under U.S. GAAP, fair value represents the price that should be received to sell an asset (exit price) in an orderly transaction between willing market participants at the measurement date.
Determination of Fair Value
The determination of the fair value of the Trust's investments is the responsibility of the Trust's Board of Trustees (the "Trustees"). The Trustees have adopted procedures for the valuation of the Trust's securities and has delegated responsibility for applying those procedures to Barings. Barings has established a Pricing Committee which is responsible for setting the guidelines used in following the procedures adopted by the Trustees ensuring that those guidelines are being followed. Barings considers all relevant factors that are reasonably available, through either public information or information available to Barings, when determining the fair value of a security. The Trustees meet at least once each quarter to approve the value of the Trust's portfolio securities as of the close of business on the last business day of the preceding quarter. This valuation requires the approval of a majority of the Trustees of the Trust, including a majority of the Trustees who are not interested persons of the Trust or of Barings. In approving valuations, the Trustees will consider reports by Barings analyzing each portfolio security in accordance with the procedures and guidelines referred to above, which include the relevant factors referred to below. Barings has agreed to provide such reports to the Trust at least quarterly. The consolidated financial statements include private placement restricted securities valued at $94,771,586 (69.38% of net assets) as of December 31, 2016 whose values have been estimated by the Trustees based on the process described above in the absence of readily ascertainable market values. Due to the inherent uncertainty of valuation, those estimated values may differ significantly from the values that would have been used had a ready market for the securities existed, and the differences could be material.
Following is a description of valuation methodologies used for assets recorded at fair value.
Corporate Public Securities – Bank Loans, Corporate Bonds, Preferred Stocks and Common Stocks
The Trust uses external independent third-party pricing services to determine the fair values of its Corporate Public Securities. At December 31, 2016, 100% of the carrying value of these investments was from external pricing services. In the event that the primary pricing service does not provide a price, the
2016 Annual Report
NOTES TO CONSOLIDATED FINANCIAL STATEMENTS (CONTINUED)
Trust utilizes the pricing provided by a secondary pricing service.
Public debt securities generally trade in the over-the-counter market rather than on a securities exchange. The Trust's pricing services use multiple valuation techniques to determine fair value. In instances where significant market activity exists, the pricing services may utilize a market based approach through which quotes from market makers are used to determine fair value. In instances where significant market activity may not exist or is limited, the pricing services also utilize proprietary valuation models which may consider market characteristics such as benchmark yield curves, option adjusted spreads, credit spreads, estimated default rates, coupon rates, anticipated timing of principal underlying prepayments, collateral, and other unique security features in order to estimate the relevant cash flows, which are then discounted to calculate the fair value.
The Trust's investments in bank loans are normally valued at the bid quotation obtained from dealers in loans by an independent pricing service in accordance with the Trust's valuation policies and procedures approved by the Trustees.
Public equity securities listed on an exchange or on the NASDAQ National Market System are valued at the last quoted sales price of that day.
Annually, Barings conducts reviews of the primary pricing vendors to validate that the inputs used in that vendors' pricing process are deemed to be market observable as defined in the standard. While Barings is not provided access to proprietary models of the vendors, the reviews have included on-site walk-throughs of the pricing process, methodologies and control procedures for each asset class and level for which prices are provided. The review also includes an examination of the underlying inputs and assumptions for a sample of individual securities across asset classes, credit rating levels and various durations, a process Barings continues to perform annually. In addition, the pricing vendors have an established challenge process in place for all security valuations, which facilitates identification and resolution of prices that fall outside expected ranges. Barings believes that the prices received from the pricing vendors are representative of prices that would be received to sell the assets at the measurement date (exit prices) and are classified appropriately in the hierarchy.
Corporate Restricted Securities – Corporate Bonds
The fair value of certain notes is determined using an internal model that discounts the anticipated cash flows of those notes using a specific discount rate. Changes to that discount rate are driven by changes in general interest rates, probabilities of default and credit adjustments. The discount rate used within the models to discount the future anticipated cash flows is considered a significant unobservable input. Significant increases/(decreases) in the discount rate would result in a significant (decrease)/increase to the notes' fair value.
The fair value of certain distressed notes is based on an enterprise waterfall methodology which is discussed in the equity security valuation section below.
Corporate Restricted Securities – Common Stock, Preferred Stock and Partnerships & LLC's
The fair value of equity securities is determined using an enterprise waterfall methodology. Under this methodology, the enterprise value of the company is first estimated and that value is then allocated to the company's outstanding debt and equity securities based on the documented priority of each class of securities in the capital structure. Generally, the waterfall proceeds from senior debt tranches of the capital structure to senior then junior subordinated debt, followed by each class of preferred stock and finally the common stock.
To estimate a company's enterprise value, the company's trailing twelve months earnings before interest, taxes, depreciation and amortization ("EBITDA") is multiplied by a valuation multiple.
Both the company's EBITDA and valuation multiple are considered significant unobservable inputs. Significant increases/(decreases) to the company's EBITDA and/or valuation multiple would result in significant increases/(decreases) to the equity value. An increase/(decrease) to the discount would result in a (decrease)/increase to the equity value.
Short-Term Securities
Short-term securities, of sufficient credit quality, with more than sixty days to maturity are valued at fair value, using external independent third-party services. Short-term securities having a maturity of sixty days or less are valued at amortized cost, which approximates fair value.
Barings Participation Investors (formerly known as Babson Capital Participation Investors)
NOTES TO CONSOLIDATED FINANCIAL STATEMENTS (CONTINUED)
Quantitative Information about Level 3 Fair Value Measurements
The following table represents quantitative information about Level 3 fair value measurements as of December 31, 2016:
| | | | | | |
| | Fair Value | Valuation Technique | Unobservable Inputs | Range | Weighted Average |
| Bank Loans | $1,690,500 | Broker Quote | Single Broker | 98% | 98% |
| | | | | | |
| | $3,442,390 | Discounted Cash Flows | Discount Rate | 8.8% to 9.2% | 9.0% |
| | | | | | |
| Corporate Bonds | $64,814,541 | Discounted Cash Flows | Discount Rate | 9.3% to 17.1% | 12.5% |
| | | | | | |
| | $4,785,853 | Market Approach | Valuation Multiple | 3.8x to 10.2x | 7.4x |
| | | | | | |
| | | | EBITDA | $0.0 million to $9.2 million | $4.9 million |
| | | | | | |
| Equity Securities | $19,245,989 | Market Approach | Valuation Multiple | 3.8x to 12.2x | 7.8x |
| | | | | | |
| | | | EBITDA | $0.0 million to $157.6 million | $23.4 million |
Certain of the Trust's Level 3 investments have been valued using unadjusted inputs that have not been internally developed by the Trust, including recently purchased securities held at cost. As a result, fair value of assets of $792,313 have been excluded from the preceding table.
Fair Value Hierarchy
The Trust categorizes its investments measured at fair value in three levels, based on the inputs and assumptions used to determine fair value. These levels are as follows:
Level 1 – quoted prices in active markets for identical securities
Level 2 – other significant observable inputs (including quoted prices for similar securities, interest rates, prepayment speeds, credit risk, etc.)
Level 3 – significant unobservable inputs (including the Trust's own assumptions in determining the fair value of investments)
The following table summarizes the levels in the fair value hierarchy into which the Trusts' financial instruments are categorized as of December 31, 2016.
The fair values of our investments disaggregated into the three levels of the fair value hierarchy based upon the lowest level of significant input used in the valuation as of December 31, 2016 are as follows:
| | | | | | | | | | | | | |
| Assets: | | Total | | | Level 1 | | | Level 2 | | | Level 3 | |
| Restricted Securities | | | | | | | | | | | | |
| Corporate Bonds | | $ | 87,792,048 | | | $ | — | | | $ | 18,191,653 | | | $ | 69,600,395 | |
| Bank Loans | | | 5,132,890 | | | | — | | | | — | | | | 5,132,890 | |
| Common Stock - U.S. | | | 5,972,591 | | | | — | | | | — | | | | 5,972,591 | |
| Preferred Stock | | | 3,878,030 | | | | — | | | | — | | | | 3,878,030 | |
| Partnerships and LLCs | | | 10,187,680 | | | | — | | | | — | | | | 10,187,680 | |
| Public Securities | | | | | | | | | | | | | | | | |
| Bank Loans | | | 490,199 | | | | — | | | | 490,199 | | | | — | |
| Corporate Bonds | | | 26,244,450 | | | | — | | | | 26,244,450 | | | | — | |
| Short-term Securities | | | 9,999,142 | | | | — | | | | 9,999,142 | | | | — | |
| Total | | $ | 149,697,030 | | | $ | — | | | $ | 54,925,444 | | | $ | 94,771,586 | |
See information disaggregated by security type and industry classification in the Consolidated Schedule of Investments.
2016 Annual Report
NOTES TO CONSOLIDATED FINANCIAL STATEMENTS (CONTINUED)
Following is a reconciliation of Level 3 assets for which significant unobservable inputs were used to determine fair value:
| | | | | | | | | | | | | | | | | | | | | | | | | |
| Assets: | | Beginning balance at 12/31/2015 | | | Included in earnings | | | Purchases | | | Sales | | | Prepayments | | | Transfers
into Level 3 | | | Transfers out of Level 3 | | | Ending balance at 12/31/2016 | |
| Restricted Securities | | | | | | | | | | | | | | | | | | | | | | | | |
| Corporate Bonds | | $ | 64,291,346 | | | $ | (4,240,349 | ) | | $ | 21,708,153 | | | $ | (4,966,788 | ) | | $ | (7,191,967 | ) | | $ | — | | | $ | — | | | $ | 69,600,395 | |
| Bank Loans | | | 3,366,726 | | | | 144,664 | | | | 3,381,000 | | | | (1,759,500 | ) | | | — | | | | — | | | | — | | | | 5,132,890 | |
| Common Stock - U.S. | | | 7,806,723 | | | | (330,138 | ) | | | 1,182,594 | | | | (2,686,588 | ) | | | — | | | | — | | | | — | | | | 5,972,591 | |
| Preferred Stock | | | 6,609,176 | | | | 748,482 | | | | 304,376 | | | | (3,784,004 | ) | | | — | | | | — | | | | — | | | | 3,878,030 | |
| Partnerships and LLCs | | | 9,670,199 | | | | 2,830,837 | | | | 1,124,122 | | | | (3,437,478 | ) | | | — | | | | — | | | | — | | | | 10,187,680 | |
| | | $ | 91,744,170 | | | $ | (846,504 | ) | | $ | 27,700,245 | | | $ | (16,634,358 | ) | | $ | (7,191,967 | ) | | $ | — | | | $ | — | | | $ | 94,771,586 | |
There were no transfers into or out of Level 1 and Level 2 assets.
Income, Gains and Losses included in Net Increase in Net Assets resulting from Operations for the year are presented in the following accounts on the Statement of Operations:
| | | | | | | |
| | | Net Increase in Net Assets Resulting from Operations | | | Change in Unrealized Gains & (Losses) in Net Assets
from assets still held | |
| Interest (Amortization) | | $ | 250,345 | | | $ | — | |
| Net realized gain on investments before taxes | | | 3,160,604 | | | | — | |
Net change in unrealized depreciation of investments before taxes | | | (4,257,453 | ) | | | (4,533,796 | ) |
B. Accounting for Investments:
Investment transactions are accounted for on the trade date. Dividend income is recorded on the ex-dividend date. Interest income is recorded on the accrual basis, including the amortization of premiums and accretion of discounts on bonds held using the yield-to-maturity method. The Trust does not accrue income when payment is delinquent and when management believes payment is questionable.
Realized gains and losses on investment transactions and unrealized appreciation and depreciation of investments are reported for financial statement and Federal income tax purposes on the identified cost method.
C. Use of Estimates:
The preparation of financial statements in conformity with U.S. GAAP requires management to make estimates and assumptions that affect the reported amounts of assets and liabilities, disclosure of contingent assets and liabilities and the reported amounts of revenues and expenses during the reporting period. Actual results could differ from those estimates.
D. Federal Income Taxes:
The Trust has elected to be taxed as a "regulated investment company" under the Internal Revenue Code, and intends to maintain this qualification and to distribute substantially all of its net taxable income to its shareholders. In any year when net long-term capital gains are realized by the Trust, management, after evaluating the prevailing economic conditions, will recommend that Trustees either designate the net realized long-term gains as undistributed and pay the federal capital gains taxes thereon, or distribute all or a portion of such net gains. For the year ended December 31, 2016, the Trust did not have any realized taxable long-term capital gains.
As of December 31, 2016, for federal income tax purposes, capital loss carryforwards of $62,362 were available to the extent provided by the regulations to offset future realized gains of the Trust. These unlimited capital loss carryforwards do not expire and are used to offset future realized gains. The Trust utilized $628,445 of capital loss carryforwards during the year ended December 31, 2016.
The Trust is taxed as a regulated investment company and is therefore limited as to the amount of
Barings Participation Investors (formerly known as Babson Capital Participation Investors)
NOTES TO CONSOLIDATED FINANCIAL STATEMENTS (CONTINUED)
non-qualified income that it may receive as the result of operating a trade or business, e.g. the Trust's pro rata share of income allocable to the Trust by a partnership operating company. The Trust's violation of this limitation could result in the loss of its status as a regulated investment company, thereby subjecting all of its net income and capital gains to corporate taxes prior to distribution to its shareholders. The Trust, from time-to-time, identifies investment opportunities in the securities of entities that could cause such trade or business income to be allocable to the Trust. The PI Subsidiary Trust (described in Footnote 1, above) was formed in order to allow investment in such securities without adversely affecting the Trust's status as a regulated investment company.
Net investment income and net realized gains or losses of the Trust as presented under U.S. GAAP may differ from distributable taxable earnings due to earnings from the PI Subsidiary Trust as well as certain permanent and temporary differences in the recognition of income and realized gains or losses on certain investments. Permanent differences will result in reclassifications to the capital accounts. In 2016, the Trust increased undistributed net investment income by $32,617, increased accumulated net realized gain on investments by $1,119,320 and decreased additional paid in capital by $1,151,937 to more accurately display the Trust's capital financial position on a tax-basis in accordance with U.S. GAAP. These re-classifications had no impact on net asset value.
The PI Subsidiary Trust is not taxed as a regulated investment company. Accordingly, prior to the Trust receiving any distributions from the PI Subsidiary Trust, all of the PI Subsidiary Trust's taxable income and realized gains, including non-qualified income and realized gains, is subject to taxation at prevailing corporate tax rates.
The components of income taxes included in the consolidated statement of operations for the year ended December 31, 2016 were as follows:
Income tax expense (benefit)
| | | | |
| Current: | | | |
| Federal | | $ | 411,581 | |
| State | | | 239,711 | |
| Total current | | | 651,292 | |
| | | | | |
| Deferred: | | | | |
| Federal | | | (82,917 | ) |
| State | | | (11,157 | ) |
| Total deferred | | | (94,074 | ) |
| | | | | |
Total income tax expense from continuing operations | | $ | 557,218 | |
Deferred tax assets and liabilities are recognized for the future tax consequences attributable to differences between the financial statement carrying amounts of the existing assets and liabilities and their respective tax basis.
The tax effects of temporary differences that give rise to significant portions of the deferred tax assets and liabilities as of December 31, 2016 were as follows:
Deferred tax liabilities:
| Unrealized gain on investments | | | 415,014 | |
| | | | | |
| Total deferred tax liabilities | | | 415,014 | |
| Net deferred tax liability | | $ | (415,014 | ) |
| | | | | |
The Trust recognizes a tax benefit from an uncertain position only if it is more likely than not that the position is sustainable, based solely on its technical merits and consideration of the relevant taxing authority's widely understood administrative practices and precedents. If this threshold is met, the Trust measures the tax benefit as the largest amount of benefit that is greater than fifty percent likely of being realized upon ultimate settlement. Tax positions not deemed to meet the "more-likely-than-not" threshold are reserved and recorded as a tax benefit or expense in the current year. All penalties and interest associated with income taxes are included in income tax expense. The Trust has evaluated and determined that the tax positions did not have a material effect on the Trust's financial position and results of operations for the year ended December 31, 2016.
A reconciliation of the differences between the PI Subsidiary Trust's income tax expense and the amount computed by applying the prevailing U.S. federal tax rate to pretax income for the year ended December 31, 2016 is as follows:
| | | | | | | |
| | | Amount | | | Percentage | |
| | | | | | | |
Provision for income taxes at the U.S. federal rate | | $ | 311,048 | | | | 34.00% | |
| | | | | | | | | |
State tax, net of federal effect | | | 228,553 | | | | 24.98% | |
| | | | | | | | | |
Change in valuation allowance | | | — | | | | 0.00% | |
| | | | | | | | | |
| Other | | | 17,617 | | | | 1.93% | |
| | | | | | | | | |
| Income tax expense | | $ | 557,218 | | | | 60.91% | |
| | | | | | | | | |
Each of the Trust's Federal tax returns for the prior three fiscal years remain subject to examination by the Internal Revenue Service.
2016 Annual Report
NOTES TO CONSOLIDATED FINANCIAL STATEMENTS (CONTINUED)
E. Distributions to Shareholders:
The Trust records distributions to shareholders from net investment income and net realized gains, if any, on the ex-dividend date. The Trust's net investment income dividend is declared four times per year, in April, July, October, and December. The Trust's net realized capital gain distribution, if any, is declared in December.
The components of capital shown in the following table represent the Trust's undistributed net investment income, undistributed net capital gains, losses the Trust may be able to offset against gains in future taxable years, as well as unrealized appreciation (depreciation) on securities and other fund investments, if any, at December 31, 2016, each of which determined on a U.S. Federal tax basis:
| | | | | | | | | | | |
Undistributed (Overdistributed) Net Investment
Income | | | Undistributed Net Capital
Gain | | | Accumulated Loss Carryforward | | | Net Unrealized
Appreciation (Depreciation)
on Securities and Other
Investments | |
| $ | 1,329,982 | | | $ | 0 | | | $ | (62,362 | ) | | $ | (3,094,878 | ) |
| | | | | | | | | | | | | | | |
The tax character of distributions declared during the years ended December 31, 2016 and 2015 was as follows:
| | | | | | | |
| Distributions paid from: | | 2016 | | | 2015 | |
| | | | | | | |
| Ordinary Income | | $ | 11,192,508 | | | $ | 11,143,733 | |
| 3. | Investment Advisory and Administrative Services Contract |
A. Services:
Under an Investment Advisory and Administrative Services Contract (the "Contract") with the Trust, Barings has agreed to use its best efforts to present to the Trust a continuing and suitable investment program consistent with the investment objectives and policies of the Trust. Barings represents the Trust in any negotiations with issuers, investment banking firms, securities brokers or dealers and other institutions or investors relating to the Trust's investments. Under the Contract, Barings also provides administration of the day-to-day operations of the Trust and provides the Trust with office space and office equipment, accounting and bookkeeping services, and necessary executive, clerical and secretarial personnel for the performance of the foregoing services.
B. Fee:
For its services under the Contract, Barings is paid a quarterly investment advisory fee equal to 0.225% of the value of the Trust's net assets as of the last business day of each fiscal quarter, an amount approximately equivalent to 0.90% on an annual basis. A majority of the
Trustees, including a majority of the Trustees who are not interested persons of the Trust or of Barings, approve the valuation of the Trust's net assets as of such day.
MassMutual holds the Trust's $15,000,000 Senior Fixed Rate Convertible Note (the "Note") issued by the Trust on December 13, 2011. The Note is due December 13, 2023 and accrues interest at 4.09% per annum. MassMutual, at its option, can convert the principal amount of the Note into common shares. The dollar amount of principal would be converted into an equivalent dollar amount of common shares based upon the average price of the common shares for ten business days prior to the notice of conversion. For the year ended December 31, 2016, the Trust incurred total interest expense on the Note of $613,500.
The Trust may redeem the Note, in whole or in part, at the principal amount proposed to be redeemed together with the accrued and unpaid interest thereon through the redemption date plus the Make Whole Premium. The Make Whole Premium equals the excess of (i) the present value of the scheduled payments of principal and interest which the Trust would have paid but for the proposed redemption, discounted at the rate of interest of U.S. Treasury obligations whose maturity approximates that of the Note plus 0.50% over (ii) the principal of the Note proposed to be redeemed.
Management estimates that the fair value of the Note was $15,405,615 as of December 31, 2016. The fair value of the Note is categorized as a Level 3 under ASC 820.
| 5. | Purchases and Sales of Investments |
| | | For the year ended
12/31/16 | |
| | | Cost of
Investments
Acquired | | | Proceeds
from
Sales or
Maturities | |
| | | | | | | | | |
Corporate restricted securities | | $ | 33,373,750 | | | $ | 34,533,703 | |
| | | | | | | | | |
Corporate public securities | | | 10,488,553 | | | | 15,129,660 | |
The difference between book-basis and tax-basis cost is primarily due to holdings of partnerships. The net unrealized depreciation of investments for financial reporting and Federal tax purposes as of December 31, 2016 is $1,558,883 and consists of $11,658,423 appreciation and $13,217,306 depreciation.
Barings Participation Investors (formerly known as Babson Capital Participation Investors)
NOTES TO CONSOLIDATED FINANCIAL STATEMENTS (CONTINUED)
Net unrealized depreciation of investments on the Statement of Assets and Liabilities reflects the balance net of a deferred tax liability of $415,014 on net unrealized gains on the PI Subsidiary Trust.
| 6. | Quarterly Results of Investment Operations |
| | | | | | | |
| | | March 31, 2016 | |
| | | Amount | | | Per Share | |
| Investment income | | $ | 2,914,218 | | | | |
| Net investment income | | | 2,253,036 | | | $ | 0.22 | |
Net realized and unrealized gain on investments (net of taxes) | | | 655,058 | | | | 0.06 | |
| | | | | | | | | |
| | | | |
| | | June 30, 2016 | |
| | | Amount | | | Per Share | |
| Investment income | | $ | 3,195,325 | | | | | |
| Net investment income | | | 2,534,391 | | | $ | 0.25 | |
Net realized and unrealized gain on investments (net of taxes) | | | 1,008,402 | | | | 0.10 | |
| | | | | | | | | |
| | | | |
| | | September 30, 2016 | |
| | | Amount | | | Per Share | |
| Investment income | | $ | 3,089,755 | | | | | |
| Net investment income | | | 2,425,345 | | | $ | 0.23 | |
Net realized and unrealized gain on investments (net of taxes) | | | 2,299,389 | | | | 0.22 | |
| | | | | | | | | |
| | | | |
| | | December 31, 2016 | |
| | | Amount | | | Per Share | |
| Investment income | | $ | 3,614,460 | | | | | |
| Net investment income | | | 3,111,470 | | | $ | 0.30 | |
Net realized and unrealized loss on investments (net of taxes) | | | (2,644,459 | ) | | | (0.26 | ) |
In the normal course of its business, the Trust trades various financial instruments and enters into certain investment activities with investment risks. These risks include: (i) market risk, (ii) volatility risk and (iii) credit, counterparty and liquidity risk. It is the Trust's policy to identify, measure and monitor risk through various mechanisms including risk management strategies and credit policies. These include monitoring risk guidelines and diversifying exposures across a variety of instruments, markets and counterparties. There can be
no assurance that the Trust will be able to implement its credit guidelines or that its risk monitoring strategies will be successful.
| 8. | Commitments and Contingencies |
During the normal course of business, the Trust may enter into contracts and agreements that contain a variety of representations and warranties. The exposure, if any, to the Trust under these arrangements is unknown as this would involve future claims that may or may not be made against the Trust and which have not yet occurred. The Trust has no history of prior claims related to such contracts and agreements. At December 31, 2016, the Trust had the following unfunded commitments:
Investment | | Unfunded Amount | |
| | | | |
| CORA Health Services, Inc. | | $ | 890,933 | |
| | | | | |
| HVAC Holdings, Inc. | | $ | 600,572 | |
| 9. | Aggregate Remuneration Paid to Officers, Trustees and Their Affiliated Persons |
For the year ended December 31, 2016, the Trust paid its Trustees aggregate remuneration of $212,600. During the year, the Trust did not pay any compensation to any of its Trustees who are "interested persons" (as defined by the 1940 Act) of the Trust. The Trust classifies Messrs. Noreen and Joyal as "interested persons" of the Trust.
All of the Trust's officers are employees of Barings or MassMutual. Pursuant to the Contract, the Trust does not compensate its officers who are employees of Barings or MassMutual (except for the Chief Compliance Officer of the Trust unless assumed by Barings). For the year ended December 31, 2016, Barings paid the compensation of the Chief Compliance Officer of the Trust.
Mr. Noreen, one of the Trust's Trustees, is an "affiliated person" (as defined by the 1940 Act) of MassMutual and Barings.
The Trust did not make any payments to Barings for the year ended December 31, 2016, other than amounts payable to Barings pursuant to the Contract.
As required under New York Stock Exchange ("NYSE") Corporate Governance Rules, the Trust's principal executive officer has certified to the NYSE that he was not aware, as of the certification date, of any violation by the Trust of the NYSE's Corporate Governance listing standards. In addition, as required by Section 302 of the Sarbanes-Oxley Act of 2002 and related SEC rules, the Trust's principal executive and principal financial officers have made quarterly
2016 Annual Report
NOTES TO CONSOLIDATED FINANCIAL STATEMENTS (CONTINUED)
certifications, included in filings with the SEC on Forms N-CSR and N-Q, relating to, among other things, the Trust's disclosure controls and procedures and internal control over financial reporting, as applicable.
The Trust has evaluated the possibility of subsequent events after the balance sheet date of December 31, 2016, through the date that the financial statements are issued. The Trust has determined that there are no material events that would require recognition or disclosure in this report through this date.
Barings Participation Investors (formerly known as Babson Capital Participation Investors)
REPORT OF INDEPENDENT REGISTERED PUBLIC ACCOUNTING FIRM
The Shareholders and Board of Trustees of Barings Participation Investors:
We have audited the accompanying consolidated statement of assets and liabilities of Barings Participation Investors (f/k/a Babson Capital Participation Investors) (the "Trust"), including the consolidated schedule of investments, as of December 31, 2016, and the related consolidated statements of operations and cash flows for the year then ended, the consolidated statements of changes in net assets for each of the years in the two-year period then ended, and the consolidated selected financial highlights for each of the years in the five-year period then ended. These consolidated financial statements and consolidated selected financial highlights are the responsibility of the Trust's management. Our responsibility is to express an opinion on these consolidated financial statements and consolidated selected financial highlights based on our audits.
We conducted our audits in accordance with the standards of the Public Company Accounting Oversight Board (United States). Those standards require that we plan and perform the audit to obtain reasonable assurance about whether the consolidated financial statements and consolidated selected financial highlights are free of material misstatement. An audit includes examining, on a test basis, evidence supporting the amounts and disclosures in the financial statements. Our procedures included confirmation of securities owned as of December 31, 2016, by correspondence with custodian and counterparties. An audit also includes assessing the accounting principles used and significant estimates made by management, as well as evaluating the overall financial statement presentation. We believe that our audits provide a reasonable basis for our opinion.
In our opinion, the consolidated financial statements and consolidated selected financial highlights referred to above present fairly, in all material respects, the financial position of Barings Participation Investors (f/k/a Babson Capital Participation Investors), as of December 31, 2016, the consolidated results of their operations and cash flows for the year then ended, the consolidated changes in their net assets for each of the years in the two-year period then ended, and the consolidated selected financial highlights for each of the years in the five-year period then ended, in conformity with U.S. generally accepted accounting principles.
Boston, Massachusetts
February 24, 2017
2016 Annual Report
INTERESTED TRUSTEES
| | | | | | |
| Name (Age), Address | Position With
The Trust | Office Term / Length
of Time Served | Principal Occupations
During Past 5 Years | Portfolios Overseen
in Fund Complex | Other Directorships
Held by Director |
| | | | | | |
| | | | | | |
Clifford M. Noreen* (59) Barings Participation Investors 1500 Main Street P.O. Box 15189 Springfield, MA 01115-5189 | Trustee, Chairman | Term expires 2018; Trustee since 2009 | Deputy Chief Investment Officer and Managing Director (since 2016), MassMutual; President (2008-2016), Vice Chairman (2007-2008), Member of the Board of Managers (2006-2016), Managing Director (2000-2016), Barings; President (2005-2009), Vice President (1993-2005) of the Trust. | 2 | Chairman and Trustee (since 2009), President (2005-2009), Vice President (1993-2005), Barings Corporate Investors; President (since 2009), Senior Vice President (1996-2009), HYP Management LLC (LLC Manager); Director (2005-2013), MassMutual Corporate Value Limited (investment company); Director (2005-2013), MassMutual Corporate Value Partners Limited (investment company); Director (since 2008), Jefferies Finance LLC (finance company); Chairman and Chief Executive Officer (since 2009), Manager (since 2007), MMC Equipment Finance LLC; Director (2011-2016), Wood Creek Capital Management, LLC (investment advisory firm); Chairman (since 2009), Trustee (since 2005), President (2005-2009), CI Subsidiary Trust and PI Subsidiary Trust; Member of Investment Committee (since 1999), Diocese of Springfield; and Member of Investment Committee (since 2015), Baystate Health Systems. |
| | | | | | |
| | | | | | |
| * | Mr. Noreen is classified as an "interested person" of the Trust and Barings (as defined by the Investment Company Act of 1940, as amended) because of his position as an Officer of the Trust and his former position as President of Barings. |
Barings Participation Investors (formerly known as Babson Capital Participation Investors)
INTERESTED TRUSTEES
| | | | | | |
| Name (Age), Address | Position With
The Trust | Office Term / Length
of Time Served | Principal Occupations
During Past 5 Years | Portfolios Overseen
in Fund Complex | Other Directorships
Held by Director |
| | | | | | |
| | | | | | |
Robert E. Joyal* (72) Barings Participation Investors 1500 Main Street P.O. Box 15189 Springfield, MA 01115-5189 | Trustee | Term expires 2019; Trustee since 2003 | Retired (since 2003); President (2001-2003), Barings; and President (1993-2003) of the Trust. | 95 | Trustee (since 2003), President (1993-2003), Barings Corporate Investors; Director (2006-2014), Jefferies Group, Inc. (financial services); Director (2007-2011), Scottish Re Group Ltd. (global life reinsurance specialist); Trustee (since 2003), MassMutual Select Funds (an open-end investment company advised by MassMutual); Trustee (since 2003), MML Series Investment Fund (an open-end investment company advised by MassMutual); Trustee (since 2012), MML Series Investment Fund II (an open-ended investment company advised by MassMutual); Trustee (since 2012), MassMutual Premier Funds (an open-ended investment company advised by MassMutual); Director (since 2012), Ormat Technologies, Inc. (a geothermal energy company); Director (2013-2016), Leucadia National Corporation (holding company owning businesses ranging from insurance to telecommunications); and Director (2013-2016), Baring Asset Management Korea Limited (company that engages in asset management, business administration and investment management). |
| | | | | | |
| | | | | | |
| * | Mr. Joyal retired as President of Barings in June 2003. In addition and as noted above, Mr. Joyal is a director of Leucadia National Corporation, which is the parent company of Jefferies Group, Inc., and a former Director of Jefferies Group, Inc., which has a wholly-owned broker-dealer subsidiary that may execute portfolio transactions and/or engage in principal transactions with the Trust, other investment companies advised by Barings or any other advisory accounts over which Barings has brokerage placement discretion. Accordingly, the Trust has determined to classify Mr. Joyal as an "interested person" of the Trust and Barings (as defined by the Investment Company Act of 1940, as amended). |
2016 Annual Report
INDEPENDENT TRUSTEES
| | | | | | |
| Name (Age), Address | Position With
The Trust | Office Term / Length
of Time Served | Principal Occupations
During Past 5 Years | Portfolios Overseen
in Fund Complex | Other Directorships
Held by Director |
| | | | | | |
| | | | | | |
Michael H. Brown (59) Barings Participation Investors 1500 Main Street P.O. Box 15189 Springfield, MA 01115-5189 | Trustee /Nominee | Term expires 2017; Trustee since 2005 | Private Investor; and Managing Director (1994-2005), Morgan Stanley. | 2 | Trustee (since 2005), Barings Corporate Investors; Independent Director (2006-2014), Invicta Holdings LLC and its subsidiaries (a derivative trading company owned indirectly by MassMutual). |
| | | | | |
Barbara M. Ginader (60) Barings Participation Investors 1500 Main Street P.O. Box 15189 Springfield, MA 01115-5189 | Trustee /Nominee | Term expires 2017; Trustee since 2013 | Managing Director and General Partner (since 1993), Boston Ventures Management (private equity firm). | 2 | Trustee (since 2013), Barings Corporate Investors; Managing Director (since 1993), Boston Ventures V L.P. (private equity fund); Managing Director (since 1993), Boston Ventures VI L.P. (private equity fund); Member of the Board Overseers (2013-2014), MSPCA-Angell; Member of the Grants Committee (2013-2014), IECA Foundation; and President of the Board (2006-2012), Codman Academy Public Charter School. |
| | | | | |
Edward P. Grace III (66) Barings Participation Investors 1500 Main Street P.O. Box 15189 Springfield, MA 01115-5189 | Trustee | Term expires 2018; Trustee since 2012 | President (since 1997), Phelps Grace International, Inc. (investment management); Managing Director (since 1998), Grace Ventures Partners LP (venture capital fund); Senior Advisor (since 2011), Angelo Gordon & Co. (Investment adviser). | 2 | Trustee (since 2012), Barings Corporate Investors; Director (since 2010), Larkburger, Inc. (restaurant chain); Director (since 2012), Benihana, Inc. (restaurant chain); Director (since 2011), Firebirds Wood Fired Holding Corporation (restaurant chain); Director (since 1998), Shawmut Design and Construction (construction management and general contracting firm); Director (2004-2012), Not Your Average Joe's, Inc. (restaurant chain). |
| | | | | | |
Barings Participation Investors (formerly known as Babson Capital Participation Investors)
INDEPENDENT TRUSTEES
| | | | | | |
| Name (Age), Address | Position With
The Trust | Office Term / Length
of Time Served | Principal Occupations
During Past 5 Years | Portfolios Overseen
in Fund Complex | Other Directorships
Held by Director |
| | | | | | |
| | | | | | |
Susan B. Sweeney (64) Barings Participation Investors 1500 Main Street P.O. Box 15189 Springfield, MA 01115-5189 | Trustee | Term expires 2019; Trustee since 2012 | Retired (since 2014); Senior Vice President and Chief Investment Officer (2010-2014), Selective Insurance Company of America; Senior Managing Director (2008-2010), Ironwood Capital. | 95 | Trustee (since 2012), Barings Corporate Investors; Trustee (since 2009), MassMutual Select Funds (an open-ended investment company advised by MassMutual); Trustee (since 2009), MML Series Investment Fund (an open-ended investment company advised by MassMutual); Trustee (since 2012), MassMutual Premier Funds (an open-ended investment company advised by MassMutual); Trustee (since 2012), MML Series Investment Fund II (an open-ended investment company advised by MassMutual). |
| | | | | |
Maleyne M. Syracuse (60) Barings Participation Investors 1500 Main Street P.O. Box 15189 Springfield, MA 01115-5189 | Trustee / Nominee | Term expires 2017; Trustee since 2007 | Private Investor; Managing Director (2000-2007), JP Morgan Securities, Inc. (investments and banking); Managing Director (1999-2000), Deutsche Bank Securities; Managing Director (1981-1999), Bankers Trust / BT Securities. | 2 | Trustee (since 2007), Barings Corporate Investors. |
| | | | | | |
| | | | | | |
2016 Annual Report
OFFICERS OF THE TRUST
| | | | |
| Name (Age), Address | Position With
The Trust | Office Term / Length
of Time Served | Principal Occupations
During Past 5 Years |
| | | | |
| | | | |
Robert M. Shettle (49) Barings Corporate Investors 1500 Main Street P.O. Box 15189 Springfield, MA 01115-5189 | President | Since 2016 | Vice President (2015-2016) of the Trust; President (since 2016), Vice President (2015-2016), Barings Corporate Investors; Managing Director (since 2006), Director (1998-2006), Barings; President (since 2016), Vice President (2005-2016), CI Subsidiary Trust and PI Subsidiary Trust. |
| | | |
Janice M. Bishop (52) Barings Participation Investors 1500 Main Street P.O. Box 15189 Springfield, MA 01115-5189 | Vice President, Secretary and Chief Legal Officer | Since 2015 | Associate Secretary (2008-2015) of the Trust; Vice President, Secretary and Chief Legal Officer (since 2015), Associate Secretary (2008-2015), Barings Corporate Investors; Vice President, Secretary and Chief Legal Officer (since 2013), Barings Funds Trust; Vice President, Secretary and Chief Legal Officer (since 2012), Barings Global Short Duration High Yield Fund; Senior Counsel and Managing Director (since 2014), Counsel (2007-2014), Barings; Vice President and Secretary (since 2015), Assistant Secretary (2008-2015), CI Subsidiary Trust and PI Subsidiary Trust. |
| | | |
James M. Roy (54) Barings Participation Investors 1500 Main Street P.O. Box 15189 Springfield, MA 01115-5189 | Vice President and Chief Financial Officer | Since 2005 | Treasurer (2003-2005), Associate Treasurer (1999-2003) of the Trust; Vice President and Chief Financial Officer (since 2005), Treasurer (2003-2005), Associate Treasurer (1999-2003), Barings Corporate Investors; Managing Director (since 2005), Director (2000-2005), Barings; and Trustee (since 2005), Treasurer (since 2005), Controller (2003-2005), CI Subsidiary Trust and PI Subsidiary Trust. |
| | | |
Melissa M. LaGrant (43) Barings Participation Investors 1500 Main Street P.O. Box 15189 Springfield, MA 01115-5189 | Chief Compliance Officer | Since 2006 | Chief Compliance Officer (since 2006), Barings Corporate Investors; Chief Compliance Officer (since 2013), Barings Finance LLC; Chief Compliance Officer (since 2013), Barings Funds Trust; Chief Compliance Officer (since 2012), Barings Global Short Duration High Yield Fund; Managing Director (since 2005), Barings. |
| | | |
Daniel J. Florence (44) Barings Participation Investors 1500 Main Street P.O. Box 15189 Springfield, MA 01115-5189 | Treasurer | Since 2008 | Associate Treasurer (2006-2008) of the Trust; Treasurer (since 2008), Associate Treasurer (2006-2008), Barings Corporate Investors; and Director (since 2013), Associate Director (2008-2013), Analyst (2000-2008), Barings. |
| | | |
Sean Feeley (49) Barings Participation Investors 1500 Main Street P.O. Box 15189 Springfield, MA 01115-5189 | Vice President | Since 2011 | Vice President (since 2011), Barings Corporate Investors; Vice President (since 2012), Barings Global Short Duration High Yield Fund; Managing Director (since 2003), Barings; and Vice President (since 2011), CI Subsidiary Trust and PI Subsidiary Trust. |
| * | Officers hold their position with the Trust until a successor has been duly elected and qualified. Officers are generally elected annually by the Board of Trustees of the Trust. The officers were last elected on July 20, 2016. |
Barings Participation Investors (formerly known as Babson Capital Participation Investors)
This page left intentionally blank.
Barings Participation Investors (formerly known as Babson Capital Participation Investors)
DIVIDEND REINVESTMENT AND CASH PURCHASE PLAN
Barings Participation Investors (the "Trust") offers a Dividend Reinvestment and Cash Purchase Plan (the "Plan"). The Plan provides a simple and automatic way for shareholders to add to their holdings in the Trust through the receipt of dividend shares issued by the Trust or through the reinvestment of cash dividends in Trust shares purchased in the open market. The dividends of each shareholder will be automatically reinvested in the Trust by DST Systems, Inc., the Transfer Agent, in accordance with the Plan, unless such shareholder elects not to participate by providing written notice to the Transfer Agent. A shareholder may terminate his or her participation by notifying the Transfer Agent in writing.
Participating shareholders may also make additional contributions to the Plan from their own funds. Such contributions may be made by personal check or other means in an amount not less than $100 nor more than $5,000 per quarter. Cash contributions must be received by the Transfer Agent at least five days (but no more then 30 days) before the payment date of a dividend or distribution.
Whenever the Trust declares a dividend payable in cash or shares, the Transfer Agent, acting on behalf of each participating shareholder, will take the dividend in shares only if the net asset value is lower than the market price plus an estimated brokerage commission as of the close of business on the valuation day. The valuation day is the last day preceding the day of dividend payment. When the dividend is to be taken in shares, the number of shares to be received is determined by dividing the cash dividend by the net asset value as of the close of business on the valuation date or, if greater than net asset value, 95% of the closing share price. If the net asset value of the shares is higher than the market value plus an estimated commission, the Transfer Agent, consistent with obtaining the best price and execution, will buy shares on the open market at current prices promptly after the dividend payment date.
The reinvestment of dividends does not, in any way, relieve participating shareholders of any federal, state or local tax. For federal income tax purposes, the amount reportable in respect of a dividend received in newly-issued shares of the Trust will be the fair market value of the shares received, which will be reportable as ordinary income and/or capital gains.
As compensation for its services, the Transfer Agent receives a fee of 5% of any dividend and cash contribution (in no event in excess of $2.50 per distribution per shareholder.)
Any questions regarding the Plan should be addressed to DST Systems, Inc., Agent for Barings Participation Investors' Dividend Reinvestment and Cash Purchase Plan, P.O. Box 219086, Kansans City, MO 64121-9086.
| Members of the Board of Trustees |
Michael H. Brown* Private Investor | Barbara M. Ginader Managing Director and General Partner Boston Ventures Management | Edward P. Grace President Phelps Grace International, Inc |
Robert E. Joyal Retired President, Barings LLC | Clifford M. Noreen Deputy Chief Investment Officer Massachusetts Mutual Life Insurance Company | Susan B. Sweeney* Private Investor |
Maleyne M. Syracuse* Private Investor | | |
| |
| Officers |
Clifford M. Noreen Chairman | Robert M. Shettle President | James M. Roy Vice President & Chief Financial Officer |
Janice M. Bishop Vice President, Secretary & Chief Legal Officer | Sean Feeley Vice President | Daniel J. Florence Treasurer |
Melissa M. LaGrant Chief Compliance Officer | | |
* Member of the Audit Committee

ITEM 2. CODE OF ETHICS.
The Registrant adopted a Code of Ethics for Senior Financials Officers (the "Code") on October 17, 2003, which is available on the Registrant's website at www.barings.com/mpv. During the period covered by this Form N-CSR, there were no amendments to, or waivers from, the Code.
ITEM 3. AUDIT COMMITTEE FINANCIAL EXPERT.
The Registrant's Board of Trustees has determined that Mr. Michael H. Brown, a Trustee of the Registrant and a member of its Audit Committee, is an audit committee financial expert. Mr. Brown is "independent" for purposes of this Item 3 as required by applicable regulation.
ITEM 4. PRINCIPAL ACCOUNTANT FEES AND SERVICES.
The Registrant has engaged its principal accountant, KPMG LLP, to perform audit services, audit-related services, tax services and other services during the past two fiscal years. The following table details the aggregate fees billed or expected to be billed for each of the last two fiscal years by KPMG LLP.
Fees Billed to the Registrant:
| | | KPMG LLP | | | KPMG LLP | |
| | | Year Ended | | | Year Ended | |
| | | December 31, 2016 | | | December 31, 2015 | |
Audit Fees | | $ | 78,100 | | | $ | 71,000 | |
Audit-Related Fees | | | 0 | | | | 0 | |
Tax Fees | | | 45,665 | | | | 45,665 | |
All Other Fees | | | 0 | | | | 0 | |
Total Fees | | $ | 123,765 | | | $ | 116,665 | |
Non-Audit Fees Billed to Barings and MassMutual:
| | | KPMG LLP | | | KPMG LLP | |
| | | Year Ended | | | Year Ended | |
| | December 31, 2016 | | | December 31, 2015 | |
Audit-Related Fees | | $ | 1,239,527 | | | $ | 1,393,808 | |
Tax Fees | | | 227,500 | | | | 333,000 | |
All Other Fees | | | 35,000 | | | | 23,100 | |
Total Fees | | $ | 1,502,027 | | | $ | 1,749,908 | |
The category "Audit Fees" refers to performing an audit of the Registrant's annual financial statements or services that are normally provided by the principal accountant in connection with statutory and regulatory filings or engagements for those fiscal years. The category "Audit-Related Fees" reflects fees billed by KPMG LLP for various non-audit and non-tax services rendered to the Registrant, Barings and MassMutual, such as a SOC - 1 review, consulting and agreed upon procedures reports. Preparation of Federal, state and local income tax and tax compliance work are representative of the fees reported in the "Tax Fees" category. The category "All Other Fees" represents fees billed by KPMG LLP for consulting rendered to the Registrant, Barings and MassMutual.
The Sarbanes-Oxley Act of 2002 and its implementing regulations allow the Registrant's Audit Committee to establish a pre-approval policy for certain services rendered by the Registrant's principal accountant. During 2016, the Registrant's Audit Committee approved all of the services rendered to the Registrant by KPMG LLP and did not rely on such a pre-approval policy for any such services.
The Audit Committee has also reviewed the aggregate fees billed for professional services rendered by KPMG LLP for 2015 and 2016 for the Registrant and for the non-audit services provided to Barings, and Barings' parent, MassMutual. As part of this review, the Audit Committee considered whether the provision of such non-audit services was compatible with maintaining the principal accountant's independence.
The 2015 fees billed represent final 2015 amounts, which may differ from the preliminary figures available as of the filing date of the Registrant's 2016 Annual Form N-CSR and includes, among other things, fees for services that may not have been billed as of the filing date of the Registrant's 2016 Annual Form N-CSR, but are now properly included in the 2015 fees billed to the Registrant, Barings and MassMutual.
ITEM 5. AUDIT COMMITTEE OF LISTED REGISTRANTS.
The Registrant maintains an Audit Committee composed exclusively of Trustees of the Registrant who qualify as "independent" Trustees under the current listing standards of the New York Stock Exchange and the rules of the U.S. Securities and Exchange Commission. The Audit Committee operates pursuant to a written Audit Committee Charter, which is available (1) on the Registrant's website, www.barings.com/mpv; and (2) without charge, upon request, by calling, toll-free 866-399-1516. The current members of the Audit Committee are Michael H. Brown, Susan B. Sweeney and Maleyne M. Syracuse.
ITEM 6. SCHEDULE OF INVESTMENTS
A schedule of investments for the Registrant is included as part of this report to shareholders under Item 1 of this Form N-CSR.
ITEM 7. DISCLOSURE OF PROXY VOTING POLICIES AND PROCEDURES FOR CLOSED-END MANAGEMENT INVESTMENT COMPANIES.
The Registrant's Board of Trustees has delegated proxy voting responsibilities relating to the voting securities held by the Registrant to its investment adviser, Barings LLC ("Barings"). A summary of Barings' proxy voting policies and procedures are set forth below.
Summary of Barings' Proxy Voting Policy:
Barings understands that the voting of proxies is an integral part of its investment management responsibility and believes, as a general principle, that proxies should be acted upon (voted or abstained) solely in the best interest of its clients (i.e. in a manner believed by Barings to best pursue a client's investment objectives). To implement this general principle, Barings engages a proxy service provider (the "Service Provider") that is responsible for processing and maintaining records of proxy votes. In addition, the Service Provider will retain the services of an independent third party research provider (the "Research Provider") to provide research and recommendations on proxies. It is Barings' Proxy Voting Policy to generally vote proxies in accordance with the recommendations of the Research Provider. In circumstances where the Research Provider has not provided recommendations with respect to a proxy, Barings will vote in accordance with the Research Provider's proxy voting guidelines (the "Guidelines"). In circumstances where the Research Provider has not provided a recommendation or has not contemplated an issue within its Guidelines, the proxy will be analyzed on a case-by-case basis.
Barings recognizes that there could be times when it is in the best interest of clients to vote proxies (i) against the Research Provider's recommendations or (ii) in instances where the Research Provider has not provided a recommendation vote against the Guidelines. Barings can vote, in whole or in part, against the Research Provider's recommendations or Guidelines, as it deems appropriate. The procedures set forth in the Proxy Voting Policy are designed to ensure that votes against the Research Provider's recommendations or Guidelines are made in the best interests of clients and are not the result of any material conflict of interest (a "Material Conflict"). For purposes of the Proxy Voting Policy, a Material Conflict is defined as any position, relationship or interest, financial or otherwise, of Barings or a Barings associate that could reasonably be expected to affect the independence or judgment concerning proxy voting.
Summary of Barings' Proxy Voting Procedures:
Barings will vote all client proxies for which it has proxy voting discretion, where no Material Conflict exists, in accordance with the Research Provider's recommendations or Guidelines, unless (i) Barings is unable or determines not to vote a proxy in accordance with the Proxy Voting Policy or (ii) an authorized investment person or designee (a "Proxy Analyst") determines that it is in the client's best interests to vote against the Research Provider's recommendations or Guidelines. In such cases where a Proxy Analyst believes a proxy should be voted against the Research Provider's recommendations or Guidelines, the proxy administrator will vote the proxy in accordance with the Proxy Analyst's recommendation as long as (i) no other Proxy Analyst disagrees with such recommendation and (ii) no known Material Conflict is identified by the Proxy Analyst(s) or the proxy administrator. If a Material Conflict is identified by a Proxy Analyst or the proxy administrator, the proxy will be submitted to the Trading Practices Committee to determine how the proxy is to be voted in order to achieve that client's best interests.
No associate, officer, director or board of managers/directors of Barings or its affiliates (other than those assigned such responsibilities under the Proxy Voting Policy) can influence how Barings votes client proxies, unless such person has been requested to provide assistance by a Proxy Analyst or Trading Practices Committee member and has disclosed any known Material Conflict. Pre-vote communications with proxy solicitors are prohibited. In the event that pre-vote communications occur, it should be reported to the Trading Practices Committee or Barings' Chief Compliance Officer prior to voting. Any questions or concerns regarding proxy-solicitor arrangements should be addressed to Barings' Chief Compliance Officer.
Investment management agreements generally delegate the authority to vote proxies to Barings in accordance with Barings' Proxy Voting Policy. In the event an investment management agreement is silent on proxy voting, Barings should obtain written instructions from the client as to their voting preference. However, when the client does not provide written instructions as to their voting preferences, Barings will assume proxy voting responsibilities. In the event that a client makes a written request regarding voting, Barings will vote as instructed.
Obtaining a Copy of the Proxy Voting Policy:
Clients can obtain a copy of Barings' Proxy Voting Policy and information about how Barings voted proxies related to their securities, free of charge, by contacting the Chief Compliance Officer, Barings LLC, 1500 Main Street, Suite 2800, P.O. Box 15189, Springfield, MA 01115-5189, or calling toll-free, 1-877-766-0014.
ITEM 8. PORTFOLIO MANAGERS OF CLOSED-END MANAGEMENT INVESTMENT COMPANIES.
The following disclosure item is made as of the date of this Form N-CSR unless otherwise indicated.
PORTFOLIO MANAGER. Robert M. Shettle serves as the President of the Registrant (since June 2016) and as one of its Portfolio Managers. Mr. Shettle began his service to the Registrant in 2015 as a Vice President. With over 17 years of industry experience, Mr. Shettle is a Managing Director of Barings and Head of the North America Mezzanine and Private Equity Group of Barings. He joined Barings in 2006. Prior to joining Barings, he spent six years at Fleet National Bank as a Vice President and commercial loan officer and three years at Anderson Consulting. At Barings, he has focused on originating, analyzing, structuring and documenting mezzanine and private equity investments. Mr. Shettle holds a B.S. from the University of Connecticut and a M.B.A. from Rensselaer Polytechnic Institute. He is also a Chartered Financial Analyst. Mr. Shettle also presently serves as President of Barings Participation Investors, another closed-end management investment company advised by Barings.
PORTFOLIO MANAGEMENT TEAM. Mr. Shettle has primary responsibility for overseeing the investment of the Registrant's portfolio, with the day-to-day investment management responsibility of the Registrant's portfolio being shared with the following Barings' investment professional (together with the Portfolio Manager, the "Portfolio Team").
Sean Feeley is responsible for the day-to-day management of the Registrant's public high yield and investment grade fixed income portfolio. Mr. Feeley has been a Vice President of the Registrant since 2011. Mr. Feeley is a Managing Director of Barings and head of the High Yield Research Team with over 22 years of industry experience in high yield bonds and loans in various investment strategies. Prior to joining Barings in 2003, he was a Vice President at Cigna Investment Management in project finance and a Vice President at Credit Suisse in leveraged loan finance. Mr. Feeley holds a B.S. from Canisius College and an M.B.A. from Cornell University. Mr. Feeley is a Certified Public Accountant and a Chartered Financial Analyst. Mr. Feeley also serves as Vice President of Barings Participation Investors, another closed-end management investment company advised by Barings.
OTHER ACCOUNTS MANAGED BY THE PORTFOLIO TEAM. The members of the Registrant's Portfolio Team also have primary responsibility for the day-to-day management of other Barings advisory accounts, including, among others, closed-end and open-end investment companies, private investment funds, MassMutual-affiliated accounts, as well as separate accounts for institutional clients. These advisory accounts are identified below.
OTHER ACCOUNTS MANAGED BY THE PORTFOLIO MANAGEMENT TEAM.
| | | | | | | | | | NUMBER OF | | | |
| | | | | | | | | | ACCOUNTS | | | APPROXIMATE |
| | | | | TOTAL | | | | | WITH | | | ASSET SIZE OF |
| | | | | NUMBER | | | APPROXIMATE | | PERFORMANCE- | | | PERFORMANCE- |
PORTFOLIO | | ACCOUNT | | OF | | | TOTAL ASSET | | BASED | | | BASED ADVISORY |
TEAM | | CATEGORY | | ACCOUNTS | | | SIZE (A) (B) | | ADVISORY FEE | | | FEE ACCOUNTS (A) (B) |
| | | | | | | | | | | | | |
| Eric | | Registered | | | 1 | | | $315.1 | | | 0 | | | N/A |
Lloyd (C) (D) | | Investment | | | | | | | | | | | | |
| | Companies | | | | | | | | | | | | |
| | | | | | | | | | | | | | | |
| | | Other Pooled | | | 1 | | | $479.9 | | | 0 | | | N/A |
| | | Investment | | | | | | | | | | | | |
| | | Vehicles | | | | | | | | | | | | |
| | | | | | | | | | | | | | | |
| | | Other | | | 0 | | | N/A | | | 0 | | | N/A |
| | | Accounts | | | | | | | | | | | | |
| | | | | | | | | | | | | | | |
| Sean | | Registered | | | 7 | | | $1,620.6 | | | 0 | | | N/A |
Feeley (C) | | Investment | | | | | | | | | | | | |
| | Companies | | | | | | | | | | | | |
| | | | | | | | | | | | | | | |
| | | Other Pooled | | | 5 | | | $2,749.8 | | | 0 | | | N/A |
| | | Investment | | | | | | | | | | | | |
| | | Vehicles | | | | | | | | | | | | |
| | | | | | | | | | | | | | | |
| | | Other | | | 14 | | | $4,165.4 | | | 0 | | | N/A |
| | | Accounts (E) | | | | | | | | | | | | |
| | | | | | | | | | | | | | | |
Robert M. | | Registered | | | 1 | | | $315.1 | | | 0 | | | N/A |
Shettle (C) | | Investment | | | | | | | | | | | | |
| | Companies | | | | | | | | | | | | |
| | | | | | | | | | | | | | |
| | Other Pooled | | | 6 | | | $540.9 | | | 0 | | | N/A |
| | Investment | | | | | | | | | | | | |
| | Vehicles | | | | | | | | | | | | |
| | | | | | | | | | | | | | |
| | Other | | | 0 | | | N/A | | | 0 | | | N/A |
| | Accounts (F) | | | | | | | | | | | | |
| (A) | Account asset size has been calculated as of December 31, 2016. |
| |
| (B) | Asset size in millions. |
| |
| (C) | Represents accounts advised by Barings over which Messrs. Lloyd, Feeley and Shettle have day-to-day management responsibilities. |
| |
| (D) | Mr. Lloyd, as head of Barings' Global Private Finance Group, has overall responsibility for all private placement mezzanine assets managed by Barings. Except for the accounts noted in the table above, Mr. Lloyd is not primarily responsible for the day-to-management of the other accounts managed by Barings' Global Private Finance Group. |
| |
| (E) | Mr. Feeley manages the high yield sector of the general investment account of Massachusetts Mutual Life Insurance Company and C.M. Life Insurance Company; however, these assets are not represented in the table above. |
| |
| (F) | Mr. Shettle manages the private placement mezzanine debt securities of the general investment account of Massachusetts Mutual Life Insurance Company and C.M. Life Insurance Company; however, these assets are not represented in the table above. |
MATERIAL CONFLICTS OF INTEREST. The potential for material conflicts of interest may exist as the members of the Portfolio Management Team have responsibilities for the day-to-day management of multiple advisory accounts. These conflicts may be heightened to the extent the individual, Barings and/or an affiliate has an investment in one or more of such accounts. Barings has identified (and summarized below) areas where material conflicts of interest are most likely to arise, and has adopted policies and procedures that it believes are reasonable to address such conflicts.
Transactions with Affiliates: Barings or its affiliates, including MassMutual and its affiliates, may from time to time, acting as principal, buy securities or other investments for itself from or sell securities or other investments it owns to its advisory clients. Likewise, Barings may either directly or on behalf of MassMutual, purchase and/or hold securities or other investments that are subsequently sold or transferred to advisory clients. Barings has a conflict of interest in connection with a transaction where it or an affiliate is acting as principal since it may have an incentive to favor itself or its affiliates over its advisory clients in connection with the transaction. To address the conflicts of interest, Barings has adopted a Transactions with Affiliates Policy, which ensures any such transaction is consistent with Barings' fiduciary obligations to act in the best interests of its clients, including its ability to obtain best execution in connection with the transaction, and is in compliance with applicable legal and regulatory requirements.
Cross Trades: Barings may effect cross-trades on behalf of its advisory clients whereby one advisory client buys securities or other investments from or sells securities or other investments to another advisory client. Barings may also effect cross-trades involving advisory accounts or funds in which it or its affiliates, including MassMutual, and their respective employees, have an ownership interest or for which Barings is entitled to earn a performance fee. As a result, Barings has a conflict of interest in connection with the cross-trade since it may have an incentive to favor the advisory client or fund in which it or its affiliate has an ownership interest and/or is entitled to a performance fee. To address the conflicts of interest, Barings has adopted a Transactions with Affiliates Policy, which ensures any such cross-trade is consistent with Barings' fiduciary obligations to act in the best interests of each of its advisory clients, including its ability to obtain best execution for each advisory client in connection with the cross-trade transaction, and is in compliance with applicable legal and regulatory requirements. Barings will not receive a commission or any other remuneration (other than its advisory fee) for effecting cross-trades between advisory clients.
Loan Origination Transactions: While Barings or its affiliates generally do not act as an underwriter or member of a syndicate in connection with a securities offering, Barings or its affiliates (or an unaffiliated entity in which Barings or its affiliates have an ownership interest) may act as an underwriter, originator, agent, or member of a syndicate in connection with the origination of senior secured loans or other lending arrangements with borrowers, where such loans may be purchased by Barings advisory clients during or after the original syndication. Barings advisory clients may purchase such loans directly from Barings or its affiliates (or an unaffiliated entity in which Barings or its affiliates have an ownership interest) or from other members of the lending syndicate. Barings or its affiliates may directly or indirectly receive underwriting, origination, or agent fees in connection with such loan originations. As a result, Barings has a conflict of interest in connection with such loan origination transactions since it has an incentive to base its investment recommendation to its advisory clients on the amount of compensation, underwriting, origination or agent fees it would receive rather than on its advisory clients' best interests. To address the conflict of interest, Barings has adopted a Transactions with Affiliates Policy, which ensures any such transaction is consistent with Barings' fiduciary obligations to act in the best interests of its clients, including its ability to obtain best execution in connection with the transaction, and is in compliance with applicable legal and regulatory requirements.
MML Investors Services, LLC ("MMLISI"), an indirect wholly-owned subsidiary of MassMutual, is an SEC-registered investment adviser and broker-dealer and is a member of the Financial Industry Regulatory Authority. MMLISI may act as an introducing broker for the purpose of effecting securities transactions for brokerage customers. While a Barings advisory client could request that MMLISI effect securities transactions for it that would result in commissions to MMLISI, currently no Barings advisory client directs Barings to effect securities transactions for its account through MMLISI.
Investments by Advisory Clients: Barings may invest client assets in securities or other investments that are also held by (i) Barings or its affiliates, including MassMutual, (ii) other Barings advisory accounts, (iii) funds or accounts in which Barings or its affiliates or their respective employees have an ownership or economic interest or (iv) employees of Barings or its affiliates. Barings may also, on behalf of its advisory clients, invest in the same or different securities or instruments of issuers in which (a) Barings or its affiliates, including MassMutual, (b) other Barings advisory accounts, (c) funds or accounts in which Barings, its affiliates, or their respective employees have an ownership or economic interest or (d) employees of Barings or its affiliates, have an ownership interest as a holder of the debt, equity or other instruments of the issuer. Barings has a conflict of interest in connection with any such transaction since investments by its advisory clients may directly or indirectly benefit Barings and/or its affiliates and employees by potentially increasing the value of the securities or instruments it holds in the issuer. Any investment by Barings on behalf of its advisory clients will be consistent with its fiduciary obligations to act in the best interests of its advisory clients, and otherwise be consistent with such clients' investment objectives and restrictions.
Barings or its affiliates may also recommend that clients invest in registered or unregistered investment companies, including private investment funds such as hedge funds, private equity funds or structured funds (i) advised by Barings or an affiliate, (ii) in which Barings, an affiliate or their respective employees has an ownership or economic interest or (iii) with respect to which Barings or an affiliate has an interest in the entity entitled to receive the fees paid by such funds. Barings has a conflict of interest in connection with any such recommendation since it may have an incentive to base its recommendation to invest in such investment companies or private funds on the fees that Barings or its affiliates would earn as a result of the investment by its advisory clients in the investment companies or private funds. Any recommendation to invest in a Barings advised fund or other investment company will be consistent with Barings' fiduciary obligations to act in the best interests of its advisory clients, consistent with such clients' investment objectives and restrictions. Barings may, in certain limited circumstances, offer to clients that invest in private investment funds that it advises an equity interest in entities that receive advisory fees and carried profits interest from such funds.
Employee Co-Investment: Barings may permit certain of its portfolio managers and other eligible employees to invest in certain private investment funds advised by Barings or its affiliates and/or share in the performance fees received by Barings from such funds. If the portfolio manager or other eligible employee was responsible for both the portfolio management of the private fund and other Barings advisory accounts, such person would have a conflict of interest in connection with investment decisions since the person may have an incentive to direct the best investment ideas, or to allocate trades, in favor of the fund in which he or she is invested or otherwise entitled to share in the performance fees received from such fund. To address the conflicts of interest, Barings has adopted a Side by Side Management of Private Investment Funds and Other Advisory Accounts Policy which requires, among others things, that Barings treat each of its advisory clients in a manner consistent with its fiduciary obligations and prohibits Barings from favoring any particular advisory account as a result of the ownership or economic interests of Barings, its affiliates or employees, in such advisory account. Any investment by a Barings employee in one of its private funds is also governed by Barings' Employee Co-Investment Policy, which ensures that any co-investment by a Barings employee is consistent with Barings' Code of Ethics, as summarized above.
Management of Multiple Accounts: As noted above, Barings' portfolio managers are often responsible for the day-to-day management of multiple accounts, including, among others, separate accounts for institutional clients, closed-end and open-end registered investment companies, and/or private investment funds (such as hedge funds, private equity funds and structured funds), as well as for proprietary accounts of Barings and its affiliates, including MassMutual and its affiliates. The potential for material conflicts of interest exist whenever a portfolio manager has responsibility for the day-to-day management of multiple advisory accounts. These conflicts may be heightened to the extent a portfolio manager is responsible for managing a proprietary account for Barings or its affiliates or where the portfolio manager, Barings and/or an affiliate has an investment in one or more of such accounts or an interest in the performance of one or more of such accounts (e.g., through the receipt of a performance fee).
Investment Allocation: Such potential conflicts include those relating to allocation of investment opportunities. For example, it is possible that an investment opportunity may be suitable for more than one account managed by Barings, but may not be available in sufficient quantities for all accounts to participate fully. Similarly, there may be limited opportunity to sell an investment held by multiple accounts. A conflict arises where the portfolio manager has an incentive to treat an account preferentially because the account pays Barings or its affiliates a performance-based fee or the portfolio manager, Barings or an affiliate has an ownership or other economic interest in the account. As noted above, Barings also acts as an investment manager for certain of its affiliates, including MassMutual. These affiliate accounts sometimes co-invest jointly and concurrently with Barings' other advisory clients and therefore share in the allocation of such investment opportunities. To address the conflicts of interest associated with the allocation of trading and investment opportunities, Barings has adopted an Investment Allocation Policy and trade allocation procedures that govern the allocation of portfolio transactions and investment opportunities across multiple advisory accounts, including affiliated accounts, which are summarized below under Item 12 – Brokerage Practices, Investment Allocation Policy. In addition, as noted above, to address the conflicts, Barings has adopted a Side by Side Management of Private Investment Funds and Other Advisory Accounts Policy which requires, among others things, that Barings treat each of its advisory clients in a manner consistent with its fiduciary obligations and prohibits Barings from favoring any particular advisory account as a result of the ownership or economic interests of Barings, its affiliates or employees, in such advisory accounts. Any investment by a Barings employee in one of its private funds is also governed by Barings' Employee Co-Investment Policy, which ensures that any co-investment by a Barings employee is consistent with Barings' Code of Ethics.
Personal Securities Transactions; Short Sales: Potential material conflicts of interest may also arise related to the knowledge and timing of an account's trades, investment opportunities and broker or dealer selection. Barings and its portfolio managers have information about the size, timing and possible market impact of the trades of each account they manage. It is possible that portfolio managers could use this information for their personal advantage and/or to the advantage or disadvantage of various accounts which they manage. For example, a portfolio manager could cause a favored account to "front run" an account's trade or sell short a security for an account immediately prior to another account's sale of that security. To address these conflicts, Barings has adopted policies and procedures, including a Short Sales Policy, which ensures that the use of short sales by Barings is consistent with Barings' fiduciary obligations to its clients, a Side by Side Management of Private Investment Funds and Other Advisory Accounts Policy, which requires, among other things, that Barings treat each of its advisory clients in a manner consistent with its fiduciary obligations and prohibits Barings from favoring any particular account as a result of the ownership or economic interest of Barings, its affiliates or employees and a Code of Ethics.
Trade Errors: Potential material conflicts of interest may also arise if a trade error occurs in a client account. A trade error is deemed to occur if there is a deviation by Barings from the applicable standard of care in connection with the placement, execution or settlement of a trade for an advisory account that results in (1) Barings purchasing assets not permitted or authorized by a client's investment advisory agreement or otherwise failing to follow a client's specific investment directives; (2) Barings purchasing or selling the wrong security or the wrong amount of securities on behalf of a client's account; or (3) Barings purchasing or selling assets for, or allocating assets to, the wrong client account. When correcting these errors, conflicts of interest between Barings and its advisory accounts may arise as decisions are made on whether to cancel, reverse or reallocate the erroneous trades. In order to address the conflicts, Barings has adopted a Global Errors Policy governing the resolution of trading errors, and will follow the Global Errors Policy in order to ensure that trade errors are handled promptly and appropriately and that any action taken to remedy an error places the interest of a client ahead of Barings' interest.
Best Execution; Directed or Restricted Brokerage: With respect to securities and other transactions (including, but not limited to, derivatives transactions) for most of the accounts it manages, Barings determines which broker, dealer or other counterparty to use to execute each order, consistent with its fiduciary duty to seek best execution of the transaction. Barings manages certain accounts, however, for clients who limit its discretion with respect to the selection of counterparties or direct it to execute such client's transaction through a particular counterparty. In these cases, trades for such an account in a particular security or other transaction may be placed separately from, rather than aggregated with, those in the same security or transaction for other accounts. Placing separate transaction orders for a security or transaction may temporarily affect the market price of the security or transaction or otherwise affect the execution of the transaction to the possible detriment of one or more of the other account(s) involved. Barings has adopted a Best Execution Policy and a Directed or Restricted Brokerage Policy which are summarized below under Item 12 – Brokerage Practices, Counterparty Selection/Recommendations and Directed/Restricted Brokerage.
Barings and its portfolio managers or employees may have other actual or potential conflicts of interest in managing an advisory account, and the list above is not a complete description of every conflict of interest that could be deemed to exist.
COMPENSATION. Compensation packages at Barings are structured such that key professionals have a vested interest in the continuing success of the firm. Portfolio managers' compensation is comprised of base salary and a discretionarily allocated incentive bonus, which includes a performance-driven annual bonus, and may include a deferred long-term incentive bonus and also may contain a performance fee award. As part of the firm's continuing effort to monitor retention, Barings participates in annual compensation surveys of investment management firms to ensure that Barings' compensation is competitive with industry norms.
The base salary component is generally positioned at mid-market. Increases are tied to market, individual performance evaluations and budget constraints.
Portfolio Managers may receive a yearly incentive bonus. Factors impacting the potential bonuses include but are not limited to: i) investment performance of funds/accounts managed by a Portfolio Manager, ii) financial performance of Barings, iii) client satisfaction, iv) collaboration, v) risk management and vi) integrity.
Long-term incentives are designed to share the long-term success of the firm and take the form of deferred cash awards, which may include an award that resembles phantom restricted stock; linking the value of the award to a formula which includes Babson's overall earnings, revenue and assets under management. A voluntary separation of service will result in a forfeiture of unvested long-term incentive awards.
BENEFICIAL OWNERSHIP. As of December 31, 2016, members of the Portfolio Management Team beneficially owned the following dollar range of equity securities in the Registrant:
Portfolio Management Team: | | Dollar Range of Beneficially Owned* Equity Securities of the Registrant: |
| | | |
Eric Lloyd | | None |
Sean Feeley | | None |
Robert M. Shettle | | None |
* Beneficial ownership has been determined in accordance with Rule 16(a)-1(a)(2) under the Securities Exchange Act of 1934, as amended.
ITEM 9. PURCHASES OF EQUITY SECURITIES BY CLOSED-END MANAGEMENT INVESTMENT COMPANY AND AFFILIATED PURCHASERS.
Not applicable for this filing.
ITEM 10. SUBMISSION OF MATTERS TO A VOTE OF SECURITY HOLDERS.
Not applicable for this filing.
ITEM 11. CONTROLS AND PROCEDURES.
| (a) | The principal executive officer and principal financial officer of the Registrant evaluated the effectiveness of the Registrant's disclosure controls and procedures (as defined in Rule 30a-3(c) under the Investment Company Act of 1940 (the "Act")) as of a date within 90 days of the filing date of this report and based on that evaluation have concluded that such disclosure controls and procedures are effective to provide reasonable assurance that material information required to be disclosed by the Registrant on Form N-CSR is recorded, processed, summarized and reported within the time periods specified in the Securities and Exchange Commission's rules and forms. |
| (b) | There were no changes in the Registrant's internal control over financial reporting (as defined in Rule 30a-3(d) under the Act) during the Registrant's second fiscal half year that have materially affected, or are reasonably likely to materially affect, the Registrant's internal control over financial reporting. |
ITEM 12. EXHIBITS.
| (a)(1) | ANY CODE OF ETHICS, OR AMENDMENTS THERETO, THAT IS THE SUBJECT OF DISCLOSURE REQUIRED BY ITEM 2, TO THE EXTENT THAT THE REGISTRANT INTENDS TO SATISFY THE ITEM 2 REQUIREMENTS THROUGH THE FILING OF AN EXHIBIT. |
Not applicable for this filing.
| (a)(2) | A SEPARATE CERTIFICATION FOR EACH PRINCIPAL EXECUTIVE OFFICER AND PRINCIPAL FINANCIAL OFFICER OF THE REGISTRANT AS REQUIRED BY RULE 30a-2 UNDER THE ACT. |
Attached hereto as EX-99.31.1
Attached hereto as EX-99.31.2
| (a)(3) | ANY WRITTEN SOLICITATION TO PURCHASE SECURITIES UNDER RULE 23c-1 UNDER THE ACT (17 CFR 270.23c-1) SENT OR GIVEN DURING THE PERIOD COVERED BY THE REPORT BY OR ON BEHALF OF THE REGISTRANT TO 10 OR MORE PERSONS. |
Not applicable for this filing.
| (b) | CERTIFICATIONS PURSUANT TO RULE 302-2(b) UNDER THE ACT. |
Attached hereto as EX-99.32
SIGNATURES
Pursuant to the requirements of the Securities Exchange Act of 1934 and the Investment Company Act of 1940, the Registrant has duly caused this report to be signed on its behalf by the undersigned, thereunto duly authorized.
(Registrant): | Barings Participation Investors | |
| | |
| | |
By: | /s/ Robert M. Shettle | |
| Robert M. Shettle, President | |
| | |
Date: | March 10, 2017 | |
| | |
Pursuant to the requirements of the Securities Exchange Act of 1934 and the Investment Company Act of 1940, this report has been signed below by the following persons on behalf of the Registrant and in the capacities and on the dates indicated.
By: | /s/ Robert M. Shettle | |
| Robert M. Shettle, President | |
| | |
Date: | March 10, 2017 | |
| | |
| | |
By: | /s/ James M. Roy | |
| James M. Roy, Vice President and Chief Financial Officer | |
| | |
Date: | March 10, 2017 | |