Barings
Participation Investors
Report for the Three Months Ended March 31, 2022
|

Adviser
Barings LLC
300 S Tryon St., Suite 2500
Charlotte, NC 28202
Independent Registered Public Accounting Firm
KPMG LLP
Boston, Massachusetts 02110
Counsel to the Trust
Ropes & Gray LLP
Boston, Massachusetts 02111
Custodian
State Street Bank and Trust Company
Boston, Massachusetts 02110
Transfer Agent & Registrar
DST Systems, Inc.
P.O. Box 219086
Kansas City, Missouri 64121-9086
1-800-647-7374
Internet Website
https://www.barings.com/en-us/guest/funds/closed-end-
funds/barings-participation-investors
 | Barings Participation Investors c/o Barings LLC 300 S Tryon St., Suite 2500 Charlotte, NC 28202 1-866-399-1516
|
Investment Objective and Policy
Barings Participation Investors (the “Trust”) is a closed-end management investment company, first offered to the public in 1988, whose shares are traded on the New York Stock Exchange under the trading symbol “MPV”. The Trust’s share price can be found in the financial section of most newspapers under either the New York Stock Exchange listings or Closed-End Fund Listings.
The Trust’s investment objective is to maintain a portfolio of securities providing a current yield and, when available, an opportunity for capital gains. The Trust’s principal investments are privately placed, below investment grade, long-term debt obligations including bank loans and mezzanine debt instruments. Such private placement securities may, in some cases, be accompanied by equity features such as common stock, preferred stock, warrants, conversion rights, or other equity features. The Trust typically purchases these investments, which are not publicly tradable, directly from their issuers in private placement transactions. These investments are typically made to small or middle market companies. In addition, the Trust may invest, subject to certain limitations, in marketable debt securities (including high yield and/or investment grade securities) and marketable common stock. Below investment grade or high yield securities have predominantly speculative characteristics with respect to the capacity of the issuer to pay interest and repay capital.
The Trust distributes substantially all of its net income to shareholders each year. Accordingly, the Trust pays dividends to shareholders four times per year. All registered shareholders are automatically enrolled in the Dividend Reinvestment and Cash Purchase Plan unless cash distributions are requested.
Form N-PORT
The Trust files its complete schedule of portfolio holdings with the U.S. Securities and Exchange Commission (“SEC”) for the first and third quarters of each fiscal year on part F of Form N-PORT. This information is available (i) on the SEC’s website at http://www.sec.gov; and (ii) at the SEC’s Public Reference Room in Washington, DC (which information on their operation may be obtained by calling 1-800-SEC-0330). A complete schedule of portfolio holdings as of each quarter-end is available upon request by calling, toll-free, 866-399-1516.
Proxy Voting Policies & Procedures; Proxy Voting Record
The Trustees of the Trust have delegated proxy voting responsibilities relating to the voting of securities held by the Trust to Barings LLC (“Barings”). A description of Barings’ proxy voting policies and procedures is available (1) without charge, upon request, by calling, toll-free 866-399-1516; (2) on the Trust’s website at https://www.barings.com/en-us/guest/funds/closed-end-funds/barings-participation-investors; and (3) on the SEC’s website at http://www.sec.gov. Information regarding how the Trust voted proxies relating to portfolio securities during the most recent 12-month period ended June 30 is available (1) on the Trust’s website at https://www.barings.com/en-us/guest/funds/closed-end-funds/barings-participation-investors; and (2) on the SEC’s website at http://www.sec.gov.
Legal Matters
The Trust has entered into contractual arrangements with an investment adviser, transfer agent and custodian (collectively “service providers”) who each provide services to the Trust. Shareholders are not parties to, or intended beneficiaries of, these contractual arrangements, and these contractual arrangements are not intended to create any shareholder right to enforce them against the service providers or to seek any remedy under them against the service providers, either directly or on behalf of the Trust.
Under the Trust’s Bylaws, any claims asserted against or on behalf of the Trust, including claims against Trustees and officers must be brought in courts located within the Commonwealth of Massachusetts.
The Trust’s registration statement and this shareholder report are not contracts between the Trust and its shareholders and do not give rise to any contractual rights or obligations or any shareholder rights other than any rights conferred explicitly by federal or state securities laws that may not be waived.

Barings Participation Investors
TO OUR SHAREHOLDERS
April 30, 2022
We are pleased to present the March 31, 2022 Quarterly Report of Barings Participation Investors (the “Trust”).
PORTFOLIO PERFORMANCE
The Board of Trustees declared a quarterly dividend of $0.20 per share, payable on June 10, 2022 to shareholders of record on May 31, 2022. The Trust paid a $0.20 per share dividend for the preceding quarter. The Trust earned $0.20 per share of net investment income for the first quarter of 2022, compared to $0.28 per share in the previous quarter.
During the first quarter, the net assets of the Trust increased to $162,516,736.44 or $15.33 per share compared to $161,080,475 or $15.19 per share on December 31, 2021. This translates to a 0.92% total return for the quarter, based on the change in the Trust’s net assets assuming the reinvestment of all dividends. Longer term, the Trust returned 14.1%, 11.0%, 9.9%, 10.6% and 11.5% for the 1, 3, 5, 10, and 25-year periods, respectively, based on the change in the Trust’s net assets assuming the reinvestment of all dividends.
The Trust’s market price decreased 9.5% during the quarter, from $14.80 per share as of December 31, 2021 to $13.39 per share as of March 31, 2022. The Trust’s market price of $13.39 per share equates to a 12.7% discount to the March 31, 2022 net asset value per share of $15.33. The Trust’s average quarter-end discount/premium for the 3, 5 and 10-year periods was -2.0%, 1.3% and 3.0%, respectively. U.S. fixed income markets, as approximated by the Bloomberg Barclays U.S. Corporate High Yield Index and the Credit Suisse Leverage Loan Index, decreased 4.8% and 0.1% for the quarter, respectively.
PORTFOLIO ACTIVITY
The Trust closed eight new private placement investments and ten add-on investments to existing portfolio companies during the first quarter. The total amount invested by the Trust in these transactions was $7,539,084. Of note, the new platform investments included one fixed rate Sr. Subordinated Note and seven floating rate term loans, five of which included equity co-investments, and the add-on investments included eight floating rate term loans and one fixed rate Sr. Subordinated Note that included an equity co-investment.
The investment activity in the first quarter of 2022 was lower than the first quarter of 2021, however, it was in line with historical first quarter investment activity. As the investment landscape remains stable, some key trends have continued. First, investment activity is now back to (and even beyond) pre-pandemic levels. Secondly, in the current market, financial sponsors and other ownership groups are motivated to divest portfolio companies due to the high valuations for strong businesses. With the significant dry powder they have available, financial sponsors are also motivated to acquire high-quality businesses which have outperformed through both good times and the more recent uncertainty. Lastly, private equity clients continue to work with a smaller group of trusted lenders with whom they have long-standing relationships and who can offer certainty of execution and creative solutions.
With demand for products and services continuing to increase, one key question is whether supply chains can keep up with the renewed demand and whether we will see material increases in prices as a result of supply-chain bottlenecks, rising raw material and energy costs and labor shortages. Across the world, and particularly in regions with large manufacturing sectors which depend on international trade, these risks may be key. However, it is important to note that such issues do not affect every geography and sector the same. When constructing portfolios, we focus on investing in high-quality businesses which are leaders in their space and offer defensive characteristics which will allow them to perform through the cycle. Therefore, while segments of the broader economy may be affected by potential supply chain issues, increasing raw material and energy costs and labor shortages, we remain confident in the current diverse portfolio to perform through the potential cycle.
We continue to be selective in our investment choices and maintain our underwriting discipline throughout multiple cycles. First, the Trust continues to invest in first lien senior secured loans in high-quality companies in defensive sectors and remains well diversified by industry. This was a strategy put in place more than five years ago and has provided strong risk adjusted returns for the Trust given their senior position in the capital stack. As of March 31, 2022, 66.0% of the Trust’s investment portfolio is in first lien senior secured loans compared to 2.7% as of December 31, 2017. These
(Continued)
1
investments have proven resilient to date and their management teams now have the benefit of having a wealth of knowledge to draw upon from working in such unique and challenging circumstances. Second, we hold meaningful investment liquidity based on the Trust’s combined available cash balance and short-term investments of $5,182,564 or 2.8% of total assets, and low leverage profile at 0.14x as of March 31, 2022. We have strengthened our liquidity position with a $15.0 million committed revolving credit facility with MassMutual (See Note 4). This facility coupled with the current cash balance provides ample liquidity to support our current portfolio as well as invest in new portfolio companies. Third, we continue to be selective in pruning our equity investments and reinvesting the proceeds into first lien senior secured investments further driving investment income. As always, the Trust continues to benefit from strong relationships with our financial sponsor partners which provides clear benefits including potential access to additional capital if needed, strategic thinking alongside their management teams and high-quality and timely information which is only available in a private market setting. This allows us to work constructively together and maximize the portfolio companies’ long-term health and value.
In closing, we believe it is always appropriate to provide views on the Trust’s long-term dividend policy which is to say, ‘we believe that long-term dividends should be a reflection of long-term core earnings power, even when core earnings power is lower as a result of a higher quality asset mix’. The Trust’s recently announced dividend of $0.20 per share is in line with our most recently reported net investment income of $0.20 per share. That said, as we continue to both (1) deploy the Trust’s excess liquidity and (2) seek opportunities to shift the Trust’s non-yielding equity investments to senior secured loans, we expect long-term earnings power to meet the dividend distribution.
Thank you for your continued interest in and support of Barings Participation Investors.
Sincerely,

Christina Emery
President
Portfolio Composition as of 03/31/22*
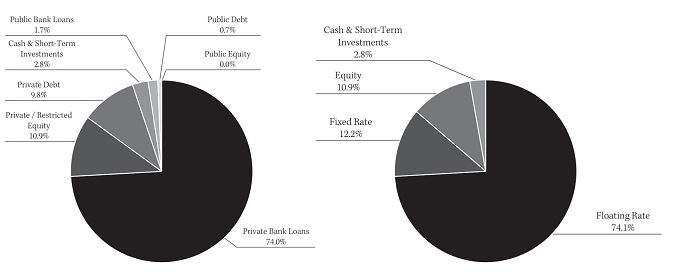
* Based on market value of total investments (including cash)
Cautionary Notice: Certain statements contained in this report may be “forward looking” statements. Investors are cautioned not to place undue reliance on forward-looking statements, which speak only as of the date on which they are made and which reflect management’s current estimates, projections, expectations or beliefs, and which are subject to risks and uncertainties that may cause actual results to differ materially. These statements are subject to change at any time based upon economic, market or other conditions and may not be relied upon as investment advice or an indication of the Trust’s trading intent. References to specific securities are not recommendations of such securities, and may not be representative of the Trust’s current or future investments. We undertake no obligation to publicly update forward looking statements, whether as a result of new information, future events, or otherwise.
2
Barings Participation Investors

| Average Annual Returns March 31, 2022 | 1 Year | 5 Year | 10 Year |
| Barings Participation Investors | 9.85% | 6.08% | 6.73% |
| Bloomberg Barclays U.S. Corporate High Yield Index | -0.66% | 4.69% | 5.75% |
Data for Barings Participation Investors (the “Trust”) represents returns based on the change in the Trust’s market price assuming the reinvestment of all dividends and distributions. Past performance is no guarantee of future results.
The graph and table do not reflect the deduction of taxes that a shareholder would pay on distributions from the Trust or the sale of shares.
3
In July 2017, the head of the U.K. Financial Conduct Authority (the “FCA”), announced that the FCA will no longer persuade or compel banks to submit rates for the calculation of LIBOR after 2021. In March 2021, the FCA confirmed that all LIBOR settings will either cease to be provided by any administrator or no longer be representative: (a) immediately after December 31, 2021, in the case of sterling, euro, Swiss franc, and Japanese yen, and the one week and two month U.S. dollar settings; and (b) immediately after June 30, 2023, in the case of the remaining U.S. dollar settings. In addition, as a result of supervisory guidance from U.S. regulators, some U.S. regulated entities will cease to enter into new LIBOR contracts after January 1, 2022. At this time, no consensus exists as to what rate or rates will become accepted alternatives to LIBOR, although the Alternative Reference Rates Committee, a steering committee convened by the Board of Governors of the Federal Reserve System and the Federal Reserve Bank of New York and comprised of large U.S. financial institutions, has recommended the use of the Secured Overnight Financing Rate, SOFR. There are many uncertainties regarding a transition from LIBOR to SOFR or any other alternative benchmark rate that may be established, including, but not limited to, the timing of any such transition, the need to amend all contracts with LIBOR as the referenced rate and, given the inherent differences between LIBOR and SOFR or any other alternative benchmark rate, how any transition may impact the cost and performance of impacted securities, variable rate debt and derivative financial instruments. In addition, SOFR or another alternative benchmark rate may fail to gain market acceptance, which could adversely affect the return on, value of and market for securities, variable rate debt and derivative financial instruments linked to such rates. The effects of a transition from LIBOR to SOFR or any other alternative benchmark rate on our cost of capital and net investment income cannot yet be determined definitively. All of our loan agreements with our portfolio companies include fallback language in the event that LIBOR becomes unavailable. This language generally either includes a clearly defined alternative reference rate after LIBOR’s discontinuation or provides that the administrative agent may identify a replacement reference rate, typically with the consent of (or prior consultation with) the borrower. In certain cases, the administrative agent will be required to obtain the consent of either a majority of the lenders under the facility, or the consent of each lender, prior to identifying a replacement reference rate. In addition, any further changes or reforms to the determination or supervision of LIBOR may result in a sudden or prolonged increase or decrease in reported LIBOR, which could have an adverse impact on the market value for or value of any LIBOR-linked securities, loans, and other financial obligations or extensions of credit held by or due to us and could have a material adverse effect on our business, financial condition and results of operations.
4
Barings Participation Investors
CONSOLIDATED STATEMENT OF ASSETS AND LIABILITIES
March 31, 2022
(Unaudited)
| Assets: | ||||
| Investments (See Consolidated Schedule of Investments) | ||||
| Corporate restricted securities - private placement investments at fair value (Cost - $160,751,267) | $ | 166,824,571 | ||
| Corporate restricted securities - rule 144A securities at fair value (Cost - $7,596,992) | 8,006,113 | |||
| Corporate public securities at fair value (Cost - $4,571,044) | 4,612,581 | |||
| Total investments (Cost - $172,919,303) | 179,443,265 | |||
| Cash | 5,175,650 | |||
| Foreign currencies (Cost - $6,831) | 6,914 | |||
| Dividend and interest receivable | 1,896,405 | |||
| Receivable for investments sold | 91,288 | |||
| Deferred financing fees | 63,708 | |||
| Other assets | 142,392 | |||
| Total assets | 186,819,622 | |||
| Liabilities: | ||||
| Note payable | 15,000,000 | |||
| Credit facility | 8,200,000 | |||
| Deferred tax liability | 365,141 | |||
| Investment advisory fee payable | 355,543 | |||
| Payable for investments purchased | 290,250 | |||
| Interest payable | 33,935 | |||
| Accrued expenses | 58,017 | |||
| Total liabilities | 24,302,886 | |||
| Commitments and Contingencies (See Note 7) | ||||
| Total net assets | $ | 162,516,736 | ||
| Net Assets: | ||||
| Common shares, par value $.01 per share | $ | 106,017 | ||
| Additional paid-in capital | 145,010,902 | |||
| Total distributable earnings | 17,399,817 | |||
| Total net assets | $ | 162,516,736 | ||
| Common shares issued and outstanding (14,787,750 authorized) | 10,601,700 | |||
| Net asset value per share | $ | 15.33 | ||
See Notes to Consolidated Financial Statements
5
CONSOLIDATED STATEMENT OF OPERATIONS
For the three months ended March 31, 2022
(Unaudited)
| Investment Income: | ||||
| Interest | $ | 2,935,120 | ||
| Other | 34,933 | |||
| Total investment income | 2,970,053 | |||
| Expenses: | ||||
| Investment advisory fees | 355,543 | |||
| Interest | 200,689 | |||
| Professional fees | 73,565 | |||
| Trustees’ fees and expenses | 69,000 | |||
| Reports to shareholders | 22,500 | |||
| Custodian fees | 6,000 | |||
| Other | 28,342 | |||
| Total expenses | 755,639 | |||
| Investment income - net | 2,214,414 | |||
| Income tax, including excise tax expense | 52,650 | |||
| Net investment income after taxes | 2,161,764 | |||
| Net realized and unrealized loss on investments and foreign currency: | ||||
| Net realized gain on investments before taxes | 118,901 | |||
| Income tax expenses | (21,004 | ) | ||
| Net realized gain on investments after taxes | 97,897 | |||
| Net increase in unrealized depreciation of investments before taxes | (682,652 | ) | ||
| Net increase in unrealized appreciation of foreign currency translation before taxes | 77 | |||
| Net increase in deferred income tax expense | (140,825 | ) | ||
| Net increase in unrealized depreciation of investments and foreign currency transactions after taxes | (823,400 | ) | ||
| Net loss on investments and foreign currency | (725,503 | ) | ||
| Net increase in net assets resulting from operations | $ | 1,436,261 | ||
See Notes to Consolidated Financial Statements
6
Barings Participation Investors
CONSOLIDATED STATEMENT OF CASH FLOWS
For the three months ended March 31, 2022
(Unaudited)
| Net decrease in cash & foreign currencies: | ||||
| Cash flows from operating activities: | ||||
| Purchases of portfolio securities | $ | (9,467,410 | ) | |
| Proceeds from disposition of portfolio securities | 2,579,827 | |||
| Interest, dividends and other income received | 2,410,643 | |||
| Interest expense paid | (198,536 | ) | ||
| Operating expenses paid | (589,937 | ) | ||
| Income taxes paid | (1,236,229 | ) | ||
| Net cash used for operating activities | (6,501,642 | ) | ||
| Cash flows from financing activities: | ||||
| Borrowings under credit facility | 2,200,000 | |||
| Cash dividends paid from net investment income | (2,120,340 | ) | ||
| Financing fees paid | (14,279 | ) | ||
| Net cash provided by financing activities | 65,381 | |||
| Net decrease in cash & foreign currencies | (6,436,261 | ) | ||
| Cash & foreign currencies - beginning of period | 11,618,748 | |||
| Effects of foreign currency exchange rate changes on cash and cash equivalents | 77 | |||
| Cash & foreign currencies - end of period | $ | 5,182,564 | ||
| Reconciliation of net increase in net assets to net cash used for operating activities: | ||||
| Net increase in net assets resulting from operations | $ | 1,436,261 | ||
| Increase in investments | (6,344,157 | ) | ||
| Increase in interest receivable | (378,596 | ) | ||
| Decrease in receivable for investments sold | 349,380 | |||
| Decrease in other assets | 108,330 | |||
| Increase in deferred tax liability | 140,825 | |||
| Decrease in investment advisory fee payable | (17,430 | ) | ||
| Decrease in payable for investments purchased | (618,199 | ) | ||
| Decrease in accrued expenses | (17,557 | ) | ||
| Increase in interest payable | 2,153 | |||
| Decrease in tax payable | (1,162,575 | ) | ||
| Total adjustments to net assets from operations | (7,937,826 | ) | ||
| Effects of foreign currency exchange rate changes on cash and cash equivalents | (77 | ) | ||
| Net cash used for operating activities | (6,501,642 | ) | ||
See Notes to Consolidated Financial Statements
7
CONSOLIDATED STATEMENTS OF CHANGES IN NET ASSETS
For the three months ended March 31, 2022
For the three | For the | |||||||
| Increase in net assets: | ||||||||
| Operations: | ||||||||
| Investment income - net | $ | 2,161,764 | $ | 9,188,642 | ||||
| Net realized gain on investments and foreign currency after taxes | 97,897 | 4,867,781 | ||||||
| Net change in unrealized appreciation (depreciation) of investments and foreign currency after taxes | (823,400 | ) | 11,328,033 | |||||
| Net increase in net assets resulting from operations | 1,436,261 | 25,384,456 | ||||||
| Dividends to shareholders from: | ||||||||
| Distributable earnings to Common Stock Shareholders (2022 - $0.00 per share; 2021 - $0.80 per share) | — | (8,481,360 | ) | |||||
| Total increase in net assets | 1,436,261 | 16,903,096 | ||||||
| Net assets, beginning of period/year | 161,080,475 | 144,177,379 | ||||||
| Net assets, end of period/year | $ | 162,516,736 | $ | 161,080,475 | ||||
See Notes to Consolidated Financial Statements
8
Barings Participation Investors
CONSOLIDATED SELECTED FINANCIAL HIGHLIGHTS
Selected data for each share of beneficial interest outstanding:
For the three months ended | For the years ended December 31, | |||||||||||||||||||||||
| (Unaudited) | 2021 | 2020 | 2019 | 2018 | 2017 | |||||||||||||||||||
| Net asset value: | ||||||||||||||||||||||||
| Beginning of period / year | $ | 15.19 | $ | 13.60 | $ | 13.80 | $ | 13.18 | $ | 13.91 | $ | 13.15 | ||||||||||||
| Net investment income (a) | 0.20 | 0.86 | 1.00 | 1.00 | 1.03 | 1.09 | ||||||||||||||||||
| Net realized and unrealized gain (loss) on investments | (0.06) | 1.53 | (0.40) | 0.69 | (0.68) | 0.75 | ||||||||||||||||||
| Total from investment operations | 0.14 | 2.39 | 0.60 | 1.69 | 0.35 | 1.84 | ||||||||||||||||||
| Dividends from net investment income to common shareholders | — | (0.80) | (0.80) | (1.08) | (1.08) | (1.08) | ||||||||||||||||||
| Increase / (Decrease) from dividends reinvested | — | 0.00 | 0.00 (b) | 0.01 (b) | (0.00) (b) | (0.00) (b) | ||||||||||||||||||
| Total dividends | — | (0.80) | (0.80) | (1.07) | (1.08) | (1.08) | ||||||||||||||||||
| Net asset value: End of period / year | $ | 15.33 | $ | 15.19 | $ | 13.60 | $ | 13.80 | $ | 13.18 | $ | 13.91 | ||||||||||||
| Per share market value: | ||||||||||||||||||||||||
| End of period / year | $ | 13.39 | $ | 14.80 | $ | 11.88 | $ | 16.13 | $ | 15.05 | $ | 14.10 | ||||||||||||
| Total investment return | ||||||||||||||||||||||||
| Net asset value (c) | 0.92% | 17.84% | 4.66% | 13.21% | 2.53% | 14.29% | ||||||||||||||||||
| Market value (c) | (9.52%) | 32.09% | (21.11%) | 14.72% | 15.02% | 7.21% | ||||||||||||||||||
| Net assets (in millions): | ||||||||||||||||||||||||
| End of period / year | $ | 162.52 | $ | 161.08 | $ | 144.18 | $ | 146.08 | $ | 138.75 | $ | 145.48 | ||||||||||||
| Ratio of total expenses to average net assets (d) | 2.07%(e) | 2.66% | 1.47% | 2.26% | 2.76% | 3.23% | ||||||||||||||||||
| Ratio of operating expenses to average net assets | 1.39%(e) | 1.46% | 1.38% | 1.45% | 1.56% | 1.49% | ||||||||||||||||||
| Ratio of interest expense to average net assets | 0.50%(e) | 0.41% | 0.43% | 0.42% | 0.42% | 0.43% | ||||||||||||||||||
| Ratio of income tax expense to average net assets | 0.18%(e) | 0.79% | (0.34%) | 0.39% | 0.78% | 1.31% | ||||||||||||||||||
| Ratio of net investment income to average net assets | 5.40%(e) | 5.99% | 7.52% | 7.30% | 7.47% | 7.92% | ||||||||||||||||||
| Portfolio turnover | 1% | 43% | 34% | 22% | 48% | 24% | ||||||||||||||||||
| (a) | Calculated using average shares. |
| (b) | Rounds to less than $0.01 per share. distributions which differs from the total investment return based on the Trust’s market value due to the difference between the Trust’s net asset |
| (c) | Net asset value return represents portfolio returns based on change in the Trust’s net asset value assuming the reinvestment of all dividends and distributions which differs from the total investment return based on the Trust’s market value due to the difference between the Trust’s net asset value and the market value of its shares outstanding; past performance is no guarantee of future results. |
| (d) | Total expenses include income tax expense. |
| (e) | Annualized |
| Senior borrowings: | ||||||||||||||||||||||||
| Total principal amount (in millions) | $ | 23.2 | $ | 21 | $ | 15 | $ | 15 | $ | 15 | $ | 15 | ||||||||||||
| Asset coverage per $1,000 of indebtedness | $ | 8,005 | $ | 8,670 | $ | 10,612 | $ | 10,739 | $ | 10,250 | $ | 10,699 | ||||||||||||
See Notes to Consolidated Financial Statements
9
CONSOLIDATED SCHEDULE OF INVESTMENTS
March 31, 2022
(Unaudited)
| Corporate Restricted Securities - 107.58%: (A) | Principal Amount, | Acquisition | Cost | Fair Value | ||||||||||
| Private Placement Investments - 102.65%: (C) | ||||||||||||||
| 1WorldSync, Inc. | ||||||||||||||
| A product information sharing platform that connects manufacturers/suppliers and key retailers via the Global Data Synchronization Network. | ||||||||||||||
| 6.75% Term Loan due 06/24/2025 (LIBOR + 5.750%) | $ | 2,434,019 | * | $ | 2,404,969 | $ | 2,429,647 | |||||||
| * 07/01/19 and 12/09/20. | ||||||||||||||
| Accelerate Learning | ||||||||||||||
| A provider of standards-based, digital science education content of K-12 schools. | ||||||||||||||
| 6.01% Term Loan due 12/31/2024 (LIBOR + 5.000%) | $ | 974,753 | 12/19/18 | 965,913 | 958,507 | |||||||||
| 6.00% Term Loan due 12/20/2024 (LIBOR + 5.000%) | $ | 746,495 | 09/30/21 | 733,876 | 734,053 | |||||||||
| 1,699,789 | 1,692,560 | |||||||||||||
| Advanced Manufacturing Enterprises LLC | ||||||||||||||
| A designer and manufacturer of large, custom gearing products for a number of critical customer applications. | ||||||||||||||
| Limited Liability Company Unit (B) | 1,945 uts. | * | 207,911 | — | ||||||||||
| * 12/07/12, 07/11/13 and 06/30/15. | ||||||||||||||
| Advantage Software | ||||||||||||||
| A provider of enterprise resource planning (ERP) software built for advertising and marketing agencies. | ||||||||||||||
| Limited Liability Company Unit Class A (F) | 766 uts. | 10/01/21 | 24,353 | 79,188 | ||||||||||
| Limited Liability Company Unit Class A (F) | 197 uts. | 10/01/21 | 6,320 | 20,424 | ||||||||||
| Limited Liability Company Unit Class B (F) | 766 uts. | 10/01/21 | 784 | 513 | ||||||||||
| Limited Liability Company Unit Class B (F) | 197 uts. | 10/01/21 | 202 | 132 | ||||||||||
| 31,659 | 100,257 | |||||||||||||
| Aftermath, Inc. | ||||||||||||||
| A provider of crime scene cleanup and biohazard remediation services. | ||||||||||||||
| 6.00% Term Loan due 04/10/2025 (LIBOR + 5.000%) | $ | 963,473 | 04/09/19 | 952,545 | 943,240 | |||||||||
| 6.00% Term Loan due 04/10/2025 (LIBOR + 5.000%) | $ | 757,719 | 04/23/21 | 747,239 | 741,807 | |||||||||
| 1,699,784 | 1,685,047 | |||||||||||||
| AIT Worldwide Logistics, Inc. | ||||||||||||||
| A provider of domestic and international third-party logistics services. | ||||||||||||||
| 8.75% Second Lien Term Loan due 03/31/2029 (LIBOR + 7.750%) | $ | 1,669,355 | 04/06/21 | 1,636,431 | 1,633,180 | |||||||||
| Limited Liability Company Unit (B) | 56 uts. | 04/06/21 | 55,645 | 109,548 | ||||||||||
| 1,692,076 | 1,742,728 | |||||||||||||
| AMS Holding LLC | ||||||||||||||
| A leading multi-channel direct marketer of high-value collectible coins and proprietary-branded jewelry and watches. | ||||||||||||||
| Limited Liability Company Unit Class A Preferred (B)(F) | 114 uts. | 10/04/12 | 113,636 | 244,986 | ||||||||||
10
Barings Participation Investors
CONSOLIDATED SCHEDULE OF INVESTMENTS (CONTINUED)
March 31, 2022
(Unaudited)
| Corporate Restricted Securities: (A) (Continued) | Principal Amount, | Acquisition | Cost | Fair Value | ||||||||||
| Amtech Software | ||||||||||||||
| A provider of enterprise resource planning software and technology solutions for packaging manufacturers. | ||||||||||||||
| 6.25% First Lien Term Loan due 11/02/2027 (LIBOR + 5.500%) (G) | $ | 1,000,000 | 11/02/21 | $ | 526,824 | $ | 528,214 | |||||||
| ASC Holdings, Inc. | ||||||||||||||
| A manufacturer of capital equipment used by corrugated box manufacturers. | ||||||||||||||
| 13% Senior Subordinated Note due 12/31/2024 | $ | 805,872 | 11/19/15 | 805,858 | 718,838 | |||||||||
| Limited Liability Company Unit (B) | 111,100 uts. | 11/18/15 | 111,100 | 18,576 | ||||||||||
| 916,958 | 737,414 | |||||||||||||
| ASPEQ Holdings | ||||||||||||||
| A manufacturer of highly-engineered electric heating parts and equipment for a range of industrial, commercial, transportation and marine applications. | ||||||||||||||
| 6.26% Term Loan due 10/31/2025 (LIBOR + 5.250%) | $ | 1,131,056 | 11/08/19 | 1,120,862 | 1,131,056 | |||||||||
| Audio Precision | ||||||||||||||
| A provider of high-end audio test and measurement sensing instrumentation software and accessories. | ||||||||||||||
| 7.00% Term Loan due 07/27/2024 (LIBOR + 6.000%) | $ | 1,746,000 | 10/30/18 | 1,730,961 | 1,746,000 | |||||||||
| Aurora Parts & Accessories LLC | ||||||||||||||
| A distributor of aftermarket over-the-road semi-trailer parts and accessories sold to customers across North America. | ||||||||||||||
| Preferred Stock (B) | 210 shs. | 08/17/15 | 209,390 | 209,390 | ||||||||||
| Common Stock (B) | 210 shs. | 08/17/15 | 210 | 145,107 | ||||||||||
| 209,600 | 354,497 | |||||||||||||
| BDP International, Inc. | ||||||||||||||
| A provider of transportation and related services to the chemical and life sciences industries. | ||||||||||||||
| 6.25% Term Loan due 12/14/2024 (LIBOR + 5.250%) | $ | 2,384,888 | 12/18/18 | 2,363,340 | 2,384,888 | |||||||||
| 6.25% Incremental Term Loan due 12/19/2024 (LIBOR + 5.250%) | $ | 42,598 | 12/07/20 | 42,024 | 42,598 | |||||||||
| 6.25% Incremental Term Loan due 12/21/2024 (LIBOR + 5.250%) | $ | 40,854 | 03/30/21 | 40,256 | 40,854 | |||||||||
| 2,445,620 | 2,468,340 | |||||||||||||
| Best Lawyers (Azalea Investment Holdings, LLC) | ||||||||||||||
| A global digital media company that provides ranking and marketing services to the legal community. | ||||||||||||||
| 12.00% HoldCo PIK Note due 05/19/2028 | $ | 289,712 | 11/30/21 | 284,217 | 284,561 | |||||||||
| 6.25% First Lien Term Loan due 11/19/2027 (LIBOR + 5.250%) (G) | $ | 1,391,058 | 11/30/21 | 1,033,063 | 1,034,597 | |||||||||
| Limited Liability Company Unit | 44,231 uts. | 11/30/21 | 44,231 | 44,231 | ||||||||||
| 1,361,511 | 1,363,389 | |||||||||||||
11
CONSOLIDATED SCHEDULE OF INVESTMENTS (CONTINUED)
March 31, 2022
(Unaudited)
| Corporate Restricted Securities: (A) (Continued) | Principal Amount, | Acquisition | Cost | Fair Value | ||||||||||
| Blue Wave Products, Inc. | ||||||||||||||
| A distributor of pool supplies. | ||||||||||||||
| Common Stock (B) | 51,064 shs. | 10/12/12 | $ | 51,064 | $ | 138,521 | ||||||||
| Warrant, exercisable until 2022, to purchase common stock at $.01 per share (B) | 20,216 shs. | 10/12/12 | 20,216 | 54,638 | ||||||||||
| 71,280 | 193,159 | |||||||||||||
| BrightSign | ||||||||||||||
| A provider of digital signage hardware and software solutions, serving a variety of end markets, including retail, restaurants, government, sports, and entertainment. | ||||||||||||||
| 6.75% Term Loan due 10/14/2027 (LIBOR + 5.750%) (G) | $ | 1,424,643 | 10/14/21 | 1,277,263 | 1,266,221 | |||||||||
| Limited Liability Company Unit (F) | 111,835 uts. | 10/14/21 | 111,835 | 111,835 | ||||||||||
| 1,389,098 | 1,378,056 | |||||||||||||
| Brown Machine LLC | ||||||||||||||
| A designer and manufacturer of thermoforming equipment used in the production of plastic packaging containers within the food and beverage industry. | ||||||||||||||
| 6.25% Term Loan due 10/04/2024 (LIBOR + 5.250%) | $ | 808,993 | 10/03/18 | 804,158 | 808,993 | |||||||||
| Cadence, Inc. | ||||||||||||||
| A full-service contract manufacturer (“CMO”) and supplier of advanced products, technologies, and services to medical device, life science, and industrial companies. | ||||||||||||||
| 6.00% First Lien Term Loan due 04/30/2025 (LIBOR + 5.000%) | $ | 879,427 | 05/14/18 | 871,513 | 844,250 | |||||||||
| Cadent, LLC | ||||||||||||||
| A provider of advertising solutions driven by data and technology. | ||||||||||||||
| 6.00% Term Loan due 09/07/2023 (LIBOR + 5.000%) | $ | 890,428 | 09/04/18 | 887,844 | 890,428 | |||||||||
| CAi Software | ||||||||||||||
| A vendor of mission-critical, production-oriented software to niche manufacturing and distribution sectors. | ||||||||||||||
| 7.25% Term Loan due 12/10/2028 (LIBOR + 6.250%) (G) | $ | 2,500,000 | 12/13/21 | 2,216,388 | 2,219,254 | |||||||||
| Cash Flow Management | ||||||||||||||
| A software provider that integrates core banking systems with branch technology and creates modern retail banking experiences for financial institutions. | ||||||||||||||
| 6.25% Term Loan due 12/27/2027 (LIBOR + 5.250%) (G) | $ | 986,967 | 12/28/21 | 893,448 | 894,300 | |||||||||
| Claritas Holdings, Inc. | ||||||||||||||
| A market research company that provides market segmentation insights to customers engaged in direct-to-consumer and business-to-business marketing activities. | ||||||||||||||
| 6.76% Term Loan due 12/31/2023 (LIBOR + 5.750%) | $ | 1,533,322 | 12/20/18 | 1,520,117 | 1,533,322 | |||||||||
12
Barings Participation Investors
CONSOLIDATED SCHEDULE OF INVESTMENTS (CONTINUED)
March 31, 2022
(Unaudited)
| Corporate Restricted Securities: (A) (Continued) | Principal Amount, | Acquisition | Cost | Fair Value | ||||||||||
| CloudWave | ||||||||||||||
| A provider of managed cloud hosting and IT services for hospitals. | ||||||||||||||
| 7.00% Term Loan due 01/04/2027 (LIBOR + 6.000%) | $ | 1,652,661 | 01/29/21 | $ | 1,622,807 | $ | 1,563,418 | |||||||
| Limited Liability Company Unit (B) (F) | 55,645 uts. | 01/29/21 | 55,645 | 34,305 | ||||||||||
| 1,678,452 | 1,597,723 | |||||||||||||
| Cogency Global | ||||||||||||||
| A provider of statutory representation and compliance services for corporate and professional services clients. | ||||||||||||||
| 6.25% Term Loan due 12/28/2027 (LIBOR + 5.500%) | $ | 972,449 | 02/14/22 | 892,807 | 892,389 | |||||||||
| Preferred Stock | 28 shs. | 02/14/22 | 27,551 | 27,550 | ||||||||||
| 920,358 | 919,939 | |||||||||||||
| Command Alkon | ||||||||||||||
| A vertical-market software and technology provider to the heavy building materials industry delivering purpose-built, mission critical products that serve as the core operating & production systems for ready-mix concrete producers, asphalt producers, and aggregate suppliers. | ||||||||||||||
| 8.00% Term Loan due 04/17/2027 (LIBOR + 7.000%) (G) | $ | 2,489,559 | * | 2,000,152 | 2,045,868 | |||||||||
| Limited Liability Company Unit (B)(F) | 18 uts. | 04/23/20 | 18,006 | 20,113 | ||||||||||
| Limited Liability Company Unit Class B | 6,629 uts. | 04/23/20 | — | 39,486 | ||||||||||
| * 04/23/20, 10/30/20 and 11/18/20. | 2,018,158 | 2,105,467 | ||||||||||||
| Concept Machine Tool Sales, LLC | ||||||||||||||
| A full-service distributor of high-end machine tools and metrology equipment, exclusively representing a variety of global manufacturers in the Upper Midwest. | ||||||||||||||
| 6.00% Term Loan due 01/31/2025 (LIBOR + 5.000%) | $ | 584,016 | 01/30/20 | 577,393 | 548,683 | |||||||||
| Limited Liability Company Unit (F) | 1,237 shs. | * | 49,559 | 10,210 | ||||||||||
| * 01/30/20 and 03/05/21 | 626,952 | 558,893 | ||||||||||||
| CTS Engines | ||||||||||||||
| A provider of maintenance, repair and overhaul services within the aerospace & defense market. | ||||||||||||||
| 6.26% Term Loan due 12/22/2026 (LIBOR + 5.250%) | $ | 1,388,868 | 12/22/20 | 1,366,976 | 1,329,147 | |||||||||
| Dart Buyer, Inc. | ||||||||||||||
| A manufacturer of helicopter aftermarket equipment and OEM Replacement parts for rotorcraft operators, providers and OEMs. | ||||||||||||||
| 6.25% Term Loan due 04/01/2025 (LIBOR + 5.250%) (G) | $ | 1,689,077 | 04/01/19 | 1,537,636 | 1,554,527 | |||||||||
| Decks Direct | ||||||||||||||
| An eCommerce direct-to-consumer seller of specialty residential decking products in the United States. | ||||||||||||||
| 7.00% Term Loan due 12/28/2026 (LIBOR + 6.000%) (G) | $ | 1,630,909 | 12/29/21 | 1,499,589 | 1,500,736 | |||||||||
| Limited Liability Company Unit | 2,209 uts. | 12/29/21 | 94,091 | 94,097 | ||||||||||
| 1,593,680 | 1,594,833 | |||||||||||||
13
CONSOLIDATED SCHEDULE OF INVESTMENTS (CONTINUED)
March 31, 2022
(Unaudited)
| Corporate Restricted Securities: (A) (Continued) | Principal Amount, | Acquisition | Cost | Fair Value | ||||||||||
| Del Real LLC | ||||||||||||||
| A manufacturer and distributor of fully-prepared fresh refrigerated Hispanic entrees as well as side dishes that are typically sold on a heat-and-serve basis at retail grocers. | ||||||||||||||
| 11% Senior Subordinated Note due 04/06/2023 (D) | $ | 1,420,588 | 10/07/16 | $ | 1,403,759 | $ | 1,275,688 | |||||||
| Limited Liability Company Unit (B)(F) | 368,799 uts. | * | 368,928 | 29,467 | ||||||||||
| * 10/07/16, 07/25/18, 03/13/19 and 06/17/19. | 1,772,687 | 1,305,155 | ||||||||||||
| DistroKid (IVP XII DK Co-Invest, LP) | ||||||||||||||
| A subscription-based music distribution platform that allows artists to easily distribute, promote, and monetize their music across digital service providers, such as Spotify and Apple Music. | ||||||||||||||
| 6.75% Term Loan due 09/30/2027 (LIBOR + 5.750%) | $ | 1,647,467 | 10/01/21 | 1,617,256 | 1,620,008 | |||||||||
| Limited Liability Company Unit (F) | 73,333 uts. | 10/01/21 | 73,404 | 73,333 | ||||||||||
| 1,690,660 | 1,693,341 | |||||||||||||
| Dunn Paper | ||||||||||||||
| A provider of specialty paper for niche product applications. | ||||||||||||||
| 10.26% Second Lien Term Loan due 08/31/2023 (LIBOR + 9.250%) | $ | 1,725,000 | 09/28/16 | 1,714,183 | 1,223,025 | |||||||||
| Dwyer Instruments, Inc. | ||||||||||||||
| A designer and manufacturer of precision measurement and control products for use with solids, liquids and gases. | ||||||||||||||
| 6.51% Term Loan due 07/01/2027 (LIBOR + 5.500%) | $ | 1,000,000 | 07/20/21 | 850,739 | 853,051 | |||||||||
| Echo Logistics | ||||||||||||||
| A provider of tech-enabled freight brokerage across various modes including Truckload, Less-than-Truckload, Parcel, and Intermodal, as well as managed (contracted) transportation services. | ||||||||||||||
| 7.75% Second Lien Term Loan due 11/05/2029 (LIBOR + 7.250%) | $ | 1,679,204 | 11/22/21 | 1,651,133 | 1,653,300 | |||||||||
| Limited Liability Company Unit | 46 uts. | 11/22/21 | 45,796 | 45,800 | ||||||||||
| 1,696,929 | 1,699,100 | |||||||||||||
| EFI Productivity Software | ||||||||||||||
| A provider of ERP software solutions purpose-built for the print and packaging industry. | ||||||||||||||
| 6.76% Term Loan due 12/30/2027 (LIBOR + 5.75%) (G) | $ | 1,000,000 | 12/30/21 | 907,828 | 908,655 | |||||||||
| Electric Power Systems International, Inc. | ||||||||||||||
| A provider of electrical testing services for apparatus equipment and protection & controls infrastructure. | ||||||||||||||
| 6.75% Term Loan due 04/19/2028 (LIBOR + 5.750%) (G) | $ | 1,247,434 | 04/19/21 | 1,111,950 | 1,116,464 | |||||||||
14
Barings Participation Investors
CONSOLIDATED SCHEDULE OF INVESTMENTS (CONTINUED)
March 31, 2022
(Unaudited)
| Corporate Restricted Securities: (A) (Continued) | Principal Amount, | Acquisition | Cost | Fair Value | ||||||||||
| Elite Sportswear Holding, LLC | ||||||||||||||
| A designer and manufacturer of gymnastics, competitive cheerleading and swimwear apparel in the U.S. and internationally. | ||||||||||||||
| Limited Liability Company Unit (B)(F) | 1,218,266 uts. | 10/14/16 | $ | 159,722 | $ | — | ||||||||
| Ellkay | ||||||||||||||
| A provider of data interoperability solutions for labs, hospitals and healthcare providers. | ||||||||||||||
| 6.85% Term Loan due 09/14/2027 (LIBOR + 5.750%) | $ | 703,900 | 09/14/21 | 691,048 | 692,389 | |||||||||
| English Color & Supply LLC | ||||||||||||||
| A distributor of aftermarket automotive paint and related products to collision repair shops, auto dealerships and fleet customers through a network of stores in the Southern U.S. | ||||||||||||||
| 11.5% (0.5% PIK) Senior Subordinated Note due 12/31/2023 | $ | 1,359,186 | 06/30/17 | 1,350,803 | 1,359,186 | |||||||||
| Limited Liability Company Unit (B)(F) | 397,695 uts. | 06/30/17 | 397,695 | 783,936 | ||||||||||
| 1,748,498 | 2,143,122 | |||||||||||||
| ENTACT Environmental Services, Inc. | ||||||||||||||
| A provider of environmental remediation and geotechnical services for blue-chip companies with regulatory-driven liability enforcement needs. | ||||||||||||||
| 7.76% Term Loan due 12/15/2025 (LIBOR + 6.750%) | $ | 1,012,672 | 02/09/21 | 1,004,925 | 988,368 | |||||||||
| eShipping | ||||||||||||||
| An asset-life third party logistics Company that serves a broad variety of end markets and offers service across all major transportation modes. | ||||||||||||||
| 6.75% Term Loan due 11/05/2027 (LIBOR + 5.750%) (G) | $ | 1,721,847 | 11/05/21 | 1,301,938 | 1,304,283 | |||||||||
| E.S.P. Associates, P.A. | ||||||||||||||
| A professional services firm providing engineering, surveying and planning services to infrastructure projects. | ||||||||||||||
| Limited Liability Company Unit (B) | 273 uts. | * | 295,518 | 247,797 | ||||||||||
| * 06/29/18 and 12/29/20. | ||||||||||||||
| F G I Equity LLC | ||||||||||||||
| A manufacturer of a broad range of filters and related products that are used in commercial, light industrial, healthcare, gas turbine, nuclear, laboratory, clean room, hotel, educational system, and food processing settings. | ||||||||||||||
| Limited Liability Company Unit Class B-1 (B) | 49,342 uts. | 12/15/10 | 42,343 | 736,278 | ||||||||||
15
CONSOLIDATED SCHEDULE OF INVESTMENTS (CONTINUED)
March 31, 2022
(Unaudited)
| Corporate Restricted Securities: (A) (Continued) | Principal Amount, | Acquisition | Cost | Fair Value | ||||||||||
| Follett School Solutions | ||||||||||||||
| A provider of software for K-12 school libraries. | ||||||||||||||
| 6.50% First Lien Term Loan due 07/09/2028 (LIBOR + 5.750%) | $ | 1,705,621 | 08/31/21 | $ | 1,672,446 | $ | 1,678,142 | |||||||
| LP Units (B)(F) | 881 uts. | 08/30/21 | 8,805 | 8,805 | ||||||||||
| LP Interest (B)(F) | 200 shs. | 08/30/21 | 2,003 | 2,003 | ||||||||||
| 1,683,254 | 1,688,950 | |||||||||||||
| FragilePAK | ||||||||||||||
| A provider of third-party logistics services focused on the full delivery life-cycle for big and bulky products. | ||||||||||||||
| 5.96% Term Loan due 05/24/2027 (LIBOR + 5.750%) (G) | $ | 1,611,797 | 05/21/21 | 1,034,652 | 984,085 | |||||||||
| Limited Liability Company Unit (B)(F) | 108 shs. | 05/21/21 | 107,813 | 92,948 | ||||||||||
| 1,142,465 | 1,077,033 | |||||||||||||
| GD Dental Services LLC | ||||||||||||||
| A provider of convenient “onestop” general, specialty, and cosmetic dental services with 21 offices located throughout South and Central Florida. | ||||||||||||||
| Limited Liability Company Unit Preferred (B) | 76 uts. | 10/05/12 | 75,920 | 28,399 | ||||||||||
| Limited Liability Company Unit Common (B) | 767 uts. | 10/05/12 | 767 | — | ||||||||||
| 76,687 | 28,399 | |||||||||||||
| gloProfessional Holdings, Inc. | ||||||||||||||
| A marketer and distributor of premium mineral-based cosmetics, cosmeceuticals and professional hair care products to the professional spa and physician’s office channels. | ||||||||||||||
| Preferred Stock (B) | 650 shs. | 03/29/19 | 649,606 | 814,392 | ||||||||||
| Common Stock (B) | 1,181 shs. | 03/27/13 | 118,110 | 22,023 | ||||||||||
| 767,716 | 836,415 | |||||||||||||
| GraphPad Software, Inc. | ||||||||||||||
| A provider of data analysis, statistics and graphing software solution for scientific research applications, with a focus on the life sciences and academic end-markets. | ||||||||||||||
| 7.01% Term Loan due 12/15/2023 (LIBOR + 6.000%) | $ | 2,390,711 | * | 2,376,990 | 2,402,665 | |||||||||
| 6.50% Term Loan due 04/27/2027 (LIBOR + 5.500%) | $ | 84,102 | 04/27/21 | 82,681 | 84,523 | |||||||||
| Preferred Stock (B)(F) | 3,737 shs. | 04/27/21 | 103,147 | 121,966 | ||||||||||
| * 12/19/17 and 04/16/19. | 2,562,818 | 2,609,154 | ||||||||||||
| Handi Quilter Holding Company (Premier Needle Arts) | ||||||||||||||
| A designer and manufacturer of long-arm quilting machines and related components for the consumer quilting market. | ||||||||||||||
| Limited Liability Company Unit Preferred (B) | 372 uts. | * | 371,644 | 530,231 | ||||||||||
| Limited Liability Company Unit Common Class A (B) | 3,594 uts. | 12/19/14 | — | — | ||||||||||
| *12/19/14 and 04/29/16. | 371,644 | 530,231 | ||||||||||||
16
Barings Participation Investors
CONSOLIDATED SCHEDULE OF INVESTMENTS (CONTINUED)
March 31, 2022
(Unaudited)
| Corporate Restricted Securities: (A) (Continued) | Principal Amount, | Acquisition | Cost | Fair Value | ||||||||||
| Heartland Veterinary Partners | ||||||||||||||
| A veterinary support organization that provides a comprehensive set of general veterinary services as well as ancillary services such as boarding and grooming. | ||||||||||||||
| 11.00% Opco PIK Note due 11/09/2028 (G) | $ | 1,725,000 | 11/17/21 | $ | 1,570,925 | $ | 1,573,869 | |||||||
| HHI Group, LLC | ||||||||||||||
| A developer, marketer, and distributor of hobby-grade radio control products. | ||||||||||||||
| Limited Liability Company Unit (B)(F) | 102 uts. | 01/17/14 | 101,563 | 553,889 | ||||||||||
| Home Care Assistance, LLC | ||||||||||||||
| A provider of private pay non-medical home care assistance services. | ||||||||||||||
| 5.75% Term Loan due 03/30/2027 (LIBOR + 4.750%) | $ | 850,872 | 03/26/21 | 836,705 | 836,518 | |||||||||
| HOP Entertainment LLC | ||||||||||||||
| A provider of post production equipment and services to producers of television shows and motion pictures. | ||||||||||||||
| Limited Liability Company Unit Class F (B)(F) | 47 uts. | 10/14/11 | — | — | ||||||||||
| Limited Liability Company Unit Class G (B)(F) | 114 uts. | 10/14/11 | — | — | ||||||||||
| Limited Liability Company Unit Class H (B)(F) | 47 uts. | 10/14/11 | — | — | ||||||||||
| Limited Liability Company Unit Class I (B)(F) | 47 uts. | 10/14/11 | — | — | ||||||||||
| — | — | |||||||||||||
| IGL Holdings III Corp. | ||||||||||||||
| A specialty label and flexible packaging converter. | ||||||||||||||
| 6.75% Term Loan due 10/23/2026 (LIBOR + 5.750%) (G) | $ | 1,708,189 | 11/02/20 | 1,499,333 | 1,498,852 | |||||||||
| IM Analytics Holdings, LLC | ||||||||||||||
| A provider of test and measurement equipment used for vibration, noise, and shock testing. | ||||||||||||||
| 8.01% Term Loan due 11/22/2023 (LIBOR + 7.000%) | $ | 1,044,550 | 11/21/19 | 1,040,238 | 826,761 | |||||||||
| Warrant, exercisable until 2026, to purchase common stock at $.01 per share (B) | 8,885 shs. | 11/25/19 | — | — | ||||||||||
| 1,040,238 | 826,761 | |||||||||||||
| Industrial Service Solutions | ||||||||||||||
| A provider of maintenance, repair and overhaul services for process equipment within the industrial, energy and power end-markets. | ||||||||||||||
| 6.51% Term Loan due 01/31/2026 (LIBOR + 5.500%) | $ | 885,785 | 02/05/20 | 874,422 | 847,697 | |||||||||
17
CONSOLIDATED SCHEDULE OF INVESTMENTS (CONTINUED)
March 31, 2022
(Unaudited)
| Corporate Restricted Securities: (A) (Continued) | Principal Amount, | Acquisition | Cost | Fair Value | ||||||||||
| JF Petroleum Group | ||||||||||||||
| A provider of repair, maintenance, instalation and projection management servicese to the US fueling infrastructure industry. | ||||||||||||||
| 6.50% Term Loan due 04/20/2026 (LIBOR + 5.500%) | $ | 681,428 | 05/04/21 | $ | 664,702 | $ | 651,445 | |||||||
| Jones Fish | ||||||||||||||
| A provider of lake management services, fish stocking and pond aeration sales and services. | ||||||||||||||
| 6.50% First Lien Term Loan due 12/20/2027 (LIBOR + 5.500%) (G) | $ | 1,261,603 | 02/28/22 | 1,072,196 | 1,071,814 | |||||||||
| Common Stock (F) | 384 shs. | 02/28/22 | 38,397 | 38,397 | ||||||||||
| 1,110,593 | 1,110,211 | |||||||||||||
| Kano Laboratories LLC | ||||||||||||||
| A producer of industrial strength penetrating oils and lubricants. | ||||||||||||||
| 6.00% Term Loan due 09/30/2026 (LIBOR + 5.000%) (G) | $ | 1,245,108 | 11/18/20 | 830,858 | 828,365 | |||||||||
| 6.00% Term Loan due 10/31/2027 (LIBOR + 5.000%) (G) | $ | 452,766 | 11/08/21 | 269,845 | 270,446 | |||||||||
| Limited Liability Company Unit | 20 uts. | 11/19/20 | 19,757 | 19,760 | ||||||||||
| 1,120,460 | 1,118,571 | |||||||||||||
| LeadsOnline | ||||||||||||||
| A nationwide provider of data, technology and intelligence tools used by law enforcement agencies, investigators, and businesses. | ||||||||||||||
| 6.00% Term Loan due 12/23/2027 (LIBOR + 5.000%) (G) | $ | 1,721,258 | 02/07/22 | 1,467,368 | 1,466,624 | |||||||||
| Limited Liability Company Unit (F) | 4,528 uts. | 02/07/22 | 4,528 | 4,528 | ||||||||||
| 1,471,896 | 1,471,152 | |||||||||||||
| LYNX Franchising | ||||||||||||||
| A global franchisor of B2B services including commercial janitorial services, shared office space solutions, and textile and electronics restoration services. | ||||||||||||||
| 7.25% Term Loan due 12/18/2026 (LIBOR + 6.250%) | $ | 2,483,144 | * | 2,442,360 | 2,438,356 | |||||||||
| * 12/22/20 and 09/09/21 | ||||||||||||||
| Manhattan Beachwear Holding Company | ||||||||||||||
| A designer and distributor of women’s swimwear. | ||||||||||||||
| 12.5% Senior Subordinated Note due 05/30/2022 (D) | $ | 419,971 | 01/15/10 | 404,121 | — | |||||||||
| 15% (2.5% PIK) Senior Subordinated Note due 05/30/2022 (D) | $ | 115,253 | 10/05/10 | 114,604 | — | |||||||||
| Common Stock (B) | 35 shs. | 10/05/10 | 35,400 | — | ||||||||||
| Common Stock Class B (B) | 118 shs. | 01/15/10 | 117,647 | — | ||||||||||
| Warrant, exercisable until 2023, to purchase common stock at $.01 per share (B) | 104 shs. | 10/05/10 | 94,579 | — | ||||||||||
| 766,351 | — | |||||||||||||
18
Barings Participation Investors
CONSOLIDATED SCHEDULE OF INVESTMENTS (CONTINUED)
March 31, 2022
(Unaudited)
| Corporate Restricted Securities: (A) (Continued) | Principal Amount, | Acquisition | Cost | Fair Value | ||||||||||
| Marshall Excelsior Co. | ||||||||||||||
| A designer, manufacturer and supplier of mission critical, highly engineered flow control products used in the transportation, storage and consumption of liquified petroleum gas, liquified anhydrous ammonia, refined industrial and cryogenic gasses. | ||||||||||||||
| 6.50% Term Loan due 02/18/2028 (SOFR + 5.500%) (G) | $ | 580,882 | 02/24/22 | $ | 520,718 | $ | 520,550 | |||||||
| 520,718 | 520,550 | |||||||||||||
| Master Cutlery LLC | ||||||||||||||
| A designer and marketer of a wide assortment of knives and swords. | ||||||||||||||
| 13.00% Senior Subordinated Note due 07/20/2022 (D) | $ | 868,102 | 04/17/15 | 867,529 | 58,163 | |||||||||
| Limited Liability Company Unit | 5 uts. | 04/17/15 | 678,329 | — | ||||||||||
| 1,545,858 | 58,163 | |||||||||||||
| Media Recovery, Inc. | ||||||||||||||
| A global manufacturer and developer of shock, temperature, vibration and other condition indicators and monitors for in-transit and storage applications. | ||||||||||||||
| 7.00% First Out Term Loan due 11/22/2025 (SOFR + 6.000%) | $ | 488,583 | 11/25/19 | 482,536 | 488,583 | |||||||||
| MES Partners, Inc. | ||||||||||||||
| An industrial service business offering an array of cleaning and environmental services to the Gulf Coast region of the U.S. | ||||||||||||||
| Preferred Stock Series A (B) | 30,926 shs. | 07/25/19 | 12,412 | — | ||||||||||
| Preferred Stock Series C (B) | 1,275 shs. | 09/22/20 | 457,365 | — | ||||||||||
| Common Stock Class B (B) | 259,252 shs. | * | 244,163 | — | ||||||||||
| Warrant, exercisable until 2030, to purchase common stock at $.01 per share (B) | 351,890 shs. | 09/22/20 | — | — | ||||||||||
| * 09/30/14 and 02/28/18. | 713,940 | — | ||||||||||||
| MeTEOR Education LLC | ||||||||||||||
| A leading provider of classroom and common area design services, furnishings, equipment and instructional support to K-12 schools. | ||||||||||||||
| 12.00% Senior Subordinated Note due 03/20/2024 | $ | 915,819 | 03/09/18 | 911,064 | 897,503 | |||||||||
| 12.00% Senior Subordinated Debt due 03/31/2025 | $ | 351,088 | 03/31/22 | 344,066 | 344,066 | |||||||||
| Limited Liability Company Unit (B)(F) | 190 uts. | 03/09/18 | 200,718 | 412,709 | ||||||||||
| 1,455,848 | 1,654,278 | |||||||||||||
| MNS Engineers, Inc. | ||||||||||||||
| A consulting firm that provides civil engineering, construction management and land surveying services. | ||||||||||||||
| 5.96% Term Loan due 07/30/2027 (LIBOR + 5.500%) | $ | 1,197,000 | 08/09/21 | 1,175,600 | 1,177,848 | |||||||||
| Limited Liability Company Unit (B) | 100,000 uts. | 08/09/21 | 100,000 | 100,000 | ||||||||||
| 1,275,600 | 1,277,848 | |||||||||||||
19
CONSOLIDATED SCHEDULE OF INVESTMENTS (CONTINUED)
March 31, 2022
(Unaudited)
| Corporate Restricted Securities: (A) (Continued) | Principal Amount, | Acquisition | Cost | Fair Value | ||||||||||
| Music Reports, Inc. | ||||||||||||||
| An administrator of comprehensive offering of rights and royalties solutions for music and cue sheet copyrights to music and entertainment customers. | ||||||||||||||
| 7.00% Incremental Term Loan due 08/21/2026 (LIBOR + 6.000%) | $ | 820,507 | 11/05/21 | $ | 805,475 | $ | 802,767 | |||||||
| 7.00% Term Loan due 08/21/2026 (LIBOR + 6.000%) | $ | 597,605 | 08/25/20 | 586,642 | 584,685 | |||||||||
| 1,392,117 | 1,387,452 | |||||||||||||
| Narda-MITEQ (JFL-Narda Partners, LLC) | ||||||||||||||
| A manufacturer of radio frequency and microwave components and assemblies. | ||||||||||||||
| 6.25% First Lien Term Loan due 11/30/2027 (LIBOR + 5.250%) (G) | $ | 763,436 | 12/06/21 | 543,090 | 543,545 | |||||||||
| 6.25% Incremental Term Loan due 12/06/2027 (LIBOR + 5.250%) | $ | 873,738 | 12/28/21 | 859,110 | 859,764 | |||||||||
| Limited Liability Company Unit Class A Preferred | 790 uts. | 12/06/21 | 79,043 | 80,608 | ||||||||||
| Limited Liability Company Unit Class B Common | 88 uts. | 12/06/21 | 8,783 | 8,783 | ||||||||||
| 1,490,026 | 1,492,700 | |||||||||||||
| National Auto Care | ||||||||||||||
| A provider of professional finance and insurance products and consulting services to auto, RV, and powersports dealerships. | ||||||||||||||
| 6.26% First Lien Term Loan due 09/28/2024 (LIBOR + 5.250%) (G) | $ | 998,707 | 12/20/21 | 533,232 | 533,143 | |||||||||
| Navia Benefit Solutions, Inc. | ||||||||||||||
| A third-party administrator of employee-directed healthcare benefits. | ||||||||||||||
| 6.25% Term Loan due 02/01/2026 (LIBOR + 5.250%) (G) | $ | 1,717,238 | 02/10/21 | 1,149,145 | 1,154,875 | |||||||||
| Northstar Recycling | ||||||||||||||
| A managed service provider for waste and recycling services, primarily targeting food and beverage end markets. | ||||||||||||||
| 5.75% Term Loan due 09/30/2027 (LIBOR + 4.750%) | $ | 749,313 | 10/01/21 | 735,571 | 736,822 | |||||||||
| Office Ally (OA TOPCO, LP) | ||||||||||||||
| A provider of medical claims clearinghouse software to office-based physician providers and healthcare insurance payers. | ||||||||||||||
| 7.00% Term Loan due 12/10/2028 (LIBOR + 6.000%) (G) | $ | 983,176 | 12/20/21 | 830,494 | 832,226 | |||||||||
| Limited Liability Company Unit | 21,092 uts. | 09/29/17 | 21,092 | 21,092 | ||||||||||
| 851,586 | 853,318 | |||||||||||||
| Omega Holdings | ||||||||||||||
| A distributor of aftermarket automotive air conditioning products. | ||||||||||||||
| 6.00% Term Loan due 03/31/2029 (SOFR + 5.000%) | $ | 645,704 | 03/31/22 | 544,324 | 544,324 | |||||||||
| 544,324 | 544,324 | |||||||||||||
20
Barings Participation Investors
CONSOLIDATED SCHEDULE OF INVESTMENTS (CONTINUED)
March 31, 2022
(Unaudited)
| Corporate Restricted Securities: (A) (Continued) | Principal Amount, | Acquisition | Cost | Fair Value | ||||||||||
| Omni Logistics, LLC | ||||||||||||||
| A specialty freight forwarding business specifically targeting the semiconductor, media, technology and healthcare end markets. | ||||||||||||||
| 6.00% Term Loan due 12/30/2026 (LIBOR + 5.000%) | $ | 1,736,897 | 12/30/20 | $ | 1,695,658 | $ | 1,705,989 | |||||||
| Options Technology Ltd | ||||||||||||||
| A provider of vertically focused financial technology managed services and IT infrastructure products for the financial services industry. | ||||||||||||||
| 5.76% Term Loan due 12/18/2025 (LIBOR + 4.750%) | $ | 1,582,958 | 12/23/19 | 1,563,235 | 1,555,756 | |||||||||
| PANOS Brands LLC | ||||||||||||||
| A marketer and distributor of branded consumer foods in the specialty, natural, better-for-you,“free from” healthy and gluten-free categories. | ||||||||||||||
| 12% (1% PIK) Senior Subordinated Note due 08/17/2022 | $ | 1,775,705 | 02/17/17 | 1,772,646 | 1,775,705 | |||||||||
| Common Stock Class A (B) | 380,545 shs. | * | 380,545 | 336,135 | ||||||||||
| * 01/29/16 and 02/17/17. | 2,153,191 | 2,111,840 | ||||||||||||
| PB Holdings LLC | ||||||||||||||
| A designer, manufacturer and installer of maintenance and repair parts and equipment for industrial customers. | ||||||||||||||
| 6.26% Term Loan due 02/28/2024 (LIBOR + 5.250%) | $ | 783,253 | 03/06/19 | 775,607 | 751,923 | |||||||||
| Pearl Holding Group | ||||||||||||||
| A managing general agent that originates, underwrites, and administers non-standard auto insurance policies for carries in Florida. | ||||||||||||||
| 7.00% First Lien Term Loan due 12/16/2026 (LIBOR + 6.000%) (G) | $ | 1,739,980 | 12/20/21 | 1,554,971 | 1,551,596 | |||||||||
| Warrant - Class A, to purchase common stock at $.01 per share | 924 uts. | 12/22/21 | — | — | ||||||||||
| Warrant - Class B, to purchase common stock at $.01 per share | 312 uts. | 12/22/21 | — | — | ||||||||||
| Warrant - Class CC, to purchase common stock at $.01 per share | 32 uts. | 12/22/21 | — | — | ||||||||||
| Warrant - Class D, to purchase common stock at $.01 per share | 82 uts. | 12/22/21 | — | — | ||||||||||
| 1,554,971 | 1,551,596 | |||||||||||||
21
CONSOLIDATED SCHEDULE OF INVESTMENTS (CONTINUED)
March 31, 2022
(Unaudited)
| Corporate Restricted Securities: (A) (Continued) | Principal Amount, | Acquisition | Cost | Fair Value | ||||||||||
| Pegasus Transtech Corporation | ||||||||||||||
| A provider of end-to-end document, driver and logistics management solutions, which enable its customers (carriers, brokers, and drivers) to operate more efficiently, reduce manual overhead, enhance compliance, and shorten cash conversion cycles. | ||||||||||||||
| 6.96% Term Loan due 08/31/2026 (LIBOR + 6.500%) | $ | 382,796 | 09/29/20 | $ | 372,791 | $ | 373,227 | |||||||
| 6.96% Term Loan due 11/17/2024 (LIBOR + 6.500%) | $ | 1,894,364 | 11/14/17 | 1,876,553 | 1,847,005 | |||||||||
| 2,249,344 | 2,220,232 | |||||||||||||
| Petroplex Inv Holdings LLC | ||||||||||||||
| A leading provider of acidizing services to E&P customers in the Permian Basin. | ||||||||||||||
| Limited Liability Company Unit | 0.40% int. | * | 174,669 | 13,647 | ||||||||||
| * 11/29/12 and 12/20/16. | ||||||||||||||
| Polara (VSC Polara LLC) | ||||||||||||||
| A manufacturer of pedestrian traffic management and safety systems, including accessible pedestrian signals, “push to walk” buttons, and related “traffic” control units. | ||||||||||||||
| 5.75% First Lien Term Loan due 12/03/2027 (LIBOR + 4.750%) (G) | $ | 950,713 | 12/03/21 | 824,466 | 808,221 | |||||||||
| Limited Liability Company Unit (F) | 759 uts. | 12/03/21 | 75,861 | 75,861 | ||||||||||
| 900,327 | 884,082 | |||||||||||||
| Polytex Holdings LLC | ||||||||||||||
| A manufacturer of water based inks and related products serving primarily the wall covering market. | ||||||||||||||
| 13.9% (7.9% PIK) Senior Subordinated Note due 12/31/2024 (D) | $ | 1,069,985 | 07/31/14 | 1,064,183 | 967,801 | |||||||||
| Limited Liability Company Unit | 148,096 uts. | 07/31/14 | 148,096 | — | ||||||||||
| Limited Liability Company Unit Class F | 36,976 uts. | * | 24,802 | — | ||||||||||
| * 09/28/17 and 02/15/18. | 1,237,081 | 967,801 | ||||||||||||
| Portfolio Group | ||||||||||||||
| A provider of professional finance and insurance products to automobile dealerships, delivering a suite of offerings that supplement earnings derived from vehicle transactions. | ||||||||||||||
| 7.00% First Lien Term Loan due 12/02/2025 (LIBOR + 6.000%) (G) | $ | 1,205,775 | 11/15/21 | 943,413 | 938,435 | |||||||||
| 943,413 | 938,435 | |||||||||||||
22
Barings Participation Investors
CONSOLIDATED SCHEDULE OF INVESTMENTS (CONTINUED)
March 31, 2022
(Unaudited)
| Corporate Restricted Securities: (A) (Continued) | Principal Amount, | Acquisition | Cost | Fair Value | ||||||||||
| PPC Event Services | ||||||||||||||
| A special event equipment rental business. | ||||||||||||||
| 16.00% Term Loan due 05/28/2023 (D) | $ | 791,691 | 07/21/20 | $ | 616,461 | $ | 687,980 | |||||||
| 8.00% Term Loan due 05/28/2023 (D) | $ | 781,249 | 07/21/20 | 616,911 | 651,562 | |||||||||
| Preferred Stock Series P-1 (B) | 71 shs. | 07/21/20 | 71,018 | 211,129 | ||||||||||
| Common Stock (B) | 170,927 shs. | 07/21/20 | — | 10,962 | ||||||||||
| Limited Liability Company Unit (B) | 3,450 uts. | 11/20/14 | 172,500 | — | ||||||||||
| Limited Liability Company Unit Series A-1 (B) | 339 uts. | 03/16/16 | 42,419 | — | ||||||||||
| 1,519,309 | 1,561,633 | |||||||||||||
| ProfitOptics | ||||||||||||||
| A software development and consulting company that delivers solutions via its proprietary software development platform, Catalyst. | ||||||||||||||
| 6.50% Term Loan due 02/15/2028 (LIBOR + 5.750%) (G) | $ | 901,452 | 03/15/22 | 690,015 | 689,874 | |||||||||
| 8% Senior Subordinated Note due 02/15/2029 | $ | 32,258 | 03/15/22 | 32,258 | 32,258 | |||||||||
| Limited Liability Company Unit | 96,774 uts. | 03/15/22 | 64,516 | 64,548 | ||||||||||
| 786,789 | 786,680 | |||||||||||||
| Recovery Point Systems, Inc. | ||||||||||||||
| A provider of IT infrastructure, colocation and cloud based resiliency services. | ||||||||||||||
| 7.50% Term Loan due 07/31/2026 (LIBOR + 6.500%) | $ | 1,336,166 | 08/12/20 | 1,316,724 | 1,325,477 | |||||||||
| Limited Liability Company Unit (F) | 21,532 uts. | 03/05/21 | 21,532 | 14,450 | ||||||||||
| 1,338,256 | 1,339,927 | |||||||||||||
| RedSail Technologies | ||||||||||||||
| A provider of pharmacy management software solutions for independent pharmacies and long-term care facilities. | ||||||||||||||
| 5.50% Term Loan due 10/27/2026 (LIBOR + 4.750%) | $ | 1,639,207 | 12/09/20 | 1,607,316 | 1,622,815 | |||||||||
| ReelCraft Industries, Inc. | ||||||||||||||
| A designer and manufacturer of heavy-duty reels for diversified industrial, mobile equipment OEM, auto aftermarket, government/military and other end markets. | ||||||||||||||
| Limited Liability Company Unit Class B | 293,617 uts. | 11/13/17 | 184,689 | 747,696 | ||||||||||
| Renovation Brands (Renovation Parent Holdings, LLC) | ||||||||||||||
| A portfolio of seven proprietary brands that sell various home improvement products primarily through the e-Commerce channel. | ||||||||||||||
| 6.50% Term Loan due 08/16/2027 (LIBOR + 5.500%) | $ | 970,874 | 11/15/21 | 948,185 | 949,658 | |||||||||
| Limited Liability Company Unit | 39,474 uts. | 09/29/17 | 39,474 | 39,474 | ||||||||||
| 987,659 | 989,132 | |||||||||||||
23
CONSOLIDATED SCHEDULE OF INVESTMENTS (CONTINUED)
March 31, 2022
(Unaudited)
| Corporate Restricted Securities: (A) (Continued) | Principal Amount, | Acquisition | Cost | Fair Value | ||||||||||
| Resonetics, LLC | ||||||||||||||
| A provider of laser micro-machining manufacturing services for medical device and diagnostic companies. | ||||||||||||||
| 7.75% Second Lien Term Loan due 04/28/2029 (LIBOR + 7.000%) | $ | 1,725,000 | 04/28/21 | $ | 1,694,491 | $ | 1,694,845 | |||||||
| 7.75% Secomd Lien Term Loan due 04/28/2029 (LIBOR + 7.000%) | $ | 552,000 | 11/15/21 | 541,516 | 542,350 | |||||||||
| 2,236,007 | 2,237,195 | |||||||||||||
| REVSpring, Inc. | ||||||||||||||
| A provider of accounts receivable management and revenue cycle management services to customers in the healthcare, financial and utility industries. | ||||||||||||||
| 9.26% Second Lien Term Loan due 10/11/2026 (LIBOR + 8.250%) | $ | 1,725,000 | 10/11/18 | 1,695,707 | 1,725,000 | |||||||||
| Rock-it Cargo | ||||||||||||||
| A provider of specialized international logistics solutions to the music touring, performing arts, live events, fine art and specialty industries. | ||||||||||||||
| 6.00% Term Loan due 06/22/2024 (LIBOR + 5.000% Cash) | $ | 2,448,431 | * | 2,425,131 | 2,071,373 | |||||||||
| * 07/30/18 and 09/30/20. | ||||||||||||||
| ROI Solutions | ||||||||||||||
| Call center outsourcing and end user engagement services provider. | ||||||||||||||
| 6.00% Term Loan due 07/31/2024 (LIBOR + 5.000%) (G) | $ | 1,592,918 | 07/31/18 | 1,045,893 | 1,058,290 | |||||||||
| RPX Corp | ||||||||||||||
| A provider of subscription services that help member companies mitigate the risk of patent disputes and reduce the cost of patent litigation. | ||||||||||||||
| 7.00% Term Loan due 10/23/2025 (LIBOR + 6.000%) | $ | 2,477,283 | * | 2,434,320 | 2,430,983 | |||||||||
| * 10/22/20 and 09/28/21. | ||||||||||||||
| Ruffalo Noel Levitz | ||||||||||||||
| A provider of enrollment management, student retention and career services, and fundraising management for colleges and universities. | ||||||||||||||
| 7.00% Term Loan due 05/29/2022 (LIBOR + 6.000%) | $ | 1,226,029 | 01/08/19 | 1,225,166 | 1,226,029 | |||||||||
| Safety Products Holdings, Inc. | ||||||||||||||
| A manufacturer of highly engineered safety cutting tools. | ||||||||||||||
| 7.00% Term Loan due 12/15/2026 (LIBOR + 6.000%) | $ | 1,672,310 | 12/15/20 | 1,642,775 | 1,668,965 | |||||||||
| Common Stock | 29 shs. | 12/16/20 | 29,262 | 40,236 | ||||||||||
| 1,672,037 | 1,709,201 | |||||||||||||
24
Barings Participation Investors
CONSOLIDATED SCHEDULE OF INVESTMENTS (CONTINUED)
March 31, 2022
(Unaudited)
| Corporate Restricted Securities: (A) (Continued) | Principal Amount, | Acquisition | Cost | Fair Value | ||||||||||
| Sandvine Corporation | ||||||||||||||
| A provider of active network intelligence solutions. | ||||||||||||||
| 8.46% Second Lien Term Loan due 11/02/2026 (LIBOR + 8.000%) | $ | 1,725,000 | 11/01/18 | $ | 1,700,264 | $ | 1,725,000 | |||||||
| Sara Lee Frozen Foods | ||||||||||||||
| A provider of frozen bakery products, desserts and sweet baked goods. | ||||||||||||||
| 5.50% Lien Term Loan due 07/30/2025 (LIBOR + 4.500%) | $ | 1,483,456 | 07/27/18 | 1,467,583 | 1,364,780 | |||||||||
| Scaled Agile, Inc. | ||||||||||||||
| A provider of training and certifications for IT professionals focused on software development. | ||||||||||||||
| 6.50% Term Loan due 12/15/2027 (LIBOR + 5.500%) (G) | $ | 1,725,000 | 12/16/21 | 1,173,077 | 1,190,537 | |||||||||
| SEKO Worldwide, LLC | ||||||||||||||
| A third-party logistics provider of ground, ocean, air and home delivery forwarding services. | ||||||||||||||
| 6.00% Term Loan due 12/30/2026 (LIBOR + 5.000%) (G) | $ | 1,710,259 | 12/30/20 | 1,450,597 | 1,463,760 | |||||||||
| Smart Bear | ||||||||||||||
| A provider of web-based tools for software development, testing and monitoring. | ||||||||||||||
| 8.51% Second Lien Term Loan due 11/10/2028 (LIBOR + 7.500%) | $ | 1,725,000 | 03/02/21 | 1,683,547 | 1,694,533 | |||||||||
| Smartling, Inc. | ||||||||||||||
| A provider in SaaS-based translation management systems and related translation services. | ||||||||||||||
| 6.75% Term Loan due 10/26/2027 (LIBOR + 5.750%) (G) | $ | 1,725,000 | 11/03/21 | 1,388,369 | 1,390,816 | |||||||||
| Specified Air Solutions (dba Madison Indoor Air Solutions) | ||||||||||||||
| A manufacturer and distributor of heating, dehumidification and other air quality solutions. | ||||||||||||||
| Limited Liability Company Unit (B) | 726,845 uts. | 02/20/19 | 2,298,574 | 11,039,545 | ||||||||||
| Springbrook Software | ||||||||||||||
| A provider of vertical-market enterprise resource planning software and payments platforms focused on the local government end-market. | ||||||||||||||
| 6.76% Term Loan due 12/20/2026 (LIBOR + 5.750%) (G) | $ | 1,633,473 | 12/23/19 | 1,309,447 | 1,300,168 | |||||||||
25
CONSOLIDATED SCHEDULE OF INVESTMENTS (CONTINUED)
March 31, 2022
(Unaudited)
| Corporate Restricted Securities: (A) (Continued) | Principal Amount, | Acquisition | Cost | Fair Value | ||||||||||
| Stackline | ||||||||||||||
| An e-commerce data company that tracks products sold through online retailers. | ||||||||||||||
| 8.75% Term Loan due 07/30/2028 (LIBOR + 7.750%) | $ | 1,758,600 | 07/29/21 | $ | 1,728,166 | $ | 1,731,236 | |||||||
| Common Stock (B) | 1,340 shs. | 07/30/21 | 42,078 | 63,588 | ||||||||||
| 1,770,244 | 1,794,824 | |||||||||||||
| Standard Elevator Systems | ||||||||||||||
| A scaled manufacturer of elevator components combining four elevator companies, Standard Elevator Systems, EMI Porta, Texacone, and ZZIPCO. | ||||||||||||||
| 6.50% First Lien Term Loan due 12/02/2027 (LIBOR + 5.750%) (G) | $ | 1,725,000 | 12/02/21 | 1,023,440 | 1,025,353 | |||||||||
| Strahman Holdings Inc. | ||||||||||||||
| A manufacturer of industrial valves and wash down equipment for a variety of industries, including chemical, petrochemical, polymer, pharmaceutical, food processing, beverage and mining. | ||||||||||||||
| Preferred Stock Series A (B) | 158,967 shs. | 12/13/13 | 158,967 | 179,633 | ||||||||||
| Preferred Stock Series A-2 (B) | 26,543 shs. | 09/10/15 | 29,994 | 29,994 | ||||||||||
| 188,961 | 209,627 | |||||||||||||
| Stratus Unlimited | ||||||||||||||
| A nationwide provide of brand implementation services, including exterior and interior signage, refresh and remodel, and facility maintenance and repair. | ||||||||||||||
| 6.51% Term Loan due 06/08/2027 (LIBOR + 5.500%) (G) | $ | 946,707 | 07/02/21 | 756,975 | 759,549 | |||||||||
| Limited Liability Company Unit (B) | 75 uts. | 06/30/21 | 74,666 | 73,394 | ||||||||||
| 831,641 | 832,943 | |||||||||||||
| Sunvair Aerospace Group Inc. | ||||||||||||||
| An aerospace maintenance, repair, and overhaul provider servicing landing gears on narrow body aircraft. | ||||||||||||||
| 12% (1% PIK) Senior Subordinated Note due 08/01/2024 | $ | 2,012,135 | * | 1,993,015 | 1,980,878 | |||||||||
| Preferred Stock Series A | 28 shs. | 12/21/20 | 71,176 | 78,309 | ||||||||||
| Common Stock (B) | 68 shs. | ** | 104,986 | 231,297 | ||||||||||
| * 07/31/15 and 12/21/20. | 2,169,177 | 2,290,484 | ||||||||||||
| ** 07/31/15 and 11/08/17. | ||||||||||||||
| Syntax Systems Ltd | ||||||||||||||
| A cloud management service provider. | ||||||||||||||
| 6.25% Term Loan due 10/14/2028 (LIBOR + 5.500%) (G) | $ | 998,236 | 10/28/21 | 750,813 | 750,184 | |||||||||
26
Barings Participation Investors
CONSOLIDATED SCHEDULE OF INVESTMENTS (CONTINUED)
March 31, 2022
(Unaudited)
| Corporate Restricted Securities: (A) (Continued) | Principal Amount, | Acquisition | Cost | Fair Value | ||||||||||
| Tank Holding | ||||||||||||||
| A manufacturer of proprietary rotational molded polyethylene and steel storage tanks and containers. | ||||||||||||||
| 6.75% Term Loan due 03/31/2028 (SOFR + 6.000%) (G) | $ | 500,000 | 03/31/22 | $ | 466,937 | $ | 466,932 | |||||||
| 466,937 | 466,932 | |||||||||||||
| Tencarva Machinery Company | ||||||||||||||
| A distributor of mission critical, engineered equipment, replacement parts and services in the industrial and municipal end-markets. | ||||||||||||||
| 6.51% Term Loan due 12/20/2027 (LIBOR + 5.500%) (G) | $ | 1,977,260 | 12/20/21 | 1,413,180 | 1,414,806 | |||||||||
| The Caprock Group (aka TA/TCG Holdings, LLC) | ||||||||||||||
| A wealth manager focused on ultra-high-net-worth individuals, who have $25-30 million of investable assets on average. | ||||||||||||||
| 8.05% HoldCo PIK Note due 10/21/2028 | $ | 1,150,000 | 10/28/21 | 1,128,390 | 1,130,258 | |||||||||
| 5.26% Term Loan due 12/15/2027 (LIBOR + 4.250%) (G) | $ | 575,000 | 12/21/21 | 98,134 | 100,761 | |||||||||
| 1,226,524 | 1,231,019 | |||||||||||||
| The Hilb Group, LLC | ||||||||||||||
| An insurance brokerage platform that offers insurance and benefits programs to middle-market companies throughout the Eastern seaboard. | ||||||||||||||
| 6.76% Term Loan due 09/30/2026 (LIBOR + 5.750%) | $ | 1,705,581 | * | 1,676,529 | 1,667,324 | |||||||||
| * 12/02/19 and 12/15/20. | ||||||||||||||
| Therma-Stor Holdings LLC | ||||||||||||||
| A designer and manufacturer of dehumidifiers and water damage restoration equipment for residential and commercial applications. | ||||||||||||||
| Limited Liability Company Unit (B) | 19,696 uts. | 11/30/17 | — | 10,698 | ||||||||||
| Transit Technologies LLC | ||||||||||||||
| A software platform for the transportation market that offers end-to-end software solutions focused on operations, fleet management and telematics services. | ||||||||||||||
| 5.75% Term Loan due 02/10/2025 (LIBOR + 4.750%) | $ | 780,310 | 02/13/20 | 772,479 | 752,219 | |||||||||
| Trident Maritime Systems | ||||||||||||||
| A leading provider of turnkey marine vessel systems and solutions for government and commercial new ship construction as well as repair, refurbishment, and retrofit markets worldwide. | ||||||||||||||
| 6.51% Term Loan due 02/19/2026 (LIBOR + 5.500%) | $ | 1,712,063 | 02/25/21 | 1,688,673 | 1,712,063 | |||||||||
27
CONSOLIDATED SCHEDULE OF INVESTMENTS (CONTINUED)
March 31, 2022
(Unaudited)
| Corporate Restricted Securities: (A) (Continued) | Principal Amount, | Acquisition | Cost | Fair Value | ||||||||||
| Tristar Global Energy Solutions, Inc. | ||||||||||||||
| A hydrocarbon and decontamination services provider serving refineries worldwide. | ||||||||||||||
| 12.5% (1.5% PIK) Senior Subordinated Note due 06/30/2024 (D) | $ | 1,204,904 | 01/23/15 | $ | 1,203,934 | $ | 1,085,618 | |||||||
| Truck-Lite | ||||||||||||||
| A leading provider of harsh environment LED safety lighting, electronics, filtration systems, and telematics for a wide range of commercial vehicles, specialty vehicles, final mile delivery vehicles, off-road/off-highway, marine, and other adjacent harsh environment markets. | ||||||||||||||
| 7.26% Term Loan due 12/02/2026 (LIBOR + 6.250%) | $ | 1,692,159 | 12/13/19 | 1,669,429 | 1,665,083 | |||||||||
| 7.26% First Lien Term Loan due 04/28/2029 (LIBOR + 6.250%) (G) | $ | 802,272 | 11/15/21 | 486,431 | 488,649 | |||||||||
| 2,155,860 | 2,153,732 | |||||||||||||
| Trystar, Inc. | ||||||||||||||
| A niche manufacturer of temporary power distribution products for the power rental, industrial, commercial utility and back-up emergency markets. | ||||||||||||||
| 6.25% Term Loan due 10/01/2023 (LIBOR + 5.250%) | $ | 2,271,264 | 09/28/18 | 2,257,770 | 2,234,923 | |||||||||
| 6.25% Third Amendment Term Loan due 09/28/2023 (LIBOR + 5.250%) | $ | 215,038 | 10/27/21 | 212,044 | 211,598 | |||||||||
| Limited Liability Company Unit (B)(F) | 56 uts. | 09/28/18 | 60,413 | 50,794 | ||||||||||
| 2,530,227 | 2,497,315 | |||||||||||||
| Turnberry Solutions, Inc. | ||||||||||||||
| A provider of technology consulting services. | ||||||||||||||
| 7.00% Term Loan due 07/30/2026 (SOFR + 6.000%) | $ | 1,624,908 | 07/29/21 | 1,596,770 | 1,592,410 | |||||||||
| U.S. Legal Support, Inc. | ||||||||||||||
| A provider of court reporting, record retrieval and other legal supplemental services. | ||||||||||||||
| 6.26% Term Loan due 11/12/2024 (LIBOR + 5.250%) | $ | 2,083,995 | * | 2,065,454 | 2,042,316 | |||||||||
| * 11/29/18 and 03/25/19. | ||||||||||||||
| UroGPO, LLC | ||||||||||||||
| A group purchasing organization that connects pharmaceutical companies with urology practices to facilitate the purchase of pharmaceutical drugs for discounted prices. | ||||||||||||||
| 6.75% Term Loan due 12/15/2026 (LIBOR + 5.750%) | $ | 2,316,667 | 12/14/20 | 2,280,315 | 2,316,667 | |||||||||
| VitalSource | ||||||||||||||
| A provider of digital fulfillment software for the higher education sector. | ||||||||||||||
| 6.25% Term Loan due 06/01/2028 (LIBOR + 5.500%) | $ | 1,694,196 | 06/01/21 | 1,664,341 | 1,694,195 | |||||||||
| Limited Liability Company Unit (B)(F) | 1,891 uts. | 06/01/21 | 18,909 | 32,570 | ||||||||||
| 1,683,250 | 1,726,765 | |||||||||||||
28
Barings Participation Investors
CONSOLIDATED SCHEDULE OF INVESTMENTS (CONTINUED)
March 31, 2022
(Unaudited)
| Corporate Restricted Securities: (A) (Continued) | Principal Amount, | Acquisition | Cost | Fair Value | ||||||||||
| VP Holding Company | ||||||||||||||
| A provider of school transportation services for special-needs and homeless children in Massachusetts and Connecticut. | ||||||||||||||
| 5.96% Term Loan due 05/22/2024 (LIBOR + 5.500%) | $ | 2,396,318 | 05/17/18 | $ | 2,379,226 | $ | 2,348,392 | |||||||
| Westminster Acquisition LLC | ||||||||||||||
| A manufacturer of premium, all-natural oyster cracker products sold under the Westminster and Olde Cape Cod brands. | ||||||||||||||
| Limited Liability Company Unit (B)(F) | 370,241 uts. | 08/03/15 | 370,241 | 74,381 | ||||||||||
| Wolf-Gordon, Inc. | ||||||||||||||
| A designer and specialty distributor of wallcoverings and related building products, including textiles, paint, and writeable surfaces. | ||||||||||||||
| Common Stock (B) | 157 shs. | 01/22/16 | 62,177 | 262,270 | ||||||||||
| Woodland Foods, Inc. | ||||||||||||||
| A provider of specialty dry ingredients such as herbs & spices, rice & grains, mushrooms & truffles, chilies, and other ingredients to customers within the industrial, foodservice, and retail end-markets. | ||||||||||||||
| 6.50% Term Loan due 11/30/2027 (LIBOR + 5.500%) (G) | $ | 1,205,684 | 12/01/21 | 1,030,941 | 1,032,287 | |||||||||
| Limited Liability Company Unit (F) | 146 uts. | 09/29/17 | 145,803 | 145,803 | ||||||||||
| 1,176,744 | 1,178,090 | |||||||||||||
| World 50, Inc. | ||||||||||||||
| A provider of exclusive peer-to-peer networks for C-suite executives at leading corporations. | ||||||||||||||
| 6.25% Term Loan due 01/10/2026 (LIBOR + 5.250%) | $ | 303,267 | 09/21/20 | 296,782 | 302,661 | |||||||||
| 5.50% Term Loan due 12/31/2025 (LIBOR + 4.500%) | $ | 1,206,358 | 01/09/20 | 1,187,361 | 1,187,257 | |||||||||
| 1,484,143 | 1,489,918 | |||||||||||||
| Ziyad | ||||||||||||||
| An end-to-end importer, brand manager, value-added processor, and distributor of Middle Eastern and Mediterranean foods. | ||||||||||||||
| 6.00% First Lien Term Loan due 02/09/2028 (LIBOR + 5.000%) (G) | $ | 1,003,440 | 02/09/22 | 534,020 | 533,554 | |||||||||
| Limited Liability Company Unit (F) | 31 uts. | 02/09/22 | 31,256 | 31,260 | ||||||||||
| 565,276 | 564,814 | |||||||||||||
| Total Private Placement Investments (E) | $ | 160,751,267 | $ | 166,824,571 | ||||||||||
29
CONSOLIDATED SCHEDULE OF INVESTMENTS (CONTINUED)
March 31, 2022
(Unaudited)
| Corporate Restricted Securities: (A) (Continued) | Interest | Maturity | Principal | Cost | Market | |||||||||||||||
| Rule 144A Securities - 4.93%: (H) | ||||||||||||||||||||
| Bonds - 4.93% | ||||||||||||||||||||
| American Airlines Inc. | 11.750 | 07/15/25 | $ | 500,000 | $ | 496,452 | $ | 583,745 | ||||||||||||
| Cleveland-Cliffs Inc. | 9.875 | 10/17/25 | 331,000 | 353,867 | 369,065 | |||||||||||||||
| Coronado Finance Pty Ltd. | 10.750 | 05/15/26 | 247,000 | 243,012 | 264,599 | |||||||||||||||
| CVR Energy Inc. | 5.750 | 02/15/28 | 500,000 | 461,128 | 474,205 | |||||||||||||||
| First Quantum Minerals Ltd. | 7.500 | 04/01/25 | 500,000 | 476,300 | 507,500 | |||||||||||||||
| First Quantum Minerals Ltd. | 7.250 | 04/01/23 | 238,000 | 237,290 | 237,586 | |||||||||||||||
| Houghton Mifflin Harcourt | 9.000 | 02/15/25 | 500,000 | 493,991 | 522,500 | |||||||||||||||
| Neptune Energy Bondco PLC | 6.625 | 05/15/25 | 500,000 | 495,259 | 502,745 | |||||||||||||||
| Panther BF Aggregator 2 LP | 8.500 | 05/15/27 | 100,000 | 94,037 | 103,750 | |||||||||||||||
| Picou Holdings LLC | 10.000 | 12/31/25 | 500,000 | 457,704 | 513,125 | |||||||||||||||
| Prime Security Services, LLC | 6.250 | 01/15/28 | 885,000 | 791,678 | 866,056 | |||||||||||||||
| Terrier Media Buyer, Inc. | 8.875 | 12/15/27 | 530,000 | 511,319 | 539,275 | |||||||||||||||
| The Manitowoc Company, Inc. | 9.000 | 04/01/26 | 500,000 | 490,463 | 521,345 | |||||||||||||||
| Trident TPI Holdings Inc. | 9.250 | 08/01/24 | 500,000 | 491,687 | 502,500 | |||||||||||||||
| Verscend Holding Corp | 9.750 | 08/15/26 | 482,000 | 504,941 | 501,280 | |||||||||||||||
| CSC Holdings LLC | 5.000 | 11/15/31 | 625,000 | 517,864 | 523,663 | |||||||||||||||
| Scientific Games Holdings LP | 6.625 | 03/01/30 | 480,000 | 480,000 | 473,174 | |||||||||||||||
| Total Bonds | 7,596,992 | 8,006,113 | ||||||||||||||||||
| Common Stock - 0.00% | ||||||||||||||||||||
| TherOX, Inc. (B) | 2 | — | — | |||||||||||||||||
| Touchstone Health Partnership (B) | 292 | — | — | |||||||||||||||||
| Total Common Stock | — | — | ||||||||||||||||||
| Total Rule 144A Securities | $ | 7,596,992 | $ | 8,006,113 | ||||||||||||||||
| Total Corporate Restricted Securities | $ | 168,348,259 | $ | 174,830,684 | ||||||||||||||||
30
Barings Participation Investors
CONSOLIDATED SCHEDULE OF INVESTMENTS (CONTINUED)
March 31, 2022
(Unaudited)
| Corporate Public Securities - 2.85%: (A) | LIBOR | Interest | Maturity | Principal | Cost | Market | ||||||||||||||||
| Bank Loans - 1.99% | ||||||||||||||||||||||
| Almonde, Inc. | 7.250 | 8.250 | 06/13/25 | $ | 500,000 | $ | 505,000 | $ | 491,015 | |||||||||||||
| Alpine US Bidco LLC | 9.000 | 9.750 | 04/28/29 | 628,215 | 611,440 | 609,369 | ||||||||||||||||
| Edelman Financial Services | 6.750 | 7.199 | 06/08/26 | 128,178 | 127,832 | 126,127 | ||||||||||||||||
| Kenan Advantage Group Inc. | 7.250 | 8.250 | 08/17/27 | 564,317 | 549,773 | 544,566 | ||||||||||||||||
| Magenta Buyer LLC | 8.250 | 9.000 | 05/03/29 | 503,333 | 498,347 | 497,671 | ||||||||||||||||
| STS Operating, Inc. | 8.000 | 9.000 | 04/25/26 | 500,000 | 505,000 | 483,750 | ||||||||||||||||
| Front Line Power Construction LLC | 12.500 | 13.500 | 11/01/28 | 250,000 | 241,864 | 242,500 | ||||||||||||||||
| Syncsort Incorporated | 7.250 | 8.000 | 04/23/29 | 222,222 | 220,698 | 217,889 | ||||||||||||||||
| Total Bank Loans | 3,259,954 | 3,212,887 | ||||||||||||||||||||
| Bonds - 0.84% | ||||||||||||||||||||||
| Genesis Energy LP | 6.500 | 10/01/25 | 337,000 | 324,538 | 332,383 | |||||||||||||||||
| Hecla Mining Company | 7.250 | 02/15/28 | 500,000 | 476,092 | 523,830 | |||||||||||||||||
| Triumph Group, Inc. | 7.750 | 08/15/25 | 500,000 | 502,324 | 503,690 | |||||||||||||||||
| Total Bonds | 1,302,954 | 1,359,903 | ||||||||||||||||||||
| Common Stock - 0.02% | ||||||||||||||||||||||
| Tourmaline Oil Corp | 42,397 | — | 33,943 | |||||||||||||||||||
| Front Line Power Construction LLC | 3,178 | 8,136 | 5,848 | |||||||||||||||||||
| Total Common Stock | 8,136 | 39,791 | ||||||||||||||||||||
| Preferred Stock - 0.00% | ||||||||||||||||||||||
| Total Corporate Public Securities | $ | 4,571,044 | $ | 4,612,581 | ||||||||||||||||||
| Total Investments | 110.41 | % | $ | 172,919,303 | $ | 179,443,265 | ||||||||||||||||
| Other Assets | 4.54 | $ | 7,376,357 | |||||||||||||||||||
| Liabilities | (14.95 | ) | $ | (24,302,886 | ) | |||||||||||||||||
| Total Net Assets | 100.00 | % | $ | 162,516,736 | ||||||||||||||||||
| (A) | In each of the convertible note, warrant, and common stock investments, the issuer has agreed to provide certain registration rights. |
| (B) | Non-income producing security. |
| (C) | Security valued at fair value using methods determined in good faith by or under the direction of the Board of Trustees. |
| (D) | Defaulted security; interest not accrued. |
| (E) | Illiquid security. As of March 31, 2022 the values of these securities amounted to $166,824,571 or 102.65% of net assets. |
| (F) | Held in PI Subsidiary Trust |
| (G) | A portion of these securities contain unfunded commitments. As of March 31, 2022, total unfunded commitments amounted to $11,370,297 and had unrealized appreciation of $8,212 or 0.01% of net assets. See Note 7. |
| (H) | Security exempt from registration under Rule 144a of the Securities Act of 1933. These securities may only be resold in transactions exempt from registration, normally to qualified institutional buyers. |
PIK - Payment-in-kind
31
CONSOLIDATED SCHEDULE OF INVESTMENTS (CONTINUED)
March 31, 2022
(Unaudited)
| Industry Classification: | Fair Value/ | |||
| AEROSPACE & DEFENSE - 5.77% | ||||
| CTS Engines | $ | 1,329,147 | ||
| Dart Buyer, Inc. | 1,554,527 | |||
| Narda-MITEQ (JFL-Narda Partners, LLC) | 1,492,700 | |||
| Sunvair Aerospace Group Inc. | 2,290,484 | |||
| Trident Maritime Systems | 1,712,063 | |||
| Trident TPI Holdings Inc. | 502,500 | |||
| Triumph Group, Inc. | 503,690 | |||
| 9,385,111 | ||||
| AIRLINES - 1.40% | ||||
| American Airlines Inc. | 583,745 | |||
| Echo Logistics | 1,699,100 | |||
| 2,282,845 | ||||
| AUTOMOTIVE - 3.66% | ||||
| Aurora Parts & Accessories LLC | 354,497 | |||
| English Color & Supply LLC | 2,143,122 | |||
| JF Petroleum Group | 651,445 | |||
| Omega Holdings | 544,324 | |||
| Panther BF Aggregator 2 LP | 103,750 | |||
| Truck-Lite | 2,153,732 | |||
| 5,950,870 | ||||
| BROKERAGE, ASSET MANAGERS & EXCHANGES - 1.78% | ||||
| The Caprock Group (aka TA/TCG Holdings, LLC) | 1,231,019 | |||
| The Hilb Group, LLC | 1,667,324 | |||
| 2,898,343 | ||||
| BUILDING MATERIALS - 1.14% | ||||
| Decks Direct | 1,594,833 | |||
| Wolf-Gordon, Inc. | 262,270 | |||
| 1,857,103 | ||||
| Cable & Statellite - 0.32% | ||||
| CSC Holdings LLC | 523,663 | |||
| CHEMICALS - 1.28% | ||||
| Kano Laboratories LLC | 1,118,571 | |||
| Polytex Holdings LLC | 967,801 | |||
| 2,086,372 | ||||
Fair Value/ | ||||
| CONSUMER CYCLICAL SERVICES - 6.68% | ||||
| Accelerate Learning | $ | 1,692,560 | ||
| LYNX Franchising | 2,438,356 | |||
| MeTEOR Education LLC | 1,654,278 | |||
| PPC Event Services | 1,561,633 | |||
| Prime Security Services, LLC | 866,056 | |||
| ROI Solutions | 1,058,290 | |||
| Turnberry Solutions, Inc. | 1,592,410 | |||
| 10,863,583 | ||||
| CONSUMER PRODUCTS - 2.78% | ||||
| AMS Holding LLC | 244,986 | |||
| Blue Wave Products, Inc. | 193,159 | |||
| Elite Sportswear Holding, LLC | — | |||
| gloProfessional Holdings, Inc. | 836,415 | |||
| Handi Quilter Holding Company | 530,231 | |||
| HHI Group, LLC | 553,889 | |||
| Jones Fish | 1,110,211 | |||
| Manhattan Beachwear Holding Company | — | |||
| Master Cutlery LLC | 58,163 | |||
| Renovation Brands (Renovation Parent Holdings, LLC) | 989,132 | |||
| 4,516,186 | ||||
| DIVERSIFIED MANUFACTURING - 7.04% | ||||
| Advanced Manufacturing Enterprises LLC | — | |||
| F G I Equity LLC | 736,278 | |||
| MNS Engineers, Inc. | 1,277,848 | |||
| Reelcraft Industries, Inc. | 747,696 | |||
| Resonetics, LLC | 2,237,195 | |||
| Safety Products Holdings, Inc. | 1,709,201 | |||
| Standard Elevator Systems | 1,025,353 | |||
| Strahman Holdings Inc. | 209,627 | |||
| Tank Holding | 466,932 | |||
| The Manitowoc Company, Inc. | 521,345 | |||
| Therma-Stor Holdings LLC | 10,698 | |||
| Trystar, Inc. | 2,497,315 | |||
| 11,439,488 | ||||
| ELECTRIC - 1.21% | ||||
| Dwyer Instruments, Inc. | 853,051 | |||
| Electric Power Systems International, Inc. | 1,116,464 | |||
| 1,969,515 | ||||
See Notes to Consolidated Financial Statements
32
Barings Participation Investors
CONSOLIDATED SCHEDULE OF INVESTMENTS (CONTINUED)
March 31, 2022
(Unaudited)
| Industry Classification: (Continued) | Fair Value/ | |||
| ENVIRONMENTAL - 1.38% | ||||
| ENTACT Environmental Services, Inc. | $ | 988,368 | ||
| Marshall Excelsior Co. | 520,550 | |||
| Northstar Recycling | 736,822 | |||
| 2,245,740 | ||||
| FINANCE COMPANIES - 0.58% | ||||
| Portfolio Group | 938,435 | |||
| FINANCIAL OTHER - 0.97% | ||||
| Cogency Global | 919,939 | |||
| Edelman Financial Services | 126,127 | |||
| National Auto Care | 533,143 | |||
| 1,579,209 | ||||
| FOOD & BEVERAGE - 4.44% | ||||
| Alpine US Bidco LLC | 609,369 | |||
| Del Real LLC | 1,305,155 | |||
| PANOS Brands LLC | 2,111,840 | |||
| Sara Lee Frozen Foods | 1,364,780 | |||
| Westminster Acquisition LLC | 74,381 | |||
| Woodland Foods, Inc. | 1,178,090 | |||
| Ziyad | 564,814 | |||
| 7,208,429 | ||||
| GAMING - 0.29% | ||||
| Scientific Games Holdings LP | 473,174 | |||
| HEALTHCARE - 6.42% | ||||
| Cadence, Inc. | 844,250 | |||
| Ellkay | 692,389 | |||
| GD Dental Services LLC | 28,399 | |||
| Heartland Veterinary Partners | 1,573,869 | |||
| Home Care Assistance, LLC | 836,518 | |||
| Navia Benefit Solutions, Inc. | 1,154,875 | |||
| Office Ally (OA TOPCO, LP) | 853,318 | |||
| RedSail Technologies | 1,622,815 | |||
| TherOX, Inc. | — | |||
| Touchstone Health Partnership | — | |||
| UroGPO, LLC | 2,316,667 | |||
| Verscend Holding Corp | 501,280 | |||
| 10,424,380 | ||||
Fair Value/ | ||||
| INDUSTRIAL OTHER - 15.03% | ||||
| Aftermath, Inc. | $ | 1,685,047 | ||
| ASPEQ Holdings | 1,131,056 | |||
| Concept Machine Tool Sales, LLC | 558,893 | |||
| E.S.P. Associates, P.A. | 247,797 | |||
| Front Line Power Construction LLC | 248,348 | |||
| IGL Holdings III Corp. | 1,498,852 | |||
| IM Analytics Holdings, LLC | 826,761 | |||
| Industrial Service Solutions | 847,697 | |||
| Media Recovery, Inc. | 488,583 | |||
| PB Holdings LLC | 751,923 | |||
| Polara (VSC Polara LLC) | 884,082 | |||
| Specified Air Solutions (dba Madison Indoor Air Solutions) | 11,039,545 | |||
| Stratus Unlimited | 832,943 | |||
| STS Operating, Inc. | 483,750 | |||
| Tencarva Machinery Company | 1,414,806 | |||
| World 50, Inc. | 1,489,918 | |||
| 24,430,001 | ||||
| Local Authority - 0.91% | ||||
| LeadsOnline | 1,471,152 | |||
| MEDIA & ENTERTAINMENT - 4.01% | ||||
| Advantage Software | 100,257 | |||
| BrightSign | 1,378,056 | |||
| Cadent, LLC | 890,428 | |||
| DistroKid (IVP XII DK Co-Invest, LP) | 1,693,341 | |||
| HOP Entertainment LLC | — | |||
| Houghton Mifflin Harcourt | 522,500 | |||
| Music Reports, Inc. | 1,387,452 | |||
| Terrier Media Buyer, Inc. | 539,275 | |||
| 6,511,309 | ||||
| METALS & MINING - 1.49% | ||||
| Cleveland-Cliffs Inc. | 369,065 | |||
| Coronado Finance Pty Ltd. | 264,599 | |||
| First Quantum Minerals Ltd. | 745,086 | |||
| Hecla Mining Company | 523,830 | |||
| Picou Holdings LLC | 513,125 | |||
| 2,415,705 | ||||
| MIDSTREAM - 0.20% | ||||
| Genesis Energy LP | 332,383 | |||
See Notes to Consolidated Financial Statements
33
CONSOLIDATED SCHEDULE OF INVESTMENTS (CONTINUED)
March 31, 2022
(Unaudited)
| Industry Classification: (Continued) | Fair Value/ | |||
| OIL FIELD SERVICES - 0.34% | ||||
| Neptune Energy Bondco PLC | $ | 502,745 | ||
| Petroplex Inv Holdings LLC | 13,647 | |||
| Tourmaline Oil Corp | 33,943 | |||
| 550,335 | ||||
| PACKAGING - 0.95% | ||||
| ASC Holdings, Inc. | 737,414 | |||
| Brown Machine LLC | 808,993 | |||
| 1,546,407 | ||||
| PAPER - 0.75% | ||||
| Dunn Paper | 1,223,025 | |||
| PROPERTY & CASUALTY - 0.95% | ||||
| Pearl Holding Group | 1,551,596 | |||
| REFINING - 0.96% | ||||
| CVR Energy Inc. | 474,205 | |||
| MES Partners, Inc. | — | |||
| Tristar Global Energy Solutions, Inc. | 1,085,618 | |||
| 1,559,823 | ||||
| TECHNOLOGY - 27.25% | ||||
| 1WorldSync, Inc. | 2,429,647 | |||
| Almonde, Inc. | 491,015 | |||
| Amtech Software | 528,214 | |||
| Audio Precision | 1,746,000 | |||
| Best Lawyers (Azalea Investment Holdings, LLC) | 1,363,389 | |||
| CAi Software | 2,219,254 | |||
| Cash Flow Management | 894,300 | |||
| Claritas Holdings, Inc. | 1,533,322 | |||
| CloudWave | 1,597,723 | |||
| Command Alkon | 2,105,467 | |||
| EFI Productivity Software | 908,655 | |||
| Follett School Solutions | 1,688,950 | |||
| GraphPad Software, Inc. | 2,609,154 | |||
| Magenta Buyer LLC | 497,671 | |||
| Options Technology Ltd | 1,555,756 | |||
| ProfitOptics | 786,680 | |||
| Recovery Point Systems, Inc. | 1,339,927 | |||
| REVSpring, Inc. | 1,725,000 | |||
| RPX Corp | 2,430,983 | |||
| Ruffalo Noel Levitz | 1,226,029 | |||
Fair Value/ | ||||
| Sandvine Corporation | $ | 1,725,000 | ||
| Scaled Agile, Inc. | 1,190,537 | |||
| Smart Bear | 1,694,533 | |||
| Smartling, Inc. | 1,390,816 | |||
| Springbrook Software | 1,300,168 | |||
| Stackline | 1,794,824 | |||
| Syncsort Incorporated | 217,889 | |||
| Syntax Systems Ltd | 750,184 | |||
| Transit Technologies LLC | 752,219 | |||
| U.S. Legal Support, Inc. | 2,042,316 | |||
| VitalSource | 1,726,765 | |||
| 44,262,387 | ||||
| TRANSPORTATION SERVICES - 10.44% | ||||
| AIT Worldwide Logistics, Inc. | 1,742,728 | |||
| BDP International, Inc. | 2,468,340 | |||
| eShipping | 1,304,283 | |||
| FragilePAK | 1,077,033 | |||
| Omni Logistics, LLC | 1,705,989 | |||
| Pegasus Transtech Corporation | 2,220,232 | |||
| Rock-it Cargo | 2,071,373 | |||
| SEKO Worldwide, LLC | 1,463,760 | |||
| VP Holding Company | 2,348,392 | |||
| Kenan Advantage Group Inc. | 544,566 | |||
| 16,946,696 | ||||
| Total Investments - 110.42% (Cost - $172,919,303) | $ | 179,443,265 | ||
See Notes to Consolidated Financial Statements
34
Barings Participation Investors
NOTES TO CONSOLIDATED FINANCIAL STATEMENTS
(Unaudited)
| 1. | History |
Barings Participation Investors (the “Trust”) was organized as a Massachusetts business trust under the laws of the Commonwealth of Massachusetts pursuant to a Declaration of Trust dated April 7, 1988.
The Trust is a diversified closed-end management investment company. Barings LLC (“Barings”), a wholly-owned indirect subsidiary of Massachusetts Mutual Life Insurance Company (“MassMutual”), acts as its investment adviser. The Trust’s investment objective is to maintain a portfolio of securities providing a current yield and, when available, an opportunity for capital gains. The Trust’s principal investments are privately placed, below investment grade, long-term debt obligations including bank loans and mezzanine debt instruments. Such direct placement securities may, in some cases, be accompanied by equity features such as common stock, preferred stock, warrants, conversion rights, or other equity features. The Trust typically purchases these investments, which are not publicly tradable, directly from their issuers in private placement transactions. These investments are typically made to small or middle market companies. In addition, the Trust may invest, subject to certain limitations, in marketable debt securities (including high yield and/or investment grade securities) and marketable common stock. Below investment grade or high yield securities have predominantly speculative characteristics with respect to the capacity of the issuer to pay interest and repay capital.
On January 27, 1998, the Board of Trustees authorized the formation of a wholly-owned subsidiary of the Trust (“PI Subsidiary Trust”) for the purpose of holding certain investments. The results of the PI Subsidiary Trust are consolidated in the accompanying financial statements. Footnote 2.D below discusses the Federal tax consequences of the PI Subsidiary Trust.
| 2. | Significant Accounting Policies |
The following is a summary of significant accounting policies followed consistently by the Trust in the preparation of its consolidated financial statements in conformity with accounting principles generally accepted in the United States of America (“U.S. GAAP”).
The Trustees have determined that the Trust is an investment company in accordance with Accounting Standards Codification (“ASC”) 946, Financial Services – Investment Companies, for the purpose of financial reporting.
A. Fair Value Measurements:
Under U.S. GAAP, fair value represents the price that should be received to sell an asset (exit price) in an orderly transaction between willing market participants at the measurement date.
Determination of Fair Value
The determination of the fair value of the Trust’s investments is the responsibility of the Trust’s Board of Trustees (the
“Trustees”). The Trustees have adopted procedures for the valuation of the Trust’s securities and have delegated responsibility for applying those procedures to Barings. Barings has established a Pricing Committee which is responsible for setting the guidelines used in following the procedures adopted by the Trustees ensuring that those guidelines are being followed. Barings considers all relevant factors that are reasonably available, through either public information or information available to Barings, when determining the fair value of a security. The Trustees meet at least once each quarter to approve the value of the Trust’s portfolio securities as of the close of business on the last business day of the preceding quarter. This valuation requires the approval of a majority of the Trustees of the Trust, including a majority of the Trustees who are not interested persons of the Trust or of Barings. In approving valuations, the Trustees will consider reports by Barings analyzing each portfolio security in accordance with the procedures and guidelines referred to above, which include the relevant factors referred to below. Barings has agreed to provide such reports to the Trust at least quarterly. The consolidated financial statements include private placement restricted securities valued at $166,824,571 (102.65% of net assets) as of March 31, 2022, the values of which have been estimated by the Trustees based on the process described above in the absence of readily ascertainable market values. Due to the inherent uncertainty of valuation, those estimated values may differ significantly from the values that would have been used had a ready market for the securities existed, and the differences could be material.
Independent Valuation Process
The fair value of bank loans and equity investments that are unsyndicated or for which market quotations are not readily available, including middle-market bank loans, will be submitted to an independent provider to perform an independent valuation on those bank loans and equity investments as of the end of each quarter. Such bank loans and equity investments will be held at cost until such time as they are sent to the valuation provider for an initial valuation subject to override by the Adviser should it determine that there have been material changes in interest rates and/or the credit quality of the issuer. The independent valuation provider applies various methods (synthetic rating analysis, discounting cash flows, and re-underwriting analysis) to establish the rate of return a market participant would require (the “discount rate”) as of the valuation date, given market conditions, prevailing lending standards and the perceived credit quality of the issuer. Future expected cash flows for each investment are discounted back to present value using these discount rates in the discounted cash flow analysis. A range of value will be provided by the valuation provider and the Adviser will determine the point within that range that it will use in making valuation recommendations to the Trustees, and will report to the Trustees on its rationale for each such determination. The Adviser will continue to use its internal valuation model as a comparison point to validate
35
NOTES TO CONSOLIDATED FINANCIAL STATEMENTS (CONTINUED)
(Unaudited)
the price range provided by the valuation provider and, where applicable, in determining the point within that range that it will use in making valuation recommendations to the Trustees. If the Advisers’ Pricing Committee disagrees with the price range provided, it may make a fair value recommendation to the Trustees that is outside of the range provided by the independent valuation provider, and will notify the Trustees of any such override and the reasons therefore. In certain instances, the Trust may determine that it is not cost-effective, and as a result is not in the shareholders’ best interests, to request the independent valuation firm to perform the Procedures on certain investments. Such instances include, but are not limited to, situations where the fair value of the investment in the portfolio company is determined to be insignificant relative to the total investment portfolio. Finally, the Trustees determined in good faith that the Trust’s investments were valued at fair value in accordance with the Trust’s valuation policies and procedures and the 1940 Act based on, among other things, the input of Barings, the Trust’s Audit Committee and the independent valuation firm.
Following is a description of valuation methodologies used for assets recorded at fair value.
Corporate Public Securities at Fair Value – Bank Loans, Corporate Bonds, Preferred Stocks and Common Stocks
The Trust uses external independent third-party pricing services to determine the fair values of its Corporate Public Securities. At March 31, 2022, 100% of the carrying value of these investments was from external pricing services. In the event that the primary pricing service does not provide a price, the Trust utilizes the pricing provided by a secondary pricing service.
Public debt securities generally trade in the over-the-counter market rather than on a securities exchange. The Trust’s pricing services use multiple valuation techniques to determine fair value. In instances where significant market activity exists, the pricing services may utilize a market based approach through which quotes from market makers are used to determine fair value. In instances where significant market activity may not exist or is limited, the pricing services also utilize proprietary valuation models which may consider market characteristics such as benchmark yield curves, option adjusted spreads, credit spreads, estimated default rates, coupon rates, anticipated timing of principal underlying prepayments, collateral, and other unique security features in order to estimate the relevant cash flows, which are then discounted to calculate the fair value.
The Trust’s investments in bank loans are normally valued at the bid quotation obtained from dealers in loans by an independent pricing service in accordance with the Trust’s valuation policies and procedures approved by the Trustees.
Public equity securities listed on an exchange or on the NASDAQ National Market System are valued at the last quoted sales price of that day.
At least annually, Barings conducts reviews of the primary pricing vendors to validate that the inputs used in that vendors’ pricing process are deemed to be market observable as defined in the standard. While Barings is not provided access to proprietary models of the vendors, the reviews have included on-site walk-throughs of the pricing process, methodologies and control procedures for each asset class and level for which prices are provided. The reviews also include an examination of the underlying inputs and assumptions for a sample of individual securities across asset classes, credit rating levels and various durations. In addition, the pricing vendors have an established challenge process in place for all security valuations, which facilitates identification and resolution of prices that fall outside expected ranges. Barings believes that the prices received from the pricing vendors are representative of prices that would be received to sell the assets at the measurement date (exit prices) and are classified appropriately in the hierarchy.
Corporate Restricted Securities at Fair Value – Bank Loans, Corporate Bonds
The fair value of certain notes is determined using an internal model that discounts the anticipated cash flows of those notes using a specific discount rate. Changes to that discount rate are driven by changes in general interest rates, probabilities of default and credit adjustments. The discount rate used within the models to discount the future anticipated cash flows is considered a significant unobservable input. Increases/(decreases) in the discount rate would result in a (decrease)/increase to the notes’ fair value.
The fair value of certain distressed notes is based on an enterprise waterfall methodology which is discussed in the equity security valuation section below.
Corporate Restricted Securities at Fair Value – Common Stock, Preferred Stock and Partnerships & LLC’s
The fair value of equity securities is determined using an enterprise waterfall methodology. Under this methodology, the enterprise value of the company is first estimated and that value is then allocated to the company’s outstanding debt and equity securities based on the documented priority of each class of securities in the capital structure. Generally, the waterfall proceeds from senior debt, to senior and junior subordinated debt, to preferred stock, then finally common stock.
To estimate a company’s enterprise value, the company’s trailing twelve months earnings before interest, taxes, depreciation and amortization (“EBITDA”) is multiplied by a valuation multiple.
Both the company’s EBITDA and valuation multiple are considered significant unobservable inputs. Increases/(decreases) to the company’s EBITDA and/or valuation multiple would result in increases/(decreases) to the equity value.
36
Barings Participation Investors
NOTES TO CONSOLIDATED FINANCIAL STATEMENTS (CONTINUED)
(Unaudited)
Short-Term Securities
Short-term securities with more than sixty days to maturity are valued at fair value, using external independent third-party services. Short-term securities, of sufficient credit quality, having a maturity of sixty days or less are valued at amortized cost, which approximates fair value.
New Accounting Pronouncement
In March 2020, the Financial Accounting Standards Board issued Accounting Standards Update 2020-04 (“ASU 2020-04”) “Reference Rate Reform (Topic 848): Facilitation of the
Effects of Reference Rate Reform on Financial Reporting.” This guidance provides optional expedients and exceptions for applying generally accepted accounting principles to contract modifications and hedging relationships, subject to meeting certain criteria, that reference LIBOR or another reference rate expected to be discontinued. ASU 2020-04 is effective for all entities as of March 12, 2020 through December 31, 2022. The Trust expects that the adoption of this guidance will not have a material impact on the Trust’s financial position, result of operations or cash flows.
Fair Value Hierarchy
The Trust categorizes its investments measured at fair value in three levels, based on the inputs and assumptions used to determine fair value. These levels are as follows:
Level 1 – quoted prices in active markets for identical securities
Level 2 – other significant observable inputs (including quoted prices for similar securities, interest rates, prepayment speeds, credit risk, etc.)
Level 3 – significant unobservable inputs (including the Trust’s own assumptions in determining the fair value of investments)
The following table summarizes the levels in the fair value hierarchy into which the Trust’s financial instruments are categorized as of March 31, 2022.
The fair values of the Trust’s investments disaggregated into the three levels of the fair value hierarchy based upon the lowest level of significant input used in the valuation as of March 31, 2022 are as follows:
| Assets: | Total | Level 1 | Level 2 | Level 3 | ||||||||||||
| Restricted Securities | ||||||||||||||||
| Corporate Bonds | $ | 18,125,493 | $ | — | $ | 8,006,113 | $ | 10,119,380 | ||||||||
| Bank Loans | 136,667,522 | — | — | 136,667,522 | ||||||||||||
| Common Stock - U.S. | 1,343,175 | — | — | 1,343,175 | ||||||||||||
| Preferred Stock | 1,550,396 | — | — | 1,550,396 | ||||||||||||
| Partnerships and LLCs | 17,144,098 | — | — | 17,144,098 | ||||||||||||
| Public Securities | ||||||||||||||||
| Bank Loans | 3,212,887 | — | 1,816,452 | 1,396,435 | ||||||||||||
| Corporate Bonds | 1,359,903 | — | 1,359,903 | — | ||||||||||||
| Common Stock - U.S. | 39,791 | 5,848 | — | 33,943 | ||||||||||||
| Preferred Stock | — | — | — | — | ||||||||||||
| Short-term Securities | — | — | — | — | ||||||||||||
| Total | $ | 179,443,265 | $ | 5,848 | $ | 11,182,468 | $ | 168,254,949 | ||||||||
See information disaggregated by security type and industry classification in the Consolidated Schedule of Investments.
37
NOTES TO CONSOLIDATED FINANCIAL STATEMENTS (CONTINUED)
(Unaudited)
Quantitative Information about Level 3 Fair Value Measurements
The following table represents quantitative information about Level 3 fair value measurements as of March 31, 2022.
| Fair Value | Valuation Technique | Unobservable Inputs | Range | Weighted* | |
| Bank Loans | $ 116,741,698 | Income Approach | Implied Spread | 8.8% - 9.7% | 9.3% |
| Corporate Bonds | $ 8,503,040 | Income Approach | Implied Spread | 16.0% - 17.2% | 16.6% |
| Equity Securities** | $ 20,443,776 | Enterprise Value Waterfall Approach | Valuation Multiple | 5.5x to 55.0x | 13.5x |
Certain of the Trust’s Level 3 equity securities investments may be valued using unadjusted inputs that have not been internally developed by the Trust, including recently purchased securities held at cost. As a result, fair value of assets of $22,5566,435 have been excluded from the preceding table.
| * | The weighted averages disclosed in the table above were weighted by relative fair value |
| ** | Including partnerships and LLC’s |
Following is a reconciliation of Level 3 assets for which significant unobservable inputs were used to determine fair value:
| Assets: | Beginning balance at 12/31/2021 | Included in earnings | Purchases | Sales | Prepayments | Transfers into Level 3 | Transfers out of Level 3 | Ending balance at 03/31/2022 | ||||||||||||||||||||||||
| Restricted Securities | ||||||||||||||||||||||||||||||||
| Corporate Bonds | $ | 9,549,244 | $ | 510,991 | $ | 59,145 | $ | — | $ | — | $ | — | $ | — | $ | 10,119,380 | ||||||||||||||||
| Bank Loans | 130,187,625 | (425,650 | ) | 7,468,625 | — | (563,078 | ) | — | — | 136,667,522 | ||||||||||||||||||||||
| Common Stock - U.S. | 1,257,986 | 119,019 | 38,397 | (72,227 | ) | — | — | — | 1,343,175 | |||||||||||||||||||||||
| Preferred Stock | 1,608,973 | (86,128 | ) | 27,551 | — | — | — | — | 1,550,396 | |||||||||||||||||||||||
| Partnerships and LLCs | 17,285,572 | (248,965 | ) | 117,854 | (10,363 | ) | — | — | — | 17,144,098 | ||||||||||||||||||||||
| Public Securities | ||||||||||||||||||||||||||||||||
| Bank Loans | 1,127,428 | (21,244 | ) | 290,251 | — | — | — | — | 1,396,435 | |||||||||||||||||||||||
| Common Stock - U.S. | 33,565 | 378 | — | — | — | — | — | 33,943 | ||||||||||||||||||||||||
| Corporate Bonds | — | — | — | — | — | — | — | — | ||||||||||||||||||||||||
| $ | 161,050,393 | $ | (151,599 | ) | $ | 8,001,823 | $ | (82,590 | ) | $ | (563,078 | ) | $ | — | $ | — | $ | 168,254,949 | ||||||||||||||
| * | For the three months ended March 31, 2022, transfers into and out of Level 3 were the result of changes in the observability of significant inputs for certain portfolio companies. |
38
Barings Participation Investors
NOTES TO CONSOLIDATED FINANCIAL STATEMENTS (CONTINUED)
(Unaudited)
Income, Gains and Losses on Level 3 assets included in Net Increase in Net Assets resulting from Operations for the year are presented in the following accounts on the Statement of Operations:
Net Increase | Change in Unrealized (Depreciation) in Net Assets from assets still held | |||||||
| Interest Income (OID Amortization) | $ | 128,666 | $ | — | ||||
| Net realized gain on investments before taxes | 91,615 | — | ||||||
| Net change in unrealized (depreciation) of investments before taxes | (371,880 | ) | (1,259,155 | ) | ||||
B. Accounting for Investments:
Investment Income
Investment transactions are accounted for on the trade date. Interest income, including the amortization of premiums and accretion of discounts on bonds held using the yield-to-maturity method, is recorded on the accrual basis to the extent that such amounts are expected to be collected. Generally, when interest and/or principal payments on a loan become past due, or if the Trust otherwise does not expect the borrower to be able to service its debt and other obligations, the Trust will place the investment on non-accrual status and will cease recognizing interest income on that investment for financial reporting purposes until all principal and interest have been brought current through payment or due to a restructuring such that the interest income is deemed to be collectible. The Trust writes off any previously accrued and uncollected interest when it is determined that interest is no longer considered collectible. As of March 31, 2022, the fair value of the Trust’s non-accrual assets was $4,726,812, or 2.6% of the total fair value of the Trust’s portfolio, and the cost of the Trust’s non-accrual assets was $6,291,502, or 3.6% of the total cost of the Trust’s portfolio.
Payment-in-Kind Interest
The Trust currently holds, and expects to hold in the future, some investments in its portfolio that contain Payment-in-Kind (“PIK”) interest provisions. The PIK interest, computed at the contractual rate specified in each loan agreement, is added to the principal balance of the investment, rather than being paid to the Trust in cash, and is recorded as interest income. Thus, the actual collection of PIK interest may be deferred until the time of debt principal repayment. PIK interest, which is a non-cash source of income at the time of recognition, is included in the Trust’s taxable income and therefore affects the amount the Trust is required to distribute
to its stockholders to maintain its qualification as a “regulated investment company” for federal income tax purposes, even though the Trust has not yet collected the cash.
Generally, when current cash interest and/or principal payments on an investment become past due, or if the Trust otherwise does not expect the borrower to be able to service its debt and other obligations, the Trust will place the investment on PIK non-accrual status and will cease recognizing PIK interest income on that investment for financial reporting purposes until all principal and interest have been brought current through payment or due to a restructuring such that the interest income is deemed to be collectible. The Trust writes off any accrued and uncollected PIK interest when it is determined that the PIK interest is no longer collectible. As of March 31, 2022, the Trust held no PIK non-accrual assets.
Realized Gain or Loss and Unrealized Appreciation or Depreciation of Portfolio Investments
Realized gains and losses on investment transactions and unrealized appreciation and depreciation of investments are reported for financial statement and Federal income tax purposes on the identified cost method.
C. Use of Estimates:
The preparation of financial statements in conformity with U.S. GAAP requires management to make estimates and assumptions that affect the reported amounts of assets and liabilities, disclosure of contingent assets and liabilities and the reported amounts of revenues and expenses during the reporting period. Actual results could differ from those estimates and the differences could be material.
D. Federal Income Taxes:
The Trust has elected to be taxed as a “regulated investment company” under the Internal Revenue Code, and intends to maintain this qualification and to distribute substantially all of its net taxable income to its shareholders. In any year when net long-term capital gains are realized by the Trust, management, after evaluating the prevailing economic conditions, will recommend that Trustees either designate the net realized long-term gains as undistributed and pay the federal capital gains taxes thereon, or distribute all or a portion of such net gains.
The Trust is taxed as a regulated investment company and is therefore limited as to the amount of non-qualified income that it may receive as the result of operating a trade or business, e.g. the Trust’s pro rata share of income allocable to the Trust by a partnership operating company. The Trust’s violation of this limitation could result in the loss of its status as a regulated investment company, thereby subjecting all of its net income and capital gains to corporate taxes prior to distribution to its shareholders. The Trust, from time-to-time, identifies investment opportunities in the securities of entities that could cause such trade or business income to be allocable to the Trust. The PI Subsidiary Trust (described in
39
NOTES TO CONSOLIDATED FINANCIAL STATEMENTS (CONTINUED)
(Unaudited)
Footnote 1, above) was formed in order to allow investment in such securities without adversely affecting the Trust’s status as a regulated investment company.
The PI Subsidiary Trust is not taxed as a regulated investment company. Accordingly, prior to the Trust receiving any distributions from the PI Subsidiary Trust, all of the PI Subsidiary Trust’s taxable income and realized gains, including non-qualified income and realized gains, is subject to taxation at prevailing corporate tax rates. As of March 31, 2022, the PI Subsidiary Trust has incurred income tax expense of $21.004.
Deferred tax assets and liabilities are recognized for the future tax consequences attributable to differences between the financial statement carrying amounts of the existing assets and liabilities and their respective tax basis. As of March 31, 2022, the PI Subsidiary Trust has a deferred tax liability of $365,141.
E. Distributions to Shareholders:
The Trust records distributions to shareholders from distributable earnings and net realized gains, if any, on the ex-dividend date. The Trust’s dividend is declared four times per year. The Trust’s net realized capital gain distribution, if any, is declared in December.
| 3. | Investment Advisory and Administrative Services Contract |
A. Services:
Under an Investment Advisory and Administrative Services Contract (the “Contract”) with the Trust, Barings has agreed to use its best efforts to present to the Trust a continuing and suitable investment program consistent with the investment objectives and policies of the Trust. Barings represents the Trust in any negotiations with issuers, investment banking firms, securities brokers or dealers and other institutions or investors relating to the Trust’s investments. Under the Contract, Barings also provides administration of the day-to-day operations of the Trust and provides the Trust with office space and office equipment, accounting and bookkeeping services, and necessary executive, clerical and secretarial personnel for the performance of the foregoing services.
B. Fee:
For its services under the Contract, Barings is paid a quarterly investment advisory fee equal to 0.225% of the value of the Trust’s net assets as of the last business day of each fiscal quarter, an amount approximately equivalent to 0.90% on an annual basis. A majority of the Trustees, including a majority of the Trustees who are not interested persons of the Trust or of Barings, approve the valuation of the Trust’s net assets as of such day.
| 4. | Borrowings |
Senior Secured Indebtedness
MassMutual holds the Trust’s $15,000,000 Senior Fixed Rate Convertible Note (the “Note”) issued by the Trust on December 13, 2011. The Note is due December 13, 2023 and accrues interest at 4.09% per annum. MassMutual, at its option, can convert the principal amount of the Note into common shares. The dollar amount of principal would be converted into an equivalent dollar amount of common shares based upon the average price of the common shares for ten business days prior to the notice of conversion. For the three months ended March 31, 2022, the Trust incurred total interest expense on the Note of $153,375.
The Trust may redeem the Note, in whole or in part, at the principal amount proposed to be redeemed together with the accrued and unpaid interest thereon through the redemption date plus the Make Whole Premium. The Make Whole Premium equals the excess of (i) the present value of the scheduled payments of principal and interest which the Trust would have paid but for the proposed redemption, discounted at the rate of interest of U.S. Treasury obligations whose maturity approximates that of the Note plus 0.50% over (ii) the principal of the Note proposed to be redeemed.
Credit Facility
On July 22, 2021 (the “Effective Date”), MassMutual provided to the Trust, a five-year $15,000,000 committed revolving credit facility. Interest charged is at the rate of LIBOR (London Interbank Offered Rate) plus 2.25% on the outstanding borrowings. The Trust will also be responsible for paying a commitment fee of 0.50% on the unused amount. For purposes of calculating the commitment fee for the period from the Effective Date to the earlier to occur of (x) the date that is 270 days after the Effective Date and (y) the first date on which the aggregate outstanding borrowings is greater than $7,500,000, the unused amount shall be deemed to be in an amount equal to $7,500,000. As of March 31, 2022, the Trust had $8,200,000 of outstanding borrowings on the revolving credit facility.
| 5. | Purchases and Sales of Investments |
For the three | ||||||||
Cost of | Proceeds | |||||||
| Corporate restricted securities | $ | 8,362,274 | $ | 2,230,447 | ||||
| Corporate public securities | 486,937 | — | ||||||
| 6. | Investment Risks |
In the normal course of its business, the Trust trades various financial instruments and enters into certain investment activities with investment risks. These risks include: (i) market risk, (ii) volatility risk and (iii) credit, counterparty and liquidity
40
Barings Participation Investors
NOTES TO CONSOLIDATED FINANCIAL STATEMENTS (CONTINUED)
(Unaudited)
risk. It is the Trust’s policy to identify, measure and monitor risk through various mechanisms including risk management strategies and credit policies. These include monitoring risk guidelines and diversifying exposures across a variety of instruments, markets and counterparties. There can be no assurance that the Trust will be able to implement its credit guidelines or that its risk monitoring strategies will be successful.
Impacts of COVID-19
The pandemic related to the global spread of novel coronavirus disease (COVID-19), which was first detected in December 2019, has resulted in significant disruptions to global business activity and the global economy, as well as the economies of individual countries, the financial performance of individual companies and sectors, and the securities and commodities markets in general. This pandemic, the full effects of which are still unknown, has resulted in substantial market volatility and may continue to adversely impact the prices and liquidity of the Trust’s investments and the Trust’s performance.
LIBOR
The United Kingdom’s Financial Conduct Authority (“FCA”), which regulates LIBOR, announced a desire to phase out the use of LIBOR by the end of 2021. LIBOR has historically been a common benchmark interest rate index used to make adjustments to variable-rate loans. It is used throughout global banking and financial industries to determine interest rates for a variety of financial instruments and borrowing arrangements. The transition process might lead to increased volatility and illiquidity in markets that currently rely on LIBOR to determine interest rates. It could also lead to a reduction in the value of some LIBOR-based investments held by a fund and reduce the effectiveness of new hedges placed against existing LIBOR-based investments. While some LIBOR-based instruments contemplate a scenario where LIBOR is no longer available by providing for an alternative rate-setting methodology, not all have such provisions and there may be significant uncertainty regarding the effectiveness of any such alternative methodologies.
| 7. | Commitments and Contingencies |
During the normal course of business, the Trust may enter into contracts and agreements that contain a variety of representations and warranties. The exposure, if any, to the Trust under these arrangements is unknown as this would involve future claims that may or may not be made against the Trust and which have not yet occurred. The Trust has no history of prior claims related to such contracts and agreements.
At March 31, 2022 the Trust had the following unfunded commitments:
Delayed Draw Term Loans:
Investment | Unfunded Amount | Unfunded Value | ||||||
| Amtech Software | $ | 363,636 | $ | 364,142 | ||||
| Best Lawyers | 221,154 | 221,398 | ||||||
| Command Alkon | 436,013 | 436,490 | ||||||
| Dart Buyer, Inc. | 134,550 | 140,487 | ||||||
| Dwyer Instruments, Inc. | 131,579 | 131,883 | ||||||
| Electric Power Systems International Inc. | 113,921 | 114,333 | ||||||
| eShipping | 293,035 | 293,434 | ||||||
| FragilePAK | 539,063 | 522,151 | ||||||
| Heartland Veterinary Partners | 113,357 | 113,672 | ||||||
| IGL Holdings III Corp. | 182,733 | 182,582 | ||||||
| Kano Laboratories LLC | 569,601 | 569,042 | ||||||
| National Auto Care | 356,209 | 356,174 | ||||||
| Navia Benefit Solutions Inc. | 543,720 | 546,023 | ||||||
| Pearl Holding Group | 136,184 | 135,287 | ||||||
| Portfolio Group | 496,800 | 493,097 | ||||||
| ROI Solutions, LLC | 534,628 | 542,112 | ||||||
| Scaled Agile, Inc. | 287,170 | 289,516 | ||||||
| SEKO Worldwide, LLC | 225,121 | 229,310 | ||||||
| Smartling, Inc. | 202,941 | 203,229 | ||||||
| Standard Elevator Systems | 552,585 | 553,389 | ||||||
| Stratus Unlimited | 172,106 | 173,099 | ||||||
| Syntax Systems Ltd | 193,308 | 193,191 | ||||||
| Tencarva Machinery Company | 233,555 | 233,747 | ||||||
| The Caprock Group | 360,424 | 362,391 | ||||||
| Truck-Lite Co., LLC | 300,786 | 301,618 | ||||||
| Ziyad | 276,811 | 276,682 | ||||||
| $ | 7,970,990 | $ | 7,978,477 | |||||
41
NOTES TO CONSOLIDATED FINANCIAL STATEMENTS (CONTINUED)
(Unaudited)
Revolvers:
Investment | Unfunded Amount | Unfunded Value | ||||||
| Amtech Software | $ | 90,909 | $ | 91,035 | ||||
| Best Lawyers | 110,577 | 110,699 | ||||||
| BrightSign | 134,202 | 133,162 | ||||||
| CAi Software | 235,746 | 236,017 | ||||||
| Cash Flow Management | 74,627 | 74,691 | ||||||
| Cogency Global | 60,611 | 60,576 | ||||||
| Decks Direct | 100,364 | 100,628 | ||||||
| EFI Productivity Software | 73,012 | 73,072 | ||||||
| eShipping | 94,748 | 94,981 | ||||||
| Jones Fish | 164,557 | 164,507 | ||||||
| LeadsOnline | 224,512 | 224,415 | ||||||
| Marshall Excelsior Co. | 50,167 | 50,144 | ||||||
| Narda-MITEQ | 207,682 | 207,815 | ||||||
| National Auto Care | 98,039 | 98,030 | ||||||
| Office Ally | 133,124 | 133,267 | ||||||
| Polara | 108,266 | 106,416 | ||||||
| ProfitOptics | 193,548 | 193,518 | ||||||
| Scaled Agile, Inc. | 231,716 | 233,230 | ||||||
| Smartling, Inc. | 101,471 | 101,615 | ||||||
| Standard Elevator Systems | 116,364 | 116,526 | ||||||
| Syntax Systems Ltd | 44,762 | 44,676 | ||||||
| Tank Holding | 21,818 | 21,818 | ||||||
| Tencarva Machinery Company | 297,534 | 297,779 | ||||||
| The Caprock Group | 105,981 | 106,307 | ||||||
| Woodland Foods, Inc. | 151,961 | 152,181 | ||||||
| Ziyad | 173,007 | 172,926 | ||||||
| 3,399,307 | 3,400,033 | |||||||
Total Unfunded Commitments | $ | 11,370,297 | $ | 11,378,510 | ||||
As of March 31, 2022, unfunded commitments had unrealized appreciation of $8,212 or 0.01% of net assets.
| 8. | Quarterly Results of Investment Operations (unaudited) |
| March 31, 2022 | ||||||||
Amount | Per Share | |||||||
| Investment income | $ | 2,970,053 | ||||||
| Net investment income (net of taxes) | 2,161,764 | $ | 0.20 | |||||
| Net realized and unrealized loss on investments (net of taxes) | (725,503 | ) | (0.06 | ) | ||||
42
Barings Participation Investors
This privacy notice is being provided on behalf of Barings LLC and its affiliates: Barings Securities LLC; Barings Australia Pty Ltd; Barings Japan Limited; Barings Investment Advisers (Hong Kong) Limited; Barings Funds Trust; Barings Global Short Duration High Yield Fund; Barings BDC, Inc.; Barings Corporate Investors and Barings Participation Investors (together, for purposes of this privacy notice, “Barings”).
When you use Barings you entrust us not only with your hard-earned assets but also with your personal and financial data. We consider your data to be private and confidential, and protecting its confidentiality is important to us. Our policies and procedures regarding your personal information are summarized below.
We may collect non-public personal information about you from:
| • | Applications or other forms, interviews, or by other means; |
| • | Consumer or other reporting agencies, government agencies, employers or others; |
| • | Your transactions with us, our affiliates, or others; and |
| • | Our Internet website. |
We may share the financial information we collect with our financial service affiliates, such as insurance companies, investment companies and securities broker-dealers. Additionally, so that we may continue to offer you products and services that best meet your investment needs and to effect transactions that you request or authorize, we may disclose the information we collect, as described above, to companies that perform administrative or marketing services on our behalf, such as transfer agents, custodian banks, service providers or printers and mailers that assist us in the distribution of investor materials or that provide operational support to Barings. These companies are required to protect this information and will use this information only for the services for which we hire them, and are not permitted to use or share this information for any other purpose. Some of these companies may perform such services in jurisdictions other than the United States. We may share some or all of the information we collect with other financial institutions with whom we jointly market products. This may be done only if it is permitted by the state in which you live. Some disclosures may be limited to your name, contact and transaction information with us or our affiliates.
Any disclosures will be only to the extent permitted by federal and state law. Certain disclosures may require us to get an “opt-in” or “opt-out” from you. If this is required, we will do so before information is shared. Otherwise, we do not share any personal information about our customers or former customers unless authorized by the customer or as permitted by law.
We restrict access to personal information about you to those employees who need to know that information to provide products and services to you. We maintain physical, electronic and procedural safeguards that comply with legal standards to guard your personal information. As an added measure, we do not include personal or account information in non-secure e-mails that we send you via the Internet without your prior consent. We advise you not to send such information to us in non-secure e-mails.
This joint notice describes the privacy policies of Barings, the Funds and Barings Securities LLC. It applies to all Barings and the Funds accounts you presently have, or may open in the future, using your social security number or federal taxpayer identification number - whether or not you remain a shareholder of our Funds or as an advisory client of Barings. As mandated by rules issued by the Securities and Exchange Commission, we will be sending you this notice annually, as long as you own shares in the Funds or have an account with Barings.
Barings Securities LLC is a member of the Financial Industry Regulatory Authority (FINRA) and the Securities Investor Protection Corporation (SIPC). Investors may obtain information about SIPC including the SIPC brochure by contacting SIPC online at www.sipc.org or calling (202)-371-8300. Investors may obtain information about FINRA including the FINRA Investor Brochure by contacting FINRA online at www.finra.org or by calling (800) 289-9999.
April 2019
43
This page left intentionally blank.
44
Members of the Board of Trustees Clifford M. Noreen Chairman Michael H. Brown* Barbara M. Ginader* Edward P. Grace III* Eric J. Lloyd Susan B. Sweeney* Maleyne M. Syracuse* *Member of the Audit Committee
Officers Christina Emery President Jonathan Bock Chief Financial Officer Jill Dinerman Chief Legal Officer Michael Cowart Chief Compliance Officer Elizabeth Murray Principal Accounting Officer Christopher D. Hanscom Treasurer Ashlee Steinnerd Secretary Alexandra Pacini Assistant Secretary Sean Feeley Vice President Jonathan Landsberg Vice President
| DIVIDEND REINVESTMENT AND CASH PURCHASE PLAN Barings Participation Investors (the “Trust”) offers a Dividend Reinvestment and Cash Purchase Plan (the “Plan”). The Plan provides a simple and automatic way for shareholders to add to their holdings in the Trust through the receipt of dividend shares issued by the Trust or through the reinvestment of cash dividends in Trust shares purchased in the open market. The dividends of each shareholder will be automatically reinvested in the Trust by DST Systems, Inc., the Transfer Agent, in accordance with the Plan, unless such shareholder elects not to participate by providing written notice to the Transfer Agent. A shareholder may terminate his or her participation by notifying the Transfer Agent in writing. Participating shareholders may also make additional contributions to the Plan from their own funds. Such contributions may be made by personal check or other means in an amount not less than $100 nor more than $5,000 per quarter. Cash contributions must be received by the Transfer Agent at least five days (but no more then 30 days) before the payment date of a dividend or distribution. Whenever the Trust declares a dividend payable in cash or shares, the Transfer Agent, acting on behalf of each participating shareholder, will take the dividend in shares only if the net asset value is lower than the market price plus an estimated brokerage commission as of the close of business on the valuation day. The valuation day is the last day preceding the day of dividend payment. When the dividend is to be taken in shares, the number of shares to be received is determined by dividing the cash dividend by the net asset value as of the close of business on the valuation date or, if greater than net asset value, 95% of the closing share price. If the net asset value of the shares is higher than the market value plus an estimated commission, the Transfer Agent, consistent with obtaining the best price and execution, will buy shares on the open market at current prices promptly after the dividend payment date. The reinvestment of dividends does not, in any way, relieve participating shareholders of any federal, state or local tax. For federal income tax purposes, the amount reportable in respect of a dividend received in newly-issued shares of the Trust will be the fair market value of the shares received, which will be reportable as ordinary income and/or capital gains. As compensation for its services, the Transfer Agent receives a fee of 5% of any dividend and cash contribution (in no event in excess of $2.50 per distribution per shareholder.) Any questions regarding the Plan should be addressed to DST Systems, Inc., Transfer Agent for Barings Participation Investors’ Dividend Reinvestment and Cash Purchase Plan, P.O. Box 219086, Kansas City, MO 64121-9086.
|
 | Barings Participation Investors |
PI6217
|