Exhibit 99.1
Introduction to MAM Software Group, Inc Michael G. Jamieson President & Chief Executive Officer Charles F. Trapp Executive Vice President & Chief Financial Officer November 2014 Driving Business Performance
Driving Business Performance Statements and/or figures included in this presentation that are not historical facts (including any statements or projection s c oncerning plans and objectives of management for future operations or economic performance, or assumptions or forecasts related thereto ), are forward - looking statements. These statements can be identified by the use of forward - looking terminology including “forecast,” “ may,” “believe,” “will,” “expect,” “anticipate,” “estimate,” “continue” or other similar words. These statements discuss future exp ect ations, contain projections of results of operations or of financial condition or state other “forward - looking” information. We and our representatives may from time to time make other oral or written statements that are also forward - looking statements. These forward - looking statements are made based upon management’s current plans, and best expectations, estimates, assumptions and beliefs concerning future events that may impact the company’s future prospects and therefore involve a number of risks a nd uncertainties. MAM Software Group, Inc cautions that forward - looking statements are not guarantees and that actual results could differ materially from those expressed or implied in the forward - looking statements. Because these forward - looking statements involve risks and uncertainties, actual results could differ materially from those expr essed or implied by these forward - looking statements for a number of important reasons. MAM Software Group, Inc. expressly disclaims any intention or obligation to revise or update any forward - looking statements whether as a result of new information, future events , or otherwise. Safe harbor statement 2
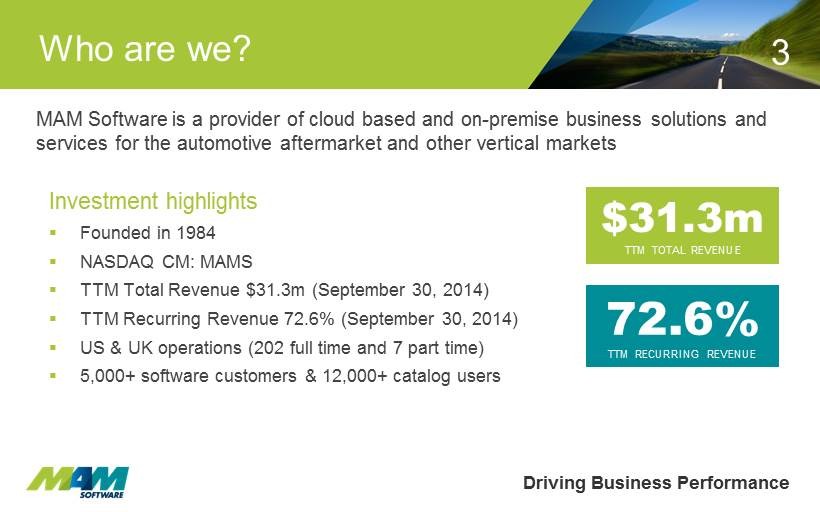
Driving Business Performance MAM Software is a provider of cloud based and on - premise business solutions and services for the automotive aftermarket and other vertical markets Who are we? Investment highlights ▪ Founded in 1984 ▪ NASDAQ CM: MAMS ▪ TTM Total Revenue $ 31.3m (September 30, 2014) ▪ TTM Recurring Revenue 72.6% (September 30, 2014) ▪ US & UK operations ( 202 full time and 7 part time) ▪ 5,000+ software customers & 12,000+ catalog users $31.3m TTM TOTAL REVENUE 72.6% TTM RECURRING REVENUE 3
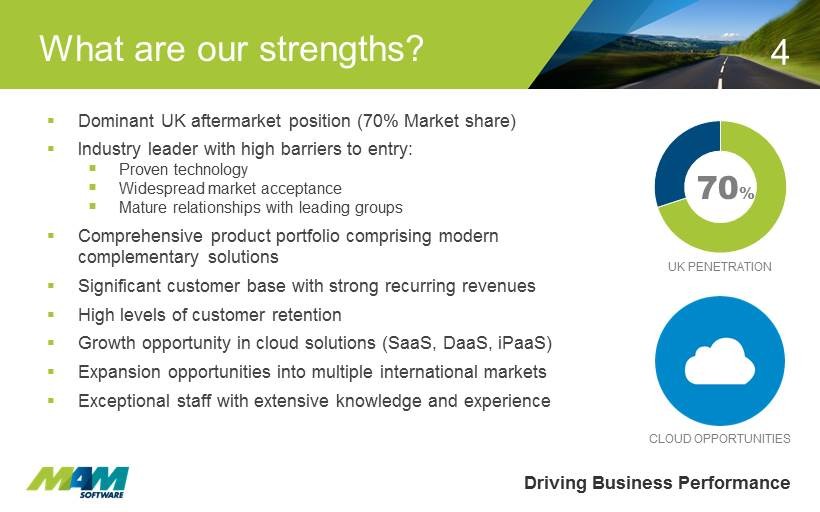
Driving Business Performance ▪ Dominant UK aftermarket position (70% Market share ) ▪ Industry leader with high barriers to entry: ▪ Proven technology ▪ Widespread market acceptance ▪ Mature relationships with leading groups ▪ Comprehensive product portfolio comprising modern complementary solutions ▪ Significant customer base with strong recurring revenues ▪ High levels of customer retention ▪ Growth opportunity in cloud solutions (SaaS, DaaS , iPaaS ) ▪ Expansion opportunities into multiple international markets ▪ Exceptional staff with extensive knowledge and experience What are our strengths? 70 % CLOUD OPPORTUNITIES UK PENETRATION 4
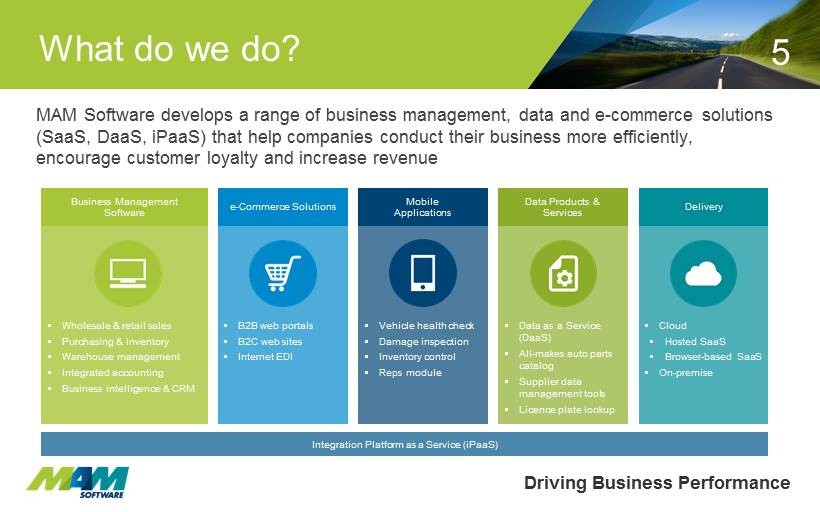
Driving Business Performance MAM Software develops a range of business management, data and e - commerce solutions (SaaS, DaaS , iPaaS ) that help companies conduct their business more efficiently, encourage customer loyalty and increase revenue What do we do? Business Management Software ▪ Wholesale & retail sales ▪ Purchasing & inventory ▪ Warehouse management ▪ Integrated accounting ▪ Business intelligence & CRM e - Commerce Solutions ▪ B2B web portals ▪ B2C web sites ▪ Internet EDI Mobile Applications ▪ Vehicle health check ▪ Damage inspection ▪ Inventory control ▪ Reps module Data Products & Services ▪ Data as a Service ( DaaS ) ▪ All - makes auto parts catalog ▪ Supplier d ata management tools ▪ Licence plate lookup Delivery ▪ Cloud ▪ Hosted SaaS ▪ Browser - based SaaS ▪ On - premise Integration Platform as a Service ( iPaaS ) 5
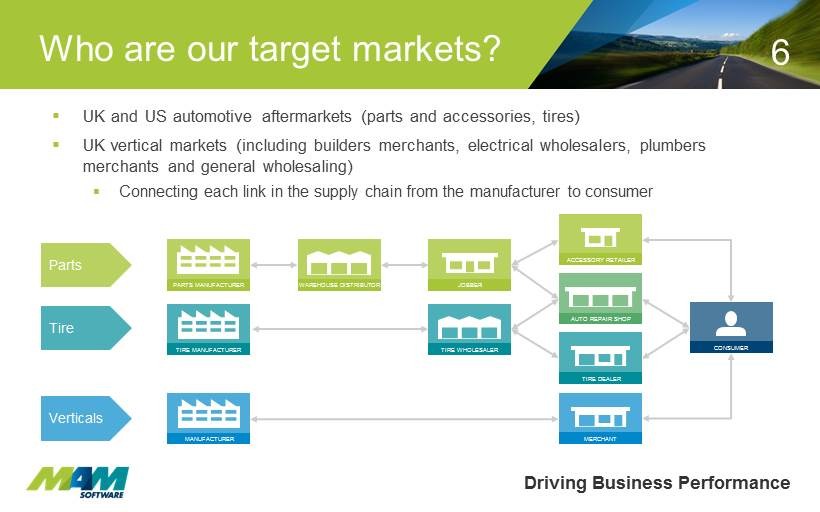
Driving Business Performance ▪ UK and US automotive aftermarkets ( parts and accessories , tires) ▪ UK vertical markets (including builders merchants, electrical wholesalers, plumbers merchants and general wholesaling ) ▪ Connecting each link in the supply chain from the manufacturer to consumer Who are our target markets ? MANUFACTURER MERCHANT ACCESSORY RETAILER AUTO SHOP (SIGLE SITE) AUTO REPAIR SHOP TIRE DEALER CONSUMER PARTS MANUFACTURER WAREHOUSE DISTRIBUTOR JOBBER Parts Verticals TIRE MANUFACTURER TIRE WHOLESALER Tire 6
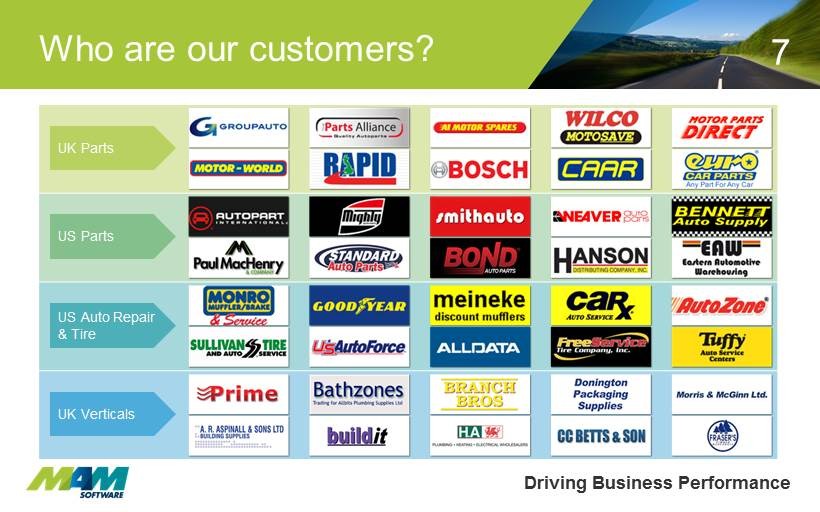
Driving Business Performance Who are our customers? 7 UK Parts UK Verticals US Auto Repair & Tire US Parts
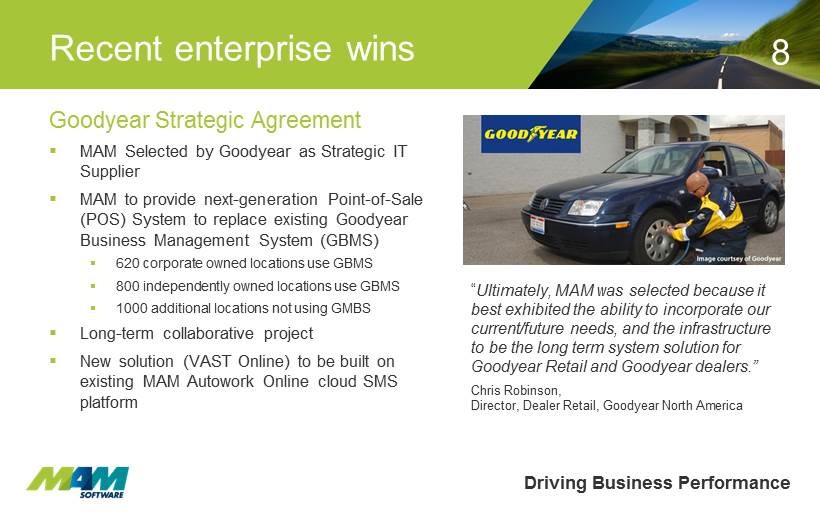
Driving Business Performance Goodyear Strategic Agreement ▪ MAM Selected by Goodyear as Strategic IT Supplier ▪ MAM to provide next - generation Point - of - Sale (POS) System to replace existing Goodyear Business Management System (GBMS ) ▪ 620 corporate owned locations use GBMS ▪ 800 independently owned locations use GBMS ▪ 1 000 additional locations not using GMBS ▪ Long - term collaborative project ▪ New solution (VAST Online) to be built on existing MAM Autowork Online cloud SMS platform “ Ultimately , MAM was selected because it best exhibited the ability to incorporate our current/future needs, and the infrastructure to be the long term system solution for Goodyear Retail and Goodyear dealers .” Chris Robinson, Director , Dealer Retail, Goodyear North America Recent enterprise wins 8
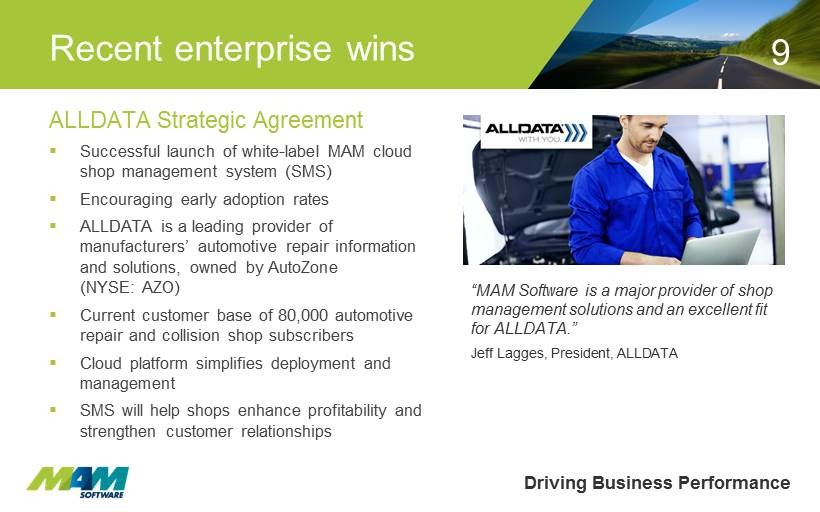
Driving Business Performance ALLDATA Strategic Agreement ▪ Successful launch of white - label MAM cloud shop management system (SMS) ▪ Encouraging early adoption rates ▪ ALLDATA is a leading provider of manufacturers’ automotive repair information and solutions, owned by AutoZone (NYSE: AZO) ▪ Current customer base of 80,000 automotive repair and collision shop subscribers ▪ Cloud platform simplifies deployment and management ▪ SMS will help shops enhance profitability and strengthen customer relationships “MAM Software is a major provider of shop management solutions and an excellent fit for ALLDATA.” Jeff Lagges , President, ALLDATA Recent enterprise wins 9
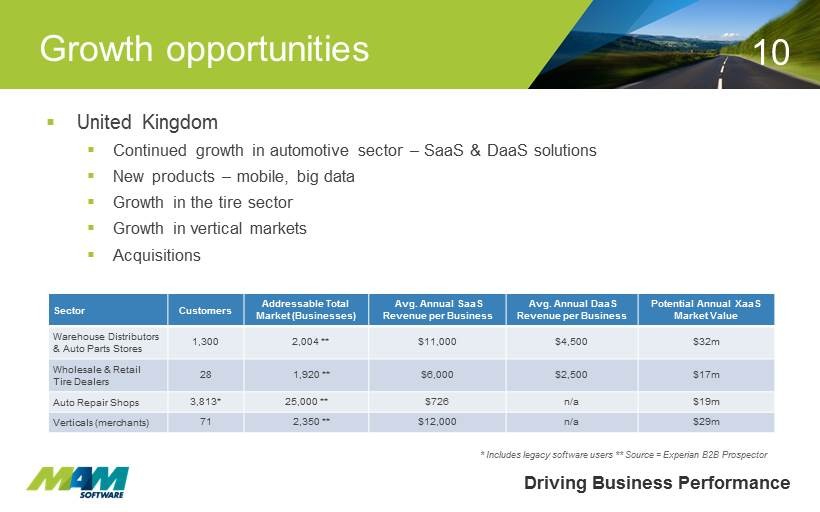
Driving Business Performance ▪ United Kingdom ▪ Continued growth in automotive sector – SaaS & DaaS solutions ▪ New products – mobile, big data ▪ Growth in the tire sector ▪ Growth in vertical markets ▪ Acquisitions Growth o pportunities * Includes legacy software users ** Source = Experian B2B Prospector Sector Customers Addressable Total Market (Businesses) Avg. Annual SaaS Revenue per Business Avg. Annual DaaS Revenue per Business Potential Annual XaaS Market Value Warehouse Distributors & Auto Parts Stores 1,300 2,004 ** $11,000 $4,500 $32m Wholesale & Retail Tire Dealers 28 1,920 ** $6,000 $2,500 $17m Auto Repair Shops 3,813* 25,000 ** $726 n/a $19m Verticals (merchants) 71 2,350 ** $12,000 n/a $29m 10
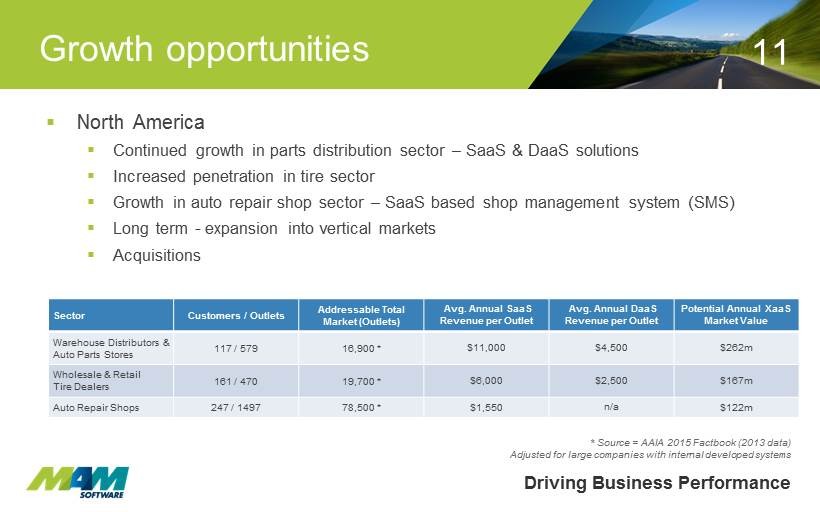
Driving Business Performance ▪ North America ▪ Continued growth in parts distribution sector – SaaS & DaaS solutions ▪ Increased penetration in tire sector ▪ Growth in auto repair shop sector – SaaS based shop management system (SMS) ▪ Long term - expansion into vertical markets ▪ Acquisitions Growth o pportunities * Source = AAIA 2015 Factbook (2013 data) Adjusted for large companies with internal developed systems Sector Customers / Outlets Addressable Total Market (Outlets) Avg. Annual SaaS Revenue per Outlet Avg. Annual DaaS Revenue per Outlet Potential Annual XaaS Market Value Warehouse Distributors & Auto Parts Stores 117 / 579 16,900 * $11,000 $4,500 $262m Wholesale & Retail Tire Dealers 161 / 470 19,700 * $6,000 $2,500 $167m Auto Repair Shops 247 / 1497 78,500 * $1,550 n/a $122m 11
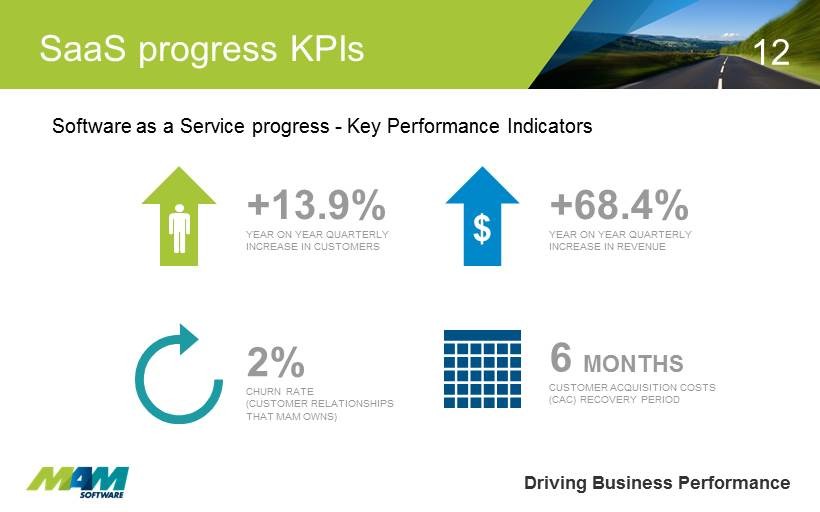
Driving Business Performance S aaS progress KPIs 12 2 % CHURN RATE (CUSTOMER RELATIONSHIPS THAT MAM OWNS) +13.9% YEAR ON YEAR QUARTERLY INCREASE IN CUSTOMERS +68.4% YEAR ON YEAR QUARTERLY INCREASE IN REVENUE $ 6 MONTHS CUSTOMER ACQUISITION COSTS (CAC) RECOVERY PERIOD Software as a Service progress - Key Performance Indicators
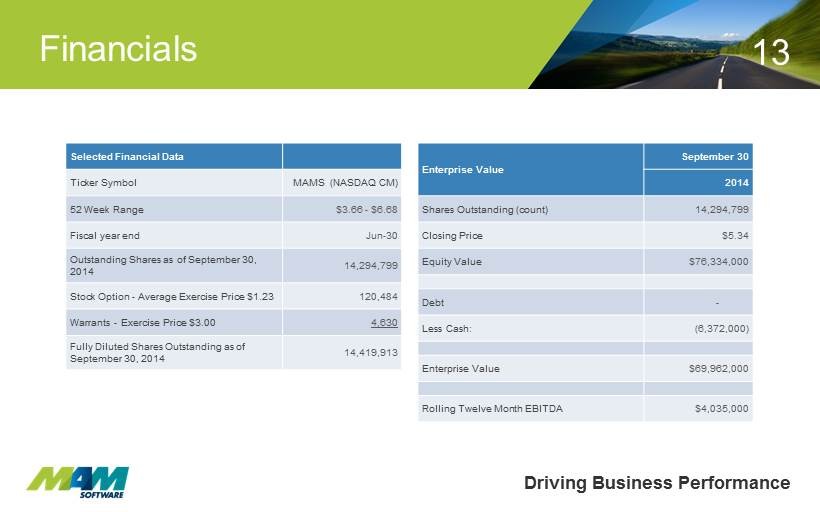
Selected Financial Data Ticker Symbol MAMS (NASDAQ CM) 52 Week Range $3.66 - $6.68 Fiscal year end Jun - 30 Outstanding Shares as of September 30, 2014 14,294,799 Stock Option - Average Exercise Price $1.23 120,484 Warrants - Exercise Price $3.00 4,630 Fully Diluted Shares Outstanding as of September 30, 2014 14,419,913 Enterprise Value September 30 2014 Shares Outstanding (count) 14,294,799 Closing Price $5.34 Equity Value $76,334,000 Debt - Less Cash : (6,372,000) Enterprise Value $69,962,000 Rolling Twelve Month EBITDA $4,035,000 Driving Business Performance Financials 13
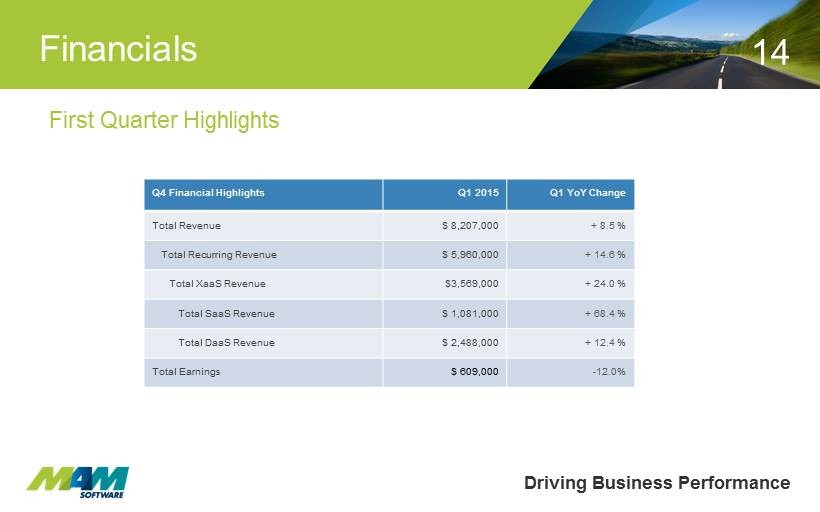
Driving Business Performance Financials Q4 Financial Highlights Q1 2015 Q1 YoY Change Total Revenue $ 8,207,000 + 8.5 % Total Recurring Revenue $ 5,960,000 + 14.6 % Total XaaS Revenue $3,569,000 + 24.0 % Total SaaS Revenue $ 1,081,000 + 68.4 % Total DaaS Revenue $ 2,488,000 + 12.4 % Total Earnings $ 609,000 - 12.0% First Quarter Highlights 14
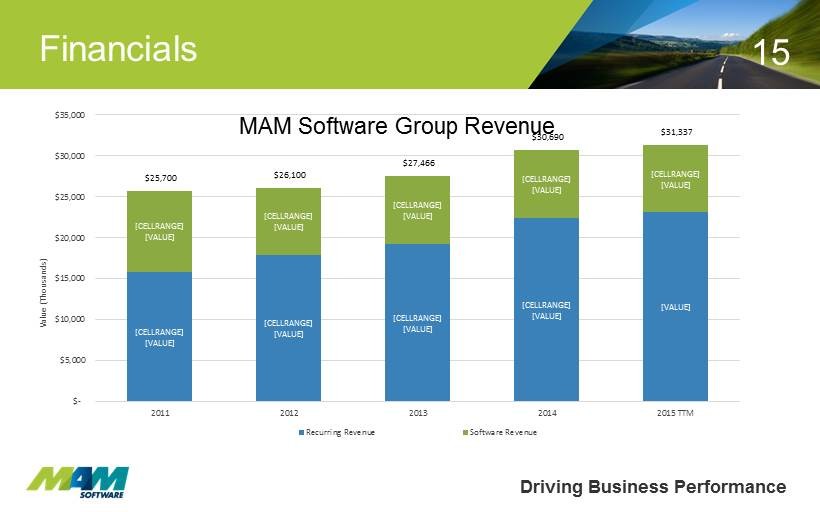
Driving Business Performance Financials 15 [CELLRANGE] [VALUE] [CELLRANGE] [VALUE] [CELLRANGE] [VALUE] [CELLRANGE] [VALUE] [VALUE] [CELLRANGE] [VALUE] [CELLRANGE] [VALUE] [CELLRANGE] [VALUE] [CELLRANGE] [VALUE] [CELLRANGE] [VALUE] $25,700 $26,100 $27,466 $30,690 $31,337 $- $5,000 $10,000 $15,000 $20,000 $25,000 $30,000 $35,000 2011 2012 2013 2014 2015 TTM Value (Thousands) MAM Software Group Revenue Recurring Revenue Software Revenue
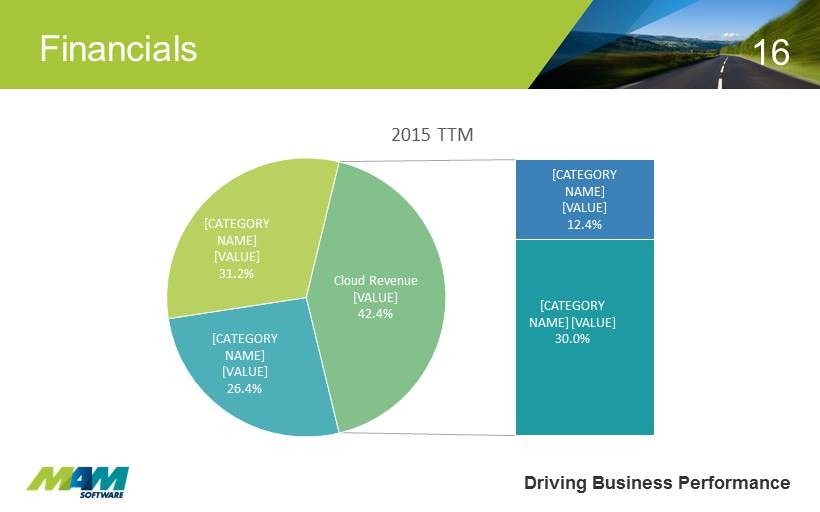
Driving Business Performance Financials 16 [CATEGORY NAME] [VALUE] 26.4% [CATEGORY NAME] [VALUE] 31.2% [CATEGORY NAME] [VALUE] 12.4% [CATEGORY NAME] [VALUE] 30.0% Cloud Revenue [VALUE] 42.4% 2015 TTM
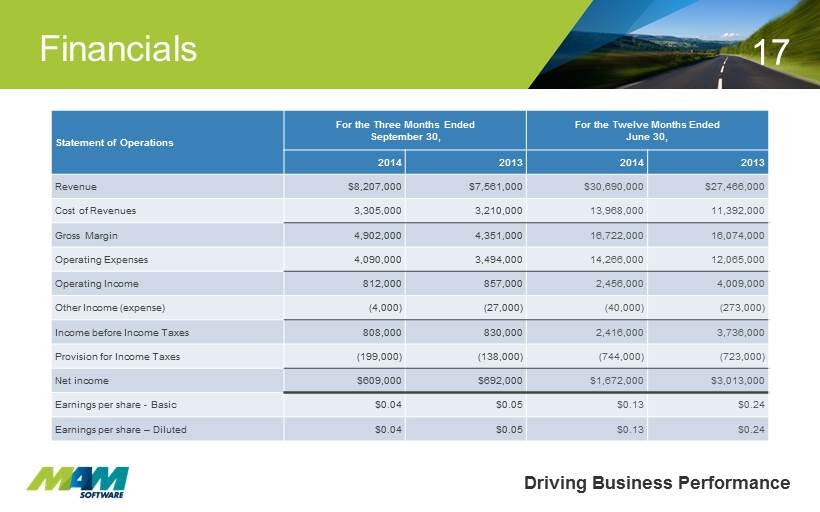
Statement of Operations For the Three Months Ended September 30, For the Twelve Months Ended June 30, 2014 2013 2014 2013 Revenue $8,207,000 $7,561,000 $30,690,000 $27,466,000 Cost of Revenues 3,305,000 3,210,000 13,968,000 11,392,000 Gross Margin 4,902,000 4,351,000 16,722,000 16,074,000 Operating Expenses 4,090,000 3,494,000 14,266,000 12,065,000 Operating Income 812,000 857,000 2,456,000 4,009,000 Other Income (expense) (4,000) (27,000) (40,000) (273,000) Income before Income Taxes 808,000 830,000 2,416,000 3,736,000 Provision for Income Taxes (199,000) (138,000) (744,000) (723,000) Net income $609,000 $692,000 $1,672,000 $3,013,000 Earnings per share - Basic $0.04 $0.05 $ 0.13 $ 0.24 Earnings per share – Diluted $0.04 $ 0.05 $ 0.13 $ 0.24 Driving Business Performance Financials 17
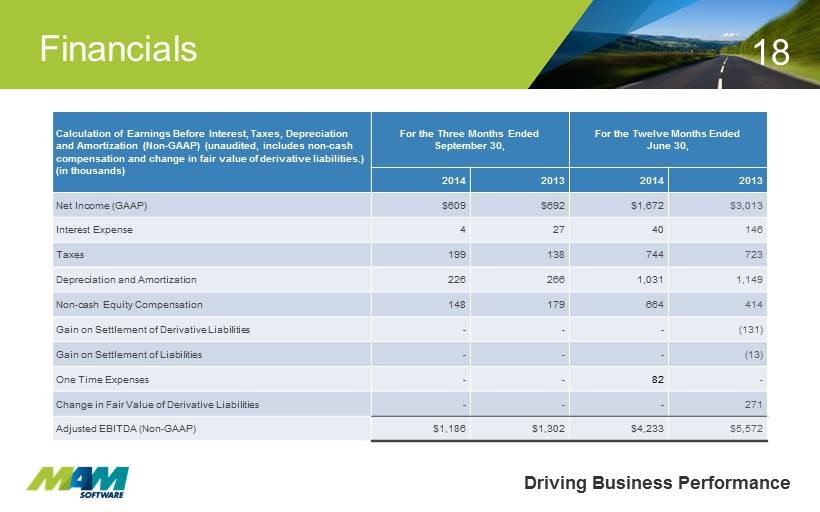
Calculation of Earnings Before Interest, Taxes, Depreciation and Amortization (Non - GAAP) (unaudited, includes non - cash compensation and change in fair value of derivative liabilities.) (in thousands) For the Three Months Ended September 30, For the Twelve Months Ended June 30, 2014 2013 2014 2013 Net Income (GAAP) $609 $692 $1,672 $3,013 Interest Expense 4 27 40 146 Taxes 199 138 744 723 Depreciation and Amortization 226 266 1,031 1,149 Non - cash Equity Compensation 148 179 664 414 Gain on Settlement of Derivative Liabilities - - - (131) Gain on Settlement of Liabilities - - - (13) One Time Expenses - - 82 - Change in Fair Value of Derivative Liabilities - - - 271 Adjusted EBITDA (Non - GAAP) $1,186 $1,302 $4,233 $5,572 Driving Business Performance Financials 18
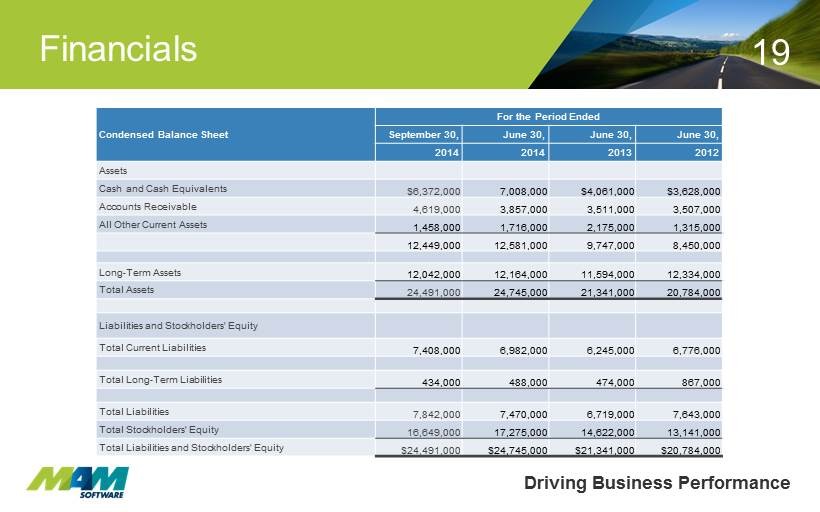
Condensed Balance Sheet For the Period Ended September 30, June 30, June 30, June 30, 2014 2014 2013 2012 Assets Cash and Cash Equivalents $6,372,000 7,008,000 $4,061,000 $3,628,000 Accounts Receivable 4,619,000 3,857,000 3,511,000 3,507,000 All Other Current Assets 1,458,000 1,716,000 2,175,000 1,315,000 12,449,000 12,581,000 9,747,000 8,450,000 Long - Term Assets 12,042,000 12,164,000 11,594,000 12,334,000 Total Assets 24,491,000 24,745,000 21,341,000 20,784,000 Liabilities and Stockholders' Equity Total Current Liabilities 7,408,000 6,982,000 6,245,000 6,776,000 Total Long - Term Liabilities 434,000 488,000 474,000 867,000 Total Liabilities 7,842,000 7,470,000 6,719,000 7,643,000 Total Stockholders' Equity 16,649,000 17,275,000 14,622,000 13,141,000 Total Liabilities and Stockholders' Equity $ 24,491,000 $24,745,000 $21,341,000 $20,784,000 Driving Business Performance Financials 19
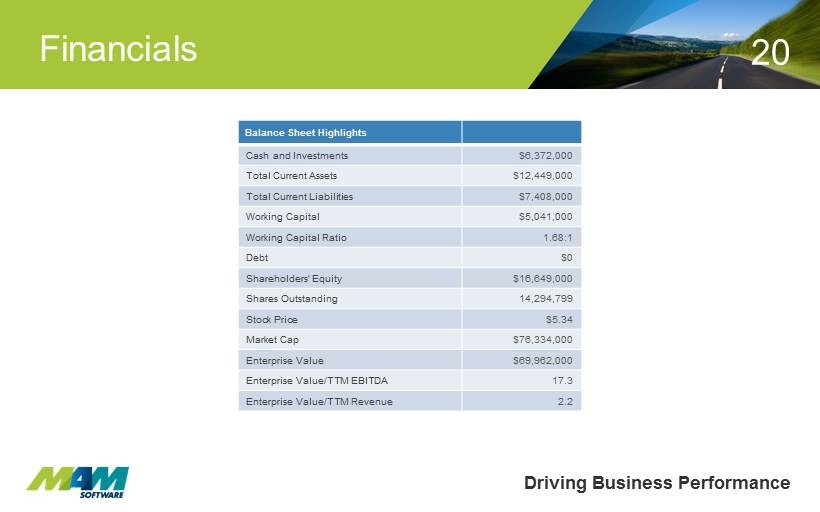
Driving Business Performance Financial s 20 Balance Sheet Highlights Cash and Investments $6,372,000 Total Current Assets $12,449,000 Total Current Liabilities $7,408,000 Working Capital $5,041,000 Working Capital Ratio 1.68:1 Debt $0 Shareholders' Equity $16,649,000 Shares Outstanding 14,294,799 Stock Price $5.34 Market Cap $76,334,000 Enterprise Value $69,962,000 Enterprise Value/TTM EBITDA 17.3 Enterprise Value/TTM Revenue 2.2
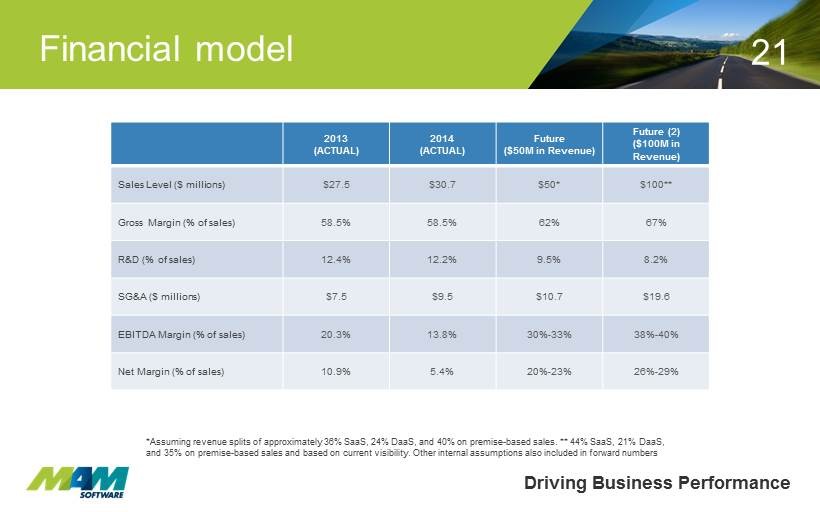
Driving Business Performance Financial model 21 2013 (ACTUAL) 2014 (ACTUAL) Future ($50M in Revenue) Future (2) ($100M in Revenue) Sales Level ($ millions) $27.5 $30.7 $50* $100** Gross Margin (% of sales) 58.5% 58.5% 62% 67% R&D (% of sales) 12.4% 12.2% 9.5% 8.2% SG&A ($ millions) $7.5 $9.5 $10.7 $19.6 EBITDA Margin (% of sales) 20.3% 13.8% 30% - 33% 38% - 40% Net Margin (% of sales) 10.9% 5.4% 20% - 23% 26% - 29% *Assuming revenue splits of approximately 36% SaaS, 24% DaaS , and 40% on premise - based sales. ** 44% SaaS, 21% DaaS , and 35% on premise - based sales and based on current visibility. Other internal assumptions also included in forward numbers
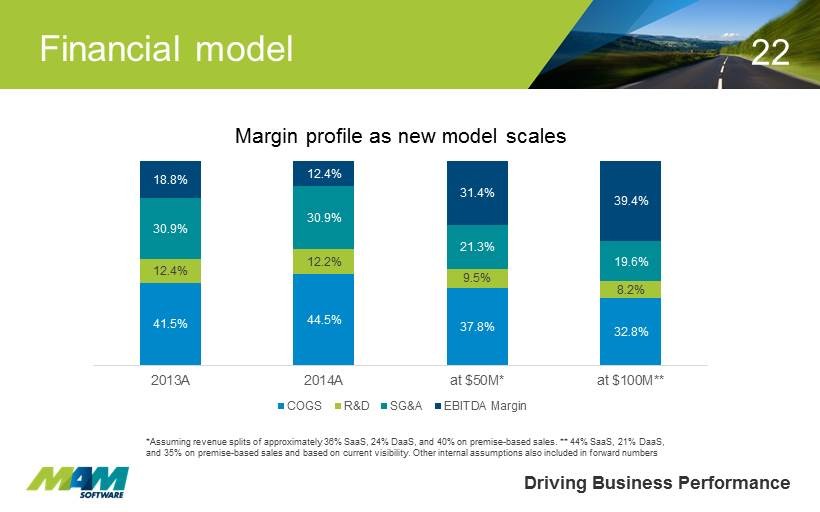
Driving Business Performance Financial model 22 41.5% 44.5% 37.8% 32.8% 12.4% 12.2% 9.5% 8.2% 30.9% 30.9% 21.3% 19.6% 18.8% 12.4% 31.4% 39.4% 2013A 2014A at $50M* at $100M** Margin profile as new model scales COGS R&D SG&A EBITDA Margin *Assuming revenue splits of approximately 36% SaaS, 24% DaaS , and 40% on premise - based sales. ** 44% SaaS, 21% DaaS , and 35% on premise - based sales and based on current visibility. Other internal assumptions also included in forward numbers
Driving Business Performance Investment Highlights ▪ Highly recurring revenue stream ▪ Exceptional customer retention rate ▪ Dominant UK Market Position ▪ Emerging vendor in an under - penetrated North American market evidenced by 2013 - 2014 wins with ALLDATA/AutoZone (NYSE:AZO) and Goodyear Tire (NASDAQ:GT) ▪ Opportunity to Achieve Sustainable Net Margins of 20% - 30% at Scale ▪ Debt - free since October 2013 23
Driving Business Performance Questions Thank you. Any Questions? Michael G. Jamieson President & Chief Executive Officer Email : mikej@mamsoft.co.uk Tel: +44 (0) 1226 352900 Charles F. Trapp Executive Vice President & Chief Financial Officer Email: charlie.trapp@mamsoftwaregroup.com Tel: (610) 336 9045 x 240 24