UNITED STATES
SECURITIES AND EXCHANGE COMMISSION
Washington, D.C. 20549
FORM N-CSRS
CERTIFIED SHAREHOLDER REPORT OF REGISTERED MANAGEMENT INVESTMENT COMPANIES
Investment Company Act file number_811-01700
_Franklin Gold and Precious Metals Fund
(Exact name of registrant as specified in charter)
_One Franklin Parkway, San Mateo, CA 94403-1906
(Address of principal executive offices) (Zip code)
Craig S. Tyle, One Franklin Parkway, San Mateo, CA 94403-1906
(Name and address of agent for service)
Registrant's telephone number, including area code: (650) 312-2000
Date of fiscal year end: 7/31
Date of reporting period: 1/31/11
Item 1. Reports to Stockholders.
| 1
Semiannual Report
Franklin Gold and Precious Metals Fund
Your Fund’s Goals and Main Investments: Franklin Gold and Precious Metals Fund seeks capital appreciation, with current income as its secondary goal, by investing at least 80% of its net assets in securities of gold and precious metals operation companies.
Performance data represent past performance, which does not guarantee future results. Investment return and principal value will fluctuate, and you may have a gain or loss when you sell your shares. Current performance may differ from figures shown. Please visit franklintempleton.com or call (800) 342-5236 for most recent month-end performance.
We are pleased to bring you Franklin Gold and Precious Metals Fund’s semi-annual report for the period ended January 31, 2011.
Performance Overview
Franklin Gold and Precious Metals Fund – Class A delivered a +19.56% cumulative total return for the six months ended January 31, 2011. The Fund outperformed U.S. equities as measured by the +17.93% total return of the broad Standard & Poor’s 500 Index (S&P 500).1 At the same time, the Fund also outperformed the +10.59% price return of the sector-specific FTSE Gold Mines (All Mines) Index, which comprises companies whose principal activity is gold mining.1 You can find the Fund’s long-term performance data in the Performance Summary beginning on page 10.
Economic and Market Overview
During the six-month period ended January 31, 2011, the U.S. economic recovery continued. In 2010’s third quarter, U.S. gross domestic product (GDP) growth increased at a modest 2.6% annualized rate as trade dynamics turned negative and government spending waned. In the fourth quarter, GDP rose at an annualized 2.8% rate amid rising exports, shrinking imports, and increased consumer and business spending. Corporate profits largely surpassed consensus estimates during the period, and many businesses restocked depleted inventories.
1. Source: © 2011 Morningstar. All Rights Reserved. The information contained herein: (1) is proprietary to Morningstar and/or its content providers; (2) may not be copied or distributed; and (3) is not warranted to be accurate, complete or timely. Neither Morningstar nor its content providers are responsible for any damages or losses arising from any use of this information. STANDARD & POOR’S®, S&P® and S&P 500® are registered trademarks of Standard & Poor’s Financial Services LLC. Standard & Poor’s does not sponsor, endorse, sell or promote any S&P index-based product. The indexes are unmanaged. One cannot invest directly in an index, and an index is not representative of the Fund’s portfolio.
The dollar value, number of shares or principal amount, and names of all portfolio holdings are listed in the Fund’s Statement of Investments (SOI). The SOI begins on page 19.
Semiannual Report | 3
Challenges remained as mixed economic data, elevated debt concerns surrounding the U.S. budget deficit and a lack of job prospects for the unemployed reflected considerable slack in the economy.
Amid signs of a demand-led global recovery, oil prices rose from $79 per barrel at the end of July to a six-month high of $92 at period-end. The January 2011 inflation rate was an annualized 1.6%, while core inflation, which excludes volatile food and energy costs, stood at a 1.0% annualized rate.2 During the reporting period, companies generally added jobs, and the unemployment rate fell from 9.5% in July to 9.0% in January.2 However, job gains were generally weak during the period, and the declining unemployment rate was partly attributable to a shrinking labor force as some unemployed workers stopped looking for jobs.
Given lingering uncertainty surrounding the economic recovery and few inflationary pressures, the Federal Open Market Committee (FOMC) made no major changes to its monetary policy early in the period. The FOMC kept the federal funds target rate within the exceptionally low 0% to 0.25% range while shifting its focus to its outlook and the status of its current holdings. In September, the FOMC revealed concerns about the subdued recovery and said inflation was below the pace “consistent with its mandate.” Having already lowered interest rates effectively to zero, the FOMC announced its intention to purchase government securities to stimulate the economy and promote a low level of inflation consistent with healthy economic growth.
Equity markets were volatile as investor confidence shifted with each release of encouraging or discouraging economic, regulatory and political news. Ultimately, stock indexes experienced solid gains during the six months under review amid generally improving economic signs and rising consumer spending. Overall, the blue-chip stocks of the Dow Jones Industrial Average posted a +15.16% total return, while the broader S&P 500 generated a +17.93% total return and the technology-heavy NASDAQ Composite Index produced a +20.34% total return.3 During the period, growth stocks outperformed their value counterparts. Performance among the major sectors was positive, with energy, materials and industrials making the largest gains, while utilities and consumer staples had weaker results.
2. Source: Bureau of Labor Statistics.
3. Source: © 2011 Morningstar.
4 | Semiannual Report
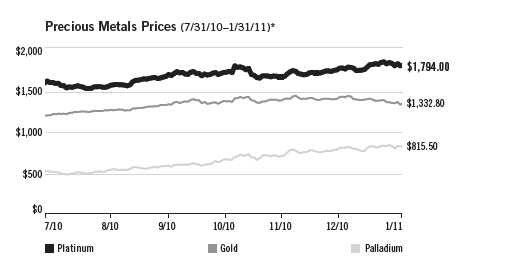
*Amounts shown are based on spot prices quoted in U.S. dollars per troy ounce. For illustrative purposes only; not representative of the Fund’s portfolio composition or performance.
Precious Metals Sector Overview
Prices for all four primary precious metals increased significantly — in some cases to record highs — as demand for jewelry, industrial use, investment and government holdings generally accelerated in 2010. Improving economic conditions and new demand from emerging markets helped to drive jewelry and industrial demand. Many investors adhered to the traditional view that precious metals can be a safe haven with a higher potential return than cash or money market accounts. This sentiment was particularly keen considering their concerns over potential longer term inflation in light of the mounting government debt in several developed economies, a new round of quantitative easing (monetary stimulus) from the U.S. Federal Reserve Board, and debasement of the U.S. dollar, the value of which fell 4.35% versus the currencies of its major trading partners.4
Gold frequently enjoyed the attention of bears and bulls alike. The former sought gold as a store of value, while the latter responded to gold’s momentum and its potential as an inflation hedge. With investment demand overshadowing fundamentals at several points during the period, the yellow metal often decoupled from its typically inverse relationship to the dollar. However, with risk appetites rising significantly amid optimistic market sentiment toward period-end, gold declined during January 2011 as an equity rally spurred by the global economic recovery eroded demand for alternative investments. Silver, platinum
4. Source: Federal Reserve H10 Report.
Semiannual Report | 5
and palladium received more steady support than gold, often rising even when gold prices dipped, largely due to their hybrid characteristics as a perceived safe haven and an industrial correlative with the economic cycle. Aggregate precious metals demand within the commodity-backed exchange-traded fund (ETF) niche also remained robust as investors continued to funnel billions of dollars into ETFs that stockpile raw materials. These physically backed commodity funds focus largely on precious metals, with the largest holdings occurring in gold ETFs. ETFs were an increasingly meaningful component in the price of gold, silver, platinum and palladium during the six-month review period.
Gold spot prices, which began the reporting period at a six-month low of $1,181 per troy ounce, rose 13% to finish at $1,333 per ounce, including an intra-period peak and all-time high of $1,424 on December 6, 2010. As 2011 began, gold had just completed its 10th consecutive annual advance having rallied nearly 30% for the year, was in the midst of its longest winning streak since 1920, and had risen about fivefold over the past decade. Meanwhile, silver’s spot price movements dwarfed gold’s as it spiked 56% from $18 per ounce to $28 over the six-month period, and reached a 30-year high of $31 on the final day of 2010. Two countervailing forces combined to drive silver as the metal, supported by its heavy usage in industrial applications, attracted bullish investors betting on faster economic growth just as bearish traders were using it as an investment safe haven. In reaction, several mining companies sought to increase silver extraction activity or reopen older mines. Much like gold prices, silver prices weakened in January when traders took profits to invest in other areas of the market as the investment environment turned reasonably benign.
Most of platinum’s 14% advance took place in the first half of the six months under review, followed by a series of ups and downs that pushed it to an all-time high of $1,835 per troy ounce in mid-January but ultimately left it little changed between November and period-end. Overall, its per-ounce spot price increased from $1,573 to $1,794. Meanwhile, palladium prices skyrocketed well above all other precious metals and actually outperformed all types of commodities during the six-month period. After a short-lived August dip below its $498 per ounce starting level, the metal’s spot price vaulted steadily upward during the following five months and ended at $816 per ounce — its highest since February 2001 — with an astounding 64% six-month gain as manufacturing activity accelerated around the world.
6 | Semiannual Report
Investment Strategy
We believe that investing in gold and other precious metals offers an excellent opportunity for diversification in an attractive asset class over the long term. We like companies with multiple mines, attractive production profiles, strong reserve bases and active exploration programs that can drive future reserve and production growth. While the sector can be volatile, especially over the short term, precious metals, such as gold, can be attractive because they are hard assets not tied to any particular country or financial system.
Manager’s Discussion
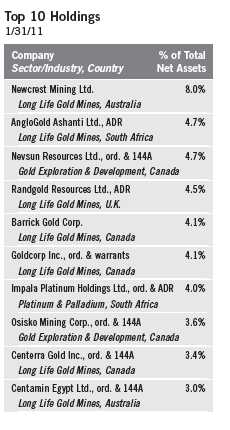
Given the high-price environment, merger and acquisition activity continued at a brisk pace during the six months under review. Newcrest Mining successfully closed its acquisition of Lihir Gold in October 2010. The combined entity created the world’s third-largest gold company by market capitalization and was the Fund’s largest holding as of period-end. During the period, Kinross Gold acquired Red Back Mining, due to Kinross’s belief the Tasiast mine in Mauritania will ultimately contain over 20 million ounces of gold. Elsewhere, Goldcorp continued its asset restructuring by acquiring Andean Resources, which had an attractive high-grade development project in Argentina. Finally, Anatolia Minerals announced a merger with Avoca Resources to create a new middle-capitalization mining company with key assets in Turkey and Australia.
In this environment, most of the Fund’s investments appreciated in value during the six-month reporting period, adding to its long-term track record. As gold soared to all-time highs, most of the Fund’s investments in gold-mining companies followed suit until pricing momentum faded somewhat in January. Key Fund contributors from the group included Newcrest Mining, whose shares were supported foremost by its successful acquisition of Lihir Gold and position as one of the world’s largest gold mining companies. Newcrest operates mines in Australia, Papua New Guinea, Indonesia and Ivory Coast, creating what we believe is an excellent base of production and cash flow to fund its exciting pipeline of attractive growth projects.
Our position in Nevsun Resources also delivered strong returns and significantly aided the Fund’s overall results. Nevsun is focused on the rapid completion and production of the Bisha Mine in Eritrea, Africa. The Bisha Project is a fully financed and permitted high-grade gold, copper and zinc deposit, upon which operations commenced in late 2010. The Bisha Project has received continuous
Semiannual Report | 7
support from the Eritrean government, who granted Nevsun’s mining license in January 2008. The project is positioned to become the first modern-day mine in this northeast African country. Plans are for the Bisha Mine to be a low-cost gold producer for the first two years and a low-cost, high-grade copper and zinc producer for the remaining 10-year mine life. Nevsun officials also believed that further resource potential existed at depth and from nearby discoveries within the company’s licensed areas.
Centerra Gold was another significant contributor to Fund performance. Its share price climbed in response to strong operating results within the company’s Kumtor mine in Kyrgyzstan and diminishing concern over the political changes that took place in the country following riots in April 2010.
Ivanhoe Mines also appreciated meaningfully during the period as it continued to move forward the construction of Oyu Tolgoi, the company’s large copper-gold mine in Mongolia. Company management also successfully completed a rights offering and restructured its agreement with Rio Tinto, which we believe should adequately fund Ivanhoe through its first production phase.
Despite the Fund’s outperformance of its benchmark indexes, some holdings declined in value. For example, the stock price of Randgold Resources, an exploration and mining company operating in West Africa and the Democratic Republic of Congo, fell following a contentious early December political election in Ivory Coast that left the country without clear leadership. Tongon, Randgold’s newest mine located in Ivory Coast, started up in 2010’s fourth quarter and, prior to the country’s geopolitical disruptions, was expected to produce approximately one-third of the company’s total gold output for 2011.
Our investment in Centamin Egypt, an Australian exploration and development company focused on gold-producing regions in Egypt, also lost value during the six months under review. Shares of Centamin, whose principal property is the promising Sukari gold mine located in the Eastern Desert near the Red Sea, performed poorly toward period-end as civil unrest and political protests in Egypt intensified through end of January.
Primero Mining, a Canada-based precious metals producer with operations in Mexico and intentions to become a leading intermediate gold producer, was another detractor within the Fund’s portfolio. The company’s share price declined as high silver prices created a drag on earnings given the structure of a silver sales agreement with Silver Wheaton.
8 | Semiannual Report
It is important to recognize the effect of currency movements on the Fund’s performance. In general, if the value of the U.S. dollar increases compared with a foreign currency, an investment traded in that foreign currency will decrease in value because it will be worth fewer U.S. dollars. This can have a negative effect on Fund performance. Conversely, when the U.S. dollar weakens in relation to a foreign currency, an investment traded in that foreign currency will increase in value, which can contribute to Fund performance. For the six months ended January 31, 2011, the U.S. dollar fell in value relative to most currencies. As a result, the Fund’s performance was positively affected by the Fund’s predominant investment in securities with non-U.S. currency exposure. However, one cannot expect the same result in future periods.
Thank you for your continued participation in Franklin Gold and Precious Metals Fund. We look forward to serving your future investment needs.


Stephen M. Land, CFA Portfolio Manager
Franklin Gold and Precious Metals Fund
CFA® is a trademark owned by CFA Institute.
The foregoing information reflects our analysis, opinions and portfolio holdings as of January 31, 2011, the end of the reporting period. The way we implement our main investment strategies and the resulting portfolio holdings may change depending on factors such as market and economic conditions. These opinions may not be relied upon as investment advice or an offer for a particular security. The information is not a complete analysis of every aspect of any market, country, industry, security or the Fund. Statements of fact are from sources considered reliable, but the investment manager makes no representation or warranty as to their completeness or accuracy. Although historical performance is no guarantee of future results, these insights may help you understand our investment management philosophy.
Semiannual Report | 9
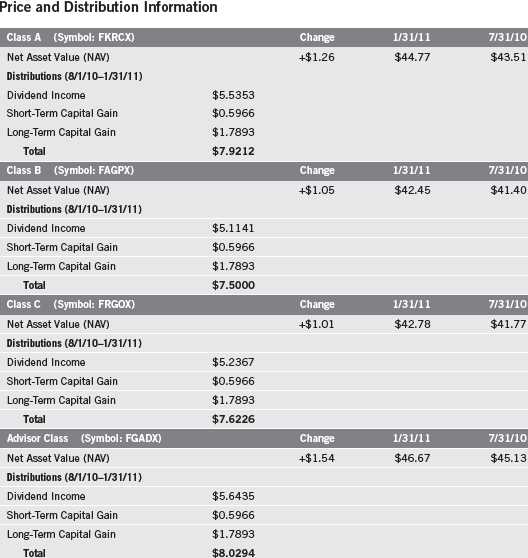
Performance Summary as of 1/31/11
Your dividend income will vary depending on dividends or interest paid by securities in the Fund’s portfolio, adjusted for operating expenses of each class. Capital gain distributions are net profits realized from the sale of portfolio securities. The performance table does not reflect any taxes that a shareholder would pay on Fund dividends, capital gain distributions, if any, or any realized gains on the sale of Fund shares. Total return reflects reinvestment of the Fund’s dividends and capital gain distributions, if any, and any unrealized gains or losses.
10 | Semiannual Report
Performance Summary (continued)
Performance
Cumulative total return excludes sales charges. Average annual total returns and value of $10,000 investment include maximum sales charges. Class A: 5.75% maximum initial sales charge; Class B: contingent deferred sales charge (CDSC) declining from 4% to 1% over six years, and eliminated thereafter; Class C: 1% CDSC in first year only; Advisor Class: no sales charges.
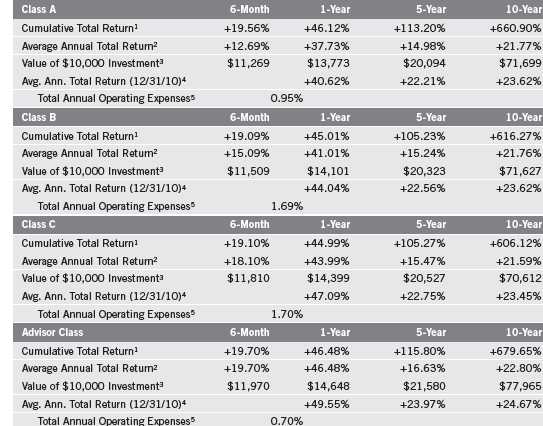
Performance data represent past performance, which does not guarantee future results. Investment return and principal value will fluctuate, and you may have a gain or loss when you sell your shares. Current performance may differ from figures shown. For most recent month-end performance, go to franklintempleton.com or call (800) 342-5236.
Semiannual Report | 11
Performance Summary (continued)
Endnotes
The Fund concentrates in the precious metals sector, which involves fluctuations in the price of gold and other precious metals and increased susceptibility to adverse economic and regulatory developments affecting the sector. In addition, the Fund is subject to the risks of currency fluctuation and political uncertainty associated with foreign investing. Investments in developing markets involve heightened risks related to the same factors, in addition to those associated with their relatively small size and lesser liquidity. The Fund may also invest in smaller companies, which can be particularly sensitive to changing economic conditions, and their prospects for growth are less certain than those of larger, more established companies. Also, the Fund is nondiversified, and investing in a nondiversified fund involves the risk of greater price fluctuation than a more diversified portfolio. The manager applies various techniques and analyses in making investment decisions for the Fund, but there can be no guarantee that these decisions will produce the desired results. The Fund’s prospectus also includes a description of the main investment risks.
Class B: These shares have higher annual fees and expenses than Class A shares.
Class C: Prior to 1/1/04, these shares were offered with an initial sales charge; thus actual total returns would have differed. These shares have higher annual fees and expenses than Class A shares.
Advisor Class: Shares are available to certain eligible investors as described in the prospectus.
1. Cumulative total return represents the change in value of an investment over the periods indicated.
2. Average annual total return represents the average annual change in value of an investment over the periods indicated. Six-month return has not been annualized.
3. These figures represent the value of a hypothetical $10,000 investment in the Fund over the periods indicated.
4. In accordance with SEC rules, we provide standardized average annual total return information through the latest calendar quarter.
5. Figures are as stated in the Fund’s prospectus current as of the date of this report. In periods of market volatility, assets may decline significantly, causing total annual Fund operating expenses to become higher than the figures shown.
12 | Semiannual Report
Your Fund’s Expenses
As a Fund shareholder, you can incur two types of costs:
- Transaction costs, including sales charges (loads) on Fund purchases; and
- Ongoing Fund costs, including management fees, distribution and service (12b-1) fees, and other Fund expenses. All mutual funds have ongoing costs, sometimes referred to as operating expenses.
The following table shows ongoing costs of investing in the Fund and can help you understand these costs and compare them with those of other mutual funds. The table assumes a $1,000 investment held for the six months indicated.
Actual Fund Expenses
The first line (Actual) for each share class listed in the table provides actual account values and expenses. The “Ending Account Value” is derived from the Fund’s actual return, which includes the effect of Fund expenses.
You can estimate the expenses you paid during the period by following these steps. Of course, your account value and expenses will differ from those in this illustration:
| 1. | Divide your account value by $1,000. |
| | If an account had an $8,600 value, then $8,600 ÷ $1,000 = 8.6. |
| 2. | Multiply the result by the number under the heading “Expenses Paid During Period.” |
| | If Expenses Paid During Period were $7.50, then 8.6 x $7.50 = $64.50. |
In this illustration, the estimated expenses paid this period are $64.50.
Hypothetical Example for Comparison with Other Funds
Information in the second line (Hypothetical) for each class in the table can help you compare ongoing costs of investing in the Fund with those of other mutual funds. This information may not be used to estimate the actual ending account balance or expenses you paid during the period. The hypothetical “Ending Account Value” is based on the actual expense ratio for each class and an assumed 5% annual rate of return before expenses, which does not represent the Fund’s actual return. The figure under the heading “Expenses Paid During Period” shows the hypothetical expenses your account would have incurred under this scenario. You can compare this figure with the 5% hypothetical examples that appear in shareholder reports of other funds.
Semiannual Report | 13
Your Fund’s Expenses (continued)
Please note that expenses shown in the table are meant to highlight ongoing costs and do not reflect any transaction costs, such as sales charges. Therefore, the second line for each class is useful in comparing ongoing costs only, and will not help you compare total costs of owning different funds. In addition, if transaction costs were included, your total costs would have been higher. Please refer to the Fund prospectus for additional information on operating expenses.
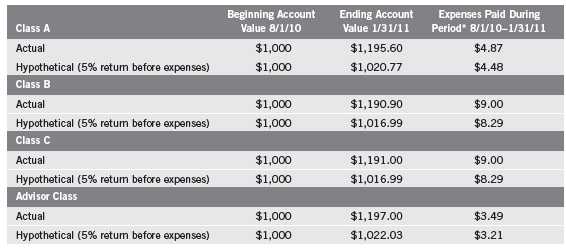
*Expenses are calculated using the most recent six-month expense ratio, annualized for each class (A: 0.88%; B: 1.63%; C: 1.63%; and Advisor: 0.63%), multiplied by the average account value over the period, multiplied by 184/365 to reflect the one-half year period.
14 | Semiannual Report
Franklin Gold and Precious Metals Fund
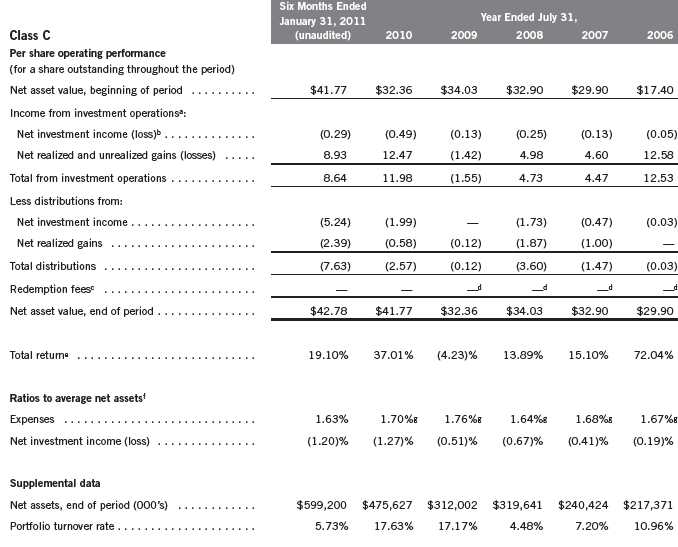
Financial Highlights
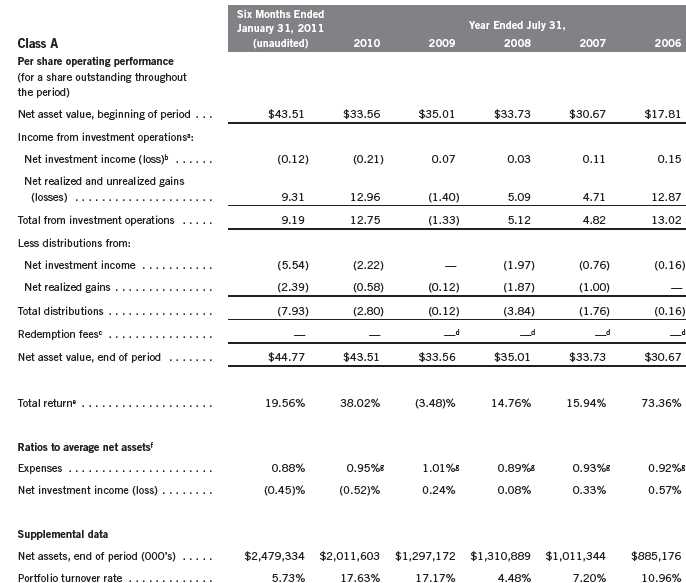

Semiannual Report | The accompanying notes are an integral part of these financial statements. | 15
Franklin Gold and Precious Metals Fund
Financial Highlights (continued)
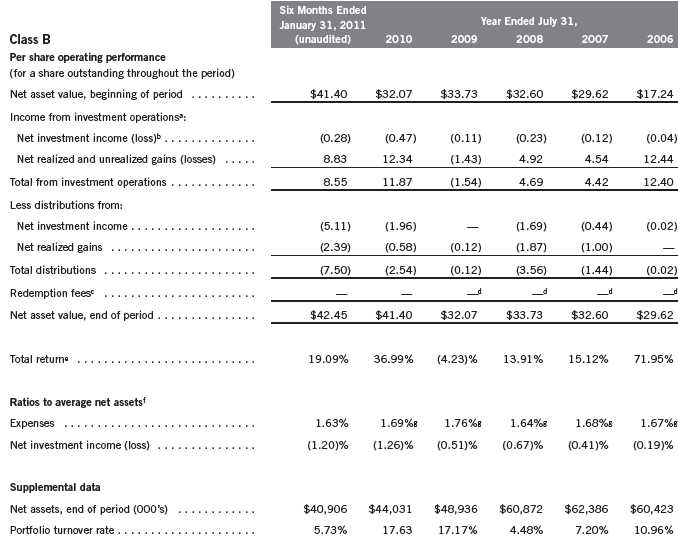
16 | The accompanying notes are an integral part of these financial statements. | Semiannual Report
Franklin Gold and Precious Metals Fund
Financial Highlights (continued)
Semiannual Report | The accompanying notes are an integral part of these financial statements. | 17
Franklin Gold and Precious Metals Fund
Financial Highlights (continued)

18 | The accompanying notes are an integral part of these financial statements. | Semiannual Report
Franklin Gold and Precious Metals Fund
Statement of Investments, January 31, 2011 (unaudited)
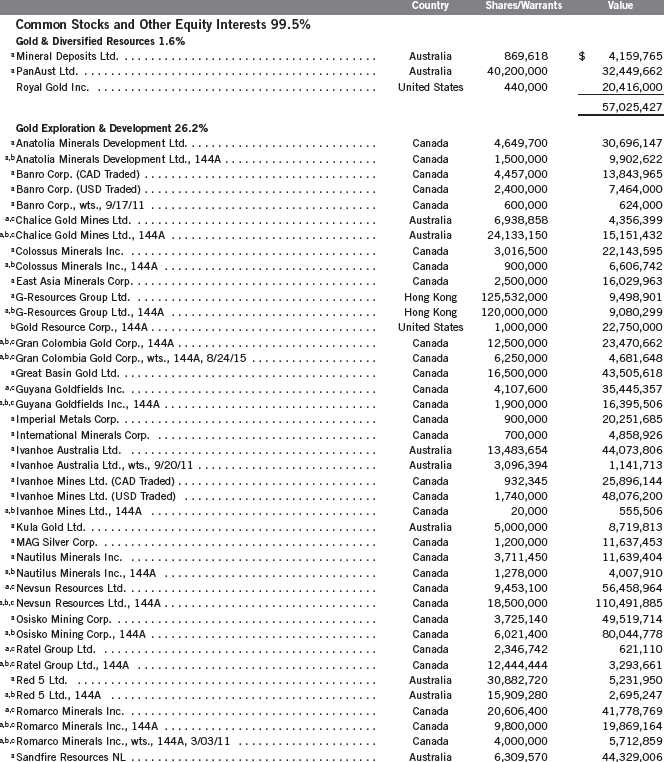
Semiannual Report | 19
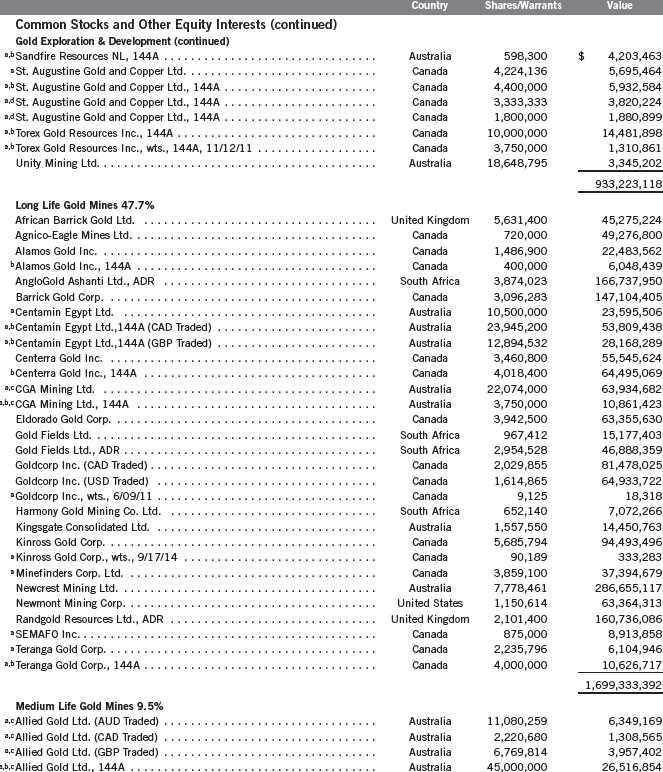
Franklin Gold and Precious Metals Fund
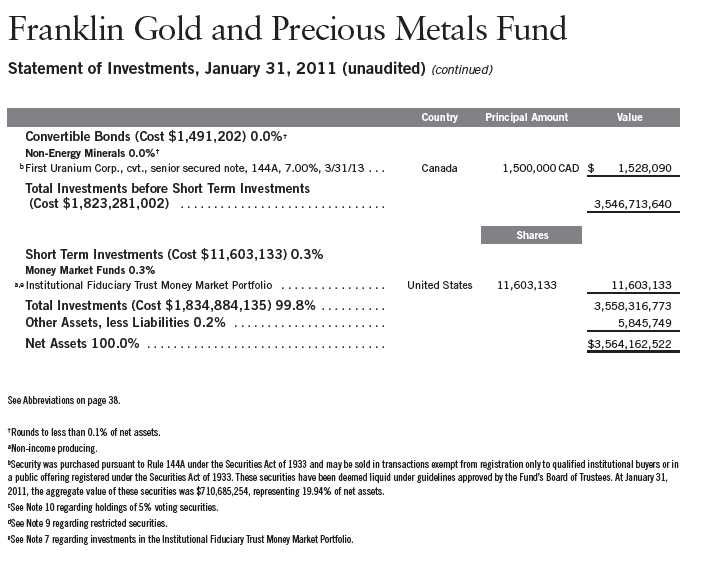
Statement of Investments, January 31, 2011 (unaudited) (continued)
20 | Semiannual Report
Franklin Gold and Precious Metals Fund
Statement of Investments, January 31, 2011 (unaudited) (continued)
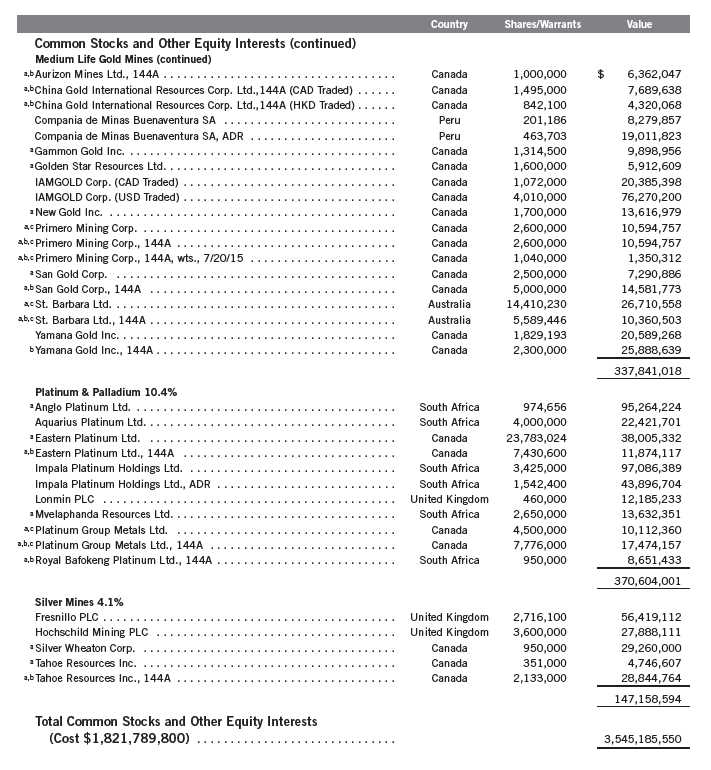
Semiannual Report | 21
Franklin Gold and Precious Metals Fund
Financial Statements (continued)
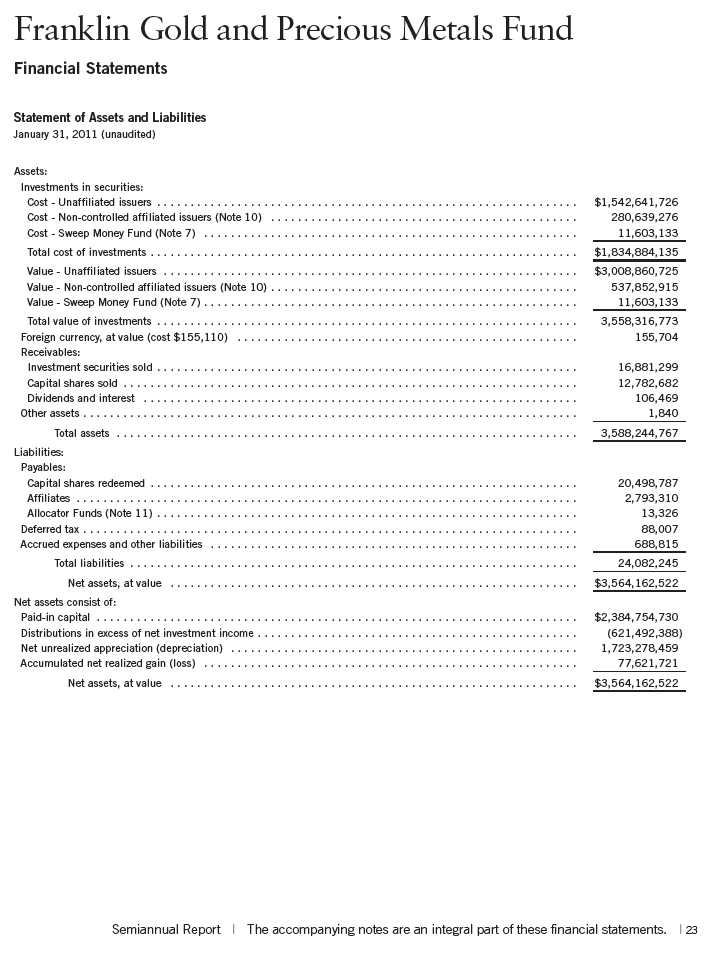
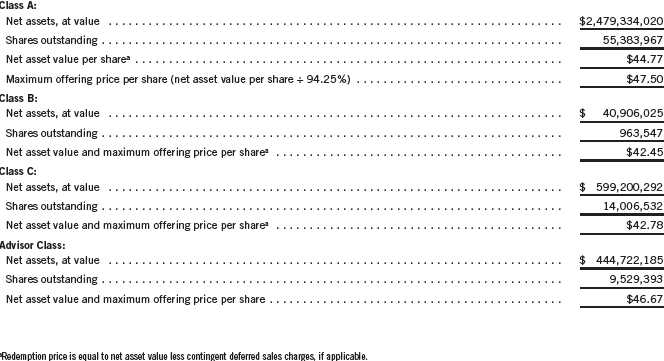
Statement of Assets and Liabilities (continued)
January 31, 2011 (unaudited)
24 | The accompanying notes are an integral part of these financial statements. | Semiannual Report
Franklin Gold and Precious Metals Fund
Financial Statements (continued)
Statement of Operations
for the six months ended January 31, 2011 (unaudited)
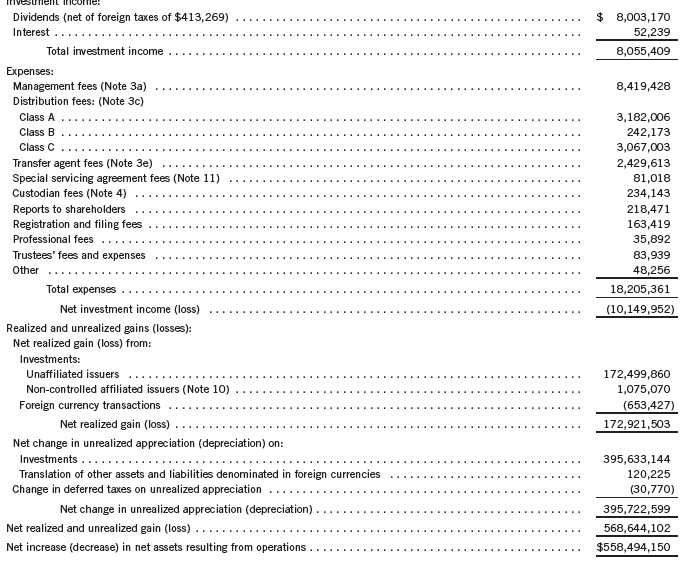
Semiannual Report | The accompanying notes are an integral part of these financial statements. | 25
Franklin Gold and Precious Metals Fund
Financial Statements (continued)
26 | The accompanying notes are an integral part of these financial statements. | Semiannual Report
Franklin Gold and Precious Metals Fund
Notes to Financial Statements (unaudited)
1. ORGANIZATION AND SIGNIFICANT ACCOUNTING POLICIES
Franklin Gold and Precious Metals Fund (Fund) is registered under the Investment Company Act of 1940, as amended, (1940 Act) as an open-end investment company. The Fund offers four classes of shares: Class A, Class B, Class C, and Advisor Class. Each class of shares differs by its initial sales load, contingent deferred sales charges, distribution fees, voting rights on matters affecting a single class and its exchange privilege.
The following summarizes the Fund’s significant accounting policies.
a. Financial Instrument Valuation
The Fund’s investments in securities and other financial instruments are carried at fair value daily. Fair value is the price that would be received to sell an asset or paid to transfer a liability in an orderly transaction between market participants on the measurement date. Under procedures approved by the Trust’s Board of Trustees, the Fund may utilize independent pricing services, quotations from securities and financial instrument dealers, and other market sources to determine fair value.
Equity securities listed on an exchange or on the NASDAQ National Market System are valued at the last quoted sale price or the official closing price of the day, respectively. Foreign equity securities are valued as of the close of trading on the foreign stock exchange on which the security is primarily traded, or the NYSE, whichever is earlier. The value is then converted into its U.S. dollar equivalent at the foreign exchange rate in effect at the close of the NYSE on the day that the value of the security is determined. Over-the-counter securities are valued within the range of the most recent quoted bid and ask prices. Securities that trade in multiple markets or on multiple exchanges are valued according to the broadest and most representative market. Certain equity securities are valued based upon fundamental characteristics or relationships to similar securities. Investments in open-end mutual funds are valued at the closing net asset value.
Debt securities generally trade in the over-the-counter market rather than on a securities exchange. The Fund’s pricing services use multiple valuation techniques to determine fair value. In instances where sufficient market activity exists, the pricing services may utilize a market-based approach through which quotes from market makers are used to determine fair value. In instances where sufficient market activity may not exist or is limited, the pricing services also utilize proprietary valuation models which may consider market characteristics such as benchmark yield curves, option-adjusted spreads, credit spreads, estimated default rates, coupon rates, anticipated timing of principal repayments, underlying collateral, and other unique security features in order to estimate the relevant cash flows, which are then discounted to calculate the fair value. Securities denominated in a foreign currency are converted into their U.S. dollar equivalent at the foreign exchange rate in effect at the close of the NYSE on the date that the values of the foreign debt securities are determined.
Semiannual Report | 27
Franklin Gold and Precious Metals Fund
Notes to Financial Statements (unaudited) (continued)
| 1. | ORGANIZATION AND SIGNIFICANT ACCOUNTING POLICIES (continued) |
| a. | Financial Instrument Valuation (continued) |
The Fund has procedures to determine the fair value of securities and other financial instruments for which market prices are not readily available or which may not be reliably priced. Under these procedures, the Fund primarily employs a market-based approach which may use related or comparable assets or liabilities, recent transactions, market multiples, book values, and other relevant information for the investment to determine the fair value of the investment. The Fund may also use an income-based valuation approach in which the anticipated future cash flows of the investment are discounted to calculate fair value. Discounts may also be applied due to the nature or duration of any restrictions on the disposition of the investments. Due to the inherent uncertainty of valuations of such investments, the fair values may differ significantly from the values that would have been used had an active market existed.
Trading in securities on foreign securities stock exchanges and over-the-counter markets may be completed before the daily close of business on the NYSE. Occasionally, events occur between the time at which trading in a foreign security is completed and the close of the NYSE that might call into question the reliability of the value of a portfolio security held by the Fund. As a result, differences may arise between the value of the Fund’s portfolio securities as determined at the foreign market close and the latest indications of value at the close of the NYSE. In order to minimize the potential for these differences, the investment manager monitors price movements following the close of trading in foreign stock markets through a series of country specific market proxies (such as baskets of American Depository Receipts, futures contracts and exchange traded funds). These price movements are measured against established trigger thresholds for each specific market proxy to assist in determining if an event has occurred that may call into question the reliability of the values of the foreign securities held by the Fund. If such an event occurs, the securities may be valued using fair value procedures, which may include the use of independent pricing services.
b. Foreign Currency Translation
Portfolio securities and other assets and liabilities denominated in foreign currencies are translated into U.S. dollars based on the exchange rate of such currencies against U.S. dollars on the date of valuation. The Fund may enter into foreign currency exchange contracts to facilitate transactions denominated in a foreign currency. Purchases and sales of securities, income and expense items denominated in foreign currencies are translated into U.S. dollars at the exchange rate in effect on the transaction date. Portfolio securities and assets and liabilities denominated in foreign currencies contain risks that those currencies will decline in value relative to the U.S. dollar. Occasionally, events may impact the availability or reliability of foreign exchange rates used to convert the U.S. dollar equivalent value. If such an event occurs, the foreign exchange rate will be valued at fair value using procedures established and approved by the Fund’s Board of Trustees.
28 | Semiannual Report
Franklin Gold and Precious Metals Fund
Notes to Financial Statements (unaudited) (continued)
| 1. | ORGANIZATION AND SIGNIFICANT ACCOUNTING POLICIES (continued) |
| b. | Foreign Currency Translation (continued) |
The Fund does not separately report the effect of changes in foreign exchange rates from changes in market prices on securities held. Such changes are included in net realized and unrealized gain or loss from investments on the Statement of Operations.
Realized foreign exchange gains or losses arise from sales of foreign currencies, currency gains or losses realized between the trade and settlement dates on securities transactions and the difference between the recorded amounts of dividends, interest, and foreign withholding taxes and the U.S. dollar equivalent of the amounts actually received or paid. Net unrealized foreign exchange gains and losses arise from changes in foreign exchange rates on foreign denominated assets and liabilities other than investments in securities held at the end of the reporting period.
c. Income and Deferred Taxes
It is the Fund’s policy to qualify as a regulated investment company under the Internal Revenue Code. The Fund intends to distribute to shareholders substantially all of its taxable income and net realized gains to relieve it from federal income and excise taxes. As a result, no provision for U.S. federal income taxes is required. The Fund files U.S. income tax returns as well as tax returns in certain other jurisdictions. The Fund’s application of those tax rules is subject to its understanding. The Fund records a provision for taxes in its financial statements including penalties and interest, if any, for a tax position taken on a tax return (or expected to be taken) when it fails to meet the more likely than not (a greater than 50% probability) threshold and based on the technical merits, the tax position may not be sustained upon examination by the tax authorities. As of January 31, 2011, and for all open tax years, the Fund has determined that no provision for income tax is required in the Fund’s financial statements. Open tax years are those that remain subject to examination and are based on each tax jurisdiction statute of limitation. The Fund is not aware of any tax position for which it is reasonably possible that the total amounts of unrecognized tax effects will significantly change in the next twelve months.
The Fund may be subject to foreign taxation related to income received, capital gains on the sale of securities and certain foreign currency transactions in the foreign jurisdictions in which it invests. Foreign taxes, if any, are recorded based on the tax regulations and rates that exist in the foreign markets in which the Fund invests. When a capital gain tax is determined to apply the Fund records an estimated deferred tax liability for net unrealized gains on these securities in an amount that would be payable if the securities were disposed of on the valuation date.
d. Security Transactions, Investment Income, Expenses and Distributions
Security transactions are accounted for on trade date. Realized gains and losses on security transactions are determined on a specific identification basis. Interest income and estimated expenses
Semiannual Report | 29
Franklin Gold and Precious Metals Fund
Notes to Financial Statements (unaudited) (continued)
| 1. | ORGANIZATION AND SIGNIFICANT ACCOUNTING POLICIES (continued) |
| d. | Security Transactions, Investment Income, Expenses and Distributions (continued) |
are accrued daily. Dividend income is recorded on the ex-dividend date except that certain dividends from foreign securities are recognized as soon as the Fund is notified of the ex-dividend date. Distributions to shareholders are recorded on the ex-dividend date and are determined according to income tax regulations (tax basis). Distributable earnings determined on a tax basis may differ from earnings recorded in accordance with accounting principles generally accepted in the United States of America. These differences may be permanent or temporary. Permanent differences are reclassified among capital accounts to reflect their tax character. These reclassifications have no impact on net assets or the results of operations. Temporary differences are not reclassified, as they may reverse in subsequent periods.
Realized and unrealized gains and losses and net investment income, not including class specific expenses, are allocated daily to each class of shares based upon the relative proportion of net assets of each class. Differences in per share distributions, by class, are generally due to differences in class specific expenses.
e. Accounting Estimates
The preparation of financial statements in accordance with accounting principles generally accepted in the United States of America requires management to make estimates and assumptions that affect the reported amounts of assets and liabilities at the date of the financial statements and the amounts of income and expenses during the reporting period. Actual results could differ from those estimates.
f. Guarantees and Indemnifications
Under the Trust’s organizational documents, its officers and trustees are indemnified by the Trust against certain liabilities arising out of the performance of their duties to the Trust. Additionally, in the normal course of business, the Trust, on behalf of the Fund, enters into contracts with service providers that contain general indemnification clauses. The Trust’s maximum exposure under these arrangements is unknown as this would involve future claims that may be made against the Trust that have not yet occurred. Currently, the Trust expects the risk of loss to be remote.
30 | Semiannual Report
Franklin Gold and Precious Metals Fund
Notes to Financial Statements (unaudited) (continued)
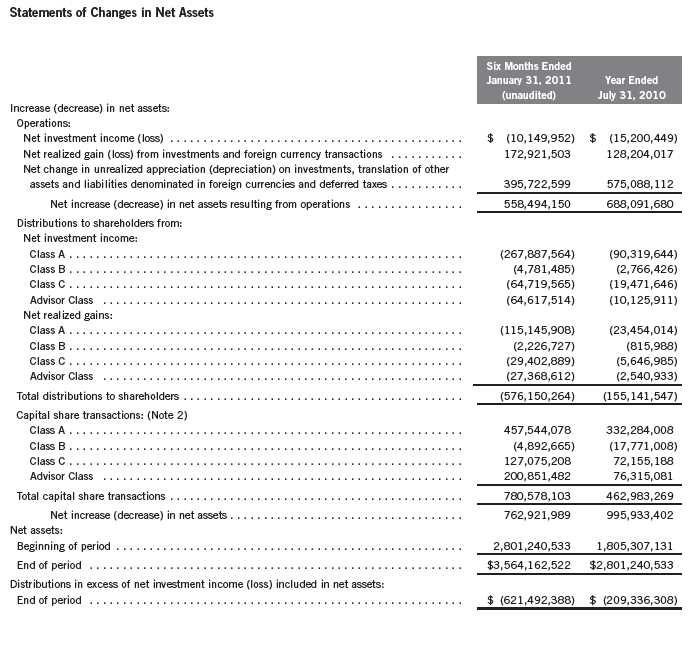
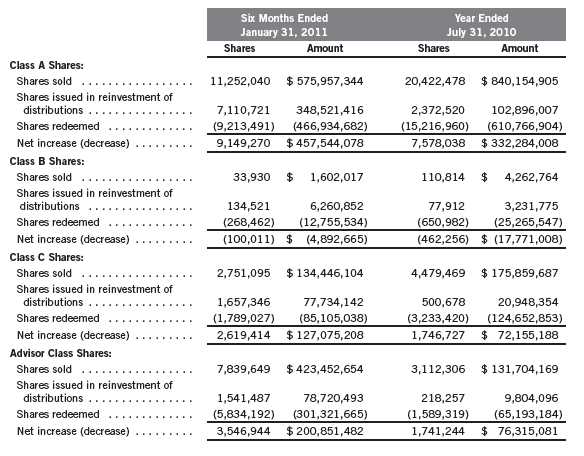
2. SHARES OF BENEFICIAL INTEREST
At January 31, 2011, there were an unlimited number of shares authorized (without par value).
Transactions in the Fund’s shares were as follows:
3. TRANSACTIONS WITH AFFILIATES
Franklin Resources, Inc. is the holding company for various subsidiaries that together are referred to as Franklin Templeton Investments. Certain officers and trustees of the Fund are also officers and/or directors of the following subsidiaries:
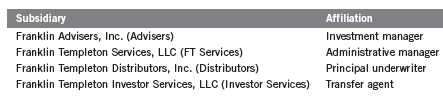
Semiannual Report | 31
Franklin Gold and Precious Metals Fund
Notes to Financial Statements (unaudited) (continued)
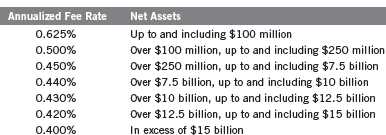
3. TRANSACTIONS WITH AFFILIATES (continued) a. Management Fees
The Fund pays an investment management fee to Advisers based on the month-end net assets of the Fund as follows:
b. Administrative Fees
Under an agreement with Advisers, FT Services provides administrative services to the Fund. The fee is paid by Advisers based on average daily net assets, and is not an additional expense of the Fund.
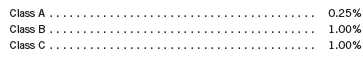
c. Distribution Fees
The Trust’s Board of Trustees has adopted distribution plans for each share class, with the exception of Advisor Class shares, pursuant to Rule 12b-1 under the 1940 Act. Under the Fund’s Class A reimbursement distribution plan, the Fund reimburses Distributors for costs incurred in connection with the servicing, sale and distribution of the Fund’s shares up to the maximum annual plan rate. Under the Class A reimbursement distribution plan, costs exceeding the maximum for the current plan year cannot be reimbursed in subsequent periods.
In addition, under the Fund’s Class B and C compensation distribution plans, the Fund pays Distributors for costs incurred in connection with the servicing, sale and distribution of the Fund’s shares up to the maximum annual plan rate for each class.
The maximum annual plan rates, based on the average daily net assets, for each class, are as follows:
32 | Semiannual Report
Franklin Gold and Precious Metals Fund
Notes to Financial Statements (unaudited) (continued)
| 3. | TRANSACTIONS WITH AFFILIATES (continued) |
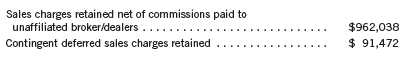
| d. | Sales Charges/Underwriting Agreements |
Distributors has advised the Fund of the following commission transactions related to the sales and redemptions of the Fund’s shares for the period:
e. Transfer Agent Fees
For the period ended January 31, 2011, the Fund paid transfer agent fees of $2,429,613, of which $1,664,728 was retained by Investor Services.
4. EXPENSE OFFSET ARRANGEMENT
The Fund has entered into an arrangement with its custodian whereby credits realized as a result of uninvested cash balances are used to reduce a portion of the Fund’s custodian expenses. During the period ended January 31, 2011, there were no credits earned.
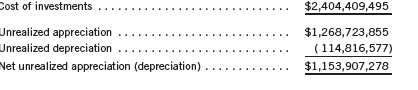
5. INCOME TAXES
At January 31, 2011, the cost of investments and net unrealized appreciation (depreciation) for income tax purposes were as follows:
Net investment income (loss) differs for financial statement and tax purposes primarily due to differing treatments of foreign currency transactions, passive foreign investment company shares, regulatory settlements, and corporate actions.
Net realized gains (losses) differ for financial statement and tax purposes primarily due to differing treatments of wash sales, foreign currency transactions, passive foreign investment company shares, and corporate actions.
Semiannual Report | 33
Franklin Gold and Precious Metals Fund
Notes to Financial Statements (unaudited) (continued)
6. INVESTMENT TRANSACTIONS
Purchases and sales of investments (excluding short term securities) for the period ended January 31, 2011, aggregated $528,088,964 and $198,937,948, respectively.
7. INVESTMENTS IN INSTITUTIONAL FIDUCIARY TRUST MONEY MARKET PORTFOLIO
The Fund may invest in the Institutional Fiduciary Trust Money Market Portfolio (Sweep Money Fund), an open-end investment company managed by Advisers. Management fees paid by the Fund are reduced on assets invested in the Sweep Money Fund, in an amount not to exceed the management and administrative fees paid by the Sweep Money Fund.
8. CONCENTRATION OF RISK
Investing in foreign securities may include certain risks and considerations not typically associated with investing in U.S. securities, such as fluctuating currency values and changing local and regional economic, political and social conditions, which may result in greater market volatility. In addition, certain foreign securities may not be as liquid as U.S. securities.
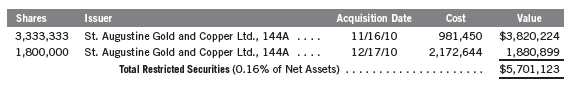
9. RESTRICTED SECURITIES
The Fund may invest in securities that are restricted under the Securities Act of 1933 (1933 Act) or which are subject to legal, contractual, or other agreed upon restrictions on resale. Restricted securities are often purchased in private placement transactions, and cannot be sold without prior registration unless the sale is pursuant to an exemption under the 1933 Act. Disposal of these securities may require greater effort and expense, and prompt sale at an acceptable price may be difficult. The Fund may have registration rights for restricted securities. The issuer generally incurs all registration costs.
At January 31, 2011, the Fund held investments in restricted securities, excluding certain securities exempt from registration under the 1933 Act deemed to be liquid, as follows:
34 | Semiannual Report
Franklin Gold and Precious Metals Fund
Notes to Financial Statements (unaudited) (continued)
10. HOLDINGS OF 5% VOTING SECURITIES OF PORTFOLIO COMPANIES
The 1940 Act defines “affiliated companies” to include investments in portfolio companies in which a fund owns 5% or more of the outstanding voting securities. Investments in “affiliated companies” for the Fund for the period ended January 31, 2011, were as shown below.
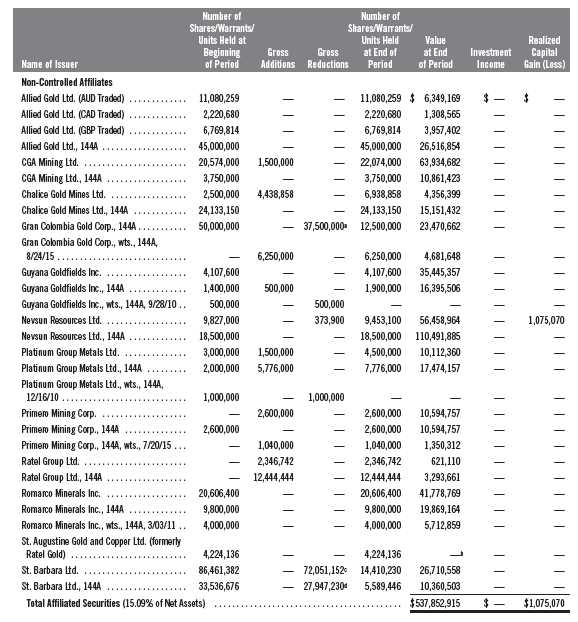
aReflects a 4:1 reverse stock split during the current period. Balance as of November 11, 2010, was 50,000,000.
bAs of January 31, 2011, no longer an affiliate.
cReflects a 6:1 reverse stock split during the current period. Balance as of November 22, 2010, was 86,461,382.
dReflects a 6:1 reverse stock split during the current period. Balance as of November 22, 2010, was 33,536,676.
Semiannual Report | 35
Franklin Gold and Precious Metals Fund
Notes to Financial Statements (unaudited) (continued)
11. SPECIAL SERVICING AGREEMENT
The Fund, which is an eligible underlying investment of one or more of the Franklin Templeton Fund Allocator Series Funds (Allocator Funds), participates in a Special Servicing Agreement (SSA) with the Allocator Funds and certain service providers of the Fund and the Allocator Funds. Under the SSA, the Fund may pay a portion of the Allocator Funds’ expenses (other than any asset allocation, administrative, and distribution fees) to the extent such payments are less than the amount of the benefits realized or expected to be realized by the Fund (e.g., due to reduced costs associated with servicing accounts) from the investment in the Fund by the Allocator Funds. The Allocator Funds are either managed by Advisers or administered by FT Services, affiliates of the Fund. For the period ended January 31, 2011, the Fund was held by one or more of the Allocator Funds and the amount of expenses borne by the Fund is noted in the Statement of Operations. At January 31, 2011, 2.98% of the Fund’s outstanding shares was held by one or more of the Allocator Funds.
12. CREDIT FACILITY
The Fund, together with other U.S. registered and foreign investment funds (collectively “Borrowers”), managed by Franklin Templeton Investments, are borrowers in a joint syndicated senior unsecured credit facility totaling $750 million (Global Credit Facility) which matures on January 20, 2012. This Global Credit Facility provides a source of funds to the Borrowers for temporary and emergency purposes, including the ability to meet future unanticipated or unusually large redemption requests.
Under the terms of the Global Credit Facility, the Fund shall, in addition to interest charged on any borrowings made by the Fund and other costs incurred by the Fund, pay its share of fees and expenses incurred in connection with the implementation and maintenance of the Global Credit Facility, based upon its relative share of the aggregate net assets of all of the Borrowers, including an annual commitment fee of 0.08% based upon the unused portion of the Global Credit Facility, which is reflected in other expenses on the Statement of Operations. During the period ended January 31, 2011, the Fund did not use the Global Credit Facility.
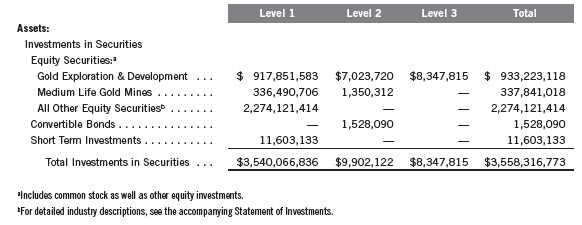
13. FAIR VALUE MEASUREMENTS
The Fund follows a fair value hierarchy that distinguishes between market data obtained from independent sources (observable inputs) and the Fund’s own market assumptions (unobservable inputs). These inputs are used in determining the value of the Fund’s investments and are summarized in the following fair value hierarchy:
- Level 1 – quoted prices in active markets for identical securities
- Level 2 – other significant observable inputs (including quoted prices for similar securities, interest rates, prepayment speed, credit risk, etc.)
- Level 3 – significant unobservable inputs (including the Fund’s own assumptions in deter- mining the fair value of investments)
36 | Semiannual Report
Franklin Gold and Precious Metals Fund
Notes to Financial Statements (unaudited) (continued)
13. FAIR VALUE MEASUREMENTS (continued)
The inputs or methodology used for valuing securities are not an indication of the risk associated with investing in those securities.
For movements between the levels within the fair value hierarchy, the Fund has adopted a policy of recognizing the transfers as of the date of the underlying event which caused the movement.
The following is a summary of the inputs used as of January 31, 2011, in valuing the Fund’s assets and liabilities carried at fair value:
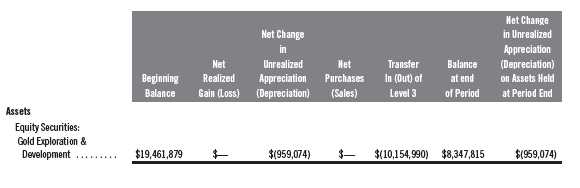
At January 31, 2011, the reconciliation of assets in which significant unobservable inputs (Level 3) were used in determining fair value, is as follows:
14. SUBSEQUENT EVENTS
The Fund has evaluated subsequent events through the issuance of the financial statements and determined that no events have occurred that require disclosure.
Semiannual Report | 37
Franklin Gold and Precious Metals Fund
Notes to Financial Statements (unaudited) (continued)
38 | Semiannual Report
Franklin Gold and Precious Metals Fund
Tax Designation (unaudited)
At July 31, 2010, more than 50% of the Fund’s total assets were invested in securities of foreign issuers. In most instances, foreign taxes were withheld from income paid to the Fund on these investments. As shown in the table below, the Fund designates to shareholders the foreign source income and foreign taxes paid, pursuant to Section 853 of the Internal Revenue Code (Code). This designation will allow shareholders of record on November 30, 2010, to treat their proportionate share of foreign taxes paid by the Fund as having been paid directly by them. The shareholder shall consider these amounts as foreign taxes paid in the tax year in which they receive the Fund distribution.
The following table provides a detailed analysis of foreign tax paid, foreign source income, and foreign qualified dividends as designated by the Fund, to Class A, Class B, Class C, and Advisor Class shareholders of record.
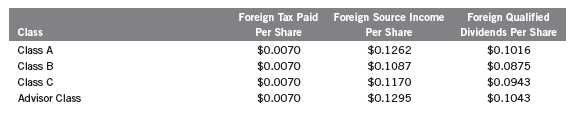
Foreign Tax Paid Per Share (Column 1) is the amount per share available to you, as a tax credit (assuming you held your shares in the Fund for a minimum of 16 days during the 31-day period beginning 15 days before the ex-dividend date of the Fund’s distribution to which the foreign taxes relate), or, as a tax deduction.
Foreign Source Income Per Share (Column 2) is the amount per share of income dividends paid to you that is attributable to foreign securities held by the Fund, plus any foreign taxes withheld on these dividends. The amounts reported include foreign source qualified dividends that have not been adjusted for the rate differential applicable to such dividend income.1
Foreign Qualified Dividends Per Share (Column 3) is the amount per share of foreign source qualified dividends the Fund paid to you, plus any foreign taxes withheld on these dividends. These amounts represent the portion of the Foreign Source Income reported to you in column 2 that were derived from qualified foreign securities held by the Fund.1
In January 2011, shareholders received Form 1099-DIV which included their share of taxes paid and foreign source income distributed during the calendar year 2010. The Foreign Source Income reported on Form 1099-DIV has not been adjusted for the rate differential on foreign source qualified dividend income. Shareholders are advised to check with their tax advisors for information on the treatment of these amounts on their 2010 individual income tax returns.
1Qualified dividends are taxed at reduced long term capital gains tax rates. In determining the amount of foreign tax credit that may be applied against the U.S. tax liability of individuals receiving foreign source qualified dividends, adjustments may be required to the foreign tax credit limitation calculation to reflect the rate differential applicable to such dividend income. The rules however permit certain individuals to elect not to apply the rate differential adjustments for capital gains and/or dividends for any taxable year. Please consult your tax advisor and the instructions to Form 1116 for more information.
Semiannual Report | 39
Franklin Gold and Precious Metals Fund
Shareholder Information
Proxy Voting Policies and Procedures
The Fund’s investment manager has established Proxy Voting Policies and Procedures (Policies) that the Fund uses to determine how to vote proxies relating to portfolio securities. Shareholders may view the Fund’s complete Policies online at franklintempleton.com. Alternatively, shareholders may request copies of the Policies free of charge by calling the Proxy Group collect at (954) 527-7678 or by sending a written request to: Franklin Templeton Companies, LLC, 500 East Broward Boulevard, Suite 1500, Fort Lauderdale, FL 33394, Attention: Proxy Group. Copies of the Fund’s proxy voting records are also made available online at franklintempleton.com and posted on the U.S. Securities and Exchange Commission’s website at sec.gov and reflect the most recent 12-month period ended June 30.
Quarterly Statement of Investments
The Fund files a complete statement of investments with the U.S. Securities and Exchange Commission for the first and third quarters for each fiscal year on Form N-Q. Shareholders may view the filed Form N-Q by visiting the Commission’s website at sec.gov. The filed form may also be viewed and copied at the Commission’s Public Reference Room in Washington, DC. Information regarding the operations of the Public Reference Room may be obtained by calling (800) SEC-0330.
40 | Semiannual Report
SECTOR GLOBAL
INTERNATIONAL
HYBRID ASSET ALLOCATION
FIXED INCOME
TAX-FREE INCOME
< GAIN FROM OUR PERSPECTIVE® >
Semiannual Report and Shareholder Letter
FRANKLIN GOLD AND
PRECIOUS METALS FUND
Investment Manager
Franklin Advisers, Inc.
Distributor
Franklin Templeton Distributors, Inc.
(800) DIAL BEN®
franklintempleton.com
Shareholder Services
(800) 632-2301
Authorized for distribution only when accompanied or preceded by a summary prospectus and/or prospectus. Investors should carefully consider a fund’s investment goals, risks, charges and expenses before investing. A prospectus contains this and other information; please read it carefully before investing.
To ensure the highest quality of service, telephone calls to or from our service departments may be monitored, recorded and accessed. These calls can be identified by the presence of a regular beeping tone.

Item 2. Code of Ethics.
(a) The Registrant has adopted a code of ethics that applies to its principal executive officers and principal financial and accounting officer.
(c) N/A
(d) N/A
(f) Pursuant to Item 12(a)(1), the Registrant is attaching as an exhibit a copy of its code of ethics that applies to its principal executive officers and principal financial and accounting officer.
Item 3. Audit Committee Financial Expert.
(a)(1) The Registrant has an audit committee financial expert serving on its audit committee.
(2) The audit committee financial expert is John B. Wilson and he is "independent" as defined under the relevant Securities and Exchange Commission Rules and Releases.
Item 4. Principal Accountant Fees and Services. N/A
Item 5. Audit Committee of Listed Registrants. N/A
Item 6. Schedule of Investments. N/A
Item 7. Disclosure of Proxy Voting Policies and Procedures for Closed-End Management Investment Companies. N/A
Item 8. Portfolio Managers of Closed-End Management Investment Companies. N/A
Item 9. Purchases of Equity Securities by Closed-End Management Investment Company and Affiliated Purchasers. N/A
Item 10. Submission of Matters to a Vote of Security Holders.
There have been no changes to the procedures by which shareholders may recommend nominees to the Registrant's Board of Trustees that would require disclosure herein.
Item 11. Controls and Procedures.
(a) Evaluation of Disclosure Controls and Procedures. The Registrant maintains disclosure controls and procedures that are designed to ensure that information required to be disclosed in the Registrant’s filings under the Securities Exchange Act of 1934 and the Investment Company Act of 1940 is recorded, processed, summarized and reported within the periods specified in the rules and forms of the Securities and Exchange Commission. Such information is accumulated and communicated to the Registrant’s management, including its principal executive officer and principal financial officer, as appropriate, to allow timely decisions regarding required disclosure. The Registrant’s management, including the principal executive officer and the principal financial officer, recognizes that any set of controls and procedures, no matter how well designed and operated, can provide only reasonable assurance of achieving the desired control objectives.
Within 90 days prior to the filing date of this Shareholder Report on Form N-CSR, the Registrant had carried out an evaluation, under the supervision and with the participation of the Registrant’s management, including the Registrant’s principal executive officer and the Registrant’s principal financial officer, of the effectiveness of the design and operation of the Registrant’s disclosure controls and procedures. Based on such evaluation, the Registrant’s principal executive officer and principal financial officer concluded that the Registrant’s disclosure controls and procedures are effective.
(b) Changes in Internal Controls. There have been no significant changes in the Registrant’s internal controls or in other factors that could significantly affect the internal controls subsequent to the date of their evaluation in connection with the preparation of this Shareholder Report on Form N-CSR.
Item 12. Exhibits.
(a)(1) Code of Ethics
(a)(2) Certifications pursuant to Section 302 of the Sarbanes-Oxley Act of 2002 of Laura F. Fergerson, Chief Executive Officer - Finance and Administration, and Gaston Gardey, Chief Financial Officer, Chief Accounting Officer and Treasurer
(b) Certifications pursuant to Section 906 of the Sarbanes-Oxley Act of 2002 of Laura F. Fergerson, Chief Executive Officer - Finance and Administration, and Gaston Gardey, Chief Financial Officer, Chief Accounting Officer and Treasurer
SIGNATURES
Pursuant to the requirements of the Securities Exchange Act of 1934 and the Investment Company Act of 1940, the registrant has duly caused this report to be signed on its behalf by the undersigned, thereunto duly authorized.
FRANKLIN GOLD AND PERCIOUS METALS FUND
By /s/LAURA F. FERGERSON
Laura F. Fergerson
Chief Executive Officer –
Finance and Administration
Date March 30, 2011
Pursuant to the requirements of the Securities Exchange Act of 1934 and the Investment Company Act of 1940, this report has been signed below by the following persons on behalf of the registrant and in the capacities and on the dates indicated.
By /s/LAURA F. FERGERSON
Laura F. Fergerson
Chief Executive Officer –
Finance and Administration
Date March 30, 2011
By /s/GASTON GARDEY
Gaston Gardey
Chief Financial Officer and
Chief Accounting Officer
Date March 30, 2011