
Semiannual Report
Franklin Gold and Precious Metals Fund
Your Fund’s Goals and Main Investments: Franklin Gold and Precious Metals Fund seeks capital
appreciation, with current income as its secondary goal, by investing at least 80% of its net assets in securities of
gold and precious metals operation companies.
This semiannual report for Franklin Gold and Precious Metals Fund covers
the period ended January 31, 2013.
Performance Overview
Franklin Gold and Precious Metals Fund – Class A posted a +3.00% cumulative
total return for the six months ended January 31, 2013. In comparison, the
Standard & Poor’s® 500 Index (S&P 500®), which is a broad measure of U.S.
stock performance, returned +9.91%.1 For the same period, the sector-specific
FTSE® Gold Mines (All Mines) Index, which comprises companies whose princi-
pal activity is gold mining, had a -3.22% total return.1 You can find the Fund’s
long-term performance data in the Performance Summary beginning on page 9.
Economic and Market Overview
During the six months under review, headwinds to global economic growth
negatively affected most world regions. Several major governments intervened
to support their countries’ currencies, liquidity and growth rates. In an effort
to support the euro, the European Central Bank announced a plan to buy
troubled eurozone countries’ government bonds and extended its liquidity
provisions to the region’s banks. China announced a fiscal stimulus plan that
funded a number of infrastructure projects. The Bank of Japan doubled its
inflation rate target to 2% and announced it would switch to an open-ended
commitment to its asset-purchase program in 2014. The U.S. Federal Reserve
Board (Fed) implemented a third round of quantitative easing and established
a 6.5% unemployment rate guideline in maintaining the historically low federal
funds target rate.
1. Source: © 2013 Morningstar. All Rights Reserved. The information contained herein: (1) is proprietary to Morningstar
and/or its content providers; (2) may not be copied or distributed; and (3) is not warranted to be accurate, complete or
timely. Neither Morningstar nor its content providers are responsible for any damages or losses arising from any use of
this information. STANDARD & POOR’S®, S&P® and S&P 500® are registered trademarks of Standard & Poor’s Financial
Services LLC. FTSE® is a trademark of London Stock Exchange Plc and The Financial Times Limited. The indexes are
unmanaged and include reinvested dividends. One cannot invest directly in an index, and an index is not representative
of the Fund’s portfolio.
The dollar value, number of shares or principal amount, and names of all portfolio holdings are listed in the Fund’s
Statement of Investments (SOI). The SOI begins on page 18.
Semiannual Report | 3
The U.S. economy, as measured by gross domestic product (GDP), grew at a
healthy pace in the third quarter of 2012 but slowed in the fourth quarter. A
large decline in federal government spending, business disruptions caused by
Hurricane Sandy and the continuing effects of the Midwest drought on farm
production more than offset solid growth in personal income and consumer
spending. Slowing GDP growth did not deter investors, however, as positive
construction, housing and labor market trends, as well as relatively strong
manufacturing data, seemed to suggest the U.S. economic recovery remained
largely intact. Consumer sentiment rose to a five-year high, although potential
U.S. tax hikes and spending cuts scheduled to take effect in 2013 dampened
consumer and business confidence near the end of 2012. At the beginning of
2013, Congress passed compromise legislation that preserved lower income
tax rates for most U.S. households and delayed far-reaching federal spending
cuts, and business confidence rose.
Stock markets were volatile with periodic downturns primarily attributable to
concerns about slowing global economic growth, European sovereign debt and
U.S. fiscal negotiations. As Europe’s leadership took measures to address the
region’s fiscal debt crisis, investor attention shifted to the U.S. election and
budget negotiations. Despite uncertainties, investors generally became optimistic
as stimulus measures undertaken by many global governments seemed to gain
traction. For the six months ended January 31, 2013, U.S. stocks, as measured
by the S&P 500, as well as global developed market stocks, as measured by the
MSCI World Index, delivered strong returns.
Precious Metals Sector Overview
All precious metals’ prices advanced during the six months under review, led
by a 26.0% rise for palladium, while gold trailed, returning 3.1%.2 Spot gold
prices began the period at $1,614 per troy ounce and rose through September
to a high of $1,790 in the first week of October 2012 following the European
Central Bank’s announcement that it was prepared to buy unlimited quantities
of bonds issued by its weakest members and the U.S. Fed’s announcement of a
third round of quantitative easing.2 Such central bank programs have frequently
raised the prospect of future inflation and have drawn interest in precious metals
from investors looking for a hedge against inflation. Gold generally declined
from its October peak through January 2013 as low inflation expectations
in developed countries and increasing investor appetite for risk assets eroded
demand for the metal. Nonetheless, gold spot prices ended the period at $1,664,
supported by persistent demand from gold exchange-traded funds, Asian con-
sumers and expanding central bank reserve purchases.2
2. Source: Bloomberg LP.
4 | Semiannual Report
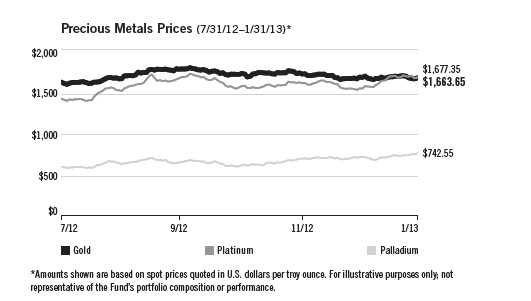
The prices of other precious metals rose more significantly during the period,
with platinum, palladium and silver each posting double-digit gains. Palladium
was the top performer, and its period-end spot price of $743 was near the
period peak of $750, the highest price since early September 2011.2 Platinum
rose 18.5% to end the period at $1,677 per troy ounce.2 In January 2013,
platinum reached parity with gold for the first time since April 2012 and ulti-
mately reclaimed its premium over the yellow metal. Platinum and palladium
are often mined together, and the run-up in their prices was primarily attribut-
able to supply constraints arising from a series of turbulent strikes at mines in
South Africa, which is home to approximately 75% of the world’s platinum
reserves. A strong South African rand and higher input prices have compressed
margins, forcing platinum and palladium miners to stop production to avoid
losses. Both metals are used in catalytic converters for vehicle exhaust systems,
and improving auto sales bolstered demand, further supporting platinum and
palladium prices. Silver spot prices began the reporting period at $28 and
reached a high of $35 in the first week of October before declining sharply late
in 2012.2 Silver rallied somewhat in January 2013 and ended the period at $31,
up 12.4% from six months earlier.2
Investment Strategy
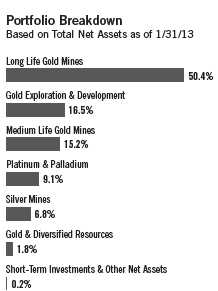
We believe that investing in securities of gold and precious metals operation
companies offers an excellent opportunity for diversification in an attractive
asset class over the long term. We like companies with multiple mines, attrac-
tive production profiles, strong reserve bases and active exploration programs
that can drive future reserve and production growth. While the sector can be
Semiannual Report | 5
volatile, especially over the short term, precious metals, such as gold, can be
attractive because they are hard assets not tied to any particular country or
financial system.
Manager’s Discussion
The six months under review was a strong period for mergers and acquisitions,
with much of the activity occurring among Fund holdings. St Barbara closed its
acquisition of Allied Gold, combining St Barbara’s Australian operations with
Allied’s mines in Papua New Guinea and the Solomon Islands. In January,
B2Gold received final approval for its acquisition of CGA Mining, and Alamos
Gold launched a hostile bid for Aurizon Mines. Yamana Gold closed on its
acquisition of Extorre Gold Mines, increasing its exposure to Argentina. Osisko
Mines acquired Queenston Mining, expanding its footprint in Canada. Other
deals included Primero’s planned acquisition of Cerro Resources, Hochschild
Mining’s takeover of Andina Minerals and Silver Lake Resources’ merger with
Intergra Mining. A few companies went against the consolidation trend by
divesting assets. Aurico Gold sold its El Cubo mine and its Ocampo mine,
both located in Mexico, in two separate transactions to focus the company on
its recently acquired Young-Davidson mine in Canada. Gold Fields announced
plans to split the company into two parts by spinning out its mature South
African assets into a new company, Sibanye Gold.
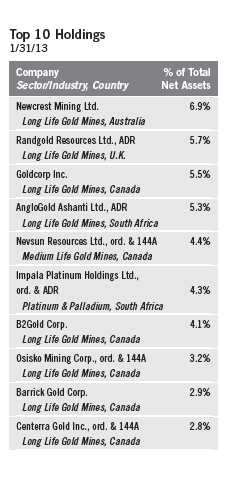
Merger activity drove the Fund’s top contributor for the six-month period as
CGA Mining agreed to be acquired by B2Gold in a friendly merger in an all-
share deal. B2Gold and CGA Mining each reported strong 2012 results. The
deal diversified B2Gold’s geographic exposure with the acquisition of operating
rights to the Masbate mine in the Philippines, adding to B2Gold’s La Libertad
and Limon mines in Nicaragua and development projects in Columbia, Uruguay
and Namibia. The combined company generates good cash flow, has no net debt
and possesses several high-quality options to grow production given potential
expansion opportunities and new development projects.
Shares of Canadian gold and copper miner Nevsun Resources responded
positively to an increase in production guidance announced in August 2012,
calendar year 2012 results that exceeded production targets, and the con-
tinued payment of a semiannual dividend. During the year, Nevsun also
completed its acquisition of the Mogoraib River exploration license in Eritrea.
The 97.4 square kilometer license is located in close proximity to its existing
Bisha gold mine and contains some prospective exploration targets including
the Hambok copper-zinc deposit. Nevsun is nearing completion of a new cop-
per circuit for its mill at Bisha, which will enable the company to continue
production as the ore body transitions from a gold rich cap to a high-grade
copper-gold zone of mineralization.
6 | Semiannual Report
Primero Mining delivered strong performance for the six-month period following a positive ruling by the Mexican tax authority that confirmed Primero need only pay taxes on the silver price it receives in contract rather than spot silver prices. This ruling had significant positive implications for the company’s cash flow given sales agreements with Silver Wheaton. Following the run-up in its shares, Primero announced plans to acquire Cerro Resources in a stock deal as management executed on plans to diversify away from a single mine operation. Cerro is developing the del Gallo gold-silver mine in Guanajuato, Mexico.
In contrast, several holdings declined in value during the period and negatively affected Fund performance. Key detractors included AngloGold Ashanti, Great Basin Gold and Banro.
AngloGold Ashanti experienced a number of unprotected strikes on its South African operation in September, October and briefly in November, which brought operations to a standstill for over a month, severely reducing production and cash flow. AngloGold agreed to some job-grading improvements that raised the minimum wage and made adjustments for other categories of employees but did not pay any wages to actively striking workers. Work had resumed at all of its South African operations by the end of November after management, employees and organized labor unions agreed to a code of conduct.
In August 2012, Great Basin Gold reported that its chief executive officer had resigned and that it was facing liquidity challenges arising from revenue shortfalls as a result of technical problems and delays at its Burnstone and Hollister mines. In September 2012, the company announced a suspension of operations at Burnstone and initiated creditor protection proceedings. Third-quarter 2012 production remained below planned levels and the company posted operating and net losses. In January, Great Basin filed to voluntarily delist its shares from the New York Stock Exchange.
In November, Banro shares plummeted on news that a rebel faction had marched on the city of Goma in the Democratic Republic of the Congo; Banro’s Twangiza gold mine is located approximately 125 miles southwest of Goma. On November 21, Banro issued a statement maintaining that Twangiza operations were unaffected by the development. On the same day, however, the company also reported lower-than-anticipated production at Twangiza in September and October 2012, which it attributed to mechanical issues. Although the resolution of these issues contributed to record production in the fourth quarter of 2012, Banro shares failed to recover their earlier losses.
It is important to recognize the effect of currency movements on the Fund’s performance. In general, if the value of the U.S. dollar goes up compared with a foreign currency, an investment traded in that foreign currency will go down
Semiannual Report | 7
in value because it will be worth fewer U.S. dollars. This can have a negative
effect on Fund performance. Conversely, when the U.S. dollar weakens in
relation to a foreign currency, an investment traded in that foreign currency
will increase in value, which can contribute to Fund performance. For the six
months ended January 31, 2013, the U.S. dollar rose in value relative to some
currencies in which the Fund’s investments were traded, resulting in currency
losses for the Fund given the portfolio’s investment predominantly in securities
with non-U.S. currency exposure.
Thank you for your continued participation in Franklin Gold and Precious
Metals Fund. We look forward to serving your future investment needs.
CFA® is a trademark owned by CFA Institute.
The foregoing information reflects our analysis, opinions and portfolio holdings as of January 31, 2013, the end of
the reporting period. The way we implement our main investment strategies and the resulting portfolio holdings
may change depending on factors such as market and economic conditions. These opinions may not be relied
upon as investment advice or an offer for a particular security. The information is not a complete analysis of
every aspect of any market, country, industry, security or the Fund. Statements of fact are from sources consid-
ered reliable, but the investment manager makes no representation or warranty as to their completeness or
accuracy. Although historical performance is no guarantee of future results, these insights may help you under-
stand our investment management philosophy.
8 | Semiannual Report
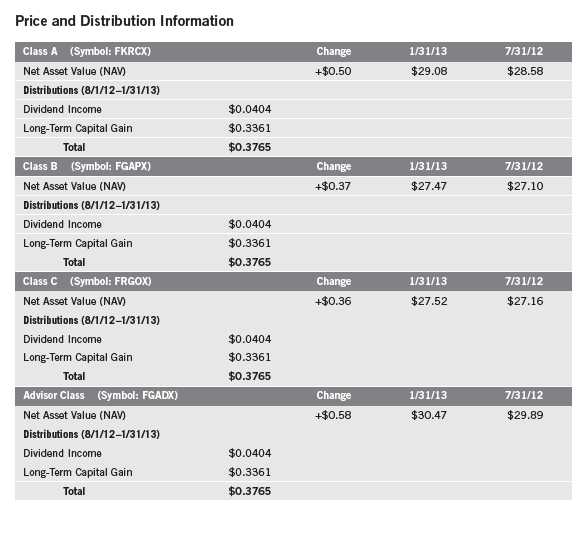
Performance Summary as of 1/31/13
Your dividend income will vary depending on dividends or interest paid by securities in the Fund’s
portfolio, adjusted for operating expenses of each class. Capital gain distributions are net profits
realized from the sale of portfolio securities. The performance table does not reflect any taxes that
a shareholder would pay on Fund dividends, capital gain distributions, if any, or any realized gains
on the sale of Fund shares. Total return reflects reinvestment of the Fund’s dividends and capital
gain distributions, if any, and any unrealized gains or losses.
Semiannual Report | 9
Performance Summary (continued)
Performance
Cumulative total return excludes sales charges. Average annual total returns and value of $10,000 investment include
maximum sales charges. Class A: 5.75% maximum initial sales charge; Class B: contingent deferred sales charge (CDSC)
declining from 4% to 1% over six years, and eliminated thereafter; Class C: 1% CDSC in first year only; Advisor Class: no
sales charges.
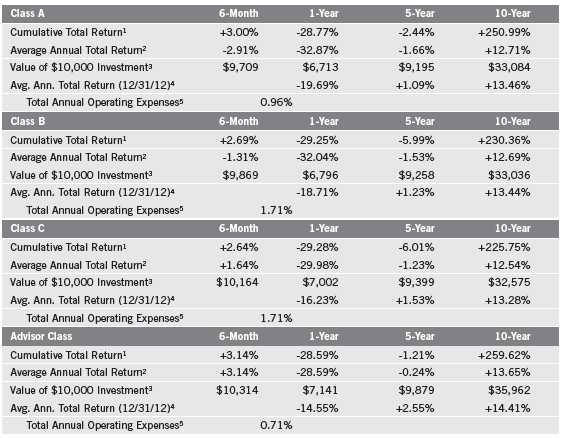
Performance data represent past performance, which does not guarantee future results. Investment return and principal
value will fluctuate, and you may have a gain or loss when you sell your shares. Current performance may differ from
figures shown. For most recent month-end performance, go to franklintempleton.com or call (800) 342-5236.
10 | Semiannual Report
Performance Summary (continued)
Endnotes
All investments involve risks, including possible loss of principal. Investing in a nondiversified fund involves the risk of greater price fluctuation
than a more diversified portfolio. Also, the Fund concentrates in the precious metals sector, which involves fluctuations in the prices of gold and
other precious metals and increased susceptibility to adverse economic and regulatory developments affecting the sector. In addition, the Fund
is subject to the risks of currency fluctuation and political uncertainty associated with foreign investing. Investments in developing markets
involve heightened risks related to the same factors, in addition to those associated with their relatively small size and lesser liquidity. The Fund
may also invest in smaller companies, which can be particularly sensitive to changing economic conditions, and their prospects for growth are
less certain than those of larger, more established companies. The Fund is actively managed but there is no guarantee that the manager’s
investment decisions will produce the desired results. The Fund’s prospectus also includes a description of the main investment risks.

1. Cumulative total return represents the change in value of an investment over the periods indicated.
2. Average annual total return represents the average annual change in value of an investment over the periods indicated. Six-month return has not
been annualized.
3. These figures represent the value of a hypothetical $10,000 investment in the Fund over the periods indicated.
4. In accordance with SEC rules, we provide standardized average annual total return information through the latest calendar quarter.
5. Figures are as stated in the Fund’s prospectus current as of the date of this report. In periods of market volatility, assets may decline significantly,
causing total annual Fund operating expenses to become higher than the figures shown.
Semiannual Report | 11
Your Fund’s Expenses
As a Fund shareholder, you can incur two types of costs:
- Transaction costs, including sales charges (loads) on Fund purchases; and
- Ongoing Fund costs, including management fees, distribution and service (12b-1) fees, and other Fund expenses. All mutual funds have ongoing costs, sometimes referred to as operating expenses.
The following table shows ongoing costs of investing in the Fund and can help you understand these costs and compare them with those of other mutual funds. The table assumes a $1,000 investment held for the six months indicated.
Actual Fund Expenses
The first line (Actual) for each share class listed in the table provides actual account values and expenses. The “Ending Account Value” is derived from the Fund’s actual return, which includes the effect of Fund expenses.
You can estimate the expenses you paid during the period by following these steps. Of course, your account value and expenses will differ from those in this illustration:
| 1. | Divide your account value by $1,000. |
| | If an account had an $8,600 value, then $8,600 ÷ $1,000 = 8.6. |
| 2. | Multiply the result by the number under the heading “Expenses Paid During Period.” |
| | If Expenses Paid During Period were $7.50, then 8.6 x $7.50 = $64.50. |
In this illustration, the estimated expenses paid this period are $64.50.
Hypothetical Example for Comparison with Other Funds
Information in the second line (Hypothetical) for each class in the table can help you compare ongoing costs of investing in the Fund with those of other mutual funds. This information may not be used to estimate the actual ending account balance or expenses you paid during the period. The hypothetical “Ending Account Value” is based on the actual expense ratio for each class and an assumed 5% annual rate of return before expenses, which does not represent the Fund’s actual return. The figure under the heading “Expenses Paid During Period” shows the hypothetical expenses your account would have incurred under this scenario. You can compare this figure with the 5% hypothetical examples that appear in shareholder reports of other funds.
12 | Semiannual Report
Your Fund’s Expenses (continued)
Please note that expenses shown in the table are meant to highlight ongoing costs and do not reflect
any transaction costs, such as sales charges. Therefore, the second line for each class is useful in
comparing ongoing costs only, and will not help you compare total costs of owning different funds.
In addition, if transaction costs were included, your total costs would have been higher. Please refer
to the Fund prospectus for additional information on operating expenses.
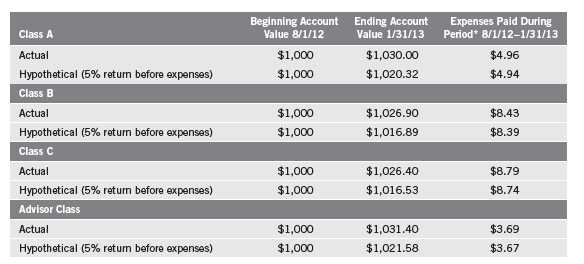
*Expenses are calculated using the most recent six-month expense ratio, annualized for each class (A: 0.97%; B: 1.65%; C: 1.72%; and Advisor: 0.72%), multiplied by the average account value over the period, multiplied by 184/365 to reflect the one-half year period.
Semiannual Report | 13
Franklin Gold and Precious Metals Fund
Financial Highlights
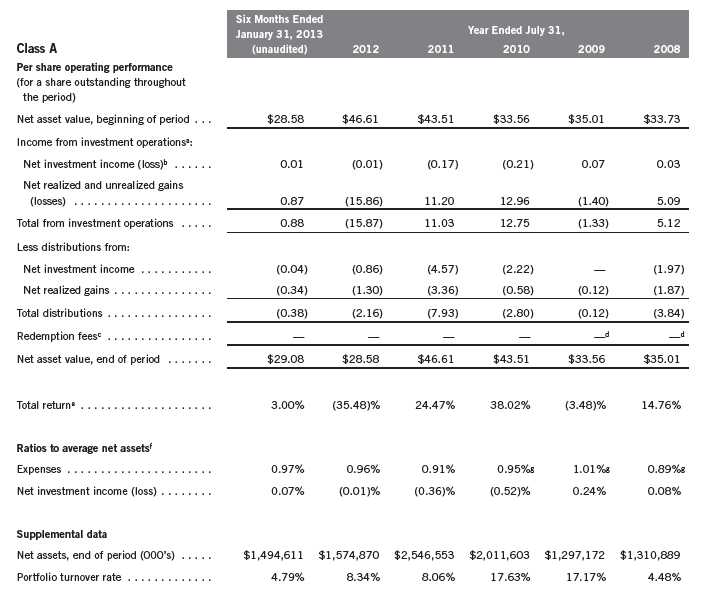
aThe amount shown for a share outstanding throughout the period may not correlate with the Statement of Operations for the period due to the timing of sales and repurchases of
the Fund shares in relation to income earned and/or fluctuating market value of the investments of the Fund.
bBased on average daily shares outstanding.
cEffective September 1, 2008, the redemption fee was eliminated.
dAmount rounds to less than $0.01 per share.
eTotal return does not reflect sales commissions or contingent deferred sales charges, if applicable, and is not annualized for periods less than one year.
fRatios are annualized for periods less than one year.
gBenefit of expense reduction rounds to less than 0.01%.
14 | The accompanying notes are an integral part of these financial statements. | Semiannual Report
Franklin Gold and Precious Metals Fund
Financial Highlights (continued)
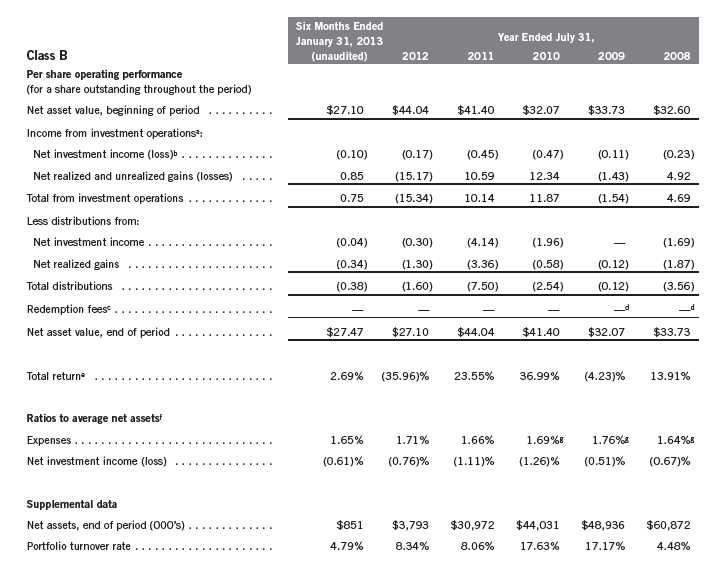
aThe amount shown for a share outstanding throughout the period may not correlate with the Statement of Operations for the period due to the timing of sales and repurchases of
the Fund shares in relation to income earned and/or fluctuating market value of the investments of the Fund.
bBased on average daily shares outstanding.
cEffective September 1, 2008, the redemption fee was eliminated.
dAmount rounds to less than $0.01 per share.
eTotal return does not reflect sales commissions or contingent deferred sales charges, if applicable, and is not annualized for periods less than one year.
fRatios are annualized for periods less than one year.
gBenefit of expense reduction rounds to less than 0.01%.
Semiannual Report | The accompanying notes are an integral part of these financial statements. | 15
Franklin Gold and Precious Metals Fund
Financial Highlights (continued)
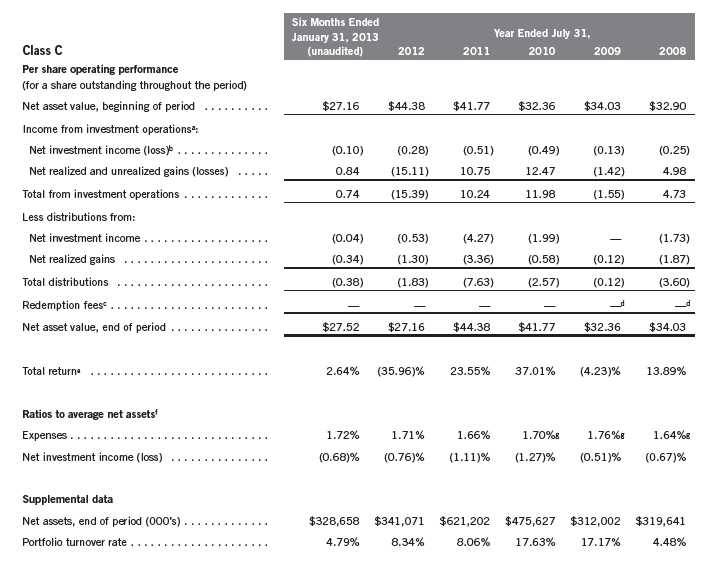
aThe amount shown for a share outstanding throughout the period may not correlate with the Statement of Operations for the period due to the timing of sales and repurchases of
the Fund shares in relation to income earned and/or fluctuating market value of the investments of the Fund.
bBased on average daily shares outstanding.
cEffective September 1, 2008, the redemption fee was eliminated.
dAmount rounds to less than $0.01 per share.
eTotal return does not reflect sales commissions or contingent deferred sales charges, if applicable, and is not annualized for periods less than one year.
fRatios are annualized for periods less than one year.
gBenefit of expense reduction rounds to less than 0.01%.
16 | The accompanying notes are an integral part of these financial statements. | Semiannual Report
Franklin Gold and Precious Metals Fund
Financial Highlights (continued)
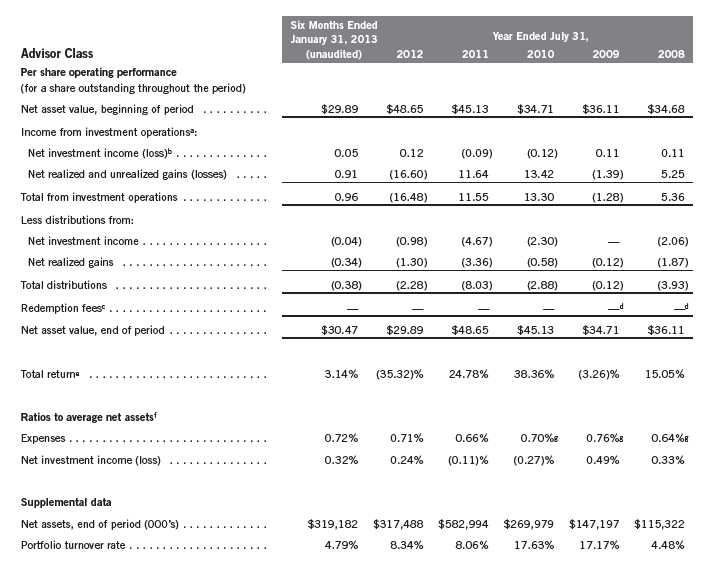
aThe amount shown for a share outstanding throughout the period may not correlate with the Statement of Operations for the period due to the timing of sales and repurchases of
the Fund shares in relation to income earned and/or fluctuating market value of the investments of the Fund.
bBased on average daily shares outstanding.
cEffective September 1, 2008, the redemption fee was eliminated.
dAmount rounds to less than $0.01 per share.
eTotal return is not annualized for periods less than one year.
fRatios are annualized for periods less than one year.
gBenefit of expense reduction rounds to less than 0.01%.
Semiannual Report | The accompanying notes are an integral part of these financial statements. | 17
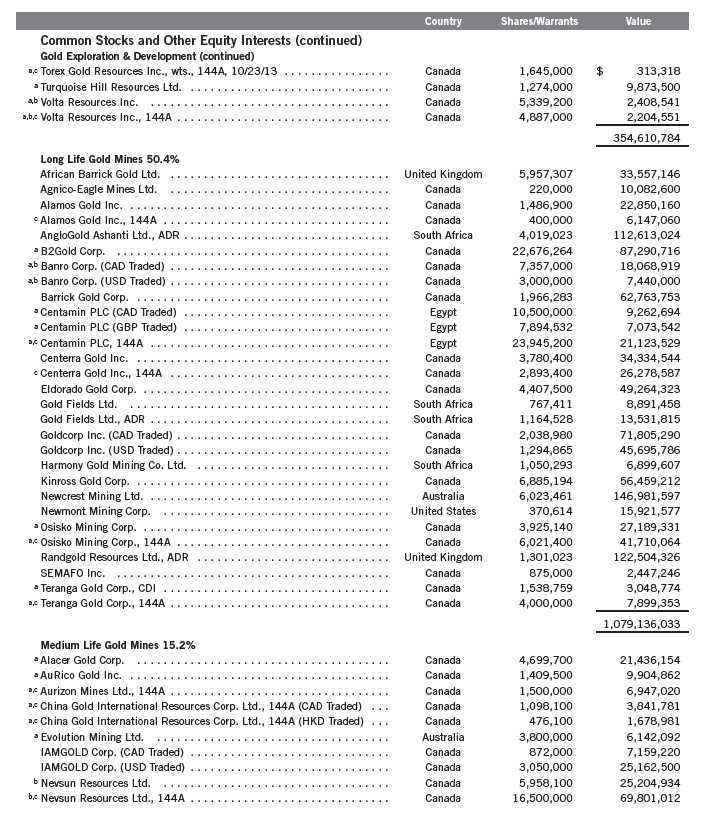
Franklin Gold and Precious Metals Fund
Statement of Investments, January 31, 2013 (unaudited)
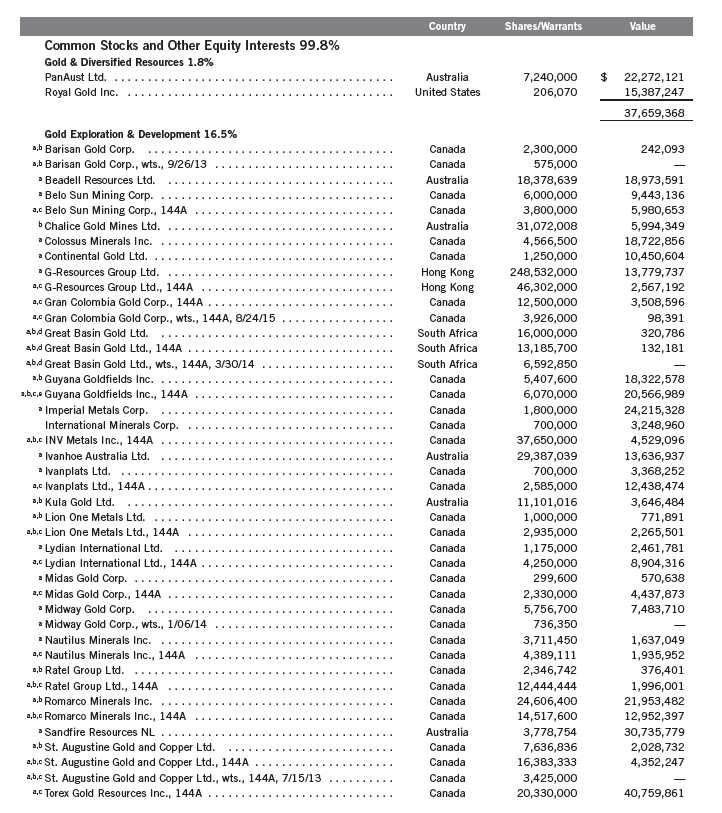
18 | Semiannual Report
Franklin Gold and Precious Metals Fund
Statement of Investments, January 31, 2013 (unaudited) (continued)
Semiannual Report | 19
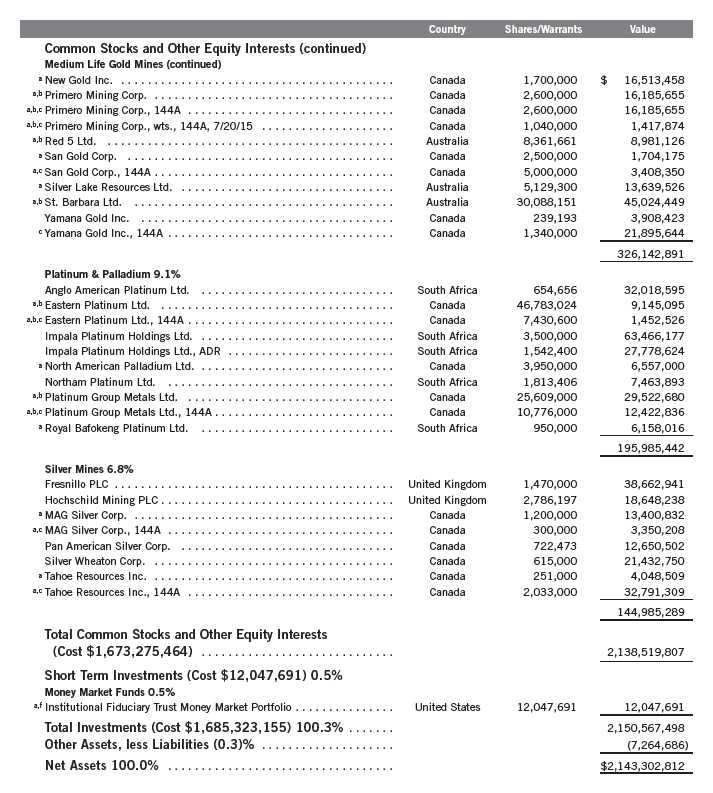
Franklin Gold and Precious Metals Fund
Statement of Investments, January 31, 2013 (unaudited) (continued)
20 | Semiannual Report
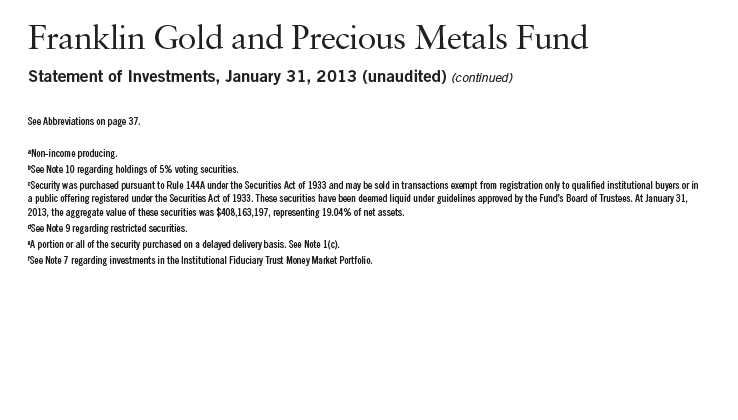
Semiannual Report | The accompanying notes are an integral part of these financial statements. | 21
Franklin Gold and Precious Metals Fund
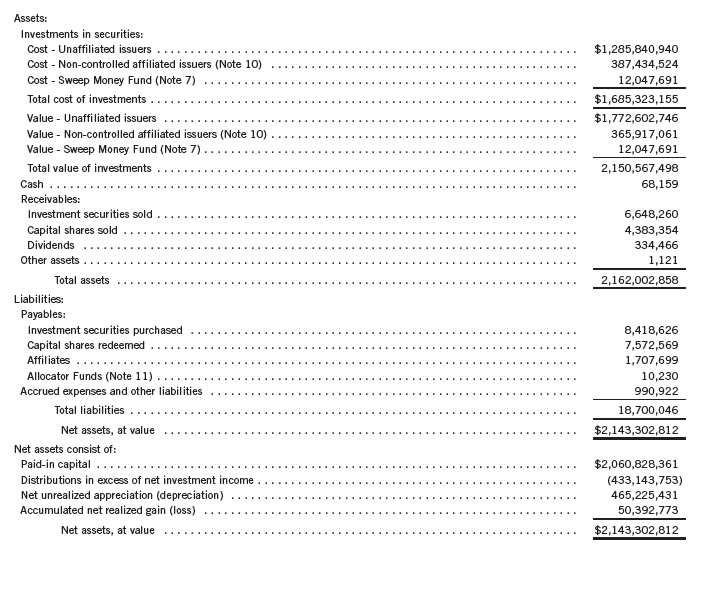
Financial Statements
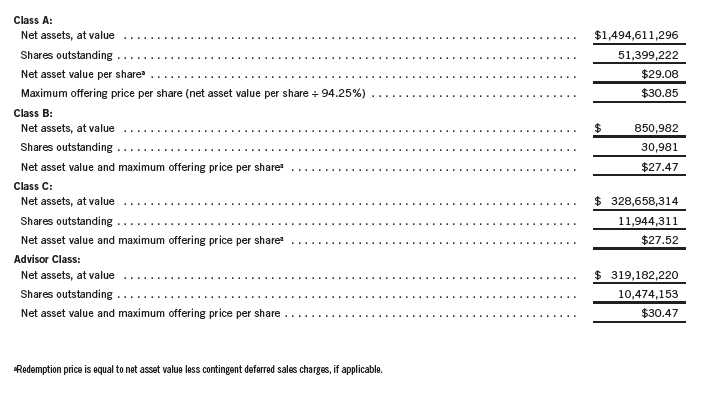
Statement of Assets and Liabilities
January 31, 2013 (unaudited)
22 | The accompanying notes are an integral part of these financial statements. | Semiannual Report
Franklin Gold and Precious Metals Fund
Financial Statements (continued)
Statement of Assets and Liabilities (continued)
January 31, 2013 (unaudited)
Semiannual Report | The accompanying notes are an integral part of these financial statements. | 23
Franklin Gold and Precious Metals Fund
Financial Statements (continued)
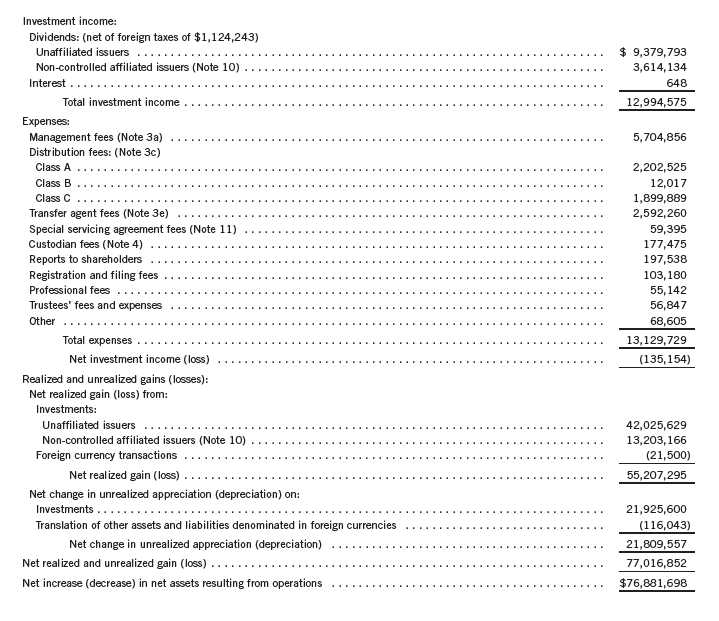
Statement of Operations
for the six months ended January 31, 2013 (unaudited)
24 | The accompanying notes are an integral part of these financial statements. | Semiannual Report
Franklin Gold and Precious Metals Fund
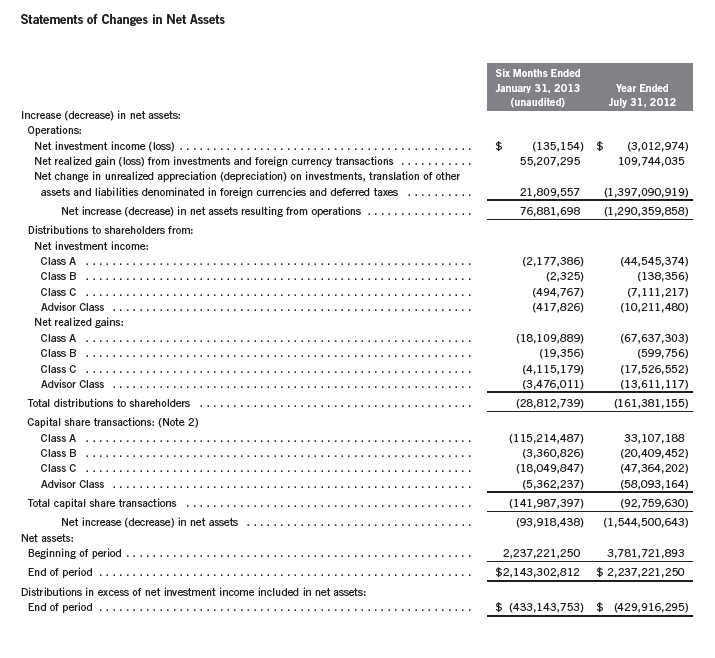
Financial Statements (continued)
Semiannual Report | The accompanying notes are an integral part of these financial statements. | 25
Franklin Gold and Precious Metals Fund
Notes to Financial Statements (unaudited)
1. ORGANIZATION AND SIGNIFICANT ACCOUNTING POLICIES
Franklin Gold and Precious Metals Fund (Fund) is registered under the Investment Company Act of 1940, as amended, (1940 Act) as an open-end investment company. The Fund offers four classes of shares: Class A, Class B, Class C, and Advisor Class. Effective March 1, 2005, the Fund no longer offered Class B shares for purchase. As disclosed in the fund prospectus, Class B shares convert to Class A shares after eight years of investment; therefore, all Class B shares will convert to Class A by March 2013. Each class of shares differs by its initial sales load, contingent deferred sales charges, distribution fees, voting rights on matters affecting a single class and its exchange privilege.
The following summarizes the Fund’s significant accounting policies.
a. Financial Instrument Valuation
The Fund’s investments in financial instruments are carried at fair value daily. Fair value is the price that would be received to sell an asset or paid to transfer a liability in an orderly transaction between market participants on the measurement date. Under procedures approved by the Fund’s Board of Trustees (the Board), the Fund’s administrator, investment manager and other affiliates have formed the Valuation and Liquidity Oversight Committee (VLOC). The VLOC provides administration and oversight of the Fund’s valuation policies and procedures, which are approved annually by the Board. Among other things, these procedures allow the Fund to utilize independent pricing services, quotations from securities and financial instrument dealers, and other market sources to determine fair value.
Equity securities listed on an exchange or on the NASDAQ National Market System are valued at the last quoted sale price or the official closing price of the day, respectively. Foreign equity securities are valued as of the close of trading on the foreign stock exchange on which the security is primarily traded, or the NYSE, whichever is earlier. The value is then converted into its U.S. dollar equivalent at the foreign exchange rate in effect at the close of the NYSE on the day that the value of the security is determined. Over-the-counter (OTC) securities are valued within the range of the most recent quoted bid and ask prices. Securities that trade in multiple markets or on multiple exchanges are valued according to the broadest and most representative market. Certain equity securities are valued based upon fundamental characteristics or relationships to similar securities. Investments in open-end mutual funds are valued at the closing net asset value.
The Fund has procedures to determine the fair value of financial instruments for which market prices are not reliable or readily available. Under these procedures, the VLOC convenes on a regular basis to review such financial instruments and considers a number of factors, including significant unobservable valuation inputs, when arriving at fair value. The VLOC primarily employs a market-based approach which may use related or comparable assets or liabilities, recent transactions, market multiples, book values, and other relevant information for the investment to determine the fair value of the investment. An income-based valuation approach may also be used in which the anticipated future cash flows of the investment are discounted to calculate
26 | Semiannual Report
Franklin Gold and Precious Metals Fund
Notes to Financial Statements (unaudited) (continued)
| 1. | ORGANIZATION AND SIGNIFICANT ACCOUNTING POLICIES (continued) |
| a. | Financial Instrument Valuation (continued) |
fair value. Discounts may also be applied due to the nature or duration of any restrictions on the disposition of the investments. Due to the inherent uncertainty of valuations of such investments, the fair values may differ significantly from the values that would have been used had an active market existed. The VLOC employs various methods for calibrating these valuation approaches including a regular review of key inputs and assumptions, transactional back-testing or disposition analysis, and reviews of any related market activity.
Trading in securities on foreign securities stock exchanges and OTC markets may be completed before the daily close of business on the NYSE. Occasionally, events occur between the time at which trading in a foreign security is completed and the close of the NYSE that might call into question the reliability of the value of a portfolio security held by the Fund. As a result, differences may arise between the value of the Fund’s portfolio securities as determined at the foreign market close and the latest indications of value at the close of the NYSE. In order to minimize the potential for these differences, the VLOC monitors price movements following the close of trading in foreign stock markets through a series of country specific market proxies (such as baskets of American Depositary Receipts, futures contracts and exchange traded funds). These price movements are measured against established trigger thresholds for each specific market proxy to assist in determining if an event has occurred that may call into question the reliability of the values of the foreign securities held by the Fund. If such an event occurs, the securities may be valued using fair value procedures, which may include the use of independent pricing services.
b. Foreign Currency Translation
Portfolio securities and other assets and liabilities denominated in foreign currencies are translated into U.S. dollars based on the exchange rate of such currencies against U.S. dollars on the date of valuation. The Fund may enter into foreign currency exchange contracts to facilitate transactions denominated in a foreign currency. Purchases and sales of securities, income and expense items denominated in foreign currencies are translated into U.S. dollars at the exchange rate in effect on the transaction date. Portfolio securities and assets and liabilities denominated in foreign currencies contain risks that those currencies will decline in value relative to the U.S. dollar. Occasionally, events may impact the availability or reliability of foreign exchange rates used to convert the U.S. dollar equivalent value. If such an event occurs, the foreign exchange rate will be valued at fair value using procedures established and approved by the Board.
The Fund does not separately report the effect of changes in foreign exchange rates from changes in market prices on securities held. Such changes are included in net realized and unrealized gain or loss from investments on the Statement of Operations.
Realized foreign exchange gains or losses arise from sales of foreign currencies, currency gains or losses realized between the trade and settlement dates on securities transactions and the difference between the recorded amounts of dividends, interest, and foreign withholding taxes and the U.S. dollar equivalent of the amounts actually received or paid. Net unrealized foreign exchange
Semiannual Report | 27
Franklin Gold and Precious Metals Fund
Notes to Financial Statements (unaudited) (continued)
| 1. | ORGANIZATION AND SIGNIFICANT ACCOUNTING POLICIES (continued) |
| b. | Foreign Currency Translation (continued) |
gains and losses arise from changes in foreign exchange rates on foreign denominated assets and liabilities other than investments in securities held at the end of the reporting period.
c. Securities Purchased on a Delayed Delivery Basis
The Fund purchases securities on a delayed delivery basis, with payment and delivery scheduled for a future date. These transactions are subject to market fluctuations and are subject to the risk that the value at delivery may be more or less than the trade date purchase price. Although the Fund will generally purchase these securities with the intention of holding the securities, it may sell the securities before the settlement date. Sufficient assets have been segregated for these securities.
d. Income and Deferred Taxes
It is the Fund’s policy to qualify as a regulated investment company under the Internal Revenue Code. The Fund intends to distribute to shareholders substantially all of its taxable income and net realized gains to relieve it from federal income and excise taxes. As a result, no provision for U.S. federal income taxes is required.
The Fund may be subject to foreign taxation related to income received, capital gains on the sale of securities and certain foreign currency transactions in the foreign jurisdictions in which it invests. Foreign taxes, if any, are recorded based on the tax regulations and rates that exist in the foreign markets in which the Fund invests. When a capital gain tax is determined to apply the Fund records an estimated deferred tax liability in an amount that would be payable if the securities were disposed of on the valuation date.
The Fund recognizes the tax benefits of uncertain tax positions only when the position is “more likely than not” to be sustained upon examination by the tax authorities based on the technical merits of the tax position. As of January 31, 2013, and for all open tax years, the Fund has determined that no liability for unrecognized tax benefits is required in the Fund’s financial statements related to uncertain tax positions taken on a tax return (or expected to be taken on future tax returns). Open tax years are those that remain subject to examination and are based on each tax jurisdiction statute of limitation.
e. Security Transactions, Investment Income, Expenses and Distributions
Security transactions are accounted for on trade date. Realized gains and losses on security transactions are determined on a specific identification basis. Interest income and estimated expenses are accrued daily. Dividend income is recorded on the ex-dividend date except that certain dividends from foreign securities are recognized as soon as the Fund is notified of the ex-dividend date. Distributions to shareholders are recorded on the ex-dividend date and are determined according to income tax regulations (tax basis). Distributable earnings determined on a tax basis may differ from earnings recorded in accordance with accounting principles generally accepted
28 | Semiannual Report
Franklin Gold and Precious Metals Fund
Notes to Financial Statements (unaudited) (continued)
| 1. | ORGANIZATION AND SIGNIFICANT ACCOUNTING POLICIES (continued) |
| e. | Security Transactions, Investment Income, Expenses and Distributions (continued) |
in the United States of America. These differences may be permanent or temporary. Permanent differences are reclassified among capital accounts to reflect their tax character. These reclassifications have no impact on net assets or the results of operations. Temporary differences are not reclassified, as they may reverse in subsequent periods.
Realized and unrealized gains and losses and net investment income, not including class specific expenses, are allocated daily to each class of shares based upon the relative proportion of net assets of each class. Differences in per share distributions, by class, are generally due to differences in class specific expenses.
f. Accounting Estimates
The preparation of financial statements in accordance with accounting principles generally accepted in the United States of America requires management to make estimates and assumptions that affect the reported amounts of assets and liabilities at the date of the financial statements and the amounts of income and expenses during the reporting period. Actual results could differ from those estimates.
g. Guarantees and Indemnifications
Under the Trust’s organizational documents, its officers and trustees are indemnified by the Trust against certain liabilities arising out of the performance of their duties to the Trust. Additionally, in the normal course of business, the Trust, on behalf of the Fund, enters into contracts with service providers that contain general indemnification clauses. The Trust’s maximum exposure under these arrangements is unknown as this would involve future claims that may be made against the Trust that have not yet occurred. Currently, the Trust expects the risk of loss to be remote.
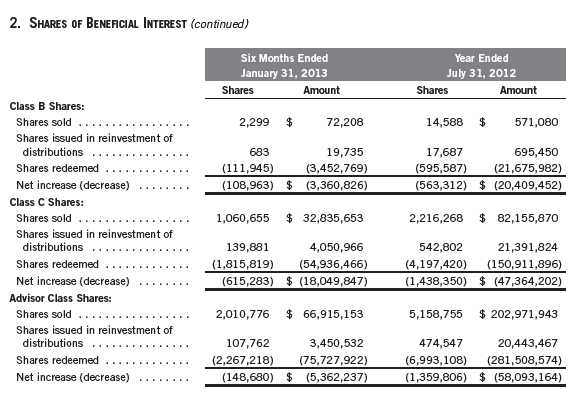
2. SHARES OF BENEFICIAL INTEREST
At January 31, 2013, there were an unlimited number of shares authorized (without par value).
Transactions in the Fund’s shares were as follows:

Semiannual Report | 29
Franklin Gold and Precious Metals Fund
Notes to Financial Statements (unaudited) (continued)
3. TRANSACTIONS WITH AFFILIATES
Franklin Resources, Inc. is the holding company for various subsidiaries that together are referred to as Franklin Templeton Investments. Certain officers and trustees of the Fund are also officers and/or directors of the following subsidiaries:

a. Management Fees
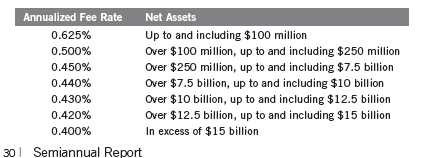
The Fund pays an investment management fee to Advisers based on the average daily month-end net assets of the Fund as follows:
Franklin Gold and Precious Metals Fund
Notes to Financial Statements (unaudited) (continued)
| 3. | TRANSACTIONS WITH AFFILIATES (continued) |
| b. | Administrative Fees |
FT Services, under terms of an agreement, provides administrative services to the Fund and is not paid by the Fund for the services.
c. Distribution Fees
The Board has adopted distribution plans for each share class, with the exception of Advisor Class shares, pursuant to Rule 12b-1 under the 1940 Act. Distribution fees are not charged on shares held by affiliates. Under the Fund’s Class A reimbursement distribution plan, the Fund reimburses Distributors for costs incurred in connection with the servicing, sale and distribution of the Fund’s shares up to the maximum annual plan rate. Under the Class A reimbursement distribution plan, costs exceeding the maximum for the current plan year cannot be reimbursed in subsequent periods. In addition, under the Fund’s Class B and C compensation distribution plans, the Fund pays Distributors for costs incurred in connection with the servicing, sale and distribution of the Fund’s shares up to the maximum annual plan rate for each class.
The maximum annual plan rates, based on the average daily net assets, for each class, are as follows:

d. Sales Charges/Underwriting Agreements
Front-end sales charges and contingent deferred sales charges (CDSC) do not represent expenses of the Fund. These charges are deducted from the proceeds of sales of Fund shares prior to investment or from redemption proceeds prior to remittance, as applicable. Distributors has advised the Fund of the following commission transactions related to the sales and redemptions of the Fund’s shares for the period:

e. Transfer Agent Fees
For the period ended January 31, 2013, the Fund paid transfer agent fees of $2,592,260, of which $1,343,438 was retained by Investor Services.
4. EXPENSE OFFSET ARRANGEMENT
The Fund has entered into an arrangement with its custodian whereby credits realized as a result of uninvested cash balances are used to reduce a portion of the Fund’s custodian expenses. During the period ended January 31, 2013, there were no credits earned.
Semiannual Report | 31
Franklin Gold and Precious Metals Fund
Notes to Financial Statements (unaudited) (continued)
5. INCOME TAXES
For tax purposes, the Fund may elect to defer any portion of a post-October capital loss or late-year ordinary loss to the first day of the following fiscal year. At July 31, 2012, the Fund deferred post-October capital losses of $506,667.
At January 31, 2013, the cost of investments, net unrealized appreciation (depreciation), for income tax purposes were as follows:

Differences between income and/or capital gains as determined on a book basis and a tax basis are primarily due to differing treatment of passive foreign investment company shares.
6. INVESTMENT TRANSACTIONS
Purchases and sales of investments (excluding short term securities) for the period ended January 31, 2013, aggregated $115,950,474 and $273,210,845, respectively.
7. INVESTMENTS IN INSTITUTIONAL FIDUCIARY TRUST MONEY MARKET PORTFOLIO
The Fund invests in the Institutional Fiduciary Trust Money Market Portfolio (Sweep Money Fund), an open-end investment company managed by Advisers. Management fees paid by the Fund are reduced on assets invested in the Sweep Money Fund, in an amount not to exceed the management and administrative fees paid by the Sweep Money Fund.
8. CONCENTRATION OF RISK
Investing in foreign securities may include certain risks and considerations not typically associated with investing in U.S. securities, such as fluctuating currency values and changing local and regional economic, political and social conditions, which may result in greater market volatility. In addition, certain foreign securities may not be as liquid as U.S. securities.
9. RESTRICTED SECURITIES
The Fund invests in securities that are restricted under the Securities Act of 1933 (1933 Act) or which are subject to legal, contractual, or other agreed upon restrictions on resale. Restricted securities are often purchased in private placement transactions, and cannot be sold without prior registration unless the sale is pursuant to an exemption under the 1933 Act. Disposal of
32 | Semiannual Report
Franklin Gold and Precious Metals Fund
Notes to Financial Statements (unaudited) (continued)
9. RESTRICTED SECURITIES (continued)
these securities may require greater effort and expense, and prompt sale at an acceptable price may be difficult. The Fund may have registration rights for restricted securities. The issuer generally incurs all registration costs.
At January 31, 2013, the Fund held investments in restricted securities, excluding certain securities exempt from registration under the 1933 Act deemed to be liquid, as follows:

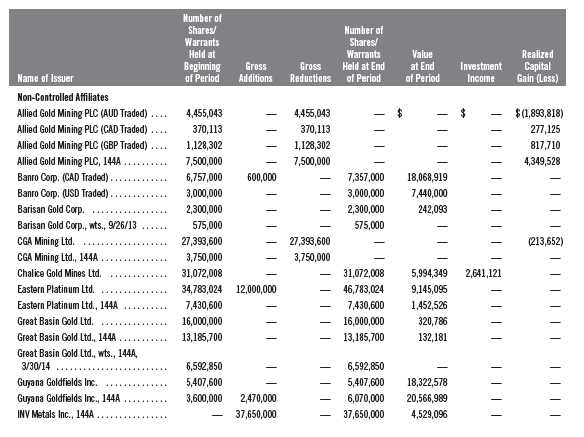
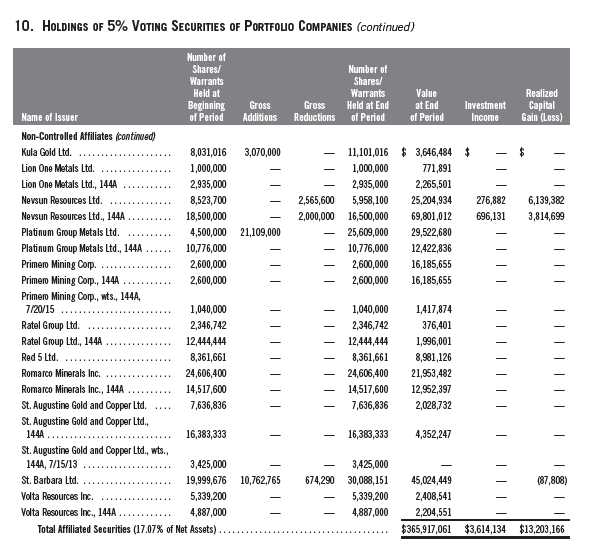
10. HOLDINGS OF 5% VOTING SECURITIES OF PORTFOLIO COMPANIES
The 1940 Act defines “affiliated companies” to include investments in portfolio companies in which a fund owns 5% or more of the outstanding voting securities. Investments in “affiliated companies” for the Fund for the period ended January 31, 2013, were as shown below.
Semiannual Report | 33
Franklin Gold and Precious Metals Fund
Notes to Financial Statements (unaudited) (continued)
11. SPECIAL SERVICING AGREEMENT
The Fund, which is an eligible underlying investment of one or more of the Franklin Templeton Fund Allocator Series Funds (Allocator Funds), participates in a Special Servicing Agreement (SSA) with the Allocator Funds and certain service providers of the Fund and the Allocator Funds. Under the SSA, the Fund may pay a portion of the Allocator Funds’ expenses (other than any asset allocation, administrative, and distribution fees) to the extent such payments are less than the amount of the benefits realized or expected to be realized by the Fund (e.g., due to reduced costs associated with servicing accounts) from the investment in the Fund by the Allocator Funds. The Allocator Funds are either managed by Advisers or administered by FT Services, affiliates of the Fund. For the period ended January 31, 2013, the Fund was held by one or more
34 | Semiannual Report
Franklin Gold and Precious Metals Fund
Notes to Financial Statements (unaudited) (continued)
11. SPECIAL SERVICING AGREEMENT (continued)
of the Allocator Funds and the amount of expenses borne by the Fund is noted in the Statement of Operations. At January 31, 2013, 2.60% of the Fund’s outstanding shares was held by one or more of the Allocator Funds. Effective May 1, 2013, the SSA will be discontinued until further notice and approval by the Board.
12. CREDIT FACILITY
The Fund, together with other U.S. registered and foreign investment funds (collectively, Borrowers), managed by Franklin Templeton Investments, are borrowers in a joint syndicated senior unsecured credit facility totaling $1.5 billion (Global Credit Facility) which matures on January 17, 2014. This Global Credit Facility provides a source of funds to the Borrowers for temporary and emergency purposes, including the ability to meet future unanticipated or unusually large redemption requests.
Under the terms of the Global Credit Facility, the Fund shall, in addition to interest charged on any borrowings made by the Fund and other costs incurred by the Fund, pay its share of fees and expenses incurred in connection with the implementation and maintenance of the Global Credit Facility, based upon its relative share of the aggregate net assets of all of the Borrowers, including an annual commitment fee of 0.07% based upon the unused portion of the Global Credit Facility. These fees are reflected in other expenses on the Statement of Operations. During the period ended January 31, 2013, the Fund did not use the Global Credit Facility.
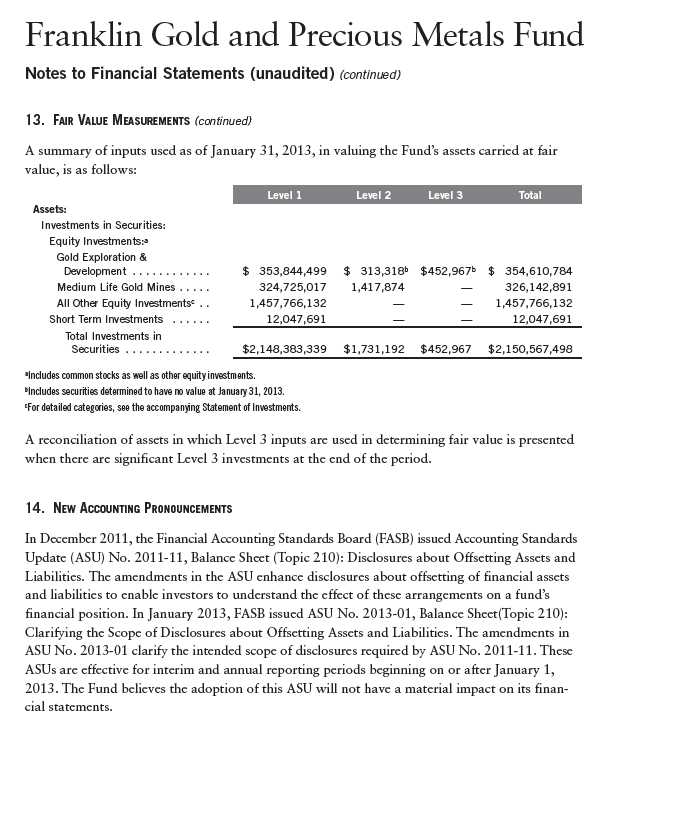
13. FAIR VALUE MEASUREMENTS
The Fund follows a fair value hierarchy that distinguishes between market data obtained from independent sources (observable inputs) and the Fund’s own market assumptions (unobservable inputs). These inputs are used in determining the value of the Fund’s financial instruments and are summarized in the following fair value hierarchy:
- Level 1 – quoted prices in active markets for identical financial instruments
- Level 2 – other significant observable inputs (including quoted prices for similar financial instruments, interest rates, prepayment speed, credit risk, etc.)
- Level 3 – significant unobservable inputs (including the Fund’s own assumptions in determining the fair value of financial instruments)
The inputs or methodology used for valuing financial instruments are not an indication of the risk associated with investing in those financial instruments.
For movements between the levels within the fair value hierarchy, the Fund has adopted a policy of recognizing the transfers as of the date of the underlying event which caused the movement.
Semiannual Report | 35
36 | Semiannual Report
Semiannual Report | 37
Franklin Gold and Precious Metals Fund
Shareholder Information
Proxy Voting Policies and Procedures
The Fund’s investment manager has established Proxy Voting Policies and Procedures (Policies) that the Fund uses to determine how to vote proxies relating to portfolio securities. Shareholders may view the Fund’s complete Policies online at franklintempleton.com. Alternatively, shareholders may request copies of the Policies free of charge by calling the Proxy Group collect at (954) 527-7678 or by sending a written request to: Franklin Templeton Companies, LLC, 300 S.E. 2nd Street, Fort Lauderdale, FL 33301, Attention: Proxy Group. Copies of the Fund’s proxy voting records are also made available online at franklintempleton.com and posted on the U.S. Securities and Exchange Commission’s website at sec.gov and reflect the most recent 12-month period ended June 30.
Quarterly Statement of Investments
The Fund files a complete statement of investments with the U.S. Securities and Exchange Commission for the first and third quarters for each fiscal year on Form N-Q. Shareholders may view the filed Form N-Q by visiting the Commission’s website at sec.gov. The filed form may also be viewed and copied at the Commission’s Public Reference Room in Washington, DC. Information regarding the operations of the Public Reference Room may be obtained by calling (800) SEC-0330.
38 | Semiannual Report
This page intentionally left blank.
This page intentionally left blank.


