UNITED STATES
SECURITIES AND EXCHANGE COMMISSION
Washington, DC 20549
FORM N-CSRS
CERTIFIED SHAREHOLDER REPORT OF REGISTERED MANAGEMENT INVESTMENT COMPANIES
Investment Company Act file number_811-01700
__Franklin Gold and Precious Metals Fund
(Exact name of registrant as specified in charter)
One Franklin Parkway, San Mateo, CA 94403-1906
(Address of principal executive offices) (Zip code)
Craig S. Tyle, One Franklin Parkway, San Mateo, CA 94403-1906
(Name and address of agent for service)
Registrant's telephone number, including area code: _650 312-2000
Date of fiscal year end: 7/31
Date of reporting period: _1/31/15
Item 1. Reports to Stockholders.
Franklin Templeton Investments
Gain From Our Perspective®
At Franklin Templeton Investments, we’re dedicated to one goal: delivering exceptional asset management for our clients. By bringing together multiple, world-class investment teams in a single firm, we’re able to offer specialized expertise across styles and asset classes, all supported by the strength and resources of one of the world’s largest asset managers. This has helped us to become a trusted partner to individual and institutional investors across the globe.
Focus on Investment Excellence
At the core of our firm, you’ll find multiple independent investment teams—each with a focused area of expertise—from traditional to alternative strategies and multi-asset solutions. And because our portfolio groups operate autonomously, their strategies can be combined to deliver true style and asset class diversification.
All of our investment teams share a common commitment to excellence grounded in rigorous, fundamental research and robust, disciplined risk management. Decade after decade, our consistent, research-driven processes have helped Franklin Templeton earn an impressive record of strong, long-term results.
Global Perspective Shaped by Local Expertise
In today’s complex and interconnected world, smart investing demands a global perspective. Franklin Templeton pioneered international investing over 60 years ago, and our expertise in emerging markets spans more than a quarter of a century. Today, our investment professionals are on the ground across the globe, spotting investment ideas and potential risks firsthand. These locally based teams bring in-depth understanding of local companies, economies and cultural nuances, and share their best thinking across our global research network.
Strength and Experience
Franklin Templeton is a global leader in asset management serving clients in over 150 countries.1 We run our business with the same prudence we apply to asset management, staying focused on delivering relevant investment solutions, strong long-term results and reliable, personal service. This approach, focused on putting clients first, has helped us to become one of the most trusted names in financial services.
1. As of 12/31/14. Clients are represented by the total number of shareholder accounts.
Not FDIC Insured | May Lose Value | No Bank Guarantee
| Contents | ||
| Semiannual Report | ||
| Franklin Gold and | ||
| Precious Metals Fund | 3 | |
| Performance Summary | 7 | |
| Your Fund’s Expenses | 10 | |
| Financial Highlights and | ||
| Statement of Investments | 12 | |
| Financial Statements | 19 | |
| Notes to Financial Statements | 23 | |
| Shareholder Information | 32 | |
| . | ||||
| See www.franklintempletondatasources.com for additional data provider information. | ||||
| Not FDIC Insured | May Lose Value | | No Bank Guarantee | |||
| franklintempleton.com | | | 1 | ||
Semiannual Report
Franklin Gold and Precious Metals Fund
This semiannual report for Franklin Gold and Precious Metals Fund covers the six months ended January 31, 2015.
Your Fund’s Goals and Main Investments
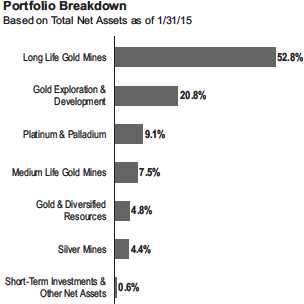
The Fund seeks capital appreciation, with current income as its secondary goal, by investing at least 80% of its net assets in securities of gold and precious metals operation companies.
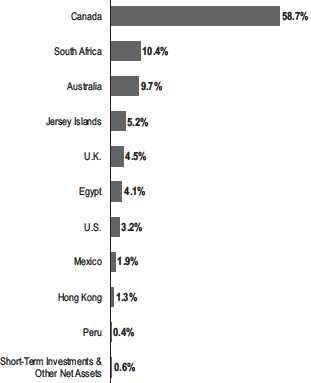
Geographic Breakdown
Based on Total Net Assets as of 1/31/15
Performance Overview
The Fund’s Class A shares had a -23.23% cumulative total return for the six months under review. In comparison, the Standard & Poor’s 500 Index (S&P 500®), which is a broad measure of U.S. stock performance, generated a +4.37% total return.1 For the same period, the sector-specific FTSE® Gold Mines Index, which comprises companies whose principal activity is gold mining, had a -13.80% total return.1 You can find the Fund’s long-term performance data in the Performance Summary beginning on page 7.
Performance data represent past performance, which does not guarantee future results. Investment return and principal value will fluctuate, and you may have a gain or loss when you sell your shares. Current performance may differ from figures shown. Please visit franklintempleton.com or call (800) 342-5236 for most recent month-end performance.
Economic and Market Overview
U.S. economic growth trends were generally encouraging during the six months under review, although economic expansion moderated in 2014’s fourth quarter. A wider trade deficit and lower federal government spending partially offset the positive effect from greater spending by consumers, businesses, and state and local governments. Manufacturing and non-manufacturing activities increased, and the unemployment rate declined to 5.7% in January 2015 from 6.2% in July 2014.2 The housing market improved as home prices rose in most metropolitan areas and mortgage rates declined for the six-month period. Retail sales rose for most of the period but softened near period-end.
The U.S. Federal Reserve Board (Fed) ended its bond buying program in October 2014, based on its view that underlying economic strength could support ongoing progress in labor market conditions. The Fed stated that it could be patient with regard to raising interest rates and that it would consider inflationary pressures, labor market conditions, and financial and international developments in determining its next course of action.
1. Source: Morningstar.
The indexes are unmanaged and include reinvested dividends. One cannot invest directly in an index, and an index is not representative of the Fund’s portfolio.
2. Source: Bureau of Labor Statistics.
See www.franklintempletondatasources.com for additional data provider information.
The dollar value, number of shares or principal amount, and names of all portfolio holdings are listed in the Fund’s Statement of Investments (SOI).
The SOI begins on page 16.
franklintempleton.com
Semiannual Report | 3
FRANKLIN GOLD AND PRECIOUS METALS FUND
The global economy overall expanded moderately during the period even though economic activity in some countries slowed. Major developed market central banks generally reaffirmed their accommodative monetary policies to support economic recovery. Several emerging market central banks cut interest rates to boost economic growth, while others raised rates to control inflation and currency depreciation.
The U.K. economy grew relatively well, supported by the services and manufacturing sectors. In the eurozone, the economy showed signs of improvement as the gross domestic product growth rate picked up in the third and fourth quarters of 2014, led by Germany, the region’s largest economy. In addition to maintaining a low benchmark interest rate and a negative bank deposit rate, the European Central Bank (ECB) implemented a major asset purchase program to boost inflation and stimulate the economy. Although the region benefited from lower oil prices, a weaker euro that supported exports and the ECB’s accommodative policy, it continued to face headwinds such as deflationary pressures and the crisis in Ukraine. Near period-end, concerns arose about Greece’s election of a new prime minister whose platform included restructuring the terms of the country’s debt and loosening austerity mandates.
Japan slid into recession in the third quarter, prompting the Bank of Japan to broaden its stimulus measures amid weak domestic demand and lower inflation resulting from falling crude oil prices. In December, Japan’s ruling coalition was reelected and announced a new stimulus package to revive economic growth. The country exited recession in the fourth quarter, supported largely by exports, while growth in domestic consumption and capital spending remained relatively soft.
Global developed market stocks, as measured by the MSCI World Index, declined slightly for the six-month period as investor concerns about global economic growth, particularly in the eurozone, Japan and China, and the future course of U.S. monetary policy overshadowed continued corporate profit strength. During the period, oil prices plummeted mainly because of strong supply. Despite benign global inflation and a strong U.S. dollar, gold prices ended the period slightly higher after prices surged in January as oil prices weakened, the Swiss National Bank removed the franc’s peg to the euro and the ECB increased monetary stimulus.
Precious Metals Sector Overview
During the period, a stronger U.S. dollar, decelerating inflation and widespread expectations for U.S. economic growth and
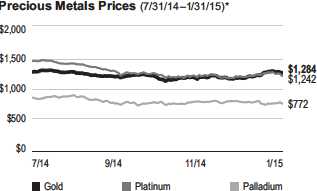
*Source: Bloomberg LP. Amounts shown are based on spot prices quoted in U.S. dollars per troy ounce. For illustrative purposes only; not representative of the Fund’s portfolio composition or performance.
stock market gains in 2015 helped limit demand and upward price movements for gold and silver, as did the prospect for higher U.S. interest rates. Thus, gold prices were flat for the six-month period. After reaching a period low in November, gold prices rebounded in December and in January when it recorded its biggest monthly gain in three years. The gold market was supported in the latter portion of the period by stimulus initiatives in Asia, the threat of economy-damaging deflation in many countries amid collapsing oil prices, slower-than-forecast fourth-quarter U.S. economic expansion, and a generally unsettled January stock market environment. Silver prices generally followed gold’s price movements but ended the period lower than where they began. Unlike gold, silver was negatively affected by concerns that slowing global growth could crimp its industrial usage.
Prices for platinum and palladium experienced double-digit declines during the reporting period. Platinum fell steadily early in the six-month period but rallied somewhat in December and January. Palladium was more volatile with some strong periods partially offsetting some of the weaker months.
Investment Strategy
We believe that investing in securities of gold and precious metals operation companies offers an excellent opportunity for portfolio diversification over the long term. We tend to favor companies with multiple mines, attractive production profiles, strong reserve bases and active exploration programs that can drive future reserve and production growth. While the sector can be volatile, especially over the short term, precious metals, such as gold, can be attractive because they are hard assets not tied to any particular country or financial system.
4 | Semiannual Report
franklintempleton.com
FRANKLIN GOLD AND PRECIOUS METALS FUND
Manager’s Discussion
During the six months under review, merger and acquisition activity continued as midsized and small gold mining companies purchased assets from larger competitors who trimmed their portfolios to focus on their most profitable operations. In general, gold producers struggled with lower gold prices after a decade of expansion, acquisitions and inflation during the boom years, which peaked in 2011.
Key detractors from the Fund’s absolute performance during the period under review included Platinum Group Metals, Eldorado Gold and Romarco Minerals. Platinum Group Metals (PGM) is a Canada-based, platinum-focused exploration and development company with projects in South Africa. The company was unable to finalize a debt deal to cover the remaining costs to finish development of its WBJV project and opted to fund the shortfall with equity, pressuring the share price. Management remained committed to completing the mine as it believed a weaker South African rand could provide a positive environment to begin production.
Canada-based Eldorado Gold is a mining company with operations in Turkey, China, Greece and Romania. Eldorado’s stock plunged in January as Greece’s newly elected government said it was against the company’s Skouries gold and copper mine, which has a history of violent local protests and criticism about its environmental impact. Additionally, the firm’s shares were
negatively impacted by disappointing 2015 production guidance released in January that forecast a larger-than-expected decline in gold production from its largest mine located in Turkey.
Gold exploration and development company Romarco Minerals, which has been looking to restart the Haile Gold Mine in South Carolina, had a volatile six months despite receiving the key government approval that would allow the mine to begin construction. A last-minute request for review by the Sierra Club forced the company to do an equity offering in December to keep the project development timetable on track. The project gained final approval in January, but the shares came under further pressure after the company announced a large equity placement to cover the development costs of the Haile project.
In contrast, key contributors to the Fund’s absolute performance during the period under review included Centerra Gold, Randgold Resources and Eastern Platinum. Centerra Gold is a gold mining and exploration company with operations primarily in Kyrgyzstan, Mongolia and Turkey. Toward period-end, the company’s shares benefited from an announcement that its Gatsuurt Project in Mongolia had been designated as a mineral deposit of strategic importance by the Mongolian parliament, reviving hopes that this project could move forward to production. Also in late January, investment analysts at Scotiabank upgraded the company’s stock.
Randgold Resources explores and develops gold deposits in Sub-Saharan Africa. Randgold stock rallied in January following the successful completion of the first phase of its Kibali gold mine development, which the firm expected could serve as the foundation of a new mining frontier in northeast Democratic Republic of the Congo. Analysts also favored Randgold’s low and improving cost position, strong capital discipline, potential for higher dividends and strong management team.
Platinum group metal-focused company Eastern Platinum’s shares doubled in value in November after the company reached an agreement with China’s Hebei Zhongbo Platinum to sell all of its mining interests in South Africa, which were in care and maintenance. Low metal prices, rising electricity costs and labor disruptions made it unlikely that Eastern Platinum could restart operations in the near term. Eastern Platinum’s management stated that the sale would make the company better capitalized to take advantage of considerable mining opportunities in a weak market.
franklintempleton.com
Semiannual Report | 5
FRANKLIN GOLD AND PRECIOUS METALS FUND
| Top 10 Holdings | ||
| 1/31/15 | ||
| Company | % of Total | |
| Sector/Industry, Country | Net Assets | |
| Goldcorp Inc. | 5.7 | % |
| Long Life Gold Mines, Canada | ||
| AngloGold Ashanti Ltd., ADR | 5.5 | % |
| Long Life Gold Mines, South Africa | ||
| Newcrest Mining Ltd. | 5.3 | % |
| Long Life Gold Mines, Australia | ||
| B2Gold Corp. | 5.3 | % |
| Long Life Gold Mines, Canada | ||
| Randgold Resources Ltd., ADR | 5.2 | % |
| Long Life Gold Mines, Jersey Islands | ||
| Eldorado Gold Corp. | 4.3 | % |
| Long Life Gold Mines, Canada | ||
| Centamin PLC, ord. & 144A | 4.1 | % |
| Long Life Gold Mines, Egypt | ||
| Centerra Gold Inc., ord. & 144A | 3.7 | % |
| Long Life Gold Mines, Canada | ||
| Platinum Group Metals Ltd., ord. & 144A | 3.7 | % |
| Platinum & Palladium, Canada | ||
| Nevsun Resources Ltd., 144A | 3.5 | % |
| Gold & Diversified Resources, Canada | ||
It is important to recognize the effect of currency movements on the Fund’s performance. In general, if the value of the U.S. dollar goes up compared with a foreign currency, an investment traded in that foreign currency will go down in value because it will be worth fewer U.S. dollars. This can have a negative effect on Fund performance. Conversely, when the U.S. dollar weakens in relation to a foreign currency, an investment traded in that foreign currency will increase in value, which can contribute to Fund performance. For the six months ended January 31, 2015, the U.S. dollar rose in value relative to most currencies. As a result, the Fund’s performance was negatively affected by the portfolio’s investment predominantly in securities with non-U.S. currency exposure.
Thank you for your continued participation in Franklin Gold and Precious Metals Fund. We look forward to serving your future investment needs.
The foregoing information reflects our analysis, opinions and portfolio holdings as of January 31, 2015, the end of the reporting period. The way we implement our main investment strategies and the resulting portfolio holdings may change depending on factors such as market and economic conditions. These opinions may not be relied upon as investment advice or an offer for a particular security. The information is not a complete analysis of every aspect of any market, country, industry, security or the Fund. Statements of fact are from sources considered reliable, but the investment manager makes no representation or warranty as to their completeness or accuracy. Although historical performance is no guarantee of future results, these insights may help you understand our investment management philosophy.
CFA® is a trademark owned by CFA Institute.
6 | Semiannual Report
franklintempleton.com
FRANKLIN GOLD AND PRECIOUS METALS FUND
Performance Summary as of January 31, 2015
Your dividend income will vary depending on dividends or interest paid by securities in the Fund’s portfolio, adjusted for operating expenses of each class. Capital gain distributions are net profits realized from the sale of portfolio securities. The performance table does not reflect any taxes that a shareholder would pay on Fund dividends, capital gain distributions, if any, or any realized gains on the sale of Fund shares. Total return reflects reinvestment of the Fund’s dividends and capital gain distributions, if any, and any unrealized gains or losses.
| Net Asset Value | ||||||
| Share Class (Symbol) | 1/31/15 | 7/31/14 | Change | |||
| A (FKRCX) | $ | 15.40 | $ | 20.27 | -$ | 4.87 |
| C (FRGOX) | $ | 14.49 | $ | 18.97 | -$ | 4.48 |
| R6 (n/a) | $ | 16.23 | $ | 21.44 | -$ | 5.21 |
| Advisor (FGADX) | $ | 16.18 | $ | 21.32 | -$ | 5.14 |
| Distributions (8/1/14–1/31/15) | ||||||
| Dividend | ||||||
| Share Class | Income | |||||
| A | $ | 0.1558 | ||||
| C | $ | 0.0225 | ||||
| R6 | $ | 0.2545 | ||||
| Advisor | $ | 0.1990 | ||||
franklintempleton.com
Semiannual Report | 7
FRANKLIN GOLD AND PRECIOUS METALS FUND
PERFORMANCE SUMMARY
Performance as of 1/31/151
Cumulative total return excludes sales charges. Average annual total returns and value of $10,000 investment include maximum sales charges. Class A: 5.75% maximum initial sales charge; Class C: 1% contingent deferred sales charge in first year only;
Class R6/Advisor Class: no sales charges.
| Value of | Average Annual | Total Annual | |||||||||||||
| Operating Expenses6 | |||||||||||||||
| Cumulative | Average Annual | $ | 10,000 | Total Return | |||||||||||
| Share Class | Total Return2 | Total Return3 | Investment4 | (12/31/14 | )5 | (with waiver) | (without waiver) | ||||||||
| A | 1.07 | % | 1.07 | % | |||||||||||
| 6-Month | -23.23 | % | -27.65 | % | $ | 7,235 | |||||||||
| 1-Year | -10.98 | % | -16.11 | % | $ | 8,389 | -15.30 | % | |||||||
| 5-Year | -45.90 | % | -12.60 | % | $ | 5,099 | -15.91 | % | |||||||
| 10-Year | + | 39.81 | % | + | 2.80 | % | $ | 13,175 | + | 1.37 | % | ||||
| C | 1.82 | % | 1.82 | % | |||||||||||
| 6-Month | -23.55 | % | -24.31 | % | $ | 7,569 | |||||||||
| 1-Year | -11.67 | % | -12.56 | % | $ | 8,744 | -11.68 | % | |||||||
| 5-Year | -47.90 | % | -12.22 | % | $ | 5,210 | -15.53 | % | |||||||
| 10-Year | + | 29.70 | % | + | 2.63 | % | $ | 12,970 | + | 1.22 | % | ||||
| R6 | 0.54 | % | 0.67 | % | |||||||||||
| 6-Month | -23.07 | % | -23.07 | % | $ | 7,693 | |||||||||
| 1-Year | -10.55 | % | -10.55 | % | $ | 8,945 | -9.73 | % | |||||||
| Since Inception (5/1/13) | -22.20 | % | -13.34 | % | $ | 7,780 | -18.10 | % | |||||||
| Advisor | 0.82 | % | 0.82 | % | |||||||||||
| 6-Month | -23.14 | % | -23.14 | % | $ | 7,686 | |||||||||
| 1-Year | -10.75 | % | -10.75 | % | $ | 8,925 | -9.96 | % | |||||||
| 5-Year | -45.22 | % | -11.34 | % | $ | 5,478 | -14.69 | % | |||||||
| 10-Year | + | 43.27 | % | + | 3.66 | % | $ | 14,327 | + | 2.23 | % | ||||
Performance data represent past performance, which does not guarantee future results. Investment return and principal value will fluctuate, and you may have a gain or loss when you sell your shares. Current performance may differ from figures shown. For most recent month-end performance, go to franklintempleton.com or call (800) 342-5236.
8 | Semiannual Report
franklintempleton.com
FRANKLIN GOLD AND PRECIOUS METALS FUND
PERFORMANCE SUMMARY
All investments involve risks, including possible loss of principal. Also, the Fund concentrates in the precious metals sector, which involves fluctuations in the prices of gold and other precious metals and increased susceptibility to adverse economic and regulatory developments affecting the sector. In addition, the Fund is subject to the risks of currency fluctuation and political uncertainty associated with foreign investing. Investments in developing markets involve heightened risks related to the same factors, in addition to those associated with their relatively small size and lesser liquidity. The Fund may also invest in smaller companies, which can be particularly sensitive to changing economic conditions, and their prospects for growth are less certain than those of larger, more established companies. Investing in a nondiversified fund involves the risk of greater price fluctuation than a more diversified portfolio. The Fund is actively managed but there is no guarantee that the manager’s investment decisions will produce the desired results. The Fund’s prospectus also includes a description of the main investment risks.
Class C: These shares have higher annual fees and expenses than Class A shares.
Class R6: Shares are available to certain eligible investors as described in the prospectus.
Advisor Class: Shares are available to certain eligible investors as described in the prospectus.
1. The Fund has a fee waiver associated with its investments in a Franklin Templeton money fund, contractually guaranteed through at least its current fiscal year-end.
Class R6 shares have a fee waiver contractually guaranteed through at least 11/30/15. Fund investment results reflect the fee waivers, to the extent applicable; without
these reductions, the results would have been lower.
2. Cumulative total return represents the change in value of an investment over the periods indicated.
3. Average annual total return represents the average annual change in value of an investment over the periods indicated. Six-month return has not been annualized.
4. These figures represent the value of a hypothetical $10,000 investment in the Fund over the periods indicated.
5. In accordance with SEC rules, we provide standardized average annual total return information through the latest calendar quarter.
6. Figures are as stated in the Fund’s current prospectus. In periods of market volatility, assets may decline significantly, causing total annual Fund operating expenses
to become higher than the figures shown.
franklintempleton.com
Semiannual Report | 9
FRANKLIN GOLD AND PRECIOUS METALS FUND
Your Fund’s Expenses
As a Fund shareholder, you can incur two types of costs:
- Transaction costs, including sales charges (loads) on Fund purchases; and
- Ongoing Fund costs, including management fees, distribu- tion and service (12b-1) fees, and other Fund expenses. All mutual funds have ongoing costs, sometimes referred to as operating expenses.
The following table shows ongoing costs of investing in the Fund and can help you understand these costs and compare them with those of other mutual funds. The table assumes a $1,000 investment held for the six months indicated.
Actual Fund Expenses
The first line (Actual) of the table provides actual account values and expenses. The “Ending Account Value” is derived from the Fund’s actual return, which includes the effect of Fund expenses.
You can estimate the expenses you paid during the period by following these steps. Of course, your account value and expenses will differ from those in this illustration:
| 1. | Divide your account value by $1,000. |
| If an account had an $8,600 value, then $8,600 ÷ $1,000 = 8.6. | |
| 2. | Multiply the result by the number under the heading “Expenses Paid During Period.” |
| If Expenses Paid During Period were $7.50, then 8.6 x $7.50 = $64.50. |
In this illustration, the estimated expenses paid this period are $64.50.
Hypothetical Example for Comparison with Other Funds
Information in the second line (Hypothetical) of the table can help you compare ongoing costs of investing in the Fund with those of other mutual funds. This information may not be used to estimate the actual ending account balance or expenses you paid during the period. The hypothetical “Ending Account Value” is based on the Fund’s actual expense ratio and an assumed 5% annual rate of return before expenses, which does not represent the Fund’s actual return. The figure under the heading “Expenses Paid During Period” shows the hypothetical expenses your account would have incurred under this scenario. You can compare this figure with the 5% hypothetical examples that appear in shareholder reports of other funds.
Please note that expenses shown in the table are meant to highlight ongoing costs and do not reflect any transaction costs, such as sales charges. Therefore, the second line for each class is useful in comparing ongoing costs only, and will not help you compare total costs of owning different funds. In addition, if transaction costs were included, your total costs would have been higher. Please refer to the Fund prospectus for additional information on operating expenses.
10 | Semiannual Report
franklintempleton.com
FRANKLIN GOLD AND PRECIOUS METALS FUND
YOUR FUND’S EXPENSES
| Beginning Account | Ending Account | Expenses Paid During | ||||
| Value 8/1/14 | Value 1/31/15 | Period* 8/1/14–1/31/15 | ||||
| A | ||||||
| Actual | $ | 1,000 | $ | 767.70 | $ | 4.68 |
| Hypothetical (5% return before expenses) | $ | 1,000 | $ | 1,019.91 | $ | 5.35 |
| C | ||||||
| Actual | $ | 1,000 | $ | 764.50 | $ | 8.01 |
| Hypothetical (5% return before expenses) | $ | 1,000 | $ | 1,016.13 | $ | 9.15 |
| R6 | ||||||
| Actual | $ | 1,000 | $ | 769.30 | $ | 2.36 |
| Hypothetical (5% return before expenses) | $ | 1,000 | $ | 1,022.53 | $ | 2.70 |
| Advisor | ||||||
| Actual | $ | 1,000 | $ | 768.60 | $ | 3.57 |
| Hypothetical (5% return before expenses) | $ | 1,000 | $ | 1,021.17 | $ | 4.08 |
*Expenses are calculated using the most recent six-month expense ratio, net of expense waivers, annualized for each class (A: 1.05%;
C: 1.80%; R6: 0.53%; and Advisor: 0.80%), multiplied by the average account value over the period, multiplied by 184/365 to reflect the
one-half year period.
franklintempleton.com
Semiannual Report | 11
FRANKLIN GOLD AND PRECIOUS METALS FUND
| Financial Highlights | ||||||||||||||||||
| Six Months Ended | ||||||||||||||||||
| January 31, 2015 | Year Ended July 31, | |||||||||||||||||
| (unaudited) | 2014 | 2013 | 2012 | 2011 | 2010 | |||||||||||||
| Class A | ||||||||||||||||||
| Per share operating performance | ||||||||||||||||||
| (for a share outstanding throughout the period) | ||||||||||||||||||
| Net asset value, beginning of period | $ | 20.27 | $ | 17.72 | $ | 28.58 | $ | 46.61 | $ | 43.51 | $ | 33.56 | ||||||
| Income from investment operationsa: | ||||||||||||||||||
| Net investment income (loss)b | (0.04 | ) | (0.09 | ) | 0.03 | (0.01 | ) | (0.17 | ) | (0.21 | ) | |||||||
| Net realized and unrealized gains | ||||||||||||||||||
| (losses) | (4.67 | ) | 2.64 | (10.51 | ) | (15.86 | ) | 11.20 | 12.96 | |||||||||
| Total from investment operations | (4.71 | ) | 2.55 | (10.48 | ) | (15.87 | ) | 11.03 | 12.75 | |||||||||
| Less distributions from: | ||||||||||||||||||
| Net investment income | (0.16 | ) | — | (0.04 | ) | (0.86 | ) | (4.57 | ) | (2.22 | ) | |||||||
| Net realized gains | — | — | (0.34 | ) | (1.30 | ) | (3.36 | ) | (0.58 | ) | ||||||||
| Total distributions | (0.16 | ) | — | (0.38 | ) | (2.16 | ) | (7.93 | ) | (2.80 | ) | |||||||
| Net asset value, end of period | $ | 15.40 | $ | 20.27 | $ | 17.72 | $ | 28.58 | $ | 46.61 | $ | 43.51 | ||||||
| Total returnc | (23.23 | )% | 14.39 | % | (37.24 | )% | (35.48 | )% | 24.47 | % | 38.02 | % | ||||||
| Ratios to average net assetsd | ||||||||||||||||||
| Expenses | 1.05 | %e | 1.07 | %e | 1.01 | %f | 0.96 | % | 0.91 | % | 0.95 | %f | ||||||
| Net investment income (loss) | (0.44 | )% | (0.49 | )% | 0.10 | % | (0.01 | )% | (0.36 | )% | (0.52 | )% | ||||||
| Supplemental data | ||||||||||||||||||
| Net assets, end of period (000’s) | $ | 603,946 | $ | 776,333 | $ | 682,385 | $ | 1,574,870 | $ | 2,546,553 | $ | 2,011,603 | ||||||
| Portfolio turnover rate | 7.09 | % | 16.13 | % | 7.36 | % | 8.34 | % | 8.06 | % | 17.63 | % | ||||||
aThe amount shown for a share outstanding throughout the period may not correlate with the Statement of Operations for the period due to the timing of sales and
repurchases of the Fund shares in relation to income earned and/or fluctuating fair value of the investments of the Fund.
bBased on average daily shares outstanding.
cTotal return does not reflect sales commissions or contingent deferred sales charges, if applicable, and is not annualized for periods less than one year.
dRatios are annualized for periods less than one year.
eBenefit of waiver and payments by affiliates and expense reduction rounds to less than 0.01%.
fBenefit of expense reduction rounds to less than 0.01%.
12 | Semiannual Report | The accompanying notes are an integral part of these financial statements. franklintempleton.com
FRANKLIN GOLD AND PRECIOUS METALS FUND
FINANCIAL HIGHLIGHTS
| Six Months Ended | ||||||||||||||||||
| January 31, 2015 | Year Ended July 31, | |||||||||||||||||
| (unaudited) | 2014 | 2013 | 2012 | 2011 | 2010 | |||||||||||||
| Class C | ||||||||||||||||||
| Per share operating performance | ||||||||||||||||||
| (for a share outstanding throughout the period) | ||||||||||||||||||
| Net asset value, beginning of period | $ | 18.97 | $ | 16.70 | $ | 27.16 | $ | 44.38 | $ | 41.77 | $ | 32.36 | ||||||
| Income from investment operationsa: | ||||||||||||||||||
| Net investment income (loss)b | (0.09 | ) | (0.22 | ) | (0.17 | ) | (0.28 | ) | (0.51 | ) | (0.49 | ) | ||||||
| Net realized and unrealized gains | ||||||||||||||||||
| (losses) | (4.37 | ) | 2.49 | (9.91 | ) | (15.11 | ) | 10.75 | 12.47 | |||||||||
| Total from investment operations | (4.46 | ) | 2.27 | (10.08 | ) | (15.39 | ) | 10.24 | 11.98 | |||||||||
| Less distributions from: | ||||||||||||||||||
| Net investment income | (0.02 | ) | — | (0.04 | ) | (0.53 | ) | (4.27 | ) | (1.99 | ) | |||||||
| Net realized gains | — | — | (0.34 | ) | (1.30 | ) | (3.36 | ) | (0.58 | ) | ||||||||
| Total distributions | (0.02 | ) | — | (0.38 | ) | (1.83 | ) | (7.63 | ) | (2.57 | ) | |||||||
| Net asset value, end of period | $ | 14.49 | $ | 18.97 | $ | 16.70 | $ | 27.16 | $ | 44.38 | $ | 41.77 | ||||||
| Total returnc | (23.55 | )% | 13.59 | % | (37.71 | )% | (35.96 | )% | 23.55 | % | 37.01 | % | ||||||
| Ratios to average net assetsd | ||||||||||||||||||
| Expenses | 1.80 | %e | 1.82 | %e | 1.76 | %f | 1.71 | % | 1.66 | % | 1.70 | %f | ||||||
| Net investment income (loss) | (1.19 | )% | (1.24 | )% | (0.65 | )% | (0.76 | )% | (1.11 | )% | (1.27 | )% | ||||||
| Supplemental data | ||||||||||||||||||
| Net assets, end of period (000’s) | $ | 135,119 | $ | 185,450 | $ | 172,234 | $ | 341,071 | $ | 621,202 | $ | 475,627 | ||||||
| Portfolio turnover rate | 7.09 | % | 16.13 | % | 7.36 | % | 8.34 | % | 8.06 | % | 17.63 | % | ||||||
aThe amount shown for a share outstanding throughout the period may not correlate with the Statement of Operations for the period due to the timing of sales and
repurchases of the Fund shares in relation to income earned and/or fluctuating fair value of the investments of the Fund.
bBased on average daily shares outstanding.
cTotal return does not reflect sales commissions or contingent deferred sales charges, if applicable, and is not annualized for periods less than one year.
dRatios are annualized for periods less than one year.
eBenefit of waiver and payments by affiliates and expense reduction rounds to less than 0.01%.
fBenefit of expense reduction rounds to less than 0.01%.
franklintempleton.com The accompanying notes are an integral part of these financial statements. | Semiannual Report | 13
FRANKLIN GOLD AND PRECIOUS METALS FUND
FINANCIAL HIGHLIGHTS
| Six Months Ended | Year Ended | ||||||||
| January 31, 2015 | July 31, | ||||||||
| (unaudited) | 2014 | 2013 | a | ||||||
| Class R6 | |||||||||
| Per share operating performance | |||||||||
| (for a share outstanding throughout the period) | |||||||||
| Net asset value, beginning of period | $ | 21.44 | $ | 18.62 | $ | 21.20 | |||
| Income from investment operationsb: | |||||||||
| Net investment incomec | 0.01 | 0.01 | 0.01 | ||||||
| Net realized and unrealized gains (losses) | (4.97 | ) | 2.81 | (2.59 | ) | ||||
| Total from investment operations | (4.96 | ) | 2.82 | (2.58 | ) | ||||
| Less distributions from net investment income | (0.25 | ) | — | — | |||||
| Net asset value, end of period | $ | 16.23 | $ | 21.44 | $ | 18.62 | |||
| Total returnd | (23.07 | )% | 15.15 | % | (12.17 | )% | |||
| Ratios to average net assetse | |||||||||
| Expenses before waiver and payments by affiliates and expense reduction | 0.60 | % | 0.67 | % | 0.53 | % | |||
| Expenses net of waiver and payments by affiliates and expense reductionf | 0.53 | % | 0.54 | % | 0.53 | % | |||
| Net investment income | 0.08 | % | 0.04 | % | 0.58 | % | |||
| Supplemental data | |||||||||
| Net assets, end of period (000’s) | $ | 820 | $ | 848 | $ | 4 | |||
| Portfolio turnover rate | 7.09 | % | 16.13 | % | 7.36 | % | |||
aFor the period May 1, 2013 (commencement of operations) to July 31, 2013.
bThe amount shown for a share outstanding throughout the period may not correlate with the Statement of Operations for the period due to the timing of sales and
repurchases of the Fund shares in relation to income earned and/or fluctuating fair value of the investments of the Fund.
cBased on average daily shares outstanding.
dTotal return is not annualized for periods less than one year.
eRatios are annualized for periods less than one year.
fBenefit of expense reduction rounds to less than 0.01%.
14 | Semiannual Report | The accompanying notes are an integral part of these financial statements. franklintempleton.com
FRANKLIN GOLD AND PRECIOUS METALS FUND
FINANCIAL HIGHLIGHTS
| Six Months Ended | ||||||||||||||||||
| January 31, 2015 | Year Ended July 31, | |||||||||||||||||
| (unaudited) | 2014 | 2013 | 2012 | 2011 | 2010 | |||||||||||||
| Advisor Class | ||||||||||||||||||
| Per share operating performance | ||||||||||||||||||
| (for a share outstanding throughout the period) | ||||||||||||||||||
| Net asset value, beginning of period | $ | 21.32 | $ | 18.59 | $ | 29.89 | $ | 48.65 | $ | 45.13 | $ | 34.71 | ||||||
| Income from investment operationsa: | ||||||||||||||||||
| Net investment income (loss)b | (0.02 | ) | (0.05 | ) | 0.10 | 0.12 | (0.09 | ) | (0.12 | ) | ||||||||
| Net realized and unrealized gains | ||||||||||||||||||
| (losses) | (4.92 | ) | 2.78 | (11.02 | ) | (16.60 | ) | 11.64 | 13.42 | |||||||||
| Total from investment operations | (4.94 | ) | 2.73 | (10.92 | ) | (16.48 | ) | 11.55 | 13.30 | |||||||||
| Less distributions from: | ||||||||||||||||||
| Net investment income | (0.20 | ) | — | (0.04 | ) | (0.98 | ) | (4.67 | ) | (2.30 | ) | |||||||
| Net realized gains | — | — | (0.34 | ) | (1.30 | ) | (3.36 | ) | (0.58 | ) | ||||||||
| Total distributions | (0.20 | ) | — | (0.38 | ) | (2.28 | ) | (8.03 | ) | (2.88 | ) | |||||||
| Net asset value, end of period | $ | 16.18 | $ | 21.32 | $ | 18.59 | $ | 29.89 | $ | 48.65 | $ | 45.13 | ||||||
| Total returnc | (23.14 | )% | 14.69 | % | (37.07 | )% | (35.32 | )% | 24.78 | % | 38.36 | % | ||||||
| Ratios to average net assetsd | ||||||||||||||||||
| Expenses | 0.80 | %e | 0.82 | %e | 0.76 | %f | 0.71 | % | 0.66 | % | 0.70 | %f | ||||||
| Net investment income (loss) | (0.19 | )% | (0.24 | )% | 0.35 | % | 0.24 | % | (0.11 | )% | (0.27 | )% | ||||||
| Supplemental data | ||||||||||||||||||
| Net assets, end of period (000’s) | $ | 121,001 | $ | 160,425 | $ | 143,843 | $ | 317,488 | $ | 582,994 | $ | 269,979 | ||||||
| Portfolio turnover rate | 7.09 | % | 16.13 | % | 7.36 | % | 8.34 | % | 8.06 | % | 17.63 | % | ||||||
aThe amount shown for a share outstanding throughout the period may not correlate with the Statement of Operations for the period due to the timing of sales and
repurchases of the Fund shares in relation to income earned and/or fluctuating fair value of the investments of the Fund.
bBased on average daily shares outstanding.
cTotal return is not annualized for periods less than one year.
dRatios are annualized for periods less than one year.
eBenefit of waiver and payments by affiliates and expense reduction rounds to less than 0.01%.
fBenefit of expense reduction rounds to less than 0.01%.
franklintempleton.com The accompanying notes are an integral part of these financial statements. | Semiannual Report | 15
| FRANKLIN GOLD AND PRECIOUS METALS FUND | ||||
| Statement of Investments, January 31, 2015 (unaudited) | ||||
| Shares/ | ||||
| Country | Warrants | Value | ||
| Common Stocks and Other Equity Interests 99.4% | ||||
| Gold & Diversified Resources 4.8% | ||||
| aNevsun Resources Ltd., 144A | Canada | 8,730,000 | $ | 30,167,428 |
| PanAust Ltd. | Australia | 5,320,000 | 5,010,073 | |
| Sandfire Resources NL | Australia | 1,762,870 | 5,858,618 | |
| 41,036,119 | ||||
| Gold Exploration & Development 20.8% | ||||
| a,b,c,dAmara Mining PLC, 144A | United Kingdom | 52,100,000 | 13,047,005 | |
| bBelo Sun Mining Corp. | Canada | 6,000,000 | 1,039,043 | |
| a,bBelo Sun Mining Corp., 144A | Canada | 3,800,000 | 658,060 | |
| b,dChalice Gold Mines Ltd. | Australia | 31,072,008 | 3,143,835 | |
| b,eColossus Minerals Inc., wts., 8/09/15 | Canada | 2,000,000 | — | |
| bContinental Gold Ltd. | Canada | 3,002,600 | 5,010,636 | |
| a,bGran Colombia Gold Corp., wts., 144A, 8/24/15 | Canada | 157,040 | 927 | |
| b,fGreat Basin Gold Ltd., 144A | South Africa | 13,185,700 | 9,889 | |
| b,dGuyana Goldfields Inc. | Canada | 3,688,000 | 8,592,947 | |
| a,b,dGuyana Goldfields Inc., 144A | Canada | 8,820,000 | 20,550,378 | |
| bImperial Metals Corp. | Canada | 1,615,000 | 11,377,716 | |
| a,b,dINV Metals Inc., 144A | Canada | 3,765,000 | 770,545 | |
| a,bIvanhoe Mines Ltd., 144A | Canada | 6,185,000 | 3,700,094 | |
| bIvanhoe Mines Ltd., A | Canada | 3,258,400 | 1,949,295 | |
| a,bIvanhoe Mines Ltd., wts., 144A, 12/10/15 | Canada | 3,600,000 | 85,013 | |
| b,dKula Gold Ltd. | Australia | 35,521,219 | 1,354,662 | |
| Kula Gold Ltd., wts., 11/28/16 | Australia | 7,600,000 | — | |
| b,dLion One Metals Ltd. | Canada | 1,000,000 | 216,467 | |
| a,b,dLion One Metals Ltd., 144A | Canada | 2,935,000 | 635,331 | |
| b,dLydian International Ltd. | Canada | 3,175,000 | 1,374,567 | |
| a,b,c,dLydian International Ltd., 144A | Canada | 9,450,000 | 4,091,232 | |
| bMidas Gold Corp. | Canada | 1,967,400 | 805,296 | |
| a,bMidas Gold Corp., 144A | Canada | 2,330,000 | 953,715 | |
| bMidway Gold Corp. | United States | 7,956,700 | 5,490,123 | |
| bNautilus Minerals Inc. | Canada | 3,711,450 | 1,314,667 | |
| a,bNautilus Minerals Inc., 144A | Canada | 11,228,698 | 3,977,420 | |
| bPretium Resources Inc. | Canada | 2,264,200 | 15,202,791 | |
| b,dRed 5 Ltd. | Australia | 91,361,661 | 7,466,212 | |
| b,c,dRomarco Minerals Inc. | Canada | 33,275,200 | 14,929,836 | |
| a,b,dRomarco Minerals Inc., 144A | Canada | 18,517,600 | 8,308,432 | |
| b,d,fRomarco Minerals Inc., 144A | Canada | 7,000,000 | 2,815,843 | |
| b,dRTG Mining Inc. | Australia | 1,769,918 | 989,170 | |
| a,b,dRTG Mining Inc., 144A | Australia | 2,397,790 | 1,340,075 | |
| b,dRTG Mining Inc., IDR | Australia | 1,739,525 | 1,001,865 | |
| b,dRTG Mining Inc., wts., 6/04/17 | Australia | 116,666 | 10,561 | |
| bSt. Augustine Gold and Copper Ltd. | Canada | 7,636,836 | 871,648 | |
| a,bSt. Augustine Gold and Copper Ltd., 144A | Canada | 16,383,333 | 1,869,949 | |
| b,fSt. Augustine Gold and Copper Ltd., 144A | Canada | 10,000,000 | 1,058,509 | |
| b,fSt. Augustine Gold and Copper Ltd., wts., 12/22/16 | Canada | 5,000,000 | — | |
| a,bStornoway Diamond Corp., 144A | Canada | 27,500,000 | 11,689,232 | |
| a,bStornoway Diamond Corp., wts., 144A, 7/08/16 | Canada | 13,750,000 | 595,285 | |
| a,bTorex Gold Resources Inc., 144A | Canada | 18,625,000 | 21,258,068 | |
| 179,556,339 | ||||
16 | Semiannual Report
franklintempleton.com
FRANKLIN GOLD AND PRECIOUS METALS FUND
STATEMENT OF INVESTMENTS (UNAUDITED)
| Shares/ | ||||
| Country | Warrants | Value | ||
| Common Stocks and Other Equity Interests (continued) | ||||
| Long Life Gold Mines 52.8% | ||||
| Agnico Eagle Mines Ltd. (CAD Traded) | Canada | 277,797 | $ | 9,367,777 |
| Agnico Eagle Mines Ltd. (USD Traded) | Canada | 190,000 | 6,406,800 | |
| Alamos Gold Inc. | Canada | 2,845,900 | 15,188,289 | |
| aAlamos Gold Inc., 144A | Canada | 375,000 | 2,001,338 | |
| bAngloGold Ashanti Ltd., ADR | South Africa | 3,854,023 | 47,712,805 | |
| AuRico Gold Inc. | Canada | 579,500 | 2,285,339 | |
| bB2Gold Corp. | Canada | 22,991,094 | 45,243,809 | |
| Barrick Gold Corp. | Canada | 1,801,283 | 23,020,397 | |
| bBeadell Resources Ltd. | Australia | 26,378,639 | 5,851,191 | |
| Centamin PLC (CAD Traded) | Egypt | 10,500,000 | 10,414,043 | |
| Centamin PLC (GBP Traded) | Egypt | 994,532 | 1,002,204 | |
| aCentamin PLC, 144A | Egypt | 23,945,200 | 23,749,175 | |
| Centerra Gold Inc. | Canada | 2,433,600 | 14,597,002 | |
| aCenterra Gold Inc., 144A | Canada | 2,893,400 | 17,354,934 | |
| bDetour Gold Corp. | Canada | 1,691,300 | 17,307,069 | |
| Eldorado Gold Corp. | Canada | 7,754,000 | 37,231,895 | |
| bG-Resources Group Ltd. | Hong Kong | 385,769,400 | 10,897,862 | |
| Gold Fields Ltd. | South Africa | 427,411 | 2,395,099 | |
| Goldcorp Inc. | Canada | 2,038,845 | 48,993,445 | |
| bNewcrest Mining Ltd. | Australia | 4,348,461 | 45,892,562 | |
| Newmont Mining Corp. | United States | 115,614 | 2,907,692 | |
| Osisko Gold Royalties Ltd. | Canada | 317,430 | 4,270,213 | |
| Randgold Resources Ltd., ADR | Jersey Islands | 527,023 | 44,933,981 | |
| bSEMAFO Inc. | Canada | 2,010,000 | 7,040,696 | |
| bTeranga Gold Corp. | Canada | 4,000,000 | 1,983,627 | |
| bTeranga Gold Corp., IDR | Canada | 1,538,759 | 706,593 | |
| Yamana Gold Inc. | Canada | 1,012,330 | 4,191,480 | |
| aYamana Gold Inc., 144A | Canada | 330,000 | 1,366,341 | |
| 454,313,658 | ||||
| Medium Life Gold Mines 7.5% | ||||
| Acacia Mining PLC | United Kingdom | 5,957,307 | 25,296,272 | |
| Alacer Gold Corp. | United States | 2,079,700 | 4,878,389 | |
| aAlacer Gold Corp., 144A | United States | 1,500,000 | 3,518,577 | |
| bChina Gold International Resources Corp. Ltd. | Canada | 326,100 | 567,035 | |
| a,bChina Gold International Resources Corp. Ltd., 144A | Canada | 598,100 | 1,021,629 | |
| bKinross Gold Corp. | Canada | 515,194 | 1,747,864 | |
| bNew Gold Inc. | Canada | 1,110,000 | 4,866,735 | |
| bPrimero Mining Corp. | Canada | 1,430,000 | 5,740,711 | |
| a,bPrimero Mining Corp., 144A | Canada | 2,850,000 | 11,441,278 | |
| a,bPrimero Mining Corp., wts., 144A, 7/20/15 | Canada | 1,040,000 | 180,101 | |
| bSilver Lake Resources Ltd. | Australia | 3,683,245 | 645,001 | |
| b,dSt. Barbara Ltd. | Australia | 29,088,151 | 4,754,255 | |
| 64,657,847 | ||||
| Platinum & Palladium 9.1% | ||||
| bAnglo American Platinum Ltd. | South Africa | 364,656 | 11,178,467 | |
| b,dEastern Platinum Ltd. | Canada | 5,577,802 | 6,673,693 | |
| bImpala Platinum Holdings Ltd. | South Africa | 1,585,000 | 10,309,618 | |
| bImpala Platinum Holdings Ltd., ADR | South Africa | 1,506,100 | 9,789,650 | |
| bNortham Platinum Ltd. | South Africa | 1,209,019 | 4,022,865 | |
| b,dPlatinum Group Metals Ltd. (CAD Traded) | Canada | 31,140,820 | 14,707,566 |
franklintempleton.com
Semiannual Report | 17
FRANKLIN GOLD AND PRECIOUS METALS FUND
STATEMENT OF INVESTMENTS (UNAUDITED)
| Shares/ | |||||
| Country | Warrants | Value | |||
| Common Stocks and Other Equity Interests (continued) | |||||
| Platinum & Palladium (continued) | |||||
| b,dPlatinum Group Metals Ltd. (USD Traded) | Canada | 26,000,000 | $ | 11,962,600 | |
| a,b,dPlatinum Group Metals Ltd., 144A | Canada | 10,776,000 | 5,089,421 | ||
| bRoyal Bafokeng Platinum Ltd. | South Africa | 919,704 | 4,263,753 | ||
| 77,997,633 | |||||
| Silver Mines 4.4% | |||||
| Fresnillo PLC | Mexico | 1,195,000 | 16,182,256 | ||
| bHochschild Mining PLC | Peru | 2,486,197 | 3,389,187 | ||
| bMAG Silver Corp. | Canada | 755,000 | 5,598,316 | ||
| a,bMAG Silver Corp., 144A | Canada | 240,000 | 1,779,597 | ||
| aTahoe Resources Inc., 144A | United States | 815,000 | 11,124,134 | ||
| 38,073,490 | |||||
| Total Common Stocks and Other Equity Interests | |||||
| (Cost $1,076,313,296) | 855,635,086 | ||||
| Short Term Investments (Cost $17,977,129) 2.1% | |||||
| Money Market Funds 2.1% | |||||
| b,gInstitutional Fiduciary Trust Money Market Portfolio | United States | 17,977,129 | 17,977,129 | ||
| Total Investments (Cost $1,094,290,425) 101.5% | 873,612,215 | ||||
| Other Assets, less Liabilities (1.5)% | (12,725,727 | ) | |||
| Net Assets 100.0% | $ | 860,886,488 |
See Abbreviations on page 31.
aSecurity was purchased pursuant to Rule 144A under the Securities Act of 1933 and may be sold in transactions exempt from registration only to qualified institutional buyers
or in a public offering registered under the Securities Act of 1933. These securities have been deemed liquid under guidelines approved by the Fund’s Board of Trustees. At
January 31, 2015, the aggregate value of these securities was $202,324,714, representing 23.50% of net assets.
bNon-income producing.
cA portion or all of the security purchased on a delayed delivery basis. See Note 1(c).
dSee Note 9 regarding holdings of 5% voting securities.
eSecurity has been deemed illiquid because it may not be able to be sold within seven days.
fSee Note 8 regarding restricted securities.
gSee Note 3(f) regarding investments in Institutional Fiduciary Trust Money Market Portfolio.
18 | Semiannual Report | The accompanying notes are an integral part of these financial statements. franklintempleton.com
FRANKLIN GOLD AND PRECIOUS METALS FUND
Financial Statements
Statement of Assets and Liabilities
January 31, 2015 (unaudited)
| Assets: | |||
| Investments in securities: | |||
| Cost - Unaffiliated issuers | $ | 796,466,139 | |
| Cost - Non-controlled affiliated issuers (Note 9) | 279,847,157 | ||
| Cost - Sweep Money Fund (Note 3f) | 17,977,129 | ||
| Total cost of investments | $ | 1,094,290,425 | |
| Value - Unaffiliated issuers | $ | 721,808,588 | |
| Value - Non-controlled affiliated issuers (Note 9) | 133,826,498 | ||
| Value - Sweep Money Fund (Note 3f) | 17,977,129 | ||
| Total value of investments | 873,612,215 | ||
| Receivables: | |||
| Investment securities sold | 8,370,515 | ||
| Capital shares sold | 2,321,063 | ||
| Dividends | 56,235 | ||
| Other assets | 23 | ||
| Total assets | 884,360,051 | ||
| Liabilities: | |||
| Payables: | |||
| Investment securities purchased | 20,936,678 | ||
| Capital shares redeemed | 1,366,869 | ||
| Management fees | 342,680 | ||
| Distribution fees | 244,637 | ||
| Transfer agent fees | 453,269 | ||
| Trustees’ fees and expenses | 963 | ||
| Accrued expenses and other liabilities | 128,467 | ||
| Total liabilities | 23,473,563 | ||
| Net assets, at value | $ | 860,886,488 | |
| Net assets consist of: | |||
| Paid-in capital | $ | 1,695,203,924 | |
| Distributions in excess of net investment income | (197,043,239 | ) | |
| Net unrealized appreciation (depreciation) | (220,560,680 | ) | |
| Accumulated net realized gain (loss) | (416,713,517 | ) | |
| Net assets, at value | $ | 860,886,488 |
franklintempleton.com The accompanying notes are an integral part of these financial statements. | Semiannual Report | 19
FRANKLIN GOLD AND PRECIOUS METALS FUND
FINANCIAL STATEMENTS
| Statement of Assets and Liabilities (continued) | ||
| January 31, 2015 (unaudited) | ||
| Class A: | ||
| Net assets, at value | $ | 603,946,450 |
| Shares outstanding | 39,222,433 | |
| Net asset value per sharea | $ | 15.40 |
| Maximum offering price per share (net asset value per share ÷ 94.25%) | $ | 16.34 |
| Class C: | ||
| Net assets, at value | $ | 135,119,472 |
| Shares outstanding | 9,326,707 | |
| Net asset value and maximum offering price per sharea | $ | 14.49 |
| Class R6: | ||
| Net assets, at value | $ | 819,801 |
| Shares outstanding | 50,514 | |
| Net asset value and maximum offering price per share | $ | 16.23 |
| Advisor Class: | ||
| Net assets, at value | $ | 121,000,765 |
| Shares outstanding | 7,477,869 | |
| Net asset value and maximum offering price per share | $ | 16.18 |
| aRedemption price is equal to net asset value less contingent deferred sales charges, if applicable. | |
| 20 | Semiannual Report | The accompanying notes are an integral part of these financial statements. | franklintempleton.com |
FRANKLIN GOLD AND PRECIOUS METALS FUND
FINANCIAL STATEMENTS
Statement of Operations
for the six months ended January 31, 2015 (unaudited)
| Investment income: | |||
| Dividends: (net of foreign taxes $382,294) | $ | 2,791,933 | |
| Expenses: | |||
| Management fees (Note 3a) | 2,095,187 | ||
| Distribution fees: (Note 3c) | |||
| Class A | 802,245 | ||
| Class C | 748,611 | ||
| Transfer agent fees: (Note 3e) | |||
| Class A | 896,007 | ||
| Class C | 208,538 | ||
| Class R6 | 313 | ||
| Advisor Class | 186,368 | ||
| Custodian fees (Note 4) | 42,921 | ||
| Reports to shareholders | 118,369 | ||
| Registration and filing fees | 63,111 | ||
| Professional fees | 34,077 | ||
| Trustees’ fees and expenses | 31,694 | ||
| Other | 12,254 | ||
| Total expenses | 5,239,695 | ||
| Expense reductions (Note 4) | (12 | ) | |
| Expenses waived/paid by affiliates (Notes 3f and 3g) | (6,938 | ) | |
| Net expenses | 5,232,745 | ||
| Net investment income (loss) | (2,440,812 | ) | |
| Realized and unrealized gains (losses): | |||
| Net realized gain (loss) from: | |||
| Investments: | |||
| Unaffiliated issuers | (54,971,500 | ) | |
| Non-controlled affiliated issuers (Note 9) | (33,332,389 | ) | |
| Foreign currency transactions | (154,044 | ) | |
| Net realized gain (loss) | (88,457,933 | ) | |
| Net change in unrealized appreciation (depreciation) on: | |||
| Investments | (173,058,617 | ) | |
| Translation of other assets and liabilities denominated in foreign currencies | 120,443 | ||
| Net change in unrealized appreciation (depreciation) | (172,938,174 | ) | |
| Net realized and unrealized gain (loss) | (261,396,107 | ) | |
| Net increase (decrease) in net assets resulting from operations | $ | (263,836,919 | ) |
franklintempleton.com The accompanying notes are an integral part of these financial statements. | Semiannual Report | 21
| FRANKLIN GOLD AND PRECIOUS METALS FUND | ||||||
| FINANCIAL STATEMENTS | ||||||
| Statements of Changes in Net Assets | ||||||
| Six Months Ended | ||||||
| January 31, 2015 | Year Ended | |||||
| (unaudited) | July 31, 2014 | |||||
| Increase (decrease) in net assets: | ||||||
| Operations: | ||||||
| Net investment income (loss) | $ | (2,440,812 | ) | $ | (5,982,632 | ) |
| Net realized gain (loss) from investments and foreign currency transactions | (88,457,933 | ) | (142,130,197 | ) | ||
| Net change in unrealized appreciation (depreciation) on investments and translation of other | ||||||
| assets and liabilities denominated in foreign currencies | (172,938,174 | ) | 274,094,215 | |||
| Net increase (decrease) in net assets resulting from operations | (263,836,919 | ) | 125,981,386 | |||
| Distributions to shareholders from: | ||||||
| Net investment income: | ||||||
| Class A | (6,055,219 | ) | — | |||
| Class C | (214,709 | ) | — | |||
| Class R6 | (11,639 | ) | — | |||
| Advisor Class | (1,497,629 | ) | — | |||
| Total distributions to shareholders | (7,779,196 | ) | — | |||
| Capital share transactions: (Note 2) | ||||||
| Class A | 13,961,074 | 6,130,862 | ||||
| Class C | (6,078,264 | ) | (7,878,934 | ) | ||
| Class R6 | 183,229 | 835,969 | ||||
| Advisor Class | 1,379,427 | (479,490 | ) | |||
| Total capital share transactions | 9,445,466 | (1,391,593 | ) | |||
| Net increase (decrease) in net assets | (262,170,649 | ) | 124,589,793 | |||
| Net assets: | ||||||
| Beginning of period | 1,123,057,137 | 998,467,344 | ||||
| End of period | $ | 860,886,488 | $ | 1,123,057,137 | ||
| Distributions in excess of net investment income included in net assets, end of period | $ | (197,043,239 | ) | $ | (186,823,231 | ) |
22 | Semiannual Report | The accompanying notes are an integral part of these financial statements. franklintempleton.com
FRANKLIN GOLD AND PRECIOUS METALS FUND
Notes to Financial Statements (unaudited)
1. Organization and Significant Accounting Policies
Franklin Gold and Precious Metals Fund (Fund) is registered under the Investment Company Act of 1940, as amended, (1940 Act) as an open-end management investment company and applies the specialized accounting and reporting guidance in U.S. Generally Accepted Accounting Principles (U.S. GAAP). The Fund offers four classes of shares: Class A, Class C, Class R6, and Advisor Class. Each class of shares differs by its initial sales load, contingent deferred sales charges, voting rights on matters affecting a single class, its exchange privilege and fees primarily due to differing arrangements for distribution and transfer agent fees.
The following summarizes the Fund’s significant accounting policies.
a. Financial Instrument Valuation
The Fund’s investments in financial instruments are carried at fair value daily. Fair value is the price that would be received to sell an asset or paid to transfer a liability in an orderly transaction between market participants on the measurement date. The Fund calculates the net asset value (NAV) per share at the close of the New York Stock Exchange (NYSE), generally at 4 p.m. Eastern time (NYSE close) on each day the NYSE is open for trading. Under compliance policies and procedures approved by the Fund’s Board of Trustees (the Board), the Fund’s administrator has responsibility for oversight of valuation, including leading the cross-functional Valuation and Liquidity Oversight Committee (VLOC). The VLOC provides administration and oversight of the Fund’s valuation policies and procedures, which are approved annually by the Board. Among other things, these procedures allow the Fund to utilize independent pricing services, quotations from securities and financial instrument dealers, and other market sources to determine fair value.
Equity securities listed on an exchange or on the NASDAQ National Market System are valued at the last quoted sale price or the official closing price of the day, respectively. Foreign equity securities are valued as of the close of trading on the foreign stock exchange on which the security is primarily traded or as of the NYSE close, whichever is earlier. The value is then converted into its U.S. dollar equivalent at the foreign exchange rate in effect at the NYSE close on the day that the value of the security is determined. Over-the-counter (OTC) securities are valued within the range of the most recent quoted
bid and ask prices. Securities that trade in multiple markets or on multiple exchanges are valued according to the broadest and most representative market. Certain equity securities are valued based upon fundamental characteristics or relationships to similar securities. Investments in open-end mutual funds are valued at the closing NAV.
The Fund has procedures to determine the fair value of financial instruments for which market prices are not reliable or readily available. Under these procedures, the VLOC convenes on a regular basis to review such financial instruments and considers a number of factors, including significant unobservable valuation inputs, when arriving at fair value. The VLOC primarily employs a market-based approach which may use related or comparable assets or liabilities, recent transactions, market multiples, book values, and other relevant information for the investment to determine the fair value of the investment. An income-based valuation approach may also be used in which the anticipated future cash flows of the investment are discounted to calculate fair value. Discounts may also be applied due to the nature or duration of any restrictions on the disposition of the investments. Due to the inherent uncertainty of valuations of such investments, the fair values may differ significantly from the values that would have been used had an active market existed. The VLOC employs various methods for calibrating these valuation approaches including a regular review of key inputs and assumptions, transactional back-testing or disposition analysis, and reviews of any related market activity.
Trading in securities on foreign securities stock exchanges and OTC markets may be completed before the daily NYSE close. In addition, trading in certain foreign markets may not take place on every NYSE business day. Occasionally, events occur between the time at which trading in a foreign security is completed and the close of the NYSE that might call into question the reliability of the value of a portfolio security held by the Fund. As a result, differences may arise between the value of the Fund’s portfolio securities as determined at the foreign market close and the latest indications of value at the close of the NYSE. In order to minimize the potential for these differences, the VLOC monitors price movements following the close of trading in foreign stock markets through a series of country specific market proxies (such as baskets of American Depositary Receipts, futures contracts and exchange traded funds). These price movements are measured against established trigger thresholds for each specific market proxy to assist in determining if an event has occurred that may call into
franklintempleton.com
Semiannual Report | 23
FRANKLIN GOLD AND PRECIOUS METALS FUND
NOTES TO FINANCIAL STATEMENTS (UNAUDITED)
1. Organization and Significant Accounting Policies
(continued)
a. Financial Instrument Valuation (continued)
question the reliability of the values of the foreign securities held by the Fund. If such an event occurs, the securities may be valued using fair value procedures, which may include the use of independent pricing services.
When the last day of the reporting period is a non-business day, certain foreign markets may be open on those days that the NYSE is closed, which could result in differences between the value of the Fund’s portfolio securities on the last business day and the last calendar day of the reporting period. Any significant security valuation changes due to an open foreign market are adjusted and reflected by the Fund for financial reporting purposes.
b. Foreign Currency Translation
Portfolio securities and other assets and liabilities denominated in foreign currencies are translated into U.S. dollars based on the exchange rate of such currencies against U.S. dollars on the date of valuation. The Fund may enter into foreign currency exchange contracts to facilitate transactions denominated in a foreign currency. Purchases and sales of securities, income and expense items denominated in foreign currencies are translated into U.S. dollars at the exchange rate in effect on the transaction date. Portfolio securities and assets and liabilities denominated in foreign currencies contain risks that those currencies will decline in value relative to the U.S. dollar. Occasionally, events may impact the availability or reliability of foreign exchange rates used to convert the U.S. dollar equivalent value. If such an event occurs, the foreign exchange rate will be valued at fair value using procedures established and approved by the Board.
The Fund does not separately report the effect of changes in foreign exchange rates from changes in market prices on securities held. Such changes are included in net realized and unrealized gain or loss from investments in the Statement of Operations.
Realized foreign exchange gains or losses arise from sales of foreign currencies, currency gains or losses realized between the trade and settlement dates on securities transactions and the difference between the recorded amounts of dividends, interest, and foreign withholding taxes and the U.S. dollar equivalent of the amounts actually received or paid. Net unrealized foreign exchange gains and losses arise from changes in foreign exchange rates on foreign denominated assets and
liabilities other than investments in securities held at the end of the reporting period.
c. Securities Purchased on a Delayed Delivery Basis
The Fund purchases securities on a delayed delivery basis, with payment and delivery scheduled for a future date. These transactions are subject to market fluctuations and are subject to the risk that the value at delivery may be more or less than the trade date purchase price. Although the Fund will generally purchase these securities with the intention of holding the securities, it may sell the securities before the settlement date. Sufficient assets have been segregated for these securities.
d. Income and Deferred Taxes
It is the Fund’s policy to qualify as a regulated investment company under the Internal Revenue Code. The Fund intends to distribute to shareholders substantially all of its taxable income and net realized gains to relieve it from federal income and excise taxes. As a result, no provision for U.S. federal income taxes is required.
The Fund may be subject to foreign taxation related to income received, capital gains on the sale of securities and certain foreign currency transactions in the foreign jurisdictions in which it invests. Foreign taxes, if any, are recorded based on the tax regulations and rates that exist in the foreign markets in which the Fund invests. When a capital gain tax is determined to apply the Fund records an estimated deferred tax liability in an amount that would be payable if the securities were disposed of on the valuation date.
The Fund recognizes the tax benefits of uncertain tax positions only when the position is “more likely than not” to be sustained upon examination by the tax authorities based on the technical merits of the tax position. As of January 31, 2015, and for all open tax years, the Fund has determined that no liability for unrecognized tax benefits is required in the Fund’s financial statements related to uncertain tax positions taken on a tax return (or expected to be taken on future tax returns). Open tax years are those that remain subject to examination and are based on each tax jurisdiction statute of limitation.
e. Security Transactions, Investment Income, Expenses and Distributions
Security transactions are accounted for on trade date. Realized gains and losses on security transactions are determined on a specific identification basis. Estimated expenses are accrued
24 | Semiannual Report
franklintempleton.com
FRANKLIN GOLD AND PRECIOUS METALS FUND
NOTES TO FINANCIAL STATEMENTS (UNAUDITED)
daily. Dividend income recorded on the ex-dividend date except for certain dividends from foreign securities where the dividend rate is not available. In such cases, the dividend is recorded as soon as the information is received by the Fund. Distributions to shareholders are recorded on the ex-dividend date and are determined according to income tax regulations (tax basis). Distributable earnings determined on a tax basis may differ from earnings recorded in accordance with U.S. GAAP. These differences may be permanent or temporary. Permanent differences are reclassified among capital accounts to reflect their tax character. These reclassifications have no impact on net assets or the results of operations. Temporary differences are not reclassified, as they may reverse in subsequent periods.
Realized and unrealized gains and losses and net investment income, not including class specific expenses, are allocated daily to each class of shares based upon the relative proportion of net assets of each class. Differences in per share distributions, by class, are generally due to differences in class specific expenses.
f. Accounting Estimates
The preparation of financial statements in accordance with U.S. GAAP requires management to make estimates and assumptions that affect the reported amounts of assets and liabilities at the date of the financial statements and the amounts of income and expenses during the reporting period. Actual results could differ from those estimates.
g. Guarantees and Indemnifications
Under the Trust’s organizational documents, its officers and trustees are indemnified by the Trust against certain liabilities arising out of the performance of their duties to the Trust. Additionally, in the normal course of business, the Trust, on behalf of the Fund, enters into contracts with service providers that contain general indemnification clauses. The Trust’s maximum exposure under these arrangements is unknown as this would involve future claims that may be made against the Trust that have not yet occurred. Currently, the Trust expects the risk of loss to be remote.
2. Shares of Beneficial Interest
At January 31, 2015, there were an unlimited number of shares authorized (without par value). Transactions in the Fund’s shares were as follows:
| Six Months Ended | Year Ended | |||||||||||
| January 31, 2015 | July 31, 2014 | |||||||||||
| Shares | Amount | Shares | Amount | |||||||||
| Class A Shares: | ||||||||||||
| Shares sold | 9,288,820 | $ | 149,729,514 | 19,651,374 | $ | 371,925,321 | ||||||
| Shares issued in reinvestment of distributions | 356,376 | 5,292,181 | (77 | ) | (3,005 | ) | ||||||
| Shares redeemed | (8,720,577 | ) | (141,060,621 | ) | (19,870,405 | ) | (365,791,454 | ) | ||||
| Net increase (decrease) | 924,619 | $ | 13,961,074 | (219,108 | ) | $ | 6,130,862 | |||||
| Class C Shares: | ||||||||||||
| Shares sold | 1,100,123 | $ | 16,832,155 | 2,465,126 | $ | 43,051,036 | ||||||
| Shares issued in reinvestment of distributions | 14,097 | 197,220 | — | — | ||||||||
| Shares redeemed | (1,563,854 | ) | (23,107,639 | ) | (3,000,045 | ) | (50,929,970 | ) | ||||
| Net increase (decrease) | (449,634 | ) | $ | (6,078,264 | ) | (534,919 | ) | $ | (7,878,934 | ) | ||
| Class R6 Shares: | ||||||||||||
| Shares sold | 14,167 | $ | 242,689 | 40,541 | $ | 858,825 | ||||||
| Shares issued in reinvestment of distributions | 744 | 11,639 | — | — | ||||||||
| Shares redeemed | (3,971 | ) | (71,099 | ) | (1,203 | ) | (22,856 | ) | ||||
| Net increase (decrease) | 10,940 | $ | 183,229 | 39,338 | $ | 835,969 | ||||||
| Advisor Class Shares: | ||||||||||||
| Shares sold | 2,860,206 | $ | 48,971,767 | 4,890,633 | $ | 95,036,385 | ||||||
| Shares issued in reinvestment of distributions | 87,581 | 1,366,270 | — | — | ||||||||
| Shares redeemed | (2,993,036 | ) | (48,958,610 | ) | (5,104,977 | ) | (95,515,875 | ) | ||||
| Net increase (decrease) | (45,249 | ) | $ | 1,379,427 | (214,344 | ) | $ | (479,490 | ) | |||
franklintempleton.com
Semiannual Report | 25
FRANKLIN GOLD AND PRECIOUS METALS FUND
NOTES TO FINANCIAL STATEMENTS (UNAUDITED)
3. Transactions with Affiliates
Franklin Resources, Inc. is the holding company for various subsidiaries that together are referred to as Franklin Templeton Investments. Certain officers and trustees of the Fund are also officers and/or directors of the following subsidiaries:
| Subsidiary | Affiliation |
| Franklin Advisers, Inc. (Advisers) | Investment manager |
| Franklin Templeton Services, LLC (FT Services) | Administrative manager |
| Franklin Templeton Distributors, Inc. (Distributors) | Principal underwriter |
| Franklin Templeton Investor Services, LLC (Investor Services) | Transfer agent |
a. Management Fees
The Fund pays an investment management fee to Advisers based on the average daily month-end net assets of the Fund as follows:
| Annualized Fee Rate | Net Assets | |
| 0.625 | % | Up to and including $100 million |
| 0.500 | % | Over $100 million, up to and including $250 million |
| 0.450 | % | Over $250 million, up to and including $7.5 billion |
| 0.440 | % | Over $7.5 billion, up to and including $10 billion |
| 0.430 | % | Over $10 billion, up to and including $12.5 billion |
| 0.420 | % | Over $12.5 billion, up to and including $15 billion |
| 0.400 | % | In excess of $15 billion |
b. Administrative Fees
Under an agreement with Advisers, FT Services provides administrative services to the Fund. The fee is paid by Advisers based on the Fund’s average daily net assets, and is not an additional expense of the Fund.
c. Distribution Fees
The Board has adopted distribution plans for each share class, with the exception of Class R6 and Advisor Class shares, pursuant to Rule 12b-1 under the 1940 Act. Distribution fees are not charged on shares held by affiliates. Under the Fund’s Class A reimbursement distribution plan, the Fund reimburses Distributors for costs incurred in connection with the servicing, sale and distribution of the Fund’s shares up to the maximum annual plan rate. Under the Class A reimbursement distribution plan, costs exceeding the maximum for the current plan year cannot be reimbursed in subsequent periods. In addition, under the Fund’s Class C compensation distribution plan, the Fund pays Distributors for costs incurred in connection with the servicing, sale and distribution of the Fund’s shares up to the maximum annual plan rate. The plan year, for purposes of monitoring compliance with the maximum annual plan rate, is February 1 through January 31.
The maximum annual plan rates, based on the average daily net assets, for each class, are as follows:
| Class A | 0.25 | % |
| Class C | 1.00 | % |
26 | Semiannual Report
franklintempleton.com
FRANKLIN GOLD AND PRECIOUS METALS FUND
NOTES TO FINANCIAL STATEMENTS (UNAUDITED)
d. Sales Charges/Underwriting Agreements
Front-end sales charges and contingent deferred sales charges (CDSC) do not represent expenses of the Fund. These charges are deducted from the proceeds of sales of Fund shares prior to investment or from redemption proceeds prior to remittance, as applicable. Distributors has advised the Fund of the following commission transactions related to the sales and redemptions of the Fund’s shares for the period:
| Sales charges retained net of commissions paid to unaffiliated broker/dealers | $ | 120,641 |
| CDSC retained | $ | 15,114 |
e. Transfer Agent Fees
Each class of shares, except for Class R6, pays transfer agent fees to Investor Services for its performance of shareholder servicing obligations and reimburses Investor Services for out of pocket expenses incurred, including shareholding servicing fees paid to third parties. These fees are allocated daily based upon their relative proportion of such classes’ aggregate net assets. Class R6 pays Investor Services transfer agent fees specific to that class.
For the period ended January 31, 2015, the Fund paid transfer agent fees of $1,291,226, of which $676,224 was retained by Investor Services.
f. Investments in Institutional Fiduciary Trust Money Market Portfolio
The Fund invests in Institutional Fiduciary Trust Money Market Portfolio (Sweep Money Fund), an affiliated open-end management investment company. Management fees paid by the Fund are waived on assets invested in the Sweep Money Fund, as noted in the Statement of Operations, in an amount not to exceed the management and administrative fees paid directly or indirectly by the Sweep Money Fund.
g. Waiver and Expense Reimbursements
Investor Services has contractually agreed in advance to waive or limit its fees so that the Class R6 transfer agent fees do not exceed 0.01% until November 30, 2015.
4. Expense Offset Arrangement
The Fund has entered into an arrangement with its custodian whereby credits realized as a result of uninvested cash balances are used to reduce a portion of the Fund’s custodian expenses. During the period ended January 31, 2015, the custodian fees were reduced as noted in the Statement of Operations.
5. Income Taxes
For tax purposes, capital losses may be carried over to offset future capital gains, if any. At July 31, 2014 the capital loss carryforwards were as follows:
| Short term | $ | 4,043,488 |
| Long term | 316,443,150 | |
| Total capital loss carryforwards | $ | 320,486,638 |
franklintempleton.com
Semiannual Report | 27
FRANKLIN GOLD AND PRECIOUS METALS FUND
NOTES TO FINANCIAL STATEMENTS (UNAUDITED)
5. Income Taxes (continued)
At January 31, 2015, the cost of investments and net unrealized appreciation (depreciation), for income tax purposes were as follows:
| Cost of investments | $ | 1,293,633,456 | |
| Unrealized appreciation | $ | 145,923,765 | |
| Unrealized depreciation | (565,945,006 | ) | |
| Net unrealized appreciation (depreciation) | $ | (420,021,241 | ) |
Differences between income and/or capital gains as determined on a book basis and a tax basis are primarily due to differing treatment of passive foreign investment company shares.
6. Investment Transactions
Purchases and sales of investments (excluding short term securities) for the period ended January 31, 2015, aggregated $77,199,733 and $63,985,594 respectively.
7. Concentration of Risk
Investing in foreign securities may include certain risks and considerations not typically associated with investing in U.S. securities, such as fluctuating currency values and changing local and regional economic, political and social conditions, which may result in greater market volatility. In addition, certain foreign securities may not be as liquid as U.S. securities.
8. Restricted Securities
The Fund invests in securities that are restricted under the Securities Act of 1933 (1933 Act) or which are subject to legal, contractual, or other agreed upon restrictions on resale. Restricted securities are often purchased in private placement transactions, and cannot be sold without prior registration unless the sale is pursuant to an exemption under the 1933 Act. Disposal of these securities may require greater effort and expense, and prompt sale at an acceptable price may be difficult. The Fund may have registration rights for restricted securities. The issuer generally incurs all registration costs.
At January 31, 2015, the Fund held investments in restricted securities, excluding certain securities exempt from registration under the 1933 Act deemed to be liquid, as follows:
| Acquisition | ||||||
| Shares | Issuer | Dates | Cost | Value | ||
| 13,185,700 | Great Basin Gold Ltd., 144A | 3/26/12 | $ | 9,977,073 | $ | 9,889 |
| 7,000,000 | aRomarco Minerals Inc., 144A | 12/12/14 | 3,026,111 | 2,815,843 | ||
| 10,000,000 | bSt. Augustine Gold and Copper Ltd., 144A | 12/4/14 | 1,000,000 | 1,058,509 | ||
| 5,000,000 | St. Augustine Gold and Copper Ltd., wts., 12/22/16 | 12/4/14 | — | — | ||
| Total Restricted Securities (Value is 0.45% of Net Assets) | $ | 14,003,184 | $ | 3,884,241 | ||
| aThe Fund also invests in unrestricted securities of the issuer, valued at $23,238,268 as of January 31, 2015. | ||||||
| bThe Fund also invest in unrestricted securities of the issuer, valued at $2,741,597 as of January 31, 2015. | ||||||
28 | Semiannual Report
franklintempleton.com
FRANKLIN GOLD AND PRECIOUS METALS FUND
NOTES TO FINANCIAL STATEMENTS (UNAUDITED)
9. Holdings of 5% Voting Securities of Portfolio Companies
The 1940 Act defines “affiliated companies” to include investments in portfolio companies in which a fund owns 5% or more of the outstanding voting securities. Investments in “affiliated companies” for the Fund for the period ended January 31, 2015, were as shown below.
| Number of | Number of | |||||||||||||
| Shares/ | Shares/ | |||||||||||||
| Warrants Held | Warrants Held | Value | ||||||||||||
| at Beginning | Gross | Gross | at End | at End | Investment | Realized | ||||||||
| Name of Issuer | of Period | Additions | Reductions | of Period | of Period | Income | Gain (Loss) | |||||||
| Non-Controlled Affiliates | ||||||||||||||
| Amara Mining PLC, 144A | 28,000,000 | 24,100,000 | — | 52,100,000 | $ 13,047,005 | $ | — | $ | — | |||||
| Banro Corp. (CAD Traded) | 7,803,000 | — | (7,803,000 | ) | — | — | — | (9,829,386 | ) | |||||
| Banro Corp. (USD Traded) | 673,319 | — | (673,319 | ) | — | — | — | (782,670 | ) | |||||
| Banro Corp., 144A | 7,210,000 | — | (7,210,000 | ) | — | — | — | (9,057,154 | ) | |||||
| Chalice Gold Mines Ltd. | 31,072,008 | — | — | 31,072,008 | 3,143,835 | — | — | |||||||
| Eastern Platinum Ltd. | 6,298,302 | — | (720,500 | ) | 5,577,802 | 6,673,693 | — | (1,475,158 | ) | |||||
| Eastern Platinum Ltd., 144A | 743,060 | — | (743,060 | ) | — | — | — | (10,730,306 | ) | |||||
| Guyana Goldfields Inc. | 5,077,600 | — | (1,389,600 | ) | 3,688,000 | 8,592,947 | — | (1,457,715 | ) | |||||
| Guyana Goldfields Inc., 144A | 8,820,000 | — | — | 8,820,000 | 20,550,378 | — | — | |||||||
| INV Metals Inc., 144A | 3,765,000 | — | — | 3,765,000 | 770,545 | — | — | |||||||
| Kula Gold Ltd. | 20,321,219 | 15,200,000 | a | — | 35,521,219 | 1,354,662 | — | — | ||||||
| Kula Gold Ltd., wts., 11/28/16 | — | 7,600,000 | a | — | 7,600,000 | — | — | — | ||||||
| Lion One Metals Ltd. | 1,000,000 | — | — | 1,000,000 | 216,467 | — | — | |||||||
| Lion One Metals Ltd., 144A | 2,935,000 | — | — | 2,935,000 | 635,331 | — | — | |||||||
| Lydian International Ltd. | 1,975,000 | 1,200,000 | — | 3,175,000 | 1,374,567 | — | — | |||||||
| Lydian International Ltd., 144A | 5,950,000 | 3,500,000 | — | 9,450,000 | 4,091,232 | — | — | |||||||
| Platinum Group Metals Ltd. | ||||||||||||||
| (CAD Traded) | 29,686,820 | 1,454,000 | — | 31,140,820 | 14,707,566 | — | — | |||||||
| Platinum Group Metals Ltd. | ||||||||||||||
| (USD Traded) | — | 26,000,000 | — | 26,000,000 | 11,962,600 | — | — | |||||||
| Platinum Group Metals Ltd., 144A | 10,776,000 | — | — | 10,776,000 | 5,089,421 | — | — | |||||||
| Red 5 Ltd. | 91,361,661 | — | — | 91,361,661 | 7,466,212 | — | — | |||||||
| Romarco Minerals Inc. | 24,668,400 | 8,606,800 | — | 33,275,200 | 14,929,836 | — | — | |||||||
| Romarco Minerals Inc., 144A | 18,517,600 | — | — | 18,517,600 | 8,308,432 | — | — | |||||||
| Romarco Minerals Inc., 144A | — | 7,000,000 | — | 7,000,000 | 2,815,843 | — | — | |||||||
| RTG Mining Inc. | 1,769,918 | — | — | 1,769,918 | 989,170 | — | — | |||||||
| RTG Mining Inc., 144A | 2,397,790 | — | — | 2,397,790 | 1,340,075 | — | — | |||||||
| RTG Mining Inc., IDR | 1,399,169 | 340,356 | — | 1,739,525 | 1,001,865 | — | — | |||||||
| RTG Mining Inc., wts., 6/04/17 | 116,666 | — | — | 116,666 | 10,561 | — | — | |||||||
| St. Barbara Ltd. | 29,088,151 | — | — | 29,088,151 | 4,754,255 | — | — | |||||||
| Total Affiliated Securities (Value is 15.55% of Net Assets) | $ | 133,826,498 | $ | — | $ | (33,332,389 | ) | |||||||
| aGross addition was a result of a corporate action. | ||||||||||||||
10. Credit Facility
The Fund, together with other U.S. registered and foreign investment funds (collectively, Borrowers), managed by Franklin Templeton Investments, are borrowers in a joint syndicated senior unsecured credit facility totaling $1.5 billion (Global Credit Facility) which matured on February 13, 2015. This Global Credit Facility provides a source of funds to the Borrowers for temporary and emergency purposes, including the ability to meet future unanticipated or unusually large redemption requests. Effective February 13, 2015, the Borrowers renewed the Global Credit Facility for a one year term, maturing February 12, 2016, for a total of $2 billion.
franklintempleton.com
Semiannual Report | 29
FRANKLIN GOLD AND PRECIOUS METALS FUND
NOTES TO FINANCIAL STATEMENTS (UNAUDITED)
10. Credit Facility (continued)
Under the terms of the Global Credit Facility, the Fund shall, in addition to interest charged on any borrowings made by the Fund and other costs incurred by the Fund, pay its share of fees and expenses incurred in connection with the implementation and maintenance of the Global Credit Facility, based upon its relative share of the aggregate net assets of all of the Borrowers, including an annual commitment fee of 0.07% based upon the unused portion of the Global Credit Facility. These fees are reflected in other expenses in the Statement of Operations. During the period ended January 31, 2015, the Fund did not use the Global Credit Facility.
11. Fair Value Measurements
The Fund follows a fair value hierarchy that distinguishes between market data obtained from independent sources (observable inputs) and the Fund’s own market assumptions (unobservable inputs). These inputs are used in determining the value of the Fund’s financial instruments and are summarized in the following fair value hierarchy:
- Level 1 – quoted prices in active markets for identical financial instruments
- Level 2 – other significant observable inputs (including quoted prices for similar financial instruments, interest rates, prepayment speed, credit risk, etc.)
- Level 3 – significant unobservable inputs (including the Fund’s own assumptions in determining the fair value of financial instruments)
The input levels are not necessarily an indication of the risk or liquidity associated with financial instruments at that level.
For movements between the levels within the fair value hierarchy, the Fund has adopted a policy of recognizing the transfers as of the date of the underlying event which caused the movement.
A summary of inputs used as of January 31, 2015, in valuing the Fund’s assets carried at fair value, is as follows:
| Level 1 | Level 2 | Level 3 | Total | ||||||
| Assets: | |||||||||
| Investments in Securities: | |||||||||
| Equity Investments:a | |||||||||
| Gold Exploration & Development | $ | 175,661,537 | $ | 10,561 | $ | 3,884,241 | b | $ | 179,556,339 |
| All Other Equity Investmentsc | 676,078,747 | — | — | 676,078,747 | |||||
| Short Term Investments | 17,977,129 | — | — | 17,977,129 | |||||
| Total Investments in Securities | $ | 869,717,413 | $ | 10,561 | $ | 3,884,241 | $ | 873,612,215 |
aIncludes common stocks as well as other equity investments.
bIncludes securities determined to have no value at January 31, 2015.
cFor detailed categories, see the accompanying Statement of Investments.
A reconciliation of assets in which Level 3 inputs are used in determining fair value is presented when there are significant Level 3 financial instruments at the end of the period.
30 | Semiannual Report
franklintempleton.com
FRANKLIN GOLD AND PRECIOUS METALS FUND
NOTES TO FINANCIAL STATEMENTS (UNAUDITED)
12. Subsequent Events
The Fund has evaluated subsequent events through the issuance of the financial statements and determined that no events have occurred that require disclosure other than those already disclosed in the financial statements.
| Abbreviations | |||
| Currency | Selected Portfolio | ||
| CAD | Canadian Dollar | ADR | American Depositary Receipt |
| GBP | British Pound | IDR | International Depositary Receipt |
| USD | United States Dollar | ||
franklintempleton.com
Semiannual Report | 31
FRANKLIN GOLD AND PRECIOUS METALS FUND
Shareholder Information
Proxy Voting Policies and Procedures
The Fund’s investment manager has established Proxy Voting Policies and Procedures (Policies) that the Fund uses to determine how to vote proxies relating to portfolio securities. Alternatively, shareholders may request copies of the Policies free of charge by calling the Proxy Group collect at (954) 527-7678 or by sending a written request to: Franklin Templeton Companies, LLC, 300 S.E. 2nd Street, Fort Lauderdale, FL 33301, Attention: Proxy Group. Copies of the Fund’s proxy voting records are posted on the U.S. Securities and Exchange Commission’s website at sec.gov and reflect the most recent 12-month period ended June 30.
Quarterly Statement of Investments
The Fund files a complete statement of investments with the U.S. Securities and Exchange Commission for the first and third quarters for each fiscal year on Form N-Q. Shareholders may view the filed Form N-Q by visiting the Commission’s website at sec.gov. The filed form may also be viewed and copied at the Commission’s Public Reference Room in Washington, DC. Information regarding the operations of the Public Reference Room may be obtained by calling (800) SEC-0330.
32 | Semiannual Report
franklintempleton.com
| 132 P-1 03/15 | ||||||||
| SUPPLEMENT DATED MARCH 19, 2015 | ||||||||
| TO THE PROSPECTUS DATED DECEMBER 1, 2014 | ||||||||
| OF | ||||||||
| FRANKLIN GOLD AND PRECIOUS METALS FUND | ||||||||
| The Prospectus is amended as follows: | ||||||||
| I. The “Fund Summary – Annual Fund Operating Expenses” table is revised as follows: | ||||||||
| Annual Fund Operating Expenses | ||||||||
| (expenses that you pay each year as a percentage of the value of your investment) | ||||||||
| Class A | Class C | Class R6 | Advisor Class | |||||
| Management fees | 0.47 | % | 0.47 | % | 0.47 | % | 0.47 | % |
| Distribution and service (12b-1) fees | 0.25 | % | 1.00 | % | None | None | ||
| Other expenses | 0.35 | % | 0.35 | % | 0.20 | % | 0.35 | % |
| Total annual Fund operating expenses | 1.07 | % | 1.82 | % | 0.67 | % | 0.82 | % |
| Fee waiver and/or expense reimbursement1 | None | None | -0.13 | % | None | |||
| Total annual Fund operating expenses after fee waiver and/or | ||||||||
| expense reimbursement1 | 1.07 | % | 1.82 | % | 0.54 | % | 0.82 | % |
1. The transfer agent has contractually agreed to cap transfer agency fees for Class R6 shares of the Fund so that transfer agency fees for that class do not exceed 0.01%,
until at least November 30, 2015. Contractual fee waiver and/or expense reimbursement agreements may not be terminated during the term set forth above.
Please keep this supplement for future reference.
This page intentionally left blank.
This page intentionally left blank.
This page intentionally left blank.
Item 2. Code of Ethics.
(a) The Registrant has adopted a code of ethics that applies to its principal executive officers and principal financial and accounting officer.
(c) N/A
(d) N/A
(f) Pursuant to Item 12(a)(1), the Registrant is attaching as an exhibit a copy of its code of ethics that applies to its principal executive officers and principal financial and accounting officer.
Item 3. Audit Committee Financial Expert.
(a)(1) The Registrant has an audit committee financial expert serving on its audit committee.
(2) The audit committee financial expert is John B. Wilson and he is "independent" as defined under the relevant Securities and Exchange Commission Rules and Releases.
Item 4. Principal Accountant Fees and Services. N/A
Item 5. Audit Committee of Listed Registrants. N/A
Item 6. Schedule of Investments. N/A
Item 7. Disclosure of Proxy Voting Policies and Procedures for Closed-End Management Investment Companies. N/A
Item 8. Portfolio Managers of Closed-End Management Investment Companies. N/A
Item 9. Purchases of Equity Securities by Closed-End Management Investment Company and Affiliated Purchasers. N/A
Item 10. Submission of Matters to a Vote of Security Holders.
There have been no changes to the procedures by which shareholders may recommend nominees to the Registrant's Board of Trustees that would require disclosure herein.
Item 11. Controls and Procedures.
(a) Evaluation of Disclosure Controls and Procedures. The Registrant maintains disclosure controls and procedures that are designed to ensure that information required to be disclosed in the Registrant’s filings under the Securities Exchange Act of 1934 and the Investment Company Act of 1940 is recorded, processed, summarized and reported within the periods specified in the rules and forms of the Securities and Exchange Commission. Such information is accumulated and communicated to the Registrant’s management, including its principal executive officer and principal financial officer, as appropriate, to allow timely decisions regarding required disclosure. The Registrant’s management, including the principal executive officer and the principal financial officer, recognizes that any set of controls and procedures, no matter how well designed and operated, can provide only reasonable assurance of achieving the desired control objectives.
Within 90 days prior to the filing date of this Shareholder Report on Form N-CSR, the Registrant had carried out an evaluation, under the supervision and with the participation of the Registrant’s management, including the Registrant’s principal executive officer and the Registrant’s principal financial officer, of the effectiveness of the design and operation of the Registrant’s disclosure controls and procedures. Based on such evaluation, the Registrant’s principal executive officer and principal financial officer concluded that the Registrant’s disclosure controls and procedures are effective.
(b) Changes in Internal Controls. There have been no changes in the Registrant’s internal controls or in other factors that could materially affect the internal controls over financial reporting subsequent to the date of their evaluation in connection with the preparation of this Shareholder Report on Form N-CSR.
Item 12. Exhibits.
(a) (1) Code of Ethics
(a) (2) Certifications pursuant to Section 302 of the Sarbanes-Oxley Act of 2002 of Laura F. Fergerson, Chief Executive Officer - Finance and Administration, and Gaston Gardey, Chief Financial Officer and Chief Accounting Officer
(b) Certifications pursuant to Section 906 of the Sarbanes-Oxley Act of 2002 of Laura F. Fergerson, Chief Executive Officer - Finance and Administration, and Gaston Gardey, Chief Financial Officer and Chief Accounting Officer
SIGNATURES
Pursuant to the requirements of the Securities Exchange Act of 1934 and the Investment Company Act of 1940, the registrant has duly caused this report to be signed on its behalf by the undersigned, thereunto duly authorized.
FRANKLIN GOLD AND PRECIOUS METALS FUND
By /s/ Laura F. Fergerson
Laura F. Fergerson
Chief Executive Officer - Finance and Administration
Date March 27, 2015
Pursuant to the requirements of the Securities Exchange Act of 1934 and the Investment Company Act of 1940, this report has been signed below by the following persons on behalf of the registrant and in the capacities and on the dates indicated.
By /s/ Laura F. Fergerson
Laura F. Fergerson
Chief Executive Officer - Finance and Administration
Date March 27, 2015
By /s/ Gaston Gardey
Gaston Gardey
Chief Financial Officer and Chief Accounting Officer
Date March 27, 2015