UNITED STATES
SECURITIES AND EXCHANGE COMMISSION
Washington, DC 20549
FORMN-CSRS
CERTIFIED SHAREHOLDER REPORT OF REGISTERED
MANAGEMENT INVESTMENT COMPANIES
Investment Company Act file number 811-01700
Franklin Gold and Precious Metals Fund
(Exact name of registrant as specified in charter)
One Franklin Parkway, San Mateo, CA 94403-1906
(Address of principal executive offices) (Zip code)
Craig S. Tyle, One Franklin Parkway, San Mateo, CA 94403-1906
(Name and address of agent for service)
Registrant’s telephone number, including area code: 650312-2000
Date of fiscal year end: 7/31
Date of reporting period: 1/31/19
| Item 1. | Reports to Stockholders. |
| | | | |
| |  | | Semiannual Report and Shareholder Letter |
| | January 31, 2019 |
Sign up for electronic delivery at franklintempleton.com/edelivery
Internet Delivery of Fund Reports Unless You Request Paper Copies:Effective January 1, 2021, as permitted by the SEC, paper copies of the Fund’s shareholder reports will no longer be sent by mail, unless you specifically request them from the Fund or your financial intermediary. Instead, the reports will be made available on a website, and you will be notified by mail each time a report is posted and provided with a website link to access the report.
If you already elected to receive shareholder reports electronically, you will not be affected by this change and you need not take any action. If you have not signed up for electronic delivery, we would encourage you to join fellow shareholders who have. You may elect to receive shareholder reports and other communications electronically from the Fund by calling (800)632-2301 or by contacting your financial intermediary.
You may elect to continue to receive paper copies of all your future shareholder reports free of charge by contacting your financial intermediary or, if you invest directly with a Fund, calling (800)632-2301 to let the Fund know of your request. Your election to receive reports in paper will apply to all funds held in your account.
Franklin Templeton
Successful investing begins with ambition. And achievement only comes when you reach for it. That’s why we continually strive to deliver better outcomes for investors. No matter what your goals are, our deep, global investment expertise allows us to offer solutions that can help.
During our more than 70 years of experience, we’ve managed through all kinds of markets—up, down and those in between. We’re always preparing for what may come next. It’s because of this, combined with our strength as one of the world’s largest asset managers that we’ve earned the trust of millions of investors around the world.
Dear Shareholder:
During the six months ended January 31, 2019, the global economy generally expanded amid upbeat economic data, solid corporate earnings and hints of a slower pace of interest-rate increases from the U.S. Federal Reserve (Fed). The European Central Bank left its benchmark interest rate unchanged but reduced its monthly bond purchases and concluded the program at the end of 2018. The Fed raised its federal funds rate range by 0.25% twice during the period and continued reducing its balance sheet. Global markets were pressured by concerns about increased technology company regulation, U.S. and European Union political uncertainties, major central banks’ interest-rate policies, and the impact of the U.S.-China trade dispute on global growth and corporate earnings. In this environment, U.S. stocks, as measured by the Standard & Poor’s® 500 Index, and global developed market stocks, as measured by the MSCI World Index, ended the period with negative returns.
After falling in August and September, gold prices rallied for the remainder of thesix-month period, resulting in a solid gain. Gold prices rose starting in October given investor concerns about a weaker global economy and heightened market volatility. Investor worries about the U.K.’s pending withdrawal from the European Union, U.S.-China trade tensions and a partial U.S. government shutdown increased demand for gold, as did an expected slower pace of Fed
interest-rate increases in 2019. Central bank and exchange-traded fund purchases of gold also rose substantially, positively impacting the prices of gold and gold-mining equities. In this environment, gold stocks, as measured by the FTSE® Gold Mines Index, generated a total return of +8.66% for thesix-month period.1
We are committed to our long-term perspective and disciplined investment approach as we conduct a rigorous, fundamental analysis of securities with a regular emphasis on investment risk management.
We believe active, professional investment management serves investors well. We also recognize the important role of financial advisors in today’s markets and encourage investors to continue to seek their advice. Amid changing markets and economic conditions, we are confident investors with a well-diversified portfolio and a patient, long-term outlook should be well positioned for the years ahead.
Franklin Gold and Precious Metals Fund’s semiannual report includes more detail about prevailing conditions and discussions about investment decisions during the period. Please remember all securities markets fluctuate, as do mutual fund share prices.
1. Source: Morningstar.
See www.franklintempletondatasources.com for additional data provider information.
|
Not FDIC Insured| May Lose Value| No Bank Guarantee |
| | | | |
| | | |
| franklintempleton.com | | Not part of the semiannual report | | 1 |
We thank you for investing with Franklin Templeton, welcome your questions and comments, and look forward to serving your future investment needs.
Sincerely,

Edward Perks, CFA
President and Chief Executive Officer – Investment Management Franklin Gold and Precious Metals Fund
This letter reflects our analysis and opinions as of January 31, 2019, unless otherwise indicated. The information is not a complete analysis of every aspect of any market, country, industry, security or fund. Statements of fact are from sources considered reliable.
Visitfranklintempleton.comfor fund updates, to access your account, or to find helpful financial planning tools.
CFA® is a trademark owned by CFA Institute.
| | | | |
| | | |
2 | | Not part of the semiannual report | | franklintempleton.com |
Semiannual Report
Franklin Gold and Precious Metals Fund
This semiannual report for Franklin Gold and Precious Metals Fund covers the period ended January 31, 2019.
Your Fund’s Goals and Main Investments
The Fund seeks capital appreciation, with current income as its secondary goal, by investing under normal market conditions at least 80% of its net assets in securities of gold and precious metals operation companies. The Fund primarily invests in equity securities, mainly common stock, and also invests in American, global and European depositary receipts.
Performance Overview
The Fund’s Class A shares delivered a +4.65% cumulative total return for the six months under review. In comparison, the Fund’s new primary and old secondary benchmark, the sector-specific FTSE Gold Mines Index, which comprises companies whose principal activity is gold mining, generated a +8.66% total return.1 As the investment manager believes the composition of the FTSE Gold Mines Index more accurately reflects the Fund’s holdings, it has replaced the Standard & Poor’s 500 Index (S&P 500®) as the Fund’s primary benchmark. Also for comparison, the Fund’s new secondary and old primary benchmark, the S&P 500, which is a broad measure of U.S. stock performance, had a-3.00% total return.1 You can find the Fund’s long-term performance data in the Performance Summary beginning on page 7.
Performance data represent past performance, which does not guarantee future results. Investment return and principal value will fluctuate, and you may have a gain or loss when you sell your shares. Current performance may differ from figures shown. For most recentmonth-end performance, go tofranklintempleton.comor call(800)342-5236.
Economic and Market Overview
The U.S. economy grew during thesix-month period. After accelerating in 2018’s second quarter, the economy moderated in the third and fourth quarters. Growth in consumer spending, business investment and inventory investment were partly
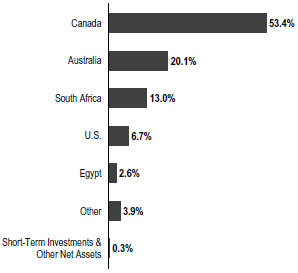
Geographic Composition
Based on Total Net Assets as of 1/31/19
offset by a decline in housing investment and an increase in imports (a subtraction from growth calculation). The manufacturing and services sectors expanded during the period. The unemployment rate increased from 3.9% in July 2018 to 4.0% atperiod-end.2 The annual inflation rate, as measured by the Consumer Price Index, decreased from 2.9% in July 2018 to 1.6% atperiod-end.2
The U.S. Federal Reserve (Fed) raised its target range for the federal funds rate twice during the period, to 2.25%–2.50%, and continued reducing its balance sheet as part of its ongoing plan to normalize monetary policy. At its January meeting, the Fed held its target range for the federal funds rate unchanged and mentioned it would be patient in deciding further rate adjustments. Furthermore, the Fed signaled it might take a flexible approach to its balance sheet reduction. The broad U.S. stock market, as measured by the Standard & Poor’s 500 Index, declined for thesix-month period ended January 31, 2019.
The global economy expanded during the six months under review, despite weakness in certain regions. Global developed
1. Source: Morningstar.
The indexes are unmanaged and include reinvestment of any income or distributions. They do not reflect any fees, expenses or sales charges. One cannot invest directly in an index, and an index is not representative of the Fund’s portfolio.
2. Source: U.S. Bureau of Labor Statistics.
The dollar value, number of shares or principal amount, and names of all portfolio holdings are listed in the Fund’s Statement of Investments (SOI).
The SOI begins on page 14.
| | | | |
| | | |
| franklintempleton.com | | Semiannual Report | | 3 |
FRANKLIN GOLD AND PRECIOUS METALS FUND
and emerging market stocks were aided at certain points during the period by upbeat economic data, easing trade tensions in some regions, encouraging corporate earnings reports and the Fed’s indications of a cautious approach to its monetary policy decisions.
However, various factors weighed on global markets during the period, including concerns about tighter regulation of technology companies, political uncertainties in the U.S. and the European Union (EU), and major central banks’ interest-rate path and unwinding of monetary stimulus measures. Markets were further pressured by U.S. trade disputes with its allies and China, and their impact on global growth and corporate earnings. In this environment, global stocks, as measured by the MSCI All Country World Index, had a-4.49% total return for the six months ended January 31, 2019.1
In Europe, the U.K.’s quarterly gross domestic product (GDP) growth accelerated in 2018’s third quarter but moderated in the fourth quarter. The Bank of England raised its key policy rate once during the period. After moderating in 2018’s third quarter, the eurozone’s quarterly GDP growth stabilized in the fourth quarter. The bloc’s annual inflation rate ended the period lower than in July 2018. The European Central Bank (ECB) kept its benchmark interest rate unchanged during the period and concluded its bond purchase program at the end of 2018. In January 2019, the ECB reiterated that it expected key interest rates to remain unchanged through at least the summer of 2019 and intended to reinvest principal payments from maturing bonds for an extended period of time.
In Asia, Japan’s quarterly GDP expanded in 2018’s fourth quarter after contracting in the third quarter. The Bank of Japan left its benchmark interest rate unchanged during the period and continued its monetary stimulus measures. China’s annual GDP moderated in 2018’s third and fourth quarters. The People’s Bank of China left its benchmark interest rate unchanged during the period, but it took measures to improve financial liquidity to mitigate the negative effects of the U.S.-China trade dispute and support economic growth.
Precious Metals Sector Overview
After declining in the first two weeks of August to a period low of $1,174 per ounce, gold prices recovered, ending at a period high of $1,321 per ounce to deliver a solid gain. During the period’s first two months, a strengthening U.S. dollar, robust returns from other asset classes, concerns about demand from emerging market countries, lower global holdings in gold-backed exchange-traded funds (ETFs) and the Fed’s interest-rate increase caused gold prices to continue a
downward trend that began in early 2018. However, gold prices began to rise in the fourth quarter as investors sought perceived safe-haven investments due to concerns about a weaker global economy and heightened market volatility. Further supporting gold prices later in the period were higher global holdings in gold-backed ETFs and investor concerns about the U.K.’s pending withdrawal from the EU, U.S.-China trade tensions and a partial U.S. government shutdown late in the period. Gold also benefited from the Fed’s decision in January to leave the federal funds target rate unchanged and investor expectations for a slower pace of interest-rate increases in 2019. Silver prices also increased during the period as the U.S. dollar began to weaken in the period’s second half. Palladium continued to rise, setting a record price high towardperiod-end, and became more valuable than gold due to tight supplies and strong demand for auto catalytic converters and other applications. Platinum prices fell during the reporting period amid ebbing demand for its use in diesel engines.
Precious Metals Prices(7/31/18–1/31/19)*
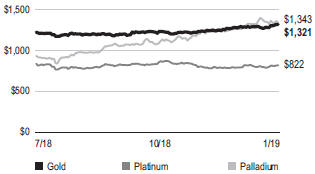
*Source: Bloomberg LP. Amounts shown are based on spot prices quoted in US dollars per troy ounce. For illustrative purposes only; not representative of the Fund’s portfolio composition or performance.
Investment Strategy
Gold and precious metals operation companies include companies that mine, process, or deal in gold or other precious metals, such as silver, platinum and palladium, including mining finance and exploration companies as well as operating companies with long- or medium-life mines. The Fund may buy securities of gold and precious metals operation companies of any market capitalization size, located anywhere in the world, and in general invests predominantly innon-U.S. companies. The Fund’s investment manager looks for companies with low cost reserves and experienced management teams with established track records, particularly focusing on companies with long life production profiles, expandable resources basis, and active exploration programs that can potentially drive future reserve and production growth.
| | | | |
| | | |
4 | | Semiannual Report | | franklintempleton.com |
FRANKLIN GOLD AND PRECIOUS METALS FUND
Manager’s Discussion
Key contributors to the Fund’s absolute performance during thesix-month period under review included the Fund’s holdings in AngloGold Ashanti, B2Gold and Torex Gold Resources.
Global gold mining company AngloGold Ashanti reported solid quarterly earnings that resulted from strong production and cost performance, which also increased liquidity and allowed the company to reduce debt. In September, Kelvin Dushnisky, the former president of Barrick Gold, became chief executive officer of AngloGold and focused on improving the overall quality and life of the company’s portfolio and raising margins for key assets. Rising gold prices during the period also helped the stock.
Key contributor B2Gold made positive strides on several fronts, including record third-quarter 2018 gold production (up 78% year-over-year to 242,040 ounces) and a 110% increase in gold revenue (to US$324 million) amid continued strong performances of the Fekola Mine in Mali, Masbate Mine in the Philippines and the Otjikoto Mine in Namibia. B2Gold also raised the gold mineral resource estimate for Fekola and announced positive results from an expansion study at its El Limon Mine in Nicaragua along with the signing of a newtwo-year collective agreement with local labor unions.
The share price of gold producer Torex Gold Resources rose, as the company benefited from the reopening and restarting of operations in April 2018 of its El Limon-Guajes (ELG) mine in Mexico, which was previously closed since December 2017 due to union-related issues. Torex reported record third-quarter gold production of more than 100,000 ounces as it successfully continued toward a fullramp-up. Torex forecasts that at full production, ELG will be among the world’s largest and lowest cost gold mines, with expected average annual production of 370,000 ounces of gold at a cost of around US$616 an ounce.
Detractors from the Fund’s absolute performance during the period under review included the Fund’s holdings in Guyana Goldfields, IAMGOLD and Continental Gold.
Guyana Goldfields operates the Aurora gold mine in Guyana, and was forced to substantially lower its full-year 2018 guidance. The stock dramatically underperformed in the latter half of 2018, following weaker-than-expected financial results. Stock performance was further hindered by the announcement that management hired an outside consulting firm to do a resource review following poor grade reconciliation between Aurora’s resource model and production in the current active area of the mine. The company also announced the first blast for the portal to a planned underground mine (the first step in
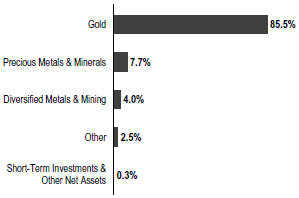
Portfolio Composition
Based on Total Net Assets as of 1/31/19
facilitating subsurface development), but work was subsequently suspended due to a request for further information by the Guyana Environmental Protection Agency. The company expects to resume construction once the matter has been resolved, while all open pit operations, including surface mining and milling, remained unaffected.
Shares of gold miner IAMGOLD declined after a slight net loss for the third-quarter due to anticipated gold margin pressure and lighter production from its Rosebel mine in Suriname. Despite these results, the company maintained its full-year 2018 production and cost guidance, and the smaller third-quarter loss was an improvement over the second quarter. The company also reduced its capital spending guidance due to spending deferrals for its Saramacca project in Suriname, spending reductions for its Sadiola mine in Mali, and evaluation of cost-effective production expansion at its Essakane mine in Burkina Faso. The company expects to benefit from new labor agreements for its Rosebel mine as well as its Westwood mine in Quebec, and also reported positive feasibility results from its Cote Gold and Boto Gold projects in Ontario and Senegal.
Continental Gold is a Canada-based gold mining company with operations in Colombia. Shares of the company suffered from quarterly net losses during the period resulting from increased administration and exploration costs related to its Berlin and Dojura projects in Colombia, the impact of foreign exchange on deferred taxes and the revaluation of derivative financial instruments. Continental suffered four security-related fatalities in two separate incidents, increasing investor concern around the company’s ability to operate in Colombia. Newmont Mining, Continental’s largest shareholder, announced its intent
| | | | |
| | | |
| franklintempleton.com | | Semiannual Report | | 5 |
FRANKLIN GOLD AND PRECIOUS METALS FUND
to acquire Goldcorp3, raising investor concern about the stability of Newmont’s interest in Continental, despite a statement from Continental highlighting that they remain a supportive partner. Nearperiod-end, the company announced a substantially increased mineral resource estimate for its flagship Buritica project in Colombia.
For the six months ended January 31, 2019, the U.S. dollar rose in value relative to certain currencies in which the Fund’s investments were traded. As a result, the Fund’s performance was negatively affected by currency appreciation from the portfolio’s investment predominantly in securities withnon-U.S. currency exposure. Whether the U.S. dollar goes up or weakens compared with foreign currencies, company-specific factors may offset the effects of the currency movements on the value of individual investments and, possibly, the Fund’s performance overall.
Thank you for your continued participation in Franklin Gold and Precious Metals Fund. We look forward to serving your future investment needs.
| | |
 | | 
Stephen M. Land, CFA |
| | |
 | | 
Frederick G. Fromm, CFA |
| |
| | Portfolio Management Team |
Top 10 Holdings
1/31/19
| | |
Company Sector/Industry, Country | | % of Total
Net Assets |
| |
AngloGold Ashanti Ltd. Gold, South Africa | | 7.8% |
| |
B2Gold Corp. Gold, Canada | | 7.5% |
| |
Barrick Gold Corp. Gold, Canada | | 5.1% |
| |
Newcrest Mining Ltd. Gold, Australia | | 5.1% |
| |
Alamos Gold Inc. Gold, Canada | | 4.5% |
| |
OceanaGold Corp. Gold, Australia | | 3.9% |
| |
Centerra Gold Inc. Gold, Canada | | 3.5% |
| |
Pretium Resources Inc. Gold, Canada | | 3.1% |
| |
St. Barbara Ltd. Gold, Australia | | 3.0% |
| |
Newmont Mining Corp. Gold, U.S. | | 2.9% |
The foregoing information reflects our analysis, opinions and portfolio holdings as of January 31, 2019, the end of the reporting period. The way we implement our main investment strategies and the resulting portfolio holdings may change depending on factors such as market and economic conditions. These opinions may not be relied upon as investment advice or an offer for a particular security. The information is not a complete analysis of every aspect of any market, country, industry, security or the Fund. Statements of fact are from sources considered reliable, but the investment manager makes no representation or warranty as to their completeness or accuracy. Although historical performance is no guarantee of future results, these insights may help you understand our investment management philosophy.
3. Not held atperiod-end.
See www.franklintempletondatasources.com for additional data provider information.
| | | | |
| | | |
6 | | Semiannual Report | | franklintempleton.com |
FRANKLIN GOLD AND PRECIOUS METALS FUND
Performance Summary as of January 31, 2019
The performance table does not reflect any taxes that a shareholder would pay on Fund dividends, capital gain distributions, if any, or any realized gains on the sale of Fund shares. Total return reflects reinvestment of the Fund’s dividends and capital gain distributions, if any, and any unrealized gains or losses. Your dividend income will vary depending on dividends or interest paid by securities in the Fund’s portfolio, adjusted for operating expenses of each class. Capital gain distributions are net profits realized from the sale of portfolio securities.
Performance as of 1/31/191
Cumulative total return excludes sales charges. Average annual total return includes maximum sales charges. Sales charges will vary depending on the size of the investment and the class of share purchased. The maximum is 5.50% and the minimum is 0%.Class A:5.50% maximum initial sales charge;Advisor Class:no sales charges. For other share classes, visitfranklintempleton.com.
| | | | |
| Share Class | | Cumulative Total Return2 | | Average Annual Total Return3 |
| | |
A4 | | | | |
| | |
6-Month | | +4.65% | | -1.11% |
| | |
1-Year | | -9.39% | | -14.36% |
| | |
5-Year | | -10.48% | | -3.29% |
| | |
10-Year | | -16.11% | | -2.30% |
| | |
Advisor | | | | |
| | |
6-Month | | +4.80% | | +4.80% |
| | |
1-Year | | -9.16% | | -9.16% |
| | |
5-Year | | -9.33% | | -1.94% |
| | |
10-Year | | -13.98% | | -1.49% |
Performance data represent past performance, which does not guarantee future results. Investment return and principal value will fluctuate, and you may have a gain or loss when you sell your shares. Current performance may differ from figures shown. For most recentmonth-end performance, go tofranklintempleton.comor call(800)342-5236.
See page 8 for Performance Summary footnotes.
| | | | |
| | | |
| franklintempleton.com | | Semiannual Report | | 7 |
FRANKLIN GOLD AND PRECIOUS METALS FUND
PERFORMANCE SUMMARY
Total Annual Operating Expenses5
| | | | |
Share Class | | With Fee Waiver | | Without Fee Waiver |
A | | 0.98% | | 0.98% |
Advisor | | 0.73% | | 0.73% |
Each class of shares is available to certain eligible investors and has different annual fees and expenses, as described in the prospectus.
All investments involve risks, including possible loss of principal. The Fund concentrates in the precious metals sector, which involves fluctuations in the prices of gold and other precious metals and increased susceptibility to adverse economic and regulatory developments affecting the sector. In times of stable economic growth, traditional equity and debt investments could offer great appreciation potential and the prices of gold and other precious metals may be adversely affected. In addition, the Fund is subject to the risks of currency fluctuation and political uncertainty associated with foreign(non-U.S.) investing. Investments in emerging and frontier markets involve heightened risks related to the same factors, in addition to those associated with their relatively small size and lesser liquidity. The Fund may also heavily invest in smaller companies, which can be particularly sensitive to changing economic conditions, and their prospects for growth are less certain than those of larger, more established companies. Investing in anon-diversified fund involves the risk of greater price fluctuation than a more diversified portfolio. The Fund is actively managed but there is no guarantee that the manager’s investment decisions will produce the desired results. The Fund’s prospectus also includes a description of the main investment risks.
1. The Fund has a fee waiver associated with any investment it makes in a Franklin Templeton money fund and/or other Franklin Templeton fund, contractually guaranteed through 11/30/19. Fund investment results reflect the fee waiver; without this waiver, the results would have been lower.
2. Cumulative total return represents the change in value of an investment over the periods indicated.
3. Average annual total return represents the average annual change in value of an investment over the periods indicated. Return for less than one year, if any, has not been annualized.
4. Prior to 9/10/18, these shares were offered at a higher initial sales charge of 5.75%, thus actual returns would have differed. Total returns with sales charges have been restated to reflect the current maximum initial sales charge of 5.50%.
5. Figures are as stated in the Fund’s current prospectus and may differ from the expense ratios disclosed in the Your Fund’s Expenses and Financial Highlights sections in this report. In periods of market volatility, assets may decline significantly, causing total annual Fund operating expenses to become higher than the figures shown.
| | | | |
| | | |
8 | | Semiannual Report | | franklintempleton.com |
FRANKLIN GOLD AND PRECIOUS METALS FUND
Your Fund’s Expenses
As a Fund shareholder, you can incur two types of costs: (1) transaction costs, including sales charges (loads) on Fund purchases and redemptions; and (2) ongoing Fund costs, including management fees, distribution and service(12b-1) fees, and other Fund expenses. All mutual funds have ongoing costs, sometimes referred to as operating expenses. The table below shows ongoing costs of investing in the Fund and can help you understand these costs and compare them with those of other mutual funds. The table assumes a $1,000 investment held for the six months indicated.
Actual Fund Expenses
The table below provides information about actual account values and actual expenses in the columns under the heading “Actual.” In these columns the Fund’s actual return, which includes the effect of Fund expenses, is used to calculate the “Ending Account Value” for each class of shares. You can estimate the expenses you paid during the period by following these steps (of course, your account value and expenses will differ from those in this illustration): Divide your account value by $1,000 (if your account had an $8,600 value, then $8,600 ÷ $1,000 = 8.6). Then multiply the result by the number in the row for your class of shares under the headings “Actual” and “Expenses Paid During Period” (if Actual Expenses Paid During Period were $7.50, then 8.6 x $7.50 =$64.50). In this illustration, the actual expenses paid this period are $64.50.
Hypothetical Example for Comparison with Other Funds
Under the heading “Hypothetical” in the table, information is provided about hypothetical account values and hypothetical expenses based on the Fund’s actual expense ratio and an assumed rate of return of 5% per year before expenses, which is not the Fund’s actual return. This information may not be used to estimate the actual ending account balance or expenses you paid for the period, but it can help you compare ongoing costs of investing in the Fund with those of other funds. To do so, compare this 5% hypothetical example for the class of shares you hold with the 5% hypothetical examples that appear in the shareholder reports of other funds.
Please note that expenses shown in the table are meant to highlight ongoing costs and do not reflect any transactional costs. Therefore, information under the heading “Hypothetical” is useful in comparing ongoing costs only, and will not help you compare total costs of owning different funds. In addition, if transactional costs were included, your total costs would have been higher.
| | | | | | | | | | | | |
| | | | | Actual
(actual return after expenses) | | Hypothetical
(5% annual return before expenses) | | |
Share Class | | Beginning Account Value 8/1/18 | | Ending Account Value 1/31/19 | | Expenses Paid During
Period 8/1/18–1/31/191,2 | | Ending
Account
Value 1/31/19 | | Expenses Paid During Period 8/1/18–1/31/191,2 | | Net Annualized Expense Ratio2 |
| | | | | | |
| A | | $1,000 | | $1,046.50 | | $5.16 | | $1,020.16 | | $5.09 | | 1.00% |
| C | | $1,000 | | $1,042.40 | | $9.01 | | $1,016.38 | | $8.89 | | 1.75% |
| R6 | | $1,000 | | $1,049.00 | | $3.00 | | $1,022.28 | | $2.96 | | 0.58% |
| Advisor | | $1,000 | | $1,048.00 | | $3.87 | | $1,021.42 | | $3.82 | | 0.75% |
1. Expenses are equal to the annualized expense ratio for thesix-month period as indicated above—in the far right column—multiplied by the simple average account value over the period indicated, and then multiplied by 184/365 to reflect theone-half year period.
2. Reflects expenses after fee waivers and expense reimbursements. Does not include acquired fund fees and expenses.
| | | | |
| | | |
| franklintempleton.com | | Semiannual Report | | 9 |
FRANKLIN GOLD AND PRECIOUS METALS FUND
Financial Highlights
| | | | | | | | | | | | | | | | | | | | | | | | |
| | | Six Months Ended
January 31, 2019 | | | Year Ended July 31, | |
| | | (unaudited) | | | 2018 | | | 2017 | | | 2016 | | | 2015 | | | 2014 | |
| | | | | | |
Class A | | | | | | | | | | | | | | | | | | | | | | | | |
| | | | | | |
Per share operating performance | | | | | | | | | | | | | | | | | | | | | | | | |
(for a share outstanding throughout the period) | | | | | | | | | | | | | | | | | | | | | | | | |
Net asset value, beginning of period | | | $13.56 | | | | $16.19 | | | | $24.06 | | | | $11.63 | | | | $20.27 | | | | $17.72 | |
| | | | | | |
Income from investment operationsa: | | | | | | | | | | | | | | | | | | | | | | | | |
Net investment income (loss)b | | | (0.01 | ) | | | (0.06 | ) | | | (0.04 | ) | | | (0.09 | ) | | | (0.05 | ) | | | (0.09 | ) |
Net realized and unrealized gains (losses) | | | 0.64 | | | | (2.51 | ) | | | (6.45 | ) | | | 12.52 | | | | (8.43 | ) | | | 2.64 | |
| | | | | | |
Total from investment operations | | | 0.63 | | | | (2.57 | ) | | | (6.49 | ) | | | 12.43 | | | | (8.48 | ) | | | 2.55 | |
| | | | | | |
Less distributions from net investment income | | | — | | | | (0.06 | ) | | | (1.38 | ) | | | — | | | | (0.16 | ) | | | — | |
| | | | | | |
Net asset value, end of period | | | $14.19 | | | | $13.56 | | | | $16.19 | | | | $24.06 | | | | $11.63 | | | | $20.27 | |
| | | | | | |
Total returnc | | | 4.65% | | | | (15.92)% | | | | (26.85)% | | | | 106.88% | | | | (42.02)% | | | | 14.39% | |
| | | | | | |
Ratios to average net assetsd | | | | | | | | | | | | | | | | | | | | | | | | |
| | | | | | |
Expensese | | | 1.00% | f | | | 1.02% | f | | | 0.98% | f | | | 1.11% | | | | 1.09% | f | | | 1.07% | f |
| | | | | | | |
Net investment income (loss) | | | (0.09)% | | | | (0.37)% | | | | (0.24)% | | | | (0.57)% | | | | (0.35)% | | | | (0.49)% | |
| | | | | | |
Supplemental data | | | | | | | | | | | | | | | | | | | | | | | | |
| | | | | | |
Net assets, end of period (000’s) | | | $631,369 | | | | $587,294 | | | | $776,677 | | | | $988,701 | | | | $444,295 | | | | $776,333 | |
| | | | | | |
Portfolio turnover rate | | | 7.63% | | | | 8.36% | | | | 13.99% | | | | 16.76% | | | | 12.52% | | | | 16.13% | |
aThe amount shown for a share outstanding throughout the period may not correlate with the Statement of Operations for the period due to the timing of sales and repurchases of the Fund’s shares in relation to income earned and/or fluctuating fair value of the investments of the Fund.
bBased on average daily shares outstanding.
cTotal return does not reflect sales commissions or contingent deferred sales charges, if applicable, and is not annualized for periods less than one year.dRatios are annualized for periods less than one year.
eBenefit of waiver and payments by affiliates rounds to less than 0.01%.
fBenefit of expense reduction rounds to less than 0.01%.
| | | | |
| | | |
10 | | Semiannual Report | The accompanying notes are an integral part of these financial statements. | | franklintempleton.com |
FRANKLIN GOLD AND PRECIOUS METALS FUND
FINANCIAL HIGHLIGHTS
| | | | | | | | | | | | | | | | | | | | | | | | |
| | | Six Months Ended
January 31, 2019 | | | Year Ended July 31, | |
| | | (unaudited) | | | 2018 | | | 2017 | | | 2016 | | | 2015 | | | 2014 | |
| | | | | | |
Class C | | | | | | | | | | | | | | | | | | | | | | | | |
| | | | | | |
Per share operating performance | | | | | | | | | | | | | | | | | | | | | | | | |
(for a share outstanding throughout the period) | | | | | | | | | | | | | | | | | | | | | | | | |
Net asset value, beginning of period | | | $12.49 | | | | $14.96 | | | | $22.39 | | | | $10.90 | | | | $18.97 | | | | $16.70 | |
| | | | | | |
Income from investment operationsa: | | | | | | | | | | | | | | | | | | | | | | | | |
Net investment income (loss)b | | | (0.05 | ) | | | (0.15 | ) | | | (0.17 | ) | | | (0.18 | ) | | | (0.16 | ) | | | (0.22 | ) |
Net realized and unrealized gains (losses) | | | 0.58 | | | | (2.32 | ) | | | (5.99 | ) | | | 11.67 | | | | (7.89 | ) | | | 2.49 | |
| | | | | | |
Total from investment operations | | | 0.53 | | | | (2.47 | ) | | | (6.16 | ) | | | 11.49 | | | | (8.05 | ) | | | 2.27 | |
| | | | | | |
Less distributions from net investment income | | | — | | | | — | | | | (1.27 | ) | | | — | | | | (0.02 | ) | | | — | |
| | | | | | |
Net asset value, end of period | | | $13.02 | | | | $12.49 | | | | $14.96 | | | | $22.39 | | | | $10.90 | | | | $18.97 | |
| | | | | | |
Total returnc | | | 4.24% | | | | (16.51)% | | | | (27.41)% | | | | 105.41% | | | | (42.45)% | | | | 13.59% | |
| | | | | | |
Ratios to average net assetsd | | | | | | | | | | | | | | | | | | | | | | | | |
| | | | | | |
Expensese | | | 1.75% | f | | | 1.77% | f | | | 1.73% | f | | | 1.86% | | | | 1.84% | f | | | 1.82% | f |
| | | | | | | |
Net investment income (loss) | | | (0.84)% | | | | (1.12)% | | | | (0.99)% | | | | (1.32)% | | | | (1.10)% | | | | (1.24)% | |
| | | | | | |
Supplemental data | | | | | | | | | | | | | | | | | | | | | | | | |
| | | | | | |
Net assets, end of period (000’s) | | | $71,478 | | | | $94,997 | | | | $137,487 | | | | $200,179 | | | | $97,483 | | | | $185,450 | |
| | | | | | |
Portfolio turnover rate | | | 7.63% | | | | 8.36% | | | | 13.99% | | | | 16.76% | | | | 12.52% | | | | 16.13% | |
aThe amount shown for a share outstanding throughout the period may not correlate with the Statement of Operations for the period due to the timing of sales and repurchases of the Fund’s shares in relation to income earned and/or fluctuating fair value of the investments of the Fund.
bBased on average daily shares outstanding.
cTotal return does not reflect sales commissions or contingent deferred sales charges, if applicable, and is not annualized for periods less than one year.
dRatios are annualized for periods less than one year.
eBenefit of waiver and payments by affiliates rounds to less than 0.01%. fBenefit of expense reduction rounds to less than 0.01%.
| | | | |
| | | |
| franklintempleton.com | | The accompanying notes are an integral part of these financial statements. | Semiannual Report | | 11 |
FRANKLIN GOLD AND PRECIOUS METALS FUND
FINANCIAL HIGHLIGHTS
| | | | | | | | | | | | | | | | | | | | | | | | |
| | | Six Months Ended January 31, 2019 | | | Year Ended July 31, | |
| | | (unaudited) | | | 2018 | | | 2017 | | | 2016 | | | 2015 | | | 2014 | |
| | | | | | |
Class R6 | | | | | | | | | | | | | | | | | | | | | | | | |
| | | | | | |
Per share operating performance | | | | | | | | | | | | | | | | | | | | | | | | |
(for a share outstanding throughout the period) | | | | | | | | | | | | | | | | | | | | | | | | |
Net asset value, beginning of period | | | $14.50 | | | | $17.31 | | | | $25.58 | | | | $12.29 | | | | $21.44 | | | | $18.62 | |
| | | | | | |
Income from investment operationsa: | | | | | | | | | | | | | | | | | | | | | | | | |
Net investment income (loss)b | | | 0.02 | | | | 0.01 | | | | 0.04 | | | | (0.01 | ) | | | 0.03 | | | | 0.01 | |
Net realized and unrealized gains (losses) | | | 0.69 | | | | (2.68 | ) | | | (6.87 | ) | | | 13.30 | | | | (8.93 | ) | | | 2.81 | |
| | | | | | |
Total from investment operations | | | 0.71 | | | | (2.67 | ) | | | (6.83 | ) | | | 13.29 | | | | (8.90 | ) | | | 2.82 | |
| | | | | | |
Less distributions from net investment income | | | — | | | | (0.14 | ) | | | (1.44 | ) | | | — | | | | (0.25 | ) | | | — | |
| | | | | | |
Net asset value, end of period | | | $15.21 | | | | $14.50 | | | | $17.31 | | | | $25.58 | | | | $12.29 | | | | $21.44 | |
| | | | | | |
Total returnc | | | 4.90% | | | | (15.50)% | | | | (26.53)% | | | | 108.14% | | | | (41.74)% | | | | 15.15% | |
| | | | | | |
Ratios to average net assetsd | | | | | | | | | | | | | | | | | | | | | | | | |
| | | | | | |
Expenses before waiver and payments by affiliates | | | 0.89% | | | | 0.79% | | | | 0.57% | | | | 0.63% | | | | 0.62% | | | | 0.67% | |
| | | | | | |
Expenses net of waiver and payments by affiliates | | | 0.58% | e | | | 0.55% | e | | | 0.52% | e | | | 0.59% | | | | 0.55% | e | | | 0.54% | e |
| | | | | | | |
Net investment income (loss) | | | 0.33% | | | | 0.10% | | | | 0.21% | | | | (0.05)% | | | | 0.19% | | | | 0.04% | |
| | | | | | |
Supplemental data | | | | | | | | | | | | | | | | | | | | | | | | |
| | | | | | |
Net assets, end of period (000’s) | | | $8,035 | | | | $8,153 | | | | $4,635 | | | | $3,764 | | | | $1,188 | | | | $848 | |
| | | | | | |
Portfolio turnover rate | | | 7.63% | | | | 8.36% | | | | 13.99% | | | | 16.76% | | | | 12.52% | | | | 16.13% | |
aThe amount shown for a share outstanding throughout the period may not correlate with the Statement of Operations for the period due to the timing of sales and repurchases of the Fund’s shares in relation to income earned and/or fluctuating fair value of the investments of the Fund.
bBased on average daily shares outstanding.
cTotal return is not annualized for periods less than one year.
dRatios are annualized for periods less than one year.
eBenefit of expense reduction rounds to less than 0.01%.
| | | | |
| | | |
12 | | Semiannual Report | The accompanying notes are an integral part of these financial statements. | | franklintempleton.com |
FRANKLIN GOLD AND PRECIOUS METALS FUND
FINANCIAL HIGHLIGHTS
| | | | | | | | | | | | | | | | | | | | | | | | |
| | | Six Months Ended
January 31, 2019 | | | Year Ended July 31, | |
| | | (unaudited) | | | 2018 | | | 2017 | | | 2016 | | | 2015 | | | 2014 | |
| | | | | | |
Advisor Class | | | | | | | | | | | | | | | | | | | | | | | | |
| | | | | | |
Per share operating performance | | | | | | | | | | | | | | | | | | | | | | | | |
(for a share outstanding throughout the period) | | | | | | | | | | | | | | | | | | | | | | | | |
Net asset value, beginning of period | | | $14.38 | | | | $17.17 | | | | $25.38 | | | | $12.23 | | | | $21.32 | | | | $18.59 | |
| | | | | | |
Income from investment operationsa: | | | | | | | | | | | | | | | | | | | | | | | | |
Net investment income (loss)b | | | 0.01 | | | | (0.02 | ) | | | — | c | | | (0.05 | ) | | | (0.02 | ) | | | (0.05 | ) |
Net realized and unrealized gains (losses) | | | 0.68 | | | | (2.67 | ) | | | (6.81 | ) | | | 13.20 | | | | (8.87 | ) | | | 2.78 | |
| | | | | | |
Total from investment operations | | | 0.69 | | | | (2.69 | ) | | | (6.81 | ) | | | 13.15 | | | | (8.89 | ) | | | 2.73 | |
| | | | | | |
Less distributions from net investment income | | | — | | | | (0.10 | ) | | | (1.40 | ) | | | — | | | | (0.20 | ) | | | — | |
| | | | | | |
Net asset value, end of period | | | $15.07 | | | | $14.38 | | | | $17.17 | | | | $25.38 | | | | $12.23 | | | | $21.32 | |
| | | | | | |
Total returnd | | | 4.80% | | | | (15.70)% | | | | (26.69)% | | | | 107.52% | | | | (41.90)% | | | | 14.69% | |
| | | | | | |
Ratios to average net assetse | | | | | | | | | | | | | | | | | | | | | | | | |
| | | | | | |
Expensesf | | | 0.75% | g | | | 0.77% | g | | | 0.73% | g | | | 0.86% | | | | 0.84% | g | | | 0.82% | g |
| | | | | | | |
Net investment income (loss) | | | 0.16% | | | | (0.12)% | | | | 0.01% | | | | (0.32)% | | | | (0.10)% | | | | (0.24)% | |
| | | | | | |
Supplemental data | | | | | | | | | | | | | | | | | | | | | | | | |
| | | | | | |
Net assets, end of period (000’s) | | | $123,279 | | | | $130,812 | | | | $164,253 | | | | $207,574 | | | | $90,628 | | | | $160,425 | |
| | | | | | |
Portfolio turnover rate | | | 7.63% | | | | 8.36% | | | | 13.99% | | | | 16.76% | | | | 12.52% | | | | 16.13% | |
aThe amount shown for a share outstanding throughout the period may not correlate with the Statement of Operations for the period due to the timing of sales and repurchases of the Fund’s shares in relation to income earned and/or fluctuating fair value of the investments of the Fund.
bBased on average daily shares outstanding.
cAmount rounds to less than $0.01 per share.
dTotal return is not annualized for periods less than one year.
eRatios are annualized for periods less than one year.
fBenefit of waiver and payments by affiliates rounds to less than 0.01%.
gBenefit of expense reduction rounds to less than 0.01%.
| | | | |
| | | |
| franklintempleton.com | | The accompanying notes are an integral part of these financial statements. | Semiannual Report | | 13 |
FRANKLIN GOLD AND PRECIOUS METALS FUND
Statement of Investments, January 31, 2019 (unaudited)
| | | | | | | | | | | | |
| | | Country | | | Shares/
Warrants | | | Value | |
Common Stocks and Other Equity Interests 99.4% | | | | | | | | | | | | |
Copper 0.6% | | | | | | | | | | | | |
aImperial Metals Corp. | | | Canada | | | | 1,496,100 | | | $ | 2,028,070 | |
Sandfire Resources NL | | | Australia | | | | 565,309 | | | | 2,873,538 | |
| | | | | | | | | | | | |
| | | | | | | | | | | 4,901,608 | |
| | | | | | | | | | | | |
Diversified Metals & Mining 4.0% | | | | | | | | | | | | |
a,bBluestone Resources Inc., 144A | | | Canada | | | | 1,400,000 | | | | 1,567,284 | |
a,cGeopacific Resources Ltd. | | | Australia | | | | 165,027,382 | | | | 1,440,095 | |
a,b,cINV Metals Inc., 144A | | | Canada | | | | 6,565,000 | | | | 3,699,718 | |
a,bIvanhoe Mines Ltd., 144A | | | Canada | | | | 6,185,000 | | | | 13,377,047 | |
aIvanhoe Mines Ltd., A | | | Canada | | | | 3,231,800 | | | | 6,989,804 | |
a,cNautilus Minerals Inc. | | | Canada | | | | 9,222,015 | | | | 421,385 | |
a,b,cNautilus Minerals Inc., 144A | | | Canada | | | | 28,535,816 | | | | 1,303,898 | |
aOrla Mining Ltd. | | | Canada | | | | 4,770,713 | | | | 4,468,797 | |
a,dOrla Mining Ltd., wts., 2/15/21 | | | Canada | | | | 460,000 | | | | 31,437 | |
| | | | | | | | | | | | |
| | | | | | | | | | | 33,299,465 | |
| | | | | | | | | | | | |
Gold 85.5% | | | | | | | | | | | | |
Agnico Eagle Mines Ltd., (CAD Traded) | | | Canada | | | | 397,797 | | | | 17,313,303 | |
Agnico Eagle Mines Ltd., (USD Traded) | | | Canada | | | | 312,000 | | | | 13,596,960 | |
aAlacer Gold Corp. | | | United States | | | | 6,262,500 | | | | 14,450,823 | |
a,bAlacer Gold Corp., 144A | | | United States | | | | 1,500,000 | | | | 3,461,275 | |
Alamos Gold Inc., A, (CAD Traded) | | | Canada | | | | 4,938,316 | | | | 22,000,723 | |
Alamos Gold Inc., A, (USD Traded) | | | Canada | | | | 3,479,500 | | | | 15,518,570 | |
AngloGold Ashanti Ltd., ADR | | | South Africa | | | | 4,544,823 | | | | 64,945,521 | |
aAsanko Gold Inc. | | | Canada | | | | 10,353,375 | | | | 8,278,915 | |
aB2Gold Corp. | | | Canada | | | | 19,683,694 | | | | 62,359,430 | |
Barrick Gold Corp. | | | Canada | | | | 3,204,383 | | | | 42,906,688 | |
a,cBeadell Resources Ltd. | | | Australia | | | | 127,485,930 | | | | 5,377,051 | |
aBelo Sun Mining Corp. | | | Canada | | | | 3,496,500 | | | | 931,974 | |
a,bBelo Sun Mining Corp., 144A | | | Canada | | | | 13,800,000 | | | | 3,678,318 | |
Centamin PLC | | | Egypt | | | | 13,815,200 | | | | 21,319,130 | |
aCenterra Gold Inc. | | | Canada | | | | 2,845,700 | | | | 14,433,297 | |
a,bCenterra Gold Inc., 144A | | | Canada | | | | 2,893,400 | | | | 14,675,230 | |
cChalice Gold Mines Ltd. | | | Australia | | | | 31,072,008 | | | | 2,937,423 | |
aContinental Gold Inc. | | | Canada | | | | 6,136,230 | | | | 10,935,023 | |
a,bContinental Gold Inc., 144A | | | Canada | | | | 1,000,000 | | | | 1,782,043 | |
aDacian Gold Ltd. | | | Australia | | | | 4,195,412 | | | | 7,932,350 | |
aDetour Gold Corp. | | | Canada | | | | 1,646,300 | | | | 16,499,359 | |
aEldorado Gold Corp. | | | Canada | | | | 3,453,724 | | | | 12,940,615 | |
aEndeavour Mining Corp. | | | Canada | | | | 1,055,000 | | | | 18,189,932 | |
aGascoyne Resources Ltd. | | | Australia | | | | 12,803,100 | | | | 1,256,906 | |
aGolden Star Resources Ltd. | | | United States | | | | 3,614,533 | | | | 13,843,661 | |
a,cGuyana Goldfields Inc. | | | Canada | | | | 4,646,700 | | | | 6,086,607 | |
a,b,cGuyana Goldfields Inc., 144A | | | Canada | | | | 6,220,000 | | | | 8,147,437 | |
aIAMGOLD Corp. | | | Canada | | | | 4,760,500 | | | | 17,899,480 | |
a,cLion One Metals Ltd. | | | Canada | | | | 5,500,000 | | | | 1,968,624 | |
a,b,cLion One Metals Ltd., 144A | | | Canada | | | | 2,935,000 | | | | 1,050,529 | |
a,cLydian International Ltd. | | | Canada | | | | 7,319,500 | | | | 1,003,358 | |
a,b,cLydian International Ltd., 144A | | | Canada | | | | 35,250,000 | | | | 4,832,077 | |
aMidas Gold Corp. | | | Canada | | | | 2,520,900 | | | | 1,670,233 | |
a,bMidas Gold Corp., 144A | | | Canada | | | | 4,030,000 | | | | 2,670,094 | |
Newcrest Mining Ltd. | | | Australia | | | | 2,411,439 | | | | 42,875,482 | |
Newmont Mining Corp. | | | United States | | | | 698,614 | | | | 23,829,724 | |
OceanaGold Corp. | | | Australia | | | | 9,088,488 | | | | 32,461,358 | |
| | | | |
| | | |
14 | | Semiannual Report | | franklintempleton.com |
FRANKLIN GOLD AND PRECIOUS METALS FUND
STATEMENT OF INVESTMENTS (UNAUDITED)
| | | | | | | | | | | | |
| | | Country | | | Shares/
Warrants | | | Value | |
Common Stocks and Other Equity Interests(continued) | | | | | | | | | | | | |
Gold(continued) | | | | | | | | | | | | |
Osisko Gold Royalties Ltd. | | | Canada | | | | 215,000 | | | $ | 2,105,628 | |
a,cPerseus Mining Ltd. | | | Australia | | | | 61,253,901 | | | | 18,485,692 | |
a,c,dPerseus Mining Ltd., wts., 4/19/19 | | | Australia | | | | 19,006,000 | | | | 32,452 | |
aPretium Resources Inc. | | | Canada | | | | 3,289,000 | | | | 25,849,120 | |
a,cRed 5 Ltd. | | | Australia | | | | 127,268,146 | | | | 11,105,928 | |
a,cRTG Mining Inc. | | | Australia | | | | 1,769,918 | | | | 188,705 | |
a,b,cRTG Mining Inc., 144A | | | Australia | | | | 2,397,790 | | | | 255,647 | |
a,cRTG Mining Inc., IDR | | | Australia | | | | 41,087,582 | | | | 4,332,439 | |
aRubicon Minerals Corp. | | | Canada | | | | 3,508,900 | | | | 3,420,449 | |
aSEMAFO Inc. | | | Canada | | | | 4,694,200 | | | | 10,617,450 | |
a,b,eShandong Gold Mining Co. Ltd., 144A, Reg S | | | China | | | | 3,500,000 | | | | 9,165,923 | |
aSolGold PLC | | | Australia | | | | 16,000,000 | | | | 7,554,642 | |
aSt. Augustine Gold and Copper Ltd. | | | Philippines | | | | 8,136,836 | | | | 123,933 | |
a,bSt. Augustine Gold and Copper Ltd., 144A, (CAD Traded) | | | Philippines | | | | 16,383,333 | | | | 249,537 | |
a,bSt. Augustine Gold and Copper Ltd., 144A, (USD Traded) | | | Philippines | | | | 10,000,000 | | | | 152,311 | |
St. Barbara Ltd. | | | Australia | | | | 6,973,991 | | | | 25,408,146 | |
aTahoe Resources Inc. | | | Canada | | | | 1,850,600 | | | | 7,018,497 | |
aTeranga Gold Corp. | | | Canada | | | | 1,107,751 | | | | 3,408,205 | |
aTMAC Resources Inc. | | | Canada | | | | 510,000 | | | | 2,660,498 | |
aTorex Gold Resources Inc. | | | Canada | | | | 673,400 | | | | 7,328,373 | |
a,bTorex Gold Resources Inc., 144A. | | | Canada | | | | 1,450,000 | | | | 15,779,834 | |
aWest African Resources Ltd. | | | Australia | | | | 9,450,000 | | | | 1,614,929 | |
| | | | | | | | | | | | |
| | | | | | | | | | | 712,917,861 | |
| | | | | | | | | | | | |
Precious Metals & Minerals 7.4% | | | | | | | | | | | | |
Anglo American Platinum Ltd. | | | South Africa | | | | 287,656 | | | | 13,835,662 | |
aEastern Platinum Ltd. | | | Canada | | | | 2,592,102 | | | | 424,417 | |
Fresnillo PLC | | | United Kingdom | | | | 1,120,000 | | | | 14,757,742 | |
aImpala Platinum Holdings Ltd. | | | South Africa | | | | 3,065,000 | | | | 8,930,706 | |
aImpala Platinum Holdings Ltd., ADR | | | South Africa | | | | 1,506,100 | | | | 4,316,483 | |
aNortham Platinum Ltd. | | | South Africa | | | | 1,259,019 | | | | 4,586,327 | |
a,cPlatinum Group Metals Ltd., (CAD Traded) | | | South Africa | | | | 1,802,787 | | | | 2,636,015 | |
a,cPlatinum Group Metals Ltd., (USD Traded) | | | South Africa | | | | 1,610,015 | | | | 2,334,522 | |
a,b,cPlatinum Group Metals Ltd., 144A | | | South Africa | | | | 134,388 | | | | 196,501 | |
a,cPlatinum Group Metals Ltd., wts., 11/15/19 | | | South Africa | | | | 12,093,795 | | | | 181,407 | |
aRoyal Bafokeng Platinum Ltd. | | | South Africa | | | | 1,794,704 | | | | 3,889,883 | |
aStornoway Diamond Corp. | | | Canada | | | | 38,429,400 | | | | 5,706,902 | |
| | | | | | | | | | | | |
| | | | | | | | | | | 61,796,567 | |
| | | | | | | | | | | | |
Silver 1.9% | | | | | | | | | | | | |
Hochschild Mining PLC | | | Peru | | | | 3,268,520 | | | | 8,092,896 | |
aMAG Silver Corp. | | | Canada | | | | 672,000 | | | | 6,038,840 | |
a,bMAG Silver Corp., 144A | | | Canada | | | | 240,000 | | | | 2,156,728 | |
| | | | | | | | | | | | |
| | | | | | | | | | | 16,288,464 | |
| | | | | | | | | | | | |
Total Common Stocks and Other Equity Interests
(Cost $1,020,901,467) | | | | | | | | | | | 829,203,965 | |
| | | | | | | | | | | | |
| | | | |
| | | |
| franklintempleton.com | | Semiannual Report | | 15 |
FRANKLIN GOLD AND PRECIOUS METALS FUND
STATEMENT OF INVESTMENTS (UNAUDITED)
| | | | | | | | | | | | |
| | | Country | | | Principal
Amount* | | | Value | |
Convertible Bonds (Cost $3,000,000) 0.3% | | | | | | | | | | | | |
Precious Metals & Minerals 0.3% | | | | | | | | | | | | |
cPlatinum Group Metals Ltd., cvt., 6.875%, 7/01/22 | | | South Africa | | | $ | 3,000,000 | | | $ | 2,141,250 | |
| | | | | | | | | | | | |
Total Investments before Short Term Investments
(Cost $1,023,901,467) | | | | | | | | | | | 831,345,215 | |
| | | | | | | | | | | | |
| | | |
| | | | | | Shares | | | | |
| | | |
Short Term Investments (Cost $4,637,144) 0.5% | | | | | | | | | | | | |
| | | |
Money Market Funds 0.5% | | | | | | | | | | | | |
f,gInstitutional Fiduciary Trust Money Market Portfolio, 2.05% | | | United States | | | | 4,637,144 | | | | 4,637,144 | |
| | | | | | | | | | | | |
Total Investments (Cost $1,028,538,611) 100.2% | | | | | | | | | | | 835,982,359 | |
Other Assets, less Liabilities (0.2)% | | | | | | | | | | | (1,821,486 | ) |
| | | | | | | | | | | | |
Net Assets 100.0% | | | | | | | | | | $ | 834,160,873 | |
| | | | | | | | | | | | |
See Abbreviations on page 29.
*The principal amount is stated in U.S. dollars unless otherwise indicated.
aNon-income producing.
bSecurity was purchased pursuant to Rule 144A under the Securities Act of 1933 and may be sold in transactions exempt from registration only to qualified institutional buyers or in a public offering registered under the Securities Act of 1933. These securities have been deemed liquid under guidelines approved by the Fund’s Board of Trustees. At January 31, 2019, the aggregate value of these securities was $88,201,431, representing 10.6% of net assets.
cSee Note 8 regarding holdings of 5% voting securities.
dFair valued using significant unobservable inputs. See Note 11 regarding fair value measurements.
eSecurity was purchased pursuant to Regulation S under the Securities Act of 1933, which exempts from registration securities offered and sold outside of the United States. Such a security cannot be sold in the United States without either an effective registration statement filed pursuant to the Securities Act of 1933, or pursuant to an exemption from registration. This security has been deemed liquid under guidelines approved by the Fund’s Board of Trustees.
fSee Note 3(f) regarding investments in affiliated management investment companies.
gThe rate shown is the annualizedseven-day effective yield at period end.
| | | | |
| | | |
16 | | Semiannual Report | The accompanying notes are an integral part of these financial statements. | | franklintempleton.com |
FRANKLIN GOLD AND PRECIOUS METALS FUND
Financial Statements
Statement of Assets and Liabilities
January 31, 2019 (unaudited)
| | | | |
| |
Assets: | | | | |
Investments in securities: | | | | |
Cost - Unaffiliated issuers | | $ | 746,263,684 | |
Cost -Non-controlled affiliates (Note 3f and 8) | | | 282,274,927 | |
| | | | |
Value - Unaffiliated issuers | | $ | 751,186,455 | |
Value -Non-controlled affiliates (Note 3f and 8) | | | 84,795,904 | |
Receivables: | | | | |
Investment securities sold | | | 772,154 | |
Capital shares sold | | | 4,416,460 | |
Dividends and interest | | | 25,375 | |
Other assets | | | 23 | |
| | | | |
Total assets | | | 841,196,371 | |
| | | | |
| |
Liabilities: | | | | |
Payables: | | | | |
Investment securities purchased | | | 1,047,519 | |
Capital shares redeemed | | | 5,018,249 | |
Management fees | | | 333,770 | |
Distribution fees | | | 180,532 | |
Transfer agent fees | | | 318,134 | |
Trustees’ fees and expenses | | | 3,752 | |
Accrued expenses and other liabilities. | | | 133,542 | |
| | | | |
Total liabilities | | | 7,035,498 | |
| | | | |
Net assets, at value | | $ | 834,160,873 | |
| | | | |
| |
Net assets consist of: | | | | |
Paid-in capital | | $ | 1,763,258,600 | |
Total distributable earnings (loss) | | | (929,097,727 | ) |
| | | | |
Net assets, at value | | $ | 834,160,873 | |
| | | | |
| |
Class A: | | | | |
Net assets, at value | | $ | 631,368,796 | |
| | | | |
Shares outstanding | | | 44,480,197 | |
| | | | |
Net asset value per sharea | | | $14.19 | |
| | | | |
Maximum offering price per share (net asset value per share ÷ 94.50%) | | | $15.02 | |
| | | | |
| |
Class C: | | | | |
Net assets, at value | | $ | 71,478,106 | |
| | | | |
Shares outstanding | | | 5,490,294 | |
| | | | |
Net asset value and maximum offering price per sharea | | | $13.02 | |
| | | | |
| |
Class R6: | | | | |
Net assets, at value | | $ | 8,034,698 | |
| | | | |
Shares outstanding | | | 528,297 | |
| | | | |
Net asset value and maximum offering price per share | | | $15.21 | |
| | | | |
| |
Advisor Class: | | | | |
Net assets, at value | | $ | 123,279,273 | |
| | | | |
Shares outstanding | | | 8,178,826 | |
| | | | |
Net asset value and maximum offering price per share | | | $15.07 | |
| | | | |
aRedemption price is equal to net asset value less contingent deferred sales charges, if applicable.
| | | | |
| | | |
| franklintempleton.com | | The accompanying notes are an integral part of these financial statements. | Semiannual Report | | 17 |
FRANKLIN GOLD AND PRECIOUS METALS FUND
FINANCIAL STATEMENTS
Statement of Operations
for the six months ended January 31, 2019 (unaudited)
| | | | |
Investment income: | | | | |
Dividends: (net of foreign taxes)* | | | | |
Unaffiliated issuers | | | $ 2,424,541 | |
Non-controlled affiliates (Note 3f and 8) | | | 948,851 | |
| | | | |
Total investment income | | | 3,373,392 | |
| | | | |
| |
Expenses: | | | | |
Management fees (Note 3a) | | | 1,799,272 | |
Distribution fees: (Note 3c) | | | | |
Class A | | | 685,747 | |
Class C | | | 368,129 | |
Transfer agent fees: (Note 3e) | | | | |
Class A | | | 548,395 | |
Class C | | | 73,597 | |
Class R6 | | | 12,373 | |
Advisor Class | | | 115,650 | |
Custodian fees (Note 4) | | | 30,905 | |
Reports to shareholders | | | 69,745 | |
Registration and filing fees | | | 54,251 | |
Professional fees | | | 48,522 | |
Trustees’ fees and expenses | | | 32,000 | |
Other | | | 15,364 | |
| | | | |
Total expenses | | | 3,853,950 | |
Expense reductions (Note 4) | | | (200 | ) |
Expenses waived/paid by affiliates (Note 3f) | | | (19,132 | ) |
| | | | |
Net expenses | | | 3,834,618 | |
| | | | |
Net investment income (loss) | | | (461,226 | ) |
| | | | |
| |
Realized and unrealized gains (losses): | | | | |
Net realized gain (loss) from: | | | | |
Investments: | | | | |
Unaffiliated issuers | | | (11,828,504 | ) |
Non-controlled affiliates (Note 3f and 8) | | | (2,858,610 | ) |
Foreign currency transactions | | | (32,851 | ) |
| | | | |
Net realized gain (loss) | | | (14,719,965 | ) |
| | | | |
| |
Net change in unrealized appreciation (depreciation) on: | | | | |
Investments: | | | | |
Unaffiliated issuers | | | 61,745,553 | |
Non-controlled affiliates (Note 3f and 8) | | | (11,362,888 | ) |
Translation of other assets and liabilities denominated in foreign currencies | | | 2,170 | |
| | | | |
Net change in unrealized appreciation (depreciation) | | | 50,384,835 | |
| | | | |
Net realized and unrealized gain (loss) | | | 35,664,870 | |
| | | | |
Net increase (decrease) in net assets resulting from operations | | | $ 35,203,644 | |
| | | | |
| |
*Foreign taxes withheld on dividends | | | $ 134,050 | |
| | | | |
| | | |
18 | | Semiannual Report | The accompanying notes are an integral part of these financial statements. | | franklintempleton.com |
FRANKLIN GOLD AND PRECIOUS METALS FUND
FINANCIAL STATEMENTS
Statements of Changes in Net Assets
| | | | | | | | |
| | | Six Months Ended January 31, 2019 (unaudited) | | | Year Ended July 31, 2018 | |
| | |
Increase (decrease) in net assets: | | | | | | | | |
Operations: | | | | | | | | |
Net investment income (loss) | | | $ (461,226 | ) | | | $ (4,028,486 | ) |
Net realized gain (loss) | | | (14,719,965 | ) | | | 14,625,179 | |
Net change in unrealized appreciation (depreciation) | | | 50,384,835 | | | | (171,679,838 | ) |
| | | | |
Net increase (decrease) in net assets resulting from operations | | | 35,203,644 | | | | (161,083,145 | ) |
| | | | |
Distributions to shareholders: (Note 1d) | | | | | | | | |
Class A | | | — | | | | (2,669,273 | ) |
Class R6 | | | — | | | | (42,473 | ) |
Advisor Class | | | — | | | | (990,657 | ) |
| | | | |
Total distributions to shareholders | | | — | | | | (3,702,403 | ) |
| | | | |
Capital share transactions: (Note 2) | | | | | | | | |
Class A | | | 14,253,867 | | | | (72,490,928 | ) |
Class C | | | (24,461,767 | ) | | | (21,657,772 | ) |
Class R6 | | | (380,076 | ) | | | 4,662,395 | |
Advisor Class | | | (11,710,845 | ) | | | (7,524,340 | ) |
| | | | |
Total capital share transactions | | | (22,298,821 | ) | | | (97,010,645 | ) |
| | | | |
Net increase (decrease) in net assets | | | 12,904,823 | | | | (261,796,193 | ) |
| | |
Net assets: | | | | | | | | |
Beginning of period | | | 821,256,050 | | | | 1,083,052,243 | |
| | | | |
End of period (Note 1d) | | | $834,160,873 | | | | $ 821,256,050 | |
| | | | |
| | | | |
| | | |
| franklintempleton.com | | The accompanying notes are an integral part of these financial statements. | Semiannual Report | | 19 |
FRANKLIN GOLD AND PRECIOUS METALS FUND
Notes to Financial Statements (unaudited)
1. Organization and Significant Accounting Policies
Franklin Gold and Precious Metals Fund (Fund) is registered under the Investment Company Act of 1940 (1940 Act) as anopen-end management investment company and applies the specialized accounting and reporting guidance in U.S. Generally Accepted Accounting Principles (U.S. GAAP). The Fund offers four classes of shares: Class A, Class C, Class R6 and Advisor Class. Beginning on October 19, 2018, Class C shares automatically convert to Class A shares after they have been held for 10 years. Each class of shares may differ by its initial sales load, contingent deferred sales charges, voting rights on matters affecting a single class, its exchange privilege and fees due to differing arrangements for distribution and transfer agent fees.
The following summarizes the Fund’s significant accounting policies.
a. Financial Instrument Valuation
The Fund’s investments in financial instruments are carried at fair value daily. Fair value is the price that would be received to sell an asset or paid to transfer a liability in an orderly transaction between market participants on the measurement date. The Fund calculates the net asset value (NAV) per share each business day as of 4 p.m. Eastern time or the regularly scheduled close of the New York Stock Exchange (NYSE), whichever is earlier. Under compliance policies and procedures approved by the Fund’s Board of Trustees (the Board), the Fund’s administrator has responsibility for oversight of valuation, including leading the cross-functional Valuation Committee (VC). The Fund may utilize independent pricing services, quotations from securities and financial instrument dealers, and other market sources to determine fair value.
Equity securities listed on an exchange or on the NASDAQ National Market System are valued at the last quoted sale price or the official closing price of the day, respectively. Foreign equity securities are valued as of the close of trading on the foreign stock exchange on which the security is primarily traded, or as of 4 p.m. Eastern time. The value is then converted into its U.S. dollar equivalent at the foreign exchange rate in effect at 4 p.m. Eastern time on the day that the value of the security is determined.Over-the-counter (OTC) securities are valued within the range of the most recent quoted bid and ask prices. Securities that trade in multiple markets or on multiple
exchanges are valued according to the broadest and most representative market. Certain equity securities are valued based upon fundamental characteristics or relationships to similar securities.
Investments inopen-end mutual funds are valued at the closing NAV.
The Fund has procedures to determine the fair value of financial instruments for which market prices are not reliable or readily available. Under these procedures, the Fund primarily employs a market-based approach which may use related or comparable assets or liabilities, recent transactions, market multiples, book values, and other relevant information for the investment to determine the fair value of the investment. An income-based valuation approach may also be used in which the anticipated future cash flows of the investment are discounted to calculate fair value. Discounts may also be applied due to the nature or duration of any restrictions on the disposition of the investments. Due to the inherent uncertainty of valuations of such investments, the fair values may differ significantly from the values that would have been used had an active market existed.
Trading in securities on foreign securities stock exchanges and OTC markets may be completed before 4 p.m. Eastern time. In addition, trading in certain foreign markets may not take place on every Fund’s business day. Occasionally, events occur between the time at which trading in a foreign security is completed and 4 p.m. Eastern time that might call into question the reliability of the value of a portfolio security held by the Fund. As a result, differences may arise between the value of the Fund’s portfolio securities as determined at the foreign market close and the latest indications of value at 4 p.m. Eastern time. In order to minimize the potential for these differences, the VC monitors price movements following the close of trading in foreign stock markets through a series of country specific market proxies (such as baskets of American Depositary Receipts, futures contracts and exchange traded funds). These price movements are measured against established trigger thresholds for each specific market proxy to assist in determining if an event has occurred that may call into question the reliability of the values of the foreign securities held by the Fund. If such an event occurs, the securities may be valued using fair value procedures, which may include the use of independent pricing services.
| | | | |
| | | |
20 | | Semiannual Report | | franklintempleton.com |
FRANKLIN GOLD AND PRECIOUS METALS FUND
NOTES TO FINANCIAL STATEMENTS (UNAUDITED)
When the last day of the reporting period is anon-business day, certain foreign markets may be open on those days that the Fund’s NAV is not calculated, which could result in differences between the value of the Fund’s portfolio securities on the last business day and the last calendar day of the reporting period. Any significant security valuation changes due to an open foreign market are adjusted and reflected by the Fund for financial reporting purposes.
b. Foreign Currency Translation
Portfolio securities and other assets and liabilities denominated in foreign currencies are translated into U.S. dollars based on the exchange rate of such currencies against U.S. dollars on the date of valuation. The Fund may enter into foreign currency exchange contracts to facilitate transactions denominated in a foreign currency. Purchases and sales of securities, income and expense items denominated in foreign currencies are translated into U.S. dollars at the exchange rate in effect on the transaction date. Portfolio securities and assets and liabilities denominated in foreign currencies contain risks that those currencies will decline in value relative to the U.S. dollar. Occasionally, events may impact the availability or reliability of foreign exchange rates used to convert the U.S. dollar equivalent value. If such an event occurs, the foreign exchange rate will be valued at fair value using procedures established and approved by the Board.
The Fund does not separately report the effect of changes in foreign exchange rates from changes in market prices on securities held. Such changes are included in net realized and unrealized gain or loss from investments in the Statement of Operations.
Realized foreign exchange gains or losses arise from sales of foreign currencies, currency gains or losses realized between the trade and settlement dates on securities transactions and the difference between the recorded amounts of dividends, interest, and foreign withholding taxes and the U.S. dollar equivalent of the amounts actually received or paid. Net unrealized foreign exchange gains and losses arise from changes in foreign exchange rates on foreign denominated assets and liabilities other than investments in securities held at the end of the reporting period.
c. Income and Deferred Taxes
It is the Fund’s policy to qualify as a regulated investment company under the Internal Revenue Code. The Fund intends to distribute to shareholders substantially all of its taxable income
and net realized gains to relieve it from federal income and excise taxes. As a result, no provision for U.S. federal income taxes is required.
The Fund may be subject to foreign taxation related to income received, capital gains on the sale of securities and certain foreign currency transactions in the foreign jurisdictions in which it invests. Foreign taxes, if any, are recorded based on the tax regulations and rates that exist in the foreign markets in which the Fund invests. When a capital gain tax is determined to apply, the Fund records an estimated deferred tax liability in an amount that would be payable if the securities were disposed of on the valuation date.
The Fund may recognize an income tax liability related to its uncertain tax positions under U.S. GAAP when the uncertain tax position has a less than 50% probability that it will be sustained upon examination by the tax authorities based on its technical merits. As of January 31, 2019, the Fund has determined that no tax liability is required in its financial statements related to uncertain tax positions for any open tax years (or expected to be taken in future tax years). Open tax years are those that remain subject to examination and are based on the statute of limitations in each jurisdiction in which the Fund invests.
d. Security Transactions, Investment Income, Expenses and Distributions
Security transactions are accounted for on trade date. Realized gains and losses on security transactions are determined on a specific identification basis. Interest income and estimated expenses are accrued daily. Dividend income is recorded on theex-dividend date except for certain dividends from securities where the dividend rate is not available. In such cases, the dividend is recorded as soon as the information is received by the Fund. Distributions to shareholders are recorded on theex-dividend date. Distributable earnings are determined according to income tax regulations (tax basis) and may differ from earnings recorded in accordance with U.S. GAAP. These differences may be permanent or temporary. Permanent differences are reclassified among capital accounts to reflect their tax character. These reclassifications have no impact on net assets or the results of operations. Temporary differences are not reclassified, as they may reverse in subsequent periods.*
| | | | |
| | | |
| franklintempleton.com | | Semiannual Report | | 21 |
FRANKLIN GOLD AND PRECIOUS METALS FUND
NOTES TO FINANCIAL STATEMENTS (UNAUDITED)
1. Organization and Significant Accounting Policies(continued)
d. Security Transactions, Investment Income, Expenses and Distributions(continued)
Realized and unrealized gains and losses and net investment income, excluding class specific expenses, are allocated daily to each class of shares based upon the relative proportion of net assets of each class. Differences in per share distributions by class are generally due to differences in class specific expenses.
e. Accounting Estimates
The preparation of financial statements in accordance with U.S. GAAP requires management to make estimates and assumptions that affect the reported amounts of assets and liabilities at the date of the financial statements and the amounts of income and expenses during the reporting period. Actual results could differ from those estimates.
f. Guarantees and Indemnifications
Under the Fund’s organizational documents, its officers and trustees are indemnified by the Fund against certain liabilities arising out of the performance of their duties to the Fund. Additionally, in the normal course of business, the Fund enters into contracts with service providers that contain general indemnification clauses. The Fund’s maximum exposure under these arrangements is unknown as this would involve future claims that may be made against the Fund that have not yet occurred. Currently, the Fund expects the risk of loss to be remote.
*Effective during the current reporting period, it is no longer required to present certain line items in the Statements of Changes in Net Assets. The below prior period amounts affected by this change are shown as they were in the prior year Statements of Changes in Net Assets.
For the year ended July 31, 2018, distributions to shareholders were as follows:
| | | | |
Distributions from net investment income: | | | | |
Class A | | $ | (2,669,273 | ) |
Class R6 | | | (42,473 | ) |
Advisor Class | | | (990,657 | ) |
For the year ended July 31, 2018, distributions in excess of net investment income included in net assets was $(156,416,032).
2. Shares of Beneficial Interest
At January 31, 2019, there were an unlimited number of shares authorized (without par value). Transactions in the Fund’s shares were as follows:
| | | | | | | | | | | | | | | | |
| | | Six Months Ended January 31, 2019 | | | Year Ended July 31, 2018 | |
| | | Shares | | | Amount | | | Shares | | | Amount | |
Class A Shares: | | | | | | | | | | | | | | | | |
Shares solda | | | 11,333,570 | | | $ | 141,140,074 | | | | 21,932,108 | | | $ | 334,081,638 | |
Shares issued in reinvestment of distributions | | | — | | | | — | | | | 136,248 | | | | 2,017,824 | |
Shares redeemed | | | (10,155,292 | ) | | | (126,886,207 | ) | | | (26,747,211 | ) | | | (408,590,390 | ) |
| | | | |
| | | | |
Net increase (decrease) | | | 1,178,278 | | | $ | 14,253,867 | | | | (4,678,855 | ) | | $ | (72,490,928 | ) |
| | | | |
| | | | |
Class C Shares: | | | | | | | | | | | | | | | | |
Shares sold | | | 499,897 | | | $ | 5,694,202 | | | | 955,568 | | | $ | 13,443,635 | |
Shares redeemeda | | | (2,617,838 | ) | | | (30,155,969 | ) | | | (2,539,818 | ) | | | (35,101,407 | ) |
| | | | |
| | | | |
Net increase (decrease) | | | (2,117,941 | ) | | $ | (24,461,767 | ) | | | (1,584,250 | ) | | $ | (21,657,772 | ) |
| | | | |
| | | | |
| | | |
22 | | Semiannual Report | | franklintempleton.com |
FRANKLIN GOLD AND PRECIOUS METALS FUND
NOTES TO FINANCIAL STATEMENTS (UNAUDITED)
| | | | | | | | | | | | | | | | |
| | | Six Months Ended January 31, 2019 | | | Year Ended July 31, 2018 | |
| | | Shares | | | Amount | | | Shares | | | Amount | |
| | | | |
Class R6 Shares: | | | | | | | | | | | | | | | | |
Shares sold | | | 178,481 | | | $ | 2,363,289 | | | | 476,053 | | | $ | 7,584,565 | |
Shares issued in reinvestment of distributions | | | — | | | | — | | | | 2,671 | | | | 42,201 | |
Shares redeemed | | | (212,362 | ) | | | (2,743,365 | ) | | | (184,220 | ) | | | (2,964,371 | ) |
| | | | |
Net increase (decrease) | | | (33,881 | ) | | $ | (380,076 | ) | | | 294,504 | | | $ | 4,662,395 | |
| | | | |
Advisor Class Shares: | | | | | | | | | | | | | | | | |
Shares sold | | | 1,871,442 | | | $ | 24,469,926 | | | | 3,574,164 | | | $ | 57,004,070 | |
Shares issued in reinvestment of distributions | | | — | | | | — | | | | 55,251 | | | | 866,343 | |
Shares redeemed | | | (2,786,752 | ) | | | (36,180,771 | ) | | | (4,101,007 | ) | | | (65,394,753 | ) |
| | | | |
Net increase (decrease) | | | (915,310 | ) | | $ | (11,710,845 | ) | | | (471,592 | ) | | $ | (7,524,340 | ) |
aMay include a portion of Class C shares that were automatically converted to Class A.
3. Transactions with Affiliates
Franklin Resources, Inc. is the holding company for various subsidiaries that together are referred to as Franklin Templeton. Certain officers and trustees of the Fund are also officers and/or directors of the following subsidiaries:
| | |
| Subsidiary | | Affiliation |
Franklin Advisers, Inc. (Advisers) | | Investment manager |
Franklin Templeton Services, LLC (FT Services) | | Administrative manager |
Franklin Templeton Distributors, Inc. (Distributors) | | Principal underwriter |
Franklin Templeton Investor Services, LLC (Investor Services) | | Transfer agent |
a. Management Fees
The Fund pays an investment management fee to Advisers based on themonth-end net assets of the Fund as follows:
| | |
| Annualized Fee Rate | | Net Assets |
0.625% | | Up to and including $100 million |
0.500% | | Over $100 million, up to and including $250 million |
0.450% | | Over $250 million, up to and including $7.5 billion |
0.440% | | Over $7.5 billion, up to and including $10 billion |
0.430% | | Over $10 billion, up to and including $12.5 billion |
0.420% | | Over $12.5 billion, up to and including $15 billion |
0.400% | | In excess of $15 billion |
For the period ended January 31, 2019, the annualized gross effective investment management fee rate was 0.482% of the Fund’s average daily net assets.
b. Administrative Fees
Under an agreement with Advisers, FT Services provides administrative services to the Fund. The fee is paid by Advisers based on the Fund’s average daily net assets, and is not an additional expense of the Fund.
| | | | |
| | | |
| franklintempleton.com | | Semiannual Report | | 23 |
FRANKLIN GOLD AND PRECIOUS METALS FUND
NOTES TO FINANCIAL STATEMENTS (UNAUDITED)
3. Transactions with Affiliates(continued)
c. Distribution Fees
The Board has adopted distribution plans for Class A and Class C shares, pursuant to Rule12b-1 under the 1940 Act. Under the Funds’ Class A reimbursement distribution plan, the Fund reimburses Distributors for costs incurred in connection with the servicing, sale and distribution of the Fund’s shares up to the maximum annual plan rate. Under the Class A reimbursement distribution plan, costs exceeding the maximum for the current plan year cannot be reimbursed in subsequent periods. In addition, under the Funds’ Class C compensation distribution plan, the Fund pays Distributors for costs incurred in connection with the servicing, sale and distribution of each Fund’s shares up to the maximum annual plan rate. The plan year, for purposes of monitoring compliance with the maximum annual plan rates, is February 1 through January 31.
The maximum annual plan rates, based on the average daily net assets, for each class, are as follows:
| | | | |
Class A | | | 0.25 | % |
Class C | | | 1.00 | % |
d. Sales Charges/Underwriting Agreements
Front-end sales charges and contingent deferred sales charges (CDSC) do not represent expenses of the Fund. These charges are deducted from the proceeds of sales of Fund shares prior to investment or from redemption proceeds prior to remittance, as applicable. Distributors has advised the Fund of the following commission transactions related to the sales and redemptions of the Fund’s shares for the period:
| | | | |
Sales charges retained net of commissions paid to unaffiliated brokers/dealers | | $ | 23,189 | |
CDSC retained | | $ | 3,319 | |
Effective September 10, 2018, the Board approved changes to certainfront-end sales charges and dealer commissions on Class A shares. Further details are disclosed in the Fund’s Prospectus.
e. Transfer Agent Fees
Each class of shares pays transfer agent fees to Investor Services for its performance of shareholder servicing obligations. The fees are based on an annualized asset based fee of 0.02% plus a transaction based fee. In addition, each class reimburses Investor Services for out of pocket expenses incurred and, except for Class R6, reimburses shareholder servicing fees paid to third parties. These fees are allocated daily based upon their relative proportion of such classes’ aggregate net assets. Class R6 pays Investor Services transfer agent fees specific to that class.
For the period ended January 31, 2019, the Fund paid transfer agent fees of $750,015, of which $313,350 was retained by Investor Services.
| | | | |
| | | |
24 | | Semiannual Report | | franklintempleton.com |
FRANKLIN GOLD AND PRECIOUS METALS FUND
NOTES TO FINANCIAL STATEMENTS (UNAUDITED)
f. Investments in Affiliated Management Investment Companies
The Fund invests in one or more affiliated management investment companies for purposes other than exercising a controlling influence over the management or policies. Management fees paid by the Fund are waived on assets invested in the affiliated management investment companies, as noted in the Statement of Operations, in an amount not to exceed the management and administrative fees paid directly or indirectly by each affiliate. During the period ended January 31, 2019, the Fund held investments in affiliated management investment companies as follows:
| | | | | | | | | | | | | | | | | | | | | | | | | | | | | | | | |
| | | Number of
Shares Held
at Beginning
of Period | | | Gross Additions | | | Gross Reductions | | | Number of Shares Held at End
of Period | | | Value at End of Period | | | Dividend
Income | | | Realized Gain (Loss) | | | Net Change in Unrealized Appreciation (Depreciation) | |
Non-Controlled Affiliates | | | | | | | | | | | | | | | | | | | | | | | | | | | | | | | | |
Institutional Fiduciary Trust Money Market Portfolio, 2.05% | | | 755,389 | | | | 75,065,897 | | | | (71,184,142 | ) | | | 4,637,144 | | | | $4,637,144 | | | | $40,616 | | | | $ — | | | | $ — | |
g. Waiver and Expense Reimbursements
Investor Services has contractually agreed in advance to waive or limit its fees so that the Class R6 transfer agent fees do not exceed 0.03% based on the average net assets of the class until November 30, 2019.
4. Expense Offset Arrangement
The Fund has entered into an arrangement with its custodian whereby credits realized as a result of uninvested cash balances are used to reduce a portion of the Fund’s custodian expenses. During the period ended January 31, 2019, the custodian fees were reduced as noted in the Statement of Operations.
5. Income Taxes
For tax purposes, capital losses may be carried over to offset future capital gains, if any. At July 31, 2018, the capital loss carryforwards were as follows:
| | | | |
Capital loss carryforwards not subject to expiration: | | | | |
Short Term | | | $ 11,967,005 | |
Long Term | | | 549,650,755 | |
| | | | |
Total capital loss carryforwards | | | $561,617,760 | |
| | | | |
At January 31, 2019, the cost of investments and net unrealized appreciation (depreciation) for income tax purposes were as follows:
| | | | |
Cost of investments. | | $ | 1,173,693,655 | |
| | | | |
| |
Unrealized appreciation | | $ | 188,768,686 | |
Unrealized depreciation | | | (526,479,982 | ) |
| | | | |
Net unrealized appreciation (depreciation) | | $ | (337,711,296 | ) |
| | | | |
Differences between income and/or capital gains as determined on a book basis and a tax basis are primarily due to differing treatments of passive foreign investment company shares.
| | | | |
| | | |
| franklintempleton.com | | Semiannual Report | | 25 |
FRANKLIN GOLD AND PRECIOUS METALS FUND
NOTES TO FINANCIAL STATEMENTS (UNAUDITED)
6. Investment Transactions
Purchases and sales of investments (excluding short term securities) for the period ended January 31, 2019, aggregated $57,262,651 and $81,725,468, respectively.
7. Concentration of Risk
Investing in foreign securities may include certain risks and considerations not typically associated with investing in U.S. securities, such as fluctuating currency values and changing local and regional economic, political and social conditions, which may result in greater market volatility. Current political and financial uncertainty surrounding the European Union may increase market volatility and the economic risk of investing in securities in Europe. In addition, certain foreign securities may not be as liquid as U.S. securities.
| | | | |
| | | |
26 | | Semiannual Report | | franklintempleton.com |
FRANKLIN GOLD AND PRECIOUS METALS FUND
NOTES TO FINANCIAL STATEMENTS (UNAUDITED)
8. Holdings of 5% Voting Securities of Portfolio Companies
The 1940 Act defines “affiliated companies” to include investments in portfolio companies in which a fund owns 5% or more of the outstanding voting securities. During the period ended January 31, 2019, investments in “affiliated companies” were as follows:
| | | | | | | | | | | | | | | | | | | | | | | | | | | | | | | | |
| Name of Issuer | | Number of Shares/ Warrants/ Principal Amount* Held at Beginning of Period | | | Gross Additions | | | Gross Reductions | | | Number of Shares/ Warrants/ Principal Amount* Held at End of Period | | | Value at End of Period | | | Investment
Income | | | Realized
Gain (Loss) | | | Net Change in
Unrealized
Appreciation
(Depreciation) | |
| |
Non-Controlled Affiliates | | | | | | | | | | | | | | | | | | | | | | | | | | | | | | | | |
| | | | | | | | | | | | | | | | | | | | | | | Dividends | | | | | | | | | |
| | | | | | | | | | | | | | | | | | | | | | | | | | | | | | | | |
Beadell Resources Ltd. | | | 68,266,330 | | | | 59,219,600 | | | | — | | | | 127,485,930 | | | | $ 5,377,051 | | | | $ — | | | | $ — | | | | $ 220,369 | |
Chalice Gold Mines Ltd. | | | 31,072,008 | | | | — | | | | — | | | | 31,072,008 | | | | 2,937,423 | | | | 908,235 | | | | — | | | | (641,707 | ) |
Geopacific Resources Ltd. | | | 165,027,382 | | | | — | | | | — | | | | 165,027,382 | | | | 1,440,095 | | | | — | | | | — | | | | (1,748,548 | ) |
Guyana Goldfields Inc | | | 1,845,000 | | | | 2,801,700 | | | | — | | | | 4,646,700 | | | | 6,086,607 | | | | — | | | | — | | | | (3,354,254 | ) |
Guyana Goldfields Inc., 144A | | | 6,220,000 | | | | — | | | | — | | | | 6,220,000 | | | | 8,147,437 | | | | — | | | | — | | | | (10,979,253 | ) |
INV Metals Inc., 144A | | | 6,565,000 | | | | — | | | | — | | | | 6,565,000 | | | | 3,699,718 | | | | — | | | | — | | | | 1,327,678 | |
Lion One Metals Ltd. | | | 5,500,000 | | | | — | | | | — | | | | 5,500,000 | | | | 1,968,624 | | | | — | | | | — | | | | (230,023 | ) |
Lion One Metals Ltd., 144A | | | 2,935,000 | | | | — | | | | — | | | | 2,935,000 | | | | 1,050,529 | | | | — | | | | — | | | | (122,749 | ) |
Lydian International Ltd. | | | 22,701,000 | | | | — | | | | (15,381,500 | ) | | | 7,319,500 | | | | 1,003,358 | | | | — | | | | (2,858,610 | ) | | | 1,306,460 | |
Lydian International Ltd., 144A | | | 35,250,000 | | | | — | | | | — | | | | 35,250,000 | | | | 4,832,077 | | | | — | | | | — | | | | (2,755,562 | ) |
Nautilus Minerals Inc. | | | 9,222,015 | | | | — | | | | — | | | | 9,222,015 | | | | 421,385 | | | | — | | | | — | | | | (571,145 | ) |
Nautilus Minerals Inc., 144A | | | 28,535,816 | | | | — | | | | — | | | | 28,535,816 | | | | 1,303,898 | | | | — | | | | — | | | | (1,767,300 | ) |
Perseus Mining Ltd. | | | 61,253,901 | | | | — | | | | — | | | | 61,253,901 | | | | 18,485,692 | | | | — | | | | — | | | | 277,358 | |
Perseus Mining Ltd., wts., 4/19/19 | | | 19,006,000 | | | | — | | | | — | | | | 19,006,000 | | | | 32,452 | | | | — | | | | — | | | | (46,051 | ) |
Platinum Group Metals Ltd., (CAD Traded) | | | 5,934,082 | | | | 12,093,795 | a | | | (16,225,090 | )a | | | 1,802,787 | | | | 2,636,015 | | | | — | | | | — | | | | 426,645 | |
Platinum Group Metals Ltd., (units consisting of common stock and wts.) | | | 12,093,795 | | | | — | | | | (12,093,795 | )a | | | — | | | | — | | | | — | | | | — | | | | 468,030 | |
Platinum Group Metals Ltd., (USD Traded) | | | 15,281,172 | | | | 81,898 | a | | | (13,753,055 | )a | | | 1,610,015 | | | | 2,334,522 | | | | — | | | | — | | | | 786,539 | |
Platinum Group Metals Ltd., 144A | | | 1,343,876 | | | | — | | | | (1,209,488 | )a | | | 134,388 | | | | 196,501 | | | | — | | | | — | | | | 57,030 | |
Platinum Group Metals Ltd., wts., 11/15/19 | | | — | | | | 12,093,795 | a | | | — | | | | 12,093,795 | | | | 181,407 | | | | — | | | | — | | | | (39,144 | ) |
Red 5 Ltd. | | | 127,268,146 | | | | — | | | | — | | | | 127,268,146 | | | | 11,105,928 | | | | — | | | | — | | | | 4,863,693 | |
RTG Mining Inc. | | | 1,769,918 | | | | — | | | | — | | | | 1,769,918 | | | | 188,705 | | | | — | | | | — | | | | 52,641 | |
RTG Mining Inc., 144A | | | 2,397,790 | | | | — | | | | — | | | | 2,397,790 | | | | 255,647 | | | | — | | | | — | | | | 71,315 | |
RTG Mining Inc., IDR | | | 41,087,582 | | | | — | | | | — | | | | 41,087,582 | | | | 4,332,439 | | | | — | | | | — | | | | 1,126,344 | |
Rubicon Minerals Corp. | | | 3,508,900 | | | | — | | | | — | | | | 3,508,900 | | | | — | b | | | — | | | | — | | | | — | b |
| | | | | | | | | | | | | | | | | | | | |
| | | | | | | | | | | | | | | | | | | $78,017,510 | | | | $908,235 | | | | $(2,858,610 | ) | | | $(11,271,634 | ) |
| | | | | | | | | | | | | | | | | | | | |
| | | | | | | | |
| | | | | | | | | | | | | | | | | | | | | | | Interest | | | | | | | | | |
| | | | | | | | | | | | | | | | | | | | | | | | | | | | | | | | |
Platinum Group Metals Ltd., cvt., 6.875%, 7/01/22 | | | 3,000,000 | | | | — | | | | — | | | | 3,000,000 | | | | 2,141,250 | | | | — | | | | — | | | | (91,254 | ) |
| | | | | | | | | | | | | | | | | | | | |
Total Affiliated Securities(Value is 9.6% of Net Assets) | | | | | | | | | | | | | | | | $80,158,760 | | | | $908,235 | | | | $(2,858,610) | | | | $(11,362,888 | ) |
| | | | | | | | | | | | | | | | | | | | |
aGross addition/reduction was the result of various corporate actions.
bAs of January 31, 2019, no longer an affiliate.
*In U.S. dollars unless otherwise indicated.
| | | | |
| | | |
| franklintempleton.com | | Semiannual Report | | 27 |
FRANKLIN GOLD AND PRECIOUS METALS FUND
NOTES TO FINANCIAL STATEMENTS (UNAUDITED)
9. Credit Facility
The Fund, together with other U.S. registered and foreign investment funds (collectively, Borrowers), managed by Franklin Templeton, are borrowers in a joint syndicated senior unsecured credit facility totaling $2 billion (Global Credit Facility) which matured on February 8, 2019. This Global Credit Facility provides a source of funds to the Borrowers for temporary and emergency purposes, including the ability to meet future unanticipated or unusually large redemption requests. Effective February 8, 2019, the Borrowers renewed the Global Credit Facility for a one year term, maturing February 7, 2020, for a total of $2 billion.
Under the terms of the Global Credit Facility, the Fund shall, in addition to interest charged on any borrowings made by the Fund and other costs incurred by the Fund, pay its share of fees and expenses incurred in connection with the implementation and maintenance of the Global Credit Facility, based upon its relative share of the aggregate net assets of all of the Borrowers, including an annual commitment fee of 0.15% based upon the unused portion of the Global Credit Facility. These fees are reflected in other expenses in the Statement of Operations. During the year ended December 31, 2018, the Fund did not use the Global Credit Facility.
10. Fair Value Measurements
The Fund follows a fair value hierarchy that distinguishes between market data obtained from independent sources (observable inputs) and the Fund’s own market assumptions (unobservable inputs). These inputs are used in determining the value of the Fund’s financial instruments and are summarized in the following fair value hierarchy:
| | • | | Level 1 – quoted prices in active markets for identical financial instruments |
| | • | | Level 2 – other significant observable inputs (including quoted prices for similar financial instruments, interest rates, prepayment speed, credit risk, etc.) |
| | • | | Level 3 – significant unobservable inputs (including the Fund’s own assumptions in determining the fair value of financial instruments) |
The input levels are not necessarily an indication of the risk or liquidity associated with financial instruments at that level.
A summary of inputs used as of January 31, 2019, in valuing the Fund’s assets carried at fair value, is as follows:
| | | | | | | | | | | | | | | | |
| | | Level 1 | | | Level 2 | | | Level 3 | | | Total | |
Assets: | | | | | | | | | | | | | | | | |
Investments in Securities:a | | | | | | | | | | | | | | | | |
Equity Investments:b | | | | | | | | | | | | | | | | |
Diversified Metals & Mining | | $ | 33,268,028 | | | $ | — | | | $ | 31,437 | | | $ | 33,299,465 | |
Gold | | | 712,885,409 | | | | — | | | | 32,452 | | | | 712,917,861 | |
All Other Equity Investments | | | 82,986,639 | | | | — | | | | — | | | | 82,986,639 | |
Convertible Bonds | | | — | | | | 2,141,250 | | | | — | | | | 2,141,250 | |
Short Term Investments | | | 4,637,144 | | | | — | | | | — | | | | 4,637,144 | |
| | | | |
Total Investments in Securities | | $ | 833,777,220 | | | $ | 2,141,250 | | | $ | 63,889 | | | $ | 835,982,359 | |
| | | | |
aFor detailed categories, see the accompanying Statement of Investments.
bIncludes common stocks as well as other equity investments.
A reconciliation of assets in which Level 3 inputs are used in determining fair value is presented when there are significant Level 3 financial instruments at the beginning and/or end of the period.
| | | | |
| | | |
28 | | Semiannual Report | | franklintempleton.com |
FRANKLIN GOLD AND PRECIOUS METALS FUND
NOTES TO FINANCIAL STATEMENTS (UNAUDITED)
11. Subsequent Events
The Fund has evaluated subsequent events through the issuance of the financial statements and determined that no events have occurred that require disclosure other than those already disclosed in the financial statements.
Abbreviations
| | | | | | |
| Currency | | Selected Portfolio |
CAD | | Canadian Dollar | | ADR | | American Depositary Receipt |
USD | | United States Dollar | | IDR | | International Depositary Receipt |
| | | | |
| | | |
| franklintempleton.com | | Semiannual Report | | 29 |
FRANKLIN GOLD AND PRECIOUS METALS FUND
Shareholder Information
Proxy Voting Policies and Procedures
The Fund’s investment manager has established Proxy Voting Policies and Procedures (Policies) that the Fund uses to determine how to vote proxies relating to portfolio securities. Shareholders may view the Fund’s complete Policies online at franklintempleton.com. Alternatively, shareholders may request copies of the Policies free of charge by calling the Proxy Group collect at (954)527-7678 or by sending a written request to: Franklin Templeton Companies, LLC, 300 S.E. 2nd Street, Fort Lauderdale, FL 33301, Attention: Proxy Group. Copies of the Fund’s proxy voting records are also made available online at franklintempleton.com and posted on the U.S. Securities and Exchange Commission’s website at sec.gov and reflect the most recent12-month period ended June 30.
Quarterly Statement of Investments
The Fund files a complete statement of investments with the U.S. Securities and Exchange Commission for the first and third quarters for each fiscal year on FormN-Q. Shareholders may view the filed FormN-Q by visiting the Commission’s website at sec.gov. The filed form may also be viewed and copied at the Commission’s Public Reference Room in Washington, DC. Information regarding the operations of the Public Reference Room may be obtained by calling(800) SEC-0330.
| | | | |
| | | |
30 | | Semiannual Report | | franklintempleton.com |
This page intentionally left blank.
This page intentionally left blank.
| | |
| | Semiannual Report and Shareholder Letter |
| | Franklin Gold and Precious Metals Fund |
| | Investment Manager |
| | Franklin Advisers, Inc. |
| | Distributor |
| | Franklin Templeton Distributors, Inc. |
| | (800) DIAL BEN®/342-5236 |
| | franklintempleton.com |
| | Shareholder Services |
| | (800)632-2301 |
Authorized for distribution only when accompanied or preceded by a summary prospectus and/or prospectus. Investors should carefully consider a fund’s investment goals, risks, charges and expenses before investing. A prospectus contains this and other information; please read it carefully before investing.
To help ensure we provide you with quality service, all calls to and from our service areas are monitored and/or recorded.
| | |
© 2019 Franklin Templeton Investments. All rights reserved. | | 132 S 03/19 |
(a) The Registrant has adopted a code of ethics that applies to its principal executive officers and principal financial and accounting officer.
(c) N/A
(d) N/A
(f) Pursuant to Item 12(a)(1), the Registrant is attaching as an exhibit a copy of its code of ethics that applies to its principal executive officers and principal financial and accounting officer.
| Item 3. | Audit Committee Financial Expert. |
(a)(1) The Registrant has an audit committee financial expert serving on its audit committee.
(2) The audit committee financial expert is Terrence J. Checki and he is “independent” as defined under the relevant Securities and Exchange Commission Rules and Releases.
| Item 4. | Principal Accountant Fees and Services. N/A |
| Item 5. | Audit Committee of Listed Registrants. N/A |
| Item 6. | Schedule of Investments. N/A |
| Item 7. | Disclosure of Proxy Voting Policies and Procedures forClosed-End Management Investment Companies. N/A |
| Item 8. | Portfolio Managers ofClosed-End Management Investment Companies. N/A |
| Item 9. | Purchases of Equity Securities byClosed-End Management Investment Company and Affiliated Purchasers. N/A |
| Item 10. | Submission of Matters to a Vote of Security Holders. |
There have been no changes to the procedures by which shareholders may recommend nominees to the Registrant’s Board of Trustees that would require disclosure herein.
| Item 11. | Controls and Procedures. |
(a)Evaluation of Disclosure Controls and Procedures. The Registrant maintains disclosure controls and procedures that are designed to
provide reasonable assurance that information required to be disclosed in the Registrant’s filings under the Securities Exchange Act of 1934, as amended, and the Investment Company Act of 1940 is recorded, processed, summarized and reported within the periods specified in the rules and forms of the Securities and Exchange Commission. Such information is accumulated and communicated to the Registrant’s management, including its principal executive officer and principal financial officer, as appropriate, to allow timely decisions regarding required disclosure. The Registrant’s management, including the principal executive officer and the principal financial officer, recognizes that any set of controls and procedures, no matter how well designed and operated, can provide only reasonable assurance of achieving the desired control objectives.
Within 90 days prior to the filing date of this Shareholder Report on FormN-CSR, the Registrant had carried out an evaluation, under the supervision and with the participation of the Registrant’s management, including the Registrant’s principal executive officer and the Registrant’s principal financial officer, of the effectiveness of the design and operation of the Registrant’s disclosure controls and procedures. Based on such evaluation, the Registrant’s principal executive officer and principal financial officer concluded that the Registrant’s disclosure controls and procedures were not effective related to internal control over financial reporting specific to the monitoring of market events following the close of trading in foreign stock markets that assist in determining the reliability of the values of the foreign securities held by the Fund and which may require the use of fair valuation factors to account for changes in the values of those securities subsequent to the local close of the foreign market but prior to the net asset calculation of the Fund. As a result, a material weakness exists at period end for the Franklin Gold & Precious Metals Fund. There are no misstatements to current and previously issued financial statements. However, this material weakness could result in misstatements of security values and unrealized gains or losses and associated disclosures that would result in a material misstatement of the interim or annual consolidated financial statements that would not be prevented or detected.
Effective November 1, 2018, the Registrant’s controls were enhanced through the implementation of a daily secondary review of market events following the close of trading on foreign stock markets to ensure the appropriate application of market level fair value. Registrant’s management believes this will facilitate the remediation of the control deficiency we have identified and strengthen the internal control over financial reporting. This material weakness will not be considered remediated until the applicable controls operate for a sufficient period of time and management has concluded, through testing, that these controls are operating effectively.
(b) Changes in Internal Controls. As described above, there have been changes in the Registrant’s internal control over financial reporting that occurred during the period covered by this report that have materially affected, or is reasonably likely to materially affect, the internal control over financial reporting.
| Item 12. | Disclosure of Securities Lending Activities forClosed-End Management Investment Company. N/A |
(a) (1) Code of Ethics
(a) (2) Certifications pursuant to Section 302 of the Sarbanes-Oxley Act of 2002 of Matthew T. Hinkle, Chief ExecutiveOfficer - Finance and Administration, and Gaston Gardey, Chief Financial Officer and Chief Accounting Officer
(b) Certifications pursuant to Section 906 of the Sarbanes-Oxley Act of 2002 of Matthew T. Hinkle, Chief Executive Officer - Finance and Administration, and Gaston Gardey, Chief Financial Officer and Chief Accounting Officer
SIGNATURES
Pursuant to the requirements of the Securities Exchange Act of 1934 and the Investment Company Act of 1940, the registrant has duly caused this report to be signed on its behalf by the undersigned, thereunto duly authorized.
FRANKLIN GOLD AND PRECIOUS METALS FUND
| | |
| By | | /s/ MATTHEW T. HINKLE |
| | Matthew T. Hinkle |
| | Chief Executive Officer – Finance and Administration |
| Date | | March 27, 2019 |
Pursuant to the requirements of the Securities Exchange Act of 1934 and the Investment Company Act of 1940, this report has been signed below by the following persons on behalf of the registrant and in the capacities and on the dates indicated.
| | |
| By | | /s/ MATTHEW T. HINKLE |
| | Matthew T. Hinkle |
| | Chief Executive Officer – Finance and Administration |
| Date | | March 27, 2019 |
| |
| By | | /s/ GASTON GARDEY |
| | Gaston Gardey |
| | Chief Financial Officer and |
| | Chief Accounting Officer |
| Date | | March 27, 2019 |