UNITED STATES
SECURITIES AND EXCHANGE COMMISSION
Washington, DC 20549
FORMN-CSRS
CERTIFIED SHAREHOLDER REPORT OF REGISTERED
MANAGEMENT INVESTMENT COMPANIES
Investment Company Act file number811-01700
Franklin Gold and Precious Metals Fund
(Exact name of registrant as specified in charter)
| | |
| One Franklin Parkway, San Mateo, CA | | 94403-1906 |
(Address of principal executive offices) | | (Zip code) |
Craig S. Tyle, One Franklin Parkway, San Mateo, CA 94403-1906
(Name and address of agent for service)
Registrant’s telephone number, including area code: 650312-2000
Date of fiscal year end: 7/31
Date of reporting period: 1/31/20
Item 1. Reports to Stockholders.
Sign up for electronic delivery at franklintempleton.com/edelivery
Internet Delivery of Fund Reports Unless You Request Paper Copies: Effective January 1, 2021, as permitted by the SEC, paper copies of the Fund’s shareholder reports will no longer be sent by mail, unless you specifically request them from the Fund or your financial intermediary. Instead, the reports will be made available on a website, and you will be notified by mail each time a report is posted and provided with a website link to access the report.
If you already elected to receive shareholder reports electronically, you will not be affected by this change and you need not take any action. If you have not signed up for electronic delivery, we would encourage you to join fellow shareholders who have. You may elect to receive shareholder reports and other communications electronically from the Fund by calling (800) 632-2301 or by contacting your financial intermediary.
You may elect to continue to receive paper copies of all your future shareholder reports free of charge by contacting your financial intermediary or, if you invest directly with a Fund, calling (800) 632-2301 to let the Fund know of your request. Your election to receive reports in paper will apply to all funds held in your account.
SHAREHOLDER LETTER
Dear Shareholder:
During the six months ended January 31, 2020, global economic growth moderated amid ongoing U.S.-China trade disputes, but interest rate cuts from many central banks and the easing of trade tensions since mid-December provided a boost for equities worldwide. However, in January 2020, the identification of a novel coronavirus outbreak hindered stocks, particularly in Asia. The European Central Bank left its headline refinancing rate unchanged during the period but lowered the deposit rate and restarted its bond-buying stimulus program, further supporting stocks. The U.S. Federal Reserve (Fed) cut the federal funds target rate twice during the period, lowering it to a range of 1.50%–1.75%. Stocks responded positively to the supportive economic policy and the Fed indicated that a return to a tighter monetary policy in 2020 was unlikely given the economic climate. In this environment, U.S. stocks, as measured by the Standard & Poor’s® 500 Index, and global developed market stocks, as measured by the MSCI World Index, ended the period with positive returns.
Gold reached its 2019 high in September before retreating in 2019’s last quarter as gold exchange-traded funds recorded modest outflows in the first half of October and remained muted through year-end. A phase one U.S.-China trade deal and a better global economy supported investments generally perceived as riskier in late 2019, curbing gold prices despite the U.S. dollar’s decline against most currencies and an expanding global money supply. However, in January 2020, gold rallied to its highest price level since April 2013 as investors sought perceived safe haven assets amid uncertainty about global economic growth, geopolitics and the impact of the coronavirus outbreak on financial markets.1The Fed’s more accommodative monetary policy and lower global bond yields also increased demand for gold and gold-mining equities. In this environment, gold stocks, as measured by the FTSE® Gold Mines Index, posted a total return of +9.08% for the six-month period.2
We are committed to our long-term perspective and disciplined investment approach as we conduct a rigorous,
fundamental analysis of securities with a regular emphasis on investment risk management.
We believe active, professional investment management serves investors well. We also recognize the important role of financial advisors in today’s markets and encourage investors to continue to seek their advice. Amid changing markets and economic conditions, we are confident investors with a well-diversified portfolio and a patient, long-term outlook should be well positioned for the years ahead.
Franklin Gold and Precious Metals Fund’s semiannual report includes more detail about prevailing conditions and discussions about investment decisions during the period. Please remember all securities markets fluctuate, as do mutual fund share prices.
We thank you for investing with Franklin Templeton, welcome your questions and comments, and look forward to serving your future investment needs.
Sincerely,

Edward Perks, CFA
President and Chief Executive Officer –
Investment Management
Franklin Gold and Precious Metals Fund
This letter reflects our analysis and opinions as of January 31, 2020, unless otherwise indicated. The information is not a complete analysis of every aspect of any market, country, industry, security or fund. Statements of fact are from sources considered reliable.
CFA® is a trademark owned by CFA Institute.
1. Source: Bloomberg LP. Based on spot prices quoted in U.S. dollars per troy ounce.
2. Source: Morningstar.
See www.franklintempletondatasources.com for additional data provider information.

| | | | |
| | | |
| franklintempleton.com | | Not part of the semiannual report | | 1 |
Contents
| | |
| | | Visitfranklintempleton.com for fund updates, to access your account, or to find helpful financial planning tools. |
| | | | |
| | | |
2 | | Semiannual Report | | franklintempleton.com |
SEMIANNUAL REPORT
Franklin Gold and Precious Metals Fund
This semiannual report for Franklin Gold and Precious Metals Fund covers the period ended January 31, 2020.
Your Fund’s Goals and Main Investments
The Fund seeks capital appreciation, with current income as its secondary goal, by investing under normal market conditions at least 80% of its net assets in securities of gold and precious metals operation companies. The Fund primarily invests in equity securities, mainly common stock, and also invests in American, global and European depositary receipts.
Performance Overview
The Fund’s Class A shares posted a +14.09% cumulative total return for the six months under review. In comparison, the Fund’s primary benchmark, the sector-specific FTSE Gold Mines Index, which comprises companies whose principal activity is gold mining, posted a +9.08% total return.1The Fund’s secondary benchmark, the Standard & Poor’s 500 Index (S&P 500®), which is a broad measure of U.S. stock performance, posted a +9.31% total return.1You can find the Fund’s long-term performance data in the Performance Summary beginning on page 8.
Performance data represent past performance, which does not guarantee future results. Investment return and principal value will fluctuate, and you may have a gain or loss when you sell your shares. Current performance may differ from figures shown. For most recent month-end performance, go tofranklintempleton.comor call(800) 342-5236.
Economic and Market Overview
Global developed and emerging market stocks, as measured by the MSCI All Country World Index, posted strong returns during the reporting period. Although global economic growth remained tepid, interest-rate cuts from many central banks and the easing of trade tensions near period-end contributed to the generally positive environment for equities worldwide. However, in January 2020, the novel coronavirus outbreak and investor fears of economic disruption weighed on stocks, particularly in Asia.
Geographic Composition
Based on Total Net Assets as of 1/31/20
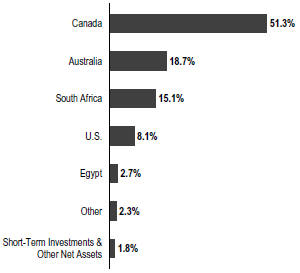
In the U.S., steady economic growth also supported equities, as healthy consumer spending and a strong labor market helped drive the economy. The unemployment rate fell to 3.5% in late 2019, the lowest unemployment rate in 50 years, before ending the period at 3.6%.2Wages also grew, albeit at a moderate pace, and inflation remained historically low despite a slight increase late in the reporting period. Although the consumer sector remained strong, some parts of the economy struggled, particularly heavy industry. Annual industrial production contracted late in the reporting period, manufacturing output stalled and capital spending declined.
The U.S. Federal Reserve (Fed) provided a substantial boost to equity markets as it adopted a more accommodative monetary policy. The Fed cut the federal funds target rate two times during the period, lowering it to a range of 1.50%–1.75%. In addition, U.S. government spending also boosted economic growth. Stocks responded positively to the supportive economic policy, especially the interest-rate cuts, and the Fed indicated in January that a return to a
1. Source: Morningstar.
The indexes are unmanaged and include reinvestment of any income or distributions. They do not reflect any fees, expenses or sales charges. One cannot invest directly in an index, and an index is not representative of the Fund’s portfolio.
2. Source: U.S. Bureau of Labor Statistics.
The dollar value, number of shares or principal amount, and names of all portfolio holdings are listed in the Fund’s Statement of Investments (SOI).
The SOI begins on page 15.
| | | | |
| | | |
| franklintempleton.com | | Semiannual Report | | 3 |
FRANKLIN GOLD AND PRECIOUS METALS FUND
tighter monetary policy in 2020 was unlikely given the economic climate.
Growth was tepid in the eurozone, particularly in Germany, the largest economy in the region. Germany, which is heavily reliant on exports, was adversely affected by the trade conflict between the U.S. and China and the resulting slowdown in global trade. Growth also remained persistently low in Italy, where political uncertainty and a large budget deficit weighed on the economy. Despite sluggish economic conditions, European developed market equities, as measured by the MSCI Europe Index, posted strong returns overall, as easing trade tensions buoyed investor optimism and an electoral victory by the U.K. Conservative Party in December 2019 alleviated uncertainty surrounding Brexit, which subsequently occurred in January 2020. Although the European Central Bank left its headline refinancing rate unchanged, it lowered the deposit rate and restarted its bond-buying stimulus program, further supporting stocks.
Economic growth in Asia was relatively solid overall, despite slowdowns in several large emerging market countries, such as China and India. Japan’s economy grew amid monetary stimulus from the Bank of Japan and fiscal stimulus from the government. The trade conflict between the U.S. and China was a significant source of volatility for Asian stocks, which rose and fell in sync with investor sentiment regarding a trade deal. A phase one trade agreement reached between the two countries in December 2019 propelled Asian developed and emerging market stocks, although some of these gains were reversed following the outbreak of the novel coronavirus. Overall, Asian stocks posted strong returns during the period, as measured by the MSCI All Country Asia Index.
Emerging market stocks, as measured by the MSCI Emerging Markets Index, posted modest gains during the period, despite experiencing several sharp selloffs. In aggregate, economic growth slowed somewhat but remained relatively solid, although there was some variation among individual countries. Many central banks in emerging markets cut interest rates throughout the reporting period, which, along with resilient GDP growth, provided a supportive environment for equities. However, emerging market stocks were negatively impacted by the spread of the novel coronavirus near period-end.
Precious Metals Sector Overview
After starting the six-month period at $1,414 per ounce, gold reached its 2019 peak of $1,553 per ounce in September before retreating in 2019’s last quarter as gold exchange-traded funds recorded modest outflows in the first half of October, reversing the summer’s trend.3A phase one U.S.-China trade deal and improvement in global economic data supported investments generally perceived as riskier in late 2019, keeping gold prices in check despite the additional lift from the U.S. dollar’s decline against most currencies and an expanding global money supply. A recovery in U.S. Treasury yields also cooled the gold rally through the autumn months. However, in January 2020, gold rallied to its highest price level since April 2013, closing the six-month period up 12.41% to $1,589 per ounce as investors continued to seek perceived safe haven assets amid uncertainty about global economic growth, geopolitical conflicts and, most recently, the impact of the novel coronavirus outbreak on financial markets.3Fed comments indicating the continuation of its accommodative monetary policy and lower bond yields around the world also continued to create new demand for gold and gold-mining equities, and by period-end, the yield on the 10-year U.S. Treasury fell to the lowest level since October 2019.
Among the other major precious metals, platinum, used in catalytic converters for diesel-powered engines, rose 11.14%, and silver advanced 10.93% for the six-month period, while palladium soared 50.52%, making it the period’s best-performing precious metal.3Palladium continued its long run of record highs as demand from the automotive sector has been booming as a result of tightening emissions legislation in all major regions (including India, China, the U.S. and Europe). Many palladium experts agree there is little chance that supply conditions will ease, with South Africa indicating in late 2019 a drop in platinum-group metal production. Precious metals, in general, were aided in varying degrees by a challenging 2020 supply growth as miners around the globe dealt with declining metals grades and increased production costs.
Investment Strategy
Gold and precious metals operation companies include companies that mine, process, or deal in gold or other precious metals, such as silver, platinum and palladium, including mining finance and exploration companies as well as operating companies with long- or medium-life mines. The Fund may buy securities of gold and precious metals
3. Source: Bloomberg LP. Based on spot prices quoted in U.S. dollars per troy ounce.
| | | | |
| | | |
4 | | Semiannual Report | | franklintempleton.com |
FRANKLIN GOLD AND PRECIOUS METALS FUND
Precious Metals Prices(7/31/19–1/31/20)*
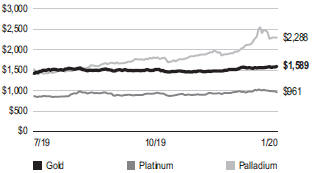
*Source: Bloomberg LP. Amounts shown are based on spot prices quoted in US dollars per troy ounce. For illustrative purposes only; not representative of the Fund’s portfolio composition or performance.
operation companies located anywhere in the world and invests predominantly in non-U.S. companies. The Fund may invest in companies without regard to market capitalization, and may heavily invest in small- and mid-capitalization companies. We look for companies with low-cost reserves and experienced management teams with established track records, particularly focusing on companies with long life production profiles, expandable resource bases, and active exploration programs that can potentially drive future reserve and production growth.
Manager’s Discussion
Key contributors to the Fund’s absolute performance during the six-month period under review included the Fund’s holdings in Perseus Mining, B2Gold and Impala Platinum Holdings.
The share price of West African-focused gold miner Perseus Mining increased during the period, continuing the company’s solid results from earlier in 2019. Perseus reported December quarter operating results highlighting a 5% increase over September quarter gold production, at a slightly higher cost, which was more than offset by higher gold prices. Through the end of December, the company spent $99 million of the estimated $265 million for the Yaoure project in Côte d’Ivoire as Perseus continued to advance its successful transition to a multi-mine, multi-jurisdictional gold producer.
Shares of Canada-based B2Gold, a low-cost senior gold producer, benefited from positive results during the period, including record gold production during 2019 that exceeded company guidance, helped by above-guidance production from its Fekola (Mali), Masbate (Philippines) and Otjikoto (Namibia) mines. Low consolidated costs in 2019 and positive projections for 2020 also boosted its share price. In
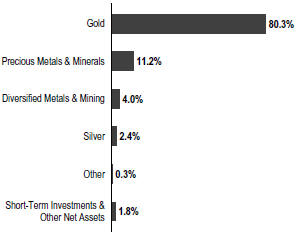
Portfolio Composition
Based on Total Net Assets as of 1/31/20
October, B2Gold sold its Nicaragua assets to Calibre Mining (not a Fund holding) for cash and shares. Near period-end, B2Gold also announced an increased mineral resource estimate for its Fekola mine and positive results from its updated preliminary economic assessment for the Gramalote Ridge deposit in Colombia with its joint venture partner, AngloGold Ashanti.
Platinum and palladium producer Impala Platinum Holdings benefited as palladium—a sought-after catalyst component in pollution-control devices for gasoline-powered cars and trucks—has maintained its status as the most valuable of the four major precious metals since summer, with strong demand and limited new supply driving prices to new heights. As palladium is often a by-product to platinum or nickel mining, output tends to lag price gains. Moreover, the amount produced was believed to have fallen short of demand for an eighth straight year in 2019, and production is slated to trail consumption through 2020 assuming normal auto demand, in our view. Tighter vehicle emissions regulations, especially in China, are driving greater palladium usage as companies look to exceed increasingly stringent standards.
Detractors from the Fund’s absolute performance during the period under review included the Fund’s holdings in St. Barbara, SEMAFO and Newcrest Mining.
Despite investor enthusiasm after Australia-based gold-mining company St. Barbara acquired Canada-based Atlantic Gold in July 2019, St. Barbara’s shares underperformed after the company announced a sharp decline in fiscal year 2019 earnings compared with the prior year. Reduced production guidance for a second year at St.
| | | | |
| | | |
| franklintempleton.com | | Semiannual Report | | 5 |
FRANKLIN GOLD AND PRECIOUS METALS FUND
Barbara’s Gwalia gold mine in Western Australia also hindered the stock.
Top 10 Holdings
1/31/20
| | |
Company Sector/Industry, Country | | % of Total Net Assets |
| |
B2Gold Corp. Gold, Canada | | 7.1% |
| |
Barrick Gold Corp. Gold, Canada | | 5.8% |
| |
AngloGold Ashanti Ltd. Gold, South Africa | | 4.8% |
| |
Perseus Mining Ltd. Gold, Australia | | 4.7% |
| |
Impala Platinum Holdings Ltd. Precious Metals & Minerals, South Africa | | 4.3% |
| |
Newcrest Mining Ltd. Gold, Australia | | 4.2% |
| |
Newmont Corp. Gold, U.S. | | 4.1% |
| |
Alamos Gold Inc. Gold, Canada | | 4.1% |
| |
Agnico EagleMines Ltd. Gold, Canada | | 2.9% |
| |
Centerra Gold Inc. Gold, Canada | | 2.8% |
SEMAFO is a Canada-based mining company with gold production and exploration activities in West Africa, including Burkino Faso, Niger and Guinea. After solid second-quarter 2019 results, shares of SEMAFO declined due in part to a pit wall failure in the northern portion of the Wona pit at its Mana mine in Burkina Faso during August 2019 that limited gold production at the mine. However, SEMAFO’s shares plunged in November after insurgents in Burkino Faso attacked five buses transporting workers from their Boungo mine, killing 37 and injuring over 60 people. In response, SEMAFO halted operations at the company’s new flagship mine through period-end.
Newcrest Mining is an Australia-based gold mining exploration and production company that operates in Australia and the Asia-Pacific region. Newcrest began the period with investor optimism about significant profits, debt reduction and a recent joint venture with Imperial Metals (not a Fund holding), a Canada-based metals and mining company, to operate the Red Chris gold-copper mine in British Columbia. However, the impending decline of gold grades at Newcrest’s top-performing Cadia mine in New South Wales, Australia, concerns around the limited mine life
of its Telfer mine in Western Australia and its Gosowong mine in Indonesia, and political issues delaying the development of the Wafi Golpu mine in Papua New Guinea depressed Newcrest’s stock price.
Although gold equites have delivered strong results and outperformed physical gold’s price over the past six months, our analysis shows many gold companies have maintained a focus on improving the cost structure of their operations, debt repayment and asset rationalization, which we believe has improved the outlook going forward. In addition, we believe small- and mid-capitalization gold equities may present some of the best investment opportunities given their generally lower valuation multiples and the industry’s recent uptick in merger and acquisition activity, which is receiving a boost as mining companies seek to replenish their resources following several years of limited exploration and development activity.
Thank you for your continued participation in Franklin Gold and Precious Metals Fund. We look forward to serving your future investment needs.
| | |
 | | 
Stephen M. Land, CFA |
| | |
 | | 
Frederick G. Fromm, CFA |
| |
| | Portfolio Management Team |
| | | | |
| | | |
6 | | Semiannual Report | | franklintempleton.com |
FRANKLIN GOLD AND PRECIOUS METALS FUND
The foregoing information reflects our analysis, opinions and portfolio holdings as of January 31, 2020, the end of the reporting period. The way we implement our main investment strategies and the resulting portfolio holdings may change depending on factors such as market and economic conditions. These opinions may not be relied upon as investment advice or an offer for a particular security. The information is not a complete analysis of every aspect of any market, country, industry, security or the Fund. Statements of fact are from sources considered reliable, but the investment manager makes no representation or warranty as to their completeness or accuracy. Although historical performance is no guarantee of future results, these insights may help you understand our investment management philosophy.
| | | | |
| | | |
| franklintempleton.com | | Semiannual Report | | 7 |
FRANKLIN GOLD AND PRECIOUS METALS FUND
Performance Summary as of January 31, 2020
The performance table does not reflect any taxes that a shareholder would pay on Fund dividends, capital gain distributions, if any, or any realized gains on the sale of Fund shares. Total return reflects reinvestment of the Fund’s dividends and capital gain distributions, if any, and any unrealized gains or losses. Your dividend income will vary depending on dividends or interest paid by securities in the Fund’s portfolio, adjusted for operating expenses of each class. Capital gain distributions are net profits realized from the sale of portfolio securities.
Performance as of 1/31/201
Cumulative total return excludes sales charges. Average annual total return includes maximum sales charges. Sales charges will vary depending on the size of the investment and the class of share purchased. The maximum is 5.50% and the minimum is 0%.Class A:5.50% maximum initial sales charge;Advisor Class:no sales charges. For other share classes, visitfranklintempleton.com.
| | | | |
| Share Class | | Cumulative Total Return2 | | Average Annual Total Return3 |
| | |
A4 | | | | |
| | |
6-Month | | +14.09% | | +7.82% |
| | |
1-Year | | +34.11% | | +26.70% |
| | |
5-Year | | +34.86% | | +4.96% |
| | |
10-Year | | -27.04% | | -3.65% |
| | |
Advisor | | | | |
| | |
6-Month | | +14.27% | | +14.27% |
| | |
1-Year | | +34.44% | | +34.44% |
| | |
5-Year | | +36.58% | | +6.43% |
| | |
10-Year | | -25.18% | | -2.86% |
Performance data represent past performance, which does not guarantee future results. Investment return and principal value will fluctuate, and you may have a gain or loss when you sell your shares. Current performance may differ from figures shown. For most recent month-end performance, go tofranklintempleton.comor call(800) 342-5236.
See page 9 for Performance Summary footnotes.
| | | | |
| | | |
8 | | Semiannual Report | | franklintempleton.com |
FRANKLIN GOLD AND PRECIOUS METALS FUND
PERFORMANCE SUMMARY
Total Annual Operating Expenses5
| | | | |
Share Class | | With Fee Waiver | | Without Fee Waiver |
| | |
A | | 0.98% | | 0.98% |
| | |
| Advisor | | 0.73% | | 0.73% |
Each class of shares is available to certain eligible investors and has different annual fees and expenses, as described in the prospectus.
All investments involve risks, including possible loss of principal. The Fund concentrates in the precious metals sector, which involves fluctuations in the prices of gold and other precious metals and increased susceptibility to adverse economic and regulatory developments affecting the sector. In times of stable economic growth, traditional equity and debt investments could offer greater appreciation potential and the prices of gold and other precious metals may be adversely affected. In addition, the Fund is subject to the risks of currency fluctuation and political uncertainty associated with foreign (non-U.S.) investing. Investments in emerging and frontier markets involve heightened risks related to the same factors, in addition to those associated with their relatively small size and lesser liquidity. The Fund may also heavily invest in smaller companies, which can be particularly sensitive to changing economic conditions, and their prospects for growth are less certain than those of larger, more established companies. Investing in a non-diversified fund involves the risk of greater price fluctuation than a more diversified portfolio. Unexpected events and their aftermaths, such as the spread of deadly diseases; natural, environmental or man-made disasters; financial, political or social disruptions; terrorism and war; and other tragedies or catastrophes, can cause investor fear and panic, which can adversely affect the economies of many companies, sectors, nations, regions and the market in general, in ways that cannot necessarily be foreseen. The Fund’s prospectus also includes a description of the main investment risks.
1. The Fund has a fee waiver associated with any investment it makes in a Franklin Templeton money fund and/or other Franklin Templeton fund, contractually guaranteed through 11/30/20. Fund investment results reflect the fee waiver; without this waiver, the results would have been lower.
2. Cumulative total return represents the change in value of an investment over the periods indicated.
3. Average annual total return represents the average annual change in value of an investment over the periods indicated. Return for less than one year, if any, has not been annualized.
4. Prior to 9/10/18 these shares were offered at a higher initial sales charge of 5.75%, thus actual returns (with sales charges) would have differed. Average annual total returns (with sales charges) have been restated to reflect the current maximum initial sales charge of 5.50%.
5. Figures are as stated in the Fund’s current prospectus and may differ from the expense ratios disclosed in the Your Fund’s Expenses and Financial Highlights sections in this report. In periods of market volatility, assets may decline significantly, causing total annual Fund operating expenses to become higher than the figures shown.
| | | | |
| | | |
| franklintempleton.com | | Semiannual Report | | 9 |
FRANKLIN GOLD AND PRECIOUS METALS FUND
Your Fund’s Expenses
As a Fund shareholder, you can incur two types of costs: (1) transaction costs, including sales charges (loads) on Fund purchases and redemptions; and (2) ongoing Fund costs, including management fees, distribution and service (12b-1) fees, and other Fund expenses. All mutual funds have ongoing costs, sometimes referred to as operating expenses. The table below shows ongoing costs of investing in the Fund and can help you understand these costs and compare them with those of other mutual funds. The table assumes a $1,000 investment held for the six months indicated.
Actual Fund Expenses
The table below provides information about actual account values and actual expenses in the columns under the heading “Actual.” In these columns the Fund’s actual return, which includes the effect of Fund expenses, is used to calculate the “Ending Account Value” for each class of shares. You can estimate the expenses you paid during the period by following these steps (ofcourse, your account value and expenses will differ from those in this illustration):Divide your account value by $1,000 (ifyour account had an $8,600 value, then $8,600 ÷ $1,000 = 8.6). Then multiply the result by the number in the row for your class of shares under the headings “Actual” and “Expenses Paid During Period” (ifActual Expenses Paid During Period were $7.50, then 8.6 x $7.50 = $64.50). In this illustration, the actual expenses paid this period are $64.50.
Hypothetical Example for Comparison with Other Funds
Under the heading “Hypothetical” in the table, information is provided about hypothetical account values and hypothetical expenses based on the Fund’s actual expense ratio and an assumed rate of return of 5% per year before expenses, which is not the Fund’s actual return. This information may not be used to estimate the actual ending account balance or expenses you paid for the period, but it can help you compare ongoing costs of investing in the Fund with those of other funds. To do so, compare this 5% hypothetical example for the class of shares you hold with the 5% hypothetical examples that appear in the shareholder reports of other funds.
Please note that expenses shown in the table are meant to highlight ongoing costs and do not reflect any transactional costs. Therefore, information under the heading “Hypothetical” is useful in comparing ongoing costs only, and will not help you compare total costs of owning different funds. In addition, if transactional costs were included, your total costs would have been higher.
| | | | | | | | | | | | |
| | | | | Actual
(actual return after expenses) | | Hypothetical
(5% annual return before expenses) | | |
Share Class | | Beginning Account Value 8/1/19 | | Ending Account Value 1/31/20 | | Expenses Paid During Period 8/1/19–1/31/201, 2 | | Ending Account Value 1/31/20 | | Expenses Paid During Period 8/1/19–1/31/201, 2 | | Net Annualized Expense Ratio2 |
| | | | | | |
| A | | $1,000 | | $1,140.90 | | $5.06 | | $1,020.41 | | $4.77 | | 0.94% |
| C | | $1,000 | | $1,137.10 | | $9.08 | | $1,016.64 | | $8.57 | | 1.69% |
| R6 | | $1,000 | | $1,143.60 | | $3.07 | | $1,022.27 | | $2.90 | | 0.57% |
| Advisor | | $1,000 | | $1,142.70 | | $3.72 | | $1,021.67 | | $3.51 | | 0.69% |
1. Expenses are equal to the annualized expense ratio for the six-month period as indicated above—in the far right column—multiplied by the simple average account value over the period indicated, and then multiplied by 184/366 to reflect the one-half year period.
2. Reflects expenses after fee waivers and expense reimbursements. Does not include acquired fund fees and expenses.
| | | | |
| | | |
10 | | Semiannual Report | | franklintempleton.com |
FRANKLIN GOLD AND PRECIOUS METALS FUND
Financial Highlights
| | | | | | | | | | | | | | | | | | | | | | | | |
| | | Six Months Ended
January 31, 2020 | | | Year Ended July 31, | |
| | | (unaudited) | | | 2019 | | | 2018 | | | 2017 | | | 2016 | | | 2015 | |
| | | | | | |
Class A | | | | | | | | | | | | | | | | | | | | | | | | |
| | | | | | |
Per share operating performance | | | | | | | | | | | | | | | | | | | | | | | | |
(for a share outstanding throughout the period) | | | | | | | | | | | | | | | | | | | | | | | | |
Net asset value, beginning of period | | | $16.68 | | | | $13.56 | | | | $16.19 | | | | $24.06 | | | | $11.63 | | | | $20.27 | |
| | | | | | |
Income from investment operationsa: | | | | | | | | | | | | | | | | | | | | | | | | |
Net investment income (loss)b | | | (0.03 | ) | | | (0.02 | ) | | | (0.06 | ) | | | (0.04 | ) | | | (0.09 | ) | | | (0.05 | ) |
Net realized and unrealized gains (losses) | | | 2.38 | | | | 3.14 | | | | (2.51 | ) | | | (6.45 | ) | | | 12.52 | | | | (8.43 | ) |
| | | | | | |
Total from investment operations | | | 2.35 | | | | 3.12 | | | | (2.57 | ) | | | (6.49 | ) | | | 12.43 | | | | (8.48 | ) |
| | | | | | |
Less distributions from: | | | | | | | | | | | | | | | | | | | | | | | | |
Net investment income | | | — | | | | — | | | | (0.06 | ) | | | (1.38 | ) | | | — | | | | (0.16 | ) |
| | | | | | |
Net asset value, end of period | | | $19.03 | | | | $16.68 | | | | $13.56 | | | | $16.19 | | | | $24.06 | | | | $11.63 | |
| | | | | | |
Total returnc | | | 14.09% | | | | 23.01% | | | | (15.92)% | | | | (26.85)% | | | | 106.88% | | | | (42.02)% | |
| | | | | | |
Ratios to average net assetsd | | | | | | | | | | | | | | | | | | | | | | | | |
| | | | | | |
Expensese | | | 0.94%f | | | | 0.98%f | | | | 1.02%f | | | | 0.98%f | | | | 1.11% | | | | 1.09%f | |
| | | | | | |
Net investment income (loss) | | | (0.39)% | | | | (0.15)% | | | | (0.37)% | | | | (0.24)% | | | | (0.57)% | | | | (0.35)% | |
| | | | | | |
Supplemental data | | | | | | | | | | | | | | | | | | | | | | | | |
| | | | | | |
Net assets, end of period (000’s) | | | $721,862 | | | | $645,108 | | | | $587,294 | | | | $776,677 | | | | $988,701 | | | | $444,295 | |
| | | | | | |
Portfolio turnover rate | | | 6.41% | | | | 12.82% | | | | 8.36% | | | | 13.99% | | | | 16.76% | | | | 12.52% | |
aThe amount shown for a share outstanding throughout the period may not correlate with the Statement of Operations for the period due to the timing of sales and repurchases of the Fund’s shares in relation to income earned and/or fluctuating fair value of the investments of the Fund.
bBased on average daily shares outstanding.
cTotal return does not reflect sales commissions or contingent deferred sales charges, if applicable, and is not annualized for periods less than one year.
dRatios are annualized for periods less than one year.
eBenefit of waiver and payments by affiliates rounds to less than 0.01%.
fBenefit of expense reduction rounds to less than 0.01%.
| | | | |
| | | |
| franklintempleton.com | | The accompanying notes are an integral part of these financial statements. | Semiannual Report | | 11 |
FRANKLIN GOLD AND PRECIOUS METALS FUND
FINANCIAL HIGHLIGHTS
| | | | | | | | | | | | | | | | | | | | | | | | |
| | | Six Months Ended
January 31, 2020 | | | Year Ended July 31, | |
| | | (unaudited) | | | 2019 | | | 2018 | | | 2017 | | | 2016 | | | 2015 | |
| | | | | | |
Class C | | | | | | | | | | | | | | | | | | | | | | | | |
| | | | | | |
Per share operating performance | | | | | | | | | | | | | | | | | | | | | | | | |
(for a share outstanding throughout the period) | | | | | | | | | | | | | | | | | | | | | | | | |
Net asset value, beginning of period | | | $15.24 | | | | $12.49 | | | | $14.96 | | | | $22.39 | | | | $10.90 | | | | $18.97 | |
| | | | | | |
Income from investment operationsa: | | | | | | | | | | | | | | | | | | | | | | | | |
Net investment income (loss)b | | | (0.09 | ) | | | (0.11 | ) | | | (0.15 | ) | | | (0.17 | ) | | | (0.18 | ) | | | (0.16 | ) |
Net realized and unrealized gains (losses) | | | 2.18 | | | | 2.86 | | | | (2.32 | ) | | | (5.99 | ) | | | 11.67 | | | | (7.89 | ) |
| | | | | | |
Total from investment operations | | | 2.09 | | | | 2.75 | | | | (2.47 | ) | | | (6.16 | ) | | | 11.49 | | | | (8.05 | ) |
| | | | | | |
Less distributions from: | | | | | | | | | | | | | | | | | | | | | | | | |
Net investment income | | | — | | | | — | | | | — | | | | (1.27 | ) | | | — | | | | (0.02 | ) |
| | | | | | |
Net asset value, end of period | | | $17.33 | | | | $15.24 | | | | $12.49 | | | | $14.96 | | | | $22.39 | | | | $10.90 | |
| | | | | | |
Total returnc | | | 13.71% | | | | 22.02% | | | | (16.51)% | | | | (27.41)% | | | | 105.41% | | | | (42.45)% | |
| | | | | | |
Ratios to average net assetsd | | | | | | | | | | | | | | | | | | | | | | | | |
| | | | | | |
Expensese | | | 1.69%f | | | | 1.73%f | | | | 1.77%f | | | | 1.73%f | | | | 1.86% | | | | 1.84%f | |
| | | | | | |
Net investment income (loss) | | | (1.14)% | | | | (0.90)% | | | | (1.12)% | | | | (0.99)% | | | | (1.32)% | | | | (1.10)% | |
| | | | | | |
Supplemental data | | | | | | | | | | | | | | | | | | | | | | | | |
| | | | | | |
Net assets, end of period (000’s) | | | $81,435 | | | | $75,129 | | | | $94,997 | | | | $137,487 | | | | $200,179 | | | | $97,483 | |
| | | | | | |
Portfolio turnover rate | | | 6.41% | | | | 12.82% | | | | 8.36% | | | | 13.99% | | | | 16.76% | | | | 12.52% | |
aThe amount shown for a share outstanding throughout the period may not correlate with the Statement of Operations for the period due to the timing of sales and repurchases of the Fund’s shares in relation to income earned and/or fluctuating fair value of the investments of the Fund.
bBased on average daily shares outstanding.
cTotal return does not reflect sales commissions or contingent deferred sales charges, if applicable, and is not annualized for periods less than one year.
dRatios are annualized for periods less than one year.
eBenefit of waiver and payments by affiliates rounds to less than 0.01%.
fBenefit of expense reduction rounds to less than 0.01%.
| | | | |
| | | |
12 | | Semiannual Report | The accompanying notes are an integral part of these financial statements. | | franklintempleton.com |
FRANKLIN GOLD AND PRECIOUS METALS FUND
FINANCIAL HIGHLIGHTS
| | | | | | | | | | | | | | | | | | | | | | | | |
| | | Six Months Ended
January 31, 2020 | | | Year Ended July 31, | |
| | | (unaudited) | | | 2019 | | | 2018 | | | 2017 | | | 2016 | | | 2015 | |
| | | | | | |
Class R6 | | | | | | | | | | | | | | | | | | | | | | | | |
| | | | | | |
Per share operating performance | | | | | | | | | | | | | | | | | | | | | | | | |
(for a share outstanding throughout the period) | | | | | | | | | | | | | | | | | | | | | | | | |
Net asset value, beginning of period | | | $17.90 | | | | $14.50 | | | | $17.31 | | | | $25.58 | | | | $12.29 | | | | $21.44 | |
| | | | | | |
Income from investment operationsa: | | | | | | | | | | | | | | | | | | | | | | | | |
Net investment income (loss)b | | | (— | )c | | | 0.04 | | | | 0.01 | | | | 0.04 | | | | (0.01 | ) | | | 0.03 | |
Net realized and unrealized gains (losses) | | | 2.57 | | | | 3.36 | | | | (2.68 | ) | | | (6.87 | ) | | | 13.30 | | | | (8.93 | ) |
| | | | | | |
Total from investment operations | | | 2.57 | | | | 3.40 | | | | (2.67 | ) | | | (6.83 | ) | | | 13.29 | | | | (8.90 | ) |
| | | | | | |
Less distributions from: | | | | | | | | | | | | | | | | | | | | | | | | |
Net investment income | | | — | | | | — | | | | (0.14 | ) | | | (1.44 | ) | | | — | | | | (0.25 | ) |
| | | | | | |
Net asset value, end of period | | | $20.47 | | | | $17.90 | | | | $14.50 | | | | $17.31 | | | | $25.58 | | | | $12.29 | |
| | | | | | |
Total returnd | | | 14.36% | | | | 23.45% | | | | (15.50)% | | | | (26.53)% | | | | 108.14% | | | | (41.74)% | |
| | | | | | |
Ratios to average net assetse | | | | | | | | | | | | | | | | | | | | | | | | |
| | | | | | |
Expenses before waiver and payments by affiliates | | | 0.71% | | | | 0.83% | | | | 0.79% | | | | 0.57% | | | | 0.63% | | | | 0.62% | |
| | | | | | |
Expenses net of waiver and payments by affiliates | | | 0.57%f | | | | 0.58%f | | | | 0.55%f | | | | 0.52%f | | | | 0.59% | | | | 0.55%f | |
| | | | | | |
Net investment income (loss) | | | (0.02)% | | | | 0.25% | | | | 0.10% | | | | 0.21% | | | | (0.05)% | | | | 0.19% | |
| | | | | | |
Supplemental data | | | | | | | | | | | | | | | | | | | | | | | | |
| | | | | | |
Net assets, end of period (000’s) | | | $12,498 | | | | $10,808 | | | | $8,153 | | | | $4,635 | | | | $3,764 | | | | $1,188 | |
| | | | | | |
Portfolio turnover rate | | | 6.41% | | | | 12.82% | | | | 8.36% | | | | 13.99% | | | | 16.76% | | | | 12.52% | |
aThe amount shown for a share outstanding throughout the period may not correlate with the Statement of Operations for the period due to the timing of sales and repurchases of the Fund’s shares in relation to income earned and/or fluctuating fair value of the investments of the Fund.
bBased on average daily shares outstanding.
cAmount rounds to less than $0.01 per share.
dTotal return is not annualized for periods less than one year.
eRatios are annualized for periods less than one year.
fBenefit of expense reduction rounds to less than 0.01%.
| | | | |
| | | |
| franklintempleton.com | | The accompanying notes are an integral part of these financial statements. | Semiannual Report | | 13 |
FRANKLIN GOLD AND PRECIOUS METALS FUND
FINANCIAL HIGHLIGHTS
| | | | | | | | | | | | | | | | | | | | | | | | |
| | | Six Months Ended
January 31, 2020 | | | Year Ended July 31, | |
| | | (unaudited) | | | 2019 | | | 2018 | | | 2017 | | | 2016 | | | 2015 | |
| | | | | | |
Advisor Class | | | | | | | | | | | | | | | | | | | | | | | | |
| | | | | | |
Per share operating performance | | | | | | | | | | | | | | | | | | | | | | | | |
(for a share outstanding throughout the period) | | | | | | | | | | | | | | | | | | | | | | | | |
Net asset value, beginning of period | | | $17.73 | | | | $14.38 | | | | $17.17 | | | | $25.38 | | | | $12.23 | | | | $21.32 | |
| | | | | | |
Income from investment operationsa: | | | | | | | | | | | | | | | | | | | | | | | | |
Net investment income (loss)b | | | (0.01 | ) | | | 0.01 | | | | (0.02 | ) | | | — | c | | | (0.05 | ) | | | (0.02 | ) |
Net realized and unrealized gains (losses) | | | 2.54 | | | | 3.34 | | | | (2.67 | ) | | | (6.81 | ) | | | 13.20 | | | | (8.87 | ) |
| | | | | | |
Total from investment operations | | | 2.53 | | | | 3.35 | | | | (2.69 | ) | | | (6.81 | ) | | | 13.15 | | | | (8.89 | ) |
| | | | | | |
Less distributions from: | | | | | | | | | | | | | | | | | | | | | | | | |
Net investment income | | | — | | | | — | | | | (0.10 | ) | | | (1.40 | ) | | | — | | | | (0.20 | ) |
| | | | | | |
Net asset value, end of period | | | $20.26 | | | | $17.73 | | | | $14.38 | | | | $17.17 | | | | $25.38 | | | | $12.23 | |
| | | | | | |
Total returnd | | | 14.27% | | | | 23.30% | | | | (15.70)% | | | | (26.69)% | | | | 107.52% | | | | (41.90)% | |
| | | | | | |
Ratios to average net assetse | | | | | | | | | | | | | | | | | | | | | | | | |
| | | | | | |
Expensesf | | | 0.69%g | | | | 0.73%g | | | | 0.77%g | | | | 0.73%g | | | | 0.86% | | | | 0.84%g | |
| | | | | | |
Net investment income (loss) | | | (0.14)% | | | | 0.10% | | | | (0.12)% | | | | 0.01% | | | | (0.32)% | | | | (0.10)% | |
| | | | | | |
Supplemental data | | | | | | | | | | | | | | | | | | | | | | | | |
| | | | | | |
Net assets, end of period (000’s) | | | $175,947 | | | | $143,589 | | | | $130,812 | | | | $164,253 | | | | $207,574 | | | | $90,628 | |
| | | | | | |
Portfolio turnover rate | | | 6.41% | | | | 12.82% | | | | 8.36% | | | | 13.99% | | | | 16.76% | | | | 12.52% | |
aThe amount shown for a share outstanding throughout the period may not correlate with the Statement of Operations for the period due to the timing of sales and repurchases of the Fund’s shares in relation to income earned and/or fluctuating fair value of the investments of the Fund.
bBased on average daily shares outstanding.
cAmount rounds to less than $0.01 per share.
dTotal return is not annualized for periods less than one year.
eRatios are annualized for periods less than one year.
fBenefit of waiver and payments by affiliates rounds to less than 0.01%.
gBenefit of expense reduction rounds to less than 0.01%.
| | | | |
| | | |
14 | | Semiannual Report | The accompanying notes are an integral part of these financial statements. | | franklintempleton.com |
FRANKLIN GOLD AND PRECIOUS METALS FUND
Statement of Investments, January 31, 2020 (unaudited)
| | | | | | | | | | | | |
| | | Country | | | Shares/ Rights/ Warrants | | | Value | |
Common Stocks and Other Equity Interests 98.0% | | | | | | | | | | | | |
Copper 0.3% | | | | | | | | | | | | |
aImperial Metals Corp. | | | Canada | | | | 1,950,300 | | | $ | 2,844,034 | |
| | | | | | | | | | | | |
Diversified Metals & Mining 4.0% | | | | | | | | | | | | |
aAdventus Mining Corp. | | | Canada | | | | 5,000,000 | | | | 3,324,518 | |
a,bBluestone Resources Inc., 144A | | | Canada | | | | 2,500,000 | | | | 3,305,629 | |
a,c,dBluestone Resources Inc., wts., 3/19/21 | | | Canada | | | | 550,000 | | | | 149,938 | |
a,eGeopacific Resources Ltd. | | | Australia | | | | 13,001,094 | | | | 4,116,167 | |
a,bINV Metals Inc., 144A | | | Canada | | | | 6,565,000 | | | | 1,661,712 | |
a,bIvanhoe Mines Ltd., 144A | | | Canada | | | | 5,735,000 | | | | 14,819,569 | |
aIvanhoe Mines Ltd., A | | | Canada | | | | 575,800 | | | | 1,487,900 | |
a,c,eNautilus Minerals Inc. | | | Canada | | | | 9,222,015 | | | | — | |
a,c,d,eNautilus Minerals Inc., 144A | | | Canada | | | | 28,535,816 | | | | — | |
aOrla Mining Ltd. | | | Canada | | | | 4,770,713 | | | | 9,191,778 | |
a,cOrla Mining Ltd., wts., 2/15/21 | | | Canada | | | | 460,000 | | | | 206,341 | |
aPantoro Ltd. | | | Australia | | | | 15,400,000 | | | | 1,030,802 | |
| | | | | | | | | | | | |
| | | | | | | | | | | 39,294,354 | |
| | | | | | | | | | | | |
Gold 80.3% | | | | | | | | | | | | |
Agnico Eagle Mines Ltd. (CAD Traded) | | | Canada | | | | 317,797 | | | | 19,641,703 | |
Agnico Eagle Mines Ltd. (USD Traded) | | | Canada | | | | 150,000 | | | | 9,273,000 | |
aAlacer Gold Corp. | | | United States | | | | 4,242,500 | | | | 19,938,307 | |
a,bAlacer Gold Corp., 144A | | | United States | | | | 1,500,000 | | | | 7,049,490 | |
Alamos Gold Inc., A (CAD Traded) | | | Canada | | | | 4,038,316 | | | | 25,477,853 | |
Alamos Gold Inc., A (USD Traded) | | | Canada | | | | 2,354,500 | | | | 14,833,350 | |
AngloGold Ashanti Ltd., ADR | | | South Africa | | | | 2,349,823 | | | | 47,842,396 | |
aAsanko Gold Inc. | | | Canada | | | | 10,803,375 | | | | 10,121,787 | |
aAscot Resources Ltd. | | | Canada | | | | 7,500,000 | | | | 4,250,094 | |
a,c,dAscot Resources Ltd., wts., 5/21/20 | | | Canada | | | | 5,000,000 | | | | 283,011 | |
B2Gold Corp. | | | Canada | | | | 16,138,694 | | | | 69,871,339 | |
Barrick Gold Corp. | | | Canada | | | | 3,089,383 | | | | 57,215,373 | |
aBelo Sun Mining Corp. | | | Canada | | | | 3,500,000 | | | | 1,375,142 | |
a,bBelo Sun Mining Corp., 144A | | | Canada | | | | 3,800,000 | | | | 1,493,011 | |
Centamin PLC | | | Egypt | | | | 15,015,200 | | | | 26,924,135 | |
aCenterra Gold Inc. | | | Canada | | | | 590,700 | | | | 4,730,956 | |
a,bCenterra Gold Inc., 144A | | | Canada | | | | 2,893,400 | | | | 23,173,434 | |
a,eChalice Gold Mines Ltd. | | | Australia | | | | 31,072,008 | | | | 5,724,486 | |
a,bContinental Gold Inc., 144A | | | Canada | | | | 1,000,000 | | | | 4,132,981 | |
aCorvus Gold Inc. | | | Canada | | | | 2,000,000 | | | | 3,218,738 | |
aDacian Gold Ltd. | | | Australia | | | | 6,245,412 | | | | 5,989,989 | |
aDetour Gold Corp. | | | Canada | | | | 1,096,300 | | | | 19,631,515 | |
aEldorado Gold Corp. | | | Canada | | | | 2,853,724 | | | | 20,742,595 | |
aEmerald Resources NL | | | Australia | | | | 71,898,840 | | | | 2,358,149 | |
aEndeavour Mining Corp. | | | Canada | | | | 1,160,000 | | | | 23,752,172 | |
a,cGascoyne Resources Ltd. | | | Australia | | | | 23,023,100 | | | | 300,505 | |
aGold Standard Ventures Corp. | | | Canada | | | | 1,870,000 | | | | 1,469,437 | |
aGolden Star Resources Ltd. | | | United States | | | | 4,129,533 | | | | 12,140,827 | |
aGreat Panther Mining Ltd. | | | Canada | | | | 9,171,889 | | | | 5,824,149 | |
a,eGuyana Goldfields Inc. | | | Canada | | | | 9,655,100 | | | | 5,179,540 | |
a,b,eGuyana Goldfields Inc., 144A | | | Canada | | | | 6,220,000 | | | | 3,336,758 | |
| | | | |
| | | |
| franklintempleton.com | | Semiannual Report | | 15 |
FRANKLIN GOLD AND PRECIOUS METALS FUND
STATEMENT OF INVESTMENTS (UNAUDITED)
| | | | | | | | | | | | |
| | | Country | | | Shares/ Rights/ Warrants | | | Value | |
Common Stocks and Other Equity Interests(continued) | | | | | | | | | | | | |
Gold(continued) | | | | | | | | | | | | |
a,c,d,eHighGold Mining Inc. | | | Canada | | | | 3,840,000 | | | $ | 3,295,141 | |
aIAMGOLD Corp. | | | Canada | | | | 2,600,500 | | | | 7,697,480 | |
aIntegra Resources Corp. | | | Canada | | | | 5,300,000 | | | | 5,285,984 | |
aLiberty Gold Corp. | | | Canada | | | | 10,272,200 | | | | 9,934,579 | |
a,c,d,eLion One Metals Ltd. | | | Canada | | | | 1,089,000 | | | | 1,300,514 | |
a,eLion One Metals Ltd. | | | Canada | | | | 4,500,000 | | | | 5,848,130 | |
a,b,eLion One Metals Ltd., 144A | | | Canada | | | | 2,935,000 | | | | 3,814,280 | |
a,c,d,eLion One Metals Ltd., wts., 4/06/21 | | | Canada | | | | 1,089,000 | | | | 412,272 | |
a,cLydian International Ltd. | | | Canada | | | | 6,375,000 | | | | 36,126 | |
a,c,dLydian International Ltd., 144A | | | Canada | | | | 25,250,000 | | | | 143,087 | |
aMidas Gold Corp. | | | Canada | | | | 4,020,900 | | | | 1,822,849 | |
a,bMidas Gold Corp., 144A | | | Canada | | | | 4,030,000 | | | | 1,826,974 | |
Newcrest Mining Ltd. | | | Australia | | | | 2,061,439 | | | | 41,266,986 | |
Newmont Corp. | | | United States | | | | 907,614 | | | | 40,897,087 | |
Northern Star Resources Ltd. | | | Australia | | | | 903,106 | | | | 7,778,912 | |
OceanaGold Corp. | | | Australia | | | | 9,088,488 | | | | 19,021,618 | |
Osisko Gold Royalties Ltd. | | | Canada | | | | 275,000 | | | | 2,742,728 | |
a,ePerseus Mining Ltd. | | | Australia | | | | 58,759,901 | | | | 46,738,311 | |
aPretium Resources Inc. | | | Canada | | | | 2,084,000 | | | | 22,690,170 | |
a,eRed 5 Ltd. | | | Australia | | | | 117,268,146 | | | | 24,063,426 | |
a,eRTG Mining Inc. | | | Australia | | | | 1,769,918 | | | | 110,327 | |
a,b,eRTG Mining Inc., 144A | | | Australia | | | | 2,397,790 | | | | 149,466 | |
a,eRTG Mining Inc., IDR | | | Australia | | | | 41,087,582 | | | | 2,337,668 | |
a,c,d,eRubicon Minerals Corp. | | | Canada | | | | 1,330,000 | | | | 1,113,471 | |
a,eRubicon Minerals Corp. | | | Canada | | | | 6,038,900 | | | | 5,247,250 | |
aSEMAFO Inc. | | | Canada | | | | 2,829,200 | | | | 5,964,086 | |
b,fShandong Gold Mining Co. Ltd., 144A, Reg S | | | China | | | | 2,500,000 | | | | 6,104,432 | |
a,c,dSkeena Resources Ltd. | | | Canada | | | | 4,150,000 | | | | 2,891,849 | |
aSolGold PLC | | | Australia | | | | 14,650,000 | | | | 3,763,506 | |
aSt. Augustine Gold and Copper Ltd. | | | Philippines | | | | 8,136,836 | | | | 107,589 | |
a,bSt. Augustine Gold and Copper Ltd., 144A, (CAD Traded) | | | Philippines | | | | 16,383,333 | | | | 216,629 | |
a,bSt. Augustine Gold and Copper Ltd., 144A, (USD Traded) | | | Philippines | | | | 10,000,000 | | | | 132,225 | |
St. Barbara Ltd. | | | Australia | | | | 9,508,021 | | | | 17,722,342 | |
aTeranga Gold Corp. | | | Canada | | | | 1,357,751 | | | | 7,724,870 | |
aTeranga Gold Corp., SCR | | | Canada | | | | 1,970,000 | | | | 11,089,158 | |
aTMAC Resources Inc. | | | Canada | | | | 510,000 | | | | 1,017,303 | |
aTorex Gold Resources Inc. | | | Canada | | | | 252,000 | | | | 3,467,693 | |
a,bTorex Gold Resources Inc., 144A | | | Canada | | | | 1,450,000 | | | | 19,950,510 | |
aWest African Resources Ltd. | | | Australia | | | | 9,450,000 | | | | 3,024,207 | |
| | | | | | | | | | | | |
| | | | | | | | | | | 796,047,457 | |
| | | | | | | | | | | | |
Precious Metals & Minerals 11.0% | | | | | | | | | | | | |
Anglo American Platinum Ltd. | | | South Africa | | | | 277,656 | | | | 22,198,267 | |
aEastern Platinum Ltd. | | | Canada | | | | 2,592,102 | | | | 851,956 | |
Fresnillo PLC | | | United Kingdom | | | | 1,120,000 | | | | 9,798,852 | |
aImpala Platinum Holdings Ltd. | | | South Africa | | | | 3,065,000 | | | | 28,906,711 | |
aImpala Platinum Holdings Ltd., ADR | | | South Africa | | | | 1,506,100 | | | | 14,315,481 | |
aNortham Platinum Ltd. | | | South Africa | | | | 1,259,019 | | | | 10,547,384 | |
| | | | |
| | | |
16 | | Semiannual Report | | franklintempleton.com |
FRANKLIN GOLD AND PRECIOUS METALS FUND
STATEMENT OF INVESTMENTS (UNAUDITED)
| | | | | | | | | | | | |
| | | Country | | | Shares/ Rights/ Warrants | | | Value | |
Common Stocks and Other Equity Interests(continued) | | | | | | | | | | | | |
Precious Metals & Minerals(continued) | | | | | | | | | | | | |
a,ePlatinum Group Metals Ltd. (CAD Traded) | | | South Africa | | | | 2,252,787 | | | $ | 4,970,260 | |
a,ePlatinum Group Metals Ltd. (USD Traded) | | | South Africa | | | | 4,687,673 | | | | 10,219,127 | |
a,b,ePlatinum Group Metals Ltd., 144A | | | South Africa | | | | 134,388 | | | | 296,496 | |
aRoyal Bafokeng Platinum Ltd. | | | South Africa | | | | 2,193,527 | | | | 7,601,067 | |
| | | | | | | | | | | | |
| | | | | | | | | | | 109,705,601 | |
| | | | | | | | | | | | |
Silver 2.4% | | | | | | | | | | | | |
Hochschild Mining PLC | | | Peru | | | | 3,268,520 | | | | 7,260,614 | |
aMAG Silver Corp. | | | Canada | | | | 612,000 | | | | 6,667,956 | |
a,bMAG Silver Corp., 144A | | | Canada | | | | 240,000 | | | | 2,614,885 | |
Pan American Silver Corp. | | | Canada | | | | 255,021 | | | | 5,861,533 | |
aPan American Silver Corp., rts., 2/20/49 | | | Canada | | | | 1,850,600 | | | | 1,221,396 | |
| | | | | | | | | | | | |
| | | | | | | | | | | 23,626,384 | |
| | | | | | | | | | | | |
Total Common Stocks and Other Equity Interests
(Cost $873,317,438) | | | | | | | | | | | 971,517,830 | |
| | | | | | | | | | | | |
| | | |
| | | | | | Principal Amount* | | | | |
Convertible Bonds (Cost $3,000,000) 0.2% | | | | | | | | | | | | |
Precious Metals & Minerals 0.2% | | | | | | | | | | | | |
ePlatinum Group Metals Ltd., cvt., 6.875%, 7/01/22 | | | South Africa | | | $ | 3,000,000 | | | | 2,400,000 | |
| | | | | | | | | | | | |
Total Investments before Short Term Investments
(Cost $876,317,438) | | | | | | | | | | | 973,917,830 | |
| | | | | | | | | | | | |
| | | |
| | | | | | Shares | | | | |
Short Term Investments (Cost $14,967,704) 1.5% | | | | | | | | | | | | |
| | | |
Money Market Funds 1.5% | | | | | | | | | | | | |
g,hInstitutional Fiduciary Trust Money Market Portfolio, 1.21% | | | United States | | | | 14,967,704 | | | | 14,967,704 | |
| | | | | | | | | | | | |
Total Investments (Cost $891,285,142) 99.7% | | | | | | | | | | | 988,885,534 | |
Other Assets, less Liabilities 0.3% | | | | | | | | | | | 2,856,996 | |
| | | | | | | | | | | | |
Net Assets 100.0% | | | | | | | | | | $ | 991,742,530 | |
| | | | | | | | | | | | |
| | | | |
| | | |
| franklintempleton.com | | Semiannual Report | | 17 |
FRANKLIN GOLD AND PRECIOUS METALS FUND
STATEMENT OF INVESTMENTS (UNAUDITED)
See Abbreviations on page 32.
*The principal amount is stated in U.S. dollars unless otherwise indicated.
aNon-income producing.
bSecurity was purchased pursuant to Rule 144A under the Securities Act of 1933 and may be sold in transactions exempt from registration only to qualified institutional buyers or in a public offering registered under the Securities Act of 1933. At January 31, 2020, the aggregate value of these securities was $94,078,481, representing 9.5% of net assets.
cFair valued using significant unobservable inputs. See Note 11 regarding fair value measurements.
dSee Note 8 regarding restricted securities.
eSee Note 9 regarding holdings of 5% voting securities.
fSecurity was purchased pursuant to Regulation S under the Securities Act of 1933, which exempts from registration securities offered and sold outside of the United States. Such a security cannot be sold in the United States without either an effective registration statement filed pursuant to the Securities Act of 1933, or pursuant to an exemption from registration. At January 31, 2020, the value of this security was $6,104,432, representing 0.6% of net assets.
gSee Note 3(f) regarding investments in affiliated management investment companies.
hThe rate shown is the annualized seven-day effective yield at period end.
| | | | |
| | | |
18 | | Semiannual Report | The accompanying notes are an integral part of these financial statements. | | franklintempleton.com |
FRANKLIN GOLD AND PRECIOUS METALS FUND
FINANCIAL STATEMENTS
Statement of Assets and Liabilities
January 31, 2020 (unaudited)
| | | | |
| |
Assets: | | | | |
Investments in securities: | | | | |
Cost - Unaffiliated issuers | | $ | 641,944,331 | |
Cost - Non-controlled affiliates (Note 3f and 9) | | | 249,340,811 | |
| | | | |
| |
Value - Unaffiliated issuers | | $ | 843,244,740 | |
Value - Non-controlled affiliates (Note 3f and 9) | | | 145,640,794 | |
Receivables: | | | | |
Investment securities sold | | | 1,084,718 | |
Capital shares sold | | | 5,076,959 | |
Dividends and interest | | | 17,015 | |
Other assets | | | 18 | |
| | | | |
| |
Total assets | | | 995,064,244 | |
| | | | |
| |
Liabilities: | | | | |
Payables: | | | | |
Investment securities purchased | | | 344,647 | |
Capital shares redeemed | | | 1,943,271 | |
Management fees | | | 388,042 | |
Distribution fees | | | 221,477 | |
Transfer agent fees | | | 239,466 | |
Accrued expenses and other liabilities | | | 184,811 | |
| | | | |
| |
Total liabilities | | | 3,321,714 | |
| | | | |
| |
Net assets, at value | | $ | 991,742,530 | |
| | | | |
| |
Net assets consist of: | | | | |
Paid-in capital | | $ | 1,660,485,462 | |
Total distributable earnings (losses) | | | (668,742,932 | ) |
| | | | |
| |
Net assets, at value | | $ | 991,742,530 | |
| | | | |
| |
Class A: | | | | |
Net assets, at value | | $ | 721,862,286 | |
| | | | |
Shares outstanding | | | 37,924,331 | |
| | | | |
Net asset value per sharea | | | $19.03 | |
| | | | |
Maximum offering price per share (net asset value per share ÷ 94.50%) | | | $20.14 | |
| | | | |
| |
Class C: | | | | |
Net assets, at value | | $ | 81,434,780 | |
| | | | |
Shares outstanding | | | 4,699,304 | |
| | | | |
Net asset value and maximum offering price per sharea | | | $17.33 | |
| | | | |
| |
Class R6: | | | | |
Net assets, at value | | $ | 12,498,261 | |
| | | | |
Shares outstanding | | | 610,505 | |
| | | | |
Net asset value and maximum offering price per share | | | $20.47 | |
| | | | |
| |
Advisor Class: | | | | |
Net assets, at value | | $ | 175,947,203 | |
| | | | |
Shares outstanding | | | 8,682,809 | |
| | | | |
Net asset value and maximum offering price per share | | | $20.26 | |
| | | | |
aRedemption price is equal to net asset value less contingent deferred sales charges, if applicable.
| | | | |
| | | |
| franklintempleton.com | | The accompanying notes are an integral part of these financial statements. | Semiannual Report | | 19 |
FRANKLIN GOLD AND PRECIOUS METALS FUND
FINANCIAL STATEMENTS
Statement of Operations
for the six months ended January 31, 2020 (unaudited)
| | | | |
Investment income: | | | | |
Dividends: (net of foreign taxes)* | | | | |
Unaffiliated issuers | | | $ 2,356,318 | |
Non-controlled affiliates (Note 3f and 9) | | | 72,977 | |
Interest: | | | | |
Non-controlled affiliates (Note 9) | | | 135,902 | |
| | | | |
Total investment income | | | 2,565,197 | |
| | | | |
Expenses: | | | | |
Management fees (Note 3a) | | | 2,252,529 | |
Distribution fees: (Note 3c) | | | | |
Class A | | | 858,421 | |
Class C | | | 398,772 | |
Transfer agent fees: (Note 3e) | | | | |
Class A | | | 521,123 | |
Class C | | | 60,523 | |
Class R6 | | | 11,241 | |
Advisor Class | | | 119,941 | |
Custodian fees (Note 4) | | | 65,393 | |
Reports to shareholders | | | 65,170 | |
Registration and filing fees | | | 46,618 | |
Professional fees | | | 53,250 | |
Trustees’ fees and expenses | | | 26,014 | |
Other | | | 13,265 | |
| | | | |
Total expenses | | | 4,492,260 | |
Expense reductions (Note 4) | | | (63 | ) |
Expenses waived/paid by affiliates (Note 3f and 3g) | | | (25,861 | ) |
| | | | |
Net expenses | | | 4,466,336 | |
| | | | |
Net investment income (loss) | | | (1,901,139 | ) |
| | | | |
Realized and unrealized gains (losses): | | | | |
Net realized gain (loss) from: | | | | |
Investments: | | | | |
Unaffiliated issuers | | | 1,252,928 | |
Non-controlled affiliates (Note 3f and 9) | | | 2,784,443 | |
Foreign currency transactions | | | (14,846 | ) |
| | | | |
Net realized gain (loss) | | | 4,022,525 | |
| | | | |
Net change in unrealized appreciation (depreciation) on: | | | | |
Investments: | | | | |
Unaffiliated issuers | | | 86,937,004 | |
Non-controlled affiliates (Note 3f and 9) | | | 33,784,759 | |
Translation of other assets and liabilities denominated in foreign currencies | | | 2,732 | |
| | | | |
Net change in unrealized appreciation (depreciation) | | | 120,724,495 | |
| | | | |
Net realized and unrealized gain (loss) | | | 124,747,020 | |
| | | | |
Net increase (decrease) in net assets resulting from operations | | | $122,845,881 | |
| | | | |
| |
*Foreign taxes withheld on dividends | | | $ 144,133 | |
| | | | |
| | | |
20 | | Semiannual Report | The accompanying notes are an integral part of these financial statements. | | franklintempleton.com |
FRANKLIN GOLD AND PRECIOUS METALS FUND
FINANCIAL STATEMENTS
Statements of Changes in Net Assets
| | | | | | | | |
| | | Six Months Ended January 31, 2020 (unaudited) | | | Year Ended July 31, 2019 | |
| | |
Increase (decrease) in net assets: | | | | | | | | |
Operations: | | | | | | | | |
Net investment income (loss) | | | $ (1,901,139) | | | | $ (1,326,326) | |
Net realized gain (loss) | | | 4,022,525 | | | | (45,771,177) | |
Net change in unrealized appreciation (depreciation) | | | 120,724,495 | | | | 219,810,077 | |
| | | | |
| | |
Net increase (decrease) in net assets resulting from operations | | | 122,845,881 | | | | 172,712,574 | |
| | | | |
Capital share transactions: (Note 2) | | | | | | | | |
Class A | | | (14,096,180) | | | | (75,849,158) | |
Class C | | | (3,586,411) | | | | (31,756,462) | |
Class R6 | | | 71,462 | | | | 971,552 | |
Advisor Class | | | 11,873,509 | | | | (12,700,287) | |
| | | | |
| | |
Total capital share transactions | | | (5,737,620 | ) | | | (119,334,355 | ) |
| | | | |
| | |
Net increase (decrease) in net assets | | | 117,108,261 | | | | 53,378,219 | |
| | |
Net assets: | | | | | | | | |
Beginning of period | | | 874,634,269 | | | | 821,256,050 | |
| | | | |
| | |
End of period | | | $991,742,530 | | | | $874,634,269 | |
| | | | |
| | | | |
| | | |
| franklintempleton.com | | The accompanying notes are an integral part of these financial statements. | Semiannual Report | | 21 |
FRANKLIN GOLD AND PRECIOUS METALS FUND
Notes to Financial Statements (unaudited)
1. Organization and Significant Accounting Policies
Franklin Gold and Precious Metals Fund (Fund) is registered under the Investment Company Act of 1940 (1940 Act) as an open-end management investment company and applies the specialized accounting and reporting guidance in U.S. Generally Accepted Accounting Principles (U.S. GAAP). The Fund offers four classes of shares: Class A, Class C, Class R6 and Advisor Class. Class C shares automatically convert to Class A shares after they have been held for 10 years. Each class of shares may differ by its initial sales load, contingent deferred sales charges, voting rights on matters affecting a single class, its exchange privilege and fees due to differing arrangements for distribution and transfer agent fees.
The following summarizes the Fund’s significant accounting policies.
a. Financial Instrument Valuation
The Fund’s investments in financial instruments are carried at fair value daily. Fair value is the price that would be received to sell an asset or paid to transfer a liability in an orderly transaction between market participants on the measurement date. The Fund calculates the net asset value (NAV) per share each business day as of 4 p.m. Eastern time or the regularly scheduled close of the New York Stock Exchange (NYSE), whichever is earlier. Under compliance policies and procedures approved by the Fund’s Board of Trustees (the Board), the Fund’s administrator has responsibility for oversight of valuation, including leading the cross-functional Valuation Committee (VC). The Fund may utilize independent pricing services, quotations from securities and financial instrument dealers, and other market sources to determine fair value.
Equity securities listed on an exchange or on the NASDAQ National Market System are valued at the last quoted sale price or the official closing price of the day, respectively. Foreign equity securities are valued as of the close of trading on the foreign stock exchange on which the security is primarily traded, or as of 4 p.m. Eastern time. The value is then converted into its U.S. dollar equivalent at the foreign exchange rate in effect at 4 p.m. Eastern time on the day that the value of the security is determined. Over-the-counter (OTC) securities are valued within the range of the most recent quoted bid and ask prices. Securities that trade in multiple markets or on multiple exchanges are valued
according to the broadest and most representative market. Certain equity securities are valued based upon fundamental characteristics or relationships to similar securities.
Debt securities generally trade in the OTC market rather than on a securities exchange. The Fund’s pricing services use multiple valuation techniques to determine fair value. In instances where sufficient market activity exists, the pricing services may utilize a market-based approach through which quotes from market makers are used to determine fair value. In instances where sufficient market activity may not exist or is limited, the pricing services also utilize proprietary valuation models which may consider market characteristics such as benchmark yield curves, credit spreads, estimated default rates, anticipated market interest rate volatility, coupon rates, anticipated timing of principal repayments, underlying collateral, and other unique security features in order to estimate the relevant cash flows, which are then discounted to calculate the fair value.
Investments in open-end mutual funds are valued at the closing NAV.
The Fund has procedures to determine the fair value of financial instruments for which market prices are not reliable or readily available. Under these procedures, the Fund primarily employs a market-based approach which may use related or comparable assets or liabilities, recent transactions, market multiples, book values, and other relevant information for the investment to determine the fair value of the investment. An income-based valuation approach may also be used in which the anticipated future cash flows of the investment are discounted to calculate fair value. Discounts may also be applied due to the nature or duration of any restrictions on the disposition of the investments. Due to the inherent uncertainty of valuations of such investments, the fair values may differ significantly from the values that would have been used had an active market existed.
Trading in securities on foreign securities stock exchanges and OTC markets may be completed before 4 p.m. Eastern time. In addition, trading in certain foreign markets may not take place on every Fund’s business day. Occasionally, events occur between the time at which trading in a foreign security is completed and 4 p.m. Eastern time that might call into question the reliability of the value of a portfolio security held by the Fund. As a result, differences may arise between the value of the Fund’s portfolio securities as determined at the foreign market close and the latest indications of value at
| | | | |
| | | |
22 | | Semiannual Report | | franklintempleton.com |
FRANKLIN GOLD AND PRECIOUS METALS FUND
NOTES TO FINANCIAL STATEMENTS (UNAUDITED)
4 p.m. Eastern time. In order to minimize the potential for these differences, the VC monitors price movements following the close of trading in foreign stock markets through a series of country specific market proxies (such as baskets of American Depositary Receipts, futures contracts and exchange traded funds). These price movements are measured against established trigger thresholds for each specific market proxy to assist in determining if an event has occurred that may call into question the reliability of the values of the foreign securities held by the Fund. If such an event occurs, the securities may be valued using fair value procedures, which may include the use of independent pricing services. At January 31, 2020, a market event occurred resulting in a portion of the securities held by the Fund being valued using fair value procedures.
When the last day of the reporting period is a non-business day, certain foreign markets may be open on those days that the Fund’s NAV is not calculated, which could result in differences between the value of the Fund’s portfolio securities on the last business day and the last calendar day of the reporting period. Any significant security valuation changes due to an open foreign market are adjusted and reflected by the Fund for financial reporting purposes.
b. Foreign Currency Translation
Portfolio securities and other assets and liabilities denominated in foreign currencies are translated into U.S. dollars based on the exchange rate of such currencies against U.S. dollars on the date of valuation. The Fund may enter into foreign currency exchange contracts to facilitate transactions denominated in a foreign currency. Purchases and sales of securities, income and expense items denominated in foreign currencies are translated into U.S. dollars at the exchange rate in effect on the transaction date. Portfolio securities and assets and liabilities denominated in foreign currencies contain risks that those currencies will decline in value relative to the U.S. dollar. Occasionally, events may impact the availability or reliability of foreign exchange rates used to convert the U.S. dollar equivalent value. If such an event occurs, the foreign exchange rate will be valued at fair value using procedures established and approved by the Board.
The Fund does not separately report the effect of changes in foreign exchange rates from changes in market prices on securities held. Such changes are included in net realized and unrealized gain or loss from investments in the Statement of Operations.
Realized foreign exchange gains or losses arise from sales of foreign currencies, currency gains or losses realized between the trade and settlement dates on securities transactions and the difference between the recorded amounts of dividends, interest, and foreign withholding taxes and the U.S. dollar equivalent of the amounts actually received or paid. Net unrealized foreign exchange gains and losses arise from changes in foreign exchange rates on foreign denominated assets and liabilities other than investments in securities held at the end of the reporting period.
c. Income and Deferred Taxes
It is the Fund’s policy to qualify as a regulated investment company under the Internal Revenue Code. The Fund intends to distribute to shareholders substantially all of its taxable income and net realized gains to relieve it from federal income and excise taxes. As a result, no provision for U.S. federal income taxes is required.
The Fund may be subject to foreign taxation related to income received, capital gains on the sale of securities and certain foreign currency transactions in the foreign jurisdictions in which it invests. Foreign taxes, if any, are recorded based on the tax regulations and rates that exist in the foreign markets in which the Fund invests. When a capital gain tax is determined to apply, the Fund records an estimated deferred tax liability in an amount that would be payable if the securities were disposed of on the valuation date.
The Fund may recognize an income tax liability related to its uncertain tax positions under U.S. GAAP when the uncertain tax position has a less than 50% probability that it will be sustained upon examination by the tax authorities based on its technical merits. As of January 31, 2020, the Fund has determined that no tax liability is required in its financial statements related to uncertain tax positions for any open tax years (or expected to be taken in future tax years). Open tax years are those that remain subject to examination and are based on the statute of limitations in each jurisdiction in which the Fund invests.
| | | | |
| | | |
| franklintempleton.com | | Semiannual Report | | 23 |
FRANKLIN GOLD AND PRECIOUS METALS FUND
NOTES TO FINANCIAL STATEMENTS (UNAUDITED)
1. Organization and Significant Accounting Policies(continued)
d. Security Transactions, Investment Income, Expenses and Distributions
Security transactions are accounted for on trade date. Realized gains and losses on security transactions are determined on a specific identification basis. Interest income and estimated expenses are accrued daily. Dividend income is recorded on the ex-dividend date except for certain dividends from securities where the dividend rate is not available. In such cases, the dividend is recorded as soon as the information is received by the Fund. Distributions to shareholders are recorded on the ex-dividend date. Distributable earnings are determined according to income tax regulations (tax basis) and may differ from earnings recorded in accordance with U.S. GAAP. These differences may be permanent or temporary. Permanent differences are reclassified among capital accounts to reflect their tax character. These reclassifications have no impact on net assets or the results of operations. Temporary differences are not reclassified, as they may reverse in subsequent periods.
Realized and unrealized gains and losses and net investment income, excluding class specific expenses, are allocated daily to each class of shares based upon the relative proportion of
net assets of each class. Differences in per share distributions by class are generally due to differences in class specific expenses.
e. Accounting Estimates
The preparation of financial statements in accordance with U.S. GAAP requires management to make estimates and assumptions that affect the reported amounts of assets and liabilities at the date of the financial statements and the amounts of income and expenses during the reporting period. Actual results could differ from those estimates.
f. Guarantees and Indemnifications
Under the Fund’s organizational documents, its officers and trustees are indemnified by the Fund against certain liabilities arising out of the performance of their duties to the Fund. Additionally, in the normal course of business, the Fund enters into contracts with service providers that contain general indemnification clauses. The Fund’s maximum exposure under these arrangements is unknown as this would involve future claims that may be made against the Fund that have not yet occurred. Currently, the Fund expects the risk of loss to be remote.
2. Shares of Beneficial Interest
At January 31, 2020, there were an unlimited number of shares authorized (without par value). Transactions in the Fund’s shares were as follows:
| | | | | | | | | | | | | | | | |
| | | Six Months Ended January 31, 2020 | | | Year Ended July 31, 2019 | |
| | | Shares | | | Amount | | | Shares | | | Amount | |
Class A Shares: | | | | | | | | | | | | | | | | |
Shares solda | | | 17,108,133 | | | $ | 305,684,211 | | | | 23,599,735 | | | $ | 320,367,522 | |
Shares redeemed | | | (17,866,980 | ) | | | (319,782,577 | ) | | | (28,218,476 | ) | | | (396,216,680 | ) |
| | | | |
| | | | |
Net increase (decrease) | | | (758,847 | ) | | $ | (14,098,366 | ) | | | (4,618,741 | ) | | $ | (75,849,158 | ) |
| | | | |
| | | | |
Class C Shares: | | | | | | | | | | | | | | | | |
Shares sold | | | 751,827 | | | $ | 12,283,187 | | | | 864,478 | | | $ | 10,574,026 | |
Shares redeemeda | | | (982,331 | ) | | | (15,869,852 | ) | | | (3,542,905 | ) | | | (42,330,488 | ) |
| | | | |
| | | | |
Net increase (decrease) | | | (230,504 | ) | | $ | (3,586,665 | ) | | | (2,678,427 | ) | | $ | (31,756,462 | ) |
| | | | |
| | | | |
Class R6 Shares: | | | | | | | | | | | | | | | | |
Shares sold | | | 305,143 | | | $ | 5,828,265 | | | | 431,162 | | | $ | 6,434,093 | |
Shares redeemed | | | (298,398 | ) | | | (5,756,846 | ) | | | (389,580 | ) | | | (5,462,541 | ) |
| | | | |
| | | | |
Net increase (decrease) | | | 6,745 | | | $ | 71,419 | | | | 41,582 | | | $ | 971,552 | |
| | | | |
| | | | |
| | | |
24 | | Semiannual Report | | franklintempleton.com |
FRANKLIN GOLD AND PRECIOUS METALS FUND
NOTES TO FINANCIAL STATEMENTS (UNAUDITED)
| | | | | | | | | | | | | | | | |
| | | Six Months Ended January 31, 2020 | | | Year Ended July 31, 2019 | |
| | | Shares | | | Amount | | | Shares | | | Amount | |
Advisor Class Shares: | | | | | | | | | | | | | | | | |
Shares sold | | | 2,402,263 | | | $ | 46,073,670 | | | | 3,233,625 | | | $ | 45,629,801 | |
Shares redeemed | | | (1,817,684 | ) | | | (34,200,653 | ) | | | (4,229,531 | ) | | | (58,330,088 | ) |
| | | | |
| | | | |
Net increase (decrease) | | | 584,579 | | | $ | 11,873,017 | | | | (995,906 | ) | | $ | (12,700,287 | ) |
| | | | |
aMay include a portion of Class C shares that were automatically converted to Class A.
3. Transactions with Affiliates
Franklin Resources, Inc. is the holding company for various subsidiaries that together are referred to as Franklin Templeton. Certain officers and trustees of the Fund are also officers and/or directors of the following subsidiaries:
| | |
| Subsidiary | | Affiliation |
| |
Franklin Advisers, Inc. (Advisers) | | Investment manager |
| |
Franklin Templeton Services, LLC (FT Services) | | Administrative manager |
| |
Franklin Templeton Distributors, Inc. (Distributors) | | Principal underwriter |
| |
Franklin Templeton Investor Services, LLC (Investor Services) | | Transfer agent |
a. Management Fees
The Fund pays an investment management fee to Advisers based on the month-end net assets of the Fund as follows:
| | |
| Annualized Fee Rate | | Net Assets |
| |
0.625% | | Up to and including $100 million |
| |
0.500% | | Over $100 million, up to and including $250 million |
| |
0.450% | | Over $250 million, up to and including $7.5 billion |
| |
0.440% | | Over $7.5 billion, up to and including $10 billion |
| |
0.430% | | Over $10 billion, up to and including $12.5 billion |
| |
0.420% | | Over $12.5 billion, up to and including $15 billion |
| |
0.400% | | In excess of $15 billion |
For the period ended January 31, 2020, the annualized gross effective investment management fee rate was 0.481% of the Fund’s average daily net assets.
b. Administrative Fees
Under an agreement with Advisers, FT Services provides administrative services to the Fund. The fee is paid by Advisers based on the Fund’s average daily net assets, and is not an additional expense of the Fund.
c. Distribution Fees
The Board has adopted distribution plans for Class A and Class C shares, pursuant to Rule 12b-1 under the 1940 Act. Under the Fund’s Class A reimbursement distribution plan, the Fund reimburses Distributors for costs incurred in connection with the servicing, sale and distribution of the Fund’s shares up to the maximum annual plan rate. Under the Class A reimbursement distribution plan, costs exceeding the maximum for the current plan year cannot be reimbursed in subsequent periods. In
| | | | |
| | | |
| franklintempleton.com | | Semiannual Report | | 25 |
FRANKLIN GOLD AND PRECIOUS METALS FUND
NOTES TO FINANCIAL STATEMENTS (UNAUDITED)
3. Transactions with Affiliates(continued)
c. Distribution Fees(continued)
addition, under the Fund’s Class C compensation distribution plan, the Fund pays Distributors for costs incurred in connection with the servicing, sale and distribution of the Fund’s shares up to the maximum annual plan rate. The plan year, for purposes of monitoring compliance with the maximum annual plan rates, is February 1 through January 31.
The maximum annual plan rates, based on the average daily net assets, for each class, are as follows:
| | | | |
Class A | | | 0.25 | % |
Class C | | | 1.00 | % |
d. Sales Charges/Underwriting Agreements
Front-end sales charges and contingent deferred sales charges (CDSC) do not represent expenses of the Fund. These charges are deducted from the proceeds of sales of Fund shares prior to investment or from redemption proceeds prior to remittance, as applicable. Distributors has advised the Fund of the following commission transactions related to the sales and redemptions of the Fund’s shares for the period:
| | | | |
Sales charges retained net of commissions paid to unaffiliated brokers/dealers | | $ | 51,795 | |
CDSC retained | | $ | 6,244 | |
e. Transfer Agent Fees
Each class of shares pays transfer agent fees to Investor Services for its performance of shareholder servicing obligations. The fees are based on an annualized asset based fee of 0.02% plus a transaction based fee. In addition, each class reimburses Investor Services for out of pocket expenses incurred and, except for Class R6, reimburses shareholder servicing fees paid to third parties. These fees are allocated daily based upon their relative proportion of such classes’ aggregate net assets. Class R6 pays Investor Services transfer agent fees specific to that class.
For the period ended January 31, 2020, the Fund paid transfer agent fees of $712,828, of which $290,118 was retained by Investor Services.
| | | | |
| | | |
26 | | Semiannual Report | | franklintempleton.com |
FRANKLIN GOLD AND PRECIOUS METALS FUND
NOTES TO FINANCIAL STATEMENTS (UNAUDITED)
f. Investments in Affiliated Management Investment Companies
The Fund invests in one or more affiliated management investment companies for purposes other than exercising a controlling influence over the management or policies. Management fees paid by the Fund are waived on assets invested in the affiliated management investment companies, as noted in the Statement of Operations, in an amount not to exceed the management and administrative fees paid directly or indirectly by each affiliate. During the period ended January 31, 2020, the Fund held investments in affiliated management investment companies as follows:
| | | | | | | | | | | | | | | | | | | | | | | | | | | | | | | | |
| | | Value at Beginning of Period | | | Purchases | | | Sales | | | Realized Gain (Loss) | | | Net Change in Unrealized Appreciation (Depreciation) | | | Value at End of Period | | | Number of Shares Held at End of Period | | | Dividend Income | |
Non-Controlled Affiliates | | | | | | | | | | | | | | | | | | | | | | | | | | | | | | | | |
Institutional Fiduciary Trust Money Market Portfolio, 1.21% | | | $4,722 | | | | $152,001,866 | | | | $(137,038,884 | ) | | | $ — | | | | $ — | | | | $14,967,704 | | | | 14,967,704 | | | | $72,977 | |
g. Waiver and Expense Reimbursements
Investor Services has contractually agreed in advance to waive or limit its fees so that the Class R6 transfer agent fees do not exceed 0.03% based on the average net assets of the class until November 30, 2020.
4. Expense Offset Arrangement
The Fund has entered into an arrangement with its custodian whereby credits realized as a result of uninvested cash balances are used to reduce a portion of the Fund’s custodian expenses. During the period ended January 31, 2020, the custodian fees were reduced as noted in the Statement of Operations.
5. Income Taxes
For tax purposes, capital losses may be carried over to offset future capital gains, if any.
At July 31, 2019, the capital loss carryforwards were as follows:
| | | | |
Capital loss carryforwards not subject to expiration: | | | | |
Short term | | $ | 9,915,934 | |
Long term | | | 636,684,167 | |
| | | | |
Total capital loss carryforwards | | $ | 646,600,101 | |
| | | | |
At January 31, 2020, the cost of investments and net unrealized appreciation (depreciation) for income tax purposes were as follows:
| | | | |
Cost of investments. | | $ | 1,012,575,126 | |
| | | | |
| |
Unrealized appreciation | | $ | 384,831,962 | |
Unrealized depreciation | | | (408,521,554 | ) |
| | | | |
Net unrealized appreciation (depreciation) | | $ | (23,689,592 | ) |
| | | | |
Differences between income and/or capital gains as determined on a book basis and a tax basis are primarily due to differing treatments of passive foreign investment company shares.
| | | | |
| | | |
| franklintempleton.com | | Semiannual Report | | 27 |
FRANKLIN GOLD AND PRECIOUS METALS FUND
NOTES TO FINANCIAL STATEMENTS (UNAUDITED)
6. Investment Transactions
Purchases and sales of investments (excluding short term securities) for the period ended January 31, 2020, aggregated $59,340,902 and $77,350,258, respectively.
7. Concentration of Risk
Investing in foreign securities may include certain risks and considerations not typically associated with investing in U.S. securities, such as fluctuating currency values and changing local, regional and global economic, political and social conditions, which may result in greater market volatility. Current political and financial uncertainty surrounding the European Union may increase market volatility and the economic risk of investing in securities in Europe. In addition, certain foreign securities may not be as liquid as U.S. securities.
8. Restricted Securities
The Fund invests in securities that are restricted under the Securities Act of 1933 (1933 Act). Restricted securities are often purchased in private placement transactions, and cannot be sold without prior registration unless the sale is pursuant to an exemption under the 1933 Act. Disposal of these securities may require greater effort and expense, and prompt sale at an acceptable price may be difficult. The Fund may have registration rights for restricted securities. The issuer generally incurs all registration costs.
At January 31, 2020, investments in restricted securities, excluding securities exempt from registration under the 1933 Act, were as follows:
| | | | | | | | | | | | | | | | |
Shares/
Warrants | | | Issuer | | Acquisition Date | | | Cost | | | Value | |
| | | | |
| | 5,000,000 | | | aAscot Resources Ltd., wts., 5/21/20 | | | 5/22/19 | | | $ | 170,134 | | | $ | 283,011 | |
| | | | |
| | 550,000 | | | bBluestone Resources Inc., wts., 3/19/21 | | | 2/20/19 | | | | 76,682 | | | | 149,938 | |
| | | | |
| | 3,840,000 | | | HighGold Mining Inc. | | | 11/27/19 | | | | 3,614,458 | | | | 3,295,141 | |
| | | | |
| | 1,089,000 | | | cLion One Metals Ltd. | | | 12/04/19 | | | | 569,078 | | | | 1,300,514 | |
| | | | |
| | 1,089,000 | | | cLion One Metals Ltd., wts., 4/06/21 | | | 12/04/19 | | | | 86,157 | | | | 412,272 | |
| | | | |
| | 25,250,000 | | | dLydian International Ltd., 144A | | | 3/06/12 | | | | 14,750,154 | | | | 143,087 | |
| | | | |
| | 28,535,816 | | | eNautilus Minerals Inc., 144A | | | 2/08/07 - 4/05/16 | | | | 10,752,996 | | | | — | |
| | | | |
| | 1,330,000 | | | fRubicon Minerals Corp. | | | 9/20/19 | | | | 1,002,034 | | | | 1,113,471 | |
| | | | |
| | 4,150,000 | | | Skeena Resources Ltd. | | | 12/11/19 | | | | 1,724,724 | | | | 2,891,849 | |
| | | | | | | | | | | | |
| | | | |
| | | | Total Restricted Securities(Value is 1.0% of Net Assets) | | | | | | $ | 32,746,417 | | | $ | 9,589,283 | |
| | | | | | | | | | | | |
aThe Fund also invests in unrestricted securities of the issuer, valued at $4,250,094 as of January 31, 2020.
bThe Fund also invests in unrestricted securities of the issuer, valued at $3,305,629 as of January 31, 2020.
cThe Fund also invests in unrestricted securities of the issuer, valued at $9,662,410 as of January 31, 2020.
dThe Fund also invests in unrestricted securities of the issuer, valued at $36,126 as of January 31, 2020.
eThe Fund also invests in unrestricted securities of the issuer, determined to have no value as of January 31, 2020.
fThe Fund also invests in unrestricted securities of the issuer, valued at $5,247,250 as of January 31, 2020.
| | | | |
| | | |
28 | | Semiannual Report | | franklintempleton.com |
FRANKLIN GOLD AND PRECIOUS METALS FUND
NOTES TO FINANCIAL STATEMENTS (UNAUDITED)
9. Holdings of 5% Voting Securities of Portfolio Companies
The 1940 Act defines “affiliated companies” to include investments in portfolio companies in which a fund owns 5% or more of the outstanding voting securities. During the period ended January 31, 2020, investments in “affiliated companies” were as follows:
| | | | | | | | | | | | | | | | | | | | | | | | | | | | | | | | |
| Name of Issuer | | Value at Beginning of Period | | | Purchases | | | Sales | | | Realized Gain (Loss) | | | Net Change in Unrealized Appreciation (Depreciation) | | | Value at End of Period | | | Number of Shares/ Warrants/ Principal Amount* Held at End of Period | | | Investment Income | |
| |
Non-Controlled Affiliates | | | | | | | | | | | | | | | | | | | | | | | | | | | | | | | | |
| | | | | | | | | | | | | | | | | | | | | | | | | | | | | | | Dividends | |
| | | | | | | | | | | | | | | | | | | | | | | | | | | | | | | | |
Chalice Gold Mines Ltd. | | | $3,504,992 | | | | $ — | | | | $ — | | | | $ — | | | | $2,219,494 | | | | $5,724,486 | | | | 31,072,008 | | | | $— | |
Geopacific Resources Ltd. | | | 1,917,956 | | | | 2,733,982 | a | | | — | | | | — | | | | (535,771 | ) | | | 4,116,167 | | | | 13,001,094 | | | | — | |
Guyana Goldfields Inc. | | | 7,387,545 | | | | 713,255 | | | | — | | | | — | | | | (2,921,260 | ) | | | 5,179,540 | | | | 9,655,100 | | | | — | |
Guyana Goldfields Inc., 144A | | | 5,278,575 | | | | — | | | | — | | | | — | | | | (1,941,817 | ) | | | 3,336,758 | | | | 6,220,000 | | | | — | |
HighGold Mining Inc. | | | — | | | | 3,614,458 | | | | — | | | | — | | | | (319,317 | ) | | | 3,295,141 | | | | 3,840,000 | | | | — | |
INV Metals Inc., 144A | | | 1,790,794 | | | | — | | | | — | | | | — | | | | — | b | | | — | b | | | — | b | | | — | |
Lion One Metals Ltd. | | | — | | | | 569,078 | a | | | — | | | | — | | | | 731,436 | | | | 1,300,514 | | | | 1,089,000 | | | | — | |
Lion One Metals Ltd. | | | 2,591,400 | | | | — | | | | — | | | | — | | | | 3,256,730 | | | | 5,848,130 | | | | 4,500,000 | | | | — | |
Lion One Metals Ltd., 144A | | | 1,690,169 | | | | — | | | | — | | | | — | | | | 2,124,111 | | | | 3,814,280 | | | | 2,935,000 | | | | — | |
Lion One Metals Ltd., wts., 4/06/21 | | | — | | | | 86,157 | a | | | — | | | | — | | | | 326,115 | | | | 412,272 | | | | 1,089,000 | | | | — | |
Lydian International Ltd. | | | 483,046 | | | | — | | | | — | | | | — | | | | — | b | | | — | b | | | — | b | | | — | |
Lydian International Ltd., 144A | | | 2,395,189 | | | | — | | | | (619,781 | ) | | | (550,931 | ) | | | — | b | | | — | b | | | — | b | | | — | |
Nautilus Minerals Inc. | | | — | | | | — | | | | — | | | | — | | | | — | | | | — | | | | 9,222,015 | | | | — | |
Nautilus Minerals Inc., 144A | | | — | | | | — | | | | — | | | | — | | | | — | | | | — | | | | 28,535,816 | | | | — | |
Perseus Mining Ltd. | | | 33,001,379 | | | | — | | | | (7,663,781 | ) | | | 3,473,860 | | | | 17,926,853 | | | | 46,738,311 | | | | 58,759,901 | | | | — | |
Platinum Group Metals Ltd. (CAD Traded) | | | 3,174,983 | | | | — | | | | — | | | | — | | | | 1,795,277 | | | | 4,970,260 | | | | 2,252,787 | | | | — | |
Platinum Group Metals Ltd. (USD Traded) | | | 2,270,121 | | | | 3,885,902 | a | | | — | | | | — | | | | 4,063,104 | | | | 10,219,127 | | | | 4,687,673 | | | | — | |
Platinum Group Metals Ltd., 144A | | | 189,401 | | | | — | | | | — | | | | — | | | | 107,095 | | | | 296,496 | | | | 134,388 | | | | — | |
Platinum Group Metals Ltd., wts., 11/15/19 | | | 75,938 | | | | — | | | | — | | | | (138,486 | ) | | | 62,548 | | | | — | | | | — | | | | — | |
Red 5 Ltd. | | | 18,840,036 | | | | — | | | | — | | | | — | | | | 5,223,390 | | | | 24,063,426 | | | | 117,268,146 | | | | — | |
RTG Mining Inc. | | | 120,699 | | | | — | | | | — | | | | — | | | | (10,372 | ) | | | 110,327 | | | | 1,769,918 | | | | — | |
RTG Mining Inc., 144A | | | 163,517 | | | | — | | | | — | | | | — | | | | (14,051 | ) | | | 149,466 | | | | 2,397,790 | | | | — | |
RTG Mining Inc., IDR | | | 2,766,818 | | | | — | | | | — | | | | — | | | | (429,150 | ) | | | 2,337,668 | | | | 41,087,582 | | | | — | |
Rubicon Minerals Corp. | | | — | | | | 1,002,034 | | | | — | | | | — | | | | 111,437 | | | | 1,113,471 | | | | 1,330,000 | | | | — | |
Rubicon Minerals Corp. | | | 3,431,843 | | | | — | | | | — | | | | — | | | | 1,815,407 | | | | 5,247,250 | | | | 6,038,900 | | | | — | |
| | | | | | | | | | | | |
| | | $91,074,401 | | | | $12,604,866 | | | | $(8,283,562 | ) | | | $2,784,443 | | | | $33,591,259 | | | | $128,273,090 | | | | | | | | $— | |
| | | | | | | | | | | | |
| | | | |
| | | |
| franklintempleton.com | | Semiannual Report | | 29 |
FRANKLIN GOLD AND PRECIOUS METALS FUND
NOTES TO FINANCIAL STATEMENTS (UNAUDITED)
9. Holdings of 5% Voting Securities of Portfolio Companies(continued)
| | | | | | | | | | | | | | | | | | | | | | | | | | | | | | | | |
| Name of Issuer | | Value at Beginning of Period | | | Purchases | | | Sales | | | Realized Gain (Loss) | | | Net Change in Unrealized Appreciation (Depreciation) | | | Value at End of Period | | | Number of Shares/ Warrants/ Principal Amount* Held at End of Period | | | Investment Income | |
| |
Non-Controlled Affiliates(continued) | | | | | | | | | | | | | | | | | | | | | | | | | |
| | | | | | | | | | | | | | | | | | | | | | | | | | | | | | | Interest | |
| | | | | | | | | | | | | | | | | | | | | | | | | | | | | | | | |
Platinum Group Metals Ltd., cvt., 6.875%, 7/01/22 | | | $2,206,500 | | | | $ — | | | | $ — | | | | $ — | | | | $ 193,500 | | | | $ 2,400,000 | | | | 3,000,000 | | | | $135,902 | c |
| | | | | | | | | | | | |
Total Affiliated Securities(Value is 13.2% of Net Assets) | | | $93,280,901 | | | | $12,604,866 | | | | $(8,283,562 | ) | | | $2,784,443 | | | | $33,784,759 | | | | $130,673,090 | | | | | | | | $135,902 | |
| | | | | | | | | | | | |
*In U.S. dollars unless otherwise indicated.
aMay include accretion, amortization, partnership adjustments, and/or corporate actions.
bAs of January 31, 2020, no longer an affiliate.
cIncludes non-cash dividend/interest received.
10. Credit Facility
The Fund, together with other U.S. registered and foreign investment funds (collectively, Borrowers), managed by Franklin Templeton, are borrowers in a joint syndicated senior unsecured credit facility totaling $2 billion (Global Credit Facility) which matured on February 7, 2020. This Global Credit Facility provides a source of funds to the Borrowers for temporary and emergency purposes, including the ability to meet future unanticipated or unusually large redemption requests. Effective February 7, 2020, the Borrowers renewed the Global Credit Facility for a one year term, maturing February 5, 2021, for a total of $2 billion.
Under the terms of the Global Credit Facility, the Fund shall, in addition to interest charged on any borrowings made by the Fund and other costs incurred by the Fund, pay its share of fees and expenses incurred in connection with the implementation and maintenance of the Global Credit Facility, based upon its relative share of the aggregate net assets of all of the Borrowers, including an annual commitment fee of 0.15% based upon the unused portion of the Global Credit Facility. These fees are reflected in other expenses in the Statement of Operations. During the period ended January 31, 2020, the Fund did not use the Global Credit Facility.
11. Fair Value Measurements
The Fund follows a fair value hierarchy that distinguishes between market data obtained from independent sources (observable inputs) and the Fund’s own market assumptions (unobservable inputs). These inputs are used in determining the value of the Fund’s financial instruments and are summarized in the following fair value hierarchy:
| | • | | Level 1 – quoted prices in active markets for identical financial instruments |
| | • | | Level 2 – other significant observable inputs (including quoted prices for similar financial instruments, interest rates, prepayment speed, credit risk, etc.) |
| | • | | Level 3 – significant unobservable inputs (including the Fund’s own assumptions in determining the fair value of financial instruments) |
The input levels are not necessarily an indication of the risk or liquidity associated with financial instruments at that level.
| | | | |
| | | |
30 | | Semiannual Report | | franklintempleton.com |
FRANKLIN GOLD AND PRECIOUS METALS FUND
NOTES TO FINANCIAL STATEMENTS (UNAUDITED)
A summary of inputs used as of January 31, 2020, in valuing the Fund’s assets carried at fair value, is as follows:
| | | | | | | | | | | | | | | | |
| | | Level 1 | | | Level 2 | | | Level 3 | | | Total | |
Assets: | | | | | | | | | | | | | | | | |
Investments in Securities:a | | | | | | | | | | | | | | | | |
Equity Investments:b | | | | | | | | | | | | | | | | |
Diversified Metals & Mining | | $ | 33,791,106 | | | $ | 5,146,969 | | | $ | 356,279 | c | | $ | 39,294,354 | |
Gold | | | 607,038,687 | | | | 179,232,794 | | | | 9,775,976 | | | | 796,047,457 | |
Precious Metals & Minerals | | | 99,906,749 | | | | 9,798,852 | | | | — | | | | 109,705,601 | |
Silver | | | 16,365,770 | | | | 7,260,614 | | | | — | | | | 23,626,384 | |
All Other Equity Investments | | | 2,844,034 | | | | — | | | | — | | | | 2,844,034 | |
Convertible Bonds | | | — | | | | 2,400,000 | | | | — | | | | 2,400,000 | |
Short Term Investments | | | 14,967,704 | | | | — | | | | — | | | | 14,967,704 | |
| | | | |
Total Investments in Securities | | $ | 774,914,050 | | | $ | 203,839,229 | | | $ | 10,132,255 | | | $ | 988,885,534 | |
| | | | |
aFor detailed categories, see the accompanying Statement of Investments.
bIncludes common stocks as well as other equity interests.
cIncludes securities determined to have no value at January 31, 2020.
A reconciliation of assets in which Level 3 inputs are used in determining fair value is presented when there are significant Level 3 financial instruments at the beginning and/or end of the period. At January 31, 2020, the reconciliation of assets is as follows:
| | | | | | | | | | | | | | | | | | | | | | | | | | | | | | | | | | | | | | | | |
| | | Balance at Beginning of Period | | | Purchases | | | Sales | | | Transfer Into Level 3a | | | Transfer Out of Level 3b | | | Cost Basis Adjustmentsc | | | Net Realized Gain (Loss) | | | Net Unrealized Appreciation (Depreciation) | | | Balance at End of Period | | | Net Change in Unrealized Appreciation (Depreciation) on Assets Held at Period End | |
| |
Assets: | | | | | | | | | | | | | | | | | | | | | | | | | | | | | | | | | | | | | | | | |
Investments in Securities: | | | | | | | | | | | | | | | | | | | | | | | | | | | | | | | | | | | | | | | | |
Equity Investments:d | | | | | | | | | | | | | | | | | | | | | | | | | | | | | | | | | | | | | | | | |
Diversified Metals & | | | | | | | | | | | | | | | | | | | | | | | | | | | | | | | | | | | | | | | | |
Mining | | $ | 43,010 | e | | $ | — | | | $ | — | | | $ | — | | | $ | — | | | $ | — | | | | $— | | | $ | 313,269 | | | $ | 356,279 | e | | $ | 313,269 | |
Gold | | | 2,701,920 | | | | 6,341,216 | | | | — | | | | 179,898 | | | | — | | | | (1,786,182 | ) | | | — | | | | 2,339,124 | | | | 9,775,976 | | | | 2,339,124 | |
Silver | | | 559,255 | | | | — | | | | — | | | | — | | | | (1,184,384 | ) | | | — | | | | — | | | | 625,129 | | | | — | | | | — | |
| | | | |
Total Investments in Securities | | $ | 3,304,185 | | | $ | 6,341,216 | | | $ | — | | | $ | 179,898 | | | $ | (1,184,384 | ) | | $ | (1,786,182 | ) | | | $— | | | $ | 3,277,522 | | | $ | 10,132,255 | | | $ | 2,652,393 | |
| | | | |
aThe investments were transferred into Level 3 as a result of the unavailability of a quoted market price in an active market for identical securities.
bThe investment was transferred out of Level 3 as a result of the availability of a quoted price in an active market for identical securities.
cMay include accretion, amortization, partnership adjustments, and/or other cost basis adjustments.
dIncludes common stocks as well as other equity interests.
eIncludes securities determined to have no value.
| | | | |
| | | |
| franklintempleton.com | | Semiannual Report | | 31 |
FRANKLIN GOLD AND PRECIOUS METALS FUND
NOTES TO FINANCIAL STATEMENTS (UNAUDITED)
11. Fair Value Measurements(continued)
Significant unobservable valuation inputs for material Level 3 financial instruments and impact to fair value as a result of changes in unobservable valuation inputs as of January 31, 2020, are as follows:
| | | | | | | | | | | | | | | | | | | | |
| Description | | Fair Value at End of Period | | | Valuation Technique | | | Unobservable Input | | | Amount/Range (Weighted Averagea) | | | Impact to Fair Value if Input Increasesb | |
| |
Assets: | | | | | | | | | | | | | | | | | | | | |
Investments in Securities: | | | | | | | | | | | | | | | | | | | | |
Equity Investments:c | | | | | | | | | | | | | | | | | | | | |
Gold | | | $ 8,600,975 | | | | Market Comparables | | | | Discount for lack of marketability | | | | 2.8% - 7.8% | | | | Decrease | |
| | | | | | | | | | | | | | | (5.2%) | | | | | |
| |
| | | | | |
All other investmentsd | | | 1,531,280 | e | | | | | | | | | | | | | | | | |
| |
| | | | | |
Total | | | $10,132,255 | | | | | | | | | | | | | | | | | |
| |
aWeighted based on the relative fair value of the financial instruments.
bRepresents the directional change in the fair value of the Level 3 financial instruments that would result from a significant and reasonable increase in the corresponding input. A significant and reasonable decrease in the input would have the opposite effect. Significant impacts, if any, to fair value and/or net assets have been indicated.
cIncludes common stocks as well as other equity interests.
dIncludes financial instruments with values derived using private transaction prices or non-public third party pricing information which is unobservable. May also include fair value of immaterial financial instruments developed using various valuation techniques and unobservable inputs.
eIncludes securities determined to have no value at January 31, 2020.
12. Subsequent Events
The Fund has evaluated subsequent events through the issuance of the financial statements and determined that no events have occurred that require disclosure other than those already disclosed in the financial statements.
Abbreviations
| | | | | | |
| Currency | | Selected Portfolio |
CAD | | Canadian Dollar | | ADR | | American Depositary Receipt |
USD | | United States Dollar | | IDR | | International Depositary Receipt |
| | | | |
| | | |
32 | | Semiannual Report | | franklintempleton.com |
FRANKLIN GOLD AND PRECIOUS METALS FUND
Shareholder Information
Proxy Voting Policies and Procedures
The Fund’s investment manager has established Proxy Voting Policies and Procedures (Policies) that the Fund uses to determine how to vote proxies relating to portfolio securities. Shareholders may view the Fund’s complete Policies online at franklintempleton.com. Alternatively, shareholders may request copies of the Policies free of charge by calling the Proxy Group collect at (954) 527-7678 or by sending a written request to: Franklin Templeton Companies, LLC, 300 S.E. 2nd Street, Fort Lauderdale, FL 33301, Attention: Proxy Group. Copies of the Fund’s proxy voting records are also made available online at franklintempleton.com and posted on the U.S. Securities and Exchange Commission’s website at sec.gov and reflect the most recent 12-month period ended June 30.
Quarterly Statement of Investments
The Fund files a complete statement of investments with the U.S. Securities and Exchange Commission for the first and third quarters for each fiscal year as an exhibit to its report on Form N-PORT. Shareholders may view the filed Form N-PORT by visiting the Commission’s website at sec.gov. The filed form may also be viewed and copied at the Commission’s Public Reference Room in Washington, DC. Information regarding the operations of the Public Reference Room may be obtained by calling(800) SEC-0330.
| | | | |
| | | |
| franklintempleton.com | | Semiannual Report | | 33 |
This page intentionally left blank.
This page intentionally left blank.
This page intentionally left blank.
Authorized for distribution only when accompanied or preceded by a summary prospectus and/or prospectus. Investors should carefully consider a fund’s investment goals, risks, charges and expenses before investing. A prospectus contains this and other information; please read it carefully before investing.
To help ensure we provide you with quality service, all calls to and from our service areas are monitored and/or recorded.
| | | | | | |
 | | Semiannual Report and Shareholder Letter Franklin Gold and Precious Metals Fund |
| | | |
| | Investment Manager | | Distributor | | Shareholder Services |
| | Franklin Advisers, Inc. | | Franklin Templeton Distributors, Inc. | | (800) 632-2301 |
| | | | (800) DIAL BEN® / 342-5236 | | |
| | | | franklintempleton.com | | |
| | |
| © 2020 Franklin Templeton Investments. All rights reserved. | | 132 S 03/20 |
(a) The Registrant has adopted a code of ethics that applies to its principal executive officers and principal financial and accounting officer.
(c) N/A
(d) N/A
(f) Pursuant to Item 13(a)(1), the Registrant is attaching as an exhibit a copy of its code of ethics that applies to its principal executive officers and principal financial and accounting officer.
| Item 3. | Audit Committee Financial Expert. |
(a)(1) The Registrant has an audit committee financial expert serving on its audit committee.
(2) The audit committee financial expert is Mary C. Choksi and she is “independent” as defined under the relevant Securities and Exchange Commission Rules and Releases.
| Item 4. | Principal Accountant Fees and Services. N/A |
| Item 5. | Audit Committee of Listed Registrants. N/A |
| Item 6. | Schedule of Investments. N/A |
| Item 7. | Disclosure of Proxy Voting Policies and Procedures forClosed-End Management Investment Companies. N/A |
| Item 8. | Portfolio Managers ofClosed-End Management Investment Companies. N/A |
| Item 9. | Purchases of Equity Securities byClosed-End Management Investment Company and Affiliated Purchasers. N/A |
| Item 10. | Submission of Matters to a Vote of Security Holders. |
There have been no changes to the procedures by which shareholders may recommend nominees to the Registrant’s Board of Trustees that would require disclosure herein.
| Item 11. | Controls and Procedures. |
(a)Evaluation of Disclosure Controls and Procedures. The Registrant maintains disclosure controls and procedures that are designed to provide reasonable assurance that information required to be disclosed in the Registrant’s filings under the Securities Exchange Act of 1934, as amended, and the Investment Company Act of 1940 is recorded, processed, summarized and reported within the periods specified in the rules and forms of the Securities and Exchange Commission. Such information is accumulated and communicated to the Registrant’s management, including its principal executive officer and principal financial officer, as appropriate, to allow timely decisions regarding required disclosure. The Registrant’s management, including the principal executive officer and the principal financial officer, recognizes that any set of controls and procedures, no matter how well designed and operated, can provide only reasonable assurance of achieving the desired control objectives.
Within 90 days prior to the filing date of this Shareholder Report on FormN-CSR, the Registrant had carried out an evaluation, under the supervision and with the participation of the Registrant’s management, including the Registrant’s principal executive officer and the Registrant’s principal financial officer, of the effectiveness of the design and operation of the Registrant’s disclosure controls and procedures. Based on such evaluation, the Registrant’s principal
executive officer and principal financial officer concluded that the Registrant’s disclosure controls and procedures are effective.
(b)Changes in Internal Controls. There have been no changes in the Registrant’s internal control over financial reporting that occurred during the period covered by this report that has materially affected, or is reasonably likely to materially affect the internal control over financial reporting.
| Item 12. | Disclosure of Securities Lending Activities forClosed-End Management Investment Company N/A |
SIGNATURES
Pursuant to the requirements of the Securities Exchange Act of 1934 and the Investment Company Act of 1940, the registrant has duly caused this report to be signed on its behalf by the undersigned, thereunto duly authorized.
| | |
| FRANKLIN GOLD AND PRECIOUS METALS FUND |
| |
| By | | S\MATTHEW T. HINKLE |
| | Matthew T. Hinkle |
| | Chief Executive Officer – Finance and Administration |
Date March 31, 2020
Pursuant to the requirements of the Securities Exchange Act of 1934 and the Investment Company Act of 1940, this report has been signed below by the following persons on behalf of the registrant and in the capacities and on the dates indicated.
| | |
| By | | S\MATTHEW T. HINKLE |
| | Matthew T. Hinkle |
| | Chief Executive Officer – Finance and Administration |
Date March 31, 2020
| | |
| By | | S\GASTON GARDEY |
| | Gaston Gardey |
| | Chief Financial Officer and Chief Accounting Officer |
Date March 31, 2020