UNITED STATES
SECURITIES AND EXCHANGE COMMISSION
Washington, D.C. 20549
FORM N-CSR
CERTIFIED SHAREHOLDER REPORT OF REGISTERED MANAGEMENT INVESTMENT COMPANIES
Investment Company Act file number: 811-05576
Name of Fund: BlackRock Global Allocation Fund, Inc.
Fund Address: 100 Bellevue Parkway, Wilmington, DE 19809
Name and address of agent for service: John M. Perlowski, Chief Executive Officer, BlackRock Global Allocation Fund, Inc., 55 East 52nd Street, New York, NY 10055
Registrant’s telephone number, including area code: (800) 441-7762
Date of fiscal year end: 10/31/2016
Date of reporting period: 04/30/2016
Item 1 – Report to Stockholders
APRIL 30, 2016
| | | | |
SEMI-ANNUAL REPORT (UNAUDITED) | | | |  |
BlackRock Global Allocation Fund, Inc.
|
| Not FDIC Insured • May Lose Value • No Bank Guarantee |

| | | | | | |
| | | | | | | |
| 2 | | BLACKROCK GLOBAL ALLOCATION FUND, INC. | | APRIL 30, 2016 | | |
Dear Shareholder,
Diverging monetary policies and shifting economic outlooks across regions have been the overarching themes driving financial markets over the past couple of years. Investors spent most of 2015 anticipating the end of the Federal Reserve’s (the “Fed”) near-zero interest rate policy as U.S. growth outpaced other developed markets. The Fed ultimately hiked rates in December, whereas the European Central Bank and the Bank of Japan took additional steps to stimulate growth, even introducing negative interest rates. The U.S. dollar had strengthened considerably ahead of these developments, causing profit challenges for U.S. companies that generate revenues overseas, and pressuring emerging market currencies and commodities prices.
Global market volatility increased in the latter part of 2015 and spilled over into early 2016. Oil prices were a key factor behind the instability after collapsing in mid-2015 due to excess global supply. China, one of the world’s largest consumers of oil, was another notable source of stress for financial markets. Signs of slowing economic growth, a depreciating yuan and declining confidence in the country’s policymakers stoked investors’ worries about the potential impact of China’s weakness on the global economy. Risk assets (such as equities and high yield bonds) suffered in this environment.
After a painful start to the new year, fears of a global recession began to fade as the first quarter wore on, allowing markets to calm and risk assets to rebound. Central bank stimulus in Europe and Japan, combined with a more tempered outlook for rate hikes in the United States, helped bolster financial markets. A softening in U.S. dollar strength offered some relief to U.S. exporters and emerging market economies. Oil prices found firmer footing as global supply showed signs of leveling off.
The selloff in risk assets at the turn of the year brought valuations to more reasonable levels, creating some appealing entry points for investors in 2016. Nonetheless, slow but relatively stable growth in the United States is countered by a less optimistic global economic outlook and uncertainties around the efficacy of China’s policy response, the potential consequences of negative interest rates in Europe and Japan, and a host of geopolitical risks.
For the 12 months ended April 30, 2016, higher-quality assets such as municipal bonds, U.S. Treasuries and investment grade corporate bonds generated positive returns, while riskier assets such as non-U.S. and small cap equities broadly declined.
At BlackRock, we believe investors need to think globally, extend their scope across a broad array of asset classes and be prepared to adjust accordingly as market conditions change over time. We encourage you to talk with your financial advisor and visit blackrock.com for further insight about investing in today’s markets.
Sincerely,

Rob Kapito
President, BlackRock Advisors, LLC

Rob Kapito
President, BlackRock Advisors, LLC
| | | | | | | | |
| Total Returns as of April 30, 2016 | |
| | | 6-month | | | 12-month | |
U.S. large cap equities
(S&P 500® Index) | | | 0.43 | % | | | 1.21 | % |
U.S. small cap equities
(Russell 2000® Index) | | | (1.90 | ) | | | (5.94 | ) |
International equities
(MSCI Europe, Australasia,
Far East Index) | | | (3.07 | ) | | | (9.32 | ) |
Emerging market equities
(MSCI Emerging
Markets Index) | | | (0.13 | ) | | | (17.87 | ) |
3-month Treasury bills
(BofA Merrill Lynch 3-Month
U.S. Treasury Bill Index) | | | 0.14 | | | | 0.15 | |
U.S. Treasury securities
(BofA Merrill Lynch 10-Year
U.S. Treasury Index) | | | 3.76 | | | | 3.74 | |
U.S. investment grade
bonds (Barclays
U.S. Aggregate Bond Index) | | | 2.82 | | | | 2.72 | |
Tax-exempt municipal
bonds (S&P Municipal
Bond Index) | | | 3.52 | | | | 5.16 | |
U.S. high yield bonds
(Barclays U.S.
Corporate High Yield 2%
Issuer Capped Index) | | | 2.38 | | | | (1.08 | ) |
| Past performance is no guarantee of future results. Index performance is shown for illustrative purposes only. You cannot invest directly in an index. | |
| | | | | | |
| | | | | | | |
| | THIS PAGE NOT PART OF YOUR FUND REPORT | | | | 3 |
| | | | |
| Fund Summary as of April 30, 2016 | | |
BlackRock Global Allocation Fund, Inc.’s (the “Fund”) investment objective is to provide high total investment return through a fully managed investment policy utilizing United States and foreign equity securities, debt and money market securities, the combination of which will be varied from time to time both with respect to types of securities and markets in response to changing market and economic trends. Total return means the combination of capital growth and investment income.
|
| Portfolio Management Commentary |
How did the Fund perform?
| • | | For the 6-month period ended April 30, 2016, the Fund underperformed both its reference benchmark, which is comprised of the S&P 500® Index (36%), FTSE World (ex-U.S.) Index (24%), BofA Merrill Lynch Current 5-Year U.S. Treasury Index (24%) and Citigroup Non-U.S. Dollar World Government Bond Index (16%) (the “Reference Benchmark”), and the broad-based all-equity benchmark, the FTSE World Index. The Fund invests in both equities and bonds; therefore, the Reference Benchmark provides a truer representation of the Fund’s composition and a more comparable means for measurement. The following discussion of relative performance pertains to the Reference Benchmark. The following commentary (and referenced allocation percentages) are based on the economic exposures of the Fund, which reflect adjustments for futures, swaps, options and convertible bonds, and may vary relative to the market value. |
What factors influenced performance?
| • | | Within equities, an overweight in Japan and an underweight in the United States detracted from performance. From a sector perspective, stock selection in industrials, consumer discretionary, and financials weighed on returns. An underweight in fixed income (relative to the Reference Benchmark) detracted from performance. Currency management, notably an overweight in the U.S. dollar, negatively impacted performance. |
| • | | Within equities, an overweight in precious metal securities (notably gold miners) contributed to performance. Exposure to commodity-related securities (notably gold) and to cash equivalents positively impacted performance. |
| • | | The Fund uses derivatives, which may include options, futures, swaps and forward contracts both to seek to enhance returns of the Fund and to hedge (or protect) against adverse movements in currency exchange rates, interest rates and movements in the securities markets. During the period, the Fund’s use of derivatives had a negative impact on the absolute performance of the Fund. |
Describe recent portfolio activity.
| • | | During the 6-month period, the Fund’s overall equity allocation decreased from 58% to 57% of net assets. Within equities, the Fund decreased exposure to Asia, notably Japan, and Europe, and increased |
| | | exposure to the United States. On a sector basis, the Fund reduced exposures to healthcare, financials, industrials, materials, and consumer discretionary, and increased exposures to consumer staples and information technology (“IT”). |
| • | | The Fund’s allocation to fixed income increased from 22% to 35% of net assets. Within fixed income, the Fund increased exposure to government bonds, notably in the United States, Australia and Canada. |
| • | | The Fund’s exposure to commodity-related securities increased from 2% to 4% of net assets. |
| • | | Reflecting the changes in the Fund’s overall allocations to the equity, fixed income and commodity-related asset classes during the period, the Fund’s exposure to cash and cash equivalent holdings decreased from 18% to 4% of net assets. During the 6-month period, cash helped mitigate portfolio volatility and served as a source of funds for new investments. In addition, the Fund’s cash position helped keep overall portfolio duration (sensitivity to interest rate movements) relatively low. |
Describe portfolio positioning at period end.
| • | | Relative to its Reference Benchmark, the Fund ended the period underweight in equities and fixed income and overweight in commodity-related securities and cash and cash equivalents. Within the equity segment, the Fund was overweight in Japan and underweight in the United States. Within Europe, the Fund was overweight in France and Italy, and underweight in Sweden and Germany. From a sector perspective, the Fund was overweight in health care, telecommunication services, and IT, and underweight in financials, consumer discretionary, consumer staples, utilities, materials, and industrials. Within fixed income, the Fund was underweight in U.S. Treasuries, European sovereign debt and Japanese government bonds, and overweight in government bonds in Australia, Mexico, Poland, and Hungary. In addition, the Fund was overweight in corporate and convertible debt. |
| • | | With respect to currency exposure, the Fund was overweight in the U.S. dollar, Mexican peso, and Singapore dollar, and was underweight in the Japanese yen, euro, British pound sterling, and Swiss franc. |
| | | | | | |
| | | | | | | |
| 4 | | BLACKROCK GLOBAL ALLOCATION FUND, INC. | | APRIL 30, 2016 | | |
|
| Total Return Based on a $10,000 Investment |
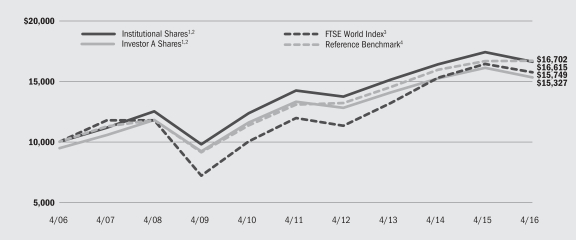
| | 1 | | Assuming maximum sales charges, if any, transaction costs and other operating expenses, including advisory fees. Institutional Shares do not have a sales charge. |
| | 2 | | The Fund invests in a portfolio of U.S. and foreign equity securities, debt and money market securities, the combination of which will be varied from time to time with respect to types of securities and markets in response to changing market and economic trends. |
| | 3 | | This unmanaged capitalization-weighted index is comprised of 2,531 equities from 35 countries in 4 regions, including the United States. |
| | 4 | | The Reference Benchmark is an unmanaged weighted index comprised as follows: 36% S&P 500® Index; 24% FTSE World (ex-U.S.) Index; 24% BofA Merrill Lynch Current 5-Year U.S. Treasury Index; and 16% Citigroup Non-U.S. Dollar World Government Bond Index. |
| | | | Descriptions of these indexes can be found in the footnotes below. |
|
| Performance Summary for the Period Ended April 30, 2016 |
| | | | | | | | | | | | | | | | | | | | | | | | | | | | |
| | | | | | Average Annual Total Returns5 | |
| | | | | | 1 Year | | | 5 Years | | | 10 Years | |
| | | 6-Month
Total Returns | | | w/o sales
charge | | | w/sales
charge | | | w/o sales
charge | | | w/sales
charge | | | w/o sales charge | | | w/sales
charge | |
Institutional | | | (0.74 | )% | | | (4.58 | )% | | | N/A | | | | 3.12 | % | | | N/A | | | | 5.21 | % | | | N/A | |
Investor A | | | (0.90 | ) | | | (4.87 | ) | | | (9.87 | )% | | | 2.84 | | | | 1.73 | % | | | 4.93 | | | | 4.36 | % |
Investor B | | | (1.25 | ) | | | (5.61 | ) | | | (9.51 | ) | | | 2.02 | | | | 1.70 | | | | 4.25 | | | | 4.25 | |
Investor C | | | (1.27 | ) | | | (5.56 | ) | | | (6.42 | ) | | | 2.07 | | | | 2.07 | | | | 4.13 | | | | 4.13 | |
Class R | | | (1.05 | )6 | | | (5.14 | ) | | | N/A | | | | 2.49 | | | | N/A | | | | 4.58 | | | | N/A | |
FTSE World Index | | | (0.45 | ) | | | (4.21 | ) | | | N/A | | | | 5.66 | | | | N/A | | | | 4.65 | | | | N/A | |
Reference Benchmark | | | 1.95 | | | | 0.24 | | | | N/A | | | | 5.00 | | | | N/A | | | | 5.26 | | | | N/A | |
U.S. Stocks: S&P 500® Index7 | | | 0.43 | | | | 1.21 | | | | N/A | | | | 11.02 | | | | N/A | | | | 6.91 | | | | N/A | |
Non-U.S. Stocks: FTSE World (ex-U.S.) Index8 | | | (1.20 | ) | | | (9.34 | ) | | | N/A | | | | 0.79 | | | | N/A | | | | 2.39 | | | | N/A | |
U.S. Bonds: BofA Merrill Lynch Current
5-Year U.S. Treasury Index9 | | | 1.93 | | | | 2.67 | | | | N/A | | | | 2.88 | | | | N/A | | | | 4.82 | | | | N/A | |
Non-U.S. Bonds: Citigroup Non-U.S. Dollar
World Government Bond Index10 | | | 9.52 | | | | 7.78 | | | | N/A | | | | (0.17 | ) | | | N/A | | | | 3.84 | | | | N/A | |
| | 5 | | Assuming maximum sales charges, if any. Average annual total returns with and without sales charges reflect reductions for distribution and service fees. See “About Fund Performance” on page 7 for a detailed description of share classes, including any related sales charges and fees. |
| | 6 | | Performance results do not reflect adjustments related to valuation for financial reporting purposes in accordance with U.S. generally accepted accounting principles and therefore differ from the return reported in the Financial Highlights on page 40. |
| | 7 | | This unmanaged index covers 500 leading companies and captures approximately 80% coverage of available market capitalization. |
| | 8 | | This unmanaged capitalization-weighted index is comprised of 1,888 equities from 34 countries, excluding the United States. |
| | 9 | | This unmanaged index is designed to track the total return of the current coupon five-year U.S. Treasury bond. |
| | 10 | | This unmanaged market capitalization-weighted index tracks 22 government bond indexes, excluding the United States. |
| | | | N/A — Not applicable as share class and index do not have a sales charge. |
| | | | Past performance is not indicative of future results. |
| | | | | | |
| | | | | | | |
| | BLACKROCK GLOBAL ALLOCATION FUND, INC. | | APRIL 30, 2016 | | 5 |
| | | | | | | | | | | | |
| | | Percent of Fund’s Net Assets1 | | | Reference
Benchmark2
Percentages | |
| | | 4/30/2016 | | | 10/31/2015 | | |
| US Equities | | | 29 | % | | | 27 | % | | | 35 | % |
| European Equities | | | 13 | % | | | 14 | % | | | 13 | % |
| Asia Pacific Equities | | | 13 | % | | | 15 | % | | | 9 | % |
| Other Equities | | | 2 | % | | | 2 | % | | | 3 | % |
Total Equities | | | 57 | % | | | 58 | % | | | 60 | % |
| | | | | | | | | | | | | |
| US Dollar Denominated Fixed Income Securities | | | 26 | % | | | 17 | % | | | 24 | % |
U.S. Issuers | | | 21 | % | | | 12 | % | | | — | |
Non-U.S. Issuers | | | 5 | % | | | 5 | % | | | — | |
| Non-U.S. Dollar Denominated Fixed Income Securities | | | 9 | % | | | 5 | % | | | 16 | % |
Total Fixed Income Securities | | | 35 | % | | | 22 | % | | | 40 | % |
| | | | | | | | | | | | | |
Commodity-Related | | | 4 | % | | | 2 | % | | | — | |
| | | | | | | | | | | | | |
Cash & Short-Term Securities | | | 4 | % | | | 18 | % | | | — | |
| | 1 | | Exposure based on market value and adjusted for the economic value of futures, swaps, options and convertible bonds. |
| | 2 | | The Reference Benchmark is an unmanaged weighted index comprised as follows: 36% of the S&P 500 Index®; 24% FTSE World (ex U.S.) Index; 24% BofA Merrill Lynch Current 5-Year U.S. Treasury Index; and 16% Citigroup Non-U.S. Dollar World Government Bond Index. Descriptions of these indexes are found on page 5 of this report to shareholders in the “Performance Summary” section. |
| | |
| Geographic Allocation | | Percent of Total Investments3 |
| | | | |
United States | | | 59 | % |
Japan | | | 9 | |
United Kingdom | | | 5 | |
France | | | 4 | |
Canada | | | 2 | |
Germany | | | 2 | |
Australia | |
| 2
|
|
Netherlands | | | 2 | |
Mexico | | | 2 | |
Italy | | | 2 | |
Switzerland | | | 2 | |
Other4 | | | 9 | |
| | 3 | | Excludes short-term securities, options purchased, options written and investments sold short. |
| | 4 | | Includes holdings within countries and geographic regions that are 1% or less of long-term investments. Please refer to the Consolidated Schedule of Investments for such countries. |
| | |
| Ten Largest Holdings (Equity Investments) | | Percent of Total Investments3 |
| | | | |
Apple, Inc. | | | 1 | % |
Alphabet, Inc. | | | 1 | |
Marathon Petroleum Corp. | | | 1 | |
General Electric Co. | |
| 1
|
|
SABMiller PLC. | | | 1 | |
Nestle SA, Registered Shares | |
| 1
|
|
JPMorgan Chase & Co. | | | 1 | |
Pfizer, Inc. | |
| 1
|
|
Wells Fargo & Co. | | | 1 | |
Anadarko Petroleum Corp. | | | 1 | |
| | | | | | |
| | | | | | | |
| 6 | | BLACKROCK GLOBAL ALLOCATION FUND, INC. | | APRIL 30, 2016 | | |
| • | | Institutional Shares are not subject to any sales charge. These shares bear no ongoing distribution or service fees and are available only to eligible investors. |
| • | | Investor A Shares are subject to a maximum initial sales charge (front-end load) of 5.25% and a service fee of 0.25% per year (but no distribution fee). Certain redemptions of these shares may be subject to a contingent deferred sales charge (“CDSC”) where no initial sales charge was paid at the time of purchase. These shares are generally available through financial intermediaries. |
| • | | Investor B Shares are subject to a maximum CDSC of 4.50% declining to 0% after six years. In addition, these shares are subject to a distribution fee of 0.75% per year and a service fee of 0.25% per year. These shares automatically convert to Investor A Shares after approximately eight years. (There is no initial sales charge for automatic share conversions.) All returns for periods greater than eight years reflect this conversion. These shares are only available through exchanges and distribution reinvestment by current holders and for purchase by certain employer-sponsored retirement plans. |
| • | | Investor C Shares are subject to a 1.00% CDSC if redeemed within one year of purchase. In addition, these shares are subject to a distribution fee of 0.75% per year and a service fee of 0.25% per year. These shares are generally available through financial intermediaries. |
| • | | Class R Shares are not subject to any sales charge. These shares are subject to a distribution fee of 0.25% per year and a service fee of 0.25% per year. These shares are available only to certain employer-sponsored retirement plans. |
Performance information reflects past performance and does not guarantee future results. Current performance may be lower or higher than the performance data quoted. Refer to www.blackrock.com/funds to obtain performance data current to the most recent month end. Performance results do not reflect the deduction of taxes that a shareholder would pay on fund distributions or the redemption of fund shares. Figures shown in the performance table on the previous page assume reinvestment of all distributions, if any, at NAV on the ex-dividend date. Investment return and principal value of shares will fluctuate so that shares, when redeemed, may be worth more or less than their original cost. Distributions paid to each class of shares will vary because of the different levels of service, distribution and transfer agency fees applicable to each class, which are deducted from the income available to be paid to shareholders.
BlackRock Advisors, LLC (the “Manager”), the Fund’s investment advisor waived a portion of its expenses. Without such waiver, the Fund’s performance would have been lower. The Manager is under no obligation to waive or to continue waiving the fees and such voluntary waiver may be reduced or discontinued at any time. See Note 6 of the Notes to Financial Statements for additional information on waivers.
| | | | | | |
| | | | | | | |
| | BLACKROCK GLOBAL ALLOCATION FUND, INC. | | APRIL 30, 2016 | | 7 |
Shareholders of the Fund may incur the following charges: (a) transactional expenses, such as sales charges; and (b) operating expenses, including investment advisory fees, service and distribution fees, including 12b-1 fees, acquired fund fees and expenses, and other Fund expenses. The expense example shown below (which is based on a hypothetical investment of $1,000 invested on November 1, 2015 and held through April 30, 2016) is intended to assist shareholders both in calculating expenses based on an investment in the Fund and in comparing these expenses with similar costs of investing in other mutual funds.
The expense example provides information about actual account values and actual expenses. In order to estimate the expenses a shareholder paid during the period covered by this report, shareholders can divide their account value by $1,000 and then multiply the result by the number corresponding to their share class under the heading entitled “Expenses Paid During the Period.”
The expense example also provides information about hypothetical account values and hypothetical expenses based on the Fund’s actual expense ratio and an assumed rate of return of 5% per year before expenses. In order to assist shareholders in comparing the ongoing expenses of investing in the Fund and other funds, compare the 5% hypothetical example with the 5% hypothetical examples that appear in other funds’ shareholder reports.
The expenses shown in the expense example are intended to highlight shareholders’ ongoing costs only and do not reflect any transactional expenses, such as sales charges, if any. Therefore, the hypothetical example is useful in comparing ongoing expenses only, and will not help shareholders determine the relative total expenses of owning different funds. If these transactional expenses were included, shareholder expenses would have been higher.
| | | | | | | | | | | | | | | | | | | | | | | | | | | | | | | | | | | | |
| | | Actual | | | Hypothetical3 | |
| | | | | | | | | Expenses Paid During the Period | | | | | | Including Dividend Expense
and Stock Loan Fees | | | Excluding Dividend Expense
and Stock Loan Fees | |
| | | Beginning
Account Value
November 1, 2015 | | | Ending
Account Value
April 30, 2016 | | | Including Dividend
Expense and Stock
Loan Fees1 | | | Excluding Dividend
Expense and Stock
Loan Fees2 | | | Beginning
Account Value
November 1, 2015 | | | Ending
Account Value
April 30, 2016 | | | Expenses Paid
During the
Period1 | | | Ending
Account Value
April 30, 2016 | | | Expenses Paid
During the
Period2 | |
Institutional | | $ | 1,000.00 | | | $ | 992.60 | | | $ | 3.91 | | | $ | 3.91 | | | $ | 1,000.00 | | | $ | 1,020.93 | | | $ | 3.97 | | | $ | 1,020.93 | | | $ | 3.97 | |
Investor A | | $ | 1,000.00 | | | $ | 991.00 | | | $ | 5.30 | | | $ | 5.30 | | | $ | 1,000.00 | | | $ | 1,019.54 | | | $ | 5.37 | | | $ | 1,019.54 | | | $ | 5.37 | |
Investor B | | $ | 1,000.00 | | | $ | 987.50 | | | $ | 9.29 | | | $ | 9.24 | | | $ | 1,000.00 | | | $ | 1,015.51 | | | $ | 9.42 | | | $ | 1,015.56 | | | $ | 9.37 | |
Investor C | | $ | 1,000.00 | | | $ | 987.30 | | | $ | 8.94 | | | $ | 8.94 | | | $ | 1,000.00 | | | $ | 1,015.86 | | | $ | 9.07 | | | $ | 1,015.86 | | | $ | 9.07 | |
Class R | | $ | 1,000.00 | | | $ | 989.50 | | | $ | 6.93 | | | $ | 6.88 | | | $ | 1,000.00 | | | $ | 1,017.90 | | | $ | 7.02 | | | $ | 1,017.95 | | | $ | 6.97 | |
| | 1 | | For each class of the Funds, expenses are equal to the annualized net expense ratio for the class (0.79% for Institutional, 1.07% for Investor A, 1.88% for Investor B, 1.81% for Investor C and 1.40% for Class R), multiplied by the average account value over the period, multiplied by 182/366 (to reflect the one-half year period shown). |
| | 2 | | For each class of the Funds, expenses are equal to the annualized net expense ratio for the class (0.79% for Institutional, 1.07% for Investor A, 1.87% for Investor B, 1.81% for Investor C and 1.39% for Class R), multiplied by the average account value over the period, multiplied by 182/366 (to reflect the one-half year period shown). |
| | 3 | | Hypothetical 5% annual return before expenses is calculated by pro rating the number of days in the most recent fiscal half year divided by 366. |
| | |
| Derivative Financial Instruments | | |
The Fund may invest in various derivative financial instruments. These instruments are used to obtain exposure to a security, commodity, index, market, and/or other asset without owning or taking physical custody of securities, commodities and/or other referenced assets or to manage market, equity, credit, interest rate, foreign currency exchange rate, commodity and/or other risks. Derivative financial instruments may give rise to a form of economic leverage and involve risks, including the imperfect correlation between the value of a derivative financial instrument and the underlying asset, possible default of the
counterparty to the transaction or illiquidity of the instrument. The Fund’s successful use of a derivative financial instrument depends on the investment advisor’s ability to predict pertinent market movements accurately, which cannot be assured. The use of these instruments may result in losses greater than if they had not been used, may limit the amount of appreciation the Fund can realize on an investment and/or may result in lower distributions paid to shareholders. The Fund’s investments in these instruments, if any, are discussed in detail in the Notes to Consolidated Financial Statements.
| | | | | | |
| | | | | | | |
| 8 | | BLACKROCK GLOBAL ALLOCATION FUND, INC. | | APRIL 30, 2016 | | |
| | |
Consolidated Schedule of Investments April 30, 2016 (Unaudited) | | (Percentages shown are based on Net Assets) |
| | | | | | | | | | |
| | |
| Common Stocks | | Shares | | | Value | |
Australia — 0.3% | | | | | | |
Commonwealth Bank of Australia | | | | | 682,075 | | | $ | 38,078,209 | |
CSL Ltd. | | | | | 142,869 | | | | 11,384,981 | |
Healthscope Ltd. | | | | | 22,998,205 | | | | 47,364,673 | |
Westpac Banking Corp. | | | | | 2,588,784 | | | | 60,767,919 | |
| | | | | | | | | | |
| | | | | 157,595,782 | |
Belgium — 0.2% | | | | | | |
Anheuser-Busch InBev SA | | | | | 565,654 | | | | 70,171,570 | |
Umicore SA | | | | | 494,975 | | | | 24,708,931 | |
| | | | | | | | | | |
| | | | | | 94,880,501 | |
Brazil — 0.0% | | | | | | |
SLC Agricola SA | | | | | 1,744,971 | | | | 7,874,377 | |
Canada — 1.2% | | | | | | |
Athabasca Oil Corp. (a)(b) | | | | | 6,928,919 | | | | 7,399,977 | |
Brookfield Asset Management, Inc., Class A | | | | | 2,021,535 | | | | 68,364,360 | |
Cameco Corp. | | | | | 3,687,373 | | | | 46,129,036 | |
Canadian National Railway Co. | | | | | 441,976 | | | | 27,208,043 | |
Cenovus Energy, Inc. | | | | | 3,945,651 | | | | 62,548,018 | |
Eldorado Gold Corp. | | | | | 5,603,633 | | | | 23,625,742 | |
Encana Corp. | | | | | 23,698,991 | | | | 181,534,271 | |
Goldcorp, Inc. | | | | | 2,908,753 | | | | 58,611,373 | |
Platinum Group Metals Ltd. (a)(c) | | | | | 6,099,951 | | | | 20,225,030 | |
Toronto-Dominion Bank | | | | | 1,610,003 | | | | 71,665,472 | |
| | | | | | | | | | |
| | | | | 567,311,322 | |
China — 0.3% | | | | | | |
Alibaba Group Holding Ltd. — ADR (a)(b) | | | | | 1,371,476 | | | | 105,521,364 | |
Dongfeng Motor Group Co. Ltd., Class H | | | | | 6,938,700 | | | | 7,582,531 | |
Haitian International Holdings Ltd. | | | | | 13,062,600 | | | | 22,286,913 | |
Zhongsheng Group Holdings Ltd. | | | | | 19,035,171 | | | | 9,749,279 | |
| | | | | | | | | | |
| | | | | 145,140,087 | |
Cyprus — 0.0% | | | | | | |
Ocean Rig UDW, Inc. | | | | | 1,295,615 | | | | 2,720,792 | |
Denmark — 0.0% | | | | | | |
Novo Nordisk A/S, Class B | | | | | 370,708 | | | | 20,698,241 | |
Egypt — 0.0% | | | | | | |
Integrated Diagnostics Holdings PLC (a)(d) | | | | | 1,648,003 | | | | 7,663,214 | |
France — 2.6% | | | | | | |
Accor SA | | | | | 975,139 | | | | 43,182,325 | |
Aeroports de Paris | | | | | 131,620 | | | | 16,566,924 | |
Airbus Group SE | | | | | 1,761,103 | | | | 110,099,882 | |
| | | | | | | | | | |
| | |
| Common Stocks | | Shares | | | Value | |
France (continued) | | | | | | |
Arkema SA | | | | | 116,577 | | | $ | 9,304,765 | |
AXA SA | | | | | 3,521,395 | | | | 88,913,817 | |
BNP Paribas SA | | | | | 895,653 | | | | 47,432,831 | |
Cie Generale des Etablissements Michelin | | | | | 55,095 | | | | 5,754,675 | |
Compagnie de Saint-Gobain | | | | | 950,913 | | | | 43,573,241 | |
Danone SA | | | | | 1,002,581 | | | | 70,244,229 | |
Dassault Aviation SA | | | | | 45,642 | | | | 53,282,200 | |
Engie SA | | | | | 1,826,294 | | | | 30,121,873 | |
Legrand SA | | | | | 742,674 | | | | 42,330,705 | |
Orange SA | | | | | 1,289,226 | | | | 21,419,099 | |
Publicis Groupe SA | | | | | 1,153,142 | | | | 85,336,200 | |
Renault SA | | | | | 303,147 | | | | 29,249,977 | |
Safran SA | | | | | 2,042,046 | | | | 140,777,918 | |
Sanofi | | | | | 1,570,225 | | | | 129,428,267 | |
Sodexo SA | | | | | 355,657 | | | | 35,929,750 | |
TOTAL SA | | | | | 1,131,612 | | | | 57,192,572 | |
TOTAL SA — ADR (b) | | | | | 141,447 | | | | 7,178,435 | |
UbiSoft Entertainment SA (a) | | | | | 775,521 | | | | 22,509,545 | |
Unibail-Rodamco SE | | | | | 225,471 | | | | 60,436,424 | |
Veolia Environnement SA | | | | | 614,304 | | | | 15,090,720 | |
Vinci SA | | | | | 553,158 | | | | 41,314,429 | |
Worldline SA (a)(d) | | | | | 195,390 | | | | 5,478,769 | |
| | | | | | | | | | |
| | | | | 1,212,149,572 | |
Germany — 1.0% | | | | | | |
adidas AG | | | | | 171,195 | | | | 22,087,131 | |
Allianz SE, Registered Shares | | | | | 291,994 | | | | 49,676,314 | |
BASF SE | | | | | 591,763 | | | | 48,957,026 | |
Bayer AG, Registered Shares | | | | | 411,846 | | | | 47,595,753 | |
Bayerische Motoren Werke AG | | | | | 333,603 | | | | 30,862,799 | |
Beiersdorf AG | | | | | 263,070 | | | | 23,622,457 | |
Deutsche Post AG, Registered Shares | | | | | 759,189 | | | | 22,299,865 | |
Deutsche Telekom AG, Registered Shares | | | | | 3,465,231 | | | | 60,826,683 | |
E.ON SE | | | | | 956,677 | | | | 9,915,164 | |
Evonik Industries AG | | | | | 839,032 | | | | 26,621,017 | |
HUGO BOSS AG | | | | | 375,097 | | | | 23,937,214 | |
RWE AG (a) | | | | | 344,486 | | | | 5,161,293 | |
Siemens AG, Registered Shares | | | | | 384,396 | | | | 40,226,361 | |
Volkswagen AG | | | | | 23,192 | | | | 3,703,681 | |
Vonovia SE | | | | | 2,150,264 | | | | 72,481,401 | |
| | | | | | | | | | |
| | | | | 487,974,159 | |
Hong Kong — 0.6% | | | | | | |
AIA Group Ltd. | | | | | 9,046,400 | | | | 54,139,091 | |
Beijing Enterprises Holdings Ltd. | | | | | 9,072,232 | | | | 47,315,040 | |
| | | | | | | | | | |
| ADR | | American Depositary Receipts | | EURIBOR | | Euro Interbank Offered Rate | | MXN | | Mexican Peso |
| AED | | United Arab Emirates Dirham | | FTSE | | Financial Times Stock Exchange | | NOK | | Norwegian Krone |
| AUD | | Australian Dollar | | GBP | | British Pound | | OTC | | Over-the-Counter |
| BRL | | Brazilian Real | | GDR | | Global Depositary Receipt | | PLN | | Polish Zloty |
| CAD | | Canadian Dollar | | HKD | | Hong Kong Dollar | | SEK | | Swedish Krona |
| CHF | | Swiss Franc | | INR | | Indian Rupee | | SGD | | Singapore Dollar |
| CLP | | Chilean Peso | | ISDA | | International Swaps and Derivatives Association, Inc. | | S&P | | Standard and Poor’s |
| CME | | Chicago Mercantile Exchange | | JPY | | Japanese Yen | | SPDR | | Standard & Poor’s Depository Receipts |
| CVA | | Certificaten Van Aandelen (Dutch Certificate) | | JSC | | Joint Stock Company | | TWD | | Taiwan Dollar |
| DKK | | Danish Krone | | KRW | | South Korean Won | | USD | | U.S. Dollar |
| ETF | | Exchange-Traded Fund | | LIBOR | | London Interbank Offered Rate | | | | |
| EUR | | Euro | | MSCI | | Morgan Stanley Capital International | | | | |
See Notes to Consolidated Financial Statements.
| | | | | | |
| | | | | | | |
| | BLACKROCK GLOBAL ALLOCATION FUND, INC. | | APRIL 30, 2016 | | 9 |
| | |
Consolidated Schedule of Investments (continued) | | |
| | | | | | | | | | |
| | |
| Common Stocks | | Shares | | | Value | |
Hong Kong (continued) | | | | | | |
Brilliance China Automotive Holdings Ltd. | | | | | 14,902,000 | | | $ | 14,698,514 | |
Chaoda Modern Agriculture Holdings Ltd. (a)(b) | | | | | 116,959,394 | | | | 2,508,349 | |
Haier Electronics Group Co. Ltd. | | | | | 12,806,000 | | | | 21,508,044 | |
Sino Biopharmaceutical Ltd. | | | | | 22,780,229 | | | | 16,142,169 | |
Sun Hung Kai Properties Ltd. | | | | | 6,960,166 | | | | 87,719,810 | |
Techtronic Industries Co. Ltd. | | | | | 1,480,500 | | | | 5,549,906 | |
Wharf Holdings Ltd. | | | | | 6,503,000 | | | | 35,148,960 | |
| | | | | | | | | | |
| | | | | | | | | | 284,729,883 | |
India — 0.3% | | | | | | |
Coal India Ltd. | | | | | 9,331,670 | | | | 40,484,869 | |
Maruti Suzuki India Ltd. | | | | | 241,010 | | | | 13,756,477 | |
Reliance Industries Ltd. | | | | | 4,946,609 | | | | 73,128,018 | |
| | | | | | | | | | |
| | | | | | | | | | 127,369,364 | |
Indonesia — 0.1% | | | | | | |
Siloam International Hospitals Tbk PT | | | | | 37,642,084 | | | | 24,118,563 | |
Ireland — 0.4% | | | | | | |
CRH PLC | | | | | 1,126,023 | | | | 32,790,813 | |
Medtronic PLC | | | | | 318,373 | | | | 25,199,223 | |
Shire PLC | | | | | 1,004,472 | | | | 62,681,090 | |
XL Group PLC | | | | | 1,701,550 | | | | 55,691,732 | |
| | | | | | | | | | |
| | | | | | | | | | 176,362,858 | |
Israel — 0.3% | | | | | | |
Check Point Software Technologies Ltd. (a)(b) | | | 60,783 | | | | 5,037,087 | |
Teva Pharmaceutical Industries Ltd. Euro | | | | | 2,059,395 | | | | 112,134,058 | |
| | | | | | | | | | |
| | | | | | | | | | 117,171,145 | |
Italy — 0.7% | | | | | | |
Ei Towers SpA (c) | | | | | 1,439,596 | | | | 84,510,333 | |
Enel SpA | | | | | 8,505,864 | | | | 38,657,676 | |
Intesa Sanpaolo SpA | | | | | 25,730,635 | | | | 71,526,017 | |
Prysmian SpA | | | | | 1,307,046 | | | | 30,923,200 | |
RAI Way SpA (d) | | | | | 7,166,193 | | | | 36,104,870 | |
Recordati SpA | | | | | 338,194 | | | | 8,605,665 | |
Snam SpA | | | | | 1,667,138 | | | | 10,195,211 | |
Telecom Italia SpA (a) | | | | | 69,508,082 | | | | 67,872,741 | |
Telecom Italia SpA, Non-Convertible Savings Shares | | | | | 4,852,222 | | | | 3,816,604 | |
| | | | | | | | | | |
| | | | | | | | | | 352,212,317 | |
Japan — 7.3% | | | | | | |
Aisin Seiki Co. Ltd. | | | | | 1,175,990 | | | | 45,698,732 | |
Ajinomoto Co., Inc. | | | | | 1,505,000 | | | | 34,690,633 | |
Alpine Electronics, Inc. | | | | | 241,900 | | | | 2,977,375 | |
Asahi Group Holdings Ltd. | | | | | 1,243,000 | | | | 39,449,122 | |
Asahi Kasei Corp. | | | | | 6,505,900 | | | | 44,514,192 | |
ASKUL Corp. | | | | | 8,900 | | | | 349,939 | |
Astellas Pharma, Inc. | | | | | 2,639,350 | | | | 35,585,251 | |
Autobacs Seven Co. Ltd. | | | | | 114,000 | | | | 1,966,876 | |
Bandai Namco Holdings, Inc. | | | | | 346,700 | | | | 7,380,998 | |
Benesse Holdings, Inc. | | | | | 52,500 | | | | 1,489,505 | |
Bridgestone Corp. | | | | | 2,062,500 | | | | 75,915,278 | |
Canon Marketing Japan, Inc. | | | | | 171,300 | | | | 3,070,085 | |
Chiba Bank Ltd. | | | | | 1,164,000 | | | | 5,878,224 | |
Chiyoda Corp. | | | | | 305,000 | | | | 2,313,016 | |
Chubu Electric Power Co., Inc. | | | | | 2,129,500 | | | | 28,050,091 | |
COMSYS Holdings Corp. | | | | | 105,800 | | | | 1,590,764 | |
| | | | | | | | | | |
| | |
| Common Stocks | | Shares | | | Value | |
Japan (continued) | | | | | | |
Concordia Financial Group Ltd. (a) | | | | | 1,369,000 | | | $ | 6,592,816 | |
Daikin Industries Ltd. | | | | | 635,500 | | | | 50,445,328 | |
Daikyo, Inc. | | | | | 2,314,000 | | | | 3,705,597 | |
Daiwa Securities Group, Inc. | | | | | 3,842,000 | | | | 22,375,127 | |
DeNA Co. Ltd. | | | | | 483,400 | | | | 8,135,381 | |
Denso Corp. | | | | | 1,895,480 | | | | 72,049,415 | |
East Japan Railway Co. | | | | | 1,509,473 | | | | 132,797,463 | |
Eisai Co. Ltd. | | | | | 301,100 | | | | 18,637,988 | |
Electric Power Development Co. Ltd. | | | | | 463,900 | | | | 13,981,044 | |
Exedy Corp. | | | | | 115,100 | | | | 2,686,484 | |
FamilyMart Co. Ltd. | | | | | 663,800 | | | | 35,031,778 | |
FANUC Corp. | | | | | 125,580 | | | | 18,550,919 | |
Fuji Heavy Industries Ltd. | | | | | 4,187,090 | | | | 137,483,021 | |
Fukuoka Financial Group, Inc. | | | | | 2,962,000 | | | | 10,125,571 | |
Futaba Industrial Co. Ltd. | | | | | 1,623,250 | | | | 7,513,413 | |
GS Yuasa Corp. | | | | | 5,167,000 | | | | 21,180,466 | |
GungHo Online Entertainment, Inc. (b) | | | | | 987,700 | | | | 2,585,206 | |
Hitachi Chemical Co. Ltd. | | | | | 1,967,600 | | | | 33,043,336 | |
Hitachi Kokusai Electric, Inc. | | | | | 189,000 | | | | 1,981,106 | |
Honda Motor Co. Ltd. | | | | | 1,975,081 | | | | 53,299,079 | |
Hoya Corp. | | | | | 995,717 | | | | 38,130,241 | |
Inpex Corp. | | | | | 7,712,800 | | | | 61,315,532 | |
Isuzu Motors Ltd. | | | | | 3,055,900 | | | | 32,698,972 | |
Japan Airlines Co. Ltd. | | | | | 3,399,600 | | | | 122,366,202 | |
Japan Post Bank Co. Ltd. (b) | | | | | 2,891,000 | | | | 35,296,394 | |
Japan Tobacco, Inc. | | | | | 714,100 | | | | 29,176,639 | |
JGC Corp. | | | | | 1,118,630 | | | | 19,078,174 | |
JSR Corp. | | | | | 2,018,300 | | | | 27,667,199 | |
Kamigumi Co. Ltd. | | | | | 475,000 | | | | 4,258,769 | |
Kansai Electric Power Co., Inc. (a) | | | | | 504,200 | | | | 4,440,553 | |
KDDI Corp. | | | | | 2,100,500 | | | | 60,506,443 | |
Keyence Corp. | | | | | 30,300 | | | | 18,161,605 | |
Kinden Corp. | | | | | 382,000 | | | | 4,486,663 | |
Koito Manufacturing Co. Ltd. | | | | | 641,300 | | | | 27,783,859 | |
Komatsu Ltd. | | | | | 2,196,300 | | | | 37,721,262 | |
Kubota Corp. | | | | | 2,646,510 | | | | 38,551,325 | |
Kuraray Co. Ltd. | | | | | 1,468,420 | | | | 18,616,683 | |
Kyocera Corp. | | | | | 930,300 | | | | 46,161,627 | |
Kyushu Electric Power Co. Inc. | | | | | 2,015,200 | | | | 20,225,977 | |
Mabuchi Motor Co. Ltd. | | | | | 181,300 | | | | 9,024,510 | |
Maeda Road Construction Co. Ltd. | | | | | 182,000 | | | | 3,315,732 | |
Medipal Holdings Corp. | | | | | 80,800 | | | | 1,278,354 | |
Mitsubishi Corp. | | | | | 1,896,630 | | | | 31,879,699 | |
Mitsubishi Electric Corp. | | | | | 7,845,000 | | | | 83,372,019 | |
Mitsubishi Estate Co. Ltd. | | | | | 5,229,000 | | | | 99,364,622 | |
Mitsubishi UFJ Financial Group, Inc. | | | | | 11,765,500 | | | | 54,295,572 | |
Mitsui & Co. Ltd. | | | | | 3,483,934 | | | | 42,557,090 | |
MS&AD Insurance Group Holdings, Inc. | | | | | 1,050,162 | | | | 27,736,328 | |
Murata Manufacturing Co. Ltd. | | | | | 205,540 | | | | 26,804,728 | |
Nabtesco Corp. | | | | | 541,600 | | | | 12,218,063 | |
NEC Corp. | | | | | 12,833,000 | | | | 31,232,614 | |
Nexon Co. Ltd. | | | | | 518,900 | | | | 7,791,480 | |
Nikon Corp. (b) | | | | | 2,439,200 | | | | 35,557,194 | |
Nintendo Co. Ltd. | | | | | 423,700 | | | | 57,369,383 | |
Nippo Corp. | | | | | 76,000 | | | | 1,260,125 | |
Nippon Express Co. Ltd. | | | | | 2,010,000 | | | | 9,172,473 | |
Nippon Steel & Sumitomo Metal Corp. | | | | | 760,200 | | | | 15,818,057 | |
Nippon Telegraph & Telephone Corp. | | | | | 1,140,600 | | | | 51,042,202 | |
Nitto Denko Corp. | | | | | 1,182,000 | | | | 63,674,871 | |
See Notes to Consolidated Financial Statements.
| | | | | | |
| | | | | | | |
| 10 | | BLACKROCK GLOBAL ALLOCATION FUND, INC. | | APRIL 30, 2016 | | |
| | |
Consolidated Schedule of Investments (continued) | | |
| | | | | | | | | | |
| | |
| Common Stocks | | Shares | | | Value | |
Japan (continued) | | | | | | |
Nomura Holdings, Inc. | | | | | 6,039,100 | | | $ | 25,658,694 | |
NS Solutions Corp. | | | | | 39,800 | | | | 691,914 | |
Okumura Corp. | | | | | 5,009,620 | | | | 26,240,472 | |
Omron Corp. | | | | | 565,400 | | | | 17,944,023 | |
Otsuka Holdings Co. Ltd. | | | | | 1,069,100 | | | | 41,678,333 | |
Rinnai Corp. | | | | | 420,075 | | | | 37,072,893 | |
Rohm Co. Ltd. | | | | | 1,301,400 | | | | 56,319,001 | |
Sanrio Co. Ltd. (b) | | | | | 1,194,000 | | | | 23,474,808 | |
Sawai Pharmaceutical Co. Ltd. | | | | | 126,500 | | | | 8,149,115 | |
SCSK Corp. | | | | | 43,500 | | | | 1,577,783 | |
Secom Co. Ltd. | | | | | 100,300 | | | | 7,707,559 | |
Sega Sammy Holdings, Inc. | | | | | 2,406,800 | | | | 26,206,099 | |
Seino Holdings Co Ltd. | | | | | 533,100 | | | | 5,418,113 | |
Seven & i Holdings Co. Ltd. | | | | | 1,059,200 | | | | 43,217,920 | |
Shimamura Co. Ltd. | | | | | 48,900 | | | | 6,601,178 | |
Shin-Etsu Chemical Co. Ltd. | | | | | 2,116,540 | | | | 118,544,815 | |
Ship Healthcare Holdings, Inc. | | | | | 475,900 | | | | 11,744,450 | |
Shizuoka Bank Ltd. | | | | | 785,000 | | | | 5,818,186 | |
SHO-BOND Holdings Co. Ltd. (b) | | | | | 16,800 | | | | 726,922 | |
SMC Corp. | | | | | 69,200 | | | | 16,875,083 | |
Sohgo Security Services Co. Ltd. | | | | | 172,900 | | | | 9,601,119 | |
Sompo Japan Nipponkoa Holdings, Inc. | | | | | 940,800 | | | | 24,701,656 | |
Sony Financial Holdings, Inc. | | | | | 2,504,400 | | | | 30,961,713 | |
Stanley Electric Co. Ltd. | | | | | 192,100 | | | | 3,905,823 | |
Sumco Corp. | | | | | 3,286,300 | | | | 20,810,966 | |
Sumitomo Corp. | | | | | 2,553,400 | | | | 26,995,205 | |
Sumitomo Electric Industries Ltd. | | | | | 2,304,300 | | | | 27,719,887 | |
Sumitomo Mitsui Financial Group, Inc. | | | | | 1,170,400 | | | | 35,219,314 | |
Suntory Beverage & Food Ltd. | | | | | 477,700 | | | | 20,866,939 | |
Suzuki Motor Corp. | | | | | 2,505,908 | | | | 68,670,747 | |
Toda Corp. | | | | | 5,260,900 | | | | 24,523,228 | |
Tokio Marine Holdings, Inc. | | | | | 993,821 | | | | 32,520,278 | |
Tokyo Gas Co. Ltd. | | | | | 19,629,285 | | | | 86,637,214 | |
Toyota Industries Corp. | | | | | 2,644,180 | | | | 114,725,511 | |
Toyota Motor Corp. | | | | | 832,800 | | | | 42,214,386 | |
Toyota Tsusho Corp. | | | | | 672,400 | | | | 15,219,344 | |
Trend Micro, Inc. | | | | | 342,600 | | | | 12,992,778 | |
TV Asahi Holdings Corp. | | | | | 169,300 | | | | 2,811,541 | |
Ube Industries Ltd. | | | | | 15,268,500 | | | | 28,999,281 | |
Yahoo! Japan Corp. | | | | | 4,669,800 | | | | 20,890,004 | |
Yamada Denki Co. Ltd. | | | | | 6,088,200 | | | | 30,649,598 | |
Yamaha Corp. | | | | | 475,100 | | | | 13,635,427 | |
Yamato Kogyo Co. Ltd. | | | | | 22,700 | | | | 532,871 | |
| | | | | | | | | | |
| | | | | | | | | | 3,472,002,045 | |
Kazakhstan — 0.0% | | | | | | |
KazMunaiGas Exploration Production JSC — GDR | | | | | 1,815,620 | | | | 12,200,966 | |
Luxembourg — 0.0% | | | | | | |
RTL Group SA | | | | | 50,089 | | | | 4,193,802 | |
Malaysia — 0.0% | | | | | | |
Axiata Group Bhd | | | | | 12,633,353 | | | | 18,247,755 | |
Mexico — 0.3% | | | | | | |
America Movil SAB de CV, Series L | | | | | 22,920,805 | | | | 16,200,096 | |
America Movil SAB de CV, Series L — ADR | | | | | 1,514,036 | | | | 21,438,750 | |
Fibra Uno Administracion SA de CV | | | | | 26,767,698 | | | | 63,727,243 | |
Telesites SAB de CV (a) | | | | | 36,906,597 | | | | 22,652,810 | |
| | | | | | | | | | |
| | | | | | | | | | 124,018,899 | |
| | | | | | | | | | |
| | |
| Common Stocks | | Shares | | | Value | |
Netherlands — 1.3% | | | | | | |
Akzo Nobel NV | | | | | 1,722,371 | | | $ | 122,368,612 | |
CNH Industrial NV, Special Voting Shares | | | | | 759,054 | | | | 5,875,078 | |
Constellium NV, Class A (a) | | | | | 2,806,277 | | | | 16,360,595 | |
ING Groep NV CVA | | | | | 3,040,171 | | | | 37,252,483 | |
Koninklijke KPN NV | | | | | 19,677,640 | | | | 77,326,291 | |
Koninklijke Philips NV | | | | | 2,907,721 | | | | 79,900,019 | |
Randstad Holding NV | | | | | 734,084 | | | | 39,446,999 | |
SBM Offshore NV | | | | | 10,500,542 | | | | 140,648,640 | |
Unilever NV CVA | | | | | 2,372,650 | | | | 104,230,179 | |
| | | | | | | | | | |
| | | | | | | | | | 623,408,896 | |
Norway — 0.1% | | | | | | |
Statoil ASA | | | | | 1,467,700 | | | | 25,833,418 | |
Peru — 0.0% | | | | | | |
Southern Copper Corp. (b) | | | | | 341,304 | | | | 10,126,490 | |
Portugal — 0.1% | | | | | | |
NOS SGPS SA | | | | | 4,588,429 | | | | 32,898,620 | |
Singapore — 0.6% | | | | | | |
CapitaLand Ltd. | | | | | 39,135,800 | | | | 90,146,406 | |
Global Logistic Properties Ltd. | | | | | 79,507,200 | | | | 112,745,034 | |
Keppel Corp. Ltd. | | | | | 10,782,400 | | | | 43,088,935 | |
Singapore Telecommunications Ltd. | | | | | 20,731,310 | | | | 59,299,609 | |
| | | | | | | | | | |
| | | | | | | | | | 305,279,984 | |
South Korea — 0.5% | | | | | | |
Hyundai Motor Co. | | | | | 516,847 | | | | 64,849,604 | |
Hyundai Wia Corp. | | | | | 129,439 | | | | 10,929,561 | |
Samsung Electronics Co. Ltd. | | | | | 90,094 | | | | 98,187,202 | |
Samsung SDI Co. Ltd. | | | | | 47,765 | | | | 4,756,884 | |
SK Hynix, Inc. | | | | | 1,310,610 | | | | 32,146,388 | |
| | | | | | | | | | |
| | | | | | | | | | 210,869,639 | |
Spain — 0.3% | | | | | | |
Cellnex Telecom SAU (d) | | | | | 5,083,072 | | | | 84,005,191 | |
Gas Natural SDG SA | | | | | 913,069 | | | | 19,040,231 | |
Iberdrola SA | | | | | 4,116,035 | | | | 29,300,981 | |
| | | | | | | | | | |
| | | | | | | | | | 132,346,403 | |
Sweden — 0.1% | | | | | | |
Svenska Handelsbanken AB, A Shares | | | | | 2,762,491 | | | | 36,852,033 | |
Switzerland — 1.3% | | | | | | |
Cie Financiere Richemont SA, Registered Shares | | | | | 213,501 | | | | 14,236,292 | |
Glencore PLC | | | | | 11,061,032 | | | | 26,434,963 | |
Nestle SA, Registered Shares | | | | | 3,631,429 | | | | 271,048,588 | |
Novartis AG, Registered Shares | | | | | 1,152,965 | | | | 87,743,182 | |
Roche Holding AG | | | | | 308,738 | | | | 78,113,547 | |
Syngenta AG, Registered Shares | | | | | 105,380 | | | | 42,274,759 | |
UBS Group AG, Registered Shares | | | | | 4,837,114 | | | | 83,853,542 | |
Zurich Insurance Group AG | | | | | 80,865 | | | | 18,144,830 | |
| | | | | | | | | | |
| | | | | | | | | | 621,849,703 | |
Taiwan — 0.2% | | | | | | |
Cheng Shin Rubber Industry Co. Ltd. | | | | | 8,308,672 | | | | 17,240,156 | |
Eclat Textile Co. Ltd. | | | | | 286,000 | | | | 3,255,279 | |
Taiwan Semiconductor Manufacturing Co. Ltd. | | | | | 11,498,000 | | | | 52,826,043 | |
Yulon Motor Co. Ltd. | | | | | 10,551,000 | | | | 9,250,990 | |
| | | | | | | | | | |
| | | | | | | | | | 82,572,468 | |
See Notes to Consolidated Financial Statements.
| | | | | | |
| | | | | | | |
| | BLACKROCK GLOBAL ALLOCATION FUND, INC. | | APRIL 30, 2016 | | 11 |
| | |
Consolidated Schedule of Investments (continued) | | |
| | | | | | | | | | |
| | |
| Common Stocks | | Shares | | | Value | |
United Arab Emirates — 0.2% | | | | | | |
Mediclinic International PLC | | | | | 2,195,516 | | | $ | 29,048,768 | |
NMC Health PLC | | | | | 3,721,605 | | | | 56,934,044 | |
| | | | | | | | | | |
| | | | | | | | | | 85,982,812 | |
United Kingdom — 3.2% | | | | | | |
Aggreko PLC | | | | | 2,568,751 | | | | 40,887,911 | |
ARM Holdings PLC | | | | | 1,597,561 | | | | 21,927,904 | |
AstraZeneca PLC | | | | | 2,144,420 | | | | 123,030,949 | |
Aviva PLC | | | | | 1,504,966 | | | | 9,534,700 | |
Berkeley Group Holdings PLC | | | | | 482,116 | | | | 21,126,566 | |
BT Group PLC | | | | | 6,981,910 | | | | 45,257,221 | |
Burberry Group PLC | | | | | 395,740 | | | | 6,890,453 | |
Coats Group PLC (a) | | | | | 9,662,955 | | | | 4,174,837 | |
Delphi Automotive PLC | | | | | 1,063,382 | | | | 78,296,817 | |
Delta Topco Ltd., (Acquired 5/02/12, cost $48,436,537) (a)(e) | | | | | 78,481,957 | | | | 31,392,783 | |
Diageo PLC — ADR | | | | | 517,204 | | | | 56,028,709 | |
GlaxoSmithKline PLC | | | | | 4,373,236 | | | | 93,466,846 | |
HSBC Holdings PLC | | | | | 29,675,859 | | | | 196,658,198 | |
Legal & General Group PLC | | | | | 4,527,028 | | | | 14,793,851 | |
Liberty Global PLC, Class A (a) | | | | | 894,994 | | | | 33,768,124 | |
Lloyds Banking Group PLC | | | | | 26,904,678 | | | | 26,407,226 | |
National Grid PLC | | | | | 3,188,147 | | | | 45,490,424 | |
Pearson PLC | | | | | 3,327,132 | | | | 39,205,206 | |
Prudential PLC | | | | | 2,049,021 | | | | 40,446,710 | |
Rio Tinto PLC | | | | | 1,441,267 | | | | 48,349,193 | |
SABMiller PLC | | | | | 4,596,156 | | | | 281,496,288 | |
Smiths Group PLC | | | | | 2,522,708 | | | | 40,939,448 | |
Spire Healthcare Group PLC (d) | | | | | 14,082,788 | | | | 67,530,618 | |
Vodafone Group PLC | | | | | 24,572,676 | | | | 79,169,176 | |
Vodafone Group PLC, SP — ADR | | | | | 2,685,008 | | | | 87,907,162 | |
| | | | | | | | | | |
| | | | | | | | | | 1,534,177,320 | |
United States — 28.4% | | | | | | |
3M Co. | | | | | 61,625 | | | | 10,314,792 | |
AbbVie, Inc. | | | | | 858,295 | | | | 52,355,995 | |
Accenture PLC, Class A | | | | | 123,452 | | | | 13,940,200 | |
Activision Blizzard, Inc. | | | | | 1,423,072 | | | | 49,053,292 | |
Adobe Systems, Inc. (a) | | | | | 323,261 | | | | 30,457,651 | |
Aetna, Inc. | | | | | 1,285,302 | | | | 144,300,856 | |
Agilent Technologies, Inc. | | | | | 989,030 | | | | 40,471,108 | |
Air Products & Chemicals, Inc. | | | | | 197,331 | | | | 28,788,620 | |
Alexion Pharmaceuticals, Inc. (a) | | | | | 372,064 | | | | 51,821,074 | |
Alliance Data Systems Corp. (a) | | | | | 25,858 | | | | 5,257,190 | |
Allstate Corp. | | | | | 1,541,631 | | | | 100,283,097 | |
Alphabet, Inc., Class A (a) | | | | | 79,090 | | | | 55,986,229 | |
Alphabet, Inc., Class C (a) | | | | | 628,408 | | | | 435,493,028 | |
Altria Group, Inc. | | | | | 1,926,292 | | | | 120,797,771 | |
Amazon.com, Inc. (a) | | | | | 2,953 | | | | 1,947,769 | |
Amdocs Ltd. | | | | | 188,833 | | | | 10,676,618 | |
American Electric Power Co., Inc. | | | | | 458,361 | | | | 29,105,923 | |
American International Group, Inc. | | | | | 1,466,156 | | | | 81,840,828 | |
American Water Works Co., Inc. | | | | | 930,110 | | | | 67,674,804 | |
Ameriprise Financial, Inc. | | | | | 39,645 | | | | 3,801,955 | |
AmerisourceBergen Corp. | | | | | 42,319 | | | | 3,601,347 | |
Amgen, Inc. | | | | | 1,010,862 | | | | 160,019,455 | |
Anacor Pharmaceuticals, Inc. (a)(b) | | | | | 205,057 | | | | 12,865,276 | |
Anadarko Petroleum Corp. | | | | | 4,596,148 | | | | 242,492,768 | |
Anthem, Inc. | | | | | 643,941 | | | | 90,647,575 | |
Apple, Inc. | | | | | 6,091,483 | | | | 571,015,616 | |
| | | | | | | | | | |
| | |
| Common Stocks | | Shares | | | Value | |
United States (continued) | | | | | | |
Archer-Daniels-Midland Co. | | | | | 71,107 | | | $ | 2,840,014 | |
AT&T, Inc. | | | | | 1,803,674 | | | | 70,018,625 | |
Axalta Coating Systems Ltd. (a) | | | | | 3,297,599 | | | | 93,882,644 | |
Axis Capital Holdings Ltd. | | | | | 191,659 | | | | 10,209,675 | |
Bank of America Corp. | | | | | 14,436,964 | | | | 210,202,196 | |
Baxter International, Inc. | | | | | 1,911,727 | | | | 84,536,568 | |
Bed Bath & Beyond, Inc. (a) | | | | | 576,772 | | | | 27,235,174 | |
Berkshire Hathaway, Inc., Class A (a) | | | | | 586 | | | | 128,334,000 | |
Berkshire Hathaway, Inc., Class B (a) | | | | | 1,118,682 | | | | 162,745,857 | |
Biogen, Inc. (a) | | | | | 194,562 | | | | 53,502,604 | |
Boeing Co. | | | | | 52,126 | | | | 7,026,585 | |
Bristol-Myers Squibb Co. | | | | | 1,162,804 | | | | 83,931,193 | |
Bunge Ltd. | | | | | 90,784 | | | | 5,674,000 | |
Calpine Corp. (a) | | | | | 1,603,437 | | | | 25,302,236 | |
Capital One Financial Corp. | | | | | 136,527 | | | | 9,883,190 | |
Cardinal Health, Inc. | | | | | 142,649 | | | | 11,192,241 | |
Catalent, Inc. (a) | | | | | 1,761,993 | | | | 52,031,653 | |
Caterpillar, Inc. (b) | | | | | 308,002 | | | | 23,937,915 | |
Celgene Corp. (a) | | | | | 408,798 | | | | 42,273,801 | |
Charles Schwab Corp. | | | | | 1,651,624 | | | | 46,922,638 | |
Chevron Corp. | | | | | 37,879 | | | | 3,870,476 | |
Chipotle Mexican Grill, Inc. (a) | | | | | 72,047 | | | | 30,329,626 | |
Chubb Ltd. | | | | | 889,359 | | | | 104,819,852 | |
Cintas Corp. | | | | | 130,137 | | | | 11,683,700 | |
Cisco Systems, Inc. | | | | | 3,870,283 | | | | 106,394,080 | |
Citigroup, Inc. | | | | | 3,379,722 | | | | 156,413,534 | |
Citizens Financial Group, Inc. | | | | | 95,639 | | | | 2,185,351 | |
CME Group, Inc. | | | | | 450,957 | | | | 41,447,458 | |
Coca-Cola Co. | | | | | 1,372,826 | | | | 61,502,605 | |
Coca-Cola Enterprises, Inc. | | | | | 94,320 | | | | 4,949,914 | |
Colfax Corp. (a)(b) | | | | | 754,699 | | | | 24,474,889 | |
Colgate-Palmolive Co. | | | | | 624,104 | | | | 44,261,456 | |
Comcast Corp., Class A | | | | | 3,204,340 | | | | 194,695,698 | |
Computer Sciences Corp. | | | | | 191,023 | | | | 6,328,592 | |
CONSOL Energy, Inc. | | | | | 3,733,075 | | | | 56,182,779 | |
Constellation Brands, Inc., Class A | | | | | 116,219 | | | | 18,137,137 | |
CSX Corp. | | | | | 1,256,834 | | | | 34,273,863 | |
CVS Health Corp. | | | | | 1,135,026 | | | | 114,070,113 | |
DaVita HealthCare Partners, Inc. (a) | | | | | 536,428 | | | | 39,642,029 | |
Delta Air Lines, Inc. | | | | | 787,308 | | | | 32,807,124 | |
Discover Financial Services | | | | | 866,367 | | | | 48,750,471 | |
DISH Network Corp., Class A (a) | | | | | 881,948 | | | | 43,471,217 | |
Dominion Resources, Inc. | | | | | 502,801 | | | | 35,935,187 | |
Dover Corp. | | | | | 43,435 | | | | 2,853,679 | |
Dow Chemical Co. | | | | | 827,106 | | | | 43,514,047 | |
Dr. Pepper Snapple Group, Inc. | | | | | 63,650 | | | | 5,786,421 | |
DTE Energy Co. | | | | | 201,999 | | | | 18,010,231 | |
E.I. du Pont de Nemours & Co. | | | | | 655,368 | | | | 43,195,305 | |
Eaton Corp. PLC | | | | | 1,156,674 | | | | 73,182,764 | |
eBay, Inc. (a) | | | | | 1,138,220 | | | | 27,806,715 | |
Edgewell Personal Care Co. | | | | | 1,459,711 | | | | 119,798,482 | |
Edison International | | | | | 142,887 | | | | 10,103,540 | |
Electronic Arts, Inc. (a) | | | | | 99,264 | | | | 6,139,478 | |
Eli Lilly & Co. | | | | | 1,290,662 | | | | 97,483,701 | |
Envision Healthcare Holdings, Inc. (a) | | | | | 2,385,173 | | | | 53,976,465 | |
EQT Corp. | | | | | 1,229,698 | | | | 86,201,830 | |
Equity Residential | | | | | 367,437 | | | | 25,011,437 | |
Exelon Corp. | | | | | 144,245 | | | | 5,061,557 | |
Expedia, Inc. | | | | | 207,534 | | | | 24,026,211 | |
See Notes to Consolidated Financial Statements.
| | | | | | |
| | | | | | | |
| 12 | | BLACKROCK GLOBAL ALLOCATION FUND, INC. | | APRIL 30, 2016 | | |
| | |
Consolidated Schedule of Investments (continued) | | |
| | | | | | | | | | |
| | |
| Common Stocks | | Shares | | | Value | |
United States (continued) | | | | | | |
Exxon Mobil Corp. | | | | | 832,673 | | | $ | 73,608,293 | |
Facebook, Inc., Class A (a) | | | | | 1,886,041 | | | | 221,760,701 | |
FedEx Corp. | | | | | 648,332 | | | | 107,046,097 | |
Fifth Third Bancorp | | | | | 271,226 | | | | 4,966,148 | |
Fitbit, Inc., Series A (a)(b) | | | | | 2,206,388 | | | | 40,266,581 | |
Ford Motor Co. | | | | | 5,751,709 | | | | 77,993,174 | |
Fortune Brands Home & Security, Inc. | | | | | 153,169 | | | | 8,487,094 | |
General Dynamics Corp. | | | | | 90,078 | | | | 12,657,761 | |
General Electric Co. | | | | | 9,439,577 | | | | 290,266,993 | |
General Growth Properties, Inc. | | | | | 487,895 | | | | 13,675,697 | |
Gilead Sciences, Inc. | | | | | 341,011 | | | | 30,080,580 | |
Global Payments, Inc. | | | | | 91,839 | | | | 6,628,939 | |
GoDaddy, Inc., Class A (a) | | | | | 559,775 | | | | 17,000,367 | |
Goldman Sachs Group, Inc. | | | | | 519,497 | | | | 85,254,653 | |
Goodyear Tire & Rubber Co. | | | | | 195,871 | | | | 5,674,383 | |
Hain Celestial Group, Inc. (a) | | | | | 328,234 | | | | 13,739,875 | |
Hartford Financial Services Group, Inc. | | | | | 410,254 | | | | 18,207,073 | |
HCA Holdings, Inc. (a) | | | | | 75,165 | | | | 6,059,802 | |
HD Supply Holdings, Inc. (a) | | | | | 277,611 | | | | 9,516,505 | |
Helmerich & Payne, Inc. | | | | | 117,423 | | | | 7,764,009 | |
Hershey Co. | | | | | 156,155 | | | | 14,539,592 | |
Hexcel Corp. | | | | | 112,906 | | | | 5,111,255 | |
Home Depot, Inc. | | | | | 93,579 | | | | 12,529,292 | |
HP, Inc. | | | | | 3,425,165 | | | | 42,026,775 | |
HTG Molecular Diagnostics, Inc. (a) | | | | | 329,002 | | | | 954,106 | |
Ingersoll-Rand PLC | | | | | 1,178,456 | | | | 77,236,006 | |
Intel Corp. | | | | | 2,078,216 | | | | 62,928,380 | |
International Business Machines Corp. | | | | | 399,223 | | | | 58,262,605 | |
International Paper Co. | | | | | 195,201 | | | | 8,446,347 | |
Intuit, Inc. | | | | | 251,664 | | | | 25,390,381 | |
Invitae Corp. (a)(c) | | | | | 1,972,699 | | | | 18,819,548 | |
Johnson & Johnson | | | | | 2,000,100 | | | | 224,171,208 | |
JPMorgan Chase & Co. | | | | | 4,220,641 | | | | 266,744,511 | |
Kansas City Southern | | | | | 576,069 | | | | 54,582,538 | |
Kimberly-Clark Corp. | | | | | 89,669 | | | | 11,225,662 | |
KLA-Tencor Corp. | | | | | 106,686 | | | | 7,461,619 | |
Kraft Heinz Co. | | | | | 351,308 | | | | 27,426,616 | |
Kroger Co. | | | | | 1,094,956 | | | | 38,750,493 | |
Las Vegas Sands Corp. | | | | | 466,533 | | | | 21,063,965 | |
Lear Corp. | | | | | 127,265 | | | | 14,652,019 | |
Liberty Broadband Corp., Class A (a) | | | | | 354,514 | | | | 20,320,742 | |
Liberty Broadband Corp., Class C (a) | | | | | 552,463 | | | | 31,628,507 | |
Liberty Media Group, Class A (a) | | | | | 322,680 | | | | 5,905,044 | |
Liberty Media Group, Class C (a) | | | | | 599,210 | | | | 10,785,780 | |
Liberty SiriusXM Group, Class A (a) | | | | | 1,254,891 | | | | 41,122,778 | |
Liberty SiriusXM Group, Class C (a) | | | | | 2,353,016 | | | | 75,343,572 | |
Lincoln National Corp. | | | | | 129,921 | | | | 5,645,067 | |
Lookout, Inc., (Acquired 3/04/15, cost
$2,096,082) (a)(e) | | | | | 183,495 | | | | 1,585,360 | |
Lowe’s Cos., Inc. | | | | | 124,263 | | | | 9,446,473 | |
LyondellBasell Industries NV, Class A | | | | | 45,034 | | | | 3,722,961 | |
Marathon Oil Corp. | | | | | 9,693,184 | | | | 136,576,963 | |
Marathon Petroleum Corp. | | | | | 8,313,808 | | | | 324,903,617 | |
Marsh & McLennan Cos., Inc. | | | | | 1,012,912 | | | | 63,965,393 | |
Masco Corp. | | | | | 489,137 | | | | 15,021,397 | |
Mastercard, Inc., Class A | | | | | 997,111 | | | | 96,709,796 | |
McDonald’s Corp. | | | | | 83,108 | | | | 10,512,331 | |
McKesson Corp. | | | | | 1,024,741 | | | | 171,972,035 | |
Merck & Co., Inc. | | | | | 1,495,958 | | | | 82,038,337 | |
MetLife, Inc. | | | | | 490,888 | | | | 22,139,049 | |
| | | | | | | | | | |
| | |
| Common Stocks | | Shares | | | Value | |
United States (continued) | | | | | | |
Michael Kors Holdings Ltd. (a) | | | | | 637,104 | | | $ | 32,912,793 | |
Micron Technology, Inc. (a) | | | | | 4,551,339 | | | | 48,926,894 | |
Microsoft Corp. | | | | | 3,436,075 | | | | 171,357,060 | |
Mondelez International, Inc., Class A (f) | | | | | 2,092,339 | | | | 89,886,883 | |
Monsanto Co. | | | | | 194,069 | | | | 18,180,384 | |
Morgan Stanley | | | | | 118,588 | | | | 3,208,991 | |
Mylan NV (a) | | | | | 2,474,415 | | | | 103,207,850 | |
NextEra Energy Partners LP | | | | | 1,218,771 | | | | 35,210,294 | |
NextEra Energy, Inc. | | | | | 859,123 | | | | 101,015,682 | |
Northrop Grumman Corp. | | | | | 183,927 | | | | 37,936,783 | |
Norwegian Cruise Line Holdings Ltd. (a) | | | | | 263,494 | | | | 12,882,222 | |
Oracle Corp. | | | | | 3,795,009 | | | | 151,269,059 | |
PACCAR, Inc. | | | | | 707,701 | | | | 41,690,666 | |
PayPal Holdings, Inc. (a) | | | | | 828,035 | | | | 32,442,411 | |
PepsiCo, Inc. | | | | | 1,403,363 | | | | 144,490,254 | |
Pfizer, Inc. | | | | | 8,083,130 | | | | 264,399,182 | |
Phillips 66 | | | | | 103,483 | | | | 8,496,989 | |
Pioneer Natural Resources Co. | | | | | 284,185 | | | | 47,203,128 | |
PPG Industries, Inc. | | | | | 294,637 | | | | 32,524,978 | |
Procter & Gamble Co. | | | | | 2,605,637 | | | | 208,763,636 | |
Prologis, Inc. | | | | | 426,333 | | | | 19,359,782 | |
Prudential Financial, Inc. | | | | | 98,484 | | | | 7,646,298 | |
PulteGroup, Inc. | | | | | 562,670 | | | | 10,347,501 | |
Pure Storage, Inc., Class A (a)(b) | | | | | 2,778,874 | | | | 40,432,617 | |
Qorvo, Inc. (a) | | | | | 342,811 | | | | 15,436,779 | |
QUALCOMM, Inc. | | | | | 2,904,219 | | | | 146,721,144 | |
Raytheon Co. | | | | | 96,213 | | | | 12,156,513 | |
Realogy Holdings Corp. (a) | | | | | 188,138 | | | | 6,724,052 | |
Regeneron Pharmaceuticals, Inc. (a) | | | | | 33,390 | | | | 12,578,347 | |
Reinsurance Group of America, Inc. | | | | | 106,608 | | | | 10,151,214 | |
Rockwell Automation, Inc. | | | | | 92,020 | | | | 10,441,509 | |
Schlumberger Ltd. | | | | | 1,538,476 | | | | 123,601,162 | |
Scripps Networks Interactive, Inc., Class A | | | | | 47,461 | | | | 2,959,193 | |
Sealed Air Corp. | | | | | 102,322 | | | | 4,845,970 | |
Sempra Energy | | | | | 517,752 | | | | 53,509,669 | |
Simon Property Group, Inc. | | | | | 529,611 | | | | 106,541,845 | |
Skyworks Solutions, Inc. | | | | | 192,127 | | | | 12,837,926 | |
Southwest Airlines Co. | | | | | 619,384 | | | | 27,630,720 | |
Square, Inc., Class A (a)(b) | | | | | 1,111,862 | | | | 16,555,625 | |
St. Joe Co. (a)(c) | | | | | 6,750,883 | | | | 113,752,379 | |
Starbucks Corp. | | | | | 61,567 | | | | 3,461,912 | |
Stryker Corp. | | | | | 67,066 | | | | 7,310,865 | |
SunTrust Banks, Inc. | | | | | 912,743 | | | | 38,097,893 | |
Surgery Partners, Inc. (a) | | | | | 885,781 | | | | 14,429,372 | |
Synchrony Financial (a) | | | | | 2,029,582 | | | | 62,044,322 | |
Tahoe Resources, Inc. | | | | | 4,495,065 | | | | 63,483,344 | |
Target Corp. | | | | | 672,918 | | | | 53,496,981 | |
Tenet Healthcare Corp. (a)(b) | | | | | 1,802,892 | | | | 57,133,647 | |
TESARO, Inc. (a) | | | | | 316,539 | | | | 13,117,376 | |
Textron, Inc. | | | | | 2,846,492 | | | | 110,102,311 | |
Thermo Fisher Scientific, Inc. | | | | | 374,594 | | | | 54,035,184 | |
Tiffany & Co. | | | | | 503,689 | | | | 35,938,210 | |
Time Warner Cable, Inc. | | | | | 322,163 | | | | 68,333,994 | |
Time Warner, Inc. | | | | | 440,387 | | | | 33,090,679 | |
Travelers Cos., Inc. | | | | | 238,079 | | | | 26,164,882 | |
Tyco International PLC | | | | | 775,397 | | | | 29,868,292 | |
Union Pacific Corp. | | | | | 565,894 | | | | 49,362,934 | |
United Continental Holdings, Inc. (a) | | | | | 1,752,512 | | | | 80,282,575 | |
United Parcel Service, Inc., Class B | | | | | 387,864 | | | | 40,752,870 | |
See Notes to Consolidated Financial Statements.
| | | | | | |
| | | | | | | |
| | BLACKROCK GLOBAL ALLOCATION FUND, INC. | | APRIL 30, 2016 | | 13 |
| | |
Consolidated Schedule of Investments (continued) | | |
| | | | | | | | | | | | |
| | |
| Common Stocks | | Shares | | | Value | |
United States (continued) | | | | | | | | |
United Rentals, Inc. (a) | | | | | | | 1,110,270 | | | $ | 74,310,371 | |
United Technologies Corp. | | | | | | | 696,097 | | | | 72,651,644 | |
UnitedHealth Group, Inc. | | | | | | | 59,579 | | | | 7,845,363 | |
Univar, Inc. (a) | | | | | | | 1,401,545 | | | | 24,386,883 | |
Unum Group | | | | | | | 1,365,641 | | | | 46,718,579 | |
Urban Outfitters, Inc. (a) | | | | | | | 802,325 | | | | 24,326,494 | |
US Bancorp | | | | | | | 2,399,341 | | | | 102,427,867 | |
Valero Energy Corp. | | | | | | | 220,709 | | | | 12,993,139 | |
Veeva Systems, Inc., Class A (a)(b) | | | | | | | 1,736,028 | | | | 47,758,130 | |
VeriSign, Inc. (a)(b) | | | | | | | 134,697 | | | | 11,637,821 | |
Verizon Communications, Inc. | | | | | | | 2,529,626 | | | | 128,859,148 | |
Verizon Communications, Inc. | | | | | | | 526,433 | | | | 26,816,497 | |
Visa, Inc., Class A | | | | | | | 1,654,756 | | | | 127,813,353 | |
VMware, Inc., Class A (a)(b) | | | | | | | 455,061 | | | | 25,897,521 | |
WABCO Holdings, Inc. (a) | | | | | | | 33,703 | | | | 3,780,128 | |
Walgreens Boots Alliance, Inc. | | | | | | | 882,339 | | | | 69,951,836 | |
Wal-Mart Stores, Inc. | | | | | | | 1,883,218 | | | | 125,930,788 | |
Wells Fargo & Co. | | | | | | | 5,212,656 | | | | 260,528,547 | |
Western Digital Corp. | | | | | | | 1,073,277 | | | | 43,859,465 | |
WestRock Co. | | | | | | | 2,080,947 | | | | 87,087,632 | |
Whirlpool Corp. | | | | | | | 279,799 | | | | 48,724,198 | |
WhiteWave Foods Co. (a)(f) | | | | | | | 309,823 | | | | 12,457,983 | |
Whiting Petroleum Corp. (a)(b) | | | | | | | 3,266,283 | | | | 39,195,396 | |
Whole Foods Market, Inc. | | | | | | | 774,192 | | | | 22,513,503 | |
Williams Cos., Inc. | | | | | | | 5,606,131 | | | | 108,702,880 | |
Williams-Sonoma, Inc. | | | | | | | 348,109 | | | | 20,461,847 | |
Wyndham Worldwide Corp. | | | | | | | 120,136 | | | | 8,523,649 | |
Yahoo!, Inc. (a) | | | | | | | 727,968 | | | | 26,643,629 | |
Zimmer Biomet Holdings, Inc. | | | | | | | 430,370 | | | | 49,823,935 | |
| | | | | | | | | | | | |
| | | | | | | | | | | | 13,441,167,758 | |
| Total Common Stocks — 51.9% | | | | | | | | | | | 24,560,001,188 | |
| | | | | | | | | | | | |
| | | | | | | | | | | | | |
| | |
| Corporate Bonds | | Par (000) | | | | |
Argentina — 0.3% | | | | | | | | |
IRSA Propiedades Comerciales SA, 8.75%, 3/23/23 (d) | | | USD | | | | 21,247 | | | | 22,335,909 | |
YPF SA (d): | | | | | | | | |
8.88%, 12/19/18 | | | | | | | 30,031 | | | | 32,236,777 | |
8.50%, 7/28/25 | | | | | | | 91,036 | | | | 93,767,080 | |
| | | | | | | | | | | | |
| | | | | | | | | | | | 148,339,766 | |
Australia — 0.2% | | | | | | | | |
TFS Corp. Ltd., 11.00%, 7/15/18 (d) | | | | | | | 83,470 | | | | 86,808,800 | |
Brazil — 0.0% | | | | | | | | |
Odebrecht Finance Ltd., 4.38%, 4/25/25 (d) | | | | | | | 30,805 | | | | 11,382,448 | |
Canada — 0.1% | | | | | | | | |
First Quantum Minerals Ltd.: | | | | | | | | |
6.75%, 2/15/20 | | | | | | | 19,191 | | | | 15,976,508 | |
7.00%, 2/15/21 | | | | | | | 56,482 | | | | 46,032,830 | |
| | | | | | | | | | | | |
| | | | | | | | | | | | 62,009,338 | |
Chile — 0.0% | | | | | | | | |
Inversiones Alsacia SA, 8.00%,
12/31/18 (d) | | | | | | | 34,787 | | | | 2,087,231 | |
| | | | | | | | | | | | |
| Corporate Bonds | | Par (000) | | | Value | |
China — 0.2% | | | | | | | | |
Alibaba Group Holding Ltd.: | | | | | | | | |
3.13%, 11/28/21 | | | USD | | | | 40,351 | | | $ | 40,983,179 | |
3.60%, 11/28/24 | | | | 11,461 | | | | 11,596,962 | |
Celestial Nutrifoods Ltd., 0.00%,
6/12/49 (a)(g)(h) | | | SGD | | | | 88,600 | | | | 658,810 | |
China Milk Products Group Ltd., 0.00%, 1/15/49 (a)(g)(i) | | | USD | | | | 39,500 | | | | 395,000 | |
SINA Corp., 1.00%, 12/01/18 (h) | | | | 26,718 | | | | 26,233,736 | |
| | | | | | | | | | | | |
| | | | | 79,867,687 | |
France — 0.2% | | | | | | | | |
BNP Paribas SA, 2.40%, 12/12/18 | | | | | | | 69,765 | | | | 70,991,538 | |
Germany — 0.1% | | | | | | | | |
Deutsche Bank AG, 1.88%, 2/13/18 | | | | 27,067 | | | | 27,031,894 | |
Unitymedia Hessen GmbH & Co. KG/Unitymedia NRW GmbH, 5.50%, 1/15/23 (d) | | | | | | | 13,784 | | | | 14,283,670 | |
| | | | | | | | | | | | |
| | | | | 41,315,564 | |
Hong Kong — 0.1% | | | | | | | | |
Hutchison Whampoa International 11 Ltd., 3.50%, 1/13/17 (d) | | | | | | | 24,032 | | | | 24,363,954 | |
Sun Hung Kai Properties Capital Market Ltd., 4.50%, 2/14/22 | | | | | | | 22,484 | | | | 24,722,754 | |
| | | | | | | | | | | | |
| | | | | 49,086,708 | |
India — 0.2% | | | | | | | | |
REI Agro Ltd.: | | | | | | | | |
5.50%, 11/13/16 (a)(d)(g) | | | | | | | 8,271 | | | | 41,355 | |
5.50%, 11/13/16 (a)(g) | | | | | | | 46,516 | | | | 232,580 | |
Suzlon Energy Ltd., 5.75%, 7/16/19 (d)(h)(j) | | | | | | | 89,276 | | | | 90,838,330 | |
| | | | | | | | | | | | |
| | | | | 91,112,265 | |
Italy — 0.2% | | | | | | | | |
Intesa Sanpaolo SpA, 3.88%, 1/15/19 | | | | 56,884 | | | | 58,925,794 | |
Telecom Italia SpA, 5.30%, 5/30/24 (d) | | | | 43,375 | | | | 45,337,719 | |
| | | | | | | | | | | | |
| | | | | 104,263,513 | |
Japan — 0.1% | | | | | | | | |
Sumitomo Mitsui Banking Corp., 2.45%, 1/10/19 | | | | 31,358 | | | | 31,828,339 | |
Luxembourg — 0.2% | | | | | | | | |
Intelsat Jackson Holdings SA: | | | | | | | | |
7.50%, 4/01/21 | | | | 37,384 | | | | 26,636,100 | |
8.00%, 2/15/24 (d) | | | | 11,320 | | | | 11,716,200 | |
Telecom Italia Finance SpA, 6.13%,
11/15/16 (d)(h) | | | EUR | | | | 35,900 | | | | 44,909,736 | |
| | | | | | | | | | | | |
| | | | | 83,262,036 | |
Mexico — 0.3% | | | | | | | | |
Petroleos Mexicanos: | | | | | | | | |
5.75%, 3/01/18 | | | USD | | | | 35,122 | | | | 36,817,690 | |
3.50%, 7/23/20 | | | | 47,538 | | | | 46,563,471 | |
6.38%, 2/04/21 (d) | | | | 30,773 | | | | 33,228,070 | |
Trust F/1401, 5.25%, 12/15/24 (d) | | | | 19,282 | | | | 20,005,075 | |
| | | | | | | | | | | | |
| | | | | 136,614,306 | |
See Notes to Consolidated Financial Statements.
| | | | | | |
| | | | | | | |
| 14 | | BLACKROCK GLOBAL ALLOCATION FUND, INC. | | APRIL 30, 2016 | | |
| | |
Consolidated Schedule of Investments (continued) | | |
| | | | | | | | | | | | |
| Corporate Bonds | | Par (000) | | | Value | |
Netherlands — 0.2% | | | | | | | | |
Bio City Development Co. BV, 8.00%, 7/06/18 (a)(c)(d)(g)(h) | | | USD | | | | 140,850 | | | $ | 56,523,105 | |
Constellium NV (d): | | | | | | | | |
7.00%, 1/15/23 | | | EUR | | | | 20,901 | | | | 20,881,279 | |
8.00%, 1/15/23 | | | USD | | | | 5,675 | | | | 4,866,313 | |
Cooperatieve Rabobank UA, 3.95%, 11/09/22 | | | | | | | 14,559 | | | | 14,980,439 | |
Volkswagen International Finance NV, 4.00%, 8/12/20 | | | | | | | 13,139 | | | | 13,768,700 | |
| | | | | | | | | | | | |
| | | | | 111,019,836 | |
Singapore — 0.3% | | | | | | | | |
CapitaLand Ltd. (h): | | | | | | | | |
2.10%, 11/15/16 | | | SGD | | | | 57,500 | | | | 42,488,474 | |
1.95%, 10/17/23 (d) | | | | 50,500 | | | | 37,729,022 | |
Global Logistic Properties Ltd., 3.88%, 6/04/25 | | | USD | | | | 68,851 | | | | 68,781,323 | |
| | | | | | | | | | | | |
| | | | | 148,998,819 | |
South Korea — 0.0% | | | | | | | | |
Export-Import Bank of Korea, 2.88%, 9/17/18 | | | | | | | 19,188 | | | | 19,646,593 | |
Spain — 0.2% | | | | | | | | |
Telefonica Participaciones SAU, 4.90%, 9/25/17 (h) | | | EUR | | | | 57,000 | | | | 56,978,853 | |
Telefonica SA, 6.00%, 7/14/17 | | | | 19,200 | | | | 21,202,303 | |
| | | | | | | | | | | | |
| | | | | 78,181,156 | |
Switzerland — 0.1% | | | | | | | | |
UBS AG, 2.38%, 8/14/19 | | | USD | | | | 23,290 | | | | 23,695,432 | |
UBS Group Funding Jersey Ltd., 4.13%, 9/24/25 (d) | | | | | | | 29,225 | | | | 29,984,587 | |
| | | | | | | | | | | | |
| | | | | 53,680,019 | |
United Arab Emirates — 0.2% | | | | | | | | |
Dana Gas Sukuk Ltd., 7.00%, 10/31/17 (d)(h) | | | | | | | 96,220 | | | | 82,749,200 | |
United Kingdom — 0.2% | | | | | | | | |
Delta Topco Ltd.,
(Acquired 5/02/12 — 1/01/13, cost $73,552,638), 10.00%, 11/24/60 (e) | | | | | | | 79,637 | | | | 79,637,367 | |
Lloyds Bank PLC, 2.30%, 11/27/18 | | | | | | | 10,412 | | | | 10,550,740 | |
| | | | | | | | | | | | |
| | | | | 90,188,107 | |
United States — 4.1% | | | | | | | | |
AbbVie, Inc., 2.50%, 5/14/20 | | | | 49,923 | | | | 50,776,034 | |
Actavis Funding SCS, 3.00%, 3/12/20 | | | | | | | 40,606 | | | | 41,476,552 | |
AliphCom (e)(h)(k): | | | | | | | | |
(Acquired 11/11/15, cost $11,493,000), 12.00%, 4/28/20 | | | | | | | 11,493 | | | | 11,493,000 | |
(Acquired 4/27/15 — 7/21/15, cost $204,855,000), 12.00%, 4/28/20 | | | | | | | 204,855 | | | | 204,855,000 | |
Ally Financial, Inc.: | | | | | | | | |
2.75%, 1/30/17 | | | | | | | 37,516 | | | | 37,469,105 | |
3.50%, 1/27/19 | | | | 26,089 | | | | 25,925,944 | |
American Tower Corp., 3.40%, 2/15/19 | | | | 11,299 | | | | 11,655,009 | |
Anheuser-Busch InBev Finance, Inc., 2.65%, 2/01/21 | | | | | | | 79,717 | | | | 81,872,787 | |
| | | | | | | | | | | | |
| Corporate Bonds | | Par (000) | | | Value | |
United States (continued) | | | | | | | | |
Apple, Inc., 2.25%, 2/23/21 | | | USD | | | | 84,299 | | | $ | 86,174,568 | |
AT&T, Inc.: | | | | | | | | |
2.38%, 11/27/18 | | | | 58,130 | | | | 59,420,602 | |
3.00%, 6/30/22 | | | | 96,043 | | | | 97,964,340 | |
Bank of America Corp.: | | | | | | | | |
2.00%, 1/11/18 | | | | | | | 23,616 | | | | 23,725,389 | |
1.69%, 3/22/18 (k) | | | | | | | 19,393 | | | | 19,491,516 | |
6.88%, 4/25/18 | | | | | | | 22,982 | | | | 25,201,372 | |
Series L, 2.60%, 1/15/19 | | | | | | | 23,119 | | | | 23,520,901 | |
Berkshire Hathaway, Inc.: | | | | | | | | |
2.20%, 3/15/21 | | | | | | | 11,401 | | | | 11,707,356 | |
2.75%, 3/15/23 | | | | | | | 32,613 | | | | 33,637,929 | |
BioMarin Pharmaceutical, Inc. (h): | | | | | | | | |
0.75%, 10/15/18 | | | | | | | 11,220 | | | | 13,162,463 | |
1.50%, 10/15/20 | | | | | | | 11,220 | | | | 13,604,250 | |
Cablevision Systems Corp., 5.88%, 9/15/22 | | | | | | | 15,743 | | | | 13,696,410 | |
Capital One Bank USA NA, 2.15%, 11/21/18 | | | | | | | 18,394 | | | | 18,492,997 | |
Chesapeake Energy Corp., 8.00%,
12/15/22 (d) | | | | | | | 15,552 | | | | 10,575,360 | |
Cisco Systems, Inc., 2.20%, 2/28/21 | | | | | | | 32,384 | | | | 33,045,605 | |
Citigroup, Inc., 1.80%, 2/05/18 | | | | | | | 66,760 | | | | 66,823,823 | |
Cobalt International Energy, Inc. (h): | | | | | | | | |
2.63%, 12/01/19 | | | | | | | 56,543 | | | | 28,448,197 | |
3.13%, 5/15/24 | | | | | | | 69,805 | | | | 29,841,637 | |
eBay, Inc.: | | | | | | | | |
2.20%, 8/01/19 | | | | | | | 15,736 | | | | 15,855,735 | |
3.80%, 3/09/22 | | | | | | | 32,754 | | | | 34,249,155 | |
Edgewell Personal Care Co.: | | | | | | | | |
4.70%, 5/19/21 | | | | | | | 22,823 | | | | 23,833,808 | |
4.70%, 5/24/22 | | | | | | | 10,745 | | | | 11,228,525 | |
Ford Motor Credit Co. LLC: | | | | | | | | |
1.72%, 12/06/17 | | | | | | | 46,640 | | | | 46,709,773 | |
2.38%, 1/16/18 | | | | | | | 29,880 | | | | 30,243,909 | |
5.00%, 5/15/18 | | | | | | | 37,314 | | | | 39,688,514 | |
2.55%, 10/05/18 | | | | | | | 13,271 | | | | 13,469,786 | |
Forest Laboratories, Inc. (d): | | | | | | | | |
4.38%, 2/01/19 | | | | | | | 29,779 | | | | 31,427,327 | |
5.00%, 12/15/21 | | | | | | | 20,993 | | | | 23,159,625 | |
Freeport-McMoRan, Inc., 3.88%, 3/15/23 | | | | | | | 19,532 | | | | 16,358,050 | |
GE Capital International Funding Co., 2.34%, 11/15/20 (d) | | | | | | | 15,189 | | | | 15,540,109 | |
General Electric Co., 5.55%, 5/04/20 | | | | | | | 5,989 | | | | 6,893,141 | |
General Motors Financial Co., Inc.: | | | | | | | | |
2.40%, 4/10/18 | | | | | | | 15,383 | | | | 15,478,098 | |
3.50%, 7/10/19 | | | | | | | 35,371 | | | | 36,575,559 | |
Gilead Sciences, Inc., Series D, 1.63%, 5/01/16 (h) | | | | | | | 18,029 | | | | 71,243,396 | |
Hewlett Packard Enterprise Co., 2.85%, 10/05/18 (d) | | | | | | | 78,553 | | | | 80,187,609 | |
Hughes Satellite Systems Corp., 7.63%, 6/15/21 | | | | | | | 9,375 | | | | 10,429,688 | |
Hyundai Capital America, 2.00%, 3/19/18 (d) | | | | | | | 17,360 | | | | 17,434,856 | |
Intel Corp., 3.25%, 8/01/39 (h) | | | | | | | 14,490 | | | | 22,033,856 | |
JPMorgan Chase & Co., 4.35%, 8/15/21 | | | | | | | 19,374 | | | | 21,208,156 | |
McKesson Corp., 2.28%, 3/15/19 | | | | | | | 25,607 | | | | 26,031,846 | |
See Notes to Consolidated Financial Statements.
| | | | | | |
| | | | | | | |
| | BLACKROCK GLOBAL ALLOCATION FUND, INC. | | APRIL 30, 2016 | | 15 |
| | |
Consolidated Schedule of Investments (continued) | | |
| | | | | | | | | | | | |
| Corporate Bonds | | Par (000) | | | Value | |
United States (continued) | | | | | | | | |
Medtronic, Inc., 3.15%, 3/15/22 | | | USD | | | | 52,252 | | | $ | 55,628,420 | |
Mylan, Inc., 2.55%, 3/28/19 | | | | | | | 32,225 | | | | 32,282,522 | |
QUALCOMM, Inc., 3.00%, 5/20/22 | | | | | | | 58,637 | | | | 61,060,584 | |
Sabine Pass Liquefaction LLC, 5.63%, 4/15/23 | | | | | | | 18,952 | | | | 18,572,960 | |
Synchrony Financial, 3.75%, 8/15/21 | | | | | | | 12,243 | | | | 12,601,181 | |
T-Mobile USA, Inc., 6.00%, 4/15/24 | | | | | | | 26,576 | | | | 27,805,140 | |
Take-Two Interactive Software, Inc., 1.75%, 12/01/16 (h) | | | | | | | 20,422 | | | | 36,542,616 | |
Twitter, Inc., 1.00%, 9/15/21 (h) | | | | | | | 10,698 | | | | 8,979,634 | |
Volkswagen Group of America Finance LLC, 2.45%, 11/20/19 | | | | | | | 19,386 | | | | 19,414,207 | |
| | | | | | | | | | | | |
| | | | | 1,956,225,931 | |
| Total Corporate Bonds — 7.5% | | | | 3,539,659,200 | |
| | | | | | | | | | | | |
| | | | | | | | | | | | | |
| | |
| Floating Rate Loan Interests (k) | | | | | | |
Canada — 0.1% | | | | | | | | |
Novelis, Inc., 2015 Term Loan B, 4.00%, 6/02/22 | | | | | | | 23,403 | | | | 23,256,880 | |
Cyprus — 0.0% | | | | | | | | |
Drillships Ocean Ventures, Inc., Term Loan B, 5.50%, 7/25/21 | | | | | | | 27,622 | | | | 16,227,881 | |
Ireland — 0.0% | | | | | | | | |
Grifols Worldwide Operations USA, Inc., Term Loan B, 3.44%, 2/27/21 | | | | | | | 20,306 | | | | 20,319,108 | |
Luxembourg — 0.0% | | | | | | | | |
Mallinckrodt International Finance SA, Term Loan B, 3.25%, 3/19/21 | | | | | | | 14,605 | | | | 14,267,178 | |
Netherlands — 0.2% | | | | | | | | |
Promontoria Blue Holding 2 BV, Mezzanine, 7.00%, 4/17/20 | | | EUR | | | | 60,295 | | | | 69,040,769 | |
Norway — 0.0% | | | | | | | | |
Drillships Financing Holding, Inc., Term Loan B1, 6.00%, 3/31/21 | | | USD | | | | 29,853 | | | | 14,217,276 | |
United States — 0.7% | | | | | | | | |
Calpine Corp., Term Loan B5, 3.50%, 5/27/22 | | | | | | | 40,688 | | | | 40,425,917 | |
Fieldwood Energy LLC, 2nd Lien Term Loan, 8.38%, 9/30/20 | | | | | | | 41,969 | | | | 10,702,010 | |
Hilton Worldwide Finance LLC, Term Loan B2, 3.50%, 10/26/20 | | | | | | | 112,553 | | | | 112,924,425 | |
Seadrill Partners Finco LLC, Term Loan B, 4.00%, 2/21/21 | | | | | | | 54,974 | | | | 26,983,065 | |
Sheridan Investment Partners II LP: | | | | | | | | |
Term Loan A, 4.25%, 12/16/20 | | | | | | | 62,158 | | | | 30,457,190 | |
Term Loan B, 4.25%, 12/16/20 | | | | | | | 3,225 | | | | 1,580,074 | |
Term Loan M, 4.25%, 12/16/20 | | | | | | | 8,647 | | | | 4,236,821 | |
Univar, Inc., 2015 Term Loan, 4.25%, 7/01/22 | | | | | | | 39,128 | | | | 38,632,227 | |
Univision Communications, Inc., Term Loan C4, 4.00%, 3/01/20 | | | | | | | 59,962 | | | | 59,865,188 | |
| | | | | | | | | | | | |
| | | | | 325,806,917 | |
| Total Floating Rate Loan Interests — 1.0% | | | | 483,136,009 | |
| | | | | | | | | | | | |
| | | | | | | | | | | | |
| Foreign Agency Obligations | | Par (000) | | | Value | |
Argentina — 0.4% | | | | | | | | |
Argentine Republic Government International Bond: | | | | | | | | |
6.88%, 4/22/21 (d) | | | USD | | | | 89,460 | | | $ | 92,143,800 | |
8.75%, 5/07/24 | | | | | | | 23,794 | | | | 25,454,451 | |
7.50%, 4/22/26 (d) | | | | | | | 6,364 | | | | 6,459,460 | |
7.63%, 4/22/46 (d) | | | | | | | 31,939 | | | | 31,412,006 | |
City of Buenos Aires Argentina, 8.95%, 2/19/21 (d) | | | | | | | 20,687 | | | | 22,290,243 | |
Provincia de Buenos Aires, 9.13%, 3/16/24 (d) | | | | | | | 27,221 | | | | 28,990,365 | |
| | | | | | | | | | | | |
| | | | | | | | | | | | 206,750,325 | |
Australia — 1.2% | | | | | | | | |
Australia Government Bond: | | | | | | | | |
5.75%, 5/15/21 | | | AUD | | | | 384,082 | | | | 343,303,163 | |
5.75%, 7/15/22 | | | | | | | 259,400 | | | | 237,408,127 | |
| | | | | | | | | | | | |
| | | | | | | | | | | | 580,711,290 | |
Brazil — 0.4% | | | | | | | | |
Brazil Notas do Tesouro Nacional: | | | | | | | | |
Series F, 10.00%, 1/01/21 | | | BRL | | | | 411 | | | | 110,943,120 | |
6.00%, 8/15/22 | | | | | | | 27 | | | | 22,161,659 | |
Brazilian Government International Bond, 6.00%, 1/17/17 | | | USD | | | | 57,930 | | | | 59,725,830 | |
| | | | | | | | | | | | |
| | | | | | | | | | | | 192,830,609 | |
Canada — 0.8% | | | | | | | | |
Canadian Government Bond: | | | | | | | | |
0.25%, 5/01/18 | | | CAD | | | | 212,624 | | | | 167,996,176 | |
0.75%, 3/01/21 | | | | | | | 265,784 | | | | 210,644,465 | |
| | | | | | | | | | | | |
| | | | | | | | | | | | 378,640,641 | |
Colombia — 0.1% | | | | | | | | |
Colombia Government International Bond, 7.38%, 1/27/17 | | | USD | | | | 48,625 | | | | 50,752,344 | |
France — 0.6% | | | | | | | | |
France Government Bond, 0.50%, 5/25/26 | | | EUR | | | | 248,027 | | | | 279,981,928 | |
Germany — 0.7% | | | | | | | | |
Bundesobligation, 0.00%, 4/09/21 | | | | | | | 273,275 | | | | 317,135,167 | |
Hungary — 0.7% | | | | | | | | |
Hungary Government Bond, 5.50%, 6/24/25 | | | HUF | | | | 31,280,850 | | | | 135,632,639 | |
Hungary Government International Bond, 6.38%, 3/29/21 | | | USD | | | | 159,418 | | | | 181,497,393 | |
| | | | | | | | | | | | |
| | | | | | | | | | | | 317,130,032 | |
Indonesia — 0.1% | | | | | | | | |
Indonesia Government International Bond, 6.88%, 1/17/18 (d) | | | | | | | 29,150 | | | | 31,556,362 | |
Italy — 0.6% | | | | | | | | |
Italy Buoni Poliennali Del Tesoro, 1.50%, 6/01/25 | | | EUR | | | | 247,823 | | | | 286,148,953 | |
Japan — 0.7% | | | | | | | | |
Japan Government Bond: | | | | | | | | |
0.10%, 3/15/17 | | | JPY | | | | 11,078,850 | | | | 104,391,089 | |
0.10%, 3/15/18 | | | | | | | 26,525,200 | | | | 250,909,944 | |
| | | | | | | | | | | | |
| | | | | | | | | | | | 355,301,033 | |
See Notes to Consolidated Financial Statements.
| | | | | | |
| | | | | | | |
| 16 | | BLACKROCK GLOBAL ALLOCATION FUND, INC. | | APRIL 30, 2016 | | |
| | |
Consolidated Schedule of Investments (continued) | | |
| | | | | | | | | | | | |
| Foreign Agency Obligations | | Par (000) | | | Value | |
Mexico — 1.0% | | | | | | | | |
Mexican Bonos, 6.50%, 6/10/21 | | | MXN | | | | 76,291 | | | $ | 467,624,890 | |
Poland — 0.9% | | | | | | | | |
Poland Government Bond: | | | | | | | | |
5.25%, 10/25/20 | | | PLN | | | | 461,062 | | | | 135,244,917 | |
5.75%, 10/25/21 | | | | | | | 226,782 | | | | 69,722,862 | |
3.25%, 7/25/25 | | | | | | | 312,108 | | | | 83,918,657 | |
2.50%, 7/25/26 | | | | | | | 344,396 | | | | 85,637,619 | |
Poland Government International Bond, 6.38%, 7/15/19 | | | USD | | | | 39,697 | | | | 45,200,989 | |
| | | | | | | | | | | | |
| | | | | | | | | | | | 419,725,044 | |
South Korea — 0.1% | | | | | | | | |
Export-Import Bank of Korea, 2.63%, 12/30/20 | | | | | | | 54,460 | | | | 55,656,976 | |
Spain — 0.3% | | | | | | | | |
Spain Government Bond, 1.95%,
4/30/26 (d) | | | EUR | | | | 130,453 | | | | 154,060,416 | |
Turkey — 0.1% | | | | | | | | |
Turkey Government International Bond, 6.75%, 4/03/18 | | | USD | | | | 27,611 | | | | 29,763,609 | |
United Kingdom — 0.9% | | | | | | | | |
United Kingdom Gilt, 2.00%, 9/07/25 | | | GBP | | | | 267,174 | | | | 403,520,123 | |
| Total Foreign Agency Obligations — 9.6% | | | | 4,527,289,742 | |
| | | | | | | | | | | | |
| | | | | | | | | | | | | |
| |
| Non-Agency Mortgage-Backed Securities | | | | |
Commercial Mortgage-Backed Securities — 0.1% | | | | | |
Logistics UK PLC, Series 2015 1-A, Class F, 4.17%, 8/20/25 (d)(k) | | | | | | | 30,423 | | | | 41,785,439 | |
| | | | | | | | | | | | |
| | | | | | | | | | | | | |
| |
| U.S. Government Sponsored Agency Securities | | | | |
Mortgage-Backed Securities — 0.6% | | | | | | | | |
Fannie Mae Mortgage-Backed Securities, 3.00%, 5/01/46 (l) | | | USD | | | | 265,424 | | | | 272,090,195 | |
| | | | | | | | | | | | |
| | | | | | | | | | | | | |
| |
| U.S. Treasury Obligations | | | | |
U.S. Treasury Inflation Protected Security, 0.38%, 7/15/25 | | | | | | | 307,543 | | | | 315,820,167 | |
U.S. Treasury Inflation Indexed Bond: | | | | | | | | |
0.13%, 4/15/21 | | | | | | | 79,773 | | | | 81,575,957 | |
0.63%, 1/15/26 (m) | | | | | | | 1,127,985 | | | | 1,184,575,381 | |
U.S. Treasury Notes: | | | | | | | | |
1.38%, 4/30/21 (m) | | | | | | | 3,073,061 | | | | 3,086,984,637 | |
1.75%, 3/31/22 (n) | | | | | | | 195,753 | | | | 198,865,183 | |
1.88%, 8/31/22 (n) | | | | | | | 279,073 | | | | 284,905,272 | |
1.75%, 9/30/22 | | | | | | | 296,940 | | | | 300,698,073 | |
1.88%, 10/31/22 | | | | | | | 274,720 | | | | 280,192,972 | |
2.00%, 8/15/25 (m)(n) | | | | | | | 376,639 | | | | 383,053,946 | |
1.63%, 2/15/26 (m) | | | | | | | 689,180 | | | | 677,226,960 | |
1.00%, 2/15/46 | | | | | | | 10,640 | | | | 11,143,457 | |
| Total U.S. Treasury Obligations — 14.4% | | | | 6,805,042,005 | |
| Total Fixed Income Securities — 33.2% | | | | 15,669,002,590 | |
| | | | | | | | | | | | |
| | | | | | | | | | | | |
| | |
| Investment Companies (a)(o) | | Shares | | | Value | |
United States — 2.6% | | | | | | | | |
ETFS Gold Trust | | | | | | | 1,201,717 | | | $ | 151,488,445 | |
ETFS Palladium Trust | | | | | | | 348,916 | | | | 20,987,298 | |
ETFS Platinum Trust | | | | | | | 294,567 | | | | 30,534,815 | |
iShares Gold Trust (p) | | | | | | | 11,663,809 | | | | 145,564,336 | |
SPDR Gold Shares | | | | | | | 7,301,806 | | | | 902,868,312 | |
| Total Investment Companies — 2.6% | | | | 1,251,443,206 | |
| | | | | | | | | | | | |
| | | | | | | | | | | | | |
| | | |
| Preferred Securities | | | | | | | | | |
| | |
| Capital Trusts | | Par (000) | | | | |
Netherlands — 0.0% | | | | | | | | |
ING Groep NV, 6.00% (k)(q) | | | USD | | | | 20,995 | | | | 19,945,250 | |
Switzerland — 0.1% | | | | | | | | |
Credit Suisse Group Guernsey I Ltd., 7.88% (k) | | | | | | | 27,444 | | | | 27,689,953 | |
United Kingdom — 0.4% | | | | | | | | |
HSBC Holdings PLC, 6.38% (k)(q) | | | | | | | 78,926 | | | | 74,683,727 | |
Lloyds Bank PLC, 13.00% (k)(q) | | | | | | | 42,174 | | | | 102,389,797 | |
Standard Chartered PLC, 6.50% (d)(k)(q) | | | | | | | 31,655 | | | | 29,201,738 | |
| | | | | | | | | | | | |
| | | | | | | | | | | | 206,275,262 | |
United States — 1.0% | | | | | | | | |
American Express Co., Series C, 4.90% (k)(q) | | | | | | | 26,868 | | | | 24,181,200 | |
Citigroup, Inc.: | | | | | | | | |
5.95% (k)(q) | | | | | | | 17,778 | | | | 17,555,775 | |
Series O, 5.88% (k)(q) | | | | | | | 50,050 | | | | 48,413,365 | |
General Electric Co.: | | | | | | | | |
6.38% (k)(q) | | | | | | | 28,013 | | | | 28,923,423 | |
Series D, 5.00% (k)(q) | | | | | | | 42,607 | | | | 44,258,021 | |
Goldman Sachs Group, Inc.: | | | | | | | | | | | | |
Series L, 5.70% (k)(q) | | | | | | | 41,250 | | | | 40,167,187 | |
Series M, 5.38% (k)(q) | | | | | | | 43,265 | | | | 41,772,357 | |
JPMorgan Chase & Co.: | | | | | | | | | | | | |
Series Q, 5.15% (k)(q) | | | | | | | 47,644 | | | | 46,333,790 | |
Series X, 6.10% (k)(q) | | | | | | | 93,305 | | | | 95,987,519 | |
Morgan Stanley, Series H, 5.45% (k)(q) | | | | | | | 30,531 | | | | 29,080,778 | |
NBCUniversal Enterprise, Inc.,
5.25% (d)(q) | | | | | | | 24,311 | | | | 25,161,885 | |
USB Capital IX, 3.50% (k)(q) | | | | | | | 38,356 | | | | 29,006,725 | |
| | | | | | | | | | | | |
| | | | | | | | | | | | 470,842,025 | |
| Total Capital Trusts — 1.5% | | | | | | | | | | | 724,752,490 | |
| | | | | | | | | | | | |
| | | | | | | | | | | | | |
| | |
| Preferred Stocks | | Shares | | | | |
Germany — 0.2% | | | | | | | | | | | | |
Volkswagen AG, Preference Shares, 0.00% | | | | | | | 467,872 | | | | 67,870,966 | |
Ireland — 0.2% | | | | | | | | | | | | |
Allergan PLC, Series A, 5.50% (h) | | | | | | | 132,304 | | | | 107,363,373 | |
Israel — 0.3% | | | | | | | | | | | | |
Teva Pharmaceutical Industries Ltd., 7.00% (h) | | | | | | | 132,978 | | | | 119,813,178 | |
See Notes to Consolidated Financial Statements.
| | | | | | |
| | | | | | | |
| | BLACKROCK GLOBAL ALLOCATION FUND, INC. | | APRIL 30, 2016 | | 17 |
| | |
Consolidated Schedule of Investments (continued) | | |
| | | | | | | | | | |
| | |
| Preferred Stocks | | Shares | | | Value | |
South Korea — 0.1% | | | | | | | | | | |
Samsung Electronics Co. Ltd., Preference Shares, 0.00% | | | | | 39,853 | | | $ | 36,397,293 | |
United Kingdom — 0.1% | | | | | | | | | | |
HSBC Holdings PLC, Series 2, 8.00% | | | | | 1,008,469 | | | | 26,724,428 | |
Royal Bank of Scotland Group PLC, Series T, 7.25% | | | | | 937,672 | | | | 23,648,088 | |
| | | | | | | | | | |
| | | | | | | | | | 50,372,516 | |
United States — 1.8% | | | | | | | | | | |
American Tower Corp., Series A, 5.25% (h) | | | | | 233,294 | | | | 24,761,825 | |
Anthem, Inc., 5.25% (h) | | | | | 1,466,969 | | | | 67,994,013 | |
Crown Castle International Corp., Series A, 4.50% (h) | | | | | 553,128 | | | | 58,714,537 | |
Dominion Resources, Inc., 6.38% (h) | | | | | 457,226 | | | | 22,554,959 | |
Domo, Inc., Series D-2, (Acquired 4/01/15, cost $81,820,921), 0.00% (a)(e) | | | | | 9,704,080 | | | | 80,386,658 | |
DropBox, Inc., Series C (Acquired 1/28/14, cost $150,070,985), 0.00% (a)(e) | | | | | 7,856,626 | | | | 85,165,826 | |
Forestar Group, Inc., 6.00% (h) | | | | | 961,441 | | | | 17,786,658 | |
Grand Rounds, Inc., Series C, (Acquired 3/31/15, cost $27,587,148), 0.00% (a)(e) | | | | | 9,935,944 | | | | 26,405,765 | |
Lookout, Inc., Series F (Acquired 9/19/14, cost $53,322,391), 0.00% (a)(e) | | | | | 4,667,944 | | | | 40,330,102 | |
Palantir Technologies, Inc., Series I (Acquired 3/27/14, cost $58,747,474), 0.00% (a)(e) | | | | | 9,583,601 | | | | 102,161,187 | |
Uber Technologies, Inc., Series D (Acquired 6/06/14, cost $90,664,966), 0.00% (a)(e) | | | | | 5,844,432 | | | | 280,626,247 | |
US Bancorp, Series F, 6.50% (k) | | | | | 911,610 | | | | 26,947,192 | |
US Bancorp, Series G, 6.00% (k) | | | | | 579,854 | | | | 15,313,944 | |
Wells Fargo & Co., Series L, 7.50% (h) | | | | | 16,793 | | | | 20,924,078 | |
| | | | | | | | | | |
| | | | | | | | | | 870,072,991 | |
| Total Preferred Stocks — 2.7% | | | | | | | | | 1,251,890,317 | |
| | | | | | | | | | |
| | | | | | | | | | | |
| | |
| Trust Preferreds | | | | | | |
United States — 0.5% | | | | | | | | | | |
Citigroup Capital XIII, 7.88% | | | | | 1,648,686 | | | | 42,401,321 | |
GMAC Capital Trust I, Series 2, 8.13% | | | | | 2,217,389 | | | | 54,651,594 | |
RBS Capital Funding Trust V, 5.90% | | | | | 1,400,022 | | | | 34,160,537 | |
RBS Capital Funding Trust VII, 6.08% | | | | | 1,734,842 | | | | 42,377,949 | |
Welltower, Inc., Series I, 6.50% (h) | | | | | 807,678 | | | | 49,857,963 | |
| Total Trust Preferreds — 0.5% | | | | | | | | | 223,449,364 | |
| Total Preferred Securities — 4.7% | | | | | | | | | 2,200,092,171 | |
| | | | | | | | | | |
| | | | | | | | | | | |
| | | |
| Warrants — 0.0% | | | | | | | | |
Australia — 0.0% | | | | | | | | | | |
TFS Corp. Ltd., (Issued/exercisable 8/01/11, 1 share for 1 warrant, Expires 7/15/18, Strike Price AUD 1.28) | | | | | 21,267,513 | | | | 9,943,073 | |
Total Long-Term Investments
(Cost — $40,467,857,791) — 92.4% | | | | 43,690,482,228 | |
| | | | | | | | | | |
| | | | | | | | | | | | |
| Short-Term Securities | | Par (000) | | | Value | |
Foreign Agency Obligations (a) | | | | | | | | | | | | |
Japan Treasury Discount Bills: | | | | | | | | | | | | |
(0.12%), 5/16/16 | | | JPY | | | | 15,970,000 | | | $ | 150,093,385 | |
0.00%, 5/23/16 | | | | | | | 53,340,000 | | | | 501,330,829 | |
(0.10%), 5/30/16 | | | | | | | 53,370,000 | | | | 501,638,374 | |
(0.10%), 6/06/16 | | | | | | | 53,000,000 | | | | 498,171,109 | |
0.00%, 6/20/16 | | | | | | | 53,310,000 | | | | 501,110,994 | |
(0.19%), 7/19/16 | | | | | | | 51,970,000 | | | | 488,574,170 | |
(0.18%), 9/12/16 | | | | | | | 27,170,000 | | | | 255,511,889 | |
Mexico Cetes, 3.79%, 5/26/16 | | | MXN | | | | 137,966 | | | | 79,964,704 | |
| Total Foreign Agency Obligations — 6.3% | | | | 2,976,395,454 | |
| | | | | | | | | | | | |
| | | | | | | | | | | | | |
| | |
| Money Market Funds (p)(r) | | Shares | | | | |
BlackRock Liquidity Funds, TempFund, Institutional Class, 0.40% | | | | | | | 2,589,788 | | | | 2,589,788 | |
| | | |
| | | | | | Beneficial
Interest
(000) | | | | |
BlackRock Liquidity Series, LLC, Money Market Series, 0.55% (s) | | | USD | | | | 331,860 | | | | 331,860,268 | |
| Total Money Market Funds — 0.7% | | | | 334,450,056 | |
| | | | | | | | | | | | |
| | | | | | | | | | | | | |
| | |
| U.S. Treasury Obligations | | Par (000) | | | | |
U.S. Treasury Bills (t): | | | | | | | | | | | | |
0.14% - 0.18%, 5/26/16 | | | | | | | 826,003 | | | | 825,915,444 | |
0.24%, 6/02/16 | | | | | | | 190,000 | | | | 189,977,200 | |
0.11%, 6/09/16 | | | | | | | 130,000 | | | | 129,982,450 | |
0.20% - 0.22%, 7/07/16 | | | | | | | 350,000 | | | | 349,904,100 | |
0.18% - 0.20%, 7/14/16 | | | | | | | 228,000 | | | | 227,921,568 | |
0.19% - 0.22%, 7/21/16 | | | | | | | 213,000 | | | | 212,908,410 | |
U.S. Treasury Notes, 0.88%, 1/31/17 (n)(o) | | | | 139,048 | | | | 139,396,021 | |
| Total U.S. Treasury Obligations — 4.4% | | | | | | | | 2,076,005,193 | |
Total Short-Term Securities
(Cost — $5,235,907,147) — 11.4% | | | | 5,386,850,703 | |
Options Purchased
(Cost — $300,602,566) — 0.3% | | | | 150,292,065 | |
Total Investments Before Options Written
(Cost — $46,004,367,504) — 104.1% | | | | 49,227,624,996 | |
| | | | | | | | | | | | |
| | | | | | | | | | | | | |
| | |
| Investments Sold Short | | Shares | | | | |
Alcoa, Inc. | | | | | | | (2,414,623 | ) | | | (26,971,339 | ) |
Autoliv, Inc. | | | | | | | (41,400 | ) | | | (5,070,258 | ) |
Canadian Natural Resources Ltd. | | | | | | | (1,520,624 | ) | | | (45,649,133 | ) |
Ecolab, Inc. | | | | | | | (164,788 | ) | | | (18,947,324 | ) |
Gentex Corp. | | | | | | | (1,507,160 | ) | | | (24,174,846 | ) |
LafargeHolcim Ltd. | | | | | | | (581,715 | ) | | | (29,536,854 | ) |
Total Investments Sold Short
(Proceeds — $141,964,439) — (0.3)% | | | | (150,349,754 | ) |
See Notes to Consolidated Financial Statements.
| | | | | | |
| | | | | | | |
| 18 | | BLACKROCK GLOBAL ALLOCATION FUND, INC. | | APRIL 30, 2016 | | |
| | |
Consolidated Schedule of Investments (continued) | | |
| | | | | | | | |
| | | | | Value | |
Options Written
(Premiums Received — $178,672,833) — (0.4)% | | $ | (166,103,424 | ) |
Total Investments, Net of Investments Sold Short and Options Written
(Cost — $45,683,730,232) — 103.4% | | | 48,911,171,818 | |
| Liabilities in Excess of Other Assets — (3.4)% | | | (1,617,108,678 | ) |
| | | | | | | | |
| Net Assets — 100.0% | | $ | 47,294,063,140 | |
| | | | | | | | |
|
| Notes to Consolidated Schedule of Investments |
| (a) | | Non-income producing security. |
| (b) | | Security, or a portion of security, is on loan. |
| (c) | | During the six months ended April 30, 2016, investments in issuers that are affiliated persons and/or related parties of the Fund, as applicable, were as follows: |
| | | | | | | | | | | | | | | | | | | | | | | | | | | | |
| Affiliated Persons and/or Related Parties | | Par/Shares
Held at
October 31,
2015 | | | Par/Shares
Purchased | | | Par/Shares
Sold | | | Par/Shares
Held at
April 30,
2016 | | | Value at
April 30,
2016 | | | Income | | | Realized
Gain (Loss) | |
Bio City Development Co. BV | | $ | 140,850,000 | | | | — | | | | — | | | $ | 140,850,000 | | | $ | 56,523,105 | | | | — | | | | — | |
Ei Towers SpA | | | 1,333,706 | | | | 172,680 | | | | (66,790 | ) | | | 1,439,596 | | | | 84,510,333 | | | | — | | | $ | 124,864 | |
Invitae Corp. | | | 2,094,662 | | | | — | | | | (121,963 | ) | | | 1,972,699 | | | | 18,819,548 | | | | — | | | | (476,119 | ) |
Platinum Group Metals Ltd. | | | 4,005,904 | | | | 2,447,777 | | | | (353,730 | ) | | | 6,099,951 | | | | 20,225,030 | | | | — | | | | (2,809,878 | ) |
St. Joe Co. | | | 6,750,883 | | | | — | | | | — | | | | 6,750,883 | | | | 113,752,379 | | | | — | | | | — | |
Total | | | | | | | | | | | | | | | | | | $ | 293,830,395 | | | | — | | | $ | (3,161,133 | ) |
| (d) | | Security exempt from registration pursuant to Rule 144A under the Securities Act of 1933, as amended. These securities may be resold in transactions exempt from registration to qualified institutional investors. |
| (e) | | Restricted security as to resale, excluding 144A securities. As of period end, the Fund held restricted securities with a current value of $944,039,295 and an original cost of $802,647,142 which was 1.7% of its net assets. |
| (f) | | All or a portion of security has been pledged and/or segregated as collateral in connection with outstanding exchange-traded options written. |
| (g) | | Issuer filed for bankruptcy and/or is in default of interest payments. |
| (h) | | Convertible security. |
| (j) | | Step-up bond that pays an initial coupon rate for the first period and then a higher coupon rate for the following periods. Rate as of period end. |
| (k) | | Variable rate security. Rate as of period end. |
| (l) | | Represents or includes a TBA transaction. As of period end, unsettled TBA transactions were as follows: |
| | | | | | | | |
| Counterparty | | Value | | | Unrealized
Appreciation | |
Bank of America Securities, Inc. | | $ | 272,090,195 | | | $ | 238,443 | |
| (m) | | All or a portion of security has been pledged as collateral in connection with outstanding OTC derivatives. |
| (n) | | All or a portion of security has been pledged in connection with outstanding futures contracts. |
| (o) | | All or a portion of security is held by a wholly owned subsidiary. |
See Notes to Consolidated Financial Statements.
| | | | | | |
| | | | | | | |
| | BLACKROCK GLOBAL ALLOCATION FUND, INC. | | APRIL 30, 2016 | | 19 |
| | |
Consolidated Schedule of Investments (continued) | | |
| (p) | | During the six months ended April 30, 2016, investments in issuers considered to be affiliates of the Fund for purposes of Section 2(a)(3) of the Investment Company Act of 1940, as amended, were as follows: |
| | | | | | | | | | | | | | | | | | | | | | | | | | | | |
| Affiliate | | Shares/
Beneficial
Interest Held at
October 31,
2015 | | | Shares/
Beneficial
Interest
Purchased | | | Shares/
Beneficial
Interest
Sold | | | Shares/
Beneficial
Interest Held at
April 30,
2016 | | | Value at
April 30,
2016 | | | Income | | | Realized
Gain | |
BlackRock Liquidity Funds, TempFund, Institutional Class | | | 1,040,534 | | | | 1,549,254 | 1 | | | — | | | | 2,589,788 | | | $ | 2,589,788 | | | $ | 39,647 | | | | — | |
BlackRock Liquidity Series, LLC, Money Market Series | | $ | 497,499,535 | | | | — | | | $ | (165,639,267 | )2 | | $ | 331,860,268 | | | | 331,860,268 | | | | 7,264,115 | 3 | | | — | |
iShares Gold Trust | | | 11,663,809 | | | | — | | | | — | | | | 11,663,809 | | | | 145,564,336 | | | | — | | | | — | |
iShares iBoxx $ High Yield Corporate Bond ETF | | | — | | | | 2,327,420 | | | | (2,327,420 | ) | | | — | | | | — | | | | 974,502 | | | $ | 7,781,013 | |
Total | | | | | | | | | | | | | | | | | | $ | 480,014,392 | | | $ | 8,278,264 | | | $ | 7,781,013 | |
1 Represents net shares/beneficial interest purchased. | | | | | | | | | | | | | |
2 Represents net shares/beneficial interest sold. | | | | | | | | | | | | | | | | | |
3 Represents securities lending income earned from the reinvestments of cash collateral from loaned securities, net of fees and collateral investment expenses, and other payments to and from borrowers of securities. | |
| (q) | | Perpetual security with no stated maturity date. |
| (r) | | Current yield as of period end. |
| (s) | | Security was purchased with the cash collateral from loaned securities. The Fund may withdraw up to 25% of its investment daily, although the manager of the BlackRock Liquidity Series, LLC, Money Market Series, in its sole discretion, may permit an investor to withdraw more than 25% on any one day. |
| (t) | | Rates shown are discount rates or a range of discount rates at the time of purchase. |
|
| Derivative Financial Instruments Outstanding as of Period End |
Futures Contracts
| | | | | | | | | | | | | | | | | | |
Contracts Long (Short) | | | Issue | | Expiration | | Notional
Value | | | Unrealized
Appreciation
(Depreciation) | | | |
| | (862 | ) | | MSCI Taiwan Stock Index | | May 2016 | | USD | | | 26,239,280 | | | $ | 901,161 | | | |
| | (3,802 | ) | | Euro STOXX 50 Index | | June 2016 | | USD | | | 129,603,148 | | | | 373,621 | | | |
| | (467 | ) | | FTSE 100 Index | | June 2016 | | USD | | | 42,388,047 | | | | (894,803 | ) | | |
| | 2,041 | | | Mini MSCI Emerging Markets Index | | June 2016 | | USD | | | 85,558,720 | | | | (2,060,406 | ) | | |
| | (1,429 | ) | | NASDAQ 100 E-Mini Index | | June 2016 | | USD | | | 123,794,270 | | | | 741,136 | | | |
| | (931 | ) | | S&P 500 E-Mini Index | | June 2016 | | USD | | | 95,851,105 | | | | (605,480 | ) | | |
| | (115 | ) | | Topix Index | | June 2016 | | USD | | | 14,337,171 | | | | 266,196 | | | |
| | 1,129 | | | Yen Denom Nikkei Index | | June 2016 | | USD | | | 84,144,455 | | | | (1,662,188 | ) | | |
| | Total | | | | | | | | | | | | | $ | (2,940,763 | ) | | |
| | | | | | | | | | | | | | | |
Forward Foreign Currency Exchange Contracts
| | | | | | | | | | | | | | | | | | | | | | |
Currency Purchased | | | Currency Sold | | | Counterparty | | Settlement
Date | | | Unrealized
Appreciation
(Depreciation) | | | |
| CLP | | | 32,845,182,000 | | | USD | | | 49,092,268 | | | Goldman Sachs International | | | 5/09/16 | | | $ | 595,884 | | | |
| USD | | | 48,049,478 | | | CLP | | | 32,845,182,000 | | | Goldman Sachs International | | | 5/09/16 | | | | (1,638,674 | ) | | |
| TWD | | | 832,500,000 | | | USD | | | 25,962,888 | | | Credit Suisse International | | | 5/12/16 | | | | (192,883 | ) | | |
| TWD | | | 1,695,468,000 | | | USD | | | 52,843,011 | | | Deutsche Bank AG | | | 5/12/16 | | | | (359,866 | ) | | |
| USD | | | 25,373,362 | | | TWD | | | 832,500,000 | | | Credit Suisse International | | | 5/12/16 | | | | (396,643 | ) | | |
| USD | | | 51,576,309 | | | TWD | | | 1,695,468,000 | | | Deutsche Bank AG | | | 5/12/16 | | | | (906,836 | ) | | |
| EUR | | | 147,786,000 | | | USD | | | 164,023,248 | | | Citibank, N.A. | | | 5/13/16 | | | | 5,247,747 | | | |
| USD | | | 141,866,022 | | | JPY | | | 15,970,000,000 | | | Morgan Stanley Capital Services LLC | | | 5/16/16 | | | | (8,259,356 | ) | | |
| CNH | | | 305,325,574 | | | USD | | | 46,968,107 | | | Goldman Sachs International | | | 5/17/16 | | | | 81,590 | | | |
| CNH | | | 457,988,361 | | | USD | | | 70,421,828 | | | Goldman Sachs International | | | 5/17/16 | | | | 152,718 | | | |
| CNH | | | 414,951,897 | | | USD | | | 63,974,576 | | | Goldman Sachs International | | | 5/17/16 | | | | (31,812 | ) | | |
| CNH | | | 414,951,897 | | | USD | | | 64,064,457 | | | Goldman Sachs International | | | 5/17/16 | | | | (121,693 | ) | | |
| USD | | | 105,778,000 | | | CNH | | | 702,344,764 | | | Goldman Sachs International | | | 5/17/16 | | | | (2,451,089 | ) | | |
| USD | | | 133,985,000 | | | CNH | | | 890,872,964 | | | Goldman Sachs International | | | 5/17/16 | | | | (3,295,684 | ) | | |
| EUR | | | 145,915,000 | | | USD | | | 166,464,209 | | | Morgan Stanley Capital Services LLC | | | 5/19/16 | | | | 692,590 | | | |
| JPY | | | 13,303,684,560 | | | USD | �� | | 118,660,000 | | | Morgan Stanley Capital Services LLC | | | 5/19/16 | | | | 6,409,541 | | | |
| SGD | | | 135,085,000 | | | USD | | | 100,610,733 | | | HSBC Bank USA, N.A. | | | 5/19/16 | | | | (203,639 | ) | | |
See Notes to Consolidated Financial Statements.
| | | | | | |
| | | | | | | |
| 20 | | BLACKROCK GLOBAL ALLOCATION FUND, INC. | | APRIL 30, 2016 | | |
| | |
Consolidated Schedule of Investments (continued) | | |
Forward Foreign Currency Exchange Contracts (continued)
| | | | | | | | | | | | | | | | | | | | | | |
Currency Purchased | | | Currency Sold | | | Counterparty | | Settlement
Date | | | Unrealized
Appreciation
(Depreciation) | | | |
| USD | | | 98,778,838 | | | SGD | | | 135,085,000 | | | HSBC Bank USA, N.A. | | | 5/19/16 | | | $ | (1,628,255 | ) | | |
| EUR | | | 69,299,000 | | | USD | | | 78,979,031 | | | Deutsche Bank AG | | | 5/20/16 | | | | 410,558 | | | |
| USD | | | 473,947,967 | | | JPY | | | 53,340,000,000 | | | JPMorgan Chase Bank, N.A. | | | 5/23/16 | | | | (27,554,629 | ) | | |
| EUR | | | 44,421,000 | | | USD | | | 50,645,493 | | | Credit Suisse International | | | 5/26/16 | | | | 252,398 | | | |
| EUR | | | 43,436,000 | | | USD | | | 49,526,596 | | | Goldman Sachs International | | | 5/26/16 | | | | 242,675 | | | |
| JPY | | | 4,746,174,000 | | | USD | | | 43,124,612 | | | Citibank, N.A. | | | 5/26/16 | | | | 1,502,035 | | | |
| EUR | | | 66,263,000 | | | USD | | | 74,930,200 | | | Citibank, N.A. | | | 5/27/16 | | | | 996,587 | | | |
| EUR | | | 146,740,000 | | | USD | | | 165,715,683 | | | JPMorgan Chase Bank, N.A. | | | 5/27/16 | | | | 2,424,860 | | | |
| USD | | | 87,840,000 | | | BRL | | | 314,028,000 | | | Goldman Sachs International | | | 5/27/16 | | | | (2,746,034 | ) | | |
| USD | | | 473,978,686 | | | JPY | | | 53,370,000,000 | | | Credit Suisse International | | | 5/31/16 | | | | (27,899,714 | ) | | |
| EUR | | | 82,864,000 | | | USD | | | 93,787,961 | | | JPMorgan Chase Bank, N.A. | | | 6/03/16 | | | | 1,180,017 | | | |
| KRW | | | 132,627,761,000 | | | USD | | | 116,248,366 | | | Deutsche Bank AG | | | 6/03/16 | | | | (608,153 | ) | | |
| USD | | | 107,373,511 | | | KRW | | | 132,627,761,000 | | | Deutsche Bank AG | | | 6/03/16 | | | | (8,266,702 | ) | | |
| USD | | | 468,032,497 | | | JPY | | | 53,000,000,000 | | | Deutsche Bank AG | | | 6/06/16 | | | | (30,436,357 | ) | | |
| KRW | | | 101,459,000,106 | | | USD | | | 89,422,704 | | | Morgan Stanley Capital Services LLC | | | 6/07/16 | | | | (965,768 | ) | | |
| KRW | | | 34,117,827,894 | | | USD | | | 30,080,963 | | | Morgan Stanley Capital Services LLC | | | 6/07/16 | | | | (335,366 | ) | | |
| USD | | | 111,723,797 | | | KRW | | | 135,576,828,000 | | | Morgan Stanley Capital Services LLC | | | 6/07/16 | | | | (6,478,736 | ) | | |
| USD | | | 48,017,470 | | | BRL | | | 172,061,000 | | | Morgan Stanley Capital Services LLC | | | 6/09/16 | | | | (1,415,270 | ) | | |
| CAD | | | 163,759,000 | | | USD | | | 126,354,913 | | | Morgan Stanley Capital Services LLC | | | 6/10/16 | | | | 4,162,585 | | | |
| EUR | | | 131,039,000 | | | USD | | | 148,411,495 | | | Morgan Stanley Capital Services LLC | | | 6/10/16 | | | | 1,803,080 | | | |
| USD | | | 123,643,022 | | | CAD | | | 163,759,000 | | | Morgan Stanley Capital Services LLC | | | 6/10/16 | | | | (6,874,477 | ) | | |
| CAD | | | 153,341,000 | | | USD | | | 119,168,299 | | | JPMorgan Chase Bank, N.A. | | | 6/16/16 | | | | 3,045,953 | | | |
| EUR | | | 83,758,000 | | | USD | | | 95,392,824 | | | Deutsche Bank AG | | | 6/16/16 | | | | 640,888 | | | |
| USD | | | 478,043,706 | | | JPY | | | 53,310,000,000 | | | Deutsche Bank AG | | | 6/20/16 | | | | (23,598,983 | ) | | |
| AUD | | | 154,644,000 | | | USD | | | 118,785,149 | | | JPMorgan Chase Bank, N.A. | | | 6/30/16 | | | | (1,482,114 | ) | | |
| CAD | | | 153,337,000 | | | USD | | | 119,213,366 | | | Deutsche Bank AG | | | 6/30/16 | | | | 2,997,698 | | | |
| EUR | | | 83,269,000 | | | USD | | | 95,065,719 | | | Credit Suisse International | | | 6/30/16 | | | | 451,416 | | | |
| EUR | | | 145,714,000 | | | USD | | | 166,571,502 | | | Credit Suisse International | | | 7/01/16 | | | | 581,255 | | | |
| BRL | | | 93,313,945 | | | USD | | | 24,109,638 | | | Morgan Stanley Capital Services LLC | | | 7/13/16 | | | | 2,421,772 | | | |
| PLN | | | 467,429,054 | | | USD | | | 123,728,527 | | | JPMorgan Chase Bank, N.A. | | | 7/13/16 | | | | (1,424,537 | ) | | |
| USD | | | 21,916,000 | | | BRL | | | 93,313,945 | | | Morgan Stanley Capital Services LLC | | | 7/13/16 | | | | (4,615,411 | ) | | |
| USD | | | 115,759,000 | | | PLN | | | 467,429,054 | | | JPMorgan Chase Bank, N.A. | | | 7/13/16 | | | | (6,544,990 | ) | | |
| USD | | | 478,078,487 | | | JPY | | | 51,970,000,000 | | | Morgan Stanley Capital Services LLC | | | 7/19/16 | | | | (11,419,719 | ) | | |
| TWD | | | 3,062,283,248 | | | USD | | | 95,180,000 | | | Citibank, N.A. | | | 8/03/16 | | | | (404,746 | ) | | |
| TWD | | | 3,068,635,440 | | | USD | | | 95,181,000 | | | Deutsche Bank AG | | | 8/03/16 | | | | (209,150 | ) | | |
| TWD | | | 2,296,098,525 | | | USD | | | 71,385,000 | | | Goldman Sachs International | | | 8/03/16 | | | | (322,559 | ) | | |
| USD | | | 119,834,449 | | | GBP | | | 82,018,000 | | | Deutsche Bank AG | | | 8/03/16 | | | | (40,291 | ) | | |
| EUR | | | 59,713,000 | | | JPY | | | 7,337,067,678 | | | Deutsche Bank AG | | | 8/09/16 | | | | (564,939 | ) | | |
| JPY | | | 7,645,771,946 | | | EUR | | | 59,713,000 | | | Deutsche Bank AG | | | 8/09/16 | | | | 3,474,306 | | | |
| USD | | | 2,863,718 | | | JPY | | | 308,704,268 | | | Goldman Sachs International | | | 8/09/16 | | | | (45,649 | ) | | |
| EUR | | | 100,287,000 | | | JPY | | | 12,478,661,266 | | | Morgan Stanley Capital Services LLC | | | 8/10/16 | | | | (2,421,007 | ) | | |
| JPY | | | 12,770,747,154 | | | EUR | | | 100,287,000 | | | Morgan Stanley Capital Services LLC | | | 8/10/16 | | | | 5,173,857 | | | |
| KRW | | | 53,462,991,838 | | | USD | | | 46,692,569 | | | Credit Suisse International | | | 8/10/16 | | | | (134,450 | ) | | |
| KRW | | | 54,272,478,162 | | | USD | | | 46,706,091 | | | Credit Suisse International | | | 8/10/16 | | | | 556,967 | | | |
| USD | | | 2,675,463 | | | JPY | | | 292,085,888 | | | Goldman Sachs International | | | 8/10/16 | | | | (77,387 | ) | | |
| USD | | | 88,953,036 | | | KRW | | | 107,735,470,000 | | | Credit Suisse International | | | 8/10/16 | | | | (4,868,141 | ) | | |
| EUR | | | 103,356,000 | | | JPY | | | 12,798,780,192 | | | Deutsche Bank AG | | | 8/19/16 | | | | (1,915,849 | ) | | |
| JPY | | | 12,829,786,992 | | | EUR | | | 103,356,000 | | | Deutsche Bank AG | | | 8/19/16 | | | | 2,208,179 | | | |
| USD | | | 283,526 | | | JPY | | | 31,006,800 | | | Goldman Sachs International | | | 8/19/16 | | | | (8,804 | ) | | |
| USD | | | 240,442,478 | | | JPY | | | 27,170,000,000 | | | Credit Suisse International | | | 9/12/16 | | | | (15,942,447 | ) | | |
| CNH | | | 828,419,000 | | | USD | | | 126,119,967 | | | Deutsche Bank AG | | | 11/04/16 | | | | 344,632 | | | |
| USD | | | 127,486,342 | | | CNH | | | 828,419,000 | | | Deutsche Bank AG | | | 11/04/16 | | | | 1,021,743 | | | |
| TWD | | | 3,990,132,560 | | | USD | | | 122,205,524 | | | Citibank, N.A. | | | 1/09/17 | | | | 1,257,237 | | | |
| TWD | | | 4,022,492,520 | | | USD | | | 123,427,202 | | | Goldman Sachs International | | | 1/09/17 | | | | 1,036,841 | | | |
| TWD | | | 3,972,276,449 | | | USD | | | 121,735,078 | | | JPMorgan Chase Bank, N.A. | | | 1/09/17 | | | | 1,175,179 | | | |
| USD | | | 119,291,000 | | | TWD | | | 4,022,492,520 | | | Goldman Sachs International | | | 1/09/17 | | | | (5,173,044 | ) | | |
| USD | | | 119,144,000 | | | TWD | | | 3,990,132,560 | | | JPMorgan Chase Bank, N.A. | | | 1/09/17 | | | | (4,318,761 | ) | | |
| USD | | | 119,144,000 | | | TWD | | | 3,972,276,449 | | | JPMorgan Chase Bank, N.A. | | | 1/09/17 | | | | (3,766,257 | ) | | |
See Notes to Consolidated Financial Statements.
| | | | | | |
| | | | | | | |
| | BLACKROCK GLOBAL ALLOCATION FUND, INC. | | APRIL 30, 2016 | | 21 |
| | |
Consolidated Schedule of Investments (continued) | | |
Forward Foreign Currency Exchange Contracts (concluded)
| | | | | | | | | | | | | | | | | | | | | | |
Currency Purchased | | | Currency Sold | | | Counterparty | | Settlement
Date | | | Unrealized
Appreciation
(Depreciation) | | | |
| TWD | | | 3,963,025,240 | | | USD | | | 121,647,285 | | | Credit Suisse International | | | 1/11/17 | | | $ | 976,318 | | | |
| USD | | | 118,130,000 | | | TWD | | | 3,963,025,240 | | | Credit Suisse International | | | 1/11/17 | | | | (4,493,602 | ) | | |
| USD | | | 46,134,000 | | | AED | | | 170,815,748 | | | BNP Paribas S.A. | | | 1/19/17 | | | | (318,132 | ) | | |
| USD | | | 46,138,000 | | | AED | | | 170,964,359 | | | Goldman Sachs International | | | 1/19/17 | | | | (354,545 | ) | | |
| USD | | | 45,689,000 | | | AED | | | 169,195,505 | | | BNP Paribas S.A. | | | 1/25/17 | | | | (320,478 | ) | | |
| EUR | | | 40,755,000 | | | JPY | | | 5,069,616,337 | | | HSBC Bank USA, N.A. | | | 2/13/17 | | | | (999,591 | ) | | |
| JPY | | | 5,283,763,485 | | | EUR | | | 40,755,000 | | | HSBC Bank USA, N.A. | | | 2/13/17 | | | | 3,033,345 | | | |
| USD | | | 1,976,694 | | | JPY | | | 214,147,148 | | | HSBC Bank USA, N.A. | | | 2/13/17 | | | | (57,059 | ) | | |
| TWD | | | 1,503,331,860 | | | USD | | | 46,920,470 | | | Deutsche Bank AG | | | 2/16/17 | | | | (407,316 | ) | | |
| USD | | | 44,983,000 | | | TWD | | | 1,503,331,860 | | | Deutsche Bank AG | | | 2/16/17 | | | | (1,530,154 | ) | | |
| Total | | | | | | | | | | | | | | | | | | $ | (174,295,297 | ) | | |
| | | | | | | | | | | | | | | | | | | |
Exchange-Traded Options Purchased
| | | | | | | | | | | | | | | | | | |
| Description | | Put/
Call | | Expiration
Date | | Strike
Price | | | Contracts | | | Value | |
SPDR Gold Trust ETF1 | | Call | | 5/20/16 | | USD | | | 117.00 | | | | 11,130 | | | $ | 7,679,700 | |
SPDR Gold Trust ETF1 | | Call | | 5/20/16 | | USD | | | 118.00 | | | | 13,246 | | | | 8,013,830 | |
SPDR Gold Trust ETF1 | | Call | | 6/17/16 | | USD | | | 120.00 | | | | 13,261 | | | | 7,293,550 | |
SPDR Gold Trust ETF1 | | Call | | 6/30/16 | | USD | | | 121.00 | | | | 13,280 | | | | 7,071,600 | |
SPDR Gold Trust ETF1 | | Call | | 9/30/16 | | USD | | | 125.00 | | | | 13,257 | | | | 7,490,205 | |
Total | | | | | | | | | | | | | | | | $ | 37,548,885 | |
| | | | | | | | | | | | | | | | | | |
1 All or a portion of security is held by a wholly owned subsidiary. See Note 1 of the Consolidated Notes to Financial Statements for details on the wholly owned subsidiary. | |
OTC Interest Rate Swaptions Purchased
| | | | | | | | | | | | | | | | | | | | | | | | |
| Description | | Counterparty | | Put/
Call | | Exercise
Rate | | Pay/
Receive
Exercise Rate | | Floating Rate
Index | | Expiration
Date | | | Notional
Amount
(000) | | | Value | |
5-Year Interest Rate Swap | | Deutsche Bank AG | | Call | | 1.32% | | Receive | | 3-month USD LIBOR | | | 8/26/16 | | | USD | | | 1,328,895 | | | $ | 10,771,106 | |
10-Year Interest Rate Swap | | Deutsche Bank AG | | Put | | 1.25% | | Pay | | 6-month JPY LIBOR | | | 7/29/16 | | | JPY | | | 14,080,590 | | | | 4,896 | |
5-Year Interest Rate Swap | | Deutsche Bank AG | | Put | | 1.07% | | Pay | | 6-month JPY LIBOR | | | 4/04/18 | | | JPY | | | 12,739,074 | | | | 153,773 | |
Total | | | | | | | | | | | | | | | | | | | | | | $ | 10,929,775 | |
| | | | | | | | | | | | | | | | | | | | | | | | |
OTC Options Purchased
| | | | | | | | | | | | | | | | | | | | | | | | | | | | |
| Description | | Put/
Call | | Counterparty | | Expiration
Date | | | Strike
Price | | | Notional
Amount
(000) | | | Contracts | | | Value | |
Bank of New York Mellon Corp. | | Call | | Deutsche Bank AG | | | 5/20/2016 | | | USD | | | 46.00 | | | | | | — | | | | 4,039,860 | | | $ | 100,148 | |
Gilead Sciences, Inc. | | Call | | Deutsche Bank AG | | | 5/20/2016 | | | USD | | | 99.00 | | | | | | — | | | | 532,030 | | | | 80,416 | |
Goldman Sachs Group, Inc. | | Call | | Deutsche Bank AG | | | 5/20/2016 | | | USD | | | 220.00 | | | | | | — | | | | 969,600 | | | | 87 | |
KeyCorp | | Call | | Deutsche Bank AG | | | 5/20/2016 | | | USD | | | 15.75 | | | | | | — | | | | 5,386,481 | | | | 323 | |
SunTrust Banks, Inc. | | Call | | Deutsche Bank AG | | | 5/20/2016 | | | USD | | | 45.50 | | | | | | — | | | | 4,039,800 | | | | 242,469 | |
Teva Pharmaceutical Industries Ltd. — ADR | | Call | | Deutsche Bank AG | | | 5/20/2016 | | | USD | | | 63.50 | | | | | | — | | | | 1,079,500 | | | | 13,828 | |
Wells Fargo & Co. | | Call | | Deutsche Bank AG | | | 5/20/2016 | | | USD | | | 59.00 | | | | | | — | | | | 4,039,860 | | | | 10,221 | |
Morgan Stanley | | Call | | Deutsche Bank AG | | | 5/20/2016 | | | USD | | | 40.75 | | | | | | — | | | | 4,039,859 | | | | 40 | |
Topix Index | | Call | | Morgan Stanley & Co. International PLC | | | 6/10/2016 | | | JPY | | | 1,675.00 | | | | | | — | | | | 9,208,067 | | | | 9,957 | |
Euro STOXX 600 Index | | Call | | JPMorgan Chase Bank, N.A. | | | 6/17/2016 | | | EUR | | | 345.00 | | | | | | — | | | | 183,351 | | | | 1,354,153 | |
MSCI Emerging Markets Index | | Call | | Morgan Stanley & Co. International PLC | | | 6/17/2016 | | | USD | | | 850.00 | | | | | | — | | | | 84,770 | | | | 1,703,877 | |
SPDR Gold Trust ETF1 | | Call | | JPMorgan Chase Bank, N.A. | | | 6/17/2016 | | | USD | | | 121.00 | | | | | | — | | | | 1,325,018 | | | | 6,459,463 | |
USD Currency | | Call | | Deutsche Bank AG | | | 7/07/2016 | | | JPY | | | 110.00 | | | USD | | | 263,201 | | | | — | | | | 2,110,609 | |
See Notes to Consolidated Financial Statements.
| | | | | | |
| | | | | | | |
| 22 | | BLACKROCK GLOBAL ALLOCATION FUND, INC. | | APRIL 30, 2016 | | |
| | |
Consolidated Schedule of Investments (continued) | | |
OTC Options Purchased (concluded)
| | | | | | | | | | | | | | | | | | | | | | | | | | | | |
| Description | | Put/
Call | | Counterparty | | Expiration
Date | | | Strike
Price | | | Notional
Amount
(000) | | | Contracts | | | Value | |
EUR Currency | | Call | | JPMorgan Chase Bank, N.A. | | | 7/27/2016 | | | USD | | | 1.12 | | | EUR | | | 92,218 | | | | — | | | $ | 3,410,363 | |
USD Currency | | Call | | Morgan Stanley & Co. International PLC | | | 7/27/2016 | | | EUR | | | 1.12 | | | USD | | | 105,363 | | | | — | | | | 1,115,474 | |
USD Currency | | Call | | Morgan Stanley & Co. International PLC | | | 8/08/2016 | | | JPY | | | 111.00 | | | USD | | | 262,918 | | | | — | | | | 2,277,922 | |
USD Currency | | Call | | Goldman Sachs International | | | 9/08/2016 | | | JPY | | | 110.50 | | | USD | | | 262,896 | | | | — | | | | 3,200,496 | |
Apple, Inc. | | Call | | Citibank, N.A. | | | 9/16/2016 | | | USD | | | 100.00 | | | | | | — | | | | 884,250 | | | | 2,929,529 | |
Euro STOXX 600 Index | | Call | | Credit Suisse International | | | 9/16/2016 | | | EUR | | | 345.00 | | | | | | — | | | | 209,321 | | | | 3,079,928 | |
SPDR Gold Trust ETF1 | | Call | | JPMorgan Chase Bank, N.A. | | | 6/17/2016 | | | USD | | | 120.00 | | | | | | — | | | | 1,325,200 | | | | 10,336,560 | |
Taiwan Stock Exchange Weighted Index | | Call | | Citibank, N.A. | | | 9/21/2016 | | | TWD | | | 9,000.77 | | | | | | — | | | | 480,300 | | | | 489,586 | |
USD Currency | | Call | | JPMorgan Chase Bank, N.A. | | | 10/04/2016 | | | JPY | | | 110.00 | | | USD | | | 263,419 | | | | — | | | | 3,927,053 | |
MetLife, Inc. | | Call | | UBS AG | | | 1/20/2017 | | | USD | | | 50.00 | | | | | | — | | | | 834,786 | | | | 1,502,615 | |
MetLife, Inc. | | Call | | UBS AG | | | 1/20/2017 | | | USD | | | 52.50 | | | | | | — | | | | 756,300 | | | | 896,215 | |
Prudential Financial, Inc. | | Call | | Morgan Stanley & Co. International PLC | | | 1/20/2017 | | | USD | | | 87.50 | | | | | | — | | | | 927,000 | | | | 2,280,420 | |
Euro STOXX 50 Index | | Call | | Morgan Stanley & Co. International PLC | | | 3/17/2017 | | | EUR | | | 3,025.00 | | | | | | — | | | | 8,862 | | | | 2,040,173 | |
Euro STOXX 50 Index | | Call | | Morgan Stanley & Co. International PLC | | | 3/17/2017 | | | EUR | | | 3,025.00 | | | | | | — | | | | 8,851 | | | | 2,037,641 | |
Euro STOXX 50 Index | | Call | | Morgan Stanley & Co. International PLC | | | 3/17/2017 | | | EUR | | | 3,450.00 | | | | | | — | | | | 19,780 | | | | 1,265,239 | |
Euro STOXX 600 Index | | Call | | Credit Suisse International | | | 3/17/2017 | | | EUR | | | 355.61 | | | | | | — | | | | 361,239 | | | | 5,255,591 | |
QUALCOMM, Inc. | | Call | | Deutsche Bank AG | | | 5/19/2017 | | | USD | | | 52.50 | | | | | | — | | | | 1,644,508 | | | | 6,346,419 | |
Euro STOXX 50 Index | | Call | | Citibank, N.A. | | | 6/16/2017 | | | EUR | | | 3,150.00 | | | | | | — | | | | 33,114 | | | | 5,530,223 | |
Euro STOXX 50 Index | | Call | | Bank of America, N.A. | | | 9/15/2017 | | | EUR | | | 3,600.00 | | | | | | — | | | | 39,432 | | | | 2,464,009 | |
Euro STOXX 600 Index | | Call | | JPMorgan Chase Bank, N.A. | | | 9/15/2017 | | | EUR | | | 372.06 | | | | | | — | | | | 234,650 | | | | 2,703,090 | |
Taiwan Stock Exchange Weighted Index | | Call | | Morgan Stanley & Co. International PLC | | | 9/20/2017 | | | TWD | | | 9,000.00 | | | | | | — | | | | 424,064 | | | | 2,652,774 | |
Euro STOXX 50 Index | | Call | | Barclays Bank PLC | | | 12/15/2017 | | | EUR | | | 3,500.00 | | | | | | — | | | | 40,448 | | | | 4,075,720 | |
Taiwan Stock Exchange Weighted Index | | Call | | Morgan Stanley & Co. International PLC | | | 12/20/2017 | | | TWD | | | 9,000.00 | | | | | | — | | | | 432,159 | | | | 2,777,837 | |
Nikkei 225 Index | | Call | | Goldman Sachs International | | | 3/09/2018 | | | JPY | | | 21,968.28 | | | | | | — | | | | 1,144,461 | | | | 4,081,745 | |
Euro STOXX 50 Index | | Call | | Goldman Sachs International | | | 3/16/2018 | | | EUR | | | 3,500.00 | | | | | | — | | | | 33,589 | | | | 3,728,847 | |
Euro STOXX 50 Index | | Call | | UBS AG | | | 6/15/2018 | | | EUR | | | 3,600.00 | | | | | | — | | | | 16,276 | | | | 1,594,900 | |
Euro STOXX 50 Index | | Call | | Deutsche Bank AG | | | 9/21/2018 | | | EUR | | | 3,426.55 | | | | | | — | | | | 15,600 | | | | 2,443,008 | |
USD Currency | | Put | | Morgan Stanley & Co. International PLC | | | 7/27/2016 | | | EUR | | | 1.12 | | | USD | | | 105,363 | | | | — | | | | 3,502,676 | |
EUR Currency | | Put | | JPMorgan Chase Bank, N.A. | | | 7/27/2016 | | | USD | | | 1.12 | | | EUR | | | 92,218 | | | | — | | | | 1,156,041 | |
Gentex Corp. | | Put | | Morgan Stanley & Co. International PLC | | | 9/16/2016 | | | USD | | | 12.50 | | | | | | — | | | | 4,171,464 | | | | 625,720 | |
Total | | | | | | | | | | | | | | | | | | | | | | | | | | $ | 101,813,405 | |
| | | | | | | | | | | | | | | | | | | | | | | | | | | | |
Exchange-Traded Options Written
| | | | | | | | | | | | | | | | | | | | | | |
| Description | | Put/
Call | | Expiration
Date | | | Strike
Price | | | Contracts | | | Value | |
SPDR Gold Trust ETF1 | | Call | | | 6/30/16 | | | | USD | | | | 133.00 | | | | 13,280 | | | $ | (1,733,040 | ) |
WhiteWave Foods Co. | | Call | | | 7/15/16 | | | | USD | | | | 37.50 | | | | 2,811 | | | | (1,110,345 | ) |
Mondelez International, Inc. | | Call | | | 9/16/16 | | | | USD | | | | 43.00 | | | | 5,897 | | | | (1,506,684 | ) |
SPDR Gold Trust ETF1 | | Call | | | 9/30/16 | | | | USD | | | | 145.00 | | | | 13,257 | | | | (1,922,265 | ) |
Total | | | | | | | | | | | | | | | | | | | | $ | (6,272,334 | ) |
| | | | | | | | | | | | | | | | | | | | | | |
1 All or a portion of security is held by a wholly owned subsidiary. See Note 1 of the Notes to Consolidated Financial Statements for details on the wholly owned subsidiary. | |
OTC Barrier Options Written
| | | | | | | | | | | | | | | | | | | | | | | | | | | | | | | | |
| Description | | Put/
Call | | Type of
Option | | | Counterparty | | Expiration
Date | | | Strike
Price | | | Barrier
Price | | | Contracts | | | Value | |
Euro STOXX 50 Index | | Put | | | Down-and-In | | | Morgan Stanley & Co. International PLC | | | 3/17/17 | | | EUR | | | 2,375.00 | | | EUR | | | 2,000.00 | | | | 8,862 | | | $ | (846,708 | ) |
Euro STOXX 50 Index | | Put | | | Down-and-In | | | Morgan Stanley & Co. International PLC | | | 3/17/17 | | | EUR | | | 2,375.00 | | | EUR | | | 2,000.00 | | | | 8,851 | | | | (746,793 | ) |
Euro STOXX 50 Index | | Put | | | Down-and-In | | | Citibank, N.A. | | | 6/16/17 | | | EUR | | | 2,350.00 | | | EUR | | | 1,823.00 | | | | 33,114 | | | | (4,100,745 | ) |
Nikkei 225 Index | | Put | | | Down-and-In | | | Goldman Sachs International | | | 3/09/18 | | | JPY | | | 17,974.04 | | | JPY | | | 14,978.37 | | | | 1,144,461 | | | | (32,972,987 | ) |
Euro STOXX 50 Index | | Put | | | Down-and-In | | | Deutsche Bank AG | | | 9/21/18 | | | EUR | | | 2,586.07 | | | EUR | | | 2,165.83 | | | | 15,600 | | | | (5,176,342 | ) |
Total | | | | | | | | | | | | | | | | | | | | | | | | | | | | | | $ | (43,843,575 | ) |
| | | | | | | | | | | | | | | | | | | | | | | | | | | | | | | | |
See Notes to Consolidated Financial Statements.
| | | | | | |
| | | | | | | |
| | BLACKROCK GLOBAL ALLOCATION FUND, INC. | | APRIL 30, 2016 | | 23 |
| | |
Consolidated Schedule of Investments (continued) | | |
OTC Interest Rate Swaptions Written
| | | | | | | | | | | | | | | | | | | | | | | | | | |
| Description | | Counterparty | | Put/ Call | | Exercise Rate | | | Pay/ Receive Exercise Rate | | Floating Rate Index | | Expiration Date | | | Notional Amount (000) | | | Value | |
5-Year Interest Rate Swap | | Deutsche Bank AG | | Call | | | 1.07 | % | | Pay | | 3-month USD LIBOR | | | 8/26/16 | | | USD | | | 1,328,895 | | | $ | (4,824,673 | ) |
5-Year Interest Rate Swap | | Deutsche Bank AG | | Put | | | 1.77 | % | | Receive | | 3-month USD LIBOR | | | 8/26/16 | | | USD | | | 1,328,895 | | | | (2,361,459 | ) |
Total | | | | | | | | | | | | | | | | | | | | | | | | $ | (7,186,132 | ) |
| | | | | | | | | | | | | | | | | | | | | | | | | | |
OTC Options Written
| | | | | | | | | | | | | | | | | | | | | | | | | | | | | | |
| Description | | Put/
Call | | Counterparty | | Expiration
Date | | | Strike
Price | | | Notional
Amount
(000) | | | Contracts | | | Value | |
Bank of New York Mellon Corp. | | Call | | Deutsche Bank AG | | | 5/20/2016 | | | USD | | | 51.25 | | | | | | | | — | | | | 4,039,860 | | | $ | (242 | ) |
Gilead Sciences, Inc. | | Call | | Deutsche Bank AG | | | 5/20/2016 | | | USD | | | 107.50 | | | | | | | | — | | | | 532,030 | | | | (9,369 | ) |
Goldman Sachs Group, Inc. | | Call | | Deutsche Bank AG | | | 5/20/2016 | | | USD | | | 245.00 | | | | | | | | — | | | | 969,600 | | | | (10 | ) |
KeyCorp | | Call | | Deutsche Bank AG | | | 5/20/2016 | | | USD | | | 17.90 | | | | | | | | — | | | | 5,386,481 | | | | (54 | ) |
Morgan Stanley | | Call | | Deutsche Bank AG | | | 5/20/2016 | | | USD | | | 46.00 | | | | | | | | — | | | | 4,039,859 | | | | (40 | ) |
SunTrust Banks, Inc. | | Call | | Deutsche Bank AG | | | 5/20/2016 | | | USD | | | 51.75 | | | | | | | | — | | | | 4,039,800 | | | | (30,864 | ) |
Teva Pharmaceutical Industries Ltd. — ADR | | Call | | Deutsche Bank AG | | | 5/20/2016 | | | USD | | | 73.00 | | | | | | | | — | | | | 1,079,500 | | | | (11 | ) |
Wells Fargo & Co. | | Call | | Deutsche Bank AG | | | 5/20/2016 | | | USD | | | 66.00 | | | | | | | | — | | | | 4,039,860 | | | | (40 | ) |
Mylan, Inc. | | Call | | Barclays Bank PLC | | | 7/15/2016 | | | USD | | | 45.00 | | | | | | | | — | | | | 313,757 | | | | (574,175 | ) |
USD Currency | | Call | | Morgan Stanley & Co. International PLC | | | 8/08/2016 | | | JPY | | | 118.00 | | | | USD | | | | 262,918 | | | | — | | | | (350,733 | ) |
Alexion Pharmaceuticals, Inc. | | Call | | Citibank, N.A. | | | 8/19/2016 | | | USD | | | 175.00 | | | | | | | | — | | | | 58,917 | | | | (131,090 | ) |
USD Currency | | Call | | Goldman Sachs International | | | 9/08/2016 | | | JPY | | | 117.50 | | | | USD | | | | 262,896 | | | | — | | | | (661,446 | ) |
Apple, Inc. | | Call | | Citibank, N.A. | | | 9/16/2016 | | | USD | | | 120.00 | | | | | | | | — | | | | 884,250 | | | | (505,818 | ) |
General Electric Co. | | Call | | UBS AG | | | 9/16/2016 | | | USD | | | 31.00 | | | | | | | | — | | | | 4,629,805 | | | | (5,092,786 | ) |
SPDR Gold Trust ETF1 | | Call | | JPMorgan Chase Bank, N.A. | | | 9/16/2016 | | | USD | | | 140.00 | | | | | | | | — | | | | 1,325,200 | | | | (2,365,482 | ) |
USD Currency | | Call | | JPMorgan Chase Bank, N.A. | | | 10/04/2016 | | | JPY | | | 117.00 | | | | USD | | | | 263,419 | | | | — | | | | (962,007 | ) |
General Electric Co. | | Call | | Deutsche Bank AG | | | 1/20/2017 | | | USD | | | 32.50 | | | | | | | | — | | | | 3,931,353 | | | | (3,849,699 | ) |
Johnson & Johnson Co. | | Call | | Barclays Bank PLC | | | 1/20/2017 | | | USD | | | 110.00 | | | | | | | | — | | | | 1,305,562 | | | | (8,094,484 | ) |
MetLife, Inc. | | Call | | UBS AG | | | 1/20/2017 | | | USD | | | 55.00 | | | | | | | | — | | | | 834,786 | | | | (596,872 | ) |
MetLife, Inc. | | Call | | UBS AG | | | 1/20/2017 | | | USD | | | 57.50 | | | | | | | | — | | | | 756,300 | | | | (313,865 | ) |
Prudential Financial, Inc. | | Call | | Morgan Stanley & Co. International PLC | | | 1/20/2017 | | | USD | | | 93.50 | | | | | | | | — | | | | 927,000 | | | | (1,133,832 | ) |
QUALCOMM, Inc. | | Call | | Deutsche Bank AG | | | 5/19/2017 | | | USD | | | 70.00 | | | | | | | | — | | | | 1,644,508 | | | | (682,093 | ) |
Gilead Sciences, Inc. | | Put | | Deutsche Bank AG | | | 5/20/2016 | | | USD | | | 90.00 | | | | | | | | — | | | | 532,030 | | | | (1,795,601 | ) |
Teva Pharmaceutical Industries Ltd. — ADR | | Put | | Deutsche Bank AG | | | 5/20/2016 | | | USD | | | 55.00 | | | | | | | | — | | | | 1,079,500 | | | | (2,076,138 | ) |
Topix Index | | Put | | Morgan Stanley & Co. International PLC | | | 6/10/2016 | | | JPY | | | 1,450.00 | | | | | | | | — | | | | 9,208,067 | | | | (10,112,388 | ) |
MSCI Emerging Markets Index | | Put | | Morgan Stanley & Co. International PLC | | | 6/17/2016 | | | USD | | | 850.00 | | | | | | | | — | | | | 84,770 | | | | (2,788,933 | ) |
USD Currency | | Put | | Deutsche Bank AG | | | 7/07/2016 | | | JPY | | | 100.00 | | | | USD | | | | 263,201 | | | | — | | | | (1,287,316 | ) |
USD Currency | | Put | | Morgan Stanley & Co. International PLC | | | 8/08/2016 | | | JPY | | | 101.00 | | | | USD | | | | 262,918 | | | | — | | | | (2,391,239 | ) |
USD Currency | | Put | | Goldman Sachs International | | | 9/08/2016 | | | JPY | | | 100.50 | | | | USD | | | | 262,896 | | | | — | | | | (2,862,149 | ) |
Apple, Inc. | | Put | | Citibank, N.A. | | | 9/16/2016 | | | USD | | | 90.00 | | | | | | | | — | | | | 884,250 | | | | (4,183,643 | ) |
Gentex Corp. | | Put | | Morgan Stanley & Co. International PLC | | | 9/16/2016 | | | USD | | | 9.00 | | | | | | | | — | | | | 3,650,044 | | | | (37 | ) |
Taiwan Stock Exchange Weighted Index | | Put | | Citibank, N.A. | | | 9/21/2016 | | | TWD | | | 8,100.70 | | | | | | | | — | | | | 480,300 | | | | (5,808,972 | ) |
USD Currency | | Put | | JPMorgan Chase Bank, N.A. | | | 10/04/2016 | | | JPY | | | 100.00 | | | | USD | | | | 263,419 | | | | — | | | | (3,335,677 | ) |
Johnson & Johnson | | Put | | Barclays Bank PLC | | | 1/20/2017 | | | USD | | | 97.50 | | | | | | | | — | | | | 1,305,562 | | | | (2,891,820 | ) |
MetLife, Inc. | | Put | | UBS AG | | | 1/20/2017 | | | USD | | | 45.00 | | | | | | | | — | | | | 417,393 | | | | (1,951,312 | ) |
MetLife, Inc. | | Put | | UBS AG | | | 1/20/2017 | | | USD | | | 46.00 | | | | | | | | — | | | | 378,150 | | | | (1,997,672 | ) |
Prudential Financial, Inc. | | Put | | Morgan Stanley & Co. International PLC | | | 1/20/2017 | | | USD | | | 77.50 | | | | | | | | — | | | | 463,500 | | | | (3,615,300 | ) |
QUALCOMM, Inc. | | Put | | Deutsche Bank AG | | | 5/19/2017 | | | USD | | | 40.00 | | | | | | | | — | | | | 1,644,508 | | | | (4,015,806 | ) |
Taiwan Stock Exchange Weighted Index | | Put | | Morgan Stanley & Co. International PLC | | | 9/20/2017 | | | TWD | | | 8,600.00 | | | | | | | | — | | | | 424,064 | | | | (15,044,659 | ) |
Taiwan Stock Exchange Weighted Index | | Put | | Morgan Stanley & Co. International PLC | | | 12/20/2017 | | | TWD | | | 8,600.00 | | | | | | | | — | | | | 432,159 | | | | (17,287,709 | ) |
Total | | | | | | | | | | | | | | | | | | | | | | | | | | | | $ | (108,801,383 | ) |
| | | | | | | | | | | | | | | | | | | | | | | | | | | | | | |
1 All or a portion of security is held by a wholly owned subsidiary. See Note 1 of the Notes to Consolidated Financial Statements for details on the wholly owned subsidiary. | |
See Notes to Consolidated Financial Statements.
| | | | | | |
| | | | | | | |
| 24 | | BLACKROCK GLOBAL ALLOCATION FUND, INC. | | APRIL 30, 2016 | | |
| | |
Consolidated Schedule of Investments (continued) | | |
Centrally Cleared Credit Default Swaps — Buy Protection
| | | | | | | | | | | | | | | | |
| Index | | Pay
Fixed
Rate | | | Expiration
Date | | Notional
Amount
(000) | | | Unrealized
Depreciation | |
CDX.NA. High Yield Series 26, Version 1 | | | 5.00 | % | | 6/20/21 | | USD | | | 399,158 | | | $ | (2,472,111 | ) |
Centrally Cleared Credit Default Swaps — Sold Protection
| | | | | | | | | | | | | | | | | | |
| Index | | Receive
Fixed
Rate | | | Expiration
Date | | Credit Rating1 | | Notional
Amount
(000)2 | | | Unrealized
Appreciation
(Depreciation) | |
CDX.NA. IG Series 26, Version 1 | | | 1.00 | % | | 6/20/21 | | BBB+ | | USD | | | 265,874 | | | $ | (113,408 | ) |
Markit iTraxx Europe, Series 25, Version 1 | | | 1.00 | % | | 6/20/21 | | A- | | USD | | | 203,775 | | | | 303,805 | |
Markit iTraxx XO, Series 25, Version 1 | | | 5.00 | % | | 6/20/21 | | B+ | | USD | | | 188,228 | | | | 489,642 | |
Total | | | | | | | | | | | | | | | | $ | 680,039 | |
| | | | | | | | | | | | | | | | | | |
1 Using Standard & Poor’s (“S&P”) rating of the issuer or the underlying securities of the index, as applicable. | |
2 The maximum potential amount the Fund may pay should a negative credit event take place as defined under the terms of the agreement. | |
Centrally Cleared Interest Rate Swaps
| | | | | | | | | | | | | | | | | | |
| Fixed Rate | | Floating
Rate | | Effective
Date | | Expiration
Date | | | Notional
Amount
(000) | | | Unrealized
Appreciation
(Depreciation) | |
0.02%1 | | 6 Month EURIBOR | | N/A | | | 4/09/21 | | | EUR | | | 69,500 | | | $ | 221,562 | |
1.95%1 | | 3 Month LIBOR | | N/A | | | 9/11/22 | | | USD | | | 270,760 | | | | (9,723,531 | ) |
1.64%1 | | 3 Month LIBOR | | N/A | | | 10/19/22 | | | USD | | | 269,920 | | | | (4,023,653 | ) |
1.83%1 | | 3 Month LIBOR | | N/A | | | 11/03/22 | | | USD | | | 269,320 | | | | (9,101,791 | ) |
Total | | | | | | | | | | | | | | | | $ | (22,627,413 | ) |
| | | | | | | | | | | | | | | | | | |
1 Fund pays the fixed rate and receives the floating rate. | |
OTC Currency Swaps
| | | | | | | | | | | | | | | | | | | | | | | | | | | | | | | | |
| | | | | | Notional Amount (000) | | | | | | | | | | | | | | |
| Fund Pays | | Fund
Receives | | | Fund
Pays | | | Fund
Receives | | | Counterparty | | Expiration
Date | | | Value | | | Premiums
Paid
(Received) | | Unrealized
Depreciation | |
0.10% JPY | | | 1.23 | % | | USD | | | 92,066 | | | JPY | | | 11,078,850 | | | Bank of America, N.A. | | | 3/15/17 | | | $ | (12,079,342 | ) | | — | | $ | (12,079,342 | ) |
0.10% JPY | | | 1.84 | % | | USD | | | 94,685 | | | JPY | | | 10,596,100 | | | Bank of America, N.A. | | | 3/15/18 | | | | (4,986,518 | ) | | — | | | (4,986,518 | ) |
0.10% JPY | | | 1.96 | % | | USD | | | 141,258 | | | JPY | | | 15,929,100 | | | Bank of America, N.A. | | | 3/15/18 | | | | (8,192,270 | ) | | — | | | (8,192,270 | ) |
Total | | | | | | | | | | | | | | | | | | | | | | | | $ | (25,258,130 | ) | | — | | $ | (25,258,130 | ) |
| | | | | | | | | | | | | | | | | | | | | | | | | | |
OTC Total Return Swaps
| | | | | | | | | | | | | | | | | | | | | | | | | | | | |
| Reference Entity | | Fixed Amount/
Floating Rate1 | | | Counterparty | | Expiration
Date | | | Contract
Amount | | | Value | | | Premiums
Paid
(Received) | | Unrealized
Appreciation
(Depreciation) | |
SGX Nikkei Stock Average Dividend Point Index Future December 2016 | | JPY | | | 2,778,300,000 | | | BNP Paribas S.A. | | | 3/31/17 | | | JPY | | | 980 | | | $ | 4,674,173 | | | — | | $ | 4,674,173 | |
SGX Nikkei Stock Average Dividend Point Index Future December 2016 | | JPY | | | 2,726,515,000 | | | BNP Paribas S.A. | | | 3/31/17 | | | JPY | | | 979 | | | | 4,218,421 | | | — | | | 4,218,421 | |
EURO Stoxx 50 Index Dividend Future December 2017 | | EUR | | | 24,621,520 | | | BNP Paribas S.A. | | | 12/15/17 | | | EUR | | | 2,156 | | | | (394,997 | ) | | — | | | (394,997 | ) |
EURO Stoxx 50 Index Dividend Future December 2017 | | EUR | | | 24,702,982 | | | BNP Paribas S.A. | | | 12/15/17 | | | EUR | | | 2,143 | | | | (655,888 | ) | | — | | | (655,888 | ) |
SGX Nikkei Stock Average Dividend Point Index Future December 2017 | | JPY | | | 2,613,262,500 | | | BNP Paribas S.A. | | | 4/02/18 | | | JPY | | | 783 | | | | 161,163 | | | — | | | 161,163 | |
SGX Nikkei Stock Average Dividend Point Index Future December 2017 | | JPY | | | 2,587,893,300 | | | BNP Paribas S.A. | | | 4/02/18 | | | JPY | | | 783 | | | | (77,270 | ) | | — | | | (77,270 | ) |
See Notes to Consolidated Financial Statements.
| | | | | | |
| | | | | | | |
| | BLACKROCK GLOBAL ALLOCATION FUND, INC. | | APRIL 30, 2016 | | 25 |
| | |
Consolidated Schedule of Investments (continued) | | |
OTC Total Return Swaps (concluded)
| | | | | | | | | | | | | | | | | | | | | | | | | | | | |
| Reference Entity | | Fixed Amount/
Floating Rate1 | | | Counterparty | | Expiration
Date | | | Contract
Amount | | | Value | | | Premiums
Paid
(Received) | | Unrealized
Appreciation
(Depreciation) | |
EURO Stoxx 50 Index Dividend Future December 2018 | | EUR | | | 12,051,630 | | | BNP Paribas S.A. | | | 12/21/18 | | | EUR | | | 1,077 | | | $ | (801,593 | ) | | — | | $ | (801,593 | ) |
EURO Stoxx 50 Index Dividend Future December 2018 | | EUR | | | 13,288,800 | | | BNP Paribas S.A. | | | 12/21/18 | | | EUR | | | 1,176 | | | | (1,023,400 | ) | | — | | | (1,023,400 | ) |
EURO Stoxx 50 Index Dividend Future December 2018 | | EUR | | | 24,499,253 | | | BNP Paribas S.A. | | | 12/21/18 | | | EUR | | | 2,159 | | | | (1,996,272 | ) | | — | | | (1,996,272 | ) |
SGX Nikkei Stock Average Dividend Point Index Future December 2018 | | JPY | | | 1,376,320,000 | | | BNP Paribas S.A. | | | 3/29/19 | | | JPY | | | 391 | | | | (249,319 | ) | | — | | | (249,319 | ) |
SGX Nikkei Stock Average Dividend Point Index Future December 2018 | | JPY | | | 1,350,937,500 | | | BNP Paribas S.A. | | | 3/29/19 | | | JPY | | | 393 | | | | (551,222 | ) | | — | | | (551,222 | ) |
SGX Nikkei Stock Average Dividend Point Index Future December 2019 | | JPY | | | 1,825,270,000 | | | BNP Paribas S.A. | | | 3/31/20 | | | JPY | | | 523 | | | | (264,304 | ) | | — | | | (264,304 | ) |
SGX Nikkei Stock Average Dividend Point Index Future December 2019 | | JPY | | | 2,223,600,000 | | | BNP Paribas S.A. | | | 3/31/20 | | | JPY | | | 654 | | | | (653,750 | ) | | — | | | (653,750 | ) |
SGX Nikkei Stock Average Dividend Point Index Future December 2019 | | JPY | | | 1,370,432,000 | | | BNP Paribas S.A. | | | 3/31/20 | | | JPY | | | 392 | | | | (512,105 | ) | | — | | | (512,105 | ) |
Total | | | | | | | | | | | | | | | | | | | | $ | 1,873,637 | | | — | | $ | 1,873,637 | |
| | | | | | | | | | | | | | | | | | | | | | |
1 Fund receives the total return of the reference entity and pays the fixed amount. Net payment at termination. | |
Transactions in Options Written for the Six Months Ended April 30, 2016
| | | | | | | | | | | | | | | | | | | | | | | | | | | | | | |
| | | Calls | | | | | Puts | |
| | | Contracts | | | Notional
USD (000)1 | | | Premiums Received | | | | | Contracts | | | Notional
EUR (000)1 | | | Notional
USD (000)1 | | | Premiums
Received | |
Outstanding options, beginning of period | | | 70,464,646 | | | | 3,251,370 | | | $ | 64,676,718 | | | | | | 208,097,218 | | | | 540,328 | | | | 1,619,400 | | | $ | 134,806,039 | |
Options written | | | 46,512,092 | | | | 7,141,486 | | | | 82,324,589 | | | | | | 321,552,324 | | | | — | | | | 6,140,608 | | | | 112,419,176 | |
Options exercised | | | (2,913,008 | ) | | | — | | | | (6,759,059 | ) | | | | | (21,497,396 | ) | | | — | | | | — | | | | (10,669,001 | ) |
Options expired | | | (58,812,592 | ) | | | (3,251,370 | ) | | | (25,438,349 | ) | | | | | (10,600,104 | ) | | | — | | | | — | | | | (5,962,775 | ) |
Options closed | | | (14,477,465 | ) | | | (5,023,358 | ) | | | (51,185,904 | ) | | | | | (475,356,857 | ) | | | (540,328 | ) | | | (5,378,679 | ) | | | (115,538,601 | ) |
| | | | | | | | | | |
Outstanding options, end of period | | | 40,773,673 | | | | 2,118,128 | | | $ | 63,617,995 | | | | | | 22,195,185 | | | | — | | | | 2,381,329 | | | $ | 115,054,838 | |
| | | | | | | | | | |
1 Amount shown is in the currency in which the transaction was denominated. | |
|
| Derivative Financial Instruments Categorized by Risk Exposure |
As of period end, the fair values of derivative financial instruments located in the Consolidated Statement of Assets and Liabilities were as follows:
| | | | | | | | | | | | | | | | | | | | | | | | | | |
| Assets — Derivative Financial Instruments | | Commodity
Contracts | | Credit
Contracts | | | Equity
Contracts | | | Foreign
Currency
Exchange
Contracts | | | Interest
Rate
Contracts | | | Other
Contracts | | Total | |
Futures contracts | | Net unrealized appreciation1 | | — | | | — | | | $ | 2,282,114 | | | | — | | | | — | | | — | | $ | 2,282,114 | |
Forward foreign currency exchange contracts | | Unrealized appreciation on forward foreign currency exchange contracts | | — | | | — | | | | — | | | $ | 56,552,451 | | | | — | | | — | | | 56,552,451 | |
Options purchased | | Investments at value — unaffiliated2 | | — | | | — | | | | 118,661,656 | | | | 20,700,634 | | | $ | 10,929,775 | | | — | | | 150,292,065 | |
Swaps — OTC | | Unrealized appreciation on OTC swaps | | — | | | — | | | | 9,053,757 | | | | — | | | | — | | | — | | | 9,053,757 | |
Swaps — centrally cleared | | Net unrealized appreciation1 | | — | | $ | 793,447 | | | | — | | | | — | | | | 221,562 | | | — | | | 1,015,009 | |
Total | | | | — | | $ | 793,447 | | | $ | 129,997,527 | | | $ | 77,253,085 | | | $ | 11,151,337 | | | — | | $ | 219,195,396 | |
See Notes to Consolidated Financial Statements.
| | | | | | |
| | | | | | | |
| 26 | | BLACKROCK GLOBAL ALLOCATION FUND, INC. | | APRIL 30, 2016 | | |
| | |
Consolidated Schedule of Investments (continued) | | |
| | | | | | | | | | | | | | | | | | | | | | | | | | |
| Liabilities — Derivative Financial Instruments | | Commodity Contracts | | Credit
Contracts | | | Equity
Contracts | | | Foreign
Currency
Exchange
Contracts | | | Interest
Rate
Contracts | | | Other
Contracts | | Total | |
Futures contracts | | Net unrealized depreciation1 | | — | | | — | | | $ | 5,222,877 | | | | — | | | | — | | | — | | $ | 5,222,877 | |
Forward foreign currency exchange contracts | | Unrealized depreciation on forward foreign currency exchange contracts | | — | | | — | | | | — | | | $ | 230,847,748 | | | | — | | | — | | | 230,847,748 | |
Options written | | Options written at value | | — | | | — | | | | 147,066,725 | | | | 11,850,567 | | | $ | 7,186,132 | | | | | | 166,103,424 | |
Swaps — OTC | | Unrealized depreciation on OTC swaps; Swap premiums received | | — | | | — | | | | 7,180,120 | | | | — | | | | 25,258,130 | | | — | | | 32,438,250 | |
Swaps — centrally cleared | | Net unrealized depreciation1 | | — | | $ | 2,585,519 | | | | — | | | | — | | | | 22,848,975 | | | — | | | 25,434,494 | |
Total | | | | — | | $ | 2,585,519 | | | $ | 159,469,722 | | | $ | 242,698,315 | | | $ | 55,293,237 | | | — | | $ | 460,046,793 | |
1 Includes cumulative appreciation (depreciation) on futures contracts and centrally cleared swaps, if any, as reported in the Schedule of Investments. Only current day’s variation margin is reported within the Consolidated Statement of Assets and Liabilities. | |
2 Includes options purchased at value as reported in the Consolidated Schedule of Investments. | |
For the period ended April 30, 2016, the effect of derivative financial instruments in the Consolidated Statement of Operations was as follows:
| | | | | | | | | | | | | | | | | | | | | | | | |
| Net Realized Gain (Loss) from: | | Commodity Contracts | | Credit Contracts | | | Equity Contracts | | | Foreign Currency Exchange Contracts | | | Interest Rate Contracts | | | Other
Contracts | | Total | |
Futures contracts | | — | | | — | | | $ | (32,232,688 | ) | | | — | | | | — | | | — | | $ | (32,232,688 | ) |
Forward foreign currency exchange contracts | | — | | | — | | | | — | | | $ | (227,869,944 | ) | | | — | | | — | | | (227,869,944 | ) |
Options purchased1 | | — | | | — | | | | (60,811,088 | ) | | | (5,850,866 | ) | | $ | (50,094,375 | ) | | — | | | (116,756,329 | ) |
Options written | | — | | | — | | | | (12,778,415 | ) | | | 500,082 | | | | (7,377,630 | ) | | — | | | (19,655,963 | ) |
Swaps | | — | | $ | 24,204,302 | | | | 8,043,537 | | | | — | | | | 55,774,131 | | | — | | | 88,021,970 | |
Total | | — | | $ | 24,204,302 | | | $ | (97,778,654 | ) | | $ | (233,220,728 | ) | | $ | (1,697,874 | ) | | — | | $ | (308,492,954 | ) |
1 Options purchased are included in net realized gain (loss) from investments. | | | | | | | | | | | |
Net Change in Unrealized
Appreciation (Depreciation) on: | | | | | | | | | | | | | | | | | | | |
Futures contracts | | — | | | — | | | $ | 60,183,565 | | | | — | | | | — | | | — | | $ | 60,183,565 | |
Forward foreign currency exchange contracts | | — | | | — | | | | — | | | $ | (137,139,025 | ) | | | — | | | — | | | (137,139,025 | ) |
Options purchased2 | | — | | | — | | | | (102,295,970 | ) | | | (2,223,598 | ) | | $ | 28,738,638 | | | — | | | (75,780,930 | ) |
Options written | | — | | | — | | | | (1,909,298 | ) | | | (859,077 | ) | | | (11,133,295 | ) | | — | | | (13,901,670 | ) |
Swaps | | — | | $ | (9,957,284 | ) | | | (16,167,272 | ) | | | — | | | | (51,299,994 | ) | | — | | | (77,424,550 | ) |
Total | | — | | $ | (9,957,284 | ) | | $ | (60,188,975 | ) | | $ | (140,221,700 | ) | | $ | (33,694,651 | ) | | — | | $ | (244,062,610 | ) |
2 Options purchased are included in net change in unrealized appreciation (depreciation) on investments. | | | | | | | | | | | |
See Notes to Consolidated Financial Statements.
| | | | | | |
| | | | | | | |
| | BLACKROCK GLOBAL ALLOCATION FUND, INC. | | APRIL 30, 2016 | | 27 |
| | |
Consolidated Schedule of Investments (continued) | | |
|
| Average Quarterly Balances of Outstanding Derivative Financial Instruments |
| | | | |
Financial futures contracts: | | | | |
Average notional value of contracts — long | | $ | 244,191,653 | |
Average notional value of contracts — short | | $ | 827,304,323 | |
Forward foreign currency exchange contracts: | | | | |
Average amounts purchased — in USD | | $ | 5,549,422,863 | |
Average amounts sold — in USD | | $ | 2,556,441,573 | |
Options: | | | | |
Average market value of option contracts purchased | | $ | 135,361,662 | |
Average market value of option contracts written | | $ | 176,923,333 | |
Average notional value of swaption contracts purchased | | | 1,429,794,782 | |
Average notional value of swaption contracts written | | | 1,857,444,446 | |
Credit default swaps: | | | | |
Average notional value — buy protection | | $ | 582,786,014 | |
Average notional value — sell protection | | $ | 256,775,995 | |
Interest rate swaps: | | | | |
Average notional value — pays fixed rate | | $ | 1,710,506,502 | |
Average notional value — receives fixed rate | | $ | 555,385,861 | |
Cross currency swaps: | | | | |
Average notional value — pays | | $ | 45,755,792 | |
Average notional value — receives | | $ | 176,710,761 | |
Total return swaps: | | | | |
Average notional amount | | $ | 244,435,329 | |
For more information about the Fund’s investment risks regarding derivative financial instruments, refer to the Notes to Consolidated Financial Statements.
|
| Derivative Financial Instruments — Offsetting as of Period End |
The Fund’s derivative assets and liabilities (by type) were as follows:
| | | | | | | | |
| | | Assets | | | Liabilities | |
| Derivative Financial Instruments: | | | | | | | | |
Futures contracts | | $ | 4,258,362 | | | | — | |
Forward foreign currency exchange contracts | | | 56,552,451 | | | $ | 230,847,748 | |
Options | | | 150,292,065 | 1 | | | 166,103,424 | |
Swaps — Centrally cleared | | | — | | | | 818,219 | |
Swaps — OTC2 | | | 9,053,757 | | | | 32,438,250 | |
| | | | |
Total derivative assets and liabilities in the Consolidated Statement of Assets and Liabilities | | $ | 220,156,635 | | | $ | 430,207,641 | |
| | | | |
Derivatives not subject to a Master Netting Agreement or similar agreement (“MNA”) | | | (41,807,247 | ) | | | (7,090,553 | ) |
| | | | |
Total derivative assets and liabilities subject to an MNA | | $ | 178,349,388 | | | $ | 423,117,088 | |
| | | | |
1 Includes options purchased at value which is included in Investments at value—unaffiliated in the Consolidated Statement of Assets and Liabilities and reported in the Consolidated Schedule of Investments. | |
2 Includes unrealized appreciation (depreciation) on OTC swaps in the Consolidated Statement of Assets and Liabilities. | |
The following table presents the Fund’s derivative assets and liabilities by counterparty net of amounts available for offset under an MNA and net of the related collateral received and pledged by the Fund:
| | | | | | | | | | | | | | | | | | |
| Counterparty | | Derivative Assets
Subject to an MNA
by Counterparty | | | Derivatives
Available for Offset3 | | | Non-cash
Collateral
Received | | Cash Collateral Received4 | | | Net Amount
of Derivative
Assets5 | |
Bank of America N.A. | | $ | 2,464,009 | | | $ | (2,464,009 | ) | | — | | | — | | | | — | |
Barclays Bank PLC | | | 4,075,720 | | | | (4,075,720 | ) | | — | | | — | | | | — | |
BNP Paribas S.A. | | | 9,053,757 | | | | (7,818,730 | ) | | — | | $ | (1,235,027 | ) | | | — | |
Citibank N.A. | | | 17,952,944 | | | | (15,135,014 | ) | | — | | | (820,000 | ) | | $ | 1,997,930 | |
Credit Suisse International | | | 11,153,873 | | | | (11,153,873 | ) | | — | | | — | | | | — | |
Deutsche Bank AG | | | 33,375,347 | | | | (33,375,347 | ) | | — | | | — | | | | — | |
Goldman Sachs International | | | 13,120,796 | | | | (13,120,796 | ) | | — | | | — | | | | — | |
HSBC Bank USA N.A. | | | 3,033,345 | | | | (2,888,544 | ) | | — | | | — | | | | 144,801 | |
JPMorgan Chase Bank, N.A. | | | 37,172,732 | | | | (37,172,732 | ) | | — | | | — | | | | — | |
Morgan Stanley & Co. International PLC | | | 22,289,710 | | | | (22,289,710 | ) | | — | | | — | | | | — | |
Morgan Stanley Capital Services LLC | | | 20,663,425 | | | | (20,663,425 | ) | | — | | | — | | | | — | |
UBS AG | | | 3,993,730 | | | | (3,993,730 | ) | | — | | | — | | | | — | |
Total | | $ | 178,349,388 | | | $ | (174,151,630 | ) | | — | | $ | (2,055,027 | ) | | $ | 2,142,731 | |
| | | | |
See Notes to Consolidated Financial Statements.
| | | | | | |
| | | | | | | |
| 28 | | BLACKROCK GLOBAL ALLOCATION FUND, INC. | | APRIL 30, 2016 | | |
| | |
Consolidated Schedule of Investments (continued) | | |
| | | | | | | | | | | | | | | | | | | | |
| Counterparty | | Derivative Liabilities
Subject to an MNA
by Counterparty | | | Derivatives
Available for Offset3 | | | Non-cash
Collateral
Pledged | | | Cash Collateral
Pledged | | Net Amount of
Derivative
Liabilities6 | | | |
Bank of America N.A. | | $ | 25,258,130 | | | $ | (2,464,009 | ) | | $ | (8,683,886 | ) | | — | | $ | 14,110,235 | | | |
Barclays Bank PLC | | | 11,560,479 | | | | (4,075,720 | ) | | | (7,195,810 | ) | | — | | | 288,949 | | | |
BNP Paribas S.A. | | | 7,818,730 | | | | (7,818,730 | ) | | | — | | | — | | | — | | | |
Citibank N.A. | | | 15,135,014 | | | | (15,135,014 | ) | | | — | | | — | | | — | | | |
Credit Suisse International | | | 53,927,880 | | | | (11,153,873 | ) | | | — | | | — | | | 42,774,007 | | | |
Deutsche Bank AG | | | 94,954,353 | | | | (33,375,347 | ) | | | — | | | — | | | 61,579,006 | | | |
Goldman Sachs International | | | 52,763,556 | | | | (13,120,796 | ) | | | (25,835,675 | ) | | — | | | 13,807,085 | | | |
HSBC Bank USA N.A. | | | 2,888,544 | | | | (2,888,544 | ) | | | — | | | — | | | — | | | |
JPMorgan Chase Bank, N.A. | | | 51,754,454 | | | | (37,172,732 | ) | | | — | | | — | | | 14,581,722 | | | |
Morgan Stanley & Co. International PLC | | | 54,318,331 | | | | (22,289,710 | ) | | | (27,894,245 | ) | | — | | | 4,134,376 | | | |
Morgan Stanley Capital Services LLC | | | 42,785,110 | | | | (20,663,425 | ) | | | — | | | — | | | 22,121,685 | | | |
UBS AG | | | 9,952,507 | | | | (3,993,730 | ) | | | (4,585,819 | ) | | — | | | 1,372,958 | | | |
Total | | $ | 423,117,088 | | | $ | (174,151,630 | ) | | $ | (74,195,435 | ) | | — | | $ | 174,770,023 | | | |
| | | |
3 The amount of derivatives available for offset is limited to the amount of derivative assets and/or liabilities that are subject to an MNA. | | | |
4 Excess of collateral received from the individual counterparty is not shown for financial reporting purposes. | | | |
5 Net amount represents the net amount receivable from the counterparty in the event of default. | | | |
6 Net amount represents the net amount payable due to the counterparty in the event of default. Net amount may be offset further by the options written receivable/payable on the Consolidated Statement of Assets and Liabilities. | | | |
|
| Fair Value Hierarchy as of Period End |
Various inputs are used in determining the fair value of investments and derivative financial instruments. For information about the Fund’s policy regarding valuation of investments and derivative financial instruments, refer to the Notes to Consolidated Financial Statements.
The following tables summarize the Fund’s investments and derivative financial instruments categorized in the disclosure hierarchy:
| | | | | | | | | | | | | | |
| | | Level 1 | | | Level 2 | | | Level 3 | | Total | |
Assets: | | | | | | | | | | | | | | |
| Investments: | | | | | | | | | | | | | | |
| Common Stocks: | | | | | | | | | | | | | | |
Australia | | | — | | | $ | 157,595,782 | | | — | | $ | 157,595,782 | |
Belgium | | | — | | | | 94,880,501 | | | — | | | 94,880,501 | |
Brazil | | $ | 7,874,377 | | | | — | | | — | | | 7,874,377 | |
Canada | | | 567,311,322 | | | | — | | | — | | | 567,311,322 | |
China | | | 105,521,364 | | | | 39,618,723 | | | — | | | 145,140,087 | |
Cyprus | | | 2,720,792 | | | | — | | | — | | | 2,720,792 | |
Denmark | | | — | | | | 20,698,241 | | | — | | | 20,698,241 | |
Egypt | | | 7,663,214 | | | | — | | | — | | | 7,663,214 | |
France | | | 7,178,435 | | | | 1,204,971,137 | | | — | | | 1,212,149,572 | |
Germany | | | — | | | | 487,974,159 | | | — | | | 487,974,159 | |
Hong Kong | | | — | | | | 284,729,883 | | | — | | | 284,729,883 | |
India | | | — | | | | 127,369,364 | | | — | | | 127,369,364 | |
Indonesia | | | 24,118,563 | | | | — | | | — | | | 24,118,563 | |
Ireland | | | 80,890,955 | | | | 95,471,903 | | | — | | | 176,362,858 | |
Israel | | | 117,171,145 | | | | — | | | — | | | 117,171,145 | |
Italy | | | 36,104,870 | | | | 316,107,447 | | | — | | | 352,212,317 | |
Japan | | | 6,592,816 | | | | 3,465,409,229 | | | — | | | 3,472,002,045 | |
Kazakhstan | | | 12,200,966 | | | | — | | | — | | | 12,200,966 | |
Luxembourg | | | — | | | | 4,193,802 | | | — | | | 4,193,802 | |
Malaysia | | | — | | | | 18,247,755 | | | — | | | 18,247,755 | |
Mexico | | | 124,018,899 | | | | — | | | — | | | 124,018,899 | |
Netherlands | | | 126,465,852 | | | | 496,943,044 | | | — | | | 623,408,896 | |
Norway | | | — | | | | 25,833,418 | | | — | | | 25,833,418 | |
Peru | | | 10,126,490 | | | | — | | | — | | | 10,126,490 | |
Portugal | | | — | | | | 32,898,620 | | | — | | | 32,898,620 | |
Singapore | | | — | | | | 305,279,984 | | | — | | | 305,279,984 | |
South Korea | | | — | | | | 210,869,639 | | | — | | | 210,869,639 | |
Spain | | | — | | | | 132,346,403 | | | — | | | 132,346,403 | |
See Notes to Consolidated Financial Statements.
| | | | | | |
| | | | | | | |
| | BLACKROCK GLOBAL ALLOCATION FUND, INC. | | APRIL 30, 2016 | | 29 |
| | |
Consolidated Schedule of Investments (continued) | | |
| | | | | | | | | | | | | | | | |
| | | Level 1 | | | Level 2 | | | Level 3 | | | Total | |
Assets (concluded): | | | | | | | | | | | | | | | | |
| Investments (concluded): | | | | | | | | | | | | | | | | |
| Common Stocks (concluded): | | | | | | | | | | | | | | | | |
Sweden | | | — | | | $ | 36,852,033 | | | | — | | | $ | 36,852,033 | |
Switzerland | | | — | | | | 621,849,703 | | | | — | | | | 621,849,703 | |
Taiwan | | | — | | | | 82,572,468 | | | | — | | | | 82,572,468 | |
United Arab Emirates | | $ | 56,934,044 | | | | 29,048,768 | | | | — | | | | 85,982,812 | |
United Kingdom | | | 256,000,812 | | | | 1,246,783,725 | | | $ | 31,392,783 | | | | 1,534,177,320 | |
United States | | | 13,412,765,901 | | | | 26,816,497 | | | | 1,585,360 | | | | 13,441,167,758 | |
Corporate Bonds | | | — | | | | 3,185,822,983 | | | | 353,836,217 | | | | 3,539,659,200 | |
Floating Rate Loan Interests | | | — | | | | 414,095,240 | | | | 69,040,769 | | | | 483,136,009 | |
Foreign Agency Obligations | | | — | | | | 4,527,289,742 | | | | — | | | | 4,527,289,742 | |
Non-Agency Mortgage-Backed Securities | | | — | | | | — | | | | 41,785,439 | | | | 41,785,439 | |
U.S. Government Sponsored Agency Securities | | | — | | | | 272,090,195 | | | | — | | | | 272,090,195 | |
U.S. Treasury Obligations | | | — | | | | 6,805,042,005 | | | | — | | | | 6,805,042,005 | |
Investment Companies | | | 1,251,443,206 | | | | — | | | | — | | | | 1,251,443,206 | |
Preferred Securities | | | 755,995,637 | | | | 829,020,749 | | | | 615,075,785 | | | | 2,200,092,171 | |
Warrants | | | — | | | | 9,943,073 | | | | — | | | | 9,943,073 | |
| Short-Term Securities: | | | | | | | | | | | | | | | | |
Foreign Agency Obligations | | | — | | | | 2,976,395,454 | | | | — | | | | 2,976,395,454 | |
Money Market Funds | | | 2,589,788 | | | | 331,860,268 | | | | — | | | | 334,450,056 | |
U.S. Treasury Obligations | | | — | | | | 2,076,005,193 | | | | — | | | | 2,076,005,193 | |
Options Purchased | | | 37,548,885 | | | | 112,743,180 | | | | — | | | | 150,292,065 | |
Liabilities: | | | | | | | | | | | | | | | | |
| Investments: | | | | | | | | | | | | | | | | |
Investments Sold Short | | | (120,812,900 | ) | | | (29,536,854 | ) | | | — | | | | (150,349,754 | ) |
| | | | |
Total | | $ | 16,888,425,433 | | | $ | 31,076,133,456 | | | $ | 1,112,716,353 | | | $ | 49,077,275,242 | |
| | | | |
| | | | | | | | | | | | | | | | |
| Derivative Financial Instruments1 | | | | | | | | | | | | | | | | |
Assets: | | | | | | | | | | | | | | | | |
Credit contracts | | | — | | | $ | 793,447 | | | | — | | | $ | 793,447 | |
Equity contracts | | $ | 2,282,114 | | | | 9,053,757 | | | | — | | | | 11,335,871 | |
Foreign currency exchange contracts | | | — | | | | 56,552,451 | | | | — | | | | 56,552,451 | |
Interest rate contracts | | | — | | | | 221,562 | | | | — | | | | 221,562 | |
Liabilities: | | | | | | | | | | | | | | | | |
Credit contracts | | | — | | | | (2,585,519 | ) | | | — | | | | (2,585,519 | ) |
Equity contracts | | | (11,495,211 | ) | | | (147,974,511 | ) | | | — | | | | (159,469,722 | ) |
Foreign currency exchange contracts | | | — | | | | (267,956,445 | ) | | | — | | | | (267,956,445 | ) |
Interest rate contracts | | | — | | | | (30,035,107 | ) | | | — | | | | (30,035,107 | ) |
| | | | |
Total | | $ | (9,213,097 | ) | | $ | (381,930,365 | ) | | | — | | | $ | (391,143,462 | ) |
| | | | |
1 Derivative financial instruments are swaps, futures contracts and forward foreign currency contracts and options written. Swaps, futures contracts and forward foreign currency contracts are valued at the unrealized appreciation (depreciation) on the instrument and options written are shown at value. | |
The Fund may hold assets and/or liabilities in which the fair value approximates the carrying amount for financial statement purposes. As of period end, such assets and/or liabilities are categorized within the disclosure hierarchy as follows: | |
| | | Level 1 | | | Level 2 | | | Level 3 | | | Total | |
Assets: | | | | | | | | | | | | | | | | |
Cash | | $ | 15,073 | | | | — | | | | — | | | $ | 15,073 | |
Cash pledged for centrally cleared swaps | | | 52,396,940 | | | | — | | | | — | | | | 52,396,940 | |
Cash held for investments sold short | | | 150,884,963 | | | | — | | | | — | | | | 150,884,963 | |
Foreign currency at value | | | 4,673,054 | | | | — | | | | — | | | | 4,673,054 | |
Liabilities: | | | | | | | | | | | | | | | | |
Collateral on securities loaned at value | | | — | | | $ | (331,860,268 | ) | | | — | | | | (331,860,268 | ) |
Cash received as collateral for OTC derivatives | | | — | | | | (32,102,000 | ) | | | — | | | | (32,102,000 | ) |
| | | | |
Total | | $ | 207,970,030 | | | $ | (363,962,268 | ) | | | — | | | $ | (155,992,238 | ) |
| | | | |
See Notes to Consolidated Financial Statements.
| | | | | | |
| | | | | | | |
| 30 | | BLACKROCK GLOBAL ALLOCATION FUND, INC. | | APRIL 30, 2016 | | |
| | |
Consolidated Schedule of Investments (continued) | | |
A reconciliation of Level 3 investments is presented when the Fund had a significant amount of Level 3 investments at the beginning and/or end of the period in relation to net assets. The following table is a reconciliation of Level 3 investments for which significant unobservable inputs were used in determining fair value:
| | | | | | | | | | | | | | | | | | | | | | | | | | | | |
| | | Common
Stocks | | | Corporate
Bonds | | | Floating Rate
Loan
Interests | | | Non-Agency Mortgage-Backed Securities | | | Preferred Securities | | | Options Purchased | | | Total | |
Assets: | | | | | | | | | | | | | | | | | | | | | | | | | | | | |
Opening balance, as of October 31, 2015 | | $ | 39,429,932 | | | $ | 320,580,970 | | | $ | 142,254,921 | | | $ | 43,912,540 | | | $ | 619,340,600 | | | $ | 20,507,616 | | | $ | 1,186,026,579 | |
Transfers into Level 3 | | | — | | | | — | | | | — | | | | — | | | | — | | | | — | | | | — | |
Transfers out of Level 3 | | | — | | | | (9,789,138 | ) | | | (44,530,846 | ) | | | — | | | | — | | | | — | | | | (54,319,984 | ) |
Accrued discounts/premiums | | | — | | | | — | | | | 21 | | | | 69,975 | | | | — | | | | — | | | | 69,996 | |
Net realized gain (loss) | | | — | | | | (68,909 | ) | | | 272,125 | | | | — | | | | — | | | | 4,759,297 | | | | 4,962,513 | |
Net change in unrealized appreciation (depreciation)1,2 | | | (6,451,789 | ) | | | 24,380,534 | | | | 2,552,602 | | | | (2,197,076 | ) | | | (4,264,815 | ) | | | (8,590,790 | ) | | | 5,428,666 | |
Purchases | | | — | | | | 73,789,305 | | | | — | | | | — | | | | — | | | | — | | | | 73,789,305 | |
Sales | | | — | | | | (55,056,545 | ) | | | (31,508,054 | ) | | | — | | | | — | | | | (16,676,123 | ) | | | (103,240,722 | ) |
Closing Balance, as of April 30, 2016 | | $ | 32,978,143 | | | $ | 353,836,217 | | | $ | 69,040,769 | | | $ | 41,785,439 | | | $ | 615,075,785 | | | | — | | | $ | 1,112,716,353 | |
| | | | | | | | | | | | | | | | | | | | | | | | | | | | |
Net change in unrealized appreciation (depreciation) on investments still held at April 30, 20162 | | $ | (6,451,789 | ) | | $ | (29,649,180 | ) | | $ | 2,535,328 | | | $ | (2,197,076 | ) | | $ | (4,264,815 | ) | | | — | | | $ | (40,027,532 | ) |
| | | | | | | | | | | | | | | | | | | | | | | | | | | | |
1 Included in the related net change in unrealized appreciation (depreciation) in the Consolidated Statement of Operations. | |
2 Any difference between net change in unrealized appreciation (depreciation) and net change in unrealized appreciation (depreciation) on investments still held April 30, 2016 is generally due to investments no longer held or categorized as Level 3 at period end. | |
The following table is a reconciliation of Level 3 derivative financial instruments for which significant unobservable inputs were used in determining fair value:
| | | | |
| | | Equity Contracts | |
| | | Liabilities | |
Opening Balance, as of October 31, 2015 | | $ | (266,389 | ) |
Transfers into Level 3 | | | — | |
Transfers out of Level 3 | | | — | |
Accrued discounts/premiums | | | — | |
Net realized gain (loss) | | | 11,247,241 | |
Net change in unrealized appreciation (depreciation) | | | (10,991,225 | ) |
Purchases | | | 10,373 | |
Sales | | | — | |
Closing Balance, as of April 30, 2016 | | | — | |
| | | | |
Net change in unrealized appreciation (depreciation) on investments still held at April 30, 2016 | | | — | |
| | | | |
See Notes to Consolidated Financial Statements.
| | | | | | |
| | | | | | | |
| | BLACKROCK GLOBAL ALLOCATION FUND, INC. | | APRIL 30, 2016 | | 31 |
| | |
Consolidated Schedule of Investments (concluded) | | |
The following table summarizes the valuation techniques used and unobservable inputs utilized by the BlackRock Global Valuation Methodologies Committee (the “Global Valuation Committee”) to determine the value of certain of the Fund’s Level 3 investments as of period end. The table does not include Level 3 investments with values based upon unadjusted third party pricing information in the amount of $111,495,143. A significant change in the third party information could result in a significantly lower or higher value of such Level 3 investments.
| | | | | | | | | | | | | | |
| | | Value | | | Valuation
Techniques | | Unobservable
Inputs | | Range of
Unobservable Inputs
Utilized | | Weighted
Average of
Unobservable Inputs | |
Assets: | | | | | | | | | | | | | | |
Common Stocks3 | | $ | 32,978,143 | | | Market Comparables | | Run Rate EBITDA Multiple1 | | 21.0x | | | — | |
| | | | | |
| | | | | | Probability-Weighted Expected Return Model | | Discount Rate2 IPO Exit Probablility1 | | 20.00% 45.00% | |
| —
— |
|
| | | | | | | | Merger & Acquisition Probability1 | | 50.00% | | | — | |
| | | | | | | | Revenue Multiple1 | | 9.0x – 13.25x | | | — | |
| | | | | | | | Revenue Growth Rate1 | | 138.00% | | | — | |
| | | | | | | | Time to Exit2 | | 1-2 years | | | — | |
Corporate Bonds4 | | | 353,167,282 | | | Discounted Cash Flow | | Discount Rate2 | | 15.00% | | | — | |
| | | | | | | | Years to Recovery1 | | 3 | | | — | |
| | | | | | Estimated Recovery Value | | Recovery Rate1 | | — | | | — | |
| | | | | | Market Comparables | | Run Rate EBITDA Multiple1 | | 21.0x | | | — | |
| | | | | | Option Pricing Model | | Revenue Multiple1 | | 2.0x – 2.2x | | | — | |
| | | | | | | | Revenue Growth Rate1 | | 44.00% | | | — | |
| | | | | | | | Risk Free Rate2 | | 0.45% – 0.81% | | | — | |
| | | | | | | | Merger & Acquisition Probability1 | | 75.00% | | | — | |
| | | | | | | | IPO Exit Probability1 | | 25.00% | | | — | |
| | | | | | | | Volatility1 | | 61.00% | | | — | |
| | | | | | | | Time to Exit2 | | 1-3 years | | | — | |
Preferred Stocks3,5 | | | 615,075,785 | | | Market Comparables | | Revenue Multiple1 | | 34.44x | | | — | |
| | | | | | | | Revenue Growth Rate1 | | 47.00% – 110.00% | | | 81.36 | % |
| | | | | | | | Revenue Multiple1 | | 7.0x - 12.0x | | | 9.73x | |
| | | | | | Probability Weighted Expected Return Model | | Discount Rate2 | | 20.00% | | | — | |
| | | | | | | | IPO Exit Probablility1 | | 45.00% - 85.00% | | | 71.64 | % |
| | | | | | | | Merger & Acquisition Probability1 | | 10.00% - 50.00% | | | 23.36 | % |
| | | | | | | | Revenue Growth Rate1 | | 138.00% - 162.00% | | | 153.98 | % |
| | | | | | | | Time to Exit2 | | 1-2 years | | | — | |
| | | | | | | | Revenue Multiple1 | | 7.75x - 17.15x | | | — | |
| | | | | | | | Revenue Multiple1 | | 9.0x - 13.25x | | | — | |
| | | | | | Option Pricing Model | | Revenue Multiple1 | | 4.0x - 4.5x | | | — | |
| | | | | | | | Revenue Growth Rate1 | | 150.00% | | | — | |
| | | | | | | | Risk Free Rate1 | | 0.85% | | | — | |
| | | | | | | | Time to Exit2 | | 2-3 years | | | — | |
| | | | | | | | Volatility1 | | 57.00% | | | — | |
| | | | | | | | | | | | | | |
Total | | $ | 1,001,221,210 | | | | | | | | | | | |
| | | | | | | | | | | | | | |
1 Increase in unobservable input may result in a significant increase to value, while a decrease in unobservable input may result in a significant decrease to value. | |
2 Decrease in unobservable input may result in a significant increase to value, while an increase in unobservable input may result in a significant decrease to value. | |
3 For the period ended April 30, 2016, the valuation technique for certain investments classified as common stocks and preferred stocks changed to a Probability Weighted Expected Return Model. The investment was previously valued utilizing Last Transaction Price. The Probability Weighted Expected Return Model was considered to be a more relevant measure of fair value for these investments. | |
4 For the period ended April 30, 2016, the valuation technique for certain investments classified as corporate bonds changed to an Option Pricing Model. The investment was previously valued utilizing a Hybrid Approach. An Option Pricing Model was considered to be a more relevant measure of fair value for these investments. | |
5 For the period ended April 30, 2016, the valuation technique for certain investments classified as preferred stocks changed to an Option Pricing Model. The investment was previously valued utilizing a Probability Weighted Expected Return Model. An Option Pricing Model was considered to be a more relevant measure of fair value for these investments. | |
See Notes to Consolidated Financial Statements.
| | | | | | |
| | | | | | | |
| 32 | | BLACKROCK GLOBAL ALLOCATION FUND, INC. | | APRIL 30, 2016 | | |
| | |
| Consolidated Statement of Assets and Liabilities | | |
| | | | |
| April 30, 2016 (Unaudited) | | | |
| | | | |
| Assets | | | | |
Investments at value — unaffiliated (including securities loaned of $319,808,647) (cost — $45,101,716,085) | | $ | 48,453,780,209 | |
Investments at value — affiliated (cost — $902,651,419) | | | 773,844,787 | |
Cash | | | 15,073 | |
Cash held for investments sold short | | | 150,884,963 | |
Cash pledged for centrally cleared swaps | | | 52,396,940 | |
Foreign currency at value (cost — $4,319,931) | | | 4,673,054 | |
| Receivables: | | | | |
Investments sold | | | 3,062,582,382 | |
Investments sold — affiliated | | | 682,321 | |
Capital shares sold | | | 45,930,050 | |
Interest | | | 133,250,389 | |
Dividends — unaffiliated | | | 74,248,023 | |
Variation margin on futures contracts | | | 4,258,362 | |
Options written | | | 3,640,453 | |
Securities lending income — affiliated | | | 1,015,010 | |
Dividends — affiliated | | | 28,747 | |
| Unrealized appreciation on: | | | | |
Forward foreign currency exchange contracts | | | 56,552,451 | |
OTC derivatives | | | 9,053,757 | |
Prepaid expenses | | | 669,437 | |
| | | | |
Total assets | | | 52,827,506,408 | |
| | | | |
| | | | |
| Liabilities | | | | |
Collateral on securities loaned at value | | | 331,860,268 | |
Cash received as collateral for OTC derivatives | | | 32,102,000 | |
Investments sold short at value (proceeds — $141,964,439) | | | 150,349,754 | |
Options written at value (premiums received — $178,672,833) | | | 166,103,424 | |
| Payables: | | | | |
Investments purchased | | | 4,415,283,693 | |
Capital shares redeemed | | | 105,668,697 | |
Investment advisory fees | | | 26,040,838 | |
Service and distribution fees | | | 13,899,305 | |
Options written | | | 5,226,022 | |
Deferred foreign capital gain tax | | | 1,357,343 | |
Variation margin on centrally cleared swaps | | | 898,219 | |
Officer’s and Directors’ fees | | | 157,432 | |
Other affiliates | | | 146,750 | |
Other accrued expenses | | | 21,063,525 | |
| Unrealized depreciation on: | | | | |
Forward foreign currency exchange contracts | | | 230,847,748 | |
OTC derivatives | | | 32,438,250 | |
| | | | |
Total liabilities | | | 5,533,443,268 | |
| | | | |
Net Assets | | $ | 47,294,063,140 | |
| | | | |
| | | | |
| Net Assets Consist of | | | | |
Paid-in capital | | $ | 45,530,005,248 | |
Distributions in excess of net investment income | | | (58,338,944 | ) |
Accumulated net realized loss | | | (1,182,783,350 | ) |
Net unrealized appreciation (depreciation) | | | 3,005,180,186 | |
| | | | |
Net Assets | | $ | 47,294,063,140 | |
| | | | |
| | | | |
| Net Asset Value | | | | |
Institutional — Based on net assets of $18,768,827,534 and 1,039,485,625 shares outstanding, 2 billion shares authorized, $0.10 par value | | $ | 18.06 | |
| | | | |
Investor A — Based on net assets of $14,740,344,406 and 821,639,919 shares outstanding, 2 billion shares authorized, $0.10 par value | | $ | 17.94 | |
| | | | |
Investor B — Based on net assets of $120,222,897 and 6,887,601 shares outstanding, 1.5 billion shares authorized, $0.10 par value | | $ | 17.45 | |
| | | | |
Investor C — Based on net assets of $12,485,782,971 and 765,508,934 shares outstanding, 2 billion shares authorized, $0.10 par value | | $ | 16.31 | |
| | | | |
Class R — Based on net assets of $1,178,885,332 and 68,704,582 shares outstanding, 2 billion shares authorized, $0.10 par value | | $ | 17.16 | |
| | | | |
| | | | | | |
| See Notes to Consolidated Financial Statements. | | | | |
| | | | | | | |
| | BLACKROCK GLOBAL ALLOCATION FUND, INC. | | APRIL 30, 2016 | | 33 |
| | |
| Consolidated Statement of Operations | | |
| | | | |
| Six Months Ended April 30, 2016 (Unaudited) | | | |
| | | | |
| Investment Income | |
Dividends — unaffiliated | | $ | 324,890,307 | |
Interest — unaffiliated | | | 211,687,386 | |
Securities lending — affiliated — net | | | 7,264,115 | |
Dividends — affiliated | | | 1,014,149 | |
Foreign taxes withheld | | | (16,856,864 | ) |
| | | | |
Total income | | | 527,999,093 | |
| | | | |
| | | | |
| Expenses | | | | |
Investment advisory | | | 178,510,439 | |
Service and distribution — class specific | | | 86,491,268 | |
Transfer agent — class specific | | | 24,967,606 | |
Accounting services | | | 2,759,370 | |
Custodian | | | 2,585,732 | |
Professional | | | 686,883 | |
Officer and Directors | | | 368,451 | |
Printing | | | 334,440 | |
Registration | | | 270,064 | |
Miscellaneous | | | 426,669 | |
| | | | |
Total expenses excluding dividend expense and stock loan fees | | | 297,400,922 | |
Dividend expense | | | 749,822 | |
Stock loan fees | | | 128,257 | |
| | | | |
Total expenses | | | 298,279,001 | |
Less fees waived by the Manager | | | (18,762,986 | ) |
| | | | |
Total expenses after fees waived | | | 279,516,015 | |
| | | | |
Net investment income | | | 248,483,078 | |
| | | | |
| | | | |
| Realized and Unrealized Gain (Loss) | | | | |
| Net realized gain (loss) from: | | | | |
Investments — unaffiliated (including $889,690 foreign capital gain tax) | | | (425,967,153 | ) |
Investments — affiliated | | | 4,619,880 | |
Futures contracts | | | (32,232,688 | ) |
Foreign currency transactions | | | (237,271,894 | ) |
Options written | | | (19,655,996 | ) |
Swaps | | | 88,021,970 | |
Short sales | | | 21,919,814 | |
| | | | |
| | | (600,566,067 | ) |
| | | | |
| Net change in unrealized appreciation (depreciation) on: | | | | |
Investments — unaffiliated (including $1,357,343 foreign capital gain tax) | | | 62,408,120 | |
Investments affiliated | | | (58,360,268 | ) |
Futures contracts | | | 60,183,565 | |
Foreign currency translations | | | (129,281,135 | ) |
Options written | | | (13,901,670 | ) |
Swaps | | | (77,424,550 | ) |
Short sales | | | (139,984 | ) |
| | | | |
| | | (156,515,922 | ) |
| | | | |
Net realized and unrealized loss | | | (757,081,989 | ) |
| | | | |
Net Decrease in Net Assets Resulting from Operations | | $ | (508,598,911 | ) |
| | | | |
| | | | | | |
| See Notes to Consolidated Financial Statements. | | | | |
| | | | | | | |
| 34 | | BLACKROCK GLOBAL ALLOCATION FUND, INC. | | APRIL 30, 2016 | | |
| | |
| Consolidated Statements of Changes in Net Assets | | |
| | | | | | | | |
| Increase (Decrease) in Net Assets: | | Six Months Ended
April 30,
2016
(Unaudited) | | | Year Ended
October 31,
2015 | |
| | | | | | | | |
| Operations | | | | | | | | |
Net investment income | | $ | 248,483,078 | | | $ | 486,092,595 | |
Net realized gain (loss) | | | (600,566,067 | ) | | | 3,816,153,250 | |
Net change in unrealized appreciation (depreciation) | | | (156,515,922 | ) | | | (4,327,148,661 | ) |
| | | | |
Net decrease in net assets resulting from operations | | | (508,598,911 | ) | | | (24,902,816 | ) |
| | | | |
| | | | | | | | |
| Distributions to Shareholders1 | | | | | | | | |
| From net investment income: | | | | | | | | |
Institutional | | | (130,714,979 | ) | | | (446,831,157 | ) |
Investor A | | | (84,686,688 | ) | | | (319,418,730 | ) |
Investor B | | | (173,390 | ) | | | (3,234,467 | ) |
Investor C | | | (29,564,955 | ) | | | (198,975,386 | ) |
Class R | | | (4,864,307 | ) | | | (19,546,643 | ) |
| From net realized gain: | | | | | | | | |
Institutional | | | (1,489,406,204 | ) | | | (1,447,355,150 | ) |
Investor A | | | (1,210,626,993 | ) | | | (1,191,743,896 | ) |
Investor B | | | (13,930,781 | ) | | | (21,915,871 | ) |
Investor C | | | (1,149,192,726 | ) | | | (1,159,361,959 | ) |
Class R | | | (95,807,722 | ) | | | (88,285,445 | ) |
| | | | |
Decrease in net assets resulting from distributions to shareholders | | | (4,208,968,745 | ) | | | (4,896,668,704 | ) |
| | | | |
| | | | | | | | |
| Capital Share Transactions | | | | | | | | |
Net increase (decrease) in net assets derived from capital share transactions | | | 321,522,319 | | | | (838,291,796 | ) |
| | | | |
| | | | | | | | |
| Net Assets | | | | | | | | |
Total decrease in net assets | | | (4,396,045,337 | ) | | | (5,759,863,316 | ) |
Beginning of period | | | 51,690,108,477 | | | | 57,449,971,793 | |
| | | | |
End of period | | $ | 47,294,063,140 | | | $ | 51,690,108,477 | |
| | | | |
Distributions in excess of net investment income, end of period | | $ | (58,338,944 | ) | | $ | (56,817,703 | ) |
| | | | |
| | 1 | | Distributions for annual periods determined in accordance with federal income tax regulations. |
| | | | | | |
| See Notes to Consolidated Financial Statements. | | | | |
| | | | | | | |
| | BLACKROCK GLOBAL ALLOCATION FUND, INC. | | APRIL 30, 2016 | | 35 |
| | | | | | | | | | | | | | | | | | | | | | | | |
| | | Institutional | |
| | | Six Months Ended
April 30,
2016
(Unaudited) | | | Year Ended October 31, | |
| | | | 2015 | | | 2014 | | | 2013 | | | 2012 | | | 2011 | |
| | | | | | | | | | | | | | | | | | | | | | | | |
| Per Share Operating Performance | | | | | | | | | | | | | | | | | | | | | | | | |
Net asset value, beginning of period | | $ | 19.88 | | | $ | 21.77 | | | $ | 21.95 | | | $ | 19.54 | | | $ | 19.16 | | | $ | 19.07 | |
| | | | |
Net investment income1 | | | 0.13 | | | | 0.26 | | | | 0.35 | | | | 0.28 | | | | 0.31 | | | | 0.38 | |
Net realized and unrealized gain (loss) | | | (0.30 | ) | | | (0.22 | ) | | | 0.77 | | | | 2.43 | | | | 0.64 | | | | 0.08 | 2 |
| | | | |
Net increase (decrease) from investment operations | | | (0.17 | ) | | | 0.04 | | | | 1.12 | | | | 2.71 | | | | 0.95 | | | | 0.46 | |
| | | | |
| Distributions:3 | | | | | | | | | | | | | | | | | | | | | | | | |
From net investment income | | | (0.13 | ) | | | (0.45 | ) | | | (0.33 | ) | | | (0.30 | ) | | | (0.38 | ) | | | (0.37 | ) |
From net realized gain | | | (1.52 | ) | | | (1.48 | ) | | | (0.97 | ) | | | — | | | | (0.19 | ) | | | — | |
| | | | |
Total distributions | | | (1.65 | ) | | | (1.93 | ) | | | (1.30 | ) | | | (0.30 | ) | | | (0.57 | ) | | | (0.37 | ) |
| | | | |
Net asset value, end of period | | $ | 18.06 | | | $ | 19.88 | 4 | | $ | 21.77 | | | $ | 21.95 | | | $ | 19.54 | | | $ | 19.16 | |
| | | | |
| | | | | | | | | | | | | | | | | | | | | | | | |
| Total Return5 | | | | | | | | | | | | | | | | | | | | | | | | |
Based on net asset value | | | (0.74 | )%6 | | | 0.31% | 4 | | | 5.35% | | | | 13.97% | | | | 5.20% | | | | 2.39% | |
| | | | |
| | | | | | | | | | | | | | | | | | | | | | | | |
| Ratios to Average Net Assets | | | | | | | | | | | | | | | | | | | | | | | | |
Total expenses | | | 0.87% | 7,8 | | | 0.87% | | | | 0.87% | | | | 0.87% | | | | 0.87% | | | | 0.87% | |
| | | | |
Total expenses after fees waived | | | 0.79% | 7,8 | | | 0.78% | | | | 0.78% | | | | 0.78% | | | | 0.79% | | | | 0.78% | |
| | | | |
Total expenses after fees waived and excluding interest expense, dividend expense and stock loan fees | | | 0.79% | 7,8 | | | 0.78% | | | | 0.78% | | | | 0.78% | | | | 0.79% | | | | 0.78% | |
| | | | |
Net investment income | | | 1.43% | 7,8 | | | 1.28% | | | | 1.60% | | | | 1.35% | | | | 1.61% | | | | 1.92% | |
| | | | |
| | | | | | | | | | | | | | | | | | | | | | | | |
| Supplemental Data | | | | | | | | | | | | | | | | | | | | | | | | |
Net assets, end of period (000) | | $ | 18,768,828 | | | $ | 20,210,226 | | | $ | 22,075,330 | | | $ | 20,968,279 | | | $ | 18,657,773 | | | $ | 16,879,389 | |
| | | | |
Portfolio turnover rate9 | | | 53% | | | | 84% | | | | 75% | | | | 50% | | | | 39% | | | | 31% | |
| | | | |
| | 1 | | Based on average shares outstanding. |
| | 2 | | Includes a redemption fee, which is less than $0.01 per share. |
| | 3 | | Distributions for annual periods determined in accordance with federal income tax regulations. |
| | 4 | | For financial reporting purposes, the market value of certain investments was adjusted as of the report date. Accordingly, the NAV per share and total return performance based on NAV presented herein are different than the information previously published on October 31, 2015. |
| | 5 | | Where applicable, assumes the reinvestment of distributions. |
| | 6 | | Aggregate total return. |
| | 8 | | Ratios do not include expenses incurred indirectly as a result of investments in underlying funds of approximately 0.01% for the six months ended April 30, 2016. |
| | 9 | | Includes mortgage dollar roll transactions (“MDRs”). Additional information regarding portfolio turnover rate is as follows: |
| | | | | | | | | | | | | | | | | | | | | | | | |
| | | Six Months Ended
April 30,
2016
(Unaudited) | | | Year Ended October 31, | |
| | | | 2015 | | | 2014 | | | 2013 | | | 2012 | | | 2011 | |
| | | | | | | | | | | | | | | | | | | | | | | | |
Portfolio turnover rate (excluding MDRs) | | | 51% | | | | 82% | | | | — | | | | — | | | | — | | | | — | |
| | | | | | | | | | | | | | | | | | | | | | | | |
| | | | | | |
| See Notes to Consolidated Financial Statements. | | | | |
| | | | | | | |
| 36 | | BLACKROCK GLOBAL ALLOCATION FUND, INC. | | APRIL 30, 2016 | | |
| | |
| Financial Highlights (continued) | | |
| | | | | | | | | | | | | | | | | | | | | | | | |
| | | Investor A | |
| | | Six Months Ended
April 30,
2016
(Unaudited) | | | Year Ended October 31, | |
| | | | 2015 | | | 2014 | | | 2013 | | | 2012 | | | 2011 | |
| | | | | | | | | | | | | | | | | | | | | | | | |
| Per Share Operating Performance | | | | | | | | | | | | | | | | | | | | | | | | |
Net asset value, beginning of period | | $ | 19.76 | | | $ | 21.65 | | | $ | 21.83 | | | $ | 19.44 | | | $ | 19.06 | | | $ | 18.97 | |
| | | | |
Net investment income1 | | | 0.10 | | | | 0.21 | | | | 0.29 | | | | 0.22 | | | | 0.25 | | | | 0.32 | |
Net realized and unrealized gain (loss) | | | (0.29 | ) | | | (0.23 | ) | | | 0.77 | | | | 2.41 | | | | 0.65 | | | | 0.09 | 2 |
| | | | |
Net increase (decrease) from investment operations | | | (0.19 | ) | | | (0.02 | ) | | | 1.06 | | | �� | 2.63 | | | | 0.90 | | | | 0.41 | |
| | | | |
| Distributions:3 | | | | | | | | | | | | | | | | | | | | | | | | |
From net investment income | | | (0.11 | ) | | | (0.39 | ) | | | (0.27 | ) | | | (0.24 | ) | | | (0.33 | ) | | | (0.32 | ) |
From net realized gain | | | (1.52 | ) | | | (1.48 | ) | | | (0.97 | ) | | | — | | | | (0.19 | ) | | | — | |
| | | | |
Total distributions | | | (1.63 | ) | | | (1.87 | ) | | | (1.24 | ) | | | (0.24 | ) | | | (0.52 | ) | | | (0.32 | ) |
| | | | |
Net asset value, end of period | | $ | 17.94 | | | $ | 19.76 | 4 | | $ | 21.65 | | | $ | 21.83 | | | $ | 19.44 | | | $ | 19.06 | |
| | | | |
| | | | | | | | | | | | | | | | | | | | | | | | |
| Total Return5 | | | | | | | | | | | | | | | | | | | | | | | | |
Based on net asset value | | | (0.90)% | 6 | | | 0.02% | 4 | | | 5.10% | | | | 13.63% | | | | 4.92% | | | | 2.13% | |
| | | | |
| | | | | | | | | | | | | | | | | | | | | | | | |
| Ratios to Average Net Assets | | | | | | | | | | | | | | | | | | | | | | | | |
Total expenses | | | 1.15% | 7,8 | | | 1.14% | | | | 1.13% | | | | 1.13% | | | | 1.15% | | | | 1.14% | |
| | | | |
Total expenses after fees waived | | | 1.07% | 7,8 | | | 1.05% | | | | 1.04% | | | | 1.05% | | | | 1.07% | | | | 1.06% | |
| | | | |
Total expenses after fees waived and excluding interest expense, dividend expense and stock loan fees | | | 1.07% | 7,8 | | | 1.05% | | | | 1.04% | | | | 1.05% | | | | 1.07% | | | | 1.06% | |
| | | | |
Net investment income | | | 1.15% | 7,8 | | | 1.01% | | | | 1.33% | | | | 1.08% | | | | 1.33% | | | | 1.63% | |
| | | | |
| | | | | | | | | | | | | | | | | | | | | | | | |
| Supplemental Data | | | | | | | | | | | | | | | | | | | | | | | | |
Net assets, end of period (000) | | $ | 14,740,344 | | | $ | 16,016,234 | | | $ | 17,792,885 | | | $ | 18,858,846 | | | $ | 17,292,587 | | | $ | 17,638,914 | |
| | | | |
Portfolio turnover rate9 | | | 53% | | | | 84% | | | | 75% | | | | 50% | | | | 39% | | | | 31% | |
| | | | |
| | 1 | | Based on average shares outstanding. |
| | 2 | | Includes a redemption fee, which is less than $0.01 per share. |
| | 3 | | Distributions for annual periods determined in accordance with federal income tax regulations. |
| | 4 | | For financial reporting purposes, the market value of certain investments was adjusted as of the report date. Accordingly, the NAV per share and total return performance based on NAV presented herein are different than the information previously published on October 31, 2015. |
| | 5 | | Where applicable, excludes the effects of any sales charges and assumes the reinvestment of distributions. |
| | 6 | | Aggregate total return. |
| | 8 | | Ratios do not include expenses incurred indirectly as a result of investments in underlying funds of approximately 0.01% for the six months ended April 30, 2016. |
| | 9 | | Includes MDRs. Additional information regarding portfolio turnover rate is as follows: |
| | | | | | | | | | | | | | | | | | | | | | | | |
| | | Six Months Ended
April 30,
2016
(Unaudited) | | | Year Ended October 31, | |
| | | | 2015 | | | 2014 | | | 2013 | | | 2012 | | | 2011 | |
| | | | | | | | | | | | | | | | | | | | | | | | |
Portfolio turnover rate (excluding MDRs) | | | 51% | | | | 82% | | | | — | | | | — | | | | — | | | | — | |
| | | | |
| | | | | | |
| See Notes to Consolidated Financial Statements. | | | | |
| | | | | | | |
| | BLACKROCK GLOBAL ALLOCATION FUND, INC. | | APRIL 30, 2016 | | 37 |
| | |
| Financial Highlights (continued) | | |
| | | | | | | | | | | | | | | | | | | | | | | | |
| | | Investor B | |
| | | Six Months Ended
April 30,
2016
(Unaudited) | | | Year Ended October 31, | |
| | | | 2015 | | | 2014 | | | 2013 | | | 2012 | | | 2011 | |
| | | | | | | | | | | | | | | | | | | | | | | | |
| Per Share Operating Performance | | | | | | | | | | | | | | | | | | | | | | | | |
Net asset value, beginning of period | | $ | 19.25 | | | $ | 21.13 | | | $ | 21.31 | | | $ | 18.96 | | | $ | 18.57 | | | $ | 18.49 | |
| | | | |
Net investment income1 | | | 0.03 | | | | 0.04 | | | | 0.11 | | | | 0.06 | | | | 0.09 | | | | 0.10 | |
Net realized and unrealized gain (loss) | | | (0.29 | ) | | | (0.22 | ) | | | 0.76 | | | | 2.35 | | | | 0.65 | | | | 0.14 | 2 |
| | | | |
Net increase (decrease) from investment operations | | | (0.26 | ) | | | (0.18 | ) | | | 0.87 | | | | 2.41 | | | | 0.74 | | | | 0.24 | |
| | | | |
| Distributions:3 | | | | | | | | | | | | | | | | | | | | | | | | |
From net investment income | | | (0.02 | ) | | | (0.22 | ) | | | (0.08 | ) | | | (0.06 | ) | | | (0.16 | ) | | | (0.16 | ) |
From net realized gain | | | (1.52 | ) | | | (1.48 | ) | | | (0.97 | ) | | | — | | | | (0.19 | ) | | | — | |
| | | | |
Total distributions | | | (1.54 | ) | | | (1.70 | ) | | | (1.05 | ) | | | (0.06 | ) | | | (0.35 | ) | | | (0.16 | ) |
| | | | |
Net asset value, end of period | | $ | 17.45 | | | $ | 19.25 | 4 | | $ | 21.13 | | | $ | 21.31 | | | $ | 18.96 | | | $ | 18.57 | |
| | | | |
| | | | | | | | | | | | | | | | | | | | | | | | |
| Total Return5 | | | | | | | | | | | | | | | | | | | | | | | | |
Based on net asset value | | | (1.25)% | 6 | | | (0.82)% | 4 | | | 4.27% | | | | 12.75% | | | | 4.10% | | | | 1.25% | |
| | | | |
| | | | | | | | | | | | | | | | | | | | | | | | |
| Ratios to Average Net Assets | | | | | | | | | | | | | | | | | | | | | | | | |
Total expenses | | | 1.96% | 7,8 | | | 1.92% | | | | 1.93% | | | | 1.95% | | | | 1.95% | | | | 1.97% | |
| | | | |
Total expenses after fees waived | | | 1.88% | 7,8 | | | 1.84% | | | | 1.84% | | | | 1.86% | | | | 1.86% | | | | 1.87% | |
| | | | |
Total expenses after fees waived and excluding interest expense, dividend expense and stock loan fees | | | 1.87% | 7,8 | | | 1.84% | | | | 1.84% | | | | 1.86% | | | | 1.86% | | | | 1.87% | |
| | | | |
Net investment income | | | 0.31% | 7,8 | | | 0.22% | | | | 0.54% | | | | 0.28% | | | | 0.51% | | | | 0.50% | |
| | | | |
| | | | | | | | | | | | | | | | | | | | | | | | |
| Supplemental Data | | | | | | | | | | | | | | | | | | | | | | | | |
Net assets, end of period (000) | | $ | 120,223 | | | $ | 191,881 | | | $ | 335,683 | | | $ | 500,197 | | | $ | 660,370 | | | $ | 930,028 | |
| | | | |
Portfolio turnover rate9 | | | 53% | | | | 84% | | | | 75% | | | | 50% | | | | 39% | | | | 31% | |
| | | | |
| | 1 | | Based on average shares outstanding. |
| | 2 | | Includes a redemption fee, which is less than $0.01 per share. |
| | 3 | | Distributions for annual periods determined in accordance with federal income tax regulations. |
| | 4 | | For financial reporting purposes, the market value of certain investments was adjusted as of the report date. Accordingly, the NAV per share and total return performance based on NAV presented herein are different than the information previously published on October 31, 2015. |
| | 5 | | Where applicable, excludes the effects of any sales charges and assumes the reinvestment of distributions. |
| | 6 | | Aggregate total return. |
| | 8 | | Ratios do not include expenses incurred indirectly as a result of investments in underlying funds of approximately 0.01% for the six months ended April 30, 2016. |
| | 9 | | Includes MDRs. Additional information regarding portfolio turnover rate is as follows: |
| | | | | | | | | | | | | | | | | | | | | | | | |
| | | Six Months Ended
April 30,
2016
(Unaudited) | | | Year Ended October 31, | |
| | | | 2015 | | | 2014 | | | 2013 | | | 2012 | | | 2011 | |
| | | | | | | | | | | | | | | | | | | | | | | | |
Portfolio turnover rate (excluding MDRs) | | | 51% | | | | 82% | | | | — | | | | — | | | | — | | | | — | |
| | | | |
| | | | | | |
| See Notes to Consolidated Financial Statements. | | | | |
| | | | | | | |
| 38 | | BLACKROCK GLOBAL ALLOCATION FUND, INC. | | APRIL 30, 2016 | | |
| | |
| Financial Highlights (continued) | | |
| | | | | | | | | | | | | | | | | | | | | | | | |
| | | Investor C | |
| | | Six Months Ended
April 30,
2016
(Unaudited) | | | Year Ended October 31, | |
| | | | 2015 | | | 2014 | | | 2013 | | | 2012 | | | 2011 | |
| | | | | | | | | | | | | | | | | | | | | | | | |
| Per Share Operating Performance | | | | | | | | | | | | | | | | | | | | | | | | |
Net asset value, beginning of period | | $ | 18.11 | | | $ | 20.00 | | | $ | 20.27 | | | $ | 18.06 | | | $ | 17.75 | | | $ | 17.70 | |
| | | | |
Net investment income1 | | | 0.03 | | | | 0.05 | | | | 0.12 | | | | 0.06 | | | | 0.10 | | | | 0.16 | |
Net realized and unrealized gain (loss) | | | (0.27 | ) | | | (0.21 | ) | | | 0.71 | | | | 2.26 | | | | 0.59 | | | | 0.08 | 2 |
| | | | |
Net increase (decrease) from investment operations | | | (0.24 | ) | | | (0.16 | ) | | | 0.83 | | | | 2.32 | | | | 0.69 | | | | 0.24 | |
| | | | |
| Distributions:3 | | | | | | | | | | | | | | | | | | | | | | | | |
From net investment income | | | (0.04 | ) | | | (0.25 | ) | | | (0.13 | ) | | | (0.11 | ) | | | (0.19 | ) | | | (0.19 | ) |
From net realized gain | | | (1.52 | ) | | | (1.48 | ) | | | (0.97 | ) | | | — | | | | (0.19 | ) | | | — | |
| | | | |
Total distributions | | | (1.56 | ) | | | (1.73 | ) | | | (1.10 | ) | | | (0.11 | ) | | | (0.38 | ) | | | (0.19 | ) |
| | | | |
Net asset value, end of period | | $ | 16.31 | | | $ | 18.11 | 4 | | $ | 20.00 | | | $ | 20.27 | | | $ | 18.06 | | | $ | 17.75 | |
| | | | |
| | | | | | | | | | | | | | | | | | | | | | | | |
| Total Return5 | | | | | | | | | | | | | | | | | | | | | | | | |
Based on net asset value | | | (1.27)%6 | | | | (0.73) | %4 | | | 4.29% | | | | 12.86% | | | | 4.08% | | | | 1.34% | |
| | | | |
| | | | | | | | | | | | | | | | | | | | | | | | |
| Ratios to Average Net Assets | | | | | | | | | | | | | | | | | | | | | | | | |
Total expenses | | | 1.89% | 7,8 | | | 1.88% | | | | 1.87% | | | | 1.88% | | | | 1.90% | | | | 1.90 | % |
| | | | |
Total expenses after fees waived | | | 1.81% | 7,8 | | | 1.79% | | | | 1.79% | | | | 1.80% | | | | 1.82% | | | | 1.81 | % |
| | | | |
Total expenses after fees waived and excluding interest expense, dividend expense and stock loan fees | | | 1.81% | 7,8 | | | 1.79% | | | | 1.79% | | | | 1.80% | | | | 1.82% | | | | 1.81 | % |
| | | | |
Net investment income | | | 0.40% | 7,8 | | | 0.27% | | | | 0.59% | | | | 0.33% | | | | 0.58% | | | | 0.89 | % |
| | | | |
| | | | | | | | | | | | | | | | | | | | | | | | |
| Supplemental Data | | | | | | | | | | | | | | | | | | | | | | | | |
Net assets, end of period (000) | | $ | 12,485,783 | | | $ | 14,085,089 | | | $ | 15,976,240 | | | $ | 16,170,658 | | | $ | 15,179,009 | | | $ | 15,853,615 | |
| | | | |
Portfolio turnover rate9 | | | 53% | | | | 84% | | | | 75% | | | | 50% | | | | 39% | | | | 31 | % |
| | | | |
| | 1 | | Based on average shares outstanding. |
| | 2 | | Includes a redemption fee, which is less than $0.01 per share. |
| | 3 | | Distributions for annual periods determined in accordance with federal income tax regulations. |
| | 4 | | For financial reporting purposes, the market value of certain investments was adjusted as of the report date. Accordingly, the NAV per share and total return performance based on NAV presented herein are different than the information previously published on October 31, 2015. |
| | 5 | | Where applicable, excludes the effects of any sales charges and assumes the reinvestment of distributions. |
| | 6 | | Aggregate total return. |
| | 8 | | Ratios do not include expenses incurred indirectly as a result of investments in underlying funds of approximately 0.01% for the six months ended April 30, 2016. |
| | 9 | | Includes MDRs. Additional information regarding portfolio turnover rate is as follows: |
| | | | | | | | | | | | | | | | | | | | | | | | |
| | | Six Months Ended
April 30,
2016
(Unaudited) | | | Year Ended October 31, | |
| | | | 2015 | | | 2014 | | | 2013 | | | 2012 | | | 2011 | |
| | | | | | | | | | | | | | | | | | | | | | | | |
Portfolio turnover rate (excluding MDRs) | | | 51% | | | | 82% | | | | — | | | | — | | | | — | | | | — | |
| | | | |
| | | | | | |
| See Notes to Consolidated Financial Statements. | | | | |
| | | | | | | |
| | BLACKROCK GLOBAL ALLOCATION FUND, INC. | | APRIL 30, 2016 | | 39 |
| | |
| Financial Highlights (concluded) | | |
| | | | | | | | | | | | | | | | | | | | | | | | |
| | | Class R | |
| | | Six Months Ended
April 30,
2016
(Unaudited) | | | Year Ended October 31, | |
| | | | 2015 | | | 2014 | | | 2013 | | | 2012 | | | 2011 | |
| | | | | | | | | | | | | | | | | | | | | | | | |
| Per Share Operating Performance | | | | | | | | | | | | | | | | | | | | | | | | |
Net asset value, beginning of period | | $ | 18.96 | | | $ | 20.86 | | | $ | 21.08 | | | $ | 18.78 | | | $ | 18.44 | | | $ | 18.36 | |
| | | | |
Net investment income1 | | | 0.07 | | | | 0.13 | | | | 0.21 | | | | 0.15 | | | | 0.18 | | | | 0.21 | |
Net realized and unrealized gain (loss) | | | (0.27 | ) | | | (0.22 | ) | | | 0.74 | | | | 2.33 | | | | 0.62 | | | | 0.13 | 2 |
| | | | |
Net increase (decrease) from investment operations | | | (0.20 | ) | | | (0.09 | ) | | | 0.95 | | | | 2.48 | | | | 0.80 | | | | 0.34 | |
| | | | |
| Distributions:3 | | | | | | | | | | | | | | | | | | | | | | | | |
From net investment income | | | (0.08 | ) | | | (0.33 | ) | | | (0.20 | ) | | | (0.18 | ) | | | (0.27 | ) | | | (0.26 | ) |
From net realized gain | | | (1.52 | ) | | | (1.48 | ) | | | (0.97 | ) | | | — | | | | (0.19 | ) | | | — | |
| | | | |
Total distributions | | | (1.60 | ) | | | (1.81 | ) | | | (1.17 | ) | | | (0.18 | ) | | | (0.46 | ) | | | (0.26 | ) |
| | | | |
Net asset value, end of period | | $ | 17.16 | | | $ | 18.96 | 4 | | $ | 20.86 | | | $ | 21.08 | | | $ | 18.78 | | | $ | 18.44 | |
| | | | |
| | | | | | | | | | | | | | | | | | | | | | | | |
| Total Return5 | | | | | | | | | | | | | | | | | | | | | | | | |
Based on net asset value | | | (0.94)% | 6 | | | (0.37)% | 4 | | | 4.73% | | | | 13.26% | | | | 4.52% | | | | 1.84% | |
| | | | |
| | | | | | | | | | | | | | | | | | | | | | | | |
| Ratios to Average Net Assets | | | | | | | | | | | | | | | | | | | | | | | | |
Total expenses | | | 1.48% | 7,8 | | | 1.48% | | | | 1.47% | | | | 1.48% | | | | 1.51% | | | | 1.47% | |
| | | | |
Total expenses after fees waived | | | 1.40% | 7,8 | | | 1.40% | | | | 1.38% | | | | 1.39% | | | | 1.43% | | | | 1.38% | |
| | | | |
Total expenses after fees waived and excluding interest expense, dividend expense and stock loan fees | | | 1.39% | 7,8 | | | 1.40% | | | | 1.38% | | | | 1.39% | | | | 1.43% | | | | 1.38% | |
| | | | |
Net investment income | | | 0.83% | 7,8 | | | 0.67% | | | | 0.99% | | | | 0.74% | | | | 0.97% | | | | 1.11% | |
| | | | |
| | | | | | | | | | | | | | | | | | | | | | | | |
| Supplemental Data | | | | | | | | | | | | | | | | | | | | | | | | |
Net assets, end of period (000) | | $ | 1,178,885 | | | $ | 1,186,678 | | | $ | 1,269,833 | | | $ | 1,296,522 | | | $ | 1,171,179 | | | $ | 1,077,174 | |
| | | | |
Portfolio turnover rate9 | | | 53% | | | | 84% | | | | 75% | | | | 50% | | | | 39% | | | | 31% | |
| | | | |
| | 1 | | Based on average shares outstanding. |
| | 2 | | Includes a redemption fee, which is less than $0.01 per share. |
| | 3 | | Distributions for annual periods determined in accordance with federal income tax regulations. |
| | 4 | | For financial reporting purposes, the market value of certain investments was adjusted as of the report date. Accordingly, the NAV per share and total return performance based on NAV presented herein are different than the information previously published on October 31, 2015. |
| | 5 | | Where applicable, assumes the reinvestment of distributions. |
| | 6 | | Aggregate total return. |
| | 8 | | Ratios do not include expenses incurred indirectly as a result of investments in underlying funds of approximately 0.01% for the six months ended April 30, 2016. |
| | 9 | | Includes MDRs. Additional information regarding portfolio turnover rate is as follows: |
| | | | | | | | | | | | | | | | | | | | | | | | |
| | | Six Months Ended
April 30,
2016
(Unaudited) | | | Year Ended October 31, | |
| | | | 2015 | | | 2014 | | | 2013 | | | 2012 | | | 2011 | |
| | | | | | | | | | | | | | | | | | | | | | | | |
Portfolio turnover rate (excluding MDRs) | | | 51% | | | | 82% | | | | — | | | | — | | | | — | | | | — | |
| | | | |
| | | | | | |
| See Notes to Consolidated Financial Statements. | | | | |
| | | | | | | |
| 40 | | BLACKROCK GLOBAL ALLOCATION FUND, INC. | | APRIL 30, 2016 | | |
| | | | |
| Notes to Consolidated Financial Statements (Unaudited) | | |
1. Organization:
BlackRock Global Allocation Fund, Inc. (the “Fund”) is registered under the Investment Company Act of 1940, as amended (the “1940 Act”). The Fund is registered as a diversified, open-end management investment company. The Fund is organized as a Maryland Corporation.
The Fund offers multiple classes of shares. All classes of shares have identical voting, dividend, liquidation and other rights and are subject to the same terms and conditions, except that certain classes bear expenses related to the shareholder servicing and distribution of such shares. Institutional Shares are sold only to certain eligible investors. Investor B Shares are only available through exchanges and distribution reinvestments by current holders and for purchase by certain employer-sponsored retirement plans. Investor A and Investor C Shares are generally available through financial intermediaries. Class R Shares are available only to certain employer-sponsored retirement plans. Each class has exclusive voting rights with respect to matters relating to its shareholder servicing and distribution expenditures (except that Investor B shareholders may vote on material changes to the Investor A distribution and service plan).
| | | | | | | | | | |
| Share Class | | Initial Sales
Charge | | | CDSC | | | Conversion Privilege |
Institutional and Class R Shares | | | No | | | | No | | | None |
Investor A Shares | | | Yes | | | | No | 1 | | None |
Investor B Shares | | | No | | | | Yes | | | To Investor A Shares
after approximately 8 years |
Investor C Shares | | | No | | | | Yes | | | None |
| | 1 | | Investor A Shares may be subject to a CDSC where no initial sales charge was paid at the time of purchase. |
The Fund, together with certain other registered investment companies advised by Manager or its affiliates, is included in a complex of open-end funds referred to as the Equity-Bond Complex.
Basis of Consolidation: The accompanying consolidated financial statements include the account of BlackRock Cayman Global Allocation Fund I, Ltd. (the “Subsidiary”), which is a wholly owned subsidiary of the Fund and primarily invests in commodity-related instruments and other derivatives. The Subsidiary enables the Fund to hold these commodity-related instruments and other derivatives and satisfy regulated investment company tax requirements. The Fund may invest up to 25% of its total assets in the Subsidiary. The accompanying Consolidated Schedule of Investments and Consolidated financial statements of the Fund includes the position and account, respectively, of its Subsidiary. Intercompany accounts and transactions, if any, have been eliminated. The Subsidiary is subject to the same investment policies and restrictions that apply to the Fund, except that the Subsidiary may invest without limitation in commodity-related instruments.
2. Significant Accounting Policies:
The consolidated financial statements are prepared in conformity with accounting principles generally accepted in the United States of America (“U.S. GAAP”), which may require management to make estimates and assumptions that affect the reported amounts of assets and liabilities in the financial statements, disclosure of contingent assets and liabilities at the date of the financial statements and the reported amounts of increases and decreases in net assets from operations during the reporting period. Actual results could differ from those estimates. The Fund is considered an investment company under U.S. GAAP and follows the accounting and reporting guidance applicable to investment companies. Below is a summary of significant accounting policies:
Foreign Currency: The Fund’s books and records are maintained in U.S. dollars. Purchases and sales of investments are recorded at the rates of exchange prevailing on the respective dates of such transactions. Generally, when the U.S. dollar rises in value against a foreign currency, the investments denominated in that currency will lose value; the opposite effect occurs if the U.S. dollar falls in relative value.
The Fund does not isolate changes in the exchange rates from the changes in the market prices of investments held or sold for financial reporting purposes. Accordingly, the effects of changes in exchange rates on investments are not segregated in the Statement of Operations from the effects of changes in market prices of those investments, but are included as a component of net realized and unrealized gain (loss) from investments. The Fund reports realized currency gains (losses) on foreign currency related transactions as components of net realized gain (loss) for financial reporting purposes, whereas such components are generally treated as ordinary income for federal income tax purposes.
Segregation and Collateralization: In cases where the Fund enters into certain investments (dollar rolls, TBA sale commitments, futures contracts, forward foreign currency exchange contracts, options written, swaps and short sales) that would be treated as “senior securities” for 1940 Act purposes, the Fund may segregate or designate on its books and records cash or liquid assets having a market value at least equal to the amount of its
| | | | | | |
| | | | | | | |
| | BLACKROCK GLOBAL ALLOCATION FUND, INC. | | APRIL 30, 2016 | | 41 |
| | | | |
| Notes to Consolidated Financial Statements (continued) | | |
future obligations under such investments. Doing so allows the investment to be excluded from treatment as a “senior security.” Furthermore, if required by an exchange or counterparty agreement, the Fund may be required to deliver/deposit cash and/or securities to/with an exchange, or broker-dealer or custodian as collateral for certain investments or obligations.
Investment Transactions and Investment Income: For financial reporting purposes, investment transactions are recorded on the dates the transactions are entered into (the trade dates). Realized gains and losses on investment transactions are determined on the identified cost basis. Dividend income is recorded on the ex-dividend date. Dividends from foreign securities where the ex-dividend date may have passed are subsequently recorded when the Fund is informed of the ex-dividend date. Under the applicable foreign tax laws, a withholding tax at various rates may be imposed on capital gains, dividends and interest. Upon notification from issuers, some of the dividend income received from a real estate investment trust may be redesignated as a reduction of cost of the related investment and/or realized gain. Interest income, including amortization and accretion of premiums and discounts on debt securities, is recognized on the accrual basis. Income, expenses and realized and unrealized gains and losses are allocated daily to each class based on its relative net assets.
Distributions: Distributions paid by the Fund are recorded on the ex-dividend date. The character and timing of distributions are determined in accordance with federal income tax regulations, which may differ from U.S. GAAP.
Net income and realized gains from investments held by the Subsidiary are treated as ordinary income for tax purposes. If a net loss is realized by the Subsidiary in any taxable year, the loss will generally not be available to offset the Fund’s ordinary income and/or capital gains for that year.
Indemnifications: In the normal course of business, the Fund enters into contracts that contain a variety of representations that provide general indemnification. The Fund’s maximum exposure under these arrangements is unknown because it involves future potential claims against the Fund, which cannot be predicted with any certainty.
Other: Expenses directly related to the Fund or its classes are charged to the Fund or the applicable class. Other operating expenses shared by several funds, including other funds managed by the Manager, are prorated among those funds on the basis of relative net assets or other appropriate methods. Expenses directly related to the Fund and other shared expenses prorated to the Fund are allocated daily to each class based on its relative net assets or other appropriate methods.
The Fund has an arrangement with its custodian whereby fees may be reduced by credits earned on uninvested cash balances, which, if applicable, are shown as fees paid indirectly in the Consolidated Statement of Operations. The custodian imposes fees on overdrawn cash balances, which can be offset by accumulated credits earned or may result in additional custody charges. Effective October 2015, the custodian is imposing fees on certain uninvested cash balances.
3. Investment Valuation and Fair Value Measurements:
Investment Valuation Policies: The Fund’s investments are valued at fair value (also referred to as “market value” within the financial statements) as of the close of trading on the New York Stock Exchange (“NYSE”) (generally 4:00 p.m., Eastern time) (or if the reporting date falls on a day the NYSE is closed, investments are valued at fair value as of the report date). U.S. GAAP defines fair value as the price the Fund would receive to sell an asset or pay to transfer a liability in an orderly transaction between market participants at the measurement date. The Fund determines the fair values of its financial instruments using various independent dealers or pricing services under policies approved by the Board of Directors of the Fund (the “Board”). The Global Valuation Committee is the committee formed by management to develop global pricing policies and procedures and to oversee the pricing function for all financial instruments.
Fair Value Inputs and Methodologies: The following methods (or “techniques”) and inputs are used to establish the fair value of the Fund’s assets and liabilities:
| • | | Bond investments are valued on the basis of last available bid prices or current market quotations provided by dealers or pricing services. Floating rate loan interests are valued at the mean of the bid prices from one or more brokers or dealers as obtained from a pricing service. In determining the value of a particular investment, pricing services may use certain information with respect to transactions in such investments, quotations from dealers, pricing matrixes, market transactions in comparable investments, various relationships observed in the market between investments and calculated yield measures. Asset-backed and mortgage-backed securities are valued by independent pricing services using models that consider estimated cash flows of each tranche of the security, establish a benchmark yield and develop an estimated tranche-specific spread to the benchmark yield based on the unique attributes of the tranche. |
| | | | | | |
| | | | | | | |
| 42 | | BLACKROCK GLOBAL ALLOCATION FUND, INC. | | APRIL 30, 2016 | | |
| | |
| Notes to Consolidated Financial Statements (continued) | | |
| • | | Equity investments traded on a recognized securities exchange are valued at the official closing price each day, if available. For equity investments traded on more than one exchange, the official close price on the exchange where the stock is primarily traded is used. Equity investments traded on a recognized exchange for which there were no sales on that day may be valued at the last available bid (long positions) or ask (short positions) price. |
| • | | Generally, trading in foreign instruments is substantially completed each day at various times prior to the close of business on the NYSE. Occasionally, events affecting the values of such instruments may occur between the foreign market close and the close of business on the NYSE that may not be reflected in the computation of the Fund’s net assets. Each business day, the Fund uses a pricing service to assist with the valuation of certain foreign exchange-traded equity securities and foreign exchange-traded and over-the-counter (“OTC”) options (the “Systematic Fair Value Price”). Using current market factors, the Systematic Fair Value Price is designed to value such foreign securities and foreign options at fair value as of the close of business on the NYSE, which follows the close of the local markets. |
| • | | Investments in open-end U.S. mutual funds are valued at NAV each business day. |
| • | | The Fund values its investment in BlackRock Liquidity Series, LLC, Money Market Series (the “Money Market Series”) at fair value, which is ordinarily based upon its pro rata ownership in the underlying fund’s net assets. The Money Market Series seeks current income consistent with maintaining liquidity and preserving capital. Although the Money Market Series is not registered under the 1940 Act, its investments may follow the parameters of investments by a money market fund that is subject to Rule 2a-7 under the 1940 Act. The Fund may withdraw up to 25% of its investment daily, although the manager of the Money Market Series, in its sole discretion, may permit an investor to withdraw more than 25% on any one day. |
| • | | Credit-Linked Notes are valued utilizing quotes received daily by the Fund’s pricing service or through brokers. The Fund’s pricing service utilizes daily credit curves and valuation models that incorporate a number of market data factors, such as the performance of reference entities, trades and price of the underlying reference instruments. |
| • | | Futures contracts traded on exchanges are valued at their last sale price. |
| • | | Securities and other assets and liabilities denominated in foreign currencies are translated into U.S. dollars using exchange rates determined as of the close of business on the NYSE. Forward foreign currency exchange contracts are valued at the mean between the bid and ask prices and are determined as of the close of business on the NYSE. Interpolated values are derived when the settlement date of the contract is an interim date for which quotations are not available. |
| • | | Exchange-traded options are valued at the mean between the last bid and ask prices at the close of the options market in which the options trade. An exchange-traded option for which there is no mean price is valued at the last bid (long positions) or ask (short positions) price. If no bid or ask price is available, the prior day’s price will be used, unless it is determined that the prior day’s price no longer reflects the fair value of the option. OTC options and options on swaps (“swaptions”) are valued by an independent pricing service using a mathematical model, which incorporates a number of market data factors, such as the trades and prices of the underlying instruments. |
| • | | Swap agreements are valued utilizing quotes received daily by the Fund’s pricing service or through brokers, which are derived using daily swap curves and models that incorporate a number of market data factors, such as discounted cash flows, trades and values of the underlying reference instruments. |
| • | | To-be-announced (“TBA”) commitments are valued on the basis of last available bid prices or current market quotations provided by pricing services. |
If events (e.g., a company announcement, market volatility or a natural disaster) occur that are expected to materially affect the value of such instruments, or in the event that the application of these methods of valuation results in a price for an investment that is deemed not to be representative of the market value of such investment, or if a price is not available, the investment will be valued by the Global Valuation Committee, or its delegate, in accordance with a policy approved by the Board as reflecting fair value (“Fair Valued Investments”). When determining the price for Fair Valued Investments, the Global Valuation Committee, or its delegate, seeks to determine the price that the Fund might reasonably expect to receive or pay from the current sale or purchase of that asset or liability in an arm’s-length transaction. Fair value determinations shall be based upon all available factors that the Global Valuation Committee, or its delegate, deems relevant consistent with the principles of fair value measurement, which include the market approach, income approach and/or in the case of recent investments, the cost approach, as appropriate. The market approach generally consists of using comparable market transactions. The income approach generally is used to discount future cash flows to present value and is adjusted for liquidity as appropriate. These factors include but are not limited to: (i) attributes specific to the investment or asset; (ii) the principal market for the investment or asset; (iii) the customary participants in the principal market for the investment or asset; (iv) data assumptions by market participants for the investment or asset, if reasonably available; (v) quoted prices for similar investments or assets in active markets; and
| | | | | | |
| | | | | | | |
| | BLACKROCK GLOBAL ALLOCATION FUND, INC. | | APRIL 30, 2016 | | 43 |
| | | | |
| Notes to Consolidated Financial Statements (continued) | | |
(vi) other factors, such as future cash flows, interest rates, yield curves, volatilities, prepayment speeds, loss severities, credit risks, recovery rates, liquidation amounts and/or default rates. Due to the inherent uncertainty of valuations of such investments, the fair values may differ from the values that would have been used had an active market existed.
The Global Valuation Committee, or its delegate, employs various methods for calibrating valuation approaches for investments where an active market does not exist, including regular due diligence of the Fund’s pricing vendors, regular reviews of key inputs and assumptions, transactional back-testing or disposition analysis to compare unrealized gains and losses to realized gains and losses, reviews of missing or stale prices and large movements in market values and reviews of any market related activity. The pricing of all Fair Valued Investments is subsequently reported to the Board or a committee thereof on a quarterly basis.
Fair Value Hierarchy: Various inputs are used in determining the fair value of investments and derivative financial instruments. These inputs to valuation techniques are categorized into a fair value hierarchy consisting of three broad levels for financial statement purposes as follows:
| • | | Level 1 — unadjusted price quotations in active markets/exchanges for identical assets or liabilities that the Fund has the ability to access |
| • | | Level 2 — other observable inputs (including, but not limited to, quoted prices for similar assets or liabilities in markets that are active, quoted prices for identical or similar assets or liabilities in markets that are not active, inputs other than quoted prices that are observable for the assets or liabilities (such as interest rates, yield curves, volatilities, prepayment speeds, loss severities, credit risks and default rates) or other market–corroborated inputs) |
| • | | Level 3 — unobservable inputs based on the best information available in the circumstances, to the extent observable inputs are not available (including the Fund’s own assumptions used in determining the fair value of investments and derivative financial instruments) |
The hierarchy gives the highest priority to unadjusted quoted prices in active markets for identical assets or liabilities (Level 1 measurements) and the lowest priority to unobservable inputs (Level 3 measurements). Accordingly, the degree of judgment exercised in determining fair value is greatest for instruments categorized in Level 3. The inputs used to measure fair value may fall into different levels of the fair value hierarchy. In such cases, for disclosure purposes, the fair value hierarchy classification is determined based on the lowest level input that is significant to the fair value measurement in its entirety. The significant unobservable inputs used by the Global Valuation Committee in determining the price for Fair Valued Investments are typically categorized as Level 3. The fair value hierarchy for the Fund’s investments and derivative financial instruments have been included in the Consolidated Schedule of Investments.
Changes in valuation techniques may result in transfers into or out of an assigned level within the hierarchy. In accordance with the Fund’s policy, transfers between different levels of the fair value hierarchy are deemed to have occurred as of the beginning of the reporting period. The categorization of a value determined for investments and derivative financial instruments is based on the pricing transparency of the investments and derivative financial instruments and is not necessarily an indication of the risks associated with investing in those securities.
4. Securities and Other Investments:
Asset-Backed and Mortgage-Backed Securities: Asset-backed securities are generally issued as pass-through certificates or as debt instruments. Asset-backed securities issued as pass-through certificates represent undivided fractional ownership interests in an underlying pool of assets. Asset-backed securities issued as debt instruments, which are also known as collateralized obligations, are typically issued as the debt of a special purpose entity organized solely for the purpose of owning such assets and issuing such debt. Asset-backed securities are often backed by a pool of assets representing the obligations of a number of different parties. The yield characteristics of certain asset-backed securities may differ from traditional debt securities. One such major difference is that all or a principal part of the obligations may be prepaid at any time because the underlying assets (i.e., loans) may be prepaid at any time. As a result, a decrease in interest rates in the market may result in increases in the level of prepayments as borrowers, particularly mortgagors, refinance and repay their loans. An increased prepayment rate with respect to an asset-backed security will have the effect of shortening the maturity of the security. In addition, the Fund may subsequently have to reinvest the proceeds at lower interest rates. If the Fund has purchased such an asset-backed security at a premium, a faster than anticipated prepayment rate could result in a loss of principal to the extent of the premium paid.
For mortgage pass-through securities (the “Mortgage Assets”) there are a number of important differences among the agencies and instrumentalities of the U.S. Government that issue mortgage-related securities and among the securities that they issue. For example, mortgage-related securities guaranteed by Ginnie Mae are guaranteed as to the timely payment of principal and interest by Ginnie Mae and such guarantee is backed by the full faith and credit of the United States. However, mortgage-related securities issued by Freddie Mac and Fannie Mae, including Freddie Mac and Fannie
| | | | | | |
| | | | | | | |
| 44 | | BLACKROCK GLOBAL ALLOCATION FUND, INC. | | APRIL 30, 2016 | | |
| | |
| Notes to Consolidated Financial Statements (continued) | | |
Mae guaranteed mortgage pass-through certificates, which are solely the obligations of Freddie Mac and Fannie Mae, are not backed by or entitled to the full faith and credit of the United States, but are supported by the right of the issuer to borrow from the U.S. Treasury.
Non-agency mortgage-backed securities are securities issued by non-governmental issuers and have no direct or indirect government guarantees of payment and are subject to various risks. Non-agency mortgage loans are obligations of the borrowers thereunder only and are not typically insured or guaranteed by any other person or entity. The ability of a borrower to repay a loan is dependent upon the income or assets of the borrower. A number of factors, including a general economic downturn, acts of God, terrorism, social unrest and civil disturbances, may impair a borrower’s ability to repay its loans.
Inflation-Indexed Bonds: Inflation-indexed bonds are fixed income securities whose principal value is periodically adjusted according to the rate of inflation. If the index measuring inflation rises or falls, the principal value of inflation-indexed bonds will be adjusted upward or downward, and consequently the interest payable on these securities (calculated with respect to a larger or smaller principal amount) will be increased or reduced, respectively. Any upward or downward adjustment in the principal amount of an inflation-indexed bond will be included as interest income in the Consolidated Statement of Operations, even though investors do not receive their principal until maturity. Repayment of the original bond principal upon maturity (as adjusted for inflation) is guaranteed in the case of U.S. Treasury inflation-indexed bonds. For bonds that do not provide a similar guarantee, the adjusted principal value of the bond repaid at maturity may be less than the original principal.
Zero-Coupon Bonds: Zero-coupon bonds are normally issued at a significant discount from face value and do not provide for periodic interest payments. These bonds may experience greater volatility in market value than other debt obligations of similar maturity which provide for regular interest payments.
Capital Securities and Trust Preferred Securities: Capital securities, including trust preferred securities, are typically issued by corporations, generally in the form of interest-bearing notes with preferred securities characteristics. In the case of trust preferred securities, an affiliated business trust of a corporation issues these securities, generally in the form of beneficial interests in subordinated debentures or similarly structured securities. The securities can be structured with either a fixed or adjustable coupon that can have either a perpetual or stated maturity date. For trust preferred securities, the issuing bank or corporation pays interest to the trust, which is then distributed to holders of these securities as a dividend. Dividends can be deferred without creating an event of default or acceleration, although maturity cannot take place unless all cumulative payment obligations have been met. The deferral of payments does not affect the purchase or sale of these securities in the open market. Payments on these securities are treated as interest rather than dividends for federal income tax purposes. These securities generally are rated below that of the issuing company’s senior debt securities and are freely callable at the issuer’s option.
Preferred Stock: Preferred stock has a preference over common stock in liquidation (and generally in receiving dividends as well) but is subordinated to the liabilities of the issuer in all respects. As a general rule, the market value of preferred stock with a fixed dividend rate and no conversion element varies inversely with interest rates and perceived credit risk, while the market price of convertible preferred stock generally also reflects some element of conversion value. Because preferred stock is junior to debt securities and other obligations of the issuer, deterioration in the credit quality of the issuer will cause greater changes in the value of a preferred stock than in a more senior debt security with similar stated yield characteristics. Unlike interest payments on debt securities, preferred stock dividends are payable only if declared by the issuer’s board of directors. Preferred stock also may be subject to optional or mandatory redemption provisions.
Warrants: Warrants entitle the Fund to purchase a specified number of shares of common stock and are non-income producing. The purchase price and number of shares are subject to adjustment under certain conditions until the expiration date of the warrants, if any. If the price of the underlying stock does not rise above the strike price before the warrant expires, the warrant generally expires without any value and the Fund will lose any amount it paid for the warrant. Thus, investments in warrants may involve more risk than investments in common stock. Warrants may trade in the same markets as their underlying stock; however, the price of the warrant does not necessarily move with the price of the underlying stock.
Floating Rate Loan Interests: Floating rate loan interests are typically issued to companies (the “borrower”) by banks, other financial institutions, or privately and publicly offered corporations (the “lender”). Floating rate loan interests are generally non-investment grade, often involve borrowers whose financial condition is troubled or uncertain and companies that are highly leveraged. The Fund may invest in obligations of borrowers who are in bankruptcy proceedings. In addition, transactions in floating rate loan interests may settle on a delayed basis, which may result in proceeds from the sale not being readily available for the Fund to make additional investments or meet its redemption obligations. Floating rate loan interests may include fully funded term loans or revolving lines of credit. Floating rate loan interests are typically senior in the corporate capital structure of the borrower. Floating rate loan interests generally pay interest at rates that are periodically determined by reference to a base lending rate plus a
| | | | | | |
| | | | | | | |
| | BLACKROCK GLOBAL ALLOCATION FUND, INC. | | APRIL 30, 2016 | | 45 |
| | | | |
| Notes to Consolidated Financial Statements (continued) | | |
premium. The base lending rates are generally the lending rate offered by one or more European banks, such as the London Interbank Offered Rate (“LIBOR”), the prime rate offered by one or more U.S. banks or the certificate of deposit rate. Floating rate loan interests may involve foreign borrowers, and investments may be denominated in foreign currencies. These investments are treated as investments in debt securities for purposes of the Fund’s investment policies.
When the Fund purchases a floating rate loan interest, it may receive a facility fee and when it sells a floating rate loan interest, it may pay a facility fee. On an ongoing basis, the Fund may receive a commitment fee based on the undrawn portion of the underlying line of credit amount of a floating rate loan interest. Facility and commitment fees are typically amortized to income over the term of the loan or term of the commitment, respectively. Consent and amendment fees are recorded to income as earned. Prepayment penalty fees, which may be received by the Fund upon the prepayment of a floating rate loan interest by a borrower, are recorded as realized gains. The Fund may invest in multiple series or tranches of a loan. A different series or tranche may have varying terms and carry different associated risks.
Floating rate loan interests are usually freely callable at the borrower’s option. The Fund may invest in such loans in the form of participations in loans (“Participations”) or assignments (“Assignments”) of all or a portion of loans from third parties. Participations typically will result in the Fund having a contractual relationship only with the lender, not with the borrower. The Fund has the right to receive payments of principal, interest and any fees to which it is entitled only from the lender selling the Participation and only upon receipt by the lender of the payments from the borrower. In connection with purchasing Participations, the Fund generally will have no right to enforce compliance by the borrower with the terms of the loan agreement, nor any rights of offset against the borrower. The Fund may not benefit directly from any collateral supporting the loan in which it has purchased the Participation. As a result, the Fund assumes the credit risk of both the borrower and the lender that is selling the Participation. The Fund’s investment in loan participation interests involves the risk of insolvency of the financial intermediaries who are parties to the transactions. In the event of the insolvency of the lender selling the Participation, the Fund may be treated as a general creditor of the lender and may not benefit from any offset between the lender and the borrower. Assignments typically result in the Fund having a direct contractual relationship with the borrower, and the Fund may enforce compliance by the borrower with the terms of the loan agreement.
Forward Commitments and When-Issued Delayed Delivery Securities: The Fund may purchase securities on a when-issued basis and may purchase or sell securities on a forward commitment basis. Settlement of such transactions normally occurs within a month or more after the purchase or sale commitment is made. The Fund may purchase securities under such conditions with the intention of actually acquiring them, but may enter into a separate agreement to sell the securities before the settlement date. Since the value of securities purchased may fluctuate prior to settlement, the Fund may be required to pay more at settlement than the security is worth. In addition, the Fund is not entitled to any of the interest earned prior to settlement. When purchasing a security on a delayed delivery basis, the Fund assumes the rights and risks of ownership of the security, including the risk of price and yield fluctuations. In the event of default by the counterparty, the Fund’s maximum amount of loss is the unrealized appreciation of unsettled when-issued transactions.
TBA Commitments: TBA commitments are forward agreements for the purchase or sale of mortgage-backed securities for a fixed price, with payment and delivery on an agreed upon future settlement date. The specific securities to be delivered are not identified at the trade date. However, delivered securities must meet specified terms, including issuer, rate and mortgage terms. When entering into TBA commitments, the Fund may take possession of or deliver the underlying mortgage-backed securities but can extend the settlement or roll the transaction. TBA commitments involve a risk of loss if the value of the security to be purchased or sold declines or increases, respectively, prior to settlement date.
In order to better define contractual rights and to secure rights that will help the Fund mitigate its counterparty risk, TBA commitments may be entered into by the Fund under Master Securities Forward Transaction Agreements (each, an “MSFTA”). An MSFTA typically contains, among other things, collateral posting terms and netting provisions in the event of default and/or termination event. The collateral requirements are typically calculated by netting the mark-to-market amount for each transaction under such agreement and comparing that amount to the value of the collateral currently pledged by the Fund and the counterparty. Cash collateral that has been pledged to cover the obligations of the Fund and cash collateral received from the counterparty, if any, is reported separately on the Consolidated Statement of Assets and Liabilities as cash pledged as collateral for TBA commitments or cash received as collateral for TBA commitments, respectively. Non-cash collateral pledged by the Fund, if any, is noted in the Consolidated Schedule of Investments. Typically, the Fund is permitted to sell, repledge or use the collateral it receives; however, the counterparty is not permitted to do so. To the extent amounts due to the Fund is not fully collateralized, contractually or otherwise, the Fund bears the risk of loss from counterparty non-performance.
Mortgage Dollar Roll Transactions: The Fund may sell TBA mortgage-backed securities and simultaneously contract to repurchase substantially similar (i.e., same type, coupon and maturity) securities on a specific future date at an agreed upon price. During the period between the sale and
| | | | | | |
| | | | | | | |
| 46 | | BLACKROCK GLOBAL ALLOCATION FUND, INC. | | APRIL 30, 2016 | | |
| | |
| Notes to Consolidated Financial Statements (continued) | | |
repurchase, the Fund is not entitled to receive interest and principal payments on the securities sold. Mortgage dollar roll transactions are treated as purchases and sales and realizes gains and losses on these transactions. Mortgage dollar rolls involve the risk that the market value of the securities that the Fund is required to purchase may decline below the agreed upon repurchase price of those securities.
Short Sale Transactions: In short sale transactions the Fund sells a security it does not hold in anticipation of a decline in the market price of that security. When the Fund makes a short sale, it will borrow the security sold short from a broker/counterparty and deliver the security to the purchaser. To close out a short position, the Fund delivers the same security to the broker and records a liability to reflect the obligation to return the security to the broker. The amount of the liability is subsequently marked-to-market to reflect the market value of the short sale. The Fund maintains a segregated account of securities or deposits cash with the broker-dealer as collateral for the short sales. Cash deposited with the broker is recorded as an asset in the Consolidated Statement of Assets and Liabilities. Securities segregated as collateral are denoted in the Consolidated Schedule of Investments. The Fund may pay a financing fee for the difference between the market value of the short position and the cash collateral deposited with the broker which would be recorded as interest expense. The Fund is required to repay the counterparty any dividends received on the security sold short, which, if applicable, is shown as dividend expense in the Consolidated Statement of Operations. The Fund may pay a fee on the assets borrowed from the counterparty, which, if applicable, is shown as stock loan fees in the Consolidated Statement of Operations. The Fund is exposed to market risk based on the amount, if any, that the market value of the security increases beyond the market value at which the position was sold. Thus, a short sale of a security involves the risk that instead of declining, the price of the security sold short will rise. The short sale of securities involves the possibility of an unlimited loss since there is an unlimited potential for the market price of the security sold short to increase. A gain, limited to the price at which the Fund sold the security short. A realized gain or loss is recognized upon the termination of a short sale if the market price is either less than or greater than the proceeds originally received. There is no assurance that the Fund will be able to close out a short position at a particular time or at an acceptable price.
Securities Lending: The Fund may lend its securities to approved borrowers, such as brokers, dealers and other financial institutions. The borrower pledges and maintains with the Fund collateral consisting of cash, an irrevocable letter of credit issued by a bank, or securities issued or guaranteed by the U.S. government. The initial collateral received by the Fund is required to have a value of at least 102% of the current value of the loaned securities for securities traded on U.S. exchanges and a value of at least 105% for all other securities. The collateral is maintained thereafter at a value equal to at least 100% of the current market value of the securities on loan. The market value of the loaned securities is determined at the close of each business day of the Fund and any additional required collateral is delivered to the Fund, or excess collateral returned by the Fund, on the next business day. During the term of the loan, the Fund is entitled to all distributions made on or in respect of the loaned securities. Loans of securities are terminable at any time and the borrower, after notice, is required to return borrowed securities within the standard time period for settlement of securities transactions.
The market value of any securities on loan, all of which were classified as common stocks in the Fund’s Consolidated Schedule of Investments, and the value of any related collateral are shown separately in the Consolidated Statement of Assets and Liabilities as a component of investments at value — unaffiliated, and collateral on securities loaned at value, respectively. As of period end, any securities on loan were collateralized by cash. The cash collateral invested by the securities lending agent, BlackRock Investment Management, LLC (“BIM”), if any, is disclosed in the Consolidated Schedule of Investments.
Securities lending transactions are entered into by the Fund under Master Securities Lending Agreements (each, an “MSLA”), which provide the right, in the event of default (including bankruptcy or insolvency), for the non-defaulting party to liquidate the collateral and calculate a net exposure to the defaulting party or request additional collateral. In the event that a borrower defaults, the Fund, as lender, would offset the market value of the collateral received against the market value of the securities loaned. When the value of the collateral is greater than that of the market value of the securities loaned, the lender is left with a net amount payable to the defaulting party. However, bankruptcy or insolvency laws of a particular jurisdiction may impose restrictions on or prohibitions against such a right of offset in the event of an MSLA counterparty’s bankruptcy or insolvency. Under the MSLA, absent an event of default the borrower can resell or re-pledge the loaned securities, and the Fund can reinvest cash collateral received in connection with loaned securities. Upon an event of default, the parties’ obligations to return the securities or collateral to the other party are extinguished, and the parties can resell or re-pledge the loaned securities or the collateral received in connection with the loaned securities in order to satisfy the defaulting party’s net payment obligation for all transactions under the MSLA. The defaulting party remains liable for any deficiency.
| | | | | | |
| | | | | | | |
| | BLACKROCK GLOBAL ALLOCATION FUND, INC. | | APRIL 30, 2016 | | 47 |
| | | | |
| Notes to Consolidated Financial Statements (continued) | | |
As of period end, the following table is a summary of the Fund’s securities lending agreements by counterparty which are subject to offset under an MSLA:
| | | | | | | | | | | | |
| Counterparty | | Securities Loaned
at Value | | | Cash Collateral
Received1 | | | Net
Amount | |
BMO Capital Markets Corp. | | $ | 1,886,424 | | | $ | (1,886,424 | ) | | | — | |
BNP Paribas S.A. | | $ | 1,461,620 | | | $ | (1,461,620 | ) | | | — | |
Citigroup Global Markets, Inc. | | $ | 52,696,968 | | | $ | (52,696,968 | ) | | | — | |
Credit Suisse Securities (USA) LLC | | $ | 45,465,632 | | | $ | (45,465,632 | ) | | | — | |
Deutsche Bank Securities , Inc. | | $ | 1,800,000 | | | $ | (1,800,000 | ) | | | — | |
Goldman Sachs & Co. | | $ | 55,768,006 | | | $ | (55,768,006 | ) | | | — | |
JP Morgan Securities LLC. | | $ | 38,989,937 | | | $ | (38,989,937 | ) | | | — | |
Merrill Lynch, Pierce, Fenner & Smith, Inc. | | $ | 35,171,802 | | | $ | (35,171,802 | ) | | | — | |
Morgan Stanley & Co. LLC | | $ | 36,728,052 | | | $ | (36,728,052 | ) | | | — | |
State Street Bank & Trust Co. | | $ | 42,267,117 | | | $ | (42,267,117 | ) | | | — | |
UBS Securties LLC | | $ | 7,573,089 | | | $ | (7,573,089 | ) | | | — | |
| | | | | | | | | | | | |
Total | | $ | 319,808,647 | | | $ | (319,808,647 | ) | | | — | |
| | | | | | | | | | | | |
| | 1 | | Collateral with a value of $331,860,268 has been received in connection with securities lending agreements. Excess of collateral received from the individual counterparty is not shown for financial reporting purposes. |
The risks of securities lending include the risk that the borrower may not provide additional collateral when required or may not return the securities when due. To mitigate these risks, the Fund benefits from a borrower default indemnity provided by BIM. BIM’s indemnity allows for full replacement of the securities loaned if the collateral received does not cover the value on the securities loaned in the event of borrower default. The Fund could suffer a loss if the value of an investment purchased with cash collateral falls below the market value of loaned securities or if the value of an investment purchased with cash collateral falls below the value of the original cash collateral received.
5. Derivative Financial Instruments:
The Fund engages in various portfolio investment strategies using derivative contracts both to increase the returns of the Fund and/or to manage its exposure to certain risks such as credit risk, equity risk, interest rate risk and foreign currency exchange rate risk. Derivative financial instruments categorized by risk exposure are included in the Consolidated Schedule of Investments. These contracts may be transacted on an exchange or OTC.
Futures Contracts: The Fund invests in long and/or short positions in futures and options on futures contracts to gain exposure to, or manage exposure to changes in interest rates (interest rate risk), changes in the value of equity securities (equity risk) or foreign currencies (foreign currency exchange rate risk).
Futures contracts are agreements between the Fund and a counterparty to buy or sell a specific quantity of an underlying instrument at a specified price and on a specified date. Depending on the terms of a contract, it is settled either through physical delivery of the underlying instrument on the settlement date or by payment of a cash amount on the settlement date. Upon entering into a futures contract, the Fund is required to deposit initial margin with the broker in the form of cash or securities in an amount that varies depending on a contract’s size and risk profile. The initial margin deposit must then be maintained at an established level over the life of the contract.
Securities deposited as initial margin are designated in the Consolidated Schedule of Investments and cash deposited, if any, is shown as cash pledged for futures contracts in the Consolidated Statement of Assets and Liabilities. Pursuant to the contract, the Fund agrees to receive from or pay to the broker an amount of cash equal to the daily fluctuation in market value of the contract (“variation margin”). Variation margin is recorded as unrealized appreciation (depreciation) and, if any, shown as variation margin receivable (or payable) on futures contracts in the Consolidated Statement of Assets and Liabilities. When the contract is closed, a realized gain or loss is recorded in the Consolidated Statement of Operations equal to the difference between the value of the contract at the time it was opened and the value at the time it was closed. The use of futures contracts involves the risk of an imperfect correlation in the movements in the price of futures contracts and interest, foreign currency exchange rates or underlying assets.
Forward Foreign Currency Exchange Contracts: The Fund enters into forward foreign currency exchange contracts to gain or reduce exposure, to foreign currencies (foreign currency exchange rate risk).
A forward foreign currency exchange contract is an agreement between two parties to buy and sell a currency at a set exchange rate on a specified date. These contracts help to manage the overall exposure to the currencies in which some of the investments held by the Fund are denominated and in some cases, may be used to obtain exposure to a particular market.
| | | | | | |
| | | | | | | |
| 48 | | BLACKROCK GLOBAL ALLOCATION FUND, INC. | | APRIL 30, 2016 | | |
| | |
| Notes to Consolidated Financial Statements (continued) | | |
The daily change in market value is recorded as unrealized appreciation (depreciation) in the Consolidated Statement of Assets and Liabilities. When a contract is closed, a realized gain or loss is recorded in the Consolidated Statement of Operations equal to the difference between the value at the time it was opened and the value at the time it was closed. Non-deliverable forward foreign currency exchange contracts are settled with the counterparty in cash without delivery of foreign currency. The use of forward foreign currency exchange contracts involves the risk that the value of a forward foreign currency exchange contract changes unfavorably due to movements in the value of the referenced foreign currencies.
Options: The Fund purchases and writes call and put options to increase or decrease its exposure to the risks of underlying instruments, including equity risk, interest rate risk and/or commodity price risk and/or, in the case of options written, to generate gains from options premiums.
A call option gives the purchaser (holder) of the option the right (but not the obligation) to buy, and obligates the seller (writer) to sell (when the option is exercised) the underlying instrument at the exercise or strike price at any time or at a specified time during the option period. A put option gives the holder the right to sell and obligates the writer to buy the underlying instrument at the exercise or strike price at any time or at a specified time during the option period.
Premiums paid on options purchased and premiums received on options written, as well as the daily fluctuations in market value, are included in investments at value — unaffiliated and options written at value, respectively, in the Consolidated Statement of Assets and Liabilities. When an instrument is purchased or sold through the exercise of an option, the premium is offset against the cost or proceeds of the underlying instrument. When an option expires, a realized gain or loss is recorded in the Consolidated Statement of Operations to the extent of the premiums received or paid. When an option is closed or sold, a gain or loss is recorded in the Consolidated Statement of Operations to the extent the cost of the closing transaction exceeds the premiums received or paid. When the Fund writes a call option, such option is typically “covered,” meaning that it holds the underlying instrument subject to being called by the option counterparty. When the Fund writes a put option, such option is covered by cash in an amount sufficient to cover the obligation.
| • | | Swaptions — The Fund purchases and writes options on swaps (“swaptions”) primarily to preserve a return or spread on a particular investment or portion of the Fund’s holdings, as a duration management technique or to protect against an increase in the price of securities it anticipates purchasing at a later date. The purchaser and writer of a swaption is buying or granting the right to enter into a previously agreed upon interest rate or credit default swap agreement (interest rate risk and/or credit risk) at any time before the expiration of the option. |
| • | | Foreign Currency options — The Fund purchases and writes foreign currency options, foreign currency futures and options on foreign currency futures to gain or reduce exposure to foreign currencies (foreign currency exchange rate risk). Foreign currency options give the purchaser the right to buy from or sell to the writer a foreign currency at any time before the expiration of the option. |
| • | | Barrier options — The Fund may purchase and write a variety of options with non-standard payout structures or other features (“barrier options”) that are generally traded OTC. |
The Fund may invest in various types of barrier options, including down-and-out options, down-and-in options, double no-touch options, one-touch options and up-and-out options. Down-and-out options expire worthless to the purchaser if the price of the underlying instrument falls below a specific barrier price level prior to the expiration date. Down-and-in options expire worthless to the purchaser unless the price of the underlying instrument falls below a specific barrier price level prior to the expiration date. Double no-touch options provide the purchaser an agreed-upon payout if the price of the underlying instrument does not reach or surpass predetermined barrier price levels prior to the option’s expiration date. One-touch options provide the purchaser an agreed-upon payout if the price of the underlying instrument reaches or surpasses predetermined barrier price levels prior to the expiration date. Up-and-out options expire worthless if the price of the underlying instrument increases beyond a predetermined barrier price level prior to the expiration date.
The Fund invests in structured options to increase or decrease its exposure to an underlying index or group of securities (equity risk).
These options may consist of single or multiple OTC options which are priced as a single instrument. They may only be exercised at the expiration date, but may be transferred/sold prior to the expiration date. The value of a structured option may either increase or decrease with the underlying index or group of securities, depending on the combination of options used. Structured options are issued in units whereby each unit represents a structure based on the specific index with an initial reference strike price. One type of structure involves the combination of selling a put while buying a call on a specific index. This option would rise in value as the underlying index increases and fall in value as the underlying index decreases. Alternatively, another structure involves the sale of a call and the purchase of a put. This option structure would rise in value as the underlying index decreases and fall in value as the underlying index increases. Upon the exercise of the structured option, the Fund will receive a payment from, or be required to remit a payment to, the counterparty depending on the value of the underlying index at exercise.
| | | | | | |
| | | | | | | |
| | BLACKROCK GLOBAL ALLOCATION FUND, INC. | | APRIL 30, 2016 | | 49 |
| | | | |
| Notes to Consolidated Financial Statements (continued) | | |
In purchasing and writing options, the Fund bears the risk of an unfavorable change in the value of the underlying instrument or the risk that it may not be able to enter into a closing transaction due to an illiquid market. Exercise of a written option could result in the Fund purchasing or selling a security when it otherwise would not, or at a price different from the current market value.
As of April 30, 2016 the value of portfolio securities subject to covered call options written was $1,745,153,146.
Swaps: The Fund enters into swap contracts to manage exposure to issuers, markets and securities. Such contracts are agreements between the Fund and a counterparty to make periodic net payments on a specified notional amount or a net payment upon termination. Swap agreements are privately negotiated in the OTC market and may be entered into as a bilateral contract (“OTC swaps”) or centrally cleared (“centrally cleared swaps”).
For OTC swaps, any upfront premiums paid and any upfront fees received are shown as swap premiums paid and swap premiums received, respectively, in the Consolidated Statement of Assets and Liabilities and amortized over the term of the contract. The daily fluctuation in market value is recorded as unrealized appreciation (depreciation) on OTC Swaps in the Consolidated Statement of Assets and Liabilities. Payments received or paid are recorded in the Consolidated Statement of Operations as realized gains or losses, respectively. When an OTC swap is terminated, a realized gain or loss is recorded in the Consolidated Statement of Operations equal to the difference between the proceeds from (or cost of) the closing transaction and the Fund’s basis in the contract, if any. Generally, the basis of the contract is the premium received or paid.
In a centrally cleared swap, immediately following execution of the swap contract, the swap contract is novated to a central counterparty (the “CCP”) and the Fund’s counterparty on the swap agreement becomes the CCP. The Fund is required to interface with the CCP through the broker. Upon entering into a centrally cleared swap, the Fund is required to deposit initial margin with the broker in the form of cash or securities in an amount that varies depending on the size and risk profile of the particular swap. Securities deposited as initial margin are designated in the Consolidated Schedule of Investments and cash deposited is shown as cash pledged for centrally cleared swaps in the Consolidated Statement of Assets and Liabilities. Pursuant to the contract, the Fund agrees to receive from or pay to the broker an amount of cash equal to the daily fluctuation in market value of the contract (“variation margin”). Variation margin is recorded as unrealized appreciation (depreciation) and shown as variation margin receivable (or payable) on centrally cleared swaps in the Consolidated Statement of Assets and Liabilities. Payments received from (paid to) the counterparty, including at termination, are recorded as realized gains (losses) in the Consolidated Statement of Operations.
| • | | Credit default swaps — The Fund enters into credit default swaps to manage its exposure to the market or certain sectors of the market, to reduce its risk exposure to defaults of corporate and/or sovereign issuers or to create exposure to corporate and/or sovereign issuers to which it is not otherwise exposed (credit risk). |
The Fund may either buy or sell (write) credit default swaps on single-name issuers (corporate or sovereign), a combination or basket of single-name issuers or traded indexes. Credit default swaps are agreements in which the protection buyer pays fixed periodic payments to the seller in consideration for a promise from the protection seller to make a specific payment should a negative credit event take place with respect to the referenced entity (e.g., bankruptcy, failure to pay, obligation acceleration, repudiation, moratorium or restructuring). As a buyer, if an underlying credit event occurs, the Fund will either (i) receive from the seller an amount equal to the notional amount of the swap and deliver the referenced security or underlying securities comprising the index, or (ii) receive a net settlement of cash equal to the notional amount of the swap less the recovery value of the security or underlying securities comprising the index. As a seller (writer), if an underlying credit event occurs, the Fund will either pay the buyer an amount equal to the notional amount of the swap and take delivery of the referenced security or underlying securities comprising the index or pay a net settlement of cash equal to the notional amount of the swap less the recovery value of the security or underlying securities comprising the index.
| • | | Total return swaps — The Fund enters into total return swaps to obtain exposure to a security or market without owning such security or investing directly in such market or to exchange the risk/return of one market (e.g., fixed income) with another market (e.g., equity or commodity prices) (equity risk, commodity price risk and/or interest rate risk). |
Total return swaps are agreements in which there is an exchange of cash flows whereby one party commits to make payments based on the total return (distributions plus capital gains/losses) of an underlying instrument in exchange for fixed or floating rate interest payments. If the total return of the instrument or index underlying the transaction exceeds or falls short of the offsetting fixed or floating interest rate obligation, the Fund receives payment from or makes a payment to the counterparty.
| • | | Interest rate swaps — The Fund enters into interest rate swaps to gain or reduce exposure to interest rates or to manage duration, the yield curve or interest rate risk (interest rate risk). |
| | | | | | |
| | | | | | | |
| 50 | | BLACKROCK GLOBAL ALLOCATION FUND, INC. | | APRIL 30, 2016 | | |
| | |
| Notes to Consolidated Financial Statements (continued) | | |
Interest rate swaps are agreements in which one party pays a stream of interest payments, either fixed or floating, in exchange for another party’s stream of interest payments, either fixed or floating, on the same notional amount for a specified period of time. In more complex interest rate swaps, the notional principal amount may decline (or amortize) over time.
| • | | Currency swaps — The Fund enters into currency swaps to gain or reduce exposure to foreign currencies (foreign currency exchange rate risk). |
Currency swaps are interest rate swaps in which one party pays a stream of interest payments, either fixed or floating, in exchange for another party’s stream of interest payments, either fixed or floating, based on the notional amounts of two different currencies. The notional amounts are typically determined based on the spot exchange rates at the inception of the trade. Currency swaps may also involve an exchange of notional amounts at the start, during and/or at expiration of the contract, either at the current spot rate or another specified rate.
| • | | Forward swaps — The Fund enters into forward interest rate swaps and forward total return swaps. In a forward swap, the Fund and the counterparty agree to make periodic net payments beginning on a specified date or a net payment at termination. |
Swap transactions involve, to varying degrees, elements of interest rate, credit and market risk in excess of the amounts recognized in the Consolidated Statement of Assets and Liabilities. Such risks involve the possibility that there will be no liquid market for these agreements, that the counterparty to the agreements may default on its obligation to perform or disagree as to the meaning of the contractual terms in the agreements, and that there may be unfavorable changes in interest rates and/or market values associated with these transactions.
Master Netting Arrangements: In order to define its contractual rights and to secure rights that will help it mitigate its counterparty risk, the Fund may enter into an International Swaps and Derivatives Association, Inc. Master Agreement (“ISDA Master Agreement”) or similar agreement with its counterparties. An ISDA Master Agreement is a bilateral agreement between the Fund and a counterparty that governs certain OTC derivatives and typically contains, among other things, collateral posting terms and netting provisions in the event of a default and/or termination event. Under an ISDA Master Agreement, the Fund may, under certain circumstances, offset with the counterparty certain derivative financial instruments’ payables and/or receivables with collateral held and/or posted and create one single net payment. The provisions of the ISDA Master Agreement typically permit a single net payment in the event of default including the bankruptcy or insolvency of the counterparty. Bankruptcy or insolvency laws of a particular jurisdiction may restrict or prohibit the right of offset in bankruptcy, insolvency or other events. In addition, certain ISDA Master Agreements allow counterparties to terminate derivative contracts prior to maturity in the event the Fund’s net assets decline by a stated percentage or the Fund fails to meet the terms of its ISDA Master Agreements. The result would cause the Fund to accelerate payment of any net liability owed to the counterparty.
Collateral Requirements: For derivatives traded under an ISDA Master Agreement, the collateral requirements are typically calculated by netting the mark-to-market amount for each transaction under such agreement and comparing that amount to the value of any collateral currently pledged by the Fund and the counterparty.
Cash collateral that has been pledged to cover obligations of the Fund and cash collateral received from the counterparty, if any, is reported separately on the Consolidated Statement of Assets and Liabilities as cash pledged as collateral and cash received as collateral, respectively. Non-cash collateral pledged by the Fund, if any, is noted in the Consolidated Schedule of Investments. Generally, the amount of collateral due from or to a counterparty is subject to a certain minimum transfer amount threshold before a transfer is required, which is determined at the close of business of the Fund. Any additional required collateral is delivered to/pledged by the Fund on the next business day. Typically, the counterparty is not permitted to sell, re-pledge or use cash and non-cash collateral it receives. The Fund generally agrees not to use non-cash collateral that it receives but may, absent default or certain other circumstances defined in the underlying ISDA Master Agreement, be permitted to use cash collateral received. In such cases, interest may be paid pursuant to the collateral arrangement with the counterparty. To the extent amounts due to the Fund from its counterparties are not fully collateralized, the Fund bears the risk of loss from counterparty non-performance. Likewise, to the extent the Fund has delivered collateral to a counterparty and stands ready to perform under the terms of its agreement with such counterparty, it bears the risk of loss from a counterparty in the amount of the value of the collateral in the event the counterparty fails to return such collateral. Based on the terms of agreements, collateral may not be required for all derivative contracts.
For financial reporting purposes, the Fund does not offset derivative assets and derivative liabilities that are subject to netting arrangements, if any, in the Consolidated Statement of Assets and Liabilities.
6. Investment Advisory Agreement and Other Transactions with Affiliates:
The PNC Financial Services Group, Inc. is the largest stockholder and an affiliate of BlackRock, Inc. (“BlackRock”) for 1940 Act purposes.
| | | | | | |
| | | | | | | |
| | BLACKROCK GLOBAL ALLOCATION FUND, INC. | | APRIL 30, 2016 | | 51 |
| | | | |
| Notes to Consolidated Financial Statements (continued) | | |
The Fund entered into an Investment Advisory Agreement with the Manager, the Fund’s investment advisor, an indirect, wholly owned subsidiary of BlackRock, to provide investment advisory and administration services. The Manager is responsible for the management of the Fund’s portfolio and provides the personnel, facilities, equipment and certain other services necessary to the operations of the Fund. For such services, the Fund pays the Manager a monthly fee, which is determined by calculating a percentage of the Fund’s average daily net assets, based on an annual rate of 0.75%.
The Manager provides investment management and other services to the Subsidiary. The Manager does not receive separate compensation from the Subsidiary for providing investment management or administrative services. However, the Fund pays the Manager based on the Fund’s net assets, which includes the assets of the Subsidiary.
Service and Distribution Fees
The Fund, entered into a Distribution Agreement and a Distribution and Service Plan with BlackRock Investments, LLC (“BRIL”), an affiliate of the Manager. Pursuant to the Distribution and Service Plan and in accordance with Rule 12b-1 under the 1940 Act, the Fund pays BRIL ongoing service and distribution fees. The fees are accrued daily and paid monthly at annual rates based upon the average daily net assets of the relevant share class of the Fund as follows:
| | | | | | | | | | | | | | | | |
| | | Investor A | | | Investor B | | | Investor C | | | Class R | |
Service Fee | | | 0.25% | | | | 0.25% | | | | 0.25% | | | | 0.25% | |
Distribution Fee | | | — | | | | 0.75% | | | | 0.75% | | | | 0.25% | |
BRIL and broker-dealers, pursuant to sub-agreements with BRIL, provide shareholder servicing and distribution services to the Fund. The ongoing service and/or distribution fee compensates BRIL and each broker-dealer for providing shareholder servicing and/or distribution related services to the shareholders.
For the six months ended April 30, 2016, the following table shows the class specific service and distribution fees borne directly by each share class of the Fund:
| | | | | | | | | | | | | | | | |
| Investor A | | Investor B | | | Investor C | | | Class R | | | Total | |
$18,598,999 | | $ | 765,939 | | | $ | 64,249,859 | | | $ | 2,876,471 | | | $ | 86,491,268 | |
Transfer Agent
Pursuant to written agreements, certain financial intermediaries, some of which may be affiliates, provide the Fund with sub-accounting, recordkeeping, sub-transfer agency and other administrative services with respect to sub-accounts they service. For these services, these entities receive an asset-based fee or an annual fee per shareholder account, which will vary depending on share class and/or net assets. For the six months ended April 30, 2016, the Fund paid the following amounts to affiliates of BlackRock in return for these services.
The Manager maintains a call center that is responsible for providing certain shareholder services to the Fund. Shareholder services include responding to inquiries and processing subscriptions and redemptions based upon instructions from shareholders. For the six months ended April 30, 2016, the Fund reimbursed the Manager the following amounts for costs incurred in running the call center, which are included in transfer agent — class specific in the Consolidated Statement of Operations:
| | | | | | | | | | | | | | | | | | | | |
| Institutional | | Investor A | | | Investor B | | | Investor C | | | Class R | | | Total | |
$26,006 | | $ | 140,441 | | | $ | 3,233 | | | $ | 100,324 | | | $ | 3,911 | | | $ | 273,915 | |
For the six months ended April 30, 2016, the following table shows the class specific transfer agent fees borne directly by each class of the Fund:
| | | | | | | | | | | | | | | | | | | | |
| Institutional | | Investor A | | | Investor B | | | Investor C | | | Class R | | | Total | |
$8,263,229 | | $ | 8,690,688 | | | $ | 129,129 | | | $ | 6,787,964 | | | $ | 1,096,596 | | | $ | 24,967,606 | |
Other Fees
For the six months ended April 30, 2016, affiliates earned underwriting discounts, direct commissions and dealer concessions on sales of the Fund’s Investor A Shares, which totaled $573,943.
For the six months ended April 30, 2016, affiliates received CDSCs as follows:
| | | | | | | | | | | | |
| Investor A | | Investor B | | | Investor C | | | Total | |
$188,979 | | $ | 2,987 | | | $ | 458,075 | | | $ | 650,041 | |
| | | | | | |
| | | | | | | |
| 52 | | BLACKROCK GLOBAL ALLOCATION FUND, INC. | | APRIL 30, 2016 | | |
| | |
| Notes to Consolidated Financial Statements (continued) | | |
Waivers and Reimbursements
The Manager voluntarily agreed to waive a portion of its fees payable by the Fund, which is included in fees waived by the Manager in the Consolidated Statement of Operations. Such fee was reduced for average daily net assets as follows:
| | | | |
First $10 Billion | | | 0.75% | |
In excess of $10 Billion, but not exceeding $15 Billion | | | 0.69% | |
In excess of $15 Billion, but not exceeding $20 Billion | | | 0.68% | |
In excess of $20 Billion, but not exceeding $25 Billion | | | 0.67% | |
In excess of $25 Billion, but not exceeding $30 Billion | | | 0.65% | |
In excess of $30 Billion, but not exceeding $40 Billion | | | 0.63% | |
In excess of $40 Billion, but not exceeding $60 Billion | | | 0.62% | |
In excess of $60 Billion, but not exceeding $80 Billion | | | 0.61% | |
Greater than $80 Billion | | | 0.60% | |
For the six months ended April 30, 2016, the Manager waived $18,758,246, which is included in fees waived by the Manager in the Consolidated Statement of Operations. This voluntary waiver may be reduced or discontinued at any time without notice.
The Manager voluntarily agreed to waive its investment advisory fees by the amount of investment advisory fees the Fund pays to the Manager indirectly through its investment in affiliated money market funds. However, the Manager does not waive its investment advisory fees by the amount of investment advisory fees paid in connection with the Fund’s investment in other affiliated investment companies, if any. This amount is included in fees waived by the Manager in the Consolidated Statement of Operations. For the six months ended April 30, 2016, the amount waived was $4,740.
For the six months ended April 30, 2016, the Fund reimbursed the Manager $271,231 for certain accounting services, which is included in accounting services in the Consolidated Statement of Operations.
Securities Lending
The U.S. Securities and Exchange Commission has issued an exemptive order which permits BIM, an affiliate of the Manager, to serve as securities lending agent for the Fund, subject to applicable conditions. As securities lending agent, BIM bears all operational costs directly related to securities lending. The Fund is responsible for expenses in connection with the investment of cash collateral received for securities on loan (the “collateral investment expenses”). The cash collateral is invested in a private investment company managed by the Manager or its affiliates. However, BIM has agreed to cap the collateral investment expenses of the private investment company to an annual rate of 0.04%. The investment advisor to the private investment company will not charge any advisory fees with respect to shares purchased by the Fund.
Securities lending income is equal to the total of income earned from the reinvestment of cash collateral, net of fees and other payments to and from borrowers of securities, and less the collateral investment expenses. The Fund retains a portion of securities lending income and remits a remaining portion to BIM as compensation for its services as securities lending agent.
Pursuant to a securities lending agreement, the Fund retains 80% of securities lending income, and this amount retained can never be less than 70% of the total of securities lending income plus the collateral investment expenses.
In addition, commencing the business day following the date that the aggregate securities lending income earned across the Equity-Bond Complex in a calendar year exceeds a specified threshold, the Fund, pursuant to the securities lending agreement, will retain for the remainder of that calendar year securities lending income as follows: 85% of securities lending income, and this amount retained can never be less than 70% of the total of securities lending income plus the collateral investment expenses.
The share of securities lending income earned by the Fund is shown as securities lending — affiliated — net in the Consolidated Statement of Operations. For the six months ended April 30, 2016, the Fund paid BIM $1,606,409 for securities lending agent services.
Officer and Directors
Certain officers and/or directors of the Fund are officers and/or directors of BlackRock or its affiliates. The Fund reimburses the Manager for a portion of the compensation paid to the Fund’s Chief Compliance Officer, which is included in Officer and Directors in the Consolidated Statement of Operations.
| | | | | | |
| | | | | | | |
| | BLACKROCK GLOBAL ALLOCATION FUND, INC. | | APRIL 30, 2016 | | 53 |
| | | | |
| Notes to Consolidated Financial Statements (continued) | | |
Other Transactions
The Fund may purchase securities from, or sell securities to, an affiliated fund provided the affiliation is due solely to having a common investment advisor, common officers, or common directors. For the six months ended April 30, 2016, the purchase and sale transactions with an affiliated fund in compliance with Rule 17a-7 under the 1940 Act were as follows:
| | | | | | | | |
| | | Purchases | | | Sales | |
| | | $ | 32,284,301 | | | $ | 33,182,792 | |
7. Purchases and Sales:
For the six months ended April 30, 2016, purchases and sales of investments including paydowns and mortgage dollar rolls and excluding short-term securities were as follows:
| | | | | | | | |
| | | Purchases | | | Sales | |
Non-U.S. Government Securities | | $ | 15,390,145,180 | | | $ | 15,506,982,189 | |
U.S. Government Securities | | $ | 9,188,817,204 | | | $ | 5,837,190,208 | |
Purchases and sales related to mortgage dollar rolls for the six months ended April 30, 2016 were as follows:
| | | | | | | | |
| | | Purchases | | | Sales | |
MDRs | | $ | 645,276,340 | | | $ | 649,272,911 | |
8. Income Tax Information:
It is the Fund’s policy to comply with the requirements of the Internal Revenue Code of 1986, as amended, applicable to regulated investment companies, and to distribute substantially all of its taxable income to its shareholders. Therefore, no federal income tax provision is required.
The Fund files U.S. federal and various state and local tax returns. No income tax returns are currently under examination. The statute of limitations on the Fund’s U.S. federal tax returns remains open for each of the four years ended October 31, 2015. The statutes of limitations on the Fund’s state and local tax returns may remain open for an additional year depending upon the jurisdiction.
Management has analyzed tax laws and regulations and their application to the Fund as of April 30, 2016, inclusive of the open tax return years, and does not believe there are any uncertain tax positions that require recognition of a tax liability in the Fund’s financial statements.
As of April 30, 2016, gross unrealized appreciation and depreciation based on cost for federal income tax purposes were as follows:
| | | | |
Tax cost | | $ | 46,539,717,991 | |
| | | | |
Gross unrealized appreciation | | $ | 5,394,725,655 | |
Gross unrealized depreciation | | | (2,706,818,650 | ) |
| | | | |
Net unrealized appreciation | | $ | 2,687,907,005 | |
| | | | |
9. Bank Borrowings:
The Fund, along with certain other funds managed by the Manager and its affiliates (“Participating Funds”), is a party to a 364-day, $2.1 billion credit agreement with a group of lenders. Under this agreement, the Fund may borrow to fund shareholder redemptions. Excluding commitments designated for certain individual funds, the Participating Funds, including the Fund, can borrow up to an aggregate commitment amount of $1.6 billion at any time outstanding, subject to asset coverage and other limitations as specified in the agreement. The credit agreement has the following terms: a fee of 0.12% per annum on unused commitment amounts and interest at a rate equal to the higher of (a) one-month LIBOR (but, in any event, not less than 0.00%) on the date the loan is made plus 0.80% per annum or (b) the Fed Funds rate (but, in any event, not less than 0.00%) in effect from time to time plus 0.80% per annum on amounts borrowed. The agreement expires in April 2017 unless extended or renewed. Prior to April 21, 2016, a fee per annum was 0.06% on unused commitment amounts and interest at a rate equal to the higher of (a) one-month LIBOR (but, in any event, not less than 0.00%) on the date the loan is made plus 0.80% per annum or (b) the Fed Funds rate (but, in any event, not less than 0.00%) in effect from time to time plus 0.80% per annum on amounts borrowed. Participating Funds paid administration, legal and arrangement fees, which, if applicable, are included in miscellaneous expenses in the Consolidated Statement of Operations. These fees were allocated among such funds based upon portions of the aggregate commitment available to them and relative net assets of Participating Funds. During the six months ended April 30. 2016, the Fund did not borrow under the credit agreement.
| | | | | | |
| | | | | | | |
| 54 | | BLACKROCK GLOBAL ALLOCATION FUND, INC. | | APRIL 30, 2016 | | |
| | |
| Notes to Consolidated Financial Statements (continued) | | |
10. Principal Risks:
In the normal course of business, the Fund invests in securities and enters into transactions where risks exist due to fluctuations in the market (market risk) or failure of the issuer to meet all its obligations, including the ability to pay principal and interest when due (issuer credit risk). The value of securities held by the Fund may decline in response to certain events, including those directly involving the issuers of securities owned by the Fund. Changes arising from the general economy, the overall market and local, regional or global political and/or social instability, as well as currency, interest rate and price fluctuations, may also affect the securities’ value.
The Fund may be exposed to prepayment risk, which is the risk that borrowers may exercise their option to prepay principal earlier than scheduled during periods of declining interest rates, which would force the Fund to reinvest in lower yielding securities. The Fund may also be exposed to reinvestment risk, which is the risk that income from the Fund’s portfolio will decline if the Fund invests the proceeds from matured, traded or called fixed income securities at market interest rates that are below the Fund portfolio’s current earnings rate.
Counterparty Credit Risk: Similar to issuer credit risk, the Fund may be exposed to counterparty credit risk, or the risk that an entity may fail to or be unable to perform on its commitments related to unsettled or open transactions. The Fund manages counterparty credit risk by entering into transactions only with counterparties that the Manager believes have the financial resources to honor their obligations and by monitoring the financial stability of those counterparties. Financial assets, which potentially expose the Fund to market, issuer and counterparty credit risks, consist principally of financial instruments and receivables due from counterparties. The extent of the Fund’s exposure to market, issuer and counterparty credit risks with respect to these financial assets is approximately their value recorded in the Consolidated Statement of Assets and Liabilities, less any collateral held by the Fund.
A derivative contract may suffer a mark-to-market loss if the value of the contract decreases due to an unfavorable change in the market rates or values of the underlying instrument. Losses can also occur if the counterparty does not perform under the contract.
The Fund’s risk of loss from counterparty credit risk on OTC derivatives is generally limited to the aggregate unrealized gain less the value of any collateral held by the Fund.
For OTC options purchased, the Fund bears the risk of loss of the amount of the premiums paid plus the positive change in market values net of any collateral held by the Fund should the counterparty fail to perform under the contracts. Options written by the Fund do not typically give rise to counterparty credit risk, as options written generally obligate the Fund, and not the counterparty, to perform. The Fund may be exposed to counterparty credit risk with respect to options written to the extent the Fund deposits collateral with its counterparty to a written option.
With exchange-traded options purchased and futures and centrally cleared swaps, there is less counterparty credit risk to the Fund since the exchange or clearinghouse, as counterparty to such instruments, guarantees against a possible default. The clearinghouse stands between the buyer and the seller of the contract; therefore, credit risk is limited to failure of the clearinghouse. While offset rights may exist under applicable law, the Fund does not have a contractual right of offset against a clearing broker or clearinghouse in the event of a default (including the bankruptcy or insolvency). Additionally, credit risk exists in exchange-traded futures and centrally cleared swaps with respect to initial and variation margin that is held in a clearing broker’s customer accounts. While clearing brokers are required to segregate customer margin from their own assets, in the event that a clearing broker becomes insolvent or goes into bankruptcy and at that time there is a shortfall in the aggregate amount of margin held by the clearing broker for all its clients, typically the shortfall would be allocated on a pro rata basis across all the clearing broker’s customers, potentially resulting in losses to the Fund.
Concentration Risk: The Fund invests a substantial amount of its assets in issuers located in a single country or a limited number of countries. When the Fund concentrates its investments in this manner, it assumes the risk that economic, political and social conditions in those countries may have a significant impact on their investment performance. Foreign issuers may not be subject to the same uniform accounting, auditing and financial reporting standards and practices as used in the United States. Foreign securities markets may also be less liquid, more volatile and less subject to governmental supervision not typically associated with investing in U.S. securities. Investment percentages in specific countries are presented in the Consolidated Schedule of Investments.
The Fund invests a significant portion of its assets in fixed-income securities and/or uses derivatives tied to the fixed-income markets. Changes in market interest rates or economic conditions may affect the value and/or liquidity of such investments. Interest rate risk is the risk that prices of bonds and other fixed-income securities will increase as interest rates fall and decrease as interest rates rise. The Fund may be subject to a greater risk of rising interest rates due to the current period of historically low rates.
| | | | | | |
| | | | | | | |
| | BLACKROCK GLOBAL ALLOCATION FUND, INC. | | APRIL 30, 2016 | | 55 |
| | | | |
| Notes to Consolidated Financial Statements (concluded) | | |
As of period end, the Fund’s investments had the following industry classifications:
| | | | |
| Industry | | Percent of
Long-Term Investments | |
Bank | | | 6 | % |
Oil, Gas & Consumable Fuels | | | 5 | |
Pharmaceuticals | | | 5 | |
Other1 | | | 84 | |
| | 1 | | Consists of U.S. Treasury Obligations and Foreign Government Obligations (25%), all other industries less than 5% of long-term investments (59%). |
11. Capital Share Transactions:
Transactions in capital shares for each class were as follows:
| | | | | | | | | | | | | | | | | | |
| | | Six Months Ended
April 30, 2016 | | | | | Year Ended
October 31, 2015 | |
| | | Shares | | | Amount | | | | | Shares | | | Amount | |
| Institutional | | | | | | | | | | | | | | | | | | |
Shares sold | | | 136,079,695 | | | $ | 2,435,924,676 | | | | | | 198,137,831 | | | $ | 4,033,806,809 | |
Shares issued to shareholders in reinvestment of distributions | | | 84,341,321 | | | | 1,500,432,396 | | | | | | 88,541,465 | | | | 1,742,728,283 | |
Shares redeemed | | | (197,764,571 | ) | | | (3,604,846,332 | ) | | | | | (283,809,571 | ) | | | (5,808,229,917 | ) |
| | | | | | | | | | |
Net increase (decrease) | | | 22,656,445 | | | $ | 331,510,740 | | | | | | 2,869,725 | | | $ | (31,694,825 | ) |
| | | | | | | | | | |
| | | | | | | | | | | | | | | | | | |
| Investor A | | | | | | | | | | | | | | | | | | |
Shares sold | | | 56,358,361 | | | $ | 1,012,161,107 | | | | | | 104,279,701 | | | $ | 2,114,934,349 | |
Shares issued to shareholders in reinvestment of distributions | | | 68,832,802 | | | | 1,218,341,676 | | | | | | 72,294,043 | | | | 1,414,821,009 | |
Shares redeemed | | | (114,152,883 | ) | | | (2,059,090,438 | ) | | | | | (187,819,520 | ) | | | (3,805,078,899 | ) |
| | | | | | | | | | |
Net increase (decrease) | | | 11,038,280 | | | $ | 171,412,345 | | | | | | (11,245,776 | ) | | $ | (275,323,541 | ) |
| | | | | | | | | | |
| | | | | | | | | | | | | | | | | | |
| Investor B | | | | | | | | | | | | | | | | | | |
Shares sold | | | 18,927 | | | $ | 332,638 | | | | | | 79,111 | | | $ | 1,568,173 | |
Shares issued to shareholders in reinvestment of distributions | | | 757,798 | | | | 13,087,172 | | | | | | 1,204,126 | | | | 22,986,730 | |
Shares redeemed | | | (3,855,688 | ) | | | (67,001,293 | ) | | | | | (7,206,587 | ) | | | (143,331,269 | ) |
| | | | | | | | | | |
Net decrease | | | (3,078,963 | ) | | $ | (53,581,483 | ) | | | | | (5,923,350 | ) | | $ | (118,776,366 | ) |
| | | | | | | | | | |
| | | | | | | | | | | | | | | | | | |
| Investor C | | | | | | | | | | | | | | | | | | |
Shares sold | | | 35,073,255 | | | $ | 568,557,368 | | | | | | 73,316,764 | | | $ | 1,366,789,759 | |
Shares issued to shareholders in reinvestment of distributions | | | 68,596,464 | | | | 1,106,462,321 | | | | | | 70,612,958 | | | | 1,268,717,235 | |
Shares redeemed | | | (115,932,118 | ) | | | (1,907,055,125 | ) | | | | | (165,020,273 | ) | | | (3,074,566,720 | ) |
| | | | | | | | | | |
Net decrease | | | (12,262,399 | ) | | $ | (232,035,436 | ) | | | | | (21,090,551 | ) | | $ | (439,059,726 | ) |
| | | | | | | | | | |
| | | | | | | | | | | | | | | | | | |
| Class R | | | | | | | | | | | | | | | | | | |
Shares sold | | | 10,493,376 | | | $ | 180,311,862 | | | | | | 13,860,593 | | | $ | 268,625,117 | |
Shares issued to shareholders in reinvestment of distributions | | | 5,935,563 | | | | 100,548,434 | | | | | | 5,734,133 | | | | 107,765,431 | |
Shares redeemed | | | (10,297,085 | ) | | | (176,644,143 | ) | | | | | (17,907,156 | ) | | | (349,827,886 | ) |
| | | | | | | | | | |
Net increase | | | 6,131,854 | | | $ | 104,216,153 | | | | | | 1,687,570 | | | $ | 26,562,662 | |
| | | | | | | | | | |
Total Net Increase (decrease) | | | 24,485,217 | | | $ | 321,522,319 | | | | | | (33,702,382 | ) | | $ | (838,291,796 | ) |
| | | | | | | | | | |
12. Subsequent Events:
Management has evaluated the impact of all subsequent events on the Fund through the date the consolidated financial statements were issued and has determined that there were no subsequent events requiring adjustment or additional disclosure in the consolidated financial statements.
| | | | | | |
| | | | | | | |
| 56 | | BLACKROCK GLOBAL ALLOCATION FUND, INC. | | APRIL 30, 2016 | | |
Robert M. Hernandez, Chair of the Board and Director
Fred G. Weiss, Vice Chair of the Board and Director
James H. Bodurtha, Director
Bruce R. Bond, Director
Valerie G. Brown, Director
Donald W. Burton, Director
Honorable Stuart E. Eizenstat, Director
Robert Fairbairn, Director
Kenneth A. Froot, Director
Henry Gabbay, Director
John F. O’Brien, Director
Donald C. Opatrny, Director
Roberta Cooper Ramo, Director
David H. Walsh, Director
John M. Perlowski, Director, President and Chief Executive Officer
Jennifer McGovern, Vice President
Neal J. Andrews, Chief Financial Officer
Jay M. Fife, Treasurer
Charles Park, Chief Compliance Officer
Fernanda Piedra, Anti-Money Laundering Compliance Officer
Benjamin Archibald, Secretary
Effective May 6, 2016, Valerie G. Brown resigned as a Director of the Fund.
Effective May 10, 2016, Kenneth A. Froot resigned as a Director of the Fund.
On June 2, 2016, the Board appointed Henry R. Keizer as a Director of the Fund, effective July 28, 2016.
| | | | | | |
| | | | |
Investment Advisor BlackRock Advisors, LLC Wilmington, DE 19809 | | Custodian Brown Brothers Harriman & Co. Boston, MA 02109 | | Distributor BlackRock Investments, LLC
New York, NY 10022 | | Address of the Fund
100 Bellevue Parkway
Wilmington, DE 19809 |
| | | |
| | Transfer Agent BNY Mellon Investment
Servicing (U.S.) Inc.
Wilmington, DE 19809 | | Independent Registered
Public Accounting Firm
Deloitte & Touche LLP
Boston, MA 02116 | | |
| | | |
| | Accounting Agent State Street Bank and Trust Company Boston, MA 02110 | | Legal Counsel Willkie Farr & Gallagher LLP New York, NY 10019 | | |
| | | | | | |
| | | | | | | |
| | BLACKROCK GLOBAL ALLOCATION FUND, INC. | | APRIL 30, 2016 | | 57 |
Householding
The Fund will mail only one copy of shareholder documents, including prospectuses, annual and semi-annual reports and proxy statements, to shareholders with multiple accounts at the same address. This practice is commonly called “householding” and is intended to reduce expenses and eliminate duplicate mailings of shareholder documents. Mailings of your shareholder documents may be householded indefinitely unless you instruct us otherwise. If you do not want the mailing of these documents to be combined with those for other members of your household, please call the Fund at (800) 441-7762.
Availability of Quarterly Schedule of Investments
The Fund files its complete schedule of portfolio holdings with the SEC for the first and third quarters of each fiscal year on Form N-Q. The Fund’s Forms N-Q are available on the SEC’s website at http://www.sec.gov and may also be reviewed and copied at the SEC’s Public Reference Room in Washington, DC. Information on how to access documents on the SEC’s website without charge may be obtained by calling (800) SEC-0330. The Fund’s Forms N-Q may also be obtained upon request and without charge by calling (800) 441-7762.
Availability of Proxy Voting Policies and Procedures
A description of the policies and procedures that the Fund uses to determine how to vote proxies relating to portfolio securities is available upon request and without charge (1) by calling (800) 441-7762; (2) at http://www.blackrock.com; and (3) on the SEC’s website at http://www.sec.gov.
Availability of Proxy Voting Record
Information about how the Fund voted proxies relating to securities held in the Fund’s portfolio during the most recent 12-month period ended June 30 is available upon request and without charge (1) at http://www.blackrock.com or by calling (800) 441-7762 and (2) on the SEC’s website at http://www.sec.gov.
BlackRock’s Mutual Fund Family
BlackRock offers a diverse lineup of open-end mutual funds crossing all investment styles and managed by experts in equity, fixed income and tax-exempt investing. Visit http://www.blackrock.com for more information.
Account Information
Call us at (800) 441-7762 from 8:00 AM to 6:00 PM EST on any business day to get information about your account balances, recent transactions and share prices. You can also reach us on the Web at http://www.blackrock.com/funds.
Automatic Investment Plans
Investor Class shareholders who want to invest regularly can arrange to have $50 or more automatically deducted from their checking or savings account and invested in any of the BlackRock funds.
Systematic Withdrawal Plans
Investor Class shareholders can establish a systematic withdrawal plan and receive periodic payments of $50 or more from their BlackRock funds, as long as their account balance is at least $10,000.
Retirement Plans
Shareholders may make investments in conjunction with Traditional, Rollover, Roth, Coverdell, Simple IRAs, SEP IRAs and 403(b) Plans.
| | | | | | |
| | | | | | | |
| 58 | | BLACKROCK GLOBAL ALLOCATION FUND, INC. | | APRIL 30, 2016 | | |
| | |
| Additional Information (concluded) | | |
|
| BlackRock Privacy Principles |
BlackRock is committed to maintaining the privacy of its current and former fund investors and individual clients (collectively, “Clients”) and to safeguarding their non-public personal information. The following information is provided to help you understand what personal information BlackRock collects, how we protect that information and why in certain cases we share such information with select parties.
If you are located in a jurisdiction where specific laws, rules or regulations require BlackRock to provide you with additional or different privacy-related rights beyond what is set forth below, then BlackRock will comply with those specific laws, rules or regulations.
BlackRock obtains or verifies personal non-public information from and about you from different sources, including the following: (i) information we receive from you or, if applicable, your financial intermediary, on applications, forms or other documents; (ii) information about your transactions with us, our affiliates, or others; (iii) information we receive from a consumer reporting agency; and (iv) from visits to our websites.
BlackRock does not sell or disclose to non-affiliated third parties any non-public personal information about its Clients, except as permitted by law or as is necessary to respond to regulatory requests or to service Client accounts. These non-affiliated third parties are required to protect the confidentiality and security of this information and to use it only for its intended purpose.
We may share information with our affiliates to service your account or to provide you with information about other BlackRock products or services that may be of interest to you. In addition, BlackRock restricts access to non-public personal information about its Clients to those BlackRock employees with a legitimate business need for the information. BlackRock maintains physical, electronic and procedural safeguards that are designed to protect the non-public personal information of its Clients, including procedures relating to the proper storage and disposal of such information.
| | | | | | |
| | | | | | | |
| | BLACKROCK GLOBAL ALLOCATION FUND, INC. | | APRIL 30, 2016 | | 59 |
This report is intended for current holders. It is not authorized for use as an offer of sale or a solicitation of an offer to buy shares of the Fund unless preceded or accompanied by the Fund’s current prospectus. Past performance results shown in this report should not be considered a representation of future performance. Investment returns and principal value of shares will fluctuate so that shares, when redeemed, may be worth more or less than their original cost. Statements and other information herein are as dated and are subject to change.

| | |
| GA-4/16-SAR | |  |
| Item 2 – | Code of Ethics – Not Applicable to this semi-annual report |
| Item 3 – | Audit Committee Financial Expert – Not Applicable to this semi-annual report |
| Item 4 – | Principal Accountant Fees and Services – Not Applicable to this semi-annual report |
| Item 5 – | Audit Committee of Listed Registrants – Not Applicable |
| | (a) The registrant’s Schedule of Investments is included as part of the Report to Stockholders filed under Item 1 of this Form. |
| | (b) Not Applicable due to no such divestments during the semi-annual period covered since the previous Form N-CSR filing. |
| Item 7 – | Disclosure of Proxy Voting Policies and Procedures for Closed-End Management Investment Companies – Not Applicable |
| Item 8 – | Portfolio Managers of Closed-End Management Investment Companies – Not Applicable |
| Item 9 – | Purchases of Equity Securities by Closed-End Management Investment Company and Affiliated Purchasers – Not Applicable |
| Item 10 – | Submission of Matters to a Vote of Security Holders –There have been no material changes to these procedures. |
| Item 11 – | Controls and Procedures |
| | (a) – The registrant’s principal executive and principal financial officers, or persons performing similar functions, have concluded that the registrant’s disclosure controls and procedures (as defined in Rule 30a-3(c) under the Investment Company Act of 1940, as amended (the “1940 Act”)) are effective as of a date within 90 days of the filing of this report based on the evaluation of these controls and procedures required by Rule 30a-3(b) under the 1940 Act and Rule 15d-15(b) under the Securities Exchange Act of 1934, as amended. | |
| | (b) – There were no changes in the registrant’s internal control over financial reporting (as defined in Rule 30a-3(d) under the 1940 Act) that occurred during the second fiscal quarter of the period covered by this report that have materially affected, or are reasonably likely to materially affect, the registrant’s internal control over financial reporting. | |
| Item 12 – | Exhibits attached hereto |
| | (a)(1) – Code of Ethics – Not Applicable to this semi-annual report |
| | (a)(2) – Certifications – Attached hereto |
| | (b) – Certifications – Attached hereto |
2
Pursuant to the requirements of the Securities Exchange Act of 1934 and the Investment Company Act of 1940, the registrant has duly caused this report to be signed on its behalf by the undersigned, thereunto duly authorized.
| | |
| BlackRock Global Allocation Fund, Inc. |
| |
| By: | | /s/ John M. Perlowski |
| | John M. Perlowski |
| | Chief Executive Officer (principal executive officer) of |
| | BlackRock Global Allocation Fund, Inc. |
Date: July 1, 2016
Pursuant to the requirements of the Securities Exchange Act of 1934 and the Investment Company Act of 1940, this report has been signed below by the following persons on behalf of the registrant and in the capacities and on the dates indicated.
| | |
| By: | | /s/ John M. Perlowski |
| | John M. Perlowski |
| | Chief Executive Officer (principal executive officer) of |
| | BlackRock Global Allocation Fund, Inc. |
Date: July 1, 2016
| | |
| By: | | /s/ Neal J. Andrews |
| | Neal J. Andrews |
| | Chief Financial Officer (principal financial officer) of |
| | BlackRock Global Allocation Fund, Inc. |
Date: July 1, 2016
3