| UNITED STATES |
| SECURITIES AND EXCHANGE COMMISSION |
| Washington, D.C. 20549 |
FORM N-CSR |
CERTIFIED SHAREHOLDER REPORT OF REGISTERED |
MANAGEMENT INVESTMENT COMPANIES |
| Investment Company Act File Number: 811-2215 |
| T. Rowe Price Small-Cap Value Fund, Inc. |
| (Exact name of registrant as specified in charter) |
| 100 East Pratt Street, Baltimore, MD 21202 |
| (Address of principal executive offices) |
| David Oestreicher |
| 100 East Pratt Street, Baltimore, MD 21202 |
| (Name and address of agent for service) |
| Registrant’s telephone number, including area code: (410) 345-2000 |
| Date of fiscal year end: December 31 |
| Date of reporting period: December 31, 2010 |
Item 1: Report to Shareholders
 |
| Small-Cap Value Fund | December 31, 2010 |
The views and opinions in this report were current as of December 31, 2010. They are not guarantees of performance or investment results and should not be taken as investment advice. Investment decisions reflect a variety of factors, and the managers reserve the right to change their views about individual stocks, sectors, and the markets at any time. As a result, the views expressed should not be relied upon as a forecast of the fund’s future investment intent. The report is certified under the Sarbanes-Oxley Act, which requires mutual funds and other public companies to affirm that, to the best of their knowledge, the information in their financial reports is fairly and accurately stated in all material respects.
REPORTS ON THE WEB
Sign up for our E-mail Program, and you can begin to receive updated fund reports and prospectuses online rather than through the mail. Log in to your account at troweprice.com for more information.
Manager’s Letter
Fellow Shareholders
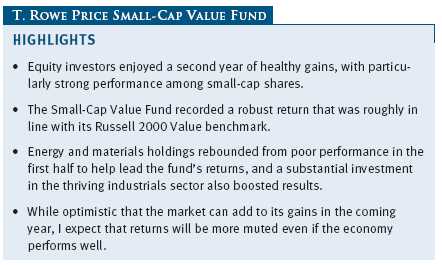
After threatening to stall during the spring and summer, the economic recovery regained momentum in the fall, and a stellar rally in the last few months of 2010 helped stocks record another year of strong gains. Returns were particularly strong for small-cap stocks, which ended the year only 9% below their all-time highs achieved in the summer of 2007. I am happy to report that the Small-Cap Value Fund performed very well in this environment, roughly matching the returns of its Russell benchmark. While I think that further gains lie ahead, I caution investors that we are unlikely to see a repeat of the very strong gains of the last two years.
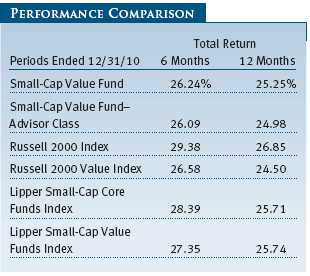
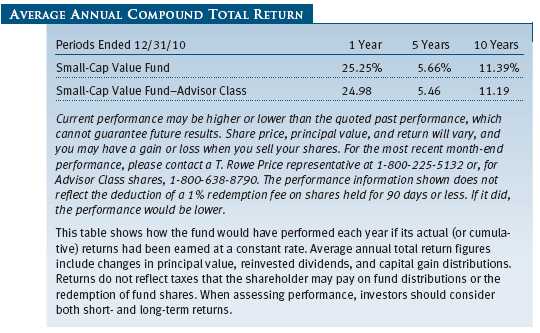
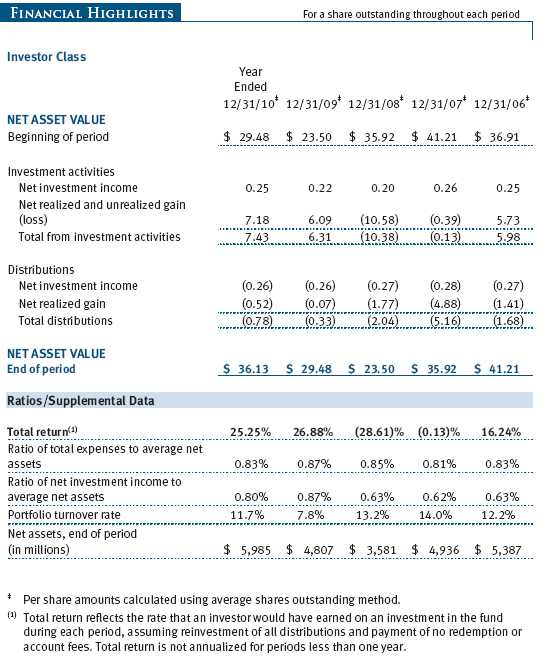
The Small-Cap Value Fund returned 26.24% over the past six months and 25.25% over the past year. The fund performed roughly in line with the Russell 2000 Value Index and its Lipper peer group index. The fund remained very favorably ranked among its peers over longer time periods. (As in past reports, we show results for both the small-cap core and small-cap value funds categories as we think the latter is more compatible with our investment style and objective. Based on cumulative total return, Lipper ranked the Small-Cap Value Fund 419 of 797, 164 of 706, 160 of 569, and 21 of 330 small-cap core funds for the 1-, 3-, 5-, and 10-year periods ended December 31, 2010, respectively. Results will vary for other periods. Past performance cannot guarantee future results.)
MARKET ENVIRONMENT
The U.S. economy continued to recover in 2010, although the pace of growth slowed considerably at midyear. After growing sharply in May, private sector hiring fell back significantly in June, and gross domestic product increased at less than half the pace in the second quarter as it had in the first. A number of culprits may have been to blame for the slowdown, including reverberations from a sovereign debt crisis in Europe, the end of the homebuyer tax credit, and the waning impact of government stimulus measures. With nerves already frayed, investors had to endure a sharp downturn in stock prices in the spring, punctuated by the “flash crash” of May 6, which saw the major indexes plunge nearly 10% in minutes before recovering most of their losses just as quickly. The flash crash itself was eventually attributed to a glitch in electronic trading, but stock prices continued to slump through June.
While many began to worry that the economy might experience a “double dip” recession, signs of renewed economic strength later in the year suggested that the recovery remained on track. Both the service and manufacturing sectors continued to expand, and consumers proved willing to spend income gains. Exports remained a bright spot for corporate profits and the economy as a whole as emerging markets in particular continued to benefit from growing domestic consumption fed by burgeoning middle classes. Two dark clouds remained on the U.S. economic horizon, however. First, the housing sector continued to languish, with sales and construction stuck at low levels while home prices ended the year falling again across the country, according to the latest available data. Second, rising corporate profits failed to boost the weak labor market. Private employers added jobs throughout most of the year but at a meager pace that kept the unemployment rate near 10%.
Continued weakness in the job market encouraged further government stimulus, both monetary and fiscal. After trading sideways through much of the summer, stocks began climbing in late August amid hopes for new stimulus measures from the Federal Reserve. On November 3, Fed officials announced that they had agreed on a plan to buy $600 billion of longer-term Treasuries by mid-2011 in an effort to lower borrowing costs and add liquidity to the financial system. In December, stocks marched still higher when the White House and Congressional Republicans announced a deal to extend existing tax rates and unemployment benefits while introducing a new payroll tax cut.

Small-cap value stocks rallied strongly over the past six months, if not quite as much as their growth counterparts. Small-caps fared well relative to other market capitalizations, outperforming large-caps handily for the year, while modestly outpacing mid-caps.
PORTFOLIO ACTIVITY
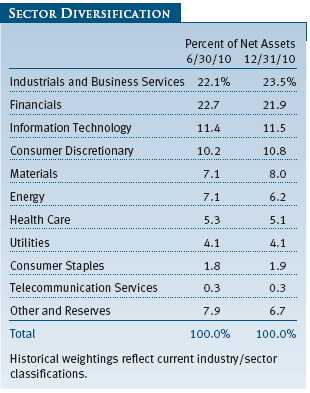
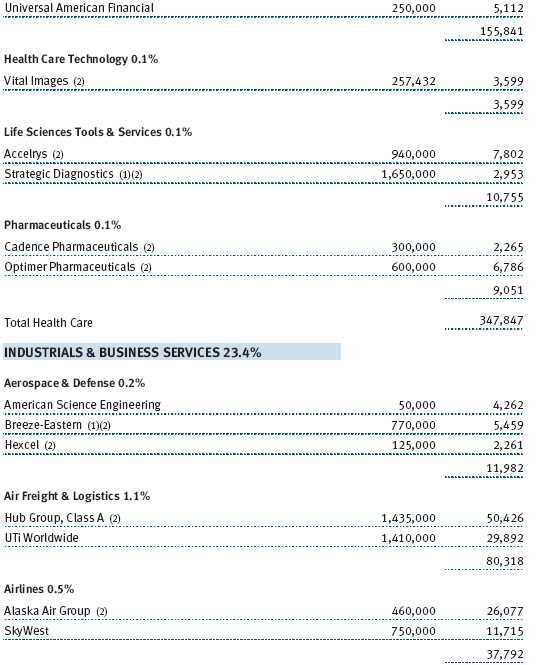
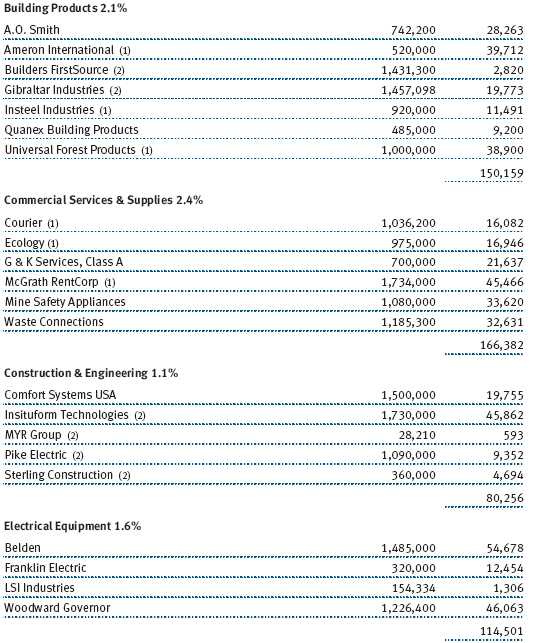
In a year of such strong returns, it is not surprising to note that the large majority of our holdings advanced for the year, as did every sector but one—telecommunication services. We saw our largest contribution from the industrials and business services sector, which has long been an area of emphasis for the fund. Our top contributor within the sector was 3D Systems, a company we have owned without much reward for several years. The company produces systems that make three-dimensional objects directly from computer models. The systems are mostly used today in prototyping and small-batch manufacturing, and the products are high enough in quality to be used for aerospace applications or racing cars. Confident in the technology’s long-term promise and in the company’s CEO, Abe Reichental, we have maintained our investment as 3D Systems worked through design, production, and cost issues. Over the past year, our patience was rewarded as earnings finally came through alongside a rebound in the manufacturing sector as a whole. Other top performers in the sector included Genesee & Wyoming, a short-haul railroad whose performance we have celebrated in previous letters, as well as industrial conglomerate Raven Industries. (Please refer to the fund’s portfolio of investments for a complete list of holdings and the amount each represents in the portfolio.)
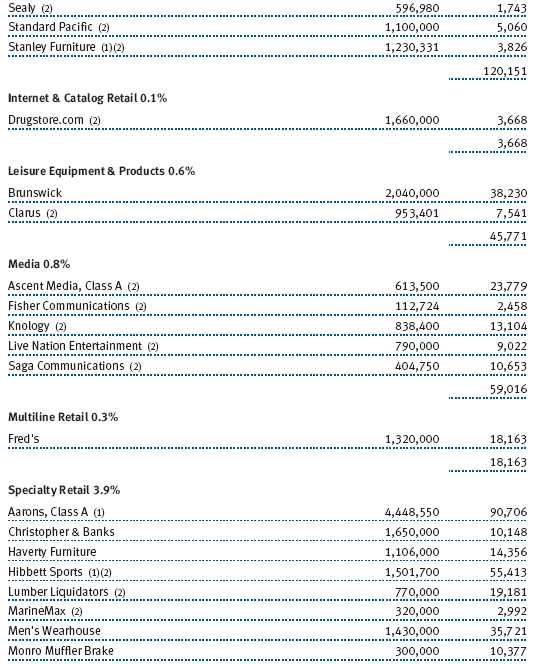
In a remarkable turnaround, our top individual contributor for the year was home and office furnishings rental firm Aaron’s. In our semiannual letter, we described how our position in the company had weighed heavily on results early in the year as investors shunned consumer discretionary firms, especially those with ties to the languishing housing sector. Aaron’s stock came roaring back in the second half, however, due to improving current operating results and a brighter outlook for 2011. To be sure, we did not have such happy results from all housing-related retailers in the portfolio. Haverty Furniture and Lumber Liquidators weighed heavily on returns for the year, as did general discount retailer Stein Mart.
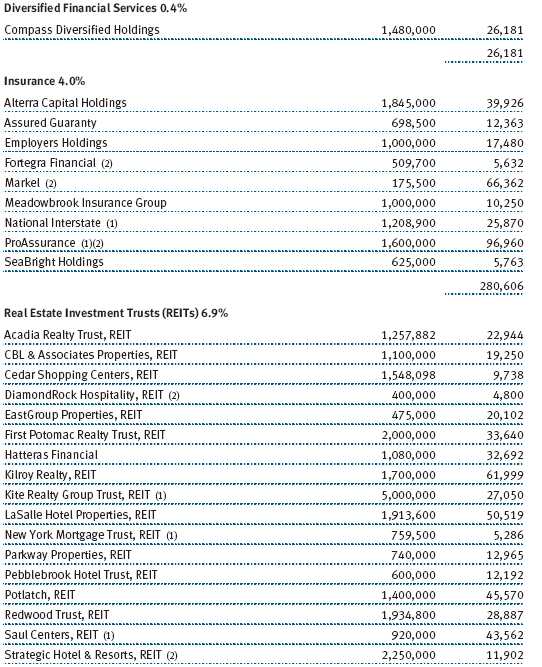
Financials contributed nicely to the fund’s results for the year, thanks largely to decent performance from our extensive holdings among real estate investment trusts (REITs). Unlike the residential market, commercial real estate has shown signs of a sustained recovery. Shopping center operator Saul Centers has benefited from an improvement in retail sales, while Kilroy Realty has enjoyed success in the challenging southern California office space market. Our disappointments in the financials sector included capital markets firms Piper Jaffray and Gleacher, a new addition to the portfolio. Narrowing net interest rates and a weak commercial lending environment weighed on many of our regional banks, such as Home BancShares. Generally, we did well by being underweight in financials, which represent well more than one-third of the Russell 2000 Value Index—an imprudently high weighting, in our opinion, for a single sector in a diversified portfolio.
Strength in commodity prices helped materials holdings rebound from a weak first half and end the year with strong gains. The fund’s energy holdings, although only a small portion of the portfolio, were also very strong after weakness early in the year. Our most notable contributor was Whiting Petroleum, an oil company with extensive drilling rights in the productive Bakken Shale formation in North Dakota and Montana. We made our first investment in the company in late 2003, and we added to our holdings periodically over the following years. We were attracted to the company in part by its astute management team, which proved forward-thinking in acquiring land in North Dakota and applying new production techniques, such as horizontal drilling and hydraulic fracturing. We sold most of our stake in the company over the past six months as Whiting’s market cap has grown too large for our small-cap focus, but not before our fund’s investment in Whiting had created over $130 million in profits for our shareholders.
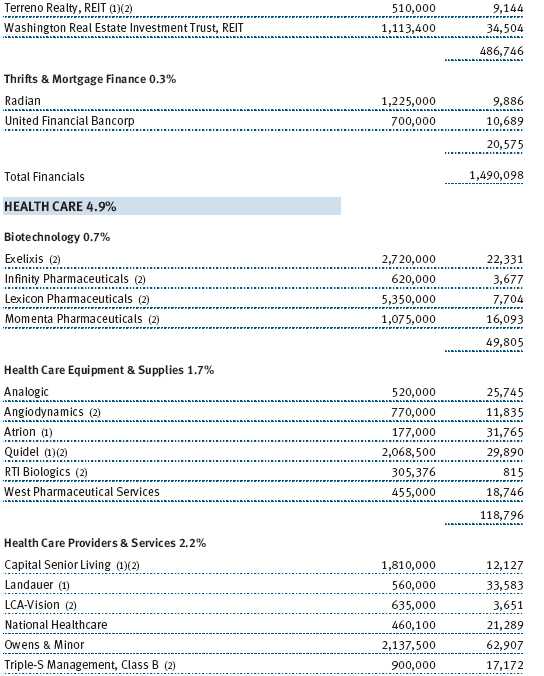
The laggards in the portfolio over the past year were spread out over a number of sectors. Premiere Global Services, which offers video- and Web-based teleconferencing, dragged down our results in the telecommunication services sector. Several of our biotechnology holdings performed poorly, including Exelixis, Myriad Genetics, and Incyte, the latter two of which we eliminated from the portfolio. Poor results from Coca-Cola Bottling were partly responsible for our consumer staples holdings lagging other segments of the fund. While oil companies benefited from rising prices, falling natural gas prices hindered holdings such as Penn Virginia, which produces mostly natural gas. Perhaps in a hopeful sign for the overall economy, bankruptcy consultant FTI Consulting declined following disappointing results and lowered guidance.
PURCHASE AND SALE ACTIVITY
Many of our purchases over the past six months resulted from a favorable need to readjust the portfolio following the sale of successful holdings. This was particularly true in the case of Whiting Petroleum, which we replaced with Oasis Petroleum and Northern Oil & Gas, two other firms with operations in the Bakken Shale, as well as southern California-based Venoco and Gulf of Mexico operator Contango. Similarly, we replaced most of a successful investment in semiconductor maker Microsemi with additional purchases of Cymer, a producer of semiconductor capital equipment.
As usual, some sales followed the announced takeover of one of our holdings, but the pace of acquisitions remains lower than it was a few years ago. The energy industry has been a focus of recent takeover activity, and we eliminated takeover targets Arena Resources and Superior Well Services. Of course, not all of our trades followed happy outcomes. In the case of Corinthian Colleges, we decided to take our losses and move on. The for-profit education business has come under scrutiny due to high default rates on student loans. While we still believe the industry has a viable business model, we determined that Corinthian was poorly positioned to adapt to new regulations coming from Washington.
OUTLOOK
The economic recovery appears to have recently entered a more secure phase. The drastic imbalances that characterized the global economy in recent years have diminished, and central banks remain committed to providing stimulus. While many investors are focused on the debt woes of several European countries, I believe the biggest concern for the global economy is the potential for inflation. Rapid price increases have already taken hold within commodities, driven in large part by voracious demand from China and India, and they are likely to eventually work their way to the consumer level. For this reason, I am maintaining significant weightings in the energy and materials sectors, with a particular emphasis in the latter on metals and mining firms.
Continued growth in the U.S. and abroad should provide a favorable backdrop for equity prices, but I am mindful that strong gains will be difficult to achieve following a year in which small-cap stock prices increased by well over 20%. Indeed, I would not be surprised to see a correction in the coming months, if just to consolidate gains and drain some of the exuberance from the market. On balance, I expect an up year in 2011 but not on the scale of the past two years.
In line with my moderately positive expectations for the market’s performance, I perceive stock valuations as roughly where they should be—neither sharply undervalued, as they were two years ago, nor particularly pricey in historical terms. Similarly, I do not sense any extraordinary imbalances in the valuations of small-caps relative to large-caps or value shares relative to growth stocks. My team and I continue to search for opportunities in a range of industries as part of the goal of maintaining a highly diversified portfolio with a clear value bias, and I look forward to reporting to you on the progress of our search in six months.
Respectfully submitted,

Preston G. Athey
President of the fund and chairman of its Investment Advisory Committee
January 17, 2011
The committee chairman has day-to-day responsibility for managing the portfolio and works with committee members in developing and executing the fund’s investment program.
RISKS OF STOCK INVESTING
The fund’s share price can fall because of weakness in the stock markets, a particular industry, or specific holdings. Stock markets can decline for many reasons, including adverse political or economic developments, changes in investor psychology, or heavy institutional selling. The prospects for an industry or company may deteriorate because of a variety of factors, including disappointing earnings or changes in the competitive environment. In addition, the investment manager’s assessment of companies held in a fund may prove incorrect, resulting in losses or poor performance even in rising markets.
GLOSSARY
Gross domestic product (GDP): The total market value of all goods and services produced in a country in a given year.
Lipper indexes: Fund benchmarks that consist of a small number (10 to 30) of the largest mutual funds in a particular category as tracked by Lipper Inc.
Price-to-book ratio: A valuation measure that compares a stock’s market price with its book value; i.e., the company’s net worth divided by the number of outstanding shares.
Russell 2000 Index: An unmanaged index that tracks the stocks of 2,000 small U.S. companies.
Russell 2000 Growth Index: An index of those firms in the Russell 2000 with higher price-to-book ratios and higher forecasted growth values.
Russell 2000 Value Index: An index of those firms in the Russell 2000 with lower price-to-book ratios and lower forecasted growth values.

Performance and Expenses
| GROWTH OF $10,000 |
This chart shows the value of a hypothetical $10,000 investment in the fund over the past 10 fiscal year periods or since inception (for funds lacking 10-year records). The result is compared with benchmarks, which may include a broad-based market index and a peer group average or index. Market indexes do not include expenses, which are deducted from fund returns as well as mutual fund averages and indexes.

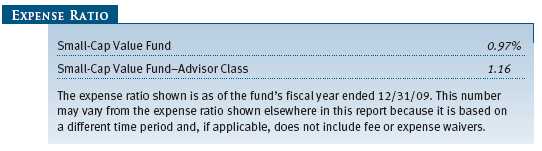
| FUND EXPENSE EXAMPLE |
As a mutual fund shareholder, you may incur two types of costs: (1) transaction costs, such as redemption fees or sales loads, and (2) ongoing costs, including management fees, distribution and service (12b-1) fees, and other fund expenses. The following example is intended to help you understand your ongoing costs (in dollars) of investing in the fund and to compare these costs with the ongoing costs of investing in other mutual funds. The example is based on an investment of $1,000 invested at the beginning of the most recent six-month period and held for the entire period.
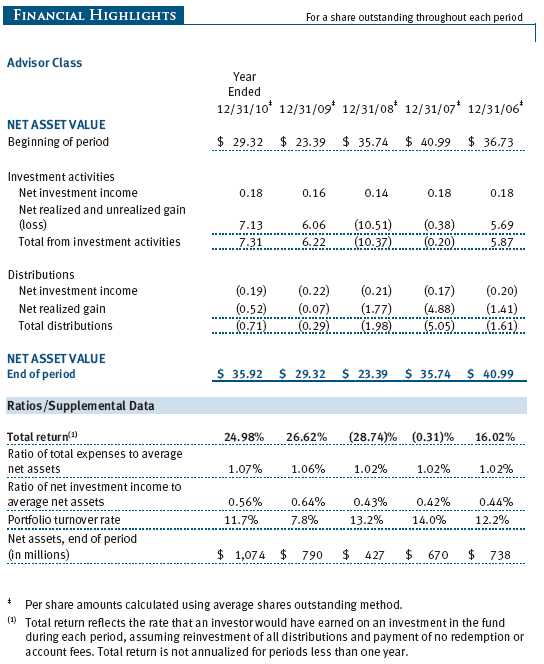
Please note that the fund has two share classes: The original share class (“investor class”) charges no distribution and service (12b-1) fee, and the Advisor Class shares are offered only through unaffiliated brokers and other financial intermediaries and charge a 0.25% 12b-1 fee. Each share class is presented separately in the table.
Actual Expenses
The first line of the following table (“Actual”) provides information about actual account values and expenses based on the fund’s actual returns. You may use the information in this line, together with your account balance, to estimate the expenses that you paid over the period. Simply divide your account value by $1,000 (for example, an $8,600 account value divided by $1,000 = 8.6), then multiply the result by the number in the first line under the heading “Expenses Paid During Period” to estimate the expenses you paid on your account during this period.
Hypothetical Example for Comparison Purposes
The information on the second line of the table (“Hypothetical”) is based on hypothetical account values and expenses derived from the fund’s actual expense ratio and an assumed 5% per year rate of return before expenses (not the fund’s actual return). You may compare the ongoing costs of investing in the fund with other funds by contrasting this 5% hypothetical example and the 5% hypothetical examples that appear in the shareholder reports of the other funds. The hypothetical account values and expenses may not be used to estimate the actual ending account balance or expenses you paid for the period.
Note: T. Rowe Price charges an annual small-account maintenance fee of $10, generally for accounts with less than $2,000 ($500 for UGMA/UTMA). The fee is waived for any investor whose T. Rowe Price mutual fund accounts total $25,000 or more, accounts employing automatic investing, and IRAs and other retirement plan accounts that utilize a prototype plan sponsored by T. Rowe Price (although a separate custodial or administrative fee may apply to such accounts). This fee is not included in the accompanying table. If you are subject to the fee, keep it in mind when you are estimating the ongoing expenses of investing in the fund and when comparing the expenses of this fund with other funds.
You should also be aware that the expenses shown in the table highlight only your ongoing costs and do not reflect any transaction costs, such as redemption fees or sales loads. Therefore, the second line of the table is useful in comparing ongoing costs only and will not help you determine the relative total costs of owning different funds. To the extent a fund charges transaction costs, however, the total cost of owning that fund is higher.

The accompanying notes are an integral part of these financial statements.
The accompanying notes are an integral part of these financial statements.


The accompanying notes are an integral part of these financial statements.

The accompanying notes are an integral part of these financial statements.
The accompanying notes are an integral part of these financial statements.

The accompanying notes are an integral part of these financial statements.
| NOTES TO FINANCIAL STATEMENTS |
T. Rowe Price Small-Cap Value Fund, Inc. (the fund), is registered under the Investment Company Act of 1940 (the 1940 Act) as a diversified, open-end management investment company. The fund seeks long-term capital growth by investing primarily in small companies whose common stocks are believed to be undervalued. The fund has two classes of shares: the Small-Cap Value Fund original share class, referred to in this report as the Investor Class, offered since June 30, 1988, and the Small-Cap Value Fund – Advisor Class (Advisor Class), offered since March 31, 2000. Advisor Class shares are sold only through unaffiliated brokers and other unaffiliated financial intermediaries that are compensated by the class for distribution, shareholder servicing, and/or certain administrative services under a Board-approved Rule 12b-1 plan. Each class has exclusive voting rights on matters related solely to that class; separate voting rights on matters that relate to both classes; and, in all other respects, the same rights and obligations as the other class.
NOTE 1 - SIGNIFICANT ACCOUNTING POLICIES
Basis of Preparation The accompanying financial statements were prepared in accordance with accounting principles generally accepted in the United States of America (GAAP), which require the use of estimates made by fund management. Fund management believes that estimates and valuations are appropriate; however, actual results may differ from those estimates, and the valuations reflected in the accompanying financial statements may differ from the value ultimately realized upon sale or maturity.
Investment Transactions, Investment Income, and Distributions Income and expenses are recorded on the accrual basis. Premiums and discounts on debt securities are amortized for financial reporting purposes. Dividends received from mutual fund investments are reflected as dividend income; capital gain distributions are reflected as realized gain/loss. Dividend income and capital gain distributions are recorded on the ex-dividend date. Income tax-related interest and penalties, if incurred, would be recorded as income tax expense. Investment transactions are accounted for on the trade date. Realized gains and losses are reported on the identified cost basis. Distributions to shareholders are recorded on the ex-dividend date. Income distributions are declared and paid by each class annually. Capital gain distributions, if any, are generally declared and paid by the fund annually.
Currency Translation Assets, including investments, and liabilities denominated in foreign currencies are translated into U.S. dollar values each day at the prevailing exchange rate, using the mean of the bid and asked prices of such currencies against U.S. dollars as quoted by a major bank. Purchases and sales of securities, income, and expenses are translated into U.S. dollars at the prevailing exchange rate on the date of the transaction. The effect of changes in foreign currency exchange rates on realized and unrealized security gains and losses is reflected as a component of security gains and losses.
Class Accounting The Advisor Class pays distribution, shareholder servicing, and/or certain administrative expenses in the form of Rule 12b-1 fees, in an amount not exceeding 0.25% of the class’s average daily net assets. Shareholder servicing, prospectus, and shareholder report expenses incurred by each class are charged directly to the class to which they relate. Expenses common to both classes, investment income, and realized and unrealized gains and losses are allocated to the classes based upon the relative daily net assets of each class.
Rebates and Credits Subject to best execution, the fund may direct certain security trades to brokers who have agreed to rebate a portion of the related brokerage commission to the fund in cash. Commission rebates are reflected as realized gain on securities in the accompanying financial statements and totaled $59,000 for the year ended December 31, 2010. Additionally, the fund earns credits on temporarily uninvested cash balances held at the custodian, which reduce the fund’s custody charges. Custody expense in the accompanying financial statements is presented before reduction for credits, which are reflected as expenses paid indirectly.
Redemption Fees A 1% fee is assessed on redemptions of fund shares held for 90 days or less to deter short-term trading and to protect the interests of long-term shareholders. Redemption fees are withheld from proceeds that shareholders receive from the sale or exchange of fund shares. The fees are paid to the fund and are recorded as an increase to paid-in capital. The fees may cause the redemption price per share to differ from the net asset value per share.
In-Kind Redemptions In accordance with guidelines described in the fund’s prospectus, the fund may distribute portfolio securities rather than cash as payment for a redemption of fund shares (in-kind redemption). For financial reporting purposes, the fund recognizes a gain on in-kind redemptions to the extent the value of the distributed securities on the date of redemption exceeds the cost of those securities. Gains and losses realized on in-kind redemptions are not recognized for tax purposes and are reclassified from undistributed realized gain (loss) to paid-in capital. During the year ended December 31, 2010, the fund realized $1,109,000 of net gain on $734,000 of in-kind redemptions.
New Accounting Pronouncement On January 1, 2010, the fund adopted new accounting guidance that requires enhanced disclosures about fair value measurements in the financial statements. Adoption of this guidance had no impact on the fund’s net assets or results of operations.
NOTE 2 - VALUATION
The fund’s financial instruments are reported at fair value as defined by GAAP. The fund determines the values of its assets and liabilities and computes each class’s net asset value per share at the close of the New York Stock Exchange (NYSE), normally 4 p.m. ET, each day that the NYSE is open for business.
Valuation Methods Equity securities listed or regularly traded on a securities exchange or in the over-the-counter (OTC) market are valued at the last quoted sale price or, for certain markets, the official closing price at the time the valuations are made, except for OTC Bulletin Board securities, which are valued at the mean of the latest bid and asked prices. A security that is listed or traded on more than one exchange is valued at the quotation on the exchange determined to be the primary market for such security. Listed securities not traded on a particular day are valued at the mean of the latest bid and asked prices for domestic securities and the last quoted sale price for international securities.
Debt securities are generally traded in the OTC market. Securities with remaining maturities of one year or more at the time of acquisition are valued at prices furnished by dealers who make markets in such securities or by an independent pricing service, which considers the yield or price of bonds of comparable quality, coupon, maturity, and type, as well as prices quoted by dealers who make markets in such securities. Securities with remaining maturities of less than one year at the time of acquisition generally use amortized cost in local currency to approximate fair value. However, if amortized cost is deemed not to reflect fair value or the fund holds a significant amount of such securities with remaining maturities of more than 60 days, the securities are valued at prices furnished by dealers who make markets in such securities or by an independent pricing service.
Investments in mutual funds are valued at the mutual fund’s closing net asset value per share on the day of valuation.
Other investments, including restricted securities, and those financial instruments for which the above valuation procedures are inappropriate or are deemed not to reflect fair value are stated at fair value as determined in good faith by the T. Rowe Price Valuation Committee, established by the fund’s Board of Directors.
For valuation purposes, the last quoted prices of non-U.S. equity securities may be adjusted under the circumstances described below. If the fund determines that developments between the close of a foreign market and the close of the NYSE will, in its judgment, materially affect the value of some or all of its portfolio securities, the fund will adjust the previous closing prices to reflect what it believes to be the fair value of the securities as of the close of the NYSE. In deciding whether it is necessary to adjust closing prices to reflect fair value, the fund reviews a variety of factors, including developments in foreign markets, the performance of U.S. securities markets, and the performance of instruments trading in U.S. markets that represent foreign securities and baskets of foreign securities. A fund may also fair value securities in other situations, such as when a particular foreign market is closed but the fund is open. The fund uses outside pricing services to provide it with closing prices and information to evaluate and/or adjust those prices. The fund cannot predict how often it will use closing prices and how often it will determine it necessary to adjust those prices to reflect fair value. As a means of evaluating its security valuation process, the fund routinely compares closing prices, the next day’s opening prices in the same markets, and adjusted prices.
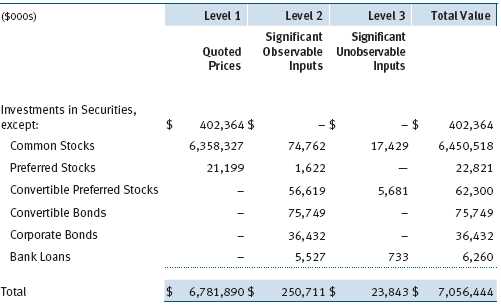
Valuation Inputs Various inputs are used to determine the value of the fund’s financial instruments. These inputs are summarized in the three broad levels listed below:
Level 1 – quoted prices in active markets for identical financial instruments
Level 2 – observable inputs other than Level 1 quoted prices (including, but not limited to, quoted prices for similar financial instruments, interest rates, prepayment speeds, and credit risk)
Level 3 – unobservable inputs
Observable inputs are those based on market data obtained from sources independent of the fund, and unobservable inputs reflect the fund’s own assumptions based on the best information available. The input levels are not necessarily an indication of the risk or liquidity associated with financial instruments at that level. For example, non-U.S. equity securities actively traded in foreign markets generally are reflected in Level 2 despite the availability of closing prices because the fund evaluates and determines whether those closing prices reflect fair value at the close of the NYSE or require adjustment, as described above. The following table summarizes the fund’s financial instruments, based on the inputs used to determine their values on December 31, 2010:
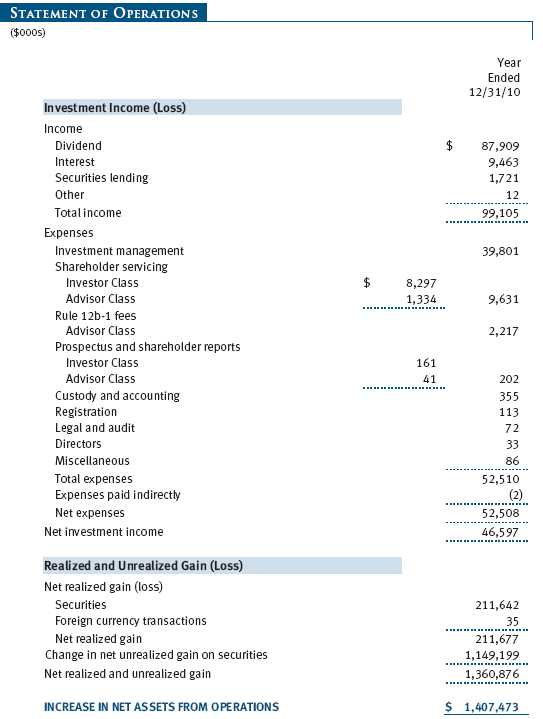
Following is a reconciliation of the fund’s Level 3 holdings for the year ended December 31, 2010. Transfers into and out of Level 3 are reflected at the value of the financial instrument at the beginning of the period. Gain (loss) reflects both realized and change in unrealized gain (loss) on Level 3 holdings during the period, if any, and is included on the accompanying Statement of Operations. The change in unrealized gain (loss) on Level 3 instruments held at December 31, 2010, totaled $1,155,000 for the year ended December 31, 2010.
![]()
NOTE 3 - OTHER INVESTMENT TRANSACTIONS
Consistent with its investment objective, the fund engages in the following practices to manage exposure to certain risks and/or to enhance performance. The investment objective, policies, program, and risk factors of the fund are described more fully in the fund’s prospectus and Statement of Additional Information.
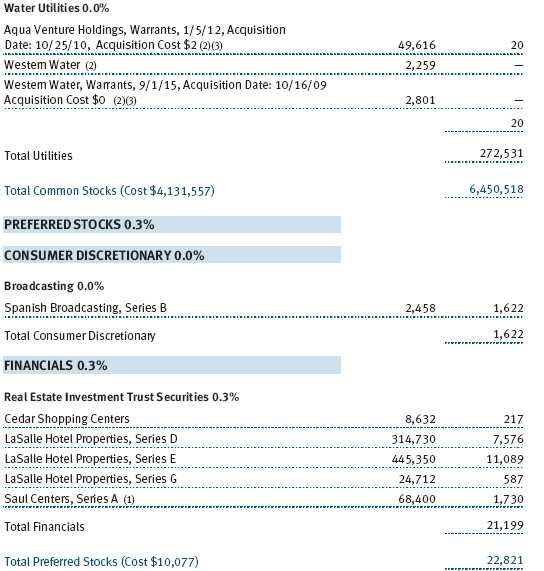
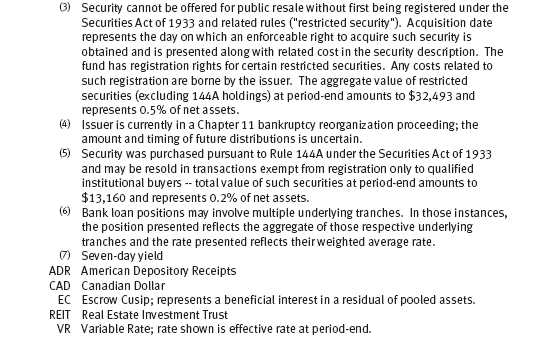
Restricted Securities The fund may invest in securities that are subject to legal or contractual restrictions on resale. Prompt sale of such securities at an acceptable price may be difficult and may involve substantial delays and additional costs.
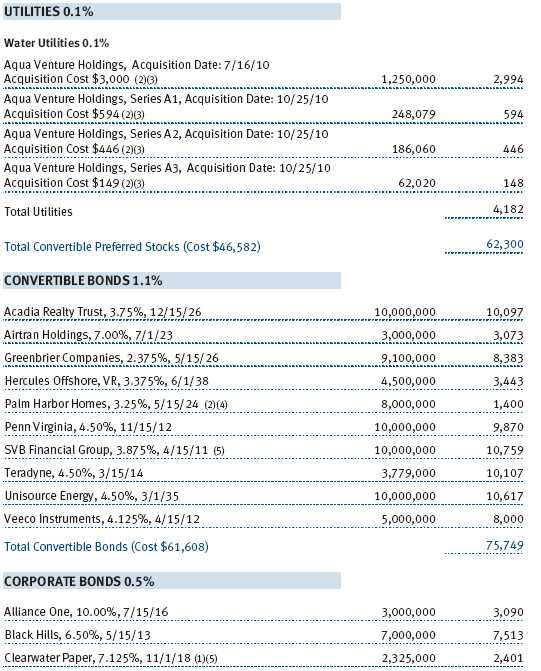
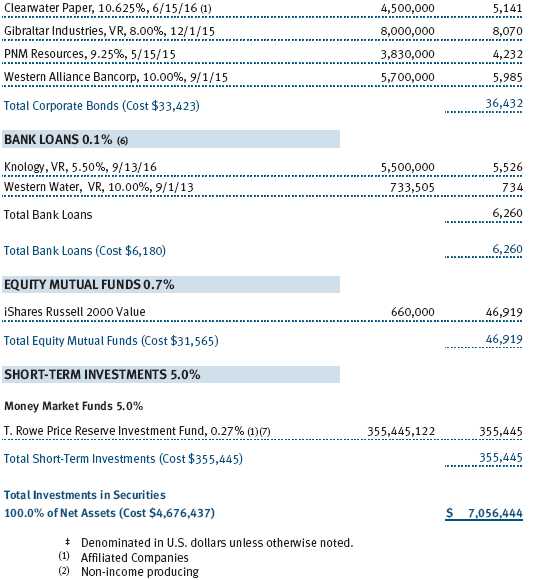
Bank Loans The fund may invest in bank loans, which represent an interest in amounts owed by a borrower to a syndication of lenders. Bank loans may involve multiple loans with the same borrower under a single credit agreement (each loan, a tranche) and each tranche may have different terms and associated risks. A bank or other financial institution typically acts as the agent and administers a bank loan in accordance with the associated credit agreement. Bank loans are generally noninvestment grade and often involve borrowers whose financial condition is troubled or uncertain and companies that are highly leveraged. The fund may buy and sell bank loans in the form of either loan assignments or loan participations. A loan assignment transfers all legal, beneficial, and economic rights to the buyer. Although loan assignments continue to be administered by the agent, the buyer acquires direct rights against the borrower. In many cases, a loan assignment requires the consent of both the borrower and the agent. In contrast, a loan participation generally entitles the buyer to receive the cash flows from principal, interest, and any fee payments that the seller is entitled to receive from the borrower; however, the seller continues to hold legal title to the loan. As a result, with loan participations, the buyer generally has no right to enforce compliance with the terms of the credit agreement against the borrower, and the buyer is subject to the credit risk of both the borrower and the seller. Bank loans often have extended settlement periods, during which the fund is subject to nonperformance by the counterparty. A portion of the fund’s bank loans may require additional principal to be funded at the borrowers’ discretion at a later date (unfunded commitments) and bank loans usually may be repaid at any time at the option of the borrower. The fund reflects both the funded portion of the bank loan as well as any unfunded commitment on the loan in the Portfolio of Investments. At December 31, 2010, the fund’s total unfunded commitments were $315,000.
Securities Lending The fund lends its securities to approved brokers to earn additional income. It receives as collateral cash and U.S. government securities valued at 102% to 105% of the value of the securities on loan. Cash collateral is invested by the fund’s lending agent(s) in accordance with investment guidelines approved by fund management. Although risk is mitigated by the collateral, the fund could experience a delay in recovering its securities and a possible loss of income or value if the borrower fails to return the securities or if collateral investments decline in value. Securities lending revenue recognized by the fund consists of earnings on invested collateral and borrowing fees, net of any rebates to the borrower and compensation to the lending agent. In accordance with GAAP, investments made with cash collateral are reflected in the accompanying financial statements, but collateral received in the form of securities are not. At December 31, 2010, there were no securities on loan.
Other Purchases and sales of portfolio securities other than short-term securities aggregated $774,153,000 and $670,426,000, respectively, for the year ended December 31, 2010.
NOTE 4 - FEDERAL INCOME TAXES
No provision for federal income taxes is required since the fund intends to continue to qualify as a regulated investment company under Subchapter M of the Internal Revenue Code and distribute to shareholders all of its taxable income and gains. Distributions determined in accordance with federal income tax regulations may differ in amount or character from net investment income and realized gains for financial reporting purposes. Financial reporting records are adjusted for permanent book/tax differences to reflect tax character but are not adjusted for temporary differences.
The fund files U.S. federal, state, and local tax returns as required. The fund’s tax returns are subject to examination by the relevant tax authorities until expiration of the applicable statute of limitations, which is generally three years after the filing of the tax return but which can be extended to six years in certain circumstances. Tax returns for open years have incorporated no uncertain tax positions that require a provision for income taxes.
Reclassifications to paid-in capital relate primarily to a tax practice that treats a portion of the proceeds from each redemption of capital shares as a distribution of taxable net investment income and/or realized capital gain. Reclassifications between income and gain relate primarily to the character of dividends received from REIT investments. For the year ended December 31, 2010, the following reclassifications were recorded to reflect tax character; there was no impact on results of operations or net assets:

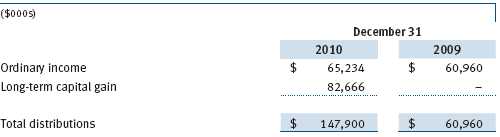
Distributions during the years ended December 31, 2010 and December 31, 2009 were characterized for tax purposes as follows:
At December 31, 2010, the tax-basis cost of investments and components of net assets were as follows:

The difference between book-basis and tax-basis net unrealized appreciation (depreciation) is attributable to the realization of unrealized gains/losses on passive foreign investment companies and the recognition of income on contingent debt obligations for tax purposes. In accordance with federal income tax regulations applicable to investment companies, recognition of capital and/or currency losses on certain transactions realized between November 1 and December 31 is deferred for tax purposes until the subsequent year (post-October loss deferrals); however, such losses are recognized for financial reporting purposes in the year realized. Similarly, certain dividends declared by real estate investment trusts (REITs) in December and paid the following January are recognized for tax purposes in the subsequent year (REIT income deferrals), but for financial reporting purposes are included in the fund’s dividend income on ex-date.
NOTE 5 - RELATED PARTY TRANSACTIONS
The fund is managed by T. Rowe Price Associates, Inc. (the manager or Price Associates), a wholly owned subsidiary of T. Rowe Price Group, Inc. The investment management agreement between the fund and the manager provides for an annual investment management fee, which is computed daily and paid monthly. The fee consists of an individual fund fee, equal to 0.35% of the fund’s average daily net assets, and a group fee. The group fee rate is calculated based on the combined net assets of certain mutual funds sponsored by Price Associates (the group) applied to a graduated fee schedule, with rates ranging from 0.48% for the first $1 billion of assets to 0.285% for assets in excess of $220 billion. The fund’s group fee is determined by applying the group fee rate to the fund’s average daily net assets. At December 31, 2010, the effective annual group fee rate was 0.30%.
In addition, the fund has entered into service agreements with Price Associates and two wholly owned subsidiaries of Price Associates (collectively, Price). Price Associates computes the daily share prices and provides certain other administrative services to the fund. T. Rowe Price Services, Inc., provides shareholder and administrative services in its capacity as the fund’s transfer and dividend disbursing agent. T. Rowe Price Retirement Plan Services, Inc., provides subaccounting and recordkeeping services for certain retirement accounts invested in the Investor Class. For the year ended December 31, 2010, expenses incurred pursuant to these service agreements were $164,000 for Price Associates; $1,488,000 for T. Rowe Price Services, Inc.; and $3,050,000 for T. Rowe Price Retirement Plan Services, Inc. The total amount payable at period-end pursuant to these service agreements is reflected as Due to Affiliates in the accompanying financial statements.
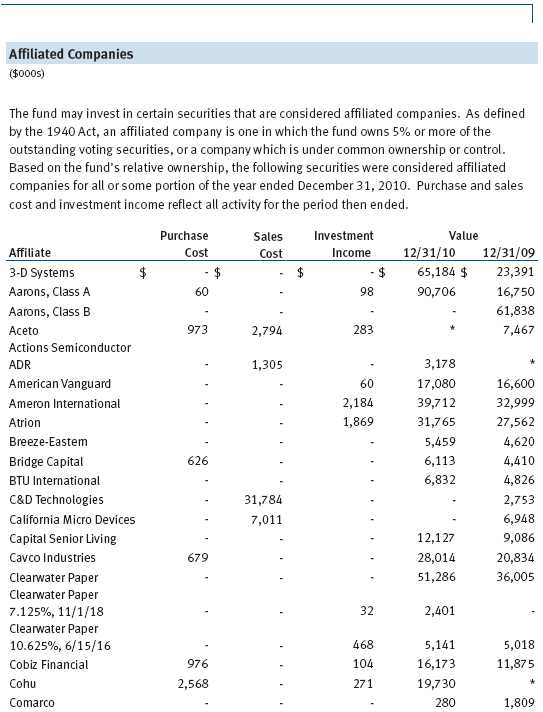
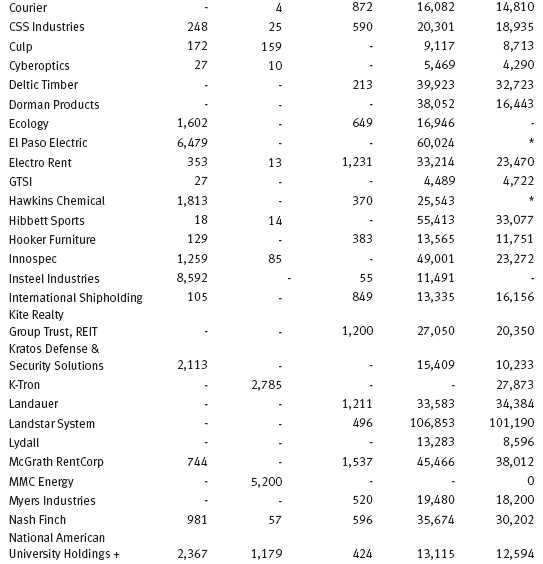
The fund is also one of several mutual funds sponsored by Price Associates (underlying Price funds) in which the T. Rowe Price Spectrum Funds (Spectrum Funds) and T. Rowe Price Retirement Funds (Retirement Funds) may invest. Neither the Spectrum Funds nor the Retirement Funds invest in the underlying Price funds for the purpose of exercising management or control. Pursuant to separate special servicing agreements, expenses associated with the operation of the Spectrum and Retirement Funds are borne by each underlying Price fund to the extent of estimated savings to it and in proportion to the average daily value of its shares owned by the Spectrum and Retirement Funds, respectively. Expenses allocated under these agreements are reflected as shareholder servicing expenses in the accompanying financial statements. For the year ended December 31, 2010, the fund was allocated $121,000 of Spectrum Funds’ expenses and $1,554,000 of Retirement Funds’ expenses. Of these amounts, $1,034,000 related to services provided by Price. The amount payable at period-end pursuant to this agreement is reflected as Due to Affiliates in the accompanying financial statements. At December 31, 2010, approximately 1% of the outstanding shares of the Investor Class were held by the Spectrum Funds and 14% were held by the Retirement Funds.
The fund may invest in the T. Rowe Price Reserve Investment Fund and the T. Rowe Price Government Reserve Investment Fund (collectively, the T. Rowe Price Reserve Investment Funds), open-end management investment companies managed by Price Associates and considered affiliates of the fund. The T. Rowe Price Reserve Investment Funds are offered as cash management options to mutual funds, trusts, and other accounts managed by Price Associates and/or its affiliates and are not available for direct purchase by members of the public. The T. Rowe Price Reserve Investment Funds pay no investment management fees.
| REPORT OF INDEPENDENT REGISTERED PUBLIC ACCOUNTING FIRM |
To the Board of Directors and Shareholders of
T. Rowe Price Small-Cap Value Fund, Inc.
In our opinion, the accompanying statement of assets and liabilities, including the portfolio of investments, and the related statements of operations and of changes in net assets and the financial highlights present fairly, in all material respects, the financial position of T. Rowe Price Small-Cap Value Fund, Inc. (the “Fund”) at December 31, 2010, the results of its operations for the year then ended, the changes in its net assets for each of the two years in the period then ended and the financial highlights for each of the five years in the period then ended, in conformity with accounting principles generally accepted in the United States of America. These financial statements and financial highlights (hereafter referred to as “financial statements”) are the responsibility of the Fund’s management; our responsibility is to express an opinion on these financial statements based on our audits. We conducted our audits of these financial statements in accordance with the standards of the Public Company Accounting Oversight Board (United States). Those standards require that we plan and perform the audit to obtain reasonable assurance about whether the financial statements are free of material misstatement. An audit includes examining, on a test basis, evidence supporting the amounts and disclosures in the financial statements, assessing the accounting principles used and significant estimates made by management, and evaluating the overall financial statement presentation. We believe that our audits, which included confirmation of securities at December 31, 2010 by correspondence with the custodian and brokers, and confirmation of the underlying funds by correspondence with the transfer agent, provide a reasonable basis for our opinion.
PricewaterhouseCoopers LLP
Baltimore, Maryland
February 17, 2011
| TAX INFORMATION (UNAUDITED) FOR THE TAX YEAR ENDED 12/31/10 |
We are providing this information as required by the Internal Revenue Code. The amounts shown may differ from those elsewhere in this report because of differences between tax and financial reporting requirements.
The fund’s distributions to shareholders included:
• $21,534,000 from short-term capital gains.
• $90,281,000 from long-term capital gains, of which $90,019,000 was subject to the 15% rate gains category, and $262,000 to the 25% rate gains category.
For taxable non-corporate shareholders, $63,047,000 of the fund’s income represents qualified dividend income subject to the 15% rate category.
For corporate shareholders, $57,933,000 of the fund’s income qualifies for the dividends-received deduction.
| INFORMATION ON PROXY VOTING POLICIES, PROCEDURES, AND RECORDS |
A description of the policies and procedures used by T. Rowe Price funds and portfolios to determine how to vote proxies relating to portfolio securities is available in each fund’s Statement of Additional Information, which you may request by calling 1-800-225-5132 or by accessing the SEC’s website, sec.gov. The description of our proxy voting policies and procedures is also available on our website, troweprice.com. To access it, click on the words “Our Company” at the top of our corporate homepage. Then, when the next page appears, click on the words “Proxy Voting Policies” on the left side of the page.
Each fund’s most recent annual proxy voting record is available on our website and through the SEC’s website. To access it through our website, follow the directions above, then click on the words “Proxy Voting Records” on the right side of the Proxy Voting Policies page.
| HOW TO OBTAIN QUARTERLY PORTFOLIO HOLDINGS |
The fund files a complete schedule of portfolio holdings with the Securities and Exchange Commission for the first and third quarters of each fiscal year on Form N-Q. The fund’s Form N-Q is available electronically on the SEC’s website (sec.gov); hard copies may be reviewed and copied at the SEC’s Public Reference Room, 450 Fifth St. N.W., Washington, DC 20549. For more information on the Public Reference Room, call 1-800-SEC-0330.
| ABOUT THE FUND’S DIRECTORS AND OFFICERS |
Your fund is overseen by a Board of Directors (Board) that meets regularly to review a wide variety of matters affecting the fund, including performance, investment programs, compliance matters, advisory fees and expenses, service providers, and other business affairs. The Board elects the fund’s officers, who are listed in the final table. At least 75% of the Board’s members are independent of T. Rowe Price Associates, Inc. (T. Rowe Price), and T. Rowe Price International Ltd (T. Rowe Price International); “inside” or “interested” directors are employees or officers of T. Rowe Price. The business address of each director and officer is 100 East Pratt Street, Baltimore, Maryland 21202. The Statement of Additional Information includes additional information about the fund directors and is available without charge by calling a T. Rowe Price representative at 1-800-225-5132.
| Independent Directors | |
| Name | |
| (Year of Birth) | Principal Occupation(s) and Directorships of Public Companies and |
| Year Elected* | Other Investment Companies During the Past Five Years |
| William R. Brody, M.D., | President and Trustee, Salk Institute for Biological Studies (2009 |
| Ph.D. | to present); Director, Novartis, Inc. (2009 to present); Director, IBM |
| (1944) | (2007 to present); President and Trustee, Johns Hopkins University |
| 2009 | (1996 to 2009); Chairman of Executive Committee and Trustee, |
| Johns Hopkins Health System (1996 to 2009); Director, Medtronic, | |
| Inc. (1998 to 2007); Director, Mercantile Bankshares (1997 to 2007) | |
| Jeremiah E. Casey | Director, National Life Insurance (2001 to 2005); Director, NLV |
| (1940) | Financial Corporation (2004 to 2005) |
| 2005 | |
| Anthony W. Deering | Chairman, Exeter Capital, LLC, a private investment firm (2004 |
| (1945) | to present); Director, Under Armour (2008 to present); Director, |
| 2001 | Vornado Real Estate Investment Trust (2004 to present); Director, |
| Mercantile Bankshares (2002 to 2007); Member, Advisory Board, | |
| Deutsche Bank North America (2004 to present) | |
| Donald W. Dick, Jr. | Principal, EuroCapital Partners, LLC, an acquisition and management |
| (1943) | advisory firm (1995 to present) |
| 1994 | |
| Karen N. Horn | Senior Managing Director, Brock Capital Group, an advisory and |
| (1943) | investment banking firm (2004 to present); Director, Eli Lilly and |
| 2003 | Company (1987 to present); Director, Simon Property Group (2004 |
| to present); Director, Norfolk Southern (2008 to present); Director, | |
| Fannie Mae (2006 to 2008); Director, Georgia Pacific (2004 to 2005) | |
| Theo C. Rodgers | President, A&R Development Corporation (1977 to present) |
| (1941) | |
| 2005 | |
| John G. Schreiber | Owner/President, Centaur Capital Partners, Inc., a real estate |
| (1946) | investment company (1991 to present); Cofounder and Partner, |
| 2001 | Blackstone Real Estate Advisors, L.P. (1992 to present) |
| Mark R. Tercek | President and Chief Executive Officer, The Nature Conservancy |
| (1957) | (2008 to present); Managing Director, The Goldman Sachs Group, |
| 2009 | Inc. (1984 to 2008) |
| *Each independent director oversees 128 T. Rowe Price portfolios and serves until retirement, | |
| resignation, or election of a successor. | |
| Inside Directors | |
| Name | |
| (Year of Birth) | |
| Year Elected* | |
| [Number of T. Rowe Price | Principal Occupation(s) and Directorships of Public Companies and |
| Portfolios Overseen] | Other Investment Companies During the Past Five Years |
| Edward C. Bernard | Director and Vice President, T. Rowe Price; Vice Chairman of the |
| (1956) | Board, Director, and Vice President, T. Rowe Price Group, Inc.; |
| 2006 | Chairman of the Board, Director, and President, T. Rowe Price |
| [128] | Investment Services, Inc.; Chairman of the Board and Director, |
| T. Rowe Price Retirement Plan Services, Inc., T. Rowe Price | |
| Savings Bank, and T. Rowe Price Services, Inc.; Director and Chief | |
| Executive Officer, T. Rowe Price International; Chief Executive | |
| Officer, Chairman of the Board, Director, and President, T. Rowe | |
| Price Trust Company; Chairman of the Board, all funds | |
| John H. Laporte, CFA | Vice President, T. Rowe Price, T. Rowe Price Group, Inc., and |
| (1945) | T. Rowe Price Trust Company |
| 1994 | |
| [16] | |
| *Each inside director serves until retirement, resignation, or election of a successor. | |
| Officers | |
| Name (Year of Birth) | |
| Position Held With Small-Cap Value Fund | Principal Occupation(s) |
| Preston G. Athey, CFA, CIC (1949) | Vice President, T. Rowe Price, T. Rowe Price |
| President | Group, Inc., and T. Rowe Price Trust Company |
| Hugh M. Evans III, CFA (1966) | Vice President, T. Rowe Price and T. Rowe Price |
| Vice President | Group, Inc. |
| Roger L. Fiery III, CPA (1959) | Vice President, Price Hong Kong, Price |
| Vice President | Singapore, T. Rowe Price, T. Rowe Price Group, |
| Inc., T. Rowe Price International, and T. Rowe | |
| Price Trust Company | |
| Christopher T. Fortune (1973) | Vice President, T. Rowe Price and T. Rowe Price |
| Vice President | Group, Inc. |
| John R. Gilner (1961) | Chief Compliance Officer and Vice President, |
| Chief Compliance Officer | T. Rowe Price; Vice President, T. Rowe Price |
| Group, Inc., and T. Rowe Price Investment | |
| Services, Inc. | |
| Gregory S. Golczewski (1966) | Vice President, T. Rowe Price and T. Rowe Price |
| Vice President | Trust Company |
| Gregory K. Hinkle, CPA (1958) | Vice President, T. Rowe Price, T. Rowe Price |
| Treasurer | Group, Inc., and T. Rowe Price Trust Company; |
| formerly Partner, PricewaterhouseCoopers LLP | |
| (to 2007) | |
| Steven Krichbaum (1977) | Vice President, T. Rowe Price and T. Rowe Price |
| Vice President | Group, Inc.; formerly student, University of |
| Michigan, Stephen M. Ross School of Business | |
| (to 2007) | |
| Patricia B. Lippert (1953) | Assistant Vice President, T. Rowe Price and |
| Secretary | T. Rowe Price Investment Services, Inc. |
| Gregory A. McCrickard, CFA (1958) | Vice President, T. Rowe Price, T. Rowe Price |
| Vice President | Group, Inc., and T. Rowe Price Trust Company |
| David Oestreicher (1967) | Director and Vice President, T. Rowe Price |
| Vice President | Investment Services, Inc., T. Rowe Price Trust |
| Company, T. Rowe Price Services, Inc.; Vice | |
| President, Price Hong Kong, Price Singapore, | |
| T. Rowe Price, T. Rowe Price Group, Inc., | |
| T. Rowe Price International, and T. Rowe Price | |
| Retirement Plan Services, Inc. | |
| Curt J. Organt, CFA (1968) | Vice President, T. Rowe Price and T. Rowe Price |
| Vice President | Group, Inc. |
| Deborah D. Seidel (1962) | Vice President, T. Rowe Price, T. Rowe Price |
| Vice President | Group, Inc., and T. Rowe Price Investment |
| Services, Inc.; Vice President and Assistant | |
| Treasurer, T. Rowe Price Services, Inc. | |
| J. David Wagner, CFA (1974) | Vice President, T. Rowe Price and T. Rowe Price |
| Vice President | Group, Inc. |
| Julie L. Waples (1970) | Vice President, T. Rowe Price |
| Vice President | |
| Kwame C. Webb (1982) | Vice President, T. Rowe Price and T. Rowe Price |
| Vice President | Group, Inc. |
| Unless otherwise noted, officers have been employees of T. Rowe Price or T. Rowe Price | |
| International for at least 5 years. | |
Item 2. Code of Ethics.
The registrant has adopted a code of ethics, as defined in Item 2 of Form N-CSR, applicable to its principal executive officer, principal financial officer, principal accounting officer or controller, or persons performing similar functions. A copy of this code of ethics is filed as an exhibit to this Form N-CSR. No substantive amendments were approved or waivers were granted to this code of ethics during the period covered by this report.
Item 3. Audit Committee Financial Expert.
The registrant’s Board of Directors/Trustees has determined that Mr. Anthony W. Deering qualifies as an audit committee financial expert, as defined in Item 3 of Form N-CSR. Mr. Deering is considered independent for purposes of Item 3 of Form N-CSR.
Item 4. Principal Accountant Fees and Services.
(a) – (d) Aggregate fees billed to the registrant for the last two fiscal years for professional services rendered by the registrant’s principal accountant were as follows:
Audit fees include amounts related to the audit of the registrant’s annual financial statements and services normally provided by the accountant in connection with statutory and regulatory filings. Audit-related fees include amounts reasonably related to the performance of the audit of the registrant’s financial statements and specifically include the issuance of a report on internal controls and, if applicable, agreed-upon procedures related to fund acquisitions. Tax fees include amounts related to services for tax compliance, tax planning, and tax advice. The nature of these services specifically includes the review of distribution calculations and the preparation of Federal, state, and excise tax returns. All other fees include the registrant’s pro-rata share of amounts for agreed-upon procedures in conjunction with service contract approvals by the registrant’s Board of Directors/Trustees.
(e)(1) The registrant’s audit committee has adopted a policy whereby audit and non-audit services performed by the registrant’s principal accountant for the registrant, its investment adviser, and any entity controlling, controlled by, or under common control with the investment adviser that provides ongoing services to the registrant require pre-approval in advance at regularly scheduled audit committee meetings. If such a service is required between regularly scheduled audit committee meetings, pre-approval may be authorized by one audit committee member with ratification at the next scheduled audit committee meeting. Waiver of pre-approval for audit or non-audit services requiring fees of a de minimis amount is not permitted.
(2) No services included in (b) – (d) above were approved pursuant to paragraph (c)(7)(i)(C) of Rule 2-01 of Regulation S-X.
(f) Less than 50 percent of the hours expended on the principal accountant’s engagement to audit the registrant’s financial statements for the most recent fiscal year were attributed to work performed by persons other than the principal accountant’s full-time, permanent employees.
(g) The aggregate fees billed for the most recent fiscal year and the preceding fiscal year by the registrant’s principal accountant for non-audit services rendered to the registrant, its investment adviser, and any entity controlling, controlled by, or under common control with the investment adviser that provides ongoing services to the registrant were $1,417,000 and $1,879,000, respectively.
(h) All non-audit services rendered in (g) above were pre-approved by the registrant’s audit committee. Accordingly, these services were considered by the registrant’s audit committee in maintaining the principal accountant’s independence.
Item 5. Audit Committee of Listed Registrants.
Not applicable.
Item 6. Investments.
(a) Not applicable. The complete schedule of investments is included in Item 1 of this Form N-CSR.
(b) Not applicable.
Item 7. Disclosure of Proxy Voting Policies and Procedures for Closed-End Management Investment Companies.
Not applicable.
Item 8. Portfolio Managers of Closed-End Management Investment Companies.
Not applicable.
Item 9. Purchases of Equity Securities by Closed-End Management Investment Company and Affiliated Purchasers.
Not applicable.
Item 10. Submission of Matters to a Vote of Security Holders.
Not applicable.
Item 11. Controls and Procedures.
(a) The registrant’s principal executive officer and principal financial officer have evaluated the registrant’s disclosure controls and procedures within 90 days of this filing and have concluded that the registrant’s disclosure controls and procedures were effective, as of that date, in ensuring that information required to be disclosed by the registrant in this Form N-CSR was recorded, processed, summarized, and reported timely.
(b) The registrant’s principal executive officer and principal financial officer are aware of no change in the registrant’s internal control over financial reporting that occurred during the registrant’s second fiscal quarter covered by this report that has materially affected, or is reasonably likely to materially affect, the registrant’s internal control over financial reporting.
Item 12. Exhibits.
(a)(1) The registrant’s code of ethics pursuant to Item 2 of Form N-CSR is attached.
(2) Separate certifications by the registrant's principal executive officer and principal financial officer, pursuant to Section 302 of the Sarbanes-Oxley Act of 2002 and required by Rule 30a-2(a) under the Investment Company Act of 1940, are attached.
(3) Written solicitation to repurchase securities issued by closed-end companies: not applicable.
(b) A certification by the registrant's principal executive officer and principal financial officer, pursuant to Section 906 of the Sarbanes-Oxley Act of 2002 and required by Rule 30a-2(b) under the Investment Company Act of 1940, is attached.
SIGNATURES | |
| Pursuant to the requirements of the Securities Exchange Act of 1934 and the Investment | |
| Company Act of 1940, the registrant has duly caused this report to be signed on its behalf by the | |
| undersigned, thereunto duly authorized. | |
| T. Rowe Price Small-Cap Value Fund, Inc. | |
| By | /s/ Edward C. Bernard |
| Edward C. Bernard | |
| Principal Executive Officer | |
| Date | February 17, 2011 |
| Pursuant to the requirements of the Securities Exchange Act of 1934 and the Investment | |
| Company Act of 1940, this report has been signed below by the following persons on behalf of | |
| the registrant and in the capacities and on the dates indicated. | |
| By | /s/ Edward C. Bernard |
| Edward C. Bernard | |
| Principal Executive Officer | |
| Date | February 17, 2011 |
| By | /s/ Gregory K. Hinkle |
| Gregory K. Hinkle | |
| Principal Financial Officer | |
| Date | February 17, 2011 |