| UNITED STATES |
| SECURITIES AND EXCHANGE COMMISSION |
| Washington, D.C. 20549 |
FORM N-CSR |
CERTIFIED SHAREHOLDER REPORT OF REGISTERED |
MANAGEMENT INVESTMENT COMPANIES |
| Investment Company Act File Number: 811-2215 |
| T. Rowe Price Small-Cap Value Fund, Inc. |
| (Exact name of registrant as specified in charter) |
| 100 East Pratt Street, Baltimore, MD 21202 |
| (Address of principal executive offices) |
| David Oestreicher |
| 100 East Pratt Street, Baltimore, MD 21202 |
| (Name and address of agent for service) |
| Registrant’s telephone number, including area code: (410) 345-2000 |
| Date of fiscal year end: December 31 |
| Date of reporting period: December 31, 2008 |
Item 1: Report to Shareholders
 |
| Small-Cap Value Fund | December 31, 2008 |
The views and opinions in this report were current as of December 31, 2008. They are not guarantees of performance or investment results and should not be taken as investment advice. Investment decisions reflect a variety of factors, and the managers reserve the right to change their views about individual stocks, sectors, and the markets at any time. As a result, the views expressed should not be relied upon as a forecast of the fund’s future investment intent. The report is certified under the Sarbanes-Oxley Act, which requires mutual funds and other public companies to affirm that, to the best of their knowledge, the information in their financial reports is fairly and accurately stated in all material respects.
REPORTS ON THE WEB
Sign up for our E-mail Program, and you can begin to receive updated fund reports and prospectuses online rather than through the mail. Log in to your account at troweprice.com for more information.
Manager’s Letter
Fellow Shareholders
The turmoil that dogged the broader market earlier in the year caught up with our fund over the past six months. Small-cap value shares managed to escape most of the market downdraft early in 2008, but a downturn of historic scale eventually left no place to hide for equity investors. Events over the past six months frankly surprised us in scope and severity and led to the current tough economic situation. Nevertheless, markets generally prove to be forward looking, and I suspect share prices in 2009 will fare better than the overall economy.

The Small-Cap Value Fund returned -26.19% over the past six months. There is no way to sugarcoat these results except to note they were roughly in line with those of other small-cap value funds and somewhat better than the performance of small-cap blend funds. (Although Lipper classifies the portfolio as “small-cap core,” we also show results for the small-cap value funds category, which we think is more compatible with our investment style and objective.) We acknowledge this may be only cold comfort in the current environment, but the fund’s performance over the past year was in the top 10% of its official peers, and we remained very favorably ranked over longer time periods. (Based on cumulative total return, Lipper ranked the Small-Cap Value Fund 71 out of 775, 77 out of 616, 52 out of 487, and 24 out of 221 small-cap core funds for the 1-, 3-, 5-, and 10-year periods ended December 31, 2008, respectively. Results will vary for other periods. Past performance cannot guarantee future results.)
HIGHLIGHTS
• Small-cap value stocks suffered steep losses over the past six months, although the decline in the broader market was even greater.
• Your fund recorded a substantial loss in the second half of the year that accounted for most of its annual performance and was in line with that of similar funds; the fund fared better than its peer group over the full year.
• With some notable exceptions, the fund’s investments in typically defensive sectors fared best in the period, while energy holdings that had performed well earlier in the year were among its largest detractors.
• Despite what promises to be a tough year for the economy, investors may still enjoy good returns as stock prices discount better times ahead.

MARKET ENVIRONMENT
The second half of 2008 will be remembered as the period when the troubles that had developed in the housing sector and financial system boiled over and affected the entire global economy. A key factor in the accelerating slump has been the rapid contraction in liquidity—the general availability of credit—for households and businesses. While the precise chain of events is complex and will undoubtedly be studied for years to come, the first link was the sudden drop in the value of mortgage-backed securities as a result of the downturn in housing prices and rising foreclosures. The drop in the price of these securities took a toll on balance sheets of banks and other institutions, which, in turn, led to a contraction in lending.
A signal that something profound was amiss came in September when the Treasury placed mortgage giants Fannie Mae and Freddie Mac under conservatorship in an attempt to allay concerns that the two might default on their obligations. Unfortunately, the government’s intervention in the mortgage giants did not have a large impact on confidence in mortgage-related assets held elsewhere, and the action served merely as a precursor to further historic events over the following weeks as other major U.S. financial institutions stumbled. In a ripple pattern that few foresaw, surviving firms hoarded cash, causing many types of credit markets to grind nearly to a halt.
Since late September, we have seen central governments around the world enact sweeping bailout packages aimed to strike at the heart of the crisis. The Treasury and the Fed have tried several different approaches to encourage banks to resume lending to consumers and businesses. While the most prominent of these was the $700 billion Troubled Asset Relief Program (TARP), the government has committed hundreds of billions of additional dollars through other measures as well. The Fed has also guided short-term interest rates to virtually 0%, and many central banks around the world have followed suit. As of this writing, government actions finally seem to be having a thawing effect on the credit markets. Interbank lending rates have come down somewhat, and long-term Treasury yields have finally followed short-term yields lower.
Signs of recovery in the real economy have been more elusive. The job market has continued to worsen, with unemployment rising to 7.2% as of the end of December. Home construction and housing prices have continued to fall, and commercial real estate is showing similar strains. The manufacturing sector in the U.S. has slowed as exports have declined. The steep drop in oil prices—from over $140 per barrel in July to around $40—has helped drive the consumer price index sharply lower. But while this reversal in prices has aided family budgets, it has also raised the specter of deflation, or a broad pattern of price declines that encourages consumers to delay purchases and further weakens growth. Crucial year-end holiday sales were poor for most retailers and would have been worse but for steep discounting.

Markets took a double blow in the second half of the year, the first from the credit contraction and a second from the accelerating economic slowdown that followed. For the year, equity markets endured their worst performance in three quarters of a century. Small-cap stocks declined somewhat less than large-caps, and value shares fared less poorly than growth stocks.
PORTFOLIO ACTIVITY
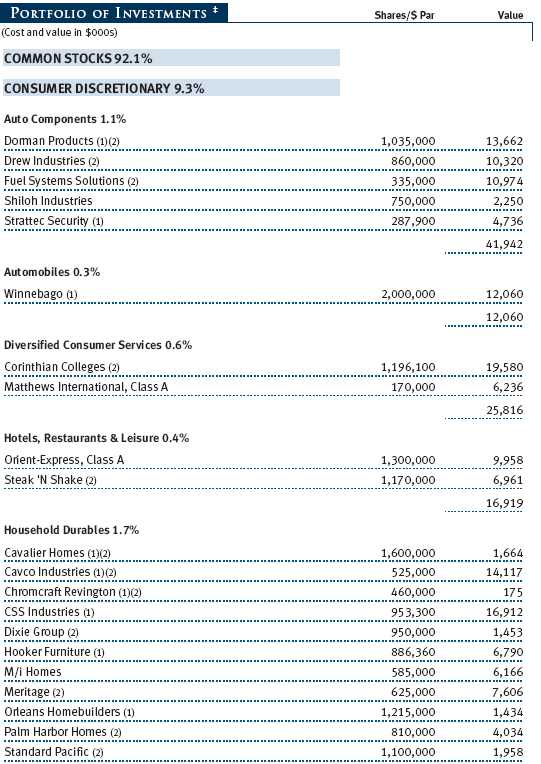
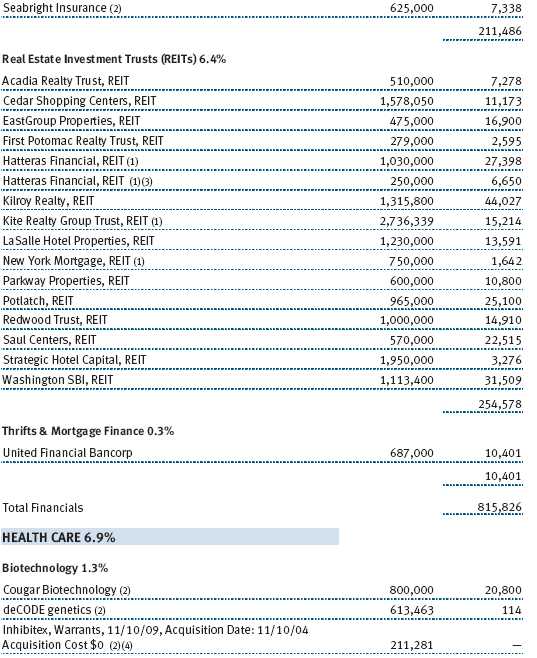
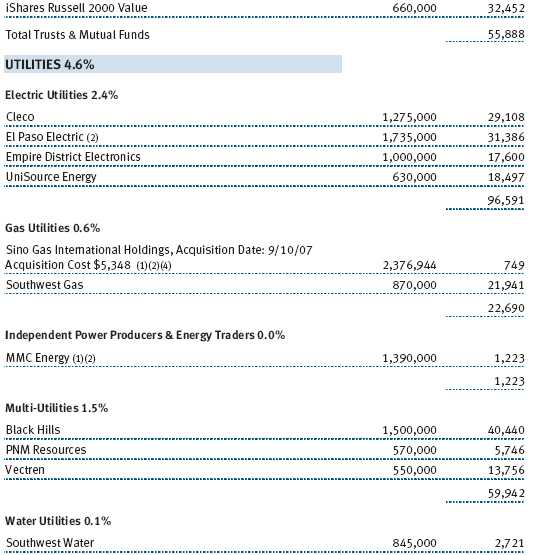
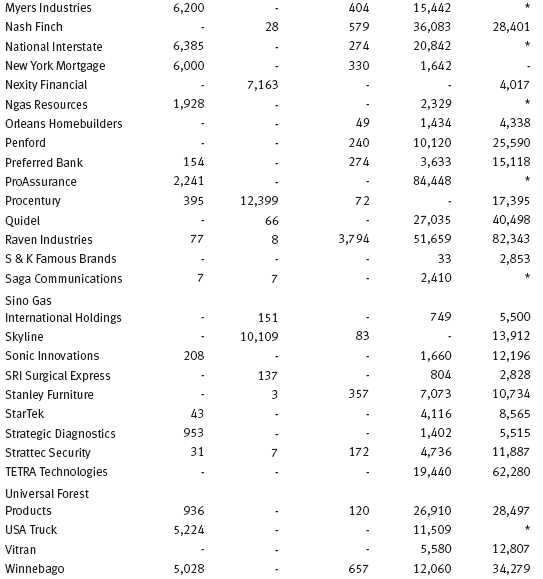
Amidst a market that left almost no place to hide, every sector represented in the fund declined over the past six months. Consumer staples are typically considered a safe haven for investors in times of economic turmoil. Our holdings in the sector, although still negative overall, fared best in the period. We enjoyed small gains from holdings in grocery distributor Nash Finch, Coca-Cola Bottling, and clay-based household products firm Oil-Dri. All three companies benefit from fairly inflexible demand for their products and services. (Please refer to the fund’s portfolio of investments for a complete listing of our holdings and the amount each represents in the portfolio.)
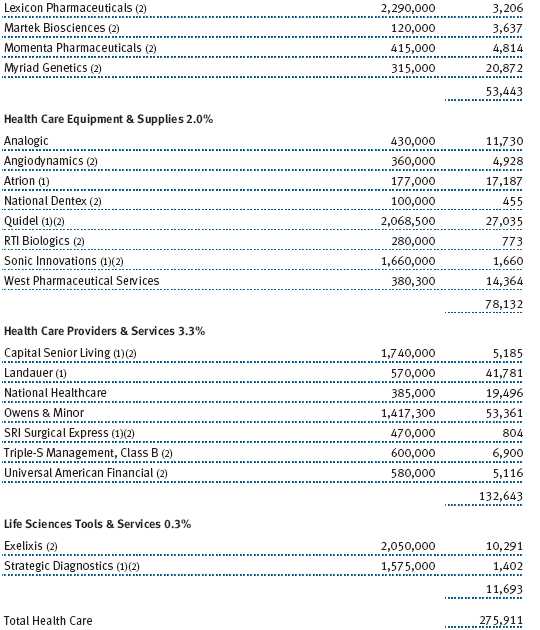
Other holdings that managed a gain were scattered among different sectors. Aaron Rents benefited from the poor economy as consumers turned to its rent-to-own service to acquire televisions and other expensive items they would otherwise purchase outright in better times. We had some positive returns from East West Bancorp and Glacier Bancorp. Myriad Genetics rose after reporting good earnings on its sales of molecular diagnostics products. Demand for health care is also resistant to economic patterns, and Landauer, which offers radiation monitoring services, performed very well as its international business thrived.

Good results were the exception, however. The fund’s energy positions exerted the largest drag on results as oil and natural gas prices plunged. Penn Virginia, Encore Acquisition, Whiting Petroleum, and TETRA Technologies were the four largest detractors from the fund’s results, and Forest Oil followed close behind. Notwithstanding the poor results, we ended the year with a slight overweight in the sector; although energy prices have been volatile in recent years, I believe that the long-term trend of increased energy demand remains intact, making for healthy profits for these firms once the economy stabilizes.
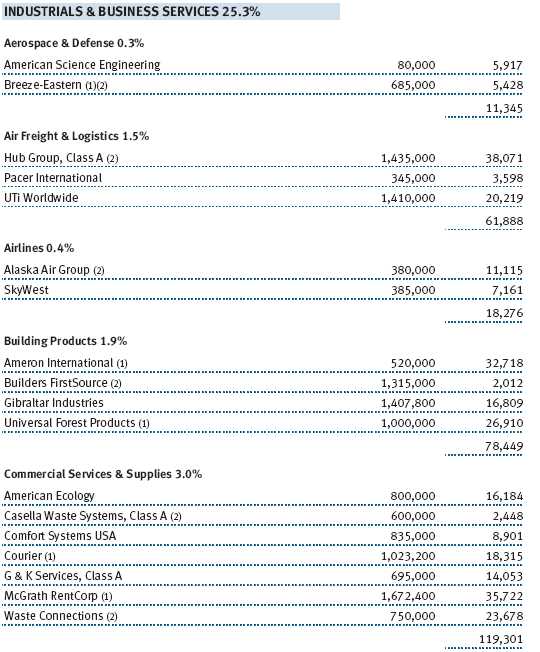
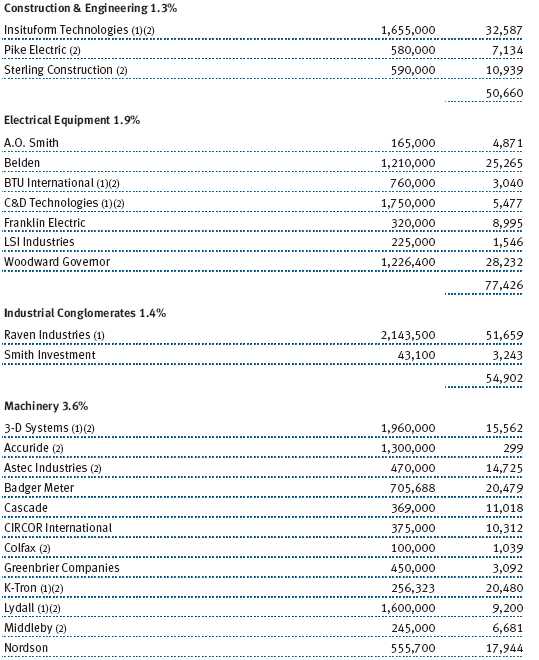
The slowdown in the global economy and the consequent weakening in U.S. exports in the second half of the year took a large toll on manufacturers and producers of raw materials. Commodities prices fell dramatically alongside the price of crude oil. Metals firms Carpenter Technology and Sims Metal Management were among our top detractors, as was chemicals maker Innospec. Industrials and business services holdings performed especially poorly. Trucker Landstar System felt the double blow of the slowing economy and higher fuel costs earlier in the period. Information technology holdings were also particularly weak.
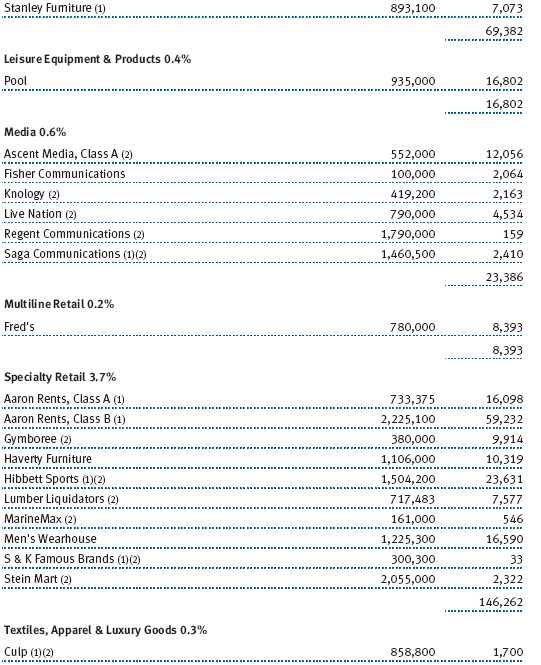
We continued to look across all sectors in making new investments. In some cases, we have focused on companies that would be considered growth stocks in more normal times. One example is clothing retailer Men’s Wearhouse, which has recorded years of impressive market gains. We expect this is one company that will emerge even stronger following the recession, which is likely to drive many smaller competitors out of business. A similar investment is Gymboree, the upscale retailer of children’s clothing. In the fall, we made an investment in Sonus Networks, a provider of voice over Internet protocol (VoIP) products. The company stands to benefit as more businesses and individuals shift to using broadband instead of telephone lines for phone calls. The global aerospace industry is likely to continue to grow and innovate, and we purchased shares in Kaman, which makes bearings and other aircraft parts.
If the market downturn resulted in any change in our approach, it led us to look beyond common stock in some cases and be more flexible in the types of investments we make. A good example of this is our purchases of corporate loans, which are currently offering extremely attractive interest rates. We purchased the bank debt of professional services firm On Assignment, media company Knology, and personal digital assistant and cell phone maker Palm—all companies we are familiar with and own as equity investors. And in an effort to lower risk, we purchased puts, or the right to sell stocks at a given price, earlier this year to moderate our relatively heavy investment in the energy sector. When energy stock prices fell dramatically this summer, we made a good profit on the puts we had bought. Such strategies are hardly central to our investment approach, but they can prove to be a useful part of our tool bag.
OUTLOOK
The recent carnage in the financial system indicates that we are in the midst of one of the worst recessions since World War II. Corporate profits are likely to have declined substantially in the last quarter of 2008, and I expect that most companies will see poor results continue in 2009. Indeed, I anticipate a rising wave of bankruptcies and would not be surprised if, despite our best efforts to exclude them, these include some companies in our portfolio.
Despite this backdrop, I am bullish on equities in the coming year. My optimism has two primary currents. First, I believe that the steep drop in stock prices this fall has already discounted a sharp recession that would last even longer than most experts now predict. Valuations appear reasonable to us on almost every metric imaginable. Strong companies are trading at fair valuations, and weak firms are trading at liquidation prices. While small-cap value stocks have fallen less than other equity classes this year, they still offer excellent absolute values.
Second, I am persuaded that policy actions by governments around the globe will help avert worst-case scenarios for the world economy. While stock prices would have room to fall further if the current recession turns into a full-blown depression, I view this outcome as unlikely given the substantial fiscal and monetary stimulus flowing into the system. Instead, I expect the economy to find a bottom sometime in the latter half of the year and to enjoy an expansion in 2010.
In general, I believe we are currently being amply rewarded for taking risk—a condition that does not always hold true for investors. While I expect more choppy times ahead for the markets, I am not shying away from putting cash to work, whether in longtime holdings that have been bid down or in new opportunities.
Respectfully submitted,

Preston G. Athey
President of the fund and chairman of its Investment Advisory Committee
January 16, 2009
The committee chairman has day-to-day responsibility for managing the portfolio and works with committee members in developing and executing the fund’s investment program.
RISKS OF STOCK INVESTING
The fund’s share price can fall because of weakness in the stock markets, a particular industry, or specific holdings. Stock markets can decline for many reasons, including adverse political or economic developments, changes in investor psychology, or heavy institutional selling. The prospects for an industry or company may deteriorate because of a variety of factors, including disappointing earnings or changes in the competitive environment. In addition, the investment manager’s assessment of companies held in a fund may prove incorrect, resulting in losses or poor performance even in rising markets.
GLOSSARY
Lipper indexes: Fund benchmarks that consist of a small number (10 to 30) of the largest mutual funds in a particular category as tracked by Lipper Inc.
Russell 2000 Growth Index: An index of those firms in the Russell 2000 with higher price-to-book ratios and higher forecasted growth values.
Russell 2000 Index: Consists of the smallest 2,000 companies in the Russell 3000 Index (approximately 98% of the investable U.S. equity market). Performance is reported on a total return basis.
Russell 2000 Value Index: An index of those firms in the Russell 2000 with lower price-to-book ratios and lower forecasted growth values.

Performance and Expenses
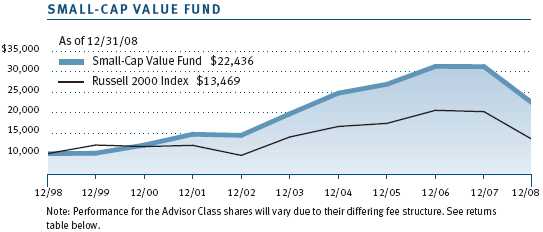
| GROWTH OF $10,000 |
This chart shows the value of a hypothetical $10,000 investment in the fund over the past 10 fiscal year periods or since inception (for funds lacking 10-year records). The result is compared with benchmarks, which may include a broad-based market index and a peer group average or index. Market indexes do not include expenses, which are deducted from fund returns as well as mutual fund averages and indexes.
| AVERAGE ANNUAL COMPOUND TOTAL RETURN |
This table shows how the fund would have performed each year if its actual (or cumulative) returns had been earned at a constant rate.


| FUND EXPENSE EXAMPLE |
As a mutual fund shareholder, you may incur two types of costs: (1) transaction costs, such as redemption fees or sales loads, and (2) ongoing costs, including management fees, distribution and service (12b-1) fees, and other fund expenses. The following example is intended to help you understand your ongoing costs (in dollars) of investing in the fund and to compare these costs with the ongoing costs of investing in other mutual funds. The example is based on an investment of $1,000 invested at the beginning of the most recent six-month period and held for the entire period.
Please note that the fund has two share classes: The original share class (“investor class”) charges no distribution and service (12b-1) fee, and the Advisor Class shares are offered only through unaffiliated brokers and other financial intermediaries and charge a 0.25% 12b-1 fee. Each share class is presented separately in the table.
Actual Expenses
The first line of the following table (“Actual”) provides information about actual account values and expenses based on the fund’s actual returns. You may use the information in this line, together with your account balance, to estimate the expenses that you paid over the period. Simply divide your account value by $1,000 (for example, an $8,600 account value divided by $1,000 = 8.6), then multiply the result by the number in the first line under the heading “Expenses Paid During Period” to estimate the expenses you paid on your account during this period.
Hypothetical Example for Comparison Purposes
The information on the second line of the table (“Hypothetical”) is based on hypothetical account values and expenses derived from the fund’s actual expense ratio and an assumed 5% per year rate of return before expenses (not the fund’s actual return). You may compare the ongoing costs of investing in the fund with other funds by contrasting this 5% hypothetical example and the 5% hypothetical examples that appear in the shareholder reports of the other funds. The hypothetical account values and expenses may not be used to estimate the actual ending account balance or expenses you paid for the period.
Note: T. Rowe Price charges an annual small-account maintenance fee of $10, generally for accounts with less than $2,000 ($500 for UGMA/UTMA). The fee is waived for any investor whose T. Rowe Price mutual fund accounts total $25,000 or more, accounts employing automatic investing, and IRAs and other retirement plan accounts that utilize a prototype plan sponsored by T. Rowe Price (although a separate custodial or administrative fee may apply to such accounts). This fee is not included in the accompanying table. If you are subject to the fee, keep it in mind when you are estimating the ongoing expenses of investing in the fund and when comparing the expenses of this fund with other funds.
You should also be aware that the expenses shown in the table highlight only your ongoing costs and do not reflect any transaction costs, such as redemption fees or sales loads. Therefore, the second line of the table is useful in comparing ongoing costs only and will not help you determine the relative total costs of owning different funds. To the extent a fund charges transaction costs, however, the total cost of owning that fund is higher.

The accompanying notes are an integral part of these financial statements.

The accompanying notes are an integral part of these financial statements.


The accompanying notes are an integral part of these financial statements.

The accompanying notes are an integral part of these financial statements.
The accompanying notes are an integral part of these financial statements.


The accompanying notes are an integral part of these financial statements.
| NOTES TO FINANCIAL STATEMENTS |
T. Rowe Price Small-Cap Value Fund, Inc. (the fund), is registered under the Investment Company Act of 1940 (the 1940 Act) as a diversified, open-end management investment company. The fund seeks long-term capital growth by investing primarily in small companies whose common stocks are believed to be undervalued. The fund has two classes of shares: the Small-Cap Value Fund original share class, referred to in this report as the Investor Class, offered since June 30, 1988, and Small-Cap Value Fund—Advisor Class (Advisor Class), offered since March 31, 2000. Advisor Class shares are sold only through unaffiliated brokers and other unaffiliated financial intermediaries that are compensated by the class for distribution, shareholder servicing, and/or certain administrative services under a Board-approved Rule 12b-1 plan. Each class has exclusive voting rights on matters related solely to that class, separate voting rights on matters that relate to both classes, and, in all other respects, the same rights and obligations as the other class.
NOTE 1 - SIGNIFICANT ACCOUNTING POLICIES
Basis of Preparation The accompanying financial statements were prepared in accordance with accounting principles generally accepted in the United States of America, which require the use of estimates made by fund management. Fund management believes that estimates and security valuations are appropriate; however, actual results may differ from those estimates, and the security valuations reflected in the financial statements may differ from the value the fund ultimately realizes upon sale of the securities.
Investment Transactions, Investment Income, and Distributions Income and expenses are recorded on the accrual basis. Premiums and discounts on debt securities are amortized for financial reporting purposes. Dividends received from mutual fund investments are reflected as dividend income; capital gain distributions are reflected as realized gain/loss. Dividend income and capital gain distributions are recorded on the ex-dividend date. Income tax-related interest and penalties, if incurred, would be recorded as income tax expense. Investment transactions are accounted for on the trade date. Realized gains and losses are reported on the identified cost basis. Payments (“variation margin”) made or received to settle the daily fluctuations in the value of futures contracts are recorded as unrealized gains or losses until the contracts are closed. Distributions to shareholders are recorded on the ex-dividend date. Income distributions are declared and paid by each class on an annual basis. Capital gain distributions, if any, are declared and paid by the fund, typically on an annual basis.
Currency Translation Assets, including investments, and liabilities denominated in foreign currencies are translated into U.S. dollar values each day at the prevailing exchange rate, using the mean of the bid and asked prices of such currencies against U.S. dollars as quoted by a major bank. Purchases and sales of securities, income, and expenses are translated into U.S. dollars at the prevailing exchange rate on the date of the transaction. The effect of changes in foreign currency exchange rates on realized and unrealized security gains and losses is reflected as a component of security gains and losses.
Class Accounting The Advisor Class pays distribution, shareholder servicing, and/or certain administrative expenses in the form of Rule 12b-1 fees, in an amount not exceeding 0.25% of the class’s average daily net assets. Shareholder servicing, prospectus, and shareholder report expenses incurred by each class are charged directly to the class to which they relate. Expenses common to both classes, investment income, and realized and unrealized gains and losses are allocated to the classes based upon the relative daily net assets of each class.
Rebates and Credits Subject to best execution, the fund may direct certain security trades to brokers who have agreed to rebate a portion of the related brokerage commission to the fund in cash. Commission rebates are reflected as realized gain on securities in the accompanying financial statements and totaled $105,000 for the year ended December 31, 2008. Additionally, the fund earns credits on temporarily uninvested cash balances at the custodian that reduce the fund’s custody charges. Custody expense in the accompanying financial statements is presented before reduction for credits, which are reflected as expenses paid indirectly.
Redemption Fees A 1% fee is assessed on redemptions of fund shares held for 90 days or less to deter short-term trading and to protect the interests of long-term shareholders. Redemption fees are withheld from proceeds that shareholders receive from the sale or exchange of fund shares. The fees are paid to the fund, and are recorded as an increase to paid-in capital. The fees may cause the redemption price per share to differ from the net asset value per share.
New Accounting Pronouncements On January 1, 2008, the fund adopted Statement of Financial Accounting Standards No. 157 (FAS 157), Fair Value Measurements. FAS 157 defines fair value, establishes the framework for measuring fair value, and expands the disclosures of fair value measurements in the financial statements. Adoption of FAS 157 did not have a material impact on the fund’s net assets or results of operations.
In March 2008, the Financial Accounting Standards Board issued Statement of Financial Accounting Standards No. 161 (FAS 161), Disclosures about Derivative Instruments and Hedging Activities, which is effective for fiscal years and interim periods beginning after November 15, 2008. FAS 161 requires enhanced disclosures about derivative and hedging activities, including how such activities are accounted for and their effect on financial position, performance and cash flows. Management is currently evaluating the impact the adoption of FAS 161 will have on the fund’s financial statements and related disclosures.
NOTE 2 - VALUATION
The fund’s investments are reported at fair value as defined under FAS 157. The fund values its investments and computes its net asset value per share at the close of the New York Stock Exchange (NYSE), normally 4 p.m. ET, each day that the NYSE is open for business.
Equity securities listed or regularly traded on a securities exchange or in the over-the-counter (OTC) market are valued at the last quoted sale price or, for certain markets, the official closing price at the time the valuations are made, except for OTC Bulletin Board securities, which are valued at the mean of the latest bid and asked prices. A security that is listed or traded on more than one exchange is valued at the quotation on the exchange determined to be the primary market for such security. Listed securities not traded on a particular day are valued at the mean of the latest bid and asked prices for domestic securities and the last quoted sale price for international securities.
Debt securities are generally traded in the OTC market. Securities with remaining maturities of one year or more at the time of acquisition are valued at prices furnished by dealers who make markets in such securities or by an independent pricing service, which considers the yield or price of bonds of comparable quality, coupon, maturity, and type, as well as prices quoted by dealers who make markets in such securities. Securities with remaining maturities of less than one year at the time of acquisition generally use amortized cost in local currency to approximate fair value. However, if amortized cost is deemed not to reflect fair value or the fund holds a significant amount of such securities with remaining maturities of more than 60 days, the securities are valued at prices furnished by dealers who make markets in such securities or by an independent pricing service.
Investments in mutual funds are valued at the mutual fund’s closing net asset value per share on the day of valuation.
Other investments, including restricted securities, and those for which the above valuation procedures are inappropriate or are deemed not to reflect fair value are stated at fair value as determined in good faith by the T. Rowe Price Valuation Committee, established by the fund’s Board of Directors.
For valuation purposes, the last quoted prices of non-U.S. equity securities may be adjusted under the circumstances described below. If the fund determines that developments between the close of a foreign market and the close of the NYSE will, in its judgment, materially affect the value of some or all of its portfolio securities, the fund will adjust the previous closing prices to reflect what it believes to be the fair value of the securities as of the close of the NYSE. In deciding whether it is necessary to adjust closing prices to reflect fair value, the fund reviews a variety of factors, including developments in foreign markets, the performance of U.S. securities markets, and the performance of instruments trading in U.S. markets that represent foreign securities and baskets of foreign securities. A fund may also fair value securities in other situations, such as when a particular foreign market is closed but the fund is open. The fund uses outside pricing services to provide it with closing prices and information to evaluate and/or adjust those prices. The fund cannot predict how often it will use closing prices and how often it will determine it necessary to adjust those prices to reflect fair value. As a means of evaluating its security valuation process, the fund routinely compares closing prices, the next day’s opening prices in the same markets, and adjusted prices.
Valuation Inputs Various inputs are used to determine the value of the fund’s investments. These inputs are summarized in the three broad levels listed below:
Level 1 – quoted prices in active markets for identical securities
Level 2 – observable inputs other than Level 1 quoted prices (including, but not limited to, quoted prices for similar securities, interest rates, prepayment speeds, credit risk)
Level 3 – unobservable inputs
Observable inputs are those based on market data obtained from sources independent of the fund, and unobservable inputs reflect the fund’s own assumptions based on the best information available. The input levels are not necessarily an indication of the risk or liquidity associated with investments at that level. For example, non-U.S. equity securities actively traded in foreign markets generally are reflected in Level 2 despite the availability of closing prices, because the fund evaluates and determines whether those closing prices reflect fair value at the close of the NYSE or require adjustment, as described above. The following table summarizes the fund’s investments, based on the inputs used to determine their values on December 31, 2008:

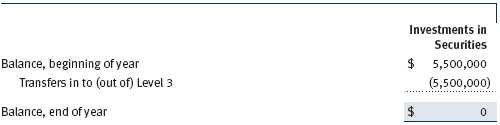
Following is a reconciliation of the fund’s Level 3 investments for the year ended December 31, 2008:
NOTE 3 - INVESTMENT TRANSACTIONS
Consistent with its investment objective, the fund engages in the following practices to manage exposure to certain risks or to enhance performance. The investment objective, policies, program, and risk factors of the fund are described more fully in the fund’s prospectus and Statement of Additional Information.
Restricted Securities The fund may invest in securities that are subject to legal or contractual restrictions on resale. Prompt sale of such securities at an acceptable price may be difficult and may involve substantial delays and additional costs.
Futures Contracts During the year ended December 31, 2008, the fund was a party to futures contracts, which provide for the future sale by one party and purchase by another of a specified amount of a specific financial instrument at an agreed upon price, date, time, and place. Risks arise from possible illiquidity of the futures market and from movements in security values.
Other Purchases and sales of portfolio securities, other than short-term securities, aggregated $857,864,000 and $627,149,000, respectively, for the year ended December 31, 2008.
NOTE 4 - FEDERAL INCOME TAXES
No provision for federal income taxes is required since the fund intends to continue to qualify as a regulated investment company under Subchapter M of the Internal Revenue Code and distribute to shareholders all of its taxable income and gains. Distributions are determined in accordance with Federal income tax regulations, which differ from generally accepted accounting principles, and, therefore, may differ significantly in amount or character from net investment income and realized gains for financial reporting purposes. Financial reporting records are adjusted for permanent book/tax differences to reflect tax character but are not adjusted for temporary differences.
Reclassifications to paid-in capital relate primarily to a tax practice that treats a portion of the proceeds from each redemption of capital shares as a distribution of taxable net investment income and/or realized capital gain. Reclassifications between income and gain relate primarily to the character of dividends received from REIT investments. For the year ended December 31, 2008, the following reclassifications, which had no impact on results of operations or net assets, were recorded to reflect tax character:

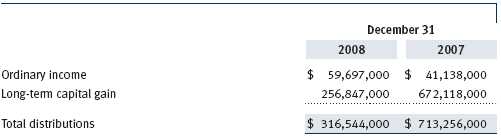
Distributions during the years ended December 31, 2008 and December 31, 2007 were characterized for tax purposes as follows:
At December 31, 2008, the tax-basis cost of investments and components of net assets were as follows:
![]()
The difference between book-basis and tax-basis net unrealized appreciation (depreciation) is attributable to the realization of unrealized gains/losses on passive foreign investment companies, for tax purposes. Pursuant to federal income tax regulations applicable to investment companies, recognition of capital losses on certain transactions is deferred until the subsequent tax year. Consequently, realized losses reflected in the accompanying financial statements include net capital losses realized between November 1 and the fund’s fiscal year-end that have not been recognized for tax purposes (Post-October loss deferrals).
NOTE 5 - RELATED PARTY TRANSACTIONS
The fund is managed by T. Rowe Price Associates, Inc. (the manager or Price Associates), a wholly owned subsidiary of T. Rowe Price Group, Inc. The investment management agreement between the fund and the manager provides for an annual investment management fee, which is computed daily and paid monthly. The fee consists of an individual fund fee, equal to 0.35% of the fund’s average daily net assets, and a group fee. The group fee rate is calculated based on the combined net assets of certain mutual funds sponsored by Price Associates (the group) applied to a graduated fee schedule, with rates ranging from 0.48% for the first $1 billion of assets to 0.285% for assets in excess of $220 billion. The fund’s group fee is determined by applying the group fee rate to the fund’s average daily net assets. At December 31, 2008, the effective annual group fee rate was 0.31%.
In addition, the fund has entered into service agreements with Price Associates and two wholly owned subsidiaries of Price Associates (collectively, Price). Price Associates computes the daily share prices and provides certain other administrative services to the fund. T. Rowe Price Services, Inc., provides shareholder and administrative services in its capacity as the fund’s transfer and dividend disbursing agent. T. Rowe Price Retirement Plan Services, Inc., provides subaccounting and recordkeeping services for certain retirement accounts invested in the Investor Class. For the year ended December 31, 2008, expenses incurred pursuant to these service agreements were $152,000 for Price Associates, $1,530,000 for T. Rowe Price Services, Inc., and $3,478,000 for T. Rowe Price Retirement Plan Services, Inc. The total amount payable at period-end pursuant to these service agreements is reflected as Due to Affiliates in the accompanying financial statements.
The fund is also one of several mutual funds sponsored by Price Associates (underlying Price funds) in which the T. Rowe Price Spectrum Funds (Spectrum Funds) and T. Rowe Price Retirement Funds (Retirement Funds) may invest. Neither the Spectrum Funds nor the Retirement Funds invest in the underlying Price funds for the purpose of exercising management or control. Pursuant to separate special servicing agreements, expenses associated with the operation of the Spectrum and Retirement Funds are borne by each underlying Price fund to the extent of estimated savings to it and in proportion to the average daily value of its shares owned by the Spectrum and Retirement Funds, respectively. Expenses allocated under these agreements are reflected as shareholder servicing expenses in the accompanying financial statements. For the year ended December 31, 2008, the fund was allocated $11,000 of Spectrum Funds’ expenses and $1,127,000 of Retirement Funds’ expenses. Of these amounts, $849,000 related to services provided by Price. The amount payable at period-end pursuant to this agreement is reflected as Due to Affiliates in the accompanying financial statements. At December 31, 2008, approximately 1% of the outstanding shares of the Investor Class were held by the Spectrum Funds and 11% were held by the Retirement Funds.
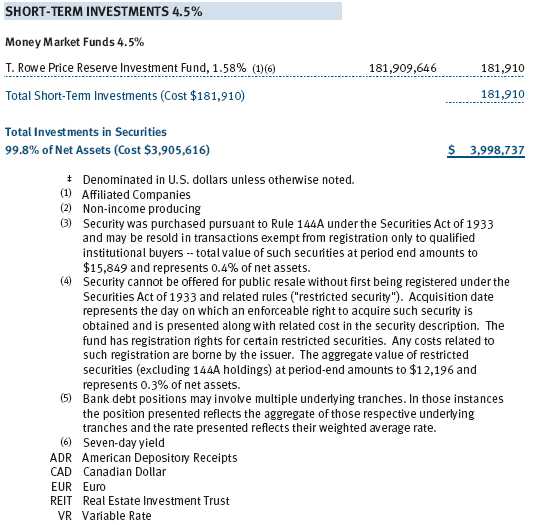
The fund may invest in the T. Rowe Price Reserve Investment Fund and the T. Rowe Price Government Reserve Investment Fund (collectively, the T. Rowe Price Reserve Investment Funds), open-end management investment companies managed by Price Associates and considered affiliates of the fund. The T. Rowe Price Reserve Investment Funds are offered as cash management options to mutual funds, trusts, and other accounts managed by Price Associates and/or its affiliates and are not available for direct purchase by members of the public. The T. Rowe Price Reserve Investment Funds pay no investment management fees.
As of December 31, 2008, T. Rowe Price Group, Inc., and/or its wholly owned subsidiaries owned 104,858 shares of the Investor Class, representing less than 1% of the fund’s net assets.
| REPORT OF INDEPENDENT REGISTERED PUBLIC ACCOUNTING FIRM |
To the Board of Directors and Shareholders of T. Rowe Price Small-Cap Value Fund, Inc.
In our opinion, the accompanying statement of assets and liabilities, including the schedule of investments, and the related statements of operations and of changes in net assets and the financial highlights present fairly, in all material respects, the financial position of T. Rowe Price Small-Cap Value Fund, Inc. (the “Fund”) at December 31, 2008, the results of its operations for the year then ended, the changes in its net assets for each of the two years in the period then ended and the financial highlights for each of the five years in the period then ended, in conformity with accounting principles generally accepted in the United States of America. These financial statements and financial highlights (hereafter referred to as “financial statements”) are the responsibility of the Fund’s management; our responsibility is to express an opinion on these financial statements based on our audits. We conducted our audits of these financial statements in accordance with the standards of the Public Company Accounting Oversight Board (United States). Those standards require that we plan and perform the audit to obtain reasonable assurance about whether the financial statements are free of material misstatement. An audit includes examining, on a test basis, evidence supporting the amounts and disclosures in the financial statements, assessing the accounting principles used and significant estimates made by management, and evaluating the overall financial statement presentation. We believe that our audits, which included confirmation of securities at December 31, 2008 by correspondence with the custodian and brokers and confirmation of the underlying fund by correspondence with the transfer agent, provide a reasonable basis for our opinion.
PricewaterhouseCoopers LLP
Baltimore, Maryland
February 12, 2009
| TAX INFORMATION (UNAUDITED) FOR THE TAX YEAR ENDED 12/31/08 |
We are providing this information as required by the Internal Revenue Code. The amounts shown may differ from those elsewhere in this report because of differences between tax and financial reporting requirements.
The fund’s distributions to shareholders included:
• $27,017,000 from short-term capital gains,
• $280,325,000 from long-term capital gains, of which $279,754,000 was subject to the 15% rate gains category, and $571,000 to the 25% rate gains category.
For taxable non-corporate shareholders, $47,290,000 of the fund’s income represents qualified dividend income subject to the 15% rate category.
For corporate shareholders, $46,678,000 of the fund’s income qualifies for the dividends-received deduction.
| INFORMATION ON PROXY VOTING POLICIES, PROCEDURES, AND RECORDS |
A description of the policies and procedures used by T. Rowe Price funds and portfolios to determine how to vote proxies relating to portfolio securities is available in each fund’s Statement of Additional Information, which you may request by calling 1-800-225-5132 or by accessing the SEC’s Web site, www.sec.gov. The description of our proxy voting policies and procedures is also available on our Web site, www.troweprice.com. To access it, click on the words “Our Company” at the top of our corporate homepage. Then, when the next page appears, click on the words “Proxy Voting Policies” on the left side of the page.
Each fund’s most recent annual proxy voting record is available on our Web site and through the SEC’s Web site. To access it through our Web site, follow the directions above, then click on the words “Proxy Voting Records” on the right side of the Proxy Voting Policies page.
| HOW TO OBTAIN QUARTERLY PORTFOLIO HOLDINGS |
The fund files a complete schedule of portfolio holdings with the Securities and Exchange Commission for the first and third quarters of each fiscal year on Form N-Q. The fund’s Form N-Q is available electronically on the SEC’s Web site (www.sec.gov); hard copies may be reviewed and copied at the SEC’s Public Reference Room, 450 Fifth St. N.W., Washington, DC 20549. For more information on the Public Reference Room, call 1-800-SEC-0330.
| ABOUT THE FUND’S DIRECTORS AND OFFICERS |
Your fund is governed by a Board of Directors (Board) that meets regularly to review a wide variety of matters affecting the fund, including performance, investment programs, compliance matters, advisory fees and expenses, service providers, and other business affairs. The Board elects the fund’s officers, who are listed in the final table. At least 75% of Board members are independent of T. Rowe Price Associates, Inc. (T. Rowe Price), and T. Rowe Price International, Inc. (T. Rowe Price International); “inside” or “interested” directors are employees or officers of T. Rowe Price. The business address of each director and officer is 100 East Pratt Street, Baltimore, Maryland 21202. The Statement of Additional Information includes additional information about the directors and is available without charge by calling a T. Rowe Price representative at 1-800-225-5132.
| Independent Directors | |
| Name | |
| (Year of Birth) | Principal Occupation(s) During Past Five Years and Directorships of |
| Year Elected* | Other Public Companies |
| Jeremiah E. Casey | Director, National Life Insurance (2001 to 2005); Director, The Rouse |
| (1940) | Company, real estate developers (1990 to 2004) |
| 2005 | |
| Anthony W. Deering | Chairman, Exeter Capital, LLC, a private investment firm (2004 to |
| (1945) | present); Director, Under Armour (8/08 to present); Director, |
| 2001 | Vornado Real Estate Investment Trust (3/04 to present); Director, |
| Mercantile Bankshares (2002 to 2007); Member, Advisory Board, | |
| Deutsche Bank North America (2004 to present); Director, | |
| Chairman of the Board, and Chief Executive Officer, The Rouse | |
| Company, real estate developers (1997 to 2004) | |
| Donald W. Dick, Jr. | Principal, EuroCapital Advisors, LLC, an acquisition and management |
| (1943) | advisory firm (10/95 to present); Chairman, The Haven Group, a cus- |
| 1994 | tom manufacturer of modular homes (1/04 to present) |
| David K. Fagin | Chairman and President, Nye Corporation (6/88 to present); Director, |
| (1938) | Golden Star Resources Ltd. (5/92 to present); Director, Pacific Rim |
| 1994 | Mining Corp. (2/02 to present); Director, B.C. Corporation (3/08 to |
| present); Chairman, Canyon Resources Corp. (8/07 to 3/08); Director, | |
| Atna Resources Ltd. (3/08 to present) | |
| Karen N. Horn | Director, Eli Lilly and Company (1987 to present); Director, Simon |
| (1943) | Property Group (2004 to present); Director, Federal National Mortgage |
| 2003 | Association (9/06 to present); Director, Norfolk Southern (2/08 |
| to present); Director, Georgia Pacific (5/04 to 12/05); Managing | |
| Director and President, Global Private Client Services, Marsh Inc. | |
| (1999 to 2003) | |
| Theo C. Rodgers | President, A&R Development Corporation (1977 to present) |
| (1941) | |
| 2005 | |
| John G. Schreiber | Owner/President, Centaur Capital Partners, Inc., a real estate invest- |
| (1946) | ment company (1991 to present); Partner, Blackstone Real Estate |
| 2001 | Advisors, L.P. (10/92 to present) |
| *Each independent director oversees 126 T. Rowe Price portfolios (except for Mr. Fagin, who oversees 125 | |
| T. Rowe Price portfolios) and serves until retirement, resignation, or election of a successor. | |
| Inside Directors | |
| Name | |
| (Year of Birth) | |
| Year Elected* | |
| [Number of T. Rowe Price | Principal Occupation(s) During Past Five Years and Directorships of |
| Portfolios Overseen] | Other Public Companies |
| Edward C. Bernard | Director and Vice President, T. Rowe Price; Vice Chairman of the Board, |
| (1956) | Director, and Vice President, T. Rowe Price Group, Inc.; Chairman of |
| 2006 | the Board, Director, and President, T. Rowe Price Investment Services, |
| [126] | Inc.; Chairman of the Board and Director, T. Rowe Price Global Asset |
| Management Limited, T. Rowe Price Global Investment Services | |
| Limited, T. Rowe Price Retirement Plan Services, Inc., T. Rowe Price | |
| Savings Bank, and T. Rowe Price Services, Inc.; Director, T. Rowe Price | |
| International, Inc.; Chief Executive Officer, Chairman of the Board, | |
| Director, and President, T. Rowe Price Trust Company; Chairman of | |
| the Board, all funds | |
| John H. Laporte, CFA | Director and Vice President, T. Rowe Price and T. Rowe Price Group, |
| (1945) | Inc.; Vice President, T. Rowe Price Trust Company |
| 1994 | |
| [16] | |
| *Each inside director serves until retirement, resignation, or election of a successor. | |
| Officers | |
| Name (Year of Birth) | |
| Title and Fund(s) Served | Principal Occupation(s) |
| Preston G. Athey, CFA, CIC (1949) | Vice President, T. Rowe Price, T. Rowe Price |
| President, Small-Cap Value Fund | Group, Inc., and T. Rowe Price Trust Company |
| Hugh M. Evans III, CFA (1966) | Vice President, T. Rowe Price and T. Rowe Price |
| Vice President, Small-Cap Value Fund | Group, Inc. |
| Roger L. Fiery III, CPA (1959) | Vice President, T. Rowe Price, T. Rowe Price |
| Vice President, Small-Cap Value Fund | Group, Inc., T. Rowe Price International, Inc., |
| and T. Rowe Price Trust Company | |
| Christopher T. Fortune (1973) | Vice President, T. Rowe Price and T. Rowe Price |
| Vice President, Small-Cap Value Fund | Group, Inc.; formerly intern, Hillman Capital |
| Management (to 2005) | |
| John R. Gilner (1961) | Chief Compliance Officer and Vice President, |
| Chief Compliance Officer, Small-Cap | T. Rowe Price; Vice President, T. Rowe Price |
| Value Fund | Group, Inc., and T. Rowe Price Investment |
| Services, Inc. | |
| Gregory S. Golczewski (1966) | Vice President, T. Rowe Price and T. Rowe Price |
| Vice President, Small-Cap Value Fund | Trust Company |
| Gregory K. Hinkle, CPA (1958) | Vice President, T. Rowe Price, T. Rowe Price |
| Treasurer, Small-Cap Value Fund | Group, Inc., T. Rowe Price Investment Services, |
| Inc., and T. Rowe Price Trust Company; formerly | |
| Partner, PricewaterhouseCoopers LLP (to 2007) | |
| Susan J. Klein (1950) | Vice President, T. Rowe Price |
| Vice President, Small-Cap Value Fund | |
| Patricia B. Lippert (1953) | Assistant Vice President, T. Rowe Price and |
| Secretary, Small-Cap Value Fund | T. Rowe Price Investment Services, Inc. |
| Gregory A. McCrickard, CFA (1958) | Vice President, T. Rowe Price, T. Rowe Price |
| Vice President, Small-Cap Value Fund | Group, Inc., and T. Rowe Price Trust Company |
| David Oestreicher (1967) | Director and Vice President, T. Rowe Price |
| Vice President, Small-Cap Value Fund | Investment Services, Inc., T. Rowe Price Trust |
| Company, and T. Rowe Price Services, Inc.; Vice | |
| President, T. Rowe Price, T. Rowe Price Global | |
| Asset Management Limited, T. Rowe Price Global | |
| Investment Services Limited, T. Rowe Price | |
| Group, Inc., T. Rowe Price International, Inc., | |
| and T. Rowe Price Retirement Plan Services, Inc. | |
| Curt J. Organt, CFA (1968) | Vice President, T. Rowe Price and T. Rowe Price |
| Vice President, Small-Cap Value Fund | Group, Inc. |
| J. David Wagner, CFA (1974) | Vice President, T. Rowe Price and T. Rowe Price |
| Vice President, Small-Cap Value Fund | Group, Inc. |
| Julie L. Waples (1970) | Vice President, T. Rowe Price |
| Vice President, Small-Cap Value Fund | |
| Kwame C. Webb (1982) | Vice President, T. Rowe Price; formerly student, |
| Vice President, Small-Cap Value Fund | The College of William & Mary (to 2004) |
| Unless otherwise noted, officers have been employees of T. Rowe Price or T. Rowe Price International for at | |
| least five years. | |
Item 2. Code of Ethics.
The registrant has adopted a code of ethics, as defined in Item 2 of Form N-CSR, applicable to its principal executive officer, principal financial officer, principal accounting officer or controller, or persons performing similar functions. A copy of this code of ethics is filed as an exhibit to this Form N-CSR. No substantive amendments were approved or waivers were granted to this code of ethics during the period covered by this report.
Item 3. Audit Committee Financial Expert.
The registrant’s Board of Directors/Trustees has determined that Ms. Karen N. Horn qualifies as an audit committee financial expert, as defined in Item 3 of Form N-CSR. Ms. Horn is considered independent for purposes of Item 3 of Form N-CSR.
Item 4. Principal Accountant Fees and Services.
(a) – (d) Aggregate fees billed to the registrant for the last two fiscal years for professional services rendered by the registrant’s principal accountant were as follows:
Audit fees include amounts related to the audit of the registrant’s annual financial statements and services normally provided by the accountant in connection with statutory and regulatory filings. Audit-related fees include amounts reasonably related to the performance of the audit of the registrant’s financial statements and specifically include the issuance of a report on internal controls and, if applicable, agreed-upon procedures related to fund acquisitions. Tax fees include amounts related to services for tax compliance, tax planning, and tax advice. The nature of these services specifically includes the review of distribution calculations and the preparation of Federal, state, and excise tax returns. All other fees include the registrant’s pro-rata share of amounts for agreed-upon procedures in conjunction with service contract approvals by the registrant’s Board of Directors/Trustees.
(e)(1) The registrant’s audit committee has adopted a policy whereby audit and non-audit services performed by the registrant’s principal accountant for the registrant, its investment adviser, and any entity controlling, controlled by, or under common control with the investment adviser that provides ongoing services to the registrant require pre-approval in advance at regularly scheduled audit committee meetings. If such a service is required between regularly scheduled audit committee meetings, pre-approval may be authorized by one audit committee member with ratification at the next scheduled audit committee meeting. Waiver of pre-approval for audit or non-audit services requiring fees of a de minimis amount is not permitted.
(2) No services included in (b) – (d) above were approved pursuant to paragraph (c)(7)(i)(C) of Rule 2-01 of Regulation S-X.
(f) Less than 50 percent of the hours expended on the principal accountant’s engagement to audit the registrant’s financial statements for the most recent fiscal year were attributed to work performed by persons other than the principal accountant’s full-time, permanent employees.
(g) The aggregate fees billed for the most recent fiscal year and the preceding fiscal year by the registrant’s principal accountant for non-audit services rendered to the registrant, its investment adviser, and any entity controlling, controlled by, or under common control with the investment adviser that provides ongoing services to the registrant were $1,922,000 and $1,486,000, respectively.
(h) All non-audit services rendered in (g) above were pre-approved by the registrant’s audit committee. Accordingly, these services were considered by the registrant’s audit committee in maintaining the principal accountant’s independence.
Item 5. Audit Committee of Listed Registrants.
Not applicable.
Item 6. Investments.
(a) Not applicable. The complete schedule of investments is included in Item 1 of this Form N-CSR.
(b) Not applicable.
Item 7. Disclosure of Proxy Voting Policies and Procedures for Closed-End Management Investment Companies.
Not applicable.
Item 8. Portfolio Managers of Closed-End Management Investment Companies.
Not applicable.
Item 9. Purchases of Equity Securities by Closed-End Management Investment Company and Affiliated Purchasers.
Not applicable.
Item 10. Submission of Matters to a Vote of Security Holders.
Not applicable.
Item 11. Controls and Procedures.
(a) The registrant’s principal executive officer and principal financial officer have evaluated the registrant’s disclosure controls and procedures within 90 days of this filing and have concluded that the registrant’s disclosure controls and procedures were effective, as of that date, in ensuring that information required to be disclosed by the registrant in this Form N-CSR was recorded, processed, summarized, and reported timely.
(b) The registrant’s principal executive officer and principal financial officer are aware of no change in the registrant’s internal control over financial reporting that occurred during the registrant’s second fiscal quarter covered by this report that has materially affected, or is reasonably likely to materially affect, the registrant’s internal control over financial reporting.
Item 12. Exhibits.
(a)(1) The registrant’s code of ethics pursuant to Item 2 of Form N-CSR is attached.
(2) Separate certifications by the registrant's principal executive officer and principal financial officer, pursuant to Section 302 of the Sarbanes-Oxley Act of 2002 and required by Rule 30a-2(a) under the Investment Company Act of 1940, are attached.
(3) Written solicitation to repurchase securities issued by closed-end companies: not applicable.
(b) A certification by the registrant's principal executive officer and principal financial officer, pursuant to Section 906 of the Sarbanes-Oxley Act of 2002 and required by Rule 30a-2(b) under the Investment Company Act of 1940, is attached.
SIGNATURES | |
| Pursuant to the requirements of the Securities Exchange Act of 1934 and the Investment | |
| Company Act of 1940, the registrant has duly caused this report to be signed on its behalf by the | |
| undersigned, thereunto duly authorized. | |
| T. Rowe Price Small-Cap Value Fund, Inc. | |
| By | /s/ Edward C. Bernard |
| Edward C. Bernard | |
| Principal Executive Officer | |
| Date | February 19, 2009 |
| Pursuant to the requirements of the Securities Exchange Act of 1934 and the Investment | |
| Company Act of 1940, this report has been signed below by the following persons on behalf of | |
| the registrant and in the capacities and on the dates indicated. | |
| By | /s/ Edward C. Bernard |
| Edward C. Bernard | |
| Principal Executive Officer | |
| Date | February 19, 2009 |
| By | /s/ Gregory K. Hinkle |
| Gregory K. Hinkle | |
| Principal Financial Officer | |
| Date | February 19, 2009 |