UNITED STATES
SECURITIES AND EXCHANGE COMMISSION
Washington, D.C. 20549
FORM N-CSR
CERTIFIED SHAREHOLDER REPORT OF REGISTERED
MANAGEMENT INVESTMENT COMPANIES
Investment Company Act File Number: 811-02215
| T. Rowe Price Small-Cap Value Fund, Inc. |
| (Exact name of registrant as specified in charter) |
| 100 East Pratt Street, Baltimore, MD 21202 |
| (Address of principal executive offices) |
| David Oestreicher |
| 100 East Pratt Street, Baltimore, MD 21202 |
| (Name and address of agent for service) |
Registrant’s telephone number, including area code: (410) 345-2000
Date of fiscal year end: December 31
Date of reporting period: December 31, 2012
Item 1. Report to Shareholders
 |
| Small-Cap Value Fund | December 31, 2012 |
The views and opinions in this report were current as of December 31, 2012. They are not guarantees of performance or investment results and should not be taken as investment advice. Investment decisions reflect a variety of factors, and the managers reserve the right to change their views about individual stocks, sectors, and the markets at any time. As a result, the views expressed should not be relied upon as a forecast of the fund’s future investment intent. The report is certified under the Sarbanes-Oxley Act, which requires mutual funds and other public companies to affirm that, to the best of their knowledge, the information in their financial reports is fairly and accurately stated in all material respects.
REPORTS ON THE WEB
Sign up for our E-mail Program, and you can begin to receive updated fund reports and prospectuses online rather than through the mail. Log in to your account at troweprice.com for more information.
Manager’s Letter
Fellow Shareholders
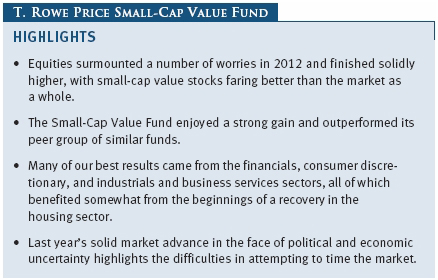
Stocks are sometimes described as having “climbed a wall of worry,” and the description seems particularly apt for 2012. Despite a host of concerns, equities enjoyed a healthy gain over the past year as the U.S. economy and corporate profits continued to grow. It was also a period that favored our investment approach as small-cap value stocks fared better than most other categories. I am happy to report that your fund enjoyed a strong gain that outpaced the average return of its peers.
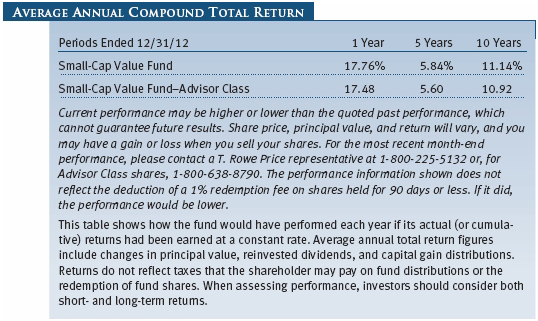
The Small-Cap Value Fund returned 9.53% over the past six months and 17.76% over the past year. These returns outpaced those of the Lipper Small-Cap Core Funds Index over both periods. The fund also outpaced the Russell 2000 Value Index over the past six months, but it lagged a bit over the full year. The fund remained very favorably ranked among its peers over longer time periods, including top 15% rankings for the 5- and 10-year periods. (As in past reports, we show results for both the small-cap core and small-cap value funds categories, as we think the latter is more reflective of our investment style and objective.) Based on cumulative total return, Lipper ranked the Small-Cap Value Fund 138 of 705, 125 of 623, 66 of 539, and 46 of 337 small-cap core funds for the 1-, 3-, 5-, and 10-year periods ended December 31, 2012, respectively. (Past performance cannot guarantee future results.)

MARKET ENVIRONMENT
Equities produced solid returns in 2012 even as the global economy remained unsettled four years after the global financial crisis of 2008. The eurozone recession and sovereign debt crisis, a slowdown in emerging economies, and worries over fiscal policy at home kept U.S. economic growth muted. Worries about Europe, in particular, drove down stock prices in the spring. Stocks recovered into the fall as U.S. corporate earnings remained strong, although the pace of earnings growth slowed. Equities also received a boost from the Federal Reserve, which announced two new rounds of long-term bond buying in order to drive down government interest rates and encourage investors to choose riskier assets, including stocks.
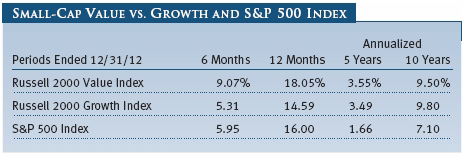
Small-cap shares, along with mid-caps, narrowly surpassed their large-cap counterparts. The small-cap Russell 2000 Index neared a new record high late in the year, as investors began to perceive that policymakers would avert going over the “fiscal cliff” of automatic spending cuts and tax increases at the start of 2013. As measured by various Russell indexes, value stocks outperformed growth stocks across all market capitalizations.
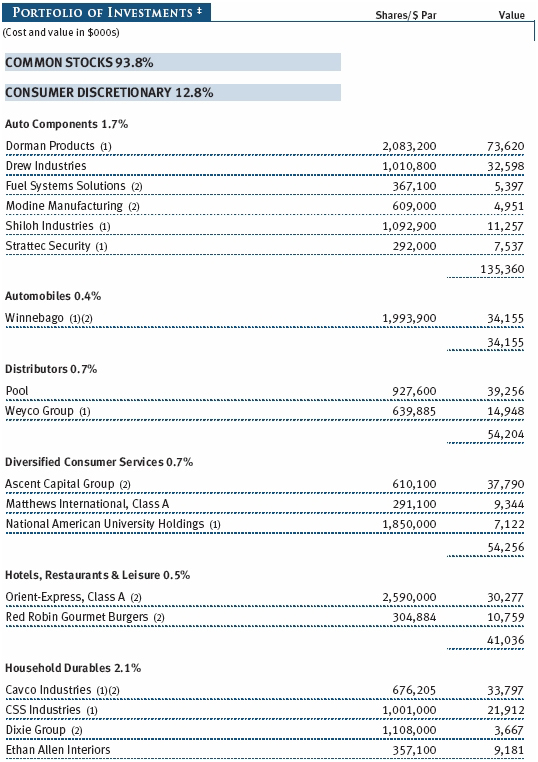
PORTFOLIO ACTIVITY
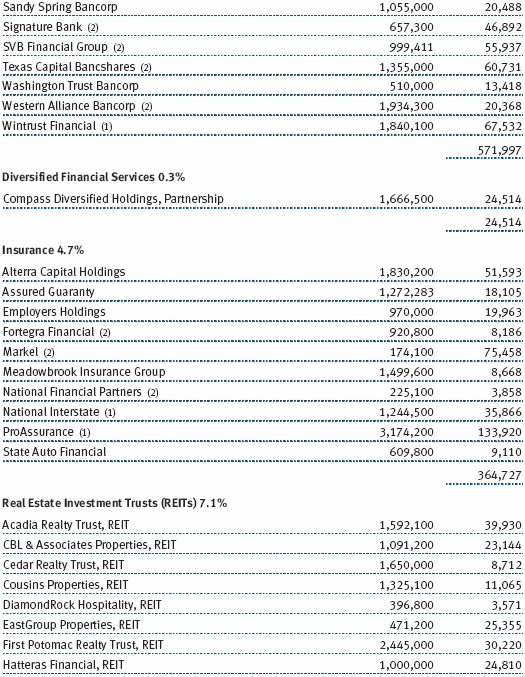
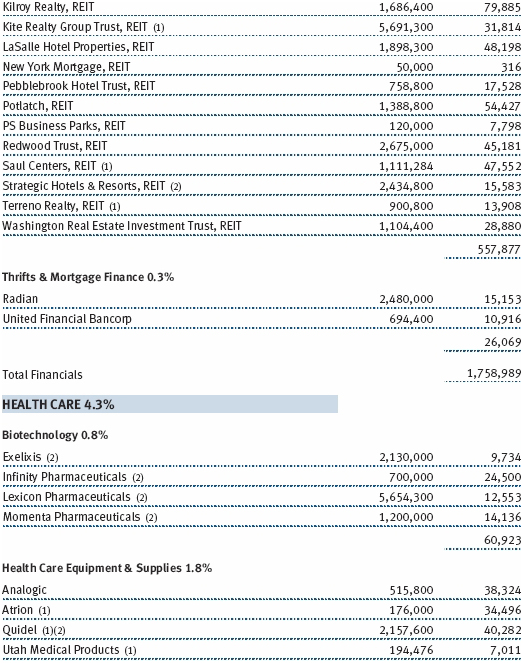
A broad range of our fund’s holdings performed well over the past year, with the only real drag on results coming from the struggling energy sector. Financials provided the greatest overall boost to performance. Our real estate investment trust (REIT) holdings contributed the most, with particularly strong results from two West Coast REITs, Redwood Trust and Kilroy Realty. Our commercial bank holdings also did well, led by Texas Capital Bancshares, as did several of our holdings in insurance and capital markets. (Please refer to the fund’s portfolio of investments for a complete list of our holdings and the amount each represents in the portfolio.)
As longtime shareholders are aware, the fund is significantly underweight in financials; the sector represented about 23% of the portfolio at the end of the year, but a whopping 37% of the Russell 2000 Value Index—an imprudently large weighting, in our opinion, for a diversified portfolio. While we do not intend to match the benchmark weight, we have recently found a number of new opportunities in commercial banks and, if attractively priced, will continue to add to these positions.
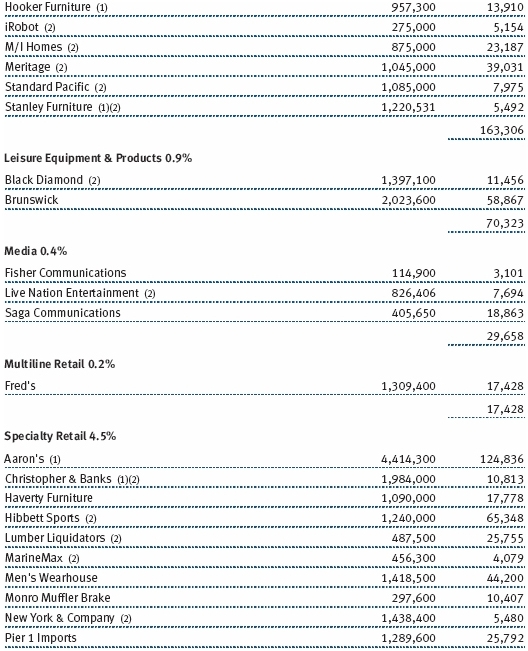
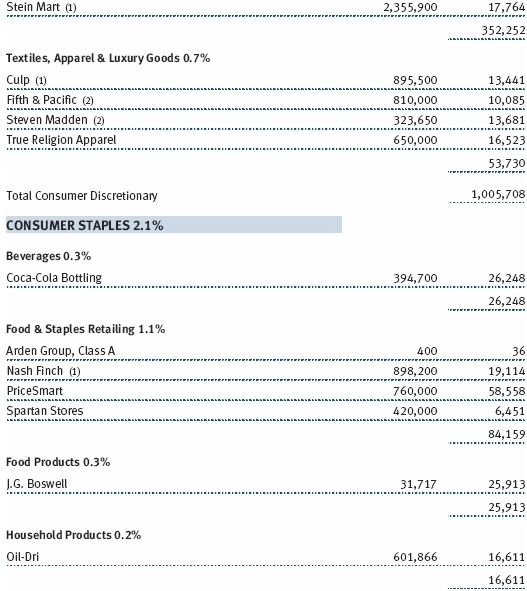
Our consumer discretionary holdings also generally fared well. A recovery from internal problems it had suffered in 2011 and a comeback in the housing sector led to good results for do-it-yourself hardwood flooring company Lumber Liquidators. Dorman Products, a supplier of primarily aftermarket automotive parts, saw sharp gains in the second half of the year after it reported record sales and earnings driven by rising margins due to lower costs and strong demand—the average U.S. car has been on the road for a record 11 years. Brunswick has been able to restructure debt to survive and then thrive coming out of the downturn. The company’s share price has remained volatile but on a recovering path as consumer attitudes continue to improve, boding well for leisure spending. We had our disappointments in the sector as well, however. National American University Holdings was among our top detractors, as the for-profit provider of education for working adults reported lower net income.
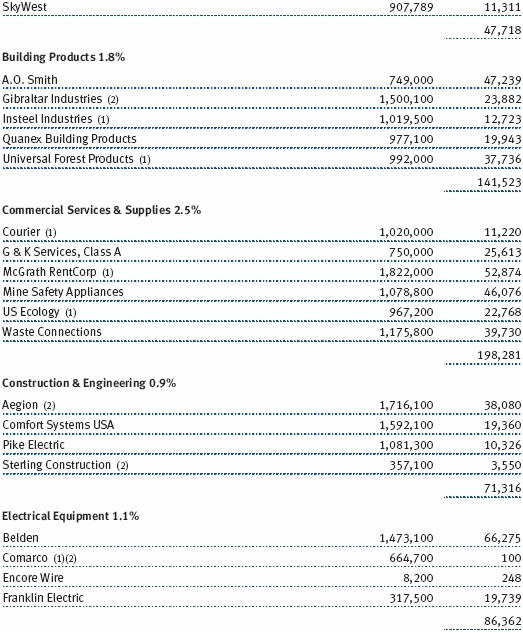
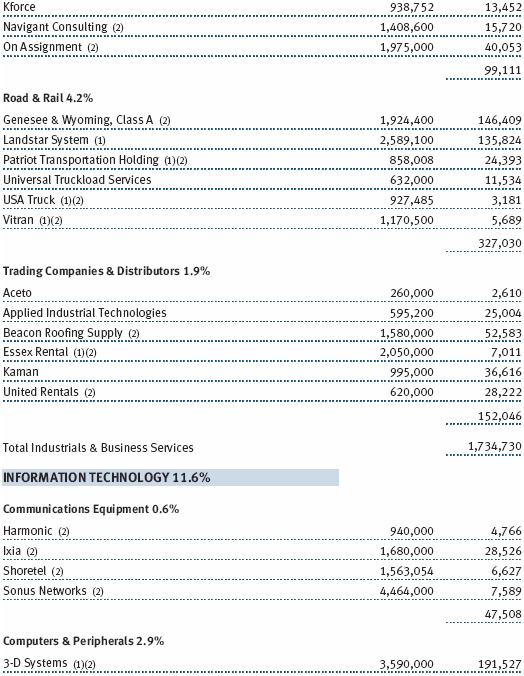
In the strong industrials and business services sector, short-haul railroad Genesee & Wyoming was a standout. The firm announced the acquisition of a competitor, which will unite the two largest short-haul railroads in the U.S. Investors greeted the announcement favorably, as the recent boom in domestic energy production has created transportation bottlenecks and opened opportunities for these carriers. Industrials firm Nordson, an Ohio-based maker of industrial equipment including adhesives dispensing systems, has benefited from the weak U.S. dollar, which has boosted exports. The company has also exhibited excellent business execution, including the consolidation of a number of small-scale acquisitions. The improved housing market benefited Beacon Roofing Supply, as well as homebuilders Meritage and M/I Homes, which are included in the consumer discretionary sector.
I should reserve special mention for 3-D Systems, which contributed over one-tenth of our overall gains in the period—an especially noteworthy contribution given that it was only 0.9% of the portfolio at the start of the year. We have described 3-D Systems’ remarkable three-dimensional printing technology in past reports, but the potential of the technology continued to grow and captured the public’s imagination in 2012. Investors seem to be compelled by the fundamentals that have drawn us to the holding: recurring revenue; high profit margins and return on invested capital; prodigious cash flow generation; strong management, balance sheet, and patent position; and a seemingly open-ended opportunity for growth. I also want to acknowledge my colleague Hugh Evans, a longtime member of the fund’s team, who encouraged us to hold on to our 3-D investment through its lean years. As of today, 3-D is the single largest contributor to shareholder profits in the nearly 25-year history of the Small-Cap Value Fund.

Only a couple of years ago, I was writing in these letters about the strong results coming from the energy sector, as firms benefited from rising global demand, particularly from emerging markets. Energy has gone from the top of the class to the bottom in terms of stock performance, however. Ironically, a large part of the sector’s poor market performance has been its stellar technological development. “Fracking” was an uncommon term when we first began discussing it a few years ago; now, of course, it is widely known as the drilling process that is allowing dramatic increases in oil and especially gas production in the U.S. The flood of new supply, combined with warmer-than-average winters, has weighed heavily on many producers, as natural gas prices fell to multiyear lows this spring. Indeed, five of our 10 worst performers—Swift Energy, Contango Oil & Gas, Clayton Williams Energy, Northern Oil & Gas, and CARBO Ceramics (which makes proppants used in the fracking process)—felt the brunt of declining gas prices.
Finally, a mea culpa on Overseas Shipholding Group. In my last letter, I acknowledged the stiff challenges facing the global shipping industry, which are largely the result of a steep drop in oil demand. Nevertheless, I expected firms with ample cash on their balance sheets to survive the worst industry downturn in 20 years and emerge in a stronger position once shipping rates recovered. While our analysts and I believed Overseas Shipholding fit this category, the tanker owner and operator faced widening losses over the year and an unexpected tax problem, and it eventually declared bankruptcy. The overall effect on the portfolio was limited, given that the stock represented only about 0.15% of our holdings at the start of the period. But recognition that we will occasionally make such mistakes is one reason that we take care to maintain a highly diversified portfolio.
PURCHASE AND SALE ACTIVITY
While I rarely select a stock because it is a takeover target, the fund often benefits from the announcement of a merger or acquisition of a holding at a premium to its current stock price. We saw 18 takeover announcements in the fund over the past year—a good number but well below our record of 34 in 2007, a year characterized by motivated buyers fed by cheap credit. The number was also somewhat less than we might have expected given the prospect of higher capital gains rates in 2013, suggesting that it takes both motivated sellers and motivated buyers to spur higher-than-usual deal activity. However, the prospect of tax changes encouraged a number of our holdings to pay out special dividends in 2012; indeed, we calculated that these special dividends occurred at 12 times the normal rate. This should result in a small increase in taxable income to our shareholders for the year.
As usual, new purchases involved a range of sectors, although we have recently focused much of our buying on the downtrodden energy sector. Given concern about the potential for longer-term inflation, we have continued to look for ways to expose the portfolio to hard assets, which tend to fare well in periods of rapid inflation. One of our latest purchases was Luxfer Holdings, a global materials company that specializes in the design and production of high-performance materials. Although based in London, the company conducted an initial public offering on the New York Stock Exchange in October.
OUTLOOK
Imagine that in January 2012 you were given the following crystal ball insights for the year:
1. The U.S. would undergo a bruising presidential election campaign, and the winner would be a clear advocate for higher taxes on investors.
2. The economy would grow at a below average pace, and job gains would be painfully slow.
3. Europe would slip into recession. Spanish unemployment would top 20%, and there would be riots in the streets in Athens, Greece.
4. China would undergo a slowdown as the government attempted to tamp down rampant housing speculation.
5. U.S. investors as a whole would continue pulling money out of equities as they had in recent years.
With those future events firmly in mind, how many of us would then have predicted that U.S. stocks would return over 15% in 2012? I did not, even though I was optimistic that moderate valuations would result in a modest gain for the year. The market proved to be surprisingly resilient in the face of a lot of arguably negative news. And it ended the year still relatively cheap when viewed against its previous 50 years or against bond yields.
So what did we learn? First, don’t try to time the market, unless you are particularly adept at investing at points of high pessimism. Those who thought they would wait to invest until the world economic background improved have missed a nice 15% move. Second, don’t fight the Federal Reserve. When our central bank is aggressively lowering interest rates and providing liquidity to our economy, that backdrop is usually good for stocks. Third, don’t count out the U.S. The resilience of our economy and markets in the face of external shocks is amazing. And combined with our rapidly improving energy outlook, our manufacturing sector is beginning a secular renaissance that bodes well for North American production.
I believe U.S. equities will rise in 2013, maybe not at the pace of 2012, but probably at a rate substantially higher than that available from fixed income. With valuations among our small-cap value universe close to average over the past 30 years versus large-cap companies and growth companies, I believe our sector will enjoy returns in line with, or perhaps better than, the average small-cap company, and thus remain close to fully invested.
Respectfully submitted,

Preston G. Athey
President of the fund and chairman of its Investment Advisory Committee
January 14, 2013
The committee chairman has day-to-day responsibility for managing the portfolio and works with committee members in developing and executing the fund’s investment program.
RISKS OF STOCK INVESTING
The fund’s share price can fall because of weakness in the stock markets, a particular industry, or specific holdings. Stock markets can decline for many reasons, including adverse political or economic developments, changes in investor psychology, or heavy institutional selling. The prospects for an industry or company may deteriorate because of a variety of factors, including disappointing earnings or changes in the competitive environment. In addition, the investment manager’s assessment of companies held in a fund may prove incorrect, resulting in losses or poor performance even in rising markets.
GLOSSARY
Lipper indexes: Fund benchmarks that consist of a small number (10 to 30) of the largest mutual funds in a particular category as tracked by Lipper Inc.
Russell 2000 Index: An unmanaged index that tracks the stocks of 2,000 small U.S. companies.
Russell 2000 Growth Index: An index that tracks the performance of small-cap stocks with higher price-to-book ratios and higher forecast growth values.
Russell 2000 Value Index: An index that tracks the performance of small-cap stocks with lower price-to-book ratios and lower forecast growth values.
S&P 500 Index: An unmanaged index that tracks the stocks of 500 primarily large-cap U.S. companies.
Note: Russell Investment Group is the source and owner of the trademarks, service marks, and copyrights related to the Russell indexes. Russell® is a trademark of Russell Investment Group.

Performance and Expenses
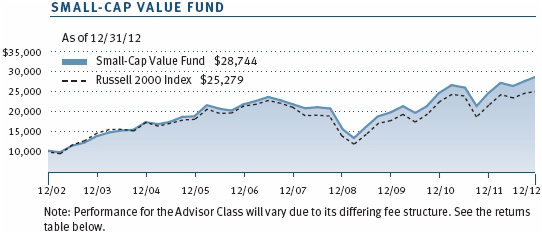
| Growth of $10,000 |
This chart shows the value of a hypothetical $10,000 investment in the fund over the past 10 fiscal year periods or since inception (for funds lacking 10-year records). The result is compared with benchmarks, which may include a broad-based market index and a peer group average or index. Market indexes do not include expenses, which are deducted from fund returns as well as mutual fund averages and indexes.

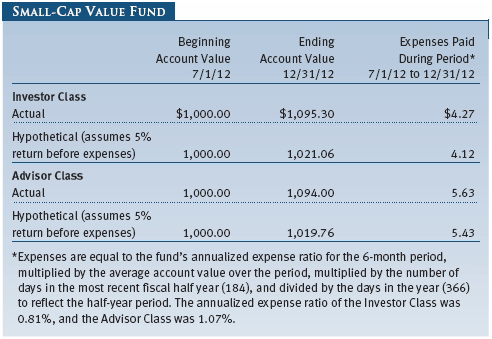
| Fund Expense Example |
As a mutual fund shareholder, you may incur two types of costs: (1) transaction costs, such as redemption fees or sales loads, and (2) ongoing costs, including management fees, distribution and service (12b-1) fees, and other fund expenses. The following example is intended to help you understand your ongoing costs (in dollars) of investing in the fund and to compare these costs with the ongoing costs of investing in other mutual funds. The example is based on an investment of $1,000 invested at the beginning of the most recent six-month period and held for the entire period.
Please note that the fund has two share classes: The original share class (Investor Class) charges no distribution and service (12b-1) fee, and the Advisor Class shares are offered only through unaffiliated brokers and other financial intermediaries and charge a 0.25% 12b-1 fee. Each share class is presented separately in the table.
Actual Expenses
The first line of the following table (Actual) provides information about actual account values and expenses based on the fund’s actual returns. You may use the information on this line, together with your account balance, to estimate the expenses that you paid over the period. Simply divide your account value by $1,000 (for example, an $8,600 account value divided by $1,000 = 8.6), then multiply the result by the number on the first line under the heading “Expenses Paid During Period” to estimate the expenses you paid on your account during this period.
Hypothetical Example for Comparison Purposes
The information on the second line of the table (Hypothetical) is based on hypothetical account values and expenses derived from the fund’s actual expense ratio and an assumed 5% per year rate of return before expenses (not the fund’s actual return). You may compare the ongoing costs of investing in the fund with other funds by contrasting this 5% hypothetical example and the 5% hypothetical examples that appear in the shareholder reports of the other funds. The hypothetical account values and expenses may not be used to estimate the actual ending account balance or expenses you paid for the period.
Note: T. Rowe Price charges an annual account service fee of $20, generally for accounts with less than $10,000. The fee is waived for any investor whose T. Rowe Price mutual fund accounts total $50,000 or more; accounts electing to receive electronic delivery of account statements, transaction confirmations, prospectuses, and shareholder reports; or accounts of an investor who is a T. Rowe Price Preferred Services, Personal Services, or Enhanced Personal Services client (enrollment in these programs generally requires T. Rowe Price assets of at least $100,000). This fee is not included in the accompanying table. If you are subject to the fee, keep it in mind when you are estimating the ongoing expenses of investing in the fund and when comparing the expenses of this fund with other funds.
You should also be aware that the expenses shown in the table highlight only your ongoing costs and do not reflect any transaction costs, such as redemption fees or sales loads. Therefore, the second line of the table is useful in comparing ongoing costs only and will not help you determine the relative total costs of owning different funds. To the extent a fund charges transaction costs, however, the total cost of owning that fund is higher.

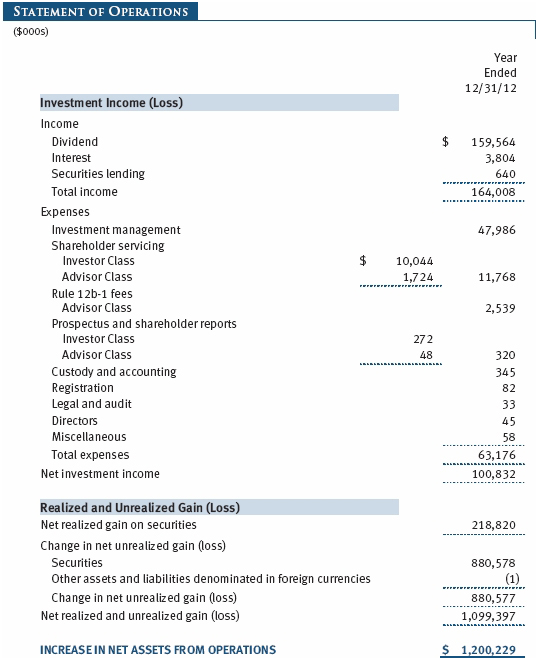
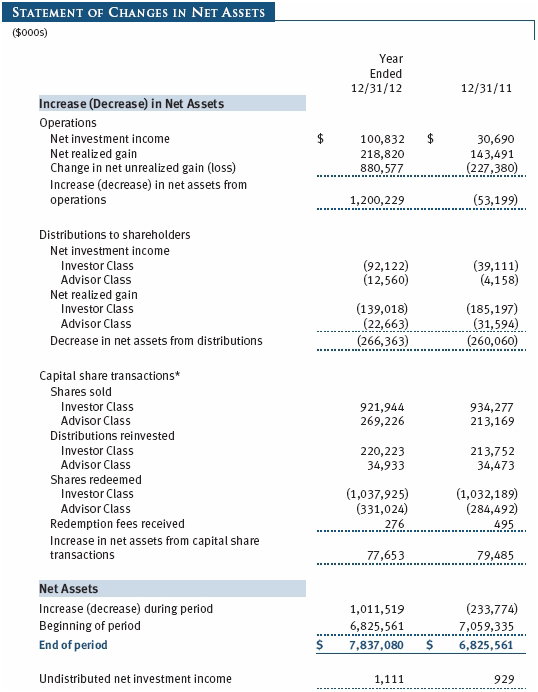
The accompanying notes are an integral part of these financial statements.
The accompanying notes are an integral part of these financial statements.


The accompanying notes are an integral part of these financial statements.
The accompanying notes are an integral part of these financial statements.
The accompanying notes are an integral part of these financial statements.

The accompanying notes are an integral part of these financial statements.
| Notes to Financial Statements |
T. Rowe Price Small-Cap Value Fund, Inc. (the fund), is registered under the Investment Company Act of 1940 (the 1940 Act) as a diversified, open-end management investment company. The fund seeks long-term capital growth by investing primarily in small companies whose common stocks are believed to be undervalued. The fund has two classes of shares: the Small-Cap Value Fund original share class, referred to in this report as the Investor Class, offered since June 30, 1988, and the Small-Cap Value Fund–Advisor Class (Advisor Class), offered since March 31, 2000. Advisor Class shares are sold only through unaffiliated brokers and other unaffiliated financial intermediaries that are compensated by the class for distribution, shareholder servicing, and/or certain administrative services under a Board-approved Rule 12b-1 plan. Each class has exclusive voting rights on matters related solely to that class; separate voting rights on matters that relate to both classes; and, in all other respects, the same rights and obligations as the other class.
NOTE 1 - SIGNIFICANT ACCOUNTING POLICIES
Basis of Preparation The accompanying financial statements were prepared in accordance with accounting principles generally accepted in the United States of America (GAAP), which require the use of estimates made by management. Management believes that estimates and valuations are appropriate; however, actual results may differ from those estimates, and the valuations reflected in the accompanying financial statements may differ from the value ultimately realized upon sale or maturity.
Investment Transactions, Investment Income, and Distributions Income and expenses are recorded on the accrual basis. Premiums and discounts on debt securities are amortized for financial reporting purposes. Dividends received from mutual fund investments are reflected as dividend income; capital gain distributions are reflected as realized gain/loss. Earnings on investments recognized as partnerships for federal income tax purposes reflect the tax character of such earnings. Dividend income and capital gain distributions are recorded on the ex-dividend date. Income tax-related interest and penalties, if incurred, would be recorded as income tax expense. Investment transactions are accounted for on the trade date. Realized gains and losses are reported on the identified cost basis. Distributions to shareholders are recorded on the ex-dividend date. Income distributions are declared and paid by each class annually. Capital gain distributions, if any, are generally declared and paid by the fund annually.
Currency Translation Assets, including investments, and liabilities denominated in foreign currencies are translated into U.S. dollar values each day at the prevailing exchange rate, using the mean of the bid and asked prices of such currencies against U.S. dollars as quoted by a major bank. Purchases and sales of securities, income, and expenses are translated into U.S. dollars at the prevailing exchange rate on the date of the transaction. The effect of changes in foreign currency exchange rates on realized and unrealized security gains and losses is reflected as a component of security gains and losses.
Class Accounting The Advisor Class pays distribution, shareholder servicing, and/or certain administrative expenses in the form of Rule 12b-1 fees, in an amount not exceeding 0.25% of the class’s average daily net assets. Shareholder servicing, prospectus, and shareholder report expenses incurred by each class are charged directly to the class to which they relate. Expenses common to both classes, investment income, and realized and unrealized gains and losses are allocated to the classes based upon the relative daily net assets of each class.
Rebates and Credits Subject to best execution, the fund may direct certain security trades to brokers who have agreed to rebate a portion of the related brokerage commission to the fund in cash. Commission rebates are reflected as realized gain on securities in the accompanying financial statements and totaled $28,000 for the year ended December 31, 2012. Additionally, the fund earns credits on temporarily uninvested cash balances held at the custodian, which reduce the fund’s custody charges. Custody expense in the accompanying financial statements is presented before reduction for credits.
Redemption Fees A 1% fee is assessed on redemptions of fund shares held for 90 days or less to deter short-term trading and to protect the interests of long-term shareholders. Redemption fees are withheld from proceeds that shareholders receive from the sale or exchange of fund shares. The fees are paid to the fund and are recorded as an increase to paid-in capital. The fees may cause the redemption price per share to differ from the net asset value per share.
In-Kind Redemptions In accordance with guidelines described in the fund’s prospectus, the fund may distribute portfolio securities rather than cash as payment for a redemption of fund shares (in-kind redemption). For financial reporting purposes, the fund recognizes a gain on in-kind redemptions to the extent the value of the distributed securities on the date of redemption exceeds the cost of those securities. Gains and losses realized on in-kind redemptions are not recognized for tax purposes and are reclassified from undistributed realized gain (loss) to paid-in capital. During the year ended December 31, 2012, the fund realized $35,177,000 of net gain on $56,677,000 of in-kind redemptions.
New Accounting Pronouncements In December 2011, the FASB issued amended guidance to enhance disclosure for offsetting assets and liabilities. The guidance is effective for fiscal years and interim periods beginning on or after January 1, 2013. Adoption will have no effect on the fund’s net assets or results of operations.
NOTE 2 - VALUATION
The fund’s financial instruments are reported at fair value as defined by GAAP. The fund determines the values of its assets and liabilities and computes each class’s net asset value per share at the close of the New York Stock Exchange (NYSE), normally 4 p.m. ET, each day that the NYSE is open for business.
Valuation Methods Equity securities listed or regularly traded on a securities exchange or in the over-the-counter (OTC) market are valued at the last quoted sale price or, for certain markets, the official closing price at the time the valuations are made, except for OTC Bulletin Board securities, which are valued at the mean of the latest bid and asked prices. A security that is listed or traded on more than one exchange is valued at the quotation on the exchange determined to be the primary market for such security. Listed securities not traded on a particular day are valued at the mean of the latest bid and asked prices for domestic securities and the last quoted sale price for international securities.
Debt securities are generally traded in the OTC market. Securities with remaining maturities of one year or more at the time of acquisition are valued at prices furnished by dealers who make markets in such securities or by an independent pricing service, which considers the yield or price of bonds of comparable quality, coupon, maturity, and type, as well as prices quoted by dealers who make markets in such securities. Securities with remaining maturities of less than one year at the time of acquisition generally use amortized cost in local currency to approximate fair value. However, if amortized cost is deemed not to reflect fair value or the fund holds a significant amount of such securities with remaining maturities of more than 60 days, the securities are valued at prices furnished by dealers who make markets in such securities or by an independent pricing service.
Investments in mutual funds are valued at the mutual fund’s closing net asset value per share on the day of valuation.
Other investments, including restricted securities and private placements, and those financial instruments for which the above valuation procedures are inappropriate or are deemed not to reflect fair value, are stated at fair value as determined in good faith by the T. Rowe Price Valuation Committee, established by the fund’s Board of Directors (the Board). Subject to oversight by the Board, the Valuation Committee develops pricing-related policies and procedures and approves all fair-value determinations. The Valuation Committee regularly makes good faith judgments, using a wide variety of sources and information, to establish and adjust valuations of certain securities as events occur and circumstances warrant. For instance, in determining the fair value of private-equity instruments, the Valuation Committee considers a variety of factors, including the company’s business prospects, its financial performance, strategic events impacting the company, relevant valuations of similar companies, new rounds of financing, and any negotiated transactions of significant size between other investors in the company. Because any fair-value determination involves a significant amount of judgment, there is a degree of subjectivity inherent in such pricing decisions.
For valuation purposes, the last quoted prices of non-U.S. equity securities may be adjusted under the circumstances described below. If the fund determines that developments between the close of a foreign market and the close of the NYSE will, in its judgment, materially affect the value of some or all of its portfolio securities, the fund will adjust the previous closing prices to reflect what it believes to be the fair value of the securities as of the close of the NYSE. In deciding whether it is necessary to adjust closing prices to reflect fair value, the fund reviews a variety of factors, including developments in foreign markets, the performance of U.S. securities markets, and the performance of instruments trading in U.S. markets that represent foreign securities and baskets of foreign securities. A fund may also fair value securities in other situations, such as when a particular foreign market is closed but the fund is open. The fund uses outside pricing services to provide it with closing prices and information to evaluate and/or adjust those prices. The fund cannot predict how often it will use closing prices and how often it will determine it necessary to adjust those prices to reflect fair value. As a means of evaluating its security valuation process, the fund routinely compares closing prices, the next day’s opening prices in the same markets, and adjusted prices. Additionally, trading in the underlying securities of the fund may take place in various foreign markets on certain days when the fund is not open for business and does not calculate a net asset value. As a result, net asset values may be significantly affected on days when shareholders cannot make transactions.
Valuation Inputs Various inputs are used to determine the value of the fund’s financial instruments. These inputs are summarized in the three broad levels listed below:
Level 1 – quoted prices in active markets for identical financial instruments
Level 2 – observable inputs other than Level 1 quoted prices (including, but not limited to, quoted prices for similar financial instruments, interest rates, prepayment speeds, and credit risk)
Level 3 – unobservable inputs
Observable inputs are those based on market data obtained from sources independent of the fund, and unobservable inputs reflect the fund’s own assumptions based on the best information available. The input levels are not necessarily an indication of the risk or liquidity associated with financial instruments at that level. For example, non-U.S. equity securities actively traded in foreign markets generally are reflected in Level 2 despite the availability of closing prices because the fund evaluates and determines whether those closing prices reflect fair value at the close of the NYSE or require adjustment, as described above. The following table summarizes the fund’s financial instruments, based on the inputs used to determine their values on December 31, 2012:

Following is a reconciliation of the fund’s Level 3 holdings for the year ended December 31, 2012. Transfers into and out of Level 3 are reflected at the value of the financial instrument at the beginning of the period. Gain (loss) reflects both realized and change in unrealized gain (loss) on Level 3 holdings during the period, if any, and is included on the accompanying Statement of Operations. The change in unrealized gain (loss) on Level 3 instruments held at December 31, 2012, totaled $(10,296,000) for the year ended December 31, 2012.

NOTE 3 - OTHER INVESTMENT TRANSACTIONS
Consistent with its investment objective, the fund engages in the following practices to manage exposure to certain risks and/or to enhance performance. The investment objective, policies, program, and risk factors of the fund are described more fully in the fund’s prospectus and Statement of Additional Information.
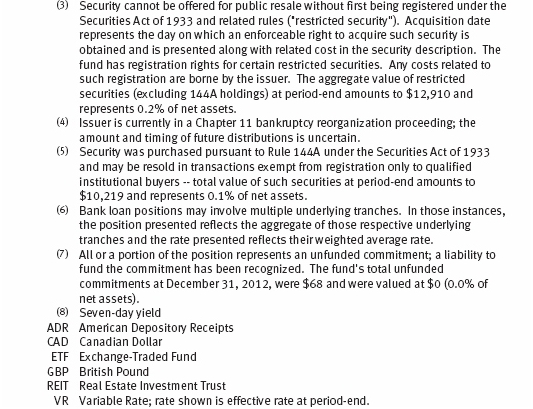
Restricted Securities The fund may invest in securities that are subject to legal or contractual restrictions on resale. Prompt sale of such securities at an acceptable price may be difficult and may involve substantial delays and additional costs.
Bank Loans The fund may invest in bank loans, which represent an interest in amounts owed by a borrower to a syndication of lenders. Bank loans may involve multiple loans with the same borrower under a single credit agreement (each loan, a tranche), and each tranche may have different terms and associated risks. A bank or other financial institution typically acts as the agent and administers a bank loan in accordance with the associated credit agreement. Bank loans are generally noninvestment grade and often involve borrowers whose financial condition is troubled or uncertain and companies that are highly leveraged. The fund may buy and sell bank loans in the form of either loan assignments or loan participations. A loan assignment transfers all legal, beneficial, and economic rights to the buyer. Although loan assignments continue to be administered by the agent, the buyer acquires direct rights against the borrower. In many cases, a loan assignment requires the consent of both the borrower and the agent. In contrast, a loan participation generally entitles the buyer to receive the cash flows from principal, interest, and any fee payments that the seller is entitled to receive from the borrower; however, the seller continues to hold legal title to the loan. As a result, with loan participations, the buyer generally has no right to enforce compliance with the terms of the credit agreement against the borrower, and the buyer is subject to the credit risk of both the borrower and the seller. Bank loans often have extended settlement periods, during which the fund is subject to nonperformance risk by the counterparty. A portion of the fund’s bank loans may require additional principal to be funded at the borrowers’ discretion at a later date (unfunded commitments), and bank loans usually may be repaid at any time at the option of the borrower. The fund reflects both the funded portion of the bank loan as well as any unfunded commitment on the loan in the Portfolio of Investments. At December 31, 2012, the fund’s total unfunded commitments were $68,000.
Securities Lending The fund lends its securities to approved brokers to earn additional income. It receives as collateral cash and U.S. government securities valued at 102% to 105% of the value of the securities on loan. Collateral is maintained over the life of the loan in an amount not less than the value of loaned securities as determined at the close of fund business each day; any additional collateral required due to changes in security values is delivered to the fund the next business day. Cash collateral is invested by the fund’s lending agent(s) in accordance with investment guidelines approved by management. Although risk is mitigated by the collateral, the fund could experience a delay in recovering its securities and a possible loss of income or value if the borrower fails to return the securities or if collateral investments decline in value. Securities lending revenue recognized by the fund consists of earnings on invested collateral and borrowing fees, net of any rebates to the borrower and compensation to the lending agent. In accordance with GAAP, investments made with cash collateral are reflected in the accompanying financial statements, but collateral received in the form of securities is not. At December 31, 2012, there were no securities on loan.
Other Purchases and sales of portfolio securities other than short-term securities aggregated $341,505,000 and $563,055,000, respectively, for the year ended December 31, 2012.
NOTE 4 - FEDERAL INCOME TAXES
No provision for federal income taxes is required since the fund intends to continue to qualify as a regulated investment company under Subchapter M of the Internal Revenue Code and distribute to shareholders all of its taxable income and gains. Distributions determined in accordance with federal income tax regulations may differ in amount or character from net investment income and realized gains for financial reporting purposes. Financial reporting records are adjusted for permanent book/tax differences to reflect tax character but are not adjusted for temporary differences.
The fund files U.S. federal, state, and local tax returns as required. The fund’s tax returns are subject to examination by the relevant tax authorities until expiration of the applicable statute of limitations, which is generally three years after the filing of the tax return but which can be extended to six years in certain circumstances. Tax returns for open years have incorporated no uncertain tax positions that require a provision for income taxes.
Reclassifications to paid-in capital relate primarily to redemptions in kind or a tax practice that treats a portion of the proceeds from each redemption of capital shares as a distribution of taxable net investment income and/or realized capital gain. Reclassifications between income and gain relate primarily to the character of dividends received from real estate investment trusts (REITs). For the year ended December 31, 2012, the following reclassifications were recorded to reflect tax character (there was no impact on results of operations or net assets):
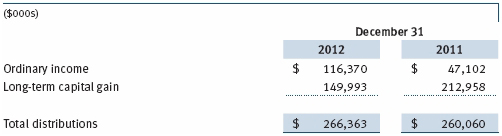
Distributions during the years ended December 31, 2012 and December 31, 2011, were characterized for tax purposes as follows:
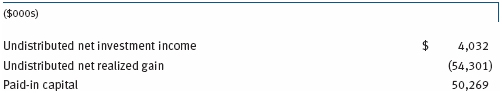
At December 31, 2012, the tax-basis cost of investments and components of net assets were as follows:

The difference between book-basis and tax-basis net unrealized appreciation (depreciation) is attributable to the realization of gains/losses on passive foreign investment companies for tax purposes. Certain dividends declared by REITs in December and paid the following January are recognized for tax purposes in the subsequent year (REIT income deferrals) but, for financial reporting purposes, are included in the fund’s dividend income on ex-date.
NOTE 5 - RELATED PARTY TRANSACTIONS
The fund is managed by T. Rowe Price Associates, Inc. (Price Associates), a wholly owned subsidiary of T. Rowe Price Group, Inc. (Price Group). The investment management agreement between the fund and Price Associates provides for an annual investment management fee, which is computed daily and paid monthly. The fee consists of an individual fund fee, equal to 0.35% of the fund’s average daily net assets, and a group fee. The group fee rate is calculated based on the combined net assets of certain mutual funds sponsored by Price Associates (the group) applied to a graduated fee schedule, with rates ranging from 0.48% for the first $1 billion of assets to 0.28% for assets in excess of $300 billion. The fund’s group fee is determined by applying the group fee rate to the fund’s average daily net assets. At December 31, 2012, the effective annual group fee rate was 0.30%.
In addition, the fund has entered into service agreements with Price Associates and two wholly owned subsidiaries of Price Associates (collectively, Price). Price Associates computes the daily share prices and provides certain other administrative services to the fund. T. Rowe Price Services, Inc., provides shareholder and administrative services in its capacity as the fund’s transfer and dividend disbursing agent. T. Rowe Price Retirement Plan Services, Inc., provides subaccounting and recordkeeping services for certain retirement accounts invested in the Investor Class. For the year ended December 31, 2012, expenses incurred pursuant to these service agreements were $172,000 for Price Associates; $1,515,000 for T. Rowe Price Services, Inc.; and $3,595,000 for T. Rowe Price Retirement Plan Services, Inc. The total amount payable at period-end pursuant to these service agreements is reflected as Due to Affiliates in the accompanying financial statements.
The fund is also one of several mutual funds sponsored by Price Associates (underlying Price funds) in which the T. Rowe Price Spectrum Funds (Spectrum Funds) and T. Rowe Price Retirement Funds (Retirement Funds) may invest. Neither the Spectrum Funds nor the Retirement Funds invest in the underlying Price funds for the purpose of exercising management or control. Pursuant to separate special servicing agreements, expenses associated with the operation of the Spectrum and Retirement Funds are borne by each underlying Price fund to the extent of estimated savings to it and in proportion to the average daily value of its shares owned by the Spectrum and Retirement Funds, respectively. Expenses allocated under these agreements are reflected as shareholder servicing expenses in the accompanying financial statements. For the year ended December 31, 2012, the fund was allocated $83,000 of Spectrum Funds’ expenses and $1,801,000 of Retirement Funds’ expenses. Of these amounts, $1,063,000 related to services provided by Price. The amount payable at period-end pursuant to this agreement is reflected as Due to Affiliates in the accompanying financial statements. At December 31, 2012, approximately 1% of the outstanding shares of the Investor Class were held by the Spectrum Funds and 15% were held by the Retirement Funds.
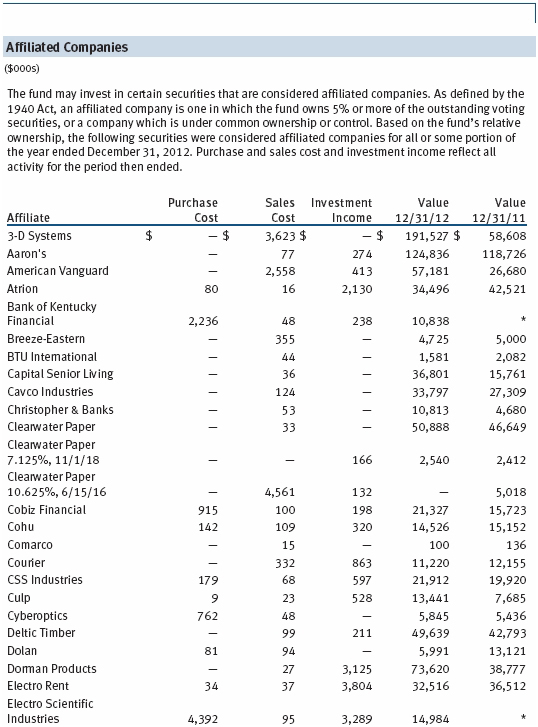
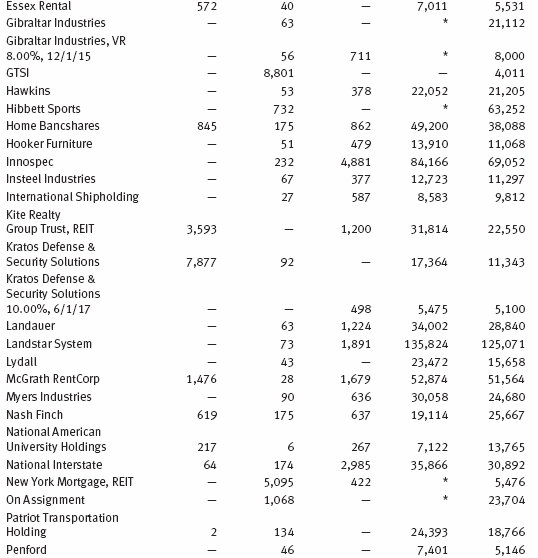
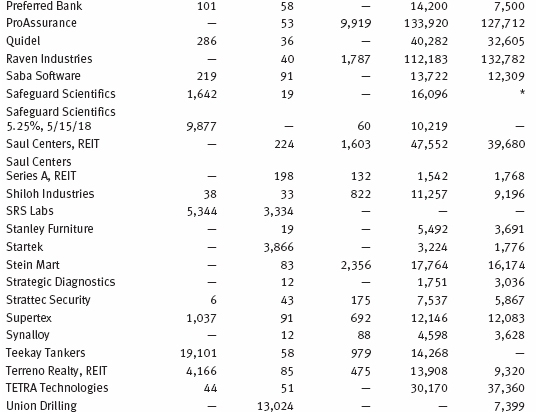
The fund may invest in the T. Rowe Price Reserve Investment Fund and the T. Rowe Price Government Reserve Investment Fund (collectively, the T. Rowe Price Reserve Investment Funds), open-end management investment companies managed by Price Associates and considered affiliates of the fund. The T. Rowe Price Reserve Investment Funds are offered as cash management options to mutual funds, trusts, and other accounts managed by Price Associates and/or its affiliates and are not available for direct purchase by members of the public. The T. Rowe Price Reserve Investment Funds pay no investment management fees.
| Report of Independent Registered Public Accounting Firm |
To the Board of Directors and Shareholders of
T. Rowe Price Small-Cap Value Fund, Inc.
In our opinion, the accompanying statement of assets and liabilities, including the portfolio of investments, and the related statements of operations and of changes in net assets and the financial highlights present fairly, in all material respects, the financial position of T. Rowe Price Small-Cap Value Fund, Inc. (the “Fund”) at December 31, 2012, and the results of its operations, the changes in its net assets and the financial highlights for each of the periods indicated therein, in conformity with accounting principles generally accepted in the United States of America. These financial statements and financial highlights (hereafter referred to as “financial statements”) are the responsibility of the Fund’s management; our responsibility is to express an opinion on these financial statements based on our audits. We conducted our audits of these financial statements in accordance with the standards of the Public Company Accounting Oversight Board (United States). Those standards require that we plan and perform the audit to obtain reasonable assurance about whether the financial statements are free of material misstatement. An audit includes examining, on a test basis, evidence supporting the amounts and disclosures in the financial statements, assessing the accounting principles used and significant estimates made by management, and evaluating the overall financial statement presentation. We believe that our audits, which included confirmation of securities at December 31, 2012 by correspondence with the custodian and brokers, and confirmation of the underlying funds by correspondence with the transfer agent, provide a reasonable basis for our opinion.
PricewaterhouseCoopers LLP
Baltimore, Maryland
February 15, 2013
| Tax Information (Unaudited) for the Tax Year Ended 12/31/12 |
We are providing this information as required by the Internal Revenue Code. The amounts shown may differ from those elsewhere in this report because of differences between tax and financial reporting requirements.
The fund’s distributions to shareholders included:
- $17,309,000 from short-term capital gains
- $163,701,000 from long-term capital gains, of which $163,345,000 was subject to the 15% rate gains category, and $356,000 to the 25% rate gains category.
For taxable non-corporate shareholders, $117,958,000 of the fund’s income represents qualified dividend income subject to the 15% rate category.
For corporate shareholders, $117,958,000 of the fund’s income qualifies for the dividends-received deduction.
| Information on Proxy Voting Policies, Procedures, and Records |
A description of the policies and procedures used by T. Rowe Price funds and portfolios to determine how to vote proxies relating to portfolio securities is available in each fund’s Statement of Additional Information, which you may request by calling 1-800-225-5132 or by accessing the SEC’s website, sec.gov. The description of our proxy voting policies and procedures is also available on our website, troweprice.com. To access it, click on the words “Our Company” at the top of our corporate homepage. Then, when the next page appears, click on the words “Proxy Voting Policies” on the left side of the page.
Each fund’s most recent annual proxy voting record is available on our website and through the SEC’s website. To access it through our website, follow the directions above, then click on the words “Proxy Voting Records” on the right side of the Proxy Voting Policies page.
| How to Obtain Quarterly Portfolio Holdings |
The fund files a complete schedule of portfolio holdings with the Securities and Exchange Commission for the first and third quarters of each fiscal year on Form N-Q. The fund’s Form N-Q is available electronically on the SEC’s website (sec.gov); hard copies may be reviewed and copied at the SEC’s Public Reference Room, 100 F St. N.E., Washington, DC 20549. For more information on the Public Reference Room, call 1-800-SEC-0330.
| About the Fund’s Directors and Officers |
Your fund is overseen by a Board of Directors (Board) that meets regularly to review a wide variety of matters affecting the fund, including performance, investment programs, compliance matters, advisory fees and expenses, service providers, and other business affairs. The Board elects the fund’s officers, who are listed in the final table. At least 75% of the Board’s members are independent of T. Rowe Price Associates, Inc. (T. Rowe Price), and its affiliates; “inside” or “interested” directors are employees or officers of T. Rowe Price. The business address of each director and officer is 100 East Pratt Street, Baltimore, Maryland 21202. The Statement of Additional Information includes additional information about the fund directors and is available without charge by calling a T. Rowe Price representative at 1-800-638-5660.
| Independent Directors | ||
| Name | ||
| (Year of Birth) | ||
| Year Elected* | ||
| [Number of T. Rowe Price | Principal Occupation(s) and Directorships of Public Companies and | |
| Portfolios Overseen] | Other Investment Companies During the Past Five Years | |
| William R. Brody, M.D., Ph.D. | President and Trustee, Salk Institute for Biological Studies (2009 to | |
| (1944) | present); Director, Novartis, Inc. (2009 to present); Director, IBM | |
| 2009 | (2007 to present); President and Trustee, Johns Hopkins University | |
| [142] | (1996 to 2009); Chairman of Executive Committee and Trustee, | |
| Johns Hopkins Health System (1996 to 2009) | ||
| Anthony W. Deering | Chairman, Exeter Capital, LLC, a private investment firm (2004 | |
| (1945) | to present); Director, Under Armour (2008 to present); Director, | |
| 2001 | Vornado Real Estate Investment Trust (2004 to present); Director | |
| [142] | and Member of the Advisory Board, Deutsche Bank North America | |
| (2004 to present); Director, Mercantile Bankshares (2002 to 2007) | ||
| Donald W. Dick, Jr. | Principal, EuroCapital Partners, LLC, an acquisition and management | |
| (1943) | advisory firm (1995 to present) | |
| 1994 | ||
| [142] | ||
| Robert J. Gerrard, Jr. | Chairman of Compensation Committee and Director, Syniverse | |
| (1952) | Holdings, Inc. (2008 to 2011); Executive Vice President and General | |
| 2012 | Counsel, Scripps Networks, LLC (1997 to 2009); Advisory Board | |
| [90] | Member, Pipeline Crisis/Winning Strategies (1997 to present) | |
| Karen N. Horn | Senior Managing Director, Brock Capital Group, an advisory and | |
| (1943) | investment banking firm (2004 to present); Director, Eli Lilly and | |
| 2003 | Company (1987 to present); Director, Simon Property Group (2004 | |
| [142] | to present); Director, Norfolk Southern (2008 to present); Director, | |
| Fannie Mae (2006 to 2008) | ||
| Theo C. Rodgers | President, A&R Development Corporation (1977 to present) | |
| (1941) | ||
| 2005 | ||
| [142] | ||
| Cecilia E. Rouse, Ph.D. | Professor and Researcher, Princeton University (1992 to present); | |
| (1963) | Director, MDRC (2011 to present); Member, National Academy of | |
| 2012 | Education (2010 to present); Research Associate, National Bureau | |
| [90] | of Economic Research’s Labor Studies Program (1998 to 2009 | |
| and 2011 to present); Member, President’s Council of Economic | ||
| Advisors (2009 to 2011); Member, The MacArthur Foundation | ||
| Network on the Transition to Adulthood and Public Policy (2000 to | ||
| 2008); Member, National Advisory Committee for the Robert Wood | ||
| Johnson Foundation’s Scholars in Health Policy Research Program | ||
| (2008); Director and Member, National Economic Association | ||
| (2006 to 2008); Member, Association of Public Policy Analysis and | ||
| Management Policy Council (2006 to 2008); Member, Hamilton | ||
| Project’s Advisory Board at The Brookings Institute (2006 to 2008); | ||
| Chair of Committee on the Status of Minority Groups in the Economic | ||
| Profession, American Economic Association (2006 to 2008) | ||
| John G. Schreiber | Owner/President, Centaur Capital Partners, Inc., a real estate | |
| (1946) | investment company (1991 to present); Cofounder and Partner, | |
| 2001 | Blackstone Real Estate Advisors, L.P. (1992 to present); Director, | |
| [142] | General Growth Properties, Inc. (2010 to present) | |
| Mark R. Tercek | President and Chief Executive Officer, The Nature Conservancy (2008 | |
| (1957) | to present); Managing Director, The Goldman Sachs Group, Inc. | |
| 2009 | (1984 to 2008) | |
| [142] | ||
| *Each independent director serves until retirement, resignation, or election of a successor. | ||
| Inside Directors | ||
| Name | ||
| (Year of Birth) | ||
| Year Elected* | ||
| [Number of T. Rowe Price | Principal Occupation(s) and Directorships of Public Companies and | |
| Portfolios Overseen] | Other Investment Companies During the Past Five Years | |
| Edward C. Bernard | Director and Vice President, T. Rowe Price; Vice Chairman of the | |
| (1956) | Board, Director, and Vice President, T. Rowe Price Group, Inc.; | |
| 2006 | Chairman of the Board, Director, and President, T. Rowe Price | |
| [142] | Investment Services, Inc.; Chairman of the Board and Director, | |
| T. Rowe Price Retirement Plan Services, Inc., T. Rowe Price Savings | ||
| Bank, and T. Rowe Price Services, Inc.; Chairman of the Board, Chief | ||
| Executive Officer, and Director, T. Rowe Price International; Chief | ||
| Executive Officer, Chairman of the Board, Director, and President, | ||
| T. Rowe Price Trust Company; Chairman of the Board, all funds | ||
| John H. Laporte, CFA | Vice President, T. Rowe Price, T. Rowe Price Group, Inc., and | |
| (1945) | T. Rowe Price Trust Company | |
| 1994 | ||
| [16] | ||
| *Each inside director serves until retirement, resignation, or election of a successor. | ||
| Officers | ||
| Name (Year of Birth) | ||
| Position Held With Small-Cap Value Fund | Principal Occupation(s) | |
| Francisco M. Alonso (1978) | Vice President, T. Rowe Price and T. Rowe Price | |
| Vice President | Group, Inc. | |
| Preston G. Athey, CFA, CIC (1949) | Vice President, T. Rowe Price, T. Rowe Price | |
| President | Group, Inc., and T. Rowe Price Trust Company | |
| Hugh M. Evans III, CFA (1966) | Vice President, T. Rowe Price and T. Rowe Price | |
| Vice President | Group, Inc. | |
| Roger L. Fiery III, CPA (1959) | Vice President, Price Hong Kong, Price | |
| Vice President | Singapore, T. Rowe Price, T. Rowe Price Group, | |
| Inc., T. Rowe Price International, and T. Rowe | ||
| Price Trust Company | ||
| Christopher T. Fortune (1973) | Vice President, T. Rowe Price and T. Rowe Price | |
| Vice President | Group, Inc. | |
| John R. Gilner (1961) | Chief Compliance Officer and Vice President, | |
| Chief Compliance Officer | T. Rowe Price; Vice President, T. Rowe Price | |
| Group, Inc., and T. Rowe Price Investment | ||
| Services, Inc. | ||
| Gregory S. Golczewski (1966) | Vice President, T. Rowe Price and T. Rowe Price | |
| Vice President | Trust Company | |
| Gregory K. Hinkle, CPA (1958) | Vice President, T. Rowe Price, T. Rowe Price | |
| Treasurer | Group, Inc., and T. Rowe Price Trust Company | |
| Nina P. Jones, CPA (1980) | Vice President, T. Rowe Price and T. Rowe | |
| Vice President | Price Group, Inc.; formerly student Columbia | |
| Business School (to 2008) | ||
| Steven D. Krichbaum (1977) | Vice President, T. Rowe Price and T. Rowe Price | |
| Vice President | Group, Inc. | |
| Patricia B. Lippert (1953) | Assistant Vice President, T. Rowe Price and | |
| Secretary | T. Rowe Price Investment Services, Inc. | |
| Gregory A. McCrickard, CFA (1958) | Vice President, T. Rowe Price, T. Rowe Price | |
| Vice President | Group, Inc., and T. Rowe Price Trust Company | |
| David Oestreicher (1967) | Director, Vice President, and Secretary, T. Rowe | |
| Vice President | Price Investment Services, Inc., T. Rowe | |
| Price Retirement Plan Services, Inc., T. Rowe | ||
| Price Services, Inc., and T. Rowe Price Trust | ||
| Company; Vice President and Secretary, | ||
| T. Rowe Price, T. Rowe Price Group, Inc., and | ||
| T. Rowe Price International; Vice President, | ||
| Price Hong Kong and Price Singapore | ||
| Curt J. Organt, CFA (1968) | Vice President, T. Rowe Price and T. Rowe Price | |
| Vice President | Group, Inc. | |
| Deborah D. Seidel (1962) | Vice President, T. Rowe Price, T. Rowe Price | |
| Vice President | Group, Inc., T. Rowe Price Investment Services, | |
| Inc., and T. Rowe Price Services, Inc. | ||
| J. David Wagner, CFA (1974) | Vice President, T. Rowe Price and T. Rowe Price | |
| Vice President | Group, Inc. | |
| Julie L. Waples (1970) | Vice President, T. Rowe Price | |
| Vice President | ||
| Unless otherwise noted, officers have been employees of T. Rowe Price or T. Rowe Price International for at least 5 years. | ||
Item 2. Code of Ethics.
The registrant has adopted a code of ethics, as defined in Item 2 of Form N-CSR, applicable to its principal executive officer, principal financial officer, principal accounting officer or controller, or persons performing similar functions. A copy of this code of ethics is filed as an exhibit to this Form N-CSR. No substantive amendments were approved or waivers were granted to this code of ethics during the period covered by this report.
Item 3. Audit Committee Financial Expert.
The registrant’s Board of Directors/Trustees has determined that Mr. Anthony W. Deering qualifies as an audit committee financial expert, as defined in Item 3 of Form N-CSR. Mr. Deering is considered independent for purposes of Item 3 of Form N-CSR.
Item 4. Principal Accountant Fees and Services.
(a) – (d) Aggregate fees billed for the last two fiscal years for professional services rendered to, or on behalf of, the registrant by the registrant’s principal accountant were as follows:
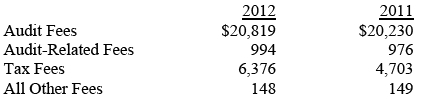
Audit fees include amounts related to the audit of the registrant’s annual financial statements and services normally provided by the accountant in connection with statutory and regulatory filings. Audit-related fees include amounts reasonably related to the performance of the audit of the registrant’s financial statements and specifically include the issuance of a report on internal controls and, if applicable, agreed-upon procedures related to fund acquisitions. Tax fees include amounts related to services for tax compliance, tax planning, and tax advice. The nature of these services specifically includes the review of distribution calculations and the preparation of Federal, state, and excise tax returns. All other fees include the registrant’s pro-rata share of amounts for agreed-upon procedures in conjunction with service contract approvals by the registrant’s Board of Directors/Trustees.
(e)(1) The registrant’s audit committee has adopted a policy whereby audit and non-audit services performed by the registrant’s principal accountant for the registrant, its investment adviser, and any entity controlling, controlled by, or under common control with the investment adviser that provides ongoing services to the registrant require pre-approval in advance at regularly scheduled audit committee meetings. If such a service is required between regularly scheduled audit committee meetings, pre-approval may be authorized by one audit committee member with ratification at the next scheduled audit committee meeting. Waiver of pre-approval for audit or non-audit services requiring fees of a de minimis amount is not permitted.
(2) No services included in (b) – (d) above were approved pursuant to paragraph (c)(7)(i)(C) of Rule 2-01 of Regulation S-X.
(f) Less than 50 percent of the hours expended on the principal accountant’s engagement to audit the registrant’s financial statements for the most recent fiscal year were attributed to work performed by persons other than the principal accountant’s full-time, permanent employees.
(g) The aggregate fees billed for the most recent fiscal year and the preceding fiscal year by the registrant’s principal accountant for non-audit services rendered to the registrant, its investment adviser, and any entity controlling, controlled by, or under common control with the investment adviser that provides ongoing services to the registrant were $1,802,000 and $1,764,000, respectively.
(h) All non-audit services rendered in (g) above were pre-approved by the registrant’s audit committee. Accordingly, these services were considered by the registrant’s audit committee in maintaining the principal accountant’s independence.
Item 5. Audit Committee of Listed Registrants.
Not applicable.
Item 6. Investments.
(a) Not applicable. The complete schedule of investments is included in Item 1 of this Form N-CSR.
(b) Not applicable.
Item 7. Disclosure of Proxy Voting Policies and Procedures for Closed-End Management Investment Companies.
Not applicable.
Item 8. Portfolio Managers of Closed-End Management Investment Companies.
Not applicable.
Item 9. Purchases of Equity Securities by Closed-End Management Investment Company and Affiliated Purchasers.
Not applicable.
Item 10. Submission of Matters to a Vote of Security Holders.
Not applicable.
Item 11. Controls and Procedures.
(a) The registrant’s principal executive officer and principal financial officer have evaluated the registrant’s disclosure controls and procedures within 90 days of this filing and have concluded that the registrant’s disclosure controls and procedures were effective, as of that date, in ensuring that information required to be disclosed by the registrant in this Form N-CSR was recorded, processed, summarized, and reported timely.
(b) The registrant’s principal executive officer and principal financial officer are aware of no change in the registrant’s internal control over financial reporting that occurred during the registrant’s second fiscal quarter covered by this report that has materially affected, or is reasonably likely to materially affect, the registrant’s internal control over financial reporting.
Item 12. Exhibits.
(a)(1) The registrant’s code of ethics pursuant to Item 2 of Form N-CSR is attached.
(2) Separate certifications by the registrant's principal executive officer and principal financial officer, pursuant to Section 302 of the Sarbanes-Oxley Act of 2002 and required by Rule 30a-2(a) under the Investment Company Act of 1940, are attached.
(3) Written solicitation to repurchase securities issued by closed-end companies: not applicable.
(b) A certification by the registrant's principal executive officer and principal financial officer, pursuant to Section 906 of the Sarbanes-Oxley Act of 2002 and required by Rule 30a-2(b) under the Investment Company Act of 1940, is attached.
SIGNATURES
Pursuant to the requirements of the Securities Exchange Act of 1934 and the Investment Company Act of 1940, the registrant has duly caused this report to be signed on its behalf by the undersigned, thereunto duly authorized.
T. Rowe Price Small-Cap Value Fund, Inc.
| By | /s/ Edward C. Bernard | |
| Edward C. Bernard | ||
| Principal Executive Officer | ||
| Date February 15, 2013 | ||
Pursuant to the requirements of the Securities Exchange Act of 1934 and the Investment Company Act of 1940, this report has been signed below by the following persons on behalf of the registrant and in the capacities and on the dates indicated.
| By | /s/ Edward C. Bernard | |
| Edward C. Bernard | ||
| Principal Executive Officer | ||
| Date February 15, 2013 | ||
| By | /s/ Gregory K. Hinkle | |
| Gregory K. Hinkle | ||
| Principal Financial Officer | ||
| Date February 15, 2013 | ||