UNITED STATES
SECURITIES AND EXCHANGE COMMISSION
Washington, D.C. 20549
FORM N-CSR
CERTIFIED SHAREHOLDER REPORT OF REGISTERED
MANAGEMENT INVESTMENT COMPANIES
Investment Company Act file number | 811-5577 |
|
The Glenmede Fund, Inc. |
(Exact name of registrant as specified in charter) |
|
200 Clarendon Street
Boston, Massachusetts | | 02116 |
(Address of principal executive offices) | | (Zip code) |
|
Michael P. Malloy, Esq.
Secretary
Drinker Biddle & Reath LLP
One Logan Square
18th & Cherry Streets
Philadelphia, PA 19103-6996 |
(Name and address of agent for service) |
|
Registrant’s telephone number, including area code: | 1-800-442-8299 | |
|
Date of fiscal year end: | October 31, 2005 | |
|
Date of reporting period: | October 31, 2005 | |
| | | | | | | | |
Item 1. Reports to Stockholders.
GLENMEDE
THE GLENMEDE FUND, INC.
THE GLENMEDE PORTFOLIOS
ANNUAL REPORT
OCTOBER 31, 2005
The performance for each of the portfolios shown on pages 6 to 18 represents past performance and is not a guarantee of future results. A portfolio's share price and investment return will vary with market conditions, and the principal value of shares, when redeemed, may be more or less than their original cost. An investment in a portfolio is neither insured nor guaranteed by the US Government, the Federal Deposit Insurance Corporation, the Federal Reserve Board or any other governmental agency or bank. The yields of money market funds will fluctuate as market conditions change. Although the money market funds seek to preserve the value of your investment at $1.00 per share, it is possible to lose money by investing in these funds. Unlike actual fund performance, performance of an index does not reflect any expenses or transaction costs. A direct investment in an unmanaged index is not possible.
The reports concerning the portfolios included in this shareholder report may contain certain forward-looking statements about the factors that may affect the performance of the portfolios in the future. These statements are based on the adviser's or sub-adviser's predictions and expectations concerning certain future events and their expected impact on the portfolios, such as performance of the economy as a whole and of specific industry sectors, changes in the levels of interest rates, the impact of developing world events and other factors that may influence the future performance of the portfolios. The adviser or sub-adviser, as applicable, believes these forward-looking statements to be reasonable, although they are inherently uncertain and difficult to predict. Actual events may cause adjustments in portfolio management strategies from those currently expected to be employed.
THE GLENMEDE FUND, INC. AND THE GLENMEDE PORTFOLIOS
PRESIDENT'S LETTER
Dear Shareholder:
We are pleased to present the investment results of The Glenmede family of funds for the fiscal year ended October 31, 2005. In February of 2005, the name of the Small Capitalization Growth Portfolio was changed to the U.S. Emerging Growth Portfolio and management of the portfolio was taken over by Vladimir ("Val") de Vassal of Glenmede Advisers, Inc. We hope you find the description of the management team and investment process for this portfolio which follows interesting. We have also included a description of the Strategic Equity Portfolio which has been managed by Peter Zuleba, Gordon Fowler and their team since August of 2004.
At the fiscal year end on October 31, 2005, The Glenmede Fund, Inc. and The Glenmede Portfolios (collectively the "Glenmede Funds") consisted of thirteen portfolios with total net assets of $3.3 billion. These included two EAFE International portfolios, International and Philadelphia International (formerly Institutional International), which are sub-advised and advised respectively by Philadelphia International Advisors LP ("PIA"). The Glenmede Trust Company formed the PIA partnership with members of their International Equity team on January 1, 2002 to allow them to focus entirely on the International Equity products. These portfolios account for 44% of the fund family's net assets as of October 31, 2005.
All of the Glenmede Funds, other than the money market funds, are managed to seek long-term total returns consistent with reasonable risk to principal for their asset category.1 Efforts are made to keep expenses at competitive levels. All of the portfolios use a quantitative style of investing.
This fiscal year ended October 31, 2005 showed positive returns across all asset classes. The S&P 500 Index2 returned 8.71% and the Lehman Brothers U.S. Aggregate Index3 returned 1.13% for the fiscal year ended October 31, 2005. All of the Glenmede domestic funds outperformed (before taxes) their primary benchmarks for the fiscal year. These returns are shown in the Portfolio Highlights section of the report. The MSCI EAFE Index4 performed better than domestic stocks for the fiscal year returning 18.09%5. The bulk of the equity returns occurred during the last two months of 2004.
The Federal Reserve continued to raise interest rates as a result of steady economic growth. There were eight increases in the Fed Funds Target rate, from 1.75% to 3.75% during the fiscal year ended October 31, 2005. Long rates remained low as inflation appeared to be under control. The yield curve flattened dramatically during the period with three-month treasury bills rising 198 basis points in yield and the 30-year treasury bond dropping 4 basis points. Correlating with higher short term rates, mortgage-backed securities were the best performing sector resulting in the Lehman Brothers MBS Fixed Rate Index6 returning 1.75% versus the return on the Lehman Brothers US Credit Index7 of 0.65% and the return on the Lehman Brothers US Government Bond Index8 of 0.94%.
1
We welcome any questions about the Glenmede Funds and thank our clients for their continued support.
Sincerely,

Mary Ann B. Wirts
President
November 21, 2005
1 Mutual fund investing involves risks. Principal loss is possible. The Portfolios may invest in foreign securities which will involve greater volatility and political, economic and currency risks and differences in accounting methods. The Small Cap Equity and U.S. Emerging Growth Portfolios invest in smaller companies, which will involve additional risks such as limited liquidity and greater volatility.
2 The S&P 500 Stock Index is a market capitalization weighted index comprised of 500 widely held common stocks.
3 The Lehman Brothers U.S. Aggregate Index represents securities that are SEC-registered, taxable, and dollar denominated. The index covers the U.S. investment grade fixed rate bond market, with components for government and corporate securities, mortgage pass-through securities, and asset-backed securities. These major sectors are subdivided into more specific indices that are calculated and reported on a regular basis.
4 The Morgan Stanley EAFE Index is an unmanaged capitalization weighted composite portfolio consisting of equity total returns of countries in Australia, New Zealand, Europe and the Far East.
5 Please refer to Portfolio Highlights of the Annual Report for fund performance information.
6 The Lehman Brothers MBS Fixed Rate Index, an unmanaged index measuring the performance of mortgage-backed pass-through securities of Ginnie Mae (GNMA), Fannie Mae (FNMA) and Freddie Mac (FHLMC). This index is formed by grouping the universe of over 600,000 individual fixed rate MBS pools into approximately 3,500 generic aggregates.
7 The Lehman Brothers U.S. Credit Index measures the performance of a large group of high quality corporate bonds with maturities greater than one year.
8 The Lehman Brothers U.S. Government Bond Index is an unmanaged total return index comprised of all public obligations of the U.S. Treasury, U.S. government agencies, quasi-federal agencies, and corporate debt guaranteed by the U.S. government.
Past performance is no guarantee of future results.
This material must be preceded or accompanied by a current prospectus.
The Glenmede Fund, Inc. and the Glenmede Portfolios are distributed by Quasar Distributors, LLC. 12/05.
2
THE GLENMEDE FUND, INC.
Inside the
STRATEGIC EQUITY PORTFOLIO
The portfolio is led by Gordon B. Fowler, Jr., who joined Glenmede as Chief Investment Officer in 2003 and Peter J. Zuleba, III, CFA, who joined Glenmede as Director of Fundamental Research in 2004.
The investment process we employ to the Glenmede Strategic Equity Portfolio is the marriage of our quantitative and fundamental analysis which we believe should create a portfolio of stocks that are statistically attractive and whose growth should outpace the broader market. Our quantitative analysis team, led by Val deVassal, has developed a proprietary stock ranking model by industry group. Rankings range from 1 (most attractive) to 100 (least attractive). Stocks that rank 30 or less are potential candidates for inclusion in the portfolio, if they meet a minimum prospective growth score. A prospective growth score on each company that quantitatively ranks is developed by our fundamental analysts and is our assessment of a company's ability to outgrow its industry over the next 3-5 years. Our team of four fundamental analysts is as follows: John Kichula, CFA, Cindy Axelrod, CFA, Brad Hoopman and Robert Niemeyer. Each analyst is an industry specialist and, together, have an average of 15 years experience.
Glenmede believes that a portfolio of large cap stocks, constructed with a disciplined blend of proprietary, multifactor models and fundamental analysis, will achieve superior long-term performance1. The portfolio is managed based on the following investment process:


PETER J. ZULEBA, III AND
GORDON B. FOWLER, JR.
3
THE GLENMEDE FUND, INC.
• Multifactor Models. The first stage in the investment process is the creation of multi-factor models to rank the relative attractiveness of stocks within the large cap universe. The team performs historical backtests for each market sector to find which combination of factors and weightings the team believes produces equity portfolios with relatively consistent outperformance versus the average stock.
• Prospective Growth Scores. The second stage of the investment process is the development of forward looking assessments of a company's business model and revenue, earnings and cash-flow growth rates by our fundamental research analysts.
• Opportunity Lists. For the portfolio, the multifactor models and downside risk screens are applied to a large cap universe of Russell 1000 stocks, other domestic large cap stocks and ADRs to determine an opportunity list of stocks for buying consideration.
• Portfolio Optimization – Based on the multifactor models, prospective growth score ranks and the opportunity lists, the goal is to optimize the Portfolio to provide relatively broad diversification across sectors, industries, and individual companies, while controlling turnover and limiting tax consequences.
We believe the proprietary multifactor models combined with our internal fundamental analysis and disciplined investment processes will provide a successful portfolio for the long-term. The goal of the portfolio is to create relatively strong return performance with relatively broad diversification and relatively limited risk.
1 Please refer to Portfolio Highlights on page 9 for detailed performance figures.
4
THE GLENMEDE FUND, INC.
Inside the
U.S. EMERGING GROWTH PORTFOLIO
In February 2005, Glenmede's Small Capitalization Growth Portfolio was renamed the U.S. Emerging Growth Portfolio with portfolio management responsibilities assigned to Val de Vassal, CFA. Val and his quantitative research team are also responsible for the Large Cap 100 and Large Cap Growth Portfolios. Val joined Glenmede in 1998 as Director of Quantitative Research. Val has over 20 years of asset management experience and has been managing equity portfolios for Glenmede since March 2002. Val is supported in portfolio management by Paul Sullivan, CFA, who has been with Glenmede for over 10 years. In addition, the team gets active support from six fundamental analysts, three experienced equity traders, as well as senior high net worth and institutional portfolio managers.
Glenmede believes that portfolios of stocks, constructed with a disciplined blend of proprietary, multifactor models and downside risk screens, will achieve superior long-term performance1. The benchmark for the U.S. Emerging Growth Portfolio is the Russell 2000 Growth Index. The portfolio attempts to hold the stocks in this universe that Glenmede believes are most attractive using the following investment process:
• Multifactor Models. The first stage in the investment process is the creation of multi-factor models to rank the relative attractiveness of stocks within the Russell 2000 universe. The team performs historical backtests for each market sector to find which combination of factors and weightings the team believes produces equity portfolios with relatively consistent outperformance versus the average stock. Based on these multi-factor models, stock ranking screens are run on a monthly basis to identify attractive and unattractive stocks.
• Downside Risk Screens. To help reduce downside risk, the quantitative team uses several screens to identify stocks that the team believes may have a greater risk for a price decline. These screens include multi-factor sell models, proprietary earnings surprise signals and liquidity.
• Opportunity Lists. For the U.S. Emerging Growth Portfolio, the multifactor models and downside risk screens are applied to the universe of stocks in the Russell 2000 Growth universe to determine an opportunity list of stocks for buying consideration.
• Portfolio Optimization. Based on the multifactor stock ranking models, proprietary leading industry group indicators and the opportunity list, the team attempts to optimize the Portfolio to provide relatively broad diversification across sectors and individual companies, while controlling turnover and limiting tax consequences.
We believe the proprietary multifactor and leading industry group models, along with the disciplined investment process will provide a successful portfolio for the long-term. The goal of this small cap growth portfolio is to create relatively strong return performance with relatively broad diversification and relatively limited risk.
1 Please refer to Portfolio Highlights on page 14 for detailed performance figures.

VLADIMIR ("VAL") DE VASSAL
5
THE GLENMEDE FUND, INC.
Government Cash Portfolio
PORTFOLIO HIGHLIGHTS
October 31, 2005
Average Annual Total Return
| Government Cash Portfolio | | | | iMoneyNet's
Government
All AverageTM1 | |
| Year ended 10/31/05 | | | 2.74 | % | | | 2.28 | % | |
| Five Years ended 10/31/05 | | | 2.34 | % | | | 1.88 | % | |
| Ten Years ended 10/31/05 | | | 3.93 | % | | | 3.46 | % | |
| Inception (11/7/88) through 10/31/05 | | | 4.74 | % | | | 4.23 | % | |
| Government Cash Portfolio | | 7-Day2
Current Yield | | 7-Day2
Effective Yield | |
| As of 10/31/05 | | | 3.66 | % | | | 3.73 | % | |
During the past fiscal year, the Government Cash Portfolio outperformed the iMoneyNet's Government All AverageTM1 due to its use of overnight and term mortgage-backed securities repurchase agreements. This strategy plus the low expense ratio enhanced the yield while maintaining a high quality diversified portfolio of money market instruments.
Hypothetical Illustration of $10,000 Invested in
Government Cash Portfolio vs.
iMoneyNet's Government All Average(TM)1
11/7/88 through 10/31/05
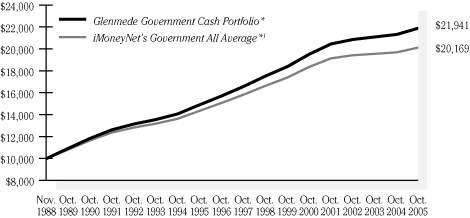
* Assumes the reinvestment of all dividends.
Performance data quoted represents past performance; past performance does not guarantee future results. Current performance may be higher or lower than the total return shown. Please call the Fund at 1-800-442-8299 to obtain the most recent month-end returns. Although the Portfolio seeks to preserve the value of your investment at $1.00 per share, it is possible to lose money by investing in the Portfolio. Returns do not reflect taxes that the shareholder may pay on fund distributions or the redemption of fund shares.
1 iMoneyNet's Government All AverageTM is comprised of money market funds investing in U.S. treasury securities and government agency obligations. It is not possible to invest directly in an index.
Benchmark return is for the period beginning November 30, 1988.
2 "Current Yield" also referred to as the "SEC Yield," refers to the income generated by an investment in the Fund over a 7-day period. This income is then "annualized." The "effective yield" is calculated similarly but, when annualized, the income earned by an investment in the Fund is assumed to be reinvested. The "effective yield" will be slightly higher than the "current yield" because of the compounding effect of this assumed reinvestment. The yield quotation more closely reflects the current earnings of the Fund than the total return quotation.
6
THE GLENMEDE FUND, INC.
Tax-Exempt Cash Portfolio
PORTFOLIO HIGHLIGHTS
October 31, 2005
Average Annual Total Return
| Tax-Exempt Cash Portfolio | | | | iMoneyNet's
National Retail
Tax-Free AverageTM1 | |
| Year ended 10/31/05 | | | 1.94 | % | | | 1.52 | % | |
| Five Years ended 10/31/05 | | | 1.58 | % | | | 1.20 | % | |
| Ten Years ended 10/31/05 | | | 2.50 | % | | | 2.09 | % | |
| Inception (11/10/88) through 10/31/05 | | | 3.17 | % | | | 2.75 | % | |
| Tax-Exempt Cash Portfolio | | 7-Day
Current Yield2 | | 7-Day
Effective Yield2 | |
| As of 10/31/05 | | | 2.42 | % | | | 2.45 | % | |
The Tax-Exempt Cash Portfolio has outperformed iMoneyNet's National Retail Tax-Free AverageTM1 in all of the periods shown above. During the past fiscal year, the strategy of maintaining a shorter average maturity, which increases yield when rates rise or when there is a greater supply of short-term securities, combined with a low expense ratio has resulted in good relative performance.
Hypothetical Illustration of $10,000 Invested in
Tax-Exempt Cash Portfolio vs.
iMoneyNet's National Retail Tax-Free Average(TM)1
11/10/88 through 10/31/05
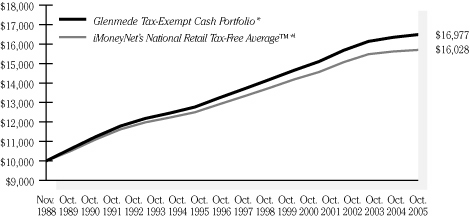
* Assumes the reinvestment of all dividends and distributions.
Performance data quoted represents past performance; past performance does not guarantee future results. Current performance may be higher or lower than the total return shown. Please call the Fund at 1-800-442-8299 to obtain the most recent month-end returns. Although the Portfolio seeks to preserve the value of your investment at $1.00 per share, it is possible to lose money by investing in the Portfolio.
1 iMoneyNet's National Retail Tax-Free AverageTM is comprised of money market funds investing in fixed-income securities issued by state and local governments. Generally, interest payments on securities qualify for exemption from Federal income taxes. Funds may also own municipal securities subject to the alternative minimum tax. It is not possible to invest directly in an index.
Benchmark return is for the period beginning November 30, 1988.
2 "Current Yield" also referred to as the "SEC Yield," refers to the income generated by an investment in the Fund over a 7-day period. This income is then "annualized." The "effective yield" is calculated similarly but, when annualized, the income earned by an investment in the Fund is assumed to be reinvested. The "effective yield" will be slightly higher than the "current yield" because of the compounding effect of this assumed reinvestment. The yield quotation more closely reflects the current earnings of the Fund than the total return quotation.
7
THE GLENMEDE FUND, INC.
Core Fixed Income Portfolio
PORTFOLIO HIGHLIGHTS
October 31, 2005
Average Annual Total Return
| Core Fixed Income Portfolio | | | | Lehman Brothers
U.S. Aggregate
Index1 | | Lipper
Intermediate
U.S. Government
Fund Index*1 | |
| Year ended 10/31/05 | | | 1.32 | % | | | 1.13 | % | | | 0.69 | % | |
| Five Years ended 10/31/05 | | | 6.08 | % | | | 6.31 | % | | | 5.35 | % | |
| Ten Years ended 10/31/05 | | | 6.11 | % | | | 6.32 | % | | | 5.46 | % | |
| Inception (11/17/88) through 10/31/05 | | | 7.26 | % | | | 7.64 | % | | | 5.88 | % | |
The Core Fixed Income Portfolio outperformed its benchmarks returning 1.32% for the year ended October 31, 2005. The Portfolio outperformed both the Lehman Brothers U.S. Aggregate Index and the Lipper Intermediate U.S. Government Fund Index. The Portfolio's outperformance versus the Lehman Brothers U.S. Aggregate Index can be attributed to accurately selected yield curve exposure and sector rotation strategies. The Portfolio also outperformed its peer group by monitoring and matching its equivalent benchmark duration target and interest rate exposure.
Diversification, liquidity, and low risk themes dominate the Portfolio's investment discipline. The Portfolio seeks to add value monitoring yield curve exposure while utilizing sector and security selection. The Portfolio seeks to maintain market neutral interest rate risk.
Hypothetical Illustration of $10,000 Invested in
Core Fixed Income Portfolio vs.
Lehman Brothers U.S. Aggregate Index and
Lipper Intermediate U.S. Government Fund Index*
11/17/88 through 10/31/05
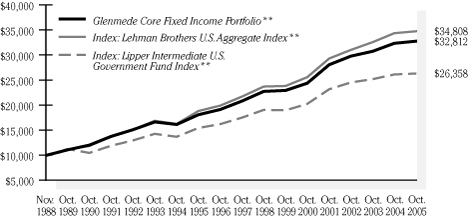
* Index commenced 12/31/89. The Index starts at $11,284, which is the value of the Portfolio in the graph on this date.
** Assumes the reinvestment of all dividends and distributions.
Performance data quoted represents past performance; past performance does not guarantee future results. The investment return and principal value of an investment will fluctuate so that an investor's shares, when redeemed, may be worth more or less than their original cost. Current performance may be higher or lower than the total return shown. Please call the Fund at 1-800-442-8299 to obtain the most recent month-end returns. Returns do not reflect taxes that the shareholder may pay on fund distributions or the redemption of fund shares.
1 The Lehman Brothers U.S. Aggregate Index represents securities that are SEC-registered, taxable, and dollar denominated. The index covers the U.S. investment grade fixed rate bond market, with index components for government and corporate securities, mortgage pass-through securities, and asset-backed securities. These major sectors are subdivided into more specific indices that are calculated and reported on a regular basis. The Lipper Intermediate U.S. Government Fund Index is comprised of the 30 largest funds in the Lipper Intermediate U.S. Government Fund classification. This classification consists of funds that invest at least 65% of their assets in securities issued or guaranteed by the U.S. government, its agencies or instrumentalities with dollar-weighted average matur ities of 5 to 10 years. Total return consists of price appreciation/depreciation and income as a percentage of the original investment. Indexes are rebalanced by market capitalization each month. It is not possible to invest directly in an index.
Benchmark returns are for the periods beginning November 30, 1988 for Lehman Brothers U.S. Aggregate Index and December 31, 1989 for Lipper Intermediate U.S. Government Fund Index.
8
THE GLENMEDE FUND, INC.
Strategic Equity Portfolio
PORTFOLIO HIGHLIGHTS
October 31, 2005
Average Annual Total Return
| Strategic Equity Portfolio | | | | After-tax
Pre
Redemption | | After-tax
Post
Redemption | | Dow Jones Ind.
Monthly
Reinvested1 | | S&P 500
Stock
Index1 | | Lipper Large Cap
Core Fund
Index1 | |
| Year ended 10/31/05 | | | 9.98 | % | | | 9.50 | % | | | 7.11 | % | | | 6.44 | % | | | 8.71 | % | | | 8.67 | % | |
Five Years ended
10/31/05 | | | (2.83 | )% | | | (3.20 | )% | | | (2.53 | )% | | | 1.09 | % | | | (1.73 | )% | | | (2.75 | )% | |
Ten Years ended
10/31/05 | | | 8.13 | % | | | 6.51 | % | | | 6.47 | % | | | 10.31 | % | | | 9.33 | % | | | 8.00 | % | |
Inception (07/20/89)
through 10/31/05 | | | 9.21 | % | | | 7.62 | % | | | 7.44 | % | | | 11.60 | % | | | 10.50 | % | | | 9.19 | % | |
The Portfolio invests in companies that we believe are high quality with good growth prospects and attractively valued. In order to identify stocks that meet these criteria, the Portfolio combines our proprietary quantitative model with the insight of our fundamental research analysts. For the fiscal year ended October 31, 2005, the Portfolio outperformed the S&P 500 Stock Index and Lipper Large Cap Core index by 1.27% and 1.31%, respectively. The Portfolio's focus on valuation, catalyst identification and potential for positive earnings revision drove stock selection and the bulk of the Portfolio's excess.
Hypothetical Illustration of $10,000 Invested in
Strategic Equity Portfolio vs. S&P 500 Stock Index,
Dow Jones Industrial Average and Lipper Large Cap Core Fund Index
7/20/89 through 10/31/05
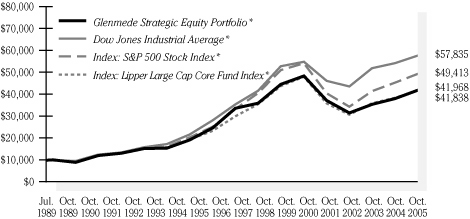
* Assumes the reinvestment of all dividends and distributions.
Performance data quoted represents past performance; past performance does not guarantee future results. The investment return and principal value of an investment will fluctuate so that an investor's shares, when redeemed, may be worth more or less than their original cost. Current performance may be higher or lower than the total return shown. Please call the Fund at 1-800-442-8299 to obtain the most recent month-end returns. Returns, other than after-tax returns, do not reflect taxes that the shareholder may pay on fund distributions or the redemption of fund shares. After-tax returns are calculated using the historical highest individual federal marginal income tax rates, do not reflect the impact of state and local taxes and are not relevant to investors who hold their shares through tax-deferred arrangements such as 401(k) plans or IRAs. Actual after-tax returns depend on the investor's tax situation and may differ from those shown.
1 The S&P 500 Stock Index is a market capitalization weighted index comprised of 500 widely held common stocks. The Dow Jones Industrial Average is a price-weighted average of 30 blue-chip stocks. The average is computed by adding the prices of the 30 stocks and dividing by a denominator, which has been adjusted over the years for stock splits, stock dividends, and substitutions of stock. The Lipper Large Cap Core Fund Index is comprised of the 30 largest mutual funds in the Lipper Large Cap Core Funds classification. This classification consists of funds that invest at least 75% of their equity assets in companies with market capitalizations greater than 300% of the dollar-weighted median market capitalization of the middle 1,000 securities of the S&P SuperComposite 150 0 Index. It is not possible to invest directly in an index.
Benchmark returns are for the period beginning July 31, 1989.
9
THE GLENMEDE FUND, INC.
Small Cap Equity Portfolio
PORTFOLIO HIGHLIGHTS
October 31, 2005
Average Annual Total Return
Small Cap Equity Portfolio -
Advisor Class | | | | Russell 2000
Stock Index1 | | S&P 500
Stock Index1 | | Lipper Small
Capitalization
Core Index*1 | |
| Year ended 10/31/05 | | | 12.22 | % | | | 12.08 | % | | | 8.71 | % | | | 12.43 | % | |
| Five Years ended 10/31/05 | | | 11.02 | % | | | 6.75 | % | | | (1.73 | )% | | | 7.89 | % | |
| Ten Years ended 10/31/05 | | | 10.82 | % | | | 9.53 | % | | | 9.33 | % | | | 10.97 | % | |
| Inception (03/01/91) through 10/31/05 | | | 12.09 | % | | | 11.49 | % | | | 10.56 | % | | | N/A | | |
Small Cap Equity Portfolio -
Institutional Class2 | | | | | | | | | |
| Year ended 10/31/05 | | | 12.43 | % | | | 12.08 | % | | | 8.71 | % | | | 12.43 | % | |
| Five Years ended 10/31/05 | | | 11.26 | % | | | 6.75 | % | | | (1.73 | )% | | | 7.89 | % | |
| Inception (01/02/98) through 10/31/05 | | | 12.21 | % | | | 11.49 | % | | | 10.56 | % | | | N/A | | |
The Small Cap Equity Portfolio performed well over the past twelve months slightly outperforming the Russell 2000. The Portfolio was primarily led by strong stock selection and a strategic overweight in the energy sector. More specifically, stock selection within the technology sector offered the largest contribution to our relative outperformance with the real estate and consumer sectors following closely behind.
Hypothetical Illustration of $10,000 Invested in
Small Cap Equity Portfolio Advisor Class vs. S&P 500 Stock Index,
Russell 2000 Stock Index and Lipper Small Capitalization Core Index*
3/1/91 through 10/31/05
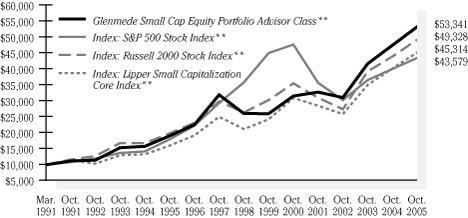
* Index commenced 12/31/91. The Index starts at $11,371, which is the value of the Portfolio in the graph on this date. Thus Portfolio inception comparisons are not provided.
** Assumes the reinvestment of all dividends and distributions.
Performance data quoted represents past performance; past performance does not guarantee future results. The investment return and principal value of an investment will fluctuate so that an investor's shares, when redeemed, may be worth more or less than their original cost. Current performance may be higher or lower than the total return shown. Please call the Fund at 1-800-442-8299 to obtain the most recent month-end returns. Returns do not reflect taxes that the shareholder may pay on fund distributions or the redemption of fund shares. Performance of the Institutional Class will vary from the Advisor Class due to differences in fees.
1 The S&P 500 Stock Index is a market capitalization weighted index comprised of 500 widely held common stocks. The Russell 2000 Stock Index is an unmanaged market capitalization weighted total return index which measures the performance of the 2,000 smallest companies in the Russell 3000 Index. The Lipper Small Capitalization Core Index is comprised of the 30 largest funds in the Lipper Small Capitalization Core funds classification. This classification consists of funds that invest at least 75% of their equity assets in companies with market capitalizations less than 250% of the dollar weighted median of the smallest 500 of the middle 1,000 securities of the S&P SuperComposite 1500 Index. It is not possible to invest directly in an index.
2 Average annual total return for the Institutional Class includes the period from 03/01/91 through 10/31/03. Prior to the inception of the Institutional Class on 01/02/98, performance for the Institutional Class is based on the average annual total return of the Advisor Class.
Benchmark returns for the Russell 2000 Stock Index and the S&P 500 Stock Index are for the period beginning February 28, 1991.
10
THE GLENMEDE FUND, INC.
Large Cap Value Portfolio
PORTFOLIO HIGHLIGHTS
October 31, 2005
Average Annual Total Return
| Large Cap Value Portfolio | | | | Russell 1000
Value Index1 | | S&P 500
Stock Index1 | | Lipper
Large Cap
Value Index1 | |
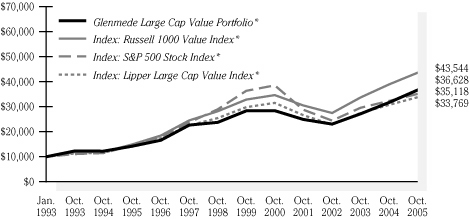
| Year ended 10/31/05 | | | 15.66 | % | | | 11.86 | % | | | 8.71 | % | | | 9.96 | % | |
| Five Years ended 10/31/05 | | | 5.20 | % | | | 4.71 | % | | | (1.73 | )% | | | 1.37 | % | |
| Ten Years ended 10/31/05 | | | 9.98 | % | | | 11.34 | % | | | 9.33 | % | | | 9.00 | % | |
| Inception (01/04/93) through 10/31/05 | | | 10.65 | % | | | 12.16 | % | | | 10.29 | % | | | 9.96 | % | |
The Large Cap Value Portfolio turned in another very good year of performance, outpacing the Russell 1000 Value Index and the S&P 500 Index by a wide margin. The value style has now turned in three straight years of double digit returns despite the fact that p/e ratios have declined.
The Portfolio took advantage of the continued strength in the energy and utility sectors where we were overweight until later in the year. Relative to the Russell index, the energy (integrated oils, refineries and exploration companies) and health care (service providers) overweights contributed over 0.75% of outperformance, but stock selection was responsible for most of the gains. The Portfolio owned strong companies in the sectors mentioned above, yet our best relative gains came from top-picks in our two largest underweighted sectors, financials and consumer discretionary.
Hypothetical Illustration of $10,000 Invested in
Large Cap Value Portfolio vs. S&P 500 Stock Index,
Russell 1000 Value Index and Lipper Large Cap Value Index
1/4/93 through 10/31/05
* Assumes the reinvestment of all dividends and distributions.
Performance data quoted represents past performance; past performance does not guarantee future results. The investment return and principal value of an investment will fluctuate so that an investor's shares, when redeemed, may be worth more or less than their original cost. Current performance may be higher or lower than the total return shown. Please call the Fund at 1-800-442-8299 to obtain the most recent month-end returns. Returns do not reflect taxes that the shareholder may pay on fund distributions or the redemption of fund shares.
1 The S&P 500 Stock Index is a market capitalization weighted index comprised of 500 widely held common stocks. The Russell 1000 Value Index is an unmanaged capitalization weighted total return index which is comprised of those securities in the Russell 1000 Index with a less than average growth orientation. The Lipper Large Cap Value Index is comprised of the 30 largest mutual funds within the Lipper Large Cap Value funds classification. This classification consists of funds that normally invest between 25% to 75% of their assets in companies with market capitalizations above 300% of the dollar-weighted median market capitalization of the middle 1,000 securities of the S&P Super Composite 1500 Index. It is not possible to invest directly in an index.
Benchmark returns are for the period beginning December 31, 1992.
11
THE GLENMEDE FUND, INC.
International Portfolio
PORTFOLIO HIGHLIGHTS
October 31, 2005
Average Annual Total Return
| International Portfolio | | | | Morgan Stanley
EAFE
Index1 | | Lipper
International
Fund Index1 | |
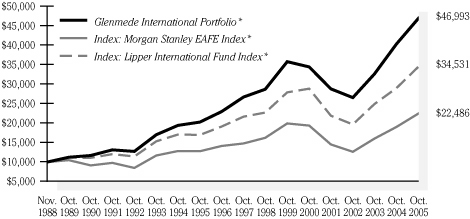
| Year ended 10/31/05 | | | 16.34 | % | | | 18.09 | % | | | 18.91 | % | |
| Five Years ended 10/31/05 | | | 6.39 | % | | | 3.04 | % | | | 3.62 | % | |
| Ten Years ended 10/31/05 | | | 8.78 | % | | | 5.81 | % | | | 7.35 | % | |
| Inception (11/17/88) through 10/31/05 | | | 9.56 | % | | | 4.90 | % | | | 7.66 | % | |
The International Portfolio underperformed the Morgan Stanley EAFE index over the past twelve months. Security selection, on a country and sector basis, was the primary driver of the shortfall. In particular, the Portfolio's holdings in Australia, Japan, Switzerland, and the UK underperformed their respective country indices. On a sector basis, the Portfolio's overweight in the Materials sector, which posted solid returns over the year, was not enough to overcome poor stock selection in Consumer Discretionary and Staples. Over longer periods, favorable security selection has been a primary driver for the enhanced comparative results versus the Index.
Hypothetical Illustration of $10,000 Invested in
International Portfolio vs. Morgan Stanley EAFE Index
and Lipper International Fund Index
11/17/88 through 10/31/05
* Assumes the reinvestment of all dividends and distributions excluding withholding taxes.
Performance data quoted represents past performance; past performance does not guarantee future results. The investment return and principal value of an investment will fluctuate so that an investor's shares, when redeemed, may be worth more or less than their original cost. Current performance may be higher or lower than the total return shown. Please call the Fund at 1-800-442-8299 to obtain the most recent month-end returns. Returns do not reflect taxes that the shareholder may pay on fund distributions or the redemption of fund shares.
1 The Morgan Stanley EAFE Index is an unmanaged capitalization weighted composite portfolio consisting of equity total returns of countries in Australia, New Zealand, Europe and the Far East. The Lipper International Fund Index is comprised of the 30 largest funds in the Lipper International Fund classification. This classification consists of funds that invest in securities whose primary trading markets are outside the United States. It is not possible to invest directly in an index.
Benchmark returns are for the period beginning November 30, 1988.
12
THE GLENMEDE FUND, INC.
Philadelphia International Fund
PORTFOLIO HIGHLIGHTS
October 31, 2005
Average Annual Total Return
| Philadelphia International Fund | | | | Morgan Stanley
EAFE
Index1 | | Lipper
International
Fund Index1 | |
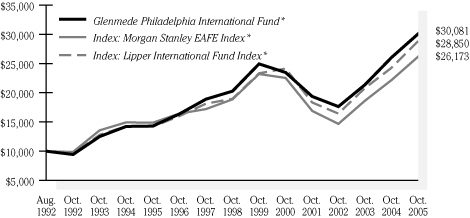
| Year ended 10/31/05 | | | 15.50 | % | | | 18.09 | % | | | 18.91 | % | |
| Five Years ended 10/31/05 | | | 5.09 | % | | | 3.04 | % | | | 3.62 | % | |
| Ten Years ended 10/31/05 | | | 7.72 | % | | | 5.81 | % | | | 7.35 | % | |
| Inception (08/01/92) through 10/31/05 | | | 8.67 | % | | | 7.53 | % | | | 8.33 | % | |
During the past fiscal year, international equity markets posted solid absolute returns. The Philadelphia International Fund participated in the rally but fell short of the Morgan Stanley EAFE index return. This shortfall is primarily attributed to poor stock selection in the Consumer Discretionary and Staples sectors and also within the Japanese, Swiss, UK, and Australian markets. The Portfolio's overweight in the Materials sector, which posted solid returns over the year, was not enough to overcome the stock selection shortfall. Favorable security selection has been a primary driver for the enhanced comparative results of the longer time periods.
Hypothetical Illustration of $10,000 Invested in
Philadelphia International Fund vs. Morgan Stanley EAFE Index and
Lipper International Fund Index
8/1/92 through 10/31/05
* Assumes the reinvestment of all dividends and distributions excluding withholding taxes.
Performance data quoted represents past performance; past performance does not guarantee future results. The investment return and principal value of an investment will fluctuate so that an investor's shares, when redeemed, may be worth more or less than their original cost. Current performance may be higher or lower than the total return shown. Please call the Fund at 1-800-442-8299 to obtain the most recent month-end returns. Returns do not reflect taxes that the shareholder may pay on fund distributions or the redemption of fund shares.
1 The Morgan Stanley EAFE Index is an unmanaged capitalization weighted composite portfolio consisting of equity total returns of countries in Australia, New Zealand, Europe and the Far East. The Lipper International Fund Index is comprised of the 30 largest funds in the Lipper International Fund classification. This classification consists of funds that invest in securities whose primary trading markets are outside the United States. It is not possible to invest directly in an index.
Benchmark returns are for the period beginning July 31, 1992.
13
THE GLENMEDE FUND, INC.
U.S. Emerging Growth Portfolio
PORTFOLIO HIGHLIGHTS
October 31, 2005
Average Annual Total Return
| U.S. Emerging Growth Portfolio | | | | After-tax
Pre
Redemption | | After-tax
Post
Redemption | | Russell 2000
Growth Index1 | | Lipper Small Cap
Growth Index1 | |
Year ended
10/31/05 | | | 16.92 | % | | | 16.92 | % | | | 11.00 | % | | | 10.91 | % | | | 11.79 | % | |
Five Years ended
10/31/05 | | | (7.57 | )% | | | (7.57 | )% | | | (6.27 | )% | | | (1.62 | )% | | | (1.08 | )% | |
Inception (12/29/99)
through 10/31/05 | | | (7.80 | )% | | | (7.80 | )% | | | (6.24 | )% | | | (2.98 | )% | | | (0.71 | )% | |
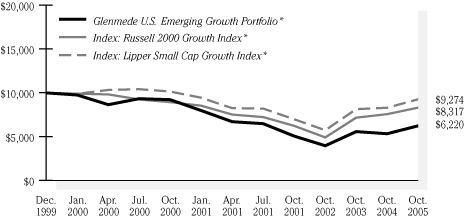
As of February 27, 2005, the management of the US Emerging Growth (formerly Small Capitalization Growth) Portfolio was changed from two outside managers to an in-house team headed by Val de Vassal. The Portfolio invests in small cap growth companies based on proprietary multi-factor models that include valuation, fundamental, earnings, and technical characteristics. Since its inception on December 29, 1999, the Portfolio has underperformed the Russell 2000 Growth Index and the Lipper Small Cap Growth Index by -4.82% and -7.09%, respectively. However, for the fiscal year ended October 31, 2005, the Portfolio has outperformed the Russell 2000 Growth benchmark and Lipper Small Cap Growth indexes by 6.01% and 5.13%, respectively. The strong recent performance of the Portfolio has come from its quantitative discipline with a bias towards small cap growth companies with cheaper valuations and improving earnings.
Hypothetical Illustration of $10,000 Invested in
U.S. Emerging Growth Portfolio vs. Russell 2000 Growth Index
and Lipper Small Cap Growth Index
12/29/99 through 10/31/05
* Assumes the reinvestment of all dividends and distributions.
Performance data quoted represents past performance; past performance does not guarantee future results. The investment return and principal value of an investment will fluctuate so that an investor's shares, when redeemed, may be worth more or less than their original cost. Current performance may be higher or lower than the total return shown. Please call the Fund at 1-800-442-8299 to obtain the most recent month-end returns. Returns, other than after-tax returns, do not reflect taxes that the shareholder may pay on fund distributions or the redemption of fund shares. After-tax returns are calculated using the historical highest individual federal marginal income tax rates, do not reflect the impact of state and local taxes and are not relevant to investors who hold their shares through tax-deferred arrangements such as 401(k) plans or IRAs. Actual after-tax returns depend on the investor's tax situation and may differ from those shown.
1 The Russell 2000 Growth Index is an unmanaged capitalization weighted total return index which is comprised of securities in the Russell 2000 Index with greater than average growth orientation. The Lipper Small Cap Growth Index is comprised of the 30 largest funds in the Lipper Small Cap Growth funds classification. This classification consists of funds that invest at least 75% of their equity assets in companies with market capitalizations less than 250% of the dollar weighted median of the smallest 500 of the middle 1,000 securities of the S&P SuperComposite 1500 Index. It is not possible to invest directly in an index.
Benchmark returns are for the period beginning December 31, 1999.
14
THE GLENMEDE FUND, INC.
Large Cap 100 Portfolio
PORTFOLIO HIGHLIGHTS
October 31, 2005
Average Annual Total Return
| Large Cap 100 Portfolio | | | | After-tax
Pre
Redemption | | After-tax
Post
Redemption | | Russell 1000
Index1 | | Lipper
Large Cap
Core Index1 | |
Year ended
10/31/05 | | | 13.58 | % | | | 13.31 | % | | | 9.17 | % | | | 10.47 | % | | | 8.67 | % | |
Inception (2/27/04)
through 10/31/05 | | | 8.55 | % | | | 8.39 | % | | | 7.29 | % | | | 6.00 | % | | | 4.21 | % | |
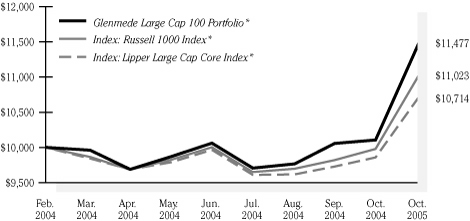
The Large Cap 100 Portfolio invests in large cap companies based on proprietary multi-factor models that include valuation, fundamental, earnings, and technical characteristics. Since its inception on February 27, 2004, the portfolio has outperformed the Russell 1000 Index and Lipper Large Cap Core index by +2.55% and +4.34%, respectively. For the fiscal year ended October 31, 2005, the Portfolio outperformed the Russell 1000 benchmark index by 3.11%. The strong performance of the Portfolio came from its bias towards various factors, including companies with cheaper valuations, greater profitablity and positvie technicals. In addition, the Portfolio benefited from its relatively higher weighting in mid-cap companies.
Hypothetical Illustration of $10,000 Invested in
Large Cap 100 Portfolio vs. Russell 1000 Index and
Lipper Large Cap Core Index
2/27/04 through 10/31/05
* Assumes the reinvestment of all dividends and distributions.
Performance data quoted represents past performance; past performance does not guarantee future results. The investment return and principal value of an investment will fluctuate so that an investor's shares, when redeemed, may be worth more or less than their original cost. Current performance may be higher or lower than the total return shown. Please call the Fund at 1-800-442-8299 to obtain the most recent month-end returns. Returns, other than after-tax returns, do not reflect taxes that the shareholder may pay on fund distributions or the redemption of fund shares. After-tax returns are calculated using the historical highest individual federal marginal income tax rates, do not reflect the impact of state and local taxes and are not relevant to investors who hold their shares through tax-deferred arrangements such as 401(k) plans or IRAs. Actual after-tax returns depend on the investor's tax situation and may differ from those shown.
1 The Russell 1000 Index is an unmanaged market capitalization weighted total return index which is comprised of the 1,000 largest companies in the Russell 3000 Index. The Lipper Large Cap Core Index is comprised of the 30 largest mutual funds in the Lipper Large Cap Core Funds classification. This classification consists of funds that invest at least 75% of their equity assets in companies with market capitalizations greater than 300% of the dollar-weighted median market capitalization of the middle 1,000 securities of the S&P SuperComposite 1500 Index. It is not possible to invest directly in an index.
Benchmark returns are for the period beginning February 28, 2004.
15
THE GLENMEDE FUND, INC.
Large Cap Growth Portfolio
PORTFOLIO HIGHLIGHTS
October 31, 2005
Average Annual Total Return
| Large Cap Growth Portfolio | | | | After-tax
Pre
Redemption | | After-tax
Post
Redemption | | Russell 1000
Growth Index1 | | Lipper Large
Cap Growth
Index1 | |
| Year ended 10/31/05 | | | 11.29 | % | | | 11.28 | % | | | 7.34 | % | | | 8.81 | % | | | 12.09 | % | |
Inception (2/27/04)
through 10/31/05 | | | 6.83 | % | | | 6.82 | % | | | 5.82 | % | | | 2.83 | % | | | 4.87 | % | |
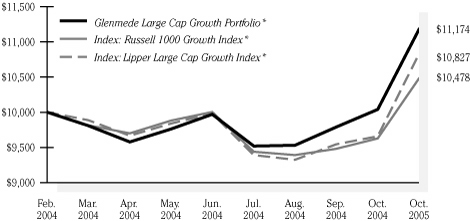
The Large Cap Growth Portfolio invests in large cap growth companies based on proprietary multi-factor models that include valuation, fundamental, earnings, and technical characteristics. Since its inception on February 27, 2004, the Portfolio has outperformed the Russell 1000 Growth Index and the Lipper Large Cap Growth Index by +4.00% and +1.96%, respectively. For the fiscal year ended October 31, 2005, the Portfolio outperformed the Russell 1000 Growth benchmark index by 2.48%. The strong performance of the Portfolio came from its bias towards large cap growth companies with cheaper valuations and improving earnings. In addition, the Portfolio benefited from its relatively higher weighting in mid-cap companies.
Hypothetical Illustration of $10,000 Invested in
Large Cap Growth Portfolio vs. Russell 1000 Growth Index
and Lipper Large Cap Growth Index
2/27/04 through 10/31/05
* Assumes the reinvestment of all dividends and distributions.
Performance data quoted represents past performance; past performance does not guarantee future results. The investment return and principal value of an investment will fluctuate so that an investor's shares, when redeemed, may be worth more or less than their original cost. Current performance may be higher or lower than the total return shown. Please call the Fund at 1-800-442-8299 to obtain the most recent month-end returns. Returns, other than after-tax returns, do not reflect taxes that the shareholder may pay on fund distributions or the redemption of fund shares. After-tax returns are calculated using the historical highest individual federal marginal income tax rates, do not reflect the impact of state and local taxes and are not relevant to investors who hold their shares through tax-deferred arrangements such as 401(k) plans or IRAs. Actual after-tax returns depend on the investor's tax situation and may differ from those shown.
1 The Russell 1000 Growth Index is an unmanaged capitalization weighted total return index which is comprised of securities in the Russell 1000 Index with greater than average growth orientation. The Lipper Large Cap Growth Index is the average of the 30 largest funds in the Lipper Large-Cap Growth Funds Category. These funds invest at least 75% of equity assets in companies with market capitalizations (on three-year weighted basis) greater than 300% of the dollar-weighted median market capitalization of the middle 1,000 securities of the S&P SuperComposite 1500 Index. These funds typically have an above average price-to-earnings ration, price-to-book ratio, and three-year sales-per-share.
Benchmark returns are for the period beginning February 28, 2004.
16
THE GLENMEDE PORTFOLIOS
Muni Intermediate Portfolio
PORTFOLIO HIGHLIGHTS
October 31, 2005
Average Annual Total Return
| Muni Intermediate Portfolio | | | | Lehman Brothers
Municipal 5-Year
Bond Index1 | | Lipper Intermediate
Municipal
Debt Fund Index1 | | Lehman
Municipal 1-10
Year Blend Index*1 | |
| Year ended 10/31/05 | | | 0.55 | % | | | 0.54 | % | | | 1.08 | % | | | 0.78 | % | |
| Five Years ended 10/31/05 | | | 4.47 | % | | | 4.87 | % | | | 4.74 | % | | | 4.85 | % | |
| Ten Years ended 10/31/05 | | | 4.69 | % | | | 4.85 | % | | | 4.69 | % | | | 4.98 | % | |
Inception (06/05/92)
through 10/31/05 | | | 4.93 | % | | | 5.32 | % | | | 5.16 | % | | | N/A | | |
Muni Intermediate performed in line with the Lehman 5 Year index in 2005. However, the Portfolio underperformed versus the Lehman 1-10 and the Lipper Intermediate Index due to the defensive nature of the fund and the shorter duration. The Portfolio is defensively positioned to provide high current interest and protection to the value of the bonds in the Portfolio if rates begin to rise.
Hypothetical Illustration of $10,000 Invested in
Muni Intermediate Portfolio vs. Lehman Brothers
Municipal 5-Year Bond Index, Lipper Intermediate
Municipal Debt Fund Index and Lehman Municipal 1-10 Year Blend Index
6/5/92 through 10/31/05
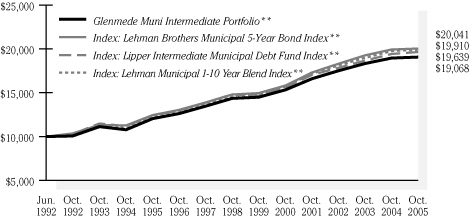
* Index commenced 6/30/93. The Index starts at $10,811, which is the value of the Portfolio in the graph on this date. Thus comparison to the Portfolio's inception is not provided.
** Assumes the reinvestment of all dividends and distributions.
Performance data quoted represents past performance; past performance does not guarantee future results. The investment return and principal value of an investment will fluctuate so that an investor's shares, when redeemed, may be worth more or less than their original cost. Current performance may be higher or lower than the total return shown. Please call the Fund at 1-800-442-8299 to obtain the most recent month-end returns.
1 The Lehman Brothers Municipal 5-Year Bond Index is an unmanaged total return performance benchmark for the short-intermediate, investment-grade tax-exempt bond market. The Lipper Intermediate Municipal Debt Fund Index is comprised of the 30 largest funds in the Lipper Intermediate Municipal Debt Fund Average. The Average consists of funds that invest in municipal debt issues with dollar-weighted average maturities of 5 to 10 years. The Lehman Municipal 1-10 Year Blend Index is a composite index made up of several different broad sub-indices: the Lehman Municipal 1-Year Index; Lehman Municipal 3-Year Index; Lehman Municipal 5-Year Index; Lehman Municipal 7-Year Index and the Lehman Municipal 10-Year Index. The total of all these indices represents all maturities between 1-10 Years. It is not possible to invest directly in an index.
Benchmark returns for the Lehman Brothers Municipal 5-Year Bond Index and the Lipper
Intermediate Municipal Debt Fund Index are for the period beginning May 31, 1992.
17
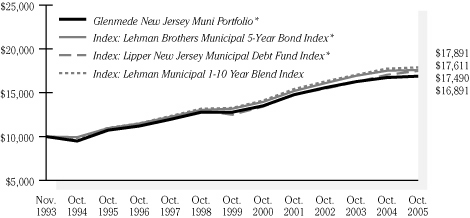
THE GLENMEDE PORTFOLIOS
New Jersey Muni Portfolio
PORTFOLIO HIGHLIGHTS
October 31, 2005
Average Annual Total Return
| New Jersey Muni Portfolio | | | | Lehman Brothers
Municipal 5-Year
Bond Index1 | | Lipper
New Jersey
Municipal Debt
Fund Index1 | | Lehman
Municipal 1-10
Year Blend Index1 | |
| Year ended 10/31/05 | | | 0.94 | % | | | 0.54 | % | | | 2.62 | % | | | 0.78 | % | |
| Five Years ended 10/31/05 | | | 4.55 | % | | | 4.87 | % | | | 5.41 | % | | | 4.85 | % | |
| Ten Years Ended 10/31/05 | | | 4.63 | % | | | 4.85 | % | | | 5.02 | % | | | 4.98 | % | |
Inception (11/01/93)
through 10/31/05 | | | 4.47 | % | | | 4.83 | % | | | 4.79 | % | | | 5.19 | % | |
New Jersey Muni outperformed versus the Lehman 5 year and the Lehman 1-10 over the last 12 months. As opportunities to sell shorter dated maturities and extend on the yield curve presented themselves, bonds were swapped to take advantage of those opportunities. The overall credit quality of the Portfolio is high and this has helped the outperformance of the Portfolio in volatile markets.
Hypothetical Illustration of $10,000 Invested in
New Jersey Muni Portfolio vs. Lehman Brothers
Municipal 5-Year Bond Index, Lipper New Jersey
Municipal Debt Fund Index and Lehman Municipal 1-10 Year Blend Index
11/1/93 through 10/31/05
* Assumes the reinvestment of all dividends and distributions.
Performance data quoted represents past performance; past performance does not guarantee future results. The investment return and principal value of an investment will fluctuate so that an investor's shares, when redeemed, may be worth more or less than their original cost. Current performance may be higher or lower than the total return shown. Please call the Fund at 1-800-442-8299 to obtain the most recent month-end returns.
1 The Lehman Brothers Municipal 5-Year Bond Index is an unmanaged total return performance benchmark for the short-intermediate, investment-grade tax-exempt bond market. The Lipper New Jersey Municipal Debt Fund Index is comprised of the 10 largest funds in the Lipper New Jersey Municipal Debt Fund Average. The Average consists of funds that invest only in securities that are exempt from taxation in New Jersey or cities in New Jersey. The Lehman Municipal 1-10 Year Blend Index is a composite index made up of several different broad sub-indices: the Lehman Municipal 1-Year Index; Lehman Municipal 3-Year Index; Lehman Municipal 5-Year Index; Lehman Municipal 7-Year Index and the Lehman Municipal 10-Year Index. The total of all these indices represents all maturities between 1-10 Years. It is not possible to invest directly in an index.
Benchmark returns are for the period beginning October 31, 1993.
18
THE GLENMEDE FUND, INC.
Shareholder Expenses (Unaudited)
As a shareholder of a Glenmede Portfolio, you incur ongoing costs, including management fees and other portfolio expenses. The following example is intended to help you understand your ongoing costs (in dollars and cents) of investing in a Glenmede Portfolio and to compare these costs with the ongoing costs of investing in other mutual funds.
The example is based on an investment of $1,000 invested at the beginning of the period and held for the entire period from May 1, 2005 to October 31, 2005.
Actual Expenses
The first line under each Portfolio in the table below provides information about actual account values and actual expenses. You may use the information in this line, together with the amount you invested, to estimate the expenses that you paid over the period. Simply divide your account value by $1,000 (for example, an $8,600 account value divided by $1,000 = 8.6), then multiply the result by the number in the first line for your Portfolio under the heading entitled "Expenses Paid During Period" to estimate the expenses you paid on your account during this period.
Hypothetical Example for Comparison Purposes
The second line under each Portfolio in the table below provides information about hypothetical account values and hypothetical expenses based on each Portfolio's actual expense ratio and an assumed rate of return of 5% per year before expenses, which is not the Portfolio's actual return. The hypothetical account values and expenses may not be used to estimate the actual ending account balance or expenses you paid for the period. You may use this information to compare the ongoing costs of investing in your Portfolio and other funds. To do so, compare this 5% hypothetical example with the 5% hypothetical examples that appear in the shareholder reports of the other funds.
Please note that the expenses shown in the table are meant to highlight your ongoing costs only. As a shareholder of a Glenmede Portfolio, you do not incur any transaction costs, such as sales charges (loads), redemption fees or exchange fees, but shareholders of other funds may incur such costs. Therefore, the second line under each Portfolio in the table is useful in comparing ongoing costs only, and will not help you determine the relative total costs of owning different funds whose shareholders may incur transaction costs.
| | | Beginning
Account
Value
(May 1,
2005) | | Ending
Account
Value
(October 31,
2005) | | Annualized
Expense
Ratio* | | Expenses
Paid During
Period**
(May 1, to
October 31,
2005) | |
| Government Cash Portfolio | |
| Actual | | $ | 1,000.00 | | | $ | 1,016.10 | | | | 0.19 | % | | $ | 0.97 | | |
| Hypothetical (5% return less expenses) | | | 1,000.00 | | | | 1,024.25 | | | | 0.19 | | | | 0.97 | | |
| Tax-Exempt Cash Portfolio | |
| Actual | | | 1,000.00 | | | | 1,011.30 | | | | 0.19 | | | | 0.97 | | |
| Hypothetical (5% return less expenses) | | | 1,000.00 | | | | 1,024.25 | | | | 0.19 | | | | 0.97 | | |
19
THE GLENMEDE FUND, INC.
Shareholder Expenses (Unaudited) — (Continued)
| | | Beginning
Account
Value
(May 1,
2005) | | Ending
Account
Value
(October 31,
2005) | | Annualized
Expense
Ratio* | | Expenses
Paid During
Period**
(May 1, to
October 31,
2005) | |
| Core Fixed Income Portfolio*** | |
| Actual | | $ | 1,000.00 | | | $ | 1,001.30 | | | | 0.38 | % | | $ | 1.92 | | |
| Hypothetical (5% return less expenses) | | | 1,000.00 | | | | 1,023.29 | | | | 0.38 | | | | 1.94 | | |
| Strategic Equity Portfolio*** | |
| Actual | | | 1,000.00 | | | | 1,042.40 | | | | 0.57 | | | | 2.93 | | |
| Hypothetical (5% return less expenses) | | | 1,000.00 | | | | 1,022.33 | | | | 0.57 | | | | 2.91 | | |
| Small Cap Equity Portfolio - Advisor | |
| Actual | | | 1,000.00 | | | | 1,098.50 | | | | 0.92 | | | | 4.87 | | |
| Hypothetical (5% return less expenses) | | | 1,000.00 | | | | 1,020.57 | | | | 0.92 | | | | 4.69 | | |
| Small Cap Equity Portfolio - Institutional | |
| Actual | | | 1,000.00 | | | | 1,099.60 | | | | 0.72 | | | | 3.81 | | |
| Hypothetical (5% return less expenses) | | | 1,000.00 | | | | 1,021.58 | | | | 0.72 | | | | 3.67 | | |
| Large Cap Value Portfolio*** | |
| Actual | | | 1,000.00 | | | | 1,065.50 | | | | 0.62 | | | | 3.23 | | |
| Hypothetical (5% return less expenses) | | | 1,000.00 | | | | 1,022.08 | | | | 0.62 | | | | 3.16 | | |
| International Portfolio*** | |
| Actual | | | 1,000.00 | | | | 1,079.80 | | | | 0.23 | | | | 1.21 | | |
| Hypothetical (5% return less expenses) | | | 1,000.00 | | | | 1,024.05 | | | | 0.23 | | | | 1.17 | | |
| Philadelphia International Fund | |
| Actual | | | 1,000.00 | | | | 1,076.70 | | | | 0.86 | | | | 4.50 | | |
| Hypothetical (5% return less expenses) | | | 1,000.00 | | | | 1,020.87 | | | | 0.86 | | | | 4.38 | | |
| U.S. Emerging Growth Portfolio*** | |
| Actual | | | 1,000.00 | | | | 1,167.00 | | | | 0.95 | | | | 5.19 | | |
| Hypothetical (5% return less expenses) | | | 1,000.00 | | | | 1,020.42 | | | | 0.95 | | | | 4.84 | | |
| Large Cap 100 Portfolio | |
| Actual | | | 1,000.00 | | | | 1,074.80 | | | | 0.87 | | | | 4.55 | | |
| Hypothetical (5% return less expenses) | | | 1,000.00 | | | | 1,020.82 | | | | 0.87 | | | | 4.43 | | |
| Large Cap Growth Portfolio | |
| Actual | | | 1,000.00 | | | | 1,085.80 | | | | 0.93 | | | | 4.89 | | |
| Hypothetical (5% return less expenses) | | | 1,000.00 | | | | 1,020.52 | | | | 0.93 | | | | 4.74 | | |
* Expense ratios for the period may differ from expense ratios based on one-year data in the Financial Highlights.
** Expenses are calculated using each Portfolio's annualized expense ratio (as disclosed in the table), multiplied by the average account value for the period, multiplied by the number of days in the period (184 days), and divided by the number of days in the calendar year (365 days).
*** Since August 1, 2005, the Core Fixed Income, Strategic Equity and Large Cap Value Portfolios have paid investment advisory fees at the annual rate of 0.35%, 0.55% and 0.55%, respectively. Upon the expiration of the Advisor's voluntary fee waiver on January 1, 2006, the International Portfolio will pay investment advisory fees at the annual rate of 0.75%. In addition, the shareholder servicing fee for the International
20
THE GLENMEDE FUND, INC.
Shareholder Expenses (Unaudited) — (Concluded)
Portfolio increased effective August 1, 2005 from 0.05% to 0.25% of the Portfolio's average daily net assets. Effective August 1, 2005, the investment advisory fee paid by the U.S. Emerging Growth Portfolio increased from 0.25% to 0.55%. Had these fee changes been in effect throughout the period from May 1, 2005 to October 31, 2005, the expense information for these Portfolios would have been as follows:
| | | Beginning
Account
Value
(May 1,
2005) | | Ending
Account
Value
(October 31,
2005) | | Annualized
Expense
Ratio* | | Expenses
Paid During
Period**
(May 1, to
October 31,
2005) | |
| Core Fixed Income Portfolio | |
| Actual | | $ | 1,000.00 | | | $ | 999.50 | | | | 0.56 | % | | $ | 2.82 | | |
| Hypothetical (5% return less expenses) | | | 1,000.00 | | | | 1,022.38 | | | | 0.56 | | | | 2.85 | | |
| Strategic Equity Portfolio | |
| Actual | | | 1,000.00 | | | | 1,039.60 | | | | 0.85 | | | | 4.37 | | |
| Hypothetical (5% return less expenses) | | | 1,000.00 | | | | 1,020.92 | | | | 0.85 | | | | 4.33 | | |
| Large Cap Value Portfolio | |
| Actual | | | 1,000.00 | | | | 1,062.70 | | | | 0.95 | | | | 4.94 | | |
| Hypothetical (5% return less expenses) | | | 1,000.00 | | | | 1,020.42 | | | | 0.95 | | | | 4.84 | | |
| International Portfolio | |
| Actual | | | 1,000.00 | | | | 1,071.80 | | | | 1.09 | | | | 5.69 | | |
| Hypothetical (5% return less expenses) | | | 1,000.00 | | | | 1,019.71 | | | | 1.09 | | | | 5.55 | | |
| U.S. Emerging Growth Portfolio | |
| Actual | | | 1,000.00 | | | | 1,165.50 | | | | 1.10 | | | | 6.00 | | |
| Hypothetical (5% return less expenses) | | | 1,000.00 | | | | 1,019.66 | | | | 1.10 | | | | 5.60 | | |
* Expense ratios for the period may differ from expense ratios based on one-year data in the Financial Highlights.
** Expenses are calculated using each Portfolio's annualized expense ratio (as disclosed in the table), multiplied by the average account value for the period, multiplied by the number of days in the period (184 days), and divided by the number of days in the calendar year (365 days).
21
THE GLENMEDE PORTFOLIOS
Shareholder Expenses (Unaudited)
As a shareholder of a Glenmede Portfolio, you incur ongoing costs, including management fees and other portfolio expenses. The following example is intended to help you understand your ongoing costs (in dollars and cents) of investing in a Glenmede Portfolio and to compare these costs with the ongoing costs of investing in other mutual funds.
The example is based on an investment of $1,000 invested at the beginning of the period and held for the entire period from May 1, 2005 to October 31, 2005.
Actual Expenses
The first line under each Portfolio in the table below provides information about actual account values and actual expenses. You may use the information in this line, together with the amount you invested, to estimate the expenses that you paid over the period. Simply divide your account value by $1,000 (for example, an $8,600 account value divided by $1,000 = 8.6), then multiply the result by the number in the first line for your Portfolio under the heading entitled "Expenses Paid During Period" to estimate the expenses you paid on your account during this period.
Hypothetical Example for Comparison Purposes
The second line under each Portfolio in the table below provides information about hypothetical account values and hypothetical expenses based on each Portfolio's actual expense ratio and an assumed rate of return of 5% per year before expenses, which is not the Portfolio's actual return. The hypothetical account values and expenses may not be used to estimate the actual ending account balance or expenses you paid for the period. You may use this information to compare the ongoing costs of investing in your Portfolio and other funds. To do so, compare this 5% hypothetical example with the 5% hypothetical examples that appear in the shareholder reports of the other funds.
Please note that the expenses shown in the table are meant to highlight your ongoing costs. As a shareholder of a Glenmede Portfolio, you do not incur any transaction costs, such as sales charges (loads), redemption fees or exchange fees, but shareholders of other funds may incur such costs. Therefore, the second line under each Portfolio in the table is useful in comparing ongoing costs only, and will not help you determine the relative total costs of owning different funds whose shareholders may incur transaction costs.
| | | Beginning
Account
Value
(May 1,
2005) | | Ending
Account
Value
(October 31,
2005) | | Annualized
Expense
Ratio* | | Expenses
Paid During
Period**
(May 1, to
October 31,
2005) | |
| Muni Intermediate Portfolio | |
| Actual | | $ | 1,000.00 | | | $ | 1,004.80 | | | | 0.29 | % | | $ | 1.47 | | |
| Hypothetical (5% return less expenses) | | | 1,000.00 | | | | 1,023.77 | | | | 0.29 | | | | 1.48 | | |
22
THE GLENMEDE PORTFOLIOS
Shareholder Expenses (Unaudited) — (Concluded)
| | | Beginning
Account
Value
(May 1,
2005) | | Ending
Account
Value
(October 31,
2005) | | Annualized
Expense
Ratio* | | Expenses
Paid During
Period**
(May 1, to
October 31,
2005) | |
| New Jersey Muni Portfolio | |
| Actual | | $ | 1,000.00 | | | $ | 1,005.40 | | | | 0.32 | % | | $ | 1.62 | | |
| Hypothetical (5% return less expenses) | | | 1,000.00 | | | | 1,023.59 | | | | 0.32 | | | | 1.63 | | |
* Expense ratios for the period may differ from expense ratios based on one-year data in the Financial Highlights.
** Expenses are calculated using each Portfolio's annualized expense ratio (as disclosed in the table), multiplied by the average account value for the period, multiplied by the number of days in the period (184 days), and divided by the number of days in the calendar year (365 days).
23
THE GLENMEDE FUND, INC.
STATEMENTS OF ASSETS AND LIABILITIES
October 31, 2005
| | | Government
Cash
Portfolio | | Tax-
Exempt
Cash
Portfolio | | Core
Fixed
Income
Portfolio | |
| Assets: | |
| Investments1: | |
| Investments at value2 | | $ | 327,821,907 | | | $ | 551,481,523 | | | $ | 212,180,459 | | |
| Repurchase agreements at value | | | 320,315,084 | | | | — | | | | 34,680,470 | | |
| Total investments | | | 648,136,991 | | | | 551,481,523 | | | | 246,860,929 | | |
| Cash | | | — | | | | 6,755 | | | | — | | |
| Receivable for securities sold | | | — | | | | — | | | | 297 | | |
| Interest receivable | | | 2,101,414 | | | | 1,518,447 | | | | 1,736,490 | | |
| Prepaid expenses | | | 20,071 | | | | 18,642 | | | | 6,575 | | |
| Total assets | | | 650,258,476 | | | | 553,025,367 | | | | 248,604,291 | | |
| Liabilities: | |
| Dividends payable | | | 1,900,575 | | | | 1,105,651 | | | | — | | |
| Payable for fund shares redeemed | | | 8,774 | | | | — | | | | 57,199 | | |
| Payable for securities purchased | | | 11,752,427 | | | | — | | | | — | | |
Obligation to return securities lending
collateral | | | — | | | | — | | | | 23,973,850 | | |
| Payable for when-issued securities | | | — | | | | — | | | | 29,465,930 | | |
| Payable for Directors' fees | | | 1,947 | | | | — | | | | 198 | | |
| Accrued expenses | | | 169,324 | | | | 155,874 | | | | 111,611 | | |
| Total liabilities | | | 13,833,047 | | | | 1,261,525 | | | | 53,608,788 | | |
| Net Assets | | $ | 636,425,429 | | | $ | 551,763,842 | | | $ | 194,995,503 | | |
| Net Assets consist of: | |
| Par value ($0.001 of shares outstanding) | | | 636,357 | | | | 551,974 | | | | 18,326 | | |
| Paid-in capital in excess of par value | | | 635,720,151 | | | | 551,347,683 | | | | 196,699,251 | | |
| Undistributed net investment income | | | 73,094 | | | | (265 | ) | | | 701,518 | | |
Accumulated net realized gain (loss) from
investment transactions | | | (4,173 | ) | | | (135,550 | ) | | | (2,650,905 | ) | |
Net unrealized appreciation (depreciation)
on investments | | | — | | | | — | | | | 227,313 | | |
| Total Net Assets | | | 636,425,429 | | | | 551,763,842 | | | | 194,995,503 | | |
| Shares Outstanding3 | | | 636,356,507 | | | | 551,974,146 | | | | 18,326,329 | | |
| Net Asset Value Per Share | | $ | 1.00 | | | $ | 1.00 | | | $ | 10.64 | | |
| 1 Investments at cost | | $ | 648,136,991 | | | $ | 551,481,523 | | | $ | 246,633,616 | | |
| 2 Market value of securities on loan | | | — | | | | — | | | $ | 23,391,478 | | |
| 3 Authorized shares | | | 700,000,000 | | | | 740,000,000 | | | | 135,000,000 | | |
See Notes to Financial Statements.
24
THE GLENMEDE FUND, INC.
STATEMENTS OF ASSETS AND LIABILITIES — (Continued)
October 31, 2005
| | | Strategic
Equity
Portfolio | | Small Cap
Equity
Portfolio | | Large Cap
Value
Portfolio | |
| Assets: | |
| Investments1: | |
| Investments at value2 | | $ | 88,458,759 | | | $ | 304,843,755 | | | $ | 25,478,396 | | |
| Repurchase agreements at value | | | 254,119 | | | | 2,113,897 | | | | 1,182,302 | | |
| Total investments | | | 88,712,878 | | | | 306,957,652 | | | | 26,660,698 | | |
| Receivable for fund shares sold | | | — | | | | 58,151 | | | | 150,000 | | |
| Dividends receivable | | | 96,625 | | | | 127,554 | | | | 35,088 | | |
| Interest receivable | | | 1,522 | | | | 15,035 | | | | 201 | | |
| Prepaid expenses | | | 2,641 | | | | 8,804 | | | | 20,939 | | |
| Total assets | | | 88,813,666 | | | | 307,167,196 | | | | 26,866,926 | | |
| Liabilities: | |
| Payable for fund shares redeemed | | | 43,042 | | | | 618,411 | | | | 133,225 | | |
Obligation to return securities lending
collateral | | | 8,806,394 | | | | 64,356,600 | | | | 204,610 | | |
| Payable for Directors' fees | | | 399 | | | | 352 | | | | 152 | | |
| Accrued expenses | | | 58,568 | | | | 221,187 | | | | 22,272 | | |
| Total liabilities | | | 8,908,403 | | | | 65,196,550 | | | | 360,259 | | |
| Net Assets | | $ | 79,905,263 | | | $ | 241,970,646 | | | $ | 26,506,667 | | |
| Net Assets consist of: | |
| Par value ($0.001 of shares outstanding) | | | 4,714 | | | | 14,480 | | | | 2,579 | | |
| Paid-in capital in excess of par value | | | 68,983,023 | | | | 187,251,826 | | | | 22,976,179 | | |
| Undistributed net investment income | | | 18,543 | | | | 43,437 | | | | 10,499 | | |
Accumulated net realized gain (loss) from
investment transactions | | | (39,938 | ) | | | (166,598 | ) | | | (37,549 | ) | |
Net unrealized appreciation (depreciation)
on investments | | | 10,938,921 | | | | 54,827,501 | | | | 3,554,959 | | |
| Total Net Assets | | | 79,905,263 | | | | 241,970,646 | | | | 26,506,667 | | |
| Shares Outstanding3 | | | 4,713,870 | | | | 14,480,434 | | | | 2,579,137 | | |
| Net Asset Value Per Share | | $ | 16.95 | | | | — | | | $ | 10.28 | | |
Advisor Class — based on net assets of
$241,969,518 and shares outstanding of
14,480,367 (175,000,000
authorized shares) | | | — | | | $ | 16.71 | | | | — | | |
Institutional Class — based on net assets of
$1,128 and shares outstanding of 66.825 4
(75,000,000 authorized shares) | | | — | | | $ | 16.88 | | | | — | | |
| 1 Investments at cost | | $ | 77,773,957 | | | $ | 252,130,151 | | | $ | 23,105,739 | | |
| 2 Market value of securities on loan | | $ | 8,568,138 | | | $ | 62,059,628 | | | $ | 196,426 | | |
| 3 Authorized shares | | | 125,000,000 | | | | 250,000,000 | | | | 75,000,000 | | |
4 Net assets have been rounded for presentation purposes. The net asset value per share is as reported on October 31, 2005.
See Notes to Financial Statements.
25
THE GLENMEDE FUND, INC.
STATEMENTS OF ASSETS AND LIABILITIES — (Continued)
October 31, 2005
| | | International
Portfolio | | Philadelphia
International
Fund5 | | U.S.
Emerging
Growth
Portfolio6 | |
| Assets: | |
| Investments1: | |
| Investments at value2 | | $ | 841,140,946 | | | $ | 639,264,862 | | | $ | 17,313,108 | | |
| Repurchase agreements at value | | | — | | | | 9,727,993 | | | | 326,865 | | |
| Total investments | | | 841,140,946 | | | | 648,992,855 | | | | 17,639,973 | | |
| Foreign currency, at value (Note 1)4 | | | 131,118 | | | | 469,232 | | | | — | | |
| Receivable for securities sold | | | 426 | | | | 4,279,990 | | | | — | | |
| Receivable for fund shares sold | | | 186,200 | | | | 491,553 | | | | 20,000 | | |
| Receivable from shareholders | | | 1,290,769 | | | | — | | | | — | | |
| Dividends receivable | | | 1,920,847 | | | | 1,284,258 | | | | 12,869 | | |
| Interest receivable | | | 6,213 | | | | 3,755 | | | | 1,564 | | |
| Foreign tax reclaims receivable | | | 460,518 | | | | 178,888 | | | | — | | |
| Prepaid expenses | | | 35,759 | | | | 19,626 | | | | 403 | | |
| Total assets | | | 845,172,796 | | | | 655,720,157 | | | | 17,674,809 | | |
| Liabilities: | |
| Payable for fund shares redeemed | | | 975,832 | | | | 56,950 | | | | 4,000 | | |
| Payable for securities purchased | | | — | | | | 4,008,068 | | | | 204,658 | | |
Obligation to return securities lending
collateral | | | 31,510,571 | | | | 17,127,711 | | | | 3,231,407 | | |
| Due to bank | | | 481,501 | | | | — | | | | — | | |
| Payable for Directors' fees | | | — | | | | 582 | | | | — | | |
| Accrued expenses | | | 355,224 | | | | 508,724 | | | | 17,828 | | |
| Total liabilities | | | 33,323,128 | | | | 21,702,035 | | | | 3,457,893 | | |
| Net Assets | | $ | 811,849,668 | | | $ | 634,018,122 | | | $ | 14,216,916 | | |
| Net Assets consist of: | |
| Par value ($0.001 of shares outstanding) | | | 46,172 | | | | 36,251 | | | | 2,285 | | |
| Paid-in capital in excess of par value | | | 631,423,316 | | | | 544,565,910 | | | | 14,846,732 | | |
| Undistributed net investment income | | | — | | | | — | | | | — | | |
Accumulated net realized gain (loss) from
investment transactions | | | (1,048,241 | ) | | | (1,489,610 | ) | | | (2,274,130 | ) | |
Net unrealized appreciation (depreciation)
on investments | | | 181,428,421 | | | | 90,905,571 | | | | 1,642,029 | | |
| Total Net Assets | | | 811,849,668 | | | | 634,018,122 | | | | 14,216,916 | | |
| Shares Outstanding3 | | | 46,171,752 | | | | 36,250,804 | | | | 2,284,646 | | |
| Net Asset Value Per Share | | $ | 17.58 | | | $ | 17.49 | | | $ | 6.22 | | |
| 1 Investments at cost | | $ | 659,650,511 | | | $ | 558,038,078 | | | $ | 15,997,944 | | |
| 2 Market value of securities on loan | | $ | 29,996,035 | | | $ | 16,509,143 | | | $ | 3,100,303 | | |
| 3 Authorized shares | | | 225,000,000 | | | | 120,000,000 | | | | 75,000,000 | | |
4 The International Portfolio and Philadelphia International Fund had foreign currency cost of $132,100 and $473,041, respectively.
5 Effective July 1, 2005, Institutional International Portfolio changed its name to Philadelphia International Fund.
6 Effective February 27, 2005, Small Capitalization Growth Portfolio changed its name to U.S. Emerging Growth Portfolio.
See Notes to Financial Statements.
26
THE GLENMEDE FUND, INC.
STATEMENTS OF ASSETS AND LIABILITIES — (Concluded)
October 31, 2005
| | | Large
Cap
100
Portfolio | | Large
Cap
Growth
Portfolio | |
| Assets: | |
| Investments1: | |
| Investments at value2 | | $ | 53,214,004 | | | $ | 16,330,611 | | |
| Repurchase agreements at value | | | 882,799 | | | | 221,879 | | |
| Total investments | | | 54,096,803 | | | | 16,552,490 | | |
| Receivable for securities sold | | | — | | | | 164,732 | | |
| Receivable for fund shares sold | | | 50,000 | | | | 226,260 | | |
| Dividends receivable | | | 36,387 | | | | 8,550 | | |
| Interest receivable | | | 836 | | | | 24 | | |
| Foreign tax reclaims receivable | | | 733 | | | | — | | |
| Prepaid expenses | | | 1,417 | | | | 470 | | |
| Total assets | | | 54,186,176 | | | | 16,952,526 | | |
| Liabilities: | |
| Payable for fund shares redeemed | | | 1,000 | | | | — | | |
| Payable for securities purchased | | | 340,266 | | | | 367,524 | | |
| Obligation to return securities lending collateral | | | 3,672,750 | | | | — | | |
| Payable for Directors' fees | | | 261 | | | | 234 | | |
| Accrued expenses | | | 38,446 | | | | 13,213 | | |
| Total liabilities | | | 4,052,723 | | | | 380,971 | | |
| Net Assets | | $ | 50,133,453 | | | $ | 16,571,555 | | |
| Net Assets consist of: | |
| Par value ($0.001 of shares outstanding) | | | 4,446 | | | | 1,483 | | |
| Paid-in capital in excess of par value | | | 47,184,334 | | | | 15,428,523 | | |
| Undistributed net investment income | | | — | | | | — | | |
Accumulated net realized gain (loss) from investment
transactions | | | (6,270 | ) | | | (86,231 | ) | |
| Net unrealized appreciation (depreciation) on investments | | | 2,950,943 | | | | 1,227,780 | | |
| Total Net Assets | | | 50,133,453 | | | | 16,571,555 | | |
| Shares Outstanding3 | | | 4,445,987 | | | | 1,483,012 | | |
| Net Asset Value Per Share | | $ | 11.28 | | | $ | 11.17 | | |
| 1 Investments at cost | | $ | 51,145,860 | | | $ | 15,324,710 | | |
| 2 Market value of securities on loan | | $ | 3,575,809 | | | | — | | |
| 3 Authorized shares | | | 20,000,000 | | | | 20,000,000 | | |
See Notes to Financial Statements.
27
THE GLENMEDE FUND, INC.
STATEMENTS OF OPERATIONS
For the Year Ended October 31, 2005
| | | Government
Cash
Portfolio | | Tax-
Exempt
Cash
Portfolio | | Core
Fixed
Income
Portfolio | |
| Investment income: | |
| Interest | | $ | 17,954,282 | | | $ | 11,544,022 | | | $ | 8,379,506 | | |
| Income from security lending | | | — | | | | — | | | | 30,997 | | |
| Total investment income | | | 17,954,282 | | | | 11,544,022 | | | | 8,410,503 | | |
| Expenses: | |
| Management fees | | | — | | | | — | | | | 173,957 | | |
| Administration, transfer agent and custody fees | | | 380,289 | | | | 343,628 | | | | 133,150 | | |
| Professional fees | | | 80,974 | | | | 69,513 | | | | 25,974 | | |
| Shareholder report expense | | | 15,100 | | | | 15,645 | | | | 7,547 | | |
| Shareholder servicing fees | | | 614,914 | | | | 548,710 | | | | 195,245 | | |
| Directors' fees and expenses | | | 25,852 | | | | 23,138 | | | | 8,257 | | |
| Registration and filing fees | | | 2,840 | | | | 2,840 | | | | 4,587 | | |
| Other expenses | | | 40,234 | | | | 43,686 | | | | 15,553 | | |
| Total expenses | | | 1,160,203 | | | | 1,047,160 | | | | 564,270 | | |
| Net investment income | | | 16,794,079 | | | | 10,496,862 | | | | 7,846,233 | | |
| Realized and unrealized gain (loss): | |
| Net realized gain (loss) on: | |
| Investment transactions | | | — | | | | — | | | | 323,113 | | |
| Net change in unrealized gain (loss) of: | |
| Investments | | | — | | | | — | | | | (5,681,607 | ) | |
| Net realized and unrealized gain (loss) | | | — | | | | — | | | | (5,358,494 | ) | |
Net increase (decrease) in net assets resulting
from operations | | $ | 16,794,079 | | | $ | 10,496,862 | | | $ | 2,487,739 | | |
See Notes to Financial Statements.
28
THE GLENMEDE FUND, INC.
STATEMENTS OF OPERATIONS — (Continued)
For the Year Ended October 31, 2005
| | | Strategic
Equity
Portfolio | | Small Cap
Equity
Portfolio | | Large Cap
Value
Portfolio | |
| Investment income: | |
| Dividends | | $ | 1,029,581 | | | $ | 1,451,435 | | | $ | 507,320 | | |
| Interest | | | 27,459 | | | | 140,917 | | | | 26,275 | | |
| Income from security lending | | | 4,702 | | | | 129,879 | | | | 1,838 | | |
| Total investment income | | | 1,061,742 | | | | 1,722,231 | | | | 535,433 | | |
| Expenses: | |
| Management fees | | | 111,176 | | | | 1,481,927 | | | | 37,606 | | |
| Administration, transfer agent and custody fees | | | 48,256 | | | | 193,416 | | | | 22,040 | | |
| Professional fees | | | 9,579 | | | | 35,784 | | | | 3,447 | | |
| Shareholder report expense | | | 3,383 | | | | 9,758 | | | | 1,535 | | |
| Shareholder servicing fees (Advisor Class) | | | 145,842 | | | | 675,219 | | | | 50,965 | | |
| Shareholder servicing fees (Institutional Class) | | | — | | | | 1 | | | | — | | |
| Directors' fees and expenses | | | 3,414 | | | | 11,782 | | | | 1,133 | | |
| Registration and filing fees | | | 6,007 | | | | 29,401 | | | | 2,937 | | |
| Other expenses | | | 6,452 | | | | 23,168 | | | | 2,166 | | |
| Total expenses | | | 334,109 | | | | 2,460,456 | | | | 121,829 | | |
| Net investment (loss) income | | | 727,633 | | | | (738,225 | ) | | | 413,604 | | |
| Realized and unrealized gain (loss): | |
| Net realized gain (loss) on: | |
| Investment transactions | | | 1,629,909 | | | | 40,569,024 | | | | 2,569,135 | | |
| Net change in unrealized gain (loss) of: | |
| Investments | | | 4,323,696 | | | | (8,857,974 | ) | | | 582,215 | | |
| Net realized and unrealized gain (loss) | | | 5,953,605 | | | | 31,711,050 | | | | 3,151,350 | | |
Net increase (decrease) in net assets resulting
from operations | | $ | 6,681,238 | | | $ | 30,972,825 | | | $ | 3,564,954 | | |
See Notes to Financial Statements.
29
THE GLENMEDE FUND, INC.
STATEMENTS OF OPERATIONS — (Continued)
For the Year Ended October 31, 2005
| | | International
Portfolio | | Philadelphia
International
Fund2 | | U.S.
Emerging
Growth
Portfolio3 | |
| Investment income: | |
| Dividends1 | | $ | 36,121,884 | | | $ | 13,977,989 | | | $ | 66,489 | | |
| Interest | | | 520,390 | | | | 524,566 | | | | 11,640 | | |
| Income from security lending | | | 41,936 | | | | 17,510 | | | | 24,227 | | |
| Total investment income | | | 36,684,210 | | | | 14,520,065 | | | | 102,356 | | |
| Expenses: | |
| Management fees | | | 1,785,967 | | | | 4,137,245 | | | | 213,623 | | |
Administration, transfer agent and
custody fees | | | 893,924 | | | | 391,477 | | | | 45,513 | | |
| Professional fees | | | 170,707 | | | | 75,818 | | | | 5,587 | | |
| Shareholder report expense | | | 43,132 | | | | 14,580 | | | | 1,453 | | |
| Shareholder servicing fees | | | 1,139,122 | | | | — | | | | 76,497 | | |
| Directors' fees and expenses | | | 59,418 | | | | 21,382 | | | | 2,017 | | |
| Registration and filing fees | | | 7,800 | | | | 22,707 | | | | 6,077 | | |
| Other expenses | | | 107,591 | | | | 36,645 | | | | 5,882 | | |
| Total expenses | | | 4,207,661 | | | | 4,699,854 | | | | 356,649 | | |
| Less expenses waived | | | (1,785,967 | ) | | | — | | | | — | | |
| Net expenses | | | 2,421,694 | | | | 4,699,854 | | | | 356,649 | | |
| Net investment (loss) income | | | 34,262,516 | | | | 9,820,211 | | | | (254,293 | ) | |
| Realized and unrealized gain (loss): | |
| Net realized gain (loss) on: | |
| Investment transactions | | | 184,480,756 | | | | 50,270,026 | | | | 23,157,841 | | |
| In-kind redemptions | | | 85,060,835 | | | | — | | | | — | | |
| Foreign currency transactions | | | (2,016,327 | ) | | | (904,816 | ) | | | — | | |
| Net realized gain (loss) | | | 267,525,264 | | | | 49,365,210 | | | | 23,157,841 | | |
| Net change in unrealized gain (loss) of: | |
| Investments | | | (101,160,362 | ) | | | 13,931,966 | | | | (16,011,414 | ) | |
| Foreign currency translation | | | (131,640 | ) | | | (83,780 | ) | | | — | | |
| Net change in unrealized gain (loss) | | | (101,292,002 | ) | | | 13,848,186 | | | | (16,011,414 | ) | |
| Net realized and unrealized gain | | | 166,233,262 | | | | 63,213,396 | | | | 7,146,427 | | |
Net increase (decrease) in net assets resulting
from operations | | $ | 200,495,778 | | | $ | 73,033,607 | | | $ | 6,892,134 | | |
1 The International Portfolio and Philadelphia International Fund had foreign dividend withholding taxes of $4,433,097 and $1,315,779, respectively.
2 Effective July 1, 2005, Institutional International Portfolio changed its name to Philadelphia International Fund.
3 Effective February 27, 2005, Small Capitalization Growth Portfolio changed its name to U.S. Emerging Growth Portfolio.
See Notes to Financial Statements.
30
THE GLENMEDE FUND, INC.
STATEMENTS OF OPERATIONS — (Concluded)
For the Year Ended October 31, 2005
| | | Large
Cap
100
Portfolio | | Large
Cap
Growth
Portfolio | |
| Investment income: | |
| Dividends | | $ | 546,353 | | | $ | 105,051 | | |
| Interest | | | 17,454 | | | | 5,569 | | |
| Income from security lending | | | 2,663 | | | | — | | |
| Total investment income | | | 566,470 | | | | 110,620 | | |
| Expenses: | |
| Management fees | | | 191,541 | | | | 63,946 | | |
| Administration, transfer agent and custody fees | | | 25,911 | | | | 11,850 | | |
| Professional fees | | | 4,355 | | | | 1,421 | | |
| Shareholder report expense | | | 746 | | | | 180 | | |
| Shareholder servicing fees | | | 69,652 | | | | 23,253 | | |
| Directors' fees and expenses | | | 1,272 | | | | 577 | | |
| Registration and filing fees | | | 6,000 | | | | 6,000 | | |
| Other expenses | | | 2,060 | | | | 1,327 | | |
| Total expenses | | | 301,537 | | | | 108,554 | | |
| Net investment income | | | 264,933 | | | | 2,066 | | |
| Realized and unrealized gain (loss): | |
| Net realized gain (loss) on: | |
| Investment transactions | | | 770,150 | | | | 68,711 | | |
| Net change in unrealized gain (loss) of: | |
| Investments | | | 2,258,704 | | | | 902,009 | | |
| Net realized and unrealized gain (loss) | | | 3,028,854 | | | | 970,720 | | |
| Net increase (decrease) in net assets resulting from operations | | $ | 3,293,787 | | | $ | 972,786 | | |
See Notes to Financial Statements.
31
THE GLENMEDE FUND, INC.
STATEMENTS OF CHANGES IN NET ASSETS
For the Year Ended October 31, 2005
| | | Government
Cash
Portfolio | | Tax-
Exempt
Cash
Portfolio | | Core
Fixed
Income
Portfolio | |
| Increase (decrease) in net assets | |
| Operations: | |
| Net investment income | | $ | 16,794,079 | | | $ | 10,496,862 | | | $ | 7,846,233 | | |
| Net realized gain (loss) on: | |
| Investment transactions | | | — | | | | — | | | | 323,113 | | |
| Net change in unrealized gain (loss) of: | |
| Investments | | | — | | | | — | | | | (5,681,607 | ) | |
Net increase (decrease) in net assets
resulting from operations | | | 16,794,079 | | | | 10,496,862 | | | | 2,487,739 | | |
| Distributions to shareholders from: | |
| Net investment income | | | (16,794,079 | ) | | | (10,496,862 | ) | | | (7,978,340 | ) | |
Net increase(decrease) in net assets from
capital share transactions | | | 149,556,068 | | | | 21,542,433 | | | | 6,202,184 | | |
| Net increase (decrease) in net assets | | | 149,556,068 | | | | 21,542,433 | | | | 711,583 | | |
| NET ASSETS: | |
| Beginning of year | | | 486,869,361 | | | | 530,221,409 | | | | 194,283,920 | | |
| End of year | | $ | 636,425,429 | | | $ | 551,763,842 | | | $ | 194,995,503 | | |
Undistributed net investment income
included in net assets at end of year | | $ | 73,094 | | | $ | (265 | ) | | $ | 701,518 | | |
| For the Year Ended October 31, 2004 | |
| | | Government
Cash
Portfolio | | Tax-
Exempt
Cash
Portfolio | | Core
Fixed
Income
Portfolio | |
| Increase (decrease) in net assets | |
| Operations: | |
| Net investment income | | $ | 5,062,997 | | | $ | 4,898,829 | | | $ | 7,288,033 | | |
| Net realized gain on: | |
| Investment transactions | | | — | | | | — | | | | 649,020 | | |
| Net change in unrealized gain (loss) of: | |
| Investments | | | — | | | | — | | | | 1,673,905 | | |
Net increase (decrease) in net assets
from operations | | | 5,062,997 | | | | 4,898,829 | | | | 9,610,958 | | |
| Distributions to shareholders from: | |
| Net investment income | | | (5,062,997 | ) | | | (4,898,828 | ) | | | (7,851,993 | ) | |
Net increase (decrease) in net assets from
capital share transactions | | | 36,702,157 | | | | (66,408,575 | ) | | | 115,417 | | |
| Net increase (decrease) in net assets | | | 36,702,157 | | | | (66,408,574 | ) | | | 1,874,382 | | |
| NET ASSETS: | |
| Beginning of year | | | 450,167,204 | | | | 596,629,983 | | | | 192,409,538 | | |
| End of year | | $ | 486,869,361 | | | $ | 530,221,409 | | | $ | 194,283,920 | | |
Undistributed net investment income
included in net assets at end of year | | $ | 73,094 | | | $ | (265 | ) | | $ | 616,886 | | |
See Notes to Financial Statements.
32
THE GLENMEDE FUND, INC.
STATEMENTS OF CHANGES IN NET ASSETS — (Continued)
For the Year Ended October 31, 2005
| | | Strategic
Equity
Portfolio | | Small Cap
Equity
Portfolio | | Large Cap
Value
Portfolio | |
| Increase (decrease) in net assets | |
| Operations: | |
| Net investment income (loss) | | $ | 727,633 | | | $ | (738,225 | ) | | $ | 413,604 | | |
| Net realized gain (loss) on: | |
| Investment transactions | | | 1,629,909 | | | | 40,569,024 | | | | 2,569,135 | | |
| Net change in unrealized gain (loss) of: | |
| Investments | | | 4,323,696 | | | | (8,857,974 | ) | | | 582,215 | | |
Net increase (decrease) in net assets
resulting from operations | | | 6,681,238 | | | | 30,972,825 | | | | 3,564,954 | | |
| Distributions to shareholders from: | |
| Net investment income: | |
| Advisor Class | | | (758,552 | ) | | | — | | | | (423,863 | ) | |
| Net realized gain on investments: | |
| Advisor Class | | | (1,486,505 | ) | | | (39,647,331 | ) | | | (2,510,624 | ) | |
| Institutional Class | | | — | | | | (170 | ) | | | — | | |
Net increase (decrease) in net assets from
capital share transactions | | | 9,912,014 | | | | (14,519,332 | ) | | | 3,154,910 | | |
| Net increase (decrease) in net assets | | | 14,348,195 | | | | (23,194,008 | ) | | | 3,785,377 | | |
| NET ASSETS: | |
| Beginning of year | | | 65,557,068 | | | | 265,164,654 | | | | 22,721,290 | | |
| End of year | | $ | 79,905,263 | | | $ | 241,970,646 | | | $ | 26,506,667 | | |
Undistributed net investment income
included in net assets at end of year | | $ | 18,543 | | | $ | 43,437 | | | $ | 10,499 | | |
| For the Year Ended October 31, 2004 | |
| | | Strategic
Equity
Portfolio | | Small Cap
Equity
Portfolio | | Large Cap
Value
Portfolio | |
| Increase (decrease) in net assets | |
| Operations: | |
| Net investment income (loss) | | $ | 905,824 | | | $ | (923,506 | ) | | $ | 382,615 | | |
| Net realized gain on: | |
| Investment transactions | | | 10,214,476 | | | | 41,310,243 | | | | 2,782,198 | | |
| Net change in unrealized gain (loss) of: | |
| Investments | | | (4,976,139 | ) | | | (820,032 | ) | | | 296,072 | | |
Net increase (decrease) in net assets
from operations | | | 6,144,161 | | | | 39,566,705 | | | | 3,460,885 | | |
| Distributions to shareholders from: | |
| Net investment income: | |
| Advisor Class | | | (919,610 | ) | | | — | | | | (370,990 | ) | |
| Net realized gain on investments: | |
| Advisor Class | | | — | | | | (40,762,644 | ) | | | (658,620 | ) | |
| Institutional Class | | | — | | | | (153 | ) | | | — | | |
Net decrease in net assets from capital
share transactions | | | (28,188,025 | ) | | | (49,676,469 | ) | | | (1,006,687 | ) | |
| Net increase (decrease) in net assets | | | (22,963,474 | ) | | | (50,872,561 | ) | | | 1,424,588 | | |
| NET ASSETS: | |
| Beginning of year | | | 88,520,542 | | | | 316,037,215 | | | | 21,296,702 | | |
| End of year | | $ | 65,557,068 | | | $ | 265,164,654 | | | $ | 22,721,290 | | |
Undistributed net investment income
included in net assets at end of year | | $ | 75,476 | | | $ | 11,630 | | | $ | 20,955 | | |
See Notes to Financial Statements.
33
THE GLENMEDE FUND, INC.
STATEMENTS OF CHANGES IN NET ASSETS — (Continued)
For the Year Ended October 31, 2005
See Notes to Financial Statements.
| | | International
Portfolio | | Philadelphia
International
Fund1 | | U.S.
Emerging
Growth
Portfolio2 | |
| Increase (decrease) in net assets | |
| Operations: | |
| Net investment income (loss) | | $ | 34,262,516 | | | $ | 9,820,211 | | | $ | (254,293 | ) | |
| Net realized gain (loss) on: | |
| Investment transactions | | | 184,480,756 | | | | 50,270,026 | | | | 23,157,841 | | |
| In-kind transactions | | | 85,060,835 | | | | — | | | | — | | |
| Foreign currency transactions | | | (2,016,327 | ) | | | (904,816 | ) | | | — | | |
| Net change in unrealized gain (loss) of: | |
| Investments | | | (101,160,362 | ) | | | 13,931,966 | | | | (16,011,414 | ) | |
| Foreign currency translation | | | (131,640 | ) | | | (83,780 | ) | | | — | | |
Net increase(decrease) in net assets
resulting from operations | | | 200,495,778 | | | | 73,033,607 | | | | 6,892,134 | | |
| Distributions to shareholders from: | |
| Net investment income | | | (33,411,817 | ) | | | (10,506,757 | ) | | | — | | |
Net realized gain on investments and
foreign currency transactions | | | (69,712,993 | ) | | | (16,362,020 | ) | | | — | | |
Net increase(decrease) in net assets from
capital share transactions | | | (603,283,740 | ) | | | 142,947,659 | | | | (68,740,112 | ) | |
| Net increase (decrease) in net assets | | | (505,912,772 | ) | | | 189,112,489 | | | | (61,847,978 | ) | |
| NET ASSETS: | |
| Beginning of year | | | 1,317,762,440 | | | | 444,905,633 | | | | 76,064,894 | | |
| End of year | | $ | 811,849,668 | | | $ | 634,018,122 | | | $ | 14,216,916 | | |
Undistributed net investment income
included in net assets at end of year | | $ | — | | | $ | — | | | $ | — | | |
| For the Year Ended October 31, 2004 | |
| | | International
Portfolio | | Philadelphia
International
Fund1 | | U.S.
Emerging
Growth
Portfolio2 | |
| Increase (decrease) in net assets | |
| Operations: | |
| Net investment income (loss) | | $ | 31,065,694 | | | $ | 9,054,401 | | | $ | (973,213 | ) | |
| Net realized gain (loss) on: | |
| Investment transactions | | | 114,608,644 | | | | 26,338,857 | | | | 4,160,566 | | |
| In-kind transactions | | | — | | | | 5,643,518 | | | | — | | |
| Foreign currency transactions | | | (1,756,734 | ) | | | (829,220 | ) | | | — | | |
| Net change in unrealized gain (loss) of: | |
| Investments | | | 101,390,871 | | | | 52,060,400 | | | | (7,229,592 | ) | |
| Foreign currency translation | | | 57,652 | | | | 21,148 | | | | — | | |
Net increase (decrease) in net assets
resulting from operations | | | 245,366,127 | | | | 92,289,104 | | | | (4,042,239 | ) | |
| Distributions to shareholders from: | |
| Net investment income | | | (23,757,261 | ) | | | (3,804,497 | ) | | | — | | |
Net increase (decrease) in net assets from
capital share transactions | | | 58,688,554 | | | | (117,949,555 | ) | | | (21,535,801 | ) | |
| Net increase (decrease) in net assets | | | 280,297,420 | | | | (29,464,948 | ) | | | (25,578,040 | ) | |
| NET ASSETS: | |
| Beginning of year | | | 1,037,465,020 | | | | 474,370,581 | | | | 101,642,934 | | |
| End of year | | $ | 1,317,762,440 | | | $ | 444,905,633 | | | $ | 76,064,894 | | |
Undistributed net investment income
included in net assets at end of year | | $ | 10,600,102 | | | $ | 4,796,057 | | | $ | (344 | ) | |
1 Effective July 1, 2005, Institutional International Portfolio changed its name to Philadelphia International Fund.
2 Effective February 27, 2005, Small Capitalization Growth Portfolio changed its name to U.S. Emerging Growth Portfolio.
34
THE GLENMEDE FUND, INC.
STATEMENTS OF CHANGES IN NET ASSETS — (Concluded)
For the Year Ended October 31, 2005
| | | Large
Cap
100
Portfolio | | Large
Cap
Growth
Portfolio | |
| Increase (decrease) in net assets | |
| Operations: | |
| Net investment income | | $ | 264,933 | | | $ | 2,066 | | |
| Net realized gain (loss) on: | |
| Investment transactions | | | 770,150 | | | | 68,711 | | |
| Net change in unrealized gain (loss) of: | |
| Investments | | | 2,258,704 | | | | 902,009 | | |
| Net increase(decrease) in net assets resulting from operations | | | 3,293,787 | | | | 972,786 | | |
| Distributions to shareholders from: | |
| Net investment income | | | (290,607 | ) | | | (4,149 | ) | |
| Net realized gain on investments | | | (378,313 | ) | | | — | | |
Net increase(decrease) in net assets from capital share
transactions | | | 29,314,519 | | | | 9,657,404 | | |
| Net increase (decrease) in net assets | | | 31,939,386 | | | | 10,626,041 | | |
| NET ASSETS: | |
| Beginning of year | | | 18,194,067 | | | | 5,945,514 | | |
| End of year | | $ | 50,133,453 | | | $ | 16,571,555 | | |
Undistributed net investment income included in net assets at
end of year | | $ | — | | | $ | — | | |
| For the Year Ended October 31, 2004 | |
| | | Large
Cap
100
Portfolio | | Large
Cap
Growth
Portfolio | |
| Increase (decrease) in net assets | |
| Operations: | |
| Net investment income (loss) | | $ | 32,813 | | | $ | (6,580 | ) | |
| Net realized loss on: | |
| Investment transactions | | | (400,248 | ) | | | (154,942 | ) | |
| Net change in unrealized gain (loss) of: | |
| Investments | | | 692,239 | | | | 325,771 | | |
| Net increase (decrease) in net assets resulting from operations | | | 324,804 | | | | 164,249 | | |
| Distributions to shareholders from: | |
| Net investment income | | | (17,370 | ) | | | — | | |
| Net increase in net assets from capital share transactions | | | 17,886,633 | | | | 5,781,265 | | |
| Net increase (decrease) in net assets | | | 18,194,067 | | | | 5,945,514 | | |
| NET ASSETS: | |
| Beginning of year | | | — | | | | — | | |
| End of year | | $ | 18,194,067 | | | $ | 5,945,514 | | |
Undistributed net investment income included in net assets at
end of year | | $ | 15,235 | | | $ | — | | |
See Notes to Financial Statements.
35
THE GLENMEDE FUND, INC.
FINANCIAL HIGHLIGHTS
For a share outstanding throughout each year
| | | Government Cash Portfolio | |
| | | For the Years Ended October 31, | |
| | | 2005 | | 2004 | | 2003 | | 2002 | | 2001 | |
Net asset value, beginning
of year | | $ | 1.00 | | | $ | 1.00 | | | $ | 1.00 | | | $ | 1.00 | | | $ | 1.00 | | |
Income from investment
operations: | |
| Net investment income | | | 0.027 | | | | 0.011 | | | | 0.011 | | | | 0.019 | | | | 0.048 | | |
| Distributions to shareholders from: | |
| Net investment income | | | (0.027 | ) | | | (0.011 | ) | | | (0.011 | ) | | | (0.019 | ) | | | (0.048 | ) | |
Net asset value, end
of year | | $ | 1.00 | | | $ | 1.00 | | | $ | 1.00 | | | $ | 1.00 | | | $ | 1.00 | | |
| Total return | | | 2.74 | % | | | 1.05 | % | | | 1.15 | % | | | 1.95 | % | | | 4.86 | % | |
Ratios to average net assets/
Supplemental data: | |
Net assets, end of year
(in 000's) | | $ | 636,425 | | | $ | 486,869 | | | $ | 450,167 | | | $ | 533,034 | | | $ | 421,509 | | |
Ratio of operating expenses to
average net assets | | | 0.19 | % | | | 0.18 | % | | | 0.13 | % | | | 0.13 | % | | | 0.11 | % | |
Ratio of net investment income
to average net assets | | | 2.73 | % | | | 1.05 | % | | | 1.16 | % | | | 1.91 | % | | | 4.86 | % | |
See Notes to Financial Statements.
36
THE GLENMEDE FUND, INC.
FINANCIAL HIGHLIGHTS
For a share outstanding throughout each year
| | | Tax-Exempt Cash Portfolio | |
| | | For the Years Ended October 31, | |
| | | 2005 | | 2004 | | 2003 | | 2002 | | 2001 | |
Net asset value, beginning
of year | | $ | 1.00 | | | $ | 1.00 | | | $ | 1.00 | | | $ | 1.00 | | | $ | 1.00 | | |
Income from investment
operations: | |
| Net investment income | | | 0.019 | | | | 0.009 | | | | 0.009 | | | | 0.012 | | | | 0.029 | | |
| Distributions to shareholders from: | |
| Net investment income | | | (0.019 | ) | | | (0.009 | ) | | | (0.009 | ) | | | (0.012 | ) | | | (0.029 | ) | |
Net asset value, end
of year | | $ | 1.00 | | | $ | 1.00 | | | $ | 1.00 | | | $ | 1.00 | | | $ | 1.00 | | |
| Total return | | | 1.94 | % | | | 0.90 | % | | | 0.88 | % | | | 1.25 | % | | | 2.95 | % | |
Ratios to average net assets/
Supplemental data: | |
Net assets, end of year
(in 000's) | | $ | 551,764 | | | $ | 530,221 | | | $ | 596,630 | | | $ | 607,069 | | | $ | 541,881 | | |
Ratio of operating expenses to
average net assets | | | 0.19 | % | | | 0.18 | % | | | 0.14 | % | | | 0.14 | % | | | 0.11 | % | |
Ratio of net investment income
to average net assets | | | 1.91 | % | | | 0.90 | % | | | 0.88 | % | | | 1.24 | % | | | 2.88 | % | |
See Notes to Financial Statements.
37
THE GLENMEDE FUND, INC.
FINANCIAL HIGHLIGHTS
For a share outstanding throughout each year
| | | Core Fixed Income Portfolio | |
| | | For the Years Ended October 31, | |
| | | 2005 | | 2004 | | 2003 | | 2002 | | 2001 | |
Net asset value, beginning
of year | | $ | 10.94 | | | $ | 10.85 | | | $ | 10.98 | | | $ | 10.88 | | | $ | 10.08 | | |
Income from investment
operations: | |
| Net investment income | | | 0.44 | | | | 0.45 | | | | 0.44 | | | | 0.54 | | | | 0.65 | | |
Net realized and unrealized
gain (loss) on investments | | | (0.30 | ) | | | 0.09 | | | | (0.09 | ) | | | 0.10 | | | | 0.82 | | |
Total from investment
operations | | | 0.14 | | | | 0.54 | | | | 0.35 | | | | 0.64 | | | | 1.47 | | |
| Distributions to shareholders from: | |
| Net investment income | | | (0.44 | ) | | | (0.45 | ) | | | (0.48 | ) | | | (0.54 | ) | | | (0.67 | ) | |
| Total distributions | | | (0.44 | ) | | | (0.45 | ) | | | (0.48 | ) | | | (0.54 | ) | | | (0.67 | ) | |
Net asset value, end
of year | | $ | 10.64 | | | $ | 10.94 | | | $ | 10.85 | | | $ | 10.98 | | | $ | 10.88 | | |
| Total return | | | 1.32 | % | | | 5.07 | % | | | 3.26 | % | | | 6.18 | % | | | 15.09 | % | |
Ratios to average net assets/
Supplemental data: | |
Net assets, end of year
(in 000's) | | $ | 194,996 | | | $ | 194,284 | | | $ | 192,410 | | | $ | 188,298 | | | $ | 178,811 | | |
Ratio of operating expenses to
average net assets | | | 0.29 | % | | | 0.19 | % | | | 0.14 | % | | | 0.14 | % | | | 0.11 | % | |
Ratio of gross expenses
to average net assets | | | 0.29 | % | | | 0.19 | % | | | 0.14 | % | | | 0.24 | % | | | 0.63 | % | |
Ratio of net investment income
to average net assets | | | 4.02 | % | | | 3.82 | % | | | 4.08 | % | | | 5.19 | % | | | 6.19 | % | |
| Portfolio turnover rate | | | 229 | % | | | 203 | % | | | 205 | % | | | 191 | % | | | 138 | % | |
See Notes to Financial Statements.
38
THE GLENMEDE FUND, INC.
FINANCIAL HIGHLIGHTS
For a share outstanding throughout each year
| | | Strategic Equity Portfolio | |
| | | For the Years Ended October 31, | |
| | | 20051 | | 2004 | | 2003 | | 2002 | | 2001 | |
Net asset value, beginning
of year | | $ | 15.87 | | | $ | 14.94 | | | $ | 13.47 | | | $ | 16.06 | | | $ | 21.19 | | |
Income from investment
operations: | |
| Net investment income | | | 0.17 | | | | 0.19 | | | | 0.20 | | | | 0.16 | | | | 0.20 | | |
Net realized and unrealized
gain (loss) on investments | | | 1.41 | | | | 0.93 | | | | 1.46 | | | | (2.59 | ) | | | (5.09 | ) | |
Total from investment
operations | | | 1.58 | | | | 1.12 | | | | 1.66 | | | | (2.43 | ) | | | (4.89 | ) | |
| Distributions to shareholders from: | |
| Net investment income | | | (0.18 | ) | | | (0.19 | ) | | | (0.19 | ) | | | (0.16 | ) | | | (0.24 | ) | |
| Net realized capital gains | | | (0.32 | ) | | | — | | | | — | | | | — | | | | — | | |
| Total distributions | | | (0.50 | ) | | | (0.19 | ) | | | (0.19 | ) | | | (0.16 | ) | | | (0.24 | ) | |
Net asset value, end
of year | | $ | 16.95 | | | $ | 15.87 | | | $ | 14.94 | | | $ | 13.47 | | | $ | 16.06 | | |
| Total return | | | 9.98 | % | | | 7.53 | % | | | 12.43 | % | | | (15.20 | )% | | | (23.18 | )% | |
Ratios to average net assets/
Supplemental data: | |
Net assets, end of year
(in 000's) | | $ | 79,905 | | | $ | 65,557 | | | $ | 88,521 | | | $ | 90,051 | | | $ | 123,803 | | |
Ratio of operating expenses to
average net assets | | | 0.45 | % | | | 0.27 | % | | | 0.14 | % | | | 0.14 | % | | | 0.12 | % | |
Ratio of net investment income
to average net assets | | | 0.97 | % | | | 1.19 | % | | | 1.39 | % | | | 1.04 | % | | | 1.09 | % | |
| Portfolio turnover rate | | | 89 | % | | | 87 | % | | | 79 | % | | | 36 | % | | | 41 | % | |
1 Per share net investment income (loss) has been calculated using the average shares outstanding during the period.
See Notes to Financial Statements.
39
THE GLENMEDE FUND, INC.
FINANCIAL HIGHLIGHTS
For a share outstanding throughout each year
| | | Small Cap Equity Portfolio Advisor Class | |
| | | For the Years Ended October 31, | |
| | | 2005 | | 20041 | | 2003 | | 2002 | | 2001 | |
Net asset value, beginning
of year | | $ | 17.61 | | | $ | 18.28 | | | $ | 13.93 | | | $ | 15.57 | | | $ | 17.04 | | |
Income from investment
operations: | |
| Net investment income (loss) | | | (0.05 | ) | | | (0.06 | ) | | | 0.01 | | | | 0.07 | | | | 0.23 | | |
Net realized and unrealized
gain (loss) on investments | | | 2.15 | | | | 2.59 | | | | 4.75 | | | | (0.90 | ) | | | 0.45 | | |
Total from investment
operations | | | 2.10 | | | | 2.53 | | | | 4.76 | | | | (0.83 | ) | | | 0.68 | | |
| Distributions to shareholders from: | |
| Net investment income | | | — | | | | — | | | | (0.02 | ) | | | (0.07 | ) | | | (0.24 | ) | |
| Net realized capital gains | | | (3.00 | ) | | | (3.20 | ) | | | (0.39 | ) | | | (0.74 | ) | | | (1.83 | ) | |
| Tax Return of capital | | | — | | | | — | | | | — | | | | — | | | | (0.08 | ) | |
| Total distributions | | | (3.00 | ) | | | (3.20 | ) | | | (0.41 | ) | | | (0.81 | ) | | | (2.15 | ) | |
Net asset value, end
of year | | $ | 16.71 | | | $ | 17.61 | | | $ | 18.28 | | | $ | 13.93 | | | $ | 15.57 | | |
| Total return | | | 12.22 | % | | | 13.90 | % | | | 34.23 | % | | | (5.32 | )% | | | 3.84 | % | |
Ratios to average net assets/
Supplemental data: | |
Net assets, end of year
(in 000's) | | $ | 241,970 | | | $ | 265,164 | | | $ | 275,408 | | | $ | 199,264 | | | $ | 216,638 | | |
Ratio of operating expenses to
average net assets | | | 0.92 | % | | | 0.90 | % | | | 0.90 | % | | | 0.90 | % | | | 0.87 | % | |
Ratio of net investment income
(expenses in excess of income)
to average net assets | | | (0.28 | )% | | | (0.33 | )% | | | 0.10 | % | | | 0.44 | % | | | 1.28 | % | |
| Portfolio turnover rate2 | | | 51 | % | | | 64 | % | | | 58 | % | | | 67 | % | | | 65 | % | |
1 Per share net investment income (loss) has been calculated using the average shares outstanding during the period.
2 Portfolio turnover is calculated at the fund level.
See Notes to Financial Statements.
40
THE GLENMEDE FUND, INC.
FINANCIAL HIGHLIGHTS
For a share outstanding throughout each year
| | | Small Cap Equity Portfolio Institutional Class | |
| | | For the Years Ended October 31, | |
| | | 2005 | | 20041 | | 2003 | | 2002 | | 2001 | |
Net asset value, beginning
of year | | $ | 17.73 | | | $ | 18.35 | | | $ | 13.96 | | | $ | 15.60 | | | $ | 17.01 | | |
Income from investment
operations: | |
| Net investment income (loss) | | | 0.00 | | | | (0.02 | ) | | | 0.05 | | | | 0.11 | | | | 0.26 | | |
Net realized and unrealized
gain (loss) on investments | | | 2.15 | | | | 2.60 | | | | 4.76 | | | | (0.90 | ) | | | 0.46 | | |
Total from investment
operations | | | 2.15 | | | | 2.58 | | | | 4.81 | | | | (0.79 | ) | | | 0.72 | | |
| Distributions to shareholders from: | |
| Net investment income | | | — | | | | — | | | | (0.03 | ) | | | (0.11 | ) | | | (0.22 | ) | |
| Net realized capital gains | | | (3.00 | ) | | | (3.20 | ) | | | (0.39 | ) | | | (0.74 | ) | | | (1.83 | ) | |
| Tax Return of capital | | | — | | | | — | | | | — | | | | — | | | | (0.08 | ) | |
| Total distributions | | | (3.00 | ) | | | (3.20 | ) | | | (0.42 | ) | | | (0.85 | ) | | | (2.13 | ) | |
Net asset value, end
of year | | $ | 16.88 | | | $ | 17.73 | | | $ | 18.35 | | | $ | 13.96 | | | $ | 15.60 | | |
| Total return | | | 12.43 | % | | | 14.13 | % | | | 34.50 | % | | | (5.10 | )% | | | 4.08 | % | |
Ratios to average net assets/
Supplemental data: | |
Net assets, end of year
(in 000's) | | $ | 1 | | | $ | 1 | | | $ | 40,629 | | | $ | 29,644 | | | $ | 30,417 | | |
Ratio of operating expenses to
average net assets | | | 0.72 | % | | | 0.70 | % | | | 0.70 | % | | | 0.70 | % | | | 0.66 | % | |
Ratio of net investment income
(expenses in excess of income)
to average net assets | | | (0.09 | )% | | | (0.12 | )% | | | 0.30 | % | | | 0.64 | % | | | 1.44 | % | |
| Portfolio turnover rate2 | | | 51 | % | | | 64 | % | | | 58 | % | | | 67 | % | | | 65 | % | |
1 Per share net investment income (loss) has been calculated using the average shares outstanding during the period.
2 Portfolio turnover is calculated at the fund level.
See Notes to Financial Statements.
41
THE GLENMEDE FUND, INC.
FINANCIAL HIGHLIGHTS
For a share outstanding throughout each year
| | | Large Cap Value Portfolio | |
| | | For the Years Ended October 31, | |
| | | 2005 | | 2004 | | 2003 | | 2002 | | 2001 | |
Net asset value, beginning
of year | | $ | 10.01 | | | $ | 9.00 | | | $ | 7.78 | | | $ | 8.56 | | | $ | 11.03 | | |
Income from investment
operations: | |
| Net investment income | | | 0.18 | | | | 0.17 | | | | 0.16 | | | | 0.14 | | | | 0.17 | | |
Net realized and unrealized
gain (loss) on investments | | | 1.36 | | | | 1.31 | | | | 1.22 | | | | (0.79 | ) | | | (1.49 | ) | |
Total from investment
operations | | | 1.54 | | | | 1.48 | | | | 1.38 | | | | (0.65 | ) | | | (1.32 | ) | |
| Distributions to shareholders from: | |
| Net investment income | | | (0.19 | ) | | | (0.17 | ) | | | (0.16 | ) | | | (0.13 | ) | | | (0.18 | ) | |
| Net realized capital gains | | | (1.08 | ) | | | (0.30 | ) | | | — | | | | — | | | | (0.97 | ) | |
| Total distributions | | | (1.27 | ) | | | (0.47 | ) | | | (0.16 | ) | | | (0.13 | ) | | | (1.15 | ) | |
Net asset value, end
of year | | $ | 10.28 | | | $ | 10.01 | | | $ | 9.00 | | | $ | 7.78 | | | $ | 8.56 | | |
| Total return | | | 15.66 | % | | | 16.54 | % | | | 18.01 | % | | | (7.64 | )% | | | (12.31 | )% | |
Ratios to average net assets/
Supplemental data: | |
Net assets, end of year
(in 000's) | | $ | 26,507 | | | $ | 22,721 | | | $ | 21,297 | | | $ | 15,326 | | | $ | 14,002 | | |
Ratio of operating expenses to
average net assets | | | 0.48 | % | | | 0.29 | % | | | 0.17 | % | | | 0.17 | % | | | 0.21 | % | |
Ratio of net investment income
to average net assets | | | 1.62 | % | | | 1.78 | % | | | 2.06 | % | | | 1.75 | % | | | 1.51 | % | |
| Portfolio turnover rate | | | 76 | % | | | 76 | % | | | 96 | % | | | 96 | % | | | 174 | % | |
See Notes to Financial Statements.
42
THE GLENMEDE FUND, INC.
FINANCIAL HIGHLIGHTS
For a share outstanding throughout each year
| | | International Portfolio | |
| | | For the Years Ended October 31, | |
| | | 20051 | | 2004 | | 2003 | | 2002 | | 2001 | |
Net asset value, beginning
of year | | $ | 16.96 | | | $ | 13.99 | | | $ | 11.67 | | | $ | 12.89 | | | $ | 15.79 | | |
Income from investment
operations: | |
| Net investment income | | | 0.48 | | | | 0.40 | | | | 0.40 | | | | 0.33 | | | | 0.35 | | |
Net realized and unrealized
gain (loss) on investments | | | 2.26 | | | | 2.88 | | | | 2.23 | | | | (1.31 | ) | | | (2.91 | ) | |
Total from investment
operations | | | 2.74 | | | | 3.28 | | | | 2.63 | | | | (0.98 | ) | | | (2.56 | ) | |
Distributions to shareholders
from: | |
| Net investment income | | | (0.47 | ) | | | (0.31 | ) | | | (0.31 | ) | | | (0.24 | ) | | | (0.34 | ) | |
From net realized gain on
investments | | | (1.65 | ) | | | — | | | | — | | | | — | | | | — | | |
| Total distributions | | | (2.12 | ) | | | (0.31 | ) | | | (0.31 | ) | | | (0.24 | ) | | | (0.34 | ) | |
Net asset value, end
of year | | $ | 17.58 | | | $ | 16.96 | | | $ | 13.99 | | | $ | 11.67 | | | $ | 12.89 | | |
| Total return | | | 16.34 | % | | | 23.60 | % | | | 22.89 | % | | | (7.82 | )% | | | (16.34 | )% | |
Ratios to average net assets/
Supplemental data: | |
Net assets, end of year
(in 000's) | | $ | 811,850 | | | $ | 1,317,762 | | | $ | 1,037,465 | | | $ | 983,337 | | | $ | 1,219,138 | | |
Ratio of operating expenses
before waiver to average
net assets | | | 0.32 | % | | | 0.14 | % | | | 0.14 | % | | | 0.14 | % | | | 0.11 | % | |
Ratio of operating expenses
after waiver to average
net assets | | | 0.18 | % | | | 0.14 | % | | | 0.14 | % | | | 0.14 | % | | | 0.11 | % | |
Ratio of net investment income
to average net assets | | | 2.58 | % | | | 2.59 | % | | | 3.14 | % | | | 2.42 | % | | | 2.34 | % | |
| Portfolio turnover rate | | | 47 | % | | | 38 | % | | | 48 | % | | | 33 | % | | | 40 | % | |
1 Per share net investment income (loss) has been calculated using the average shares outstanding during the period.
See Notes to Financial Statements.
43
THE GLENMEDE FUND, INC.
FINANCIAL HIGHLIGHTS
For a share outstanding throughout each year
| | | Philadelphia International Fund1 | |
| | | For the Years Ended October 31, | |
| | | 2005 | | 2004 | | 2003 | | 2002 | | 2001 | |
Net asset value, beginning
of year | | $ | 15.86 | | | $ | 13.14 | | | $ | 11.03 | | | $ | 12.25 | | | $ | 15.10 | | |
Income from investment
operations: | |
| Net investment income | | | 0.28 | | | | 0.33 | | | | 0.24 | | | | 0.19 | | | | 0.23 | | |
Net realized and unrealized
gain (loss) on investments | | | 2.16 | | | | 2.53 | | | | 2.09 | | | | (1.28 | ) | | | (2.86 | ) | |
Total from investment
operations | | | 2.44 | | | | 2.86 | | | | 2.33 | | | | (1.09 | ) | | | (2.63 | ) | |
| Distributions to shareholders from: | |
| Net investment income | | | (0.34 | ) | | | (0.14 | ) | | | (0.22 | ) | | | (0.13 | ) | | | (0.16 | ) | |
| Net realized capital gains | | | (0.47 | ) | | | — | | | | — | | | | — | | | | — | | |
| Tax Return of capital | | | — | | | | — | | | | — | | | | — | | | | (0.06 | ) | |
| Total distributions | | | (0.81 | ) | | | (0.14 | ) | | | (0.22 | ) | | | (0.13 | ) | | | (0.22 | ) | |
Net asset value, end
of year | | $ | 17.49 | | | $ | 15.86 | | | $ | 13.14 | | | $ | 11.03 | | | $ | 12.25 | | |
| Total return | | | 15.50 | % | | | 21.78 | % | | | 21.32 | % | | | (9.02 | )% | | | (17.45 | )% | |
Ratios to average net assets/
Supplemental data: | |
Net assets, end of year
(in 000's) | | $ | 634,018 | | | $ | 444,906 | | | $ | 474,371 | | | $ | 263,769 | | | $ | 275,132 | | |
Ratio of operating expenses to
average net assets | | | 0.85 | % | | | 0.85 | % | | | 0.85 | % | | | 0.85 | % | | | 0.83 | % | |
Ratio of net investment income
to average net assets | | | 1.78 | % | | | 1.86 | % | | | 2.33 | % | | | 1.72 | % | | | 1.71 | % | |
| Portfolio turnover rate | | | 47 | % | | | 50 | % | | | 42 | % | | | 37 | % | | | 53 | % | |
1 Effective July 1, 2005, the Institutional International Portfolio changed its name to Philadelphia International Fund.
See Notes to Financial Statements.
44
THE GLENMEDE FUND, INC.
FINANCIAL HIGHLIGHTS
For a share outstanding throughout each year
| | | U.S. Emerging Growth Portfolio1 | |
| | | For the Years Ended October 31, | |
| | | 20052 | | 2004 | | 2003 | | 2002 | | 2001 | |
Net asset value, beginning
of year | | $ | 5.32 | | | $ | 5.56 | | | $ | 3.93 | | | $ | 5.04 | | | $ | 9.22 | | |
Income from investment
operations: | |
| Net investment loss | | | (0.05 | ) | | | (0.07 | ) | | | (0.05 | ) | | | — | | | | — | | |
Net realized and unrealized
gain (loss) on investments | | | 0.95 | | | | (0.17 | ) | | | 1.68 | | | | (1.11 | ) | | | (4.18 | ) | |
Total from investment
operations | | | 0.90 | | | | (0.24 | ) | | | 1.63 | | | | (1.11 | ) | | | (4.18 | ) | |
Net asset value, end
of year | | $ | 6.22 | | | $ | 5.32 | | | $ | 5.56 | | | $ | 3.93 | | | $ | 5.04 | | |
| Total return | | | 16.92 | % | | | (4.32 | )% | | | 41.48 | % | | | (22.02 | )% | | | (45.34 | )% | |
Ratios to average net assets/
Supplemental data: | |
Net assets, end of year
(in 000's) | | $ | 14,217 | | | $ | 76,065 | | | $ | 101,643 | | | $ | 78,122 | | | $ | 105,052 | | |
Ratio of operating expenses to
average net assets | | | 1.17 | % | | | 1.22 | % | | | 1.18 | % | | | 1.23 | % | | | 1.17 | % | |
Ratio of net investment income (loss)
to average net assets | | | (0.83 | )% | | | (1.05 | )% | | | (1.04 | )% | | | (1.02 | )% | | | (0.83 | )% | |
| Portfolio turnover rate | | | 145 | % | | | 89 | % | | | 114 | % | | | 42 | % | | | 67 | % | |
1 Effective February 27, 2005, Small Capitalization Growth Portfolio changed its name to U.S. Emerging Growth Portfolio.
2 Per share net investment income (loss) has been calculated using the average shares outstanding during the period.
See Notes to Financial Statements.
45
THE GLENMEDE FUND, INC.
FINANCIAL HIGHLIGHTS
For a share outstanding throughout each year
| | | Large Cap 100 Portfolio | |
| | | For the
Year Ended
October 31,
2005 | | For the Period
February 27, 20041
through
October 31, 2004 | |
Net asset value, beginning
of period | | $ | 10.09 | | | $ | 10.00 | | |
Income from investment
operations: | |
| Net investment income | | | 0.08 | | | | 0.03 | | |
Net realized and unrealized
gain (loss) on investments | | | 1.29 | | | | 0.08 | | |
Total from investment
operations | | | 1.37 | | | | 0.11 | | |
| Distributions to shareholders from: | |
| Net investment income | | | (0.09 | ) | | | (0.02 | ) | |
| Net realized capital gains | | | (0.09 | ) | | | — | | |
| Total distributions | | | (0.18 | ) | | | (0.02 | ) | |
Net asset value, end
of period | | $ | 11.28 | | | $ | 10.09 | | |
| Total return | | | 13.58 | % | | | 1.05 | %2 | |
Ratios to average net assets/
Supplemental data: | |
Net assets, end of period
(in 000's) | | $ | 50,133 | | | $ | 18,194 | | |
Ratio of operating expenses to
average net assets | | | 0.87 | % | | | 1.12 | %3 | |
Ratio of net investment income
to average net assets | | | 0.76 | % | | | 0.45 | %3 | |
| Portfolio turnover rate | | | 83 | % | | | 56 | % | |
1 Commencement of operations.
2 Total return calculation is not annualized.
3 Annualized.
See Notes to Financial Statements.
46
THE GLENMEDE FUND, INC.
FINANCIAL HIGHLIGHTS
For a share outstanding throughout each year
| | | Large Cap Growth Portfolio | |
| | | For the
Year Ended
October 31,
2005 | | For the Period
February 27, 20041
through
October 31, 2004 | |
Net asset value, beginning
of period | | $ | 10.04 | | | $ | 10.00 | | |
Income from investment
operations: | |
| Net investment income (loss) | | | 0.00 | 2 | | | (0.01 | ) | |
Net realized and unrealized
gain (loss) on investments | | | 1.13 | | | | 0.05 | | |
Total from investment
operations | | | 1.13 | | | | 0.04 | | |
| Distributions to shareholders from: | |
| Net investment income | | | (0.00 | )2 | | | — | | |
| Total distributions | | | (0.00 | ) | | | — | | |
Net asset value, end
of period | | $ | 11.17 | | | $ | 10.04 | | |
| Total return | | | 11.29 | % | | | 0.40 | %3 | |
Ratios to average net assets/
Supplemental data: | |
Net assets, end of period
(in 000's) | | $ | 16,572 | | | $ | 5,946 | | |
Ratio of operating expenses to
average net assets | | | 0.93 | % | | | 1.26 | %4 | |
Ratio of net investment income
(expenses in excess of income)
to average net assets | | | 0.02 | % | | | (0.23 | )%4 | |
| Portfolio turnover rate | | | 97 | % | | | 64 | % | |
1 Commencement of operations.
2 Amount rounds to less than $0.01 per share.
3 Total return calculation is not annualized.
4 Annualized.
See Notes to Financial Statements.
47
THE GLENMEDE FUND, INC.
Government Cash Portfolio
SCHEDULE OF PORTFOLIO INVESTMENTS
October 31, 2005
Face
Amount | | | | Value | |
| AGENCY DISCOUNT NOTESt1 — 18.1% | | | |
| | | Federal Home Loan Bank — 2.7% | |
| $ | 10,000,000 | | | 3.70% due 11/1/05 | | $ | 10,000,000 | | |
| | 7,264,000 | | | 0.00% due 11/7/05 | | | 7,254,872 | | |
| | | | 17,254,872 | | |
| | | Federal Home Loan Mortgage Corporation — 6.6% | |
| | 7,364,000 | | | 3.79% due 11/1/05 | | | 7,364,000 | | |
| | 10,000,000 | | | 3.00% due 12/12/05 | | | 9,965,832 | | |
| | 5,000,000 | | | 3.88% due 1/3/06 | | | 4,966,050 | | |
| | 10,000,000 | | | 3.84% due 2/7/06 | | | 9,895,467 | | |
| | 10,000,000 | | | 3.915% due 5/8/06 | | | 9,795,550 | | |
| | | | 41,986,899 | | |
| | | | | Federal National Mortgage Association — 8.8% | | | | | |
| | 22,000,000 | | | 3.72% due 11/1/05 | | | 22,000,000 | | |
| | 10,000,000 | | | 3.77% due 3/1/06 | | | 9,874,333 | | |
| | 7,500,000 | | | 3.82% due 3/8/06 | | | 7,398,927 | | |
| | 12,000,000 | | | 4.22% due 4/26/06 | | | 11,752,427 | | |
| | 5,000,000 | | | 4.08% due 6/16/06 | | | 4,871,367 | | |
| | | | 55,897,054 | | |
| | TOTAL AGENCY DISCOUNT NOTES
(Cost $115,138,825) | | | | | | 115,138,825 | | |
| AGENCY NOTES — 33.4% | | | |
| | | Federal Farm Credit Bank — 0.4% | |
| | 2,475,000 | | | 6.50% due 11/22/05 | | | 2,479,474 | | |
| | | Federal Home Loan Bank — 9.1% | |
| | 10,000,000 | | | 2.125% due 11/15/05 | | | 10,031,489 | | |
| | 1,000,000 | | | 2.00% due 11/21/05 | | | 1,003,004 | | |
| | 5,000,000 | | | 2.03% due 11/25/05 | | | 4,988,106 | | |
| | 3,440,000 | | | 2.50% due 12/15/05 | | | 3,453,294 | | |
| | 1,000,000 | | | 2.81% due 12/19/05 | | | 1,006,185 | | |
| | 2,640,000 | | | 1.75% due 1/13/06 | | | 2,624,209 | | |
| | 5,425,000 | | | 2.00% due 2/13/06 | | | 5,384,409 | | |
| | 5,000,000 | | | 2.375% due 2/15/06 | | | 4,995,741 | | |
| | 5,000,000 | | | 3.922% due 3/1/06 | | | 5,000,000 | | |
| | 9,500,000 | | | 5.125% due 3/6/06 | | | 9,531,825 | | |
| | 5,000,000 | | | 2.50% due 3/15/06 | | | 4,981,515 | | |
| | 2,350,000 | | | 2.35% due 5/4/06 | | | 2,352,184 | | |
| | 2,355,000 | | | 2.25% due 5/15/06 | | | 2,352,410 | | |
| | | | 57,704,371 | | |
See Notes to Financial Statements.
48
THE GLENMEDE FUND, INC.
Government Cash Portfolio
SCHEDULE OF PORTFOLIO INVESTMENTS — (Continued)
October 31, 2005
Face
Amount | | | | Value | |
| AGENCY NOTES — (Continued) | | | |
| | | Federal Home Loan Mortgage Corporation — 7.5% | |
| $ | 6,426,000 | | | 2.125% due 11/15/05 | | $ | 6,457,806 | | |
| | 3,350,000 | | | 2.50% due 12/1/05 | | | 3,346,805 | | |
| | 26,366,000 | | | 5.25% due 1/15/06 | | | 26,443,410 | | |
| | 3,500,000 | | | 2.15% due 1/30/06 | | | 3,492,182 | | |
| | 2,000,000 | | | 2.81% due 2/2/06 | | | 2,003,398 | | |
| | 1,742,000 | | | 1.875% due 2/15/06 | | | 1,732,307 | | |
| | 4,500,000 | | | 2.25% due 2/17/06 | | | 4,484,555 | | |
| | | | 47,960,463 | | |
| | | Federal National Mortgage Association — 16.4% | |
| | 3,044,000 | | | 2.375% due 11/28/05 | | | 3,056,944 | | |
| | 31,724,000 | | | 6.00% due 12/15/05 | | | 31,808,246 | | |
| | 10,000,000 | | | 2.375% due 12/15/05 | | | 10,038,011 | | |
| | 10,000,000 | | | 2.375% due 12/30/05 | | | 10,022,771 | | |
| | 15,205,000 | | | 2.00% due 1/15/06 | | | 15,192,703 | | |
| | 5,000,000 | | | 5.875% due 2/2/06 | | | 5,025,622 | | |
| | 2,370,000 | | | 2.375% due 2/13/06 | | | 2,361,310 | | |
| | 7,511,000 | | | 5.50% due 2/15/06 | | | 7,542,468 | | |
| | 8,087,000 | | | 2.15% due 4/13/06 | | | 8,011,963 | | |
| | 3,445,000 | | | 2.21% due 5/5/06 | | | 3,423,543 | | |
| | 8,000,000 | | | 5.25% due 6/15/06 | | | 8,055,193 | | |
| | | | 104,538,774 | | |
| | | | | TOTAL AGENCY NOTES
(Cost $212,683,082) | | | 212,683,082 | | |
| REPURCHASE AGREEMENTS — 50.3% | | | |
| | 150,000,000 | | | With Bear Stearns, Inc. dated 10/31/05, 4.03%,
principal and interest in the amount of $150,016,792,
due 11/01/05, (collateralized by FHR #2755 with a
par value of $27,241,586, coupon rate of 4.37%, due
10/15/31, market value of $27,361,449, FNR #2005-30
A with a par value of $37,474,161, coupon rate of
5.00%, due 06/25/31, market value of $36,923,291,
FHR #2727 with a par value of $39,634,258, coupon
rate of 3.57%, due 06/15/29, market value of
$38,627,548, FNR 1994-36 with a par value of
$50,000,000, coupon rate of 6.50%, due 03/25/24,
market value of $51,730,000) | | | 150,000,000 | | |
See Notes to Financial Statements.
49
THE GLENMEDE FUND, INC.
Government Cash Portfolio
SCHEDULE OF PORTFOLIO INVESTMENTS — (Concluded)
October 31, 2005
Face
Amount | | | | Value | |
| REPURCHASE AGREEMENTS — (Continued) | |
| $ | 140,315,084 | | | With Merrill Lynch & Co., Inc., dated 10/31/05, 3.97%,
principal and interest in the amount of $140,330,558,
due 11/01/05, (collateralized by FN #814549 with a
par value of $45,268,022, coupon rate of 5.11%,
due 04/01/35, market value of $45,326,870, FN #821697
with a par value of $43,022,620, coupon rate of 5.05%,
due 06/01/35, market value of $43,022,620, FH #1G0042
with a par value of $40,744,867, coupon rate of 4.9 3%,
due 01/01/35, market value of $40,520,770,
FN #765675 with a par value of $14,364,990,
coupon rate of 3.69%, due 02/01/34,
market value of $14,310,403) | | $ | 140,315,084 | | |
| | 30,000,000 | | | With Paine Webber, Inc. dated 10/31/05, 3.95%,
principal and interest in the amount of $30,003,292,
due 11/01/05, (collateralized by FG G01810 with a
par value of $30,361,022, coupon rate of 5.50%,
due 05/01/35, market value of $30,606,946) | | | 30,000,000 | | |
| | | TOTAL REPURCHASE AGREEMENTS
(Cost $320,315,084) | | | 320,315,084 | | |
TOTAL INVESTMENTS
(Cost $648,136,991)2 | | | 101.8 | % | | $ | 648,136,991 | | |
| LIABILITIES IN EXCESS OF OTHER ASSETS | | | (1.8 | ) | | | (11,711,562 | ) | |
| NET ASSETS | | | 100.0 | % | | $ | 636,425,429 | | |
t Percentages indicated are based on net assets.
1 Rate represents annualized discount yield at date of purchase.
2 Aggregate cost for federal tax purposes was $648,136,991.
Abbreviation:
FG — Federal Home Loan Mortgage Corporation Gold
FH — Federal Home Loan Mortgage Corporation
FHR — Federal Home Loan Mortgage Corporation REMIC
FN — Federal National Mortgage Association
FNR — Federal National Mortgage Association REMIC
See Notes to Financial Statements.
50
THE GLENMEDE FUND, INC.
Government Cash Portfolio
AGENCY DIVERSIFICATION
On October 31, 2005, agency diversification of the Portfolio was as follows (Unaudited):
| | | % of
Net Assets | | Value | |
| AGENCIES: | |
| Federal National Mortgage Association | | | 25.2 | % | | $ | 160,435,828 | | |
| Federal Home Loan Mortgage Corporation | | | 14.1 | | | | 89,947,362 | | |
| Federal Home Loan Bank | | | 11.8 | | | | 74,959,243 | | |
| Federal Farm Credit Bank | | | 0.4 | | | | 2,479,474 | | |
| TOTAL | | | 51.5 | % | | $ | 327,821,907 | | |
| REPURCHASE AGREEMENTS | | | 50.3 | | | | 320,315,084 | | |
| TOTAL INVESTMENTS | | | 101.8 | % | | $ | 648,136,991 | | |
See Notes to Financial Statements.
51
THE GLENMEDE FUND, INC.
Tax-Exempt Cash Portfolio
SCHEDULE OF PORTFOLIO INVESTMENTS
October 31, 2005
Face
Amount | | | | Value | |
| VARIABLE/FLOATING RATE NOTESt1 — 97.5% | | | |
| | | Daily Variable/Floating Rate Notes — 58.0% | |
| $ | 5,090,000 | | | California State, Economic Recovery, Series C-2, (SPA: Bank
of America),
2.65% due 7/1/23 | | $ | 5,090,000 | | |
| | 7,290,000 | | | California State, School Improvements, Series A, Refunding,
(LOC: 75% Citibank, 25% California State Teachers Retirement),
2.69% due 5/1/34 | | | 7,290,000 | | |
| | 6,500,000 | | | California State, Series A, (LOC: Westdeutsche Landesbank 80% &
J.P. Morgan Chase 20%),
2.65% due 5/1/33 | | | 6,500,000 | | |
| | 6,300,000 | | | Clark County, Nevada, School District Revenue, Series B,
(SPA: Bayerische Landesbank), (FSA Insured),
2.73% due 6/15/21 | | | 6,300,000 | | |
| | 4,100,000 | | | Connecticut State Health & Educational Facilities Authority,
(LOC: KBC Bank NV), (Edgehill Project),
2.69% due 7/1/27 | | | 4,100,000 | | |
| | 2,100,000 | | | Connecticut State Health & Educational Facilities Authority,
Revenue, Yale University, Series T-1,
2.70% due 7/1/29 | | | 2,100,000 | | |
| | 6,220,000 | | | Cuyahoga County, Ohio, Hospital Revenue, University
Hospital of Cleveland, (LOC: J.P. Morgan Chase),
2.73% due 1/1/16 | | | 6,220,000 | | |
| | 16,830,000 | | | Delaware County, Pennsylvania, Industrial Development
Authority, Airport Facilities Revenue, United Parcel
Service Project, DATES,
2.69% due 12/1/15 | | | 16,830,000 | | |
| | 6,300,000 | | | East Baton Rouge Parish, Louisiana, Pollution Control
Revenue, Revenue Refunding, Exxon Project,
2.62% due 11/1/19 | | | 6,300,000 | | |
| | 2,600,000 | | | Hapeville, Georgia, Development Authority, Industrial
Development Revenue, Hapeville Hotel Ltd.,
(LOC: Bank of America),
2.65% due 11/1/15 | | | 2,600,000 | | |
| | 4,200,000 | | | Harris County, Texas, Industrial Development Corp.,
(Exxon Mobil Corp.),
2.73% due 3/1/24 | | | 4,200,000 | | |
| | 6,385,000 | | | Idaho Health Facilities Authority, Revenue, St. Luke's Medical
Center Project, (SPA: Bayerische Landesbank),
(FSA Insured),
2.73% due 7/1/30 | | | 6,385,000 | | |
See Notes to Financial Statements.
52
THE GLENMEDE FUND, INC.
Tax-Exempt Cash Portfolio
SCHEDULE OF PORTFOLIO INVESTMENTS — (Continued)
October 31, 2005
Face
Amount | | | | Value | |
| VARIABLE/FLOATING RATE NOTESt1 — (Continued) | | | |
| | | Daily Variable/Floating Rate Notes — (Continued) | |
| $ | 8,940,000 | | | Idaho Health Facilities Authority, Revenue, St. Luke's Medical
Center Project, (SPA: Harris Trust & Savings Bank),
(FSA Insured),
2.73% due 7/1/35 | | $ | 8,940,000 | | |
| | 8,800,000 | | | Indiana State Health Facility Financing Authority, Clarian
Health Obligations Group, Series, (LOC: J.P. Morgan Chase),
2.80% due 3/1/30 | | | 8,800,000 | | |
| | 9,700,000 | | | Irvine Ranch, California, Water District Revenue, Certificates
of Participation, (LOC: Landesbank Baden-Wurttemberg),
2.65% due 8/1/16 | | | 9,700,000 | | |
| | 1,000,000 | | | Irvine Ranch, California, Water District Revenue, Series A,
(LOC: State Street Bank),
2.65% due 1/1/21 | | | 1,000,000 | | |
| | 3,405,000 | | | Irvine Ranch, California, Water District, General Obligation,
(LOC: Landesbank Baden-Wurttemberg),
2.65% due 6/1/15 | | | 3,405,000 | | |
| | 1,450,000 | | | Irvine Ranch, California, Water District, General Obligation,
Series A, Refunding, (LOC: Bank of America),
2.65% due 5/1/09 | | | 1,450,000 | | |
| | 8,813,000 | | | Irvine, California, Improvement Board, Limited Obligation,
Special Assessment, Assessment District 93-14
(LOC: Bank of America),
2.65% due 9/2/25 | | | 8,813,000 | | |
| | 100,000 | | | Irvine, California, Special Assessment, Assessment
District 00-18, Series A, (LOC: Bank of New York),
2.66% due 9/2/26 | | | 100,000 | | |
| | 1,000,000 | | | Jackson County, Mississippi, Port Facilities Revenue,
Chevron USA Project, Refunding,
2.71% due 6/1/23 | | | 1,000,000 | | |
| | 4,000,000 | | | Jacksonville, Florida, Pollution Control Revenue, Refunding,
Florida Power & Light Co.,
2.73% due 5/1/29 | | | 4,000,000 | | |
| | | | | Kansas State Department of Transportation, Highway
Liquidity Provider Revenue, Series B-1, Pooled Money
Investment Board: | | | | | |
| | 6,800,000 | | | 2.73% due 9/1/20 | | | 6,800,000 | | |
| | 8,900,000 | | | 2.73% due 9/1/20 | | | 8,900,000 | | |
| | 3,000,000 | | | Kemmerer, Wyoming, Pollution Control Revenue,
DATES, Exxon Corp. Project,
2.73% due 11/1/14 | | | 3,000,000 | | |
See Notes to Financial Statements.
53
THE GLENMEDE FUND, INC.
Tax-Exempt Cash Portfolio
SCHEDULE OF PORTFOLIO INVESTMENTS — (Continued)
October 31, 2005
Face
Amount | | | | Value | |
| VARIABLE/FLOATING RATE NOTESt1 — (Continued) | | | |
| | | Daily Variable/Floating Rate Notes — (Continued) | |
| $ | 1,600,000 | | | Lawrence County, South Dakota, Pollution Control Revenue,
Daily Refunding, Homestake Mining, Series B,
(LOC: J.P. Morgan Chase),
2.68% due 7/1/32 | | $ | 1,600,000 | | |
| | 1,830,000 | | | Lehigh County, Pennsylvania, General Purpose Authority,
Lehigh Valley Hospital, Series B, (MBIA Insured),
(SPA: Wachovia Bank),
2.73% due 7/1/29 | | | 1,830,000 | | |
| | 3,300,000 | | | Lincoln County, Wyoming, Pollution Control Revenue,
Exxon Corp. Project - A,
2.73% due 11/1/14 | | | 3,300,000 | | |
| | 3,375,000 | | | Lincoln County, Wyoming, Pollution Control Revenue,
Exxon Corp. Project - C,
2.73% due 11/1/14 | | | 3,375,000 | | |
| | 13,385,000 | | | Los Angeles, California, Regional Airports Improvement Corp.,
Lease Revenue, Sublease - Los Angeles International
Airport, LAX Two Corp., (LOC: Societe Generale),
2.73% due 12/1/25 | | | 13,385,000 | | |
| | 15,100,000 | | | Loudoun County, Virginia, Industrial Development Authority
Revenue, Howard Hughes Medical Institute, Series E,
2.65% due 2/15/38 | | | 15,100,000 | | |
| | 11,850,000 | | | Louisiana State, Public Facilities Authority, Industrial
Development, Kenner Hotel Ltd., (LOC: BankAmerica, NA),
2.65% due 12/1/15 | | | 11,850,000 | | |
| | 2,300,000 | | | Massachusetts State, Central Artery, Series A,
(SPA: Landesbank Baden-Wurtttemberg),
2.72% due 12/1/30 | | | 2,300,000 | | |
| | 4,100,000 | | | Metropolitan Water District, Southern California Waterworks
Revenue, Series B-3, (SPA: Westdeutsche Landesbank),
2.65% due 7/1/35 | | | 4,100,000 | | |
| | 500,000 | | | Mount Vernon, Indiana, Pollution Control and Solid Waste
Disposal Revenue, General Electric Project,
2.65% due 12/1/14 | | | 500,000 | | |
| | 15,995,000 | | | New Jersey Economic Development Authority, Stolthaven
Project, Series A, (LOC: Citibank NA),
2.61% due 1/15/18 | | | 15,995,000 | | |
| | 13,740,000 | | | New Jersey, State Educational Facilities Authority Revenue,
Princeton University, Series F,
2.57% due 7/1/23 | | | 13,740,000 | | |
See Notes to Financial Statements.
54
THE GLENMEDE FUND, INC.
Tax-Exempt Cash Portfolio
SCHEDULE OF PORTFOLIO INVESTMENTS — (Continued)
October 31, 2005
Face
Amount | | | | Value | |
| VARIABLE/FLOATING RATE NOTESt1 — (Continued) | | | |
| | | Daily Variable/Floating Rate Notes — (Continued) | |
| $ | 900,000 | | | New York City, New York, General Obligations, Subseries A-10
(LOC: J.P. Morgan Chase),
2.75% due 8/15/19 | | $ | 900,000 | | |
| | | | | New York City, New York, General Obligations, Subseries A-10,
(LOC: J.P. Morgan Chase): | | | | | |
| | 1,500,000 | | | 2.75% due 8/1/16 | | | 1,500,000 | | |
| | 1,500,000 | | | 2.75% due 8/1/17 | | | 1,500,000 | | |
| | 840,000 | | | 2.75% due 8/15/18 | | | 840,000 | | |
| | 9,300,000 | | | New York City, New York, General Obligations, Subseries A-7,
(LOC: J.P. Morgan Chase),
2.73% due 11/1/24 | | | 9,300,000 | | |
| | | | | New York City, New York, General Obligations, Subseries B-2,
(LOC: J.P. Morgan Chase): | | | | | |
| | 265,000 | | | 2.75% due 8/15/20 | | | 265,000 | | |
| | 1,410,000 | | | 2.75% due 8/1/21 | | | 1,410,000 | | |
| | 1,000,000 | | | New York City, New York, General Obligations, Subseries B-4,
(LOC: J.P. Morgan Chase),
2.65% due 8/15/23 | | | 1,000,000 | | |
| | 4,810,000 | | | New York City, New York, Municipal Water Finance Authority,
Water & Sewer System Revenue, Series C, (SPA: Credit
Local de France),
2.75% due 6/15/33 | | | 4,810,000 | | |
| | 6,925,000 | | | New York City, New York, Municipal Water Finance Authority,
Water & Sewer System Revenue, Series F, Subseries F-2,
(SPA: Bayerische Landesbank),
2.75% due 6/15/35 | | | 6,925,000 | | |
| | | | | New York, NY, City Municipal Water Finance Authority,
(SPA: J.P. Morgan Chase), (FGIC Insured): | | | | | |
| | 4,740,000 | | | 2.65% due 6/15/22 | | | 4,740,000 | | |
| | 500,000 | | | 2.65% due 6/15/23 | | | 500,000 | | |
| | 4,770,000 | | | Newport Beach, California, Hoag Memorial Presbyterian
Hospital Revenue, (SPA: BankAmerica),
2.70% due 10/1/22 | | | 4,770,000 | | |
| | 200,000 | | | North Carolina Medical Care Commission, Hospital Revenue,
ACES, Pooled Financing Projects, Series B,
(LOC: Wachovia Bank),
2.68% due 10/1/13 | | | 200,000 | | |
| | | | | North Central, Texas, Health Facility Development Corp.,
(Presbyterian Medical Center), (SPA: J.P. Morgan Chase),
(MBIA Insured): | | | | | |
| | 1,700,000 | | | 2.73% due 12/1/15 | | | 1,700,000 | | |
| | 275,000 | | | 2.73% due 12/1/15 | | | 275,000 | | |
See Notes to Financial Statements.
55
THE GLENMEDE FUND, INC.
Tax-Exempt Cash Portfolio
SCHEDULE OF PORTFOLIO INVESTMENTS — (Continued)
October 31, 2005
Face
Amount | | | | Value | |
| VARIABLE/FLOATING RATE NOTESt1 — (Continued) | | | |
| | | Daily Variable/Floating Rate Notes — (Continued) | |
| $ | 1,800,000 | | | Orange County, California, Sanitation District Partnership,
Series B, Refunding, (SPA: Credit Locale de France),
2.66% due 8/1/30 | | $ | 1,800,000 | | |
| | 9,500,000 | | | Peninsula Ports Authority, Virginia, Revenue Refunding,
Dominion Terminal Associates, Term PJ-C,
(LOC: Citibank NA),
2.73% due 7/1/16 | | | 9,500,000 | | |
| | 2,135,000 | | | Sublette County, Wyoming, Pollution Control Revenue,
Exxon Corp. Project,
2.62% due 11/1/14 | | | 2,135,000 | | |
| | 5,700,000 | | | Uinta County, Wyoming, Pollution Control Revenue,
Chevron USA Project, Refunding,
2.72% due 8/15/20 | | | 5,700,000 | | |
| | 4,700,000 | | | Union County, New Jersey, Pollution Control Financing
Authority, Revenue Refunding, Exxon Corp. Project,
2.52% due 10/1/24 | | | 4,700,000 | | |
| | 13,130,000 | | | University of North Carolina at Chapel Hill, Hospital Revenue,
UPDATES, Series A, (SPA: Landesbank Hessen-Thuer),
2.73% due 2/15/31 | | | 13,130,000 | | |
| | 6,600,000 | | | Valdez, Alaska, Marine Ternminal Revenue, ExxonMobil
Pipeline Co, Project,
2.73% due 12/1/29 | | | 6,600,000 | | |
| | 9,100,000 | | | Washington State Health Care Facilities, (Virginia Mason
Medical Center), (SPA: Credit Suisse First Boston),
(MBIA Insured),
2.73% due 2/15/27 | | | 9,100,000 | | |
| | | | | Total Daily Variable/Floating Rate Notes
(Cost $320,198,000) | | | 320,198,000 | | |
| | | Weekly Variable/Floating Rate Notes — 39.5% | |
| | 3,200,000 | | | Alabama State Special Care Facilities Financing Authority,
Montgomery Hospital Revenue, (SPA: FGIC),
2.63% due 4/1/15 | | | 3,200,000 | | |
| | 5,605,000 | | | Bexar County, Texas, Housing Finance Corp., Multi Family
Housing Revenue, Aamha LLC Project,
(Credit Support: FNMA),
2.70% due 12/15/25 | | | 5,605,000 | | |
| | 7,365,000 | | | Burke County, Georgia, Development Authority, Pollution
Control Revenue, Oglethorpe Power Corp., Series A,
(SPA: Credit Local de France), (FGIC Insured),
2.70% due 1/1/19 | | | 7,365,000 | | |
See Notes to Financial Statements.
56
THE GLENMEDE FUND, INC.
Tax-Exempt Cash Portfolio
SCHEDULE OF PORTFOLIO INVESTMENTS — (Continued)
October 31, 2005
Face
Amount | | | | Value | |
| VARIABLE/FLOATING RATE NOTESt1 — (Continued) | | | �� |
| | | Weekly Variable/Floating Rate Notes — (Continued) | |
| $ | 3,120,000 | | | Charlotte, North Carolina, Airport Revenue Refunding,
Series A, (SPA: J.P. Morgan Chase), (MBIA Insured),
2.68% due 7/1/16 | | $ | 3,120,000 | | |
| | 2,955,000 | | | Chicago, Illinois, O'Hare International Airport Revenue,
General Airport 2nd Lien, Series B, (LOC: Societe Generale),
2.63% due 1/1/15 | | | 2,955,000 | | |
| | | | | Clayton County, Georgia, Housing Authority, Multi Family
Housing Revenue Refunding, Huntington Woods Apartment
Project, Series A, (SPA: Societe Generale), (FSA Insured): | | | | | |
| | 1,355,000 | | | 2.69% due 1/1/21 | | | 1,355,000 | | |
| | 1,000,000 | | | 2.69% due 1/1/21 | | | 1,000,000 | | |
| | 1,100,000 | | | 2.69% due 1/1/21 | | | 1,100,000 | | |
| | 2,335,000 | | | 2.69% due 1/1/21 | | | 2,335,000 | | |
| | 1,400,000 | | | Colton, California, Redevelopment Agency, Multi Family
Revenue, Series A, (LOC: Coast Federal Bank & Federal
Home Loan Bank),
2.53% due 5/1/10 | | | 1,400,000 | | |
| | 10,100,000 | | | Connecticut State Health & Educational Facilities Authority,
(Yale University),
2.60% due 7/1/29 | | | 10,100,000 | | |
| | 8,300,000 | | | Connecticut State, General Obligations, Series B,
(SPA: Bayerische Landesbank),
2.67% due 5/15/14 | | | 8,300,000 | | |
| | 1,600,000 | | | Dauphin County, Pennsylvania, General Authority, School
District Pooled Financing Program II, (SPA: Bank of
Nova Scotia), (AMBAC Insured),
2.73% due 9/1/32 | | | 1,600,000 | | |
| | 1,000,000 | | | Delaware River & Bay Authority, Revenue, Series B,
(SPA: Credit Locale de France), (AMBAC Insured),
2.66% due 1/1/30 | | | 1,000,000 | | |
| | 1,900,000 | | | Durham, North Carolina, Public Improvement,
(SPA: Wachovia Bank),
2.71% due 2/1/13 | | | 1,900,000 | | |
| | 6,900,000 | | | Emmaus, Pennsylvania, General Authority Revenue,
(SPA: Wachovia Bank), (FSA Insured),
2.70% due 12/1/28 | | | 6,900,000 | | |
| | | | | Fairfax County, Virginia, Industrial Development Authority
Revenue, Fairfax Hospital, Series A: | | | | | |
| | 3,000,000 | | | 2.63% due 10/1/25 | | | 3,000,000 | | |
| | 600,000 | | | 2.64% due 10/1/25 | | | 600,000 | | |
| | 4,300,000 | | | Florida State Housing Finance Agency, Multi Family
Housing Revenue, Series A, (LOC: FHLMC),
2.58% due 2/1/08 | | | 4,300,000 | | |
See Notes to Financial Statements.
57
THE GLENMEDE FUND, INC.
Tax-Exempt Cash Portfolio
SCHEDULE OF PORTFOLIO INVESTMENTS — (Continued)
October 31, 2005
Face
Amount | | | | Value | |
| VARIABLE/FLOATING RATE NOTESt1 — (Continued) | | | |
| | | Weekly Variable/Floating Rate Notes — (Continued) | |
| $ | 2,400,000 | | | Hamilton County, Ohio, Hospital Facilities Revenue,
Health Alliance of Greater Cincinnati, Series E,
(SPA: Credit Suisse First Boston), (MBIA Insured),
2.60% due 1/1/18 | | $ | 2,400,000 | | |
| | 2,400,000 | | | Illinois Health Facilities Authority, Revenue, Decatur
Memorial Hospital Project, Series A, (SPA: Northern
Trust Company), (MBIA Insured),
2.70% due 11/15/24 | | | 2,400,000 | | |
| | 16,700,000 | | | Illinois State Housing Development Authority, Housing
Revenue, Illinois Center Apartments, GTY
AGMT-Metropolitan Life, (FHLMC Insured),
2.63% due 1/1/08 | | | 16,700,000 | | |
| | 2,100,000 | | | Iowa Higher Education Loan, (SPA: J.P. Morgan Chase),
(MBIA Insured),
2.73% due 12/1/15 | | | 2,100,000 | | |
| | 1,355,000 | | | Kentucky State, Area Development Districts Revenue,
Ewing Project, (LOC: Wachovia Bank),
2.80% due 6/1/33 | | | 1,355,000 | | |
| | 666,000 | | | Kern Water Bank Authority Revenue, Series A,
(LOC: Wells Fargo Bank),
2.66% due 7/1/28 | | | 666,000 | | |
| | 8,000,000 | | | Lisle County, Illinois, Multi Family Housing Revenue
Refunding, Four Lakes Projects Phase V, (FNMA Insured),
2.70% due 9/15/26 | | | 8,000,000 | | |
| | 7,500,000 | | | Long Island, New York Electric System Revenue, Power
Authority, Series 7, Subseries 7-A, (SPA: Credit Suisse
First Boston), (MBIA Insured),
2.61% due 4/1/25 | | | 7,500,000 | | |
| | 1,100,000 | | | Los Angeles County, California, Pension Obligation, Refunding,
Series C, (SPA: Bank of Nova Scotia), (AMBAC Insured),
2.64% due 6/30/07 | | | 1,100,000 | | |
| | 114,936 | | | Los Angeles, California, Multi Family Housing Revenue,
Series K, (LOC: FHLB),
2.68% due 7/1/10 | | | 114,936 | | |
| | 2,190,000 | | | Louisiana State, Public Facilities Authority, Revenue,
College & University Equipment & Capital, Series A,
(SPA: Societe Generale), (FGIC Insured),
2.78% due 9/1/10 | | | 2,190,000 | | |
| | 10,700,000 | | | Massachusetts State Health & Educational Facilities
Authority Revenue, Amherst College Project, Series F,
2.60% due 11/1/26 | | | 10,700,000 | | |
See Notes to Financial Statements.
58
THE GLENMEDE FUND, INC.
Tax-Exempt Cash Portfolio
SCHEDULE OF PORTFOLIO INVESTMENTS — (Continued)
October 31, 2005
Face
Amount | | | | Value | |
| VARIABLE/FLOATING RATE NOTESt1 — (Continued) | | | |
| | | Weekly Variable/Floating Rate Notes — (Continued) | |
| $ | 5,000,000 | | | Massachusetts State Health & Educational Facilities
Authority Revenue, Boston University Project, Series H,
(SPA: State Street Bank & Trust Co.),
2.63% due 12/1/15 | | $ | 5,000,000 | | |
| | 700,000 | | | Massachusetts State Housing Finance Agency, Revenue
Refunding, Multi Family Housing Project, Series A,
(FNMA Collateral Agreement),
2.68% due 1/15/10 | | | 700,000 | | |
| | 9,100,000 | | | Massachusetts State Water Resources Authority, General
Obligations, Series B, (LOC: Landesbank Hessen-Thuer),
2.63% due 8/1/28 | | | 9,100,000 | | |
| | 5,400,000 | | | Mecklenburg County, North Carolina, Series C,
(LOC: Wachovia Bank),
2.68% due 2/1/18 | | | 5,400,000 | | |
| | 5,000,000 | | | Moffat County, CO, Pollution Control, (Natural Rural Utility
Cooperative), (SPA: J.P. Morgan Chase), (AMBAC Insured),
2.83% due 7/1/10 | | | 5,000,000 | | |
| | 9,900,000 | | | New Jersey State Turnpike Authority Revenue, Series D,
(LOC: Societe Generale), (FGIC Insured),
2.66% due 1/1/18 | | | 9,900,000 | | |
| | 1,850,000 | | | New York City, New York, Transitional Finance Authority
Revenue, Recovery, Series 3, Subseries 3-C,
(SPA: Credit Local de France),
2.66% due 11/1/22 | | | 1,850,000 | | |
| | 8,200,000 | | | New York City, New York, Transitional Finance Authority
Revenue, Recovery, Series 3, Subseries 3-D,
(SPA: Credit Local de France),
2.66% due 11/1/22 | | | 8,200,000 | | |
| | 10,600,000 | | | New York State Local Government Assistance Corp., Series B,
(LOC: Westdeutsche Landesbank 50% & Bayerische
Landesbank 50%),
2.59% due 4/1/23 | | | 10,600,000 | | |
| | 7,600,000 | | | New York, NY, City Transitional Finance Authority Revenue,
Future Tax Secured, Series A-1, (SPA: Commerzbank),
2.75% due 11/15/28 | | | 7,600,000 | | |
| | | | | Ohio State, University General Receipts, Series B: | | | | | |
| | 300,000 | | | 2.66% due 12/1/07 | | | 300,000 | | |
| | 10,350,000 | | | 2.58% due 12/1/19 | | | 10,350,000 | | |
| | 3,800,000 | | | 2.58% due 12/1/29 | | | 3,800,000 | | |
See Notes to Financial Statements.
59
THE GLENMEDE FUND, INC.
Tax-Exempt Cash Portfolio
SCHEDULE OF PORTFOLIO INVESTMENTS — (Continued)
October 31, 2005
Face
Amount | | | | Value | |
| VARIABLE/FLOATING RATE NOTESt1 — (Continued) | | | |
| | | Weekly Variable/Floating Rate Notes — (Continued) | |
| $ | 1,839,000 | | | Roseville, Minnesota, Commercial Development Revenue,
Berger Transfer & Storage Project, Series F,
(LOC: Wells Fargo Bank),
2.65% due 12/1/15 | | $ | 1,839,000 | | |
| | 4,200,000 | | | Tulsa, Oklahoma, Industrial Authority Revenue Refunding,
University of Tulsa, Series B, (SPA: Credit Local de France),
(MBIA Insured),
2.78% due 10/1/26 | | | 4,200,000 | | |
| | 11,500,000 | | | Washington State, (SPA: Landesbank Hessen-Thuer),
2.60% due 6/1/20 | | | 11,500,000 | | |
| | | | | Total Weekly Variable/Floating Rate Notes
(Cost $217,699,936) | | | 217,699,936 | | |
| | | | | TOTAL VARIABLE/FLOATING RATE NOTES
(Cost $537,897,936) | | | 537,897,936 | | |
| FIXED RATE NOTES — 2.4% | | | |
| | 5,000,000 | | | Newton, MA Bond Anticipation Notes:
3.75% due 3/15/06 | | | 5,016,371 | | |
| | 8,500,000 | | | Philadelphia, Pennsylvannia, Tax & Revenue Anticipation Notes:
4.00% due 6/30/06 | | | 8,567,216 | | |
| | | | | TOTAL FIXED RATE NOTES
(Cost $13,583,587) | | | 13,583,587 | | |
TOTAL INVESTMENTS
(Cost $551,481,523)2 | | | 99.9 | % | | $ | 551,481,523 | | |
| OTHER ASSETS IN EXCESS OF LIABILITIES | | | 0.1 | | | | 282,319 | | |
| NET ASSETS | | | 100.0 | % | | $ | 551,763,842 | | |
t Percentages indicated are based on net assets.
1 Demand Security; payable upon demand by the Fund with usually no more than thirty (30) calendar day's notice. The coupon rate shown on floating or adjustable rate securities represents the rate at period end. The due dates on these types of securities reflect the next interest rate reset date or, when applicable, the final maturity date.
2 Aggregate cost for federal tax purposes was $551,481,523.
See Notes to Financial Statements.
60
THE GLENMEDE FUND, INC.
Tax-Exempt Cash Portfolio
SCHEDULE OF PORTFOLIO INVESTMENTS — (Concluded)
October 31, 2005
Abbreviations:
ACES — Adjustable Convertible Extendable Securities
AMBAC — American Municipal Bond Assurance Corporation
DATES — Daily Adjustable Tax-Exempt Securities
FGIC — Financial Guaranty Insurance Corporation
FHLB — Federal Home Loan Bank
FHLMC — Federal Home Loan Mortgage Corporation
FNMA — Federal National Mortgage Association
FSA — Financial Security Assurance
LOC — Letter of Credit
MBIA — Municipal Bond Investors Assurance
SPA — Stand-By Purchase Agreement
UPDATES — Unit Price Demand Adjustable Tax-Exempt Securities
See Notes to Financial Statements.
61
THE GLENMEDE FUND, INC.
Tax-Exempt Cash Portfolio
COUPON TYPE
On October 31, 2005, coupon type of the Portfolio was as follows (Unaudited):
| | | % of
Net Assets | |
Value | |
| COUPON TYPE: | |
| Variable/Floating Rate Notes | | | 97.5 | % | | $ | 537,897,936 | | |
| Fixed Rate Notes | | | 2.4 | | | | 13,583,587 | | |
| TOTAL INVESTMENTS | | | 99.9 | % | | $ | 551,481,523 | | |
See Notes to Financial Statements.
62
THE GLENMEDE FUND, INC.
Core Fixed Income Portfolio
SCHEDULE OF PORTFOLIO INVESTMENTS
October 31, 2005
Face
Amount | | | | Value | |
| AGENCY NOTESt — 18.3% | | | |
| | | Federal Home Loan Bank — 7.5% | |
| $ | 10,000,000 | | | 3.625% due 1/15/08 | | $ | 9,786,480 | | |
| | 5,000,000 | | | 3.875% due 8/22/08 | | | 4,893,670 | | |
| | | | 14,680,150 | | |
| | | Federal Home Loan Mortgage Corporation — 10.8% | |
| | 5,000,000 | | | 3.75% due 4/15/07 | | | 4,941,490 | | |
| | 2,000,000 | | | 4.00% due 12/15/09 | | | 1,945,272 | | |
| | 2,000,000 | | | 6.875% due 9/15/10 | | | 2,179,840 | | |
| | 6,000,000 | | | 4.50% due 1/15/14 | | | 5,838,882 | | |
| | 6,000,000 | | | 5.00% due 7/15/141 | | | 6,026,814 | | |
| | | | 20,932,298 | | |
| | | | | TOTAL AGENCY NOTES
(Cost $36,275,126) | | | 35,612,448 | | |
| MORTGAGE-BACKED SECURITIES2 — 28.7% | | | |
| | | Federal Home Loan Mortgage Corporation — 3.5% | |
| | 7,041 | | | # 555359, 6.50% due 4/1/08 | | | 7,123 | | |
| | 2,308,448 | | | # C00742, 6.50% due 4/1/29 | | | 2,374,631 | | |
| | 133,159 | | | # D78677, 8.00% due 3/1/27 | | | 142,144 | | |
| | 131,038 | | | # D84894, 8.00% due 12/1/27 | | | 139,883 | | |
| | 27,068 | | | # G00807, 9.50% due 3/1/21 | | | 28,778 | | |
| | 98,326 | | | # G10753, 6.50% due 9/1/09 | | | 99,944 | | |
| | 4,050,000 | | | TBA, 5.00% due 11/1/203 | | | 3,994,313 | | |
| | | | 6,786,816 | | |
| | | Federal National Mortgage Association — 24.4% | |
| | 15,376 | | | # 125275, 7.00% due 3/1/24 | | | 16,124 | | |
| | 63,242 | | | # 252806, 7.50% due 10/1/29 | | | 66,828 | | |
| | 2,257,349 | | | # 254685, 5.00% due 4/1/18 | | | 2,228,354 | | |
| | 592,938 | | | # 255159, 5.50% due 3/1/19 | | | 597,118 | | |
| | 101,075 | | | # 313795, 9.50% due 1/1/25 | | | 112,427 | | |
| | 29,985 | | | # 313796, 9.50% due 2/1/21 | | | 32,794 | | |
| | 126,221 | | | # 313815, 6.50% due 1/1/11 | | | 129,139 | | |
| | 392,759 | | | # 373328, 8.00% due 3/1/27 | | | 420,021 | | |
| | 301,731 | | | # 390895, 8.00% due 6/1/27 | | | 322,675 | | |
| | 131,639 | | | # 395715, 8.00% due 8/1/27 | | | 140,776 | | |
| | 764,761 | | | # 397602, 8.00% due 8/1/27 | | | 817,845 | | |
| | 33,663 | | | # 405845, 8.00% due 11/1/27 | | | 35,999 | | |
| | 142,224 | | | # 481401, 6.50% due 12/1/28 | | | 146,536 | | |
| | 18,211 | | | # 499335, 6.50% due 8/1/29 | | | 18,757 | | |
| | 5,899 | | | # 523497, 7.50% due 11/1/29 | | | 6,234 | | |
See Notes to Financial Statements.
63
THE GLENMEDE FUND, INC.
Core Fixed Income Portfolio
SCHEDULE OF PORTFOLIO INVESTMENTS — (Continued)
October 31, 2005
Face
Amount | | | | Value | |
| MORTGAGE-BACKED SECURITIES2 — (Continued) | | | |
| | | Federal National Mortgage Association — (Continued) | |
| $ | 157,664 | | | # 535729, 6.50% due 2/1/16 | | $ | 162,880 | | |
| | 168,382 | | | # 535962, 6.50% due 5/1/16 | | | 173,894 | | |
| | 282,071 | | | # 555016, 6.50% due 10/1/17 | | | 291,305 | | |
| | 24,555 | | | # 588945, 7.00% due 6/1/31 | | | 25,687 | | |
| | 100,189 | | | # 595134, 6.50% due 7/1/16 | | | 103,468 | | |
| | 479,132 | | | # 596498, 6.00% due 7/1/16 | | | 490,264 | | |
| | 545,909 | | | # 607862, 7.00% due 9/1/31 | | | 571,089 | | |
| | 75,299 | | | # 608777, 6.50% due 10/1/16 | | | 77,764 | | |
| | 236,068 | | | # 624571, 7.00% due 3/1/32 | | | 246,883 | | |
| | 882,279 | | | # 625990, 5.50% due 12/1/16 | | | 888,888 | | |
| | 162,955 | | | # 643340, 6.50% due 3/1/17 | | | 168,302 | | |
| | 85,181 | | | # 656872, 6.50% due 8/1/32 | | | 87,558 | | |
| | 2,010,265 | | | # 686230, 5.50% due 2/1/18 | | | 2,024,438 | | |
| | 144,320 | | | # 687575, 7.00% due 2/1/33 | | | 150,884 | | |
| | 2,121,751 | | | # 740449, 5.50% due 9/1/18 | | | 2,136,710 | | |
| | 1,687,819 | | | # 768557, 5.50% due 2/1/19 | | | 1,699,719 | | |
| | 5,943,415 | | | # 789856, 6.00% due 8/1/34 | | | 5,995,905 | | |
| | 1,735,435 | | | # 820811, 6.00% due 4/1/35 | | | 1,750,813 | | |
| | 15,070,000 | | | TBA, 5.50% due 11/1/203 | | | 15,168,889 | | |
| | 3,220,000 | | | TBA, 6.00% due 11/1/203 | | | 3,292,450 | | |
| | 2,000,000 | | | TBA, 6.50% due 11/1/353 | | | 2,052,500 | | |
| | 5,000,000 | | | TBA, 5.00% due 11/1/353 | | | 4,810,940 | | |
| | | | 47,462,857 | | |
| | | Government National Mortgage Association — 0.8% | |
| | 128,757 | | | # 460389, 7.00% due 5/15/28 | | | 135,495 | | |
| | 57,737 | | | # 464049, 7.00% due 7/15/28 | | | 60,758 | | |
| | 62,677 | | | # 476259, 7.00% due 8/15/28 | | | 65,957 | | |
| | 93,860 | | | # 485264, 7.50% due 2/15/31 | | | 99,396 | | |
| | 28,680 | | | # 496632, 7.00% due 12/15/28 | | | 30,180 | | |
| | 13,372 | | | # 530571, 7.50% due 2/15/31 | | | 14,161 | | |
| | 218,428 | | | # 539971, 7.00% due 1/15/31 | | | 229,635 | | |
| | 23,324 | | | # 556417, 7.00% due 6/15/31 | | | 24,521 | | |
| | 22,252 | | | # 557379, 7.00% due 5/15/31 | | | 23,393 | | |
| | 120,581 | | | # 559304, 7.00% due 9/15/31 | | | 126,768 | | |
| | 137,236 | | | # 570289, 7.00% due 1/15/32 | | | 144,264 | | |
| | 37,256 | | | # 571365, 7.00% due 12/15/31 | | | 39,168 | | |
| | 630,142 | | | # 574687, 6.00% due 4/15/34 | | | 641,677 | | |
| | | | 1,635,373 | | |
| | | | | TOTAL MORTGAGE-BACKED SECURITIES
(Cost $56,312,775) | | | 55,885,046 | | |
See Notes to Financial Statements.
64
THE GLENMEDE FUND, INC.
Core Fixed Income Portfolio
SCHEDULE OF PORTFOLIO INVESTMENTS — (Continued)
October 31, 2005
Face
Amount | | | | Value | |
| COLLATERALIZED MORTGAGE OBLIGATIONS — 0.6% | | | |
| $ | 802,885 | | | Credit-Based Asset Servicing, 6.50% due 9/25/26 | | $ | 823,441 | | |
| | 722,087 | | | Federal National Mortgage Association
Series, 1993-135 (IO) 6.50% due 7/25/08 | | | 29,039 | | |
| | 387,720 | | | Washington Mutual Mortgage Securities Corp.,
Series 2003-MS9 - Class 1P (PO),
0.00% due 11/1/18 | | | 333,207 | | |
| | | | | TOTAL COLLATERALIZED MORTGAGE OBLIGATIONS
(Cost $1,144,653) | | | 1,185,687 | | |
| CORPORATE NOTES — 24.2% | | | |
| | 5,000,000 | | | American General Finance, 4.50% due 11/15/07 | | | 4,963,635 | | |
| | 5,000,000 | | | Citigroup, Inc., 7.25% due 10/1/10 | | | 5,474,740 | | |
| | 5,000,000 | | | General Electric Capital Corp., 5.875% due 2/15/12 | | | 5,222,715 | | |
| | 6,000,000 | | | Goldman Sachs Group, Inc. 5.125% due 1/15/151 | | | 5,851,974 | | |
| | 5,000,000 | | | IBM Corp., 4.75% due 11/29/12 | | | 4,936,890 | | |
| | 5,000,000 | | | JP Morgan Chase & Co., 3.50% due 3/15/09 | | | 4,777,535 | | |
| | 3,000,000 | | | Procter & Gamble Co. (The), 4.75% due 6/15/07 | | | 3,005,049 | | |
| | 4,000,000 | | | Procter & Gamble Co. (The), 4.85% due 12/15/15 | | | 3,933,152 | | |
| | 5,000,000 | | | Wal-Mart Stores, Inc., 4.55% due 5/1/13 | | | 4,847,145 | | |
| | 4,000,000 | | | Wells Fargo Bank, 6.45% due 2/1/11 | | | 4,255,024 | | |
| | | | | TOTAL CORPORATE NOTES
(Cost $47,123,790) | | | 47,267,859 | | |
| US TREASURY NOTES/BONDS — 24.7% | | | |
| | 8,553,360 | | | U.S. Inflation Index Treasury Bond (TIPS), 1.875% due 7/15/134 | | | 8,506,915 | | |
| | 10,900,000 | | | U.S. Treasury Bond, 6.125% due 8/15/294 | | | 12,919,901 | | |
| | 1,000,000 | | | U.S. Treasury Bond, 5.375% due 2/15/311 | | | 1,090,625 | | |
| | 6,000,000 | | | U.S. Treasury Note 3.125% due 1/31/071,4 | | | 5,907,888 | | |
| | 8,000,000 | | | U.S. Treasury Note 3.50% due 12/15/09 | | | 7,713,128 | | |
| | 1,000,000 | | | U.S. Treasury Note, 4.375% due 5/15/071 | | | 999,883 | | |
| | 9,000,000 | | | U.S. Treasury Note, 4.875% due 2/15/121,4 | | | 9,178,947 | | |
| | 2,000,000 | | | U.S. Treasury Note, 4.00% due 11/15/12 | | | 1,938,282 | | |
| | | | | TOTAL US TREASURY NOTES/BONDS
(Cost $47,122,952) | | | 48,255,569 | | |
| REPURCHASE AGREEMENTS — 17.8% | | | |
| | 80,470 | | | With Investors Bank & Trust Co., dated 10/31/05, 3.82%,
principal and interest in the amount of $80,479,
due 11/01/05, (collateralized by FNMA #303705 with a
par value of $80,991, coupon rate of
6.50%, due 07/01/14, market value of $84,493) | | | 80,470 | | |
See Notes to Financial Statements.
65
THE GLENMEDE FUND, INC.
Core Fixed Income Portfolio
SCHEDULE OF PORTFOLIO INVESTMENTS — (Continued)
October 31, 2005
Face
Amount | | | | Value | |
| REPURCHASE AGREEMENTS — (Continued) | | | |
| $ | 34,600,000 | | | With Merrill Lynch & Co., Inc., dated 10/31/05, 3.97%,
principal and interest in the amount of $34,603,816,
due 11/01/05, (collateralized by FN #735475 with a
par value of $34,957,253, coupon rate of 4.36%,
due 03/01/38, market value of $35,306,826) | | $ | 34,600,000 | | |
| | | | | TOTAL REPURCHASE AGREEMENTS
(Cost $34,680,470) | | | 34,680,470 | | |
| INVESTMENTS OF SECURITY LENDING COLLATERAL — 12.3% | | | |
| | 5,488,379 | | | American Beacon Funds, Money Market Fund | | | 5,488,379 | | |
| | 1,712,772 | | | Canadian Imperial Bank, Certificate of Deposit,
4.072%, due 11/4/05 | | | 1,712,772 | | |
| | 1,568,108 | | | Fortis Bank, Eurodollar Time Deposit,
3.85%, due 11/3/05 | | | 1,568,108 | | |
| | 1,724,919 | | | Goldman Sachs Group Inc., Promissory Note,
4.02%, due 12/28/05 | | | 1,724,919 | | |
| | 1,568,108 | | | Lexington Parker Capital Corp., Commercial Paper,
3.952%, due 11/16/05 | | | 1,568,108 | | |
| | 5,488,379 | | | Merrill Lynch & Co., Inc., Repurchase Agreement,
4.053%, due 11/1/05 | | | 5,488,379 | | |
| | 1,568,108 | | | Skandinaviska Enskilda Banken AB (SEB), Eurodollar Term,
3.95%, due 11/21/05 | | | 1,568,108 | | |
| | 3,286,969 | | | Svenska Handlesbanken, Eurodollar Overnight,
4.031%, due 11/1/05 | | | 3,286,969 | | |
| | 1,568,108 | | | Wells Fargo, Eurodollar Time Deposit,
4.01%, due 12/12/05 | | | 1,568,108 | | |
| | | | | TOTAL INVESTMENTS OF SECURITY LENDING COLLATERAL
(Cost $23,973,850) | | | 23,973,850 | | |
TOTAL INVESTMENTS
(Cost $246,633,616)5 | | | 126.6 | % | | $ | 246,860,929 | | |
| LIABILITIES IN EXCESS OF OTHER ASSETS | | | (26.6 | ) | | | (51,865,426 | ) | |
| NET ASSETS | | | 100.0 | % | | $ | 194,995,503 | | |
t Percentages indicated are based on net assets.
1 Securities or partial securities on loan. See Note 5.
2 Represents current face amount at October 31, 2005.
3 When-issued security.
4 All or a portion of security segregated as collateral for when-issued securities.
5 Aggregate cost for federal tax purposes was $246,633,616.
See Notes to Financial Statements.
66
THE GLENMEDE FUND, INC.
Core Fixed Income Portfolio
SCHEDULE OF PORTFOLIO INVESTMENTS — (Concluded)
October 31, 2005
Abbreviations:
FHLMC — Federal Home Loan Mortgage Corporation
FN — Federal National Mortgage Association
FNMA — Federal National Mortgage Association
IO — Interest Only
PO — Principal Only
TBA — To be announced
TIPS — Treasury Inflation Protected Security
See Notes to Financial Statements.
67
THE GLENMEDE FUND, INC.
Core Fixed Income Portfolio
SECTOR DIVERSIFICATION
On October 31, 2005, sector diversification of the Portfolio was as follows (Unaudited):
| | | % of
Net Assets | | Value | |
| SECTOR: | |
| US Treasury | | | 24.7 | % | | $ | 48,255,569 | | |
| Federal National Mortgage Association | | | 24.4 | | | | 47,462,857 | | |
| Corporate | | | 24.2 | | | | 47,267,859 | | |
| Federal Home Loan Mortgage Corporation | | | 14.3 | | | | 27,719,114 | | |
| Federal Home Loan Bank | | | 7.5 | | | | 14,680,150 | | |
| Government National Mortgage Association | | | 0.8 | | | | 1,635,373 | | |
| Collateralized Mortgage Obligations | | | 0.6 | | | | 1,185,687 | | |
| TOTAL | | | 96.5 | % | | $ | 188,206,609 | | |
| REPURCHASE AGREEMENTS | | | 17.8 | | | | 34,680,470 | | |
| INVESTMENTS OF SECURITY LENDING COLLATERAL | | | 12.3 | | | | 23,973,850 | | |
| TOTAL INVESTMENTS | | | 126.6 | % | | $ | 246,860,929 | | |
See Notes to Financial Statements.
68
THE GLENMEDE FUND, INC.
Strategic Equity Portfolio
SCHEDULE OF PORTFOLIO INVESTMENTS
October 31, 2005
| Shares | | | | Value | |
| COMMON STOCKSt— 99.7% | | | |
| | | Aerospace & Defense — 4.4% | |
| | 30,725 | | | Boeing Co. | | $ | 1,986,064 | | |
| | 30,290 | | | United Technologies Corp. | | | 1,553,271 | | |
| | | | 3,539,335 | | |
| | | Air Freight & Logistics — 0.5% | |
| | 5,400 | | | United Parcel Service, Inc. - Class B | | | 393,876 | | |
| | | Biotechnology — 1.4% | |
| | 15,000 | | | Amgen, Inc.1 | | | 1,136,400 | | |
| | | Building Products — 1.7% | |
| | 48,800 | | | Masco Corp. | | | 1,390,800 | | |
| | | Capital Markets — 6.6% | |
| | 15,575 | | | Goldman Sachs Capital, Inc. | | | 1,968,213 | | |
| | 10,675 | | | Lehman Brothers Holdings, Inc. | | | 1,277,477 | | |
| | 25,000 | | | Merrill Lynch & Co., Inc. | | | 1,618,500 | | |
| | 10,000 | | | Nuveen Investments, Inc. - Class A | | | 404,700 | | |
| | | | 5,268,890 | | |
| | | Commercial Banks — 1.4% | |
| | 42,500 | | | North Fork Bancorporation, Inc. | | | 1,076,950 | | |
| | | Communications Equipment — 1.0% | |
| | 45,875 | | | Cisco Systems, Inc.1 | | | 800,519 | | |
| | | Computers & Peripherals — 5.7% | |
| | 15,000 | | | Apple Computer, Inc.1 | | | 863,850 | | |
| | 107,800 | | | EMC Corp.1 | | | 1,504,888 | | |
| | 38,000 | | | Hewlett-Packard Co. | | | 1,065,520 | | |
| | 14,145 | | | International Business Machines Corp. | | | 1,158,193 | | |
| | | | 4,592,451 | | |
| | | Consumer Finance — 0.6% | |
| | 18,700 | | | MBNA Corp. | | | 478,159 | | |
| | | Diversified Financial Services — 2.3% | |
| | 39,505 | | | Citigroup, Inc. | | | 1,808,539 | | |
| | | Energy Equipment & Services — 3.6% | |
| | 41,400 | | | BJ Services Co.2 | | | 1,438,650 | | |
| | 23,325 | | | Weatherford International, Ltd.1 | | | 1,460,145 | | |
| | | | 2,898,795 | | |
| | | Food & Staples Retailing — 1.2% | |
| | 40,000 | | | CVS Corp. | | | 976,400 | | |
See Notes to Financial Statements.
69
THE GLENMEDE FUND, INC.
Strategic Equity Portfolio
SCHEDULE OF PORTFOLIO INVESTMENTS — (Continued)
October 31, 2005
| Shares | | | | Value | |
| COMMON STOCKSt — (Continued) | | | |
| | | Food Products — 3.3% | |
| | 20,050 | | | Hershey Co. (The) | | $ | 1,139,441 | | |
| | 34,400 | | | Kellogg Co. | | | 1,519,448 | | |
| | | | 2,658,889 | | |
| | | Health Care Equipment & Supplies — 3.6% | |
| | 33,975 | | | Medtronic, Inc.2 | | | 1,925,023 | | |
| | 20,400 | | | Varian Medical Systems, Inc.1,2 | | | 929,424 | | |
| | | | 2,854,447 | | |
| | | Health Care Providers & Services — 5.4% | |
| | 37,400 | | | Quest Diagnostics, Inc. | | | 1,746,954 | | |
| | 21,150 | | | UnitedHealth Group, Inc. | | | 1,224,373 | | |
| | 17,550 | | | WellPoint, Inc.1 | | | 1,310,634 | | |
| | | | 4,281,961 | | |
| | | Hotels Restaurants & Leisure — 2.5% | |
| | 39,525 | | | Yum! Brands, Inc. | | | 2,010,637 | | |
| | | Household Durables — 1.6% | |
| | 10,000 | | | Lennar Corp. - Class A | | | 555,800 | | |
| | 19,350 | | | Pulte Homes, Inc.2 | | | 731,236 | | |
| | | | 1,287,036 | | |
| | | Household Products — 7.1% | |
| | 52,550 | | | Church & Dwight, Inc.2 | | | 1,841,877 | | |
| | 34,000 | | | Colgate-Palmolive Co. | | | 1,800,640 | | |
| | 35,636 | | | Procter & Gamble Co. (The) | | | 1,995,260 | | |
| | | | 5,637,777 | | |
| | | Industrial Conglomerates — 3.3% | |
| | 19,775 | | | 3M Co. | | | 1,502,504 | | |
| | 33,325 | | | General Electric Co. | | | 1,130,051 | | |
| | | | 2,632,555 | | |
| | | Insurance — 5.0% | |
| | 16,250 | | | Everest Re Group, Ltd. | | | 1,616,063 | | |
| | 15,700 | | | Hartford Financial Services Group, Inc. | | | 1,252,075 | | |
| | 20,000 | | | MBIA, Inc.2 | | | 1,164,800 | | |
| | | | 4,032,938 | | |
| | | IT Services — 1.6% | |
| | 47,775 | | | Accenture, Ltd. - Class A | | | 1,256,960 | | |
See Notes to Financial Statements.
70
THE GLENMEDE FUND, INC.
Strategic Equity Portfolio
SCHEDULE OF PORTFOLIO INVESTMENTS — (Continued)
October 31, 2005
| Shares | | | | Value | |
| COMMON STOCKSt — (Continued) | | | |
| | | Machinery — 3.4% | |
| | 18,650 | | | Eaton Corp. | | $ | 1,097,180 | | |
| | 19,000 | | | Illinois Tool Works, Inc.2 | | | 1,610,440 | | |
| | | | 2,707,620 | | |
| | | Media — 1.5% | |
| | 50,125 | | | Disney (Walt) Co. | | | 1,221,546 | | |
| | | Oil Gas & Consumable Fuels — 6.1% | |
| | 43,200 | | | ConocoPhillips | | | 2,824,416 | | |
| | 36,695 | | | Exxon Mobil Corp. | | | 2,060,057 | | |
| | | | 4,884,473 | | |
| | | Pharmaceuticals — 6.1% | |
| | 34,700 | | | Abbott Laboratories | | | 1,493,835 | | |
| | 30,095 | | | Johnson & Johnson | | | 1,884,549 | | |
| | 33,000 | | | Wyeth | | | 1,470,480 | | |
| | | | 4,848,864 | | |
| | | Semiconductors & Semiconductor Equipment — 3.8% | |
| | 57,825 | | | Altera Corp.1,2 | | | 962,786 | | |
| | 43,900 | | | Intel Corp. | | | 1,031,650 | | |
| | 45,525 | | | National Semiconductor Corp. | | | 1,030,231 | | |
| | | | 3,024,667 | | |
| | | Software — 6.3% | |
| | 34,050 | | | Adobe Systems, Inc.2 | | | 1,098,113 | | |
| | 41,775 | | | Microsoft Corp. | | | 1,073,618 | | |
| | 116,900 | | | Oracle Corp.1 | | | 1,482,292 | | |
| | 59,200 | | | Symantec Corp.1 | | | 1,411,920 | | |
| | | | 5,065,943 | | |
| | | Speciality Retail — 2.3% | |
| | 44,700 | | | Home Depot, Inc. | | | 1,834,488 | | |
| | | Textiles Apparel & Luxury Goods — 2.4% | |
| | 22,500 | | | Nike, Inc. - Class B | | | 1,891,125 | | |
| | | Thrifts & Mortgage Finance — 2.1% | |
| | 52,875 | | | Countrywide Financial Corp. | | | 1,679,839 | | |
| | | Wireless Telecommunication Services — 1.9% | |
| | 63,470 | | | Sprint Nextel Corp. | | | 1,479,486 | | |
| | | | | TOTAL COMMON STOCKS
(Cost $68,713,444) | | | 79,652,365 | | |
See Notes to Financial Statements.
71
THE GLENMEDE FUND, INC.
Strategic Equity Portfolio
SCHEDULE OF PORTFOLIO INVESTMENTS — (Concluded)
October 31, 2005
Face
Amount | | | | Value | |
| REPURCHASE AGREEMENT — 0.3% | | | |
| $ | 254,119 | | | With Investors Bank & Trust Co., dated 10/31/05, 3.82%,
principal and interest in the amount of $254,146
due 11/1/05, (collateralized by FNMA, with a par value
of $266,626, coupon rate of 3.53%, due 06/25/23,
market value of $266,825) | | $ | 254,119 | | |
| | | | | TOTAL REPURCHASE AGREEMENT
(Cost $254,119) | | | 254,119 | | |
| INVESTMENTS OF SECURITY LENDING COLLATERAL — 11.0% | | | |
| | 2,016,065 | | | American Beacon Funds, Money Market Fund | | | 2,016,065 | | |
| | 629,158 | | | Canadian Imperial Bank, Certificate of Deposit,
4.072%, due 11/4/05 | | | 629,158 | | |
| | 576,019 | | | Fortis Bank, Eurodollar Time Deposit,
3.85%, due 11/3/05 | | | 576,019 | | |
| | 633,620 | | | Goldman Sachs Group Inc., Promissory Note,
4.02%, due 12/28/05 | | | 633,620 | | |
| | 576,018 | | | Lexington Parker Capital Corp., Commercial Paper,
3.952%, due 11/16/05 | | | 576,018 | | |
| | 2,016,065 | | | Merrill Lynch & Co., Inc., Repurchase Agreement,
4.053%, due 11/1/05 | | | 2,016,065 | | |
| | 576,018 | | | Skandinaviska Enskilda Banken AB (SEB), Eurodollar Term,
3.95%, due 11/21/05 | | | 576,018 | | |
| | 1,207,413 | | | Svenska Handlesbanken, Eurodollar Overnight,
4.031%, due 11/1/05 | | | 1,207,413 | | |
| | 576,018 | | | Wells Fargo, Eurodollar Time Deposit,
4.01%, due 12/12/05 | | | 576,018 | | |
| | | | | TOTAL INVESTMENTS OF SECURITY LENDING COLLATERAL
(Cost $8,806,394) | | | 8,806,394 | | |
TOTAL INVESTMENTS
(Cost $77,773,957)3 | | | 111.0 | % | | $ | 88,712,878 | | |
| LIABILITIES IN EXCESS OF OTHER ASSETS | | | (11.0 | ) | | | (8,807,615 | ) | |
| NET ASSETS | | | 100.0 | % | | $ | 79,905,263 | | |
t Percentages indicated are based on net assets.
1 Non-income producing security.
2 Securities or partial securities on loan. See Note 5.
3 Aggregate cost for federal tax purposes was $77,813,895.
Abbreviation:
FNMA — Federal National Mortgage Association
See Notes to Financial Statements.
72
THE GLENMEDE FUND, INC.
Strategic Equity Portfolio
INDUSTRY DIVERSIFICATION
On October 31, 2005, industry diversification of the Portfolio was as follows (Unaudited):
| | | % of
Net Assets | | Value | |
| INDUSTRIES: | |
| Household Products | | | 7.1 | % | | $ | 5,637,777 | | |
| Capital Markets | | | 6.6 | | | | 5,268,890 | | |
| Software | | | 6.3 | | | | 5,065,943 | | |
| Oil Gas & Consumable Fuels | | | 6.1 | | | | 4,884,473 | | |
| Pharmaceuticals | | | 6.1 | | | | 4,848,864 | | |
| Computers & Peripherals | | | 5.7 | | | | 4,592,451 | | |
| Health Care Providers & Services | | | 5.4 | | | | 4,281,961 | | |
| Insurance | | | 5.0 | | | | 4,032,938 | | |
| Aerospace & Defense | | | 4.4 | | | | 3,539,335 | | |
| Semiconductors & Semiconductor Equipment | | | 3.8 | | | | 3,024,667 | | |
| Energy Equipment & Services | | | 3.6 | | | | 2,898,795 | | |
| Health Care Equipment & Supplies | | | 3.6 | | | | 2,854,447 | | |
| Machinery | | | 3.4 | | | | 2,707,620 | | |
| Food Products | | | 3.3 | | | | 2,658,889 | | |
| Industrial Conglomerates | | | 3.3 | | | | 2,632,555 | | |
| Hotels Restaurants & Leisure | | | 2.5 | | | | 2,010,637 | | |
| Textiles Apparel & Luxury Goods | | | 2.4 | | | | 1,891,125 | | |
| Speciality Retail | | | 2.3 | | | | 1,834,488 | | |
| Diversified Financial Services | | | 2.3 | | | | 1,808,539 | | |
| Thrifts & Mortgage Finance | | | 2.1 | | | | 1,679,839 | | |
| Wireless Telecommunication Services | | | 1.9 | | | | 1,479,486 | | |
| Building Products | | | 1.7 | | | | 1,390,800 | | |
| Household Durables | | | 1.6 | | | | 1,287,036 | | |
| IT Services | | | 1.6 | | | | 1,256,960 | | |
| Media | | | 1.5 | | | | 1,221,546 | | |
| Biotechnology | | | 1.4 | | | | 1,136,400 | | |
| Commercial Banks | | | 1.4 | | | | 1,076,950 | | |
| Food & Staples Retailing | | | 1.2 | | | | 976,400 | | |
| Communications Equipment | | | 1.0 | | | | 800,519 | | |
| Consumer Finance | | | 0.6 | | | | 478,159 | | |
| Air Freight & Logistics | | | 0.5 | | | | 393,876 | | |
| TOTAL COMMON STOCKS | | | 99.7 | % | | $ | 79,652,365 | | |
| REPURCHASE AGREEMENT | | | 0.3 | | | | 254,119 | | |
| INVESTMENTS OF SECURITY LENDING COLLATERAL | | | 11.0 | | | | 8,806,394 | | |
| TOTAL INVESTMENTS | | | 111.0 | % | | $ | 88,712,878 | | |
See Notes to Financial Statements.
73
THE GLENMEDE FUND, INC.
Small Cap Equity Portfolio
SCHEDULE OF PORTFOLIO INVESTMENTS
October 31, 2005
| Shares | | | | Value | |
| COMMON STOCKSt — 99.4% | | | |
| | | Aerospace & Defense — 0.8% | |
| | 139,790 | | | Innovative Solutions & Support, Inc.1,2 | | $ | 1,997,599 | | |
| | | Apparel Retailers — 1.0% | |
| | 56,804 | | | Jos. A. Bank Clothiers, Inc.1,2 | | | 2,318,171 | | |
| | | Automotive — 0.7% | |
| | 96,080 | | | Wabash National Corp. | | | 1,768,833 | | |
| | | Banking — 2.4% | |
| | 30,640 | | | Corus Bankshares, Inc.2 | | | 1,682,136 | | |
| | 46,105 | | | Frontier Financial Corp. | | | 1,486,425 | | |
| | 72,040 | | | Pacific Capital Bancorp | | | 2,598,483 | | |
| | | | 5,767,044 | | |
| | | | | Basic Industry — 3.1% | | | | | |
| | 56,840 | | | AptarGroup, Inc. | | | 2,909,640 | | |
| | 56,771 | | | Georgia Gulf Corp. | | | 1,652,036 | | |
| | 56,820 | | | Mettler-Toledo International, Inc.1 | | | 2,931,912 | | |
| | | | 7,493,588 | | |
| | | Beverages, Food & Tobacco — 1.1% | |
| | 48,070 | | | J & J Snack Foods Corp. | | | 2,711,629 | | |
| | | Biotechnology — 1.6% | |
| | 89,630 | | | SFBC International, Inc.1,2 | | | 3,821,823 | | |
| | | Chemicals — 2.3% | |
| | 69,850 | | | Cytec Industries, Inc. | | | 2,884,805 | | |
| | 50,210 | | | FMC Corp.1 | | | 2,733,432 | | |
| | | | 5,618,237 | | |
| | | Commercial Services — 5.6% | |
| | 89,620 | | | Gevity HR, Inc. | | | 2,306,819 | | |
| | 69,860 | | | Global Payments, Inc. | | | 2,993,501 | | |
| | 152,940 | | | Korn/Ferry International1 | | | 2,633,627 | | |
| | 131,080 | | | Labor Ready, Inc.1 | | | 3,060,718 | | |
| | 74,240 | | | Steiner Leisure, Ltd.1 | | | 2,530,842 | | |
| | | | 13,525,507 | | |
| | | Computer Software & Processing — 3.5% | |
| | 109,140 | | | Digital Insight Corp.1 | | | 3,255,646 | | |
| | 74,248 | | | F5 Networks, Inc.1 | | | 3,863,123 | | |
| | 43,730 | | | SafeNet, Inc.1 | | | 1,450,524 | | |
| | | | 8,569,293 | | |
See Notes to Financial Statements.
74
THE GLENMEDE FUND, INC.
Small Cap Equity Portfolio
SCHEDULE OF PORTFOLIO INVESTMENTS — (Continued)
October 31, 2005
| Shares | | | | Value | |
| COMMON STOCKSt — (Continued) | | | |
| | | Computers & Information — 3.3% | |
| | 144,140 | | | Emulex Corp.1,2 | | $ | 2,668,031 | | |
| | 80,830 | | | Global Imaging Systems, Inc.1,2 | | | 2,878,356 | | |
| | 126,720 | | | NETGEAR, Inc.1,2 | | | 2,477,376 | | |
| | | | 8,023,763 | | |
| | | Cosmetics & Personal Care — 0.6% | |
| | 72,090 | | | Elizabeth Arden, Inc.1 | | | 1,562,190 | | |
| | | Education — 0.9% | |
| | 52,430 | | | Bright Horizons Family Solution, Inc.1,2 | | | 2,095,627 | | |
| | | Electronics — 4.4% | |
| | 76,520 | | | Cymer, Inc.1,2 | | | 2,666,722 | | |
| | 87,390 | | | Synaptics, Inc.1,2 | | | 2,030,070 | | |
| | 67,716 | | | Trimble Navigation, Ltd.1 | | | 1,954,961 | | |
| | 98,290 | | | WESCO International, Inc.1 | | | 3,907,027 | | |
| | | | 10,558,780 | | |
| | | Energy — 1.8% | |
| | 41,570 | | | Houston Exploration Co. (The)1 | | | 2,142,933 | | |
| | 48,060 | | | Oceaneering International, Inc.1 | | | 2,312,647 | | |
| | | | 4,455,580 | | |
| | | Entertainment & Leisure — 1.1% | |
| | 52,420 | | | Avid Technology, Inc.1,2 | | | 2,580,637 | | |
| | | | | Financial Services — 3.3% | | | | | |
| | 34,925 | | | Affiliated Managers Group, Inc.1,2 | | | 2,680,494 | | |
| | 52,440 | | | FirstFed Financial Corp.1,2 | | | 2,805,016 | | |
| | 87,382 | | | Independent Bank Corp. | | | 2,498,251 | | |
| | | | 7,983,761 | | |
| | | Food Retailers — 1.5% | |
| | 93,420 | | | Pantry (The), Inc.1 | | | 3,614,420 | | |
| | | Health Care — 4.9% | |
| | 54,630 | | | Covance, Inc.1 | | | 2,657,750 | | |
| | 52,430 | | | Kensey Nash Corp.1,2 | | | 1,202,220 | | |
| | 122,353 | | | LCA-Vision, Inc. | | | 5,140,050 | | |
| | 48,060 | | | Stericycle, Inc.1,2 | | | 2,766,334 | | |
| | | | 11,766,354 | | |
| | | Health Care Providers — 3.7% | |
| | 90,460 | | | Amedisys, Inc.1,2 | | | 3,456,477 | | |
| | 32,760 | | | Pediatrix Medical Group, Inc.1 | | | 2,524,486 | | |
| | 113,640 | | | VCA Antech, Inc.1,2 | | | 2,931,912 | | |
| | | | 8,912,875 | | |
See Notes to Financial Statements.
75
THE GLENMEDE FUND, INC.
Small Cap Equity Portfolio
SCHEDULE OF PORTFOLIO INVESTMENTS — (Continued)
October 31, 2005
| Shares | | | | Value | |
| COMMON STOCKSt — (Continued) | | | |
| | | Heavy Machinery — 3.7% | |
| | 124,530 | | | AGCO Corp.1,2 | | $ | 1,991,235 | | |
| | 45,920 | | | Middleby Corp. (The)1,2 | | | 3,329,200 | | |
| | 65,580 | | | Terex Corp.1,2 | | | 3,604,933 | | |
| | | | 8,925,368 | | |
| | | Industrial — 1.8% | |
| | 89,850 | | | Gardner Denver, Inc.1 | | | 4,366,710 | | |
| | | Insurance — 7.0% | |
| | 74,240 | | | AmerUs Group Co. | | | 4,389,069 | | |
| | 63,336 | | | Arch Capital Group, Ltd.1 | | | 3,135,132 | | |
| | 50,210 | | | IPC Holdings, Ltd. | | | 1,322,029 | | |
| | 93,880 | | | Scottish Re Group, Ltd.2 | | | 2,304,754 | | |
| | 54,680 | | | Selective Insurance Group, Inc.2 | | | 3,002,479 | | |
| | 30,630 | | | Stancorp Financial Group, Inc. | | | 2,821,023 | | |
| | | | 16,974,486 | | |
| | | Medical Supplies — 2.0% | |
| | 248,972 | | | HealthTronics, Inc.1 | | | 2,263,155 | | |
| | 65,550 | | | MTS Systems Corp. | | | 2,619,378 | | |
| | | | 4,882,533 | | |
| | | Metals — 0.9% | |
| | 100,490 | | | Griffon Corp.1,2 | | | 2,210,780 | | |
| | | Oil & Gas — 5.0% | |
| | 48,010 | | | CAL Dive International, Inc.1,2 | | | 2,954,535 | | |
| | 52,420 | | | Holly Corp. | | | 3,019,392 | | |
| | 152,850 | | | KCS Energy, Inc.1,2 | | | 3,686,742 | | |
| | 67,700 | | | Remington Oil & Gas Corp.1 | | | 2,369,500 | | |
| | | | 12,030,169 | | |
| | | Pharmaceuticals — 1.1% | |
| | 185,720 | | | First Horizon Pharmaceutical Corp.1,2 | | | 2,679,940 | | |
| | | Real Estate — 0.9% | |
| | 43,700 | | | Jones Lang Lasalle, Inc. | | | 2,197,236 | | |
| | | REIT — 4.9% | |
| | 106,990 | | | BioMed Realty Trust, Inc. | | | 2,675,820 | | |
| | 284,000 | | | Equity Inns, Inc. | | | 3,703,360 | | |
| | 93,890 | | | LaSalle Hotel Properties | | | 3,322,767 | | |
| | 207,530 | | | Winston Hotels, Inc. | | | 2,139,634 | | |
| | | | 11,841,581 | | |
See Notes to Financial Statements.
76
THE GLENMEDE FUND, INC.
Small Cap Equity Portfolio
SCHEDULE OF PORTFOLIO INVESTMENTS — (Continued)
October 31, 2005
| Shares | | | | Value | |
| COMMON STOCKSt — (Continued) | | | |
| | | Restaurants — 3.2% | |
| | 109,190 | | | California Pizza Kitchen, Inc.1 | | $ | 3,495,172 | | |
| | 137,660 | | | CKE Restaurants, Inc. | | | 1,751,035 | | |
| | 78,710 | | | RARE Hospitality International, Inc.1 | | | 2,405,378 | | |
| | | | 7,651,585 | | |
| | | Retailers — 6.0% | |
| | 109,160 | | | GameStop Corp. - Class A1,2 | | | 3,872,997 | | |
| | 43,700 | | | Guitar Center, Inc.1 | | | 2,277,207 | | |
| | 126,750 | | | Insight Enterprises, Inc.1 | | | 2,600,910 | | |
| | 135,510 | | | MarineMax, Inc.1 | | | 3,347,097 | | |
| | 144,100 | | | Marvel Entertainment Inc.1,2 | | | 2,536,160 | | |
| | | | 14,634,371 | | |
| | | Technology — 9.0% | |
| | 76,470 | | | ANSYS, Inc.1 | | | 2,849,272 | | |
| | 74,242 | | | Benchmark Electronics, Inc.1 | | | 2,085,458 | | |
| | 39,310 | | | CACI International, Inc. - Class A1 | | | 2,143,967 | | |
| | 78,680 | | | Digital River, Inc.1 | | | 2,203,827 | | |
| | 113,640 | | | Internet Security Systems, Inc.1,2 | | | 2,798,953 | | |
| | 117,930 | | | Manhattan Associates, Inc.1 | | | 2,619,225 | | |
| | 190,020 | | | Methode Electronics, Inc. | | | 1,949,605 | | |
| | 56,820 | | | MICROS Systems, Inc.1 | | | 2,609,174 | | |
| | 41,540 | | | Websense, Inc.1 | | | 2,454,183 | | |
| | | | 21,713,664 | | |
| | | | | Technology Systems/Semi Conductors — 0.9% | | | | | |
| | 56,780 | | | Diodes, Inc.1 | | | 2,058,843 | | |
| | | | | Telephone Systems — 1.5% | | | | | |
| | 172,575 | | | Brightpoint, Inc.1 | | | 3,725,894 | | |
| | | | | Textiles, Clothing & Fabrics — 0.8% | | | | | |
| | 76,200 | | | Rocky Shoes & Boots, Inc.1 | | | 1,883,664 | | |
| | | | | Transportation — 0.9% | | | | | |
| | 126,680 | | | OMI Corp.2 | | | 2,290,374 | | |
| | | | | Trucking — 1.1% | | | | | |
| | 96,112 | | | Greenbrier Cos., Inc. | | | 2,647,886 | | |
| | | | | Utilities — 1.1% | | | | | |
| | 69,850 | | | Energen Corp. | | | 2,626,360 | | |
| | | | | TOTAL COMMON STOCKS
(Cost $185,659,654) | | | 240,487,155 | | |
See Notes to Financial Statements.
77
THE GLENMEDE FUND, INC.
Small Cap Equity Portfolio
SCHEDULE OF PORTFOLIO INVESTMENTS — (Concluded)
October 31, 2005
Face
Amount | | | | Value | |
| REPURCHASE AGREEMENT — 0.9% | | | |
| $ | 2,113,897 | | | With Investors Bank & Trust Co., dated 10/31/05, 3.82%,
principal and interest in the amount of $2,114,121,
due 11/01/05, (collateralized by FN #794357 with a
par value of $2,237,773, coupon rate of
5.50%, due 09/01/34, market value of $2,219,592) | | $ | 2,113,897 | | |
| | | | | TOTAL REPURCHASE AGREEMENT
(Cost $2,113,897) | | | 2,113,897 | | |
| INVESTMENTS OF SECURITY LENDING COLLATERAL — 26.6% | | | |
| | 14,733,279 | | | American Beacon Funds, Money Market Fund | | | 14,733,279 | | |
| | 4,597,849 | | | Canadian Imperial Bank, Certificate of Deposit,
4.072%, due 11/4/05 | | | 4,597,849 | | |
| | 4,209,508 | | | Fortis Bank, Eurodollar Time Deposit,
3.85%, due 11/3/05 | | | 4,209,508 | | |
| | 4,630,459 | | | Goldman Sachs Group, Inc., Promissory Note,
4.02%, due 12/28/05 | | | 4,630,459 | | |
| | 4,209,508 | | | Lexington Parker Capital, Commercial Paper,
3.952%, due 11/16/05 | | | 4,209,508 | | |
| | 14,733,279 | | | Merrill Lynch & Co., Inc., Repurchase Agreement,
4.053%, due 11/1/05 | | | 14,733,279 | | |
| | 4,209,508 | | | Skandinaviska Enskilda Banken AB, Eurodollar Time Deposit,
3.95%, due 11/21/05 | | | 4,209,508 | | |
| | 8,823,702 | | | Svenska Handlesbanken, Eurodollar Time Deposit,
4.031%, due 11/1/05 | | | 8,823,702 | | |
| | 4,209,508 | | | Wells Fargo, Eurodollar Time Deposit,
4.01%, due 12/12/05 | | | 4,209,508 | | |
| | | | | TOTAL INVESTMENTS OF SECURITY LENDING COLLATERAL
(Cost $64,356,600) | | | 64,356,600 | | |
TOTAL INVESTMENTS
(Cost $252,130,151)3 | | | 126.9 | % | | $ | 306,957,652 | | |
| LIABILITIES IN EXCESS OF OTHER ASSETS | | | (26.9 | ) | | | (64,987,006 | ) | |
| NET ASSETS | | | 100.0 | % | | $ | 241,970,646 | | |
t Percentages indicated are based on net assets.
1 Non-income producing security.
2 Securities or partial securities on loan. See Note 5.
3 Aggregate cost for federal tax purposes was $252,253,312.
Abbreviations:
FN — Federal National Mortgage Association
REIT — Real Estate Investment Trust
See Notes to Financial Statements.
78
THE GLENMEDE FUND, INC.
Small Cap Equity Portfolio
INDUSTRY DIVERSIFICATION
On October 31, 2005, industry diversification of the Portfolio was as follows (Unaudited):
| | | % of
Net Assets | | Value | |
| INDUSTRIES: | |
| Technology | | | 9.0 | % | | $ | 21,713,664 | | |
| Insurance | | | 7.0 | | | | 16,974,486 | | |
| Retailers | | | 6.0 | | | | 14,634,371 | | |
| Commercial Services | | | 5.6 | | | | 13,525,507 | | |
| Oil & Gas | | | 5.0 | | | | 12,030,169 | | |
| REIT | | | 4.9 | | | | 11,841,581 | | |
| Health Care | | | 4.9 | | | | 11,766,354 | | |
| Electronics | | | 4.4 | | | | 10,558,780 | | |
| Heavy Machinery | | | 3.7 | | | | 8,925,368 | | |
| Health Care Providers | | | 3.7 | | | | 8,912,875 | | |
| Computer Software & Processing | | | 3.5 | | | | 8,569,293 | | |
| Computers & Information | | | 3.3 | | | | 8,023,763 | | |
| Financial Services | | | 3.3 | | | | 7,983,761 | | |
| Restaurants | | | 3.2 | | | | 7,651,585 | | |
| Basic Industry | | | 3.1 | | | | 7,493,588 | | |
| Banking | | | 2.4 | | | | 5,767,044 | | |
| Chemicals | | | 2.3 | | | | 5,618,237 | | |
| Medical Supplies | | | 2.0 | | | | 4,882,533 | | |
| Energy | | | 1.8 | | | | 4,455,580 | | |
| Industrial | | | 1.8 | | | | 4,366,710 | | |
| Biotechnology | | | 1.6 | | | | 3,821,823 | | |
| Telephone Systems | | | 1.5 | | | | 3,725,894 | | |
| Food Retailers | | | 1.5 | | | | 3,614,420 | | |
| Beverages, Food & Tobacco | | | 1.1 | | | | 2,711,629 | | |
| Pharmaceuticals | | | 1.1 | | | | 2,679,940 | | |
| Trucking | | | 1.1 | | | | 2,647,886 | | |
| Utilities | | | 1.1 | | | | 2,626,360 | | |
| Entertainment & Leisure | | | 1.1 | | | | 2,580,637 | | |
| Apparel Retailers | | | 1.0 | | | | 2,318,171 | | |
| Transportation | | | 0.9 | | | | 2,290,374 | | |
| Metals | | | 0.9 | | | | 2,210,780 | | |
| Real Estate | | | 0.9 | | | | 2,197,236 | | |
| Education | | | 0.9 | | | | 2,095,627 | | |
| Technology Systems/Semi Conductors | | | 0.9 | | | | 2,058,843 | | |
| Aerospace & Defense | | | 0.8 | | | | 1,997,599 | | |
| Textiles, Clothing & Fabrics | | | 0.8 | | | | 1,883,664 | | |
| Automotive | | | 0.7 | | | | 1,768,833 | | |
| Cosmetics & Personal Care | | | 0.6 | | | | 1,562,190 | | |
| TOTAL COMMON STOCKS | | | 99.4 | % | | $ | 240,487,155 | | |
| REPURCHASE AGREEMENT | | | 0.9 | | | | 2,113,897 | | |
| INVESTMENTS OF SECURITY LENDING COLLATERAL | | | 26.6 | | | | 64,356,600 | | |
| TOTAL INVESTMENTS | | | 126.9 | % | | $ | 306,957,652 | | |
See Notes to Financial Statements.
79
THE GLENMEDE FUND, INC.
Large Cap Value Portfolio
SCHEDULE OF PORTFOLIO INVESTMENTS
October 31, 2005
| Shares | | | | Value | |
| COMMON STOCKSt — 95.3% | | | |
| | | Aerospace & Defense — 2.8% | |
| | 4,275 | | | Boeing Co. | | $ | 276,336 | | |
| | 13,700 | | | Honeywell International, Inc. | | | 468,540 | | |
| | | | 744,876 | | |
| | | Automotive — 2.2% | |
| | 6,287 | | | Toyota Motor Corp., Sponsored ADR | | | 583,496 | | |
| | | Banking — 3.3% | |
| | 10,300 | | | Countrywide Financial Corp. | | | 327,231 | | |
| | 10,875 | | | Wachovia Corp. | | | 549,405 | | |
| | | | 876,636 | | |
| | | Beverages, Food & Tobacco — 4.7% | |
| | 10,311 | | | Altria Group, Inc. | | | 773,841 | | |
| | 6,025 | | | Coca-Cola Co. (The) | | | 257,749 | | |
| | 6,613 | | | Pilgrim's Pride Corp. | | | 208,177 | | |
| | | | 1,239,767 | | |
| | | Building Materials — 0.9% | |
| | 4,025 | | | Lowe's Companies, Inc. | | | 244,599 | | |
| | | Chemicals — 1.9% | |
| | 11,025 | | | Dow Chemical (The) | | | 505,606 | | |
| | | Commercial Services — 1.3% | |
| | 9,800 | | | RR Donnelley & Sons Co. | | | 343,196 | | |
| | | Computers & Information — 1.0% | |
| | 3,150 | | | International Business Machines Corp. | | | 257,922 | | |
| | | Consumer Services — 1.3% | |
| | 14,575 | | | Disney (Walt) Co. | | | 355,193 | | |
| | | Cosmetics & Personal Care — 2.1% | |
| | 9,925 | | | Procter & Gamble Co. (The) | | | 555,701 | | |
| | | Electric Utilities — 2.8% | |
| | 5,150 | | | FirstEnergy Corp. | | | 244,625 | | |
| | 13,825 | | | PG&E Corp. | | | 502,953 | | |
| | | | 747,578 | | |
| | | Electronics — 3.0% | |
| | 8,425 | | | Amphenol Corp. - Class A | | | 336,747 | | |
| | 4,900 | | | Canon, Inc. ADR | | | 260,043 | | |
| | 21,111 | | | Flextronics International Ltd.1,2 | | | 196,121 | | |
| | | | 792,911 | | |
| | | Energy — 3.1% | |
| | 14,824 | | | Exxon Mobil Corp. | | | 832,219 | | |
See Notes to Financial Statements.
80
THE GLENMEDE FUND, INC.
Large Cap Value Portfolio
SCHEDULE OF PORTFOLIO INVESTMENTS — (Continued)
October 31, 2005
| Shares | | | | Value | |
| COMMON STOCKSt — (Continued) | | | |
| | | Financial Services — 16.4% | |
| | 19,250 | | | Bank of America Corp. | | $ | 841,995 | | |
| | 21,233 | | | Citigroup, Inc. | | | 972,047 | | |
| | 4,525 | | | Goldman Sachs Capital, Inc. | | | 571,824 | | |
| | 12,051 | | | J.P. Morgan Chase & Co. | | | 441,308 | | |
| | 12,650 | | | MBNA Corp. | | | 323,461 | | |
| | 10,250 | | | Merrill Lynch & Co., Inc. | | | 663,585 | | |
| | 9,800 | | | Morgan Stanley | | | 533,218 | | |
| | | | 4,347,438 | | |
| | | Health Care — 3.5% | |
| | 7,800 | | | Johnson & Johnson | | | 488,436 | | |
| | 9,300 | | | Quest Diagnostics, Inc. | | | 434,403 | | |
| | | | 922,839 | | |
| | | Health Care Providers — 1.0% | |
| | 5,275 | | | HCA, Inc. | | | 254,202 | | |
| | | Heavy Machinery — 1.0% | |
| | 7,275 | | | Ingersoll-Rand Co. - Class A | | | 274,922 | | |
| | | Insurance — 12.3% | |
| | 6,150 | | | Aetna, Inc. | | | 544,645 | | |
| | 13,811 | | | American International Group, Inc. | | | 894,953 | | |
| | 7,400 | | | Hartford Financial Services Group, Inc. | | | 590,150 | | |
| | 4,250 | | | Loews Corp. | | | 395,165 | | |
| | 11,550 | | | Prudential Financial, Inc. | | | 840,725 | | |
| | | | 3,265,638 | | |
| | | Metals — 0.6% | |
| | 5,175 | | | BHP Billiton Ltd. ADR | | | 160,684 | | |
| | | Oil & Gas — 10.1% | |
| | 9,675 | | | ConocoPhillips | | | 632,552 | | |
| | 3,875 | | | Nabors Industries, Ltd. | | | 265,941 | | |
| | 7,288 | | | Occidental Petroleum Corp. | | | 574,877 | | |
| | 3,775 | | | Valero Energy Corp. | | | 397,281 | | |
| | 23,750 | | | Williams Cos., Inc. | | | 529,625 | | |
| | 6,308 | | | XTO Energy, Inc. | | | 274,146 | | |
| | �� | | 2,674,422 | | |
| | | Pharmaceuticals — 3.6% | |
| | 4,900 | | | GlaxoSmithKline PLC ADR | | | 254,751 | | |
| | 20,350 | | | Pfizer, Inc. | | | 442,409 | | |
| | 5,900 | | | Wyeth | | | 262,904 | | |
| | | | 960,064 | | |
See Notes to Financial Statements.
81
THE GLENMEDE FUND, INC.
Large Cap Value Portfolio
SCHEDULE OF PORTFOLIO INVESTMENTS — (Continued)
October 31, 2005
| Shares | | | | Value | |
| COMMON STOCKSt — (Continued) | | | |
| | | Process Industries — 2.4% | |
| | 18,839 | | | General Electric Co. | | $ | 638,830 | | |
| | | REIT — 2.6% | |
| | 6,778 | | | General Growth Properties, Inc. | | | 287,929 | | |
| | 14,575 | | | Host Marriott Corp. | | | 244,714 | | |
| | 5,025 | | | Ventas, Inc. | | | 153,916 | | |
| | | | 686,559 | | |
| | | Retailers — 2.4% | |
| | 12,425 | | | J.C. Penney Co., Inc. (Holding Co.) | | | 636,160 | | |
| | | Technology — 1.1% | |
| | 11,175 | | | Microsoft Corp. | | | 287,198 | | |
| | | Telecommunications — 1.5% | |
| | 17,675 | | | Motorola, Inc. | | | 391,678 | | |
| | | Telephone — 3.3% | |
| | 21,350 | | | SBC Communications, Inc. | | | 509,198 | | |
| | 11,730 | | | Verizon Communications, Inc. | | | 369,612 | | |
| | | | 878,810 | | |
| | | Transportation — 1.2% | |
| | 5,025 | | | Burlington Northern Santa Fe Corp. | | | 311,852 | | |
| | | Utilities — 1.9% | |
| | 9,175 | | | Constellation Energy Group, Inc. | | | 502,790 | | |
| | | | | TOTAL COMMON STOCKS
(Cost $21,718,827) | | | 25,273,786 | | |
Face
Amount | | | | | |
| REPURCHASE AGREEMENT — 4.5% | | | |
| $ | 1,182,302 | | | With Investors Bank & Trust Co., dated 10/31/05,
3.82%, principal and interest in the amount of
$1,182,427 due 11/01/05, (collateralized by FN #783719
with a par value of $1,251,586, coupon rate of 5.500%,
due 08/01/34, market value of $1,241,417) | | | 1,182,302 | | |
| | | | | TOTAL REPURCHASE AGREEMENT
(Cost $1,182,302) | | | 1,182,302 | | |
See Notes to Financial Statements.
82
THE GLENMEDE FUND, INC.
Large Cap Value Portfolio
SCHEDULE OF PORTFOLIO INVESTMENTS — (Concluded)
October 31, 2005
Face
Amount | | | | Value | |
| INVESTMENTS OF SECURITY LENDING COLLATERAL — 0.8% | | | |
| $ | 46,842 | | | American Beacon Funds, Money Market Fund | | $ | 46,842 | | |
| | 14,619 | | | Canadian Imperial Bank, Certificate of Deposit,
4.072%, due 11/4/05 | | | 14,619 | | |
| | 13,383 | | | Fortis Bank, Eurodollar Time Deposit,
3.85%, due 11/3/05 | | | 13,383 | | |
| | 14,722 | | | Goldman Sachs Group, Inc., Promissory Note,
4.02%, due 12/28/05 | | | 14,722 | | |
| | 13,383 | | | Lexington Parker Capital, Commercial Paper,
3.952%, due 11/16/05 | | | 13,383 | | |
| | 46,842 | | | Merrill Lynch & Co., Inc., Repurchase Agreement,
4.053%, due 11/1/05 | | | 46,842 | | |
| | 13,383 | | | Skandinaviska Enskilda Banken AB, Eurodollar Time Deposit,
3.95%, due 11/21/05 | | | 13,383 | | |
| | 28,053 | | | Svenska Handlesbanken, Eurodollar Time Deposit,
4.031%, due 11/1/05 | | | 28,053 | | |
| | 13,383 | | | Wells Fargo, Eurodollar Time Deposit,
4.01%, due 12/12/05 | | | 13,383 | | |
| | | | | TOTAL INVESTMENTS OF SECURITY LENDING COLLATERAL
(Cost $204,610) | | | 204,610 | | |
TOTAL INVESTMENTS
(Cost $23,105,739)3 | | | 100.6 | % | | $ | 26,660,698 | | |
| LIABILITIES IN EXCESS OF OTHER ASSETS | | | (0.6 | ) | | | (154,031 | ) | |
| NET ASSETS | | | 100.0 | % | | $ | 26,506,667 | | |
t Percentages indicated are based on net assets.
1 Non-income producing security.
2 Securities or partial securities on loan. See Note 5.
3 Aggregate cost for federal tax purposes was $23,228,361.
Abbreviations:
ADR — American Depositary Receipt
FN — Federal National Mortgage Association
REIT — Real Estate Investment Trust
SBA — Small Business Administration
See Notes to Financial Statements.
83
THE GLENMEDE FUND, INC.
Large Cap Value Portfolio
INDUSTRY DIVERSIFICATION
On October 31, 2005, industry diversification of the Portfolio was as follows (Unaudited):
| | | % of
Net Assets | | Value | |
| INDUSTRIES: | |
| Financial Services | | | 16.4 | % | | $ | 4,347,438 | | |
| Insurance | | | 12.3 | | | | 3,265,638 | | |
| Oil & Gas | | | 10.1 | | | | 2,674,422 | | |
| Beverages, Food & Tobacco | | | 4.7 | | | | 1,239,767 | | |
| Pharmaceuticals | | | 3.6 | | | | 960,064 | | |
| Health Care | | | 3.5 | | | | 922,839 | | |
| Telephone | | | 3.3 | | | | 878,810 | | |
| Banking | | | 3.3 | | | | 876,636 | | |
| Energy | | | 3.1 | | | | 832,219 | | |
| Electronics | | | 3.0 | | | | 792,911 | | |
| Electric Utilities | | | 2.8 | | | | 747,578 | | |
| Aerospace & Defense | | | 2.8 | | | | 744,876 | | |
| REIT | | | 2.6 | | | | 686,559 | | |
| Process Industries | | | 2.4 | | | | 638,830 | | |
| Retailers | | | 2.4 | | | | 636,160 | | |
| Automotive | | | 2.2 | | | | 583,496 | | |
| Cosmetics & Personal Care | | | 2.1 | | | | 555,701 | | |
| Chemicals | | | 1.9 | | | | 505,606 | | |
| Utilities | | | 1.9 | | | | 502,790 | | |
| Telecommunications | | | 1.5 | | | | 391,678 | | |
| Consumer Services | | | 1.3 | | | | 355,193 | | |
| Commercial Services | | | 1.3 | | | | 343,196 | | |
| Transportation | | | 1.2 | | | | 311,852 | | |
| Technology | | | 1.1 | | | | 287,198 | | |
| Heavy Machinery | | | 1.0 | | | | 274,922 | | |
| Computers & Information | | | 1.0 | | | | 257,922 | | |
| Health Care Providers | | | 1.0 | | | | 254,202 | | |
| Building Materials | | | 0.9 | | | | 244,599 | | |
| Metals | | | 0.6 | | | | 160,684 | | |
| TOTAL COMMON STOCKS | | | 95.3 | % | | $ | 25,273,786 | | |
| REPURCHASE AGREEMENT | | | 4.5 | | | | 1,182,302 | | |
| INVESTMENTS OF SECURITY LENDING COLLATERAL | | | 0.8 | | | | 204,610 | | |
| TOTAL INVESTMENTS | | | 100.6 | % | | $ | 26,660,698 | | |
See Notes to Financial Statements.
84
THE GLENMEDE FUND, INC.
International Portfolio
SCHEDULE OF PORTFOLIO INVESTMENTS
October 31, 2005
| Shares | | | | Value | |
| COMMON STOCKSt — 99.7% | | | |
| | | Japan — 25.2% | |
| | 1,052,565 | | | Ajinomoto Co., Inc. | | $ | 10,264,980 | | |
| | 1,245,275 | | | Asahi Glass Co., Ltd. | | | 13,462,876 | | |
| | 233,066 | | | Canon, Inc. | | | 12,335,992 | | |
| | 2,056 | | | East Japan Railway Co. | | | 12,215,659 | | |
| | 385,275 | | | FamilyMart Co., Ltd. | | | 11,462,152 | | |
| | 635,242 | | | JS Group Corp. | | | 10,794,239 | | |
| | 1,514,404 | | | Kuraray Co., Ltd. | | | 14,376,159 | | |
| | 1,956,284 | | | Mitsubishi Electric Corp. | | | 11,728,167 | | |
| | 2,630,867 | | | Nippon Express Co., Ltd. | | | 14,412,939 | | |
| | 300,112 | | | Sega Sammy Holdings, Inc. | | | 10,799,059 | | |
| | 1,939,817 | | | Sumitomo Chemical Co., Ltd. | | | 11,448,518 | | |
| | 1,783,023 | | | Sumitomo Trust & Banking Co., Ltd. (The) | | | 15,179,467 | | |
| | 211,668 | | | Takeda Pharmaecutical Co., Ltd. | | | 11,602,179 | | |
| | 168,988 | | | Takefuji Corp. | | | 11,826,610 | | |
| | 134,890 | | | TDK Corp. | | | 9,095,051 | | |
| | 397,851 | | | THK Co., Ltd. | | | 8,978,803 | | |
| | 316,584 | | | Toyota Motor Corp. | | | 14,680,151 | | |
| | | | 204,663,001 | | |
| | | United Kingdom — 15.4% | |
| | 846,356 | | | Aviva PLC | | | 9,995,092 | | |
| | 579,671 | | | BOC Group PLC | | | 11,427,966 | | |
| | 1,337,972 | | | BP Amoco PLC | | | 14,821,869 | | |
| | 1,406,099 | | | Cattles PLC | | | 6,809,558 | | |
| | 2,352,574 | | | Centrica PLC | | | 9,944,211 | | |
| | 2,821,974 | | | Compass Group PLC | | | 9,497,132 | | |
| | 161,272 | | | GlaxoSmithKline PLC | | | 4,194,635 | | |
| | 2,794,027 | | | Misys PLC | | | 10,145,130 | | |
| | 439,452 | | | Rio Tinto PLC | | | 16,743,262 | | |
| | 487,190 | | | Royal Bank of Scotland Group PLC | | | 13,491,291 | | |
| | 6,696,938 | | | Vodafone Group PLC | | | 17,582,925 | | |
| | | | 124,653,071 | | |
| | | Germany — 12.8% | |
| | 106,300 | | | Allianz AG | | | 15,039,393 | | |
| | 165,883 | | | BASF AG | | | 11,963,105 | | |
| | 258,736 | | | Bayerische Motoren Werke AG | | | 11,226,799 | | |
| | 151,507 | | | Continental AG | | | 11,589,004 | | |
| | 135,215 | | | E.On AG | | | 12,253,977 | | |
| | 128,199 | | | Henkel KGaA Preferred2 | | | 11,050,190 | | |
| | 156,227 | | | Metro AG | | | 7,106,157 | | |
| | 165,181 | | | Schering AG | | | 10,214,784 | | |
| | 185,172 | | | Siemens AG Reg. | | | 13,793,068 | | |
| | | | 104,236,477 | | |
See Notes to Financial Statements.
85
THE GLENMEDE FUND, INC.
International Portfolio
SCHEDULE OF PORTFOLIO INVESTMENTS — (Continued)
October 31, 2005
| Shares | | | | Value | |
| COMMON STOCKSt — (Continued) | | | |
| | | France — 9.5% | |
| | 145,641 | | | Assurances Generales De France | | $ | 13,871,470 | | |
| | 490,156 | | | Axa | | | 14,197,814 | | |
| | 213,804 | | | Compagnie de Saint-Gobain | | | 11,713,328 | | |
| | 302,752 | | | France Telecom SA | | | 7,871,018 | | |
| | 139,936 | | | LaFarge SA ADR | | | 11,490,136 | | |
| | 76,962 | | | Societe BIC SA | | | 4,372,038 | | |
| | 54,383 | | | Total SA | | | 13,686,095 | | |
| | | | 77,201,899 | | |
| | | Netherlands — 8.7% | |
| | 229,485 | | | Akzo Nobel N.V. | | | 9,919,798 | | |
| | 522,205 | | | ING Groep N.V. | | | 15,061,475 | | |
| | 1,067,286 | | | Reed Elsevier N.V. | | | 14,374,908 | | |
| | 540,698 | | | Royal Dutch Shell PLC - Class A | | | 16,673,028 | | |
| | 136,268 | | | TNT NV, ADR2 | | | 3,215,925 | | |
| | 165,304 | | | Unilever N.V. | | | 11,631,690 | | |
| | | | 70,876,824 | | |
| | | Switzerland — 4.8% | |
| | 163,589 | | | Ciba Specialty Chemicals AG Reg. | | | 9,394,296 | | |
| | 41,819 | | | Nestle SA Reg. | | | 12,451,919 | | |
| | 81,838 | | | Novartis AG | | | 4,401,583 | | |
| | 72,509 | | | Zurich Financial Services AG1 | | | 12,364,066 | | |
| | | | 38,611,864 | | |
| | | Ireland — 3.6% | |
| | 580,909 | | | Allied Irish Banks PLC | | | 12,191,193 | | |
| | 507,970 | | | CRH PLC | | | 12,694,239 | | |
| | 224,504 | | | Irish Life & Permanent PLC | | | 3,956,325 | | |
| | | | 28,841,757 | | |
| | | Canada — 3.1% | |
| | 318,800 | | | Alcan, Inc. | | | 10,043,644 | | |
| | 560,803 | | | CGI Group, Inc.1 | | | 4,035,920 | | |
| | 242,197 | | | Talisman Energy, Inc. | | | 10,726,717 | | |
| | | | 24,806,281 | | |
| | | Italy — 3.0% | |
| | 459,733 | | | ENI SPA2 | | | 12,306,257 | | |
| | 1,134,098 | | | Mediaset SPA | | | 12,457,549 | | |
| | | | 24,763,806 | | |
See Notes to Financial Statements.
86
THE GLENMEDE FUND, INC.
International Portfolio
SCHEDULE OF PORTFOLIO INVESTMENTS — (Continued)
October 31, 2005
| Shares | | | | Value | |
| COMMON STOCKSt — (Continued) | | | |
| | | Spain — 2.3% | |
| | 886,788 | | | Banco Santander Central Hispano SA | | $ | 11,292,493 | | |
| | 313,078 | | | Endesa SA | | | 7,773,698 | | |
| | | | 19,066,191 | | |
| | | Hong Kong — 1.8% | |
| | 6,687,115 | | | Hang Lung Properties Ltd. | | | 9,612,983 | | |
| | 110,300 | | | Honam Petrochemical Corp. | | | 5,358,911 | | |
| | | | 14,971,894 | | |
| | | Australia — 1.9% | |
| | 2,369,347 | | | John Fairfax Holdings, Ltd. | | | 7,330,971 | | |
| | 3,149,894 | | | Qantas Airways, Ltd. | | | 8,075,818 | | |
| | | | 15,406,789 | | |
| | | Israel — 1.7% | |
| | 366,527 | | | Teva Pharmaceutical Industries, Ltd., Sponsored ADR2 | | | 13,972,009 | | |
| | | China — 1.9% | |
| | 24,000,000 | | | China Construction Bank - Class H1 | | | 7,275,448 | | |
| | 16,500,810 | | | China Telecom Corp., Ltd. - Class H | | | 5,400,665 | | |
| | 6,140,110 | | | Global Bio-Chem Technology Group Co., Ltd. | | | 2,446,152 | | |
| | | | 15,122,265 | | |
| | | Norway — 1.5% | |
| | 97,933 | | | Norsk Hydro ASA | | | 9,716,533 | | |
| | 128,216 | | | Yara International ASA | | | 2,110,991 | | |
| | | | 11,827,524 | | |
| | | Denmark — 1.4% | |
| | 1,135,191 | | | Nordea AB | | | 11,122,901 | | |
| | | Portugal — 0.9% | |
| | 839,246 | | | Portugal Telecom SGPS SA | | | 7,588,568 | | |
| | | Singapore — 0.2% | |
| | 958,000 | | | Neptune Orient Lines, Ltd. | | | 1,725,032 | | |
| | 125,000 | | | Singapore Telecommunications, Ltd. | | | 172,222 | | |
| | | | 1,897,254 | | |
| | | | | TOTAL COMMON STOCKS
(Cost $628,139,940) | | | 809,630,375 | | |
See Notes to Financial Statements.
87
THE GLENMEDE FUND, INC.
International Portfolio
SCHEDULE OF PORTFOLIO INVESTMENTS — (Concluded)
October 31, 2005
Face
Amount | | | | Value | |
| INVESTMENTS OF SECURITY LENDING COLLATERAL — 3.9% | | | |
| $ | 7,213,774 | | | American Beacon Funds, Money Market Fund | | $ | 7,213,774 | | |
| | 2,251,220 | | | Canadian Imperial Bank, Certificate of Deposit,
4.072%, due 11/4/05 | | | 2,251,220 | | |
| | 2,061,079 | | | Fortis Bank, Eurodollar Time Deposit,
3.85%, due 11/3/05 | | | 2,061,079 | | |
| | 2,267,186 | | | Goldman Sachs Group, Inc., Promissory Note,
4.02%, due 12/28/05 | | | 2,267,186 | | |
| | 2,061,079 | | | Lexington Parker Capital, Commercial Paper,
3.952%, due 11/16/05 | | | 2,061,079 | | |
| | 7,213,775 | | | Merrill Lynch & Co., Inc., Repurchase Agreement,
4.053%, due 11/1/05 | | | 7,213,775 | | |
| | 2,061,079 | | | Skandinaviska Enskilda Banken AB, Eurodollar Time Deposit,
3.95%, due 11/21/05 | | | 2,061,079 | | |
| | 4,320,301 | | | Svenska Handlesbanken, Eurodollar Time Deposit,
4.031%, due 11/1/05 | | | 4,320,301 | | |
| | 2,061,078 | | | Wells Fargo, Eurodollar Time Deposit,
4.01%, due 12/12/05 | | | 2,061,078 | | |
| | | | | TOTAL INVESTMENTS OF SECURITY LENDING COLLATERAL
(Cost $31,510,571) | | | 31,510,571 | | |
TOTAL INVESTMENTS
(Cost $659,650,511)3 | | | 103.6 | % | | $ | 841,140,946 | | |
| LIABILITIES IN EXCESS OF OTHER ASSETS | | | (3.6 | ) | | | (29,291,278 | ) | |
| NET ASSETS | | | 100.0 | % | | $ | 811,849,668 | | |
t Percentages indicated are based on net assets.
1 Non-income producing security.
2 Securities or partial securities on loan. See Note 5.
3 Aggregate cost for federal tax purposes was $660,698,752.
See Notes to Financial Statements.
88
THE GLENMEDE FUND, INC.
International Portfolio
INDUSTRY DIVERSIFICATION
On October 31, 2005, industry diversification of the Portfolio was as follows (Unaudited):
| | | % of
Net Assets | | Value | |
| INDUSTRIES: | |
| Industrial | | | 7.7 | % | | $ | 62,795,400 | | |
| Chemicals | | | 7.6 | | | | 61,623,585 | | |
| Banking | | | 6.7 | | | | 54,048,257 | | |
| Insurance | | | 6.5 | | | | 52,460,026 | | |
| Finance | | | 6.3 | | | | 51,383,378 | | |
| Pharmaceuticals | | | 5.4 | | | | 44,385,190 | | |
| Oil & Gas | | | 4.8 | | | | 38,923,496 | | |
| Telecommunications | | | 4.7 | | | | 38,615,398 | | |
| Energy | | | 4.7 | | | | 38,224,497 | | |
| Automotive | | | 4.6 | | | | 37,495,954 | | |
| Media - Broadcasting & Publishing | | | 4.2 | | | | 34,163,428 | | |
| Transportation | | | 3.9 | | | | 31,569,555 | | |
| Retailers | | | 3.6 | | | | 29,295,026 | | |
| Mining | | | 3.3 | | | | 26,786,906 | | |
| Beverages, Food & Tobacco | | | 2.8 | | | | 22,716,899 | | |
| Utilities | | | 2.5 | | | | 20,027,675 | | |
| Electronics | | | 2.2 | | | | 18,073,854 | | |
| Miscellaneous | | | 2.0 | | | | 16,003,728 | | |
| Financial Services | | | 1.9 | | | | 15,782,935 | | |
| Textiles, Clothing & Fabrics | | | 1.8 | | | | 14,376,159 | | |
| Computers & Information | | | 1.8 | | | | 14,181,050 | | |
| Heavy Machinery | | | 1.6 | | | | 12,694,239 | | |
| Electrical Equipment | | | 1.4 | | | | 11,728,167 | | |
| Cosmetics & Personal Care | | | 1.4 | | | | 11,050,190 | | |
| Entertainment & Leisure | | | 1.3 | | | | 10,799,059 | | |
| Building Materials | | | 1.3 | | | | 10,794,239 | | |
| Real Estate | | | 1.2 | | | | 9,612,983 | | |
| Consumer Services | | | 1.2 | | | | 9,497,132 | | |
| Airlines | | | 1.0 | | | | 8,075,818 | | |
| Biotechnology | | | 0.3 | | | | 2,446,152 | | |
| TOTAL COMMON STOCKS | | | 99.7 | % | | $ | 809,630,375 | | |
| INVESTMENTS OF SECURITY LENDING COLLATERAL | | | 3.9 | | | | 31,510,571 | | |
| TOTAL INVESTMENTS | | | 103.6 | % | | $ | 841,140,946 | | |
See Notes to Financial Statements.
89
THE GLENMEDE FUND, INC.
Philadelphia International Fund
SCHEDULE OF PORTFOLIO INVESTMENTS
October 31, 2005
| Shares | | | | Value | |
| COMMON STOCKSt — 98.1% | | | |
| | | Japan — 23.9% | |
| | 717,000 | | | Ajinomoto Co., Inc. | | $ | 6,992,433 | | |
| | 921,000 | | | Asahi Glass Co., Ltd. | | | 9,957,085 | | |
| | 84,800 | | | Canon, Inc. | | | 4,488,394 | | |
| | 1,567 | | | East Japan Railway Co. | | | 9,310,281 | | |
| | 277,000 | | | FamilyMart Co., Ltd. | | | 8,240,909 | | |
| | 507,000 | | | JS Group Corp. | | | 8,615,109 | | |
| | 1,095,000 | | | Kuraray Co., Ltd. | | | 10,394,778 | | |
| | 1,394,100 | | | Mitsubishi Electric Corp. | | | 8,357,804 | | |
| | 1,897,000 | | | Nippon Express Co., Ltd. | | | 10,392,523 | | |
| | 1,435,000 | | | Osaka Gas Co., Ltd. | | | 5,246,892 | | |
| | 220,000 | | | Sega Sammy Holdings, Inc. | | | 7,916,354 | | |
| | 1,397,000 | | | Sumitomo Chemical Co., Ltd. | | | 8,244,891 | | |
| | 1,262,000 | | | Sumitomo Trust & Banking Co., Ltd. (The) | | | 10,743,825 | | |
| | 148,200 | | | Takeda Pharmaecutical Co., Ltd. | | | 8,123,301 | | |
| | 120,300 | | | Takefuji Corp. | | | 8,419,185 | | |
| | 132,500 | | | TDK Corp. | | | 8,933,903 | | |
| | 289,100 | | | THK Co., Ltd. | | | 6,524,483 | | |
| | 225,600 | | | Toyota Motor Corp. | | | 10,461,180 | | |
| | | | 151,363,330 | | |
| | | United Kingdom — 15.1% | |
| | 678,100 | | | Aviva PLC | | | 8,008,063 | | |
| | 469,711 | | | BOC Group PLC | | | 9,260,152 | | |
| | 952,499 | | | BP Amoco PLC | | | 10,551,652 | | |
| | 884,000 | | | Cattles PLC | | | 4,281,099 | | |
| | 1,550,078 | | | Centrica PLC | | | 6,552,101 | | |
| | 2,123,000 | | | Compass Group PLC | | | 7,144,790 | | |
| | 308,127 | | | GlaxoSmithKline PLC | | | 8,014,288 | | |
| | 1,929,230 | | | Misys PLC | | | 7,005,046 | | |
| | 326,000 | | | Rio Tinto PLC | | | 12,420,705 | | |
| | 365,150 | | | Royal Bank of Scotland Group PLC | | | 10,111,753 | | |
| | 4,671,231 | | | Vodafone Group PLC | | | 12,264,397 | | |
| | | | 95,614,046 | | |
| | | Germany — 13.2% | |
| | 82,600 | | | Allianz AG | | | 11,686,302 | | |
| | 118,361 | | | BASF AG | | | 8,535,926 | | |
| | 184,681 | | | Bayerische Motoren Werke AG | | | 8,013,483 | | |
| | 124,006 | | | Continental AG | | | 9,485,410 | | |
| | 109,751 | | | E.On AG | | | 9,946,280 | | |
| | 140,400 | | | Hannover Rueckversicherung AG | | | 5,082,619 | | |
| | 91,300 | | | Henkel KGaA Preferred | | | 7,869,659 | | |
See Notes to Financial Statements.
90
THE GLENMEDE FUND, INC.
Philadelphia International Fund
SCHEDULE OF PORTFOLIO INVESTMENTS — (Continued)
October 31, 2005
| Shares | | | | Value | |
| COMMON STOCKSt — (Continued) | | | |
| | | Germany — (Continued) | |
| | 108,188 | | | Metro AG | | $ | 4,921,050 | | |
| | 120,000 | | | Schering AG | | | 7,420,793 | | |
| | 143,300 | | | Siemens AG Reg. | | | 10,674,112 | | |
| | | | 83,635,634 | | |
| | | France — 9.2% | |
| | 156,676 | | | Air France - KLM | | | 2,634,775 | | |
| | 103,647 | | | Assurances Generales De France | | | 9,871,782 | | |
| | 373,700 | | | Axa | | | 10,824,560 | | |
| | 160,997 | | | Compagnie de Saint-Gobain | | | 8,820,278 | | |
| | 206,583 | | | France Telecom SA | | | 5,370,794 | | |
| | 108,183 | | | LaFarge SA ADR | | | 8,882,899 | | |
| | 45,749 | | | Societe BIC SA | | | 2,598,898 | | |
| | 37,598 | | | Total SA | | | 9,461,960 | | |
| | | | 58,465,946 | | |
| | | Netherlands — 8.7% | |
| | 156,094 | | | Akzo Nobel N.V. | | | 6,747,373 | | |
| | 374,500 | | | ING Groep N.V. | | | 10,801,357 | | |
| | 773,404 | | | Reed Elsevier N.V. | | | 10,416,712 | | |
| | 354,816 | | | Royal Dutch Shell PLC - Class A | | | 10,941,148 | | |
| | 284,922 | | | TNT N.V. | | | 6,719,138 | | |
| | 136,084 | | | Unilever N.V. | | | 9,575,612 | | |
| | | | 55,201,340 | | |
| | | Switzerland — 4.4% | |
| | 111,315 | | | Ciba Specialty Chemicals AG Reg. | | | 6,392,399 | | |
| | 29,727 | | | Nestle SA Reg. | | | 8,851,436 | | |
| | 62,202 | | | Novartis AG | | | 3,345,478 | | |
| | 56,223 | | | Zurich Financial Services AG1 | | | 9,587,015 | | |
| | | | 28,176,328 | | |
| | | Ireland — 3.2% | |
| | 394,893 | | | Allied Irish Banks PLC | | | 8,287,385 | | |
| | 370,345 | | | CRH PLC (Dublin Exchange) | | | 9,254,972 | | |
| | 29,149 | | | CRH PLC (London Exchange) | | | 728,650 | | |
| | 127,319 | | | Irish Life & Permanent PLC | | | 2,243,681 | | |
| | | | 20,514,688 | | |
| | | Canada — 2.9% | |
| | 242,300 | | | Alcan, Inc. | | | 7,633,548 | | |
| | 378,000 | | | CGI Group, Inc.1 | | | 2,720,345 | | |
| | 178,331 | | | Talisman Energy, Inc. | | | 7,898,141 | | |
| | | | 18,252,034 | | |
See Notes to Financial Statements.
91
THE GLENMEDE FUND, INC.
Philadelphia International Fund
SCHEDULE OF PORTFOLIO INVESTMENTS — (Continued)
October 31, 2005
| Shares | | | | Value | |
| COMMON STOCKSt — (Continued) | | | |
| | | Italy — 2.7% | |
| | 106,649 | | | ENI SPA2 | | $ | 2,854,809 | | |
| | 36,776 | | | ENI SPA Sponsored ADR | | | 4,918,790 | | |
| | 866,340 | | | Mediaset SPA | | | 9,516,349 | | |
| | | | 17,289,948 | | |
| | | Spain — 2.5% | |
| | 781,000 | | | Banco Santander Central Hispano SA | | | 9,945,373 | | |
| | 240,651 | | | Endesa SA | | | 5,975,342 | | |
| | | | 15,920,715 | | |
| | | Australia — 2.0% | |
| | 2,318,111 | | | John Fairfax Holdings, Ltd. | | | 7,172,442 | | |
| | 2,086,334 | | | Qantas Airways, Ltd. | | | 5,349,023 | | |
| | | | 12,521,465 | | |
| | | Hong Kong — 1.6% | |
| | 4,765,920 | | | Hang Lung Properties Ltd. | | | 6,851,192 | | |
| | 67,000 | | | Honam Petrochemical Corp. | | | 3,255,186 | | |
| | | | 10,106,378 | | |
| | | Israel — 1.8% | |
| | 299,700 | | | Teva Pharmaceutical Industries, Ltd., Sponsored ADR2 | | | 11,424,564 | | |
| | | China — 1.9% | |
| | 19,000,000 | | | China Construction Bank - Class H1 | | | 5,759,730 | | |
| | 13,146,000 | | | China Telecom Corp., Ltd. - Class H | | | 4,302,646 | | |
| | 4,445,000 | | | Global Bio-Chem Technology Group Co., Ltd. | | | 1,770,839 | | |
| | | | 11,833,215 | | |
| | | Singapore — 1.6% | |
| | 1,060,000 | | | Neptune Orient Lines, Ltd. | | | 1,908,700 | | |
| | 5,779,000 | | | Singapore Telecommunications, Ltd. | | | 7,962,157 | | |
| | | | 9,870,857 | | |
| | | Denmark — 1.4% | |
| | 909,411 | | | Nordea AB | | | 8,910,649 | | |
| | | Norway — 1.2% | |
| | 67,667 | | | Norsk Hydro ASA | | | 6,713,658 | | |
| | 67,667 | | | Yara International ASA | | | 1,114,092 | | |
| | | | 7,827,750 | | |
| | | Portugal — 0.8% | |
| | 576,000 | | | Portugal Telecom SGPS SA | | | 5,208,264 | | |
| | | | | TOTAL COMMON STOCKS
(Cost $531,182,374) | | | 622,137,151 | | |
See Notes to Financial Statements.
92
THE GLENMEDE FUND, INC.
Philadelphia International Fund
SCHEDULE OF PORTFOLIO INVESTMENTS — (Continued)
October 31, 2005
Face
Amount | | | | Value | |
| REPURCHASE AGREEMENT — 1.6% | | | |
| $ | 9,727,993 | | | With Investors Bank & Trust Co., dated 10/31/05,
3.82%, principal and interest in the amount of
$9,729,026, due 11/01/05, (collateralized by FHR
#2722FB with a par value of $3,431,709, coupon rate
of 4.665%, due 04/15/23, market value of $3,516,843,
SBA #505781 with a par value of $3,433,261, coupon
rate of 7.375%, due 05/25/15, market value of
$3,658,150 and SBA #505965 with a par value of
$2,802,975, coupon rate of 7.125%, due 05/25/27,
market value of $3,039,400) | | $ | 9,727,993 | | |
| | | | | TOTAL REPURCHASE AGREEMENT
(Cost $9,727,993) | | | 9,727,993 | | |
| INVESTMENTS OF SECURITY LENDING COLLATERAL — 2.7% | | | |
| | 3,921,082 | | | American Beacon Funds, Money Market Fund | | | 3,921,082 | | |
| | 1,223,660 | | | Canadian Imperial Bank, Certificate of Deposit,
4.072%, due 11/4/05 | | | 1,223,660 | | |
| | 1,120,308 | | | Fortis Bank, Eurodollar Time Deposit,
3.85%, due 11/3/05 | | | 1,120,308 | | |
| | 1,232,339 | | | Goldman Sachs Group, Inc., Promissory Note,
4.02%, due 12/28/05 | | | 1,232,339 | | |
| | 1,120,308 | | | Lexington Parker Capital, Commercial Paper,
3.952%, due 11/16/05 | | | 1,120,308 | | |
| | 3,921,079 | | | Merrill Lynch & Co., Inc., Repurchase Agreement,
4.053%, due 11/1/05 | | | 3,921,079 | | |
| | 1,120,308 | | | Skandinaviska Enskilda Banken AB, Eurodollar Time Deposit,
3.95%, due 11/21/05 | | | 1,120,308 | | |
| | 2,348,319 | | | Svenska Handlesbanken, Eurodollar Time Deposit,
4.031%, due 11/1/05 | | | 2,348,319 | | |
| | 1,120,308 | | | Wells Fargo, Eurodollar Time Deposit,
4.01%, due 12/12/05 | | | 1,120,308 | | |
| | | | | TOTAL INVESTMENTS OF SECURITY LENDING COLLATERAL
(Cost $17,127,711) | | | 17,127,711 | | |
TOTAL INVESTMENTS
(Cost $558,038,078)3 | | | 102.4 | % | | $ | 648,992,855 | | |
| LIABILITIES IN EXCESS OF OTHER ASSETS | | | (2.4 | ) | | | (14,974,733 | ) | |
| NET ASSETS | | | 100.0 | % | | $ | 634,018,122 | | |
See Notes to Financial Statements.
93
THE GLENMEDE FUND, INC.
Philadelphia International Fund
SCHEDULE OF PORTFOLIO INVESTMENTS — (Concluded)
October 31, 2005
t Percentages indicated are based on net assets.
1 Non-income producing security.
2 Securities or partial securities on loan. See Note 5.
3 Aggregate cost for federal tax purposes was $559,527,688.
Abbreviations:
ADR — American Depositary Receipt
FHR — Federal Home Loan Mortgage Corporation REMIC
SBA — Small Business Administration
See Notes to Financial Statements.
94
THE GLENMEDE FUND, INC.
Philadelphia International Fund
INDUSTRY DIVERSIFICATION
On October 31, 2005, industry diversification of the Portfolio was as follows (Unaudited):
| | | % of
Net Assets | | Value | |
| INDUSTRIES: | |
| Industrial | | | 7.8 | % | | $ | 49,541,906 | | |
| Insurance | | | 7.1 | | | | 45,165,356 | | |
| Chemicals | | | 6.9 | | | | 43,550,019 | | |
| Banking | | | 6.4 | | | | 40,841,780 | | |
| Pharmaceuticals | | | 6.1 | | | | 38,328,424 | | |
| Finance | | | 6.0 | | | | 37,894,376 | | |
| Telecommunications | | | 5.5 | | | | 35,108,258 | | |
| Energy | | | 5.0 | | | | 31,646,060 | | |
| Automotive | | | 4.4 | | | | 27,960,073 | | |
| Media - Broadcasting & Publishing | | | 4.3 | | | | 27,105,503 | | |
| Transportation | | | 3.4 | | | | 21,611,504 | | |
| Retailers | | | 3.3 | | | | 21,060,100 | | |
| Oil & Gas | | | 3.2 | | | | 20,348,058 | | |
| Mining | | | 3.2 | | | | 20,054,253 | | |
| Utilities | | | 2.5 | | | | 15,921,622 | | |
| Beverages, Food & Tobacco | | | 2.5 | | | | 15,843,869 | | |
| Electronics | | | 2.4 | | | | 15,458,386 | | |
| Miscellaneous | | | 1.9 | | | | 12,174,510 | | |
| Financial Services | | | 1.7 | | | | 10,662,866 | | |
| Textiles, Clothing & Fabrics | | | 1.6 | | | | 10,394,778 | | |
| Heavy Machinery | | | 1.6 | | | | 9,983,622 | | |
| Computers & Information | | | 1.5 | | | | 9,725,391 | | |
| Building Materials | | | 1.4 | | | | 8,615,109 | | |
| Electrical Equipment | | | 1.3 | | | | 8,357,804 | | |
| Airlines | | | 1.3 | | | | 7,983,798 | | |
| Entertainment & Leisure | | | 1.3 | | | | 7,916,354 | | |
| Cosmetics & Personal Care | | | 1.2 | | | | 7,869,659 | | |
| Consumer Services | | | 1.1 | | | | 7,144,790 | | |
| Real Estate | | | 1.1 | | | | 6,851,192 | | |
| Gas | | | 0.8 | | | | 5,246,892 | | |
| Biotechnology | | | 0.3 | | | | 1,770,839 | | |
| TOTAL COMMON STOCKS | | | 98.1 | % | | $ | 622,137,151 | | |
| REPURCHASE AGREEMENT | | | 1.6 | | | | 9,727,993 | | |
| INVESTMENTS OF SECURITY LENDING COLLATERAL | | | 2.7 | | | | 17,127,711 | | |
| TOTAL INVESTMENTS | | | 102.4 | % | | $ | 648,992,855 | | |
See Notes to Financial Statements.
95
THE GLENMEDE FUND, INC.
U.S. Emerging Growth Portfolio
SCHEDULE OF PORTFOLIO INVESTMENTS
October 31, 2005
| Shares | | | | Value | |
| COMMON STOCKSt — 99.1% | | | |
| | | Aerospace & Defense — 1.5% | |
| | 2,010 | | | Ceradyne, Inc.1,2 | | $ | 78,792 | | |
| | 3,895 | | | Teledyne Technologies, Inc.1 | | | 137,338 | | |
| | | | 216,130 | | |
| | | Air Freight & Logistics — 1.9% | |
| | 3,970 | | | HUB Group, Inc. - Class A1 | | | 144,389 | | |
| | 4,555 | | | Pacer International, Inc. | | | 117,747 | | |
| | | | 262,136 | | |
| | | Airlines — 2.3% | |
| | 15,603 | | | Mesa Air Group, Inc.1,2 | | | 176,002 | | |
| | 5,295 | | | Skywest, Inc. | | | 155,196 | | |
| | | | 331,198 | | |
| | | Biotechnology — 3.2% | |
| | 5,535 | | | Eyetech Pharmaceuticals, Inc.1,2 | | | 97,637 | | |
| | 3,880 | | | Myriad Genetics, Inc.1,2 | | | 75,194 | | |
| | 4,985 | | | Pharmion Corp.1 | | | 94,167 | | |
| | 2,515 | | | United Therapeutics Corp.1 | | | 185,758 | | |
| | | | 452,756 | | |
| | | Building Products — 1.0% | |
| | 4,515 | | | American Woodmark Corp. | | | 139,830 | | |
| | | Commercial Banks — 2.0% | |
| | 5,975 | | | Center Financial Corp. | | | 151,406 | | |
| | 4,618 | | | Glacier Bancorp, Inc. | | | 136,139 | | |
| | | | 287,545 | | |
| | | Commercial Services & Supplies — 4.0% | |
| | 3,390 | | | Administaff, Inc. | | | 143,465 | | |
| | 7,972 | | | Healthcare Services Group, Inc. | | | 148,598 | | |
| | 3,185 | | | John H. Harland Co. | | | 132,464 | | |
| | 6,230 | | | Labor Ready, Inc.1 | | | 145,471 | | |
| | | | 569,998 | | |
| | | Communications Equipment — 4.1% | |
| | 11,310 | | | Arris Group, Inc.1 | | | 93,534 | | |
| | 7,840 | | | Commscope, Inc.1 | | | 153,037 | | |
| | 4,845 | | | Comtech Telecommunications Corp.1 | | | 185,854 | | |
| | 7,975 | | | NETGEAR, Inc.1 | | | 155,911 | | |
| | | | 588,336 | | |
See Notes to Financial Statements.
96
THE GLENMEDE FUND, INC.
U.S. Emerging Growth Portfolio
SCHEDULE OF PORTFOLIO INVESTMENTS — (Continued)
October 31, 2005
| Shares | | | | Value | |
| COMMON STOCKSt — (Continued) | | | |
| | | Computers & Peripherals — 2.4% | |
| | 6,885 | | | Emulex Corp.1 | | $ | 127,441 | | |
| | 3,660 | | | Komag, Inc.1,2 | | | 98,161 | | |
| | 5,125 | | | Synaptics, Inc.1,2 | | | 119,054 | | |
| | | | 344,656 | | |
| | | Consumer Finance — 1.9% | |
| | 4,895 | | | Asta Funding, Inc. | | | 132,801 | | |
| | 5,250 | | | First Cash Financial Services, Inc.1 | | | 137,708 | | |
| | | | 270,509 | | |
| | | Containers & Packaging — 1.0% | |
| | 4,260 | | | Silgan Holdings, Inc. | | | 137,044 | | |
| | | Diversified Consumer Services — 1.8% | |
| | 8,215 | | | Escala Group, Inc.1,2 | | | 135,219 | | |
| | 1,310 | | | Strayer Education, Inc.2 | | | 117,258 | | |
| | | | 252,477 | | |
| | | Diversified Financial Services — 1.8% | |
| | 4,720 | | | Asset Acceptance Capital Corp.1 | | | 125,033 | | |
| | 7,270 | | | Encore Capital Group, Inc.1,2 | | | 124,971 | | |
| | | | 250,004 | | |
| | | Electrical Equipment — 0.9% | |
| | 7,740 | | | General Cable Corp.1 | | | 125,775 | | |
| | | Electronic Equipment & Instruments — 3.1% | |
| | 2,995 | | | Anixter International, Inc. | | | 111,055 | | |
| | 7,479 | | | Brightpoint, Inc.1 | | | 161,472 | | |
| | 6,315 | | | Multi-Fineline Electronix, Inc.1 | | | 168,105 | | |
| | | | 440,632 | | |
| | | Energy Equipment & Services — 4.3% | |
| | 3,070 | | | Lone Star Technologies1 | | | 140,453 | | |
| | 5,005 | | | Maverick Tube Corp.1 | | | 154,955 | | |
| | 4,115 | | | NS Group, Inc.1 | | | 142,420 | | |
| | 5,335 | | | Oil States International, Inc.1,2 | | | 176,589 | | |
| | | | 614,417 | | |
| | | Health Care Equipment & Supplies — 8.8% | |
| | 2,320 | | | Biosite, Inc.1,2 | | | 128,134 | | |
| | 5,305 | | | Greatbatch, Inc.1 | | | 138,248 | | |
| | 3,639 | | | ICU Medical, Inc.1,2 | | | 127,037 | | |
| | 4,480 | | | Kensey Nash Corp.1,2 | | | 102,726 | | |
See Notes to Financial Statements.
97
THE GLENMEDE FUND, INC.
U.S. Emerging Growth Portfolio
SCHEDULE OF PORTFOLIO INVESTMENTS — (Continued)
October 31, 2005
| Shares | | | | Value | |
| COMMON STOCKSt — (Continued) | | | |
| | | Health Care Equipment & Supplies — (Continued) | |
| | 4,635 | | | Kyphon, Inc.1,2 | | $ | 185,817 | | |
| | 7,360 | | | Lifecell Corp.1 | | | 119,232 | | |
| | 5,440 | | | Molecular Devices Corp.1 | | | 121,856 | | |
| | 3,460 | | | SurModics, Inc.1,2 | | | 136,739 | | |
| | 9,660 | | | Thoratec Corp.1 | | | 191,075 | | |
| | | | 1,250,864 | | |
| | | Health Care Providers & Services — 6.9% | |
| | 3,555 | | | Amedisys, Inc.1,2 | | | 135,837 | | |
| | 2,880 | | | LCA-Vision, Inc. | | | 120,989 | | |
| | 7,495 | | | Merge Technologies, Inc.1 | | | 172,910 | | |
| | 7,780 | | | Odyssey Healthcare, Inc.1 | | | 134,438 | | |
| | 4,540 | | | PRA International1 | | | 120,582 | | |
| | 9,640 | | | Trizetto Group1 | | | 136,599 | | |
| | 6,180 | | | Ventiv Health, Inc.1 | | | 155,983 | | |
| | | | 977,338 | | |
| | | Hotels Restaurants & Leisure — 1.9% | |
| | 2,685 | | | Papa John's International, Inc.1 | | | 139,432 | | |
| | 5,080 | | | Shuffle Master, Inc.1,2 | | | 128,829 | | |
| | | | 268,261 | | |
| | | Household Durables — 1.7% | |
| | 5,055 | | | Tupperware Corp. | | | 115,911 | | |
| | 5,355 | | | Yankee Candle Co., Inc. | | | 121,077 | | |
| | | | 236,988 | | |
| | | Household Products — 1.2% | |
| | 6,328 | | | Wd-40 Co. | | | 174,210 | | |
| | | Industrial Conglomerates — 1.1% | |
| | 5,160 | | | Raven Industries, Inc. | | | 162,230 | | |
| | | Insurance — 1.9% | |
| | 2,815 | | | ProAssurance Corp.1 | | | 131,742 | | |
| | 4,345 | | | State Auto Financial Corp. | | | 143,124 | | |
| | | | 274,866 | | |
| | | Internet & Catalog Retail — 1.4% | |
| | 2,365 | | | Netflix, Inc.1,2 | | | 62,460 | | |
| | 4,405 | | | Nutri/System, Inc.1,2 | | | 132,018 | | |
| | | | 194,478 | | |
See Notes to Financial Statements.
98
THE GLENMEDE FUND, INC.
U.S. Emerging Growth Portfolio
SCHEDULE OF PORTFOLIO INVESTMENTS — (Continued)
October 31, 2005
| Shares | | | | Value | |
| COMMON STOCKSt — (Continued) | | | |
| | | Internet Software & Services — 3.0% | |
| | 1,563 | | | Blue Coat Systems, Inc.1 | | $ | 73,445 | | |
| | 3,420 | | | Digital River, Inc.1 | | | 95,794 | | |
| | 13,090 | | | Earthlink, Inc.1 | | | 144,121 | | |
| | 5,000 | | | Webex Communications, Inc.1,2 | | | 114,550 | | |
| | | | 427,910 | | |
| | | IT Services — 3.2% | |
| | 2,765 | | | Anteon International Corp.1 | | | 124,978 | | |
| | 6,503 | | | CSG Systems International, Inc.1 | | | 152,886 | | |
| | 11,910 | | | SYKES Enterprises, Inc.1 | | | 171,980 | | |
| | | | 449,844 | | |
| | | Machinery — 1.0% | |
| | 1,920 | | | Middleby Corp. (The)1 | | | 139,200 | | |
| | | Metals & Mining — 3.0% | |
| | 2,165 | | | Quanex Corp.2 | | | 125,375 | | |
| | 2,610 | | | Reliance Steel & Aluminum Co. | | | 148,822 | | |
| | 5,615 | | | Steel Technologies, Inc. | | | 147,169 | | |
| | | | 421,366 | | |
| | | Oil Gas & Consumable Fuels — 4.1% | |
| | 3,670 | | | Frontier Oil Corp. | | | 135,350 | | |
| | 2,380 | | | Giant Industries, Inc.1 | | | 136,112 | | |
| | 2,630 | | | Holly Corp. | | | 151,488 | | |
| | 6,735 | | | KCS Energy, Inc.1,2 | | | 162,448 | | |
| | | | 585,398 | | |
| | | Pharmaceuticals — 1.5% | |
| | 4,365 | | | CNS, Inc. | | | 113,796 | | |
| | 6,600 | | | First Horizon Pharmaceutical Corp.1,2 | | | 95,238 | | |
| | | | 209,034 | | |
| | | Real Estate — 1.0% | |
| | 2,880 | | | Jones Lang Lasalle, Inc. | | | 144,806 | | |
| | | Road & Rail — 1.7% | |
| | 3,595 | | | Old Dominion Freight Line, Inc.1 | | | 127,227 | | |
| | 5,090 | | | USA Truck, Inc.1 | | | 118,139 | | |
| | | | 245,366 | | |
| | | Semiconductors & Semiconductor Equipment — 3.2% | |
| | 2,190 | | | Diodes, Inc.1 | | | 79,409 | | |
| | 9,510 | | | Omnivision Technologies, Inc.1,2 | | | 122,584 | | |
See Notes to Financial Statements.
99
THE GLENMEDE FUND, INC.
U.S. Emerging Growth Portfolio
SCHEDULE OF PORTFOLIO INVESTMENTS — (Continued)
October 31, 2005
| Shares | | | | Value | |
| COMMON STOCKSt — (Continued) | | | |
| | | Semiconductors & Semiconductor Equipment — (Continued) | |
| | 4,845 | | | Photronics, Inc.1 | | $ | 87,210 | | |
| | 4,485 | | | Sigmatel, Inc.1 | | | 61,041 | | |
| | 2,860 | | | Varian Semiconductor Equipment Associates, Inc.1,2 | | | 108,165 | | |
| | | | 458,409 | | |
| | | Software — 3.1% | |
| | 5,580 | | | Internet Security Systems, Inc.1 | | | 137,435 | | |
| | 2,250 | | | MicroStrategy, Inc. - Class A1 | | | 159,525 | | |
| | 6,277 | | | THQ, Inc.1 | | | 145,501 | | |
| | | | 442,461 | | |
| | | Speciality Retail — 7.9% | |
| | 5,439 | | | Dress Barn, Inc.1 | | | 144,514 | | |
| | 3,305 | | | Genesco, Inc.1 | | | 121,624 | | |
| | 5,585 | | | Guess ?, Inc.1 | | | 151,465 | | |
| | 1,950 | | | Guitar Center, Inc.1 | | | 101,615 | | |
| | 6,080 | | | Hibbet Sporting Goods, Inc.1 | | | 159,478 | | |
| | 4,027 | | | Jos. A. Bank Clothiers, Inc.1,2 | | | 164,342 | | |
| | 3,315 | | | Pantry (The), Inc.1 | | | 128,257 | | |
| | 6,620 | | | Select Comfort Corp.1 | | | 144,978 | | |
| | | | 1,116,273 | | |
| | | Textiles Apparel & Luxury Goods — 2.5% | |
| | 4,680 | | | Deckers Outdoor Corp.1,2 | | | 80,262 | | |
| | 4,430 | | | K-Swiss, Inc. - Class A | | | 134,894 | | |
| | 2,920 | | | Oxford Industries, Inc. | | | 143,810 | | |
| | | | 358,966 | | |
| | | Thrifts & Mortgage Finance — 0.8% | |
| | 2,140 | | | Corus Bankshares, Inc.2 | | | 117,486 | | |
| | | Trading Companies & Distributors — 1.0% | |
| | 3,585 | | | WESCO International, Inc.1 | | | 142,504 | | |
| | | | | TOTAL COMMON STOCKS
(Cost $12,439,672) | | | 14,081,701 | | |
See Notes to Financial Statements.
100
THE GLENMEDE FUND, INC.
U.S. Emerging Growth Portfolio
SCHEDULE OF PORTFOLIO INVESTMENTS — (Concluded)
October 31, 2005
Face
Amount | | | | Value | |
| REPURCHASE AGREEMENT — 2.3% | | | |
| $ | 326,865 | | | With Investors Bank & Trust Co., dated 10/31/05,
3.82%, principal and interest in the amount of
$326,900, due 11/01/05, (collateralized by FN #779763
with a par value of $346,020, coupon rate of 5.50%,
due 06/01/34, market value of $343,208) | | $ | 326,865 | | |
| | | | | TOTAL REPURCHASE AGREEMENT
(Cost $326,865) | | | 326,865 | | |
| INVESTMENTS OF SECURITY LENDING COLLATERAL — 22.7% | | | |
| | 739,772 | | | American Beacon Funds, Money Market Fund | | | 739,772 | | |
| | 230,862 | | | Canadian Imperial Bank, Certificate of Deposit,
4.072%, due 11/4/05 | | | 230,862 | | |
| | 211,364 | | | Fortis Bank, Eurodollar Time Deposit,
3.85%, due 11/3/05 | | | 211,364 | | |
| | 232,500 | | | Goldman Sachs Group Inc., Promissory Note,
4.02%, due 12/28/05 | | | 232,500 | | |
| | 211,363 | | | Lexington Parker Capital Corp., Commercial Paper,
3.952%, due 11/16/05 | | | 211,363 | | |
| | 739,772 | | | Merrill Lynch & Co., Inc., Repurchase Agreement,
4.053%, due 11/1/05 | | | 739,772 | | |
| | 211,364 | | | Skandinaviska Enskilda Banken AB (SEB), Eurodollar Term,
3.95%, due 11/21/05 | | | 211,364 | | |
| | 443,047 | | | Svenska Handlesbanken, Eurodollar Overnight,
4.031%, due 11/1/05 | | | 443,047 | | |
| | 211,363 | | | Wells Fargo, Eurodollar Time Deposit,
4.01%, due 12/12/05 | | | 211,363 | | |
| | | | | TOTAL INVESTMENTS OF SECURITY LENDING COLLATERAL
(Cost $3,231,407) | | | 3,231,407 | | |
TOTAL INVESTMENTS
(Cost $15,997,944)3 | | | 124.1 | % | | $ | 17,639,973 | | |
| LIABILITIES IN EXCESS OF OTHER ASSETS | | | (24.1 | ) | | | (3,423,057 | ) | |
| NET ASSETS | | | 100.0 | % | | $ | 14,216,916 | | |
t Percentages indicated are based on net assets.
1 Non-income producing security.
2 Securities or partial securities on loan. See Note 5.
3 Aggregate cost for federal tax purposes was $15,998,941.
Abbreviation:
FN — Federal National Mortgage Association
See Notes to Financial Statements.
101
THE GLENMEDE FUND, INC.
U.S. Emerging Growth Portfolio
INDUSTRY DIVERSIFICATION
On October 31, 2005, industry diversification of the Portfolio was as follows (Unaudited):
| | | % of
Net Assets | | Value | |
| INDUSTRIES: | |
| Health Care Equipment & Supplies | | | 8.8 | % | | $ | 1,250,864 | | |
| Speciality Retail | | | 7.9 | | | | 1,116,273 | | |
| Health Care Providers & Services | | | 6.9 | | | | 977,338 | | |
| Energy Equipment & Services | | | 4.3 | | | | 614,417 | | |
| Communications Equipment | | | 4.1 | | | | 588,336 | | |
| Oil Gas & Consumable Fuels | | | 4.1 | | | | 585,398 | | |
| Commercial Services & Supplies | | | 4.0 | | | | 569,998 | | |
| Semiconductors & Semiconductor Equipment | | | 3.2 | | | | 458,409 | | |
| Biotechnology | | | 3.2 | | | | 452,756 | | |
| IT Services | | | 3.2 | | | | 449,844 | | |
| Software | | | 3.1 | | | | 442,461 | | |
| Electronic Equipment & Instruments | | | 3.1 | | | | 440,632 | | |
| Internet Software & Services | | | 3.0 | | | | 427,910 | | |
| Metals & Mining | | | 3.0 | | | | 421,366 | | |
| Textiles Apparel & Luxury Goods | | | 2.5 | | | | 358,966 | | |
| Computers & Peripherals | | | 2.4 | | | | 344,656 | | |
| Airlines | | | 2.3 | | | | 331,198 | | |
| Commercial Banks | | | 2.0 | | | | 287,545 | | |
| Insurance | | | 1.9 | | | | 274,866 | | |
| Consumer Finance | | | 1.9 | | | | 270,509 | | |
| Hotels Restaurants & Leisure | | | 1.9 | | | | 268,261 | | |
| Air Freight & Logistics | | | 1.9 | | | | 262,136 | | |
| Diversified Consumer Services | | | 1.8 | | | | 252,477 | | |
| Diversified Financial Services | | | 1.8 | | | | 250,004 | | |
| Road & Rail | | | 1.7 | | | | 245,366 | | |
| Household Durables | | | 1.7 | | | | 236,988 | | |
| Aerospace & Defense | | | 1.5 | | | | 216,130 | | |
| Pharmaceuticals | | | 1.5 | | | | 209,034 | | |
| Internet & Catalog Retail | | | 1.4 | | | | 194,478 | | |
| Household Products | | | 1.2 | | | | 174,210 | | |
| Industrial Conglomerates | | | 1.1 | | | | 162,230 | | |
| Real Estate | | | 1.0 | | | | 144,806 | | |
| Trading Companies & Distributors | | | 1.0 | | | | 142,504 | | |
| Building Products | | | 1.0 | | | | 139,830 | | |
| Machinery | | | 1.0 | | | | 139,200 | | |
| Containers & Packaging | | | 1.0 | | | | 137,044 | | |
| Electrical Equipment | | | 0.9 | | | | 125,775 | | |
| Thrifts & Mortgage Finance | | | 0.8 | | | | 117,486 | | |
| TOTAL COMMON STOCKS | | | 99.1 | % | | $ | 14,081,701 | | |
| REPURCHASE AGREEMENT | | | 2.3 | | | | 326,865 | | |
| INVESTMENTS OF SECURITY LENDING COLLATERAL | | | 22.7 | | | | 3,231,407 | | |
| TOTAL INVESTMENTS | | | 124.1 | % | | $ | 17,639,973 | | |
See Notes to Financial Statements.
102
THE GLENMEDE FUND, INC.
Large Cap 100 Portfolio
SCHEDULE OF PORTFOLIO INVESTMENTS
October 31, 2005
| Shares | | | | Value | |
| COMMON STOCKSt — 98.8% | | | |
| | | Aerospace & Defense — 3.4% | |
| | 5,425 | | | Boeing Co. | | $ | 350,672 | | |
| | 3,290 | | | General Dynamics Corp. | | | 382,627 | | |
| | 5,815 | | | L-3 Communications Holdings, Inc.2 | | | 452,523 | | |
| | 10,465 | | | United Technologies Corp. | | | 536,645 | | |
| | | | 1,722,467 | | |
| | | Air Freight & Logistics — 1.0% | |
| | 7,110 | | | United Parcel Service, Inc. - Class B | | | 518,603 | | |
| | | Beverages — 3.9% | |
| | 6,590 | | | Brown-Forman Corp. - Class B | | | 417,411 | | |
| | 26,400 | | | Coca-Cola Enterprises, Inc. | | | 498,960 | | |
| | 17,675 | | | Pepsi Bottling Group, Inc. | | | 502,500 | | |
| | 9,325 | | | PepsiCo, Inc. | | | 550,921 | | |
| | | | 1,969,792 | | |
| | | Biotechnology — 2.0% | |
| | 6,975 | | | Amgen, Inc.1 | | | 528,426 | | |
| | 20,210 | | | Applera Corp. - Applied Biosystems Group | | | 490,497 | | |
| | | | 1,018,923 | | |
| | | Building Products — 1.0% | |
| | 18,060 | | | Masco Corp. | | | 514,710 | | |
| | | Capital Markets — 2.2% | |
| | 4,600 | | | Goldman Sachs Capital, Inc. | | | 581,302 | | |
| | 4,225 | | | Lehman Brothers Holdings, Inc.2 | | | 505,606 | | |
| | | | 1,086,908 | | |
| | | Chemicals — 2.2% | |
| | 5,500 | | | Ashland, Inc. | | | 294,305 | | |
| | 5,135 | | | BASF AG | | | 369,669 | | |
| | 7,535 | | | PPG Industries, Inc. | | | 451,874 | | |
| | | | 1,115,848 | | |
| | | Commercial Banks — 4.0% | |
| | 12,365 | | | Bank of America Corp. | | | 540,845 | | |
| | 8,950 | | | Barclays PLC | | | 354,599 | | |
| | 9,605 | | | Comerica, Inc. | | | 554,977 | | |
| | 17,025 | | | KeyCorp | | | 548,886 | | |
| | | | 1,999,307 | | |
| | | Communications Equipment — 1.7% | |
| | 24,615 | | | Cisco Systems, Inc.1 | | | 429,532 | | |
| | 11,610 | | | Scientific-Atlanta, Inc. | | | 411,458 | | |
| | | | 840,990 | | |
See Notes to Financial Statements.
103
THE GLENMEDE FUND, INC.
Large Cap 100 Portfolio
SCHEDULE OF PORTFOLIO INVESTMENTS — (Continued)
October 31, 2005
| Shares | | | | Value | |
| COMMON STOCKSt — (Continued) | | | |
| | | Computers & Peripherals — 3.2% | |
| | 26,000 | | | EMC Corp.1 | | $ | 362,960 | | |
| | 6,450 | | | International Business Machines Corp. | | | 528,126 | | |
| | 15,200 | | | QLogic Corp.1 | | | 458,432 | | |
| | 4,685 | | | SanDisk Corp.1 | | | 275,900 | | |
| | | | 1,625,418 | | |
| | | Diversified Financial Services — 1.1% | |
| | 11,595 | | | CIT Group, Inc. | | | 530,239 | | |
| | | Electric Utilities — 1.9% | |
| | 13,760 | | | American Electric Power Co., Inc. | | | 522,330 | | |
| | 16,825 | | | DPL, Inc.2 | | | 433,580 | | |
| | | | 955,910 | | |
| | | Electronic Equipment & Instruments — 0.9% | |
| | 14,730 | | | Jabil Circuit, Inc.1 | | | 439,690 | | |
| | | Energy Equipment & Services — 2.2% | |
| | 17,050 | | | BJ Services Co.2 | | | 592,487 | | |
| | 15,970 | | | Smith International, Inc. | | | 517,428 | | |
| | | | 1,109,915 | | |
| | | Food & Staples Retailing — 1.9% | |
| | 19,365 | | | Albertson's Inc.2 | | | 486,255 | | |
| | 13,935 | | | Supervalu, Inc. | | | 437,977 | | |
| | | | 924,232 | | |
| | | Food Products — 1.8% | |
| | 22,600 | | | Archer-Daniels-Midland Co. | | | 550,762 | | |
| | 6,210 | | | Hershey Co. (The) | | | 352,914 | | |
| | | | 903,676 | | |
| | | Health Care Equipment & Supplies — 3.1% | |
| | 4,470 | | | Alcon, Inc. | | | 594,063 | | |
| | 10,290 | | | Becton Dickinson & Co. | | | 522,217 | | |
| | 12,675 | | | Waters Corp.1 | | | 458,835 | | |
| | | | 1,575,115 | | |
| | | Health Care Providers & Services — 2.2% | |
| | 6,370 | | | Aetna, Inc. | | | 564,127 | | |
| | 4,530 | | | CIGNA Corp. | | | 524,891 | | |
| | | | 1,089,018 | | |
See Notes to Financial Statements.
104
THE GLENMEDE FUND, INC.
Large Cap 100 Portfolio
SCHEDULE OF PORTFOLIO INVESTMENTS — (Continued)
October 31, 2005
| Shares | | | | Value | |
| COMMON STOCKSt — (Continued) | | | |
| | | Hotels Restaurants & Leisure — 1.1% | |
| | 17,520 | | | Darden Restaurants, Inc. | | $ | 567,998 | | |
| | | Household Durables — 3.7% | |
| | 4,755 | | | Black & Decker Corp. (The) | | | 390,528 | | |
| | 3,060 | | | KB Home | | | 199,971 | | |
| | 7,725 | | | Lennar Corp. - Class A | | | 429,356 | | |
| | 4,660 | | | MDC Holdings, Inc. | | | 319,676 | | |
| | 270 | | | NVR, Inc.1 | | | 185,085 | | |
| | 8,970 | | | Pulte Homes, Inc.2 | | | 338,976 | | |
| | | | 1,863,592 | | |
| | | Household Products — 2.1% | |
| | 9,775 | | | Clorox Co. | | | 529,023 | | |
| | 9,706 | | | Colgate-Palmolive Co. | | | 514,030 | | |
| | | | 1,043,053 | | |
| | | Independent Power Producers & Energy Traders — 1.8% | |
| | 6,800 | | | Constellation Energy Group, Inc. | | | 372,640 | | |
| | 19,120 | | | Duke Energy Corp. | | | 506,298 | | |
| | | | 878,938 | | |
| | | Industrial Conglomerates — 1.0% | |
| | 6,685 | | | 3M Co. | | | 507,926 | | |
| | | Insurance — 7.4% | |
| | 9,610 | | | Allstate Corp. | | | 507,312 | | |
| | 13,205 | | | Assurant, Inc.2 | | | 504,431 | | |
| | 4,945 | | | Chubb Corp. | | | 459,737 | | |
| | 6,230 | | | Hartford Financial Services Group, Inc. | | | 496,843 | | |
| | 8,120 | | | Mercury General Corp. | | | 490,854 | | |
| | 9,639 | | | Metlife, Inc. | | | 476,263 | | |
| | 5,625 | | | St. Paul Companies, Inc. | | | 253,294 | | |
| | 11,360 | | | WR Berkley Corp. | | | 496,432 | | |
| | | | 3,685,166 | | |
| | | Internet Software & Services — 1.3% | |
| | 1,760 | | | Google, Inc. - Class A1 | | | 654,966 | | |
| | | Leisure Equipment & Products — 0.8% | |
| | 10,650 | | | Brunswick Corp. | | | 406,085 | | |
| | | Machinery — 3.0% | |
| | 9,515 | | | Caterpillar, Inc. | | | 500,394 | | |
| | 5,490 | | | Deere & Co.2 | | | 333,133 | | |
| | 5,655 | | | Eaton Corp. | | | 332,684 | | |
| | 4,615 | | | Paccar, Inc. | | | 323,142 | | |
| | | | 1,489,353 | | |
See Notes to Financial Statements.
105
THE GLENMEDE FUND, INC.
Large Cap 100 Portfolio
SCHEDULE OF PORTFOLIO INVESTMENTS — (Continued)
October 31, 2005
| Shares | | | | Value | |
| COMMON STOCKSt — (Continued) | | | |
| | | Metals & Mining — 1.7% | |
| | 8,170 | | | Nucor Corp. | | $ | 488,975 | | |
| | 2,280 | | | Rio Tinto PLC, Sponsored ADR | | | 347,974 | | |
| | | | 836,949 | | |
| | | Multiline Retail — 1.4% | |
| | 13,436 | | | Nordstrom, Inc. | | | 465,557 | | |
| | 2,130 | | | Sears Holdings Corp.1,2 | | | 256,133 | | |
| | | | 721,690 | | |
| | | Multiple Utilities — 0.9% | |
| | 12,465 | | | PG&E Corp. | | | 453,477 | | |
| | | Oil Gas & Consumable Fuels — 7.1% | |
| | 3,645 | | | Amerada Hess Corp. | | | 455,990 | | |
| | 5,155 | | | Anadarko Petroleum Corp. | | | 467,610 | | |
| | 4,220 | | | Burlington Resources, Inc. | | | 304,768 | | |
| | 8,560 | | | Chevron Corp. | | | 488,519 | | |
| | 8,200 | | | ConocoPhillips | | | 536,116 | | |
| | 5,920 | | | Devon Energy Corp. | | | 357,450 | | |
| | 8,165 | | | Exxon Mobil Corp. | | | 458,383 | | |
| | 4,600 | | | Valero Energy Corp. | | | 484,104 | | |
| | | | 3,552,940 | | |
| | | Pharmaceuticals — 7.7% | |
| | 4,930 | | | Allergan, Inc. | | | 440,249 | | |
| | 15,555 | | | Bristol-Myers Squibb Co. | | | 329,299 | | |
| | 7,760 | | | GlaxoSmithKline PLC ADR | | | 403,442 | | |
| | 7,440 | | | Johnson & Johnson | | | 465,893 | | |
| | 20,015 | | | Merck & Co., Inc. | | | 564,823 | | |
| | 8,815 | | | Novartis AG ADR | | | 474,423 | | |
| | 16,860 | | | Pfizer, Inc. | | | 366,536 | | |
| | 22,375 | | | Schering-Plough Corp. | | | 455,108 | | |
| | 7,840 | | | Wyeth | | | 349,350 | | |
| | | | 3,849,123 | | |
| | | Road & Rail — 1.1% | |
| | 13,450 | | | Norfolk Southern Corp. | | | 540,690 | | |
| | | Semiconductors & Semiconductor Equipment — 4.0% | |
| | 28,335 | | | Altera Corp.1,2 | | | 471,778 | | |
| | 22,745 | | | Intel Corp. | | | 534,508 | | |
| | 10,315 | | | Kla-Tencor Corp. | | | 477,481 | | |
| | 17,900 | | | Texas Instruments, Inc. | | | 511,045 | | |
| | | | 1,994,812 | | |
See Notes to Financial Statements.
106
THE GLENMEDE FUND, INC.
Large Cap 100 Portfolio
SCHEDULE OF PORTFOLIO INVESTMENTS — (Continued)
October 31, 2005
Shares/
Face Amount | | | | Value | |
| COMMON STOCKSt — (Continued) | | | |
| | | Software — 2.2% | |
| | 13,950 | | | Autodesk, Inc. | | $ | 629,564 | | |
| | 10,490 | | | Check Point Software Technologies, Ltd.1 | | | 234,556 | | |
| | 10,905 | | | Symantec Corp.1 | | | 260,084 | | |
| | | | 1,124,204 | | |
| | | Speciality Retail — 3.5% | |
| | 5,300 | | | Abercrombie & Fitch Co. - Class A | | | 275,547 | | |
| | 4,890 | | | Autozone, Inc.1 | | | 395,601 | | |
| | 8,575 | | | Lowe's Companies, Inc. | | | 521,103 | | |
| | 25,000 | | | Staples, Inc. | | | 568,250 | | |
| | | | 1,760,501 | | |
| | | Thrifts & Mortgage Finance — 4.2% | |
| | 12,400 | | | Countrywide Financial Corp. | | | 393,948 | | |
| | 6,705 | | | Fannie Mae | | | 318,622 | | |
| | 12,715 | | | IndyMac Bancorp, Inc. | | | 474,651 | | |
| | 8,500 | | | MGIC Investment Corp. | | | 503,540 | | |
| | 10,950 | | | Washington Mutual, Inc. | | | 433,620 | | |
| | | | 2,124,381 | | |
| | | Tobacco — 1.1% | |
| | 6,610 | | | Reynolds American, Inc. | | | 561,850 | | |
| | | Wireless Telecommunication Services — 2.0% | |
| | 6,940 | | | ALLTEL Corp. | | | 429,308 | | |
| | 6,675 | | | NII Holdings, Inc. - Class B1,2 | | | 553,491 | | |
| | | | 982,799 | | |
| | | | | TOTAL COMMON STOCKS
(Cost $46,590,311) | | | 49,541,254 | | |
| REPURCHASE AGREEMENT — 1.8% | |
| $ | 882,799 | | | With Investors Bank & Trust Co., dated 10/31/05,
3.82%, principal and interest in the amount of
$882,892, due 11/01/05, (collateralized by FN #797477
with a par value of $958,792, coupon rate of 5.00%,
due 03/01/35, market value of $926,939) | | | 882,799 | | |
| | | | | TOTAL REPURCHASE AGREEMENT
(Cost $882,799) | | | 882,799 | | |
See Notes to Financial Statements.
107
THE GLENMEDE FUND, INC.
Large Cap 100 Portfolio
SCHEDULE OF PORTFOLIO INVESTMENTS — (Concluded)
October 31, 2005
Face
Amount | | | | Value | |
| INVESTMENTS OF SECURITY LENDING COLLATERAL — 7.3% | |
| $ | 840,810 | | | American Beacon Funds, Money Market Fund | | $ | 840,810 | | |
| | 262,393 | | | Canadian Imperial Bank, Certificate of Deposit,
4.072%, due 11/4/05 | | | 262,393 | | |
| | 240,231 | | | Fortis Bank, Eurodollar Time Deposit,
3.85%, due 11/3/05 | | | 240,231 | | |
| | 264,255 | | | Goldman Sachs Group Inc., Promissory Note,
4.02%, due 12/28/05 | | | 264,255 | | |
| | 240,231 | | | Lexington Parker Capital Corp., Commercial Paper,
3.952%, due 11/16/05 | | | 240,231 | | |
| | 840,810 | | | Merrill Lynch & Co., Inc., Repurchase Agreement,
4.053%, due 11/1/05 | | | 840,810 | | |
| | 240,231 | | | Skandinaviska Enskilda Banken AB (SEB), Eurodollar Term,
3.95%, due 11/21/05 | | | 240,231 | | |
| | 503,558 | | | Svenska Handlesbanken, Eurodollar Overnight,
4.031%, due 11/1/05 | | | 503,558 | | |
| | 240,231 | | | Wells Fargo, Eurodollar Time Deposit,
4.01%, due 12/12/05 | | | 240,231 | | |
| | | | | TOTAL INVESTMENTS OF SECURITY LENDING COLLATERAL
(Cost $3,672,750) | | | 3,672,750 | | |
TOTAL INVESTMENTS
(Cost $51,145,860)3 | | | 107.9 | % | | $ | 54,096,803 | | |
| LIABILITIES IN EXCESS OF OTHER ASSETS | | | (7.9 | ) | | | (3,963,350 | ) | |
| NET ASSETS | | | 100.0 | % | | $ | 50,133,453 | | |
t Percentages indicated are based on net assets.
1 Non-income producing security.
2 Securities or partial securities on loan. See Note 5.
3 Aggregate cost for federal tax purposes was $51,152,130.
Abbreviation:
FN — Federal National Mortgage Association
See Notes to Financial Statements.
108
THE GLENMEDE FUND, INC.
Large Cap 100 Portfolio
INDUSTRY DIVERSIFICATION
On October 31, 2005, industry diversification of the Portfolio was as follows (Unaudited):
| | | % of
Net Assets | | Value | |
| INDUSTRIES: | |
| Pharmaceuticals | | | 7.7 | % | | $ | 3,849,123 | | |
| Insurance | | | 7.4 | | | | 3,685,166 | | |
| Oil Gas & Consumable Fuels | | | 7.1 | | | | 3,552,940 | | |
| Thrifts & Mortgage Finance | | | 4.2 | | | | 2,124,381 | | |
| Commercial Banks | | | 4.0 | | | | 1,999,307 | | |
| Semiconductors & Semiconductor Equipment | | | 4.0 | | | | 1,994,812 | | |
| Beverages | | | 3.9 | | | | 1,969,792 | | |
| Household Durables | | | 3.7 | | | | 1,863,592 | | |
| Speciality Retail | | | 3.5 | | | | 1,760,501 | | |
| Aerospace & Defense | | | 3.4 | | | | 1,722,467 | | |
| Computers & Peripherals | | | 3.2 | | | | 1,625,418 | | |
| Health Care Equipment & Supplies | | | 3.1 | | | | 1,575,115 | | |
| Machinery | | | 3.0 | | | | 1,489,353 | | |
| Software | | | 2.2 | | | | 1,124,204 | | |
| Chemicals | | | 2.2 | | | | 1,115,848 | | |
| Energy Equipment & Services | | | 2.2 | | | | 1,109,915 | | |
| Health Care Providers & Services | | | 2.2 | | | | 1,089,018 | | |
| Capital Markets | | | 2.2 | | | | 1,086,908 | | |
| Household Products | | | 2.1 | | | | 1,043,053 | | |
| Biotechnology | | | 2.0 | | | | 1,018,923 | | |
| Wireless Telecommunication Services | | | 2.0 | | | | 982,799 | | |
| Electric Utilities | | | 1.9 | | | | 955,910 | | |
| Food & Staples Retailing | | | 1.9 | | | | 924,232 | | |
| Food Products | | | 1.8 | | | | 903,676 | | |
| Independent Power Producers & Energy Traders | | | 1.8 | | | | 878,938 | | |
| Communications Equipment | | | 1.7 | | | | 840,990 | | |
| Metals & Mining | | | 1.7 | | | | 836,949 | | |
| Multiline Retail | | | 1.4 | | | | 721,690 | | |
| Internet Software & Services | | | 1.3 | | | | 654,966 | | |
| Hotels Restaurants & Leisure | | | 1.1 | | | | 567,998 | | |
| Tobacco | | | 1.1 | | | | 561,850 | | |
| Road & Rail | | | 1.1 | | | | 540,690 | | |
| Diversified Financial Services | | | 1.1 | | | | 530,239 | | |
| Air Freight & Logistics | | | 1.0 | | | | 518,603 | | |
| Building Products | | | 1.0 | | | | 514,710 | | |
| Industrial Conglomerates | | | 1.0 | | | | 507,926 | | |
| Multiple Utilities | | | 0.9 | | | | 453,477 | | |
| Electronic Equipment & Instruments | | | 0.9 | | | | 439,690 | | |
| Leisure Equipment & Products | | | 0.8 | | | | 406,085 | | |
| TOTAL COMMON STOCKS | | | 98.8 | % | | $ | 49,541,254 | | |
| REPURCHASE AGREEMENT | | | 1.8 | | | | 882,799 | | |
| INVESTMENTS OF SECURITY LENDING COLLATERAL | | | 7.3 | | | | 3,672,750 | | |
| TOTAL INVESTMENTS | | | 107.9 | % | | $ | 54,096,803 | | |
See Notes to Financial Statements.
109
THE GLENMEDE FUND, INC.
Large Cap Growth Portfolio
SCHEDULE OF PORTFOLIO INVESTMENTS
October 31, 2005
| Shares | | | | Value | |
| COMMON STOCKSt — 98.6% | | | |
| | | Aerospace & Defense — 5.1% | |
| | 3,315 | | | Boeing Co. | | $ | 214,282 | | |
| | 1,480 | | | L-3 Communications Holdings, Inc. | | | 115,174 | | |
| | 5,355 | | | Lockheed Martin Corp. | | | 324,299 | | |
| | 3,775 | | | United Technologies Corp. | | | 193,582 | | |
| | | | 847,337 | | |
| | | Air Freight & Logistics — 3.9% | |
| | 3,620 | | | FedEx Corp. | | | 332,787 | | |
| | 4,355 | | | United Parcel Service, Inc. - Class B | | | 317,654 | | |
| | | | 650,441 | | |
| | | Automobiles — 0.5% | |
| | 1,640 | | | Harley-Davidson, Inc. | | | 81,229 | | |
| | | Biotechnology — 1.9% | |
| | 4,125 | | | Amgen, Inc.1 | | | 312,510 | | |
| | | Building Products — 1.5% | |
| | 6,350 | | | American Standard Cos., Inc. | | | 241,554 | | |
| | | Capital Markets — 1.8% | |
| | 1,025 | | | Ameriprise Financial, Inc. | | | 38,150 | | |
| | 1,535 | | | Northern Trust Corp. | | | 82,276 | | |
| | 4,575 | | | Nuveen Investments, Inc. - Class A | | | 185,150 | | |
| | | | 305,576 | | |
| | | Communications Equipment — 3.3% | |
| | 18,830 | | | Cisco Systems, Inc.1 | | | 328,583 | | |
| | 6,225 | | | Scientific-Atlanta, Inc. | | | 220,614 | | |
| | | | 549,197 | | |
| | | Computers & Peripherals — 3.6% | |
| | 6,130 | | | Apple Computer, Inc.1 | | | 353,027 | | |
| | 8,160 | | | QLogic Corp.1 | | | 246,106 | | |
| | | | 599,133 | | |
| | | Consumer Finance — 2.5% | |
| | 5,125 | | | American Express Co. | | | 255,071 | | |
| | 2,015 | | | Capital One Financial Corp. | | | 153,845 | | |
| | | | 408,916 | | |
| | | Electronic Equipment & Instruments — 1.8% | |
| | 5,380 | | | CDW Corp. | | | 303,163 | | |
See Notes to Financial Statements.
110
THE GLENMEDE FUND, INC.
Large Cap Growth Portfolio
SCHEDULE OF PORTFOLIO INVESTMENTS — (Continued)
October 31, 2005
| Shares | | | | Value | |
| COMMON STOCKSt — (Continued) | | | |
| | | Energy Equipment & Services — 2.1% | |
| | 9,930 | | | BJ Services Co. | | $ | 345,067 | | |
| | | Food Products — 3.7% | |
| | 5,020 | | | Hershey Co. (The) | | | 285,287 | | |
| | 7,410 | | | Kellogg Co. | | | 327,300 | | |
| | | | 612,587 | | |
| | | Health Care Equipment & Supplies — 3.6% | |
| | 2,490 | | | Bausch & Lomb, Inc. | | | 184,733 | | |
| | 8,605 | | | Baxter International, Inc. | | | 328,969 | | |
| | 1,690 | | | Becton Dickinson & Co. | | | 85,767 | | |
| | | | 599,469 | | |
| | | Health Care Providers & Services — 6.1% | |
| | 3,780 | | | Aetna, Inc. | | | 334,757 | | |
| | 5,140 | | | Express Scripts, Inc.1 | | | 387,607 | | |
| | 6,050 | | | Quest Diagnostics, Inc. | | | 282,595 | | |
| | | | 1,004,959 | | |
| | | Hotels Restaurants & Leisure — 3.0% | |
| | 4,235 | | | Brinker International, Inc.1 | | | 161,438 | | |
| | 10,145 | | | Darden Restaurants, Inc. | | | 328,901 | | |
| | | | 490,339 | | |
| | | Household Durables — 3.7% | |
| | 1,410 | | | Black & Decker Corp. (The) | | | 115,803 | | |
| | 4,506 | | | D.R. Horton, Inc. | | | 138,289 | | |
| | 820 | | | KB Home | | | 53,587 | | |
| | 1,000 | | | Lennar Corp. - Class A | | | 55,580 | | |
| | 1,200 | | | MDC Holdings, Inc. | | | 82,320 | | |
| | 1,790 | | | Ryland Group, Inc. | | | 120,467 | | |
| | 1,330 | | | Toll Brothers, Inc.1 | | | 49,090 | | |
| | | | 615,136 | | |
| | | Household Products — 5.0% | |
| | 7,265 | | | Church & Dwight, Inc. | | | 254,638 | | |
| | 5,560 | | | Colgate-Palmolive Co. | | | 294,458 | | |
| | 4,835 | | | Kimberly-Clark Corp. | | | 274,821 | | |
| | | | 823,917 | | |
| | | Industrial Conglomerates — 1.8% | |
| | 3,960 | | | 3M Co. | | | 300,881 | | |
See Notes to Financial Statements.
111
THE GLENMEDE FUND, INC.
Large Cap Growth Portfolio
SCHEDULE OF PORTFOLIO INVESTMENTS — (Continued)
October 31, 2005
| Shares | | | | Value | |
| COMMON STOCKSt — (Continued) | | | |
| | | Insurance — 1.3% | |
| | 3,240 | | | American International Group, Inc. | | $ | 209,952 | | |
| | | Internet Software & Services — 3.0% | |
| | 1,000 | | | Google, Inc. — Class A1 | | | 372,140 | | |
| | 5,475 | | | Verisign, Inc.1 | | | 129,374 | | |
| | | | 501,514 | | |
| | | Machinery — 1.9% | |
| | 3,610 | | | Cummins, Inc. | | | 308,186 | | |
| | | Metals & Mining — 2.8% | |
| | 2,355 | | | Phelps Dodge Corp. | | | 283,707 | | |
| | 3,360 | | | Southern Copper Corp. | | | 185,270 | | |
| | | | 468,977 | | |
| | | Multiline Retail — 2.8% | |
| | 3,800 | | | J.C. Penney Co., Inc. (Holding Co.) | | | 194,560 | | |
| | 8,000 | | | Nordstrom, Inc. | | | 277,200 | | |
| | | | 471,760 | | |
| | | Oil Gas & Consumable Fuels — 2.8% | |
| | 5,675 | | | Murphy Oil Corp. | | | 265,874 | | |
| | 4,460 | | | Newfield Exploration Co.1 | | | 202,172 | | |
| | | | 468,046 | | |
| | | Personal Products — 1.4% | |
| | 8,825 | | | Avon Products, Inc. | | | 238,187 | | |
| | | Pharmaceuticals — 9.5% | |
| | 3,540 | | | Allergan, Inc. | | | 316,122 | | |
| | 13,700 | | | Bristol-Myers Squibb Co. | | | 290,029 | | |
| | 5,475 | | | Johnson & Johnson | | | 342,844 | | |
| | 15,560 | | | Schering-Plough Corp. | | | 316,490 | | |
| | 6,935 | | | Wyeth | | | 309,024 | | |
| | | | 1,574,509 | | |
| | | Semiconductors & Semiconductor Equipment — 8.0% | |
| | 16,200 | | | Applied Materials, Inc. | | | 265,356 | | |
| | 12,340 | | | Intel Corp. | | | 289,990 | | |
| | 4,530 | | | Kla-Tencor Corp. | | | 209,694 | | |
| | 8,135 | | | Linear Technology Corp. | | | 270,163 | | |
| | 12,725 | | | National Semiconductor Corp. | | | 287,967 | | |
| | | | 1,323,170 | | |
See Notes to Financial Statements.
112
THE GLENMEDE FUND, INC.
Large Cap Growth Portfolio
SCHEDULE OF PORTFOLIO INVESTMENTS — (Concluded)
October 31, 2005
Shares/
Face Amount | | | | Value | |
| COMMON STOCKSt — (Continued) | | | |
| | | Software — 7.0% | |
| | 11,150 | | | Adobe Systems, Inc. | | $ | 359,588 | | |
| | 7,470 | | | Autodesk, Inc. | | | 337,121 | | |
| | 25,835 | | | Oracle Corp.1 | | | 327,588 | | |
| | 5,356 | | | Symantec Corp.1 | | | 127,741 | | |
| | | | 1,152,038 | | |
| | | Speciality Retail — 3.2% | |
| | 3,550 | | | Abercrombie & Fitch Co. - Class A | | | 184,565 | | |
| | 4,880 | | | American Eagle Outfitters, Inc. | | | 114,924 | | |
| | 1,440 | | | Autozone, Inc.1 | | | 116,496 | | |
| | 4,702 | | | Staples, Inc. | | | 106,876 | | |
| | | | 522,861 | | |
| | | | | TOTAL COMMON STOCKS
(Cost $15,102,831) | | | 16,330,611 | | |
| REPURCHASE AGREEMENT — 1.3% | | | |
| $ | 221,879 | | | With Investors Bank & Trust Co., dated 10/31/05,
3.82%, principal and interest in the amount of
$221,903, due 11/01/05, (collateralized by GNR #2002-27 FA
with a par value of $230,654, coupon rate of 4.47%,
due 05/16/32, market value of $232,973) | | | 221,879 | | |
| | | | | TOTAL REPURCHASE AGREEMENT
(Cost $221,879) | | | 221,879 | | |
TOTAL INVESTMENTS
(Cost $15,324,710)2 | | | 99.9 | % | | $ | 16,552,490 | | |
| OTHER ASSETS IN EXCESS OF LIABILITIES | | | 0.1 | | | | 19,065 | | |
| NET ASSETS | | | 100.0 | % | | $ | 16,571,555 | | |
t Percentages indicated are based on net assets.
1 Non-income producing security.
2 Aggregate cost for federal tax purposes was $15,333,489.
Abbreviation:
GNR — Government National Mortgage Association REMIC
See Notes to Financial Statements.
113
THE GLENMEDE FUND, INC.
Large Cap Growth Portfolio
INDUSTRY DIVERSIFICATION
On October 31, 2005, industry diversification of the Portfolio was as follows (Unaudited):
| | | % of
Net Assets | | Value | |
| INDUSTRIES: | |
| Pharmaceuticals | | | 9.5 | % | | $ | 1,574,509 | | |
| Semiconductors & Semiconductor Equipment | | | 8.0 | | | | 1,323,170 | | |
| Software | | | 7.0 | | | | 1,152,038 | | |
| Health Care Providers & Services | | | 6.1 | | | | 1,004,959 | | |
| Aerospace & Defense | | | 5.1 | | | | 847,337 | | |
| Household Products | | | 5.0 | | | | 823,917 | | |
| Air Freight & Logistics | | | 3.9 | | | | 650,441 | | |
| Household Durables | | | 3.7 | | | | 615,136 | | |
| Food Products | | | 3.7 | | | | 612,587 | | |
| Health Care Equipment and Supplies | | | 3.6 | | | | 599,469 | | |
| Computers & Peripherals | | | 3.6 | | | | 599,133 | | |
| Communications Equipment | | | 3.3 | | | | 549,197 | | |
| Speciality Retail | | | 3.2 | | | | 522,861 | | |
| Internet Software & Services | | | 3.0 | | | | 501,514 | | |
| Hotels Restaurants & Leisure | | | 3.0 | | | | 490,339 | | |
| Multiline Retail | | | 2.8 | | | | 471,760 | | |
| Metals & Mining | | | 2.8 | | | | 468,977 | | |
| Oil Gas & Consumable Fuels | | | 2.8 | | | | 468,046 | | |
| Consumer Finance | | | 2.5 | | | | 408,916 | | |
| Energy Equipment & Services | | | 2.1 | | | | 345,067 | | |
| Biotechnology | | | 1.9 | | | | 312,510 | | |
| Machinery | | | 1.9 | | | | 308,186 | | |
| Capital Markets | | | 1.8 | | | | 305,576 | | |
| Electronic Equipment & Instruments | | | 1.8 | | | | 303,163 | | |
| Industrial Conglomerates | | | 1.8 | | | | 300,881 | | |
| Building Products | | | 1.5 | | | | 241,554 | | |
| Personal Products | | | 1.4 | | | | 238,187 | | |
| Insurance | | | 1.3 | | | | 209,952 | | |
| Automobiles | | | 0.5 | | | | 81,229 | | |
| TOTAL COMMON STOCKS | | | 98.6 | % | | $ | 16,330,611 | | |
| REPURCHASE AGREEMENT | | | 1.3 | | | | 221,879 | | |
| TOTAL INVESTMENTS | | | 99.9 | % | | $ | 16,552,490 | | |
See Notes to Financial Statements.
114
THE GLENMEDE FUND, INC.
Notes to Financial Statements
1. Organization and Significant Accounting Policies
The Glenmede Fund, Inc. (the "Fund") consists of eleven portfolios: the Government Cash Portfolio, the Tax-Exempt Cash Portfolio, the Core Fixed Income Portfolio, the Strategic Equity Portfolio, the Small Cap Equity Portfolio, the Large Cap Value Portfolio, the International Portfolio, the Philadelphia International Fund (formerly Institutional International Portfolio), the U.S. Emerging Growth Portfolio (formerly Small Capitalization Growth Portfolio), the Large Cap 100 Portfolio, and the Large Cap Growth Portfolio (each, a "Portfolio" and collectively, the "Portfolios"). The Fund was incorporated in the State of Maryland on June 30, 1988 and is registered with the Securities and Exchange Commission under the Investment Company Act of 1940 (the "1940 Act"), as amended, as an open-end management investment company. Since January 2, 1998 the Small Cap Equity Portfolio has consisted of two classes of shares: the Advisor Class and the Instituti onal Class.
The preparation of financial statements in conformity with accounting principles generally accepted in the United States of America requires management to make estimates and assumptions that affect the reported amounts of assets and liabilities and disclosures of contingent assets and liabilities at the date of the financial statements and the reported amounts of revenues and expenses during the reporting period. Actual results could differ from those estimates. The following is a summary of significant accounting policies consistently followed by the Portfolios in the preparation of their financial statements.
Valuation of Securities: As permitted under Rule 2a-7 of the 1940 Act, securities held by the Government Cash and Tax-Exempt Cash Portfolios are valued by the "amortized cost" method of valuation, which approximates current value. Amortized cost valuation involves valuing an instrument at its cost initially and thereafter assuming a constant amortization to maturity of any discount or premium, regardless of the effect of fluctuating interest rates on the market value of the instrument.
Equity securities listed on a United States ("US") securities exchange for which market quotations are readily available are valued at the last quoted sale price as of the close of the exchange's regular trading hours on the day the valuation is made. Price information on listed securities is taken from the exchange where the securities are primarily traded. Securities traded on the NASDAQ System are valued at the NASDAQ Official Closing Price ("NOCP"). Unlisted equity securities and listed securities not traded on the valuation date for which market quotations are readily available are valued at an amount that does not exceed the asked price and is not less than the bid price. Securities listed on a foreign exchange and unlisted foreign securities are valued at the last quoted sales price available before the time when assets are valued.
Bonds and other fixed-income securities are valued at the most recent quoted bid price or, when exchange valuations are used, at the latest quoted sale price on the day of valuation. If there is no such reported sale, the latest quoted bid price is used. In addition, bond and other fixed-income securities may be valued on the basis of prices provided by a pricing service or by using a matrix or formula, when the Portfolio's investment advisor believes such prices reflect the fair market value of such securities. Debt securities purchased by non-money market Portfolios with
115
THE GLENMEDE FUND, INC.
Notes to Financial Statements — (Continued)
remaining maturities of 60 days or less are valued at amortized cost. Securities with remaining maturities exceeding 60 days are valued at their market or fair value until the 61st day prior to maturity and are valued at amortized cost, thereafter.
When market quotations are not readily available or events occur for which the above valuation procedures are deemed not to reflect fair value, securities and other assets are valued in a manner that is intended to reflect their fair value as determined in accordance with procedures approved by the Board of Directors of the Fund (the "Board"). In that regard, at October 31, 2005, substantially all foreign equity securities held by the International Portfolio and Philadelphia International Fund were fair valued using fair value factors provided by an independent valuation service.
Repurchase Agreements: Each Portfolio may engage in repurchase agreement transactions. Under the terms of a typical repurchase agreement, the Portfolio takes possession of an underlying debt obligation subject to an obligation of the seller to repurchase, and the Portfolio to resell the obligation at an agreed-upon price and time, thereby determining the yield during the Portfolio's holding period. This arrangement results in a fixed rate of return that is not subject to market fluctuations during the Portfolio's holding period. The value of the collateral at the time of execution must be at least equal to 102% of the total amount of the repurchase obligations, including interest. In the event of counterparty default, the Portfolio has the right to collect the collateral to offset losses incurred. There is potential loss to the Portfolio in the event the Po rtfolio is delayed or prevented from exercising its rights to dispose of the collateral securities, including the risk of a possible decline in the value of the underlying securities during the period while the Portfolio seeks to assert its rights. The Portfolio's investment advisor, acting under the supervision of the Board, reviews the value of the collateral and the creditworthiness of those banks and dealers with which the Portfolio enters into repurchase agreements to evaluate potential risks.
Forward Foreign Currency Contracts: The International Portfolio and Philadelphia International Fund may enter into forward foreign exchange contracts to hedge currency risk of securities denominated in a foreign currency. Forward foreign exchange contracts are valued at the forward rate and marked-to-market daily. The change in market value is recorded by the Portfolio as an unrealized gain or loss. When the contract is closed, the Portfolio records a realized gain or loss equal to the difference between the value of the contract at the time it was opened and the value at the time it was closed.
The use of forward foreign exchange contracts does not eliminate fluctuations in the underlying prices of the securities, but it does establish a rate of exchange that can be achieved in the future. Although forward foreign currency contracts limit the risk of loss due to a decline in the value of the hedged currency, they also limit any potential gain that might result should the value of the currency increase. In addition, the Portfolios could be exposed to risks if the counterparties to the contracts are unable to meet the terms of their contracts. There were no contracts open at October 31, 2005.
Foreign Currency Translation: The books and records of each Portfolio are maintained in US dollars. Foreign currencies, investments and other assets and liabilities are translated into US dollars at the exchange rates prevailing at the end of the period, and purchases and sales of investment securities, income and
116
THE GLENMEDE FUND, INC.
Notes to Financial Statements — (Continued)
expenses are translated at exchange rates prevailing on the dates of such transactions. Unrealized gains and losses that result from changes in foreign currency exchange rates have been included in the unrealized gains (losses) on foreign currency translation. Net realized foreign currency gains and losses resulting from changes in exchange rates include foreign currency gains and losses between trade date and settlement date on investment securities transactions, foreign currency transactions and the difference between the amounts of interest and dividends recorded on the books of the Portfolio and the amount actually received. The portion of foreign currency gains and losses related to fluctuation in exchange rates between the purchase settlement date and subsequent sale trade date is included in realized gains and losses on investment transactions.
Foreign Securities: The Strategic Equity Portfolio, Small Cap Equity Portfolio, Large Cap Value Portfolio, U.S. Emerging Growth Portfolio, Large Cap 100 Portfolio, Large Cap Growth Portfolio, International Portfolio and Philadelphia International Fund may invest in foreign securities. Investing in securities of foreign companies and foreign governments involves special risks and considerations not typically associated with investing in securities of US companies and the US Government. These risks include valuation of currencies and future adverse political and economic developments. Moreover, securities of many foreign companies and foreign governments and their markets may be less liquid and their prices more volatile than those of securities of comparable US companies and the US Government. This is particularly true with respect to emerging markets in dev eloping countries.
Reverse Repurchase Agreements: The Government Cash Portfolio and the Core Fixed Income Portfolio may enter into reverse repurchase agreements. Under the terms of a reverse repurchase agreement, the Portfolio sells a security subject to an obligation to repurchase the security from the buyer at a later date and price thereby determining the yield during the buyer's holding period. The use of reverse repurchase agreements involves certain risks in that the securities acquired by a Portfolio with the proceeds of such an agreement may decline in value, although the Portfolio is obligated to repay the proceeds. In addition, the market value of the securities sold by a Portfolio may decline below the repurchase price, to which the Portfolio remains committed. In the event the buyer of securities under a reverse repurchase agreement files for bankruptcy or becomes insolvent, the Portfolio's use of the proceeds of the agreement may be restricted pending a determination by the party, or its trustee or receiver, whether to enforce the Portfolio's obligation to repurchase the securities. In entering into reverse repurchase agreements, the Portfolio will maintain cash, US Government securities or other liquid high grade debt obligations at least equal in value to its obligations with respect to reverse repurchase agreements. Under normal circumstances, the Government Cash Portfolio and the Core Fixed Income Portfolio will not enter into reverse repurchase agreements if entering into such agreements would cause more than one-third of the value of their respective total assets to be subject to such agreements at the time of entering into such agreements. There were no open reverse repurchase agreements as of October 31, 2005.
Interest-Only Securities: The Core Fixed Income Portfolio may invest in interest-only securities, which are the interest portions of "stripped" securities. The holders of interest-only securities receive the interest on the underlying security, but no principal payments. While the timing of the interest receipts is known, the amount of interest to be received is not known.
117
THE GLENMEDE FUND, INC.
Notes to Financial Statements — (Continued)
Principal-Only Securities: The Core Fixed Income Portfolio may invest in principal-only securities, which are the principal portions of "stripped" securities. The holders of principal-only securities receive the principal on the underlying security, but no interest payments.
Collateralized Mortgage Obligations: The Core Fixed Income Portfolio may invest in collateralized mortgage obligations, which are backed by a pool of mortgages or mortgage-backed securities. The bonds that form collateralized mortgage obligations are grouped into classes, which have different coupon rates or maturities. The principal cash flows of the underlying pool of mortgages are channeled sequentially into each class.
TBA/When-Issued Purchase Commitments: The Core Fixed Income Portfolio may enter into TBA (to be announced)/when-issued purchase commitments to purchase securities for a fixed price at a future date, typically not exceeding 45 days. TBA purchase commitments may be considered securities in themselves, and involve a risk of loss if the value of the security to be purchased declines prior to settlement date. This risk is in addition to the risk of decline in the value of the Portfolio's other assets.
Options Transactions: The Strategic Equity Portfolio may purchase or write option contracts to hedge against changes in the value of securities the portfolio owns or expects to own. A call option gives the option holder the right to purchase the underlying security at a specified price until a specified date. A put option gives the option holder the right to sell the underlying security at a specified price until a specified date. The risk in writing a covered call option is that the Portfolio may forgo the opportunity of profit if the market price of the underlying security increases and the option is exercised. The risk in writing a put option is that the Portfolio may incur a loss if the market price of the underlying security decreases and the option is exercised. In addition, there is a risk the Portfolio may not be able to enter into a closing transac tion because of an illiquid secondary market or, for over-the-counter options, because of the counterparty's inability to perform. As of October 31, 2005, there were no option contracts open or outstanding.
Lending of Portfolio Securities Each Portfolio, using Investors Bank & Trust Company ("IBT") as its lending agent, may loan securities to brokers and dealers in exchange for negotiated lenders' fees. These fees are disclosed as "Income from security lending" in the Statement of Operations, net of expenses retained by IBT as compensation for its services as lending agent. Each applicable Portfolio receives cash collateral, which is invested by the lending agent in short-term money market instruments, in an amount at least equal to the current market value of the loaned securities. Information regarding the value of the securities loaned and the value of the collateral at period end is included in a footnote at the end of each applicable Portfolio's Statement of Assets and Liabilities and Schedule of Portfolio Investments. Although risk is mitigated by th e collateral, a Portfolio could experience a delay in recovering its securities and a possible loss of income or value if the borrower fails to return the securities when due.
Securities Transactions and Investment Income: Securities transactions are recorded as of the trade date. Realized gains and losses on investments sold are computed on the basis of identified cost. Dividend income and distributions to shareholders are recorded on the ex-dividend date. Dividend income for foreign securities is recorded on the ex-dividend date except that certain dividends from
118
THE GLENMEDE FUND, INC.
Notes to Financial Statements — (Continued)
foreign securities are recorded as soon as the Portfolio is informed of the ex-dividend date. Interest income is recorded on the accrual basis and includes amortization of premiums and accretion of discounts when appropriate.
Securities purchased or sold on a when-issued or delayed-delivery basis may be settled a month or more after the trade date. Interest income is accrued based on the terms of the security. Each Portfolio segregates assets with a current value at least equal to the amount of its when-issued purchase commitments. When-issued purchase commitments involve a risk of loss if the value of the security to be purchased declines prior to settlement date, or if the counterparty does not perform under the contract.
Dividends and Distributions to Shareholders: Dividends from net investment income, if any, of the Government Cash and Tax-Exempt Cash Portfolios are declared each day the Portfolios are open for business and are paid monthly. Dividends from net investment income, if any, of the Core Fixed Income Portfolio are declared and paid monthly. Dividends from net investment income, if any, of the Strategic Equity, Small Cap Equity, Large Cap Value, International, Philadelphia International, U.S. Emerging Growth, Large Cap 100 and Large Cap Growth Portfolios are declared and paid quarterly. The Portfolios distribute any net realized capital gains on an annual basis. Additional distr ibutions of net investment income and capital gains for each Portfolio may be made at the discretion of the Board in order to avoid a nondeductible excise tax under Section 4982 of the Internal Revenue Code, as amended. Distributions to shareholders from net realized gains on investments and related reinvestment amounts and receivable amounts from shareholders presented in the financial statements and corresponding per share information presented in the Financial Highlights pertaining to the International Portfolio reflect the subsequent correction to an erroneously computed amount of the capital gain distribution which was paid to shareholders on October 31, 2005.
Income and capital gains distributions are determined in accordance with income tax regulations which may differ from accounting principles generally accepted in the United States of America. These differences are primarily due to differing treatments of income and gains on various investment securities held by each Portfolio, timing differences and differing characterization of distributions made by each Portfolio.
Income and Expense Allocations: Expenses which are not readily identifiable to a specific Portfolio are allocated among Portfolios taking into consideration, among other things, the nature and type of expenses and the relative size of the Portfolios. Investment income, realized and unrealized gains and losses, and certain fund-level expenses are borne pro rata on the basis of relative net assets by the holders of all classes of shares, except that each class bears certain expenses unique to that class such as shareholder servicing fees, and certain other class-specific expenses. Differences in class-level expenses may result in payment of different per share dividends by class.
Federal Income Taxes: Each Portfolio intends to qualify as a regulated investment company by complying with the requirements of the Internal Revenue Code applicable to regulated investment companies and by distributing substantially all of its taxable income to its shareholders. Therefore, no Federal income tax provision is required. Income distributions and capital gain distributions are determined in accordance with income tax regulations which may differ from
119
THE GLENMEDE FUND, INC.
Notes to Financial Statements — (Continued)
accounting principles generally accepted in the United States of America. These differences are primarily due to differing treatments for amortized premiums, expired net capital loss carryforwards, redemptions in kind, foreign currency transactions, market discounts, net operating losses and nontaxable dividends.
On October 31, 2005, the tax year end of the Fund, the following Portfolios had available capital loss carryforwards to be utilized in the current period to offset future net capital gains through the indicated expiration dates as follows:
| | | Expiring October 31, | |
| Portfolio | | 2007 | | 2008 | | 2009 | | 2010 | | 2011 | | 2012 | |
Government Cash
Portfolio | | $ | — | | | $ | — | | | $ | — | | | $ | 4,173 | | | $ | — | | | $ | — | | |
Tax-Exempt Cash
Portfolio | | | 7,168 | | | | — | | | | 128,382 | | | | — | | | | — | | | | — | | |
Core Fixed Income
Portfolio | | | — | | | | 2,650,905 | | | | — | | | | — | | | | — | | | | — | | |
U.S. Emerging Growth
Portfolio | | | — | | | | — | | | | 1,417,923 | | | | 427,605 | | | | 427,605 | | | | — | | |
Large Cap Growth
Portfolio | | | — | | | | — | | | | — | | | | — | | | | — | | | | 77,452 | | |
As of October 31, 2005, substantially all the losses reflected above for U.S. Emerging Growth Portfolio are subject to certain IRS limitations.
During the year ended October 31, 2005, the following Portfolios utilized capital loss carryforwards of the following:
| Core Fixed Income Portfolio | | $ | 106,374 | | |
| Strategic Equity Portfolio | | | 157,136 | | |
| International Portfolio | | | 123,581,496 | | |
| Philadelphia International Fund | | | 38,395,394 | | |
| U.S. Emerging Growth Portfolio | | | 22,708,467 | | |
| Large Cap 100 Portfolio | | | 376,191 | | |
| Large Cap Growth Portfolio | | | 77,410 | | |
As of October 31, 2005, the tax year end of the Fund, the components of distributable earnings on a tax basis were as follows:
| Portfolio | | Undistributed
Ordinary
Income | | Undistributed
Long-Term
Gain | | Total
Distributable
Earnings | |
| Core Fixed Income Portfolio | | $ | 701,518 | | | $ | — | | | $ | (1,722,074 | ) | |
| Strategic Equity Portfolio | | | 18,543 | | | | — | | | | 10,917,526 | | |
| Small Cap Equity Portfolio | | | — | | | | — | | | | 54,704,340 | | |
| Large Cap Value Portfolio | | | 19,283 | | | | 76,289 | | | | 3,527,909 | | |
| International Portfolio | | | — | | | | — | | | | 180,380,180 | | |
| Philadelphia International Fund | | | — | | | | — | | | | 89,415,961 | | |
| U.S. Emerging Growth Portfolio | | | — | | | | — | | | | (632,101 | ) | |
| Large Cap 100 Portfolio | | | — | | | | — | | | | 2,944,673 | | |
| Large Cap Growth Portfolio | | | — | | | | — | | | | 1,141,549 | | |
120
THE GLENMEDE FUND, INC.
Notes to Financial Statements — (Continued)
Total Distributable Earnings are additionally comprised of Net Unrealized Appreciation/(Depreciation) and Capital Loss Carryforwards, which are shown elsewhere in the Notes to Financial Statements.
For the year ended October 31, 2005, Government Cash and Tax-Exempt Cash Portfolios' components of distributable earnings on a tax basis were equal to the components of distributable earnings on a book basis.
2. Investment Advisory Fee, Administration Fee and Other Related Party Transactions
Glenmede Advisers, Inc. (the "Advisor"), a wholly-owned subsidiary of The Glenmede Trust Company, N.A., ("Glenmede Trust") serves as investment advisor to the Strategic Equity, Large Cap Value, International, Government Cash, Tax-Exempt Cash, Core Fixed Income, Small Cap Equity, U.S. Emerging Growth, Large Cap 100 and Large Cap Growth Portfolios, pursuant to investment management agreements with the Fund. Under these agreements, the Advisor manages the Portfolios, subject to the general supervision of the Board.
The Government Cash and Tax-Exempt Cash Portfolios do not pay a management fee for advisory services. Glenmede Trust charges a fee directly to its clients for fiduciary, trust and/or advisory services. The actual annual fees charged vary dependent on a number of factors, including the particular services provided to the client and are generally 1.25% or less of the clients' assets under management. The Small Cap Equity, Large Cap 100 and Large Cap Growth Portfolios each pay the Advisor management fees at the annual rate of 0.55% of such Portfolio's average daily net assets.
Effective August 1, 2005, the Core Fixed Income, Strategic Equity, International and Large Cap Value Portfolios pay the Advisor management fees at the annual rate of 0.35%, 0.55%, 0.75% and 0.55%, respectively, of such Portfolio's average daily net assets. Prior to August 1, 2005, the Advisor was not entitled to receive any management fees from such Portfolios. With respect to the International Portfolio, the Advisor has voluntarily agreed to waive its management fee until January 1, 2006.
Prior to February 27, 2005, Winslow Capital Management, Inc. ("Winslow Capital") and Sterling Johnston Capital Management, L.P. ("Sterling Johnston") served as investment sub-advisors to the U.S. Emerging Growth Portfolio. The
U.S. Emerging Growth Portfolio paid a management fee to each sub-advisor at the annual rate of 0.60% of the portion of the Portfolio's average daily net assets that the sub-advisor managed. The Board approved the termination of the sub-investment advisory agreements with Sterling Johnson and Winslow Capital at its
December 8, 2004 Board meeting. The Advisor assumed direct management of the U.S. Emerging Growth Portfolio effective February 27, 2005.
Prior to August 1, 2005, the U.S. Emerging Growth Portfolio paid the Advisor a management fee at the annual rate of 0.25% of the Portfolio's average daily net assets. Effective August 1, 2005, the management fee paid to the Advisor increased from 0.25% to 0.55% of the Portfolio's average daily net assets.
Philadelphia International Advisors, LP ("PIA"), a limited partnership in which Glenmede Trust is a limited partner, serves as investment advisor to the Philadelphia International Fund. PIA became the investment advisor to the Philadelphia International Fund effective January 1, 2002. From September 1, 2000 through
121
THE GLENMEDE FUND, INC.
Notes to Financial Statements — (Continued)
December 31, 2001, investment advisory services were provided by the Advisor. The Philadelphia International Fund pays a management fee to PIA at the annual rate of 0.75% of the Portfolio's average daily net assets. PIA has agreed to waive its fees to the extent necessary to ensure that the Portfolio's total operating expenses do not exceed 1.00% of the Portfolio's average net assets. No management fees were waived for the year ended October 31, 2005.
Effective January 1, 2002, PIA also serves as investment sub-advisor to the International Portfolio. Effective August 1, 2005, the Advisor has agreed to pay PIA a fee for its sub-investment services to the International Portfolio, calculated daily and payable monthly, at the annual rate of 0.26% of the Portfolio's average daily net assets. PIA has voluntarily agreed to waive its sub-advisory fee until January 1, 2006. Prior to August 1, 2005, PIA was not entitled to receive any fees for its sub-investment advisory services to the Portfolio.
The Institutional Class of Small Cap Equity Portfolio pays Glenmede Trust a shareholder servicing fee at the annual rate of 0.05% of such Portfolio's average daily net assets. The Government Cash, Tax-Exempt Cash and Core Fixed Income Portfolios each pay Glenmede Trust a shareholder servicing fee at the annual rate of 0.10% of such Portfolio's average daily net assets. Strategic Equity, Large Cap Value, Large Cap 100 and Large Cap Growth Portfolios each pay Glenmede Trust a shareholder servicing fee at the annual rate of 0.20% of such Portfolio's average daily net assets. The International, U.S. Emerging Growth Portfolios and the Advisor Shares of Small Cap Equity Portfolio each pay Glenmede Trust a shareholder servicing fee at the annual rate of 0.25% of such Portfolio's average daily net assets. Prior to August 1, 2005, the annual rate of the shareholder servicing fee for the International Portfolio was 0.05%. The Philadelphia Internationa l Fund is not subject to a shareholder servicing plan and, accordingly, pays no shareholder servicing fee. The Advisor, Glenmede Trust and/or PIA may pay additional compensation out of their assets to selected institutions and other persons in connection with the servicing of Portfolio shareholders and other accounts managed by the Advisor, Glenmede Trust, or PIA.
Investors Bank & Trust Company ("IBT") serves as administrator, transfer agent, dividend-paying agent and custodian with respect to the Fund. The Fund pays IBT a fee based on the combined aggregate average daily net assets of the Portfolios and The Glenmede Portfolios, a registered investment company. The fee is computed daily and paid monthly. IBT is also paid an annual fee plus out-of pocket expenses for the provision of personnel and services related to the Fund's compliance program. The Fund's Chief Compliance Officer holds the position of Senior Director at IBT.
Quasar Distributors, LLC serves as distributor of the Portfolios' shares. The distributor receives no fees from the Fund in connection with distribution services provided to the Fund.
The Fund pays each Board member an annual fee of $24,000 plus $1,250 for each Board meeting attended and out-of-pocket expenses incurred in attending Board meetings and the Audit Committee Chairman receives an annual fee of $2,000 for his services as Chairman of the Audit Committee.
Expenses for the year ended October 31, 2005 include legal fees paid to Drinker Biddle & Reath LLP. A partner of the law firm is Secretary of the Fund.
122
THE GLENMEDE FUND, INC.
Notes to Financial Statements — (Continued)
3. Purchases and Sales of Securities
For the year ended October 31, 2005, cost of purchases and proceeds from sales of investment securities other than US Government securities and short-term securities were:
| Portfolio | | Purchases | | Sales | |
| Core Fixed Income Portfolio | | $ | 16,000,360 | | | $ | 23,062,418 | | |
| Strategic Equity Portfolio | | | 74,005,260 | | | | 65,203,216 | | |
| Small Cap Equity Portfolio | | | 134,515,646 | | | | 185,610,825 | | |
| Large Cap Value Portfolio | | | 19,463,513 | | | | 18,663,987 | | |
| International Portfolio | | | 606,089,166 | | | | 1,172,323,500 | | |
| Philadelphia International Fund | | | 377,503,420 | | | | 248,710,610 | | |
| U.S. Emerging Growth Portfolio | | | 43,511,123 | | | | 111,104,430 | | |
| Large Cap 100 Portfolio | | | 57,026,644 | | | | 28,472,882 | | |
| Large Cap Growth Portfolio | | | 20,668,940 | | | | 11,157,713 | | |
For the year ended October 31, 2005, cost of purchases and proceeds from sales of long-term US Government securities were:
| Portfolio | | Purchases | | Sales | |
| Core Fixed Income Portfolio | | $ | 422,812,313 | | | $ | 410,383,046 | | |
On October 31, 2005, aggregate gross unrealized appreciation for all securities in which there was an excess of value over tax cost and aggregate gross unrealized depreciation for all securities in which there was an excess of tax cost over value were as follows:
| Portfolio | | Appreciation | | Depreciation | | Net | |
| Core Fixed Income Portfolio | | $ | 2,577,331 | | | $ | 2,350,018 | | | $ | 227,313 | | |
| Strategic Equity Portfolio | | | 11,600,388 | | | | 701,405 | | | | 10,898,983 | | |
| Small Cap Equity Portfolio | | | 62,332,733 | | | | 7,628,393 | | | | 54,704,340 | | |
| Large Cap Value Portfolio | | | 3,848,891 | | | | 416,554 | | | | 3,432,337 | | |
| International Portfolio | | | 196,389,820 | | | | 15,947,626 | | | | 180,442,194 | | |
| Philadelphia International Fund | | | 102,934,950 | | | | 13,469,783 | | | | 89,465,167 | | |
| U.S. Emerging Growth Portfolio | | | 2,161,061 | | | | 520,029 | | | | 1,641,032 | | |
| Large Cap 100 Portfolio | | | 4,672,312 | | | | 1,727,639 | | | | 2,944,673 | | |
| Large Cap Growth Portfolio | | | 1,563,053 | | | | 344,052 | | | | 1,219,001 | | |
123
THE GLENMEDE FUND, INC.
Notes to Financial Statements — (Continued)
4. Common Stock
Since the Government Cash Portfolio and the Tax-Exempt Cash Portfolio have sold shares, issued shares as reinvestments of dividends, and redeemed shares only at a constant net asset value of $1.00 per share, the number of shares represented by such sales, reinvestments and redemptions is the same as the amounts shown below for such transactions. Changes in the capital shares outstanding were as follows:
| | | Year Ended
10/31/05 | | Year Ended
10/31/04 | |
| Government Cash Portfolio: | |
| Sold | | $ | 3,527,623,383 | | | $ | 2,938,908,916 | | |
| Issued as reinvestment of dividends | | | 63,389 | | | | 25,036 | | |
| Redeemed | | | (3,378,130,704 | ) | | | (2,902,231,795 | ) | |
| Net increase | | $ | 149,556,068 | | | $ | 36,702,157 | | |
| Tax-Exempt Cash Portfolio: | |
| Sold | | $ | 2,028,202,215 | | | $ | 1,875,580,215 | | |
| Redeemed | | | (2,006,659,782 | ) | | | (1,941,988,790 | ) | |
| Net increase (decrease) | | $ | 21,542,433 | | | $ | (66,408,575 | ) | |
| | | Year Ended
10/31/05 | | Year Ended
10/31/04 | |
| | | Shares | | Amount | | Shares | | Amount | |
| Core Fixed Income Portfolio: | |
| Sold | | | 1,916,315 | | | $ | 20,743,306 | | | | 1,853,380 | | | $ | 20,081,815 | | |
Issued as reinvestment
of dividends | | | 67,008 | | | | 724,588 | | | | 60,427 | | | | 651,925 | | |
| Redeemed | | | (1,408,020 | ) | | | (15,265,710 | ) | | | (1,903,807 | ) | | | (20,618,323 | ) | |
| Net increase | | | 575,303 | | | $ | 6,202,184 | | | | 10,000 | | | $ | 115,417 | | |
| Strategic Equity Portfolio: | |
| Sold | | | 1,179,214 | | | $ | 20,183,218 | | | | 544,476 | | | $ | 8,437,215 | | |
Issued as reinvestment
of dividends | | | 92,490 | | | | 1,547,749 | | | | 3,975 | | | | 62,139 | | |
| Redeemed | | | (688,350 | ) | | | (11,818,953 | ) | | | (2,341,891 | ) | | | (36,687,379 | ) | |
| Net increase (decrease) | | | 583,354 | | | $ | 9,912,014 | | | | (1,793,440 | ) | | $ | (28,188,025 | ) | |
| Small Cap Equity – Advisor Class | |
| Sold | | | 901,465 | | | $ | 17,289,911 | | | | 1,988,606 | | | $ | 38,011,399 | | |
Issued as reinvestment
of dividends | | | 1,316,233 | | | | 21,635,867 | | | | 2,323,982 | | | | 40,762,644 | | |
| Redeemed | | | (2,793,735 | ) | | | (53,445,280 | ) | | | (4,321,332 | ) | | | (83,276,225 | ) | |
| Net increase (decrease) | | | (576,037 | ) | | $ | (14,519,502 | ) | | | (8,744 | ) | | $ | (4,502,182 | ) | |
124
THE GLENMEDE FUND, INC.
Notes to Financial Statements — (Continued)
| | | Year Ended
10/31/05 | | Year Ended
10/31/04 | |
| | | Shares | | Amount | | Shares | | Amount | |
| Small Cap Equity – Institutional Class | |
| Sold | | | — | | | $ | — | | | | 119,080 | | | $ | 2,291,717 | | |
Issued as reinvestment
of dividends | | | 10 | | | | 170 | | | | 9 | | | | 153 | | |
| Redeemed | | | — | | | | — | | | | (2,333,055 | ) | | | (47,466,157 | ) | |
| Net increase (decrease) | | | 10 | | | $ | 170 | | | | (2,213,966 | ) | | $ | (45,174,287 | ) | |
| Large Cap Value Portfolio: | |
| Sold | | | 831,167 | | | $ | 9,155,008 | | | | 352,975 | | | $ | 3,491,984 | | |
Issued as reinvestment
of dividends | | | 272,644 | | | | 2,775,160 | | | | 90,431 | | | | 904,979 | | |
| Redeemed | | | (793,475 | ) | | | (8,775,258 | ) | | | (542,015 | ) | | | (5,403,650 | ) | |
| Net increase (decrease) | | | 310,336 | | | $ | 3,154,910 | | | | (98,609 | ) | | $ | (1,006,687 | ) | |
| International Portfolio: | |
| Sold | | | 11,135,881 | | | $ | 204,387,029 | | | | 12,158,317 | | | $ | 190,679,248 | | |
Issued as reinvestment
of dividends | | | 4,520,055 | | | | 79,517,907 | | | | 484,183 | | | | 7,761,539 | | |
| Redeemed | | | (19,306,736 | ) | | | (364,450,187 | ) | | | (9,062,226 | ) | | | (139,752,233 | ) | |
| Redemptions-in-kind | | | (27,892,008 | ) | | | (522,738,490 | ) | | | — | | | | — | | |
| Net increase (decrease) | | | (31,542,808 | ) | | $ | (603,283,741 | ) | | | 3,580,274 | | | $ | 58,688,554 | | |
| Philadelphia International Fund: | |
| Sold | | | 12,792,450 | | | $ | 222,449,378 | | | | 12,812,319 | | | $ | 187,653,924 | | |
Issued as reinvestment
of dividends | | | 1,363,126 | | | | 23,513,067 | | | | 215,739 | | | | 3,274,614 | | |
| Redeemed | | | (5,955,503 | ) | | | (103,014,786 | ) | | | (11,145,596 | ) | | | (160,629,127 | ) | |
| Redemptions-in-kind | | | — | | | | — | | | | (9,929,603 | ) | | | (148,248,966 | ) | |
| Net increase (decrease) | | | 8,200,073 | | | $ | 142,947,659 | | | | (8,047,141 | ) | | $ | (117,949,555 | ) | |
| U.S. Emerging Growth Portfolio: | |
| Sold | | | 947,286 | | | $ | 5,576,852 | | | | 1,154,042 | | | $ | 6,477,252 | | |
| Redeemed | | | (12,950,747 | ) | | | (74,316,964 | ) | | | (5,159,474 | ) | | | (28,013,053 | ) | |
| Net decrease | | | (12,003,461 | ) | | $ | (68,740,112 | ) | | | (4,005,432 | ) | | $ | (21,535,801 | ) | |
| Large Cap 100 Portfolio: | |
| Sold | | | 2,844,614 | | | $ | 31,537,126 | | | | 1,814,826 | | | $ | 17,996,781 | | |
Issued as reinvestment
of dividends | | | 34,509 | | | | 382,030 | | | | 15 | | | | 145 | | |
| Redeemed | | | (236,629 | ) | | | (2,604,637 | ) | | | (11,348 | ) | | | (110,293 | ) | |
| Net increase | | | 2,642,494 | | | $ | 29,314,519 | | | | 1,803,493 | | | $ | 17,886,633 | | |
| Large Cap Growth Portfolio: | |
| Sold | | | 1,001,509 | | | $ | 10,841,504 | | | | 593,345 | | | $ | 5,791,191 | | |
Issued as reinvestment
of dividends | | | 86 | | | | 947 | | | | — | | | | — | | |
| Redeemed | | | (110,875 | ) | | | (1,185,047 | ) | | | (1,053 | ) | | | (9,926 | ) | |
| Net increase | | | 890,720 | | | $ | 9,657,404 | | | | 592,292 | | | $ | 5,781,265 | | |
125
THE GLENMEDE FUND, INC.
Notes to Financial Statements — (Concluded)
As of October 31, 2005, with the exception of the Philadelphia International Fund, Glenmede Trust, on behalf of its clients, holds of record and has voting and/or investment authority over substantially all of the Portfolios' outstanding shares. The following Portfolios have shareholders which, to the Fund's knowledge, own beneficially 10% or more of the shares outstanding of the Portfolio as of October 31, 2005. The total percentage of the shares of a Portfolio held by such shareholders are as follows:
| | | 10% or Greater Shareholders | |
| Portfolio | | # of
Shareholders | | % of
Shares Held | |
| Government Cash Portfolio | | | 1 | | | | 27 | % | |
| Core Fixed Income Portfolio | | | 1 | | | | 26 | % | |
| Small Cap Equity Portfolio (Advisor Class) | | | 2 | | | | 36 | % | |
| Small Cap Equity Portfolio (Institutional Class) | | | 1 | | | | 100 | % | |
| Large Cap Value Portfolio | | | 3 | | | | 44 | % | |
| International Portfolio | | | 1 | | | | 35 | % | |
| Philadelphia International Fund | | | 2 | | | | 47 | % | |
| Large Cap Growth Portfolio | | | 1 | | | | 21 | % | |
5. Lending of Portfolio Securities
On October 31, 2005, the following Portfolios had outstanding loans of securities to certain approved brokers for which the Portfolios received collateral:
| Portfolio | | Market Value of
Loaned Securities | | Market Value of
Collateral | | % of Total
Assets
on Loan | |
| Core Fixed Income Portfolio | | $ | 23,391,478 | | | $ | 23,973,850 | | | | 9.41 | | |
| Strategic Equity Portfolio | | | 8,568,138 | | | | 8,806,394 | | | | 9.65 | | |
| Small Cap Equity Portfolio | | | 62,059,628 | | | | 64,356,600 | | | | 20.20 | | |
| Large Cap Value Portfolio | | | 196,426 | | | | 204,610 | | | | 0.73 | | |
| International Portfolio | | | 29,996,035 | | | | 31,510,571 | | | | 3.55 | | |
| Philadelphia International Fund | | | 16,509,143 | | | | 17,127,711 | | | | 2.52 | | |
| U.S. Emerging Growth Portfolio | | | 3,100,303 | | | | 3,231,407 | | | | 17.54 | | |
| Large Cap 100 Portfolio | | | 3,575,809 | | | | 3,672,750 | | | | 6.60 | | |
126
REPORT OF INDEPENDENT REGISTERED PUBLIC ACCOUNTING FIRM
To the Board of Directors of The Glenmede Fund, Inc. and Shareholders of Government Cash Portfolio, Tax-Exempt Cash Portfolio, Core Fixed Income Portfolio, Strategic Equity Portfolio, Small Cap Equity Portfolio, Large Cap Value Portfolio, International Portfolio, Philadelphia International Fund (formerly Institutional International Portfolio), U.S. Emerging Growth Portfolio (formerly Small Capitalization Growth Portfolio), Large Cap 100 Portfolio and Large Cap Growth Portfolio:
In our opinion, the accompanying statements of assets and liabilities, including the schedules of portfolio investments, and the related statements of operations and of changes in net assets and the financial highlights present fairly, in all material respects, the financial position of Government Cash Portfolio, Tax-Exempt Cash Portfolio, Core Fixed Income Portfolio, Strategic Equity Portfolio, Small Cap Equity Portfolio, Large Cap Value Portfolio, International Portfolio, Philadelphia International Fund (formerly Institutional International Portfolio), U.S. Emerging Growth Portfolio (formerly Small Capitalization Growth Portfolio), Large Cap 100 Portfolio and Large Cap Growth Portfolio (constituting The Glenmede Fund, Inc., hereafter referred to as the "Fund") at October 31, 2005, the results of each of their operations for the year then ended, the changes in each of their net assets for each of the two years in the period then ended, and the financial highlights for each of the periods indicated, in conformity with accounting principles generally accepted in the United States of America. These financial statements and financial highlights (hereafter referred to as "financial statements") are the responsibility of the Fund's management; our responsibility is to express an opinion on these financial statements based on our audits. We conducted our audits of these financial statements in accordance with the standards of the Public Company Accounting Oversight Board (United States). Those standards require that we plan and perform the audit to obtain reasonable assurance about whether the financial statements are free of material misstatement. An audit includes examining, on a test basis, evidence supporting the amounts and disclosures in the financial statements, assessing the accounting principles used and significant estimates made by management, and evaluating the overall financial statement presentation. We believe that our audits, which in cluded confirmation of securities at October 31, 2005 by correspondence with the custodian and brokers, provide a reasonable basis for our opinion.
PricewaterhouseCoopers LLP
Boston, Massachusetts
January 5, 2006
127
THE GLENMEDE PORTFOLIOS
STATEMENTS OF ASSETS AND LIABILITIES
October 31, 2005
| | | Muni
Intermediate
Portfolio | | New Jersey
Muni
Portfolio | |
| Assets: | |
| Investments: | |
| Investments at value1 | | $ | 20,259,283 | | | $ | 16,193,918 | | |
| Cash | | | 238,629 | | | | 114,852 | | |
| Receivable for fund shares sold | | | — | | | | 35,000 | | |
| Interest receivable | | | 257,123 | | | | 220,821 | | |
| Prepaid expenses | | | 693 | | | | 554 | | |
| Total assets | | | 20,755,728 | | | | 16,565,145 | | |
| Liabilities: | |
| Payable for Trustees' fees | | | 399 | | | | 328 | | |
| Accrued expenses | | | 9,316 | | | | 8,931 | | |
| Total liabilities | | | 9,715 | | | | 9,259 | | |
| Net Assets | | $ | 20,746,013 | | | $ | 16,555,886 | | |
| Net Assets Consist of: | |
| Par value | | | 2,003 | | | | 1,616 | | |
| Paid-in capital in excess of par value | | | 20,516,332 | | | | 16,238,069 | | |
| Undistributed net investment income | | | 64,181 | | | | 61,526 | | |
Accumulated net realized gain (loss) from
investment transactions | | | (2,521 | ) | | | (275 | ) | |
| Net unrealized appreciation (depreciation) on investments | | | 166,018 | | | | 254,950 | | |
| Total Net Assets | | | 20,746,013 | | | | 16,555,886 | | |
| Shares Outstanding | | | 2,002,531 | | | | 1,615,548 | | |
| Net Asset Value Per Share | | $ | 10.36 | | | $ | 10.25 | | |
| 1 Investments at cost | | $ | 20,093,265 | | | $ | 15,938,968 | | |
See Notes to Financial Statements.
128
THE GLENMEDE PORTFOLIOS
STATEMENTS OF OPERATIONS
For the Year Ended October 31, 2005
| | | Muni
Intermediate
Portfolio | | New Jersey
Muni
Portfolio | |
| Investment income: | |
| Interest | | $ | 759,163 | | | $ | 675,837 | | |
| Total investment income | | | 759,163 | | | | 675,837 | | |
| Expenses: | |
| Administration and custody fees | | | 16,033 | | | | 18,073 | | |
| Professional fees | | | 2,553 | | | | 2,149 | | |
| Shareholder report expense | | | 2,336 | | | | 2,055 | | |
| Shareholder servicing fees | | | 30,140 | | | | 25,768 | | |
| Trustees' fees and expenses | | | 1,307 | | | | 1,150 | | |
| Registration and filing fees | | | 3,680 | | | | 3,072 | | |
| Other expenses | | | 1,922 | | | | 1,792 | | |
| Total expenses | | | 57,971 | | | | 54,059 | | |
| Net investment income | | | 701,192 | | | | 621,778 | | |
| Realized and unrealized gain (loss): | |
| Net realized gain (loss) on: | |
| Investment transactions | | | (2,521 | ) | | | 129,048 | | |
| Net change in unrealized gain (loss) of: | |
| Investments | | | (590,509 | ) | | | (601,589 | ) | |
| Net realized and unrealized gain (loss) | | | (593,030 | ) | | | (472,541 | ) | |
Net increase (decrease) in net assets resulting from
operations | | $ | 108,162 | | | $ | 149,237 | | |
See Notes to Financial Statements.
129
THE GLENMEDE PORTFOLIOS
STATEMENTS OF CHANGES IN NET ASSETS
For the Year Ended October 31, 2005
| | | Muni
Intermediate
Portfolio | | New Jersey
Muni
Portfolio | |
| Increase (decrease) in net assets | |
| Operations: | |
| Net investment income | | $ | 701,192 | | | $ | 621,778 | | |
| Net realized gain (loss) on securities transactions | | | (2,521 | ) | | | 129,048 | | |
| Net change in unrealized gain (loss) on securities | | | (590,509 | ) | | | (601,589 | ) | |
Net increase (decrease) in net assets resulting
from operations | | | 108,162 | | | | 149,237 | | |
| Distributions to shareholders from: | |
| Net investment income | | | (698,018 | ) | | | (628,848 | ) | |
| Net realized gain on investments | | | — | | | | (121,664 | ) | |
Net increase(decrease) in net assets from capital share
transactions | | | 2,065,716 | | | | (1,171,590 | ) | |
| Net increase (decrease) in net assets | | | 1,475,860 | | | | (1,772,865 | ) | |
| NET ASSETS: | |
| Beginning of year | | | 19,270,153 | | | | 18,328,751 | | |
| End of year | | $ | 20,746,013 | | | $ | 16,555,886 | | |
Undistributed net investment income included in
net assets at end of year | | $ | 64,181 | | | $ | 61,526 | | |
| For the Year Ended October 31, 2004 | |
| | | Muni
Intermediate
Portfolio | | New Jersey
Muni
Portfolio | |
| Increase (decrease) in net assets | |
| Operations: | |
| Net investment income | | $ | 705,744 | | | $ | 679,179 | | |
| Net realized gain (loss) on securities transactions | | | 119,510 | | | | 6,000 | | |
| Net change in unrealized loss on securities | | | (154,608 | ) | | | (189,112 | ) | |
| Net increase (decrease) in net assets from operations | | | 670,646 | | | | 496,067 | | |
| Distributions to shareholders from: | |
| Net investment income | | | (713,138 | ) | | | (710,811 | ) | |
Net decrease in net assets from capital share
transactions | | | (1,006,858 | ) | | | (991,829 | ) | |
| Net increase (decrease) in net assets | | | (1,049,350 | ) | | | (1,206,573 | ) | |
| NET ASSETS: | |
| Beginning of year | | | 20,319,503 | | | | 19,535,324 | | |
| End of year | | $ | 19,270,153 | | | $ | 18,328,751 | | |
Undistributed net investment income included in
net assets at end of year | | $ | 61,007 | | | $ | 61,212 | | |
See Notes to Financial Statements.
130
THE GLENMEDE PORTFOLIOS
FINANCIAL HIGHLIGHTS
For a share outstanding throughout each year
| | | Muni Intermediate Portfolio | |
| | | For the Years Ended October 31, | |
| | | 2005 | | 2004 | | 2003 | | 2002 | | 2001 | |
| Net asset value, beginning of year | | $ | 10.67 | | | $ | 10.69 | | | $ | 10.64 | | | $ | 10.55 | | | $ | 10.20 | | |
| Income from investment operations: | |
| Net investment income | | | 0.37 | | | | 0.39 | | | | 0.43 | | | | 0.46 | | | | 0.50 | | |
Net realized and unrealized
gain (loss) on investments | | | (0.31 | ) | | | (0.02 | ) | | | 0.06 | | | | 0.09 | | | | 0.34 | | |
| Total from investment operations | | | 0.06 | | | | 0.37 | | | | 0.49 | | | | 0.55 | | | | 0.84 | | |
| Distributions to shareholders from: | |
| Net investment income | | | (0.37 | ) | | | (0.39 | ) | | | (0.44 | ) | | | (0.46 | ) | | | (0.49 | ) | |
| Total distributions | | | (0.37 | ) | | | (0.39 | ) | | | (0.44 | ) | | | (0.46 | ) | | | (0.49 | ) | |
| Net asset value, end of year | | $ | 10.36 | | | $ | 10.67 | | | $ | 10.69 | | | $ | 10.64 | | | $ | 10.55 | | |
| Total return | | | 0.55 | % | | | 3.49 | % | | | 4.67 | % | | | 5.41 | % | | | 8.39 | % | |
Ratios to average net assets/
Supplemental data: | |
| Net assets, end of year (in 000's) | | $ | 20,746 | | | $ | 19,270 | | | $ | 20,320 | | | $ | 22,700 | | | $ | 17,607 | | |
Ratio of operating expenses to
average net assets | | | 0.29 | % | | | 0.29 | % | | | 0.20 | % | | | 0.22 | % | | | 0.27 | % | |
Ratio of net investment income
to average net assets | | | 3.49 | % | | | 3.58 | % | | | 4.03 | % | | | 4.45 | % | | | 4.78 | % | |
| Portfolio turnover rate | | | 17 | % | | | 28 | % | | | 12 | % | | | 29 | % | | | 25 | % | |
See Notes to Financial Statements.
131
THE GLENMEDE PORTFOLIOS
FINANCIAL HIGHLIGHTS
For a share outstanding throughout each year
| | | New Jersey Muni Portfolio | |
| | | For the Years Ended October 31, | |
| | | 2005 | | 2004 | | 2003 | | 2002 | | 2001 | |
| Net asset value, beginning of year | | $ | 10.61 | | | $ | 10.73 | | | $ | 10.71 | | | $ | 10.60 | | | $ | 10.11 | | |
| Income from investment operations: | |
| Net investment income | | | 0.37 | | | | 0.40 | | | | 0.44 | | | | 0.46 | | | | 0.45 | | |
Net realized and unrealized
gain (loss) on investments | | | (0.27 | ) | | | (0.11 | ) | | | 0.03 | | | | 0.10 | | | | 0.48 | | |
| Total from investment operations | | | 0.10 | | | | 0.29 | | | | 0.47 | | | | 0.56 | | | | 0.93 | | |
| Distributions to shareholders from: | |
| Net investment income | | | (0.38 | ) | | | (0.41 | ) | | | (0.45 | ) | | | (0.45 | ) | | | (0.44 | ) | |
| Net realized capital gains | | | (0.08 | ) | | | — | | | | — | | | | — | | | | — | | |
| Total distributions | | | (0.46 | ) | | | (0.41 | ) | | | (0.45 | ) | | | (0.45 | ) | | | (0.44 | ) | |
| Net asset value, end of year | | $ | 10.25 | | | $ | 10.61 | | | $ | 10.73 | | | $ | 10.71 | | | $ | 10.60 | | |
| Total return | | | 0.94 | % | | | 2.78 | % | | | 4.46 | % | | | 5.40 | % | | | 9.34 | % | |
Ratios to average net assets/
Supplemental data: | |
| Net assets, end of year (in 000's) | | $ | 16,556 | | | $ | 18,329 | | | $ | 19,535 | | | $ | 20,037 | | | $ | 19,154 | | |
Ratio of operating expenses to
average net assets | | | 0.31 | % | | | 0.28 | % | | | 0.20 | % | | | 0.27 | % | | | 0.27 | % | |
Ratio of net investment income
to average net assets | | | 3.62 | % | | | 3.73 | % | | | 4.09 | % | | | 4.22 | % | | | 4.33 | % | |
| Portfolio turnover rate | | | 31 | % | | | 33 | % | | | 9 | % | | | 36 | % | | | 18 | % | |
See Notes to Financial Statements.
132
THE GLENMEDE PORTFOLIOS
Muni Intermediate Portfolio
SCHEDULE OF PORTFOLIO INVESTMENTS
October 31, 2005
Face
Amount | | | | Value | |
| MUNICIPAL BONDSt — 97.7% | | | |
| | | Pennsylvania — 94.4% | |
| $ | 100,000 | | | Allegheny County, PA, General Obligation Unlimited, Refunding,
Series C 55, (MBIA Insured),
5.375%, 11/1/14 | | $ | 108,973 | | |
| | 200,000 | | | Allegheny County, PA, Hospital Development Authority Revenue,
University of Pittsburgh, Health Center, Series A, (MBIA Insured),
5.30%, 4/1/08 | | | 208,834 | | |
| | | Allegheny County, PA, Industrial Development Authority Revenue,
Carnegie Library of Pittsburgh, (AMBAC Insured): | |
| | 205,000 | | | 4.25%, 6/1/09 | | | 210,875 | | |
| | 215,000 | | | 4.25%, 12/1/09 | | | 221,684 | | |
| | 300,000 | | | Allegheny County, PA, Port Authority Special Revenue,
(MBIA Insured), Prerefunded, 3/1/09 @ 101,
5.30%, 3/1/10 | | | 320,850 | | |
| | 100,000 | | | Allegheny County, PA, Sanitation Authority Revenue,
(MBIA Insured),
5.00%, 12/1/17 | | | 106,518 | | |
| | 500,000 | | | Boyertown, PA, Area School District, (FSA Insured),
5.00%, 10/1/17 | | | 532,430 | | |
| | 375,000 | | | Dauphin County, PA, General Authority Hospital Revenue,
Escrowed to Maturity, (FGIC Insured),
6.125%, 7/1/10 | | | 399,401 | | |
| | 400,000 | | | Dauphin County, PA, Refunding, (AMBAC Insured), Series B,
5.00%, 11/15/17 | | | 426,228 | | |
| | 285,000 | | | Delaware River Joint Toll Bridge Commission Revenue,
(MBIA Insured), Prerefunded 7/1/13 @ 100,
5.25%, 7/1/16 | | | 311,058 | | |
| | 750,000 | | | Delaware River Port Authority, PA and NJ Revenue, (FSA Insured),
5.25%, 1/1/12 | | | 797,745 | | |
| | | Delaware River Port Authority, PA and NJ, Delaware River Bridges
Revenue, Escrowed to Maturity: | |
| | 140,000 | | | 6.00%, 1/15/10 | | | 148,712 | | |
| | 120,000 | | | 6.50%, 1/15/11 | | | 130,096 | | |
| | 100,000 | | | Delaware River Port Authority, PA and NJ, Refunding,
(AMBAC Insured), Series B,
5.25%, 1/1/09 | | | 105,628 | | |
| | 700,000 | | | Delaware River Port Authority, PA and NJ, Refunding,
(FSA Insured), Series A,
5.25%, 1/1/09 | | | 739,396 | | |
See Notes to Financial Statements.
133
THE GLENMEDE PORTFOLIOS
Muni Intermediate Portfolio
SCHEDULE OF PORTFOLIO INVESTMENTS — (Continued)
October 31, 2005
Face
Amount | | | | Value | |
| MUNICIPAL BONDSt — (Continued) | | | |
| | | Pennsylvania — (Continued) | |
| | | Downington, PA, Area School District, General Obligation Unlimited: | |
| $ | 300,000 | | | 5.50%, 2/1/10 | | $ | 323,940 | | |
| | 500,000 | | | 5.25%, 4/1/14 | | | 537,025 | | |
| | 500,000 | | | 4.90%, 4/1/16 | | | 522,225 | | |
| | 390,000 | | | Geisinger Authority, PA, Health System, Refunding,
5.00%, 8/15/08 | | | 404,765 | | |
| | 200,000 | | | Harrisburg, PA, Parking Authority Revenue, Refunding,
(FSA Insured),
5.50%, 5/15/11 | | | 218,590 | | |
| | 100,000 | | | Hopewell, PA, Area School District, General Obligation,
(FSA Insured), Prerefunded 9/1/08 @ 100,
4.90%, 9/1/09 | | | 104,436 | | |
| | 300,000 | | | Indiana County, PA, Municipal Services Authority, Sewer Revenue,
(AMBAC Insured),
4.00%, 10/1/09 | | | 303,474 | | |
| | 30,000 | | | Lancaster, PA, Area Sewer Authority, Revenue, Escrowed to Maturity,
6.00%, 4/1/12 | | | 32,137 | | |
| | 120,000 | | | Lebanon County, PA, Series B, General Obligation Unlimited,
Refunding, (FGIC Insured),
4.00%, 10/15/09 | | | 122,544 | | |
| | 250,000 | | | Lycoming County, PA, Authority College Revenue, (MBIA Insured),
Prerefunded to 7/1/07 @ 101,
4.90%, 7/1/09 | | | 259,537 | | |
| | 250,000 | | | Moon Area School District, PA, General Obligation Unlimited,
(FSA State Aid Witholding),
5.00%, 11/15/17 | | | 267,085 | | |
| | 315,000 | | | Northampton Bucks, PA, Bucks County Municipal Authority,
Sewer Revenue, Escrowed to Maturity,
6.20%, 11/1/13 | | | 345,379 | | |
| | 500,000 | | | Northampton County, PA, General Obligation Unlimited,
5.00%, 8/15/13 | | | 525,645 | | |
| | 425,000 | | | Northampton County, PA, Higher Education Authority
Revenue - Lehigh University,
5.25%, 11/15/09 | | | 454,350 | | |
| | 325,000 | | | Northampton Township, PA, General Obligation Unlimited,
(MBIA Insured),
4.60%, 11/15/10 | | | 333,242 | | |
| | 230,000 | | | Pennsylvania Housing Finance Agency, (Single Family Mortgage),
Series 61B, Revenue,
5.20%, 10/1/14 | | | 236,523 | | |
See Notes to Financial Statements.
134
THE GLENMEDE PORTFOLIOS
Muni Intermediate Portfolio
SCHEDULE OF PORTFOLIO INVESTMENTS — (Continued)
October 31, 2005
Face
Amount | | | | Value | |
| MUNICIPAL BONDSt — (Continued) | | | |
| | | Pennsylvania — (Continued) | |
| $ | 225,000 | | | Pennsylvania Housing Finance Agency, Residential Development
Section 8-A, Revenue,
4.00%, 7/1/09 | | $ | 228,442 | | |
| | 370,000 | | | Pennsylvania State Higher Educational Facilities Authority Revenue,
Temple University, (MBIA Insured), First Series,
4.00%, 7/15/09 | | | 377,485 | | |
| | 500,000 | | | Pennsylvania State Higher Educational Facilities Authority
Revenue, University of Pennsylvania, (AMBAC Insured),
5.00%, 8/15/10 | | | 531,260 | | |
| | 435,000 | | | Pennsylvania State Higher Educational Facilties Authority
Revenue, University of Pennsylvania Health Services, Series A,
5.375%, 1/15/15 | | | 453,879 | | |
| | | Pennsylvania State Turnpike Commission Oil Franchise,
Tax Revenue, Escrowed to Maturity, Series A, (AMBAC Insured): | |
| | 145,000 | | | 5.25%, 12/1/13 | | | 153,991 | | |
| | 60,000 | | | 5.25%, 12/1/14 | | | 63,630 | | |
| | | Pennsylvania State Turnpike Commission Oil Franchise,
Tax Revenue, Unrefunded Balance Series A, (AMBAC Insured): | |
| | 105,000 | | | 5.25%, 12/1/13 | | | 111,434 | | |
| | 40,000 | | | 5.25%, 12/1/14 | | | 42,451 | | |
| | 250,000 | | | Pennsylvania State University, College & University Revenues,
Series A, (General Obligation of University),
5.00%, 8/15/13 | | | 262,072 | | |
| | 275,000 | | | Pennsylvania State, General Obligation Unlimited, Refunding,
(AMBAC Insured),
5.125%, 9/15/11 | | | 285,816 | | |
| | 150,000 | | | Pennsylvania State, Intermediate Unit 1, Educational Facilities
Revenue Refunding, (AMBAC Insured),
4.00%, 10/15/09 | | | 153,683 | | |
| | 250,000 | | | Pennsylvania State, Refunding, Third Series,
4.00%, 9/1/10 | | | 255,280 | | |
| | 125,000 | | | Pennsylvania State, Second Series, General Obligation Unlimited,
5.25%, 10/1/10 | | | 133,920 | | |
| | | Philadelphia, PA, General Obligation Unlimited, (FSA Insured): | |
| | 400,000 | | | 5.00%, 9/15/11 | | | 425,268 | | |
| | 500,000 | | | 5.25%, 9/15/13 | | | 535,060 | | |
| | 150,000 | | | 5.25%, 9/15/16 | | | 160,022 | | |
| | 500,000 | | | Philadelphia, PA, Municipal Authority Revenue, Refunding -
Lease - Series A, (FSA Insured),
5.25%, 5/15/09 | | | 527,345 | | |
See Notes to Financial Statements.
135
THE GLENMEDE PORTFOLIOS
Muni Intermediate Portfolio
SCHEDULE OF PORTFOLIO INVESTMENTS — (Continued)
October 31, 2005
Face
Amount | | | | Value | |
| MUNICIPAL BONDSt — (Continued) | | | |
| | | Pennsylvania — (Continued) | |
| $ | 250,000 | | | Philadelphia, PA, Municipal Authority Revenue, Refunding -
Lease - Series B, (FSA Insured),
5.25%, 11/15/18 | | $ | 264,773 | | |
| | 600,000 | | | Pittsburgh, PA, Public Parking Authority Revenue, Series A,
(FGIC Insured),
5.00%, 12/1/16 | | | 639,108 | | |
| | | Pittsburgh, PA, Urban Redevelopment Authority Mortgage
Revenue, Series D: | |
| | 255,000 | | | 5.75%, 10/1/07 | | | 255,000 | | |
| | 150,000 | | | 6.20%, 4/1/11 | | | 150,000 | | |
| | 155,000 | | | 6.20%, 10/1/11 | | | 155,000 | | |
| | 350,000 | | | Pleasant Hills, PA, Authority Sewer Revenue, Refunding,
(FGIC Muni Government Guaranteed),
5.00%, 9/1/12 | | | 364,672 | | |
| | 100,000 | | | Radnor Township, PA, General Obligation Unlimited, Series A,
4.00%, 12/15/10 | | | 101,586 | | |
| | 235,000 | | | Ringgold, PA, School District, Escrowed to Maturity,
6.20%, 1/15/13 | | | 256,286 | | |
| | 250,000 | | | Seneca Valley, PA, School District, Series A, General Obligation
Unlimited,
4.85%, 7/1/11 | | | 258,240 | | |
| | 100,000 | | | Shaler, PA, School District, General Obligation Unlimited, Series B,
(FSA Insured),
4.50%, 9/1/10 | | | 102,698 | | |
| | 400,000 | | | Southeastern Pennsylvania Transportation Authority, PA,
Special Revenue, (FGIC Insured),
5.45%, 3/1/11 | | | 418,912 | | |
| | 325,000 | | | State Public School Building Authority, PA, School Revenue,
Clearfield Career & Technology Center, (XCLA Insured),
4.00%, 9/15/12 | | | 328,455 | | |
| | 250,000 | | | State Public School Building Authority, PA, School Revenue,
Garnet Valley School District Project, (AMBAC Insured),
5.25%, 2/1/12 | | | 269,595 | | |
| | 500,000 | | | Swarthmore Boro Authority, PA, College Revenue,
4.50%, 9/15/10 | | | 521,925 | | |
| | 400,000 | | | University of Pittsburgh, PA, Refunded Series B, (MBIA Insured),
5.50%, 6/1/09 | | | 421,096 | | |
| | 125,000 | | | Wallingford - Swarthmore, PA, School District, Series C,
(FSA State Aid Withholding),
5.00%, 5/15/09 | | | 128,218 | | |
See Notes to Financial Statements.
136
THE GLENMEDE PORTFOLIOS
Muni Intermediate Portfolio
SCHEDULE OF PORTFOLIO INVESTMENTS — (Concluded)
October 31, 2005
Face
Amount | | | | Value | |
| MUNICIPAL BONDSt — (Continued) | | | |
| | | Pennsylvania — (Continued) | | | |
| $ | 200,000 | | | | Wilkes Barre, PA, Area School District, General Obligation
Unlimited, (FGIC Insured),
5.25%, 4/1/14 | | | $ | 205,460 | | |
| | 250,000 | | | | York, PA, General Authority Guaranteed Revenue, York City
Recreation Corp., (AMBAC Insured),
5.50%, 5/1/15 | | | | 271,303 | | |
| | | | 19,572,690 | | |
| | | Puerto Rico — 2.2% | | | |
| | | Puerto Rico, Industrial Tourist Educational Medical &
Environmental Control Facilities Financing Authority, Inter
American University of Puerto Rico Project, (MBIA Insured): | | | |
| | 190,000 | | | | 4.25%, 10/1/10 | | | | 196,511 | | |
| | 250,000 | | | | 4.25%, 10/1/11 | | | | 258,383 | | |
| | | | 454,894 | | |
| | | New Jersey — 1.1% | | | |
| | 215,000 | | | | Delaware River Joint Toll Bridge Commission, Revenue
(MBIA Insured),
5.25%, 7/1/16 | | | | 231,699 | | |
| | | | | | TOTAL MUNICIPAL BONDS
(Cost $20,093,265) | | | | 20,259,283 | | |
| | TOTAL INVESTMENTS
(Cost $20,093,265)1 | | | | 97.7 | % | | $ | 20,259,283 | | |
| | OTHER ASSETS IN EXCESS OF LIABILITIES | | | | 2.3 | | | | 486,730 | | |
| | NET ASSETS | | | | 100.0 | % | | $ | 20,746,013 | | |
t Percentages indicated are based on net assets.
1 Aggregate cost for federal tax purposes was $20,093,265.
Abbreviations:
AMBAC — American Municipal Bond Assurance Corporation
FGIC — Financial Guaranty Insurance Corporation
FSA — Financial Security Assurance
MBIA — Municipal Bond Investors Assurance
XCLA — XL Capital Assurance, Inc.
See Notes to Financial Statements.
137
THE GLENMEDE PORTFOLIOS
Muni Intermediate Portfolio
CREDIT QUALITY
| On October 31, 2005, credit quality of the Portfolio was as follows (Unaudited): | |
| | | % of
Net Assets | | Value | |
| MOODY'S CREDIT RATING: | |
| Aaa | | | 74.5 | % | | $ | 15,451,792 | | |
| Aa | | | 23.2 | | | | 4,807,491 | | |
| TOTAL MUNICIPAL BONDS | | | 97.7 | % | | $ | 20,259,283 | | |
| TOTAL INVESTMENTS | | | 97.7 | % | | $ | 20,259,283 | | |
See Notes to Financial Statements.
138
THE GLENMEDE PORTFOLIOS
New Jersey Muni Portfolio
SCHEDULE OF PORTFOLIO INVESTMENTS
October 31, 2005
Face
Amount | | | | Value | |
| MUNICIPAL BONDSt — 97.8% | | | |
| | | New Jersey — 89.3% | |
| $ | 100,000 | | | Asbury Park, NJ, Board of Education, General Obligation
Unlimited, (MBIA Insured),
5.55%, 2/1/07 | | $ | 103,055 | | |
| | | Bergen County, NJ, Utilities Authority, Water Pollution Control
Revenue, (FGIC Insured), Series A: | |
| | 200,000 | | | 5.125%, 12/15/11 | | | 205,820 | | |
| | 150,000 | | | 5.125%, 12/15/12 | | | 154,365 | | |
| | 370,000 | | | Brigantine, NJ, General Obligation Unlimited, (MBIA Insured),
5.00%, 8/15/12 | | | 375,332 | | |
| | 350,000 | | | Burlington County, NJ, Bridge Commission Revenue,
(County Guaranteed),
5.25%, 10/1/13 | | | 380,044 | | |
| | 150,000 | | | Cherry Hill Township NJ, General Obligation Unlimited,
(FGIC Insured), Prerefunded 7/15/09 @ 100,
5.125%, 7/15/10 | | | 159,091 | | |
| | 100,000 | | | Delaware River & Bay Authority, Public Improvements Revenue,
Series A,
5.10%, 1/1/08 | | | 103,687 | | |
| | 435,000 | | | Delaware River Joint Toll Bridge Commission, Revenue
(MBIA Insured),
5.25%, 7/1/16 | | | 468,786 | | |
| | 115,000 | | | Delaware River Joint Toll Bridge Commission, Revenue,
Series A, (MBIA Insured),
5.00%, 7/1/13 | | | 123,623 | | |
| | 150,000 | | | Delaware River Port Authority, Pennsylvania & New Jersey
Revenue, Refunding, (AMBAC Insured), Series B,
5.25%, 1/1/09 | | | 158,441 | | |
| | | Delaware River Port Authority, Pennsylvania, New Jersey & Delaware
River Bridges Revenue, Escrowed to Maturity: | |
| | 190,000 | | | 5.625%, 1/15/09 | | | 196,916 | | |
| | 200,000 | | | 6.00%, 1/15/10 | | | 212,446 | | |
| | 115,000 | | | 6.50%, 1/15/11 | | | 124,675 | | |
| | 100,000 | | | Gloucester County, NJ, Improvement Authority, Revenue,
County Library Lease Project,
5.20%, 12/15/05 | | | 100,272 | | |
| | 250,000 | | | Hazlet Township, NJ, School District, General Obligation
Unlimited, (FSA School Board Residual Fund Insured),
5.00%, 2/1/14 | | | 265,170 | | |
| | 200,000 | | | Hopewell Valley, NJ, Regional School District, General Obligation
Unlimited, (FGIC School Board Residual Fund Insured),
5.00%, 8/15/12 | | | 211,908 | | |
See Notes to Financial Statements.
139
THE GLENMEDE PORTFOLIOS
New Jersey Muni Portfolio
SCHEDULE OF PORTFOLIO INVESTMENTS — (Continued)
October 31, 2005
Face
Amount | | | | Value | |
| MUNICIPAL BONDSt — (Continued) | | | |
| | | New Jersey — (Continued) | |
| $ | 250,000 | | | Lenape, NJ, Regional School District, General Obligation Unlimited,
(FGIC School Board Residual Fund Insured),
5.00%, 4/1/16 | | $ | 267,232 | | |
| | 235,000 | | | Mantua Township, NJ, School District, General Obligation Unlimited,
(MBIA Insured),
5.00%, 3/1/13 | | | 250,186 | | |
| | 200,000 | | | Maplewood Township, NJ, General Improvements, General
Obligation Unlimited, (FSA Insured),
5.00%, 2/1/09 | | | 210,658 | | |
| | 150,000 | | | Mercer County, NJ, Improvement Authority, Revenue Refunding,
Government Leasing, (County Guaranteed), Series A,
5.40%, 12/1/05 | | | 150,312 | | |
| | 100,000 | | | Mercer County, NJ, Improvement Authority, Revenue Refunding,
Solid Waste, (County Guaranteed), Series 97,
5.20%, 9/15/08 | | | 105,140 | | |
| | 145,000 | | | Middlesex County, NJ, Improvement Authority, Revenue,
(County Guaranteed),
5.45%, 9/15/11 | | | 149,256 | | |
| | | Monmouth County, NJ, Improvement Authority, Revenue,
(AMBAC Insured): | |
| | 250,000 | | | 5.00%, 12/1/12 | | | 265,475 | | |
| | 375,000 | | | 5.20%, 12/1/14 | | | 401,520 | | |
| | 100,000 | | | Monmouth County, NJ, Improvement Authority, Revenue,
Series A, (AMBAC Muni Government Guaranteed),
5.25%, 12/1/16 | | | 108,803 | | |
| | 100,000 | | | Morris County, NJ, General Improvement, General Obligation
Unlimited,
4.625%, 8/15/08 | | | 102,480 | | |
| | 80,000 | | | Mount Holly, NJ, Municipal Utilities Authority, Sewer Revenue,
Prerefunded, 12/1/08 @ 100, (MBIA Insured),
5.00%, 12/1/13 | | | 84,009 | | |
| | 20,000 | | | Mount Holly, NJ, Municipal Utilities Authority, Sewer Revenue,
Unrefunded, (MBIA Insured),
5.00%, 12/1/13 | | | 20,901 | | |
| | 500,000 | | | New Jersey Building Authority State Building Revenue,
5.00%, 6/15/13 | | | 520,175 | | |
| | 300,000 | | | New Jersey Economic Development Authority, School Facilities
Construction, Series L, (FSA Insured),
5.25%, 3/1/12 | | | 325,320 | | |
| | 500,000 | | | New Jersey Sports & Exposition Authority Convention Center,
Tobacco and Liquor Taxes, (MBIA Insured), Refunding,
5.125%, 9/1/14 | | | 527,910 | | |
See Notes to Financial Statements.
140
THE GLENMEDE PORTFOLIOS
New Jersey Muni Portfolio
SCHEDULE OF PORTFOLIO INVESTMENTS — (Continued)
October 31, 2005
Face
Amount | | | | Value | |
| MUNICIPAL BONDSt — (Continued) | | | |
| | | New Jersey — (Continued) | |
| $ | 250,000 | | | New Jersey Sports & Exposition Authority State Contract, General
Improvements, Series A,
5.00%, 3/1/10 | | $ | 263,710 | | |
| | 100,000 | | | New Jersey State Economic Development Authority, Parking
Facility Improvements, Elizabeth Development Project,
(FGIC Insured),
5.20%, 10/15/08 | | | 105,301 | | |
| | 200,000 | | | New Jersey State Economic Development Authority, School
Facilities Construction Revenue, (MBIA Insured), Series C,
Prerefunded 6/15/12 @ 100,
5.00%, 6/15/16 | | | 214,580 | | |
| | 250,000 | | | New Jersey State Educational Facilities Authority, (AMBAC Insured),
5.00%, 7/1/17 | | | 266,150 | | |
| | 300,000 | | | New Jersey State Educational Facilities Authority, Revenue,
High Education Capital Improvement, Series B,
5.00%, 9/1/14 | | | 319,794 | | |
| | 500,000 | | | New Jersey State Educational Facilities Authority, Revenue,
Higher Education Facilities Trust Fund, (FSA Insured), Series A:,
5.00%, 9/1/16 | | | 536,510 | | |
| | 100,000 | | | New Jersey State Educational Facilities Authority, Revenue,
Institutional Advanced Studies, Series F,
5.00%, 7/1/09 | | | 104,249 | | |
| | 200,000 | | | New Jersey State Health Care Facilities Financing Authority,
Revenue, Kennedy Health System Project, (MBIA Insured), Series A,
5.00%, 7/1/09 | | | 206,892 | | |
| | | New Jersey State Housing & Mortgage Finance Agency,
Multi-Family Housing
Revenue, (FSA Insured), Series B: | |
| | 450,000 | | | 5.55%, 11/1/09 | | | 467,455 | | |
| | 250,000 | | | 5.75%, 11/1/11 | | | 265,372 | | |
| | 150,000 | | | New Jersey State Housing & Mortgage Finance Agency, Revenue,
Home Buyer, (MBIA Insured), Series P,
5.05%, 4/1/07 | | | 153,181 | | |
| | 130,000 | | | New Jersey State Transportation Trust Fund Authority, Transit
Revenue, Series A, Prerefunded, 6/15/09 @ 100,
5.00%, 6/15/13 | | | 137,164 | | |
| | 70,000 | | | New Jersey State Turnpike Authority, Turnpike Revenue,
(MBIA Insured), Series A,
5.75%, 1/1/18 | | | 75,546 | | |
See Notes to Financial Statements.
141
THE GLENMEDE PORTFOLIOS
New Jersey Muni Portfolio
SCHEDULE OF PORTFOLIO INVESTMENTS — (Continued)
October 31, 2005
Face
Amount | | | | Value | |
| MUNICIPAL BONDSt — (Continued) | | | |
| | | New Jersey — (Continued) | |
| $ | 180,000 | | | New Jersey State Turnpike Authority, Turnpike Revenue,
(MBIA Insured), Series A, Prerefunded to 1/01/10 @ 100,
5.75%, 1/1/18 | | $ | 196,076 | | |
| | 250,000 | | | New Jersey State, Certificates of Participation, (AMBAC Insured),
Escrowed to Maturity,
5.00%, 6/15/11 | | | 267,320 | | |
| | 10,000 | | | New Jersey State, Wastewater Treatment Trust Revenue, Series A,
Unrefunded Balance,
5.25%, 9/1/13 | | | 10,218 | | |
| | | Ocean County, NJ, General Obligation Unlimited, Refunding,
Series B: | |
| | 250,000 | | | 4.875%, 12/15/09 | | | 261,085 | | |
| | 200,000 | | | 4.50%, 8/1/10 | | | 208,896 | | |
| | 800,000 | | | Ocean County, NJ, Utilities Authority, Wastewater Revenue,
Refunding,
5.00%, 1/1/12 | | | 831,744 | | |
| | 325,000 | | | Ocean County, NJ, Utilities Authority, Wastewater Revenue,
Refunding, (General Obligation of Authority),
5.125%, 1/1/11 | | | 338,397 | | |
| | 200,000 | | | Passaic County, NJ, General Obligation Unlimited, (FSA Insured),
5.25%, 6/1/15 | | | 215,296 | | |
| | | Red Bank, NJ, Board of Education, General Obligation Unlimited,
(School Board Residual Fund Insured): | |
| | 250,000 | | | 5.15%, 5/1/12 | | | 263,268 | | |
| | 100,000 | | | 5.15%, 5/1/13 | | | 105,307 | | |
| | 500,000 | | | Ridgewood, NJ, Board of Education, General Obligation Unlimited,
5.20%, 10/1/08 | | | 527,050 | | |
| | 400,000 | | | South Jersey Transportation Authority, NJ, Transportation System,
Revenue, (FSA Insured),
4.00%, 11/1/09 | | | 408,456 | | |
| | 500,000 | | | Union County, NJ,
5.00%, 3/1/17 | | | 526,060 | | |
| | 150,000 | | | Warren Township, NJ, School District, General Obligation
Unlimited, (School Board Residual Fund Insured),
5.35%, 3/15/10 | | | 161,798 | | |
| | 500,000 | | | West Deptford Township, NJ, General Obligation Unlimited,
(AMBAC Insured),
5.20%, 3/1/11 | | |
513,429 | | |
| | | | | | | | 14,783,312 | | |
See Notes to Financial Statements.
142
THE GLENMEDE PORTFOLIOS
New Jersey Muni Portfolio
SCHEDULE OF PORTFOLIO INVESTMENTS — (Concluded)
October 31, 2005
Face
Amount | | | | Value | |
| MUNICIPAL BONDSt — (Continued) | | | |
| | | Puerto Rico — 4.8% | | | |
| $ | 250,000 | | | | Puerto Rico Commonwealth Appropration, Revenue, Series A,
(MBIA Insured), (LOC: Government Development Bank for
Puerto Rico), Mandatory Put, 2/1/12 @ 100,
4.10%, 8/1/29 | | | $ | 253,333 | | |
| | 500,000 | | | | Puerto Rico Municipal Finance Agency,
5.25%, 8/1/18 | | | | 540,615 | | |
| | | | 793,948 | | |
| | | Pennsylvania — 3.7% | | | |
| | 565,000 | | | | Delaware River Joint Toll Bridge Commission Revenue,
(MBIA Insured), Prerefunded 7/1/13 @ 100,
5.25%, 7/1/16 | | | | 616,658 | | |
| | | | | | TOTAL MUNICIPAL BONDS
(Cost $15,938,968) | | | | 16,193,918 | | |
| | TOTAL INVESTMENTS
(Cost $15,938,968)1 | | | | 97.8 | % | | $ | 16,193,918 | | |
| | OTHER ASSETS IN EXCESS OF LIABILITIES | | | | 2.2 | | | | 361,968 | | |
| | NET ASSETS | | | | 100.0 | % | | $ | 16,555,886 | | |
t Percentages indicated are based on net assets.
1 Aggregate cost for federal tax purposes was $15,939,243.
Abbreviations:
AMBAC — American Municipal Bond Assurance Corporation
FGIC — Financial Guaranty Insurance Corporation
FSA — Financial Security Assurance
LOC — Letter of Credit
MBIA — Municipal Bond Investors Assurance
See Notes to Financial Statements.
143
THE GLENMEDE PORTFOLIOS
New Jersey Muni Portfolio
CREDIT QUALITY
| On October 31, 2005, credit quality of the Portfolio was as follows (Unaudited): | |
| | | % of
Net Assets | | Value | |
| MOODY'S CREDIT RATING: | |
| Aaa | | | 58.3 | % | | $ | 9,655,315 | | |
| Aa | | | 31.4 | | | | 5,194,073 | | |
| A | | | 8.1 | | | | 1,344,530 | | |
| TOTAL MUNICIPAL BONDS | | | 97.8 | % | | $ | 16,193,918 | | |
| TOTAL INVESTMENTS | | | 97.8 | % | | $ | 16,193,918 | | |
See Notes to Financial Statements.
144
THE GLENMEDE PORTFOLIOS
Notes to Financial Statements
1. Organization and Significant Accounting Policies
The Glenmede Portfolios (the "Fund") is an investment company that was organized as a Massachusetts business trust on March 3, 1992 and is registered with the Securities and Exchange Commission under the Investment Company Act of 1940 (the "1940 Act"), as amended, as an open-end management investment company. As of October 31, 2005, the Fund offered shares of two Sub-Trusts, the Muni Intermediate Portfolio and the New Jersey Muni Portfolio (each, a "Portfolio" and collectively, the "Portfolios"). Each Portfolio is classified as non-diversified.
The preparation of financial statements in conformity with accounting principles generally accepted in the United States of America requires management to make estimates and assumptions that affect the reported amounts of assets and liabilities and disclosure of contingent assets and liabilities at the date of the financial statements and the reported amounts of revenues and expenses during the reporting period. Actual results could differ from those estimates. The following is a summary of significant accounting policies consistently followed by each Portfolio in the preparation of its financial statements.
Valuation of Securities: Municipal obligations for which market quotations are readily available are valued at the most recent quoted bid price provided by investment dealers, provided that municipal obligations may be valued on the basis of prices provided by a pricing service when such prices are determined by the investment advisor to reflect the fair market value of such municipal obligations. When market quotations are not readily available or events occur for which the above valuation procedures are deemed not to reflect fair value, municipal obligations are valued in a manner which is intended to reflect their fair value as determined in accordance with procedures approved by of the Board of Trustees of the Fund (the "Board"). Debt obligations with remaining maturities of 60 days or less are valued on the basis of amortized cost.
Securities Transactions and Investment Income: Securities transactions are recorded as of the trade date. Realized gains and losses on investments sold are computed on the basis of identified cost. Interest income is recorded on the accrual basis and includes amortization of premiums and accretion of discounts when appropriate.
Securities purchased or sold on a when-issued or delayed-delivery basis may be settled a month or more after the trade date. Interest income is accrued based on the terms of the security. Each Portfolio segregates assets with a current value at least equal to the amount of its when-issued purchase commitments. When-issued purchase commitments involve a risk of loss if the value of the security to be purchased declines prior to settlement date, or if the counterparty does not perform under the contract.
Dividends and Distributions to Shareholders: Dividends from net investment income, if any, are declared and paid monthly. The Portfolios distribute any net realized capital gains on an annual basis. Additional distributions of net investment income and capital gains for each Portfolio may be made at the discretion of the Board in order to avoid a nondeductible excise tax under Section 498 of the Internal Revenue Code, as amended.
Income and capital gains distributions are determined in accordance with income tax regulations which may differ from accounting principles generally accepted in the United States of America. These differences are primarily due to differing treatments
145
THE GLENMEDE PORTFOLIOS
Notes to Financial Statements — (Continued)
of income and gains on various investment securities held by each Portfolio, timing differences and differing characterization of distributions made by each Portfolio.
Federal Income Taxes: Each Portfolio intends to qualify as a regulated investment company by complying with the requirements of the Internal Revenue Code applicable to regulated investment companies and by distributing substantially all of its tax-exempt (and taxable, if any) income to its shareholders. Therefore, no Federal income tax provision is required. Income distributions and capital gains distributions are determined in accordance with income tax regulations which may differ from accounting principles generally accepted in the United States of America. These differences are primarily due to differing treatments for amortized premiums, expired net capital loss carryforwards, discounts and net operating losses. Net investment income/(loss), net realized capital gains/(losses) and net assets are not affected. The calculation of net investment income/(l oss) per share in the financial highlights tables excludes such adjustments.
On October 31, 2005, the tax year end of the Fund, Muni Intermediate Portfolio had available capital loss carryforwards of $2,521 expiring October 31, 2013.
As of October 31, 2005, the components of distributable earnings on a tax basis were as follows:
| Portfolio | | Undistributed
Tax-exempt
Income | | Undistributed
Ordinary Income | | Undistributed
Long-Term Gains | | Total
Distributable
Earnings | |
Muni Intermediate
Portfolio | | $ | 64,181 | | | $ | — | | | $ | — | | | $ | 227,678 | | |
New Jersey Muni
Portfolio | | | 61,526 | | | | — | | | | — | | | | 316,201 | | |
Total Distributable Earnings are additionally comprised of Net Unrealized Appreciation/(Depreciation) and Capital Loss Carryforwards, which are shown elsewhere in the Notes to Financial Statements.
As of October 31, 2005, the tax characterization of distributions paid during the year was equal to the book characterization of distributions paid for the Portfolios, with the following exception:
| Portfolio | | Tax
Exempt | | Ordinary
Income | | Long-Term
Gains | |
| New Jersey Muni Portfolio | | $ | 621,450 | | | $ | 14 | | | $ | 129,048 | | |
2. Investment Advisory Fee, Administration Fee and Other Related PartyTransactions
Glenmede Advisers, Inc. (the "Advisor"), a wholly-owned subsidiary of The Glenmede Trust Company, N.A., ("Glenmede Trust") serves as investment advisor to the Muni Intermediate and New Jersey Muni Portfolios, pursuant to an investment management agreement with the Fund. Under this agreement, the Advisor manages the Portfolios, subject to the general supervision of the Board.
Muni Intermediate and New Jersey Muni Portfolios do not pay a management fee for advisory services. Glenmede Trust charges a fee directly to its clients for fiduciary, trust and /or advisory services. The actual annual fees charged vary dependent on a number of factors, including the particular services provided to the client and are generally 1.25% or less of the clients' assets under management.
146
THE GLENMEDE PORTFOLIOS
Notes to Financial Statements — (Continued)
The Muni Intermediate and New Jersey Muni Portfolios each pays Glenmede Trust shareholder servicing fees at the annual rate of 0.15% of such Portfolio's average daily net assets.
Investors Bank & Trust Company ("IBT") serves as administrator, transfer agent, dividend-paying agent and custodian with respect to the Fund. The Fund pays IBT a fee based on the combined aggregate average daily net assets of the Portfolios and The Glenmede Fund, Inc., a registered investment company. The fee is computed daily and paid monthly. IBT is also paid an annual fee plus out-of-pocket expenses for the provision of personnel and services related to the Fund's compliance program. The Fund's Chief Compliance Officer holds the position of Senior Director at IBT.
Quasar Distributors, LLC serves as distributor of the Portfolios' shares. The distributor receives no fees in connection with distribution services provided to the Fund.
The Fund pays each Board member an annual fee of $1,000 and out-of-pocket expenses incurred in attending Board meetings.
Expenses for the year ended October 31, 2005 include legal fees paid to Drinker Biddle & Reath LLP. A partner of the law firm is Secretary of the Fund.
3. Purchases and Sales of Securities
For the year ended October 31, 2005, cost of purchases and proceeds from sales of investment securities other than US Government securities and short-term securities were:
| Portfolio | | Purchases | | Sales | |
| Muni Intermediate Portfolio | | $ | 5,213,051 | | | $ | 3,284,771 | | |
| New Jersey Muni Portfolio | | | 5,332,828 | | | | 6,567,576 | | |
On October 31, 2005, aggregate gross unrealized appreciation for all securities in which there was an excess of value over tax cost and aggregate gross unrealized depreciation for all securities in which there was an excess of tax cost over value were as follows:
| Portfolio | | Appreciation | | Depreciation | | Net | |
| Muni Intermediate Portfolio | | $ | 319,530 | | | $ | 153,512 | | | $ | 166,018 | | |
| New Jersey Muni Portfolio | | | 340,986 | | | | 86,311 | | | | 254,675 | | |
4. Shares of Beneficial Interest
As Of October, 31, 2005, Glenmede Trust, on behalf of its clients, holds of record and has voting and/or investment authority over substantially all of the Portfolios' outstanding shares. The Fund may issue an unlimited number of shares of beneficial interest with a $.001 par value. Changes in shares of beneficial interest outstanding were as follows:
| | | Year Ended
10/31/05 | | Year Ended
10/31/04 | |
| | | Shares | | Amount | | Shares | | Amount | |
| Muni Intermediate Portfolio: | |
| Sold | | | 529,292 | | | $ | 5,555,774 | | | | 276,425 | | | $ | 2,939,660 | | |
| Redeemed | | | (332,792 | ) | | | (3,490,058 | ) | | | (371,219 | ) | | | (3,946,518 | ) | |
| Net increase (decrease) | | | 196,500 | | | $ | 2,065,716 | | | | (94,794 | ) | | $ | (1,006,858 | ) | |
147
THE GLENMEDE PORTFOLIOS
Notes to Financial Statements — (Continued)
| | | Year Ended
10/31/05 | | Year Ended
10/31/04 | |
| | | Shares | | Amount | | Shares | | Amount | |
| New Jersey Muni Portfolio: | |
| Sold | | | 167,786 | | | $ | 1,752,700 | | | | 113,765 | | | $ | 1,203,400 | | |
| Issued as reinvestment of dividends | | | 11,881 | | | | 121,663 | | | | — | | | | — | | |
| Redeemed | | | (291,933 | ) | | | (3,045,953 | ) | | | (206,460 | ) | | | (2,195,229 | ) | |
| Net decrease | | | (112,266 | ) | | $ | (1,171,590 | ) | | | (92,695 | ) | | $ | (991,829 | ) | |
5. Concentration of Credit
The Muni Intermediate Portfolio and New Jersey Muni Portfolio primarily invest in debt obligations issued by the Commonwealth of Pennsylvania and the State of New Jersey, respectively, and their political subdivisions, agencies, instrumentalities and authorities to obtain funds for various purposes. Each Portfolio is more susceptible to factors adversely affecting issuers of the respective region that the Portfolio invests in than is a municipal bond fund that is not concentrated in these issuers to the same extent.
148
REPORT OF INDEPENDENT REGISTERED PUBLIC ACCOUNTING FIRM
To the Board of Trustees of The Glenmede Portfolios and Shareholders of Muni Intermediate Portfolio and New Jersey Muni Portfolio:
In our opinion, the accompanying statements of assets and liabilities, including the schedules of portfolio investments, and the related statements of operations and of changes in net assets and the financial highlights present fairly, in all material respects, the financial position of Muni Intermediate Portfolio and New Jersey Muni Portfolio (constituting The Glenmede Portfolios, hereafter referred to as the "Fund") at October 31, 2005, and the results of each of their operations for the year then ended, the changes in each of their net assets for the two years in the period then ended, and the financial highlights for each of the five years in the period then ended, in conformity with accounting principles generally accepted in the United States of America. These financial statements and financial highlights (hereafter referred to as "financial statements") are the responsibility of the Fund's management; our responsibility is to express an opinion on these financial statements based on our audits. We conducted our audits of these financial statements in accordance with the standards of the Public Company Accounting Oversight Board (United States). Those standards require that we plan and perform the audit to obtain reasonable assurance about whether the financial statements are free of material misstatement. An audit includes examining, on a test basis, evidence supporting the amounts and disclosures in the financial statements, assessing the accounting principles used and significant estimates made by management, and evaluating the overall financial statement presentation. We believe that our audits, which included confirmation of securities at October 31, 2005 by correspondence with the custodian, provide a reasonable basis for our opinion.
PricewaterhouseCoopers LLP
Boston, Massachusetts
January 5, 2006
149
THE GLENMEDE FUND, INC.
Tax Information (Unaudited)
For the year ended October 31, 2005
The amount of long-term capital gains paid for the fiscal year ended October 31, 2005 was as follows:
| Strategic Equity Portfolio | | $ | 1,460,491 | | |
| Small Cap Equity Portfolio | | | 36,821,056 | | |
| Large Cap Value Portfolio | | | 1,931,606 | | |
| International Portfolio | | | 58,462,105 | | |
| Philadelphia International Fund | | | 11,073,031 | | |
| Large Cap 100 Portfolio | | | 376,380 | | |
Of the ordinary distributions made during the fiscal year ended October 31, 2005, the following percentages have been derived from investments in US Government and Agency Obligations. All or a portion of the distributions from this income may be exempt from taxation at the state level. Consult your tax advisor for state specific information.
| Government Cash Portfolio | | | 50.58 | % | |
| Core Fixed Income Portfolio | | | 57.11 | % | |
Of the ordinary distributions made during the fiscal year ended October 31, 2005, the following percentages are tax exempt for regular Federal income tax purposes.
| Tax-Exempt Cash Portfolio | | | 100 | % | |
Of the ordinary distributions made during the fiscal year ended October 31, 2005, the following percentages qualify for the dividends received deduction available to corporate shareholders:
| Large Cap Value Portfolio | | | 100.00 | % | |
| Large Cap 100 Portfolio | | | 94.76 | % | |
| Large Cap Growth Portfolio | | | 100.00 | % | |
The above figures may differ from those cited elsewhere in this report due to differences in the calculation of income and gains for Securities and Exchange Commission (book) purposes and Internal Revenue Service (tax) purposes.
Foreign Taxes Paid or Withheld
| | | Total | | Per Share | |
| International Portfolio | | $ | 4,306,418 | | | $ | 0.08 | | |
| Philadelphia International Fund | | | 1,290,101 | | | | 0.04 | | |
The foreign taxes paid or withheld per share represent taxes incurred by the Fund on interest and dividends received by the Fund from foreign sources. Foreign taxes paid or withheld should be included in taxable income with an offsetting deduction from gross income or as a credit for taxes paid to foreign governments. Consult your tax advisor regarding the appropriate treatment of foreign taxes paid.
150
THE GLENMEDE FUND, INC.
Tax Information (Unaudited) — (Continued)
For the year ended October 31, 2005
Qualified dividend income ("QDI") received through October 31, 2005, that qualified for a reduced tax rate pursuant to the Internal Revenue Code Section 1(h)(11) are as follows:
| Strategic Equity Portfolio | | $ | 954,617 | | |
| Small Cap Equity Portfolio | | | 800,871 | | |
| Large Cap Value Portfolio | | | 482,895 | | |
| International Portfolio | | | 38,238,859 | | |
| Philadelphia International Fund | | | 14,716,315 | | |
| U.S. Emerging Growth Portfolio | | | 58,075 | | |
| Large Cap 100 Portfolio | | | 537,153 | | |
| Large Cap Growth Portfolio | | | 103,558 | | |
151
THE GLENMEDE PORTFOLIOS
Tax Information (Unaudited)
For the year ended October 31, 2005
Of the dividends paid by the Muni Intermediate Portfolio from net investment income for the fiscal year ended October 31, 2005, 100% is tax-exempt for regular Federal income taxes and Pennsylvania taxes.
Of the dividends paid by the New Jersey Muni Portfolio from net investment income for the fiscal year ended October 31, 2005, 100% is tax-exempt for regular Federal income taxes and New Jersey taxes.
The amount of long-term capital gains paid for the fiscal year ended October 31, 2005 for New Jersey Muni Portfolio was $129,048.
152
THE GLENMEDE FUND, INC.
THE GLENMEDE PORTFOLIOS
OFFICERS & DIRECTORS/TRUSTEES TABLE (Unaudited)
Information pertaining to the Board of Directors of The Glenmede Fund, Inc. and the Board of Trustees of The Glenmede Portfolios (collectively, the "Funds") and their respective officers is set forth below. Unless otherwise indicated below, the address of each Board member and officer is 200 Clarendon Street, Boston, Massachusetts 02116. The Statement of Additional Information includes additional information about the Directors and Trustees and is available without charge, upon request, by calling 1-800-442-8299.
Independent Directors/Trustees(1)
| Name, Address and Age | | Positions Held
with the Funds | | Term of Office* and
Length of Time Served | | Principal
Occupations(s) During
Past 5 Years; Other
Directorships Held by
Director/Trustee | | Number of
Portfolios
in Fund
Complex
Overseen
by
Director/
Trustee | |
H. Franklin Allen, D. Phil.
Age: 49 | | Director of the Glenmede Fund.
Trustee of the Glenmede Portfolios. | | Director of the Glenmede Fund since March 1991.
Trustee of the Glenmede Portfolios since May 1992. | | Nippon Life Professor of Finance and Professor of Economics from 1990-1996; Vice Dean and Director of Wharton Doctoral Programs from 1990-1993. Employed by The University of Pennsylvania since 1980. | | | 13 | | |
|
Willard S. Boothby, Jr.
Age: 84 | | Director of the Glenmede Fund.
Trustee of the Glenmede Portfolios. | | Director of the Glenmede Fund since October 1988.
Trustee of the Glenmede Portfolios since May 1992. | | Former Director, Getty Oil Corporation; Former Director of Georgia-Pacific Corp.; Former Chairman and Chief Executive Officer Blyth Eastman Dillon & Co., Inc.; Former Managing Director of Paine Webber, Inc.; Former Chairman of U.S. Securities Industry Association. | | | 13 | | |
|
Francis J. Palamara
Age: 80 | | Director of the Glenmede Fund.
Trustee of the Glenmede Portfolios. | | Director of the Glenmede Fund since October 1988.
Trustee of the Glenmede Portfolios since May 1992. | | Former Chief Operating Officer of the New York Stock Exchange; Former Trustee of Gintel Fund Former Director of XTRA Corporation; Former Director and Executive Vice President-Finance of ARAMARK, Inc. | | | 13 | | |
|
(1) Independent Directors/Trustees are those Directors/Trustees who are not "interested persons" of the Funds as defined in the 1940 Act.
* Each Director holds office until the earliest of (i) the next meeting of shareholders, if any, called for the purpose of considering the election or re-election of such Director and until the election and qualification of his or her successor, if any, elected, at such meeting, or (ii) the date he or she dies, resigns or retires, or is removed by the Board of Directors or shareholders. Each Trustee holds office until the earliest of (i) the termination of the Glenmede Portfolios, or (ii) the date he or she dies, resigns or retires, or is removed by the Board of Trustees or shareholders.
153
THE GLENMEDE FUND, INC.
THE GLENMEDE PORTFOLIOS
OFFICERS & DIRECTORS/TRUSTEES TABLE (Unaudited) — (Continued)
Interested Directors/Trustees(2)
| Name, Address and Age | | Positions Held
with the Funds | | Term of Office* and
Length of Time Served | | Principal
Occupation(s) During
Past 5 Years; Other
Directorships Held by
Director/Trustee | | Number of
Portfolios
in Fund
Complex
Overseen
by
Director/
Trustee | |
John W. Church,(3)
Age: 73 | | Chairman and Director of the Glenmede Fund.
Chairman and Trustee of the Glenmede Portfolios. | | Chairman and Director of the Glenmede Fund since October 1988.
Chairman and Trustee of the Glenmede Portfolios since May 1992. | | Director of Girard Partners LTD;
Retired, Executive Vice President and Chief Investment Officer of The Glenmede Trust Company from 1979–1997. | | | 13 | | |
|
G. Thompson Pew, Jr.(4)
Age: 63 | | Director of the Glenmede Fund.
Trustee of the Glenmede Portfolios. | | Director of the Glenmede Fund since October 1988.
Trustee of the Glenmede Portfolios since May 1992. | | Director, Member Relationship Oversight Committee and Chairman of the Compensation Committee of Glenmede Trust; Former Director of Brown & Glenmede Holdings, Inc.; Former Co-Director, Principal and Officer of Philadelphia Investment Banking Co.; Former Director and Officer of Valley Forge Administrative Services Company. | | | 13 | | |
|
(2) Interested Directors/Trustees are those Directors/Trustees who are "interested persons" of the Funds as defined in the 1940 Act.
(3) Mr. Church is deemed to be an "interested" Director/Trustee of the Funds because of his stock ownership in
The Glenmede Corporation, of which the Advisor is a subsidiary.
(4) Mr. Pew is deemed to be an "interested" Director/Trustee of the Funds because of his affiliations with Glenmede Trust, and his stock ownership in the Glenmede Corporation, of which the Advisor is a subsidiary.
154
THE GLENMEDE FUND, INC.
THE GLENMEDE PORTFOLIOS
OFFICERS & DIRECTORS/TRUSTEES TABLE (Unaudited) — (Concluded)
Officers
| Name, Address and Age | | Positions Held with
the Funds | | Term of Office** and
Length of Time Served | | Principal
Occupation(s) During
Past 5 Years and
Directorships Held | |
Mary Ann B. Wirts
One Liberty Place
1650 Market Street, Suite 1200
Philadelphia, PA 19103
Age: 54 | | President and Treasurer of the Funds. | | President of the Funds since December 1997.
Treasurer of the Funds since December 2002. | | First Vice President and Managing Director of The Fixed Income Division of Glenmede Trust. Employed by Glenmede Trust since 1982 and Glenmede Advisers since 2002. | |
|
Kimberly C. Osborne
One Liberty Place
1650 Market Street,
Suite 1200
Philadelphia, PA 19103
Age: 40 | | Executive Vice President of the Funds. | | Executive Vice President of the Funds since December 1997. | | Vice President of Glenmede Trust. Employed by Glenmede Trust since 1993 and Glenmede Advisers since 2002. | |
|
Michael P. Malloy
One Logan Square
18th and Cherry Streets
Philadelphia, PA 19103
Age: 46 | | Secretary of the Funds. | | Secretary of the Funds since January 1995. | | Partner in the law firm of Drinker Biddle & Reath LLP. | |
|
Peter W. Kronberg
200 Clarendon Street
Boston, MA 02116
Age: 50 | | Assistant Secretary of the Funds. | | Assistant Secretary of the Funds since September 2005. | | Director and Counsel, Investors Bank & Trust Company since 2005. Attorney and Principal, Contract Corporate Counsel, 1998-2005. | |
|
Odeh L. Stevens
200 Clarendon Street
Boston, MA 02116
Age: 33 | | Assistant Secretary of the Funds. | | Assistant Secretary of the Funds since September 2005. | | Associate Counsel, Investors Bank & Trust Company since 2005. Legal Product Manager, Fidelity Investments (2000-2005). | |
|
Daniel Shea
200 Clarendon Street
Boston, MA 02116
Age: 43 | | Assistant Treasurer of the Funds. | | Assistant Secretary of the Funds since March 2005 | | Director, Investors Bank & Trust Company. Employed by Investors Bank & Trust Company since 1996. | |
|
Donna M. Rogers
200 Clarendon Street
Boston, MA 02116
Age: 39 | | Chief Compliance Officer | | Chief Compliance Officer of the Funds since September 2004. | | Senior Director, Investors Bank & Trust Company since 2002. Employed by Investors Bank & Trust Company since 1994. | |
|
** Each officer is elected by the respective Board and holds office for the term of one year and until his or her successor is duly elected and qualified, or until he or she dies, resigns, is removed, or becomes disqualified.
155
THE GLENMEDE FUND, INC.
THE GLENMEDE PORTFOLIOS
(Unaudited)
Proxy Voting
A description of the policies and procedures that the Funds' investment advisors and sub-advisor use to vote proxies relating to the Funds' portfolio securities is available, without charge, upon request, by calling 1-800-442-8299, and on the Securities and Exchange Commission's (the "SEC") website at http://www.sec.gov.
Information regarding how the Funds voted proxies relating to portfolio securities during the most recent 12-month period ended June 30 is available, without charge, upon request, by calling 1-800-442-8299, and on the SEC's website at http://www.sec.gov.
Quarterly Portfolio Holdings
The Funds file their complete schedule of portfolio holdings of each Portfolio with the SEC for the first and third quarter of each fiscal year on Form N-Q. The Funds' Forms N-Q are available on the SEC's website at http://www.sec.gov and may be reviewed and copied at the SEC's Public Reference Room in Washington, D.C. Information on the operation of the SEC's Public Reference Room may be obtained by calling 1-800-SEC-0330.
Board of Directors/Trustees - Considerations in Renewing Investment Advisory and Sub-Investment Advisory Agreements
At meetings held on September 7, 2005, the Board of Directors of Glenmede Fund and the Board of Trustees of Glenmede Portfolios (collectively, the "Boards") approved the renewal of the Investment Advisory Agreements for each Portfolio of the Funds and the Sub-Investment Advisory Agreement for the International Portfolio (collectively, the "Portfolios").
In determining whether to renew the Investment Advisory Agreements and the Sub-Investment Advisory Agreement (collectively, the "Agreements"), the Boards, including all of the Directors/Trustees who are not interested persons under the Investment Company Act of 1940 (the "Independent Directors"), reviewed and considered, among other items: (1) a memorandum from independent counsel setting forth the Boards' fiduciary duties, responsibilities and the factors the Boards should consider in their evaluation of the renewal of the Agreements; (2) reports prepared by an independent rating and ranking organization and charts prepared by the Advisor comparing the performance of each Portfolio to the performance of its applicable benchmark index and relevant peer group; (3) a Lipper Inc. ("Lipper") report comparing each Portfolio's advisory fees and expenses to those of its relevant peer group; and
(4) reports of and presentations by representatives of the Advisor and PIA that described: (i) the nature, extent and quality of the Advisor's and PIA's services provided to their respective Portfolios; (ii) the experience and qualifications of
156
the personnel providing those services; (iii) their investment philosophies and processes; (iv) their assets under management and client descriptions; (v) their soft dollar commission and trade allocation policies, including information on the types of research and services obtained in connection with soft dollar commissions; (vi) their advisory fee arrangements with the Funds, including voluntary fee waivers in effect for the International Portfolio and Philadelphia International Fund; (vii) the advisory fee arrangements between PIA and its other similarly managed clients; (viii) their compliance processes; (ix) their financial information, insurance coverage and profitability analyses related to providing services to the Portfolios; and (x) the extent to which economies of scale are relevant to the Portfolios. The Directors/Trustees discussed the written materials, the Advisor's and PIA's presentations, the report of the Funds' Chief Compl iance Officer on the Advisor's compliance program, and deliberated on the renewal of the Agreements in light of this information. In their deliberations, the Directors/Trustees did not identify any single piece of information that was all-important or controlling.
The Boards, including all of the Independent Directors/Trustees, reached the following conclusions, among others, regarding the Advisor and PIA and their respective Agreements: the Advisor and PIA each have the capabilities, resources and personnel necessary to manage their respective Portfolios; the Boards are satisfied with the quality of services provided by the Advisor and PIA in advising their respective Portfolios; the advisory fee for each Portfolio that pays an advisory fee is below both the median and the average fees paid by comparable funds in their respective Lipper peer group; and each advisory and sub-advisory fee payable to PIA is reasonable as compared to PIA's other similarly managed mutual fund clients. The Boards noted that the Funds are the Advisor's only clients and therefore, there is no comparative fee information for the Advisor's other similarly managed clients.
The Boards also concluded that: the total annual portfolio operating expenses paid by each Portfolio are below the average expenses paid by comparable funds in their respective Lipper peer group, and either below or, in the case of the Large Cap Growth Portfolio, equivalent to, the median expenses paid by such comparable funds; the performance of the Portfolios are generally competitive (in some cases performance for certain periods was higher than the comparative performance information, and in other cases it was lower) with their benchmark indices and other mutual funds in their peer groups as ranked by an independent rating and ranking organization and as demonstrated by charts provided by the Advisor comparing the performance of each Portfolio to its respective benchmark index and Lipper peer gr oup; the expected profit to the Advisor for advisory services based on the advisory fees and Glenmede Trust for shareholder servicing seem reasonable; the expected profit to PIA for advisory and sub-advisory services seem reasonable; and the benefits derived by the Advisor and PIA from managing their respective Portfolios, including how each uses soft dollars, the ways in which they conduct portfolio transactions and select brokers, seem reasonable. The Boards noted that since the investment advisory fees and shareholder servicing fees do not have breakpoints, there would be no economies of scale for those fees as the Portfolios' assets increase. With respect to the Glenmede Fund Board's evaluation of the Sub-Investment Advisory Agreement, economies of scale were not
157
considered relevant because the sub-advisory fee is to be paid by the Advisor, not the International Portfolio or its shareholders, and therefore would have no impact on the International Portfolio's expense ratio.
Based upon each Board's deliberations and evaluation of the information described above, the Directors/Trustees, including all of the Independent Directors/Trustees, determined that the terms of each Investment Advisory Agreement and Sub-Advisory Agreement were reasonable and fair to the respective Portfolios and their shareholders.
158
THE GLENMEDE FUND, INC.
Additional Information (Unaudited)
Results of Special Meeting of Shareholders
A special meeting of the shareholders (the "Meeting") of each of the Core Fixed Income, International, Large Cap Value, Strategic Equity and U.S. Emerging Growth Portfolios was held on June 23, 2005. The Meeting was adjourned for lack of a quorum and reconvened on July 14, 2005. The proposals acted upon by shareholders of each Portfolio at the reconvened Meeting and the results of the shareholder vote were as follows:
Proposal 1: To approve an Amendment to the Investment Advisory Agreement between the Fund, on behalf of the Core Fixed Income Portfolio, and the Advisor to pay the Advisor an annual advisory fee of 0.35% of the Portfolio's average daily net assets:
12,857,060.693 shares or 95.65% of the votes cast in favor, with 170,017.760 shares or 1.26% of the votes cast against and 414,815.78 shares or 3.09% of the votes cast abstaining.
Proposal 2: To approve an Amendment to the Investment Advisory Agreement between the Fund, on behalf of the Large Cap Value Portfolio, and the Advisor to pay the Advisor an annual advisory fee of 0.55% of the Portfolio's average daily net assets:
1,246,730.747 shares or 97.83% of the votes cast in favor, with 13,889.300 shares or 1.09% of the votes cast against and 13,770.930 shares or 1.08% of the votes cast abstaining.
Proposal 3: To approve an Amendment to the Investment Advisory Agreement between the Fund, on behalf of the Strategic Equity Portfolio, and the Advisor to pay the Advisor an annual advisory fee of 0.55% of the Portfolio's average daily net assets:
1,878,250.598 shares or 83.82% of the votes cast in favor, with 312,820.859 shares or 13.96% of the votes cast against and 49,704.12 shares or 2.22% of the votes cast abstaining.
Proposal 4: To approve an Amendment to the Investment Advisory Agreement between the Fund, on behalf of the International Portfolio, and the Advisor to pay the Advisor an annual advisory fee of 0.75% of the Portfolio's average daily net assets:
45,030,633.807 shares or 79.89% of the votes cast in favor, with 3,445,329.010 shares or 6.11% of the votes cast against and 7,889,571.75 shares or 14.0% of the votes cast abstaining.
Proposal 5: To approve an Amendment to the Sub-Investment Advisory Agreement among the Fund, on behalf of the International Portfolio, the Advisor and PIA for the Advisor to pay PIA and annual sub-advisory fee of 0.26% of the Portfolio's average daily net assets:
44,813,296.701 shares or 79.51% of the votes cast in favor, with 3,614,753.845 shares or 6.41% of the votes cast against and 7,937,484.02 shares or 14.08% of the votes cast abstaining.
Proposal 6: To approve an Amendment to the Investment Advisory Agreement between the Fund, on behalf of the U.S. Emerging Growth Portfolio, and the Advisor to increase the annual advisory fee paid to the Advisor from 0.25% to 0.55% of the Portfolio's average daily net assets:
887,083.553 shares or 91.75% of the votes cast in favor, with 76,564.187 shares or 7.92% of the votes cast against and 3,175.80 shares or 0.33% of the votes cast abstaining.
On the basis of the votes cast by proxy at the Meeting, it was declared that each proposal was approved. The Amendments to the Investment Advisory and Sub-Investment Advisory Agreements became effective on August 1, 2005.
159
THE GLENMEDE FUND, INC.
THE GLENMEDE PORTFOLIOS
Privacy Notice
The Glenmede Fund, Inc. and The Glenmede Portfolios (each the "Company") are committed to protecting the security and confidentiality of the personal information of our shareholders. We provide you with this notice to inform you about our practices with respect to personal information.
We collect nonpublic personal information about you from the following sources:
• Information we receive from you on applications or other forms; and
• Information about your transactions with us or others;
• Information received from you in written, telephonic or electronic communications with us, or affiliates or others.
We may share all of the nonpublic personal information that we collect (as described above) with our affiliated providers of financial services, such as The Glenmede Trust Company and its affiliated banking and insurance companies, and with companies that perform marketing services on our behalf. We are permitted by law to disclose nonpublic personal information about you to other third parties in certain circumstances. For example, we may disclose nonpublic personal information about you to affiliated and nonaffiliated third parties to assist us in servicing your account with us and to government entities.
If you decide to close your account(s) or become an inactive customer, we will adhere to the privacy policies and practices as described in this notice.
We restrict access to your personal and account information to those employees who need to know that information to provide products or services to you. We maintain physical, electronic, and procedural safeguards to guard your nonpublic personal information.
If you have any questions about our privacy policies, please call 1-800-442-8299.
160
The Glenmede Fund, Inc. and The Glenmede Portfolios
Investment Advisor
Glenmede Advisers, Inc.
One Liberty Place
1650 Market Street, Suite 1200
Philadelphia, Pennsylvania 19103
Administrator
Investors Bank & Trust Company
200 Clarendon Street
Boston, Massachusetts 02116
Custodian
Investors Bank & Trust Company
200 Clarendon Street
Boston, Massachusetts 02116
Legal Counsel
Drinker Biddle & Reath LLP
One Logan Square
18th & Cherry Streets
Philadelphia, Pennsylvania 19103-6996
Distributor
Quasar Distributors, LLC.
615 East Michigan Street
Milwaukee, Wisconsin 53202
Independent Auditors
PricewaterhouseCoopers LLP
125 High Street
Boston, Massachusetts 02110
Investment Advisor
(for Philadelphia International Fund)
Investment Sub-Advisor
(for International Portfolio)
Philadelphia International Advisors LP
One Liberty Place
1650 Market Street, Suite 1400
Philadelphia, Pennsylvania 19103
The report is submitted for the general information of the shareholders of The Glenmede Fund, Inc. and The Glenmede Portfolios. It is not authorized for distribution to prospective investors unless accompanied or preceded by an effective prospectus for the Funds, which contain information concerning the Fund's investment policies and expenses as well as other pertinent information.
Item 2. Code of Ethics.
As of October 31, 2005, the Registrant has adopted a code of ethics that applies to the Registrant’s President and Treasurer (Principal Executive Officer and Principal Financial Officer). For the year ended October 31, 2005, there were no amendments to a provision of its code of ethics, nor were there any waivers, including implicit waivers granted from a provision of the code of ethics. A copy of the Registrant’s code of ethics is filed with the Form N-CSR under Item 12(a)(1).
Item 3. Audit Committee Financial Expert.
The Registrant’s Board of Directors has determined that the Registrant has at least one audit committee financial expert serving on its audit committee. The audit committee financial expert serving on the Registrant’s audit committee is Francis J. Palamara, who is “independent” as defined in Item 3(a)(2) of this Form.
Item 4. Principal Accountant Fees and Services.
(a) Audit Fees – The aggregate fees billed for each of the last two fiscal years for professional services rendered by the principal accountant for the audit of the Registrant’s annual financial statements or services that are normally provided by the accountant in connection with statutory and regulatory filings or engagements for those fiscal years were $178,671 and $189,413 for the fiscal years ended October 31, 2004 and October 31, 2005, respectively.
(b) Audit-Related Fees – There were no fees billed for the fiscal years ended October 31, 2004 and October 31, 2005 for assurance and related services by the principal accountant that are reasonably related to the performance of the audit of the Registrant’s financial statements and are not reported under (a) of this Item.
(c) Tax Fees – The aggregate fees billed in each of the last two fiscal years for professional services rendered by the principal accountant for the review of the Registrant’s tax returns and excise tax calculations were $38,605 and $38,609 for the fiscal years ended October 31, 2004 and October 31, 2005, respectively.
(d) All Other Fees – There were no other fees billed for the fiscal years ended October 31, 2004 and October 31, 2005 for products and services provided by the principal accountant, other than the services reported in (a) through (c) of this Item.
(e) (1) The Registrant’s audit committee pre-approves all audit and non-audit services to be performed by the Registrant’s accountant before the accountant is engaged by the Registrant to perform such services.
(2) There were no services described in (b) through (d) above (including services required to be approved by the audit committee pursuant to paragraph (c)(7)(ii) of Rule 2-01 of Regulation S-X) that were approved by the audit committee pursuant to paragraph (c)(7)(i)(C) of Rule 2-01 of Regulation S-X.
(f) None of the hours expended on the principal accountant’s engagement to audit the Registrant’s financial statements for the fiscal year ended October 31, 2005 were attributable to work performed by persons other than the principal accountant’s full-time, permanent employees.
(g) Not applicable.
(h) Not applicable.
Item 5. Audit Committee of Listed Registrants.
Not applicable.
Item 6. Schedule of Investments.
The Registrant’s full schedules of investments are included as part of the report to shareholders filed under Item 1 of this Form.
Item 7. Disclosure of Proxy Voting Policies and Procedures for Closed-End Management Investment Companies.
Not applicable.
Item 8. Portfolio Managers of Closed-End Management Investment Companies
Not applicable
Item 9. Purchases of Equity Securities by Closed-End Management Investment Company and Affiliated Purchasers.
Not applicable.
Item 10. Submission of Matters to a Vote of Security Holders.
There have been no material changes to the procedures by which the shareholders may recommend nominees to the Registrant’s Board of Directors.
Item 11. Controls and Procedures.
(a) The Registrant’s Principal Executive Officer and Principal Financial Officer concluded that the Registrant’s disclosure controls and procedures (as defined in Rule 30a-3(c) under the Investment Company Act of 1940 (17 CFR 270.30a-3(c))), are effective based on the evaluation of Registrant’s disclosure controls and procedures as of a date within 90 days prior to the filing date of this report.
(b) There were no changes in the Registrant’s internal control over financial reporting (as defined in Rule 30a-3(d) under the Investment Company Act of 1940 (17 CFR 270.30a-3(d))), that occurred during the second fiscal quarter of the period covered by this report that has materially affected, or is reasonably likely to materially affect, the Registrant’s internal control over financial reporting.
Item 12. Exhibits.
(a)(1) Code of Ethics for the Registrant’s President and Treasurer (Principal Executive Officer and Principal Financial Officer) described in Item 2 is attached hereto.
(a)(2) Certification of the Principal Executive Officer and Principal Financial Officer of the Registrant as required by Rule 30a-2(a) under the Investment Company Act of 1940 (17 CFR 270.30a-2(a)) is attached hereto as Exhibit 99CERT.
(a)(3) Not applicable.
(b) Certification pursuant to Section 906 of the Sarbanes-Oxley Act of 2002 as required by Rule 30a-2(b), under the Investment Company Act of 1940 (17 CFR 270.30a-2(b)), Rule 15d-14(b) under the Securities Exchange Act of 1934 (17 CFR 240.15d-14(b)) and Section 1350 of Chapter 63 of Title 18 of the United States Code (18 U.S.C. 1350) is attached hereto as Exhibit 99.906CERT.
SIGNATURES
Pursuant to the requirements of the Securities Exchange Act of 1934 and the Investment Company Act of 1940, the Registrant has duly caused this report to be signed on its behalf by the undersigned, thereunto duly authorized.
(Registrant) | THE GLENMEDE FUND, INC. |
|
By (Signature and Title) | By: /s/ Mary Ann B. Wirts |
| Mary Ann B. Wirts |
| President and Treasurer |
| (Principal Executive Officer and Principal Financial Officer) |
Date | January 9, 2006 | |
|
Pursuant to the requirements of the Securities Exchange Act of 1934 and the Investment Company Act of 1940, this report has been signed below by the following person on behalf of the Registrant and in the capacities and on the date indicated. |
| | | | |
By (Signature and Title) | By: /s/ Mary Ann B. Wirts |
| Mary Ann B. Wirts |
| President and Treasurer |
| (Principal Executive Officer and Principal Financial Officer) |
Date | January 9, 2006 | |
| | | |