UNITED STATES
SECURITIES AND EXCHANGE COMMISSION
Washington, D.C. 20549
FORM N-CSR
CERTIFIED SHAREHOLDER REPORT OF REGISTERED
MANAGEMENT INVESTMENT COMPANIES
Investment Company Act file number | 811-5577 |
|
The Glenmede Fund, Inc. |
(Exact name of registrant as specified in charter) |
|
200 Clarendon Street
Boston, Massachusetts | | 02116 |
(Address of principal executive offices) | | (Zip code) |
|
Michael P. Malloy, Esq. Secretary Drinker Biddle & Reath LLP One Logan Square 18th & Cherry Streets Philadelphia, PA 19103-6996 |
(Name and address of agent for service) |
|
Registrant’s telephone number, including area code: | 1-800-442-8299 | |
|
Date of fiscal year end: | October 31, 2006 | |
|
Date of reporting period: | October 31, 2006 | |
| | | | | | | |
Item 1. Reports to Stockholders.
Annual Report for the period November 1, 2005 through October 31, 2006 is filed herewith.


The Glenmede Fund, Inc.
The Glenmede Portfolios
Annual Report
October 31, 2006
The performance for each of the portfolios shown on pages 5 to 18 represents past performance and is not a guarantee of future results. A portfolio's share price and investment return will vary with market conditions, and the principal value of shares, when redeemed, may be more or less than their original cost. An investment in a portfolio is neither insured nor guaranteed by the US Government, the Federal Deposit Insurance Corporation, the Federal Reserve Board or any other governmental agency or bank. The yields of money market funds will fluctuate as market conditions change. Although the money market funds seek to preserve the value of your investment at $1.00 per share, it is possible to lose money by investing in these funds. Unlike actual fund performance, performance of an index does not reflect any expenses or transaction costs. A direct investment in an unmanaged index is not possible.
The reports concerning the portfolios included in this shareholder report may contain certain forward-looking statements about the factors that may affect the performance of the portfolios in the future. These statements are based on the adviser's or sub-adviser's predictions and expectations concerning certain future events and their expected impact on the portfolios, such as performance of the economy as a whole and of specific industry sectors, changes in the levels of interest rates, the impact of developing world events and other factors that may influence the future performance of the portfolios. The adviser or sub-adviser, as applicable, believes these forward-looking statements to be reasonable, although they are inherently uncertain and difficult to predict. Actual events may cause adjustments in portfolio management strategies from those currently expected to be employed.
THE GLENMEDE FUND, INC. AND THE GLENMEDE PORTFOLIOS
PRESIDENT'S LETTER
Dear Shareholder:
We are pleased to present the annual report of The Glenmede family of funds for the fiscal year ended October 31, 2006. Two new quantitative funds were launched in 2006, the Absolute Return Portfolio and the Total Market Long/Short Portfolio1. Both of these funds are managed by Vladimir ("Val") de Vassal of Glenmede Advisers, Inc. We hope you find the description of the management team and investment process for these portfolios which follows interesting.
At the fiscal year end on October 31, 2006, The Glenmede Fund, Inc. and The Glenmede Portfolios (collectively the "Glenmede Funds") consisted of fourteen portfolios with total assets of $3.6 billion. These included two EAFE International Portfolios, International and Philadelphia International (formerly Institutional International), which are sub-advised and advised respectively by Philadelphia International Advisors LP ("PIA"). The Glenmede Trust Company formed the PIA partnership with members of their International Equity team on January 1, 2002 to allow them to focus entirely on the International Equity products. These portfolios account for 40% of the fund family's assets as of October 31, 2006.
All of the Glenmede Funds, other than the money market funds, are managed to seek long-term total returns consistent with reasonable risk to principal for their asset category2. Efforts are made to keep expenses at competitive levels. All of the portfolios managed by Glenmede Advisers, Inc. use a quantitative style of investing.
This fiscal year ended October 31, 2006 showed positive returns across all asset classes. The S&P 500 Index3 returned 16.33% and the Lehman Brothers U.S. Aggregate Bond Index4 returned 5.19% for the fiscal year ended October 31, 2006. The MSCI EAFE Index5 performed better than domestic stocks for the fiscal year returning 27.52%, helped by a weakening U.S. dollar. Small Cap stocks continued to outperform Large Cap stocks with the Russell 2000 Index6 returning 19.98% versus a return of 16.02% on the Russell 1000 Index7 for the fiscal year ended October 31, 2006. It was a very difficult year for active equity management, resulting in a substantial percentage of managers underperforming their style benchmark, especially in the Small Cap arena.
The Federal Reserve left short term rates unchanged at 5.25% at their August 8, 2006 meeting, after two years of steady increases. Long rates remained low as inflation appeared to be under control. The yield curve inverted during the period, with three-month bills rising 119 basis points in yield and the 30-year Treasury bond dropping 4 basis points.
1
We welcome any questions about the Glenmede Funds and thank our clients for their continued support.
Sincerely,

Mary Ann B. Wirts
President
December 21, 2006
1The Total Market Long/Short Portfolio commenced operations on December 21, 2006.
2Mutual fund investing involves risks. Principal loss is possible. The Portfolios may invest in foreign securities which will involve greater volatility and political, economic and currency risks and differences in accounting methods. The Small Cap Equity and U.S. Emerging Growth Portfolios invest in smaller companies, which may involve additional risks such as limited liquidity and greater volatility. Short sales by the Absolute Return and Total Market Long/Short Portfolios involves leverage risk, credit exposure to brokers that execute the short sales and has potentially unlimited losses. Use of derivatives by the Absolute Return Portfolio may involve greater liquidity, counterparty, credit and pricing risks.
3The S&P 500 Index is a market capitalization weighted index comprised of 500 widely held common stocks.
4The Lehman Brothers U.S. Aggregate Bond Index includes securities that are SEC-registered, taxable, and dollar denominated. The index covers the U.S. investment grade fixed rate bond market, with components for government and corporate securities, mortgage pass-through securities, and asset-backed securities. These major sectors are subdivided into more specific indices that are calculated and reported on a regular basis.
5The MSCI EAFE Index is an unmanaged capitalization weighted composite portfolio consisting of equity total returns of countries in Australia, New Zealand, Europe and the Far East.
6The Russell 2000 Index is an unmanaged market capitalization weighted total return index which measures the performance of the 2,000 smallest companies in the Russell 3000 Index.
7The Russell 1000 Index is an unmanaged market capitalization weighted total return index which is comprised of the 1,000 largest companies in the Russell 3000 Index.
Past performance is no guarantee of future results.
This material must be preceded or accompanied by a current prospectus.
The Glenmede Fund, Inc. and the Glenmede Portfolios are distributed by Quasar Distributors, LLC. 12/06.
2
THE GLENMEDE FUND, INC.
Inside the
ABSOLUTE RETURN AND TOTAL MARKET LONG/SHORT PORTFOLIOS
Glenmede recently introduced two new portfolios, the Absolute Return Portfolio and the Total Market Long/Short Portfolio1. These two new Portfolios are managed by Glenmede's Quantitative Research Team lead by Vladimir ("Val") de Vassal, CFA. Val and his team are also responsible for Glenmede's other quantitatively-based equity portfolios, including the Large Cap 100, Large Cap Growth and U.S. Emerging Growth Portfolios. Val joined Glenmede in 1998 as Director of Quantitative Research. Val has over 20 years of asset management experience and has been managing equity portfolios for Glenmede since March 2002. Val is supported in portfolio management by Paul Sullivan, CFA, who has been with Glenmede for over 11 years, and Alex Atanasiu, who joined Glenmede as research analyst in 2005. In addit ion, the team gets active support from five fundamental analysts, two experienced equity traders, the structured products group, as well as senior high net worth and institutional portfolio managers.
Glenmede believes that actively managed portfolios of long and short equity positions constructed with a disciplined blend of proprietary, multifactor models and risk screens, can achieve superior long-term performance2. The benchmarks for the Absolute Return Portfolio and Total Market Long/Short Portfolios are the 90-Day U.S. Treasury Bill and the Russell 3000 Indices, respectively. These portfolios attempt to hold stocks in the Russell 3000 universe that Glenmede believes are the most attractive (long positions) and unattractive (short positions), using the following investment process:
• Multifactor Models. The first stage in the investment process is the creation of multi-factor models to rank the relative attractiveness of stocks within the Russell 3000 universe. The team performs historical backtests for each market sector to find which combination of factors and weightings the team believes produces equity portfolios with relatively consistent outperformance and underperformance versus the average stock over 12-month holding periods. Based on these buy and sell multi-factor models, stock ranking screens are run on a monthly basis to identify attractive and unattractive stocks.
• Risk Screens. To help reduce company specific risk, the quantitative team uses several screens to identify stocks that the team believes may have a greater risk for a price decline or price increase. These screens include multi-factor short-term buy and sell models, proprietary earnings surprise signals and liquidity.
• Opportunity Lists. For the Absolute Return and Total Market Long/Short Portfolios, the multifactor models and risk screens are applied to the universe of stocks in the Russell 3000 universe to determine an opportunity list of stocks for buying or shorting consideration. In addition, for the Absolute Return Portfolio, market index funds and derivatives may be used to manage asset allocation and other risk exposures.

ALEX ATANASIU, VAL DE VASSAL
AND PAUL SULLIVAN
3
THE GLENMEDE FUND, INC.
• Portfolio Optimization. Based on the multifactor stock ranking models, proprietary leading industry group indicators and the opportunity buy and sell lists, the team attempts to optimize the portfolios to provide relatively broad diversification across sectors and individual companies, while attempting to control turnover and limit tax consequences.
We believe the proprietary multifactor and leading industry group models, along with the disciplined investment process can provide successful portfolios for the long-term. The goal of the Absolute Return Portfolio is to create a positive excess return across capital market cycles through an optimized combination of long/short equity positions with relatively less volatility than the U.S. Equity Market. The goal of the Total Market Long/Short Portfolio is to create relatively strong return performance relative to the U.S. equity market through an optimized combination of long and short equity positions with relatively broad sector diversification and relatively limited risk.
1Short sales by the Absolute Return and Total Market Long/Short Portfolios involves leverage risk, credit exposure to brokers that execute the short sales and has potentially unlimited losses. Use of derivatives by the Absolute Return Portfolio may involve greater liquidity, counterparty, credit and pricing risks.
2 Please refer to Portfolio Highlights on page 16 for detailed performance figures for the Absolute Return Portfolio. The Total Market Long/Short Portfolio commenced operations on December 21, 2006.
4
THE GLENMEDE FUND, INC.
Government Cash Portfolio
PORTFOLIO HIGHLIGHTS
October 31, 2006
Average Annual Total Return
| Government Cash Portfolio | | | | iMoneyNet's
Government
All AverageTM1 | |
| Year ended 10/31/06 | | | 4.68 | % | | | 4.25 | % | |
| Five Years ended 10/31/06 | | | 2.30 | % | | | 1.86 | % | |
| Ten Years ended 10/31/06 | | | 3.86 | % | | | 3.38 | % | |
| Inception (11/7/88) through 10/31/06 | | | 4.73 | % | | | 4.23 | % | |
| Government Cash Portfolio | | 7-Day2
Current Yield | | 7-Day2
Effective Yield | |
| As of 10/31/06 | | | 5.10 | % | | | 5.23 | % | |
During the past fiscal year, the Government Cash Portfolio outperformed the iMoneyNet's Government All AverageTM1 due to its use of overnight and term mortgage-backed securities repurchase agreements. This strategy plus the low expense ratio enhanced the yield while maintaining a high quality diversified portfolio of money market instruments.
Hypothetical Illustration of $10,000 Invested in
Government Cash Portfolio vs.
iMoneyNet's Government All Average(TM)1
11/7/88 through 10/31/06
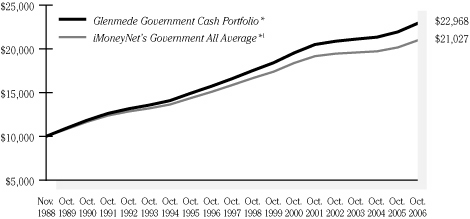
* Assumes the reinvestment of all dividends.
Performance data quoted represents past performance; past performance does not guarantee future results. Current performance may be higher or lower than the total return shown. Please call the Fund at 1-800-442-8299 to obtain the most recent month-end returns. Although the Portfolio seeks to preserve the value of your investment at $1.00 per share, it is possible to lose money by investing in the Portfolio. Returns do not reflect taxes that the shareholder may pay on fund distributions or the redemption of fund shares.
1 iMoneyNet's Government All AverageTM is comprised of money market funds investing in U.S. treasury securities and government agency obligations. It is not possible to invest directly in an index.
Benchmark return is for the period beginning November 30, 1988.
2 "Current Yield" also referred to as the "SEC Yield," refers to the income generated by an investment in the Fund over a 7-day period. This income is then "annualized." The "effective yield" is calculated similarly but, when annualized, the income earned by an investment in the Fund is assumed to be reinvested. The "effective yield" will be slightly higher than the "current yield" because of the compounding effect of this assumed reinvestment. The yield quotation more closely reflects the current earnings of the Fund than the total return quotation.
5
THE GLENMEDE FUND, INC.
Tax-Exempt Cash Portfolio
PORTFOLIO HIGHLIGHTS
October 31, 2006
Average Annual Total Return
| Tax-Exempt Cash Portfolio | | | | iMoneyNet's
National Retail
Tax-Free AverageTM1 | |
| Year ended 10/31/06 | | | 3.10 | % | | | 2.67 | % | |
| Five Years ended 10/31/06 | | | 1.61 | % | | | 1.22 | % | |
| Ten Years ended 10/31/06 | | | 2.47 | % | | | 2.06 | % | |
| Inception (11/10/88) through 10/31/06 | | | 3.16 | % | | | 2.75 | % | |
| Tax-Exempt Cash Portfolio | | 7-Day
Current Yield2 | | 7-Day
Effective Yield2 | |
| As of 10/31/06 | | | 3.33 | % | | | 3.38 | % | |
The Tax-Exempt Cash Portfolio has outperformed iMoneyNet's National Retail Tax-Free AverageTM1 in all of the periods shown above. During the past fiscal year, the strategy of maintaining a shorter average maturity, which increases yield when rates rise or when there is a greater supply of short-term securities, combined with a low expense ratio has resulted in good relative performance.
Hypothetical Illustration of $10,000 Invested in
Tax-Exempt Cash Portfolio vs.
iMoneyNet's National Retail Tax-Free Average(TM)1
11/10/88 through 10/31/06
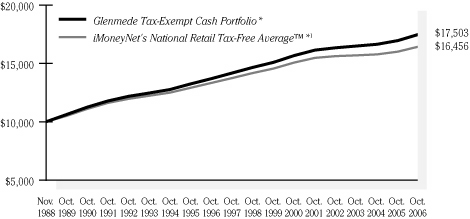
* Assumes the reinvestment of all dividends and distributions.
Performance data quoted represents past performance; past performance does not guarantee future results. Current performance may be higher or lower than the total return shown. Please call the Fund at 1-800-442-8299 to obtain the most recent month-end returns. Although the Portfolio seeks to preserve the value of your investment at $1.00 per share, it is possible to lose money by investing in the Portfolio.
1 iMoneyNet's National Retail Tax-Free AverageTM is comprised of money market funds investing in fixed-income securities issued by state and local governments. Generally, interest payments on securities qualify for exemption from Federal income taxes. Funds may also own municipal securities subject to the alternative minimum tax. It is not possible to invest directly in an index.
Benchmark return is for the period beginning November 30, 1988.
2 "Current Yield" also referred to as the "SEC Yield," refers to the income generated by an investment in the Fund over a 7-day period. This income is then "annualized." The "effective yield" is calculated similarly but, when annualized, the income earned by an investment in the Fund is assumed to be reinvested. The "effective yield" will be slightly higher than the "current yield" because of the compounding effect of this assumed reinvestment. The yield quotation more closely reflects the current earnings of the Fund than the total return quotation.
6
THE GLENMEDE FUND, INC.
Core Fixed Income Portfolio
PORTFOLIO HIGHLIGHTS
October 31, 2006
Average Annual Total Return
| Core Fixed Income Portfolio | | | | Lehman Brothers
U.S. Aggregate
Index1 | | Lipper
Intermediate
U.S. Government
Fund Index*1 | |
| Year ended 10/31/06 | | | 4.38 | % | | | 5.19 | % | | | 4.39 | % | |
| Five Years ended 10/31/06 | | | 4.03 | % | | | 4.51 | % | | | 3.47 | % | |
| Ten Years ended 10/31/06 | | | 5.96 | % | | | 6.26 | % | | | 5.41 | % | |
| Inception (11/17/88) through 10/31/06 | | | 7.10 | % | | | 7.50 | % | | | N/A | | |
The Core Fixed Income Portfolio returned 4.38% for the year ended October 31, 2006. The benchmark, the Lehman Brothers Aggregate Index, returned 5.19% for the year and the Portfolio's peer group, the Lipper Intermediate U.S. Government Fund Index, returned 4.39% for the year.
The Portfolio's performance versus the Lehman Brothers U.S. Aggregate Index can be attributed to the Portfolio's low risk themes and enhanced liquidity verses its benchmark. The Portfolio's returns closely matched that of its peer group, the Lipper Intermediate U.S. Government Fund Index. Diversification, liquidity, and low risk themes dominate the Portfolio's investment discipline. The Portfolio seeks to add value monitoring yield curve exposure while utilizing sector and security selection and seeks to maintain market neutral interest rate risk.
Hypothetical Illustration of $10,000 Invested in
Core Fixed Income Portfolio vs.
Lehman Brothers U.S. Aggregate Index and
Lipper Intermediate U.S. Government Fund Index*
11/17/88 through 10/31/06
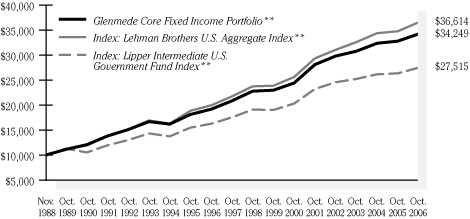
* Index commenced 12/31/89. The Index starts at $11,284, which is the value of the Portfolio in the graph on this date. Thus Portfolio inception comparisons are not provided.
** Assumes the reinvestment of all dividends and distributions.
Performance data quoted represents past performance; past performance does not guarantee future results. The investment return and principal value of an investment will fluctuate so that an investor's shares, when redeemed, may be worth more or less than their original cost. Current performance may be higher or lower than the total return shown. Please call the Fund at 1-800-442-8299 to obtain the most recent month-end returns. Returns do not reflect taxes that the shareholder may pay on fund distributions or the redemption of fund shares.
1 The Lehman Brothers U.S. Aggregate Index represents securities that are SEC-registered, taxable, and dollar denominated. The index covers the U.S. investment grade fixed rate bond market, with index components for government and corporate securities, mortgage pass-through securities, and asset-backed securities. These major sectors are subdivided into more specific indices that are calculated and reported on a regular basis. The Lipper Intermediate U.S. Government Fund Index is comprised of the 30 largest funds in the Lipper Intermediate U.S. Government Fund classification. This classification consists of funds that invest at least 65% of their assets in securities issued or guaranteed by the U.S. government, its agencies or instrumentalities with dollar-weighted average matur ities of 5 to 10 years. Total return consists of price appreciation/depreciation and income as a percentage of the original investment. Indexes are rebalanced by market capitalization each month. It is not possible to invest directly in an index.
Benchmark returns are for the periods beginning November 30, 1988 for Lehman Brothers U.S. Aggregate Index and December 31, 1989 for Lipper Intermediate U.S. Government Fund Index.
7
THE GLENMEDE FUND, INC.
Strategic Equity Portfolio
PORTFOLIO HIGHLIGHTS
October 31, 2006
Average Annual Total Return
| Strategic Equity Portfolio | | | | After-tax
Pre
Redemption | | Ater-tax
Post
Redemption | | Dow Jones Ind.
Monthly
Reinvested1 | |
S&P 500
Index1 | | Lipper Large Cap
Core Fund
Index1 | |
| Year ended 10/31/06 | | | 13.28 | % | | | 11.97 | % | | | 10.33 | % | | | 18.45 | % | | | 16.33 | % | | | 14.65 | % | |
Five Years ended
10/31/06 | | | 5.02 | % | | | 4.46 | % | | | 4.18 | % | | | 8.24 | % | | | 7.24 | % | | | 5.95 | % | |
Ten Years ended
10/31/06 | | | 6.77 | % | | | 5.40 | % | | | 5.41 | % | | | 9.31 | % | | | 8.63 | % | | | 7.43 | % | |
Inception (07/20/89)
through 10/31/06 | | | 9.44 | % | | | 7.86 | % | | | 7.66 | % | | | 11.99 | % | | | 10.83 | % | | | 9.50 | % | |
The Portfolio invests in companies that we believe are high quality with good growth prospects and attractively valued. In order to identify stocks that meet these criteria, the Portfolio combines our proprietary quantitative model with the insight of our fundamental research analysts. For the fiscal year ended October 31, 2006 the Portfolio posted a positive return of 13.28% but underperformed the S&P 500 Index and Lipper Large Cap Core Index by 3.05% and 1.37%, respectively. The majority of the underperformance can be attributed to the Portfolio's investment style, "growth at a reasonable price." During this time period, growth has underperformed value by 10.62% as measured by the Russell 1000 Growth and Value Indices.
Hypothetical Illustration of $10,000 Invested in
Strategic Equity Portfolio vs. S&P 500 Index,
Dow Jones Industrial Average and Lipper Large Cap Core Fund Index
7/20/89 through 10/31/06

* Assumes the reinvestment of all dividends and distributions.
Performance data quoted represents past performance; past performance does not guarantee future results. The investment return and principal value of an investment will fluctuate so that an investor's shares, when redeemed, may be worth more or less than their original cost. Current performance may be higher or lower than the total return shown. Please call the Fund at 1-800-442-8299 to obtain the most recent month-end returns. Returns, other than after-tax returns, do not reflect taxes that the shareholder may pay on fund distributions or the redemption of fund shares. After-tax returns are calculated using the historical highest individual federal marginal income tax rates, do not reflect the impact of state and local taxes and are not relevant to investors who hold their shares through tax-deferred arrangements such as 401(k) plans or IRAs. Actual after-tax returns depend on the investor's tax situation and may differ from those shown.
1 The S&P 500 Index is a market capitalization weighted index comprised of 500 widely held common stocks. The Dow Jones Industrial Average is a price-weighted average of 30 blue-chip stocks. The average is computed by adding the prices of the 30 stocks and dividing by a denominator, which has been adjusted over the years for stock splits, stock dividends, and substitutions of stock. The Lipper Large Cap Core Fund Index is comprised of the 30 largest mutual funds in the Lipper Large Cap Core Funds classification. This classification consists of funds that invest at least 75% of their equity assets in companies with market capitalizations greater than 300% of the dollar-weighted median market capitalization of the middle 1,000 securities of the S&P SuperComposite 1500 Inde x. It is not possible to invest directly in an index.
Benchmark returns are for the period beginning July 31, 1989.
8
THE GLENMEDE FUND, INC.
Small Cap Equity Portfolio
PORTFOLIO HIGHLIGHTS
October 31, 2006
Average Annual Total Return
Small Cap Equity Portfolio -
Advisor Class | | | | Russell 2000
Stock Index1 | | S&P 500
Index1 | | Lipper Small
Capitalization
Core Index*1 | |
| Year ended 10/31/06 | | | 16.69 | % | | | 19.98 | % | | | 16.33 | % | | | 15.69 | % | |
| Five Years ended 10/31/06 | | | 13.64 | % | | | 13.76 | % | | | 7.24 | % | | | 12.94 | % | |
| Ten Years ended 10/31/06 | | | 10.68 | % | | | 9.84 | % | | | 8.63 | % | | | 10.57 | % | |
| Inception (03/01/91) through 10/31/06 | | | 12.38 | % | | | 12.02 | % | | | 10.92 | % | | | N/A | | |
Small Cap Equity Portfolio -
Institutional Class2 | | | | | | | | | |
| Year ended 10/31/06 | | | 16.99 | % | | | 19.98 | % | | | 16.33 | % | | | 15.69 | % | |
| Five Years ended 10/31/06 | | | 13.89 | % | | | 13.76 | % | | | 7.24 | % | | | 12.94 | % | |
| Ten Years ended 10/31/06 | | | 10.89 | % | | | 9.84 | % | | | 8.63 | % | | | 10.57 | % | |
| Inception (01/02/98) through 10/31/06 | | | 12.51 | % | | | 12.02 | % | | | 10.92 | % | | | N/A | | |
Small Capitalization stocks experienced another strong year of performance. For the trailing twelve months, the Small Cap Equity Portfolio was up 16.69%, outpacing the average Small Cap Core manager as defined by Lipper. All sectors in the Portfolio were higher, with the basic industry, consumer, real estate and energy sectors accounting for the majority of the performance. Relative performance was negatively impacted by security selection within the technology sector.
Hypothetical Illustration of $10,000 Invested in
Small Cap Equity Portfolio Advisor Class vs. S&P 500 Index,
Russell 2000 Stock Index and Lipper Small Capitalization Core Index*
3/1/91 through 10/31/06
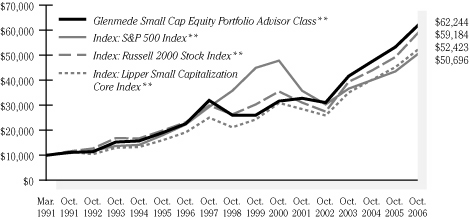
* Index commenced 12/31/91. The Index starts at $11,371, which is the value of the Portfolio in the graph on this date. Thus Portfolio inception comparisons are not provided.
** Assumes the reinvestment of all dividends and distributions.
Performance data quoted represents past performance; past performance does not guarantee future results. The investment return and principal value of an investment will fluctuate so that an investor's shares, when redeemed, may be worth more or less than their original cost. Current performance may be higher or lower than the total return shown. Please call the Fund at 1-800-442-8299 to obtain the most recent month-end returns. Returns do not reflect taxes that the shareholder may pay on fund distributions or the redemption of fund shares. Performance of the Institutional Class will vary from the Advisor Class due to differences in fees.
1 The S&P 500 Index is a market capitalization weighted index comprised of 500 widely held common stocks. The Russell 2000 Stock Index is an unmanaged market capitalization weighted total return index which measures the performance of the 2,000 smallest companies in the Russell 3000 Index. The Lipper Small Capitalization Core Index is comprised of the 30 largest funds in the Lipper Small Capitalization Core funds classification. This classification consists of funds that invest at least 75% of their equity assets in companies with market capitalizations less than 250% of the dollar weighted median of the smallest 500 of the middle 1,000 securities of the S&P SuperComposite 1500 Index. It is not possible to invest directly in an index.
2 Average annual total return for the Institutional Class includes the period from 03/01/91 through 10/31/03. Prior to the inception of the Institutional Class on 01/02/98, performance for the Institutional Class is based on the average annual total return of the Advisor Class.
Benchmark returns for the Russell 2000 Stock Index and the S&P 500 Index are for the period beginning February 28, 1991.
9
THE GLENMEDE FUND, INC.
Large Cap Value Portfolio
PORTFOLIO HIGHLIGHTS
October 31, 2006
Average Annual Total Return
| Large Cap Value Portfolio | | | | Russell 1000
Value Index1 | | S&P 500
Index1 | | Lipper
Large Cap
Value Index1 | |
| Year ended 10/31/06 | | | 13.81 | % | | | 21.46 | % | | | 16.33 | % | | | 18.41 | % | |
| Five Years ended 10/31/06 | | | 10.83 | % | | | 11.64 | % | | | 7.24 | % | | | 8.51 | % | |
| Ten Years ended 10/31/06 | | | 9.67 | % | | | 11.14 | % | | | 8.63 | % | | | 8.69 | % | |
| Inception (01/04/93) through 10/31/06 | | | 10.88 | % | | | 12.81 | % | | | 10.72 | % | | | 10.55 | % | |
The Large Cap Value Portfolio turned in another year of double-digit returns, but results fell short of the Russell 1000 Value Index in fiscal 2006. Despite a solid start for large cap stocks, smaller stocks in the index were very strong through April; leading the index higher. Weakness in early summer turned into a rally by the 4th fiscal quarter when investors' hopes of a pause in monetary tightening materialized, yet we were somewhat too defensive in the Portfolio.
In 2006, our investment process led us increasingly to the largest capitalized companies in the market which have been mostly overlooked during this recovery cycle. The profile of the Portfolio at year-end indicates a very large capitalization bias with a below-market valuation. This composition represents recent extremes for the Portfolio, with capitalization the largest it has been in over 5 years and well above the index. We think this is a desirable position for investors as we enter 2007.
Hypothetical Illustration of $10,000 Invested in
Large Cap Value Portfolio vs. S&P 500 Index,
Russell 1000 Value Index and Lipper Large Cap Value Index
1/4/93 through 10/31/06

* Assumes the reinvestment of all dividends and distributions.
Performance data quoted represents past performance; past performance does not guarantee future results. The investment return and principal value of an investment will fluctuate so that an investor's shares, when redeemed, may be worth more or less than their original cost. Current performance may be higher or lower than the total return shown. Please call the Fund at 1-800-442-8299 to obtain the most recent month-end returns. Returns do not reflect taxes that the shareholder may pay on fund distributions or the redemption of fund shares.
1 The S&P 500 Index is a market capitalization weighted index comprised of 500 widely held common stocks. The Russell 1000 Value Index is an unmanaged capitalization weighted total return index which is comprised of those securities in the Russell 1000 Index with a less than average growth orientation. The Lipper Large Cap Value Index is comprised of the 30 largest mutual funds within the Lipper Large Cap Value funds classification. This classification consists of funds that normally invest between 25% to 75% of their assets in companies with market capitalizations above 300% of the dollar-weighted median market capitalization of the middle 1,000 securities of the S&P Super Composite 1500 Index. It is not possible to invest directly in an index.
Benchmark returns are for the period beginning December 31, 1992.
10
THE GLENMEDE FUND, INC.
International Portfolio
PORTFOLIO HIGHLIGHTS
October 31, 2006
Average Annual Total Return
| International Portfolio | | | | Morgan Stanley
EAFE
Index1 | | Lipper
International
Fund Index1 | |
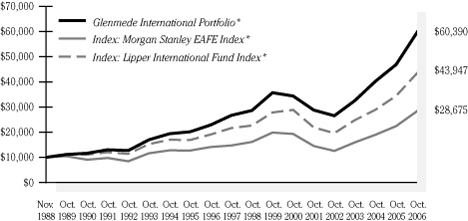
| Year ended 10/31/06 | | | 28.51 | % | | | 27.52 | % | | | 27.27 | % | |
| Five Years ended 10/31/06 | | | 15.93 | % | | | 14.56 | % | | | 14.91 | % | |
| Ten Years ended 10/31/06 | | | 10.15 | % | | | 7.34 | % | | | 8.67 | % | |
| Inception (11/17/88) through 10/31/06 | | | 10.53 | % | | | 6.04 | % | | | 8.67 | % | |
The International Portfolio outperformed the Morgan Stanley EAFE Index by a small margin over the past twelve months. Security selection, on both a country and sector basis, was the primary factor attributing to this favorable comparison. In particular, the Portfolio's holdings in the UK, Switzerland and Australia outperformed their respective country indices. The Portfolio's overweight in the materials sector, which posted solid returns over the year, combined with solid stock picking in the financials sector added to the relative returns. Over longer periods, favorable security selection has been a primary driver for the enhanced comparative results versus the Index.
Hypothetical Illustration of $10,000 Invested in
International Portfolio vs. Morgan Stanley EAFE Index
and Lipper International Fund Index
11/17/88 through 10/31/06
* Assumes the reinvestment of all dividends and distributions excluding withholding taxes.
Performance data quoted represents past performance; past performance does not guarantee future results. The investment return and principal value of an investment will fluctuate so that an investor's shares, when redeemed, may be worth more or less than their original cost. Current performance may be higher or lower than the total return shown. Please call the Fund at 1-800-442-8299 to obtain the most recent month-end returns. Returns do not reflect taxes that the shareholder may pay on fund distributions or the redemption of fund shares.
1 The Morgan Stanley EAFE Index is an unmanaged capitalization weighted composite portfolio consisting of equity total returns of countries in Australia, New Zealand, Europe and the Far East. The Lipper International Fund Index is comprised of the 30 largest funds in the Lipper International Fund classification. This classification consists of funds that invest in securities whose primary trading markets are outside the United States. It is not possible to invest directly in an index.
Benchmark returns are for the period beginning November 30, 1988.
11
THE GLENMEDE FUND, INC.
Philadelphia International Fund
PORTFOLIO HIGHLIGHTS
October 31, 2006
Average Annual Total Return
| Philadelphia International Fund | | | | Morgan Stanley
EAFE
Index1 | | Lipper
International
Fund Index1 | |
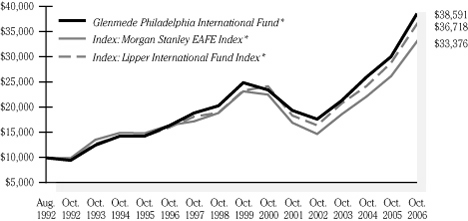
| Year ended 10/31/06 | | | 28.29 | % | | | 27.52 | % | | | 27.27 | % | |
| Five Years ended 10/31/06 | | | 14.77 | % | | | 14.56 | % | | | 14.91 | % | |
| Ten Years ended 10/31/06 | | | 8.96 | % | | | 7.34 | % | | | 8.67 | % | |
| Inception (08/01/92) through 10/31/06 | | | 9.94 | % | | | 8.82 | % | | | 9.56 | % | |
During the past fiscal year, international equity markets posted solid absolute returns. The Philadelphia International Fund participated in the rally and marginally outperformed the Morgan Stanley EAFE Index return. Security selection within the UK, Switzerland and Australia helped drive the positive relative returns. In addition, stock selection within the financials sectors was particularly strong for the period. Structurally, the Portfolio's overweight in the materials sector also proved beneficial to returns relative to the Index. Favorable security selection has been a primary driver for the enhanced comparative results of the longer time periods.
Hypothetical Illustration of $10,000 Invested in
Philadelphia International Fund vs. Morgan Stanley EAFE Index and
Lipper International Fund Index
8/1/92 through 10/31/06
* Assumes the reinvestment of all dividends and distributions excluding withholding taxes.
Performance data quoted represents past performance; past performance does not guarantee future results. The investment return and principal value of an investment will fluctuate so that an investor's shares, when redeemed, may be worth more or less than their original cost. Current performance may be higher or lower than the total return shown. Please call the Fund at 1-800-442-8299 to obtain the most recent month-end returns. Returns do not reflect taxes that the shareholder may pay on fund distributions or the redemption of fund shares.
1 The Morgan Stanley EAFE Index is an unmanaged capitalization weighted composite portfolio consisting of equity total returns of countries in Australia, New Zealand, Europe and the Far East. The Lipper International Fund Index is comprised of the 30 largest funds in the Lipper International Fund classification. This classification consists of funds that invest in securities whose primary trading markets are outside the United States. It is not possible to invest directly in an index.
Benchmark returns are for the period beginning July 31, 1992.
12
THE GLENMEDE FUND, INC.
U.S. Emerging Growth Portfolio
PORTFOLIO HIGHLIGHTS
October 31, 2006
Average Annual Total Return
| U.S. Emerging Growth Portfolio | | | | After-tax
Pre
Redemption | | After-tax
Post
Redemption | | Russell 2000
Growth Index1 | | Lipper Small Cap
Growth Index1 | |
Year ended
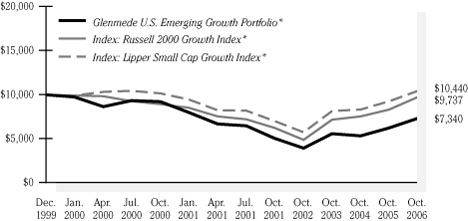
10/31/06 | | | 18.01 | % | | | 18.01 | % | | | 11.71 | % | | | 17.07 | % | | | 12.57 | % | |
Five Years ended
10/31/06 | | | 7.81 | % | | | 7.81 | % | | | 6.78 | % | | | 9.51 | % | | | 8.36 | % | |
Inception (12/29/99)
through 10/31/06 | | | -4.42 | % | | | -4.42 | % | | | -3.68 | % | | | -0.28 | % | | | 0.63 | % | |
The U.S. Emerging Growth Portfolio invests in small cap growth companies based on proprietary multi-factor models that include valuation, fundamental, earnings, and technical characteristics. Since its inception on December 29, 1999, the Portfolio has underperformed the Russell 2000 Growth Index and the Lipper Small Cap Growth Index by -4.14% and -5.05%, respectively. Over the last five years, the U.S. Emerging Growth Portfolio has had an annualized return of 7.81% versus 9.51% for the Russell 2000 Growth Index and 8.36% for the Lipper Small Cap Growth Index. For the fiscal year ended October 31, 2006, the Portfolio has outperformed the Russell 2000 Growth benchmark and Lipper Small Cap Growth indices by .94% and 5.44%, respectively. The strong performance of the Portfolio since February 2005 has come from its shift towards a quantitative discipline with a bias towards small cap growth companies with cheaper valuations, strong fundamentals a nd positive earnings trends.
Hypothetical Illustration of $10,000 Invested in
U.S. Emerging Growth Portfolio vs. Russell 2000 Growth Index
and Lipper Small Cap Growth Index
12/29/99 through 10/31/06
* Assumes the reinvestment of all dividends and distributions.
Performance data quoted represents past performance; past performance does not guarantee future results. The investment return and principal value of an investment will fluctuate so that an investor's shares, when redeemed, may be worth more or less than their original cost. Current performance may be higher or lower than the total return shown. Please call the Fund at 1-800-442-8299 to obtain the most recent month-end returns. Returns, other than after-tax returns, do not reflect taxes that the shareholder may pay on fund distributions or the redemption of fund shares. After-tax returns are calculated using the historical highest individual federal marginal income tax rates, do not reflect the impact of state and local taxes and are not relevant to investors who hold their shares through tax-deferred arrangements such as 401(k) plans or IRAs. Actual after-tax returns depend on the investor's tax situation and may differ from those shown.
1 The Russell 2000 Growth Index is an unmanaged capitalization weighted total return index which is comprised of securities in the Russell 2000 Index with greater than average growth orientation. The Lipper Small Cap Growth Index is comprised of the 30 largest funds in the Lipper Small Cap Growth funds classification. This classification consists of funds that invest at least 75% of their equity assets in companies with market capitalizations less than 250% of the dollar weighted median of the smallest 500 of the middle 1,000 securities of the S&P SuperComposite 1500 Index. It is not possible to invest directly in an index.
Benchmark returns are for the period beginning December 31, 1999.
13
THE GLENMEDE FUND, INC.
Large Cap 100 Portfolio
PORTFOLIO HIGHLIGHTS
October 31, 2006
Average Annual Total Return
| Large Cap 100 Portfolio | | | | After-tax
Pre
Redemption | | After-tax
Post
Redemption | | Russell 1000
Index1 | | Lipper
Large Cap
Core Index1 | |
Year ended
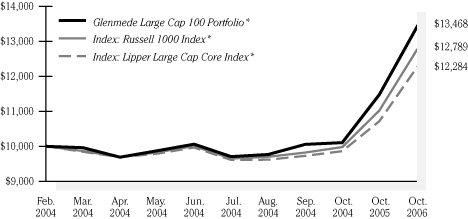
10/31/06 | | | 17.34 | % | | | 16.91 | % | | | 11.82 | % | | | 16.02 | % | | | 14.65 | % | |
Inception (2/27/04)
through 10/31/06 | | | 11.75 | % | | | 11.49 | % | | | 10.09 | % | | | 9.65 | % | | | 9.50 | % | |
The Large Cap 100 Portfolio invests in large cap companies based on proprietary multi-factor models that include valuation, fundamental, earnings, and technical characteristics. Since its inception on February 27, 2004, the Portfolio has outperformed the Russell 1000 Index and Lipper Large Cap Core Index by +2.10% and +2.25%, respectively. For the fiscal year ended October 31, 2006, the Portfolio outperformed the Russell 1000 benchmark index by 1.32%. The strong performance of the Portfolio came from its bias towards various factors, including companies with cheaper valuations and positive earnings trends.
Hypothetical Illustration of $10,000 Invested in
Large Cap 100 Portfolio vs. Russell 1000 Index and
Lipper Large Cap Core Index
2/27/04 through 10/31/06
* Assumes the reinvestment of all dividends and distributions.
Performance data quoted represents past performance; past performance does not guarantee future results. The investment return and principal value of an investment will fluctuate so that an investor's shares, when redeemed, may be worth more or less than their original cost. Current performance may be higher or lower than the total return shown. Please call the Fund at 1-800-442-8299 to obtain the most recent month-end returns. Returns, other than after-tax returns, do not reflect taxes that the shareholder may pay on fund distributions or the redemption of fund shares. After-tax returns are calculated using the historical highest individual federal marginal income tax rates, do not reflect the impact of state and local taxes and are not relevant to investors who hold their shares through tax-deferred arrangements such as 401(k) plans or IRAs. Actual after-tax returns depend on the investor's tax situation and may differ from those shown.
1 The Russell 1000 Index is an unmanaged market capitalization weighted total return index which is comprised of the 1,000 largest companies in the Russell 3000 Index. The Lipper Large Cap Core Index is comprised of the 30 largest mutual funds in the Lipper Large Cap Core Funds classification. This classification consists of funds that invest at least 75% of their equity assets in companies with market capitalizations greater than 300% of the dollar-weighted median market capitalization of the middle 1,000 securities of the S&P SuperComposite 1500 Index. It is not possible to invest directly in an index.
Benchmark returns are for the period beginning February 28, 2004.
14
THE GLENMEDE FUND, INC.
Large Cap Growth Portfolio
PORTFOLIO HIGHLIGHTS
October 31, 2006
Average Annual Total Return
| Large Cap Growth Portfolio | | | | After-tax
Pre
Redemption | | After-tax
Post
Redemption | | Russell 1000
Growth Index1 | | Lipper Large
Cap Growth
Index1 | |
| Year ended 10/31/06 | | | 17.65 | % | | | 17.32 | % | | | 11.89 | % | | | 10.84 | % | | | 6.23 | % | |
Inception (2/27/04)
through 10/31/06 | | | 10.75 | % | | | 10.63 | % | | | 9.24 | % | | | 5.76 | % | | | 5.38 | % | |
The Large Cap Growth Portfolio invests in large cap growth companies based on proprietary multi-factor models that include valuation, fundamental, earnings, and technical characteristics. Since its inception on February 27, 2004, the Portfolio has outperformed the Russell 1000 Growth Index and the Lipper Large Cap Growth Index by +4.99% and +5.37%, respectively. For the fiscal year ended October 31, 2006, the Portfolio outperformed the Russell 1000 Growth benchmark index by 6.81%. The strong performance of the Portfolio came from its bias towards large cap growth companies with cheaper valuations and improving earnings.
Hypothetical Illustration of $10,000 Invested in
Large Cap Growth Portfolio vs. Russell 1000 Growth Index
and Lipper Large Cap Growth Index
2/27/04 through 10/31/06

* Assumes the reinvestment of all dividends and distributions.
Performance data quoted represents past performance; past performance does not guarantee future results. The investment return and principal value of an investment will fluctuate so that an investor's shares, when redeemed, may be worth more or less than their original cost. Current performance may be higher or lower than the total return shown. Please call the Fund at 1-800-442-8299 to obtain the most recent month-end returns. Returns, other than after-tax returns, do not reflect taxes that the shareholder may pay on fund distributions or the redemption of fund shares. After-tax returns are calculated using the historical highest individual federal marginal income tax rates, do not reflect the impact of state and local taxes and are not relevant to investors who hold their shares through tax-deferred arrangements such as 401(k) plans or IRAs. Actual after-tax returns depend on the investor's tax situation and may differ from those shown.
1 The Russell 1000 Growth Index is an unmanaged capitalization weighted total return index which is comprised of securities in the Russell 1000 Index with greater than average growth orientation. The Lipper Large Cap Growth Index is the average of the 30 largest funds in the Lipper Large-Cap Growth Funds Category. These funds invest at least 75% of equity assets in companies with market capitalizations (on three-year weighted basis) greater than 300% of the dollar-weighted median market capitalization of the middle 1,000 securities of the S&P SuperComposite 1500 Index. These funds typically have an above average price-to-earnings ratio, price-to-book ratio, and three-year sales-per-share.
Benchmark returns are for the period beginning February 28, 2004.
15
THE GLENMEDE FUND, INC.
Absolute Return Portfolio
PORTFOLIO HIGHLIGHTS
October 31, 2006
Cumulative Annual Total Return
| Absolute Return Portfolio | | | | Merrill Lynch
3 Month
Treasury Bill | | Russell 3000
Index1 | | Lipper
Long/Short
Equity Index1 | |
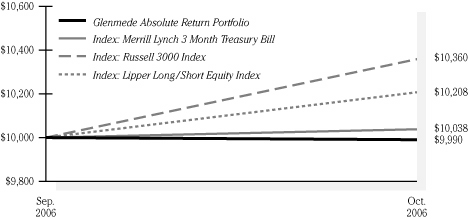
| Inception (09/29/06) through 10/31/06 | | | -0.10 | % | | | 0.38 | % | | | 3.60 | % | | | 2.08 | % | |
On September 29, 2006, Glenmede introduced a new mutual fund called the Absolute Return Portfolio. A goal of the Absolute Return Portfolio is to create a positive excess return across capital market cycles through an optimized combination of long/short equity positions with relatively less volatility than the U.S. Equity Market. Equities from the Russell 3000 Index are selected based on a proprietary set of buy and sell multi-factor models that include valuation, fundamental, earnings, and technical characteristics. The Portfolio is optimized monthly to provide broad diversification across sectors, industries and individual companies. In October 2006, its first month, the Absolute Return Portfolio reflected a -.1% versus 0.38% for the Merrill Lynch 3-Month Treasury Bill Index and 3.6% for the Russell 3000 Index. The Lipper Long/Short Equity Index had a return of 2.08% for the month. The underperformance of the Portfolio in the month was a re flection of its net bias towards stocks with larger market capitalizations, lower valuations, higher profitability and strong earnings. The Portfolio was negatively impacted by its short positions in more speculative, higher valuation, smaller cap stocks which outperformed in the strong equity market.
Hypothetical Illustration of $10,000 Invested in
Absolute Return Portfolio vs. Merrill Lynch
3 Months Treasury Bill, Russell 3000 Index and
Lipper Long/Short Equity Index
9/29/06 through 10/31/06
* Assumes the reinvestment of all dividends and distributions.
Performance data quoted represents past performance; past performance does not guarantee future results. The investment return and principal value of an investment will fluctuate so that an investor's shares, when redeemed, may be worth more or less than their original cost. Current performance may be higher or lower than the total return shown. Please call the Fund at 1-800-442-8299 to obtain the most recent month-end returns. Returns do not reflect taxes that the shareholder may pay on fund distributions or the redemption of fund shares.
The Merrill Lynch 3-month U.S. Treasury Bill Index is comprised of a single issue purchased at the beginning of the month and held for a full month. At the end of the month that issue is sold and rolled into a newly selected issue. The Russell 3000 Index is an unmanaged capitalization weighted total return index which is comprised of the 3,000 largest U.S. companies based on total market capitalization. The Index re-balances annually. The Lipper Long/Short Equity Index is equally weighted which is made up of the top 10 funds based upon net asset size. The index re-balances quarterly.
16
THE GLENMEDE PORTFOLIOS
Muni Intermediate Portfolio
PORTFOLIO HIGHLIGHTS
October 31, 2006
Average Annual Total Return
| Muni Intermediate Portfolio | | | | Lehman Brothers
Municipal 5-Year
Bond Index1 | | Lipper Intermediate
Municipal
Debt Fund Index1 | | Lehman
Municipal 1-10
Year Blend Index*1 | |
| Year ended 10/31/06 | | | 3.97 | % | | | 3.95 | % | | | 4.72 | % | | | 4.42 | % | |
| Five Years ended 10/31/06 | | | 3.60 | % | | | 3.78 | % | | | 3.84 | % | | | 3.89 | % | |
| Ten Years ended 10/31/06 | | | 4.62 | % | | | 4.79 | % | | | 4.71 | % | | | 4.95 | % | |
Inception (06/05/92)
through 10/31/06 | | | 4.86 | % | | | 5.23 | % | | | 5.13 | % | | | N/A | | |
Muni Intermediate performed in line with the Lehman 5 Year Index in 2006. The Portfolio did underperform versus the Lehman 1-10 Year Index and the Lipper Intermediate Index due to the defensive nature of the Portfolio as the tax-exempt yield curve flattened through 2006. The overall credit quality of the Portfolio added to the underperformance. The Portfolio remains positioned defensively and provides high current interest income.
Hypothetical Illustration of $10,000 Invested in
Muni Intermediate Portfolio vs. Lehman Brothers
Municipal 5-Year Bond Index, Lipper Intermediate
Municipal Debt Fund Index and Lehman Municipal 1-10 Year Blend Index
6/5/92 through 10/31/06
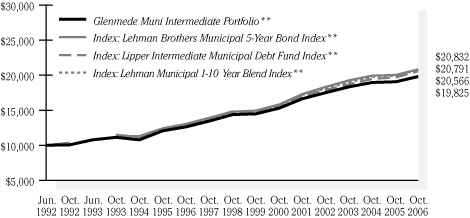
* Index commenced 6/30/93. The Index starts at $10,811, which is the value of the Portfolio in the graph on this date. Thus comparison to the Portfolio's inception is not provided.
** Assumes the reinvestment of all dividends and distributions.
Performance data quoted represents past performance; past performance does not guarantee future results. The investment return and principal value of an investment will fluctuate so that an investor's shares, when redeemed, may be worth more or less than their original cost. Current performance may be higher or lower than the total return shown. Please call the Fund at 1-800-442-8299 to obtain the most recent month-end returns.
1 The Lehman Brothers Municipal 5-Year Bond Index is an unmanaged total return performance benchmark for the short-intermediate, investment-grade tax-exempt bond market. The Lipper Intermediate Municipal Debt Fund Index is comprised of the 30 largest funds in the Lipper Intermediate Municipal Debt Fund Average. The Average consists of funds that invest in municipal debt issues with dollar-weighted average maturities of 5 to 10 years. The Lehman Municipal 1-10 Year Blend Index is a composite index made up of several different broad sub-indices: the Lehman Municipal 1-Year Index; Lehman Municipal 3-Year Index; Lehman Municipal 5-Year Index; Lehman Municipal 7-Year Index and the Lehman Municipal 10-Year Index. The total of all these indices represents all maturities between 1-10 Years. It is not possible to invest directly in an index.
Benchmark returns for the Lehman Brothers Municipal 5-Year Bond Index and the Lipper
Intermediate Municipal Debt Fund Index are for the period beginning May 31, 1992.
17
THE GLENMEDE PORTFOLIOS
New Jersey Muni Portfolio
PORTFOLIO HIGHLIGHTS
October 31, 2006
Average Annual Total Return
| New Jersey Muni Portfolio | | | | Lehman Brothers
Municipal 5-Year
Bond Index1 | | Lipper
New Jersey
Municipal Debt
Fund Index1 | | Lehman
Municipal 1-10
Year Blend Index1 | |
| Year ended 10/31/06 | | | 3.84 | % | | | 3.95 | % | | | 5.92 | % | | | 4.42 | % | |
| Five Years ended 10/31/06 | | | 3.47 | % | | | 3.78 | % | | | 4.61 | % | | | 3.89 | % | |
| Ten Years Ended 10/31/06 | | | 4.59 | % | | | 4.79 | % | | | 5.12 | % | | | 4.95 | % | |
Inception (11/01/93)
through 10/31/06 | | | 4.42 | % | | | 4.76 | % | | | 4.88 | % | | | 4.92 | % | |
New Jersey Muni underperformed the three benchmarks due to shorter duration relative to the benchmarks, as the flattening of the tax-exempt yield curve continued throughout 2006. In addition, higher credit quality added to this underperformance as triple-B credits outperformed single-A and higher credit. The Portfolio remains positioned defensively and provides high current interest income.
Hypothetical Illustration of $10,000 Invested in
New Jersey Muni Portfolio vs. Lehman Brothers
Municipal 5-Year Bond Index, Lipper New Jersey
Municipal Debt Fund Index and Lehman Municipal 1-10 Year Blend Index
11/1/93 through 10/31/06

* Assumes the reinvestment of all dividends and distributions.
Performance data quoted represents past performance; past performance does not guarantee future results. The investment return and principal value of an investment will fluctuate so that an investor's shares, when redeemed, may be worth more or less than their original cost. Current performance may be higher or lower than the total return shown. Please call the Fund at 1-800-442-8299 to obtain the most recent month-end returns.
1 The Lehman Brothers Municipal 5-Year Bond Index is an unmanaged total return performance benchmark for the short-intermediate, investment-grade tax-exempt bond market. The Lipper New Jersey Municipal Debt Fund Index is comprised of the 10 largest funds in the Lipper New Jersey Municipal Debt Fund Average. The Average consists of funds that invest only in securities that are exempt from taxation in New Jersey or cities in New Jersey. The Lehman Municipal 1-10 Year Blend Index is a composite index made up of several different broad sub-indices: the Lehman Municipal 1-Year Index; Lehman Municipal 3-Year Index; Lehman Municipal 5-Year Index; Lehman Municipal 7-Year Index and the Lehman Municipal 10-Year Index. The total of all these indices represents all maturities between 1-10 Years. It is not possible to invest directly in an index.
Benchmark returns are for the period beginning October 31, 1993.
18
THE GLENMEDE FUND, INC.
Shareholder Expenses (Unaudited)
As a shareholder of a Glenmede Portfolio, you incur ongoing costs, including management fees and other portfolio expenses. The following example is intended to help you understand your ongoing costs (in dollars and cents) of investing in a Glenmede Portfolio and to compare these costs with the ongoing costs of investing in other mutual funds.
The example is based on an investment of $1,000 invested at the beginning of the period and held for the entire period from May 1, 2006 to October 31, 2006.
Actual Expenses
The first line under each Portfolio in the table below provides information about actual account values and actual expenses. You may use the information in this line, together with the amount you invested, to estimate the expenses that you paid over the period. Simply divide your account value by $1,000 (for example, an $8,600 account value divided by $1,000 = 8.6), then multiply the result by the number in the first line for your Portfolio under the heading entitled "Expenses Paid During Period" to estimate the expenses you paid on your account during this period.
Hypothetical Example for Comparison Purposes
The second line under each Portfolio in the table below provides information about hypothetical account values and hypothetical expenses based on each Portfolio's actual expense ratio and an assumed rate of return of 5% per year before expenses, which is not the Portfolio's actual return. The hypothetical account values and expenses may not be used to estimate the actual ending account balance or expenses you paid for the period. You may use this information to compare the ongoing costs of investing in your Portfolio and other funds. To do so, compare this 5% hypothetical example with the 5% hypothetical examples that appear in the shareholder reports of the other funds. No information has been provided for the Total Market Long/Short Portfolio because it has not commenced operations as of October 31, 2006.
Please note that the expenses shown in the table are meant to highlight your ongoing costs only. As a shareholder of a Glenmede Portfolio, you do not incur any transaction costs, such as sales charges (loads), redemption fees or exchange fees, but shareholders of other funds may incur such costs. Therefore, the second line under each Portfolio in the table is useful in comparing ongoing costs only, and will not help you determine the relative total costs of owning different funds whose shareholders may incur transaction costs.
| | | Beginning
Account
Value
(May 1,
2006) | | Ending
Account
Value
(October 31,
2006) | |
Annualized
Expense
Ratio* | | Expenses
Paid During
Period**
(May 1,
to October 31,
2006) | |
| Government Cash Portfolio | |
| Actual | | $ | 1,000.00 | | | $ | 1,025.40 | | | | 0.18 | % | | $ | 0.92 | | |
| Hypothetical (5% return less expenses) | | | 1,000.00 | | | | 1,024.30 | | | | 0.18 | | | | 0.92 | | |
| Tax-Exempt Cash Portfolio | |
| Actual | | | 1,000.00 | | | | 1,016.70 | | | | 0.18 | | | | 0.91 | | |
| Hypothetical (5% return less expenses) | | | 1,000.00 | | | | 1,024.30 | | | | 0.18 | | | | 0.92 | | |
19
THE GLENMEDE FUND, INC.
Shareholder Expenses (Unaudited) — (Concluded)
| | | Beginning
Account
Value
(May 1,
2006) | | Ending
Account
Value
(October 31,
2006) | |
Annualized
Expense
Ratio* | | Expenses
Paid During
Period**
(May 1,
to October 31,
2006) | |
| Core Fixed Income Portfolio | |
| Actual | | $ | 1,000.00 | | | $ | 1,043.40 | | | | 0.54 | % | | $ | 2.78 | | |
| Hypothetical (5% return less expenses) | | | 1,000.00 | | | | 1,022.48 | | | | 0.54 | | | | 2.75 | | |
| Strategic Equity Portfolio | |
| Actual | | | 1,000.00 | | | | 1,026.80 | | | | 0.84 | | | | 4.29 | | |
| Hypothetical (5% return less expenses) | | | 1,000.00 | | | | 1,020.97 | | | | 0.84 | | | | 4.28 | | |
| Small Cap Equity Portfolio - Advisor | |
| Actual | | | 1,000.00 | | | | 992.80 | | | | 0.91 | | | | 4.57 | | |
| Hypothetical (5% return less expenses) | | | 1,000.00 | | | | 1,020.62 | | | | 0.91 | | | | 4.63 | | |
| Small Cap Equity Portfolio - Institutional | |
| Actual | | | 1,000.00 | | | | 993.80 | | | | 0.71 | | | | 3.57 | | |
| Hypothetical (5% return less expenses) | | | 1,000.00 | | | | 1,021.63 | | | | 0.71 | | | | 3.62 | | |
| Large Cap Value Portfolio | |
| Actual | | | 1,000.00 | | | | 1,031.30 | | | | 0.98 | | | | 5.02 | | |
| Hypothetical (5% return less expenses) | | | 1,000.00 | | | | 1,020.27 | | | | 0.98 | | | | 4.99 | | |
| International Portfolio | |
| Actual | | | 1,000.00 | | | | 1,016.90 | | | | 1.10 | | | | 5.59 | | |
| Hypothetical (5% return less expenses) | | | 1,000.00 | | | | 1,019.66 | | | | 1.10 | | | | 5.60 | | |
| Philadelphia International Fund | |
| Actual | | | 1,000.00 | | | | 1,018.50 | | | | 0.85 | | | | 4.32 | | |
| Hypothetical (5% return less expenses) | | | 1,000.00 | | | | 1,020.92 | | | | 0.85 | | | | 4.33 | | |
| U.S. Emerging Growth Portfolio | |
| Actual | | | 1,000.00 | | | | 968.30 | | | | 0.87 | | | | 4.32 | | |
| Hypothetical (5% return less expenses) | | | 1,000.00 | | | | 1,020.82 | | | | 0.87 | | | | 4.43 | | |
| Large Cap 100 Portfolio | |
| Actual | | | 1,000.00 | | | | 1,042.40 | | | | 0.84 | | | | 4.32 | | |
| Hypothetical (5% return less expenses) | | | 1,000.00 | | | | 1,020.97 | | | | 0.84 | | | | 4.28 | | |
| Large Cap Growth Portfolio | |
| Actual | | | 1,000.00 | | | | 1,045.10 | | | | 0.85 | | | | 4.38 | | |
| Hypothetical (5% return less expenses) | | | 1,000.00 | | | | 1,020.92 | | | | 0.85 | | | | 4.33 | | |
| Absolute Return Portfolio*** | |
| Actual | | | 1,000.00 | | | | 999.00 | | | | 1.25 | | | | 1.03 | | |
| Hypothetical (5% return less expenses) | | | 1,000.00 | | | | 1,003.08 | | | | 1.25 | | | | 1.03 | | |
* Expense ratios for the period may differ from expense ratios based on one-year data in the Financial Highlights.
** Expenses are calculated using the Portfolio's annualized expense ratio (as disclosed in the table), multiplied by the average account value for the period, multiplied by the number of days in the period (184 days), and divided by the number of days in the calendar year (365 days).
*** The Portfolio commenced operations on September 29, 2006. Expenses are calculated
using the Portfolio's annualized expense ratio (as disclosed in the table), multiplied by the average account value for the period, multiplied by the number of days in the period (30 days) (the Portfolio began accruing expenses on October 2, 2006), and divided by the number of days in the calendar year (365 days).
20
THE GLENMEDE PORTFOLIOS
Shareholder Expenses (Unaudited)
As a shareholder of a Glenmede Portfolio, you incur ongoing costs, including management fees and other portfolio expenses. The following example is intended to help you understand your ongoing costs (in dollars and cents) of investing in a Glenmede Portfolio and to compare these costs with the ongoing costs of investing in other mutual funds.
The example is based on an investment of $1,000 invested at the beginning of the period and held for the entire period from May 1, 2006 to October 31, 2006.
Actual Expenses
The first line under each Portfolio in the table below provides information about actual account values and actual expenses. You may use the information in this line, together with the amount you invested, to estimate the expenses that you paid over the period. Simply divide your account value by $1,000 (for example, an $8,600 account value divided by $1,000 = 8.6), then multiply the result by the number in the first line for your Portfolio under the heading entitled "Expenses Paid During Period" to estimate the expenses you paid on your account during this period.
Hypothetical Example for Comparison Purposes
The second line under each Portfolio in the table below provides information about hypothetical account values and hypothetical expenses based on each Portfolio's actual expense ratio and an assumed rate of return of 5% per year before expenses, which is not the Portfolio's actual return. The hypothetical account values and expenses may not be used to estimate the actual ending account balance or expenses you paid for the period. You may use this information to compare the ongoing costs of investing in your Portfolio and other funds. To do so, compare this 5% hypothetical example with the 5% hypothetical examples that appear in the shareholder reports of the other funds.
Please note that the expenses shown in the table are meant to highlight your ongoing costs. As a shareholder of a Glenmede Portfolio, you do not incur any transaction costs, such as sales charges (loads), redemption fees or exchange fees, but shareholders of other funds may incur such costs. Therefore, the second line under each Portfolio in the table is useful in comparing ongoing costs only, and will not help you determine the relative total costs of owning different funds whose shareholders may incur transaction costs.
| | | Beginning
Account
Value
(May 1,
2006) | | Ending
Account
Value
(October 31,
2006) | |
Annualized
Expense
Ratio* | | Expenses
Paid During
Period**
(May 1,
to October 31,
2006) | |
| Muni Intermediate Portfolio | |
| Actual | | $ | 1,000.00 | | | $ | 1,030.40 | | | | 0.28 | % | | $ | 1.43 | | |
| Hypothetical (5% return less expenses) | | | 1,000.00 | | | | 1,023.79 | | | | 0.28 | | | | 1.43 | | |
21
THE GLENMEDE PORTFOLIOS
Shareholder Expenses (Unaudited) — (Concluded)
| | | Beginning
Account
Value
(May 1,
2006) | | Ending
Account
Value
(October 31,
2006) | |
Annualized
Expense
Ratio* | | Expenses
Paid During
Period**
(May 1,
to October 31,
2006) | |
| New Jersey Muni Portfolio | |
| Actual | | $ | 1,000.00 | | | $ | 1,030.80 | | | | 0.28 | % | | $ | 1.43 | | |
| Hypothetical (5% return less expenses) | | | 1,000.00 | | | | 1,023.79 | | | | 0.28 | | | | 1.43 | | |
* Expense ratios for the period may differ from expense ratios based on one-year data in the Financial Highlights.
** Expenses are calculated using each Portfolio's annualized expense ratio (as disclosed in the table), multiplied by the average account value for the period, multiplied by the number of days in the period (184 days), and divided by the number of days in the calendar year (365 days).
22
THE GLENMEDE FUND, INC.
STATEMENTS OF ASSETS AND LIABILITIES
October 31, 2006
| | | Government
Cash
Portfolio | | Tax-Exempt
Cash
Portfolio | | Core Fixed
Income
Portfolio | |
| Assets: | |
| Investments1: | |
| Investments at value2 | | $ | 325,008,709 | | | $ | 704,871,780 | | | $ | 215,335,958 | | |
| Repurchase agreements at value | | | 327,125,627 | | | | — | | | | 30,987,993 | | |
| Total investments | | | 652,134,336 | | | | 704,871,780 | | | | 246,323,951 | | |
| Cash | | | — | | | | 83,499 | | | | — | | |
| Receivable for securities sold | | | — | | | | — | | | | 302 | | |
| Receivable for fund shares sold | | | — | | | | — | | | | 145,000 | | |
| Interest receivable | | | 2,480,965 | | | | 2,546,834 | | | | 1,836,536 | | |
| Prepaid expenses | | | 21,616 | | | | 23,326 | | | | 8,153 | | |
| Total assets | | | 654,636,917 | | | | 707,525,439 | | | | 248,313,942 | | |
| Liabilities: | |
| Dividend payable | | | 2,801,328 | | | | 1,947,596 | | | | — | | |
| Payable for fund shares redeemed | | | — | | | | — | | | | 155,000 | | |
Obligation to return securities lending
collateral | | | — | | | | — | | | | 22,221,438 | | |
| Payable for when-issued securities | | | — | | | | — | | | | 27,583,687 | | |
| Due to bank | | | 5,726 | | | | — | | | | — | | |
| Payable for Directors' fees | | | 298 | | | | 580 | | | | 179 | | |
| Accrued expenses | | | 172,940 | | | | 182,630 | | | | 110,346 | | |
| Total liabilities | | | 2,980,292 | | | | 2,130,806 | | | | 50,070,650 | | |
| Net Assets | | $ | 651,656,625 | | | $ | 705,394,633 | | | $ | 198,243,292 | | |
| Net Assets consist of: | |
| Par value ($0.001 of shares outstanding) | | | 651,588 | | | | 705,605 | | | | 18,667 | | |
| Paid-in capital in excess of par value | | | 650,936,116 | | | | 704,824,843 | | | | 200,342,500 | | |
| Undistributed net investment income | | | 73,094 | | | | (265 | ) | | | 759,139 | | |
Accumulated net realized gain (loss) from
investment transactions | | | (4,173 | ) | | | (135,550 | ) | | | (3,086,509 | ) | |
Net unrealized appreciation (depreciation)
on investments | | | — | | | | — | | | | 209,495 | | |
| Total Net Assets | | | 651,656,625 | | | | 705,394,633 | | | | 198,243,292 | | |
| Shares Outstanding3 | | | 651,587,703 | | | | 705,604,937 | | | | 18,667,366 | | |
| Net Asset Value Per Share | | $ | 1.00 | | | $ | 1.00 | | | $ | 10.62 | | |
| 1 Investments at cost | | $ | 652,134,336 | | | $ | 704,871,780 | | | $ | 246,114,456 | | |
| 2 Market value of securities on loan | | | — | | | | — | | | $ | 21,682,235 | | |
| 3 Authorized shares | | | 800,000,000 | | | | 740,000,000 | | | | 135,000,000 | | |
See Notes to Financial Statements.
23
THE GLENMEDE FUND, INC.
STATEMENTS OF ASSETS AND LIABILITIES — (Continued)
October 31, 2006
| | | Strategic
Equity
Portfolio | | Small Cap
Equity
Portfolio | | Large Cap
Value
Portfolio | |
| Assets: | |
| Investments1: | |
| Investments at value2 | | $ | 102,151,789 | | | $ | 288,669,839 | | | $ | 49,473,951 | | |
| Repurchase agreements at value | | | 435,657 | | | | 3,266,548 | | | | 801,436 | | |
| Total investments | | | 102,587,446 | | | | 291,936,387 | | | | 50,275,387 | | |
| Receivable for securities sold | | | — | | | | — | | | | 1,603,451 | | |
| Receivable for fund shares sold | | | 7,000 | | | | 60,148 | | | | 39,392 | | |
| Dividends receivable | | | 70,833 | | | | 176,255 | | | | 51,588 | | |
| Interest receivable | | | 3,135 | | | | 35,604 | | | | 1,081 | | |
| Prepaid expenses | | | 4,799 | | | | 8,300 | | | | 10,843 | | |
| Total assets | | | 102,673,213 | | | | 292,216,694 | | | | 51,981,742 | | |
| Liabilities: | |
| Payable for fund shares redeemed | | | 16,158 | | | | 123,510 | | | | 507 | | |
| Payable for securities purchased | | | — | | | | — | | | | 120,633 | | |
Obligation to return securities lending
collateral | | | 17,096,815 | | | | 54,641,285 | | | | 3,932,517 | | |
| Payable for Directors' fees | | | 92 | | | | 98 | | | | 78 | | |
| Accrued expenses | | | 68,151 | | | | 200,804 | | | | 39,699 | | |
| Total liabilities | | | 17,181,216 | | | | 54,965,697 | | | | 4,093,434 | | |
| Net Assets | | $ | 85,491,997 | | | $ | 237,250,997 | | | $ | 47,888,308 | | |
| Net Assets consist of: | |
| Par value ($0.001 of shares outstanding) | | | 4,818 | | | | 14,268 | | | | 4,345 | | |
| Paid-in capital in excess of par value | | | 70,754,867 | | | | 183,438,173 | | | | 42,212,025 | | |
| Undistributed net investment income | | | 13,486 | | | | — | | | | 2,835 | | |
Accumulated net realized gain (loss) from
investment transactions | | | (35,056 | ) | | | (294,036 | ) | | | (120,704 | ) | |
Net unrealized appreciation (depreciation)
on investments | | | 14,753,882 | | | | 54,092,592 | | | | 5,789,807 | | |
| Total Net Assets | | | 85,491,997 | | | | 237,250,997 | | | | 47,888,308 | | |
| Shares Outstanding3 | | | 4,817,805 | | | | 14,268,365 | | | | 4,345,445 | | |
| Net Asset Value Per Share | | $ | 17.75 | | | | — | | | $ | 11.02 | | |
Advisor Class — based on net assets of
$237,249,678 and shares outstanding
of 14,268,287 (155,000,000
authorized shares) | | | — | | | $ | 16.63 | | | | — | | |
Institutional Class — based on net assets
of $1,319 and shares outstanding of
78.164 (65,000,000 authorized shares)4 | | | — | | | $ | 16.88 | | | | — | | |
| 1 Investments at cost | | $ | 87,833,564 | | | $ | 237,843,795 | | | $ | 44,485,580 | | |
| 2 Market value of securities on loan | | $ | 16,573,990 | | | $ | 52,838,161 | | | $ | 3,789,850 | | |
| 3 Authorized shares | | | 125,000,000 | | | | 220,000,000 | | | | 75,000,000 | | |
4 Net assets have been rounded for presentation purposes. The net asset value per share is as reported on October 31, 2006.
See Notes to Financial Statements.
24
THE GLENMEDE FUND, INC.
STATEMENTS OF ASSETS AND LIABILITIES — (Continued)
October 31, 2006
| | | International
Portfolio | | Philadelphia
International
Fund | | U.S.
Emerging
Growth
Portfolio | |
| Assets: | |
| Investments1: | |
| Investments at value2 | | $ | 927,126,836 | | | $ | 486,244,266 | | | $ | 44,707,348 | | |
| Repurchase agreements at value | | | 1,898,611 | | | | 1,576,791 | | | | 179,936 | | |
| Total investments | | | 929,025,447 | | | | 487,821,057 | | | | 44,887,284 | | |
| Foreign currency, at value (Note 1)4 | | | 5,608,252 | | | | 84,985 | | | | — | | |
| Receivable for fund shares sold | | | 651,959 | | | | 344,268 | | | | 103,750 | | |
| Dividends receivable | | | 1,452,781 | | | | 1,392,853 | | | | 8,717 | | |
| Interest receivable | | | 1,379 | | | | 793 | | | | 5,319 | | |
| Foreign tax reclaims receivable | | | 583,346 | | | | 429,783 | | | | — | | |
| Prepaid expenses | | | 32,035 | | | | 32,673 | | | | 2,803 | | |
| Total assets | | | 937,355,199 | | | | 490,106,412 | | | | 45,007,873 | | |
| Liabilities: | |
| Payable for fund shares redeemed | | | 11,246 | | | | 701,711 | | | | 5,000 | | |
| Payable for securities purchased | | | 5,399,184 | | | | 406 | | | | — | | |
Obligation to return securities lending
collateral | | | 2,307,888 | | | | 622,386 | | | | 9,970,162 | | |
| Payable for Directors' fees | | | 140 | | | | 181 | | | | 164 | | |
| Accrued expenses | | | 939,736 | | | | 554,914 | | | | 30,245 | | |
| Total liabilities | | | 8,658,194 | | | | 1,879,598 | | | | 10,005,571 | | |
| Net Assets | | $ | 928,697,005 | | | $ | 488,226,814 | | | $ | 35,002,302 | | |
| Net Assets consist of: | |
| Par value ($0.001 of shares outstanding) | | | 47,398 | | | | 24,906 | | | | 4,771 | | |
| Paid-in capital in excess of par value | | | 651,052,600 | | | | 345,354,156 | | | | 32,048,035 | | |
| Undistributed net investment income | | | 3,980,814 | | | | 4,664,928 | | | | — | | |
Accumulated net realized gain (loss) from
investment transactions | | | (424,238 | ) | | | (1,127,713 | ) | | | (2,233,932 | ) | |
Net unrealized appreciation (depreciation)
on investments | | | 274,040,431 | | | | 139,310,537 | | | | 5,183,428 | | |
| Total Net Assets | | | 928,697,005 | | | | 488,226,814 | | | | 35,002,302 | | |
| Shares Outstanding3 | | | 47,397,567 | | | | 24,905,876 | | | | 4,771,411 | | |
| Net Asset Value Per Share | | $ | 19.59 | | | $ | 19.60 | | | $ | 7.34 | | |
| 1 Investments at cost | | $ | 654,997,894 | | | $ | 348,524,366 | | | $ | 39,703,856 | | |
| 2 Market value of securities on loan | | $ | 2,181,358 | | | $ | 588,264 | | | $ | 9,623,468 | | |
| 3 Authorized shares | | | 115,000,000 | | | | 120,000,000 | | | | 75,000,000 | | |
| 4 The International Portfolio and Philadelphia International Fund had foreign currency costs of $5,545,814 and $84,795, respectively. | | | | | | | | | | | | | |
See Notes to Financial Statements.
25
THE GLENMEDE FUND, INC.
STATEMENTS OF ASSETS AND LIABILITIES — (Concluded)
October 31, 2006
| | | Large
Cap
100
Portfolio | | Large
Cap
Growth
Portfolio | | Absolute
Return
Portfolio5 | |
| Assets: | |
| Investments1: | |
| Investments at value2 | | $ | 113,596,493 | | | $ | 36,610,547 | | | $ | 18,048,365 | | |
| Repurchase agreements at value | | | 1,858,420 | | | | 397,810 | | | | 1,516,392 | | |
| Total investments | | | 115,454,913 | | | | 37,008,357 | | | | 19,564,757 | | |
| Receivable for fund shares sold | | | 119,000 | | | | — | | | | 246,000 | | |
| Dividends receivable | | | 73,454 | | | | 6,013 | | | | 8,380 | | |
| Interest receivable | | | 6,191 | | | | 52 | | | | 36,540 | | |
| Initial offering fee | | | — | | | | — | | | | 16,127 | | |
| Cash collateral on deposit at broker | | | — | | | | — | | | | 13,099,197 | | |
| Prepaid expenses | | | 5,151 | | | | 2,774 | | | | — | | |
| Other assets | | | — | | | | — | | | | 9,445 | | |
| Total assets | | | 115,658,709 | | | | 37,017,196 | | | | 32,980,446 | | |
| Liabilities: | |
| Dividend payable on securities sold short | | | — | | | | — | | | | 2,386 | | |
| Payable for fund shares redeemed | | | 16,366 | | | | — | | | | — | | |
| Payable for securities purchased | | | 1,182,260 | | | | 182,442 | | | | — | | |
Obligation to return securities lending
collateral | | | 10,107,142 | | | | — | | | | — | | |
| Payable for securities sold short, at value4 | | | — | | | | — | | | | 13,110,907 | | |
| Payable for Directors' fees | | | 266 | | | | 179 | | | | 31 | | |
| Accrued expenses | | | 81,421 | | | | 29,646 | | | | 23,012 | | |
| Total liabilities | | | 11,387,455 | | | | 212,267 | | | | 13,136,336 | | |
| Net Assets | | $ | 104,271,254 | | | $ | 36,804,929 | | | $ | 19,844,110 | | |
| Net Assets consist of: | |
| Par value ($0.001 of shares outstanding) | | | 8,071 | | | | 2,852 | | | | 1,986 | | |
| Paid-in capital in excess of par value | | | 91,558,415 | | | | 32,148,544 | | | | 19,900,514 | | |
| Undistributed net investment income | | | 8,228 | | | | — | | | | 38,239 | | |
Accumulated net realized gain (loss) from
investment transactions | | | — | | | | (1,216 | ) | | | (85,546 | ) | |
Net unrealized appreciation (depreciation)
on investments and securities sold short | | | 12,696,540 | | | | 4,654,749 | | | | (11,083 | ) | |
| Total Net Assets | | | 104,271,254 | | | | 36,804,929 | | | | 19,844,110 | | |
| Shares Outstanding3 | | | 8,071,314 | | | | 2,852,025 | | | | 1,985,638 | | |
| Net Asset Value Per Share | | $ | 12.92 | | | $ | 12.90 | | | $ | 9.99 | | |
| 1 Investments at cost | | $ | 102,758,373 | | | $ | 32,353,608 | | | $ | 19,109,905 | | |
| 2 Market value of securities on loan | | $ | 9,817,971 | | | | — | | | | — | | |
| 3 Authorized shares | | | 20,000,000 | | | | 20,000,000 | | | | 20,000,000 | | |
| 4 Proceeds from securities sold short for the Absolute Return Portfolio were $12,644,972. | | | | | | | | | | | | | |
| 5 The Absolute Return Portfolio commenced operations on September 29, 2006. | | | | | | | | | | | | | |
See Notes to Financial Statements.
26
THE GLENMEDE FUND, INC.
STATEMENTS OF OPERATIONS
For the Year Ended October 31, 2006
| | | Government
Cash
Portfolio | | Tax-
Exempt
Cash
Portfolio | | Core
Fixed
Income
Portfolio | |
| Investment income: | |
| Interest | | $ | 32,353,664 | | | $ | 19,690,129 | | | $ | 9,628,465 | | |
| Income from security lending | | | — | | | | — | | | | 35,412 | | |
| Total investment income | | | 32,353,664 | | | | 19,690,129 | | | | 9,663,877 | | |
| Expenses: | |
| Management fees | | | — | | | | — | | | | 680,730 | | |
Administration, transfer agent and
custody fees | | | 391,932 | | | | 366,700 | | | | 126,499 | | |
| Professional fees | | | 94,609 | | | | 90,895 | | | | 27,687 | | |
| Shareholder report expense | | | 13,753 | | | | 12,323 | | | | 3,738 | | |
| Shareholder servicing fees | | | 676,490 | | | | 604,266 | | | | 194,532 | | |
| Directors' fees and expenses | | | 23,913 | | | | 22,595 | | | | 7,566 | | |
| Registration and filing fees | | | 1,393 | | | | 2,271 | | | | 3,770 | | |
| Other expenses | | | 50,333 | | | | 39,755 | | | | 14,842 | | |
| Total expenses | | | 1,252,423 | | | | 1,138,805 | | | | 1,059,364 | | |
| Net investment income | | | 31,101,241 | | | | 18,551,324 | | | | 8,604,513 | | |
| Realized and unrealized gain (loss): | |
| Net realized gain (loss) on: | |
| Investment transactions | | | — | | | | — | | | | (303,857 | ) | |
| Net change in unrealized gain (loss) of: | |
| Investments | | | — | | | | — | | | | (17,818 | ) | |
| Net realized and unrealized gain (loss) | | | — | | | | — | | | | (321,675 | ) | |
Net increase (decrease) in net assets resulting
from operations | | $ | 31,101,241 | | | $ | 18,551,324 | | | $ | 8,282,838 | | |
See Notes to Financial Statements.
27
THE GLENMEDE FUND, INC.
STATEMENTS OF OPERATIONS — (Continued)
For the Year Ended October 31, 2006
| | | Strategic
Equity
Portfolio | | Small Cap
Equity
Portfolio | | Large Cap
Value
Portfolio | |
| Investment income: | |
| Dividends1 | | $ | 1,134,780 | | | $ | 1,620,736 | | | $ | 832,411 | | |
| Interest | | | 62,937 | | | | 215,073 | | | | 77,684 | | |
| Income from security lending | | | 5,368 | | | | 202,023 | | | | 2,201 | | |
| Total investment income | | | 1,203,085 | | | | 2,037,832 | | | | 912,296 | | |
| Expenses: | |
| Management fees | | | 457,500 | | | | 1,363,303 | | | | 216,436 | | |
Administration, transfer agent and
custody fees | | | 55,609 | | | | 168,954 | | | | 47,549 | | |
| Professional fees | | | 10,371 | | | | 33,921 | | | | 5,765 | | |
| Shareholder report expense | | | 2,297 | | | | 8,447 | | | | 838 | | |
| Shareholder servicing fees (Advisor Class) | | | 170,258 | | | | 621,639 | | | | 78,708 | | |
Shareholder servicing fees
(Institutional Class) | | | — | | | | 1 | | | | — | | |
| Directors' fees and expenses | | | 2,893 | | | | 9,777 | | | | 1,237 | | |
| Registration and filing fees | | | 3,500 | | | | 30,989 | | | | 24,111 | | |
| Other expenses | | | 6,210 | | | | 20,226 | | | | 2,277 | | |
| Total expenses | | | 708,638 | | | | 2,257,257 | | | | 376,921 | | |
| Net investment income (loss) | | | 494,447 | | | | (219,425 | ) | | | 535,375 | | |
| Realized and unrealized gain (loss): | |
| Net realized gain (loss) on: | |
| Investment transactions | | | 6,037,041 | | | | 34,927,432 | | | | 2,082,417 | | |
| In-kind redemptions | | | — | | | | 4,391,268 | | | | — | | |
| Net realized gain (loss) | | | 6,037,041 | | | | 39,318,700 | | | | 2,082,417 | | |
| Net change in unrealized gain (loss) of: | |
| Investments | | | 3,814,961 | | | | (734,909 | ) | | | 2,234,848 | | |
| Net realized and unrealized gain (loss) | | | 9,852,002 | | | | 38,583,791 | | | | 4,317,265 | | |
Net increase (decrease) in net assets resulting
from operations | | $ | 10,346,449 | | | $ | 38,364,366 | | | $ | 4,852,640 | | |
1 The Strategic Equity Portfolio and Large Cap Value Portfolio had foreign dividend withholding taxes of $8,367 and $428, respectively.
See Notes to Financial Statements.
28
THE GLENMEDE FUND, INC.
STATEMENTS OF OPERATIONS — (Continued)
For the Year Ended October 31, 2006
| | | International
Portfolio | | Philadelphia
International
Fund | | U.S.
Emerging
Growth
Portfolio | |
| Investment income: | |
| Dividends1 | | $ | 25,326,236 | | | $ | 22,653,904 | | | $ | 87,045 | | |
| Interest | | | 371,407 | | | | 1,026,988 | | | | 19,065 | | |
| Income from security lending | | | 35,347 | | | | 19,752 | | | | 27,979 | | |
| Total investment income | | | 25,732,990 | | | | 23,700,644 | | | | 134,089 | | |
| Expenses: | |
| Management fees | | | 6,677,018 | | | | 5,834,038 | | | | 157,701 | | |
Administration, transfer agent and
custody fees | | | 602,622 | | | | 535,656 | | | | 17,435 | | |
| Professional fees | | | 133,839 | | | | 107,356 | | | | 2,485 | | |
| Shareholder report expense | | | 23,219 | | | | 17,967 | | | | 871 | | |
| Shareholder servicing fees | | | 2,226,411 | | | | — | | | | 71,917 | | |
| Directors' fees and expenses | | | 35,036 | | | | 27,690 | | | | 1,036 | | |
| Registration and filing fees | | | 3,644 | | | | 23,000 | | | | 3,500 | | |
| Other expenses | | | 78,292 | | | | 62,698 | | | | 1,668 | | |
| Total expenses | | | 9,780,081 | | | | 6,608,405 | | | | 256,613 | | |
| Less expenses waived | | | (1,053,157 | ) | | | — | | | | — | | |
| Net expenses | | | 8,726,924 | | | | 6,608,405 | | | | 256,613 | | |
| Net investment income (loss) | | | 17,006,066 | | | | 17,092,239 | | | | (122,524 | ) | |
| Realized and unrealized gain (loss): | |
| Net realized gain (loss) on: | |
| Investment transactions | | | 113,231,039 | | | | 57,597,390 | | | | 40,198 | | |
| In-kind redemptions | | | — | | | | 53,054,766 | | | | — | | |
| Foreign currency transactions | | | (964,615 | ) | | | (863,336 | ) | | | — | | |
| Net realized gain (loss) | | | 112,266,424 | | | | 109,788,820 | | | | 40,198 | | |
| Net change in unrealized gain (loss) of: | |
| Investments | | | 92,537,118 | | | | 48,341,914 | | | | 3,541,399 | | |
| Foreign currency translation | | | 74,892 | | | | 63,052 | | | | — | | |
| Net change in unrealized gain (loss) | | | 92,612,010 | | | | 48,404,966 | | | | 3,541,399 | | |
| Net realized and unrealized gain (loss) | | | 204,878,434 | | | | 158,193,786 | | | | 3,581,597 | | |
Net increase (decrease) in net assets resulting
from operations | | $ | 221,884,500 | | | $ | 175,286,025 | | | $ | 3,459,073 | | |
1 The International Portfolio and Philadelphia International Fund had foreign dividend withholding taxes of $2,136,648 and $1,958,992, respectively.
See Notes to Financial Statements.
29
THE GLENMEDE FUND, INC.
STATEMENTS OF OPERATIONS — (Concluded)
For the Year Ended October 31, 2006
| | | Large
Cap
100
Portfolio | | Large
Cap
Growth
Portfolio | | Absolute
Return
Portfolio2 | |
| Investment income: | |
| Dividends1 | | $ | 1,360,801 | | | $ | 406,989 | | | $ | 13,738 | | |
| Interest | | | 50,626 | | | | 16,119 | | | | 48,015 | | |
| Income from security lending | | | 28,134 | | | | — | | | | — | | |
| Total investment income | | | 1,439,561 | | | | 423,108 | | | | 61,753 | | |
| Expenses: | |
| Management fees | | | 433,121 | | | | 157,619 | | | | 15,357 | | |
Administration, transfer agent and
custody fees | | | 52,843 | | | | 22,966 | | | | 4,011 | | |
| Professional fees | | | 10,774 | | | | 3,958 | | | | 1,016 | | |
| Shareholder report expense | | | 1,823 | | | | 572 | | | | 16 | | |
| Shareholder servicing fees | | | 157,499 | | | | 57,316 | | | | 2,560 | | |
| Dividends on securities sold short | | | — | | | | — | | | | 6,668 | | |
| Directors' fees and expenses | | | 2,524 | | | | 843 | | | | 31 | | |
| Initial offering fee | | | — | | | | — | | | | 1,454 | | |
| Registration and filing fees | | | 3,597 | | | | 3,897 | | | | — | | |
| Other expenses | | | 4,274 | | | | 2,051 | | | | 998 | | |
| Total expenses | | | 666,455 | | | | 249,222 | | | | 32,111 | | |
| Less expenses waived/reimbursed | | | — | | | | — | | | | (9,445 | ) | |
| Net expenses | | | 666,455 | | | | 249,222 | | | | 22,666 | | |
| Net investment income | | | 773,106 | | | | 173,886 | | | | 39,087 | | |
| Realized and unrealized gain (loss): | |
| Net realized gain (loss) on: | |
| Investment transactions | | | 1,553,768 | | | | 537,727 | | | | 15,680 | | |
| Securities sold short | | | — | | | | — | | | | (102,074 | ) | |
| Net realized gain (loss) | | | 1,553,768 | | | | 537,727 | | | | (86,394 | ) | |
| Net change in unrealized gain (loss) of: | |
| Investments | | | 9,745,597 | | | | 3,426,969 | | | | 454,852 | | |
| Securities sold short | | | — | | | | — | | | | (465,935 | ) | |
| Net change in unrealized gain (loss) | | | 9,745,597 | | | | 3,426,969 | | | | (11,083 | ) | |
| Net realized and unrealized gain (loss) | | | 11,299,365 | | | | 3,964,696 | | | | (97,477 | ) | |
Net increase (decrease) in net assets resulting
from operations | | $ | 12,072,471 | | | $ | 4,138,582 | | | $ | (58,390 | ) | |
1 The Large Cap 100 Portfolio had foreign dividend withholding tax of $2,184.
2 The Absolute Return Portfolio commenced operations on September 29, 2006.
See Notes to Financial Statements.
30
THE GLENMEDE FUND, INC.
STATEMENTS OF CHANGES IN NET ASSETS
For the Year Ended October 31, 2006
| | | Government
Cash
Portfolio | | Tax-
Exempt
Cash
Portfolio | | Core
Fixed
Income
Portfolio | |
| Increase (decrease) in net assets | |
| Operations: | |
| Net investment income | | $ | 31,101,241 | | | $ | 18,551,324 | | | $ | 8,604,513 | | |
| Net realized gain (loss) on: | |
| Investment transactions | | | — | | | | — | | | | (303,857 | ) | |
| Net change in unrealized gain (loss) of: | |
| Investments | | | — | | | | — | | | | (17,818 | ) | |
Net increase (decrease) in net assets
resulting from operations | | | 31,101,241 | | | | 18,551,324 | | | | 8,282,838 | | |
| Distributions to shareholders from: | |
| Net investment income | | | (31,101,241 | ) | | | (18,551,324 | ) | | | (8,678,639 | ) | |
Net increase (decrease) in net assets from
capital share transactions | | | 15,231,196 | | | | 153,630,791 | | | | 3,643,590 | | |
| Net increase (decrease) in net assets | | | 15,231,196 | | | | 153,630,791 | | | | 3,247,789 | | |
| NET ASSETS: | |
| Beginning of year | | | 636,425,429 | | | | 551,763,842 | | | | 194,995,503 | | |
| End of year | | $ | 651,656,625 | | | $ | 705,394,633 | | | $ | 198,243,292 | | |
Undistributed net investment income (loss)
included in net assets at end of year | | $ | 73,094 | | | $ | (265 | ) | | $ | 759,139 | | |
For the Year Ended October 31, 2005
| | | Government
Cash
Portfolio | | Tax-
Exempt
Cash
Portfolio | | Core
Fixed
Income
Portfolio | |
| Increase (decrease) in net assets | |
| Operations: | |
| Net investment income | | $ | 16,794,079 | | | $ | 10,496,862 | | | $ | 7,846,233 | | |
| Net realized gain (loss) on: | |
| Investment transactions | | | — | | | | — | | | | 323,113 | | |
| Net change in unrealized gain (loss) of: | |
| Investments | | | — | | | | — | | | | (5,681,607 | ) | |
Net increase (decrease) in net assets
resulting from operations | | | 16,794,079 | | | | 10,496,862 | | | | 2,487,739 | | |
| Distributions to shareholders from: | |
| Net investment income | | | (16,794,079 | ) | | | (10,496,862 | ) | | | (7,978,340 | ) | |
Net increase (decrease) in net assets from
capital share transactions | | | 149,556,068 | | | | 21,542,433 | | | | 6,202,184 | | |
| Net increase (decrease) in net assets | | | 149,556,068 | | | | 21,542,433 | | | | 711,583 | | |
| NET ASSETS: | |
| Beginning of year | | | 486,869,361 | | | | 530,221,409 | | | | 194,283,920 | | |
| End of year | | $ | 636,425,429 | | | $ | 551,763,842 | | | $ | 194,995,503 | | |
Undistributed net investment income (loss)
included in net assets at end of year | | $ | 73,094 | | | $ | (265 | ) | | $ | 701,518 | | |
See Notes to Financial Statements.
31
THE GLENMEDE FUND, INC.
STATEMENTS OF CHANGES IN NET ASSETS — (Continued)
For the Year Ended October 31, 2006
| | | Strategic
Equity
Portfolio | | Small Cap
Equity
Portfolio | | Large Cap
Value
Portfolio | |
| Increase (decrease) in net assets | |
| Operations: | |
| Net investment income (loss) | | $ | 494,447 | | | $ | (219,425 | ) | | $ | 535,375 | | |
| Net realized gain (loss) on: | |
| Investment transactions | | | 6,037,041 | | | | 34,927,432 | | | | 2,082,417 | | |
| In-kind transactions | | | — | | | | 4,391,268 | | | | — | | |
| Net change in unrealized gain (loss) of: | |
| Investments | | | 3,814,961 | | | | (734,909 | ) | | | 2,234,848 | | |
Net increase (decrease) in net assets
resulting from operations | | | 10,346,449 | | | | 38,364,366 | | | | 4,852,640 | | |
| Distributions to shareholders from: | |
| Net investment income: | |
| Advisor Class | | | (497,094 | ) | | | — | | | | (522,107 | ) | |
| Net realized gain on investments: | |
| Advisor Class | | | (6,034,569 | ) | | | (34,898,866 | ) | | | (2,186,504 | ) | |
| Institutional Class | | | — | | | | (191 | ) | | | — | | |
Net increase (decrease) in net assets from
capital share transactions | | | 1,771,948 | | | | (8,184,958 | ) | | | 19,237,612 | | |
| Net increase (decrease) in net assets | | | 5,586,734 | | | | (4,719,649 | ) | | | 21,381,641 | | |
| NET ASSETS: | |
| Beginning of year | | | 79,905,263 | | | | 241,970,646 | | | | 26,506,667 | | |
| End of year | | $ | 85,491,997 | | | $ | 237,250,997 | | | $ | 47,888,308 | | |
Undistributed net investment income
included in net assets at end of year | | $ | 13,486 | | | $ | — | | | $ | 2,835 | | |
For the Year Ended October 31, 2005
| | | Strategic
Equity
Portfolio | | Small Cap
Equity
Portfolio | | Large Cap
Value
Portfolio | |
| Increase (decrease) in net assets | |
| Operations: | |
| Net investment income | | $ | 727,633 | | | $ | (738,225 | ) | | $ | 413,604 | | |
| Net realized gain (loss) on: | |
| Investment transactions | | | 1,629,909 | | | | 40,569,024 | | | | 2,569,135 | | |
| Net change in unrealized gain (loss) of: | |
| Investments | | | 4,323,696 | | | | (8,857,974 | ) | | | 582,215 | | |
Net increase (decrease) in net assets
resulting from operations | | | 6,681,238 | | | | 30,972,825 | | | | 3,564,954 | | |
| Distributions to shareholders from: | |
| Net investment income: | |
| Advisor Class | | | (758,552 | ) | | | — | | | | (423,863 | ) | |
| Net realized gain on investments: | |
| Advisor Class | | | (1,486,505 | ) | | | (39,647,331 | ) | | | (2,510,624 | ) | |
| Institutional Class | | | — | | | | (170 | ) | | | — | | |
Net increase (decrease) in net assets from
capital share transactions | | | 9,912,014 | | | | (14,519,332 | ) | | | 3,154,910 | | |
| Net increase (decrease) in net assets | | | 14,348,195 | | | | (23,194,008 | ) | | | 3,785,377 | | |
| NET ASSETS: | |
| Beginning of year | | | 65,557,068 | | | | 265,164,654 | | | | 22,721,290 | | |
| End of year | | $ | 79,905,263 | | | $ | 241,970,646 | | | $ | 26,506,667 | | |
Undistributed net investment income
included in net assets at end of year | | $ | 18,543 | | | $ | 43,437 | | | $ | 10,499 | | |
See Notes to Financial Statements.
32
THE GLENMEDE FUND, INC.
STATEMENTS OF CHANGES IN NET ASSETS — (Continued)
For the Year Ended October 31, 2006
| | | International
Portfolio | | Philadelphia
International
Fund | | U.S.
Emerging
Growth
Portfolio | |
| Increase (decrease) in net assets | |
| Operations: | |
| Net investment income (loss) | | $ | 17,006,066 | | | $ | 17,092,239 | | | $ | (122,524 | ) | |
| Net realized gain (loss) on: | |
| Investment transactions | | | 113,231,039 | | | | 57,597,390 | | | | 40,198 | | |
| In-kind transactions | | | — | | | | 53,054,766 | | | | — | | |
| Foreign currency transactions | | | (964,615 | ) | | | (863,336 | ) | | | — | | |
| Net change in unrealized gain (loss) of: | |
| Investments | | | 92,537,118 | | | | 48,341,914 | | | | 3,541,399 | | |
| Foreign currency translation | | | 74,892 | | | | 63,052 | | | | — | | |
Net increase (decrease) in net assets
resulting from operations | | | 221,884,500 | | | | 175,286,025 | | | | 3,459,073 | | |
| Distributions to shareholders from: | |
| Net investment income | | | (12,024,295 | ) | | | (11,556,255 | ) | | | — | | |
| Net realized gain on investments | | | (112,643,378 | ) | | | (57,325,797 | ) | | | — | | |
Net increase (decrease) in net assets from
capital share transactions | | | 19,630,510 | | | | (252,195,281 | ) | | | 17,326,313 | | |
| Net increase (decrease) in net assets | | | 116,847,337 | | | | (145,791,308 | ) | | | 20,785,386 | | |
| NET ASSETS: | |
| Beginning of year | | | 811,849,668 | | | | 634,018,122 | | | | 14,216,916 | | |
| End of year | | $ | 928,697,005 | | | $ | 488,226,814 | | | $ | 35,002,302 | | |
Undistributed net investment income (loss)
included in net assets at end of year | | $ | 3,980,814 | | | $ | 4,664,928 | | | $ | — | | |
For the Year Ended October 31, 2005
| | | International
Portfolio | | Philadelphia
International
Fund | | U.S.
Emerging
Growth
Portfolio | |
| Increase (decrease) in net assets | |
| Operations: | |
| Net investment income | | $ | 34,262,516 | | | $ | 9,820,211 | | | $ | (254,293 | ) | |
| Net realized gain (loss) on: | |
| Investment transactions | | | 184,480,756 | | | | 50,270,026 | | | | 23,157,841 | | |
| In-kind transactions | | | 85,060,835 | | | | — | | | | — | | |
| Foreign currency transactions | | | (2,016,327 | ) | | | (904,816 | ) | | | — | | |
| Net change in unrealized gain (loss) of: | |
| Investments | | | (101,160,362 | ) | | | 13,931,966 | | | | (16,011,414 | ) | |
| Foreign currency translation | | | (131,640 | ) | | | (83,780 | ) | | | — | | |
Net increase (decrease) in net assets
resulting from operations | | | 200,495,778 | | | | 73,033,607 | | | | 6,892,134 | | |
| Distributions to shareholders from: | |
| Net investment income | | | (33,411,817 | ) | | | (10,506,757 | ) | | | — | | |
| Net realized gain on investments | | | (69,712,993 | ) | | | (16,362,020 | ) | | | — | | |
Net increase (decrease) in net assets from
capital share transactions | | | (603,283,740 | ) | | | 142,947,659 | | | | (68,740,112 | ) | |
| Net increase (decrease) in net assets | | | (505,912,772 | ) | | | 189,112,489 | | | | (61,847,978 | ) | |
| NET ASSETS: | |
| Beginning of year | | | 1,317,762,440 | | | | 444,905,633 | | | | 76,064,894 | | |
| End of year | | $ | 811,849,668 | | | $ | 634,018,122 | | | $ | 14,216,916 | | |
Undistributed net investment income (loss)
included in net assets at end of year | | $ | — | | | $ | — | | | $ | — | | |
See Notes to Financial Statements.
33
THE GLENMEDE FUND, INC.
STATEMENTS OF CHANGES IN NET ASSETS — (Concluded)
For the Year Ended October 31, 2006
| | | Large
Cap 100
Portfolio | | Large Cap
Growth
Portfolio | | Absolute
Return
Portfolio1 | |
| Increase (decrease) in net assets | |
| Operations: | |
| Net investment income | | $ | 773,106 | | | $ | 173,886 | | | $ | 39,087 | | |
| Net realized gain (loss) on: | |
| Investment transactions | | | 1,553,768 | | | | 537,727 | | | | 15,680 | | |
| Securities sold short | | | — | | | | — | | | | (102,074 | ) | |
| Net change in unrealized gain (loss) of: | |
| Investments | | | 9,745,597 | | | | 3,426,969 | | | | 454,852 | | |
| Securities sold short | | | — | | | | — | | | | (465,935 | ) | |
Net increase (decrease) in net assets
resulting from operations | | | 12,072,471 | | | | 4,138,582 | | | | (58,390 | ) | |
| Distributions to shareholders from: | |
| Net investment income | | | (757,177 | ) | | | (187,299 | ) | | | — | | |
| Net realized gain on investments | | | (1,555,199 | ) | | | (452,804 | ) | | | — | | |
Net increase (decrease) in net assets from
capital share transactions | | | 44,377,706 | | | | 16,734,895 | | | | 19,902,500 | | |
| Net increase (decrease) in net assets | | | 54,137,801 | | | | 20,233,374 | | | | 19,844,110 | | |
| NET ASSETS: | |
| Beginning of year | | | 50,133,453 | | | | 16,571,555 | | | | — | | |
| End of year | | $ | 104,271,254 | | | $ | 36,804,929 | | | $ | 19,844,110 | | |
Undistributed net investment income
included in net assets at end of year | | $ | 8,228 | | | $ | — | | | $ | 38,239 | | |
For the Year Ended October 31, 2005
| | | Large
Cap 100
Portfolio | | Large Cap
Growth
Portfolio | | Absolute
Return
Portfolio1 | |
| Increase (decrease) in net assets | |
| Operations: | |
| Net investment income | | $ | 264,933 | | | $ | 2,066 | | | $ | — | | |
| Net realized gain (loss) on: | |
| Investment transactions | | | 770,150 | | | | 68,711 | | | | — | | |
| Net change in unrealized gain (loss) of: | |
| Investments | | | 2,258,704 | | | | 902,009 | | | | — | | |
Net increase (decrease) in net assets
resulting from operations | | | 3,293,787 | | | | 972,786 | | | | — | | |
| Distributions to shareholders from: | |
| Net investment income | | | (290,607 | ) | | | (4,149 | ) | | | — | | |
| Net realized gain on investments | | | (378,313 | ) | | | — | | | | — | | |
Net increase (decrease) in net assets from
capital share transactions | | | 29,314,519 | | | | 9,657,404 | | | | — | | |
| Net increase (decrease) in net assets | | | 31,939,386 | | | | 10,626,041 | | | | — | | |
| NET ASSETS: | |
| Beginning of year | | | 18,194,067 | | | | 5,945,514 | | | | — | | |
| End of year | | $ | 50,133,453 | | | $ | 16,571,555 | | | $ | — | | |
Undistributed net investment income
included in net assets at end of year | | $ | — | | | $ | — | | | $ | — | | |
1 The Absolute Return Portfolio commenced operations on September 29, 2006.
See Notes to Financial Statements.
34
THE GLENMEDE FUND, INC.
FINANCIAL HIGHLIGHTS
For a share outstanding throughout each year
| | | Government Cash Portfolio | |
| | | For the Years Ended October 31, | |
| | | 2006 | | 2005 | | 2004 | | 2003 | | 2002 | |
Net asset value, beginning
of year | | $ | 1.00 | | | $ | 1.00 | | | $ | 1.00 | | | $ | 1.00 | | | $ | 1.00 | | |
Income from investment
operations: | |
| Net investment income | | | 0.046 | | | | 0.027 | | | | 0.011 | | | | 0.011 | | | | 0.019 | | |
Distributions to
shareholders from: | |
| Net investment income | | | (0.046 | ) | | | (0.027 | ) | | | (0.011 | ) | | | (0.011 | ) | | | (0.019 | ) | |
Net asset value, end
of year | | $ | 1.00 | | | $ | 1.00 | | | $ | 1.00 | | | $ | 1.00 | | | $ | 1.00 | | |
| Total return | | | 4.68 | % | | | 2.74 | % | | | 1.05 | % | | | 1.15 | % | | | 1.95 | % | |
Ratios to average net assets/
Supplemental data: | |
Net assets, end of year
(in 000's) | | $ | 651,657 | | | $ | 636,425 | | | $ | 486,869 | | | $ | 450,167 | | | $ | 533,034 | | |
Ratio of operating expenses
to average net assets | | | 0.19 | % | | | 0.19 | % | | | 0.18 | % | | | 0.13 | % | | | 0.13 | % | |
Ratio of net investment income
to average net assets | | | 4.60 | % | | | 2.73 | % | | | 1.05 | % | | | 1.16 | % | | | 1.91 | % | |
See Notes to Financial Statements.
35
THE GLENMEDE FUND, INC.
FINANCIAL HIGHLIGHTS
For a share outstanding throughout each year
| | | Tax-Exempt Cash Portfolio | |
| | | For the Years Ended October 31, | |
| | | 2006 | | 2005 | | 2004 | | 2003 | | 2002 | |
Net asset value, beginning
of year | | $ | 1.00 | | | $ | 1.00 | | | $ | 1.00 | | | $ | 1.00 | | | $ | 1.00 | | |
Income from investment
operations: | |
| Net investment income | | | 0.031 | | | | 0.019 | | | | 0.009 | | | | 0.009 | | | | 0.012 | | |
Distributions to
shareholders from: | |
| Net investment income | | | (0.031 | ) | | | (0.019 | ) | | | (0.009 | ) | | | (0.009 | ) | | | (0.012 | ) | |
Net asset value, end
of year | | $ | 1.00 | | | $ | 1.00 | | | $ | 1.00 | | | $ | 1.00 | | | $ | 1.00 | | |
| Total return | | | 3.10 | % | | | 1.94 | % | | | 0.90 | % | | | 0.88 | % | | | 1.25 | % | |
Ratios to average net assets/
Supplemental data: | |
Net assets, end of year
(in 000's) | | $ | 705,395 | | | $ | 551,764 | | | $ | 530,221 | | | $ | 596,630 | | | $ | 607,069 | | |
Ratio of operating expenses
to average net assets | | | 0.19 | % | | | 0.19 | % | | | 0.18 | % | | | 0.14 | % | | | 0.14 | % | |
Ratio of net investment income
to average net assets | | | 3.07 | % | | | 1.91 | % | | | 0.90 | % | | | 0.88 | % | | | 1.24 | % | |
See Notes to Financial Statements.
36
THE GLENMEDE FUND, INC.
FINANCIAL HIGHLIGHTS
For a share outstanding throughout each year
| | | Core Fixed Income Portfolio | |
| | | For the Years Ended October 31, | |
| | | 2006 | | 2005 | | 2004 | | 2003 | | 2002 | |
Net asset value, beginning
of year | | $ | 10.64 | | | $ | 10.94 | | | $ | 10.85 | | | $ | 10.98 | | | $ | 10.88 | | |
Income from investment
operations: | |
| Net investment income | | | 0.47 | | | | 0.44 | | | | 0.45 | | | | 0.44 | | | | 0.54 | | |
Net realized and unrealized
gain (loss) on investments | | | (0.02 | ) | | | (0.30 | ) | | | 0.09 | | | | (0.09 | ) | | | 0.10 | | |
Total from investment
operations | | | 0.45 | | | | 0.14 | | | | 0.54 | | | | 0.35 | | | | 0.64 | | |
Distributions to
shareholders from: | |
| Net investment income | | | (0.47 | ) | | | (0.44 | ) | | | (0.45 | ) | | | (0.48 | ) | | | (0.54 | ) | |
| Total distributions | | | (0.47 | ) | | | (0.44 | ) | | | (0.45 | ) | | | (0.48 | ) | | | (0.54 | ) | |
Net asset value, end
of year | | $ | 10.62 | | | $ | 10.64 | | | $ | 10.94 | | | $ | 10.85 | | | $ | 10.98 | | |
| Total return | | | 4.38 | % | | | 1.32 | % | | | 5.07 | % | | | 3.26 | % | | | 6.18 | % | |
Ratios to average net assets/
Supplemental data: | |
Net assets, end of year
(in 000's) | | $ | 198,243 | | | $ | 194,996 | | | $ | 194,284 | | | $ | 192,410 | | | $ | 188,298 | | |
Ratio of operating expenses
before waiver to average
net assets | | | 0.54 | % | | | 0.29 | % | | | 0.19 | % | | | 0.14 | % | | | 0.24 | % | |
Ratio of operating expenses
after waiver to average
net assets | | | 0.54 | % | | | 0.29 | % | | | 0.19 | % | | | 0.14 | % | | | 0.14 | % | |
Ratio of net investment income
to average net assets | | | 4.42 | % | | | 4.02 | % | | | 3.82 | % | | | 4.08 | % | | | 5.19 | % | |
| Portfolio turnover rate | | | 272 | % | | | 229 | % | | | 203 | % | | | 205 | % | | | 191 | % | |
See Notes to Financial Statements.
37
THE GLENMEDE FUND, INC.
FINANCIAL HIGHLIGHTS
For a share outstanding throughout each year
| | | Strategic Equity Portfolio | |
| | | For the Years Ended October 31, | |
| | | 20061 | | 20051 | | 2004 | | 2003 | | 2002 | |
Net asset value, beginning
of year | | $ | 16.95 | | | $ | 15.87 | | | $ | 14.94 | | | $ | 13.47 | | | $ | 16.06 | | |
Income from investment
operations: | |
| Net investment income | | | 0.11 | | | | 0.17 | | | | 0.19 | | | | 0.20 | | | | 0.16 | | |
Net realized and unrealized
gain (loss) on investments | | | 2.14 | | | | 1.41 | | | | 0.93 | | | | 1.46 | | | | (2.59 | ) | |
Total from investment
operations | | | 2.25 | | | | 1.58 | | | | 1.12 | | | | 1.66 | | | | (2.43 | ) | |
Distributions to
shareholders from: | |
| Net investment income | | | (0.11 | ) | | | (0.18 | ) | | | (0.19 | ) | | | (0.19 | ) | | | (0.16 | ) | |
| Net realized capital gains | | | (1.34 | ) | | | (0.32 | ) | | | — | | | | — | | | | — | | |
| Total distributions | | | (1.45 | ) | | | (0.50 | ) | | | (0.19 | ) | | | (0.19 | ) | | | (0.16 | ) | |
Net asset value, end
of year | | $ | 17.75 | | | $ | 16.95 | | | $ | 15.87 | | | $ | 14.94 | | | $ | 13.47 | | |
| Total return | | | 13.28 | % | | | 9.98 | % | | | 7.53 | % | | | 12.43 | % | | | (15.20 | )% | |
Ratios to average net assets/
Supplemental data: | |
Net assets, end of year
(in 000's) | | $ | 85,492 | | | $ | 79,905 | | | $ | 65,557 | | | $ | 88,521 | | | $ | 90,051 | | |
Ratio of operating expenses
to average net assets | | | 0.85 | % | | | 0.45 | % | | | 0.27 | % | | | 0.14 | % | | | 0.14 | % | |
Ratio of net investment income
to average net assets | | | 0.59 | % | | | 0.97 | % | | | 1.19 | % | | | 1.39 | % | | | 1.04 | % | |
| Portfolio turnover rate | | | 85 | % | | | 89 | % | | | 87 | % | | | 79 | % | | | 36 | % | |
1 Per share net investment income (loss) has been calculated using the average shares outstanding during the period.
See Notes to Financial Statements.
38
THE GLENMEDE FUND, INC.
FINANCIAL HIGHLIGHTS
For a share outstanding throughout each year
| | | Small Cap Equity Portfolio Advisor Shares | |
| | | For the Years Ended October 31, | |
| | | 2006 | | 2005 | | 20041 | | 2003 | | 2002 | |
Net asset value, beginning
of year | | $ | 16.71 | | | $ | 17.61 | | | $ | 18.28 | | | $ | 13.93 | | | $ | 15.57 | | |
Income from investment
operations: | |
| Net investment income (loss) | | | (0.02 | ) | | | (0.05 | ) | | | (0.06 | ) | | | 0.01 | | | | 0.07 | | |
Net realized and unrealized
gain (loss) on investments | | | 2.81 | | | | 2.15 | | | | 2.59 | | | | 4.75 | | | | (0.90 | ) | |
Total from investment
operations | | | 2.79 | | | | 2.10 | | | | 2.53 | | | | 4.76 | | | | (0.83 | ) | |
Distributions to
shareholders from: | |
| Net investment income | | | — | | | | — | | | | — | | | | (0.02 | ) | | | (0.07 | ) | |
| Net realized capital gains | | | (2.87 | ) | | | (3.00 | ) | | | (3.20 | ) | | | (0.39 | ) | | | (0.74 | ) | |
| Total distributions | | | (2.87 | ) | | | (3.00 | ) | | | (3.20 | ) | | | (0.41 | ) | | | (0.81 | ) | |
Net asset value, end
of year | | $ | 16.63 | | | $ | 16.71 | | | $ | 17.61 | | | $ | 18.28 | | | $ | 13.93 | | |
| Total return | | | 16.69 | % | | | 12.22 | % | | | 13.90 | % | | | 34.23 | % | | | (5.32 | )% | |
Ratios to average net assets/
Supplemental data: | |
Net assets, end of year
(in 000's) | | $ | 237,250 | | | $ | 241,970 | | | $ | 265,164 | | | $ | 275,408 | | | $ | 199,264 | | |
Ratio of operating expenses
to average net assets | | | 0.91 | % | | | 0.92 | % | | | 0.90 | % | | | 0.90 | % | | | 0.90 | % | |
Ratio of net investment income
(expenses in excess of income)
to average net assets | | | (0.09 | )% | | | (0.28 | )% | | | (0.33 | )% | | | 0.10 | % | | | 0.44 | % | |
| Portfolio turnover rate2 | | | 60 | % | | | 51 | % | | | 64 | % | | | 58 | % | | | 67 | % | |
1 Per share net investment income (loss) has been calculated using the average shares outstanding during the period.
2 Portfolio turnover is calculated at the fund level.
See Notes to Financial Statements.
39
THE GLENMEDE FUND, INC.
FINANCIAL HIGHLIGHTS
For a share outstanding throughout each year
| | | Small Cap Equity Portfolio Institutional Shares | |
| | | For the Years Ended October 31, | |
| | | 20061 | | 2005 | | 20041 | | 2003 | | 2002 | |
Net asset value, beginning
of year | | $ | 16.88 | | | $ | 17.73 | | | $ | 18.35 | | | $ | 13.96 | | | $ | 15.60 | | |
Income from investment
operations: | |
| Net investment income (loss) | | | 0.04 | | | | 0.00 | | | | (0.02 | ) | | | 0.05 | | | | 0.11 | | |
Net realized and unrealized
gain (loss) on investments | | | 2.83 | | | | 2.15 | | | | 2.60 | | | | 4.76 | | | | (0.90 | ) | |
Total from investment
operations | | | 2.87 | | | | 2.15 | | | | 2.58 | | | | 4.81 | | | | (0.79 | ) | |
Distributions to
shareholders from: | |
| Net investment income | | | — | | | | — | | | | — | | | | (0.03 | ) | | | (0.11 | ) | |
| Net realized capital gains | | | (2.87 | ) | | | (3.00 | ) | | | (3.20 | ) | | | (0.39 | ) | | | (0.74 | ) | |
| Total distributions | | | (2.87 | ) | | | (3.00 | ) | | | (3.20 | ) | | | (0.42 | ) | | | (0.85 | ) | |
Net asset value, end
of year | | $ | 16.88 | | | $ | 16.88 | | | $ | 17.73 | | | $ | 18.35 | | | $ | 13.96 | | |
| Total return | | | 16.99 | % | | | 12.43 | % | | | 14.13 | % | | | 34.50 | % | | | (5.10 | )% | |
Ratios to average net assets/
Supplemental data: | |
Net assets, end of year
(in 000's) | | $ | 1 | | | $ | 1 | | | $ | 1 | | | $ | 40,629 | | | $ | 29,644 | | |
Ratio of operating expenses
to average net assets | | | 0.71 | % | | | 0.72 | % | | | 0.70 | % | | | 0.70 | % | | | 0.70 | % | |
Ratio of net investment income
(expenses in excess of income)
to average net assets | | | 0.22 | % | | | (0.09 | )% | | | (0.12 | )% | | | 0.30 | % | | | 0.64 | % | |
| Portfolio turnover rate2 | | | 60 | % | | | 51 | % | | | 64 | % | | | 58 | % | | | 67 | % | |
1 Per share net investment income (loss) has been calculated using the average shares outstanding during the period.
2 Portfolio turnover is calculated at the fund level.
See Notes to Financial Statements.
40
THE GLENMEDE FUND, INC.
FINANCIAL HIGHLIGHTS
For a share outstanding throughout each year
| | | Large Cap Value Portfolio | |
| | | For the Years Ended October 31, | |
| | | 2006 | | 2005 | | 2004 | | 2003 | | 2002 | |
Net asset value, beginning
of year | | $ | 10.28 | | | $ | 10.01 | | | $ | 9.00 | | | $ | 7.78 | | | $ | 8.56 | | |
Income from investment
operations: | |
| Net investment income | | | 0.15 | | | | 0.18 | | | | 0.17 | | | | 0.16 | | | | 0.14 | | |
Net realized and unrealized
gain (loss) on investments | | | 1.26 | | | | 1.36 | | | | 1.31 | | | | 1.22 | | | | (0.79 | ) | |
Total from investment
operations | | | 1.41 | | | | 1.54 | | | | 1.48 | | | | 1.38 | | | | (0.65 | ) | |
Distributions to
shareholders from: | |
| Net investment income | | | (0.14 | ) | | | (0.19 | ) | | | (0.17 | ) | | | (0.16 | ) | | | (0.13 | ) | |
| Net realized capital gains | | | (0.53 | ) | | | (1.08 | ) | | | (0.30 | ) | | | — | | | | — | | |
| Total distributions | | | (0.67 | ) | | | (1.27 | ) | | | (0.47 | ) | | | (0.16 | ) | | | (0.13 | ) | |
Net asset value, end
of year | | $ | 11.02 | | | $ | 10.28 | | | $ | 10.01 | | | $ | 9.00 | | | $ | 7.78 | | |
| Total return | | | 13.81 | % | | | 15.66 | % | | | 16.54 | % | | | 18.01 | % | | | (7.64 | )% | |
Ratios to average net assets/
Supplemental data: | |
Net assets, end of year
(in 000's) | | $ | 47,888 | | | $ | 26,507 | | | $ | 22,721 | | | $ | 21,297 | | | $ | 15,326 | | |
Ratio of operating expenses
to average net assets | | | 0.96 | % | | | 0.48 | % | | | 0.29 | % | | | 0.17 | % | | | 0.17 | % | |
Ratio of net investment income
to average net assets | | | 1.36 | % | | | 1.62 | % | | | 1.78 | % | | | 2.06 | % | | | 1.75 | % | |
| Portfolio turnover rate | | | 92 | % | | | 76 | % | | | 76 | % | | | 96 | % | | | 96 | % | |
See Notes to Financial Statements.
41
THE GLENMEDE FUND, INC.
FINANCIAL HIGHLIGHTS
For a share outstanding throughout each year
| | | International Portfolio | |
| | | For the Years Ended October 31, | |
| | | 2006 | | 20051 | | 2004 | | 2003 | | 2002 | |
Net asset value, beginning
of year | | $ | 17.58 | | | $ | 16.96 | | | $ | 13.99 | | | $ | 11.67 | | | $ | 12.89 | | |
Income from investment
operations: | |
| Net investment income | | | 0.39 | | | | 0.48 | | | | 0.40 | | | | 0.40 | | | | 0.33 | | |
Net realized and unrealized
gain (loss) on investments | | | 4.61 | | | | 2.26 | | | | 2.88 | | | | 2.23 | | | | (1.31 | ) | |
Total from investment
operations | | | 5.00 | | | | 2.74 | | | | 3.28 | | | | 2.63 | | | | (0.98 | ) | |
Distributions to
shareholders from: | |
| Net investment income | | | (0.29 | ) | | | (0.47 | ) | | | (0.31 | ) | | | (0.31 | ) | | | (0.24 | ) | |
| Net realized capital gains | | | (2.70 | ) | | | (1.65 | ) | | | — | | | | — | | | | — | | |
| Total distributions | | | (2.99 | ) | | | (2.12 | ) | | | (0.31 | ) | | | (0.31 | ) | | | (0.24 | ) | |
Net asset value, end
of year | | $ | 19.59 | | | $ | 17.58 | | | $ | 16.96 | | | $ | 13.99 | | | $ | 11.67 | | |
| Total return | | | 28.51 | % | | | 16.34 | % | | | 23.60 | % | | | 22.89 | % | | | (7.82 | )% | |
Ratios to average net assets/
Supplemental data: | |
Net assets, end of year
(in 000's) | | $ | 928,697 | | | $ | 811,850 | | | $ | 1,317,762 | | | $ | 1,037,465 | | | $ | 983,337 | | |
Ratio of operating expenses
before waiver to average
net assets | | | 1.10 | % | | | 0.32 | % | | | 0.14 | % | | | 0.14 | % | | | 0.14 | % | |
Ratio of operating expenses
after waiver to average
net assets | | | 0.98 | % | | | 0.18 | % | | | 0.14 | % | | | 0.14 | % | | | 0.14 | % | |
Ratio of net investment income
to average net assets | | | 1.91 | % | | | 2.58 | % | | | 2.59 | % | | | 3.14 | % | | | 2.42 | % | |
| Portfolio turnover rate | | | 45 | % | | | 47 | % | | | 38 | % | | | 48 | % | | | 33 | % | |
1 Per share net investment income has been calculated using the average shares outstanding during the period.
See Notes to Financial Statements.
42
THE GLENMEDE FUND, INC.
FINANCIAL HIGHLIGHTS
For a share outstanding throughout each year
| | | Philadelphia International Fund | |
| | | For the Years Ended October 31, | |
| | | 20061 | | 2005 | | 2004 | | 2003 | | 2002 | |
Net asset value, beginning
of year | | $ | 17.49 | | | $ | 15.86 | | | $ | 13.14 | | | $ | 11.03 | | | $ | 12.25 | | |
Income from investment
operations: | |
| Net investment income | | | 0.45 | | | | 0.28 | | | | 0.33 | | | | 0.24 | | | | 0.19 | | |
Net realized and unrealized
gain (loss) on investments | | | 4.48 | | | | 2.16 | | | | 2.53 | | | | 2.09 | | | | (1.28 | ) | |
Total from investment
operations | | | 4.93 | | | | 2.44 | | | | 2.86 | | | | 2.33 | | | | (1.09 | ) | |
Distributions to
shareholders from: | |
| Net investment income | | | (0.28 | ) | | | (0.34 | ) | | | (0.14 | ) | | | (0.22 | ) | | | (0.13 | ) | |
| Net realized capital gains | | | (2.54 | ) | | | (0.47 | ) | | | — | | | | — | | | | — | | |
| Total distributions | | | (2.82 | ) | | | (0.81 | ) | | | (0.14 | ) | | | (0.22 | ) | | | (0.13 | ) | |
Net asset value, end
of year | | $ | 19.60 | | | $ | 17.49 | | | $ | 15.86 | | | $ | 13.14 | | | $ | 11.03 | | |
| Total return | | | 28.29 | % | | | 15.50 | % | | | 21.78 | % | | | 21.32 | % | | | (9.02 | )% | |
Ratios to average net assets/
Supplemental data: | |
Net assets, end of year
(in 000's) | | $ | 488,227 | | | $ | 634,018 | | | $ | 444,906 | | | $ | 474,371 | | | $ | 263,769 | | |
Ratio of operating expenses
to average net assets | | | 0.85 | % | | | 0.85 | % | | | 0.85 | % | | | 0.85 | % | | | 0.85 | % | |
Ratio of net investment income
to average net assets | | | 2.20 | % | | | 1.78 | % | | | 1.86 | % | | | 2.33 | % | | | 1.72 | % | |
| Portfolio turnover rate | | | 49 | % | | | 47 | % | | | 50 | % | | | 42 | % | | | 37 | % | |
1 Per share net investment income (loss) has been calculated using the average shares outstanding during the period.
See Notes to Financial Statements.
43
THE GLENMEDE FUND, INC.
FINANCIAL HIGHLIGHTS
For a share outstanding throughout each year
| | | U.S. Emerging Growth Portfolio | |
| | | For the Years Ended October 31, | |
| | | 2006 | | 20051 | | 2004 | | 2003 | | 2002 | |
Net asset value, beginning
of year | | $ | 6.22 | | | $ | 5.32 | | | $ | 5.56 | | | $ | 3.93 | | | $ | 5.04 | | |
Income from investment
operations: | |
| Net investment loss | | | (0.03 | ) | | | (0.05 | ) | | | (0.07 | ) | | | (0.05 | ) | | | — | | |
Net realized and unrealized
gain (loss) on investments | | | 1.15 | | | | 0.95 | | | | (0.17 | ) | | | 1.68 | | | | (1.11 | ) | |
Total from investment
operations | | | 1.12 | | | | 0.90 | | | | (0.24 | ) | | | 1.63 | | | | (1.11 | ) | |
Net asset value, end
of year | | $ | 7.34 | | | $ | 6.22 | | | $ | 5.32 | | | $ | 5.56 | | | $ | 3.93 | | |
| Total return | | | 18.01 | % | | | 16.92 | % | | | (4.32 | )% | | | 41.48 | % | | | (22.02 | )% | |
Ratios to average net assets/
Supplemental data: | |
Net assets, end of year
(in 000's) | | $ | 35,002 | | | $ | 14,217 | | | $ | 76,065 | | | $ | 101,643 | | | $ | 78,122 | | |
Ratio of operating expenses
to average net assets | | | 0.89 | % | | | 1.17 | % | | | 1.22 | % | | | 1.18 | % | | | 1.23 | % | |
Ratio of net investment income
(loss) to average net assets | | | (0.43 | )% | | | (0.83 | )% | | | (1.05 | )% | | | (1.04 | )% | | | (1.02 | )% | |
| Portfolio turnover rate | | | 114 | % | | | 145 | % | | | 89 | % | | | 114 | % | | | 42 | % | |
1 Per share net investment income (loss) has been calculated using the average shares and outstanding during the period.
See Notes to Financial Statements.
44
THE GLENMEDE FUND, INC.
FINANCIAL HIGHLIGHTS
For a share outstanding throughout each year
| | | Large Cap 100 Portfolio | |
| | | For the
Years Ended October 31, | | For the Period
February 27, 20041
through | |
| | | 2006 | | 2005 | | October 31, 2004 | |
| Net asset value, beginning of year | | $ | 11.28 | | | $ | 10.09 | | | $ | 10.00 | | |
| Income from investment operations: | |
| Net investment income | | | 0.11 | | | | 0.08 | | | | 0.03 | | |
Net realized and unrealized
gain (loss) on investments | | | 1.84 | | | | 1.29 | | | | 0.08 | | |
| Total from investment operations | | | 1.95 | | | | 1.37 | | | | 0.11 | | |
| Distributions to shareholders from: | |
| Net investment income | | | (0.11 | ) | | | (0.09 | ) | | | (0.02 | ) | |
| Net realized capital gains | | | (0.20 | ) | | | (0.09 | ) | | | — | | |
| Total distributions | | | (0.31 | ) | | | (0.18 | ) | | | (0.02 | ) | |
| Net asset value, end of year | | $ | 12.92 | | | $ | 11.28 | | | $ | 10.09 | | |
| Total return | | | 17.34 | % | | | 13.58 | % | | | 1.05 | %2 | |
Ratios to average net assets/
Supplemental data: | |
Net assets, end of year
(in 000's) | | $ | 104,271 | | | $ | 50,133 | | | $ | 18,194 | | |
Ratio of operating expenses to
average net assets | | | 0.85 | % | | | 0.87 | % | | | 1.12 | %3 | |
Ratio of net investment income to
average net assets | | | 0.98 | % | | | 0.76 | % | | | 0.45 | %3 | |
| Portfolio turnover rate | | | 90 | % | | | 83 | % | | | 56 | % | |
1 Commencement of operations.
2 Total return calculation is not annualized
3 Annualized
See Notes to Financial Statements.
45
THE GLENMEDE FUND, INC.
FINANCIAL HIGHLIGHTS
For a share outstanding throughout each year
| | | Large Cap Growth Portfolio | |
| | | For the
Years Ended October 31, | | For the Period
February 27, 20041
through | |
| | | 2006 | | 2005 | | October 31, 2004 | |
| Net asset value, beginning of year | | $ | 11.17 | | | $ | 10.04 | | | $ | 10.00 | | |
| Income from investment operations: | |
| Net investment income (loss) | | | 0.08 | | | | 0.00 | 2 | | | (0.01 | ) | |
Net realized and unrealized
gain (loss) on investments | | | 1.89 | | | | 1.13 | | | | 0.05 | | |
| Total from investment operations | | | 1.97 | | | | 1.13 | | | | 0.04 | | |
| Distributions to shareholders from: | |
| Net investment income | | | (0.08 | ) | | | (0.00 | )2 | | | — | | |
| Net realized capital gains | | | (0.16 | ) | | | — | | | | — | | |
| Total distributions | | | (0.24 | ) | | | (0.00 | ) | | | — | | |
| Net asset value, end of year | | $ | 12.90 | | | $ | 11.17 | | | $ | 10.04 | | |
| Total return | | | 17.65 | % | | | 11.29 | % | | | 0.40 | %3 | |
Ratios to average net assets/
Supplemental data: | |
| Net assets, end of year (in 000's) | | $ | 36,805 | | | $ | 16,572 | | | $ | 5,946 | | |
Ratio of operating expenses to
average net assets | | | 0.87 | % | | | 0.93 | % | | | 1.26 | %4 | |
Ratio of net investment income
(expenses in excess of income)
to average net assets | | | 0.61 | % | | | 0.02 | % | | | (0.23 | )%4 | |
| Portfolio turnover rate | | | 111 | % | | | 97 | % | | | 64 | % | |
1 Commencement of operations.
2 Amount rounds to less than $0.01 per share.
3 Total return calculation is not annualized.
4 Annualized.
See Notes to Financial Statements.
46
THE GLENMEDE FUND, INC.
FINANCIAL HIGHLIGHTS
For a share outstanding throughout each year
| | | Absolute Return Portfolio | |
| | | For the Period
September 29, 20061
through
October 31, 2006 | |
| Net asset value, beginning of period | | $ | 10.00 | | |
| Income from investment operations: | |
| Net investment income2 | | | 0.02 | | |
Net realized and unrealized
gain (loss) on investments | | | (0.03 | ) | |
| Total from investment operations | | | (0.01 | ) | |
| Net asset value, end of period | | $ | 9.99 | | |
| Total return | | | (0.10 | )%3 | |
Ratios to average net assets/
Supplemental data: | |
| Net assets, end of period (in 000's) | | $ | 19,844 | | |
Ratio of operating expenses before
waiver/reimbursement to average net assets | | | 1.99 | %4,5 | |
Ratio of operating expenses after
waiver/reimbursement to average net assets | | | 1.25 | %4,5 | |
Ratio of net investment income
to average net assets | | | 3.05 | %4 | |
| Portfolio turnover rate | | | 344 | % | |
1 Commencement of operations.
2 Per share net investment income has been calculated using the average shares outstanding during the period.
3 Total return calculation is not annualized.
4 Annualized.
5 The Fund expense ratios do not include dividends on securities sold short expense. The ratio of dividends on securities sold short expense to average net assets was 0.52% for the period ending October 31, 2006.
See Notes to Financial Statements.
47
THE GLENMEDE FUND, INC.
Government Cash Portfolio
SCHEDULE OF PORTFOLIO INVESTMENTS
October 31, 2006
Face
Amount | | | | Value | |
| AGENCY DISCOUNT NOTESt1 — 10.6% | | | |
| | | Federal Home Loan Bank — 2.3% | |
| $ | 15,000,000 | | | 5.114% due 11/22/06 | | $ | 14,955,256 | | |
| | | Federal Home Loan Mortgage Corporation — 2.2% | |
| | 7,500,000 | | | 5.245% due 1/23/07 | | | 7,409,305 | | |
| | 7,500,000 | | | 5.15% due 7/24/07 | | | 7,215,677 | | |
| | | | 14,624,982 | | |
| | | Federal National Mortgage Association — 6.1% | |
| | 15,000,000 | | | 4.98% due 11/1/06 | | | 15,000,000 | | |
| | 15,000,000 | | | 4.992% due 11/1/06 | | | 15,000,000 | | |
| | 10,000,000 | | | 5.00% due 3/30/07 | | | 9,793,056 | | |
| | | | 39,793,056 | | |
| | | | | TOTAL AGENCY DISCOUNT NOTES
(Cost $69,373,294) | | | 69,373,294 | | |
| AGENCY NOTES — 39.3% | | | |
| | | Federal Home Loan Bank — 18.6% | |
| | 2,030,000 | | | 4.835% due 11/9/06 | | | 2,029,913 | | |
| | 5,000,000 | | | 3.125% due 11/15/06 | | | 4,996,633 | | |
| | 1,415,000 | | | 2.375% due 12/26/06 | | | 1,409,505 | | |
| | 10,000,000 | | | 2.37% due 12/26/06 | | | 9,962,119 | | |
| | 10,000,000 | | | 2.25% due 12/26/06 | | | 9,951,642 | | |
| | 4,675,000 | | | 3.10% due 12/29/06 | | | 4,661,233 | | |
| | 5,000,000 | | | 4.65% due 12/29/06 | | | 4,993,008 | | |
| | 5,000,000 | | | 2.225% due 1/10/07 | | | 4,971,175 | | |
| | 14,285,000 | | | 2.26% due 1/26/07 | | | 14,177,681 | | |
| | 9,380,000 | | | 2.875% due 2/15/07 | | | 9,311,927 | | |
| | 5,000,000 | | | 4.51% due 2/16/07 | | | 4,986,293 | | |
| | 2,750,000 | | | 4.47% due 2/22/072 | | | 2,741,878 | | |
| | 7,100,000 | | | 4.58% due 2/22/072 | | | 7,087,404 | | |
| | 5,000,000 | | | 4.65% due 2/22/072 | | | 4,994,501 | | |
| | 1,000,000 | | | 4.555% due 4/27/072 | | | 996,353 | | |
| | 5,000,000 | | | 3.50% due 5/15/07 | | | 4,951,034 | | |
| | 10,000,000 | | | 5.375% due 6/19/07 | | | 9,986,124 | | |
| | 3,000,000 | | | 5.55% due 8/8/07 | | | 3,000,962 | | |
| | 4,000,000 | | | 5.58% due 8/14/07 | | | 4,001,918 | | |
| | 1,545,000 | | | 3.75% due 8/15/07 | | | 1,527,200 | | |
| | 10,000,000 | | | 5.17% due 9/21/07 | | | 9,987,755 | | |
| | | | 120,726,258 | | |
See Notes to Financial Statements.
48
THE GLENMEDE FUND, INC.
Government Cash Portfolio
SCHEDULE OF PORTFOLIO INVESTMENTS — (Continued)
October 31, 2006
Face
Amount | | | | Value | |
| AGENCY NOTES — (Continued) | | | |
| | | Federal Home Loan Mortgage Corporation — 7.7% | |
| $ | 8,000,000 | | | 3.125% due 11/13/06 | | $ | 7,994,525 | | |
| | 9,700,000 | | | 3.50% due 11/17/06 | | | 9,694,616 | | |
| | 2,470,000 | | | 2.50% due 11/28/06 | | | 2,465,544 | | |
| | 1,570,000 | | | 2.45% due 12/11/06 | | | 1,565,712 | | |
| | 5,444,000 | | | 3.875% due 3/23/07 | | | 5,414,227 | | |
| | 8,230,000 | | | 2.40% due 3/29/07 | | | 8,130,297 | | |
| | 3,709,000 | | | 2.875% due 5/15/07 | | | 3,661,953 | | |
| | 7,800,000 | | | 4.26% due 7/19/07 | | | 7,744,101 | | |
| | 3,500,000 | | | 3.50% due 9/15/07 | | | 3,446,701 | | |
| | | | 50,117,676 | | |
| | | Federal National Mortgage Association — 13.0% | |
| | 15,000,000 | | | 3.00% due 11/22/06 | | | 14,981,535 | | |
| | 15,000,000 | | | 3.25% due 12/21/06 | | | 14,960,056 | | |
| | 5,040,000 | | | 3.50% due 12/22/06 | | | 5,030,043 | | |
| | 4,451,000 | | | 2.625% due 1/19/07 | | | 4,423,238 | | |
| | 2,497,000 | | | 3.31% due 1/26/07 | | | 2,485,947 | | |
| | 17,890,000 | | | 2.71% due 1/30/07 | | | 17,773,478 | | |
| | 5,000,000 | | | 3.00% due 2/12/07 | | | 4,965,441 | | |
| | 4,655,000 | | | 2.75% due 3/8/07 | | | 4,612,248 | | |
| | 5,000,000 | | | 2.625% due 3/22/07 | | | 4,949,857 | | |
| | 1,425,000 | | | 3.02% due 4/12/07 | | | 1,410,817 | | |
| | 1,500,000 | | | 4.10% due 6/14/07 | | | 1,488,771 | | |
| | 7,740,000 | | | 4.75% due 8/3/07 | | | 7,710,050 | | |
| | | | 84,791,481 | | |
| | | | | TOTAL AGENCY NOTES
(Cost $255,635,415) | | | 255,635,415 | | |
| REPURCHASE AGREEMENTS — 50.2% | | | |
| | 155,000,000 | | | With Bear Stearns, Inc., dated 10/31/06, 5.30%, principal and
interest in the amount of $155,022,819, due 11/01/06
(collateralized by FNR #2005-30 A with a par value of
$29,609,957, coupon rate of 5.00%, due 06/25/31, market
value of $29,056,251, FNR #2004-78 F with a par value of
$30,004,555, coupon rate of 5.72%, due 05/25/32, market
value of $30,175,581, FHR #2835 LE with a par value of
$40,850,224, coupon rate of 5.67% , due 11/15/30, market
value of $41,070,816, FNR #2005-101 A with a par value of
$60,897,174, coupon rate of 5.00%, due 06/25/33, market
value of 59,496,539) | | | 155,000,000 | | |
See Notes to Financial Statements.
49
THE GLENMEDE FUND, INC.
Government Cash Portfolio
SCHEDULE OF PORTFOLIO INVESTMENTS — (Concluded)
October 31, 2006
Face
Amount | | | | Value | |
| REPURCHASE AGREEMENTS — (Continued) | |
| $ | 17,125,627 | | | With Merrill Lynch & Co., Inc., dated 10/31/06, 5.25%,
principal and interest in the amount of $17,128,124,
due 11/01/06, (collateralized by FNR 2006-82 F with a
par value of $17,399,412, coupon rate of 5.89%,
due 09/25/36, market value of $17,475,445) | | $ | 17,125,627 | | |
| | 155,000,000 | | | With Paine Webber, Inc., dated 10/31/06, 5.24%, principal
and interest in the amount of $155,022,561, due 11/01/06,
(collateralized by FN #745392 with a par value of
$160,473,913, coupon rate of 4.50% due 12/01/20,
market value of $158,205,661) | | | 155,000,000 | | |
| | | TOTAL REPURCHASE AGREEMENTS
(Cost $327,125,627) | | | 327,125,627 | | |
TOTAL INVESTMENTS
(Cost $652,134,336)3 | | | 100.1 | % | | $ | 652,134,336 | | |
| LIABILITIES IN EXCESS OF OTHER ASSETS | | | (0.1 | ) | | | (477,711 | ) | |
| NET ASSETS | | | 100.0 | % | | $ | 651,656,625 | | |
t Percentages indicated are based on net assets.
1 Rate represents annualized discount yield at date of purchase.
2 Floating rate securities - maturity dates on these types of securities reflect the next interest rate reset date or, when applicable, the final maturity date.
3 Aggregate cost for federal tax purposes was $652,134,336.
Abbreviations:
FHR — Federal Home Loan Mortgage Corporation REMIC
FN — Federal National Mortgage Association
FNR — Federal National Mortgage Association REMIC
See Notes to Financial Statements.
50
THE GLENMEDE FUND, INC.
Government Cash Portfolio
AGENCY DIVERSIFICATION
On October 31, 2006, agency diversification of the Portfolio was as follows (Unaudited):
| | | % of
Net Assets | | Value | |
| AGENCIES: | |
| Federal Home Loan Bank | | | 20.8 | % | | $ | 135,681,514 | | |
| Federal National Mortgage Association | | | 19.1 | | | | 124,584,537 | | |
| Federal Home Loan Mortgage Corporation | | | 10.0 | | | | 64,742,658 | | |
| TOTAL | | | 49.9 | % | | $ | 325,008,709 | | |
| REPURCHASE AGREEMENTS | | | 50.2 | | | | 327,125,627 | | |
| TOTAL INVESTMENTS | | | 100.1 | % | | $ | 652,134,336 | | |
See Notes to Financial Statements.
51
THE GLENMEDE FUND, INC.
Tax-Exempt Cash Portfolio
SCHEDULE OF PORTFOLIO INVESTMENTS
October 31, 2006
Face
Amount | | | | Value | |
| VARIABLE/FLOATING RATE NOTESt1 — 97.4% | | | |
| | | Daily Variable/Floating Rate Notes — 60.7% | |
| $ | 6,800,000 | | | California State Economic Recovery, Series C-1, State
Guaranteed, (SPA: Landesbank Baden-Wurttemberg),
3.53% due 7/1/23 | | $ | 6,800,000 | | |
| | 3,890,000 | | | California State, Economic Recovery, Series C-2, State
Guaranteed (SPA: Bank of America),
3.50% due 7/1/23 | | | 3,890,000 | | |
| | 8,275,000 | | | California State, Economic Recovery, Series C-3, State
Guaranteed (SPA: Landesbank Hessen-Thuer),
3.50% due 7/1/23 | | | 8,275,000 | | |
| | 2,050,000 | | | California State, Economic Recovery, Series C-5,
(SPA: Bank of America),
3.36% due 7/1/23 | | | 2,050,000 | | |
| | 5,200,000 | | | California State, School Improvements, Series A, Refunding,
(LOC: 75% Citibank, 25% California State Teachers
Retirement),
3.36% due 5/1/34 | | | 5,200,000 | | |
| | 11,200,000 | | | California State, Series A-3, (LOC: Westdeutsche Landesbank
80% & J.P. Morgan Chase 20%),
3.50% due 5/1/33 | | | 11,200,000 | | |
| | 1,900,000 | | | Charlotte, Mecklenburg Hospital Authority, North Carolina
Health Care System Revenue, Carolinas Healthcare,
Series D (SPA: Bank of America),
3.63% due 1/15/26 | | | 1,900,000 | | |
| | 11,355,000 | | | Clark County, Nevada, School District Revenue, Series B,
(SPA: Bayerische Landesbank), (FSA Insured),
3.60% due 6/15/21 | | | 11,355,000 | | |
| | 8,300,000 | | | Connecticut State Health & Educational Facilities Authority
Revenue, Edgehill Project, Series C (LOC: KBC Bank NV),
3.52% due 7/1/27 | | | 8,300,000 | | |
| | 2,100,000 | | | Connecticut State Health & Educational Facilities Authority
Revenue, Yale University, Series T-1,
3.60% due 7/1/29 | | | 2,100,000 | | |
| | 5,905,000 | | | Cuyahoga County, Ohio, Hospital Revenue, University
Hospitals of Cleveland, (LOC: J.P. Morgan Chase),
3.60% due 1/1/16 | | | 5,905,000 | | |
| | 18,730,000 | | | Delaware County, Pennsylvania, Industrial Development
Authority, Airport Facilities Revenue, United Parcel
Service Project, DATES,
3.59% due 12/1/15 | | | 18,730,000 | | |
| | 6,300,000 | | | East Baton Rouge Parish, Louisiana, Pollution Control
Revenue, ExxonMobil Corp. Project,
3.60% due 11/1/19 | | | 6,300,000 | | |
See Notes to Financial Statements.
52
THE GLENMEDE FUND, INC.
Tax-Exempt Cash Portfolio
SCHEDULE OF PORTFOLIO INVESTMENTS — (Continued)
October 31, 2006
Face
Amount | | | | Value | |
| VARIABLE/FLOATING RATE NOTESt1 — (Continued) | | | |
| | | Daily Variable/Floating Rate Notes — (Continued) | |
| $ | 1,950,000 | | | Gulf Coast Waste Disposal Authority, Texas Pollution Control
Revenue, ExxonMobil Corp. Project:,
3.56% due 10/1/24 | | $ | 1,950,000 | | |
| | 2,600,000 | | | Hapeville, Georgia, Development Authority, Industrial
Development Revenue, Hapefille Hotel Ltd.,
(LOC: Bank of America),
3.62% due 11/1/15 | | | 2,600,000 | | |
| | 5,600,000 | | | Harris County, Texas, Industrial Development Corp.,
Pollution Control Revenue, (ExxonMobil Corp.),
3.56% due 3/1/24 | | | 5,600,000 | | |
| | 1,700,000 | | | Idaho Health Facilities Authority Revenue, St. Lukes Medical
Center, (FSA Insured),
3.64% due 7/1/30 | | | 1,700,000 | | |
| | 15,470,000 | | | Idaho Health Facilities Authority Revenue, St. Lukes Regional
Medical Center Project, (SPA: Bayerische Landesbank),
(FSA Insured),
3.60% due 7/1/35 | | | 15,470,000 | | |
| | 900,000 | | | Irvine Ranch, California, Water District Numbers 105, 140,
240 & 250, (LOC: State Street Bank & Trust Co.),
3.50% due 1/1/21 | | | 900,000 | | |
| | 15,500,000 | | | Irvine Ranch, California, Water District, Capital Improvement
Project, (LOC: Landesbank Baden-Wurttemberg),
3.31% due 8/1/16 | | | 15,500,000 | | |
| | 1,705,000 | | | Irvine Ranch, California, Water District, General Obligation,
(LOC: Landesbank Baden-Wurttemberg),
3.31% due 6/1/15 | | | 1,705,000 | | |
| | 920,000 | | | Irvine Ranch, California, Water District, Series A,
(LOC; Bank of America),
3.31% due 5/1/09 | | | 920,000 | | |
| | 100,000 | | | Irvine, California, Improvement Board Act of 1915,
Assessment District No. 00-18, Series A,
(LOC: Bank of New York),
3.36% due 9/2/26 | | | 100,000 | | |
| | 9,008,000 | | | Irvine, California, Improvement Board Act of 1915,
Assessment District No. 93-14, (LOC: Bank of America),
3.50% due 9/2/25 | | | 9,008,000 | | |
| | 1,000,000 | | | Jackson County Mississippi, Port Facilities Revenue,
Chevron USA, Inc. Project,
3.64% due 6/1/23 | | | 1,000,000 | | |
| | 4,000,000 | | | Jacksonville, Florida, Pollution Control Revenue, Refunding,
Florida Power & Light Co., Project,
3.70% due 5/1/29 | | | 4,000,000 | | |
See Notes to Financial Statements.
53
THE GLENMEDE FUND, INC.
Tax-Exempt Cash Portfolio
SCHEDULE OF PORTFOLIO INVESTMENTS — (Continued)
October 31, 2006
Face
Amount | | | | Value | |
| VARIABLE/FLOATING RATE NOTESt1 — (Continued) | | | |
| | | Daily Variable/Floating Rate Notes — (Continued) | |
| | | Kansas State Department of Transportation, Highway
Liquidity Provider Revenue, Series B-1, Pooled Money
Investment Board: | |
| $ | 10,300,000 | | | 3.60% due 9/1/20 | | $ | 10,300,000 | | |
| | 8,880,000 | | | 3.60% due 9/1/20 | | | 8,880,000 | | |
| | 6,700,000 | | | Kemmerer, Wyoming, Pollution Control Revenue, DATES,
ExxonMobil Corp. Project,
3.56% due 9/1/21 | | | 6,700,000 | | |
| | 8,300,000 | | | Lawrence County, South Dakota, Pollution Control Revenue,
Daily Refunding, Homestake Mining Co., Series B
(LOC: J.P. Morgan Chase),
3.65% due 7/1/32 | | | 8,300,000 | | |
| | 2,225,000 | | | Lehigh County, Pennsylvania, General Purpose Authority
Revenue, Lehigh Valley Hospital, Series B,
(SPA: Wachovia Bank), (MBIA Insured),
3.60% due 7/1/29 | | | 2,225,000 | | |
| | 3,600,000 | | | Lincoln County, Wyoming, Pollution Control Revenue,
ExxonMobil Corp.,
3.60% due 8/1/15 | | | 3,600,000 | | |
| | 17,885,000 | | | Los Angeles, California, Regional Airports Improvement Corp.,
Lease Revenue, Sublease - Los Angeles International
Airport, LAX Two Corp., (LOC: Societe Generale),
3.60% due 12/1/25 | | | 17,885,000 | | |
| | 19,000,000 | | | Loudoun County, Virginia, Industrial Development Authority
Revenue, Howard Hughes Medical Institute, Series E,
3.62% due 2/15/38 | | | 19,000,000 | | |
| | 1,890,000 | | | Massachusetts State Health & Educational Facilities
Authority Revenue, Amherst College Project, Series J-2,
3.52% due 11/1/35 | | | 1,890,000 | | |
| | 2,300,000 | | | Massachusetts State, Central Artery, Series A,
(SPA: Landesbank Baden-Wurttemberg),
3.63% due 12/1/30 | | | 2,300,000 | | |
| | 12,700,000 | | | Metropolitan Water District, Southern California Waterworks
Revenue, Series B-3, (SPA:BNP Paribas),
3.50% due 7/1/35 | | | 12,700,000 | | |
| | 13,700,000 | | | Montgomery, Alabama, Industrial Development Board,
Pollution Control and Solid Waste Disposal Revenue,
General Electric Project,
3.62% due 5/1/21 | | | 13,700,000 | | |
| | 9,920,000 | | | Mount Vernon, Indiana, Pollution Control and Solid Waste
Disposal Revenue, General Electric Project,
3.62% due 12/1/14 | | | 9,920,000 | | |
See Notes to Financial Statements.
54
THE GLENMEDE FUND, INC.
Tax-Exempt Cash Portfolio
SCHEDULE OF PORTFOLIO INVESTMENTS — (Continued)
October 31, 2006
Face
Amount | | | | Value | |
| VARIABLE/FLOATING RATE NOTESt1 — (Continued) | | | |
| | | Daily Variable/Floating Rate Notes — (Continued) | |
| $ | 15,995,000 | | | New Jersey Economic Development Authority Revenue,
Stolthaven Perth Amboy Project, Series A, (LOC: Citibank),
3.52% due 1/15/18 | | $ | 15,995,000 | | |
| | 15,600,000 | | | New Jersey, State Educational Facilities Authority Revenue,
Princeton University, Series F,
3.21% due 7/1/23 | | | 15,600,000 | | |
| | 4,710,000 | | | New York City, New York, General Obligations, Subseries A-7,
(SPA: Bank of Nova Scotia), (AMBAC Insured),
3.55% due 11/1/24 | | | 4,710,000 | | |
| | | New York City, New York, General Obligations, Subseries A-8,
(LOC: J.P. Morgan Chase): | |
| | 800,000 | | | 3.62% due 8/1/17 | | | 800,000 | | |
| | 1,200,000 | | | 3.62% due 8/1/18 | | | 1,200,000 | | |
| | | New York City, New York, General Obligations, Subseries B-2,
(LOC: J.P. Morgan Chase): | |
| | 1,240,000 | | | 3.58% due 8/15/18 | | | 1,240,000 | | |
| | 2,865,000 | | | 3.58% due 8/15/20 | | | 2,865,000 | | |
| | 3,000,000 | | | New York City, New York, General Obligations, Subseries B-4,
(SPA: Landesbank Hessen-Thuer), (MBIA Insured),
3.62% due 8/15/23 | | | 3,000,000 | | |
| | | New York City, New York, General Obligations, Subseries E-2,
(LOC: J.P. Morgan Chase): | |
| | 2,700,000 | | | 3.58% due 8/1/20 | | | 2,700,000 | | |
| | 2,710,000 | | | 3.58% due 8/1/21 | | | 2,710,000 | | |
| | 1,000,000 | | | New York City, New York, General Obligations, Subseries H-2,
(LOC: Credit Local de France),
3.62% due 1/1/36 | | | 1,000,000 | | |
| | 4,000,000 | | | New York City, New York, Municipal Water Finance Authority,
Water & Sewer System Revenue, Series F, Subseries F-2,
(SPA: Bayerische Landesbank),
3.58% due 6/15/35 | | | 4,000,000 | | |
| | 7,810,000 | | | New York City, New York, Municipal Water Finance Authority,
Water and Sewer System Revenue, Series C,
(SPA: Credit Local de France),
3.58% due 6/15/33 | | | 7,810,000 | | |
| | | New York City, New York, Municipal Water Finance Authority,
Water and Sewer System Revenue, Series C, (SPA: FGIC),
(FGIC Insured): | |
| | 6,040,000 | | | 3.62% due 6/15/22 | | | 6,040,000 | | |
| | 3,100,000 | | | 3.62% due 6/15/35 | | | 3,100,000 | | |
See Notes to Financial Statements.
55
THE GLENMEDE FUND, INC.
Tax-Exempt Cash Portfolio
SCHEDULE OF PORTFOLIO INVESTMENTS — (Continued)
October 31, 2006
Face
Amount | | | | Value | |
| VARIABLE/FLOATING RATE NOTESt1 — (Continued) | | | |
| | | Daily Variable/Floating Rate Notes — (Continued) | |
| $ | 700,000 | | | New York State Environmental Facilities Corp., Solid Waste
Disposal Revenue, General Electric Project,
3.62% due 7/1/19 | | $ | 700,000 | | |
| | 7,630,000 | | | Newport Beach, California, Hoag Memorial Presbyterian
Hospital Revenue, (SPA: Bank of America),
3.36% due 10/1/22 | | | 7,630,000 | | |
| | 1,200,000 | | | North Carolina Medical Care Commission, ACES, Pooled
Financing Projects, Series B, (LOC: Wachovia Bank),
3.65% due 10/1/13 | | | 1,200,000 | | |
| | 3,100,000 | | | North Central Texas, Health Facility Development Corp.
Revenue, Presbyterian Medical Center, Series C,
(SPA: J.P. Morgan Chase), (MBIA Insured),
3.60% due 12/1/15 | | | 3,100,000 | | |
| | 2,775,000 | | | North Central Texas, Health Facility Development Corp.
Revenue, Presbyterian Medical Center, Series D,
(SPA: J.P. Morgan Chase), (MBIA Insured),
3.60% due 12/1/15 | | | 2,775,000 | | |
| | 1,800,000 | | | Orange County, California, Sanitation District Partnership,
Series B, (SPA: Credit Local de France),
3.37% due 8/1/30 | | | 1,800,000 | | |
| | 6,000,000 | | | Peninsula Ports Authority, Virginia, Coal Revenue Refunding,
Dominion Terminal Associates, Term PJ-C, (LOC: Citibank),
3.60% due 7/1/16 | | | 6,000,000 | | |
| | 2,135,000 | | | Sublette County, Wyoming, Pollution Control Revenue,
ExxonMobil Corp. Project,
3.60% due 11/1/14 | | | 2,135,000 | | |
| | 4,605,000 | | | Union County, New Jersey, Industrial Pollution Financing
Authority and Control, ExxonMobil Project,
3.21% due 7/1/33 | | | 4,605,000 | | |
| | 5,700,000 | | | Unita County, Wyoming, Pollution Control Revenue,
Chevron USA, Inc. Project,
3.59% due 8/15/20 | | | 5,700,000 | | |
| | 9,185,000 | | | University of North Carolina at Chapel Hill, Hospital Revenue,
UPDATES, Series A, (SPA: Landesbank Hessen-Thuer),
3.60% due 2/15/31 | | | 9,185,000 | | |
| | | Valdez, Alaska, Marine Terminal Revenue, ExxonMobil
Pipeline Co. Project: | |
| | 7,400,000 | | | 3.56% due 10/1/25 | | | 7,400,000 | | |
| | 3,100,000 | | | 3.56% due 12/1/29 | | | 3,100,000 | | |
| | 11,740,000 | | | Virginia Commonwealth University, Revenue Bonds, Series A,
(LOC: Wachovia Bank), (AMBAC Insured),
3.60% due 11/1/30 | | | 11,740,000 | | |
See Notes to Financial Statements.
56
THE GLENMEDE FUND, INC.
Tax-Exempt Cash Portfolio
SCHEDULE OF PORTFOLIO INVESTMENTS — (Continued)
October 31, 2006
Face
Amount | | | | Value | |
| VARIABLE/FLOATING RATE NOTESt1 — (Continued) | | | |
| | | Daily Variable/Floating Rate Notes — (Continued) | |
| $ | 9,025,000 | | | Washington State Health Care Facilities Authority Revenue,
Virginia Mason Medical Center, Series B,
(SPA: Credit Suisse First Boston), (MBIA Insured),
3.60% due 2/15/27 | | $ | 9,025,000 | | |
| | 9,545,000 | | | Wisconsin State Health & Educational Facilities Authority
Revenue, Gundersen Lutheran, Series B,
(SPA: Credit Local de France), (FGIC Insured),
3.64% due 5/1/33 | | | 9,545,000 | | |
| | | | | Total Daily Variable/Floating Rate Notes
(Cost $428,268,000) | | | 428,268,000 | | |
| | | Weekly Variable/Floating Rate Notes — 36.7% | |
| | 3,000,000 | | | Alabama Special Care Facilities Financing Authority,
Montgomery Hospital Revenue, (FGIC Insured),
3.51% due 4/1/15 | | | 3,000,000 | | |
| | 6,475,000 | | | Alaska State, Housing Finance Corp., Housing Development,
Series D, (MBIA Insured),
3.51% due 6/1/37 | | | 6,475,000 | | |
| | 5,605,000 | | | Bexar County, Texas, Housing Finance Corp., Multi Family
Housing Revenue, AAMHA LLC Project, (LOC: FNMA),
3.56% due 12/18/25 | | | 5,605,000 | | |
| | 7,165,000 | | | Burke County, Georgia, Development Authority Pollution
Control Revenue, Oglethorpe Power Corp., Series A,
(SPA: Credit Locale de France), (FGIC Insured),
3.60% due 1/1/19 | | | 7,165,000 | | |
| | 5,760,000 | | | California Housing Finance Agency Revenue, Multi Family
Housing III, Series D, (LOC: FNMA),
3.28% due 2/1/35 | | | 5,760,000 | | |
| | 2,920,000 | | | Charlotte, North Carolina, Airport Revenue, Series A,
(SPA: J.P. Morgan Chase), (MBIA Insured),
3.55% due 7/1/16 | | | 2,920,000 | | |
| | 3,715,000 | | | Chicago, Illinois, O'Hare International Airport Revenue,
General Airport 2nd Lien B, (LOC: Societe Generale),
3.51% due 1/1/15 | | | 3,715,000 | | |
| | 1,355,000 | | | Clayton County, Georgia, Housing Authority Multi Family
Housing Revenue, Huntington Woods, Series A
(SPA: Societe Generale) (FSA Insured),
3.62% due 1/1/21 | | | 1,355,000 | | |
| | 1,000,000 | | | Clayton County, Georgia, Housing Authority Multi Family
Housing Revenue, Kimberly Forest, Series B
(SPA: Societe Generale), (FSA Insured),
3.62% due 1/1/21 | | | 1,000,000 | | |
See Notes to Financial Statements.
57
THE GLENMEDE FUND, INC.
Tax-Exempt Cash Portfolio
SCHEDULE OF PORTFOLIO INVESTMENTS — (Continued)
October 31, 2006
Face
Amount | | | | Value | |
| VARIABLE/FLOATING RATE NOTESt1 — (Continued) | | | |
| | | Weekly Variable/Floating Rate Notes — (Continued) | |
| $ | 1,100,000 | | | Clayton County, Georgia, Housing Authority Multi Family
Housing Revenue, Kings Arms Apartments, Series D
(SPA: Societe Generale) (FSA Insured),
3.62% due 1/1/21 | | $ | 1,100,000 | | |
| | 2,335,000 | | | Clayton County, Georgia, Housing Authority Multi Family
Housing Revenue, Ten Oaks Apartments, Series F
(SPA: Societe Generale) (FSA Insured),
3.62% due 1/1/21 | | | 2,335,000 | | |
| | 1,000,000 | | | Colorado Educational & Cultural Facility Authority Revenue,
Boulder Country Day School, (LOC: Wells Fargo Bank),
3.57% due 9/1/24 | | | 1,000,000 | | |
| | 2,100,000 | | | Colorado Educational & Cultural Facility Authority Revenue,
Regis Jesuit High School Project, (LOC: Wells Fargo Bank),
3.57% due 12/1/33 | | | 2,100,000 | | |
| | 8,865,000 | | | Colorado Springs, Colorado, Utilities Revenue, Sub Lien,
Series A, (SPA: State Street Bank & Trust),
3.53% due 11/1/35 | | | 8,865,000 | | |
| | 1,400,000 | | | Colton, California, Redevelopment Agency, Multi Family
Housing Revenue, 1985 Issue, Series A
(LOC: Coast Federal Bank & Federal Home Loan Bank),
3.40% due 5/1/10 | | | 1,400,000 | | |
| | 7,355,000 | | | Connecticut State General Obligations, Series B
(SPA: Bayerische Landesbank),
3.53% due 5/15/14 | | | 7,355,000 | | |
| | 10,100,000 | | | Connecticut State Health & Educational Facilities Authority
Revenue, Yale University, Series T-2,
3.52% due 7/1/29 | | | 10,100,000 | | |
| | 1,600,000 | | | Dauphin County, Pennsylvania, General Authority,
School District Pooled Financing, PG II,
(SPA: Bank of Nova Scotia), (AMBAC Insured),
3.59% due 9/1/32 | | | 1,600,000 | | |
| | 1,000,000 | | | Delaware River & Bay Authority Revenue, Series B,
(SPA: Credit Local de France), (AMBAC Insured),
3.51% due 1/1/30 | | | 1,000,000 | | |
| | 1,900,000 | | | Durham, North Carolina, Public Improvements,
(SPA: Wachovia Bank),
3.57% due 2/1/13 | | | 1,900,000 | | |
| | 6,900,000 | | | Emmaus, Pennsylvania, General Authority Revenue
(SPA: Wachovia Bank), (FSA Insured),
3.57% due 12/1/28 | | | 6,900,000 | | |
See Notes to Financial Statements.
58
THE GLENMEDE FUND, INC.
Tax-Exempt Cash Portfolio
SCHEDULE OF PORTFOLIO INVESTMENTS — (Continued)
October 31, 2006
Face
Amount | | | | Value | |
| VARIABLE/FLOATING RATE NOTESt1 — (Continued) | | | |
| | | Weekly Variable/Floating Rate Notes — (Continued) | |
| $ | 3,000,000 | | | Fairfax County, Virginia, Industrial Development
Authority Revenue, Fairfax Hospital, Series A,
3.46% due 10/1/25 | | $ | 3,000,000 | | |
| | 600,000 | | | Fairfax County, Virginia, Industrial Development Authority
Revenue, Fairfax Hospital, Series C,
3.55% due 10/1/25 | | | 600,000 | | |
| | 4,300,000 | | | Florida State Housing Finance Agency, Multi Family Housing
Revenue, Series A, (LOC: FHLMC),
3.42% due 2/1/08 | | | 4,300,000 | | |
| | 2,120,000 | | | Hennepin County, Minnesota, General Obligations, Series A,
(LOC: State Street Bank & Trust Co.),
3.44% due 12/1/25 | | | 2,120,000 | | |
| | 2,300,000 | | | Illinois Health Facilities Authority Revenue, Decatur Memorial
Hospital Project, Series A (SPA: Northern Trust Company),
(MBIA Insured),
3.56% due 11/15/24 | | | 2,300,000 | | |
| | 16,700,000 | | | Illinois Housing Development Authority, Housing Revenue,
Illinois Center Apartments, GTY AGMT-Metropolitan Life
(FHLMC Insured),
3.51% due 1/1/08 | | | 16,700,000 | | |
| | 1,900,000 | | | Iowa Higher Education Loan Authority Revenue, Education
Loan Private College Facilities, (SPA: J.P. Morgan Chase),
(MBIA Insured),
3.67% due 12/1/15 | | | 1,900,000 | | |
| | 1,355,000 | | | Kentucky Area Development Districts, Lease Program
Revenue, Ewing, Kentucky, (LOC: Wachovia Bank),
3.67% due 6/1/33 | | | 1,355,000 | | |
| | 663,000 | | | Kern Water Bank Authority California Revenue, Series A,
(LOC: Wells Fargo Bank),
3.38% due 7/1/28 | | | 663,000 | | |
| | 8,000,000 | | | Lisle, Illinois, Multi Family Revenue Housing Four Lakes
Phase V, (FNMA Collateral Agreement Insured),
3.58% due 9/15/26 | | | 8,000,000 | | |
| | 600,000 | | | Los Angeles County, California Pension Obligation, Series C,
(SPA: Bank of Nova Scotia), (AMBAC Insured),
3.38% due 6/30/07 | | | 600,000 | | |
| | 114,936 | | | Los Angeles, California, Multi Family Housing Revenue,
Series K, (LOC: FHLB),
3.30% due 7/1/10 | | | 114,936 | | |
See Notes to Financial Statements.
59
THE GLENMEDE FUND, INC.
Tax-Exempt Cash Portfolio
SCHEDULE OF PORTFOLIO INVESTMENTS — (Continued)
October 31, 2006
Face
Amount | | | | Value | |
| VARIABLE/FLOATING RATE NOTESt1 — (Continued) | | | |
| | | Weekly Variable/Floating Rate Notes — (Continued) | |
| $ | 1,990,000 | | | Louisiana Public Facilities Authority Revenue, College and
University Equipment and Capital, Series A,
(SPA: Societe Generale), (FGIC Insured),
3.58% due 9/1/10 | | $ | 1,990,000 | | |
| | 6,600,000 | | | Maine Health & Higher Educational Facility Authority
Revenue, Bowdoin College, Series B,
(LOC: State Street Bank & Trust Co.),
3.51% due 7/1/25 | | | 6,600,000 | | |
| | 10,500,000 | | | Massachusetts State Health & Educational Facilities
Authority Revenue, Amherst College Project, Series F,
3.43% due 11/1/26 | | | 10,500,000 | | |
| | 6,300,000 | | | Massachusetts State Health & Educational Facilities Authority
Revenue, Boston University Project, Series H,
(LOC: State Street Bank & Trust Co.):
3.49% due 12/1/29 | | | 6,300,000 | | |
| | 200,000 | | | Massachusetts State Housing Finance Agency, Revenue
Refunding, Multi Family Housing Project, Series A,
(FNMA Collateral Agreement),
3.53% due 1/15/10 | | | 200,000 | | |
| | 9,000,000 | | | Massachusetts State Water Resources Authority, General
Obligations, Series B, (LOC: Landesbank Hessen-Thuer),
3.48% due 8/1/28 | | | 9,000,000 | | |
| | 5,400,000 | | | Mecklenburg County, North Carolina, General Obligations,
Series C, (SPA: Wachovia Bank),
3.54% due 2/1/18 | | | 5,400,000 | | |
| | 9,650,000 | | | Minneapolis, Minnesota, Revenue, Guthrie Theater Project,
Series A, (LOC: Wells Fargo Bank),
3.44% due 10/1/23 | | | 9,650,000 | | |
| | 3,225,000 | | | Minneapolis, Minnesota, Multifamily Revenue, St. Hedwings
Assisted Project, (LOC: Wells Fargo Bank),
3.52% due 12/1/27 | | | 3,225,000 | | |
| | 6,430,000 | | | Minnesota State Higher Education Facilities Authority Revenue,
Carleton College, Series 5G, (SPA: Wells Fargo Bank),
3.44% due 11/1/29 | | | 6,430,000 | | |
| | 4,190,000 | | | Moffat County, Colorado, Pollution Control Revenue,
Natural Rural Utility Cooperative, (SPA: J.P. Morgan Chase),
(AMBAC Insured),
3.58% due 7/1/10 | | | 4,190,000 | | |
| | 9,900,000 | | | New Jersey State Turnpike Authority Revenue, Series D,
(LOC: Societe Generale), (FGIC Insured),
3.51% due 1/1/18 | | | 9,900,000 | | |
See Notes to Financial Statements.
60
THE GLENMEDE FUND, INC.
Tax-Exempt Cash Portfolio
SCHEDULE OF PORTFOLIO INVESTMENTS — (Continued)
October 31, 2006
Face
Amount | | | | Value | |
| VARIABLE/FLOATING RATE NOTESt1 — (Continued) | | | |
| | | Weekly Variable/Floating Rate Notes — (Continued) | |
| $ | 7,600,000 | | | New York City, New York, City Transitional Finance Authority
Revenue, Future Tax, Series A-1,
(SPA: Westdeutsche Landesbank),
3.54% due 11/15/28 | | $ | 7,600,000 | | |
| | 1,850,000 | | | New York City, New York, City Transitional Finance Authority
Revenue, NYC Recovery, Series 3, Subseries 3-C,
(SPA: Credit Local de France),
3.48% due 11/1/22 | | | 1,850,000 | | |
| | 8,200,000 | | | New York City, New York, City Transitional Finance
Authority Revenue, NYC Recovery, Series 3, Subseries 3-D,
(SPA: Credit Local de France),
3.48% due 11/1/22 | | | 8,200,000 | | |
| | 10,300,000 | | | New York State Local Government Assistance Corp., Series B,
(LOC: Westdeutsche Landesbank 50% & Bayerische
Landesbank 50%),
3.46% due 4/1/23 | | | 10,300,000 | | |
| | 200,000 | | | Ohio State University General Receipts,
3.40% due 12/1/07 | | | 200,000 | | |
| | | Ohio State University General Receipts, Series B: | |
| | 9,165,000 | | | 3.40% due 12/1/29 | | | 9,165,000 | | |
| | 3,800,000 | | | 3.40% due 12/1/29 | | | 3,800,000 | | |
| | 1,739,000 | | | Roseville, Minnesota, Commercial Development Revenue,
Berger Transfers & Storage, Series F,
(LOC; Wells Fargo Bank),
3.52% due 12/1/15 | | | 1,739,000 | | |
| | 4,200,000 | | | Tulsa, Oklahoma, Tulsa Industrial Authority Revenue,
University of Tulsa, Series B, (SPA: Credit Local de France),
(MBIA Insured),
3.58% due 10/1/26 | | | 4,200,000 | | |
| | 13,000,000 | | | Washington State, (SPA: Landesbank Hessen-Thuer),
3.48% due 6/1/20 | | | 13,000,000 | | |
| | 1,250,000 | | | Wisconsin State Health & Educational Facilities Authority
Revenue, Goodwill Industries of North Central Wisconsin,
(LOC: Wells Fargo Bank),
3.57% due 11/1/25 | | | 1,250,000 | | |
| | | | | Total Weekly Variable/Floating Rate Notes
(Cost $258,991,936) | | | 258,991,936 | | |
| | | | | TOTAL VARIABLE/FLOATING RATE NOTES
(Cost $687,259,936) | | | 687,259,936 | | |
See Notes to Financial Statements.
61
THE GLENMEDE FUND, INC.
Tax-Exempt Cash Portfolio
SCHEDULE OF PORTFOLIO INVESTMENTS — (Concluded)
October 31, 2006
Face
Amount | | | | Value | |
| FIXED RATE NOTES — 2.5% | | | |
| $ | 5,000,000 | | | Colorado State, General Fund Revenue Anticipation Notes:
4.50% due 6/27/07 | | $ | 5,024,139 | | |
| | 2,500,000 | | | Philadelphia, Pennsylvania, Tax & Revenue Anticipation Notes:
4.50% due 6/29/07 | | | 2,511,581 | | |
| | 10,000,000 | | | Texas State Tax & Revenue Anticipation Notes:
4.50% due 8/31/07 | | | 10,076,124 | | |
| | | | | TOTAL FIXED RATE NOTES
(Cost $17,611,844) | | | 17,611,844 | | |
TOTAL INVESTMENTS
(Cost $704,871,780)2 | | | 99.9 | % | | $ | 704,871,780 | | |
| OTHER ASSETS IN EXCESS OF LIABILITIES | | | 0.1 | | | | 522,853 | | |
| NET ASSETS | | | 100.0 | % | | $ | 705,394,633 | | |
t Percentages indicated are based on net assets.
1 Demand Security; payable upon demand by the Fund with usually no more than thirty (30) calendar day's notice. The coupon rate shown on floating or adjustable rate securities represents the rate at period end. The due dates on these types of securities reflect the next interest rate reset date or, when applicable, the final maturity date.
2 Aggregate cost for federal tax purposes was $704,871,780.
Abbreviations:
AMBAC — American Municipal Bond Assurance Corporation
DATES — Daily Adjustable Tax-Exempt Securities
FGIC — Financial Guaranty Insurance Corporation
FHLB — Federal Home Loan Bank
FHLMC — Federal Home Loan Mortgage Corporation
FNMA — Federal National Mortgage Association
FSA — Financial Security Assurance
LOC — Letter of Credit
MBIA — Municipal Bond Investors Assurance
SPA — Stand-By Purchase Agreement
UPDATES — Unit Price Demand Adjustable Tax-Exempt Securities
See Notes to Financial Statements.
62
THE GLENMEDE FUND, INC.
Tax-Exempt Cash Portfolio
COUPON TYPE
On October 31, 2006, coupon type of the Portfolio was as follows (Unaudited):
| | | % of
Net Assets | | Value | |
| COUPON TYPE: | |
| Variable/Floating Rate Notes | | | 97.4 | % | | $ | 687,259,936 | | |
| Fixed Rate Notes | | | 2.5 | | | | 17,611,844 | | |
| TOTAL INVESTMENTS | | | 99.9 | % | | $ | 704,871,780 | | |
See Notes to Financial Statements.
63
THE GLENMEDE FUND, INC.
Core Fixed Income Portfolio
SCHEDULE OF PORTFOLIO INVESTMENTS
October 31, 2006
Face
Amount | | | | Value | |
| AGENCY NOTESt — 17.7% | | | |
| | | Federal Home Loan Bank — 12.9% | |
| $ | 9,000,000 | | | 3.875% due 12/1/061 | | $ | 8,988,345 | | |
| | 3,000,000 | | | 3.625% due 1/15/08 | | | 2,949,939 | | |
| | 5,000,000 | | | 3.875% due 8/22/08 | | | 4,911,615 | | |
| | 8,500,000 | | | 5.625% due 6/13/16 | | | 8,776,624 | | |
| | | | 25,626,523 | | |
| | | Federal Home Loan Mortgage Corporation — 4.8% | |
| | 5,000,000 | | | 3.75% due 4/15/07 | | | 4,964,925 | | |
| | 2,500,000 | | | 4.625% due 2/21/081 | | | 2,487,370 | | |
| | 2,000,000 | | | 4.00% due 12/15/09 | | | 1,950,638 | | |
| | | | 9,402,933 | | |
| | | | | TOTAL AGENCY NOTES
(Cost $35,185,539) | | | 35,029,456 | | |
| MORTGAGE-BACKED SECURITIES2 — 31.8% | | | |
| | | Federal Home Loan Mortgage Corporation — 4.2% | |
| | 3,557 | | | # 555359, 6.50% due 4/1/08 | | | 3,548 | | |
| | 47,583 | | | # G10753, 6.50% due 9/1/09 | | | 47,609 | | |
| | 18,963 | | | # G00807, 9.50% due 3/1/21 | | | 19,663 | | |
| | 1,690,904 | | | # J03604, 5.50% due 10/1/21 | | | 1,691,996 | | |
| | 1,000,000 | | | # J03649, 5.50% due 10/1/21 | | | 1,000,646 | | |
| | 3,309,099 | | | # J03536, 5.50% due 11/1/21 | | | 3,311,233 | | |
| | 130,685 | | | # D78677, 8.00% due 3/1/27 | | | 137,767 | | |
| | 129,030 | | | # D84894, 8.00% due 12/1/27 | | | 136,018 | | |
| | 1,834,800 | | | # C00742, 6.50% due 4/1/29 | | | 1,884,293 | | |
| | | | 8,232,773 | | |
| | | Federal National Mortgage Association — 22.7% | |
| | 70,267 | | | # 313815, 6.50% due 1/1/11 | | | 70,464 | | |
| | 119,957 | | | # 535729, 6.50% due 2/1/16 | | | 122,588 | | |
| | 119,712 | | | # 535962, 6.50% due 5/1/16 | | | 122,313 | | |
| | 81,850 | | | # 595134, 6.50% due 7/1/16 | | | 83,629 | | |
| | 382,823 | | | # 596498, 6.00% due 7/1/16 | | | 389,148 | | |
| | 61,766 | | | # 608777, 6.50% due 10/1/16 | | | 63,107 | | |
| | 740,061 | | | # 625990, 5.50% due 12/1/16 | | | 742,875 | | |
| | 113,326 | | | # 643340, 6.50% due 3/1/17 | | | 115,747 | | |
| | 215,967 | | | # 555016, 6.50% due 10/1/17 | | | 220,659 | | |
| | 1,708,557 | | | # 686230, 5.50% due 2/1/18 | | | 1,713,634 | | |
| | 1,853,497 | | | # 254685, 5.00% due 4/1/18 | | | 1,829,627 | | |
| | 1,811,616 | | | # 740449, 5.50% due 9/1/18 | | | 1,817,000 | | |
| | 481,644 | | | # 255159, 5.50% due 3/1/19 | | | 483,076 | | |
See Notes to Financial Statements.
64
THE GLENMEDE FUND, INC.
Core Fixed Income Portfolio
SCHEDULE OF PORTFOLIO INVESTMENTS — (Continued)
October 31, 2006
Face
Amount | | | | Value | |
| MORTGAGE-BACKED SECURITIES2 — (Continued) | | | |
| | | Federal National Mortgage Association — (Continued) | |
| $ | 24,062 | | | # 313796, 9.50% due 2/1/21 | | $ | 26,018 | | |
| | 1,592,776 | | | # 768557, 5.50% due 2/1/21 | | | 1,597,509 | | |
| | 11,826 | | | # 125275, 7.00% due 3/1/24 | | | 12,233 | | |
| | 71,312 | | | # 313795, 9.50% due 1/1/25 | | | 78,214 | | |
| | 382,574 | | | # 373328, 8.00% due 3/1/27 | | | 405,496 | | |
| | 252,424 | | | # 390895, 8.00% due 6/1/27 | | | 267,548 | | |
| | 54,302 | | | # 395715, 8.00% due 8/1/27 | | | 57,555 | | |
| | 553,684 | | | # 397602, 8.00% due 8/1/27 | | | 586,858 | | |
| | 33,092 | | | # 405845, 8.00% due 11/1/27 | | | 35,075 | | |
| | 11,704 | | | # 499335, 6.50% due 8/1/29 | | | 12,014 | | |
| | 47,647 | | | # 252806, 7.50% due 10/1/29 | | | 49,759 | | |
| | 3,386 | | | # 523497, 7.50% due 11/1/29 | | | 3,536 | | |
| | 17,985 | | | # 588945, 7.00% due 6/1/31 | | | 18,573 | | |
| | 494,692 | | | # 607862, 7.00% due 9/1/31 | | | 510,844 | | |
| | 119,892 | | | # 624571, 7.00% due 3/1/32 | | | 123,733 | | |
| | 77,959 | | | # 656872, 6.50% due 8/1/32 | | | 79,862 | | |
| | 4,786,247 | | | # 789856, 6.00% due 8/1/34 | | | 4,822,288 | | |
| | 1,367,959 | | | # 820811, 6.00% due 4/1/35 | | | 1,376,752 | | |
| | 2,299,472 | | | # 829202, 5.00% due 7/1/35 | | | 2,220,827 | | |
| | 2,140,017 | | | # 826586, 5.00% due 8/1/35 | | | 2,066,825 | | |
| | 116,684 | | | # 687575, 7.00% due 2/1/36 | | | 120,347 | | |
| | 1,466,361 | | | # 256216, 7.00% due 3/1/36 | | | 1,509,078 | | |
| | 1,940,998 | | | # 867021, 7.00% due 3/1/36 | | | 1,997,541 | | |
| | 7,570,000 | | | TBA, 5.50% due 11/1/213 | | | 7,577,101 | | |
| | 3,220,000 | | | TBA, 6.00% due 11/1/213 | | | 3,269,305 | | |
| | 6,500,000 | | | TBA, 5.00% due 11/1/363 | | | 6,274,528 | | |
| | 2,000,000 | | | TBA, 6.50% due 11/1/363 | | | 2,038,124 | | |
| | | | 44,911,410 | | |
| | | Government National Mortgage Association — 4.9% | |
| | 125,714 | | | # 460389, 7.00% due 5/15/28 | | | 130,023 | | |
| | 42,735 | | | # 464049, 7.00% due 7/15/28 | | | 44,200 | | |
| | 59,485 | | | # 476259, 7.00% due 8/15/28 | | | 61,524 | | |
| | 28,131 | | | # 496632, 7.00% due 12/15/28 | | | 29,096 | | |
| | 215,397 | | | # 539971, 7.00% due 1/15/31 | | | 222,803 | | |
| | 52,257 | | | # 485264, 7.50% due 2/15/31 | | | 54,471 | | |
| | 4,572 | | | # 557379, 7.00% due 5/15/31 | | | 4,729 | | |
| | 23,000 | | | # 556417, 7.00% due 6/15/31 | | | 23,791 | | |
| | 99,828 | | | # 559304, 7.00% due 9/15/31 | | | 103,260 | | |
| | 135,181 | | | # 570289, 7.00% due 1/15/32 | | | 139,814 | | |
| | 428,057 | | | # 574687, 6.00% due 4/15/34 | | | 434,311 | | |
See Notes to Financial Statements.
65
THE GLENMEDE FUND, INC.
Core Fixed Income Portfolio
SCHEDULE OF PORTFOLIO INVESTMENTS — (Continued)
October 31, 2006
Face
Amount | | | | Value | |
| MORTGAGE-BACKED SECURITIES2 — (Continued) | | | |
| | | Government National Mortgage Association — (Continued) | |
| $ | 3,500,000 | | | TBA, 5.50% due 11/1/363 | | $ | 3,484,687 | | |
| | 5,000,000 | | | TBA, 6.00% due 11/1/363 | | | 5,067,190 | | |
| | | | 9,799,899 | | |
| | | | | TOTAL MORTGAGE-BACKED SECURITIES
(Cost $63,148,767) | | | 62,944,082 | | |
| COLLATERALIZED MORTGAGE OBLIGATIONS — 0.4% | | | |
| | 556,484 | | | Credit-Based Asset Servicing and Securitization,
Series 1999-CB1-Class 1A,
6.50% due 9/25/26 | | | 566,954 | | |
| | 194,817 | | | Federal National Mortgage Association Series, 1993-135 (IO),
6.50% due 7/25/08 | | | 2,518 | | |
| | 288,677 | | | Washington Mutual Mortgage Securities Corp.,
Series 2003-MS9-Class 1P (PO),
0.00% due 12/25/33 | | | 246,041 | | |
| | | | | TOTAL COLLATERALIZED MORTGAGE OBLIGATIONS
(Cost $798,157) | | | 815,513 | | |
| CORPORATE NOTES — 29.7% | | | |
| | 5,000,000 | | | American General Finance Corp., 4.50% due 11/15/07 | | | 4,961,795 | | |
| | 7,000,000 | | | Citigroup, Inc., 5.00% due 9/15/14 | | | 6,837,306 | | |
| | 6,000,000 | | | General Electric Capital Corp., 5.875% due 2/15/12 | | | 6,189,576 | | |
| | 6,000,000 | | | Goldman Sachs Group, Inc., 5.125% due 1/15/15 | | | 5,865,636 | | |
| | 5,000,000 | | | IBM Corp., 4.75% due 11/29/12 | | | 4,901,130 | | |
| | 6,000,000 | | | J.P. Morgan Chase & Co., 5.15% due 10/1/15 | | | 5,869,824 | | |
| | 6,000,000 | | | Morgan Stanley, 4.75% due 4/1/14 | | | 5,740,866 | | |
| | 3,000,000 | | | Procter & Gamble Co. (The), 4.75% due 6/15/07 | | | 2,991,762 | | |
| | 4,000,000 | | | Procter & Gamble Co. (The), 4.85% due 12/15/15 | | | 3,884,676 | | |
| | 6,000,000 | | | Wal-Mart Stores, Inc., 4.55% due 5/1/13 | | | 5,808,204 | | |
| | 6,000,000 | | | Wells Fargo & Co., 5.125% due 9/15/16 | | | 5,887,566 | | |
| | | | | TOTAL CORPORATE NOTES
(Cost $59,131,268) | | | 58,938,341 | | |
| US TREASURY NOTES/BONDS — 17.9% | | | |
| | 8,880,880 | | | U.S. Inflation Index Treasury Bond (TIPS),
1.875% due 7/15/131 | | | 8,599,880 | | |
| | 3,500,000 | | | U.S. Treasury Bond, 8.75% due 5/15/201,4 | | | 4,878,944 | | |
| | 5,000,000 | | | U.S. Treasury Bond, 7.875% due 2/15/214 | | | 6,582,420 | | |
| | 7,900,000 | | | U.S. Treasury Bond, 6.125% due 8/15/291,4 | | | 9,354,714 | | |
| | 6,000,000 | | | U.S. Treasury Note, 3.125% due 1/31/071,4 | | | 5,971,170 | | |
| | | | | TOTAL US TREASURY NOTES/BONDS
(Cost $34,641,294) | | | 35,387,128 | | |
See Notes to Financial Statements.
66
THE GLENMEDE FUND, INC.
Core Fixed Income Portfolio
SCHEDULE OF PORTFOLIO INVESTMENTS — (Continued)
October 31, 2006
Face
Amount | | | | Value | |
| REPURCHASE AGREEMENTS — 15.6% | | | |
| $ | 87,993 | | | With Investors Bank & Trust Co., dated 10/31/06, 4.75%,
principal and interest in the amount of $88,005,
due 11/01/06, (collateralized by SBA #502997 with a
par value of $92,086, coupon rate of 6.250%,
due 06/25/20, market value of $92,393) | | $ | 87,993 | | |
| | 30,900,000 | | | With Merrill Lynch & Co., Inc., dated 10/31/06, 5.25%,
principal and interest in the amount of $30,904,506,
due 11/01/06, (collateralized by FNR #2006-82 with a
par value of $31,393,540, coupon rate of 5.89%,
due 9/25/36, market value of $31,530,726) | | | 30,900,000 | | |
| | | | | TOTAL REPURCHASE AGREEMENTS
(Cost $30,987,993) | | | 30,987,993 | | |
| INVESTMENTS OF SECURITY LENDING COLLATERAL — 11.2% | | | |
| | 735,203 | | | Abbey National PLC, Eurodollar Term,
5.28%, due 12/1/06 | | | 735,203 | | |
| | 735,203 | | | Australia & New Zealand Banking Group, Ltd., Eurodollar Term,
5.28%, due 12/19/06 | | | 735,203 | | |
| | 919,003 | | | BancoBilbao Vizcaya Argentaria SA, Eurodollar Term,
5.31%, due 1/3/07 | | | 919,003 | | |
| | 919,003 | | | Bank of America, Bank Note,
5.30%, due 11/20/06 | | | 919,003 | | |
| | 919,003 | | | Bank of Montreal, Eurodollar Term,
5.28%, due 12/4/06 | | | 919,003 | | |
| | 919,003 | | | Bank of Nova Scotia, Eurodollar Term,
5.27%, due 11/13/06 | | | 919,003 | | |
| | 919,003 | | | Barclays, Eurodollar Term,
5.305%, due 11/21/06 | | | 919,003 | | |
| | 551,402 | | | Barton Capital LLC, Commercial Paper,
5.268%, due 11/2/06 | | | 551,402 | | |
| | 429,858 | | | BGI Institutional Money Market Fund | | | 429,858 | | |
| | 919,003 | | | BNP Paribas, Eurodollar Term,
5.28%, due 12/15/06 | | | 919,003 | | |
| | 919,004 | | | Canadian Imperial Bank of Commerce, Eurodollar Term,
5.28%, due 11/29/06 | | | 919,004 | | |
| | 735,203 | | | Charta LLC, Commercial Paper,
5.314%, due 11/1/06 | | | 735,203 | | |
| | 551,402 | | | Ciesco LLC, Commercial Paper,
5.29%, due 11/16/06 | | | 551,402 | | |
| | 551,402 | | | Compass Securitization, Commercial Paper,
5.292%, due 11/29/06 | | | 551,402 | | |
See Notes to Financial Statements.
67
THE GLENMEDE FUND, INC.
Core Fixed Income Portfolio
SCHEDULE OF PORTFOLIO INVESTMENTS — (Continued)
October 31, 2006
Face
Amount | | | | Value | |
| INVESTMENTS OF SECURITY LENDING COLLATERAL — (Continued) | | | |
| $ | 919,004 | | | Credit Suisse First Boston Corporation, Eurodollar Term,
5.31%, due 11/13/06 | | $ | 919,004 | | |
| | 735,203 | | | First Tennessee National Corporation, Eurodollar Term,
5.29%, due 12/18/06 | | | 735,203 | | |
| | 919,004 | | | Fortis Bank, Eurodollar Term,
5.30%, due 11/20/06 | | | 919,004 | | |
| | 551,402 | | | Jupiter Securitization Corp., Commercial Paper,
5.284%, due 11/6/06 | | | 551,402 | | |
| | 919,004 | | | Liberty Street, Commercial Paper,
5.284%, due 11/13/06 | | | 919,004 | | |
| | 919,004 | | | Merrill Lynch & Co., Inc., Repurchase Agreement,
5.303%, due 11/1/06 | | | 919,004 | | |
| | 919,004 | | | Morgan Stanley Dean Witter & Co., Repurchase Agreement,
5.303%, due 11/1/06 | | | 919,004 | | |
| | 919,004 | | | National Australia Bank, Eurodollar Overnight,
5.29%, due 11/1/06 | | | 919,004 | | |
| | 919,004 | | | Royal Bank of Canada, Eurodollar Term,
5.30%, due 11/17/06 | | | 919,004 | | |
| | 551,402 | | | Sheffield Receivables Corp., Commercial Paper,
5.296%, due 11/28/06 | | | 551,402 | | |
| | 919,004 | | | Skandinaviska Enskilda Banken AB, Eurodollar Term,
5.30%, due 11/20/06 | | | 919,004 | | |
| | 919,003 | | | Societe Generale, Eurodollar Term,
5.28%, due 12/4/06 | | | 919,003 | | |
| | 838,299 | | | Svenska Handelsbanken, Eurodollar Overnight,
5.30%, due 11/1/06 | | | 838,299 | | |
| | 551,402 | | | Yorktown Capital LLC, Commercial Paper,
5.292%, due 11/15/06 | | | 551,402 | | |
| | | | | TOTAL INVESTMENTS OF SECURITY LENDING COLLATERAL
(Cost $22,221,438) | | | 22,221,438 | | |
TOTAL INVESTMENTS
(Cost $246,114,456)5 | | | 124.3 | % | | $ | 246,323,951 | | |
| LIABILITIES IN EXCESS OF OTHER ASSETS | | | (24.3 | ) | | | (48,080,659 | ) | |
| NET ASSETS | | | 100.0 | % | | $ | 198,243,292 | | |
t Percentages indicated are based on net assets.
1 All or a portion of security segregated as collateral for when-issued securities.
2 Represents current face amount at October 31, 2006.
3 When-issued security.
4 Securities or partial securities on loan. See Note 5.
5 Aggregate cost for federal tax purposes was $246,114,456.
See Notes to Financial Statements.
68
THE GLENMEDE FUND, INC.
Core Fixed Income Portfolio
SCHEDULE OF PORTFOLIO INVESTMENTS — (Concluded)
October 31, 2006
Abbreviations:
| FNR — Federal National Mortgage Association REMIC | |
| IO — Interest Only | |
| PO — Principal Only | |
| SBA — Small Business Administration | |
| TIPS — Treasury Inflation Protected Security | |
See Notes to Financial Statements.
69
THE GLENMEDE FUND, INC.
Core Fixed Income Portfolio
SECTOR DIVERSIFICATION
On October 31, 2006, sector diversification of the Portfolio was as follows (Unaudited):
| | | % of
Net Assets | | Value | |
| SECTOR: | |
| Corporate | | | 29.7 | % | | $ | 58,938,341 | | |
| Federal National Mortgage Association | | | 22.7 | | | | 44,911,410 | | |
| US Treasury | | | 17.9 | | | | 35,387,128 | | |
| Federal Home Loan Bank | | | 12.9 | | | | 25,626,523 | | |
| Federal Home Loan Mortgage Corporation | | | 9.0 | | | | 17,635,706 | | |
| Government National Mortgage Association | | | 4.9 | | | | 9,799,899 | | |
| Collateralized Mortgage Obligations | | | 0.4 | | | | 815,513 | | |
| TOTAL | | | 97.5 | % | | $ | 193,114,520 | | |
| REPURCHASE AGREEMENTS | | | 15.6 | | | | 30,987,993 | | |
| INVESTMENTS OF SECURITY LENDING COLLATERAL | | | 11.2 | | | | 22,221,438 | | |
| TOTAL INVESTMENTS | | | 124.3 | % | | $ | 246,323,951 | | |
See Notes to Financial Statements.
70
THE GLENMEDE FUND, INC.
Strategic Equity Portfolio
SCHEDULE OF PORTFOLIO INVESTMENTS
October 31, 2006
| Shares | | | | Value | |
| COMMON STOCKSt — 99.5% | | | |
| | | Aerospace & Defense — 4.2% | |
| | 17,892 | | | Boeing Co.2 | | $ | 1,428,855 | | |
| | 33,290 | | | United Technologies Corp. | | | 2,187,819 | | |
| | | | 3,616,674 | | |
| | | Air Freight & Logistics — 1.8% | |
| | 20,400 | | | United Parcel Service, Inc. - Class B | | | 1,537,140 | | |
| | | Beverages — 2.6% | |
| | 34,450 | | | PepsiCo, Inc. | | | 2,185,508 | | |
| | | Biotechnology — 1.9% | |
| | 21,150 | | | Amgen, Inc.1 | | | 1,605,496 | | |
| | | Capital Markets — 7.4% | |
| | 24,000 | | | Bank of New York Co. (The), Inc. | | | 824,880 | | |
| | 9,680 | | | Goldman Sachs Capital, Inc. | | | 1,837,167 | | |
| | 30,675 | | | Merrill Lynch & Co., Inc. | | | 2,681,608 | | |
| | 19,675 | | | Nuveen Investments, Inc. - Class A | | | 969,977 | | |
| | | | 6,313,632 | | |
| | | Chemicals — 1.5% | |
| | 18,220 | | | Air Products & Chemicals, Inc. | | | 1,269,387 | | |
| | | Communications Equipment — 2.7% | |
| | 58,950 | | | Cisco Systems, Inc.1 | | | 1,422,463 | | |
| | 44,525 | | | Nokia OYJ ADR2 | | | 885,157 | | |
| | | | 2,307,620 | | |
| | | Computers & Peripherals — 4.7% | |
| | 15,475 | | | Apple Computer, Inc.1 | | | 1,254,713 | | |
| | 38,000 | | | Hewlett-Packard Co. | | | 1,472,120 | | |
| | 14,145 | | | International Business Machines Corp. | | | 1,306,008 | | |
| | | | 4,032,841 | | |
| | | Diversified Financial Services — 5.0% | |
| | 40,810 | | | Citigroup, Inc. | | | 2,047,030 | | |
| | 47,000 | | | J.P. Morgan Chase & Co.2 | | | 2,229,680 | | |
| | | | 4,276,710 | | |
| | | Diversified Telecommunication Services — 0.1% | |
| | 2,508 | | | Embarq Corp. | | | 121,262 | | |
| | | Energy Equipment & Services — 5.1% | |
| | 14,500 | | | Baker Hughes, Inc. | | | 1,001,225 | | |
| | 61,400 | | | BJ Services Co. | | | 1,851,824 | | |
| | 37,525 | | | Smith International, Inc. | | | 1,481,487 | | |
| | | | 4,334,536 | | |
See Notes to Financial Statements.
71
THE GLENMEDE FUND, INC.
Strategic Equity Portfolio
SCHEDULE OF PORTFOLIO INVESTMENTS — (Continued)
October 31, 2006
| Shares | | | | Value | |
| COMMON STOCKSt — (Continued) | | | |
| | | Food & Staples Retailing — 1.5% | |
| | 40,000 | | | CVS Corp. | | $ | 1,255,200 | | |
| | | Food Products — 4.0% | |
| | 34,850 | | | Kellogg Co. | | | 1,753,304 | | |
| | 44,450 | | | McCormick & Co., Inc. | | | 1,662,430 | | |
| | | | 3,415,734 | | |
| | | Health Care Equipment & Supplies — 1.9% | |
| | 33,975 | | | Medtronic, Inc.2 | | | 1,653,903 | | |
| | | Health Care Providers & Services — 3.1% | |
| | 32,800 | | | Caremark Rx, Inc. | | | 1,614,744 | | |
| | 21,425 | | | Quest Diagnostics, Inc. | | | 1,065,680 | | |
| | | | 2,680,424 | | |
| | | Hotels, Restaurants & Leisure — 2.4% | |
| | 33,850 | | | Yum! Brands, Inc. | | | 2,012,721 | | |
| | | Household Products — 4.1% | |
| | 41,075 | | | Church & Dwight, Inc. | | | 1,666,413 | | |
| | 29,250 | | | Colgate-Palmolive Co.2 | | | 1,871,123 | | |
| | | | 3,537,536 | | |
| | | Industrial Conglomerates ��� 1.6% | |
| | 16,900 | | | 3M Co. | | | 1,332,396 | | |
| | | Insurance — 9.6% | |
| | 14,225 | | | AMBAC Financial Group, Inc. | | | 1,187,645 | | |
| | 24,525 | | | American International Group, Inc. | | | 1,647,344 | | |
| | 33,095 | | | Assurant, Inc.2 | | | 1,742,783 | | |
| | 20,200 | | | Hartford Financial Services Group, Inc. | | | 1,760,834 | | |
| | 24,300 | | | Prudential Financial, Inc. | | | 1,869,399 | | |
| | | | 8,208,005 | | |
| | | IT Services — 1.8% | |
| | 47,775 | | | Accenture, Ltd. - Class A | | | 1,572,275 | | |
| | | Machinery — 3.1% | |
| | 9,700 | | | Deere & Co.2 | | | 825,761 | | |
| | 38,800 | | | Illinois Tool Works, Inc. | | | 1,859,684 | | |
| | | | 2,685,445 | | |
| | | Metals & Mining — 1.2% | |
| | 23,630 | | | BHP Billiton Ltd. ADR2 | | | 1,005,929 | | |
See Notes to Financial Statements.
72
THE GLENMEDE FUND, INC.
Strategic Equity Portfolio
SCHEDULE OF PORTFOLIO INVESTMENTS — (Continued)
October 31, 2006
| Shares | | | | Value | |
| COMMON STOCKSt — (Continued) | | | |
| | | Oil, Gas & Consumable Fuels — 4.3% | |
| | 31,045 | | | Exxon Mobil Corp. | | $ | 2,217,234 | | |
| | 33,860 | | | Hess Corp.2 | | | 1,435,664 | | |
| | | | 3,652,898 | | |
| | | Pharmaceuticals — 7.6% | |
| | 27,720 | | | Johnson & Johnson2 | | | 1,868,328 | | |
| | 39,275 | | | Novartis AG ADR | | | 2,385,171 | | |
| | 44,680 | | | Wyeth | | | 2,280,020 | | |
| | | | 6,533,519 | | |
| | | Semiconductors & Semiconductor Equipment — 2.2% | |
| | 47,000 | | | Intersil Corp. - Class A | | | 1,102,150 | | |
| | 23,615 | | | Silicon Laboratories, Inc.1,2 | | | 770,557 | | |
| | | | 1,872,707 | | |
| | | Software — 6.2% | |
| | 24,200 | | | Adobe Systems, Inc.1,2 | | | 925,650 | | |
| | 18,750 | | | Autodesk, Inc.1 | | | 689,063 | | |
| | 58,425 | | | BEA Systems, Inc.1 | | | 950,575 | | |
| | 34,300 | | | Citrix Systems, Inc.1 | | | 1,012,879 | | |
| | 92,000 | | | Oracle Corp.1 | | | 1,699,240 | | |
| | | | 5,277,407 | | |
| | | Specialty Retail — 5.2% | |
| | 16,750 | | | American Eagle Outfitters, Inc. | | | 767,150 | | |
| | 17,000 | | | Circuit City Stores, Inc. | | | 458,660 | | |
| | 10,000 | | | GameStop Corp. - Class A1,2 | | | 510,600 | | |
| | 31,130 | | | Sherwin-Williams Co. (The) | | | 1,843,830 | | |
| | 30,000 | | | TJX Cos., Inc. (The) | | | 868,500 | | |
| | | | 4,448,740 | | |
| | | Textiles, Apparel & Luxury Goods — 1.6% | |
| | 35,415 | | | Coach, Inc.1 | | | 1,403,851 | | |
| | | Wireless Telecommunication Services — 1.1% | |
| | 13,924 | | | NII Holdings, Inc. - Class B1,2 | | | 905,478 | | |
| | | | | TOTAL COMMON STOCKS
(Cost $70,301,092) | | | 85,054,974 | | |
See Notes to Financial Statements.
73
THE GLENMEDE FUND, INC.
Strategic Equity Portfolio
SCHEDULE OF PORTFOLIO INVESTMENTS — (Continued)
October 31, 2006
Face
Amount | | | | Value | |
| REPURCHASE AGREEMENT — 0.5% | | | |
| $ | 435,657 | | | With Investors Bank & Trust Co., dated 10/31/06, 4.75%,
principal and interest in the amount of $435,715,
due 11/01/06, (collateralized by FNR #2004-43WF, with a
par value of $450,857, coupon rate of 5.920%, due 08/25/33,
market value of $457,440) | | $ | 435,657 | | |
| | | | | TOTAL REPURCHASE AGREEMENT
(Cost $435,657) | | | 435,657 | | |
| INVESTMENTS OF SECURITY LENDING COLLATERAL — 20.0% | | | |
| | 565,653 | | | Abbey National PLC, Eurodollar Term,
5.28%, due 12/1/06 | | | 565,653 | | |
| | 565,653 | | | Australia & New Zealand Banking Group, Ltd., Eurodollar Term,
5.28%, due 12/19/06 | | | 565,653 | | |
| | 707,067 | | | BancoBilbao Vizcaya Argentaria SA, Eurodollar Term,
5.31%, due 1/3/07 | | | 707,067 | | |
| | 707,067 | | | Bank of America, Bank Note,
5.30%, due 11/20/06 | | | 707,067 | | |
| | 707,067 | | | Bank of Montreal, Eurodollar Term,
5.28%, due 12/4/06 | | | 707,067 | | |
| | 707,067 | | | Bank of Nova Scotia, Eurodollar Term,
5.27%, due 11/13/06 | | | 707,067 | | |
| | 707,067 | | | Barclays, Eurodollar Term,
5.305%, due 11/21/06 | | | 707,067 | | |
| | 424,240 | | | Barton Capital LLC, Commercial Paper,
5.268%, due 11/2/06 | | | 424,240 | | |
| | 330,726 | | | BGI Institutional Money Market Fund | | | 330,726 | | |
| | 707,066 | | | BNP Paribas, Eurodollar Term,
5.28%, due 12/15/06 | | | 707,066 | | |
| | 707,066 | | | Canadian Imperial Bank of Commerce, Eurodollar Term,
5.28%, due 11/29/06 | | | 707,066 | | |
| | 565,653 | | | Charta LLC, Commercial Paper,
5.314%, due 11/1/06 | | | 565,653 | | |
| | 424,240 | | | Ciesco LLC, Commercial Paper,
5.29%, due 11/16/06 | | | 424,240 | | |
| | 424,240 | | | Compass Securitization, Commercial Paper,
5.292%, due 11/29/06 | | | 424,240 | | |
| | 707,067 | | | Credit Suisse First Boston Corporation, Eurodollar Term,
5.31%, due 11/13/06 | | | 707,067 | | |
| | 565,653 | | | First Tennessee National Corporation, Eurodollar Term,
5.29%, due 12/18/06 | | | 565,653 | | |
| | 707,067 | | | Fortis Bank, Eurodollar Term,
5.30%, due 11/20/06 | | | 707,067 | | |
See Notes to Financial Statements.
74
THE GLENMEDE FUND, INC.
Strategic Equity Portfolio
SCHEDULE OF PORTFOLIO INVESTMENTS — (Concluded)
October 31, 2006
Face
Amount | | | | Value | |
| INVESTMENTS OF SECURITY LENDING COLLATERAL — (Continued) | | | |
| $ | 424,240 | | | Jupiter Securitization Corp., Commercial Paper,
5.284%, due 11/6/06 | | $ | 424,240 | | |
| | 707,066 | | | Liberty Street, Commercial Paper,
5.284%, due 11/13/06 | | | 707,066 | | |
| | 707,066 | | | Merrill Lynch & Co., Inc., Repurchase Agreement,
5.303%, due 11/1/06 | | | 707,066 | | |
| | 707,066 | | | Morgan Stanley Dean Witter & Co., Repurchase Agreement,
5.303%, due 11/1/06 | | | 707,066 | | |
| | 707,066 | | | National Australia Bank, Eurodollar Overnight,
5.29%, due 11/1/06 | | | 707,066 | | |
| | 707,066 | | | Royal Bank of Canada, Eurodollar Term,
5.30%, due 11/17/06 | | | 707,066 | | |
| | 424,240 | | | Sheffield Receivables Corp., Commercial Paper,
5.296%, due 11/28/06 | | | 424,240 | | |
| | 707,066 | | | Skandinaviska Enskilda Banken AB, Eurodollar Term,
5.30%, due 11/20/06 | | | 707,066 | | |
| | 707,066 | | | Societe Generale, Eurodollar Term,
5.28%, due 12/4/06 | | | 707,066 | | |
| | 644,974 | | | Svenska Handelsbanken, Eurodollar Overnight,
5.30%, due 11/1/06 | | | 644,974 | | |
| | 424,240 | | | Yorktown Capital LLC, Commercial Paper,
5.292%, due 11/15/06 | | | 424,240 | | |
| | | | | TOTAL INVESTMENTS OF SECURITY LENDING COLLATERAL
(Cost $17,096,815) | | | 17,096,815 | | |
TOTAL INVESTMENTS
(Cost $87,833,564)3 | | | 120.0 | % | | $ | 102,587,446 | | |
| LIABILITIES IN EXCESS OF OTHER ASSETS | | | (20.0 | ) | | | (17,095,449 | ) | |
| NET ASSETS | | | 100.0 | % | | $ | 85,491,997 | | |
t Percentages indicated are based on net assets.
1 Non-income producing security.
2 Securities or partial securities on loan. See Note 5.
3 Aggregate cost for federal tax purposes was $87,868,620.
Abbreviations:
ADR — American Depositary Receipt
FNR — Federal National Mortgage Association REMIC
See Notes to Financial Statements.
75
THE GLENMEDE FUND, INC.
Strategic Equity Portfolio
INDUSTRY DIVERSIFICATION
On October 31, 2006, industry diversification of the Portfolio was as follows (Unaudited):
| | | % of
Net Assets | | Value | |
| INDUSTRIES: | |
| Insurance | | | 9.6 | % | | $ | 8,208,005 | | |
| Pharmaceuticals | | | 7.6 | | | | 6,533,519 | | |
| Capital Markets | | | 7.4 | | | | 6,313,632 | | |
| Software | | | 6.2 | | | | 5,277,407 | | |
| Specialty Retail | | | 5.2 | | | | 4,448,740 | | |
| Energy Equipment & Services | | | 5.1 | | | | 4,334,536 | | |
| Diversified Financial Services | | | 5.0 | | | | 4,276,710 | | |
| Computers & Peripherals | | | 4.7 | | | | 4,032,841 | | |
| Oil, Gas & Consumable Fuels | | | 4.3 | | | | 3,652,898 | | |
| Aerospace & Defense | | | 4.2 | | | | 3,616,674 | | |
| Household Products | | | 4.1 | | | | 3,537,536 | | |
| Food Products | | | 4.0 | | | | 3,415,734 | | |
| Machinery | | | 3.1 | | | | 2,685,445 | | |
| Health Care Providers & Services | | | 3.1 | | | | 2,680,424 | | |
| Communications Equipment | | | 2.7 | | | | 2,307,620 | | |
| Beverages | | | 2.6 | | | | 2,185,508 | | |
| Hotels, Restaurants & Leisure | | | 2.4 | | | | 2,012,721 | | |
| Semiconductors & Semiconductor Equipment | | | 2.2 | | | | 1,872,707 | | |
| Health Care Equipment & Supplies | | | 1.9 | | | | 1,653,903 | | |
| Biotechnology | | | 1.9 | | | | 1,605,496 | | |
| IT Services | | | 1.8 | | | | 1,572,275 | | |
| Air Freight & Logistics | | | 1.8 | | | | 1,537,140 | | |
| Textiles, Apparel & Luxury Goods | | | 1.6 | | | | 1,403,851 | | |
| Industrial Conglomerates | | | 1.6 | | | | 1,332,396 | | |
| Chemicals | | | 1.5 | | | | 1,269,387 | | |
| Food & Staples Retailing | | | 1.5 | | | | 1,255,200 | | |
| Metals & Mining | | | 1.2 | | | | 1,005,929 | | |
| Wireless Telecommunication Services | | | 1.1 | | | | 905,478 | | |
| Diversified Telecommunication Services | | | 0.1 | | | | 121,262 | | |
| TOTAL COMMON STOCKS | | | 99.5 | % | | $ | 85,054,974 | | |
| REPURCHASE AGREEMENT | | | 0.5 | | | | 435,657 | | |
| INVESTMENTS OF SECURITY LENDING COLLATERAL | | | 20.0 | | | | 17,096,815 | | |
| TOTAL INVESTMENTS | | | 120.0 | % | | $ | 102,587,446 | | |
See Notes to Financial Statements.
76
THE GLENMEDE FUND, INC.
Small Cap Equity Portfolio
SCHEDULE OF PORTFOLIO INVESTMENTS
October 31, 2006
| Shares | | | | Value | |
| COMMON STOCKSt — 98.6% | | | |
| | | Aerospace & Defense — 0.8% | |
| | 116,716 | | | Innovative Solutions & Support, Inc.1,2 | | $ | 1,860,453 | | |
| | | Apparel Retailers — 1.0% | |
| | 80,169 | | | Jos. A. Bank Clothiers, Inc.1,2 | | | 2,380,218 | | |
| | | Automotive — 1.9% | |
| | 89,247 | | | Sonic Automotive, Inc. | | | 2,347,196 | | |
| | 94,228 | | | Tenneco Automotive, Inc.1 | | | 2,138,976 | | |
| | | | 4,486,172 | | |
| | | Banking — 4.3% | |
| | 25,660 | | | City Bank Lynnwood Wa | | | 1,378,968 | | |
| | 41,983 | | | First Community Bancorp | | | 2,244,831 | | |
| | 109,415 | | | Frontier Financial Corp.2 | | | 3,174,129 | | |
| | 23,460 | | | Preferred Bank | | | 1,374,052 | | |
| | 75,005 | | | Umpqua Holdings Corp. | | | 2,118,141 | | |
| | | | 10,290,121 | | |
| | | Basic Industry — 2.1% | |
| | 47,380 | | | AptarGroup, Inc. | | | 2,601,636 | | |
| | 34,668 | | | Mettler-Toledo International, Inc.1 | | | 2,379,958 | | |
| | | | 4,981,594 | | |
| | | Beverages, Food & Tobacco — 1.1% | |
| | 80,181 | | | J & J Snack Foods Corp. | | | 2,678,847 | | |
| | | Chemicals — 3.8% | |
| | 58,362 | | | Cytec Industries, Inc. | | | 3,232,671 | | |
| | 49,204 | | | FMC Corp. | | | 3,372,934 | | |
| | 56,470 | | | West Pharmaceutical Services | | | 2,373,999 | | |
| | | | 8,979,604 | | |
| | | Commercial Services — 5.5% | |
| | 127,620 | | | Korn/Ferry International1 | | | 2,821,678 | | |
| | 92,911 | | | PeopleSupport, Inc.1 | | | 1,820,126 | | |
| | 43,733 | | | Steiner Leisure, Ltd.1 | | | 1,995,974 | | |
| | 100,280 | | | United Rentals Inc.1,2 | | | 2,375,633 | | |
| | 91,183 | | | Watson Wyatt & Co. Holdings | | | 4,116,912 | | |
| | | | 13,130,323 | | |
| | | Computer Software & Processing — 1.8% | |
| | 78,417 | | | Digital Insight Corp.1 | | | 2,413,675 | | |
| | 269,814 | | | Secure Computing Corp.1 | | | 1,937,265 | | |
| | | | 4,350,940 | | |
See Notes to Financial Statements.
77
THE GLENMEDE FUND, INC.
Small Cap Equity Portfolio
SCHEDULE OF PORTFOLIO INVESTMENTS — (Continued)
October 31, 2006
| Shares | | | | Value | |
| COMMON STOCKSt — (Continued) | | | |
| | | Computers & Information — 2.9% | |
| | 105,792 | | | Global Imaging Systems, Inc.1 | | $ | 2,303,092 | | |
| | 105,792 | | | NETGEAR, Inc.1,2 | | | 2,835,226 | | |
| | 114,430 | | | Palm Inc.1,2 | | | 1,756,500 | | |
| | | | 6,894,818 | | |
| | | Diversified Financial Services — 0.9% | |
| | 69,309 | | | Calamos Asset Management, Inc. - Class A | | | 2,025,209 | | |
| | | Education — 0.9% | |
| | 52,854 | | | Bright Horizons Family Solution, Inc.1 | | | 2,030,651 | | |
| | | Electronics — 6.6% | |
| | 60,231 | | | Brady Corp. - Class A | | | 2,228,547 | | |
| | 51,036 | | | Cymer, Inc.1,2 | | | 2,364,498 | | |
| | 120,378 | | | Omnivision Technologies, Inc.1,2 | | | 1,976,607 | | |
| | 382,920 | | | RF Micro Devices, Inc.1 | | | 2,795,316 | | |
| | 45,572 | | | Trimble Navigation, Ltd.1 | | | 2,106,338 | | |
| | 29,266 | | | WESCO International, Inc.1 | | | 1,910,192 | | |
| | 60,700 | | | Woodward Governor Co. | | | 2,167,597 | | |
| | | | 15,549,095 | | |
| | | Energy — 1.6% | |
| | 129,430 | | | Brigham Exploration Co.1 | | | 1,008,260 | | |
| | 78,472 | | | Oceaneering International, Inc.1 | | | 2,824,207 | | |
| | | | 3,832,467 | | |
| | | Entertainment & Leisure — 2.0% | |
| | 114,863 | | | Ameristar Casinos, Inc. | | | 2,826,778 | | |
| | 54,633 | | | Avid Technology, Inc.1,2 | | | 1,973,344 | | |
| | | | 4,800,122 | | |
| | | Financial Services — 3.4% | |
| | 43,745 | | | FirstFed Financial Corp.1,2 | | | 2,702,129 | | |
| | 92,897 | | | Independent Bank Corp. | | | 2,220,238 | | |
| | 98,520 | | | optionsXpress Holdings, Inc. | | | 3,062,002 | | |
| | | | 7,984,369 | | |
| | | Food Retailers — 0.7% | |
| | 29,219 | | | Pantry (The), Inc.1,2 | | | 1,594,773 | | |
| | | Health Care — 2.1% | |
| | 74,802 | | | LCA-Vision, Inc.2 | | | 2,627,794 | | |
| | 34,682 | | | Stericycle, Inc.1 | | | 2,452,364 | | |
| | | | 5,080,158 | | |
See Notes to Financial Statements.
78
THE GLENMEDE FUND, INC.
Small Cap Equity Portfolio
SCHEDULE OF PORTFOLIO INVESTMENTS — (Continued)
October 31, 2006
| Shares | | | | Value | |
| COMMON STOCKSt — (Continued) | | | |
| | | Health Care Providers — 6.9% | |
| | 80,200 | | | Amedisys, Inc.1,2 | | $ | 3,253,714 | | |
| | 69,300 | | | LifePoint Hospital, Inc.1 | | | 2,460,150 | | |
| | 52,847 | | | Pediatrix Medical Group, Inc.1 | | | 2,374,416 | | |
| | 107,596 | | | Psychiatric Solutions, Inc.1 | | | 3,572,187 | | |
| | 80,170 | | | Sunrise Senior Living, Inc.1 | | | 2,502,106 | | |
| | 71,096 | | | VCA Antech, Inc.1 | | | 2,301,378 | | |
| | | | 16,463,951 | | |
| | | Heavy Machinery — 2.0% | |
| | 96,570 | | | Applied Industrial Technologies, Inc. | | | 2,775,422 | | |
| | 51,052 | | | Bucyrus International, Inc. - Class A | | | 2,139,079 | | |
| | | | 4,914,501 | | |
| | | Home Construction, Furnishings & Appliances — 1.1% | |
| | 107,580 | | | BE Aerospace, Inc.1 | | | 2,719,622 | | |
| | | Household Products — 0.7% | |
| | 83,872 | | | Lifetime Brands, Inc.2 | | | 1,718,537 | | |
| | | Industrial — 3.2% | |
| | 149,510 | | | Gardner Denver, Inc.1 | | | 5,081,845 | | |
| | 27,207 | | | Middleby Corp. (The)1,2 | | | 2,451,623 | | |
| | | | 7,533,468 | | |
| | | Insurance — 2.3% | |
| | 54,617 | | | Selective Insurance Group, Inc. | | | 3,017,589 | | |
| | 105,798 | | | United America Indemnity, Ltd. - Class A1 | | | 2,429,122 | | |
| | | | 5,446,711 | | |
| | | Medical Supplies — 0.9% | |
| | 54,707 | | | DJ Orthopedics, Inc.1 | | | 2,200,863 | | |
| | | Metals — 2.2% | |
| | 21,937 | | | Carpenter Technology Corp. | | | 2,347,040 | | |
| | 76,589 | | | Crane Co. | | | 2,982,376 | | |
| | | | 5,329,416 | | |
| | | Oil & Gas — 3.3% | |
| | 248,002 | | | Grey Wolf, Inc.1,2 | | | 1,736,014 | | |
| | 41,979 | | | Holly Corp. | | | 1,996,521 | | |
| | 200,569 | | | Petrohawk Energy Corp.1 | | | 2,272,447 | | |
| | 144,018 | | | Pioneer Drilling Co.1 | | | 1,890,956 | | |
| | | | 7,895,938 | | |
See Notes to Financial Statements.
79
THE GLENMEDE FUND, INC.
Small Cap Equity Portfolio
SCHEDULE OF PORTFOLIO INVESTMENTS — (Continued)
October 31, 2006
| Shares | | | | Value | |
| COMMON STOCKSt — (Continued) | | | |
| | | Pharmaceuticals — 2.4% | |
| | 178,715 | | | PetMed Express, Inc.1,2 | | $ | 2,233,938 | | |
| | 154,994 | | | Sciele Pharma, Inc.1,2 | | | 3,380,419 | | |
| | | | 5,614,357 | | |
| | | Real Estate — 1.7% | |
| | 43,697 | | | Jones Lang Lasalle, Inc. | | | 4,020,124 | | |
| | | REIT — 7.0% | |
| | 45,570 | | | Entertainment Properties Trust | | | 2,506,350 | | |
| | 188,828 | | | Equity Inns, Inc. | | | 3,168,534 | | |
| | 164,883 | | | Highland Hospitality Corp. | | | 2,278,683 | | |
| | 56,339 | | | LaSalle Hotel Properties | | | 2,380,323 | | |
| | 175,010 | | | Medical Properties Trust, Inc. | | | 2,376,636 | | |
| | 171,421 | | | Senior Housing Property Trust | | | 3,930,684 | | |
| | | | 16,641,210 | | |
| | | Restaurants — 2.3% | |
| | 136,793 | | | CKE Restaurants, Inc. | | | 2,672,935 | | |
| | 87,551 | | | Rare Hospitality International, Inc.1 | | | 2,758,732 | | |
| | | | 5,431,667 | | |
| | | Retailers — 3.0% | |
| | 74,750 | | | GameStop Corp. - Class A1,2 | | | 3,816,735 | | |
| | 113,044 | | | MarineMax, Inc.1,2 | | | 3,222,884 | | |
| | | | 7,039,619 | | |
| | | Technology — 5.8% | |
| | 76,588 | | | Avocent Corp.1 | | | 2,811,545 | | |
| | 92,949 | | | Benchmark Electronics, Inc.1 | | | 2,467,796 | | |
| | 65,612 | | | Digital River, Inc.1,2 | | | 3,795,654 | | |
| | 56,537 | | | MICROS Systems, Inc.1 | | | 2,808,758 | | |
| | 54,705 | | | MTS Systems Corp. | | | 1,821,129 | | |
| | | | 13,704,882 | | |
| | | Technology Systems/Semi Conductors — 1.8% | |
| | 57,874 | | | Diodes, Inc.1 | | | 2,548,771 | | |
| | 85,674 | | | Cohu, Inc. | | | 1,694,632 | | |
| | | | 4,243,403 | | |
| | | Telecommunications — 2.0% | |
| | 78,400 | | | Commscope, Inc.1,2 | | | 2,501,744 | | |
| | 61,970 | | | InterDigital Communications Corp.1 | | | 2,216,047 | | |
| | | | 4,717,791 | | |
See Notes to Financial Statements.
80
THE GLENMEDE FUND, INC.
Small Cap Equity Portfolio
SCHEDULE OF PORTFOLIO INVESTMENTS — (Continued)
October 31, 2006
| Shares | | | | Value | |
| COMMON STOCKSt — (Continued) | | | |
| | | Telephone Systems — 0.7% | |
| | 143,033 | | | Brightpoint, Inc.1 | | $ | 1,730,699 | | |
| | | Textiles, Clothing & Fabrics — 2.1% | |
| | 68,120 | | | Crocs Inc.1,2 | | | 2,698,914 | | |
| | 100,261 | | | True Religion Apparel, Inc.1,2 | | | 2,173,658 | | |
| | | | 4,872,572 | | |
| | | Transportation — 1.4% | |
| | 78,470 | | | Emergency Medical Services1 | | | 1,428,154 | | |
| | 86,275 | | | OMI Corp.2 | | | 1,925,658 | | |
| | | | 3,353,812 | | |
| | | Trucking — 1.3% | |
| | 80,227 | | | Greenbrier Cos., Inc.2 | | | 3,008,514 | | |
| | | Utilities — 1.1% | |
| | 58,313 | | | Energen Corp. | | | 2,496,963 | | |
| | | | | TOTAL COMMON STOCKS
(Cost $179,935,962) | | | 234,028,554 | | |
Face
Amount
| REPURCHASE AGREEMENT — 1.4% | | | |
| $ | 3,266,548 | | | With Investors Bank & Trust Co., 4.75%, principal and interest
in the amount of $3,266,979, due 11/01/06, (collateralized by
SBA #506315 with a par value of $3,184,074, coupon rate of
8.875%, due 08/25/16, market value of $3,429,875) | | | 3,266,548 | | |
| | | | | TOTAL REPURCHASE AGREEMENT
(Cost $3,266,548) | | | 3,266,548 | | |
| INVESTMENTS OF SECURITY LENDING COLLATERAL — 23.0% | | | |
| | 1,807,823 | | | Abbey National PLC, Eurodollar Term,
5.28%, due 12/1/06 | | | 1,807,823 | | |
| | 1,807,823 | | | Australia & New Zealand Banking Group, Ltd., Eurodollar Term,
5.28%, due 12/19/06 | | | 1,807,823 | | |
| | 2,259,779 | | | BancoBilbao Vizcaya Argentaria SA, Eurodollar Term,
5.31%, due 1/3/07 | | | 2,259,779 | | |
| | 2,259,779 | | | Bank of America, Bank Note,
5.30%, due 11/20/06 | | | 2,259,779 | | |
| | 2,259,779 | | | Bank of Montreal, Eurodollar Term,
5.28%, due 12/4/06 | | | 2,259,779 | | |
See Notes to Financial Statements.
81
THE GLENMEDE FUND, INC.
Small Cap Equity Portfolio
SCHEDULE OF PORTFOLIO INVESTMENTS — (Continued)
October 31, 2006
Face
Amount | | | | Value | |
| INVESTMENTS OF SECURITY LENDING COLLATERAL — (Continued) | | | |
| $ | 2,259,779 | | | Bank of Nova Scotia, Eurodollar Term,
5.27%, due 11/13/06 | | $ | 2,259,779 | | |
| | 2,259,779 | | | Barclays, Eurodollar Term,
5.305%, due 11/21/06 | | | 2,259,779 | | |
| | 1,355,867 | | | Barton Capital LLC, Commercial Paper,
5.268%, due 11/2/06 | | | 1,355,867 | | |
| | 1,056,998 | | | BGI Institutional Money Market Fund | | | 1,056,998 | | |
| | 2,259,779 | | | BNP Paribas, Eurodollar Term,
5.28%, due 12/15/06 | | | 2,259,779 | | |
| | 2,259,779 | | | Canadian Imperial Bank of Commerce, Eurodollar Term,
5.28%, due 11/29/06 | | | 2,259,779 | | |
| | 1,807,823 | | | Charta LLC, Commercial Paper,
5.314%, due 11/1/06 | | | 1,807,823 | | |
| | 1,355,867 | | | Ciesco LLC, Commercial Paper,
5.29%, due 11/16/06 | | | 1,355,867 | | |
| | 1,355,867 | | | Compass Securitization, Commercial Paper,
5.292%, due 11/29/06 | | | 1,355,867 | | |
| | 2,259,779 | | | Credit Suisse First Boston Corporation, Eurodollar Term,
5.31%, due 11/13/06 | | | 2,259,779 | | |
| | 1,807,823 | | | First Tennessee National Corporation, Eurodollar Term,
5.29%, due 12/18/06 | | | 1,807,823 | | |
| | 2,259,779 | | | Fortis Bank, Eurodollar Term,
5.30%, due 11/20/06 | | | 2,259,779 | | |
| | 1,355,867 | | | Jupiter Securitization Corp., Commercial Paper,
5.284%, due 11/6/06 | | | 1,355,867 | | |
| | 2,259,779 | | | Liberty Street, Commercial Paper,
5.284%, due 11/13/06 | | | 2,259,779 | | |
| | 2,259,779 | | | Merrill Lynch & Co., Inc., Repurchase Agreement,
5.303%, due 11/1/06 | | | 2,259,779 | | |
| | 2,259,779 | | | Morgan Stanley Dean Witter & Co., Repurchase Agreement,
5.303%, due 11/1/06 | | | 2,259,779 | | |
| | 2,259,779 | | | National Australia Bank, Eurodollar Overnight,
5.29%, due 11/1/06 | | | 2,259,779 | | |
| | 2,259,779 | | | Royal Bank of Canada, Eurodollar Term,
5.30%, due 11/17/06 | | | 2,259,779 | | |
| | 1,355,867 | | | Sheffield Receivables Corp., Commercial Paper,
5.296%, due 11/28/06 | | | 1,355,867 | | |
| | 2,259,777 | | | Skandinaviska Enskilda Banken AB, Eurodollar Term,
5.30%, due 11/20/06 | | | 2,259,777 | | |
| | 2,259,779 | | | Societe Generale, Eurodollar Term,
5.28%, due 12/4/06 | | | 2,259,779 | | |
See Notes to Financial Statements.
82
THE GLENMEDE FUND, INC.
Small Cap Equity Portfolio
SCHEDULE OF PORTFOLIO INVESTMENTS — (Concluded)
October 31, 2006
Face
Amount | | | | Value | |
| INVESTMENTS OF SECURITY LENDING COLLATERAL — (Continued) | |
| $ | 2,061,331 | | | Svenska Handelsbanken, Eurodollar Overnight,
5.30%, due 11/1/06 | | $ | 2,061,331 | | |
| | 1,355,867 | | | Yorktown Capital LLC, Commercial Paper,
5.292%, due 11/15/06 | | | 1,355,867 | | |
| | | TOTAL INVESTMENTS OF SECURITY LENDING COLLATERAL
(Cost $54,641,285) | | | 54,641,285 | | |
TOTAL INVESTMENTS
(Cost $237,843,795) | | | 123.0 | % | | $ | 291,936,387 | | |
| LIABILITIES IN EXCESS OF OTHER ASSETS | | | (23.0 | ) | | | (54,685,390 | ) | |
| NET ASSETS | | | 100.0 | % | | $ | 237,250,997 | | |
t Percentages indicated are based on net assets.
1 Non-income producing security.
2 Securities or partial securities on loan. See Note 5.
3 Aggregate cost for federal tax purposes was $238,137,831.
Abbreviation:
REIT — Real Estate Investment Trust
SBA — Small Business Administration
See Notes to Financial Statements.
83
THE GLENMEDE FUND, INC.
Small Cap Equity Portfolio
INDUSTRY DIVERSIFICATION
On October 31, 2006, industry diversification of the Portfolio was as follows (Unaudited):
| | | % of
Net Assets | | Value | |
| INDUSTRIES: | |
| REIT | | | 7.0 | % | | $ | 16,641,210 | | |
| Health Care Providers | | | 6.9 | | | | 16,463,951 | | |
| Electronics | | | 6.6 | | | | 15,549,095 | | |
| Technology | | | 5.8 | | | | 13,704,882 | | |
| Commercial Services | | | 5.5 | | | | 13,130,323 | | |
| Banking | | | 4.3 | | | | 10,290,121 | | |
| Chemicals | | | 3.8 | | | | 8,979,604 | | |
| Financial Services | | | 3.4 | | | | 7,984,369 | | |
| Oil & Gas | | | 3.3 | | | | 7,895,938 | | |
| Industrial | | | 3.2 | | | | 7,533,468 | | |
| Retailers | | | 3.0 | | | | 7,039,619 | | |
| Computers & Information | | | 2.9 | | | | 6,894,818 | | |
| Pharmaceuticals | | | 2.4 | | | | 5,614,357 | | |
| Insurance | | | 2.3 | | | | 5,446,711 | | |
| Restaurants | | | 2.3 | | | | 5,431,667 | | |
| Metals | | | 2.2 | | | | 5,329,416 | | |
| Basic Industry | | | 2.1 | | | | 4,981,594 | | |
| Health Care | | | 2.1 | | | | 5,080,158 | | |
| Textiles, Clothing & Fabrics | | | 2.1 | | | | 4,872,572 | | |
| Entertainment & Leisure | | | 2.0 | | | | 4,800,122 | | |
| Heavy Machinery | | | 2.0 | | | | 4,914,501 | | |
| Telecommunications | | | 2.0 | | | | 4,717,791 | | |
| Automotive | | | 1.9 | | | | 4,486,172 | | |
| Computer Software & Processing | | | 1.8 | | | | 4,350,940 | | |
| Technology Systems/Semi Conductors | | | 1.8 | | | | 4,243,403 | | |
| Real Estate | | | 1.7 | | | | 4,020,124 | | |
| Energy | | | 1.6 | | | | 3,832,467 | | |
| Transportation | | | 1.4 | | | | 3,353,812 | | |
| Trucking | | | 1.3 | | | | 3,008,514 | | |
| Beverages, Food & Tobacco | | | 1.1 | | | | 2,678,847 | | |
| Home Construction, Furnishings & Appliances | | | 1.1 | | | | 2,719,622 | | |
| Utilities | | | 1.1 | | | | 2,496,963 | | |
| Apparel Retailers | | | 1.0 | | | | 2,380,218 | | |
| Diversified Financial Services | | | 0.9 | | | | 2,025,209 | | |
| Education | | | 0.9 | | | | 2,030,651 | | |
| Medical Supplies | | | 0.9 | | | | 2,200,863 | | |
| Aerospace & Defense | | | 0.8 | | | | 1,860,453 | | |
| Food Retailers | | | 0.7 | | | | 1,594,773 | | |
| Household Products | | | 0.7 | | | | 1,718,537 | | |
| Telephone Systems | | | 0.7 | | | | 1,730,699 | | |
| TOTAL COMMON STOCKS | | | 98.6 | % | | $ | 234,028,554 | | |
| REPURCHASE AGREEMENT | | | 1.4 | | | | 3,266,548 | | |
| INVESTMENTS OF SECURITY LENDING COLLATERAL | | | 23.0 | | | | 54,641,285 | | |
| TOTAL INVESTMENTS | | | 123.0 | % | | $ | 291,936,387 | | |
See Notes to Financial Statements.
84
THE GLENMEDE FUND, INC.
Large Cap Value Portfolio
SCHEDULE OF PORTFOLIO INVESTMENTS
October 31, 2006
| Shares | | | | Value | |
| COMMON STOCKSt — 95.1% | | | |
| | | Aerospace & Defense — 1.8% | |
| | 11,234 | | | Honeywell International, Inc. | | $ | 473,176 | | |
| | 4,289 | | | Lockheed Martin Corp. | | | 372,843 | | |
| | | | 846,019 | | |
| | | Banking — 8.3% | |
| | 11,642 | | | Capital One Financial Corp. | | | 923,560 | | |
| | 13,475 | | | CapitalSource, Inc.2 | | | 373,796 | | |
| | 10,008 | | | Deutsche Bank AG2 | | | 1,264,511 | | |
| | 7,171 | | | Federal Home Loan Mortgage Corp. | | | 494,727 | | |
| | 12,868 | | | PNC Financial Services Group, Inc. | | | 901,146 | | |
| | | | 3,957,740 | | |
| | | Beverages, Food & Tobacco — 5.1% | |
| | 18,456 | | | Altria Group, Inc. | | | 1,501,026 | | |
| | 9,804 | | | Coca-Cola Co. (The)2 | | | 458,043 | | |
| | 6,536 | | | Diageo Plc - Sponsored ADR | | | 486,736 | | |
| | | | 2,445,805 | | |
| | | Chemicals — 0.8% | |
| | 14,298 | | | Lyondell Chemical Company | | | 367,030 | | |
| | | Communications — 2.0% | |
| | 27,165 | | | Koninklijke Philips Electronics NV, NY Shares2 | | | 946,157 | | |
| | | Computers & Information — 3.1% | |
| | 11,234 | | | International Business Machines Corp. | | | 1,037,235 | | |
| | 18,791 | | | Seagate Technology | | | 424,301 | | |
| | | | 1,461,536 | | |
| | | Cosmetics & Personal Care — 2.5% | |
| | 18,995 | | | Procter & Gamble Co. (The) | | | 1,204,093 | | |
| | | Electric Utilities — 4.8% | |
| | 41,667 | | | Duke Energy Corp.2 | | | 1,318,344 | | |
| | 22,468 | | | PG&E Corp. | | | 969,270 | | |
| | | | 2,287,614 | | |
| | | Electrical Equipment — 1.0% | |
| | 5,719 | | | Emerson Electric Co. | | | 482,684 | | |
| | | Energy — 3.4% | |
| | 23,080 | | | Exxon Mobil Corp. | | | 1,648,374 | | |
| | | Entertainment & Leisure — 0.5% | |
| | 11,175 | | | Mattel, Inc. | | | 252,890 | | |
See Notes to Financial Statements.
85
THE GLENMEDE FUND, INC.
Large Cap Value Portfolio
SCHEDULE OF PORTFOLIO INVESTMENTS — (Continued)
October 31, 2006
| Shares | | | | Value | |
| COMMON STOCKSt — (Continued) | | | |
| | | Financial Services — 13.8% | |
| | 28,799 | | | Bank of America Corp. | | $ | 1,551,402 | | |
| | 33,293 | | | Citigroup, Inc. | | | 1,669,977 | | |
| | 1,923 | | | Goldman Sachs Capital, Inc. | | | 364,966 | | |
| | 34,314 | | | J.P. Morgan Chase & Co. | | | 1,627,856 | | |
| | 16,136 | | | Merrill Lynch & Co., Inc. | | | 1,410,609 | | |
| | | | 6,624,810 | | |
| | | Food Retailers — 1.6% | |
| | 34,314 | | | Kroger Co. (The) | | | 771,722 | | |
| | | Health Care — 1.1% | |
| | 7,966 | | | Johnson & Johnson2 | | | 536,908 | | |
| | | Heavy Machinery — 1.0% | |
| | 7,914 | | | Caterpillar, Inc. | | | 480,459 | | |
| | | Household Products — 1.3% | |
| | 12,051 | | | Rohm & Haas Co. | | | 624,483 | | |
| | | Insurance — 10.2% | |
| | 22,468 | | | American International Group, Inc. | | | 1,509,176 | | |
| | 6,956 | | | Aspen Insurance Holdings, Ltd. | | | 172,648 | | |
| | 14,550 | | | Axis Capital Holdings Ltd. | | | 477,967 | | |
| | 10,825 | | | Hartford Financial Services Group, Inc. | | | 943,615 | | |
| | 20,834 | | | Loews Corp. | | | 810,859 | | |
| | 13,481 | | | XL Capital, Ltd. - Class A | | | 951,085 | | |
| | | | 4,865,350 | | |
| | | Mining — 0.8% | |
| | 6,150 | | | Freeport-McMoran Copper-B2 | | | 371,952 | | |
| | | Oil & Gas — 7.2% | |
| | 18,738 | | | Anadarko Petroleum Corp. | | | 869,818 | | |
| | 20,221 | | | Chevron Corp. | | | 1,358,851 | | |
| | 11,425 | | | Marathon Oil Corp. | | | 987,120 | | |
| | 4,720 | | | Valero Energy Corp. | | | 246,998 | | |
| | | | 3,462,787 | | |
| | | Pharmaceuticals — 7.6% | |
| | 12,459 | | | GlaxoSmithKline PLC ADR | | | 663,442 | | |
| | 16,749 | | | McKesson Corp. | | | 838,957 | | |
| | 50,103 | | | Pfizer, Inc. | | | 1,335,245 | | |
| | 15,987 | | | Wyeth | | | 815,817 | | |
| | | | 3,653,461 | | |
See Notes to Financial Statements.
86
THE GLENMEDE FUND, INC.
Large Cap Value Portfolio
SCHEDULE OF PORTFOLIO INVESTMENTS — (Continued)
October 31, 2006
Shares/
Face Amount | | | | Value | |
| COMMON STOCKSt — (Continued) | | | |
| | | Process Industries — 3.0% | |
| | 40,850 | | | General Electric Co. | | $ | 1,434,244 | | |
| | | REIT — 1.1% | |
| | 23,693 | | | Host Marriott Corp.2 | | | 546,361 | | |
| | | Retailers — 4.4% | |
| | 19,255 | | | Federated Department Stores | | | 845,487 | | |
| | 13,276 | | | J.C. Penney Co., Inc. (Holding Co.) | | | 998,753 | | |
| | 5,683 | | | Wal-Mart Stores, Inc. | | | 280,058 | | |
| | | | 2,124,298 | | |
| | | Technology — 3.5% | |
| | 48,234 | | | Cisco Systems, Inc.1 | | | 1,163,886 | | |
| | 18,178 | | | Microsoft Corp. | | | 521,890 | | |
| | | | 1,685,776 | | |
| | | Telecommunications — 2.5% | |
| | 34,723 | | | AT&T, Inc. | | | 1,189,263 | | |
| | | Telephone Systems — 2.7% | |
| | 34,314 | | | Verizon Communications, Inc. | | | 1,269,618 | | |
| | | | | TOTAL COMMON STOCKS
(Cost $39,751,627) | | | 45,541,434 | | |
| REPURCHASE AGREEMENT — 1.7% | | | |
| $ | 801,436 | | | With Investors Bank & Trust Co., dated 10/31/06, 4.75%,
principal and interest in the amount of $801,542,
due 11/01/06, (collateralized by SBA #505732 with a
par value of $781,309 coupon rate of 8.625%, due 01/25/27,
market value of $841,508) | | | 801,436 | | |
| | | | | TOTAL REPURCHASE AGREEMENT
(Cost $801,436) | | | 801,436 | | |
| INVESTMENTS OF SECURITY LENDING COLLATERAL — 8.2% | | | |
| | 130,108 | | | Abbey National PLC, Eurodollar Term,
5.28%, due 12/1/06 | | | 130,108 | | |
| | 130,108 | | | Australia & New Zealand Banking Group, Ltd., Eurodollar Term,
5.28%, due 12/19/06 | | | 130,108 | | |
| | 162,636 | | | BancoBilbao Vizcaya Argentaria SA, Eurodollar Term,
5.31%, due 1/3/07 | | | 162,636 | | |
| | 162,636 | | | Bank of America, Bank Note,
5.30%, due 11/20/06 | | | 162,636 | | |
| | 162,636 | | | Bank of Montreal, Eurodollar Term,
5.28%, due 12/4/06 | | | 162,636 | | |
See Notes to Financial Statements.
87
THE GLENMEDE FUND, INC.
Large Cap Value Portfolio
SCHEDULE OF PORTFOLIO INVESTMENTS — (Continued)
October 31, 2006
Face
Amount | | | | Value | |
| INVESTMENTS OF SECURITY LENDING COLLATERAL — (Continued) | | | |
| $ | 162,636 | | | Bank of Nova Scotia, Eurodollar Term,
5.27%, due 11/13/06 | | $ | 162,636 | | |
| | 162,636 | | | Barclays, Eurodollar Term,
5.305%, due 11/21/06 | | | 162,636 | | |
| | 97,581 | | | Barton Capital LLC, Commercial Paper,
5.268%, due 11/2/06 | | | 97,581 | | |
| | 76,072 | | | BGI Institutional Money Market Fund | | | 76,072 | | |
| | 162,636 | | | BNP Paribas, Eurodollar Term,
5.28%, due 12/15/06 | | | 162,636 | | |
| | 162,636 | | | Canadian Imperial Bank of Commerce, Eurodollar Term,
5.28%, due 11/29/06 | | | 162,636 | | |
| | 130,108 | | | Charta LLC, Commercial Paper,
5.314%, due 11/1/06 | | | 130,108 | | |
| | 97,581 | | | Ciesco LLC, Commercial Paper,
5.29%, due 11/16/06 | | | 97,581 | | |
| | 97,579 | | | Compass Securitization, Commercial Paper,
5.292%, due 11/29/06 | | | 97,579 | | |
| | 162,636 | | | Credit Suisse First Boston Corporation, Eurodollar Term,
5.31%, due 11/13/06 | | | 162,636 | | |
| | 130,108 | | | First Tennessee National Corporation, Eurodollar Term,
5.29%, due 12/18/06 | | | 130,108 | | |
| | 162,636 | | | Fortis Bank, Eurodollar Term,
5.30%, due 11/20/06 | | | 162,636 | | |
| | 97,581 | | | Jupiter Securitization Corp., Commercial Paper,
5.284%, due 11/6/06 | | | 97,581 | | |
| | 162,636 | | | Liberty Street, Commercial Paper,
5.284%, due 11/13/06 | | | 162,636 | | |
| | 162,636 | | | Merrill Lynch & Co., Inc., Repurchase Agreement,
5.303%, due 11/1/06 | | | 162,636 | | |
| | 162,636 | | | Morgan Stanley Dean Witter & Co., Repurchase Agreement,
5.303%, due 11/1/06 | | | 162,636 | | |
| | 162,636 | | | National Australia Bank, Eurodollar Overnight,
5.29%, due 11/1/06 | | | 162,636 | | |
| | 162,636 | | | Royal Bank of Canada, Eurodollar Term,
5.30%, due 11/17/06 | | | 162,636 | | |
| | 97,581 | | | Sheffield Receivables Corp., Commercial Paper,
5.296%, due 11/28/06 | | | 97,581 | | |
| | 162,636 | | | Skandinaviska Enskilda Banken AB, Eurodollar Term,
5.30%, due 11/20/06 | | | 162,636 | | |
| | 162,636 | | | Societe Generale, Eurodollar Term,
5.28%, due 12/4/06 | | | 162,636 | | |
| | 148,353 | | | Svenska Handelsbanken, Eurodollar Overnight,
5.30%, due 11/1/06 | | | 148,353 | | |
See Notes to Financial Statements.
88
THE GLENMEDE FUND, INC.
Large Cap Value Portfolio
SCHEDULE OF PORTFOLIO INVESTMENTS — (Concluded)
October 31, 2006
Face
Amount | | | | Value | |
| INVESTMENTS OF SECURITY LENDING COLLATERAL — (Continued) | |
| $ | 97,581 | | | Yorktown Capital LLC, Commercial Paper,
5.292%, due 11/15/06 | | $ | 97,581 | | |
| | | TOTAL INVESTMENTS OF SECURITY LENDING COLLATERAL
(Cost $3,932,517) | | | 3,932,517 | | |
TOTAL INVESTMENTS
(Cost $44,485,580)3 | | | 105.0 | % | | $ | 50,275,387 | | |
| LIABILITIES IN EXCESS OF OTHER ASSETS | | | (5.0 | ) | | | (2,387,079 | ) | |
| NET ASSETS | | | 100.0 | % | | $ | 47,888,308 | | |
t Percentages indicated are based on net assets.
1 Non-income producing security.
2 Securities or partial securities on loan. See Note 5.
3 Aggregate cost for federal tax purposes was $44,606,284.
Abbreviations:
ADR — American Depositary Receipt
REIT — Real Estate Investment Trust
SBA — Small Business Administration
See Notes to Financial Statements.
89
THE GLENMEDE FUND, INC.
Large Cap Value Portfolio
INDUSTRY DIVERSIFICATION
On October 31, 2006, industry diversification of the Portfolio was as follows (Unaudited):
| | | % of
Net Assets | | Value | |
| INDUSTRIES: | |
| Financial Services | | | 13.8 | % | | $ | 6,624,810 | | |
| Insurance | | | 10.2 | | | | 4,865,350 | | |
| Banking | | | 8.3 | | | | 3,957,740 | | |
| Pharmaceuticals | | | 7.6 | | | | 3,653,461 | | |
| Oil & Gas | | | 7.2 | | | | 3,462,787 | | |
| Beverages, Food & Tobacco | | | 5.1 | | | | 2,445,805 | | |
| Electric Utilities | | | 4.8 | | | | 2,287,614 | | |
| Retailers | | | 4.4 | | | | 2,124,298 | | |
| Technology | | | 3.5 | | | | 1,685,776 | | |
| Energy | | | 3.4 | | | | 1,648,374 | | |
| Computers & Information | | | 3.1 | | | | 1,461,536 | | |
| Process Industries | | | 3.0 | | | | 1,434,244 | | |
| Telephone Systems | | | 2.7 | | | | 1,269,618 | | |
| Cosmetics & Personal Care | | | 2.5 | | | | 1,204,093 | | |
| Telecommunications | | | 2.5 | | | | 1,189,263 | | |
| Communications | | | 2.0 | | | | 946,157 | | |
| Aerospace & Defense | | | 1.8 | | | | 846,019 | | |
| Food Retailers | | | 1.6 | | | | 771,722 | | |
| Household Products | | | 1.3 | | | | 624,483 | | |
| REIT | | | 1.1 | | | | 546,361 | | |
| Health Care | | | 1.1 | | | | 536,908 | | |
| Electrical Equipment | | | 1.0 | | | | 482,684 | | |
| Heavy Machinery | | | 1.0 | | | | 480,459 | | |
| Mining | | | 0.8 | | | | 371,952 | | |
| Chemicals | | | 0.8 | | | | 367,030 | | |
| Entertainment & Leisure | | | 0.5 | | | | 252,890 | | |
| TOTAL COMMON STOCKS | | | 95.1 | % | | $ | 45,541,434 | | |
| REPURCHASE AGREEMENT | | | 1.7 | | | | 801,436 | | |
| INVESTMENTS OF SECURITY LENDING COLLATERAL | | | 8.2 | | | | 3,932,517 | | |
| TOTAL INVESTMENTS | | | 105.0 | % | | $ | 50,275,387 | | |
See Notes to Financial Statements.
90
THE GLENMEDE FUND, INC.
International Portfolio
SCHEDULE OF PORTFOLIO INVESTMENTS
October 31, 2006
| Shares | | | | Value | |
| COMMON STOCKSt— 99.6% | | | |
| | | United Kingdom — 19.7% | |
| | 212,300 | | | AstraZeneca PLC | | $ | 12,546,059 | | |
| | 846,356 | | | Aviva PLC | | | 12,512,114 | | |
| | 1,637,172 | | | BP Amoco PLC | | | 18,207,017 | | |
| | 1,151,099 | | | Cattles PLC | | | 8,267,108 | | |
| | 1,912,574 | | | Centrica PLC | | | 12,085,095 | | |
| | 398,090 | | | Emap PLC | | | 5,953,512 | | |
| | 618,872 | | | GlaxoSmithKline PLC | | | 16,527,410 | | |
| | 566,000 | | | HBOS PLC | | | 11,736,049 | | |
| | 1,461,700 | | | Prudential PLC | | | 17,914,608 | | |
| | 959,600 | | | Rexam PLC | | | 10,809,014 | | |
| | 275,252 | | | Rio Tinto PLC | | | 15,184,647 | | |
| | 487,190 | | | Royal Bank of Scotland Group PLC | | | 17,360,058 | | |
| | 280,100 | | | Travis Perkins PLC | | | 9,574,741 | | |
| | 5,397,820 | | | Vodafone Group PLC | | | 13,900,426 | | |
| | | | 182,577,858 | | |
| | | Japan — 15.6% | |
| | 152,000 | | | Daito Trust Construction Co., Ltd. | | | 8,018,811 | | |
| | 385,275 | | | FamilyMart Co., Ltd. | | | 10,442,664 | | |
| | 50,400 | | | Funai Electric Co., Ltd. | | | 4,417,083 | | |
| | 301,142 | | | JS Group Corp. | | | 6,179,649 | | |
| | 747,404 | | | Kuraray Co., Ltd. | | | 8,461,057 | | |
| | 394,000 | | | Onward Kashiyama Company Ltd. | | | 5,403,583 | | |
| | 50,600 | | | ORIX Corp. | | | 14,255,654 | | |
| | 725,000 | | | Ricoh Company, Ltd. | | | 14,319,610 | | |
| | 406,112 | | | Sega Sammy Holdings, Inc. | | | 10,208,792 | | |
| | 517,000 | | | Sharp Corp. | | | 9,216,750 | | |
| | 1,669,817 | | | Sumitomo Chemical Co., Ltd. | | | 11,907,378 | | |
| | 1,100 | | | Sumitomo Mitsui Financial Group, Inc. | | | 12,038,818 | | |
| | 176,668 | | | Takeda Pharmaceutical Co., Ltd. | | | 11,344,335 | | |
| | 173,500 | | | TIS, Inc. | | | 3,849,622 | | |
| | 256,584 | | | Toyota Motor Corp. | | | 15,203,515 | | |
| | | | 145,267,321 | | |
| | | France — 13.6% | |
| | 107,341 | | | Assurances Generales De France | | | 15,069,925 | | |
| | 392,156 | | | Axa | | | 14,940,185 | | |
| | 109,890 | | | BNP Paribas | | | 12,082,762 | | |
| | 121,200 | | | Casino Guichard Perrachon | | | 10,278,988 | | |
| | 175,804 | | | Compagnie de Saint-Gobain | | | 12,957,867 | | |
| | 302,752 | | | France Telecom SA | | | 7,863,288 | | |
| | 76,136 | | | LaFarge SA, ADR | | | 10,232,251 | | |
| | 159,000 | | | Sanofi-Aventis | | | 13,515,251 | | |
See Notes to Financial Statements.
91
THE GLENMEDE FUND, INC.
International Portfolio
SCHEDULE OF PORTFOLIO INVESTMENTS — (Continued)
October 31, 2006
| Shares | | | | Value | |
| COMMON STOCKSt — (Continued) | | | |
| | | France — (Continued) | |
| | 76,962 | | | Societe BIC SA | | $ | 4,950,621 | | |
| | 258,332 | | | Total SA | | | 17,491,069 | | |
| | 195,500 | | | Valeo SA | | | 7,358,246 | | |
| | | | 126,740,453 | | |
| | | Germany — 12.0% | |
| | 89,400 | | | Allianz AG | | | 16,592,599 | | |
| | 165,883 | | | BASF AG | | | 14,621,140 | | |
| | 258,736 | | | Bayerische Motoren Werke AG | | | 14,860,114 | | |
| | 121,507 | | | Continental AG | | | 13,588,056 | | |
| | 135,215 | | | E.On AG | | | 16,222,041 | | |
| | 228,000 | | | Hannover Rueckversicherung AG1 | | | 9,678,540 | | |
| | 156,227 | | | Metro AG | | | 9,281,722 | | |
| | 185,172 | | | Siemens AG Reg. | | | 16,661,619 | | |
| | | | 111,505,831 | | |
| | | Netherlands — 9.3% | |
| | 229,485 | | | Akzo Nobel N.V. | | | 12,869,661 | | |
| | 395,205 | | | ING Groep N.V., Sponsored ADR | | | 17,507,729 | | |
| | 304,100 | | | Koninklijke Philips Electronics NV | | | 10,622,922 | | |
| | 893,286 | | | Reed Elsevier N.V. | | | 15,357,159 | | |
| | 490,298 | | | Royal Dutch Shell PLC - Class A | | | 16,989,583 | | |
| | 136,268 | | | TNT NV, ADR | | | 5,232,691 | | |
| | 332,912 | | | Unilever N.V., Sponsored ADR | | | 8,208,983 | | |
| | | | 86,788,728 | | |
| | | Ireland — 5.1% | |
| | 460,909 | | | Allied Irish Banks PLC | | | 12,588,725 | | |
| | 599,200 | | | Bank of Ireland | | | 12,060,249 | | |
| | 476,570 | | | CRH PLC | | | 16,799,763 | | |
| | 224,504 | | | Irish Life & Permanent PLC | | | 5,515,788 | | |
| | | | 46,964,525 | | |
| | | Denmark — 2.7% | |
| | 387,000 | | | H. Lundbeck AS | | | 9,111,651 | | |
| | 1,135,191 | | | Nordea AB | | | 15,599,024 | | |
| | | | 24,710,675 | | |
| | | Sweden — 2.4% | |
| | 450,700 | | | Assa Abloy AB - Class B | | | 8,674,028 | | |
| | 3,679,000 | | | Telefonaktiebolaget LM Ericsson | | | 13,957,216 | | |
| | | | 22,631,244 | | |
See Notes to Financial Statements.
92
THE GLENMEDE FUND, INC.
International Portfolio
SCHEDULE OF PORTFOLIO INVESTMENTS — (Continued)
October 31, 2006
| Shares | | | | Value | |
| COMMON STOCKSt — (Continued) | | | |
| | | Italy — 2.4% | |
| | 322,733 | | | ENI SPA | | $ | 9,733,294 | | |
| | 1,134,098 | | | Mediaset SPA | | | 12,723,079 | | |
| | | | 22,456,373 | | |
| | | Hong Kong — 2.4% | |
| | 954,000 | | | HSBC Holdings Plc | | | 18,007,406 | | |
| | 2,858,000 | | | Techtronic Industries Co. | | | 4,049,679 | | |
| | | | 22,057,085 | | |
| | | Canada — 1.7% | |
| | 89,200 | | | Alcan, Inc. | | | 4,183,770 | | |
| | 726,591 | | | Talisman Energy, Inc. | | | 11,937,846 | | |
| | | | 16,121,616 | | |
| | | Spain — 1.7% | |
| | 886,788 | | | Banco Santander Central Hispano SA | | | 15,347,310 | | |
| | | Switzerland — 1.6% | |
| | 58,509 | | | Zurich Financial Services AG | | | 14,462,053 | | |
| | | Greece — 1.4% | |
| | 518,000 | | | Public Power Corp. | | | 13,222,468 | | |
| | | Finland — 1.3% | |
| | 613,750 | | | Nokia | | | 12,180,768 | | |
| | | Norway — 1.2% | |
| | 373,665 | | | Norsk Hydro ASA | | | 8,588,719 | | |
| | 128,216 | | | Yara International ASA2 | | | 2,245,842 | | |
| | | | 10,834,561 | | |
| | | Singapore — 1.1% | |
| | 376,000 | | | Neptune Orient Lines, Ltd. | | | 490,288 | | |
| | 5,636,350 | | | Singapore Telecommunications, Ltd. | | | 9,594,249 | | |
| | | | 10,084,537 | | |
| | | South Korea — 1.0% | |
| | 15,000 | | | Samsung Electronics | | | 9,726,718 | | |
| | | Australia — 1.0% | |
| | 2,369,347 | | | John Fairfax Holdings, Ltd. | | | 8,916,661 | | |
| | | Taiwan — 0.8% | |
| | 13,386,910 | | | United Microelectronics Corp. | | | 7,465,680 | | |
| | | Israel — 0.8% | |
| | 225,000 | | | Teva Pharmaceutical Industries, Ltd., Sponsored ADR | | | 7,418,250 | | |
See Notes to Financial Statements.
93
THE GLENMEDE FUND, INC.
International Portfolio
SCHEDULE OF PORTFOLIO INVESTMENTS — (Continued)
October 31, 2006
Shares/
Face Amount | | | | Value | |
| COMMON STOCKSt — (Continued) | | | |
| | | China — 0.8% | |
| | 16,500,810 | | | China Telecom Corp., Ltd. | | $ | 6,216,553 | | |
| | 3,826,110 | | | Global Bio-Chem Technology Group Co., Ltd. | | | 1,121,680 | | |
| | | | 7,338,233 | | |
| | | | | TOTAL COMMON STOCKS
(Cost $650,791,395) | | | 924,818,948 | | |
| REPURCHASE AGREEMENT — 0.2% | | | |
| $ | 1,898,611 | | | With Investors Bank & Trust Co., dated 10/31/06, 4.75%,
principal and interest in the amount of $1,898,862
due 11/01/06, (collateralized by SBA #505780 with a
par value of $1,870,828, coupon rate of 8.625%, due 01/25/15,
market value of $1,993,542) | | | 1,898,611 | | |
| | | | | TOTAL REPURCHASE AGREEMENT
(Cost $1,898,611) | | | 1,898,611 | | |
| INVESTMENTS OF SECURITY LENDING COLLATERAL — 0.2% | | | |
| | 76,364 | | | Abbey National PLC, Eurodollar Term,
5.28%, due 12/1/06 | | | 76,364 | | |
| | 76,357 | | | Australia & New Zealand Banking Group, Ltd., Eurodollar Term,
5.28%, due 12/19/06 | | | 76,357 | | |
| | 95,446 | | | BancoBilbao Vizcaya Argentaria SA, Eurodollar Term,
5.31%, due 1/3/07 | | | 95,446 | | |
| | 95,446 | | | Bank of America, Bank Note,
5.30%, due 11/20/06 | | | 95,446 | | |
| | 95,446 | | | Bank of Montreal, Eurodollar Term,
5.28%, due 12/4/06 | | | 95,446 | | |
| | 95,446 | | | Bank of Nova Scotia, Eurodollar Term,
5.27%, due 11/13/06 | | | 95,446 | | |
| | 95,446 | | | Barclays, Eurodollar Term,
5.305%, due 11/21/06 | | | 95,446 | | |
| | 57,268 | | | Barton Capital LLC, Commercial Paper,
5.268%, due 11/2/06 | | | 57,268 | | |
| | 44,644 | | | BGI Institutional Money Market Fund | | | 44,644 | | |
| | 95,446 | | | BNP Paribas, Eurodollar Term,
5.28%, due 12/15/06 | | | 95,446 | | |
| | 95,446 | | | Canadian Imperial Bank of Commerce, Eurodollar Term,
5.28%, due 11/29/06 | | | 95,446 | | |
| | 76,357 | | | Charta LLC, Commercial Paper,
5.314%, due 11/1/06 | | | 76,357 | | |
| | 57,268 | | | Ciesco LLC, Commercial Paper,
5.29%, due 11/16/06 | | | 57,268 | | |
See Notes to Financial Statements.
94
THE GLENMEDE FUND, INC.
International Portfolio
SCHEDULE OF PORTFOLIO INVESTMENTS — (Concluded)
October 31, 2006
Face
Amount | | | | Value | |
| INVESTMENTS OF SECURITY LENDING COLLATERAL — (Continued) | | | |
| $ | 57,268 | | | Compass Securitization, Commercial Paper,
5.292%, due 11/29/06 | | $ | 57,268 | | |
| | 95,446 | | | Credit Suisse First Boston Corporation, Eurodollar Term,
5.31%, due 11/13/06 | | | 95,446 | | |
| | 76,357 | | | First Tennessee National Corporation, Eurodollar Term,
5.29%, due 12/18/06 | | | 76,357 | | |
| | 95,446 | | | Fortis Bank, Eurodollar Term,
5.30%, due 11/20/06 | | | 95,446 | | |
| | 57,268 | | | Jupiter Securitization Corp., Commercial Paper,
5.284%, due 11/6/06 | | | 57,268 | | |
| | 95,446 | | | Liberty Street, Commercial Paper,
5.284%, due 11/13/06 | | | 95,446 | | |
| | 95,446 | | | Merrill Lynch & Co., Inc., Repurchase Agreement,
5.303%, due 11/1/06 | | | 95,446 | | |
| | 95,446 | | | Morgan Stanley Dean Witter & Co., Repurchase Agreement,
5.303%, due 11/1/06 | | | 95,446 | | |
| | 95,446 | | | National Australia Bank, Eurodollar Overnight,
5.29%, due 11/1/06 | | | 95,446 | | |
| | 95,446 | | | Royal Bank of Canada, Eurodollar Term,
5.30%, due 11/17/06 | | | 95,446 | | |
| | 57,268 | | | Sheffield Receivables Corp., Commercial Paper,
5.296%, due 11/28/06 | | | 57,268 | | |
| | 95,446 | | | Skandinaviska Enskilda Banken AB, Eurodollar Term,
5.30%, due 11/20/06 | | | 95,446 | | |
| | 95,446 | | | Societe Generale, Eurodollar Term,
5.28%, due 12/4/06 | | | 95,446 | | |
| | 87,065 | | | Svenska Handelsbanken, Eurodollar Overnight,
5.30%, due 11/1/06 | | | 87,065 | | |
| | 57,268 | | | Yorktown Capital LLC, Commercial Paper,
5.292%, due 11/15/06 | | | 57,268 | | |
| | | | | TOTAL INVESTMENTS OF SECURITY LENDING COLLATERAL
(Cost $2,307,888) | | | 2,307,888 | | |
TOTAL INVESTMENTS
(Cost $654,997,894)3 | | | 100.0 | % | | $ | 929,025,447 | | |
| LIABILITIES IN EXCESS OF OTHER ASSETS | | | 0.0 | | | | (328,442 | ) | |
| NET ASSETS | | | 100.0 | % | | $ | 928,697,005 | | |
t Percentages indicated are based on net assets.
1 Non-income producing security.
2 Securities or partial securities on loan. See Note 5.
3 Aggregate cost for federal tax purposes was $655,828,702.
Abbreviations:
ADR — American Depositary Receipt
SBA — Small Business Administration
See Notes to Financial Statements.
95
THE GLENMEDE FUND, INC.
International Portfolio
INDUSTRY DIVERSIFICATION
On October 31, 2006, industry diversification of the Portfolio was as follows (Unaudited):
| | | % of
Net Assets | | Value | |
| INDUSTRIES: | |
| Banking | | | 13.0 | % | | $ | 121,155,414 | | |
| Insurance | | | 9.6 | | | | 88,667,643 | | |
| Oil & Gas | | | 7.0 | | | | 64,887,760 | | |
| Pharmaceuticals | | | 6.6 | | | | 61,351,305 | | |
| Finance | | | 6.3 | | | | 58,197,859 | | |
| Automotive | | | 5.5 | | | | 51,009,931 | | |
| Media - Broadcasting & Publishing | | | 4.6 | | | | 42,950,411 | | |
| Chemicals | | | 4.5 | | | | 41,644,021 | | |
| Industrial | | | 4.3 | | | | 39,851,737 | | |
| Telecommunications | | | 4.0 | | | | 37,574,516 | | |
| Electronics | | | 3.4 | | | | 31,722,435 | | |
| Retailers | | | 3.4 | | | | 31,662,232 | | |
| Heavy Machinery | | | 3.2 | | | | 29,523,470 | | |
| Communications | | | 2.8 | | | | 26,137,984 | | |
| Mining | | | 2.1 | | | | 19,368,417 | | |
| Energy | | | 2.0 | | | | 18,207,017 | | |
| Utilities | | | 1.7 | | | | 16,222,041 | | |
| Building Materials | | | 1.7 | | | | 15,754,390 | | |
| Computers & Information | | | 1.5 | | | | 14,319,610 | | |
| Textiles, Clothing & Fabrics | | | 1.5 | | | | 13,864,640 | | |
| Electric | | | 1.4 | | | | 13,222,468 | | |
| Containers & Packaging | | | 1.2 | | | | 10,809,014 | | |
| Food Retailers | | | 1.1 | | | | 10,278,988 | | |
| Entertainment & Leisure | | | 1.1 | | | | 10,208,792 | | |
| Electrical Equipment | | | 1.1 | | | | 9,726,718 | | |
| Health Care | | | 1.0 | | | | 9,111,651 | | |
| Beverages, Food & Tobacco | | | 0.9 | | | | 8,208,983 | | |
| Real Estate | | | 0.9 | | | | 8,018,811 | | |
| Transportation | | | 0.6 | | | | 5,722,979 | | |
| Financial Services | | | 0.6 | | | | 5,515,788 | | |
| Miscellaneous | | | 0.5 | | | | 4,950,621 | | |
| Commercial Services | | | 0.4 | | | | 3,849,622 | | |
| Biotechnology | | | 0.1 | | | | 1,121,680 | | |
| TOTAL COMMON STOCKS | | | 99.6 | % | | $ | 924,818,948 | | |
| REPURCHASE AGREEMENT | | | 0.2 | | | | 1,898,611 | | |
| INVESTMENTS OF SECURITY LENDING COLLATERAL | | | 0.2 | | | | 2,307,888 | | |
| TOTAL INVESTMENTS | | | 100.0 | % | | $ | 929,025,447 | | |
See Notes to Financial Statements.
96
THE GLENMEDE FUND, INC.
Philadelphia International Fund
SCHEDULE OF PORTFOLIO INVESTMENTS
October 31, 2006
| Shares | | | | Value | |
| COMMON STOCKSt — 99.5% | | | |
| | | United Kingdom — 19.5% | |
| | 121,874 | | | AstraZeneca PLC | | $ | 7,202,254 | | |
| | 392,955 | | | Aviva PLC | | | 5,809,255 | | |
| | 825,243 | | | BP Amoco PLC | | | 9,177,541 | | |
| | 550,449 | | | Cattles PLC | | | 3,953,284 | | |
| | 913,368 | | | Centrica PLC | | | 5,771,353 | | |
| | 242,935 | | | Emap PLC | | | 3,633,140 | | |
| | 309,568 | | | GlaxoSmithKline PLC | | | 8,267,230 | | |
| | 299,169 | | | HBOS PLC | | | 6,203,290 | | |
| | 744,586 | | | Prudential PLC | | | 9,125,652 | | |
| | 679,318 | | | Rexam PLC | | | 7,651,894 | | |
| | 135,864 | | | Rio Tinto PLC | | | 7,495,120 | | |
| | 264,329 | | | Royal Bank of Scotland Group PLC | | | 9,418,844 | | |
| | 138,070 | | | Travis Perkins PLC | | | 4,719,688 | | |
| | 2,611,243 | | | Vodafone Group PLC | | | 6,724,453 | | |
| | | | 95,152,998 | | |
| | | Japan — 15.5% | |
| | 89,300 | | | Daito Trust Construction Co., Ltd. | | | 4,711,051 | | |
| | 200,200 | | | FamilyMart Co., Ltd. | | | 5,426,309 | | |
| | 24,100 | | | Funai Electric Co., Ltd. | | | 2,112,137 | | |
| | 182,100 | | | JS Group Corp. | | | 3,736,822 | | |
| | 363,000 | | | Kuraray Co., Ltd. | | | 4,109,375 | | |
| | 207,000 | | | Onward Kashiyama Company Ltd. | | | 2,838,938 | | |
| | 25,830 | | | ORIX Corp. | | | 7,277,145 | | |
| | 381,000 | | | Ricoh Company, Ltd. | | | 7,525,202 | | |
| | 195,300 | | | Sega Sammy Holdings, Inc. | | | 4,909,427 | | |
| | 265,000 | | | Sharp Corp. | | | 4,724,253 | | |
| | 839,000 | | | Sumitomo Chemical Co., Ltd. | | | 5,982,865 | | |
| | 592 | | | Sumitomo Mitsui Financial Group, Inc. | | | 6,479,073 | | |
| | 91,000 | | | Takeda Pharmaceutical Co., Ltd. | | | 5,843,359 | | |
| | 82,100 | | | TIS, Inc. | | | 1,821,637 | | |
| | 134,300 | | | Toyota Motor Corp. | | | 7,957,753 | | |
| | | | 75,455,346 | | |
| | | France — 14.3% | |
| | 61,151 | | | Assurances Generales De France | | | 8,585,172 | | |
| | 247,460 | | | Axa | | | 9,427,621 | | |
| | 55,040 | | | BNP Paribas | | | 6,051,827 | | |
| | 59,780 | | | Casino Guichard Perrachon | | | 5,069,950 | | |
| | 91,579 | | | Compagnie de Saint-Gobain | | | 6,749,952 | | |
| | 255,361 | | | France Telecom SA | | | 6,632,416 | | |
| | 39,109 | | | LaFarge SA, ADR | | | 5,256,030 | | |
See Notes to Financial Statements.
97
THE GLENMEDE FUND, INC.
Philadelphia International Fund
SCHEDULE OF PORTFOLIO INVESTMENTS — (Continued)
October 31, 2006
| Shares | | | | Value | |
| COMMON STOCKSt — (Continued) | | | |
| | | France — (Continued) | |
| | 83,617 | | | Sanofi-Aventis | | $ | 7,107,577 | | |
| | 31,612 | | | Societe BIC SA | | | 2,033,458 | | |
| | 116,866 | | | Total SA | | | 7,912,730 | | |
| | 138,616 | | | Valeo SA | | | 5,217,241 | | |
| | | | 70,043,974 | | |
| | | Germany — 11.5% | |
| | 54,077 | | | Allianz AG | | | 10,036,667 | | |
| | 85,210 | | | BASF AG | | | 7,510,518 | | |
| | 104,215 | | | Bayerische Motoren Werke AG | | | 5,985,432 | | |
| | 66,725 | | | Continental AG | | | 7,461,817 | | |
| | 62,444 | | | E.On AG | | | 7,491,544 | | |
| | 125,318 | | | Hannover Rueckversicherung AG1 | | | 5,319,716 | | |
| | 62,195 | | | Metro AG | | | 3,695,115 | | |
| | 93,302 | | | Siemens AG Reg. | | | 8,395,235 | | |
| | | | 55,896,044 | | |
| | | Netherlands — 10.0% | |
| | 103,899 | | | Akzo Nobel N.V. | | | 5,826,721 | | |
| | 212,808 | | | ING Groep N.V., Sponsored ADR | | | 9,427,474 | | |
| | 154,858 | | | Koninklijke Philips Electronics NV | | | 5,409,551 | | |
| | 440,093 | | | Reed Elsevier N.V. | | | 7,565,974 | | |
| | 263,149 | | | Royal Dutch Shell PLC - Class A | | | 9,118,519 | | |
| | 153,309 | | | TNT N.V. | | | 5,901,355 | | |
| | 219,670 | | | Unilever N.V., Sponsored ADR | | | 5,416,648 | | |
| | | | 48,666,242 | | |
| | | Ireland — 5.2% | |
| | 246,380 | | | Allied Irish Banks PLC | | | 6,729,333 | | |
| | 305,949 | | | Bank of Ireland | | | 6,157,912 | | |
| | 235,001 | | | CRH PLC | | | 8,284,116 | | |
| | 15,685 | | | CRH PLC (London Exchange) | | | 554,320 | | |
| | 144,914 | | | Irish Life & Permanent PLC | | | 3,560,359 | | |
| | | | 25,286,040 | | |
| | | Sweden — 2.8% | |
| | 290,200 | | | Assa Abloy AB - Class B | | | 5,585,096 | | |
| | 2,145,000 | | | Telefonaktiebolaget LM Ericsson | | | 8,137,600 | | |
| | | | 13,722,696 | | |
| | | Denmark — 2.4% | |
| | 189,400 | | | H. Lundbeck AS | | | 4,459,294 | | |
| | 538,111 | | | Nordea AB | | | 7,394,356 | | |
| | | | 11,853,650 | | |
See Notes to Financial Statements.
98
THE GLENMEDE FUND, INC.
Philadelphia International Fund
SCHEDULE OF PORTFOLIO INVESTMENTS — (Continued)
October 31, 2006
| Shares | | | | Value | |
| COMMON STOCKSt — (Continued) | | | |
| | | Hong Kong — 2.3% | |
| | 481,883 | | | HSBC Holdings Plc | | | 9,095,873 | | |
| | 1,376,000 | | | Techtronic Industries Co. | | | 1,949,740 | | |
| | | | 11,045,613 | | |
| | | Italy — 2.1% | |
| | 130,563 | | | ENI SPA | | | 3,937,645 | | |
| | 577,966 | | | Mediaset SPA | | | 6,484,014 | | |
| | | | 10,421,659 | | |
| | | Spain — 1.7% | |
| | 474,043 | | | Banco Santander Central Hispano SA | | | 8,204,086 | | |
| | | Switzerland — 1.6% | |
| | 31,598 | | | Zurich Financial Services AG | | | 7,810,285 | | |
| | | Canada — 1.4% | |
| | 45,252 | | | Alcan, Inc. | | | 2,122,466 | | |
| | 287,866 | | | Talisman Energy, Inc. | | | 4,729,621 | | |
| | | | 6,852,087 | | |
| | | Taiwan — 1.3% | |
| | 11,247,584 | | | United Microelectronics Corp. | | | 6,272,610 | | |
| | | Singapore — 1.3% | |
| | 361,000 | | | Neptune Orient Lines, Ltd. | | | 470,728 | | |
| | 3,337,550 | | | Singapore Telecommunications, Ltd. | | | 5,681,210 | | |
| | | | 6,151,938 | | |
| | | Finland — 1.2% | |
| | 305,000 | | | Nokia | | | 6,053,172 | | |
| | | Greece — 1.2% | |
| | 230,500 | | | Public Power Corp. | | | 5,883,743 | | |
| | | South Korea — 1.2% | |
| | 8,800 | | | Samsung Electronics | | | 5,706,341 | | |
| | | Norway — 1.1% | |
| | 214,085 | | | Norsk Hydro ASA | | | 4,920,760 | | |
| | 36,367 | | | Yara International ASA2 | | | 637,007 | | |
| | | | 5,557,767 | | |
| | | Australia — 1.0% | |
| | 1,247,313 | | | John Fairfax Holdings, Ltd. | | | 4,694,064 | | |
| | | China — 0.6% | |
| | 7,074,000 | | | China Telecom Corp., Ltd. | | | 2,665,075 | | |
| | 1,428,000 | | | Global Bio-Chem Technology Group Co., Ltd. | | | 418,639 | | |
| | | | 3,083,714 | | |
See Notes to Financial Statements.
99
THE GLENMEDE FUND, INC.
Philadelphia International Fund
SCHEDULE OF PORTFOLIO INVESTMENTS — (Continued)
October 31, 2006
Shares/
Face Amount | | | | Value | |
| COMMON STOCKSt — (Continued) | | | |
| | | Israel — 0.4% | |
| | 54,832 | | | Teva Pharmaceutical Industries, Ltd., Sponsored ADR | | $ | 1,807,811 | | |
| | | | | TOTAL COMMON STOCKS
(Cost $346,325,189) | | | 485,621,880 | | |
| REPURCHASE AGREEMENT — 0.3% | | | |
| $ | 1,576,791 | | | With Investors Bank & Trust Co., dated 10/31/06, 4.75%,
principal and interest in the amount of $1,576,999,
due 11/01/06, (collateralized by SBA #505611, with a
par value of $1,540,365, coupon rate of 9.3750%, due 05/25/15,
market value of $1,655,631) | | | 1,576,791 | | |
| | | | | TOTAL REPURCHASE AGREEMENT
(Cost $1,576,791) | | | 1,576,791 | | |
| INVESTMENTS OF SECURITY LENDING COLLATERAL — 0.1% | | | |
| | 20,592 | | | Abbey National PLC, Eurodollar Term,
5.28%, due 12/1/06 | | | 20,592 | | |
| | 20,592 | | | Australia & New Zealand Banking Group, Ltd., Eurodollar Term,
5.28%, due 12/19/06 | | | 20,592 | | |
| | 25,739 | | | BancoBilbao Vizcaya Argentaria SA, Eurodollar Term,
5.31%, due 1/3/07 | | | 25,739 | | |
| | 25,740 | | | Bank of America, Bank Note,
5.30%, due 11/20/06 | | | 25,740 | | |
| | 25,740 | | | Bank of Montreal, Eurodollar Term,
5.28%, due 12/4/06 | | | 25,740 | | |
| | 25,740 | | | Bank of Nova Scotia, Eurodollar Term,
5.27%, due 11/13/06 | | | 25,740 | | |
| | 25,739 | | | Barclays, Eurodollar Term,
5.305%, due 11/21/06 | | | 25,739 | | |
| | 15,444 | | | Barton Capital LLC, Commercial Paper,
5.268%, due 11/2/06 | | | 15,444 | | |
| | 12,040 | | | BGI Institutional Money Market Fund | | | 12,040 | | |
| | 25,739 | | | BNP Paribas, Eurodollar Term,
5.28%, due 12/15/06 | | | 25,739 | | |
| | 25,740 | | | Canadian Imperial Bank of Commerce, Eurodollar Term,
5.28%, due 11/29/06 | | | 25,740 | | |
| | 20,592 | | | Charta LLC, Commercial Paper,
5.314%, due 11/1/06 | | | 20,592 | | |
| | 15,444 | | | Ciesco LLC, Commercial Paper,
5.29%, due 11/16/06 | | | 15,444 | | |
| | 15,444 | | | Compass Securitization, Commercial Paper,
5.292%, due 11/29/06 | | | 15,444 | | |
See Notes to Financial Statements.
100
THE GLENMEDE FUND, INC.
Philadelphia International Fund
SCHEDULE OF PORTFOLIO INVESTMENTS — (Concluded)
October 31, 2006
Face
Amount | | | | Value | |
| INVESTMENTS OF SECURITY LENDING COLLATERAL — (Continued) | | | |
| $ | 25,739 | | | Credit Suisse First Boston Corporation, Eurodollar Term,
5.31%, due 11/13/06 | | | 25,739 | | |
| | 20,592 | | | First Tennessee National Corporation, Eurodollar Term,
5.29%, due 12/18/06 | | | 20,592 | | |
| | 25,739 | | | Fortis Bank, Eurodollar Term,
5.30%, due 11/20/06 | | | 25,739 | | |
| | 15,444 | | | Jupiter Securitization Corp., Commercial Paper,
5.284%, due 11/6/06 | | | 15,444 | | |
| | 25,740 | | | Liberty Street, Commercial Paper,
5.284%, due 11/13/06 | | | 25,740 | | |
| | 25,740 | | | Merrill Lynch & Co., Inc., Repurchase Agreement,
5.303%, due 11/1/06 | | | 25,740 | | |
| | 25,740 | | | Morgan Stanley Dean Witter & Co., Repurchase Agreement,
5.303%, due 11/1/06 | | | 25,740 | | |
| | 25,740 | | | National Australia Bank, Eurodollar Overnight,
5.29%, due 11/1/06 | | | 25,740 | | |
| | 25,740 | | | Royal Bank of Canada, Eurodollar Term,
5.30%, due 11/17/06 | | | 25,740 | | |
| | 15,444 | | | Sheffield Receivables Corp., Commercial Paper,
5.296%, due 11/28/06 | | | 15,444 | | |
| | 25,740 | | | Skandinaviska Enskilda Banken AB, Eurodollar Term,
5.30%, due 11/20/06 | | | 25,740 | | |
| | 25,740 | | | Societe Generale, Eurodollar Term,
5.28%, due 12/4/06 | | | 25,740 | | |
| | 23,479 | | | Svenska Handelsbanken, Eurodollar Overnight,
5.30%, due 11/1/06 | | | 23,479 | | |
| | 15,444 | | | Yorktown Capital LLC, Commercial Paper,
5.292%, due 11/15/06 | �� | | 15,444 | | |
| | | | | TOTAL INVESTMENTS OF SECURITY LENDING COLLATERAL
(Cost $622,386) | | | 622,386 | | |
TOTAL INVESTMENTS
(Cost $348,524,366)3 | | | 99.9 | % | | $ | 487,821,057 | | |
| OTHER ASSETS IN EXCESS OF LIABILITIES | | | 0.1 | | | | 405,757 | | |
| NET ASSETS | | | 100.0 | % | | $ | 488,226,814 | | |
t Percentages indicated are based on net assets.
1 Non-income producing security.
2 Securities or partial securities on loan. See Note 5.
3 Aggregate cost for federal tax purposes was $349,830,824.
Abbreviations:
ADR — American Depositary Receipt
SBA — Small Business Administration
See Notes to Financial Statements.
101
THE GLENMEDE FUND, INC.
Philadelphia International Fund
INDUSTRY DIVERSIFICATION
On October 31, 2006, industry diversification of the Portfolio was as follows (Unaudited):
| | | % of
Net Assets | | Value | |
| INDUSTRIES: | |
| Banking | | | 12.9 | % | | $ | 62,841,334 | | |
| Insurance | | | 9.7 | | | | 47,529,049 | | |
| Finance | | | 6.6 | | | | 32,136,482 | | |
| Oil & Gas | | | 6.5 | | | | 31,661,007 | | |
| Pharmaceuticals | | | 6.2 | | | | 30,228,231 | | |
| Automotive | | | 5.5 | | | | 26,622,243 | | |
| Industrial | | | 5.4 | | | | 26,302,572 | | |
| Media - Broadcasting & Publishing | | | 4.6 | | | | 22,377,192 | | |
| Telecommunications | | | 4.4 | | | | 21,703,154 | | |
| Chemicals | | | 4.1 | | | | 19,957,111 | | |
| Electronics | | | 3.8 | | | | 18,518,551 | | |
| Heavy Machinery | | | 3.4 | | | | 16,373,272 | | |
| Communications | | | 2.9 | | | | 14,190,772 | | |
| Retailers | | | 2.8 | | | | 13,851,045 | | |
| Mining | | | 2.0 | | | | 9,617,586 | | |
| Energy | | | 1.9 | | | | 9,177,541 | | |
| Building Materials | | | 1.7 | | | | 8,456,510 | | |
| Containers & Packaging | | | 1.6 | | | | 7,651,894 | | |
| Computers & Information | | | 1.5 | | | | 7,525,202 | | |
| Utilities | | | 1.5 | | | | 7,491,544 | | |
| Textiles, Clothing & Fabrics | | | 1.4 | | | | 6,948,313 | | |
| Electric | | | 1.2 | | | | 5,883,743 | | |
| Electrical Equipment | | | 1.2 | | | | 5,706,341 | | |
| Beverages, Food & Tobacco | | | 1.1 | | | | 5,416,648 | | |
| Food Retailers | | | 1.0 | | | | 5,069,950 | | |
| Entertainment & Leisure | | | 1.0 | | | | 4,909,427 | | |
| Real Estate | | | 1.0 | | | | 4,711,051 | | |
| Health Care | | | 0.9 | | | | 4,459,294 | | |
| Financial Services | | | 0.7 | | | | 3,560,359 | | |
| Miscellaneous | | | 0.4 | | | | 2,033,458 | | |
| Commercial Services | | | 0.4 | | | | 1,821,637 | | |
| Transportation | | | 0.1 | | | | 470,728 | | |
| Biotechnology | | | 0.1 | | | | 418,639 | | |
| TOTAL COMMON STOCKS | | | 99.5 | % | | $ | 485,621,880 | | |
| REPURCHASE AGREEMENT | | | 0.3 | | | | 1,576,791 | | |
| INVESTMENTS OF SECURITY LENDING COLLATERAL | | | 0.1 | | | | 622,386 | | |
| TOTAL INVESTMENTS | | | 99.9 | % | | $ | 487,821,057 | | |
See Notes to Financial Statements.
102
THE GLENMEDE FUND, INC.
U.S. Emerging Growth Portfolio
SCHEDULE OF PORTFOLIO INVESTMENTS
October 31, 2006
| Shares | | | | Value | |
| COMMON STOCKSt — 99.2% | | | |
| | | Aerospace & Defense — 2.9% | |
| | 8,290 | | | Ceradyne, Inc.1,2 | | $ | 341,962 | | |
| | 8,240 | | | Teledyne Technologies, Inc.1 | | | 343,773 | | |
| | 7,066 | | | United Industrial Corp.2 | | | 318,041 | | |
| | | | 1,003,776 | | |
| | | Air Freight & Logistics — 2.7% | |
| | 32,900 | | | ABX Air, Inc.1 | | | 189,175 | | |
| | 14,750 | | | HUB Group, Inc. - Class A1 | | | 400,610 | | |
| | 11,653 | | | Pacer International, Inc. | | | 357,631 | | |
| | | | 947,416 | | |
| | | Biotechnology — 2.2% | |
| | 9,679 | | | ICOS Corp.1 | | | 307,018 | | |
| | 19,587 | | | Pharmion Corp.1,2 | | | 478,902 | | |
| | | | 785,920 | | |
| | | Building Products — 2.4% | |
| | 9,485 | | | American Woodmark Corp.2 | | | 350,850 | | |
| | 8,303 | | | Builders FirstSource, Inc.1 | | | 131,353 | | |
| | 5,835 | | | NCI Building Systems, Inc.1 | | | 349,225 | | |
| | | | 831,428 | | |
| | | Capital Markets — 2.5% | |
| | 3,809 | | | GFI Group, Inc.1 | | | 219,665 | | |
| | 5,989 | | | Greenhill & Co., Inc.2 | | | 406,893 | | |
| | 15,710 | | | TradeStation Group, Inc.1,2 | | | 245,861 | | |
| | | | 872,419 | | |
| | | Chemicals — 0.9% | |
| | 16,580 | | | CF Industries Holdings, Inc. | | | 328,616 | | |
| | | Commercial Banks — 0.9% | |
| | 5,444 | | | Preferred Bank | | | 318,855 | | |
| | | Commercial Services & Supplies — 5.4% | |
| | 10,333 | | | Administaff, Inc. | | | 355,972 | | |
| | 6,735 | | | Consolidated Graphics, Inc.1 | | | 418,715 | | |
| | 16,062 | | | Healthcare Services Group, Inc. | | | 436,565 | | |
| | 28,629 | | | Kforce, Inc.1 | | | 428,576 | | |
| | 14,839 | | | Labor Ready, Inc.1 | | | 259,831 | | |
| | | | 1,899,659 | | |
See Notes to Financial Statements.
103
THE GLENMEDE FUND, INC.
U.S. Emerging Growth Portfolio
SCHEDULE OF PORTFOLIO INVESTMENTS — (Continued)
October 31, 2006
| Shares | | | | Value | |
| COMMON STOCKSt — (Continued) | | | |
| | | Communications Equipment — 4.0% | |
| | 20,957 | | | Arris Group, Inc.1 | | $ | 280,824 | | |
| | 12,600 | | | Commscope, Inc.1,2 | | | 402,066 | | |
| | 16,158 | | | NETGEAR, Inc.1,2 | | | 433,034 | | |
| | 26,255 | | | Packeteer, Inc.1 | | | 294,319 | | |
| | | | 1,410,243 | | |
| | | Computers & Peripherals — 1.9% | |
| | 8,035 | | | Komag, Inc.1,2 | | | 307,339 | | |
| | 12,535 | | | Synaptics, Inc.1,2 | | | 355,493 | | |
| | | | 662,832 | | |
| | | Construction Materials — 0.9% | |
| | 48,721 | | | U.S. Concrete Inc.1 | | | 307,917 | | |
| | | Consumer Finance — 2.6% | |
| | 4,885 | | | Asta Funding, Inc.2 | | | 166,285 | | |
| | 4,645 | | | Cash America International, Inc. | | | 191,978 | | |
| | 14,140 | | | First Cash Financial Services, Inc.1 | | | 305,565 | | |
| | 4,569 | | | World Acceptance Corp.1 | | | 228,404 | | |
| | | | 892,232 | | |
| | | Electrical Equipment — 2.2% | |
| | 10,095 | | | Encore Wire Corp.1,2 | | | 271,354 | | |
| | 8,480 | | | General Cable Corp.1 | | | 318,848 | | |
| | 3,790 | | | Regal Beloit | | | 187,415 | | |
| | | | 777,617 | | |
| | | Electronic Equipment & Instruments — 4.8% | |
| | 20,592 | | | Brightpoint, Inc.1 | | | 249,163 | | |
| | 6,440 | | | Itron, Inc.1,2 | | | 350,594 | | |
| | 9,638 | | | Littelfuse, Inc.1 | | | 326,343 | | |
| | 13,505 | | | LoJack Corp.1 | | | 269,560 | | |
| | 14,755 | | | Plexus Corp.1 | | | 323,430 | | |
| | 13,665 | | | TTM Technologies, Inc.1 | | | 166,030 | | |
| | | | 1,685,120 | | |
| | | Energy Equipment & Services — 4.9% | |
| | 8,018 | | | Basic Energy Services Inc.1 | | | 195,960 | | |
| | 44,245 | | | Grey Wolf, Inc.1 | | | 309,715 | | |
| | 3,483 | | | Lufkin Industries, Inc. | | | 210,164 | | |
| | 11,574 | | | Oil States International, Inc.1 | | | 336,109 | | |
| | 23,203 | | | Pioneer Drilling Co.1 | | | 304,655 | | |
| | 16,769 | | | RPC, Inc. | | | 364,223 | | |
| | | | 1,720,826 | | |
See Notes to Financial Statements.
104
THE GLENMEDE FUND, INC.
U.S. Emerging Growth Portfolio
SCHEDULE OF PORTFOLIO INVESTMENTS — (Continued)
October 31, 2006
| Shares | | | | Value | |
| COMMON STOCKSt — (Continued) | | | |
| | | Food & Staples Retailing — 1.0% | |
| | 7,745 | | | Longs Drug Stores Corp. | | $ | 333,345 | | |
| | | Health Care Equipment & Supplies — 7.6% | |
| | 12,320 | | | Abaxis, Inc.1,2 | | | 247,139 | | |
| | 4,135 | | | Arthrocare Corp.1,2 | | | 167,095 | | |
| | 7,282 | | | Biosite, Inc.1,2 | | | 334,462 | | |
| | 13,953 | | | Greatbatch, Inc.1 | | | 313,803 | | |
| | 8,749 | | | ICU Medical, Inc.1 | | | 369,645 | | |
| | 4,635 | | | Kyphon, Inc.1,2 | | | 183,082 | | |
| | 9,975 | | | Neurometrix, Inc.1,2 | | | 162,493 | | |
| | 10,106 | | | SurModics, Inc.1,2 | | | 352,699 | | |
| | 13,220 | | | Zoll Medical Corp.1 | | | 511,614 | | |
| | | | 2,642,032 | | |
| | | Health Care Providers & Services — 4.7% | |
| | 8,831 | | | Amedisys, Inc.1,2 | | | 358,274 | | |
| | 10,000 | | | Healthspring, Inc.1 | | | 201,400 | | |
| | 15,075 | | | MedCath Corp.1 | | | 399,337 | | |
| | 8,685 | | | Molina Healthcare, Inc.1 | | | 340,713 | | |
| | 11,902 | | | Providence Service Corp. (The)1,2 | | | 327,186 | | |
| | | | 1,626,910 | | |
| | | Health Care Technology — 1.8% | |
| | 9,288 | | | Omnicell, Inc.1 | | | 173,964 | | |
| | 14,968 | | | Vital Images, Inc.1 | | | 464,607 | | |
| | | | 638,571 | | |
| | | Hotels, Restaurants & Leisure — 2.1% | |
| | 3,306 | | | Chipoltle Mexican Grill - Class A1,2 | | | 198,029 | | |
| | 10,398 | | | CKE Restaurants, Inc. | | | 203,177 | | |
| | 17,218 | | | Ruth's Chris Steak House1 | | | 339,022 | | |
| | | | 740,228 | | |
| | | Household Durables — 2.3% | |
| | 23,254 | | | Tempur-Pedic International, Inc.1 | | | 459,034 | | |
| | 10,055 | | | Yankee Candle Co., Inc. | | | 340,362 | | |
| | | | 799,396 | | |
| | | Household Products — 0.9% | |
| | 9,513 | | | WD-40 Co. | | | 323,347 | | |
| | | Insurance — 1.0% | |
| | 5,080 | | | Navigators Group, Inc.1 | | | 239,116 | | |
| | 2,580 | | | ProAssurance Corp.1 | | | 125,646 | | |
| | | | 364,762 | | |
See Notes to Financial Statements.
105
THE GLENMEDE FUND, INC.
U.S. Emerging Growth Portfolio
SCHEDULE OF PORTFOLIO INVESTMENTS — (Continued)
October 31, 2006
| Shares | | | | Value | |
| COMMON STOCKSt — (Continued) | | | |
| | | Internet & Catalog Retail — 1.0% | |
| | 8,760 | | | Priceline.com, Inc.1,2 | | $ | 352,940 | | |
| | | Internet Software & Services — 1.3% | |
| | 8,115 | | | Digital River, Inc.1,2 | | | 469,453 | | |
| | | IT Services — 2.4% | |
| | 15,283 | | | CSG Systems International, Inc.1 | | | 412,335 | | |
| | 21,870 | | | SYKES Enterprises, Inc.1 | | | 443,742 | | |
| | | | 856,077 | | |
| | | Life Sciences Tools & Services — 3.1% | |
| | 34,835 | | | Albany Molecular Research, Inc.1 | | | 414,885 | | |
| | 9,910 | | | Illumina, Inc.1,2 | | | 435,644 | | |
| | 12,200 | | | Molecular Devices Corp.1 | | | 245,708 | | |
| | | | 1,096,237 | | |
| | | Machinery — 3.4% | |
| | 3,335 | | | Actuant Corp. - Class A | | | 171,219 | | |
| | 6,531 | | | Freightcar America, Inc.2 | | | 347,253 | | |
| | 4,165 | | | Middleby Corp. (The)1,2 | | | 375,308 | | |
| | 6,045 | | | Nordson Corp. | | | 278,372 | | |
| | | | 1,172,152 | | |
| | | Media — 0.5% | |
| | 4,311 | | | Arbitron, Inc. | | | 181,062 | | |
| | | Metals & Mining — 1.1% | |
| | 10,952 | | | Quanex Corp. | | | 367,002 | | |
| | | Oil, Gas & Consumable Fuels — 1.1% | |
| | 4,535 | | | Giant Industries, Inc.1 | | | 367,244 | | |
| | | Pharmaceuticals — 2.3% | |
| | 13,750 | | | Sciele Pharma, Inc.1,2 | | | 299,888 | | |
| | 37,809 | | | Viropharma, Inc.1 | | | 503,994 | | |
| | | | 803,882 | | |
| | | Road & Rail — 2.7% | |
| | 12,592 | | | Old Dominion Freight Line, Inc.1 | | | 348,295 | | |
| | 11,386 | | | P.A.M. Transportation Services, Inc.1 | | | 288,294 | | |
| | 16,104 | | | U.S. Xpress Enterprises, Inc. - Class A1 | | | 317,893 | | |
| | | | 954,482 | | |
| | | Semiconductors & Semiconductor Equipment — 6.1% | |
| | 26,536 | | | Advanced Energy Industries, Inc.1 | | | 417,146 | | |
| | 7,960 | | | Diodes, Inc.1 | | | 350,558 | | |
| | 18,950 | | | Eagle Test Systems, Inc.1 | | | 333,520 | | |
See Notes to Financial Statements.
106
THE GLENMEDE FUND, INC.
U.S. Emerging Growth Portfolio
SCHEDULE OF PORTFOLIO INVESTMENTS — (Continued)
October 31, 2006
Shares/
Face Amount | | | | Value | |
| COMMON STOCKSt — (Continued) | | | |
| | | Semiconductors & Semiconductor Equipment — (Continued) | |
| | 16,667 | | | Omnivision Technologies, Inc.1,2 | | $ | 273,672 | | |
| | 15,445 | | | Portalplayer, Inc.1,2 | | | 185,803 | | |
| | 27,823 | | | RF Micro Devices, Inc.1 | | | 203,108 | | |
| | 30,058 | | | Silicon Image, Inc.1 | | | 355,586 | | |
| | | | 2,119,393 | | |
| | | Software — 2.6% | |
| | 20,995 | | | Informatica Corp.1 | | | 260,128 | | |
| | 6,872 | | | Macrovision Corp.1 | | | 182,864 | | |
| | 3,885 | | | MicroStrategy, Inc. - Class A1,2 | | | 463,675 | | |
| | | | 906,667 | | |
| | | Specialty Retail — 6.2% | |
| | 11,420 | | | Aeropostale, Inc.1 | | | 334,720 | | |
| | 12,637 | | | Charlotte Russe Holding, Inc.1 | | | 349,413 | | |
| | 11,838 | | | Dress Barn, Inc.1 | | | 257,121 | | |
| | 3,664 | | | Guess ?, Inc.1 | | | 208,665 | | |
| | 11,200 | | | Gymboree Corp. (The)1 | | | 520,352 | | |
| | 15,438 | | | Select Comfort Corp.1,2 | | | 330,064 | | |
| | 4,371 | | | Tween Brands, Inc.1 | | | 182,795 | | |
| | | | 2,183,130 | | |
| | | Textiles, Apparel & Luxury Goods — 2.8% | |
| | 8,210 | | | Deckers Outdoor Corp.1,2 | | | 436,526 | | |
| | 5,801 | | | K-Swiss, Inc. - Class A | | | 204,891 | | |
| | 7,705 | | | Phillips-Van Heusen Corp. | | | 352,581 | | |
| | | | 993,998 | | |
| | | | | TOTAL COMMON STOCKS
(Cost $29,553,758) | | | 34,737,186 | | |
| REPURCHASE AGREEMENT — 0.5% | | | |
| $ | 179,936 | | | With Investors Bank & Trust Co., dated 10/31/06, 4.75%,
principal and interest in the amount of $179,960,
due 11/01/06, (collateralized by SBA #506065 with
a par value of $175,407, coupon rate of 8.875%,
due 05/25/16, market value of $188,933) | | | 179,936 | | |
| | | | | TOTAL REPURCHASE AGREEMENT
(Cost $179,936) | | | 179,936 | | |
See Notes to Financial Statements.
107
THE GLENMEDE FUND, INC.
U.S. Emerging Growth Portfolio
SCHEDULE OF PORTFOLIO INVESTMENTS — (Continued)
October 31, 2006
Face
Amount | | | | Value | |
| INVESTMENTS OF SECURITY LENDING COLLATERAL — 28.5% | | | |
| $ | 329,870 | | | Abbey National PLC, Eurodollar Term, 5.28%, due 12/1/06 | | $ | 329,870 | | |
| | 329,866 | | | Australia & New Zealand Banking Group, Ltd., Eurodollar Term,
5.28%, due 12/19/06 | | | 329,866 | | |
| | 412,332 | | | BancoBilbao Vizcaya Argentaria SA, Eurodollar Term,
5.31%, due 1/3/07 | | | 412,332 | | |
| | 412,332 | | | Bank of America, Bank Note, 5.30%, due 11/20/06 | | | 412,332 | | |
| | 412,332 | | | Bank of Montreal, Eurodollar Term, 5.28%, due 12/4/06 | | | 412,332 | | |
| | 412,332 | | | Bank of Nova Scotia, Eurodollar Term, 5.27%, due 11/13/06 | | | 412,332 | | |
| | 412,332 | | | Barclays, Eurodollar Term, 5.305%, due 11/21/06 | | | 412,332 | | |
| | 247,399 | | | Barton Capital LLC, Commercial Paper,
5.268%, due 11/2/06 | | | 247,399 | | |
| | 192,866 | | | BGI Institutional Money Market Fund | | | 192,866 | | |
| | 412,332 | | | BNP Paribas, Eurodollar Term, 5.28%, due 12/15/06 | | | 412,332 | | |
| | 412,332 | | | Canadian Imperial Bank of Commerce, Eurodollar Term,
5.28%, due 11/29/06 | | | 412,332 | | |
| | 329,866 | | | Charta LLC, Commercial Paper, 5.314%, due 11/1/06 | | | 329,866 | | |
| | 247,399 | | | Ciesco LLC, Commercial Paper, 5.29%, due 11/16/06 | | | 247,399 | | |
| | 247,399 | | | Compass Securitization, Commercial Paper,
5.292%, due 11/29/06 | | | 247,399 | | |
| | 412,332 | | | Credit Suisse First Boston Corporation, Eurodollar Term,
5.31%, due 11/13/06 | | | 412,332 | | |
| | 329,866 | | | First Tennessee National Corporation, Eurodollar Term,
5.29%, due 12/18/06 | | | 329,866 | | |
| | 412,332 | | | Fortis Bank, Eurodollar Term, 5.30%, due 11/20/06 | | | 412,332 | | |
| | 247,399 | | | Jupiter Securitization Corp., Commercial Paper,
5.284%, due 11/6/06 | | | 247,399 | | |
| | 412,332 | | | Liberty Street, Commercial Paper, 5.284%, due 11/13/06 | | | 412,332 | | |
| | 412,332 | | | Merrill Lynch & Co., Inc., Repurchase Agreement,
5.303%, due 11/1/06 | | | 412,332 | | |
| | 412,332 | | | Morgan Stanley Dean Witter & Co., Repurchase Agreement,
5.303%, due 11/1/06 | | | 412,332 | | |
| | 412,332 | | | National Australia Bank, Eurodollar Overnight,
5.29%, due 11/1/06 | | | 412,332 | | |
| | 412,332 | | | Royal Bank of Canada, Eurodollar Term,
5.30%, due 11/17/06 | | | 412,332 | | |
| | 247,399 | | | Sheffield Receivables Corp., Commercial Paper,
5.296%, due 11/28/06 | | | 247,399 | | |
| | 412,332 | | | Skandinaviska Enskilda Banken AB, Eurodollar Term,
5.30%, due 11/20/06 | | | 412,332 | | |
| | 412,332 | | | Societe Generale, Eurodollar Term, 5.28%, due 12/4/06 | | | 412,332 | | |
| | 376,122 | | | Svenska Handelsbanken, Eurodollar Overnight,
5.30%, due 11/1/06 | | | 376,122 | | |
See Notes to Financial Statements.
108
THE GLENMEDE FUND, INC.
U.S. Emerging Growth Portfolio
SCHEDULE OF PORTFOLIO INVESTMENTS — (Concluded)
October 31, 2006
Face
Amount | | | | Value | |
| INVESTMENTS OF SECURITY LENDING COLLATERAL — (Continued) | |
| $ | 247,399 | | | Yorktown Capital LLC, Commercial Paper,
5.292%, due 11/15/06 | | $ | 247,399 | | |
| | | TOTAL INVESTMENTS OF SECURITY LENDING COLLATERAL
(Cost $9,970,162) | | | 9,970,162 | | |
TOTAL INVESTMENTS
(Cost $39,703,856)3 | | | 128.2 | % | | $ | 44,887,284 | | |
| LIABILITIES IN EXCESS OF OTHER ASSETS | | | (28.2 | ) | | | (9,884,982 | ) | |
| NET ASSETS | | | 100.0 | % | | $ | 35,002,302 | | |
t Percentages indicated are based on net assets.
1 Non-income producing security.
2 Securities or partial securities on loan. See Note 5.
3 Aggregate cost for federal tax purposes was $39,739,430.
Abbreviations:
SBA — Small Business Administration
See Notes to Financial Statements.
109
THE GLENMEDE FUND, INC.
U.S. Emerging Growth Portfolio
INDUSTRY DIVERSIFICATION
On October 31, 2006, industry diversification of the Portfolio was as follows (Unaudited):
| | | % of
Net Assets | | Value | |
| INDUSTRIES: | |
| Health Care Equipment & Supplies | | | 7.6 | % | | $ | 2,642,032 | | |
| Specialty Retail | | | 6.2 | | | | 2,183,130 | | |
| Semiconductors & Semiconductor Equipment | | | 6.1 | | | | 2,119,393 | | |
| Commercial Services & Supplies | | | 5.4 | | | | 1,899,659 | | |
| Energy Equipment & Services | | | 4.9 | | | | 1,720,826 | | |
| Electronic Equipment & Instruments | | | 4.8 | | | | 1,685,120 | | |
| Health Care Providers & Services | | | 4.7 | | | | 1,626,910 | | |
| Communications Equipment | | | 4.0 | | | | 1,410,243 | | |
| Machinery | | | 3.4 | | | | 1,172,152 | | |
| Life Sciences Tools & Services | | | 3.1 | | | | 1,096,237 | | |
| Aerospace & Defense | | | 2.9 | | | | 1,003,776 | | |
| Textiles, Apparel & Luxury Goods | | | 2.8 | | | | 993,998 | | |
| Road & Rail | | | 2.7 | | | | 954,482 | | |
| Air Freight & Logistics | | | 2.7 | | | | 947,416 | | |
| Software | | | 2.6 | | | | 906,667 | | |
| Consumer Finance | | | 2.6 | | | | 892,232 | | |
| Capital Markets | | | 2.5 | | | | 872,419 | | |
| IT Services | | | 2.4 | | | | 856,077 | | |
| Building Products | | | 2.4 | | | | 831,428 | | |
| Pharmaceuticals | | | 2.3 | | | | 803,882 | | |
| Household Durables | | | 2.3 | | | | 799,396 | | |
| Biotechnology | | | 2.2 | | | | 785,920 | | |
| Electrical Equipment | | | 2.2 | | | | 777,617 | | |
| Hotels, Restaurants & Leisure | | | 2.1 | | | | 740,228 | | |
| Computers & Peripherals | | | 1.9 | | | | 662,832 | | |
| Health Care Technology | | | 1.8 | | | | 638,571 | | |
| Internet Software & Services | | | 1.3 | | | | 469,453 | | |
| Oil, Gas & Consumable Fuels | | | 1.1 | | | | 367,244 | | �� |
| Metals & Mining | | | 1.1 | | | | 367,002 | | |
| Insurance | | | 1.0 | | | | 364,762 | | |
| Internet & Catalog Retail | | | 1.0 | | | | 352,940 | | |
| Food & Staples Retailing | | | 1.0 | | | | 333,345 | | |
| Chemicals | | | 0.9 | | | | 328,616 | | |
| Household Products | | | 0.9 | | | | 323,347 | | |
| Commercial Banks | | | 0.9 | | | | 318,855 | | |
| Construction Materials | | | 0.9 | | | | 307,917 | | |
| Media | | | 0.5 | | | | 181,062 | | |
| TOTAL COMMON STOCKS | | | 99.2 | % | | $ | 34,737,186 | | |
| REPURCHASE AGREEMENT | | | 0.5 | | | | 179,936 | | |
| INVESTMENTS OF SECURITY LENDING COLLATERAL | | | 28.5 | | | | 9,970,162 | | |
| TOTAL INVESTMENTS | | | 128.2 | % | | $ | 44,887,284 | | |
See Notes to Financial Statements.
110
THE GLENMEDE FUND, INC.
Large Cap 100 Portfolio
SCHEDULE OF PORTFOLIO INVESTMENTS
October 31, 2006
| Shares | | | | Value | |
| COMMON STOCKSt — 99.2% | | | |
| | | Aerospace & Defense — 3.2% | |
| | 16,060 | | | General Dynamics Corp. | | $ | 1,141,866 | | |
| | 13,665 | | | Lockheed Martin Corp. | | | 1,187,898 | | |
| | 15,375 | | | United Technologies Corp. | | | 1,010,445 | | |
| | | | 3,340,209 | | |
| | | Air Freight & Logistics — 1.3% | |
| | 21,235 | | | CH Robinson Worldwide, Inc. | | | 886,349 | | |
| | 4,415 | | | FedEx Corp. | | | 505,694 | | |
| | | | 1,392,043 | | |
| | | Airlines — 0.7% | |
| | 49,420 | | | Southwest Airlines, Inc. | | | 742,783 | | |
| | | Automobiles — 0.9% | |
| | 13,550 | | | Harley-Davidson, Inc. | | | 929,936 | | |
| | | Beverages — 0.9% | |
| | 14,750 | | | PepsiCo, Inc. | | | 935,740 | | |
| | | Biotechnology — 0.9% | |
| | 12,445 | | | Amgen, Inc.1 | | | 944,700 | | |
| | | Capital Markets — 7.0% | |
| | 27,370 | | | American Capital Strategies, Ltd.2 | | | 1,181,289 | | |
| | 6,250 | | | Bear Stearns Cos., Inc. | | | 945,938 | | |
| | 5,600 | | | Goldman Sachs Capital, Inc. | | | 1,062,824 | | |
| | 12,450 | | | Lehman Brothers Holdings, Inc.2 | | | 969,108 | | |
| | 11,675 | | | Merrill Lynch & Co., Inc. | | | 1,020,628 | | |
| | 14,430 | | | Morgan Stanley2 | | | 1,102,885 | | |
| | 20,865 | | | Nuveen Investments, Inc. - Class A | | | 1,028,644 | | |
| | | | 7,311,316 | | |
| | | Commercial Banks — 1.8% | |
| | 15,830 | | | Comerica, Inc. | | | 921,148 | | |
| | 32,865 | | | North Fork Bancorporation, Inc. | | | 939,282 | | |
| | | | 1,860,430 | | |
| | | Commercial Services & Supplies — 1.1% | |
| | 30,745 | | | Waste Management, Inc. | | | 1,152,323 | | |
| | | Communications Equipment — 1.0% | |
| | 44,325 | | | Motorola, Inc. | | | 1,022,134 | | |
| | | Computers & Peripherals — 3.2% | |
| | 86,585 | | | EMC Corp.1 | | | 1,060,666 | | |
| | 27,875 | | | Hewlett-Packard Co. | | | 1,079,877 | | |
| | 13,255 | | | International Business Machines Corp. | | | 1,223,834 | | |
| | | | 3,364,377 | | |
See Notes to Financial Statements.
111
THE GLENMEDE FUND, INC.
Large Cap 100 Portfolio
SCHEDULE OF PORTFOLIO INVESTMENTS — (Continued)
October 31, 2006
| Shares | | | | Value | |
| COMMON STOCKSt — (Continued) | | | |
| | | Construction Materials — 0.7% | |
| | 18,225 | | | Florida Rock Industries, Inc. | | $ | 781,853 | | |
| | | Consumer Finance — 1.1% | |
| | 16,350 | | | First Marblehead Corp. (The)2 | | | 1,102,808 | | |
| | | Diversified Financial Services — 3.9% | |
| | 19,000 | | | Bank of America Corp. | | | 1,023,530 | | |
| | 12,025 | | | CIT Group, Inc. | | | 625,901 | | |
| | 16,830 | | | IntercontinentalExchange, Inc.1 | | | 1,420,789 | | |
| | 20,815 | | | J.P. Morgan Chase & Co. | | | 987,464 | | |
| | | | 4,057,684 | | |
| | | Diversified Telecommunication Services — 2.0% | |
| | 30,665 | | | AT&T, Inc. | | | 1,050,277 | | |
| | 20,700 | | | Embarq Corp. | | | 1,000,845 | | |
| | | | 2,051,122 | | |
| | | Electrical Equipment — 0.9% | |
| | 11,085 | | | Cooper Industries, Ltd. - Class A | | | 991,553 | | |
| | | Electronic Equipment & Instruments — 2.0% | |
| | 29,325 | | | Agilent Technologies, Inc.1 | | | 1,043,970 | | |
| | 15,965 | | | CDW Corp. | | | 1,048,422 | | |
| | | | 2,092,392 | | |
| | | Energy Equipment & Services — 3.3% | |
| | 36,395 | | | BJ Services Co. | | | 1,097,673 | | |
| | 20,200 | | | Cameron International Corp.1 | | | 1,012,020 | | |
| | 15,490 | | | Smith International, Inc. | | | 611,545 | | |
| | 14,065 | | | Tidewater, Inc. | | | 699,452 | | |
| | | | 3,420,690 | | |
| | | Food & Staples Retailing — 3.5% | |
| | 12,115 | | | Costco Wholesale Corp. | | | 646,699 | | |
| | 33,780 | | | CVS Corp. | | | 1,060,016 | | |
| | 42,200 | | | Kroger Co. (The) | | | 949,078 | | |
| | 33,670 | | | Safeway, Inc. | | | 988,551 | | |
| | | | 3,644,344 | | |
| | | Food Products — 2.8% | |
| | 17,705 | | | General Mills, Inc. | | | 1,005,998 | | |
| | 27,315 | | | Hormel Foods Corp. | | | 986,345 | | |
| | 26,170 | | | Kraft Foods, Inc. - Class A2 | | | 900,248 | | |
| | | | 2,892,591 | | |
See Notes to Financial Statements.
112
THE GLENMEDE FUND, INC.
Large Cap 100 Portfolio
SCHEDULE OF PORTFOLIO INVESTMENTS — (Continued)
October 31, 2006
| Shares | | | | Value | |
| COMMON STOCKSt — (Continued) | | | |
| | | Gas Utilities — 0.9% | |
| | 10,970 | | | Questar Corp. | | $ | 893,836 | | |
| | | Health Care Equipment & Supplies — 1.5% | |
| | 4,470 | | | Alcon, Inc.2 | | | 474,178 | | |
| | 15,510 | | | Becton Dickinson & Co. | | | 1,086,165 | | |
| | | | 1,560,343 | | |
| | | Health Care Providers & Services — 6.2% | |
| | 24,370 | | | Aetna, Inc. | | | 1,004,532 | | |
| | 20,010 | | | AmerisourceBergen Corp. | | | 944,472 | | |
| | 9,880 | | | CIGNA Corp. | | | 1,155,763 | | |
| | 12,985 | | | Express Scripts, Inc.1 | | | 827,404 | | |
| | 16,820 | | | McKesson Corp. | | | 842,514 | | |
| | 17,840 | | | UnitedHealth Group, Inc. | | | 870,235 | | |
| | 11,285 | | | WellPoint, Inc.1 | | | 861,271 | | |
| | | | 6,506,191 | | |
| | | Hotels, Restaurants & Leisure — 0.5% | |
| | 11,495 | | | Darden Restaurants, Inc. | | | 481,641 | | |
| | | Household Durables — 0.8% | |
| | 9,410 | | | Whirlpool Corp. | | | 818,011 | | |
| | | Household Products — 1.0% | |
| | 13,720 | | | Energizer Holdings, Inc.1 | | | 1,072,218 | | |
| | | Independent Power Producers & Energy Traders — 1.8% | |
| | 15,590 | | | Constellation Energy Group, Inc. | | | 972,816 | | |
| | 14,360 | | | TXU Corp. | | | 906,547 | | |
| | | | 1,879,363 | | |
| | | Insurance — 4.3% | |
| | 18,920 | | | Chubb Corp. | | | 1,005,598 | | |
| | 27,780 | | | Genworth Financial, Inc.-Class A | | | 928,963 | | |
| | 6,410 | | | Hartford Financial Services Group, Inc. | | | 558,760 | | |
| | 16,230 | | | Lincoln National Corp. | | | 1,027,521 | | |
| | 8,784 | | | Metlife, Inc. | | | 501,830 | | |
| | 7,745 | | | SAFECO Corp. | | | 450,682 | | |
| | | | 4,473,354 | | |
| | | Internet Software & Services — 0.4% | |
| | 1,000 | | | Google, Inc. - Class A1 | | | 476,391 | | |
| | | Life Sciences Tools & Services — 1.1% | |
| | 32,050 | | | Applera Corp. - Applied Biosystems Group | | | 1,195,465 | | |
See Notes to Financial Statements.
113
THE GLENMEDE FUND, INC.
Large Cap 100 Portfolio
SCHEDULE OF PORTFOLIO INVESTMENTS — (Continued)
October 31, 2006
| Shares | | | | Value | |
| COMMON STOCKSt — (Continued) | | | |
| | | Machinery — 5.1% | |
| | 8,845 | | | Cummins, Inc.2 | | $ | 1,123,138 | | |
| | 15,200 | | | Eaton Corp. | | | 1,100,936 | | |
| | 22,900 | | | Illinois Tool Works, Inc. | | | 1,097,597 | | |
| | 25,435 | | | Ingersoll-Rand Co. - Class A | | | 933,719 | | |
| | 17,387 | | | Paccar, Inc. | | | 1,029,484 | | |
| | | | 5,284,874 | | |
| | | Media — 0.9% | |
| | 29,955 | | | Disney (Walt) Co. | | | 942,384 | | |
| | | Metals & Mining — 2.7% | |
| | 21,150 | | | Nucor Corp. | | | 1,235,372 | | |
| | 2,280 | | | Rio Tinto PLC, Sponsored ADR | | | 504,769 | | |
| | 20,690 | | | Southern Copper Corp.2 | | | 1,063,052 | | |
| | | | 2,803,193 | | |
| | | Multiline Retail — 3.0% | |
| | 14,300 | | | Kohl's Corp.1 | | | 1,009,580 | | |
| | 24,676 | | | Nordstrom, Inc. | | | 1,168,409 | | |
| | 5,440 | | | Sears Holdings Corp.1,2 | | | 949,117 | | |
| | | | 3,127,106 | | |
| | | Multi-Utilities — 0.8% | |
| | 19,695 | | | PG&E Corp. | | | 849,642 | | |
| | | Office Electronics — 1.0% | |
| | 63,230 | | | Xerox Corp.1 | | | 1,074,911 | | |
| | | Oil, Gas & Consumable Fuels — 6.6% | |
| | 14,480 | | | Anadarko Petroleum Corp. | | | 672,162 | | |
| | 15,104 | | | ConocoPhillips | | | 909,865 | | |
| | 16,220 | | | Devon Energy Corp. | | | 1,084,145 | | |
| | 13,200 | | | Exxon Mobil Corp. | | | 942,744 | | |
| | 25,825 | | | Hess Corp. | | | 1,094,980 | | |
| | 14,450 | | | Marathon Oil Corp. | | | 1,248,480 | | |
| | 17,510 | | | Valero Energy Corp. | | | 916,298 | | |
| | | | 6,868,674 | | |
| | | Pharmaceuticals — 3.5% | |
| | 7,710 | | | Eli Lilly & Co. | | | 431,837 | | |
| | 53,415 | | | King Pharmaceuticals, Inc.1 | | | 893,633 | | |
| | 26,640 | | | Merck & Co., Inc.2 | | | 1,209,989 | | |
| | 21,115 | | | Wyeth | | | 1,077,498 | | |
| | | | 3,612,957 | | |
See Notes to Financial Statements.
114
THE GLENMEDE FUND, INC.
Large Cap 100 Portfolio
SCHEDULE OF PORTFOLIO INVESTMENTS — (Continued)
October 31, 2006
| Shares | | | | Value | |
| COMMON STOCKSt — (Continued) | | | |
| | | REIT — 2.0% | |
| | 21,510 | | | Hospitality Properties Trust | | $ | 1,042,375 | | |
| | 21,805 | | | Istar Financial, Inc. | | | 1,010,226 | | |
| | | | 2,052,601 | | |
| | | Semiconductors & Semiconductor Equipment — 3.9% | |
| | 58,435 | | | Altera Corp.1 | | | 1,077,542 | | |
| | 30,460 | | | Analog Devices, Inc. | | | 969,237 | | |
| | 47,870 | | | Intel Corp. | | | 1,021,546 | | |
| | 32,790 | | | Texas Instruments, Inc. | | | 989,602 | | |
| | | | 4,057,927 | | |
| | | Software — 1.6% | |
| | 38,900 | | | Microsoft Corp. | | | 1,116,815 | | |
| | 29,420 | | | Oracle Corp.1 | | | 543,387 | | |
| | | | 1,660,202 | | |
| | | Specialty Retail — 4.1% | |
| | 10,255 | | | Abercrombie & Fitch Co. - Class A | | | 786,046 | | |
| | 29,290 | | | American Eagle Outfitters, Inc. | | | 1,341,482 | | |
| | 9,090 | | | Autozone, Inc.1 | | | 1,018,080 | | |
| | 25,000 | | | Staples, Inc. | | | 644,750 | | |
| | 16,960 | | | TJX Cos., Inc. (The) | | | 490,992 | | |
| | | | 4,281,350 | | |
| | | Textiles, Apparel & Luxury Goods — 1.0% | |
| | 11,225 | | | Nike, Inc. - Class B | | | 1,031,353 | | |
| | | Thrifts & Mortgage Finance — 0.9% | |
| | 11,145 | | | IndyMac Bancorp, Inc.2 | | | 506,540 | | |
| | 10,325 | | | PMI Group, Inc. (The) | | | 440,361 | | |
| | | | 946,901 | | |
| | | Tobacco — 1.4% | |
| | 16,950 | | | Carolina Group | | | 980,049 | | |
| | 8,350 | | | Reynolds American, Inc.2 | | | 527,386 | | |
| | | | 1,507,435 | | |
| | | | | TOTAL COMMON STOCKS
(Cost $90,792,811) | | | 103,489,351 | | |
See Notes to Financial Statements.
115
THE GLENMEDE FUND, INC.
Large Cap 100 Portfolio
SCHEDULE OF PORTFOLIO INVESTMENTS — (Continued)
October 31, 2006
Face
Amount | | | | Value | |
| REPURCHASE AGREEMENT — 1.8% | | | |
| $ | 1,858,420 | | | With Investors Bank & Trust Co., dated 10/31/06,
4.75%, principal and interest in the amount of
$1,858,665, due 11/01/06, (collateralized by SBA #506401
with a par value of $1,825,972 coupon rate of 8.125%,
due 09/25/23, market value of $1,951,341) | | $ | 1,858,420 | | |
| | | | | TOTAL REPURCHASE AGREEMENT
(Cost $1,858,420) | | | 1,858,420 | | |
| INVESTMENTS OF SECURITY LENDING COLLATERAL — 9.7% | | | |
| | 334,398 | | | Abbey National PLC, Eurodollar Term,
5.28%, due 12/1/06 | | | 334,398 | | |
| | 334,398 | | | Australia & New Zealand Banking Group, Ltd., Eurodollar Term,
5.28%, due 12/19/06 | | | 334,398 | | |
| | 417,997 | | | BancoBilbao Vizcaya Argentaria SA, Eurodollar Term,
5.31%, due 1/3/07 | | | 417,997 | | |
| | 417,997 | | | Bank of America, Bank Note,
5.30%, due 11/20/06 | | | 417,997 | | |
| | 417,997 | | | Bank of Montreal, Eurodollar Term,
5.28%, due 12/4/06 | | | 417,997 | | |
| | 417,997 | | | Bank of Nova Scotia, Eurodollar Term,
5.27%, due 11/13/06 | | | 417,997 | | |
| | 417,997 | | | Barclays, Eurodollar Term,
5.305%, due 11/21/06 | | | 417,997 | | |
| | 250,798 | | | Barton Capital LLC, Commercial Paper,
5.268%, due 11/2/06 | | | 250,798 | | |
| | 195,516 | | | BGI Institutional Money Market Fund | | | 195,516 | | |
| | 417,997 | | | BNP Paribas, Eurodollar Term,
5.28%, due 12/15/06 | | | 417,997 | | |
| | 417,997 | | | Canadian Imperial Bank of Commerce, Eurodollar Term,
5.28%, due 11/29/06 | | | 417,997 | | |
| | 334,398 | | | Charta LLC, Commercial Paper,
5.314%, due 11/1/06 | | | 334,398 | | |
| | 250,798 | | | Ciesco LLC, Commercial Paper,
5.29%, due 11/16/06 | | | 250,798 | | |
| | 250,798 | | | Compass Securitization, Commercial Paper,
5.292%, due 11/29/06 | | | 250,798 | | |
| | 417,997 | | | Credit Suisse First Boston Corporation, Eurodollar Term,
5.31%, due 11/13/06 | | | 417,997 | | |
| | 334,398 | | | First Tennessee National Corporation, Eurodollar Term,
5.29%, due 12/18/06 | | | 334,398 | | |
| | 417,997 | | | Fortis Bank, Eurodollar Term,
5.30%, due 11/20/06 | | | 417,997 | | |
See Notes to Financial Statements.
116
THE GLENMEDE FUND, INC.
Large Cap 100 Portfolio
SCHEDULE OF PORTFOLIO INVESTMENTS — (Concluded)
October 31, 2006
Face
Amount | | | | Value | |
| INVESTMENTS OF SECURITY LENDING COLLATERAL — (Continued) | | | |
| $ | 250,798 | | | Jupiter Securitization Corp., Commercial Paper,
5.284%, due 11/6/06 | | $ | 250,798 | | |
| | 417,997 | | | Liberty Street, Commercial Paper,
5.284%, due 11/13/06 | | | 417,997 | | |
| | 417,997 | | | Merrill Lynch & Co., Inc., Repurchase Agreement,
5.303%, due 11/1/06 | | | 417,997 | | |
| | 417,997 | | | Morgan Stanley Dean Witter & Co., Repurchase Agreement,
5.303%, due 11/1/06 | | | 417,997 | | |
| | 417,997 | | | National Australia Bank, Eurodollar Overnight,
5.29%, due 11/1/06 | | | 417,997 | | |
| | 417,997 | | | Royal Bank of Canada, Eurodollar Term,
5.30%, due 11/17/06 | | | 417,997 | | |
| | 250,798 | | | Sheffield Receivables Corp., Commercial Paper,
5.296%, due 11/28/06 | | | 250,798 | | |
| | 417,997 | | | Skandinaviska Enskilda Banken AB, Eurodollar Term,
5.30%, due 11/20/06 | | | 417,997 | | |
| | 417,997 | | | Societe Generale, Eurodollar Term,
5.28%, due 12/4/06 | | | 417,997 | | |
| | 381,294 | | | Svenska Handelsbanken, Eurodollar Overnight,
5.30%, due 11/1/06 | | | 381,294 | | |
| | 250,798 | | | Yorktown Capital LLC, Commercial Paper,
5.292%, due 11/15/06 | | | 250,798 | | |
| | | | | TOTAL INVESTMENTS OF SECURITY LENDING COLLATERAL
(Cost $10,107,142) | | | 10,107,142 | | |
TOTAL INVESTMENTS
(Cost $102,758,373)3 | | | 110.7 | % | | $ | 115,454,913 | | |
| LIABILITIES IN EXCESS OF OTHER ASSETS | | | (10.7 | ) | | | (11,183,659 | ) | |
| NET ASSETS | | | 100.0 | % | | $ | 104,271,254 | | |
t Percentages indicated are based on net assets.
1 Non-income producing security.
2 Securities or partial securities on loan. See Note 5.
3 Aggregate cost for federal tax purposes was $102,750,801.
Abbreviations:
ADR — American Depositary Receipt
REIT — Real Estate Investment Trust
SBA — Small Business Administration
See Notes to Financial Statements.
117
THE GLENMEDE FUND, INC.
Large Cap 100 Portfolio
INDUSTRY DIVERSIFICATION
On October 31, 2006, industry diversification of the Portfolio was as follows (Unaudited):
| | | % of
Net Assets | | Value | |
| INDUSTRIES: | |
| Capital Markets | | | 7.0 | % | | $ | 7,311,316 | | |
| Oil, Gas & Consumable Fuels | | | 6.6 | | | | 6,868,674 | | |
| Health Care Providers & Services | | | 6.2 | | | | 6,506,191 | | |
| Machinery | | | 5.1 | | | | 5,284,874 | | |
| Insurance | | | 4.3 | | | | 4,473,354 | | |
| Specialty Retail | | | 4.1 | | | | 4,281,350 | | |
| Semiconductors & Semiconductor Equipment | | | 3.9 | | | | 4,057,927 | | |
| Diversified Financial Services | | | 3.9 | | | | 4,057,684 | | |
| Food & Staples Retailing | | | 3.5 | | | | 3,644,344 | | |
| Pharmaceuticals | | | 3.5 | | | | 3,612,957 | | |
| Energy Equipment & Services | | | 3.3 | | | | 3,420,690 | | |
| Computers & Peripherals | | | 3.2 | | | | 3,364,377 | | |
| Aerospace & Defense | | | 3.2 | | | | 3,340,209 | | |
| Multiline Retail | | | 3.0 | | | | 3,127,106 | | |
| Food Products | | | 2.8 | | | | 2,892,591 | | |
| Metals & Mining | | | 2.7 | | | | 2,803,193 | | |
| Electronic Equipment & Instruments | | | 2.0 | | | | 2,092,392 | | |
| REIT | | | 2.0 | | | | 2,052,601 | | |
| Diversified Telecommunication Services | | | 2.0 | | | | 2,051,122 | | |
| Independent Power Producers & Energy Traders | | | 1.8 | | | | 1,879,363 | | |
| Commercial Banks | | | 1.8 | | | | 1,860,430 | | |
| Software | | | 1.6 | | | | 1,660,202 | | |
| Health Care Equipment & Supplies | | | 1.5 | | | | 1,560,343 | | |
| Tobacco | | | 1.4 | | | | 1,507,435 | | |
| Air Freight & Logistics | | | 1.3 | | | | 1,392,043 | | |
| Life Sciences Tools & Services | | | 1.1 | | | | 1,195,465 | | |
| Commercial Services & Supplies | | | 1.1 | | | | 1,152,323 | | |
| Consumer Finance | | | 1.1 | | | | 1,102,808 | | |
| Office Electronics | | | 1.0 | | | | 1,074,911 | | |
| Household Products | | | 1.0 | | | | 1,072,218 | | |
| Textiles, Apparel & Luxury Goods | | | 1.0 | | | | 1,031,353 | | |
| Communications Equipment | | | 1.0 | | | | 1,022,134 | | |
| Electrical Equipment | | | 0.9 | | | | 991,553 | | |
| Thrifts & Mortgage Finance | | | 0.9 | | | | 946,901 | | |
| Biotechnology | | | 0.9 | | | | 944,700 | | |
| Media | | | 0.9 | | | | 942,384 | | |
| Beverages | | | 0.9 | | | | 935,740 | | |
| Automobiles | | | 0.9 | | | | 929,936 | | |
| Gas Utilities | | | 0.9 | | | | 893,836 | | |
| Multi-Utilities | | | 0.8 | | | | 849,642 | | |
| Household Durables | | | 0.8 | | | | 818,011 | | |
| Construction Materials | | | 0.7 | | | | 781,853 | | |
| Airlines | | | 0.7 | | | | 742,783 | | |
| Hotels, Restaurants & Leisure | | | 0.5 | | | | 481,641 | | |
| Internet Software & Services | | | 0.4 | | | | 476,391 | | |
| TOTAL COMMON STOCKS | | | 99.2 | % | | $ | 103,489,351 | | |
| REPURCHASE AGREEMENT | | | 1.8 | | | | 1,858,420 | | |
| INVESTMENTS OF SECURITY LENDING COLLATERAL | | | 9.7 | | | | 10,107,142 | | |
| TOTAL INVESTMENTS | | | 110.7 | % | | $ | 115,454,913 | | |
See Notes to Financial Statements.
118
THE GLENMEDE FUND, INC.
Large Cap Growth Portfolio
SCHEDULE OF PORTFOLIO INVESTMENTS
October 31, 2006
| Shares | | | | Value | |
| COMMON STOCKSt — 99.5% | | | |
| | | Aerospace & Defense — 4.0% | |
| | 8,555 | | | Lockheed Martin Corp. | | $ | 743,686 | | |
| | 11,000 | | | United Technologies Corp. | | | 722,920 | | |
| | | | 1,466,606 | | |
| | | Air Freight & Logistics — 1.9% | |
| | 6,215 | | | FedEx Corp. | | | 711,866 | | |
| | | Beverages — 1.3% | |
| | 9,870 | | | Coca-Cola Co. (The) | | | 461,126 | | |
| | | Biotechnology — 4.5% | |
| | 9,500 | | | Amgen, Inc.1 | | | 721,145 | | |
| | 4,825 | | | Biogen Idec, Inc.1 | | | 229,670 | | |
| | 22,350 | | | ImClone Systems, Inc.1 | | | 699,331 | | |
| | | | 1,650,146 | | |
| | | Capital Markets — 3.8% | |
| | 3,950 | | | Goldman Sachs Capital, Inc. | | | 749,670 | | |
| | 13,005 | | | Nuveen Investments, Inc. - Class A | | | 641,147 | | |
| | | | 1,390,817 | | |
| | | Commercial Services & Supplies — 1.7% | |
| | 4,210 | | | Dun & Bradstreet Corp.1 | | | 325,180 | | |
| | 8,400 | | | Robert Half International, Inc. | | | 307,020 | | |
| | | | 632,200 | | |
| | | Communications Equipment — 1.7% | |
| | 27,680 | | | Motorola, Inc. | | | 638,301 | | |
| | | Computers & Peripherals — 8.2% | |
| | 9,425 | | | Apple Computer, Inc.1 | | | 764,179 | | |
| | 14,025 | | | EMC Corp.1 | | | 171,806 | | |
| | 18,535 | | | Hewlett-Packard Co. | | | 718,046 | | |
| | 8,755 | | | International Business Machines Corp. | | | 808,349 | | |
| | 30,005 | | | Western Digital Corp.1 | | | 548,491 | | |
| | | | 3,010,871 | | |
| | | Consumer Finance — 2.4% | |
| | 13,335 | | | First Marblehead Corp. (The) | | | 899,446 | | |
| | | Electronic Equipment & Instruments — 1.9% | |
| | 10,920 | | | CDW Corp. | | | 717,116 | | |
See Notes to Financial Statements.
119
THE GLENMEDE FUND, INC.
Large Cap Growth Portfolio
SCHEDULE OF PORTFOLIO INVESTMENTS — (Continued)
October 31, 2006
| Shares | | | | Value | |
| COMMON STOCKSt — (Continued) | | | |
| | | Energy Equipment & Services — 5.5% | |
| | 18,000 | | | BJ Services Co. | | $ | 542,880 | | |
| | 13,835 | | | ENSCO International, Inc. | | | 677,500 | | |
| | 15,915 | | | Tidewater, Inc. | | | 791,453 | | |
| | | | 2,011,833 | | |
| | | Food & Staples Retailing — 1.5% | |
| | 17,235 | | | CVS Corp. | | | 540,834 | | |
| | | Health Care Equipment & Supplies — 1.1% | |
| | 5,820 | | | Becton Dickinson & Co. | | | 407,575 | | |
| | | Health Care Providers & Services — 4.5% | |
| | 16,790 | | | Aetna, Inc. | | | 692,084 | | |
| | 8,600 | | | Express Scripts, Inc.1 | | | 547,992 | | |
| | 8,960 | | | Manor Care, Inc. | | | 429,990 | | |
| | | | 1,670,066 | | |
| | | Health Care Technology — 0.8% | |
| | 10,310 | | | IMS Health, Inc. | | | 287,134 | | |
| | | Hotels, Restaurants & Leisure — 0.9% | |
| | 7,880 | | | Darden Restaurants, Inc. | | | 330,172 | | |
| | | Household Durables — 0.9% | |
| | 575 | | | NVR, Inc.1 | | | 322,863 | | |
| | | Household Products — 2.2% | |
| | 10,150 | | | Energizer Holdings, Inc.1 | | | 793,223 | | |
| | | Independent Power Producers & Energy Traders — 1.7% | |
| | 9,815 | | | TXU Corp. | | | 619,621 | | |
| | | Insurance — 0.9% | |
| | 5,195 | | | American International Group, Inc. | | | 348,948 | | |
| | | Internet Software & Services — 2.0% | |
| | 1,565 | | | Google, Inc. - Class A1 | | | 745,550 | | |
| | | Machinery — 6.5% | |
| | 5,795 | | | Cummins, Inc. | | | 735,849 | | |
| | 5,165 | | | Danaher Corp. | | | 370,692 | | |
| | 11,705 | | | Illinois Tool Works, Inc. | | | 561,021 | | |
| | 8,790 | | | Parker Hannifin Corp. | | | 735,108 | | |
| | | | 2,402,670 | | |
| | | Media — 2.0% | |
| | 12,690 | | | Disney (Walt) Co. | | | 399,227 | | |
| | 3,440 | | | Omnicom Group, Inc. | | | 348,988 | | |
| | | | 748,215 | | |
See Notes to Financial Statements.
120
THE GLENMEDE FUND, INC.
Large Cap Growth Portfolio
SCHEDULE OF PORTFOLIO INVESTMENTS — (Continued)
October 31, 2006
| Shares | | | | Value | |
| COMMON STOCKSt — (Continued) | | | |
| | | Metals & Mining — 2.9% | |
| | 9,325 | | | Alcoa, Inc. | | $ | 269,586 | | |
| | 15,360 | | | Southern Copper Corp. | | | 789,197 | | |
| | | | 1,058,783 | | |
| | | Multiline Retail — 5.1% | |
| | 12,360 | | | Family Dollar Stores, Inc. | | | 364,002 | | |
| | 10,225 | | | J.C. Penney Co., Inc. (Holding Co.) | | | 769,227 | | |
| | 5,095 | | | Kohl's Corp.1 | | | 359,707 | | |
| | 8,070 | | | Nordstrom, Inc. | | | 382,115 | | |
| | | | 1,875,051 | | |
| | | Personal Products — 1.4% | |
| | 12,645 | | | Estee Lauder Companies - Class A | | | 510,732 | | |
| | | Pharmaceuticals — 7.3% | |
| | 11,580 | | | Eli Lilly & Co. | | | 648,596 | | |
| | 13,570 | | | Forest Laboratories, Inc.1 | | | 664,116 | | |
| | 15,100 | | | Merck & Co., Inc. | | | 685,842 | | |
| | 13,235 | | | Wyeth | | | 675,382 | | |
| | | | 2,673,936 | | |
| | | Road & Rail — 1.8% | |
| | 8,540 | | | Burlington Northern Santa Fe Corp. | | | 662,106 | | |
| | | Semiconductors & Semiconductor Equipment — 6.2% | |
| | 20,475 | | | Altera Corp.1 | | | 377,559 | | |
| | 16,200 | | | Applied Materials, Inc. | | | 281,718 | | |
| | 6,585 | | | Kla-Tencor Corp. | | | 323,784 | | |
| | 7,515 | | | Maxim Integrated Products, Inc. | | | 225,525 | | |
| | 15,725 | | | National Semiconductor Corp. | | | 381,960 | | |
| | 24,515 | | | Novellus Systems Inc.1 | | | 677,840 | | |
| | | | 2,268,386 | | |
| | | Software — 4.9% | |
| | 10,165 | | | Autodesk, Inc.1 | | | 373,564 | | |
| | 44,770 | | | BEA Systems, Inc.1 | | | 728,408 | | |
| | 38,810 | | | Oracle Corp.1 | | | 716,821 | | |
| | | | 1,818,793 | | |
| | | Specialty Retail — 4.0% | |
| | 4,340 | | | Abercrombie & Fitch Co. - Class A | | | 332,661 | | |
| | 12,625 | | | American Eagle Outfitters, Inc. | | | 578,225 | | |
| | 1,620 | | | Autozone, Inc.1 | | | 181,440 | | |
| | 7,026 | | | Circuit City Stores, Inc. | | | 189,561 | | |
| | 6,045 | | | TJX Cos., Inc. (The) | | | 175,003 | | |
| | | | 1,456,890 | | |
See Notes to Financial Statements.
121
THE GLENMEDE FUND, INC.
Large Cap Growth Portfolio
SCHEDULE OF PORTFOLIO INVESTMENTS — (Concluded)
October 31, 2006
Shares/
Face Amount | | | | Value | |
| COMMON STOCKSt — (Continued) | | | |
| | | Textiles, Apparel & Luxury Goods — 0.5% | |
| | 2,545 | | | Polo Ralph Lauren Corp. | | $ | 180,695 | | |
| | | Tobacco — 3.5% | |
| | 5,900 | | | Altria Group, Inc. | | | 479,847 | | |
| | 15,275 | | | UST, Inc. | | | 818,129 | | |
| | | | 1,297,976 | | |
| | | | | TOTAL COMMON STOCKS
(Cost $31,955,798) | | | 36,610,547 | | |
| REPURCHASE AGREEMENT — 1.1% | | | |
| $ | 397,810 | | | With Investors Bank & Trust Co., dated 10/31/06,
4.75%, principal and interest in the amount of
$397,863, due 11/01/06, (collateralized by SBA #504278
with a par value of $392,159, coupon rate of 7.865%,
due 10/25/23, market value of $417,701) | | | 397,810 | | |
| | | | | TOTAL REPURCHASE AGREEMENT
(Cost $397,810) | | | 397,810 | | |
TOTAL INVESTMENTS
(Cost $32,353,608)2 | | | 100.6 | % | | $ | 37,008,357 | | |
| LIABILITIES IN EXCESS OF OTHER ASSETS | | | (0.6 | ) | | | (203,428 | ) | |
| NET ASSETS | | | 100.0 | % | | $ | 36,804,929 | | |
t Percentages indicated are based on net assets.
1 Non-income producing security.
2 Aggregate cost for federal tax purposes was $32,354,824.
Abbreviation:
SBA — Small Business Administration
See Notes to Financial Statements.
122
THE GLENMEDE FUND, INC.
Large Cap Growth Portfolio
INDUSTRY DIVERSIFICATION
On October 31, 2006, industry diversification of the Portfolio was as follows (Unaudited):
| | | % of
Net Assets | | Value | |
| INDUSTRIES: | |
| Computers & Peripherals | | | 8.2 | % | | $ | 3,010,871 | | |
| Pharmaceuticals | | | 7.3 | | | | 2,673,936 | | |
| Machinery | | | 6.5 | | | | 2,402,670 | | |
| Semiconductors & Semiconductor Equipment | | | 6.2 | | | | 2,268,386 | | |
| Energy Equipment & Services | | | 5.5 | | | | 2,011,833 | | |
| Multiline Retail | | | 5.1 | | | | 1,875,051 | | |
| Software | | | 4.9 | | | | 1,818,793 | | |
| Health Care Providers & Services | | | 4.5 | | | | 1,670,066 | | |
| Biotechnology | | | 4.5 | | | | 1,650,146 | | |
| Aerospace & Defense | | | 4.0 | | | | 1,466,606 | | |
| Specialty Retail | | | 4.0 | | | | 1,456,890 | | |
| Capital Markets | | | 3.8 | | | | 1,390,817 | | |
| Tobacco | | | 3.5 | | | | 1,297,976 | | |
| Metals & Mining | | | 2.9 | | | | 1,058,783 | | |
| Consumer Finance | | | 2.4 | | | | 899,446 | | |
| Household Products | | | 2.2 | | | | 793,223 | | |
| Media | | | 2.0 | | | | 748,215 | | |
| Internet Software & Services | | | 2.0 | | | | 745,550 | | |
| Electronic Equipment & Instruments | | | 1.9 | | | | 717,116 | | |
| Air Freight & Logistics | | | 1.9 | | | | 711,866 | | |
| Road & Rail | | | 1.8 | | | | 662,106 | | |
| Communications Equipment | | | 1.7 | | | | 638,301 | | |
| Commercial Services & Supplies | | | 1.7 | | | | 632,200 | | |
| Independent Power Producers & Energy Traders | | | 1.7 | | | | 619,621 | | |
| Food & Staples Retailing | | | 1.5 | | | | 540,834 | | |
| Personal Products | | | 1.4 | | | | 510,732 | | |
| Beverages | | | 1.3 | | | | 461,126 | | |
| Health Care Equipment & Supplies | | | 1.1 | | | | 407,575 | | |
| Insurance | | | 0.9 | | | | 348,948 | | |
| Hotels, Restaurants & Leisure | | | 0.9 | | | | 330,172 | | |
| Household Durables | | | 0.9 | | | | 322,863 | | |
| Health Care Technology | | | 0.8 | | | | 287,134 | | |
| Textiles, Apparel & Luxury Goods | | | 0.5 | | | | 180,695 | | |
| TOTAL COMMON STOCKS | | | 99.5 | % | | $ | 36,610,547 | | |
| REPURCHASE AGREEMENT | | | 1.1 | | | | 397,810 | | |
| TOTAL INVESTMENTS | | | 100.6 | % | | $ | 37,008,357 | | |
See Notes to Financial Statements.
123
THE GLENMEDE FUND, INC.
Absolute Return Portfolio
SCHEDULE OF PORTFOLIO INVESTMENTS
October 31, 2006
| Shares | | | | Value | |
| COMMON STOCKSt — 91.0% | | | |
| | | Aerospace & Defense — 2.3% | |
| | 1,860 | | | Lockheed Martin Corp.2 | | $ | 161,690 | | |
| | 1,985 | | | Northrop Grumman Corp.2 | | | 131,784 | | |
| | 3,320 | | | Raytheon Co.2 | | | 165,834 | | |
| | | | 459,308 | | |
| | | Air Freight & Logistics — 1.0% | |
| | 1,660 | | | FedEx Corp.2 | | | 190,136 | | |
| | | Building Products — 1.2% | |
| | 3,286 | | | PW Eagle, Inc.2 | | | 116,554 | | |
| | 2,490 | | | Universal Forest Products, Inc. | | | 112,996 | | |
| | | | 229,550 | | |
| | | Capital Markets — 3.9% | |
| | 1,135 | | | Bear Stearns Cos., Inc.2 | | | 171,782 | | |
| | 935 | | | Goldman Sachs Capital, Inc.2 | | | 177,454 | | |
| | 5,210 | | | Knight Capital Group, Inc. - Class A1,2 | | | 97,166 | | |
| | 2,165 | | | Lehman Brothers Holdings, Inc.2 | | | 168,524 | | |
| | 2,190 | | | Morgan Stanley2 | | | 167,382 | | |
| | | | 782,308 | | |
| | | Commercial Banks — 0.8% | |
| | 4,280 | | | Regions Financial Corp.2 | | | 162,426 | | |
| | | Commercial Services & Supplies — 0.9% | |
| | 2,605 | | | Manpower, Inc.2 | | | 176,541 | | |
| | | Communications Equipment — 4.0% | |
| | 16,805 | | | Andrew Corp.1,2 | | | 155,614 | | |
| | 4,860 | | | Commscope, Inc.1,2 | | | 155,083 | | |
| | 3,465 | | | Harris Corp.2 | | | 147,609 | | |
| | 6,455 | | | Motorola, Inc.2 | | | 148,852 | | |
| | 17,975 | | | UTStarcom, Inc.1,2 | | | 193,591 | | |
| | | | 800,749 | | |
| | | Computers & Peripherals — 2.6% | |
| | 4,440 | | | Hewlett-Packard Co.2 | | | 172,006 | | |
| | 1,935 | | | International Business Machines Corp.2 | | | 178,659 | | |
| | 2,710 | | | Lexmark International, Inc.1,2 | | | 172,329 | | |
| | | | 522,994 | | |
| | | Consumer Finance — 0.8% | |
| | 2,300 | | �� | First Marblehead Corp. (The)2 | | | 155,135 | | |
See Notes to Financial Statements.
124
THE GLENMEDE FUND, INC.
Absolute Return Portfolio
SCHEDULE OF PORTFOLIO INVESTMENTS — (Continued)
October 31, 2006
| Shares | | | | Value | |
| COMMON STOCKSt — (Continued) | | | |
| | | Diversified Financial Services — 1.6% | |
| | 2,955 | | | Bank of America Corp.2 | | $ | 159,186 | | |
| | 3,360 | | | J.P. Morgan Chase & Co.2 | | | 159,398 | | |
| | | | 318,584 | | |
| | | Electronic Equipment & Instruments — 8.2% | |
| | 15,150 | | | Aeroflex, Inc.1,2 | | | 163,620 | | |
| | 2,775 | | | Anixter International, Inc.1,2 | | | 165,834 | | |
| | 5,895 | | | Arrow Electronics, Inc.1,2 | | | 175,966 | | |
| | 8,200 | | | Avnet, Inc.1,2 | | | 194,176 | | |
| | 8,900 | | | Avx Corp.2 | | | 140,264 | | |
| | 5,475 | | | Jabil Circuit, Inc.2 | | | 157,187 | | |
| | 5,235 | | | Technitrol, Inc.2 | | | 132,027 | | |
| | 5,645 | | | Tektronix, Inc.2 | | | 171,439 | | |
| | 13,470 | | | TTM Technologies, Inc.1,2 | | | 163,660 | | |
| | 11,640 | | | Vishay Intertechnology, Inc.1,2 | | | 157,024 | | |
| | | | 1,621,197 | | |
| | | Energy Equipment & Services — 8.8% | |
| | 2,340 | | | Baker Hughes, Inc.2 | | | 161,577 | | |
| | 5,360 | | | BJ Services Co.2 | | | 161,658 | | |
| | 5,235 | | | Global Industries, Ltd.1,2 | | | 86,901 | | |
| | 4,225 | | | Grant Prideco, Inc.1,2 | | | 159,578 | | |
| | 5,490 | | | Halliburton Co.2 | | | 177,601 | | |
| | 7,010 | | | Helmerich & Payne, Inc.2 | | | 167,889 | | |
| | 5,800 | | | Oil States International, Inc.1,2 | | | 168,432 | | |
| | 6,670 | | | Patterson-UTI Energy Inc.2 | | | 154,744 | | |
| | 12,575 | | | Pioneer Drilling Co.1,2 | | | 165,110 | | |
| | 4,120 | | | Smith International, Inc.2 | | | 162,658 | | |
| | 3,540 | | | Tidewater, Inc.2 | | | 176,044 | | |
| | | | 1,742,192 | | |
| | | Food & Staples Retailing — 2.8% | |
| | 3,170 | | | Costco Wholesale Corp.2 | | | 169,215 | | |
| | 2,840 | | | CVS Corp.2 | | | 89,119 | | |
| | 6,860 | | | Kroger Co. (The)2 | | | 154,281 | | |
| | 3,410 | | | Longs Drug Stores Corp.2 | | | 146,766 | | |
| | | | 559,381 | | |
| | | Food Products — 0.8% | |
| | 4,200 | | | Archer-Daniels-Midland Co.2 | | | 161,700 | | |
See Notes to Financial Statements.
125
THE GLENMEDE FUND, INC.
Absolute Return Portfolio
SCHEDULE OF PORTFOLIO INVESTMENTS — (Continued)
October 31, 2006
| Shares | | | | Value | |
| COMMON STOCKSt — (Continued) | | | |
| | | Health Care Providers & Services — 3.5% | |
| | 2,315 | | | Aetna, Inc.2 | | $ | 95,424 | | |
| | 1,360 | | | CIGNA Corp.2 | | | 159,093 | | |
| | 1,845 | | | McKesson Corp.2 | | | 92,416 | | |
| | 3,230 | | | UnitedHealth Group, Inc.2 | | | 157,559 | | |
| | 2,420 | | | WellPoint, Inc.1,2 | | | 184,694 | | |
| | | | 689,186 | | |
| | | Hotels, Restaurants & Leisure — 2.5% | |
| | 3,920 | | | Brinker International, Inc.2 | | | 182,006 | | |
| | 3,705 | | | Darden Restaurants, Inc.2 | | | 155,239 | | |
| | 2,950 | | | Jack In The Box, Inc.1,2 | | | 165,525 | | |
| | | | 502,770 | | |
| | | Insurance — 3.2% | |
| | 1,920 | | | AMBAC Financial Group, Inc.2 | | | 160,301 | | |
| | 3,360 | | | American Financial Group, Inc.2 | | | 160,810 | | |
| | 3,035 | | | Chubb Corp.2 | | | 161,310 | | |
| | 1,805 | | | Hartford Financial Services Group, Inc.2 | | | 157,342 | | |
| | | | 639,763 | | |
| | | Internet Software & Services — 0.5% | |
| | 6,695 | | | United Online, Inc.2 | | | 90,516 | | |
| | | IT Services — 3.0% | |
| | 3,300 | | | Computer Sciences Corp.1,2 | | | 174,405 | | |
| | 6,535 | | | Electronic Data Systems Corp.2 | | | 165,532 | | |
| | 3,090 | | | First Data Corp.2 | | | 74,933 | | |
| | 6,860 | | | Sabre Holdings Corp.2 | | | 174,381 | | |
| | | | 589,251 | | |
| | | Life Sciences Tools & Services — 2.0% | |
| | 5,525 | | | Applera Corp. - Applied Biosystems Group2 | | | 206,083 | | |
| | 4,105 | | | Varian, Inc.1,2 | | | 192,483 | | |
| | | | 398,566 | | |
| | | Machinery — 4.2% | |
| | 1,345 | | | Cummins, Inc.2 | | | 170,788 | | |
| | 2,290 | | | Eaton Corp.2 | | | 165,865 | | |
| | 2,895 | | | Freightcar America, Inc.2 | | | 153,927 | | |
| | 4,455 | | | Mueller Industries, Inc.2 | | | 163,365 | | |
| | 2,025 | | | Parker Hannifin Corp.2 | | | 169,351 | | |
| | | | 823,296 | | |
See Notes to Financial Statements.
126
THE GLENMEDE FUND, INC.
Absolute Return Portfolio
SCHEDULE OF PORTFOLIO INVESTMENTS — (Continued)
October 31, 2006
| Shares | | | | Value | |
| COMMON STOCKSt — (Continued) | | | |
| | | Media — 4.1% | |
| | 5,565 | | | CBS Corp. - Class B2 | | $ | 161,051 | | |
| | 5,105 | | | Disney (Walt) Co.2 | | | 160,603 | | |
| | 1,885 | | | Liberty Media Hold Corp. - Class A1,2 | | | 167,878 | | |
| | 1,690 | | | Omnicom Group, Inc.2 | | | 171,451 | | |
| | 7,870 | | | Time Warner, Inc.2 | | | 157,479 | | |
| | | | 818,462 | | |
| | | Metals & Mining — 0.7% | |
| | 2,180 | | | United States Steel Corp.2 | | | 147,368 | | |
| | | Multiline Retail — 3.4% | |
| | 3,705 | | | Federated Department Stores2 | | | 162,687 | | |
| | 2,300 | | | J.C. Penney Co., Inc. (Holding Co.)2 | | | 173,029 | | |
| | 2,400 | | | Kohl's Corp.1,2 | | | 169,440 | | |
| | 995 | | | Sears Holdings Corp.1,2 | | | 173,598 | | |
| | | | 678,754 | | |
| | | Office Electronics — 0.9% | |
| | 10,300 | | | Xerox Corp.1,2 | | | 175,100 | | |
| | | Oil, Gas & Consumable Fuels — 5.9% | |
| | 5,485 | | | Chesapeake Energy Corp.2 | | | 177,933 | | |
| | 2,685 | | | ConocoPhillips2 | | | 161,744 | | |
| | 2,355 | | | Exxon Mobil Corp.2 | | | 168,194 | | |
| | 3,770 | | | Hess Corp.2 | | | 159,848 | | |
| | 2,075 | | | Marathon Oil Corp.2 | | | 179,280 | | |
| | 2 | | | Petroleum Development Corp.1 | | | 92 | | |
| | 2,510 | | | Sunoco, Inc.2 | | | 165,986 | | |
| | 3,090 | | | Valero Energy Corp.2 | | | 161,700 | | |
| | | | 1,174,777 | | |
| | | Pharmaceuticals — 5.5% | |
| | 2,835 | | | Johnson & Johnson2 | | | 191,079 | | |
| | 10,845 | | | King Pharmaceuticals, Inc.1,2 | | | 181,437 | | |
| | 3,740 | | | Merck & Co., Inc.2 | | | 169,871 | | |
| | 6,690 | | | Pfizer, Inc.2 | | | 178,289 | | |
| | 8,355 | | | Schering-Plough Corp.2 | | | 184,980 | | |
| | 3,565 | | | Wyeth2 | | | 181,922 | | |
| | | | 1,087,578 | | |
See Notes to Financial Statements.
127
THE GLENMEDE FUND, INC.
Absolute Return Portfolio
SCHEDULE OF PORTFOLIO INVESTMENTS — (Continued)
October 31, 2006
Shares/
Face Amount | | | | Value | |
| COMMON STOCKSt — (Continued) | |
| | | REIT — 4.2% | |
| | 3,320 | | | Hospitality Properties Trust2 | | $ | 160,887 | | |
| | 3,755 | | | Istar Financial, Inc.2 | | | 173,969 | | |
| | 3,000 | | | Mack-Cali Realty Corp.2 | | | 158,700 | | |
| | 4,038 | | | New Century Financial Corp.2 | | | 159,016 | | |
| | 4,230 | | | Rayonier, Inc.2 | | | 173,388 | | |
| | | | 825,960 | | |
| | | Road & Rail — 0.8% | |
| | 3,895 | | | Arkansas Best Corp.2 | | | 159,617 | | |
| | | Semiconductors & Semiconductor Equipment — 2.0% | |
| | 3,820 | | | Kla-Tencor Corp.2 | | | 187,829 | | |
| | 12,370 | | | Omnivision Technologies, Inc.1,2 | | | 203,115 | | |
| | | | 390,944 | | |
| | | Specialty Retail — 2.7% | |
| | 4,410 | | | AnnTaylor Stores Corp.1,2 | | | 194,128 | | |
| | 4,470 | | | Office Depot, Inc.1,2 | | | 187,695 | | |
| | 5,545 | | | TJX Cos., Inc. (The)2 | | | 160,528 | | |
| | | | 542,351 | | |
| | | Thrifts & Mortgage Finance — 2.2% | |
| | 5,930 | | | Bankunited Financial Corp. - Class A2 | | | 159,932 | | |
| | 3,590 | | | PMI Group, Inc. (The)2 | | | 153,114 | | |
| | 2,230 | | | Radian Group Inc.2 | | | 118,859 | | |
| | | | 431,905 | | |
| | | TOTAL COMMON STOCKS
(Cost $17,593,513) | | | 18,048,365 | | |
| REPURCHASE AGREEMENT — 7.6% | |
| $ | 1,516,392 | | | With Investors Bank & Trust Co., dated 10/31/06,
4.75%, principal and interest in the amount of
$1,516,592, due 11/01/06, (collateralized by SBA #505623
with a par value of $1,477,283, coupon rate of 8.125%,
due 10/25/26, market value of $1,592,212) | | | 1,516,392 | | |
| | | TOTAL REPURCHASE AGREEMENT
(Cost $1,516,392) | | | 1,516,392 | | |
TOTAL LONG INVESTMENTS
(Cost $19,109,905) | | | 98.6 | % | | $ | 19,564,757 | | |
See Notes to Financial Statements.
128
THE GLENMEDE FUND, INC.
Absolute Return Portfolio
SCHEDULE OF PORTFOLIO INVESTMENTS — (Continued)
October 31, 2006
| Shares | | | | Value | |
| COMMON STOCKS SOLD SHORTt — (66.1)% | | | |
| | | Aerospace & Defense — (1.8)% | |
| | (14,928 | ) | | Gencorp, Inc.1 | | $ | (195,557 | ) | |
| | (10,200 | ) | | Hexcel Corp.1 | | | (165,138 | ) | |
| | | | (360,695 | ) | |
| | | Biotechnology — (3.1)% | |
| | (5,085 | ) | | Alexion Pharmaceuticals, Inc.1 | | | (189,976 | ) | |
| | (4,417 | ) | | Amylin Pharmaceuticals, Inc.1 | | | (194,171 | ) | |
| | (5,749 | ) | | Vertex Pharmaceuticals, Inc.1 | | | (233,409 | ) | |
| | | | (617,556 | ) | |
| | | Capital Markets — (4.1)% | |
| | (5,990 | ) | | Calamos Asset Management, Inc. - Class A | | | (175,028 | ) | |
| | (6,841 | ) | | Eaton Vance Corp. | | | (212,345 | ) | |
| | (5,848 | ) | | Federated Investors, Inc. - Class B | | | (200,528 | ) | |
| | (3,259 | ) | | Piper Jaffray Cos.1 | | | (225,360 | ) | |
| | | | (813,261 | ) | |
| | | Chemicals — (1.0)% | |
| | (4,564 | ) | | Monsanto Co. | | | (201,820 | ) | |
| | | Commercial Banks — (2.1)% | |
| | (7,482 | ) | | Boston Private Financial Holdings, Inc. | | | (206,802 | ) | |
| | (4,177 | ) | | Wintrust Financial Corp. | | | (201,582 | ) | |
| | | | (408,384 | ) | |
| | | Communications Equipment — (2.9)% | |
| | (12,580 | ) | | Comtech Group, Inc.1 | | | (212,350 | ) | |
| | (8,063 | ) | | Corning, Inc.1 | | | (164,727 | ) | |
| | (3,044 | ) | | F5 Networks, Inc.1 | | | (201,482 | ) | |
| | | | (578,559 | ) | |
| | | Consumer Finance — (1.0)% | |
| | (6,807 | ) | | Nelnet, Inc. - Class A1 | | | (200,398 | ) | |
| | | Diversified Financial Services — (1.0)% | |
| | (5,396 | ) | | Nasdaq Stock Market, Inc.1 | | | (192,799 | ) | |
| | | Electrical Equipment — (2.1)% | |
| | (8,838 | ) | | American Power Conversion Corp. | | | (267,173 | ) | |
| | (3,998 | ) | | Energy Conversion Devices, Inc.1 | | | (147,086 | ) | |
| | | | (414,259 | ) | |
See Notes to Financial Statements.
129
THE GLENMEDE FUND, INC.
Absolute Return Portfolio
SCHEDULE OF PORTFOLIO INVESTMENTS — (Continued)
October 31, 2006
| Shares | | | | Value | |
| COMMON STOCKS SOLD SHORTt — (Continued) | | | |
| | | Electronic Equipment & Instruments — (1.8)% | |
| | (12,457 | ) | | Cogent, Inc.1 | | $ | (143,255 | ) | |
| | (9,216 | ) | | Daktronics, Inc. | | | (218,511 | ) | |
| | | | (361,766 | ) | |
| | | Energy Equipment & Services — (1.9)% | |
| | (10,295 | ) | | Dresser-Rand Group, Inc.1 | | | (223,299 | ) | |
| | (2,470 | ) | | National Oilwell Varco, Inc.1 | | | (149,188 | ) | |
| | | | (372,487 | ) | |
| | | Food & Staples Retailing — (2.1)% | |
| | (7,009 | ) | | Performance Food Group, Co.1 | | | (203,752 | ) | |
| | (3,278 | ) | | Whole Foods Market, Inc. | | | (209,268 | ) | |
| | | | (413,020 | ) | |
| | | Food Products — (1.0)% | |
| | (13,591 | ) | | Tyson Foods, Inc. - Class A | | | (196,390 | ) | |
| | | Hotels, Restaurants & Leisure — (2.9)% | |
| | (3,768 | ) | | Aztar Corp.1 | | | (201,852 | ) | |
| | (4,416 | ) | | Gaylord Entertainment Co.1 | | | (205,521 | ) | |
| | (2,821 | ) | | Station Casinos, Inc. | | | (170,106 | ) | |
| | | | (577,479 | ) | |
| | | Insurance — (1.0)% | |
| | (5,098 | ) | | National Financial Partners Corp. | | | (200,861 | ) | |
| | | Internet & Catalog Retail — (1.0)% | |
| | (5,189 | ) | | Amazon.Com, Inc.1 | | | (197,649 | ) | |
| | | Internet Software & Services — (2.2)% | |
| | (3,248 | ) | | Equinix, Inc.1 | | | (222,163 | ) | |
| | (8,515 | ) | | Knot, Inc. (the)1 | | | (204,105 | ) | |
| | | | (426,268 | ) | |
| | | IT Services — (1.1)% | |
| | (7,685 | ) | | Wright Express Corp.1 | | | (210,338 | ) | |
| | | Machinery — (2.6)% | |
| | (4,468 | ) | | Esco Technologies, Inc.1 | | | (194,001 | ) | |
| | (14,628 | ) | | Flow International Corp.1 | | | (172,318 | ) | |
| | (2,962 | ) | | Flowserve Corp.1 | | | (156,986 | ) | |
| | | | (523,305 | ) | |
See Notes to Financial Statements.
130
THE GLENMEDE FUND, INC.
Absolute Return Portfolio
SCHEDULE OF PORTFOLIO INVESTMENTS — (Continued)
October 31, 2006
| Shares | | | | Value | |
| COMMON STOCKS SOLD SHORTt — (Continued) | | | |
| | | Media — (4.0)% | |
| | (5,290 | ) | | Arbitron, Inc. | | $ | (222,180 | ) | |
| | (5,921 | ) | | Dow Jones & Co, Inc. | | | (207,768 | ) | |
| | (3,709 | ) | | Lamar Advertising Co.1 | | | (213,935 | ) | |
| | (4,028 | ) | | Viacom, Inc. - Class B1 | | | (156,770 | ) | |
| | | | (800,653 | ) | |
| | | Multiline Retail — (1.0)% | |
| | (12,052 | ) | | Retail Ventures, Inc.1 | | | (206,330 | ) | |
| | | Oil, Gas & Consumable Fuels — (12.6)% | |
| | (4,912 | ) | | ATP Oil & Gas Corp.1 | | | (211,167 | ) | |
| | (7,734 | ) | | Bill Barrett Corp.1 | | | (220,651 | ) | |
| | (7,067 | ) | | Carrizo Oil & Gas, Inc.1 | | | (201,834 | ) | |
| | (6,213 | ) | | Cheniere Energy, Inc.1 | | | (163,526 | ) | |
| | (8,686 | ) | | CNX Gas Corp.1 | | | (227,139 | ) | |
| | (7,266 | ) | | Denbury Resources, Inc.1 | | | (208,825 | ) | |
| | (15,212 | ) | | El Paso Corp. | | | (208,404 | ) | |
| | (7,495 | ) | | Energy Partners, Ltd.1 | | | (183,103 | ) | |
| | (6,773 | ) | | Goodrich Petroleum Corp.1 | | | (231,704 | ) | |
| | (10,532 | ) | | Parallel Petroleum Corp.1 | | | (213,273 | ) | |
| | (4,852 | ) | | Plains Exploration & Product Co.1 | | | (205,191 | ) | |
| | (6,179 | ) | | Southwestern Energy Co.1 | | | (219,849 | ) | |
| | | | (2,494,666 | ) | |
| | | Pharmaceuticals — (1.0)% | |
| | (3,998 | ) | | Sepracor, Inc.1 | | | (206,936 | ) | |
| | | REIT — (2.9)% | |
| | (4,093 | ) | | General Growth Properties, Inc. | | | (212,427 | ) | |
| | (3,623 | ) | | Global Signal, Inc. | | | (196,729 | ) | |
| | (4,952 | ) | | United Dominion Realty Trust | | | (160,296 | ) | |
| | | | (569,452 | ) | |
| | | Semiconductors & Semiconductor Equipment — (1.0)% | |
| | (5,855 | ) | | Tessera Technologies, Inc.1 | | | (204,398 | ) | |
| | | Software — (3.9)% | |
| | (4,556 | ) | | ANSYS, Inc.1 | | | (209,576 | ) | |
| | (8,070 | ) | | Net 1 UEPS Technologies, Inc.1 | | | (198,764 | ) | |
| | (21,375 | ) | | Opsware, Inc.1 | | | (194,299 | ) | |
| | (3,920 | ) | | Quality Systems, Inc. | | | (166,365 | ) | |
| | | | (769,004 | ) | |
See Notes to Financial Statements.
131
THE GLENMEDE FUND, INC.
Absolute Return Portfolio
SCHEDULE OF PORTFOLIO INVESTMENTS — (Concluded)
October 31, 2006
| Shares | | | | Value | |
| COMMON STOCKS SOLD SHORTt — (Continued) | | | |
| | | Thrifts & Mortgage Finance — (2.0)% | |
| | (14,834 | ) | | Bankatlantic Bancorp, Inc. - Class A | | $ | (194,325 | ) | |
| | (4,785 | ) | | MAF Bancorp, Inc. | | | (206,186 | ) | |
| | | | (400,511 | ) | |
| | | Trading Companies & Distributors — (1.0)% | |
| | (4,763 | ) | | Fastenal Co. | | | (191,663 | ) | |
| | | | | TOTAL COMMON STOCKS SOLD SHORT
(Proceeds $12,644,972) | | | (13,110,907 | ) | |
TOTAL SHORT INVESTMENTS
(Proceeds $12,644,972) | | | (66.1 | )% | | $ | (13,110,907 | ) | |
TOTAL INVESTMENTS
(Cost $6,464,933)3 | | | 32.5 | | | $ | 6,453,850 | | |
| OTHER ASSETS IN EXCESS OF LIABILITIES | | | 67.5 | | | | 13,390,260 | | |
| NET ASSETS | | | 100.0 | % | | $ | 19,844,110 | | |
t Percentages indicated are based on net assets.
1 Non-income producing security.
2 All or a portion of security pledged as collateral for securities sold short.
3 Aggregate cost for federal tax purposes was $19,109,370.
Abbreviation:
REIT — Real Estate Investment Trust
SBA — Small Business Administration
See Notes to Financial Statements.
132
THE GLENMEDE FUND, INC.
Absolute Return Portfolio
INDUSTRY DIVERSIFICATION
On October 31, 2006, industry diversification of the Portfolio was as follows (Unaudited):
| | | % of
Net Assets | | Value | |
| INDUSTRIES: | |
| Long Positions: | |
| Energy Equipment & Services | | | 8.8 | % | | | 1,742,192 | | |
| Electronic Equipment & Instruments | | | 8.2 | | | | 1,621,197 | | |
| Oil, Gas & Consumable Fuels | | | 5.9 | | | | 1,174,777 | | |
| Pharmaceuticals | | | 5.5 | | | | 1,087,578 | | |
| REIT | | | 4.2 | | | | 825,960 | | |
| Machinery | | | 4.2 | | | | 823,296 | | |
| Media | | | 4.1 | | | | 818,462 | | |
| Communications Equipment | | | 4.0 | | | | 800,749 | | |
| Capital Markets | | | 3.9 | | | | 782,308 | | |
| Health Care Providers & Services | | | 3.5 | | | | 689,186 | | |
| Multiline Retail | | | 3.4 | | | | 678,754 | | |
| Insurance | | | 3.2 | | | | 639,763 | | |
| IT Services | | | 3.0 | | | | 589,251 | | |
| Food & Staples Retailing | | | 2.8 | | | | 559,381 | | |
| Specialty Retail | | | 2.7 | | | | 542,351 | | |
| Computers & Peripherals | | | 2.6 | | | | 522,994 | | |
| Hotels, Restaurants & Leisure | | | 2.5 | | | | 502,770 | | |
| Aerospace & Defense | | | 2.3 | | | | 459,308 | | |
| Thrifts & Mortgage Finance | | | 2.2 | | | | 431,905 | | |
| Life Sciences Tools & Services | | | 2.0 | | | | 398,566 | | |
| Semiconductors & Semiconductor Equipment | | | 2.0 | | | | 390,944 | | |
| Diversified Financial Services | | | 1.6 | | | | 318,584 | | |
| Building Products | | | 1.2 | | | | 229,550 | | |
| Air Freight & Logistics | | | 1.0 | | | | 190,136 | | |
| Commercial Services & Supplies | | | 0.9 | | | | 176,541 | | |
| Office Electronics | | | 0.9 | | | | 175,100 | | |
| Commercial Banks | | | 0.8 | | | | 162,426 | | |
| Food Products | | | 0.8 | | | | 161,700 | | |
| Road & Rail | | | 0.8 | | | | 159,617 | | |
| Consumer Finance | | | 0.8 | | | | 155,135 | | |
| Metals & Mining | | | 0.7 | | | | 147,368 | | |
| Internet Software & Services | | | 0.5 | | | | 90,516 | | |
| Short Positions: | |
| Trading Companies & Distributors | | | (1.0 | ) | | | (191,663 | ) | |
| Diversified Financial Services | | | (1.0 | ) | | | (192,799 | ) | |
| Food Products | | | (1.0 | ) | | | (196,390 | ) | |
| Internet & Catalog Retail | | | (1.0 | ) | | | (197,649 | ) | |
| Consumer Finance | | | (1.0 | ) | | | (200,398 | ) | |
| Insurance | | | (1.0 | ) | | | (200,861 | ) | |
| Chemicals | | | (1.0 | ) | | | (201,820 | ) | |
| Semiconductors & Semiconductor Equipment | | | (1.0 | ) | | | (204,398 | ) | |
See Notes to Financial Statements.
133
THE GLENMEDE FUND, INC.
Absolute Return Portfolio
INDUSTRY DIVERSIFICATION — (Continued)
On October 31, 2006, industry diversification of the Portfolio was as follows (Unaudited):
| | | % of
Net Assets | | Value | |
| Multiline Retail | | | (1.0 | )% | | | (206,330 | ) | |
| Pharmaceuticals | | | (1.0 | ) | | | (206,936 | ) | |
| IT Services | | | (1.1 | ) | | | (210,338 | ) | |
| Aerospace & Defense | | | (1.8 | ) | | | (360,695 | ) | |
| Electronic Equipment & Instruments | | | (1.8 | ) | | | (361,766 | ) | |
| Energy Equipment & Services | | | (1.9 | ) | | | (372,487 | ) | |
| Thrifts & Mortgage Finance | | | (2.0 | ) | | | (400,511 | ) | |
| Commercial Banks | | | (2.1 | ) | | | (408,384 | ) | |
| Food & Staples Retailing | | | (2.1 | ) | | | (413,020 | ) | |
| Electrical Equipment | | | (2.1 | ) | | | (414,259 | ) | |
| Internet Software & Services | | | (2.2 | ) | | | (426,268 | ) | |
| Machinery | | | (2.6 | ) | | | (523,305 | ) | |
| REIT | | | (2.9 | ) | | | (569,452 | ) | |
| Hotels, Restaurants & Leisure | | | (2.9 | ) | | | (577,479 | ) | |
| Communications Equipment | | | (2.9 | ) | | | (578,559 | ) | |
| Biotechnology | | | (3.1 | ) | | | (617,556 | ) | |
| Software | | | (3.9 | ) | | | (769,004 | ) | |
| Media | | | (4.0 | ) | | | (800,653 | ) | |
| Capital Markets | | | (4.1 | ) | | | (813,261 | ) | |
| Oil, Gas & Consumable Fuels | | | (12.6 | ) | | | (2,494,666 | ) | |
| TOTAL COMMON STOCKS | | | 24.9 | % | | $ | 4,937,458 | | |
| REPURCHASE AGREEMENT | | | 7.60 | | | | 1,516,392 | | |
| TOTAL INVESTMENTS | | | 32.50 | % | | $ | 6,453,850 | | |
See Notes to Financial Statements.
134
THE GLENMEDE FUND, INC.
Notes to Financial Statements
1. Organization and Significant Accounting Policies
The Glenmede Fund, Inc. (the "Fund") consists of thirteen portfolios: the Government Cash Portfolio, the Tax-Exempt Cash Portfolio, the Core Fixed Income Portfolio, the Strategic Equity Portfolio, the Small Cap Equity Portfolio, the Large Cap Value Portfolio, the International Portfolio, the Philadelphia International Fund, the U.S. Emerging Growth Portfolio, the Large Cap 100 Portfolio, the Large Cap Growth Portfolio, the Absolute Return Portfolio and the Total Market Long/Short Portfolio (each, a "Portfolio" and collectively, the "Portfolios"). The Fund was incorporated in the State of Maryland on June 30, 1988, and is registered with the Securities and Exchange Commission under the Investment Company Act of 1940 (the "1940 Act"), as amended, as an open-end management investment company. Since January 2, 1998, the Small Cap Equity Portfolio has consisted of two classes of shares: the Advisor Class and the Institutional Class. The Absolute Return Portfolio commenced operations on September 29, 2006. The Total Market Long/Short Portfolio commenced operations on December 21, 2006.
The preparation of financial statements in conformity with accounting principles generally accepted in the United States of America requires management to make estimates and assumptions that affect the reported amounts of assets and liabilities and disclosures of contingent assets and liabilities at the date of the financial statements and the reported amounts of revenues and expenses during the reporting period. Actual results could differ from those estimates. The following is a summary of significant accounting policies consistently followed by the Portfolios in the preparation of their financial statements.
Valuation of Securities: As permitted under Rule 2a-7 of the 1940 Act, securities held by the Government Cash and Tax-Exempt Cash Portfolios are valued by the "amortized cost" method of valuation, which approximates current value. Amortized cost valuation involves valuing an instrument at its cost initially and thereafter assuming a constant amortization to maturity of any discount or premium, regardless of the effect of fluctuating interest rates on the market value of the instrument.
Equity securities listed on a United States ("US") securities exchange for which market quotations are readily available are valued at the last quoted sale price as of the close of the exchange's regular trading hours on the day the valuation is made. Price information on listed securities is taken from the exchange where the securities are primarily traded. Securities traded on the NASDAQ System are valued at the NASDAQ Official Closing Price ("NOCP"). Unlisted equity securities and listed securities not traded on the valuation date for which market quotations are readily available are valued at an amount that does not exceed the asked price and is not less than the bid price. Securities listed on a foreign exchange and unlisted foreign securities are valued at the last quoted sales price available before the time when assets are valued.
Bonds and other fixed-income securities are valued at the most recent quoted bid price or, when exchange valuations are used, at the latest quoted sale price on the day of valuation. If there is no such reported sale, the latest quoted bid price is used. In addition, bond and other fixed-income securities may be valued on the basis of prices provided by a pricing service or by using a matrix or formula, when the Portfolio's investment advisor believes such prices reflect the fair market value of such securities. Debt securities purchased by non-money market Portfolios with
135
THE GLENMEDE FUND, INC.
Notes to Financial Statements — (Continued)
remaining maturities of 60 days or less are valued at amortized cost. Securities with remaining maturities exceeding 60 days are valued at their market or fair value until the 61st day prior to maturity and are valued at amortized cost, thereafter.
When market quotations are not readily available or events occur that make established valuation methods unreliable, securities and other assets are valued in a manner that is intended to reflect their fair value as determined in accordance with procedures approved by the Board of Directors of the Fund (the "Board").
Repurchase Agreements: Each Portfolio may engage in repurchase agreement transactions. Under the terms of a typical repurchase agreement, the Portfolio takes possession of an underlying debt obligation subject to an obligation of the seller to repurchase, and the Portfolio to resell the obligation at an agreed-upon price and time, thereby determining the yield during the Portfolio's holding period. This arrangement results in a fixed rate of return that is not subject to market fluctuations during the Portfolio's holding period. The value of the collateral at the time of execution must be at least equal to 102% of the total amount of the repurchase obligations, including interest. In the event of counterparty default, the Portfolio has the right to collect the collateral to offset losses incurred. There is potential loss to the Portfolio in the event the Po rtfolio is delayed or prevented from exercising its rights to dispose of the collateral securities, including the risk of a possible decline in the value of the underlying securities during the period while the Portfolio seeks to assert its rights. The Portfolio's investment advisor, acting under the supervision of the Board, reviews the value of the collateral and the creditworthiness of those banks and dealers with which the Portfolio enters into repurchase agreements to evaluate potential risks.
Forward Foreign Currency Contracts: The International Portfolio, Philadelphia International Fund and Absolute Return Portfolio may enter into forward foreign exchange contracts to hedge currency risk of securities denominated in a foreign currency. Forward foreign exchange contracts are valued at the forward rate and marked-to-market daily. The change in market value is recorded by the Portfolio as an unrealized gain or loss. When the contract is closed, the Portfolio records a realized gain or loss equal to the difference between the value of the contract at the time it was opened and the value at the time it was closed.
The use of forward foreign exchange contracts does not eliminate fluctuations in the underlying prices of the securities, but it does establish a rate of exchange that can be achieved in the future. Although forward foreign currency contracts limit the risk of loss due to a decline in the value of the hedged currency, they also limit any potential gain that might result should the value of the currency increase. In addition, the Portfolios could be exposed to risks if the counterparties to the contracts are unable to meet the terms of their contracts. There were no contracts open as of October 31, 2006.
Foreign Currency Translation: The books and records of each Portfolio are maintained in US dollars. Foreign currencies, investments and other assets and liabilities are translated into US dollars at the exchange rates prevailing at the end of the period, and purchases and sales of investment securities, income and expenses are translated at exchange rates prevailing on the dates of such transactions. Unrealized gains and losses that result from changes in foreign currency exchange rates have been included in the unrealized gains (losses) on foreign currency translations. Net realized foreign currency gains and losses resulting from changes in
136
THE GLENMEDE FUND, INC.
Notes to Financial Statements — (Continued)
exchange rates include foreign currency gains and losses between trade date and settlement date on investment securities transactions, foreign currency transactions and the difference between the amounts of interest and dividends recorded on the books of the Portfolio and the amount actually received. The portion of foreign currency gains and losses related to fluctuation in exchange rates between the purchase settlement date and subsequent sale trade date is included in realized gains and losses on investment transactions.
Foreign Securities: The Strategic Equity Portfolio, Small Cap Equity Portfolio, Large Cap Value Portfolio, U.S. Emerging Growth Portfolio, Large Cap 100 Portfolio, Large Cap Growth Portfolio, International Portfolio, Philadelphia International Fund, Absolute Return Portfolio and Total Market Long/Short Portfolio may invest in foreign securities. Investing in securities of foreign companies and foreign governments involves special risks and considerations not typically associated with investing in securities of US companies and the US Government. These risks include valuation of currencies and future adverse political and economic developments. Moreover, securities of many foreign companies and foreign governments and their markets may be less liquid and their prices more volatile than those of securities of comparable US companies and the US Government. Thi s is particularly true with respect to emerging markets in developing countries.
Reverse Repurchase Agreements: The Government Cash Portfolio, Core Fixed Income Portfolio, Absolute Return Portfolio and Total Market Long/Short Portfolio may enter into reverse repurchase agreements. Under the terms of a reverse repurchase agreement, the Portfolio sells a security subject to an obligation to repurchase the security from the buyer at a later date and price thereby determining the yield during the buyer's holding period. The use of reverse repurchase agreements involves certain risks in that the securities acquired by a Portfolio with the proceeds of such an agreement may decline in value, although the Portfolio is obligated to repay the proceeds. In addition, the market value of the securities sold by a Portfolio may decline below the repurchase price, to which the Portfolio remains committed. In the event the buyer of securities under a re verse repurchase agreement files for bankruptcy or becomes insolvent, the Portfolio's use of the proceeds of the agreement may be restricted pending a determination by the party, or its trustee or receiver, whether to enforce the Portfolio's obligation to repurchase the securities. In entering into reverse repurchase agreements, the Portfolio will maintain cash, US Government securities or other liquid high grade debt obligations at least equal in value to its obligations with respect to reverse repurchase agreements. Under normal circumstances, the Government Cash Portfolio, the Core Fixed Income Portfolio, Absolute Return Portfolio and Total Market Long/Short Portfolio will not enter into reverse repurchase agreements if entering into such agreements would cause more than one-third of the value of their respective total assets to be subject to such agreements at the time of entering into such agreements. There were no open reverse repurchase agreements as of October 31, 2006.
Interest-Only Securities: The Core Fixed Income Portfolio may invest in interest-only securities, which are the interest portions of "stripped" securities. The holders of interest-only securities receive the interest on the underlying security, but no principal payments. While the timing of the interest receipts is known, the amount of interest to be received is not known.
137
THE GLENMEDE FUND, INC.
Notes to Financial Statements — (Continued)
Principal-Only Securities: The Core Fixed Income Portfolio may invest in principal-only securities, which are the principal portions of "stripped" securities. The holders of principal-only securities receive the principal on the underlying security, but no interest payments.
Collateralized Mortgage Obligations: The Core Fixed Income Portfolio may invest in collateralized mortgage obligations, which are backed by a pool of mortgages or mortgage-backed securities. The bonds that form collateralized mortgage obligations are grouped into classes, which have different coupon rates or maturities. The principal cash flows of the underlying pool of mortgages are channeled sequentially into each class.
TBA/When-Issued Purchase Commitments: The Core Fixed Income Portfolio and Absolute Return Portfolio may enter into TBA (to be announced)/when-issued purchase commitments to purchase securities for a fixed price at a future date, typically not exceeding 45 days. TBA purchase commitments may be considered securities in themselves, and involve a risk of loss if the value of the security to be purchased declines prior to settlement date. This risk is in addition to the risk of decline in the value of the Portfolio's other assets.
Options Transactions: The Strategic Equity Portfolio and Absolute Return Portfolio may purchase or write option contracts to hedge against changes in the value of securities the portfolio owns or expects to own. A call option gives the option holder the right to purchase the underlying security at a specified price until a specified date. A put option gives the option holder the right to sell the underlying security at a specified price until a specified date. The risk in writing a covered call option is that the Portfolio may forgo the opportunity of profit if the market price of the underlying security increases and the option is exercised. The risk in writing a put option is that the Portfolio may incur a loss if the market price of the underlying security decreases and the option is exercised. In addition, there is a risk the Portfolio may not be able t o enter into a closing transaction because of an illiquid secondary market or, for over-the-counter options, because of the counterparty's inability to perform. There were no option contracts open or outstanding as of October 31, 2006.
Futures: The Absolute Return Portfolio may enter into futures contracts. A futures contract is an agreement between two parties to buy and sell a security at a set price on a future date and is exchange-traded. Risks of entering into futures contracts include the possibility that there may be an illiquid market or that a change in the value of the contract may not correlate with changes in the value of underlying securities. Upon entering into a contract, the Portfolio deposits and maintains as collateral such initial margin as required by the exchange on which the transaction is effected. Pursuant to the contract, the Portfolio agrees to receive from or pay to the broker an amount of cash equal to the daily fluctuation in value of the contract. Such receipts or payments are known as variation margin and are recorded by the Portfolio as unrealized gains or losses. When the contract is closed, the Portfolio records a realized gain or loss equal to the difference between the value of the contract at the time it was opened and the value at the time it was closed. Futures contracts are valued at the settlement price established each day by the board of trade or exchange on which they are traded. There were no open futures contracts outstanding at October 31, 2006.
Lending of Portfolio Securities: Each Portfolio, using Investors Bank & Trust Company ("IBT") as its lending agent, may loan securities to qualified brokers and
138
THE GLENMEDE FUND, INC.
Notes to Financial Statements — (Continued)
dealers in exchange for negotiated lenders' fees. These fees are disclosed as "Income from security lending" in the Statement of Operations, net of expenses retained by IBT as compensation for its services as lending agent. Each applicable Portfolio receives cash collateral, which is invested by the lending agent in short-term money market instruments, in an amount at least equal to the current market value of the loaned securities. Information regarding the value of the securities loaned and the value of the collateral at period end is included in a footnote at the end of each applicable Portfolio's Statement of Assets and Liabilities and Schedule of Portfolio Investments. Although risk is mitigated by the collateral, a Portfolio could experience a delay in recovering its securities and a possible loss of income or value if the borrower fails to return the securities when due.
Swap Agreements: The Absolute Return Portfolio may enter into swap agreements for hedging purposes or to seek to increase total return. In a standard swap transaction, two parties agree to pay or exchange the returns (or differentials in rates of return) earned or realized on particular assets, which may be adjusted for transaction costs, interest payments, dividends paid on the referenced assets or other factors. There were no open swap agreements as of October 31, 2006.
Swap agreements are subject to the risk that the swap counterparty will default on its obligations. If such a default occurs, the Portfolio will have to rely on its contractual remedies (which may be limited by bankruptcy, insolvency or similar laws) pursuant to the agreements related to the transaction.
Securities Sold Short: The Absolute Return Portfolio and Total Market Long/Short Portfolio may engage in short sales which are sales by the Portfolio of securities which have been borrowed from a third party on the expectation that the market price will drop. If the price of the securities declines, the Portfolio will make a profit by purchasing the securities in the open market at a lower price than the one at which it sold the securities. If the price of the securities increases, the Portfolio may have to cover its short positions at a higher price than the short sale price, resulting in a loss. Gains are limited to the price at which the Portfolios sold the security short, while losses are potentially unlimited in size. Proceeds received from short sales may be maintained by a broker as collateral. Such proceeds are included in the "Cash collateral on de posit at broker" on the Statement of Assets and Liabilities. The Portfolio is required to maintain a segregated account of cash, cash equivalents or other appropriate liquid marketable securities with the custodian in at least an amount equal to the current market value of the securities sold short (less any additional collateral held by the broker) until the Portfolio replaces a borrowed security. Depending on arrangements made with the broker or custodian, the Portfolio may not receive any payments (including interest) on the deposits made with the broker or custodian. The Portfolio is liable to the buyer for any dividends payable on securities while those securities are in a short position. These dividends are recorded as an expense of the Portfolio. As of October 31, 2006, the Absolute Return Portfolio had pledged securities in the amount of $15,140,832 and cash in the amount of $13,099,197 to Goldman Sachs & Co as collateral for short sales.
Exchange-traded Funds: The Absolute Return Portfolio may invest in shares of registered investment companies, including exchange-traded funds ("ETFs"). An ETF seeks to track the performance of a particular market index. These indices include both broad-market indices and more narrowly-based indices, including those relating to particular sectors, markets, regions, or industries. ETF shares are traded
139
THE GLENMEDE FUND, INC.
Notes to Financial Statements — (Continued)
like traditional equity securities on a national securities exchange or NASDAQ National Market System.
Securities Transactions and Investment Income: Securities transactions are recorded as of the trade date. Realized gains and losses on investments sold are computed on the basis of identified cost. Dividend income and distributions to shareholders are recorded on the ex-dividend date. Dividend income for foreign securities is recorded on the ex-dividend date except that certain dividends from foreign securities are recorded as soon thereafter as the Portfolio is informed of the ex-dividend date. Interest income is recorded on the accrual basis and includes amortization of premiums and accretion of discounts when appropriate.
Securities purchased or sold on a when-issued or delayed-delivery basis may be settled a month or more after the trade date. Interest income is accrued based on the terms of the security. Each Portfolio segregates assets with a current value at least equal to the amount of its when-issued purchase commitments. When-issued purchase commitments involve a risk of loss if the value of the security to be purchased declines prior to settlement date, or if the counterparty does not perform under the contract.
Dividends and Distributions to Shareholders: Dividends from net investment income, if any, of the Government Cash and Tax-Exempt Cash Portfolios are declared each day the Portfolios are open for business and are paid monthly. Dividends from net investment income, if any, of the Core Fixed Income Portfolio are declared and paid monthly. Dividends from net investment income, if any, of the Strategic Equity, Small Cap Equity, Large Cap Value, International, Philadelphia International, U.S. Emerging Growth, Large Cap 100, Large Cap Growth, Absolute Return and Total Market Long/Short Portfolios are declared and paid quarterly. The Portfolios distribute any net realized capital gains on an annual basis. Additional distributions of net investment income and capital gains for each Portfolio may be made at the discretion of the Board in order to avoid a nondeductibl e excise tax under Section 4982 of the Internal Revenue Code, as amended.
Income and capital gains distributions are determined in accordance with income tax regulations which may differ from accounting principles generally accepted in the United States of America. These differences are primarily due to differing treatments of income and gains on various investment securities held by each Portfolio, timing differences and differing characterization of distributions made by each Portfolio.
Income and Expense Allocation: Expenses which are not readily identifiable to a specific Portfolio are allocated among Portfolios taking into consideration, among other things, the nature and type of expenses and the relative size of the Portfolios. Investment income, realized and unrealized gains and losses, and certain fund-level expenses are borne pro rata on the basis of relative net assets by the holders of all classes of shares, except that each class bears certain expenses unique to that class such as shareholder servicing fees, and certain other class-specific expenses. Differences in class-level expenses may result in payment of different per share dividends by class.
Federal Income Taxes: Each Portfolio intends to qualify as a regulated investment company by complying with the requirements of the Internal Revenue Code applicable to regulated investment companies and by distributing substantially all of its taxable income to its shareholders. Therefore, no Federal income tax provision is required. Income distributions and capital gain distributions are determined in
140
THE GLENMEDE FUND, INC.
Notes to Financial Statements — (Continued)
accordance with income tax regulations which may differ from accounting principles generally accepted in the United States of America. These differences are primarily due to differing treatments for amortized premiums, expired net capital loss carryforwards, redemptions in kind, foreign currency transactions, market discounts, net operating losses and nontaxable dividends.
On October 31, 2006, the tax year end of the Fund, the following Portfolios had available capital loss carryforwards to be utilized in the current period to offset future net capital gains through the indicated expiration dates as follows:
| | | Expiring October 31, | |
| Portfolio | | 2007 | | 2008 | | 2009 | | 2010 | | 2011 | | 2012 | |
| Government Cash Portfolio | | $ | — | | | $ | — | | | $ | — | | | $ | 4,173 | | | $ | — | | | $ | — | | |
| Tax-Exempt Cash Portfolio | | | 7,168 | | | | — | | | | 128,382 | | | | — | | | | — | | | | — | | |
| Core Fixed Income Portfolio | | | — | | | | 2,650,905 | | | | — | | | | — | | | | — | | | | — | | |
| U.S. Emerging Growth Portfolio | | | — | | | | — | | | | 1,343,148 | | | | 427,605 | | | | 427,605 | | | | — | | |
| Absolute Return Portfolio | | | — | | | | — | | | | — | | | | — | | | | — | | | | — | | |
| | | Expiring October 31, | |
| Portfolio | | 2013 | | 2014 | |
| Government Cash Portfolio | | $ | — | | | $ | — | | |
| Tax-Exempt Cash Portfolio | | | — | | | | — | | |
| Core Fixed Income Portfolio | | | — | | | | 435,604 | | |
| U.S. Emerging Growth Portfolio | | | — | | | | — | | |
| Absolute Return Portfolio | | | — | | | | 86,081 | | |
As of October 31, 2006, substantially all the losses reflected above for U.S. Emerging Growth Portfolio are subject to certain IRS limitations.
During the year ended October 31, 2006, the following Portfolios utilized capital loss carryforwards of the following:
| U.S. Emerging Growth Portfolio | | $ | 74,775 | | |
| Large Cap Growth Portfolio | | | 77,452 | | |
As of October 31, 2006, the tax year end of the Fund, the components of distributable earnings on a tax basis were as follows:
| Portfolio | | Undistributed
Tax-exempt
Income | | Undistributed
Ordinary
Income | | Undistributed
Long-Term
Gain | | Total*
Distributable
Earnings | |
Government
Cash Portfolio | | $ | — | | | $ | 2,874,422 | | | $ | — | | | $ | 2,870,249 | | |
Tax-Exempt
Cash Portfolio | | | 1,947,331 | | | | — | | | | — | | | | 1,811,781 | | |
Core Fixed
Income Portfolio | | | — | | | | 759,139 | | | | — | | | | (2,117,875 | ) | |
Strategic
Equity Portfolio | | | — | | | | 13,486 | | | | — | | | | 14,732,312 | | |
Small Cap
Equity Portfolio | | | — | | | | — | | | | — | | | | 53,798,556 | | |
141
THE GLENMEDE FUND, INC.
Notes to Financial Statements — (Continued)
Portfolio | | Undistributed
Tax-exempt
Income | | Undistributed
Ordinary
Income | | Undistributed
Long-Term
Gain | | Total*
Distributable
Earnings | |
Large Cap
Value Portfolio | | $ | — | | | $ | 2,835 | | | $ | — | | | $ | 5,671,938 | | |
| International Portfolio | | | — | | | | 3,980,814 | | | | 406,570 | | | | 277,597,007 | | |
Philadelphia
International Fund | | | — | | | | 4,664,928 | | | | 178,745 | | | | 142,847,752 | | |
U.S. Emerging
Growth Portfolio | | | — | | | | — | | | | — | | | | 2,949,496 | | |
| Large Cap 100 Portfolio | | | — | | | | 656 | | | | — | | | | 12,704,768 | | |
Large Cap
Growth Portfolio | | | — | | | | — | | | | — | | | | 4,653,533 | | |
| Absolute Return Portfolio | | | — | | | | 38,239 | | | | — | | | | (58,390 | ) | |
* Total Distributable Earnings are additionally comprised of Net Unrealized Appreciation/(Depreciation) and Capital Loss Carryforwards, which are shown elsewhere in the Notes to Financial Statements.
For the year ended October 31, 2006, Government Cash and Tax-Exempt Cash Portfolios' components of distributable earnings on a tax basis were equal to the components of distributable earnings on a book basis.
2. Investment Advisory Fee, Administration Fee and Other Related Party Transactions
Glenmede Advisers, Inc. (the "Advisor"), a wholly-owned subsidiary of The Glenmede Trust Company, N.A. ("Glenmede Trust"), serves as investment advisor to the Strategic Equity, Large Cap Value, International, Government Cash, Tax-Exempt Cash, Core Fixed Income, Small Cap Equity, U.S. Emerging Growth, Large Cap 100, Large Cap Growth, Absolute Return and Total Market Long/Short Portfolios, pursuant to investment management agreements with the Fund. Under these agreements, the Advisor manages the Portfolios, subject to the general supervision of the Board.
The Government Cash and Tax-Exempt Cash Portfolios do not pay a management fee for advisory services. Glenmede Trust charges a fee directly to its clients, the investors in the Portfolios are the clients of Glenmede Trust, for fiduciary, trust and/or advisory services. The actual annual fees charged vary dependent on a number of factors, including the particular services provided to the client and are generally 1.25% or less of the clients' assets under management. The Small Cap Equity, Strategic Equity, Large Cap Value, U.S. Emerging Growth, Large Cap 100 and Large Cap Growth Portfolios each pay the Advisor management fees at the annual rate of 0.55% of such Portfolio's average daily net assets. The Core Fixed Income and International Portfolios pay the Advisor management fees at the annual rate of 0.35% and 0.75%, respectively, of such Portfolio's average daily net assets. Prior to August 1, 2005, the Advisor was not entitled to receive an y management fees from the Strategic Equity, Large Cap Value, International, Core Fixed Income, Small Cap Equity, U.S. Emerging Growth, Large Cap 100 and Large Cap Growth Portfolios. With respect to the International Portfolio, the Advisor voluntarily waived its management fee prior to January 1, 2006.
The Absolute Return Portfolio and Total Market Long/Short Portfolios pay the Advisor a management fee at the annual rate of 1.20% of such Portfolio's average daily net assets. The Advisor has contractually agreed to waive a portion of its
142
THE GLENMEDE FUND, INC.
Notes to Financial Statements — (Continued)
management fees so that after giving effect to such contractual waiver, the management fee will be 0.75%. The Advisor has also contractually agreed to waive an additional portion of its management fees and/or reimburse the Portfolios to the extent that total annual Portfolio operating expenses, as a percentage of the Portfolio's average net assets, exceed 1.25% (excluding short-sale dividends, prime broker interest, brokerage commissions, taxes, interest and extraordinary expenses). The Advisor has contractually agreed to these waivers and/or reimbursements until at least October 31, 2007. Shareholders of the Portfolios will be notified if the waivers/reimbursements are discontinued after that date.
Philadelphia International Advisors, LP ("PIA"), a limited partnership in which Glenmede Trust is a limited partner, serves as investment advisor to the Philadelphia International Fund. The Philadelphia International Fund pays a management fee to PIA at the annual rate of 0.75% of the Portfolio's average daily net assets. PIA has agreed to waive its fees to the extent necessary to ensure that the Portfolio's total operating expenses do not exceed 1.00% of the Portfolio's average net assets. No management fees were waived for the year ended October 31, 2006.
PIA also serves as investment sub-advisor to the International Portfolio. The Advisor has agreed to pay PIA a fee for its sub-investment services to the International Portfolio, calculated daily and payable monthly, at the annual rate of 0.26% of the Portfolio's average daily net assets. PIA voluntarily waived its sub-advisory fee prior to January 1, 2006.
The Institutional Class of Small Cap Equity Portfolio pays Glenmede Trust a shareholder servicing fee at the annual rate of 0.05% of such Portfolio's average daily net assets. The Government Cash, Tax-Exempt Cash and Core Fixed Income Portfolios each pay Glenmede Trust a shareholder servicing fee at the annual rate of 0.10% of such Portfolio's average daily net assets. Strategic Equity, Large Cap Value, Large Cap 100, Large Cap Growth, Absolute Return and Total Market Long/Short Portfolios each pay Glenmede Trust a shareholder servicing fee at the annual rate of 0.20% of such Portfolio's average daily net assets. The International, U.S. Emerging Growth Portfolios and the Advisor Class of Small Cap Equity Portfolio each pay Glenmede Trust a shareholder servicing fee at the annual rate of 0.25% of such Portfolio's average daily net assets. The Philadelphia International Fund is not subject to a shareholder servicing plan and, accordingly, pays no shareholder servicing fee. The Advisor, Glenmede Trust and/or PIA may pay additional compensation out of their assets to selected institutions and other persons in connection with selling of shares and/or the servicing of Portfolio shareholders and other accounts managed by the Advisor, Glenmede Trust, or PIA.
IBT serves as administrator, transfer agent, dividend-paying agent and custodian with respect to the Fund. The Fund pays IBT a fee based on the combined aggregate average daily net assets of the Portfolios and The Glenmede Portfolios, a registered investment company. The fee is computed daily and paid monthly. IBT is also paid an annual fee plus out-of pocket expenses for the provision of personnel and services related to the Fund's compliance program. The Fund's Chief Compliance Officer holds the position of Senior Director at IBT.
Quasar Distributors, LLC serves as distributor of the Portfolios' shares. The distributor receives no fees from the Fund in connection with distribution services provided to the Fund.
143
THE GLENMEDE FUND, INC.
Notes to Financial Statements — (Continued)
The Fund pays each Board member an annual fee of $24,000 plus $1,250 for each Board meeting attended and out-of-pocket expenses incurred in attending Board meetings and the Audit Committee Chairman receives an annual fee of $2,000 for his services as Chairman of the Audit Committee. Effective January 1, 2007, the annual fee will increase to $34,000.
Expenses for the year ended October 31, 2006 include legal fees paid to Drinker Biddle & Reath LLP. A partner of the law firm is Secretary of the Fund.
3. Purchases and Sales of Securities
For the year ended October 31, 2006, cost of purchases and proceeds from sales of investment securities other than US Government securities and short-term securities were:
| Portfolio | | Purchases | | Sales | |
| Core Fixed Income Portfolio | | $ | 26,075,860 | | | $ | 14,636,743 | | |
| Strategic Equity Portfolio | | | 69,997,923 | | | | 74,447,316 | | |
| Small Cap Equity Portfolio | | | 147,538,853 | | | | 175,593,184 | | |
| Large Cap Value Portfolio | | | 50,446,908 | | | | 34,496,525 | | |
| International Portfolio | | | 398,853,628 | | | | 489,433,212 | | |
| Philadelphia International Fund | | | 456,517,631 | | | | 364,687,438 | | |
| U.S. Emerging Growth Portfolio | | | 49,419,114 | | | | 32,345,226 | | |
| Large Cap 100 Portfolio | | | 112,836,588 | | | | 70,187,856 | | |
| Large Cap Growth Portfolio | | | 47,760,701 | | | | 31,445,461 | | |
| Absolute Return Portfolio | | | 20,333,932 | | | | 15,298,997 | | |
For the year ended October 31, 2006, cost of purchases and proceeds from sales of long-term US Government securities were:
| Portfolio | | Purchases | | Sales | |
| Core Fixed Income Portfolio | | $ | 466,561,627 | | | $ | 481,921,956 | | |
As of October 31, 2006, aggregate gross unrealized appreciation for all securities in which there was an excess of value over tax cost and aggregate gross unrealized depreciation for all securities in which there was an excess of tax cost over value were as follows:
| Portfolio | | Appreciation | | Depreciation | | Net | |
| Core Fixed Income Portfolio | | $ | 1,812,633 | | | $ | 1,603,138 | | | $ | 209,495 | | |
| Strategic Equity Portfolio | | | 15,169,024 | | | | 450,198 | | | | 14,718,826 | | |
| Small Cap Equity Portfolio | | | 60,870,386 | | | | 7,071,830 | | | | 53,798,556 | | |
| Large Cap Value Portfolio | | | 5,853,182 | | | | 184,079 | | | | 5,669,103 | | |
| International Portfolio | | | 281,765,858 | | | | 8,569,113 | | | | 273,196,745 | | |
| Philadelphia International Fund | | | 141,381,769 | | | | 3,391,536 | | | | 137,990,233 | | |
| U.S. Emerging Growth Portfolio | | | 5,816,647 | | | | 668,793 | | | | 5,147,854 | | |
| Large Cap 100 Portfolio | | | 14,009,855 | | | | 1,305,743 | | | | 12,704,112 | | |
| Large Cap Growth Portfolio | | | 5,140,591 | | | | 487,058 | | | | 4,653,533 | | |
| Absolute Return Portfolio | | | 631,117 | | | | 641,665 | | | | (10,548 | ) | |
144
THE GLENMEDE FUND, INC.
Notes to Financial Statements — (Continued)
4. Common Stock
Since the Government Cash Portfolio and the Tax-Exempt Cash Portfolio have sold shares, issued shares as reinvestments of dividends, and redeemed shares only at a constant net asset value of $1.00 per share, the number of shares represented by such sales, reinvestments and redemptions is the same as the amounts shown below for such transactions. Changes in the capital shares outstanding were as follows:
| | | Year Ended
10/31/06 | | Year Ended
10/31/05 | |
| Government Cash Portfolio: | |
| Sold | | $ | 3,837,388,847 | | | $ | 3,527,623,383 | | |
| Issued as reinvestment of dividends | | | 109,305 | | | | 63,389 | | |
| Redeemed | | | (3,822,266,956 | ) | | | (3,378,130,704 | ) | |
| Net increase | | $ | 15,231,196 | | | $ | 149,556,068 | | |
| Tax-Exempt Cash Portfolio: | |
| Sold | | $ | 2,250,504,341 | | | $ | 2,028,202,215 | | |
| Redeemed | | | (2,096,873,550 | ) | | | (2,006,659,782 | ) | |
| Net increase | | $ | 153,630,791 | | | $ | 21,542,433 | | |
| | | Year Ended
10/31/06 | | Year Ended
10/31/05 | |
| | | Shares | | Amount | | Shares | | Amount | |
| Core Fixed Income Portfolio: | |
| Sold | | | 1,946,607 | | | $ | 20,500,143 | | | | 1,916,315 | | | $ | 20,743,306 | | |
Issued as reinvestment
of dividends | | | 78,545 | | | | 823,840 | | | | 67,008 | | | | 724,588 | | |
| Redeemed | | | (1,684,115 | ) | | | (17,680,393 | ) | | | (1,408,020 | ) | | | (15,265,710 | ) | |
| Net increase | | | 341,037 | | | $ | 3,643,590 | | | | 575,303 | | | $ | 6,202,184 | | |
| Strategic Equity Portfolio: | |
| Sold | | | 665,091 | | | $ | 11,874,604 | | | | 1,179,214 | | | $ | 20,183,218 | | |
Issued as reinvestment
of dividends | | | 341,160 | | | | 6,080,483 | | | | 92,490 | | | | 1,547,749 | | |
| Redeemed | | | (902,316 | ) | | | (16,183,139 | ) | | | (688,350 | ) | | | (11,818,953 | ) | |
| Net increase | | | 103,935 | | | $ | 1,771,948 | | | | 583,354 | | | $ | 9,912,014 | | |
| Small Cap Equity Portfolio (Advisor Class): | |
| Sold | | | 934,695 | | | $ | 17,158,384 | | | | 901,465 | | | $ | 17,289,911 | | |
Issued as reinvestment
of dividends | | | 2,096,107 | | | | 34,819,333 | | | | 1,316,233 | | | | 21,635,867 | | |
| Redeemed | | | (2,332,330 | ) | | | (43,162,866 | ) | | | (2,793,735 | ) | | | (53,445,280 | ) | |
| Redemptions in-kind | | | (910,552 | ) | | | (17,000,000 | ) | | | — | | | | — | | |
| Net decrease | | | (212,080 | ) | | $ | (8,185,149 | ) | | | (576,037 | ) | | $ | (14,519,502 | ) | |
145
THE GLENMEDE FUND, INC.
Notes to Financial Statements — (Continued)
| | | Year Ended
10/31/06 | | Year Ended
10/31/05 | |
| | | Shares | | Amount | | Shares | | Amount | |
| Small Cap Equity Portfolio (Institutional Class): | |
| Sold | | | — | | | $ | — | | | | — | | | $ | — | | |
Issued as reinvestment
of dividends | | | 11 | | | | 191 | | | | 10 | | | | 170 | | |
| Redeemed | | | — | | | | — | | | | — | | | | — | | |
| Net increase | | | 11 | | | $ | 191 | | | | 10 | | | $ | 170 | | |
| Large Cap Value Portfolio: | |
| Sold | | | 1,974,139 | | | $ | 21,506,039 | | | | 831,167 | | | $ | 9,155,008 | | |
Issued as reinvestment
of dividends | | | 217,661 | | | | 2,415,808 | | | | 272,644 | | | | 2,775,160 | | |
| Redeemed | | | (425,492 | ) | | | (4,684,235 | ) | | | (793,475 | ) | | | (8,775,258 | ) | |
| Net increase | | | 1,766,308 | | | $ | 19,237,612 | | | | 310,336 | | | $ | 3,154,910 | | |
| International Portfolio: | |
| Sold | | | 2,867,069 | | | $ | 58,857,503 | | | | 11,135,881 | | | $ | 204,387,029 | | |
Issued as reinvestment
of dividends | | | 5,660,829 | | | | 110,914,978 | | | | 4,520,055 | | | | 79,517,907 | | |
| Redeemed | | | (7,302,083 | ) | | | (150,141,971 | ) | | | (19,306,736 | ) | | | (364,450,187 | ) | |
| Redemptions in-kind | | | — | | | | — | | | | (27,892,008 | ) | | | (522,738,490 | ) | |
| Net increase (decrease) | | | 1,225,815 | | | $ | 19,630,510 | | | | (31,542,808 | ) | | $ | (603,283,741 | ) | |
| Philadelphia International Fund: | |
| Sold | | | 11,015,536 | | | $ | 228,601,786 | | | | 12,792,450 | | | $ | 222,449,378 | | |
Issued as reinvestment
of dividends | | | 2,578,058 | | | | 51,218,930 | | | | 1,363,126 | | | | 23,513,067 | | |
| Redeemed | | | (5,594,147 | ) | | | (114,177,502 | ) | | | (5,955,503 | ) | | | (103,014,786 | ) | |
| Redemptions in-kind | | | (19,344,375 | ) | | | (417,838,495 | ) | | | — | | | | — | | |
| Net increase (decrease) | | | (11,344,928 | ) | | $ | (252,195,281 | ) | | | 8,200,073 | | | $ | 142,947,659 | | |
| U.S. Emerging Growth Portfolio: | |
| Sold | | | 3,109,513 | | | $ | 21,728,626 | | | | 947,286 | | | $ | 5,576,852 | | |
| Redeemed | | | (622,748 | ) | | | (4,402,313 | ) | | | (12,950,747 | ) | | | (74,316,964 | ) | |
| Net increase (decrease) | | | 2,486,765 | | | $ | 17,326,313 | | | | (12,003,461 | ) | | $ | (68,740,112 | ) | |
| Large Cap 100 Portfolio: | |
| Sold | | | 4,117,094 | | | $ | 50,371,917 | | | | 2,844,614 | | | $ | 31,537,126 | | |
Issued as reinvestment
of dividends | | | 120,022 | | | | 1,562,344 | | | | 34,509 | | | | 382,030 | | |
| Redeemed | | | (611,789 | ) | | | (7,556,555 | ) | | | (236,629 | ) | | | (2,604,637 | ) | |
| Net increase | | | 3,625,327 | | | $ | 44,377,706 | | | | 2,642,494 | | | $ | 29,314,519 | | |
| Large Cap Growth Portfolio: | |
| Sold | | | 1,576,676 | | | $ | 19,177,705 | | | | 1,001,509 | | | $ | 10,841,504 | | |
Issued as reinvestment
of dividends | | | 36,994 | | | | 479,288 | | | | 86 | | | | 947 | | |
| Redeemed | | | (244,657 | ) | | | (2,922,098 | ) | | | (110,875 | ) | | | (1,185,047 | ) | |
| Net increase | | | 1,369,013 | | | $ | 16,734,895 | | | | 890,720 | | | $ | 9,657,404 | | |
146
THE GLENMEDE FUND, INC.
Notes to Financial Statements — (Continued)
| | | Year Ended
10/31/06 | | Year Ended
10/31/05 | |
| | | Shares | | Amount | | Shares | | Amount | |
| Absolute Return Portfolio1: | |
| Sold | | | 1,985,638 | | | $ | 19,902,500 | | | | — | | | $ | — | | |
| Net increase | | | 1,985,638 | | | $ | 19,902,500 | | | | — | | | $ | — | | |
1 The Absolute Return Portfolio commenced operations on September 29, 2006.
As of October 31, 2006, with the exception of the Philadelphia International Fund, Glenmede Trust, on behalf of its clients, holds of record and has voting and/or investment authority over substantially all of the Portfolios' outstanding shares. The following Portfolios have shareholders which, to the Fund's knowledge, own beneficially 10% or more of the shares outstanding of the Portfolio as of October 31, 2006. The total percentage of the shares of a Portfolio held by such shareholders is as follows:
| | | 10% or Greater Shareholders | |
| Portfolio | | # of
Shareholders | | % of
Shares Held | |
| Government Cash Portfolio | | | 1 | | | | 18 | % | |
| Core Fixed Income Portfolio | | | 1 | | | | 26 | % | |
| Small Cap Equity Portfolio (Advisor Class) | | | 1 | | | | 24 | % | |
| Small Cap Equity Portfolio (Institutional Class) | | | 1 | | | | 100 | % | |
| Large Cap Value Portfolio | | | 2 | | | | 23 | % | |
| International Portfolio | | | 1 | | | | 31 | % | |
| Large Cap Growth Portfolio | | | 1 | | | | 11 | % | |
| Absolute Return Portfolio | | | 1 | | | | 10 | % | |
5. Lending of Portfolio Securities
As of October 31, 2006, the following Portfolios had outstanding loans of securities to certain approved brokers for which the Portfolios received collateral:
| Portfolio | | Market Value of
Loaned Securities | | Market Value of
Collateral | | % of Total
Assets
on Loan | |
| Core Fixed Income Portfolio | | $ | 21,682,235 | | | $ | 22,221,438 | | | | 8.73 | | |
| Strategic Equity Portfolio | | | 16,573,990 | | | | 17,096,815 | | | | 16.14 | | |
| Small Cap Equity Portfolio | | | 52,838,161 | | | | 54,641,285 | | | | 18.08 | | |
| Large Cap Value Portfolio | | | 3,789,850 | | | | 3,932,517 | | | | 7.29 | | |
| International Portfolio | | | 2,181,358 | | | | 2,307,888 | | | | 0.23 | | |
| Philadelphia International Fund | | | 588,264 | | | | 622,386 | | | | 0.12 | | |
| U.S. Emerging Growth Portfolio | | | 9,623,468 | | | | 9,970,162 | | | | 21.38 | | |
| Large Cap 100 Portfolio | | | 9,817,971 | | | | 10,107,142 | | | | 8.49 | | |
6. Recently Issued Accounting Pronouncement
In June 2006, the Financial Accounting Standards Board ("FASB") issued FASB Interpretation No. 48, ("FIN 48") "Accounting for Uncertainty in Income Taxes — an
147
THE GLENMEDE FUND, INC.
Notes to Financial Statements — (Concluded)
interpretation of FASB Statement No. 109". FIN 48 clarifies the accounting for uncertainty in income taxes recognized in accordance with FASB Statement No. 109, "Accounting for Income Taxes." This interpretation prescribes a recognition threshold and measurement attribute for the financial statement recognition and measurement of a tax position taken or expected to be taken in a tax return. It also provides guidance on de-recognition, classification, interest and penalties, accounting in interim periods, disclosure and transition. FIN 48 is effective for fiscal years beginning after December 15, 2006. The Fund is currently evaluating the impact of applying the various provisions of FIN 48.
In September 2006, the Financial Accounting Standards Board (FASB) issued Statement of Financial Accounting Standards No. 157, "Fair Value Measurements" (SFAS No. 157). SFAS No. 157 defines fair value, establishes a framework for measuring fair value in accordance with generally accepted accounting principles and expands disclosure about fair value measurements. SFAS No. 157 is effective for fiscal years beginning after November 15, 2007. Management is currently evaluating the impact the adoption of SFAS No. 157 will have on the Fund's financial statement disclosures.
7. Subsequent Event
Glenmede Investment Management LP ("GIM"), a newly formed limited partnership wholly-owned by The Glenmede Trust Company, N.A., will become the investment adviser to the Absolute Return, Core Fixed Income, Government Cash, International, Large Cap Growth, Large Cap 100, Large Cap Value, U.S. Emerging Growth, Small Cap Equity, Strategic Equity, Tax-Exempt Cash and Total Market Long/Short Portfolios (the "Portfolios") on January 1, 2007. Prior thereto, investment advisory services have been provided by Glenmede Trust's wholly-owned subsidiary, Glenmede Advisers, Inc. ("Glenmede Advisers"). As of January 1, 2007, Glenmede Advisers and GIM are merging, and GIM will succeed to Glenmede Advisers' investment adviser registration, acquire all of Glenmede Advisers' assets and liabilities and undertake all rights, obligations and responsibilities of Glenmede Advisers under the Portfolios' Investment Advisory Agreements and Sub-Investment Advisory Agre ement. Management personnel of Glenmede Advisers responsible for providing investment advisory services to the Portfolios under the Investment Advisory Agreements, including the portfolio managers and the supervisory personnel, will be employees of GIM, where they will continue to provide such services for the Portfolios. Therefore, management of the Portfolios will not be affected by this change.
148
REPORT OF INDEPENDENT REGISTERED PUBLIC ACCOUNTING FIRM
To the Board of Directors of The Glenmede Fund, Inc. and Shareholders of Government Cash Portfolio, Tax-Exempt Cash Portfolio, Core Fixed Income Portfolio, Strategic Equity Portfolio, Small Cap Equity Portfolio, Large Cap Value Portfolio, International Portfolio, Philadelphia International Fund, U.S. Emerging Growth Portfolio, Large Cap 100 Portfolio, Large Cap Growth Portfolio and Absolute Return Portfolio:
In our opinion, the accompanying statements of assets and liabilities, including the schedules of portfolio investments, and the related statements of operations and of changes in net assets and the financial highlights present fairly, in all material respects, the financial position of Government Cash Portfolio, Tax-Exempt Cash Portfolio, Core Fixed Income Portfolio, Strategic Equity Portfolio, Small Cap Equity Portfolio, Large Cap Value Portfolio, International Portfolio, Philadelphia International Fund, U.S. Emerging Growth Portfolio, Large Cap 100 Portfolio, Large Cap Growth Portfolio and Absolute Return Portfolio (constituting The Glenmede Fund, Inc., hereafter referred to as the "Fund") at October 31, 2006, the results of each of their operations for the periods then ended, the changes in each of their net assets for each of the periods indicated, and the financial highlights for each of the periods indicated, in conformity with accoun ting principles generally accepted in the United States of America. These financial statements and financial highlights (hereafter referred to as "financial statements") are the responsibility of the Fund's management. Our responsibility is to express an opinion on these financial statements based on our audits. We conducted our audits of these financial statements in accordance with the standards of the Public Company Accounting Oversight Board (United States). Those standards require that we plan and perform the audit to obtain reasonable assurance about whether the financial statements are free of material misstatement. An audit includes examining, on a test basis, evidence supporting the amounts and disclosures in the financial statements, assessing the accounting principles used and significant estimates made by management, and evaluating the overall financial statement presentation. We believe that our audits, which included confirmation of securities at October 31, 2006 by correspondence with the cust odian and brokers, provide a reasonable basis for our opinion.

PricewaterhouseCoopers LLP
Boston, Massachusetts
December 22, 2006
149
THE GLENMEDE PORTFOLIOS
STATEMENTS OF ASSETS AND LIABILITIES
October 31, 2006
| | | Muni
Intermediate
Portfolio | | New Jersey
Muni
Portfolio | |
| Assets: | |
| Investments1: | |
| Investments at value | | $ | 22,026,386 | | | $ | 16,564,415 | | |
| Cash | | | 389,981 | | | | 73,422 | | |
| Interest receivable | | | 291,636 | | | | 226,287 | | |
| Prepaid expenses | | | 863 | | | | 1,187 | | |
| Total assets | | | 22,708,866 | | | | 16,865,311 | | |
| Liabilities: | |
| Payable for fund shares redeemed | | | — | | | | 59,289 | | |
| Payable for securities purchased | | | 270,753 | | | | — | | |
| Payable for Trustees' fees | | | 4 | | | | 15 | | |
| Accrued expenses | | | 7,793 | | | | 6,645 | | |
| Total liabilities | | | 278,550 | | | | 65,949 | | |
| Net Assets | | $ | 22,430,316 | | | $ | 16,799,362 | | |
| Net Assets consist of: | |
| Par value ($0.001 of shares outstanding) | | | 2,159 | | | | 1,639 | | |
| Paid-in capital in excess of par value | | | 22,147,634 | | | | 16,478,457 | | |
| Undistributed net investment income | | | 69,027 | | | | 55,309 | | |
Accumulated net realized gain (loss) from
investment transactions | | | (55,217 | ) | | | (1,596 | ) | |
| Net unrealized appreciation (depreciation) on investments | | | 266,713 | | | | 265,553 | | |
| Total Net Assets | | | 22,430,316 | | | | 16,799,362 | | |
| Shares Outstanding | | | 2,159,252 | | | | 1,639,242 | | |
| Net Asset Value Per Share | | $ | 10.39 | | | $ | 10.25 | | |
| 1 Investments at cost | | $ | 21,759,673 | | | $ | 16,298,862 | | |
See Notes to Financial Statements.
150
THE GLENMEDE PORTFOLIOS
STATEMENTS OF OPERATIONS
For the Year Ended October 31, 2006
| | | Muni
Intermediate
Portfolio | | New Jersey
Muni
Portfolio | |
| Investment income: | |
| Interest | | $ | 860,672 | | | $ | 668,152 | | |
| Total investment income | | | 860,672 | | | | 668,152 | | |
| Expenses: | |
| Administration, transfer agent and custody fees | | | 16,399 | | | | 13,988 | | |
| Professional fees | | | 3,306 | | | | 2,574 | | |
| Shareholder report expense | | | 2,530 | | | | 1,816 | | |
| Shareholder servicing fees | | | 32,968 | | | | 24,826 | | |
| Trustees' fees and expenses | | | 2,181 | | | | 1,660 | | |
| Registration and filing fees | | | 4,000 | | | | 2,300 | | |
| Other expenses | | | 2,008 | | | | 1,588 | | |
| Total expenses | | | 63,392 | | | | 48,752 | | |
| Net investment income | | | 797,280 | | | | 619,400 | | |
| Realized and unrealized gain (loss): | |
| Net realized gain (loss) on: | |
| Investment transactions | | | (52,696 | ) | | | (1,321 | ) | |
| Net change in unrealized gain (loss) of: | |
| Investments | | | 100,695 | | | | 10,603 | | |
| Net realized and unrealized gain (loss) | | | 47,999 | | | | 9,282 | | |
Net increase (decrease) in net assets resulting from
operations | | $ | 845,279 | | | $ | 628,682 | | |
See Notes to Financial Statements.
151
THE GLENMEDE PORTFOLIOS
STATEMENTS OF CHANGES IN NET ASSETS
For the Year Ended October 31, 2006
| | | Muni
Intermediate
Portfolio | | New Jersey
Muni
Portfolio | |
| Increase (decrease) in net assets | |
| Operations: | |
| Net investment income | | $ | 797,280 | | | $ | 619,400 | | |
| Net realized gain (loss) on: | |
| Investment transactions | | | (52,696 | ) | | | (1,321 | ) | |
| Net change in unrealized gain (loss) of: | |
| Investments | | | 100,695 | | | | 10,603 | | |
Net increase (decrease) in net assets resulting
from operations | | | 845,279 | | | | 628,682 | | |
| Distributions to shareholders from: | |
| Net investment income | | | (792,434 | ) | | | (625,617 | ) | |
Net increase (decrease) in net assets from capital share
transactions | | | 1,631,458 | | | | 240,411 | | |
| Net increase (decrease) in net assets | | | 1,684,303 | | | | 243,476 | | |
| NET ASSETS: | |
| Beginning of year | | | 20,746,013 | | | | 16,555,886 | | |
| End of year | | $ | 22,430,316 | | | $ | 16,799,362 | | |
Undistributed net investment income
included in net assets at end of year | | $ | 69,027 | | | $ | 55,309 | | |
For the Year Ended October 31, 2005
| | | Muni
Intermediate
Portfolio | | New Jersey
Muni
Portfolio | |
| Increase (decrease) in net assets | |
| Operations: | |
| Net investment income | | $ | 701,192 | | | $ | 621,778 | | |
| Net realized gain (loss) on: | |
| Investment transactions | | | (2,521 | ) | | | 129,048 | | |
| Net change in unrealized gain (loss) of: | |
| Investments | | | (590,509 | ) | | | (601,589 | ) | |
Net increase (decrease) in net assets resulting
from operations | | | 108,162 | | | | 149,237 | | |
| Distributions to shareholders from: | |
| Net investment income | | | (698,018 | ) | | | (628,848 | ) | |
| Net realized gain on investments | | | — | | | | (121,664 | ) | |
Net increase (decrease) in net assets from capital share
transactions | | | 2,065,716 | | | | (1,171,590 | ) | |
| Net increase (decrease) in net assets | | | 1,475,860 | | | | (1,772,865 | ) | |
| NET ASSETS: | |
| Beginning of year | | | 19,270,153 | | | | 18,328,751 | | |
| End of year | | $ | 20,746,013 | | | $ | 16,555,886 | | |
Undistributed net investment income
included in net assets at end of year | | $ | 64,181 | | | $ | 61,526 | | |
See Notes to Financial Statements.
152
THE GLENMEDE PORTFOLIOS
FINANCIAL HIGHLIGHTS
For a share outstanding throughout each year
| | | Muni Intermediate Portfolio | |
| | | For the Years Ended October 31, | |
| | | 2006 | | 2005 | | 2004 | | 2003 | | 2002 | |
| Net asset value, beginning of year | | $ | 10.36 | | | $ | 10.67 | | | $ | 10.69 | | | $ | 10.64 | | | $ | 10.55 | | |
| Income from investment operations: | |
| Net investment income | | | 0.37 | | | | 0.37 | | | | 0.39 | | | | 0.43 | | | | 0.46 | | |
Net realized and unrealized
gain (loss) on investments | | | 0.03 | | | | (0.31 | ) | | | (0.02 | ) | | | 0.06 | | | | 0.09 | | |
| Total from investment operations | | | 0.40 | | | | 0.06 | | | | 0.37 | | | | 0.49 | | | | 0.55 | | |
| Distributions to shareholders from: | |
| Net investment income | | | (0.37 | ) | | | (0.37 | ) | | | (0.39 | ) | | | (0.44 | ) | | | (0.46 | ) | |
| Total distributions | | | (0.37 | ) | | | (0.37 | ) | | | (0.39 | ) | | | (0.44 | ) | | | (0.46 | ) | |
| Net asset value, end of year | | $ | 10.39 | | | $ | 10.36 | | | $ | 10.67 | | | $ | 10.69 | | | $ | 10.64 | | |
| Total return | | | 3.97 | % | | | 0.55 | % | | | 3.49 | % | | | 4.67 | % | | | 5.41 | % | |
Ratios to average net assets/
Supplemental data: | |
| Net assets, end of year (in 000's) | | $ | 22,430 | | | $ | 20,746 | | | $ | 19,270 | | | $ | 20,320 | | | $ | 22,700 | | |
Ratio of operating expenses to
average net assets | | | 0.29 | % | | | 0.29 | % | | | 0.29 | % | | | 0.20 | % | | | 0.22 | % | |
Ratio of net investment income
to average net assets | | | 3.63 | % | | | 3.49 | % | | | 3.58 | % | | | 4.03 | % | | | 4.45 | % | |
| Portfolio turnover rate | | | 17 | % | | | 17 | % | | | 28 | % | | | 12 | % | | | 29 | % | |
See Notes to Financial Statements.
153
THE GLENMEDE PORTFOLIOS
FINANCIAL HIGHLIGHTS
For a share outstanding throughout each year
| | | New Jersey Muni Portfolio | |
| | | For the Years Ended October 31, | |
| | | 2006 | | 2005 | | 2004 | | 2003 | | 2002 | |
| Net asset value, beginning of year | | $ | 10.25 | | | $ | 10.61 | | | $ | 10.73 | | | $ | 10.71 | | | $ | 10.60 | | |
| Income from investment operations: | |
| Net investment income | | | 0.38 | | | | 0.37 | | | | 0.40 | | | | 0.44 | | | | 0.46 | | |
Net realized and unrealized
gain (loss) on investments | | | 0.00 | 1 | | | (0.27 | ) | | | (0.11 | ) | | | 0.03 | | | | 0.10 | | |
| Total from investment operations | | | 0.38 | | | | 0.10 | | | | 0.29 | | | | 0.47 | | | | 0.56 | | |
| Distributions to shareholders from: | |
| Net investment income | | | (0.38 | ) | | | (0.38 | ) | | | (0.41 | ) | | | (0.45 | ) | | | (0.45 | ) | |
| Net realized capital gains | | | — | | | | (0.08 | ) | | | — | | | | — | | | | — | | |
| Total distributions | | | (0.38 | ) | | | (0.46 | ) | | | (0.41 | ) | | | (0.45 | ) | | | (0.45 | ) | |
| Net asset value, end of year | | $ | 10.25 | | | $ | 10.25 | | | $ | 10.61 | | | $ | 10.73 | | | $ | 10.71 | | |
| Total return | | | 3.84 | % | | | 0.94 | % | | | 2.78 | % | | | 4.46 | % | | | 5.40 | % | |
Ratios to average net assets/
Supplemental data: | |
| Net assets, end of year (in 000's) | | $ | 16,799 | | | $ | 16,556 | | | $ | 18,329 | | | $ | 19,535 | | | $ | 20,037 | | |
Ratio of operating expenses to
average net assets | | | 0.29 | % | | | 0.31 | % | | | 0.28 | % | | | 0.20 | % | | | 0.27 | % | |
Ratio of net investment income
to average net assets | | | 3.74 | % | | | 3.62 | % | | | 3.73 | % | | | 4.09 | % | | | 4.22 | % | |
| Portfolio turnover rate | | | 15 | % | | | 31 | % | | | 33 | % | | | 9 | % | | | 36 | % | |
1 Amount rounds to less than $0.01 per share.
See Notes to Financial Statements.
154
THE GLENMEDE PORTFOLIOS
Muni Intermediate Portfolio
SCHEDULE OF PORTFOLIO INVESTMENTS
October 31, 2006
Face
Amount | | | | Value | |
| MUNICIPAL BONDSt — 98.2% | | | |
| | | Pennsylvania — 98.2% | |
| $ | 100,000 | | | Allegheny County, PA, General Obligation Unlimited, Refunding,
Series C-55, (MBIA Insured),
5.375%, 11/1/14 | | $ | 109,040 | | |
| | 200,000 | | | Allegheny County, PA, General Obligation Unlimited, Refunding, Series C-57, (FGIC Insured),
5.00%, 11/1/22 | | | 213,718 | | |
| | 200,000 | | | Allegheny County, PA, Higher Education Building Authority Revenue, Duquesne University, Series A, (FGIC Insured):
5.00%, 3/1/17 | | | 215,450 | | |
| | 560,000 | | | 5.00%, 3/1/18 | | | 601,446 | | |
| | 200,000 | | | Allegheny County, PA, Hospital Development Authority Revenue, University of Pittsburgh, Health Center, Series A, (MBIA Insured),
5.30%, 4/1/08 | | | 204,760 | | |
| | 300,000 | | | Allegheny County, PA, Port Authority Special Revenue, (MBIA Insured), Prerefunded, 3/1/09 @ 101,
5.30%, 3/1/10 | | | 314,475 | | |
| | 100,000 | | | Allegheny County, PA, Sanitation Authority Revenue, (MBIA Insured),
5.00%, 12/1/17 | | | 108,757 | | |
| | 500,000 | | | Allegheny County, PA, Sanitation Authority Sewer Revenue, (MBIA Insured),
5.375%, 12/1/15 | | | 541,895 | | |
| | 500,000 | | | Boyertown, PA, Area School District, (FSA Insured),
5.00%, 10/1/17 | | | 543,045 | | |
| | 310,000 | | | Dauphin County, PA, General Authority Hospital Revenue, Escrowed to Maturity, (FGIC Insured),
6.125%, 7/1/10 | | | 324,626 | | |
| | 400,000 | | | Dauphin County, PA, Refunding, Series B, (AMBAC Insured),
5.00%, 11/15/17 | | | 434,808 | | |
| | 215,000 | | | Delaware River Joint Toll Bridge Commission Revenue, (MBIA Insured),
5.25%, 7/1/16 | | | 234,651 | | |
| | 285,000 | | | Delaware River Joint Toll Bridge Commission Revenue, (MBIA Insured), Prerefunded 7/1/13 @ 100,
5.25%, 7/1/16 | | | 312,106 | | |
| | 750,000 | | | Delaware River Port Authority, PA and NJ Revenue, (FSA Insured),
5.25%, 1/1/12 | | | 785,766 | | |
| | 120,000 | | | Delaware River Port Authority, PA and NJ, Delaware River Bridges Revenue, Escrowed to Maturity:
6.00%, 1/15/10 | | | 125,260 | | |
| | 105,000 | | | 6.50%, 1/15/11 | | | 111,623 | | |
See Notes to Financial Statements.
155
THE GLENMEDE PORTFOLIOS
Muni Intermediate Portfolio
SCHEDULE OF PORTFOLIO INVESTMENTS — (Continued)
October 31, 2006
Face
Amount | | | | Value | |
| MUNICIPAL BONDSt — (Continued) | | | |
| | | Pennsylvania — (Continued) | |
| $ | 700,000 | | | Delaware River Port Authority, PA and NJ, Refunding, Series A, (FSA Insured),
5.25%, 1/1/09 | | $ | 725,018 | | |
| | 100,000 | | | Delaware River Port Authority, PA and NJ, Refunding, Series B, (AMBAC Insured),
5.25%, 1/1/09 | | | 103,574 | | |
| | 300,000 | | | Downington, PA, Area School District, General Obligation Unlimited,
5.50%, 2/1/10 | | | 317,979 | | |
| | 500,000 | | | Downington, PA, Area School District, General Obligation Unlimited, (FSA Insured):
5.25%, 4/1/14 | | | 531,550 | | |
| | 500,000 | | | 4.90%, 4/1/16 | | | 523,150 | | |
| | 390,000 | | | Geisinger Authority, PA, Health System, Refunding,
5.00%, 8/15/08 | | | 398,167 | | |
| | 400,000 | | | Great Valley School District, Chester County PA, (FSA State Aid Withholding),
5.00%, 2/15/18 | | | 436,236 | | |
| | 250,000 | | | Harrisburg, PA Authority, Recovery Facilities Revenue, Series D-2, (FSA Insured), Mandatory Put 12/31/13 @100
5.00%, 12/1/33 | | | 266,917 | | |
| | 200,000 | | | Harrisburg, PA, Parking Authority Revenue, Refunding, (FSA Insured),
5.50%, 5/15/11 | | | 216,040 | | |
| | 100,000 | | | Hopewell, PA, Area School District, General Obligation, (FSA Insured), Prerefunded 9/1/08 @ 100,
4.90%, 9/1/09 | | | 102,407 | | |
| | 300,000 | | | Indiana County, PA, Municipal Services Authority, Sewer Revenue, (AMBAC Insured),
4.00%, 10/1/09 | | | 301,038 | | |
| | 30,000 | | | Jim Thorpe, PA, Area School District, (FSA Insured),
5.00%, 3/15/18 | | | 682,252 | | |
| | 630,000 | | | Lancaster, PA, Area Sewer Authority, Revenue, Escrowed to Maturity,
6.00%, 4/1/12 | | | 31,656 | | |
| | 250,000 | | | Moon Area School District, PA, General Obligation Unlimited, (FSA State Aid Withholding),
5.00%, 11/15/17 | | | 272,825 | | |
| | 290,000 | | | Northampton Bucks, PA, Bucks County Municipal Authority, Sewer Revenue, Escrowed to Maturity,
6.20%, 11/1/13 | | | 311,399 | | |
See Notes to Financial Statements.
156
THE GLENMEDE PORTFOLIOS
Muni Intermediate Portfolio
SCHEDULE OF PORTFOLIO INVESTMENTS — (Continued)
October 31, 2006
Face
Amount | | | | Value | |
| MUNICIPAL BONDSt — (Continued) | | | |
| | | Pennsylvania — (Continued) | |
| $ | 325,000 | | | Northampton County, PA, Prerefunded 2/15/08 @100
5.00%, 8/15/13 | | $ | 337,480 | | |
| | 175,000 | | | Northampton County, PA, Unrefunded Balance
5.00%, 8/15/13 | | | 181,202 | | |
| | 425,000 | | | Northampton County, PA, Higher Education Authority Revenue - Lehigh University,
5.25%, 11/15/09 | | | 446,258 | | |
| | 325,000 | | | Northampton Township, PA, General Obligation Unlimited, (MBIA Insured),
4.60%, 11/15/10 | | | 329,576 | | |
| | 225,000 | | | Pennsylvania Housing Finance Agency, Residential Development Section 8-A, Revenue,
4.00%, 7/1/09 | | | 226,804 | | |
| | 230,000 | | | Pennsylvania Housing Finance Agency, Single Family Mortgage, Series 61B, Revenue,
5.20%, 10/1/14 | | | 234,727 | | |
| | 500,000 | | | Pennsylvania State Higher Educational Facilities Authority Revenue, University of Pennsylvania Health Services, Series A, (AMBAC Insured),
5.00%, 8/15/20 | | | 537,100 | | |
| | 435,000 | | | Pennsylvania State Higher Educational Facilities Authority Revenue, University of Pennsylvania Health Services, Series A, (MBIA Insured),
5.375%, 1/15/15 | | | 445,231 | | |
| | 500,000 | | | Pennsylvania State Higher Educational Facilities Authority Revenue, University of Pennsylvania, (AMBAC Insured),
5.00%, 8/15/10 | | | 524,525 | | |
| | 145,000 | | | Pennsylvania State Turnpike Commission Oil Franchise, Tax Revenue, Escrowed to Maturity, Series A, (AMBAC Insured):
5.25%, 12/1/13 | | | 151,042 | | |
| | 60,000 | | | 5.25%, 12/1/14 | | | 62,464 | | |
| | 250,000 | | | Pennsylvania State Turnpike Commission Oil Franchise, Tax Revenue, Refunded Balance, Series B, (AMBAC Insured),
5.00%, 12/1/17 | | | 274,970 | | |
| | 105,000 | | | Pennsylvania State Turnpike Commission Oil Franchise, Tax Revenue, Unrefunded Balance Series A, (AMBAC Insured):
5.25%, 12/1/13 | | | 109,311 | | |
| | 40,000 | | | 5.25%, 12/1/14 | | | 41,618 | | |
| | 250,000 | | | Pennsylvania State University, College and University Revenues, Series A, (General Obligation of University),
5.00%, 8/15/13 | | | 257,448 | | |
See Notes to Financial Statements.
157
THE GLENMEDE PORTFOLIOS
Muni Intermediate Portfolio
SCHEDULE OF PORTFOLIO INVESTMENTS — (Continued)
October 31, 2006
Face
Amount | | | | Value | |
| MUNICIPAL BONDSt — (Continued) | | | |
| | | Pennsylvania — (Continued) | |
| $ | 275,000 | | | Pennsylvania State, General Obligation Unlimited, Refunding, (AMBAC Insured),
5.125%, 9/15/11 | | $ | 280,547 | | |
| | 125,000 | | | Pennsylvania State, Second Series, General Obligation Unlimited,
5.25%, 10/1/10 | | | 131,714 | | |
| | 400,000 | | | Philadelphia, PA, General Obligation Unlimited, (FSA Insured):
5.00%, 9/15/11 | | | 422,384 | | |
| | 500,000 | | | 5.25%, 9/15/13 | | | 531,205 | | |
| | 150,000 | | | 5.25%, 9/15/16 | | | 159,051 | | |
| | 460,000 | | | Philadelphia, PA, General Obligation Unlimited, Series A (XLCA Insured),
5.25%, 2/15/14 | | | 498,258 | | |
| | 500,000 | | | Philadelphia, PA, Municipal Authority Revenue, Refunding - Lease - Series A, (FSA Insured),
5.25%, 5/15/09 | | | 519,655 | | |
| | 540,000 | | | Philadelphia, PA, Municipal Authority Revenue, Refunding - Lease - Series B, (FSA Insured):
5.25%, 11/15/16 | | | 585,176 | | |
| | 250,000 | | | 5.25%, 11/15/18 | | | 269,655 | | |
| | 600,000 | | | Pittsburgh, PA, Public Parking Authority Revenue, Series A, (FGIC Insured),
5.00%, 12/1/16 | | | 654,948 | | |
| | 350,000 | | | Pleasant Hills, PA, Authority Sewer Revenue, Refunding, (FGIC Muni Government Guaranteed),
5.00%, 9/1/12 | | | 358,351 | | |
| | 210,000 | | | Ringgold, PA, School District, Escrowed to Maturity,
6.20%, 1/15/13 | | | 225,158 | | |
| | 250,000 | | | Seneca Valley, PA, School District, Series A, General Obligation Unlimited, (FGIC Insured),
4.85%, 7/1/11 | | | 254,675 | | |
| | 100,000 | | | Shaler, PA, School District, General Obligation Unlimited, Series B, (FSA Insured),
4.50%, 9/1/10 | | | 101,698 | | |
| | 400,000 | | | Southeastern Pennsylvania Transportation Authority, PA, Special Revenue, (FGIC Insured),
5.45%, 3/1/11 | | | 410,244 | | |
| | 250,000 | | | State Public School Building Authority, PA, School Revenue, Garnet Valley School District Project, (AMBAC Insured), Prerefunded to 2/1/11 @100,
5.25%, 2/1/12 | | | 266,513 | | |
| | 500,000 | | | Swarthmore Boro Authority, PA, College Revenue,
4.50%, 9/15/10 | | | 516,950 | | |
See Notes to Financial Statements.
158
THE GLENMEDE PORTFOLIOS
Muni Intermediate Portfolio
SCHEDULE OF PORTFOLIO INVESTMENTS — (Concluded)
October 31, 2006
Face
Amount | | | | Value | |
| MUNICIPAL BONDSt — (Continued) | | | |
| | | Pennsylvania — (Continued) | |
| $ | 400,000 | | | University of Pittsburgh, PA, Refunded Series B, (MBIA Insured),
5.50%, 6/1/09 | | $ | 412,100 | | |
| | 125,000 | | | Wallingford - Swarthmore, PA, School District, Series C, (FSA State Aid Withholding),
5.00%, 5/15/09 | | | 125,904 | | |
| | 250,000 | | | Wayne Highlands, PA, Area School District, General Obligation Unlimited, (FSA State Aid Withholding),
5.375%, 4/1/14 | | | 270,913 | | |
| | 200,000 | | | Wilkes Barre, PA, Area School District, General Obligation Unlimited, (FGIC Insured),
5.25%, 4/1/14 | | | 201,292 | | |
| | | | | York, PA, General Authority Guaranteed Revenue, York City Recreation Corp., (AMBAC Insured), | | | | | |
| | 250,000 | | | 5.50%, 5/1/15 | | | 268,605 | | |
| | | | | TOTAL MUNICIPAL BONDS
(Cost $21,759,673) | | $ | 22,026,386 | | |
TOTAL INVESTMENTS
(Cost $21,759,673)1 | | | 98.2 | % | | $ | 22,026,386 | | |
| OTHER ASSETS IN EXCESS OF LIABILITIES | | | 1.8 | | | | 403,930 | | |
| NET ASSETS | | | 100.0 | % | | $ | 22,430,316 | | |
t Percentages indicated are based on net assets.
1 Aggregate cost for federal tax purposes was $21,759,673.
Abbreviations:
AMBAC — American Municipal Bond Assurance Corporation
FGIC — Financial Guaranty Insurance Corporation
FSA — Financial Security Assurance
MBIA — Municipal Bond Investors Assurance
XLCA — XL Capital Assurance, Inc.
See Notes to Financial Statements.
159
THE GLENMEDE PORTFOLIOS
Muni Intermediate Portfolio
CREDIT QUALITY
On October 31, 2006, credit quality of the Portfolio was as follows (Unaudited):
| | | % of
Net Assets | | Value | |
| MOODY'S CREDIT RATING: | |
| Aaa | | | 79.2 | % | | $ | 17,760,512 | | |
| Aa | | | 19.0 | | | | 4,265,874 | | |
| TOTAL MUNICIPAL BONDS | | | 98.2 | % | | $ | 22,026,386 | | |
| TOTAL INVESTMENTS | | | 98.2 | % | | $ | 22,026,386 | | |
See Notes to Financial Statements.
160
THE GLENMEDE PORTFOLIOS
New Jersey Muni Portfolio
SCHEDULE OF PORTFOLIO INVESTMENTS
October 31, 2006
Face
Amount | | | | Value | |
| MUNICIPAL BONDSt — 98.6% | | | |
| | | Delaware — 6.4% | |
| $ | 500,000 | | | Delaware River & Bay Authority, Development Revenue,
(MBIA Insured):
5.00%, 1/1/17 | | $ | 542,860 | | |
| | 500,000 | | | 5.00%, 1/1/19 | | | 539,215 | | |
| | | | 1,082,075 | | |
| | | New Jersey — 82.5% | |
| | 100,000 | | | Asbury Park, NJ, Board of Education, General Obligation Unlimited, (MBIA Insured),
5.55%, 2/1/07 | | | 100,514 | | |
| | 200,000 | | | Bergen County, NJ, Utilities Authority, Water Pollution Control Revenue, (FGIC Insured), Series A:
5.125%, 12/15/11 | | | 201,802 | | |
| | 150,000 | | | 5.125%, 12/15/12 | | | 151,351 | | |
| | 370,000 | | | Brigantine, NJ, General Obligation Unlimited, (MBIA Insured),
5.00%, 8/15/12 | | | 370,396 | | |
| | 350,000 | | | Burlington County, NJ, Bridge Commission Revenue,
(County Guaranteed),
5.25%, 10/1/13 | | | 381,825 | | |
| | 150,000 | | | Cherry Hill Township, NJ, General Obligation Unlimited, (FGIC
Insured), Prerefunded 7/15/09 @ 100,
5.125%, 7/15/10 | | | 156,075 | | |
| | 115,000 | | | Delaware River Joint Toll Bridge Commission, Revenue, Series A,
(MBIA Insured),
5.00%, 7/1/13 | | | 124,178 | | |
| | 150,000 | | | Delaware River Port Authority, Pennsylvania & New Jersey
Revenue, Refunding, (AMBAC Insured), Series B,
5.25%, 1/1/09 | | | 155,361 | | |
| | 150,000 | | | Delaware River Port Authority, Pennsylvania, New Jersey &
Delaware River Bridges Revenue, Escrowed to Maturity:
5.625%, 1/15/09 | | | 153,096 | | |
| | 175,000 | | | 6.00%, 1/15/10 | | | 182,670 | | |
| | 100,000 | | | 6.50%, 1/15/11 | | | 106,308 | | |
| | 250,000 | | | Hazlet Township, NJ, School District, General Obligation
Unlimited, (FSA School Board Residual Fund Insured),
5.00%, 2/1/14 | | | 262,770 | | |
| | 200,000 | | | Hopewell Valley, NJ, Regional School District, General Obligation Unlimited, (FGIC School Board Residual Fund Insured),
5.00%, 8/15/12 | | | 209,534 | | |
See Notes to Financial Statements.
161
THE GLENMEDE PORTFOLIOS
New Jersey Muni Portfolio
SCHEDULE OF PORTFOLIO INVESTMENTS — (Continued)
October 31, 2006
Face
Amount | | | | Value | |
| MUNICIPAL BONDSt — (Continued) | | | |
| | | New Jersey — (Continued) | |
| $ | 250,000 | | | Lenape, NJ, Regional School District, General Obligation Unlimited,
(FGIC School Board Residual Fund Insured),
5.00%, 4/1/16 | | $ | 272,567 | | |
| | 235,000 | | | Mantua Township, NJ, School District, General Obligation
Unlimited, (MBIA Insured),
5.00%, 3/1/13 | | | 250,437 | | |
| | 200,000 | | | Maplewood Township, NJ, General Improvements, General
Obligation Unlimited, (FSA Insured),
5.00%, 2/1/09 | | | 206,208 | | |
| | 100,000 | | | Mercer County, NJ, Improvement Authority, Revenue Refunding,
Solid Waste, (County Guaranteed), Series 97,
5.20%, 9/15/08 | | | 102,977 | | |
| | 145,000 | | | Middlesex County, NJ, Improvement Authority, Revenue, (County
Guaranteed),
5.45%, 9/15/11 | | | 146,653 | | |
| | 250,000 | | | Monmouth County, NJ, Improvement Authority, Revenue, (AMBAC
Insured):
5.00%, 12/1/12 | | | 262,785 | | |
| | 375,000 | | | 5.20%, 12/1/14 | | | 396,401 | | |
| | 100,000 | | | Monmouth County, NJ, Improvement Authority, Revenue, Series A,
(AMBAC Muni Government Guaranteed),
5.25%, 12/1/16 | | | 110,241 | | |
| | 80,000 | | | Mount Holly, NJ, Municipal Utilities Authority, Sewer Revenue,
Prerefunded, 12/1/08 @ 100, (MBIA Insured),
5.00%, 12/1/13 | | | 82,340 | | |
| | 20,000 | | | Mount Holly, NJ, Municipal Utilities Authority, Sewer Revenue,
Unrefunded, (MBIA Insured),
5.00%, 12/1/13 | | | 20,536 | | |
| | 500,000 | | | New Jersey Building Authority, State Building Revenue,
5.00%, 6/15/13 | | | 513,745 | | |
| | 450,000 | | | New Jersey Economic Development Authority, School Facilities
Construction, Series L, (AMBAC Insured),
5.00%, 3/1/18 | | | 485,838 | | |
| | 300,000 | | | New Jersey Economic Development Authority, School Facilities
Construction, Series L, (FSA Insured),
5.25%, 3/1/12 | | | 323,313 | | |
| | 500,000 | | | New Jersey Sports & Exposition Authority Convention Center,
Tobacco and Liquor Taxes, (MBIA Insured), Refunding,
5.125%, 9/1/14 | | | 519,205 | | |
| | 250,000 | | | New Jersey Sports & Exposition Authority State Contract, General Improvements, Series A,
5.00%, 3/1/10 | | | 260,570 | | |
See Notes to Financial Statements.
162
THE GLENMEDE PORTFOLIOS
New Jersey Muni Portfolio
SCHEDULE OF PORTFOLIO INVESTMENTS — (Continued)
October 31, 2006
Face
Amount | | | | Value | |
| MUNICIPAL BONDSt — (Continued) | | | |
| | | New Jersey — (Continued) | |
| $ | 250,000 | | | New Jersey Sports & Exposition Authority State Contract,
Recreational Facilities Improvements, Series A,
5.00%, 3/1/17 | | $ | 273,520 | | |
| | 100,000 | | | New Jersey State Economic Development Authority, Parking Facility Improvements, Elizabeth Development Project, (FGIC Insured),
5.20%, 10/15/08 | | | 103,108 | | |
| | 200,000 | | | New Jersey State Economic Development Authority, School Facilities Construction Revenue, (MBIA Insured), Series C, Prerefunded 6/15/12 @ 100,
5.00%, 6/15/16 | | | 214,360 | | |
| | 500,000 | | | New Jersey State Educational Facilities Authority, Higher Education Capacity Improvement Revenue Bonds, Series A (FSA Insured),
5.00%, 9/1/14 | | | 543,720 | | |
| | 250,000 | | | New Jersey State Educational Facilities Authority, Montclair State University, (AMBAC Insured),
5.00%, 7/1/19 | | | 272,062 | | |
| | 300,000 | | | New Jersey State Educational Facilities Authority, Revenue, High Education Capital Improvement, Series B, Prefunded to 9/1/10 @100,
5.00%, 9/1/14 | | | 314,898 | | |
| | 500,000 | | | New Jersey State Educational Facilities Authority, Revenue, Higher Education Facilities Trust Fund, (FSA Insured), Series A,
5.00%, 9/1/16 | | | 544,915 | | |
| | 100,000 | | | New Jersey State Educational Facilities Authority, Revenue, Institutional Advanced Studies, Series F,
5.00%, 7/1/09 | | | 102,534 | | |
| | 250,000 | | | New Jersey State Educational Facilities Authority, Robert Stockton College, (AMBAC Insured),
5.00%, 7/1/17 | | | 271,962 | | |
| | 200,000 | | | New Jersey State Health Care Facilities Financing Authority, Revenue, Kennedy Health System Project, (MBIA Insured), Series A,
5.00%, 7/1/09 | | | 203,506 | | |
| | 450,000 | | | New Jersey State Housing & Mortgage Finance Agency, Multi-Family Housing Revenue, (FSA Insured), Series B:
5.55%, 11/1/09 | | | 459,995 | | |
| | 250,000 | | | 5.75%, 11/1/11 | | | 262,238 | | |
| | 150,000 | | | New Jersey State Housing & Mortgage Finance Agency, Revenue, Home Buyer, (MBIA Insured), Series P,
5.05%, 4/1/07 | | | 150,635 | | |
See Notes to Financial Statements.
163
THE GLENMEDE PORTFOLIOS
New Jersey Muni Portfolio
SCHEDULE OF PORTFOLIO INVESTMENTS — (Continued)
October 31, 2006
Face
Amount | | | | Value | |
| MUNICIPAL BONDSt — (Continued) | | | |
| | | New Jersey — (Continued) | |
| $ | 250,000 | | | New Jersey State Transportation Trust Fund Authority, Transit Revenue, Series A, (FGIC Insured),
5.00%, 6/15/17 | | $ | 273,368 | | |
| | 130,000 | | | New Jersey State Transportation Trust Fund Authority, Transit Revenue, Series A, Prerefunded, 6/15/09 @ 100,
5.00%, 6/15/13 | | | 134,709 | | |
| | 70,000 | | | New Jersey State Turnpike Authority, Turnpike Revenue, (MBIA Insured), Series A,
5.75%, 1/1/18 | | | 74,311 | | |
| | 180,000 | | | New Jersey State Turnpike Authority, Turnpike Revenue, (MBIA Insured), Series A, Prerefunded to 1/01/10 @ 100,
5.75%, 1/1/18 | | | 191,808 | | |
| | 250,000 | | | New Jersey State, Certificates of Participation, (AMBAC Insured), Escrowed to Maturity,
5.00%, 6/15/11 | | | 265,318 | | |
| | 10,000 | | | New Jersey State, Wastewater Treatment Trust Revenue, Series A, Unrefunded Balance,
5.25%, 9/1/13 | | | 10,112 | | |
| | 800,000 | | | Ocean County, NJ, Utilities Authority, Wastewater Revenue, Refunding,
5.00%, 1/1/12 | | | 817,664 | | |
| | 325,000 | | | Ocean County, NJ, Utilities Authority, Wastewater Revenue, Refunding, (General Obligation of Authority),
5.125%, 1/1/11 | | | 332,244 | | |
| | 200,000 | | | Passaic County, NJ, General Obligation Unlimited, (FSA Insured),
5.25%, 6/1/15 | | | 214,730 | | |
| | 250,000 | | | Red Bank, NJ, Board of Education, General Obligation Unlimited, (School Board Residual Fund Insured), Prerefunded to 5/1/09 @ 100,:
5.15%, 5/1/12 | | | 258,943 | | |
| | 100,000 | | | 5.15%, 5/1/13 | | | 103,553 | | |
| | 250,000 | | | Ridgewood, NJ, Board of Education, General Obligation Unlimited,
5.20%, 10/1/08 | | | 257,898 | | |
| | 500,000 | | | Union County, NJ,
5.00%, 3/1/17 | | | 529,435 | | |
| | 150,000 | | | Warren Township, NJ, School District, General Obligation Unlimited, (School Board Residual Fund Insured),
5.35%, 3/15/10 | | | 158,357 | | |
| | | | 13,849,599 | | |
See Notes to Financial Statements.
164
THE GLENMEDE PORTFOLIOS
New Jersey Muni Portfolio
SCHEDULE OF PORTFOLIO INVESTMENTS — (Concluded)
October 31, 2006
Face
Amount | | | | Value | |
| MUNICIPAL BONDSt — (Continued) | | | |
| | | Pennsylvania — 6.5% | |
| $ | 435,000 | | | Delaware River Joint Toll Bridge Commission Revenue, (MBIA Insured),
5.25%, 7/1/16 | | $ | 474,759 | | |
| | 565,000 | | | Delaware River Joint Toll Bridge Commission Revenue, (MBIA Insured), Prerefunded 7/1/13 @ 100,
5.25%, 7/1/16 | | | 618,737 | | |
| | | | 1,093,496 | | |
| | | Puerto Rico — 3.2% | |
| | 500,000 | | | Puerto Rico Municipal Finance Agency, Series A, (FSA Insured)
5.25%, 8/1/18 | | | 539,245 | | |
| | | | | TOTAL MUNICIPAL BONDS
(Cost $16,298,862) | | | 16,564,415 | | |
TOTAL INVESTMENTS
(Cost $16,298,862)1 | | | 98.6 | % | | $ | 16,564,415 | | |
| OTHER ASSETS IN EXCESS OF LIABILITIES | | | 1.4 | | | | 234,947 | | |
| NET ASSETS | | | 100.0 | % | | $ | 16,799,362 | | |
t Percentages indicated are based on net assets.
1 Aggregate cost for federal tax purposes was $16,299,137.
Abbreviations:
AMBAC — American Municipal Bond Assurance Corporation
FGIC — Financial Guaranty Insurance Corporation
FSA — Financial Security Assurance
MBIA — Municipal Bond Investors Assurance
See Notes to Financial Statements.
165
THE GLENMEDE PORTFOLIOS
New Jersey Muni Portfolio
CREDIT QUALITY
On October 31, 2006, credit quality of the Portfolio was as follows (Unaudited):
| | | % of
Net Assets | | Value | |
| MOODY'S CREDIT RATING: | |
| Aaa | | | 66.4 | % | | $ | 11,157,448 | | |
| Aa | | | 24.9 | | | | 4,183,045 | | |
| A | | | 7.3 | | | | 1,223,922 | | |
| TOTAL MUNICIPAL BONDS | | | 98.6 | % | | $ | 16,564,415 | | |
| TOTAL INVESTMENTS | | | 98.6 | % | | $ | 16,564,415 | | |
See Notes to Financial Statements.
166
THE GLENMEDE PORTFOLIOS
Notes to Financial Statements
1. Organization and Significant Accounting Policies
The Glenmede Portfolios (the "Fund") is an investment company that was organized as a Massachusetts business trust on March 3, 1992, and is registered with the Securities and Exchange Commission under the Investment Company Act of 1940 (the "1940 Act"), as amended, as an open-end management investment company. As of October 31, 2006, the Fund offered shares of two Sub-Trusts, the Muni Intermediate Portfolio and the New Jersey Muni Portfolio (each, a "Portfolio" and collectively, the "Portfolios"). Each Portfolio is classified as non-diversified.
The preparation of financial statements in conformity with accounting principles generally accepted in the United States of America requires management to make estimates and assumptions that affect the reported amounts of assets and liabilities and disclosure of contingent assets and liabilities at the date of the financial statements and the reported amounts of revenues and expenses during the reporting period. Actual results could differ from those estimates. The following is a summary of significant accounting policies consistently followed by each Portfolio in the preparation of its financial statements.
Valuation of Securities: Municipal obligations for which market quotations are readily available are valued at the most recent quoted bid price provided by investment dealers, provided that municipal obligations may be valued on the basis of prices provided by a pricing service when such prices are determined by the investment advisor to reflect the fair market value of such municipal obligations. When market quotations are not readily available or events occur that make established valuation methods unreliable, municipal obligations are valued in a manner which is intended to reflect their fair value as determined in accordance with procedures approved by of the Board of Trustees of the Fund (the "Board"). Debt obligations with remaining maturities of 60 days or less are valued on the basis of amortized cost.
Securities Transactions and Investment Income: Securities transactions are recorded as of the trade date. Realized gains and losses on investments sold are computed on the basis of identified cost. Interest income is recorded on the accrual basis and includes amortization of premiums and accretion of discounts when appropriate.
Securities purchased or sold on a when-issued or delayed-delivery basis may be settled a month or more after the trade date. Interest income is accrued based on the terms of the security. Each Portfolio segregates assets with a current value at least equal to the amount of its when-issued purchase commitments. When-issued purchase commitments involve a risk of loss if the value of the security to be purchased declines prior to settlement date, or if the counterparty does not perform under the contract.
Dividends and Distributions to Shareholders: Dividends from net investment income, if any, are declared and paid monthly. The Portfolios distribute any net realized capital gains on an annual basis. Additional distributions of net investment income and capital gains for each Portfolio may be made at the discretion of the Board in order to avoid a nondeductible excise tax under Section 498 of the Internal Revenue Code, as amended.
Income and capital gains distributions are determined in accordance with income tax regulations which may differ from accounting principles generally accepted in the United States of America. These differences are primarily due to
167
THE GLENMEDE PORTFOLIOS
Notes to Financial Statements — (Continued)
differing treatments of income and gains on various investment securities held by each Portfolio, timing differences and differing characterization of distributions made by each Portfolio.
Federal Income Taxes: Each Portfolio intends to qualify as a regulated investment company by complying with the requirements of the Internal Revenue Code applicable to regulated investment companies and by distributing substantially all of its tax-exempt (and taxable, if any) income to its shareholders. Therefore, no Federal income tax provision is required. Income distributions and capital gains distributions are determined in accordance with income tax regulations which may differ from accounting principles generally accepted in the United States of America. These differences are primarily due to differing treatments for amortized premiums, expired net capital loss carryforwards, discounts and net operating losses. Net investment income/(loss), net realized capital gains/(losses) and net assets are not affected. The calculation of net investment income/(l oss) per share in the financial highlights tables excludes such adjustments.
As of October 31, 2006, the tax year end of the Fund, the following Portfolios had available capital loss carryforwards to be utilized in the current period to offset future net capital gains through the indicated expiration dates as follows:
| | | Expiring October 31, | |
| Portfolio | | 2013 | | 2014 | |
| Muni Intermediate Portfolio | | $ | 2,521 | | | $ | 52,696 | | |
| New Jersey Muni Portfolio | | | — | | | | 1,321 | | |
As of October 31, 2006, the tax year end of the Fund, the components of distributable earnings on a tax basis were as follows:
| Portfolio | | Undistributed
Tax-exempt
Income | | Undistributed
Ordinary
Income | | Undistributed
Long-Term
Gains | | Total
Distributable
Earnings | |
Muni Intermediate
Portfolio | | $ | 69,027 | | | $ | — | | | $ | — | | | $ | 280,523 | | |
New Jersey Muni
Portfolio | | | 55,309 | | | | — | | | | — | | | | 319,266 | | |
Total Distributable Earnings are additionally comprised of Net Unrealized Appreciation/(Depreciation) and Capital Loss Carryforwards, which are shown elsewhere in the Notes to Financial Statements.
As of October 31, 2006, the tax characterization of distributions paid during the year was equal to the book characterization of distributions paid for the Portfolios, with the following exception:
| Portfolio | | Tax
Exempt | | Ordinary
Income | | Long-Term
Gains | |
| New Jersey Muni Portfolio | | $ | 625,602 | | | $ | 15 | | | $ | — | | |
168
THE GLENMEDE PORTFOLIOS
Notes to Financial Statements — (Continued)
2. Investment Advisory Fee, Administration Fee and Other Related Party Transactions
Glenmede Advisers, Inc. (the "Advisor"), a wholly-owned subsidiary of The Glenmede Trust Company, N.A. ("Glenmede Trust"), serves as investment advisor to the Muni Intermediate and New Jersey Muni Portfolios, pursuant to an investment management agreement with the Fund. Under this agreement, the Advisor manages the Portfolios, subject to the general supervision of the Board.
Muni Intermediate and New Jersey Muni Portfolios do not pay a management fee for advisory services. Glenmede Trust charges a fee directly to its clients, the investors in the Portfolios are the clients of Glenmede Trust, for fiduciary, trust and /or advisory services. The actual annual fees charged vary dependent on a number of factors, including the particular services provided to the client and are generally 1.25% or less of the clients' assets under management.
The Muni Intermediate and New Jersey Muni Portfolios each pay Glenmede Trust shareholder servicing fees at the annual rate of 0.15% of such Portfolio's average daily net assets.
Investors Bank & Trust Company ("IBT") serves as administrator, transfer agent, dividend-paying agent and custodian with respect to the Fund. The Fund pays IBT a fee based on the combined aggregate average daily net assets of the Portfolios and the Glenmede Fund, Inc., a registered investment company. The fee is computed daily and paid monthly. IBT is also paid an annual fee plus out-of-pocket expenses for the provision of personnel and services related to the Fund's compliance program. The Fund's Chief Compliance Officer holds the position of Senior Director at IBT.
Quasar Distributors, LLC serves as distributor of the Portfolios' shares. The distributor receives no fees in connection with distribution services provided to the Fund.
The Fund pays each Board member an annual fee of $1,000 and out-of-pocket expenses incurred in attending Board meetings.
Expenses for the year ended October 31, 2006, include legal fees paid to Drinker Biddle & Reath LLP. A partner of the law firm is Secretary of the Fund.
3. Purchases and Sales of Securities
For the year ended October 31, 2006, cost of purchases and proceeds from sales of investment securities other than US Government securities and short-term securities were:
| Portfolio | | Purchases | | Sales | |
| Muni Intermediate Portfolio | | $ | 5,578,901 | | | $ | 3,676,671 | | |
| New Jersey Muni Portfolio | | | 2,908,008 | | | | 2,424,553 | | |
169
THE GLENMEDE PORTFOLIOS
Notes to Financial Statements — (Continued)
As of October 31, 2006, aggregate gross unrealized appreciation for all securities in which there was an excess of value over tax cost and aggregate gross unrealized depreciation for all securities in which there was an excess of tax cost over value were as follows:
| Portfolio | | Appreciation | | Depreciation | | Net | |
| Muni Intermediate Portfolio | | $ | 343,505 | | | $ | 76,792 | | | $ | 266,713 | | |
| New Jersey Muni Portfolio | | | 307,816 | | | | 42,538 | | | | 265,278 | | |
4. Shares of Beneficial Interest
As of October 31, 2006, Glenmede Trust, on behalf of its clients, holds of record and has voting and/or investment authority over substantially all of the Portfolios' outstanding shares. The Fund may issue an unlimited number of shares of beneficial interest with a $.001 par value. Changes in shares of beneficial interest outstanding were as follows:
| | | Year Ended
10/31/06 | | Year Ended
10/31/05 | |
| | | Shares | | Amount | | Shares | | Amount | |
| Muni Intermediate Portfolio: | |
| Sold | | | 442,992 | | | $ | 4,578,898 | | | | 529,292 | | | $ | 5,555,774 | | |
| Redeemed | | | (286,271 | ) | | | (2,947,440 | ) | | | (332,792 | ) | | | (3,490,058 | ) | |
| Net increase | | | 156,721 | | | $ | 1,631,458 | | | | 196,500 | | | $ | 2,065,716 | | |
| New Jersey Muni Portfolio: | |
| Sold | | | 215,319 | | | $ | 2,196,501 | | | | 167,786 | | | $ | 1,752,700 | | |
| Issued as reinvestment of dividends | | | — | | | | — | | | | 11,881 | | | | 121,663 | | |
| Redeemed | | | (191,625 | ) | | | (1,956,090 | ) | | | (291,933 | ) | | | (3,045,953 | ) | |
| Net increase (decrease) | | | 23,694 | | | $ | 240,411 | | | | (112,266 | ) | | $ | (1,171,590 | ) | |
5. Concentration of Credit
The Muni Intermediate Portfolio and New Jersey Muni Portfolio primarily invest in debt obligations issued by the Commonwealth of Pennsylvania and the State of New Jersey, respectively, and their political subdivisions, agencies, instrumentalities and authorities to obtain funds for various purposes. Each Portfolio is more susceptible to factors adversely affecting issuers of the respective region that the Portfolio invests in than is a municipal bond fund that is not concentrated in these issuers to the same extent.
6. Recently Issued Accounting Pronouncements
In June 2006, the Financial Accounting Standards Board ("FASB") issued FASB Interpretation No. 48, ("FIN 48") "Accounting for Uncertainty in Income Taxes — an interpretation of FASB Statement No. 109". FIN 48 clarifies the accounting for uncertainty in income taxes recognized in accordance with FASB Statement No. 109, "Accounting for Income Taxes." This interpretation prescribes a recognition threshold and measurement attribute for the financial statement recognition and measurement of a tax position taken or expected to be taken in a tax return. It also
170
THE GLENMEDE PORTFOLIOS
Notes to Financial Statements — (Concluded)
provides guidance on de-recognition, classification, interest and penalties, accounting in interim periods, disclosure and transition. FIN 48 is effective for fiscal years beginning after December 15, 2006. The Fund is currently evaluating the impact of applying the various provisions of FIN 48.
In September 2006, the Financial Accounting Standards Board (FASB) issued Statement of Financial Accounting Standards No. 157, "Fair Value Measurements" (SFAS No. 157). SFAS No. 157 defines fair value, establishes a framework for measuring fair value in accordance with generally accepted accounting principles and expands disclosure about fair value measurements. SFAS No. 157 is effective for fiscal years beginning after November 15, 2007. Management is currently evaluating the impact the adoption of SFAS No. 157 will have on the Fund's financial statement disclosures.
7. Subsequent Event
Glenmede Investment Management LP ("GIM"), a newly formed limited partnership wholly-owned by The Glenmede Trust Company, N.A., will become the investment adviser to the Muni Intermediate and New Jersey Muni (the "Portfolios") on January 1, 2007. Prior thereto, investment advisory services have been provided by Glenmede Trust's wholly-owned subsidiary, Glenmede Advisers, Inc. ("Glenmede Advisers"). As of January 1, 2007, Glenmede Advisers and GIM are merging, and GIM will succeed to Glenmede Advisers' investment adviser registration, acquire all of Glenmede Advisers' assets and liabilities and undertake all rights, obligations and responsibilities of Glenmede Advisers under the Portfolios' Investment Advisory Agreement. Management personnel of Glenmede Advisers responsible for providing investment advisory services to the Portfolios under the Investment Advisory Agreement, including the portfolio managers and the supervisory personnel, will be employees of GIM, where they will continue to provide such services for the Portfolios. Therefore, management of the Portfolios will not be affected by this change.
171
REPORT OF INDEPENDENT REGISTERED PUBLIC ACCOUNTING FIRM
To the Board of Trustees of The Glenmede Portfolios and Shareholders of Muni Intermediate Portfolio and New Jersey Muni Portfolio:
In our opinion, the accompanying statements of assets and liabilities, including the schedules of portfolio investments, and the related statements of operations and of changes in net assets and the financial highlights present fairly, in all material respects, the financial position of Muni Intermediate Portfolio and New Jersey Muni Portfolio (constituting The Glenmede Portfolios, hereafter referred to as the "Fund") at October 31, 2006, and the results of each of their operations for the year then ended, the changes in each of their net assets for the two years in the period then ended, and the financial highlights for each of the five years in the period then ended, in conformity with accounting principles generally accepted in the United States of America. These financial statements and financial highlights (hereafter referred to as "financial statements") are the responsibility of the Fund's management. Our responsibility is to express an opinion on these financial statements based on our audits. We conducted our audits of these financial statements in accordance with the standards of the Public Company Accounting Oversight Board (United States). Those standards require that we plan and perform the audit to obtain reasonable assurance about whether the financial statements are free of material misstatement. An audit includes examining, on a test basis, evidence supporting the amounts and disclosures in the financial statements, assessing the accounting principles used and significant estimates made by management, and evaluating the overall financial statement presentation. We believe that our audits, which included confirmation of securities at October 31, 2006 by correspondence with the custodian, provide a reasonable basis for our opinion.
PricewaterhouseCoopers LLP
Boston, Massachusetts
December 22, 2006
172
THE GLENMEDE FUND, INC.
Tax Information (Unaudited)
For the year ended October 31, 2006
The amount of long-term capital gains paid for the fiscal year ended October 31, 2006 was as follows:
| Strategic Equity Portfolio | | $ | 6,032,159 | | |
| Small Cap Equity Portfolio | | | 33,773,001 | | |
| Large Cap Value Portfolio | | | 2,161,460 | | |
| International Portfolio | | | 67,450,011 | | |
| Philadelphia International Fund | | | 22,767,692 | | |
| Large Cap 100 Portfolio | | | 1,552,162 | | |
| Large Cap Growth Portfolio | | | 452,804 | | |
Of the ordinary distributions made during the fiscal year ended October 31, 2006, the following percentages have been derived from investments in US Government and Agency Obligations. All or a portion of the distributions from this income may be exempt from taxation at the state level. Consult your tax advisor for state specific information.
| Government Cash Portfolio | | | 36.66 | % | |
| Core Fixed Income Portfolio | | | 51.69 | % | |
Of the ordinary distributions made during the fiscal year ended October 31, 2006, the following percentages are tax exempt for regular Federal income tax purposes.
| Tax-Exempt Cash Portfolio | | | 100 | % | |
Of the ordinary distributions made during the fiscal year ended October 31, 2006, the following percentages qualify for the dividends received deduction available to corporate shareholders:
| Strategic Equity Portfolio | | | 100.00 | % | |
| Small Cap Equity Portfolio | | | 89.00 | % | |
| Large Cap Value Portfolio | | | 100.00 | % | |
| Large Cap Growth Portfolio | | | 93.00 | % | |
The above figures may differ from those cited elsewhere in this report due to differences in the calculation of income and gains for Securities and Exchange Commission (book) purposes and Internal Revenue Service (tax) purposes.
Foreign Taxes Paid or Withheld
| | | Total | | Per Share | |
| International Portfolio | | $ | 1,965,474 | | | $ | 0.04 | | |
| Philadelphia International Fund | | | 1,802,961 | | | | 0.07 | | |
The foreign taxes paid or withheld per share represent taxes incurred by the Fund on interest and dividends received by the Fund from foreign sources. Foreign taxes paid or withheld should be included in taxable income with an offsetting deduction from gross income or as a credit for taxes paid to foreign governments. Consult your tax advisor regarding the appropriate treatment of foreign taxes paid.
173
Qualified dividend income ("QDI") received through October 31, 2006, that qualified for a reduced tax rate pursuant to the Internal Revenue Code Section 1(h)(11) are as follows:
| Strategic Equity Portfolio | | $ | 494,447 | | |
| Small Cap Equity Portfolio | | | 994,575 | | |
| Large Cap Value Portfolio | | | 530,820 | | |
| International Portfolio | | | 22,755,721 | | |
| Philadelphia International Fund | | | 20,386,471 | | |
| Large Cap 100 Portfolio | | | 757,177 | | |
| Large Cap Growth Portfolio | | | 187,299 | | |
174
THE GLENMEDE PORTFOLIOS
Tax Information (Unaudited)
For the year October 31, 2006
Of the dividends paid by the Muni Intermediate Portfolio from net investment income for the fiscal year ended October 31, 2006, 100% is tax-exempt for regular Federal income taxes and Pennsylvania taxes.
Of the dividends paid by the New Jersey Muni Portfolio from net investment income for the fiscal year ended October 31, 2006, 100% is tax-exempt for regular Federal income taxes and New Jersey taxes.
175
THE GLENMEDE FUND, INC.
THE GLENMEDE PORTFOLIOS
BOARD MEMBERS AND OFFICERS TABLE (Unaudited)
The information pertaining to the Board of Directors of The Glenmede Fund, Inc. and the Board of Trustees of The Glenmede Portfolios (collectively, the "Funds") and their respective officers is set forth below. Each Director/Trustee holds office until the earliest of (i) the next meeting of shareholders, if any, called for the purpose of considering the election or re-election of such Director/Trustee and until the election and qualification of his/her successor, if any, elected at such meeting, or (ii) the date he or she dies, resigns or retires, or is removed by the applicable Board or shareholders. Each officer is elected by the applicable Board and holds office for the term of one year and until his or her successor is duly elected and qualified, or until he or she dies, resigns, is removed, or becomes disqualified.
| Independent Directors/Trustees(1) | |
|
| Name and Age | | Positions Held
with the Funds/
Time Seved | | Principal
Occupations(s)
During Past 5 Years | | Number of
Portfolios
in Fund
Complex
Overseen
by
Director/
Trustee | | Other
Directorship
Held by
Director/
Trustees | |
H. Franklin Allen, Ph.D.
Age: 50 | | Director of the Glenmede Fund (since 1991)
Trustee of the Glenmede Portfolios (since 1992) | | Nippon Life Professor of Finance, and Professor of Economics; Professor of Finance and Economics from 1990-1996; Vice Dean and Director of Wharton Doctoral Programs from 1990-1993. Employed by The University of Pennsylvania since 1980. | | | 15 | | | None | |
|
Willard S. Boothby, Jr.
Age: 85 | | Director of the Glenmede Fund (since 1988)
Trustee of the Glenmede Portfolios (since 1992) | | Former Director, Getty Oil Corp.; Former Director of Georgia-Pacific Corp.; Former Chairman and Chief Executive Officer Blyth Eastman Dillon & Co., Inc.; Former Managing Director of Paine Webber, Inc.; Former Chairman of U.S. Securities Industry Association. | | | 15 | | | None | |
|
Francis J. Palamara
Age: 81 | | Director of the Glenmede Fund (since 1988)
Trustee of the Glenmede Portfolios (since 1992) | | Former Chief Operating Officer of the New York Stock Exchange; Former Trustee of Gintel Fund; Former Director of XTRA Corporation; Former Director and Executive Vice President—Finance of ARAMARK, Inc. | | | 15 | | | None | |
|
(1) Independent Directors/Trustees are those Directors/Trustees who are not "interested persons" of the Funds as defined in the 1940 Act.
176
THE GLENMEDE FUND, INC.
THE GLENMEDE PORTFOLIOS
BOARD MEMBERS AND OFFICERS TABLE (Unaudited) — (Continued)
| Interested Director/Trustee(2) | |
|
| Name and Age | | Positions Held
with the Funds | | Principal
Occupations(s)
During Past 5 Years | | Number of
Portfolios
in Fund
Complex
Overseen
by
Director/
Trustee | | Other
Directorship
Held by
Director/
Trustees | |
G. Thompson Pew, Jr.(3)
Age: 63 | | Director of the Glenmede Fund (since 1988)
Trustee of the Glenmede Portfolios (since 1992)
Chairman of the Glenmede Fund and the Glenmede Portfolios (since 2006) | | Director, Member Relationship Oversight Committee and Executive Committee, and Chairman of the Compensation Committee of Glenmede Trust; Former Director of Brown & Glenmede Holdings, Inc.; Former Co-Director, Principal and Officer of Philadelphia Investment Banking Co.; Former Director and Officer of Valley Forge Administrative Services Company. | | | 15 | | | None | |
|
(2) Interested Directors/Trustees are those Directors/Trustees who are "interested persons" of the Funds as defined in the 1940 Act.
(3) Mr. Pew is deemed to be an "interested" Director/Trustee of the Funds because of his affiliations with Glenmede Trust and his stock ownership in The Glenmede Corporation, of which Glenmede Advisers is a subsidiary.
177
THE GLENMEDE FUND, INC.
THE GLENMEDE PORTFOLIOS
BOARD MEMBERS AND OFFICERS TABLE (Unaudited) — (Continued)
| Officers | |
|
| Name, Address and Age | | Positions Held with
the Fund/Time Served | | Principal Occupation(s)
During Past 5 Years | |
Mary Ann B. Wirts
1650 Market Street,
Suite 1200 Philadelphia,
PA 19103
Age: 55 | | President (since 1997) and Treasurer (since 2002). | | First Vice President and Managing Director of Fixed Income of Glenmede Trust and Glenmede Advisers. Managing Partner and Chief Administrative Officer of Glenmede Investment Management LP (since 2006). Director of Glenmede Advisers (2002-2006). Employed by Glenmede Trust (since 1982), Glenmede Advisers (2000-2006) and Glenmede Investment Management LP (since 2006). | |
|
Kimberly C. Osborne
1650 Market Street,
Suite 1200 Philadelphia,
PA 19103
Age: 40 | | Executive Vice President (since 1997). | | Vice President of Glenmede Trust and Glenmede Advisers. Employed by Glenmede Trust (since 1993), Glenmede Advisers (since 2000) and Glenmede Investment Management LP (since 2006). | |
|
Michael P. Malloy
One Logan Square
18th and Cherry Streets
Philadelphia,
PA 19103-6996
Age: 47 | | Secretary (since 1995). | | Partner in the law firm of Drinker Biddle & Reath LLP. | |
|
Odeh L. Stevens
200 Clarendon Street
Boston, MA 02116
Age: 35 | | Assistant Secretary (since 2005). | | Associate Counsel, Investors Bank & Trust Company (since 2005). Legal Product Manager, Fidelity Investments (2000-2005). | |
|
Daniel Shea
200 Clarendon Street
Boston, MA 02116
Age: 44 | | Assistant Treasurer (since 2005). | | Director, Investors Bank & Trust Company. Employee of Investors Bank & Trust Company (since 1996). | |
|
Donna Rogers
200 Clarendon Street
Boston, MA 02116
Age: 40 | | Chief Compliance Officer (since 2004). | | Senior Director, Investors Bank & Trust Company (since 2002). Employee of Investors Bank & Trust Company (since 1994). | |
|
178
THE GLENMEDE FUND, INC.
THE GLENMEDE PORTFOLIOS
(Unaudited)
Proxy Voting
A description of the policies and procedures that the Funds' investment advisors and sub-advisor use to vote proxies relating to the Funds' portfolio securities is available, without charge, upon request, by calling 1-800-442-8299, and on the Securities and Exchange Commission's (the "SEC") website at http://www.sec.gov.
Information regarding how the Funds voted proxies relating to portfolio securities during the most recent 12-month period ended June 30 is available without charge, upon request, by calling 1-800-442-8299, and on the SEC's website at http://www.sec.gov.
Quarterly Portfolio Holdings
The Funds file their complete schedule of portfolio holdings of each Portfolio with the SEC for the first and third quarter of each fiscal year on Form N-Q. The Funds' Forms N-Q are available on the SEC's website at http://www.sec.gov and may be reviewed and copied at the SEC's Public Reference Room in Washington, D.C. Information on the operation of the SEC's Public Reference Room may be obtained by calling 1-800-SEC-0330.
Boards of Directors/Trustees - Considerations Regarding Investment Advisory and Sub-Investment Advisory Agreements
At meetings held on September 11, 2006, the Board of Directors of Glenmede Fund and the Board of Trustees of Glenmede Portfolios (collectively, the "Boards") renewed the current Investment Advisory Agreements for each Portfolio of the Funds and the Sub-Investment Advisory Agreement for the International Portfolio and approved the Investment Advisory Agreements for the new Absolute Return and Total Market Long/Short Portfolios (the "New Portfolios") (the existing and New Portfolios collectively, the "Portfolios").
In determining whether to renew the Investment Advisory Agreements and the Sub-Investment Advisory Agreement for the existing Portfolios, and to approve the Investment Advisory Agreements for the New Portfolios (collectively, the "Agreements"), the Boards, including all of the Directors/Trustees who are not interested persons under the Investment Company Act of 1940 (the "Independent Directors"), reviewed and considered, among other items: (1) a memorandum from independent counsel setting forth the Boards' fiduciary duties, responsibilities and the factors the Boards should consider in their evaluation of the Agreements; (2) reports prepared by an independent rating and ranking organization and charts prepared by the Advisor and PIA comparing the performance of each existing Portfolio to the performance of its applicable benchmark index and relevant peer group; (3) a Lipper Inc. ("Lipper") report comparing each Portfolio's advisory fees and expenses to those of its relevant
179
peer group; and (4) reports of and presentations by representatives of the Advisor and PIA that described: (i) the nature, extent and quality of the Advisor's and PIA's services provided to their respective Portfolios and the Advisor's services to be provided to the New Portfolios; (ii) the experience and qualifications of the personnel providing those services; (iii) their organizational structures; (iv) their investment philosophies and processes; (v) their assets under management and client descriptions; (vi) their soft dollar commission and trade allocation policies, including information on the types of research and services obtained in connection with soft dollar commissions; (vii) their advisory fee arrangements with the Funds; (viii) the proposed advisory fee arrangements for the New Portfolios; (ix) the voluntary fee waivers in effect for the Philadelphia International Fund and the proposed contractual fee and expense waivers for th e New Portfolios; (x) the advisory fee arrangements between PIA and its other similarly managed clients; (xi) their compliance processes; (xii) their financial information, insurance coverage and profitability analyses related to providing services to the Portfolios; (xiii) the extent to which economies of scale are relevant to the Portfolios; and (xiv) the benefits of adding the New Portfolios to the Glenmede Fund complex. The Directors/Trustees discussed the written materials, the Advisor's and PIA's presentations, the Funds' Chief Compliance Officer's quarterly reports on the Advisor's and PIA's compliance programs and their responsiveness in addressing her recommendations, and deliberated on the renewal of the existing Agreements and approval of the Agreements for the New Portfolios in light of this information. In their deliberations, the Directors/Trustees did not identify any single piece of information that was all-important or controlling.
The Boards, including all of the Independent Directors/Trustees, reached the following conclusions, among others, regarding the Advisor and PIA and their respective Agreements: the Advisor and PIA each have the capabilities, resources and personnel necessary to manage their respective Portfolios; the Advisor has the capabilities, resources and personnel necessary to oversee the management of PIA as sub-adviser to the Philadelphia International Fund; the Boards are satisfied with the quality of services provided by the Advisor and PIA in advising their respective Portfolios; the advisory fee for each existing Portfolio that pays an advisory fee is below both the median and the average contractual fees paid by comparable funds in their respective Lipper peer group; the proposed advisory fees of the New Portfolios are below the median and average advisory fees of such comparable funds; and each advisory and sub-advisory fee payable to PIA is re asonable as compared to PIA's other similarly managed mutual fund clients. The Boards noted that the Funds are currently the Advisor's only clients and therefore, there is no comparative fee information for the Advisor's other similarly managed clients.
The Boards also concluded that the total annual portfolio operating expenses paid by each existing Portfolio are below the median expenses paid by comparable funds in their respective Lipper peer group, and either below or, in the case of the International Portfolio, equivalent to, the average expenses paid by such comparable funds; the estimated annual portfolio operating expenses for the New Portfolio are below the median and average expenses of such comparable funds; and the performance of the existing Portfolios are generally competitive (in some cases performance for certain periods was higher than
180
the comparative performance information, and in other cases it was lower) with their benchmark indices and other mutual funds in their peer groups as ranked by an independent rating and ranking organization and as demonstrated by charts provided by the Advisor and PIA comparing the performance of each existing Portfolio to its respective benchmark index and Lipper peer group.
The Boards also concluded that the expected profit to the Advisor for advisory services and Glenmede Trust for shareholder servicing seem reasonable; the expected profit to PIA for advisory and sub-advisory services seem reasonable; and the benefits derived by the Advisor and PIA from managing their respective Portfolios, including how each uses soft dollars, the ways in which they conduct portfolio transactions and select brokers, seem reasonable. The Boards noted that since the investment advisory fees and shareholder servicing fees do not have breakpoints, there would be no economies of scale for those fees as the Portfolios' assets increase. With respect to the Glenmede Fund Board's evaluation of the Sub-Investment Advisory Agreement, economies of scale were not considered relevant because the sub-advisory fee is to be paid by the Advisor, not the International Portfolio or its shareholders, and therefore would have no impact on the Inte rnational Portfolio's expense ratio.
Based upon each Board's deliberations and evaluation of the information described above, the Directors/Trustees, including all of the Independent Directors/Trustees, determined that the terms of each Investment Advisory Agreement and Sub-Advisory Agreement were reasonable and fair to the respective Portfolios and their shareholders.
181
THE GLENMEDE PORTFOLIOS
THE GLENMEDE FUND, INC.
Privacy Notice
The Glenmede Fund, Inc. and The Glenmede Portfolios (each the "Company") are committed to protecting the security and confidentiality of the personal information of our shareholders. We provide you with this notice to inform you about our practices with respect to personal information.
We collect nonpublic personal information about you from the following sources:
• Information we receive from you on applications or other forms; and
• Information about your transactions with us or others;
• Information received from you in written, telephonic or electronic communications with us, or affiliates or others.
We may share all of the nonpublic personal information that we collect (as described above) with our affiliated providers of financial services, such as The Glenmede Trust Company and its affiliated banking and insurance companies, and with companies that perform marketing services on our behalf. We are permitted by law to disclose nonpublic personal information about you to other third parties in certain circumstances. For example, we may disclose nonpublic personal information about you to affiliated and nonaffiliated third parties to assist us in servicing your account with us and to government entities.
If you decide to close your account(s) or become an inactive customer, we will adhere to the privacy policies and practices as described in this notice.
We restrict access to your personal and account information to those employees who need to know that information to provide products or services to you. We maintain physical, electronic, and procedural safeguards to guard your nonpublic personal information. If you have any questions about our privacy policies, please call 1-800-442-8299.
182
The Glenmede Fund, Inc. and The Glenmede Portfolios
Investment Advisor
Glenmede Advisers, Inc.
One Liberty Place
1650 Market Street, Suite 1200
Philadelphia, Pennsylvania 19103
Administrator
Investors Bank & Trust Company
200 Clarendon Street
Boston, Massachusetts 02116
Custodian
Investors Bank & Trust Company
200 Clarendon Street
Boston, Massachusetts 02116
Legal Counsel
Drinker Biddle & Reath LLP
One Logan Square
18th & Cherry Streets
Philadelphia, Pennsylvania 19103-6996
Distributor
Quasar Distributors, LLC.
615 East Michigan Street
Milwaukee, Wisconsin 53202
Independent Auditors
PricewaterhouseCoopers LLP
125 High Street
Boston, Massachusetts 02110
Investment Advisor
(for Philadelphia International Fund)
Investment Sub-Advisor
(for International Portfolio)
Philadelphia International Advisors LP
One Liberty Place
1650 Market Street, Suite 1400
Philadelphia, Pennsylvania 19103
The report is submitted for the general information of the shareholders of The Glenmede Fund, Inc. and The Glenmede Portfolios. It is not authorized for distribution to prospective investors unless accompanied or preceded by an effective prospectus for the Funds, which contain information concerning the Fund's investment policies and expenses as well as other pertinent information.
Item 2. Code of Ethics.
As of October 31, 2006, the Registrant has adopted a code of ethics that applies to the Registrant’s President and Treasurer (Principal Executive Officer and Principal Financial Officer). For the year ended October 31, 2006, there were no amendments to a provision of its code of ethics, nor were there any waivers, including implicit waivers granted from a provision of the code of ethics. A copy of the Registrant’s code of ethics is filed with the Form N-CSR under Item 12(a)(1).
Item 3. Audit Committee Financial Expert.
The Registrant’s Board of Directors has determined that the Registrant has at least one audit committee financial expert serving on its audit committee. The audit committee financial expert serving on the Registrant’s audit committee is Francis J. Palamara, who is “independent” as defined in Item 3(a)(2) of this Form.
Item 4. Principal Accountant Fees and Services.
(a) Audit Fees – The aggregate fees billed for each of the last two fiscal years for professional services rendered by the principal accountant for the audit of the Registrant’s annual financial statements or services that are normally provided by the accountant in connection with statutory and regulatory filings or engagements for those fiscal years were $189,413 and $220,484 for the fiscal years ended October 31, 2005 and October 31, 2006, respectively.
(b) Audit-Related Fees – There were no fees billed for the fiscal years ended October 31, 2005 and October 31, 2006 for assurance and related services by the principal accountant that are reasonably related to the performance of the audit of the Registrant’s financial statements and are not reported under (a) of this Item.
(c) Tax Fees – The aggregate fees billed in each of the last two fiscal years for professional services rendered by the principal accountant for the review of the Registrant’s tax returns, other tax-related filings and excise tax calculations were $38,609 and $62,800 for the fiscal years ended October 31, 2005 and October 31, 2006, respectively.
(d) All Other Fees – There were no other fees billed for the fiscal years ended October 31, 2005 and October 31, 2006 for products and services provided by the principal accountant, other than the services reported in (a) through (c) of this Item.
(e) (1) The Registrant’s audit committee pre-approves all audit and non-audit services to be performed by the Registrant’s accountant before the accountant is engaged by the Registrant to perform such services.
(2) There were no services described in (b) through (d) above (including services required to be approved by the audit committee pursuant to paragraph (c)(7)(ii) of Rule 2-01 of Regulation S-X) that were approved by the audit committee pursuant to paragraph (c)(7)(i)(C) of Rule 2-01 of Regulation S-X.
(f) None of the hours expended on the principal accountant’s engagement to audit the Registrant’s financial statements for the fiscal year ended October 31, 2006 were attributable to work performed by persons other than the principal accountant’s full-time, permanent employees.
(g) Not applicable.
(h) Not applicable.
Item 5. Audit Committee of Listed Registrants.
Not applicable.
Item 6. Schedule of Investments.
The Registrant’s full schedules of investments are included as part of the report to shareholders filed under Item 1 of this Form.
Item 7. Disclosure of Proxy Voting Policies and Procedures for Closed-End Management Investment Companies.
Not applicable.
Item 8. Portfolio Managers of Closed-End Management Investment Companies
Not applicable
Item 9. Purchases of Equity Securities by Closed-End Management Investment Company and Affiliated Purchasers.
Not applicable.
Item 10. Submission of Matters to a Vote of Security Holders.
There have been no material changes to the procedures by which the shareholders may recommend nominees to the Registrant’s Board of Directors.
Item 11. Controls and Procedures.
(a) The Registrant’s Principal Executive Officer and Principal Financial Officer concluded that the Registrant’s disclosure controls and procedures (as defined in Rule 30a-3(c) under the Investment Company Act of 1940 (17 CFR 270.30a-3(c))), are effective based on the evaluation of Registrant’s disclosure controls and procedures as of a date within 90 days prior to the filing date of this report.
(b) There were no changes in the Registrant’s internal control over financial reporting (as defined in Rule 30a-3(d) under the Investment Company Act of 1940 (17 CFR 270.30a-3(d))), that occurred during the second fiscal quarter of the period covered by this report that has materially affected, or is reasonably likely to materially affect, the Registrant’s internal control over financial reporting.
Item 12. Exhibits.
(a)(1) Code of Ethics for the Registrant’s President and Treasurer (Principal Executive Officer and Principal Financial Officer) described in Item 2 is attached hereto.
(a)(2) Certification of the Principal Executive Officer and Principal Financial Officer of the Registrant as required by Rule 30a-2(a) under the Investment Company Act of 1940 (17 CFR 270.30a-2(a)) is attached hereto as Exhibit 99CERT.
(a)(3) Not applicable.
(b) Certification pursuant to Section 906 of the Sarbanes-Oxley Act of 2002 as required by Rule 30a-2(b), under the Investment Company Act of 1940 (17 CFR 270.30a-2(b)), Rule 15d-14(b) under the Securities Exchange Act of 1934 (17 CFR 240.15d-14(b)) and Section 1350 of Chapter 63 of Title 18 of the United States Code (18 U.S.C. 1350) is attached hereto as Exhibit 99.906CERT.
SIGNATURES
Pursuant to the requirements of the Securities Exchange Act of 1934 and the Investment Company Act of 1940, the Registrant has duly caused this report to be signed on its behalf by the undersigned, thereunto duly authorized.
(Registrant) | THE GLENMEDE FUND, INC. |
| | | | |
By (Signature and Title) | | By: | /s/ Mary Ann B. Wirts | | |
| | Mary Ann B. Wirts
President and Treasurer
(Principal Executive Officer and Principal Financial Officer) | | |
Date: | 1/5/07 | | | |
| | | | | | | | |
Pursuant to the requirements of the Securities Exchange Act of 1934 and the Investment Company Act of 1940, this report has been signed below by the following person on behalf of the Registrant and in the capacities and on the date indicated.
By (Signature and Title) | | By: | /s/ Mary Ann B. Wirts | |
| | Mary Ann B. Wirts
President and Treasurer
(Principal Executive Officer and Principal Financial Officer) | | |
Date: | 1/5/07 | | | |
| | | | | | | | |