UNITED STATES
SECURITIES AND EXCHANGE COMMISSION
Washington, DC 20549
FORM N-CSR
CERTIFIED SHAREHOLDER REPORT OF REGISTERED
MANAGEMENT INVESTMENT COMPANIES
Investment Company Act File Number:
811-05577
The Glenmede Fund, Inc.
(Exact Name of Registrant as Specified in Charter)
1 Lincoln Street, Floor 8
SFC0805
Boston, MA 02111
(Address of Principal Executive Offices)(Zip Code)
Michael P. Malloy, Esq.
Secretary
Faegre Drinker Biddle & Reath LLP
One Logan Square
Suite 2000
Philadelphia, PA 19103-6996
(Name and Address of Agent for Service)
Registrant’s Telephone Number, including Area Code:
1-800-442-8299
Date of Fiscal Year End: October 31
Date of Reporting Period: October 31, 2021
Item 1. Reports to Stockholders.
(a)
The Glenmede Fund, Inc.
The Glenmede Portfolios
Annual Report
October 31, 2021
The performance for the portfolios shown on pages 2 to 22 represents past performance and is not a guarantee of future results. A portfolio’s share price and investment return will vary with market conditions, and the principal value of shares, when redeemed, may be more or less than their original cost.
An investment in a portfolio is neither insured nor guaranteed by the U.S. Government, the Federal Deposit Insurance Corporation, the Federal Reserve Board or any other governmental agency or bank.
Unlike actual fund performance, performance of an index does not reflect any expenses or transaction costs. A direct investment in an unmanaged index is not possible.
The reports concerning the portfolios included in this shareholder report may contain certain forwardlooking statements about the factors that may affect the performance of the portfolios in the future. These statements are based on the adviser’s predictions and expectations concerning certain future events and their expected impact on the portfolios, such as performance of the economy as a whole and of specific industry sectors, changes in the levels of interest rates, the impact of developing world events and other factors that may influence the future performance of the portfolios. The adviser believes these forwardlooking statements to be reasonable, although they are inherently uncertain and difficult to predict. Actual events may cause adjustments in portfolio management strategies from those currently expected to be employed.
The Glenmede Fund, Inc.
The Glenmede Portfolios
Table of Contents
| 2 |
| 5 |
| 23 |
| 26 |
| 29 |
| 29 |
| 35 |
| 41 |
| 47 |
| 49 |
| 66 |
| 170 |
| 194 |
| 195 |
| 195 |
| 196 |
| 197 |
| 198 |
| 199 |
| 208 |
| 212 |
| 213 |
| 215 |
| 219 |
The Glenmede Fund, Inc. and the Glenmede Portfolios
President’s Letter
Dear Shareholder:
We are pleased to present the annual report of the Glenmede family of funds for the fiscal year ended October 31, 2021. At the fiscal year end on October 31, 2021, The Glenmede Fund, Inc. and The Glenmede Portfolios (collectively, the “Glenmede Funds”) consisted of 18 Portfolios with total assets of $7.3 billion. During the fiscal year, no new portfolios were launched and one portfolio was closed: The Glenmede Fund, Inc. – Large Cap Value Portfolio.
The fiscal year was marked by improved investor sentiment in response to supportive fiscal/monetary policies, stronger than expected earnings and revenues, business re-openings, and medical advances against COVID-19. The enhanced outlook led to an equity rally during the fiscal year while fixed income markets were relatively flat comparatively.
A strong economic recovery combined with commitments from global central banks that monetary policies will remain accommodative for some time provided the underpinnings for the surge in equities. The COVID-19 vaccine developments and the certification of the U.S. election results provided additional catalysts for the equity rally. The fiscal year ended October 31, 2021 saw all major equity indices rally significantly with the S& P 500® Index1 gaining 42.9%. Small cap stocks, as represented by the Russell 2000® Index1, outpaced their large cap counterparts, rising 50.8%. International markets also rallied with the MSCI EAFE Index1 up 34.2% for the fiscal year.
As the economy continues to recover from the COVID-19 pandemic, the treasury curve steepened as long-term interest rates ascended. The Federal Reserve maintained its accommodative stance with Fed funds at the effective lower range. Inflation expectations grew as the year progressed and pushed long term rates even higher with the U.S. 10 Year treasury at 1.55% by the close of October 2021. The treasury yield curve flattened towards the end of the fiscal year as the market patiently waited for the Federal Reserve to unveil its tapering plan and U.S. 2-year treasury yields rose 23 basis points2 over the month of October. For the fiscal year ended October 31, 2021, the Bloomberg U.S. Aggregate Bond Index1 returned -0.48% and the Bloomberg Municipal 1-10 Year Blend Index1 returned a modest 1.28%. High yield debt performed the best with the Bloomberg High Yield Index1 returning 9.1%.
The Glenmede Quantitative U.S. Total Market Equity Portfolio achieved a five star (★★★★★) Overall Morningstar RatingTM3 among 392 Mid Cap Value Equity Funds for the period ended October 31, 2021 (based on risk adjusted returns). The Glenmede Equity Income Portfolio acheived a four star (★★★★) Overall Morningstar RatingTM3 among 1,146 Large Value Equity Funds for the period ended October 31, 2021 (based on risk adjusted returns). The Glenmede Secured Options Portfolio (Advisor Class) achieved a four star (★★★★) Overall Morningstar RatingTM3 among 88 Option-based Funds for the period ended October 31, 2021 (based on risk adjusted returns). The Glenmede Women in Leadership Equity Portfolio achieved a four star (★★★★) Overall Morningstar RatingTM3 among 1,146 Large Value Equity Funds for the period ended October 31, 2021 (based on risk adjusted returns).
We have included Portfolio Highlights for each individual fund in this report. We welcome any questions about the Glenmede Funds and thank our shareholders for their continued support.
Sincerely,
Kent E. Weaver, Jr.
President
November 23, 2021
Past performance is no guarantee of future results.
Mutual fund investing involves risks. Principal loss is possible. Shareholders should consult each Portfolio’s prospectus for a complete listing of risks associated with their Portfolio(s). Certain Portfolios invest in foreign securities which, especially in emerging markets, will involve greater volatility and political, economic and currency risks and differences in accounting methods. The Small Cap Equity Portfolio and Quantitative U.S. Small Cap Equity Portfolio invest in smaller companies, which will involve additional risks such as limited liquidity and greater volatility than larger companies. The Quantitative U.S. Large Cap Value Equity Portfolio may invest in IPOs and the market value of IPO shares could fluctuate considerably due to factors such as the absence of a prior public market, unseasoned trading, the small number of shares available for trading, and limited information about the issuer. Short sales by the Quantitative U.S. Long/Short Equity Portfolio and the Quantitative U.S. Total Market Equity Portfolio involve leverage risk, credit exposure to brokers that execute the short sales and have potentially unlimited losses. Use of derivatives by the Secured Options Portfolio and the Global Secured Options Portfolio may involve greater liquidity, counterparty, credit and pricing risks. The Muni Intermediate Portfolio, High Yield Municipal Portfolio and Short Term Tax Aware Fixed Income Portfolio invest in debt instruments of municipal issuers whose ability to meet their obligations may be affected by political and economic factors in the issuer’s region. Investments in debt securities typically decrease in value when interest rates rise. This risk is usually greater for longer-term debt securities. Income from tax-exempt funds may be subject to state and local taxes and a portion of such income may be subject to the federal alternative minimum tax for certain investors. Federal income tax rules will apply to any capital gains distributions. Investments in asset backed and mortgage backed securities by the Core Fixed Income Portfolio include additional risks that investors should be aware of such as credit risk, prepayment risk, possible illiquidity and default, as well as increased susceptibility to adverse economic developments. The High Yield Municipal Portfolio invests in “Junk Bonds” which are securities rated below investment grade and are high risk investments that have greater credit risk, are less liquid and have more volatile prices than investment grade bonds. The Secured Options Portfolio and the Global Secured Options Portfolio invest in options which have risks of unlimited losses of the underlying holdings due to unanticipated market movements and failure to correctly predict the direction of the securities prices, interest rates and currency exchange rates. Covered call writing may limit the upside of an underlying security. This investment may not be suitable for all investors. The application of the social, governance and/or environmental standards of the Responsible ESG U.S. Equity Portfolio and the women in leadership criteria of the Women in Leadership U.S. Equity Portfolio will affect each Portfolio’s exposure to certain issuers, industries, sectors, regions and countries and may impact the relative performance of these Portfolios, either positively or negatively, depending on whether such investments are in or out of favor. The Equity Income Portfolio invests in dividend paying stocks. Issuers that have paid regular dividends or distributions to shareholders may not continue to do so at the same level or at all in the future. Dividend paying securities can fall out of favor with the market, causing the Portfolio during such periods to underperform funds that do not focus on dividends.
Diversification does not assure a profit or protect against a loss in a declining market.
An investment in a Portfolio is neither insured nor guaranteed by the Federal Deposit Insurance Corporation, any other government agency or bank.
| 1 | The indices are defined on pages 23 to 25. |
| 2 | A basis point equals .01%. |
| 3 | ©2021 Morningstar, Inc. All Rights Reserved. The information contained herein: (1) is proprietary to Morningstar and/or its content providers; (2) may not be copied or distributed; and (3) is not warranted to be accurate, complete or timely. Neither Morningstar nor its content providers are responsible for any damages or losses arising from any use of this information. Past performance is no guarantee of future results. |
| | The Morningstar Rating™ for funds, or "star rating", is calculated for managed products (including mutual funds, variable annuity and variable life subaccounts, exchange-traded funds, closed-end funds, and separate accounts) with at least a three-year history. Exchange-traded funds and open-end mutual funds are considered a single population for comparative purposes. It is calculated based on a Morningstar Risk-Adjusted Return measure that accounts for variation in a managed product’s monthly excess performance, placing more emphasis on downward variations and rewarding consistent performance. The top 10% of products in each product category receive 5 stars, the next 22.5% receive 4 stars, the next 35% receive 3 stars, the next 22.5% receive 2 stars, and the bottom 10% receive 1 star. The Overall Morningstar Rating™ for a managed product is derived from a weighted average of the performance figures associated with its three-, five-, and 10-year (if applicable) Morningstar Rating™ metrics. The weights are: 100% three-year rating for 36-59 months of total returns, 60% five-year rating/40% three-year rating for 60-119 months of total returns, and 50% 10-year rating/30% five-year rating/20% three-year rating for 120 or more months of total returns. While the 10-year overall star rating formula seems to give the most weight to the 10-year period, the most recent three-year period actually has the greatest impact because it is included in all three rating periods. |
| | As of October 31, 2021, the Equity Income Portfolio was rated against the following numbers of U.S.-domiciled Large Value Equity funds over the following time periods: 1,146 funds overall and 1,146 funds in the last three years. With respect to these Large Value Equity funds, the Equity Income Portfolio received an Overall Morningstar Rating™ of ★★★★ stars and a Morningstar Rating™ of ★★★★ stars for the three-year period. As of October 31, 2021, the Secured Options Portfolio (Advisor Class and Institutional Class) was rated against the following numbers of Option-based funds over the following time periods: 88 funds overall, 88 funds in the last three years, 62 funds in the last five years and 11 funds in the last ten years. With respect to these Option-based |
| | funds, the Secured Options Portfolio (Advisor Class) received an Overall Morningstar Rating™ of ★★★★ stars and a Morningstar Rating™ of ★★★ stars, ★★★ stars and ★★★★★ stars for the three-, five- and ten year periods, respectively. With respect to these Option-based funds, the Secured Options Portfolio (Institutional Class) received an Overall Morningstar Rating™ of ★★★ stars and a Morningstar Rating™ of ★★★ stars, ★★★ stars and ★★★★★ stars for the three-, five- and ten year periods, respectively. As of October 31, 2021, the Quantitative U.S. Total Market Equity Portfolio was rated against the following numbers of U.S.- domiciled Mid-Cap Value funds over the following time periods: 392 funds overall, 392 funds in the last three years, 350 funds in the last five years and 254 funds in the last ten years. With respect to these Mid-Cap Value funds, the Quantitative U.S. Total Market Equity Portfolio received an Overall Morningstar Rating™ of ★★★★★ stars and a Morningstar Rating™ of ★★★★ stars, ★★★★★ stars and ★★★★★ stars for the three-, five- and ten-year periods, respectively. As of October 31, 2021, the Women in Leadership Equity Portfolio was rated against the following numbers of U.S.- domiciled Large Value funds over the following time periods: 1,146 funds overall, 1,146 funds in the last three years and 1,027 funds in the last five years. With respect to these Large Value funds, the Women in Leadership Equity Portfolio received an Overall Morningstar Rating™ of ★★★★ stars and a Morningstar Rating™ of ★★★★ stars and ★★★★ stars for the three- and five year periods, respectively. Past performance is no guarantee of future results. Ratings for other share classes may differ. |
| | This material must be preceded or accompanied by a current prospectus. |
| | The Glenmede Fund, Inc. and The Glenmede Portfolios are distributed by Quasar Distributors, LLC. 12/21. |
| | Bond ratings are grades given to bonds that indicate their credit quality as determined by a private independent rating service such as S&P Global Ratings. The firm evaluates a bond issuer’s financial strength, or its ability to pay a bond’s principal and interest in a timely fashion. Ratings are expressed as letters ranging from ’AAA’, which is the highest grade, to ’D’, which is the lowest grade. In limited situations when the rating agency has not issued a formal rating, the rating agency will classify the security as non-rated. |
| | A Portfolio’s holdings and allocations are subject to change and are not recommendations to buy or sell any security. Current and future portfolio holdings are subject to risk. Please refer to a Portfolio’s Schedule of Portfolio Investments contained in this report for a full listing of portfolio holdings. |
Quantitative U.S. Large Cap Core Equity Portfolio
PORTFOLIO HIGHLIGHTS
October 31, 2021
| Average Annual Total Return |
| | | | | Return After Taxes on | | | | |
| Quantitative U.S. Large Cap Core Equity Portfolio – Advisor Class | | Return
Before
Taxes | | Distributions | | Distributions
and Sales of
Fund Shares | | Russell 1000®
Index | | Morningstar
Large Blend
Average |
| Year ended 10/31/21 | | 43.77% | | 40.82% | | 27.11% | | 43.51% | | 41.27% |
| Five Years ended 10/31/21 | | 14.71% | | 13.11% | | 11.41% | | 19.16% | | 16.60% |
| Ten Years ended 10/31/21 | | 14.69% | | 13.60% | | 12.08% | | 16.30% | | 13.92% |
| Inception (02/27/04) through 10/31/211 | | 10.22% | | 9.52% | | 8.60% | | 10.62% | | 8.90% |
| Quantitative U.S. Large Cap Core Equity Portfolio – Institutional Class | | | | | | | | | | |
| Year ended 10/31/21 | | 44.10% | | 41.04% | | 27.31% | | 43.51% | | 41.27% |
| Five Years Ended 10/31/21 | | 14.94% | | 13.28% | | 11.58% | | 19.16% | | 16.60% |
| Inception (12/30/15) through 10/31/212 | | 13.18% | | 11.74% | | 10.25% | | 17.15% | | 14.83% |
For the fiscal year ended October 31, 2021, the Portfolio’s Advisor Class outperformed the Russell 1000® Index by 0.26% and the Morningstar Large Blend Average by 2.50%, respectively. The Portfolio was positively impacted from its relatively lower average market capitalization versus the Russell 1000® Index as the average stock (50.4%) outperformed the Index by about 6.9%. However, the Portfolio’s relative performance was negatively impacted from underexposure to Alphabet (GOOG 82.9%) and no exposure to Tesla (TSLA 187%). The Portfolio’s performance had net positive contributions from multifactor stock ranking models, including biases towards stocks with lower valuations, as the Russell 1000® Value Index outperformed the Russell 1000® Growth Index by about 0.5%. The Portfolio had positive relative stock performance in four of eleven sectors. The most favorable contributions from stock selection came in the information technology and consumer discretionary sectors. The most negative contributions from stock selection were in the communication services and materials. The Portfolio’s gross annual operating expense ratios, as stated in the February 28, 2021 Prospectuses, are 0.87% and 0.67% for the Advisor and Institutional Class shares, respectively. These ratios can fluctuate and may differ from the expense ratios disclosed in the Financial Highlights section of this report.
Hypothetical Illustration of $10,000 Invested in
Quantitative U.S. Large Cap Core Equity Portfolio - Advisor Class vs.
Russell 1000® Index and
Morningstar Large Blend Average
10/31/11 through 10/31/21
| * | Assumes the reinvestment of all dividends and distributions. |
Performance data quoted represents past performance; past performance does not guarantee future results. The investment return and principal value of an investment will fluctuate so that an investor’s shares, when redeemed, may be worth more or less than their original cost. Current performance may be higher or lower than the total return shown. Please call the Fund at 1-800-442-8299 to obtain the most recent month-end returns. Returns, other than after-tax returns, do not reflect taxes that the shareholder may pay on fund distributions or the redemption of fund shares. After-tax returns are calculated using the historical highest individual federal marginal income tax rates, do not reflect the impact of state and local taxes and are not relevant to investors who hold their shares through tax-deferred arrangements such as 401(k) plans or IRAs. Actual after-tax returns depend on the investor’s tax situation and may differ from those shown. Performance of the Institutional Class will vary from the Advisor Class due to differences in fees.
| | 1 Returns are for the period beginning March 1, 2004 for Morningstar Large Blend Average. |
| | 2 Returns are for the period beginning January 1, 2016 for Morningstar Large Blend Average. |
| | The indices and certain terms are defined on pages 23 to 25. |
Quantitative U.S. Large Cap Growth Equity Portfolio
PORTFOLIO HIGHLIGHTS
October 31, 2021
| Average Annual Total Return |
| | | | | Return After Taxes on | | | | |
| Quantitative U.S. Large Cap Growth Equity Portfolio – Advisor Class | | Return
Before
Taxes | | Distributions | | Distributions
and Sales of
Fund Shares | | Russell 1000®
Growth Index | | Morningstar
Large Growth
Average |
| Year ended 10/31/21 | | 46.17% | | 41.57% | | 29.23% | | 43.21% | | 39.55% |
| Five Years ended 10/31/21 | | 20.97% | | 18.49% | | 16.33% | | 25.49% | | 22.35% |
| Ten Years ended 10/31/21 | | 17.85% | | 16.37% | | 14.74% | | 19.42% | | 16.89% |
| Inception (02/27/04) through 10/31/211 | | 12.17% | | 11.30% | | 10.32% | | 12.44% | | 10.61% |
| Quantitative U.S. Large Cap Growth Equity Portfolio – Institutional Class | | | | | | | | | | |
| Year ended 10/31/21 | | 46.47% | | 41.75% | | 29.40% | | 43.21% | | 39.55% |
| Five Years Ended 10/31/21 | | 21.21% | | 18.66% | | 16.50% | | 25.49% | | 22.35% |
| Inception (11/05/15) through 10/31/212 | | 17.53% | | 15.43% | | 13.67% | | 21.14% | | 18.44% |
For the fiscal year ended October 31, 2021, the Portfolio’s Advisor Class outperformed the Russell 1000® Growth Index by 2.96% and the Morningstar Large Growth Average by 6.62%, respectively. The Portfolio was positively impacted from relative underexposure to megacap companies such as Apple (AAPL, 38.5%) and Amazon (AMZN, 11.1%). However, the Portfolio’s relative performance was negatively impacted from underexposure to Alphabet (GOOG 82.9%) and no exposure to Tesla (TSLA 187%). The Portfolio’s performance had mixed contributions from multifactor stock ranking models, including biases towards stocks with lower valuations, better fundamentals and more positive earnings trends. The Portfolio benefitted from downside risk screens, avoiding stocks ranked poorly in multifactor sell models and negative earnings surprise signals. The Portfolio had positive relative stock performance in two of nine sectors. The most favorable contributions from stock selection came in the information technology and materials sectors. The most negative contributions from stock selection were in the communication services and health care sectors. The Portfolio’s gross annual operating expense ratios, as stated in the February 28, 2021 Prospectuses, are 0.88% and 0.68% for the Advisor and Institutional Class shares, respectively. These ratios can fluctuate and may differ from the expense ratios disclosed in the Financial Highlights section of this report.
Hypothetical Illustration of $10,000 Invested in
Quantitative U.S. Large Cap Growth Equity Portfolio-Advisor Class vs.
Russell 1000® Growth Index and Morningstar Large Growth Average
10/31/11 through 10/31/21
| * | Assumes the reinvestment of all dividends and distributions. |
Performance data quoted represents past performance; past performance does not guarantee future results. The investment return and principal value of an investment will fluctuate so that an investor’s shares, when redeemed, may be worth more or less than their original cost. Current performance may be higher or lower than the total return shown. Please call the Fund at 1-800-442-8299 to obtain the most recent month-end returns. Returns, other than after-tax returns, do not reflect taxes that the shareholder may pay on fund distributions or the redemption of fund shares. After-tax returns are calculated using the historical highest individual federal marginal income tax rates, do not reflect the impact of state and local taxes and are not relevant to investors who hold their shares through tax-deferred arrangements such as 401(k) plans or IRAs. Actual after-tax returns depend on the investor’s tax situation and may differ from those shown. Performance of the Institutional Class will vary from the Advisor Class due to differences in fees.
| | 1 Returns are for the period beginning March 1, 2004 for Morningstar Large Growth Average. |
| | 2 Returns are for the period beginning December 1, 2015 for Morningstar Large Growth Average. |
| | The indices and certain terms are defined on pages 23 to 25. |
Quantitative U.S. Large Cap Value Equity Portfolio
PORTFOLIO HIGHLIGHTS
October 31, 2021
| Average Annual Total Return |
| | | | | Return After Taxes on | | | | |
| Quantitative U.S. Large Cap Value Equity Portfolio | | Return
Before
Taxes | | Distributions | | Distributions
and Sales of
Fund Shares | | Russell 1000®
Value Index | | Morningstar
Large Value
Average |
| Year ended 10/31/21 | | 46.66% | | 45.89% | | 27.67% | | 43.76% | | 43.70% |
| Inception (11/13/17) through 10/31/211 | | 8.93% | | 8.40% | | 6.84% | | 11.18% | | 10.01% |
For the fiscal year ended October 31, 2021, the Portfolio outperformed the Russell 1000® Value Index by 2.90% and the Morningstar Large Value Average by 2.96%, respectively. In the past year, the Portfolio’s performance had net positive contributions from multifactor ranking models, including biases towards stocks with lower valuations. Stocks in the Russell 1000® Value Index with lower valuations (Price/Earnings<20) had a total return of 56.0%. The Portfolio benefitted from leading industry group indicators, including relative overweightings in financials and underweightings in health care stocks. The Portfolio had positive relative stock performance in six of eleven sectors. The most favorable contributions from stock selection came in the information technology and communication services sectors. The most negative contributions from stock selection were in the materials and energy sectors. The Portfolio’s gross annual operating expense ratio, as stated in the February 28, 2021 Prospectus, is 2.66%. This ratio can fluctuate and may differ from the expense ratio disclosed in the Financial Highlights section of this report.
Hypothetical Illustration of $10,000 Invested in
Quantitative U.S. Large Cap Value Equity Portfolio vs.
Russell 1000® Value Index and
Morningstar Large Value Average
11/13/17 through 10/31/21
| * | Assumes the reinvestment of all dividends and distributions. |
Performance data quoted represents past performance; past performance does not guarantee future results. The investment return and principal value of an investment will fluctuate so that an investor’s shares, when redeemed, may be worth more or less than their original cost. The performance quoted reflects fee waivers and/or expense reimbursements in effect and would have been lower in their absence. Current performance may be higher or lower than the total return shown. Please call the Fund at 1-800-442-8299 to obtain the most recent month-end returns. Returns, other than after-tax returns, do not reflect taxes that the shareholder may pay on fund distributions or the redemption of fund shares. After-tax returns are calculated using the historical highest individual federal marginal income tax rates, do not reflect the impact of state and local taxes and are not relevant to investors who hold their shares through tax-deferred arrangements such as 401(k) plans or IRAs. Actual after-tax returns depend on the investor’s tax situation and may differ from those shown.
| | 1 Returns are for the period beginning December 1, 2017 for Morningstar Large Value Average. |
| | The indices and certain terms are defined on pages 23 to 25. |
Quantitative U.S. Small Cap Equity Portfolio
PORTFOLIO HIGHLIGHTS
October 31, 2021
| Average Annual Total Return |
| | | | | Return After Taxes on | | | | |
| Quantitative U.S. Small Cap Equity Portfolio | | Return
Before
Taxes | | Distributions | | Distributions
and Sales of
Fund Shares | | Russell 2000®
Index | | Morningstar
Small Blend
Average |
| Year ended 10/31/21 | | 58.45% | | 58.14% | | 34.62% | | 50.80% | | 54.25% |
| Inception (11/13/17) through 10/31/211 | | 11.55% | | 11.36% | | 9.05% | | 13.27% | | 10.09% |
For the fiscal year ended October 31, 2021, the Portfolio outperformed the Russell 2000® Index by 7.65% and the Morningstar Small Blend Average by 4.20%, respectively. In the past year, the Portfolio’s performance had net positive contributions from multifactor ranking models, including biases towards stocks with lower valuations. Stocks in the Russell 2000® Index with lower valuations (Price/Earnings<20) had a total return of 64.9%. The Portfolio benefitted from leading industry group indicators, including relative overweightings in financials/communication services and underweightings in health care/utilities stocks. The Portfolio had positive relative stock performance in seven of eleven sectors. The most favorable contributions from stock selection came in the health care and financials sectors. The most negative contributions from stock selection were in the energy and communication services sectors. The Portfolio’s gross annual operating expense ratio, as stated in the February 28, 2021 Prospectus, is 4.63%. This ratio can fluctuate and may differ from the expense ratio disclosed in the Financial Highlights section of this report.
Hypothetical Illustration of $10,000 Invested in
Quantitative U.S. Small Cap Equity Portfolio vs.
Russell 2000® Index and
Morningstar Small Blend Average
11/13/17 through 10/31/21
| * | Assumes the reinvestment of all dividends and distributions. |
Performance data quoted represents past performance; past performance does not guarantee future results. The investment return and principal value of an investment will fluctuate so that an investor’s shares, when redeemed, may be worth more or less than their original cost. The performance quoted reflects fee waivers and/or expense reimbursements in effect and would have been lower in their absence. Current performance may be higher or lower than the total return shown. Please call the Fund at 1-800-442-8299 to obtain the most recent month-end returns. Returns, other than after-tax returns, do not reflect taxes that the shareholder may pay on fund distributions or the redemption of fund shares. After-tax returns are calculated using the historical highest individual federal marginal income tax rates, do not reflect the impact of state and local taxes and are not relevant to investors who hold their shares through tax-deferred arrangements such as 401(k) plans or IRAs. Actual after-tax returns depend on the investor’s tax situation and may differ from those shown.
| | 1 Returns are for the period beginning December 1, 2017 for Morningstar Small Blend Average. |
| | The indices and certain terms are defined on pages 23 to 25. |
Quantitative International Equity Portfolio
PORTFOLIO HIGHLIGHTS
October 31, 2021
| Average Annual Total Return |
| | | | | Return After Taxes on | | | | |
| Quantitative International Equity Portfolio | | Return
Before
Taxes | | Distributions | | Distributions
and Sales of
Fund Shares | | MSCI World
ex-USA
Index | | Morningstar
Foreign Large
Value Average |
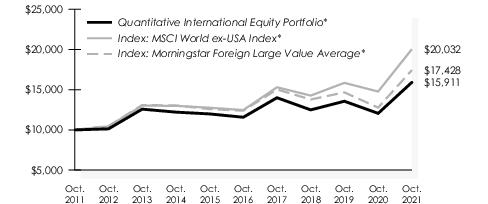
| Year ended 10/31/21 | | 31.96% | | 30.73% | | 18.90% | | 35.59% | | 36.44% |
| Five Years ended 10/31/21 | | 6.57% | | 6.10% | | 5.20% | | 9.95% | | 6.92% |
| Ten Years ended 10/31/21 | | 4.75% | | 4.38% | | 3.84% | | 7.19% | | 5.60% |
| Inception (11/17/88) through 10/31/211 | | 6.49% | | 5.32% | | 5.23% | | 5.19% | | 6.31% |
For the fiscal year ended October 31, 2021, the Portfolio underperformed the MSCI World excluding the United States Index (“MSCI World ex-USA Index”) by 3.63%. In the past year, the Portfolio was negatively impacted from its relatively lower average market capitalization versus the MSCI World ex-USA Index as the average stock (32.1%, equal-weighted) underperformed the Index by about 4.1%. The Portfolio’s performance had mixed contributions from multifactor stock ranking models, including biases towards stocks with lower valuations, better fundamentals and more positive earnings trends. Leading industry group indicators had minor effects on performance, including relative overweightings of financials/communication services/materials and underweightings of consumer discretionary/industrials/health care stocks. The Portfolio had positive relative stock performance in four of eleven sectors. The most favorable contributions from stock selection came in the consumer discretionary and utilities sectors. The most negative contributions from stock selection were in the energy and information technology sectors. The Portfolio’s gross annual operating expense ratio, as stated in the February 28, 2021 Prospectus, is 1.15%. This ratio can fluctuate and may differ from the expense ratio disclosed in the Financial Highlights section of this report.
Hypothetical Illustration of $10,000 Invested in
Quantitative International Equity Portfolio vs.
MSCI World ex-USA Index and
Morningstar Foreign Large Value Average
10/31/11 through 10/31/21
| * | Assumes the reinvestment of all dividends and distributions. |
Performance data quoted represents past performance; past performance does not guarantee future results. The investment return and principal value of an investment will fluctuate so that an investor’s shares, when redeemed, may be worth more or less than their original cost. The performance quoted above reflects fee waivers in effect during certain periods and would have been lower in their absence. Current performance may be higher or lower than the total return shown. Please call the Fund at 1-800-442-8299 to obtain the most recent month-end returns. Returns other than after tax returns, do not reflect taxes that the shareholder may pay on fund distributions or the redemption of fund shares. After-tax returns are calculated using the historical highest individual federal marginal income tax rates, do not reflect the impact of state and local taxes and are not relevant to investors who hold their shares through tax-deferred arrangements such as 401(k) plans or IRAs. Actual after-tax returns depend on the investor’s tax situation and may differ from those shown.
| | 1 Returns are for the period beginning December 1, 1988 for Morningstar Foreign Large Value Average. |
| | The indices and certain terms are defined on pages 23 to 25. |
Responsible ESG U.S. Equity Portfolio
PORTFOLIO HIGHLIGHTS
October 31, 2021
| Average Annual Total Return | |
| | | | | Return After Taxes on | | | | |
| Responsible ESG U.S. Equity Portfolio | | | | Distributions | | Distributions
and Sales of
Fund Shares | | Russell 1000®
Index | Morningstar
Large Blend
Average | |
| Year ended 10/31/21 | | 46.31% | | 45.92% | | 27.44% | | 43.51% | 41.27% | |
| Five Years ended 10/31/21 | | 15.91% | | 15.39% | | 12.70% | | 19.16% | 16.60% | |
| Inception (12/22/15) through 10/31/211 | | 15.07% | | 14.62% | | 12.14% | | 17.33% | 14.83% | |
For the fiscal year ended October 31, 2021, the Portfolio outperformed the Russell 1000® Index by 2.80% and the Morningstar Large Blend Average by 5.04%, respectively. The Portfolio selects stocks based on a combination of multi-factor models and ESG ratings (environmental, socially responsible and governance). The Portfolio was positively impacted from its relatively lower average market capitalization versus the Russell 1000® Index as the average stock (50.4%) outperformed the Index by about 6.9%. However, the Portfolio’s relative performance was negatively impacted from no exposure to Tesla (TSLA 187%). The Portfolio’s performance had net positive contributions from multifactor stock ranking models, including biases towards stocks with lower valuations. In addition, the Portfolio benefitted from exposure to companies with more favorable ESG ratings. The Portfolio had positive relative stock performance in five of eleven sectors. The most favorable contributions from stock selection came in the information technology and financial sectors. The most negative contributions from stock selection were in the health care and communication services sectors. The Portfolio’s gross annual operating expense ratio, as stated in the February 28, 2021 Prospectus, is 1.05%. This ratio can fluctuate and may differ from the expense ratio disclosed in the Financial Highlights section of this report.
Hypothetical Illustration of $10,000 Invested in
Responsible ESG U.S. Equity Portfolio vs.
Russell 1000® Index and
Morningstar Large Blend Average
12/22/15 through 10/31/21
| * | Assumes the reinvestment of all dividends and distributions. |
Performance data quoted represents past performance; past performance does not guarantee future results. The investment return and principal value of an investment will fluctuate so that an investor’s shares, when redeemed, may be worth more or less than their original cost. The performance quoted reflects fee waivers and/or expense reimbursements in effect and would have been lower in their absence. Current performance may be higher or lower than the total return shown. Please call the Fund at 1-800-442-8299 to obtain the most recent month-end returns. Returns, other than after-tax returns, do not reflect taxes that a shareholder may pay on fund distributions or redemption of fund shares. After tax returns are calculated using the historical highest individual federal marginal income tax rates, do not reflect the impact of state and local taxes and are not relevant to investors who hold their shares through tax-deferred arrangements such as 401(k) plans or IRAs. Actual after-tax returns depend on the investor’s tax situation and may differ from those shown.
| | 1 Returns are for the period beginning January 1, 2016 for Morningstar Large Blend Average. |
| | The indices and certain terms are defined on pages 23 to 25. |
Women in Leadership U.S. Equity Portfolio
PORTFOLIO HIGHLIGHTS
October 31, 2021
| Average Annual Total Return | |
| | | | | Return After Taxes on | | | | |
| Women in Leadership U.S. Equity Portfolio | | | | Distributions | | Distributions
and Sales of
Fund Shares | | Russell 1000®
Index | Morningstar
Large Value
Average | |
| Year ended 10/31/21 | | 43.94% | | 43.41% | | 26.04% | | 43.51% | 43.70% | |
| Five Years ended 10/31/21 | | 14.67% | | 14.15% | | 11.66% | | 19.16% | 12.38% | |
| Inception (12/22/15) through 10/31/211 | | 13.82% | | 13.32% | | 11.05% | | 17.33% | 11.67% | |
For the fiscal year ended October 31, 2021, the Portfolio outperformed the Russell 1000® Index by 0.43% and the Morningstar Large Value Average by 0.24%, respectively. The Portfolio selects stocks based on companies that meet specific women in leadership criteria by the inclusion of women in significant roles, including, but not limited to, a chairwoman, a female chief executive officer, female board members or women in management positions and gender diversity metrics. The Portfolio was positively impacted from its relatively lower average market capitalization versus the Russell 1000® Index as the average stock (50.4%) outperformed the Index by about 6.9%. However, the Portfolio’s relative performance was negatively impacted from no exposure to Tesla (TSLA 187%). The Portfolio’s performance had net positive contributions from multifactor stock ranking models, including biases towards stocks with lower valuations, as the Russell 1000® Value Index outperformed the Russell 1000® Growth Index by about 0.5%. The Portfolio had positive relative stock performance in four of eleven sectors. The most favorable contributions from stock selection came in the information technology and health care sectors. The most negative contributions from stock selection were in the industrials and communication services sectors. The Portfolio’s gross annual operating expense ratio, as stated in the February 28, 2021 Prospectus, is 1.08%. This ratio can fluctuate and may differ from expense ratio disclosed in Financial Highlights section of this report.
Hypothetical Illustration of $10,000 Invested in
Women in Leadership U.S. Equity Portfolio vs.
Russell 1000® Index and
Morningstar Large Value Average
12/22/15 through 10/31/21
| * | Assumes the reinvestment of all dividends and distributions. |
Performance data quoted represents past performance; past performance does not guarantee future results. The investment return and principal value of an investment will fluctuate so that an investor’s shares, when redeemed, may be worth more or less than their original cost. The performance quoted reflects fee waivers and/or expense reimbursements in effect and would have been lower in their absence. Current performance may be higher or lower than the total return shown. Please call the Fund at 1-800-442-8299 to obtain the most recent month-end returns. Returns, other than after-tax returns, do not reflect taxes that a shareholder may pay on fund distributions or redemption of fund shares. After tax returns are calculated using the historical highest individual federal marginal income tax rates, do not reflect the impact of state and local taxes and are not relevant to investors who hold their shares through tax-deferred arrangements such as 401(k) plans or IRAs. Actual after-tax returns depend on the investor’s tax situation and may differ from those shown.
| | 1 Returns are for the period beginning January 1, 2016 for Morningstar Large Value Average. |
| | The indices and certain terms are defined on pages 23 to 25. |
Quantitative U.S. Long/Short Equity Portfolio
PORTFOLIO HIGHLIGHTS
October 31, 2021
| Average Annual Total Return | |
| | | | | Return After Taxes on | | | | | | | | | |
| Quantitative U.S. Long/Short Equity Portfolio – Advisor Class | | | | Distributions | | Distributions
and Sales of
Fund Shares | | Russell 3000®
Index | | Bloomberg U.S
Treasury Bellwether
3-Month Index | | Blended
Index | | Morningstar
Long/Short
Average | |
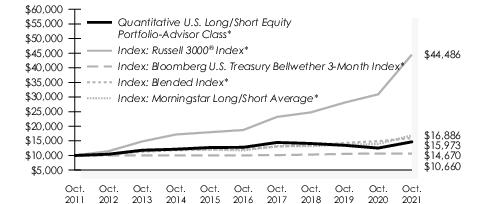
| Year ended 10/31/21 | | 17.01% | | 17.01% | | 10.07% | | 43.90% | | 0.05% | | 11.91% | | 21.16% | |
| Five Years ended 10/31/21 | | 2.77% | | 2.72% | | 2.13% | | 18.91% | | 1.16% | | 6.47% | | 6.76% | |
| Ten Years ended 10/31/21 | | 3.91% | | 3.88% | | 3.09% | | 16.10% | | 0.64% | | 5.24% | | 4.98% | |
| Inception (09/29/06) through 10/31/211 | | 2.07% | | 1.99% | | 1.61% | | 10.83% | | 1.02% | | 4.12% | | 3.14% | |
| Quantitative U.S. Long/Short Equity Portfolio – Institutional Class | | | | | | | | | | | | | | | |
| Year ended 10/31/21 | | 17.25% | | 17.25% | | 10.21% | | 43.90% | | 0.05% | | 11.91% | | 21.16% | |
| Inception (09/13/19) through 10/31/212 | | 3.97% | | 3.92% | | 3.04% | | 24.90% | | 0.60% | | 7.72% | | 9.64% | |
For the fiscal year ended October 31, 2021, the Portfolio’s Advisor Class underperformed the Russell 3000® Index by 26.89% and outperformed the Bloomberg U.S. Treasury Bellwether 3-Month Index by 16.96%, respectively. The Portfolio outperformed a blended benchmark mix of 70% Bloomberg U.S. Treasury Bellwether 3 Month Index and 30% Russell 3000® Index by 5.10%. Over the past year, the average net equity exposure (long minus short equity position weights) for the Portfolio was about 34%. The Portfolio’s performance had favorable contributions from multifactor stock ranking models, including biases towards stocks with lower valuations and attractive fundamentals. The Portfolio’s long positions had positive relative stock performance in eight of eleven sectors. The most favorable contributions from stock selection came in the information technology and industrials sectors. The most negative contributions from stock selection were in the communication services and real estate sectors. The Portfolio’s long stock positions (51.7% return) outperformed the short positions (40.0% return) by about 11.7%. The Portfolio’s gross annual operating expense ratios, as stated in the February 28, 2021 Prospectuses, are 2.99%. and 2.59% for the Advisor and Institutional Class shares, respectively These ratios can fluctuate and may differ from the expense ratios disclosed in the Financial Highlights section of this report.
Hypothetical Illustration of $10,000 Invested in
Quantitative U.S. Long/Short Equity Portfolio-Advisor Class vs.
Russell 3000® Index, Bloomberg U.S. Treasury Bellwether 3-Month Index,
Blended Index and Morningstar Long/Short Average
10/31/11 through 10/31/21
| * | Assumes the reinvestment of all dividends and distributions. |
Performance data quoted represents past performance; past performance does not guarantee future results. The investment return and principal value of an investment will fluctuate so that an investor’s shares, when redeemed, may be worth more or less than their original cost. The performance quoted reflects fee waivers and/or expense reimbursements in effect and would have been lower in their absence. Current performance may be higher or lower than the total return shown. Please call the Fund at 1-800-442-8299 to obtain the most recent month-end returns. Returns, other than after-tax returns, do not reflect taxes that a shareholder may pay on fund distributions or the redemption of fund shares. After tax returns are calculated using the historical highest individual federal marginal income tax rates, do not reflect the impact of state and local taxes and are not relevant to investors who hold their shares through tax-deferred arrangements such as 401(k) plans or IRAs. Actual after-tax returns depend on the investor’s tax situation and may differ from those shown. Performance of the Institutional Class will vary from the Advisor Class due to differences in fees.
| | 1 Returns are for the period beginning October 1, 2006 for Morningstar Long/Short Average. |
| | 2 Returns are for the period beginning October 1, 2019 for Morningstar Long/Short Average. |
| | The indices and certain terms are defined on pages 23 to 25. |
Quantitative U.S. Total Market Equity Portfolio
PORTFOLIO HIGHLIGHTS
October 31, 2021
| Average Annual Total Return | |
| | | | | Return After Taxes on | | | | |
| Quantitative U.S. Total Market Equity Portfolio | | | | Distributions | | Distributions
and Sales of
Fund Shares | | Russell 3000®
Index | Morningstar
Mid-Cap
Value Average | |
| Year ended 10/31/21 | | 66.37% | | 62.26% | | 40.74% | | 43.90% | 51.37% | |
| Five Years ended 10/31/21 | | 16.01% | | 14.43% | | 12.43% | | 18.91% | 11.66% | |
| Ten Years ended 10/31/21 | | 14.06% | | 13.06% | | 11.51% | | 16.10% | 11.77% | |
| Inception (12/21/06) through 10/31/211 | | 8.59% | | 7.93% | | 6.99% | | 10.50% | 7.79% | |
For the fiscal year ended October 31, 2021, the Portfolio outperformed the Russell 3000® Index by 22.47% and the Morningstar Mid-Cap Value Average by 15.00%, respectively. In the past year, the Portfolio was positively impacted from its relatively lower average market capitalization versus the Russell 3000® Index as the average stock (57.1% return, equal-weighted) outperformed the Index by about 13.2%. The Portfolio’s performance had favorable contributions from multifactor stock ranking models, including biases towards stocks with lower valuations and attractive fundamentals. The Portfolio’s long positions had positive relative stock performance in nine of eleven sectors. The most favorable contributions from stock selection came in the consumer discretionary and information technology sectors. Negative contributions from stock selection were in the financials and communication services sectors. The Portfolio’s long stock positions (61.9% return) outperformed the short positions (37.0% return) by about 24.9%. The Portfolio’s gross annual operating expense ratio, as stated in the February 28, 2021 Prospectus, is 2.57%. This ratio can fluctuate and may differ from the expense ratio disclosed in the Financial Highlights section of this report.
Hypothetical Illustration of $10,000 Invested in
Quantitative U.S. Total Market Equity Portfolio vs.
Russell 3000® Index and
Morningstar Mid-Cap Value Average
10/31/11 through 10/31/21
| * | Assumes the reinvestment of all dividends and distributions. |
Performance data quoted represents past performance; past performance does not guarantee future results. The investment return and principal value of an investment will fluctuate so that an investor’s shares, when redeemed, may be worth more or less than their original cost. The performance quoted reflects fee waivers and/or expense reimbursements in effect and would have been lower in their absence. Current performance may be higher or lower than the total return shown. Please call the Fund at 1-800-442-8299 to obtain the most recent month-end returns. Returns, other than after-tax returns, do not reflect taxes that a shareholder may pay on fund distributions or redemption of fund shares. After tax returns are calculated using the historical highest individual federal marginal income tax rates, do not reflect the impact of state and local taxes and are not relevant to investors who hold their shares through tax-deferred arrangements such as 401(k) plans or IRAs. Actual after-tax returns depend on the investor’s tax situation and may differ from those shown.
| | 1 Returns are for the period beginning January 1, 2007 for Morningstar Mid-Cap Value Average. |
| | The indices and certain terms are defined on pages 23 to 25. |
Strategic Equity Portfolio
PORTFOLIO HIGHLIGHTS
October 31, 2021
| Average Annual Total Return |
| | | | | Return After Taxes on | | | | | | |
| Strategic Equity Portfolio | | Return
Before
Taxes | | Distributions | | Distributions
and Sales of
Fund Shares | | S&P 500®
Index | | Dow Jones
Industrial Average | | Morningstar
Large Blend
Average |
| Year ended 10/31/21 | | 42.57% | | 40.59% | | 26.03% | | 42.91% | | 37.73% | | 41.27% |
| Five Years ended 10/31/21 | | 16.97% | | 15.58% | | 13.31% | | 18.93% | | 17.21% | | 16.60% |
| Ten Years ended 10/31/21 | | 14.55% | | 12.88% | | 11.57% | | 16.21% | | 14.32% | | 13.92% |
| Inception (07/20/89) through 10/31/211 | | 9.61% | | 8.23% | | 7.79% | | 10.76% | | 11.16% | | 9.11% |
For the fiscal year ended October 31, 2021, the Strategic Equity Portfolio returned 42.57%. The S&P 500® Index returned 42.91% for the same period. The first half of the fiscal year saw the Portfolio perform well versus the Index as more Portfolio holdings generated strong returns, partially reversing the trend from the prior year when returns for the Index were supported by strong outperformance by a relatively narrow group of mega-capitalization companies. But this was offset over the second half of the year as some of the prior leaders again outperformed, along with a small handful of stocks that the Portfolio generally avoids due to our view that their valuations have already been stretched. In total, the Portfolio’s strong absolute returns were relatively in-line with the Index for the year. The Portfolio seeks to generate outperformance over time by investing in those companies with strong profitability whose shares are trading at reasonable valuations relative to business fundamentals. The Portfolio’s gross annual operating expense ratio, as stated in the February 28, 2021 Prospectus, is 0.86%. This ratio can fluctuate and may differ from the expense ratio disclosed in the Financial Highlights section of this report.
Hypothetical Illustration of $10,000 Invested in
Strategic Equity Portfolio vs.
S&P 500® Index, Dow Jones Industrial Average and
Morningstar Large Blend Average
10/31/11 through 10/31/21
| * | Assumes the reinvestment of all dividends and distributions. |
Performance data quoted represents past performance; past performance does not guarantee future results. The investment return and principal value of an investment will fluctuate so that an investor’s shares, when redeemed, may be worth more or less than their original cost. Current performance may be higher or lower than the total return shown. Please call the Fund at 1-800-442-8299 to obtain the most recent month-end returns. Returns, other than after-tax returns, do not reflect taxes that the shareholder may pay on fund distributions or the redemption of fund shares. Aftertax returns are calculated using the historical highest individual federal marginal income tax rates, do not reflect the impact of state and local taxes and are not relevant to investors who hold their shares through tax-deferred arrangements such as 401(k) plans or IRAs. Actual after-tax returns depend on the investor’s tax situation and may differ from those shown.
| | 1 Returns are for the period beginning August 1, 1989 for Morningstar Large Blend Average. |
| | The indices and certain terms are defined on pages 23 to 25. |
Small Cap Equity Portfolio
PORTFOLIO HIGHLIGHTS
October 31, 2021
| Average Annual Total Return | |
| Small Cap Equity Portfolio – Advisor Class | | | | Russell 2000®
Index | | Russell 2000®
Value Index | | S&P 500®
Index | | Morningstar
Small
Blend Average | |
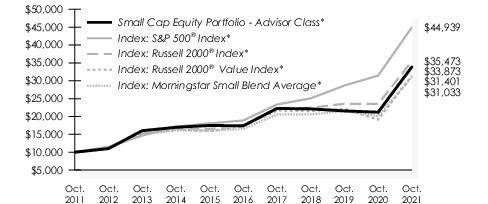
| Year ended 10/31/21 | | 59.75% | | 50.80% | | 64.30% | | 42.91% | | 54.25% | |
| Five Years ended 10/31/21 | | 14.23% | | 15.52% | | 12.61% | | 18.93% | | 13.33% | |
| Ten Years ended 10/31/21 | | 12.98% | | 13.50% | | 12.12% | | 16.21% | | 11.93% | |
| Inception (03/01/91) through 10/31/211 | | 10.97% | | 10.58% | | 11.44% | | 10.83% | | 10.52% | |
| Small Cap Equity Portfolio – Institutional Class | | | | | | | | | | | |
| Year ended 10/31/21 | | 60.04% | | 50.80% | | 64.30% | | 42.91% | | 54.25% | |
| Five Years ended 10/31/21 | | 14.47% | | 15.52% | | 12.61% | | 18.93% | | 13.33% | |
| Ten Years ended 10/31/21 | | 13.20% | | 13.50% | | 12.12% | | 16.21% | | 11.93% | |
| Inception (01/02/98) through 10/31/212 | | 9.05% | | 8.62% | | 8.78% | | 8.77% | | 8.80% | |
For the fiscal year ended October 31, 2021, the Small Cap Equity Portfolio Advisor Class returned 59.75% and the Institutional Class returned 60.04%, compared to the Russell 2000® Index return of 50.80% and the Morningstar Small Blend Average return of 54.25%. The healthcare sector accounted for the largest share of the outperformance, followed by the financials and communication services sectors. The consumer discretionary sector was the worst performing sector on a relative basis. The Portfolio’s gross annual operating expense ratios, as stated in the February 28, 2021 Prospectuses are 0.94% and 0.74% for the Advisor and Institutional Class shares, respectively. These ratios can fluctuate and may differ from the expense ratios disclosed in the Financial Highlights section of this report.
Hypothetical Illustration of $10,000 Invested in
Small Cap Equity Portfolio-Advisor Class vs.
S&P 500® Index,
Russell 2000® Index,
Russell 2000® Value Index and
Morningstar Small Blend Average
10/31/11 through 10/31/21
| * | Assumes the reinvestment of all dividends and distributions. |
Performance data quoted represents past performance; past performance does not guarantee future results. The investment return and principal value of an investment will fluctuate so that an investor’s shares, when redeemed, may be worth more or less than their original cost. Current performance may be higher or lower than the total return shown. Please call the Fund at 1-800-442-8299 to obtain the most recent month-end returns. Returns shown do not reflect taxes that a shareholder may pay on fund distributions or the redemption of fund shares. Performance shown of the Institutional Class will vary from the Advisor Class due to differences in fees.
| | 1 Returns are for the period beginning April 1, 1991 for Morningstar Small Blend Average. |
| | 2 Returns are for the period beginning February 1, 1998 for Morningstar Small Blend Average. |
| | The indices and certain terms are defined on pages 23 to 25. |
Equity Income Portfolio
PORTFOLIO HIGHLIGHTS
October 31, 2021
| Average Annual Total Return | |
| Equity Income Portfolio | | | | S&P 500®
Index | | Russell 1000®
Value Index | Morningstar
Large Value
Average | |
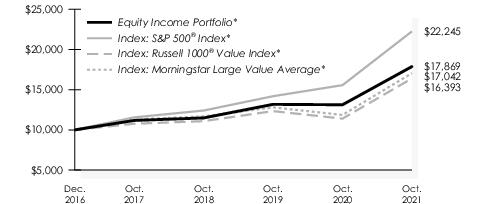
| Year ended 10/31/21 | | 36.12% | | 42.91% | | 43.76% | 43.70% | |
| Inception (12/21/16) through 10/31/211 | | 12.68% | | 17.88% | | 10.70% | 11.07% | |
For the fiscal year ended October 31, 2021, the Equity Income Portfolio returned 36.12% versus 42.91% for the S&P 500® Index and 43.76% for the Russell 1000® Value Index (the “Value Index”). The Portfolio’s underperformance versus the Value Index was concentrated in the first half of the year as the market recovery allowed more cyclical companies to recapture more of their prior year underperformance. As performance versus the Value Index improved in the second half of the year, relative performance versus the S&P 500® Index lagged given that benchmark being more driven by lower yielding, higher valuation stocks that the Portfolio avoids. The Portfolio seeks to drive attractive total returns over time from a combination of current and future dividends along with price appreciation in its holdings. The Portfolio’s gross annual operating expense ratio, as stated in the February 28, 2021 Prospectus, is 1.04%. This ratio can fluctuate and may differ from the expense ratio disclosed in the Financial Highlights section of this report.
Hypothetical Illustration of $10,000 Invested in
Equity Income Portfolio vs.
S&P 500® Index,
Russell 1000® Value Index and
Morningstar Large Value Average
12/21/16 through 10/31/21
| * | Assumes the reinvestment of all dividends and distributions. |
Performance data quoted represents past performance; past performance does not guarantee future results. The investment return and principal value of an investment will fluctuate so that an investor’s shares, when redeemed, may be worth more or less than their original cost. The performance quoted reflects fee waivers and/or expense reimbursements in effect and would have been lower in their absence. Current performance may be higher or lower than the total return shown. Please call the Fund at 1-800-442-8299 to obtain the most recent month-end returns. Returns shown do not reflect taxes that a shareholder may pay on fund distributions or redemption of fund shares.
| | 1 Returns are for the period beginning January 1, 2017 for Morningstar Large Value Average. |
| | The indices and certain terms are defined on pages 23 to 25. |
Secured Options Portfolio
PORTFOLIO HIGHLIGHTS
October 31, 2021
| Average Annual Total Return | | | | | | | |
| Secured Options Portfolio – Advisor Class | | | | CBOE S&P 500®
PutWrite
Index | | S&P 500®
Index | |
| Year ended 10/31/21 | | 27.08% | | 32.34% | | 42.91% | |
| Five Years ended 10/31/21 | | 8.01% | | 8.04% | | 18.93% | |
| Ten year ended 10/31/21 | | 8.37% | | 8.34% | | 16.21% | |
| Inception (06/30/10) through 10/31/21 | | 9.43% | | 8.99% | | 16.43% | |
| Secured Options Portfolio – Institutional Class | | | | | | | |
| Year ended 10/31/21 | | 27.36% | | 32.34% | | 42.91% | |
| Inception (11/09/16) through 10/31/21 | | 7.99% | | 7.80% | | 18.59% | |
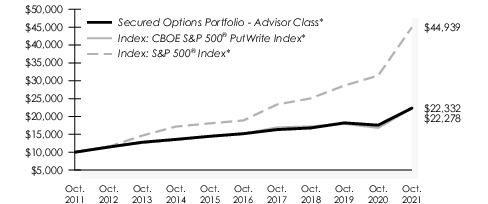
For the fiscal year ended October 31, 2021, the Secured Options Portfolio invested in cash-secured put options on the S&P 500® Index in an effort to reduce equity volatility, obtain option premiums and provide more stable returns. For this period, the Portfolio’s Advisor Class experienced a total return of 27.08% while its benchmark, the CBOE S&P 500® PutWrite Index, had a return of 32.34%. The Portfolio’s underperformance was driven primarily by the Portfolio’s active strike selection process, which seeks to identify the more advantageously priced options that expire in less than 3-months. The more defensive and wider strike selection under-performed this year as the S&P 500® Index saw five months of mean price reversion between expirations. These conditions created a more favorable environment for tighter strike selection and an outlier to what the market typically experiences over an average of two months. The Portfolio’s use of cash-secured puts, which outperformed covered calls added to performance. Generally speaking, cash or cash-like instruments are pledged to fully collateralize cash-secured written put options. In lieu of cash secured put options, the Portfolio may also pledge long equities to fully collateralize covered call options. The Portfolio’s gross annual operating expense ratios, as stated in the February 28, 2021 Prospectuses, are 0.88% and 0.68% for the Advisor and Institutional Classes, respectively. These ratios can fluctuate and may differ from the expense ratios disclosed in the Financial Highlights section, of this report.
Hypothetical Illustration of $10,000 Invested in
Secured Options Portfolio - Advisor Class vs.
CBOE S&P 500® PutWrite Index
and S&P 500® Index
10/31/11 through 10/31/21
| * | Assumes the reinvestment of all dividends and distributions. |
Performance data quoted represents past performance; past performance does not guarantee future results. The investment return and principal value of an investment will fluctuate so that an investor’s shares, when redeemed, may be worth more or less than their original cost. Current performance may be higher or lower than the total return shown. Please call the Fund at 1-800-442-8299 to obtain the most recent month-end returns. Returns shown do not reflect taxes that a shareholder may pay on fund distributions or the redemption of fund shares. Performance shown of the Institutional Class will vary from the Advisor Class due to differences in fees.
| | The indices and certain terms are defined on pages 23 to 25. |
Global Secured Options Portfolio
PORTFOLIO HIGHLIGHTS
October 31, 2021
| Average Annual Total Return | |
| Global Secured Options Portfolio | | | | MSCI All
Country World
Index | Blended PutWrite
Index1 | |
| Year ended 10/31/21 | | 21.59% | | 37.28% | 26.65% | |
| Five Years ended 10/31/21 | | 7.53% | | 14.72% | 4.54% | |
| Inception (09/28/12) through 10/31/21 | | 5.27% | | 11.37% | 4.43% | |
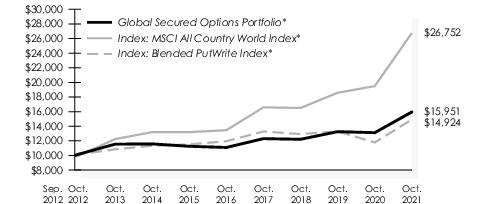
For the fiscal year ended October 31, 2021, the Global Secured Options Portfolio invested in cash-secured put options on the S&P 500® Index, Russell 2000® Index, iShares MSCI EAFE ETF (EFA) and iShares MSCI Emerging Market ETF (EEM) in an effort to reduce equity volatility, obtain option premiums and provide more stable returns. For this period, the Portfolio had a total return of 21.59% while its benchmark, the MSCI All Country World (ACWI) Index, returned 37.28% and our Blended CBOE® PutWrite Index (“Blended PutWrite Index”) returned 26.65%. Our Blended PutWrite Index is comprised of 40% CBOE S&P 500® PutWrite T-W (PWT) Index, 10% CBOE Russell 2000® PutWrite (PUTR) Index, 40% CBOE MSCI EAFE PutWrite (PXEA) Index and 10% CBOE MSCI Emerging Markets PutWrite (PXEF) Index. The Portfolio’s underperformance relative to the Blended PutWrite Index was driven primarily by the Portfolio’s option selection process that seeks to identify the most advantageously priced put options that expire in less than 3-months. The more defensive and wider strike selection under-performed this year, primarily driven by the upside performance in the CBOE Russell 2000® PutWrite (PUTR) Index and CBOE MSCI EAFE PutWrite (PXEA) Index. Additionally, the mean reversion experienced in the S&P 500® Index, which is a more favorable environment for tighter strike selection and an outlier to what the market typically experiences, also contributed to the underperformance. The Portfolio’s underperformance relative to the MSCI All Country World Index was primarily driven by our lower exposure to equities during the global equity rally. Generally speaking, cash or cash-like instruments are pledged to fully collateralize cash-secured written put options. In lieu of cash secured put options, the Portfolio may also pledge long equities to fully collateralize covered call options. The Portfolio’s gross annual operating expense ratio, as stated in the February 28, 2021 Prospectus, is 2.16%. This ratio can fluctuate and may differ from the expense ratio disclosed in the Financial Highlights section of this report.
Hypothetical Illustration of $10,000 Invested in
Global Secured Options Portfolio vs.
MSCI All Country World Index
and Blended PutWrite Index
09/28/12 through 10/31/21
| * | Assumes the reinvestment of all dividends and distributions. |
Performance data quoted represents past performance; past performance does not guarantee future results. The investment return and principal value of an investment will fluctuate so that an investor’s shares, when redeemed, may be worth more or less than their original cost. The performance quoted above reflects expense reimbursements in effect during certain periods and would have been lower in their absence. The total return was affected by a deficiency dividend paid during the period. If the deficiency dividend was not paid total return would have been lower. Current performance may be higher or lower than the total return shown. Please call the Fund at 1-800-442-8299 to obtain the most recent month-end returns. Returns shown do not reflect taxes that the shareholder may pay on fund distributions or the redemption of fund shares.
| | 1 The Portfolio has added a secondary options blended benchmark because the Investment Advisor believes that, given the Portfolio’s investment strategy, having a blended CBOE PutWrite Index for comparative purposes provides appropriate context when assessing the Portfolio’s performance. |
| | The indices and certain terms are defined on pages 23 to 25. |
Core Fixed Income Portfolio
PORTFOLIO HIGHLIGHTS
October 31, 2021
| Average Annual Total Return | |
| Core Fixed Income Portfolio | | | | Bloomberg U.S. Aggregate
Bond Index | Morningstar
Intermediate - Core
Bond Average | |
| Year ended 10/31/21 | | -1.91% | | -0.48% | 0.00% | |
| Five Years ended 10/31/21 | | 2.44% | | 3.10% | 3.04% | |
| Ten Years ended 10/31/21 | | 2.38% | | 3.00% | 3.11% | |
| Inception (11/17/88) through 10/31/211 | | 5.50% | | 5.99% | 5.42% | |
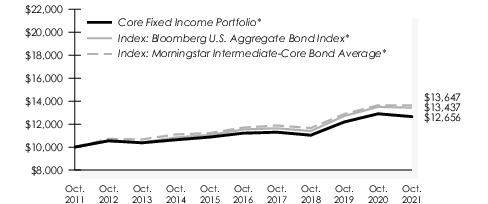
The Core Fixed Income Portfolio returned -1.91% for the year ended October 31, 2021. The benchmark, the Bloomberg U. S. Aggregate Bond Index, returned -0.48% for the year and the Portfolio’s peer group, the Morningstar Intermediate – Core Bond Average, returned 0.00% for the year. The Portfolio’s underperformance versus the Bloomberg U.S. Aggregate Bond Index can be attributed to the Portfolio’s bias towards higher credit quality, and less corporate exposure to the long end of the curve. The Portfolio’s long corporate bonds returned 4.55% for the year versus the Portfolio’s intermediate corporate bonds, which returned 0.71%. The Index also holds over 14% of the lower tier BBB sector which returned 3.53% for the year, while the Portfolio holds none. The Portfolio’s performance versus its peer group can also be attributed to the Portfolio’s high credit quality bias, yield curve positioning, and low risk themes.
The Portfolio seeks to add value by monitoring yield curve exposure while utilizing sector and security selection. Diversification, liquidity, and low risk themes dominate the Portfolio’s investment discipline. The Portfolio’s gross annual operating expense ratio, as stated in the February 28, 2021 prospectus, is 0.54%. This ratio can fluctuate and may differ from the expense ratio disclosed in the Financial Highlights section of this report.
Hypothetical Illustration of $10,000 Invested in
Core Fixed Income Portfolio vs.
Bloomberg U.S. Aggregate Bond Index and
Morningstar Intermediate-Core Bond Average
10/31/11 through 10/31/21
| * | Assumes the reinvestment of all dividends and distributions. |
Performance data quoted represents past performance; past performance does not guarantee future results. The investment return and principal value of an investment will fluctuate so that an investor’s shares, when redeemed, may be worth more or less than their original cost. Current performance may be higher or lower than the total return shown. Please call the Fund at 1-800-442-8299 to obtain the most recent month-end returns. Returns shown do not reflect taxes that a shareholder may pay on fund distributions or the redemption of fund shares.
| | 1 Returns are for the period beginning December 1, 1988 for Morningstar Intermediate - Core Bond Average. |
| | The indices and certain terms are defined on pages 23 to 25. |
Short Term Tax Aware Fixed Income Portfolio
PORTFOLIO HIGHLIGHTS
October 31, 2021
| Average Annual Total Return |
| | | | | Return After Taxes on | | | | |
| Short Term Tax Aware Fixed Income Portfolio | | Return
Before
Taxes | | Distributions | | Distributions
and Sales of
Fund Shares | | BofA Merrill
Lynch 1-3 Year U.S.
Municipal Securities
Index | | Morningstar
Short-Term Bond
Average |
| Year ended 10/31/21 | | 0.15% | | -0.09% | | 0.20% | | 0.60% | | 1.25% |
| Five Years Ended 10/31/21 | | 1.16% | | 1.03% | | 0.98% | | 1.51% | | 2.11% |
| Inception (06/29/16) through 10/31/211 | | 1.08% | | 0.95% | | 0.91% | | 1.38% | | 2.06% |
For the fiscal year ended October 31, 2021, the Short Term Tax Aware Fixed Income Portfolio returned 0.15%. Its benchmark, the BofA Merrill Lynch 1-3 year U.S. Municipal Securities Index returned 0.60% and the Portfolio’s peer group, the Morningstar Short-Term Bond Average, returned 1.25%. The Portfolio benefitted from both duration positioning and ratings distribution, but felt some performance drag from sector/security selection. The tactical exposure to taxable securities, both corporate and municipal, was a positive contributor to relative performance. This tactical exposure was relatively steady through the period, ending the fiscal year at 23% as taxable municipal relative value remained attractive.
The Portfolio seeks to add value through active credit-quality and taxable exposure, as well as sector and security selection. Diversification, liquidity, and measured risk taking are the focus of the Portfolio’s investment discipline. The Portfolio’s gross annual operating expense ratio, as stated in the February 28, 2021 prospectus, is 0.54%. This rate can fluctuate and may differ from the expense ratio disclosed in the Financial Highlights in this report.
Hypothetical Illustration of $10,000 Invested in
Short Term Tax Aware Fixed Income Portfolio vs.
BofA Merrill Lynch 1-3 Year U.S. Municipal Securities Index and
Morningstar Short-Term Bond Average
06/29/16 through 10/31/21
| * | Assumes the reinvestment of all dividends and distributions. |
Performance data quoted represents past performance; past performance does not guarantee future results. The investment return and principal value of an investment will fluctuate so that an investor’s shares, when redeemed, may be worth more or less than their original cost. The performance quoted reflects fee waivers and/or expense reimbursements in effect and would have been lower in their absence. Current performance may be higher or lower than the total return shown. Please call the Fund at 1-800-442-8299 to obtain the most recent month-end returns. Returns, other than after-tax returns, do not reflect taxes that the shareholder may pay on fund distributions or the redemption of fund shares. After-tax returns are calculated using the historical highest individual federal marginal income tax rates, do not reflect the impact of state and local taxes and are not relevant to investors who hold their shares through tax-deferred arrangements such as 401(k) plans or IRAs. Actual after-tax returns depend on the investor’s tax situation and may differ from those shown.
| | 1 Returns are for the period beginning July 1, 2016 for Morningstar Short-Term Bond Average. |
| | The indices and certain terms are defined on pages 23 to 25. |
High Yield Municipal Portfolio
PORTFOLIO HIGHLIGHTS
October 31, 2021
| Average Annual Total Return | |
| High Yield Municipal Portfolio | | | | Bloomberg
Muni High Yield 5%
Tobacco Cap 2%
Issuer Cap Index | | Bloomberg
Muni BBB
Index | | Bloomberg
Municipal Bond
Index | Morningstar
High Yield
Muni
Average | |
| Year ended 10/31/21 | | 6.68% | | 10.55% | | 7.40% | | 2.64% | 8.09% | |
| Five Years ended 10/31/21 | | 4.26% | | 5.57% | | 5.01% | | 3.41% | 4.34% | |
| Inception (12/22/15) through 10/31/211 | | 4.59% | | 5.93% | | 4.93% | | 3.43% | 4.58% | |
The High Yield Municipal Portfolio (the “Portfolio”) trailed the Bloomberg Municipal High Yield 5% Tobacco Cap, 2% Issuer Cap Index, for the trailing 12 months through October 31, 2021. The Portfolio returned 6.68% while the Bloomberg Muni High Yield 5% Tobacco Cap 2% Issuer Cap Index returned 10.55%. With municipal rates moving higher over the year, the Portfolio’s shorter duration position contributed 0.31% to relative return. The sector and security selection were both negative contributors to the Portfolio’s relative return. The Portfolio maintained a bias to higher credit quality with spread valuations at expensive levels in anticipation of increased market volatility. Concerns about inflation and rising interest rates impacted the municipal markets, causing valuations to become more expensive until September 2021. As markets started to weaken the Portfolio started to selectively add risk at more attractive valuations. The Portfolio’s gross annual operating expense ratio, as stated in the February 28, 2021 prospectus, is 1.02%. This ratio can fluctuate and may differ from the expense ratio disclosed in the Financial Highlights section of this report.
Hypothetical Illustration of $10,000 Invested in
High Yield Municipal Portfolio vs.
Bloomberg Muni High Yield 5% Tobacco Cap 2% Issuer Cap Index,
Bloomberg Muni BBB Index,
Bloomberg Municipal Bond Index and
Morningstar High Yield Muni Average
12/22/15 through 10/31/21
| * | Assumes the reinvestment of all dividends and distributions. |
Performance data quoted represents past performance; past performance does not guarantee future results. The investment return and principal value of an investment will fluctuate so that an investor’s shares, when redeemed, may be worth more or less than their original cost. The performance quoted reflects fee waivers and/or expense reimbursements in effect during certain periods and would have been lower in their absence. Current performance may be higher or lower than the total return shown. Please call the Fund at 1-800-442-8299 to obtain the most recent month-end returns. Returns shown do not reflect taxes that a shareholder may pay on fund distributions or redemption of fund shares.
| | 1 Returns are for the period beginning January 1, 2016 for Morningstar High Yield Muni Average. |
| | The indices and certain terms are defined on pages 23 to 25. |
Muni Intermediate Portfolio
PORTFOLIO HIGHLIGHTS
October 31, 2021
| Average Annual Total Return | |
| Muni Intermediate Portfolio | | | | Bloomberg Municipal
1-10 Year
Blend Index | Morningstar
Muni National
Intermediate Average | |
| Year ended 10/31/21 | | 0.60% | | 1.28% | 3.07% | |
| Five Years ended 10/31/21 | | 2.32% | | 2.57% | 2.85% | |
| Ten Years ended 10/31/21 | | 2.27% | | 2.74% | 3.11% | |
| Inception (06/05/92) through 10/31/211 | | 3.83% | | 4.20% | 4.17% | |
For the fiscal year ended October 31, 2021, the Muni Intermediate Portfolio returned 0.60%. Its benchmark, the Bloomberg Municipal 1-10 Year Blend Index, returned 1.28% and the Portfolio’s peer group, the Morningstar Muni National Intermediate Average, returned 3.07% for the year. The Portfolio’s underperformance versus its benchmark was a function of the market’s insatiable demand for lower credit quality bonds in contrast to the Portfolio’s high credit quality mandate. The Portfolio was able to recover some of the performance drag through beneficial curve positioning and security selection.
The Portfolio seeks to add value through active yield curve and credit-quality exposure, as well as sector and security selection. Diversification, liquidity, and measured risk taking are the focus of the Portfolio’s investment discipline. The Portfolio’s gross annual operating expense ratio, as stated in the February 28, 2021 prospectus, is 0.25%. This rate can fluctuate and may differ from the expense ratio disclosed in the Financial Highlights in this report.
Hypothetical Illustration of $10,000 Invested in
Muni Intermediate Portfolio vs.
Bloomberg Municipal 1-10 Year Blend Index and
Morningstar Muni National Intermediate Average
10/31/11 through 10/31/21
| * | Index commenced 6/30/93. Thus Portfolio inception comparisons are not provided. |
| ** | Assumes the reinvestment of all dividends and distributions. |
Performance data quoted represents past performance; past performance does not guarantee future results. The investment return and principal value of an investment will fluctuate so that an investor’s shares, when redeemed, may be worth more or less than their original cost. Current performance may be higher or lower than the total return shown. Please call the Fund at 1-800-442-8299 to obtain the most recent month-end returns. Returns shown do not reflect taxes that a shareholder may pay on fund distributions or the redemption of fund shares.
| | 1 Returns are for the periods beginning July 1, 1992 for Bloomberg Municipal 1-10 Year Blend Index and July 1, 1992 for Morningstar Muni National Intermediate Average. |
| | The indices and certain terms are defined on pages 23 to 25. |
THE GLENMEDE FUND, INC.
THE GLENMEDE PORTFOLIOS
Glossary of Indices & Terms
Indices — It is not possible to invest directly in an index.
The Blended Index is comprised of two benchmarks, weighted 70% Bloomberg U.S. Treasury Bellwether 3-Month Index and 30% Russell 3000® Index.
The Bloomberg U.S. Treasury Bellwether 3-Month Index is a market value-weighted index of investment-grade fixed-rate public obligations of the U.S. Treasury with maturities of 3 months, excluding zero coupon strips.
The Bloomberg Municipal 1-10 Year Blend Index is a composite index made up of several different broad sub-indices: the Bloomberg Municipal 1-Year Index; the Bloomberg Municipal 3-Year Index; the Bloomberg Municipal 5-Year Index; the Bloomberg Municipal 7-Year Index and the Bloomberg Municipal 10-Year Index. The total of all these indices represents all maturities between 1-10 Years.
The Bloomberg U.S. Aggregate Bond Index represents securities that are SEC-registered, taxable, and dollar denominated. The index covers the U.S. investment grade fixed rate bond market, with index components for government and corporate securities, mortgage pass-through securities, and asset-backed securities. These major sectors are subdivided into more specific indices that are calculated and reported on a regular basis. Indexes are rebalanced by market capitalization each month.
The Bloomberg Muni BBB Index is a sub-index of the Bloomberg U.S. Municipal Index that includes only bonds rated BBB on the day the Index resets. The rating is established using the middle rating of Moody’s Investor Services, Inc. (“Moody’s”), S&P Global Ratings (“S&P”) and Fitch Ratings, Inc.
The Bloomberg Muni High Yield 5% Tobacco 2% Issuer Cap Index is an issuer constrained sub-index of the Bloomberg U.S. Municipal High Yield Index that caps issuer exposure to 2% and tobacco stocks to 5%.
The Bloomberg Municipal Bond Index is an unmanaged index of municipal bonds with maturities greater than two years.
The Bloomberg High Yield Index measures the USD-denominated, high yield, fixed-rate corporate bond market. Securities are classified as high yield if the middle rating of Moody’s, Fitch and S&P is Ba1/BB+/BB+ or below. Bonds from issuers with an emerging markets country of risk, based on the indices’ EM country definition, are excluded.
The BofA Merrill Lynch 1-3 Year U.S. Municipal Securities Index is a subset of The BofA Merrill Lynch US Municipal Securities Index including all securities with a remaining term to final maturity less than 3 years.
The CBOE S&P 500® PutWrite Index is a benchmark index that measures the performance of a hypothetical portfolio that sells S&P 500® Index (SPX) put options against collateralized cash reserves held in a money market account.
The MSCI All Country World Index is a market capitalization weighted index designed to provide a broad measure of equity-market performance throughout the world. The MSCI All Country World Index is comprised of stocks from both developed and emerging markets.
The MSCI EAFE Index is an unmanaged capitalization weighted composite portfolio consisting of equity total returns of countries in Australia, New Zealand, Europe and the Far East.
The MSCI World ex-USA Index captures large and mid cap representation across 22 of 23 Developed Markets countries--excluding the United States. With 982 constituents, the index covers approximately 85% of the free float-adjusted market capitalization in each country.
The Russell 1000® Index is an unmanaged market capitalization weighted total return index which is comprised of the 1,000 largest companies in the Russell 3000® Index.
The Russell 1000® Growth Index is an unmanaged capitalization weighted total return index which is comprised of securities in the Russell 1000® Index with greater than average growth orientation.
The Russell 1000® Value Index is an unmanaged capitalization weighted total return index which is comprised of those securities in the Russell 1000® Index with a less than average growth orientation.
The Russell 2000® Index is an unmanaged market capitalization weighted total return index which measures the performance of the 2,000 smallest companies in the Russell 3000® Index.
The Russell 2000® Value Index is an index measuring the performance of approximately 2,000 small-cap companies in the Russell 3000® Index, which is made up of 3,000 of the biggest U.S. stocks. The Russell 2000® Value Index serves as a benchmark for small-cap stocks in the United States.
The Russell 3000® Index is an unmanaged capitalization weighted total return index which is comprised of the 3,000 largest U.S. companies based on total market capitalization. The Index re-balances annually.
The S&P 500® Index is a market capitalization weighted index comprised of 500 widely held common stocks.
Morningstar Foreign Large Value Average funds invest mainly in a variety of big international stocks. Most of these funds divide their assets among a dozen or more developed markets, including Japan, Britain, France, and Germany. The blend style is assigned to funds where neither growth nor value characteristics predominate.
THE GLENMEDE FUND, INC.
THE GLENMEDE PORTFOLIOS
Glossary of Indices & Terms — (Continued)
Morningstar High Yield Muni Average funds invest at least 50% of assets in high-income municipal securities that are not rated or that are rated by a major agency such as S&P or Moody’s at the level of BBB (considered speculative in the municipal industry) and below.
Morningstar Intermediate-Core Bond Average contains bond funds that have average durations of greater than 3.5 years and less than 6 years. Most of the funds rotate among a variety of sectors in the bond market, based upon that which appears to offer better values.
Morningstar Large Blend Average funds are fairly representative of the overall U.S. Stock market in size, growth rates, and price. The blend style is assigned to funds where neither growth nor value characteristics predominate. These funds tend to invest across the spectrum of U.S. industries, and owing to their broad exposure, the funds returns are often similar to those of the S&P 500 Index.
Morningstar Large Growth Average funds invest in big U.S. companies that are projected to grow faster than other large-cap stocks. This classification consists of stocks in the top 70% of the capitalization of the U.S. equity market defined as large-cap. Growth is defined based on fast growth (high growth rates for earnings, sales, book value, and cash flow) and high valuations (high price ratios and low dividend yields). Most of these funds focus on companies in rapidly expanding industries.
Morningstar Large Value Average funds focus on big companies that are less expensive or growing more slowly than other large-cap stocks. These funds often feature investments in energy, financial, or manufacturing sectors.
Morningstar Long/Short Average funds aim to deliberately exploit market movements through the use of a variety of derivative instruments. These can include (but are not limited to) futures, options, swaps, short sells along with physical positions.
Morningstar Mid-Cap Value Average funds invest primarily in mid-cap U.S. stocks that are value-oriented. Midcap stocks collectively represent 20% of the total capitalization of the U.S. equity market (large-cap stocks represent the top 70%). The mid-cap range for market capitalization typically falls between $1-$8 billion. Value is defined based on low valuations (low price ratios and high dividend yields) and slow growth (low growth rates for earnings, sales, book value, and cash flow).
Morningstar Muni National Short Average invests in bonds with an average duration of less than 4.5 years issued by state and local governments to fund projects. Such bonds are free from federal taxes and from state taxes in the issuing state.
Morningstar Short-Term Bond Average funds invest primarily in corporate and other investment-grade U.S. fixed-income issues and have durations of one to 3.5 years (or, if duration is unavailable, average effective maturities of one to four years).
Morningstar Small Blend Average funds favor firms at the smaller end of the market-capitalization range, and are flexible in the types of small caps they buy. Some aim to own an array of value and growth stocks while others employ a discipline that leads to holdings with valuations and growth rates close to the small-cap averages.
The Morningstar Muni National Intermediate Average funds have an average duration of more than 4.5 years but less than seven years, or average maturity of more than five years but less than 12 years.
The Dow Jones Industrial Average (DJIA) is a price-weighted index that tracks 30 large, publicly-owned companies trading on the New York Stock Exchange and the NASDAQ.
The CBOE Russell 2000® PutWrite Index is designed to track the performance of a hypothetical strategy that sells a monthly at-the-money (ATM) Russell 2000® Index put option. The written Russell 2000® put option is collateralized by a money market account invested in one-month Treasury bills.
The Blended PutWrite Index is a weighted benchmark comprised of four indices: 40% CBOE S&P 500® PutWrite T-W (PWT) Index, 10% CBOE Russell 2000® PutWrite (PUTR) Index, 40% CBOE MSCI EAFE PutWrite Index (PXEA) and 10% CBOE MSCI Emerging Markets PutWrite (PXEF) Index.
Terms
Cash flow: measures the cash generating capability of a company by adding non-cash charges (e.g. depreciation) and interest expense to pretax income.
Duration: is a commonly used measure of the potential volatility of the price of a debt security, or the aggregate market value of a portfolio of debt securities, prior to maturity. Securities with a longer duration generally have more volatile prices than securities of comparable quality with a shorter duration.
Market Capitalization: is the market price of an entire company, calculated by multiplying the number of shares outstanding by the price per share.
Total return: consists of price appreciation/depreciation and income as a percentage of the original investment.
THE GLENMEDE FUND, INC.
THE GLENMEDE PORTFOLIOS
Glossary of Indices & Terms — (Concluded)
Dividend Yield: The dividend yield or dividend-price ratio of a share is the dividend per share, divided by the price per share. It is also a company’s total annual dividend payments divided by its market capitalization, assuming the number of shares is constant.
Yield Curve: A yield curve is a line that plots yields (interest rates) of bonds having equal credit quality but differing maturity dates. The slope of the yield curve gives an idea of future interest rate changes and economic activity. There are three main types of yield curve shapes: normal (upward sloping curve), inverted (downward sloping curve) and flat.
Price-to-earnings ratio (P/E ratio): is the ratio for valuing a company that measures its current share price relative to its per-share earnings (EPS).
Credit spread: is the difference in yield between a U.S. Treasury bond and another debt security of the same maturity but different credit quality.
The Glenmede Fund, Inc.
Shareholder Expenses (Unaudited)
As a shareholder of a Glenmede Portfolio, you incur ongoing costs, including management fees and, for certain classes, shareholder servicing fees and other portfolio expenses. The following example is intended to help you understand your ongoing costs (in dollars and cents) of investing in a Glenmede Portfolio and to compare these costs with the ongoing costs of investing in other mutual funds.
Unless otherwise noted, the examples are based on an investment of $1,000 invested at the beginning of the period and held for the entire period from May 1, 2021 to October 31, 2021.
Actual Expenses
The first line under each Portfolio in the table below provides information about actual account values and actual expenses. You may use the information in this line, together with the amount you invested, to estimate the expenses that you paid over the period. Simply divide your account value by $1,000 (for example, an $8,600 account value divided by $1,000 = 8.6), then multiply the result by the number in the first line for your Portfolio under the heading entitled “Expenses Paid During Period” to estimate the expenses you paid on your account during this period.
Hypothetical Example for Comparison Purposes
The second line under each Portfolio in the table below provides information about hypothetical account values and hypothetical expenses based on each Portfolio’s actual expense ratio and an assumed rate of return of 5% per year before expenses, which is not the Portfolio’s actual return. The hypothetical account values and expenses may not be used to estimate the actual ending account balance or expenses you paid for the period. You may use this information to compare the ongoing costs of investing in your Portfolio and other funds. To do so, compare this 5% hypothetical example with the 5% hypothetical examples that appear in the shareholder reports of the other funds.
| | Beginning
Account
Value
(May 1, 2021) | | Ending
Account
Value
(October 31, 2021) | | Annualized
Expense
Ratio | | Expenses
Paid During
Period*
(May 1, 2021 to
October 31, 2021) |
| Quantitative U.S. Large Cap Core Equity Portfolio – Advisor | | | | | | | |
Actual
| $1,000.00 | | $1,064.80 | | 0.83% | | $ 4.32 |
Hypothetical (5% return less expenses)
| 1,000.00 | | 1,021.00 | | 0.83 | | 4.23 |
| Quantitative U.S. Large Cap Core Equity Portfolio – Institutional | | | | | | | |
Actual
| 1,000.00 | | 1,066.20 | | 0.62 | | 3.23 |
Hypothetical (5% return less expenses)
| 1,000.00 | | 1,022.10 | | 0.62 | | 3.16 |
| Quantitative U.S. Large Cap Growth Equity Portfolio – Advisor | | | | | | | |
Actual
| 1,000.00 | | 1,139.80 | | 0.83 | | 4.48 |
Hypothetical (5% return less expenses)
| 1,000.00 | | 1,021.00 | | 0.83 | | 4.23 |
| Quantitative U.S. Large Cap Growth Equity Portfolio – Institutional | | | | | | | |
Actual
| 1,000.00 | | 1,140.70 | | 0.63 | | 3.40 |
Hypothetical (5% return less expenses)
| 1,000.00 | | 1,022.00 | | 0.63 | | 3.21 |
| Quantitative U.S. Large Cap Value Equity Portfolio | | | | | | | |
Actual
| 1,000.00 | | 1,049.80 | | 0.85 | | 4.39 |
Hypothetical (5% return less expenses)
| 1,000.00 | | 1,020.90 | | 0.85 | | 4.33 |
| Quantitative U.S. Small Cap Equity Portfolio | | | | | | | |
Actual
| 1,000.00 | | 1,043.40 | | 0.85 | | 4.38 |
Hypothetical (5% return less expenses)
| 1,000.00 | | 1,020.90 | | 0.85 | | 4.33 |
| Quantitative International Equity Portfolio | | | | | | | |
Actual
| 1,000.00 | | 1,031.60 | | 1.00 | | 5.12 |
Hypothetical (5% return less expenses)
| 1,000.00 | | 1,020.20 | | 1.00 | | 5.09 |
| Responsible ESG U.S. Equity Portfolio | | | | | | | |
Actual
| 1,000.00 | | 1,067.20 | | 0.85 | | 4.43 |
Hypothetical (5% return less expenses)
| 1,000.00 | | 1,020.90 | | 0.85 | | 4.33 |
| Women in Leadership U.S. Equity Portfolio | | | | | | | |
Actual
| 1,000.00 | | 1,046.80 | | 0.85 | | 4.39 |
Hypothetical (5% return less expenses)
| 1,000.00 | | 1,020.90 | | 0.85 | | 4.33 |
| Quantitative U.S. Long/Short Equity Portfolio – Advisor | | | | | | | |
Actual
| 1,000.00 | | 1,041.90 | | 2.43 | | 12.51 |
Hypothetical (5% return less expenses)
| 1,000.00 | | 1,013.00 | | 2.43 | | 12.33 |
| Quantitative U.S. Long/Short Equity Portfolio – Institutional | | | | | | | |
Actual
| 1,000.00 | | 1,043.40 | | 3.63 | | 18.70 |
Hypothetical (5% return less expenses)
| 1,000.00 | | 1,006.90 | | 3.63 | | 18.36 |
The Glenmede Fund, Inc.
Shareholder Expenses (Unaudited) — (Concluded)
| | Beginning
Account
Value
(May 1, 2021) | | Ending
Account
Value
(October 31, 2021) | | Annualized
Expense
Ratio | | Expenses
Paid During
Period*
(May 1, 2021 to
October 31, 2021) |
| Quantitative U.S. Total Market Equity Portfolio | | | | | | | |
Actual
| $1,000.00 | | $1,125.40 | | 1.82% | | $ 9.75 |
Hypothetical (5% return less expenses)
| 1,000.00 | | 1,016.00 | | 1.82 | | 9.25 |
| Strategic Equity Portfolio | | | | | | | |
Actual
| 1,000.00 | | 1,077.40 | | 0.84 | | 4.40 |
Hypothetical (5% return less expenses)
| 1,000.00 | | 1,021.00 | | 0.84 | | 4.28 |
| Small Cap Equity Portfolio – Advisor | | | | | | | |
Actual
| 1,000.00 | | 1,040.00 | | 0.89 | | 4.58 |
Hypothetical (5% return less expenses)
| 1,000.00 | | 1,020.70 | | 0.89 | | 4.53 |
| Small Cap Equity Portfolio – Institutional | | | | | | | |
Actual
| 1,000.00 | | 1,041.20 | | 0.69 | | 3.55 |
Hypothetical (5% return less expenses)
| 1,000.00 | | 1,021.70 | | 0.69 | | 3.52 |
| Equity Income Portfolio | | | | | | | |
Actual
| 1,000.00 | | 1,066.80 | | 0.85 | | 4.43 |
Hypothetical (5% return less expenses)
| 1,000.00 | | 1,020.90 | | 0.85 | | 4.33 |
| Secured Options Portfolio – Advisor | | | | | | | |
Actual
| 1,000.00 | | 1,076.20 | | 0.84 | | 4.40 |
Hypothetical (5% return less expenses)
| 1,000.00 | | 1,021.00 | | 0.84 | | 4.28 |
| Secured Options Portfolio – Institutional | | | | | | | |
Actual
| 1,000.00 | | 1,076.90 | | 0.64 | | 3.35 |
Hypothetical (5% return less expenses)
| 1,000.00 | | 1,022.00 | | 0.64 | | 3.26 |
| Global Secured Options Portfolio | | | | | | | |
Actual
| 1,000.00 | | 1,062.10 | | 1.00 | | 5.20 |
Hypothetical (5% return less expenses)
| 1,000.00 | | 1,020.20 | | 1.00 | | 5.09 |
| Core Fixed Income Portfolio | | | | | | | |
Actual
| 1,000.00 | | 1,004.80 | | 0.54 | | 2.73 |
Hypothetical (5% return less expenses)
| 1,000.00 | | 1,022.50 | | 0.54 | | 2.75 |
| Short Term Tax Aware Fixed Income Portfolio | | | | | | | |
Actual
| 1,000.00 | | 997.30 | | 0.55 | | 2.77 |
Hypothetical (5% return less expenses)
| 1,000.00 | | 1,022.40 | | 0.55 | | 2.80 |
| High Yield Municipal Portfolio | | | | | | | |
Actual
| 1,000.00 | | 1,012.10 | | 1.00 | | 5.07 |
Hypothetical (5% return less expenses)
| 1,000.00 | | 1,020.20 | | 1.00 | | 5.09 |
|
| * | Expenses are calculated using the Portfolio’s annualized expense ratio (as disclosed in the table), which is net of fee waivers, and include dividends on securities sold short, interest expense and expense reimbursements, if any, multiplied by the average account value for the period, multiplied by the number of days in the period (184 days), and divided by the number of days in the calendar year (365 days). |
The Glenmede Portfolios
Shareholder Expenses (Unaudited)
As a shareholder of the Glenmede Muni Intermediate Portfolio, you incur ongoing costs, including shareholder servicing fees and other portfolio expenses. The following example is intended to help you understand your ongoing costs (in dollars and cents) of investing in the Glenmede Muni Intermediate Portfolio and to compare these costs with the ongoing costs of investing in other mutual funds.
The example is based on an investment of $1,000 invested at the beginning of the period and held for the entire period from May 1, 2021 to October 31, 2021.
Actual Expenses
The first line under the Portfolio in the table below provides information about actual account values and actual expenses. You may use the information in this line, together with the amount you invested, to estimate the expenses that you paid over the period. Simply divide your account value by $1,000 (for example, an $8,600 account value divided by $1,000 = 8.6), then multiply the result by the number in the first line for the Portfolio under the heading entitled “Expenses Paid During Period” to estimate the expenses you paid on your account during this period.
Hypothetical Example for Comparison Purposes
The second line under the Portfolio in the table below provides information about hypothetical account values and hypothetical expenses based on the Portfolio’s actual expense ratio and an assumed rate of return of 5% per year before expenses, which is not the Portfolio’s actual return. The hypothetical account values and expenses may not be used to estimate the actual ending account balance or expenses you paid for the period. You may use this information to compare the ongoing costs of investing in the Portfolio and other funds. To do so, compare this 5% hypothetical example with the 5% hypothetical examples that appear in the shareholder reports of the other funds.
Please note that the expenses shown in the table are meant to highlight your ongoing costs only. As a shareholder of the Glenmede Muni Intermediate Portfolio, you do not incur any transaction costs, such as sales charges (loads), redemption fees or exchange fees, but shareholders of other funds may incur such costs. Therefore, the second line under the Portfolio in the table is useful in comparing ongoing costs only, and will not help you determine the relative total costs of owning different funds whose shareholders may incur transaction costs.
| | Beginning
Account
Value
(May 1, 2021) | | Ending
Account
Value
(October 31, 2021) | | Annualized
Expense
Ratio | | Expenses
Paid During
Period*
(May 1, 2021 to
October 31, 2021) |
| Muni Intermediate Portfolio | | | | | | | |
Actual
| $1,000.00 | | $ 997.00 | | 0.24% | | $1.21 |
Hypothetical (5% return less expenses)
| 1,000.00 | | 1,024.00 | | 0.24 | | 1.22 |
|
| * | Expenses are calculated using the Portfolio’s annualized expense ratio (as disclosed in the table), multiplied by the average account value for the period, multiplied by the number of days in the period (184 days), and divided by the number of days in the calendar year (365 days). |
The Glenmede Fund, Inc.
Statements Of Assets And Liabilities
October 31, 2021
| | Quantitative
U.S. Large Cap
Core Equity
Portfolio | | Quantitative
U.S. Large Cap
Growth Equity
Portfolio | | Quantitative
U.S. Large Cap
Value Equity
Portfolio |
| Assets: | | | | | |
Investments at value1, 2
| $ 1,414,320,857 | | $ 2,326,308,398 | | $ 2,526,837 |
Repurchase agreements at value1
| 6,710,130 | | 7,549,716 | | 10,906 |
Receivable from Advisor
| — | | — | | 4,179 |
Receivable for fund shares sold
| 214,650 | | 489,204 | | — |
Dividends receivable
| 1,204,025 | | 976,951 | | 3,441 |
Prepaid expenses
| 7,785 | | 14,498 | | 9 |
Total assets
| 1,422,457,447 | | 2,335,338,767 | | 2,545,372 |
| Liabilities: | | | | | |
Obligation to return securities lending collateral
| — | | — | | 50,738 |
Line of credit interest payable
| — | | 40 | | — |
Payable for fund shares redeemed
| 466,047 | | 987,519 | | — |
Payable for Management fees
| 652,138 | | 1,055,643 | | 1,158 |
Payable for Directors’ fees
| 41,318 | | 68,378 | | 66 |
Payable for Shareholder Servicing fees
| 209,636 | | 288,927 | | 421 |
Accrued expenses
| 187,590 | | 313,254 | | 5,854 |
Total liabilities
| 1,556,729 | | 2,713,761 | | 58,237 |
Net Assets
| $1,420,900,718 | | $2,332,625,006 | | $ 2,487,135 |
| Net Assets consist of: | | | | | |
Par value ($0.001 of shares outstanding)
| $ 43,094 | | $ 57,398 | | $ 191 |
Paid-in capital in excess of par value
| 727,151,339 | | 925,856,963 | | 1,926,750 |
Total distributable earnings
| 693,706,285 | | 1,406,710,645 | | 560,194 |
Total Net Assets
| $1,420,900,718 | | $2,332,625,006 | | $ 2,487,135 |
Shares Outstanding3
| 43,093,888 | | 57,398,169 | | 190,542 |
Net Asset Value Per Share
| $ — | | $ — | | $ 13.05 |
Advisor Class — based on net assets of $1,255,794,979 and $1,751,369,998, respectively and shares outstanding of 38,087,167 and 43,096,767, respectively
| 32.97 | | 40.64 | | — |
Institutional Class — based on net assets of $165,105,739 and $581,255,008, respectively and shares outstanding of 5,006,721 and 14,301,402, respectively
| 32.98 | | 40.64 | | — |
1 Investments at cost
| $ 887,553,095 | | $ 1,326,137,424 | | $ 1,970,265 |
2 Market value of securities on loan
| $ — | | $ — | | $ 48,428 |
3 Authorized shares
| — | | — | | 80,000,000 |
Authorized shares - Advisor Class
| 155,000,000 | | 240,000,000 | | — |
Authorized shares - Institutional Class
| 155,000,000 | | 140,000,000 | | — |
See Notes to Financial Statements.
The Glenmede Fund, Inc.
Statements Of Assets And Liabilities — (Continued)
October 31, 2021
| | Quantitative
U.S. Small Cap
Equity Portfolio | | Quantitative
International
Equity Portfolio | | Responsible
ESG U.S.
Equity
Portfolio |
| Assets: | | | | | |
Investments at value1, 2
| $ 1,572,530 | | $ 42,924,273 | | $ 32,601,825 |
Repurchase agreements at value1
| 12,420 | | 123,409 | | 252,633 |
Receivable from Advisor
| 4,264 | | 7,112 | | 2,260 |
Receivable for securities sold
| — | | 14,498 | | — |
Receivable for fund shares sold
| — | | — | | 3,000 |
Dividends receivable
| 397 | | 113,379 | | 32,349 |
Securities lending income receivable
| — | | 14,585 | | 3 |
Foreign tax reclaims receivable
| — | | 708,635 | | — |
Prepaid expenses
| 5 | | 491 | | 121 |
Total assets
| 1,589,616 | | 43,906,382 | | 32,892,191 |
| Liabilities: | | | | | |
Obligation to return securities lending collateral
| 26,965 | | 2,786,439 | | — |
Payable for Management fees
| 730 | | 26,219 | | 14,988 |
Payable for Directors’ fees
| 42 | | 1,785 | | 882 |
Payable for Shareholder Servicing fees
| 265 | | 8,740 | | 5,450 |
Accrued expenses
| 6,060 | | 14,067 | | 9,509 |
Total liabilities
| 34,062 | | 2,837,250 | | 30,829 |
Net Assets
| $ 1,555,554 | | $ 41,069,132 | | $32,861,362 |
| Net Assets consist of: | | | | | |
Par value ($0.001 of shares outstanding)
| $ 103 | | $ 2,642 | | $ 1,587 |
Paid-in capital in excess of par value
| 1,017,276 | | 37,360,823 | | 19,706,315 |
Total distributable earnings
| 538,175 | | 3,705,667 | | 13,153,460 |
Total Net Assets
| $ 1,555,554 | | $ 41,069,132 | | $32,861,362 |
Shares Outstanding3
| 103,392 | | 2,642,445 | | 1,587,102 |
Net Asset Value Per Share
| $ 15.05 | | $ 15.54 | | $ 20.71 |
1 Investments at cost
| $ 1,184,945 | | $ 38,775,864 | | $ 22,508,755 |
2 Market value of securities on loan
| $ 26,296 | | $ 5,579,376 | | $ — |
3 Authorized shares
| 80,000,000 | | 120,000,000 | | 80,000,000 |
See Notes to Financial Statements.
The Glenmede Fund, Inc.
Statements Of Assets And Liabilities — (Continued)
October 31, 2021
| | Women in
Leadership
U.S. Equity
Portfolio | | Quantitative U.S.
Long/Short
Equity Portfolio | | Quantitative
U.S. Total
Market Equity
Portfolio |
| Assets: | | | | | |
Investments at value1, 2
| $ 28,295,776 | | $ 62,483,096 | | $ 46,280,096 |
Repurchase agreements at value1
| 282,217 | | 132,067 | | 187,604 |
Receivable from Advisor
| 2,192 | | — | | — |
Receivable for securities sold
| — | | 396,945 | | — |
Receivable for fund shares sold
| 143 | | 5,500 | | 4,558 |
Dividends receivable
| 36,109 | | 32,272 | | 14,396 |
Securities lending income receivable
| 14 | | 142 | | 107 |
Cash collateral on deposit at broker (Note 1)
| — | | 44,748,443 | | — |
Prepaid expenses
| 115 | | 726 | | 192 |
Total assets
| 28,616,566 | | 107,799,191 | | 46,486,953 |
| Liabilities: | | | | | |
Payable for securities purchased
| 87,339 | | 847,675 | | — |
Obligation to return securities lending collateral
| 614,846 | | 687,600 | | 316,958 |
Payable for fund shares redeemed
| — | | 10,225 | | 2,458 |
Dividend payable on securities sold short
| — | | 16,885 | | 3,184 |
Payable for securities sold short, at value3
| — | | 42,871,983 | | 10,141,755 |
Payable for Management fees
| 12,880 | | 72,026 | | 35,858 |
Payable for Directors’ fees
| 823 | | 2,826 | | 1,023 |
Payable for Shareholder Servicing fees
| 4,684 | | 9,690 | | 5,966 |
Accrued expenses
| 9,126 | | 22,963 | | 19,163 |
Total liabilities
| 729,698 | | 44,541,873 | | 10,526,365 |
Net Assets
| $27,886,868 | | $ 63,257,318 | | $ 35,960,588 |
| Net Assets consist of: | | | | | |
Par value ($0.001 of shares outstanding)
| $ 1,447 | | $ 4,889 | | $ 1,570 |
Paid-in capital in excess of par value
| 16,611,659 | | 46,248,017 | | 11,167,467 |
Total distributable earnings
| 11,273,762 | | 17,004,412 | | 24,791,551 |
Total Net Assets
| $27,886,868 | | $ 63,257,318 | | $ 35,960,588 |
Shares Outstanding4
| 1,446,838 | | 4,889,236 | | 1,570,075 |
Net Asset Value Per Share
| $ 19.27 | | $ — | | $ 22.90 |
Advisor Class — based on net assets of $56,002,125 and shares outstanding of 4,330,061
| — | | 12.93 | | — |
Institutional Class — based on net assets of $7,255,193 and shares outstanding of 559,175
| — | | 12.97 | | — |
1 Investments at cost
| $ 21,788,459 | | $ 43,267,303 | | $ 27,429,216 |
2 Market value of securities on loan
| $ 586,853 | | $ 1,902,793 | | $ 1,352,293 |
3 Proceeds from securities sold short
| $ — | | $ 42,779,692 | | $ 10,314,567 |
4 Authorized shares
| 80,000,000 | | — | | 120,000,000 |
Authorized shares - Advisor Class
| — | | 120,000,000 | | — |
Authorized shares - Institutional Class
| — | | 120,000,000 | | — |
See Notes to Financial Statements.
The Glenmede Fund, Inc.
Statements Of Assets And Liabilities — (Continued)
October 31, 2021
| | Strategic
Equity
Portfolio | | Small
Cap
Equity
Portfolio | | Equity
Income
Portfolio |
| Assets: | | | | | |
Investments at value1, 2
| $ 266,978,553 | | $ 1,504,944,549 | | $ 22,175,459 |
Repurchase agreements at value1
| 1,720,703 | | 19,490,176 | | 120,692 |
Receivable from Advisor
| — | | — | | 1,445 |
Receivable for fund shares sold
| — | | 1,115,869 | | — |
Dividends receivable
| 196,538 | | 43,597 | | 22,655 |
Securities lending income receivable
| — | | 4,872 | | — |
Prepaid expenses
| 1,244 | | 7,652 | | 108 |
Total assets
| 268,897,038 | | 1,525,606,715 | | 22,320,359 |
| Liabilities: | | | | | |
Obligation to return securities lending collateral
| — | | 48,882,501 | | — |
Payable for fund shares redeemed
| 30,795 | | 795,735 | | — |
Payable for Management fees
| 123,344 | | 685,041 | | 10,287 |
Payable for Directors’ fees
| 7,696 | | 42,434 | | 637 |
Payable for Shareholder Servicing fees
| 44,852 | | 151,879 | | 3,741 |
Accrued expenses
| 42,562 | | 206,423 | | 9,580 |
Total liabilities
| 249,249 | | 50,764,013 | | 24,245 |
Net Assets
| $268,647,789 | | $1,474,842,702 | | $22,296,114 |
| Net Assets consist of: | | | | | |
Par value ($0.001 of shares outstanding)
| $ 7,554 | | $ 38,349 | | $ 1,400 |
Paid-in capital in excess of par value
| 93,242,915 | | 949,333,656 | | 14,227,171 |
Total distributable earnings
| 175,397,320 | | 525,470,697 | | 8,067,543 |
Total Net Assets
| $268,647,789 | | $1,474,842,702 | | $22,296,114 |
Shares Outstanding3
| 7,554,302 | | 38,349,117 | | 1,400,488 |
Net Asset Value Per Share
| $ 35.56 | | $ — | | $ 15.92 |
Advisor Class — based on net assets of $530,400,747 and shares outstanding of 14,311,323
| — | | 37.06 | | — |
Institutional Class — based on net assets of $944,441,955 and shares outstanding of 24,037,794
| — | | 39.29 | | — |
1 Investments at cost
| $ 119,499,832 | | $ 1,031,247,755 | | $ 15,106,144 |
2 Market value of securities on loan
| $ — | | $ 79,395,062 | | $ — |
3 Authorized shares
| 150,000,000 | | — | | 80,000,000 |
Authorized shares - Advisor Class
| — | | 180,000,000 | | — |
Authorized shares - Institutional Class
| — | | 135,000,000 | | — |
See Notes to Financial Statements.
The Glenmede Fund, Inc.
Statements Of Assets And Liabilities — (Continued)
October 31, 2021
| | Secured
Options
Portfolio | | Global
Secured
Options
Portfolio | | Core
Fixed
Income
Portfolio |
| Assets: | | | | | |
Investments at value1, 2
| $ 1,141,641,965 | | $ 44,082,995 | | $ 447,332,136 |
Repurchase agreements at value1
| 7,484,965 | | 854,352 | | 10,070,273 |
Receivable from Advisor
| — | | 1,823 | | — |
Receivable for fund shares sold
| 64,379 | | 10,004 | | 10,515 |
Interest receivable
| — | | — | | 2,379,701 |
Securities lending income receivable
| — | | — | | 2,004 |
Cash collateral on deposit at broker (Note 1)
| 8,581,321 | | 947,986 | | — |
Foreign tax reclaims receivable
| — | | 33,504 | | — |
Prepaid expenses
| 2,657 | | 41 | | 2,384 |
Total assets
| 1,157,775,287 | | 45,930,705 | | 459,797,013 |
| Liabilities: | | | | | |
Due to custodian
| — | | — | | 5,298,943 |
Payable for securities purchased
| — | | — | | 2,075,499 |
Obligation to return securities lending collateral
| — | | — | | 27,537,200 |
Payable for fund shares redeemed
| 185,425 | | — | | 133,759 |
Options written, at value3
| 725,913,525 | | 28,758,928 | | — |
Payable for Management fees
| 199,068 | | 7,862 | | 125,941 |
Payable for Directors’ fees
| 12,668 | | 392 | | 13,096 |
Payable for Shareholder Servicing fees
| 15,125 | | 2,859 | | 35,983 |
Accrued expenses
| 61,992 | | 8,491 | | 64,686 |
Total liabilities
| 726,387,803 | | 28,778,532 | | 35,285,107 |
Net Assets
| $ 431,387,484 | | $ 17,152,173 | | $424,511,906 |
| Net Assets consist of: | | | | | |
Par value ($0.001 of shares outstanding)
| $ 28,843 | | $ 3,038 | | $ 38,221 |
Paid-in capital in excess of par value
| 363,977,453 | | 21,417,815 | | 413,407,347 |
Total distributable earnings
| 67,381,188 | | (4,268,680) | | 11,066,338 |
Total Net Assets
| $ 431,387,484 | | $ 17,152,173 | | $424,511,906 |
Shares Outstanding4
| 28,843,315 | | 3,038,478 | | 38,220,597 |
Net Asset Value Per Share
| $ — | | $ 5.64 | | $ 11.11 |
Advisor Class — based on net assets of $90,142,523 and shares outstanding of 6,077,007
| 14.83 | | — | | — |
Institutional Class — based on net assets of $341,244,961 and shares outstanding of 22,766,308
| 14.99 | | — | | — |
1 Investments at cost
| $ 1,084,840,612 | | $ 43,004,267 | | $ 447,347,100 |
2 Market value of securities on loan
| $ — | | $ — | | $ 26,984,406 |
3 Premiums received from options written
| $ 679,740,011 | | $ 27,007,963 | | $ — |
4 Authorized shares
| — | | 120,000,000 | | 160,000,000 |
Authorized shares - Advisor Class
| 160,000,000 | | — | | — |
Authorized shares - Institutional Class
| 160,000,000 | | — | | — |
See Notes to Financial Statements.
The Glenmede Fund, Inc.
Statements Of Assets And Liabilities — (Concluded)
October 31, 2021
| | Short Term
Tax Aware
Fixed
Income
Portfolio | | High Yield
Municipal
Portfolio |
| Assets: | | | |
Investments at value1
| $ 54,145,187 | | $ 278,017,756 |
Repurchase agreements at value1
| 3,841,170 | | — |
Cash
| — | | 2,673,740 |
Receivable from Advisor
| 2,400 | | — |
Receivable for securities sold
| — | | 286,419 |
Receivable for fund shares sold
| — | | 188,600 |
Interest receivable
| 531,942 | | 3,316,987 |
Prepaid expenses
| 289 | | 1,178 |
Total assets
| 58,520,988 | | 284,484,680 |
| Liabilities: | | | |
Payable for securities purchased
| 200,187 | | — |
Payable for when-issued securities purchased
| 1,998,438 | | 1,584,260 |
Payable for fund shares redeemed
| — | | 118,407 |
Payable for Management fees
| 16,318 | | 158,292 |
Payable for Directors’ fees
| 1,598 | | 8,052 |
Payable for Shareholder Servicing fees
| 4,662 | | 59,905 |
Accrued expenses
| 15,695 | | 44,168 |
Total liabilities
| 2,236,898 | | 1,973,084 |
Net Assets
| $56,284,090 | | $282,511,596 |
| Net Assets consist of: | | | |
Par value ($0.001 of shares outstanding)
| $ 5,576 | | $ 25,465 |
Paid-in capital in excess of par value
| 56,025,361 | | 264,885,054 |
Total distributable earnings
| 253,153 | | 17,601,077 |
Total Net Assets
| $56,284,090 | | $282,511,596 |
Shares Outstanding2
| 5,576,065 | | 25,464,713 |
Net Asset Value Per Share
| $ 10.09 | | $ 11.09 |
1 Investments at cost
| $ 57,581,503 | | $ 263,092,020 |
2 Authorized shares
| 80,000,000 | | 80,000,000 |
See Notes to Financial Statements.
The Glenmede Fund, Inc.
Statements Of Operations
For the Year Ended October 31, 2021
| | Quantitative
U.S. Large Cap
Core Equity
Portfolio | | Quantitative
U.S. Large Cap
Growth Equity
Portfolio | | Quantitative
U.S. Large Cap
Value Equity
Portfolio |
| Investment income: | | | | | |
Dividends
| $ 22,039,972 | | $ 22,592,978 | | $ 51,386 |
Income from security lending
| 39 | | 16 | | 6 |
Total investment income
| 22,040,011 | | 22,592,994 | | 51,392 |
| Expenses: | | | | | |
Management fees
| 7,588,526 | | 12,444,966 | | 12,153 |
Administration, transfer agent and custody fees
| 591,619 | | 960,431 | | 28,572 |
Professional fees
| 233,913 | | 387,933 | | 362 |
Shareholder report expenses
| 98,940 | | 263,876 | | 852 |
Shareholder servicing fees
| — | | — | | 4,419 |
Shareholder servicing fees (Advisor Class)
| 2,442,956 | | 3,438,919 | | — |
Directors’ fees and expenses
| 162,684 | | 273,262 | | 272 |
Interest expense
| 3,142 | | 20,328 | | — |
Registration and filing fees
| 46,119 | | 74,326 | | 4,992 |
Other expenses
| 193,840 | | 325,688 | | 2,531 |
Total expenses
| 11,361,739 | | 18,189,729 | | 54,153 |
Less expenses waived/reimbursed
| — | | — | | (35,371) |
Net expenses
| 11,361,739 | | 18,189,729 | | 18,782 |
Net investment income
| 10,678,272 | | 4,403,265 | | 32,610 |
| Realized and unrealized gain: | | | | | |
| Net realized gain on: | | | | | |
Investment transactions
| 174,197,674 | | 472,680,948 | | 192,898 |
| Net change in unrealized gain of: | | | | | |
Investments
| 303,612,374 | | 383,735,184 | | 531,814 |
Net realized and unrealized gain
| 477,810,048 | | 856,416,132 | | 724,712 |
Net increase in net assets resulting from operations
| $488,488,320 | | $860,819,397 | | $757,322 |
See Notes to Financial Statements.
The Glenmede Fund, Inc.
Statements Of Operations — (Continued)
For the Year Ended October 31, 2021
| | Quantitative
U.S. Small Cap
Equity Portfolio | | Quantitative
International
Equity Portfolio | | Responsible
ESG U.S.
Equity
Portfolio |
| Investment income: | | | | | |
Dividends1
| $ 19,579 | | $ 1,547,985 | | $ 470,050 |
Income from security lending
| 90 | | 162,297 | | 3 |
Total investment income
| 19,669 | | 1,710,282 | | 470,053 |
| Expenses: | | | | | |
Management fees
| 7,827 | | 376,729 | | 162,791 |
Administration, transfer agent and custody fees
| 29,744 | | 42,993 | | 50,814 |
Professional fees
| 238 | | 8,776 | | 5,010 |
Shareholder report expenses
| 831 | | 2,083 | | 2,474 |
Shareholder servicing fees
| 2,846 | | 125,576 | | 59,197 |
Directors’ fees and expenses
| 178 | | 5,601 | | 3,606 |
Interest expense
| — | | 726 | | — |
Registration and filing fees
| 4,988 | | 21,797 | | 20,484 |
Other expenses
| 2,485 | | 11,325 | | 5,377 |
Total expenses
| 49,137 | | 595,606 | | 309,753 |
Less expenses waived/reimbursed
| (37,040) | | (92,575) | | (58,167) |
Net expenses
| 12,097 | | 503,031 | | 251,586 |
Net investment income
| 7,572 | | 1,207,251 | | 218,467 |
| Realized and unrealized gain (loss): | | | | | |
| Net realized gain on: | | | | | |
Investment transactions
| 213,765 | | 11,341,780 | | 3,795,554 |
Foreign currency transactions
| — | | 6,448 | | — |
Net realized gain
| 213,765 | | 11,348,228 | | 3,795,554 |
| Net change in unrealized gain (loss) of: | | | | | |
Investments
| 351,970 | | 2,809,057 | | 6,354,818 |
Foreign currency translation
| — | | (578) | | — |
Net change in unrealized gain
| 351,970 | | 2,808,479 | | 6,354,818 |
Net realized and unrealized gain
| 565,735 | | 14,156,707 | | 10,150,372 |
Net increase in net assets resulting from operations
| $573,307 | | $15,363,958 | | $10,368,839 |
|
| 1 | The Quantitative U.S. Small Cap Equity Portfolio and the Quantitative International Equity Portfolio had foreign dividend withholding taxes of $58 and $170,471, respectively. |
See Notes to Financial Statements.
The Glenmede Fund, Inc.
Statements Of Operations — (Continued)
For the Year Ended October 31, 2021
| | Women in
Leadership
U.S. Equity
Portfolio | | Quantitative U.S.
Long/Short
Equity Portfolio | | Quantitative
U.S. Total
Market Equity
Portfolio |
| Investment income: | | | | | |
Dividends
| $ 511,315 | | $ 1,360,260 | | $ 676,666 |
Income from security lending
| 210 | | 5,380 | | 1,258 |
Total investment income
| 511,525 | | 1,365,640 | | 677,924 |
| Expenses: | | | | | |
Management fees
| 151,033 | | 929,454 | | 410,408 |
Administration, transfer agent and custody fees
| 42,178 | | 77,759 | | 50,488 |
Professional fees
| 4,724 | | 14,007 | | 5,690 |
Shareholder report expenses
| 2,679 | | 10,615 | | 3,459 |
Shareholder servicing fees
| 54,921 | | — | | 68,401 |
Shareholder servicing fees (Advisor Class)
| — | | 151,428 | | — |
Dividends on securities sold short
| — | | 721,779 | | 117,667 |
Directors’ fees and expenses
| 3,438 | | 9,201 | | 3,957 |
Interest expense
| 363 | | 1,086 | | 120 |
Short position flex fees
| — | | 276,636 | | 81,087 |
Registration and filing fees
| 20,473 | | 27,922 | | 12,470 |
Other expenses
| 5,777 | | 27,099 | | 9,284 |
Total expenses
| 285,586 | | 2,246,986 | | 763,031 |
Less expenses waived/reimbursed
| (51,809) | | (282,785) | | (136,648) |
Net expenses
| 233,777 | | 1,964,201 | | 626,383 |
Net investment income (loss)
| 277,748 | | (598,561) | | 51,541 |
| Realized and unrealized gain (loss): | | | | | |
| Net realized gain (loss) on: | | | | | |
Investment transactions
| 5,272,363 | | 29,703,100 | | 8,396,277 |
Securities sold short
| — | | (16,308,336) | | (1,956,213) |
Net realized gain
| 5,272,363 | | 13,394,764 | | 6,440,064 |
| Net change in unrealized gain (loss) of: | | | | | |
Investments
| 3,874,619 | | 4,352,912 | | 11,392,586 |
Securities sold short
| — | | (3,831,449) | | (1,027,369) |
Net change in unrealized gain
| 3,874,619 | | 521,463 | | 10,365,217 |
Net realized and unrealized gain
| 9,146,982 | | 13,916,227 | | 16,805,281 |
Net increase in net assets resulting from operations
| $9,424,730 | | $ 13,317,666 | | $16,856,822 |
See Notes to Financial Statements.
The Glenmede Fund, Inc.
Statements Of Operations — (Continued)
For the Year Ended October 31, 2021
| | Strategic
Equity
Portfolio | | Small
Cap
Equity
Portfolio | | Equity
Income
Portfolio |
| Investment income: | | | | | |
Dividends
| $ 3,166,904 | | $ 13,250,928 | | $ 507,899 |
Income from security lending
| — | | 35,934 | | 7 |
Total investment income
| 3,166,904 | | 13,286,862 | | 507,906 |
| Expenses: | | | | | |
Management fees
| 1,414,612 | | 7,816,936 | | 117,153 |
Administration, transfer agent and custody fees
| 122,097 | | 753,447 | | 56,706 |
Professional fees
| 42,867 | | 240,525 | | 3,642 |
Shareholder report expenses
| 6,826 | | 277,188 | | 2,532 |
Shareholder servicing fees
| 514,404 | | — | | 42,601 |
Shareholder servicing fees (Advisor Class)
| — | | 1,294,720 | | — |
Shareholder servicing fees (Institutional Class)
| — | | 451,687 | | — |
Directors’ fees and expenses
| 31,506 | | 168,854 | | 2,642 |
Interest expense
| — | | 1,933 | | — |
Registration and filing fees
| 23,324 | | 44,851 | | 3,599 |
Other expenses
| 33,781 | | 194,315 | | 5,749 |
Total expenses
| 2,189,417 | | 11,244,456 | | 234,624 |
Less expenses waived/reimbursed
| — | | — | | (53,569) |
Net expenses
| 2,189,417 | | 11,244,456 | | 181,055 |
Net investment income
| 977,487 | | 2,042,406 | | 326,851 |
| Realized and unrealized gain: | | | | | |
| Net realized gain on: | | | | | |
Investment transactions
| 28,403,863 | | 279,610,445 | | 1,138,498 |
| Net change in unrealized gain of: | | | | | |
Investments
| 58,754,619 | | 380,298,133 | | 4,859,788 |
Net realized and unrealized gain
| 87,158,482 | | 659,908,578 | | 5,998,286 |
Net increase in net assets resulting from operations
| $88,135,969 | | $661,950,984 | | $6,325,137 |
See Notes to Financial Statements.
The Glenmede Fund, Inc.
Statements Of Operations — (Continued)
For the Year Ended October 31, 2021
| | Secured
Options
Portfolio | | Global
Secured
Options
Portfolio | | Core
Fixed
Income
Portfolio |
| Investment income: | | | | | |
Dividends
| $ 283,726 | | $ 2,659 | | $ — |
Interest
| 87,154 | | 2,352 | | 7,743,880 |
Income from security lending
| — | | — | | 10,290 |
Total investment income
| 370,880 | | 5,011 | | 7,754,170 |
| Expenses: | | | | | |
Management fees
| 2,302,449 | | 73,346 | | 1,503,289 |
Administration, transfer agent and custody fees
| 199,327 | | 40,692 | | 185,936 |
Professional fees
| 72,602 | | 2,067 | | 73,538 |
Shareholder report expenses
| 27,947 | | 869 | | 10,658 |
Shareholder servicing fees
| — | | 26,671 | | 429,511 |
Shareholder servicing fees (Advisor Class)
| 186,347 | | — | | — |
Directors’ fees and expenses
| 50,675 | | 1,632 | | 53,330 |
Registration and filing fees
| 47,772 | | 19,606 | | 9,326 |
Other expenses
| 63,802 | | 8,310 | | 50,799 |
Total expenses
| 2,950,921 | | 173,193 | | 2,316,387 |
Less expenses waived/reimbursed
| — | | (39,838) | | — |
Net expenses
| 2,950,921 | | 133,355 | | 2,316,387 |
Net investment income (loss)
| (2,580,041) | | (128,344) | | 5,437,783 |
| Realized and unrealized gain (loss): | | | | | |
| Net realized gain (loss) on: | | | | | |
Investment transactions
| — | | 17,310 | | 2,358,755 |
Written options
| (222,593,355) | | (5,263,761) | | — |
Purchased options
| 305,688,495 | | 7,368,696 | | — |
Net realized gain
| 83,095,140 | | 2,122,245 | | 2,358,755 |
| Net change in unrealized gain (loss) of: | | | | | |
Investments
| 6,590,096 | | 15,767 | | (16,338,405) |
Written options
| (51,954,232) | | (1,734,507) | | — |
Purchased options
| 68,158,398 | | 2,129,858 | | — |
Net change in unrealized gain (loss)
| 22,794,262 | | 411,118 | | (16,338,405) |
Net realized and unrealized gain (loss)
| 105,889,402 | | 2,533,363 | | (13,979,650) |
Net increase (decrease) in net assets resulting from operations
| $ 103,309,361 | | $ 2,405,019 | | $ (8,541,867) |
See Notes to Financial Statements.
The Glenmede Fund, Inc.
Statements Of Operations — (Concluded)
For the Year Ended October 31, 2021
| | Short Term
Tax Aware
Fixed
Income
Portfolio | | High Yield
Municipal
Portfolio |
| Investment income: | | | |
Dividends
| $ 31,279 | | $ — |
Interest
| 672,765 | | 9,165,157 |
Income from security lending
| 44 | | — |
Total investment income
| 704,088 | | 9,165,157 |
| Expenses: | | | |
Management fees
| 186,994 | | 1,750,547 |
Administration, transfer agent and custody fees
| 71,005 | | 165,225 |
Professional fees
| 9,163 | | 47,034 |
Shareholder report expenses
| 2,222 | | 10,013 |
Shareholder servicing fees
| 53,427 | | 673,287 |
Directors’ fees and expenses
| 6,633 | | 33,359 |
Interest expense
| 81 | | — |
Registration and filing fees
| 4,606 | | 5,662 |
Other expenses
| 8,293 | | 31,430 |
Total expenses
| 342,424 | | 2,716,557 |
Less expenses waived/reimbursed
| (48,494) | | (23,408) |
Net expenses
| 293,930 | | 2,693,149 |
Net investment income
| 410,158 | | 6,472,008 |
| Realized and unrealized gain (loss): | | | |
| Net realized gain (loss) on: | | | |
Investment transactions
| (30,408) | | 2,179,563 |
| Net change in unrealized gain (loss) of: | | | |
Investments
| (277,478) | | 7,807,991 |
Net realized and unrealized gain (loss)
| (307,886) | | 9,987,554 |
Net increase in net assets resulting from operations
| $ 102,272 | | $16,459,562 |
See Notes to Financial Statements.
The Glenmede Fund, Inc.
Statements Of Changes In Net Assets
For the Year Ended October 31, 2021
| | Quantitative
U.S. Large Cap
Core Equity
Portfolio | | Quantitative
U.S. Large Cap
Growth Equity
Portfolio | | Quantitative
U.S. Large Cap
Value Equity
Portfolio |
| Increase (decrease) in net assets | | | | | |
| Operations: | | | | | |
Net investment income
| $ 10,678,272 | | $ 4,403,265 | | $ 32,610 |
| Net realized gain on: | | | | | |
Investment transactions
| 174,197,674 | | 472,680,948 | | 192,898 |
| Net change in unrealized gain of: | | | | | |
Investments
| 303,612,374 | | 383,735,184 | | 531,814 |
Net increase in net assets resulting from operations
| 488,488,320 | | 860,819,397 | | 757,322 |
Distributions from earnings
| — | | — | | (32,775) |
Distributions from earnings: Advisor Class
| (97,666,788) | | (235,473,637) | | — |
Distributions from earnings: Institutional Class
| (13,261,819) | | (80,080,381) | | — |
Net increase (decrease) in net assets from capital share transactions (See note 5)
| (195,841,253) | | (415,858,062) | | 175,088 |
Net increase in net assets
| 181,718,460 | | 129,407,317 | | 899,635 |
| NET ASSETS: | | | | | |
Beginning of year
| 1,239,182,258 | | 2,203,217,689 | | 1,587,500 |
End of year
| $1,420,900,718 | | $2,332,625,006 | | $2,487,135 |
For the Year Ended October 31, 2020
| | Quantitative
U.S. Large Cap
Core Equity
Portfolio | | Quantitative
U.S. Large Cap
Growth Equity
Portfolio | | Quantitative
U.S. Large Cap
Value Equity
Portfolio |
| Increase (decrease) in net assets | | | | | |
| Operations: | | | | | |
Net investment income
| $ 20,133,174 | | $ 14,103,182 | | $ 40,774 |
| Net realized gain (loss) on: | | | | | |
Investment transactions
| 128,888,690 | | 438,705,478 | | (130,329) |
| Net change in unrealized loss of: | | | | | |
Investments
| (284,112,813) | | (215,973,181) | | (117,380) |
Net increase (decrease) in net assets resulting from operations
| (135,090,949) | | 236,835,479 | | (206,935) |
Distributions from earnings
| — | | — | | (40,984) |
Distributions from earnings: Advisor Class
| (84,490,082) | | (286,480,973) | | — |
Distributions from earnings: Institutional Class
| (32,621,110) | | (164,957,341) | | — |
Net increase (decrease) in net assets from capital share transactions (See note 5)
| (857,128,116) | | (1,070,901,369) | | (204,252) |
Net increase (decrease) in net assets
| (1,109,330,257) | | (1,285,504,204) | | (452,171) |
| NET ASSETS: | | | | | |
Beginning of year
| 2,348,512,515 | | 3,488,721,893 | | 2,039,671 |
End of year
| $ 1,239,182,258 | | $ 2,203,217,689 | | $1,587,500 |
See Notes to Financial Statements.
The Glenmede Fund, Inc.
Statements Of Changes In Net Assets — (Continued)
For the Year Ended October 31, 2021
| | Quantitative
U.S. Small Cap
Equity Portfolio | | Quantitative
International
Equity Portfolio | | Responsible
ESG U.S.
Equity
Portfolio |
| Increase (decrease) in net assets | | | | | |
| Operations: | | | | | |
Net investment income
| $ 7,572 | | $ 1,207,251 | | $ 218,467 |
| Net realized gain on: | | | | | |
Investment transactions
| 213,765 | | 11,341,780 | | 3,795,554 |
Foreign currency transactions
| — | | 6,448 | | — |
| Net change in unrealized gain (loss) of: | | | | | |
Investments
| 351,970 | | 2,809,057 | | 6,354,818 |
Foreign currency translations
| — | | (578) | | — |
Net increase in net assets resulting from operations
| 573,307 | | 15,363,958 | | 10,368,839 |
Distributions from earnings
| (7,665) | | (1,099,884) | | (218,408) |
Net increase (decrease) in net assets from capital share transactions (See note 5)
| 7,588 | | (26,497,058) | | 369,382 |
Net increase (decrease) in net assets
| 573,230 | | (12,232,984) | | 10,519,813 |
| NET ASSETS: | | | | | |
Beginning of year
| 982,324 | | 53,302,116 | | 22,341,549 |
End of year
| $1,555,554 | | $ 41,069,132 | | $32,861,362 |
For the Year Ended October 31, 2020
| | Quantitative
U.S. Small Cap
Equity Portfolio | | Quantitative
International
Equity Portfolio | | Responsible
ESG U.S.
Equity
Portfolio |
| Increase (decrease) in net assets | | | | | |
| Operations: | | | | | |
Net investment income
| $ 6,417 | | $ 2,450,540 | | $ 235,779 |
| Net realized gain (loss) on: | | | | | |
Investment transactions
| (33,182) | | (6,604,538) | | (764,383) |
Foreign currency transactions
| — | | 2,026 | | — |
| Net change in unrealized gain (loss) of: | | | | | |
Investments
| (51,687) | | (17,865,705) | | 776,392 |
Foreign currency translations
| — | | (160) | | — |
Net increase (decrease) in net assets resulting from operations
| (78,452) | | (22,017,837) | | 247,788 |
Distributions from earnings
| (7,684) | | (2,704,110) | | (330,040) |
Return of capital distribution
| — | | (220,626) | | — |
Net increase (decrease) in net assets from capital share transactions (See note 5)
| 7,605 | | (127,384,779) | | (807,417) |
Net increase (decrease) in net assets
| (78,531) | | (152,327,352) | | (889,669) |
| NET ASSETS: | | | | | |
Beginning of year
| 1,060,855 | | 205,629,468 | | 23,231,218 |
End of year
| $ 982,324 | | $ 53,302,116 | | $22,341,549 |
See Notes to Financial Statements.
The Glenmede Fund, Inc.
Statements Of Changes In Net Assets — (Continued)
For the Year Ended October 31, 2021
| | Women in
Leadership
U.S. Equity
Portfolio | | Quantitative U.S.
Long/Short
Equity Portfolio | | Quantitative
U.S. Total
Market Equity
Portfolio |
| Increase (decrease) in net assets | | | | | |
| Operations: | | | | | |
Net investment income (loss)
| $ 277,748 | | $ (598,561) | | $ 51,541 |
| Net realized gain (loss) on: | | | | | |
Investment transactions
| 5,272,363 | | 29,703,100 | | 8,396,277 |
Securities sold short
| — | | (16,308,336) | | (1,956,213) |
| Net change in unrealized gain (loss) of: | | | | | |
Investments
| 3,874,619 | | 4,352,912 | | 11,392,586 |
Securities sold short
| — | | (3,831,449) | | (1,027,369) |
Net increase in net assets resulting from operations
| 9,424,730 | | 13,317,666 | | 16,856,822 |
Distributions from earnings
| (275,552) | | — | | (3,468,836) |
Net increase (decrease) in net assets from capital share transactions (See note 5)
| (2,940,670) | | (47,073,424) | | (5,874,024) |
Net increase (decrease) in net assets
| 6,208,508 | | (33,755,758) | | 7,513,962 |
| NET ASSETS: | | | | | |
Beginning of year
| 21,678,360 | | 97,013,076 | | 28,446,626 |
End of year
| $27,886,868 | | $ 63,257,318 | | $35,960,588 |
For the Year Ended October 31, 2020
| | Women in
Leadership
U.S. Equity
Portfolio | | Quantitative U.S.
Long/Short
Equity Portfolio | | Quantitative
U.S. Total
Market Equity
Portfolio |
| Increase (decrease) in net assets | | | | | |
| Operations: | | | | | |
Net investment income (loss)
| $ 254,469 | | $ (995,894) | | $ 196,877 |
| Net realized gain (loss) on: | | | | | |
Investment transactions
| (262,148) | | 8,573,186 | | 5,250,232 |
Securities sold short
| — | | (10,839,706) | | (221,202) |
| Net change in unrealized gain (loss) of: | | | | | |
Investments
| (262,719) | | (27,167,241) | | (12,627,092) |
Securities sold short
| — | | 11,205,471 | | 346,934 |
Net increase (decrease) in net assets resulting from operations
| (270,398) | | (19,224,184) | | (7,054,251) |
Distributions from earnings
| (239,220) | | — | | (3,629,802) |
Return of capital distribution: Advisor Class
| — | | (182,275) | | — |
Return of capital distribution: Institutional Class
| — | | (20) | | — |
Net increase (decrease) in net assets from capital share transactions (See note 5)
| 1,141,189 | | (130,805,198) | | (28,792,688) |
Net increase (decrease) in net assets
| 631,571 | | (150,211,677) | | (39,476,741) |
| NET ASSETS: | | | | | |
Beginning of year
| 21,046,789 | | 247,224,753 | | 67,923,367 |
End of year
| $21,678,360 | | $ 97,013,076 | | $ 28,446,626 |
See Notes to Financial Statements.
The Glenmede Fund, Inc.
Statements Of Changes In Net Assets — (Continued)
For the Year Ended October 31, 2021
| | Strategic
Equity
Portfolio | | Small
Cap
Equity
Portfolio | | Equity
Income
Portfolio |
| Increase (decrease) in net assets | | | | | |
| Operations: | | | | | |
Net investment income
| $ 977,487 | | $ 2,042,406 | | $ 326,851 |
| Net realized gain on: | | | | | |
Investment transactions
| 28,403,863 | | 279,610,445 | | 1,138,498 |
| Net change in unrealized gain of: | | | | | |
Investments
| 58,754,619 | | 380,298,133 | | 4,859,788 |
Net increase in net assets resulting from operations
| 88,135,969 | | 661,950,984 | | 6,325,137 |
Distributions from earnings
| (13,949,594) | | — | | (333,966) |
Distributions from earnings: Advisor Class
| — | | (675,464) | | — |
Distributions from earnings: Institutional Class
| — | | (2,355,570) | | — |
Net increase (decrease) in net assets from capital share transactions (See note 5)
| (24,985,150) | | (423,401,927) | | (2,254,877) |
Net increase in net assets
| 49,201,225 | | 235,518,023 | | 3,736,294 |
| NET ASSETS: | | | | | |
Beginning of year
| 219,446,564 | | 1,239,324,679 | | 18,559,820 |
End of year
| $268,647,789 | | $1,474,842,702 | | $22,296,114 |
For the Year Ended October 31, 2020
| | Strategic
Equity
Portfolio | | Small
Cap
Equity
Portfolio | | Equity
Income
Portfolio |
| Increase (decrease) in net assets | | | | | |
| Operations: | | | | | |
Net investment income
| $ 1,974,998 | | $ 3,649,510 | | $ 474,154 |
| Net realized gain (loss) on: | | | | | |
Investment transactions
| 14,495,061 | | (112,418,584) | | 205,837 |
| Net change in unrealized gain (loss) of: | | | | | |
Investments
| (21,934,091) | | 34,905,724 | | (1,105,315) |
Net increase (decrease) in net assets resulting from operations
| (5,464,032) | | (73,863,350) | | (425,324) |
Distributions from earnings
| (7,249,473) | | — | | (478,143) |
Distributions from earnings: Advisor Class
| — | | (1,061,071) | | — |
Distributions from earnings: Institutional Class
| — | | (3,950,793) | | — |
Return of capital distribution: Advisor Class
| — | | (54,112) | | — |
Return of capital distribution: Institutional Class
| — | | (201,481) | | — |
Net increase (decrease) in net assets from capital share transactions (See note 5)
| (36,873,429) | | (723,050,337) | | (4,437,015) |
Net increase (decrease) in net assets
| (49,586,934) | | (802,181,144) | | (5,340,482) |
| NET ASSETS: | | | | | |
Beginning of year
| 269,033,498 | | 2,041,505,823 | | 23,900,302 |
End of year
| $219,446,564 | | $1,239,324,679 | | $18,559,820 |
See Notes to Financial Statements.
The Glenmede Fund, Inc.
Statements Of Changes In Net Assets — (Continued)
For the Year Ended October 31, 2021
| | Secured
Options
Portfolio | | Global
Secured
Options
Portfolio | | Core
Fixed
Income
Portfolio |
| Increase (decrease) in net assets | | | | | |
| Operations: | | | | | |
Net investment income (loss)
| $ (2,580,041) | | $ (128,344) | | $ 5,437,783 |
| Net realized gain (loss) on: | | | | | |
Investment transactions
| — | | 17,310 | | 2,358,755 |
Options written
| (222,593,355) | | (5,263,761) | | — |
Purchased options
| 305,688,495 | | 7,368,696 | | — |
| Net change in unrealized gain (loss) of: | | | | | |
Investments
| 6,590,096 | | 15,767 | | (16,338,405) |
Options written
| (51,954,232) | | (1,734,507) | | — |
Purchased options
| 68,158,398 | | 2,129,858 | | — |
Net increase (decrease) in net assets resulting from operations
| 103,309,361 | | 2,405,019 | | (8,541,867) |
Distributions from earnings
| — | | (425,289) | | (14,413,019) |
Net increase (decrease) in net assets from capital share transactions (See note 5)
| (122,296,786) | | 5,524,771 | | 10,492,270 |
Net increase (decrease) in net assets
| (18,987,425) | | 7,504,501 | | (12,462,616) |
| NET ASSETS: | | | | | |
Beginning of year
| 450,374,909 | | 9,647,672 | | 436,974,522 |
End of year
| $ 431,387,484 | | $17,152,173 | | $424,511,906 |
For the Year Ended October 31, 2020
| | Secured
Options
Portfolio | | Global
Secured
Options
Portfolio | | Core
Fixed
Income
Portfolio |
| Increase (decrease) in net assets | | | | | |
| Operations: | | | | | |
Net investment income (loss)
| $ (2,650,478) | | $ (51,009) | | $ 8,424,927 |
| Net realized gain (loss) on: | | | | | |
Investment transactions
| 3,281 | | (248,440) | | 12,432,548 |
Options written
| (33,912,772) | | 2,359,005 | | — |
Purchased options
| 19,802,905 | | (1,340,973) | | — |
| Net change in unrealized gain (loss) of: | | | | | |
Investments
| 1,134,553 | | 28,350 | | 6,354,560 |
Options Written
| 17,907,154 | | (29,511) | | — |
Purchased options
| (40,988,616) | | (241,104) | | — |
Net increase (decrease) in net assets resulting from operations
| (38,703,973) | | 476,318 | | 27,212,035 |
Distributions from earnings
| — | | (1,977) | | (10,373,594) |
Distributions from earnings: Advisor Class
| (18,937,857) | | — | | — |
Distributions from earnings: Institutional Class
| (29,130,823) | | — | | — |
Net increase (decrease) in net assets from capital share transactions (See note 5)
| (141,159,161) | | 7,953,777 | | (85,466,807) |
Net increase (decrease) in net assets
| (227,931,814) | | 8,428,118 | | (68,628,366) |
| NET ASSETS: | | | | | |
Beginning of year
| 678,306,723 | | 1,219,554 | | 505,602,888 |
End of year
| $ 450,374,909 | | $ 9,647,672 | | $436,974,522 |
See Notes to Financial Statements.
The Glenmede Fund, Inc.
Statements Of Changes In Net Assets — (Concluded)
For the Year Ended October 31, 2021
| | Short Term
Tax Aware
Fixed
Income
Portfolio | | High Yield
Municipal
Portfolio |
| Increase (decrease) in net assets | | | |
| Operations: | | | |
Net investment income
| $ 410,158 | | $ 6,472,008 |
| Net realized gain (loss) on: | | | |
Investment transactions
| (30,408) | | 2,179,563 |
| Net change in unrealized gain (loss) of: | | | |
Investments
| (277,478) | | 7,807,991 |
Net increase in net assets resulting from operations
| 102,272 | | 16,459,562 |
Distributions from earnings
| (450,263) | | (6,432,972) |
Net increase in net assets from capital share transactions (See note 5)
| 3,107,433 | | 39,702,451 |
Net increase in net assets
| 2,759,442 | | 49,729,041 |
| NET ASSETS: | | | |
Beginning of year
| 53,524,648 | | 232,782,555 |
End of year
| $56,284,090 | | $282,511,596 |
For the Year Ended October 31, 2020
| | Short Term
Tax Aware
Fixed
Income
Portfolio | | High Yield
Municipal
Portfolio |
| Increase (decrease) in net assets | | | |
| Operations: | | | |
Net investment income
| $ 589,313 | | $ 6,221,073 |
| Net realized gain (loss) on: | | | |
Investment transactions
| (27,703) | | 112,362 |
| Net change in unrealized gain (loss) of: | | | |
Investments
| 377,357 | | (3,856,588) |
Net increase in net assets resulting from operations
| 938,967 | | 2,476,847 |
Distributions from earnings
| (571,442) | | (6,194,949) |
Net increase in net assets from capital share transactions (See note 5)
| 2,218,210 | | 21,081,964 |
Net increase in net assets
| 2,585,735 | | 17,363,862 |
| NET ASSETS: | | | |
Beginning of year
| 50,938,913 | | 215,418,693 |
End of year
| $53,524,648 | | $232,782,555 |
See Notes to Financial Statements.
The Glenmede Fund, Inc.
Statement Of Cash Flows
For the Year Ended October 31, 2021
| | Quantitative U.S.
Long/Short
Equity Portfolio |
| Cash flows from operating activities | |
| Adjustments to reconcile net increase in net assets from operations to net cash provided by (used in) operating activities | |
Net increase in net assets resulting from operations
| $ 13,317,666 |
Investments purchased
| (31,336,973) |
Investments sold
| 96,559,436 |
Purchases to cover securities sold short
| (112,987,727) |
Securities sold short
| 69,063,441 |
(Purchase)/Sale of short term investments, net
| 3,888,747 |
Decrease in Cash collateral on deposit at broker
| 23,761,960 |
Decrease in Securities lending income receivable
| 113 |
Decrease in Dividends receivable
| 86,443 |
Decrease in Prepaid expenses
| 223 |
Decrease in Obligation to return securities lending collateral
| (985,945) |
Decrease in Dividends payable for securities sold short
| (32,408) |
Decrease in Payable for Management fees
| (24,406) |
Decrease in Payable for Directors’ fees
| (1,345) |
Decrease in Payable for Shareholder Servicing fees
| (7,799) |
Decrease in Accrued expenses
| (57,822) |
Net realized gain from investments
| (29,703,100) |
Net realized loss from securities sold short
| 16,308,336 |
Net change in unrealized gain on investments
| (4,352,912) |
Net change in unrealized loss on securities sold short
| 3,831,449 |
Net cash provided by (used in) operating activities
| 47,327,377 |
| Cash flows from financing activities | |
Proceeds from shares sold
| 9,953,999 |
Payments on shares redeemed
| (57,281,376) |
Net cash provided by (used in) financing activities
| (47,327,377) |
Net increase (decrease) in cash
| — |
Cash at beginning of period
| — |
Cash at end of period
| $ — |
|
| Supplemental disclosure of cash flow information |
| Cash paid for interest was $276,636. |
| The Portfolio did not pay any prime broker fees during the year ended October 31, 2021. |
See Notes to Financial Statements.
The Glenmede Fund, Inc.
Statement Of Cash Flows — (Concluded)
For the Year Ended October 31, 2021
| | Quantitative
U.S. Total
Market Equity
Portfolio |
| Cash flows from operating activities | |
| Adjustments to reconcile net increase in net assets from operations to net cash provided by (used in) operating activities | |
Net increase in net assets resulting from operations
| $ 16,856,822 |
Investments purchased
| (16,378,105) |
Investments sold
| 27,769,747 |
Purchases to cover securities sold short
| (21,247,985) |
Securities sold short
| 19,345,543 |
(Purchase)/Sale of short term investments, net
| (170,734) |
Increase in Securities lending income receivable
| (21) |
Decrease in Dividends receivable
| 6,582 |
Decrease in Prepaid expenses
| 54 |
Increase in Obligation to return securities lending collateral
| 7,490 |
Decrease in Dividends payable for securities sold short
| (3,135) |
Increase in Payable for Management fees
| 5,852 |
Decrease in Payable for Directors’ fees
| (66) |
Increase in Payable for Shareholder Servicing fees
| 689 |
Decrease in Accrued expenses
| (8,879) |
Net realized gain from investments
| (8,396,277) |
Net realized loss from securities sold short
| 1,956,213 |
Net change in unrealized gain on investments
| (11,392,586) |
Net change in unrealized loss on securities sold short
| 1,027,369 |
Net cash provided by (used in) operating activities
| 9,378,573 |
| Cash flows from financing activities | |
Proceeds from shares sold
| 3,134,313 |
Payments on shares redeemed
| (12,344,960) |
Cash distributions paid
| (166,304) |
Net cash provided by (used in) financing activities
| (9,376,951) |
Net increase (decrease) in cash
| 1,622 |
Cash at beginning of period
| (1,622) |
Cash at end of period
| $ — |
|
| Supplemental disclosure of cash flow information |
| Cash paid for interest was $81,087. |
| Non-cash financing activities not included herein consist of a reinvestment of dividends of $3,302,532. |
| The Portfolio did not pay any prime broker fees during the year ended October 31, 2021. |
See Notes to Financial Statements.
The Glenmede Fund, Inc.
Financial Highlights
For a share outstanding throughout each year
| | Quantitative U.S. Large Cap Core Equity Portfolio Advisor Shares |
| | For The Year Ended October 31, |
| | 2021 1 | | 2020 1 | | 2019 1 | | 2018 1 | | 2017 |
Net asset value, beginning of year
| $ 24.99 | | $ 26.89 | | $ 27.88 | | $ 28.08 | | $ 22.36 |
| Income from investment operations: | | | | | | | | | |
Net investment income
| 0.23 | | 0.29 | | 0.35 | | 0.29 | | 0.23 |
Net realized and unrealized gain (loss) on investments
| 10.15 | | (0.73) | | 1.18 | | 0.95 | | 5.72 |
Total from investment operations
| 10.38 | | (0.44) | | 1.53 | | 1.24 | | 5.95 |
| Distributions to shareholders from: | | | | | | | | | |
Net investment income
| (0.24) | | (0.29) | | (0.35) | | (0.28) | | (0.23) |
Net realized capital gains
| (2.16) | | (1.17) | | (2.17) | | (1.16) | | — |
Total distributions
| (2.40) | | (1.46) | | (2.52) | | (1.44) | | (0.23) |
Net asset value, end of year
| $ 32.97 | | $ 24.99 | | $ 26.89 | | $ 27.88 | | $ 28.08 |
Total return
| 43.77% | | (1.90)% | | 6.42% | | 4.42% | | 26.74% |
| Ratios to average net assets/ Supplemental data: | | | | | | | | | |
Net assets, at end of year (in 000s)
| $1,255,795 | | $1,066,153 | | $1,674,687 | | $2,075,264 | | $2,124,803 |
Ratio of operating expenses to average net assets
| 0.85% 2 | | 0.87% | | 0.86% | | 0.85% | | 0.86% |
Ratio of net investment income to average net assets
| 0.75% | | 1.15% | | 1.32% | | 1.02% | | 0.94% |
Portfolio turnover rate3
| 41% | | 66% | | 80% | | 71% | | 62% |
|
| 1 | Per share net investment income (loss) has been calculated using the average shares outstanding during the period. |
| 2 | The ratio of operating expenses excluding interest expense was 0.85% for the year ended October 31, 2021. |
| 3 | Portfolio turnover is calculated at the fund level. |
| | Quantitative U.S. Large Cap Core Equity Portfolio Institutional Shares |
| | For The Year Ended October 31, |
| | 2021 1 | | 2020 1 | | 2019 1 | | 2018 | | 2017 |
Net asset value, beginning of year
| $ 24.99 | | $ 26.91 | | $ 27.89 | | $ 28.09 | | $ 22.37 |
| Income from investment operations: | | | | | | | | | |
Net investment income
| 0.29 | | 0.34 | | 0.40 | | 0.34 | | 0.27 |
Net realized and unrealized gain (loss) on investments
| 10.16 | | (0.75) | | 1.20 | | 0.95 | | 5.73 |
Total from investment operations
| 10.45 | | (0.41) | | 1.60 | | 1.29 | | 6.00 |
| Distributions to shareholders from: | | | | | | | | | |
Net investment income
| (0.30) | | (0.34) | | (0.41) | | (0.33) | | (0.28) |
Net realized capital gains
| (2.16) | | (1.17) | | (2.17) | | (1.16) | | — |
Total distributions
| (2.46) | | (1.51) | | (2.58) | | (1.49) | | (0.28) |
Net asset value, end of year
| $ 32.98 | | $ 24.99 | | $ 26.91 | | $ 27.89 | | $ 28.09 |
Total return
| 44.10% | | (1.75)% | | 6.68% | | 4.61% | | 26.96% |
| Ratios to average net assets/ Supplemental data: | | | | | | | | | |
Net assets, at end of year (in 000s)
| $165,106 | | $173,029 | | $673,825 | | $767,117 | | $549,352 |
Ratio of operating expenses to average net assets
| 0.65% 2 | | 0.67% | | 0.66% | | 0.65% | | 0.66% |
Ratio of net investment income to average net assets
| 0.96% | | 1.32% | | 1.52% | | 1.22% | | 1.12% |
Portfolio turnover rate3
| 41% | | 66% | | 80% | | 71% | | 62% |
|
| 1 | Per share net investment income (loss) has been calculated using the average shares outstanding during the period. |
| 2 | The ratio of operating expenses excluding interest expense was 0.65% for the year ended October 31, 2021. |
| 3 | Portfolio turnover is calculated at the fund level. |
See Notes to Financial Statements.
The Glenmede Fund, Inc.
Financial Highlights — (Continued)
For a share outstanding throughout each year
| | Quantitative U.S. Large Cap Growth Equity Portfolio Advisor Shares |
| | For The Year Ended October 31, |
| | 2021 1 | | 2020 1 | | 2019 1 | | 2018 | | 2017 |
Net asset value, beginning of year
| $ 32.02 | | $ 33.08 | | $ 32.52 | | $ 31.54 | | $ 24.76 |
| Income from investment operations: | | | | | | | | | |
Net investment income
| 0.05 | | 0.12 | | 0.16 | | 0.16 | | 0.16 |
Net realized and unrealized gain on investments
| 13.33 | | 3.19 | | 4.86 | | 1.58 | | 6.77 |
Total from investment operations
| 13.38 | | 3.31 | | 5.02 | | 1.74 | | 6.93 |
| Distributions to shareholders from: | | | | | | | | | |
Net investment income
| (0.05) | | (0.14) | | (0.15) | | (0.17) | | (0.15) |
Net realized capital gains
| (4.71) | | (4.23) | | (4.31) | | (0.59) | | — |
Total distributions
| (4.76) | | (4.37) | | (4.46) | | (0.76) | | (0.15) |
Net asset value, end of year
| $ 40.64 | | $ 32.02 | | $ 33.08 | | $ 32.52 | | $ 31.54 |
Total return
| 46.17% | | 10.68% | | 18.50% | | 5.53% | | 28.05% |
| Ratios to average net assets/ Supplemental data: | | | | | | | | | |
Net assets, at end of year (in 000s)
| $1,751,370 | | $1,659,543 | | $2,237,727 | | $2,660,858 | | $3,076,616 |
Ratio of operating expenses to average net assets
| 0.85% 2 | | 0.88% | | 0.86% | | 0.85% | | 0.86% |
Ratio of net investment income to average net assets
| 0.15% | | 0.40% | | 0.53% | | 0.44% | | 0.56% |
Portfolio turnover rate3
| 49% | | 69% | | 80% | | 63% | | 69% |
|
| 1 | Per share net investment income (loss) has been calculated using the average shares outstanding during the period. |
| 2 | The ratio of operating expenses excluding interest expense was 0.85% for the year ended October 31, 2021. |
| 3 | Portfolio turnover is calculated at the fund level. |
| | Quantitative U.S. Large Cap Growth Equity Portfolio Institutional Shares |
| | For The Year Ended October 31, |
| | 2021 1 | | 2020 1 | | 2019 1 | | 2018 | | 2017 |
Net asset value, beginning of year
| $ 32.02 | | $ 33.09 | | $ 32.53 | | $ 31.55 | | $ 24.77 |
| Income from investment operations: | | | | | | | | | |
Net investment income
| 0.12 | | 0.19 | | 0.21 | | 0.21 | | 0.18 |
Net realized and unrealized gain on investments
| 13.34 | | 3.18 | | 4.88 | | 1.59 | | 6.80 |
Total from investment operations
| 13.46 | | 3.37 | | 5.09 | | 1.80 | | 6.98 |
| Distributions to shareholders from: | | | | | | | | | |
Net investment income
| (0.13) | | (0.21) | | (0.22) | | (0.23) | | (0.20) |
Net realized capital gains
| (4.71) | | (4.23) | | (4.31) | | (0.59) | | — |
Total distributions
| (4.84) | | (4.44) | | (4.53) | | (0.82) | | (0.20) |
Net asset value, end of year
| $ 40.64 | | $ 32.02 | | $ 33.09 | | $ 32.53 | | $ 31.55 |
Total return
| 46.47% | | 10.89% | | 18.74% | | 5.74% | | 28.28% |
| Ratios to average net assets/ Supplemental data: | | | | | | | | | |
Net assets, at end of year (in 000s)
| $581,255 | | $543,675 | | $1,250,995 | | $746,030 | | $860,416 |
Ratio of operating expenses to average net assets
| 0.65% 2 | | 0.68% | | 0.66% | | 0.65% | | 0.66% |
Ratio of net investment income to average net assets
| 0.34% | | 0.62% | | 0.69% | | 0.64% | | 0.66% |
Portfolio turnover rate3
| 49% | | 69% | | 80% | | 63% | | 69% |
|
| 1 | Per share net investment income (loss) has been calculated using the average shares outstanding during the period. |
| 2 | The ratio of operating expenses excluding interest expense was 0.65% for the year ended October 31, 2021. |
| 3 | Portfolio turnover is calculated at the fund level. |
See Notes to Financial Statements.
The Glenmede Fund, Inc.
Financial Highlights — (Continued)
For a share outstanding throughout each year
| | Quantitative U.S. Large Cap Value Equity Portfolio |
| | For The Year Ended October 31, | | For the
Period
November 13, 20171
through
October 31,
2018 |
| | 2021 2 | | 2020 2 | | 2019 2 | |
Net asset value, beginning of year
| $ 9.03 | | $ 10.29 | | $ 9.82 | | $10.00 |
| Income from investment operations: | | | | | | | |
Net investment income
| 0.18 | | 0.20 | | 0.21 | | 0.14 |
Net realized and unrealized gain (loss) on investments
| 4.02 | | (1.26) | | 0.49 | | (0.20) |
Total from investment operations
| 4.20 | | (1.06) | | 0.70 | | (0.06) |
| Distributions to shareholders from: | | | | | | | |
Net investment income
| (0.18) | | (0.20) | | (0.23) | | (0.12) |
Total distributions
| (0.18) | | (0.20) | | (0.23) | | (0.12) |
Net asset value, end of year
| $13.05 | | $ 9.03 | | $10.29 | | $ 9.82 |
Total return3
| 46.66% | | (10.19)% | | 7.33% | | (0.69)% 4 |
| Ratios to average net assets/ Supplemental data: | | | | | | | |
Net assets, at end of year (in 000s)
| $2,487 | | $ 1,588 | | $2,040 | | $1,092 |
Ratio of operating expenses before waiver/reimbursement to average net assets
| 2.45% | | 2.66% | | 3.20% | | 6.52% 5 |
Ratio of operating expenses after waiver/reimbursement to average net assets
| 0.85% | | 0.85% | | 0.89% | | 1.00% 5 |
Ratio of net investment income to average net assets
| 1.48% | | 2.15% | | 2.08% | | 1.36% 5 |
Portfolio turnover rate
| 68% | | 95% | | 77% | | 61% 6 |
|
| 1 | Commencement of operations. |
| 2 | Per share net investment income (loss) has been calculated using the average shares outstanding during the period. |
| 3 | The Total Return reflects fee waivers and/or expense reimbursements in effect and would have been lower in their absence. |
| 4 | Total return calculation is not annualized. |
| 5 | Annualized. |
| 6 | Calculations represent portfolio turnover for the Portfolio for the period of November 13, 2017 through October 31, 2018. |
See Notes to Financial Statements.
The Glenmede Fund, Inc.
Financial Highlights — (Continued)
For a share outstanding throughout each year
| | Quantitative U.S. Small Cap Equity Portfolio |
| | For The Year Ended October 31, | | For the
Period
November 13, 20171
through
October 31,
2018 |
| | 2021 2 | | 2020 2 | | 2019 2 | |
Net asset value, beginning of year
| $ 9.55 | | $10.39 | | $10.25 | | $10.00 |
| Income from investment operations: | | | | | | | |
Net investment income
| 0.07 | | 0.06 | | 0.05 | | 0.05 |
Net realized and unrealized gain (loss) on investments
| 5.50 | | (0.82) | | 0.17 | | 0.24 |
Total from investment operations
| 5.57 | | (0.76) | | 0.22 | | 0.29 |
| Distributions to shareholders from: | | | | | | | |
Net investment income
| (0.07) | | (0.08) | | (0.08) | | (0.04) |
Total distributions
| (0.07) | | (0.08) | | (0.08) | | (0.04) |
Net asset value, end of year
| $15.05 | | $ 9.55 | | $10.39 | | $10.25 |
Total return3
| 58.45% | | (7.37)% | | 2.19% | | 2.85% 4 |
| Ratios to average net assets/ Supplemental data: | | | | | | | |
Net assets, at end of year (in 000s)
| $1,556 | | $ 982 | | $1,061 | | $1,074 |
Ratio of operating expenses before waiver/reimbursement to average net assets
| 3.45% | | 4.63% | | 4.12% | | 6.48% 5 |
Ratio of operating expenses after waiver/reimbursement to average net assets
| 0.85% | | 0.85% | | 0.90% | | 1.00% 5 |
Ratio of net investment income to average net assets
| 0.53% | | 0.65% | | 0.53% | | 0.44% 5 |
Portfolio turnover rate
| 84% | | 101% | | 133% | | 80% 6 |
|
| 1 | Commencement of operations. |
| 2 | Per share net investment income (loss) has been calculated using the average shares outstanding during the period. |
| 3 | The Total Return reflects fee waivers and/or expense reimbursements in effect and would have been lower in their absence. |
| 4 | Total return calculation is not annualized. |
| 5 | Annualized. |
| 6 | Calculations represent portfolio turnover for the Portfolio for the period of November 13, 2017 through October 31, 2018. |
See Notes to Financial Statements.
The Glenmede Fund, Inc.
Financial Highlights — (Continued)
For a share outstanding throughout each year
| | Quantitative International Equity Portfolio |
| | For The Year Ended October 31, |
| | 2021 1 | | 2020 1 | | 2019 1 | | 2018 | | 2017 1 |
Net asset value, beginning of year
| $ 12.05 | | $ 13.97 | | $ 13.26 | | $ 15.16 | | $ 12.76 |
| Income from investment operations: | | | | | | | | | |
Net investment income
| 0.36 | | 0.26 | | 0.39 | | 0.29 | | 0.25 |
Net realized and unrealized gain (loss) on investments
| 3.48 | | (1.79) | | 0.73 | | (1.90) | | 2.41 |
Total from investment operations
| 3.84 | | (1.53) | | 1.12 | | (1.61) | | 2.66 |
| Distributions to shareholders from: | | | | | | | | | |
Net investment income
| (0.35) | | (0.37) | | (0.41) | | (0.29) | | (0.26) |
Net return of capital
| — | | (0.02) | | — | | — | | — |
Total distributions
| (0.35) | | (0.39) | | (0.41) | | (0.29) | | (0.26) |
Net asset value, end of year
| $ 15.54 | | $ 12.05 | | $ 13.97 | | $ 13.26 | | $ 15.16 |
Total return2
| 31.96% | | (11.10)% | | 8.60% | | (10.80)% | | 20.96% |
| Ratios to average net assets/ Supplemental data: | | | | | | | | | |
Net assets, at end of year (in 000s)
| $41,069 | | $53,302 | | $205,629 | | $387,188 | | $461,686 |
Ratio of operating expenses before waiver/reimbursement to average net assets
| 1.19% | | 1.15% | | 1.10% | | 1.07% | | 1.06% |
Ratio of operating expenses after waiver/reimbursement to average net assets
| 1.00% 3 | | 1.00% | | 1.00% | | 1.00% | | 1.00% |
Ratio of net investment income to average net assets
| 2.40% | | 1.99% | | 2.90% | | 1.90% | | 1.82% |
Portfolio turnover rate
| 79% | | 76% | | 93% | | 78% | | 75% |
|
| 1 | Per share net investment income (loss) has been calculated using the average shares outstanding during the period. |
| 2 | The Total Return reflects fee waivers and/or expense reimbursements in effect and would have been lower in their absence. |
| 3 | The ratio of operating expenses after waiver/reimbursement excluding interest expense was 1.00% for the year ended October 31, 2021. |
| | Responsible ESG U.S. Equity Portfolio |
| | For The Year Ended October 31, |
| | 2021 1 | | 2020 1 | | 2019 1 | | 2018 | | 2017 |
Net asset value, beginning of year
| $ 14.26 | | $ 14.34 | | $ 14.12 | | $ 13.61 | | $ 10.84 |
| Income from investment operations: | | | | | | | | | |
Net investment income
| 0.14 | | 0.15 | | 0.16 | | 0.11 | | 0.09 |
Net realized and unrealized gain (loss) on investments
| 6.45 | | (0.02) | | 0.74 | | 0.57 | | 2.77 |
Total from investment operations
| 6.59 | | 0.13 | | 0.90 | | 0.68 | | 2.86 |
| Distributions to shareholders from: | | | | | | | | | |
Net investment income
| (0.14) | | (0.15) | | (0.17) | | (0.11) | | (0.09) |
Net realized capital gains
| — | | (0.06) | | (0.51) | | (0.06) | | — |
Total distributions
| (0.14) | | (0.21) | | (0.68) | | (0.17) | | (0.09) |
Net asset value, end of year
| $ 20.71 | | $ 14.26 | | $ 14.34 | | $ 14.12 | | $ 13.61 |
Total return2
| 46.31% | | 0.87% | | 6.78% | | 5.01% | | 26.42% |
| Ratios to average net assets/ Supplemental data: | | | | | | | | | |
Net assets, at end of year (in 000s)
| $32,861 | | $22,342 | | $23,231 | | $21,746 | | $13,589 |
Ratio of operating expenses before waiver/reimbursement to average net assets
| 1.05% | | 1.05% | | 1.07% | | 1.09% | | 1.23% |
Ratio of operating expenses after waiver/reimbursement to average net assets
| 0.85% | | 0.85% | | 0.90% | | 1.00% | | 1.00% |
Ratio of net investment income to average net assets
| 0.74% | | 1.02% | | 1.17% | | 0.87% | | 0.75% |
Portfolio turnover rate
| 74% | | 88% | | 102% | | 61% | | 54% |
|
| 1 | Per share net investment income (loss) has been calculated using the average shares outstanding during the period. |
| 2 | The Total Return reflects fee waivers and/or expense reimbursements in effect and would have been lower in their absence. |
See Notes to Financial Statements.
The Glenmede Fund, Inc.
Financial Highlights — (Continued)
For a share outstanding throughout each year
| | Women in Leadership U.S. Equity Portfolio |
| | For The Year Ended October 31, |
| | 2021 1 | | 2020 1 | | 2019 1 | | 2018 1 | | 2017 |
Net asset value, beginning of year
| $ 13.52 | | $ 13.98 | | $ 13.34 | | $ 13.10 | | $ 10.65 |
| Income from investment operations: | | | | | | | | | |
Net investment income
| 0.18 | | 0.16 | | 0.15 | | 0.12 | | 0.11 |
Net realized and unrealized gain (loss) on investments
| 5.75 | | (0.47) | | 1.08 | | 0.32 | | 2.45 |
Total from investment operations
| 5.93 | | (0.31) | | 1.23 | | 0.44 | | 2.56 |
| Distributions to shareholders from: | | | | | | | | | |
Net investment income
| (0.18) | | (0.15) | | (0.15) | | (0.11) | | (0.11) |
Net realized capital gains
| — | | — | | (0.44) | | (0.09) | | — |
Total distributions
| (0.18) | | (0.15) | | (0.59) | | (0.20) | | (0.11) |
Net asset value, end of year
| $ 19.27 | | $ 13.52 | | $ 13.98 | | $ 13.34 | | $ 13.10 |
Total return2
| 43.94% | | (2.15)% | | 9.75% | | 3.36% | | 24.11% |
| Ratios to average net assets/ Supplemental data: | | | | | | | | | |
Net assets, at end of year (in 000s)
| $27,887 | | $21,678 | | $21,047 | | $18,974 | | $11,853 |
Ratio of operating expenses before waiver/reimbursement to average net assets
| 1.04% | | 1.08% | | 1.11% | | 1.11% | | 1.28% |
Ratio of operating expenses after waiver/reimbursement to average net assets
| 0.85% 3 | | 0.85% | | 0.90% | | 1.00% | | 1.00% |
Ratio of net investment income to average net assets
| 1.01% | | 1.19% | | 1.14% | | 0.88% | | 0.88% |
Portfolio turnover rate
| 81% | | 105% | | 89% | | 81% | | 70% |
|
| 1 | Per share net investment income (loss) has been calculated using the average shares outstanding during the period. |
| 2 | The Total Return reflects fee waivers and/or expense reimbursements in effect and would have been lower in their absence. |
| 3 | The ratio of operating expenses after waiver/reimbursement excluding interest expense was 0.85% for the year ended October 31, 2021. |
See Notes to Financial Statements.
The Glenmede Fund, Inc.
Financial Highlights — (Continued)
For a share outstanding throughout each year
| | Quantitative U.S. Long/Short Equity Portfolio Advisor Shares |
| | For The Year Ended October 31, |
| | 2021 1 | | 2020 1 | | 2019 1 | | 2018 1 | | 2017 1 |
Net asset value, beginning of year
| $ 11.05 | | $ 11.90 | | $ 12.55 | | $ 12.86 | | $ 11.39 |
| Income from investment operations: | | | | | | | | | |
Net investment income (loss)
| (0.10) | | (0.07) | | 0.11 | | 0.03 | | (0.05) |
Net realized and unrealized gain (loss) on investments
| 1.98 | | (0.77) | | (0.65) | | (0.34) | | 1.52 |
Total from investment operations
| 1.88 | | (0.84) | | (0.54) | | (0.31) | | 1.47 |
| Distributions to shareholders from: | | | | | | | | | |
Net investment income
| — | | — | | (0.11) | | — | | — |
Net return of capital
| — | | (0.01) | | — | | — | | — |
Total distributions
| — | | (0.01) | | (0.11) | | — | | — |
Net asset value, end of year
| $ 12.93 | | $ 11.05 | | $ 11.90 | | $ 12.55 | | $ 12.86 |
Total return2
| 17.01% | | (7.07)% | | (4.33)% | | (2.41)% | | 12.91% |
| Ratios to average net assets/ Supplemental data: | | | | | | | | | |
Net assets, at end of year (in 000s)
| $56,002 | | $96,702 | | $247,209 | | $333,806 | | $300,784 |
Ratio of operating expenses before waiver/reimbursement to average net assets
| 2.88% | | 2.99% | | 2.78% | | 2.61% | | 2.77% |
Ratio of operating expenses after waiver/reimbursement to average net assets3
| 2.51% | | 2.63% | | 2.43% | | 2.26% | | 2.42% |
Ratio of net investment income (loss) to average net assets
| (0.78)% | | (0.59)% | | 0.91% | | 0.24% | | (0.43)% |
Portfolio turnover rate4,5
| 115% | | 133% | | 108% | | 84% | | 65% |
|
| 1 | Per share net investment income (loss) has been calculated using the average shares outstanding during the period. |
| 2 | The Total Return reflects fee waivers and/or expense reimbursements in effect and would have been lower in their absence. |
| 3 | The ratio of operating expenses after waiver/reimbursement excluding interest expense, dividends on securities sold short and flex fees was 1.25%, 1.25%, 1.21%, 1.15% and 1.15% for the years ended October 31, 2021, 2020, 2019, 2018 and 2017, respectively. |
| 4 | Portfolio turnover is calculated at the fund level. |
| 5 | The calculation of the portfolio turnover rate reflects the absolute value of the long and short positions. |
See Notes to Financial Statements.
The Glenmede Fund, Inc.
Financial Highlights — (Continued)
For a share outstanding throughout each year
| | Quantitative U.S. Long/Short Equity Portfolio Institutional Shares |
| | For The Year Ended October 31, | | For the
Period
September 13, 20191
through
October 31,
20192 |
| | 2021 2 | | 2020 2 | |
Net asset value, beginning of year
| $11.07 | | $11.89 | | $12.00 |
| Income from investment operations: | | | | | |
Net investment income (loss)
| (0.03) | | (0.10) | | 0.01 |
Net realized and unrealized gain (loss) on investments
| 1.93 | | (0.71) | | (0.08) |
Total from investment operations
| 1.90 | | (0.81) | | (0.07) |
| Distributions to shareholders from: | | | | | |
Net investment income
| — | | — | | (0.04) |
Net return of capital
| — | | (0.01) | | — |
Total distributions
| — | | (0.01) | | (0.04) |
Net asset value, end of year
| $12.97 | | $11.07 | | $11.89 |
Total return3
| 17.16% 4 | | (6.78)% | | (0.62)% 5 |
| Ratios to average net assets/ Supplemental data: | | | | | |
Net assets, at end of year (in 000s)
| $7,255 | | $ 311 | | $ 16 |
Ratio of operating expenses before waiver/reimbursement to average net assets
| 3.88% | | 2.59% | | 2.36% 6 |
Ratio of operating expenses after waiver/reimbursement to average net assets7
| 3.52% | | 2.23% | | 2.01% 6 |
Ratio of net investment income (loss) to average net assets
| (0.27)% | | (0.89)% | | 0.36% 6 |
Portfolio turnover rate8,9
| 115% | | 133% | | 108% |
|
| 1 | Shareholder activity commenced on September 13, 2019. |
| 2 | Per share net investment income (loss) has been calculated using the average shares outstanding during the period. |
| 3 | The Total Return reflects fee waivers and/or expense reimbursements in effect and would have been lower in their absence. |
| 4 | Includes adjustments in accordance with accounting principles generally accepted in the United States of America and as such, the net asset value for financial reporting purposes and the returns based upon those net asset values may differ from the net asset value and returns for shareholder transactions as shown in the management discussion and analysis and as otherwise reported to shareholders. |
| 5 | Total return calculation is not annualized. |
| 6 | Annualized. |
| 7 | The ratio of operating expenses after waiver/reimbursement excluding interest expense, dividends on securities sold short and flex fees was 1.05% and 1.05% for the years ended October 31, 2021 and October 31, 2020, respectively and 1.01% for the period ended October 31, 2019. |
| 8 | Portfolio turnover is calculated at the fund level. |
| 9 | The calculation of the portfolio turnover rate reflects the absolute value of the long and short positions. |
See Notes to Financial Statements.
The Glenmede Fund, Inc.
Financial Highlights — (Continued)
For a share outstanding throughout each year
| | Quantitative U.S. Total Market Equity Portfolio |
| | For The Year Ended October 31, |
| | 2021 1 | | 2020 1 | | 2019 1 | | 2018 | | 2017 |
Net asset value, beginning of year
| $ 15.34 | | $ 17.88 | | $ 18.85 | | $ 18.88 | | $ 14.65 |
| Income from investment operations: | | | | | | | | | |
Net investment income
| 0.03 | | 0.07 | | 0.11 | | 0.07 | | 0.04 |
Net realized and unrealized gain (loss) on investments
| 9.45 | | (1.52) | | 0.49 | | 0.51 | | 4.23 |
Total from investment operations
| 9.48 | | (1.45) | | 0.60 | | 0.58 | | 4.27 |
| Distributions to shareholders from: | | | | | | | | | |
Net investment income
| (0.03) | | (0.11) | | (0.11) | | (0.06) | | (0.04) |
Net realized capital gains
| (1.89) | | (0.98) | | (1.46) | | (0.55) | | — |
Total distributions
| (1.92) | | (1.09) | | (1.57) | | (0.61) | | (0.04) |
Net asset value, end of year
| $ 22.90 | | $ 15.34 | | $ 17.88 | | $ 18.85 | | $ 18.88 |
Total return2
| 66.37% | | (8.82)% | | 4.11% | | 3.01% | | 29.18% |
| Ratios to average net assets/ Supplemental data: | | | | | | | | | |
Net assets, at end of year (in 000s)
| $35,961 | | $28,447 | | $67,923 | | $90,610 | | $74,267 |
Ratio of operating expenses before waiver/reimbursement to average net assets
| 2.23% | | 2.56% | | 2.48% | | 2.31% | | 2.40% |
Ratio of operating expenses after waiver/reimbursement to average net assets3
| 1.83% | | 2.06% | | 2.07% | | 1.96% | | 2.05% |
Ratio of net investment income to average net assets
| 0.15% | | 0.45% | | 0.60% | | 0.37% | | 0.24% |
Portfolio turnover rate4
| 71% | | 98% | | 92% | | 82% | | 70% |
|
| 1 | Per share net investment income (loss) has been calculated using the average shares outstanding during the period. |
| 2 | The Total Return reflects fee waivers and/or expense reimbursements in effect and would have been lower in their absence. |
| 3 | The ratio of operating expenses after waiver/reimbursement excluding interest expense, dividends on securities sold short and flex fees was 1.25%, 1.25%, 1.25%, 1.25% and 1.23% for the years ended October 31, 2021, 2020, 2019, 2018 and 2017, respectively. |
| 4 | The calculation of the portfolio turnover rate reflects the absolute value of the long and short positions. |
See Notes to Financial Statements.
The Glenmede Fund, Inc.
Financial Highlights — (Continued)
For a share outstanding throughout each year
| | Strategic Equity Portfolio |
| | For The Year Ended October 31, |
| | 2021 1 | | 2020 1 | | 2019 1 | | 2018 | | 2017 |
Net asset value, beginning of year
| $ 26.43 | | $ 27.22 | | $ 24.30 | | $ 24.90 | | $ 20.94 |
| Income from investment operations: | | | | | | | | | |
Net investment income
| 0.12 | | 0.21 | | 0.23 | | 0.20 | | 0.19 |
Net realized and unrealized gain (loss) on investments
| 10.73 | | (0.25) | | 3.22 | | 1.07 | | 5.35 |
Total from investment operations
| 10.85 | | (0.04) | | 3.45 | | 1.27 | | 5.54 |
| Distributions to shareholders from: | | | | | | | | | |
Net investment income
| (0.13) | | (0.22) | | (0.23) | | (0.20) | | (0.19) |
Net realized capital gains
| (1.59) | | (0.53) | | (0.30) | | (1.67) | | (1.39) |
Total distributions
| (1.72) | | (0.75) | | (0.53) | | (1.87) | | (1.58) |
Net asset value, end of year
| $ 35.56 | | $ 26.43 | | $ 27.22 | | $ 24.30 | | $ 24.90 |
Total return
| 42.57% | | (0.18)% | | 14.51% | | 5.14% | | 27.83% |
| Ratios to average net assets/ Supplemental data: | | | | | | | | | |
Net assets, at end of year (in 000s)
| $268,648 | | $219,447 | | $269,033 | | $226,032 | | $209,339 |
Ratio of operating expenses to average net assets
| 0.85% | | 0.86% | | 0.84% | | 0.83% | | 0.82% |
Ratio of net investment income to average net assets
| 0.38% | | 0.79% | | 0.89% | | 0.79% | | 0.84% |
Portfolio turnover rate
| 14% | | 19% | | 19% | | 6% | | 15% |
|
| 1 | Per share net investment income (loss) has been calculated using the average shares outstanding during the period. |
| | Small Cap Equity Portfolio Advisor Shares |
| | For The Year Ended October 31, |
| | 2021 1 | | 2020 1 | | 2019 1 | | 2018 | | 2017 |
Net asset value, beginning of year
| $ 23.23 | | $ 23.66 | | $ 28.82 | | $ 32.13 | | $ 25.61 |
| Income from investment operations: | | | | | | | | | |
Net investment income (loss)
| — | | 0.02 | | 0.05 | | 0.02 | | (0.01) |
Net realized and unrealized gain (loss) on investments
| 13.87 | | (0.41) | | (1.04) | | (0.10) | | 7.07 |
Total from investment operations
| 13.87 | | (0.39) | | (0.99) | | (0.08) | | 7.06 |
| Distributions to shareholders from: | | | | | | | | | |
Net investment income
| (0.04) | | (0.04) | | (0.07) | | (0.02) | | (0.02) |
Net realized capital gains
| — | | — | | (4.09) | | (3.21) | | (0.52) |
Net return of capital
| — | | (0.00) 2 | | (0.01) | | — | | — |
Total distributions
| (0.04) | | (0.04) | | (4.17) | | (3.23) | | (0.54) |
Net asset value, end of year
| $ 37.06 | | $ 23.23 | | $ 23.66 | | $ 28.82 | | $ 32.13 |
Total return
| 59.75% | | (1.63)% | | (2.61)% | | (0.58)% | | 27.84% |
| Ratios to average net assets/ Supplemental data: | | | | | | | | | |
Net assets, at end of year (in 000s)
| $530,401 | | $403,309 | | $761,813 | | $1,390,136 | | $1,574,979 |
Ratio of operating expenses to average net assets
| 0.92% 3 | | 0.94% | | 0.93% | | 0.90% | | 0.90% |
Ratio of net investment income (loss) to average net assets
| 0.01% | | 0.11% | | 0.21% | | 0.07% | | (0.04)% |
Portfolio turnover rate4
| 41% | | 36% | | 54% | | 44% | | 63% |
|
| 1 | Per share net investment income (loss) has been calculated using the average shares outstanding during the period. |
| 2 | Amount rounds to less than $0.01 per share. |
| 3 | The ratio of operating expenses excluding interest expense was 0.92% for the year ended October 31, 2021. |
| 4 | Portfolio turnover is calculated at the fund level. |
See Notes to Financial Statements.
The Glenmede Fund, Inc.
Financial Highlights — (Continued)
For a share outstanding throughout each year
| | Small Cap Equity Portfolio Institutional Shares |
| | For The Year Ended October 31, |
| | 2021 1 | | 2020 1 | | 2019 1 | | 2018 | | 2017 |
Net asset value, beginning of year
| $ 24.61 | | $ 25.07 | | $ 30.25 | | $ 33.54 | | $ 26.67 |
| Income from investment operations: | | | | | | | | | |
Net investment income
| 0.08 | | 0.07 | | 0.10 | | 0.09 | | 0.05 |
Net realized and unrealized gain (loss) on investments
| 14.68 | | (0.44) | | (1.06) | | (0.10) | | 7.37 |
Total from investment operations
| 14.76 | | (0.37) | | (0.96) | | (0.01) | | 7.42 |
| Distributions to shareholders from: | | | | | | | | | |
Net investment income
| (0.08) | | (0.09) | | (0.12) | | (0.07) | | (0.03) |
Net realized capital gains
| — | | — | | (4.09) | | (3.21) | | (0.52) |
Net return of capital
| — | | (0.00) 2 | | (0.01) | | — | | — |
Total distributions
| (0.08) | | (0.09) | | (4.22) | | (3.28) | | (0.55) |
Net asset value, end of year
| $ 39.29 | | $ 24.61 | | $ 25.07 | | $ 30.25 | | $ 33.54 |
Total return
| 60.04% | | (1.44)% | | (2.38)% | | (0.36)% | | 28.10% |
| Ratios to average net assets/ Supplemental data: | | | | | | | | | |
Net assets, at end of year (in 000s)
| $944,442 | | $836,015 | | $1,279,693 | | $2,131,461 | | $1,879,657 |
Ratio of operating expenses to average net assets
| 0.72% 3 | | 0.74% | | 0.73% | | 0.70% | | 0.70% |
Ratio of net investment income to average net assets
| 0.22% | | 0.29% | | 0.39% | | 0.27% | | 0.16% |
Portfolio turnover rate4
| 41% | | 36% | | 54% | | 44% | | 63% |
|
| 1 | Per share net investment income (loss) has been calculated using the average shares outstanding during the period. |
| 2 | Amount rounds to less than $0.01 per share. |
| 3 | The ratio of operating expenses excluding interest expense was 0.72% for the year ended October 31, 2021. |
| 4 | Portfolio turnover is calculated at the fund level. |
See Notes to Financial Statements.
The Glenmede Fund, Inc.
Financial Highlights — (Continued)
For a share outstanding throughout each year
| | Equity Income Portfolio |
| | For The Year Ended October 31, | | For the
Period
December 21,
20161
through
October 31,
20172 |
| | 2021 2 | | 2020 2 | | 2019 2 | | 2018 | |
Net asset value, beginning of year
| $ 11.88 | | $ 12.22 | | $ 11.15 | | $ 11.06 | | $ 10.00 |
| Income from investment operations: | | | | | | | | | |
Net investment income
| 0.22 | | 0.26 | | 0.25 | | 0.22 | | 0.16 |
Net realized and unrealized gain (loss) on investments
| 4.05 | | (0.32) | | 1.33 | | 0.09 | | 1.01 |
Total from investment operations
| 4.27 | | (0.06) | | 1.58 | | 0.31 | | 1.17 |
| Distributions to shareholders from: | | | | | | | | | |
Net investment income
| (0.23) | | (0.28) | | (0.25) | | (0.22) | | (0.11) |
Net realized capital gains
| — | | — | | (0.26) | | (0.00) 3 | | — |
Total distributions
| (0.23) | | (0.28) | | (0.51) | | (0.22) | | (0.11) |
Net asset value, end of year
| $ 15.92 | | $ 11.88 | | $ 12.22 | | $ 11.15 | | $ 11.06 |
Total return4
| 36.12% | | (0.38)% | | 14.69% | | 2.79% | | 11.77% 5 |
| Ratios to average net assets/ Supplemental data: | | | | | | | | | |
Net assets, at end of year (in 000s)
| $22,296 | | $18,560 | | $23,900 | | $18,536 | | $12,970 |
Ratio of operating expenses before waiver/reimbursement to average net assets
| 1.10% | | 1.04% 6 | | 1.01% | | 1.11% | | 2.08% 7 |
Ratio of operating expenses after waiver/reimbursement to average net assets
| 0.85% | | 0.85% 6 | | 0.85% | | 0.85% | | 0.85% 7 |
Ratio of net investment income to average net assets
| 1.53% | | 2.21% 6 | | 2.19% | | 2.02% | | 1.82% 7 |
Portfolio turnover rate
| 27% | | 63% | | 39% | | 29% | | 14% 8 |
|
| 1 | Commencement of operations. |
| 2 | Per share net investment income (loss) has been calculated using the average shares outstanding during the period. |
| 3 | Amount rounds to less than $0.01 per share. |
| 4 | The Total Return reflects fee waivers and/or expense reimbursements in effect and would have been lower in their absence. |
| 5 | Total return calculation is not annualized. |
| 6 | This ratio does not include the expenses for any exchange-traded funds held in the Portfolio. |
| 7 | Annualized. |
| 8 | Calculations represent portfolio turnover for the Portfolio for the period of December 21, 2016 through October 31, 2017. |
See Notes to Financial Statements.
The Glenmede Fund, Inc.
Financial Highlights — (Continued)
For a share outstanding throughout each year
| | Secured Options Portfolio Advisor Shares |
| | For The Year Ended October 31, |
| | 2021 1 | | 2020 1 | | 2019 1 | | 2018 | | 2017 1 |
Net asset value, beginning of year
| $ 11.67 | | $ 13.01 | | $ 12.30 | | $ 12.75 | | $ 12.45 |
| Income from investment operations: | | | | | | | | | |
Net investment income (loss)
| (0.11) | | (0.07) | | (0.04) | | (0.06) | | (0.08) |
Net realized and unrealized gain (loss) on investments
| 3.27 | | (0.34) | | 1.04 | | 0.40 | | 0.99 |
Total from investment operations
| 3.16 | | (0.41) | | 1.00 | | 0.34 | | 0.91 |
| Distributions to shareholders from: | | | | | | | | | |
Net realized capital gains
| — | | (0.93) | | (0.29) | | (0.79) | | (0.61) |
Total distributions
| — | | (0.93) | | (0.29) | | (0.79) | | (0.61) |
Net asset value, end of year
| $ 14.83 | | $ 11.67 | | $ 13.01 | | $ 12.30 | | $ 12.75 |
Total return
| 27.08% | | (3.50)% | | 8.43% | | 2.81% | | 7.53% |
| Ratios to average net assets/ Supplemental data: | | | | | | | | | |
Net assets, at end of year (in 000s)
| $90,143 | | $95,701 | | $268,478 | | $445,946 | | $446,859 |
Ratio of operating expenses to average net assets2
| 0.86% | | 0.88% | | 0.87% 3 | | 0.84% | | 0.85% |
Ratio of net investment income (loss) to average net assets2
| (0.77)% | | (0.59)% | | (0.34)% | | (0.50)% | | (0.68)% |
Portfolio turnover rate4,5
| —% | | —% | | —% | | —% | | —% |
|
| 1 | Per share net investment income (loss) has been calculated using the average shares outstanding during the period. |
| 2 | This ratio does not include the expenses for any exchange-traded funds held in the Portfolio. |
| 3 | The ratio of operating expenses excluding interest expense was 0.86% for the year ended October 31, 2019. |
| 4 | Portfolio turnover is calculated at the fund level. |
| 5 | All trading activity in the Portfolio during the year was short term and is excluded for portfolio turnover calculations resulting in zero portfolio turnover percentage. |
See Notes to Financial Statements.
The Glenmede Fund, Inc.
Financial Highlights — (Continued)
For a share outstanding throughout each year
| | Secured Options Portfolio Institutional Shares |
| | For The Year Ended October 31, | | For the
Period
November 9, 20161
through
October 31,
20172 |
| | 2021 2 | | 2020 2 | | 2019 2 | | 2018 2 | |
Net asset value, beginning of year
| $ 11.77 | | $ 13.09 | | $ 12.34 | | $ 12.77 | | $ 12.61 |
| Income from investment operations: | | | | | | | | | |
Net investment income (loss)
| (0.08) | | (0.05) | | (0.02) | | (0.04) | | (0.06) |
Net realized and unrealized gain (loss) on investments
| 3.30 | | (0.34) | | 1.06 | | 0.40 | | 0.83 |
Total from investment operations
| 3.22 | | (0.39) | | 1.04 | | 0.36 | | 0.77 |
| Distributions to shareholders from: | | | | | | | | | |
Net realized capital gains
| — | | (0.93) | | (0.29) | | (0.79) | | (0.61) |
Total distributions
| — | | (0.93) | | (0.29) | | (0.79) | | (0.61) |
Net asset value, end of year
| $ 14.99 | | $ 11.77 | | $ 13.09 | | $ 12.34 | | $ 12.77 |
Total return
| 27.36% | | (3.31)% | | 8.73% | | 2.97% | | 6.34% 3 |
| Ratios to average net assets/ Supplemental data: | | | | | | | | | |
Net assets, at end of year (in 000s)
| $341,245 | | $354,674 | | $409,829 | | $396,523 | | $365,523 |
Ratio of operating expenses to average net assets4
| 0.66% | | 0.68% | | 0.67% 5 | | 0.64% | | 0.65% 6 |
Ratio of net investment income (loss) to average net assets4
| (0.57)% | | (0.44)% | | (0.14)% | | (0.30)% | | (0.45)% 6 |
Portfolio turnover rate7,8
| —% | | —% | | —% | | —% | | —% |
|
| 1 | Class commenced operations on November 9, 2016. |
| 2 | Per share net investment income (loss) has been calculated using the average shares outstanding during the period. |
| 3 | Total return calculation is not annualized. |
| 4 | This ratio does not include the expenses for any exchange-traded funds held in the Portfolio. |
| 5 | The ratio of operating expenses excluding interest expense was 0.66% for the year ended October 31, 2019. |
| 6 | Annualized. |
| 7 | Portfolio turnover is calculated at the fund level. |
| 8 | All trading activity in the Portfolio during the year was short term and is excluded for portfolio turnover calculations resulting in zero portfolio turnover percentage. |
See Notes to Financial Statements.
The Glenmede Fund, Inc.
Financial Highlights — (Continued)
For a share outstanding throughout each year
| | Global Secured Options Portfolio |
| | For The Year Ended October 31, |
| | 2021 1 | | 2020 1,2 | | 2019 1,2 | | 2018 1,2 | | 2017 1,2 |
Net asset value, beginning of year
| $ 4.84 | | $ 4.90 | | $104.10 | | $105.80 | | $ 96.00 |
| Income from investment operations: | | | | | | | | | |
Net investment income (loss)
| (0.05) | | (0.04) | | 0.02 | | 0.10 | | 0.60 |
Net realized and unrealized gain (loss) on investments
| 1.07 | | (0.02) | | (5.71) | | (0.90) | | 9.90 |
Total from investment operations
| 1.02 | | (0.06) | | (5.69) | | (0.80) | | 10.50 |
| Distributions to shareholders from: | | | | | | | | | |
Net investment income
| — | | (0.00) 3 | | (0.01) | | (0.90) | | (0.70) |
Net realized capital gains
| (0.22) | | — | | (93.50) | | — | | — |
Total distributions
| (0.22) | | (0.00) 3 | | (93.51) | | (0.90) | | (0.70) |
Net asset value, end of year
| $ 5.64 | | $ 4.84 | | $ 4.90 | | $104.10 | | $105.80 |
Total return
| 21.59% 4 | | (1.07)% 4 | | 8.56% 4 | | (0.76)% | | 10.94% |
| Ratios to average net assets/ Supplemental data: | | | | | | | | | |
Net assets, at end of year (in 000s)
| $17,152 | | $9,648 | | $ 1,220 | | $ 2,510 | | $10,642 |
Ratio of operating expenses to average net assets5
| —% | | —% | | —% | | 1.17% 6 | | 1.13% |
Ratio of operating expenses before waiver/reimbursement to average net assets5
| 1.30% | | 2.13% | | 9.76% | | —% | | —% |
Ratio of operating expenses after waiver/reimbursement to average net assets5
| 1.00% | | 1.00% | | 1.63% 6 | | —% | | —% |
Ratio of net investment income to average net assets5
| (0.96)% | | (0.83)% | | 0.32% | | 0.08% | | 0.58% |
Portfolio turnover rate
| —% 7 | | 995% | | 685% | | 224% | | 9% |
|
| 1 | Per share net investment income (loss) has been calculated using the average shares outstanding during the period. |
| 2 | The Board authorized a 1-for-10 reverse share split for the Global Secured Options Portfolio effective after the close of trading on March 16, 2020. The impact of the reverse share split was to decrease the number of shares outstanding by a factor of ten, while increasing the NAV of shares outstanding by a factor of ten, resulting in no effect to the net assets of the Portfolio. The financial statements for the Portfolio have been adjusted to reflect the reverse share split. |
| 3 | Amount rounds to less than $0.01 per share. |
| 4 | The Total Return reflects fee waivers and/or expense reimbursements in effect and would have been lower in their absence. |
| 5 | This ratio does not include the expenses for any exchange-traded funds held in the Portfolio. |
| 6 | The ratio of operating expenses after waiver/reimbursement excluding dividends on securities sold short and interest expense was 1.62% for the year ended October 31, 2019 and 1.11% for the year ended October 31, 2018. |
| 7 | All trading activity in the Portfolio during the year was short term and is excluded for portfolio turnover calculations resulting in zero portfolio turnover percentage. |
See Notes to Financial Statements.
The Glenmede Fund, Inc.
Financial Highlights — (Continued)
For a share outstanding throughout each year
| | Core Fixed Income Portfolio |
| | For The Year Ended October 31, |
| | 2021 1 | | 2020 1 | | 2019 1 | | 2018 | | 2017 |
Net asset value, beginning of year
| $ 11.71 | | $ 11.31 | | $ 10.49 | | $ 11.04 | | $ 11.26 |
| Income from investment operations: | | | | | | | | | |
Net investment income
| 0.14 | | 0.21 | | 0.25 | | 0.25 | | 0.21 |
Net realized and unrealized gain (loss) on investments
| (0.36) | | 0.44 | | 0.83 | | (0.50) | | (0.13) |
Total from investment operations
| (0.22) | | 0.65 | | 1.08 | | (0.25) | | 0.08 |
| Distributions to shareholders from: | | | | | | | | | |
Net investment income
| (0.20) | | (0.25) | | (0.26) | | (0.26) | | (0.22) |
Net realized capital gains
| (0.18) | | — | | — | | (0.04) | | (0.08) |
Total distributions
| (0.38) | | (0.25) | | (0.26) | | (0.30) | | (0.30) |
Net asset value, end of year
| $ 11.11 | | $ 11.71 | | $ 11.31 | | $ 10.49 | | $ 11.04 |
Total return
| (1.91)% | | 5.82% | | 10.46% | | (2.32)% | | 0.75% |
| Ratios to average net assets/ Supplemental data: | | | | | | | | | |
Net assets, at end of year (in 000s)
| $424,512 | | $436,975 | | $505,603 | | $485,201 | | $488,548 |
Ratio of operating expenses to average net assets
| 0.54% | | 0.54% | | 0.53% | | 0.52% | | 0.52% |
Ratio of net investment income to average net assets
| 1.27% | | 1.78% | | 2.30% | | 2.24% | | 1.90% |
Portfolio turnover rate
| 24% | | 52% | | 36% | | 29% | | 46% |
|
| 1 | Per share net investment income (loss) has been calculated using the average shares outstanding during the period. |
| | Short Term Tax Aware Fixed Income Portfolio |
| | For The Year Ended October 31, |
| | 2021 1 | | 2020 1 | | 2019 1 | | 2018 | | 2017 1 |
Net asset value, beginning of year
| $ 10.16 | | $ 10.07 | | $ 9.90 | | $ 9.98 | | $ 9.99 |
| Income from investment operations: | | | | | | | | | |
Net investment income
| 0.08 | | 0.11 | | 0.13 | | 0.09 | | 0.07 |
Net realized and unrealized gain (loss) on investments
| (0.06) | | 0.09 | | 0.17 | | (0.08) | | (0.01) |
Total from investment operations
| 0.02 | | 0.20 | | 0.30 | | 0.01 | | 0.06 |
| Distributions to shareholders from: | | | | | | | | | |
Net investment income
| (0.09) | | (0.11) | | (0.13) | | (0.09) | | (0.07) |
Total distributions
| (0.09) | | (0.11) | | (0.13) | | (0.09) | | (0.07) |
Net asset value, end of year
| $ 10.09 | | $ 10.16 | | $ 10.07 | | $ 9.90 | | $ 9.98 |
Total return2
| 0.15% | | 1.96% | | 3.03% | | 0.10% | | 0.57% |
| Ratios to average net assets/ Supplemental data: | | | | | | | | | |
Net assets, at end of year (in 000s)
| $56,284 | | $53,525 | | $50,939 | | $26,294 | | $33,900 |
Ratio of operating expenses before waiver/reimbursement to average net assets3
| 0.64% | | 0.63% | | 0.66% | | 0.61% | | 0.69% |
Ratio of operating expenses after waiver/reimbursement to average net assets3
| 0.55% 4 | | 0.55% | | 0.55% | | 0.55% | | 0.55% |
Ratio of net investment income to average net assets3
| 0.77% | | 1.08% | | 1.33% | | 0.92% | | 0.69% |
Portfolio turnover rate
| 25% | | 59% | | 25% | | 19% | | 31% |
|
| 1 | Per share net investment income (loss) has been calculated using the average shares outstanding during the period. |
| 2 | The Total Return reflects fee waivers and/or expense reimbursements in effect and would have been lower in their absence. |
| 3 | This ratio does not include the expenses for any exchange-traded funds and registered investment companies held in the Portfolio. |
| 4 | The ratio of operating expenses after waiver/reimbursement excluding interest expense was 0.55% for the year ended October 31, 2021. |
See Notes to Financial Statements.
The Glenmede Fund, Inc.
Financial Highlights — (Concluded)
For a share outstanding throughout each year
| | High Yield Municipal Portfolio |
| | For The Year Ended October 31, |
| | 2021 1 | | 2020 1 | | 2019 1 | | 2018 | | 2017 |
Net asset value, beginning of year
| $ 10.65 | | $ 10.84 | | $ 10.16 | | $ 10.35 | | $ 10.39 |
| Income from investment operations: | | | | | | | | | |
Net investment income
| 0.27 | | 0.30 | | 0.31 | | 0.30 | | 0.30 |
Net realized and unrealized gain (loss) on investments
| 0.44 | | (0.19) | | 0.68 | | (0.19) | | (0.01) |
Total from investment operations
| 0.71 | | 0.11 | | 0.99 | | 0.11 | | 0.29 |
| Distributions to shareholders from: | | | | | | | | | |
Net investment income
| (0.27) | | (0.30) | | (0.31) | | (0.30) | | (0.29) |
Net realized capital gains
| (0.00) 2 | | — | | — | | — | | (0.04) |
Total distributions
| (0.27) | | (0.30) | | (0.31) | | (0.30) | | (0.33) |
Net asset value, end of year
| $ 11.09 | | $ 10.65 | | $ 10.84 | | $ 10.16 | | $ 10.35 |
Total return
| 6.68% 3 | | 1.09% 3 | | 9.90% 3 | | 1.04% | | 2.89% |
| Ratios to average net assets/ Supplemental data: | | | | | | | | | |
Net assets, at end of year (in 000s)
| $282,512 | | $232,783 | | $215,419 | | $192,319 | | $170,440 |
Ratio of operating expenses to average net assets
| —% | | —% | | —% | | 0.99% | | 1.00% |
Ratio of operating expenses before waiver/reimbursement to average net assets
| 1.01% | | 1.02% | | 1.00% | | —% | | —% |
Ratio of operating expenses after waiver/reimbursement to average net assets
| 1.00% | | 1.00% | | 1.00% | | —% | | —% |
Ratio of net investment income to average net assets
| 2.40% | | 2.85% | | 2.95% | | 2.90% | | 2.92% |
Portfolio turnover rate
| 19% | | 28% | | 27% | | 44% | | 43% |
|
| 1 | Per share net investment income (loss) has been calculated using the average shares outstanding during the period. |
| 2 | Amount rounds to less than $0.01 per share. |
| 3 | The Total Return reflects fee waivers and/or expense reimbursements in effect and would have been lower in their absence. |
See Notes to Financial Statements.
THE GLENMEDE FUND, INC.
Quantitative U.S. Large Cap Core Equity Portfolio
SCHEDULE OF PORTFOLIO INVESTMENTS
October 31, 2021
| Shares | | | Value |
| COMMON STOCKS* — 99.5% |
| | Auto Components — 0.7% |
| 220,826 | BorgWarner, Inc.
| $ 9,952,628 |
| | Automobiles — 1.2% |
| 312,910 | General Motors Co.1
| 17,031,691 |
| | Banks — 5.7% |
| 121,267 | Citigroup, Inc.
| 8,386,826 |
| 405,336 | Citizens Financial Group, Inc.
| 19,204,820 |
| 453,342 | First Horizon Corp.
| 7,693,214 |
| 509,342 | KeyCorp
| 11,852,388 |
| 990,292 | Regions Financial Corp.
| 23,450,115 |
| 166,242 | US Bancorp
| 10,036,029 |
| | | | 80,623,392 |
| | Beverages — 1.0% |
| 166,223 | Monster Beverage Corp.1
| 14,128,955 |
| | Biotechnology — 1.5% |
| 101,986 | Amgen, Inc.
| 21,108,042 |
| | Building Products — 2.2% |
| 311,801 | Carrier Global Corp.
| 16,285,366 |
| 154,258 | Fortune Brands Home & Security, Inc.
| 15,641,761 |
| | | | 31,927,127 |
| | Capital Markets — 3.8% |
| 365,013 | Bank of New York Mellon Corp. (The)
| 21,608,769 |
| 174,272 | Janus Henderson Group PLC
| 8,103,648 |
| 115,014 | Raymond James Financial, Inc.
| 11,339,230 |
| 139,063 | State Street Corp.
| 13,704,659 |
| | | | 54,756,306 |
| | Chemicals — 0.8% |
| 207,140 | Dow, Inc.
| 11,593,626 |
| | Communications Equipment — 4.0% |
| 29,957 | Arista Networks, Inc.1
| 12,273,083 |
| 195,921 | Ciena Corp.1
| 10,636,551 |
| 240,792 | Cisco Systems, Inc.
| 13,477,128 |
| 94,849 | F5 Networks, Inc.1
| 20,027,367 |
| | | | 56,414,129 |
| | Construction & Engineering — 1.5% |
| 178,065 | Quanta Services, Inc.
| 21,595,723 |
| | Consumer Finance — 2.4% |
| 44,211 | Capital One Financial Corp.
| 6,677,187 |
| 556,198 | SLM Corp.
| 10,206,233 |
| 365,043 | Synchrony Financial
| 16,956,248 |
| | | | 33,839,668 |
| | Containers & Packaging — 1.2% |
| 351,692 | International Paper Co.
| 17,468,542 |
| | Diversified Telecommunication Services — 1.8% |
| 493,046 | AT&T, Inc.
| 12,454,342 |
| 236,650 | Verizon Communications, Inc.
| 12,540,083 |
| | | | 24,994,425 |
| | Electric Utilities — 0.5% |
| 82,578 | American Electric Power Co., Inc.
| 6,995,182 |
See Notes to Financial Statements.
THE GLENMEDE FUND, INC.
Quantitative U.S. Large Cap Core Equity Portfolio
SCHEDULE OF PORTFOLIO INVESTMENTS — (Continued)
October 31, 2021
| Shares | | | Value |
| COMMON STOCKS* — (Continued) |
| | Electrical Equipment — 0.5% |
| 51,285 | AMETEK, Inc.
| $ 6,790,134 |
| | Energy Equipment & Services — 1.5% |
| 830,302 | Baker Hughes Co., Class A
| 20,823,974 |
| | Entertainment — 2.9% |
| 251,356 | Activision Blizzard, Inc.
| 19,653,526 |
| 96,174 | Electronic Arts, Inc.
| 13,488,403 |
| 41,997 | Take-Two Interactive Software, Inc.1
| 7,601,457 |
| | | | 40,743,386 |
| | Equity Real Estate Investment Trusts — 3.8% |
| 47,472 | American Tower Corp.
| 13,385,680 |
| 58,237 | Crown Castle International Corp.
| 10,500,131 |
| 37,490 | Extra Space Storage, Inc.
| 7,399,401 |
| 155,978 | Prologis, Inc.
| 22,610,571 |
| | | | 53,895,783 |
| | Food & Staples Retailing — 1.4% |
| 514,303 | Kroger Co. (The)
| 20,582,406 |
| | Food Products — 2.5% |
| 217,599 | General Mills, Inc.
| 13,447,618 |
| 233,066 | Mondelez International, Inc. - Class A
| 14,156,429 |
| 92,597 | Tyson Foods, Inc. - Class A
| 7,404,982 |
| | | | 35,009,029 |
| | Health Care Providers & Services — 4.5% |
| 36,757 | Anthem, Inc.
| 15,994,074 |
| 63,439 | Cigna Corp.
| 13,551,205 |
| 107,690 | CVS Health Corp.
| 9,614,563 |
| 174,729 | DaVita, Inc.1
| 18,039,022 |
| 35,672 | McKesson Corp.
| 7,415,495 |
| | | | 64,614,359 |
| | Household Durables — 2.3% |
| 219,173 | Lennar Corp. - Class A
| 21,901,958 |
| 53,783 | Whirlpool Corp.
| 11,339,070 |
| | | | 33,241,028 |
| | Household Products — 0.7% |
| 117,483 | Church & Dwight Co., Inc.
| 10,263,315 |
| | Independent Power & Renewable Electricity Producer — 1.6% |
| 899,506 | AES Corp. (The)
| 22,604,586 |
| | Insurance — 2.3% |
| 249,961 | Aflac, Inc.
| 13,415,407 |
| 167,275 | Fidelity National Financial, Inc.
| 8,014,145 |
| 188,161 | MetLife, Inc.
| 11,816,511 |
| | | | 33,246,063 |
| | Interactive Media & Services — 3.8% |
| 9,871 | Alphabet, Inc. - Class A1
| 29,227,241 |
| 74,530 | Meta Platforms, Inc. - Class A1
| 24,115,672 |
| | | | 53,342,913 |
| | Internet & Direct Marketing Retail — 1.6% |
| 297,530 | eBay, Inc.
| 22,826,502 |
See Notes to Financial Statements.
THE GLENMEDE FUND, INC.
Quantitative U.S. Large Cap Core Equity Portfolio
SCHEDULE OF PORTFOLIO INVESTMENTS — (Continued)
October 31, 2021
| Shares | | | Value |
| COMMON STOCKS* — (Continued) |
| | IT Services — 5.7% |
| 75,286 | Accenture PLC - Class A
| $ 27,011,864 |
| 295,041 | Amdocs, Ltd.
| 22,965,992 |
| 130,387 | Cognizant Technology Solutions Corp. - Class A
| 10,181,921 |
| 88,009 | PayPal Holdings, Inc.1
| 20,470,013 |
| | | | 80,629,790 |
| | Life Sciences Tools & Services — 3.9% |
| 108,355 | Agilent Technologies, Inc.
| 17,064,829 |
| 7,166 | Mettler-Toledo International, Inc.1
| 10,611,986 |
| 53,165 | PerkinElmer, Inc.
| 9,404,357 |
| 15,949 | Thermo Fisher Scientific, Inc.
| 10,096,833 |
| 24,252 | Waters Corp.1
| 8,913,823 |
| | | | 56,091,828 |
| | Machinery — 1.4% |
| 47,398 | Parker-Hannifin Corp.
| 14,057,773 |
| 31,966 | Snap-on, Inc.
| 6,496,450 |
| | | | 20,554,223 |
| | Media — 2.7% |
| 444,449 | Comcast Corp. - Class A
| 22,858,012 |
| 380,341 | Fox Corp. - Class A
| 15,114,751 |
| | | | 37,972,763 |
| | Metals & Mining — 1.1% |
| 138,865 | Nucor Corp.
| 15,504,277 |
| | Multi-line Retail — 2.0% |
| 107,274 | Target Corp.
| 27,850,476 |
| | Paper & Forest Products — 0.0% |
| 1 | Sylvamo Corp.1
| 28 |
| | Pharmaceuticals — 1.0% |
| 85,476 | Johnson & Johnson
| 13,922,331 |
| | Professional Services — 1.5% |
| 169,015 | Booz Allen Hamilton Holding Corp.
| 14,680,643 |
| 59,496 | TransUnion
| 6,859,294 |
| | | | 21,539,937 |
| | Real Estate Management & Development — 0.6% |
| 86,260 | CBRE Group, Inc. - Class A1
| 8,977,941 |
| | Road & Rail — 1.8% |
| 475,161 | CSX Corp.
| 17,186,573 |
| 150,913 | Knight-Swift Transportation Holdings, Inc.
| 8,555,258 |
| | | | 25,741,831 |
| | Semiconductors & Semiconductor Equipment — 4.2% |
| 185,411 | Applied Materials, Inc.
| 25,336,413 |
| 57,496 | Qorvo, Inc.1
| 9,672,552 |
| 80,230 | Skyworks Solutions, Inc.
| 13,408,840 |
| 76,840 | Teradyne, Inc.
| 10,622,362 |
| | | | 59,040,167 |
| | Software — 10.2% |
| 509,524 | Dropbox, Inc. - Class A1
| 15,535,387 |
| 90,690 | Fortinet, Inc.1
| 30,502,674 |
| 94,890 | Microsoft Corp.
| 31,467,422 |
| 245,318 | Oracle Corp.
| 23,535,809 |
See Notes to Financial Statements.
THE GLENMEDE FUND, INC.
Quantitative U.S. Large Cap Core Equity Portfolio
SCHEDULE OF PORTFOLIO INVESTMENTS — (Continued)
October 31, 2021
| Shares | | | Value |
| COMMON STOCKS* — (Continued) |
| | Software — (Continued) |
| 196,785 | SS&C Technologies Holdings, Inc.
| $ 15,638,504 |
| 84,693 | Synopsys, Inc.1
| 28,218,014 |
| | | | 144,897,810 |
| | Specialty Retail — 2.7% |
| 181,363 | Best Buy Co., Inc.
| 22,169,813 |
| 68,653 | Lowe’s Cos., Inc.
| 16,052,445 |
| | | | 38,222,258 |
| | Technology Hardware, Storage & Peripherals — 3.0% |
| 78,595 | Apple, Inc.
| 11,773,531 |
| 695,964 | Hewlett Packard Enterprise Co.
| 10,195,873 |
| 692,149 | HP, Inc.
| 20,992,879 |
| | | | 42,962,283 |
| | TOTAL COMMON STOCKS
(Cost $880,842,965)
| 1,414,320,857 |
Face
Amount | | | |
| REPURCHASE AGREEMENT* — 0.5% |
| $6,710,130 | With Fixed Income Clearing Corp., dated 10/29/21, 0.00%, principal and interest in the amount of $6,710,130, due 11/1/21, (collateralized by a U.S. Treasury Note with a par value of $6,333,400, coupon rate of 2.875%, due 05/31/25, market value of $6,844,438)
| 6,710,130 |
| | TOTAL REPURCHASE AGREEMENT
(Cost $6,710,130)
| 6,710,130 |
TOTAL INVESTMENTS
(Cost $887,553,095)
| 100.0% | $1,421,030,987 |
LIABILITIES IN EXCESS OF OTHER ASSETS
| (0.0) | (130,269) |
NET ASSETS
| 100.0% | $1,420,900,718 |
|
| * | Percentages indicated are based on net assets. |
| 1 | Non income-producing security. |
See Notes to Financial Statements.
THE GLENMEDE FUND, INC.
Quantitative U.S. Large Cap Core Equity Portfolio
SCHEDULE OF PORTFOLIO INVESTMENTS — (Concluded)
October 31, 2021
INDUSTRY DIVERSIFICATION
On October 31, 2021, industry diversification of the Portfolio was as follows:
| | % of
Net Assets | | Value |
| INDUSTRIES: | | | |
Software
| 10.2% | | $ 144,897,810 |
IT Services
| 5.7 | | 80,629,790 |
Banks
| 5.7 | | 80,623,392 |
Health Care Providers & Services
| 4.5 | | 64,614,359 |
Semiconductors & Semiconductor Equipment
| 4.2 | | 59,040,167 |
Communications Equipment
| 4.0 | | 56,414,129 |
Life Sciences Tools & Services
| 3.9 | | 56,091,828 |
Capital Markets
| 3.8 | | 54,756,306 |
Equity Real Estate Investment Trusts
| 3.8 | | 53,895,783 |
Interactive Media & Services
| 3.8 | | 53,342,913 |
Technology Hardware, Storage & Peripherals
| 3.0 | | 42,962,283 |
Entertainment
| 2.9 | | 40,743,386 |
Specialty Retail
| 2.7 | | 38,222,258 |
Media
| 2.7 | | 37,972,763 |
Food Products
| 2.5 | | 35,009,029 |
Consumer Finance
| 2.4 | | 33,839,668 |
Insurance
| 2.3 | | 33,246,063 |
Household Durables
| 2.3 | | 33,241,028 |
Building Products
| 2.2 | | 31,927,127 |
Multi-line Retail
| 2.0 | | 27,850,476 |
Road & Rail
| 1.8 | | 25,741,831 |
Diversified Telecommunication Services
| 1.8 | | 24,994,425 |
Internet & Direct Marketing Retail
| 1.6 | | 22,826,502 |
Independent Power & Renewable Electricity Producer
| 1.6 | | 22,604,586 |
Construction & Engineering
| 1.5 | | 21,595,723 |
Professional Services
| 1.5 | | 21,539,937 |
Biotechnology
| 1.5 | | 21,108,042 |
Energy Equipment & Services
| 1.5 | | 20,823,974 |
Food & Staples Retailing
| 1.4 | | 20,582,406 |
Machinery
| 1.4 | | 20,554,223 |
Containers & Packaging
| 1.2 | | 17,468,542 |
Automobiles
| 1.2 | | 17,031,691 |
Metals & Mining
| 1.1 | | 15,504,277 |
Beverages
| 1.0 | | 14,128,955 |
Pharmaceuticals
| 1.0 | | 13,922,331 |
Chemicals
| 0.8 | | 11,593,626 |
Household Products
| 0.7 | | 10,263,315 |
Auto Components
| 0.7 | | 9,952,628 |
Real Estate Management & Development
| 0.6 | | 8,977,941 |
Electric Utilities
| 0.5 | | 6,995,182 |
Electrical Equipment
| 0.5 | | 6,790,134 |
Paper & Forest Products
| 0.0 | | 28 |
TOTAL COMMON STOCKS
| 99.5% | | $1,414,320,857 |
REPURCHASE AGREEMENT
| 0.5 | | 6,710,130 |
TOTAL INVESTMENTS
| 100.0% | | $1,421,030,987 |
See Notes to Financial Statements.
THE GLENMEDE FUND, INC.
Quantitative U.S. Large Cap Growth Equity Portfolio
SCHEDULE OF PORTFOLIO INVESTMENTS
October 31, 2021
| Shares | | | Value |
| COMMON STOCKS* — 99.8% |
| | Aerospace & Defense — 0.5% |
| 32,665 | Northrop Grumman Corp.
| $ 11,668,591 |
| | Air Freight & Logistics — 1.2% |
| 221,042 | Expeditors International of Washington, Inc.
| 27,245,637 |
| | Auto Components — 0.6% |
| 307,642 | BorgWarner, Inc.
| 13,865,425 |
| | Banks — 1.4% |
| 682,860 | Citizens Financial Group, Inc.
| 32,353,907 |
| | Beverages — 1.8% |
| 415,219 | Coca-Cola Co. (The)
| 23,405,895 |
| 231,644 | Monster Beverage Corp.1
| 19,689,740 |
| | | | 43,095,635 |
| | Biotechnology — 3.1% |
| 108,059 | Amgen, Inc.
| 22,364,971 |
| 79,582 | Regeneron Pharmaceuticals, Inc.1
| 50,927,705 |
| | | | 73,292,676 |
| | Building Products — 1.9% |
| 459,034 | Carrier Global Corp.
| 23,975,346 |
| 211,532 | Fortune Brands Home & Security, Inc.
| 21,449,345 |
| | | | 45,424,691 |
| | Capital Markets — 3.3% |
| 424,945 | Intercontinental Exchange, Inc.
| 58,837,885 |
| 44,655 | Moody’s Corp.
| 18,047,318 |
| | | | 76,885,203 |
| | Chemicals — 0.9% |
| 114,786 | LyondellBasell Industries N.V. - Class A
| 10,654,436 |
| 112,981 | Westlake Chemical Corp.
| 10,997,571 |
| | | | 21,652,007 |
| | Communications Equipment — 2.3% |
| 128,128 | Arista Networks, Inc.1
| 52,492,760 |
| | Containers & Packaging — 2.0% |
| 219,094 | Avery Dennison Corp.
| 47,701,146 |
| | Electronic Equipment, Instruments & Components — 5.7% |
| 882,038 | Amphenol Corp. - Class A
| 67,714,057 |
| 283,089 | CDW Corp.
| 52,838,562 |
| 68,216 | Keysight Technologies, Inc.1
| 12,280,244 |
| | | | 132,832,863 |
| | Entertainment — 2.8% |
| 252,176 | Activision Blizzard, Inc.
| 19,717,642 |
| 317,029 | Electronic Arts, Inc.
| 44,463,317 |
| | | | 64,180,959 |
| | Equity Real Estate Investment Trusts — 2.5% |
| 141,965 | American Tower Corp.
| 40,029,871 |
| 54,653 | SBA Communications Corp. REIT
| 18,873,321 |
| | | | 58,903,192 |
| | Food & Staples Retailing — 1.8% |
| 83,439 | Costco Wholesale Corp.
| 41,013,606 |
See Notes to Financial Statements.
THE GLENMEDE FUND, INC.
Quantitative U.S. Large Cap Growth Equity Portfolio
SCHEDULE OF PORTFOLIO INVESTMENTS — (Continued)
October 31, 2021
| Shares | | | Value |
| COMMON STOCKS* — (Continued) |
| | Health Care Providers & Services — 2.1% |
| 89,698 | McKesson Corp.
| $ 18,646,420 |
| 63,895 | UnitedHealth Group, Inc.
| 29,421,731 |
| | | | 48,068,151 |
| | Hotels, Restaurants & Leisure — 0.5% |
| 98,468 | Starbucks Corp.
| 10,444,501 |
| | Household Durables — 1.9% |
| 319,651 | Lennar Corp. - Class A
| 31,942,724 |
| 277,100 | Tempur Sealy International, Inc.
| 12,322,637 |
| | | | 44,265,361 |
| | Household Products — 0.5% |
| 134,043 | Church & Dwight Co., Inc.
| 11,709,997 |
| | Insurance — 0.9% |
| 126,756 | Marsh & McLennan Cos., Inc.
| 21,142,901 |
| | Interactive Media & Services — 6.8% |
| 23,894 | Alphabet, Inc. - Class A1
| 70,748,223 |
| 178,183 | Meta Platforms, Inc. - Class A1
| 57,654,673 |
| 542,235 | Twitter, Inc.1
| 29,031,262 |
| | | | 157,434,158 |
| | Internet & Direct Marketing Retail — 2.9% |
| 894,929 | eBay, Inc.
| 68,658,953 |
| | IT Services — 6.6% |
| 205,002 | Automatic Data Processing, Inc.
| 46,020,899 |
| 462,771 | Paychex, Inc.
| 57,050,409 |
| 216,306 | PayPal Holdings, Inc.1
| 50,310,612 |
| | | | 153,381,920 |
| | Life Sciences Tools & Services — 1.8% |
| 87,176 | Agilent Technologies, Inc.
| 13,729,348 |
| 84,651 | PerkinElmer, Inc.
| 14,973,916 |
| 22,715 | Thermo Fisher Scientific, Inc.
| 14,380,185 |
| | | | 43,083,449 |
| | Machinery — 0.7% |
| 125,523 | AGCO Corp.
| 15,340,166 |
| | Professional Services — 2.0% |
| 196,679 | Booz Allen Hamilton Holding Corp.
| 17,083,538 |
| 263,005 | Robert Half International, Inc.
| 29,737,975 |
| | | | 46,821,513 |
| | Semiconductors & Semiconductor Equipment — 7.6% |
| 444,561 | Applied Materials, Inc.
| 60,749,260 |
| 65,501 | KLA Corp.
| 24,416,153 |
| 28,233 | Lam Research Corp.
| 15,911,272 |
| 64,687 | Monolithic Power Systems, Inc.
| 33,990,431 |
| 167,788 | NVIDIA Corp.
| 42,898,358 |
| | | | 177,965,474 |
| | Software — 18.6% |
| 23,936 | Adobe, Inc.1
| 15,567,017 |
| 238,401 | Cadence Design Systems, Inc.1
| 41,269,597 |
| 1,276,764 | Dropbox, Inc. - Class A1
| 38,928,534 |
| 217,821 | Fortinet, Inc.1
| 73,261,915 |
| 224,278 | Microsoft Corp.
| 74,375,070 |
See Notes to Financial Statements.
THE GLENMEDE FUND, INC.
Quantitative U.S. Large Cap Growth Equity Portfolio
SCHEDULE OF PORTFOLIO INVESTMENTS — (Continued)
October 31, 2021
| Shares | | | Value |
| COMMON STOCKS* — (Continued) |
| | Software — (Continued) |
| 719,710 | Oracle Corp.
| $ 69,048,978 |
| 657,041 | SS&C Technologies Holdings, Inc.
| 52,215,048 |
| 208,791 | Synopsys, Inc.1
| 69,564,986 |
| | | | 434,231,145 |
| | Specialty Retail — 9.3% |
| 509,348 | Best Buy Co., Inc.
| 62,262,699 |
| 139,792 | Home Depot, Inc. (The)
| 51,966,278 |
| 263,082 | Lowe’s Cos., Inc.
| 61,513,833 |
| 323,718 | TJX Cos., Inc. (The)
| 21,200,292 |
| 90,180 | Tractor Supply Co.
| 19,584,391 |
| | | | 216,527,493 |
| | Technology Hardware, Storage & Peripherals — 4.0% |
| 451,166 | Apple, Inc.
| 67,584,667 |
| 233,610 | Dell Technologies, Inc. - Class C1
| 25,694,764 |
| | | | 93,279,431 |
| | Textiles, Apparel & Luxury Goods — 0.7% |
| 401,170 | Tapestry, Inc.
| 15,637,606 |
| | Tobacco — 1.1% |
| 582,813 | Altria Group, Inc.
| 25,707,881 |
| | TOTAL COMMON STOCKS
(Cost $1,318,587,708)
| 2,326,308,398 |
Face
Amount | | | |
| REPURCHASE AGREEMENT* — 0.3% |
| $7,549,716 | With Fixed Income Clearing Corp., dated 10/29/21, 0.00%, principal and interest in the amount of $7,549,716, due 11/1/21, (collateralized by a U.S. Treasury Note with a par value of $7,845,400, coupon rate of 0.250% - 2.875%, due 05/31/25, market value of $7,700,711)
| 7,549,716 |
| | TOTAL REPURCHASE AGREEMENT
(Cost $7,549,716)
| 7,549,716 |
TOTAL INVESTMENTS
(Cost $1,326,137,424)
| 100.1% | $2,333,858,114 |
LIABILITIES IN EXCESS OF OTHER ASSETS
| (0.1) | (1,233,108) |
NET ASSETS
| 100.0% | $2,332,625,006 |
|
| * | Percentages indicated are based on net assets. |
| 1 | Non income-producing security. |
See Notes to Financial Statements.
THE GLENMEDE FUND, INC.
Quantitative U.S. Large Cap Growth Equity Portfolio
SCHEDULE OF PORTFOLIO INVESTMENTS — (Concluded)
October 31, 2021
INDUSTRY DIVERSIFICATION
On October 31, 2021, industry diversification of the Portfolio was as follows:
| | % of
Net Assets | | Value |
| INDUSTRIES: | | | |
Software
| 18.6% | | $ 434,231,145 |
Specialty Retail
| 9.3 | | 216,527,493 |
Semiconductors & Semiconductor Equipment
| 7.6 | | 177,965,474 |
Interactive Media & Services
| 6.8 | | 157,434,158 |
IT Services
| 6.6 | | 153,381,920 |
Electronic Equipment, Instruments & Components
| 5.7 | | 132,832,863 |
Technology Hardware, Storage & Peripherals
| 4.0 | | 93,279,431 |
Capital Markets
| 3.3 | | 76,885,203 |
Biotechnology
| 3.1 | | 73,292,676 |
Internet & Direct Marketing Retail
| 2.9 | | 68,658,953 |
Entertainment
| 2.8 | | 64,180,959 |
Equity Real Estate Investment Trusts
| 2.5 | | 58,903,192 |
Communications Equipment
| 2.3 | | 52,492,760 |
Health Care Providers & Services
| 2.1 | | 48,068,151 |
Containers & Packaging
| 2.0 | | 47,701,146 |
Professional Services
| 2.0 | | 46,821,513 |
Building Products
| 1.9 | | 45,424,691 |
Household Durables
| 1.9 | | 44,265,361 |
Beverages
| 1.8 | | 43,095,635 |
Life Sciences Tools & Services
| 1.8 | | 43,083,449 |
Food & Staples Retailing
| 1.8 | | 41,013,606 |
Banks
| 1.4 | | 32,353,907 |
Air Freight & Logistics
| 1.2 | | 27,245,637 |
Tobacco
| 1.1 | | 25,707,881 |
Chemicals
| 0.9 | | 21,652,007 |
Insurance
| 0.9 | | 21,142,901 |
Textiles, Apparel & Luxury Goods
| 0.7 | | 15,637,606 |
Machinery
| 0.7 | | 15,340,166 |
Auto Components
| 0.6 | | 13,865,425 |
Household Products
| 0.5 | | 11,709,997 |
Aerospace & Defense
| 0.5 | | 11,668,591 |
Hotels, Restaurants & Leisure
| 0.5 | | 10,444,501 |
TOTAL COMMON STOCKS
| 99.8% | | $2,326,308,398 |
REPURCHASE AGREEMENT
| 0.3 | | 7,549,716 |
TOTAL INVESTMENTS
| 100.1% | | $2,333,858,114 |
See Notes to Financial Statements.
THE GLENMEDE FUND, INC.
Quantitative U.S. Large Cap Value Equity Portfolio
SCHEDULE OF PORTFOLIO INVESTMENTS
October 31, 2021
| Shares | | | Value |
| COMMON STOCKS* — 99.6% |
| | Automobiles — 1.0% |
| 1,449 | Ford Motor Co.1
| $ 24,749 |
| | Banks — 9.2% |
| 719 | Citigroup, Inc.
| 49,726 |
| 386 | Citizens Financial Group, Inc.
| 18,289 |
| 1,261 | Fifth Third Bancorp
| 54,891 |
| 2,497 | KeyCorp
| 58,105 |
| 2,031 | Regions Financial Corp.
| 48,094 |
| | | | 229,105 |
| | Building Products — 0.8% |
| 192 | Fortune Brands Home & Security, Inc.
| 19,469 |
| | Capital Markets — 4.9% |
| 84 | Evercore, Inc. - Class A
| 12,755 |
| 169 | Intercontinental Exchange, Inc.
| 23,400 |
| 447 | Invesco, Ltd.
| 11,358 |
| 326 | Janus Henderson Group PLC
| 15,159 |
| 278 | Nasdaq, Inc.
| 58,344 |
| | | | 121,016 |
| | Chemicals — 1.0% |
| 168 | Dow, Inc.
| 9,403 |
| 157 | Eastman Chemical Co.
| 16,333 |
| | | | 25,736 |
| | Commercial Services & Supplies — 0.6% |
| 108 | Republic Services, Inc., Class A
| 14,537 |
| | Communications Equipment — 0.8% |
| 349 | Cisco Systems, Inc.
| 19,534 |
| | Construction & Engineering — 0.8% |
| 165 | Quanta Services, Inc.
| 20,011 |
| | Consumer Finance — 4.1% |
| 979 | Ally Financial, Inc.
| 46,737 |
| 76 | Capital One Financial Corp.
| 11,478 |
| 939 | Synchrony Financial
| 43,617 |
| | | | 101,832 |
| | Containers & Packaging — 1.4% |
| 705 | International Paper Co.
| 35,017 |
| | Diversified Financial Services — 0.6% |
| 459 | Equitable Holdings, Inc.
| 15,377 |
| | Diversified Telecommunication Services — 3.6% |
| 1,283 | AT&T, Inc.
| 32,409 |
| 2,161 | Lumen Technologies, Inc.
| 25,629 |
| 580 | Verizon Communications, Inc.
| 30,734 |
| | | | 88,772 |
| | Electric Utilities — 1.5% |
| 583 | Southern Co. (The)
| 36,333 |
| | Electrical Equipment — 0.9% |
| 143 | Eaton Corp. PLC
| 23,561 |
| | Electronic Equipment, Instruments & Components — 0.6% |
| 121 | Arrow Electronics, Inc.1
| 14,006 |
See Notes to Financial Statements.
THE GLENMEDE FUND, INC.
Quantitative U.S. Large Cap Value Equity Portfolio
SCHEDULE OF PORTFOLIO INVESTMENTS — (Continued)
October 31, 2021
| Shares | | | Value |
| COMMON STOCKS* — (Continued) |
| | Energy Equipment & Services — 3.8% |
| 1,940 | Baker Hughes Co., Class A
| $ 48,655 |
| 1,429 | Schlumberger, Ltd.
| 46,100 |
| | | | 94,755 |
| | Equity Real Estate Investment Trusts — 2.5% |
| 316 | American Homes 4 Rent - Class A
| 12,830 |
| 1,650 | VICI Properties, Inc.2
| 48,427 |
| | | | 61,257 |
| | Food & Staples Retailing — 1.7% |
| 1,060 | Kroger Co. (The)
| 42,421 |
| | Food Products — 4.7% |
| 715 | Archer-Daniels-Midland Co.
| 45,932 |
| 792 | General Mills, Inc.
| 48,945 |
| 263 | Tyson Foods, Inc. - Class A
| 21,032 |
| | | | 115,909 |
| | Health Care Providers & Services — 7.5% |
| 96 | Anthem, Inc.
| 41,772 |
| 135 | Cigna Corp.
| 28,837 |
| 495 | CVS Health Corp.
| 44,194 |
| 43 | Humana, Inc.
| 19,916 |
| 120 | McKesson Corp.
| 24,946 |
| 191 | Quest Diagnostics, Inc.
| 28,035 |
| | | | 187,700 |
| | Household Durables — 1.3% |
| 161 | DR Horton, Inc.
| 14,372 |
| 360 | PulteGroup, Inc.
| 17,309 |
| | | | 31,681 |
| | Household Products — 1.1% |
| 191 | Procter & Gamble Co. (The)
| 27,311 |
| | Independent Power & Renewable Electricity Producer — 1.3% |
| 1,300 | AES Corp. (The)
| 32,669 |
| | Insurance — 4.3% |
| 279 | American International Group, Inc.
| 16,486 |
| 774 | Fidelity National Financial, Inc.
| 37,083 |
| 259 | MetLife, Inc.
| 16,265 |
| 337 | Prudential Financial, Inc.
| 37,087 |
| | | | 106,921 |
| | Interactive Media & Service — 0.8% |
| 7 | Alphabet, Inc. - Class A1
| 20,727 |
| | IT Services — 2.3% |
| 217 | Amdocs, Ltd.
| 16,891 |
| 355 | Cognizant Technology Solutions Corp. - Class A
| 27,722 |
| 271 | Genpact, Ltd.
| 13,374 |
| | | | 57,987 |
| | Life Sciences Tools & Services — 3.3% |
| 124 | Agilent Technologies, Inc.
| 19,529 |
| 243 | PerkinElmer, Inc.
| 42,984 |
| 31 | Thermo Fisher Scientific, Inc.
| 19,625 |
| | | | 82,138 |
See Notes to Financial Statements.
THE GLENMEDE FUND, INC.
Quantitative U.S. Large Cap Value Equity Portfolio
SCHEDULE OF PORTFOLIO INVESTMENTS — (Continued)
October 31, 2021
| Shares | | | Value |
| COMMON STOCKS* — (Continued) |
| | Machinery — 5.2% |
| 175 | AGCO Corp.
| $ 21,386 |
| 189 | Cummins, Inc.
| 45,330 |
| 103 | Parker-Hannifin Corp.
| 30,549 |
| 156 | Snap-on, Inc.
| 31,704 |
| | | | 128,969 |
| | Media — 4.7% |
| 191 | Comcast Corp. - Class A
| 9,823 |
| 413 | Fox Corp. - Class A
| 16,413 |
| 746 | Fox Corp. - Class B
| 27,572 |
| 1,216 | Interpublic Group of Cos., Inc. (The)
| 44,469 |
| 258 | Omnicom Group, Inc.
| 17,565 |
| | | | 115,842 |
| | Metals & Mining — 2.7% |
| 380 | Nucor Corp.
| 42,427 |
| 170 | Reliance Steel & Aluminum Co.
| 24,847 |
| | | | 67,274 |
| | Multi-Utilities — 2.1% |
| 824 | Public Service Enterprise Group, Inc.
| 52,571 |
| | Oil, Gas & Consumable Fuels — 0.5% |
| 724 | Kinder Morgan, Inc.
| 12,127 |
| | Paper & Forest Products — 0.1% |
| 64 | Sylvamo Corp.1
| 1,802 |
| | Pharmaceuticals — 4.0% |
| 817 | Bristol-Myers Squibb Co.
| 47,713 |
| 1,202 | Pfizer, Inc.
| 52,575 |
| | | | 100,288 |
| | Professional Services — 1.0% |
| 103 | ManpowerGroup, Inc.
| 9,955 |
| 140 | Robert Half International, Inc.
| 15,830 |
| | | | 25,785 |
| | Real Estate Management & Development — 3.2% |
| 438 | CBRE Group, Inc. - Class A1
| 45,587 |
| 128 | Jones Lang LaSalle, Inc.1
| 33,054 |
| | | | 78,641 |
| | Road & Rail — 1.3% |
| 866 | CSX Corp.
| 31,323 |
| | Semiconductors & Semiconductor Equipment — 1.7% |
| 116 | Applied Materials, Inc.
| 15,851 |
| 541 | Intel Corp.
| 26,509 |
| | | | 42,360 |
| | Software — 1.6% |
| 283 | Oracle Corp.
| 27,151 |
| 169 | SS&C Technologies Holdings, Inc.
| 13,431 |
| | | | 40,582 |
| | Specialty Retail — 1.0% |
| 197 | Best Buy Co., Inc.
| 24,081 |
| | Technology Hardware, Storage & Peripherals — 1.3% |
| 1,153 | Hewlett Packard Enterprise Co.
| 16,891 |
See Notes to Financial Statements.
THE GLENMEDE FUND, INC.
Quantitative U.S. Large Cap Value Equity Portfolio
SCHEDULE OF PORTFOLIO INVESTMENTS — (Continued)
October 31, 2021
| Shares | | | Value |
| COMMON STOCKS* — (Continued) |
| | Technology Hardware, Storage & Peripherals — (Continued) |
| 544 | HP, Inc.
| $ 16,500 |
| | | | 33,391 |
| | Textiles, Apparel & Luxury Goods — 1.0% |
| 630 | Tapestry, Inc.
| 24,557 |
| | Thrifts & Mortgage Finance — 0.5% |
| 1,101 | New York Community Bancorp, Inc.
| 13,685 |
| | Tobacco — 0.5% |
| 121 | Philip Morris International, Inc.
| 11,439 |
| | Trading Companies & Distributors — 0.8% |
| 55 | United Rentals, Inc.1
| 20,851 |
| | TOTAL COMMON STOCKS
(Cost $1,908,621)
| 2,476,099 |
Face
Amount | | | |
| REPURCHASE AGREEMENT* — 0.4% |
| $10,906 | With Fixed Income Clearing Corp., dated 10/29/21, 0.00%, principal and interest in the amount of $10,906, due 11/1/21, (collateralized by a U.S. Treasury Note with a par value of $10,200, coupon rate of 0.125%, due 10/15/26, market value of $11,185)
| 10,906 |
| | TOTAL REPURCHASE AGREEMENT
(Cost $10,906)
| 10,906 |
| Shares | | | |
| INVESTMENT OF SECURITY LENDING COLLATERAL* — 2.0% |
| 50,738 | State Street Navigator Securities Lending Government Money Market Portfolio3
| 50,738 |
| | TOTAL INVESTMENT OF SECURITY LENDING COLLATERAL
(Cost $50,738)
| 50,738 |
TOTAL INVESTMENTS
(Cost $1,970,265)
| 102.0% | $2,537,743 |
LIABILITIES IN EXCESS OF OTHER ASSETS
| (2.0) | (50,608) |
NET ASSETS
| 100.0% | $2,487,135 |
|
| * | Percentages indicated are based on net assets. |
| 1 | Non income-producing security. |
| 2 | Securities or partial securities on loan. See Note 1. |
| 3 | Represents an investment of securities lending cash collateral. |
See Notes to Financial Statements.
THE GLENMEDE FUND, INC.
Quantitative U.S. Large Cap Value Equity Portfolio
SCHEDULE OF PORTFOLIO INVESTMENTS — (Concluded)
October 31, 2021
INDUSTRY DIVERSIFICATION
On October 31, 2021, industry diversification of the Portfolio was as follows:
| | % of
Net Assets | | Value |
| INDUSTRIES: | | | |
Banks
| 9.2% | | $ 229,105 |
Health Care Providers & Services
| 7.5 | | 187,700 |
Machinery
| 5.2 | | 128,969 |
Capital Markets
| 4.9 | | 121,016 |
Food Products
| 4.7 | | 115,909 |
Media
| 4.7 | | 115,842 |
Insurance
| 4.3 | | 106,921 |
Consumer Finance
| 4.1 | | 101,832 |
Pharmaceuticals
| 4.0 | | 100,288 |
Energy Equipment & Services
| 3.8 | | 94,755 |
Diversified Telecommunication Services
| 3.6 | | 88,772 |
Life Sciences Tools & Services
| 3.3 | | 82,138 |
Real Estate Management & Development
| 3.2 | | 78,641 |
Metals & Mining
| 2.7 | | 67,274 |
Equity Real Estate Investment Trusts
| 2.5 | | 61,257 |
IT Services
| 2.3 | | 57,987 |
Multi-Utilities
| 2.1 | | 52,571 |
Food & Staples Retailing
| 1.7 | | 42,421 |
Semiconductors & Semiconductor Equipment
| 1.7 | | 42,360 |
Software
| 1.6 | | 40,582 |
Electric Utilities
| 1.5 | | 36,333 |
Containers & Packaging
| 1.4 | | 35,017 |
Technology Hardware, Storage & Peripherals
| 1.3 | | 33,391 |
Independent Power & Renewable Electricity Producer
| 1.3 | | 32,669 |
Household Durables
| 1.3 | | 31,681 |
Road & Rail
| 1.3 | | 31,323 |
Household Products
| 1.1 | | 27,311 |
Professional Services
| 1.0 | | 25,785 |
Chemicals
| 1.0 | | 25,736 |
Automobiles
| 1.0 | | 24,749 |
Textiles, Apparel & Luxury Goods
| 1.0 | | 24,557 |
Specialty Retail
| 1.0 | | 24,081 |
Electrical Equipment
| 0.9 | | 23,561 |
Trading Companies & Distributors
| 0.8 | | 20,851 |
Interactive Media & Service
| 0.8 | | 20,727 |
Construction & Engineering
| 0.8 | | 20,011 |
Communications Equipment
| 0.8 | | 19,534 |
Building Products
| 0.8 | | 19,469 |
Diversified Financial Services
| 0.6 | | 15,377 |
Commercial Services & Supplies
| 0.6 | | 14,537 |
Electronic Equipment, Instruments & Components
| 0.6 | | 14,006 |
Thrifts & Mortgage Finance
| 0.5 | | 13,685 |
Oil, Gas & Consumable Fuels
| 0.5 | | 12,127 |
Tobacco
| 0.5 | | 11,439 |
Paper & Forest Products
| 0.1 | | 1,802 |
TOTAL COMMON STOCKS
| 99.6% | | $2,476,099 |
REPURCHASE AGREEMENT
| 0.4 | | 10,906 |
INVESTMENT OF SECURITY LENDING COLLATERAL
| 2.0 | | 50,738 |
TOTAL INVESTMENTS
| 102.0% | | $2,537,743 |
See Notes to Financial Statements.
THE GLENMEDE FUND, INC.
Quantitative U.S. Small Cap Equity Portfolio
SCHEDULE OF PORTFOLIO INVESTMENTS
October 31, 2021
| Shares | | | Value |
| COMMON STOCKS* — 99.4% |
| | Air Freight & Logistics — 0.7% |
| 127 | Atlas Air Worldwide Holdings, Inc.1
| $ 10,302 |
| | Auto Components — 0.8% |
| 660 | American Axle & Manufacturing Holdings, Inc.1
| 5,993 |
| 81 | Gentherm, Inc.1
| 5,964 |
| | | | 11,957 |
| | Banks — 11.1% |
| 262 | Ameris Bancorp
| 13,726 |
| 342 | Cadence Bank
| 9,934 |
| 185 | Cathay General Bancorp
| 7,805 |
| 519 | Central Pacific Financial Corp.
| 14,267 |
| 333 | Eastern Bankshares, Inc.
| 6,916 |
| 257 | Financial Institutions, Inc.
| 8,203 |
| 1,455 | First BanCorp
| 19,861 |
| 211 | First Financial Corp.
| 9,041 |
| 489 | First Foundation, Inc.
| 13,012 |
| 334 | Hanmi Financial Corp.
| 7,412 |
| 268 | Heartland Financial USA, Inc.
| 13,432 |
| 408 | Hilltop Holdings, Inc.
| 14,460 |
| 853 | Hope Bancorp, Inc.
| 12,445 |
| 985 | Investors Bancorp, Inc.
| 15,071 |
| 354 | Lakeland Bancorp, Inc.
| 6,365 |
| | | | 171,950 |
| | Beverages — 0.8% |
| 739 | Primo Water Corp.
| 11,750 |
| | Biotechnology — 7.2% |
| 4,481 | Akebia Therapeutics, Inc.1
| 12,860 |
| 375 | AnaptysBio, Inc.1
| 12,337 |
| 814 | Atara Biotherapeutics, Inc.1
| 12,601 |
| 2,600 | Catalyst Pharmaceuticals, Inc.1
| 15,340 |
| 358 | Intercept Pharmaceuticals, Inc.1,2
| 6,036 |
| 909 | Ironwood Pharmaceuticals, Inc.1
| 11,608 |
| 279 | Prothena Corp. PLC1
| 15,443 |
| 621 | Vanda Pharmaceuticals, Inc.1
| 10,632 |
| 366 | Xencor, Inc.1
| 14,479 |
| | | | 111,336 |
| | Building Products — 2.2% |
| 1,437 | Cornerstone Building Brands, Inc.1
| 20,563 |
| 263 | Griffon Corp.
| 6,967 |
| 337 | Quanex Building Products Corp.
| 6,983 |
| | | | 34,513 |
| | Capital Markets — 2.0% |
| 344 | Cowen, Inc. - Class A
| 12,979 |
| 471 | Donnelley Financial Solutions, Inc.1
| 18,049 |
| | | | 31,028 |
| | Chemicals — 1.5% |
| 148 | Minerals Technologies, Inc.
| 10,499 |
| 218 | Trinseo PLC
| 12,221 |
| | | | 22,720 |
| | Commercial Services & Supplies — 1.5% |
| 278 | ABM Industries, Inc.
| 12,234 |
See Notes to Financial Statements.
THE GLENMEDE FUND, INC.
Quantitative U.S. Small Cap Equity Portfolio
SCHEDULE OF PORTFOLIO INVESTMENTS — (Continued)
October 31, 2021
| Shares | | | Value |
| COMMON STOCKS* — (Continued) |
| | Commercial Services & Supplies — (Continued) |
| 1,361 | ACCO Brands Corp.
| $ 11,255 |
| | | | 23,489 |
| | Communications Equipment — 0.5% |
| 545 | Viavi Solutions, Inc.1
| 8,393 |
| | Construction & Engineering — 0.7% |
| 214 | Primoris Services Corp.
| 5,767 |
| 408 | Tutor Perini Corp.1
| 5,557 |
| | | | 11,324 |
| | Consumer Finance — 1.4% |
| 1,082 | Navient Corp.
| 21,315 |
| | Containers & Packaging — 0.7% |
| 803 | O-I Glass, Inc.1
| 10,479 |
| | Diversified Consumer Services — 1.2% |
| 316 | Adtalem Global Education, Inc.1
| 11,670 |
| 220 | Stride, Inc.1
| 7,810 |
| | | | 19,480 |
| | Diversified Telecommunication Services — 0.4% |
| 294 | Ooma, Inc.1
| 6,791 |
| | Electronic Equipment, Instruments & Components — 2.5% |
| 649 | Knowles Corp.1
| 13,525 |
| 59 | Plexus Corp.1
| 5,152 |
| 230 | Sanmina Corp.1
| 8,683 |
| 528 | TTM Technologies, Inc.1
| 6,991 |
| 252 | Vishay Intertechnology, Inc.
| 4,843 |
| | | | 39,194 |
| | Energy Equipment & Services — 1.2% |
| 895 | Oceaneering International, Inc.1
| 12,172 |
| 1,192 | Oil States International, Inc.1
| 7,224 |
| | | | 19,396 |
| | Equity Real Estate Investment Trusts — 7.7% |
| 799 | Brandywine Realty Trust REIT
| 10,587 |
| 479 | CareTrust REIT, Inc.
| 9,939 |
| 153 | Centerspace REIT
| 15,490 |
| 822 | City Office REIT, Inc.
| 15,593 |
| 382 | Corporate Office Properties Trust
| 10,360 |
| 82 | EastGroup Properties, Inc.
| 16,218 |
| 859 | GEO Group, Inc. (The)
| 7,026 |
| 331 | National Storage Affiliates Trust
| 20,674 |
| 322 | STAG Industrial, Inc.
| 14,017 |
| | | | 119,904 |
| | Food & Staples Retailing — 1.1% |
| 440 | SpartanNash Co.
| 10,182 |
| 289 | Sprouts Farmers Market, Inc.1
| 6,398 |
| | | | 16,580 |
| | Gas Utilities — 2.3% |
| 267 | Northwest Natural Holding Co.
| 12,039 |
| 485 | South Jersey Industries, Inc.
| 11,039 |
| 177 | Southwest Gas Holdings, Inc.
| 12,257 |
| | | | 35,335 |
See Notes to Financial Statements.
THE GLENMEDE FUND, INC.
Quantitative U.S. Small Cap Equity Portfolio
SCHEDULE OF PORTFOLIO INVESTMENTS — (Continued)
October 31, 2021
| Shares | | | Value |
| COMMON STOCKS* — (Continued) |
| | Health Care Equipment & Supplies — 2.0% |
| 180 | NuVasive, Inc.1
| $ 9,605 |
| 724 | OraSure Technologies, Inc.1
| 7,725 |
| 228 | Orthofix Medical, Inc.1
| 8,204 |
| 212 | Varex Imaging Corp.1
| 5,692 |
| | | | 31,226 |
| | Health Care Providers & Services — 3.2% |
| 70 | ModivCare, Inc.1
| 11,394 |
| 209 | Patterson Cos., Inc.
| 6,534 |
| 615 | Select Medical Holdings Corp.
| 20,430 |
| 150 | Tenet Healthcare Corp.1
| 10,749 |
| | | | 49,107 |
| | Health Care Technology — 0.6% |
| 730 | Allscripts Healthcare Solutions, Inc.1
| 10,059 |
| | Hotels, Restaurants & Leisure — 1.3% |
| 687 | International Game Technology PLC1,2
| 20,260 |
| | Household Durables — 2.7% |
| 199 | Century Communities, Inc.
| 13,345 |
| 126 | Meritage Homes Corp.1
| 13,697 |
| 629 | Tri Pointe Homes, Inc.1
| 15,216 |
| | | | 42,258 |
| | Household Products — 0.3% |
| 104 | Central Garden & Pet Co.1
| 5,364 |
| | Insurance — 2.3% |
| 534 | CNO Financial Group, Inc.
| 12,891 |
| 1,800 | Genworth Financial, Inc. - Class A1
| 7,398 |
| 209 | Stewart Information Services Corp.
| 14,874 |
| | | | 35,163 |
| | IT Services — 4.0% |
| 1,611 | Conduent, Inc.1
| 10,874 |
| 122 | CSG Systems International, Inc.
| 6,106 |
| 120 | ExlService Holdings, Inc.1
| 14,716 |
| 710 | Hackett Group, Inc. (The)
| 15,009 |
| 120 | Perficient, Inc.1
| 14,832 |
| | | | 61,537 |
| | Leisure Equipment & Products — 1.2% |
| 453 | Vista Outdoor, Inc.1
| 18,954 |
| | Machinery — 2.0% |
| 217 | Altra Industrial Motion Corp.
| 11,317 |
| 239 | Hillenbrand, Inc.
| 10,865 |
| 184 | Terex Corp.
| 8,243 |
| | | | 30,425 |
| | Media — 2.5% |
| 628 | Gray Television, Inc.
| 14,720 |
| 779 | iHeartMedia, Inc.1
| 15,097 |
| 146 | Meredith Corp.1
| 8,503 |
| | | | 38,320 |
| | Metals & Mining — 2.7% |
| 629 | Alcoa Corp.
| 28,902 |
See Notes to Financial Statements.
THE GLENMEDE FUND, INC.
Quantitative U.S. Small Cap Equity Portfolio
SCHEDULE OF PORTFOLIO INVESTMENTS — (Continued)
October 31, 2021
| Shares | | | Value |
| COMMON STOCKS* — (Continued) |
| | Metals & Mining — (Continued) |
| 420 | Commercial Metals Co.
| $ 13,516 |
| | | | 42,418 |
| | Mortgage Real Estate Investment Trust — 0.9% |
| 1,027 | Great Ajax Corp.
| 14,542 |
| | Oil, Gas & Consumable Fuels — 2.8% |
| 706 | CVR Energy, Inc.
| 13,534 |
| 990 | Dorian LPG, Ltd.
| 11,999 |
| 527 | Teekay Tankers, Ltd. - Class A1
| 7,315 |
| 363 | World Fuel Services Corp.
| 11,082 |
| | | | 43,930 |
| | Paper & Forest Products — 0.5% |
| 140 | Domtar Corp.1
| 7,643 |
| | Personal Products — 0.5% |
| 233 | Edgewell Personal Care Co.
| 8,153 |
| | Pharmaceuticals — 3.5% |
| 781 | Alder Biopharmaceuticals, Inc.1,3
| 0 |
| 4,553 | Endo International PLC1
| 19,350 |
| 477 | Phibro Animal Health Corp. - Class A
| 10,465 |
| 227 | Prestige Consumer Healthcare, Inc.1
| 13,618 |
| 395 | Supernus Pharmaceuticals, Inc.1
| 11,791 |
| | | | 55,224 |
| | Professional Services — 2.8% |
| 314 | Heidrick & Struggles International, Inc.
| 14,720 |
| 140 | Kforce, Inc.
| 9,067 |
| 496 | Resources Connection, Inc.
| 8,635 |
| 395 | TrueBlue, Inc.1
| 11,001 |
| | | | 43,423 |
| | Real Estate Management & Development — 0.8% |
| 752 | Realogy Holdings Corp.1
| 13,025 |
| | Semiconductors & Semiconductor Equipment — 3.2% |
| 471 | Amkor Technology, Inc.
| 10,324 |
| 288 | Axcelis Technologies, Inc.1
| 15,820 |
| 192 | Kulicke & Soffa Industries, Inc.
| 10,944 |
| 957 | Photronics, Inc.1
| 12,432 |
| | | | 49,520 |
| | Software — 2.9% |
| 305 | ACI Worldwide, Inc.1
| 9,357 |
| 602 | ChannelAdvisor Corp.1
| 15,357 |
| 222 | Progress Software Corp.
| 11,413 |
| 479 | Xperi Holding Corp.
| 8,584 |
| | | | 44,711 |
| | Specialty Retail — 2.0% |
| 190 | Abercrombie & Fitch Co. - Class A1
| 7,513 |
| 62 | Group 1 Automotive, Inc.
| 11,147 |
| 239 | MarineMax, Inc.1
| 12,378 |
| | | | 31,038 |
| | Thrifts & Mortgage Finance — 0.9% |
| 576 | Provident Financial Services, Inc.
| 14,262 |
See Notes to Financial Statements.
THE GLENMEDE FUND, INC.
Quantitative U.S. Small Cap Equity Portfolio
SCHEDULE OF PORTFOLIO INVESTMENTS — (Continued)
October 31, 2021
| Shares | | | Value |
| COMMON STOCKS* — (Continued) |
| | Tobacco — 0.6% |
| 250 | Turning Point Brands, Inc.
| $ 9,542 |
| | Trading Companies & Distributors — 4.4% |
| 182 | Beacon Roofing Supply, Inc.1
| 9,622 |
| 194 | Boise Cascade Co.
| 10,984 |
| 1,707 | NOW, Inc.1
| 12,325 |
| 215 | Rush Enterprises, Inc. - Class A
| 11,197 |
| 185 | WESCO International, Inc.1
| 23,969 |
| | | | 68,097 |
| | Wireless Telecommunication Services — 1.3% |
| 539 | Telephone & Data Systems, Inc.
| 10,101 |
| 328 | United States Cellular Corp.1
| 10,027 |
| | | | 20,128 |
| | TOTAL COMMON STOCKS
(Cost $1,145,560)
| 1,545,565 |
Face
Amount | | | |
| REPURCHASE AGREEMENT* — 0.8% |
| $12,420 | With Fixed Income Clearing Corp., dated 10/29/21, 0.00%, principal and interest in the amount of $12,420, due 11/1/21, (collateralized by a U.S. Treasury Note with a par value of $11,600, coupon rate of 0.125%, due 10/15/26, market value of $12,720)
| 12,420 |
| | TOTAL REPURCHASE AGREEMENT
(Cost $12,420)
| 12,420 |
| Shares | | | |
| INVESTMENT OF SECURITY LENDING COLLATERAL* — 1.7% |
| 26,965 | State Street Navigator Securities Lending Government Money Market Portfolio4
| 26,965 |
| | TOTAL INVESTMENT OF SECURITY LENDING COLLATERAL
(Cost $26,965)
| 26,965 |
TOTAL INVESTMENTS
(Cost $1,184,945)
| 101.9% | $1,584,950 |
LIABILITIES IN EXCESS OF OTHER ASSETS
| (1.9) | (29,396) |
NET ASSETS
| 100.0% | $1,555,554 |
|
| * | Percentages indicated are based on net assets. |
| 1 | Non income-producing security. |
| 2 | Securities or partial securities on loan. See Note 1. |
| 3 | For fair value measurement disclosure purposes, security is categorized as Level 3 (See Note 1 of the Notes to Financial Statements). |
| 4 | Represents an investment of securities lending cash collateral. |
See Notes to Financial Statements.
THE GLENMEDE FUND, INC.
Quantitative U.S. Small Cap Equity Portfolio
SCHEDULE OF PORTFOLIO INVESTMENTS — (Concluded)
October 31, 2021
INDUSTRY DIVERSIFICATION
On October 31, 2021, industry diversification of the Portfolio was as follows:
| | % of
Net Assets | | Value |
| INDUSTRIES: | | | |
Banks
| 11.1% | | $ 171,950 |
Equity Real Estate Investment Trusts
| 7.7 | | 119,904 |
Biotechnology
| 7.2 | | 111,336 |
Trading Companies & Distributors
| 4.4 | | 68,097 |
IT Services
| 4.0 | | 61,537 |
Pharmaceuticals
| 3.5 | | 55,224 |
Semiconductors & Semiconductor Equipment
| 3.2 | | 49,520 |
Health Care Providers & Services
| 3.2 | | 49,107 |
Software
| 2.9 | | 44,711 |
Oil, Gas & Consumable Fuels
| 2.8 | | 43,930 |
Professional Services
| 2.8 | | 43,423 |
Metals & Mining
| 2.7 | | 42,418 |
Household Durables
| 2.7 | | 42,258 |
Electronic Equipment, Instruments & Components
| 2.5 | | 39,194 |
Media
| 2.5 | | 38,320 |
Gas Utilities
| 2.3 | | 35,335 |
Insurance
| 2.3 | | 35,163 |
Building Products
| 2.2 | | 34,513 |
Health Care Equipment & Supplies
| 2.0 | | 31,226 |
Specialty Retail
| 2.0 | | 31,038 |
Capital Markets
| 2.0 | | 31,028 |
Machinery
| 2.0 | | 30,425 |
Commercial Services & Supplies
| 1.5 | | 23,489 |
Chemicals
| 1.5 | | 22,720 |
Consumer Finance
| 1.4 | | 21,315 |
Hotels, Restaurants & Leisure
| 1.3 | | 20,260 |
Wireless Telecommunication Services
| 1.3 | | 20,128 |
Diversified Consumer Services
| 1.2 | | 19,480 |
Energy Equipment & Services
| 1.2 | | 19,396 |
Leisure Equipment & Products
| 1.2 | | 18,954 |
Food & Staples Retailing
| 1.1 | | 16,580 |
Mortgage Real Estate Investment Trust
| 0.9 | | 14,542 |
Thrifts & Mortgage Finance
| 0.9 | | 14,262 |
Real Estate Management & Development
| 0.8 | | 13,025 |
Auto Components
| 0.8 | | 11,957 |
Beverages
| 0.8 | | 11,750 |
Construction & Engineering
| 0.7 | | 11,324 |
Containers & Packaging
| 0.7 | | 10,479 |
Air Freight & Logistics
| 0.7 | | 10,302 |
Health Care Technology
| 0.6 | | 10,059 |
Tobacco
| 0.6 | | 9,542 |
Communications Equipment
| 0.5 | | 8,393 |
Personal Products
| 0.5 | | 8,153 |
Paper & Forest Products
| 0.5 | | 7,643 |
Diversified Telecommunication Services
| 0.4 | | 6,791 |
Household Products
| 0.3 | | 5,364 |
TOTAL COMMON STOCKS
| 99.4% | | $1,545,565 |
REPURCHASE AGREEMENT
| 0.8 | | 12,420 |
INVESTMENT OF SECURITY LENDING COLLATERAL
| 1.7 | | 26,965 |
TOTAL INVESTMENTS
| 101.9% | | $1,584,950 |
See Notes to Financial Statements.
THE GLENMEDE FUND, INC.
Quantitative International Equity Portfolio
SCHEDULE OF PORTFOLIO INVESTMENTS
October 31, 2021
| Shares | | | Value |
| COMMON STOCKS* — 97.7% |
| | Japan — 22.7% |
| 37,800 | Astellas Pharma, Inc.
| $ 635,776 |
| 30,300 | Canon, Inc.
| 680,039 |
| 62,135 | Dai Nippon Printing Co, Ltd., Sponsored ADR1
| 771,717 |
| 22,915 | Daito Trust Construction Co., Ltd., Sponsored ADR1
| 713,344 |
| 13,200 | Daiwa House Industry Co, Ltd.
| 434,422 |
| 39,600 | Daiwa Securities Group, Inc.
| 221,913 |
| 59,600 | ENEOS Holdings, Inc.
| 240,335 |
| 8,596 | Fujitsu, Ltd., Unsponsored ADR1
| 298,195 |
| 13,089 | Honda Motor Co., Ltd., Sponsored ADR1,2
| 387,173 |
| 2,600 | KDDI Corp.
| 80,481 |
| 31,032 | KDDI Corp., Unsponsored ADR1
| 472,307 |
| 24,700 | Mitsubishi Electric Corp.
| 330,489 |
| 13,979 | Nippon Telegraph & Telephone Corp., ADR
| 392,530 |
| 22,151 | Nitto Denko Corp., Unsponsored ADR
| 866,547 |
| 63,900 | Panasonic Corp.
| 780,704 |
| 41,500 | Renesas Electronics Corp.2
| 510,489 |
| 15,900 | Seiko Epson Corp.
| 282,636 |
| 8,300 | SoftBank Corp.
| 113,203 |
| 26,819 | SoftBank Corp., Unsponsored ADR1
| 365,114 |
| 42,100 | Sumitomo Chemical Co, Ltd.
| 206,852 |
| 8,700 | Suntory Beverage & Food, Ltd.
| 337,008 |
| 8,600 | Yamato Holdings Co, Ltd.
| 211,048 |
| | | | 9,332,322 |
| | United Kingdom — 12.3% |
| 10,400 | Anglo American PLC
| 396,031 |
| 79,216 | Aviva PLC
| 427,899 |
| 42,270 | Barratt Developments PLC
| 383,537 |
| 21,471 | British American Tobacco PLC, Sponsored ADR
| 749,767 |
| 29,729 | GlaxoSmithKline PLC
| 613,784 |
| 29,000 | Imperial Brands PLC, Sponsored ADR1
| 621,760 |
| 5,358 | Mondi PLC, Unsponsored ADR
| 267,203 |
| 5,100 | National Grid PLC, Sponsored ADR
| 326,808 |
| 13,918 | Schroders PLC
| 689,519 |
| 10,612 | Unilever PLC, Sponsored ADR
| 568,591 |
| | | | 5,044,899 |
| | Canada — 10.5% |
| 5,900 | Alimentation Couche-Tard, Inc.
| 221,298 |
| 3,837 | Bank of Montreal
| 416,352 |
| 10,660 | Bank of Nova Scotia (The)1
| 698,870 |
| 3,400 | Canadian Imperial Bank of Commerce
| 412,555 |
| 1,375 | Canadian Tire Corp, Ltd. - Class A
| 195,295 |
| 8,937 | Manulife Financial Corp.
| 174,104 |
| 19,456 | Manulife Financial Corp.1
| 379,197 |
| 10,181 | Royal Bank of Canada1
| 1,058,926 |
| 2,500 | Thomson Reuters Corp.
| 300,723 |
| 6,600 | Toronto-Dominion Bank (The)
| 479,108 |
| | | | 4,336,428 |
| | Germany — 8.8% |
| 32,149 | Brenntag SE, Unsponsored ADR
| 612,439 |
| 29,725 | Daimler AG, Unsponsored ADR
| 736,288 |
| 633 | Deutsche Boerse AG
| 105,079 |
| 36,825 | Deutsche Boerse AG, Unsponsored ADR
| 610,190 |
| 4,939 | Deutsche Post AG
| 305,572 |
| 5,438 | Deutsche Post AG, Sponsored ADR
| 337,917 |
| 2,600 | HeidelbergCement AG
| 195,785 |
See Notes to Financial Statements.
THE GLENMEDE FUND, INC.
Quantitative International Equity Portfolio
SCHEDULE OF PORTFOLIO INVESTMENTS — (Continued)
October 31, 2021
| Shares | | | Value |
| COMMON STOCKS* — (Continued) |
| | Germany — (Continued) |
| 1,800 | SAP SE
| $ 260,766 |
| 2,800 | Siemens AG
| 454,058 |
| | | | 3,618,094 |
| | France — 8.8% |
| 1,600 | Arkema SA
| 218,623 |
| 4,451 | Capgemini SE
| 1,035,760 |
| 2,900 | Cie de Saint-Gobain
| 199,669 |
| 1,713 | Cie Generale des Etablissements Michelin SCA
| 268,717 |
| 425 | LVMH Moet Hennessy Louis Vuitton SE
| 332,708 |
| 3,795 | Publicis Groupe SA
| 254,184 |
| 7,582 | Sanofi
| 757,541 |
| 9,056 | Schneider Electric SE, Unsponsored ADR1
| 312,341 |
| 4,690 | TotalEnergies SE, Sponsored ADR
| 235,137 |
| | | | 3,614,680 |
| | Switzerland — 7.7% |
| 32,310 | ABB, Ltd., Sponsored ADR1
| 1,067,522 |
| 14,312 | Adecco Group AG, Unsponsored ADR
| 360,376 |
| 52,536 | Holcim, Ltd., ADR1
| 521,945 |
| 7,164 | Novartis AG, Sponsored ADR
| 592,893 |
| 1,400 | Swatch Group AG (The)
| 384,098 |
| 416 | Swisscom AG
| 226,447 |
| | | | 3,153,281 |
| | Sweden — 5.4% |
| 18,116 | Electrolux AB1
| 411,133 |
| 46,038 | SKF AB, Sponsored ADR1
| 1,069,463 |
| 33,800 | Swedbank AB
| 732,989 |
| | | | 2,213,585 |
| | Australia — 4.2% |
| 226,388 | Medibank Pvt, Ltd.
| 565,397 |
| 24,708 | Sonic Healthcare, Ltd., Sponsored ADR
| 748,653 |
| 47,126 | Suncorp Group, Ltd.
| 415,480 |
| | | | 1,729,530 |
| | Spain — 3.5% |
| 12,600 | Enagas SA
| 282,645 |
| 22,791 | Red Electrica Corp. SA
| 474,499 |
| 54,587 | Repsol SA
| 697,662 |
| | | | 1,454,806 |
| | Denmark — 3.0% |
| 28,107 | Carlsberg AS, Sponsored ADR
| 933,433 |
| 2,600 | Novo Nordisk AS
| 284,566 |
| | | | 1,217,999 |
| | Netherlands — 2.5% |
| 11,419 | Akzo Nobel N.V., Sponsored ADR
| 439,974 |
| 18,605 | Koninklijke Ahold Delhaize N.V., Sponsored ADR
| 605,593 |
| | | | 1,045,567 |
| | Singapore — 1.7% |
| 1,000 | Singapore Exchange, Ltd., Unsponsored ADR
| 108,210 |
| 31,015 | United Overseas Bank, Ltd.
| 615,240 |
| | | | 723,450 |
See Notes to Financial Statements.
THE GLENMEDE FUND, INC.
Quantitative International Equity Portfolio
SCHEDULE OF PORTFOLIO INVESTMENTS — (Continued)
October 31, 2021
| Shares | | | Value |
| COMMON STOCKS* — (Continued) |
| | Austria — 1.6% |
| 5,087 | OMV AG
| $ 308,142 |
| 9,100 | voestalpine AG
| 345,463 |
| | | | 653,605 |
| | Hong Kong — 1.5% |
| 9,488 | BOC Hong Kong Holdings, Ltd., Sponsored ADR1
| 608,655 |
| | Israel — 1.0% |
| 47,200 | ICL Group, Ltd. - Class G
| 403,482 |
| | Cayman Islands — 1.0% |
| 64,300 | CK Asset Holdings, Ltd.
| 397,097 |
| | Norway — 0.8% |
| 6,100 | Yara International ASA
| 318,290 |
| | Italy — 0.7% |
| 48,060 | Snam SpA
| 272,064 |
| | TOTAL COMMON STOCKS
(Cost $35,866,016)
| 40,137,834 |
| INVESTMENT OF SECURITY LENDING COLLATERAL* — 6.8% |
| 2,786,439 | State Street Navigator Securities Lending Government Money Market Portfolio3
| 2,786,439 |
| | TOTAL INVESTMENT OF SECURITY LENDING COLLATERAL
(Cost $2,786,439)
| 2,786,439 |
Face
Amount | | | |
| REPURCHASE AGREEMENT*—0.3% |
| $ 123,409 | With Fixed Income Clearing Corp., dated 10/29/21, 0.00%, principal and interest in the amount of $123,409, due 11/1/21, (collateralized by a a U.S. Treasury Note with a par value of $114,800, coupon rate of 0.125%, due 10/15/26, market value of $125,884)
| 123,409 |
| | TOTAL REPURCHASE AGREEMENT
(Cost $123,409)
| 123,409 |
TOTAL INVESTMENTS
(Cost $38,775,864)
| 104.8% | $43,047,682 |
LIABILITIES IN EXCESS OF OTHER ASSETS
| (4.8) | (1,978,550) |
NET ASSETS
| 100.0% | $41,069,132 |
|
| * | Percentages indicated are based on net assets. |
| 1 | Securities or partial securities on loan. See Note 1. |
| 2 | Non income-producing security. |
| 3 | Represents an investment of securities lending cash collateral. |
| Abbreviations: |
| ADR — American Depositary Receipt |
See Notes to Financial Statements.
THE GLENMEDE FUND, INC.
Quantitative International Equity Portfolio
SCHEDULE OF PORTFOLIO INVESTMENTS — (Concluded)
October 31, 2021
INDUSTRY DIVERSIFICATION
On October 31, 2021, industry diversification of the Portfolio was as follows:
| | % of
Net Assets | | Value |
| INDUSTRIES: | | | |
Banks
| 12.3% | | $ 5,022,695 |
Pharmaceuticals
| 6.9 | | 2,884,560 |
Chemicals
| 5.9 | | 2,453,768 |
Insurance
| 4.7 | | 1,962,077 |
Capital Markets
| 4.2 | | 1,734,911 |
Electrical Equipment
| 4.2 | | 1,710,352 |
Household Durables
| 3.8 | | 1,575,374 |
Real Estate Management & Development
| 3.8 | | 1,544,863 |
Oil, Gas & Consumable Fuels
| 3.7 | | 1,481,276 |
Tobacco
| 3.3 | | 1,371,527 |
IT Services
| 3.2 | | 1,333,955 |
Beverages
| 3.1 | | 1,270,441 |
Automobiles
| 2.7 | | 1,123,461 |
Machinery
| 2.6 | | 1,069,463 |
Diversified Telecommunication Services
| 2.5 | | 984,091 |
Technology Hardware, Storage & Peripherals
| 2.4 | | 962,675 |
Air Freight & Logistics
| 2.0 | | 854,537 |
Food & Staples Retailing
| 2.0 | | 826,891 |
Commercial Services & Supplies
| 1.9 | | 771,717 |
Health Care Providers & Services
| 1.8 | | 748,653 |
Metals & Mining
| 1.8 | | 741,494 |
Construction Materials
| 1.8 | | 717,730 |
Textiles, Apparel & Luxury Goods
| 1.7 | | 716,806 |
Wireless Telecommunication Services
| 1.7 | | 665,991 |
Professional Services
| 1.6 | | 661,099 |
Trading Companies & Distributors
| 1.5 | | 612,439 |
Personal Products
| 1.4 | | 568,591 |
Gas Utilities
| 1.4 | | 554,709 |
Semiconductors & Semiconductor Equipment
| 1.2 | | 510,489 |
Electric Utilities
| 1.1 | | 474,499 |
Industrial Conglomerates
| 1.1 | | 454,058 |
Multi-Utilities
| 0.8 | | 326,808 |
Auto Components
| 0.7 | | 268,717 |
Paper & Forest Products
| 0.7 | | 267,203 |
Software
| 0.6 | | 260,766 |
Media
| 0.6 | | 254,184 |
Building Products
| 0.5 | | 199,669 |
Multi-line Retail
| 0.5 | | 195,295 |
TOTAL COMMON STOCKS
| 97.7% | | $40,137,834 |
REPURCHASE AGREEMENT
| 0.3 | | 123,409 |
INVESTMENT OF SECURITY LENDING COLLATERAL
| 6.8 | | 2,786,439 |
TOTAL INVESTMENTS
| 104.8% | | $43,047,682 |
See Notes to Financial Statements.
THE GLENMEDE FUND, INC.
Responsible ESG U.S. Equity Portfolio
SCHEDULE OF PORTFOLIO INVESTMENTS
October 31, 2021
| Shares | | | Value |
| COMMON STOCKS* — 99.2% |
| | Auto Components — 1.3% |
| 9,747 | BorgWarner, Inc.
| $ 439,297 |
| | Banks — 5.9% |
| 4,525 | Citigroup, Inc.
| 312,949 |
| 3,549 | Citizens Financial Group, Inc.
| 168,151 |
| 2,216 | East West Bancorp, Inc.
| 176,128 |
| 23,006 | Regions Financial Corp.
| 544,782 |
| 11,598 | Zions Bancorp N.A.
| 730,558 |
| | | | 1,932,568 |
| | Biotechnology — 1.0% |
| 1,637 | Amgen, Inc.
| 338,810 |
| | Building Products — 1.0% |
| 6,318 | Carrier Global Corp.
| 329,989 |
| | Capital Markets — 3.2% |
| 3,019 | Bank of New York Mellon Corp. (The)
| 178,725 |
| 3,829 | Janus Henderson Group PLC
| 178,048 |
| 1,864 | State Street Corp.
| 183,697 |
| 2,393 | T Rowe Price Group, Inc.
| 518,994 |
| | | | 1,059,464 |
| | Chemicals — 2.4% |
| 4,745 | Corteva, Inc.
| 204,747 |
| 2,811 | Dow, Inc.
| 157,332 |
| 4,447 | LyondellBasell Industries N.V. - Class A
| 412,770 |
| | | | 774,849 |
| | Commercial Services & Supplies — 0.9% |
| 2,249 | Republic Services, Inc., Class A
| 302,715 |
| | Communications Equipment — 1.8% |
| 6,458 | Ciena Corp.1
| 350,605 |
| 1,224 | F5 Networks, Inc.1
| 258,447 |
| | | | 609,052 |
| | Consumer Finance — 2.8% |
| 9,262 | Ally Financial, Inc.
| 442,168 |
| 10,035 | Synchrony Financial
| 466,126 |
| | | | 908,294 |
| | Containers & Packaging — 1.2% |
| 8,196 | International Paper Co.
| 407,095 |
| | Diversified Telecommunication Services — 1.5% |
| 9,234 | Verizon Communications, Inc.
| 489,310 |
| | Electronic Equipment, Instruments & Components — 2.1% |
| 5,577 | Corning, Inc.
| 198,374 |
| 5,682 | Trimble, Inc.1
| 496,436 |
| | | | 694,810 |
| | Energy Equipment & Services — 1.1% |
| 15,096 | Baker Hughes Co., Class A
| 378,608 |
| | Entertainment — 2.0% |
| 6,342 | Activision Blizzard, Inc.
| 495,881 |
| 1,075 | Electronic Arts, Inc.
| 150,769 |
| | | | 646,650 |
See Notes to Financial Statements.
THE GLENMEDE FUND, INC.
Responsible ESG U.S. Equity Portfolio
SCHEDULE OF PORTFOLIO INVESTMENTS — (Continued)
October 31, 2021
| Shares | | | Value |
| COMMON STOCKS* — (Continued) |
| | Equity Real Estate Investment Trusts — 0.8% |
| 994 | American Tower Corp.
| $ 280,278 |
| | Food & Staples Retailing — 1.6% |
| 12,793 | Kroger Co. (The)
| 511,976 |
| | Food Products — 3.7% |
| 8,143 | General Mills, Inc.
| 503,237 |
| 5,082 | Kellogg Co.
| 311,527 |
| 4,862 | Tyson Foods, Inc. - Class A
| 388,814 |
| | | | 1,203,578 |
| | Health Care Providers & Services — 3.3% |
| 1,152 | Anthem, Inc.
| 501,270 |
| 1,426 | Cigna Corp.
| 304,608 |
| 574 | Humana, Inc.
| 265,854 |
| | | | 1,071,732 |
| | Health Care Technology — 0.9% |
| 4,036 | Cerner Corp.
| 299,835 |
| | Household Durables — 0.5% |
| 32 | NVR, Inc.1
| 156,634 |
| | Household Products — 0.9% |
| 3,698 | Colgate-Palmolive Co.
| 281,751 |
| | Independent Power & Renewable Electricity Producer — 1.3% |
| 17,153 | AES Corp. (The)
| 431,055 |
| | Insurance — 2.3% |
| 2,336 | First American Financial Corp.
| 170,855 |
| 9,094 | MetLife, Inc.
| 571,103 |
| | | | 741,958 |
| | Interactive Media & Service — 2.5% |
| 276 | Alphabet, Inc. - Class A1
| 817,214 |
| | Internet & Direct Marketing Retail — 2.2% |
| 9,492 | eBay, Inc.
| 728,226 |
| | IT Services — 6.2% |
| 1,087 | Accenture PLC - Class A
| 390,005 |
| 2,449 | Automatic Data Processing, Inc.
| 549,776 |
| 2,813 | Cognizant Technology Solutions Corp. - Class A
| 219,667 |
| 1,223 | Fiserv, Inc.1
| 120,453 |
| 816 | Gartner, Inc.1
| 270,839 |
| 2,149 | PayPal Holdings, Inc.1
| 499,836 |
| | | | 2,050,576 |
| | Life Sciences Tools & Services — 5.1% |
| 1,700 | Agilent Technologies, Inc.
| 267,733 |
| 487 | Charles River Laboratories International, Inc.1
| 218,507 |
| 245 | Mettler-Toledo International, Inc.1
| 362,816 |
| 877 | Thermo Fisher Scientific, Inc.
| 555,202 |
| 732 | Waters Corp.1
| 269,047 |
| | | | 1,673,305 |
| | Machinery — 3.3% |
| 1,372 | Cummins, Inc.
| 329,060 |
| 1,040 | IDEX Corp.
| 231,473 |
| 2,100 | Oshkosh Corp.
| 224,700 |
See Notes to Financial Statements.
THE GLENMEDE FUND, INC.
Responsible ESG U.S. Equity Portfolio
SCHEDULE OF PORTFOLIO INVESTMENTS — (Continued)
October 31, 2021
| Shares | | | Value |
| COMMON STOCKS* — (Continued) |
| | Machinery — (Continued) |
| 1,460 | Snap-on, Inc.
| $ 296,716 |
| | | | 1,081,949 |
| | Media — 3.9% |
| 6,266 | Discovery, Inc. - Class C1
| 141,361 |
| 14,762 | Interpublic Group of Cos., Inc. (The)
| 539,847 |
| 11,253 | New York Times Co. (The) - Class A
| 614,301 |
| | | | 1,295,509 |
| | Metals & Mining — 0.5% |
| 1,600 | Nucor Corp.
| 178,640 |
| | Multi-Utilities — 1.1% |
| 14,181 | NiSource, Inc.
| 349,845 |
| | Oil, Gas & Consumable Fuels — 0.8% |
| 2,358 | Chevron Corp.
| 269,967 |
| | Paper & Forest Products — 0.1% |
| 745 | Sylvamo Corp.1
| 20,979 |
| | Professional Services — 1.2% |
| 3,798 | Leidos Holdings, Inc.
| 379,724 |
| | Real Estate Management & Development — 3.5% |
| 6,194 | CBRE Group, Inc. - Class A1
| 644,672 |
| 1,940 | Jones Lang LaSalle, Inc.1
| 500,966 |
| | | | 1,145,638 |
| | Road & Rail — 1.1% |
| 4,668 | CSX Corp.
| 168,841 |
| 3,136 | Knight-Swift Transportation Holdings, Inc.
| 177,780 |
| | | | 346,621 |
| | Semiconductors & Semiconductor Equipment — 4.3% |
| 6,245 | Applied Materials, Inc.
| 853,379 |
| 4,786 | Intel Corp.
| 234,514 |
| 2,018 | Skyworks Solutions, Inc.
| 337,269 |
| | | | 1,425,162 |
| | Software — 9.1% |
| 1,020 | Adobe, Inc.1
| 663,367 |
| 4,176 | Cadence Design Systems, Inc.1
| 722,907 |
| 2,184 | Fortinet, Inc.1
| 734,567 |
| 2,155 | Microsoft Corp.
| 714,641 |
| 512 | Synopsys, Inc.1
| 170,588 |
| | | | 3,006,070 |
| | Specialty Retail — 4.5% |
| 4,774 | Best Buy Co., Inc.
| 583,574 |
| 1,906 | Lowe’s Cos., Inc.
| 445,661 |
| 2,455 | Williams-Sonoma, Inc.
| 455,967 |
| | | | 1,485,202 |
| | Technology Hardware, Storage & Peripherals — 3.1% |
| 5,098 | Dell Technologies, Inc. - Class C1
| 560,729 |
| 14,636 | HP, Inc.
| 443,910 |
| | | | 1,004,639 |
| | Textiles, Apparel & Luxury Goods — 1.9% |
| 1,728 | Carter’s, Inc.
| 170,242 |
See Notes to Financial Statements.
THE GLENMEDE FUND, INC.
Responsible ESG U.S. Equity Portfolio
SCHEDULE OF PORTFOLIO INVESTMENTS — (Continued)
October 31, 2021
| Shares | | | Value |
| COMMON STOCKS* — (Continued) |
| | Textiles, Apparel & Luxury Goods — (Continued) |
| 1,460 | PVH Corp.1
| $ 159,622 |
| 2,282 | Ralph Lauren Corp., Class A
| 290,202 |
| | | | 620,066 |
| | Trading Companies & Distributors — 1.3% |
| 1,140 | United Rentals, Inc.1
| 432,185 |
| | TOTAL COMMON STOCKS
(Cost $22,256,122)
| 32,601,825 |
Face
Amount | | | |
| REPURCHASE AGREEMENT* — 0.8% |
| $252,633 | With Fixed Income Clearing Corp., dated 10/29/21, 0.00%, principal and interest in the amount of $252,633, due 11/1/21, (collateralized by a U.S. Treasury Note with a par value of $235,000, coupon rate of 0.125%, due 10/15/26, market value of $257,689)
| 252,633 |
| | TOTAL REPURCHASE AGREEMENT
(Cost $252,633)
| 252,633 |
TOTAL INVESTMENTS
(Cost $22,508,755)
| 100.0% | $32,854,458 |
OTHER ASSETS IN EXCESS OF LIABILITIES
| 0.0 | 6,904 |
NET ASSETS
| 100.0% | $32,861,362 |
|
| * | Percentages indicated are based on net assets. |
| 1 | Non income-producing security. |
See Notes to Financial Statements.
THE GLENMEDE FUND, INC.
Responsible ESG U.S. Equity Portfolio
SCHEDULE OF PORTFOLIO INVESTMENTS — (Concluded)
October 31, 2021
INDUSTRY DIVERSIFICATION
On October 31, 2021, industry diversification of the Portfolio was as follows:
| | % of
Net Assets | | Value |
| INDUSTRIES: | | | |
Software
| 9.1% | | $ 3,006,070 |
IT Services
| 6.2 | | 2,050,576 |
Banks
| 5.9 | | 1,932,568 |
Life Sciences Tools & Services
| 5.1 | | 1,673,305 |
Specialty Retail
| 4.5 | | 1,485,202 |
Semiconductors & Semiconductor Equipment
| 4.3 | | 1,425,162 |
Media
| 3.9 | | 1,295,509 |
Food Products
| 3.7 | | 1,203,578 |
Real Estate Management & Development
| 3.5 | | 1,145,638 |
Machinery
| 3.3 | | 1,081,949 |
Health Care Providers & Services
| 3.3 | | 1,071,732 |
Capital Markets
| 3.2 | | 1,059,464 |
Technology Hardware, Storage & Peripherals
| 3.1 | | 1,004,639 |
Consumer Finance
| 2.8 | | 908,294 |
Interactive Media & Service
| 2.5 | | 817,214 |
Chemicals
| 2.4 | | 774,849 |
Insurance
| 2.3 | | 741,958 |
Internet & Direct Marketing Retail
| 2.2 | | 728,226 |
Electronic Equipment, Instruments & Components
| 2.1 | | 694,810 |
Entertainment
| 2.0 | | 646,650 |
Textiles, Apparel & Luxury Goods
| 1.9 | | 620,066 |
Communications Equipment
| 1.8 | | 609,052 |
Food & Staples Retailing
| 1.6 | | 511,976 |
Diversified Telecommunication Services
| 1.5 | | 489,310 |
Auto Components
| 1.3 | | 439,297 |
Trading Companies & Distributors
| 1.3 | | 432,185 |
Independent Power & Renewable Electricity Producer
| 1.3 | | 431,055 |
Containers & Packaging
| 1.2 | | 407,095 |
Professional Services
| 1.2 | | 379,724 |
Energy Equipment & Services
| 1.1 | | 378,608 |
Multi-Utilities
| 1.1 | | 349,845 |
Road & Rail
| 1.1 | | 346,621 |
Biotechnology
| 1.0 | | 338,810 |
Building Products
| 1.0 | | 329,989 |
Commercial Services & Supplies
| 0.9 | | 302,715 |
Health Care Technology
| 0.9 | | 299,835 |
Household Products
| 0.9 | | 281,751 |
Equity Real Estate Investment Trusts
| 0.8 | | 280,278 |
Oil, Gas & Consumable Fuels
| 0.8 | | 269,967 |
Metals & Mining
| 0.5 | | 178,640 |
Household Durables
| 0.5 | | 156,634 |
Paper & Forest Products
| 0.1 | | 20,979 |
TOTAL COMMON STOCKS
| 99.2% | | $32,601,825 |
REPURCHASE AGREEMENT
| 0.8 | | 252,633 |
TOTAL INVESTMENTS
| 100.0% | | $32,854,458 |
See Notes to Financial Statements.
THE GLENMEDE FUND, INC.
Women in Leadership U.S. Equity Portfolio
SCHEDULE OF PORTFOLIO INVESTMENTS
October 31, 2021
| Shares | | | Value |
| COMMON STOCKS* — 99.3% |
| | Aerospace & Defense — 2.4% |
| 1,875 | General Dynamics Corp.
| $ 380,156 |
| 784 | Northrop Grumman Corp.
| 280,061 |
| | | | 660,217 |
| | Auto Components — 0.5% |
| 3,273 | BorgWarner, Inc.
| 147,514 |
| | Banks — 5.4% |
| 2,716 | Citigroup, Inc.
| 187,838 |
| 16,220 | Citizens Financial Group, Inc.
| 768,504 |
| 23,345 | KeyCorp
| 543,238 |
| | | | 1,499,580 |
| | Beverages — 0.5% |
| 2,448 | Coca-Cola Co. (The)
| 137,994 |
| | Biotechnology — 1.0% |
| 1,343 | Amgen, Inc.
| 277,961 |
| | Building Products — 1.2% |
| 3,507 | Owens Corning
| 327,589 |
| | Capital Markets — 3.2% |
| 1,782 | Raymond James Financial, Inc.
| 175,687 |
| 3,258 | T Rowe Price Group, Inc.
| 706,595 |
| | | | 882,282 |
| | Chemicals — 3.6% |
| 9,585 | Dow, Inc.
| 536,472 |
| 4,525 | Eastman Chemical Co.
| 470,736 |
| | | | 1,007,208 |
| | Communications Equipment — 1.5% |
| 6,600 | Ciena Corp.1
| 358,314 |
| 325 | F5 Networks, Inc.1
| 68,624 |
| | | | 426,938 |
| | Consumer Finance — 3.2% |
| 8,826 | Ally Financial, Inc.
| 421,353 |
| 10,078 | Synchrony Financial
| 468,123 |
| | | | 889,476 |
| | Containers & Packaging — 0.5% |
| 7,400 | Graphic Packaging Holding Co.
| 147,482 |
| | Diversified Consumer Services — 0.8% |
| 3,101 | Service Corp. International
| 212,388 |
| | Diversified Telecommunication Services — 2.0% |
| 10,593 | Verizon Communications, Inc.
| 561,323 |
| | Electric Utilities — 1.0% |
| 4,700 | Southern Co. (The)
| 292,904 |
| | Energy Equipment & Services — 1.2% |
| 13,337 | Baker Hughes Co., Class A
| 334,492 |
| | Equity Real Estate Investment Trusts — 4.5% |
| 1,343 | American Tower Corp.
| 378,686 |
| 3,322 | Equity Lifestyle Properties, Inc.
| 280,742 |
| 19,995 | VICI Properties, Inc.2
| 586,853 |
| | | | 1,246,281 |
See Notes to Financial Statements.
THE GLENMEDE FUND, INC.
Women in Leadership U.S. Equity Portfolio
SCHEDULE OF PORTFOLIO INVESTMENTS — (Continued)
October 31, 2021
| Shares | | | Value |
| COMMON STOCKS* — (Continued) |
| | Food & Staples Retailing — 1.5% |
| 10,592 | Kroger Co. (The)
| $ 423,892 |
| | Food Products — 2.8% |
| 10,084 | General Mills, Inc.
| 623,191 |
| 838 | Hershey Co. (The)
| 146,944 |
| | | | 770,135 |
| | Gas Utilities — 1.4% |
| 9,175 | UGI Corp.
| 398,287 |
| | Health Care Providers & Services — 4.4% |
| 326 | Anthem, Inc.
| 141,852 |
| 3,090 | CVS Health Corp.
| 275,875 |
| 1,416 | Humana, Inc.
| 655,835 |
| 1,145 | Quest Diagnostics, Inc.
| 168,063 |
| | | | 1,241,625 |
| | Household Products — 0.9% |
| 1,785 | Procter & Gamble Co. (The)
| 255,237 |
| | Insurance — 2.4% |
| 1,663 | Allstate Corp. (The)
| 205,663 |
| 5,019 | MetLife, Inc.
| 315,193 |
| 6,100 | Unum Group
| 155,367 |
| | | | 676,223 |
| | Interactive Media & Services — 5.2% |
| 278 | Alphabet, Inc. - Class A1
| 823,136 |
| 1,910 | Meta Platforms, Inc. - Class A1
| 618,019 |
| | | | 1,441,155 |
| | Internet & Direct Marketing Retail — 0.8% |
| 3,000 | eBay, Inc.
| 230,160 |
| | IT Services — 6.6% |
| 1,714 | Accenture PLC - Class A
| 614,966 |
| 5,377 | Akamai Technologies, Inc.1
| 567,058 |
| 2,111 | Cognizant Technology Solutions Corp. - Class A
| 164,848 |
| 2,071 | PayPal Holdings, Inc.1
| 481,694 |
| | | | 1,828,566 |
| | Leisure Product — 0.5% |
| 1,659 | Brunswick Corp.
| 154,436 |
| | Life Sciences Tools & Services — 2.4% |
| 1,470 | Agilent Technologies, Inc.
| 231,510 |
| 1,161 | Waters Corp.1
| 426,726 |
| | | | 658,236 |
| | Machinery — 2.2% |
| 2,512 | Cummins, Inc.
| 602,478 |
| | Media — 3.6% |
| 2,592 | Comcast Corp. - Class A
| 133,307 |
| 17,864 | Interpublic Group of Cos., Inc. (The)
| 653,286 |
| 3,303 | Omnicom Group, Inc.
| 224,868 |
| | | | 1,011,461 |
| | Multi-line Retail — 1.3% |
| 1,359 | Target Corp.
| 352,824 |
See Notes to Financial Statements.
THE GLENMEDE FUND, INC.
Women in Leadership U.S. Equity Portfolio
SCHEDULE OF PORTFOLIO INVESTMENTS — (Continued)
October 31, 2021
| Shares | | | Value |
| COMMON STOCKS* — (Continued) |
| | Oil, Gas & Consumable Fuels — 0.6% |
| 1,399 | Chevron Corp.
| $ 160,172 |
| | Pharmaceuticals — 2.2% |
| 4,697 | AstraZeneca PLC, Sponsored ADR
| 292,999 |
| 2,425 | Jazz Pharmaceuticals PLC1
| 322,622 |
| | | | 615,621 |
| | Professional Services — 2.1% |
| 6,752 | Booz Allen Hamilton Holding Corp.
| 586,479 |
| | Road & Rail — 1.1% |
| 558 | Norfolk Southern Corp.
| 163,522 |
| 1,638 | XPO Logistics, Inc.1
| 140,540 |
| | | | 304,062 |
| | Semiconductors & Semiconductor Equipment — 4.5% |
| 5,298 | Applied Materials, Inc.
| 723,972 |
| 7,476 | Intel Corp.
| 366,324 |
| 1,232 | Teradyne, Inc.
| 170,311 |
| | | | 1,260,607 |
| | Software — 8.4% |
| 1,878 | Dolby Laboratories, Inc. - Class A
| 165,921 |
| 16,668 | Dropbox, Inc. - Class A1
| 508,207 |
| 984 | Fortinet, Inc.1
| 330,959 |
| 2,712 | Microsoft Corp.
| 899,354 |
| 4,578 | Oracle Corp.
| 439,213 |
| | | | 2,343,654 |
| | Specialty Retail — 3.3% |
| 5,434 | Best Buy Co., Inc.
| 664,252 |
| 2,015 | Dick’s Sporting Goods, Inc.
| 250,283 |
| | | | 914,535 |
| | Technology Hardware, Storage & Peripherals — 5.8% |
| 2,911 | Dell Technologies, Inc. - Class C1
| 320,181 |
| 33,799 | Hewlett Packard Enterprise Co.
| 495,155 |
| 8,993 | NetApp, Inc.
| 803,075 |
| | | | 1,618,411 |
| | Textiles, Apparel & Luxury Goods — 2.8% |
| 5,006 | PVH Corp.1
| 547,306 |
| 1,838 | Ralph Lauren Corp., Class A
| 233,739 |
| | | | 781,045 |
| | TOTAL COMMON STOCKS
(Cost $20,891,396)
| 27,680,930 |
Face
Amount | | | |
| REPURCHASE AGREEMENT* — 1.0% |
| $282,217 | With Fixed Income Clearing Corp., dated 10/29/21, 0.00%, principal and interest in the amount of $282,217, due 11/1/21, (collateralized by a U.S. Treasury Note with a par value of $262,600, coupon rate of 0.125%, due 10/15/26, market value of $287,954)
| 282,217 |
| | TOTAL REPURCHASE AGREEMENT
(Cost $282,217)
| 282,217 |
See Notes to Financial Statements.
THE GLENMEDE FUND, INC.
Women in Leadership U.S. Equity Portfolio
SCHEDULE OF PORTFOLIO INVESTMENTS — (Continued)
October 31, 2021
| Shares | | | Value |
| INVESTMENT OF SECURITY LENDING COLLATERAL* — 2.2% |
| 614,846 | State Street Navigator Securities Lending Government Money Market Portfolio3
| $ 614,846 |
| | TOTAL INVESTMENT OF SECURITY LENDING COLLATERAL
(Cost $614,846)
| 614,846 |
TOTAL INVESTMENTS
(Cost $21,788,459)
| 102.5% | $28,577,993 |
LIABILITIES IN EXCESS OF OTHER ASSETS
| (2.5) | (691,125) |
NET ASSETS
| 100.0% | $27,886,868 |
|
| * | Percentages indicated are based on net assets. |
| 1 | Non income-producing security. |
| 2 | Securities or partial securities on loan. See Note 1. |
| 3 | Represents an investment of securities lending cash collateral. |
| Abbreviations: |
| ADR — American Depositary Receipt |
See Notes to Financial Statements.
THE GLENMEDE FUND, INC.
Women in Leadership U.S. Equity Portfolio
SCHEDULE OF PORTFOLIO INVESTMENTS — (Concluded)
October 31, 2021
INDUSTRY DIVERSIFICATION
On October 31, 2021, industry diversification of the Portfolio was as follows:
| | % of
Net Assets | | Value |
| INDUSTRIES: | | | |
Software
| 8.4% | | $ 2,343,654 |
IT Services
| 6.6 | | 1,828,566 |
Technology Hardware, Storage & Peripherals
| 5.8 | | 1,618,411 |
Banks
| 5.4 | | 1,499,580 |
Interactive Media & Services
| 5.2 | | 1,441,155 |
Semiconductors & Semiconductor Equipment
| 4.5 | | 1,260,607 |
Equity Real Estate Investment Trusts
| 4.5 | | 1,246,281 |
Health Care Providers & Services
| 4.4 | | 1,241,625 |
Media
| 3.6 | | 1,011,461 |
Chemicals
| 3.6 | | 1,007,208 |
Specialty Retail
| 3.3 | | 914,535 |
Consumer Finance
| 3.2 | | 889,476 |
Capital Markets
| 3.2 | | 882,282 |
Textiles, Apparel & Luxury Goods
| 2.8 | | 781,045 |
Food Products
| 2.8 | | 770,135 |
Insurance
| 2.4 | | 676,223 |
Aerospace & Defense
| 2.4 | | 660,217 |
Life Sciences Tools & Services
| 2.4 | | 658,236 |
Pharmaceuticals
| 2.2 | | 615,621 |
Machinery
| 2.2 | | 602,478 |
Professional Services
| 2.1 | | 586,479 |
Diversified Telecommunication Services
| 2.0 | | 561,323 |
Communications Equipment
| 1.5 | | 426,938 |
Food & Staples Retailing
| 1.5 | | 423,892 |
Gas Utilities
| 1.4 | | 398,287 |
Multi-line Retail
| 1.3 | | 352,824 |
Energy Equipment & Services
| 1.2 | | 334,492 |
Building Products
| 1.2 | | 327,589 |
Road & Rail
| 1.1 | | 304,062 |
Electric Utilities
| 1.0 | | 292,904 |
Biotechnology
| 1.0 | | 277,961 |
Household Products
| 0.9 | | 255,237 |
Internet & Direct Marketing Retail
| 0.8 | | 230,160 |
Diversified Consumer Services
| 0.8 | | 212,388 |
Oil, Gas & Consumable Fuels
| 0.6 | | 160,172 |
Leisure Product
| 0.5 | | 154,436 |
Auto Components
| 0.5 | | 147,514 |
Containers & Packaging
| 0.5 | | 147,482 |
Beverages
| 0.5 | | 137,994 |
TOTAL COMMON STOCKS
| 99.3% | | $27,680,930 |
REPURCHASE AGREEMENT
| 1.0 | | 282,217 |
INVESTMENT OF SECURITY LENDING COLLATERAL
| 2.2 | | 614,846 |
TOTAL INVESTMENTS
| 102.5% | | $28,577,993 |
See Notes to Financial Statements.
THE GLENMEDE FUND, INC.
Quantitative U.S. Long/Short Equity Portfolio
SCHEDULE OF PORTFOLIO INVESTMENTS
October 31, 2021
| Shares | | | Value |
| COMMON STOCKS* — 97.7% |
| | Air Freight & Logistics — 2.8% |
| 9,980 | Expeditors International of Washington, Inc.
| $ 1,230,135 |
| 7,240 | Hub Group, Inc. - Class A1
| 568,847 |
| | | | 1,798,982 |
| | Banks — 5.6% |
| 19,900 | Bank OZK
| 888,933 |
| 14,060 | East West Bancorp, Inc.
| 1,117,489 |
| 78,220 | FNB Corp.
| 911,263 |
| 31,260 | Umpqua Holdings Corp.
| 639,267 |
| | | | 3,556,952 |
| | Beverages — 0.9% |
| 6,380 | Monster Beverage Corp.1
| 542,300 |
| | Biotechnology — 1.2% |
| 34,500 | Exelixis, Inc.1
| 742,095 |
| | Capital Markets — 4.6% |
| 30,360 | Federated Hermes, Inc.2
| 1,011,292 |
| 10,414 | Franklin Resources, Inc.2
| 327,937 |
| 19,480 | Invesco, Ltd.2
| 494,987 |
| 14,790 | Stifel Financial Corp.2
| 1,077,747 |
| | | | 2,911,963 |
| | Chemicals — 2.9% |
| 13,200 | Dow, Inc.
| 738,804 |
| 16,720 | Mosaic Co. (The)
| 695,050 |
| 6,420 | Olin Corp.
| 365,812 |
| | | | 1,799,666 |
| | Commercial Services & Supplies — 1.0% |
| 4,720 | Republic Services, Inc., Class A
| 635,312 |
| | Communications Equipment — 0.5% |
| 6,080 | Ciena Corp.1
| 330,083 |
| | Construction & Engineering — 3.1% |
| 10,200 | AECOM1,2
| 697,374 |
| 10,360 | EMCOR Group, Inc.2
| 1,258,636 |
| | | | 1,956,010 |
| | Consumer Finance — 3.0% |
| 13,480 | Ally Financial, Inc.2
| 643,535 |
| 51,840 | SLM Corp.2
| 951,264 |
| 6,420 | Synchrony Financial2
| 298,209 |
| | | | 1,893,008 |
| | Distributors — 1.6% |
| 18,600 | LKQ Corp.1
| 1,024,488 |
| | Diversified Consumer Services — 2.7% |
| 21,340 | Adtalem Global Education, Inc.1
| 788,086 |
| 21,080 | H&R Block, Inc.
| 486,316 |
| 6,660 | Service Corp. International
| 456,143 |
| | | | 1,730,545 |
| | Diversified Financial Services — 1.1% |
| 10,160 | Voya Financial, Inc.2
| 708,863 |
| | Diversified Telecommunication Services — 0.5% |
| 6,200 | Verizon Communications, Inc.
| 328,538 |
See Notes to Financial Statements.
THE GLENMEDE FUND, INC.
Quantitative U.S. Long/Short Equity Portfolio
SCHEDULE OF PORTFOLIO INVESTMENTS — (Continued)
October 31, 2021
| Shares | | | Value |
| COMMON STOCKS* — (Continued) |
| | Electrical Equipment — 1.1% |
| 20,280 | nVent Electric PLC2
| $ 718,926 |
| | Electronic Equipment, Instruments & Components — 3.4% |
| 7,840 | Arrow Electronics, Inc.1
| 907,480 |
| 20,960 | Jabil, Inc.
| 1,256,762 |
| | | | 2,164,242 |
| | Energy Equipment & Services — 1.3% |
| 32,560 | Baker Hughes Co., Class A
| 816,605 |
| | Entertainment — 1.1% |
| 8,920 | Activision Blizzard, Inc.
| 697,455 |
| | Equity Real Estate Investment Trusts — 7.7% |
| 4,540 | Agree Realty Corp.2
| 322,612 |
| 9,960 | Gaming and Leisure Properties, Inc.2
| 482,961 |
| 11,720 | Highwoods Properties, Inc.2
| 525,525 |
| 17,940 | Invitation Homes, Inc.2
| 740,025 |
| 25,960 | Medical Properties Trust, Inc.2
| 553,727 |
| 35,900 | Omega Healthcare Investors, Inc.2
| 1,054,024 |
| 40,720 | VICI Properties, Inc.2
| 1,195,132 |
| | | | 4,874,006 |
| | Food & Staples Retailing — 2.3% |
| 19,084 | Kroger Co. (The)
| 763,742 |
| 30,560 | Sprouts Farmers Market, Inc.1,3
| 676,598 |
| | | | 1,440,340 |
| | Food Products — 1.9% |
| 9,200 | General Mills, Inc.
| 568,560 |
| 7,620 | Tyson Foods, Inc. - Class A
| 609,371 |
| | | | 1,177,931 |
| | Gas Utilities — 0.7% |
| 12,180 | New Jersey Resources Corp.
| 460,526 |
| | Health Care Equipment & Supplies — 0.9% |
| 10,100 | Dentsply Sirona, Inc.
| 577,821 |
| | Health Care Providers & Services — 2.7% |
| 15,230 | Centene Corp.1
| 1,084,985 |
| 7,000 | CVS Health Corp.
| 624,960 |
| | | | 1,709,945 |
| | Hotels, Restaurants & Leisure — 1.9% |
| 41,580 | International Game Technology PLC1,3
| 1,226,194 |
| | Household Durables — 1.7% |
| 22,900 | PulteGroup, Inc.
| 1,101,032 |
| | Insurance — 4.1% |
| 8,580 | American International Group, Inc.
| 506,992 |
| 14,160 | Brown & Brown, Inc.
| 893,638 |
| 6,400 | Fidelity National Financial, Inc.
| 306,624 |
| 35,320 | Old Republic International Corp.
| 912,316 |
| | | | 2,619,570 |
| | Internet & Direct Marketing Retail — 2.1% |
| 17,660 | eBay, Inc.
| 1,354,875 |
| | IT Services — 4.1% |
| 16,360 | Amdocs, Ltd.
| 1,273,462 |
See Notes to Financial Statements.
THE GLENMEDE FUND, INC.
Quantitative U.S. Long/Short Equity Portfolio
SCHEDULE OF PORTFOLIO INVESTMENTS — (Continued)
October 31, 2021
| Shares | | | Value |
| COMMON STOCKS* — (Continued) |
| | IT Services — (Continued) |
| 26,180 | Genpact, Ltd.
| $ 1,291,983 |
| | | | 2,565,445 |
| | Machinery — 2.9% |
| 16,080 | Hillenbrand, Inc.2
| 730,997 |
| 6,540 | Ingersoll Rand, Inc.1,2
| 351,590 |
| 9,900 | Pentair PLC2
| 732,303 |
| | | | 1,814,890 |
| | Media — 2.0% |
| 14,008 | Comcast Corp. - Class A
| 720,432 |
| 22,480 | Discovery, Inc. - Class A1
| 526,931 |
| | | | 1,247,363 |
| | Metals & Mining — 3.3% |
| 29,500 | Commercial Metals Co.
| 949,310 |
| 7,980 | Reliance Steel & Aluminum Co.
| 1,166,357 |
| | | | 2,115,667 |
| | Multi-Utilities — 0.6% |
| 12,780 | MDU Resources Group, Inc.
| 392,729 |
| | Oil, Gas & Consumable Fuels — 1.7% |
| 26,213 | Devon Energy Corp.
| 1,050,617 |
| | Paper & Forest Products — 1.1% |
| 10,740 | Louisiana-Pacific Corp.
| 632,908 |
| 1,098 | Sylvamo Corp.1
| 30,920 |
| | | | 663,828 |
| | Pharmaceuticals — 1.8% |
| 26,260 | Pfizer, Inc.
| 1,148,612 |
| | Professional Services — 1.7% |
| 8,880 | ASGN, Inc.1
| 1,062,581 |
| | Road & Rail — 0.7% |
| 7,540 | Knight-Swift Transportation Holdings, Inc.
| 427,443 |
| | Semiconductors & Semiconductor Equipment — 3.0% |
| 46,700 | Amkor Technology, Inc.
| 1,023,664 |
| 5,880 | Diodes, Inc.1
| 565,009 |
| 6,160 | Intel Corp.
| 301,840 |
| | | | 1,890,513 |
| | Software — 4.3% |
| 40,941 | Dropbox, Inc. - Class A1
| 1,248,291 |
| 5,840 | Oracle Corp.
| 560,290 |
| 11,320 | SS&C Technologies Holdings, Inc.
| 899,600 |
| | | | 2,708,181 |
| | Specialty Retail — 0.6% |
| 2,980 | Best Buy Co., Inc.
| 364,275 |
| | Technology Hardware, Storage & Peripherals — 0.9% |
| 38,600 | Hewlett Packard Enterprise Co.
| 565,490 |
| | Thrifts & Mortgage Finance — 2.0% |
| 77,260 | MGIC Investment Corp.
| 1,248,522 |
| | Trading Companies & Distributors — 1.2% |
| 14,780 | Rush Enterprises, Inc. - Class A2
| 769,742 |
See Notes to Financial Statements.
THE GLENMEDE FUND, INC.
Quantitative U.S. Long/Short Equity Portfolio
SCHEDULE OF PORTFOLIO INVESTMENTS — (Continued)
October 31, 2021
| Shares | | | Value |
| COMMON STOCKS* — (Continued) |
| | Wireless Telecommunication Services — 1.4% |
| 16,860 | Telephone & Data Systems, Inc.
| $ 315,956 |
| 17,840 | United States Cellular Corp.1
| 545,369 |
| | | | 861,325 |
| | TOTAL COMMON STOCKS
(Cost $42,447,636)
| 61,795,496 |
Face
Amount | | | |
| REPURCHASE AGREEMENT* — 0.2% |
| $132,067 | With Fixed Income Clearing Corp., dated 10/29/21, 0.00%, principal and interest in the amount of $132,067, due 11/1/21, (collateralized by a U.S. Treasury Note with a par value of $122,900, coupon rate of 0.125%, due 10/15/26, market value of $134,766)
| 132,067 |
| | TOTAL REPURCHASE AGREEMENT
(Cost $132,067)
| 132,067 |
| Shares | | | |
| INVESTMENT OF SECURITY LENDING COLLATERAL* — 1.1% |
| 687,600 | State Street Navigator Securities Lending Government Money Market Portfolio4
| 687,600 |
| | TOTAL INVESTMENT OF SECURITY LENDING COLLATERAL
(Cost $687,600)
| 687,600 |
TOTAL LONG INVESTMENTS
(Cost $43,267,303)
| 99.0% | $ 62,615,163 |
| COMMON STOCKS SOLD SHORT* — (67.8)% |
| | Aerospace & Defense — (3.3)% |
| (5,540) | Boeing Co. (The)1
| (1,146,946) |
| (1,480) | TransDigm Group, Inc.1
| (923,254) |
| | | | (2,070,200) |
| | Airlines — (3.0)% |
| (5,220) | Alaska Air Group, Inc.1
| (275,616) |
| (14,260) | Southwest Airlines Co.1
| (674,213) |
| (20,220) | United Airlines Holdings, Inc.1
| (932,951) |
| | | | (1,882,780) |
| | Banks — (3.2)% |
| (860) | First Citizens BancShares, Inc. - Class A
| (699,954) |
| (9,980) | Glacier Bancorp, Inc.
| (551,794) |
| (12,320) | Truist Financial Corp.
| (781,951) |
| | | | (2,033,699) |
| | Beverages — (1.5)% |
| (1,240) | Boston Beer Co., Inc. (The) Class A1
| (610,675) |
| (1,540) | Constellation Brands, Inc. - Class A
| (333,888) |
| | | | (944,563) |
| | Capital Markets — (5.9)% |
| (780) | BlackRock, Inc.
| (735,899) |
| (2,600) | Charles Schwab Corp. (The)
| (213,278) |
| (1,680) | MarketAxess Holdings, Inc.
| (686,565) |
| (1,780) | Moody’s Corp.
| (719,387) |
| (3,180) | Morningstar, Inc.
| (1,007,265) |
| (3,040) | Northern Trust Corp.
| (374,042) |
| | | | (3,736,436) |
See Notes to Financial Statements.
THE GLENMEDE FUND, INC.
Quantitative U.S. Long/Short Equity Portfolio
SCHEDULE OF PORTFOLIO INVESTMENTS — (Continued)
October 31, 2021
| Shares | | | Value |
| COMMON STOCKS SOLD SHORT* — (Continued) |
| | Chemicals — (2.5)% |
| (2,040) | Air Products and Chemicals, Inc.
| $ (611,612) |
| (2,000) | Ecolab, Inc.
| (444,440) |
| (3,700) | Scotts Miracle-Gro Co. (The)
| (549,302) |
| | | | (1,605,354) |
| | Commercial Services & Supplies — (1.7)% |
| (4,640) | Casella Waste Systems, Inc. - Class A1
| (402,381) |
| (4,240) | MSA Safety, Inc.
| (648,847) |
| | | | (1,051,228) |
| | Containers & Packaging — (1.2)% |
| (8,580) | Ball Corp.
| (784,898) |
| | Diversified Consumer Services — (1.3)% |
| (4,980) | Bright Horizons Family Solutions, Inc.1
| (826,680) |
| | Electric Utilities — (0.8)% |
| (5,220) | Duke Energy Corp.
| (532,492) |
| | Electronic Equipment, Instruments & Components — (1.9)% |
| (12,712) | National Instruments Corp.
| (539,879) |
| (1,500) | Teledyne Technologies, Inc.1
| (673,830) |
| | | | (1,213,709) |
| | Entertainment — (1.0)% |
| (3,680) | Walt Disney Co. (The)1
| (622,178) |
| | Equity Real Estate Investment Trusts — (4.9)% |
| (58,420) | Host Hotels & Resorts, Inc.1
| (983,209) |
| (26,020) | Lexington Realty Trust REIT
| (379,111) |
| (37,380) | Macerich Co. (The)
| (676,204) |
| (58,803) | Mack-Cali Realty Corp.1
| (1,069,627) |
| | | | (3,108,151) |
| | Food & Staples Retailing — (1.0)% |
| (14,600) | Performance Food Group Co.1
| (660,358) |
| | Health Care Equipment & Supplies — (2.6)% |
| (2,680) | Becton Dickinson and Co.
| (642,101) |
| (2,500) | ResMed, Inc.
| (657,275) |
| (2,200) | Zimmer Biomet Holdings, Inc.
| (314,864) |
| | | | (1,614,240) |
| | Hotels, Restaurants & Leisure — (4.3)% |
| (4,100) | Caesars Entertainment, Inc.1
| (448,786) |
| (8,600) | Cracker Barrel Old Country Store, Inc.
| (1,145,262) |
| (11,360) | Las Vegas Sands Corp.1
| (440,881) |
| (7,560) | Wynn Resorts, Ltd.1
| (678,888) |
| | | | (2,713,817) |
| | Household Products — (0.6)% |
| (2,840) | Kimberly-Clark Corp.
| (367,752) |
| | Insurance — (3.7)% |
| (3,480) | Erie Indemnity Co. - Class A
| (716,219) |
| (3,520) | Globe Life, Inc.
| (313,350) |
| (4,940) | Kemper Corp.
| (313,591) |
| (11,580) | Loews Corp.
| (649,291) |
| (3,540) | Progressive Corp. (The)
| (335,875) |
| | | | (2,328,326) |
See Notes to Financial Statements.
THE GLENMEDE FUND, INC.
Quantitative U.S. Long/Short Equity Portfolio
SCHEDULE OF PORTFOLIO INVESTMENTS — (Continued)
October 31, 2021
| Shares | | | Value |
| COMMON STOCKS SOLD SHORT* — (Continued) |
| | Internet & Direct Marketing Retail — (1.1)% |
| (200) | Amazon.com, Inc.1
| $ (674,486) |
| | Life Sciences Tools & Services — (0.5)% |
| (740) | Illumina, Inc.1
| (307,144) |
| | Machinery — (1.8)% |
| (12,180) | Kennametal, Inc.
| (484,155) |
| (5,900) | Woodward, Inc.
| (666,405) |
| | | | (1,150,560) |
| | Metals & Mining — (0.6)% |
| (16,960) | Cleveland-Cliffs, Inc.1
| (408,906) |
| | Mortgage Real Estate Investment Trust — (0.8)% |
| (23,780) | Arbor Realty Trust, Inc. REIT
| (478,216) |
| | Multi-line Retail — (1.3)% |
| (7,340) | Dollar Tree, Inc.1
| (790,958) |
| | Oil, Gas & Consumable Fuels �� (2.9)% |
| (32,640) | EQT Corp.1
| (649,863) |
| (4,820) | Hess Corp.
| (397,987) |
| (28,000) | Williams Cos., Inc. (The)
| (786,520) |
| | | | (1,834,370) |
| | Pharmaceuticals — (1.6)% |
| (2,660) | Eli Lilly & Co.
| (677,662) |
| (3,940) | Merck & Co., Inc.
| (346,917) |
| | | | (1,024,579) |
| | Real Estate Management & Development — (0.6)% |
| (16,740) | Opendoor Technologies, Inc.1
| (396,905) |
| | Semiconductors & Semiconductor Equipment — (3.4)% |
| (2,080) | Analog Devices, Inc.
| (360,859) |
| (4,380) | Silicon Laboratories, Inc.1
| (826,769) |
| (7,760) | Wolfspeed, Inc.1
| (932,054) |
| | | | (2,119,682) |
| | Software — (4.9)% |
| (2,840) | Autodesk, Inc.1
| (902,012) |
| (1,200) | MicroStrategy, Inc. - Class A1
| (858,072) |
| (4,840) | Pegasystems, Inc.
| (574,605) |
| (1,400) | Tyler Technologies, Inc.1
| (760,508) |
| | | | (3,095,197) |
| | Specialty Retail — (1.9)% |
| (19,960) | Monro, Inc.
| (1,232,730) |
| | Thrifts & Mortgage Finance — (1.2)% |
| (60,880) | Capitol Federal Financial, Inc.
| (738,474) |
See Notes to Financial Statements.
THE GLENMEDE FUND, INC.
Quantitative U.S. Long/Short Equity Portfolio
SCHEDULE OF PORTFOLIO INVESTMENTS — (Continued)
October 31, 2021
| Shares | | | Value |
| COMMON STOCKS SOLD SHORT* — (Continued) |
| | Trading Companies & Distributors — (0.8)% |
| (6,220) | MSC Industrial Direct Co., Inc. - Class A
| $ (522,915) |
| | TOTAL COMMON STOCKS SOLD SHORT
(Proceeds $(42,779,692))
| (42,871,983) |
TOTAL SHORT INVESTMENTS
(Proceeds $(42,779,692))
| (67.8)% | $(42,871,983) |
TOTAL INVESTMENTS
(Cost $487,611)
| 31.2% | $ 19,743,180 |
OTHER ASSETS IN EXCESS OF LIABILITIES
| 68.8 | 43,514,138 |
NET ASSETS
| 100.0% | $ 63,257,318 |
|
| * | Percentages indicated are based on net assets. |
| 1 | Non income-producing security. |
| 2 | All or portion of security pledged as collateral for securities sold short. The total market value of collateral is $9,992,890. |
| 3 | Securities or partial securities on loan. See Note 1. |
| 4 | Represents an investment of securities lending cash collateral. |
See Notes to Financial Statements.
THE GLENMEDE FUND, INC.
Quantitative U.S. Long/Short Equity Portfolio
SCHEDULE OF PORTFOLIO INVESTMENTS — (Continued)
October 31, 2021
INDUSTRY DIVERSIFICATION
On October 31, 2021, industry diversification of the Portfolio was as follows:
| | % of
Net Assets | | Value |
| INDUSTRIES: | | | |
| Long Positions: | | | |
Equity Real Estate Investment Trusts
| 7.7% | | $ 4,874,006 |
Banks
| 5.6 | | 3,556,952 |
Capital Markets
| 4.6 | | 2,911,963 |
Software
| 4.3 | | 2,708,181 |
Insurance
| 4.1 | | 2,619,570 |
IT Services
| 4.1 | | 2,565,445 |
Electronic Equipment, Instruments & Components
| 3.4 | | 2,164,242 |
Metals & Mining
| 3.3 | | 2,115,667 |
Construction & Engineering
| 3.1 | | 1,956,010 |
Consumer Finance
| 3.0 | | 1,893,008 |
Semiconductors & Semiconductor Equipment
| 3.0 | | 1,890,513 |
Machinery
| 2.9 | | 1,814,890 |
Chemicals
| 2.9 | | 1,799,666 |
Air Freight & Logistics
| 2.8 | | 1,798,982 |
Diversified Consumer Services
| 2.7 | | 1,730,545 |
Health Care Providers & Services
| 2.7 | | 1,709,945 |
Food & Staples Retailing
| 2.3 | | 1,440,340 |
Internet & Direct Marketing Retail
| 2.1 | | 1,354,875 |
Thrifts & Mortgage Finance
| 2.0 | | 1,248,522 |
Media
| 2.0 | | 1,247,363 |
Hotels, Restaurants & Leisure
| 1.9 | | 1,226,194 |
Food Products
| 1.9 | | 1,177,931 |
Pharmaceuticals
| 1.8 | | 1,148,612 |
Household Durables
| 1.7 | | 1,101,032 |
Professional Services
| 1.7 | | 1,062,581 |
Oil, Gas & Consumable Fuels
| 1.7 | | 1,050,617 |
Distributors
| 1.6 | | 1,024,488 |
Wireless Telecommunication Services
| 1.4 | | 861,325 |
Energy Equipment & Services
| 1.3 | | 816,605 |
Trading Companies & Distributors
| 1.2 | | 769,742 |
Biotechnology
| 1.2 | | 742,095 |
Electrical Equipment
| 1.1 | | 718,926 |
Diversified Financial Services
| 1.1 | | 708,863 |
Entertainment
| 1.1 | | 697,455 |
Paper & Forest Products
| 1.1 | | 663,828 |
Commercial Services & Supplies
| 1.0 | | 635,312 |
Health Care Equipment & Supplies
| 0.9 | | 577,821 |
Technology Hardware, Storage & Peripherals
| 0.9 | | 565,490 |
Beverages
| 0.9 | | 542,300 |
Gas Utilities
| 0.7 | | 460,526 |
Road & Rail
| 0.7 | | 427,443 |
Multi-Utilities
| 0.6 | | 392,729 |
Specialty Retail
| 0.6 | | 364,275 |
Communications Equipment
| 0.5 | | 330,083 |
Diversified Telecommunication Services
| 0.5 | | 328,538 |
| Short Positions: | | | |
Life Sciences Tools & Services
| (0.5) | | (307,144) |
Household Products
| (0.6) | | (367,752) |
Real Estate Management & Development
| (0.6) | | (396,905) |
Metals & Mining
| (0.6) | | (408,906) |
Mortgage Real Estate Investment Trust
| (0.8) | | (478,216) |
Trading Companies & Distributors
| (0.8) | | (522,915) |
Electric Utilities
| (0.8) | | (532,492) |
See Notes to Financial Statements.
THE GLENMEDE FUND, INC.
Quantitative U.S. Long/Short Equity Portfolio
SCHEDULE OF PORTFOLIO INVESTMENTS — (Concluded)
October 31, 2021
| | % of
Net Assets | | Value |
| INDUSTRIES: — (Continued) | | | |
| Short Positions: — (Continued) | | | |
Entertainment
| (1.0)% | | $ (622,178) |
Food & Staples Retailing
| (1.0) | | (660,358) |
Internet & Direct Marketing Retail
| (1.1) | | (674,486) |
Thrifts & Mortgage Finance
| (1.2) | | (738,474) |
Containers & Packaging
| (1.2) | | (784,898) |
Multi-line Retail
| (1.3) | | (790,958) |
Diversified Consumer Services
| (1.3) | | (826,680) |
Beverages
| (1.5) | | (944,563) |
Pharmaceuticals
| (1.6) | | (1,024,579) |
Commercial Services & Supplies
| (1.7) | | (1,051,228) |
Machinery
| (1.8) | | (1,150,560) |
Electronic Equipment, Instruments & Components
| (1.9) | | (1,213,709) |
Specialty Retail
| (1.9) | | (1,232,730) |
Chemicals
| (2.5) | | (1,605,354) |
Health Care Equipment & Supplies
| (2.6) | | (1,614,240) |
Oil, Gas & Consumable Fuels
| (2.9) | | (1,834,370) |
Airlines
| (3.0) | | (1,882,780) |
Banks
| (3.2) | | (2,033,699) |
Aerospace & Defense
| (3.3) | | (2,070,200) |
Semiconductors & Semiconductor Equipment
| (3.4) | | (2,119,682) |
Insurance
| (3.7) | | (2,328,326) |
Hotels, Restaurants & Leisure
| (4.3) | | (2,713,817) |
Software
| (4.9) | | (3,095,197) |
Equity Real Estate Investment Trusts
| (4.9) | | (3,108,151) |
Capital Markets
| (5.9) | | (3,736,436) |
TOTAL COMMON STOCKS
| 29.9% | | $18,923,513 |
REPURCHASE AGREEMENT
| 0.2 | | 132,067 |
INVESTMENT OF SECURITY LENDING COLLATERAL
| 1.1 | | 687,600 |
TOTAL INVESTMENTS
| 31.2% | | $19,743,180 |
See Notes to Financial Statements.
THE GLENMEDE FUND, INC.
Quantitative U.S. Total Market Equity Portfolio
SCHEDULE OF PORTFOLIO INVESTMENTS
October 31, 2021
| Shares | | | Value |
| COMMON STOCKS* — 127.8% |
| | Air Freight & Logistics — 3.9% |
| 5,680 | Expeditors International of Washington, Inc.1
| $ 700,117 |
| 9,080 | Hub Group, Inc. - Class A1,2
| 713,416 |
| | | | 1,413,533 |
| | Automobiles — 2.8% |
| 58,540 | Ford Motor Co.1,2
| 999,863 |
| | Banks — 6.0% |
| 13,660 | Citizens Financial Group, Inc.1
| 647,211 |
| 49,520 | First Horizon Corp.1
| 840,354 |
| 20,380 | KeyCorp1
| 474,243 |
| 8,960 | Umpqua Holdings Corp.
| 183,232 |
| | | | 2,145,040 |
| | Building Products — 2.1% |
| 7,620 | Fortune Brands Home & Security, Inc.1
| 772,668 |
| | Capital Markets — 2.3% |
| 3,880 | Nasdaq, Inc.1
| 814,296 |
| | Chemicals — 3.6% |
| 4,100 | CF Industries Holdings, Inc.1
| 232,880 |
| 18,600 | Huntsman Corp.1
| 605,988 |
| 11,020 | Mosaic Co. (The)1
| 458,101 |
| | | | 1,296,969 |
| | Commercial Services & Supplies — 1.0% |
| 2,700 | Republic Services, Inc., Class A1
| 363,420 |
| | Communications Equipment — 0.5% |
| 3,060 | Ciena Corp.2
| 166,127 |
| | Construction & Engineering — 3.8% |
| 7,340 | EMCOR Group, Inc.1
| 891,737 |
| 3,940 | Quanta Services, Inc.1
| 477,843 |
| | | | 1,369,580 |
| | Consumer Finance — 3.2% |
| 7,120 | Ally Financial, Inc.
| 339,909 |
| 44,620 | SLM Corp.
| 818,777 |
| | | | 1,158,686 |
| | Containers & Packaging — 0.9% |
| 8,160 | Silgan Holdings, Inc.
| 328,032 |
| | Distributors — 1.6% |
| 10,400 | LKQ Corp.1,2
| 572,832 |
| | Diversified Telecommunication Services — 1.2% |
| 36,920 | Lumen Technologies, Inc.1
| 437,871 |
| | Electric Utilities — 1.2% |
| 8,100 | Exelon Corp.1
| 430,839 |
| | Electrical Equipment — 2.4% |
| 5,560 | Regal Rexnord Corp1
| 846,955 |
| | Electronic Equipment, Instruments & Components — 1.9% |
| 6,040 | Arrow Electronics, Inc.2
| 699,130 |
| | Energy Equipment & Services — 0.7% |
| 10,620 | Baker Hughes Co., Class A1
| 266,350 |
See Notes to Financial Statements.
THE GLENMEDE FUND, INC.
Quantitative U.S. Total Market Equity Portfolio
SCHEDULE OF PORTFOLIO INVESTMENTS — (Continued)
October 31, 2021
| Shares | | | Value |
| COMMON STOCKS* — (Continued) |
| | Entertainment — 1.4% |
| 6,420 | Activision Blizzard, Inc.1
| $ 501,980 |
| | Equity Real Estate Investment Trusts — 5.8% |
| 11,460 | American Homes 4 Rent - Class A1
| 465,276 |
| 4,880 | First Industrial Realty Trust, Inc.
| 284,163 |
| 7,840 | Lamar Advertising Co. - Class A1
| 887,488 |
| 14,940 | VICI Properties, Inc.1
| 438,489 |
| | | | 2,075,416 |
| | Food & Staples Retailing — 2.0% |
| 10,220 | Kroger Co. (The)1
| 409,005 |
| 14,087 | Sprouts Farmers Market, Inc.2,3
| 311,886 |
| | | | 720,891 |
| | Food Products — 4.5% |
| 12,140 | Darling Ingredients, Inc.1,2
| 1,026,073 |
| 3,440 | General Mills, Inc.1
| 212,592 |
| 4,520 | Tyson Foods, Inc. - Class A1
| 361,464 |
| | | | 1,600,129 |
| | Gas Utilities — 1.3% |
| 10,920 | UGI Corp.1
| 474,037 |
| | Health Care Equipment & Supplies — 0.8% |
| 4,900 | Dentsply Sirona, Inc.1
| 280,329 |
| | Health Care Providers & Services — 5.1% |
| 7,180 | Centene Corp.1,2
| 511,504 |
| 5,480 | DaVita, Inc.2
| 565,755 |
| 2,548 | Molina Healthcare, Inc.2
| 753,494 |
| | | | 1,830,753 |
| | Hotels, Restaurants & Leisure — 2.9% |
| 35,280 | International Game Technology PLC2,3
| 1,040,407 |
| | Household Durables — 2.2% |
| 6,620 | DR Horton, Inc.1
| 590,967 |
| 4,337 | PulteGroup, Inc.1
| 208,523 |
| | | | 799,490 |
| | Household Products — 0.8% |
| 6,280 | Central Garden & Pet Co. - Class A1,2
| 290,136 |
| | Insurance — 3.8% |
| 3,200 | Brown & Brown, Inc.1
| 201,952 |
| 10,580 | Fidelity National Financial, Inc.1
| 506,888 |
| 18,000 | Old Republic International Corp.1
| 464,940 |
| 8,000 | Unum Group
| 203,760 |
| | | | 1,377,540 |
| | Interactive Media & Services — 2.2% |
| 18,160 | Cargurus, Inc.2
| 609,086 |
| 3,340 | Twitter, Inc.2
| 178,824 |
| | | | 787,910 |
| | Internet & Direct Marketing Retail — 1.2% |
| 5,620 | eBay, Inc.1
| 431,166 |
| | IT Services — 3.6% |
| 6,000 | Amdocs, Ltd.
| 467,040 |
See Notes to Financial Statements.
THE GLENMEDE FUND, INC.
Quantitative U.S. Total Market Equity Portfolio
SCHEDULE OF PORTFOLIO INVESTMENTS — (Continued)
October 31, 2021
| Shares | | | Value |
| COMMON STOCKS* — (Continued) |
| | IT Services — (Continued) |
| 16,560 | Genpact, Ltd.
| $ 817,236 |
| | | | 1,284,276 |
| | Leisure Product — 0.6% |
| 2,160 | Brunswick Corp.
| 201,074 |
| | Life Sciences Tools & Services — 2.9% |
| 4,660 | Medpace Holdings, Inc.2
| 1,055,723 |
| | Media — 5.5% |
| 11,360 | Comcast Corp. - Class A1
| 584,245 |
| 10,440 | Fox Corp. - Class A
| 414,885 |
| 5,340 | Interpublic Group of Cos., Inc. (The)
| 195,284 |
| 33,821 | News Corp. - Class A
| 774,501 |
| | | | 1,968,915 |
| | Metals & Mining — 1.7% |
| 7,880 | Commercial Metals Co.
| 253,579 |
| 2,546 | Reliance Steel & Aluminum Co.
| 372,123 |
| | | | 625,702 |
| | Mortgage Real Estate Investment Trust — 0.9% |
| 19,840 | Chimera Investment Corp.
| 309,702 |
| | Multi-line Retail — 2.5% |
| 3,420 | Target Corp.1
| 887,900 |
| | Multi-Utilities — 0.8% |
| 9,780 | MDU Resources Group, Inc.
| 300,539 |
| | Oil, Gas & Consumable Fuels — 2.3% |
| 20,200 | Devon Energy Corp.1
| 809,616 |
| | Pharmaceuticals — 3.1% |
| 1,000 | Johnson & Johnson1
| 162,880 |
| 12,720 | Pfizer, Inc.1
| 556,373 |
| 13,580 | Supernus Pharmaceuticals, Inc.2
| 405,363 |
| | | | 1,124,616 |
| | Professional Services — 1.4% |
| 1,700 | ASGN, Inc.2
| 203,422 |
| 2,660 | Robert Half International, Inc.
| 300,766 |
| | | | 504,188 |
| | Semiconductors & Semiconductor Equipment — 6.6% |
| 6,140 | Applied Materials, Inc.1
| 839,031 |
| 9,620 | Diodes, Inc.2
| 924,386 |
| 7,060 | Intel Corp.1
| 345,940 |
| 5,180 | ON Semiconductor Corp.1,2
| 249,003 |
| | | | 2,358,360 |
| | Software — 11.4% |
| 18,560 | Box, Inc. - Class A2
| 479,405 |
| 6,440 | Dolby Laboratories, Inc. - Class A
| 568,974 |
| 18,580 | Dropbox, Inc. - Class A2
| 566,504 |
| 9,200 | Oracle Corp.1
| 882,648 |
| 3,420 | Progress Software Corp.
| 175,822 |
| 6,120 | SPS Commerce, Inc.2
| 934,708 |
| 6,320 | SS&C Technologies Holdings, Inc.1
| 502,250 |
| | | | 4,110,311 |
See Notes to Financial Statements.
THE GLENMEDE FUND, INC.
Quantitative U.S. Total Market Equity Portfolio
SCHEDULE OF PORTFOLIO INVESTMENTS — (Continued)
October 31, 2021
| Shares | | | Value |
| COMMON STOCKS* — (Continued) |
| | Specialty Retail — 2.0% |
| 1,600 | Best Buy Co., Inc.1
| $ 195,584 |
| 2,860 | Williams-Sonoma, Inc.1
| 531,188 |
| | | | 726,772 |
| | Technology Hardware, Storage & Peripherals — 4.5% |
| 25,120 | HP, Inc.1
| 761,890 |
| 9,580 | NetApp, Inc.1
| 855,494 |
| | | | 1,617,384 |
| | Thrifts & Mortgage Finance — 2.6% |
| 58,820 | MGIC Investment Corp.
| 950,531 |
| | Trading Companies & Distributors — 1.9% |
| 5,260 | WESCO International, Inc.1,2
| 681,486 |
| | Wireless Telecommunication Services — 0.4% |
| 8,200 | Telephone & Data Systems, Inc.
| 153,668 |
| | TOTAL COMMON STOCKS
(Cost $26,924,654)
| 45,963,138 |
Face
Amount | | | |
| REPURCHASE AGREEMENT* — 0.5% |
| $187,604 | With Fixed Income Clearing Corp., dated 10/29/21, 0.00%, principal and interest in the amount of $187,604, due 11/1/21, (collateralized by a U.S. Treasury Note with a par value of $174,600, coupon rate of 0.125%, due 10/15/26, market value of $191,457)
| 187,604 |
| | TOTAL REPURCHASE AGREEMENT
(Cost $187,604)
| 187,604 |
| Shares | | | |
| INVESTMENT OF SECURITY LENDING COLLATERAL* — 0.9% |
| 316,958 | State Street Navigator Securities Lending Government Money Market Portfolio4
| 316,958 |
| | TOTAL INVESTMENT OF SECURITY LENDING COLLATERAL
(Cost $316,958)
| 316,958 |
TOTAL LONG INVESTMENTS
(Cost $27,429,216)
| 129.2% | $ 46,467,700 |
| COMMON STOCKS SOLD SHORT* — (28.2)% |
| | Aerospace & Defense — (2.5)% |
| (600) | Boeing Co. (The)2
| (124,218) |
| (1,020) | HEICO Corp.
| (142,178) |
| (2,400) | Hexcel Corp.2
| (136,176) |
| (2,020) | Mercury Systems, Inc.2
| (104,111) |
| (1,620) | Raytheon Technologies Corp.
| (143,953) |
| (380) | TransDigm Group, Inc.2
| (237,051) |
| | | | (887,687) |
| | Air Freight & Logistics — (0.4)% |
| (700) | United Parcel Service, Inc. - Class B
| (149,429) |
| | Airlines — (0.8)% |
| (3,340) | Southwest Airlines Co.2
| (157,915) |
| (2,700) | United Airlines Holdings, Inc.2
| (124,578) |
| | | | (282,493) |
See Notes to Financial Statements.
THE GLENMEDE FUND, INC.
Quantitative U.S. Total Market Equity Portfolio
SCHEDULE OF PORTFOLIO INVESTMENTS — (Continued)
October 31, 2021
| Shares | | | Value |
| COMMON STOCKS SOLD SHORT* — (Continued) |
| | Auto Components — (0.4)% |
| (4,440) | Gentex Corp.
| $ (157,132) |
| | Banks — (2.1)% |
| (5,200) | Cadence Bank
| (150,904) |
| (1,180) | Cullen/Frost Bankers, Inc.
| (152,810) |
| (180) | First Citizens BancShares, Inc. - Class A
| (146,502) |
| (3,320) | First Financial Bankshares, Inc.
| (168,390) |
| (200) | SVB Financial Group2
| (143,480) |
| | | | (762,086) |
| | Beverages — (0.4)% |
| (100) | Boston Beer Co., Inc. (The) Class A2
| (49,248) |
| (400) | Constellation Brands, Inc. - Class A
| (86,724) |
| | | | (135,972) |
| | Building Products — (0.4)% |
| (1,200) | Trex Co., Inc.2
| (127,680) |
| | Capital Markets — (0.3)% |
| (240) | MarketAxess Holdings, Inc.
| (98,081) |
| | Chemicals — (1.4)% |
| (500) | Air Products and Chemicals, Inc.
| (149,905) |
| (1) | Dow, Inc.
| (56) |
| (320) | NewMarket Corp.
| (108,803) |
| (900) | PPG Industries, Inc.
| (144,513) |
| (700) | Scotts Miracle-Gro Co. (The)
| (103,922) |
| | | | (507,199) |
| | Containers & Packaging — (0.3)% |
| (1,000) | AptarGroup, Inc.
| (120,780) |
| | Diversified Consumer Services — (0.3)% |
| (634) | Bright Horizons Family Solutions, Inc.2
| (105,244) |
| | Electric Utilities — (0.7)% |
| (1,420) | MGE Energy, Inc.
| (107,764) |
| (2,000) | Xcel Energy, Inc.
| (129,180) |
| | | | (236,944) |
| | Electrical Equipment — (0.4)% |
| (7,340) | Array Technologies, Inc.2
| (156,709) |
| | Electronic Equipment, Instruments & Components — (0.4)% |
| (3,540) | National Instruments Corp.
| (150,344) |
| | Entertainment — (0.4)% |
| (740) | Walt Disney Co. (The)2
| (125,112) |
| | Equity Real Estate Investment Trusts — (1.6)% |
| (3,940) | Healthpeak Properties, Inc.
| (139,910) |
| (8,000) | Macerich Co. (The)
| (144,720) |
| (7,786) | Mack-Cali Realty Corp.2
| (141,627) |
| (3,200) | Vornado Realty Trust
| (136,416) |
| | | | (562,673) |
| | Food Products — (0.3)% |
| (800) | J&J Snack Foods Corp.
| (118,040) |
| | Health Care Equipment & Supplies — (0.6)% |
| (480) | Becton Dickinson and Co.
| (115,003) |
See Notes to Financial Statements.
THE GLENMEDE FUND, INC.
Quantitative U.S. Total Market Equity Portfolio
SCHEDULE OF PORTFOLIO INVESTMENTS — (Continued)
October 31, 2021
| Shares | | | Value |
| COMMON STOCKS SOLD SHORT* — (Continued) |
| | Health Care Equipment & Supplies — (Continued) |
| (440) | ResMed, Inc.
| $ (115,681) |
| | | | (230,684) |
| | Hotels, Restaurants & Leisure — (2.0)% |
| (1,100) | Caesars Entertainment, Inc.2
| (120,406) |
| (1,580) | Cracker Barrel Old Country Store, Inc.
| (210,409) |
| (980) | Hilton Worldwide Holdings, Inc.2
| (141,071) |
| (2,620) | Las Vegas Sands Corp.2
| (101,682) |
| (1,580) | Wynn Resorts, Ltd.2
| (141,884) |
| | | | (715,452) |
| | Household Products — (0.4)% |
| (1,000) | Kimberly-Clark Corp.
| (129,490) |
| | Insurance — (1.5)% |
| (720) | Erie Indemnity Co. - Class A
| (148,183) |
| (760) | Hanover Insurance Group, Inc.(The)
| (95,760) |
| (2,180) | Kemper Corp.
| (138,386) |
| (1,480) | Progressive Corp. (The)
| (140,423) |
| | | | (522,752) |
| | Internet & Direct Marketing Retail — (0.4)% |
| (40) | Amazon.com, Inc.2
| (134,897) |
| | Leisure Product — (0.3)% |
| (1,020) | Polaris Industries, Inc.
| (117,249) |
| | Machinery — (1.0)% |
| (3,400) | Kennametal, Inc.
| (135,150) |
| (1,180) | PACCAR, Inc.
| (105,752) |
| (1,100) | Woodward, Inc.
| (124,245) |
| | | | (365,147) |
| | Metals & Mining — (0.4)% |
| (5,920) | Cleveland-Cliffs, Inc.2
| (142,731) |
| | Multi-line Retail — (0.4)% |
| (1,480) | Dollar Tree, Inc.2
| (159,485) |
| | Oil, Gas & Consumable Fuels — (0.4)% |
| (6,720) | EQT Corp.2
| (133,795) |
| | Pharmaceuticals — (0.4)% |
| (1,700) | Merck & Co., Inc.
| (149,685) |
| | Road & Rail — (0.9)% |
| (520) | Norfolk Southern Corp.
| (152,386) |
| (640) | Union Pacific Corp.
| (154,496) |
| | | | (306,882) |
| | Semiconductors & Semiconductor Equipment — (2.0)% |
| (800) | Analog Devices, Inc.
| (138,792) |
| (1,800) | Microchip Technology, Inc.
| (133,362) |
| (600) | NVIDIA Corp.
| (153,402) |
| (800) | Silicon Laboratories, Inc.2
| (151,008) |
| (1,300) | Wolfspeed, Inc.2
| (156,143) |
| | | | (732,707) |
| | Software — (1.4)% |
| (280) | ANSYS, Inc.2
| (106,282) |
| (500) | Autodesk, Inc.2
| (158,805) |
See Notes to Financial Statements.
THE GLENMEDE FUND, INC.
Quantitative U.S. Total Market Equity Portfolio
SCHEDULE OF PORTFOLIO INVESTMENTS — (Continued)
October 31, 2021
| Shares | | | Value |
| COMMON STOCKS SOLD SHORT* — (Continued) |
| | Software — (Continued) |
| (200) | MicroStrategy, Inc. - Class A2
| $ (143,012) |
| (200) | Tyler Technologies, Inc.2
| (108,644) |
| | | | (516,743) |
| | Specialty Retail — (1.3)% |
| (1,000) | CarMax, Inc.2
| (136,920) |
| (7,900) | Designer Brands, Inc. - Class A2
| (106,887) |
| (3,440) | Monro, Inc.
| (212,454) |
| | | | (456,261) |
| | Textiles, Apparel & Luxury Goods — (0.3)% |
| (1,660) | VF Corp.
| (120,981) |
| | Thrifts & Mortgage Finance — (0.3)% |
| (9,980) | Capitol Federal Financial, Inc.
| (121,057) |
| | Trading Companies & Distributors — (0.7)% |
| (1,500) | MSC Industrial Direct Co., Inc. - Class A
| (126,105) |
| (300) | WW Grainger, Inc.
| (138,933) |
| | | | (265,038) |
| | Water Utilities — (0.4)% |
| (2,080) | SJW Group
| (137,114) |
| | TOTAL COMMON STOCKS SOLD SHORT
(Proceeds $(10,314,567))
| (10,141,755) |
TOTAL SHORT INVESTMENTS
(Proceeds $(10,314,567))
| (28.2)% | $(10,141,755) |
TOTAL INVESTMENTS
(Cost $17,114,649)
| 101.0% | $ 36,325,945 |
LIABILITIES IN EXCESS OF OTHER ASSETS
| (1.0) | (365,357) |
NET ASSETS
| 100.0% | $ 35,960,588 |
|
| * | Percentages indicated are based on net assets. |
| 1 | All or portion of security pledged as collateral for securities sold short. The total market value of collateral is $12,368,070. |
| 2 | Non income-producing security. |
| 3 | Securities or partial securities on loan. See Note 1. |
| 4 | Represents an investment of securities lending cash collateral. |
See Notes to Financial Statements.
THE GLENMEDE FUND, INC.
Quantitative U.S. Total Market Equity Portfolio
SCHEDULE OF PORTFOLIO INVESTMENTS — (Continued)
October 31, 2021
INDUSTRY DIVERSIFICATION
On October 31, 2021, industry diversification of the Portfolio was as follows:
| | % of
Net Assets | | Value |
| INDUSTRIES: | | | |
| Long Positions: | | | |
Software
| 11.4% | | $ 4,110,311 |
Semiconductors & Semiconductor Equipment
| 6.6 | | 2,358,360 |
Banks
| 6.0 | | 2,145,040 |
Equity Real Estate Investment Trusts
| 5.8 | | 2,075,416 |
Media
| 5.5 | | 1,968,915 |
Health Care Providers & Services
| 5.1 | | 1,830,753 |
Technology Hardware, Storage & Peripherals
| 4.5 | | 1,617,384 |
Food Products
| 4.5 | | 1,600,129 |
Air Freight & Logistics
| 3.9 | | 1,413,533 |
Insurance
| 3.8 | | 1,377,540 |
Construction & Engineering
| 3.8 | | 1,369,580 |
Chemicals
| 3.6 | | 1,296,969 |
IT Services
| 3.6 | | 1,284,276 |
Consumer Finance
| 3.2 | | 1,158,686 |
Pharmaceuticals
| 3.1 | | 1,124,616 |
Life Sciences Tools & Services
| 2.9 | | 1,055,723 |
Hotels, Restaurants & Leisure
| 2.9 | | 1,040,407 |
Automobiles
| 2.8 | | 999,863 |
Thrifts & Mortgage Finance
| 2.6 | | 950,531 |
Multi-line Retail
| 2.5 | | 887,900 |
Electrical Equipment
| 2.4 | | 846,955 |
Capital Markets
| 2.3 | | 814,296 |
Oil, Gas & Consumable Fuels
| 2.3 | | 809,616 |
Household Durables
| 2.2 | | 799,490 |
Interactive Media & Services
| 2.2 | | 787,910 |
Building Products
| 2.1 | | 772,668 |
Specialty Retail
| 2.0 | | 726,772 |
Food & Staples Retailing
| 2.0 | | 720,891 |
Electronic Equipment, Instruments & Components
| 1.9 | | 699,130 |
Trading Companies & Distributors
| 1.9 | | 681,486 |
Metals & Mining
| 1.7 | | 625,702 |
Distributors
| 1.6 | | 572,832 |
Professional Services
| 1.4 | | 504,188 |
Entertainment
| 1.4 | | 501,980 |
Gas Utilities
| 1.3 | | 474,037 |
Diversified Telecommunication Services
| 1.2 | | 437,871 |
Internet & Direct Marketing Retail
| 1.2 | | 431,166 |
Electric Utilities
| 1.2 | | 430,839 |
Commercial Services & Supplies
| 1.0 | | 363,420 |
Containers & Packaging
| 0.9 | | 328,032 |
Mortgage Real Estate Investment Trust
| 0.9 | | 309,702 |
Multi-Utilities
| 0.8 | | 300,539 |
Household Products
| 0.8 | | 290,136 |
Health Care Equipment & Supplies
| 0.8 | | 280,329 |
Energy Equipment & Services
| 0.7 | | 266,350 |
Leisure Product
| 0.6 | | 201,074 |
Communications Equipment
| 0.5 | | 166,127 |
Wireless Telecommunication Services
| 0.4 | | 153,668 |
| Short Positions: | | | |
Capital Markets
| (0.3) | | (98,081) |
Diversified Consumer Services
| (0.3) | | (105,244) |
Leisure Product
| (0.3) | | (117,249) |
Food Products
| (0.3) | | (118,040) |
See Notes to Financial Statements.
THE GLENMEDE FUND, INC.
Quantitative U.S. Total Market Equity Portfolio
SCHEDULE OF PORTFOLIO INVESTMENTS — (Concluded)
October 31, 2021
| | % of
Net Assets | | Value |
| INDUSTRIES: — (Continued) | | | |
| Short Positions: — (Continued) | | | |
Containers & Packaging
| (0.3)% | | $ (120,780) |
Textiles, Apparel & Luxury Goods
| (0.3) | | (120,981) |
Thrifts & Mortgage Finance
| (0.3) | | (121,057) |
Entertainment
| (0.4) | | (125,112) |
Building Products
| (0.4) | | (127,680) |
Household Products
| (0.4) | | (129,490) |
Oil, Gas & Consumable Fuels
| (0.4) | | (133,795) |
Internet & Direct Marketing Retail
| (0.4) | | (134,897) |
Beverages
| (0.4) | | (135,972) |
Water Utilities
| (0.4) | | (137,114) |
Metals & Mining
| (0.4) | | (142,731) |
Air Freight & Logistics
| (0.4) | | (149,429) |
Pharmaceuticals
| (0.4) | | (149,685) |
Electronic Equipment, Instruments & Components
| (0.4) | | (150,344) |
Electrical Equipment
| (0.4) | | (156,709) |
Auto Components
| (0.4) | | (157,132) |
Multi-line Retail
| (0.4) | | (159,485) |
Health Care Equipment & Supplies
| (0.6) | | (230,684) |
Electric Utilities
| (0.7) | | (236,944) |
Trading Companies & Distributors
| (0.7) | | (265,038) |
Airlines
| (0.8) | | (282,493) |
Road & Rail
| (0.9) | | (306,882) |
Machinery
| (1.0) | | (365,147) |
Specialty Retail
| (1.3) | | (456,261) |
Chemicals
| (1.4) | | (507,199) |
Software
| (1.4) | | (516,743) |
Insurance
| (1.5) | | (522,752) |
Equity Real Estate Investment Trusts
| (1.6) | | (562,673) |
Hotels, Restaurants & Leisure
| (2.0) | | (715,452) |
Semiconductors & Semiconductor Equipment
| (2.0) | | (732,707) |
Banks
| (2.1) | | (762,086) |
Aerospace & Defense
| (2.5) | | (887,687) |
TOTAL COMMON STOCKS
| 99.6% | | $35,821,383 |
REPURCHASE AGREEMENT
| 0.5 | | 187,604 |
INVESTMENT OF SECURITY LENDING COLLATERAL
| 0.9 | | 316,958 |
TOTAL INVESTMENTS
| 101.0% | | $36,325,945 |
See Notes to Financial Statements.
THE GLENMEDE FUND, INC.
Strategic Equity Portfolio
SCHEDULE OF PORTFOLIO INVESTMENTS
October 31, 2021
| Shares | | | Value |
| COMMON STOCKS* — 99.4% |
| | Aerospace & Defense — 2.7% |
| 81,708 | Raytheon Technologies Corp.
| $ 7,260,573 |
| | Banks — 5.5% |
| 39,539 | JPMorgan Chase & Co.
| 6,717,281 |
| 38,393 | PNC Financial Services Group, Inc. (The)
| 8,102,075 |
| | | | 14,819,356 |
| | Beverages — 1.8% |
| 30,609 | PepsiCo, Inc.
| 4,946,414 |
| | Biotechnology — 1.3% |
| 13,575 | Biogen, Inc.1
| 3,620,181 |
| | Capital Markets — 1.9% |
| 40,599 | Northern Trust Corp.
| 4,995,301 |
| | Chemicals — 2.1% |
| 34,888 | PPG Industries, Inc.
| 5,601,966 |
| | Communications Equipment — 2.0% |
| 94,588 | Cisco Systems, Inc.
| 5,294,090 |
| | Consumer Finance — 2.4% |
| 57,127 | Discover Financial Services
| 6,473,632 |
| | Electrical Equipment — 2.7% |
| 53,993 | AMETEK, Inc.
| 7,148,673 |
| | Electronic Equipment, Instruments & Components — 3.1% |
| 109,512 | Amphenol Corp. - Class A
| 8,407,236 |
| | Food & Staples Retailing — 1.8% |
| 31,580 | Walmart, Inc.
| 4,718,684 |
| | Health Care Equipment & Supplies — 3.8% |
| 34,597 | Abbott Laboratories
| 4,459,207 |
| 21,782 | Stryker Corp.
| 5,795,537 |
| | | | 10,254,744 |
| | Health Care Providers & Services — 2.8% |
| 26,042 | Laboratory Corp. of America Holdings1
| 7,474,575 |
| | Hotels, Restaurants & Leisure — 3.3% |
| 3,604 | Booking Holdings, Inc.1
| 8,724,491 |
| | Household Products — 1.3% |
| 46,574 | Colgate-Palmolive Co.
| 3,548,473 |
| | Insurance — 2.4% |
| 32,887 | Chubb, Ltd.
| 6,425,462 |
| | Interactive Media & Services — 8.8% |
| 4,567 | Alphabet, Inc. - Class C1
| 13,543,027 |
| 31,557 | Meta Platforms, Inc. - Class A1
| 10,210,899 |
| | | | 23,753,926 |
| | Internet & Direct Marketing Retail — 1.8% |
| 1,409 | Amazon.com, Inc.1
| 4,751,754 |
| | IT Services — 10.9% |
| 20,168 | Accenture PLC - Class A
| 7,236,077 |
| 17,695 | Gartner, Inc.1
| 5,873,147 |
| 42,796 | Global Payments, Inc.
| 6,119,400 |
| 30,052 | Mastercard, Inc. - Class A
| 10,083,047 |
| | | | 29,311,671 |
See Notes to Financial Statements.
THE GLENMEDE FUND, INC.
Strategic Equity Portfolio
SCHEDULE OF PORTFOLIO INVESTMENTS — (Continued)
October 31, 2021
| Shares | | | Value |
| COMMON STOCKS* — (Continued) |
| | Life Sciences Tools & Services — 2.5% |
| 18,228 | Waters Corp.1
| $ 6,699,701 |
| | Machinery — 2.6% |
| 23,735 | Parker-Hannifin Corp.
| 7,039,564 |
| | Media — 2.7% |
| 142,350 | Comcast Corp. - Class A
| 7,321,061 |
| | Multi-line Retail — 2.4% |
| 28,997 | Dollar General Corp.
| 6,423,415 |
| | Oil, Gas & Consumable Fuels — 2.2% |
| 51,132 | Chevron Corp.
| 5,854,103 |
| | Pharmaceuticals — 5.5% |
| 70,904 | Bristol-Myers Squibb Co.
| 4,140,793 |
| 19,496 | Eli Lilly & Co.
| 4,966,801 |
| 25,697 | Zoetis, Inc.
| 5,555,691 |
| | | | 14,663,285 |
| | Road & Rail — 1.7% |
| 13,472 | Old Dominion Freight Line, Inc.
| 4,598,667 |
| | Software — 6.4% |
| 33,231 | Microsoft Corp.
| 11,020,064 |
| 63,624 | Oracle Corp.
| 6,104,087 |
| | | | 17,124,151 |
| | Specialty Retail — 7.2% |
| 18,816 | Home Depot, Inc. (The)
| 6,994,660 |
| 42,571 | Ross Stores, Inc.
| 4,819,037 |
| 20,740 | Ulta Beauty, Inc.1
| 7,619,046 |
| | | | 19,432,743 |
| | Technology Hardware, Storage & Peripherals — 3.8% |
| 68,696 | Apple, Inc.
| 10,290,661 |
| | TOTAL COMMON STOCKS
(Cost $117,779,129)
| 266,978,553 |
Face
Amount | | | |
| REPURCHASE AGREEMENT* — 0.6% |
| $1,720,703 | With Fixed Income Clearing Corp., dated 10/29/21, 0.00%, principal and interest in the amount of $1,720,703, due 11/1/21, (collateralized by a U.S. Treasury Note with a par value of $1,624,100, coupon rate of 2.875%, due 05/31/25, market value of $1,755,148)
| 1,720,703 |
| | TOTAL REPURCHASE AGREEMENT
(Cost $1,720,703)
| 1,720,703 |
TOTAL INVESTMENTS
(Cost $119,499,832)
| 100.0% | $268,699,256 |
LIABILITIES IN EXCESS OF OTHER ASSETS
| (0.0) | (51,467) |
NET ASSETS
| 100.0% | $268,647,789 |
|
| * | Percentages indicated are based on net assets. |
| 1 | Non income-producing security. |
See Notes to Financial Statements.
THE GLENMEDE FUND, INC.
Strategic Equity Portfolio
SCHEDULE OF PORTFOLIO INVESTMENTS — (Concluded)
October 31, 2021
INDUSTRY DIVERSIFICATION
On October 31, 2021, industry diversification of the Portfolio was as follows:
| | % of
Net Assets | | Value |
| INDUSTRIES: | | | |
IT Services
| 10.9% | | $ 29,311,671 |
Interactive Media & Services
| 8.8 | | 23,753,926 |
Specialty Retail
| 7.2 | | 19,432,743 |
Software
| 6.4 | | 17,124,151 |
Banks
| 5.5 | | 14,819,356 |
Pharmaceuticals
| 5.5 | | 14,663,285 |
Technology Hardware, Storage & Peripherals
| 3.8 | | 10,290,661 |
Health Care Equipment & Supplies
| 3.8 | | 10,254,744 |
Hotels, Restaurants & Leisure
| 3.3 | | 8,724,491 |
Electronic Equipment, Instruments & Components
| 3.1 | | 8,407,236 |
Health Care Providers & Services
| 2.8 | | 7,474,575 |
Media
| 2.7 | | 7,321,061 |
Aerospace & Defense
| 2.7 | | 7,260,573 |
Electrical Equipment
| 2.7 | | 7,148,673 |
Machinery
| 2.6 | | 7,039,564 |
Life Sciences Tools & Services
| 2.5 | | 6,699,701 |
Consumer Finance
| 2.4 | | 6,473,632 |
Insurance
| 2.4 | | 6,425,462 |
Multi-line Retail
| 2.4 | | 6,423,415 |
Oil, Gas & Consumable Fuels
| 2.2 | | 5,854,103 |
Chemicals
| 2.1 | | 5,601,966 |
Communications Equipment
| 2.0 | | 5,294,090 |
Capital Markets
| 1.9 | | 4,995,301 |
Beverages
| 1.8 | | 4,946,414 |
Internet & Direct Marketing Retail
| 1.8 | | 4,751,754 |
Food & Staples Retailing
| 1.8 | | 4,718,684 |
Road & Rail
| 1.7 | | 4,598,667 |
Biotechnology
| 1.3 | | 3,620,181 |
Household Products
| 1.3 | | 3,548,473 |
TOTAL COMMON STOCKS
| 99.4% | | $266,978,553 |
REPURCHASE AGREEMENT
| 0.6 | | 1,720,703 |
TOTAL INVESTMENTS
| 100.0% | | $268,699,256 |
See Notes to Financial Statements.
THE GLENMEDE FUND, INC.
Small Cap Equity Portfolio
SCHEDULE OF PORTFOLIO INVESTMENTS
October 31, 2021
| Shares | | | Value |
| COMMON STOCKS* — 98.8% |
| | Air Freight & Logistics — 1.4% |
| 258,891 | Atlas Air Worldwide Holdings, Inc.1
| $ 21,001,238 |
| | Auto Components — 1.0% |
| 104,412 | LCI Industries
| 14,580,092 |
| | Banks — 10.1% |
| 277,336 | Ameris Bancorp
| 14,529,633 |
| 395,752 | Cathay General Bancorp
| 16,696,777 |
| 1,770,737 | FNB Corp.
| 20,629,086 |
| 427,533 | Hancock Whitney Corp.
| 21,154,333 |
| 498,349 | Simmons First National Corp. - Class A
| 14,895,652 |
| 1,150,189 | Umpqua Holdings Corp.
| 23,521,365 |
| 345,188 | United Community Banks, Inc.
| 12,026,350 |
| 287,217 | Wintrust Financial Corp.
| 25,418,704 |
| | | | 148,871,900 |
| | Biotechnology — 0.9% |
| 999,992 | Ironwood Pharmaceuticals, Inc.1
| 12,769,898 |
| | Building Products — 1.5% |
| 178,523 | Masonite International Corp.1
| 21,424,545 |
| | Capital Markets — 3.7% |
| 136,362 | Evercore, Inc. - Class A
| 20,705,206 |
| 284,582 | Stifel Financial Corp.
| 20,737,490 |
| 531,945 | Virtu Financial, Inc. - Class A
| 13,234,792 |
| | | | 54,677,488 |
| | Chemicals — 2.7% |
| 217,389 | Ingevity Corp.1
| 16,936,777 |
| 676,213 | Valvoline, Inc.
| 22,964,193 |
| | | | 39,900,970 |
| | Communications Equipment — 1.1% |
| 300,393 | Ciena Corp.1
| 16,308,336 |
| | Construction & Engineering — 4.3% |
| 255,268 | Arcosa, Inc.
| 13,205,013 |
| 149,867 | Dycom Industries, Inc.1,2
| 11,902,437 |
| 149,867 | EMCOR Group, Inc.
| 18,207,342 |
| 231,552 | MasTec, Inc.1,2
| 20,638,230 |
| | | | 63,953,022 |
| | Containers & Packaging — 1.9% |
| 758,228 | Graphic Packaging Holding Co.
| 15,111,484 |
| 317,520 | Silgan Holdings, Inc.
| 12,764,304 |
| | | | 27,875,788 |
| | Electric Utilities — 1.8% |
| 240,446 | Otter Tail Corp.
| 14,910,056 |
| 236,493 | Portland General Electric Co.
| 11,661,470 |
| | | | 26,571,526 |
| | Electrical Equipment — 0.9% |
| 169,629 | EnerSys
| 13,577,105 |
| | Electronic Equipment, Instruments & Components — 0.9% |
| 1,038,200 | TTM Technologies, Inc.1,2
| 13,745,768 |
| | Equity Real Estate Investment Trusts — 7.6% |
| 531,205 | Hudson Pacific Properties, Inc.
| 13,678,529 |
| 1,118,279 | Lexington Realty Trust
| 16,293,325 |
| 640,670 | Outfront Media, Inc.
| 15,946,276 |
See Notes to Financial Statements.
THE GLENMEDE FUND, INC.
Small Cap Equity Portfolio
SCHEDULE OF PORTFOLIO INVESTMENTS — (Continued)
October 31, 2021
| Shares | | | Value |
| COMMON STOCKS* — (Continued) |
| | Equity Real Estate Investment Trusts — (Continued) |
| 884,172 | Piedmont Office Realty Trust, Inc. - Class A
| $ 15,702,895 |
| 360,807 | STAG Industrial, Inc.
| 15,705,929 |
| 1,202,518 | Uniti Group, Inc.
| 17,208,032 |
| 681,154 | Washington Real Estate Investment Trust REIT
| 17,267,254 |
| | | | 111,802,240 |
| | Food & Staples Retailing — 0.7% |
| 216,664 | Performance Food Group Co.1
| 9,799,713 |
| | Food Products — 1.5% |
| 1,148,212 | Hostess Brands, Inc.1,2
| 21,712,689 |
| | Gas Utilities — 1.4% |
| 293,476 | New Jersey Resources Corp.
| 11,096,328 |
| 435,767 | South Jersey Industries, Inc.2
| 9,918,057 |
| | | | 21,014,385 |
| | Health Care Equipment & Supplies — 5.3% |
| 66,863 | ICU Medical, Inc.1
| 15,654,634 |
| 271,407 | Merit Medical Systems, Inc.1
| 18,254,835 |
| 60,276 | Mesa Laboratories, Inc.2
| 18,426,373 |
| 307,639 | Neogen Corp.1
| 13,016,206 |
| 227,600 | NuVasive, Inc.1
| 12,144,736 |
| | | | 77,496,784 |
| | Health Care Providers & Services — 3.1% |
| 198,615 | AMN Healthcare Services, Inc.1
| 19,603,300 |
| 213,437 | HealthEquity, Inc.1
| 14,125,261 |
| 541,497 | R1 RCM, Inc.1
| 11,750,485 |
| | | | 45,479,046 |
| | Health Care Technology — 3.2% |
| 860,006 | Evolent Health, Inc. - Class A1,2
| 25,172,376 |
| 390,642 | Vocera Communications, Inc.1,2
| 22,102,524 |
| | | | 47,274,900 |
| | Hotels, Restaurants & Leisure — 1.7% |
| 397,559 | Boyd Gaming Corp.1
| 25,356,313 |
| | Household Durables — 2.7% |
| 51,053 | Helen of Troy, Ltd.1,2
| 11,484,372 |
| 418,310 | La-Z-Boy, Inc.
| 13,904,625 |
| 617,584 | Tri Pointe Homes, Inc.1
| 14,939,357 |
| | | | 40,328,354 |
| | Household Products — 1.1% |
| 438,337 | Energizer Holdings, Inc.2
| 15,986,150 |
| | Insurance — 1.3% |
| 275,689 | Stewart Information Services Corp.
| 19,620,786 |
| | Interactive Media & Services — 2.6% |
| 568,836 | Cargurus, Inc.1,2
| 19,078,760 |
| 148,220 | Ziff Davis, Inc.1,2
| 19,012,179 |
| | | | 38,090,939 |
| | Life Sciences Tools & Services — 2.2% |
| 301,381 | NeoGenomics, Inc.1,2
| 13,863,526 |
| 203,555 | Syneos Health, Inc.1
| 18,999,824 |
| | | | 32,863,350 |
| | Machinery — 2.3% |
| 402,500 | Hillenbrand, Inc.
| 18,297,650 |
See Notes to Financial Statements.
THE GLENMEDE FUND, INC.
Small Cap Equity Portfolio
SCHEDULE OF PORTFOLIO INVESTMENTS — (Continued)
October 31, 2021
| Shares | | | Value |
| COMMON STOCKS* — (Continued) |
| | Machinery — (Continued) |
| 227,271 | Timken Co. (The)
| $ 16,124,877 |
| | | | 34,422,527 |
| | Media — 1.1% |
| 105,401 | Nexstar Media Group, Inc. - Class A2
| 15,802,772 |
| | Multi-line Retail — 0.7% |
| 220,683 | Kohl’s Corp.
| 10,709,746 |
| | Oil, Gas & Consumable Fuels — 3.9% |
| 1,243,073 | CNX Resources Corp.1
| 18,161,297 |
| 408,758 | Matador Resources Co.
| 17,106,522 |
| 603,351 | Ovintiv, Inc.
| 22,637,729 |
| | | | 57,905,548 |
| | Pharmaceuticals — 3.1% |
| 182,475 | Pacira BioSciences, Inc.1
| 9,539,793 |
| 355,399 | Prestige Consumer Healthcare, Inc.1
| 21,320,386 |
| 499,996 | Supernus Pharmaceuticals, Inc.1,2
| 14,924,881 |
| | | | 45,785,060 |
| | Professional Services — 2.7% |
| 181,158 | ASGN, Inc.1
| 21,677,366 |
| 61,593 | CACI International, Inc. - Class A1
| 17,716,611 |
| | | | 39,393,977 |
| | Semiconductors & Semiconductor Equipment — 2.8% |
| 268,772 | Diodes, Inc.1
| 25,826,302 |
| 647,704 | Rambus, Inc.1
| 15,072,072 |
| | | | 40,898,374 |
| | Software — 6.8% |
| 281,618 | CommVault Systems, Inc.1
| 17,319,507 |
| 858,030 | Mandiant, Inc.1
| 14,964,043 |
| 323,759 | Progress Software Corp.
| 16,644,450 |
| 120,552 | SPS Commerce, Inc.1
| 18,411,907 |
| 257,573 | Verint Systems, Inc.1,2
| 12,002,902 |
| 1,292,151 | Vonage Holdings Corp.1
| 20,829,474 |
| | | | 100,172,283 |
| | Specialty Retail — 2.4% |
| 99,801 | Asbury Automotive Group, Inc.1
| 19,532,054 |
| 339,259 | Foot Locker, Inc.
| 16,172,476 |
| | | | 35,704,530 |
| | Thrifts & Mortgage Finance — 1.0% |
| 600,786 | Radian Group, Inc.
| 14,340,762 |
| | Trading Companies & Distributors — 5.4% |
| 360,010 | Beacon Roofing Supply, Inc.1
| 19,033,729 |
| 235,505 | Boise Cascade Co.
| 13,334,293 |
| 762,510 | Univar Solutions, Inc.1
| 19,505,006 |
| 208,167 | WESCO International, Inc.1
| 26,970,116 |
| | | | 78,843,144 |
| | TOTAL COMMON STOCKS
(Cost $962,875,078)
| 1,456,062,048 |
See Notes to Financial Statements.
THE GLENMEDE FUND, INC.
Small Cap Equity Portfolio
SCHEDULE OF PORTFOLIO INVESTMENTS — (Continued)
October 31, 2021
Face
Amount | | | Value |
| REPURCHASE AGREEMENT* — 1.3% |
| $19,490,176 | With Fixed Income Clearing Corp., dated 10/29/21, 0.00%, principal and interest in the amount of $19,490,176, due 11/1/21, (collateralized by a U.S. Treasury Note with a par value of $20,357,600, coupon rate of 0.250%, due 05/31/25, market value of $19,879,999)
| $ 19,490,176 |
| | TOTAL REPURCHASE AGREEMENT
(Cost $19,490,176)
| 19,490,176 |
| Shares | | | |
| INVESTMENT OF SECURITY LENDING COLLATERAL* — 3.3% |
| 48,882,501 | State Street Navigator Securities Lending Government Money Market Portfolio3
| 48,882,501 |
| | TOTAL INVESTMENT OF SECURITY LENDING COLLATERAL
(Cost $48,882,501)
| 48,882,501 |
TOTAL INVESTMENTS
(Cost $1,031,247,755)
| 103.4% | $1,524,434,725 |
LIABILITIES IN EXCESS OF OTHER ASSETS
| (3.4) | (49,592,023) |
NET ASSETS
| 100.0% | $1,474,842,702 |
|
| * | Percentages indicated are based on net assets. |
| 1 | Non income-producing security. |
| 2 | Securities or partial securities on loan. See Note 1. |
| 3 | Represents an investment of securities lending cash collateral. |
See Notes to Financial Statements.
THE GLENMEDE FUND, INC.
Small Cap Equity Portfolio
SCHEDULE OF PORTFOLIO INVESTMENTS — (Concluded)
October 31, 2021
INDUSTRY DIVERSIFICATION
On October 31, 2021, industry diversification of the Portfolio was as follows:
| | % of
Net Assets | | Value |
| INDUSTRIES: | | | |
Banks
| 10.1% | | $ 148,871,900 |
Equity Real Estate Investment Trusts
| 7.6 | | 111,802,240 |
Software
| 6.8 | | 100,172,283 |
Trading Companies & Distributors
| 5.4 | | 78,843,144 |
Health Care Equipment & Supplies
| 5.3 | | 77,496,784 |
Construction & Engineering
| 4.3 | | 63,953,022 |
Oil, Gas & Consumable Fuels
| 3.9 | | 57,905,548 |
Capital Markets
| 3.7 | | 54,677,488 |
Health Care Technology
| 3.2 | | 47,274,900 |
Pharmaceuticals
| 3.1 | | 45,785,060 |
Health Care Providers & Services
| 3.1 | | 45,479,046 |
Semiconductors & Semiconductor Equipment
| 2.8 | | 40,898,374 |
Household Durables
| 2.7 | | 40,328,354 |
Chemicals
| 2.7 | | 39,900,970 |
Professional Services
| 2.7 | | 39,393,977 |
Interactive Media & Services
| 2.6 | | 38,090,939 |
Specialty Retail
| 2.4 | | 35,704,530 |
Machinery
| 2.3 | | 34,422,527 |
Life Sciences Tools & Services
| 2.2 | | 32,863,350 |
Containers & Packaging
| 1.9 | | 27,875,788 |
Electric Utilities
| 1.8 | | 26,571,526 |
Hotels, Restaurants & Leisure
| 1.7 | | 25,356,313 |
Food Products
| 1.5 | | 21,712,689 |
Building Products
| 1.5 | | 21,424,545 |
Gas Utilities
| 1.4 | | 21,014,385 |
Air Freight & Logistics
| 1.4 | | 21,001,238 |
Insurance
| 1.3 | | 19,620,786 |
Communications Equipment
| 1.1 | | 16,308,336 |
Household Products
| 1.1 | | 15,986,150 |
Media
| 1.1 | | 15,802,772 |
Auto Components
| 1.0 | | 14,580,092 |
Thrifts & Mortgage Finance
| 1.0 | | 14,340,762 |
Electronic Equipment, Instruments & Components
| 0.9 | | 13,745,768 |
Electrical Equipment
| 0.9 | | 13,577,105 |
Biotechnology
| 0.9 | | 12,769,898 |
Multi-line Retail
| 0.7 | | 10,709,746 |
Food & Staples Retailing
| 0.7 | | 9,799,713 |
TOTAL COMMON STOCKS
| 98.8% | | $1,456,062,048 |
REPURCHASE AGREEMENT
| 1.3 | | 19,490,176 |
INVESTMENT OF SECURITY LENDING COLLATERAL
| 3.3 | | 48,882,501 |
TOTAL INVESTMENTS
| 103.4% | | $1,524,434,725 |
See Notes to Financial Statements.
THE GLENMEDE FUND, INC.
Equity Income Portfolio
SCHEDULE OF PORTFOLIO INVESTMENTS
October 31, 2021
| Shares | | | Value |
| COMMON STOCKS* — 99.5% |
| | Aerospace & Defense — 2.1% |
| 5,373 | Raytheon Technologies Corp.
| $ 477,445 |
| | Air Freight & Logistics — 2.0% |
| 2,106 | United Parcel Service, Inc. - Class B
| 449,568 |
| | Banks — 2.1% |
| 2,736 | JPMorgan Chase & Co.
| 464,819 |
| | Beverages — 2.6% |
| 3,514 | PepsiCo, Inc.
| 567,862 |
| | Biotechnology — 1.9% |
| 2,027 | Amgen, Inc.
| 419,528 |
| | Capital Markets — 8.9% |
| 1,304 | Ameriprise Financial, Inc.
| 393,978 |
| 413 | BlackRock, Inc.
| 389,649 |
| 7,066 | Charles Schwab Corp. (The)
| 579,624 |
| 2,707 | Northern Trust Corp.
| 333,069 |
| 1,299 | T Rowe Price Group, Inc.
| 281,727 |
| | | | 1,978,047 |
| | Chemicals — 3.8% |
| 1,279 | Air Products and Chemicals, Inc.
| 383,457 |
| 2,835 | PPG Industries, Inc.
| 455,216 |
| | | | 838,673 |
| | Communications Equipment — 2.9% |
| 11,336 | Cisco Systems, Inc.
| 634,476 |
| | Distributors — 1.1% |
| 1,850 | Genuine Parts Co.
| 242,554 |
| | Electrical Equipment — 4.0% |
| 2,696 | Eaton Corp. PLC
| 444,193 |
| 1,398 | Rockwell Automation, Inc.
| 446,521 |
| | | | 890,714 |
| | Electronic Equipment, Instruments & Components — 2.1% |
| 3,258 | TE Connectivity, Ltd.
| 475,668 |
| | Food Products — 2.9% |
| 1,987 | Hershey Co. (The)
| 348,420 |
| 4,990 | Mondelez International, Inc. - Class A
| 303,093 |
| | | | 651,513 |
| | Gas Utilities — 1.9% |
| 9,792 | UGI Corp.
| 425,071 |
| | Health Care Equipment & Supplies — 3.7% |
| 3,423 | Abbott Laboratories
| 441,190 |
| 3,238 | Medtronic PLC
| 388,107 |
| | | | 829,297 |
| | Health Care Providers & Services — 2.1% |
| 3,149 | Quest Diagnostics, Inc.
| 462,210 |
| | Hotels, Restaurants & Leisure — 3.5% |
| 1,959 | McDonald’s Corp.
| 481,032 |
| 2,785 | Starbucks Corp.
| 295,405 |
| | | | 776,437 |
| | Household Durables — 1.6% |
| 2,529 | Garmin, Ltd.
| 363,164 |
See Notes to Financial Statements.
THE GLENMEDE FUND, INC.
Equity Income Portfolio
SCHEDULE OF PORTFOLIO INVESTMENTS — (Continued)
October 31, 2021
| Shares | | | Value |
| COMMON STOCKS* — (Continued) |
| | Household Products — 3.5% |
| 5,038 | Colgate-Palmolive Co.
| $ 383,845 |
| 2,835 | Procter & Gamble Co. (The)
| 405,377 |
| | | | 789,222 |
| | Insurance — 5.7% |
| 6,140 | Aflac, Inc.
| 329,534 |
| 1,563 | Allstate Corp. (The)
| 193,296 |
| 1,318 | Everest Re Group, Ltd.
| 344,657 |
| 6,161 | Principal Financial Group, Inc.
| 413,342 |
| | | | 1,280,829 |
| | IT Services — 4.1% |
| 984 | Accenture PLC - Class A
| 353,050 |
| 4,576 | Paychex, Inc.
| 564,129 |
| | | | 917,179 |
| | Machinery — 5.1% |
| 1,574 | Cummins, Inc.
| 377,508 |
| 1,426 | Illinois Tool Works, Inc.
| 324,943 |
| 2,175 | Snap-on, Inc.
| 442,025 |
| | | | 1,144,476 |
| | Media — 4.2% |
| 9,683 | Comcast Corp. - Class A
| 497,996 |
| 11,689 | Interpublic Group of Cos., Inc. (The)
| 427,467 |
| | | | 925,463 |
| | Multi-Utilities — 3.1% |
| 5,402 | Dominion Energy, Inc.
| 410,174 |
| 2,401 | DTE Energy Co.
| 272,153 |
| | | | 682,327 |
| | Oil, Gas & Consumable Fuels — 3.2% |
| 3,434 | Chevron Corp.
| 393,159 |
| 4,380 | Phillips 66
| 327,536 |
| | | | 720,695 |
| | Pharmaceuticals — 9.2% |
| 7,439 | Bristol-Myers Squibb Co.
| 434,438 |
| 2,874 | Eli Lilly & Co.
| 732,180 |
| 3,729 | Johnson & Johnson
| 607,380 |
| 6,407 | Pfizer, Inc.
| 280,242 |
| | | | 2,054,240 |
| | Road & Rail — 2.2% |
| 1,988 | Union Pacific Corp.
| 479,903 |
| | Semiconductors & Semiconductor Equipment — 3.0% |
| 3,553 | Texas Instruments, Inc.
| 666,116 |
| | Specialty Retail — 4.4% |
| 1,692 | Home Depot, Inc. (The)
| 628,984 |
| 5,495 | TJX Cos., Inc. (The)
| 359,868 |
| | | | 988,852 |
| | Technology Hardware, Storage & Peripherals — 2.6% |
| 6,485 | NetApp, Inc.
| 579,111 |
| | TOTAL COMMON STOCKS
(Cost $14,985,452)
| 22,175,459 |
See Notes to Financial Statements.
THE GLENMEDE FUND, INC.
Equity Income Portfolio
SCHEDULE OF PORTFOLIO INVESTMENTS — (Continued)
October 31, 2021
Face
Amount | | | Value |
| REPURCHASE AGREEMENT* — 0.5% |
| $120,692 | With Fixed Income Clearing Corp., dated 10/29/21, 0.00%, principal and interest in the amount of $120,692, due 11/1/21, (collateralized by a U.S. Treasury Note with a par value of $107,900, coupon rate of 0.125%, due 04/15/25, market value of $123,145)
| $ 120,692 |
| | TOTAL REPURCHASE AGREEMENT
(Cost $120,692)
| 120,692 |
TOTAL INVESTMENTS
(Cost $15,106,144)
| 100.0% | $22,296,151 |
LIABILITIES IN EXCESS OF OTHER ASSETS
| (0.0) | (37) |
NET ASSETS
| 100.0% | $22,296,114 |
|
| * | Percentages indicated are based on net assets. |
See Notes to Financial Statements.
THE GLENMEDE FUND, INC.
Equity Income Portfolio
SCHEDULE OF PORTFOLIO INVESTMENTS — (Concluded)
October 31, 2021
INDUSTRY DIVERSIFICATION
On October 31, 2021, industry diversification of the Portfolio was as follows:
| | % of
Net Assets | | Value |
| INDUSTRIES: | | | |
Pharmaceuticals
| 9.2% | | $ 2,054,240 |
Capital Markets
| 8.9 | | 1,978,047 |
Insurance
| 5.7 | | 1,280,829 |
Machinery
| 5.1 | | 1,144,476 |
Specialty Retail
| 4.4 | | 988,852 |
Media
| 4.2 | | 925,463 |
IT Services
| 4.1 | | 917,179 |
Electrical Equipment
| 4.0 | | 890,714 |
Chemicals
| 3.8 | | 838,673 |
Health Care Equipment & Supplies
| 3.7 | | 829,297 |
Household Products
| 3.5 | | 789,222 |
Hotels, Restaurants & Leisure
| 3.5 | | 776,437 |
Oil, Gas & Consumable Fuels
| 3.2 | | 720,695 |
Multi-Utilities
| 3.1 | | 682,327 |
Semiconductors & Semiconductor Equipment
| 3.0 | | 666,116 |
Food Products
| 2.9 | | 651,513 |
Communications Equipment
| 2.9 | | 634,476 |
Technology Hardware, Storage & Peripherals
| 2.6 | | 579,111 |
Beverages
| 2.6 | | 567,862 |
Road & Rail
| 2.2 | | 479,903 |
Aerospace & Defense
| 2.1 | | 477,445 |
Electronic Equipment, Instruments & Components
| 2.1 | | 475,668 |
Banks
| 2.1 | | 464,819 |
Health Care Providers & Services
| 2.1 | | 462,210 |
Air Freight & Logistics
| 2.0 | | 449,568 |
Gas Utilities
| 1.9 | | 425,071 |
Biotechnology
| 1.9 | | 419,528 |
Household Durables
| 1.6 | | 363,164 |
Distributors
| 1.1 | | 242,554 |
TOTAL COMMON STOCKS
| 99.5% | | $22,175,459 |
REPURCHASE AGREEMENT
| 0.5 | | 120,692 |
TOTAL INVESTMENTS
| 100.0% | | $22,296,151 |
See Notes to Financial Statements.
THE GLENMEDE FUND, INC.
Secured Options Portfolio
SCHEDULE OF PORTFOLIO INVESTMENTS
October 31, 2021
| Shares | | | Value |
| EXCHANGE-TRADED FUNDS* — 5.3% |
| 22,100 | SPDR S&P 500 ETF Trust1
| $ 10,149,425 |
| 30,000 | Vanguard S&P 500 ETF1
| 12,664,800 |
| | TOTAL EXCHANGE-TRADED FUNDS
(Cost $6,430,609)
| 22,814,225 |
Face
Amount | | | |
| U.S. TREASURY BILLS* — 26.7% |
| $60,000,000 | U.S. Treasury Bill,
0.047% due 01/6/221
| 59,992,557 |
| 55,000,000 | U.S. Treasury Bill,
0.055% due 04/7/221
| 54,986,208 |
| | TOTAL U.S. TREASURY BILLS
(Cost $114,981,758)
| 114,978,765 |
| REPURCHASE AGREEMENT* — 1.7% |
| 7,484,965 | With Fixed Income Clearing Corp., dated 10/29/21, 0.00%, principal and interest in the amount of $7,484,965, due 11/1/21, (collateralized by a U.S. Treasury Note with a par value of $7,064,700, coupon rate of 2.875%, due 05/31/25, market value of $7,634,746)
| 7,484,965 |
| | TOTAL REPURCHASE AGREEMENT
(Cost $7,484,965)
| 7,484,965 |
TOTAL PURCHASED OPTIONS
(Cost $955,943,280)
| 232.7% | 1,003,848,975 |
TOTAL INVESTMENTS
(Cost $1,084,840,612)
| 266.4% | $1,149,126,930 |
LIABILITIES IN EXCESS OF OTHER ASSETS
| (166.4) | (717,739,446) |
NET ASSETS2
| 100.0% | $ 431,387,484 |
|
| * | Percentages indicated are based on net assets. |
| 1 | All or a portion of this security is held as collateral for written options. |
| 2 | Cash in the amount of $8,581,321 is held as collateral to secure the open written call and put options contracts. |
See Notes to Financial Statements.
THE GLENMEDE FUND, INC.
Secured Options Portfolio
SCHEDULE OF PORTFOLIO INVESTMENTS — (Concluded)
October 31, 2021
| Description | | Counterparty | | Exercise
Price/
FX Rate | | Expiration
Date | | Number of
Contracts | | Notional
Amount | | Market
Value | | Premiums
Paid
(Recieved
by Fund) | | Unrealized
Appreciation/
(Depreciation) |
| PURCHASED OPTIONS | | | | | | | | | | | | | | | | | |
| CALLS: | | | | | | | | | | | | | | | | | |
| S&P 500 Index | | OCC** | | 1,000.00 | | 12/17/21 | USD | | 2,790 | | $ 1,284,901,200 | | $1,003,800,150 | | $ 955,508,040 | | $ 48,292,110 |
| PUTS: | | | | | | | | | | | | | | | | | |
| S&P 500 Index | | OCC** | | 2,000.00 | | 12/17/21 | USD | | 2,790 | | 1,284,901,200 | | 48,825 | | 435,240 | | (386,415) |
| TOTAL PURCHASED OPTIONS | | | | $ 2,569,802,400 | | $1,003,848,975 | | $ 955,943,280 | | $ 47,905,695 |
| WRITTEN OPTIONS | | | | | | | | | | | | | | | | | |
| CALLS: | | | | | | | | | | | | | | | | | |
| S&P 500 Index | | OCC** | | 2,000.00 | | 12/17/21 | USD | | 2,790 | | (1,284,901,200) | | (724,995,450) | | (677,172,060) | | (47,823,390) |
| PUTS: | | | | | | | | | | | | | | | | | |
| S&P 500 Index | | OCC** | | 4,300.00 | | 11/19/21 | USD | | 770 | | (354,614,260) | | (773,850) | | (2,130,516) | | 1,356,666 |
| S&P 500 Index | | OCC** | | 4,500.00 | | 11/19/21 | USD | | 50 | | (23,026,900) | | (137,250) | | (398,375) | | 261,125 |
| S&P 500 Index | | OCC** | | 1,000.00 | | 12/17/21 | USD | | 2,790 | | (1,284,901,200) | | (6,975) | | (39,060) | | 32,085 |
| TOTAL PUTS | | | | $(1,662,542,360) | | $ (918,075) | | $ (2,567,951) | | $ 1,649,876 |
| TOTAL WRITTEN OPTIONS | | | | $(2,947,443,560) | | $ (725,913,525) | | $(679,740,011) | | $(46,173,514) |
|
| ** | The Options Clearing Corp |
SECTOR DIVERSIFICATION*
On October 31, 2021, sector diversification of the Portfolio was as follows:
| | % of
Net Assets | | Value |
| SECTOR: | | | |
Purchased Options
| 232.7% | | $ 1,003,848,975 |
U.S. Treasury Bills
| 26.7 | | 114,978,765 |
Exchange-Traded Funds
| 5.3 | | 22,814,225 |
TOTAL
| 264.7% | | $1,141,641,965 |
REPURCHASE AGREEMENT
| 1.7 | | 7,484,965 |
TOTAL INVESTMENTS
| 266.4% | | $1,149,126,930 |
|
| * | This table does not include written options. Please refer to the Schedule of Portfolio Investments for information on written options. |
See Notes to Financial Statements.
THE GLENMEDE FUND, INC.
Global Secured Options Portfolio
SCHEDULE OF PORTFOLIO INVESTMENTS
October 31, 2021
| Shares | | | Value |
| EXCHANGE-TRADED FUND* — 1.8% |
| 6,000 | iShares MSCI Emerging Markets ETF
| $ 305,520 |
| | TOTAL EXCHANGE-TRADED FUND
(Cost $261,090)
| 305,520 |
Face
Amount | | | |
| U.S. TREASURY BILLS* — 24.5% |
| $2,000,000 | U.S. Treasury Bill,
0.047% due 01/6/221
| 1,999,752 |
| 2,200,000 | U.S. Treasury Bill,
0.055% due 04/7/221
| 2,199,448 |
| | TOTAL U.S. TREASURY BILLS
(Cost $4,199,305)
| 4,199,200 |
| REPURCHASE AGREEMENT* — 5.0% |
| 854,352 | With Fixed Income Clearing Corp., dated 10/29/21, 0.00%, principal and interest in the amount of $854,352, due 11/1/21, (collateralized by a U.S. Treasury Note with a par value of $806,400, coupon rate of 2.875%, due 05/31/25, market value of $871,468)
| 854,352 |
| | TOTAL REPURCHASE AGREEMENT
(Cost $854,352)
| 854,352 |
TOTAL PURCHASED OPTIONS
(Cost $37,689,520)
| 230.7% | 39,578,275 |
TOTAL INVESTMENTS
(Cost $43,004,267)
| 262.0% | $ 44,937,347 |
LIABILITIES IN EXCESS OF OTHER ASSETS
| (162.0) | (27,785,174) |
NET ASSETS2
| 100.0% | $ 17,152,173 |
|
| * | Percentages indicated are based on net assets. |
| 1 | All or a portion of this security is held as collateral for written options. |
| 2 | Cash in the amount of $947,986 is held as collateral to secure the open written call and put options contracts. |
See Notes to Financial Statements.
THE GLENMEDE FUND, INC.
Global Secured Options Portfolio
SCHEDULE OF PORTFOLIO INVESTMENTS — (Concluded)
October 31, 2021
| Description | | Counterparty | | Exercise
Price/
FX Rate | | Expiration
Date | | Number of
Contracts | | Notional
Amount | | Market
Value | | Premiums
Paid
(Recieved
by Fund) | | Unrealized
Appreciation/
(Depreciation) |
| PURCHASED OPTIONS | | | | | | | | | | | | | | | | | |
| CALLS: | | | | | | | | | | | | | | | | | |
| S&P 500 Index | | OCC** | | 1,000.00 | | 12/17/21 | USD | | 110 | | $ 50,659,180 | | $ 39,576,350 | | $ 37,672,360 | | $ 1,903,990 |
| PUTS: | | | | | | | | | | | | | | | | | |
| S&P 500 Index | | OCC** | | 2,000.00 | | 12/17/21 | USD | | 110 | | 50,659,180 | | 1,925 | | 17,160 | | (15,235) |
| TOTAL PURCHASED OPTIONS | | | | $ 101,318,360 | | $ 39,578,275 | | $ 37,689,520 | | $ 1,888,755 |
| WRITTEN OPTIONS | | | | | | | | | | | | | | | | | |
| CALLS: | | | | | | | | | | | | | | | | | |
| S&P 500 Index | | OCC** | | 2,000.00 | | 12/17/21 | USD | | 110 | | (50,659,180) | | (28,584,050) | | (26,698,540) | | (1,885,510) |
| PUTS: | | | | | | | | | | | | | | | | | |
| iShares MSCI Emerging Market ETF | | OCC** | | 55.00 | | 11/19/21 | USD | | 225 | | (1,145,700) | | (91,688) | | (72,058) | | (19,630) |
| iShares MSCI EAFE ETF | | OCC** | | 80.00 | | 11/19/21 | USD | | 530 | | (4,265,970) | | (29,415) | | (64,685) | | 35,270 |
| Russell 2000 Index | | OCC** | | 2,250.00 | | 11/19/21 | USD | | 6 | | (1,378,314) | | (13,890) | | (28,185) | | 14,295 |
| S&P 500 Index | | OCC** | | 4,470.00 | | 11/19/21 | USD | | 17 | | (7,829,146) | | (39,610) | | (142,955) | | 103,345 |
| S&P 500 Index | | OCC** | | 1,000.00 | | 12/17/21 | USD | | 110 | | (50,659,180) | | (275) | | (1,540) | | 1,265 |
| TOTAL PUTS | | | | $ (65,278,310) | | $ (174,878) | | $ (309,423) | | $ 134,545 |
| TOTAL WRITTEN OPTIONS | | | | $(115,937,490) | | $(28,758,928) | | $(27,007,963) | | $(1,750,965) |
|
| ** | The Options Clearing Corp |
SECTOR DIVERSIFICATION*
On October 31, 2021, sector diversification of the Portfolio was as follows:
| | % of
Net Assets | | Value |
| SECTOR: | | | |
Purchased Options
| 230.7% | | $ 39,578,275 |
U.S. Treasury Bills
| 24.5 | | 4,199,200 |
Exchange-Traded Fund
| 1.8 | | 305,520 |
TOTAL
| 257.0% | | $44,082,995 |
REPURCHASE AGREEMENT
| 5.0 | | 854,352 |
TOTAL INVESTMENTS
| 262.0% | | $44,937,347 |
|
| * | This table does not include written options. Please refer to the Schedule of Portfolio Investments for information on written options. |
See Notes to Financial Statements.
THE GLENMEDE FUND, INC.
Core Fixed Income Portfolio
SCHEDULE OF PORTFOLIO INVESTMENTS
October 31, 2021
Face
Amount | | | Value |
| AGENCY NOTES* — 21.1% |
| | Federal Home Loan Bank — 11.8% |
| $ 5,000,000 | 0.250% due 12/4/23
| $ 4,974,015 |
| 15,000,000 | 2.750% due 12/13/24
| 15,890,408 |
| 7,000,000 | 0.375% due 9/23/25
| 6,827,988 |
| 15,000,000 | 3.250% due 11/16/281
| 16,780,448 |
| 4,000,000 | 5.500% due 7/15/36
| 5,825,262 |
| | | | 50,298,121 |
| | Federal National Mortgage Association — 9.3% |
| 10,000,000 | 2.000% due 10/5/221
| 10,169,547 |
| 5,100,000 | 0.250% due 11/27/23
| 5,073,113 |
| 15,000,000 | 2.625% due 9/6/241
| 15,821,895 |
| 7,960,000 | 2.125% due 4/24/261
| 8,313,085 |
| | | | 39,377,640 |
| | TOTAL AGENCY NOTES
(Cost $88,000,601)
| 89,675,761 |
| MORTGAGE-BACKED SECURITIES*,2 — 31.1% |
| | Federal Home Loan Mortgage Corporation — 11.7% |
| 457 | # G18163, 5.500% due 1/1/22
| 458 |
| 13,173 | # G13396, 5.500% due 12/1/23
| 13,453 |
| 31,537 | # D78677, 8.000% due 3/1/27
| 32,109 |
| 62,114 | # C00742, 6.500% due 4/1/29
| 69,886 |
| 1,878,820 | # J38111, 3.000% due 12/1/32
| 1,987,361 |
| 12,614 | # A68937, 6.000% due 11/1/37
| 14,259 |
| 171,647 | # A69653, 5.500% due 12/1/37
| 200,823 |
| 211,849 | # A73370, 5.000% due 2/1/38
| 242,579 |
| 154,129 | # A90421, 4.500% due 12/1/39
| 171,772 |
| 135,484 | # A92890, 4.500% due 7/1/40
| 148,439 |
| 646,342 | # A97620, 4.500% due 3/1/41
| 716,589 |
| 989,954 | # C03770, 3.500% due 2/1/42
| 1,067,664 |
| 656,766 | # Q07651, 3.500% due 4/1/42
| 711,336 |
| 1,196,643 | # Q41208, 3.500% due 6/1/46
| 1,282,190 |
| 4,483,498 | # G08737, 3.000% due 12/1/46
| 4,723,727 |
| 1,562,323 | # Q45735, 3.000% due 1/1/47
| 1,647,949 |
| 3,390,480 | # Q46279, 3.500% due 2/1/47
| 3,613,112 |
| 3,288,211 | # Q47596, 4.000% due 4/1/47
| 3,546,185 |
| 9,874,719 | # RA3173, 3.000% due 7/1/50
| 10,352,824 |
| 3,399,553 | # SD8083, 2.500% due 8/1/50
| 3,493,930 |
| 14,796,378 | # SD8152, 3.000% due 6/1/51
| 15,446,342 |
| | | | 49,482,987 |
| | Federal National Mortgage Association — 19.3% |
| 334 | # 125275, 7.000% due 3/1/24
| 350 |
| 229,593 | # AH6827, 4.000% due 3/1/26
| 243,355 |
| 218,616 | # AI1657, 4.000% due 4/1/26
| 231,359 |
| 382,454 | # AB3900, 3.000% due 11/1/26
| 401,514 |
| 14,417 | # 373328, 8.000% due 3/1/27
| 14,480 |
| 607,508 | # AK4751, 3.000% due 4/1/27
| 641,565 |
| 8,827 | # 390895, 8.000% due 6/1/27
| 8,954 |
| 1,085,567 | # AO0533, 3.000% due 6/1/27
| 1,141,051 |
| 28,838 | # 397602, 8.000% due 8/1/27
| 29,286 |
| 469 | # 499335, 6.500% due 8/1/29
| 528 |
| 3,032 | # 252806, 7.500% due 10/1/29
| 3,513 |
| 198 | # 523497, 7.500% due 11/1/29
| 220 |
| 2,509,208 | # BC2462, 3.000% due 2/1/31
| 2,635,981 |
| 978 | # 588945, 7.000% due 6/1/31
| 1,055 |
| 4,408,264 | # AS7429, 2.500% due 6/1/31
| 4,599,714 |
| 45,297 | # 607862, 7.000% due 9/1/31
| 49,765 |
| 1,966 | # 656872, 6.500% due 8/1/32
| 2,211 |
| 3,130,786 | # MA3391, 3.000% due 6/1/33
| 3,295,288 |
See Notes to Financial Statements.
THE GLENMEDE FUND, INC.
Core Fixed Income Portfolio
SCHEDULE OF PORTFOLIO INVESTMENTS — (Continued)
October 31, 2021
Face
Amount | | | Value |
| MORTGAGE-BACKED SECURITIES*,2 — (Continued) |
| | Federal National Mortgage Association — (Continued) |
| $ 92,386 | # 789856, 6.000% due 8/1/34
| $ 105,456 |
| 22,836 | # 829202, 5.000% due 7/1/35
| 25,670 |
| 67,429 | # 826586, 5.000% due 8/1/35
| 76,750 |
| 15,841 | # 256216, 7.000% due 4/1/36
| 18,558 |
| 45,399 | # 898412, 5.000% due 10/1/36
| 50,165 |
| 9,364 | # 910894, 5.000% due 2/1/37
| 10,434 |
| 15,884 | # 912456, 6.500% due 3/1/37
| 17,867 |
| 220,898 | # 973241, 5.000% due 3/1/38
| 252,692 |
| 60,187 | # 975593, 5.000% due 6/1/38
| 68,883 |
| 82,948 | # 257573, 5.500% due 2/1/39
| 96,902 |
| 219,887 | # AD7128, 4.500% due 7/1/40
| 244,016 |
| 9,972,603 | # MA4152, 2.000% due 10/1/40
| 10,027,492 |
| 2,589,934 | # AH1568, 4.500% due 12/1/40
| 2,894,914 |
| 939,495 | # AH6991, 4.000% due 1/1/41
| 1,029,855 |
| 569,788 | # AH4004, 4.500% due 3/1/41
| 636,573 |
| 536,080 | # AH8351, 4.000% due 3/1/41
| 592,201 |
| 516,853 | # AJ1315, 4.000% due 9/1/41
| 568,462 |
| 657,728 | # AI8779, 4.000% due 11/1/41
| 726,698 |
| 935,371 | # AJ5958, 4.000% due 12/1/41
| 1,031,645 |
| 356,365 | # AK5070, 3.500% due 3/1/42
| 380,021 |
| 1,543,707 | # AK5426, 3.500% due 3/1/42
| 1,668,201 |
| 3,777,297 | # AT7682, 3.500% due 6/1/43
| 4,098,983 |
| 2,000,381 | # AS6326, 3.500% due 12/1/45
| 2,149,216 |
| 1,642,252 | # AS6881, 3.500% due 3/1/46
| 1,760,444 |
| 2,204,306 | # BC0960, 4.000% due 6/1/46
| 2,401,093 |
| 1,388,282 | # AS8966, 4.000% due 3/1/47
| 1,497,071 |
| 1,908,783 | # AS9988, 4.500% due 7/1/47
| 2,077,420 |
| 2,093,014 | # MA3210, 3.500% due 12/1/47
| 2,224,934 |
| 1,670,420 | # BJ9251, 3.500% due 6/1/48
| 1,767,577 |
| 6,804,294 | # FM3727, 3.000% due 7/1/50
| 7,132,427 |
| 6,245,778 | # BQ2863, 2.500% due 9/1/50
| 6,421,638 |
| 10,160,793 | # CA7231, 2.500% due 10/1/50
| 10,461,192 |
| 5,970,276 | # MA4439, 3.000% due 10/1/51
| 6,263,521 |
| | | | 82,079,160 |
| | Government National Mortgage Association — 0.1% |
| 9,258 | # 476259, 7.000% due 8/15/28
| 9,295 |
| 3,544 | # 485264, 7.500% due 2/15/31
| 3,559 |
| 6,672 | # 559304, 7.000% due 9/15/31
| 6,773 |
| 138,620 | # 651859, 5.000% due 6/15/36
| 159,653 |
| 96,869 | # 782150, 5.500% due 4/15/37
| 113,677 |
| 13,985 | # 662521, 6.000% due 8/15/37
| 16,092 |
| 33,147 | # 677545, 6.000% due 11/15/37
| 37,250 |
| 20,703 | # 676291, 6.000% due 12/15/37
| 23,220 |
| 34,011 | # 685836, 5.500% due 4/15/38
| 38,277 |
| 187,268 | # 698235, 5.000% due 6/15/39
| 217,063 |
| | | | 624,859 |
| | TOTAL MORTGAGE-BACKED SECURITIES
(Cost $130,854,469)
| 132,187,006 |
| CORPORATE NOTES* — 27.6% |
| | Banking — 7.6% |
| 5,000,000 | Bank of America Corp., (3M USD LIBOR * 1.51 + 3.71%),
3.705% due 4/24/283
| 5,416,971 |
| 5,000,000 | Bank of America Corp., (3M USD LIBOR * 1.81 + 4.24%),
4.244% due 4/24/383
| 5,854,350 |
| 3,000,000 | Bank of America Corp., (SOFR* 1.01 + 1.20%),
1.197% due 10/24/263
| 2,950,043 |
| 6,000,000 | JPMorgan Chase & Co., (3M USD LIBOR * 0.95 + 3.51%),
3.509% due 1/23/293
| 6,478,754 |
See Notes to Financial Statements.
THE GLENMEDE FUND, INC.
Core Fixed Income Portfolio
SCHEDULE OF PORTFOLIO INVESTMENTS — (Continued)
October 31, 2021
Face
Amount | | | Value |
| CORPORATE NOTES* — (Continued) |
| | Banking — (Continued) |
| $ 5,000,000 | JPMorgan Chase & Co., (SOFR* 1.11 + 1.76%),
1.764% due 11/19/313
| $ 4,736,506 |
| 6,500,000 | PNC Bank NA,
3.250% due 6/1/251
| 6,965,047 |
| | | | 32,401,671 |
| | Beverages, Food & Tobacco — 2.6% |
| 10,000,000 | Archer-Daniels-Midland Co.,
3.250% due 3/27/30
| 10,945,636 |
| | Communications — 4.2% |
| 14,000,000 | Amazon.com, Inc.,
4.800% due 12/5/34
| 17,790,763 |
| | Computer Software & Processing — 5.7% |
| 1,000,000 | Alphabet, Inc.,
2.050% due 8/15/50
| 898,070 |
| 11,250,000 | Apple, Inc.,
4.500% due 2/23/361
| 14,060,202 |
| 8,000,000 | Microsoft Corp.,
3.450% due 8/8/36
| 9,194,534 |
| | | | 24,152,806 |
| | Heavy Machinery — 2.1% |
| 4,000,000 | Caterpillar, Inc.,
2.600% due 4/9/301
| 4,194,308 |
| 4,750,000 | John Deere Capital Corp.,
0.700% due 7/5/23
| 4,764,735 |
| | | | 8,959,043 |
| | Insurance — 1.3% |
| 5,100,000 | Aflac, Inc.,
2.875% due 10/15/26
| 5,420,683 |
| | Media - Broadcasting & Publishing — 1.8% |
| 7,000,000 | Comcast Corp.,
3.150% due 2/15/28
| 7,542,048 |
| | Pharmaceuticals — 2.3% |
| 5,000,000 | Johnson & Johnson,
2.450% due 9/1/60
| 4,830,257 |
| 5,000,000 | Merck & Co., Inc.,
2.750% due 2/10/25
| 5,248,090 |
| | | | 10,078,347 |
| | TOTAL CORPORATE NOTES
(Cost $112,382,928)
| 117,290,997 |
| U.S. TREASURY NOTES/BONDS* — 19.0% |
| 8,000,000 | U.S. Treasury Bonds,
6.625% due 2/15/27
| 10,214,375 |
| 7,000,000 | U.S. Treasury Bonds,
3.500% due 2/15/39
| 8,746,992 |
| 4,000,000 | U.S. Treasury Bonds,
3.125% due 11/15/41
| 4,770,625 |
| 9,000,000 | U.S. Treasury Bonds,
3.750% due 11/15/43
| 11,844,844 |
| 10,000,000 | U.S. Treasury Bonds,
2.250% due 8/15/46
| 10,541,406 |
| 3,000,000 | U.S. Treasury Bonds,
3.000% due 5/15/47
| 3,642,891 |
| 6,000,000 | U.S. Treasury Notes,
2.500% due 1/31/24
| 6,256,172 |
See Notes to Financial Statements.
THE GLENMEDE FUND, INC.
Core Fixed Income Portfolio
SCHEDULE OF PORTFOLIO INVESTMENTS — (Continued)
October 31, 2021
Face
Amount | | | Value |
| U.S. TREASURY NOTES/BONDS* — (Continued) |
| $10,000,000 | U.S. Treasury Notes,
2.875% due 5/31/25
| $ 10,685,937 |
| 2,000,000 | U.S. Treasury Notes,
1.875% due 7/31/26
| 2,066,797 |
| 6,000,000 | U.S. Treasury Notes,
2.250% due 8/15/27
| 6,310,781 |
| 5,000,000 | U.S. Treasury Notes,
3.125% due 11/15/28
| 5,560,352 |
| | TOTAL U.S. TREASURY NOTES/BONDS
(Cost $78,501,629)
| 80,641,172 |
| REPURCHASE AGREEMENT* — 2.4% |
| 10,070,273 | With Fixed Income Clearing Corp., dated 10/29/21, 0.00%, principal and interest in the amount of $10,070,273, due 11/1/21, (collateralized by a U.S. Treasury Note-Bill with a par value of $10,237,900, coupon rate of 0.250% - 2.875%, due 01/15/22-10/31/25, market value of $10,271,727)
| 10,070,273 |
| | TOTAL REPURCHASE AGREEMENT
(Cost $10,070,273)
| 10,070,273 |
| Shares | | | |
| INVESTMENT OF SECURITY LENDING COLLATERAL* — 6.5% |
| 27,537,200 | State Street Navigator Securities Lending Government Money Market Portfolio4
| 27,537,200 |
| | TOTAL INVESTMENT OF SECURITY LENDING COLLATERAL
(Cost $27,537,200)
| 27,537,200 |
TOTAL INVESTMENTS
(Cost $447,347,100)
| 107.7% | $457,402,409 |
LIABILITIES IN EXCESS OF OTHER ASSETS
| (7.7) | (32,890,503) |
NET ASSETS
| 100.0% | $424,511,906 |
|
| * | Percentages indicated are based on net assets. |
| 1 | Securities or partial securities on loan. See Note 1. |
| 2 | Represents current face amount at October 31, 2021. |
| 3 | Floating Rate Bond. Rate shown is as of October 31, 2021. |
| 4 | Represents an investment of securities lending cash collateral. |
See Notes to Financial Statements.
THE GLENMEDE FUND, INC.
Core Fixed Income Portfolio
SCHEDULE OF PORTFOLIO INVESTMENTS — (Concluded)
October 31, 2021
SECTOR DIVERSIFICATION
On October 31, 2021, sector diversification of the Portfolio was as follows:
| | % of
Net Assets | | Value |
| Sector: | | | |
Federal National Mortgage Association
| 28.6% | | $ 121,456,800 |
Corporate
| 27.6 | | 117,290,997 |
U.S. Treasury Notes/Bonds
| 12.4 | | 53,029,805 |
Federal Home Loan Bank
| 11.8 | | 50,298,121 |
Federal Home Loan Mortgage Corporation
| 11.7 | | 49,482,987 |
U.S. Treasury
| 6.6 | | 27,611,367 |
Government National Mortgage Association
| 0.1 | | 624,859 |
TOTAL
| 98.8% | | $419,794,936 |
REPURCHASE AGREEMENT
| 2.4 | | 10,070,273 |
INVESTMENT OF SECURITY LENDING COLLATERAL
| 6.5 | | 27,537,200 |
TOTAL INVESTMENTS
| 107.7% | | $457,402,409 |
See Notes to Financial Statements.
THE GLENMEDE FUND, INC.
Short Term Tax Aware Fixed Income Portfolio
SCHEDULE OF PORTFOLIO INVESTMENTS
October 31, 2021
Face
Amount | | | Value |
| CORPORATE NOTES* — 0.9% |
| | Health Care Services — 0.9% |
| $ 500,000 | CommonSpirit Health,
1.547% due 10/1/25
| $ 498,590 |
| | TOTAL CORPORATE NOTES
(Cost $502,022)
| 498,590 |
| MUNICIPAL BONDS* — 94.6% |
| | Alabama — 1.8% |
| 325,000 | Alabama State Public School and College Authority, Revenue Bonds, Series C,
5.000% due 9/1/22
| 338,008 |
| 500,000 | Black Belt Energy Gas District, AL, Revenue Bonds, Project No.6,
4.000% due 10/1/521
| 570,872 |
| 100,000 | Southeast Energy Authority, AL, Cooperative District, Revenue Bonds, Series A,
4.000% due 10/1/23
| 106,522 |
| | | | 1,015,402 |
| | Arizona — 1.7% |
| 250,000 | City of Phoenix, AZ, Civic Improvement Corporation Airport, AMT, Junior Line Airport, Revenue Bonds, Series B,
5.000% due 7/1/23
| 269,181 |
| 100,000 | City of Yuma AZ, Revenue Bonds, Taxable,
0.527% due 7/15/23
| 99,819 |
| 175,000 | City of Yuma AZ, Revenue Bonds,Refunding,
4.000% due 7/1/23
| 185,406 |
| 400,000 | Yuma, AZ, Municipal Property Corp., Excise Tax Revenue, Revenue Bonds, Refunding,
5.000% due 7/1/22
| 412,572 |
| | | | 966,978 |
| | California — 3.6% |
| 340,000 | California State University, Revenue Bonds, Series D,
0.885% due 11/1/25
| 336,644 |
| | California State, General Obligation Unlimited, Refunding: |
| 500,000 | 5.000% due 9/1/23
| 543,132 |
| 300,000 | 5.000% due 4/1/24
| 333,775 |
| 350,000 | City of Los Angeles, CA, Department of Airports, Airports, Revenue Bonds, Series D,
5.000% due 5/15/23
| 375,242 |
| 450,000 | Golden State Tobacco Securitization Corp, CA, Revenue Bonds, Taxable Refunding,
1.400% due 6/1/25
| 449,293 |
| | | | 2,038,086 |
| | Colorado — 3.2% |
| 450,000 | City and County of Denver, CO, Airport, Revenue Bonds, Variable Refunding, Govermental, Series C,
0.877% due 11/15/23
| 452,218 |
| 200,000 | City and County of Denver, CO, Airport, Revenue Bonds, Variable Refunding, Govermental, Series D,
5.000% due 11/15/311
| 209,579 |
| 125,000 | Colorado State Housing and Finance Authority, Revenue Bonds, AMT - Class 1 Bonds, Series A (GNMA Insured),
1.400% due 11/1/22
| 125,891 |
| 750,000 | E-470, CO, Public Highway Authority, Revenue Bonds, Variable Refunding, Series B, (SOFR*0.67+0.35%),
0.384% due 9/1/392
| 751,600 |
| 250,000 | Larimer Weld and Boulder County, CO School District R-2J Thompson, General Obligation Unlimited,Refunding (State Aid Withholding),
5.000% due 12/15/21
| 251,453 |
| | | | 1,790,741 |
| | Connecticut — 5.0% |
| 605,000 | Connecticut Housing Finance Authority, Revenue Bonds, Taxable Refunding, Series A,
0.300% due 11/15/22
| 604,467 |
| 750,000 | Connecticut State Health and Educational Facilities Authority, Revenue Bonds, Refunding, Nuvance Halthe Issue, Series A,
1.100% due 7/1/481
| 757,742 |
See Notes to Financial Statements.
THE GLENMEDE FUND, INC.
Short Term Tax Aware Fixed Income Portfolio
SCHEDULE OF PORTFOLIO INVESTMENTS — (Continued)
October 31, 2021
Face
Amount | | | Value |
| MUNICIPAL BONDS* — (Continued) |
| | Connecticut — (Continued) |
| $ 500,000 | Connecticut State, Special Tax Revenue, Revenue Bonds, Refunding, Series C,
5.000% due 1/1/23
| $ 527,803 |
| 285,000 | Connecticut, CT, General Obligation Unlimited, Refunding, Series C,
5.000% due 6/1/24
| 292,763 |
| 100,000 | Metropolitan District (The), CT, Revenue Bonds, Taxable Refunding,
0.411% due 4/1/22
| 100,087 |
| | University of Connecticut, Revenue Bonds, Series A: |
| 250,000 | 5.000% due 11/15/23
| 261,962 |
| 250,000 | 5.000% due 8/15/26
| 269,145 |
| | | | 2,813,969 |
| | District Of Columbia — 2.0% |
| 1,000,000 | Metropolitan Washington, DC, Airports Authority, Airport System, Revenue Bonds, AMT - Forward Delivery, Refunding, Series A,
5.000% due 10/1/24
| 1,126,835 |
| | Florida — 5.8% |
| 275,000 | Central Florida Expressway Authority Senior Line, Revenue Bonds, Series A,
5.000% due 7/1/23
| 296,290 |
| 335,000 | County of Broward FL Airport System Revenue, Revenue Bonds, AMT, Series A, Prerefunded 10/01/23 @ 100,
5.250% due 10/1/27
| 366,036 |
| 500,000 | County of Broward FL Port Facilities, Revenue Bonds, Refunding, Subordinate Bond, Series D,
5.000% due 9/1/24
| 559,337 |
| 100,000 | County of Miami-Dade FL Aviation Revenue, Revenue Bonds, Taxable Refunding,
2.504% due 10/1/24
| 104,612 |
| 385,000 | Hillsborough County School Board, FL, Revenue Bonds, Refunding, (AGM Insured),
5.000% due 10/1/23
| 418,123 |
| 390,000 | Manatee County, FL, Port Authority, Revenue Bonds,Taxable Refunding,
0.619% due 10/1/24
| 386,333 |
| 255,000 | Orlando & Orange County, FL, Expressway Authority, Revenue Bonds, Refunding,
5.000% due 7/1/23
| 263,112 |
| 535,000 | Orlando, FL, Utilities Commission, Revenue Bonds, Series A,
5.000% due 10/1/23
| 583,505 |
| 245,000 | School District of Broward County, FL, Certificate Participation, Refunding, BAM-TCRS,
5.000% due 7/1/23
| 264,096 |
| | | | 3,241,444 |
| | Georgia — 0.6% |
| 200,000 | Atlanta, GA, Airport General Revenue, Revenue Bonds, Series C,
5.000% due 1/1/23
| 201,537 |
| 105,000 | Municipal Electric Authority of Georgia, Revenue Bonds, Taxable Refunding, Series B,
1.421% due 1/1/25
| 105,008 |
| | | | 306,545 |
| | Illinois — 5.7% |
| 500,000 | Chicago, IL, O’Hare International Airport, Revenue Bonds, Refunding, Series B,
5.672% due 1/1/22
| 504,430 |
| 300,000 | Cook County, IL, School District No. 100 South Berwyn, General Obligation Unlimited, Refunding, (BAM),
4.000% due 12/1/23
| 321,299 |
| 500,000 | DeKalb County, IL, Community Unit School District No. 428 DeKalb, General Obligation Unlimited, Refunding,
5.000% due 1/1/24
| 548,696 |
| 500,000 | Illinois State Sales Tax Revenue, Revenue Bonds, Series B,
0.941% due 6/15/24
| 495,357 |
| 225,000 | Illinois State Toll Highway Authority, Revenue Bonds, Refunding, Series D,
5.000% due 1/1/23
| 237,321 |
| 500,000 | Illinois State, General Obligation Unlimited, Series C,
4.000% due 3/1/24
| 538,866 |
| 255,000 | McHenry County, IL, Conservation District, General Obligation Unlimited, Refunding,
5.000% due 2/1/24
| 281,223 |
See Notes to Financial Statements.
THE GLENMEDE FUND, INC.
Short Term Tax Aware Fixed Income Portfolio
SCHEDULE OF PORTFOLIO INVESTMENTS — (Continued)
October 31, 2021
Face
Amount | | | Value |
| MUNICIPAL BONDS* — (Continued) |
| | Illinois — (Continued) |
| $ 295,000 | St. Clair County, IL, Community Unit School District No 19, General Obligation Unlimited, Refunding,
4.000% due 2/1/22
| $ 297,749 |
| | | | 3,224,941 |
| | Kansas — 0.7% |
| 375,000 | Wyandotte County-Kansas City, KS, Unified Government, General Obligation Unlimited, Series A, (AGMC Insured),
4.000% due 8/1/24
| 410,912 |
| | Kentucky — 1.6% |
| | Kentucky State Property & Building Commission, Revenue Bonds, Refunding Project No. 112, Series B: |
| 260,000 | 5.000% due 11/1/21
| 260,000 |
| 285,000 | 5.000% due 11/1/24
| 323,832 |
| 300,000 | Louisville & Jefferson County, KY, Metropolitan Government Health System Revenue, Revenue Bonds, Refunding, Series A,
5.000% due 10/1/23
| 326,413 |
| | | | 910,245 |
| | Louisiana — 0.9% |
| 500,000 | New Orleans, LA, Sewage Service Revenue, Revenue Bonds, Refunding,
5.000% due 6/1/22
| 513,724 |
| | Maryland — 1.5% |
| 250,000 | Maryland State Department of Transportation, Revenue Bonds, Taxable Refunding, Series A,
0.806% due 8/1/25
| 246,828 |
| 500,000 | Maryland State, General Obligation Unlimited, Refunding, Series B,
5.000% due 8/1/24
| 563,857 |
| | | | 810,685 |
| | Michigan — 4.8% |
| 500,000 | Hazel Park, MI, School District, General Obligation Unlimited, Refunding, Q-SBLF,
4.000% due 5/1/24
| 544,127 |
| 425,000 | Maple Valley, MI, Schools, General Obligation Unlimited, Refunding (QSBLF Insured),
4.000% due 5/1/23
| 447,698 |
| 500,000 | Michigan State Building Authority, Revenue Bonds,Taxable Refunding,
0.461% due 10/15/22
| 500,750 |
| 200,000 | Michigan State Finance Authority Revenue, Revenue Bonds, Refunding, Series A,
5.000% due 5/15/23
| 214,328 |
| 200,000 | Michigan State Finance Authority Revenue, Revenue Bonds, Refunding, Series MI-1,
5.000% due 12/1/23
| 219,338 |
| 250,000 | Michigan State Finance Authority Revenue, Revenue Bonds, Taxable-Refunding-Trainity Health Credit Group, Series T,
2.208% due 12/1/23
| 257,109 |
| 500,000 | Michigan State, Finance Authority Revenue, Revenue Bonds, Series 2019B,
3.500% due 11/15/441
| 516,092 |
| | | | 2,699,442 |
| | Minnesota — 1.0% |
| 500,000 | Minneapolis-St Paul, MN, Metropolitan Airports Commission, Revenue Bonds, Refunding, Series B,
5.000% due 1/1/25
| 567,196 |
| | Nebraska — 0.2% |
| 100,000 | City of Lincoln NE Electric System Revenue, Revenue Bonds, Taxable Refunding, Series B,
0.399% due 9/1/23
| 99,777 |
| | Nevada — 0.9% |
| 210,000 | Clark County School District, NV, General Obligation, Limited., Refunding, Series A,
5.000% due 6/15/24
| 234,418 |
| 240,000 | Clark County School District, NV, General Obligation, Limited., Series D,
5.000% due 6/15/24
| 267,907 |
| | | | 502,325 |
See Notes to Financial Statements.
THE GLENMEDE FUND, INC.
Short Term Tax Aware Fixed Income Portfolio
SCHEDULE OF PORTFOLIO INVESTMENTS — (Continued)
October 31, 2021
Face
Amount | | | Value |
| MUNICIPAL BONDS* — (Continued) |
| | New Jersey — 4.1% |
| $ 250,000 | County of Morris NJ, County Improvement Authority Revenue, Revenue Bonds, Series B,
0.571% due 2/1/24
| $ 247,903 |
| 300,000 | Maple Shade Township School District, NJ, General Obligation Unlimited, Refunding,
5.000% due 10/1/253
| 347,445 |
| 200,000 | New Jersey Economic Development Authority, Revenue Bonds,
5.000% due 3/1/23
| 203,024 |
| 525,000 | New Jersey State Economic Development Authority Revenue, Revenue Bonds, Refunding, Series NN,
5.000% due 3/1/22
| 533,160 |
| 180,000 | New Jersey State Turnpike Authority, Revenue Bonds, Series B,
5.000% due 1/1/23
| 189,705 |
| 525,000 | New Jersey Turnpike Authority, Revenue Bonds, Taxable Refunding, Series B,
0.638% due 1/1/24
| 523,366 |
| 275,000 | Township of Pennsauken NJ, General Obligation Unlimited, Taxable Refunding,
0.760% due 8/15/23
| 274,245 |
| | | | 2,318,848 |
| | New York — 7.1% |
| 615,000 | New York City, NY, General Obligation Unlimited,Refunding, Series B,
5.000% due 8/1/23
| 666,050 |
| 500,000 | New York City, NY, Transitional Finance Authority Future Tax Secured Revenue, Revenue Bonds,
2.800% due 11/1/23
| 520,896 |
| | New York State Dormitory Authority, Personal Income Tax, Revenue Bonds, Refunding, Series A: |
| 125,000 | 4.000% due 12/15/22
| 130,327 |
| 250,000 | 5.000% due 3/15/24
| 277,805 |
| | New York State Dormitory Authority, Sales Tax Revenue, Revenue Bonds, Series 2015B-A: |
| 210,000 | 5.000% due 3/15/23
| 223,632 |
| 150,000 | 5.000% due 3/15/24
| 166,343 |
| | New York State Urban Development Corp., Personal Income Tax, Revenue Bonds: |
| 250,000 | 5.000% due 3/15/22
| 254,473 |
| 365,000 | 0.720% due 3/15/23
| 366,092 |
| 350,000 | New York, Metropolitan Transportation Authority Revenue, Dedicated Tax Fund,Revenue Bonds, Series A,
5.255% due 11/15/22
| 367,082 |
| 150,000 | Port Authority of New York & New Jersey, Revenue Bonds, Series 179,
5.000% due 12/1/26
| 164,503 |
| | Port Authority of New York and New Jersey, Revenue Bonds: |
| 310,000 | 1.086% due 7/1/23
| 312,858 |
| 200,000 | 5.000% due 10/15/23
| 217,748 |
| 295,000 | Triborough Bridge and Tunnel Authority, NY, General Revenue Bonds, Refunding, Series A,
5.000% due 11/15/24
| 335,648 |
| | | | 4,003,457 |
| | Ohio — 4.2% |
| | City of Akron OH Income Tax Revenue, Revenue Bonds: |
| 355,000 | 4.000% due 12/1/22
| 369,011 |
| 360,000 | 4.000% due 12/1/23
| 386,336 |
| 390,000 | Ohio State, General Obligation Unlimited, Series C,
5.000% due 3/1/24
| 432,184 |
| 325,000 | Ohio State, Higher Educational Facility Commission, Revenue Bonds, Refunding,
5.000% due 10/1/23
| 353,157 |
| 425,000 | Ohio State, Hospital Facilities Revenue, Revenue Bonds, Series A,
5.000% due 1/15/23
| 429,056 |
| 340,000 | Ohio State, Hospital Facilities Revenue, Revenue Bonds, Series B,
5.000% due 1/1/26
| 401,197 |
| | | | 2,370,941 |
| | Pennsylvania — 16.0% |
| 475,000 | Allegheny County, PA, General Obligation Unlimited, Refunding, Series C-75,
4.000% due 11/1/21
| 475,000 |
| 300,000 | Allegheny County, PA, Hospital Development Authority, Revenue Bonds, Refunding University of Pittsburgh, Series A,
5.000% due 7/15/23
| 323,751 |
See Notes to Financial Statements.
THE GLENMEDE FUND, INC.
Short Term Tax Aware Fixed Income Portfolio
SCHEDULE OF PORTFOLIO INVESTMENTS — (Continued)
October 31, 2021
Face
Amount | | | Value |
| MUNICIPAL BONDS* — (Continued) |
| | Pennsylvania — (Continued) |
| $ 325,000 | Allegheny County, PA, Hospital Development Authority, Revenue Bonds, Refunding University of Pittsburgh Center Series A,
5.000% due 7/15/25
| $ 376,440 |
| | Bensalem Township, PA, School District, General Obligation Limited, Taxable Refunding (State Aid Withholding): |
| 175,000 | 1.855% due 6/1/22
| 176,557 |
| 160,000 | 1.917% due 6/1/23
| 163,341 |
| 215,000 | 1.972% due 6/1/24
| 220,633 |
| 400,000 | Bucks County, PA, Centennial School District, General Obligation Limited, Refunding, Series B, (State Aid Withholding),
5.000% due 12/15/21
| 402,300 |
| 675,000 | City of Philadelphia PA, General Obligation Unlimited, Refunding,
5.000% due 8/1/22
| 699,274 |
| 515,000 | City of Philadelphia, PA, Airport Revenue, Revenue Bonds, AMT Refunding, Series B,
5.000% due 7/1/24
| 575,251 |
| 750,000 | Delaware Valley, PA, Regional Finance Authority, Revenue Bonds, Refunding,Series B,
5.000% due 11/1/24
| 846,670 |
| 460,000 | East Norriton-Plymouth-Whitpain, PA, Joint Sewer Authority, Revenue Bonds, Refunding,
0.904% due 8/1/23
| 458,758 |
| 400,000 | Lehigh Country, PA, General Purpose Hospital, Revenue Bonds, Refunding, Series A,
5.000% due 7/1/23
| 431,456 |
| 425,000 | Montgomery County, PA, Higher Education and Health Authority, Revenue Bonds, Refunding,
5.000% due 9/1/23
| 459,865 |
| 200,000 | Montgomery County, PA, Higher Education and Health Authority, Revenue Bonds, Refunding, (AGM Insured),
0.409% due 5/1/23
| 199,027 |
| 100,000 | Montgomery County, PA, Industrial Development Authority, Revenue Bonds, Refunding,
4.000% due 12/1/22
| 103,714 |
| 400,000 | New Castle Area School District, PA, General Obligation Limited, (BAM Insured, State Aid withholding),
3.000% due 3/1/23
| 413,483 |
| 290,000 | New Castle Sanitation Authority, PA, Revenue Bonds, Taxable Refunding, (AGMC Insured),
1.017% due 6/1/24
| 286,889 |
| 510,000 | New Kensington, PA, Municipal Sanitary Authority, Revenue Bonds, (AGMC Insured),
0.592% due 12/1/23
| 507,015 |
| 500,000 | Pennsylvania State University, Taxable, Revenue Bonds, Series B,
1.780% due 9/1/25
| 511,924 |
| 400,000 | Pennsylvania State University, Tax-Exempt, Revenue Bonds, Series E,
5.000% due 3/1/24
| 443,563 |
| 200,000 | Philadelphia, PA, School District, General Obligation Limited, Series A (State Aid Withholding),
5.000% due 9/1/23
| 217,060 |
| 105,000 | Public Parking Authority of Pittsburgh, Revenue Bonds, Prefunded, Series A,
5.000% due 12/1/23
| 115,097 |
| 195,000 | Public Parking Authority of Pittsburgh, Revenue Bonds, Unrefunded, Series A,
5.000% due 12/1/23
| 211,810 |
| 355,000 | State Public School Building Authority Paclg, Revenue Bonds, Refunding-Community College of Allegheny Co. Project, Series B (BAM Insured),
4.000% due 7/15/22
| 364,444 |
| | | | 8,983,322 |
| | Rhode Island — 0.7% |
| 400,000 | Rhode Island State, Health and Educational Building Corporation, Public School Revenue, Revenue Bonds, Refunding, Series A,
5.000% due 5/15/22
| 410,277 |
| | South Carolina — 1.0% |
| 350,000 | Charleston, SC, Educational Excellence Finance Corp., Revenue Bonds, Taxable Refunding,
0.527% due 12/1/22
| 350,379 |
| 200,000 | South Carolina St Public Svc A Scsutl 12/24 Fixed 5,
5.000% due 12/1/24
| 227,649 |
| | | | 578,028 |
See Notes to Financial Statements.
THE GLENMEDE FUND, INC.
Short Term Tax Aware Fixed Income Portfolio
SCHEDULE OF PORTFOLIO INVESTMENTS — (Continued)
October 31, 2021
Face
Amount | | | Value |
| MUNICIPAL BONDS* — (Continued) |
| | South Dakota — 0.4% |
| $ 230,000 | South Dakota State Building Authority, Revenue Bonds, Refunding, Series B,
0.676% due 9/1/23
| $ 229,103 |
| | Tennessee — 0.5% |
| 250,000 | Memphis-Shelby County Airport Authority, Revenue Bonds, Refunding, Series C,
5.000% due 7/1/23
| 269,311 |
| | Texas — 11.4% |
| | Arlington, TX, Higher Education Finance Corp., Revenue Bonds, Refunding, Series A, (PSF Guaranteed): |
| 325,000 | 5.000% due 8/15/22
| 336,922 |
| 310,000 | 5.000% due 8/15/23
| 335,356 |
| 100,000 | Central Texas Regional Mobility Authority, Revenue Bonds, Taxable Refunding, Series C,
1.345% due 1/1/24
| 100,837 |
| | Cities of Dallas and Fort Worth International Airport, Revenue Bonds, Refunding, Series A: |
| 500,000 | 5.000% due 11/1/24
| 567,645 |
| 285,000 | 2.039% due 11/1/24
| 293,571 |
| 260,000 | City of Grand Prairie TX, Revenue Bonds,
3.000% due 2/15/24
| 273,703 |
| | City of Houston TX Airport System Revenue, Revenue Bonds, Refunding, Series C: |
| 100,000 | 1.054% due 7/1/23
| 100,753 |
| 170,000 | 5.000% due 7/1/24
| 189,889 |
| 300,000 | 1.272% due 7/1/24
| 302,745 |
| 170,000 | Harris County, TX, Toll Road Authority, Revenue Bonds, Refunding, Series A,
5.000% due 8/15/22
| 176,401 |
| 225,000 | Houston, TX, Community College, General Obligation Limited,
5.000% due 2/15/23
| 238,614 |
| 1,000,000 | Lower Colorado River, TX, Authority Revenue Bond, Refunding, Series 2022,
5.000% due 5/15/243
| 1,097,082 |
| 695,000 | North Texas Tollway Authority, Revenue Bonds,
1.020% due 1/1/25
| 690,522 |
| 520,000 | North Texas, Municipal Water District, Revenue Bonds, Series 2021A,
4.000% due 9/1/233
| 553,668 |
| 555,000 | North Texas, Tollway Authority Revenue, Revenue Bonds, Refunding, Series B,
5.000% due 1/1/23
| 585,459 |
| 200,000 | Pleasanton Independent School District, TX, General Obligation Unlimited, PSF-GTD,
5.000% due 8/15/23
| 216,659 |
| 320,000 | Texas State, TX, A&M University Revenue, Revenue Bonds, Series B, Prerefunded 5/15/23 @ 100,
5.000% due 5/15/32
| 343,418 |
| | | | 6,403,244 |
| | Virginia — 2.2% |
| 200,000 | County of Fairfax VA,General Obligation Unlimited, Refunding, Series B (State Aid Withholding),
0.645% due 10/1/25
| 196,979 |
| 200,000 | County of Fairfax VA,General Obligation Unlimited, Series A (State Aid Withholding),
4.000% due 10/1/23
| 214,396 |
| 250,000 | Greater Richmond, VA, Convention Center Authority, Revenue Bonds,
5.000% due 6/15/23
| 266,955 |
| 520,000 | Virginia College Building Authority, Revenue Bonds,
5.000% due 2/1/23
| 551,144 |
| | | | 1,229,474 |
| | Washington — 3.2% |
| 425,000 | Central Puget Sound Regional Transit Authority, WA, Revenue Bonds, Refunding, Series S-1,
5.000% due 11/1/25
| 445,351 |
| 350,000 | Chelan County, WA, Public Utility District No 1, Revenue Bonds, Refunding, Series A,
0.000% due 6/1/234
| 347,884 |
| 425,000 | Klickitat Country, WA, Public Utility Distic, Revenue Bonds, Refunding, Series B (AGMC Insured),
2.277% due 12/1/23
| 436,266 |
| 125,000 | Lewis County, WA, Public Utility District No 1, Cowlitz Falls Hydroelectric Project, Revenue Bonds, Refunding,
5.000% due 10/1/22
| 130,502 |
| 120,000 | Port of Seattle WA, Revenue Bonds, Refunding, Series A,
5.000% due 8/1/25
| 124,204 |
See Notes to Financial Statements.
THE GLENMEDE FUND, INC.
Short Term Tax Aware Fixed Income Portfolio
SCHEDULE OF PORTFOLIO INVESTMENTS — (Continued)
October 31, 2021
Face
Amount | | | Value |
| MUNICIPAL BONDS* — (Continued) |
| | Washington — (Continued) |
| $ 250,000 | Port of Seattle WA, Revenue Bonds, Series D,
0.767% due 8/1/24
| $ 247,987 |
| 55,000 | Washington State Housing Finance Commission, Revenue Bonds, AMT - Refunding, Series 2A (GNMA / FNMA / FHLMC Insured),
1.700% due 12/1/21
| 55,049 |
| | | | 1,787,243 |
| | Wisconsin — 2.1% |
| 200,000 | City of Milwaukee WI, General Obligation Unlimited, Refunding, Series N-4,
5.000% due 4/1/25
| 229,705 |
| 215,000 | Eau Claire WI, General Obligation Unlimited, Refunding, Series D,
1.400% due 4/1/24
| 218,045 |
| 250,000 | Wisconsin State, WI, Health & Educational Facilities Authority Revenue, Revenue Bonds, Refunding,
5.000% due 11/15/23
| 273,572 |
| 145,000 | Wisconsin State, WI, Housing and Economic Development Authority, Revenue Bonds, Series A,
0.200% due 11/1/381
| 145,000 |
| 325,000 | Wisconsin State, WI, Transportation Revenue, Revenue Bonds, Series 2,
5.000% due 7/1/23
| 335,393 |
| | | | 1,201,715 |
| | Wyoming — 0.7% |
| 400,000 | Wyoming State, Community Development Authority, Revenue Bonds, Series 1,
1.950% due 12/1/22
| 406,384 |
| | TOTAL MUNICIPAL BONDS
(Cost $52,832,865)
| 53,230,594 |
| Shares | | | |
| REGISTERED INVESTMENT COMPANIES* — 0.7% |
| 41,460 | ESC CEF Blackrock Municipal (Escrow Shares)5
| 0 |
| 6,700 | VanEck Vectors High-Yield Municipal Index ETF
| 416,003 |
| | TOTAL REGISTERED INVESTMENT COMPANIES
(Cost $405,446)
| 416,003 |
Face
Amount | | | |
| REPURCHASE AGREEMENT* — 6.8% |
| 3,841,170 | With Fixed Income Clearing Corp., dated 10/29/21, 0.00%, principal and interest in the amount of $3,841,170, due 11/1/21, (collateralized by a U.S. Treasury Note with a par value of $4,038,300, coupon rate of 0.250%, due 10/31/25, market value of $3,918,041)
| 3,841,170 |
| | TOTAL REPURCHASE AGREEMENT
(Cost $3,841,170)
| 3,841,170 |
TOTAL INVESTMENTS
(Cost $57,581,503)
| 103.0% | $57,986,357 |
LIABILITIES IN EXCESS OF OTHER ASSETS
| (3.0) | (1,702,267) |
NET ASSETS
| 100.0% | $56,284,090 |
|
| * | Percentages indicated are based on net assets. |
| 1 | Variable/Floating interest rate security. Certain variable/floating interest rate securities are not based on a published reference rate and spread but are determined by the issuer or agent and are based on current market conditions. These securities do not indicate a reference rate and spread in their description above. Rate presented is as of October 31, 2021. |
| 2 | Floating Rate Bond. Rate shown is as of October 31, 2021. |
| 3 | When-issued security. |
| 4 | Zero Coupon Bond. |
| 5 | Non income-producing security. |
See Notes to Financial Statements.
THE GLENMEDE FUND, INC.
Short Term Tax Aware Fixed Income Portfolio
SCHEDULE OF PORTFOLIO INVESTMENTS — (Continued)
October 31, 2021
| Abbreviations: |
| AGMC — Assured Guaranty Municipal Corporation |
| AMT — Alternative Minimum Tax |
| BAM — Build America Mutual |
| FHLMC — Federal Home Loan Mortgage Corporation |
| FNMA — Federal National Mortgage Association |
| GNMA — Government National Mortgage Association |
| PSF — Permanent School Fund |
| QSBLF — Michigan Qualified School Bond Loan Fund |
See Notes to Financial Statements.
THE GLENMEDE FUND, INC.
Short Term Tax Aware Fixed Income Portfolio
SCHEDULE OF PORTFOLIO INVESTMENTS — (Concluded)
October 31, 2021
SECTOR DIVERSIFICATION
On October 31, 2021, sector diversification of the Portfolio was as follows:
| | % of
Net Assets | | Value |
| SECTOR: | | | |
Municipal Bonds
| 94.6% | | $ 53,230,594 |
Corporate Notes
| 0.9 | | 498,590 |
Registered Investment Companies
| 0.7 | | 416,003 |
TOTAL
| 96.2% | | $54,145,187 |
REPURCHASE AGREEMENT
| 6.8 | | 3,841,170 |
TOTAL INVESTMENTS
| 103.0% | | $57,986,357 |
See Notes to Financial Statements.
THE GLENMEDE FUND, INC.
High Yield Municipal Portfolio
SCHEDULE OF PORTFOLIO INVESTMENTS
October 31, 2021
Face
Amount | | | Value |
| MUNICIPAL BONDS* — 98.4% |
| | Alabama — 1.0% |
| $ 500,000 | Jefferson County, AL, Sewer Revenue Warrants, Series E,
0.000% due 10/1/341
| $ 217,360 |
| 500,000 | Jefferson County, AL, Sewer Revenue, Series B, (AGMC Insured),
0.000% due 10/1/251
| 460,381 |
| 1,070,000 | Jefferson County, AL, Sewer Revenue, Warrants, Series D,
6.000% due 10/1/42
| 1,222,160 |
| 500,000 | Montgomery, AL, Medical Clinic, Board Health Care Facility Revenue, Refunding,
5.000% due 3/1/30
| 564,497 |
| 250,000 | Selma Industrial Development Board, AL, Gulf Opportunity Zone Revenue, Revenue Bonds, Series A,
2.000% due 11/1/332
| 259,702 |
| | | | 2,724,100 |
| | Alaska — 0.4% |
| 975,000 | Alaska State, Housing Finance Corp., Revenue Bonds, Series A,
4.000% due 12/1/48
| 1,065,271 |
| | Arizona — 3.9% |
| 300,000 | Arizona State, Industrial Development Authority, Education Revenue, Basis Schools Projects, Revenue Bonds, Refunding, Series A,
5.250% due 7/1/473
| 340,338 |
| 500,000 | Arizona State, Industrial Development Authority, Education Revenue, Revenue Bonds, Refunding, Series A,
5.000% due 7/1/323
| 511,975 |
| | Arizona State, Industrial Development Authority, Education Revenue, Revenue Bonds, Series A: |
| 315,000 | 4.000% due 7/1/36
| 352,138 |
| 250,000 | 5.000% due 7/1/493
| 261,922 |
| 125,000 | 5.000% due 7/15/493
| 139,397 |
| 250,000 | 4.000% due 7/15/503
| 263,824 |
| 300,000 | Arizona State, Industrial Development Authority, Education Revenue, Revenue Bonds, Series B,
5.500% due 7/1/383
| 341,775 |
| 1,207,098 | Arizona State, Industrial Development Authority, Municipal Certificates, Revenue Bonds, Series 2, Class A,
3.625% due 5/20/33
| 1,339,580 |
| 40,000 | Florence Town, Inc., AZ, Industrial Development Authority, Legacy Traditional School Project, Revenue Bonds,
5.000% due 7/1/23
| 41,623 |
| 250,000 | Glendale, AZ, Industrial Development Authority, Senior Living Facility, Revenue Bonds,
5.000% due 5/15/39
| 270,093 |
| 1,775,000 | Industrial Development Authority of the County of Yavapai, AZ, Revenue Bonds, Refunding,
0.150% due 4/1/292
| 1,774,943 |
| 290,000 | La Paz County, AZ, Industrial Development Authority, Revenue Bonds,Series A,
5.000% due 2/15/463
| 300,492 |
| 750,000 | Maricopa County, AZ, Industrial Development Authority, Educational Revenue, Revenue Bonds, Refunding,
5.000% due 7/1/363
| 836,936 |
| 375,000 | Maricopa County, AZ, Industrial Development Authority, Revenue Bonds, Series A,
6.000% due 7/1/523
| 441,237 |
| | Phoenix, AZ, Industrial Development Authority, Education Revenue, Basis Schools, Inc., Revenue Bonds, Refunding: |
| 500,000 | 5.000% due 7/1/353
| 553,660 |
| 250,000 | 5.000% due 7/1/453
| 274,689 |
| | Phoenix, AZ, Industrial Development Authority, Education Revenue, Legacy Traditional Schools Project, Revenue Bonds, Series A: |
| 195,000 | 5.750% due 7/1/243
| 208,911 |
| 500,000 | 6.750% due 7/1/443
| 566,527 |
| 1,000,000 | 0.020% due 11/15/522
| 1,000,000 |
| 500,000 | Phoenix, AZ, Industrial Development Authority, Education Revenue, Revenue Bonds, Series A,
5.000% due 7/1/463
| 545,704 |
| 135,000 | Pima, AZ, Industrial Development Authority, Education Revenue, Revenue Bonds, Refunding,
5.000% due 6/15/493
| 141,471 |
| 150,000 | Tempe, AZ, Industrial Development Authority, Revenue Bonds,
5.000% due 12/1/54
| 166,244 |
See Notes to Financial Statements.
THE GLENMEDE FUND, INC.
High Yield Municipal Portfolio
SCHEDULE OF PORTFOLIO INVESTMENTS — (Continued)
October 31, 2021
Face
Amount | | | Value |
| MUNICIPAL BONDS* — (Continued) |
| | Arizona — (Continued) |
| $ 250,000 | Tempe, AZ, Industrial Development Authority, Revenue Bonds, Series A,
4.000% due 12/1/38
| $ 273,451 |
| | | | 10,946,930 |
| | California — 4.2% |
| 250,000 | California Community Housing Agency, Revenue Bonds, Series A,
5.000% due 8/1/493
| 275,776 |
| 500,000 | California Health Facilities Financing Authority, Revenue Bonds, Series A-2,
5.000% due 11/1/47
| 732,061 |
| 100,000 | California Infrastructure & Economic Development Bank, Revenue Bonds, Series A-1,
5.000% due 1/1/563
| 110,430 |
| 1,885,000 | California Infrastructure & Economic Development Bank, Revenue Bonds, Series B,
0.000% due 1/1/611,3
| 144,390 |
| 250,000 | California Public Finance Authority, Revenue Bonds, Refunding,
5.000% due 10/15/47
| 289,184 |
| 400,000 | California School Finance Authority, Education Revenue, Revenue Bonds, Series A,
6.375% due 7/1/463
| 450,042 |
| 290,546 | California State, Housing Finance Agency, Revenue Bonds, Series A-1,
4.250% due 1/15/35
| 350,596 |
| | California State, Municipal Finance Authority, Educational Revenue, Revenue Bonds, Refunding, Series A: |
| 360,000 | 5.000% due 6/1/36
| 407,648 |
| 500,000 | 5.000% due 6/1/46
| 558,276 |
| 300,000 | California State, Municipal Finance Authority, Higher Education Revenue, Revenue Bonds, Series A,
5.000% due 11/1/463
| 342,292 |
| 335,000 | California State, School Financing Authority, Rocketship Education Obligated Group, Revenue Bonds, Series A,
5.250% due 6/1/523
| 367,477 |
| 250,000 | California State, Statewide Communities Development Authority, CHF Irvine LLC, Revenue Bonds, Refunding,
5.000% due 5/15/29
| 296,437 |
| 500,000 | California State, Statewide Communities Development Authority, Revenue Bonds, Series A,
5.250% due 12/1/563
| 571,915 |
| 785,000 | California State, Statewide Communities Development Authority, Student Housing Revenue, Revenue Bonds,
4.305% due 7/1/32
| 824,244 |
| 1,000,000 | City of Los Angeles, CA, Department of Airports, Revenue Bonds, Series B,
5.000% due 5/15/48
| 1,258,537 |
| 440,000 | CSCDA Community Improvement Authority, CA, Revenue Bonds, Series A,
3.250% due 10/1/583
| 402,250 |
| | CSCDA Community Improvement Authority, CA, Revenue Bonds, Series A-2: |
| 100,000 | 3.000% due 12/1/563
| 92,419 |
| 390,000 | 3.250% due 4/1/573
| 369,528 |
| 110,000 | 3.250% due 5/1/573,4
| 102,320 |
| 100,000 | CSCDA Community Improvement Authority, CA, Revenue Bonds, Series B,
4.000% due 12/1/56
| 103,183 |
| 1,000,000 | Golden, CA, Tobacco Securitization Corp., Tabacco Settelment, Revenue Bonds, Series B,
0.000% due 6/1/471
| 228,211 |
| | Hastings Campus Housing Finance Authority, CA, Revenue Bonds, Series A: |
| 600,000 | 5.000% due 7/1/45
| 696,745 |
| 500,000 | 5.000% due 7/1/61
| 572,494 |
| 720,000 | Madera, CA, Unified School District, General Obligation Unlimited, (NPFG Insured),
0.000% due 5/1/301
| 625,661 |
| 250,000 | River Islands, CA, Public Financing Authority, Special Tax, Series 1,
4.000% due 9/1/41
| 267,187 |
| 500,000 | River Islands, CA, Public Financing Authority, Special Tax, Series A,
5.000% due 9/1/48
| 569,649 |
| 1,000,000 | Riverside County, CA, Redevelopment Successor Agency, Revenue Bonds, Series B,
0.000% due 10/1/391
| 641,885 |
| 200,000 | Seal Beach, CA, Community Facilities District No. 2005-1, Special Tax, Refunding,
3.000% due 9/1/29
| 206,726 |
| | | | 11,857,563 |
See Notes to Financial Statements.
THE GLENMEDE FUND, INC.
High Yield Municipal Portfolio
SCHEDULE OF PORTFOLIO INVESTMENTS — (Continued)
October 31, 2021
Face
Amount | | | Value |
| MUNICIPAL BONDS* — (Continued) |
| | Colorado — 10.2% |
| $ 500,000 | Amber Creek Metropolitan District, CO, General Obligation Limited, Refunding, Series A,
5.125% due 12/1/47
| $ 522,679 |
| 1,000,000 | Arista, CO, Metropolitan District, General Obligation Limited, Refunding, Series A,
4.375% due 12/1/28
| 1,069,656 |
| | Arkansas River Power Authority, CO, Power Revenue, Revenue Bonds, Refunding, Series A: |
| 500,000 | 5.000% due 10/1/33
| 595,653 |
| 400,000 | 5.000% due 10/1/43
| 466,355 |
| 500,000 | Banning Lewis Ranch Metropolitan District No. 8, CO, General Obligation Limited, Series A,
4.875% due 12/1/51
| 482,790 |
| 500,000 | Base Village Metropolitan District No. 2, CO, General Obligation Limited, Refunding, Series A,
5.750% due 12/1/46
| 515,942 |
| 500,000 | Belleview Station, CO, Metropolitan District No. 2, General Obligation Limited, Refunding,
5.000% due 12/1/36
| 516,886 |
| 500,000 | Big Dry Creek Metropolitan District, CO, General Obligation Limited, Series A,
5.750% due 12/1/47
| 526,481 |
| 278,000 | Bradburn, CO, Metropolitan District No. 2, General Obligation Limited, Refunding, Series A,
4.000% due 12/1/28
| 293,710 |
| 525,000 | Broadway Park North Metropolitan District No 2, CO, General Obligation,
5.000% due 12/1/493
| 571,310 |
| 1,070,000 | Broomfield, CO, Water Activity Enterprise, Revenue Bonds,
5.000% due 12/1/32
| 1,432,256 |
| 750,000 | Buffalo Ridge, CO, Metropolitan District, General Obligation Limited, Series B,
7.375% due 12/15/47
| 789,683 |
| 500,000 | Clear Creek Station, CO, Metropolitan District No. 2, General Obligation Limited, Refunding, Series A,
5.000% due 12/1/47
| 522,995 |
| 625,000 | Colorado International Center, CO, Metropolitan District No. 14, General Obligation Limited,
5.875% due 12/1/46
| 670,838 |
| 500,000 | Colorado International Center, CO, Metropolitan District No. 7, General Obligation Limited,
0.000% due 12/1/514
| 365,376 |
| 500,000 | Colorado State, Health Facilities Authority, Hospital Revenue, Christian Living Neighborhoods Project, Revenue Bonds, Refunding,
5.000% due 1/1/31
| 537,397 |
| 275,000 | Colorado State, Health Facilities Authority, Hospital Revenue, Christian Living Neighborhoods Project, Revenue Bonds, Refunding, Series A,
5.000% due 12/1/33
| 289,248 |
| 400,000 | Colorado State, Health Facilities Authority, Hospital Revenue, Refunding,
5.000% due 1/1/37
| 427,448 |
| 35,000 | Colorado State, Health Facilities Authority, Hospital Revenue, Revenue Bonds, Refunding,
4.000% due 1/1/42
| 37,954 |
| 700,000 | Colorado State, Health Facilities Authority, Hospital Revenue, Revenue Bonds, Refunding, Prerefunded 6/1/27 @ 100,
5.000% due 6/1/37
| 853,729 |
| 250,000 | Colorado State, Health Facilities Authority, Hospital Revenue, Revenue Bonds, Series A,
4.000% due 9/1/50
| 285,257 |
| 660,000 | Colorado State, Health Facilities Authority, Refunding, Series A, Prerefunded 6/1/25 @ 100,
5.000% due 6/1/45
| 766,410 |
| 250,000 | Colorado State, Health Facilities Authority, Revenue Bonds,
5.000% due 1/1/38
| 279,730 |
| 165,000 | Colorado State, Health Facilities Authority, Revenue Bonds, Prerefunded 6/1/23 @ 100,
5.625% due 6/1/43
| 179,025 |
| 350,000 | Colorado State, Housing and Finance Authority, Non AMT Non ACE SF Mortgage, Revenue Bonds, Series C, Class I, (GNMA Insured),
4.250% due 11/1/48
| 383,875 |
| 300,000 | Copper Ridge Metropolitan District, CO, Revenue Bonds,
4.000% due 12/1/29
| 310,246 |
| 500,000 | Cottonwood Hollow, CO, Residential Metropolitan District, General Obligation limited, Refunding,
5.000% due 12/1/51
| 484,173 |
| 250,000 | Denver, CO, Urban Renewal Authority, Tax Increment Revenue, Series A,
5.250% due 12/1/393
| 271,132 |
| 590,000 | DIATC Metropolitan District, CO, General Obligation Limited,
3.250% due 12/1/293
| 612,663 |
See Notes to Financial Statements.
THE GLENMEDE FUND, INC.
High Yield Municipal Portfolio
SCHEDULE OF PORTFOLIO INVESTMENTS — (Continued)
October 31, 2021
Face
Amount | | | Value |
| MUNICIPAL BONDS* — (Continued) |
| | Colorado — (Continued) |
| $ 495,000 | Dinosaur Ridge Metropolitan District, CO, Special Revenue, Revenue Bonds, Refunding, Series A,
5.000% due 6/1/49
| $ 526,370 |
| 1,000,000 | Gardens on Havana, CO, Metropolitan District No. 3, Revenue Bonds, Series A,
4.625% due 12/1/27
| 1,051,591 |
| 945,000 | Harmony Technology Park, CO, Metropolitan District No. 2, General Obligation Limited,
4.500% due 12/1/32
| 1,014,446 |
| 500,000 | Hunters Overlook, CO, Metropolitan District No. 5, General Obligation Limited, Series A,
5.000% due 12/1/49
| 543,055 |
| 500,000 | Independence Metropolitan District No 3, CO, General Obligation Limited, Series A,
6.250% due 12/1/49
| 535,681 |
| 855,000 | Lake Bluff, CO, Metropolitan District No. 2, General Obligation Limited, Refunding,
5.250% due 12/1/51
| 843,516 |
| 500,000 | Leyden Ranch, CO, Metropolitan District, General Obligation Unlimited, Series A,
5.125% due 12/1/47
| 523,505 |
| 750,000 | Leyden Rock, CO, Metropolitan District No. 10, General Obligation Limited, Series A,
5.000% due 12/1/45
| 775,393 |
| 500,000 | Midcities Metropolitan District No. 2, CO, Special Revenue, Revenue Bonds, Refunding, Series B,
7.750% due 12/15/46
| 513,939 |
| 500,000 | Parkside, CO, Centre Business Improvement District, Company Special Revenue, Revenue Bonds, Series A,
6.250% due 12/1/48
| 528,888 |
| 200,000 | Rampart Range Metropolitan District No. 5, CO, Revenue Bonds,
4.000% due 12/1/51
| 202,043 |
| 500,000 | Reunion Metropolitan District, CO, Revenue Bonds, Series A,
3.625% due 12/1/44
| 481,039 |
| 500,000 | Serenity Ridge, CO, Metropolitan District No. 2, General Obligation Limited, Refunding, Series A,
5.125% due 12/1/43
| 531,412 |
| 750,000 | Solaris, CO, Metropolitan District No. 3, General Obligation Limited, Refunding, Series A,
5.000% due 12/1/36
| 774,299 |
| | Southglenn, CO, Metropolitan District, Special Revenue, General Obligation Limited, Refunding: |
| 195,000 | 3.000% due 12/1/21
| 195,147 |
| 750,000 | 5.000% due 12/1/30
| 773,694 |
| | Southlands, CO, Metropolitan District No. 1, General Obligation limited, Series A-2: |
| 215,000 | 3.500% due 12/1/27
| 228,776 |
| 325,000 | 5.000% due 12/1/47
| 360,494 |
| 555,000 | STC Metropolitan District No 2, CO, General Obligation Limited, Series A,
3.000% due 12/1/25
| 577,995 |
| 500,000 | Tallyns Reach, CO, Metropolitan District No. 3, General Obligation Limited, Series A,
6.750% due 11/1/38
| 518,847 |
| 520,000 | Thompson Crossing Metropolitan District No. 4, CO, General Obligation Limited, Refunding,
3.500% due 12/1/29
| 549,675 |
| | Vauxmont Metropolitan District, CO, General Obligation Limited, (AGMC Insured): |
| 250,000 | 5.000% due 12/1/32
| 316,805 |
| 160,000 | 5.000% due 12/15/32
| 182,964 |
| 500,000 | Westcreek Metropolitan District No 2, CO, General Obligation Limited, Series A,
5.375% due 12/1/48
| 535,889 |
| 500,000 | Westerly Metropolitan District No. 4, CO, General Obligation, Limited, Series A-1,
5.000% due 12/1/50
| 539,829 |
| | | | 28,686,189 |
| | Connecticut — 0.7% |
| 425,000 | Connecticut State Health & Educational Facilities Authority, Church Home of Hartford, Inc. Project, Revenue Bonds, Series A,
5.000% due 9/1/533
| 465,545 |
| 165,000 | Connecticut State Health and Educational Facilities Authority, Revenue Bonds Refunding, Series G-1,
5.000% due 7/1/503
| 194,215 |
| 125,000 | Connecticut State Health and Educational Facilities Authority, Revenue Bonds, Series A,
5.000% due 1/1/553
| 137,231 |
| 125,000 | Connecticut State Health and Educational Facilities Authority, Revenue Bonds, Series E,
4.000% due 7/1/414
| 137,766 |
See Notes to Financial Statements.
THE GLENMEDE FUND, INC.
High Yield Municipal Portfolio
SCHEDULE OF PORTFOLIO INVESTMENTS — (Continued)
October 31, 2021
Face
Amount | | | Value |
| MUNICIPAL BONDS* — (Continued) |
| | Connecticut — (Continued) |
| $ 250,000 | Harbor Point, CT, Infrastructure Improvement District, Special Obligation Revenue, Tax Allocation, Refunding,
5.000% due 4/1/303
| $ 288,794 |
| 600,000 | Mohegan Tribe of Indians, CT, Gaming Authority, Revenue Bonds, Series A,
5.500% due 8/1/263
| 640,261 |
| 45,000 | SteelPoint, CT, Infrastructure, Improvement District, Special Obligation Tax Allocation,
4.000% due 4/1/51
| 46,197 |
| | | | 1,910,009 |
| | District Of Columbia — 0.8% |
| 225,000 | District of Columbia, KIPP Obligated Group, Revenue Bonds, Refunding, Series A (MBIA Insured),
5.000% due 7/1/27
| 269,452 |
| 3,415,000 | District of Columbia, Tobacco Settlement Financing Corp., Revenue Bonds, Series A,
0.000% due 6/15/461
| 750,563 |
| 2,000,000 | Metropolitan Washington, DC, Airports Authority Dulles Toll Road Revenue, Revenue Bonds, Series B, (AGMC Insured),
0.000% due 10/1/401
| 1,232,318 |
| | | | 2,252,333 |
| | Florida — 4.8% |
| 105,000 | Alachua County, FL, Health Facilities Authourity, Revenue Bonds, Series 2021,
4.000% due 10/1/404
| 114,693 |
| | Atlantic Beach, FL, Healthcare Facilities, Revenue Bonds, Series A: |
| 505,000 | 5.000% due 11/15/33
| 577,227 |
| 250,000 | 5.000% due 11/15/53
| 280,635 |
| 250,000 | Capital Trust Agency Inc, FL, Revenue Bonds, Series A,
5.000% due 10/15/493
| 274,211 |
| 290,000 | Capital Trust Agency Inc, FL, Revenue Bonds, Series A-1,
5.000% due 7/1/563
| 326,153 |
| 6,500,000 | Capital Trust Agency Inc, FL, Revenue Bonds, Series B,
0.000% due 7/1/611,3
| 655,086 |
| 195,000 | Capital Trust Agency, FL, Educational Facilities Revenue, Advantage Academy of Hillsborough Projects, Revenue Bonds, Series A,
4.000% due 12/15/24
| 205,391 |
| 160,000 | Capital Trust Agency, FL, Educational Facilities Revenue, Viera Charter School, Inc. Project, Revenue Bonds, Series A,
5.000% due 10/15/373
| 178,525 |
| 300,000 | Escambia County, FL, Health Facilities Authority, Revenue Bonds, Refunding, Series A, (MBIA Insecured),
4.000% due 8/15/45
| 331,671 |
| 145,000 | Florida Development Finance Corp., Educational Facilities Revenue, Renaissance Charter School, Inc. Projects, Series C,
5.000% due 9/15/503
| 158,698 |
| 550,000 | Florida Development Finance Corp., Healthcare Facilities Revenue, University of Florida Health Project, Series A, Revenue Bonds,
6.000% due 2/1/33
| 582,748 |
| 1,110,000 | Florida State Housing Finance Corp., Revenue Bonds, Series 1 (GNMA/FNMA/FHLMC Insured),
4.000% due 7/1/49
| 1,192,984 |
| 925,000 | Florida State Housing Finance Corp., Revenue Bonds, Series 2 (GNMA/FNMA/FHLMC Insured),
3.000% due 7/1/52
| 1,000,063 |
| 300,000 | Lakewood Ranch, FL, Stewardship District, Special Assessment Revenue,
5.375% due 5/1/47
| 332,366 |
| 500,000 | Lee County, FL, Industrial Development Authority, Shell Point/Waterside Health Project, Revenue Bonds,
5.000% due 11/15/39
| 584,295 |
| 1,250,000 | North Broward, FL, Hospital District, Revenue Bonds, Refunding, Series B,
5.000% due 1/1/48
| 1,444,641 |
| 750,000 | Orange County, FL, Health Facilities Authority Revenue, Revenue Bonds,
5.000% due 8/1/40
| 849,781 |
| 1,000,000 | Orange County, FL, Health Facilities Authority, Revenue Bonds, Refunding,
5.000% due 8/1/41
| 1,091,723 |
| 55,000 | Palm Beach County, FL, Health Facilities Authority, Lifespace Communities, Revenue Bonds, Refunding, Series C,
5.000% due 5/15/25
| 62,419 |
See Notes to Financial Statements.
THE GLENMEDE FUND, INC.
High Yield Municipal Portfolio
SCHEDULE OF PORTFOLIO INVESTMENTS — (Continued)
October 31, 2021
Face
Amount | | | Value |
| MUNICIPAL BONDS* — (Continued) |
| | Florida — (Continued) |
| $ 145,000 | Palm Beach County, FL, Health Facilities Authority, Revenue Bonds, Series A,
5.000% due 6/1/55
| $ 155,536 |
| 5,000 | Palm Beach County, FL, Health Facilities Authority, Revenue Bonds, Series B,
5.000% due 11/15/42
| 6,011 |
| | Sarasota County, FL, Health Facilities Authority, Retirement Facilities Revenue, Revenue Bonds, Series A: |
| 550,000 | 5.000% due 1/1/37
| 592,209 |
| 250,000 | 5.000% due 1/1/42
| 268,357 |
| 210,000 | Sawyers Landing, FL, Community Development Assessment, Revenue Bonds,
4.250% due 5/1/53
| 220,375 |
| 500,000 | Southeast Overtown Park West Community Redevelopment Agency, FL, Series A-1,
5.000% due 3/1/303
| 541,680 |
| 40,000 | St. Johns County Industrial Development Authority, Revenue Bonds, Refunding, Tax Allocation, Series A,
4.000% due 12/15/46
| 43,236 |
| 160,000 | Town Center at Palm Coast, FL, Community Development District, Special Assessment,
6.000% due 5/1/36
| 160,129 |
| | Winter Garden Village at Fowler Groves, FL, Community Development District, Special Assessment, Refunding: |
| 650,000 | 3.750% due 5/1/31
| 694,983 |
| 500,000 | 4.125% due 5/1/37
| 535,675 |
| | | | 13,461,501 |
| | Georgia — 0.8% |
| 375,000 | DeKalb County, GA, Housing Authority, Senior Living Revenue, Revenue Bonds, Refunding, Series A,
5.250% due 1/1/543
| 314,694 |
| 125,000 | Development Authority of Monroe County, GA, Revenue Bonds, Series A,
1.500% due 1/1/392
| 128,078 |
| 455,000 | Georgia Housing & Finance Authority, Revenue Bonds, Series A,
4.000% due 6/1/50
| 502,204 |
| 200,000 | Georgia State, Municipal Electric Authority, Revenue Bonds, Series A,
5.000% due 7/1/60
| 225,610 |
| 370,000 | Georgia State, Municipal Electric Authority, Revenue Bonds, Series A, (AGMC Insured),
4.000% due 1/1/38
| 425,203 |
| 195,000 | Houston Healthcare System, Inc., GA, Revenue Bonds, Series B,
5.000% due 10/1/312
| 215,930 |
| 340,000 | Macon-Bibb County, GA, Urban Development Authority, Revenue Bonds,
5.750% due 6/15/373
| 390,092 |
| | | | 2,201,811 |
| | Guam — 0.3% |
| 175,000 | Guam Department of Education, Certificate Participation, Refunding, Series A,
5.000% due 2/1/40
| 197,170 |
| 105,000 | Guam Government Business Privilege, Revenue Bonds, Refunding, Series F,
4.000% due 1/1/36
| 119,726 |
| 500,000 | Guam Power Authority, Revenue Bonds, Series A (AGMC Insured),
5.000% due 10/1/22
| 520,690 |
| | | | 837,586 |
| | Hawaii — 0.4% |
| 1,000,000 | State of Hawaii, Airports System Revenue, Revenue Bonds, Series D,
4.000% due 7/1/36
| 1,163,185 |
| | Idaho — 0.7% |
| 500,000 | Idaho Health Facilities Authority, Revenue Bonds, Series A,
4.750% due 7/1/443
| 529,621 |
| 250,000 | Idaho State, Health Facilities Authority Revenue, Kootenai Health Project, Revenue Bonds, Series A,
4.375% due 7/1/343
| 269,516 |
| | Idaho State, Housing and Finance Association, Nonprofit Facilities Revenue, Compass Charter School Project, Revenue Bonds, Series A: |
| 735,000 | 6.000% due 7/1/393
| 885,969 |
| 250,000 | 5.000% due 7/1/403
| 280,790 |
| | | | 1,965,896 |
See Notes to Financial Statements.
THE GLENMEDE FUND, INC.
High Yield Municipal Portfolio
SCHEDULE OF PORTFOLIO INVESTMENTS — (Continued)
October 31, 2021
Face
Amount | | | Value |
| MUNICIPAL BONDS* — (Continued) |
| | Illinois — 13.3% |
| $ 250,000 | Bolingbrook, IL, Special Service Area No 1, Special Tax, Refunding,
5.250% due 3/1/41
| $ 262,742 |
| 100,000 | Chicago, IL, Board of Education, General Obligation Unlimited, Refunding, Series A,
7.000% due 12/1/44
| 119,653 |
| | Chicago, IL, Board of Education, General Obligation Unlimited, Series A: |
| 250,000 | 0.000% due 12/1/251
| 236,896 |
| 1,205,000 | 0.000% due 12/1/311
| 977,743 |
| 765,000 | 5.000% due 12/1/41
| 767,337 |
| 400,000 | 7.000% due 12/1/463
| 512,220 |
| 325,000 | Chicago, IL, Board of Education, General Obligation Unlimited, Series A, (AGMC, AMBAC Insured),
5.500% due 12/1/31
| 440,975 |
| | Chicago, IL, Board of Education, General Obligation Unlimited, Series A, (NPFG Insured): |
| 150,000 | 0.000% due 12/1/231
| 147,674 |
| 710,000 | 0.000% due 12/1/251
| 676,891 |
| 170,000 | 5.500% due 12/1/26
| 195,721 |
| 550,000 | 0.000% due 12/1/291
| 473,603 |
| 600,000 | Chicago, IL, Board of Education, General Obligation Unlimited, Series B,
7.000% due 12/1/423
| 772,589 |
| 1,150,000 | Chicago, IL, Board of Education, General Obligation Unlimited, Series B1, (NPFG Insured),
0.000% due 12/1/311
| 933,116 |
| 640,000 | Chicago, IL, Board of Education, General Obligation Unlimited, Series C,
5.250% due 12/1/39
| 705,078 |
| 500,000 | Chicago, IL, Board of Education, General Obligation Unlimited, Series H,
5.000% due 12/1/46
| 581,554 |
| 600,000 | Chicago, IL, General Obligation Unlimited, (NPFG Insured),
0.000% due 1/1/311
| 495,161 |
| | Chicago, IL, General Obligation Unlimited, Refunding, Series A: |
| 150,000 | 5.000% due 1/1/30
| 187,263 |
| 250,000 | 5.750% due 1/1/33
| 301,162 |
| 1,195,000 | 6.000% due 1/1/38
| 1,450,056 |
| 305,000 | Chicago, IL, General Obligation Unlimited, Refunding, Series C,
5.000% due 1/1/24
| 333,140 |
| | Chicago, IL, General Obligation Unlimited, Series C: |
| 250,000 | 0.000% due 1/1/271
| 222,682 |
| 435,000 | 0.000% due 1/1/311
| 333,316 |
| 305,000 | Chicago, IL, Wastewater Transmission Revenue, Revenue Bonds, Refunding, (NPFG Insured),
5.500% due 1/1/30
| 369,279 |
| 500,000 | Chicago, IL, Waterworks Revenue, Revenue Bonds,
5.000% due 11/1/24
| 523,174 |
| 150,000 | Chicago, IL, Waterworks Revenue, Revenue Bonds, Refunding (AMBAC Insured),
5.750% due 11/1/30
| 179,866 |
| 500,000 | Cook County, IL, Community College District No. 508, General Obligation Unlimited,
5.250% due 12/1/43
| 532,945 |
| 315,000 | Illinois Housing Development Authority, Revenue Bonds, Series A,
3.000% due 4/1/51
| 338,569 |
| 1,100,000 | Illinois Housing Development Authority, Revenue Bonds, Series D,
3.000% due 10/1/51
| 1,187,064 |
| 400,000 | Illinois State Finance Authority, Christian Homes, Inc., Revenue Bonds,
5.000% due 5/15/36
| 449,200 |
| 350,000 | Illinois State Finance Authority, Revenue Bonds,
4.000% due 7/1/35
| 390,517 |
| | Illinois State Finance Authority, Revenue Bonds, Refunding: |
| 230,000 | 5.000% due 12/1/40
| 268,875 |
| 250,000 | 5.000% due 12/1/46
| 290,109 |
| 150,000 | Illinois State Finance Authority, Revenue Bonds, Refunding, Lifespace Communities Project, Series A,
5.000% due 5/15/22
| 153,249 |
| | Illinois State Finance Authority, Revenue Bonds, Refunding, Series A: |
| 300,000 | 5.000% due 7/1/35
| 349,298 |
| 250,000 | 5.000% due 8/15/37
| 300,545 |
See Notes to Financial Statements.
THE GLENMEDE FUND, INC.
High Yield Municipal Portfolio
SCHEDULE OF PORTFOLIO INVESTMENTS — (Continued)
October 31, 2021
Face
Amount | | | Value |
| MUNICIPAL BONDS* — (Continued) |
| | Illinois — (Continued) |
| | Illinois State Finance Authority, Revenue Bonds, Refunding, Series C: |
| $ 1,000,000 | 5.000% due 2/15/31
| $ 1,200,669 |
| 1,000,000 | 4.125% due 8/15/37
| 1,094,363 |
| 500,000 | Illinois State Finance Authority, Silver Cross Hospital & Medical Center, Revenue Bonds, Series C,
5.000% due 8/15/44
| 571,536 |
| | Illinois State Finance Authority, Student Housing Revenue, Northern Illinois University Project, Revenue Bonds, Series A: |
| 250,000 | 5.000% due 7/1/35
| 237,622 |
| 500,000 | 5.000% due 7/1/47
| 445,674 |
| 1,035,000 | Illinois State Finance Authority, Swedish Covenant Hospital, Revenue Bonds, Refunding, Series A,
5.000% due 8/15/34
| 1,244,257 |
| 390,000 | Illinois State Housing Development Authority, Revenue Bonds, Series A (GNMA / FNMA / FHLMC Insured),
4.250% due 10/1/49
| 430,011 |
| 460,000 | Illinois State Housing Development Authority, Revenue Bonds, Series C,
3.500% due 8/1/46
| 488,388 |
| 475,000 | Illinois State Sports Facilities Authority, Revenue Bonds, Refunding,
5.000% due 6/15/24
| 521,628 |
| | Illinois State Sports Facilities Authority, Revenue Bonds, Refunding, (BAM Insured): |
| 620,000 | 5.000% due 6/15/28
| 761,620 |
| 250,000 | 5.000% due 6/15/30
| 309,088 |
| | Illinois State Sports Facilities Authority, State Tax Supported, Capital Apprec, Revenue Bonds, (AMBAC Insured): |
| 500,000 | 0.000% due 6/15/231
| 494,157 |
| 440,000 | 0.000% due 6/15/261
| 414,693 |
| 500,000 | Illinois State University, Revenue Bonds, (AGMC Insured),
5.000% due 4/1/24
| 550,172 |
| 320,000 | Illinois State, Finance Authority, Charter School Revenue, Refunding and Improvement, Chicago International Charter School Project, Revenue Bonds,
5.000% due 12/1/47
| 364,518 |
| | Illinois State, General Obligation Unlimited: |
| 500,000 | 5.000% due 1/1/30
| 578,382 |
| 1,000,000 | 5.000% due 2/1/39
| 1,085,850 |
| 500,000 | Illinois State, General Obligation Unlimited, Series C,
5.000% due 11/1/29
| 592,276 |
| 1,000,000 | Illinois State, General Obligation Unlimited, Series D,
5.000% due 11/1/28
| 1,192,189 |
| 250,000 | Metropolitan Pier & Exposition Authority, IL, Dedicated State Tax Revenue, Revenue Bonds, Refunding (BAM, NPFG Insured),
0.000% due 6/15/281
| 223,977 |
| | Metropolitan Pier & Exposition Authority, IL, Dedicated State Tax Revenue, Revenue Bonds, Series A, (NPFG Insured): |
| 485,000 | 0.000% due 6/15/311
| 394,030 |
| 1,000,000 | 0.000% due 6/15/361
| 697,038 |
| 525,000 | Metropolitan Pier & Exposition Authority, IL, Dedicated State Tax Revenue, Revenue Bonds, Series B-1, (AGMC Insured),
0.000% due 6/15/271
| 482,534 |
| 2,000,000 | Metropolitan Pier & Exposition Authority, IL, Dedicated State Tax, Revenue Bonds, Series A, (AGMC Insured MBIA),
0.000% due 12/15/291
| 1,717,649 |
| 500,000 | Metropolitan Pier & Exposition Authority, IL, McCormick Place Expansion Project, Revenue Bonds, Refunding, Series B,
5.000% due 12/15/40
| 565,587 |
| 250,000 | Southern Illinois State University, Housing & Auxiliary Facilities System, Revenue Bonds, Series A, (NPFG Insured),
0.000% due 4/1/221
| 248,697 |
| 500,000 | Southern Illinois State University, Housing & Auxiliary Facilities System, Revenue Bonds, Series B1,
5.000% due 4/1/22
| 506,683 |
| | State of Illinois, General Obligation Unlimited: |
| 500,000 | 5.500% due 5/1/30
| 639,273 |
| 165,000 | 4.000% due 6/1/35
| 179,902 |
| 250,000 | State of Illinois, General Obligation Unlimited, Series B,
4.000% due 10/1/33
| 285,708 |
See Notes to Financial Statements.
THE GLENMEDE FUND, INC.
High Yield Municipal Portfolio
SCHEDULE OF PORTFOLIO INVESTMENTS — (Continued)
October 31, 2021
Face
Amount | | | Value |
| MUNICIPAL BONDS* — (Continued) |
| | Illinois — (Continued) |
| $ 250,000 | State of Illinois, General Obligation Unlimited, Series C,
4.000% due 10/1/42
| $ 279,019 |
| 1,000,000 | University of Illinois, Auxiliary Facilities, Revenue Bonds, Series A, (AGMC Insured),
4.000% due 4/1/36
| 1,110,718 |
| 500,000 | Volo Village, IL, Special Service Area No. 3 & 6, Special Tax, Symphony Meadows/Lancaster Falls Project, (AGMC Insured),
2.875% due 3/1/25
| 529,033 |
| 496,000 | Yorkville, IL, United City Special Service, Special Tax, (AGMC Insured),
3.000% due 3/1/25
| 526,152 |
| 250,000 | Yorkville, IL, United City Special Service, Special Tax, Refunding, (AGMC Insured),
4.000% due 3/1/36
| 264,935 |
| | | | 37,687,290 |
| | Indiana — 1.8% |
| | Indiana Finance Authority, Midwestern Disaster Relief Revenue, Revenue Bonds, Ohio Valley Electric Corp. Project, Series A: |
| 900,000 | 5.000% due 6/1/32
| 916,640 |
| 300,000 | 5.000% due 6/1/39
| 305,093 |
| | Indiana Finance Authority, Revenue Bonds, Series A: |
| 100,000 | 5.250% due 11/15/46
| 114,089 |
| 1,500,000 | 4.000% due 7/1/50
| 1,699,074 |
| | Indiana State Finance Authority, Greencroft Obligated Group, Revenue Bonds, Series A: |
| 345,000 | 5.750% due 11/15/28
| 371,115 |
| 195,000 | 6.500% due 11/15/33
| 210,874 |
| 150,000 | Indiana State Finance Authority, Pollution Control, Revenue Bonds, Series B,
2.500% due 11/1/30
| 150,267 |
| 600,000 | Indiana State Finance Authority, Revenue Bonds, Series A,
5.000% due 11/15/38
| 683,894 |
| | Knox County, IN, Economic Development Authority, Revenue Bonds, Refunding, Series A: |
| 300,000 | 5.000% due 4/1/23
| 305,681 |
| 350,000 | 5.000% due 4/1/28
| 356,627 |
| | | | 5,113,354 |
| | Iowa — 0.5% |
| 500,000 | Iowa State, Finance Authority, Midwestern Disaster Relief Revenue, Iowa Fertilizer Co. LLC Project, Revenue Bonds, Refunding, Series B,
5.250% due 12/1/502
| 543,924 |
| 250,000 | Iowa State, Finance Authority, Revenue Bonds,
5.250% due 12/1/25
| 269,291 |
| 250,000 | Iowa State, Finance Authority, Senior Housing Revenue, Revenue Bonds, Series A,
5.000% due 3/1/33
| 270,775 |
| 210,000 | lowa State Finance Aurthority Senior Living Facilities, Revenue Bonds, Refunding,
5.000% due 9/1/51
| 220,852 |
| | | | 1,304,842 |
| | Kansas — 0.1% |
| 135,000 | City of Manhattan KS, Revenue Bonds, Refunding, Series A,
4.000% due 6/1/36
| 147,701 |
| 150,000 | Wyandotte County, KS, Kansas City Unified Government, Revenue Bonds,
5.000% due 12/1/34
| 153,038 |
| 50,000 | Wyandotte County, KS, Kansas City Unified Government, Wyandotte Plaza Project, Revenue Bonds,
4.000% due 12/1/28
| 50,504 |
| | | | 351,243 |
| | Kentucky — 0.9% |
| 305,000 | City of Ashland, KY, Medical Center Revenue, Revenue Bonds, Refunding, Series A,
4.000% due 2/1/32
| 333,883 |
| 350,000 | City of Ashland, KY, Revenue Bonds, Refunding, Series A,
4.000% due 2/1/36
| 380,981 |
| 95,000 | Kentucky Public Transportation Infrastructure Authority, Revenue Bonds, Refunding, Series B,
4.000% due 7/1/53
| 108,550 |
See Notes to Financial Statements.
THE GLENMEDE FUND, INC.
High Yield Municipal Portfolio
SCHEDULE OF PORTFOLIO INVESTMENTS — (Continued)
October 31, 2021
Face
Amount | | | Value |
| MUNICIPAL BONDS* — (Continued) |
| | Kentucky — (Continued) |
| $ 130,000 | Kentucky State University, Certificate Participation, Refunding, (BAM Insured),
4.000% due 11/1/34
| $ 157,347 |
| 250,000 | Kentucky State, Economic Development Finance Authority, Healthcare Revenue, Revenue Bonds, Refunding,
5.750% due 11/15/45
| 254,942 |
| | Kentucky State, Economic Development Finance Authority, Healthcare Revenue, Revenue Bonds, Series B, (NPFG Insured): |
| 500,000 | 0.000% due 10/1/261
| 459,966 |
| 500,000 | 0.000% due 10/1/271
| 446,753 |
| 250,000 | Louisville & Jefferson County, KY, Metropolitan Government Healthcare System, Revenue Bonds, Refunding, Series A,
5.000% due 10/1/31
| 296,570 |
| | | | 2,438,992 |
| | Louisiana — 1.1% |
| 250,000 | Calcasieu Parish, LA, Memorial Hospital Service District, Hospital Revenue, Lake Charles Memorial Hospital Project, Revenue Bonds, Refunding,
5.000% due 12/1/34
| 299,425 |
| 870,000 | Juban Crossing Economic Development District, LA, Revenue Bonds, Refunding, Series C,
7.000% due 9/15/443
| 837,346 |
| 1,250,000 | Louisiana State Local Govenment Facility & Community Development Authority, Revenue Bonds, Series B,
2.500% due 4/1/36
| 1,266,521 |
| 500,000 | Louisiana State, Public Facilities Authority Revenue, Revenue Bonds, Louisiana State University Greenhouse District Phase III Project, Series A,
5.000% due 7/1/59
| 593,573 |
| 250,000 | Parish of St. John the Baptist, LA, Revenue Bonds, Refunding, Series A-1,
2.000% due 6/1/372
| 254,244 |
| | | | 3,251,109 |
| | Maryland — 1.8% |
| 1,125,000 | Baltimore, MD, Special Obligation, Revenue Bonds, Refunding, Series A,
5.000% due 9/1/38
| 1,259,818 |
| 250,000 | Brunswick, MD, Special Obligation, Special Tax, Refunding,
5.000% due 7/1/36
| 291,806 |
| 250,000 | Howard County, MD, Special Obligation, Revenue Bonds, Series A,
4.125% due 2/15/343
| 261,942 |
| 750,000 | Maryland Community Development Administration, Revenue Bonds, Series A,
3.000% due 9/1/51
| 805,898 |
| 500,000 | Maryland Economic Development Corp., Revenue Bonds,
5.000% due 7/1/56
| 592,962 |
| 310,000 | Maryland State, Community Development Administration, Department Housing & Community Development, Revenue Bonds, Refunding, Series A,
4.500% due 9/1/48
| 345,262 |
| 90,000 | Maryland State, Economic Development Corp., Special Obligation, Metro Centre Owings Mills Project, Tax Allocation,
3.750% due 7/1/27
| 99,160 |
| 250,000 | Maryland State, Economic Development Corp., Special Obligation, Tax Allocation,
4.500% due 7/1/44
| 274,965 |
| 500,000 | Prince George’s County, MD, Revenue Authority, Suitland-Naylor Road Project,
5.000% due 7/1/463
| 551,623 |
| 500,000 | Prince George’s County, MD, Special Obligation, PGC Hampton Park Project, Revenue Bonds, Series A,
4.375% due 7/1/483
| 529,439 |
| | | | 5,012,875 |
| | Michigan — 2.5% |
| 250,000 | Detroit, MI, General Obligation Unlimited,
5.000% due 4/1/34
| 291,822 |
| 125,000 | Detroit, MI, General Obligation Unlimited, Series A,
5.000% due 4/1/46
| 150,789 |
See Notes to Financial Statements.
THE GLENMEDE FUND, INC.
High Yield Municipal Portfolio
SCHEDULE OF PORTFOLIO INVESTMENTS — (Continued)
October 31, 2021
Face
Amount | | | Value |
| MUNICIPAL BONDS* — (Continued) |
| | Michigan — (Continued) |
| | Flint, MI, Hospital Building Authority Rental, Revenue Bonds, Series A: |
| $ 250,000 | 4.000% due 7/1/38
| $ 283,647 |
| 280,000 | 5.250% due 7/1/39
| 295,757 |
| 1,000,000 | Grand Rapids, MI, Charter Township Economic Development Corp., Revenue Bonds,
5.000% due 5/15/44
| 1,146,749 |
| | Grand Rapids, MI, Economic Development Corp., Beacon Hill Eastgate Project, Revenue Bonds, Refunding, Series A: |
| 600,000 | 5.000% due 11/1/37
| 655,720 |
| 250,000 | 5.000% due 11/1/553,4
| 282,563 |
| | Kentwood, MI, Economic Development Corp., Revenue Bonds, Refunding: |
| 50,000 | 4.500% due 11/15/21
| 50,062 |
| 65,000 | 4.750% due 11/15/22
| 66,541 |
| 250,000 | 5.000% due 11/15/37
| 280,280 |
| 250,000 | 5.625% due 11/15/41
| 257,098 |
| 70,000 | 4.000% due 11/15/434
| 73,814 |
| 2,500,000 | Michigan Finance Authority, Revenue Bonds, Refunding, Series B-2,
0.000% due 6/1/651
| 317,642 |
| 520,000 | Michigan State Housing Development Authority, Safe Mortgage Revenue, Revenue Bonds, Series A,
2.700% due 10/1/56
| 513,969 |
| 1,895,000 | Michigan State Housing Development Authority, Safe Mortgage Revenue, Revenue Bonds, Series C,
4.250% due 6/1/49
| 2,067,763 |
| 250,000 | Michigan State Strategic Fund, Limited Obligation Revenue, Revenue Bonds, Refunding,
5.000% due 11/15/29
| 292,148 |
| | | | 7,026,364 |
| | Minnesota — 0.2% |
| 225,748 | Minnesota Housing Finance Agency, Revenue Bonds, Series I,
2.800% due 12/1/47
| 230,830 |
| 240,000 | St. Paul, MN, Housing & Redevelopment Authority, Charter School Lease Revenue, Revenue Bonds, Series A,
5.500% due 7/1/383
| 270,496 |
| | | | 501,326 |
| | Mississippi — 0.8% |
| 220,000 | Mississippi Business Finance Corp., Revenue Bonds,
2.375% due 6/1/44
| 203,983 |
| 1,920,000 | Mississippi Business Finance Corp., Revenue Bonds, Series D,
0.030% due 12/1/302
| 1,920,000 |
| 250,000 | Mississippi Development Bank, Special Obligation Bonds, Refunding,
4.000% due 10/1/413
| 264,463 |
| | | | 2,388,446 |
| | Missouri — 1.3% |
| 405,000 | Cape Girardeau County, MO, Industrial Development Authority, Southeast Health, Revenue Bonds, Series A,
6.000% due 3/1/33
| 440,789 |
| 35,000 | Lees Summit, MO, Special Obligation Tax Increment, Tax Allocation, Refunding,
3.500% due 11/1/233
| 35,242 |
| 430,000 | Maryland Heights, MO, Industrial Development Authority, State Louis Community ICE Center Project, Revenue Bonds, Series A,
4.375% due 3/15/30
| 409,638 |
| 100,000 | Missouri State Health & Educational Facilities Authority, Lutheran Senior Services, Revenue Bonds,
5.000% due 2/1/25
| 108,912 |
| 640,000 | Missouri State Health & Educational Facilities Authority, Revenue Bonds,
5.000% due 2/1/26
| 694,645 |
| | Missouri State Health & Educational Facilities Authority, Revenue Bonds, Series A: |
| 100,000 | 5.000% due 2/1/28
| 114,703 |
| 250,000 | 5.000% due 2/1/42
| 275,838 |
| 250,000 | Missouri State, Health and Educational Facilities Authority, Revenue Bonds,
5.000% due 8/1/45
| 269,317 |
| 60,000 | Plaza at Noah’s Ark Community Improvement District, MO, Refunding, Revenue Bonds,
3.000% due 5/1/26
| 61,320 |
See Notes to Financial Statements.
THE GLENMEDE FUND, INC.
High Yield Municipal Portfolio
SCHEDULE OF PORTFOLIO INVESTMENTS — (Continued)
October 31, 2021
Face
Amount | | | Value |
| MUNICIPAL BONDS* — (Continued) |
| | Missouri — (Continued) |
| $ 355,000 | St. Louis County, MO, Industrial Development Authority, Senior Living Facilities, Revenue Bonds, Refunding,
5.000% due 9/1/32
| $ 409,524 |
| 625,000 | St. Louis County, MO, Industrial Development Authority, Senior Living Facilities, Revenue Bonds, Series A,
5.250% due 9/1/53
| 697,815 |
| 150,000 | St. Louis County, MO, Industrial Development Authority, Senior Living Revenue, Revenue Bonds, Refunding,
5.000% due 9/1/48
| 167,035 |
| | | | 3,684,778 |
| | Nebraska — 0.1% |
| 195,000 | Nebraska State, Investment Finance Authority, Safe Housing Revenue, Revenue Bonds, Series C,
4.000% due 9/1/48
| 212,097 |
| | Nevada — 0.7% |
| 290,000 | Las Vegas, NV, Sales Tax Increment Revenue,
3.500% due 6/15/253
| 290,137 |
| 225,000 | Las Vegas, NV, Special Improvement District No. 816, Sales Tax Increment Revenue Bonds,
2.750% due 6/1/31
| 225,941 |
| 335,000 | Nevada State, Department of Business & Industry, Revenue Bonds, Series A,
5.000% due 7/15/273
| 372,716 |
| 500,000 | Nevada State, Department of Business and Industry, Revenue Bonds, Series A,
5.000% due 12/15/483
| 541,894 |
| 390,000 | North Las Vegas, NV, Local Improvement, Special Assessment,
4.625% due 6/1/49
| 428,264 |
| | | | 1,858,952 |
| | New Hampshire — 0.4% |
| 976,069 | National Finance Authority, NH, Municipal Certificates, Revenue Bonds, Series 1, Class A,
4.125% due 1/20/34
| 1,152,974 |
| | New Jersey — 5.7% |
| 500,000 | New Jersey Health Care Facilities Financing Authority Revenue, Revenue Bonds, St Peters Univerdity Hospital,
5.750% due 7/1/37
| 501,509 |
| 1,085,000 | New Jersey State Economic Development Authority Revenue, Refunding, School Facilities Construction, Revenue Bonds, Series NN,
5.000% due 3/1/24
| 1,149,995 |
| 1,000,000 | New Jersey State Economic Development Authority Revenue, Revenue Bonds, Refunding, (AGMC Insured),
5.000% due 6/1/29
| 1,202,064 |
| 175,000 | New Jersey State Economic Development Authority School Revenue, Beloved Community Chart School, Inc. Project, Revenue Bonds, Series A,
5.000% due 6/15/493
| 188,137 |
| 345,000 | New Jersey State Economic Development Authority School Revenue, Foundation Academy Charter School Project, Revenue Bonds, Series A,
5.000% due 7/1/38
| 398,257 |
| 500,000 | New Jersey State Economic Development Authority, Revenue Bonds, Refunding, Series I, (SIFMA MUNI SWAP INDEX + 1.60%),
1.650% due 3/1/285
| 506,392 |
| 2,500,000 | New Jersey State Economic Development Authority, Revenue Bonds, Refunding, Series XX,
5.000% due 6/15/25
| 2,881,862 |
| 770,000 | New Jersey State Housing and Mortgage Finance Agency, Revenue Bonds, Refunding, Series C,
4.750% due 10/1/50
| 861,440 |
| | New Jersey State Transportation Trust Fund Authority, Revenue Bonds, Series A: |
| 1,000,000 | 0.000% due 12/15/351
| 710,536 |
| 1,300,000 | 0.000% due 12/15/391
| 803,909 |
| 1,000,000 | New Jersey State Transportation Trust Fund Authority, Revenue Bonds, Series A, (BAM Insured),
0.000% due 12/15/271
| 916,481 |
| 1,000,000 | New Jersey State Transportation Trust Fund Authority, Revenue Bonds, Series B, (NPFG Insured),
5.500% due 12/15/21
| 1,006,272 |
See Notes to Financial Statements.
THE GLENMEDE FUND, INC.
High Yield Municipal Portfolio
SCHEDULE OF PORTFOLIO INVESTMENTS — (Continued)
October 31, 2021
Face
Amount | | | Value |
| MUNICIPAL BONDS* — (Continued) |
| | New Jersey — (Continued) |
| | New Jersey State Transportation Trust Fund Authority, Revenue Bonds, Series C, (AGMC Insured): |
| $ 185,000 | 0.000% due 12/15/321
| $ 148,110 |
| 1,000,000 | 0.000% due 12/15/341
| 756,834 |
| 550,000 | New Jersey State Transportation Trust Fund Authority, Revenue Bonds, Series C, (AMBAC Insured),
0.000% due 12/15/351
| 399,061 |
| 1,000,000 | New Jersey State Transportation Trust Fund Authority, Revenue Bonds, Series C, (NPFG Insured),
0.000% due 12/15/311
| 813,887 |
| 1,000,000 | Tobacco Settlement Financing Corp., NJ, Revenue Bonds, Refunding, Series A,
5.000% due 6/1/29
| 1,224,142 |
| 1,500,000 | Union County, NJ, Industrial Pollution Control Financing Authority, Revenue Bonds,
0.030% due 7/1/332
| 1,500,000 |
| | | | 15,968,888 |
| | New Mexico — 0.5% |
| 500,000 | New Mexico Hospital Equipment Loan Council First Mortgage, Revenue Bonds, LA Vida Llena Expansion Project, Series A,
5.000% due 7/1/49
| 544,345 |
| 510,000 | New Mexico Mortgage Finance Authority, Revenue Bonds, Series A-1, Class I, (GNMA / FNMA / FHLMC Insured),
4.250% due 1/1/50
| 561,202 |
| 275,000 | Santa Fe, NM, Retirement Facility Revenue, Revenue Bonds, Series A,
5.000% due 5/15/34
| 310,531 |
| | | | 1,416,078 |
| | New York — 6.9% |
| 435,000 | Brookhaven, NY, Arena Local Development Corp., Revenue Bonds, Series A,
4.000% due 11/1/55
| 480,629 |
| 1,250,000 | Brooklyn, NY, Arena Local Development Corp., Pilot Revenue, Revenue Bonds, Refunding, Series A,
5.000% due 7/15/42
| 1,437,053 |
| 100,000 | Build NYC Resource Corp, NY, Revenue Bonds, Series A,
4.000% due 6/15/51
| 106,184 |
| 315,000 | Build NYC Resource Corp, NY, Revenue Bonds,Series A,
5.000% due 12/1/413
| 358,448 |
| 150,000 | County of Sullivan, NY, Special Assessment, Series E-1,
4.850% due 11/1/313
| 158,253 |
| 500,000 | County of Sullivan, NY, Special Assessment, Series E-2,
5.350% due 11/1/493
| 524,827 |
| 500,000 | Glen Cove, NY, Local Economic Assistance Corp., Revenue Bonds, Series C,
0.000% due 1/1/551
| 523,006 |
| 395,000 | Metropolitan Transportation Aurthority, NY, Revenue Bonds, Refunding, Series D-2-B, (SOFR*0.67+0.55%),
0.584% due 11/1/325
| 396,335 |
| 250,000 | Metropolitan Transportation Authority, NY, Revenue Bonds, Series A-3, (SIFMA MUNI SWAP INDEX + 0.50%),
0.550% due 11/15/425
| 250,027 |
| | Metropolitan Transportation Authority, NY, Revenue Bonds, Series C-1: |
| 250,000 | 4.750% due 11/15/45
| 292,358 |
| 120,000 | 5.000% due 11/15/50
| 142,600 |
| 500,000 | Metropolitan Transportation Authority, NY, Revenue Bonds, Series D,
4.000% due 11/15/46
| 542,331 |
| | Metropolitan Transportation Authority, NY, Revenue Bonds, Series D-2: |
| 500,000 | 4.000% due 11/15/47
| 554,345 |
| 325,000 | 4.000% due 11/15/48
| 360,041 |
| 175,000 | Metropolitan Transportation Authority, NY, Revenue Bonds, Series D-3,
4.000% due 11/15/49
| 193,683 |
| 275,000 | Monroe County, NY, Industrial Development Corp, Revenue Bonds,
5.000% due 1/1/40
| 307,703 |
| 1,900,000 | New York City, NY, General Obligation Unlimited, Series F-3,
0.020% due 3/1/422
| 1,900,000 |
| 1,000,000 | New York City, NY, Municipal Water Finance Authority, Water And Sewer Sytem Revenue, Revenue Bonds, Series A-2,
0.020% due 6/15/442
| 1,000,000 |
See Notes to Financial Statements.
THE GLENMEDE FUND, INC.
High Yield Municipal Portfolio
SCHEDULE OF PORTFOLIO INVESTMENTS — (Continued)
October 31, 2021
Face
Amount | | | Value |
| MUNICIPAL BONDS* — (Continued) |
| | New York — (Continued) |
| $ 3,800,000 | New York City, NY, Water & Sewer System, Revenue Bonds, Series FF-1,
0.020% due 6/15/442
| $ 3,800,000 |
| 460,000 | New York City, NY, Water and Sewer System Revenue, Revenue Bonds,Series BB2,
4.000% due 6/15/42
| 537,329 |
| 700,000 | New York State, Dormitory Authority Revenue, Non State Supported Debt, Refunding,
5.000% due 12/1/323
| 833,609 |
| 1,000,000 | New York State, Dormitory Authority, Revenue Bonds,Series A,
5.000% due 3/15/40
| 1,243,562 |
| 360,000 | New York State, Mortgage Agency, Homeowner Mortgage, Revenue Bonds, Refunding, Series 195,
4.000% due 10/1/46
| 382,310 |
| 1,415,000 | New York State, Urban Development Corp., Revenue Bonds, Series C,
5.000% due 3/15/50
| 1,750,456 |
| | New York Transportation Development Corp., Revenue Bonds, Series C: |
| 500,000 | 5.000% due 12/1/32
| 627,329 |
| 500,000 | 5.000% due 12/1/34
| 625,197 |
| 250,000 | The Town of Huntington, NY, Local Development Corp., Revenue Bonds, Series A,
5.250% due 7/1/56
| 272,039 |
| | | | 19,599,654 |
| | North Carolina — 0.6% |
| 995,000 | North Carolina Housing Finance Agency, Revenue Bonds, Series 46-A,
3.000% due 7/1/51
| 1,071,791 |
| 215,000 | North Carolina Medical Care Commission, Revenue Bonds, Series A,
5.000% due 7/1/34
| 242,319 |
| 500,000 | North Carolina State, Medical Care Commission, Retirement Facilities Revenue, Revenue Bonds, Series B,
5.000% due 4/1/47
| 513,083 |
| | | | 1,827,193 |
| | North Dakota — 0.3% |
| 195,000 | North Dakota Housing Finance Agency, Revenue Bonds, Series A,
3.000% due 1/1/52
| 210,246 |
| 500,000 | Ward County, ND, Healthcare Facilities Revenue, Revenue Bonds, Series C,
5.000% due 6/1/43
| 579,909 |
| | | | 790,155 |
| | Ohio — 2.5% |
| 500,000 | Buckeye, OH, Tobacco Settlement Financing Authority, Revenue Bonds, Series B-2,
5.000% due 6/1/55
| 561,070 |
| 2,500,000 | Buckeye, OH, Tobacco Settlement Financing Authority, Revenue Bonds, Series B-3,
0.000% due 6/1/571
| 390,367 |
| 600,000 | Centerville, OH, Healthcare Revenue, Refunding,
5.250% due 11/1/50
| 653,987 |
| 100,000 | Cleveland-Cuyahoga County, OH, Port Authority, Revenue Bonds, Refunding, Series B,
4.500% due 12/1/55
| 105,042 |
| 455,000 | Cuyahoga County, OH, Hospital Revenue, Refunding,
5.500% due 2/15/52
| 540,730 |
| 345,000 | Franklin Contry, OH, Revenue Bonds, Refunding,
5.250% due 11/15/55
| 386,387 |
| 815,000 | Licking County, OH, Health Care Facilities Authority Revenue, Refunding, Series A,
6.000% due 7/1/50
| 612,880 |
| 1,000,000 | Lucas County, OH, Hospital Revenue, Promedica Healthcare Obligated Group, Revenue Bonds, Refunding, Series A,
5.250% due 11/15/48
| 1,190,805 |
| 475,000 | Ohio Higher Educational Facility Commission, Revenue Bonds, Refunding, Series A,
5.000% due 12/1/50
| 545,582 |
| | Southeastern Ohio Port Authority Hospital Facilities, Revenue Bonds: |
| 300,000 | 5.750% due 12/1/32
| 311,045 |
| 500,000 | 6.000% due 12/1/42
| 517,463 |
See Notes to Financial Statements.
THE GLENMEDE FUND, INC.
High Yield Municipal Portfolio
SCHEDULE OF PORTFOLIO INVESTMENTS — (Continued)
October 31, 2021
Face
Amount | | | Value |
| MUNICIPAL BONDS* — (Continued) |
| | Ohio — (Continued) |
| | State of Ohio, Revenue Bonds: |
| $ 250,000 | 5.000% due 12/1/283
| $ 274,971 |
| 250,000 | 5.000% due 12/1/383
| 265,766 |
| 300,000 | 5.000% due 12/1/483
| 314,418 |
| 420,000 | State of Ohio, Revenue Bonds, Refunding,
5.000% due 12/1/333
| 451,652 |
| | | | 7,122,165 |
| | Oklahoma — 0.2% |
| 635,000 | Norman, OK, Regional Hospital Authority, Revenue Bonds, Refunding,
4.000% due 9/1/37
| 698,109 |
| 375,000 | Oklahoma Development Finance Authority, Revenue Bonds, Series A,
5.000% due 8/1/526
| 5,625 |
| | | | 703,734 |
| | Oregon — 0.2% |
| 125,000 | Clackamas County, OR, Hospital Facility Authority, Oregon Senior Living, Revenue Bonds, Refunding, Series A,
5.125% due 11/15/40
| 136,991 |
| 395,000 | Polk County, OR, Oregon Hospital Facility Authority, Revenue Bonds, Series A,
5.125% due 7/1/55
| 406,999 |
| 130,000 | Yamhill County, OR, Hospital Authority, Revenue Bonds, Series A,
5.000% due 11/15/51
| 149,903 |
| | | | 693,893 |
| | Pennsylvania — 4.1% |
| 500,000 | Allegheny County, PA, Hospital Development Authority, Revenue Bonds,Refunding, Series A,
5.000% due 4/1/47
| 593,247 |
| 750,000 | Berks County, PA, Industrial Development Authority, Tower Health Project, Revenue Bonds, Refunding,
5.000% due 11/1/47
| 824,093 |
| 150,000 | Berks County, PA, Municipal Authority, Revenue Bonds, Series B-3,
5.000% due 2/1/402
| 172,516 |
| 270,000 | Bucks Country, PA, Industrial Development Authority, Revenue Bonds,
4.000% due 7/1/46
| 299,581 |
| 125,000 | Chester County, PA, Industrial Development Authority, Revenue Bonds, Refunding, Series A,
5.000% due 12/15/51
| 141,401 |
| | Crawford County, PA, Hospital Authority, Revenue Bonds, Refunding, Series A: |
| 400,000 | 6.000% due 6/1/36
| 450,186 |
| 250,000 | 6.000% due 6/1/46
| 277,978 |
| 500,000 | Cumberland County, PA, Municipal Authority, Revenue Bonds, Refunding,
5.000% due 1/1/29
| 557,746 |
| 500,000 | Delaware Valley, PA, Regional Finance Authority, Revenue Bonds, Series C, (3M USD LIBOR*0.67+0.75%),
0.830% due 6/1/375
| 481,154 |
| 1,000,000 | Doylestown, PA, Hospital Authority, Revenue Bonds, Refunding, Series A,
5.000% due 7/1/41
| 1,122,946 |
| 200,000 | Franklin County, PA, Industrial Development Authority, Menno-Haven, Inc. Project, Revenue Bonds, Refunding,
5.000% due 12/1/43
| 217,803 |
| 350,000 | Lancaster County, PA, Hospital Authority, Revenue Bonds, Refunding,
5.000% due 3/1/45
| 391,680 |
| 445,000 | Montgomery County, PA, Higher Education & Health Authority, Revenue Bonds, Refunding,
5.000% due 12/1/47
| 491,696 |
| | Montgomery County, PA, Industrial Development Authority, Health System Revenue, Revenue Bonds, Refunding, Series A: |
| 600,000 | 5.250% due 1/15/27
| 679,155 |
| 250,000 | 5.250% due 1/15/46
| 281,683 |
| | Montgomery County, PA, Industrial Development Authority, Revenue Bonds, Refunding: |
| 105,000 | 5.000% due 11/15/23
| 107,727 |
| 500,000 | 5.000% due 11/15/36
| 583,256 |
| 100,000 | 5.000% due 12/1/46
| 109,079 |
See Notes to Financial Statements.
THE GLENMEDE FUND, INC.
High Yield Municipal Portfolio
SCHEDULE OF PORTFOLIO INVESTMENTS — (Continued)
October 31, 2021
Face
Amount | | | Value |
| MUNICIPAL BONDS* — (Continued) |
| | Pennsylvania — (Continued) |
| $ 250,000 | Montgomery County, PA, Industrial Development Authority, Waverly Heights, Limited. Project, Revenue Bonds, Refunding,
5.000% due 12/1/44
| $ 285,704 |
| | Northampton County, PA, Industrial Development Authority, Revenue Bonds: |
| 250,000 | 5.000% due 11/1/44
| 280,880 |
| 300,000 | 5.000% due 11/1/49
| 336,006 |
| 1,000,000 | Pennsylvania Higher Educational Facilities Authority, Revenue Bonds, Refunding, Series A,
5.000% due 8/15/44
| 1,279,450 |
| 250,000 | Pennsylvania State Lancaster County Hospital Authority, Revenue Bonds,
5.000% due 3/1/40
| 281,760 |
| | Philadelphia, PA Authority for Industrial Development, Revenue Bonds, Refunding: |
| 100,000 | 5.000% due 8/1/30
| 117,181 |
| 115,000 | 5.000% due 6/15/403
| 133,044 |
| 425,000 | 5.000% due 8/1/40
| 509,227 |
| 325,000 | The Berks County, PA, Municipal Authority, Revenue Bonds, Series A,
5.000% due 2/1/28
| 370,004 |
| 150,000 | Washington County, PA, Redevelopment Authority Revenue, Tax Allocation, Refunding,
5.000% due 7/1/28
| 161,146 |
| 100,000 | Westmoreland County, PA, Industrial Development Authority, Revenue Bonds, Series A,
4.000% due 7/1/25
| 111,497 |
| | | | 11,648,826 |
| | Puerto Rico — 6.6% |
| 35,000 | Commonwealth of Puerto Rico, General Obligation Unlimited, Refunding, (AGMC Insured),
4.500% due 7/1/23
| 35,081 |
| | Commonwealth of Puerto Rico, General Obligation Unlimited, Refunding, Series A: |
| 200,000 | 5.000% due 7/1/216
| 184,000 |
| 1,690,000 | 5.000% due 7/1/416
| 1,501,987 |
| 140,000 | Commonwealth of Puerto Rico, General Obligation Unlimited, Refunding, Series B,
3.900% due 7/1/496
| 125,825 |
| 250,000 | Puerto Rico Commonwealth Aqueduct & Sewer Authority, Revenue Bonds, Refunding, Series A,
5.000% due 7/1/373,4
| 299,799 |
| 2,000,000 | Puerto Rico Commonwealth Aqueduct & Sewer Authority, Revenue Bonds, Refunding, Series B,
4.000% due 7/1/42
| 2,203,994 |
| | Puerto Rico Commonwealth Aqueduct & Sewer Authority, Revenue Bonds, Series A: |
| 145,000 | 5.000% due 7/1/33
| 149,439 |
| 1,500,000 | 5.000% due 7/1/353
| 1,799,496 |
| 300,000 | 5.125% due 7/1/37
| 309,432 |
| 1,000,000 | Puerto Rico Electric Power Authority, Power Revenue, Revenue Bonds, Series XX-RSA-1,
5.250% due 7/1/406
| 981,250 |
| 25,000 | Puerto Rico Electric Power Authority, Revenue Bonds, (AGMC Insured),
5.000% due 7/1/27
| 25,174 |
| 610,000 | Puerto Rico Electric Power Authority, Revenue Bonds, Refunding, Series DDD, (AGMC Insured),
3.625% due 7/1/23
| 609,986 |
| 75,000 | Puerto Rico Electric Power Authority, Revenue Bonds, Refunding, Series SS, (AGMC Insured),
5.000% due 7/1/30
| 75,522 |
| 860,000 | Puerto Rico Electric Power Authority, Revenue Bonds, Refunding, Series UU, (AGMC Insured), (3M USD LIBOR * 0.67 + 0.52%),
0.608% due 7/1/295
| 857,882 |
| 500,000 | Puerto Rico Electric Power Authority, Revenue Bonds, Series 2013A-RSA-1,
7.000% due 7/1/406
| 503,125 |
| 85,000 | Puerto Rico Electric Power Authority, Revenue Bonds, Series A,
5.000% due 7/1/29
| 83,087 |
| 300,000 | Puerto Rico Electric Power Authority, Revenue Bonds, Series NN, (NPFG Insured),
4.750% due 7/1/33
| 303,788 |
| 510,000 | Puerto Rico Electric Power Authority, Revenue Bonds, Series RR, (AGC Insured),
5.000% due 7/1/28
| 513,549 |
| 10,000 | Puerto Rico Highway and Transportation Authority, Revenue Bonds, (AMBAC Insured),
0.000% due 7/1/251
| 8,662 |
| 455,000 | Puerto Rico Highway and Transportation Authority, Revenue Bonds, Refunding, Series N, (AMBAC Insured),
6.485% due 7/1/28
| 435,673 |
See Notes to Financial Statements.
THE GLENMEDE FUND, INC.
High Yield Municipal Portfolio
SCHEDULE OF PORTFOLIO INVESTMENTS — (Continued)
October 31, 2021
Face
Amount | | | Value |
| MUNICIPAL BONDS* — (Continued) |
| | Puerto Rico — (Continued) |
| $ 800,000 | Puerto Rico Industrial Tourist Educational Medical & Environmental Control Facilities Financing Authority, Auxilio Mutuo, Revenue Bonds, Series A,
6.000% due 7/1/33
| $ 802,191 |
| 250,000 | Puerto Rico Industrial Tourist Educational Medical & Environmental Control Facilities Financing Authority, International American University Project, Revenue Bonds,
5.000% due 10/1/31
| 257,338 |
| 430,000 | Puerto Rico Industrial Tourist Educational Medical & Environmental Control Facilities Financing Authority, International American University Project, Revenue Bonds, (NPFG Insured),
4.500% due 10/1/29
| 431,151 |
| 100,000 | Puerto Rico Industrial Tourist Educational Medical & Environmental Control Facilities Financing Authority, Refunding, ANA G Mendez University Project, Revenue Bonds,
5.500% due 12/1/31
| 100,250 |
| 500,000 | Puerto Rico Industrial Tourist Educational Medical & Environmental Control Facilities Financing Authority, Revenue Bonds,
5.000% due 3/1/36
| 501,250 |
| 540,000 | Puerto Rico Infrastructure Financing Authority, Special Tax Revenue,Revenue Bonds, Series A (AMBAC Insured),
0.000% due 7/1/371
| 260,918 |
| | Puerto Rico Sales Tax Financing Corp. Sales Tax Revenue, Revenue Bonds, Series A-1: |
| 7,000 | 0.000% due 7/1/241
| 6,691 |
| 15,000 | 0.000% due 7/1/271
| 13,556 |
| 14,000 | 0.000% due 7/1/291
| 11,981 |
| 18,000 | 0.000% due 7/1/311
| 14,296 |
| 500,000 | 0.000% due 7/1/461
| 162,374 |
| 11,243,000 | 0.000% due 7/1/511
| 2,647,965 |
| 750,000 | 5.000% due 7/1/58
| 846,711 |
| | Puerto Rico Sales Tax Financing Corp. Sales Tax Revenue, Revenue Bonds, Series A-2: |
| 250,000 | 4.329% due 7/1/40
| 274,368 |
| 207,000 | 4.536% due 7/1/53
| 227,772 |
| 500,000 | 4.784% due 7/1/58
| 556,684 |
| | Puerto Rico Sales Tax Financing Corp., Revenue Bonds, Series A, Class 2, (AMBAC Insured): |
| 209,663 | 0.000% due 8/1/471
| 69,126 |
| 323,124 | 0.000% due 8/1/541
| 75,410 |
| 185,000 | University of Puerto Rico, Revenue Bonds, Refunding, Series P, (NPFG Insured),
5.000% due 6/1/25
| 187,558 |
| | University of Puerto Rico, Revenue Bonds, Series Q: |
| 100,000 | 5.000% due 6/1/25
| 98,750 |
| 150,000 | 5.000% due 6/1/36
| 147,000 |
| | | | 18,700,091 |
| | Rhode Island — 1.1% |
| | Rhode Island Health & Educational Building Corp., Revenue Bonds, Refunding, Series B: |
| 900,000 | 5.000% due 9/1/31
| 1,015,644 |
| 750,000 | 5.000% due 9/1/36
| 841,909 |
| 440,000 | Rhode Island State, Housing and Mortgage Finance Corp., Revenue Bonds, Series 69-B, (GNMA / FNMA / FHLMC Insured),
4.000% due 10/1/48
| 481,122 |
| 5,000,000 | Tobacco Settlement Financing Corp., RI, Revenue Bonds, Series A,
0.000% due 6/1/521
| 835,109 |
| | | | 3,173,784 |
| | South Carolina — 1.9% |
| 2,760,004 | Connector 2000 Association, Inc., SC, Revenue Bonds, Series A-1,
0.000% due 1/1/421
| 706,433 |
| 500,000 | Connector 2000 Association, Inc., SC, Toll Road Revenue, Series A-1,
0.000% due 1/1/321
| 257,668 |
| 225,000 | South Carolina State, Housing Finance & Development Authority, Revenue Bonds, Series A, (GNMA / FNMA / FHLMC/ FHA Insured),
4.000% due 7/1/36
| 240,855 |
See Notes to Financial Statements.
THE GLENMEDE FUND, INC.
High Yield Municipal Portfolio
SCHEDULE OF PORTFOLIO INVESTMENTS — (Continued)
October 31, 2021
Face
Amount | | | Value |
| MUNICIPAL BONDS* — (Continued) |
| | South Carolina — (Continued) |
| | South Carolina State, Jobs-Economic Development Authority, Health Facilities Revenue, Revenue Bonds, Refunding: |
| $ 410,000 | 5.000% due 10/1/363
| $ 450,143 |
| 1,090,000 | 5.000% due 10/1/413
| 1,183,694 |
| 800,000 | South Carolina State, Jobs-Economic Development Authority, Residential Facilities Revenue, Revenue Bonds, Refunding,
5.000% due 4/1/47
| 868,167 |
| 105,000 | South Carolina State, Jobs-Economic Development Authority, Revenue Bonds, Refunding, Series A,
4.000% due 6/1/56
| 109,060 |
| 200,000 | South Carolina State, Public Service Authority, Revenue Bonds, Refunding, Series A,
5.000% due 12/1/33
| 234,880 |
| | South Carolina State, Public Service Authority, Revenue Bonds, Refunding, Series B: |
| 500,000 | 5.000% due 12/1/37
| 593,644 |
| 500,000 | 5.000% due 12/1/41
| 591,192 |
| 5,000 | South Carolina State, Public Service Authority, Revenue Bonds, Series E,
5.250% due 12/1/55
| 5,819 |
| | | | 5,241,555 |
| | Tennessee — 0.4% |
| 1,000,000 | Metropolitan Nashville Airport Authority, TN, Revenue Bonds, Series A,
5.000% due 7/1/54
| 1,224,000 |
| | Texas — 4.3% |
| 645,000 | Arlington, TX, Higher Education Finance Corp., Education Revenue, Revenue Bonds, Refunding, Series A,
5.000% due 12/1/51
| 729,965 |
| | Arlington, TX, Higher Education Finance Corp., Revenue Bonds, Refunding, Uplift Education, Series A: |
| 350,000 | 2.750% due 12/1/26
| 358,963 |
| 210,000 | 4.375% due 2/15/514
| 209,988 |
| 360,000 | Fort Bend County, TX, Industrial Development Corp., NRG Energy, Inc., Revenue Bonds, Series A,
4.750% due 5/1/38
| 372,890 |
| 1,510,000 | Harris County, TX, Cultural Education Facilities Finance Corp., Brazos Presbyterian Homes Project, Revenue Bonds, Refunding,
5.000% due 1/1/48
| 1,649,954 |
| 150,000 | Harris County, TX, Cultural Education Facilities Finance Corp., Revenue Bonds, Series A,
5.000% due 1/1/43
| 154,565 |
| 500,000 | Matagorda County, TX, Navigation District No. 1, Revenue Bonds, Refunding, Series A, (AMBAC Insured),
4.400% due 5/1/30
| 595,081 |
| 950,000 | New Hope Cultural Education Facilities Finance Corp., TX, Retirement Facilities Revenue, Revenue Bonds, Refunding,
5.000% due 11/15/36
| 1,027,008 |
| 375,000 | New Hope Cultural Education Facilities Finance Corp., TX, Retirement Facilities Revenue, Revenue Bonds, Series A,
5.000% due 1/1/35
| 415,731 |
| | New Hope Cultural Education Facilities Finance Corp., TX, Revenue Bonds: |
| 250,000 | 5.500% due 1/1/49
| 258,920 |
| 400,000 | 5.000% due 1/1/55
| 412,355 |
| 215,000 | New Hope Cultural Education Facilities Finance Corp., TX, Revenue Bonds, Series A,
5.000% due 7/1/40
| 244,595 |
| 500,000 | New Hope Cultural Education Facilities Finance Corp., TX, Student Housing Revenue Bonds, Series A,
5.000% due 4/1/42
| 609,491 |
| | Newark Higher Education Finance Corp., TX, Education Revenue, Revenue Bonds: |
| 300,000 | 5.000% due 6/15/33
| 305,769 |
| 500,000 | 5.000% due 6/15/38
| 508,928 |
| 230,000 | Newark Higher Education Finance Corp., TX, Education Revenue, Revenue Bonds, Series A,
5.000% due 6/15/37
| 236,680 |
| 500,000 | Plano, TX, Special Assessment, Revenue Bonds,
4.000% due 9/15/513
| 511,044 |
See Notes to Financial Statements.
THE GLENMEDE FUND, INC.
High Yield Municipal Portfolio
SCHEDULE OF PORTFOLIO INVESTMENTS — (Continued)
October 31, 2021
Face
Amount | | | Value |
| MUNICIPAL BONDS* — (Continued) |
| | Texas — (Continued) |
| | Tarrant County, TX, Cultural Education Facilities Finance Corp., Retirement Facilities, Revenue Bonds, Refunding: |
| $ 250,000 | 4.000% due 5/15/27
| $ 266,476 |
| 70,000 | 4.000% due 5/15/31
| 73,736 |
| 150,000 | 5.000% due 11/15/35
| 166,933 |
| 625,000 | 5.000% due 5/15/45
| 666,572 |
| 155,000 | Texas State, Department of Housing and Community Affairs, Revenue Bonds, Series A, (GNMA Insured),
4.750% due 3/1/49
| 171,259 |
| 1,000,000 | Texas State, Municipal Gas Acquisition and Supply Corp. I, Revenue Bonds, Series C,
0.767% due 9/15/275
| 1,005,065 |
| 500,000 | Texas State, Municipal Gas Acquisition and Supply Corp. I, Revenue Bonds, Series D,
6.250% due 12/15/26
| 578,268 |
| 700,000 | Town of Little Elm TX, Special Assessment, Series A,
5.375% due 9/1/513
| 685,680 |
| | | | 12,215,916 |
| | Utah — 0.4% |
| 500,000 | Hideout Local District No. 1, UT, Special Assessment,
6.750% due 8/1/373
| 519,516 |
| 250,000 | Mida Mountain Village, UT, Public Infrastructure District, Special Assessment, Series A,
5.000% due 8/1/50
| 278,298 |
| 270,000 | Mida Mountain Village, UT, Public Infrastucture District, Special Assessment,
4.000% due 8/1/503
| 275,830 |
| | | | 1,073,644 |
| | Vermont — 0.1% |
| 260,000 | Vermont Economic Development Authority, Series A,
4.000% due 5/1/37
| 282,645 |
| | Virginia — 2.5% |
| | Farmville, VA, Industrial Development Authority Facilities, Revenue Bonds, Refunding, Series A: |
| 750,000 | 5.000% due 1/1/38
| 876,546 |
| 500,000 | 5.000% due 1/1/50
| 587,191 |
| 500,000 | Hanover County, VA, Economic Development Authority, Care Facilities Revenue, Covenant Woods, Revenue Bonds, Refunding,
5.000% due 7/1/38
| 543,860 |
| 295,000 | Henrico County, VA, Economic Development Authority Health Care Facilities Revenue, Revenue Bonds, Refunding, Series C,
5.000% due 12/1/37
| 346,721 |
| 500,000 | Henrico County, VA, Economic Development Authority, Residencial Care Facility Revenue, Revenue Bonds, Series A,
5.000% due 6/1/39
| 543,952 |
| 600,000 | Henrico County, VA, Economic Development Authority, Residencial Care Facility Revenue, Revenue Bonds, Series C,
5.000% due 12/1/47
| 694,007 |
| | James City County, VA, Economic Development Authority, Revenue Bonds, Series A: |
| 190,000 | 4.000% due 12/1/40
| 207,814 |
| 140,000 | 4.000% due 6/1/41
| 151,532 |
| 500,000 | Newport News, VA, Industrial Development Authority, Health System Revenue, Revenue Bonds, Series A,
5.000% due 7/1/463
| 571,470 |
| 1,000,000 | Newport News, VA, Industrial Development Authority, System Revenue, Revenue Bonds,
5.330% due 7/1/453
| 1,114,556 |
| 500,000 | Virginia State, Small Business Financing Authority, Residential Care Facility Revenue, Revenue Bonds, Refunding, Series C,
5.000% due 6/1/42
| 535,376 |
| | Virginia State, Small Business Financing Authority, Revenue Bonds, Series A: |
| 500,000 | 5.000% due 1/1/32
| 608,857 |
| 250,000 | 4.000% due 1/1/45
| 282,236 |
| | | | 7,064,118 |
See Notes to Financial Statements.
THE GLENMEDE FUND, INC.
High Yield Municipal Portfolio
SCHEDULE OF PORTFOLIO INVESTMENTS — (Continued)
October 31, 2021
Face
Amount | | | Value |
| MUNICIPAL BONDS* — (Continued) |
| | Washington — 2.1% |
| $ 235,000 | Kalispel Tribe of Indians Priority District, WA, Revenue Bonds, Series B,
5.250% due 1/1/383
| $ 277,085 |
| | Washington State Convention Center Public Facilities District, Refunding, Series B: |
| 260,000 | 4.000% due 7/1/31
| 306,150 |
| 295,000 | 3.000% due 7/1/35
| 307,464 |
| 310,000 | 3.000% due 7/1/58
| 299,802 |
| 500,000 | Washington State Convention Center Public Facilities District, Revenue Bonds,
4.000% due 7/1/31
| 570,321 |
| 497,089 | Washington State Housing Finance Commission, Revenue Bonds, Series A-1,
3.500% due 12/20/35
| 570,061 |
| | Washington State, Health Care Facilities Authority, Revenue Bonds: |
| 300,000 | 5.000% due 8/15/34
| 349,746 |
| 1,125,000 | 5.000% due 12/1/36
| 1,284,099 |
| 200,000 | Washington State, Health Care Facilities Authority, Revenue Bonds, Series A-2,
5.000% due 8/1/30
| 252,116 |
| 625,000 | Washington State, Housing Finance Commission, Refunding, Judson Park Project, Revenue Bonds,
5.000% due 7/1/383
| 671,094 |
| 500,000 | Washington State, Housing Finance Commission, Rockwood Retirement Communities, Revenue Bonds,
5.000% due 1/1/553
| 526,394 |
| 500,000 | Washington State, Housing Finance Commission, Rockwood Retirement Communities, Revenue Bonds, Series A,
5.000% due 1/1/563
| 526,078 |
| | | | 5,940,410 |
| | West Virginia — 0.1% |
| 250,000 | West Virginia State, Hospital Finance Authority, Revenue Bonds, Refunding, Series A,
5.000% due 1/1/43
| 299,579 |
| | Wisconsin — 3.8% |
| 250,000 | Public Finance Authority, WI, Charter School Portfolio Project, Revenue Bonds, Series A-1,
5.000% due 1/1/553
| 273,115 |
| 500,000 | Public Finance Authority, WI, Charter School Revenue, Revenue Bonds, Series A,
5.375% due 7/15/473
| 558,186 |
| 235,000 | Public Finance Authority, WI, Education Revenue, Revenue Bonds, Series A,
5.000% due 6/15/51
| 251,249 |
| 115,000 | Public Finance Authority, WI, Hospital Facility Authority, Revenue Bonds, Refunding, Series A,
4.000% due 12/1/41
| 132,159 |
| | Public Finance Authority, WI, Retirement Facility Revenue, Revenue Bonds, Refunding: |
| 250,000 | 5.000% due 9/1/493
| 266,479 |
| 500,000 | 5.000% due 9/1/543
| 562,229 |
| 135,000 | Public Finance Authority, WI, Revenue Bond,
5.000% due 4/1/503
| 157,014 |
| 250,000 | Public Finance Authority, WI, Revenue Bond, Series A,
5.000% due 12/1/453
| 278,350 |
| 260,000 | Public Finance Authority, WI, Revenue Bonds, Refunding,
5.875% due 4/1/45
| 292,715 |
| | Public Finance Authority, WI, Revenue Bonds, Series A: |
| 375,000 | 5.000% due 6/1/293
| 414,584 |
| 250,000 | 5.000% due 1/1/35
| 290,416 |
| 750,000 | 5.000% due 1/1/46
| 852,974 |
| 1,000,000 | 4.000% due 7/1/51
| 1,128,097 |
| 295,000 | Public Finance Authority, WI, School Education Revenue, Revenue Bonds,
4.000% due 6/15/293
| 314,923 |
| 500,000 | Public Finance Authority, WI, School Education Revenue, Revenue Bonds, Series A,
4.000% due 6/15/403
| 511,967 |
| 350,000 | Public Finance Authority, WI, Senior Living Revenue, Mary’s Woods at Marylhurst Project, Revenue Bonds, Refunding, Series A,
5.250% due 5/15/373
| 381,170 |
| 70,000 | Public Finance Authority, WI, Senior Living Revenue, Rose Village Project, Revenue Bonds, Series A,
5.000% due 11/15/243
| 72,946 |
| 500,000 | Public Finance Authority, WI, Student Housing, Revenue Bonds (AGMC Insured),
5.000% due 7/1/53
| 588,294 |
See Notes to Financial Statements.
THE GLENMEDE FUND, INC.
High Yield Municipal Portfolio
SCHEDULE OF PORTFOLIO INVESTMENTS — (Continued)
October 31, 2021
Face
Amount | | | Value |
| MUNICIPAL BONDS* — (Continued) |
| | Wisconsin — (Continued) |
| $ 1,060,000 | Public Finance Authority, WI, Student Housing, Revenue Bonds, Series A,
5.000% due 7/1/25
| $ 1,177,831 |
| 955,000 | Wisconsin State, Health & Educational Facilities Authority Revenue, Revenue Bonds, Refunding,
5.000% due 6/1/41
| 1,038,948 |
| 390,000 | Wisconsin State, Health & Educational Facilities Authority Revenue, Revenue Bonds, Refunding, Series C,
0.150% due 2/15/532
| 390,000 |
| 35,000 | Wisconsin State, Housing and Economic Development Authority, Home Ownership Revenue, Revenue Bonds, Series B,
0.400% due 5/1/452
| 34,969 |
| 715,000 | Wisconsin State, Housing and Economic Development Authority, Home Ownership Revenue, Revenue Bonds, Series D,
4.000% due 3/1/47
| 778,748 |
| | | | 10,747,363 |
| | Other Territory — 0.4% |
| 719,774 | Federal Home Loan Mortgage Corporation Multifamily 2019ML-05 Certificates, Revenue Bonds, Class AUS,
3.400% due 1/25/36
| 808,559 |
| 264,142 | Federal Home Loan Mortgage Corporation Multifamily 2021ML-10 Certificates, Class AUS,
2.032% due 1/25/38
| 269,068 |
| 718,291 | Federal Home Loan Mortgage Corporation Multifamily 2021ML-10 Certificates, Class XUS,
2.055% due 1/25/382
| 149,422 |
| | TOTAL MUNICIPAL BONDS
(Cost $263,092,020)
| 278,017,756 |
TOTAL INVESTMENTS
(Cost $263,092,020)
| 98.4% | $278,017,756 |
OTHER ASSETS IN EXCESS OF LIABILITIES
| 1.6 | 4,493,840 |
NET ASSETS
| 100.0% | $282,511,596 |
|
| * | Percentages indicated are based on net assets. |
| 1 | Zero Coupon Bond. |
| 2 | Variable/Floating interest rate security. Certain variable/floating interest rate securities are not based on a published reference rate and spread but are determined by the issuer or agent and are based on current market conditions. These securities do not indicate a reference rate and spread in their description above. Rate presented is as of October 31, 2021. |
| 3 | Security exempt from registration under Rule 144A of the Securities Act of 1933, as amended. This security may be resold in transactions exempt from registration, normally to qualified buyers. At October 31, 2021, these securities amounted to $39,172,520 or 13.9% of net assets for the Fund. |
| 4 | When-issued security. |
| 5 | Floating Rate Bond. Rate shown is as of October 31, 2021. |
| 6 | This security is in default. See Note 1. |
| Abbreviations: |
| AGC — Assurance Guaranty Corporation |
| AGMC — Assured Guaranty Municipal Corporation |
| AMBAC — American Municipal Bond Assurance Corporation |
| AMT — Alternative Minimum Tax |
| BAM — Build America Mutual |
| FHA — Federal Housing Administration |
| FHLMC — Federal Home Loan Mortgage Corporation |
| FNMA — Federal National Mortgage Association |
| GNMA — Government National Mortgage Association |
| MBIA — Municipal Bond Investors Assurance |
| NPFG — National Public Finance Guarantee Corporation |
| SIFMA — Securities Industry and Financial Markets Association |
See Notes to Financial Statements.
THE GLENMEDE FUND, INC.
High Yield Municipal Portfolio
SCHEDULE OF PORTFOLIO INVESTMENTS — (Concluded)
October 31, 2021
STATE DIVERSIFICATION
On October 31, 2021, State Diversification of the Portfolio was as follows:
| | % of
Net Assets | | Value |
| STATE: | | | |
Illinois
| 13.3% | | $ 37,687,290 |
Colorado
| 10.2 | | 28,686,189 |
New York
| 6.9 | | 19,599,654 |
Puerto Rico
| 6.6 | | 18,700,091 |
New Jersey
| 5.7 | | 15,968,888 |
Florida
| 4.8 | | 13,461,501 |
Texas
| 4.3 | | 12,215,916 |
California
| 4.2 | | 11,857,563 |
Pennsylvania
| 4.1 | | 11,648,826 |
Arizona
| 3.9 | | 10,946,930 |
Wisconsin
| 3.8 | | 10,747,363 |
Ohio
| 2.5 | | 7,122,165 |
Virginia
| 2.5 | | 7,064,118 |
Michigan
| 2.5 | | 7,026,364 |
Washington
| 2.1 | | 5,940,410 |
South Carolina
| 1.9 | | 5,241,555 |
Indiana
| 1.8 | | 5,113,354 |
Maryland
| 1.8 | | 5,012,875 |
Missouri
| 1.3 | | 3,684,778 |
Louisiana
| 1.1 | | 3,251,109 |
Rhode Island
| 1.1 | | 3,173,784 |
Alabama
| 1.0 | | 2,724,100 |
Kentucky
| 0.9 | | 2,438,992 |
Mississippi
| 0.8 | | 2,388,446 |
District of Columbia
| 0.8 | | 2,252,333 |
Georgia
| 0.8 | | 2,201,811 |
Idaho
| 0.7 | | 1,965,896 |
Connecticut
| 0.7 | | 1,910,009 |
Nevada
| 0.7 | | 1,858,952 |
North Carolina
| 0.6 | | 1,827,193 |
New Mexico
| 0.5 | | 1,416,078 |
Iowa
| 0.5 | | 1,304,842 |
Other Territory
| 0.4 | | 1,227,049 |
Tennessee
| 0.4 | | 1,224,000 |
Hawaii
| 0.4 | | 1,163,185 |
New Hampshire
| 0.4 | | 1,152,974 |
Utah
| 0.4 | | 1,073,644 |
Alaska
| 0.4 | | 1,065,271 |
Guam
| 0.3 | | 837,586 |
North Dakota
| 0.3 | | 790,155 |
Oklahoma
| 0.2 | | 703,734 |
Oregon
| 0.2 | | 693,893 |
Minnesota
| 0.2 | | 501,326 |
Kansas
| 0.1 | | 351,243 |
West Virginia
| 0.1 | | 299,579 |
Vermont
| 0.1 | | 282,645 |
Nebraska
| 0.1 | | 212,097 |
TOTAL MUNICIPAL BONDS
| 98.4% | | $278,017,756 |
TOTAL INVESTMENTS
| 98.4% | | $278,017,756 |
See Notes to Financial Statements.
THE GLENMEDE FUND, INC.
Notes to Financial Statements
1. Organization and Significant Accounting Policies
As of October 31, 2021, The Glenmede Fund, Inc. (the “Fund”) consists of seventeen portfolios: the Quantitative U.S. Large Cap Core Equity Portfolio, the Quantitative U.S. Large Cap Growth Equity Portfolio, the Quantitative U.S. Large Cap Value Equity Portfolio, the Quantitative U.S. Small Cap Equity Portfolio, the Quantitative International Equity Portfolio, the Responsible ESG U.S. Equity Portfolio, the Women in Leadership U.S. Equity Portfolio, the Quantitative U.S. Long/Short Equity Portfolio, the Quantitative U.S. Total Market Equity Portfolio, the Strategic Equity Portfolio, the Small Cap Equity Portfolio, the Equity Income Portfolio, the Secured Options Portfolio, the Global Secured Options Portfolio, the Core Fixed Income Portfolio, the Short Term Tax Aware Fixed Income Portfolio and the High Yield Municipal Portfolio (each, a “Portfolio” and collectively, the “Portfolios”). The Fund was incorporated in the State of Maryland on June 30, 1988, and is registered with the Securities and Exchange Commission (the “SEC”) under the Investment Company Act of 1940, as amended (the “1940 Act”), as an open-end management investment company.
Since January 2, 1998, the Small Cap Equity Portfolio has consisted of two classes of shares: the Advisor Class and the Institutional Class. Since June 30, 2015, the Quantitative U.S. Large Cap Core Equity Portfolio and the Quantitative U.S. Large Cap Growth Equity Portfolio have offered two classes of shares: the Advisor Class and the Institutional Class. The Institutional Classes commenced operations on December 30, 2015 and November 5, 2015, respectively. Since July 14, 2016, the Secured Options Portfolio has offered two classes of shares: the Advisor Class and the Institutional Class. The Institutional Class shares of the Secured Options Portfolio commenced operations on November 9, 2016. Since February 14, 2019, the Quantitative U.S. Long/Short Equity Portfolio has offered two classes of shares: the Advisor Class and the Institutional Class. As of that date, the existing class of the Quantitative U.S. Long/Short Equity Portfolio changed its name to the Advisor Class. The Institutional Class shares of the Quantitative U.S. Long/Short Equity Portfolio commenced operations on September 13, 2019. The High Yield Municipal Portfolio, the Responsible ESG U.S. Equity Portfolio and the Women in Leadership U.S. Equity Portfolio commenced operations on December 22, 2015. The Short Term Tax Aware Fixed Income Portfolio commenced operations on June 29, 2016. The Equity Income Portfolio commenced operations on December 21, 2016. The Quantitative U.S. Large Cap Value Equity Portfolio and Quantitative U.S. Small Cap Equity Portfolio commenced operations on November 13, 2017.
The Fund is an investment company and follows accounting and reporting guidance in Financial Accounting Standards Board (“FASB”) Accounting Standards Codification ("ASC") Topic 946 (“ASC 946”). The preparation of financial statements in conformity with accounting principles generally accepted in the United States of America (“U.S.”), including but not limited to ASC 946, requires management to make estimates and assumptions that affect the reported amounts of assets and liabilities and disclosures of contingent assets and liabilities at the date of the financial statements and the reported amounts of revenues and expenses during the reporting period. Actual results could differ from those estimates, and the differences could be material. The following is a summary of significant accounting policies consistently followed by the Portfolios in the preparation of their financial statements.
Valuation of Securities: Equity securities and options listed on a U.S. securities exchange, including exchange-traded funds (“ETFs”), for which market quotations are readily available are valued at the last quoted sale price as of the close of the exchange’s regular trading hours on the day the valuation is made. These securities are typically categorized as Level 1 in the fair value hierarchy. Price information on listed securities is taken from the exchange where the securities are primarily traded. Securities traded on the NASDAQ System are valued at the NASDAQ Official Closing Price (“NOCP”) and are typically categorized as Level 1 in the fair value hierarchy. Unlisted equity securities and listed securities not traded on the valuation date for which market quotations are readily available are valued at an amount that does not exceed the asked price and is not less than the bid price and are typically categorized as Level 2. If no sales are reported, exchange traded options are valued at the mean of the bid and ask price and are typically categorized as Level 2. Options traded over-the-counter are valued using prices supplied by dealers and are typically categorized as Level 2. Securities and options listed on a foreign exchange and unlisted foreign securities that are traded on the valuation date are valued at the last quoted sales price available before the time when assets are valued and are typically categorized as Level 1. Investments in open-end registered investment companies are valued at their respective net asset values ("NAVs") as reported by such companies, and are typically categorized as Level 1.
Bonds and other fixed-income securities are valued at the most recent quoted bid price or, when exchange valuations are used, at the latest quoted sale price on the day of valuation. Such securities are typically categorized as Level 2 in the fair value hierarchy. In addition, bond and other fixed-income securities may be valued on the basis of prices provided by a pricing service or by using a matrix or formula. In such instances, when the Portfolio’s investment advisor believes such prices reflect the fair market value of such securities and are based on observable inputs, these securities are typically categorized as Level 2. Debt securities purchased with maturities of 60 days or less at the time of purchase are valued at amortized cost and are typically categorized as Level 2. Amortized cost valuation involves valuing an instrument at its cost initially and thereafter assuming a constant amortization to maturity of any discount or premium, regardless of the effect of fluctuating interest rates on the market value of the instrument.
When market quotations are not readily available or events occur that make established valuation methods unreliable, securities and other assets are valued in a manner that is intended to reflect their fair value as determined in accordance with procedures approved by the Board of Directors of the Fund (the “Board”) and are typically categorized as Level 3 in the fair value hierarchy. The fair value of securities is generally determined as the amount that a Portfolio could reasonably expect to realize from an orderly disposition of such securities over a reasonable period of time. By its nature, a fair value price is a good faith estimate of the value of a security at a given point in time and does not reflect an actual market price, which may be different by a material amount.
THE GLENMEDE FUND, INC.
Notes to Financial Statements — (Continued)
FASB ASC Topic 820 ("ASC 820") “Fair Value Measurements" defines fair value, establishes a three-level hierarchy for measuring fair value and expands disclosure about fair value measurements. The valuation hierarchy is based upon the transparency of inputs to the valuation of each Portfolio’s investments. Inputs refer broadly to the assumptions that market participants would use in pricing a security. Observable inputs are inputs that reflect the assumptions market participants would use in pricing the asset or liability based on market data obtained from sources independent of the reporting entity. Unobservable inputs are inputs that reflect the reporting entity’s own assumptions about the assumptions market participants would use in pricing the asset or liability based on the best information available in the circumstances. These inputs are summarized in the three levels listed below:
Level 1 — quoted prices in active markets for identical investments;
Level 2 — other significant observable inputs (including quoted prices for similar investments, interest rates, prepayment speeds, credit risk, adjusted quoted prices on foreign equity securities and others) or valuations based on quoted prices in markets that are not active; and
Level 3 — significant unobservable inputs (including the Fund’s own assumptions in determining the fair value of investments).
The inputs or methodology used for valuing securities are not necessarily an indication of the risks associated with investing in those securities.
Changes in valuation techniques may result in changing an investment’s assigned level within the hierarchy.
The Quantitative U.S. Large Cap Core Equity Portfolio, Quantitative U.S. Large Cap Growth Equity Portfolio, Quantitative U.S. Large Cap Value Equity Portfolio, Quantitative International Equity Portfolio, Responsible ESG U.S. Equity Portfolio, Women in Leadership U.S. Equity Portfolio, Quantitative U.S. Long/Short Equity Portfolio, Quantitative U.S. Total Market Equity Portfolio, Strategic Equity Portfolio, Small Cap Equity Portfolio and Equity Income Portfolio had all investments with corresponding industries at Level 1 except repurchase agreements which were at Level 2, at October 31, 2021. The High Yield Municipal Portfolio had all investments with corresponding states at Level 2 at October 31, 2021.
The Portfolios did not recognize any Level 3 transfers as of the fiscal year ended October 31, 2021. Transfers into and out of a level are typically recognized at the end of the reporting period.
The following is a summary of the inputs used as of October 31, 2021 in valuing the assets and liabilities of the Quantitative U.S. Small Cap Equity Portfolio, Secured Options Portfolio, Global Secured Options Portfolio, Core Fixed Income Portfolio and Short Term Tax Aware Fixed Income Portfolio:
Quantitative U.S. Small Cap Equity Portfolio
ASSETS VALUATION INPUT
| Description | | Quoted
Prices in
Active
Markets for
Identical
Assets
(Level 1) | | Significant
Other
Observable
Inputs
(Level 2) | | Significant
Unobservable
Inputs
(Level 3) | | Total |
| Common Stocks | | | | | | | | |
Air Freight & Logistics
| | $ 10,302 | | $ — | | $— | | $ 10,302 |
Auto Components
| | 11,957 | | — | | — | | 11,957 |
Banks
| | 171,950 | | — | | — | | 171,950 |
Beverages
| | 11,750 | | — | | — | | 11,750 |
Biotechnology
| | 111,336 | | — | | — | | 111,336 |
Building Products
| | 34,513 | | — | | — | | 34,513 |
Capital Markets
| | 31,028 | | — | | — | | 31,028 |
Chemicals
| | 22,720 | | — | | — | | 22,720 |
Commercial Services & Supplies
| | 23,489 | | — | | — | | 23,489 |
Communications Equipment
| | 8,393 | | — | | — | | 8,393 |
Construction & Engineering
| | 11,324 | | — | | — | | 11,324 |
Consumer Finance
| | 21,315 | | — | | — | | 21,315 |
Containers & Packaging
| | 10,479 | | — | | — | | 10,479 |
Diversified Consumer Services
| | 19,480 | | — | | — | | 19,480 |
Diversified Telecommunication Services
| | 6,791 | | — | | — | | 6,791 |
Electronic Equipment, Instruments & Components
| | 39,194 | | — | | — | | 39,194 |
Energy Equipment & Services
| | 19,396 | | — | | — | | 19,396 |
Equity Real Estate Investment Trusts
| | 119,904 | | — | | — | | 119,904 |
Food & Staples Retailing
| | 16,580 | | — | | — | | 16,580 |
THE GLENMEDE FUND, INC.
Notes to Financial Statements — (Continued)
| Description | | Quoted
Prices in
Active
Markets for
Identical
Assets
(Level 1) | | Significant
Other
Observable
Inputs
(Level 2) | | Significant
Unobservable
Inputs
(Level 3) | | Total |
Gas Utilities
| | $ 35,335 | | $ — | | $— | | $ 35,335 |
Health Care Equipment & Supplies
| | 31,226 | | — | | — | | 31,226 |
Health Care Providers & Services
| | 49,107 | | — | | — | | 49,107 |
Health Care Technology
| | 10,059 | | — | | — | | 10,059 |
Hotels, Restaurants & Leisure
| | 20,260 | | — | | — | | 20,260 |
Household Durables
| | 42,258 | | — | | — | | 42,258 |
Household Products
| | 5,364 | | — | | — | | 5,364 |
Insurance
| | 35,163 | | — | | — | | 35,163 |
IT Services
| | 61,537 | | — | | — | | 61,537 |
Leisure Equipment & Products
| | 18,954 | | — | | — | | 18,954 |
Machinery
| | 30,425 | | — | | — | | 30,425 |
Media
| | 38,320 | | — | | — | | 38,320 |
Metals & Mining
| | 42,418 | | — | | — | | 42,418 |
Mortgage Real Estate Investment Trust
| | 14,542 | | — | | — | | 14,542 |
Oil, Gas & Consumable Fuels
| | 43,930 | | — | | — | | 43,930 |
Paper & Forest Products
| | 7,643 | | — | | — | | 7,643 |
Personal Products
| | 8,153 | | — | | — | | 8,153 |
Pharmaceuticals
| | 55,224 | | — | | 0* | | 55,224 |
Professional Services
| | 43,423 | | — | | — | | 43,423 |
Real Estate Management & Development
| | 13,025 | | — | | — | | 13,025 |
Semiconductors & Semiconductor Equipment
| | 49,520 | | — | | — | | 49,520 |
Software
| | 44,711 | | — | | — | | 44,711 |
Specialty Retail
| | 31,038 | | — | | — | | 31,038 |
Thrifts & Mortgage Finance
| | 14,262 | | — | | — | | 14,262 |
Tobacco
| | 9,542 | | — | | — | | 9,542 |
Trading Companies & Distributors
| | 68,097 | | — | | — | | 68,097 |
Wireless Telecommunication Services
| | 20,128 | | — | | — | | 20,128 |
Total Common Stocks
| | 1,545,565 | | — | | — | | 1,545,565 |
Repurchase Agreement
| | — | | 12,420 | | — | | 12,420 |
Investment of Security Lending Collateral
| | 26,965 | | — | | — | | 26,965 |
Total Investments
| | 1,572,530 | | 12,420 | | 0 | | 1,584,950 |
Total
| | $1,572,530 | | $12,420 | | $ 0 | | $1,584,950 |
* Includes one security priced at $0.
Secured Options Portfolio
ASSETS VALUATION INPUT
| Description | | Quoted
Prices in
Active
Markets for
Identical
Assets
(Level 1) | | Significant
Other
Observable
Inputs
(Level 2) | | Significant
Unobservable
Inputs
(Level 3) | | Total |
Exchange-Traded Funds
| | $ 22,814,225 | | $ — | | $— | | $ 22,814,225 |
U.S. Treasury Bills
| | — | | 114,978,765 | | — | | 114,978,765 |
Repurchase Agreement
| | — | | 7,484,965 | | — | | 7,484,965 |
THE GLENMEDE FUND, INC.
Notes to Financial Statements — (Continued)
| Description | | Quoted
Prices in
Active
Markets for
Identical
Assets
(Level 1) | | Significant
Other
Observable
Inputs
(Level 2) | | Significant
Unobservable
Inputs
(Level 3) | | Total |
| Purchased Options | | | | | | | | |
Calls
| | $1,003,800,150 | | $ — | | $— | | $1,003,800,150 |
Puts
| | 48,825 | | — | | — | | 48,825 |
Total Purchased Options
| | 1,003,848,975 | | — | | — | | 1,003,848,975 |
Total Investments
| | 1,026,663,200 | | 122,463,730 | | — | | 1,149,126,930 |
Total
| | $1,026,663,200 | | $122,463,730 | | $— | | $1,149,126,930 |
LIABILITIES VALUATION INPUT
| Description | | Quoted
Prices in
Active
Markets for
Identical
Assets
(Level 1) | | Significant
Other
Observable
Inputs
(Level 2) | | Significant
Unobservable
Inputs
(Level 3) | | Total |
| Written Options | | | | | | | | |
Calls
| | $(724,995,450) | | $— | | $— | | $(724,995,450) |
Puts
| | (918,075) | | — | | — | | (918,075) |
Total Written Options
| | (725,913,525) | | — | | — | | (725,913,525) |
Total
| | $(725,913,525) | | $— | | $— | | $(725,913,525) |
Global Secured Options Portfolio
ASSETS VALUATION INPUT
| Description | | Quoted
Prices in
Active
Markets for
Identical
Assets
(Level 1) | | Significant
Other
Observable
Inputs
(Level 2) | | Significant
Unobservable
Inputs
(Level 3) | | Total |
Exchange-Traded Fund
| | $ 305,520 | | $ — | | $— | | $ 305,520 |
U.S. Treasury Bills
| | — | | 4,199,200 | | — | | 4,199,200 |
Repurchase Agreement
| | — | | 854,352 | | — | | 854,352 |
| Purchased Options | | | | | | | | |
Calls
| | 39,576,350 | | — | | — | | 39,576,350 |
Puts
| | 1,925 | | — | | — | | 1,925 |
Total Purchased Options
| | 39,578,275 | | — | | — | | 39,578,275 |
Total Investments
| | 39,883,795 | | 5,053,552 | | — | | 44,937,347 |
Total
| | $39,883,795 | | $5,053,552 | | $— | | $44,937,347 |
THE GLENMEDE FUND, INC.
Notes to Financial Statements — (Continued)
LIABILITIES VALUATION INPUT
| Description | | Quoted
Prices in
Active
Markets for
Identical
Assets
(Level 1) | | Significant
Other
Observable
Inputs
(Level 2) | | Significant
Unobservable
Inputs
(Level 3) | | Total |
| Written Options | | | | | | | | |
Calls
| | $(28,584,050) | | $— | | $— | | $(28,584,050) |
Puts
| | (174,878) | | — | | — | | (174,878) |
Total Written Options
| | (28,758,928) | | — | | — | | (28,758,928) |
Total
| | $(28,758,928) | | $— | | $— | | $(28,758,928) |
Core Fixed Income Portfolio
ASSETS VALUATION INPUT
| Description | | Quoted
Prices in
Active
Markets for
Identical
Assets
(Level 1) | | Significant
Other
Observable
Inputs
(Level 2) | | Significant
Unobservable
Inputs
(Level 3) | | Total |
| Agency Notes | | | | | | | | |
Federal Home Loan Bank
| | $ — | | $ 50,298,121 | | $— | | $ 50,298,121 |
Federal National Mortgage Association
| | — | | 39,377,640 | | — | | 39,377,640 |
Total Agency Notes
| | — | | 89,675,761 | | — | | 89,675,761 |
| Mortgage-Backed Securities | | | | | | | | |
Federal Home Loan Mortgage Corporation
| | — | | 49,482,987 | | — | | 49,482,987 |
Federal National Mortgage Association
| | — | | 82,079,160 | | — | | 82,079,160 |
Government National Mortgage Association
| | — | | 624,859 | | — | | 624,859 |
Total Mortgage-Backed Securities
| | — | | 132,187,006 | | — | | 132,187,006 |
| Corporate Notes | | | | | | | | |
Banking
| | — | | 32,401,671 | | — | | 32,401,671 |
Beverages, Food & Tobacco
| | — | | 10,945,636 | | — | | 10,945,636 |
Communications
| | — | | 17,790,763 | | — | | 17,790,763 |
Computer Software & Processing
| | — | | 24,152,806 | | — | | 24,152,806 |
Heavy Machinery
| | — | | 8,959,043 | | — | | 8,959,043 |
Insurance
| | — | | 5,420,683 | | — | | 5,420,683 |
Media - Broadcasting & Publishing
| | — | | 7,542,048 | | — | | 7,542,048 |
Pharmaceuticals
| | — | | 10,078,347 | | — | | 10,078,347 |
Total Corporate Notes
| | — | | 117,290,997 | | — | | 117,290,997 |
U.S. Treasury Notes/Bonds
| | — | | 80,641,172 | | — | | 80,641,172 |
Repurchase Agreement
| | — | | 10,070,273 | | — | | 10,070,273 |
Investment of Security Lending Collateral
| | 27,537,200 | | — | | — | | 27,537,200 |
Total Investments
| | 27,537,200 | | 429,865,209 | | — | | 457,402,409 |
Total
| | $27,537,200 | | $429,865,209 | | $— | | $457,402,409 |
THE GLENMEDE FUND, INC.
Notes to Financial Statements — (Continued)
Short Term Tax Aware Fixed Income Portfolio
ASSETS VALUATION INPUT
| Description | | Quoted
Prices in
Active
Markets for
Identical
Assets
(Level 1) | | Significant
Other
Observable
Inputs
(Level 2) | | Significant
Unobservable
Inputs
(Level 3) | | Total |
| Corporate Notes | | | | | | | | |
Health Care Services
| | $ — | | $ 498,590 | | $— | | $ 498,590 |
| Municipal Bonds | | | | | | | | |
Alabama
| | — | | 1,015,402 | | — | | 1,015,402 |
Arizona
| | — | | 966,978 | | — | | 966,978 |
California
| | — | | 2,038,086 | | — | | 2,038,086 |
Colorado
| | — | | 1,790,741 | | — | | 1,790,741 |
Connecticut
| | — | | 2,813,969 | | — | | 2,813,969 |
District of Columbia
| | — | | 1,126,835 | | — | | 1,126,835 |
Florida
| | — | | 3,241,444 | | — | | 3,241,444 |
Georgia
| | — | | 306,545 | | — | | 306,545 |
Illinois
| | — | | 3,224,941 | | — | | 3,224,941 |
Kansas
| | — | | 410,912 | | — | | 410,912 |
Kentucky
| | — | | 910,245 | | — | | 910,245 |
Louisiana
| | — | | 513,724 | | — | | 513,724 |
Maryland
| | — | | 810,685 | | — | | 810,685 |
Michigan
| | — | | 2,699,442 | | — | | 2,699,442 |
Minnesota
| | — | | 567,196 | | — | | 567,196 |
Nebraska
| | — | | 99,777 | | — | | 99,777 |
Nevada
| | — | | 502,325 | | — | | 502,325 |
New Jersey
| | — | | 2,318,848 | | — | | 2,318,848 |
New York
| | — | | 4,003,457 | | — | | 4,003,457 |
Ohio
| | — | | 2,370,941 | | — | | 2,370,941 |
Pennsylvania
| | — | | 8,983,322 | | — | | 8,983,322 |
Rhode Island
| | — | | 410,277 | | — | | 410,277 |
South Carolina
| | — | | 578,028 | | — | | 578,028 |
South Dakota
| | — | | 229,103 | | — | | 229,103 |
Tennessee
| | — | | 269,311 | | — | | 269,311 |
Texas
| | — | | 6,403,244 | | — | | 6,403,244 |
Virginia
| | — | | 1,229,474 | | — | | 1,229,474 |
Washington
| | — | | 1,787,243 | | — | | 1,787,243 |
Wisconsin
| | — | | 1,201,715 | | — | | 1,201,715 |
Wyoming
| | — | | 406,384 | | — | | 406,384 |
Total Municipal Bonds
| | — | | 53,230,594 | | — | | 53,230,594 |
Repurchase Agreement
| | — | | 3,841,170 | | — | | 3,841,170 |
Registered Investment Companies
| | 416,003* | | — | | — | | 416,003 |
Total Investments
| | 416,003 | | 57,570,354 | | — | | 57,986,357 |
Total
| | $416,003 | | $57,570,354 | | $— | | $57,986,357 |
* Includes one security priced at $0.
COVID-19: In early 2020, an outbreak of a novel strain of coronavirus ("COVID-19") emerged globally. This coronavirus has resulted in closing international borders, enhanced health screenings, healthcare service preparation and delivery, quarantines, cancellations, disruptions to supply chains and customer activity, as well as general public concern and uncertainty. The impact of this outbreak has negatively affected the worldwide economy, as well as the economies of individual countries, the financial health of individual companies and the market in general in significant and unforeseen ways. Although vaccines for COVID-19 have become more widely available, the future impact of COVID-19 is currently unknown, and the pace of recovery may vary from market to market, which may exacerbate other risks that apply to the Fund’s Portfolio(s), including political, social and economic risks. Any such impact could adversely affect the Portfolios’ performance, the performance of the securities in which the Portfolios invest and may lead to losses on your investment in the Fund’s Portfolio(s). The ultimate impact of COVID-19 on the financial performance of the Portfolios’ investments is not reasonably estimable at this time.
THE GLENMEDE FUND, INC.
Notes to Financial Statements — (Continued)
Repurchase Agreements: Each Portfolio may engage in repurchase agreement transactions. Under the terms of a typical repurchase agreement, the applicable Portfolio takes possession of an underlying debt obligation subject to an obligation of the seller to repurchase, and the applicable Portfolio to resell the obligation at an agreed-upon price and time, thereby determining the yield during the Portfolio’s holding period. This arrangement results in a fixed rate of return that is not subject to market fluctuations during the Portfolio’s holding period. The seller’s obligation is secured by collateral (underlying securities) segregated on behalf of the Portfolio. The value of the collateral at the time of execution must be at least equal to 102% of the total amount of the repurchase obligations, including interest. In the event of counterparty default, the Portfolio has the right to sell the collateral to offset losses incurred. There is a potential for loss to a Portfolio in the event the Portfolio is delayed or prevented from exercising its rights to dispose of the collateral securities, including the risk of a possible decline in the value of the underlying securities during the period while the Portfolio seeks to assert its rights. Each Portfolio’s investment advisor, acting under the supervision of the Board, reviews the value of the collateral and the creditworthiness of those banks and dealers with which each Portfolio enters into repurchase agreements to evaluate potential risks.
Master Repurchase Agreements (“MRA”) permit a Portfolio, under certain circumstances, including an event of default (such as bankruptcy or insolvency), to offset payables and/or receivables under the MRA with collateral held and/or posted to the counterparty and create one single net payment due to or from the Portfolio. However, bankruptcy or insolvency laws of a particular jurisdiction may impose restrictions on or prohibitions against such a right of offset in the event of the MRA counterparty’s bankruptcy or insolvency. Pursuant to the terms of the MRA, the applicable Portfolio receives or posts securities as collateral with a market value in excess of the repurchase price to be paid or received by the Portfolio upon the maturity of the transaction. Upon a bankruptcy or insolvency of the MRA counterparty, the Portfolio would recognize a liability with respect to such excess collateral to reflect the Portfolio’s obligation under bankruptcy law to return the excess to the counterparty. The gross value and related collateral received for each Portfolio’s investments in repurchase agreements as of October 31, 2021 are presented in each Portfolio’s Schedule of Portfolio Investments and the value of these investments are also presented in the Statements of Assets and Liabilities.
As of October 31, 2021, the following table is a summary of the Fund’s repurchase agreements by counterparty which are subject to offset under an MRA:
Quantitative U.S. Large Cap Core Equity Portfolio
| Counterparty | | Repurchase
Agreements | | Fair Value of Non-Cash
Collateral Received(a) | | Cash
Collateral
Received | | Net
Collateral
Received | | Net
Exposure(b) |
Fixed Income Clearing Corp.
| | $6,710,130 | | $(6,710,130) | | $— | | $— | | $— |
Quantitative U.S. Large Cap Growth Equity Portfolio
| Counterparty | | Repurchase
Agreements | | Fair Value of Non-Cash
Collateral Received(a) | | Cash
Collateral
Received | | Net
Collateral
Received | | Net
Exposure(b) |
Fixed Income Clearing Corp.
| | $7,549,716 | | $(7,549,716) | | $— | | $— | | $— |
Quantitative U.S. Large Cap Value Equity Portfolio
| Counterparty | | Repurchase
Agreements | | Fair Value of Non-Cash
Collateral Received(a) | | Cash
Collateral
Received | | Net
Collateral
Received | | Net
Exposure(b) |
Fixed Income Clearing Corp.
| | $10,906 | | $(10,906) | | $— | | $— | | $— |
Quantitative U.S. Small Cap Equity Portfolio
| Counterparty | | Repurchase
Agreements | | Fair Value of Non-Cash
Collateral Received(a) | | Cash
Collateral
Received | | Net
Collateral
Received | | Net
Exposure(b) |
Fixed Income Clearing Corp.
| | $12,420 | | $(12,420) | | $— | | $— | | $— |
Quantitative International Equity Portfolio
| Counterparty | | Repurchase
Agreements | | Fair Value of Non-Cash
Collateral Received(a) | | Cash
Collateral
Received | | Net
Collateral
Received | | Net
Exposure(b) |
Fixed Income Clearing Corp.
| | $123,409 | | $(123,409) | | $— | | $— | | $— |
THE GLENMEDE FUND, INC.
Notes to Financial Statements — (Continued)
Responsible ESG U.S. Equity Portfolio
| Counterparty | | Repurchase
Agreements | | Fair Value of Non-Cash
Collateral Received(a) | | Cash
Collateral
Received | | Net
Collateral
Received | | Net
Exposure(b) |
Fixed Income Clearing Corp.
| | $252,633 | | $(252,633) | | $— | | $— | | $— |
Women in Leadership U.S. Equity Portfolio
| Counterparty | | Repurchase
Agreements | | Fair Value of Non-Cash
Collateral Received(a) | | Cash
Collateral
Received | | Net
Collateral
Received | | Net
Exposure(b) |
Fixed Income Clearing Corp.
| | $282,217 | | $(282,217) | | $— | | $— | | $— |
Quantitative U.S. Long/Short Equity Portfolio
| Counterparty | | Repurchase
Agreements | | Fair Value of Non-Cash
Collateral Received(a) | | Cash
Collateral
Received | | Net
Collateral
Received | | Net
Exposure(b) |
Fixed Income Clearing Corp.
| | $132,067 | | $(132,067) | | $— | | $— | | $— |
Quantitative U.S. Total Market Equity Portfolio
| Counterparty | | Repurchase
Agreements | | Fair Value of Non-Cash
Collateral Received(a) | | Cash
Collateral
Received | | Net
Collateral
Received | | Net
Exposure(b) |
Fixed Income Clearing Corp.
| | $187,604 | | $(187,604) | | $— | | $— | | $— |
Strategic Equity Portfolio
| Counterparty | | Repurchase
Agreements | | Fair Value of Non-Cash
Collateral Received(a) | | Cash
Collateral
Received | | Net
Collateral
Received | | Net
Exposure(b) |
Fixed Income Clearing Corp.
| | $1,720,703 | | $(1,720,703) | | $— | | $— | | $— |
Small Cap Equity Portfolio
| Counterparty | | Repurchase
Agreements | | Fair Value of Non-Cash
Collateral Received(a) | | Cash
Collateral
Received | | Net
Collateral
Received | | Net
Exposure(b) |
Fixed Income Clearing Corp.
| | $19,490,176 | | $(19,490,176) | | $— | | $— | | $— |
Equity Income Portfolio
| Counterparty | | Repurchase
Agreements | | Fair Value of Non-Cash
Collateral Received(a) | | Cash
Collateral
Received | | Net
Collateral
Received | | Net
Exposure(b) |
Fixed Income Clearing Corp.
| | $120,692 | | $(120,692) | | $— | | $— | | $— |
Secured Options Portfolio
| Counterparty | | Repurchase
Agreements | | Fair Value of Non-Cash
Collateral Received(a) | | Cash
Collateral
Received | | Net
Collateral
Received | | Net
Exposure(b) |
Fixed Income Clearing Corp.
| | $7,484,965 | | $(7,484,965) | | $— | | $— | | $— |
Global Secured Options Portfolio
| Counterparty | | Repurchase
Agreements | | Fair Value of Non-Cash
Collateral Received(a) | | Cash
Collateral
Received | | Net
Collateral
Received | | Net
Exposure(b) |
Fixed Income Clearing Corp.
| | $854,352 | | $(854,352) | | $— | | $— | | $— |
THE GLENMEDE FUND, INC.
Notes to Financial Statements — (Continued)
Core Fixed Income Portfolio
| Counterparty | | Repurchase
Agreements | | Fair Value of Non-Cash
Collateral Received(a) | | Cash
Collateral
Received | | Net
Collateral
Received | | Net
Exposure(b) |
Fixed Income Clearing Corp.
| | $10,070,273 | | $(10,070,273) | | $— | | $— | | $— |
Short Term Tax Aware Fixed Income Portfolio
| Counterparty | | Repurchase
Agreements | | Fair Value of Non-Cash
Collateral Received(a) | | Cash
Collateral
Received | | Net
Collateral
Received | | Net
Exposure(b) |
Fixed Income Clearing Corp.
| | $3,841,170 | | $(3,841,170) | | $— | | $— | | $— |
(a) The value of the related collateral exceeded the value of the net position in the repurchase agreements as of October 31, 2021. The total value of the non-cash collateral received is disclosed in the Schedules of Portfolio Investments.
(b) Net exposure represents the receivable (payable) that would be due from (to) the counterparty in the event of default.
Cash: Cash includes deposits held at financial institutions, which are available for the Fund’s use with no restrictions, with original maturities of 90 days or less.
Foreign Currency Translation: The books and records of each Portfolio are maintained in U.S. dollars. Foreign currencies, investments and other assets and liabilities are translated into U.S. dollars at the exchange rates prevailing at the end of the period, and purchases and sales of investment securities, income and expenses are translated at exchange rates prevailing on the dates of such transactions. Unrealized gains and losses that result from changes in foreign currency exchange rates have been included in the unrealized gains and losses on foreign currency translations. Net realized foreign currency gains and losses resulting from changes in exchange rates include foreign currency gains and losses between trade date and settlement date on investment securities transactions, foreign currency transactions and the difference between the amounts of interest and dividends recorded on the books of each Portfolio and the amount actually received. The portion of foreign currency gains and losses related to fluctuation in exchange rates between the purchase settlement date and subsequent sale trade date is included in realized gains and losses on investment transactions. The Portfolios do not isolate that portion of the results of operations resulting from changes in the foreign exchange rates on investments from the fluctuations in the market prices of securities held at the end of the period. Similarly, the Portfolios do not isolate the effect of changes in foreign exchange rates from the fluctuations in the market prices of portfolio securities sold during the period.
Foreign Securities: The Strategic Equity Portfolio, Small Cap Equity Portfolio, Equity Income Portfolio, Secured Options Portfolio, Global Secured Options Portfolio and Quantitative International Equity Portfolio may invest in foreign securities. Investing in securities of foreign companies and foreign governments involves special risks and considerations not typically associated with investing in securities of U.S. companies and the U.S. government. These risks include valuation of currencies and future adverse political and economic developments. Moreover, securities of some foreign companies and foreign governments and their markets may be less liquid and their prices more volatile than those of securities of comparable U.S. companies and the U.S. government. This is particularly true with respect to emerging markets in developing countries.
Options Transactions: The Strategic Equity Portfolio, Quantitative U.S. Long/Short Equity Portfolio, Secured Options Portfolio and Global Secured Options Portfolio are subject to equity price risk and may purchase or write covered call options or secured put options to hedge against changes in the value of securities each Portfolio owns or expects to own. The Secured Options Portfolio and Global Secured Options Portfolio use option strategies also in an effort to earn options premiums and to provide more stable returns. These options may relate to particular securities or securities indices and may or may not be listed on a domestic securities exchange or issued by the Options Clearing Corporation. A call option gives the option holder the right to purchase the underlying security at a specified price until a specified date. A put option gives the option holder the right to sell the underlying security at a specified price until a specified date. The risk in writing a call option is that the Portfolio may forgo the opportunity of profit if the market price of the underlying security increases and the option is exercised. The risk in writing a put option is that the Portfolio may incur a loss if the market price of the underlying security decreases and the option is exercised. In addition, there is a risk the Portfolio may not be able to enter into a closing transaction because of an illiquid secondary market or, for over-the-counter options, because of the counterparty’s inability to perform. Portfolio assets covering written options cannot be sold while the option is outstanding, unless replaced by similar assets. A Portfolio also risks losing all or part of the cash paid for purchasing call and put options. The Portfolios may also write over-the-counter options where completing the obligation depends upon the credit standing of the other party. The Strategic Equity Portfolio and Quantitative U.S. Long/Short Equity Portfolio did not enter into any options transactions during the fiscal year ended October 31, 2021. During the fiscal year ended October 31, 2021, the Secured Options Portfolio and the Global Secured Options Portfolio wrote put and call options and purchased put and call options in an attempt to achieve their respective investment objective and strategies. As of October 31, 2021, the Secured Options Portfolio and Global Secured
THE GLENMEDE FUND, INC.
Notes to Financial Statements — (Continued)
Options Portfolio pledged cash in the amount of $8,581,321 and $947,986, respectively, to brokers, as collateral for written options. This amount is included in the "Cash collateral on deposit at broker" on the Statements of Assets and Liabilities. In addition, security collateral (U.S. Treasury Bills and exchange-traded funds) valued at $132,794,244 and $3,999,250 was pledged as collateral by Secured Options Portfolio and Global Secured Options Portfolio, respectively.
Lending of Portfolio Securities: Each Portfolio, using State Street Bank and Trust Company ("State Street") as its lending agent, may loan securities to qualified brokers and dealers in exchange for negotiated lenders’ fees. These fees are disclosed as “Income from security lending” in the Statements of Operations, net of expenses retained by State Street as compensation for its services as lending agent. Each applicable Portfolio receives cash collateral (which may be invested by the lending agent in short-term instruments) and/or non-cash collateral (which may include U.S. Treasuries and/or U.S. Government Agency securities), in an amount at least equal to 102% (for loans of U.S. securities) or 105% (for loans of non-U.S. securities) of the market value of the loaned securities at the inception of each loan. The market value of the loaned securities is determined at the close of business of the Fund and any additional required collateral is delivered to the applicable Portfolio on the next business day. On behalf of the Quantitative U.S. Long/Short Equity Portfolio and the Quantitative U.S. Total Market Equity Portfolio, some or all of the cash collateral may be used to finance short sales. The cash collateral received for the Quantitative U.S. Long/Short Equity Portfolio was not used to finance short sales during the fiscal year ended October 31, 2021. During the fiscal year ended October 31, 2021, the cash collateral received by the Quantitative U.S. Large Cap Value Equity Portfolio, Quantitative U.S. Small Cap Equity Portfolio, Quantitative International Equity Portfolio, Women in Leadership U.S. Equity Portfolio, Quantitative U.S. Long/Short Equity Portfolio, Quantitative U.S. Total Market Equity Portfolio, Small Cap Equity Portfolio and Core Fixed Income Portfolio was invested in the State Street Navigator Securities Lending Government Money Market Portfolio, which is a 1940 Act money market fund. To the extent that advisory or other fees paid by the State Street Navigator Securities Lending Government Money Market Portfolio are for the same or similar services as fees paid by the applicable Portfolio, there will be a layering of fees, which would increase expenses and decrease returns. Information regarding the value of the securities loaned and the value of the cash collateral at period end is included at the end of each applicable Portfolio’s Statement of Assets and Liabilities, Schedule of Portfolio Investments and Note 6. Non-cash collateral detail is not disclosed in the Schedules of Portfolio Investments as it is held by the lending agent on behalf of the Portfolio, and the Portfolio does not have the ability to re-hypothecate those securities. A Portfolio could experience a delay in recovering its securities and a possible loss of income or value if the borrower fails to return the securities when due. A Portfolio may also record realized gain or loss on securities deemed sold due to a borrower’s inability to return securities on loan. Such loans would involve risks of delay in receiving additional collateral in the event that the collateral decreased below the value of the securities loaned or risks of the loss of rights in the collateral should the borrower of the securities fail financially.
Real Estate Investment Trusts: The Portfolios may invest in real estate investment trusts (“REITs”), which pool investors’ funds for investment, primarily in income producing real estate or real estate-related loans or interests. A REIT is not taxed on income distributed to its shareholders or unitholders if it complies with regulatory requirements relating to its organization, ownership, assets and income, and with a regulatory requirement to distribute to its shareholders or unitholders at least 90% of its taxable income for each taxable year.
A shareholder in a Portfolio, by investing in REITs through the Portfolio, will bear not only the shareholder’s proportionate share of the expenses of the Portfolio, but also, indirectly, the management expenses of the underlying REITs. REITs depend generally on their ability to generate cash flow to make distributions to shareholders or unitholders, and may be subject to defaults by borrowers and to self-liquidations. In addition, the performance of a REIT may be affected by its failure to qualify for tax-free pass-through of income, or the REIT’s failure to maintain exemption from registration under the 1940 Act. Dividends representing a return of capital are reflected as a reduction of cost and/or as a realized gain when the amount of the return of capital is conclusively determined. See each Portfolio’s Schedule of Portfolio Investments for REIT securities held as of October 31, 2021.
Securities Sold Short: The Quantitative U.S. Long/Short Equity Portfolio and Quantitative U.S. Total Market Equity Portfolio may engage in short sales, which are sales by the applicable Portfolio of securities which have been borrowed from a third party on the expectation that the market price will decline. If the price of the securities declines, the Portfolio will make a profit by purchasing the securities in the open market at a lower price than the one at which it sold the securities. If the price of the securities increases, the Portfolio may have to cover its short positions at a higher price than the short sale price, resulting in a loss. Gains are limited to the price at which the Portfolios sold the security short, while losses are potentially unlimited in size. Each Portfolio pledges securities and/or other assets, which may include cash collateral from securities lending activities, to the lender as collateral. Proceeds received from short sales may be maintained by the lender as collateral or may be released to the Portfolio and used to purchase additional securities or for any other purpose. The “Short position flex fees” on the Statements of Operations are fees charged by the lender for releasing the cash proceeds to the Quantitative U.S. Long/Short Equity Portfolio and Quantitative U.S. Total Market Equity Portfolio. Each Portfolio is required to segregate an amount of cash, cash equivalents or other appropriate liquid marketable securities with the custodian in an amount at least equal to the current market value of the securities sold short (less any additional collateral held by the lender) and the amount of any securities lending cash collateral used to finance short sales until the Portfolio replaces a borrowed security. Depending on arrangements made with the lender or custodian, the Portfolio may not receive any payments (including interest) on the deposits made with the lender or custodian. The Portfolio is liable to the buyer for any dividends payable on securities while those securities are in a short position. These dividends are recorded as an expense of the Portfolio. As of October 31, 2021, the Quantitative U.S. Long/Short Equity Portfolio pledged cash in the amount of $44,748,443 to State Street, as collateral for short
THE GLENMEDE FUND, INC.
Notes to Financial Statements — (Continued)
sales. This amount is included in the “Cash collateral on deposit at broker” on the Statement of Assets and Liabilities. The Quantitative U.S. Long/Short Equity Portfolio and Quantitative U.S. Total Market Equity Portfolio also pledged securities in the amount of $9,992,890, and $12,368,070, respectively, to State Street, as collateral for short sales. In addition, State Street has a perfected security interest in a portion of each such Portfolio’s assets.
Investment Company Securities and Exchange-Traded Funds: Subject to applicable regulatory requirements, each Portfolio may invest in shares of other registered investment companies, including ETFs. Currently, pursuant to orders issued by the SEC to certain ETFs and procedures approved by the Board, each Portfolio may seek to invest in certain ETFs beyond the statutory limitations, provided the Portfolio complies with certain conditions of the SEC orders and any applicable investment limitations. Some ETFs seek to track the performance of a particular market index. These indices include both broad-market indices and more narrowly-based indices, including those relating to particular sectors, markets, regions, or industries. However, some ETFs have an actively managed investment objective. ETF shares and closed-end fund shares are traded like traditional equity securities on a national securities exchange or NASDAQ.
Fixed Income and Municipal Securities: The Core Fixed Income Portfolio, High Yield Municipal Portfolio and Short Term Tax Aware Fixed Income Portfolio invest in fixed income securities. The value of fixed income securities tends to fluctuate with changes in interest rates. Generally, their value will decrease when interest rates rise and increase when interest rates fall. Fixed income securities are also subject to the risk that an issuer will be unable to make principal and interest payments when due which could adversely impact a Portfolio’s return and NAV. Changes in the credit rating of a debt security held by a Portfolio could have a similar effect. Fixed income securities with longer maturities are more susceptible to interest rate fluctuations than those with shorter maturities. Although governmental financial regulators, including the Federal Reserve, have taken steps to maintain historically low interest rates; the Federal Reserve could raise interest rates at any time.
The High Yield Municipal Portfolio invests primarily in municipal securities and during the period, the Short Term Tax Aware Fixed Income Portfolio invested primarily in short term municipal securities. The value of, payment of interest on, repayment of principal for, and the ability to sell a municipal security may be affected by constitutional amendments, legislation, executive orders, administrative regulations, voter initiatives and the economics of the regions in which the issuers are located. A credit rating downgrade, bond default, or bankruptcy involving an issuer within a particular state or territory could affect the market values and marketability of some or all of the municipal obligations of that state or territory. In addition, since many municipal securities are issued to finance similar projects, especially those relating to education, health care, transportation and utilities, conditions in those sectors can affect the overall municipal securities market and a Portfolio’s investments in municipal securities. There is some risk that a portion or all of the interest received from certain tax-exempt municipal securities could become taxable as a result of determinations by the Internal Revenue Service.
Securities Transactions and Investment Income: Securities transactions are recorded as of the trade date. Realized gains and losses on investments sold are computed on the basis of identified cost. Dividend income and distributions to shareholders are recorded on the ex-dividend date. Dividend income for foreign securities is recorded on the ex-dividend date except that certain dividends from foreign securities are recorded “net of withholding tax” as soon thereafter as a Portfolio is informed of the ex-dividend date. Interest income is recorded on the accrual basis and includes, when appropriate, amortization of premiums and accretion of discounts using the effective interest method.
Securities purchased or sold on a when-issued or delayed-delivery basis may be settled after a period longer than the regular settlement time of trade date plus three business days. Interest income is accrued based on the terms of the security on settlement date. Each Portfolio segregates assets with a current value at least equal to the amount of its when-issued purchase commitments. When-issued purchase commitments involve a risk of loss if the value of the security to be purchased declines prior to settlement date, or if the counterparty does not perform under the contract.
Dividends and Distributions to Shareholders: Dividends from net investment income, if any, of the Core Fixed Income Portfolio, Short Term Tax Aware Fixed Income Portfolio and High Yield Municipal Portfolio are declared and paid monthly. Dividends from net investment income, if any, of the Quantitative U.S. Large Cap Core Equity Portfolio, Quantitative U.S. Large Cap Growth Equity Portfolio, Quantitative U.S. Large Cap Value Equity Portfolio, Quantitative U.S. Small Cap Equity Portfolio, Quantitative International Equity Portfolio, Responsible ESG U.S. Equity Portfolio, Women in Leadership U.S. Equity Portfolio, Quantitative U.S. Long/Short Equity Portfolio, Quantitative U.S. Total Market Equity Portfolio, Strategic Equity Portfolio, Small Cap Equity Portfolio, Equity Income Portfolio, Secured Options Portfolio and Global Secured Options Portfolio are declared and paid quarterly. Each Portfolio distributes any net realized capital gains on an annual basis. Additional distributions of net investment income and capital gains for each Portfolio may be made at the discretion of the Board in order to avoid a nondeductible excise tax under Section 4982 of the Internal Revenue Code of 1986, as amended (the “Code”). Each Portfolio may elect to treat a portion of its payment to a redeeming shareholder, which represents the pro rata share of undistributed net investment income and net realized gains, as a distribution for federal income tax purposes (tax equalization).
Income and capital gains distributions are determined in accordance with income tax regulations which may differ from accounting principles generally accepted in the U.S. These differences are primarily due to differing treatments of income and gains on various investment securities held by each Portfolio, timing differences and differing characterization of distributions made by each Portfolio.
Income and Expense Allocation: Expenses which are not readily identifiable to a specific Portfolio are allocated among Portfolios taking into consideration, among other things, the nature and type of expenses and the relative size
THE GLENMEDE FUND, INC.
Notes to Financial Statements — (Continued)
of each Portfolio. Investment income, realized and unrealized gains and losses, and certain fund-level expenses are borne pro rata on the basis of relative net assets by the holders of all classes of shares, except that each class bears certain expenses unique to that class, such as shareholder servicing fees and certain other class-specific expenses. Differences in class-level expenses may result in payment of different per share dividends by class.
Federal Income Taxes: Each Portfolio intends to continue to qualify as a regulated investment company by complying with the requirements of the Code applicable to regulated investment companies, and by distributing substantially all of its taxable income to its shareholders. Therefore, no federal income tax provision is required. Income distributions and capital gain distributions are determined in accordance with income tax regulations which may differ from accounting principles generally accepted in the U.S.
“ Accounting for Uncertainty in Income Taxes — an interpretation of FASB ASC 740” (“ASC 740”) clarifies the accounting for uncertainty in income taxes recognized in accordance with ASC 740, “Accounting for Income Taxes.” This interpretation prescribes a recognition threshold and measurement attribute for the financial statement recognition and measurement of a tax position taken or expected to be taken in a tax return. It also provides guidance on de-recognition, classification, interest and penalties, accounting in interim periods, disclosure and transition. Each Portfolio’s federal tax returns filed in the 3-year period ended October 31, 2021 remain subject to examination by the Internal Revenue Service. Management of the Funds has concluded that there are no significant uncertain tax positions that would require recognition in the financial statements. State, local and/or non-U.S. tax returns and/or other filings may be subject to examination for different periods, depending upon the tax rules of each applicable jurisdiction.
On October 31, 2021, the tax year end of the Fund, the following Portfolios had available capital loss carryforwards to be utilized in future periods to offset future capital gains as follows:
| Portfolio | | Unlimited
(Short Term) | | Unlimited
(Long Term) |
Quantitative U.S. Large Cap Value Equity Portfolio
| | $ 9,548 | | $ — |
Quantitative International Equity Portfolio
| | 679,128 | | — |
Quantitative U.S. Long/Short Equity Portfolio
| | 1,780,981 | | — |
Global Secured Options Portfolio*
| | 4,959,732 | | 1,558,146 |
Short Term Tax Aware Fixed Income Portfolio
| | 101,200 | | 80,791 |
During the fiscal year ended October 31, 2021, the following Portfolios utilized capital loss carryforwards:
Quantitative U.S. Large Cap Value Equity Portfolio
| $193,109 |
Quantitative U.S. Small Cap Equity Portfolio
| 76,142 |
Quantitative International Equity Portfolio
| 11,299,614 |
Responsible ESG U.S. Equity Portfolio
| 848,986 |
Women in Leadership U.S. Equity Portfolio
| 294,969 |
Quantitative U.S. Long/Short Equity Portfolio
| 13,319,218 |
Small Cap Equity Portfolio
| 210,945,891 |
Equity Income Portfolio
| 75,937 |
Secured Options Portfolio
| 37,188,051 |
Global Secured Options Portfolio
| 61,765 |
*Utilization of the capital loss carryforwards of the Global Secured Options Portfolio is severely limited currently and in future years pursuant to Internal Revenue Code Section 382.
As of October 31, 2021, the tax year end of the Fund, the components of distributable earnings on a tax basis were as follows:
| Portfolio | | Undistributed
Tax-exempt
Income | | Undistributed
Ordinary
Income | | Undistributed
Long-Term
Gain | | Unrealized
Appreciation/
(Depreciation) | | Other
Temporary
Differences | | Loss
Carryforwards | | Total
Distributable
Earnings |
Quantitative U.S. Large Cap Core Equity Portfolio
| | $ — | | $ 6,200,409 | | $154,027,983 | | $ 533,477,893 | | $ — | | $ — | | $ 693,706,285 |
Quantitative U.S. Large Cap Growth Equity Portfolio
| | — | | 7,374,491 | | 391,907,313 | | 1,007,428,841 | | — | | — | | 1,406,710,645 |
Quantitative U.S. Large Cap Value Equity Portfolio
| | — | | 1,959 | | — | | 567,783 | | — | | (9,548) | | 560,194 |
THE GLENMEDE FUND, INC.
Notes to Financial Statements — (Continued)
| Portfolio | | Undistributed
Tax-exempt
Income | | Undistributed
Ordinary
Income | | Undistributed
Long-Term
Gain | | Unrealized
Appreciation/
(Depreciation) | | Other
Temporary
Differences | | Loss
Carryforwards | | Total
Distributable
Earnings |
Quantitative U.S. Small Cap Equity Portfolio
| | $ — | | $ — | | $ 138,270 | | $ 399,905 | | $ — | | $ — | | $ 538,175 |
Quantitative International Equity Portfolio
| | — | | 319,053 | | — | | 4,065,742 | | — | | (679,128) | | 3,705,667 |
Responsible ESG U.S. Equity Portfolio
| | — | | 13,991 | | 2,799,444 | | 10,340,025 | | — | | — | | 13,153,460 |
Women in Leadership U.S. Equity Portfolio
| | — | | 28,014 | | 4,457,687 | | 6,788,061 | | — | | — | | 11,273,762 |
Quantitative U.S. Long/Short Equity Portfolio
| | — | | — | | — | | 19,255,569 | | (470,176)** | | (1,780,981) | | 17,004,412 |
Quantitative U.S. Total Market Equity Portfolio
| | — | | 19,359 | | 5,566,308 | | 19,206,099 | | (215) | | — | | 24,791,551 |
Strategic Equity Portfolio
| | — | | 526,442 | | 26,036,207 | | 148,834,671 | | — | | — | | 175,397,320 |
Small Cap Equity Portfolio
| | — | | — | | 61,538,021 | | 463,932,676 | | — | | — | | 525,470,697 |
Equity Income Portfolio
| | — | | 106,963 | | 916,742 | | 7,043,838 | | — | | — | | 8,067,543 |
Secured Options Portfolio
| | — | | 19,959,839 | | 31,051,096 | | 16,380,625 | | (10,372) | | — | | 67,381,188 |
Global Secured Options Portfolio
| | — | | 1,114,583 | | 1,129,077 | | 5,539 | | — | | (6,517,879) *** | | (4,268,680) |
Core Fixed Income Portfolio
| | — | | 850,607 | | 160,422 | | 10,055,309 | | — | | — | | 11,066,338 |
Short Term Tax Aware Fixed Income Portfolio
| | 30,289 | | — | | — | | 404,855 | | — | | (181,991) | | 253,153 |
High Yield Municipal Portfolio
| | 660,479 | | 851,382 | | 1,293,535 | | 14,795,681 | | — | | — | | 17,601,077 |
The difference between book-basis and tax-basis unrealized appreciation (depreciation) is attributable primarily to the tax deferral of losses on wash sales, nontaxable dividends received from investments and the realization for tax purposes of unrealized gains on investments in passive foreign investment companies.
**Other Temporary Differences for Quantitative U.S. Long/Short Equity Portfolio includes a late year ordinary loss deferral of $468,757.
***Utilization of the capital loss carryforwards of the Global Secured Options Portfolio is severely limited currently and in future years pursuant to Internal Revenue Code Section 382.
The tax character of distributions paid during the fiscal year ended October 31, 2021, was as follows:
| Portfolio | | Tax
Exempt | | Ordinary
Income | | Long-Term
Gains | | Return of
Capital |
Quantitative U.S. Large Cap Core Equity Portfolio
| | $ — | | $11,013,057 | | $ 99,915,550 | | $— |
Quantitative U.S. Large Cap Growth Equity Portfolio
| | — | | 4,362,589 | | 311,191,429 | | — |
Quantitative U.S. Large Cap Value Equity Portfolio
| | — | | 32,775 | | — | | — |
Quantitative U.S. Small Cap Equity Portfolio
| | — | | 7,532 | | 133 | | — |
Quantitative International Equity Portfolio
| | — | | 1,099,884 | | — | | — |
Responsible ESG U.S. Equity Portfolio
| | — | | 218,408 | | — | | — |
Women in Leadership U.S. Equity Portfolio
| | — | | 275,552 | | — | | — |
THE GLENMEDE FUND, INC.
Notes to Financial Statements — (Continued)
| Portfolio | | Tax
Exempt | | Ordinary
Income | | Long-Term
Gains | | Return of
Capital |
Quantitative U.S. Total Market Equity Portfolio
| | $ — | | $ 45,803 | | $ 3,423,033 | | $— |
Strategic Equity Portfolio
| | — | | 1,036,605 | | 12,912,989 | | — |
Small Cap Equity Portfolio
| | — | | 2,196,950 | | 834,084 | | — |
Equity Income Portfolio
| | — | | 333,966 | | — | | — |
Global Secured Options Portfolio
| | — | | 199,638 | | 225,651 | | — |
Core Fixed Income Portfolio
| | — | | 9,331,322 | | 5,081,697 | | — |
Short Term Tax Aware Fixed Income Portfolio
| | 368,711 | | 81,552 | | — | | — |
High Yield Municipal Portfolio
| | 6,333,610 | | 77,009 | | 22,353 | | — |
The tax character of distributions paid during the fiscal year ended October 31, 2020, was as follows:
| Portfolio | | Tax
Exempt | | Ordinary
Income | | Long-Term
Gains | | Return of
Capital |
Quantitative U.S. Large Cap Core Equity Portfolio
| | $ — | | $18,713,284 | | $ 98,397,908 | | $ — |
Quantitative U.S. Large Cap Growth Equity Portfolio
| | — | | 14,981,564 | | 436,456,750 | | — |
Quantitative U.S. Large Cap Value Equity Portfolio
| | — | | 40,984 | | — | | — |
Quantitative U.S. Small Cap Equity Portfolio
| | — | | 7,684 | | — | | — |
Quantitative International Equity Portfolio
| | — | | 2,704,110 | | — | | 220,626 |
Responsible ESG U.S. Equity Portfolio
| | — | | 237,515 | | 92,525 | | — |
Women in Leadership U.S. Equity Portfolio
| | — | | 239,220 | | — | | — |
Quantitative U.S. Long/Short Equity Portfolio
| | — | | — | | — | | 182,295 |
Quantitative U.S. Total Market Equity Portfolio
| | — | | 242,731 | | 3,387,071 | | — |
Strategic Equity Portfolio
| | — | | 2,023,010 | | 5,226,463 | | — |
Small Cap Equity Portfolio
| | — | | 5,011,864 | | — | | 255,593 |
Equity Income Portfolio
| | — | | 478,143 | | — | | — |
Secured Options Portfolio
| | — | | 18,271,570 | | 29,797,110 | | — |
Global Secured Options Portfolio
| | — | | 1,977 | | — | | — |
Core Fixed Income Portfolio
| | — | | 10,373,594 | | — | | — |
Short Term Tax Aware Fixed Income Portfolio
| | 457,915 | | 113,527 | | — | | — |
High Yield Municipal Portfolio
| | 6,132,977 | | 61,972 | | — | | — |
For the fiscal year ended October 31, 2021, permanent differences between financial and tax reporting related primarily to REITs, foreign currency gain/(loss), distribution reallocations, net operating losses, nontaxable dividends received from investments, tax equalization and the realization for tax purposes of unrealized gains on investments in passive foreign investment companies were identified and reclassified among the components of each Portfolio’s net assets as identified below. These reclassifications had no effect on net assets.
| Portfolio | | Total distributable
earnings | | Paid-in
capital |
Quantitative U.S. Large Cap Core Equity Portfolio
| | $(15,457,346) | | $15,457,346 |
Quantitative U.S. Large Cap Growth Equity Portfolio
| | (73,061,882) | | 73,061,882 |
Quantitative U.S. Small Cap Equity Portfolio
| | (45) | | 45 |
Responsible ESG U.S. Equity Portfolio
| | (136,344) | | 136,344 |
Women in Leadership U.S. Equity Portfolio
| | (519,410) | | 519,410 |
Quantitative U.S. Long/Short Equity Portfolio
| | 312,862 | | (312,862) |
Quantitative U.S. Total Market Equity Portfolio
| | (835,738) | | 835,738 |
Strategic Equity Portfolio
| | (1,812,495) | | 1,812,495 |
Small Cap Equity Portfolio
| | 53,334 | | (53,334) |
Equity Income Portfolio
| | (1,374) | | 1,374 |
Secured Options Portfolio
| | (6,213,707) | | 6,213,707 |
Core Fixed Income Portfolio
| | (1) | | 1 |
As of October 31, 2021, aggregate gross unrealized appreciation for all investments in which there was an excess of value over tax cost and aggregate gross unrealized depreciation for all investments in which there was an excess of tax cost over value were as follows:
| Portfolio | | Cost | | Appreciation | | (Depreciation) | | Net |
Quantitative U.S. Large Cap Core Equity Portfolio
| | $ 887,553,094 | | $ 539,201,442 | | $ 5,723,549 | | $ 533,477,893 |
Quantitative U.S. Large Cap Growth Equity Portfolio
| | 1,326,429,273 | | 1,014,470,480 | | 7,041,639 | | 1,007,428,841 |
Quantitative U.S. Large Cap Value Equity Portfolio
| | 1,969,960 | | 588,826 | | 21,043 | | 567,783 |
THE GLENMEDE FUND, INC.
Notes to Financial Statements — (Continued)
| Portfolio | | Cost | | Appreciation | | (Depreciation) | | Net |
Quantitative U.S. Small Cap Equity Portfolio
| | $ 1,185,045 | | $ 425,144 | | $ 25,239 | | $ 399,905 |
Quantitative International Equity Portfolio
| | 38,981,110 | | 4,942,259 | | 875,687 | | 4,066,572 |
Responsible ESG U.S. Equity Portfolio
| | 22,514,433 | | 10,468,163 | | 128,138 | | 10,340,025 |
Women in Leadership U.S. Equity Portfolio
| | 21,789,932 | | 6,888,407 | | 100,346 | | 6,788,061 |
Quantitative U.S. Long/Short Equity Portfolio
| | 487,611 | | 22,433,666 | | 3,178,097 | | 19,255,569 |
Quantitative U.S. Total Market Equity Portfolio
| | 17,119,846 | | 19,726,804 | | 520,705 | | 19,206,099 |
Strategic Equity Portfolio
| | 119,864,585 | | 149,132,934 | | 298,263 | | 148,834,671 |
Small Cap Equity Portfolio
| | 1,060,502,049 | | 477,583,068 | | 13,650,392 | | 463,932,676 |
Equity Income Portfolio
| | 15,252,313 | | 7,064,427 | | 20,589 | | 7,043,838 |
Secured Options Portfolio
| | 406,832,780 | | 64,593,423 | | 48,212,798 | | 16,380,625 |
Global Secured Options Portfolio
| | 16,172,881 | | 1,926,018 | | 1,920,479 | | 5,539 |
Core Fixed Income Portfolio
| | 447,347,100 | | 14,914,096 | | 4,858,787 | | 10,055,309 |
Short Term Tax Aware Fixed Income Portfolio
| | 57,581,502 | | 498,371 | | 93,516 | | 404,855 |
High Yield Municipal Portfolio
| | 263,222,075 | | 15,988,643 | | 1,192,962 | | 14,795,681 |
Other: In the normal course of business, the Fund enters into contracts that may include agreements to indemnify another party under given circumstances. The Fund’s maximum exposure under these arrangements is unknown as this would involve future claims that may be, but have not yet been, made against the Fund. However, based on experience, the risk of material loss from such claims is considered to be remote.
2. Financial Instruments and Hedging Activities
Disclosures about Derivative Instruments and Hedging Activities: Each Portfolio follows FASB ASC Topic 815 “Disclosures about Derivative Instruments and Hedging Activities” (“ASC 815”). ASC 815 requires enhanced disclosures about each Portfolio’s use of, and accounting for, derivative instruments and the effect on the results of each Portfolio’s operations and financial position. At October 31, 2021 and during the period then ended, the Secured Options Portfolio and the Global Secured Options Portfolio had the following derivatives and transactions in derivatives, grouped into appropriate risk categories, none of which have been designated as hedging instruments:
Secured Options Portfolio
Asset Derivatives
| | Equity
Contracts Risk | | Total |
Options Purchased1
| $1,003,848,975 | | $1,003,848,975 |
Total Value
| $1,003,848,975 | | $1,003,848,975 |
Liability Derivatives
| | Equity
Contracts
Risk | | Total |
Options Written2
| $(725,913,525) | | $(725,913,525) |
Total Value
| $(725,913,525) | | $(725,913,525) |
Realized Gain (Loss)
| | Equity
Contracts
Risk | | Total |
Options Purchased3
| $ 305,688,495 | | $ 305,688,495 |
Options Written4
| (222,593,355) | | (222,593,355) |
Total Realized Gain (Loss)
| $ 83,095,140 | | $ 83,095,140 |
THE GLENMEDE FUND, INC.
Notes to Financial Statements — (Continued)
Change in Appreciation (Depreciation)
| | Equity
Contracts
Risk | | Total |
Options Purchased5
| $ 68,158,398 | | $ 68,158,398 |
Options Written6
| (51,954,232) | | (51,954,232) |
Total Change in Appreciation (Depreciation)
| $ 16,204,166 | | $ 16,204,166 |
Number of Contracts, Notional Amounts or Shares/Units
| | Equity
Contracts
Risk | | Total |
Options Purchased7
| 5,265 | | 5,265 |
Options Written7
| (6,198) | | (6,198) |
Global Secured Options Portfolio
Asset Derivatives
| | Equity
Contracts Risk | | Total |
Options Purchased1
| $39,578,275 | | $39,578,275 |
Total Value
| $39,578,275 | | $39,578,275 |
Liability Derivatives
| | Equity
Contracts
Risk | | Total |
Options Written2
| $(28,758,928) | | $(28,758,928) |
Total Value
| $(28,758,928) | | $(28,758,928) |
Realized Gain (Loss)
| | Equity
Contracts
Risk | | Total |
Options Purchased3
| $ 7,368,696 | | $ 7,368,696 |
Options Written4
| (5,263,761) | | (5,263,761) |
Total Realized Gain (Loss)
| $ 2,104,935 | | $ 2,104,935 |
Change in Appreciation (Depreciation)
| | Equity
Contracts
Risk | | Total |
Options Purchased5
| $ 2,129,858 | | $ 2,129,858 |
Options Written6
| (1,734,507) | | (1,734,507) |
Total Change in Appreciation (Depreciation)
| $ 395,351 | | $ 395,351 |
THE GLENMEDE FUND, INC.
Notes to Financial Statements — (Continued)
Number of Contracts, Notional Amounts or Shares/Units
| | Equity
Contracts
Risk | | Total |
Options Purchased7
| 168 | | 168 |
Options Written7
| (735) | | (735) |
|
| 1 | Statement of Assets and Liabilities location: Investments at value. |
| 2 | Statement of Assets and Liabilities location: Options written, at value. |
| 3 | Statement of Operations location: Amount is included in Net realized gain (loss) on purchased options. |
| 4 | Statement of Operations location: Amount is included in Net realized gain (loss) on written options. |
| 5 | Statement of Operations location: Amount is included in Net change in unrealized gain (loss) of purchased options. |
| 6 | Statement of Operations location: Amount is included in Net change in unrealized gain (loss) of written options. |
| 7 | Amounts disclosed represent average number of contracts outstanding during the period ended October 31, 2021. |
3. Investment Advisory Fee, Administration Fee and Other Related Party Transactions
Glenmede Investment Management LP (the “Advisor” or "GIM"), a wholly-owned subsidiary of The Glenmede Trust Company, N.A. (“Glenmede Trust”), serves as investment advisor to the Quantitative U.S. Large Cap Core Equity Portfolio, Quantitative U.S. Large Cap Growth Equity Portfolio, Quantitative U.S. Large Cap Value Equity Portfolio, Quantitative U.S. Small Cap Equity Portfolio, Quantitative International Equity Portfolio, Responsible ESG U.S. Equity Portfolio, Women in Leadership U.S. Equity Portfolio, Quantitative U.S. Long/Short Equity Portfolio, Quantitative U.S. Total Market Equity Portfolio, Strategic Equity Portfolio, Small Cap Equity Portfolio, Equity Income Portfolio, Secured Options Portfolio, Global Secured Options Portfolio, Core Fixed Income Portfolio, Short Term Tax Aware Fixed Income Portfolio and High Yield Municipal Portfolio pursuant to investment management agreements with the Fund. Under these agreements, the Advisor manages the Portfolios, subject to the general supervision of the Board.
Capital International, Inc. ("Capital International") serves as sub-advisor to the High Yield Municipal Portfolio. Capital International is a wholly-owned subsidiary of Capital Group International, Inc., which is owned by Capital Research and Management Company, a wholly-owned subsidiary of The Capital Group Companies, Inc. The Advisor has agreed to pay Capital International a fee for its sub-investment advisory services to the High Yield Municipal Portfolio, calculated daily and payable monthly, at the annual rate of the High Yield Municipal Portfolio’s average daily net assets as follows: 0.38% of the first $300,000,000 of the net assets; 0.34% of the net assets between $300,000,000 and $1 billion; and 0.30% of the net assets in excess of $1 billion.
Under the investment management agreements, the Portfolios pay the Advisor a management fee on a monthly basis in an amount equal to the following annual rates of the average daily net assets of each Portfolio:
| Fund Name | | Management Fee
on Net Assets |
Quantitative U.S. Large Cap Core Equity Portfolio
| | 0.55% |
Quantitative U.S. Large Cap Growth Equity Portfolio
| | 0.55% |
Quantitative U.S. Large Cap Value Equity Portfolio
| | 0.55%* |
Quantitative U.S. Small Cap Equity Portfolio
| | 0.55%* |
Quantitative International Equity Portfolio
| | 0.75%** |
Responsible ESG U.S. Equity Portfolio
| | 0.55%* |
Women in Leadership U.S. Equity Portfolio
| | 0.55%* |
Quantitative U.S. Long/Short Equity Portfolio
| | 1.20%*** |
Quantitative U.S. Total Market Equity Portfolio
| | 1.20%*** |
Strategic Equity Portfolio
| | 0.55% |
Small Cap Equity Portfolio
| | 0.55% |
Equity Income Portfolio
| | 0.55%* |
Secured Options Portfolio
| | 0.55% |
Global Secured Options Portfolio
| | 0.55%** |
Core Fixed Income Portfolio
| | 0.35% |
Short Term Tax Aware Fixed Income Portfolio
| | 0.35%**** |
High Yield Municipal Portfolio
| | 0.65%** |
* Effective February 28, 2019, the Advisor revised the contractual fee waiver and expense reimbursement agreements with respect to the Quantitative U.S. Large Cap Value Equity Portfolio, Quantitative U.S. Small Cap Equity Portfolio, Responsible ESG U.S. Equity Portfolio and Women in Leadership U.S. Equity Portfolio to reduce the contractual expense cap from 1.00% to 0.85% of each such Portfolio’s average daily net assets (excluding Acquired Fund fees and expenses, brokerage commissions, extraordinary items, interest and taxes). The Advisor has also contractually agreed to waive its management fees and/or reimburse expenses to the extent that the Equity Income Portfolio’s total annual
THE GLENMEDE FUND, INC.
Notes to Financial Statements — (Continued)
operating expenses exceed 0.85% of such Portfolio’s average daily net assets (excluding Acquired Fund fees and expenses, brokerage commissions, extraordinary items, interest and taxes). The Advisor has contractually agreed to these waivers and/or reimbursements until at least February 28, 2022 which are included, if any, under the caption “Less expenses waived/reimbursed” in the Statement of Operations. Shareholders of the Portfolios will be notified if these waivers/reimbursements are discontinued after that date.
** The Advisor has contractually agreed to waive its management fees and/or reimburse expenses to the extent that the High Yield Municipal Portfolio’s, since February 26, 2016 the Quantitative International Equity Portfolio’s and since February 28, 2019 the Global Secured Options Portfolio’s total annual operating expenses exceed 1.00% of such Portfolio’s average daily net assets (excluding Acquired Fund fees and expenses, brokerage commissions, extraordinary items, interest and taxes). The Advisor has contractually agreed to these waivers and/or reimbursements until at least February 28, 2022 which are included, if any, under the caption “Less expenses waived/reimbursed” in the Statement of Operations. Shareholders of the Portfolios will be notified if these waivers/reimbursements are discontinued after that date.
*** The Advisor has contractually agreed to waive a portion of its management fees so that, after giving effect to such contractual waiver, the management fee for the Quantitative U.S. Long/Short Equity and Quantitative U.S. Total Market Equity Portfolios is 0.85% of such Portfolio’s average daily net assets. The Advisor has also contractually agreed to waive an additional portion of its management fees and/or reimburse the Portfolios to the extent that total annual Portfolio operating expenses, as a percentage of the Portfolio’s average daily net assets, exceed 1.25% of the average daily net assets of the Quantitative U.S. Long/Short Equity Portfolio’s Advisor Class shares, 1.05% of the average daily net assets of the Quantitative U.S. Long/Short Equity Portfolio’s Institutional Class shares and 1.25% of the average daily net assets of the Quantitative U.S. Total Market Equity Portfolio (excluding Acquired Fund fees and expenses, short-sale dividends, prime broker interest, brokerage commissions, taxes, interest, and extraordinary expenses). The Advisor has contractually agreed to these waivers and/or reimbursements until at least February 28, 2022, which are included under the caption “Less expenses waived/ reimbursed” in the Statement of Operations. Shareholders of the Portfolios will be notified if the waivers/reimbursements are discontinued after that date.
**** The Advisor has contractually agreed to waive its management fees and/or reimburse expenses to the extent that the Short Term Tax Aware Fixed Income Portfolio’s total annual operating expenses exceed 0.55% of the Portfolio’s average daily net assets (excluding Acquired Fund fees and expenses, brokerage commissions, extraordinary items, interest and taxes). The Advisor has contractually agreed to these waivers and/or reimbursements until at least February 28, 2022, which are included, if any, under the caption “Less expenses waived/reimbursed” in the Statement of Operations. Shareholders of the Portfolio will be notified if these waivers and/or reimbursements are discontinued after that date.
Under a Shareholder Servicing Agreement, the following Portfolios pay Glenmede Trust shareholder servicing fees for providing or arranging to provide shareholder support services to the beneficial owner of the Portfolios and share classes listed below:
| | Shareholder Servicing Fee
on Net Assets |
Quantitative U.S. Large Cap Core Equity Portfolio (Advisor Class)
| 0.20% |
Quantitative U.S. Large Cap Growth Equity Portfolio (Advisor Class)
| 0.20% |
Quantitative U.S. Large Cap Value Equity Portfolio
| 0.20% |
Quantitative U.S. Small Cap Equity Portfolio
| 0.20% |
Quantitative International Equity Portfolio
| 0.25% |
Responsible ESG U.S. Equity Portfolio
| 0.20% |
Women in Leadership U.S. Equity Portfolio
| 0.20% |
Quantitative U.S. Long/Short Equity Portfolio (Advisor Class)
| 0.20% |
Quantitative U.S. Total Market Equity Portfolio
| 0.20% |
Strategic Equity Portfolio
| 0.20% |
Small Cap Equity Portfolio (Advisor Class)
| 0.25% |
Small Cap Equity Portfolio (Institutional Class)
| 0.05% |
Equity Income Portfolio
| 0.20% |
Secured Options Portfolio (Advisor Class)
| 0.20% |
Global Secured Options Portfolio
| 0.20% |
Core Fixed Income Portfolio
| 0.10% |
Short Term Tax Aware Fixed Income Portfolio
| 0.10% |
High Yield Municipal Portfolio
| 0.25% |
State Street serves as administrator, transfer agent, dividend-paying agent and custodian with respect to the Fund. The Fund pays State Street a fee based on the combined aggregate average daily net assets of the Portfolios and The Glenmede Portfolios, an affiliated registered investment company, plus transaction charges for certain transactions and out-of-pocket expenses. The fee is computed daily and paid monthly. These fees can be found under the caption “Administration, transfer agent and custody fees” in the Statements of Operations.
THE GLENMEDE FUND, INC.
Notes to Financial Statements — (Continued)
Foreside Fund Officer Services, LLC (formerly known as Foreside Compliance Services, LLC) is paid an annual fee plus out-of-pocket expenses for the provision of personnel and services related to the Fund’s compliance program. The Fund’s Chief Compliance Officer is a Director of Foreside Financial Group, LLC.
Quasar Distributors, LLC (“Quasar”) serves as distributor of each Portfolio’s shares. The distributor receives no fees from the Fund in connection with distribution services provided to the Fund. The Advisor pays Quasar’s fees and out-of-pocket expenses for the distribution services it provides to the Fund.
Effective January 1, 2022, the Fund pays each Board member an annual fee of $104,000 plus $5,000 for each Board meeting attended and out-of-pocket expenses incurred in attending Board meetings, the Audit Committee Chairman receives an annual fee of $10,000 for his services as Chairman of the Audit Committee and the Chairman of the Board receives an annual fee of $15,000 for his services as Chairman of the Board. Prior to January 1, 2022, each Board member received an annual fee of $94,000 and the Chairman of the Board did not receive an annual fee for his services as Chairman of the Board. These fees can be found under the caption “Directors’ fees and expenses” in the Statements of Operations.
Expenses for the fiscal year ended October 31, 2021 include legal fees paid to Faegre Drinker Biddle & Reath LLP as legal counsel to the Fund and the independent Directors. A partner of the law firm is Secretary of the Fund. These fees are included in the amount shown under the caption “Professional fees” in the Statements of Operations.
4. Purchases and Sales of Securities
For the fiscal year ended October 31, 2021, the cost of purchases and proceeds from sales of investment securities other than U.S. government securities and short-term securities were:
| Portfolio | | Purchases | | Sales |
Quantitative U.S. Large Cap Core Equity Portfolio
| | $ 550,868,875 | | $ 846,651,132 |
Quantitative U.S. Large Cap Growth Equity Portfolio
| | 1,094,307,795 | | 1,817,454,768 |
Quantitative U.S. Large Cap Value Equity Portfolio
| | 1,653,198 | | 1,480,812 |
Quantitative U.S. Small Cap Equity Portfolio
| | 1,176,405 | | 1,162,445 |
Quantitative International Equity Portfolio
| | 38,104,078 | | 64,545,164 |
Responsible ESG U.S. Equity Portfolio
| | 21,930,548 | | 21,408,293 |
Women in Leadership U.S. Equity Portfolio
| | 21,726,273 | | 24,494,195 |
Quantitative U.S. Long/Short Equity Portfolio
| | 144,214,041 | | 165,980,767 |
Quantitative U.S. Total Market Equity Portfolio
| | 37,532,630 | | 46,858,172 |
Strategic Equity Portfolio
| | 34,082,205 | | 71,755,780 |
Small Cap Equity Portfolio
| | 572,092,157 | | 984,259,945 |
Equity Income Portfolio
| | 5,600,125 | | 7,653,461 |
Secured Options Portfolio
| | — | | — |
Global Secured Options Portfolio
| | 137,525 | | — |
Core Fixed Income Portfolio
| | 39,686,600 | | 18,171,540 |
Short Term Tax Aware Fixed Income Portfolio
| | 17,885,432 | | 12,515,424 |
High Yield Municipal Portfolio
| | 82,412,194 | | 47,684,051 |
For the fiscal year ended October 31, 2021, the cost of purchases and proceeds from sales of long-term U.S. government securities were:
| Portfolio | | Purchases | | Sales |
Core Fixed Income Portfolio
| | $78,653,366 | | $81,321,100 |
High Yield Municipal Portfolio
| | 430,235 | | 858 |
5. Common Stock
Changes in the capital shares outstanding were as follows:
| | Year Ended
10/31/21 | | Year Ended
10/31/20 |
| | Shares | | Amount | | Shares | | Amount |
| Quantitative U.S. Large Cap Core Equity Portfolio — Advisor | | | | | | | |
Sold
| 2,100,409 | | $ 64,054,495 | | 2,937,363 | | $ 71,382,611 |
Issued as reinvestment of dividends
| 3,270,039 | | 87,263,628 | | 2,803,174 | | 74,973,328 |
Redeemed
| (9,947,894) | | (293,104,464) | | (25,345,432) | | (615,432,867) |
Net Decrease
| (4,577,446) | | $(141,786,341) | | (19,604,895) | | $(469,076,928) |
THE GLENMEDE FUND, INC.
Notes to Financial Statements — (Continued)
| | Year Ended
10/31/21 | | Year Ended
10/31/20 |
| | Shares | | Amount | | Shares | | Amount |
| Quantitative U.S. Large Cap Core Equity Portfolio — Institutional | | | | | | | |
Sold
| 847,885 | | $ 25,801,902 | | 1,571,404 | | $ 40,527,775 |
Issued as reinvestment of dividends
| 423,886 | | 11,394,364 | | 1,112,383 | | 29,864,050 |
Redeemed
| (3,188,086) | | (91,251,178) | | (20,804,189) | | (458,443,013) |
Net Decrease
| (1,916,315) | | $ (54,054,912) | | (18,120,402) | | $(388,051,188) |
| Quantitative U.S. Large Cap Growth Equity Portfolio — Advisor | | | | | | | |
Sold
| 2,352,574 | | $ 82,095,688 | | 5,449,450 | | $ 163,682,444 |
Issued as reinvestment of dividends
| 6,987,144 | | 219,467,955 | | 8,853,403 | | 270,669,218 |
Redeemed
| (18,072,030) | | (626,816,029) | | (30,120,042) | | (898,362,063) |
Net Decrease
| (8,732,312) | | $(325,252,386) | | (15,817,189) | | $(464,010,401) |
| Quantitative U.S. Large Cap Growth Equity Portfolio — Institutional | | | | | | | |
Sold
| 8,458,065 | | $ 297,765,281 | | 7,148,924 | | $ 217,338,099 |
Issued as reinvestment of dividends
| 2,266,759 | | 71,268,792 | | 4,964,570 | | 151,609,541 |
Redeemed
| (13,400,857) | | (459,639,749) | | (32,941,800) | | (975,838,608) |
Net Decrease
| (2,676,033) | | $ (90,605,676) | | (20,828,306) | | $(606,890,968) |
| Quantitative U.S. Large Cap Value Equity Portfolio | | | | | | | |
Sold
| 24,366 | | $ 295,000 | | 5,004 | | $ 52,000 |
Issued as reinvestment of dividends
| 1,743 | | 20,983 | | 2,441 | | 21,484 |
Redeemed
| (11,343) | | (140,895) | | (29,802) | | (277,736) |
Net Increase (Decrease)
| 14,766 | | $ 175,088 | | (22,357) | | $ (204,252) |
| Quantitative U.S. Small Cap Equity Portfolio | | | | | | | |
Issued as reinvestment of dividends
| 551 | | $ 7,588 | | 786 | | $ 7,605 |
Net Increase
| 551 | | $ 7,588 | | 786 | | $ 7,605 |
| Quantitative International Equity Portfolio | | | | | | | |
Sold
| 33,779 | | $ 479,232 | | 62,957 | | $ 798,506 |
Issued as reinvestment of dividends
| 14,942 | | 228,413 | | 25,222 | | 327,675 |
Redeemed
| (1,830,283) | | (27,204,703) | | (10,385,416) | | (128,510,960) |
Net Decrease
| (1,781,562) | | $ (26,497,058) | | (10,297,237) | | $(127,384,779) |
| Responsible ESG U.S. Equity Portfolio | | | | | | | |
Sold
| 201,565 | | $ 3,768,049 | | 239,876 | | $ 3,278,585 |
Issued as reinvestment of dividends
| 6,883 | | 129,297 | | 16,877 | | 241,623 |
Redeemed
| (187,944) | | (3,527,964) | | (310,331) | | (4,327,625) |
Net Increase (Decrease)
| 20,504 | | $ 369,382 | | (53,578) | | $ (807,417) |
| Women in Leadership U.S. Equity Portfolio | | | | | | | |
Sold
| 183,350 | | $ 3,215,887 | | 444,566 | | $ 5,637,718 |
Issued as reinvestment of dividends
| 8,413 | | 152,570 | | 10,162 | | 130,588 |
Redeemed
| (348,442) | | (6,309,127) | | (356,959) | | (4,627,117) |
Net Increase (Decrease)
| (156,679) | | $ (2,940,670) | | 97,769 | | $ 1,141,189 |
| Quantitative U.S. Long/Short Equity Portfolio — Advisor | | | | | | | |
Sold
| 231,228 | | $ 2,833,951 | | 750,382 | | $ 8,863,412 |
Issued as reinvestment of dividends
| — | | — | | 1,645 | | 20,118 |
Redeemed
| (4,649,072) | | (56,802,686) | | (12,785,690) | | (139,987,603) |
Net Decrease
| (4,417,844) | | $ (53,968,735) | | (12,033,663) | | $(131,104,073) |
| Quantitative U.S. Long/Short Equity Portfolio — Institutional | | | | | | | |
Sold
| 547,595 | | $ 7,105,284 | | 30,611 | | $ 340,725 |
Redeemed
| (16,557) | | (209,973) | | (3,782) | | (41,850) |
Net Increase
| 531,038 | | $ 6,895,311 | | 26,829 | | $ 298,875 |
THE GLENMEDE FUND, INC.
Notes to Financial Statements — (Continued)
| | Year Ended
10/31/21 | | Year Ended
10/31/20 |
| | Shares | | Amount | | Shares | | Amount |
| Quantitative U.S. Total Market Equity Portfolio | | | | | | | |
Sold
| 153,035 | | $ 3,138,822 | | 93,429 | | $ 1,427,350 |
Issued as reinvestment of dividends
| 197,089 | | 3,302,532 | | 184,352 | | 3,278,150 |
Redeemed
| (634,270) | | (12,315,378) | | (2,222,180) | | (33,498,188) |
Net Decrease
| (284,146) | | $ (5,874,024) | | (1,944,399) | | $ (28,792,688) |
| Strategic Equity Portfolio | | | | | | | |
Sold
| 225,690 | | $ 7,026,380 | | 983,611 | | $ 25,229,443 |
Issued as reinvestment of dividends
| 426,978 | | 12,255,189 | | 183,160 | | 5,060,706 |
Redeemed
| (1,402,544) | | (44,266,719) | | (2,746,390) | | (67,163,578) |
Net Decrease
| (749,876) | | $ (24,985,150) | | (1,579,619) | | $ (36,873,429) |
| Small Cap Equity Portfolio — Advisor | | | | | | | |
Sold
| 1,266,694 | | $ 41,682,328 | | 2,865,149 | | $ 61,415,528 |
Issued as reinvestment of dividends
| 13,013 | | 405,614 | | 29,370 | | 650,585 |
Redeemed
| (4,330,396) | | (141,283,194) | | (17,726,725) | | (370,465,102) |
Net Decrease
| (3,050,689) | | $ (99,195,252) | | (14,832,206) | | $(308,398,989) |
| Small Cap Equity Portfolio — Institutional | | | | | | | |
Sold
| 9,212,748 | | $ 324,077,025 | | 19,808,990 | | $ 414,797,518 |
Issued as reinvestment of dividends
| 23,933 | | 815,748 | | 66,868 | | 1,528,106 |
Redeemed
| (19,176,316) | | (649,099,448) | | (36,951,403) | | (830,976,972) |
Net Decrease
| (9,939,635) | | $(324,206,675) | | (17,075,545) | | $(414,651,348) |
| Equity Income Portfolio | | | | | | | |
Sold
| 21,941 | | $ 331,439 | | 573,383 | | $ 6,849,468 |
Issued as reinvestment of dividends
| 1,676 | | 24,654 | | 2,550 | | 28,960 |
Redeemed
| (185,054) | | (2,610,970) | | (969,738) | | (11,315,443) |
Net Decrease
| (161,437) | | $ (2,254,877) | | (393,805) | | $ (4,437,015) |
| Secured Options Portfolio — Advisor | | | | | | | |
Sold
| 940,671 | | $ 12,846,984 | | 1,628,661 | | $ 19,275,364 |
Issued as reinvestment of dividends
| — | | — | | 1,509,519 | | 18,536,927 |
Redeemed
| (3,064,095) | | (41,110,090) | | (15,576,933) | | (170,266,139) |
Net Decrease
| (2,123,424) | | $ (28,263,106) | | (12,438,753) | | $(132,453,848) |
| Secured Options Portfolio — Institutional | | | | | | | |
Sold
| 3,429,440 | | $ 47,712,901 | | 9,628,347 | | $ 109,212,855 |
Issued as reinvestment of dividends
| — | | — | | 1,204,044 | | 14,881,983 |
Redeemed
| (10,798,791) | | (141,746,581) | | (12,015,486) | | (132,800,151) |
Net Decrease
| (7,369,351) | | $ (94,033,680) | | (1,183,095) | | $ (8,705,313) |
| Global Secured Options Portfolio1 | | | | | | | |
Sold
| 1,130,339 | | $ 5,984,091 | | 1,931,686 | | $ 8,794,981 |
Issued as reinvestment of dividends
| 12,132 | | 60,299 | | 395 | | 1,977 |
Redeemed
| (98,041) | | (519,619) | | (185,161) | | (843,181) |
Net Increase
| 1,044,430 | | $ 5,524,771 | | 1,746,920 | | $ 7,953,777 |
| Core Fixed Income Portfolio | | | | | | | |
Sold
| 5,261,656 | | $ 59,459,214 | | 6,379,234 | | $ 73,933,974 |
Issued as reinvestment of dividends
| 657,354 | | 7,548,663 | | 165,629 | | 1,905,937 |
Redeemed
| (5,004,064) | | (56,515,607) | | (13,948,961) | | (161,306,718) |
Net Increase (Decrease)
| 914,946 | | $ 10,492,270 | | (7,404,098) | | $ (85,466,807) |
| Short Term Tax Aware Fixed Income Portfolio | | | | | | | |
Sold
| 2,093,822 | | $ 21,242,499 | | 4,531,171 | | $ 45,802,969 |
Issued as reinvestment of dividends
| 5,604 | | 56,862 | | 7,353 | | 74,252 |
Redeemed
| (1,792,496) | | (18,191,928) | | (4,327,300) | | (43,659,011) |
Net Increase
| 306,930 | | $ 3,107,433 | | 211,224 | | $ 2,218,210 |
THE GLENMEDE FUND, INC.
Notes to Financial Statements — (Continued)
| | Year Ended
10/31/21 | | Year Ended
10/31/20 |
| | Shares | | Amount | | Shares | | Amount |
| High Yield Municipal Portfolio | | | | | | | |
Sold
| 6,406,515 | | $ 70,820,808 | | 4,360,207 | | $ 46,092,528 |
Issued as reinvestment of dividends
| 12,156 | | 133,646 | | 12,476 | | 132,118 |
Redeemed
| (2,811,061) | | (31,252,003) | | (2,392,062) | | (25,142,682) |
Net Increase
| 3,607,610 | | $ 39,702,451 | | 1,980,621 | | $ 21,081,964 |
|
| 1 | The Board authorized a 1-for-10 reverse share split for the Global Secured Options Portfolio effective after the close of trading on March 16, 2020. The impact of the reverse share split was to decrease the number of shares outstanding by a factor of ten, while increasing the NAV of shares outstanding by a factor of ten, resulting in no effect to the net assets of the Portfolio. The financial statements for the Portfolio have been adjusted to reflect the reverse share split. |
As of October 31, 2021, with the exception of the Small Cap Equity Portfolio, Quantitative U.S. Large Cap Core Equity Portfolio, Quantitative U.S. Large Cap Growth Equity Portfolio, Quantitative U.S. Long/Short Equity Portfolio, Quantitative U.S. Total Market Equity Portfolio and Secured Options Portfolio, Glenmede Trust, on behalf of its clients, holds of record and has voting and/or investment authority over a significant portion of each Portfolio’s outstanding shares. The following Portfolios have shareholders which, to the Fund’s knowledge, own beneficially 5% or more of the shares outstanding of a Portfolio or class of a Portfolio as of October 31, 2021. The total percentage of the shares of a Portfolio or class of a Portfolio held by such shareholders is as follows:
| | | 5% or Greater Shareholders |
| Portfolio | | # of
Shareholders | | % of
Shares Held |
Quantitative U.S Large Cap Core Equity Portfolio (Advisor Class)
| | 2 | | 38% |
Quantitative U.S. Large Cap Core Equity Portfolio (Institutional Class)
| | 4 | | 85% |
Quantitative U.S. Large Cap Growth Equity Portfolio (Advisor Class)
| | 2 | | 67% |
Quantitative U.S. Large Cap Growth Equity Portfolio (Institutional Class)
| | 3 | | 81% |
Quantitative U.S. Large Cap Value Equity Portfolio
| | 4 | | 97% |
Quantitative U.S. Small Cap Equity Portfolio
| | 1 | | 99% |
Responsible ESG U.S. Equity Portfolio
| | 4 | | 28% |
Women in Leadership U.S. Equity Portfolio
| | 5 | | 38% |
Quantitative U.S. Long/Short Equity Portfolio (Advisor Class)
| | 1 | | 12% |
Quantitative U.S. Long/Short Equity Portfolio (Institutional Class)
| | 2 | | 95% |
Quantitative U.S. Total Market Equity Portfolio
| | 2 | | 48% |
Small Cap Equity Portfolio (Advisor Class)
| | 3 | | 54% |
Small Cap Equity Portfolio (Institutional Class)
| | 3 | | 87% |
| Equity Income Portfolio | | 3 | | 23% |
Secured Options Portfolio (Advisor Class)
| | 4 | | 62% |
Secured Options Portfolio (Institutional Class)
| | 3 | | 94% |
Global Secured Options Portfolio
| | 2 | | 100% |
Short Term Tax Aware Fixed Income Portfolio
| | 2 | | 16% |
6. Lending of Portfolio Securities
As of October 31, 2021, the following Portfolios had outstanding loans of securities to certain approved brokers for which such Portfolios received collateral:
| Portfolio | | Market Value
of Loaned
Securities | | Market Value
of Cash Collateral | | Market Value
of Non-Cash
Collateral | | % of Total
Assets on
Loan |
Quantitative U.S. Large Cap Value Equity Portfolio
| | $ 48,428 | | $ 50,738 | | — | | 1.90 |
Quantitative U.S. Small Cap Equity Portfolio
| | 26,296 | | 26,965 | | — | | 1.65 |
Quantitative International Equity Portfolio
| | 5,579,376 | | 2,786,439 | | 3,007,567 | | 12.71 |
Women in Leadership U.S. Equity Portfolio
| | 586,853 | | 614,846 | | — | | 2.05 |
Quantitative U.S. Long/Short Equity Portfolio
| | 1,902,793 | | 687,600 | | 1,245,219 | | 1.77 |
Quantitative U.S. Total Market Equity Portfolio
| | 1,352,293 | | 316,958 | | 1,056,549 | | 2.91 |
Small Cap Equity Portfolio
| | 79,395,062 | | 48,882,501 | | 32,019,262 | | 5.20 |
Core Fixed Income Portfolio
| | 26,984,406 | | 27,537,200 | | — | | 5.87 |
THE GLENMEDE FUND, INC.
Notes to Financial Statements — (Continued)
The Portfolios have adopted the disclosure provisions of FASB Accounting Standards Update ("ASU") No. 2014-11 (“ASU No. 2014-11”), Transfers & Servicing (Topic 860): Repurchase-to-Maturity Transactions, Repurchase Financings, and Disclosures. ASU No. 2014-11 is intended to provide increased transparency about the types of collateral pledged in securities lending and other similar transactions that are accounted for as secured borrowings.
All of the securities on loan as of October 31, 2021 for the Quantitative U.S. Large Cap Value Equity Portfolio, Quantitative U.S. Small Cap Equity Portfolio, Women in Leadership U.S. Equity Portfolio and Core Fixed Income Portfolio were collateralized by cash; for the Quantitative International Equity Portfolio, Quantitative U.S. Long/Short Equity Portfolio, Quantitative U.S. Total Market Equity Portfolio and Small Cap Equity Portfolio were collateralized by cash and U.S. Treasuries; all of which have a contractual maturity of overnight and continuous.
7. Line of Credit
Effective November 5, 2020, the Fund and The Glenmede Portfolios, acting on behalf of their respective Portfolios, entered into unsecured committed and uncommitted lines of credit, each not to exceed $50 million, with State Street, to be utilized for temporary or emergency purposes to fund shareholder redemptions or for other short-term liquidity purposes. The lines of credit were renewed on November 4, 2021 and will expire on November 3, 2022, if not renewed. Borrowings under the lines of credit bear interest rates determined at the time of such borrowings, if any, are accrued daily and based upon an annualized spread ratio comprised of the overnight federal funds effective rate plus 1.35%. Interest charged under this facility during the fiscal year ended October 31, 2021 is identified as Interest expense on the accompanying Statements of Operations.
The average loans for the days outstanding and average interest rate for the Portfolios during the fiscal year ended October 31, 2021, were as follows:
| | Amount
Outstanding
at October 31, 2021 | | Average
Borrowings* | | Days
Outstanding* | | Average
Rate | | Maxium
Borrowings* |
Quantitative U.S. Large Cap Core Equity Portfolio
| $— | | $ 4,588,235 | | 17 | | 1.45 % | | $25,000,000 |
Quantitative U.S. Large Cap Growth Equity Portfolio
| — | | 10,755,315 | | 47 | | 1.45 % | | 83,000,000 |
Quantitative International Equity Portfolio
| — | | 1,200,000 | | 15 | | 1.45 % | | 4,000,000 |
Women in Leadership U.S. Equity Portfolio
| — | | 3,000,000 | | 3 | | 1.45 % | | 3,000,000 |
Quantitative U.S. Long/Short Equity Portfolio
| — | | 1,687,500 | | 16 | | 1.45 % | | 6,000,000 |
Quantitative U.S. Total Market Equity Portfolio
| — | | 1,000,000 | | 3 | | 1.44 % | | 1,000,000 |
Small Cap Equity Portfolio
| — | | 12,000,000 | | 4 | | 1.45 % | | 12,000,000 |
Short Term Tax Aware Fixed Income Portfolio
| — | | 1,000,000 | | 2 | | 1.45 % | | 1,000,000 |
* For the year ended October 31, 2021, based on the number of days borrowings were outstanding. Days Oustanding represents the total number of days during the period where there was an end of day open loan balance for a Portfolio.
8. Recently Issued Accounting Pronouncements
In March 2017, the FASB issued ASU 2017-08 (“ASU 2017-08”), Receivables -- Nonrefundable Fees and Other Costs (Subtopic 310-20): Premium Amortization on Purchased Callable Debt Securities, which amends the amortization period for certain purchased callable debt securities. Under ASU 2017-08, the premium amortization of purchased callable debt securities that have explicit, non-contingent call features and are callable at fixed prices are amortized to the earliest call date and is effective for fiscal years, and their interim periods, beginning after December 15, 2018. Management has adopted the requirements, and the impact, if any, is reflected within the Funds’ financial statements. In October 2020, ASU 2017-08 was amended by Accounting Standards Update 2020-08, Codification Improvements to Subtopic 310-20, Receivables—Nonrefundable Fees and Other Costs (“ASU 2020-08”). ASU 2020-08 requires entities to reevaluate whether callable debt securities fall within the scope of ASU 2017-08 at each reporting period. ASU 2020-08 also amends the relevant guidance to require premiums to be amortized to the “next call date” rather than the “earliest call date,” and further clarifies the definition of “next call date.” ASU 2020-08 is effective for fiscal years, and interim periods within those fiscal years, beginning after December 15, 2020. Early adoption of ASU 2020-08 is not permitted. Management is currently evaluating the impact of applying ASU 2020-08.
In October 2020, the SEC adopted new regulations governing the use of derivatives by registered investment companies. Rule 18f-4 will impose limits on the amount of derivatives a fund could enter into, eliminate the asset segregation framework currently used by funds to comply with Section 18 of the 1940 Act, and require funds whose use of derivatives is more than a limited specified exposure to establish and maintain a derivatives risk management program and appoint a derivatives risk manager. While the new rule became effective February 19, 2021, funds will not be required to fully comply with the new rule until August 19, 2022. It is not currently clear what impact, if any, the new rule will have on the availability, liquidity or performance of derivatives. When fully implemented, the new rule may require
THE GLENMEDE FUND, INC.
Notes to Financial Statements — (Concluded)
changes in how a Portfolio will use derivatives, may adversely affect a Portfolio’s performance and may increase costs related to a Portfolio’s use of derivatives.
In January 2021, the FASB issued Accounting Standards Update 2021-01 -- Reference Rate Reform (Topic 848) -- Scope (“ASU 2021-01”) as an update to Accounting Standards Update 2020-04 -- Reference Rate Reform (Topic 848) -- Facilitation of the Effects of Reference Rate Reform on Financial Reporting (“ASU 2020-04”) in order to make certain clarifications. ASU 2020-04 and ASU 2021-01 provide optional temporary financial reporting relief from the effect of certain types of contract modifications due to the planned discontinuation of the London Interbank Offered Rate (“LIBOR”) and other interbank-offered based reference rates. The temporary relief provided by ASU 2020-04 and ASU 2021-01 is effective for certain reference rate-related contract modifications that occur during the period March 12, 2020 through December 31, 2022. Management does not believe the impact of adopting ASU 2020-04 and ASU 2021-01 will have a material impact on the financial statements.
9. Subsequent Events
Management has evaluated events and transactions subsequent to October 31, 2021 through the date the financial statements were available to be issued, and has determined that there were no oher material events that would require recognition or disclosure in the Fund’s financial statements.
Report of Independent Registered Public Accounting Firm
To the Board of Directors of The Glenmede Fund, Inc. and Shareholders of Quantitative U.S. Large Cap Core Equity Portfolio, Quantitative U.S. Large Cap Growth Equity Portfolio, Quantitative U.S. Large Cap Value Equity Portfolio, Quantitative U.S. Small Cap Equity Portfolio, Quantitative International Equity Portfolio, Responsible ESG U.S. Equity Portfolio, Women in Leadership U.S. Equity Portfolio, Strategic Equity Portfolio, Small Cap Equity Portfolio, Equity Income Portfolio, Secured Options Portfolio, Global Secured Options Portfolio, Core Fixed Income Portfolio, Short Term Tax Aware Fixed Income Portfolio, High Yield Municipal Portfolio, Quantitative U.S. Long/Short Equity Portfolio and Quantitative U.S. Total Market Equity Portfolio
Opinions on the Financial Statements
We have audited the accompanying statements of assets and liabilities, including the schedules of portfolio investments, of Quantitative U.S. Large Cap Core Equity Portfolio, Quantitative U.S. Large Cap Growth Equity Portfolio, Quantitative U.S. Large Cap Value Equity Portfolio, Quantitative U.S. Small Cap Equity Portfolio, Quantitative International Equity Portfolio, Responsible ESG U.S. Equity Portfolio, Women in Leadership U.S. Equity Portfolio, Strategic Equity Portfolio, Small Cap Equity Portfolio, Equity Income Portfolio, Secured Options Portfolio, Global Secured Options Portfolio, Core Fixed Income Portfolio, Short Term Tax Aware Fixed Income Portfolio, High Yield Municipal Portfolio, Quantitative U.S. Long/Short Equity Portfolio and Quantitative U.S. Total Market Equity Portfolio (constituting The Glenmede Fund, Inc., hereafter collectively referred to as the “Portfolios”) as of October 31, 2021, the related statements of operations for the year ended October 31, 2021, of cash flows of Quantitative U.S. Long/Short Equity Portfolio and Quantitative U.S. Total Market Equity Portfolio for the year ended October 31, 2021, the statements of changes in net assets for each of the two years in the period ended October 31, 2021, including the related notes, and each of the financial highlights for each of the periods indicated therein (collectively referred to as the “financial statements”). In our opinion, the financial statements present fairly, in all material respects, the financial position of each of the Portfolios as of October 31, 2021, the results of each of their operations and cash flows of Quantitative U.S. Long/Short Equity Portfolio and Quantitative U.S. Total Market Equity Portfolio for the year then ended, the changes in each of their net assets for each of the two years in the period ended October 31, 2021, and each of the financial highlights for each of the periods indicated therein, in conformity with accounting principles generally accepted in the United States of America.
Basis for Opinions
These financial statements are the responsibility of the Portfolios’ management. Our responsibility is to express an opinion on the Portfolios’ financial statements based on our audits. We are a public accounting firm registered with the Public Company Accounting Oversight Board (United States) (PCAOB) and are required to be independent with respect to the Portfolios in accordance with the U.S. federal securities laws and the applicable rules and regulations of the Securities and Exchange Commission and the PCAOB.
We conducted our audits of these financial statements in accordance with the standards of the PCAOB. Those standards require that we plan and perform the audit to obtain reasonable assurance about whether the financial statements are free of material misstatement, whether due to error or fraud.
Our audits included performing procedures to assess the risks of material misstatement of the financial statements, whether due to error or fraud, and performing procedures that respond to those risks. Such procedures included examining, on a test basis, evidence regarding the amounts and disclosures in the financial statements. Our audits also included evaluating the accounting principles used and significant estimates made by management, as well as evaluating the overall presentation of the financial statements. Our procedures included confirmation of securities owned as of October 31, 2021 by correspondence with the custodian and brokers; when replies were not received from brokers, we performed other auditing procedures. We believe that our audits provide a reasonable basis for our opinions.
Philadelphia, Pennsylvania
December 20, 2021
We have served as the auditor of one or more investment companies in the Glenmede family of funds since 1988.
The Glenmede Portfolios
Statement Of Assets And Liabilities October 31, 2021
| | Muni
Intermediate
Portfolio |
| Assets: | |
Investments at value1
| $ 324,278,218 |
Cash
| 14,877,202 |
Receivable for fund shares sold
| 13,100 |
Interest receivable
| 3,910,513 |
Prepaid expenses
| 1,623 |
Total assets
| 343,080,656 |
| Liabilities: | |
Payable for when-issued securities purchased
| 6,551,921 |
Payable for fund shares redeemed
| 360,288 |
Payable for Trustees’ fees
| 10,519 |
Payable for Shareholder Servicing fees
| 42,733 |
Accrued expenses
| 51,279 |
Total liabilities
| 7,016,740 |
Net Assets
| $336,063,916 |
| Net Assets consist of: | |
Par value ($0.001 of shares outstanding)
| $ 30,025 |
Paid-in capital in excess of par value
| 327,124,974 |
Total distributable earnings
| 8,908,917 |
Total Net Assets
| $336,063,916 |
Shares Outstanding
| 30,024,635 |
Net Asset Value Per Share
| $ 11.19 |
1 Investments at cost
| $317,790,999 |
See Notes to Financial Statements.
THE GLENMEDE PORTFOLIOS
Statement Of Operations
For the Year Ended October 31, 2021
| | Muni
Intermediate
Portfolio |
| Investment income: | |
Interest
| $ 5,606,217 |
Total investment income
| 5,606,217 |
| Expenses: | |
Administration, transfer agent and custody fees
| 147,568 |
Professional fees
| 55,761 |
Shareholder report expenses
| 9,514 |
Shareholder servicing fees
| 496,011 |
Trustees’ fees and expenses
| 42,024 |
Registration and filing fees
| 9,988 |
Other expenses
| 37,221 |
Total expenses
| 798,087 |
Net investment income
| 4,808,130 |
| Realized and unrealized gain (loss): | |
| Net realized gain on: | |
Investment transactions
| 1,993,943 |
| Net change in unrealized loss of: | |
Investments
| (4,768,270) |
Net realized and unrealized loss
| (2,774,327) |
Net increase in net assets resulting from operations
| $ 2,033,803 |
See Notes to Financial Statements.
The Glenmede Portfolios
Statements Of Changes In Net Assets
For the Year Ended October 31, 2021
| | Muni
Intermediate
Portfolio |
| Increase (decrease) in net assets | |
| Operations: | |
Net investment income
| $ 4,808,130 |
| Net realized gain on: | |
Investment transactions
| 1,993,943 |
| Net change in unrealized loss of: | |
Investments
| (4,768,270) |
Net increase in net assets resulting from operations
| 2,033,803 |
Distributions from earnings
| (8,293,320) |
Net increase in net assets from capital share transactions (See note 4)
| 20,384,358 |
Net increase in net assets
| 14,124,841 |
| NET ASSETS: | |
Beginning of year
| 321,939,075 |
End of year
| $336,063,916 |
For the Year Ended October 31, 2020
| | Muni
Intermediate
Portfolio |
| Increase (decrease) in net assets | |
| Operations: | |
Net investment income
| $ 5,626,267 |
| Net realized gain on: | |
Investment transactions
| 3,469,398 |
| Net change in unrealized gain of: | |
Investments
| 1,937,819 |
Net increase in net assets resulting from operations
| 11,033,484 |
Distributions from earnings
| (6,748,049) |
Net increase in net assets from capital share transactions (See note 4)
| 6,334,307 |
Net increase in net assets
| 10,619,742 |
| NET ASSETS: | |
Beginning of year
| 311,319,333 |
End of year
| $321,939,075 |
See Notes to Financial Statements.
The Glenmede Portfolios
Financial Highlights
For a share outstanding throughout each year
| | Muni Intermediate Portfolio |
| | For The Year Ended October 31, |
| | 2021 1 | | 2020 1 | | 2019 1 | | 2018 | | 2017 |
Net asset value, beginning of year
| $ 11.41 | | $ 11.25 | | $ 10.73 | | $ 11.01 | | $ 11.08 |
| Income from investment operations: | | | | | | | | | |
Net investment income
| 0.16 | | 0.20 | | 0.22 | | 0.20 | | 0.19 |
Net realized and unrealized gain (loss) on investments
| (0.09) | | 0.21 | | 0.52 | | (0.28) | | (0.04) |
Total from investment operations
| 0.07 | | 0.41 | | 0.74 | | (0.08) | | 0.15 |
| Distributions to shareholders from: | | | | | | | | | |
Net investment income
| (0.17) | | (0.21) | | (0.22) | | (0.20) | | (0.18) |
Net realized capital gains
| (0.12) | | (0.04) | | — | | — | | (0.04) |
Total distributions
| (0.29) | | (0.25) | | (0.22) | | (0.20) | | (0.22) |
Net asset value, end of year
| $ 11.19 | | $ 11.41 | | $ 11.25 | | $ 10.73 | | $ 11.01 |
Total return
| 0.60% | | 3.64% | | 6.90% | | (0.73)% | | 1.38% |
| Ratios to average net assets/ Supplemental data: | | | | | | | | | |
Net assets, at end of year (in 000s)
| $336,064 | | $321,939 | | $311,319 | | $289,401 | | $303,982 |
Ratio of operating expenses to average net assets
| 0.24% | | 0.25% | | 0.24% | | 0.23% | | 0.23% |
Ratio of net investment income to average net assets
| 1.45% | | 1.80% | | 1.94% | | 1.86% | | 1.70% |
Portfolio turnover rate
| 31% | | 35% | | 34% | | 31% | | 19% |
|
| 1 | Per share net investment income (loss) has been calculated using the average shares outstanding during the period. |
See Notes to Financial Statements.
THE GLENMEDE PORTFOLIOS
Muni Intermediate Portfolio
SCHEDULE OF PORTFOLIO INVESTMENTS
October 31, 2021
Face
Amount | | | Value |
| MUNICIPAL BONDS* — 96.5% |
| | Alabama — 2.7% |
| $2,500,000 | Alabama State, Public School and College Authority, Revenue Bonds, Refunding, Series A,
5.000% due 11/1/31
| $ 3,275,353 |
| 1,500,000 | Black Belt Energy Gas District, AL, Revenue Bonds, Project No.4, Series A,
4.000% due 12/1/491
| 1,675,955 |
| 2,500,000 | Black Belt Energy Gas District, AL, Revenue Bonds, Project No.6,
4.000% due 10/1/521
| 2,854,359 |
| 1,000,000 | Southeast Energy Authority A Cooperative District, AL, Revenue Bonds, Project No.1, Series A,
4.000% due 11/1/511
| 1,167,037 |
| | | | 8,972,704 |
| | Alaska — 1.3% |
| 1,630,000 | Alaska State, General Obligation Unlimited, Refunding, Series B,
5.000% due 8/1/22
| 1,688,618 |
| 2,745,000 | City of Anchorage, AK, Electric Utility, Revenue Bonds, Refunding, Series A,
4.000% due 12/1/21
| 2,753,442 |
| | | | 4,442,060 |
| | Arizona — 0.7% |
| 2,015,000 | Yuma, AZ, Municipal Property Corp., Road & Excise Tax, Revenue Bonds, Refunding,
5.000% due 7/1/26
| 2,329,555 |
| | California — 2.2% |
| 1,500,000 | California State, General Obligation Unlimited,
5.000% due 3/1/34
| 1,929,108 |
| | California State, General Obligation Unlimited, Refunding: |
| 1,000,000 | 5.000% due 9/1/27
| 1,236,864 |
| 2,000,000 | 4.000% due 9/1/31
| 2,296,277 |
| 1,420,000 | 5.250% due 8/1/32
| 1,944,628 |
| | | | 7,406,877 |
| | Colorado — 1.1% |
| 1,765,000 | Colorado State, Housing and Finance Authority, Revenue Bonds, Series B,
3.750% due 5/1/50
| 1,920,217 |
| 1,425,000 | E-470 Public Highway Authority, CO, Revenue Bonds, Refunding, Series A,
5.000% due 9/1/28
| 1,784,257 |
| | | | 3,704,474 |
| | Connecticut — 2.5% |
| 2,000,000 | Connecticut State, General Obligation Unlimited, Series C,
4.000% due 6/1/28
| 2,383,617 |
| 1,780,000 | Connecticut State, Housing Finance Authority, Housing Finance Mortgage Program, Revenue Bonds, Refunding, Series F-1,
3.500% due 11/15/43
| 1,917,908 |
| | Connecticut State, Special Tax Obligation Bonds, Revenue Bonds, Series A: |
| 2,000,000 | 5.000% due 5/1/31
| 2,588,933 |
| 1,250,000 | 5.000% due 5/1/32
| 1,612,914 |
| | | | 8,503,372 |
| | Delaware — 1.9% |
| 1,590,000 | County of New Castle, DE, General Obligation Unlimited, Series A,
5.000% due 10/1/32
| 2,136,593 |
| 1,000,000 | Delaware River and Bay Authority, DE, Consisting, Revenue Bonds, Refunding, Series C,
5.000% due 1/1/27
| 1,096,025 |
| 2,640,000 | Delaware State, General Obligation Unlimited, Series B,
5.000% due 7/1/24
| 2,968,334 |
| | | | 6,200,952 |
See Notes to Financial Statements.
THE GLENMEDE PORTFOLIOS
Muni Intermediate Portfolio
SCHEDULE OF PORTFOLIO INVESTMENTS — (Continued)
October 31, 2021
Face
Amount | | | Value |
| MUNICIPAL BONDS* — (Continued) |
| | District Of Columbia — 2.8% |
| $1,550,000 | District of Columbia, General Obligation Unlimited, Series A,
5.000% due 6/1/32
| $ 1,786,148 |
| 2,700,000 | District of Columbia, General Obligation Unlimited, Series D,
5.000% due 6/1/25
| 3,136,360 |
| 1,320,000 | District of Columbia, Water and Sewer Authority, Revenue Bonds, Refunding, Series A,
5.000% due 10/1/31
| 1,561,312 |
| | Metropolitan Washington, DC, Airports Authority System, Revenue Bonds, Refunding, Series B: |
| 1,000,000 | 5.000% due 10/1/23
| 1,089,252 |
| 1,570,000 | 5.000% due 10/1/28
| 1,986,016 |
| | | | 9,559,088 |
| | Florida — 8.6% |
| 1,500,000 | Brevard County School District, FL, Certificate Participation, Refunding,
5.000% due 7/1/29
| 1,676,761 |
| 1,000,000 | Central Florida, Expressway Authority, Revenue Bonds, (AGMC Insured),
5.000% due 7/1/30
| 1,310,273 |
| 2,820,000 | Central Florida, Expressway Authority, Revenue Bonds, Refunding, Series B,
5.000% due 7/1/28
| 3,360,830 |
| 2,750,000 | City of Lakeland, FL, Energy System Revenue Bonds, Refunding,
5.000% due 10/1/25
| 3,218,616 |
| 2,765,000 | Florida State, Department of Environmental Protection, Revenue Bonds, Refunding, Series A,
5.000% due 7/1/22
| 2,852,850 |
| | Florida State, Municipal Power Agency, Revenue Bonds, Refunding, Series A: |
| 2,500,000 | 5.000% due 10/1/27
| 3,070,712 |
| 1,340,000 | 5.000% due 10/1/28
| 1,605,587 |
| 1,130,000 | JEA Electric System Revenue, FL, Revenue Bonds, Refunding, Series A,
5.000% due 10/1/27
| 1,231,584 |
| 3,000,000 | Lee County, FL, School Board, Certificate of Participation, Series A,
5.000% due 8/1/28
| 3,762,838 |
| 2,025,000 | Orlando & Orange County, FL, Expressway Authority, Revenue Bonds, Refunding,
5.000% due 7/1/23
| 2,089,421 |
| 1,000,000 | Orlando, FL, Utilities Commission, Revenue Bonds, Series B,
1.250% due 10/1/461
| 1,000,378 |
| 2,000,000 | Pasco County, FL, School Board, Certificate Participation, Series C, (AGMC Insured),
5.000% due 8/1/33
| 2,555,466 |
| 1,025,000 | School District of Broward County, FL, Certificate of Participation, Refunding, Series A,
5.000% due 7/1/27
| 1,228,865 |
| | | | 28,964,181 |
| | Georgia — 0.5% |
| 1,250,000 | City of Atlanta, GA, Department of Aviation, Revenue Bond, Series A,
5.000% due 7/1/28
| 1,571,339 |
| | Hawaii — 0.9% |
| 2,500,000 | City and County of Honolulu, HI, General Obligation Unlimited, Series A,
5.000% due 10/1/32
| 2,898,620 |
| | Illinois — 4.5% |
| 2,000,000 | Chicago, IL, O’Hare International Airport, Revenue Bonds, Refunding, Series B,
5.000% due 1/1/32
| 2,268,111 |
| | County of Cook, IL, General Obligation Unlimited, Refunding, Series A: |
| 1,000,000 | 5.000% due 11/15/25
| 1,172,216 |
| 1,360,000 | 5.000% due 11/15/26
| 1,641,123 |
| 1,000,000 | Illinois State, Municipal Electric Agency, Revenue Bonds, Series A,
4.000% due 2/1/33
| 1,112,653 |
| 3,500,000 | Illinois State, Toll Highway Authority, Revenue Bonds, Refunding,
5.000% due 1/1/28
| 4,324,161 |
See Notes to Financial Statements.
THE GLENMEDE PORTFOLIOS
Muni Intermediate Portfolio
SCHEDULE OF PORTFOLIO INVESTMENTS — (Continued)
October 31, 2021
Face
Amount | | | Value |
| MUNICIPAL BONDS* — (Continued) |
| | Illinois — (Continued) |
| $4,000,000 | McHenry County, IL, Conservation District, General Obligation Unlimited, Refunding,
5.000% due 2/1/25
| $ 4,577,487 |
| | | | 15,095,751 |
| | Indiana — 1.0% |
| 2,340,000 | Indiana State, Health and Educational Facilities Financing Authority, Revenue Bonds, Refunding, Series C,
1.750% due 11/15/311
| 2,340,000 |
| 1,025,000 | Indiana State, Municipal Power Agency, Revenue Bonds, Refunding, Series A,
5.000% due 1/1/27
| 1,166,006 |
| | | | 3,506,006 |
| | Iowa — 0.3% |
| 1,135,000 | Iowa State, Finance Authority, Variable Refunding Health facilities, Revenue Bonds,
0.030% due 2/15/391
| 1,135,000 |
| | Kansas — 2.3% |
| | Kansas State, Department of Transportation Highway Revenue, Revenue Bonds, Series C: |
| 1,190,000 | 5.000% due 9/1/23
| 1,236,433 |
| 2,750,000 | 5.000% due 9/1/24
| 2,857,949 |
| | Wyandotte County-Kansas City, KS, Unified Government, General Obligation Unlimited, Series A, (AGMC Insured): |
| 1,000,000 | 4.000% due 8/1/24
| 1,095,766 |
| 2,120,000 | 4.000% due 8/1/25
| 2,384,812 |
| | | | 7,574,960 |
| | Kentucky — 2.3% |
| 2,315,000 | Jefferson County, KY, School District Finance Corp. School Building, Revenue Bonds, Series A,
4.000% due 6/1/29
| 2,720,599 |
| 2,000,000 | Kentucky State, Infrastructure Authority, Revenue Bonds, Refunding, Series A,
5.000% due 2/1/28
| 2,023,928 |
| 1,000,000 | Kentucky State, Property & Building Commission, Revenue Bonds, Project No. 119, (BAM Insured),
5.000% due 5/1/33
| 1,228,407 |
| 1,500,000 | Kentucky State, Property & Building Commission, Revenue Bonds, Project No. 124, Series A, (AGMC Insured),
5.000% due 11/1/27
| 1,847,804 |
| | | | 7,820,738 |
| | Louisiana — 1.3% |
| 3,905,000 | Louisiana State, Gasoline and Fuels Tax Revenue, Revenue Bonds, Refunding, Series C,
5.000% due 5/1/43
| 4,183,369 |
| | Maine — 0.6% |
| 1,985,000 | Maine State, Municipal Bond Bank, Infrastructure Revenue, Revenue Bonds, Refunding, Series A,
5.000% due 9/1/22
| 2,064,110 |
| | Maryland — 2.5% |
| 2,000,000 | Maryland State, General Obligation Unlimited, Series A,
5.000% due 3/15/30
| 2,485,832 |
| 4,000,000 | Maryland State, General Obligation Unlimited,Series B,
5.000% due 8/1/24
| 4,510,858 |
| 1,240,000 | Montgomery County, MD, General Obligation Unlimited, Consolidated Public Improvement, Refunding, Series D,
4.000% due 11/1/28
| 1,462,324 |
| | | | 8,459,014 |
| | Massachusetts — 1.3% |
| 2,850,000 | Commonwealth of Massachusetts, General Obligation Limited, Series C,
5.000% due 5/1/30
| 3,048,708 |
See Notes to Financial Statements.
THE GLENMEDE PORTFOLIOS
Muni Intermediate Portfolio
SCHEDULE OF PORTFOLIO INVESTMENTS — (Continued)
October 31, 2021
Face
Amount | | | Value |
| MUNICIPAL BONDS* — (Continued) |
| | Massachusetts — (Continued) |
| $1,100,000 | Commonwealth of Massachusetts, General Obligation Limited, Series E,
5.000% due 9/1/32
| $ 1,382,275 |
| | | | 4,430,983 |
| | Michigan — 3.7% |
| 1,045,000 | Brighton Area School Districtmi, MI, General Obligation Unlimited, Refunding, Series A, (QSBLF Insured),
5.000% due 5/1/28
| 1,310,064 |
| 1,015,000 | Byron Center, MI, Public Schools, General Obligation Unlimited, Refunding, (QSBLF Insured),
5.000% due 5/1/24
| 1,131,103 |
| 4,000,000 | Detroit, MI, City School District, General Obligation Unlimited, Refunding, Series A, (QSBLF Insured),
5.000% due 5/1/26
| 4,093,743 |
| 2,275,000 | Michigan State, Finance Authority Revenue, Revenue Bonds, Refunding,
5.500% due 12/1/26
| 2,665,298 |
| 1,000,000 | Michigan State, Finance Authority Revenue, Revenue Bonds, Series 2019B,
3.500% due 11/15/441
| 1,032,185 |
| 2,140,000 | Michigan State, Housing Development Authority, Revenue Bonds, Series B,
3.500% due 6/1/47
| 2,264,554 |
| | | | 12,496,947 |
| | Minnesota — 1.6% |
| 2,000,000 | Minnesota State, General Obligation Unlimited, Series A,
4.000% due 9/1/33
| 2,478,307 |
| 2,745,000 | Minnesota State, Housing Finance Agency, Revenue Bonds, Refunding, Series E, (GNMA / FNMA / FHLMC Insured),
4.000% due 1/1/47
| 2,906,642 |
| | | | 5,384,949 |
| | Missouri — 1.4% |
| 2,000,000 | City of Kansas, MO, Sanitary Sewer System, Revenue Bonds, Refunding, Series A,
5.000% due 1/1/27
| 2,271,756 |
| 2,250,000 | Missouri State, MO, Housing Development Commission Single Family Mortgage, Revenue Bonds, Series A, (GNMA / FNMA / FHLMC Insured),
3.500% due 11/1/50
| 2,442,860 |
| | | | 4,714,616 |
| | Nevada — 1.4% |
| 2,000,000 | Clark County, NV, General Obligation Limited, Refunding, Series A,
5.000% due 11/1/29
| 2,363,555 |
| 1,000,000 | Clark County, NV, School District, General Obligation Limited, Building and Refunding Bonds, Series A,
5.000% due 6/15/26
| 1,189,270 |
| 1,000,000 | Clark County, NV, School District, General Obligation Limited, Building and Refunding Bonds, Series C,
5.000% due 6/15/26
| 1,189,270 |
| | | | 4,742,095 |
| | New Jersey — 0.8% |
| 1,375,000 | New Jersey, NJ, Turnpike Authority, Revenue Bonds, Series A,
5.000% due 1/1/27
| 1,663,955 |
| 1,000,000 | New Jersey, NJ, Turnpike Authority, Revenue Bonds, Series E,
5.000% due 1/1/32
| 1,135,066 |
| | | | 2,799,021 |
| | New Mexico — 0.7% |
| 1,075,000 | New Mexico State, Mortgage Finance Authority, Revenue Bonds, Series A, (GNMA / FNMA / FHLMC Insured),
3.500% due 1/1/51
| 1,167,275 |
See Notes to Financial Statements.
THE GLENMEDE PORTFOLIOS
Muni Intermediate Portfolio
SCHEDULE OF PORTFOLIO INVESTMENTS — (Continued)
October 31, 2021
Face
Amount | | | Value |
| MUNICIPAL BONDS* — (Continued) |
| | New Mexico — (Continued) |
| $ 975,000 | New Mexico State, Mortgage Finance Authority, Revenue Bonds, Series F, (GNMA / FNMA / FHLMC Insured),
3.500% due 7/1/50
| $ 1,057,134 |
| | | | 2,224,409 |
| | New York — 7.1% |
| 1,000,000 | Metropolitan Transportation Aurthority, NY, Revenue Bonds, (AGMC Insured), (SOFR * .670 + 0.55%),
0.584% due 11/1/322
| 1,003,381 |
| 1,250,000 | New York City, NY, General Obligation Unlimited, Fiscal 2008 Series J,
5.000% due 8/1/28
| 1,573,409 |
| 1,865,000 | New York City, NY, General Obligation Unlimited, REMK Series L,
5.000% due 4/1/33
| 2,425,060 |
| 1,000,000 | New York City, NY, General Obligation Unlimited, Series C,
5.000% due 8/1/23
| 1,083,008 |
| 2,000,000 | New York City, NY, Municipal Water Finanace Authority, Water and Sewer System, Second General resolution Revenue Bonds, Refunding, Series AA-2,
5.000% due 6/15/30
| 2,622,120 |
| 1,000,000 | New York City, NY, Municipal Water Finanace Authority,Water and Sewer System, Revenue Bonds, Series BB-2,
5.000% due 6/15/27
| 1,178,801 |
| 1,465,000 | New York City, NY, Transitional Finance Authority Building Aid Revenue, Revenue Bonds, Series S-1, (State Aid Withholding),
5.000% due 7/15/31
| 1,717,433 |
| 1,650,000 | New York City, NY, Transitional Finance Authority Revenue, Revenue Bonds, Future Tax Secured, Refunding, Series C,
5.000% due 11/1/26
| 1,999,008 |
| 2,275,000 | New York City, NY, Transitional Finance Authority, Future Tax Secured, Revenue Bonds, Subseries E-1,
5.000% due 2/1/30
| 2,672,558 |
| 2,440,000 | New York State, Dormitory Authority, Personal Income Tax, Revenue Bonds, Refunding, Series E,
4.000% due 3/15/28
| 2,741,983 |
| | New York State, Thruway Authority, Highway Revenue Tolls, Revenue Bonds, Refunding, Series K: |
| 1,000,000 | 5.000% due 1/1/31
| 1,133,382 |
| 1,200,000 | 5.000% due 1/1/32
| 1,356,831 |
| | Triborough Bridge and Tunnel Authority, NY, Revenue Bonds, Series C: |
| 1,070,000 | 4.000% due 11/15/27
| 1,264,384 |
| 1,000,000 | 5.000% due 11/15/29
| 1,215,786 |
| | | | 23,987,144 |
| | North Carolina — 2.3% |
| 1,220,000 | Duplin County, NC, Limited Obligation, Revenue Bonds,
5.000% due 4/1/23
| 1,297,214 |
| | New Hanover County, NC, Hospital Revenue, Revenue Bonds, Refunding: |
| 2,320,000 | 5.000% due 10/1/22
| 2,418,120 |
| 600,000 | 5.000% due 10/1/23
| 652,127 |
| 2,940,000 | North Carolina State, General Obligation Unlimited, Refunding, Series A,
5.000% due 6/1/27
| 3,500,110 |
| | | | 7,867,571 |
| | Ohio — 4.6% |
| 1,180,000 | City of Akron, OH, Income Tax Revenue, Revenue Bonds,
4.000% due 12/1/273
| 1,354,678 |
| 3,250,000 | Ohio State, General Obligation Unlimited, Series A,
5.000% due 6/15/28
| 3,454,475 |
| 1,010,000 | Ohio State, Hospital Refunding Revenue Bonds, Cleveland Clinic Health System, Series A,
5.000% due 1/1/27
| 1,225,670 |
| 1,670,000 | Ohio State, Hospital Revenue Bonds, Series A,
5.000% due 1/15/24
| 1,762,563 |
See Notes to Financial Statements.
THE GLENMEDE PORTFOLIOS
Muni Intermediate Portfolio
SCHEDULE OF PORTFOLIO INVESTMENTS — (Continued)
October 31, 2021
Face
Amount | | | Value |
| MUNICIPAL BONDS* — (Continued) |
| | Ohio — (Continued) |
| $2,170,000 | Ohio State, Housing Finance Agency Residential Mortgage, Revenue Bonds, Series D (GNMA / FNMA / FHLMC Insured),
4.000% due 3/1/48
| $ 2,332,567 |
| 1,000,000 | Ohio State, Mental Health Facilities, Revenue Bonds,
5.000% due 6/1/26
| 1,193,957 |
| 1,265,000 | Ohio State, The University, Revenue Bonds,
5.000% due 12/1/25
| 1,492,184 |
| 2,245,000 | Ohio State, Water Development Authority Water Pollution Control Loan Fund, Revenue Bonds, Series A,
5.000% due 6/1/30
| 2,752,034 |
| | | | 15,568,128 |
| | Oklahoma — 0.7% |
| 2,000,000 | Grand River, OK, Dam Authority, Revenue Bonds, Refunding, Series A,
5.000% due 6/1/24
| 2,237,026 |
| | Oregon — 2.0% |
| 2,975,000 | City of Portland, OR, Sewer System, Revenue Bonds, Series A,
4.500% due 5/1/30
| 3,458,896 |
| | Oregon State, General Obligation Unlimited, Article XI-Q State Project, Series K,: |
| 1,490,000 | 5.000% due 11/1/28
| 1,892,932 |
| 1,000,000 | 5.000% due 11/1/30
| 1,317,397 |
| | | | 6,669,225 |
| | Pennsylvania — 6.4% |
| 1,950,000 | City of Philadelphia, PA, Airport Revenue, Revenue Bonds, Refunding, Series A,
5.000% due 7/1/28
| 2,431,349 |
| 1,000,000 | City of Philadelphia, PA, General Obligation Unlimited, Series A,
5.000% due 8/1/26
| 1,197,148 |
| 1,000,000 | City of Philadelphia, PA, General Obligation Unlimited, Series B,
5.000% due 2/1/28
| 1,233,820 |
| | Commonwealth of Pennsylvania, General Obligation Unlimited, Series 2: |
| 1,500,000 | 5.000% due 9/15/25
| 1,755,676 |
| 2,000,000 | 5.000% due 9/15/28
| 2,399,305 |
| 2,500,000 | Cumberland County, PA, Municipal Authority, Revenue Bonds,
5.000% due 11/1/31
| 3,169,816 |
| 2,095,000 | Pennsylvania State, Higher Educational Facilities Authority, Revenue Bonds,
5.000% due 8/15/25
| 2,446,517 |
| 1,720,000 | Pennsylvania State, Housing Finance Agency Single Family Mortgage Revenue, Revenue Bonds, Series 2019-131A,
3.500% due 4/1/49
| 1,831,063 |
| 2,185,000 | Pennsylvania State, Public School Building Authority, Revenue Bonds,
5.000% due 5/1/23
| 2,339,152 |
| 2,500,000 | Pennsylvania State, Turnpike Commission, Revenue Bonds, Refunding,
5.000% due 12/1/22
| 2,628,689 |
| | | | 21,432,535 |
| | Rhode Island — 0.3% |
| 1,020,000 | Rhode Island State, Health and Educational Building Corporation, Public School Revenue, Revenue Bonds, Refunding, Series A,
5.000% due 5/15/22
| 1,046,207 |
| | South Carolina — 0.7% |
| 1,010,000 | Beaufort County, SC, General Obligation Unlimited, Series B, (State Aid Withholding),
5.000% due 5/1/22
| 1,034,081 |
| 1,000,000 | South Carolina State, Public Service Authority, Revenue Bonds, Series B,
5.000% due 12/1/27
| 1,233,690 |
| | | | 2,267,771 |
See Notes to Financial Statements.
THE GLENMEDE PORTFOLIOS
Muni Intermediate Portfolio
SCHEDULE OF PORTFOLIO INVESTMENTS — (Continued)
October 31, 2021
Face
Amount | | | Value |
| MUNICIPAL BONDS* — (Continued) |
| | Texas — 13.0% |
| $1,065,000 | Alamo, TX, Community College District, General Obligation Limited, Refunding,
5.000% due 2/15/24
| $ 1,178,622 |
| 3,500,000 | Board of Regents of the University of Texas System, TX, Revenue Bonds, Series D,
5.000% due 8/15/25
| 4,087,260 |
| 2,000,000 | City of Dallas and Fort Worth, TX, International Airport Joint Revenue, Revenue Bonds, Refunding, Series A,
5.000% due 11/1/31
| 2,583,020 |
| 3,000,000 | Dallas, TX, Area Rapid Transit, Sales Tax Revenue, Revenue Bonds, Refunding,
5.000% due 12/1/25
| 3,533,453 |
| | Harris County, TX, Cultural Education Facilities Finance Corp., Revenue Bonds, Refunding, Children’s Hospital Project: |
| 1,850,000 | 5.000% due 10/1/26
| 2,152,749 |
| 1,000,000 | 5.000% due 10/1/27
| 1,158,191 |
| 3,000,000 | Harris County, TX, Flood Control District, Revenue Bonds, Refunding, Series A,
5.000% due 10/1/28
| 3,728,178 |
| | Harris County, TX, Revenue Bonds, Series A: |
| 1,300,000 | 5.000% due 8/15/24
| 1,467,444 |
| 3,000,000 | 5.000% due 8/15/25
| 3,502,136 |
| 1,130,000 | Irving Tax Independent School District, TX, General Obligation Unlimited,
4.000% due 2/15/32
| 1,340,429 |
| 1,000,000 | Lower Colorado River Authority, TX, Revenue Bonds, (AGMC Insured),
5.000% due 5/15/273
| 1,197,460 |
| 1,125,000 | Lower Colorado River Authority, TX, Revenue Bonds, Refunding,
5.000% due 5/15/25
| 1,300,583 |
| 2,500,000 | North Texas, Municipal Water District, Revenue Bonds, Series 2021A,
4.000% due 9/1/233
| 2,661,864 |
| 1,000,000 | North Texas, Tollway Authority, Revenue Bonds, Refunding,
5.000% due 1/1/32
| 1,213,383 |
| 4,000,000 | North Texas, Tollway Authority, Revenue Bonds, Refunding, Series A,
5.000% due 1/1/30
| 4,536,222 |
| 2,550,000 | Texas State, General Obligation Unlimited, Series A,
5.000% due 10/1/26
| 3,080,699 |
| 1,375,000 | Texas State, General Obligation Unlimited, Series B,
4.000% due 8/1/29
| 1,541,858 |
| 3,090,000 | Waco, TX, Independent School District, General Obligation Unlimited, Refunding, (PSF Guaranteed),
5.000% due 8/15/23
| 3,348,539 |
| | | | 43,612,090 |
| | Vermont — 0.6% |
| 1,900,000 | Vermont State, Educational and Health Buildings Financing Agency, Revenue Bonds,Landmark Collage Project A,
0.040% due 7/1/391
| 1,900,000 |
| | Washington — 5.8% |
| 1,000,000 | Central Puget Sound Regional Transit Authority, WA, Revenue Bonds, Refunding, Series S-1,
5.000% due 11/1/303
| 1,317,211 |
| 3,695,000 | City of Seattle, WA, Municipal Light and Power Revenue, Revenue Bonds, Refunding,
4.000% due 9/1/30
| 4,036,755 |
| 1,205,000 | Grays Harbor County, WA, Public Utility District No. 1, Revenue Bonds, Refunding, Series A,
5.000% due 1/1/27
| 1,365,320 |
| 3,600,000 | King County, WA, Bellevue School District No. 405, General Obligation Unlimited,
5.000% due 12/1/25
| 3,945,704 |
| 1,000,000 | Spokane County, WA, School District No. 356 Central Valley, General Obligation Unlimited,
4.000% due 12/1/32
| 1,165,045 |
| 4,000,000 | Washington State, General Obligation Unlimited, Series R-2013A,
4.000% due 7/1/28
| 4,096,227 |
| 3,000,000 | Washington State, General Obligation Unlimited, Series D,
5.000% due 2/1/26
| 3,551,857 |
| | | | 19,478,119 |
See Notes to Financial Statements.
THE GLENMEDE PORTFOLIOS
Muni Intermediate Portfolio
SCHEDULE OF PORTFOLIO INVESTMENTS — (Continued)
October 31, 2021
Face
Amount | | | Value |
| MUNICIPAL BONDS* — (Continued) |
| | Wisconsin — 1.1% |
| $2,100,000 | Wisconsin State, Department of Transportation Revenue, Revenue Bonds, Refunding, Series 2,
5.000% due 7/1/29
| $ 2,572,942 |
| 1,000,000 | Wisconsin State, Revenue Bonds, Series A,
5.000% due 5/1/28
| 1,222,233 |
| | | | 3,795,175 |
| | Wyoming — 1.0% |
| 2,995,000 | Wyoming State, Community Development Authority, Housing Revenue, Revenue Bonds, Refunding, Series 3,
4.000% due 6/1/43
| 3,232,037 |
| | TOTAL MUNICIPAL BONDS
(Cost $317,790,999)
| 324,278,218 |
TOTAL INVESTMENTS
(Cost $317,790,999)
| 96.5% | $324,278,218 |
OTHER ASSETS IN EXCESS OF LIABILITIES
| 3.5 | 11,785,698 |
NET ASSETS
| 100.0% | $336,063,916 |
|
| * | Percentages indicated are based on net assets. |
| 1 | Variable/Floating interest rate security. Certain variable/floating interest rate securities are not based on a published reference rate and spread but are determined by the issuer or agent and are based on current market conditions. These securities do not indicate a reference rate and spread in their description above. Rate presented is as of October 31, 2021. |
| 2 | Floating Rate Bond. Rate shown is as of October 31, 2021. |
| 3 | When-issued security. |
| Abbreviations: |
| AGMC — Assured Guaranty Municipal Corporation |
| BAM — Build America Mutual |
| FHLMC — Federal Home Loan Mortgage Corporation |
| FNMA — Federal National Mortgage Association |
| GNMA — Government National Mortgage Association |
| PSF — Permanent School Fund |
| QSBLF — Michigan Qualified School Bond Loan Fund |
See Notes to Financial Statements.
THE GLENMEDE PORTFOLIOS
Muni Intermediate Portfolio
SCHEDULE OF PORTFOLIO INVESTMENTS — (Concluded)
October 31, 2021
STATE DIVERSIFICATION
On October 31, 2021, State Diversification of the Portfolio was as follows:
| | % of
Net Assets | | Value |
| STATE: | | | |
Texas
| 13.0% | | $ 43,612,090 |
Florida
| 8.6 | | 28,964,181 |
New York
| 7.1 | | 23,987,144 |
Pennsylvania
| 6.4 | | 21,432,535 |
Washington
| 5.8 | | 19,478,119 |
Ohio
| 4.6 | | 15,568,128 |
Illinois
| 4.5 | | 15,095,751 |
Michigan
| 3.7 | | 12,496,947 |
District of Columbia
| 2.8 | | 9,559,088 |
Alabama
| 2.7 | | 8,972,704 |
Connecticut
| 2.5 | | 8,503,372 |
Maryland
| 2.5 | | 8,459,014 |
North Carolina
| 2.3 | | 7,867,571 |
Kentucky
| 2.3 | | 7,820,738 |
Kansas
| 2.3 | | 7,574,960 |
California
| 2.2 | | 7,406,877 |
Oregon
| 2.0 | | 6,669,225 |
Delaware
| 1.9 | | 6,200,952 |
Minnesota
| 1.6 | | 5,384,949 |
Nevada
| 1.4 | | 4,742,095 |
Missouri
| 1.4 | | 4,714,616 |
Alaska
| 1.3 | | 4,442,060 |
Massachusetts
| 1.3 | | 4,430,983 |
Louisiana
| 1.3 | | 4,183,369 |
Wisconsin
| 1.1 | | 3,795,175 |
Colorado
| 1.1 | | 3,704,474 |
Indiana
| 1.0 | | 3,506,006 |
Wyoming
| 1.0 | | 3,232,037 |
Hawaii
| 0.9 | | 2,898,620 |
New Jersey
| 0.8 | | 2,799,021 |
Arizona
| 0.7 | | 2,329,555 |
South Carolina
| 0.7 | | 2,267,771 |
Oklahoma
| 0.7 | | 2,237,026 |
New Mexico
| 0.7 | | 2,224,409 |
Maine
| 0.6 | | 2,064,110 |
Vermont
| 0.6 | | 1,900,000 |
Georgia
| 0.5 | | 1,571,339 |
Iowa
| 0.3 | | 1,135,000 |
Rhode Island
| 0.3 | | 1,046,207 |
TOTAL MUNICIPAL BONDS
| 96.5% | | $324,278,218 |
TOTAL INVESTMENTS
| 96.5% | | $324,278,218 |
See Notes to Financial Statements.
The Glenmede Portfolios
Notes to Financial Statements
1. Organization and Significant Accounting Policies
The Glenmede Portfolios (the “Fund”) is an investment company that was organized as a Massachusetts business trust on March 3, 1992, and is registered with the Securities and Exchange Commission (the "SEC") under the Investment Company Act of 1940, as amended (the “1940 Act”), as an open-end management investment company. As of October 31, 2021, the Fund offered shares of one sub-trust, the Muni Intermediate Portfolio (the “Portfolio”). The Portfolio is classified as diversified.
The Fund is an investment company and follows accounting and reporting guidance in Financial Accounting Standards Board (“FASB”) Accounting Standards Codification ("ASC") Topic 946 (“ASC 946”). The preparation of financial statements in conformity with accounting principles generally accepted in the United States of America (“U.S.”) including, but not limited to ASC 946, requires management to make estimates and assumptions that affect the reported amounts of assets and liabilities and disclosure of contingent assets and liabilities at the date of the financial statements and the reported amounts of revenues and expenses during the reporting period. Actual results could differ from those estimates, and the differences could be material. The following is a summary of significant accounting policies consistently followed by the Portfolio in the preparation of its financial statements.
Valuation of Securities: Municipal obligations for which market quotations are readily available are valued at the most recent quoted bid price provided by investment dealers, provided that municipal obligations may be valued on the basis of prices provided by a pricing service when such prices are determined by the investment advisor to reflect the fair market value of such municipal obligations. These valuations are typically categorized as Level 2 in the fair value hierarchy described below. When market quotations are not readily available or events occur that make established valuation methods unreliable, municipal obligations are valued in a manner which is intended to reflect their fair value as determined in accordance with procedures approved by the Board of Trustees of the Fund (the “Board”) and are typically categorized as Level 3 in the fair value hierarchy. The fair value of securities is generally determined as the amount that a Portfolio could reasonably expect to realize from an orderly disposition of such securities over a reasonable period of time. By its nature, a fair value price is a good faith estimate of the value of a security at a given point in time and does not reflect an actual market price, which may be different by a material amount. Debt obligations with maturities of 60 days or less at the time of purchase are valued on the basis of amortized cost and are typically categorized as Level 2 in the fair value hierarchy.
FASB ASC Topic 820, “Fair Value Measurements” defines fair value, establishes a three-level hierarchy for measuring fair value and expands disclosure about fair value measurements. The valuation hierarchy is based upon the transparency of inputs to the valuation of the Portfolio’s investments. Inputs refer broadly to the assumptions that market participants would use in pricing a security. Observable inputs are inputs that reflect the assumptions market participants would use in pricing the asset or liability based on market data obtained from sources independent of the reporting entity. Unobservable inputs are inputs that reflect the reporting entity’s own assumptions about the assumptions market participants would use in pricing the asset or liability based on the best information available in the circumstances. These inputs are summarized in the three levels listed below:
Level 1 — quoted prices in active markets for identical investments;
Level 2 — other significant observable inputs (including quoted prices for similar investments, interest rates, prepayment speeds, credit risk and others) or valuations based on quoted prices in markets that are not active; and
Level 3 — significant unobservable inputs (including the Fund’s own assumptions in determining the fair value of investments).
The inputs or methodology used for valuing securities are not necessarily an indication of the risks associated with investing in those securities.
Changes in valuation techniques may result in changing an investment’s assigned level within the hierarchy.
The Muni Intermediate Portfolio had all long-term investments, with corresponding states at Level 2 at October 31, 2021.
COVID-19: In early 2020, an outbreak of a novel strain of coronavirus ("COVID-19") emerged globally. This coronavirus has resulted in closing international borders, enhanced health screenings, healthcare service preparation and delivery, quarantines, cancellations, disruptions to supply chains and customer activity, as well as general public concern and uncertainty. The impact of this outbreak has negatively affected the worldwide economy, as well as the economies of individual countries, the financial health of individual companies and the market in general in significant and unforeseen ways. Although vaccines for COVID-19 have become more widely available, the future impact of COVID-19 is currently unknown, and the pace of recovery may vary from market to market, which may exacerbate other risks that apply to the Fund’s Portfolio, including political, social and economic risks. Any such impact could adversely affect the Portfolio’s performance, the performance of the securities in which the Portfolio invests and may lead to losses on your investment in the Fund’s Portfolio. The ultimate impact of COVID-19 on the financial performance of the Portfolio’s investments is not reasonably estimable at this time.
Municipal Securities: The value of, payment of interest on, repayment of principal for, and the ability to sell a municipal security may be affected by constitutional amendments, legislation, executive orders, administrative regulations, voter initiatives and the economics of the regions in which the issuers are located. A credit rating downgrade,
The Glenmede Portfolios
Notes to Financial Statements — (Continued)
bond default, or bankruptcy involving an issuer within a particular state or territory could affect the market values and marketability of some or all of the municipal obligations of that state or territory.
Since many municipal securities are issued to finance similar projects, especially those relating to education, health care, transportation and utilities, conditions in those sectors can affect the overall municipal securities market and the Portfolio’s investments in municipal securities.
There is some risk that a portion or all of the interest received from certain tax-free municipal securities could become taxable as a result of determinations by the Internal Revenue Service.
Shareholders should consult the Portfolio’s prospectus for a complete listing of risks associated with the Portfolio.
Securities Transactions and Investment Income: Securities transactions are recorded as of the trade date. Realized gains and losses on investments sold are computed on the basis of identified cost. Interest income is recorded on the accrual basis and includes, when appropriate, amortization of premiums and accretion of discounts.
Securities purchased or sold on a when-issued or delayed-delivery basis may be settled after a period longer than the regular settlement time of trade date plus three business days. Interest income is accrued based on the terms of the security on settlement date. The Portfolio segregates assets with a current value at least equal to the amount of its when-issued purchase commitments. When-issued purchase commitments involve a risk of loss if the value of the security to be purchased declines prior to settlement date, or if the counterparty does not perform under the contract.
Dividends and Distributions to Shareholders: Dividends from net investment income, if any, are declared and paid monthly. The Portfolio distributes any net realized capital gains on an annual basis. Additional distributions of net investment income and capital gains for the Portfolio may be made at the discretion of the Board in order to avoid a nondeductible excise tax under Section 4982 of the Internal Revenue Code of 1986, as amended (the “Code”).
Income and capital gains distributions are determined in accordance with income tax regulations which may differ from accounting principles generally accepted in the U.S. These differences are primarily due to differing treatments of income and gains on various investment securities held by the Portfolio, timing differences and differing characterization of distributions made by the Portfolio.
Federal Income Taxes: The Portfolio intends to continue to qualify as a regulated investment company by complying with the requirements of the Code applicable to regulated investment companies, and by distributing substantially all of its tax-exempt (and taxable, if any) income to its shareholders. Therefore, no federal income tax provision is required. Income distributions and capital gains distributions are determined in accordance with income tax regulations which may differ from accounting principles generally accepted in the U.S.
“ Accounting for Uncertainty in Income Taxes — an interpretation of FASB ASC 740” (“ASC 740”) clarifies the accounting for uncertainty in income taxes recognized in accordance with ASC 740, “Accounting for Income Taxes.” This interpretation prescribes a recognition threshold and measurement attribute for the financial statement recognition and measurement of a tax position taken or expected to be taken in a tax return. It also provides guidance on de-recognition, classification, interest and penalties, accounting in interim periods, disclosure and transition. The Portfolio’s federal tax returns filed in the 3-year period ended October 31, 2021 remain subject to examination by the Internal Revenue Service. Management of the Funds has concluded that there are no significant uncertain tax positions that would require recognition in the financial statements. State, local and/or non-U.S. tax returns and/or other filings may be subject to examination for different periods, depending upon the tax rules of each applicable jurisdiction.
As of October 31, 2021, the tax year end of the Fund, the components of distributable earnings on a tax basis were as follows:
| Portfolio | | Undistributed
Tax-exempt
Income | | Undistributed
Long-Term
Gain | | Unrealized
Appreciation/
(Depreciation) | | Total
Distributable
Earnings |
Muni Intermediate Portfolio
| | $430,509 | | $1,991,189 | | $6,487,219 | | $8,908,917 |
For the fiscal year ended October 31, 2021, the Portfolio’s components of distributable earnings on a tax basis were equal to the components of distributable earnings on a book basis. Such reclasses had no effect on net assets.
As of October 31, 2021, the tax characterization of distributions paid during the year was equal to the book characterization of distributions paid for the Portfolio and was as follows:
| Portfolio | | Tax
Exempt | | Ordinary
Income | | Long-Term
Gains | | Return of
Capital |
Muni Intermediate Portfolio
| | $4,821,963 | | $927,838 | | $2,543,519 | | $— |
The Glenmede Portfolios
Notes to Financial Statements — (Continued)
As of October 31, 2020, the tax characterization of distributions paid during the year was equal to the book characterization of distributions paid for the Portfolio and was as follows:
| Portfolio | | Tax
Exempt | | Ordinary
Income | | Long-Term
Gains |
Muni Intermediate Portfolio
| | $5,680,505 | | $465,124 | | $602,420 |
As of October 31, 2021, aggregate gross unrealized appreciation for all securities in which there was an excess of value over tax cost and aggregate gross unrealized depreciation for all securities in which there was an excess of tax cost over value were as follows:
| Portfolio | | Cost | | Appreciation | | (Depreciation) | | Net |
Muni Intermediate Portfolio
| | $317,790,999 | | $7,178,517 | | $691,298 | | $6,487,219 |
Other: In the normal course of business, the Portfolio enters into contracts that may include agreements to indemnify another party under given circumstances. The Portfolio’s maximum exposure under these arrangements is unknown as this would involve future claims that may be, but have not yet been, made against the Portfolio. However, based on experience, the risk of material loss from such claims is considered to be remote.
2. Investment Advisory Fee, Administration Fee and Other Related Party Transactions
Glenmede Investment Management LP (the “Advisor” or "GIM"), a wholly-owned subsidiary of The Glenmede Trust Company, N.A. (“Glenmede Trust”), serves as investment advisor to the Portfolio, pursuant to an investment management agreement with the Portfolio. Under this agreement, the Advisor manages the Portfolio, subject to the general supervision of the Board.
The Portfolio does not pay a management fee for advisory services. The investors in the Portfolio are the clients of Glenmede Trust or its affiliated companies (“Affiliates”). Glenmede Trust or its Affiliates charge a fee directly to their clients for fiduciary, trust and/or advisory services. The actual annual fees charged vary dependent on a number of factors, including the particular services provided to the client, and are generally 1.25% or less of the clients’ assets under management.
The Portfolio pays Glenmede Trust shareholder servicing fees at the annual rate of 0.15% of the Portfolio’s average daily net assets.
State Street Bank and Trust Company (“State Street”) serves as administrator, transfer agent, dividend-paying agent and custodian with respect to the Portfolio. The Portfolio pays State Street a fee based on the combined aggregate average daily net assets of the Portfolio and The Glenmede Fund, Inc., an affiliated registered investment company, plus transaction charges for certain transactions and out-of-pocket expenses. The fee is computed daily and paid monthly.
Foreside Fund Officer Services, LLC (formerly known as Foreside Compliance Services, LLC) is paid an annual fee plus out-of-pocket expenses for the provision of personnel and services related to the Fund’s compliance program. The Fund’s Chief Compliance Officer is a Director of Foreside Financial Group, LLC.
Quasar Distributors, LLC (“Quasar”) serves as distributor of the Portfolio’s shares. The distributor receives no fees from the Fund in connection with distribution services provided to the Fund. The Advisor pays Quasar’s fees and out-of-pocket expenses for the distribution services it provides to the Portfolio.
The Portfolio pays each Board member an annual fee of $6,000 and out-of-pocket expenses incurred in attending Board meetings.
Expenses for the fiscal year ended October 31, 2021 include legal fees paid to Faegre Drinker Biddle & Reath LLP as legal counsel to the Fund and the independent Trustees. A partner of the law firm is Secretary of the Fund.
3. Purchases and Sales of Securities
For the fiscal year ended October 31, 2021, the cost of purchases and proceeds from sales of investment securities other than U.S. government securities and short-term securities were:
| Portfolio | | Purchases | | Sales |
Muni Intermediate Portfolio
| | $121,497,977 | | $95,626,644 |
The Glenmede Portfolios
Notes to Financial Statements — (Concluded)
4. Shares of Beneficial Interest
The Portfolio may issue an unlimited number of shares of beneficial interest with a $.001 par value. Changes in shares of beneficial interest outstanding were as follows:
| | Year Ended
10/31/21 | | Year Ended
10/31/20 |
| | Shares | | Amount | | Shares | | Amount |
| Muni Intermediate Portfolio | | | | | | | |
Sold
| 4,515,164 | | $ 51,089,006 | | 6,830,268 | | $ 77,223,336 |
Issued as reinvestment of dividends
| 305,295 | | 3,465,064 | | 97,052 | | 1,085,249 |
Redeemed
| (3,017,818) | | (34,169,712) | | (6,381,963) | | (71,974,278) |
Net Increase
| 1,802,641 | | $ 20,384,358 | | 545,357 | | $ 6,334,307 |
As of October 31, 2021, Glenmede Trust, on behalf of its clients, holds of record and has voting and/or investment authority over substantially all of the Portfolio’s outstanding shares. The Portfolio had no shareholders that beneficially owned 5% of the shares outstanding of the Portfolio as of October 31, 2021.
5. Line of Credit
Effective November 5, 2020, the Fund and The Glenmede Fund, Inc., acting on behalf of their respective Portfolios, entered into unsecured committed and uncommitted lines of credit, each not to exceed $50 million, with State Street, to be utilized for temporary or emergency purposes to fund shareholder redemptions or for other short-term liquidity purposes. The lines of credit were renewed on November 4, 2021 and will expire on November 3, 2022, if not renewed. Borrowings under the lines of credit bear interest rates determined at the time of such borrowings, if any, are accrued daily and based upon an annualized spread ratio comprised of the overnight federal funds effective rate plus 1.35%. Interest charged under this facility during the fiscal year ended October 31, 2021 is identified as Interest expense on the accompanying Statement of Operations.
The Muni Intermediate Portfolio did not have any borrowings during the fiscal year ended October 31, 2021.
6. Recently Issued Accounting Pronouncements
In March 2017, the FASB issued ASU 2017-08 (“ASU 2017-08”), Receivables -- Nonrefundable Fees and Other Costs (Subtopic 310-20): Premium Amortization on Purchased Callable Debt Securities, which amends the amortization period for certain purchased callable debt securities. Under ASU 2017-08, the premium amortization of purchased callable debt securities that have explicit, non-contingent call features and are callable at fixed prices are amortized to the earliest call date and is effective for fiscal years, and their interim periods, beginning after December 15, 2018. Management has adopted the requirements, and the impact, if any, is reflected within the Funds’ financial statements. In October 2020, ASU 2017-08 was amended by Accounting Standards Update 2020-08, Codification Improvements to Subtopic 310-20, Receivables—Nonrefundable Fees and Other Costs (“ASU 2020-08”). ASU 2020-08 requires entities to reevaluate whether callable debt securities fall within the scope of ASU 2017-08 at each reporting period. ASU 2020-08 also amends the relevant guidance to require premiums to be amortized to the “next call date” rather than the “earliest call date,” and further clarifies the definition of “next call date.” ASU 2020-08 is effective for fiscal years, and interim periods within those fiscal years, beginning after December 15, 2020. Early adoption of ASU 2020-08 is not permitted. Management is currently evaluating the impact of applying ASU 2020-08.
7. Subsequent Events
Management has evaluated events and transactions subsequent to October 31, 2021 through the date the financial statements were available to be issued, and has determined that there were no other material events that would require recognition or disclosure in the Fund’s financial statements.
Report of Independent Registered Public Accounting Firm
To the Board of Trustees of The Glenmede Portfolios and Shareholders of Muni Intermediate Portfolio
Opinion on the Financial Statements
We have audited the accompanying statement of assets and liabilities, including the schedule of portfolio investments, of Muni Intermediate Portfolio (constituting The Glenmede Portfolios, hereafter referred to as the "Portfolio") as of October 31, 2021, the related statement of operations for the year ended October 31, 2021, the statements of changes in net assets for each of the two years in the period ended October 31, 2021, including the related notes, and the financial highlights for each of the five years in the period ended October 31, 2021 (collectively referred to as the “financial statements”). In our opinion, the financial statements present fairly, in all material respects, the financial position of the Portfolio as of October 31, 2021, the results of its operations for the year then ended, the changes in its net assets for each of the two years in the period ended October 31, 2021 and the financial highlights for each of the five years in the period ended October 31, 2021 in conformity with accounting principles generally accepted in the United States of America.
Basis for Opinion
These financial statements are the responsibility of the Portfolio’s management. Our responsibility is to express an opinion on the Portfolio’s financial statements based on our audits. We are a public accounting firm registered with the Public Company Accounting Oversight Board (United States) (PCAOB) and are required to be independent with respect to the Portfolio in accordance with the U.S. federal securities laws and the applicable rules and regulations of the Securities and Exchange Commission and the PCAOB.
We conducted our audits of these financial statements in accordance with the standards of the PCAOB. Those standards require that we plan and perform the audit to obtain reasonable assurance about whether the financial statements are free of material misstatement, whether due to error or fraud.
Our audits included performing procedures to assess the risks of material misstatement of the financial statements, whether due to error or fraud, and performing procedures that respond to those risks. Such procedures included examining, on a test basis, evidence regarding the amounts and disclosures in the financial statements. Our audits also included evaluating the accounting principles used and significant estimates made by management, as well as evaluating the overall presentation of the financial statements. Our procedures included confirmation of securities owned as of October 31, 2021 by correspondence with the custodian and brokers; when replies were not received from brokers, we performed other auditing procedures. We believe that our audits provide a reasonable basis for our opinion.
Philadelphia, Pennsylvania
December 20, 2021
We have served as the auditor of one or more investment companies in the Glenmede family of funds since 1988.
THE GLENMEDE FUND, INC.
THE GLENMEDE PORTFOLIOS
Tax Information (Unaudited)
For the fiscal year ended October 31, 2021
Of the ordinary distributions made during the fiscal year ended October 31, 2021, the following percentages have been derived from investments in U.S. Government and Agency Obligations. All or a portion of the distributions from this income may be exempt from taxation at the state level. Consult your tax advisor for state specific information.
Core Fixed Income Portfolio
| 71.39% |
Of the ordinary distributions made during the fiscal year ended October 31, 2021, the following percentages qualify for the dividends received deduction available to corporate shareholders:
Quantitative U.S. Large Cap Core Equity Portfolio
| 100 % |
Quantitative U.S. Large Cap Growth Equity Portfolio
| 100 % |
Quantitative U.S. Large Cap Value Equity Portfolio
| 100 % |
Quantitative U.S. Small Cap Equity Portfolio
| 100 % |
Responsible ESG U.S. Equity Portfolio
| 100 % |
Women in Leadership U.S. Equity Portfolio
| 100 % |
Quantitative U.S. Total Market Equity Portfolio
| 100 % |
Strategic Equity Portfolio
| 100 % |
Small Cap Equity Portfolio
| 100 % |
Equity Income Portfolio
| 100 % |
The above figures may differ from those cited elsewhere in this report due to differences in the calculation of income and gains for Securities and Exchange Commission (book) purposes and Internal Revenue Service (tax) purposes.
Foreign Taxes Paid or Withheld
| Portfolio | | Total |
Quantitative International Equity Portfolio
| | $160,305 |
The foreign taxes paid or withheld per share represent taxes incurred by the Fund on interest and dividends received by the Fund from foreign sources. Foreign taxes paid or withheld should be included in taxable income with an offsetting deduction from gross income or as a credit for taxes paid to foreign governments. Consult your tax advisor regarding the appropriate treatment of foreign taxes paid.
The Fund paid long-term capital gain distributions of:
Quantitative U.S. Large Cap Core Equity Portfolio
| $115,445,676 |
Quantitative U.S. Large Cap Growth Equity Portfolio
| $384,253,311 |
Quantitative U.S. Small Cap Equity Portfolio
| $ 133 |
Responsible ESG U.S. Equity Portfolio
| $ 136,344 |
Women in Leadership U.S. Equity Portfolio
| $ 519,410 |
Quantitative U.S. Total Market Equity Portfolio
| $ 4,259,050 |
Strategic Equity Portfolio
| $ 14,725,484 |
Small Cap Equity Portfolio
| $ 834,084 |
Secured Options Portfolio
| $ 6,213,707 |
Global Secured Options Portfolio
| $ 225,651 |
Core Fixed Income Portfolio
| $ 5,081,697 |
High Yield Municipal Portfolio
| $ 22,353 |
Muni Intermediate Portfolio
| $2,543,519 |
The above figures may differ from those cited elsewhere in this report due to differences between reporting requirements for Securities and Exchange Commission (book) purposes and Internal Revenue Service (tax) purposes.
Qualified dividend income (“QDI”) received through October 31, 2021, that qualified for a reduced tax rate pursuant to the Code Section 1 (h)(11) are as follows:
Quantitative U.S. Large Cap Core Equity Portfolio
| $11,013,057 |
Quantitative U.S. Large Cap Growth Equity Portfolio
| $ 4,362,589 |
Quantitative U.S. Large Cap Value Equity Portfolio
| $ 32,775 |
Quantitative U.S. Small Cap Equity Portfolio
| $ 7,532 |
Quantitative International Equity Portfolio
| $ 1,099,884 |
Responsible ESG U.S. Equity Portfolio
| $ 218,408 |
Women in Leadership U.S. Equity Portfolio
| $275,552 |
THE GLENMEDE FUND, INC.
THE GLENMEDE PORTFOLIOS
Tax Information (Unaudited) — (Concluded)
For the fiscal year ended October 31, 2021
Quantitative U.S. Total Market Equity Portfolio
| $45,803 |
Strategic Equity Portfolio
| $ 1,036,605 |
Small Cap Equity Portfolio
| $ 2,196,950 |
Equity Income Portfolio
| $333,966 |
Qualified interest income (“QII”) received through October 31, 2021, that qualified for a reduced tax rate pursuant to the Code Section 871 (k) are as follows:
Secured Options Portfolio
| 22.68 % |
Global Secured Options Portfolio
| 43.52 % |
Core Fixed Income Portfolio
| 16.19 % |
Of the dividends paid by the Short Term Tax Aware Fixed Income Portfolio, High Yield Municipal Portfolio and Muni Intermediate Portfolio from net investment income for the fiscal year ended October 31, 2021, 81.89%, 98.80% and 100.00%, respectively, is tax-exempt for regular Federal income taxes.
The Glenmede Fund, Inc.
The Glenmede Portfolios
Board Members and Officers Table (Unaudited)
The information pertaining to the Board of Directors of The Glenmede Fund, Inc. and the Board of Trustees of The Glenmede Portfolios (collectively, the “Funds”) and their respective officers is set forth below. The Statement of Additional Information includes additional information about the Funds’ Directors/Trustees and is available without charge, upon request, by calling 1-800-442-8299. Each Director/Trustee holds office until the earliest of (i) the next meeting of shareholders, if any, called for the purpose of considering the election or re-election of such Director/Trustee and until the election and qualification of his/her successor, if any, elected at such meeting, or (ii) the date he or she dies, resigns or retires, or is removed by the applicable Board or shareholders. Each officer is elected by the applicable Board and holds office for the term of one year and until his or her successor is duly elected and qualified, or until he or she dies, resigns, is removed, or becomes disqualified. The address of each Board member is c/o State Street Bank and Trust Company, One Lincoln Street, Floor 8, SFC 0805, Boston, MA 02111, Attention: Fund Administration Legal Department.
Independent Directors/Trustees(1)
| Name and Age | | Positions Held
with the
Funds/Time
Served | | Principal
Occupations(s)
During Past 5 Years | | Number of
Portfolios in Fund
Complex Overseen
by Director/Trustee | | Other
Directorships
Held by
Director/
Trustee |
H. Franklin Allen, Ph.D.
Age: 65 | | Director of Glenmede Fund (since March 1991) and Trustee of Glenmede Portfolios (since May 1992) | | Vice Dean Research and Faculty of the Imperial College Business School (since 2019); Professor of Finance and Economics and Executive Director of the Brevan Howard Centre for Financial Analysis at the Imperial College London (since 2014); Professor Emeritus of Finance, The Wharton School of The University of Pennsylvania since June 2016; Professor of Finance and Economics (1990-1994); Vice Dean and Director of Wharton Doctoral Programs (1990-1993). Employed by The University of Pennsylvania (from 1980-2016). | | 18 | | None |
William L. Cobb, Jr.
Age: 74 | | Director of Glenmede Fund, Trustee of Glenmede Portfolios (since February 2007) and Chairman of the Funds (since December 2021) | | Former Executive Vice President and Former Chief Investment Officer, The Church Pension Fund (defined benefit plan for retired clergy of the Episcopal Church) (1999-2014); Chair and Member, Investment Committee, The Minister and Missionaries Benefit Board of the American Baptist Church (until 2013); Chair and Member, Investment Committee, The Minister and Missionaries Benefit Board of the American Baptist Church (until 2013); Vice Chairman, J.P. Morgan Investment Management (1994-1999). | | 18 | | Director, TCW
Direct Lending LLC |
Gail E. Keppler
Age: 75 | | Director of Glenmede Fund and Trustee of Glenmede Portfolios (since February 2007) | | Former Co-CEO/COO TVG, Inc. (pharmaceutical marketing consulting) (1992-2002); Former Board Member, Laurel House; Former Division President and Board Member, Burke Marketing Services, Inc.; Former Board member Cape May County Habitat for Humanity. | | 18 | | None |
The Glenmede Fund, Inc.
The Glenmede Portfolios
Board Members and Officers Table (Unaudited) — (Continued)
| Name and Age | | Positions Held
with the
Funds/Time
Served | | Principal
Occupations(s)
During Past 5 Years | | Number of
Portfolios in Fund
Complex Overseen
by Director/Trustee | | Other
Directorships
Held by
Director/
Trustee |
Harry Wong
Age: 73 | | Director of Glenmede Fund and Trustee of Glenmede Portfolios (since February 2007) | | Former Managing Director, Knight Capital Americas, L.P., an operating subsidiary of Knight Capital Group Inc. (investment banking) (2009-2011); Managing Director, Long Point Advisors, LLC (business consulting) (2003-2012); Managing Director, BIO-IB LLC (healthcare investment banking) (2004-2009); Senior Managing Director, ABN AMRO (investment banking) (1990-2002); Adjunct Faculty Member, Sacred Heart University (2003-2007). | | 18 | | None |
| (1)Independent Directors/Trustees are those Directors/Trustees who are not “interested persons” of the Funds as defined in the 1940 Act. |
The Glenmede Fund, Inc.
The Glenmede Portfolios
Board Members and Officers Table (Unaudited) — (Continued)
| Interested Directors/Trustees(2) |
| Name and Age | | Positions Held
with the
Funds/Time
Served | | Principal
Occupation(s)
During Past 5 Years | | Number of
Portfolios in Fund
Complex Overseen
by Director/Trustee | | Other
Directorships
Held by
Director/
Trustee |
Susan W. Catherwood(2)
Age: 78 | | Director of Glenmede Fund and Trustee of Glenmede Portfolios (since February 2007) | | Director (since 1988) and Member of the Investment Review/Relationship Oversight Committee (since 2001), Compensation Committee (since 1993) and Nominating Committee (Since 2018), Glenmede Trust; Director, The Glenmede Corporation (since 1988); Board Member, The Pew Charitable Trusts; Charter Trustee, The University of Pennsylvania; Chairman Emeritus, The University Museum of The University of Pennsylvania; Chairman of the Board of Managers, The Christopher Ludwick Foundation; Board Member, Monell Chemical Senses Center; Director: Thomas Skelton Harrison Foundation and The Catherwood Foundation; Fellow and serves on Finance and Investment Committees, and former Board member, College of Physicians of Philadelphia; Former Member and Chair, The Women’s Committee and Penn Museum Board of Overseers of the University of Pennsylvania;Former Board Chair, University of Pennsylvanita Health System (1991 - 1999). | | 18 | | None |
Mary Ann B. Wirts(2)
Age: 70 | | Director of Glenmede Fund (since June 2020) and Trustee of Glenmede Portfolios (since June 2020) | | Managing Director and Chief Administrative Officer of Glenmede Trust (until 2020); Managing Director and Chief Administrative Officer of Glenmede Investment Management LP (2006-2020); First Vice President and Managing Director of Fixed Income of Glenmede Advisers (2000-2006). | | 18 | | None |
| (2)Interested Directors/Trustees are those Directors/Trustees who are “interested persons” of the Funds as defined in the 1940 Act. Susan W. Catherwood and Mary Ann B. Wirts are considered to be “interested” Director/Trustees of the Funds because of their current or prior affiliations with Glenmede Trust, the parent company of the Funds’ investment advisor, GIM, and/or their stock ownership in The Glenmede Corporation, of which GIM is an affiliate. |
The Glenmede Fund, Inc.
The Glenmede Portfolios
Board Members and Officers Table (Unaudited) — (Concluded)
| Officers |
| Name, Address and Age | | Positions Held with
the Funds/Time Served | | Principal Occupation(s)
During Past 5 Years |
Kent E. Weaver
1650 Market Street,
Suite 1200
Philadelphia, PA 19103
Age: 54 | | President of the Funds since November 2019. | | President of Glenmede Investment Management LP (since 2021); Director of Client Service of Glenmede Investment Management LP (July 2015-2021); Former Director of Client Service and Sales, Chief Compliance Officer of Philadelphia International Advisors, LP (2002-June 2015). |
Kimberly C. Osborne
1650 Market Street,
Suite 1200
Philadelphia, PA 19103
Age: 55 | | Executive Vice President of the Funds since December 1997; Assistant Treasurer of the Funds since December 2020. | | Client Service Manager of Glenmede Investment Management LP (since 2006). Vice President of Glenmede Trust and Glenmede Advisers until 2008. Employed by Glenmede Trust 1993-2008 and Glenmede Advisers 2000-2008. |
Christopher E. McGuire
1650 Market Street,
Suite 1200
Philadelphia, PA 19103
Age: 48 | | Treasurer of the Funds since December 2019. | | Director of Administration of Glenmede Investment Management LP (since October 2019); Managing Director, State Street Bank and Trust Company (from 2007 - October 2019). |
Michael P. Malloy
One Logan Square,
Suite 2000
Philadelphia, PA 19103-
6996
Age: 62 | | Secretary of the Funds since January 1995. | | Partner in the law firm of Faegre Drinker Biddle & Reath LLP. |
Eimile J. Moore
690 Taylor Road,
Suite 210
Columbus, OH 43230
Age: 52 | | Chief Compliance Officer of the Funds since December 2017. | | Managing Director, Foreside Financial Group, LLC (since 2011); Vice President/Business Manager, JP Morgan Distribution Services, Inc. (2006-2011). |
Bernard Brick
1 Lincoln Street,
Floor 8
Boston, MA 02111
Age: 47 | | Assistant Secretary of the Funds since December 2013. | | Vice President and Senior Counsel, State Street Bank and Trust Company (2011-present). |
The Glenmede Fund, Inc.
The Glenmede Portfolios
(Unaudited)
Proxy Voting
A description of the policies and procedures that the Funds’ investment advisor and sub-advisor use to vote proxies relating to the Funds’ portfolio securities is available, without charge, upon request, by calling 1-800-442-8299, and on the Securities and Exchange Commission’s (the “SEC”) website at http://www.sec.gov.
Information regarding how the Funds voted proxies relating to portfolio securities during the most recent 12-month period ended June 30 is available, without charge, upon request, by calling 1-800-442-8299, and on the SEC’s website at http://www.sec.gov.
Quarterly Portfolio Holdings
The Funds file their complete schedule of portfolio holdings of each Portfolio with the SEC for the first and third quarter of each fiscal year as an attachment to Form N-PORT. The Funds’ Forms N-PORT are available on the SEC’s website at http://www.sec.gov. You may also visit the Funds’ website at www.glenmedeim.com or call 1-800-442-8299 for this and other information about the Funds.
Boards of Directors’/Trustees’ Consideration of Investment Advisory and Sub-Advisory Agreements
At a meeting held on September 9, 2021, the Board of Directors of The Glenmede Fund, Inc. and the Board of Trustees of The Glenmede Portfolios (collectively, the “Boards”) renewed the Investment Advisory Agreements and Sub-Advisory Agreement for each Portfolio of the Funds. Pursuant to relief granted by the U.S. Securities and Exchange Commission (the “SEC”) in light of the COVID-19 pandemic (the “Order”) and a determination by the Boards that reliance on the Order was appropriate due to circumstances related to the current or potential effects of COVID-19, the meeting was held by video- and telephone-conference.
In determining whether to renew the Investment Advisory Agreements and Sub-Advisory Agreement (collectively, the “Agreements”), the Boards, including all of the Directors/Trustees who are not interested persons under the Investment Company Act of 1940, as amended (the “Independent Directors/Trustees”), reviewed and considered, among other items: (1) a memorandum from independent counsel setting forth the Boards’ fiduciary duties, responsibilities and the factors the Boards should consider in their evaluation of the Agreements; (2) reports prepared by an independent rating and ranking organization and charts prepared by the Glenmede Investment Management, LP (the “Advisor”) and Capital International, Inc. (“Capital”), the sub-advisor to the High Yield Municipal Portfolio, comparing the performance of each Portfolio it advises or sub-advises, as applicable, to the performance of its applicable benchmark index and relevant peer group; (3) a Broadridge Financial Solutions, Inc. (“Broadridge”) report comparing each Portfolio’s advisory fees, if any, and expenses to those of its relevant peer group; and (4) reports and presentations by representatives of the Advisor and Capital, as applicable, that described: (i) the nature, extent and quality of the Advisor’s services provided to its Portfolios; (ii) the nature, extent and quality of Capital’s sub-advisory services provided to the High Yield Municipal Portfolio; (iii) the experience and qualifications of the personnel providing those services; (iv) their organizational structures, financial information, insurance coverage and Forms ADV; (v) their investment philosophies and processes; (vi) their assets under management and client descriptions; (vii) the Advisor’s soft dollar commission policy, including information on the types of research and services obtained in connection with soft dollar commissions and the Advisor’s and Capital’s trade allocation policies; (viii) the current advisory fee arrangements with those Portfolios that charge advisory fees; (ix) the contractual fee and expense waivers in effect for the Quantitative U.S. Long/Short Equity Portfolio, Quantitative International Equity Portfolio, Quantitative U.S. Large Cap Value Equity Portfolio, Quantitative U.S. Small Cap Equity Portfolio, Equity Income Portfolio, Global Secured Options Portfolio, High Yield Municipal Portfolio, Women in Leadership U.S. Equity Portfolio, Responsible ESG U.S. Equity Portfolio, Short Term Tax Aware Fixed Income Portfolio and Quantitative U.S. Total Market Equity Portfolio; (x) the advisory fee arrangements with the Advisor’s other similarly managed clients, if any, and Capital’s affiliate’s similarly managed fund; (xi) their compliance processes and conflicts of interest assessments; (xii) the Advisor’s profitability analyses related to providing services to the Portfolios; (xiii) Capital’s assessment that its profitability in managing the High Yield Municipal Portfolio is not relevant because the sub-advisory fee is only a component of the overall advisory fee paid by the High Yield Municipal Portfolio to the Advisor; and (xiv) the extent to which economies of scale are relevant to the Portfolios. The Directors/Trustees considered the written materials, the Advisor’s and Capital’s presentations, the Funds’ Chief Compliance Officer’s quarterly and annual reports, and deliberated on the Agreements in light of this information together with information provided to the Directors/Trustees in advance of each regular quarterly meeting over the course of the year. In their deliberations, the Directors/Trustees did not identify any single piece of information that was all-important or controlling.
The nature, extent and quality of the services provided to the Portfolios under the Agreements. The Directors/Trustees considered the nature, extent and quality of the services provided by the Advisor and Capital, as applicable, to the Portfolios and the resources dedicated to the Funds by the Advisor and Capital. The Directors/Trustees also considered the background and experience of the Advisor’s senior management personnel and the qualifications, background and responsibilities of the portfolio managers who are primarily responsible for the day-to-day portfolio management services for the Portfolios. The Directors/Trustees also considered the allocation of responsibilities among the Advisor and Capital. The Directors/Trustees also took into account the Advisor’s and Capital’s investment experience. The Directors/Trustees also considered that it receives information from the Funds’ Chief Compliance Officer regarding
The Glenmede Fund, Inc.
The Glenmede Portfolios
(Unaudited) — (Continued)
the Advisor’s and Capital’s compliance policies and procedures. The Directors/Trustees also took into account their knowledge of management and the quality of the performance of management’s duties through Board meetings, discussion and reports during the preceding year. After reviewing these and related factors, the Boards, including all of the Independent Directors/Trustees, reached the following conclusions, among others, regarding the Advisor and Capital and their respective Agreements: the Advisor and Capital each has the capabilities, resources and personnel necessary to manage their respective Portfolio(s) and the Advisor has the capabilities, resources and personnel necessary to oversee Capital as the sub-advisor to the High Yield Municipal Portfolio; the Boards are satisfied with the quality of services provided by the Advisor in advising its Portfolios and Capital in sub-advising the High Yield Municipal Portfolio.
The costs of the services provided and/or profits realized by the Advisor and Capital from their relationships with the Portfolios. The Directors/Trustees considered the fees charged to each Portfolio that pays an advisory fee as well as the expense levels of each Portfolio. This information included comparisons of each Portfolio’s advisory fee and expenses to those of its peer groups and information about the advisory fees charged by the Advisor and Capital’s affiliate to other accounts with a similar strategy, if any. In evaluating the Portfolios’ advisory fees, the Directors/Trustees considered the demands, complexity and quality of the investment management of the Portfolios. In considering the fees charged by the Advisor and Capital’s affiliate to any comparable accounts, the Directors/Trustees also considered, among other things, management’s discussion of the different investment restrictions or policies that may be involved in managing accounts of different types and mutual funds generally involve more compliance and regulatory filings and generally require additional services to manage shareholder purchases and redemptions than separate accounts.
The Directors/Trustees also noted that the sub-advisory fee, for the High Yield Municipal Portfolio would not be paid by the Portfolio, but would be paid by the Advisor out of its advisory fee. The Directors/Trustees also considered that the Advisor had renewed the existing expense limitation agreements with the Quantitative U.S. Long/Short Equity Portfolio, Quantitative International Equity Portfolio, Quantitative U.S. Large Cap Value Equity Portfolio, Quantitative U.S. Small Cap Equity Portfolio, Equity Income Portfolio, Global Secured Options Portfolio, High Yield Municipal Portfolio, Women in Leadership U.S. Equity Portfolio, Responsible ESG U.S. Equity Portfolio, Short Term Tax Aware Fixed Income Portfolio and Quantitative U.S. Total Market Equity Portfolio, pursuant to which the Advisor agreed to waive a portion of its advisory fee and/or reimburse certain expenses as a means of limiting each such Portfolio’s total annual operating expenses for a period of time.
The Directors/Trustees examined the profitability of the Advisor on a Portfolio-by-Portfolio basis and concluded that the profit to the Advisor for advisory services to the Portfolios seemed reasonable. The Boards also noted that The Glenmede Trust Company N.A. receives fees for shareholder servicing fees for certain classes of the Portfolios. The Glenmede Fund Board concluded that Capital’s profitability for providing services to the High Yield Municipal Portfolio was not a material factor in determining whether to renew the Sub-Advisory Agreement for the High Yield Municipal Portfolio; and the benefits derived by the Advisor from managing the Portfolios, including how the Advisor uses soft dollars and selects brokers, and the ways in which it conducts portfolio transactions, seem reasonable. The Glenmede Fund Board concluded that consideration of Capital’s use of soft dollars was not relevant because based on the information provided, Capital does not use soft dollars in sub-advising the High Yield Municipal Portfolio.
After reviewing these and related factors, including taking into account management’s discussion regarding the Portfolios’ expenses, the Boards concluded that the advisory fees and the sub-advisory fee, were reasonable, and that the costs of these services generally and the related profitability of the Advisor from its relationships with the Portfolios were reasonable and supported the continuation of the Agreements. The Boards considered the annual operating expenses paid by each Portfolio and the operating expenses being paid by other comparable mutual funds. The Boards concluded that based on the Broadridge reports and those Portfolios that have contractual fee waiver and expense reimbursement agreements with the Advisor, the annual portfolio operating expenses were reasonable. The Glenmede Fund Board also concluded that the advisory fees charged by the Advisor are based on services that are in addition to, rather than duplicative of, the services provided under the advisory contracts of exchange traded funds in which the Portfolios may invest.
Investment performance of the Portfolios. The Directors/Trustees received and reviewed with management, information about the performance of the Portfolios over various time periods, including information that compared the performance of the Portfolios to the performance of peer groups and each Portfolio’s performance benchmark. The Boards also took into account the portfolio managers’ discussion of each Portfolio’s performance, including, where applicable, the reasons for a Portfolio’s over-or-under performance as compared to its benchmark index and/or peer group. The Boards concluded that based on the information provided, the performance of the Portfolios are generally mixed as compared with their applicable benchmark indices and other mutual funds in their peer groups in light of all factors considered.
Economies of Scale. The Directors/Trustees considered the existence of any economies of scale in the provision of services by the Advisor and Capital and whether those economies would be shared with the Portfolios through expense waivers or limitations. The Directors/Trustees noted that since the fees payable to the Advisor do not have breakpoints, there would be no economies of scale for those fees as the Portfolios’ assets increase. With respect to its evaluation of the High Yield Municipal Portfolio’s sub-advisory fee, economies of scale were not considered relevant because the sub-advisory fee is paid by the Advisor, not the High Yield Municipal Portfolio nor its shareholders, and
The Glenmede Fund, Inc.
The Glenmede Portfolios
(Unaudited) — (Concluded)
therefore has no impact on the High Yield Municipal Portfolio’s expense ratio. After reviewing these and related factors, the Boards concluded that the advisory fees, and sub-advisory fee were reasonable and supported the continuation of the Agreements.
Based on their evaluation of all factors that they deemed to be material, including those factors described above, and assisted by the advice of independent counsel, the Boards, including the Independent Directors/Trustees, concluded that renewal of each of the Investment Advisory Agreements and the Sub-Advisory Agreement would be reasonable and fair to the respective Portfolios and their shareholders, and approved the Agreements for an additional one-year period. Pursuant to the SEC Order, the Boards determined that the Directors/Trustees, including the Independent Directors/Trustees, voting separately, would ratify their approval at the next in-person Board meeting.
STATEMENT REGARDING LIQUIDITY RISK MANAGEMENT PROGRAM
Each of the Portfolios has adopted the Funds’ Liquidity Risk Management Program (the “Program”) pursuant to Rule 22e-4 under the Investment Company Act of 1940 Act, as amended (the “Liquidity Rule”). The Program seeks to assess, manage and review each Portfolio’s Liquidity Risk. “Liquidity Risk” is defined as the risk that a Portfolio could not meet requests to redeem shares issued by the Portfolio without significant dilution of remaining investors’ interests in the Portfolio. Each Fund’s Board has appointed Glenmede Investment Management L.P. to be the program administrator for the Program (the “Program Administrator”). Among other things, the Liquidity Rule requires that the Program Administrator provide a written report to the Boards of Directors/Trustees (the “Boards”) on an annual basis that addresses the operation of the Program and assesses the adequacy and effectiveness of its implementation, including the operation of the Highly Liquidity Investment Minimum (“HLIM”) established for each Portfolio, if any, and any material changes to the Program (the “Report”). At the June 3, 2021 Board meetings, the Program Administrator presented the annual Report concerning the operation of the Program for the period from May 1, 2020 through April 30, 2021 (the “Program Reporting Period”). The Report summarized the operation of the Program and the information and factors considered by the Program Administrator in assessing whether the Program had been adequately and effectively implemented with respect to each Portfolio. There were no material changes to the Program during the Program Reporting Period and none of the Portfolios were required to set a HLIM. The Report concluded that the Program is appropriately designed, implemented and is effectively operating to assess and manage each Portfolio’s liquidity risk within the compliance parameters of the Liquidity Rule during the Program Reporting Period.
The Glenmede Fund, Inc. and The Glenmede Portfolios
Investment Advisor
Glenmede Investment Management LP
One Liberty Place
1650 Market Street, Suite 1200
Philadelphia, Pennsylvania 19103
Administrator
State Street Bank and Trust Company
One Lincoln Street
Boston, Massachusetts 02111
Custodian
State Street Bank and Trust Company
One Lincoln Street
Boston, Massachusetts 02111
Legal Counsel
Faegre Drinker Biddle & Reath LLP
One Logan Square
Suite 2000
Philadelphia, Pennsylvania 19103-6996
Distributor
Quasar Distributors, LLC
111 E Kilbourn Ave, Suite 2200
Milwaukee, Wisconsin 53202
Independent Auditors
PricewaterhouseCoopers LLP
2 Commerce Square, Suite #1800
2001 Market Street
Philadelphia, Pennsylvania 19103
Investment Sub-Advisor
(for High Yield Municipal Portfolio)
Capital International, Inc.
11100 Santa Monica Boulevard
Los Angeles, California 90025
The report is submitted for the general information of the shareholders of The Glenmede Fund, Inc. and The Glenmede Portfolios. It is not authorized for distribution to prospective investors unless accompanied or preceded by an effective prospectus for the Funds, which contain information concerning the Fund’s investment policies and expenses as well as other pertinent information.
(b) Not applicable.
Item 2. Code of Ethics.
As of October 31, 2021, the Registrant has adopted a code of ethics that applies to the Registrant’s President and Treasurer (Principal Executive Officer and Principal Financial Officer). For the year ended October 31, 2021, there were no amendments to a provision of its code of ethics, nor were there any waivers, including implicit waivers granted from a provision of the code of ethics. A copy of the Registrant’s code of ethics is filed with the Form N-CSR under Item 13(a)(1).
Item 3. Audit Committee Financial Expert.
The Registrant’s Board of Directors has determined that the Registrant has at least one audit committee financial expert serving on its audit committee. The audit committee financial expert serving on the Registrant’s audit committee is Harry Wong, who is “independent” as defined in Item 3(a)(2) of this Form.
Item 4. Principal Accountant Fees and Services.
| | (a) | Audit Fees – The aggregate fees billed for each of the last two fiscal years for professional services rendered by the principal accountant for the audit of the Registrant’s annual financial statements or services that are normally provided by the accountant in connection with statutory and regulatory filings or engagements for those fiscal years were $500,906 and $484,488 for the fiscal years ended October 31, 2020 and October 31, 2021, respectively. |
| | (b) | Audit-Related Fees – There were no fees billed for the fiscal years ended October 31, 2020 and October 31, 2021 for assurance and related services by the principal accountant that are reasonably related to the performance of the audit of the Registrant’s financial statements and are not reported under (a) of this Item. |
| | (c) | Tax Fees – The aggregate fees billed in each of the last two fiscal years for professional services rendered by the principal accountant for the review of the Registrant’s tax returns, other tax-related filings, excise tax calculations and final income distributions for liquidating funds were $101,200 and $97,900 for the fiscal years ended October 31, 2020 and October 31, 2021, respectively. |
| | (d) | All Other Fees – There were no other fees billed for the fiscal years ended October 31, 2020 and October 31, 2021 for products and services provided by the principal accountant, other than the services reported in (a) through (c) of this Item. |
| | (e) | (1) The Registrant’s audit committee pre-approves all audit and non-audit services to be performed by the Registrant’s accountant before the accountant is engaged by the Registrant to perform such services. |
(2) There were no services described in (b) through (d) above (including services required to be approved by the audit committee pursuant to paragraph (c)(7)(ii) of Rule 2-01 of Regulation S-X) that were approved by the audit committee pursuant to paragraph (c)(7)(i)(C) of Rule 2-01 of Regulation S-X.
| | (f) | None of the hours expended on the principal accountant’s engagement to audit the Registrant’s financial statements for the fiscal year ended October 31, 2021 were attributable to work performed by persons other than the principal accountant’s full-time, permanent employees. |
| | (g) | The aggregate non-audit fees and services billed by the Registrant’s accountant for each of the last two fiscal years were $101,200 and $97,900 for the fiscal years ended October 31, 2020 and October 31, 2021, respectively, as described above. |
(i) Not applicable.
(j) Not applicable.
Item 5. Audit Committee of Listed Registrants.
Not applicable.
Item 6. Investments.
(a) Schedules of Investments in securities of unaffiliated issuers as of the close of the reporting period are included as part of the report to shareholders filed under Item 1 of this form.
(b) Not applicable.
Item 7. Disclosure of Proxy Voting Policies and Procedures for Closed-End Management Investment Companies.
Not applicable.
Item 8. Portfolio Managers of Closed-End Investment Management Companies.
Not applicable.
Item 9. Purchases of Equity Securities by Closed-End Management Investment Company and Affiliated Purchasers.
Not applicable.
Item 10. Submission of Matters to a Vote of Security Holders.
There have been no material changes to the procedures by which the shareholders may recommend nominees to the Registrant’s Board of Directors.
Item 11. Controls and Procedures.
(a) The Registrant’s Principal Executive Officer and Principal Financial Officer have concluded that the Registrant’s disclosure controls and procedures (as defined in Rule 30a-3(c) under the Investment Company Act of 1940, as amended (the “1940 Act”) (17 CFR 270.30a-3(c))), are effective based on the evaluation of the Registrant’s disclosure controls and procedures as of a date within 90 days prior to the filing date of this report.
(b) There were no changes in the Registrant’s internal control over financial reporting (as defined in Rule 30a-3(d) under the 1940 Act (17 CFR 270.30a-3(d))), that occurred during the period covered by this report that have materially affected, or are reasonably likely to materially affect, the Registrant’s internal control over financial reporting.
Item 12. Disclosure of Securities Lending Activities for Closed-End Management Investment Companies.
(a) Not applicable.
(b) Not applicable.
Item 13. Exhibits.
(a)(1) Code of Ethics for the Registrant’s President and Treasurer (Principal Executive Officer and Principal Financial Officer) described in Item 2 is attached hereto.
(a)(2) Certifications of the Principal Executive Officer and Principal Financial Officer of the Registrant, as required by Rule 30a-2(a) under the 1940 Act (17 CFR 270.30a-2(a)), are attached hereto as Exhibit 99.CERT.
(a)(3) Not applicable.
(a)(4) Not applicable.
(b) Certifications pursuant to Section 906 of the Sarbanes-Oxley Act of 2002 as required by Rule 30a-2(b) under the 1940 Act (17 CFR 270.30a-2(b)), Rule 15d-14(b) under the Securities Exchange Act of 1934, as amended (17 CFR 240.15d-14(b)) and Section 1350 of Chapter 63 of Title 18 of the United States Code (18 U.S.C. 1350), are attached hereto as Exhibit 99.906CERT.
SIGNATURES
Pursuant to the requirements of the Securities Exchange Act of 1934 and the Investment Company Act of 1940, the Registrant has duly caused this report to be signed on its behalf by the undersigned, thereunto duly authorized.
| | |
| (Registrant) | | THE GLENMEDE FUND, INC. |
| |
| By (Signature and Title) | | /s/ Kent E. Weaver |
| | Kent E. Weaver President (Principal Executive Officer) |
| |
| Date | | January 5, 2022 |
Pursuant to the requirements of the Securities Exchange Act of 1934 and the Investment Company Act of 1940, this report has been signed below by the following persons on behalf of the Registrant and in the capacities and on the dates indicated.
| | |
| By (Signature and Title) | | /s/ Kent E. Weaver |
| | Kent E. Weaver President (Principal Executive Officer) |
| |
| Date | | January 5, 2022 |
| |
| | /s/ Christopher E. McGuire |
| | Christopher E. McGuire Treasurer (Principal Financial Officer) |
| |
| Date | | January 5, 2022 |