Exhibit 99.4

First Quarterly Report
Economic Forecast and
Fiscal Plan Update
2010/11 — 2012/13
&
Three Months
April — June 2010

British Columbia Cataloguing in Publication Data
British Columbia. Ministry of Finance.
Quarterly report on the economy, fiscal situation and Crown
corporations. — ongoing—
Quarterly.
Title on cover: Quarterly report.
Continues: British Columbia. Ministry of Finance.
Quarterly financial report. ISSN 0833-1375.
ISSN 1192-2176 — Quarterly Report on the economy, fiscal
situation and Crown corporations.
1. Finance, Public — British Columbia — Accounting
— Periodicals. 2. British Columbia — Economic conditions —
1945— — Periodicals.*
3. Corporations, Government — British Columbia —
Accounting — Periodicals. I. Title.
HJ13.B77 354.711’007231’05
TABLE OF CONTENTS | | |
| | |
2010/11 First Quarterly Report | | September 14, 2010 |
Summary | 3 |
| |
Part One — Updated Fiscal Plan | |
| |
Introduction | 5 |
Revenue | 7 |
Change from Budget 2010 | 7 |
Annual trends in current forecast | 7 |
| |
Expense | 13 |
Consolidated Revenue Fund spending | 13 |
Contingencies | 14 |
Operating transfers to service delivery agencies | 14 |
Spending recovered from third parties | 14 |
Service delivery agency spending | 15 |
Government employment (FTEs) | 15 |
| |
Provincial capital spending | 16 |
| |
Provincial debt | 17 |
| |
Risks to the Fiscal Plan | 18 |
| |
Tables: | |
1.1 | Fiscal Plan Update | 5 |
1.2 | Three-Year Fiscal Plan Update — Changes from Budget 2010 | 6 |
1.3 | Revenue by Source | 8 |
1.4 | Expense by Ministry, Program and Agency | 9 |
1.5 | Personal Income Tax Revenue | 10 |
1.6 | Corporate Income Tax Revenue | 10 |
1.7 | Sales Taxes Revenue | 11 |
1.8 | Energy, Metals and Minerals — Price and Revenue Assumptions | 12 |
1.9 | Federal Government Contributions | 13 |
1.10 | Notional Allocations to Contingencies | 14 |
1.11 | Spending Recovered From Third Parties — Changes from Budget 2010 | 15 |
1.12 | Capital Spending — Changes from Budget 2010 | 16 |
1.13 | Debt Summary — Changes from Budget 2010 | 17 |
| | |
Part Two — Economic Review and Outlook | |
| |
Summary | 19 |
| |
British Columbia Economic Activity and Outlook | 20 |
The Labour Market | 20 |
Consumer Spending and Housing | 21 |
Business and Government | 23 |
External Trade and Commodity Markets | 23 |
Demographics | 25 |
Inflation | 25 |
First Quarterly Report 2010/11
Table of Contents
Risks to the Economic Outlook | 25 |
External outlook | 26 |
United States | 26 |
Canada | 28 |
Financial markets | 30 |
Exchange Rate | 32 |
| |
Tables: | |
2.1 | British Columbia Economic Indicators | 20 |
2.2 | US real GDP forecast: Consensus vs Ministry of Finance | 28 |
2.3 | Canadian real GDP forecast: Consensus vs Ministry of Finance | 30 |
2.4 | Private Sector Canadian Three Month Treasury Bill Interest Rate Forecasts | 31 |
2.5 | Private Sector Canadian 10-year Government Bond Interest Rate Forecasts | 31 |
2.6 | Private Sector Exchange Rate Forecasts | 32 |
2.7.1 | Gross Domestic Product: British Columbia | 33 |
2.7.2 | Components of Nominal Income and Expenditure | 34 |
2.7.3 | Labour Market Indicators | 34 |
2.7.4 | Major Economic Assumptions | 35 |
| | |
Part Three — First Quarterly Report | |
| |
Tables: | |
3.1 | 2010/11 Operating Statement | 37 |
3.2 | 2010/11 Revenue by Source | 38 |
3.3 | 2010/11 Expense by Ministry, Program and Agency | 39 |
3.4 | 2010/11 Expense by Function | 40 |
3.5 | 2010/11 Capital Spending | 41 |
3.6 | 2010/11 Provincial Debt | 42 |
3.7 | 2010/11 Statement of Financial Position | 43 |
| | |
Appendix | |
| |
Tables: | |
A1 | Operating Statement — 2006/07 to 2012/13 | 45 |
A2 | Revenue by Source — 2006/07 to 2012/13 | 46 |
A3 | Expense by Function — 2006/07 to 2012/13 | 47 |
A4 | Service Delivery Agency Operating Results — 2006/07 to 2012/13 | 48 |
A5 | Material Assumptions — Revenue | 50 |
A6 | Natural Gas Price Forecasts — 2010/11 to 2012/13 | 55 |
A7 | Material Assumptions — Expense | 56 |
A8 | Full -Time Equivalents (FTEs) — 2006/07 to 2012/13 | 58 |
A9 | Capital Spending — 2006/07 to 2012/13 | 59 |
A10 | Capital Expenditure Projects Greater Than $50 million | 60 |
A11 | Statement of Financial Position — 2006/07 to 2012/13 | 62 |
A12 | Provincial Debt Summary — 2006/07 to 2012/13 | 64 |
A13 | Key Provincial Debt Indicators — 2006/07 to 2012/13 | 65 |
First Quarterly Report 2010/11
2
SUMMARY | | |
| | |
2010/11 First Quarterly Report | | September 14, 2010 |
Updated Five Year Fiscal Plan
($ millions) | | 2009/10 | | 2010/11 | | 2011/12 | | 2012/13 | | 2013/14 | |
Budget 2010 Five Year Fiscal Plan | | (2,775 | ) | (1,715 | ) | (945 | ) | (145 | ) | 410 | |
Revenue changes | | 471 | | 812 | | 773 | | 571 | | 798 | |
Expense changes | | 400 | | (477 | ) | 12 | | 144 | | 32 | |
Forecast allowance changes | | 125 | | — | | — | | — | | — | |
Impact of allocating available revenue | | — | | — | | (650 | ) | (700 | ) | (750 | ) |
Updated Five Year Fiscal Plan | | (1,779 | ) | (1,380 | ) | (810 | ) | (130 | ) | 490 | |
| | | | | | | | | | | |
Taxpayer-supported capital spending and debt: | | | | | | | | | | | |
Capital spending | | 3,754 | | 5,603 | | 3,612 | | 2,957 | | 3,187 | |
Debt | | 30,021 | | 33,669 | | 37,267 | | 38,729 | | 40,040 | |
Debt to GDP ratio | | 15.9 | % | 17.0 | % | 18.1 | % | 17.9 | % | 17.6 | % |
| | | | | | | | | | | |
Economic growth: | | | | | | | | | | | |
Real GDP | | -2.3 | % | 3.1 | % | 2.2 | % | 2.8 | % | 2.8 | % |
Fiscal position improves
· The province’s outlook over the remaining four years of the plan to balance the budget by 2013/14 has improved by $2.7 billion since Budget 2010. The improvement is primarily due to higher than expected corporate income tax revenue.
Fiscal plan improves by $2.7 billion
($ millions)
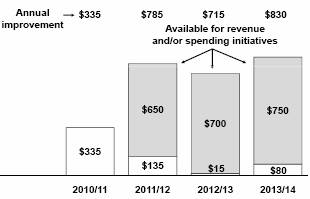
· Government has decided to make available a significant portion of this improvement for allocation to revenue and/or spending initiatives in 2011/12, 2012/13 and 2013/14.
· While the fiscal plan update reports revenue improvements in all years, the additional revenue in 2010/11 will be reserved by government to cover spending pressures and reduce the projected deficit by $335 million.
· In addition to setting aside available revenue, government has been able to reduce the projected deficits in 2011/12 and 2012/13 by $135 million and $15 million, respectively, and increase the projected surplus in 2013/14 by $80 million.
· Annual revenue growth is expected to average 4.8 per cent over the three-year fiscal plan reflecting average annual nominal GDP growth of 4.7 per cent; recovery in the natural resource sector mainly due to rising commodity prices; and updated projections provided by Crown corporations and agencies.
· Spending changes primarily result from additional forest firefighting costs in 2010/11 and adjustments to projected spending funded by third party recoveries in all three years. As well, the fiscal plan has benefited from lower than expected debt servicing costs.
· Government expects to maintain its five-year plan profile and has retained the forecast allowance at Budget 2010 levels to ensure a balanced budget is achieved by 2013/14.
· Overall, taxpayer-supported capital spending is virtually unchanged since Budget 2010; however, the updated forecast reflects approval for full day kindergarten and revised costs for the Children’s and Women’s Hospital project.
· Taxpayer-supported debt levels are down by $79 million in 2010/11 compared to Budget 2010, but higher by $547 million in 2011/12, $400 million in 2012/13 and $422 million in 2013/14. The increases are due to the impact of a higher than expected taxpayer-supported debt balance at the end of 2009/10, partially offset by higher cash flows from tax revenue.
First Quarterly Report 2010/11
3
Summary
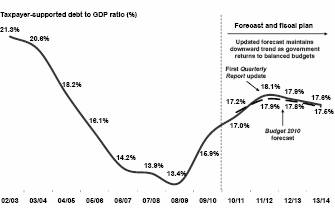
· The increases in taxpayer-supported debt levels impact the associated debt to GDP ratios; however the changes are minimal (see chart). The debt balances and ratios include the impact of fully allocating the available revenue in 2011/12, 2012/14, and 2013/14.
Debt remains affordable
· Despite the improved fiscal outlook, there are a number of risks and pressures to the fiscal plan, including the impact of changes in economic growth, the potential for abrupt changes in energy and commodity prices, and higher than expected demand for government services. Therefore, government has kept the forecast allowances in the updated five-year plan at the same levels as in Budget 2010.
Economic forecast remains prudent
· The Ministry of Finance forecasts BC’s real GDP to grow by 3.1 per cent in 2010 and by 2.2 per cent in 2011, following the contraction of 2.3 per cent in 2009.
· BC’s economy is expected to grow by 2.8 per cent per year in the medium-term, closer to historical levels. This is mainly due to the anticipated recovery of US demand (particularly in the US housing market),
Ministry forecast prudent relative to private sector

Source: BC Ministry of Finance and various private sector financial institutions
growth in domestic demand and a steady rise in commodity prices.
· The projected real GDP growth for 2010 is an improvement over the forecast in Budget 2010, reflecting better than expected performance in some economic indicators through the first half of the year.
· The Ministry’s forecast is more prudent than an average of six private sector forecasts by 0.5 percentage points in 2010 and 0.8 percentage points in 2011 in recognition of the significant downside risks to the forecast due to the potential for greater economic weakness in the US than assumed.
· Specific areas of risk include:
· a possible “double-dip” return to recession in the US;
· the sovereign debt crisis in some European countries threatening the stability of global financial markets;
· slower than anticipated global demand resulting in weaker demand for BC’s exports;
· greater than anticipated moderation in the Canadian housing market;
· further appreciation of the Canadian dollar; and
· sudden weakening of the US dollar resulting in significant disruptions to global financial and commodity markets.
Budget Consultation
· Government will be addressing new and existing priorities as it enters into the budget development process. A committee of the Legislative Assembly will be seeking public input as part of this process, and will be holding public meetings in selected communities throughout BC beginning in late September through to October.
· The available revenues outlined in the updated five year fiscal plan table provide choices for British Columbians. These include additional tax reductions, spending on social programs and debt reduction. However, commitments to these areas must be affordable today as well as being sustainable in the years ahead. The legislative committee will issue a report on its findings to the Legislature no later than November 15, 2010.
First Quarterly Report 2010/11
4
PART ONE — UPDATED FISCAL PLAN | | |
| | |
2010/11 First Quarterly Report | | September 14, 2010 |
Table 1.1 Fiscal Plan Update
| | | | 2010/11 | | | | | |
| | 2009/10 | | | | Updated | | Updated Plan | |
($ millions) | | Actual | | Budget | | Forecast | | 2011/12 | | 2012/13 | |
Revenue | | 37,521 | | 39,190 | | 39,965 | | 41,596 | | 43,236 | |
Expense | | (39,300 | ) | (40,605 | ) | (41,045 | ) | (41,456 | ) | (42,266 | ) |
Surplus (deficit) before forecast allowance | | (1,779 | ) | (1,415 | ) | (1,080 | ) | 140 | | 970 | |
Forecast allowance | | — | | (300 | ) | (300 | ) | (300 | ) | (400 | ) |
Fiscal plan before allocation of available revenue | | (1,779 | ) | (1,715 | ) | (1,380 | ) | (160 | ) | 570 | |
Impact of allocating available revenue | | — | | — | | — | | (650 | ) | (700 | ) |
Surplus/(Deficit) | | (1,779 | ) | (1,715 | ) | (1,380 | ) | (810 | ) | (130 | ) |
Capital spending: | | | | | | | | | | | |
Taxpayer-supported capital spending | | 3,754 | | 5,414 | | 5,603 | | 3,612 | | 2,957 | |
Provincial Debt: | | | | | | | | | | | |
Taxpayer-supported debt | | 30,021 | | 33,748 | | 33,669 | | 37,267 | | 38,729 | |
Taxpayer-supported debt-to-GDP ratio | | 15.9 | % | 17.2 | % | 17.0 | % | 18.1 | % | 17.9 | % |
Introduction
The province’s fiscal outlook has improved by $1.8 billion over the three-year fiscal plan period (2010/11 to 2012/13) since Budget 2010. Government has decided to make available a significant portion of this improvement for allocation to revenue or spending initiatives in 2011/12 and 2012/13. Over the coming months, the allocation of available revenue will be determined by government in conjunction with the budget consultation process, culminating in Budget 2011.
While the fiscal plan update reports revenue improvements in all three years, the additional revenue in 2010/11 will be reserved by government to cover spending pressures and reduce the projected deficit by $335 million. As well, in addition to setting aside available revenue in 2011/12 and 2012/13, government has been able to reduce the projected deficits in those years by $135 million and $15 million, respectively.
Compared to the Budget 2010 fiscal plan:
· Total revenues are up $2.2 billion over the three-year fiscal plan period, mainly due to higher corporate income tax revenue.
· Total government spending is $321 million higher over the fiscal plan period, mainly due to forest firefighting costs incurred in 2010/11 and additional spending related to federally funded programs.
· At $12.2 billion over the three years, taxpayer-supported capital spending is $76 million higher than in the Budget 2010 plan, reflecting spending approval for full day kindergarten and revised costs for the Children’s and Women’s Hospital project.
First Quarterly Report 2010/11
5
Updated Fiscal Plan
Table 1.2 Three-Year Fiscal Plan Update — Changes from Budget 2010
($ millions) | | 2010/11 | | 2011/12 | | 2012/13 | |
Budget 2010 Fiscal Plan (March 2, 2010) | | (1,715 | ) | (945 | ) | (145 | ) |
Revenue changes: | | | | | | | |
Personal income tax — mainly weak 2009 tax assessments | | (120 | ) | (71 | ) | (76 | ) |
Corporate income tax — mainly strong 2009 tax assessments | | 674 | | 523 | | 733 | |
Harmonized sales tax — updated base and economic forecast | | 35 | | 25 | | 17 | |
Property transfer tax — lower housing starts | | — | | (65 | ) | (103 | ) |
Other tax sources — mainly tobacco and fuel | | 91 | | 36 | | 45 | |
Forests — mainly improved volumes, offset by lower stumpage rates and border tax collections | | (29 | ) | 13 | | 38 | |
Natural gas royalties — reduced price outlook | | (166 | ) | (208 | ) | (174 | ) |
Crown land tenures — reflects one-year extension to deferral of cash receipts | | (58 | ) | (38 | ) | (63 | ) |
Coal, metals and minerals — mainly improved coal prices | | 92 | | 176 | | 217 | |
Other energy and natural resources — mainly lower electricity prices (Mid Columbia), offset by improved water rentals | | (43 | ) | (25 | ) | 1 | |
Fees, licenses, investment earnings and miscellaneous sources | | 170 | | 363 | | (98 | ) |
Health and social transfers — offset to tax improvement and assumes no change from current methodology of transfer allocation | | (38 | ) | 76 | | 87 | |
Disaster Financial Assistance, Labour Market Development and Strategic Training | | 152 | | 4 | | — | |
Other federal government transfers — mainly improved SUCH sector forecast | | 69 | | 64 | | 41 | |
Commercial Crown agencies operating results: | | | | | | | |
Liquor Distribution Branch — mainly consumer shift to purchasing lower priced products | | (11 | ) | (28 | ) | (37 | ) |
BC Lotteries — mainly impact of lower consumer discretionary spending | | (35 | ) | (71 | ) | (77 | ) |
ICBC — mainly lower claims costs, partially offset by lower investment income | | 36 | | (7 | ) | — | |
Other commercial Crown agencies changes | | (7 | ) | 6 | | 20 | |
Total revenue changes(1) | | 812 | | 773 | | 571 | |
Less : expense increases (decreases): | | | | | | | |
Consolidated Revenue Fund changes: | | | | | | | |
Firefighting costs | | 220 | | — | | — | |
Transfer of BC Rail shares to BC Transportation Financing Authority | | 110 | | — | | — | |
Management of public debt (net) — mainly lower interest rates | | (2 | ) | (39 | ) | (42 | ) |
Spending funded by third party recoveries (see Table 1.11) | | 192 | | 27 | | (108 | ) |
Increase in transfers to service delivery agencies | | (128 | ) | (50 | ) | (62 | ) |
Changes in spending profile of service delivery agencies: | | | | | | | |
School districts | | — | | 6 | | 8 | |
Post secondary institutions — spending related to federal research grants | | 98 | | 96 | | 100 | |
Health authorities and hospital societies — lower staffing and operating cost projections, offset in 2010/11 by an increase in physician services | | 23 | | (41 | ) | (41 | ) |
Other service delivery agencies | | (36 | ) | (11 | ) | 1 | |
Total expense increases (decreases)(1) | | 477 | | (12 | ) | (144 | ) |
Updated Fiscal Plan before allocation of available revenue | | (1,380 | ) | (160 | ) | 570 | |
Impact of allocating available revenue | | — | | (650 | ) | (700 | ) |
Updated Fiscal Plan | | (1,380 | ) | (810 | ) | (130 | ) |
(1) Revenue and expense changes are shown net of the impact of a correction to the accounting treatment of third party recoveries related to the Evergreen Line in the amounts of $37 million in 2010/11, $134 million in 2011/12 and $135 million in 2012/13. In Budget 2010 these recoveries were allocated to revenue and expense, whereas the appropriate accounting treatment is to capitalize these amounts.
· Taxpayer-supported debt is projected to decrease by $79 million in 2010/11 compared to the Budget 2010 projections, but increase by $547 million in 2011/12 and $400 million in 2012/13. The increases are due to the impact of a higher than expected taxpayer-supported debt balance at the end of 2009/10, partially offset by higher cash flows from tax revenue.
First Quarterly Report 2010/11
6
Updated Fiscal Plan
· The increases in taxpayer-supported debt balances impact the associated debt to GDP ratios; however the changes are minimal, with the 2010/11 ratio reduced by 0.2 per cent to 17.0 per cent, the 2011/12 ratio increased by 0.2 per cent to 18.1 per cent, and the 2012/13 ratio increased by 0.1 per cent to 17.9 per cent. The debt balances and ratios include the impact of fully allocating the available revenue in 2011/12 and 2012/13.
Despite the improved fiscal outlook, there are a number of risks and pressures to the fiscal plan, including the impact of slower than expected economic growth in our trading partners, continuing instability in financial markets, the potential for abrupt changes in energy or commodity prices, and higher than assumed demand for government services. Therefore, government has kept the forecast allowances in the updated fiscal plan at the same levels as in Budget 2010.
The main changes to the fiscal plan are discussed in Part 1, with detailed tables and assumptions in the Appendix. Economic changes are outlined in Part 2 while financial results for the April to June quarter can be found in Part 3.
Revenue
Change from Budget 2010
The improvement in government revenue projections compared to Budget 2010 reflects:
· strong preliminary 2009 corporate income tax assessments;
· higher federal government contributions including disaster financial assistance related to the 2009 firefighting costs and recoveries for strategic training and labour market development program spending in 2010/11; and
· an improved outlook for coal prices.
These improvements are partially offset by lower revenue from:
· personal income tax mainly due to weak 2009 assessment results;
· property transfer tax due to a reduced forecast for BC housing starts;
· natural gas royalties and Columbia River Treaty electricity sales due to lower energy prices; and
· lower net income from the Liquor Distribution Branch and BC Lottery Corporation due to a shift in consumer spending.
The revised revenue forecast for 2011/12 also includes the anticipated property sale of Little Mountain with proceeds to be reinvested into the creation of more than one thousand new supportive housing units.
Annual trends in current forecast
Annual revenue growth is expected to average 4.8 per cent over the three-year fiscal plan reflecting average annual nominal GDP growth of 4.7 per cent; recovery in the natural resource sector mainly due to rising commodity prices; and updated projections provided by Crown corporations and agencies.
First Quarterly Report 2010/11
7
Updated Fiscal Plan
Table 1.3 Revenue by Source
| | | | 2010/11 | | Updated | | Updated | |
| | Actual | | | | Updated | | Plan | | Plan | |
($ millions) | | 2009/10 | | Budget | | Forecast | | 2011/12 | | 2012/13 | |
Taxation revenue | | | | | | | | | | | |
Personal income | | 5,529 | | 5,861 | | 5,741 | | 6,053 | | 6,469 | |
Corporate income | | 1,317 | | 847 | | 1,521 | | 1,625 | | 2,076 | |
Harmonized sales | | — | | 3,784 | | 3,819 | | 5,401 | | 5,745 | |
Other sales (1) | | 4,765 | | 1,399 | | 1,399 | | 201 | | 173 | |
Fuel | | 884 | | 877 | | 890 | | 897 | | 907 | |
Carbon | | 542 | | 727 | | 730 | | 933 | | 1,141 | |
Tobacco | | 682 | | 686 | | 747 | | 686 | | 686 | |
Property | | 1,884 | | 1,906 | | 1,916 | | 1,917 | | 2,007 | |
Property transfer | | 887 | | 900 | | 900 | | 980 | | 1,027 | |
Other (2) | | 612 | | 435 | | 439 | | 413 | | 424 | |
| | 17,102 | | 17,422 | | 18,102 | | 19,106 | | 20,655 | |
Natural resource revenue | | | | | | | | | | | |
Natural gas royalties | | 406 | | 698 | | 532 | | 794 | | 1,075 | |
Forests | | 387 | | 491 | | 462 | | 610 | | 641 | |
Other resource (3) | | 1,853 | | 2,019 | | 2,010 | | 2,197 | | 2,257 | |
| | 2,646 | | 3,208 | | 3,004 | | 3,601 | | 3,973 | |
Other revenue | | | | | | | | | | | |
Medical Services Plan premiums | | 1,666 | | 1,741 | | 1,755 | | 1,900 | | 2,035 | |
Other fees (4) | | 2,453 | | 2,615 | | 2,686 | | 2,613 | | 2,650 | |
Investment earnings | | 963 | | 921 | | 939 | | 1,078 | | 1,213 | |
Miscellaneous (5) | | 2,754 | | 2,597 | | 2,627 | | 2,889 | | 2,601 | |
| | 7,836 | | 7,874 | | 8,007 | | 8,480 | | 8,499 | |
Contributions from the federal government | | | | | | | | | | | |
Health and social transfers | | 4,883 | | 5,165 | | 5,127 | | 5,368 | | 5,667 | |
Harmonized sales tax transition payments | | 250 | | 769 | | 769 | | 580 | | — | |
Other federal contributions (6) | | 1,784 | | 1,751 | | 1,972 | | 1,479 | | 1,440 | |
| | 6,917 | | 7,685 | | 7,868 | | 7,427 | | 7,107 | |
Commercial Crown corporation net income | | | | | | | | | | | |
BC Hydro (7) | | 447 | | 617 | | 604 | | 669 | | 655 | |
Liquor Distribution Branch | | 877 | | 974 | | 963 | | 985 | | 1,002 | |
BC Lotteries (net of payments to federal government) | | 1,070 | | 1,106 | | 1,071 | | 1,082 | | 1,118 | |
ICBC (8) | | 601 | | 303 | | 339 | | 238 | | 212 | |
Transportation Investment Corporation (Port Mann) | | (4 | ) | (19 | ) | (14 | ) | (14 | ) | (8 | ) |
Other | | 29 | | 20 | | 21 | | 22 | | 23 | |
| | 3,020 | | 3,001 | | 2,984 | | 2,982 | | 3,002 | |
Total revenue | | 37,521 | | 39,190 | | 39,965 | | 41,596 | | 43,236 | |
(1) Includes social service tax and continuation of the tax on designated property now at 12%. More details are available in Table A5.
(2) Corporation capital, insurance premium and hotel room taxes.
(3) Columbia River Treaty, other energy and minerals, water rental and other resources.
(4) Post-secondary, healthcare-related, motor vehicle, and other fees.
(5) Includes asset dispositions, reimbursements for healthcare and other services provided to external agencies, and other recoveries.
(6) Includes contributions for health, education, community development, housing and social service programs, and transportation projects.
(7) In July 2010 BC Hydro was re-amalgamated with BC Transmission Corporation. Amounts for 2010/11 have been restated to reflect this change.
(8) The amount for 2009/10 represents ICBC’s earnings during government’s fiscal year. On ICBC’s fiscal year basis (December), the actual amount for 2009 was $563 million.
First Quarterly Report 2010/11
8
Updated Fiscal Plan
Table 1.4 Expense by Ministry, Program and Agency
| | | | 2010/11 | | Updated | | Updated | |
| | Actual | | | | Updated | | Plan | | Plan | |
($ millions) | | 2009/10 (1) | | Budget (1) | | Forecast | | 2011/12 | | 2012/13 | |
Office of the Premier | | 10 | | 10 | | 10 | | 9 | | 9 | |
Aboriginal Relations and Reconciliation | | 66 | | 40 | | 40 | | 38 | | 37 | |
Advanced Education and Labour Market Development | | 2,095 | | 2,114 | | 2,114 | | 2,115 | | 2,121 | |
Agriculture and Lands | | 97 | | 82 | | 82 | | 80 | | 80 | |
Attorney General | | 540 | | 468 | | 468 | | 458 | | 458 | |
Children and Family Development | | 1,306 | | 1,334 | | 1,334 | | 1,334 | | 1,334 | |
Citizens’ Services | | 510 | | 613 | | 613 | | 598 | | 598 | |
Community and Rural Development | | 178 | | 309 | | 309 | | 220 | | 220 | |
Education | | 5,012 | | 5,165 | | 5,165 | | 5,243 | | 5,265 | |
Energy, Mines and Petroleum Resources | | 42 | | 54 | | 54 | | 50 | | 52 | |
Environment | | 163 | | 167 | | 167 | | 162 | | 162 | |
Finance | | 102 | | 71 | | 181 | | 64 | | 64 | |
Forests and Range | | 1,014 | | 641 | | 861 | | 595 | | 606 | |
Health Services | | 13,867 | | 14,760 | | 14,760 | | 15,680 | | 16,127 | |
Healthy Living and Sport | | 43 | | 51 | | 51 | | 51 | | 51 | |
Housing and Social Development | | 2,672 | | 2,730 | | 2,730 | | 2,694 | | 2,694 | |
Labour | | 16 | | 16 | | 16 | | 16 | | 16 | |
Public Safety and Solicitor General | | 596 | | 602 | | 602 | | 602 | | 603 | |
Small Business, Technology and Economic Development | | 44 | | 62 | | 62 | | 54 | | 54 | |
Tourism, Culture and the Arts | | 104 | | 115 | | 115 | | 96 | | 96 | |
Transportation and Infrastructure | | 732 | | 753 | | 753 | | 808 | | 808 | |
Total ministries and Office of the Premier | | 29,209 | | 30,157 | | 30,487 | | 30,967 | | 31,455 | |
Management of public funds and debt | | 1,141 | | 1,301 | | 1,299 | | 1,340 | | 1,390 | |
Contingencies | | 360 | | 450 | | 450 | | 450 | | 450 | |
Funding for capital expenditures | | 866 | | 1,751 | | 1,751 | | 1,162 | | 789 | |
Legislative and other appropriations | | 148 | | 123 | | 123 | | 122 | | 124 | |
Consolidated revenue fund expense | | 31,724 | | 33,782 | | 34,110 | | 34,041 | | 34,208 | |
Expenses recovered from external entities | | 2,748 | | 2,741 | | 2,896 | | 2,497 | | 2,570 | |
Funding provided to service delivery agencies | | (19,240 | ) | (20,704 | ) | (20,832 | ) | (20,555 | ) | (20,399 | ) |
Ministry and special office direct program spending | | 15,232 | | 15,819 | | 16,174 | | 15,983 | | 16,379 | |
Service delivery agency expense: | | | | | | | | | | | |
School districts | | 5,379 | | 5,440 | | 5,440 | | 5,515 | | 5,535 | |
Post-secondary institutions | | 4,628 | | 4,727 | | 4,825 | | 4,885 | | 4,945 | |
Health authorities and hospital societies | | 10,761 | | 11,141 | | 11,164 | | 11,701 | | 11,954 | |
Other service delivery agencies | | 3,300 | | 3,478 | | 3,442 | | 3,372 | | 3,453 | |
Total service delivery agency expense | | 24,068 | | 24,786 | | 24,871 | | 25,473 | | 25,887 | |
Total expense | | 39,300 | | 40,605 | | 41,045 | | 41,456 | | 42,266 | |
(1) Restated to reflect government’s current organization and/or accounting policies.
First Quarterly Report 2010/11
9
Updated Fiscal Plan
Detailed revenue projections are disclosed in Table 1.3 and Appendix Table A2, and key assumptions and sensitivities relating to revenue are provided in Appendix Table A5. Details of the major revenue sources are shown in the tables below.
· After adjusting for tax measures and prior year impacts in 2010/11, the personal income tax base revenue is forecast to average 5.4 per cent growth over the next three years consistent with personal and labour income growth assumptions.
Table 1.5 Personal Income Tax Revenue
($ millions) | | 2010/11 | | 2011/12 | | 2012/13 | |
First Quarterly Report forecast | | 5,741 | | 6,053 | | 6,469 | |
Previously announced measures: | | | | | | | |
– Basic personal amount tax credit increased to $11,000 | | 174 | | 183 | | 193 | |
– Elimination of sales tax & introduction of BC HST tax credit | | 157 | | 227 | | 227 | |
– Federal government | | 7 | | 8 | | 9 | |
– Dividend tax credits | | (32 | ) | (33 | ) | (35 | ) |
– Other measures | | 1 | | (3 | ) | (11 | ) |
Prior-year adjustment | | 52 | | — | | — | |
Base personal income tax revenue | | 6,100 | | 6,435 | | 6,852 | |
Annual growth | | 3.8 | % | 5.5 | % | 6.5 | % |
Personal income growth (calendar year) | | 2.7 | % | 3.6 | % | 4.6 | % |
Labour income growth (calendar year) | | 3.0 | % | 4.0 | % | 4.8 | % |
Elasticity (1) (calendar year basis, policy neutral) | | 1.2 | | 1.4 | | 1.4 | |
(1) Per cent growth in current year tax relative to per cent growth in personal income.
· Corporate income tax revenue is forecast to average 16.4 per cent annual growth over the three years 2010/11 to 2012/13 due to strong 2009 tax assessments; an updated federal government forecast of the national tax base; and rising prior-year settlements reflecting payment lags under the Tax Collection Agreement. The forecast continues to incorporate the impacts of the reduction in the general business tax rate to 10 per cent by January 2011and the elimination of the small business tax rate, effective April 1, 2012.
Table 1.6 Corporate Income Tax Revenue
($ millions) | | 2010/11 | | 2011/12 | | 2012/13 | |
Advance instalments from the federal government: | | | | | | | |
– Payment share | | 11.8 | % | 11.2 | % | 13.4 | % |
– Advances | | 1,476 | | 1,502 | | 1,767 | |
International Business Activity Act refunds | | (20 | ) | (20 | ) | (20 | ) |
Prior-year adjustment | | 65 | | 143 | | 329 | |
Corporate income tax revenue | | 1,521 | | 1,625 | | 2,076 | |
| | | | | | | |
Annual per cent growth | | 15.5 | % | 6.8 | % | 27.8 | % |
· Revenues from the harmonized sales tax (HST), social service tax and tax on private sales of vehicles are expected to grow in line with the updated forecasts of consumer expenditures, residential investment and overall economic growth. The two bases of consumer expenditures and residential investment are assumed to comprise about 84 per cent of the total BC portion of the HST base.
First Quarterly Report 2010/11
10
Updated Fiscal Plan
Table 1.7 Sales Taxes Revenue
($ millions) | | 2010/11 | | 2011/12 | | 2012/13 | |
Harmonized Sales Tax (BC’s portion of HST) | | | | | | | |
Gross | | 4,969 | | 6,946 | | 7,355 | |
Temporary restrictions of input tax credits | | 118 | | 162 | | 168 | |
Rebates | | (1,268 | ) | (1,707 | ) | (1,778 | ) |
BC’s portion of HST | | 3,819 | | 5,401 | | 5,745 | |
Social service tax | | 1,274 | | 30 | | — | |
Tax on private sales of vehicles | | 125 | | 171 | | 173 | |
Annual per cent change (calendar year) | | 2010 | | 2011 | | 2012 | |
Consumer expenditure | | 4.4 | % | 4.6 | % | 5.0 | % |
Residential investment | | 14.6 | % | 6.6 | % | 4.9 | % |
Retail sales | | 5.2 | % | 4.1 | % | 4.5 | % |
Nominal GDP | | 5.0 | % | 4.0 | % | 5.1 | % |
Harmonized sales tax revenue projections are net of rebates and credits on purchases of residential energy, motive fuel, and new housing; and net of rebates provided to municipalities, charities, non-profit organizations and the SUCH sectors.
Social service tax revenue is expected to be on budget at $1,274 million in 2010/11 and $30 million in 2011/12. Revenue from the tax on private sales of vehicles is also unchanged from budget.
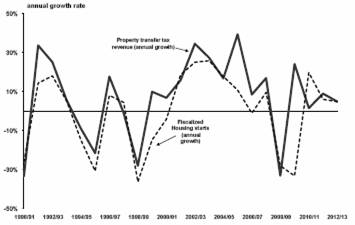
· Property transfer tax revenue is expected to average 5.0 per cent annual growth over the fiscal plan, consistent with the revised outlook for BC housing starts.
Chart 1.1 Property transfer tax
· Natural gas royalties are expected to increase each year of the fiscal plan reflecting the updated price and production volume outlook. Based on the private sector average, prices are forecast to average 17 per cent annual growth and the production volumes are based on industry’s contractual commitments with pipeline companies who have sought approval from the National Energy Board to increase pipeline capacity. See Appendix Table A6 for more details regarding the revised natural gas price forecast.
First Quarterly Report 2010/11
11
Updated Fiscal Plan
· Revenue from sales of Crown land oil and natural gas tenures is expected to increase an average of 4 per cent over the three year plan mainly due to continued strong average bid prices per hectare reflecting industry’s continuing interest in investing and developing provincial resources. Consistent with the recommendation of the Office of the Auditor General, revenue recognition has changed from eight to nine-year deferral of cash receipts.
· Metal and mineral revenues are forecast to rise an average 17.5 per cent over the fiscal plan mainly due to strong coal contract prices and continuing tight world supply in the face of rising demand for metallurgical coal.
Table 1.8 Energy, Metals and Minerals — Price and Revenue Assumptions
| | 2010/11 | | 2011/12 | | 2012/13 | |
Prices | | | | | | | |
Natural gas ($Cdn/gigajoule at plant inlet) | | 3.35 | | 4.02 | | 4.64 | |
Bid price per hectare ($) | | 1,500 | | 943 | | 1,198 | |
Coal ($US/tonne) | | 222 | | 232 | | 234 | |
Copper ($US/lb, LME) | | 2.91 | | 3.00 | | 2.75 | |
Electricity ($US/MwH, Mid-C) | | 39.59 | | 44.78 | | 48.31 | |
Petroleum ($US/barrel, Cushing Ok) | | 79.24 | | 84.33 | | 87.71 | |
Revenue ($ million) | | | | | | | |
Natural gas royalties | | 532 | | 794 | | 1,075 | |
Sales of Crown land leases | | 935 | | 969 | | 981 | |
Metals and minerals | | 389 | | 493 | | 507 | |
Other | | 282 | | 302 | | 308 | |
Total | | 2,138 | | 2,558 | | 2,871 | |
Annual per cent change | | 14.8 | % | 19.6 | % | 12.2 | % |
· Forest revenue is expected to grow 19 per cent, 32 per cent and 5 per cent in 2010/11, 2011/12 and 2012/13, respectively, as an expected recovery in lumber prices and the US housing market results in increasing Crown harvest and lumber exports. The relatively slower growth in 2012/13 reflects reduced border tax collections under the Softwood Lumber Agreement as the export tax rate is expected to fall from the current 15 per cent rate to 5 per cent by July 2012 due to rising lumber prices.
· Other revenue, comprised of revenue from fees and licences, investment earnings and other miscellaneous sources, is forecast to average 2.7 per cent annual growth, incorporating the updated real economic growth forecast for BC, a rising population trend, increasing cash balances and interest rates and updated projections provided by Crown corporations and agencies.
· Revenue from health and social transfers is expected to average 5.1 per cent annual growth reflecting national base growth, a rising BC population share and assuming no change to the current methodology of determining entitlement.
· HST transition payments of $769 million and $580 million in 2010/11 and 2011/12 are unchanged from budget and consistent with the Comprehensive Integrated Tax Coordination Agreement. Other federal contributions include funding in support of labour market development, immigration, local government grants and direct contributions to taxpayer supported Crown corporations and agencies. Table A5 provides more details of the various funding programs.
First Quarterly Report 2010/11
12
Updated Fiscal Plan
Table 1.9 Federal Government Contributions
($ millions) | | 2010/11 | | 2011/12 | | 2012/13 | |
Canada Health Transfer (CHT) | | 3,574 | | 3,777 | | 4,023 | |
Wait times | | 33 | | 33 | | 33 | |
Health deferral | | 51 | | 23 | | 23 | |
Canada Social Transfer (CST) | | 1,483 | | 1,535 | | 1,588 | |
Prior-year adjustments | | (14 | ) | — | | — | |
Total health and social transfers | | 5,127 | | 5,368 | | 5,667 | |
Harmonized sales tax transition payments | | 769 | | 580 | | — | |
Other contributions | | 1,972 | | 1,479 | | 1,440 | |
Total federal government contributions | | 7,868 | | 7,427 | | 7,107 | |
· Commercial Crown corporation net income is expected to be below budget by $17 million in 2010/11, $100 million in 2011/12 and $94 million in 2012/13. The forecast mainly reflects lower consumer discretionary spending for gaming (BCLC), and changing consumption patterns and a shift to purchasing lower priced liquor products (LDB). Lower net income in 2010/11 from these sources is partially offset by improvements in ICBC mainly due to lower claims costs.
Over the three-year plan, average annual net income growth is relatively flat as rising annual contributions from BC Hydro, LDB and BCLC are offset by reduced earnings from ICBC.
Expense
Total spending is projected to increase by $477 million in 2010/11, but decrease by $12 million in 2011/12 and $144 million in 2012/13 when compared to Budget 2010. The changes primarily result from additional forest firefighting costs in 2010/11 and adjustments to projected spending funded by third party recoveries in all three years. As well, the fiscal plan has benefited from lower than expected debt servicing costs, which partially offset the increased spending in 2010/11 and further improved the 2011/12 and 2012/13 bottom lines.
Consolidated Revenue Fund spending
The updated forecast for 2010/11 includes an increase of $220 million in spending by the Ministry of Forests and Range for forest firefighting costs. As of late August 2010, the province has experienced almost 1,600 fires that have damaged approximately 300,000 hectares.
The Ministry of Finance spending will be $110 million over budget in 2010/11 due to the transfer of BC Rail shares to the BC Transportation Financing Authority (BCTFA). This expense to the ministry is fully offset by an equity gain in BCTFA with no net impact on the fiscal plan.
Apart from these increases, ministry spending for 2010/11 through to 2012/13 is unchanged from Budget 2010.
Debt servicing costs are forecast to decrease by $2 million in 2010/11, $39 million in 2011/12 and $42 million in 2012/13, despite higher debt balances, as a result of lower interest rates and a shift in debt management strategy to take advantage of market conditions.
First Quarterly Report 2010/11
13
Updated Fiscal Plan
Contingencies
The notional allocations to the Contingencies vote are unchanged from Budget 2010, with three year funding totalling $160 million for the 2010 Sports and Arts Legacy and Climate Action and Clean Energy initiatives being managed from Contingencies as well as $10 million for cost uncertainties associated with the 2010 Olympic and Paralympic Winter Games.
Table 1.10 Notional Allocations to Contingencies
($ millions) | | 2010/11 | | 2011/12 | | 2012/13 | |
2010 Sports and Arts Legacy | | 20 | | 20 | | 20 | |
Climate Action and Clean Energy initiatives | | 20 | | 40 | | 40 | |
2010 Olympics – contingency allocation | | 10 | | — | | — | |
Subtotal notional allocations | | 50 | | 60 | | 60 | |
Reserved for unforeseen pressures | | 400 | | 390 | | 390 | |
Total contingencies | | 450 | | 450 | | 450 | |
Government continues to face a variety of pressures over the three years of the plan which ministries and agencies will work to manage within existing budgets, with additional funding provided from the Contingencies vote as necessary. These pressures include:
· Teachers Pension Plan contribution adjustments based on recent actuarial valuations;
· funding to assist employers with the adoption of the Municipal Pension Plan based on government’s commitment to protect direct services to clients;
· higher than anticipated utilization of government services; and
· First Nations treaty negotiations coming to resolution.
Operating transfers to service delivery agencies
The increase in operating transfers to service delivery agencies in 2010/11 reflects the transfer of BC Rail shares to the BC Transportation Financing Authority. As well, subsequent to Budget 2010, funding discussions between ministries and the service delivery agencies that fall within their area of responsibility resulted in increases in operating funding transfers over the fiscal plan period (2010/11 to 2012/13).
Spending recovered from third parties
Spending funded by recoveries from third parties is projected to increase by $111 million over the fiscal plan period (2010/11 to 2012/13) compared to Budget 2010. The changes reflect:
· lower recoveries for fiscal agency loan and other interest costs ($90 million), mainly in 2012/13;
· increased healthcare related cost recoveries primarily for the Pan Canadian Surveillance Project ($53 million);
· higher spending on federally funded programs for strategic training and labour market development ($96 million), mainly in 2010/11; and
· a net increase in changes to other recoveries ($52 million).
The above spending changes are offset by an equal reduction in revenue, and as a result have no net impact on the fiscal plan.
First Quarterly Report 2010/11
14
Updated Fiscal Plan
Table 1.11 Spending Recovered From Third Parties (1) — Changes from Budget 2010
($ millions) | | 2010/11 | | 2011/12 | | 2012/13 | |
Fiscal agency loan and other interest cost recoveries | | (1 | ) | 17 | | (106 | ) |
Healthcare related cost recoveries | | 37 | | 6 | | 10 | |
Federal funding for training and labour market development | | 94 | | 1 | | 1 | |
Other recoveries | | 62 | | 3 | | (13 | ) |
Total changes | | 192 | | 27 | | (108 | ) |
(1) Changes are shown net of the impact of a correction to the accounting treatment of recoveries related to the Evergreen Line in the amounts of $37 million in 2010/11, $134 million in 2011/12 and $135 million in 2012/13. In Budget 2010 these recoveries were allocated to revenue and expense, whereas the appropriate accounting treatment is to capitalize these amounts.
Service delivery agency spending
Service delivery agency spending is forecast to increase by $85 million in 2010/11, $50 million in 2011/12 and $68 million in 2012/13 compared to the projections in Budget 2010.
· School district spending is forecast to be relatively unchanged from Budget 2010 over the three-year period.
· Post secondary institution spending is projected to increase by $98 million in 2010/11, $96 million in 2011/12 and $100 million in 2012/13 primarily due to increased salary and other operating costs resulting from additional federal research funding.
· Health authority and hospital society spending is forecast to be up $23 million in 2010/11 but down $41 million in both 2011/12 and 2012/13. The 2010/11 increase is primarily due to a projected increase in the volume of physician services to be provided. The spending decreases in 2011/12 and 2012/13 reflect revised projections from health authorities for staffing and operating costs.
· Other service delivery agency spending is projected to decrease by $36 million and $11 million in 2010/11 and 2011/12, reflecting lower debt servicing costs due to lower interest rates and lower amortization expense due to changes in capital project spending and completion timelines. Spending in 2012/13 is virtually unchanged from the previous plan.
Detailed expense projections are disclosed in Table 1.4 and Appendix Table A4. Key spending assumptions and sensitivities are provided in Appendix Table A7.
Government employment (FTEs)
The projection of government employment for 2010/11 has been increased by 200 FTEs (i.e. full time equivalents) due to increased staffing requirements related to direct forest firefighting. The projections for 2011/12 and 2012/13 remain unchanged. Further details on FTEs are provided in Appendix Table A8.
First Quarterly Report 2010/11
15
Updated Fiscal Plan
Provincial capital spending
At $12.2 billion over the three years (2010/11 to 2012/13), taxpayer-supported capital spending is projected to be $76 million higher than in Budget 2010. As well, annual allocations have changed to meet revised capital project timelines.
Changes in annual taxpayer-supported spending is primarily due to carry-over of significant under spending in 2009/10, higher than expected spending on self-funded university projects and approval for full day kindergarten, partially offset by changes in project scheduling and revised costs for the Children’s and Women’s Hospital (see Table 1.12) .
Capital contingency amounts are retained as a prudent planning measure to cover risks from higher than expected costs of projects, and will also be used to fund emerging priorities.
Table 1.12 Capital Spending — Changes from Budget 2010
($ millions) | | 2010/11 | | 2011/12 | | 2012/13 | |
Budget 2010 capital spending | | 8,159 | | 6,528 | | 6,058 | |
Taxpayer-supported changes: | | | | | | | |
Education — mainly reflects timing of capital spending and addition of full day kindergarten | | 16 | | 52 | | 73 | |
Post-secondary education — mainly increased spending on self-funded projects and changes to project schedules | | 65 | | 86 | | (19 | ) |
Health — mainly due to project scheduling changes and revised costs for the Children’s and Women’s Hospital | | (23 | ) | (103 | ) | (103 | ) |
BCTFA — mainly timing of capital spending | | 100 | | 44 | | (15 | ) |
Other changes | | 31 | | 10 | | (13 | ) |
Capital contingencies — reflects allocation to government ministries and full day kindergarten projects | | — | | (86 | ) | (39 | ) |
Total taxpayer-supported | | 189 | | 3 | | (116 | ) |
Self-supported changes: | | | | | | | |
BC Hydro — mainly installation of Unit 5 and 6 generators in Mica Dam and implementation of the smart metering and smart grid programs | | (14 | ) | 84 | | 110 | |
ICBC — mainly lower costs for critical business systems | | (28 | ) | 9 | | (2 | ) |
Other | | 2 | | (9 | ) | (3 | ) |
Total self-supported | | (40 | ) | 84 | | 105 | |
Total changes | | 149 | | 87 | | (11 | ) |
Updated capital spending | | 8,308 | | 6,615 | | 6,047 | |
At $8.8 billion over the three year period, self-supported capital spending is projected to be $149 million higher than in Budget 2010. Changes in self-supported capital spending mainly reflect:
· installation of Units 5 and 6 generators in Mica Dam’s empty bays and implementation of BC Hydro’s smart metering and smart grid programs; and
· lower costs for renewal of ICBC’s insurance and claims systems.
Details on capital spending are shown in Table 3.5 and Appendix Table A9.
First Quarterly Report 2010/11
16
Updated Fiscal Plan
Provincial debt
Taxpayer-supported debt is projected to total $33.7 billion at March 31, 2011 (17.0 per cent of GDP), $37.3 billion at March 31, 2012 (18.1 per cent of GDP), and $38.7 billion at March 31, 2013 (17.9 per cent of GDP). Compared to Budget 2010, taxpayer-supported debt is expected to decrease by $79 million at March 31, 2011, increase by $547 million at March 31, 2012, and increase by $400 million at March 31, 2013. The changes reflect a higher debt balance at March 31, 2010 and the impact on allocating available revenue in 2011/12 and 2012/13 partially offset by improved cash flows from bonus bids, corporate income tax revenue and contributions from the federal government.
Self-supported debt is projected to total $13.7 billion at March 31, 2011 (a $59 million decrease from Budget 2010), $15.5 billion at March 31, 2012 (a $183 million increase from Budget 2010), and $17.4 billion at March 31, 2013 (a $311 million increase from Budget 2010). These amounts reflect the impact of increased capital spending projections for BC Hydro and lower projected borrowing requirements for the Transportation Investment Corporation.
Table 1.13 Debt Summary — Changes from Budget 2010
($ millions) | | 2010/11 | | 2011/12 | | 2012/13 | |
Budget 2010 total debt | | 47,757 | | 52,363 | | 55,862 | |
Taxpayer-supported debt changes: | | | | | | | |
Government operating: | | | | | | | |
2009/10 changes: | | | | | | | |
– impact of using available cash to reduce accounts payable | | 838 | | 838 | | 838 | |
– lower cash revenue and higher special purpose investment balances | | 339 | | 339 | | 339 | |
Impact of higher debt balance at March 31, 2010 | | 1,177 | | 1,177 | | 1,177 | |
2010/11 fiscal plan updates: | | | | | | | |
– Bonus bid proceeds | | (302 | ) | (388 | ) | (568 | ) |
– Higher cash advances mainly from the federal government | | (735 | ) | (573 | ) | (1,072 | ) |
– Other changes | | (11 | ) | (83 | ) | (11 | ) |
– Impact of allocating available revenue | | — | | 650 | | 1,350 | |
Total operating debt changes | | 129 | | 783 | | 876 | |
Education facilities — mainly impact of capital spending changes and lower opening debt at March 31, 2010 | | (58 | ) | 8 | | 88 | |
Health facilities — mainly lower capital spending projections | | (72 | ) | (164 | ) | (289 | ) |
Transportation — impact of increases to fuel tax revenue and federal contributions | | (143 | ) | (180 | ) | (221 | ) |
Social housing — change in timing of not-for-profit projects | | 91 | | 62 | | (37 | ) |
Other changes | | (26 | ) | 38 | | (17 | ) |
Total taxpayer-supported | | (79 | ) | 547 | | 400 | |
Self-supported debt changes: | | | | | | | |
BC Hydro — mainly impact of capital project timing and higher capital spending projections | | (48 | ) | 182 | | 330 | |
BC Lottery — impact of lower debt balance at March 31, 2010 | | (66 | ) | (58 | ) | (60 | ) |
Transportation Investment Corporation — lower projected borrowing requirement | | (13 | ) | (8 | ) | (26 | ) |
Post-secondary institutions’ subsidiaries — impact of higher debt balance at March 31, 2010 | | 67 | | 67 | | 67 | |
Other changes | | 1 | | — | | — | |
Total self-supported | | (59 | ) | 183 | | 311 | |
Total changes | | (138 | ) | 730 | | 711 | |
Updated total debt | | 47,619 | | 53,093 | | 56,573 | |
First Quarterly Report 2010/11
17
Updated Fiscal Plan
The debt forecast and related debt indicators reflect the impact on allocating available revenue and the updated borrowing requirements for capital spending.
Based on these assumptions, total provincial debt is projected at 24.0 per cent of GDP at the end of 2010/11, 25.8 per cent of GDP at the end of 2011/12, and 26.1 per cent at the end of 2012/13.
Details on the debt balances are disclosed in Appendix Table A12, with key provincial debt indicators shown in Appendix Table A13.
Risks to the Fiscal Plan
There are a number of risks and pressures to the fiscal plan, including slower than expected economic growth in our trading partners resulting in lower demand for BC’s exports, continuing instability in financial markets brought about by the European sovereign debt crisis and further weakening of the US dollar.
Revenues in British Columbia can also be volatile, largely due to the influence of the cyclical nature of the natural resource sector in the economy. Changes in energy or commodity prices, such as natural gas and lumber, may have a significant effect on revenue and the fiscal plan.
The spending forecast contained in the fiscal plan is based on ministry and service delivery agency spending plans and strategies. Potential changes in major assumptions and sensitivities with respect to these spending plans may impact the fiscal plan. These include:
· further increases to employer contributions to pension plans in the event an unfunded liability is determined;
· income assistance caseload decline, anticipated with a recovery in the economy, may occur at a slower than projected rate;
· natural disasters such as wildfires and floods, and other emergencies;
· higher-than-expected litigation volumes and/or size of claim amounts, and timing of settlements; and
· changes in assumed accounting policy.
As well, the fiscal plan provides no funding for wage increases in the public sector.
The fiscal plan includes contingencies of $450 million in each year of the fiscal plan period to help manage pressures and fund priority initiatives. In addition, government has included a forecast allowance of $300 million in each of 2010/11 and 2011/12, and $400 million in 2012/13 as an added measure of prudence.
A more detailed discussion of risks to the fiscal plan can be found in the Budget and Fiscal Plan 2010/11-2012/13, beginning on page 48.
First Quarterly Report 2010/11
18
PART TWO — ECONOMIC REVIEW AND OUTLOOK (1)
2010/11 First Quarterly Report | September 14, 2010 |
Summary
· The Ministry of Finance forecasts BC’s real GDP to grow by 3.1 per cent in 2010 and by 2.2 per cent in 2011, following a contraction of 2.3 per cent in 2009.
· BC’s economy is expected to grow by 2.8 per cent per year in the medium-term, closer to historical levels. This is mainly due to the anticipated recovery of US demand (particularly in the US housing market), growth in domestic demand and a steady rise in commodity prices.
Chat 2.1 Ministry forecast prudent relative to private sector

Source: BC Ministry of Finance and various private sector financial institutions
The Ministry’s outlook for BC’s real GDP growth in 2010 is 0.5 percentage points lower than the average of six private sector forecasters (a subset of the Economic Forecast Council). The Ministry’s forecast is more prudent in recognition of the significant downside risks to the 2010 forecast, due to the potential for greater economic weakness in the US than assumed.
The Ministry’s outlook for 2011 is lower than the private sector as well, with the Ministry projecting 2.2 per cent real GDP growth compared to the private sector’s 3.0 per cent. These 0.8 percentage points of prudence for expected 2011 growth are greater than the 0.5 percentage points for expected 2010 growth, since the risk of a stall in North American economic activity has shifted toward the latter half of 2010 and into 2011.
The prudence instilled relative to the private sector outlook is in recognition of the following substantial downside risks:
· a “double-dip” return to recession in the US (characterized by widespread deleveraging causing weaker investment, slower consumer spending and a delayed job market recovery);
· the sovereign debt crisis in some European countries threatening the stability of global financial markets;
· slower than anticipated global demand resulting in weaker demand for BC’s exports;
(1) Reflects information available as of August 31, 2010.
First Quarterly Report 2010/11
19
Economic Review and Outlook
· greater than anticipated moderation in the Canadian housing market;
· further appreciation of the Canadian dollar; and
· sudden weakening of the US dollar resulting in significant disruptions to global financial and commodity markets.
British Columbia Economic Activity and Outlook
Due to better than expected performance in some economic indicators through the first half of 2010, the Ministry’s forecast for BC’s real GDP growth in 2010 has increased to 3.1 per cent from the 2.2 per cent projected in Budget 2010.
Table 2.1 British Columbia Economic Indicators
| | | | | | Year-to-Date | |
| | Jan. to Mar. 2010 | | Apr. to June 2010 | | Jan. to June 2010 | |
| | change from | | change from | | change from | |
All data seasonally adjusted | | Oct. to Dec. 2009 | | Jan. to Mar. 2010 | | Jan. to June 2009 | |
| | Per cent change | |
Employment | | +0.8 | | +0.5 | | +1.7 | |
Manufacturing shipments | | +5.0 | | +1.3 | | +8.3 | |
Exports | | +7.9 | | +8.4 | | +10.5 | |
Retail sales | | +1.0 | | -0.4 | | +7.9 | |
Housing starts | | +29.7 | | -1.9 | | +111.3 | |
Non-residential building permits | | -16.7 | | +29.9 | | -16.9 | |
Indicators of economic performance through the early months of 2010 confirm that BC’s economy is gradually recovering after a period of very weak activity that occurred from late 2008 to mid-2009. Most major indicators, such as employment, retail sales and exports, have remained fairly stable or made positive gains in recent months.
The Labour Market
Employment in BC has recovered well in early 2010, following an annual loss of 54,900 jobs (or 2.4 per cent) in 2009 from the previous year. Year-to-date to July 2010, employment has risen by 1.9 per cent (or 41,900 jobs) compared to the same period last year. This rate of job growth ranks BC third among Canadian provinces, behind only Newfoundland and PEI. The provincial unemployment rate averaged 7.7 per cent through the first seven months of 2010, a small increase of 0.3 percentage points from the same period in 2009.
Of the 41,900 jobs created to date in 2010, 28,200 were full-time and 13,700 were part-time. Major year-to-date employment gains in 2010 were observed in public administration (+10.1 per cent), educational services (+6.0 per cent), and finance, insurance, real estate and leasing (+4.2 per cent). These gains helped to offset year-to-date job losses in other industries, such as information, culture and recreation (-4.9 per cent), management, administration and other support services (-3.9 per cent) and manufacturing (-2.5 per cent).
Most recently, BC saw a strong monthly gain of 16,300 jobs (or 0.7 per cent) in July 2010, by far the largest number of jobs gained among provinces. However, a large gain of 25,800 part-time jobs in July offset a loss of 9,500 full-time jobs. At the same time, the monthly unemployment rate ticked down 0.3 percentage points to 7.5 per cent from June.
First Quarterly Report 2010/11
20
Economic Review and Outlook
Chart 2.2 BC employment recovering
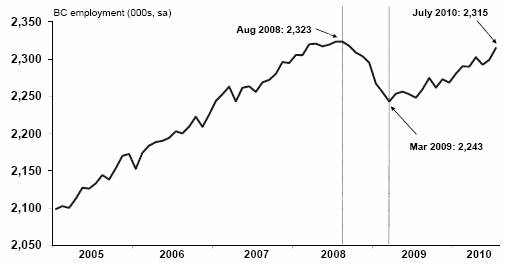
Source: Statistics Canada
Outlook
The Ministry forecasts employment in BC to increase by 1.9 per cent in 2010, or approximately 43,000 jobs. Employment growth is projected to continue in 2011, with an expected increase of 1.4 per cent, or 32,000 jobs. In the medium-term, employment is forecast to rise by about 1.8 per cent each year. BC’s labour force is expected to increase by 2.0 per cent in 2010, resulting in the annual unemployment rate holding steady at 7.6 per cent on the year. The unemployment rate is forecast to fall after 2010, reaching 7.5 per cent in 2011 and then averaging about 6.9 per cent per year over the medium-term.
Consumer Spending and Housing
Retail sales in BC have recovered well in recent months, as confidence among consumers and businesses has seen gradual improvement since mid-2009. Year-to-date to June 2010, retail sales have improved by 7.9 per cent compared to the same period in 2009, with major gains in new and used vehicle sales, in sales at health and personal care stores, and in sales at gas stations and home furnishing stores.
Chart 2.3 BC retail activity recovers from 2008 lows
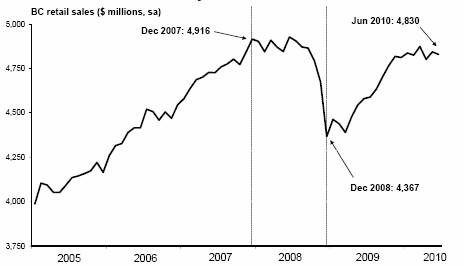
Source: Statistics Canada
First Quarterly Report 2010/11
21
Economic Review and Outlook
Housing starts in BC have also increased since plummeting during the economic downturn in late 2008 and early 2009. Year-to-date to July 2010, housing starts averaged 26,700 annualized units, an increase of 106.2 per cent from the previous year, with strong gains observed in starts of both single and multiple units. However, although housing starts in BC have improved in recent months, they remain below historical levels.
Chart 2.4 BC housing starts still struggling

Source: Canada Mortgage and Housing Corporation
Existing home sales in BC underwent a remarkable rally through 2009, with seasonally adjusted MLS home sales climbing 133.4 per cent between January and December of that year. However, the strength in home sales has faltered through the first seven months of 2010, as monthly sales fell from 8,300 units in January to 4,900 units in July (-41.4 per cent). Despite falling sales, the average home price in BC has held fairly steady in 2010, beginning the year at $495,100 in January and rising slightly to $508,600 in July. Private sector analysts expect the pace of BC’s home sales to continue to slow in 2010 as many homebuyers have already purchased houses in advance of rising interest rates and the implementation of the HST in July.
Outlook
The Ministry forecasts real consumption of goods and services to increase by 2.8 per cent in 2010, following a contraction of 1.6 per cent in 2009. Real consumer spending is projected to grow by 2.6 per cent in 2011, and then average 3.0 per cent growth annually in the medium-term.
Following last year’s sharp decline in retail sales, a gain of 5.2 per cent is forecast for 2010. Retail sales are forecast to subsequently grow by 4.1 per cent in 2011 and by about 4.6 per cent each year from 2012 to 2014.
While BC’s housing sector is expected to gradually recover from the crash it experienced in late 2008 and early 2009, housing starts are expected to remain much lower than the high levels observed during the housing boom of recent years. The Ministry forecasts housing starts to total approximately 23,600 units in 2010 — an increase of 7,500 units from the 16,100 starts observed in 2009. Starts are projected to reach 23,900 units in 2011 and to average about 26,400 units per year from 2012 to 2014.
First Quarterly Report 2010/11
22
Economic Review and Outlook
Business and Government
In the wake of the global financial crisis, real business investment in BC is estimated to have fallen by 8.0 per cent in 2009 compared to 2008, with declines in all major categories, including residential construction, non-residential construction, and machinery and equipment. Business activity has offered mixed signals so far in 2010, with bankruptcies declining 43.1 per cent year-to-date to June and incorporations growing by 21.2 per cent year-to-date to July. However, non-residential building permits in BC fell 16.9 per cent year-to-date to June 2010.
Outlook
Real business investment (including residential) is forecast to rise by 6.7 per cent in 2010, as BC businesses recover from the economic decline that occurred in 2009. Healthy investment gains in residential construction are expected this year, complemented by small increases in investments in non-residential construction and in machinery and equipment. Growth in total business investment of 4.3 per cent is anticipated in 2011, and of about 4.6 per cent annually in the medium-term.
Due to the improved economic outlook through 2010, the Ministry projects corporate pre-tax profits to rise by 19.6 per cent on the year. This follows a sizeable decline of an estimated 30.5 per cent in 2009. Growth in corporate profits is expected to be 9.3 per cent in 2011 and around 7.7 per cent per year in the medium-term. Despite the notable recovery in growth rate terms, the level of corporate profits is not expected to return to pre-recession levels until 2012.
Combined real spending by the three levels of government (federal, provincial and municipal) on goods and services is expected to increase by 2.9 per cent in 2010. Government spending is then projected to grow by 0.8 per cent in 2011 and to average 0.6 per cent per year in the medium-term.
External Trade and Commodity Markets
The value of BC’s merchandise exports has improved significantly in 2010, following a large 24.3 per cent annual drop in 2009. Year-to-date to June 2010, the value of exports has climbed by 10.5 per cent compared to the same period last year. This recovery was fuelled by increases in exports of industrial and consumer goods (+19.1 per cent), forest products (+18.4 per cent) and energy products (+10.0 per cent). Shipments of manufactured goods from BC have also increased year-to-date to June 2010, climbing 8.3 per cent relative to the first six months of 2009. Notable gains were observed in shipments of primary metals (+22.1 per cent), wood products (+21.3 per cent) and paper (+15.5 per cent).
Global commodity markets have experienced substantial volatility since mid-2008, with values of most commodities plunging in the latter months of 2008 and remaining low well into 2009. Lumber prices have recovered somewhat in 2010, with monthly Western spruce-pine-fir (SPF) 2x4 prices beginning the year at $230 US/000 board feet in January and moving above $300 US/000 board feet in April (as a supply shortage led to a temporary jump in prices early in the year). However, prices fell quickly in subsequent months, reaching as low as $205 US/000 board feet in June. Year-to-date to August 2010, lumber prices averaged $253 US/000 board feet, representing an increase of 47.2 per cent over the first eight months of 2009.
First Quarterly Report 2010/11
23
Economic Review and Outlook
Chart 2.5 Exports post nine consecutive monthly increases

Source: BC Stats
Despite some small fluctuations, the price of natural gas has remained at a relatively low level for the first seven months of 2010. Plant Inlet prices averaged $3.22 C/GJ year-to-date to July, a slight increase from the $3.13 C/GJ observed during the same period in 2009.
Oil prices recovered strongly through 2010, following a period of very low prices observed in late 2008 and early 2009. The West Texas Intermediate daily oil price averaged $78.02 US/barrel during the first seven months of 2010, representing a hefty 46.1 per cent increase from the $53.41 US/barrel recorded during the same period in 2009.
Metal and mineral prices have seen a robust recovery since the low levels observed in 2009. Year-to-date to July 2010, prices for most minerals were much higher than they were during the first seven months of 2009. Substantial price increases have occurred in copper (+67.2 per cent), molybdenum (+64.6 per cent), zinc (+55.7 per cent), aluminum (+44.7 per cent), lead (+49.0 per cent), silver (+33.9 per cent) and gold (+26.2 per cent). The price of magnesium, however, fell 9.8 per cent during this period.
Outlook
Real exports of goods and services are forecast to grow by 4.4 per cent in 2010, following an annual loss of 4.0 per cent in 2009. Positive real export growth is forecast to continue in 2011, reaching 1.8 per cent on the year. In the medium-term, average annual growth of about 3.6 per cent is anticipated for real exports.
Due to continued weakness in the US housing market, Western SPF lumber prices are projected to remain fairly low through the 2010/11 fiscal year, averaging $228 US/000 board feet on the year. As the US housing market is expected to slowly recover over the next few years, prices are forecast to average $250 US/000 board feet in fiscal year 2011/12 and $298 US for the 2012/13 to 2014/15 period.
Based on private sector forecasts, the price of natural gas price is projected to strengthen over the forecast period. Between fiscal years 2010/11 and 2014/15, the annual Plant Inlet price is expected to rise from $3.35 C/GJ to $5.80 C/GJ.
First Quarterly Report 2010/11
24
Economic Review and Outlook
Demographics
BC’s population grew 1.6 per cent in the January to March quarter of 2010 compared to the same period of 2009. During this quarter, BC saw a net inflow of 14,000 people, with 1,600 people from other provinces and 12,300 people from other countries.
Outlook
The forecast calls for BC’s population to increase by 1.6 per cent in 2010, to reach a total of 4.53 million people, and by a further 1.5 per cent in 2011, to reach 4.60 million.
Net migration is forecast to slow next year, falling from 58,400 persons in 2010 to 55,300 persons in 2011. This slowdown is due to the expectation that Alberta’s unemployment rate (forecast to be 6.4 per cent in 2011) will fall faster than BC’s (7.5 per cent in 2011), causing more workers to remain in (or move to) Alberta from other provinces and countries than will likely move to BC. This trend is expected to continue in 2012, as growth in BC’s net migration will slow further to 52,600 persons on the year. However, net migration is expected to rise in 2013 to 54,100 persons, and again in 2014, to 55,200 persons.
Inflation
Consumer price inflation in BC grew 0.9 per cent year-to-date to July 2010, as increases in the prices of non-durables and services offset price deflation in durable and semi-durable goods. Prices for durables fell despite rising automobile prices, while increasing fuel prices provided upward pressure on non-durables. At the same time, prices for food purchased in restaurants rose by 2.4 per cent. Recent CPI data from July 2010 reported prices advancing by 2.0 per cent relative to July 2009.
Outlook
Consumer price inflation in BC is forecast to be 1.7 per cent in 2010, as improved consumer spending through the year is expected to put upward pressure on some prices. CPI inflation is forecast at 1.9 per cent in 2011 and 2.1 per cent per year in the medium-term. The Canadian rate of inflation is assumed to be 1.9 per cent in 2010 and 2.2 per cent in 2011. Over the medium-term, national CPI inflation is expected to be 2.0 per cent, in line with the Bank of Canada’s inflation target.
The harmonized sales tax, which took effect on July 1, 2010, is expected to cause a slight increase in the inflation rate in the second half of 2010 and the first half of 2011.
Risks to the Economic Outlook
The Ministry’s forecast is more prudent than the private sector outlook, in recognition of the following substantial downside risks:
· a “double-dip” return to recession in the US (characterized by widespread deleveraging causing weaker investment, slower consumer spending and a delayed job market recovery);
· the sovereign debt crisis in some European countries threatening the stability of global financial markets;
· slower than anticipated global demand resulting in weaker demand for BC’s exports;
First Quarterly Report 2010/11
25
Economic Review and Outlook
· greater than anticipated moderation in he Canadian housing market;
· further appreciation of he Canadian dollar; and
· sudden weakening of he US dollar resulting in significant disruptions to global financial and commodity markets.
External outlook
United States
Following four consecutive quarter-over-quarter declines ending in mid-2009, US real GDP has seen four consecutive quarters of growth going into the latter half of 2010. This return to growth was driven mainly by improvements in consumption and investment (that were buoyed by unprecedented amounts of fiscal and monetary stimulus) offsetting declines in net exports, as well as a strong boost from inventories. However, the pace of US real GDP growth has softened through the first two quarters of 2010, and expanded at just a 1.6 per cent annualized rate in the April to June quarter.
Chart 2.6 Slowing pace of US real GDP growth

Source: US Bureau of Economic Analysis
Private sector analysts anticipate a slow recovery for the US economy over the coming quarters, as the boost from government stimulus fades, employment growth remains anemic, and consumers and businesses remain tentative about the recovery.
The risk of a stalled US recovery in late 2010 or early 2011 is now rising for several reasons. Normally, after four quarters of a traditional postwar economic recovery, US real GDP grows at an annual rate of about 6.0 per cent. As noted above, in the April to June quarter of 2010 — four quarters into the current recovery — the US economy is expanding at an annual rate of only 1.6 per cent, which is significantly lower than the historical average.
The US employment situation also remains very bleak, with 7.7 million jobs lost since the December 2007 peak (a decline of 5.6 per cent for the period). The unemployment rate sits at a relatively high 9.5 per cent as of July 2010, but would be even higher if
First Quarterly Report 2010/11
26
Economic Review and Outlook
thousands of discouraged workers were not exiting the labour force after months of searching in vain for employment. As of July 2010, there were 1.2 million discouraged workers in the US, up by 389,000 from July 2009.
The troubled American housing market has also continued to be a source of weakness for the US economy, as housing starts averaged just 600,100 units year-to-date to July 2010. Although this represents an 11.0 per cent increase over the first seven months of 2009, housing starts remain at extremely low levels. Existing home sales are also suffering in the US, as monthly sales declined to 3.8 million annualized units in July 2010. This drop of 27.2 per cent from June brought existing home sales to an unprecedented low in the data’s nearly ten-year history. Private sector analysts expect sales to remain weak for the duration of 2010, as the US employment situation remains troubled and credit conditions remain tight.
Chart 2.7 US existing home sales plummet in July
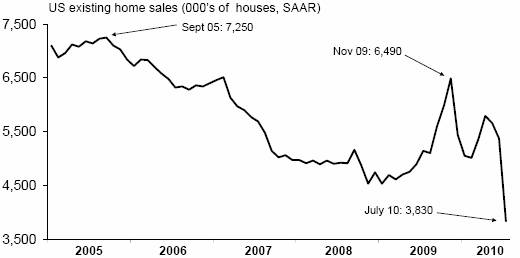
Source: U.S. National Association of Realtors
Confidence among US consumers and businesses continues to wane as they remain tentative about the sustainability of this recovery. The University of Michigan consumer sentiment index registered a 68.9 in August 2010, the second lowest score since November 2009. Consumer confidence traditionally averages about 73.8 per cent during recessions, and about 90.9 per cent during recoveries.
Business confidence is also struggling, with the National Federation of Independent Business small business optimism sentiment at 88.1 in July – a five-month low. Business optimism on this index generally averages about 91.9 during recessions, and about 100.2 during economic expansions.
Forecasts for US economic growth in 2010 have been downgraded in recent months, after averaging greater than 3.0 per cent for most of this year. The August 2010 Consensus Economics survey forecasts US real GDP to grow by 2.9 per cent in 2010, after reaching as high as 3.3 per cent in June. The recent downgrades in the US outlook are due to growing concerns over slowing real GDP growth, the dire employment situation and the struggling housing market. The August 2010 Consensus expects US economic growth to hold fairly steady in 2011, projecting an annual increase of 2.8 per cent in that year.
First Quarterly Report 2010/11
27
Economic Review and Outlook
Chart 2.8 US consensus outlook for 2010 downgraded in recent months

Source: Consensus Economics
The chart above represents forecasts for real GDP growth in 2010 as polled on specific dates. For example, forecasters surveyed on August 10, 2009 had an average 2010 US growth forecast of 2.3 per cent, while on August 9, 2010 they forecast 2010 US growth at 2.9 per cent.
The Ministry acknowledges the significant likelihood of much slower US economic growth in 2010 and 2011, characterized by weak investment, lower consumer spending and a delayed job market recovery. In order to reflect these ongoing risks, the Ministry’s growth assumptions are lower than the August 2010 Consensus, with the Ministry assuming that the US economy will expand by 2.6 per cent in 2010. The Ministry then expects 2.0 per cent US real GDP growth in 2011 and 2.6 per cent annual growth over the medium-term.
Table 2.2 US real GDP forecast: Consensus vs Ministry of Finance
| | 2010 | | 2011 | |
| | Per cent change in real GDP | |
Ministry of Finance | | 2.6 | | 2.0 | |
Consensus Economics (August 2010) | | 2.9 | | 2.8 | |
Canada
Canada’s economy has also been expanding since the July to September quarter of 2009. After gaining momentum for three successive quarters (including a very strong 5.8 per cent increase in the January to March quarter), Canadian real GDP advanced by just 2.0 per cent (annualized) in the April to June quarter of 2010. This slowdown in the most recent quarter was caused by a cooler pace in consumer expenditures and a large decline in net exports. Private sector analysts note that high debt burdens and expectations of higher interest rates are prompting Canadian consumers to pay down debt and increase their savings. These analysts also point out that the sizeable decline in Canada’s net exports is consistent with the slow pace of US economic growth (1.6 per cent) during the April to June quarter.
Canada’s domestic economy has seen recent signs of stabilization in several major indicators. Retail sales have improved by 6.1 per cent year-to-date to June 2010 compared to the same period last year. Further, housing starts have averaged 197,100
First Quarterly Report 2010/11
28
Economic Review and Outlook
year-to-date to July 2010, an increase of 50.2 per cent compared to the same period in 2009. Home sales have also improved over last year, gaining 11.3 per cent year-to-date to July 2010.
Although housing starts and home sales have increased over last year, both indicators have posted significant month-over-month declines in recent months. Private sector analysts expect the Canadian housing market to cool even further in the latter half of 2010, as many homebuyers effectively pulled forward their purchases to the early part of this year in advance of rising mortgage rates and new sales taxes in BC and Ontario.
The Canadian labour market has shown steady improvement over last year, following an annual loss of 276,900 jobs (or 1.6 per cent) in 2009 compared to 2008. Year-to-date to July 2010, employment in Canada has grown by 213,300 jobs (or 1.3 per cent) compared to the first seven months of last year. The national unemployment rate averaged 8.1 per cent during this period, with the most recent monthly rate residing at 8.0 per cent in July 2010. However, most private sector forecasters anticipate slower growth in Canada’s job market through the final five months of 2010, as the housing market cools and government stimulus begins to moderate.
Through 2009, Canada’s trade sector was weakened by an appreciating Canadian dollar and eroding demand from the US and other world economies. The value of Canadian merchandise exports fell by 26.5 per cent in 2009 compared to 2008, but has recovered somewhat during the first six months of 2010. Year-to-date to June 2010, merchandise exports increased by 11.2 per cent relative to the same period in 2009, driven by strong gains in exports of autos, energy and industrial goods. Shipments of manufactured goods also recovered in 2010, as the total value of these shipments climbed by 10.6 per cent year-to-date to June. Despite recent positive trends in Canada’s trade sector, the high value of the Canadian dollar, if sustained, will continue to provide downward pressure on trade with the US going forward.
Chart 2.9 Consensus sees healthy growth for Canada in 2010

Source: Consensus Economics
The chart above represents forecasts for real GDP growth in 2010 as polled on specific dates. For example, forecasters surveyed on August 10, 2009 had an average 2010 Canadian real GDP growth forecast of 2.2 per cent, while on August 9, 2010 they forecast 2010 Canadian real GDP to grow by 3.4 per cent.
First Quarterly Report 2010/11
29
Economic Review and Outlook
Private sector forecasters continue to see the Canadian economy expanding at a healthy pace in 2010 and 2011, with the August 2010 Consensus projecting Canada’s real GDP to grow by 3.4 per cent this year. Acknowledging the potential for further weakness in the US and global economies (and their possible negative effects on Canada), the Ministry assumes that the Canadian economy will experience a 3.0 per cent expansion in 2010. The Ministry expects Canadian growth to cool somewhat in 2011, with the economy expanding by 2.3 per cent next year, compared to the 2.7 per cent projected in the August Consensus. For the medium-term, the Ministry assumes 2.6 per cent growth per year.
Table 2.3 Canadian real GDP forecast: Consensus vs Ministry of Finance
| | 2010 | | 2011 | |
| | Per cent change in real GDP | |
Ministry of Finance | | 3.0 | | 2.3 | |
Consensus Economics (August 2010) | | 3.4 | | 2.7 | |
Financial markets
Interest rates
After holding the overnight target rate at 0.25 per cent for over a year, the Bank of Canada raised the rate to 0.50 per cent in June 2010, and again to 0.75 per cent in July. Although the Bank is withdrawing monetary stimulus, it revealed at its most recent meeting on July 20, 2010 that it now expects the global as well as domestic recoveries to gain traction at a slower pace than earlier anticipated.
Chart 2.10 Private sector expects rising interest rates
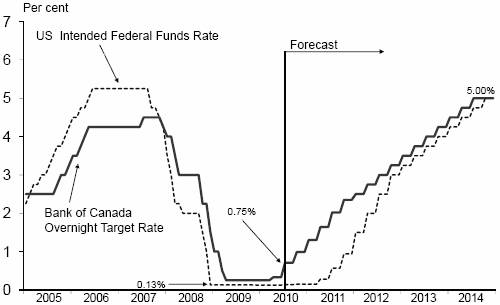
Sources: Bank of Canada, US Federal Reserve and BC Ministry of Finance forecasts.
The US Federal Reserve has held its intended federal funds rate in the 0.00 to 0.25 per cent range since December 2008. Given little inflation pressure and the high US unemployment rate, private sector analysts view an increase in the fed funds rate as unlikely before 2011.
First Quarterly Report 2010/11
30
Economic Review and Outlook
Outlook
Based on the average of six private sector forecasts as of July 27, 2010, the Ministry’s interest rate outlook assumes that the Bank of Canada will raise the overnight target rate to 1.00 per cent in the final quarter of 2010. These six forecasters then expect the rate to rise gradually through 2011, reaching 2.50 per cent by the end of next year. The forecasters project the overnight target rate to average 0.6 per cent in 2010 and 1.8 per cent in 2011.
As of July 27, 2010, the same six forecasters project that the Fed will keep the fed funds rate in the 0.00 per cent to 0.25 per cent range until the second quarter of 2011. They then expect the rate to slowly increase each quarter, arriving at 1.00 per cent at the end of next year. On average, the six forecasters project the fed funds rate will average 0.1 per cent annually in 2010 and 0.5 per cent in 2011.
The average of private sector forecasters’ views on Canadian short–term interest rates (Three-month Treasury bills) as of July 27, 2010 indicates that Three-month rates will average 0.6 per cent in 2010 and 1.9 per cent in 2011.
Table 2.4 Private Sector Canadian Three Month Treasury Bill Interest Rate Forecasts
Average annual interest rate (per cent) | | 2009 | | 2010 | |
Global Insight | | 0.5 | | 1.8 | |
CIBC | | 0.6 | | 1.5 | |
Bank of Montreal | | 0.6 | | 1.7 | |
Scotiabank | | 0.7 | | 2.0 | |
TD Economics | | 0.7 | | 2.1 | |
RBC Capital Markets | | 0.6 | | 2.2 | |
Average (as of July 27, 2010) | | 0.6 | | 1.9 | |
The same private sector forecasters project ten-year Government of Canada bonds to average 3.4 per cent in 2010 and 3.7 per cent in 2011.
Table 2.5 Private Sector Canadian 10-year Government Bond Interest Rate Forecasts
Average annual interest rate (per cent) | | 2010 | | 2011 | |
Global Insight | | 3.5 | | 3.9 | |
CIBC | | 3.4 | | 3.9 | |
Bank of Montreal | | 3.2 | | 3.4 | |
Scotiabank | | 3.3 | | 3.6 | |
TD Economics | | 3.3 | | 3.7 | |
RBC Capital Markets | | 3.4 | | 3.9 | |
Average (as of July 27, 2010) | | 3.4 | | 3.7 | |
First Quarterly Report 2010/11
31
Economic Review and Outlook
Exchange Rate
After beginning 2010 at 96.4 US cents, the value of the loonie has remained fairly high through the year, arriving at 96.6 US cents on July 27, 2010. Through the first eight months of 2010, the Canadian dollar averaged 96.5 US cents.
Chart 2.11 Private sector expects Canadian dollar to remain high
US cents/Canadian $
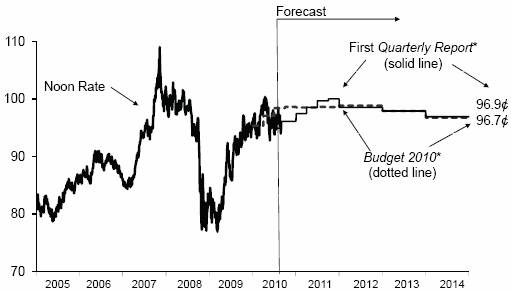
Sources: Bank of Canada and BC Ministry of Finance forecasts
*The average of 6 private sector forecasters: Global Insight, CIBC, BMO Capital Markets, RBC Financial Group, Scotiabank, and TD Bank. First Quarterly Report 2010 as of July 27, 2010 and Budget 2010 as of January 7, 2010.
The stabilization of the dollar at its present high value in recent months can be attributed to the rise in commodity prices (on which much of the resource-rich Canadian economy is dependent), strong employment growth and, primarily, a weak US dollar. Private sector analysts note that while Canadian consumers are benefiting from increased purchasing power, manufacturers already suffering from a weak export environment will face further difficulty selling goods to the US due to the high Canadian dollar.
Table 2.6 Private Sector Exchange Rate Forecasts
Average annual exchange rate (US cents/Can $) | | 2010 | | 2011 | |
Global Insight | | 96.6 | | 98.4 | |
CIBC | | 97.5 | | 98.3 | |
Bank of Montreal | | 96.0 | | 99.0 | |
Scotiabank | | 97.4 | | 101.9 | |
TD Economics | | 94.2 | | 97.9 | |
RBC Capital Markets | | 95.0 | | 98.2 | |
Average (as of July 27, 2010) | | 96.1 | | 98.9 | |
Outlook
An average of six private sector forecasts as of July 27, 2010 sees the Canadian dollar averaging 96.1 US cents in 2010, and rising to 98.9 US cents in 2011. In the medium-term, the dollar is projected to average 97.8 US cents annually. The Ministry’s exchange rate outlook is based on these private sector averages.
First Quarterly Report 2010/11
32
Economic Review and Outlook
Table 2.7.1 Gross Domestic Product: British Columbia
| | Forecast | |
| | 2008 | | 2009 (e) | | 2010 | | 2011 | | 2012 | | 2013 | | 2014 | |
BRITISH COLUMBIA: | | | | | | | | | | | | | | | |
Gross Domestic Product at Market Prices: | | | | | | | | | | | | | | | |
– Real (2002 $ billion; chain-weighted) | | 164.5 | | 160.8 | | 165.7 | | 169.4 | | 174.1 | | 179.0 | | 184.1 | |
(% change) | | 0.0 | | -2.3 | | 3.1 | | 2.2 | | 2.8 | | 2.8 | | 2.9 | |
– Current dollar ($ billion) | | 197.9 | | 188.5 | | 198.0 | | 206.0 | | 216.5 | | 227.6 | | 239.0 | |
(% change) | | 3.3 | | -4.7 | | 5.0 | | 4.0 | | 5.1 | | 5.1 | | 5.0 | |
– GDP price deflator (2002 = 100) | | 120.3 | | 117.3 | | 119.5 | | 121.6 | | 124.3 | | 127.1 | | 129.8 | |
(% change) | | 3.3 | | -2.5 | | 1.9 | | 1.8 | | 2.2 | | 2.2 | | 2.1 | |
Real GDP per person | | | | | | | | | | | | | | | |
(2002 $; chain-weighted) | | 37,529 | | 36,090 | | 36,601 | | 36,835 | | 37,320 | | 37,847 | | 38,386 | |
(% change) | | -1.7 | | -3.8 | | 1.4 | | 0.6 | | 1.3 | | 1.4 | | 1.4 | |
Real GDP per employed person | | | | | | | | | | | | | | | |
(% change) | | -2.1 | | 0.1 | | 1.2 | | 0.8 | | 0.9 | | 1.0 | | 1.0 | |
Unit labour cost(1) (% change) | | 5.3 | | 0.6 | | -0.1 | | 1.8 | | 2.0 | | 2.1 | | 2.1 | |
| | | | | | | | | | | | | | | |
Components of British Columbia Real GDP at Market Prices ($2002 billions; chain-weighted) | | | | | |
| | | | | | | | | | | | | | | |
Personal expenditure on Goods and services | | 114.3 | | 112.5 | | 115.7 | | 118.7 | | 122.2 | | 125.9 | | 129.7 | |
(% change) | | 2.4 | | -1.6 | | 2.8 | | 2.6 | | 3.0 | | 3.0 | | 3.0 | |
– Goods | | 47.2 | | 45.6 | | 47.3 | | 48.5 | | 50.0 | | 51.5 | | 53.0 | |
(% change) | | 1.0 | | -3.4 | | 3.8 | | 2.6 | | 3.0 | | 3.0 | | 3.0 | |
– Services | | 67.1 | | 66.8 | | 68.3 | | 70.1 | | 72.1 | | 74.3 | | 76.6 | |
(% change) | | 3.6 | | -0.4 | | 2.2 | | 2.6 | | 2.9 | | 3.0 | | 3.0 | |
Government current expenditures on Goods and services | | 31.5 | | 32.5 | | 33.4 | | 33.7 | | 33.8 | | 34.0 | | 34.3 | |
(% change) | | 3.4 | | 3.2 | | 2.9 | | 0.8 | | 0.5 | | 0.6 | | 0.6 | |
Investment in fixed capital | | 40.4 | | 37.2 | | 40.7 | | 40.9 | | 41.9 | | 43.5 | | 45.4 | |
(% change) | | 2.9 | | -8.0 | | 9.4 | | 0.5 | | 2.5 | | 3.9 | | 4.2 | |
Final domestic demand | | 186.3 | | 182.0 | | 189.8 | | 193.2 | | 197.9 | | 203.4 | | 209.2 | |
(% change) | | 2.7 | | -2.3 | | 4.3 | | 1.8 | | 2.4 | | 2.8 | | 2.9 | |
| | | | | | | | | | | | | | | |
Exports goods and services | | 70.2 | | 67.4 | | 70.4 | | 71.6 | | 74.3 | | 76.9 | | 79.7 | |
(% change) | | -5.1 | | -4.0 | | 4.4 | | 1.8 | | 3.7 | | 3.6 | | 3.6 | |
Imports goods and services | | 93.3 | | 88.8 | | 94.4 | | 97.1 | | 100.0 | | 103.0 | | 106.2 | |
(% change) | | -0.4 | | -4.9 | | 6.4 | | 2.8 | | 3.0 | | 3.0 | | 3.1 | |
Inventory change | | 0.5 | | -0.9 | | -0.8 | | 0.7 | | 0.9 | | 0.7 | | 0.4 | |
Statistical discrepancy | | -0.1 | | -0.1 | | -0.1 | | -0.1 | | -0.1 | | -0.1 | | -0.1 | |
Real GDP at market prices | | 164.5 | | 160.8 | | 165.7 | | 169.4 | | 174.1 | | 179.0 | | 184.1 | |
(% change) | | 0.0 | | -2.3 | | 3.1 | | 2.2 | | 2.8 | | 2.8 | | 2.9 | |
(1) Unit labour cost is the nominal cost of labour incurred to produce one unit of real output.
(e) Ministry of Finance estimate.
First Quarterly Report 2010/11
33
Economic Review and Outlook
Table 2.7.2 Components of Nominal Income and Expenditure
| | Forecast | |
| | 2008 | | 2009 | | 2010 | | 2011 | | 2012 | | 2013 | | 2014 | |
Labour income(1) ($ million) | | 103,811 | | 102,018 | (e) | 105,078 | | 109,259 | | 114,547 | | 120,242 | | 126,259 | |
(% change) | | 5.3 | | -1.7 | | 3.0 | | 4.0 | | 4.8 | | 5.0 | | 5.0 | |
Personal income ($ million) | | 158,504 | | 156,554 | (e) | 160,798 | | 166,516 | | 174,145 | | 182,103 | | 190,539 | |
(% change) | | 5.1 | | -1.2 | | 2.7 | | 3.6 | | 4.6 | | 4.6 | | 4.6 | |
Corporate profits before taxes ($ million) | | 22,050 | | 15,316 | (e) | 18,325 | | 20,020 | | 21,573 | | 23,210 | | 24,979 | |
(% change) | | 3.6 | | -30.5 | | 19.6 | | 9.3 | | 7.8 | | 7.6 | | 7.6 | |
Retail sales ($ million) | | 57,783 | | 55,222 | | 58,119 | | 60,479 | | 63,198 | | 66,130 | | 69,207 | |
(% change) | | 1.5 | | -4.4 | | 5.2 | | 4.1 | | 4.5 | | 4.6 | | 4.7 | |
Housing starts | | 34,321 | | 16,077 | | 23,600 | | 23,901 | | 25,060 | | 26,218 | | 27,907 | |
(% change) | | -12.4 | | -53.2 | | 46.8 | | 1.3 | | 4.8 | | 4.6 | | 6.4 | |
Residential investment(2) ($ million) | | 19,198 | | 15,922 | (e) | 18,243 | | 19,447 | | 20,406 | | 21,467 | | 22,780 | |
(% change) | | 1.5 | | -17.1 | | 14.6 | | 6.6 | | 4.9 | | 5.2 | | 6.1 | |
BC consumer price index (2002 = 100) | | 112.3 | | 112.3 | | 114.2 | | 116.4 | | 118.8 | | 121.3 | | 123.9 | |
(% change) | | 2.1 | | 0.0 | | 1.7 | | 1.9 | | 2.1 | | 2.1 | | 2.1 | |
(1) Domestic basis; wages, salaries and supplementary labour income.
(2) Includes renovations and improvements.
(e) Ministry of Finance estimate.
Table 2.7.3 Labour Market Indicators
| | Forecast | |
| | 2008 | | 2009 | | 2010 | | 2011 | | 2012 | | 2013 | | 2014 | |
Population (on July 1) (000’s) | | 4,384 | | 4,455 | | 4,528 | | 4,598 | | 4,664 | | 4,730 | | 4,796 | |
(% change) | | 1.7 | | 1.6 | | 1.6 | | 1.5 | | 1.4 | | 1.4 | | 1.4 | |
Labour force population, 15+ Years (000’s) | | 3,642 | | 3,707 | | 3,771 | | 3,835 | | 3,895 | | 3,952 | | 4,010 | |
(% change) | | 2.0 | | 1.8 | | 1.7 | | 1.7 | | 1.6 | | 1.5 | | 1.5 | |
Net in-migration (000’s) | | | | | | | | | | | | | | | |
– International(1),(3) | | 54.9 | | 51.1 | | 47.9 | | 46.3 | | 43.9 | | 43.6 | | 44.2 | |
– Interprovincial(3) | | 8.4 | | 7.5 | | 10.5 | | 9.0 | | 8.7 | | 10.5 | | 11.0 | |
– Total | | 63.3 | | 58.6 | | 58.4 | | 55.3 | | 52.6 | | 54.1 | | 55.2 | |
Participation rate(2) (%) | | 66.6 | | 66.0 | | 66.1 | | 65.8 | | 65.7 | | 65.8 | | 66.0 | |
Labour force (000’s) | | 2,426 | | 2,445 | | 2,494 | | 2,524 | | 2,560 | | 2,600 | | 2,645 | |
(% change) | | 2.5 | | 0.8 | | 2.0 | | 1.2 | | 1.4 | | 1.6 | | 1.7 | |
Employment (000’s) | | 2,314 | | 2,259 | | 2,302 | | 2,334 | | 2,377 | | 2,421 | | 2,465 | |
(% change) | | 2.1 | | -2.4 | | 1.9 | | 1.4 | | 1.8 | | 1.8 | | 1.8 | |
| | | | | | | | | | | | | | | |
Unemployment rate (%) | | 4.6 | | 7.6 | | 7.6 | | 7.5 | | 7.1 | | 6.8 | | 6.8 | |
(1) International migration includes net non-permanent residents and returning emigrants less net temporary residents abroad. (2) Percentage of the population 15 years of age and over in the labour force.
(3) Components may not sum to total due to rounding.
(e) Ministry of Finance estimate.
First Quarterly Report 2010/11
34
Economic Review and Outlook
Table 2.7.4 Major Economic Assumptions
| | Forecast | |
| | 2008 | | 2009 | | 2010 | | 2011 | | 2012 | | 2013 | | 2014 | |
GDP (billions) | | | | | | | | | | | | | | | |
Canada real (2002 $; chain-weighted) | | 1,318 | | 1,286 | | 1,325 | | 1,355 | | 1,390 | | 1,426 | | 1,463 | |
(% change) | | 0.5 | | -2.5 | | 3.0 | | 2.3 | | 2.6 | | 2.6 | | 2.6 | |
US real (1996 US$; chain-weighted) | | 13,229 | | 12,881 | | 13,222 | | 13,481 | | 13,823 | | 14,190 | | 14,566 | |
(% change) | | 0.0 | | -2.6 | | 2.6 | | 2.0 | | 2.5 | | 2.7 | | 2.7 | |
Japan real (2000 Yen; chain-weighted) | | 554,531 | | 525,485 | | 539,766 | | 546,275 | | 555,926 | | 565,577 | | 575,139 | |
(% change) | | -1.2 | | -5.2 | | 2.7 | | 1.2 | | 1.8 | | 1.7 | | 1.7 | |
Europe real(1) (% change) | | 0.4 | | -4.3 | | 0.4 | | 0.8 | | 1.8 | | 1.8 | | 1.8 | |
Industrial production index | | | | | | | | | | | | | | | |
US (2002 = 100) | | 96.7 | | 87.7 | | 91.9 | | 93.8 | | 96.2 | | 98.8 | | 101.4 | |
(% change) | | -3.3 | | -9.3 | | 4.8 | | 2.0 | | 2.5 | | 2.7 | | 2.7 | |
Japan (2000 = 100) | | 103.8 | | 81.8 | | 96.1 | | 99.1 | | 100.9 | | 102.6 | | 104.4 | |
(% change) | | -3.2 | | -21.2 | | 17.5 | | 3.1 | | 1.8 | | 1.7 | | 1.7 | |
Europe(1) (2000 = 100) | | 106.1 | | 90.3 | | 93.8 | | 95.2 | | 97.1 | | 99.0 | | 101.0 | |
(% change) | | -1.8 | | -14.9 | | 3.8 | | 1.5 | | 2.0 | | 2.0 | | 2.0 | |
Housing starts(2) (000’s) | | | | | | | | | | | | | | | |
Canada | | 211 | | 149 | | 184 | | 170 | | 175 | | 180 | | 180 | |
(% change) | | -7.6 | | -29.4 | | 23.4 | | -7.6 | | 2.9 | | 2.9 | | 0.0 | |
US | | 900 | | 554 | | 565 | | 650 | | 820 | | 910 | | 1,005 | |
(% change) | | -32.9 | | -38.4 | | 1.9 | | 15.0 | | 26.2 | | 11.0 | | 10.4 | |
Japan | | 1,093 | | 788 | | 780 | | 825 | | 900 | | 1,000 | | 1,050 | |
(% change) | | 3.1 | | -27.9 | | -1.1 | | 5.8 | | 9.1 | | 11.1 | | 5.0 | |
Consumer price index | | | | | | | | | | | | | | | |
Canada (2002 = 100) | | 114.1 | | 114.4 | | 116.6 | | 119.1 | | 121.5 | | 123.9 | | 126.4 | |
(% change) | | 2.3 | | 0.3 | | 1.9 | | 2.2 | | 2.0 | | 2.0 | | 2.0 | |
Canadian interest rates (%) | | | | | | | | | | | | | | | |
3-Month treasury bills | | 2.4 | | 0.3 | | 0.6 | | 1.9 | | 2.9 | | 3.9 | | 4.8 | |
10-year government bonds | | 3.6 | | 3.3 | | 3.4 | | 3.7 | | 4.2 | | 4.9 | | 5.8 | |
United States interest rates (%) | | | | | | | | | | | | | | | |
3-Month treasury bills | | 1.4 | | 0.2 | | 0.2 | | 0.6 | | 2.3 | | 3.6 | | 4.7 | |
10-year government bonds | | 3.7 | | 3.3 | | 3.3 | | 3.5 | | 4.2 | | 4.9 | | 5.8 | |
Exchange rate (US cents / Canadian $) | | 93.7 | | 87.6 | | 96.1 | | 98.9 | | 98.5 | | 97.9 | | 96.9 | |
British Columbia goods and services | | | | | | | | | | | | | | | |
Export price deflator (% change) | | 6.7 | | -9.3 | (e) | 2.6 | | 0.7 | | 2.9 | | 2.6 | | 2.6 | |
(1) Euro zone (12) is Austria, Belgium, Finland, France, Germany, Greece, Ireland, Italy, Luxembourg, Netherlands, Portugal and Spain.
(2) British Columbia housing starts appear in Table 2.7.2.
(e) Ministry of Finance estimate.
First Quarterly Report 2010/11
35
PART THREE — FIRST QUARTERLY REPORT
For the Three Months Ended June 30, 2010
2010/11 First Quarterly Report | | September 14, 2010 |
Table 3.1 2010/11 Operating Statement
| | Year-to-Date to June 30 | | Full Year | |
| | 2010/11 | | Actual | | 2010/11 | | Actual | |
($ millions) | | Budget | | Actual | | Variance | | 2009/10 | | Budget | | Forecast | | Variance | | 2009/10 | |
Revenue | | 9,408 | | 9,246 | | (162 | ) | 8,978 | | 39,190 | | 39,965 | | 775 | | 37,521 | |
Expense | | (9,976 | ) | (9,698 | ) | 278 | | (9,532 | ) | (40,605 | ) | (41,045 | ) | (440 | ) | (39,300 | ) |
Surplus (deficit) before forecast allowance | | (568 | ) | (452 | ) | 116 | | (554 | ) | (1,415 | ) | (1,080 | ) | 335 | | (1,779 | ) |
Forecast allowance | | — | | — | | — | | — | | (300 | ) | (300 | ) | — | | — | |
Surplus (deficit) | | (568 | ) | (452 | ) | 116 | | (554 | ) | (1,715 | ) | (1,380 | ) | 335 | | (1,779 | ) |
Accumulated surplus beginning of the year | | 4,211 | | 4,860 | | 649 | | 6,639 | | 4,211 | | 4,860 | | 649 | | 6,639 | |
Accumulated surplus before comprehensive income | | 3,643 | | 4,408 | | 765 | | 6,085 | | 2,496 | | 3,480 | | 984 | | 4,860 | |
Accumulated other comprehensive income from self-supported Crown agencies | | (67 | ) | 141 | | 208 | | 234 | | (67 | ) | 412 | | 479 | | 412 | |
Accumulated surplus end of period | | 3,576 | | 4,549 | | 973 | | 6,319 | | 2,429 | | 3,892 | | 1,463 | | 5,272 | |
First Quarterly Report 2010/11
37
First Quarterly Report
Table 3.2 2010/11 Revenue by Source
| | Year-to-Date to June 30 | | Full Year | |
| | 2010/11 | | Actual | | 2010/11 | | Actual | |
($ millions) | | Budget | | Actual | | Variance | | 2009/10 | | Budget | | Forecast | | Variance | | 2009/10 | |
Taxation | | | | | | | | | | | | | | | | | |
Personal income | | 1,499 | | 1,499 | | — | | 1,529 | | 5,861 | | 5,741 | | (120 | ) | 5,529 | |
Corporate income | | 290 | | 288 | | (2 | ) | 324 | | 847 | | 1,521 | | 674 | | 1,317 | |
Harmonized sales | | — | | — | | — | | — | | 3,784 | | 3,819 | | 35 | | — | |
Other sales (1) | | 1,213 | | 1,166 | | (47 | ) | 1,204 | | 1,399 | | 1,399 | | — | | 4,765 | |
Fuel | | 218 | | 219 | | 1 | | 211 | | 877 | | 890 | | 13 | | 884 | |
Carbon | | 142 | | 141 | | (1 | ) | 93 | | 727 | | 730 | | 3 | | 542 | |
Tobacco | | 181 | | 252 | | 71 | | 173 | | 686 | | 747 | | 61 | | 682 | |
Property | | 479 | | 474 | | (5 | ) | 464 | | 1,906 | | 1,916 | | 10 | | 1,884 | |
Property transfer | | 248 | | 302 | | 54 | | 191 | | 900 | | 900 | | — | | 887 | |
Other (2) | | 150 | | 146 | | (4 | ) | 167 | | 435 | | 439 | | 4 | | 612 | |
| | 4,420 | | 4,487 | | 67 | | 4,356 | | 17,422 | | 18,102 | | 680 | | 17,102 | |
Natural resources | | | | | | | | | | | | | | | | | |
Natural gas royalties | | 163 | | 115 | | (48 | ) | 77 | | 698 | | 532 | | (166 | ) | 406 | |
Forests | | 89 | | 74 | | (15 | ) | 45 | | 491 | | 462 | | (29 | ) | 387 | |
Other natural resource (3) | | 477 | | 498 | | 21 | | 442 | | 2,019 | | 2,010 | | (9 | ) | 1,853 | |
| | 729 | | 687 | | (42 | ) | 564 | | 3,208 | | 3,004 | | (204 | ) | 2,646 | |
Other revenue | | | | | | | | | | | | | | | | | |
Medical Services Plan premiums | | 435 | | 446 | | 11 | | 401 | | 1,741 | | 1,755 | | 14 | | 1,666 | |
Other fees (4) | | 639 | | 546 | | (93 | ) | 511 | | 2,615 | | 2,686 | | 71 | | 2,453 | |
Investment earnings | | 228 | | 133 | | (95 | ) | 235 | | 921 | | 939 | | 18 | | 963 | |
Miscellaneous (5) | | 625 | | 645 | | 20 | | 656 | | 2,597 | | 2,627 | | 30 | | 2,754 | |
| | 1,927 | | 1,770 | | (157 | ) | 1,803 | | 7,874 | | 8,007 | | 133 | | 7,836 | |
Contributions from the federal government | | | | | | | | | | | | | | | | | |
Health and social transfers | | 1,291 | | 1,294 | | 3 | | 1,222 | | 5,165 | | 5,127 | | (38 | ) | 4,883 | |
Harmonized sales tax transition payments | | — | | — | | — | | — | | 769 | | 769 | | — | | 250 | |
Other federal contributions (6) | | 341 | | 328 | | (13 | ) | 294 | | 1,751 | | 1,972 | | 221 | | 1,784 | |
| | 1,632 | | 1,622 | | (10 | ) | 1,516 | | 7,685 | | 7,868 | | 183 | | 6,917 | |
Commercial Crown corporation net income | | | | | | | | | | | | | | | | | |
BC Hydro (7) | | 104 | | 86 | | (18 | ) | 75 | | 617 | | 604 | | (13 | ) | 447 | |
Liquor Distribution Branch | | 223 | | 218 | | (5 | ) | 227 | | 974 | | 963 | | (11 | ) | 877 | |
BC Lotteries (net of payments to the federal government) | | 288 | | 293 | | 5 | | 266 | | 1,106 | | 1,071 | | (35 | ) | 1,070 | |
ICBC | | 85 | | 77 | | (8 | ) | 160 | | 303 | | 339 | | 36 | | 601 | |
Transportation Investment Corporation (Port Mann) | | (5 | ) | (2 | ) | 3 | | — | | (19 | ) | (14 | ) | 5 | | (4 | ) |
Other | | 5 | | 8 | | 3 | | 11 | | 20 | | 21 | | 1 | | 29 | |
| | 700 | | 680 | | (20 | ) | 739 | | 3,001 | | 2,984 | | (17 | ) | 3,020 | |
Total revenue | | 9,408 | | 9,246 | | (162 | ) | 8,978 | | 39,190 | | 39,965 | | 775 | | 37,521 | |
(1) Includes social service tax and continuation of the tax on designated property.
(2) Corporation capital, insurance premium and hotel room taxes.
(3) Columbia River Treaty, other energy and minerals, water rental and other resources.
(4) Post-secondary, healthcare-related, motor vehicle, and other fees.
(5) Includes asset dispositions, reimbursements for health care and other services provided to external agencies, and other recoveries.
(6) Includes contributions for health, education, community development, housing and social service programs, and transportation projects.
(7) In July 2010 BC Hydro was re-amalgamated with BC Transmission Corporation. Amounts for 2010/11 have been restated to reflect this change.
First Quarterly Report 2010/11
38
First Quarterly Report
Table 3.3 2010/11 Expense by Ministry, Program and Agency
| | Year-to-Date to June 30 | | Full Year | |
| | 2010/11 | | Actual | | 2010/11 | | Actual | |
($ millions) | | Budget | | Actual | | Variance | | 2009/10 (1) | | Budget (1) | | Forecast | | Variance | | 2009/10 (1) | |
Office of the Premier | | 2 | | 2 | | — | | 2 | | 10 | | 10 | | — | | 10 | |
Aboriginal Relations and Reconciliation | | 11 | | 13 | | 2 | | 8 | | 40 | | 40 | | — | | 66 | |
Advanced Education and Labour Market Development | | 534 | | 489 | | (45 | ) | 523 | | 2,114 | | 2,114 | | — | | 2,095 | |
Agriculture and Lands | | 31 | | 33 | | 2 | | 11 | | 82 | | 82 | | — | | 97 | |
Attorney General | | 119 | | 113 | | (6 | ) | 117 | | 468 | | 468 | | — | | 540 | |
Children and Family Development | | 349 | | 330 | | (19 | ) | 330 | | 1,334 | | 1,334 | | — | | 1,306 | |
Citizens’ Services | | 153 | | 156 | | 3 | | 164 | | 613 | | 613 | | — | | 510 | |
Community and Rural Development | | 56 | | 48 | | (8 | ) | 41 | | 309 | | 309 | | — | | 178 | |
Education | | 1,482 | | 1,463 | | (19 | ) | 1,426 | | 5,165 | | 5,165 | | — | | 5,012 | |
Energy, Mines and Petroleum Resources | | 16 | | 8 | | (8 | ) | 9 | | 54 | | 54 | | — | | 42 | |
Environment | | 39 | | 35 | | (4 | ) | 38 | | 167 | | 167 | | — | | 163 | |
Finance | | 24 | | 123 | | 99 | | 12 | | 71 | | 181 | | 110 | | 102 | |
Forests and Range | | 133 | | 132 | | (1 | ) | 159 | | 641 | | 861 | | 220 | | 1,014 | |
Health Services | | 3,684 | | 3,588 | | (96 | ) | 3,440 | | 14,760 | | 14,760 | | — | | 13,867 | |
Healthy Living and Sport | | 27 | | 21 | | (6 | ) | 18 | | 51 | | 51 | | — | | 43 | |
Housing and Social Development | | 671 | | 670 | | (1 | ) | 647 | | 2,730 | | 2,730 | | — | | 2,672 | |
Labour | | 4 | | 6 | | 2 | | 4 | | 16 | | 16 | | — | | 16 | |
Public Safety and Solicitor General | | 150 | | 147 | | (3 | ) | 140 | | 602 | | 602 | | — | | 596 | |
Small Business, Technology and Economic Development | | 12 | | 8 | | (4 | ) | 6 | | 62 | | 62 | | — | | 44 | |
Tourism, Culture and the Arts | | 23 | | 29 | | 6 | | 16 | | 115 | | 115 | | — | | 104 | |
Transportation and Infrastructure | | 180 | | 182 | | 2 | | 178 | | 753 | | 753 | | — | | 732 | |
Total ministries and Office of the Premier | | 7,700 | | 7,596 | | (104 | ) | 7,289 | | 30,157 | | 30,487 | | 330 | | 29,209 | |
Management of public funds and debt | | 313 | | 318 | | 5 | | 261 | | 1,301 | | 1,299 | | (2 | ) | 1,141 | |
Contingencies | | 112 | | — | | (112 | ) | — | | 450 | | 450 | | — | | 360 | |
Funding for capital expenditures | | 274 | | 99 | | (175 | ) | 103 | | 1,751 | | 1,751 | | — | | 866 | |
Legislative and other appropriations | | 32 | | 28 | | (4 | ) | 51 | | 123 | | 123 | | — | | 148 | |
Consolidated revenue fund expense | | 8,431 | | 8,041 | | (390 | ) | 7,704 | | 33,782 | | 34,110 | | 328 | | 31,724 | |
Expenses recovered from external entities | | 638 | | 572 | | (66 | ) | 639 | | 2,741 | | 2,896 | | 155 | | 2,748 | |
Funding provided to service delivery agencies | | (5,353 | ) | (5,164 | ) | 189 | | (4,985 | ) | (20,704 | ) | (20,832 | ) | (128 | ) | (19,240 | ) |
Total direct program spending | | 3,716 | | 3,449 | | (267 | ) | 3,358 | | 15,819 | | 16,174 | | 355 | | 15,232 | |
Service delivery agency expense | | | | | | | | | | | | | | | | | |
School districts | | 1,581 | | 1,583 | | 2 | | 1,563 | | 5,440 | | 5,440 | | — | | 5,379 | |
Post-secondary institutions | | 1,056 | | 1,088 | | 32 | | 1,034 | | 4,727 | | 4,825 | | 98 | | 4,628 | |
Health authorities and hospital societies | | 2,761 | | 2,854 | | 93 | | 2,759 | | 11,141 | | 11,164 | | 23 | | 10,761 | |
Other service delivery agencies | | 862 | | 724 | | (138 | ) | 818 | | 3,478 | | 3,442 | | (36 | ) | 3,300 | |
| | 6,260 | | 6,249 | | (11 | ) | 6,174 | | 24,786 | | 24,871 | | 85 | | 24,068 | |
Total expense | | 9,976 | | 9,698 | | (278 | ) | 9,532 | | 40,605 | | 41,045 | | 440 | | 39,300 | |
(1) Restated to reflect government’s current organization and/or accounting policies.
First Quarterly Report 2010/11
39
First Quarterly Report
Table 3.4 2010/11 Expense By Function
| | Year-to-Date to June 30 | | Full Year | |
| | 2010/11 | | Actual | | 2010/11 | | Actual | |
($ millions) | | Budget | | Actual | | Variance | | 2009/10 (1) | | Budget | | Forecast | | Variance | | 2009/10 (1) | |
Health: | | | | | | | | | | | | | | | | | |
Medical Services Plan | | 926 | | 941 | | 15 | | 879 | | 3,801 | | 3,818 | | 17 | | 3,609 | |
Pharmacare | | 267 | | 256 | | (11 | ) | 257 | | 1,095 | | 1,099 | | 4 | | 1,053 | |
Regional services | | 2,600 | | 2,580 | | (20 | ) | 2,517 | | 10,627 | | 10,617 | | (10 | ) | 9,966 | |
Other healthcare expenses (2) | | 205 | | 174 | | (31 | ) | 219 | | 951 | | 986 | | 35 | | 831 | |
| | 3,998 | | 3,951 | | (47 | ) | 3,872 | | 16,474 | | 16,520 | | 46 | | 15,459 | |
Education: | | | | | | | | | | | | | | | | | |
Elementary and secondary | | 1,649 | | 1,665 | | 16 | | 1,590 | | 5,809 | | 5,806 | | (3 | ) | 5,778 | |
Post-secondary | | 1,114 | | 1,081 | | (33 | ) | 1,003 | | 4,556 | | 4,694 | | 138 | | 4,740 | |
Other education expenses (3) | | 140 | | 116 | | (24 | ) | 167 | | 455 | | 508 | | 53 | | 528 | |
| | 2,903 | | 2,862 | | (41 | ) | 2,760 | | 10,820 | | 11,008 | | 188 | | 11,046 | |
Social services: | | | | | | | | | | | | | | | | | |
Social assistance (2),(3) | | 356 | | 371 | | 15 | | 331 | | 1,511 | | 1,437 | | (74 | ) | 1,462 | |
Childcare services (2) | | 324 | | 272 | | (52 | ) | 350 | | 1,171 | | 1,172 | | 1 | | 1,077 | |
Community living and other services | | 154 | | 171 | | 17 | | 145 | | 772 | | 840 | | 68 | | 729 | |
| | 834 | | 814 | | (20 | ) | 826 | | 3,454 | | 3,449 | | (5 | ) | 3,268 | |
Protection of persons and property | | 326 | | 319 | | (7 | ) | 358 | | 1,426 | | 1,414 | | (12 | ) | 1,380 | |
Transportation | | 385 | | 357 | | (28 | ) | 329 | | 1,515 | | 1,522 | | 7 | | 1,453 | |
Natural resources and economic development | | 311 | | 302 | | (9 | ) | 335 | | 1,314 | | 1,803 | | 489 | | 1,883 | |
Other | | 263 | | 244 | | (19 | ) | 272 | | 1,395 | | 1,398 | | 3 | | 1,418 | |
Contingencies | | 112 | | — | | (112 | ) | — | | 450 | | 450 | | — | | — | |
General government | | 289 | | 289 | | — | | 245 | | 1,376 | | 1,136 | | (240 | ) | 1,224 | |
Debt servicing costs | | 555 | | 560 | | 5 | | 535 | | 2,381 | | 2,345 | | (36 | ) | 2,169 | |
Total expense | | 9,976 | | 9,698 | | (278 | ) | 9,532 | | 40,605 | | 41,045 | | 440 | | 39,300 | |
(1) Restated to reflect government’s current organization and accounting policies.
(2) Payments for healthcare services by the Ministry of Housing and Social Development and the Ministry of Children and Family Development made on behalf of their clients are reported in the Health function.
(3) Payments for training costs by the Ministry of Housing and Social Development made on behalf of its clients are reported in the Education function.
First Quarterly Report 2010/11
40
First Quarterly Report
Table 3.5 2010/11 Capital Spending
| | Year-to-Date to June 30 | | Full Year | |
| | 2010/11 | | Actual | | 2010/11 | | Actual | |
($ millions) | | Budget | | Actual | | Variance | | 2009/10 | | Budget | | Forecast | | Variance | | 2009/10 | |
Taxpayer-supported | | | | | | | | | | | | | | | | | |
Education | | | | | | | | | | | | | | | | | |
Schools (K–12) | | 93 | | 95 | | 2 | | 139 | | 481 | | 497 | | 16 | | 482 | |
Post-secondary | | 186 | | 120 | | (66 | ) | 96 | | 743 | | 808 | | 65 | | 672 | |
Health | | 290 | | 203 | | (87 | ) | 127 | | 1,161 | | 1,138 | | (23 | ) | 927 | |
BC Transportation Financing Authority | | 364 | | 209 | | (155 | ) | 319 | | 1,483 | | 1,583 | | 100 | | 918 | |
BC Transit | | 22 | | 8 | | (14 | ) | 13 | | 89 | | 89 | | — | | 150 | |
Vancouver Convention Centre expansion project | | 2 | | 2 | | — | | 12 | | 8 | | 15 | | 7 | | 41 | |
BC Place rejuvenation | | 50 | | 50 | | — | | 30 | | 390 | | 391 | | 1 | | 75 | |
Government operating (ministries) | | 91 | | 17 | | (74 | ) | 62 | | 355 | | 395 | | 40 | | 306 | |
Other (1) | | 101 | | 45 | | (56 | ) | 19 | | 404 | | 387 | | (17 | ) | 183 | |
Capital spending contingencies | | — | | — | | — | | — | | 300 | | 300 | | — | | — | |
Total taxpayer-supported | | 1,199 | | 749 | | (450 | ) | 817 | | 5,414 | | 5,603 | | 189 | | 3,754 | |
| | | | | | | | | | | | | | | | | |
Self-supported | | | | | | | | | | | | | | | | | |
BC Hydro (2) | | 443 | | 317 | | (126 | ) | 363 | | 1,784 | | 1,770 | | (14 | ) | 2,406 | |
BC Transmission Corporation | | — | | — | | — | | 2 | | — | | — | | — | | 12 | |
Columbia River power projects (3) | | 4 | | 4 | | — | | 4 | | 12 | | 14 | | 2 | | 16 | |
Transportation Investment Corporation (Port Mann) | | 184 | | 164 | | (20 | ) | 148 | | 735 | | 735 | | — | | 777 | |
BC Rail (4) | | — | | — | | — | | 1 | | — | | — | | — | | 14 | |
ICBC | | 6 | | 4 | | (2 | ) | 8 | | 83 | | 55 | | (28 | ) | 22 | |
BC Lotteries | | 27 | | 11 | | (16 | ) | 20 | | 107 | | 107 | | — | | 92 | |
Liquor Distribution Branch | | 6 | | 1 | | (5 | ) | 3 | | 24 | | 24 | | — | | 19 | |
Total self-supported | | 670 | | 501 | | (169 | ) | 549 | | 2,745 | | 2,705 | | (40 | ) | 3,358 | |
Total capital spending | | 1,869 | | 1,250 | | (619 | ) | 1,366 | | 8,159 | | 8,308 | | 149 | | 7,112 | |
(1) Includes BC Housing Management Commission, Provincial Rental Housing Corporation, Rapid Transit Project 2000, BC Transit and other service delivery agencies.
(2) Amounts for 2010/11 include BC Transmission Corporation as it was re-amalgamated with BC Hydro in July 2010.
(3) Joint ventures of the Columbia Power Corporation and Columbia Basin Trust.
(4) Responsibility for the BC Railway Company was transferred to the BC Transportation Financing Authority effective April 1, 2010.
First Quarterly Report 2010/11
41
First Quarterly Report
Table 3.6 2010/11 Provincial Debt (1)
| | Year-to-Date to June 30 | | Full Year | |
| | 2010/11 | | Actual | | 2010/11 | | Actual | |
($ millions) | | Budget | | Actual | | Variance | | 2009/10 | | Budget | | Forecast | | Variance | | 2009/10 | |
Taxpayer-supported debt | | | | | | | | | | | | | | | | | |
Provincial government operating (2) | | 3,865 | | 5,987 | | 2,122 | | 3,273 | | 4,815 | | 4,944 | | 129 | | 4,663 | |
Provincial government general capital (3) | | 2,696 | | 2,696 | | — | | 2,696 | | 2,696 | | 2,696 | | — | | 2,696 | |
Provincial government operating | | 6,561 | | 8,683 | | 2,122 | | 5,969 | | 7,511 | | 7,640 | | 129 | | 7,359 | |
Other taxpayer-supported debt (mainly capital) | | | | | | | | | | | | | | | | | |
Education (2),(4) | | | | | | | | | | | | | | | | | |
Schools | | 5,927 | | 5,707 | | (220 | ) | 5,570 | | 6,194 | | 6,146 | | (48 | ) | 5,777 | |
Post-secondary institutions | | 3,906 | | 3,835 | | (71 | ) | 3,627 | | 4,111 | | 4,101 | | (10 | ) | 3,843 | |
| | 9,833 | | 9,542 | | (291 | ) | 9,197 | | 10,305 | | 10,247 | | (58 | ) | 9,620 | |
Health (2),(4),(5) | | 4,532 | | 4,406 | | (126 | ) | 3,977 | | 5,074 | | 5,002 | | (72 | ) | 4,389 | |
Highways and public transit | | | | | | | | | | | | | | | | | |
BC Transportation Financing Authority (6) | | 5,491 | | 5,118 | | (373 | ) | 4,468 | | 6,136 | | 5,991 | | (145 | ) | 5,211 | |
Public transit (2) | | 997 | | 997 | | — | | 993 | | 997 | | 997 | | — | | 997 | |
SkyTrain extension | | 1,154 | | 1,154 | | — | | 1,154 | | 1,154 | | 1,154 | | — | | 1,154 | |
BC Transit | | 165 | | 161 | | (4 | ) | 114 | | 186 | | 188 | | 2 | | 140 | |
| | 7,807 | | 7,430 | | (377 | ) | 6,729 | | 8,473 | | 8,330 | | (143 | ) | 7,502 | |
Other | | | | | | | | | | | | | | | | | |
Social housing (7) | | 394 | | 358 | | (36 | ) | 285 | | 530 | | 621 | | 91 | | 305 | |
Provincial government general capital (3) | | 455 | | 308 | | (147 | ) | — | | 774 | | 719 | | (55 | ) | 294 | |
BC Pavilion Corporation | | 143 | | 157 | | 14 | | — | | 409 | | 378 | | (31 | ) | 49 | |
BC Immigrant Investment Fund | | 288 | | 290 | | 2 | | 283 | | 297 | | 333 | | 36 | | 289 | |
Homeowner Protection Office | | — | | — | | — | | 156 | | — | | — | | — | | 144 | |
Other (8) | | 180 | | 159 | | (21 | ) | 76 | | 375 | | 399 | | 24 | | 70 | |
| | 1,460 | | 1,272 | | (188 | ) | 800 | | 2,385 | | 2,450 | | 65 | | 1,151 | |
Total other taxpayer-supported | | 23,632 | | 22,650 | | (982 | ) | 20,703 | | 26,237 | | 26,029 | | (208 | ) | 22,662 | |
Total taxpayer-supported debt | | 30,193 | | 31,333 | | 1,140 | | 26,672 | | 33,748 | | 33,669 | | (79 | ) | 30,021 | |
| | | | | | | | | | | | | | | | | |
Self-supported debt | | | | | | | | | | | | | | | | | |
Commercial Crown corporations | | | | | | | | | | | | | | | | | |
BC Hydro | | 11,186 | | 11,104 | | (82 | ) | 9,317 | | 11,830 | | 11,852 | | 22 | | 10,792 | |
BC Transmission Corporation | | 73 | | 92 | | 19 | | 87 | | 70 | | — | | (70 | ) | 70 | |
Columbia River power projects (9) | | 192 | | 189 | | (3 | ) | 202 | | 181 | | 182 | | 1 | | 196 | |
BC Lotteries | | 110 | | 52 | | (58 | ) | — | | 128 | | 62 | | (66 | ) | 60 | |
Transportation Investment Corporation (Port Mann) | | 803 | | 909 | | 106 | | 228 | | 1,365 | | 1,352 | | (13 | ) | 544 | |
Liquor Distribution Branch | | 1 | | 1 | | — | | 1 | | 1 | | 1 | | — | | 1 | |
Post-secondary institutions’ subsidiaries | | 134 | | 201 | | 67 | | 134 | | 134 | | 201 | | 67 | | 201 | |
| | 12,499 | | 12,548 | | 49 | | 9,969 | | 13,709 | | 13,650 | | (59 | ) | 11,864 | |
Warehouse borrowing program | | — | | 510 | | 510 | | 3,064 | | — | | — | | — | | — | |
Total self-supported debt | | 12,499 | | 13,058 | | 559 | | 13,033 | | 13,709 | | 13,650 | | (59 | ) | 11,864 | |
Forecast allowance | | 125 | | — | | (125 | ) | — | | 300 | | 300 | | — | | — | |
Total provincial debt | | 42,817 | | 44,391 | | 1,699 | | 39,705 | | 47,757 | | 47,619 | | (138 | ) | 41,885 | |
(1) Debt is after deduction of sinking funds and unamortized discounts, and excludes accrued interest. Government direct and fiscal agency accrued interest is reported in the government’s accounts as an accounts payable.
(2) In 2009/10, sinking funds for debt related to schools, post-secondary education, health care and public transit were liquidated and the proceeds ($763 million) used to offset direct operating borrowing requirements.
(3) Separate disclosures of borrowing for ministries’ capital spending were applied prospectively beginning in fiscal 2009/10.
(4) Includes debt and guarantees incurred by the government on behalf of school districts, universities, colleges and health authorities/hospital societies (SUCH) and debt directly incurred by these entities.
(5) Health facilities’ debt includes public-private partnership obligations of $545 million for the three months ended June 30, 2009, $816 million for the three months ended June 30, 2010, $734 million for fiscal 2009/10 and $944 million for fiscal 2010/11.
(6) BC Transportation Financing Authority debt includes public-private partnership obligations of $808 million for the three months ended June 30, 2009, $796 million for the three months ended June 30, 2010, $799 million for fiscal 2009/10 and $783 million for fiscal 2010/11.
(7) Includes the BC Housing Management Commission and the Provincial Rental Housing Corporation.
(8) Includes service delivery agencies, student loan guarantees, loan guarantees to agricultural producers, guarantees issued under economic development and home mortgage assistance programs and loan guarantee provisions.
(9) Joint ventures of the Columbia Power Corporation and Columbia Basin Trust.
First Quarterly Report 2010/11
42
First Quarterly Report
Table 3.7 2010/11 Statement of Financial Position
| | Actual | | Year-to-Date | | Forecast | |
| | March 31, | | June 30, | | March 31, | |
($ millions) | | 2010 | | 2010 | | 2011 | |
Financial assets | | | | | | | |
Cash and temporary investments | | 2,913 | | 4,037 | | 2,813 | |
Other financial assets | | 8,731 | | 8,561 | | 8,827 | |
Sinking funds | | 1,329 | | 1,383 | | 1,355 | |
Investments in commercial Crown corporations: | | | | | | | |
Retained earnings | | 7,231 | | 6,829 | | 7,110 | |
Recoverable capital loans | | 11,471 | | 12,161 | | 13,272 | |
| | 18,702 | | 18,990 | | 20,382 | |
Warehouse borrowing program assets | | — | | 510 | | — | |
| | 31,675 | | 33,481 | | 33,377 | |
Liabilities | | | | | | | |
Accounts payable and accrued liabilities | | 6,994 | | 6,868 | | 7,131 | |
Deferred revenue | | 9,997 | | 10,468 | | 10,834 | |
Debt: | | | | | | | |
Taxpayer-supported debt | | 30,021 | | 31,333 | | 33,669 | |
Self-supported debt | | 11,864 | | 13,058 | | 13,650 | |
Forecast allowance | | — | | — | | 300 | |
Total provincial debt | | 41,885 | | 44,391 | | 47,619 | |
Add: debt offset by sinking funds | | 1,329 | | 1,383 | | 1,355 | |
Less : guarantees and non-guaranteed debt | | (493 | ) | (476 | ) | (474 | ) |
Financial statement debt | | 42,721 | | 45,298 | | 48,500 | |
| | 59,712 | | 62,634 | | 66,465 | |
Net liabilities | | (28,037 | ) | (29,153 | ) | (33,088 | ) |
Capital and other non-financial assets | | | | | | | |
Tangible capital assets | | 32,371 | | 32,621 | | 36,012 | |
Other non-financial assets | | 938 | | 1,081 | | 968 | |
| | 33,309 | | 33,702 | | 36,980 | |
Accumulated surplus (deficit) | | 5,272 | | 4,549 | | 3,892 | |
Changes in Financial Position
| | Year-to-Date | | Forecast | |
| | June 30, | | March 31, | |
($ millions) | | 2010 | | 2011 | |
| | | | | |
(Surplus) deficit for the period | | 452 | | 1,380 | |
Comprehensive income (increase) decrease | | 271 | | — | |
(Increase) decrease in accumulated surplus | | 723 | | 1,380 | |
Capital and other non-financial asset changes: | | | | | |
Increase in taxpayer-supported capital investments | | 749 | | 5,603 | |
Less: amortization and other accounting changes | | (499 | ) | (1,962 | ) |
Change in net capital assets | | 250 | | 3,641 | |
Increase (decrease) in other non-financial assets | | 143 | | 30 | |
| | 393 | | 3,671 | |
Increase (decrease) in net liabilities | | 1,116 | | 5,051 | |
Investment and working capital changes: | | | | | |
Increase (reduction) in cash and temporary investments | | 1,124 | | (100 | ) |
Increase in total investment in commercial Crown corporations: | | | | | |
Increase (decrease) in retained earnings | | (402 | ) | (121 | ) |
Self-supported capital investments | | 501 | | 2,705 | |
Less: loan repayments and other accounting changes | | 189 | | (904 | ) |
| | 288 | | 1,680 | |
Other working capital changes | | 49 | | (852 | ) |
| | 1,461 | | 728 | |
Increase (decrease) in financial statement debt | | 2,577 | | 5,779 | |
(Increase) decrease in sinking fund debt | | (54 | ) | (26 | ) |
Increase (decrease) in guarantees and non-guaranteed debt | | (17 | ) | (19 | ) |
Increase (decrease) in total provincial debt | | 2,506 | | 5,734 | |
First Quarterly Report 2010/11
43
APPENDIX | |
| |
2010/11 First Quarterly Report | September 14, 2010 |
Table A1 Operating Statement — 2006/07 to 2012/13
| | | | | | | | | | Updated | | Updated | | Updated | |
| | Actual | | Actual | | Actual | | Actual | | Forecast | | Plan | | Plan | |
($ millions) | | 2006/07 | | 2007/08 | | 2008/09 | | 2009/10 | | 2010/11 | | 2011/12 | | 2012/13 | |
Revenue | | 38,448 | | 39,772 | | 38,302 | | 37,521 | | 39,965 | | 41,596 | | 43,236 | |
Expense | | (34,198 | ) | (36,555 | ) | (38,245 | ) | (39,300 | ) | (41,045 | ) | (41,456 | ) | (42,266 | ) |
Negotiating Framework incentive payments | | (264 | ) | (4 | ) | (2 | ) | — | | — | | — | | — | |
Climate Action Dividend | | — | | (440 | ) | 20 | | — | | — | | — | | — | |
Surplus (deficit) before forecast allowance | | 3,986 | | 2,773 | | 75 | | (1,779 | ) | (1,080 | ) | 140 | | 970 | |
Forecast allowance | | — | | — | | — | | — | | (300 | ) | (300 | ) | (400 | ) |
Fiscal plan before allocation of available revenue | | 3,986 | | 2,773 | | 75 | | (1,779 | ) | (1,380 | ) | (160 | ) | 570 | |
Impact of allocating available revenue | | — | | — | | — | | — | | — | | (650 | ) | (700 | ) |
Surplus/(Deficit) | | 3,986 | | 2,773 | | 75 | | (1,779 | ) | (1,380 | ) | (810 | ) | (130 | ) |
First Quarterly Report 2010/11
45
Appendix
Table A2 Revenue by Source — 2006/07 to 2012/13
| | | | | | | | | | Updated | | Updated | | Updated | |
| | Actual | | Actual | | Actual | | Actual | | Forecast | | Plan | | Plan | |
($ millions) | | 2006/07 | | 2007/08 | | 2008/09 | | 2009/10 | | 2010/11 | | 2011/12 | | 2012/13 | |
Taxation revenue | | | | | | | | | | | | | | | |
Personal income | | 6,905 | | 6,956 | | 6,093 | | 5,529 | | 5,741 | | 6,053 | | 6,469 | |
Corporate income | | 1,538 | | 2,250 | | 2,038 | | 1,317 | | 1,521 | | 1,625 | | 2,076 | |
Harmonized sales | | — | | — | | — | | — | | 3,819 | | 5,401 | | 5,745 | |
Other sales (1) | | 4,714 | | 5,072 | | 4,958 | | 4,765 | | 1,399 | | 201 | | 173 | |
Fuel | | 901 | | 935 | | 891 | | 884 | | 890 | | 897 | | 907 | |
Carbon | | — | | — | | 306 | | 542 | | 730 | | 933 | | 1,141 | |
Tobacco | | 726 | | 692 | | 708 | | 682 | | 747 | | 686 | | 686 | |
Property | | 1,732 | | 1,795 | | 1,848 | | 1,884 | | 1,916 | | 1,917 | | 2,007 | |
Property transfer | | 914 | | 1,068 | | 715 | | 887 | | 900 | | 980 | | 1,027 | |
Corporation capital | | 91 | | 117 | | 108 | | 95 | | — | | — | | — | |
Other (2) | | 496 | | 521 | | 532 | | 517 | | 439 | | 413 | | 424 | |
| | 18,017 | | 19,406 | | 18,197 | | 17,102 | | 18,102 | | 19,106 | | 20,655 | |
Natural resource revenue | | | | | | | | | | | | | | | |
Natural gas royalties | | 1,207 | | 1,132 | | 1,314 | | 406 | | 532 | | 794 | | 1,075 | |
Bonus bids, permits and fees | | 441 | | 569 | | 814 | | 867 | | 935 | | 969 | | 981 | |
Forests | | 1,276 | | 1,087 | | 558 | | 387 | | 462 | | 610 | | 641 | |
Other natural resources | | 1,020 | | 953 | | 1,121 | | 986 | | 1,075 | | 1,228 | | 1,276 | |
| | 3,944 | | 3,741 | | 3,807 | | 2,646 | | 3,004 | | 3,601 | | 3,973 | |
Other revenue | | | | | | | | | | | | | | | |
Medical Services Plan premiums | | 1,524 | | 1,557 | | 1,595 | | 1,666 | | 1,755 | | 1,900 | | 2,035 | |
Post secondary education fees | | 928 | | 979 | | 1,039 | | 1,126 | | 1,185 | | 1,217 | | 1,253 | |
Other fees and licences | | 1,351 | | 1,439 | | 1,373 | | 1,327 | | 1,501 | | 1,396 | | 1,397 | |
Investment earnings | | 1,041 | | 1,150 | | 817 | | 963 | | 939 | | 1,078 | | 1,213 | |
Miscellaneous (3) | | 2,568 | | 2,592 | | 2,585 | | 2,754 | | 2,627 | | 2,889 | | 2,601 | |
| | 7,412 | | 7,717 | | 7,409 | | 7,836 | | 8,007 | | 8,480 | | 8,499 | |
Contributions from the federal government | | | | | | | | | | | | | | | |
Health and social transfers | | 4,473 | | 4,614 | | 4,743 | | 4,883 | | 5,127 | | 5,368 | | 5,667 | |
Harmonized sales tax transition payments | | — | | — | | — | | 250 | | 769 | | 580 | | — | |
Equalization | | 459 | | — | | — | | — | | — | | — | | — | |
Other cost shared agreements (4) | | 1,455 | | 1,318 | | 1,242 | | 1,784 | | 1,972 | | 1,479 | | 1,440 | |
| | 6,387 | | 5,932 | | 5,985 | | 6,917 | | 7,868 | | 7,427 | | 7,107 | |
Commercial Crown corporation net income | | | | | | | | | | | | | | | |
BC Hydro (5) | | 407 | | 369 | | 365 | | 447 | | 604 | | 669 | | 655 | |
Liquor Distribution Branch | | 840 | | 857 | | 891 | | 877 | | 963 | | 985 | | 1,002 | |
BCLC (net of payments to the federal government) | | 1,011 | | 1,080 | | 1,082 | | 1,070 | | 1,071 | | 1,082 | | 1,118 | |
ICBC (6) | | 381 | | 633 | | 512 | | 601 | | 339 | | 238 | | 212 | |
Transportation Investment Corporation (Port Mann) | | — | | — | | (8 | ) | (4 | ) | (14 | ) | (14 | ) | (8 | ) |
Other | | 49 | | 37 | | 62 | | 29 | | 21 | | 22 | | 23 | |
| | 2,688 | | 2,976 | | 2,904 | | 3,020 | | 2,984 | | 2,982 | | 3,002 | |
Total revenue | | 38,448 | | 39,772 | | 38,302 | | 37,521 | | 39,965 | | 41,596 | | 43,236 | |
(1) Includes social service tax and, after June 30 , 2010, continuation of the tax on designated property now at 12%. More details are available in Table A6.
(2) Includes revenue from insurance premium and hotel room taxes.
(3) Includes asset dispositions, reimbursements for health care and other services provided to external agencies, and other recoveries.
(4) Includes contributions for health, education, housing and social service programs, for transportation projects, and for coastal ferry services.
(5) In July 2010 BC Hydro was re-amalgamated with BC Transmission Corporation. Amounts for 2010/11 onward have been restated to reflect this change.
(6) Actual amounts for 2006/07 to 2009/10 represent earnings during government’s fiscal year.
First Quarterly Report 2010/11
46
Appendix
Table A3 Expense by Function – 2006/07 to 2012/13
| | | | | | | | | | Updated | | Updated | | Updated | |
| | Actual | | Actual | | Actual | | Actual | | Forecast | | Plan | | Plan | |
($ millions) | | 2006/07 (1) | | 2007/08 (1) | | 2008/09 (1) | | 2009/10 (1) | | 2010/11 | | 2011/12 | | 2012/13 | |
Health | | | | | | | | | | | | | | | |
Medical Services Plan | | 2,969 | | 3,274 | | 3,424 | | 3,609 | | 3,818 | | 4,029 | | 4,131 | |
Pharmacare | | 914 | | 955 | | 1,010 | | 1,053 | | 1,099 | | 1,147 | | 1,203 | |
Regional services | | 8,496 | | 9,033 | | 9,750 | | 9,966 | | 10,617 | | 11,217 | | 11,480 | |
Other healthcare expenses (2) | | 816 | | 942 | | 854 | | 831 | | 986 | | 995 | | 1,015 | |
| | 13,195 | | 14,204 | | 15,038 | | 15,459 | | 16,520 | | 17,388 | | 17,829 | |
Education | | | | | | | | | | | | | | | |
Elementary and secondary | | 5,272 | | 5,521 | | 5,740 | | 5,778 | | 5,806 | | 5,890 | | 5,911 | |
Post-secondary | | 4,072 | | 4,314 | | 4,554 | | 4,740 | | 4,694 | | 4,699 | | 4,755 | |
Other education expenses (3) | | 147 | | 152 | | 158 | | 528 | | 508 | | 453 | | 450 | |
| | 9,491 | | 9,987 | | 10,452 | | 11,046 | | 11,008 | | 11,042 | | 11,116 | |
Social services | | | | | | | | | | | | | | | |
Social assistance (2),(3) | | 1,254 | | 1,271 | | 1,352 | | 1,462 | | 1,437 | | 1,468 | | 1,468 | |
Child welfare (2) | | 964 | | 925 | | 1,073 | | 1,077 | | 1,172 | | 1,172 | | 1,171 | |
Community living and other services | | 586 | | 756 | | 723 | | 729 | | 840 | | 785 | | 783 | |
| | 2,804 | | 2,952 | | 3,148 | | 3,268 | | 3,449 | | 3,425 | | 3,422 | |
Protection of persons and property | | 1,184 | | 1,429 | | 1,429 | | 1,380 | | 1,414 | | 1,347 | | 1,345 | |
Transportation | | 1,251 | | 1,378 | | 1,401 | | 1,453 | | 1,522 | | 1,540 | | 1,607 | |
Natural resources and economic development | | 1,581 | | 1,861 | | 1,658 | | 1,883 | | 1,803 | | 1,402 | | 1,423 | |
Other | | 1,220 | | 1,374 | | 1,637 | | 1,418 | | 1,398 | | 1,207 | | 1,255 | |
Contingencies (4) | | –– | | –– | | –– | | –– | | 450 | | 450 | | 450 | |
General government | | 1,198 | | 1,131 | | 1,321 | | 1,224 | | 1,136 | | 1,085 | | 1,063 | |
Debt servicing costs | | 2,274 | | 2,239 | | 2,161 | | 2,169 | | 2,345 | | 2,570 | | 2,756 | |
Subtotal | | 34,198 | | 36,555 | | 38,245 | | 39,300 | | 41,045 | | 41,456 | | 42,266 | |
Negotiating Framework incentive payments | | 264 | | 4 | | 2 | | –– | | –– | | –– | | –– | |
Climate Action Dividend | | –– | | 440 | | (20 | ) | –– | | –– | | –– | | –– | |
Total expense | | 34,462 | | 36,999 | | 38,227 | | 39,300 | | 41,045 | | 41,456 | | 42,266 | |
(1) Restated to reflect government’s current organization and accounting policies.
(2) Payments for healthcare services by the Ministry of Housing and Social Development and the Ministry of Children and Family Development made on behalf of their clients are reported in the Health function.
(3) Payments for training costs by the Ministry of Housing and Social Development made on behalf of its clients are reported in the Education function. Beginning in 2009/10, includes the expenses of the Labout Market Development Agreement made with the federal government.
(4) The Contingencies vote is allocated to functions according to actual results for 2006/07 to 2009/10.
First Quarterly Report 2010/11
47
Appendix
Table A4 Service Delivery Agency Operating Results (1) – 2006/07 to 2012/13
| | | | | | | | | | Updated | | Updated | | Updated | |
| | Actual | | Actual | | Actual | | Actual | | Forecast | | Plan | | Plan | |
($millions) | | 2006/07 | | 2007/08 | | 2008/09 | | 2009/10 | | 2010/11 | | 2011/12 | | 2012/13 | |
School districts | | | | | | | | | | | | | | | |
Revenue | | 5,178 | | 5,243 | | 5,385 | | 5,419 | | 5,528 | | 5,528 | | 5,554 | |
Expense | | (5,041 | ) | (5,133 | ) | (5,352 | ) | (5,379 | ) | (5,440 | ) | (5,515 | ) | (5,535 | ) |
| | 137 | | 110 | | 33 | | 40 | | 88 | | 13 | | 19 | |
Accounting adjustments | | 39 | | 88 | | 158 | | 134 | | 129 | | 206 | | 138 | |
Net impact | | 176 | | 198 | | 191 | | 174 | | 217 | | 219 | | 157 | |
| | | | | | | | | �� | | | | | | |
Post-secondary institutions | | | | | | | | | | | | | | | |
Revenue | | 4,129 | | 4,178 | | 4,145 | | 4,935 | | 4,881 | | 4,954 | | 5,007 | |
Expense | | (3,903 | ) | (4,133 | ) | (4,435 | ) | (4,628 | ) | (4,825 | ) | (4,885 | ) | (4,945 | ) |
| | 226 | | 45 | | (290 | ) | 307 | | 56 | | 69 | | 62 | |
Accounting adjustments | | 270 | | 493 | | 202 | | (21 | ) | 121 | | (19 | ) | (79 | ) |
Net impact | | 496 | | 538 | | (88 | ) | 286 | | 177 | | 50 | | (17 | ) |
| | | | | | | | | | | | | | | |
Health authorities and hospital societies | | | | | | | | | | | | | | | |
Revenue | | 8,857 | | 9,467 | | 10,272 | | 10,783 | | 11,164 | | 11,701 | | 11,954 | |
Expense | | (8,892 | ) | (9,495 | ) | (10,292 | ) | (10,761 | ) | (11,164 | ) | (11,701 | ) | (11,954 | ) |
| | (35 | ) | (28 | ) | (20 | ) | 22 | | — | | — | | — | |
Accounting adjustments | | 64 | | 181 | | (36 | ) | 32 | | 139 | | 144 | | (12 | ) |
Net impact | | 29 | | 153 | | (56 | ) | 54 | | 139 | | 144 | | (12 | ) |
| | | | | | | | | | | | | | | |
Community Living BC | | | | | | | | | | | | | | | |
Revenue | | 631 | | 687 | | 724 | | 718 | | 691 | | 697 | | 697 | |
Expense | | (631 | ) | (687 | ) | (723 | ) | (717 | ) | (690 | ) | (697 | ) | (697 | ) |
| | — | | — | | 1 | | 1 | | 1 | | — | | — | |
Accounting adjustments | | 1 | | — | | 1 | | 5 | | 1 | | (6 | ) | (4 | ) |
Net impact | | 1 | | — | | 2 | | 6 | | 2 | | (6 | ) | (4 | ) |
| | | | | | | | | | | | | | | |
BC Transportation Financing Authority | | | | | | | | | | | | | | | |
Revenue | | 618 | | 651 | | 745 | | 635 | | 624 | | 658 | | 663 | |
Expense | | (585 | ) | (722 | ) | (660 | ) | (928 | ) | (817 | ) | (919 | ) | (1,000 | ) |
| | 33 | | (71 | ) | 85 | | (293 | ) | (193 | ) | (261 | ) | (337 | ) |
Accounting adjustments | | (155 | ) | (171 | ) | (285 | ) | (35 | ) | (122 | ) | (115 | ) | (111 | ) |
Net impact | | (122 | ) | (242 | ) | (200 | ) | (328 | ) | (315 | ) | (376 | ) | (448 | ) |
| | | | | | | | | | | | | | | |
BC Pavilion Corporation | | | | | | | | | | | | | | | |
Revenue | | 39 | | 70 | | 45 | | 103 | | 76 | | 96 | | 111 | |
Expense | | (39 | ) | (41 | ) | (44 | ) | (103 | ) | (101 | ) | (117 | ) | (118 | ) |
| | — | | 29 | | 1 | | — | | (25 | ) | (21 | ) | (7 | ) |
Accounting adjustments | | 105 | | 26 | | 290 | | (8 | ) | 207 | | 44 | | (35 | ) |
Net impact | | 105 | | 55 | | 291 | | (8 | ) | 182 | | 23 | | (42 | ) |
First Quarterly Report 2010/11
48
Appendix
Table A4 Service Delivery Agency Operating Results (1) – 2006/07 to 2012/13 (continued)
| | | | | | | | | | Updated | | Updated | | Updated | |
| | Actual | | Actual | | Actual | | Actual | | Forecast | | Plan | | Plan | |
($millions) | | 2006/07 | | 2007/08 | | 2008/09 | | 2009/10 | | 2010/11 | | 2011/12 | | 2012/13 | |
British Columbia Housing Management Commission | | | | | | | | | | | | | | | |
Revenue | | 497 | | 540 | | 627 | | 621 | | 888 | | 639 | | 563 | |
Expense | | (497 | ) | (540 | ) | (627 | ) | (621 | ) | (888 | ) | (639 | ) | (570 | ) |
| | — | | — | | — | | — | | — | | — | | (7 | ) |
Accounting adjustments | | (15 | ) | (4 | ) | 14 | | (7 | ) | (4 | ) | — | | — | |
Net impact | | (15 | ) | (4 | ) | 14 | | (7 | ) | (4 | ) | — | | (7 | ) |
| | | | | | | | | | | | | | | |
British Columbia Transit | | | | | | | | | | | | | | | |
Revenue | | 165 | | 188 | | 229 | | 257 | | 294 | | 309 | | 344 | |
Expense | | (167 | ) | (187 | ) | (232 | ) | (257 | ) | (294 | ) | (309 | ) | (344 | ) |
| | (2 | ) | 1 | | (3 | ) | — | | — | | — | | — | |
Accounting adjustments | | (9 | ) | 2 | | (6 | ) | 34 | | (25 | ) | 4 | | 13 | |
Net impact | | (11 | ) | 3 | | (9 | ) | 34 | | (25 | ) | 4 | | 13 | |
| | | | | | | | | | | | | | | |
Tourism British Columbia | | | | | | | | | | | | | | | |
Revenue | | 60 | | 61 | | 65 | | 111 | | — | | — | | — | |
Expense | | (59 | ) | (63 | ) | (65 | ) | (109 | ) | — | | — | | — | |
| | 1 | | (2 | ) | — | | 2 | | — | | — | | — | |
Accounting adjustments | | 7 | | (1 | ) | 1 | | (8 | ) | — | | — | | — | |
Net impact | | 8 | | (3 | ) | 1 | | (6 | ) | — | | — | | — | |
| | | | | | | | | | | | | | | |
Other service delivery agencies | | | | | | | | | | | | | | | |
Revenue | | 683 | | 705 | | 735 | | 718 | | 681 | | 1,027 | | 749 | |
Expense | | (610 | ) | (662 | ) | (702 | ) | (704 | ) | (652 | ) | (691 | ) | (724 | ) |
| | 73 | | 43 | | 33 | | 14 | | 29 | | 336 | | 25 | |
Accounting adjustments | | 22 | | 20 | | (20 | ) | 132 | | 587 | | 151 | | 84 | |
Net impact | | 95 | | 63 | | 13 | | 146 | | 616 | | 487 | | 109 | |
| | | | | | | | | | | | | | | |
Total net impact | | 762 | | 761 | | 159 | | 351 | | 989 | | 545 | | (251 | ) |
| | | | | | | | | | | | | | | |
Total service delivery agency operating results: | | | | | | | | | | | | | | | |
Revenue | | 20,857 | | 21,790 | | 22,972 | | 24,300 | | 24,827 | | 25,609 | | 25,642 | |
Accounting adjustments | | 323 | | 624 | | 312 | | 258 | | 1,033 | | 409 | | (6 | ) |
| | 21,180 | | 22,414 | | 23,284 | | 24,558 | | 25,860 | | 26,018 | | 25,636 | |
Expense | | (20,424 | ) | (21,663 | ) | (23,132 | ) | (24,207 | ) | (24,871 | ) | (25,473 | ) | (25,887 | ) |
Accounting adjustments | | 6 | | 10 | | 7 | | — | | — | | — | | — | |
| | (20,418 | ) | (21,653 | ) | (23,125 | ) | (24,207 | ) | (24,871 | ) | (25,473 | ) | (25,887 | ) |
Total net impact | | 762 | | 761 | | 159 | | 351 | | 989 | | 545 | | (251 | ) |
(1) Revenue and expense are shown as reported in the entity financial statements and service plans, before consolidation and accounting adjustments.
First Quarterly Report 2010/11
49
Appendix
Table A5 Material Assumptions — Revenue
| | | | Updated | | Updated | | Updated | | | |
Revenue Source and Assumptions | | Budget | | Forecast | | Plan | | Plan | | | |
($ millions unless otherwise specified) | | 2010/11 | | 2011/12 | | 2012/13 | | Sensitivities 2010/11 | |
Personal income tax | | $ | 5,861 | | $ | 5,741 | | $ | 6,053 | | $ | 6,469 | | | |
Current calendar year assumptions | | | | | | | | | | | |
Personal income growth | | 2.7 | % | 2.7 | % | 3.6 | % | 4.6 | % | +/- 1% change in 2010 BC personal income growth equals +/- $50 to $100 million | |
Labour income growth | | 2.8 | % | 3.0 | % | 4.0 | % | 4.8 | % | |
Tax base growth | | 2.9 | % | 2.4 | % | 4.2 | % | 5.6 | % | |
Average tax yield | | 5.05 | % | 4.86 | % | 4.90 | % | 4.93 | % | | |
Current-year tax | | $ | 6,041 | | $ | 5,952 | | $ | 6,248 | | $ | 6,648 | | +/- 1% change in 2009 BC personal or taxable income growth equals +/- $50 to $100 million one-time effect (prior-year adjustment) and could result in an additional base change in 2010/11 | |
BC Tax Reduction | | $ | -129 | | $ | -137 | | $ | -140 | | $ | -143 | |
Low income climate action tax credit | | $ | -153 | | $ | -153 | | $ | -161 | | $ | -168 | |
Sales tax/BC HST credit | | $ | -146 | | $ | -146 | | $ | -283 | | $ | -280 | |
Other tax credits and refunds | | $ | -100 | | $ | -100 | | $ | -98 | | $ | -93 | |
Policy neutral elasticity * | | 1.4 | | 1.2 | | 1.4 | | 1.4 | |
Fiscal year assumptions | | | | | | | | | | | |
Prior-year adjustment | | | | $ | -52 | | | | | | | |
Family Bonus offset | | $ | -7 | | $ | -7 | | $ | -5 | | $ | -4 | | | |
2009 Tax-year | | 2009 Assumptions | | | | | | | |
Personal income growth | | -1.5 | % | -1.2 | % | | | | | | |
Tax base growth | | -2.3 | % | 0.5 | % | | | | | | |
Average 2009 tax yield | | 5.12 | % | 4.93 | % | | | | | | |
2009 tax | | $ | 5,955 | | $ | 5,897 | | | | | | | |
BC Tax Reduction | | $ | -127 | | $ | -135 | | | | | | | |
Low income climate action tax credit | | $ | -153 | | $ | -153 | | | | | | | |
Sales tax credit | | $ | -53 | | $ | -53 | | | | | | | |
Other tax credits and refunds | | $ | -106 | | $ | -106 | | | | | | | |
Policy neutral elasticity * | | 1.0 | | 1.6 | | | | | | | |
* Ratio of annual per cent change in current-year revenue to annual per cent change in personal income (calendar year).
Corporate income tax | | $ | 847 | | $ | 1,521 | | $ | 1,625 | | $ | 2,076 | | | |
Components of revenue (fiscal year) | | | | | | | | | | | |
Advance instalments | | $ | 1,157 | | $ | 1,476 | | $ | 1,502 | | $ | 1,767 | | | |
International Business Activity Act refunds | | $ | -10 | | $ | -20 | | $ | -20 | | $ | -20 | | | |
Prior-year adjustment | | $ | -300 | | $ | 65 | | $ | 143 | | $ | 329 | | | |
Current calendar year assumptions | | | | | | | | | | | |
National tax base ($ billions) | | $ | 169.7 | | $ | 201.8 | | $ | 225.4 | | $ | 245.8 | | +/- 1% change in the 2010 national tax base equals +/- $15 to $25 million | |
BC instalment share of national tax base | | 11.8 | % | 11.8 | % | 11.2 | % | 13.4 | % | |
Effective tax rates (general/small business) | | 10.5 / 2.5 | | 10.5 / 2.5 | | 10.0 / 2.5 | | 10.0 / 0.6 | | |
BC tax base growth (post federal measures) | | 12.8 | % | 19.8 | % | 10.0 | % | 6.8 | % | | |
BC corporate profits growth | | 12.7 | % | 19.6 | % | 9.3 | % | 7.8 | % | +/- 1% change in the 2009 BC tax base equals +/- $20 to $30 million in 2010/11 | |
BC Tax credits | | | | | | | | | | |
Film, Television and Production Services | | $ | -163 | | $ | -178 | | $ | -188 | | $ | -198 | | |
Scientific Research and Experimental Development | | $ | -140 | | $ | -140 | | $ | -149 | | $ | -149 | | | |
Interactive Digital Media | | $ | 0 | | $ | -5 | | $ | -35 | | $ | -35 | | | |
Other | | $ | -26 | | $ | -46 | | $ | -46 | | $ | -56 | | | |
2009 Tax-year | | 2009 Assumptions | | | | | | | |
BC tax base growth | | -26.2 | % | -3.6 | % | | | | | | |
BC corporate profits growth | | -35.8 | % | -30.5 | % | | | | | | |
Gross 2009 tax | | $ | 1,348 | | $ | 1,758 | | | | | | | |
Prior-year adjustments | | $ | -300 | | $ | 65 | | | | | | | |
Prior years losses/gains (included in above) | | $ | -150 | | $ | -150 | | | | | | | |
BC Tax credits | | | | | | | | | | | |
Film, Television and Production Services | | $ | -143 | | $ | -168 | | | | | | | |
Scientific Research and Experimental Development | | $ | -130 | | $ | -140 | | | | | | | |
Other | | $ | -21 | | $ | -31 | | | | | | | |
Revenue is recorded on a cash basis. Due to lags in the federal collection and instalment systems, changes to the BC corporate profits and tax base forecasts affect revenue in the succeeding year. The 2010/11 instalments from the federal government reflect 9 months of payments related to the 2010 tax year (Apr/10-Dec/10) and 3 months of payments related to the 2011 tax year (Jan/11-Mar/11). Instalments for the 2010 (2011) tax year are based on BC’s share of the national tax base for the 2008 (2009) tax year and a forecast of the 2010 (2011) national tax base. BC’s share of the 2008 national tax base was 11.8%, based on tax assessments as of December 31, 2009. Cash adjustments for any under/over payments from the federal government in respect of 2009 will be received/paid on March 31, 2011.
First Quarterly Report 2010/11
50
Appendix
Table A5 Material Assumptions — Revenue (continued)
| | | | Updated | | Updated | | Updated | | | |
Revenue Source and Assumptions | | Budget | | Forecast | | Plan | | Plan | | | |
($ millions unless otherwise specified) | | 2010/11 | | 2011/12 | | 2012/13 | | Sensitivities 2010/11 | |
Harmonized sales tax | | $ | 3,784 | | $ | 3,819 | | $ | 5,401 | | $ | 5,745 | | | |
Calendar Year | | | | | | | | | | +/- 1% change in consumer expenditure growth equals up to +/- $30 million | |
Nominal consumer expenditure | | 4.3 | % | 4.4 | % | 4.6 | % | 5.0 | % |
Nominal residential investment | | 17.9 | % | 14.6 | % | 6.6 | % | 4.9 | % |
Above two bases represent about 84% of the total base | | | | | | | | | | | |
| | | | | | | | | | | |
HST Rebates (% rebate of the provincial portion of the HST paid) | | | | | | | | | | +/- 1% change in residential construction growth equals up to +/- $10 million | |
Municipalities | | 75 | % | 75 | % | 75 | % | 75 | % |
Charities and non-profit organizations | | 57 | % | 57 | % | 57 | % | 57 | % | | |
New housing (up to $26,250) | | 71.43 | % | 71.43 | % | 71.43 | % | 71.43 | % | | |
School authorities | | 87 | % | 87 | % | 87 | % | 87 | % | | |
Universities and public colleges | | 75 | % | 75 | % | 75 | % | 75 | % | | |
Hospital authorities | | 58 | % | 58 | % | 58 | % | 58 | % | | |
| | | | | | | | | | | |
Components of revenue | | | | | | | | | | +/- 1% change in the proportion of the consumer expenditure and residential construction bases equals up to -/+ $40 million | |
Gross | | $ | 4,914 | | $ | 4,969 | | $ | 6,946 | | $ | 7,355 |
Input tax credit denial (temporary) | | $ | 118 | | $ | 118 | | $ | 162 | | $ | 168 |
Rebates: | | | | | | | | |
- Point of sale | | $ | (248 | ) | $ | (268 | ) | $ | (332 | ) | $ | (334 | ) | | |
- Municipalities, charities & non profit organizations | | $ | (220 | ) | $ | (219 | ) | $ | (305 | ) | $ | (320 | ) | | |
- SUCH sector | | $ | (167 | ) | $ | (170 | ) | $ | (237 | ) | $ | (249 | ) | | |
- New housing | | $ | (438 | ) | $ | (436 | ) | $ | (613 | ) | $ | (644 | ) | | |
- Residential energy use | | $ | (175 | ) | $ | (175 | ) | $ | (220 | ) | $ | (231 | ) | | |
Other sales taxes | | $ | 1,399 | | $ | 1,399 | | $ | 201 | | $ | 173 | | | |
Components of social service tax revenue | | | | | | | | | | | |
Consolidated Revenue Fund (net of commissions) | | $ | 1,210 | | $ | 1,210 | | $ | 0 | | $ | 0 | | | |
BC Transportation Financing Authority | | $ | 3 | | $ | 3 | | $ | 0 | | $ | 0 | | | |
Recoveries | | $ | 61 | | $ | 61 | | $ | 30 | | $ | 0 | | | |
Continued tax on private sales of vehicles (12% rate). | | $ | 125 | | $ | 125 | | $ | 171 | | $ | 173 | | | |
Fuel and carbon taxes | | $ | 1,604 | | $ | 1,620 | | $ | 1,830 | | $ | 2,048 | | | |
Calendar Year | | | | | | | | | | | |
Real GDP | | 2.2 | % | 3.1 | % | 2.2 | % | 2.8 | % | | |
Gasoline volumes | | -1.0 | % | 0.0 | % | 0.0 | % | 0.0 | % | | |
Diesel volumes | | 1.0 | % | 2.0 | % | 2.0 | % | 2.0 | % | | |
Natural gas volumes | | 2.0 | % | 1.0 | % | 1.0 | % | 1.0 | % | | |
| | | | | | | | | | | |
Carbon tax rates (July 1) | | | | | | | | | | | |
Carbon dioxide equivalent emissions ($/tonne) | | $ | 20 | | $ | 20 | | $ | 25 | | $ | 30 | | | |
Natural gas (cents/gigajoule) | | 99.32 | ¢ | 99.32 | ¢ | 124.15 | ¢ | 148.98 | ¢ | | |
Gasoline (cents/litre) | | 4.45 | ¢ | 4.45 | ¢ | 5.56 | ¢ | 6.67 | ¢ | | |
Light fuel oil (cents/litre) | | 5.11 | ¢ | 5.11 | ¢ | 6.39 | ¢ | 7.67 | ¢ | | |
Carbon tax revenue | | $ | 727 | | $ | 730 | | $ | 933 | | $ | 1,141 | | | |
Carbon tax rates change on July 1 | | | | | | | | | | | |
Components of fuel tax revenue | | | | | | | | | | | |
Consolidated Revenue Fund | | $ | 452 | | $ | 459 | | $ | 464 | | $ | 471 | | | |
BC Transit | | $ | 11 | | $ | 11 | | $ | 11 | | $ | 11 | | | |
BC Transportation Financing Authority | | $ | 414 | | $ | 420 | | $ | 422 | | $ | 425 | | | |
| | $ | 877 | | $ | 890 | | $ | 897 | | $ | 907 | | | |
Property taxes | | $ | 1,906 | | $ | 1,916 | | $ | 1,917 | | $ | 2,007 | | | |
Calendar Year | | | | | | | | | | | |
BC Consumer Price Index | | 1.8 | % | 1.7 | % | 1.9 | % | 2.1 | % | +/- 1% change in new construction and inflation equals up to +/- $5 million in residential property taxation revenue | |
Housing starts | | 20,480 | | 23,600 | | 23,901 | | 25,060 | | |
Home owner grants (fiscal year) | | $ | -723 | | $ | -724 | | $ | -804 | | $ | -824 | | |
| | | | | | | | | | |
Components of revenue | | | | | | | | | | |
Residential (net of home owner grants) | | $ | 669 | | $ | 679 | | $ | 646 | | $ | 677 | | | |
Non-residential | | $ | 987 | | $ | 988 | | $ | 1,008 | | $ | 1,042 | | +/- 1% change in new construction and inflation equals up to +/- $5 million in non-residential property taxation revenue | |
Rural area | | $ | 83 | | $ | 82 | | $ | 85 | | $ | 86 | | |
Police | | $ | 23 | | $ | 23 | | $ | 23 | | $ | 23 | | |
BC Assessment Authority | | $ | 76 | | $ | 76 | | $ | 78 | | $ | 81 | | |
BC Transit | | $ | 70 | | $ | 70 | | $ | 79 | | $ | 100 | | |
Commissions | | $ | (2 | ) | $ | (2 | ) | $ | (2 | ) | $ | (2 | ) | | |
| | | | | | | | | | | | | | | | |
First Quarterly Report 2010/11
51
Appendix
Table A5 Material Assumptions — Revenue (continued)
| | | | Updated | | Updated | | Updated | | | |
Revenue Source and Assumptions | | Budget | | Forecast | | Plan | | Plan | | | |
($ millions unless otherwise specified) | | 2010/11 | | 2011/12 | | 2012/13 | | Sensitivities 2010/11 | |
Other taxes | | $ | 2,021 | | $ | 2,086 | | $ | 2,079 | | $ | 2,137 | | | |
Calendar Year | | | | | | | | | | | |
Population | | 1.5 | % | 1.6 | % | 1.5 | % | 1.4 | % | | |
BC Consumer Price Index | | 1.8 | % | 1.7 | % | 1.9 | % | 2.1 | % | | |
BC housing starts | | 27.4 | % | 46.8 | % | 1.3 | % | 4.8 | % | | |
Real GDP | | 2.2 | % | 3.1 | % | 2.2 | % | 2.8 | % | | |
Nominal GDP | | 4.5 | % | 5.0 | % | 4.0 | % | 5.1 | % | | |
| | | | | | | | | | | |
Components of revenue | | | | | | | | | | | |
Property transfer | | $ | 900 | | $ | 900 | | $ | 980 | | $ | 1,027 | | | |
Tobacco (net of commissions) | | $ | 686 | | $ | 747 | | $ | 686 | | $ | 686 | | | |
Corporation capital | | $ | 0 | | $ | 4 | | $ | 0 | | $ | 0 | | | |
Insurance premium | | $ | 403 | | $ | 403 | | $ | 413 | | $ | 424 | | | |
Hotel room (net of commissions) | | $ | 32 | | $ | 32 | | $ | 0 | | $ | 0 | | | |
Energy, sales of Crown land tenures, metals, minerals and other | | $ | 2,320 | | $ | 2,138 | | $ | 2,558 | | $ | 2,871 | | | |
Natural gas price | | | | | | | | | | +/- $1.00 change in the | |
Plant inlet, $Cdn/gigajoule | | $ | 4.29 | | $ | 3.35 | | $ | 4.02 | | $ | 4.64 | | natural gas price equals | |
Sumas, $US/ MMBtu | | $ | 5.71 | | $ | 4.76 | | $ | 5.59 | | $ | 6.19 | | +/- $255 to $305 million | |
Natural gas volumes (petajoules) | | | | | | | | | | +/- 1% change in natural gas | |
Base gas production | | 517 | | 517 | | 444 | | 371 | | volumes equals +/- $5 to $15 | |
Incremental gas production | | 686 | | 686 | | 1,038 | | 1,325 | | million | |
Total gas volume production | | 1,203 | | 1,203 | | 1,482 | | 1,696 | | +/- 1 cent change in the exchange rate equals +/- $15 to $25 million on natural gas royalties | |
Annual per cent change | | 7.9 | % | 8.8 | % | 23.2 | % | 14.4 | % |
| | | | | | | | | |
Oil price ($US/bbl at Cushing, Ok) | | $ | 80.02 | | $ | 79.24 | | $ | 84.33 | | $ | 87.71 | | | |
Auctioned land base (000 hectares) | | 582 | | 628 | | 616 | | 609 | | | |
Average bid price/hectare ($) | | $ | 1,200 | | $ | 1,500 | | $ | 943 | | $ | 1,198 | | | |
Cash sales of Crown land tenures | | $ | 698 | | $ | 942 | | $ | 581 | | $ | 730 | | | |
Metallurgical coal price ($US/tonne, fob west coast) | | $ | 167 | | $ | 222 | | $ | 232 | | $ | 234 | | | |
Copper price ($US/lb) | | $ | 3.19 | | $ | 2.91 | | $ | 3.00 | | $ | 2.75 | | | |
Annual electricity volumes set by treaty (million mega-watt hours) | | 4.6 | | 4.6 | | 4.5 | | 4.3 | | +/- 10% change in the average Mid-Columbia electricity price equals +/- $25 to $30 million | |
Mid-Columbia electricity price ($US/mega-watt hour) | | $ | 53 | | $ | 40 | | $ | 45 | | $ | 48 | |
| | | | | | | | | | | |
Exchange rate (US¢/ Cdn$, calendar year) | | 97.4 | | 96.1 | | 98.9 | | 98.5 | | | |
| | | | | | | | | | | |
Components of revenue | | | | | | | | | | Based on a recommendation from the Auditor General to be consistent with generally accepted accounting principles, bonus bid revenue recognition reflects nine-year deferral of cash receipts from the sale of Crown land tenures | |
Natural gas royalties | | $ | 698 | | $ | 532 | | $ | 794 | | $ | 1,075 |
Bonus bids, fees and rentals | | $ | 993 | | $ | 935 | | $ | 969 | | $ | 981 |
Petroleum royalties | | $ | 68 | | $ | 78 | | $ | 73 | | $ | 70 |
Columbia River Treaty electricity sales | | $ | 230 | | $ | 170 | | $ | 190 | | $ | 195 |
Coal | | $ | 226 | | $ | 327 | | $ | 432 | | $ | 436 |
Minerals, metals and other | | $ | 71 | | $ | 62 | | $ | 61 | | $ | 71 |
Oil and Gas Commission fees and levies | | $ | 34 | | $ | 34 | | $ | 39 | | $ | 43 | | | |
| | | | | | | | | | | | | | | |
Royalty programs and infrastructure credits | | | | | | | | | | | |
Summer drilling | | $ | -37 | | $ | -37 | | $ | -37 | | $ | -37 | | | |
Deep drilling | | $ | -130 | | $ | -101 | | $ | -151 | | $ | -223 | | | |
Road and pipeline infrastructure | | $ | -115 | | $ | -56 | | $ | -127 | | $ | -105 | | | |
Total | | $ | -282 | | $ | -194 | | $ | -315 | | $ | -365 | | | |
Implicit average natural gas royalty rate | | 13.5 | % | 13.2 | % | 13.3 | % | 13.6 | % | | |
Royalty program (marginal, low productivity and ultra marginal drilling) adjustments reflect reduced royalty rates. Natural gas royalties incorporate royalty programs and Treasury Board approved infrastructure credits.
First Quarterly Report 2010/11
52
Appendix
Table A5 Material Assumptions — Revenue (continued)
| | | | Updated | | Updated | | Updated | | | |
Revenue Source and Assumptions | | Budget | | Forecast | | Plan | | Plan | | | |
($ millions unless otherwise specified) | | 2010/11 | | 2011/12 | | 2012/13 | | Sensitivities 2010/11 | |
Forests | | $ | 491 | | $ | 462 | | $ | 610 | | $ | 641 | | | |
Prices (calendar year average) | | | | | | | | | | +/- US$50 change in SPF price equals +/- $35 to $70 million +/- US$100 change in hemlock price equals +/- $10 to $20 million +/- US$50 change in pulp price equals +/-$5 to $10 million +/- Cdn$10 change in average log price equals +/-$30 to $50 million +/- 1 cent change in exchange rate equals +/- $8 to $10 million on stumpage revenue | |
SPF 2x4 ($US/1000 bd ft) | | $ | 225 | | $ | 240 | | $ | 238 | | $ | 288 |
Random Lengths Composite | | | | | | | | |
($US/thousand board feet) | | $ | 260 | | $ | 278 | | $ | 273 | | $ | 323 |
Hemlock price ($US/1000 bd ft) | | $ | 750 | | $ | 765 | | $ | 713 | | $ | 675 |
Pulp ($US/tonne) | | $ | 763 | | $ | 920 | | $ | 865 | | $ | 738 |
Coastal log ($Cdn/cubic metre) | | | | | | | | |
(Vancouver Log Market, fiscal year) | | $ | 66 | | $ | 67 | | $ | 67 | | $ | 71 |
| | | | | | | | |
Fiscal Year Trade Assumptions | | | | | | | | |
Export tax rate (effective rate) | | 15.0 | % | 12.9 | % | 13.8 | % | 6.3 | % |
Lumber shipments and consumption (billion board feet) | | | | | | | | | |
U.S. lumber consumption | | 35.1 | | 33.0 | | 36.4 | | 39.4 | | | |
BC surge trigger volumes | | 7.4 | | 7.0 | | 7.7 | | 8.4 | | | |
BC lumber exports to US | | 6.2 | | 5.9 | | 6.8 | | 7.8 | | | |
| | | | | | | | | | | |
| | | | | | | | | | | |
Crown harvest volumes (million cubic metres) | | | | | | | | | | +/- 10% change in Interior harvest volumes equals | |
Interior | | 37.2 | | 39.0 | | 40.5 | | 42.0 | | +/- $15 to $20 million | |
Coast | | 7.8 | | 11.0 | | 11.5 | | 13.0 | | +/- 10% change in Coastal harvest volumes equals | |
Total | | 45.0 | | 50.0 | | 52.0 | | 55.0 |
BC Timber Sales (included in above) | | 10.9 | | 10.9 | | 11.1 | | 11.8 | | +/- $6 to $12 million | |
| | | | | | | | | | | |
Components of revenue | | | | | | | | | | The above sensitivities relate to stumpage revenue only. Depending on market conditions, changes in stumpage revenues may be offset by changes in border tax revenues. | |
Tenures | | $ | 148 | | $ | 133 | | $ | 216 | | $ | 307 | | |
BC Timber Sales | | $ | 137 | | $ | 137 | | $ | 153 | | $ | 172 | | |
Federal border tax (SLA 2006) | | $ | 181 | | $ | 166 | | $ | 212 | | $ | 125 | | |
Logging tax | | $ | 4 | | $ | 4 | | $ | 7 | | $ | 15 | | |
Other CRF revenue | | $ | 10 | | $ | 10 | | $ | 11 | | $ | 11 | | |
Recoveries | | $ | 11 | | $ | 12 | | $ | 11 | | $ | 11 | | |
Other natural resources | | $ | 397 | | $ | 404 | | $ | 433 | | $ | 461 | | | |
Components of revenue | | | | | | | | | | | |
Water rental and licences* | | $ | 332 | | $ | 339 | | $ | 367 | | $ | 395 | | | |
Recoveries | | $ | 46 | | $ | 46 | | $ | 47 | | $ | 47 | | | |
Angling and hunting permits and licences | | $ | 12 | | $ | 12 | | $ | 12 | | $ | 12 | | | |
Recoveries | | $ | 7 | | $ | 7 | | $ | 7 | | $ | 7 | | | |
* Incorporates only BC Hydro rate increases approved by the BC Utilities Commission
Other revenue | | $ | 7,874 | | $ | 8,007 | | $ | 8,480 | | $ | 8,499 | | | |
Components of revenue | | | | | | | | | | | |
Fees and licences | | | | | | | | | | | |
Consolidated Revenue Fund | | $ | 2,495 | | $ | 2,512 | | $ | 2,636 | | $ | 2,761 | | | |
Recoveries | | $ | 212 | | $ | 223 | | $ | 127 | | $ | 134 | | | |
Crown corporations and agencies | | $ | 98 | | $ | 102 | | $ | 102 | | $ | 105 | | | |
Other service delivery agencies | | $ | 1,551 | | $ | 1,604 | | $ | 1,648 | | $ | 1,685 | | | |
Investment earnings | | | | | | | | | | | |
Consolidated Revenue Fund | | $ | 47 | | $ | 65 | | $ | 74 | | $ | 85 | | | |
Fiscal agency loans & sinking funds earnings | | $ | 726 | | $ | 725 | | $ | 817 | | $ | 929 | | | |
Crown corporations and agencies | | $ | 48 | | $ | 48 | | $ | 59 | | $ | 65 | | | |
Other service delivery agencies | | $ | 100 | | $ | 101 | | $ | 128 | | $ | 134 | | | |
Sales of goods and services | | $ | 701 | | $ | 709 | | $ | 740 | | $ | 762 | | | |
Miscellaneous | | | | | | | | | | | |
Consolidated Revenue Fund | | $ | 194 | | $ | 184 | | $ | 187 | | $ | 195 | | | |
Recoveries | | $ | 501 | | $ | 527 | | $ | 477 | | $ | 467 | | | |
Crown corporations and agencies | | $ | 75 | | $ | 84 | | $ | 386 | | $ | 73 | | | |
Other service delivery agencies | | $ | 1,126 | | $ | 1,123 | | $ | 1,099 | | $ | 1,104 | | | |
First Quarterly Report 2010/11
53
Appendix
Table A5 Material Assumptions — Revenue (continued)
| | | | | | | | | | | | | | | |
| | | | Updated | | Updated | | Updated | | | |
Revenue Source and Assumptions | | Budget | | Forecast | | Plan | | Plan | | | |
($ millions unless otherwise specified) | | 2010/11 | | 2011/12 | | 2012/13 | | Sensitivities 2010/11 | |
Health and social transfers | | $ | 5,165 | | $ | 5,127 | | $ | 5,368 | | $ | 5,667 | | | |
National Cash Transfers | | | | | | | | | | | |
Canada Health Transfer (CHT) | | $ | 25,426 | | $ | 25,426 | | $ | 26,952 | | $ | 28,569 | | | |
Wait Times Reduction Transfer (WTRT) | | $ | 250 | | $ | 250 | | $ | 250 | | $ | 250 | | +/- 0.1% change in BC’s | |
Canada Social Transfer (CST) | | $ | 11,178 | | $ | 11,178 | | $ | 11,514 | | $ | 11,859 | | population share equals | |
BC share of national population (June 1) | | 13.26 | % | 13.27 | % | 13.33 | % | 13.39 | % | +/- $45 to $50 million | |
BC health and social transfers revenue | | | | | | | | | | | |
CHT | | $ | 3,597 | | $ | 3,574 | | $ | 3,777 | | $ | 4,022 | | | |
WTRT | | $ | 33 | | $ | 33 | | $ | 33 | | $ | 34 | | | |
CST | | $ | 1,482 | | $ | 1,483 | | $ | 1,535 | | $ | 1,588 | | | |
Prior-year adjustments | | | | $ | -14 | | | | | | | |
Health deferral | | | | | | | | | | | |
Diagnostic and Medical Equipment | | $ | 16 | | $ | 16 | | $ | 16 | | $ | 16 | | | |
Medical Equipment Trust | | $ | 7 | | $ | 7 | | $ | 7 | | $ | 7 | | | |
Human Papillomavirus Immunization Trust | | $ | 13 | | $ | 11 | | — | | — | | | |
Patient Wait Times Guarantee Trust | | $ | 17 | | $ | 17 | | — | | — | | | |
Other federal contributions | | $ | 2,520 | | $ | 2,741 | | $ | 2,059 | | $ | 1,440 | | | |
Components of revenue | | | | | | | | | | | |
HST Transitional Funding | | $ | 769 | | $ | 769 | | $ | 580 | | — | | | |
Other Consolidated Revenue Fund | | $ | 176 | | $ | 259 | | $ | 156 | | $ | 149 | | | |
Labour Market Development Agreement | | $ | 296 | | $ | 349 | | $ | 294 | | $ | 292 | | | |
Local Government Services and Transfers | | $ | 172 | | $ | 172 | | $ | 50 | | $ | 50 | | | |
Canada-BC Co-operation on Immigration | | $ | 104 | | $ | 104 | | $ | 74 | | $ | 74 | | | |
Labour Market Agreement | | $ | 66 | | $ | 66 | | $ | 66 | | $ | 66 | | | |
Strategic Training and Transition Fund | | — | | $ | 30 | | — | | — | | | |
Police Officer’s Recruitment Fund | | $ | 21 | | $ | 21 | | $ | 2 | | — | | | |
Community Development Trust | | $ | 13 | | $ | 22 | | — | | — | | | |
Community Adjustment Fund Agreement | | $ | 15 | | $ | 15 | | — | | — | | | |
Other recoveries | | $ | 167 | | $ | 181 | | $ | 165 | | $ | 160 | | | |
Crown corporations and agencies | | $ | 308 | | $ | 286 | | $ | 205 | | $ | 175 | | | |
Other service delivery agencies | | $ | 413 | | $ | 467 | | $ | 467 | | $ | 474 | | | |
Service delivery agency direct revenue | | $ | 5,028 | | $ | 5,138 | | $ | 5,463 | | $ | 5,237 | | | |
School districts | | $ | 484 | | $ | 484 | | $ | 483 | | $ | 483 | | | |
Post-secondary institutions | | $ | 2,460 | | $ | 2,567 | | $ | 2,637 | | $ | 2,693 | | | |
Health authorities and hospital societies | | $ | 734 | | $ | 734 | | $ | 723 | | $ | 727 | | | |
BC Transportation Financing Authority | | $ | 471 | | $ | 486 | | $ | 486 | | $ | 494 | | | |
Other service delivery agencies | | $ | 879 | | $ | 867 | | $ | 1,134 | | $ | 840 | | | |
Commercial Crown corporation net income | | $ | 3,001 | | $ | 2,984 | | $ | 2,982 | | $ | 3,002 | | | |
BC Hydro | | $ | 617 | | $ | 604 | | $ | 669 | | $ | 655 | | | |
reservoir water inflows | | 100 | % | 90 | % | 100 | % | 100 | % | +/-1% in hydro generation | |
| | | | | | | | | | = +/-$15 million | |
mean gas price | | 5.44 | | 4.68 | | 5.46 | | 5.70 | | +/-10% = -/+$10 million | |
(Sumas, $US/MMbtu – BC Hydro forecast based on NYMEX forward selling prices) | | | | | | | | | | | |
electricity prices | | 42.13 | | 40.80 | | 42.24 | | 44.58 | | +/-$1/MWh in electricity trade margins = +/-$35 | |
(Mid-C, $US/MWh) | | | | | | | | | | |
assumed rate increases: | | | | | | | | | | million | |
- base rate | | 6.11 | % | 6.11 | % | 15.61 | % | 5.17 | % | | |
- rate rider changes from prior year | | 3.00 | % | 3.00 | % | 1.00 | % | 0.00 | % | | |
Assumed base rate increases for 2010/11 through 2012/13 reflect the notional annual increases that would be required for BC Hydro to earn its allowed return on equity as mandated by the BCUC. These increases are included for planning purposes only. Actual rate increases in these years will be determined by future applications to, and approval from, the BCUC. | |
ICBC | | $ | 303 | | $ | 339 | | $ | 238 | | $ | 212 | | | |
vehicle growth | | + 1.3 | % | + 1.5 | % | + 1.8 | % | + 1.8 | % | +/-1% = +/-$37 to $39 million | |
current claims cost percentage change | | + 3.7 | % | + 1.7 | % | + 2.4 | % | + 4.8 | % | +/-1% = -/+$27 to $31 million | |
investment return | | 4.4 | % | 3.9 | % | 3.9 | % | 4.6 | % | +/ -1% return = +/-$111 | |
| | | | | | | | | | to $118 million | |
loss ratio | | 85.1 | % | 82.9 | % | 84.9 | % | 87.6 | % | | |
| | | | | | | | | | | | | | | | | |
First Quarterly Report 2010/11
54
Appendix
Table A6 Natural Gas Price Forecasts – 2010/11 to 2012/13
| | | | | | | | Adjusted to fiscal years and | |
Private sector forecasts (calendar year) | | $C/gigajoule at plant inlet | |
| | 2010 | | 2011 | | 2012 | | 2010/11 | | 2011/12 | | 2012/13 | |
GLJ Henry Hub US$/MMBtu (Jul 1,10) | | 4.82 | | 5.50 | | 6.20 | | 3.19 | | 3.44 | | 4.09 | |
Sproule Henry Hub US$/MMBtu (Jun 30, 10) | | 4.85 | | 5.50 | | 5.81 | | 3.18 | | 3.33 | | 3.90 | |
McDaniel Henry Hub US$/MMBtu (Jul 1,10) | | 4.93 | | 5.60 | | 6.20 | | 3.26 | | 3.51 | | 4.17 | |
AJM Henry Hub US$/Mcf (Jun 30,10) | | 4.77 | | 5.90 | | 6.55 | | 3.06 | | 3.60 | | 4.18 | |
GLJ Alberta AECO-C Spot CDN$/MMBtu (Jul 1,10) | | 4.68 | | 5.21 | | 5.95 | | 3.69 | | 4.34 | | 4.97 | |
Sproule Alberta AECO-C Spot CDN$/MMBtu (Jun 30, 10) | | 4.61 | | 5.12 | | 5.45 | | 3.64 | | 4.14 | | 4.69 | |
McDaniel AECO-C Spot C$/MMBtu (Jul 1,10) | | 4.68 | | 5.30 | | 5.90 | | 3.72 | | 4.38 | | 4.99 | |
AJM AECO-C Spot C$/Mcf (Jun 30, 10) | | 4.64 | | 5.70 | | 6.55 | | 3.77 | | 4.63 | | 5.25 | |
GLJ Sumas Spot US$/MMBtu (Jul 1,10) | | 4.80 | | 5.05 | | 5.75 | | 3.48 | | 3.69 | | 4.34 | |
Sproule Sumas Spot CDN$/MMBtu (Jun 30, 10) | | 4.97 | | 5.61 | | 5.94 | | 3.61 | | 4.08 | | 4.63 | |
GLJ BC Spot Plant Gate CDN$/MMBtu (Jul 1,10) | | 4.33 | | 4.80 | | 5.53 | | 3.42 | | 3.99 | | 4.62 | |
Sproule BC Plant Inlet CDN$/MMBtu (Jun 30, 10) | | 3.70 | | 4.44 | | 4.77 | | 3.74 | | 4.30 | | 4.84 | |
McDaniel BC Spot Plant Gate C$MMBtu (Jul 1,10) | | 4.40 | | 5.10 | | 5.70 | | 3.61 | | 4.24 | | 4.85 | |
AJM BC Spot Plant Gate C$/Mcf (Jun 30, 10) | | 4.43 | | 5.40 | | 6.25 | | 3.59 | | 4.41 | | 5.03 | |
GLJ Midwest Chicago US$/MMBtu (Jul 1,10) | | 5.05 | | 5.60 | | 6.30 | | 3.43 | | 3.76 | | 4.41 | |
Sproule Alliance Plant Gate CDN$/MMBtu (Jun 30, 10) | | 3.83 | | 4.39 | | 4.82 | | 3.10 | | 3.48 | | 4.12 | |
EIA Henry Hub US$/MMBtu (Jul 7, 10) | | 4.71 | | 5.17 | | n/a | | 2.79 | | n/a | | n/a | |
TD Economics Henry Hub FuturesUS$/MMBtu (Jun 29, 10) | | 4.58 | | 5.44 | | n/a | | 2.73 | | n/a | | n/a | |
Scotiabank Group Henry Hub US$/MMBtu (Jun 1, 10) | | 4.75 | | 4.75 | | n/a | | 2.80 | | n/a | | n/a | |
BMO Alberta Empress US$/MMBtu (Jun 16, 10) | | 4.10 | | 5.15 | | n/a | | 3.12 | | n/a | | n/a | |
RBC Financial Henry Hub US$/Mcf (Jul 20, 10) | | 5.00 | | 5.75 | | n/a | | 3.05 | | n/a | | n/a | |
Exports Development Canada Henry Hub US$/MMBtu (Jul 7, 10) | | 5.00 | | 5.90 | | n/a | | 3.23 | | n/a | | n/a | |
Insite Henry Hub US$/MMBtu (Jun 30, 10) | | 4.87 | | 5.50 | | 6.25 | | 3.50 | | 4.71 | | 5.41 | |
Fekete AECO-C Spot CDN$/MMBtu (Jul 14, 10) | | 4.47 | | 5.10 | | 6.00 | | 3.57 | | 4.28 | | 5.09 | |
NYMEX Forward Market converted to Plant Inlet CDN$/GJ (Jul 7, 10) | | | | | | | | 2.86 | | 3.24 | | 3.53 | |
Average all minus high/low | | | | | | | | 3.35 | | 4.02 | | 4.64 | |
Average one forecast per consultant minus high/low | | | | | | | | 3.31 | | 4.24 | | 4.89 | |
Natural gas royalty price forecast | | | | | | | | 3.35 | | 4.02 | | 4.64 | |
GLJ: Gilbert Laustsen Jung Petroleum Consultants Ltd
AJM: Ashton Jenkins Mann Petroleum Consultants
US EIA: US Energy Information Administration
McDaniel: McDaniel & Associates Consultants Ltd
AECO: Alberta Energy Company
Natural Gas Prices
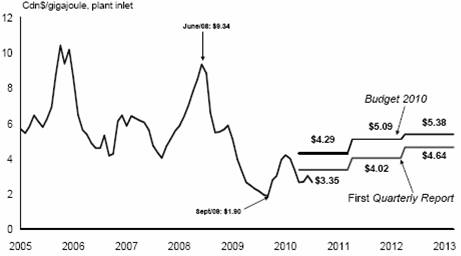
· The private sector price outlook for natural gas over the next three years has weakened since Budget 2010.
· Average prices are expected to remain volatile largely influenced by economic demand, inventory levels, weather, other energy prices, changes in drilling technologies, and overseas supply of liquefied natural gas.
First Quarterly Report 2010/11
55
Appendix
Table A7 Material Assumptions – Expense
| | | | Updated | | Updated | | Updated | | |
Ministry Programs and Assumptions | | Budget | | Forecast | | Plan | | Plan | | |
($ millions unless otherwise specified) | | 2010/11 | | 2011/12 | | 2012/13 | | Sensitivities 2010/11 |
Advanced Education and Labour Market Development | | 2,114 | | 2,114 | | 2,115 | | 2,121 | | The number of student spaces may vary depending on the financial and other policies of post secondary institutions. |
| | | | | | | | | |
Student spaces in public institutions
(# of FTEs) | | 205,278 | | 205,278 | | 205,563 | | 205,754 | |
Attorney General | | 468 | | 468 | | 458 | | 458 | | The number of criminal cases proceeded on by the provincial and federal Crown (including appeals to higher courts in BC), the number of civil and family litigation cases, the number of violation tickets disputed, and the number of municipal bylaw tickets disputed which would go to court for resolution. |
| | | | | | | | | |
New cases filed/processed
(# for all courts) | | 295,000 | | 295,000 | | 295,000 | | 295,000 | |
| | | | | | | | | |
Crown Proceeding Act (CPA) | | 25 | | 25 | | 25 | | 25 | | The number and size of litigation brought against the province, as well as the effectiveness of mitigation strategies and legal defence. |
Children and Family Development | | 1,334 | | 1,334 | | 1,334 | | 1,334 | | Caseload is expected to decline over the next 2 years then flatten out. This is due to large number of 15 to 17 year olds currently in the system who will reach maturity. Number of aboriginal children in care may also decrease over time. A 1% increase in the cost per case or a 1% increase in the average caseload will affect expenditures by approximately $2.8 million. |
| | | | | | | | | |
Average children-in-care
caseload (#) | | 8,500 | | 8,500 | | 8,300 | | 8,300 | |
| | | | | | | | | |
Average annual residential
cost per child in care ($) | | 33,800 | | 33,800 | | 34,500 | | 35,200 | |
| | | | | | | | | |
Education | | 5,165 | | 5,165 | | 5,243 | | 5,265 | | Enrolment figures are based on BC Stats enrolment trends, to which the Ministry has added forecasts for distributed learning, adult education, and summer learning. |
Enrolment (# of FTEs) | | 561,734 | | 561,734 | | 567,652 | | 566,711 | |
School age (K–12) | | 524,879 | | 524,879 | | 522,255 | | 520,949 | |
Expanded full-day kindergarten | | 7,543 | | 7,543 | | 15,085 | | 15,450 | |
Distributed Learning (online) | | 14,000 | | 14,000 | | 15,000 | | 15,000 | |
Summer | | 7,093 | | 7,093 | | 7,093 | | 7,093 | |
Adults | | 8,219 | | 8,219 | | 8,219 | | 8,219 | |
Forests and Range | | 641 | | 861 | | 595 | | 606 | | Over the past several years, fire fighting costs have ranged from a low of $19 million in 1997 to an estimated $382 million in 2009. |
Direct Fire Fighting | | 52 | | 272 | | 52 | | 52 | |
BC Timber Sales | | 159 | | 159 | | 158 | | 168 | | Targets can be impacted by changes to actual inventory costs incurred. There is a lag of approximately 2 years between when inventory costs are incurred and when they are expensed. Volume harvested can also impact targets. For example, if volume harvested is less than projected in any year then capitalized expenses will also be reduced in that year. |
First Quarterly Report 2010/11
56
Appendix
Table A7 Material Assumptions – Expense (continued)
| | | | Updated | | Updated | | Updated | | |
Ministry Programs and Assumptions | | Budget | | Forecast | | Plan | | Plan | | |
($ millions unless otherwise specified) | | 2010/11 | | 2011/12 | | 2012/13 | | Sensitivities 2010/11 |
Health Services | | 14,760 | | 14,760 | | 15,680 | | 16,127 | | |
Pharmacare | | 1,090 | | 1,090 | | 1,145 | | 1,201 | | A 1% change in utilization or drug prices affects costs by approximately $10 million. |
Medical Services Plan (MSP) | | 3,616 | | 3,616 | | 3,823 | | 3,922 | | A 1% increase in volume of services provided by fee-for-service physicians affects costs by approximately $25 million. |
Regional Health Sector funding | | 9,581 | | 9,581 | | 10,213 | | 10,489 | | |
Housing and Social Development | | 2,730 | | 2,730 | | 2,694 | | 2,694 | | The expected to work caseload is sensitive to fluctuations in economic and employment trends in the service sector. A 1% change in the Temporary Assistance annual average caseload or average cost per case will affect expenditures by approximately $4.5 million annually. |
Temporary Assistance
annual average caseload (#) | | 57,406 | | 57,406 | | 49,981 | | 49,970 | |
Disability Assistance
annual average caseload (#) | | 76,190 | | 76,190 | | 78,955 | | 78,955 | | The caseload for persons with disabilities is sensitive to the aging of the population and longer life expectancy for individuals with disabilities and significant health issues. A 1% change in the Disability Assistance annual average caseload or average cost per case will affect expenditures by approximately $7.5 million annually. |
Total annual average
caseload (#) | | 133,596 | | 133,596 | | 128,936 | | 128,925 | | The average cost per case is sensitive to the composition of the caseload, and reported income. |
Adult Community Living: | | | | | | | | | | The adult community living caseload is sensitive to the pressures of an aging population. A 1% increase in the adult caseload will increase expenditures by approximately $2.4 million. |
Residential Services: | | | | | | | | | |
Average caseload (#) | | 5,501 | | 5,501 | | 5,681 | | 5,875 | |
Average cost per client ($) | | 68,400 | | 68,400 | | 66,233 | | 64,046 | |
Day Programs: | | | | | | | | | |
Average caseload (#) | | 13,201 | | 13,201 | | 13,983 | | 14,666 | |
Average cost per client ($) | | 19,074 | | 19,074 | | 18,243 | | 17,394 | |
Personal Supports Initiative | | | | | | | | | |
Average caseload (#) | | 133 | | 133 | | 220 | | 220 | |
Average cost per client ($) | | 44,383 | | 44,383 | | 41,832 | | 41,832 | |
First Quarterly Report 2010/11
57
Appendix
Table A7 Material Assumptions – Expense (continued)
| | | | Updated | | Updated | | Updated | | |
Ministry Programs and Assumptions | | Budget | | Forecast | | Plan | | Plan | | |
($ millions unless otherwise specified) | | 2010/11 | | 2011/12 | | 2012/13 | | Sensitivities 2010/11 |
Public Safety and Solicitor General | | 602 | | 602 | | 602 | | 603 | | The volume and severity of criminal activity, the number of inmate beds occupied and the number of offenders under community supervision. |
Emergency Program Act (EPA) | | 15 | | 15 | | 15 | | 15 | | The number and severity of natural disasters. |
Management of Public Funds and Debt | | 1,301 | | 1,299 | | 1,340 | | 1,390 | | Full year impact on MoPD on interest costs of a 1% change in interest rates equals $45.8 million; $100 million increase in debt level equals $3.1 million. |
Interest rates for new provincial borrowing: | | | | | | | | | |
Short-term | | 0.81% | | 0.93% | | 2.20% | | 3.15% | |
Long-term | | 4.55% | | 4.16% | | 4.63% | | 5.08% | |
CDN/US exchange rate (cents) | | 101.9 | | 103.7 | | 100.8 | | 101.7 | |
Service delivery agency net spending | | 4,082 | | 4,149 | | 4,918 | | 5,488 | | |
School districts | | 293 | | 266 | | 264 | | 326 | | |
Post-secondary institutions | | 2,287 | | 2,391 | | 2,586 | | 2,710 | | |
Health authorities and hospital societies | | 590 | | 595 | | 579 | | 739 | | |
BC Transportation Financing Authority | | 802 | | 817 | | 919 | | 1,000 | | |
Other service delivery agencies | | 110 | | 80 | | 570 | | 713 | | |
Table A8 Full-Time Equivalents (FTEs) (1) – 2006/07 to 2012/13
| | | | | | | | | | Updated | | Updated | | Updated | |
| | Actual | | Actual | | Actual | | Actual | | Forecast | | Plan | | Plan | |
| | 2006/07 | | 2007/08 | | 2008/09 | | 2009/10 | | 2010/11 | | 2011/12 | | 2012/13 | |
Ministries and special offices (CRF) | | 28,647 | | 30,224 | | 31,874 | | 31,353 | | 30,296 | | 28,501 | | 27,732 | |
Service delivery agencies (2) | | 3,917 | | 4,128 | | 4,403 | | 4,508 | | 4,204 | | 4,249 | | 4,268 | |
Total FTEs | | 32,564 | | 34,352 | | 36,277 | | 35,861 | | 34,500 | | 32,750 | | 32,000 | |
(1) Full-time equivalents (FTEs) are a measure of staff employment. FTEs are calculated by dividing the total hours of employment paid for in a given period by the number of hours an individual, full-time person would normally work in that period. This does not equate to the physical number of employees. For example, two half-time employees would equal one FTE, or alternatively, three FTEs may represent two full-time employees who have worked sufficient overtime hours to equal an additional FTE.
(2) Service delivery agency FTE amounts do not include SUCH sector staff employment.
First Quarterly Report 2010/11
58
Appendix
Table A9 Capital Spending – 2006/07 to 2012/13
| | | | | | | | | | Updated | | Updated | | Updated | |
| | Actual | | Actual | | Actual | | Actual | | Forecast | | Plan | | Plan | |
($ millions) | | 2006/07 | | 2007/08 | | 2008/09 | | 2009/10 | | 2010/11 | | 2011/12 | | 2012/13 | |
Taxpayer-supported | | | | | | | | | | | | | | | |
Education | | | | | | | | | | | | | | | |
Schools (K–12) | | 322 | | 380 | | 413 | | 482 | | 497 | | 420 | | 356 | |
Post-secondary | | 874 | | 782 | | 658 | | 672 | | 808 | | 571 | | 394 | |
Health | | 760 | | 881 | | 892 | | 927 | | 1,138 | | 777 | | 486 | |
BC Transportation Financing Authority | | 821 | | 884 | | 881 | | 918 | | 1,583 | | 1,120 | | 1,127 | |
BC Transit | | 13 | | 37 | | 77 | | 150 | | 89 | | 163 | | 208 | |
Vancouver Convention Centre expansion project | | 105 | | 251 | | 242 | | 41 | | 15 | | — | | — | |
BC Place rejuvenation | | — | | — | | 45 | | 75 | | 391 | | 51 | | — | |
Government ministries | | 355 | | 335 | | 430 | | 306 | | 395 | | 277 | | 194 | |
Other (1) | | 159 | | 122 | | 140 | | 183 | | 387 | | 119 | | 31 | |
Capital spending contingencies | | — | | — | | — | | — | | 300 | (2) | 114 | | 161 | |
Total taxpayer-supported | | 3,409 | | 3,672 | | 3,778 | | 3,754 | | 5,603 | | 3,612 | | 2,957 | |
| | | | | | | | | | | | | | | |
Self-supported | | | | | | | | | | | | | | | |
BC Hydro | | 807 | | 1,076 | | 1,397 | | 2,406 | | 1,770 | | 2,228 | | 2,317 | |
BC Transmission Corporation | | 50 | | 70 | | 19 | | 12 | | — | | — | | — | |
Columbia River power projects (3) | | 19 | | 29 | | 32 | | 16 | | 14 | | 6 | | 4 | |
Transportation Investment Corporation | | — | | — | | 215 | | 777 | | 735 | | 539 | | 545 | |
BC Railway Company (4) | | 19 | | 20 | | 10 | | 14 | | — | | — | | — | |
ICBC | | 22 | | 23 | | 22 | | 22 | | 55 | | 86 | | 77 | |
BC Lotteries | | 44 | | 60 | | 97 | | 92 | | 107 | | 120 | | 120 | |
Liquor Distribution Branch | | 22 | | 18 | | 17 | | 19 | | 24 | | 24 | | 27 | |
Total self-supported commercial | | 983 | | 1,296 | | 1,809 | | 3,358 | | 2,705 | | 3,003 | | 3,090 | |
| | | | | | | | | | | | | | | |
Total capital spending | | 4,392 | | 4,968 | | 5,587 | | 7,112 | | 8,308 | | 6,615 | | 6,047 | |
(1) Includes BC Housing Management Commission, Provincial Rental Housing Corporation, Rapid Transit Project 2000, and other service delivery agencies.
(2) Includes $30 million for ministry capital contingencies.
(3) Joint ventures of the Columbia Power Corporation and Columbia Basin Trust. In August 2010, CPC/CBT reached an agreement in principle for a partnership with Fortis Inc. to develop an electricity generating facility at the Waneta Dam south of Trail. Capital spending information will be included in the next forecast update after the agreement has been finalized.
(4) Responsibility for the BC Railway Company was transferred to the BC Transportation Financing Authority effective April 1, 2010.
First Quarterly Report 2010/11
59
Appendix
Table A10 Capital Expenditure Projects Greater Than $50 million (1)
Note: Information in bold type denotes changes from Budget 2010.
| | Projected | | Total Costs | | Projected | | Total | | Project Financing | |
| | Completion | | to | | Costs to | | Capital | | Internal/ | | Federal | | Other | |
($ millions) | | Date | | June 30, 2010 | | Complete | | Costs | | Debt | | Government | | Contributions | |
Taxpayer-supported | | | | | | | | | | | | | | | |
K—12 Schools | | | | | | | | | | | | | | | |
Revelstoke Elementary and Secondary | | Fall 2011 | | 9 | | 51 | | 60 | | 58 | | — | | 2 | |
Chilliwack Secondary | | Fall 2012 | | 1 | | 57 | | 58 | | 58 | | — | | — | |
Burnaby Central Secondary | | Spring 2012 | | 18 | | 46 | | 64 | | 64 | | — | | — | |
Centennial Secondary | | Fall 2014 | | — | | 62 | | 62 | | 62 | | — | | — | |
Alberni District Secondary | | Fall 2012 | | 4 | | 54 | | 58 | | 54 | | — | | 4 | |
Full-day kindergarten | | Fall 2012 | | — | | 144 | | 144 | | 144 | | — | | — | |
Total K—12 schools | | | | 32 | | 414 | | 446 | | 440 | | — | | 6 | |
Post secondary facilities | | | | | | | | | | | | | | | |
University of British Columbia | | | | | | | | | | | | | | | |
— Pharmaceutical Sciences and Centre for Drug Research & Development | | Fall 2012 | | 3 | | 130 | | 133 | | 86 | | 3 | | 44 | |
Health facilities | | | | | | | | | | | | | | | |
Surrey Outpatient Facility | | | | | | | | | | | | | | | |
— Government direct cost | | Spring 2011 | | 15 | | 50 | | 65 | | 65 | | — | | — | |
— P3 contract | | Spring 2011 | | 135 | | 37 | | 172 | | 172 | | — | | — | |
Victoria Royal Jubilee Hospital — Patient Care Centre | | | | | | | | | | | | | | | |
— Government direct cost | | Spring 2013 | | 111 | | 39 | | 150 | | 23 | | — | | 127 | |
— P3 contract | | Spring 2011 | | 154 | | 45 | | 199 | | 199 | | — | | — | |
Fort St. John Hospital and Residential Care | | | | | | | | | | | | | | | |
— Government direct cost | | Spring 2012 | | 105 | | 160 | | 265 | | 169 | | — | | 96 | |
— P3 contract | | Spring 2012 | | — | | 33 | | 33 | | 33 | | — | | | |
Expansions to Kelowna General and | | | | | | | | | | | | | | | |
Vernon Jubilee Hospitals | | | | | | | | | | | | | | | |
— Government direct cost | | Fall 2012 | | 162 | | 113 | | 275 | | 26 | | — | | 249 | |
— P3 contract | | Fall 2012 | | 140 | | 18 | | 158 | | 158 | | — | | — | |
Northern Cancer Centre initiative (2) | | | | | | | | | | | | | | | |
— Government direct cost | | Winter 2012 | | 20 | | 71 | | 91 | | 88 | | — | | 3 | |
— P3 contract | | Winter 2012 | | 14 | | 1 | | 15 | | 15 | | — | | — | |
Surrey Emergency/Critical Care Tower (3) | | Summer 2013 | | 12 | | 513 | | 525 | | 505 | | — | | 20 | |
Interior Heart and Surgical Centre (4) | | Spring 2017 | | 6 | | 387 | | 393 | | 302 | | — | | 91 | |
Children’s and Women’s Hospital (5) | | Fall 2017 | | — | | 682 | | 682 | | 532 | | — | | 150 | |
Total health facilities | | | | 874 | | 2,149 | | 3,023 | | 2,287 | | — | | 736 | |
Transportation | | | | | | | | | | | | | | | |
Pitt River Bridge | | Fall 2009 | (6) | 204 | | 3 | | 207 | | 110 | | 90 | | 7 | |
Sea-to-Sky Highway | | | | | | | | | | | | | | | |
— Government direct cost | | Fall 2009 | (7) | 225 | | 11 | | 236 | | 234 | | — | | 2 | |
— P3 contract | | Fall 2009 | | 561 | | — | | 561 | | 561 | | — | | — | |
South Fraser Perimeter Road | | | | | | | | | | | | | | | |
— Government direct cost | | Summer 2014 | | 502 | | 560 | | 1,062 | | 697 | | 365 | | — | |
— P3 contract | | Summer 2014 | | — | | 202 | | 202 | | 202 | | — | | — | |
Sierra Yoyo-Desan Road upgrade | | Fall 2012 | | 52 | | 135 | | 187 | | 187 | | — | | — | |
Total transportation | | | | 1,544 | | 911 | | 2,455 | | 1,991 | | 455 | | 9 | |
Other | | | | | | | | | | | | | | | |
Vancouver Convention Centre expansion project | | Summer 2009 | (7) | 828 | | 13 | | 841 | | 499 | | 222 | | 120 | |
BC Place rejuvenation (8) | | Summer 2011 | | 169 | | 394 | | 563 | | 563 | | — | | — | |
Integrated case management system | | Fall 2014 | | 45 | | 137 | | 182 | | 182 | | — | | — | |
Surrey Pretrial Service Centre expansion | | Fall 2013 | | 3 | | 127 | | 130 | | 130 | | — | | — | |
e-Health initiative (9) | | Spring 2013 | | 194 | | 68 | | 262 | | 138 | | 124 | | — | |
Total other | | | | 1,239 | | 739 | | 1,978 | | 1,512 | | 346 | | 120 | |
Total taxpayer-supported | | | | 3,692 | | 4,343 | | 8,035 | | 6,316 | | 804 | | 915 | |
First Quarterly Report 2010/11
60
Appendix
Table A10 Capital Expenditure Projects Greater Than $50 million (1) (continued)
Note: Information in bold type denotes changes from Budget 2010.
| | Projected | | Total Costs | | Projected | | Total | | Project Financing | |
| | Completion | | to | | Costs to | | Capital | | Internal/ | | Federal | | Other | |
($ millions) | | Date | | June 30, 2010 | | Complete | | Costs | | Debt | | Government | | Contributions | |
Self-supported | | | | | | | | | | | | | | | |
Transportation | | | | | | | | | | | | | | | |
Port Mann Bridge / Highway 1 | | Winter 2013 | | 1,157 | | 2,162 | | 3,319 | | 3,319 | | — | | — | |
Power generation and transmission | | | | | | | | | | | | | | | |
BC Hydro | | | | | | | | | | | | | | | |
— Mica Dam — generator stator replacement | | Fall 2009 | (7) | 85 | | 4 | | 89 | | 89 | | — | | — | |
— Aberfeldie redevelopment | | Spring 2009 | (7) | 93 | | 2 | | 95 | | 95 | | — | | — | |
— GM Shrum G1—G4 stator replacement | | Fall 2010 | | 75 | | 7 | | 82 | | 82 | | — | | — | |
— Peace Canyon G1—G4 turbine overhaul | | Fall 2009 | (7) | 42 | | 3 | | 45 | | 45 | | — | | — | |
— Revelstoke Unit 5 generation (10) | | Fall 2010 | | 219 | | 31 | | 250 | | 250 | | — | | — | |
— Cheakamus spillway gate reliability upgrade | | Fall 2011 | | 41 | | 32 | | 73 | | 73 | | — | | — | |
— Mica Dam gas insulated switchgear replacement (10) | | Summer 2013 | | 47 | | 153 | | 200 | | 200 | | — | | — | |
— Fort Nelson generating station upgrade (10) | | Fall 2011 | | 37 | | 128 | | 165 | | 165 | | — | | — | |
— Ruskin Dam safety and powerhouse upgrade | | TBD | (11) | 37 | | 15 | | 52 | | 52 | | — | | — | |
— Stave Falls spillway gate reliability upgrade | | Fall 2012 | | 9 | | 63 | | 72 | | 72 | | — | | — | |
— GM Shrum units 1 to 5 turbine upgrade | | Fall 2016 | | 9 | | 305 | | 314 | | 314 | | — | | — | |
— Hugh Keenleyside spillway gate reliability upgrade | | Fall 2013 | | 11 | | 91 | | 102 | | 102 | | — | | — | |
— Mica units 5 and 6 project (10) | | Fall 2015 | | 24 | | 776 | | 800 | | 800 | | — | | — | |
— Vancouver Island transmission reinforcement | | Winter 2008 | (7) | 307 | | (1 | ) | 306 | | 306 | | — | | — | |
— Interior to Lower Mainland transmission line | | Fall 2014 | | 43 | | 556 | | 599 | | 599 | | — | | — | |
— Central Vancouver Island transmission line | | Fall 2010 | | 39 | | 52 | | 91 | | 91 | | — | | — | |
— Vancouver City Central transmission | | Spring 2012 | | 13 | | 188 | | 201 | | 201 | | — | | — | |
— Columbia Valley transmission | | Fall 2012 | | 5 | | 140 | | 145 | | 145 | | — | | — | |
— Southern Interior series compensation | | Fall 2014 | | 1 | | 60 | | 61 | | 61 | | — | | — | |
— Dawson Creek area reinforcement | | Fall 2013 | | 1 | | 131 | | 132 | | 132 | | — | | — | |
— Seymour Arm series capacitor | | Fall 2013 | | — | | 58 | | 58 | | 58 | | — | | — | |
— Northwest transmission line | | Winter 2012 | | 1 | | 403 | | 404 | | 184 | | 130 | | 90 | |
— Smart metering and smart grid programs | | Summer 2013 | | 34 | | 896 | | 930 | | 930 | | — | | — | |
Columbia River power projects (12) | | | | | | | | | | | | | | | |
— Waneta Dam power expansion | | TBD | | TBD | | TBD | | TBD | | TBD | | TBD | | TBD | |
Total power generation and transmission | | | | 1,173 | | 4,093 | | 5,266 | | 5,046 | | 130 | | 90 | |
Total self-supported | | | | 2,330 | | 6,255 | | 8,585 | | 8,365 | | 130 | | 90 | |
Total $50 million projects | | | | 6,022 | | 10,598 | | 16,620 | | 14,681 | | 934 | | 1,005 | |
| | | | | | | | | | | | | | | |
(1) | Only projects that receive provincial funding and have been approved by Treasury Board and/or Crown corporation boards are included in this table. Ministry service plans may include projects that still require final approval. Capital costs reflect current government accounting policy. |
(2) | Figures shown do not include an approved project reserve of $5 million. |
(3) | Figures shown are based on preliminary Treasury Board approvals and do not include approved project reserve of $32 million. These amounts will change after P3 contracts are finalized. |
(4) | Figures shown are based on preliminary Treasury Board approvals and do not include an approved project reserve of $55 million. These amounts will change after P3 contracts are finalized. |
(5) | Figures shown are based on preliminary Treasury Board approvals. These amounts will change after P3 contracts are finalized. |
(6) | The Pitt River bridge is open for traffic and decommissioning of the old bridge is forecast to be complete in Summer 2010. |
(7) | Assets have been put into service and only trailing costs remain. |
(8) | BC Place rejuvenation includes $458 million to install a retractable roof and $105 million to refurbish the facilities. |
(9) | The e-Health initiative is comprised of 7 distinct projects. Figures shown reflect the total costs of the 7 Ministry of Health Services’ provincially co-ordinated e-Health projects. |
(10) | Total costs and completion dates for these projects vary depending on the final scope. Information presented represents the highest cost estimates and latest completion dates (except for Mica Dam Units 5 and 6 which has a range from $640 million to $950 million). |
(11) | Definition phase of the Ruskin Dam safety and powerhouse upgrade project was approved for $52 million. The total project cost and completion date are being developed. |
(12) | Joint ventures of the Columbia Power Corporation and Columbia Basin Trust. In August 2010, CPC/CBT reached an agreement in principle for a partnership with Fortis Inc. to develop an electricity generating facility at the Waneta Dam south of Trail. Capital spending information will be included in the next forecast update after the agreement has been finalized. |
First Quarterly Report 2010/11
61
Appendix
Table A11 Statement of Financial Position — 2006/07 to 2012/13(1)
| | | | | | | | | | Updated | | Updated | | Updated | |
| | Actual | | Actual | | Actual | | Actual | | Forecast | | Plan | | Plan | |
($ millions) | | 2006/07 | | 2007/08 | | 2008/09 | | 2009/10 | | 2010/11 | | 2011/12 | | 2012/13 | |
Financial assets | | | | | | | | | | | | | | | |
Cash and temporary investments | | 3,492 | | 5,994 | | 5,226 | | 2,913 | | 2,813 | | 3,225 | | 3,634 | |
Other financial assets | | 8,003 | | 8,294 | | 7,360 | | 8,731 | | 8,827 | | 9,665 | | 9,905 | |
Sinking funds | | 3,798 | | 2,649 | | 2,134 | | 1,329 | | 1,355 | | 1,151 | | 1,302 | |
Investments in commercial Crown corporations | | | | | | | | | | | | | | | |
Retained earnings | | 4,415 | | 5,081 | | 5,728 | | 7,231 | | 7,110 | | 7,528 | | 7,951 | |
Recoverable capital loans | | 7,170 | | 7,719 | | 9,149 | | 11,471 | | 13,272 | | 15,162 | | 17,096 | |
| | 11,585 | | 12,800 | | 14,877 | | 18,702 | | 20,382 | | 22,690 | | 25,047 | |
Warehouse borrowing program assets | | — | | — | | 2,081 | | — | | — | | — | | — | |
| | 26,878 | | 29,737 | | 31,678 | | 31,675 | | 33,377 | | 36,731 | | 39,888 | |
Liabilities | | | | | | | | | | | | | | | |
Accounts payable & accrued liabilities (2) | | 7,225 | | 8,075 | | 7,414 | | 6,994 | | 7,131 | | 7,460 | | 7,878 | |
Deferred revenue | | 6,174 | | 7,368 | | 9,431 | | 9,997 | | 10,834 | | 10,896 | | 10,907 | |
Debt: | | | | | | | | | | | | | | | |
Taxpayer-supported debt | | 25,968 | | 26,589 | | 26,446 | | 30,021 | | 33,669 | | 37,267 | | 38,729 | |
Self-supported debt | | 7,471 | | 8,048 | | 11,568 | | 11,864 | | 13,650 | | 15,526 | | 17,444 | |
Forecast allowance | | — | | — | | — | | — | | 300 | | 300 | | 400 | |
Total provincial debt | | 33,439 | | 34,637 | �� | 38,014 | | 41,885 | | 47,619 | | 53,093 | | 56,573 | |
Add: debt offset by sinking funds | | 3,798 | | 2,649 | | 2,134 | | 1,329 | | 1,355 | | 1,151 | | 1,302 | |
Less: guarantees and non-guaranteed debt | | (416 | ) | (452 | ) | (452 | ) | (493 | ) | (474 | ) | (456 | ) | (439 | ) |
Financial statement debt | | 36,821 | | 36,834 | | 39,696 | | 42,721 | | 48,500 | | 53,788 | | 57,436 | |
| | 50,220 | | 52,277 | | 56,541 | | 59,712 | | 66,465 | | 72,144 | | 76,221 | |
Net liabilities | | (23,342 | ) | (22,540 | ) | (24,863 | ) | (28,037 | ) | (33,088 | ) | (35,413 | ) | (36,333 | ) |
Capital and other assets | | | | | | | | | | | | | | | |
Tangible capital assets | | 26,800 | | 28,737 | | 30,655 | | 32,371 | | 36,012 | | 37,520 | | 38,304 | |
Other assets | | 780 | | 732 | | 780 | | 938 | | 968 | | 975 | | 981 | |
| | 27,580 | | 29,469 | | 31,435 | | 33,309 | | 36,980 | | 38,495 | | 39,285 | |
Accumulated surplus (deficit) | | 4,238 | | 6,929 | | 6,572 | | 5,272 | | 3,892 | | 3,082 | | 2,952 | |
(1) Comparative figures have been restated to reflect government’s accounting policies in effect at March 31, 2010.
(2) Accrued liabilities include accumulated forecast allowances of $300 million in 2011/12 and $600 million in 2012/13.
First Quarterly Report 2010/11
62
Appendix
Table A11a Changes in Financial Position — 2006/07 to 2012/13
| | | | | | | | | | Updated | | Updated | | Updated | |
| | Actual | | Actual | | Actual | | Actual | | Forecast | | Plan | | Plan | |
($ millions) | | 2006/07 | | 2007/08 | | 2008/09 | | 2009/10 | | 2010/11 | | 2011/12 | | 2012/13 | |
(Surplus) deficit for the year | | (3,986 | ) | (2,773 | ) | (75 | ) | 1,779 | | 1,380 | | 810 | | 130 | |
Comprehensive income and other equity adjustments | | (447 | ) | 82 | | 432 | | (479 | ) | — | | — | | — | |
Change in accumulated (surplus) deficit | | (4,433 | ) | (2,691 | ) | 357 | | 1,300 | | 1,380 | | 810 | | 130 | |
| | | | | | | | | | | | | | | |
Capital and other asset changes: | | | | | | | | | | | | | | | |
Taxpayer-supported capital investments | | 3,409 | | 3,672 | | 3,778 | | 3,754 | | 5,603 | | 3,612 | | 2,957 | |
Less : amortization and other accounting changes | | (1,563 | ) | (1,735 | ) | (1,860 | ) | (2,038 | ) | (1,962 | ) | (2,104 | ) | (2,173 | ) |
Increase in net capital assets | | 1,846 | | 1,937 | | 1,918 | | 1,716 | | 3,641 | | 1,508 | | 784 | |
Increase (decrease) in other assets | | 19 | | (48 | ) | 48 | | 158 | | 30 | | 7 | | 6 | |
| | 1,865 | | 1,889 | | 1,966 | | 1,874 | | 3,671 | | 1,515 | | 790 | |
Increase (decrease) in net liabilities | | (2,568 | ) | (802 | ) | 2,323 | | 3,174 | | 5,051 | | 2,325 | | 920 | |
| | | | | | | | | | | | | | | |
Investment and working capital changes: | | | | | | | | | | | | | | | |
Increase (reduction) in cash and temporary investments | | (430 | ) | 2,502 | | (768 | ) | (2,313 | ) | (100 | ) | 412 | | 409 | |
Increase (decrease) in warehouse borrowing investments | | — | | — | | 2,081 | | (2,081 | ) | — | | — | | — | |
Investment in commercial Crown corporations: | | | | | | | | | | | | | | | |
Increase (decrease) in retained earnings | | 952 | | 666 | | 647 | | 1,503 | | (121 | ) | 418 | | 423 | |
Self-supported capital investments | | 983 | | 1,296 | | 1,809 | | 3,358 | | 2,705 | | 3,003 | | 3,090 | |
Less: loan repayments and other accounting changes | | (729 | ) | (747 | ) | (379 | ) | (1,036 | ) | (904 | ) | (1,113 | ) | (1,156 | ) |
| | 1,206 | | 1,215 | | 2,077 | | 3,825 | | 1,680 | | 2,308 | | 2,357 | |
Other working capital changes | | 556 | | (2,902 | ) | (2,851 | ) | 420 | | (852 | ) | 243 | | (38 | ) |
| | 1,332 | | 815 | | 539 | | (149 | ) | 728 | | 2,963 | | 2,728 | |
Increase (decrease) in financial statement debt | | (1,236 | ) | 13 | | 2,862 | | 3,025 | | 5,779 | | 5,288 | | 3,648 | |
(Increase) decrease in sinking fund debt | | 261 | | 1,149 | | 515 | | 805 | | (26 | ) | 204 | | (151 | ) |
Increase (decrease) in guarantees and non-guaranteed debt | | (43 | ) | 36 | | — | | 41 | | (19 | ) | (18 | ) | (17 | ) |
Increase (decrease) in total provincial debt | | (1,018 | ) | 1,198 | | 3,377 | | 3,871 | | 5,734 | | 5,474 | | 3,480 | |
First Quarterly Report 2010/11
63
Appendix
Table A12 Provincial Debt Summary — 2006/07 to 2012/13 (1)
| | | | | | | | | | Updated | | Updated | | Updated | |
| | Actual | | Actual | | Actual | | Actual | | Forecast | | Plan | | Plan | |
($ millions unless otherwise indicated) | | 2006/07 | | 2007/08 | | 2008/09 | | 2009/10 | | 2010/11 | | 2011/12 | | 2012/13 | |
Taxpayer-supported debt | | | | | | | | | | | | | | | |
Provincial government operating (2) | | 6,928 | | 5,330 | | 3,048 | | 4,663 | | 4,944 | | 6,296 | | 6,018 | |
Provincial government general capital (3) | | 1,961 | | 2,274 | | 2,696 | | 2,696 | | 2,696 | | 2,696 | | 2,696 | |
Provincial government direct operating | | 8,889 | | 7,604 | | 5,744 | | 7,359 | | 7,640 | | 8,992 | | 8,714 | |
Other taxpayer-supported debt (mainly capital) | | | | | | | | | | | | | | | |
Education | | | | | | | | | | | | | | | |
Schools (2) | | 5,013 | | 5,216 | | 5,522 | | 5,777 | | 6,146 | | 6,525 | | 6,841 | |
Post-secondary institutions (2) | | 3,024 | | 3,437 | | 3,626 | | 3,843 | | 4,101 | | 4,219 | | 4,267 | |
| | 8,037 | | 8,653 | | 9,148 | | 9,620 | | 10,247 | | 10,744 | | 11,108 | |
Health (2),(4) | | 3,053 | | 3,511 | | 3,936 | | 4,389 | | 5,002 | | 5,492 | | 5,812 | |
Highways and public transit | | | | | | | | | | | | | | | |
BC Transportation Financing Authority (5) | | 3,237 | | 3,948 | | 4,586 | | 5,211 | | 5,991 | | 6,626 | | 7,346 | |
Public transit (2) | | 950 | | 958 | | 997 | | 997 | | 997 | | 997 | | 997 | |
SkyTrain extension | | 1,153 | | 1,153 | | 1,154 | | 1,154 | | 1,154 | | 1,154 | | 1,154 | |
BC Transit | | 96 | | 84 | | 94 | | 140 | | 188 | | 259 | | 352 | |
| | 5,436 | | 6,143 | | 6,831 | | 7,502 | | 8,330 | | 9,036 | | 9,849 | |
Other | | | | | | | | | | | | | | | |
Social housing | | 216 | | 218 | | 286 | | 305 | | 621 | | 639 | | 531 | |
Provincial government general capital (3) | | — | | — | | — | | 294 | | 719 | | 1,024 | | 1,219 | |
BC Pavilion Corporation | | — | | — | | — | | 49 | | 378 | | 450 | | 450 | |
BC Immigrant Investment Fund | | 167 | | 256 | | 287 | | 289 | | 333 | | 384 | | 382 | |
Homeowner Protection Office | | 110 | | 136 | | 150 | | 144 | | — | | — | | — | |
Other | | 60 | | 68 | | 64 | | 70 | | 399 | | 506 | | 664 | |
| | 553 | | 678 | | 787 | | 1,151 | | 2,450 | | 3,003 | | 3,246 | |
Total other taxpayer-supported debt | | 17,079 | | 18,985 | | 20,702 | | 22,662 | | 26,029 | | 28,275 | | 30,015 | |
Total taxpayer-supported debt | | 25,968 | | 26,589 | | 26,446 | | 30,021 | | 33,669 | | 37,267 | | 38,729 | |
Self-supported debt | | | | | | | | | | | | | | | |
Commercial Crown corporations | | | | | | | | | | | | | | | |
BC Hydro | | 7,144 | | 7,633 | | 9,054 | | 10,792 | | 11,852 | | 13,154 | | 14,542 | |
BC Transmission Corporation | | 30 | | 79 | | 70 | | 70 | | — | | — | | — | |
Columbia River power projects | | 236 | | 219 | | 208 | | 196 | | 182 | | 167 | | 151 | |
BC Lotteries | | — | | — | | — | | 60 | | 62 | | 93 | | 103 | |
Transportation Investment Corporation (Port Mann) | | — | | — | | 20 | | 544 | | 1,352 | | 1,911 | | 2,447 | |
Liquor Distribution Branch | | 3 | | 2 | | 1 | | 1 | | 1 | | — | | — | |
Post-secondary institutions’ subsidiaries | | 58 | | 115 | | 134 | | 201 | | 201 | | 201 | | 201 | |
| | 7,471 | | 8,048 | | 9,487 | | 11,864 | | 13,650 | | 15,526 | | 17,444 | |
Warehouse borrowing program | | — | | — | | 2,081 | | — | | — | | — | | — | |
Total self-supported debt | | 7,471 | | 8,048 | | 11,568 | | 11,864 | | 13,650 | | 15,526 | | 17,444 | |
Total debt before forecast allowance | | 33,439 | | 34,637 | | 38,014 | | 41,885 | | 47,319 | | 52,793 | | 56,173 | |
Forecast allowance (6) | | — | | — | | — | | — | | 300 | | 300 | | 400 | |
Total provincial debt | | 33,439 | | 34,637 | | 38,014 | | 41,885 | | 47,619 | | 53,093 | | 56,573 | |
Debt as a per cent of GDP | | | | | | | | | | | | | | | |
Provincial government direct operating | | 4.9 | % | 4.0 | % | 2.9 | % | 3.9 | % | 3.9 | % | 4.4 | % | 4.0 | % |
Taxpayer-supported | | 14.2 | % | 13.9 | % | 13.4 | % | 15.9 | % | 17.0 | % | 18.1 | % | 17.9 | % |
Total provincial | | 18.3 | % | 18.1 | % | 19.2 | % | 22.2 | % | 24.0 | % | 25.8 | % | 26.1 | % |
(1) Debt is after deduction of sinking funds and unamortized discounts, and excludes accrued interest. Government direct and fiscal agency accrued interest is reported in the government’s accounts as an accounts payable.
(2) In 2009/10, sinking funds for government debt related to schools, post-secondary education, health care and public transit were liquidated and the proceeds ($763 million) used to offset direct operating borrowing requirements. Figures for prior years have been restated to reflect this decision.
(3) Separate disclosures of borrowings for ministries’ capital spending are applied prospectively beginning in fiscal 2009/10. Figures for prior years have been restated.
(4) Health facilities’ debt includes public-private partnership obligations of $179 million for 2006/07; $410 million for 2007/08; $540 million for 2008/09; $734 million for 2009/10, $944 million for 2010/11, $1,029 million for 2011/12, and $1,107 million for 2012/13.
(5) BC Transportation Financing Authority’s debt includes public-private partnership obligations of $353 million for 2006/07; $604 million for 2007/08; $776 million for 2008/09; $799 million for 2009/10, $783 million for 2010/11, $766 million for 2011/12, and $747 million for 2012/13.
(6) Reflects the operating statement forecast allowance for each year (amounts are not cumulative). Since it is unknown as to which agency would require this debt, the forecast allowance is shown as a separate item over the plan.
First Quarterly Report 2010/11
64
Appendix
Table A13 Key Provincial Debt Indicators — 2006/07 to 2012/13 (1)
| | | | | | | | | | Updated | | Updated | | Updated | |
| | Actual | | Actual | | Actual | | Actual | | Forecast | | Plan | | Plan | |
| | 2006/07 | | 2007/08 | | 2008/09 | | 2009/10 | | 2010/11 | | 2011/12 | | 2012/13 | |
Debt to revenue (per cent) | | | | | | | | | | | | | | | |
Total provincial | | 69.1 | | 69.3 | | 78.0 | | 87.8 | | 93.8 | | 99.9 | | 102.4 | |
Taxpayer-supported | | 69.8 | | 69.6 | | 72.0 | | 83.8 | | 86.0 | | 92.3 | | 92.4 | |
Debt per capita ($) (2) | | | | | | | | | | | | | | | |
Total provincial | | 7,880 | | 8,037 | | 8,671 | | 9,401 | | 10,516 | | 11,547 | | 12,129 | |
Taxpayer-supported | | 6,119 | | 6,170 | | 6,033 | | 6,738 | | 7,435 | | 8,105 | | 8,303 | |
Debt to GDP (per cent) (3) | | | | | | | | | | | | | | | |
Total provincial | | 18.3 | | 18.1 | | 19.2 | | 22.2 | | 24.0 | | 25.8 | | 26.1 | |
Taxpayer-supported | | 14.2 | | 13.9 | | 13.4 | | 15.9 | | 17.0 | | 18.1 | | 17.9 | |
Interest bite (cents per dollar of revenue) (4) | | | | | | | | | | | | | | | |
Total provincial | | 4.3 | | 4.0 | | 4.4 | | 4.4 | | 4.6 | | 5.0 | | 5.2 | |
Taxpayer-supported | | 4.2 | | 3.9 | | 4.3 | | 4.2 | | 4.3 | | 4.5 | | 4.6 | |
Interest costs ($ millions) | | | | | | | | | | | | | | | |
Total provincial | | 2,074 | | 2,012 | | 2,141 | | 2,098 | | 2,338 | | 2,649 | | 2,873 | |
Taxpayer-supported | | 1,575 | | 1,490 | | 1,573 | | 1,504 | | 1,684 | | 1,823 | | 1,911 | |
Interest rate (per cent) (5) | | | | | | | | | | | | | | | |
Taxpayer-supported | | 5.9 | | 5.7 | | 5.9 | | 5.3 | | 5.3 | | 5.1 | | 5.0 | |
Background Information: | | | | | | | | | | | | | | | |
Revenue ($ millions) | | | | | | | | | | | | | | | |
Total provincial (6) | | 48,360 | | 49,974 | | 48,765 | | 47,721 | | 50,781 | | 53,164 | | 55,268 | |
Taxpayer-supported (7) | | 37,222 | | 38,226 | | 36,745 | | 35,809 | | 39,151 | | 40,397 | | 41,921 | |
Debt ($ millions) | | | | | | | | | | | | | | | |
Total provincial | | 33,439 | | 34,637 | | 38,014 | | 41,885 | | 47,619 | | 53,093 | | 56,573 | |
Taxpayer-supported (8) | | 25,968 | | 26,589 | | 26,446 | | 30,021 | | 33,669 | | 37,267 | | 38,729 | |
Provincial GDP ($ millions) (9) | | 182,310 | | 191,598 | | 197,931 | | 188,539 | | 198,003 | | 205,980 | | 216,451 | |
Population (thousands at July 1) (10) | | 4,244 | | 4,310 | | 4,384 | | 4,455 | | 4,528 | | 4,598 | | 4,664 | |
(1) | Includes fiscal data of school districts, post-secondary institutions and regional health authorities/societies (SUCH). |
(2) | The ratio of debt to population (e.g. 2010/11 debt divided by population at July 1, 2010). |
(3) | The ratio of debt outstanding at fiscal year end to provincial nominal gross domestic product (GDP) for the calendar year ending in the fiscal year (e.g. 2010/11 debt divided by 2010 GDP). |
(4) | The ratio of interest costs (less sinking fund interest) to revenue. Figures include capitalized interest expense in order to provide a more comparable measure to outstanding debt. |
(5) | Weighted average of all outstanding debt issues. |
(6) | Includes revenue of the consolidated revenue fund (excluding dividends from enterprises) plus revenue of all government organizations and enterprises. |
(7) | Excludes revenue of government enterprises, but includes dividends from enterprises paid to the consolidated revenue fund. |
(8) | Excludes debt of commercial Crown corporations and agencies and funds held under the province’s warehouse borrowing program. |
(9) | Nominal GDP for the calendar year ending in the fiscal year (e.g. GDP for 2010 is used for the fiscal year ended March 31, 2011). |
(10) | Population at July 1st within the fiscal year (e.g. population at July 1, 2010 is used for the fiscal year ended March 31, 2011). |
First Quarterly Report 2010/11
65
