Exhibit 99.4
2007
British Columbia
Financial and Economic
Review
67th Edition
(July 2007)

Table of Contents
Introduction | 1 |
General Description of the Province | 2 |
Geography | 2 |
Physiography | 2 |
Climate and Vegetation | 3 |
Population | 3 |
| |
Chapter One — Economic Review | 5 |
2006 Overview | 6 |
External Environment | 6 |
United States Economy | 6 |
Canadian Economy | 7 |
International Economy | 7 |
Financial Markets | 8 |
British Columbia Economy | 9 |
Exports | 10 |
Population | 12 |
Labour and Income Developments | 13 |
Prices and Wages | 13 |
Consumer Expenditure and Housing | 14 |
Industrial Structure and Performance | 15 |
High Tech | 16 |
Tourism | 16 |
Conclusion | 17 |
| |
Charts | |
1.1 | Canada and British Columbia economic growth | 6 |
1.2 | External economic growth | 8 |
1.3 | Canadian dollar | 8 |
1.4 | British Columbia real GDP by component | 9 |
1.5 | Export shares by market | 10 |
1.6 | Lumber and natural gas prices | 11 |
1.7 | British Columbia population by age and sex, 2006 | 12 |
1.8 | British Columbia Building permits by category | 14 |
1.9 | Service industries in British Columbia | 15 |
1.10 | Trends in high technology sector in British Columbia | 16 |
1.11 | Visitor entries to British Columbia | 17 |
1.12 | British Columbia Tourism industry | 17 |
Map 1.1 Net interprovincial and international migration in BC, 2006 | 12 |
| |
Tables | |
1.1 | British Columbia Population and Labour Market Statistics | 13 |
1.2 | Price and Earnings Indices | 14 |
| | | |
2007 Financial and Economic Review — July 2007
ii
Appendix 1 — Economic Review | | 19 |
Tables | |
A1.1A | Aggregate and Labour Market Indicators | 20 |
A1.1B | Prices, Earnings and Financial Indicators | 21 |
A1.1C | Other Indicators | 22 |
A1.1D | Commodity Production Indicators | 23 |
A1.2 | British Columbia Real GDP at Market Prices, Expenditure Based | 24 |
A1.3 | British Columbia GDP at Basic Prices, by Industry | 25 |
A1.4 | British Columbia GDP, Income Based | 26 |
A1.5 | Employment by Industry in British Columbia | 27 |
A1.6 | Capital Investment by Industry | 28 |
A1.7 | British Columbia International Goods Exports by Major Market and Selected Commodities, 2006 | 29 |
A1.8 | British Columbia International Goods Exports by Market Area | 30 |
A1.9 | Historical Commodity Prices (in U.S. Dollars) | 31 |
A1.10 | British Columbia Forest Sector Economic Activity Indicators | 32 |
A1.11 | Historical Value of Mineral, Petroleum and Natural Gas Shipments | 33 |
A1.12 | Petroleum and Natural Gas Activity Indicators | 33 |
A1.13 | Supply and Consumption of Electrical Energy in British Columbia | 34 |
A1.14 | British Columbia High-Technology Sector Activity | 35 |
| | |
Chapter Two — Financial Review | 37 |
| |
2006/07 Overview | 38 |
| |
Revenue | 41 |
| |
Commercial Crown Corporations Net Income | 46 |
| |
Expense | 47 |
| |
Consolidated Revenue Fund Expense | 47 |
Other Expenses | 49 |
| |
Full-Time Equivalents (FTEs) | 50 |
| |
Provincial Capital Spending | 54 |
| |
Provincial Debt | 58 |
Taxpayer-supported Debt | 59 |
Self-supported Debt | 59 |
Surplus-Change in Debt Reconciliation | 60 |
| |
Statement of Financial Position | 61 |
| |
Credit Rating | 67 |
| |
Debt Indicators | 68 |
| |
Topic Boxes | |
Expense by Function | 51 |
Review of the Province’s Financial Condition | 62 |
| |
Charts | |
2.1 | 2006/07 Surplus – Major Changes from Budget 2006 | 39 |
2.2 | Revenue Changes from Budget 2006 | 41 |
2.3 | Capital Spending, 2006/07 | 54 |
| | | | |
iii
2.4 | Provincial Debt Components | 58 |
2.5 | Taxpayer-supported Debt to GDP Ratio | 59 |
2.6 | Statement of Financial Position | 61 |
2.7 | 2006/07 Changes in Financial Position | 66 |
| | |
Tables | |
| |
2.1 | Operating Statement | 38 |
2.2 | Operating Statement – Changes from Budget 2006 | 40 |
2.3 | Revenue by Source | 42 |
2.4 | Expense by Ministry, Program and Agency | 43 |
2.5 | Major Factors Underlying Revenue | 44 |
2.6 | Restated Budget by Ministry, Program and Agency | 48 |
2.7 | Full-Time Equivalents (FTEs) Utilization | 50 |
2.8 | Capital Spending | 55 |
2.9 | Capital Spending – Changes from Budget 2006 | 56 |
2.10 | 2006/07 Capital Expenditure Projects Greater Than $50 Million | 57 |
2.11 | Provincial Debt Summary | 58 |
2.12 | Debt – Changes from Budget 2006 | 60 |
2.13 | Reconciliation of Summary Surplus to Debt Decrease – 2006/07 | 60 |
2.14 | Net Liabilities and Accumulated Surplus (Deficit) | 61 |
2.15 | Interprovincial Comparison of Credit Ratings, July 2007 | 67 |
2.16 | Key Debt Indicators – 2002/03 to 2006/07 | 68 |
| | |
Appendix 2 — Financial Review | 69 |
| |
Government’s Financial Statements | 70 |
Government Reporting Entity | 70 |
Compliance with GAAP | 70 |
Accounting Policy Updates | 71 |
| |
The Annual Financial Cycle | 71 |
| |
Unfunded Pension Liabilities | 73 |
| |
Adjustments to the Accumulated Deficit | 74 |
| |
Supplementary Schedules | 75 |
| |
Charts | | |
A2.1 | Financial Planning and Reporting Cycle Overview | 72 |
| | |
Tables | |
A2.1 | Pension Plan Balances | 74 |
A2.2 | Summary of Changes in Accumulated Deficit from the balances reported in the | |
| 2005/06 Public Accounts | 75 |
A2.3 | Operating Statement Update Since the Third Quarterly Report | 76 |
A2.4 | Operating Statement – 1998/99 to 2006/07 | 77 |
A2.5 | Statement of Financial Position – 1998/99 to 2006/07 | 78 |
A2.6 | Changes in Financial Position – 1998/99 to 2006/07 | 79 |
A2.7 | Revenue by Source – 1998/99 to 2006/07 | 80 |
A2.8 | Revenue by Source Supplementary Information – 1998/99 to 2006/07 | 81 |
A2.9 | Expense by Function – 1998/99 to 2006/07 | 82 |
A2.10 | Expense by Function Supplementary Information – 1998/99 to 2006/07 | 83 |
iv
A2.11 Service Delivery Agency Operating Results – 1998/99 to 2006/07 | 84 |
A2.12 Capital Spending – 1998/99 to 2006/07 | 87 |
A2.13 Provincial Debt – 1998/99 to 2006/07 | 88 |
A2.14 Provincial Debt Supplementary Information – 1998/99 to 2006/07 | 89 |
A2.15 Historical Operating Statement Surplus (Deficit) | 90 |
A2.16 Historical Provincial Debt Summary | 91 |
A2.17 Full-Time Equivalents (FTEs) – 1998/99 to 2006/07 | 92 |
A2.18 Provincial Taxes (as of June 2007) | 93 |
A2.19 Interprovincial Comparisons of Tax Rates – 2007 | 96 |
A2.20 Summary of Tax Changes Announced in 2007 | 97 |
| |
Chapter Three — Commercial Crown Corporations Review | 99 |
| |
Introduction | 100 |
| |
BC Hydro and Power Authority | 100 |
| |
BC Liquor Distribution Branch | 102 |
| |
BC Lottery Corporation | 104 |
| |
BC Railway Company | 105 |
| |
Insurance Corporation of BC | 107 |
| |
BC Transmission Corporation | 109 |
| |
Columbia Power Corporation | 110 |
| |
Provincial Capital Commission | 112 |
| |
Charts | |
3.1 | Electricity Price Competitiveness | 102 |
3.2 | Interprovincial Gaming Comparisons | 105 |
3.3 | ICBC Claims | 108 |
| |
Tables | |
3.1 | British Columbia Hydro and Power Authority Five-Year Income Statement | 101 |
3.2 | Liquor Distribution Branch Five-Year Income Statement | 103 |
3.3 | British Columbia Lottery Corporation Five-Year Income Statement | 104 |
3.4 | British Columbia Railway Company Five-Year Income Statement | 106 |
3.5 | Insurance Corporation of British Columbia Five-Year Income Statement | 107 |
3.6 | British Columbia Transmission Corporation Five-Year Income Statement | 109 |
3.7 | Columbia Power Corporation Five-Year Income Statement | 111 |
3.8 | Provincial Capital Commission Five-Year Income Statement | 112 |
| |
Appendix 3 — Constitutional Framework | 113 |
| |
Constitutional Framework | 114 |
| |
Provincial Government | 114 |
Legislature | 114 |
Executive | 115 |
Judiciary | 115 |
Provincial Government Jurisdiction | 116 |
v
Introduction
General Description of the Province
British Columbia is located on Canada’s Pacific coast, and has a land and freshwater area of 95 million hectares. It is Canada’s third largest province and comprises 9.5 per cent of the country’s total land area.
Geography
The province is nearly four times the size of Great Britain, 2.5 times larger than Japan and larger than any American state except Alaska. BC’s 7,022-kilometre coastline supports a large shipping industry through ice-free, deep-water ports. The province has about 8.5 million hectares of grazing land, 1.8 million hectares of lakes and rivers, and 950,000 hectares of agricultural land that is capable of supporting a wide range of crops.
Physiography
BC is characterized by mountainous topography, but also has substantial areas of lowland and plateau country. The province has four basic regions, a northwesterly trending mountain system on the coast, a similar mountain system on the east, and an extensive area of plateau country between the two. The northeastern corner of the province is lowland, a segment of the continent’s Great Plains.
The western system of mountains averages about 300 kilometres in width and extends along the entire BC coast and the Alaska panhandle. The Coast Mountains contain some of the tallest peaks in the province. The western system includes the Insular Mountains that form the basis of Vancouver Island and the Queen Charlotte Islands. These islands help to shelter the waters off the mainland coast of BC, which form an important transportation route for people and products.
The interior of the province is a plateau of rolling forest and grassland, 600 to 1,200 metres in average elevation. North of Prince George the interior becomes mountainous, but plateau terrain returns just south of the Yukon boundary in the area drained by the Liard River. The southern interior’s water system is dominated by the Fraser River, which has a drainage area covering about one-quarter of the province. The Rocky Mountains, in the eastern mountain system, rise abruptly on the southern BC–Alberta boundary and are cut by passes that provide dramatic overland transportation routes into the province. The Rocky Mountain Trench lies immediately to the west of the Rockies. This extensive valley, the longest in North America, is a geological fault zone separating different earth plates. It is the source of many of BC’s major rivers, including the Peace, Columbia and Fraser.
2
Introduction
Climate and Vegetation
Coastal BC has abundant rainfall and mild temperatures associated with a maritime climate. The Pacific coast has an average annual rainfall of between 155 and 440 centimetres, while the more sheltered coasts of eastern Vancouver Island and the mainland along the Strait of Georgia average between 65 and 150 centimetres. Canada’s longest frost-free periods of over 180 days per year are enjoyed along the edges of the coastal zone and far inland along the Fraser River valley. Temperatures fall quickly up the steep slopes of the Coast Mountains. The predominant trees in this coastal region are the western hemlock, western red cedar and balsam (amabilis fir) in the wetter parts, and Douglas fir and grand fir in the drier areas.
BC’s interior region has a mainly continental type of climate, although not as severe as that of the Canadian prairies. Considerable variation in climate occurs, especially in winter, as mild Pacific storms bring relief from cold spells. The southern interior has the driest and warmest climate of the province. In the valleys, annual precipitation ranges from less than 30 centimetres to 50 centimetres, while daily temperatures can average over 20 degrees Celsius in July and just under freezing in January. The climate becomes more extreme further north and precipitation increases. The frost-free period in the north is short and variable. Lodgepole pine is the dominant tree of commercial value in the interior.
The northeast region of the province is an extension of the western prairie region of Alberta. It has a continental climate that is more extreme than that of the northern interior region. However, it does have long hot summers and a frost-free period long enough to grow grain, forage and other crops.
Population
BC is the third largest Canadian province in terms of population, which was estimated at 4.3 million persons or about 13.2 per cent of Canadians on July 1, 2006. BC’s population grew at an average annual compound rate of 1.0 per cent between 1997 and 2006, in line with the 1.0 per cent average annual growth rate of the Canadian population as a whole.
Vancouver, a principal Canadian shipping, manufacturing and services centre, has the largest urban population in BC and was the third largest metropolitan area in Canada with a population of 2,180,737 persons in 2006. Victoria, the province’s capital, is located on Vancouver Island and its regional district had a population of 353,710 persons in 2006.
3
Chapter One
Economic Review(1)
(1) Reflects information available as of June 26, 2007.
Chapter 1 – Economic Review
2006 Overview
British Columbia’s economy expanded 3.6 per cent in 2006, slightly below the 3.7 per cent growth the province experienced in 2005. The domestic economy continued to drive overall GDP growth, while the high Canadian dollar hindered BC’s net exports. Investment and consumer expenditure led BC’s economic expansion through 2006.
Chart 1.1 Canada and British Columbia economic growth
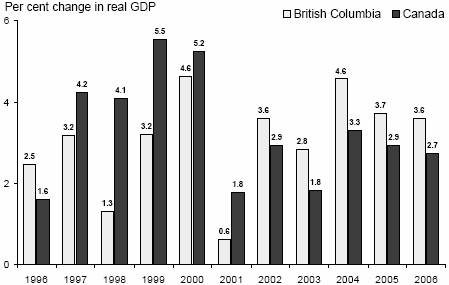
Source: Statistics Canada, April 2007 Provincial Economic Accounts
Healthy real consumer spending on goods and services took place in 2006, rising 5.3 per cent from the previous year. BC’s housing sector also continued its strong showing in 2006 despite a declining housing market in the US. The province’s employed population grew faster than its labour force in 2006, causing the annual unemployment rate to plunge to 4.8 per cent. This drop of 1.1 percentage points from 2005 to 2006 resulted in the lowest annual unemployment rate in 30 years.
External Environment
The global economy continued to grow at a fervent pace, with global real GDP increasing by 5.4 per cent in 2006. The US continued its healthy economic growth, posting an annual increase of 3.3 per cent. Developing Asian countries expanded at a rate of 9.4 per cent in 2006, with China’s economy surging ahead at a blistering growth rate of 10.7 per cent.
United States Economy
The US economy grew by 3.3 per cent in 2006, supported by continued increases in household spending and strong non-residential investment. This fairly robust growth comes in the face of a rapidly declining domestic housing market, in which housing starts dropped by 12.6 per cent for the year. However, the US labour market showed improvement as the unemployment rate fell 0.5 percentage points to 4.6 per cent, making 2006 the third consecutive year that this rate has declined.
6
Its growing trade deficit continued to weigh down the United States’ current account balance in 2006. The current account deficit reached $811 billion for the year, as imports of goods and services expanded at a faster rate than exports. The growing current account and budget deficits combined with a rapidly softening housing market put further downward pressure on the US dollar throughout the year.
Canadian Economy
Statistics Canada recently rebased its national real GDP figures to a base year of 2002. The information that follows uses the recent rebased estimates, which differ from preliminary national GDP estimates that were released with the Provincial Economic Accounts in April 2007. Canada’s real GDP increased 2.8 per cent in 2006, a small drop from the 3.1 per cent growth seen in the previous year. Final domestic demand rose by 4.7 per cent, creeping up slightly from 4.5 per cent growth in 2005. Canadian economic growth in 2006 slowed significantly after the first quarter and hovered between 1.3 and 1.5 per cent annualized quarterly growth for the final three quarters of the year.
The current account surplus was $23.6 billion in 2006, or 1.6 per cent of nominal GDP, compared to 2.0 per cent of nominal GDP in 2005. Real exports rose just 0.7 per cent compared to 2.2 per cent in 2005 (likely due to the strong Canadian dollar), while real imports of goods and services increased by 5.0 per cent in 2006.
Nominal corporate profits rose 5.0 per cent during the year, after increasing by 11.9 per cent in 2005. Real business investment continued its strong performance in 2006, expanding 7.1 per cent, with large increases in machinery and equipment investment as well as non-residential investment.
Canada saw steady employment gains in 2006, as employment rose by 1.9 per cent on the year. This increase is higher than in 2005, when employment grew by 1.4 per cent. The construction, forestry, and finance, insurance and real estate sectors saw significant growth in 2006, while the number of manufacturing jobs declined by 4.1 per cent.
Although the number of new housing starts in Canada increased by only 0.8 per cent over the previous year’s level, these still remained at historically high levels. Canadian retail sales increased by 6.4 per cent in 2006, with large gains made in furniture, home electronics and home improvement stores.
International Economy
Japanese economic growth improved in 2006 as real GDP increased by 2.2 per cent, up from 1.9 per cent in the previous year.
The European economy improved as well, growing by 2.8 per cent in 2006, up substantially from the 1.6 per cent increase observed in 2005. Strong GDP growth in the German and French economies contributed to this overall improvement in 2006.
7
The International Monetary Fund estimates that world growth in real GDP improved to 5.4 per cent in 2006 from 4.9 per cent in 2005. Rapidly expanding Asian economies are keeping world economic growth at a high rate. China’s economy grew by an astounding 10.7 per cent in 2006, after expanding by 10.4 per cent in 2005. GDP growth in India reached 9.2 per cent in 2006, and the Commonwealth of Independent States(2) expanded by 7.7 per cent.
Chart 1.2 External economic growth
Per cent change in real GDP

Source: International Monetary Fund
Financial Markets
The Bank of Canada’s overnight target rate rose steadily throughout the first half of 2006, beginning at 3.25 per cent and reaching 4.25 per cent for both the third and fourth quarters. The US federal funds target rate followed a similar pattern for 2006, starting at 4.25 per cent and reaching 5.25 per cent for the latter half of the year.
Chart 1.3 Canadian dollar
US cents/Canadian $
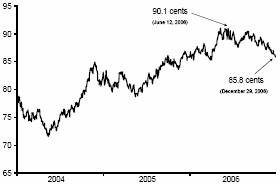
Source: Bank of Canada
(2) The Commonwealth of Independent States includes Azerbaijan, Armenia, Belarus, Georgia, Kazakhstan, Kyrgyzstan, Moldova, Russia, Tajikistan, Turkmenistan, Uzbekistan and Ukraine.
8
The value of the Canadian dollar climbed steadily against the US dollar during the first half of 2006. The loonie averaged 88.2 cents US for the year, up 5.6 cents US from 2005. The Canadian dollar noon-rate peaked at 91.0 cents US on June 12, 2006, but declined to 85.8 cents by year end.
British Columbia Economy(3)
British Columbia’s economy grew 3.6 per cent in 2006, slightly slower than last year’s 3.7 per cent increase. BC’s strong performance in 2006 was fuelled mainly by continued improvement in domestic economic activity.
Chart 1.4 British Columbia real GDP by component
Annual per cent change

Source: Statistics Canada
Last year saw robust gains in real consumer spending, as demand for both goods and services remained strong. The housing market also continued its expansion through 2006, as housing starts grew by 5.1 per cent and residential investment expanded by 15.3 per cent. In 2005, housing starts grew by 5.3 per cent and residential investment increased by 12.7 per cent.
Employment in BC grew by 3.1 per cent in 2006, while the labour force increased by 1.8 per cent. This caused the unemployment rate to fall from 5.9 per cent in 2005 to 4.8 per cent in 2006.
Real business investment rose 9.5 per cent in 2006, fuelled by a 6.6 per cent increase in residential construction investment, a 9.2 per cent jump in non-residential investment and a 14.9 per cent leap in machinery and equipment investment.
Investment figures for 2007 include spending on major capital projects across the province including:
• Sea-to-Sky Highway Improvement Project;
• UBC Life Sciences Centre;
(3) GDP estimates are based on Statistics Canada’s preliminary Provincial Accounts for 2006, released in April 2007. Further information on British Columbia’s economic performance will be released in November 2007, when Statistics Canada releases revised GDP data for 2006 and previous years.
9
• Abbotsford Regional Hospital and Cancer Centre;
• UniverCity at Simon Fraser University;
• Coal Harbour Redevelopment;
• Big White Ski Resort Expansion;
• Highland Valley Copper Mine Expansion; and
• Vancouver Island Transmission Reinforcement Project.
Overall, the nominal value of BC’s manufacturing shipments climbed by 2.5 per cent in 2006. Manufacturers of primary metal, fabricated metal products and computer and electronic equipment all experienced solid shipment growth in 2006. At the same time, however, the value of shipments of wood products from BC fell by 12.3 per cent.
Exports
The value of BC’s current dollar foreign merchandise exports declined by about $686 million (or 2.0 per cent) in 2006. Exports to the US, BC’s largest trading partner, dropped by 7.1 per cent after increasing by 9.5 per cent in 2005. This significant drop is largely due to declines in the values of forestry and energy exports. Exports to Japan, however, continued to rise steadily through 2006, growing by 13.0 per cent after increasing 9.4 per cent in 2005. BC’s exports to the Pacific Rim (excluding Japan) also showed strength in 2006, as they jumped in value by 10.6 per cent. Increases in the value of Pacific Rim exports, as in 2005, were led by rapid growth in exports to China and South Korea. Exports to India also saw significant gains during the year. Appendix Tables A1.7 and A1.8 provide further detail on exports by major market and commodity.
Chart 1.5 Export shares by market
BC origin merchandise | BC origin merchandise |
exports 2005 = $34.1 billion | exports 2006 = $33.4 billion |
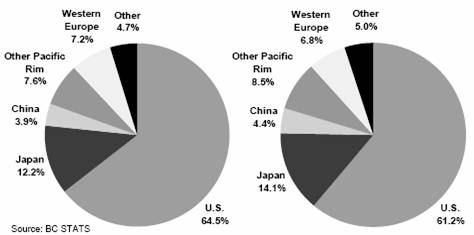
The US was the destination of a slightly smaller share of British Columbia’s international exports in 2006 than in 2005. The US accounted for 61.2 per cent of the total after taking in 64.6 per cent in 2005. The Pacific Rim (including Japan) took in 27.0 per cent of BC’s total international exports in 2006, up from the 23.7 per cent these countries purchased in 2005.
10
Strong external demand and high commodity prices were the main reasons for the boost in the value of BC’s exports in 2006. The high Canadian dollar put some downward pressure on exports, but not enough to curtail the expansion led by demand and prices.
Current dollar energy product exports plunged by 17.3 per cent in 2006 to $6.4 billion, after surging up by 71.0 per cent in 2005. The value of metallic mineral product exports rose 32.5 per cent to $3.6 billion, while the value of wood product exports fell 7.4 per cent to $8.8 billion and pulp and paper exports increased 2.9 per cent to $4.8 billion. Lumber product prices declined again in 2006, while the prices of pulp and newsprint both rose substantially.
• Lumber prices averaged $296 US per thousand board feet in 2006, down from $355 US in 2005.
• Pulp prices jumped in 2006, averaging $674 US per tonne, up from $611 US in the previous year.
• Newsprint prices rose again to average $667 US per tonne in 2006, compared to $608 US per tonne in 2005.
Chart 1.6 Lumber and natural gas prices
Natural gas | Spruce pine fir lumber |
$US/MmBTU, Sumas | $US/000 bd feet |
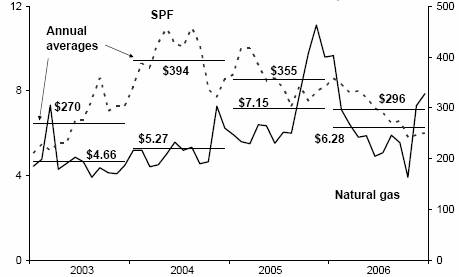
Source: Madison’s Lumber Reporter and Ministry of Energy and Mines
The year 2006 saw the value of real imports again rise faster than that of real exports. While imports jumped by 6.3 per cent on the year, exports rose by only 2.4 per cent, resulting in a decline in BC’s trade balance. Exports of services grew at a higher rate than imports of services, although both were strong in 2006. Overall, imports from international trade rose by 9.3 per cent in 2006, while interprovincial imports grew by 2.4 per cent. BC’s volume of exports to other provinces and countries also grew by 2.4 per cent on the year.
11
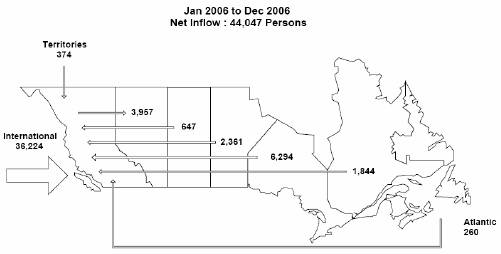
Population
British Columbia welcomed 44,047 net migrants into the province in 2006, including 36,224 from international sources and 7,823 from other Canadian provinces and territories. Historically, BC’s population has grown faster than Canada’s due to relatively strong net inflows of people from other provinces and countries. From 1998 to 2002, BC’s population growth slowed due to a net outflow of people to other parts of Canada. However, this trend has changed course since 2003, returning to a net positive inflow of migrants from other provinces.
Map 1.1 Net interprovincial and international migration in BC, 2006
British Columbia’s population is aging, as the province’s baby boom generation is currently between their early 40s and late 50s (see Chart 1.7). As a result, there will be a substantial increase in the number of retired British Columbians over the next few years. The bust generation (born during a period of lower birth rates) is currently in their mid 20s to early 30s, with the baby boom echo generation currently hovering around 20 years old.
Chart 1.7 British Columbia population by age and sex, 2006
Age (years)
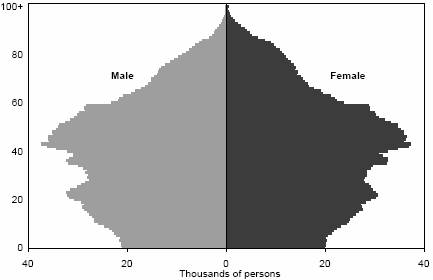
Source: BC STATS and Statistics Canada
12
Labour and Income Developments
BC’s annual average employment rose by 3.1 per cent, or 65,000 jobs, in 2006. This rate of increase was second highest to Alberta’s, which experienced employment gains of 4.8 per cent in that year. BC’s unemployment rate in 2006 dropped to 4.8 per cent from 5.9 per cent in 2005, representing the lowest average annual rate in 30 years.
Total employment in British Columbia’s goods-producing sector rose by 2.9 per cent, or 12,900 jobs. Employment in the construction sector had another strong year, as it climbed by about 11,300 jobs, or 6.7 per cent. Employment in the primary industries expanded by 2,300 jobs, or 3.0 per cent.
Employment in BC’s service industries grew 3.1 per cent in 2006, down slightly from the 3.2 per cent growth seen in 2005. The health and welfare services industry created a substantial number of jobs to the economy, adding an additional 14,800 new employees. Education and related services grew by 6.8 per cent, or 9,900 jobs. BC’s retail and wholesale trade industry also had a strong performance in 2006 in terms of employment gains, with an increase of 19,100 jobs, or 5.7 per cent. The number of British Columbians employed in finance, insurance and real estate rose by 3.8 per cent, or 5,100 positions compared to the previous year. The most significant job losses on the service side occurred in the accommodation and food services sector and the public administration sector (see Table A1.5 for more details).
British Columbia’s labour force grew by 1.8 per cent in 2006 after expanding by 1.9 per cent in 2005.
Table 1.1 British Columbia Population and Labour Market Statistics
| | Units | | 2002 | | 2003 | | 2004 | | 2005 | | 2006 | |
| | | | | | | | | | | | | |
Population (as at July 1) | | (thousands) | | 4,115 | | 4,155 | | 4,203 | | 4,258 | | 4,310 | |
| | (% change) | | 0.9 | | 1.0 | | 1.2 | | 1.3 | | 1.2 | |
| | | | | | | | | | | | | |
Net Migration | | | | | | | | | | | | | |
International | | (persons) | | 30,227 | | 31,374 | | 31,095 | | 38,843 | | 36,224 | |
Interprovincial | | (persons) | | (5,216 | ) | 4,055 | | 7,551 | | 4,811 | | 7,823 | |
| | | | | | | | | | | | | |
Labour Force | | (thousands) | | 2,148 | | 2,191 | | 2,222 | | 2,263 | | 2,305 | |
| | (% change) | | 3.1 | | 2.0 | | 1.4 | | 1.9 | | 1.8 | |
| | | | | | | | | | | | | |
Employment | | (thousands) | | 1,965 | | 2,015 | | 2,063 | | 2,131 | | 2,196 | |
| | (% change) | | 2.3 | | 2.5 | | 2.4 | | 3.3 | | 3.1 | |
| | | | | | | | | | | | | |
Unemployment Rate | | (%) | | 8.5 | | 8.0 | | 7.2 | | 5.9 | | 4.8 | |
Source: Statistics Canada
Prices and Wages
BC’s Consumer Price Index (CPI) increased by 1.7 per cent in 2006, following a gain of 2.0 per cent in 2005. Gasoline prices continued to rise in 2006, climbing by 6.9 per cent, while shelter and food costs increased at a modest rate through 2006, up 2.4 per cent and 1.9 per cent, respectively.
13
Table 1.2 Price and Earnings Indices
| | Units | | 2002 | | 2003 | | 2004 | | 2005 | | 2006 | |
| | | | | | | | | | | | | |
Consumer Price Index | | (1992=100) | | 117.9 | | 120.4 | | 122.8 | | 125.3 | | 127.5 | |
(British Columbia) | | (% change) | | 2.3 | | 2.1 | | 2.0 | | 2.0 | | 1.7 | |
| | | | | | | | | | | | | |
Average weekly earnings | | ($) | | 668.0 | | 683.7 | | 686.7 | | 704.5 | | 726.0 | |
| | (% change) | | 3.1 | | 2.3 | | 0.4 | | 2.6 | | 3.1 | |
| | | | | | | | | | | | | |
Labour income (1) | | ($ millions) | | 72,900 | | 75,605 | | 80,158 | | 85,402 | | 92,434 | |
| | (% change) | | 4.1 | | 3.7 | | 6.0 | | 6.5 | | 8.2 | |
| | | | | | | | | | | | | |
Personal income (1) | | ($ millions) | | 113,451 | | 117,059 | | 123,487 | | 130,481 | | 139,867 | |
| | (% change) | | 2.8 | | 3.2 | | 5.5 | | 5.7 | | 7.2 | |
| | | | | | | | | | | | | |
Corporate profits (pre-tax)(1) | | ($ millions) | | 11,389 | | 12,705 | | 17,009 | | 20,011 | | 21,673 | |
| | (% change) | | (2.6 | ) | 11.6 | | 33.9 | | 17.6 | | 8.3 | |
(1) As of April 2007 Provincial Economic Accounts
Source: Statistics Canada
The year 2006 saw salaries and supplementary labour income increase by 8.2 per cent, signaling robust employment gains and also reflecting a boost from the payout of provincial public sector signing bonuses. This in turn led to an increase of 7.2 per cent in total personal income. Corporate profits also pushed higher in 2006, rising 8.3 per cent, due in part to high prices for BC’s commodities and resources.
Consumer Expenditure and Housing
Real consumer spending in BC averaged 5.3 per cent growth in 2006 due to robust demand in both the goods and services sectors. The increase in consumer spending on goods was also reflected by the 6.8 per cent rise in the total value of retail sales in 2006.
Housing starts in BC continued to increase in 2006, rising by 5.1 per cent compared to the 5.3 per cent jump seen in 2005. Growth in housing starts has slowed in the last couple of years from the 21.0 per cent increase seen in 2003 and the 25.8 per cent seen in 2004.
Chart 1.8 BC Building permits by category
Per cent change

Source: Statistics Canada
14
The continued strength of BC’s housing market was also demonstrated in 2006 by the value of residential building permits, which jumped by 9.3 per cent. The strength of the province’s housing sector in 2006 was the result of several factors, as another year of strong employment growth, low mortgage rates and the scarcity of available rental and market properties combined to create attractive conditions for consumers.
The value of non-residential building permits in BC jumped by 22.1 per cent in 2006 to reach $3.9 billion. Commercial permits rose by 32.2 per cent, institutional permits climbed by 9.1 per cent and industrial permits rose by 3.7 per cent.
Industrial Structure and Performance
The province’s rich endowment of natural resources and their development historically formed the backbone of British Columbia’s economic structure. In the past, the economy was largely based on primary and secondary forest production. Other natural resource sectors, such as agriculture, mining (including oil and gas) and fishing (including aquaculture) also contributed significantly.
In recent years, a more diversified economy has emerged, supported by many non-resource activities such as film, tourism, high-technology industries including software and biotechnology, and other value-added industries. The British Columbia economy matured into a more broadly based structure that became less vulnerable to changes in international markets for natural resources.
In 2006, BC’s goods-based industries grew at a similar pace to its service industries. GDP in the construction sector grew 10.1 per cent in 2006, largely driven by the continued strength in the residential housing market. Manufacturing also grew fairly steadily in 2006, with real GDP rising 2.4 per cent over 2005. Growth in the forestry and logging industry was 2.3 per cent in 2006 after a gain of 3.1 per cent in 2005.
Chart 1.9 Service industries in BC
Per cent of total
Source: Statistics Canada
15
Service-producing industries continued to generate about three quarters of the total provincial gross domestic product in 2006. Industries within the service sector include: transportation, communications and storage; wholesale and retail trade; finance, insurance and real estate; community, business and personal services; and public administration and defense.
High Tech
British Columbia’s high technology sector is a leading performer in the provincial economy, outperforming other sectors in revenue, employment, and wage and salary growth in most years. After the 2001 global crash in high tech that also had a negative effect on BC’s high technology industries, this sector has been seen positive GDP growth since 2002 (information for 2006 is unavailable).
Real GDP generated by the high tech sector rose by 2.4 per cent in 2005 to $8.7 billion. Revenues expanded by 2.2 per cent, and wages and salaries climbed 4.8 per cent. The total number of people working in the province’s high tech sector expanded by 2.9 per cent in 2005 to reach 70,490 total jobs (see Table A1.14 for further detail).
Chart 1.10 Trends in high technology sector in BC
Annual % Change

Source: BC STATS
Tourism
Canada’s strengthening dollar hampered tourism in BC last year, leading to fewer visits from the US. The total number of visitors entering BC in 2006 fell 5.2 per cent, following a 3.0 per cent decrease in 2005. The number of US visitors entering BC in 2006 dropped by 6.5 per cent from the previous year, while the number of overseas visitors fell by 0.5 per cent. Despite the overall decline in total international visitors, overall tourism revenues continued to climb in 2006, rising 7.8 per cent over 2005, reflecting strength in domestic tourism.
16
Chart 1.11 Visitor entries to BC

Sources: Statistics Canada
Chart 1.12 BC Tourism industry
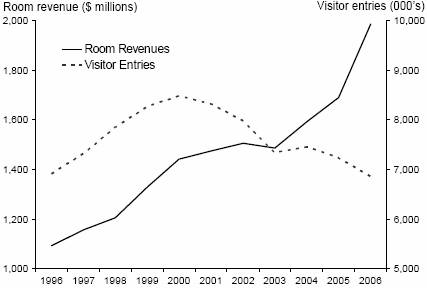
Source: BC STATS
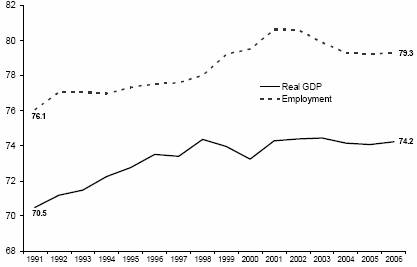
Conclusion
British Columbia’s economy expanded 3.6 per cent in 2006, primarily due to strong growth in its domestic market. Both the goods-producing and service-producing industries performed well, with strong demand for BC resources and high commodity prices. Real business investment improved by 9.5 per cent due to strong gains in both non-residential investment and machinery and equipment investment.
Employment in BC rose 3.1 per cent in 2006, marking another strong year for job growth in the province. BC’s annual unemployment rate fell to an average of 4.8 per cent, its lowest rate in 30 years.
17
Appendix 1
Economic Review
Appendix 1 – Economic Review
Table A1.1A Aggregate and Labour Market Indicators
| | | | | | Real GDP | | Personal | | Capital | | Business | | | | | | Unemployment | |
| | Population (1) | | Nominal GDP | | (chained) | | income | | investment | | incorporations | | Labour force | | Employment | | rate | |
| | (thousands) | | ($ millions) | | ($1997 millions) | | ($ millions) | | ($ millions) | | (number) | | (thousands) | | (thousands) | | (per cent) | |
1980 | | 2,743 | | — | | — | | — | | — | | 21,381 | | 1,357 | | 1,266 | | 6.7 | |
1981 | | 2,824 | | 44,869 | | 79,745 | | 37,220 | | — | | 23,368 | | 1,416 | | 1,320 | | 6.8 | |
1982 | | 2,873 | | 45,024 | | 74,877 | | 40,425 | | — | | 11,432 | | 1,427 | | 1,253 | | 12.1 | |
1983 | | 2,905 | | 47,477 | | 75,349 | | 41,634 | | — | | 13,787 | | 1,446 | | 1,245 | | 13.9 | |
1984 | | 2,946 | | 49,840 | | 75,930 | | 43,734 | | — | | 14,052 | | 1,465 | | 1,245 | | 15.0 | |
1985 | | 2,974 | | 53,540 | | 81,203 | | 46,588 | | — | | 15,581 | | 1,491 | | 1,274 | | 14.6 | |
1986 | | 3,004 | | 56,547 | | 81,355 | | 48,911 | | — | | 17,067 | | 1,524 | | 1,327 | | 12.9 | |
1987 | | 3,050 | | 62,515 | | 86,373 | | 52,903 | | — | | 18,691 | | 1,567 | | 1,378 | | 12.1 | |
1988 | | 3,115 | | 69,408 | | 91,395 | | 58,298 | | — | | 18,703 | | 1,599 | | 1,435 | | 10.3 | |
1989 | | 3,198 | | 75,582 | | 94,400 | | 65,009 | | — | | 21,817 | | 1,659 | | 1,508 | | 9.1 | |
1990 | | 3,291 | | 79,350 | | 95,722 | | 72,038 | | — | | 19,550 | | 1,703 | | 1,560 | | 8.4 | |
1991 | | 3,373 | | 81,849 | | 95,897 | | 75,336 | | 17,370 | | 18,528 | | 1,751 | | 1,578 | | 9.9 | |
1992 | | 3,468 | | 87,242 | | 98,373 | | 78,610 | | 17,979 | | 20,406 | | 1,800 | | 1,617 | | 10.1 | |
1993 | | 3,567 | | 94,077 | | 102,770 | | 81,914 | | 18,875 | | 22,955 | | 1,848 | | 1,668 | | 9.7 | |
1994 | | 3,676 | | 100,512 | | 105,669 | | 85,703 | | 21,353 | | 25,774 | | 1,918 | | 1,743 | | 9.1 | |
1995 | | 3,777 | | 105,670 | | 108,194 | | 90,056 | | 20,591 | | 23,846 | | 1,951 | | 1,786 | | 8.5 | |
1996 | | 3,874 | | 108,865 | | 110,857 | | 92,661 | | 19,408 | | 22,848 | | 1,988 | | 1,816 | | 8.7 | |
1997 | | 3,949 | | 114,383 | | 114,383 | | 95,925 | | 22,552 | | 22,958 | | 2,031 | | 1,861 | | 8.4 | |
1998 | | 3,983 | | 115,641 | | 115,883 | | 98,135 | | 20,819 | | 20,759 | | 2,038 | | 1,858 | | 8.8 | |
1999 | | 4,011 | | 120,921 | | 119,604 | | 101,465 | | 21,152 | | 21,009 | | 2,065 | | 1,894 | | 8.3 | |
2000 | | 4,039 | | 131,333 | | 125,145 | | 107,624 | | 21,799 | | 21,515 | | 2,080 | | 1,931 | | 7.1 | |
2001 | | 4,078 | | 133,514 | | 125,924 | | 110,369 | | 23,414 | | 19,749 | | 2,083 | | 1,922 | | 7.7 | |
2002 | | 4,115 | | 138,193 | | 130,445 | | 113,451 | | 23,732 | | 21,262 | | 2,148 | | 1,965 | | 8.5 | |
2003 | | 4,155 | | 145,763 | | 134,131 | | 117,059 | | 25,434 | | 23,243 | | 2,191 | | 2,015 | | 8.0 | |
2004 | | 4,203 | | 157,540 | | 140,263 | | 123,487 | | 29,665 | | 25,428 | | 2,222 | | 2,063 | | 7.2 | |
2005 | | 4,258 | | 168,855 | | 145,501 | | 130,481 | | 33,254 | | 28,593 | | 2,263 | | 2,131 | | 5.9 | |
2006 | | 4,310 | | 179,701 | | 150,741 | | 139,867 | | 37,576 | | 30,667 | | 2,305 | | 2,196 | | 4.8 | |
| | | | | | | | Personal | | Capital | | Business | | | | | | Unemployment | |
| | Population (1) | | Nominal GDP | | Real GDP | | income | | investment | | incorporations | | Labour force | | Employment | | rate | |
| | (% change) | | (% change) | | (% change) | | (% change) | | (% change) | | (% change) | | (% change) | | (% change) | | (change) | |
1981 | | 2.9 | | — | | — | | — | | — | | 9.3 | | 4.3 | | 4.2 | | 0.1 | |
1982 | | 1.7 | | 0.3 | | (6.1 | ) | 8.6 | | — | | (51.1 | ) | 0.8 | | (5.0 | ) | 5.3 | |
1983 | | 1.1 | | 5.4 | | 0.6 | | 3.0 | | — | | 20.6 | | 1.3 | | (0.7 | ) | 1.8 | |
1984 | | 1.4 | | 5.0 | | 0.8 | | 5.0 | | — | | 1.9 | | 1.3 | | 0.0 | | 1.1 | |
1985 | | 1.0 | | 7.4 | | 6.9 | | 6.5 | | — | | 10.9 | | 1.8 | | 2.3 | | (0.4 | ) |
1986 | | 1.0 | | 5.6 | | 0.2 | | 5.0 | | — | | 9.5 | | 2.2 | | 4.2 | | (1.7 | ) |
1987 | | 1.5 | | 10.6 | | 6.2 | | 8.2 | | — | | 9.5 | | 2.8 | | 3.8 | | (0.8 | ) |
1988 | | 2.1 | | 11.0 | | 5.8 | | 10.2 | | — | | 0.1 | | 2.0 | | 4.1 | | (1.8 | ) |
1989 | | 2.6 | | 8.9 | | 3.3 | | 11.5 | | — | | 16.6 | | 3.8 | | 5.1 | | (1.2 | ) |
1990 | | 2.9 | | 5.0 | | 1.4 | | 10.8 | | — | | (10.4 | ) | 2.6 | | 3.4 | | (0.7 | ) |
1991 | | 2.5 | | 3.1 | | 0.2 | | 4.6 | | — | | (5.2 | ) | 2.8 | | 1.1 | | 1.5 | |
1992 | | 2.8 | | 6.6 | | 2.6 | | 4.3 | | 3.5 | | 10.1 | | 2.8 | | 2.5 | | 0.2 | |
1993 | | 2.9 | | 7.8 | | 4.5 | | 4.2 | | 5.0 | | 12.5 | | 2.7 | | 3.1 | | (0.4 | ) |
1994 | | 3.0 | | 6.8 | | 2.8 | | 4.6 | | 13.1 | | 12.3 | | 3.8 | | 4.5 | | (0.6 | ) |
1995 | | 2.8 | | 5.1 | | 2.4 | | 5.1 | | (3.6 | ) | (7.5 | ) | 1.7 | | 2.4 | | (0.6 | ) |
1996 | | 2.6 | | 3.0 | | 2.5 | | 2.9 | | (5.7 | ) | (4.2 | ) | 1.9 | | 1.7 | | 0.2 | |
1997 | | 1.9 | | 5.1 | | 3.2 | | 3.5 | | 16.2 | | 0.5 | | 2.1 | | 2.4 | | (0.3 | ) |
1998 | | 0.9 | | 1.1 | | 1.3 | | 2.3 | | (7.7 | ) | (9.6 | ) | 0.4 | | (0.1 | ) | 0.4 | |
1999 | | 0.7 | | 4.6 | | 3.2 | | 3.4 | | 1.6 | | 1.2 | | 1.3 | | 1.9 | | (0.5 | ) |
2000 | | 0.7 | | 8.6 | | 4.6 | | 6.1 | | 3.1 | | 2.4 | | 0.7 | | 1.9 | | (1.2 | ) |
2001 | | 1.0 | | 1.7 | | 0.6 | | 2.6 | | 7.4 | | (8.2 | ) | 0.1 | | (0.5 | ) | 0.6 | |
2002 | | 0.9 | | 3.5 | | 3.6 | | 2.8 | | 1.4 | | 7.7 | | 3.1 | | 2.3 | | 0.8 | |
2003 | | 1.0 | | 5.5 | | 2.8 | | 3.2 | | 7.2 | | 9.3 | | 2.0 | | 2.5 | | (0.5 | ) |
2004 | | 1.2 | | 8.1 | | 4.6 | | 5.5 | | 16.6 | | 9.4 | | 1.4 | | 2.4 | | (0.8 | ) |
2005 | | 1.3 | | 7.2 | | 3.7 | | 5.7 | | 12.1 | | 12.4 | | 1.9 | | 3.3 | | (1.3 | ) |
2006 | | 1.2 | | 6.4 | | 3.6 | | 7.2 | | 13.0 | | 7.3 | | 1.8 | | 3.1 | | (1.1 | ) |
(1) As at July 1. Data take into account adjustments made for net census undercount in 1996 and 2001, and non-permanent residents.
Sources: Statistics Canada and BC STATS, Ministry of Finance, based on federal, provincial and industry data.
20
Table A1.1B Prices, Earnings and Financial Indicators
| | | | | | Average | | | | | | | | | | | | Conventional | |
| | BC | | Vancouver | | weekly | | Labour | | Personal income | | PDI | | Prime | | Can/US | | (5 year) | |
| | CPI | | CPI | | wage rate(1) | | income | | per capita | | per capita | | rate | | exchange rate | | mortgage rate | |
| | (2002=100) | | (2002=100) | | ($) | | ($ millions) | | (dollars) | | (dollars) | | (per cent) | | (US cents) | | (per cent) | |
1980 | | 45.4 | | 44.8 | | — | | — | | — | | — | | 14.3 | | 85.5 | | 14.5 | |
1981 | | 51.8 | | 51.2 | | — | | 25,637 | | 13,180 | | 10,792 | | 19.3 | | 83.4 | | 18.4 | |
1982 | | 57.3 | | 56.6 | | — | | 26,497 | | 14,071 | | 11,482 | | 15.8 | | 81.1 | | 18.0 | |
1983 | | 60.4 | | 59.7 | | — | | 27,018 | | 14,332 | | 11,590 | | 11.2 | | 81.1 | | 13.2 | |
1984 | | 62.8 | | 62.1 | | — | | 27,811 | | 14,845 | | 12,139 | | 12.1 | | 77.2 | | 13.6 | |
1985 | | 64.8 | | 64.0 | | — | | 29,100 | | 15,665 | | 12,781 | | 10.6 | | 73.2 | | 12.1 | |
1986 | | 66.7 | | 66.2 | | — | | 30,339 | | 16,282 | | 13,133 | | 10.5 | | 72.0 | | 11.2 | |
1987 | | 68.7 | | 68.2 | | — | | 32,837 | | 17,345 | | 13,854 | | 9.5 | | 75.4 | | 11.2 | |
1988 | | 71.2 | | 70.6 | | — | | 36,110 | | 18,715 | | 14,845 | | 10.8 | | 81.3 | | 11.6 | |
1989 | | 74.4 | | 73.8 | | — | | 40,295 | | 20,328 | | 16,149 | | 13.3 | | 84.5 | | 12.1 | |
1990 | | 78.4 | | 77.8 | | — | | 44,216 | | 21,889 | | 17,009 | | 14.1 | | 85.7 | | 13.4 | |
1991 | | 82.6 | | 81.9 | | — | | 46,296 | | 22,335 | | 17,313 | | 9.9 | | 87.3 | | 11.1 | |
1992 | | 84.8 | | 84.3 | | — | | 48,924 | | 22,667 | | 17,458 | | 7.5 | | 82.7 | | 9.5 | |
1993 | | 87.8 | | 87.3 | | — | | 51,312 | | 22,964 | | 17,806 | | 5.9 | | 77.5 | | 8.8 | |
1994 | | 89.5 | | 89.1 | | — | | 53,972 | | 23,314 | | 17,969 | | 6.9 | | 73.2 | | 9.5 | |
1995 | | 91.6 | | 91.3 | | — | | 56,768 | | 23,843 | | 18,302 | | 8.6 | | 72.9 | | 9.2 | |
1996 | | 92.4 | | 92.1 | | — | | 58,517 | | 23,919 | | 18,223 | | 6.1 | | 73.3 | | 7.9 | |
1997 | | 93.1 | | 92.6 | | 612.63 | | 60,681 | | 24,291 | | 18,482 | | 5.0 | | 72.2 | | 7.1 | |
1998 | | 93.4 | | 93.0 | | 621.21 | | 61,965 | | 24,638 | | 18,676 | | 6.6 | | 67.4 | | 6.9 | |
1999 | | 94.4 | | 93.9 | | 628.82 | | 64,045 | | 25,297 | | 19,300 | | 6.4 | | 67.3 | | 7.6 | |
2000 | | 96.1 | | 96.0 | | 639.37 | | 68,369 | | 26,646 | | 20,278 | | 7.3 | | 67.3 | | 8.4 | |
2001 | | 97.7 | | 97.8 | | 648.19 | | 70,044 | | 27,064 | | 20,925 | | 5.8 | | 64.6 | | 7.4 | |
2002 | | 100.0 | | 100.0 | | 668.04 | | 72,900 | | 27,570 | | 21,530 | | 4.2 | | 63.7 | | 7.0 | |
2003 | | 102.2 | | 102.0 | | 683.68 | | 75,605 | | 28,173 | | 21,958 | | 4.7 | | 71.4 | | 6.4 | |
2004 | | 104.2 | | 104.0 | | 686.74 | | 80,158 | | 29,381 | | 22,847 | | 4.0 | | 76.8 | | 6.2 | |
2005 | | 106.3 | | 106.0 | | 704.49 | | 85,402 | | 30,644 | | 23,731 | | 4.4 | | 82.5 | | 6.0 | |
2006 | | 108.1 | | 108.0 | | 726.02 | | 92,434 | | 32,448 | | 25,194 | | 5.8 | | 88.2 | | 6.7 | |
| | | | | | Average | | | | | | | | | | | | Conventional | |
| | BC | | Vancouver | | weekly | | Labour | | Personal income | | PDI | | Prime | | Can/US | | (5 year) | |
| | CPI | | CPI | | wage rate(1) | | income | | per capita | | per capita | | rate | | exchange rate | | mortgage rate | |
| | (% change) | | (% change) | | (% change) | | (% change) | | (% change) | | (% change) | | (change) | | (change) | | (change) | |
1981 | | 14.1 | | 14.3 | | — | | — | | — | | — | | 5.0 | | (2.1 | ) | 3.9 | |
1982 | | 10.6 | | 10.5 | | — | | 3.4 | | 6.8 | | 6.4 | | (3.5 | ) | (2.4 | ) | (0.3 | ) |
1983 | | 5.4 | | 5.5 | | — | | 2.0 | | 1.9 | | 0.9 | | (4.6 | ) | 0.1 | | (4.8 | ) |
1984 | | 4.0 | | 4.0 | | — | | 2.9 | | 3.6 | | 4.7 | | 0.9 | | (3.9 | ) | 0.4 | |
1985 | | 3.2 | | 3.1 | | — | | 4.6 | | 5.5 | | 5.3 | | (1.5 | ) | (4.0 | ) | (1.5 | ) |
1986 | | 2.9 | | 3.4 | | — | | 4.3 | | 3.9 | | 2.8 | | (0.1 | ) | (1.3 | ) | (0.9 | ) |
1987 | | 3.0 | | 3.0 | | — | | 8.2 | | 6.5 | | 5.5 | | (1.0 | ) | 3.4 | | (0.0 | ) |
1988 | | 3.6 | | 3.5 | | — | | 10.0 | | 7.9 | | 7.2 | | 1.3 | | 5.8 | | 0.4 | |
1989 | | 4.5 | | 4.5 | | — | | 11.6 | | 8.6 | | 8.8 | | 2.5 | | 3.2 | | 0.5 | |
1990 | | 5.4 | | 5.4 | | — | | 9.7 | | 7.7 | | 5.3 | | 0.7 | | 1.2 | | 1.3 | |
1991 | | 5.4 | | 5.3 | | — | | 4.7 | | 2.0 | | 1.8 | | (4.1 | ) | 1.6 | | (2.2 | ) |
1992 | | 2.7 | | 2.9 | | — | | 5.7 | | 1.5 | | 0.8 | | (2.5 | ) | (4.5 | ) | (1.6 | ) |
1993 | | 3.5 | | 3.6 | | — | | 4.9 | | 1.3 | | 2.0 | | (1.5 | ) | (5.2 | ) | (0.7 | ) |
1994 | | 1.9 | | 2.1 | | — | | 5.2 | | 1.5 | | 0.9 | | 0.9 | | (4.3 | ) | 0.8 | |
1995 | | 2.3 | | 2.5 | | — | | 5.2 | | 2.3 | | 1.9 | | 1.8 | | (0.4 | ) | (0.4 | ) |
1996 | | 0.9 | | 0.9 | | — | | 3.1 | | 0.3 | | (0.4 | ) | (2.6 | ) | 0.5 | | (1.2 | ) |
1997 | | 0.8 | | 0.5 | | — | | 3.7 | | 1.6 | | 1.4 | | (1.1 | ) | (1.1 | ) | (0.9 | ) |
1998 | | 0.3 | | 0.4 | | 1.4 | | 2.1 | | 1.4 | | 1.0 | | 1.6 | | (4.8 | ) | (0.1 | ) |
1999 | | 1.1 | | 1.0 | | 1.2 | | 3.4 | | 2.7 | | 3.3 | | (0.2 | ) | (0.1 | ) | 0.6 | |
2000 | | 1.8 | | 2.2 | | 1.7 | | 6.8 | | 5.3 | | 5.1 | | 0.8 | | 0.0 | | 0.8 | |
2001 | | 1.7 | | 1.9 | | 1.4 | | 2.4 | | 1.6 | | 3.2 | | (1.5 | ) | (2.8 | ) | (0.9 | ) |
2002 | | 2.4 | | 2.2 | | 3.1 | | 4.1 | | 1.9 | | 2.9 | | (1.6 | ) | (0.9 | ) | (0.4 | ) |
2003 | | 2.2 | | 2.0 | | 2.3 | | 3.7 | | 2.2 | | 2.0 | | 0.5 | | 7.7 | | (0.6 | ) |
2004 | | 2.0 | | 2.0 | | 0.4 | | 6.0 | | 4.3 | | 4.0 | | (0.7 | ) | 5.5 | | (0.2 | ) |
2005 | | 2.0 | | 1.9 | | 2.6 | | 6.5 | | 4.3 | | 3.9 | | 0.4 | | 5.7 | | (0.2 | ) |
2006 | | 1.7 | | 1.9 | | 3.1 | | 8.2 | | 5.9 | | 6.2 | | 1.4 | | 5.7 | | 0.7 | |
(1) Data prior to 1997 are not available.
Sources: Statistics Canada and BC STATS, Ministry of Finance, based on federal, provincial and industry data.
21
Table A1.1C Other Indicators
| | Manufacturing | | | | Housing | | Non-residential | | Tourism | | High-tech | | BC product | |
| | shipments | | Retail sales(1) | | starts | | building permits | | GDP(2) | | GDP(2) | | exports | |
| | ($ millions) | | ($ millions) | | (number) | | ($ millions) | | ($ millions) | | ($ millions) | | ($ millions) | |
1980 | | — | | — | | 37,546 | | 1,207 | | — | | — | | 12,708 | |
1981 | | — | | — | | 41,585 | | 1,335 | | — | | — | | 12,888 | |
1982 | | — | | — | | 19,807 | | 1,026 | | — | | — | | 12,353 | |
1983 | | — | | — | | 22,607 | | 775 | | — | | — | | 13,244 | |
1984 | | — | | — | | 16,169 | | 827 | | — | | — | | 15,748 | |
1985 | | — | | — | | 17,969 | | 812 | | — | | — | | 13,591 | |
1986 | | — | | — | | 20,687 | | 912 | | — | | — | | 13,033 | |
1987 | | — | | — | | 28,944 | | 999 | | — | | — | | 15,883 | |
1988 | | — | | — | | 30,487 | | 1,647 | | — | | — | | 17,822 | |
1989 | | — | | — | | 38,894 | | 1,812 | | — | | — | | 18,307 | |
1990 | | — | | — | | 36,720 | | 1,833 | | — | | — | | 16,605 | |
1991 | | — | | 25,022 | | 31,875 | | 1,803 | | — | | — | | 15,253 | |
1992 | | 24,398 | | 26,194 | | 40,621 | | 2,082 | | — | | — | | 16,336 | |
1993 | | 26,583 | | 28,463 | | 42,807 | | 1,944 | | — | | — | | 19,033 | |
1994 | | 30,333 | | 31,770 | | 39,408 | | 1,772 | | — | | — | | 22,856 | |
1995 | | 34,207 | | 34,219 | | 27,057 | | 1,966 | | — | | — | | 26,873 | |
1996 | | 32,932 | | 34,775 | | 27,641 | | 1,957 | | — | | — | | 25,717 | |
1997 | | 33,496 | | 36,591 | | 29,351 | | 1,960 | | 4,700 | | 5,105 | | 26,699 | |
1998 | | 31,757 | | 35,762 | | 19,931 | | 2,022 | | 4,854 | | 5,428 | | 25,942 | |
1999 | | 36,679 | | 36,373 | | 16,309 | | 2,104 | | 5,040 | | 5,534 | | 29,044 | |
2000 | | 40,699 | | 38,435 | | 14,418 | | 2,089 | | 5,280 | | 6,244 | | 33,639 | |
2001 | | 38,303 | | 40,719 | | 17,234 | | 2,125 | | 5,430 | | 6,277 | | 31,680 | |
2002 | | 38,610 | | 43,265 | | 21,625 | | 1,771 | | 5,559 | | 6,700 | | 28,828 | |
2003 | | 39,691 | | 44,421 | | 26,174 | | 1,880 | | 5,528 | | 7,289 | | 28,264 | |
2004 | | 42,303 | | 47,217 | | 32,925 | | 2,070 | | 5,909 | | 7,583 | | 30,992 | |
2005 | | 40,960 | | 49,286 | | 34,667 | | 3,212 | | 6,203 | | 7,835 | | 34,101 | |
2006 | | 41,974 | | 52,627 | | 36,443 | | 3,921 | | n.a. | | n.a. | | 33,415 | |
| | Manufacturing | | | | Housing | | Non-residential | | Tourism | | High-tech | | BC product | |
| | shipments | | Retail sales(1) | | starts | | building permits | | GDP(2) | | GDP(2) | | exports | |
| | (% change) | | (% change) | | (% change) | | (% change) | | (% change) | | (% change) | | (% change) | |
1981 | | — | | — | | 10.8 | | 10.7 | | — | | — | | 1.4 | |
1982 | | — | | — | | (52.4 | ) | (23.2 | ) | — | | — | | (4.2 | ) |
1983 | | — | | — | | 14.1 | | (24.5 | ) | — | | — | | 7.2 | |
1984 | | — | | — | | (28.5 | ) | 6.7 | | — | | — | | 18.9 | |
1985 | | — | | — | | 11.1 | | (1.7 | ) | — | | — | | (13.7 | ) |
1986 | | — | | — | | 15.1 | | 12.3 | | — | | — | | (4.1 | ) |
1987 | | — | | — | | 39.9 | | 9.6 | | — | | — | | 21.9 | |
1988 | | — | | — | | 5.3 | | 64.9 | | — | | — | | 12.2 | |
1989 | | — | | — | | 27.6 | | 10.0 | | — | | — | | 2.7 | |
1990 | | — | | — | | (5.6 | ) | 1.2 | | — | | — | | (9.3 | ) |
1991 | | — | | — | | (13.2 | ) | (1.6 | ) | — | | — | | (8.1 | ) |
1992 | | — | | 4.7 | | 27.4 | | 15.5 | | — | | — | | 7.1 | |
1993 | | 9.0 | | 8.7 | | 5.4 | | (6.7 | ) | — | | — | | 16.5 | |
1994 | | 14.1 | | 11.6 | | (7.9 | ) | (8.9 | ) | — | | — | | 20.1 | |
1995 | | 12.8 | | 7.7 | | (31.3 | ) | 11.0 | | — | | — | | 17.6 | |
1996 | | (3.7 | ) | 1.6 | | 2.2 | | (0.4 | ) | — | | — | | (4.3 | ) |
1997 | | 1.7 | | 5.2 | | 6.2 | | 0.1 | | — | | — | | 3.8 | |
1998 | | (5.2 | ) | (2.3 | ) | (32.1 | ) | 3.2 | | 3.3 | | 6.3 | | (2.8 | ) |
1999 | | 15.5 | | 1.7 | | (18.2 | ) | 4.0 | | 3.8 | | 2.0 | | 12.0 | |
2000 | | 11.0 | | 5.7 | | (11.6 | ) | (0.7 | ) | 4.8 | | 12.8 | | 15.8 | |
2001 | | (5.9 | ) | 5.9 | | 19.5 | | 1.7 | | 2.8 | | 0.5 | | (5.8 | ) |
2002 | | 0.8 | | 6.3 | | 25.5 | | (16.6 | ) | 2.4 | | 6.7 | | (9.0 | ) |
2003 | | 2.8 | | 2.7 | | 21.0 | | 6.1 | | (0.6 | ) | 8.8 | | (2.0 | ) |
2004 | | 6.6 | | 6.3 | | 25.8 | | 10.1 | | 6.9 | | 4.0 | | 9.6 | |
2005 | | (3.2 | ) | 4.4 | | 5.3 | | 55.2 | | 5.0 | | 3.3 | | 10.0 | |
2006 | | 2.5 | | 6.8 | | 5.1 | | 22.1 | | n.a. | | n.a. | | (2.0 | ) |
(1) Retail sales data have been revised from 1991 to 2005 and are now classified under the North American Industry Classification System (NAICS 2002).
(2) Data prior to 1997 are not available.
Sources: Statistics Canada and BC STATS, Ministry of Finance, based on federal, provincial and industry data.
22
Table A1.1D Commodity Production Indicators
| | Lumber | | Timber scale | | Pulp | | Newsprint, etc | | Oil & natural | | Coal | | Solid mineral | | Electric pwr | | Farm cash | | Landed value of | |
| | production | | billed | | shipments | | production | | gas production | | production | | shipments | | generated | | receipts | | seafood products | |
| | (thousand m(3)) | | (thousand m3) | | (000 tonnes) | | (000 tonnes) | | ($ millions) | | (000 tonnes) | | ($ millions) | | (GW.h) | | ($ millions) | | ($ millions) | |
1980 | | 28,269 | | 74,652 | | 3,266 | | 2,164 | | — | | 10,156 | | — | | 43,334 | | 779 | | 184 | |
1981 | | 24,598 | | 52,992 | | 2,854 | | 1,852 | | — | | 11,782 | | — | | 51,008 | | 877 | | 236 | |
1982 | | 23,855 | | 56,232 | | 2,662 | | 1,862 | | — | | 11,769 | | — | | 48,238 | | 962 | | 241 | |
1983 | | 30,773 | | 71,443 | | 3,221 | | 2,120 | | — | | 11,717 | | — | | 47,213 | | 917 | | 210 | |
1984 | | 30,884 | | 74,557 | | 2,836 | | 2,082 | | — | | 20,771 | | — | | 52,369 | | 1,005 | | 243 | |
1985 | | 32,994 | | 76,869 | | 3,298 | | 2,481 | | — | | 22,993 | | — | | 59,126 | | 1,061 | | 378 | |
1986 | | 31,468 | | 77,503 | | 3,628 | | 2,629 | | — | | 20,361 | | — | | 50,759 | | 1,106 | | 405 | |
1987 | | 37,336 | | 90,592 | | 4,136 | | 2,762 | | — | | 21,990 | | — | | 63,066 | | 1,122 | | 455 | |
1988 | | 36,736 | | 86,808 | | 4,141 | | 2,845 | | — | | 24,942 | | — | | 60,943 | | 1,206 | | 573 | |
1989 | | 35,952 | | 86,793 | | 4,189 | | 2,834 | | — | | 24,800 | | — | | 57,655 | | 1,255 | | 513 | |
1990 | | 33,514 | | 78,045 | | 3,547 | | 2,992 | | — | | 24,557 | | — | | 60,662 | | 1,299 | | 559 | |
1991 | | 31,406 | | 73,449 | | 4,014 | | 2,667 | | — | | 24,965 | | — | | 62,981 | | 1,342 | | 492 | |
1992 | | 33,396 | | 73,937 | | 3,825 | | 2,708 | | 890 | | 17,173 | | 2,577 | | 64,058 | | 1,404 | | 533 | |
1993 | | 33,935 | | 79,232 | | 4,040 | | 3,110 | | 1,089 | | 20,633 | | 2,415 | | 58,774 | | 1,446 | | 605 | |
1994 | | 33,671 | | 75,639 | | 4,763 | | 2,983 | | 1,270 | | 22,583 | | 2,632 | | 61,015 | | 1,538 | | 728 | |
1995 | | 32,611 | | 76,471 | | 4,572 | | 2,833 | | 1,040 | | 24,350 | | 3,438 | | 58,006 | | 1,586 | | 604 | |
1996 | | 32,671 | | 75,213 | | 4,390 | | 2,801 | | 1,333 | | 25,422 | | 3,004 | | 71,765 | | 1,706 | | 590 | |
1997 | | 31,562 | | 68,628 | | 4,532 | | 2,649 | | 1,588 | | 27,876 | | 3,047 | | 66,961 | | 1,739 | | 604 | |
1998 | | 30,238 | | 64,967 | | 4,462 | | 2,567 | | 1,574 | | 24,868 | | 2,893 | | 67,710 | | 1,814 | | 547 | |
1999 | | 32,397 | | 75,998 | | 4,995 | | 3,016 | | 2,091 | | 24,845 | | 2,445 | | 68,045 | | 1,906 | | 613 | |
2000 | | 34,346 | | 76,988 | | 5,152 | | 3,126 | | 4,783 | | 25,682 | | 2,891 | | 68,241 | | 2,048 | | 667 | |
2001 | | 32,606 | | 72,008 | | 4,710 | | 2,879 | | 5,666 | | 27,006 | | 2,867 | | 57,332 | | 2,224 | | 647 | |
2002 | | 35,501 | | 73,386 | | 4,477 | | 2,900 | | 4,251 | | 24,397 | | 2,864 | | 64,945 | | 2,195 | | 664 | |
2003 | | 36,031 | | 61,925 | | 4,762 | | 2,919 | | 6,230 | | 23,061 | | 2,914 | | 63,051 | | 2,283 | | 645 | |
2004 | | 39,879 | | 92,361 | | 4,724 | | 2,976 | | 6,784 | | 27,082 | | 3,674 | | 60,496 | | 2,402 | | 636 | |
2005 | | 41,013 | | 83,134 | | 4,932 | | 2,953 | | 8,967 | | 25,571 | | 4,925 | | 67,811 | | 2,390 | | 700 | |
2006 | | 41,051 | | 81,526 | | 4,736 | | 3,019 | | 7,050 | | 21,131 | | 5,620 | | 62,021 | | 2,342 | | n.a. | |
| | Lumber | | Timber scale | | Pulp | | Newsprint, etc | | Oil & natural | | Coal | | Solid mineral | | Electric pwr | | Farm cash | | Value of | |
| | production | | billed | | shipments | | production | | gas production | | production | | shipments | | generated | | receipts | | seafood products | |
| | (% change) | | (% change) | | (% change) | | (% change) | | (% change) | | (% change) | | (% change) | | (% change) | | (% change) | | (% change) | |
1981 | | (13.0 | ) | (29.0 | ) | (12.6 | ) | (14.4 | ) | — | | 16.0 | | — | | 17.7 | | 12.5 | | 28.3 | |
1982 | | (3.0 | ) | 6.1 | | (6.7 | ) | 0.5 | | — | | (0.1 | ) | — | | (5.4 | ) | 9.7 | | 2.1 | |
1983 | | 29.0 | | 27.1 | | 21.0 | | 13.9 | | — | | (0.4 | ) | — | | (2.1 | ) | (4.7 | ) | (12.9 | ) |
1984 | | 0.4 | | 4.4 | | (12.0 | ) | (1.8 | ) | — | | 77.3 | | — | | 10.9 | | 9.6 | | 15.7 | |
1985 | | 6.8 | | 3.1 | | 16.3 | | 19.2 | | — | | 10.7 | | — | | 12.9 | | 5.7 | | 55.6 | |
1986 | | (4.6 | ) | 0.8 | | 10.0 | | 6.0 | | — | | (11.4 | ) | — | | (14.2 | ) | 4.2 | | 7.1 | |
1987 | | 18.6 | | 16.9 | | 14.0 | | 5.1 | | — | | 8.0 | | — | | 24.2 | | 1.4 | | 12.3 | |
1988 | | (1.6 | ) | (4.2 | ) | 0.1 | | 3.0 | | — | | 13.4 | | — | | (3.4 | ) | 7.6 | | 25.9 | |
1989 | | (2.1 | ) | (0.0 | ) | 1.2 | | (0.4 | ) | — | | (0.6 | ) | — | | (5.4 | ) | 4.0 | | (10.5 | ) |
1990 | | (6.8 | ) | (10.1 | ) | (15.3 | ) | 5.5 | | — | | (1.0 | ) | — | | 5.2 | | 3.5 | | 9.0 | |
1991 | | (6.3 | ) | (5.9 | ) | 13.2 | | (10.8 | ) | — | | 1.7 | | — | | 3.8 | | 3.3 | | (12.0 | ) |
1992 | | 6.3 | | 0.7 | | (4.7 | ) | 1.5 | | — | | (31.2 | ) | — | | 1.7 | | 4.7 | | 8.3 | |
1993 | | 1.6 | | 7.2 | | 5.6 | | 14.8 | | 22.4 | | 20.1 | | (6.3 | ) | (8.2 | ) | 3.0 | | 13.5 | |
1994 | | (0.8 | ) | (4.5 | ) | 17.9 | | (4.1 | ) | 16.6 | | 9.5 | | 9.0 | | 3.8 | | 6.4 | | 20.3 | |
1995 | | (3.1 | ) | 1.1 | | (4.0 | ) | (5.0 | ) | (18.1 | ) | 7.8 | | 30.6 | | (4.9 | ) | 3.1 | | (17.0 | ) |
1996 | | 0.2 | | (1.6 | ) | (4.0 | ) | (1.1 | ) | 28.2 | | 4.4 | | (12.6 | ) | 23.7 | | 7.6 | | (2.3 | ) |
1997 | | (3.4 | ) | (8.8 | ) | 3.2 | | (5.4 | ) | 19.1 | | 9.7 | | 1.4 | | (6.7 | ) | 1.9 | | 2.4 | |
1998 | | (4.2 | ) | (5.3 | ) | (1.5 | ) | (3.1 | ) | (0.9 | ) | (10.8 | ) | (5.1 | ) | 1.1 | | 4.3 | | (9.4 | ) |
1999 | | 7.1 | | 17.0 | | 11.9 | | 17.5 | | 32.8 | | (0.1 | ) | (15.5 | ) | 0.5 | | 5.1 | | 12.1 | |
2000 | | 6.0 | | 1.3 | | 3.1 | | 3.6 | | 128.7 | | 3.4 | | 18.2 | | 0.3 | | 7.5 | | 8.8 | |
2001 | | (5.1 | ) | (6.5 | ) | (8.6 | ) | (7.9 | ) | 18.5 | | 5.2 | | (0.8 | ) | (16.0 | ) | 8.6 | | (3.0 | ) |
2002 | | 8.9 | | 1.9 | | (4.9 | ) | 0.7 | | (25.0 | ) | (9.7 | ) | (0.1 | ) | 13.3 | | (1.3 | ) | 2.6 | |
2003 | | 1.5 | | (15.6 | ) | 6.4 | | 0.7 | | 46.6 | | (5.5 | ) | 1.7 | | (2.9 | ) | 4.0 | | (2.9 | ) |
2004 | | 10.7 | | 49.2 | | (0.8 | ) | 2.0 | | 8.9 | | 17.4 | | 26.1 | | (4.1 | ) | 5.2 | | (1.4 | ) |
2005 | | 2.8 | | (10.0 | ) | 4.4 | | (0.8 | ) | 32.2 | | (5.6 | ) | 34.1 | | 12.1 | | (0.5 | ) | 10.1 | |
2006 | | 0.1 | | (1.9 | ) | (4.0 | ) | 2.2 | | (21.4 | ) | (17.4 | ) | 14.1 | | (8.5 | ) | (2.0 | ) | n.a. | |
Sources: Statistics Canada and BC STATS, Ministry of Finance, based on federal, provincial and industry data.
23
Table A1.2 British Columbia Real GDP at Market Prices, Expenditure Based
| | | | | | | | | | Machinery and | | | | | | | | | |
| | Consumer | | Government | | Residential | | Non-Residential | | Equipment | | Business | | | | | | | |
| | Expenditure | | Expenditure | | Investment | | Investment | | Investment | | Investment | | Exports | | Imports | | Real GDP | |
| | (millions of 1997 $ , chained) | |
1982 | | 43,500 | | 16,925 | | 4,173 | | 5,005 | | 3,260 | | 12,445 | | 26,193 | | 25,063 | | 74,877 | |
1983 | | 43,724 | | 16,949 | | 4,414 | | 5,365 | | 2,474 | | 12,003 | | 27,669 | | 26,953 | | 75,349 | |
1984 | | 45,023 | | 16,736 | | 4,195 | | 4,724 | | 2,651 | | 11,438 | | 30,047 | | 29,254 | | 75,930 | |
1985 | | 46,865 | | 17,144 | | 4,532 | | 4,424 | | 2,950 | | 11,822 | | 33,014 | | 30,179 | | 81,203 | |
1986 | | 48,025 | | 17,320 | | 4,986 | | 3,467 | | 2,842 | | 11,169 | | 34,514 | | 31,408 | | 81,355 | |
1987 | | 50,640 | | 17,440 | | 5,921 | | 3,690 | | 3,431 | | 12,932 | | 37,212 | | 34,106 | | 86,373 | |
1988 | | 53,193 | | 18,560 | | 6,596 | | 4,471 | | 4,465 | | 15,515 | | 39,388 | | 36,945 | | 91,395 | |
1989 | | 56,485 | | 18,891 | | 7,592 | | 4,954 | | 5,309 | | 17,866 | | 38,692 | | 40,402 | | 94,400 | |
1990 | | 58,858 | | 19,684 | | 7,730 | | 4,913 | | 5,344 | | 17,998 | | 38,359 | | 42,207 | | 95,722 | |
1991 | | 59,028 | | 20,925 | | 7,311 | | 5,160 | | 5,268 | | 17,743 | | 39,074 | | 42,706 | | 95,897 | |
1992 | | 60,930 | | 21,695 | | 8,986 | | 4,048 | | 5,151 | | 18,287 | | 40,473 | | 44,652 | | 98,373 | |
1993 | | 62,851 | | 22,015 | | 9,218 | | 3,862 | | 5,163 | | 18,371 | | 42,146 | | 44,328 | | 102,770 | |
1994 | | 65,500 | | 22,098 | | 9,270 | | 4,971 | | 5,903 | | 20,177 | | 44,723 | | 51,161 | | 105,669 | |
1995 | | 67,321 | | 21,759 | | 8,161 | | 5,001 | | 5,988 | | 19,136 | | 47,288 | | 51,747 | | 108,194 | |
1996 | | 69,812 | | 22,343 | | 8,286 | | 4,483 | | 5,807 | | 18,587 | | 47,795 | | 51,443 | | 110,857 | |
1997 | | 72,380 | | 22,266 | | 8,716 | | 5,791 | | 6,799 | | 21,306 | | 49,691 | | 55,143 | | 114,383 | |
1998 | | 73,585 | | 22,875 | | 7,543 | | 4,704 | | 7,340 | | 19,598 | | 51,092 | | 54,559 | | 115,883 | |
1999 | | 75,648 | | 22,761 | | 6,962 | | 5,000 | | 7,672 | | 19,676 | | 55,575 | | 57,889 | | 119,604 | |
2000 | | 77,953 | | 23,701 | | 7,036 | | 5,003 | | 8,209 | | 20,283 | | 60,346 | | 62,310 | | 125,145 | |
2001 | | 79,626 | | 24,838 | | 7,692 | | 5,852 | | 8,306 | | 21,924 | | 59,271 | | 62,464 | | 125,924 | |
2002 | | 82,341 | | 25,112 | | 8,913 | | 5,434 | | 8,042 | | 22,418 | | 60,017 | | 62,677 | | 130,445 | |
2003 | | 84,809 | | 25,137 | | 10,007 | | 6,227 | | 8,346 | | 24,659 | | 61,751 | | 66,124 | | 134,131 | |
2004 | | 88,488 | | 25,485 | | 11,502 | | 6,711 | | 9,002 | | 27,337 | | 65,583 | | 71,035 | | 140,263 | |
2005 | | 92,348 | | 25,858 | | 12,246 | | 6,659 | | 10,572 | | 29,371 | | 67,472 | | 75,088 | | 145,501 | |
2006 | | 97,213 | | 26,594 | | 13,052 | | 7,273 | | 12,151 | | 32,175 | | 69,089 | | 79,795 | | 150,741 | |
| | (annual percentage change) | |
1983 | | 0.5 | | 0.1 | | 5.8 | | 7.2 | | (24.1 | ) | (3.6 | ) | 5.6 | | 7.5 | | 0.6 | |
1984 | | 3.0 | | (1.3 | ) | (5.0 | ) | (11.9 | ) | 7.2 | | (4.7 | ) | 8.6 | | 8.5 | | 0.8 | |
1985 | | 4.1 | | 2.4 | | 8.0 | | (6.4 | ) | 11.3 | | 3.4 | | 9.9 | | 3.2 | | 6.9 | |
1986 | | 2.5 | | 1.0 | | 10.0 | | (21.6 | ) | (3.7 | ) | (5.5 | ) | 4.5 | | 4.1 | | 0.2 | |
1987 | | 5.4 | | 0.7 | | 18.8 | | 6.4 | | 20.7 | | 15.8 | | 7.8 | | 8.6 | | 6.2 | |
1988 | | 5.0 | | 6.4 | | 11.4 | | 21.2 | | 30.1 | | 20.0 | | 5.8 | | 8.3 | | 5.8 | |
1989 | | 6.2 | | 1.8 | | 15.1 | | 10.8 | | 18.9 | | 15.2 | | (1.8 | ) | 9.4 | | 3.3 | |
1990 | | 4.2 | | 4.2 | | 1.8 | | (0.8 | ) | 0.7 | | 0.7 | | (0.9 | ) | 4.5 | | 1.4 | |
1991 | | 0.3 | | 6.3 | | (5.4 | ) | 5.0 | | (1.4 | ) | (1.4 | ) | 1.9 | | 1.2 | | 0.2 | |
1992 | | 3.2 | | 3.7 | | 22.9 | | (21.6 | ) | (2.2 | ) | 3.1 | | 3.6 | | 4.6 | | 2.6 | |
1993 | | 3.2 | | 1.5 | | 2.6 | | (4.6 | ) | 0.2 | | 0.5 | | 4.1 | | (0.7 | ) | 4.5 | |
1994 | | 4.2 | | 0.4 | | 0.6 | | 28.7 | | 14.3 | | 9.8 | | 6.1 | | 15.4 | | 2.8 | |
1995 | | 2.8 | | (1.5 | ) | (12.0 | ) | 0.6 | | 1.4 | | (5.2 | ) | 5.7 | | 1.1 | | 2.4 | |
1996 | | 3.7 | | 2.7 | | 1.5 | | (10.4 | ) | (3.0 | ) | (2.9 | ) | 1.1 | | (0.6 | ) | 2.5 | |
1997 | | 3.7 | | (0.3 | ) | 5.2 | | 29.2 | | 17.1 | | 14.6 | | 4.0 | | 7.2 | | 3.2 | |
1998 | | 1.7 | | 2.7 | | (13.5 | ) | (18.8 | ) | 8.0 | | (8.0 | ) | 2.8 | | (1.1 | ) | 1.3 | |
1999 | | 2.8 | | (0.5 | ) | (7.7 | ) | 6.3 | | 4.5 | | 0.4 | | 8.8 | | 6.1 | | 3.2 | |
2000 | | 3.0 | | 4.1 | | 1.1 | | 0.1 | | 7.0 | | 3.1 | | 8.6 | | 7.6 | | 4.6 | |
2001 | | 2.1 | | 4.8 | | 9.3 | | 17.0 | | 1.2 | | 8.1 | | (1.8 | ) | 0.2 | | 0.6 | |
2002 | | 3.4 | | 1.1 | | 15.9 | | (7.1 | ) | (3.2 | ) | 2.3 | | 1.3 | | 0.3 | | 3.6 | |
2003 | | 3.0 | | 0.1 | | 12.3 | | 14.6 | | 3.8 | | 10.0 | | 2.9 | | 5.5 | | 2.8 | |
2004 | | 4.3 | | 1.4 | | 14.9 | | 7.8 | | 7.9 | | 10.9 | | 6.2 | | 7.4 | | 4.6 | |
2005 | | 4.4 | | 1.5 | | 6.5 | | (0.8 | ) | 17.4 | | 7.4 | | 2.9 | | 5.7 | | 3.7 | |
2006 | | 5.3 | | 2.8 | | 6.6 | | 9.2 | | 14.9 | | 9.5 | | 2.4 | | 6.3 | | 3.6 | |
Source: Statistics Canada
24
Table A1.3 British Columbia GDP at Basic Prices, by Industry
| | Crop and | | Fishing, | | Forestry | | Mining, | | | | | | | | Transportation Wholesale | | Finance, | | | | Public | | Real GDP | |
| | Animal | | Hunting and | | and | | Oil and Gas | | | | | | | | and | | and Retail Insurance and | | Other | | Administration | | at Basic | |
| | Production | | Trapping | | Logging | | Extraction | | Manufacturing | | Construction | | Utilities | | Warehousing | | Trade | | Real Estate | | Services | | and Defence | | Prices | |
| | (chained 1997 $ ) | |
1997 | | 907 | | 201 | | 3,185 | | 2,646 | | 11,479 | | 6,434 | | 2,468 | | 6,590 | | 10,982 | | 23,606 | | 29,807 | | 5,764 | | 104,554 | |
1998 | | 864 | | 131 | | 3,203 | | 2,804 | | 11,228 | | 5,932 | | 2,534 | | 6,679 | | 11,565 | | 23,903 | | 30,681 | | 5,821 | | 105,827 | |
1999 | | 930 | | 101 | | 3,026 | | 2,808 | | 12,809 | | 5,718 | | 2,576 | | 6,956 | | 11,738 | | 24,630 | | 31,187 | | 6,050 | | 109,008 | |
2000 | | 927 | | 115 | | 2,863 | | 2,821 | | 14,954 | | 5,635 | | 2,591 | | 7,458 | | 12,247 | | 25,055 | | 32,449 | | 6,236 | | 113,919 | |
2001 | | 1,084 | | 95 | | 2,872 | | 3,586 | | 13,634 | | 5,854 | | 2,024 | | 7,344 | | 12,596 | | 25,756 | | 33,270 | | 6,354 | | 115,139 | |
2002 | | 1,006 | | 115 | | 2,944 | | 3,697 | | 13,654 | | 6,153 | | 2,403 | | 7,413 | | 13,094 | | 26,765 | | 34,408 | | 6,546 | | 118,806 | |
2003 | | 1,063 | | 118 | | 3,071 | | 3,534 | | 13,751 | | 6,686 | | 2,408 | | 7,579 | | 13,564 | | 27,410 | | 35,432 | | 6,615 | | 121,769 | |
2004 | | 1,072 | | 114 | | 3,645 | | 3,526 | | 14,241 | | 7,557 | | 2,368 | | 8,148 | | 14,396 | | 28,631 | | 36,161 | | 6,690 | | 126,791 | |
2005 | | 1,084 | | 106 | | 3,760 | | 3,537 | | 14,674 | | 7,956 | | 2,587 | | 8,578 | | 15,243 | | 29,868 | | 36,849 | | 6,797 | | 131,139 | |
2006 | | 1,033 | | 99 | | 3,846 | | 3,514 | | 15,031 | | 8,758 | | 2,560 | | 8,944 | | 16,415 | | 31,006 | | 37,967 | | 6,961 | | 136,050 | |
| | (annual percentage change) | |
1998 | | (4.8 | ) | (35.0 | ) | 0.6 | | 6.0 | | (2.2 | ) | (7.8 | ) | 2.6 | | 1.4 | | 5.3 | | 1.3 | | 2.9 | | 1.0 | | 1.2 | |
1999 | | 7.7 | | (23.0 | ) | (5.5 | ) | 0.2 | | 14.1 | | (3.6 | ) | 1.7 | | 4.1 | | 1.5 | | 3.0 | | 1.6 | | 3.9 | | 3.0 | |
2000 | | (0.4 | ) | 14.5 | | (5.4 | ) | 0.5 | | 16.7 | | (1.4 | ) | 0.6 | | 7.2 | | 4.3 | | 1.7 | | 4.0 | | 3.1 | | 4.5 | |
2001 | | 17.0 | | (17.5 | ) | 0.3 | | 27.1 | | (8.8 | ) | 3.9 | | (21.9 | ) | (1.5 | ) | 2.9 | | 2.8 | | 2.5 | | 1.9 | | 1.1 | |
2002 | | (7.3 | ) | 21.0 | | 2.5 | | 3.1 | | 0.1 | | 5.1 | | 18.7 | | 0.9 | | 4.0 | | 3.9 | | 3.4 | | 3.0 | | 3.2 | |
2003 | | 5.7 | | 2.7 | | 4.3 | | (4.4 | ) | 0.7 | | 8.7 | | 0.2 | | 2.2 | | 3.6 | | 2.4 | | 3.0 | | 1.1 | | 2.5 | |
2004 | | 0.8 | | (3.1 | ) | 18.7 | | (0.2 | ) | 3.6 | | 13.0 | | (1.7 | ) | 7.5 | | 6.1 | | 4.5 | | 2.1 | | 1.1 | | 4.1 | |
2005 | | 1.2 | | (6.8 | ) | 3.1 | | 0.3 | | 3.0 | | 5.3 | | 9.2 | | 5.3 | | 5.9 | | 4.3 | | 1.9 | | 1.6 | | 3.4 | |
2006 | | (4.7 | ) | (7.2 | ) | 2.3 | | (0.6 | ) | 2.4 | | 10.1 | | (1.0 | ) | 4.3 | | 7.7 | | 3.8 | | 3.0 | | 2.4 | | 3.7 | |
Source: Statistics Canada
25
Table A1 .4 British Columbia GDP, Income Based
| | | | | | Interest and | | Accrued Net | | Net Income of | | | | | | Indirect | | Capital Cons. | | | | | | | |
| | | | Corporation | | Miscellaneous | | Income of | | Non-farm | | Inventory | | Net Domestic | | Taxes | | Allowances and | | | | GDP | | GDP at | |
| | Labour | | Profits before | | Investment | | Farm | | unincorporated | | Valuation | | Product at | | less | | Misc. Valuation | | Statistical | | at Market | | Basic | |
| | Income | | Taxes | | Income | | Operators | | Business | | Adjustment | | Basic Prices | | Subsidies | | Adjustments | | Discrapency | | Prices | | Prices | |
| | ($ millions) | |
1982 | | 26,497 | | 1,652 | | 4,384 | | (8 | ) | 2,366 | | (382 | ) | 36,927 | | 5,176 | | 5,674 | | (335 | ) | 45,024 | | 42,266 | |
1983 | | 27,018 | | 2,458 | | 4,188 | | 20 | | 2,834 | | (288 | ) | 38,924 | | 5,473 | | 6,001 | | (227 | ) | 47,477 | | 44,698 | |
1984 | | 27,811 | | 3,060 | | 4,554 | | 20 | | 3,067 | | (243 | ) | 40,795 | | 5,673 | | 6,381 | | (483 | ) | 49,840 | | 46,693 | |
1985 | | 29,100 | | 3,468 | | 4,939 | | 33 | | 3,433 | | (163 | ) | 43,360 | | 5,878 | | 6,917 | | (65 | ) | 53,540 | | 50,212 | |
1986 | | 30,339 | | 4,213 | | 4,893 | | 113 | | 3,745 | | (212 | ) | 45,603 | | 6,098 | | 7,337 | | 21 | | 56,547 | | 52,961 | |
1987 | | 32,837 | | 6,430 | | 5,085 | | 115 | | 3,954 | | (324 | ) | 50,679 | | 6,696 | | 7,517 | | 205 | | 62,515 | | 58,401 | |
1988 | | 36,110 | | 7,250 | | 5,820 | | 154 | | 4,283 | | (285 | ) | 56,076 | | 7,486 | | 8,044 | | 546 | | 69,408 | | 64,666 | |
1989 | | 40,295 | | 5,925 | | 7,183 | | 72 | | 4,580 | | (195 | ) | 60,769 | | 8,765 | | 8,748 | | 209 | | 75,582 | | 69,726 | |
1990 | | 44,216 | | 3,670 | | 7,887 | | 73 | | 4,796 | | 120 | | 63,803 | | 9,007 | | 9,590 | | (9 | ) | 79,350 | | 73,384 | |
1991 | | 46,296 | | 2,926 | | 7,650 | | 106 | | 5,067 | | (107 | ) | 64,888 | | 9,715 | | 10,016 | | 180 | | 81,849 | | 75,084 | |
1992 | | 48,924 | | 3,321 | | 7,586 | | 80 | | 5,563 | | (616 | ) | 68,325 | | 11,092 | | 10,601 | | 691 | | 87,242 | | 79,617 | |
1993 | | 51,312 | | 4,328 | | 8,035 | | 83 | | 6,034 | | (843 | ) | 72,905 | | 12,440 | | 11,258 | | 1,430 | | 94,077 | | 85,593 | |
1994 | | 53,972 | | 6,756 | | 8,649 | | 63 | | 6,665 | | (660 | ) | 79,662 | | 13,164 | | 12,043 | | (140 | ) | 100,512 | | 91,565 | |
1995 | | 56,768 | | 7,419 | | 8,808 | | 87 | | 6,758 | | (167 | ) | 83,942 | | 13,522 | | 12,882 | | (407 | ) | 105,670 | | 96,417 | |
1996 | | 58,517 | | 7,246 | | 8,731 | | 59 | | 7,173 | | (231 | ) | 85,950 | | 14,014 | | 13,494 | | (138 | ) | 108,865 | | 99,306 | |
1997 | | 60,681 | | 8,286 | | 8,444 | | 89 | | 7,780 | | 101 | | 90,040 | | 14,480 | | 14,526 | | (4 | ) | 114,383 | | 104,562 | |
1998 | | 61,965 | | 7,335 | | 8,355 | | 166 | | 8,285 | | (24 | ) | 90,860 | | 14,515 | | 15,050 | | (6 | ) | 115,641 | | 105,904 | |
1999 | | 64,045 | | 9,309 | | 8,365 | | 199 | | 8,723 | | (373 | ) | 95,125 | | 14,972 | | 15,659 | | 22 | | 120,921 | | 110,806 | |
2000 | | 68,369 | | 11,596 | | 10,184 | | 54 | | 9,078 | | (80 | ) | 104,232 | | 15,608 | | 16,526 | | (2 | ) | 131,333 | | 120,756 | |
2001 | | 70,044 | | 11,392 | | 8,834 | | 141 | | 9,637 | | 47 | | 105,163 | | 15,810 | | 17,539 | | 70 | | 133,514 | | 122,772 | |
2002 | | 72,900 | | 11,389 | | 8,828 | | 53 | | 10,591 | | (369 | ) | 108,406 | | 16,443 | | 18,341 | | 17 | | 138,193 | | 126,764 | |
2003 | | 75,605 | | 12,705 | | 9,023 | | 83 | | 11,289 | | 630 | | 114,478 | | 17,462 | | 19,031 | | (65 | ) | 145,763 | | 133,444 | |
2004 | | 80,158 | | 17,009 | | 9,583 | | 136 | | 12,108 | | (45 | ) | 124,319 | | 18,486 | | 19,968 | | 137 | | 157,540 | | 144,424 | |
2005 | | 85,402 | | 20,011 | | 9,914 | | 33 | | 12,814 | | 212 | | 133,942 | | 19,540 | | 20,934 | | (5 | ) | 168,855 | | 154,871 | |
2006 | | 92,434 | | 21,673 | | 9,749 | | (26 | ) | 13,504 | | (165 | ) | 142,891 | | 20,499 | | 21,946 | | 87 | | 179,701 | | 164,924 | |
| | (annual percentage change) | |
1983 | | 2.0 | | 48.8 | | (4.5 | ) | — | | 19.8 | | — | | 5.4 | | 5.7 | | 5.8 | | — | | 5.4 | | 5.8 | |
1984 | | 2.9 | | 24.5 | | 8.7 | | — | | 8.2 | | — | | 4.8 | | 3.7 | | 6.3 | | — | | 5.0 | | 4.5 | |
1985 | | 4.6 | | 13.3 | | 8.5 | | — | | 11.9 | | — | | 6.3 | | 3.6 | | 8.4 | | — | | 7.4 | | 7.5 | |
1986 | | 4.3 | | 21.5 | | (0.9 | ) | — | | 9.1 | | — | | 5.2 | | 3.7 | | 6.1 | | — | | 5.6 | | 5.5 | |
1987 | | 8.2 | | 52.6 | | 3.9 | | — | | 5.6 | | — | | 11.1 | | 9.8 | | 2.5 | | — | | 10.6 | | 10.3 | |
1988 | | 10.0 | | 12.8 | | 14.5 | | — | | 8.3 | | — | | 10.6 | | 11.8 | | 7.0 | | — | | 11.0 | | 10.7 | |
1989 | | 11.6 | | (18.3 | ) | 23.4 | | — | | 6.9 | | — | | 8.4 | | 17.1 | | 8.8 | | — | | 8.9 | | 7.8 | |
1990 | | 9.7 | | (38.1 | ) | 9.8 | | — | | 4.7 | | — | | 5.0 | | 2.8 | | 9.6 | | — | | 5.0 | | 5.2 | |
1991 | | 4.7 | | (20.3 | ) | (3.0 | ) | — | | 5.7 | | — | | 1.7 | | 7.9 | | 4.4 | | — | | 3.1 | | 2.3 | |
1992 | | 5.7 | | 13.5 | | (0.8 | ) | — | | 9.8 | | — | | 5.3 | | 14.2 | | 5.8 | | — | | 6.6 | | 6.0 | |
1993 | | 4.9 | | 30.3 | | 5.9 | | — | | 8.5 | | — | | 6.7 | | 12.2 | | 6.2 | | — | | 7.8 | | 7.5 | |
1994 | | 5.2 | | 56.1 | | 7.6 | | — | | 10.5 | | — | | 9.3 | | 5.8 | | 7.0 | | — | | 6.8 | | 7.0 | |
1995 | | 5.2 | | 9.8 | | 1.8 | | — | | 1.4 | | — | | 5.4 | | 2.7 | | 7.0 | | — | | 5.1 | | 5.3 | |
1996 | | 3.1 | | (2.3 | ) | (0.9 | ) | — | | 6.1 | | — | | 2.4 | | 3.6 | | 4.8 | | — | | 3.0 | | 3.0 | |
1997 | | 3.7 | | 14.4 | | (3.3 | ) | — | | 8.5 | | — | | 4.8 | | 3.3 | | 7.6 | | — | | 5.1 | | 5.3 | |
1998 | | 2.1 | | (11.5 | ) | (1.1 | ) | — | | 6.5 | | — | | 0.9 | | 0.2 | | 3.6 | | — | | 1.1 | | 1.3 | |
1999 | | 3.4 | | 26.9 | | 0.1 | | — | | 5.3 | | — | | 4.7 | | 3.1 | | 4.0 | | — | | 4.6 | | 4.6 | |
2000 | | 6.8 | | 24.6 | | 21.7 | | — | | 4.1 | | — | | 9.6 | | 4.2 | | 5.5 | | — | | 8.6 | | 9.0 | |
2001 | | 2.4 | | (1.8 | ) | (13.3 | ) | — | | 6.2 | | — | | 0.9 | | 1.3 | | 6.1 | | — | | 1.7 | | 1.7 | |
2002 | | 4.1 | | (0.0 | ) | (0.1 | ) | — | | 9.9 | | — | | 3.1 | | 4.0 | | 4.6 | | — | | 3.5 | | 3.3 | |
2003 | | 3.7 | | 11.6 | | 2.2 | | — | | 6.6 | | — | | 5.6 | | 6.2 | | 3.8 | | — | | 5.5 | | 5.3 | |
2004 | | 6.0 | | 33.9 | | 6.2 | | — | | 7.3 | | — | | 8.6 | | 5.9 | | 4.9 | | — | | 8.1 | | 8.2 | |
2005 | | 6.5 | | 17.6 | | 3.5 | | — | | 5.8 | | — | | 7.7 | | 5.7 | | 4.8 | | — | | 7.2 | | 7.2 | |
2006 | | 8.2 | | 8.3 | | (1.7 | ) | — | | 5.4 | | — | | 6.7 | | 4.9 | | 4.8 | | — | | 6.4 | | 6.5 | |
Source: Statistics Canada
26
Table A1.5 Employment by Industry in British Columbia
| | 1996 | | 1997 | | 1998 | | 1999 | | 2000 | | 2001 | | 2002 | | 2003 | | 2004 | | 2005 | | 2006 | |
| | (thousands) | |
Total – all industries | | 1,816 | | 1,861 | | 1,858 | | 1,894 | | 1,931 | | 1,922 | | 1,965 | | 2,015 | | 2,063 | | 2,131 | | 2,196 | |
| | | | | | | | | | | | | | | | | | | | | | | |
Primary industries | | 86 | | 88 | | 84 | | 77 | | 82 | | 66 | | 67 | | 79 | | 72 | | 76 | | 79 | |
Agriculture | | 31 | | 34 | | 33 | | 28 | | 30 | | 26 | | 29 | | 33 | | 37 | | 39 | | 35 | |
Forestry, logging & support activities . | | 32 | | 32 | | 30 | | 30 | | 36 | | 25 | | 25 | | 28 | | 22 | | 22 | | 22 | |
Fishing, hunting and trapping | | 5 | | 5 | | 3 | | 4 | | 4 | | 5 | | 3 | | 5 | | 3 | | 2 | | 3 | |
Mining and oil & gas extraction | | 18 | | 16 | | 18 | | 15 | | 13 | | 11 | | 9 | | 13 | | 11 | | 14 | | 19 | |
| | | | | | | | | | | | | | | | | | | | | | | |
Manufacturing | | 193 | | 196 | | 196 | | 192 | | 203 | | 195 | | 197 | | 207 | | 211 | | 198 | | 198 | |
Food, beverages & tobacco | | 24 | | 25 | | 26 | | 22 | | 23 | | 26 | | 27 | | 32 | | 31 | | 32 | | 24 | |
Wood products | | 43 | | 45 | | 43 | | 42 | | 46 | | 49 | | 44 | | 49 | | 47 | | 46 | | 45 | |
Paper | | 23 | | 23 | | 23 | | 22 | | 18 | | 15 | | 17 | | 14 | | 12 | | 12 | | 15 | |
Printing & related support activities | | 11 | | 10 | | 8 | | 9 | | 11 | | 9 | | 9 | | 8 | | 8 | | 8 | | 8 | |
Primary metals | | 11 | | 9 | | 9 | | 10 | | 11 | | 8 | | 6 | | 9 | | 7 | | 7 | | 7 | |
Metal fabrication | | 9 | | 11 | | 10 | | 12 | | 13 | | 14 | | 13 | | 14 | | 15 | | 18 | | 15 | |
Transportation equipment | | 9 | | 13 | | 13 | | 13 | | 13 | | 10 | | 13 | | 12 | | 12 | | 9 | | 10 | |
Machinery manufacturing | | 6 | | 9 | | 9 | | 8 | | 8 | | 7 | | 10 | | 9 | | 10 | | 10 | | 9 | |
Other manufacturing | | 56 | | 53 | | 55 | | 53 | | 61 | | 58 | | 58 | | 60 | | 71 | | 57 | | 64 | |
| | | | | | | | | | | | | | | | | | | | | | | |
Construction | | 119 | | 123 | | 117 | | 114 | | 111 | | 111 | | 118 | | 120 | | 144 | | 168 | | 179 | |
General contractors | | 44 | | 41 | | 38 | | 42 | | 42 | | 40 | | 42 | | 47 | | 51 | | 66 | | 66 | |
Special trade contractors | | 76 | | 82 | | 79 | | 73 | | 69 | | 71 | | 77 | | 73 | | 93 | | 102 | | 113 | |
| | | | | | | | | | | | | | | | | | | | | | | |
Utilities | | 10 | | 10 | | 11 | | 11 | | 10 | | 11 | | 11 | | 11 | | 9 | | 10 | | 9 | |
| | | | | | | | | | | | | | | | | | | | | | | |
Transportation and warehousing | | 100 | | 108 | | 106 | | 116 | | 117 | | 112 | | 113 | | 120 | | 117 | | 119 | | 120 | |
Transportation | | 97 | | 102 | | 102 | | 112 | | 114 | | 108 | | 108 | | 114 | | 112 | | 114 | | 113 | |
Warehousing and storage | | 3 | | 6 | | 3 | | 4 | | 3 | | 4 | | 5 | | 6 | | 5 | | 5 | | 7 | |
| | | | | | | | | | | | | | | | | | | | | | | |
Trade | | 291 | | 298 | | 290 | | 305 | | 301 | | 303 | | 325 | | 328 | | 316 | | 335 | | 354 | |
Wholesale trade | | 67 | | 71 | | 61 | | 79 | | 67 | | 67 | | 74 | | 76 | | 66 | | 80 | | 83 | |
Retail trade | | 224 | | 227 | | 229 | | 226 | | 234 | | 236 | | 251 | | 251 | | 250 | | 255 | | 271 | |
| | | | | | | | | | | | | | | | | | | | | | | |
Finance, Insurance, Real Estate & Leasing | | 124 | | 128 | | 122 | | 121 | | 118 | | 121 | | 123 | | 125 | | 129 | | 133 | | 138 | |
Finance | | 51 | | 56 | | 52 | | 55 | | 52 | | 56 | | 56 | | 60 | | 56 | | 60 | | 61 | |
Insurance | | 24 | | 27 | | 24 | | 23 | | 27 | | 25 | | 24 | | 20 | | 27 | | 26 | | 27 | |
Real estate | | 39 | | 34 | | 38 | | 33 | | 29 | | 28 | | 32 | | 34 | | 35 | | 35 | | 39 | |
Leasing | | 10 | | 11 | | 8 | | 10 | | 9 | | 12 | | 11 | | 11 | | 12 | | 13 | | 11 | |
| | | | | | | | | | | | | | | | | | | | | | | |
Public administration | | 106 | | 101 | | 94 | | 93 | | 92 | | 90 | | 88 | | 93 | | 97 | | 95 | | 91 | |
Federal administration | | 37 | | 34 | | 29 | | 33 | | 34 | | 30 | | 32 | | 37 | | 34 | | 33 | | 35 | |
Provincial administration | | 36 | | 32 | | 29 | | 29 | | 27 | | 33 | | 27 | | 28 | | 29 | | 30 | | 27 | |
Local administration | | 34 | | 34 | | 35 | | 31 | | 32 | | 27 | | 29 | | 29 | | 34 | | 32 | | 29 | |
| | | | | | | | | | | | | | | | | | | | | | | |
Other service industries | | 787 | | 809 | | 839 | | 866 | | 897 | | 913 | | 924 | | 933 | | 967 | | 997 | | 1,029 | |
Education & related services | | 118 | | 120 | | 118 | | 127 | | 137 | | 138 | | 139 | | 140 | | 136 | | 146 | | 156 | |
Health & welfare services | | 183 | | 191 | | 197 | | 193 | | 201 | | 197 | | 212 | | 213 | | 219 | | 217 | | 232 | |
Professional, scientific & technical | | 108 | | 112 | | 123 | | 136 | | 136 | | 139 | | 136 | | 139 | | 146 | | 164 | | 168 | |
Information, culture & recreation | | 85 | | 89 | | 93 | | 91 | | 99 | | 106 | | 106 | | 109 | | 115 | | 112 | | 113 | |
Services to business management | | 60 | | 63 | | 67 | | 65 | | 71 | | 71 | | 72 | | 80 | | 82 | | 90 | | 99 | |
Accommodation & food services | | 141 | | 142 | | 147 | | 149 | | 155 | | 164 | | 163 | | 159 | | 175 | | 176 | | 171 | |
Miscellaneous services | | 91 | | 92 | | 93 | | 105 | | 99 | | 98 | | 96 | | 93 | | 94 | | 91 | | 91 | |
Source: Statistics Canada, Labour Force Survey (unpublished data). Totals may not add due to rounding.
27
Table A1.6 Capital Investment by Industry
| | | | | | | | | | Preliminary | | | | 2005 | | 2006 | |
| | Actual | | Actual | | Actual | | Actual | | Actual | | Intentions | | to | | to | |
| | 2002 | | 2003 | | 2004 | | 2005 | | 2006 | | 2007 | | 2006 | | 2007 | |
| | ($ millions) | | (per cent) | |
Agriculture, forestry, fishing and hunting | | 383.8 | | 395.6 | | 444.5 | | 414.6 | | 393.6 | | 402.2 | | (5.1 | ) | 2.2 | |
Mining, quarrying and oil well industries | | 2,299.4 | | 3,309.3 | | 3,978.6 | | 5,026.9 | | 5,084.5 | | 4,364.9 | | 1.1 | | (14.2 | ) |
Manufacturing | | 1,098.3 | | 1,176.4 | | 1,466.9 | | 1,656.7 | | 1,471.5 | | 1,804.2 | | (11.2 | ) | 22.6 | |
Construction | | 280.3 | | 306.9 | | 355.6 | | 391.9 | | 464.6 | | 507.4 | | 18.6 | | 9.2 | |
Transport and warehousing | | 2,142.6 | | 1,429.6 | | 1,359.5 | | 1,877.6 | | 2,693.7 | | 3,114.0 | | 43.5 | | 15.6 | |
Utilities | | 1,084.6 | | 1,375.8 | | 1,374.8 | | 1,329.5 | | 1,674.1 | | 2,125.9 | | 25.9 | | 27.0 | |
Wholesale | | 369.0 | | 415.5 | | 392.5 | | 480.9 | | 548.9 | | 479.7 | | 14.1 | | (12.6 | ) |
Retail trade | | 731.8 | | 822.5 | | 1,065.6 | | 1,011.2 | | 1,116.5 | | 1,070.0 | | 10.4 | | (4.2 | ) |
Finance and insurance | | 1,333.5 | | 1,295.5 | | 1,292.0 | | 1,455.2 | | 1,496.7 | | 1,568.4 | | 2.9 | | 4.8 | |
Real estate, rental and leasing | | 1,661.4 | | 1,572.1 | | 1,557.6 | | 1,681.3 | | 2,099.5 | | 2,154.4 | | 24.9 | | 2.6 | |
Information and cultural industries | | 1,087.3 | | 764.1 | | 947.5 | | 828.2 | | 984.2 | | 950.7 | | 18.8 | | (3.4 | ) |
Professional, scientific and technical | | 348.6 | | 349.4 | | 362.8 | | 297.3 | | 281.8 | | 288.2 | | (5.2 | ) | 2.3 | |
Management of companies and enterprises | | 32.4 | | 14.4 | | 57.6 | | 32.9 | | 32.2 | | 29.2 | | (2.1 | ) | (9.3 | ) |
Admin, waste and remediation services | | 75.9 | | 99.0 | | 107.7 | | 113.2 | | 126.6 | | 134.7 | | 11.8 | | 6.4 | |
Arts, entertainment and recreation | | 98.3 | | 144.1 | | 216.6 | | 191.3 | | 167.8 | | n/a | | (12.3 | ) | n/a | |
Accommodation and food services | | 396.3 | | 431.0 | | 467.7 | | 543.0 | | 660.6 | | n/a | | 21.7 | | n/a | |
Education services | | 660.8 | | 726.2 | | 871.6 | | 1,020.7 | | 1,078.8 | | 962.8 | | 5.7 | | (10.8 | ) |
Health services | | 558.1 | | 612.3 | | 711.0 | | 993.9 | | 934.5 | | 883.3 | | (6.0 | ) | (5.5 | ) |
Public administration | | 2,158.6 | | 2,017.6 | | 2,386.8 | | 2,697.0 | | 3,119.6 | | 3,197.3 | | 15.7 | | 2.5 | |
Other services | | 176.5 | | 170.4 | | 207.4 | | 217.9 | | 171.6 | | 132.7 | | (21.2 | ) | (22.7 | ) |
Housing | | 6,754.0 | | 8,006.4 | | 10,040.4 | | 10,993.1 | | 12,974.6 | | 13,347.3 | | 18.0 | | 2.9 | |
Total | | 23,731.6 | | 25,434.1 | | 29,664.7 | | 33,254.2 | | 37,575.8 | | 38,747.9 | | 13.0 | | 3.1 | |
| | | | | | | | | | | | | | | | | |
Public | | 4,670.5 | | 4,611.1 | | 5,352.2 | | 6,106.3 | | 7,056.5 | | 8,189.0 | | 15.6 | | 16.0 | |
Private | | 19,061.1 | | 20,823.1 | | 24,312.4 | | 27,147.9 | | 30,519.4 | | 30,558.9 | | 12.4 | | 0.1 | |
Total | | 23,731.6 | | 25,434.1 | | 29,664.7 | | 33,254.2 | | 37,575.8 | | 38,747.9 | | 13.0 | | 3.1 | |
| | | | | | | | | | | | | | | | | |
Machinery and equipment | | 8,865.1 | | 8,305.8 | | 8,922.8 | | 10,215.4 | | 10,957.2 | | 11,411.7 | | 7.3 | | 4.1 | |
Construction | | 14,866.5 | | 17,128.4 | | 20,741.9 | | 23,038.8 | | 26,618.6 | | 27,336.2 | | 15.5 | | 2.7 | |
Total | | 23,731.6 | | 25,434.1 | | 29,664.7 | | 33,254.2 | | 37,575.8 | | 38,747.9 | | 13.0 | | 3.1 | |
Note: Totals may not add due to rounding.
Totals may not add due to some data not being disclosed for confidentiality reasons.
Source: Statistics Canada.
28
Table A1.7 British Columbia International Goods Exports by Major Market and Selected Commodities, 2006
| | | | | | European | | Other | | Total - | |
Commodity | | U.S. | | Japan | | Union (1) | | Markets | | All Countries | |
| | ($ millions) | |
| | | |
Solid wood products | | 6,707 | | 1,347 | | 312 | | 419 | | 8,785 | |
Lumber (softwood) | | 4,323 | | 989 | | 232 | | 306 | | 5,849 | |
Cedar shakes and shingles | | 240 | | 0 | | 7 | | 6 | | 253 | |
Plywood (softwood) | | 383 | | 11 | | 3 | | 4 | | 400 | |
Other panel products | | 644 | | 37 | | 1 | | 19 | | 701 | |
Selected value-added wood products | | 744 | | 88 | | 10 | | 14 | | 855 | |
Logs | | 243 | | 185 | | 0 | | 59 | | 487 | |
Other | | 132 | | 37 | | 59 | | 12 | | 239 | |
| | | | | | | | | | | |
Pulp and paper products | | 2,109 | | 333 | | 500 | | 1,842 | | 4,784 | |
Pulp | | 753 | | 320 | | 454 | | 1,361 | | 2,887 | |
Newsprint | | 339 | | 4 | | 0 | | 260 | | 603 | |
Paper, paperboard - excluding newsprint | | 885 | | 6 | | 45 | | 197 | | 1,133 | |
Other | | 132 | | 2 | | 1 | | 25 | | 160 | |
| | | | | | | | | | | |
Agriculture and food other than fish | | 1,091 | | 115 | | 38 | | 196 | | 1,440 | |
Fruit and nuts | | 170 | | 17 | | 9 | | 22 | | 218 | |
Vegetables | | 238 | | 4 | | 1 | | 4 | | 247 | |
Other | | 683 | | 94 | | 29 | | 169 | | 975 | |
| | | | | | | | | | | |
Fish products | | 544 | | 188 | | 72 | | 174 | | 979 | |
Whole fish; fresh, chilled, frozen - excluding salmon | | 66 | | 37 | | 21 | | 52 | | 177 | |
Whole salmon; fresh, chilled, frozen | | 326 | | 36 | | 18 | | 24 | | 404 | |
Salmon; canned, smoked, etc | | 22 | | 3 | | 29 | | 13 | | 68 | |
Other | | 130 | | 111 | | 4 | | 85 | | 330 | |
| | | | | | | | | | | |
Metallic mineral products | | 737 | | 1,622 | | 96 | | 1,128 | | 3,583 | |
Copper ores and concentrates | | — | | 910 | | — | | 722 | | 1,632 | |
Molybdenum ores and concentrates | | 132 | | 148 | | 87 | | 43 | | 411 | |
Unwrought aluminum | | 76 | | 442 | | 1 | | 170 | | 689 | |
Unwrought zinc | | 385 | | 4 | | — | | 153 | | 542 | |
Other | | 143 | | 118 | | 8 | | 40 | | 309 | |
| | | | | | | | | | | |
Fabricated metal products | | 814 | | 10 | | 13 | | 235 | | 1,072 | |
| | | | | | | | | | | |
Energy products | | 3,618 | | 868 | | 782 | | 1,132 | | 6,400 | |
Natural gas | | 3,014 | | — | | — | | — | | 3,014 | |
Coal | | 78 | | 868 | | 782 | | 1,118 | | 2,845 | |
Electricity | | 324 | | — | | — | | — | | 324 | |
Other | | 203 | | 0 | | 0 | | 14 | | 218 | |
| | | | | | | | | | | |
Machinery and equipment | | 2,499 | | 107 | | 346 | | 486 | | 3,438 | |
Motor vehicles and parts | | 345 | | 3 | | 9 | | 34 | | 391 | |
Electrical/electronic/communications | | 496 | | 15 | | 58 | | 102 | | 671 | |
Scientific/photographic/measuring equipment, etc. | | 285 | | 8 | | 72 | | 82 | | 448 | |
Other | | 1,373 | | 81 | | 206 | | 268 | | 1,928 | |
| | | | | | | | | | | |
Plastics and articles of plastic | | 528 | | 4 | | 13 | | 43 | | 587 | |
Chemicals and chemical products | | 424 | | 87 | | 17 | | 184 | | 712 | |
Apparel and accessories | | 133 | | 6 | | 13 | | 7 | | 159 | |
Textiles | | 25 | | 1 | | 2 | | 22 | | 49 | |
| | | | | | | | | | | |
All other commodities | | 1,234 | | 19 | | 64 | | 112 | | 1,428 | |
Total | | 20,463 | | 4,706 | | 2,267 | | 5,979 | | 33,415 | |
(1) As of January 1, 2007, Austria, Belgium, Bulgaria, Cyprus, Czech Republic, Denmark, Estonia, Finland, France, Germany, Greece, Hungary, Ireland, Italy, Latvia, Lithuania, Luxembourg, Malta, Netherlands, Poland, Portugal, Romania, Slovakia, Slovenia, Spain, Sweden, United Kingdom.
Source: BC STATS
29
Table A1.8 British Columbia International Goods Exports by Market Area
| | | | | | | | % Change | | Percent of Total | |
| | 2004 | | 2005 | | 2006 | | 2005-2006 | | 2005 | | 2006 | |
| | ($ millions) | | (per cent) | |
United Kingdom | | 341 | | 421 | | 386 | | (8.3 | ) | 1.2 | | 1.2 | |
Germany | | 428 | | 471 | | 447 | | (5.0 | ) | 1.4 | | 1.3 | |
People’s Republic of China | | 1,225 | | 1,325 | | 1,486 | | 12.1 | | 3.9 | | 4.4 | |
Hong Kong | | 252 | | 213 | | 199 | | (6.5 | ) | 0.6 | | 0.6 | |
Taiwan | | 487 | | 499 | | 521 | | 4.4 | | 1.5 | | 1.6 | |
Japan | | 3,805 | | 4,164 | | 4,706 | | 13.0 | | 12.2 | | 14.1 | |
South Korea | | 910 | | 1,168 | | 1,365 | | 16.9 | | 3.4 | | 4.1 | |
India | | 133 | | 197 | | 346 | | 76.0 | | 0.6 | | 1.0 | |
Australia | | 224 | | 180 | | 171 | | (4.8 | ) | 0.5 | | 0.5 | |
Mexico | | 198 | | 237 | | 185 | | (21.9 | ) | 0.7 | | 0.6 | |
United States | | 20,121 | | 22,034 | | 20,463 | | (7.1 | ) | 64.6 | | 61.2 | |
Other | | 2,867 | | 3,193 | | 3,140 | | (1.7 | ) | 9.4 | | 9.4 | |
Total | | 30,992 | | 34,101 | | 33,415 | | (2.0 | ) | 100.0 | | 100.0 | |
| | | | | | | | | | | | | |
Market Areas: | | | | | | | | | | | | | |
Western Europe (1) | | 2,205 | | 2,453 | | 2,271 | | (7.4 | ) | 7.2 | | 6.8 | |
Pacific Rim (2) | | 7,471 | | 8,078 | | 9,034 | | 11.8 | | 23.7 | | 27.0 | |
(1) Austria, Belgium, Denmark, Finland, France, Germany, Greece, Iceland, Ireland, Italy, Luxembourg, Netherlands, Norway, Portugal, Spain, Sweden, Switzerland and the United Kingdom.
(2) Australia, Brunei Darussalam, China, Fiji, Hong Kong, Indonesia, Japan, Laos, Macau, Malaysia, Mongolia, New Zealand, North Korea, Philippines, Singapore, South Korea, Taiwan, Thailand and Vietnam.
Source: BC STATS
30
Table A1.9 Historical Commodity Prices (in US Dollars)
| | 1996 | | 1997 | | 1998 | | 1999 | | 2000 | | 2001 | | 2002 | | 2003 | | 2004 | | 2005 | | 2006 | |
Metals | | | | | | | | | | | | | | | | | | | | | | | |
Copper (London; $/lb) | | 1.04 | | 1.03 | | 0.75 | | 0.71 | | 0.82 | | 0.72 | | 0.71 | | 0.81 | | 1.30 | | 1.67 | | 3.07 | |
Lead (London; $/lb) | | 0.35 | | 0.28 | | 0.24 | | 0.23 | | 0.21 | | 0.22 | | 0.21 | | 0.23 | | 0.40 | | 0.44 | | 0.59 | |
Zinc (London; $/lb) | | 0.51 | | 0.65 | | 0.51 | | 0.53 | | 0.56 | | 0.44 | | 0.35 | | 0.39 | | 0.48 | | 0.63 | | 1.49 | |
Gold (London; $/troy oz) | | 388 | | 331 | | 294 | | 279 | | 280 | | 271 | | 310 | | 363 | | 409 | | 445 | | 604 | |
Silver (London; $/troy oz) | | 5.18 | | 4.89 | | 5.53 | | 5.25 | | 5.00 | | 4.39 | | 4.60 | | 4.88 | | 6.66 | | 7.32 | | 11.55 | |
Molybdenum ($/lb) | | 3.61 | | 4.18 | | 3.31 | | 2.65 | | 2.51 | | 2.31 | | 3.59 | | 5.21 | | 15.92 | | 31.05 | | 24.46 | |
Aluminum (London; $/lb) | | 0.68 | | 0.73 | | 0.62 | | 0.62 | | 0.69 | | 0.65 | | 0.61 | | 0.65 | | 0.78 | | 0.86 | | 1.17 | |
Forest Products | | | | | | | | | | | | | | | | | | | | | | | |
Lumber (Madison’s Lumber Reporter; WSPF, $/1000 bd ft) | | 351 | | 353 | | 287 | | 342 | | 256 | | 247 | | 235 | | 270 | | 394 | | 355 | | 296 | |
Pulp (Northern Europe; $/tonne; transaction price) | | 590 | | 566 | | 515 | | 523 | | 681 | | 543 | | 463 | | 523 | | 616 | | 611 | | 674 | |
Newsprint (Pulp and Paper Week; $/tonne) | | 652 | | 560 | | 595 | | 513 | | 564 | | 588 | | 468 | | 501 | | 549 | | 608 | | 667 | |
Hemlock baby squares (Madison’s Lumber Reporter; 3 9/16”) | | 796 | | 821 | | 556 | | 585 | | 566 | | 583 | | 593 | | 535 | | 614 | | 540 | | 584 | |
Other | | | | | | | | | | | | | | | | | | | | | | | |
Oil (West Texas Intermediate; $/barrel) | | 22 | | 21 | | 14 | | 19 | | 30 | | 26 | | 26 | | 31 | | 41 | | 56 | | 66 | |
Natural Gas (Sumas; $/Mmbtu) | | 1.35 | | 1.70 | | 1.61 | | 2.15 | | 4.17 | | 4.58 | | 2.68 | | 4.66 | | 5.27 | | 7.15 | | 6.28 | |
Sources: Ministry of Finance, Ministry of Energy, Mines and Petroleum Resources, US Federal Reserve Bank
31
Table A1.10 British Columbia Forest Sector Economic Activity Indicators
| | | | | | | | | | | | Change (1) | |
Indicator | | 2002 | | 2003 | | 2004 | | 2005 | | 2006 | | 2005-2006 | |
| | (million cubic meters ) | | | | | | (per cent) | |
Wood production | | | | | | | | | | | |
Timber billed | | 73.4 | | 61.9 | | 92.4 | | 83.1 | | 81.5 | | (1.9 | ) |
Lumber | | 35.5 | | 36.0 | | 39.9 | | 41.0 | | 41.1 | | 0.1 | |
Plywood | | 1.7 | | 1.7 | | 1.9 | | 1.9 | | 1.8 | | (3.1 | ) |
| | | | | | | | | | | | | |
| | (million cubic meters ) | | | | | | | |
Timber scaled by species | | | | | | | | | | | |
Lodgepole pine | | 26.2 | | 29.5 | | 30.2 | | 37.6 | | 36.7 | | (2.3 | ) |
Spruce | | 13.0 | | 13.2 | | 11.7 | | 11.9 | | 11.8 | | (1.2 | ) |
Hemlock | | 8.7 | | 7.0 | | 9.2 | | 7.6 | | 7.4 | | (2.8 | ) |
Douglas fir | | 10.7 | | 10.1 | | 12.8 | | 10.9 | | 9.9 | | (9.4 | ) |
Balsam | | 6.5 | | 5.7 | | 6.1 | | 5.1 | | 4.9 | | (4.4 | ) |
Cedar | | 6.4 | | 5.4 | | 7.3 | | 6.0 | | 5.4 | | (9.2 | ) |
All others | | 3.8 | | 4.0 | | 4.3 | | 4.2 | | 4.4 | | 3.7 | |
Total(2) | | 75.2 | | 74.9 | | 81.6 | | 83.4 | | 80.5 | | (3.4 | ) |
| | | | | | | | | | | | | |
| | (million tonnes) | | | | | | | |
Pulp and paper shipments | | 7.4 | | 7.6 | | 7.7 | | 7.9 | | 7.8 | | (1.7 | ) |
Market pulp | | 4.5 | | 4.8 | | 4.7 | | 4.9 | | 4.7 | | (4.0 | ) |
Newsprint, paper and paperboard | | 2.9 | | 2.9 | | 3.0 | | 3.0 | | 3.0 | | 2.2 | |
| | | | | | | | | | | | | |
| | (1997=100) | | | | | | | |
Industrial product price indices | | | | | | | | | | | |
Softwood lumber – British Columbia | | 81.7 | | 72.6 | | 85.2 | | 74.7 | | 70.6 | | (5.5 | ) |
Douglas fir plywood | | 104.2 | | 110.8 | | 126.5 | | 94.6 | | 89.9 | | (5.0 | ) |
Bleached sulphate pulp | | 96.1 | | 97.2 | | 104.1 | | 97.0 | | 97.9 | | 1.0 | |
Newsprint for export | | 96.2 | | 89.3 | | 91.4 | | 94.2 | | 94.6 | | 0.4 | |
(1) Percentage change based on unrounded numbers.
(2) Total may not add due to rounding.
Sources: Timber scaled (less waste and reject) – Ministry of Forests and Range
Lumber and plywood production – Statistics Canada
Pulp and paper production – Canadian Pulp and Paper Association
Industrial product price indices – Statistics Canada
32
Table A1.11 Historical Value of Mineral, Petroleum and Natural Gas Shipments
| | | | Industrial | | Construction | | | | | | Natural Gas | | Other oil | | | |
Year | | Metals | | Minerals (1) | | Aggregates (2) | | Coal | | Crude Oil (3) | | to Pipeline | | and Gas (4) | | Total | |
| | ($ millions) | |
1991 | | 1,511 | | 290 | | 159 | | 990 | | 260 | | 562 | | 36 | | 3,808 | |
1992 | | 1,502 | | 212 | | 157 | | 706 | | 260 | | 592 | | 38 | | 3,467 | |
1993 | | 1,198 | | 229 | | 166 | | 822 | | 233 | | 814 | | 42 | | 3,504 | |
1994 | | 1,354 | | 237 | | 180 | | 861 | | 235 | | 991 | | 44 | | 3,902 | |
1995 | | 2,016 | | 249 | | 204 | | 968 | | 272 | | 710 | | 58 | | 4,477 | |
1996 | | 1,537 | | 251 | | 189 | | 1,027 | | 441 | | 817 | | 75 | | 4,337 | |
1997 | | 1,495 | | 249 | | 195 | | 1,107 | | 403 | | 1,087 | | 98 | | 4,634 | |
1998 | | 1,484 | | 245 | | 208 | | 956 | | 373 | | 1,154 | | 47 | | 4,467 | |
1999 | | 1,183 | | 246 | | 219 | | 797 | | 461 | | 1,577 | | 53 | | 4,536 | |
2000 | | 1,571 | | 284 | | 224 | | 812 | | 843 | | 3,826 | | 114 | | 7,674 | |
2001 | | 1,394 | | 296 | | 217 | | 959 | | 729 | | 4,834 | | 103 | | 8,532 | |
2002 | | 1,288 | | 310 | | 231 | | 1,035 | | 714 | | 3,458 | | 79 | | 7,115 | |
2003 | | 1,353 | | 336 | | 226 | | 998 | | 718 | | 5,396 | | 116 | | 9,143 | |
2004 | | 1,956 | | 355 | | 239 | | 1,125 | | 824 | | 5,827 | | 133 | | 10,459 | |
2005 | | 2,442 | | 364 | | 278 | | 1,840 | | 973 | | 7,821 | | 173 | | 13,891 | |
2006 (e) | | 3,298 | | 387 | | 285 | | 1,650 | | 1,013 | | 5,858 | | 179 | | 12,670 | |
(e) Estimate.
(1) Shipments of gypsum and silica to Canadian cement, lime and clay plants are not included in this table.
(2) Sand and gravel; stone.
(3) Includes Pentanes and Condensate.
(4) Liquified Petroleum Gases and Sulphur.
Sources: Natural Resources Canada and Ministry of Energy, Mines and Petroluem Resources
Table A1.12 Petroleum and Natural Gas Activity Indicators
| | | | | | | | | | | | | | Change | |
Indicator | | Unit of Measure | | 2002 | | 2003 | | 2004 | | 2005 | | 2006 | | 2005-2006 | |
| | | | | | | | | | | | | | (per cent) | |
Natural gas production (wellhead) (1) | | (billion cubic m | ) | 32.4 | | 30.8 | | 32.0 | | 32.8 | | 32.8 | | — | |
Crude oil and condensate | | (million cubic m | ) | 3.3 | | 2.8 | | 2.7 | | 2.5 | | 2.4 | | (4.0 | ) |
Wells authorized | | (number | ) | 876.0 | | 1,399.0 | | 1,698.0 | | 1,790.0 | | 1,730.0 | | (3.4 | ) |
Wells drilled | | (number | ) | 643.0 | | 1,041.0 | | 1,270.0 | | 1,426.0 | | 1,416.0 | | (0.7 | ) |
Seismic crew-weeks | | (number | ) | 160.0 | | 164.0 | | 194.0 | | 430.0 | | 334.0 | | (22.3 | ) |
Provincial reserves | | | | | | | | | | | | | | | |
Marketable gas (remaining reserves) | | (billion cubic m | ) | 255.0 | | 260.0 | | 317.0 | | 363.0 | | n/a | | | |
Oil (remaining reserves) | | (million cubic m | ) | 22.6 | | 22.4 | | 22.0 | | 20.9 | | n/a | | | |
Provincial government petroleum and natural gas revenue (2) | | ($ millions | ) | 1,241.7 | | 2,114.4 | | 1,794.5 | | 2,560.5 | | 2,661.3 | | 3.9 | |
(1) Not including gas retrieved from storage. During 2006, 0.81 billion cubic metres were produced from storage wells.
(2) Includes Crown royalties, Crown reserve disposition bonuses, fees and rentals.
Source: Ministry of Energy, Mines and Petroleum Resources
33
Table A1.13 Supply and Consumption of Electrical Energy in British Columbia
| | Supply | | Consumption | |
| | Net Generation | | | | | | | | | |
| | | | | | | | Receipts | | | | Delivered | | | |
| | | | | | Total | | From Other | | Total | | To Other | | Total | |
| | | | | | Provincial | | Provinces | | Provincial | | Provinces | | Provincial | |
Year | | Hydro | | Thermal | | Generation | | and Imports | | Supply | | and Exports | | Consumption | |
| | (gigawatt-hours)(1) | |
1986 | | 48,923 | | 1,836 | | 50,759 | | 3,345 | | 54,104 | | 4,709 | | 49,395 | |
1987 | | 61,057 | | 2,010 | | 63,066 | | 1,203 | | 64,269 | | 13,336 | | 50,934 | |
1988 | | 58,573 | | 2,370 | | 60,943 | | 2,351 | | 63,293 | | 9,215 | | 54,078 | |
1989 | | 51,082 | | 6,573 | | 57,655 | | 4,500 | | 62,155 | | 6,583 | | 55,572 | |
1990 | | 57,245 | | 3,417 | | 60,662 | | 3,233 | | 63,895 | | 6,689 | | 57,206 | |
1991 | | 60,149 | | 2,832 | | 62,981 | | 2,272 | | 65,253 | | 7,725 | | 57,528 | |
1992 | | 60,555 | | 3,503 | | 64,058 | | 2,685 | | 66,743 | | 9,473 | | 57,270 | |
1993 | | 53,057 | | 5,716 | | 58,774 | | 5,691 | | 64,465 | | 5,605 | | 58,860 | |
1994 | | 53,979 | | 7,036 | | 61,015 | | 7,836 | | 68,851 | | 9,541 | | 59,311 | |
1995 | | 49,814 | | 8,192 | | 58,006 | | 6,385 | | 64,391 | | 3,972 | | 60,419 | |
1996 | | 67,329 | | 4,436 | | 71,765 | | 3,289 | | 75,053 | | 10,390 | | 64,664 | |
1997 | | 61,772 | | 5,189 | | 66,961 | | 4,316 | | 71,278 | | 12,114 | | 59,163 | |
1998 | | 60,849 | | 6,861 | | 67,710 | | 5,056 | | 72,766 | | 10,619 | | 62,147 | |
1999 | | 61,588 | | 6,457 | | 68,045 | | 6,807 | | 74,852 | | 12,529 | | 62,323 | |
2000 | | 59,754 | | 8,487 | | 68,241 | | 6,039 | | 74,280 | | 10,698 | | 63,582 | |
2001 | | 48,338 | | 8,994 | | 57,332 | | 10,154 | | 67,486 | | 6,408 | | 61,079 | |
2002 | | 58,627 | | 6,318 | | 64,945 | | 5,769 | | 70,714 | | 8,078 | | 62,636 | |
2003 | | 56,689 | | 6,362 | | 63,051 | | 7,084 | | 70,135 | | 9,599 | | 60,535 | |
2004 | | 53,281 | | 7,214 | | 60,496 | | 8,261 | | 68,757 | | 6,791 | | 61,966 | |
2005 | | 60,605 | | 7,207 | | 67,811 | | 7,226 | | 75,037 | | 9,247 | | 65,790 | |
2006 | | 54,776 | | 7,245 | | 62,021 | | 12,695 | | 74,716 | | 6,095 | | 68,622 | |
(1) Gigawatt-hour = one million kilowatt-hours
Source: Statistics Canada
34
Table A1.14 British Columbia High-Technology Sector Activity
| | | | | | | | | | | | | | | | | | Change | |
Indicator | | 1998 | | 1999 | | 2000 | | 2001 | | 2002(r) | | 2003(r) | | 2004(r) | | 2005(p) | | 2004-2005 | |
| | | | | | | | | | | | | | | | | | (per cent) | |
Number of Establishments | | | | | | | | | | | | | | | | | | | |
Manufacturing | | 838 | | 871 | | 859 | | 826 | | 809 | | 783 | | 789 | | 815 | | 3.3 | |
Services | | 6,028 | | 6,552 | | 7,241 | | 7,526 | | 7,443 | | 7,524 | | 7,580 | | 7,933 | | 4.7 | |
Total | | 6,866 | | 7,423 | | 8,100 | | 8,352 | | 8,252 | | 8,307 | | 8,369 | | 8,748 | | 4.5 | |
| | | | | | | | | | | | | | | | | | | |
Employment (persons) | | | | | | | | | | | | | | | | | | | |
Manufacturing | | 11,230 | | 13,620 | | 15,050 | | 15,200 | | 14,080 | | 12,940 | | 12,430 | | 13,600 | | 9.4 | |
Services | | 44,940 | | 48,130 | | 52,100 | | 56,470 | | 52,630 | | 54,160 | | 56,050 | | 56,890 | | 1.5 | |
Total | | 56,170 | | 61,750 | | 67,140 | | 71,670 | | 66,700 | | 67,090 | | 68,480 | | 70,490 | | 2.9 | |
| | | | | | | | | | | | | | | | | | | |
Wages and Salaries ($ millions) | | | | | | | | | | | | | | | | | | | |
Manufacturing | | 448 | | 506 | | 555 | | 633 | | 712 | | 697 | | 641 | | 712 | | 11.2 | |
Services | | 2,244 | | 2,341 | | 2,665 | | 2,886 | | 2,652 | | 2,798 | | 2,917 | | 3,016 | | 3.4 | |
Total | | 2,691 | | 2,847 | | 3,221 | | 3,519 | | 3,364 | | 3,495 | | 3,558 | | 3,728 | | 4.8 | |
| | | | | | | | | | | | | | | | | | | |
Real GDP ($ 1997 millions) | | 5,496 | | 5,980 | | 7,261 | | 7,241 | | 7,476 | | 8,079 | | 8,470 | | 8,671 | | 2.4 | |
Nominal GDP ($ millions) | | 5,428 | | 5,534 | | 6,244 | | 6,277 | | 6,700 | | 7,289 | | 7,583 | | 7,835 | | 3.3 | |
| | | | | | | | | | | | | | | | | | | |
Revenues ($ millions) | | 9,777 | | 10,812 | | 11,770 | | 11,460 | | 12,144 | | 13,107 | | 13,913 | | 14,219 | | 2.2 | |
| | | | | | | | | | | | | | | | | | | |
Exports ($ millions) | | 769 | | 840 | | 923 | | 748 | | 685 | | 635 | | 686 | | 704 | | 2.6 | |
(r) revised
(p) preliminary
Note: Totals and percent changes are calculated using unrounded data.
Source: BC STATS
35
Chapter Two
Financial Review (1)
(1) Reflects information available as of July 4, 2007.
Chapter 2 – Financial Review
2006/07 Overview
The provincial government ended the 2006/07 fiscal year with a record surplus of $4.1 billion, $3.5 billion higher than the budgeted surplus of $600 million. The surplus reflected strong domestic economic performance, higher than anticipated federal transfers, and sound financial management on the spending side. The record surplus, after capital outlays, also enabled a $1.0 billion reduction in debt.
Table 2.1 Operating Statement
($ millions) | | Budget
2006/07 | | Actual
2006/07 | | Actual
2005/06 (1) | | Annual
Change (2) | |
| | | | | | | | (per cent) | |
Taxpayer-supported programs and agencies: | | | | | | | | | |
Revenue | | 33,393 | | 35,819 | | 33,753 | | 6.1 | |
Expense before negotiating framework incentive | | (33,914 | ) | (34,184 | ) | (32,173 | ) | 6.3 | |
Negotiating framework incentive | | — | | (264 | ) | (710 | ) | (62.8 | ) |
Taxpayer-supported balance | | (521 | ) | 1,371 | | 870 | | 57.6 | |
Commercial Crown corporation income | | 1,971 | | 2,685 | | 2,220 | | 20.9 | |
Surplus before forecast allowance | | 1,450 | | 4,056 | | 3,090 | | 31.3 | |
Forecast allowance | | (850 | ) | — | | — | | — | |
Surplus | | 600 | | 4,056 | | 3,090 | | 31.3 | |
(1) Comparative figures have been restated to reflect government accounting policies in effect at March 31, 2007.
(2) Percentage change between 2006/07 actual and 2005/06 actual.
This is the fourth year in a row that the provincial government’s actual results have significantly improved on its budget targets, reflecting British Columbia’s solid economic performance, resulting, in part, from reductions to the regulatory burden and introduction of competitive tax rates.
The 2006/07 fiscal year is the third consecutive year that the Auditor General has provided an unqualified opinion on the financial statements, and commended British Columbia for being a leader in complying with generally accepted accounting principles (GAAP) and the inclusiveness of its budget and financial reports. Further information on compliance with GAAP can be found in the Appendix to this chapter.
The $4.1 billion surplus included:
• taxpayer-supported program and agency revenue of $35.8 billion, $2.4 billion higher than budget and a 6.1 per cent improvement over the previous year;
• taxpayer-supported program and agency expense of $34.2 billion (excluding contract settlement incentive payments), $270 million higher than budget and a 6.3 per cent increase compared to the previous year;
• contract settlement incentive payments of $264 million that were an important part of the province’s negotiating framework; and
• commercial Crown corporation net income of $2.7 billion, $714 million higher than budget and a 21 per cent increase over the previous year. Chapter 3 provides more information on commercial Crown corporation operating results.
As is shown in Chart 2.1, the 2006/07 surplus was $3.5 billion higher than budget due to a number of factors.
38
Chart 2.1 2006/07 Surplus – Major Changes From Budget 2006

Taxation revenue was up $1.8 billion mainly due to the province’s robust economic growth. Major increases resulted from income taxes, partially due to higher assessments for 2005, social services tax and from the property transfer tax, reflecting a strong housing market. Revenue included the effects of tax reductions introduced in Budget 2006. The value of tax reductions in 2006/07 was $253 million.
Natural resource revenue was $870 million below budget, reflecting lower natural gas and electricity prices, partially offset by the impacts of higher metal prices on revenue from mining sector profits and the Softwood Lumber Agreement on forest revenue. Natural gas royalties were down $1.1 billion, the largest change in this revenue category.
Federal transfers to the province were $657 million higher than projected in the Budget 2006, mainly due to one-time trust funds and higher transfers in support of ministry programs, including the Millennium Scholarship Fund Canada Study grants and mitigation of the mountain pine beetle infestation.
The $714 million increase in commercial Crown corporation net income was primarily due to higher earnings for BC Hydro, resulting from lower energy costs and the inclusion of regulatory transfers in income; and higher premium revenue and investment earnings from ICBC.
Overall, program expense was $270 million higher than budget, reflecting increases in healthcare spending and forest fire costs. One-time federal transfers for housing, mountain pine beetle remediation, post-secondary scholarships and other programs also resulted in higher ministry spending. These increases were partially offset by lower debt servicing costs, unused Contingencies funding and ministry savings in other areas (see Table 2.2).
The government has continued to successfully re-negotiate its remaining collective agreements, resulting in incentive payments of $264 million during 2006/07. Incentive payments to date total $974 million compared to the initial funding of $1.0 billion. Half a dozen agreements that will expire over the next two fiscal years remain to be settled.
39
The 2006/07 budget also included an $850 million forecast allowance that was not required since the budget target was exceeded.
Chart 2.1 and Table 2.2 summarize the major changes from the 2006/07 budget.
Table 2.2 Operating Statement – Changes from Budget 2006
($ millions) | | Changes | | Actual | |
Budget 2006 Surplus (February 21, 2006) | | | | 600 | |
Revenue increases (decreases): | | | | | |
Personal income tax higher 2005 tax assessments and improved economic growth | | | | | |
– Prior-year adjustment – stronger 2005 tax assessments | 452 | | | |
– Base - higher 2005 base and improved 2006 economic growth | | 606 | | | |
Corporate income tax – higher 2005 and prior year tax results | | | | | |
– Prior-year adjustment – higher 2005 tax assessments and prior year tax results | | 232 | | | |
– Base – mainly lower federal government instalments | | (31 | ) | | |
Social service tax – higher 2005/06 results and stronger 2006 economic growth | | 340 | | | |
Property transfer tax – strong residential and commercial market sales | | 164 | | | |
Natural gas royalties – lower natural gas prices | | (1,070 | ) | | |
Columbia River Treaty – lower electricity prices | | (112 | ) | | |
Other energy, metal and mineral sources – mainly higher metal prices | | 127 | | | |
Forest revenue – higher border and logging taxes | | 193 | | | |
Medical Services Plan premiums – higher 2005/06 results and lower premium assistance take-up | | 110 | | | |
Other fee revenue – mainly stronger motor vehicle commercial permits and higher health fees | | 59 | | | |
Investment earnings – mainly higher investment balances | | 213 | | | |
Other miscellaneous revenues – higher program recoveries and SUCH sector collections | | 411 | | | |
Federal transfers: | | | | | |
Health and social transfers – higher prior-year and net tax point entitlement | | 70 | | | |
One-time trusts | | 408 | | | |
Other transfers – increased ministry recoveries for Canada Study Grants and the Millennium Scholarship Fund and direct post-secondary grant funding | | 179 | | | |
All other taxpayer supported changes | | 75 | | | |
Commercial Crown corporation net income: | | | | | |
BC Hydro – primarily impact of lower energy costs and regulatory transfers | | 389 | | | |
ICBC – primarily higher premium revenue and investment income | | 250 | | | |
Other Crown corporation changes – mainly higher LDB and BCLC income, partially offset by a change in the timing of BCRC asset dispositions | | 75 | | | |
Total revenue changes | | | | 3,140 | |
Less: expense Increases (decreases): | | | | | |
Negotiating Framework incentive payments (for contracts ratified after March 31, 2006) (1) | | 264 | | | |
Forest fire related costs | | 104 | | | |
Fewer Crown land grants | | (38 | ) | | |
Reprofiled Olympic venue funding | | (43 | ) | | |
Lower Pharmacare costs and other health spending | | (44 | ) | | |
Management of Public Funds and Debt interest savings | | (74 | ) | | |
Unused Contingencies funding | | (86 | ) | | |
Other ministry savings | | (94 | ) | | |
CRF expense changes | | (11 | ) | | |
Increased ministry expenses recoverable mainly from the federal government | | 432 | | | |
Health authorities – higher staffing levels and additional operating costs | | 106 | | | |
Other service delivery agencies net spending changes | | 7 | | | |
Total expense changes | | | | 534 | |
Subtotal | | | | 2,606 | |
Forecast allowance decrease | | | | 850 | |
Net change | | | | 3,456 | |
2006/07 surplus – 2006/07 Public Accounts | | | | 4,056 | |
(1) Budget 2006 assumed the entire $1.0 billion for incentive payments in the negotiating framework was available in 2005/06. All negotiations for contracts expiring before March 31, 2006 were successfully concluded, and incentive payments totaling $710 million were made in 2005/06. The remaining $290 million carried over into 2006/07 and was funded through a Supplementary Estimate, of which $264 million was spent.
40
The 2006/07 surplus was a $1.0 billion improvement over the $3.1 billion surplus recorded in 2005/06 (see Table 2.1), primarily due to higher revenue from taxation, increased federal transfers and improvements in commercial Crown corporation net income, partially offset by declines in natural resource revenue. Overall, revenue increased by $2.5 billion over the previous year. This improvement was accompanied by a $1.4 billion increase in health and education spending, including spending by taxpayer-supported Crown agencies and the SUCH sector, and other program spending increases totaling $609 million. Contract settlement incentive payments totaled $264 million – $446 million lower than incentive payments of $710 million in 2005/06.
The 2006/07 surplus was $1.2 billion higher than the third quarter forecast released with the 2007/08 budget on February 20, 2007. Further details on changes from the third quarter forecast are provided in Appendix Table A2.3.
Revenue
In 2006/07, revenue totaled $38.5 billion, $3.1 billion higher than budget and 7.0 per cent higher than 2005/06. The increase reflected stronger economic growth and increased federal government transfers. Higher revenues from taxation, investment earnings, fees, other miscellaneous sources, commercial Crown corporations and federal government contributions were partially offset by lower natural resources revenues mainly from natural gas royalties and electricity sales under the Columbia River Treaty. Revenue from taxation sources was $1.8 billion above budget mainly due to higher revenues from personal and corporate income, social service and property transfer taxes.
Chart 2.2 Revenue Changes from Budget 2006
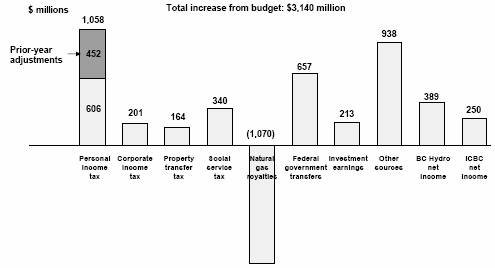
Major changes from budget include:
• Personal income tax revenue was up $1,058 million as higher than expected 2005 personal income and tax return filings, especially from upper income individuals, resulted in a $452 million prior-year adjustment. This improved base, combined with stronger 2006 economic growth and an assumed continuation of robust earnings of higher-income cohorts in 2006, led to an additional $606 million improvement.
• Stronger 2005 BC corporate profits growth resulted in a $232 million gain from higher 2005 tax assessments, partially offset by $31 million lower
41
Table 2.3 Revenue by Source
($ millions) | | Budget
2006/07 | | Actual
2006/07 | | Actual
2005/06 (1) | | Annual
Change (2) | |
| | | | | | | | (per cent) | |
Taxation | | | | | | | | | |
Personal income | | 5,847 | | 6,905 | | 5,838 | | 18.3 | |
Corporate income | | 1,337 | | 1,538 | | 1,426 | | 7.9 | |
Social service | | 4,374 | | 4,714 | | 4,367 | | 7.9 | |
Fuel | | 923 | | 901 | | 911 | | (1.1 | ) |
Tobacco | | 690 | | 726 | | 701 | | 3.6 | |
Property | | 1,726 | | 1,732 | | 1,717 | | 0.9 | |
Property transfer | | 750 | | 914 | | 843 | | 8.4 | |
Other | | 571 | | 588 | | 626 | | (6.1 | ) |
| | 16,218 | | 18,018 | | 16,429 | | 9.7 | |
Natural resources | | | | | | | | | |
Natural gas royalties | | 2,277 | | 1,207 | | 1,921 | | (37.2 | ) |
Columbia River Treaty | | 335 | | 223 | | 319 | | (30.1 | ) |
Other energy, metals and minerals | | 808 | | 935 | | 797 | | 17.3 | |
Forests | | 1,083 | | 1,276 | | 1,214 | | 5.1 | |
Water and other resources | | 349 | | 341 | | 316 | | 7.9 | |
| | 4,852 | | 3,982 | | 4,567 | | (12.8 | ) |
Other revenue | | | | | | | | | |
Medical Services Plan premiums | | 1,414 | | 1,524 | | 1,482 | | 2.8 | |
Post-secondary education fees | | 923 | | 928 | | 892 | | 4.0 | |
Other health-care related fees | | 191 | | 216 | | 204 | | 5.9 | |
Motor vehicle licences and permits | | 409 | | 424 | | 403 | | 5.2 | |
Other fees and licences | | 685 | | 699 | | 685 | | 2.0 | |
Investment earnings | | 819 | | 1,032 | | 949 | | 8.7 | |
Sales of goods and services | | 647 | | 693 | | 719 | | (3.6 | ) |
Miscellaneous | | 1,506 | | 1,917 | | 1,598 | | 20.0 | |
| | 6,594 | | 7,433 | | 6,932 | | 7.2 | |
Contributions from the federal government | | | | | | | | | |
Health and social transfers | | 4,403 | | 4,473 | | 4,220 | | 6.0 | |
Equalization | | 459 | | 459 | | 590 | | (22.2 | ) |
Other federal contributions | | 867 | | 1,454 | | 1,015 | | 43.3 | |
| | 5,729 | | 6,386 | | 5,825 | | 9.6 | |
Taxpayer-supported programs and agencies | | 33,393 | | 35,819 | | 33,753 | | 6.1 | |
Commercial Crown corporation net income | | | | | | | | | |
BC Hydro(3) | | 18 | | 407 | | 266 | | 53.0 | |
Liquor Distribution Branch | | 798 | | 840 | | 800 | | 5.0 | |
BC Lotteries (net of payments to the federal government) | | 932 | | 1,011 | | 914 | | 10.6 | |
BCRC(4) | | 84 | | 29 | | 32 | | (9.4 | ) |
ICBC(5) | | 131 | | 381 | | 191 | | 99.5 | |
Other | | 8 | | 17 | | 17 | | — | |
| | 1,971 | | 2,685 | | 2,220 | | 20.9 | |
Total revenue | | 35,364 | | 38,504 | | 35,973 | | 7.0 | |
(1) Prior year comparative figures have been restated to reflect government’s accounting policies as of March 31, 2007.
(2) Percentage change between 2006/07 actual and 2005/06 actual.
(3) Includes a change in accounting policy to reflect the BC Utilities Commission direction on the accounting treatment for asset retirement obligations.
(4) Figures represents BCRC’s earnings during government’s fiscal year. On BCRC’s fiscal year basis (December), the results are – 2006 (budget): $84 million; 2006 (actual): $67 million.
(5) Figures reflect ICBC’s earnings during government’s fiscal year. On ICBC’s fiscal year basis (December), the results are – 2006 (budget): $131 million; 2006 (actual): $350 million.
42
Table 2.4 Expense by Ministry, Program and Agency
($ millions) | | Budget
2006/07 | | Contin-
gencies
Allocation(1) | | Restated
Budget
2006/07 | | Actual
2006/07 | | Actual
2005/06(2) | | Annual
Change (3) | |
| | | | | | | | | | | | (per cent) | |
Advanced Education | | 1,982 | | 47 | | 2,029 | | 2,027 | | 1,957 | | 3.6 | |
Education | | 5,196 | | 121 | | 5,317 | | 5,312 | | 5,071 | | 4.8 | |
Health | | 11,910 | | 258 | | 12,168 | | 12,124 | | 11,417 | | 6.2 | |
Subtotal | | 19,088 | | 426 | | 19,514 | | 19,463 | | 18,445 | | 5.5 | |
Office of the Premier | | 12 | | 1 | | 13 | | 12 | | 10 | | 20.0 | |
Aboriginal Relations and Reconciliation | | 33 | | 10 | | 43 | | 43 | | 45 | | (4.4 | ) |
Agriculture and Lands | | 226 | | 39 | | 265 | | 238 | | 201 | | 18.4 | |
Attorney General | | 476 | | 15 | | 491 | | 485 | | 466 | | 4.1 | |
Children and Family Development | | 1,836 | | 18 | | 1,854 | | 1,852 | | 1,636 | | 13.2 | |
Community Services | | 267 | | 5 | | 272 | | 267 | | 264 | | 1.1 | |
Economic Development | | 310 | | — | | 310 | | 282 | | 437 | | (35.5 | ) |
Employment and Income Assistance | | 1,369 | | 3 | | 1,372 | | 1,358 | | 1,327 | | 2.3 | |
Energy, Mines and Petroleum Resources | | 77 | | 1 | | 78 | | 75 | | 91 | | (17.6 | ) |
Environment | | 194 | | 2 | | 196 | | 193 | | 184 | | 4.9 | |
Finance | | 84 | | 2 | | 86 | | 75 | | 69 | | 8.7 | |
Forests and Range | | 933 | | 13 | | 946 | | 1,000 | | 825 | | 21.2 | |
Labour and Citizen’s Services | | 206 | | 5 | | 211 | | 210 | | 191 | | 9.9 | |
Public Safety and Solicitor General | | 548 | | 50 | | 598 | | 594 | | 578 | | 2.8 | |
Small Business and Revenue | | 45 | | 2 | | 47 | | 45 | | 44 | | 2.3 | |
Tourism, Sport and the Arts | | 209 | | 5 | | 214 | | 214 | | 185 | | 15.7 | |
Transportation | | 839 | | 4 | | 843 | | 842 | | 839 | | 0.4 | |
Total ministries and Office of the Premier | | 26,752 | | 601 | | 27,353 | | 27,248 | | 25,837 | | 5.5 | |
Legislation | | 51 | | — | | 51 | | 49 | | 46 | | 6.5 | |
Officers of the Legislature | | 27 | | — | | 27 | | 24 | | 42 | | (42.9 | ) |
BC Family Bonus | | 23 | | — | | 23 | | 23 | | 37 | | (37.8 | ) |
Management of public funds and debt | | 618 | | — | | 618 | | 544 | | 593 | | (8.3 | ) |
Contingencies – new programs | | 320 | | (181 | ) | 139 | | 53 | | 30 | | 76.7 | |
Contingencies – Negotiating Framework | | 420 | | (420 | ) | — | | — | | — | | — | |
Other appropriations | | 9 | | — | | 9 | | 4 | | (3 | ) | — | |
Total CRF before unusual expenses | | 28,220 | | — | | 28,220 | | 27,945 | | 26,582 | | 5.1 | |
First Nations New Relationships Fund | | — | | — | | — | | — | | 100 | | — | |
Negotiating Framework incentive payments | | — | | — | | — | | 264 | | 710 | | (62.8 | ) |
Total consolidated revenue fund expense | | 28,220 | | — | | 28,220 | | 28,209 | | 27,392 | | 3.0 | |
Expenses recovered from external entities | | 1,685 | | — | | 1,685 | | 2,117 | | 1,849 | | 14.5 | |
Grants to service delivery agencies and other internal transfers: | | | | | | | | | | | | | |
School districts | | (4,490 | ) | (105 | ) | (4,595 | ) | (4,675 | ) | (4,341 | ) | 7.7 | |
Universities | | (1,069 | ) | (28 | ) | (1,097 | ) | (1,081 | ) | (1,058 | ) | 2.2 | |
Colleges, university colleges and institutes | | (755 | ) | (18 | ) | (773 | ) | (836 | ) | (816 | ) | 2.5 | |
Health authorities and hospital societies | | (7,937 | ) | (143 | ) | (8,080 | ) | (8,267 | ) | (7,779 | ) | 6.3 | |
Children and family development agencies | | (606 | ) | (8 | ) | (614 | ) | (629 | ) | (443 | ) | 42.0 | |
Other service delivery agencies | | (674 | ) | (9 | ) | (683 | ) | (814 | ) | (1,053 | ) | (22.7 | ) |
| | (15,531 | ) | (311 | ) | (15,842 | ) | (16,302 | ) | (15,490 | ) | 5.2 | |
Service delivery agency expense: | | | | | | | | | | | | | |
School districts | | 4,864 | | 105 | | 4,969 | | 5,041 | | 4,612 | | 9.3 | |
Universities | | 2,532 | | 28 | | 2,560 | | 2,593 | | 2,429 | | 6.8 | |
Colleges, university colleges and institutes | | 1,281 | | 18 | | 1,299 | | 1,310 | | 1,249 | | 4.9 | |
Health authorities and hospital societies | | 8,456 | | 143 | | 8,599 | | 8,892 | | 8,243 | | 7.9 | |
Children and family development agencies | | 605 | | 8 | | 613 | | 631 | | 439 | | 43.7 | |
Other service delivery agencies | | 1,802 | | 9 | | 1,811 | | 1,957 | | 2,160 | | (9.4 | ) |
| | 19,540 | | 311 | | 19,851 | | 20,424 | | 19,132 | | 6.8 | |
Net spending of service delivery agencies | | 4,009 | | — | | 4,009 | | 4,122 | | 3,642 | | 13.2 | |
Total taxpayer-supported expense | | 33,914 | | — | | 33,914 | | 34,448 | | 32,883 | | 4.8 | |
(1) Includes allocations of the negotiating framework budget for ongoing wage settlement costs and one-time funding for cost pressures.
(2) Prior year comparative figures have been restated to reflect government’s organization and accounting policies as of March 31, 2007.
(3) Percentage change between 2006/07 actual and 2005/06 actual.
43
Table 2.5 Major Factors Underlying Revenue
Calendar Year | | Budget 2006 | | Actual | |
Per cent growth unless otherwise indicated | | 2005 | | 2006 | | 2005 | | 2006 | |
| | | | | | | | | |
Real GDP | | 3.6 | | 3.3 | | 3.7 | | 3.6 | |
Nominal GDP | | 6.3 | | 5.7 | | 7.2 | | 6.4 | |
Personal income | | 5.3 | | 5.2 | | 5.7 | | 7.2 | |
Labour income | | 5.8 | | 5.1 | | 6.5 | | 8.2 | |
Coporate profits | | 7.4 | | 7.8 | | 17.6 | | 8.3 | |
Employment | | 3.3 | | 2.0 | | 3.3 | | 3.1 | |
Consumer durable purchases | | 4.7 | | 5.7 | | 4.4 | | 7.4 | |
Machinery and equipment purchases | | 7.8 | | 9.9 | | 13.4 | | 9.9 | |
Population | | 1.3 | | 1.1 | | 1.3 | | 1.2 | |
Housing starts | | 5.3 | | -7.7 | | 5.3 | | 5.1 | |
SPF 2x4 price ($US/thousand board feet) | | $ | 355 | | $ | 338 | | $ | 355 | | $ | 296 | |
Pulp ($US/tonne) | | $ | 612 | | $ | 600 | | $ | 611 | | $ | 674 | |
Exchange Rate (US cents/Cdn $) | | 82.5 | | 86.2 | | 82.6 | | 88.2 | |
2006/07 Fiscal Year | | Budget
2006/07 | | Actual
2006/07 | |
| | | | | |
Natural gas price ($Cdn/GJ at plant inlet) | | $ | 8.55 | | $ | 5.35 | |
Natural gas production (annual per cent change) | | 2.1 | | -1.4 | |
Electricity price ($US/mega-watt hour) | | $ | 70.85 | | $ | 50.24 | |
Metallurgical coal price ($US/tonne, fob west coast) | | $ | 110.00 | | $ | 108.00 | |
Copper price ($US/lb) | | $ | 1.45 | | 3.17 | |
| | | | | | |
Crown harvest volumes (million cubic metres) | | | | | |
Interior | | 52.0 | | 53.8 | |
Coast | | 16.0 | | 14.6 | |
Total | | 68.0 | | 68.4 | |
instalment payments reflecting a reduced federal government outlook of 2006 national corporate profits. The 2006/07 corporate income tax revenue also included $24 million from duty deposit refunds representing BC’s instalment share of the federal government’s assumed $2.3 billion of additional national taxable income in 2006.
• Revenue from social service tax was up $340 million compared to the budget estimate and 7.9 per cent higher than 2005/06 as higher 2005/06 results ($159 million) and stronger growth in personal income and corporate profits led to increased consumer and business purchases during the year.
• Property transfer tax revenue was $164 million above budget and up 8.4 per cent annually reflecting continued strong residential and commercial sales throughout the year reflecting higher incomes, relatively low mortgage rates and increased migration. The budget forecast assumed a moderation in market activity and although the number of residential transactions declined 9 per cent, the average house price rose 18 per cent in 2006 (BC STATS).
• Natural gas royalties were $1,070 million below budget and declined 37 per cent from 2005/06 as moderate winter temperatures resulted in high natural gas storage inventories and reduced prices. In 2006/07, average North American natural gas storage levels were up 11.9 per cent annually and 19.3 per cent higher than the previous five-year average. This high supply led to an average $5.35 plant inlet price in 2006/07 ($ Canadian/gigajoule), down 29.3 per cent from 2005/06 and $3.20 lower than the Budget 2006 forecast.
44
• Revenue from electricity sales under the Columbia River Treaty (downstream benefits) and other energy, metals and minerals was $15 million above budget in 2006/07 due to the positive impacts on revenue from improved mining sector profits reflecting higher metal prices (notably copper), partially offset by reduced downstream benefits resulting from lower electricity prices and a stronger Canadian dollar.
• Forests revenue was $193 million above budget mainly due to impacts associated with the Softwood Lumber Agreement (SLA) signed in October 2006 as the Budget 2006 status-quo forecast assumed no resolution to the softwood lumber dispute. SLA provisions included the imposition of a federally regulated border tax on lumber exports to the US, depending on lumber prices; and the partial refund of duty deposits paid by lumber exporters since May 2002. In 2006/07, higher than budgeted forests revenue included $156 million in border tax collections administered by the federal government and $58 million increased logging tax revenue, reflecting a one-time improvement in forest sector company incomes due to the receipt of duty deposit refunds. These increases were partially offset by lower stumpage revenue due to lower lumber prices and a higher Canadian dollar.
• Medical Service Plan premium revenue was up $110 million reflecting higher 2005/06 results; reduced premium assistance take-up, consistent with strong full-time employment and robust economic growth; and a change in the treatment of collection costs. These costs were previously recorded as commissions and deducted from revenue, whereas the current treatment is to record revenue gross of these costs which are now expensed. Revenue would have been $36 million lower under the previous treatment.
• Revenue from other fees was $59 million higher than budget primarily resulting from a $44 million increase from SUCH sector collections, mainly from health authorities, and strong commercial activity during the year leading to $15 million higher revenue from motor vehicle licenses and permits.
• Investment earnings were up $213 million primarily due to the effect of higher cash balances. The impacts of higher fiscal agency loans and sinking fund earnings are also included in the increase; however, government’s operating statement bottom line is not affected (under the fiscal agency loan program government borrows on behalf of Crown corporations and the interest payments from these organizations are recorded as both revenue and expense).
• Revenue from miscellaneous sources was $411 million above budget:
– $285 million improvement in SUCH sector collections;
– $51 million one-time gains due to the effect of the triennial actuarial evaluations of the Risk Management and Long Term Disability funds; and
– $75 million mainly due to increased ministry program recoveries including services delivered by partners in the regional health sector (Ministry of Health) and in support of the Student Assistance Program (Ministry of Advanced Education).
45
• Health and social transfers from the federal government were up $70 million including $42 million in respect of 2005/06 and prior years reflecting BC’s share of higher national tax points and an improved share of 2006 national population, partly offset by higher BC tax point deductions.
• All other federal government contributions were up $587 million:
– $408 million one-time trusts funding established by the federal government in support of post-secondary infrastructure, affordable housing, off-reserve aboriginal housing and public transit initiatives;
– $59 million increased expense recoveries by the Ministry of Advanced Education including program costs related to the Millennium Scholarship Fund and Canada Study grants;
– $24 million increased recoveries by the Ministry of Forests and Range in support of combating the mountain pine beetle infestation;
– $47 million increased recoveries by all other ministries including support of alternative energy programs (Ministry of Energy, Mines and Petroleum Resources) and for the management of federal properties (Ministry of Labour and Citizen Services); and
– the remaining $49 million in higher revenue mainly reflects increased direct funding received by the post-secondary institutions.
Commercial Crown Corporations Net Income
In 2006/07, commercial Crown corporation net income of $2.7 billion was $714 million higher than budget and 21 per cent higher than 2005/06.
Major changes from budget include:
• BC Hydro – up $389 million mainly reflecting lower domestic energy costs ($277 million) and the inclusion in income of regulatory transfers ($52 million);
• ICBC – up $250 million resulting from higher investment earnings ($135 million), higher premium revenue ($104 million) and lower claims/operating costs ($11 million);
• BC Lottery Corporation – up $79 million reflecting higher casino revenue ($69 million) and lower amortization expense ($10 million);
• Liquor Distribution Branch – up $42 million due to improved sales; and
• BC Rail – down $55 million reflecting the timing of real estate gains from property sales.
Further information on commercial Crown corporations is provided in Chapter 3.
46
Expense
Taxpayer-supported program and agency expense, when shown on a consolidated basis (see Table 2.4), is comprised of:
• net government spending from the consolidated revenue fund (CRF), which reflects the appropriations of ministries and legislative offices;
plus
• CRF program costs that are recovered directly from outside entities (CRF spending is reported net of these contributions);
plus
• the amount that spending by Crown agencies and the SUCH sector exceeds the transfers they receive from the CRF (i.e. net spending). Internal transfers are eliminated to avoid double counting of expense.
For 2006/07, program and agency expense (including contract settlement incentive payments) totaled $34.4 billion, $534 million higher than the Budget 2006 estimate and a 4.8 per cent increase over the previous year. The increase from budget reflects $264 million in incentive payments, $432 million in additional recovered expenses and $113 million in higher net spending by taxpayer-supported Crown agencies and the SUCH sector, partially offset by a $275 million net reduction in spending by ministries and special offices.
Consolidated Revenue Fund expense
The Budget 2006 estimate for CRF spending was $28.2 billion as reflected in the 2006/07 Estimates, which included a $740 million provision in Contingencies – $320 million for New Programs and $420 million for the ongoing costs of contract settlements. Actual CRF expenses totaled $28.2 billion, reflecting $275 million in savings by ministries and special offices, partially offset by $264 million in unbudgeted contract settlement incentive payments.
Expenses in all ministries were at or below budget in 2006/07, with the exception of the Ministry of Forests and Range which incurred $104 million higher than budgeted forest fire costs. The expenses included the ongoing Negotiating Framework costs for contract settlements and one-time cost pressures. The Contingencies budget was reallocated to ministries to cover these costs (see Table 2.6). The Ministry of Forests and Range did not require access to Contingencies for forest fire costs as it has ongoing statutory authority for these expenses.
The main cost pressures and one-time costs funded from Contingencies included:
• Education – the impacts of the Ready Report (primarily funding to correct regional disparities in substitute teacher call-out rates);
• Public Safety and Solicitor General – higher victim services, corrections and policing costs (including PRIME implementation funding);
47
Table 2.6 Restated Budget by Ministry, Program and Agency
($ millions) | | Budget
2006/07 | | Cost
pressures/
new
programs | | NF
contract
settlement
costs | | Restated
Budget
2006/07 | |
| | | | | | | | | |
Advanced Education | | 1,982 | | 3 | | 44 | | 2,029 | |
Education | | 5,196 | | 55 | | 66 | | 5,317 | |
Health | | 11,910 | | — | | 258 | | 12,168 | |
Subtotal | | 19,088 | | 58 | | 368 | | 19,514 | |
Office of the Premier | | 12 | | | | 1 | | 13 | |
Aboriginal Relations and Reconciliation | | 33 | | 10 | | — | | 43 | |
Agriculture and Lands | | 226 | | 37 | | 2 | | 265 | |
Attorney General | | 476 | | 10 | | 5 | | 491 | |
Children and Family Development | | 1,836 | | — | | 18 | | 1,854 | |
Community Services | | 267 | | 2 | | 3 | | 272 | |
Economic Development | | 310 | | — | | — | | 310 | |
Employment and Income Assistance | | 1,369 | | — | | 3 | | 1,372 | |
Energy, Mines and Petroleum Resources | | 77 | | 1 | | — | | 78 | |
Environment | | 194 | | — | | 2 | | 196 | |
Finance | | 84 | | — | | 2 | | 86 | |
Forests and Range | | 933 | | 7 | | 6 | | 946 | |
Labour and Citizen’s Services | | 206 | | 2 | | 3 | | 211 | |
Public Safety and Solicitor General | | 548 | | 46 | | 4 | | 598 | |
Small Business and Revenue | | 45 | | — | | 2 | | 47 | |
Tourism, Sport and the Arts | | 209 | | 4 | | 1 | | 214 | |
Transportation | | 839 | | 1 | | 3 | | 843 | |
Total ministries and Office of the Premier | | 26,752 | | 178 | | 423 | | 27,353 | |
Legislation | | 51 | | — | | — | | 51 | |
Officers of the Legislature | | 27 | | — | | — | | 27 | |
BC Family Bonus | | 23 | | — | | — | | 23 | |
Management of public funds and debt | | 618 | | — | | — | | 618 | |
Contingencies – new programs | | 320 | | (178 | ) | (3 | ) | 139 | |
Contingencies – Negotiating Framework | | 420 | | — | | (420 | ) | — | |
Other appropriations | | 9 | | — | | — | | 9 | |
Total consolidated revenue fund expense | | 28,220 | | — | | — | | 28,220 | |
• Agriculture and Lands – additional costs incurred by the Integrated Land Management Bureau for resource planning;
• Aboriginal Relations and Reconciliation – the impacts of First Nations economic benefits agreements and treaty negotiation costs;
• Attorney General – higher costs associated with major court trials such as Pickton; and.
• Forests and Range – new housing initiatives.
The sources of ministry savings included:
• Crown Land Account expenses that were $38 million lower due to fewer Crown land grants;
• the impact of re-profiling the 2010 Winter Olympics venue funding ($38 million);
• a $44 million reduction in Ministry of Health expenses, primarily due to lower Fair Pharmacare costs;
• Management of public funds and debt interest savings of $74 million;
• unused Contingencies funding of $86 million; and
• other savings in various ministries totaling $99 million
48
The provincial government contributed $124 million to the 2010 Winter Olympics in 2006/07, which was primarily directed by the Vancouver Organizing Committee towards venue construction ($94 million) and establishing the First Nations and municipal legacies ($26 million). To date, the provincial government has contributed $272 million of its total commitment of $600 million. Construction of the venues is proceeding on schedule, with five to be completed in 2007 and the remainder in 2008. The Athletic Villages are scheduled to be completed in 2009. Construction of the venues is planned to be completed before 2010 to allow for training by Canadian athletes.
Other Expenses(1)
In Table 2.4, CRF spending is shown net of recoveries from external entities. Recoveries are obtained for items such as interest costs for loans issued under the Fiscal Agency Loan program and medical services provided to non-residents. As well, during the year, the federal government or other entities may decide to partner with a ministry on delivery of a short-term program where the ministry delivers the service and the external entity provides the funding. Under GAAP, the financial statements must disclose separately the revenue and spending related to recoveries.
In 2006/07, CRF spending funded by recoveries from external entities was $432 million higher than budget. The increase reflected the impact of one-time funding provided by the federal government for the following:
• post-secondary scholarship funding ($60 million);
• housing grants ($56 million);
• transfer of federal gas tax to municipalities ($52 million); and,
• mountain pine beetle mitigation ($61 million).
As well, ministries had additional recoveries for:
• healthcare services related to insurance claims and to non-residents of British Columbia ($19 million);
• the distribution of gaming proceeds to charities and local governments ($21 million);
• additional sinking fund earnings and commercial Crown corporation fiscal agency loan costs ($89 million); and
• other expenses co-funded by external partners, such as transfers to local governments and various energy projects (net $74 million).
Taxpayer-supported service delivery agencies, including the SUCH sector entities, provide a number of services to the public. These agencies are primarily funded by the provincial government, but may also have outside sources of revenue.
The SUCH sector entities are school districts, universities, colleges, health authorities and hospital societies. These organizations are the primary providers of health and education services to British Columbians. Other services provided by service delivery agencies are highway construction
(1) Revenue and spending of taxpayer-supported Crown corporations and SUCH sector organizations are combined with CRF revenue and expenses in Tables 2.3 and 2.4. Revenues and expenses for individual taxpayer-supported Crown corporations and SUCH sector organizations are provided in Appendix Table A2.11.
49
(BC Transportation Financing Authority), social housing (BC Housing Management Commission), transit services (BC Transit), and legal services (Legal Services Society).
As the service delivery agencies receive most of their funding from ministry budgets, their impact on total government spending is the amount by which their total spending exceeds any grants and transfers made to these organizations by the ministries and special offices. The spending in excess of grant funding is supported by the organizations’ outside sources of revenue.
At $4,122 million, net spending by service delivery agencies was $113 million higher in 2006/07 than in the Budget 2006 fiscal plan. The increase was primarily due to additional staffing levels and higher operating costs incurred by the health organizations to meet the ongoing demand on the health care system, partially offset by higher level of funding from external sources in 2006/07.
Full-Time Equivalents (FTEs)
Staff utilization for ministries and taxpayer-supported agencies is measured in full-time equivalents. (SUCH sector employees are excluded.) FTEs are calculated by dividing the total hours of employment paid for in a given period by the number of hours an individual, full-time person would normally work in that period. In 2006/07, FTEs were 486 below budget, but up 1,443 over the previous year (see Table 2.7).
Table 2.7 Full-Time Equivalents (FTEs) Utilization
| | Budget
2006/07 (1) | | Actual
2006/07 | | Actual
2005/06 (1) | | Annual
Change (2) | |
| | | | | | | | (per cent) | |
Ministries and special offices (CRF) | | 29,250 | | 28,647 | | 27,129 | | 5.6 | ) |
Service delivery agencies | | 3,800 | | 3,917 | | 3,992 | | (1.9 | ) |
Total FTEs | | 33,050 | | 32,564 | | 31,121 | | 4.6 | |
(1) For comparative purposes, the ministries and special offices 2006/07 FTE budget and 2005/06 comparative actual have been restated to reflect a change in the methodology used to calculate the annual staff utilization of Emergency Health Services personnel that was implemented during 2006/07. The impact is a 690 increase in FTEs to the 2006/07 budget and a 628 increase in FTEs in 2005/06.
(2) Percentage change between 2006/07 actual and 2005/06 actual.
Ministry and special offices utilization was 603 FTEs lower than budget, as staffing levels in a number of ministries were impacted by delays in recruitment. The ministry and special offices reduction from budget was partially offset by a 117 increase in actual FTE utilization by service delivery agencies, mainly due to additional staffing in Community Living BC (CLBC).
The increase in ministry and special offices FTEs as compared to the previous year (1,518 FTEs) reflects government’s priority to build internal capacity in a number of areas, such as additional support for children at risk and the response to the mountain pine beetle infestation, and is also due to the transfer of BC Buildings Corporation (BCBC) and Land & Water BC (LWBC) employees to the ministries upon windup of those corporations. The 75 decrease in service delivery agency FTEs also reflects the windup of BCBC and LWBC, partially offset by an increase in the utilization by CLBC resulting from its first full year of operation.
50
Expense by Function
Introduction
As part of its compliance with generally accepted accounting principles, the provincial government reports expense on a function basis in the Public Accounts. Function reporting is based on the categories of government spending as defined by Statistics Canada, and represents the “what” of government spending rather than the “who”. The main functions are health; education; social services; protection of persons and property; transportation; natural resource and economic development; general government; debt servicing; and other.
Expense by Function | | | | | |
| | | | | |
| | 2006/07 | | | | | |
($ millions) | | Budget | | Contingencies
Allocation(1) | | Restated
Budget | | Actual | | Actual
2005/06 (2) | | Annual
Change (3) | |
| | | | | | | | | | | | (per cent) | |
Health | | | | | | | | | | | | | |
Medical Services Plan | | 2,833 | | 108 | | 2,941 | | 2,969 | | 2,696 | | 10.1 | |
Pharmacare | | 957 | | — | | 957 | | 914 | | 868 | | 5.3 | |
Regional services | | 8,339 | | 143 | | 8,482 | | 8,500 | | 8,112 | | 4.8 | |
Social assistance healthcare costs | | 202 | | — | | 202 | | 339 | | 294 | | 15.3 | |
Other healthcare expenses | | 502 | | 9 | | 511 | | 528 | | 460 | | 14.8 | |
| | 12,833 | | 260 | | 13,093 | | 13,250 | | 12,430 | | 6.6 | |
Education | | | | | | | | | | | | | |
Elementary and secondary | | 5,106 | | 105 | | 5,211 | | 5,272 | | 4,829 | | 9.2 | |
Post-secondary | | 3,912 | | 46 | | 3,958 | | 4,088 | | 3,926 | | 4.1 | |
Other education expenses | | 144 | | 17 | | 161 | | 159 | | 182 | | (12.6 | ) |
| | 9,162 | | 168 | | 9,330 | | 9,519 | | 8,937 | | 6.5 | |
Social services | | | | | | | | | | | | | |
Social assistance | | 1,776 | | 13 | | 1,789 | | 1,713 | | 1,637 | | 4.6 | |
Childcare services | | 1,168 | | 3 | | 1,171 | | 1,085 | | 985 | | 10.2 | |
Other social services | �� | 96 | | 1 | | 97 | | 94 | | 102 | | (7.8 | ) |
| | 3,040 | | 17 | | 3,057 | | 2,892 | | 2,724 | | 6.2 | |
Protection of persons and property | | | | | | | | | | | | | |
Justice systems | | 387 | | 32 | | 419 | | 434 | | 440 | | (1.4 | ) |
Policing | | 327 | | 12 | | 339 | | 333 | | 296 | | 12.5 | |
Corrections | | 247 | | 10 | | 257 | | 258 | | 253 | | 2.0 | |
Regulatory and other | | 340 | | 24 | | 364 | | 304 | | 392 | | (22.4 | ) |
| | 1,301 | | 78 | | 1,379 | | 1,329 | | 1,381 | | (3.8 | ) |
Transportation | | | | | | | | | | | | | |
Highway maintenance | | 448 | | 1 | | 449 | | 454 | | 451 | | 0.7 | |
Highway capital costs | | 410 | | — | | 410 | | 435 | | 452 | | (3.8 | ) |
Public transit, ferries and other | | 315 | | 2 | | 317 | | 362 | | 293 | | 23.5 | |
| | 1,173 | | 3 | | 1,176 | | 1,251 | | 1,196 | | 4.6 | |
Natural resource and economic development | | | | | | | | | | | | | |
Forests, energy and mining | | 888 | | 13 | | 901 | | 1,024 | | 801 | | 27.8 | |
Environment and agriculture | | 395 | | 40 | | 435 | | 423 | | 392 | | 7.9 | |
Trade and industry | | 200 | | 1 | | 201 | | 216 | | 398 | | (45.7 | ) |
| | 1,483 | | 54 | | 1,537 | | 1,663 | | 1,591 | | 4.5 | |
Other | | | | | | | | | | | | | |
Housing | | 407 | | — | | 407 | | 477 | | 356 | | 34.0 | |
Local governments | | 398 | | 2 | | 400 | | 416 | | 442 | | (5.9 | ) |
Other expenses (including Contingencies) | | 1,148 | | (592 | ) | 556 | | 385 | | 291 | | 32.3 | |
| | 1,953 | | (590 | ) | 1,363 | | 1,278 | | 1,089 | | 17.4 | |
General government | | 665 | | 10 | | 675 | | 768 | | 644 | | 19.3 | |
Debt servicing costs | | | | | | | | | | | | | |
Direct debt | | 618 | | — | | 618 | | 544 | | 593 | | (8.3 | ) |
Other taxpayer-supported debt (mainly capital) | | 1,052 | | — | | 1,052 | | 967 | | 924 | | 4.7 | |
Commercial Crown fiscal agency loans | | 430 | | — | | 430 | | 455 | | 385 | | 18.2 | |
Debt costs funded by sinking fund earnings | | 204 | | — | | 204 | | 268 | | 279 | | (3.9 | ) |
| | 2,304 | | — | | 2,304 | | 2,234 | | 2,181 | | 2.4 | |
Negotiating Framework incentive payments | | — | | — | | — | | 264 | | 710 | | | |
Total expense | | 33,914 | | — | | 33,914 | | 34,448 | | 32,883 | | 4.8 | |
| (1) | Includes allocations of the negotiating framework budget for ongoing wage settlement costs and one-time funding for cost pressures. |
| | |
| (2) | Prior year comparative figures have been restated to reflect government’s accounting policies as of March 31, 2007. |
| | |
| (3) | Percentage change between 2006/07 actual and 2005/06 actual. |
51
Each function may encompass spending by a number of ministries and service delivery agencies, including SUCH sector entities. Some ministry spending falls intuitively within a specific function, such as the Ministries of Health, Education, or Transportation. Other ministries provide programs in a number of functions.
For example, the Ministry of Employment and Income Assistance, in addition to providing social services support payments, funds client healthcare costs and education programs. All three of these initiatives are classified separately in function reporting. Similarly, the Ministry of Children and Family Development is responsible for community youth justice programs, which are classified under protection of persons and property and not social services. However, even the major ministries have program costs, such as debt servicing, that are classified outside of their main functions.
Service delivery agencies predominantly deliver service within a specific function. They are assigned to a specific function based on the classification of their program, and all their expenses are reported within that function, with the exception of interest costs, which are classified as debt servicing.
Function reporting facilitates multi-year comparison of government spending, which is difficult on an entity basis due to either government reorganizations that occur as a result of the electoral cycle or program transfers made in mid-term.
2006/07 Expense by Function
Health expense was $157 million higher than budget, mainly due to additional Medical Services Plan payments to doctors. higher Emergency Health Services (i.e. BC Ambulance) costs, and increased healthcare payments by the Ministries of Children and Family Development (CFD) and Employment and Income Assistance (EIA) made on behalf of their clients. Social assistance healthcare includes payments for in-home medical services, dental and eye-care costs, medical equipment, and diet supplements.
Education expense was $189 million higher than budget. The increase in elementary and secondary expense primarily reflects a one-time funding adjustment for the Teachers’ Pension Plan. The increase in post-secondary expense reflects additional costs for university and college operations that were funded by own-source revenue, including food services, housing and bookstores.
Social services expense was $165 million below budget. This primarily reflects the redirection of spending by both CFD and EIA based on meeting client support needs in the area of medical costs, which are reported in Health expense. It also reflects the redirection of spending towards youth justice services by CFD (reported in Protection of Persons and Property expense) and employment programs by EIA (reported in Education expense).
Protection of Persons and Property expense was $50 million under budget, mainly reflecting the collective under-spending of a number of regulatory and other agencies, such as the Officers of the Legislature, the Public Guardian and Trustee, Gaming Policy and Enforcement, the Labour Relations Board, the Office of the Superintendent of Motor Vehicles, the Employment Standards Tribunal, and the Financial Institutions Commission. The expense also included the costs incurred for aboriginal relations and treaty negotiation.
Transportation expense was $75 million over budget due to additional highway rehabilitation costs, increased spending on public transit and ferry services, and the transfer of federal gas tax to municipalities.
Natural Resource and Economic Development expense was $126 million over budget, primarily due to forest fire and mountain pine beetle mitigation costs.
52
Expense by Function – Changes from Budget 2006 |
($ millions) | | Changes | | Actual | |
Budget 2006 Expense (February 21, 2006) | | | | 33,914 | |
Less: expense increases (decreases): | | | | | |
Health – higher spending on Medical Services Plan, Emergency Health Services and healthcare for social services clients, partially offset by lower Pharmacare costs | | 157 | | | |
Education – primarily reflects federal scholarship funding, a one-time funding adjustment for the Teachers’ Pension Plan and higher spending on self-funded operations | | 189 | | | |
Social services – reflects the targeting of social support and childcare spending to meet client needs in the areas of healthcare and social justice | | (165 | ) | | |
Protection of persons and property – mainly lower spending by regulatory agencies | | (50 | ) | | |
Transportation – mainly increased public transit and highway rehabilitation costs | | 75 | | | |
Natural resource and economic development – forest fire and Mountain Pine Beetle costs, partially offset by lower Crown land grants | | 126 | | | |
Other – unspent Contingencies and reprofiling of 2010 Winter Olympics venue construction, partially offset by additional spending on housing | | (85 | ) | | |
General government – primarily the additional recovery of services provided to external clients | | 93 | | | |
Debt servicing – impact of lower debt levels | | (70 | ) | | |
Total expense changes | | | | 270 | |
Negotiating Framework incentive payments | | | | 264 | |
2006/07 Expense – 2006/07 Public Accounts | | | | 34,448 | |
Other expense was $85 million under budget, mainly reflecting the unused portion of the Contingencies vote, partially offset by higher spending on housing initiatives.
General Government expense was $93 million higher than budget, primarily due to the additional recovery of costs for services provided to external clients.
Debt Servicing expense was $70 million below budget mainly due to decreases in taxpayer-supported debt costs resulting from declining direct operating debt balances and lower than expected borrowing for capital projects. Debt costs funded by sinking fund earnings are higher than budget due to higher than expected sinking fund balances resulting from unanticipated contributions to sinking funds. These costs are offset by an increase to investment income.
Negotiating Framework Incentive Payments
The function table above reports the Negotiating Framework incentive payments on their own line as an unusual one-time expense.
Separately disclosing the incentive payments facilitates the comparison of year-over-year changes in ongoing operating costs pertaining to initiatives by government for delivering services in the various functions. Other unusual items of this nature, such as one-time restructuring costs and the impact of joint trusteeship, are also accorded similar treatment in the multi-year expense by function table in the Appendix (Table A2.9).
The allocation of the incentive payments among the functions as presented in the Public Accounts is shown below for information purposes. Approximately 80 per cent of the incentive payments made to date related to persons delivering health and education services in the province, which is reflective of the size of the workforce in these areas relative to the rest of government.
Negotiating Framework Incentive Payments by Function
($ millions) | | 2006/07 | | 2005/06 | | Total | | per
cent | |
Health | | 3 | | 408 | | 411 | | 42.2 | |
Education | | 255 | | 110 | | 365 | | 37.5 | |
Social Services | | — | | 74 | | 74 | | 7.6 | |
Protection of persons and property | | 5 | | 35 | | 40 | | 4.1 | |
Transportation | | — | | 7 | | 7 | | 0.7 | |
Natural resource and economic development | | 1 | | 39 | | 40 | | 4.1 | |
Other | | — | | 5 | | 5 | | 0.5 | |
General government | | — | | 32 | | 32 | | 3.3 | |
Total negotiating framework payments | | 264 | | 710 | | 974 | | 100.0 | |
53
Provincial Capital Spending
Capital spending is required to build, acquire or replace assets such as roads, schools, post-secondary facilities, hospitals and related major equipment.
Capital spending does not flow directly to the government’s annual surplus or deficit as it occurs. Instead, as required by generally accepted accounting principles, capital costs are spread out over the useful lives of the related assets through annual amortization expenses. These amortization expenses are charged annually against the surplus. However, the cash requirements for capital projects have an immediate impact on provincial debt. Similarly, the ongoing amortization expenses do not require cash or later borrowing.
Chart 2.3 Capital Spending, 2006/07
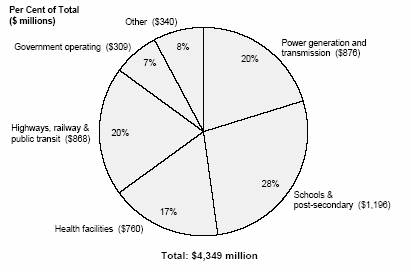
Capital spending in 2006/07 totaled $4.3 billion, $477 million below budget. Spending on education and health facilities accounted for 45 per cent of total capital investments, power generation and transmission projects for 20 per cent, and transportation projects for 20 per cent (see Chart 2.3 and Table 2.8).
Taxpayer-supported capital spending includes schools, hospitals, post-secondary facilities, social housing and transportation projects, plus minor capital spending by ministries and other minor taxpayer-supported agencies. In 2006/07, spending of $3.4 billion was $122 million below budget mainly due to:
• post-secondary facilities – down $114 million, reflecting slower than expected spending on university projects;
• government operating – down $104 million, reflecting lower capital spending by ministries;
• capital contingencies – the $165 million capital spending contingencies was not required;
• other taxpayer-supported capital spending – down $12 million, mainly reflecting delays in site preparation for the Vancouver Convention Centre expansion project (VCCEP);
54
Table 2.8 Capital Spending
| | Budget | | Actual | | Actual | | Annual | |
($ millions) | | 2006/07 | | 2006/07 | | 2005/06 | | Change | |
| | | | | | | | (per cent) | |
Taxpayer-supported | | | | | | | | | |
Education | | | | | | | | | |
Schools (K-12) | | 252 | | 322 | | 286 | | 12.6 | |
Post-secondary | | 988 | | 874 | | 790 | | 10.6 | |
Health | | 666 | | 760 | | 848 | | (10.4 | ) |
BC Transportation Financing Authority | | 794 | | 821 | | 713 | | 15.1 | |
Vancouver Convention Centre expansion project | | 164 | | 108 | | 85 | | 27.1 | |
Government operating (ministries) | | 413 | | 309 | | 268 | | 15.3 | |
Other (1) | | 46 | | 172 | | 111 | | 55.0 | |
Capital spending contingencies | | 165 | | — | | — | | — | |
Total taxpayer-supported | | 3,488 | | 3,366 | | 3,101 | | 8.5 | |
| | | | | | | | | |
Self-supported commercial | | | | | | | | | |
BC Hydro | | 1,020 | | 807 | | 610 | | 32.3 | |
BC Transmission Corporation | | 65 | | 50 | | 21 | | 138.1 | |
Columbia River power projects(2) | | 43 | | 19 | | 30 | | (36.7 | ) |
BC Rail | | 62 | | 19 | | 15 | | 26.7 | |
Insurance Corporation of British Columbia (3) | | 41 | | 22 | | 27 | | (18.5 | ) |
BC Lotteries | | 80 | | 44 | | 83 | | (47.0 | ) |
Liquor Distribution Branch | | 27 | | 22 | | 19 | | 15.8 | |
Total self-supported commercial | | 1,338 | | 983 | | 805 | | 22.1 | |
Total capital spending | | 4,826 | | 4,349 | | 3,906 | | 11.3 | |
(1) | | Includes BC Housing Management Commission, Provincial Rental Housing Corporation, BC Transit and other service delivery agencies. |
| | |
(2) | | Joint ventures of the Columbia Power Corporation and Columbia Basin Trust. |
| | |
(3) | | Includes ICBC Properties Ltd. |
partially offset by:
• K–12 schools – up $70 million, reflecting increased spending for land, computers, furniture and equipment and vehicles;
• health facilities – up $94 million, reflecting increased spending for facilities rehabilitation, and medical and diagnostic equipment purchases; and
• social housing – up $113 million, reflecting the transfer of properties from the Canadian Mortgage Housing Corporation under the social housing agreement.
In the spring of 2007, the provincial government initiated a review of the VCCEP project budget due to the impact of price inflation on construction costs. The review included a thorough assessment of the construction management contract models, budget and schedule risks, and governance issues. As a result of the review completed in early July 2007, the VCCEP budget was increased to $883 million. The provincial government portion of this cost is now $541 million, with the remaining funding coming from the federal government ($222 million), Tourism Vancouver ($90 million), and other revenue sources ($30 million).
55
Self-supported commercial Crown corporation capital spending includes projects undertaken by BC Hydro, BC Rail, ICBC and for Columbia River power projects. Spending for these agencies totaled $983 million, $355 million below budget mainly due to:
• a change in BC Hydro’s accounting policy for reporting regulatory accounts (mainly to expense rather than capitalize Power Smart programs);
• delays in BC Hydro electricity generation, transmission and distribution projects;
• the timing of real estate site preparation costs by BC Rail; and
• lower spending on gaming equipment by BC Lotteries.
Table 2.9 shows a summary of capital spending changes since Budget 2006.
Table 2.9 Capital Spending – Changes from Budget 2006
($ millions) | | Change | | Final
Results | |
Capital spending – Budget 2006 | | | | 4,826 | |
Taxpayer-supported capital spending changes | | | | | |
K–12 schools – land, computer, furniture and equipment, and vehicle purchases financed from cash balances | | 70 | | | |
Post-secondary education facilities – slower than expected spending | | (114 | ) | | |
Health facilities – additional investments in facility rehabilitation and medical/diagnostic equipment financed from cash balances | | 94 | | | |
Vancouver Convention Centre expansion project – slower than expected construction | | (56 | ) | | |
Government operating – lower ministry capital spending | | (104 | ) | | |
Social housing – mainly transfer of properties from the Canadian Mortgage Housing Corporation under the social housing agreement | | 113 | | | |
Capital spending contingencies not required | | (165 | ) | | |
Other (1) | | 40 | | (122 | ) |
Self-supported commercial capital spending changes | | | | | |
BC Hydro | | | | | |
– accounting policy change for reporting regulatory accounts (mainly to expense rather than capitalize Power Smart programs) | | (57 | ) | | |
– slower than expected spending on electricity generation, transmission and distribution projects | | (156 | ) | | |
BC Rail – timing of real estate property site preparation costs in anticipation of property sales | | (43 | ) | | |
BC Lotteries – lower spending for gaming equipment | | (36 | ) | | |
Other (2) | | (63 | ) | (355 | ) |
Total change | | | | (477 | ) |
Capital spending – 2006/07 Public Accounts | | | | 4,349 | |
(1) Includes BC Housing Management Commission, Provincial Rental Housing corporation, Rapid Transit Project 2000 and other service delivery agencies.
(2) Includes BC Transmission, Columbia Power, ICBC, and Liquor Distribution Branch.
Significant capital projects (those with multi-year budgets totaling $50 million or more) are shown in Table 2.10. During 2006/07, $628 million was invested in these larger enterprises that will provide long-term social and economic benefits for the province.
56
Table 2.10 2006/07 Capital Expenditure Projects Greater Than $50 million (1)
Note: Information in bold type denotes changes from the 2006/07 third Quarterly Report .
| | | | Forecast | | Cumulative | | Spending | | Cumulative | | | | | |
| | Start | | Completion | | Spending at | | April 1 to | | Spending at | | Total Project | |
($ millions) | | Date | | Date | | Mar. 31, 2006 (2)+ | | Mar. 31 | | = Mar. 31, 2007 | | Budget (3) | | Forecast (3) | |
Advanced Education facilities (4) | | | | | | | | | | | | | | | |
SFU – Surrey Central City Campus | | Mar. 2004 | | Mar. 2007 | | 54 | | 16 | | 70 | | 70 | | 70 | |
Health facilities (5) | | | | | | | | | | | | | | | |
Vancouver General Hospital redevelopment project | | Sept. 2000 | | Fall 2007 (6) | | 121 | | 34 | | 155 | | 156 | | 156 | |
Gordon and Leslie Diamond Health Care Centre – previously the Academic Ambulatory Care Centre | | Fall 2004 | | Summer/06 | | 76 | | 19 | | 95 | | 95 | | 95 | |
| | | | | | | | | | | | | | | |
Abbotsford Regional Hospital and Cancer Centre | | Fall 2004 | | Summer/08 | | 97 | | 85 | | 182 | | 316 | | 316 | |
Surrey Outpatient Facility | | Spring/06 | | Spring/10 | | — | | 2 | | 2 | | 151 | | 151 | |
Victoria Royal Jubilee Hospital inpatient facility | | Spring/07 | | Spring/10 | | — | | — | | — | | 150 | | 150 | |
| | | | | | | | | | | | | | | |
Kelowna General Hospital Ambulatory Care Centre and Emergency Department | | Spring/07 | | Summer/10 | | — | | — | | — | | 61 | | 61 | |
| | | | | | | | | | | | | | | |
Vernon Jubilee Hospital Diagnostic and Treatment Building | | Spring/07 | | Fall 2010 | | — | | — | | — | | 49 | | 49 | |
Total health facilities | | | | | | 294 | | 140 | | 434 | | 978 | | 978 | |
Transportation | | | | | | | | | | | | | | | |
Trans Canada Highway – | | | | | | | | | | | | | | | |
– 5 Mile (Yoho) Bridge (4) | | May 1999 | | Fall 2006 | | 40 | | 3 | | 43 | | 44 | (7) | 44 | (7) |
– 10 Mile (Park) Bridge (4) | | Oct. 2005 | | Fall 2008 | | 17 | | 37 | | 54 | | 68 | (7) | 68 | (7) |
Nisga’a Highway (4) | | Aug. 1998 | | Summer/06 | | 49 | | 3 | | 52 | | 52 | | 52 | |
Pitt River Bridge (4) | | Feb. 2006 | | Fall 2009 | | 4 | | 16 | | 20 | | 108 | | 108 | (7) |
Sea-to-Sky Highway (4) | | April 2003 | | Winter 2009 | | 179 | | 177 | | 356 | | 600 | | 600 | (8) |
William R. Bennett Bridge (4) | | Mar. 2005 | | July 2008 | | 32 | | 51 | | 83 | | 144 | | 144 | |
SkyTrain extension | | Sept. 1998 | | June 2006 | | 1,093 | | 6 | | 1,099 | | 1,167 | | 1,099 | |
Total transportation | | | | | | 1,414 | | 293 | | 1,707 | | 2,183 | | 2,115 | |
Power generation | | | | | | | | | | | | | | | |
BC Hydro | | | | | | | | | | | | | | | |
– Mica Dam – generator stator replacement | | Feb. 2004 | | Mar. 2011 | | 19 | | 18 | | 37 | | 76 | | 76 | |
– Peace Canyon Dam – generator stator | | | | | | | | | | | | | | | |
replacement and rotor modification | | Feb. 2004 | | Oct. 2009 | | 9 | | 19 | | 28 | | 67 | | 67 | |
– Coquitlam Dam seismic upgrade | | Oct. 2003 | | Jan. 2007 | | 24 | | 18 | | 42 | | 58 | | 58 | |
– Aberfeldie redevelopment | | Apr. 2005 | | Aug. 2008 | | 4 | | 9 | | 13 | | 92 | | 92 | |
– GM Shrum G2–G4 stator replacement | | Sept. 2004 | | Aug. 2010 | | 4 | | 12 | | 16 | | 66 | | 66 | |
– Peace Canyon G1–G4 turbine overhaul | | Oct. 2005 | | Oct. 2009 | | 1 | | 8 | | 9 | | 55 | | 55 | |
BC Transmission Corporation | | | | | | | | | | | | | | | |
– System control centre modernization project | | Feb. 2005 | | Oct. 2008 | | 12 | | 45 | | 57 | | 133 | | 133 | |
Brilliant Expansion Power Corporation (9) | | | | | | | | | | | | | | | |
– Brilliant Dam power expansion | | Oct. 2002 | | June 2007 | | 181 | | 10 | | 191 | | 205 | | 205 | |
Total power generation | | | | | | 254 | | 139 | | 393 | | 752 | | 752 | |
Other | | | | | | | | | | | | | | | |
ICBC Properties Ltd. | | | | | | | | | | | | | | | |
– Surrey City Centre Mall Ltd . | | Sept. 1999 | | Mar. 2007 (10) | | 260 | | 10 | | 270 | | 312 | | 278 | |
Vancouver Convention Centre expansion project | | 2003 | | 2009 | | 82 | | 30 | | 112 | | 541 | | 541 | (11) |
Total other | | | | | | 342 | | 40 | | 382 | | 853 | | 819 | |
| | | | | | | | | | | | | | | | | |
(1) | | Only projects that have been approved by Treasury Board and/or Crown corporation boards are included in this table. Ministry service plans may include projects that still require final approval. Only the provincial share of funding is presented. Total costs for some of these projects could be higher as they are cost-shared with the federal government, municipal authorities or the private sector. |
| | |
(2) | | Total expenditures since commencement of each project. |
| | |
(3) | | Represents sum of annual budgeted expenditures to complete each project. |
| | |
(4) | | Amounts shown exclude interest costs incurred during construction. |
| | |
(5) | | Amounts shown may include cost of construction, equipment, deferred development costs and land, less funding contributed by Regional Hospital Districts, and exclude interest costs incurred during construction. |
| | |
(6) | | Individual components were completed starting in December 2000 and will continue to be completed before the end of the overall project. |
| | |
(7) | | Amount represents the provincial portion of this cost-shared project with the federal government. |
| | |
(8) | | Represents capital construction costs before the addition of enhanced rehabilitation and safety features. The total estimated outlays (including both capital construction and operating activities) for the project over 25 years is $1.983 billion, which assumes 2 per cent inflation per year and maximum performance payments. |
| | |
(9) | | A joint venture of the Columbia Power Corporation and the Columbia Basin Trust. |
| | |
(10) | | The base building was substantially completed in January 2003; however, work to prepare space for new tenants is still required. |
| | |
(11) | | Amount represents the provincial portion of this cost-shared project with the federal government and the tourism industry. The total project forecast (including federal and private sector partners) has been revised to $883 million following a review of the impact of higher than expected construction costs. |
57
Provincial Debt
The government and its Crown corporations borrow to finance construction of capital projects or other investments, to refinance maturing debt, and to finance working capital needs.
Table 2.11 Provincial Debt Summary (1), (2)
| | Budget | | Actual | | Actual | | Annual | |
($ millions) | | 2006/07 | | 2006/07 | | 2005/06 | | Change | |
| | | | | | | | (per cent) | |
Taxpayer-supported debt | | | | | | | | | |
Provincial government direct operating | | 10,982 | | 9,505 | | 11,923 | | (20.3 | ) |
Other taxpayer-supported debt (mainly capital) | | | | | | | | | |
Education facilities (2) | | 7,765 | | 7,633 | | 7,238 | | 5.5 | |
Health facilities (2) | | 3,041 | | 2,813 | | 2,447 | | 15.0 | |
Highways and public transit | | 5,457 | | 5,378 | | 4,828 | | 11.4 | |
Other(3) | | 638 | | 545 | | 749 | | (27.2 | ) |
Total other taxpayer-supported debt | | 16,901 | | 16,369 | | 15,262 | | 7.3 | |
Total taxpayer-supported debt | | 27,883 | | 25,874 | | 27,185 | | (4.8 | ) |
Self-supported debt | | | | | | | | | |
Commercial Crown corporations and agencies | | 7,857 | | 7,473 | | 7,200 | | 3.8 | |
Total self-supported debt | | 7,857 | | 7,473 | | 7,200 | | 3.8 | |
Forecast allowance | | 850 | | — | | — | | — | |
Total provincial debt | | 36,590 | | 33,347 | | 34,385 | | (3.0 | ) |
(1) | | Debt is after deduction of sinking funds and unamortized discounts, and excludes accrued interest. Government direct and fiscal agency accrued interest is reported in the government’s accounts as an accounts payable. |
| | |
(2) | | Includes debt and guarantees incurred by the government on behalf of school districts, universities, colleges and health authorities/hospital societies (SUCH), as well as debt directly incurred by these entities. |
| | |
(3) | | Includes debt of other taxpayer-supported Crown corporations and agencies and fiscal agency loans to local governments. Also includes student loan guarantees, loan guarantees to agricultural producers, guarantees under economic development and home mortgage assistance programs, and loan guarantee provisions. |
Provincial debt decreased $1.0 billion to total $33.3 billion at March 31, 2007, or 18.6 per cent of provincial GDP (see Chart 2.4, Table 2.11 and Appendix Table A2.13). Total debt was $3.2 billion below budget reflecting significantly improved government operating results, reduced working capital requirements and non-utilization of the forecast allowance.
Chart 2.4 Provincial Debt Components
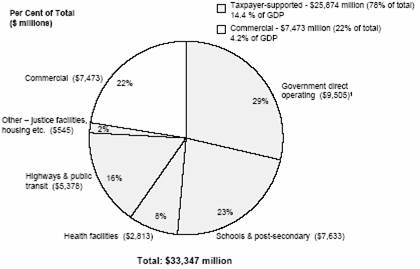
| (1) | Amount includes debt to finance deficits, ministry minor capital spending and operating activities. It also includes ferry infrastructure debt and a portion of roads infrastructure debt incurred up to 1994/95. |
58
Provincial debt was more than offset by investments in capital assets, which totaled $33.8 billion at March 31, 2007. Capital assets – such as schools, hospitals, roads, transportation, hydroelectric facilities, and other forms of provincial infrastructure – are crucial for the social and economic development of the province.
Taxpayer-supported Debt
Taxpayer-supported debt decreased by $1.3 billion to total $25.9 billion at year-end (14.4 per cent of GDP). This was $2.0 billion below budget, mainly reflecting:
• lower borrowing requirements for government’s consolidated revenue fund due to significantly better-than-expected operating results, lower ministry minor capital spending, and reduced working capital requirements; and
• reduced borrowing for post-secondary and health facilities reflecting higher than expected cash balances.
Chart 2.5 Taxpayer-supported Debt to GDP Ratio
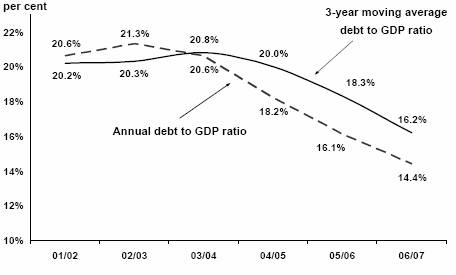
Self-supported Debt
Self-supported debt totaled $7.5 billion at March 31, 2007 (4.2 per cent of GDP). Debt at year-end was up $273 million from the previous year, but $384 million below plan mainly reflecting delayed electricity generation, distribution and transmission capital spending by BC Hydro and the BC Transmission Corporation.
Table 2.12 shows a summary of debt changes from Budget 2006.
59
Table 2.12 Debt – Changes from Budget 2006
($ millions) | | Change | | Final
Results | |
Provincial debt at March 31, 2007 – Budget 2006 | | | | 36,590 | |
Taxpayer-supported debt changes: | | | | | |
Government operating – higher revenue, mainly from taxation and energy sources, lower working capital requirements and reduced minor capital spending | | (1,477 | ) | | |
Post-secondary institutions – mainly higher cash balances to offset borrowing requirements | | (129 | ) | | |
Health facilities – mainly higher cash balances to offset borrowing requirements | | (228 | ) | | |
Other changes | | (175 | ) | (2,009 | ) |
Self-supported debt changes: | | | | | |
BC Hydro – higher revenue and lower capital spending | | (397 | ) | | |
BC Transmission Corporation – lower capital spending and reduced working capital requirements | | (40 | ) | | |
Post-secondary institutions’ subsidiaries – reclassification from taxpayer-supported debt | | 53 | | (384 | ) |
Debt forecast allowance not needed | | | | (850 | ) |
Total change | | | | (3,243 | ) |
Provincial debt at March 31, 2007 – 2006/07 Public Accounts | | | | 33,347 | |
Surplus–Change in Debt Reconciliation
Although the summary accounts surplus was $4.1 billion, total provincial debt only decreased $1.0 billion. This was due to numerous factors including the increase in capital investments; non-cash items included in the surplus (primarily amortization costs); timing differences between accrued revenue/expenses and actual cash receipts/disbursements; and changes in working capital items such as accounts receivable and accounts payable. Table 2.13 reconciles the summary accounts surplus to the total provincial debt decrease.
Table 2.13 Reconciliation of Summary Surplus to Debt Decrease – 2006/07
| | ($ millions) | |
2006/07 surplus | | | | 4,056 | |
Accrual to cash adjustment | | 867 | | | |
Reduction in cash and temporary investments | | 502 | | | |
Reclassification of PSI subsidiary debt as commercial debt | | 53 | | | |
Commercial Crown corporation retained earnings | | (501 | ) | | |
Taxpayer-supported capital spending | | (3,366 | ) | | |
Other advances and investments | | (300 | ) | (2,745 | ) |
Reduction in taxpayer-supported debt | | | | 1,311 | |
Commercial Crown corporation retained earnings | | 501 | | | |
Internal financing resources (cash balances, accrual to cash adjustment) | | 262 | | | |
Reclassification of PSI subsidiary debt as commercial debt | | (53 | ) | | |
Self-supported capital spending | | (983 | ) | | |
Increase in self-supported debt | | | | (273 | ) |
Reduction in total debt | | | | 1,038 | |
Change in guarantees | | | | 10 | |
Reduction in debt offset by sinking funds | | | | 261 | |
Reduction in financial statement debt | | | | 1,309 | |
60
Statement of Financial Position
The provincial government’s statement of financial position (often referred to as the balance sheet) summarizes the consolidated assets and liabilities of central government, Crown corporations and agencies, and the SUCH sector. In accordance with generally accepted accounting principles, the government’s financial position is presented on a net liabilities basis2 (see Table 2.14).
Table 2.14 Net Liabilities and Accumulated Surplus (Deficit)
($ millions) | | Budget
2006/07 | | Actual
2006/07 | | Actual
2005/06 (1) | | Annual
Change (2) | |
Financial assets | | 24,285 | | 26,585 | | 25,260 | | 1,325 | |
Less : liabilities | | (53,051 | ) | (49,818 | ) | (51,030 | ) | 1,212 | |
Net liabilities | | (28,766 | ) | (23,233 | ) | (25,770 | ) | 2,537 | |
Less: non-financial assets | | 27,797 | | 27,569 | | 25,603 | | 1,966 | |
Accumulated surplus (deficit) | | (969 | ) | 4,336 | | (167 | ) | 4,503 | |
(1) Comparative figures have been restated to reflect government accounting policies in effect at March 31, 2007.
(2) Change between 2006/07 actual and 2005/06 actual. Change in accumulated surplus includes $447 million in other comprehensive income, which is not included in the statement of operations.
Net liabilities represents the difference between government’s financial assets and its financial liabilities, and is the most comprehensive measure of government indebtedness and the future revenue required to pay for past transactions and events.
By the end of 2006/07, the province’s financial assets increased by $1.3 billion to $26.6 billion, mainly due to a $1.2 billion increase in investments in, and loans to, commercial Crown corporations. This increase includes $447 million in comprehensive income reported by the Insurance Corporation of British Columbia. (See Appendix 2 for a discussion on comprehensive income.)
Chart 2.6 Statement of Financial Position
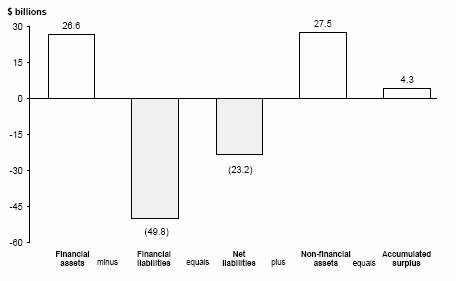
(2) Other jurisdictions refer to this as the “net debt” basis. In British Columbia, the term “net liabilities” is used to avoid confusion with provincial borrowing in financial markets, which is referred to as “debt”.
61
Review of the Province’s Financial Condition
Introduction
There are several indicators of government financial condition that are grouped into three broad categories:
• Sustainability – the ability to maintain existing programs and meet existing creditor requirements without increasing the debt burden on the economy. The indicators in this group include the net liabilities to gross domestic product (GDP) ratio, change in net liabilities to change in GDP ratio, and net liabilities per capita.
• Flexibility – the degree to which a government can increase financial resources to respond to rising commitments, by either expanding its revenues or by decreasing its debt burden. The indicators in this group are public debt charges as a per cent of revenue, annual growth in capital assets, the own-source revenue (i.e. excluding federal transfers) to GDP ratio, and the expense to GDP ratio
• Vulnerability – the degree to which a government becomes dependent on sources of funding, or vulnerable to costs, outside its control or influence. The indicators in this group are federal government transfers as a per cent of revenue and unhedged foreign currency debt as a per cent of overall debt.
Sustainability
Net liabilities to GDP(1) is similar to the familiar debt to GDP ratio. Net liabilities is a more comprehensive indicator of government’s indebtedness as it reflects the fact that government has financial liabilities not included in the debt figures, and also has financial assets available to offset its total liabilities.
A declining net liabilities to GDP ratio indicates an improvement in government’s ability to sustain its current level of operations and capital investment. Chart 1 shows that net liabilities as a per cent of GDP has decreased to 12.9 per cent in 2006/07 from the peak of 20.0 per cent in 2002/03 – a significant improvement of 7.1 percentage points.
Chart 1 Net liabilities to GDP ratio
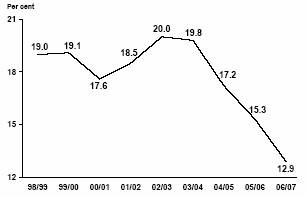
Change in net liabilities relative to the change in GDP correlates changes in government debt to annual improvements in the economy. Ratios greater than one-to-one indicate that government indebtedness is growing faster than the economy. Ratios less than zero indicate that government indebtedness is actually declining.
In 2001/02, indebtedness was growing 4.3 times the rate of economic growth (see Chart 2); by 2004/05, government begun to reduce its debt. Overall, there has been an almost six-fold improvement in this indicator over the last five years.
Chart 2 Change in Net liabilities to Change in GDP
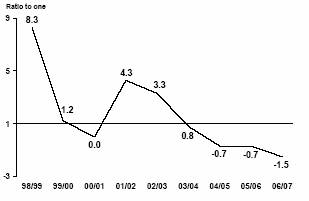
(1) The CICA, and other jurisdictions, refer to this measure as net debt to GDP. In BC, the term “net debt” has been applied to borrowing from financial markets
62
Net liabilities per capita provides context to the amount of government indebtedness by relating it to the number of people served by the programs for which the government incurred the debt. Constant increases to the indebtedness per capita indicates that government is spending beyond the capacity of its population base to fund program costs through taxation or other forms of user pay revenue.
Beginning in 2004/05, when government turned the deficit corner, net liabilities per capita have significantly decreased to the point where they are now lower than they were in 1998/99.
Overall, towards the end of the 1990s and into the first two years of this century, government indebtedness was high in relation to the size of the economy and growing faster than the economy. The energy price spike, and resultant government revenue, only produced a temporary pause in the growth pattern, and government program spending was becoming unsustainable as is demonstrated by the growth in net liabilities per capita.
In 2002/03, despite the increase in net liabilities to GDP and net liabilities per capita, the growth in government indebtedness began a sustained decline in relation to the growth of the economy. The following year (2003/04), the economy outpaced the growth in government indebtedness, and since then government indebtedness has actually decreased, reaching in 2006/07 its lowest point in eight years.
Chart 3 Net liabilities per capita

Flexibility
Taxpayer-supported debt charges as a per cent of revenue is an indicator of how much of a “bite” debt interest costs take out of provincial government revenue. Having to use a significant portion of revenue to service a debt burden limits government spending on program delivery. As is seen in Chart 4 the proportion of revenue used to pay taxpayer-supported debt servicing costs has declined sharply in the last two years and is less than half what it was nine years ago in 1998/99.
Chart 4 Debt charges as a per cent of revenue
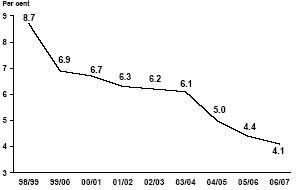
Based on the taxpayer-supported “interest bite” calculations shown in the Key Debt Indicators table (Table 2.16).
The annual growth in capital assets is an indicator of whether the provincial government is maintaining its infrastructure, a large portion of which is necessary for program delivery and sustained economic growth (e.g. education and health care facilities, highways and bridges). Sustained low growth in the face of increasing demand for services builds up a capital deficit, which must be overcome if government is to maintain or improve service levels. Conversely, high growth reflects greater capacity to provide services for British Columbians.
Chart 5 reflects the impact of government initiatives such as the transportation investment plan and increased capacity in healthcare facilities and post secondary institutes.
63
Chart 5 Annual growth in capital assets
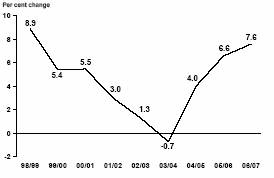
Own-source revenue to GDP is a measure of the impact that the provincial government’s taxation, fees and other revenue generating activities have on the economy, and an indicator of government’s capacity to raise additional revenue to fund its programs and services.
The own-source revenue to GDP ratio has remained stable over the last three years, despite significant tax reductions in Budget 2005 and Budget 2006. This primarily reflects the impact of recent economic strength on taxation revenues, and indicates that the government has room for further tax measures. The provincial government takes a lower percentage out of the economy in the form of revenue generation than it did prior to 2000/01 (see Chart 6), showing a strengthened capacity to react to future events.
Chart 6 Own-source revenue to GDP ratio
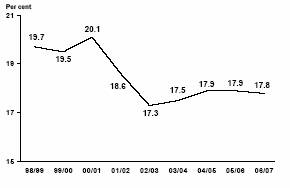
Expense to GDP ratio is a measure of the impact of government activity on the economy. If government activity is a major driver of economic growth, its flexibility to manage costs is constrained by potential negative impacts on economic growth. Government expense as a proportion of the economy was relatively high between 1998/99 and 2001/02. This correlates with the sustainability measures for the same period. Since 2001/02, the expense to GDP ratio has declined steadily to where, at 19.0 per cent, it is 3.8 percentage points below its peak of 22.8 per cent in 1998/99 (see Chart 7), despite significant increases in spending on health and education programs.
Chart 7 Expense to GDP ratio
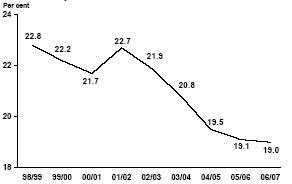
Excluding one-time items (see Appendix Table A2.9).
Overall, the decline in debt charges as a per cent of revenue, the stability of own-source revenue in relation to the economy despite tax reductions, and the decline in the expense to GDP ratio indicate increasing ability on the part of government to respond to changing demands. Growth in capital assets, though, is relatively high, indicating that the government capital spending may be a significant influence on economic growth in the province, partially offsetting the improvements in expense to GDP.
Vulnerability
The provincial government receives transfers from the federal government in support of social programs. In recent years, transfers for health and childcare have increased; however, payments under the federal equalization program have ceased.
64
Federal transfers as a percentage of total government revenue continued to grow in 2006/07 (see Chart 8), reflecting pressures on the federal government to transfer excess revenues to the provinces to help fund their key programs for health care and education and the provincial government’s success in obtaining its share of those revenues. However, the government is more exposed to the potential impact from federal funding reductions than it has been in the past, as many of the one-time commitments may not be continued.
Chart 8 Federal transfers as a per cent of total revenue
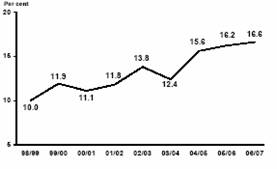
The provincial government’s debt includes debt borrowed in foreign currencies. In order to protect itself from the impact of foreign exchange rate fluctuations on interest costs for this debt, the government uses financial derivative instruments such as currency swaps and forward contracts as a “hedge” around these costs.
Not all foreign currency debt is protected in this manner. Some commercial Crown corporations with significant revenue derived from US sources, such as BC Hydro, have a natural hedge for their $US-denominated debt resulting from their operations. Chart 9 shows that the government’s exposure to foreign exchange rate fluctuations dropped significantly in 2002/03 and in 2005/06, and is now relatively insignificant in relation to its position in 1998/99.
Chart 9 Unhedged foreign currency debt as a per cent of debt
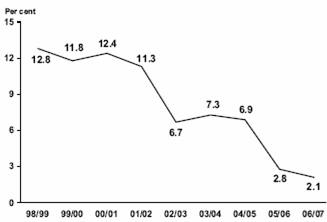
Summary
No single indicator, or subset of indicators, gives a complete financial picture of government; rather, they should be reviewed holistically. Since 2001/02, the provincial government has improved the sustainability of its program spending and its flexibility to react to future demands for its services when compared to the situation that existed up to that year. While this is in part due to recent economic strength, it also reflects the changes in policy and fiscal planning, including the Balanced Budget and Ministerial Accountability Act and the introduction of three-year fiscal plans.
The improvement has made possible significant increases in government spending, especially on healthcare and education, which have grown 25 and 24 per cent, respectively, since 2001/02.(2) However, some of the spending increases have been funded by an increase in federal transfers, which has correspondingly increased the provincial government’s vulnerability to federal funding reductions. Also, while government expense as a portion of GDP has declined, its capital spending program has expanded and is now a significant influence on economic growth.
Overall, the improvement in government’s nancial situation since 1998/99 has been significant, with a 6.1 per cent decline in net iabilities to GDP, the lowest net liabilities per capita in nine years, net indebtedness below 000/01 levels, interest “bite” reduced by more than half, and improved flexibility in revenue generation and spending.
(2) Further details on trends in provincial government revenue. expense, and financial position are provided in Appendix Tables A2.1 to A2.17
65
Financial liabilities decreased by $1.2 billion to $49.8 billion mainly due to the $1.0 billion reduction in total provincial debt. Other changes to financial liabilities included a $291 million increase in deferred revenue, primarily due to the deferral of petroleum and natural gas lease revenue over the lease term, as well as contributions received from third parties received year end towards programs whose full costs will not be realized until later on in 2007.
The financial position of government at March 31, 2007 and the changes from the previous year are summarized in Charts 2.6 and 2.7. Further data on the statement of financial position and annual changes can be found in Appendix Tables A2.5 and 2.6. A topic box on the trends over the last nine years for key indicators of the province’s financial condition is on page 62.
Chart 2.7 2006/07 Changes in Financial Position
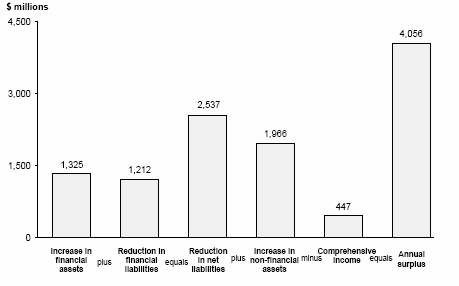
66
Credit Rating
A credit rating is an evaluation of a borrower’s ability to pay interest and to repay principal. A credit rating affects the borrower’s debt servicing costs and the investor’s rate of return since an investor will demand a higher interest rate on a higher-risk, lower-rated security. Table 2.15 provides an interprovincial comparison of credit ratings.
Table 2.15 Interprovincial Comparison of Credit Ratings, July 2007
| | Rating Agency(1) |
Province
| | Moody’s Investors
Service | |
Standard & Poor’s
| | Dominion Bond
Rating Service |
British Columbia | | Aaa | | AAA | | AA (High) |
Alberta | | Aaa | | AAA | | AAA |
Saskatchewan | | Aa1 | | AA | | AA (Low) |
Manitoba | | Aa1 | | AA- | | A (High) |
Ontario | | Aa1 | | AA | | AA |
Quebec | | Aa2 | | A+ | | A (High) |
New Brunswick | | Aa1 | | AA- | | A (High) |
Nova Scotia | | Aa2 | | A | | A |
Prince Edward Island | | Aa2 | | A | | A (Low) |
Newfoundland | | Aa2 | | A | | A (Low) |
(1) The rating agencies assign letter ratings to borrowers. The major categories, in descending order of credit quality are: AAA/Aaa; AA/Aa; A; BBB/Baa; BB/Ba; and B. The “1”, “2”, “3”, “high”, “low”, “+”, and “-” modifiers show relative standing within the major categories. For example, AA+ exceeds AA and Aa2 exceeds Aa3.
BC’s improved fiscal outlook and its record for meeting annual budget targets prompted upgrades from all three rating agencies. Moodys and Standard & Poors recognized the province’s strong financial performance by providing ratings of Aaa and AAA respectively (the highest possible ratings), while Dominion Bond Rating Service upgraded the province to AA (high).
The ratio of taxpayer-supported debt relative to gross domestic product is a measure often used by investors and credit rating agencies when analyzing a province’s ability to manage its debt load. British Columbia’s taxpayersupported debt to gross domestic product ratio is one of the lowest in Canada, translating into a strong credit rating and lower debt service costs.
67
Debt Indicators
Table 2.16 provides a historical summary of financial indicators depicting the province’s debt position, recent borrowing trends and related interest cost burden.
Table 2.16 Key Debt Indicators – 2002/03 to 2006/07 (1)
| | 2002/03 | | 2003/04 | | 2004/05 | | 2005/06 | | Budget
2006/07 | | Actual
2006/07 | |
Debt to revenue (per cent) | | | | | | | | | | | | | |
Total provincial | | 104.5 | | 100.6 | | 85.2 | | 74.7 | | 78.9 | | 69.0 | |
Taxpayer-supported | | 109.9 | | 107.1 | | 88.4 | | 77.6 | | 80.8 | | 69.4 | |
Debt per capita ($) (2) | | | | | | | | | | | | | |
Total provincial | | 8,956 | | 9,082 | | 8,527 | | 8,075 | | 8,503 | | 7,737 | |
Taxpayer-supported | | 7,140 | | 7,216 | | 6,815 | | 6,384 | | 6,480 | | 6,003 | |
Debt to GDP (per cent) (3) | | | | | | | | | | | | | |
Total provincial | | 26.7 | | 25.9 | | 22.7 | | 20.4 | | 20.7 | | 18.6 | |
Taxpayer-supported | | 21.3 | | 20.6 | | 18.2 | | 16.1 | | 15.8 | | 14.4 | |
Interest bite (cents per dollar of revenue) (4) | | | | | | | | | | | | | |
Total provincial | | 6.3 | | 5.9 | | 4.7 | | 4.3 | | 4.8 | | 4.2 | |
Taxpayer-supported | | 6.2 | | 6.1 | | 5.0 | | 4.4 | | 4.9 | | 4.1 | |
Interest costs ($millions) | | | | | | | | | | | | | |
Total provincial | | 2,237 | | 2,220 | | 1,986 | | 1,991 | | 2,241 | | 2,033 | |
Taxpayer-supported | | 1,669 | | 1,695 | | 1,622 | | 1,525 | | 1,702 | | 1,534 | |
Interest rate (per cent) (5) | | | | | | | | | | | | | |
Taxpayer-supported | | 5.9 | | 5.7 | | 5.5 | | 5.5 | | 6.2 | | 5.8 | |
Background Information: | | | | | | | | | | | | | |
Revenue ($millions) | | | | | | | | | | | | | |
Total provincial (6) | | 35,280 | | 37,495 | | 42,076 | | 46,026 | | 46,393 | | 48,333 | |
Taxpayer-supported (7) | | 26,728 | | 27,997 | | 32,391 | | 35,029 | | 34,526 | | 37,280 | |
Total debt ($millions) | | | | | | | | | | | | | |
Total provincial | | 36,853 | | 37,735 | | 35,839 | | 34,385 | | 36,590 | | 33,347 | |
Taxpayer-supported (8) | | 29,383 | | 29,982 | | 28,644 | | 27,185 | | 27,883 | | 25,874 | |
Provincial GDP ($millions) (9) | | 138,193 | | 145,763 | | 157,540 | | 168,855 | | 176,611 | | 179,701 | |
Population (thousands at July 1) (10) | | 4,115 | | 4,155 | | 4,203 | | 4,258 | | 4,303 | | 4,310 | |
(1) | | Figures for prior years and the 2006/07 budget have been restated to conform with the presentation used for 2007 and to include the effects of changes in underlying data and statistics. |
| | |
(2) | | The ratio of debt to population (e.g. debt at March 31, 2007 divided by population at July 1, 2006). |
| | |
(3) | | The ratio of debt outstanding at fiscal year end to provincial nominal gross domestic product (GDP) for the calendar year ending in the fiscal year (e.g. debt at March 31, 2007 divided by 2006 GDP). |
| | |
(4) | | The ratio of interest costs (less sinking fund interest) to revenue. Figures include capitalized interest expense in order to provide a more comparable measure to outstanding debt. |
| | |
(5) | | Weighted average of all outstanding debt issues. |
| | |
(6) | | Includes revenue of the consolidated revenue fund (excluding dividends from enterprises) plus revenue of all government organizations and enterprises. |
| | |
(7) | | Excludes revenue of government enterprises, but includes dividends from enterprises paid to the consolidated revenue fund. |
| | |
(8) | | Excludes debt of commercial Crown corporations and agencies and funds held under the province’s warehouse borrowing program. |
| | |
(9) | | GDP for the calendar year ending in the fiscal year (e.g. GDP for 2006 is used for the fiscal year ended March 31, 2007). |
| | |
(10) | | Population at July 1st within the fiscal year (e.g. population at July 1, 2006 is used for the fiscal year ended March 31, 2007). |
68
| Appendix 2 |
| Financial Review |
Appendix 2 – Financial Review
Government’s Financial Statements
Government Reporting Entity
The provincial government conducts its activities through:
• ministries;
• service delivery agencies;
• the SUCH sector (school districts; universities; colleges, university colleges and institutes; and health authorities and hospital societies); and
• commercial Crown corporations.
The accounts relating to the ministries and other direct activities of government are contained in the Consolidated Revenue Fund (CRF), whose financial results are reported as a separate entity in the Public Accounts. The CRF comprises all money over which the legislature has direct power of appropriation. The operations of service delivery agencies, the SUCH sector entities and commercial Crown corporations are recorded in their own financial statements, which are subject to audit by the Auditor General or by private sector auditors.
The relationship between the Legislature and government’s service delivery agencies, including the SUCH sector, and commercial Crown corporations is guided by either legislation or governance agreements between the boards of directors and their responsible ministers. In general, government is moving towards adopting governance agreements as its primary guide for these relationships.
According to generally accepted accounting principles (GAAP) for senior governments as established by the Public Sector Accounting Board (PSAB) of the Canadian Institute of Chartered Accountants, the province’s financial reporting consolidates the financial results of all these entities into a single set of financial statements. The provincial government publishes its financial statements annually in the Public Accounts.
Compliance with GAAP
British Columbia’s Budget Transparency and Accountability Act (BTAA) requires all financial documents produced by the province under that legislation to fully comply with GAAP. Compliance with this requirement began with the February 2004 budget and was completed in the 2004/05 Public Accounts.
Under GAAP, the CRF must be converted from a net basis to provide gross revenues and expenses. Next, service delivery agencies are consolidated with the CRF on a line-by-line basis for both the income statement and balance sheet. Commercial Crown corporations(1) are disclosed on a modified equity basis – i.e. their net income is reported as revenue and their retained earnings as an investment.
(1) Crown corporations are considered commercial if the majority of their operating revenue comes from non-government sources, and their operating revenue is sufficient to cover operating and debt service costs without the need for government grants or other forms of assistance. Otherwise they are included with the service delivery agencies.
70
Where the accounting policies of service delivery agencies differ from those used by the central government in preparing its own consolidated revenue fund financial statements, the service delivery agency financial statements are adjusted to conform to government’s accounting policies.
Revenue and expenditure are recorded on an accrual basis of accounting except when the accruals cannot be determined with a reasonable degree of certainty or when their estimation is impracticable, as is the case with corporate income tax that is recorded on a cash basis. Assets are recorded to the extent that they represent financial claims by government upon outside parties; are items held for resale, prepaid expenses, deferred charges, or prepaid capital advances; or are tangible capital assets. Similarly, liabilities are recorded only if they represent actual or probable financial claims against the government.
In this appendix, unless otherwise noted, current and historical operating results are presented in accordance with the province’s accounting polices effective March 31, 2007.
Accounting Policy Updates
In April 2005, the Canadian Institute of Chartered Accountants introduced new standards on the recognition of other comprehensive income effective for fiscal years beginning on or after October 1, 2006. Other comprehensive income reported by commercial Crown corporations is reflected only on the balance sheet in the equity asset and as part of the accumulated surplus. For taxpayer-supported service delivery agencies, including the SUCH sector, GAAP for public sector entities does not recognize other comprehensive income. Therefore, any transactions relating to comprehensive income are reversed on consolidation.
During the year, the universities changed their accounting policy for consolidation of their controlled commercial operations from full consolidation to consolidation on an equity basis, which is similar to how the provincial government accounts for its commercial Crown corporations. The commercial operations are not considered part of the universities’ core mandate, and equity basis treatment is more representative of the business relationship and purpose of these operations. The impact of the change reduced taxpayer-supported debt by $72 million (2006: $38 million), with $53 million ($2006: $19 million) allocated to self-supported debt through debt guarantees. The debt guarantees are included in the provincial government’s debt summary report, but are not reflected on its balance sheet.
The Annual Financial Cycle(2)
The BTAA outlines the province’s reporting requirements during the financial cycle and imposes specific reporting deadlines or release dates for these publications. In particular, fixed dates for presentation of the Throne Speech and budget, as well as dates for quarterly and annual reports, are set by law.
(2) Reflects the financial cycle for normal years.
71
Under the BTAA, the provincial government focuses its budgeting and reporting on a summary accounts basis. The BTAA requirements include reporting on the advice of the Economic Forecast Council; presentation of the annual Estimates, Budget and Fiscal Plan, Quarterly Reports, and Public Accounts in accordance with GAAP by 2004/05; publication of Quarterly Reports with revised forecasts; annual three-year service plans and service plan reports for each ministry and government organization; and an annual three-year government strategic plan and report.
Chart A2.1 summarizes the annual financial process of the province. This process consists of four main stages.
• Planning and Budget Preparation – Treasury Board reviews longer-term estimates of revenue, expense, capital and debt, and establishes a preliminary fiscal plan within the framework of the government’s overall strategic plan. Ministries, service delivery agencies and Crown corporations prepare three-year service plans, including performance measures and targets, and operating and capital budgets, for review by Treasury Board and/or government Caucus committees. Treasury Board makes decisions on budget allocations for ministries and agencies, and assesses commercial Crown corporation net income benchmarks, within the context of the fiscal plan. Included as inputs into this process are a consultation paper published by September 15th that invites public comment on issues for consideration
Chart A2.1 Financial Planning and Reporting Cycle Overview
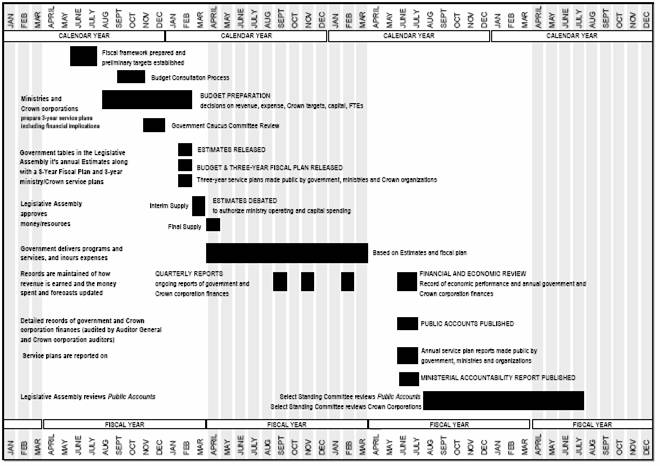
72
as government develops its fiscal and service plans, and province-wide public hearings held by a committee of the legislature. A report outlining the results of the budget consultation process is made public by November 15th of each year.
• Implementation and Reporting – The government’s revenue, expense and capital plans for the next three fiscal years, as well as other information on the government’s finances, are presented to the Legislative Assembly by the Minister of Finance in a budget document called the Budget and Fiscal Plan. The financial plan for the next fiscal year is also included in the document called the Estimates, which describes the individual appropriations to be voted on by the Legislative Assembly. Government’s strategic plan, service plans and a report on major capital projects (those where government contribution exceeds $50 million) must also be tabled. Throughout the year, the authorized funding as specified in the Estimates and ministry service plans is spent on programs and services. Crown corporations follow approved service plans under the direction of their own Boards of Directors. Quarterly Reports, including full-year forecasts, are published by legislated dates, thereby providing regular updates to the public on the government’s finances.
• Evaluation – At the end of the fiscal year, the Public Accounts are prepared by the Comptroller General and examined by the Auditor General to ensure that the financial statements fairly present the government’s financial position. The Public Accounts are augmented by the British Columbia Financial and Economic Review, which provides an overview of annual and historical financial and economic results. In addition, annual service plan reports are made public that compare actual results with ministry and Crown corporation performance targets.
• Accountability – The Public Accounts are presented to the Legislative Assembly and are reviewed by two committees of the Legislative Assembly (the Select Standing Committee on the Public Accounts and the Select Standing Committee on Crown corporations). At the same time, the Ministerial Accountability Report is published detailing the individual and collective financial performance of cabinet ministers, and the performance and revenue results achieved by the Ministers of State and the Minister of Provincial Revenue. In addition, when the Public Accounts are tabled, ministries and most Crown corporations release their service plan reports detailing results for the previous fiscal year. A report on the government’s strategic plan is also presented.
Unfunded Pension Liabilities
The province contributes to four defined benefit pension plans for most of its employees. These pension plans are managed under joint trusteeship arrangements with the plan members. Under joint trusteeship, the provincial government has no formal claim on plan surpluses or assets. As a result, government’s balance sheet does not contain any liabilities for pensions other than MLA pensions, which are not part of a joint trusteeship arrangement.
In the event that a plan is determined to be in a deficit position, the pension boards, by agreement, are required to address the deficit through contribution adjustments or other measures. As a result, it is expected that any unfunded
73
pension liability in the future would be short-term in nature. No unfunded liability exists for the future indexing of pensions, as the obligation is limited to the amount of available assets in separate inflation accounts.
The estimated financial positions of each plan (based on extrapolations of the most recent actuarial valuations) as at March 31, 2007 are shown in Table A2.1.
Table A2.1 Pension Plan Balances
| | Pension Plan | | | | | |
($ millions) | | Public Service | | Municipal | | Teachers’ | | College | | Other (1) | | Total | | 2005/06 | |
Accrued benefit obligation | | (10,850 | ) | (11,570 | ) | (12,425 | ) | (1,616 | ) | (376 | ) | (36,837 | ) | (34,879 | ) |
Pension fund assets | | 11,399 | | 12,382 | | 11,196 | | 1,968 | | 398 | | 37,343 | | 36,082 | |
Subtotal | | 549 | | 812 | | (1,229 | ) | 352 | | 22 | | 506 | | 1,203 | |
Unamortized actuarial gain (loss) | | 1,643 | | 737 | | 1,570 | | 136 | | (24 | ) | 4,062 | | 3,446 | |
Accrued net asset (obligation) | | 2,192 | | 1,549 | | 341 | | 488 | | (2 | ) | 4,568 | | 4,649 | |
(1) Represents other defined benefit plans, outside of the four main pension plans, which are funded by entities within the government reporting entity. Includes the Retirement Plan for Non-Teaching Employees of the Board of School Trustees of School District No. 43 (Coquitlam), the University of Victoria’s pension plan for employees other than faculty and professional staff, and Simon Fraser University’s Academic Pension Plan and Administrative/Union Pension Plan.
Actuarial valuations are performed on the pension plans every three years. The pension plans and the dates of their last actuarial valuation are:
• Public Service Pension Plan, March 31, 2005;
• Municipal Pension Plan, December 31, 2003;
• Teachers’ Pension Plan, December 31, 2005; and
• College Pension Plan, August 31, 2003.
Key actuarial assumptions, which are generally conservative, used in the valuations are:
• Public Service Pension Plan – long-term annual rate of return on fund assets (ARR) 6.75 per cent, long-term annual salary increase (ASI) 4.00 per cent;
• Municipal Pension Plan – ARR 7.00 per cent, ASI 4.50 per cent;
• Teachers’ Pension Plan – ARR 6.85 per cent, ASI 4.10 per cent;
and
• College Pension Plan – ARR 7.20 per cent, ASI 4.70 per cent.
The pension plans are administered by the BC Pension Corporation. The audited financial statements of each pension plan, along with full descriptions, benefit formulas, inflation assumptions and funding polices may be found on the corporation’s website at www.pensionsbc.ca.
Adjustments to the Accumulated Deficit
During 2006/07, a number of retroactive adjustments were made to the province’s financial statements to reflect changes in accounting policy and to correct previously published information. Table A2.2 provides a summary of the changes that have been requested by, or reviewed and approved by, the Office of the Auditor General.
74
The main adjustment to the prior year reflects the inclusion of liabilities arising from the Vancouver Island Natural Gas Pipeline Act (VIGAS) under which the province provides a price subsidy to Vancouver Island gas users in the form of direct payments to their supplier. The original liability for VIGAS was set at its inception in 1996. The Auditor General requested a re-estimate due to subsequent increases in natural gas prices. The adjustment is retroactive to 2003/04, when the Auditor General first raised concerns about sustained high natural gas prices.
Table A2.2 Summary of Changes in Accumulated Deficit from the balances reported in the 2005/06 Public Accounts
($ millions) | | Change | | Final Results | |
Accumulated deficit on March 31, 2005 as reported in the 2005/06 Public Accounts | | | | (3,184 | ) |
Opening balance adjustments due to accounting policy changes in 2006/07: | | | | | |
CRF – adjustment for liability arising from the contractual obligations of the VIGAS agreement | | (169 | ) | | |
CRF – adjustment for contractual obligations related to resource road development | | 44 | | | |
CRF – adjustment for capitalization of forests roads that provide community access | | 22 | | | |
School districts – adjustment for land and building additions from 1998 to 2001 | | 25 | | | |
BC Rail – adjustment to asset impairment write-down relating to Vancouver Wharves operations | | 4 | | | |
Other | | 1 | | (73 | ) |
Accumulated deficit on March 31, 2005 as reported in the 2006/07 Public Accounts | | | | (3,257 | ) |
2005/06 surplus: | | | | | |
As reported in the 2005/06 Public Accounts | | 3,060 | | | |
Adjustments due to accounting policy changes in 2006/07: | | | | | |
CRF – adjustment for contractual obligations related to resource road development | | 22 | | | |
BC Rail – adjustment to asset impairment write-down relating to Vancouver Wharves operations | | 8 | | 3,090 | |
Accumulated deficit on March 31, 2006 as reported in the 2006/07 Public Accounts | | | | (167 | ) |
Other restatements include:
• reducing the liability to contractors for reimbursement of capital costs incurred in the maintenance of certain northern resource roads;
• increasing assets for the capitalization of forest roads that provide community access (these road are maintained to a higher standard than is the norm for resource use); and
• adjusting school district asset values relating to additions of land and buildings from 1998 to 2001; and
• a partial reversal of the asset impairment write-down by BC Rail of its Vancouver Wharves operations to better reflect its initial liabilities under the long term lease agreement with Kinder Morgan for the operation of this facility.
The combined effect of these changes is a $43 million increase to the accumulated deficit of $124 million that was reported in the 2005/06 Public Accounts.
Supplementary Schedules
The following tables provide multi-year financial information on the government of British Columbia including operating results, financial position, and details on revenue, expense, debt and capital spending. As well, Tables A2.18 to A2.20 provide information on provincial taxes as of June 2007.
75
Table A2.3 Operating Statement Update Since the Third Quarterly Report
($ millions) | | Changes | | Final
Results | |
Budget 2006 (February 21, 2006) | | | | 600 | |
Revenue increases up to the third Quarterly Report | | 2,676 | | | |
Expense increases up to the third Quarterly Report | | (976 | ) | | |
Foreca st allowance decrease | | 550 | | 2,250 | |
2006/07 surplus – third Quarterly Report (February 20, 2007) | | | | 2,850 | |
2006/07 Public Accounts Update: | | | | | |
Revenue changes | | | | | |
Personal income tax revenue: | | | | | |
– Prior-year adjustment – stronger 2005 assessments related to unapplied taxes | | 67 | | | |
– Base – higher 2005 base and improved 2006 economic growth | | 136 | | | |
Tobacco tax revenue – less one-time inventory build-up by tobacco manufacturers | | (19 | ) | | |
Property tax revenue – lower growth than expected | | (27 | ) | | |
Other tax sources – mainly property transfer and corporation capital taxes | | (16 | ) | | |
Energy, metals and minerals revenue – lower natural gas and electricity prices and lower metal and petroleum revenue | | (227 | ) | | |
Forests and other natural resources | | (15 | ) | | |
Medical Services Plan revenue – change in the treatment of commissions | | 40 | | | |
Other fees – mainly lower Crown land grants and Insurance and Risk Management revenue | | (21 | ) | | |
Investment earnings – mainly higher cash balances | | 85 | | | |
Sales of goods and services – mainly higher sales from post secondary institutions | | 17 | | | |
Miscellaneous revenue – higher than expected revenue in other miscellaneous sources, program recoveries, tax-payer supported Crowns and SUCH sector | | 359 | | | |
Federal contributions – mainly lower recoveries associated with Pan-Canadian Public Health Communicable Diseases (Ministry of Health) | | (24 | ) | | |
Commercial Crown corporation operating results: | | | | | |
BC Hydro – increased hydro-electric generation due to higher water inflows into reservoirs | | 7 | | | |
Liquor Distribution Branch – higher than expected fourth quarter sales | | 19 | | | |
BC Lotteries – higher lottery and casino revenue plus lower GST costs | | 30 | | | |
BC Rail – lower than anticipated completion of real estate asset sales in March | | (9 | ) | | |
ICBC – higher than anticipated results for first quarter of 2007 | | 60 | | | |
Other Crown corporation changes | | 2 | | | |
Net revenue increase | | | | 464 | |
Less: expense increases (decreases): | | | | | |
Lower Pharmacare costs and other health spending | | (44 | ) | | |
Forest fire related costs | | (16 | ) | | |
Fewer Crown land grants | | (38 | ) | | |
Reprofiled Olympic venue funding | | (43 | ) | | |
Management of Public Funds and Debt interest savings | | (28 | ) | | |
Unused Contingencies funding | | (86 | ) | | |
Negotiating Framework incentive payments (for contracts ratified after March 31, 2006) (1) | | (26 | ) | | |
Other ministry savings | | (94 | ) | | |
CRF expense changes | | (375 | ) | | |
Increased ministry expenses recoverable mainly from the federal government | | 52 | | | |
School districts – lower than estimated staffing costs | | (60 | ) | | |
Post-secondary institutions – lower self-funded costs | | (41 | ) | | |
Health authorities – lower self-funded costs | | (52 | ) | | |
Other service delivery agencies net spending changes | | 34 | | | |
Total expense changes | | | | (442 | ) |
Subtotal | | | | 906 | |
Forecast allowance reduction | | | | 300 | |
Total change | | | | 1,206 | |
2006/07 surplus – Public Accounts | | | | 4,056 | |
(1) Budget 2006 assumed the entire $1.0 billion for incentive payments in the negotiating framework was available in 2005/06. All negotiations for contracts expiring before March 31, 2006 were successfully concluded, and incentive payments totaling $710 million were made in 2005/06. The remaining $290 million carried over into 2006/07 and was funded through a Supplementary Estimate , of which $264 million was spent.
76
Table A2.4 Operating Statement – 1998/99 to 2006/07
| | | | | | | | | | | | | | | | | | | | Average | |
| | Actual | | Actual | | Actual | | Actual | | Actual | | Actual | | Actual | | Actual | | Actual | | annual | |
($ millions) | | 1998/99 | | 1999/00 | | 2000/01 | | 2001/02 | | 2002/03 | | 2003/04 | | 2004/05 | | 2005/06 | | 2006/07 | | change | |
| | | | | | | | | | | | | | | | | | | | (per cent) | |
Taxpayer-supported programs and agencies: | | | | | | | | | | | | | | | | | | | | | |
Revenue | | 23,852 | | 25,641 | | 28,079 | | 26,936 | | 25,941 | | 27,207 | | 30,806 | | 33,753 | | 35,819 | | 5.2 | |
Expense | | (26,333 | ) | (26,820 | ) | (28,439 | ) | (30,321 | ) | (30,227 | ) | (30,357 | ) | (30,665 | ) | (32,173 | ) | (34,184 | ) | 3.3 | |
Taxpayer-supported balance | | (2,481 | ) | (1,179 | ) | (360 | ) | (3,385 | ) | (4,286 | ) | (3,150 | ) | 141 | | 1,580 | | 1,635 | | | |
Commercial Crown corporation income | | 1,520 | | 1,166 | | 1,622 | | 1,230 | | 1,832 | | 1,955 | | 2,562 | | 2,220 | | 2,685 | | 7.4 | |
Surplus/(deficit) before unusual items | | (961 | ) | (13 | ) | 1,262 | | (2,155 | ) | (2,454 | ) | (1,195 | ) | 2,703 | | 3,800 | | 4,320 | | | |
Joint trusteeship | | — | | — | | (52 | ) | 1,464 | | — | | — | | — | | — | | — | | | |
Restructuring exit expenses | | — | | — | | — | | (347 | ) | (169 | ) | (123 | ) | — | | — | | — | | | |
Negotiating Framework incentive payments | | — | | — | | — | | — | | — | | — | | — | | (710 | ) | (264 | ) | | |
Surplus/(deficit) | | (961 | ) | (13 | ) | 1,210 | | (1,038 | ) | (2,623 | ) | (1,318 | ) | 2,703 | | 3,090 | | 4,056 | | | |
| | | | | | | | | | | | | | | | | | | | | |
Percent of GDP: (1) | | | | | | | | | | | | | | | | | | | | | |
Revenue | | 21.9 | | 22.2 | | 22.6 | | 21.1 | | 20.1 | | 20.0 | | 21.2 | | 21.3 | | 21.4 | | -0.3 | |
Expense | | 22.8 | | 22.2 | | 21.7 | | 22.7 | | 21.9 | | 20.8 | | 19.5 | | 19.1 | | 19.0 | | -2.2 | |
Growth rates: | | | | | | | | | | | | | | | | | | | | | |
Revenue | | n/a | | 5.7 | | 10.8 | | -5.2 | | -1.4 | | 5.0 | | 14.4 | | 7.8 | | 7.0 | | 5.5 | |
Expense | | n/a | | 1.8 | | 6.0 | | 6.6 | | -0.3 | | 0.4 | | 1.0 | | 4.9 | | 6.3 | | 3.4 | |
Per capita: (2) | | | | | | | | | | | | | | | | | | | | | |
Revenue | | 6,369.9 | | 6,682.8 | | 7,353.2 | | 6,906.1 | | 6,748.5 | | 7,017.9 | | 7,938.5 | | 8,448.7 | | 8,932.7 | | 4.3 | |
Expense | | 6,611.2 | | 6,686.0 | | 7,040.8 | | 7,434.4 | | 7,344.8 | | 7,305.5 | | 7,295.4 | | 7,556.2 | | 7,930.5 | | 2.3 | |
(1) Revenue and expense as a percent of GDP is calculated using GDP for the calendar year ending in the fiscal year (e.g. 2006/07 amounts divided by GDP for the 2006 calendar year).
(2) Per capita revenue and expense is calculated using July 1 population (e.g. 2006/07 amounts divided by population on July 1, 2006).
77
Table A2.5 Statement of Financial Position – 1998/99 to 2006/07
| | | | | | | | | | | | | | | | | | | | Average | |
| | Actual | | Actual | | Actual | | Actual | | Actual | | Actual | | Actual | | Actual | | Actual | | annual | |
($ millions) | | 1998/99 | | 1999/00 | | 2000/01 | | 2001/02 | | 2002/03 | | 2003/04 | | 2004/05 | | 2005/06 | | 2006/07 | | change | |
| | | | | | | | | | | | | | | | | | | | (per cent) | |
Financial assets: | | | | | | | | | | | | | | | | | | | | | |
Cash and temporary investments | | 1,829 | | 2,674 | | 1,935 | | 2,452 | | 2,617 | | 2,690 | | 3,583 | | 3,869 | | 3,367 | | 7.9 | |
Other financial assets | | 4,549 | | 5,244 | | 5,746 | | 5,643 | | 5,331 | | 6,293 | | 6,619 | | 6,968 | | 7,854 | | 7.1 | |
Sinking funds | | 6,249 | | 6,188 | | 6,000 | | 5,518 | | 5,074 | | 4,619 | | 4,516 | | 4,059 | | 3,798 | | -6.0 | |
Investments in commercial Crown corporations: | | | | | | | | | | | | �� | | | | | | | | | |
Retained earnings | | 3,027 | | 2,708 | | 2,768 | | 2,429 | | 2,604 | | 3,020 | | 3,168 | | 3,448 | | 4,396 | | 4.8 | |
Recoverable capital loans | | 7,704 | | 7,304 | | 7,111 | | 7,246 | | 7,231 | | 7,512 | | 6,901 | | 6,916 | | 7,170 | | -0.9 | |
| | 10,731 | | 10,012 | | 9,879 | | 9,675 | | 9,835 | | 10,532 | | 10,069 | | 10,364 | | 11,566 | | 0.9 | |
Warehouse borrowing program assets | | 658 | | 1,320 | | 1,312 | | 1,067 | | — | | — | | — | | — | | — | | n/a | |
| | 24,016 | | 25,438 | | 24,872 | | 24,355 | | 22,857 | | 24,134 | | 24,787 | | 25,260 | | 26,585 | | 1.3 | |
| | | | | | | | | | | | | | | | | | | | | |
Liabilities: | | | | | | | | | | | | | | | | | | | | | |
Accounts payable & accrued inabilities | | 6,455 | | 6,795 | | 6,690 | | 5,630 | | 6,001 | | 7,006 | | 6,787 | | 7,288 | | 7,094 | | 1.2 | |
Deferred revenue | | 1,816 | | 2,077 | | 2,072 | | 2,349 | | 2,998 | | 4,003 | | 5,181 | | 5,695 | | 5,986 | | 16.1 | |
Debt: | | | | | | | | | | | | | | | | | | | | | |
Taxpayer-supported debt | | 23,232 | | 25,206 | | 25,104 | | 27,514 | | 29,383 | | 29,982 | | 28,644 | | 27,185 | | 25,874 | | 1.4 | |
Self-supported debt | | 8,910 | | 9,232 | | 8,684 | | 8,568 | | 7,470 | | 7,753 | | 7,195 | | 7,200 | | 7,473 | | -2.2 | |
Total provincial debt | | 32,142 | | 34,438 | | 33,788 | | 36,082 | | 36,853 | | 37,735 | | 35,839 | | 34,385 | | 33,347 | | 0.5 | |
Add: debt offset by sinking funds | | 6,249 | | 6,188 | | 6,000 | | 5,518 | | 5,074 | | 4,619 | | 4,576 | | 4,059 | | 3,798 | | -6.0 | |
Less: guarantees and non-guaranteed debt | | (707 | ) | (934 | ) | (602 | ) | (484 | ) | (433 | ) | (413 | ) | (447 | ) | (397 | ) | (407 | ) | -6.7 | |
Financial statement debt | | 37,684 | | 39,692 | | 39,186 | | 41,116 | | 41,494 | | 41,941 | | 39,908 | | 38,047 | | 36,738 | | -0.3 | |
| | 45,955 | | 48,564 | | 47,948 | | 49,095 | | 50,493 | | 52,950 | | 51,876 | | 51,030 | | 49,818 | | 1.0 | |
Net liabilities | | (21,939 | ) | (23,126 | ) | (23,076 | ) | (24,740 | ) | (27,636 | ) | (28,816 | ) | (27,089 | ) | (25,770 | ) | (23,233 | ) | 0.7 | |
Capital and other assets: | | | | | | | | | | | | | | | | | | | | | |
Tangible capital assets | | 19,364 | | 20,414 | | 21,540 | | 22,189 | | 22,470 | | 22,317 | | 23,219 | | 24,756 | | 26,626 | | 4.1 | |
Other assets | | 397 | | 521 | | 555 | | 532 | | 524 | | 539 | | 613 | | 847 | | 943 | | 11.4 | |
| | 19,761 | | 20,935 | | 22,095 | | 22,721 | | 22,994 | | 22,856 | | 23,832 | | 25,603 | | 27,569 | | 4.3 | |
Accumulated surplus (deficit) | | (2,178 | ) | (2,191 | ) | (981 | ) | (2,019 | ) | (4,642 | ) | (5,960 | ) | (3,257 | ) | (167 | ) | 4,336 | | n/a | |
Per cent of GDP: (1) | | | | | | | | | | | | | | | | | | | | | |
Net liabilities | | 19.0 | | 19.1 | | 17.6 | | 18.5 | | 20.0 | | 19.8 | | 17.2 | | 15.3 | | 12.9 | | -4.7 | |
Growth rates: | | | | | | | | | | | | | | | | | | | | | |
Net liabilities | | n/a | | 5.4 | | -0.2 | | 7.2 | | 11.7 | | 4.3 | | -6.0 | | -4.9 | | -9.8 | | 1.0 | |
Per capita: (2) | | | | | | | | | | | | | | | | | | | | | |
Net liabilities | | 5,508 | | 5,765 | | 5,713 | | 6,066 | | 6,715 | | 6,935 | | 6,445 | | 6,052 | | 5,390 | | -0.3 | |
(1) Net liabilities as a percent of GDP is calculated using GDP for the calendar year ending in the fiscal year (e.g. 2006/07 amount divided by GDP for the 2006 calendar year).
(2) Per capita net liabilities is calculated using July 1 population (e.g. 2006/07 amount divided by population on July 1, 2006).
78
Table A2.6 Changes in Financial Position – 1998/99 to 2006/07
($ millions) | | Actual
1999/00 | | Actual
2000/01 | | Actual
2001/02 | | Actual
2002/03 | | Actual
2003/04 | | Actual
2004/05 | | Actual
|2005/06 | | Actual
2006/07 | | 8-Year Total | |
Change in accumulated (surplus) deficit | | 13 | | (1,210 | ) | 1,038 | | 2,623 | | 1,318 | | (2,703 | ) | (3,090 | ) | (4,503 | ) | (6,514 | ) |
Comprehensive income | | — | | — | | — | | — | | — | | — | | — | | 447 | | 447 | |
(Surplus) deficit for the year | | 13 | | (1,210 | ) | 1,038 | | 2,623 | | 1,318 | | (2,703 | ) | (3,090 | ) | (4,056 | ) | (6,067 | ) |
Capital and other asset changes: | | | | | | | | | | | | | | | | | | | |
Taxpayer-supported capital investments | | 2,443 | | 2,542 | | 2,070 | | 1,876 | | 2,045 | | 2,323 | | 3,101 | | 3,366 | | 19,766 | |
Less: amortization and other accounting changes | | (1,393 | ) | (1,416 | ) | (1,421 | ) | (1,595 | ) | (2,198 | ) | (1,421 | ) | (1,564 | ) | (1,496 | ) | (12,504 | ) |
Increase in net capital assets | | 1,050 | | 1,126 | | 649 | | 281 | | (153 | ) | 902 | | 1,537 | | 1,870 | | 7,262 | |
Increase (decrease) in other assets | | 124 | | 34 | | (23 | ) | (8 | ) | 15 | | 74 | | 234 | | 96 | | 546 | |
| | 1,174 | | 1,160 | | 626 | | 273 | | (138 | ) | 976 | | 1,771 | | 1,966 | | 7,808 | |
Increase (decrease) in net liabilities | | 1,187 | | (50 | ) | 1,664 | | 2,896 | | 1,180 | | (1,727 | ) | (1,319 | ) | (2,090 | ) | 1,741 | |
Investment and working capital changes: | | | | | | | | | | | | | | | | | | | |
Increase (reduction) in cash and | | | | | | | | | | | | | | | | | | | |
temporary investments | | 845 | | (739 | ) | 517 | | 165 | | 73 | | 893 | | 286 | | (502 | ) | 1,538 | |
Increase (decrease) in warehouse | | | | | | | | | | | | | | | | | | | |
borrowing investments | | 662 | | (8 | ) | (245 | ) | (1,067 | ) | — | | — | | — | | — | | (658 | ) |
Investment in commercial Crown corporations: | | | | | | | | | | | | | | | | | | | |
Increase (decrease) in retained earnings | | (319 | ) | 60 | | (339 | ) | 175 | | 416 | | 148 | | 280 | | 948 | | 1,369 | |
Less: comprehensive income | | — | | — | | — | | — | | — | | — | | — | | (447 | ) | (447 | ) |
Self-supported capital investments | | 711 | | 772 | | 880 | | 882 | | 784 | | 776 | | 805 | | 983 | | 6 593 | |
Less: loan repayments and other accounting changes | | (1,111 | ) | (965 | ) | (745 | ) | (897 | ) | (503 | ) | (1,387 | ) | (790 | ) | (1,176 | ) | (7,574 | ) |
| | (719 | ) | (133 | ) | (204 | ) | 160 | | 697 | | (463 | ) | 295 | | 755 | | 388 | |
Other working capital changes | | 33 | | 424 | | 198 | | (1,776 | ) | (1,503 | ) | (736 | ) | (1,123 | ) | 528 | | (3,955 | ) |
| | 821 | | (456 | ) | 266 | | (2,518 | ) | (733 | ) | (306 | ) | (542 | ) | 781 | | (2,687 | ) |
Increase (decrease) in financial statement debt | | 2,008 | | (506 | ) | 1,930 | | 378 | | 447 | | (2,033 | ) | (1,861 | ) | (1,309 | ) | (946 | ) |
(Increase) decrease in sinking fund debt | | 61 | | 188 | | 482 | | 444 | | 455 | | 103 | | 457 | | 261 | | 2,451 | |
Increase (decrease) in guarantees and non-guaranteed debt | | 227 | | (332 | ) | (118 | ) | (51 | ) | (20 | ) | 34 | | (50 | ) | 10 | | (300 | ) |
Increase (decrease) in total provincial debt | | 2,296 | | (650 | ) | 2,294 | | 771 | | 882 | | (1,896 | ) | (1,454 | ) | (1,038 | ) | 1,205 | |
Represented by increase (decrease) in: | | | | | | | | | | | | | | | | | | | |
Self-supported debt | | 322 | | (548 | ) | (116 | ) | (1,098 | ) | 283 | | (558 | ) | 5 | | 273 | | (1,437 | ) |
Taxpayer-supported debt | | 1,974 | | (102 | ) | 2,410 | | 1,869 | | 599 | | (1,338 | ) | (1,459 | ) | (1,311 | ) | 2,642 | |
Total provincial debt | | 2,296 | | (650 | ) | 2,294 | | 771 | | 882 | | (1,896 | ) | (1,454 | ) | (1,038 | ) | 1,205 | |
79
Table A2.7 Revenue by Source – 1998/99 to 2006/07
| | Actual | | Actual | | Actual | | Actual | | Actual | | Actual | | Actual | | Actual | | Actual | | Average
annual | |
($ millions) | | 1998/99 | | 1999/00 | | 2000/01 | | 2001/02 | | 2002/03 | | 2003/04 | | 2004/05 | | 2005/06 | | 2006/07 | | change | |
| | | | | | | | | | | | | | | | | | | | (per cent) | |
Taxation revenue: | | | | | | | | | | | | | | | | | | | | | |
Personal income | | 5,423 | | 5,824 | | 5,963 | | 5,366 | | 4,150 | | 4,877 | | 5,050 | | 5,838 | | 6,905 | | 3.1 | |
Corporate income | | 1,102 | | 943 | | 1,054 | | 1,522 | | 612 | | 775 | | 1,255 | | 1,426 | | 1,538 | | 4.3 | |
Social service | | 3,204 | | 3,332 | | 3,626 | | 3,552 | | 3,794 | | 4,024 | | 4,156 | | 4,367 | | 4,714 | | 4.9 | |
Fuel and tobacco | | 1,373 | | 1,200 | | 1,175 | | 1,158 | | 1,293 | | 1,522 | | 1,603 | | 1,612 | | 1,627 | | 2.1 | |
Property and property transfer | | 1,661 | | 1,678 | | 1,714 | | 1,784 | | 1,948 | | 2,092 | | 2,265 | | 2,560 | | 2,646 | | 6.0 | |
Other | | 753 | | 770 | | 771 | | 728 | | 555 | | 540 | | 588 | | 626 | | 588 | | -3.0 | |
| | 13,516 | | 13,747 | | 14,303 | | 14,110 | | 12,352 | | 13,830 | | 14,917 | | 16,429 | | 18,018 | | 3.7 | |
Natural resource revenue: | | | | | | | | | | | | | | | | | | | | | |
Natural gas royalties | | 194 | | 328 | | 1,249 | | 836 | | 1,056 | | 1,230 | | 1,439 | | 1,921 | | 1,207 | | 25.7 | |
Columbia River Treaty | | 16 | | 100 | | 632 | | 360 | | 100 | | 230 | | 258 | | 319 | | 223 | | 39.0 | |
Other energy and minerals | | 277 | | 340 | | 444 | | 430 | | 473 | | 535 | | 612 | | 797 | | 935 | | 16.4 | |
Forests | | 1,273 | | 1,693 | | 1,341 | | 1,253 | | 1,323 | | 1,014 | | 1,363 | | 1,214 | | 1,276 | | 0.0 | |
Other resources | | 320 | | 311 | | 308 | | 298 | | 270 | | 300 | | 301 | | 316 | | 341 | | 0.8 | |
| | 2,080 | | 2,772 | | 3,974 | | 3,177 | | 3,222 | | 3,309 | | 3,973 | | 4,567 | | 3,982 | | 8.5 | |
Other revenue: | | | | | | | | | | | | | | | | | | | | | |
Medical Services Plan premiums | | 876 | | 867 | | 894 | | 954 | | 1,355 | | 1,447 | | 1,465 | | 1,482 | | 1,524 | | 7.2 | |
Post-secondary education fees | | 529 | | 528 | | 440 | | 452 | | 580 | | 781 | | 836 | | 892 | | 928 | | 7.3 | |
Other health-care related fees | | 190 | | 207 | | 211 | | 221 | | 217 | | 225 | | 189 | | 204 | | 216 | | 1.6 | |
Motor vehicle licences and permits | | 329 | | 334 | | 339 | | 342 | | 351 | | 363 | | 381 | | 403 | | 424 | | 3.2 | |
BC Ferries tolls | | 296 | | 292 | | 292 | | 306 | | 315 | | — | | — | | — | | — | | n/a | |
Other fees and licences | | 677 | | 568 | | 778 | | 767 | | 741 | | 715 | | 750 | | 685 | | 699 | | 0.4 | |
Investment earnings | | 1,346 | | 1,595 | | 1,470 | | 1,274 | | 1,024 | | 950 | | 833 | | 949 | | 1,032 | | -3.3 | |
Sales of goods and services | | 646 | | 729 | | 1,064 | | 1,006 | | 986 | | 714 | | 741 | | 719 | | 693 | | 0.9 | |
Miscellaneous | | 818 | | 822 | | 1,018 | | 1,007 | | 975 | | 1,254 | | 1,499 | | 1,598 | | 1,917 | | 11.2 | |
| | 5,707 | | 5,942 | | 6,506 | | 6,329 | | 6,544 | | 6,449 | | 6,694 | | 6,932 | | 7,433 | | 3.4 | |
Contributions from the federal government: | | | | | | | | | | | | | | | | | | | | | |
Health and social transfers | | 1,968 | | 2,438 | | 2,619 | | 2,445 | | 2,606 | | 3,044 | | 3,421 | | 4,220 | | 4,473 | | 10.8 | |
Equalization | | — | | 125 | | — | | 158 | | 543 | | (330 | ) | 979 | | 590 | | 459 | | n/a | |
Other cost shared agreements | | 581 | | 617 | | 677 | | 717 | | 674 | | 905 | | 822 | | 1,015 | | 1,454 | | 12.1 | |
| | 2,549 | | 3,180 | | 3,296 | | 3,320 | | 3,823 | | 3,619 | | 5,222 | | 5,825 | | 6,386 | | 12.2 | |
Taxpayer-supported programs and agencies | | 23,852 | | 25,641 | | 28,079 | | 26,936 | | 25,941 | | 27,207 | | 30,806 | | 33,753 | | 35,819 | | 5.2 | |
Commercial Crown corporation net income: | | | | | | | | | | | | | | | | | | | | | |
BC Hydro | | 395 | | 416 | | 446 | | 403 | | 418 | | 111 | | 402 | | 266 | | 407 | | 0.4 | |
Liquor Distribution Branch | | 616 | | 617 | | 642 | | 637 | | 654 | | 724 | | 779 | | 800 | | 840 | | 4.0 | |
BC Lotteries (net of payments to federal gov’t) | | 449 | | 525 | | 554 | | 598 | | 663 | | 719 | | 811 | | 914 | | 1,011 | | 10.7 | |
BCRC | | 22 | | (583 | ) | (7 | ) | (166 | ) | 4 | | 41 | | 182 | | 32 | | 29 | | 3.5 | |
ICBC | | 61 | | 190 | | (14 | ) | (242 | ) | 80 | | 352 | | 383 | | 191 | | 381 | | 25.7 | |
Other | | (23 | ) | 1 | | 1 | | — | | 13 | | 8 | | 5 | | 17 | | 17 | | n/a | |
| | 1,520 | | 1,166 | | 1,622 | | 1,230 | | 1,832 | | 1,955 | | 2,562 | | 2,220 | | 2,685 | | 7.4 | |
Total revenue | | 25,372 | | 26,807 | | 29,701 | | 28,166 | | 27,773 | | 29,162 | | 33,368 | | 35,973 | | 38,504 | | 5.4 | |
80
Table A2.8 Revenue by Source Supplementary Information – 1998/99 to 2006/07
($ millions) | | Actual
1998/99 | | Actual
999/00 | | Actual
2000/01 | | Actual
2001/02 | | Actual
2002/03 | | Actual
2003/04 | | Actual
2004/05 | | Actual
2005/06 | | Actual
2006/07 | | Average
annual
change | |
| | | | | | | | | | | | | | | | | | | | (per cent) | |
Per cent of GDP: (1) | | | | | | | | | | | | | | | | | | | | | |
Taxation | | 11.7 | | 11.4 | | 10.9 | | 10.6 | | 8.9 | | 9.5 | | 9.5 | | 9.7 | | 10.0 | | -1.9 | |
Natural resources | | 1.8 | | 2.3 | | 3.0 | | 2.4 | | 2.3 | | 2.3 | | 2.5 | | 2.7 | | 2.2 | | 2.6 | |
Other | | 4.9 | | 4.9 | | 5.0 | | 4.7 | | 4.7 | | 4.4 | | 4.2 | | 4.1 | | 4.1 | | -2.2 | |
Contributions from the federal government | | 2.2 | | 2.6 | | 2.5 | | 2.5 | | 2.8 | | 2.5 | | 3.3 | | 3.5 | | 3.6 | | 6.2 | |
Commercial Crown corporation income | | 1.3 | | 1.0 | | 1.2 | | 0.9 | | 1.3 | | 1.3 | | 1.6 | | 1.3 | | 1.5 | | 1.6 | |
Total revenue | | 21.9 | | 22.2 | | 22.6 | | 21.1 | | 20.1 | | 20.0 | | 21.2 | | 21.3 | | 21.4 | | -0.3 | |
Growth rates: | | | | | | | | | | | | | | | | | | | | | |
Taxation | | n/a | | 1.7 | | 4.0 | | -1.3 | | -12.5 | | 12.0 | | 7.9 | | 10.1 | | 9.7 | | 3.9 | |
Natural resources | | n/a | | 33.3 | | 43.4 | | -20.1 | | 1.4 | | 2.7 | | 20.1 | | 15.0 | | -12.8 | | 10.4 | |
Other | | n/a | | 4.1 | | 9.5 | | -2.7 | | 3.4 | | -1.5 | | 3.8 | | 3.6 | | 7.2 | | 3.4 | |
Contributions from the federal government | | n/a | | 24.8 | | 3.6 | | 0.7 | | 15.2 | | -5.3 | | 44.3 | | 11.5 | | 9.6 | | 13.1 | |
Commercial Crown corporation income | | n/a | | -23.3 | | 39.1 | | -24.2 | | 48.9 | | 6.7 | | 31.0 | | -13.3 | | 20.9 | | 10.7 | |
Total revenue | | n/a | | 5.7 | | 10.8 | | -5.2 | | -1.4 | | 5.0 | | 14.4 | | 7.8 | | 7.0 | | 5.5 | |
| | | | | | | | | | | | | | | | | | | | | |
Per capita: (2) | | | | | | | | | | | | | | | | | | | | | |
Taxation | | 3,393 | | 3,427 | | 3,541 | | 3,460 | | 3,001 | | 3,328 | | 3,549 | | 3,859 | | 4,180 | | 2.6 | |
Natural resources | | 522 | | 691 | | 984 | | 779 | | 783 | | 796 | | 945 | | 1,073 | | 924 | | 7.4 | |
Other | | 1,433 | | 1,481 | | 1,611 | | 1,552 | | 1,590 | | 1,552 | | 1,593 | | 1,628 | | 1,724 | | 2.3 | |
Contributions from the federal government | | 640 | | 793 | | 816 | | 814 | | 929 | | 871 | | 1,242 | | 1,368 | | 1,482 | | 11.1 | |
Commercial Crown corporation income | | 382 | | 291 | | 402 | | 302 | | 445 | | 470 | | 610 | | 521 | | 623 | | 6.3 | |
Total revenue | | 6,370 | | 6,683 | | 7,353 | | 6,906 | | 6,749 | | 7,018 | | 7,938 | | 8,449 | | 8,933 | | 4.3 | |
| | | | | | | | | | | | | | | | | | | | | |
Real Per Capita Revenue (2006 $) (3) | | 7,389 | | 7,668 | | 8,281 | | 7,649 | | 7,304 | | 7,438 | | 8,249 | | 8,604 | | 8,933 | | 24 | |
Growth rate (per cent) | | n/a | | 3.8 | | 8.0 | | -7.6 | | -4.5 | | 1.8 | | 10.9 | | 4.3 | | 3.8 | | 2.6 | |
(1) Revenue as a per cent of GDP is calculated using GDP for the calendar year ending in the fiscal year (e.g. 2006/07 revenue divided by GDP for the 2006 calendar year). Totals may not add due to rounding.
(2) Per capita revenue is calculated using July 1 population (e.g. 2006/07 revenue divided by population on July 1, 2006). Totals may not add due to rounding.
(3) Revenue is converted to real (inflation-adjusted) terms using the consumer price index (CPI) for the corresponding calendar year (e.g. 2006 CPI for 2006/07 revenue).
81
Table A2.9 Expense by Function (1) – 1998/99 to 2006/07
| | | | | | | | | | | | | | | | | | | | Average | |
| | Actual | | Actual | | Actual | | Actual | | Actual | | Actual | | Actual | | Actual | | Actual | | annual | |
($ millions) | | 1998/99 | | 1999/00 | | 2000/01 | | 2001/02 | | 2002/03 | | 2003/04 | | 2004/05 | | 2005/06 | | 2006/07 | | change | |
| | | | | | | | | | | | | | | | | | | | (per cent) | |
Function: | | | | | | | | | | | | | | | | | | | | | |
Health: | | | | | | | | | | | | | | | | | | | | | |
Medical Services Plan | | 1,848 | | 1,956 | | 2,118 | | 2,367 | | 2,461 | | 2,540 | | 2,546 | | 2,696 | | 2,969 | | 6.1 | |
Pharmacare | | 504 | | 569 | | 657 | | 717 | | 728 | | 723 | | 793 | | 868 | | 914 | | 7.7 | |
Regional services | | 5,213 | | 5,786 | | 6,174 | | 6,938 | | 7,202 | | 7,387 | | 7,565 | | 8,112 | | 8,500 | | 6.3 | |
Other healthcare expenses | | 459 | | 464 | | 481 | | 541 | | 571 | | 600 | | 625 | | 754 | | 867 | | 8.3 | |
| | 8,024 | | 8,775 | | 9,430 | | 10,563 | | 10,962 | | 11,250 | | 11,529 | | 12,430 | | 13,250 | | 6.5 | |
Education: | | | | | | | | | | | | | | | | | | | | | |
Elementary and secondary | | 3,878 | | 4,068 | | 4,318 | | 4,495 | | 4,542 | | 4,687 | | 4,757 | | 4,829 | | 5,272 | | 3.9 | |
Post-secondary | | 2,389 | | 2,401 | | 2,706 | | 3,005 | | 3,135 | | 3,340 | | 3,549 | | 3,926 | | 4,088 | | 6.9 | |
Other education expenses | | 188 | | 194 | | 195 | | 205 | | 223 | | 210 | | 206 | | 182 | | 159 | | -2.1 | |
| | 6,455 | | 6,663 | | 7,219 | | 7,705 | | 7,900 | | 8,237 | | 8,512 | | 8,937 | | 9,519 | | 5.0 | |
Social services: | | | | | | | | | | | | | | | | | | | | | |
Social assistance | | 1,965 | | 1,962 | | 2,053 | | 2,049 | | 1,972 | | 1,770 | | 1,671 | | 1,637 | | 1,713 | | -1.7 | |
Childcare services | | 798 | | 847 | | 929 | | 1,172 | | 953 | | 834 | | 809 | | 985 | | 1,085 | | 3.9 | |
Other social services | | 345 | | 268 | | 232 | | 198 | | 161 | | 149 | | 118 | | 102 | | 94 | | -15.0 | |
| | 3,108 | | 3,077 | | 3,214 | | 3,419 | | 3,086 | | 2,753 | | 2,598 | | 2,724 | | 2,892 | | -0.9 | |
Protection of persons and property | | 1,058 | | 1,188 | | 1,173 | | 1,216 | | 1,248 | | 1,364 | | 1,206 | | 1,381 | | 1,329 | | 2.9 | |
Transportation | | 1,967 | | 1,609 | | 1,470 | | 1,448 | | 1,606 | | 1,120 | | 1,308 | | 1,196 | | 1,251 | | -5.5 | |
Natural resources and economic development | | 1,552 | | 1,436 | | 1,790 | | 1,847 | | 1,533 | | 1,631 | | 1,686 | | 1,591 | | 1,663 | | 0.9 | |
Other | | 681 | | 709 | | 731 | | 814 | | 821 | | 1,075 | | 1,027 | | 1,089 | | 1,278 | | 8.2 | |
General government | | 439 | | 430 | | 435 | | 564 | | 539 | | 490 | | 505 | | 644 | | 768 | | 72 | |
Interest | | 3,049 | | 2,933 | | 2,977 | | 2,745 | | 2,532 | | 2,437 | | 2,294 | | 2,181 | | 2,234 | | -3.8 | |
Total expense | | 26,333 | | 26,820 | | 28,439 | | 30,321 | | 30,227 | | 30,357 | | 30,665 | | 32,173 | | 34,184 | | 3.3 | |
| | | | | | | | | | | | | | | | | | | | | |
Per cent of total expense: | | | | | | | | | | | | | | | | | | | | | |
Health | | 30.5 | | 32.7 | | 33.2 | | 34.8 | | 36.3 | | 37.1 | | 37.6 | | 38.6 | | 38.8 | | 3.1 | |
Education | | 24.5 | | 24.8 | | 25.4 | | 25.4 | | 26.1 | | 27.1 | | 27.8 | | 27.8 | | 27.8 | | 1.6 | |
Social services | | 11.8 | | 11.5 | | 11.3 | | 11.3 | | 10.2 | | 9.1 | | 8.5 | | 8.5 | | 8.5 | | -4.1 | |
Protection of persons and property | | 4.0 | | 4.4 | | 4.1 | | 4.0 | | 4.1 | | 4.5 | | 3.9 | | 4.3 | | 3.9 | | -0.4 | |
Transportation | | 7.5 | | 6.0 | | 5.2 | | 4.8 | | 5.3 | | 3.7 | | 4.3 | | 3.7 | | 3.7 | | -8.5 | |
Natural resources and economic development | | 5.9 | | 5.4 | | 6.3 | | 6.1 | | 5.1 | | 5.4 | | 5.5 | | 4.9 | | 4.9 | | -2.4 | |
Other | | 2.6 | | 2.6 | | 2.6 | | 2.7 | | 2.7 | | 3.5 | | 3.3 | | 3.4 | | 3.7 | | 4.7 | |
General government | | 1.7 | | 1.6 | | 1.5 | | 1.9 | | 1.8 | | 1.6 | | 1.6 | | 2.0 | | 2.2 | | 3.8 | |
Interest | | 11.6 | | 10.9 | | 10.5 | | 9.1 | | 8.4 | | 8.0 | | 7.5 | | 6.8 | | 6.5 | | -6.9 | |
| | 100.0 | | 100.0 | | 100.0 | | 100.0 | | 100.0 | | 100.0 | | 100.0 | | 100.0 | | 100.0 | | | |
(1) Excludes unusual items.
82
Table A2.10 Expense by Function (1) Supplementary Information – 1998/99 to 2006/07
| | Actual | | Actual | | Actual | | Actual | | Actual | | Actual | | Actual | | Actual | | Actual | | Average
annual | |
($ millions) | | 1998/99 | | 1999/00 | | 2000/01 | | 2001/02 | | 2002/03 | | 2003/04 | | 2004/05 | | 2005/06 | | 2006/07 | | change | |
| | | | | | | | | | | | | | | | | | | | (per cent) | |
Per cent of GDP: (2) | | | | | | | | | | | | | | | | | | | | | |
Health | | 6.9 | | 7.3 | | 7.2 | | 7.9 | | 7.9 | | 7.7 | | 7.3 | | 7.4 | | 7.4 | | 0.8 | |
Education | | 5.6 | | 5.5 | | 5.5 | | 5.8 | | 5.7 | | 5.7 | | 5.4 | | 5.3 | | 5.3 | | -0.7 | |
Social services | | 2.7 | | 2.5 | | 2.4 | | 2.6 | | 2.2 | | 1.9 | | 1.6 | | 1.6 | | 1.6 | | -6.2 | |
Protection of persons and property | | 0.9 | | 1.0 | | 0.9 | | 0.9 | | 0.9 | | 0.9 | | 0.8 | | 0.8 | | 0.7 | | -2.6 | |
Transportation | | 1.7 | | 1.3 | | 1.1 | | 1.1 | | 1.2 | | 0.8 | | 0.8 | | 0.7 | | 0.7 | | -10.6 | |
Natural resources anc economic development | | 1.3 | | 1.2 | | 1.4 | | 1.4 | | 1.1 | | 1.1 | | 1.1 | | 0.9 | | 0.9 | | -4.5 | |
Other | | 0.6 | | 0.6 | | 0.6 | | 0.6 | | 0.6 | | 0.7 | | 0.7 | | 0.6 | | 0.7 | | 2.4 | |
General government | | 0.4 | | 0.4 | | 0.3 | | 0.4 | | 0.4 | | 0.3 | | 0.3 | | 0.4 | | 0.4 | | 1.5 | |
Interest | | 2.6 | | 2.4 | | 2.3 | | 2.1 | | 1.8 | | 1.7 | | 1.5 | | 1.3 | | 1.2 | | -9.0 | |
Total expense | | 22.8 | | 22.2 | | 21.7 | | 22.7 | | 21.9 | | 20.8 | | 19.5 | | 19.1 | | 19.0 | | -2.2 | |
Growth rates: | | | | | | | | | | | | | | | | | | | | | |
Health | | n/a | | 9.4 | | 7.5 | | 12.0 | | 3.8 | | 2.6 | | 2.5 | | 7.8 | | 6.6 | | 6.5 | |
Education | | n/a | | 3.2 | | 8.3 | | 6.7 | | 2.5 | | 4.3 | | 3.3 | | 5.0 | | 6.5 | | 5.0 | |
Social services | | n/a | | -1.0 | | 4.5 | | 6.4 | | -9.7 | | -10.8 | | -5.6 | | 4.8 | | 6.2 | | -0.7 | |
Protection of persons and property | | n/a | | 12.3 | | -1.3 | | 3.7 | | 2.6 | | 9.3 | | -11.6 | | 14.5 | | -3.8 | | 3.2 | |
Transportation | | n/a | | -18.2 | | -8.6 | | -1.5 | | 10.9 | | -30.3 | | 16.8 | | -8.6 | | 4.6 | | -4.4 | |
Natural resources anc economic development | | n/a | | -7.5 | | 24.7 | | 3.2 | | -17.0 | | 6.4 | | 3.4 | | -5.6 | | 4.5 | | 1.5 | |
Other | | n/a | | 4.1 | | 3.1 | | 11.4 | | 0.9 | | 30.9 | | -4.5 | | 6.0 | | 17.4 | | 8.7 | |
General government | | n/a | | -2.1 | | 1.2 | | 29.7 | | -4.4 | | -9.1 | | 3.1 | | 27.5 | | 19.3 | | 8.1 | |
Interest | | n/a | | -3.8 | | 1.5 | | -7.8 | | -7.8 | | -3.8 | | -5.9 | | -4.9 | | 2.4 | | -3.7 | |
Total expense | | n/a | | 1.8 | | 6.0 | | 6.6 | | -0.3 | | 0.4 | | 1.0 | | 4.9 | | 6.3 | | 3.4 | |
Per capita: (2) | | | | | | | | | | | | | | | | | | | | | |
Health | | 2,015 | | 2,188 | | 2,335 | | 2,590 | | 2,664 | | 2,707 | | 2,743 | | 2,919 | | 3,074 | | 5.4 | |
Education | | 1,621 | | 1,661 | | 1,787 | | 1,889 | | 1,920 | | 1,982 | | 2,025 | | 2,099 | | 2,208 | | 3.9 | |
Social services | | 780 | | 767 | | 796 | | 838 | | 750 | | 663 | | 618 | | 640 | | 671 | | -1.9 | |
Protection of persons and property | | 266 | | 296 | | 290 | | 298 | | 303 | | 328 | | 287 | | 324 | | 308 | | 1.8 | |
Transportation | | 494 | | 401 | | 364 | | 355 | | 390 | | 270 | | 311 | | 281 | | 290 | | -6.4 | |
Natural resources anc economic development | | 390 | | 358 | | 443 | | 453 | | 373 | | 393 | | 401 | | 374 | | 386 | | -0.1 | |
Other | | 171 | | 177 | | 181 | | 200 | | 199 | | 259 | | 244 | | 256 | | 296 | | 7.1 | |
General government | | 110 | | 107 | | 108 | | 138 | | 131 | | 118 | | 120 | | 151 | | 178 | | 6.2 | |
Interest | | 765 | | 731 | | 737 | | 673 | | 615 | | 586 | | 546 | | 512 | | 518 | | -4.8 | |
Total expense | | 6,612 | | 6,686 | | 7,041 | | 7,434 | | 7,345 | | 7,306 | | 7,295 | | 7,556 | | 7,929 | | 2.3 | |
Real Per Capita Expense (2006 $1) (4) | | 7,669 | | 7,672 | | 7,929 | | 8,235 | | 7,949 | | 7,742 | | 7,581 | | 7,695 | | 7,930 | | 0.4 | |
Growth rate (per cent) | | n/a | | 0.0 | | 3.4 | | 3.9 | | -3.5 | | -2.6 | | -2.1 | | 1.5 | | 3.1 | | 0.5 | |
(1) | | Excludes unusual items. |
| | |
(2) | | Expense as a percent of GDP is calculated using GDP for the calendar year ending in the fiscal year (e.g. 2006/07 expense divided by GDP for the 2006 calendar year). Totals may not add due to rounding. |
| | |
(3) | | Per capita expense is calculated using July 1 population (e.g. 2006/07 expense divided by population on July 1, 2006). Totals may not add due to rounding. |
| | |
(4) | | Revenue is converted to real (inflation-adjusted) terms using the consumer price index (CPI) for the corresponding calendar year (e.g. 2006 CPI for 2006/07 revenue). |
83
Table A2.11 Service Delivery Agency Operating Results – 1998/99 to 2006/07
| | Actual | | Actual | | Actual | | Actual | | Actual | | Actual | | Actual | | Actual | | Actual | | Average annual | |
($ millions) | | 1998/99 | | 1999/00 | | 2000/01 | | 2001/02 | | 2002/03 | | 2003/04 | | 2004/05 | | 2005/06 | | 2006/07 | | change | |
| | | | | | | | | | | | | | | | | | | | (percent) | |
School districts | | | | | | | | | | | | | | | | | | | | | |
| | | | | | | | | | | | | | | | | | | | | |
Revenue | | 4,068 | | 4,080 | | 4,274 | | 4,308 | | 4,417 | | 4,555 | | 4,666 | | 4,812 | | 5,178 | | 3.1 | |
Expense | | (3,879 | ) | (4,069 | ) | (4,222 | ) | (4,277 | ) | (4,230 | ) | (4,471 | ) | (4,533 | ) | (4,612 | ) | (5,041 | ) | 3.3 | |
| | 189 | | 11 | | 52 | | 31 | | 187 | | 84 | | 133 | | 200 | | 137 | | | |
Accounting adjustments | | (3 | ) | (42 | ) | 4 | | 11 | | (37 | ) | 51 | | 44 | | 24 | | 61 | | | |
Net impact | | 186 | | (31 | ) | 56 | | 42 | | 150 | | 135 | | 177 | | 224 | | 198 | | | |
| | | | | | | | | | | | | | | | | | | | | |
Universities | | | | | | | | | | | | | | | | | | | | | |
| | | | | | | | | | | | | | | | | | | | | |
Revenue | | 1,309 | | 1,413 | | 1,506 | | 1,720 | | 1,828 | | 2,031 | | 2,158 | | 2,614 | | 2,751 | | 9.7 | |
Expense | | (1,329 | ) | (1,369 | ) | (1,433 | ) | (1,612 | ) | (1,712 | ) | (1,905 | ) | (2,073 | ) | (2,429 | ) | (2,593 | ) | 8.7 | |
| | (20 | ) | 44 | | 73 | | 108 | | 116 | | 126 | | 85 | | 185 | | 158 | | | |
Accounting adjustments | | 37 | | 44 | | 47 | | 31 | | 70 | | 32 | | 38 | | 93 | | 95 | | | |
Net impact | | 17 | | 88 | | 120 | | 139 | | 186 | | 158 | | 123 | | 278 | | 253 | | | |
| | | | | | | | | | | | | | | | | | | | | |
Colleges, university colleges, and institutes | | | | | | | | | | | | | | | | | | | | | |
| | | | | | | | | | | | | | | | | | | | | |
Revenue | | 948 | | 1,023 | | 1,149 | | 1,215 | | 1,290 | | 1,362 | | 1,400 | | 1,288 | | 1,378 | | 4.8 | |
Expense | | (1,003 | ) | (1,032 | ) | (1,138 | ) | (1,212 | ) | (1,257 | ) | (1,298 | ) | (1,345 | ) | (1,249 | ) | (1,310 | ) | 3.4 | |
| | (55 | ) | (9 | ) | 11 | | 3 | | 33 | | 64 | | 55 | | 39 | | 68 | | | |
Accounting adjustments | | 33 | | 41 | | 43 | | 51 | | 14 | | 10 | | 13 | | 40 | | 22 | | | |
Net impact | | (22 | ) | 32 | | 54 | | 54 | | 47 | | 74 | | 68 | | 79 | | 90 | | | |
| | | | | | | | | | | | | | | | | | | | | |
Health authorities and hospital societies | | | | | | | | | | | | | | | | | | | | | |
| | | | | | | | | | | | | | | | | | | | | |
Revenue | | 4,867 | | 5,614 | | 5,987 | | 6,744 | | 7,185 | | 7,702 | | 7,861 | | 8,245 | | 8,857 | | 7.8 | |
Expense | | (5,055 | ) | (5,613 | ) | (5,989 | ) | (6,799 | ) | (7,187 | ) | (7,769 | ) | (7,794 | ) | (8,243 | ) | (8,892 | ) | 7.3 | |
| | (188 | ) | 1 | | (2 | ) | (55 | ) | (2 | ) | (67 | ) | 67 | | 2 | | (35 | ) | | |
Accounting adjustments | | (49 | ) | (134 | ) | (94 | ) | (4 | ) | 154 | | 77 | | (40 | ) | 16 | | (88 | ) | | |
Net impact | | (237 | ) | (133 | ) | (96 | ) | (59 | ) | 152 | | 10 | | 27 | | 18 | | (123 | ) | | |
| | | | | | | | | | | | | | | | | | | | | |
Children and family development agencies | | | | | | | | | | | | | | | | | | | | | |
| | | | | | | | | | | | | | | | | | | | | |
Revenue | | — | | — | | — | | — | | 2 | | 4 | | 1 | | 439 | | 631 | | n/a | |
Expense | | — | | — | | — | | — | | (1 | ) | (3 | ) | (1 | ) | (439 | ) | (631 | ) | n/a | |
| | — | | — | | — | | — | | 1 | | 1 | | — | | — | | — | | | |
| | | | | | | | | | | | | | | | | | | | | |
Accounting adjustments | | — | | — | | — | | — | | 1 | | — | | — | | 4 | | 1 | | | |
Net impact | | — | | — | | — | | — | | 2 | | _1 | | — | | 4 | | 1 | | | |
84
| | Actual | | Actual | | Actual | | Actual | | Actual | | Actual | | Actual | | Actual | | Actual | | Average
annual | |
($ millions) | | 1998/99 | | 1999/00 | | 2000/01 | | 2001/02 | | 2002/03 | | 2003/04 | | 2004/05 | | 2005/06 | | 2006/07 | | change | |
| | | | | | | | | | | | | | | | | | | | (per cent) | |
BC Transportation Financing Authority | | | | | | | | | | | | | | | | | | | | | |
| | | | | | | | | | | | | | | | | | | | | |
Revenue | | 152 | | 400 | | 477 | | 466 | | 419 | | 622 | | 1,405 | | 657 | | 618 | | 19.2 | |
Expense | | (174 | ) | (378 | ) | (476 | ) | (466 | ) | (439 | ) | (497 | ) | (600 | ) | (604 | ) | (585 | ) | 16.4 | |
| | (22 | ) | 22 | | 1 | | — | | (20 | ) | 125 | | 805 | | 53 | | 33 | | | |
Accounting adjustments | | (352 | ) | (200 | ) | (184 | ) | (185 | ) | (179 | ) | (177 | ) | (172 | ) | (168 | ) | (155 | ) | | |
Net impact | | (374 | ) | (178 | ) | (183 | ) | (185 | ) | (199 | ) | (52 | ) | 633 | | (115 | ) | (122 | ) | | |
| | | | | | | | | | | | | | | | | | | | | |
British Columbia Buildings Corporation | | | | | | | | | | | | | | | | | | | | | |
| | | | | | | | | | | | | | | | | | | | | |
Revenue | | 456 | | 464 | | 462 | | 465 | | 485 | | 515 | | 436 | | 452 | | — | | n/a | |
Expense | | (408 | ) | (419 | ) | (411 | ) | (428 | ) | (433 | ) | (468 | ) | (385 | ) | (398 | ) | — | | n/a | |
| | 48 | | 45 | | 51 | | 37 | | 52 | | 47 | | 51 | | 54 | | — | | | |
Accounting adjustments | | (8 | ) | 1 | | (8 | ) | 16 | | 12 | | 1 | | (1 | ) | (7 | ) | (12 | ) | | |
Net impact | | 40 | | 46 | | 43 | | 53 | | 64 | | 48 | | 50 | | 47 | | (12 | ) | | |
| | | | | | | | | | | | | | | | | | | | | |
British Columbia Ferry Corporation | | | | | | | | | | | | | | | | | | | | | |
| | | | | | | | | | | | | | | | | | | | | |
Revenue | | 407 | | 435 | | 457 | | 473 | | 490 | | — | | — | | — | | — | | n/a | |
Expense | | (518 | ) | (734 | ) | (446 | ) | (496 | ) | (519 | ) | — | | — | | — | | — | | n/a | |
| | (111 | ) | (299 | ) | 11 | | (23 | ) | (29 | ) | — | | — | | — | | — | | | |
Accounting adjustments | | (14 | ) | 1,066 | | (21 | ) | 17 | | (95 | ) | — | | — | | — | | — | | | |
Net impact | | (125 | ) | 767 | | (10 | ) | (6 | ) | (124 | ) | — | | — | | — | | — | | | |
| | | | | | | | | | | | | | | | | | | | | |
British Columbia Housing Management Commission | | | | | | | | | | | | | | | | | | | | | |
| | | | | | | | | | | | | | | | | | | | | |
Revenue | | 206 | | 208 | | 228 | | 260 | | 263 | | 279 | | 284 | | 343 | | 497 | | 11.6 | |
Expense | | (203 | ) | (210 | ) | (228 | ) | (260 | ) | (263 | ) | (279 | ) | (284 | ) | (343 | ) | (497 | ) | 11.8 | |
| | 3 | | (2 | ) | — | | — | | — | | — | | — | | — | | — | | | |
Accounting adjustments | | (3 | ) | (2 | ) | 4 | | — | | 1 | | 7 | | 4 | | 5 | | (15 | ) | | |
Net impact | | — | | (4 | ) | 4 | | — | | 1 | | 7 | | 4 | | 5 | | (15 | ) | | |
| | | | | | | | | | | | | | | | | | | | | |
British Columbia Transit | | | | | | | | | | | | | | | | | | | | | |
| | | | | | | | | | | | | | | | | | | | | |
Revenue | | 655 | | 118 | | 120 | | 118 | | 136 | | 138 | | 146 | | 155 | | 165 | | -15.8 | |
Expense | | (660 | ) | (118 | ) | (120 | ) | (119 | ) | (136 | ) | (138 | ) | (146 | ) | (155 | ) | (167 | ) | -15.8 | |
| | (5 | ) | — | | — | | (1 | ) | — | | — | | — | | — | | (2 | ) | | |
Accounting adjustments | | (85 | ) | (1 | ) | 8 | | (9 | ) | — | | (3 | ) | (3 | ) | 6 | | — | | | |
Net impact | | (90 | ) | (1 | ) | 8 | | (10 | ) | — | | (3 | ) | (3 | ) | 6 | | (2 | ) | | |
85
| | Actual | | Actual | | Actual | | Actual | | Actual | | Actual | | Actual | | Actual | | Actual | | Average
annual | |
($ millions) | | 1998/99 | | 1999/00 | | 2000/01 | | 2001/02 | | 2002/03 | | 2003/04 | | 2004/05 | | 2005/06 | | 2006/07 | | change | |
| | | | | | | | | | | | | | | | | | | | (per cent) | |
Forest Renewal BC | | | | | | | | | | | | | | | | | | | | | |
| | | | | | | | | | | | | | | | | | | | | |
Revenue | | 221 | | 333 | | 221 | | 163 | | — | | — | | — | | — | | — | | n/a | |
Expense | | (485 | ) | (332 | ) | (285 | ) | (342 | ) | — | | — | | — | | — | | — | | n/a | |
| | (264 | ) | 1 | | (64 | ) | (179 | ) | — | | — | | — | | — | | | | | |
Accounting adjustments | | — | | — | | 3 | | — | | — | | — | | — | | — | | | | | |
Net impact | | (264 | ) | 1 | | (61 | ) | (179 | ) | — | | — | | — | | — | | | | | |
| | | | | | | | | | | | | | | | | | | | | |
Skeena Cellulose | | | | | | | | | | | | | | | | | | | | | |
| | | | | | | | | | | | | | | | | | | | | |
Revenue | | — | | — | | 295 | | 74 | | — | | — | | — | | — | | — | | n/a | |
Expense | | — | | — | | (295 | ) | (143 | ) | — | | — | | — | | — | | — | | n/a | |
| | — | | — | | — | | (69 | ) | — | | — | | — | | — | | — | | | |
Accounting adjustments | | — | | — | | — | | 153 | | — | | — | | — | | — | | — | | | |
Net impact | | — | | — | | — | | 84 | | — | | — | | — | | — | | — | | | |
| | | | | | | | | | | | | | | | | | | | | |
Tourism British Columbia | | | | | | | | | | | | | | | | | | | | | |
| | | | | | | | | | | | | | | | | | | | | |
Revenue | | 23 | | 27 | | 29 | | 35 | | 34 | | 33 | | 45 | | 58 | | 60 | | 12.7 | |
Expense | | (25 | ) | (27 | ) | (29 | ) | (36 | ) | (34 | ) | (37 | ) | (45 | ) | (57 | ) | (59 | ) | 11.3 | |
| | (2 | ) | — | | — | | (1 | ) | — | | (4 | ) | — | | 1 | | 1 | | | |
Accounting adjustments | | — | | — | | 1 | | (2 | ) | 1 | | | | 5 | | (1 | ) | 7 | | | |
Net impact | | (2 | ) | — | | 1 | | (3 | ) | 1 | | (4 | ) | 5 | | — | | 8 | | | |
| | | | | | | | | | | | | | | | | | | | | |
Other service delivery agencies | | | | | | | | | | | | | | | | | | | | | |
| | | | | | | | | | | | | | | | | | | | | |
Revenue | | 667 | | 804 | | 771 | | 891 | | 723 | | 693 | | 706 | | 683 | | 722 | | 1.0 | |
Expense | | (654 | ) | (846 | ) | (722 | ) | (845 | ) | (717 | ) | (661 | ) | (661 | ) | (603 | ) | (649 | ) | -0.1 | |
| | 13 | | (42 | ) | 49 | | 46 | | 6 | | 32 | | 45 | | 80 | | 73 | | | |
Accounting adjustments | | 13 | | 129 | | (11 | ) | 5 | | 33 | | 65 | | 45 | | 99 | | 167 | | | |
Net impact | | 26 | | 87 | | 38 | | 51 | | 39 | | 97 | | 90 | | 179 | | 240 | | | |
| | | | | | | | | | | | | | | | | | | | | |
Total net fiscal plan impact | | (845 | ) | 674 | | (26 | ) | (19 | ) | 319 | | 471 | | 1,174 | | 725 | | 516 | | | |
| | | | | | | | | | | | | | | | | | | | | |
Total service delivery agency operating results | | | | | | | | | | | | | | | | | | | | | |
| | | | | | | | | | | | | | | | | | | | | |
Revenue | | 13,979 | | 14,919 | | 15,976 | | 16,932 | | 17,272 | | 17,934 | | 19,108 | | 19,746 | | 20,857 | | 5.1 | |
Accounting adjustments | | (441 | ) | 914 | | (187 | ) | (86 | ) | 55 | | 56 | | (55 | ) | 105 | | 73 | | | |
| | 13,538 | | 15,833 | | 15,789 | | 16,846 | | 17,327 | | 17,990 | | 19,053 | | 19,851 | | 20,930 | | | |
Expense | | (14,393 | ) | (15,147 | ) | (15,794 | ) | (17,035 | ) | (16,928 | ) | (17,526 | ) | (17,867 | ) | (19,132 | ) | (20,424 | ) | 4.5 | |
Accounting adjustments | | 10 | | (12 | ) | (21 | ) | 170 | | (80 | ) | 7 | | (12 | ) | 6 | | 10 | | | |
| | (14,383 | ) | (15,159 | ) | (15,815 | ) | (16,865 | ) | (17,008 | ) | (17,519 | ) | (17,879 | ) | (19,126 | ) | (20,414 | ) | | |
Total net impact | | (845 | ) | 674 | | (26 | ) | (19 | ) | 319 | | 471 | | 1,174 | | 725 | | 516 | | | |
86
Table A2.12 Capital Spending – 1998/99 to 2006/07
| | Actual | | Actual | | Actual | | Actual | | Actual | | Actual | | Actual | | Actual | | Actual | | Average
annual | |
($ millions) | | 1998/99 | | 1999/00 | | 2000/01 | | 2001/02 | | 2002/03 | | 2003/04 | | 2004/05 | | 2005/06 | | 2006/07 | | change | |
| | | | | | | | | | | | | | | | | | | | (per cent) | |
Taxpayer-supported: | | | | | | | | | | | | | | | | | | | | | |
Education | | | | | | | | | | | | | | | | | | | | | |
Schools (K–12) | | 447 | | 595 | | 595 | | 459 | | 383 | | 313 | | 239 | | 286 | | 322 | | -4.0 | |
Post-secondary | | 230 | | 217 | | 254 | | 391 | | 412 | | 605 | | 696 | | 790 | | 874 | | 18.2 | |
Health | | 316 | | 350 | | 459 | | 275 | | 422 | | 420 | | 568 | | 848 | | 760 | | 11.6 | |
BC Transportation Financing Authority | | 384 | | 478 | | 485 | | 344 | | 275 | | 407 | | 513 | | 713 | | 821 | | 10.0 | |
Vancouver Convention Centre expansion | | — | | — | | — | | — | | — | | 56 | | 51 | | 85 | | 108 | | n/a | |
Rapid Transit Project 2000 | | 189 | | 396 | | 300 | | 210 | | 35 | | 14 | | 15 | | 16 | | 15 | | -27.1 | |
BC Ferries | | 153 | | 121 | | 55 | | 55 | | 58 | | — | | — | | — | | — | | n/a | |
Government operating (ministries) | | 218 | | 156 | | 183 | | 203 | | 183 | | 185 | | 175 | | 268 | | 309 | | 4.5 | |
Other | | 194 | | 130 | | 211 | | 133 | | 108 | | 45 | | 66 | | 95 | | 157 | | -2.6 | |
| | 2,131 | | 2,443 | | 2,542 | | 2,070 | | 1,876 | | 2,045 | | 2,323 | | 3,101 | | 3,366 | | 5.9 | |
Self-supported: | | | | | | | | | | | | | | | | | | | | | |
BC Hydro | | 382 | | 400 | | 411 | | 531 | | 696 | | 574 | | 528 | | 610 | | 807 | | 9.8 | |
BC Transmission Corporation | | — | | — | | — | | — | | — | | — | | — | | 21 | | 50 | | n/a | |
Columbia River power projects | | 24 | | 52 | | 126 | | 118 | | 54 | | 100 | | 84 | | 30 | | 19 | | -2.9 | |
BC Rail | | 92 | | 155 | | 124 | | 78 | | 52 | | 33 | | 30 | | 15 | | 19 | | -17.9 | |
ICBC | | 25 | | 91 | | 78 | | 107 | | 41 | | 26 | | 31 | | 27 | | 22 | | -1.6 | |
BC Lotteries | | 13 | | 10 | | 13 | | 20 | | 30 | | 49 | | 93 | | 83 | | 44 | | 16.5 | |
Liquor Distribution Branch | | 5 | | 3 | | 20 | | 26 | | 9 | | 2 | | 10 | | 19 | | 22 | | 20.3 | |
| | 541 | | 711 | | 772 | | 880 | | 882 | | 784 | | 776 | | 805 | | 983 | | 7.8 | |
Total capital spending | | 2,672 | | 3,154 | | 3,314 | | 2,950 | | 2,758 | | 2,829 | | 3,099 | | 3,906 | | 4,349 | | 6.3 | |
| | | | | | | | | | | | | | | | | | | | | |
Per cent of GDP: (1) | | | | | | | | | | | | | | | | | | | | | |
Taxpayer-supported | | 1.8 | | 2.0 | | 1.9 | | 1.6 | | 1.4 | | 1.4 | | 1.5 | | 1.8 | | 1.9 | | 0.2 | |
Self-supported | | 0.5 | | 0.6 | | 0.6 | | 0.7 | | 0.6 | | 0.5 | | 0.5 | | 0.5 | | 0.5 | | 2.0 | |
Total | | 2.3 | | 2.6 | | 2.5 | | 2.2 | | 2.0 | | 1.9 | | 2.0 | | 2.3 | | 2.4 | | 0.6 | |
Growth rates: | | | | | | | | | | | | | | | | | | | | | |
Taxpayer-supported | | n/a | | 14.6 | | 4.1 | | -18.6 | | -9.4 | | 9.0 | | 13.6 | | 33.5 | | 8.5 | | 6.9 | |
Self-supported | | n/a | | 31.4 | | 8.6 | | 14.0 | | 0.2 | | -11.1 | | -1.0 | | 3.7 | | 22.1 | | 8.5 | |
Total | | n/a | | 18.0 | | 5.1 | | -11.0 | | -6.5 | | 2.6 | | 9.5 | | 26.0 | | 11.3 | | 6.9 | |
Per capita: (2) | | | | | | | | | | | | | | | | | | | | | |
Taxpayer-supported | | 535 | | 609 | | 629 | | 508 | | 456 | | 492 | | 553 | | 728 | | 781 | | 4.8 | |
Self-supported | | 136 | | 177 | | 191 | | 216 | | 214 | | 189 | | 185 | | 189 | | 228 | | 6.7 | |
Total | | 671 | | 786 | | 820 | | 723 | | 670 | | 681 | | 737 | | 917 | | 1,009 | | 5.2 | |
| | | | | | | | | | | | | | | | | | | | | |
Real Per Capita Capital Spending (2006 $) (3) | | 778 | | 902 | | 924 | | 801 | | 725 | | 722 | | 766 | | 934 | | 1,009 | | 3.3 | |
Growth rate (per cent) | | n/a | | 15.9 | | 2.4 | | -13.3 | | -9.5 | | -0.5 | | 6.2 | | 21.9 | | 8.0 | | 3.9 | |
87
Table A2.13 Provincial Debt – 1998/99 to 2006/07
| | Actual | | Actual | | Actual | | Actual | | Actual | | Actual | | Actual | | Actual | | Actual | | Average
annual | |
($ millions) | | 1998/99 | | 1999/00 | | 2000/01 | | 2001/02 | | 2002/03 | | 2003/04 | | 2004/05 | | 2005/06 | | 2006/07 | | change | |
| | | | | | | | | | | | | | | | | | | | (per cent) | |
Taxpayer-supported debt: | | | | | | | | | | | | | | | | | | | | | |
Provincial government direct operating | | 12,056 | | 13,675 | | 12,007 | | 13,779 | | 15,447 | | 15,694 | | 14,510 | | 11,923 | | 9,505 | | -2.9 | |
Other taxpayer-supported debt (mainly capital): | | | | | | | | | | | | | | | | | | | | | |
Education facilities | | | | | | | | | | | | | | | | | | | | | |
Schools | | 3,291 | | 3,639 | | 3,910 | | 4,126 | | 4,333 | | 4,409 | | 4,483 | | 4,588 | | 4,724 | | 4.6 | |
Post-secondary institutions | | 1,508 | | 1,545 | | 1,543 | | 1,697 | | 1,749 | | 2,066 | | 2,284 | | 2,650 | | 2,909 | | 8.6 | |
| | 4,799 | | 5,184 | | 5,453 | | 5,823 | | 6,082 | | 6,475 | | 6,767 | | 7,238 | | 7,633 | | 6.0 | |
Health facilities | | 1,406 | | 1,584 | | 1,926 | | 2,075 | | 2,146 | | 2,215 | | 2,112 | | 2,447 | | 2,813 | | 9.1 | |
Highways, ferries and public transit | | | | | | | | | | | | | | | | | | | | | |
BC Transportation Financing Authority | | 1,433 | | 1,843 | | 2,197 | | 2,514 | | 2,661 | | 2,764 | | 2,474 | | 2,699 | | 3,237 | | 10.7 | |
Public transit | | 987 | | 952 | | 948 | | 936 | | 930 | | 914 | | 906 | | 904 | | 892 | | -1.3 | |
SkyTrain extension | | 133 | | 488 | | 836 | | 1,044 | | 1,105 | | 1,119 | | 1,135 | | 1,145 | | 1,153 | | 31.0 | |
Rapid Transit Project 2000 Ltd | | 56 | | 101 | | 114 | | 47 | | 3 | | — | | — | | — | | — | | -100.0 | |
BC Transit | | 59 | | 79 | | 75 | | 79 | | 87 | | 83 | | 78 | | 80 | | 96 | | 6.3 | |
BC Ferries | | 973 | | 24 | | 21 | | 19 | | — | | — | | — | | — | | — | | -100.0 | |
| | 3,641 | | 3,487 | | 4,191 | | 4,639 | | 4,786 | | 4,880 | | 4,593 | | 4,828 | | 5,378 | | 5.0 | |
Other | | | | | | | | | | | | | | | | | | | | | |
BC Buildings | | 715 | | 615 | | 610 | | 596 | | 456 | | 317 | | 241 | | 246 | | — | | n/a | |
Social Housing | | 183 | | 205 | | 265 | | 299 | | 161 | | 156 | | 133 | | 189 | | 216 | | 2.1 | |
Homeowner Protection Office | | 11 | | 34 | | 71 | | 113 | | 123 | | 129 | | 130 | | 110 | | 110 | | 33.4 | |
552513 British Columbia Ltd. (Skeena Cellulose) | | — | | — | | 337 | | — | | — | | — | | — | | — | | — | | n/a | |
Other | | 421 | | 422 | | 244 | | 190 | | 182 | | 116 | | 158 | | 204 | | 219 | | -7.8 | |
| | 1,330 | | 1,276 | | 1,527 | | 1,198 | | 922 | | 718 | | 662 | | 749 | | 545 | | -10.6 | |
Total other taxpayer-supported debt | | 11,176 | | 11,531 | | 13,097 | | 13,735 | | 13,936 | | 14,288 | | 14,134 | | 15,262 | | 16,369 | | 4.9 | |
Total taxpayer-supported debt | | 23,232 | | 25,206 | | 25,104 | | 27,514 | | 29,383 | | 29,982 | | 28,644 | | 27,185 | | 25,874 | | 1.4 | |
| | | | | | | | | | | | | | | | | | | | | |
Self-supported debt: | | | | | | | | | | | | | | | | | | | | | |
Commercial Crown corporations and agencies | | | | | | | | | | | | | | | | | | | | | |
BC Hydro | | 7,327 | | 6,880 | | 6,649 | | 6,670 | | 6,784 | | 7,040 | | 6,906 | | 6,892 | | 7,144 | | -0.3 | |
BC Transmission Corporation | | — | | — | | — | | — | | — | | — | | — | | 37 | | 37 | | n/a | |
Columbia River power projects | | 94 | | 94 | | 113 | | 184 | | 165 | | 215 | | 257 | | 247 | | 236 | | 12.2 | |
BC Rail | | 607 | | 655 | | 603 | | 614 | | 494 | | 477 | | — | | — | | — | | n/a | |
552513 British Columbia Ltd. (Skeena Cellulose) | | 221 | | 280 | | — | | — | | — | | — | | — | | — | | — | | n/a | |
Liquor Distribution Branch | | 3 | | 3 | | 2 | | 13 | | 9 | | 7 | | 6 | | 5 | | 3 | | n/a | |
Post-secondary institutions’ subsidiaries | | — | | — | | 5 | | 20 | | 18 | | 14 | | 26 | | 19 | | 53 | | n/a | |
| | 8,252 | | 7,912 | | 7,372 | | 7,501 | | 7,470 | | 7,753 | | 7,195 | | 7,200 | | 7,473 | | -1.2 | |
Warehouse borrowing program | | 658 | | 1,320 | | 1,312 | | 1,067 | | — | | — | | — | | — | | — | | | |
Total self-supported debt | | 8,910 | | 9,232 | | 8,684 | | 8,568 | | 7,470 | | 7,753 | | 7,195 | | 7,200 | | 7,473 | | -2.2 | |
Total provincial debt | | 32,142 | | 34,438 | | 33,788 | | 36,082 | | 36,853 | | 37,735 | | 35,839 | | 34,385 | | 33,347 | | 0.5 | |
88
Table A2.14 Provincial Debt Supplementary Information – 1998/99 to 2006/07
| | Actual | | Actual | | Actual | | Actual | | Actual | | Actual | | Actual | | Actual | | Actual | | Average
annual | |
($ millions) | | 1998/99 | | 1999/00 | | 2000/01 | | 2001/02 | | 2002/03 | | 2003/04 | | 2004/05 | | 2005/06 | | 2006/07 | | change | |
| | | | | | | | | | | | | | | | | | | | (per cent) | |
Per cent of GDP: (1) | | | | | | | | | | | | | | | | | | | | | |
Taxpayer-supported debt: | | | | | | | | | | | | | | | | | | | | | |
Provincial government direct operating | | 10.4 | | 11.3 | | 9.1 | | 10.3 | | 11.2 | | 10.8 | | 9.2 | | 7.1 | | 5.3 | | -8.1 | |
Education facilities | | 4.2 | | 4.3 | | 4.2 | | 4.4 | | 4.4 | | 4.4 | | 4.3 | | 4.3 | | 4.2 | | 0.3 | |
Health facilities | | 1.2 | | 1.3 | | 1.5 | | 1.6 | | 1.6 | | 1.5 | | 1.3 | | 1.4 | | 1.6 | | 3.2 | |
Highways, ferries and public transit | | 3.1 | | 2.9 | | 3.2 | | 3.5 | | 3.5 | | 3.3 | | 2.9 | | 2.9 | | 3.0 | | -0.6 | |
Other | | 1.2 | | 1.1 | | 1.2 | | 0.9 | | 0.7 | | 0.5 | | 0.4 | | 0.4 | | 0.3 | | -15.4 | |
Total taxpayer-supported debt | | 20.1 | | 20.8 | | 19.1 | | 20.6 | | 21.3 | | 20.6 | | 18.2 | | 16.1 | | 14.4 | | -4.1 | |
Self-supported debt: | | | | | | | | | | | | | | | | | | | | | |
Commercial Crown corporations and agencies | | 7.1 | | 6.5 | | 5.6 | | 5.6 | | 5.4 | | 5.3 | | 4.6 | | 4.3 | | 4.2 | | -6.5 | |
Warehouse borrowing program | | 0.6 | | 1.1 | | 1.0 | | 0.8 | | — | | — | | — | | — | | — | | n/a | |
Total self-supported debt | | 7.7 | | 7.6 | | 6.6 | | 6.4 | | 5.4 | | 5.3 | | 4.6 | | 4.3 | | 4.2 | | -7.4 | |
Total provincial debt | | 27.8 | | 28.5 | | 25.7 | | 27.0 | | 26.7 | | 25.9 | | 22.7 | | 20.4 | | 18.6 | | -4.9 | |
Growth rates: | | | | | | | | | | | | | | | | | | | | | |
Taxpayer-supported debt: | | | | | | | | | | | | | | | | | | | | | |
Provincial government direct operating | | n/a | | 13.4 | | -12.2 | | 14.8 | | 12.1 | | 1.6 | | -7.5 | | -17.8 | | -20.3 | | -2.0 | |
Education facilities | | n/a | | 8.0 | | 5.2 | | 6.8 | | 4.4 | | 6.5 | | 4.5 | | 7.0 | | 5.5 | | 6.0 | |
Health facilities | | n/a | | 12.7 | | 21.6 | | 7.7 | | 3.4 | | 3.2 | | -4.7 | | 15.9 | | 15.0 | | 9.3 | |
Highways, ferries and public transit | | n/a | | -4.2 | | 20.2 | | 10.7 | | 3.2 | | 2.0 | | -5.9 | | 5.1 | | 11.4 | | 5.3 | |
Other | | n/a | | -4.1 | | 19.7 | | -21.5 | | -23.0 | | -22.1 | | -7.8 | | 13.1 | | -27.2 | | -9.1 | |
Total taxpayer-supported debt | | n/a | | 8.5 | | -0.4 | | 9.6 | | 6.8 | | 2.0 | | -4.5 | | -5.1 | | -4.8 | | 1.5 | |
Self-supported debt: | | | | | | | | | | | | | | | | | | | | | |
Commercial Crown corporations and agencies | | n/a | | -4.1 | | -6.8 | | 1.7 | | -0.4 | | 3.8 | | -7.2 | | 0.1 | | 3.8 | | -1.1 | |
Warehouse borrowing program | | n/a | | 100.6 | | -0.6 | | -18.7 | | -100.0 | | — | | — | | — | | — | | n/a | |
Total self-supported debt | | n/a | | 3.6 | | -5.9 | | -1.3 | | -12.8 | | 3.8 | | -7.2 | | 0.1 | | 3.8 | | -2.0 | |
Total provincial debt | | n/a | | 7.1 | | -1.9 | | 6.8 | | 2.1 | | 2.4 | | -5.0 | | -4.1 | | -3.0 | | 0.6 | |
Per capita: (2) | | | | | | | | | | | | | | | | | | | | | |
Taxpayer-supported debt: | | | | | | | | | | | | | | | | | | | | | |
Provincial government direct operating | | 3,027 | | 3,409 | | 2,973 | | 3,378 | | 3,753 | | 3,777 | | 3,452 | | 2,800 | | 2,205 | | -3.9 | |
Education facilities | | 1,205 | | 1,292 | | 1,350 | | 1,428 | | 1,478 | | 1,558 | | 1,610 | | 1,700 | | 1,771 | | 4.9 | |
Health facilities | | 353 | | 395 | | 477 | | 509 | | 521 | | 533 | | 502 | | 575 | | 653 | | 8.0 | |
Highways, ferries and public transit | | 914 | | 869 | | 1,038 | | 1,137 | | 1,163 | | 1,174 | | 1,093 | | 1,134 | | 1,248 | | 4.0 | |
Other | | 334 | | 318 | | 378 | | 294 | | 224 | | 173 | | 157 | | 176 | | 126 | | -11.5 | |
Total taxpayer-supported debt | | 5,833 | | 6,284 | | 6,215 | | 6,746 | | 7,140 | | 7,215 | | 6,815 | | 6,385 | | 6,003 | | 0.4 | |
Self-supported debt: | | | | | | | | | | | | | | | | | | | | | |
Commercial Crown corporations and agencies | | 2,072 | | 1,972 | | 1,825 | | 1,839 | | 1,815 | | 1,866 | | 1,712 | | 1,691 | | 1,734 | | -2.2 | |
Warehouse borrowing program | | 165 | | 329 | | 325 | | 262 | | — | | — | | — | | — | | — | | n/a | |
Total self-supported debt | | 2,237 | | 2,301 | | 2,150 | | 2,101 | | 1,815 | | 1,866 | | 1,712 | | 1,691 | | 1,734 | | -3.1 | |
Total provincial debt | | 8,070 | | 8,585 | | 8,365 | | 8,847 | | 8,955 | | 9,081 | | 8,526 | | 8,076 | | 7,736 | | -0.5 | |
Real Per Capita Provincial Debt (2006 $) (3) | | 9,361 | | 9,851 | | 9,421 | | 9,799 | | 9,692 | | 9,624 | | 8,860 | | 8,224 | | 7,736 | | -2.4 | |
Growth rate (per cent) | | n/a | | 5.2 | | -4.4 | | 4.0 | | -1.1 | | -0.7 | | -7.9 | | -7.2 | | -5.9 | | -2.2 | |
(1) | | Debt as a per cent of GDP is calculated using GDP for the calendar year ending in the fiscal year (e.g. 2006/07 debt divided by GDP for the 2006 calendar year). Totals may not add due to rounding. |
| | |
(2) | | Per capita debt is calculated using July 1 population (e.g. 2006/07 debt divided by population on July 1, 2006). Totals may not add due to rounding. |
| | |
(3) | | Debt is converted to real (inflation-adjusted) terms using the consumer price index (CPI) for the corresponding calendar year (e.g. 2006 CPI for 2006/07 revenue). |
89
Table A2.15 Historical Operating Statement Surplus (Deficit)
($ millions) | | | | | | | | Crown
Corporations
and
Agencies | | SUCH
Sector &
Regional
Authorities | | Other
Adjustments | | Surplus
(Deficit) (1) | | Surplus
(Deficit)
as a Per Cent
of GDP | |
| | | | |
Consolidated Revenue Fund |
Revenue | | Expenditure | | Balance |
1969/70 | | 1,248 | | 1,244 | | 4 | | — | | — | | — | | — | | — | |
1970/71 | | 1,373 | | 1,274 | | 99 | | — | | — | | — | | — | | 1.0 | |
1971/72 | | 1,558 | | 1,474 | | 84 | | — | | — | | — | | — | | 0.8 | |
1972/73 | | 1,772 | | 1,675 | | 97 | | — | | — | | — | | — | | 0.8 | |
1973/74 | | 2,217 | | 2,071 | | 146 | | — | | — | | — | | — | | 0.9 | |
1974/75 | | 2,769 | | 2,779 | | (10 | ) | — | | — | | — | | — | | (0.1 | ) |
1975/76 | | 3,124 | | 3,534 | | (410 | ) | — | | — | | — | | — | | (2.1 | ) |
1976/77 | | 3,785 | | 3,691 | | 94 | | — | | — | | — | | — | | 0.4 | |
1977/78 | | 4,372 | | 4,168 | | 204 | | — | | — | | — | | — | | 0.8 | |
1978/79 | | 4,853 | | 4,582 | | 271 | | — | | — | | — | | — | | 0.9 | |
1979/80 (1) | | 5,860 | | 5,318 | | 542 | | (88 | ) | — | | — | | 454 | | 1.3 | |
1980/81 | | 5,982 | | 6,239 | | (257 | ) | 45 | | — | | — | | (212 | ) | (0.5 | ) |
1981/82 | | 7,139 | | 7,323 | | (184 | ) | 43 | | — | | — | | (141 | ) | (0.3 | ) |
1982/83 | | 7,678 | | 8,662 | | (984 | ) | (257 | ) | — | | — | | (1,241 | ) | (2.8 | ) |
1983/84 | | 8,335 | | 9,347 | | (1,012 | ) | 49 | | — | | — | | (963 | ) | (2.0 | ) |
1984/85 | | 8,807 | | 9,801 | | (994 | ) | 172 | | — | | — | | (822 | ) | (1.6 | ) |
1985/86 | | 9,160 | | 10,127 | | (967 | ) | 110 | | — | | — | | (857 | ) | (1.6 | ) |
1986/87 | | 9,463 | | 10,624 | | (1,161 | ) | 526 | | — | | — | | (635 | ) | (1.1 | ) |
1987/88 | | 11,007 | | 11,055 | | (48 | ) | 119 | | — | | — | | 71 | | 0.1 | |
1988/89 | | 12,570 | | 11,834 | | 736 | | 194 | | — | | — | | 930 | | 1.3 | |
1989/90 | | 13,656 | | 13,200 | | 456 | | 40 | | — | | — | | 496 | | 0.7 | |
1990/91 | | 14,236 | | 15,010 | | (774 | ) | 107 | | — | | — | | (667 | ) | (0.8 | ) |
1991/92 | | 14,570 | | 17,101 | | (2,531 | ) | 192 | | — | | — | | (2,339 | ) | (2.9 | ) |
1992/93 | | 16,172 | | 17,858 | | (1,686 | ) | 210 | | — | | — | | (1,476 | ) | (1.7 | ) |
1993/94 | | 17,923 | | 18,833 | | (910 | ) | 11 | | — | | — | | (899 | ) | (1.0 | ) |
1994/95 | | 19,506 | | 19,953 | | (447 | ) | 219 | | — | | — | | (228 | ) | (0.2 | ) |
1995/96 | | 19,698 | | 20,054 | | (356 | ) | 38 | | — | | — | | (318 | ) | (0.3 | ) |
1996/97 | | 20,126 | | 20,241 | | (115 | ) | (270 | ) | — | | — | | (385 | ) | (0.4 | ) |
1997/98 | | 20,216 | | 20,135 | | 81 | | (248 | ) | — | | — | | (167 | ) | (0.1 | ) |
1998/99 | | 20,312 | | 20,528 | | (216 | ) | (689 | ) | (56 | ) | — | | (961 | ) | (0.8 | ) |
1999/2000 | | 21,849 | | 22,161 | | (312 | ) | 343 | | (44 | ) | — | | (13 | ) | — | |
2000/01 | | 23,745 | | 22,444 | | 1,301 | | (173 | ) | 134 | | (52 | )(3) | 1,210 | | 0.9 | |
2001/02 | | 22,704 | | 24,669 | | (1,965 | )(2) | (713 | )(2) | 176 | | 1,464 | (3) | (1,038 | ) | (0.8 | ) |
2002/03 | | 21,999 | | 24,941 | | (2,942 | ) | (218 | ) | 537 | | — | | (2,623 | ) | (1.9 | ) |
2003/04 | | 23,191 | | 25,249 | | (2,058 | ) | 361 | | 378 | | — | | (1,319 | ) | (0.9 | ) |
2004/05 | | 27,309 | | 26,058 | | 1,251 | | 1,057 | | 395 | | — | | 2,703 | | 1.7 | |
2005/06 | | 29,480 | | 26,682 | | 2,798 | | 399 | | 603 | | (710 | )(4) | 3,090 | | 1.8 | |
2006/07 | | 31,246 | | 27,945 | | 3,301 | | 600 | | 419 | | (264 | )(4) | 4,056 | | 2.3 | |
(1) The provincial government began publishing summary financial statements in 1979/80. Figures for prior years are unavailable. For 1969/70 to 1978/79, the CRF balance is used in place of the summary accounts surplus/(deficit).
(2) Does not include the $256 million transfer to the CRF for the wind-up of Forest Renewal BC and Fisheries Renewal BC.
(3) Impact of move to joint trusteeship for public service pension plans.
(4) Negotiating framework incentive payments.
90
Table A2.16 Historical Provincial Debt Summary (1)
| | Taxpayer-Supported Debt | | | | | | | | Taxpayer- | |
Year | | Provincial
Government
Direct
Operating | | Education
Facilities
Capital
Financing | | Health
Facilities
Capital
Financing | | Highways,
Ferries and
Public Transit | | Other (2) | | Total
Taxpayer-
Supported
Debt | | Self-
Supported
Debt(3) | | Total
Provincial
Debt | | Total Debt
as a Per
Cent of GDP | | Supported
Debt as a
Per Cent of
GDP | |
| | | | | | | | | | (millions) | | | | | | | | | | (per cent) | |
1969/70 | | — | | 338 | | 42 | | 142 | | 100 | | 622 | | 1,661 | | 2,283 | | 24.7 | | 6.7 | |
1970/71 | | — | | 362 | | 64 | | 172 | | 99 | | 697 | | 1,808 | | 2,505 | | 25.6 | | 7.1 | |
1971/72 | | — | | 380 | | 85 | | 233 | | 95 | | 793 | | 1,948 | | 2,741 | | 24.9 | | 7.2 | |
1972/73 | | — | | 408 | | 105 | | 288 | | 87 | | 888 | | 2,062 | | 2,950 | | 23.8 | | 7.2 | |
1973/74 | | — | | 425 | | 117 | | 340 | | 145 | | 1,027 | | 2,228 | | 3,255 | | 21.1 | | 6.7 | |
1974/75 | | — | | 485 | | 133 | | 386 | | 149 | | 1,153 | | 2,650 | | 3,803 | | 21.3 | | 6.5 | |
1975/76 | | — | | 557 | | 178 | | 544 | | 145 | | 1,424 | | 3,144 | | 4,568 | | 23.1 | | 7.2 | |
1976/77 | | 261 | | 658 | | 236 | | 649 | | 188 | | 1,992 | | 3,787 | | 5,779 | | 24.4 | | 8.4 | |
1977/78 | | 261 | | 710 | | 291 | | 656 | | 215 | | 2,133 | | 4,464 | | 6,597 | | 24.9 | | 8.1 | |
1978/79 | | 261 | | 778 | | 334 | | 653 | | 91 | | 2,117 | | 4,838 | | 6,955 | | 23.3 | | 7.1 | |
1979/80 | | 235 | | 836 | | 401 | | 730 | | 195 | | 2,397 | | 5,704 | | 8,101 | | 23.3 | | 6.9 | |
1980/81 | | 209 | | 919 | | 461 | | 729 | | 270 | | 2,588 | | 5,956 | | 8,544 | | 21.6 | | 6.5 | |
1981/82 | | 183 | | 1,067 | | 561 | | 844 | | 291 | | 2,946 | | 7,227 | | 10,173 | | 22.7 | | 6.6 | |
1982/83 | | 883 | | 1,204 | | 660 | | 1,024 | | 894 | | 4,665 | | 7,692 | | 12,357 | | 27.4 | | 10.4 | |
1983/84 | | 1,596 | | 1,321 | | 712 | | 1,392 | | 1,174 | | 6,195 | | 8,440 | | 14,635 | | 30.8 | | 13.0 | |
1984/85 | | 2,476 | | 1,308 | | 717 | | 691 | | 1,276 | | 6,468 | | 9,082 | | 15,550 | | 31.2 | | 13.0 | |
1985/86 | | 3,197 | | 1,276 | | 680 | | 1,034 | | 1,376 | | 7,563 | | 8,990 | | 16,553 | | 30.9 | | 14.1 | |
1986/87 | | 4,802 | | 1,268 | | 681 | | 1,097 | | 812 | | 8,660 | | 8,485 | | 17,145 | | 30.3 | | 15.3 | |
1987/88 | | 5,017 | | 1,278 | | 716 | | 1,192 | | 660 | | 8,863 | | 8,149 | | 17,012 | | 27.2 | | 14.2 | |
1988/89 | | 4,919 | | 1,322 | | 763 | | 1,213 | | 842 | | 9,059 | | 7,396 | | 16,455 | | 23.7 | | 13.1 | |
1989/90 | | 4,209 | | 1,367 | | 837 | | 1,244 | | 1,262 | | 8,919 | | 7,340 | | 16,259 | | 21.5 | | 11.8 | |
1990/91 | | 4,726 | | 1,565 | | 959 | | 1,287 | | 1,281 | | 9,818 | | 7,444 | | 17,262 | | 21.8 | | 12.4 | |
1991/92 | | 6,611 | | 1,939 | | 1,040 | | 1,527 | | 1,431 | | 12,548 | | 7,493 | | 20,041 | | 24.5 | | 15.3 | |
1992/93 | | 8,969 | | 2,426 | | 1,141 | | 1,719 | | 1,641 | | 15,896 | | 7,526 | | 23,422 | | 26.8 | | 18.2 | |
1993/94 | | 10,257 | | 3,054 | | 1,181 | | 1,862 | | 1,627 | | 17,981 | | 7,946 | | 25,927 | | 27.6 | | 19.1 | |
1994/95 | | 10,181 | | 3,631 | | 1,318 | | 2,158 | | 1,749 | | 19,037 | | 8,013 | | 27,050 | | 26.9 | | 18.9 | |
1995/96 | | 10,237 | | 3,990 | | 1,399 | | 2,598 | | 1,695 | | 19,919 | | 8,847 | | 28,766 | | 27.2 | | 18.9 | |
1996/97 | | 11,030 | | 4,230 | | 1,431 | | 3,144 | | 1,440 | | 21,275 | | 8,096 | | 29,371 | | 27.0 | | 19.5 | |
1997/98 | | 11,488 | | 4,352 | | 1,417 | | 3,463 | | 1,431 | | 22,151 | | 8,204 | | 30,355 | | 26.5 | | 19.4 | |
Information from 1998/99 onwards has been restated to include SUCH sector fiscal data. | | | |
1998/99 | | 12,056 | | 4,757 | | 1,406 | | 3,641 | | 1,330 | | 23,190 | | 8,928 | | 32,118 | | 27.8 | | 20.1 | |
1999/2000 | | 13,675 | | 5,142 | | 1,584 | | 3,487 | | 1,276 | | 25,164 | | 9,250 | | 34,414 | | 28.5 | | 20.8 | |
2000/01 | | 12,007 | | 5,416 | | 1,926 | | 4,191 | | 1,527 | | 25,067 | | 8,697 | | 33,764 | | 25.7 | | 19.1 | |
2001/02 | | 13,779 | | 5,801 | | 2,075 | | 4,639 | | 1,198 | | 27,492 | | 8,566 | | 36,058 | | 27.0 | | 20.6 | |
2002/03 | | 15,447 | | 6,082 | | 2,146 | | 4,786 | | 922 | | 29,383 | | 7,470 | | 36,853 | | 26.7 | | 21.3 | |
2003/04 | | 15,694 | | 6,475 | | 2,215 | | 4,880 | | 718 | | 29,982 | | 7,753 | | 37,735 | | 25.9 | | 20.6 | |
2004/05 | | 14,510 | | 6,767 | | 2,112 | | 4,593 | | 662 | | 28,644 | | 7,195 | | 35,839 | | 22.7 | | 18.2 | |
2005/06 | | 11,923 | | 7,238 | | 2,447 | | 4,828 | | 749 | | 27,185 | | 7,200 | | 34,385 | | 20.4 | | 16.1 | |
2006/07 | | 9,505 | | 7,633 | | 2,813 | | 5,378 | | 545 | | 25,874 | | 7,473 | | 33,347 | | 18.6 | | 14.4 | |
| | | | | | | | | | | | | | | | | | | | | | |
(1) | Debt is after deduction of sinking funds, unamortized discounts and unrealized foreign exchange gains/(losses), and excludes accrued interest. Government direct and fiscal agency debt accrued interest is reported in the government’s accounts as an accounts payable. Figures for 1998/99 onwards have been restated to conform with the presentation used for 2006 and to reflect changes in underlying data. |
| |
(2) | Includes BC Buildings, BC Housing Management Commission, Provincial Rental Housing Corporation, other taxpayer-supported Crown agencies, and loan guarantee provisions. |
| |
(3) | Includes commercial Crown corporations and agencies and funds held under the province’s warehouse borrowing program. |
91
Table A2.17 Full-Time Equivalents (FTEs) – 1998/99 to 2006/07
| | Actual | | Actual | | Actual | | Actual | | Actual | | Actual | | Actual | | Actual | | Actual | | Average
annual | |
($ millions) | | 1998/99 | | 1999/00 | | 2000/01 | | 2001/02 | | 2002/03 | | 2003/04 | | 2004/05 | | 2005/06 | | 2006/07 | | change | |
| | | | | | | | | | | | | | | | | | | | (per cent) | |
Taxpayer-supported programs and agencies: | | | | | | | | | | | | | | | | | | | | | |
Ministries and special offices (CRF) | | 33,106 | | 33,106 | | 33,579 | | 33,495 | | 29,751 | | 29,049 | | 27,252 | | 27,129 | | 28,647 | | -1.8 | |
Service delivery agencies | | 9,527 | | 9,527 | | 8,450 | | 8,447 | | 7,814 | | 4,570 | | 3,822 | | 3,992 | | 3,917 | | -10.5 | |
Total FTEs | | 42,633 | | 42,633 | | 42,029 | | 41,942 | | 37,565 | | 33,619 | | 31,074 | | 31,121 | | 32,564 | | -3.3 | |
Growth rates: | | | | | | | | | | | | | | | | | | | | | |
Ministries and special offices (CRF) | | n/a | | 0.0 | | 1.4 | | -0.3 | | -11.2 | | -2.4 | | -6.2 | | -0.5 | | 5.6 | | -1.7 | |
Service delivery agencies | | n/a | | 0.0 | | -11.3 | | 0.0 | | -7.5 | | -41.5 | | -16.4 | | 4.4 | | -1.9 | | -9.3 | |
Population per FTE: | | | | | | | | | | | | | | | | | | | | | |
Total FTEs | | 93.4 | | 94.1 | | 96.1 | | 97.2 | | 109.6 | | 123.6 | | 135.3 | | 136.8 | | 132.4 | | 4.5 | |
(1) Population per FTE is calculated using July 1 population (e.g. population on July 1, 2006 divided by 2006/07 FTEs).
92
Table A2.18 Provincial Taxes (as of June 2007)
Type and | | | | | | |
Statute Reference | | Tax Base | | Tax Rate | | Characteristics and Exemptions |
Income — Income Tax Act | | Taxable Income (1) Corporate. | | 12% of taxable income (small business rate: 4.5%). | | The Canada Revenue Agency administers BC’s personal and corporate taxes under an agreement between the province and the federal government. |
| | | | | | Corporate tax credits include the scientific research and experimental development tax credit, book publishing tax credit and the film tax credit. In addition, the political contributions tax credit, royalty tax credit, mining exploration tax credit, logging tax credit, training tax credits and venture capital tax credits are available to both individuals and corporations. |
| | (2) Personal. | | Tax rates of 5.7%, 8.65%, 11.1%, 13.0% and 14.7% corresponding to tax brackets of up to $34,397, $34,397 to $68,794, $68,794 to $78,984, $78,984 to $95,909 and over $95,909. | | BC provides a set of non-refundable credits similar to most federal non-refundable credits. BC Family Bonus and BC Earned Income Benefit are combined with the federal government’s Canada Child Tax Benefit in a single monthly payment to families. Tax credits for claims against personal income taxes include the refundable sales tax credit, mining flow- through share tax credit and employee venture capital tax credits. |
Capital — Corporation Capital Tax Act | | Net BC paid-up capital. | | Banks, trust companies and credit unions with net paid-up capital: greater than $1 billion — 3%; $1 billion or less or headquartered in British Columbia 1%. | | Associated groups of corporations with net paid-up capital of less than $10 million are exempt from the tax. The tax rate is phased in for corporations with net British Columbia paid-up capital between $10 million and $10.25 million. There is a special flat fee for corporations above the exemption threshold but with net paid-up capital allocated to British Columbia below the threshold. |
Real Property Transfers — Property Transfer Tax Act | | Fair market value of property or interest in property transferred; for presold strata units purchased at arm’s length, total consideration for the strata unit. | | 1% on the first $200,000 of value transferred and 2% on amounts in excess of $200,000. | | Exemptions include: transfers of principal residences, recreational residences and family farms to related individuals; transfers of property between spouses pursuant to written separation agreements or court orders; transfers of property to local governments, registered charities and educational institutions; transfers of property to veterans under the Veterans’ Land Act (Canada); transfers of land to be protected, preserved, conserved or kept in a natural state; and transfers of leases less than 31 years in duration. A number of technical exemptions are also provided. Eligible first time home- buyers are exempt from tax on transfers of eligible properties. |
Retail Sales — Social Service Tax Act | | Purchase and lease price of tangible personal property, repair labour and legal services. | | General rate is 7%. Liquor 10%. Passenger vehicles: under $55,000 — 7%; $55,000 to $56,000 — 8%; $56,000 to $57,000 — 9%; over $57,000 — 10%. | | Collected through vendors and lessors registered under the act and paid by purchasers and lessees. The exemptions generally fall into four categories: (1) items considered to be basic necessities of life such as food and drugs; (2) specified inputs for certain sectors to enhance competitiveness such as the exemption for machinery and equipment used in manufacturing and in the natural resource industries and the exemption of specified equipment used by bona fide farmers, fishers and aquaculturists; (3) safety-related equipment designed to be worn by a worker, such as high-visibility vests and steel-toed boots, and specified general safety equipment such as life jackets; (4) energy conservation materials and equipment such as insulation material for buildings, and eligible wind, solar and micro- hydro equipment. |
Accommodation — Hotel Room Tax Act | | Purchase price of accommodation. | | 8%. Local governments may apply to have the province levy an additional tax of up to 2% on their behalf. | | Exemptions include accommodation rented for a period in excess of one month; lodging provided in hospitals and nursing homes; lodging supplied to employees by employers; lodging in industrial camps; lodging on ships or trains; hotel rooms not used for accommodation; charges of $30 or less per day; charitable institutions; trailer parks and campsites; cabins without utilities and other amenities; and establishments with accommodation for less than four tenants. |
Tobacco — Tobacco Tax Act | | By cigarette, cigar retail price, and weight on other tobacco products. | | 17.9 cents per cigarette and tobacco stick; 77% of retail price on cigars to a maximum tax of $5 per cigar; 17.9 cents per gram of loose tobacco. | | |
93
Motor Fuel —Motor Fuel Tax Act | | | | | | Tax generally applies to all fuels used in internal combustion engines. Qualifying persons with disabilities who own or lease a vehicle are entitled to refunds of provincial tax paid up to an annual maximum of $500. In the South Coast British Columbia transportation service region the province collects an additional 6 cents per litre tax on clear gasoline and motive fuel on behalf of Translink to help fund regional public and private transportation system costs. In the Victoria Regional Transit service area the province collects an additional 2.5 cents per litre on behalf of BC Transit to help fund the public transit system. |
| | Clear gasoline (unleaded gasoline only). | | 14.5 cents per litre. Includes 6.75 cents per litre collected on behalf of the BC Transportation Financing Authority. Of the tax collected in the South Coast British Columbia transportation service region, 6 cents is collected on behalf of TransLink. | | |
| | Motive fuel. | | 15.0 cents per litre. Includes 6.75 cents per litre collected on behalf of the BC Transportation Financing Authority. Of the tax collected in the South Coast British Columbia transportation service region, 6 cents is collected on behalf of TransLink. | | Tax applies to diesel fuel or a combination of fuels including diesel fuels, but does not include alternative motor fuels or coloured fuels. Refunds of 0.5 cents per litre are available for motive fuel used in private passenger vehicles. |
| | Alternative motor fuels. | | Propane 2.7 cents per litre. | | Natural gas and 85% methanol blends are exempt from tax. Ethanol is exempt from tax when blended with gasoline or diesel fuel if the ethanol portion is at least 5% but less than 25%. Biodiesel is exempt from tax when blended with clear diesel fuel or used as 100% clear biodiesel. |
| | Coloured fuel, marine diesel fuel. | | 3 cents per litre. | | Coloured fuel may be used in all vehicles not licensed to operate on a highway and in specific industrial vehicles. Bona fide farmers are exempt from paying the tax when fuel is used for farming purposes. |
| | Locomotive fuel. | | 3 cents per litre. | | Tax applies to fuel specifically for use in locomotives. |
| | Jet and aviation fuel. | | 2 cents per litre. | | Jet fuel tax applies to fuel produced specifically for use in a turbine aircraft engine.
Aviation fuel tax applies to fuel produced specifically for use in a non-turbine aircraft engine. |
| | Natural gas used in stationary engines. | | 7% of price if purchased. 1.1 cents per 810.32 litres if used but not purchased. | | Tax applies to natural gas used in stationary engines other than pipeline compressors. |
| | Natural gas used in pipeline compressors to transmit marketable gas. | | 1.9 cents per 810.32 litres. | | Tax applies to natural gas used in a stationary engine at a pipeline compressor station. |
| | Natural gas used in pipeline compressors to extract and transmit raw gas from wells to processing plants. | | Exempt | | |
| | Natural gas used in compressors to re-inject sour gas into depleted wells. | | Exempt. | | |
| | Marine bunker. | | Exempt | | Exemption applies to bunker fuel, or a combination of bunker and other fuels used as fuel in a ship. |
| | Marine gas oil. | | Exempt | | Exemption applies to marine gas oil when used in primary gas turbine engines to propel passenger and cargo vessels. |
Natural resources —Logging Tax Act | | Net income from logging in BC. | | 10% (fully recoverable against federal and provincial corporation and personal income tax). | | Net income from logging after deducting non-forestry income and a processing allowance. |
—Mineral Land Tax Act | | Assessed value of freehold mineral land and production areas. | | Undesignated mineral land —$1.25 to $4.94 per hectare. —
Designated production areas —$4.94 per hectare. | | Rates of tax set on sliding scale, dependent on size and designation of land. |
94
—Mineral Tax Act | | Cash flow from individual metal and coal mines (other than placer gold mines). | | 2% of net current proceeds (NCP). 13% of net revenue (NR). | | Tax calculated on a mine-by-mine basis. NCP tax paid on current operating cash flow until all current and capital costs, plus any investment allowance, are recovered. NR tax paid thereafter on cumulative cash flow. NCP tax creditable against NR tax. |
| |
Volume of production of limestone, dolomite, marble, shale, clay, volcanic ash, diatomaceous earth, sandstone, quartzite and dimension stone.
Value of minerals sold by placer gold mines.
| | $0.15 per tonne removed from all quarries operated.
0.5% of value of minerals sold. | |
An operator may deduct 25,000 tonnes from the total number of tonnes removed from all quarries operated by that operator. However the amount deducted from any one quarry by all operators of that quarry must not exceed 25,000 tonnes.
|
Insurance —Insurance Premium Tax Act | | Direct premiums written. | | 4.4% for vehicle and property insurance; 2% for life, sickness, personal accident and loss of salary and wages insurance and 4 percent for other insurance. | | Exemptions — benefit societies; mutual corporations with 50% of income from farm or 100% from religious, educational or charitable institutions; marine, except pleasure craft; approved medical or hospitalization plans. |
Real property —Taxation (Rural Area) Act | | Assessed value of land and improvements in rural areas (outside municipalities). Assessment determined under the Assessment Act. | | Rates are set annually as a percentage of assessed value. For residential properties the rates are set to increase average residential rural taxes by the rate of inflation. For 2007, the rates are set so that total non-residential rural tax revenues increase by inflation plus new construction. For 2007, the rates are 0.05% for farms; 0.046% for managed forest lands; 0.059% for residential; 0.110% for recreational property/non-profit organizations; 0.326% for light industry, business and other property not contained in any other class; 0.412% for utilities; 0.45% for major industry. | | Some exemptions apply under various statutes. |
Residential school tax —School Act | | Assessed value of residential land and improvements. Assessment determined under the Assessment Act. | | Rates are set annually to increase average gross residential taxes by the rate of inflation. The rates vary by school district. For 2007 rates range from about 0.141% to 0.777%; weighted average 0.21%. | | Basic rates are calculated using a formula to moderate effects of varying average assessments on school district taxes. School districts may levy additional tax if authorized by local referendum. Amendments to the School Act in 2002 allow the Minister of Finance to apply different tax rates within a school district. Tofino is the only municipality with a rate that differs from the rest of the school district. |
Non-residential school tax —School Act | | Assessed value of non- residential land and improvements. Assessment determined under the Assessment Act. | | Rates are set annually. For 2007, the rates are set so that total non- residential school tax revenues increase by inflation plus new construction. For 2007 the rates are 0.39% for recreational property/non-profit organizations; 0.21% for managed forest land; 0.68% for farms; 0.79% for light industry, business and other property not contained in any other class; 1.25% for major industry; 1.47% for utilities. | | Some exemptions apply under various statutes. |
Police Tax — Police Act | | Assessed value of land and improvements in municipalities under 5,000 population and in rural areas. Assessment determined under the Assessment Act. | | Rates are set annually to raise up to 50% of the cost of rural policing. Rates are set for each of the eight property classes in each municipality under 5,000 population, in each electoral area of the province and in the area of the province outside a regional district. | | 2007 is the first year that the Police Tax is imposed. Basic rates are calculated using a formula that moderates the effect of variations in assessed value in the province by adjusting for population. Adjustments are made to the rates to reflect the contribution taxpayers in the rural areas make to policing costs through the rural area property tax. Adjustments are also made to account for traffic fine revenue sharing. |
95
Table A2.19 Interprovincial Comparisons of Tax Rates – 2007
(Rates known as of June 30, 2007) (1)
| | | | | | | | | | | | | | | | | | Prince | | | |
| | British | | | | Saskat- | | | | | | | | New | | Nova | | Edward | | New- | |
Tax | | Columbia(2) | | Alberta | | chewan | | Manitoba | | Ontario | | Quebec | | Brunswick | | Scotia | | Island | | foundland | |
Corporation income tax(3) | | | | | | | | | | | | | | | | | | | | | |
(per cent of taxable income) | | | | | | | | | | | | | | | | | | | | | |
General Rate | | 12 | | 10 | | 13 | | 14 | | 14 | | 9.9 | | 13 | | 16 | | 16 | | 14 | |
Manufacturing Rate | | 12 | | 10 | | 10 | | 14 | | 12 | | 9.9 | | 13 | | 16 | | 16 | | 5 | |
Small Business Rate | | 4.5 | | 3 | | 4.5 | | 3 | | 5.5 | | 8.0 | | 5 | | 5 | | 4.3 | | 5 | |
Small Business Threshold ($000s) | | 400 | | 430 | | 450 | | 400 | | 400 | | 400 | | 400 | | 400 | | 400 | | 400 | |
Corporation Capital Tax (4) | | | | | | | | | | | | | | | | | | | | | |
Non-financial | | Nil | | Nil | | .15 | | .3/.5 | | .285 | | .49 | | .20 | | .225/.45 | | Nil | | Nil | |
Financial | | 1.0/3.0 | | Nil | | .7/3.25 | | 3.0 | | .57/.855 | | .98 | | 3.0 | | 4.0 | | 5.0 | | 4.0 | |
Health Care Premiums (5) Individual/family | | 54/108 | | 44/88 | | Nil | | Nil | | Nil | | Nil | | Nil | | Nil | | Nil | | Nil | |
Payroll tax (6) (per cent) | | Nil | | Nil | | Nil | | 2.15 | | 1.95 | | 4.26 | | Nil | | Nil | | Nil | | 2.0 | |
Insurance premium tax (per cent) (7) | | 2-4.4 | | 2-3 | | 3-4 | | 2-3 | | 2-3.5 | | 2-3 | | 2-3 | | 3-4 | | 3.5 | | 4 | |
Fuel tax (cents per litre)(8) | | | | | | | | | | | | | | | | | | | | | |
Gasoline | | 14.5 | | 9.0 | | 15.0 | | 11.5 | | 14.7 | | 22.0 | | 17.8 | | 22.8 | | 20.1 | | 24.1 | |
Diesel | | 15.0 | | 9.0 | | 15.0 | | 11.5 | | 14.3 | | 23.0 | | 24.2 | | 22.5 | | 20.2 | | 24.2 | |
Sales tax (per cent)(9) | | | | | | | | | | | | | | | | | | | | | |
General rate | | 7 | | Nil | | 5 | | 7 | | 8 | | 7.5 | | 8 | | 8 | | 10 | | 8 | |
Liquor(10) | | 10 | | Nil | | 10 | | 7 | | 10, 12 | | 7.5 | | 8 | | 8 | | 37.5 | | 8 | |
Meals | | Nil | | Nil | | Nil | | 7 | | 8 | | 7.5 | | 8 | | 8 | | 10 | | 8 | |
Accommodation | | 8 | | 4 | | 5 | | 7 | | 5 | | 7.5 | | 8 | | 8 | | 10 | | 8 | |
Tobacco tax (dollars per carton of 200 cigarettes) (11) | | 35.80 | | 37.00 | | 40.20 | | 39.90 | | 25.95 | | 20.60 | | 28.20 | | 38.50 | | 34.90 | | 41.65 | |
(1) Rates shown are those known as of June 30, 2007 and that are in effect for 2007.
(2) British Columbia rates are those announced in the February 20, 2007 Budget.
(3) Provinces planning to eliminate their general corporation capital taxes include Saskatchewan on July 1, 2008, Manitoba by 2011, Ontario by July 2010, Quebec by 2011 and Nova Scotia by 2012. Ontario and Quebec plan to eliminate their tax on financial institutions at the same time as their taxes on general corporations are eliminated.
(4) Ontario has a deduction of $10 million for all corporations; Manitoba has a $5 million deduction and the higher rate applies to corporations with taxable capital in excess of $12.5 million; Saskatchewan has a $10 million deduction with up to an additional $10 million proportional to wages and salaries paid in the province; Quebec has a $600,000 deduction. Large Saskatchewan resource corporations are assessed a surcharge on the value of Saskatchewan resource sales. Ontario and Quebec have an additional surcharge or compensation tax on financial institutions.
(5) British Columbia has a two-person rate of $96. British Columbia and Alberta offer premium assistance in the form of lower rates or an exemption from premiums for lower income individuals and families. Ontario and Quebec levy health care contributions as additions to provincial personal income taxes payable.
(6) Provinces with payroll taxes provide payroll tax relief for small businesses.
(7) The lower rate applies to premiums for life, sickness and accident insurance; the higher rate applies to premiums for property insurance including automobile insurance. In Ontario, Quebec and Newfoundland specific sales taxes also apply to insurance premiums, except those related to individual life and health.
(8) Tax rate is for regular fuel used on highways. The British Columbia rate includes 6.75 cents per litre dedicated to the BC Transportation Financing Authority. The rates do not include regional taxes. The tax rates for Quebec, New Brunswick, Nova Scotia and Newfoundland include provincial sales tax based on current pump prices. The rate for PEI includes a 10% tax on the estimated wholesale price.
(9) The rates shown are statutory rates. Quebec and PEI impose tax on the purchase price including GST.
(10) In Ontario, sellers of liquor at licensed establishments are generally required to charge sales tax at the rate of 10 per cent; however, a rate of 12 per cent applies to liquor purchased at beer manufacturers’ outlets, Brewers Retail stores, government liquor stores and wine stores.
(11) Includes estimated provincial sales tax where applicable.
96
Table A2.20 Summary of Tax Changes Announced in 2007
Income Tax Act
• A 10 per cent personal income tax cut up to $100,000 in income is introduced.
• The Book Publishing Tax Credit is extended to 2012.
• The Scientific Research and Experimental Development Tax Credit is extended to 2014.
• An enhanced dividend tax credit is introduced to parallel the federal enhanced dividend tax credit.
• A new package of training tax credits is introduced for employers and their apprentice employees.
• The royalty and deemed income rebate is eliminated effective January 1, 2007.
• An additional 10 per cent credit is made available under the Mining Exploration Tax Credit for mineral exploration activity in Mountain Pine Beetle affected areas.
Mineral Tax Act
• The new mine allowance is extended to 2016.
Social Service Tax Act
• Exemptions on energy efficient residential heating equipment are extended.
• Tax concession for hybrid electric vehicles is extended to March 31, 2011.
• The production machinery and equipment (M&E) exemption for oil and gas exploration and development is expanded to include additional equipment.
• New provisions simplify the application of tax for businesses that acquire equipment for lease and occasionally supply the equipment with an operator.
Motor Fuel Tax Act
• Effective February 21, 2007, all biodiesel is eligible for alternative motor fuel status. As a result, biodiesel fuel in all blends of biodiesel fuel with clear diesel fuel and 100 per cent clear biodiesel is exempt from tax.
Land Tax Deferment Act
• Effective for the 2007 tax year, the age at which a home owner may begin to defer annual property taxes on their principal residence is lowered to 55 years of age from 60 years of age.
Property Transfer Tax Act
• Effective February 21, 2007, purchasers who acquire a home from a BC affiliate of Habitat for Humanity Canada may claim the exemption under the First Time Home Buyers’ Program based on the principal amount of the first ranking mortgage that secures financing applied to the transfer which is in favour of Habitat.
• Effective February 21, 2007, the maximum fair market value of properties eligible for the exemption under the First Time Home Buyers’ Program is increased to $375,000 throughout the province (up from $325,000 in the Capital Regional District, Fraser Valley Regional District and Greater Vancouver Regional District and up from $265,000 in all other areas of the province).
Homeowner Grant Act
• Effective for the 2007 tax year, the threshold for the phase-out of the homeowner grant is increased to $950,000 from $780,000. This change ensures that in excess of 95 per cent of homeowners are eligible for the full grant. For properties valued above the threshold of $950,000, the grant is reduced by $5 for every $1,000 of assessed value in excess of the threshold.
• Effective for the 2007 tax year, the homeowner grant is provided to eligible low-income homeowners who, but for the high assessed value of their home, would receive the additional home owner grant. Key eligibility criteria for the supplement are that a homeowner:
• could qualify for the additional home owner grant amount (seniors, certain veterans and certain persons with disabilities), except that their home is assessed above the threshold; and
• meets low-income criteria.
This measure ensures that low-income seniors and other qualified individuals who own and reside in properties that have increased in value beyond the threshold but who may face financial hardship receive some or all of the homeowner grant.
The Ministry of Small Business and Revenue administers the program and applications must be made directly to the Ministry.
Police Act
• As previously announced, the province introduced a new funding model for policing. Effective for 2007, taxpayers in municipalities with populations under 5,000 and in rural areas will pay up to 50 per cent of the total annual provincial policing costs for these areas.
97
| Chapter Three |
| |
| Commercial Crown |
| Corporations Review |
Chapter 3 – Commercial Crown Corporations Review
Introduction
Over the years, British Columbia’s governments have created or acquired a number of commercial Crown corporations as a means of combining public policy goals with private sector management practices. The Crown corporations vary greatly in terms of size and scope, from large companies such as the BC Hydro and Power Authority and the Insurance Corporation of British Columbia to the more limited scope of entities such as the Provincial Capital Commission.
The provincial government’s commercial Crown corporations report on their operations through the usual corporate publications such as audited financial statements and annual reports. However, under the Budget Transparency and Accountability Act, they are also required to table annually in the BC Legislature a three-year Service Plan outlining financial and non-financial performance targets, as well as an Annual Service Plan Report on the results achieved in relation to the previous year’s Service Plan.
In general, the Service Plans are tabled each February in conjunction with the provincial government’s Budget and Fiscal Plan. The Annual Service Plan Reports are tabled around the end of June in conjunction with the release of the provincial government’s Public Accounts. The commercial Crown corporations also post the above reports on their websites.
BC Hydro and Power Authority
BC Hydro is one of North America’s leading providers of clean, renewable energy, and the largest electric utility in British Columbia, serving approximately 95 per cent of the province’s population and 1.7 million customers. The utility has a generating capacity of 11.3 gigawatts, and has 55.2 thousand kilometres of distribution lines and 18.3 thousand kilometres of transmission lines.
BC Hydro’s mandate is to provide a reliable, sustainable, low cost supply of electricity to the people of British Columbia. BC Hydro’s general powers and governance are established under the terms of the Hydro and Power Authority Act. The BC Hydro Public Power Legacy and Heritage Contract Act provides further direction with respect to BC Hydro’s assets. The act ensures public ownership of BC Hydro’s heritage resources, which includes BC Hydro’s transmission and distribution systems, and all of BC Hydro’s existing generation and storage assets. As well, BC Hydro is regulated by the British Columbia Utilities Commission (BCUC) under the terms of the Utilities Commission Act. The BCUC is responsible for ensuring that energy utilities under its jurisdiction charge fair, just and reasonable rates for energy, and provide safe, adequate and secure service to customers.
While BC Hydro owns the majority of the transmission and distribution systems that deliver electricity in the province, the transmission systems are managed by the BC Transmission Corporation at arm’s length from BC Hydro in order to ensure equal access to the transmission network for all power producers in the province.
100
Table 3.1 | | British Columbia Hydro and Power Authority |
| | Five-Year Income Statement for the Years Ended March 31 |
($ millions, unless otherwise indicated) | | 2003 | | 2004 | | 2005 | | 2006 | | 2007 | |
| | | | | | | | | | | |
Domestic energy revenue | | 2,475 | | 2,553 | | 2,704 | | 2,727 | | 2,791 | |
Domestic energy costs | | 863 | | 963 | | 1,095 | | 1,135 | | 1,037 | |
| | 1,612 | | 1,590 | | 1,609 | | 1,592 | | 1,754 | |
Trade margin | | 369 | | 254 | | 157 | | 231 | | 326 | |
Revenue net of energy costs | | 1,981 | | 1,844 | | 1,766 | | 1,823 | | 2,080 | |
Operations, maintenance and administration expenses | | (573 | ) | (621 | ) | (717 | ) | (805 | ) | (716 | ) |
Amortization and depreciation | | (417 | ) | (526 | ) | (410 | ) | (411 | ) | (383 | ) |
EBIT | | 991 | | 697 | | 639 | | 607 | | 981 | |
Interest and taxes | | (602 | ) | (599 | ) | (461 | ) | (582 | ) | (602 | ) |
Operating results | | 389 | | 98 | | 178 | | 25 | | 379 | |
Unusual items | | (37 | ) | (8 | ) | 137 | | — | | — | |
Net transfer (to) from regulatory accounts | | 66 | | 21 | | 87 | | 241 | | 28 | |
Net income | | 418 | | 111 | | 402 | | 266 | | 407 | |
Financial data: | | | | | | | | | | | |
Dividend paid to shareholder | | 338 | | 73 | | 339 | | 223 | | 331 | |
Capital spending (1) | | 680 | | 606 | | 529 | | 607 | | 780 | |
Property, plant and equipment (including intangible assets) | | 9,793 | | 9,900 | | 9,982 | | 10,023 | | 10,422 | |
Debt (including current portion) | | 6,849 | | 6,853 | | 6,583 | | 6,627 | | 6,916 | |
Performance indicators: | | | | | | | | | | | |
Hydro generation (gigawatt hours) | | 47,665 | | 44,540 | | 41,601 | | 46,850 | | 44,476 | |
Domestic requirements (gigawatt hours) | | 48,677 | | 50,151 | | 51,205 | | 52,440 | | 52,911 | |
Average System Availability Index (per cent) | | 99.957 | | 99.949 | | 99.955 | | 99.957 | | 99.967 | |
Customer Average Interruption Duration Index (hours) | | 2.60 | | 2.77 | | 2.69 | | 2.10 | | 2.16 | |
ROCE (1) (per cent) | | 11.44 | | 7.92 | | 7.38 | | 7.01 | | 11.52 | |
(1) Excludes impact of regulatory accounts.
BC Hydro participates in the western North America energy trade market through the activities of its subsidiary Powerex Inc. BC Hydro uses the energy trade market to make the best financial use of its hydro storage and generation capacity by selling power when energy prices are high, and acquiring electricity for domestic demand or later re-sale when energy prices are low.
BC has increasingly become a net importer of electricity. Domestic demand has risen by 8.7 per cent over the last five years while domestic generating capacity has only increased 2.0 per cent. The remaining 4.1 per cent increase in annual domestic energy revenue is due to price increases since 2004/05. Notwithstanding recent price increases, BC domestic power rates remain among the lowest in North America.
BC Hydro’s domestic energy costs are largely dependent on its hydroelectric storage and generation capability, which in turn is affected by water infows into reservoirs. Low infows, such as those that occurred in 2003/04 and 2004/05, impair hydro generation, resulting in higher energy costs from purchases to meet domestic demand. Energy prices also significantly affect energy costs as well as trade income. In 2005/06, high energy prices for purchases to meet demand resulted in an increase in energy cost despite improved hydro generation. These factors have a significant impact on operating results and BC Hydro’s return on capital employed (ROCE).
101
Chart 3.1 Electricity price competitiveness
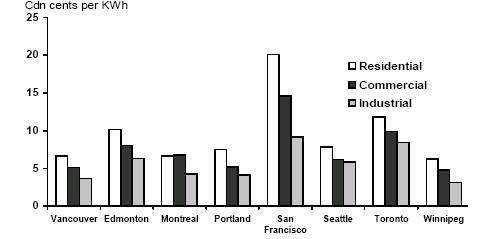
Main source for all data: Hydro Quebec’s “Comparison of Electricity Prices in Major North American Cities” for rates in effect as of April 1, 2006.
BC Hydro rates have been adjusted to reflect the net rate increase effective February 1, 2007, and comparator utility data has been adjusted to September 30, 2006 for known rate changes (based on BC Hydro estimates) and for movements in exchange rates.
BC Hydro’s capital spending is driven as much by a requirement for sustaining existing capital (many of its key assets were constructed in the 1960’s and 1970’s) as it is for capital expansion to meet the growing demands of a strong economy. Under the provincial government’s 2007 Energy Plan, increasing demand is to be met with conservation and demand management, upgrades to BC Hydro’s existing facilities, increased purchases from independent power producers, and, potentially, new larger-scale projects.
The electric utility standard for reliability is defined as a combination of Average System Availability Index (ASAI) and Customer Average Interruption Duration Index (CAIDI). BC Hydro is generally in the third quartile of Canadian and US utilities for ASAI and CAIDI due to terrain, weather, and the long distances between the primary generating facilities on the Peace and Columbia Rivers and demand centres in the Lower Mainland and Vancouver Island. For Fiscal 2007, reliability was lower than planned because of the impact of severe winter wind and snowstorms.
BC Liquor Distribution Branch
LDB is responsible for the importation, distribution and retailing of beverage alcohol in British Columbia and the operation of government liquor stores and distribution centres in the province. LDB, under the authority of the Liquor Distribution Act, has the sole right to purchase beverage alcohol, both in and out of British Columbia, in accordance with the Importation of Intoxicating Liquors Act (Canada).
LDB has a workforce of approximately 3,500 full and part-time employees, and manages its retail and wholesale business through the operation of 201 government liquor stores throughout the province; two distribution centres located in Vancouver and Kamloops; and a head office facility in Vancouver.
LDB also issues appointments or authorizations and enters into contracts with the private sector for the operation of private retail outlets, such as licensee
102
Table 3.2 | | Liquor Distribution Branch |
| | Five-Year Income Statement for the Years Ended March 31 |
($ millions) | | 2003 | | 2004 | | 2005 | | 2006 | | 2007 | |
Provincial liquor sales | | 1,885.3 | | 1,998.2 | | 2,148.4 | | 2,249.5 | | 2,434.4 | |
Less: commissions and discounts | | 55.4 | | 69.5 | | 91.3 | | 124.9 | | 145.9 | |
Net sales | | 1,829.9 | | 1,928.7 | | 2,057.1 | | 2,124.6 | | 2,288.5 | |
Cost of sales | | 925.6 | | 992.2 | | 1,048.6 | | 1,101.7 | | 1,197.7 | |
Gross margin | | 904.3 | | 936.5 | | 1,008.5 | | 1,022.9 | | 1,090.8 | |
Operating expenses | | (254.9 | ) | (215.3 | ) | (240.0 | ) | (242.4 | ) | (256.3 | ) |
Other income | | 4.8 | | 5.5 | | 10.1 | | 20.0 | | 5.8 | |
Net income | | 654.2 | | 726.7 | | 778.6 | | 800.5 | | 840.3 | |
Financial data: | | | | | | | | | | | |
Commissions as a per cent of total sales | | 2.94 | | 3.48 | | 4.25 | | 5.55 | | 5.99 | |
Gross margin percentage | | 47.97 | | 46.87 | | 46.94 | | 45.47 | | 44.81 | |
Performance indicators: | | | | | | | | | | | |
Operating costs per dollar of revenue(1) (cents) | | 12.13 | | 12.01 | | 11.47 | | 10.83 | | 10.53 | |
Sales per square foot (dollars) | | n/a | | 1,197 | | 1,309 | | 1,347 | | 1,425 | |
Inventory turnover (times per year) | | 14.5 | | 14.8 | | 15.2 | | 15.7 | | 16.6 | |
(1) Excludes the impact of restructuring accruals.
retail stores (LRSs), rural agency stores, beverage alcohol manufacturer stores, independent wine stores and duty-free stores.
As of March 31, 2007, there were a total of 1,072 private liquor stores in the province, a 94 per cent increase from 562 stores five years ago. The expansion has been predominantly in the area of LRSs, whose numbers have been allowed to increase by over 118 per cent (from 290 to 631) in a move to bring more private sector competition into the liquor marketplace.
LDB has experienced a number of policy changes over the last five years that have affected its operating ratios. In addition to the increase in their numbers, LRSs are now permitted to sell spirits as well as beer and wine beverages, and their product discount has been increased to 16 per cent from the 10 per cent of five years ago. Other policy changes include moving from a percentage to a flat markup on beer products and the consolidation of a number of government liquor stores into larger “Signature” retail outlets.
From an operating perspective, the impacts on LDB from these policy changes has been a doubling of commissions as a percentage of total sales (currently at 6.0 per cent), a 3.2 per cent decrease in gross margin, and a 16 per cent reduction in market share for counter sales. However, LDB has initiated efficiencies in its distribution network by initiating direct shipments to LRSs from its warehouses instead of routing them through the local liquor stores. This change improved its inventory turnover, and reduced its operating costs per dollar of revenue by 19 per cent. Revamping the retail outlets has also improved the sales per square foot results.
103
BC Lottery Corporation
British Columbia’s gaming industry is operated and regulated under the authority and direction of the provincial government under the terms of the Criminal Code of Canada. Under the Gaming Control Act (2002), BCLC is designated as the agent of the Crown responsible for conducting, managing and operating all forms of lottery, casino and commercial bingo gaming in the province. BCLC also participates in the marketing of nationwide and regional lottery games in association with other provinces of Canada.
At its inception, BCLC operated within a limited, traditional lottery market. A number of policy changes in the late 1990s, including the introduction of slot machines in 1997/98 and full casino gaming in 1998/99, provided opportunity for growth of gaming in the province. In 2006/07, BCLC had gross gaming receipts of $2.4 billion, and its net income exceeded $1.0 billion for the first time, an almost four-fold increase from a decade ago. Each year, approximately 22 per cent of BCLC’s net income is redistributed by the provincial government to charities and local governments.
BCLC has two corporate offices – Kamloops (finance and administration) and Richmond (sales and marketing) – and a workforce of about 600 people. Retail operations and gaming is provided by a network of licensed and regulated service providers, including 4,300 lottery retailers, 16 casinos, 20 commercial
Table 3.3 | | British Columbia Lottery Corporation |
| | Five-Year Income Statement for the Years Ended March 31 |
($ millions) | | 2003 | | 2004 | | 2005 | | 2006 | | 2007 | |
Gaming revenue net of direct costs: | | | | | | | | | | | |
Lottery products | | 358.3 | | 358.1 | | 356.6 | | 353.6 | | 368.5 | |
Casinos | | 409.8 | | 481.2 | | 585.6 | | 715.4 | | 800.0 | |
Community gaming | | 37.2 | | 35.6 | | 36.4 | | 45.9 | | 57.8 | |
| | 805.3 | | 874.9 | | 978.6 | | 1,114.9 | | 1,226.3 | |
Administrative costs | | (83.0 | ) | (90.8 | ) | (95.3 | ) | (102.2 | ) | (106.7 | ) |
Amortization | | (20.9 | ) | (24.7 | ) | (36.3 | ) | (52.8 | ) | (64.0 | ) |
GST and other costs (net) | | (30.5 | ) | (31.8 | ) | (28.1 | ) | (37.2 | ) | (36.8 | ) |
Net income | | 670.9 | | 727.6 | | 818.9 | | 922.7 | | 1,018.8 | |
Financial data: | | | | | | | | | | | |
Lottery product profit margin | | 30.3 | | 30.1 | | 30.4 | | 28.0 | | 28.2 | |
Casino profit margin | | 56.5 | | 57.0 | | 57.7 | | 57.3 | | 57.8 | |
Community gaming centre profit margin | | 11.7 | | 10.4 | | 9.6 | | 13.4 | | 16.8 | |
Gross gaming receipts | | 1,792.4 | | 1,889.5 | | 2,027.4 | | 2,260.7 | | 2,425.2 | |
Capital spending ($millions) | | 29.6 | | 49.0 | | 93.5 | | 82.9 | | 43.9 | |
Performance indicators: | | | | | | | | | | | |
Administrative costs as a percent of total revenue | | 4.6 | | 4.8 | | 4.7 | | 4.5 | | 4.4 | |
Allocation of net income | | | | | | | | | | | |
Government of Canada | | 7.8 | | 7.9 | | 8.0 | | 8.3 | | 8.4 | |
Funding for problem gaming programs | | 3.2 | | 0.5 | (1) | — | | — | | — | |
Transfers to charities/local governments | | 171.1 | | 184.7 | | 183.7 | | 210.8 | | 242.4 | |
Contribution to provincial revenue | | 488.8 | | 534.5 | | 627.2 | | 703.6 | | 768.0 | |
| | 670.9 | | 727.6 | | 818.9 | | 922.7 | | 1,018.8 | |
(1) Commencing in 2003/04, the funding for these programs was provided from general revenue.
104
Chart 3.2 Interprovincial gaming comparisons
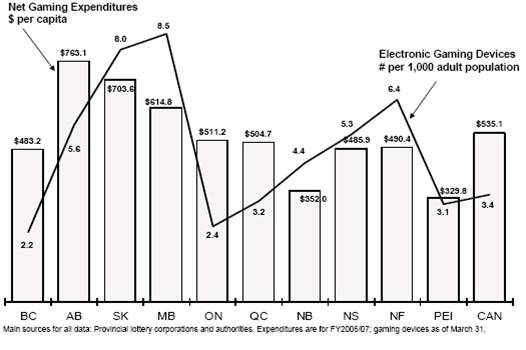
bingo halls, 6 community gaming centres, and 1 racetrack gaming centre. It is estimated that the gaming industry in BC directly employs 10,000 people and generates $1 billion in gaming facility development.
Casino operations account for half of BCLC’s revenue and two-thirds of its net win (after prizes), making it the most profitable part of BCLC’s business. The casino profit margin is double that of lottery products and more than three times that of community gaming, which includes commercial bingo halls and community gaming centres. Lottery revenues have declined since 2002/03, but recent initiatives, such as the introduction of new products and an Internet-based distribution channel, have restored some measure of growth in this area. Community gaming was also in decline until the introduction of slot machines in 2004/05. Since then, community gaming profitability has improved by 75 per cent.
Despite the increase in gaming activity in BC over the last decade, gaming activity on a per capita basis is still moderate compared to the rest of Canada. BC ranks 8th out of the 10 provinces in terms of gaming expenditures per capita, and has the fewest electronic gaming devices per 1,000 of adult population of all the provinces.
BC Railway Company
BCRC’s original mandate was to construct and operate a freight railway in British Columbia. Significant expansion of the corporation occurred in the 1990s, as it added to its rail network and acquired a telecommunications company, deep-sea bulk loading facilities in the Port of Vancouver, and barge operations in northern BC. BCRC also diversified into real estate development, and formed a joint venture management company. At its peak, BCRC was Canada’s fourth largest railway, operating 2,314 kilometres of mainline track and 638 kilometres of industrial and yard track.
105
Table 3.4 | | British Columbia Railway Company |
| | Five-Year Income Statement for the Years Ended December 31 (1) |
($ millions) | | 2002 | | 2003 | | 2004 | | 2005 | | 2006 | |
Revenue | | 366.7 | | 364.0 | | 242.3 | | 24.4 | | 17.5 | |
Expenses | | 301.2 | | 285.5 | | 223.4 | | 33.5 | | 32.1 | |
Operating income (loss) | | 65.5 | | 78.5 | | 18.9 | | (9.1 | ) | (14.6 | ) |
Non-operating income (expenses)(2) | | (40.2 | ) | (39.8 | ) | (7.6 | ) | 6.6 | | 19.1 | |
Income before special items | | 25.3 | | 38.7 | | 11.3 | | (2.5 | ) | 4.5 | |
Investment and asset impairment write-downs (3) | | (118.9 | ) | — | | (14.6 | ) | (15.2 | ) | — | |
Gain from BC Rail/CN transaction | | — | | — | | 198.6 | | (5.6 | )(4) | | |
Gain on sale of assets | | 9.4 | (5) | 27.7 | (5) | — | | 9.9 | (6) | 63.7 | (6) |
Net income (loss) | | (84.2 | ) | 66.4 | | 195.3 | | (13.4 | ) | 68.2 | |
(1) Prior years are restated to be consistent with the current presentation.
(2) Includes gain (loss) from discontinued operations.
(3) Primarily relating to the investment in Vancouver Wharves Limited Partnership.
(4) Certain aspects of the BC Rail/CN transaction were finalized in 2005, resulting in a slight reduction to the gain recorded in 2004.
(5) Sale of Canadian Stevedoring Company Limited. The gain was realized over two years due to the structure of the transaction.
(6) Property sales, including sale of intermodal yard in 2006.
In 1998/99, BCRC’s operations and financial performance began to decline. Profitability of the railway operations was heavily dependent on transporting coal from northern BC to the ports for export. Flagging coal exports significantly reduced this revenue and led to an audit of the ability of its overall rail operations to maintain profitability. The audit resulted in an impairment charge of $606 million on its rail assets. The following year, BCRC began a series of asset impairment write downs of its port operations eventually totaling $237 million.
In 2002, the provincial government decided to wind down the operations of BCRC. The main initiative was the BC Rail Investment Partnership (BCRIP) agreement with CN, completed in July 2004. Under the agreement, BCRC rail operations (with the exception of its Port Subdivision subsidiary) were sold to CN; BCRC retained ownership of the railway right-of-way, rail bed, and track infrastructure.
BCRC has also divested itself of its North Vancouver ports operations, including the sale of Canadian Stevedoring Ltd to P&O Ports in 2003, and the recent divestiture of Vancouver Wharves (VW) through a 40-year non-renewable lease with Kinder Morgan Canada Terminals ULC (KMCT). Under terms of the lease, KMCT will consolidate VW operations and assume the remediation obligations for VW lands. As well, BCRC is in the process of selling its real estate holdings not required for the support of the BCRIP and Port Subdivision.
BCRC’s current mandate is the ongoing management of the BCRIP agreement with CN, and retention and operation of the Port Subdivision as part of the provincial government’s overall Pacific Gateway strategy.
BCRC is governed by two principal pieces of legislation. The British Columbia Railway Act establishes the corporation’s structure, responsibilities and accountabilities. The British Columbia Railway Finance Act establishes the borrowing and investment framework for BCRC.
106
Insurance Corporation of BC
ICBC is one of BC’s largest corporations and one of Canada’s largest property and casualty insurers. ICBC earns approximately $3.3 billion in insurance premiums from almost 3.2 million policies sold annually, and currently holds approximately $9.0 billion in assets. ICBC offers automobile insurance products and services through a province-wide network of more than 900 independent brokers, government agents, and appointed agents. ICBC processes almost 950,000 claims per year through its 24-hour telephone claims handling facility, province-wide network of 39 claims service locations, and corporate website, www.icbc.com.
Table 3.5 | | Insurance Corporation of British Columbia |
| | Five-Year Income Statement for the Years Ended December 31 |
($ millions) | | 2002 | | 2003 | | 2004 | | 2005 | | 2006 | |
Revenue: | | | | | | | | | | | |
Net premiums | | 2,621.4 | | 2,852.4 | | 3,026.5 | | 3,117.4 | | 3,256.9 | |
Investment income | | 327.3 | | 329.9 | | 395.3 | | 579.4 | | 512.3 | |
Service fees | | 27.2 | | 33.6 | | 36.6 | | 37.5 | | 47.1 | |
| | 2,975.9 | | 3,215.9 | | 3,458.4 | | 3,734.3 | | 3,816.3 | |
Claims and expenses: | | | | | | | | | | | |
Claims incurred | | 2,193.5 | | 2,208.1 | | 2,242.3 | | 2,444.5 | | 2,544.4 | |
Prior years’ claims adjustments | | (24.8 | ) | (39.6 | ) | (4.7 | ) | 80.7 | | 99.0 | |
Net claims incurred | | 2,168.7 | | 2,168.5 | | 2,237.6 | | 2,525.2 | | 2,643.4 | |
Claims services and operations | | 397.9 | | 409.3 | | 419.3 | | 423.8 | | 433.8 | |
Insurance premium taxes and commissions | | 249.8 | | 274.8 | | 323.2 | | 478.5 | | 292.2 | |
Non-insurance operating costs | | 99.3 | | 102.6 | | 105.3 | | 108.9 | | 96.8 | |
| | 2,915.7 | | 2,955.2 | | 3,085.4 | | 3,536.4 | | 3,466.2 | |
Income before unusual items | | 60.2 | | 260.7 | | 373.0 | | 197.9 | | 350.1 | |
Unusual items | | (15.2) | (1) | 14.1 | (2) | — | | — | | — | |
Net income (loss) | | 45.0 | | 274.8 | | 373.0 | | 197.9 | | 350.1 | |
Financial data: | | | | | | | | | | | |
Average premium ($) | | 960 | | 1,009 | | 1,048 | | 1,047 | | 1,062 | |
Claims incurred per thousand earned policies (3) | | 396 | | 339 | | 330 | | 319 | | 317 | |
Average cost per claim incurred ($) | | 2,046 | | 2,372 | | 2,414 | | 2,646 | | 2,687 | |
Performance indicators: | | | | | | | | | | | |
Loss ratio | | 93.1 | | 87.4 | | 83.2 | | 90.2 | | 90.4 | |
Insurance expense ratio | | 15.5 | | 15.5 | | 15.9 | | 16.0 | | 15.7 | |
Return on investments(4) | | n/a | | 7.2 | | 6.1 | | 6.4 | | 7.3 | |
(1) Restructuring costs.
(2) Gain on sale of property and equipment.
(3) Represents the number of claims reported per average number of policies in force during the year.
(4) Four-year annualized return.
ICBC was established in 1973 under the Insurance Corporation Act to provide universal property and casualty liability (i.e. Basic) automobile insurance to BC motorists, which was made compulsory. At the time it was established, ICBC was designated the sole provider of all automobile insurance products in British Columbia, Basic and Optional. Soon afterwards, the legislation was amended to allow private insurance companies to compete in the sale of non-compulsory Optional automobile insurance products. As part of its mandate, ICBC also provides driver licensing services, vehicle licensing and registration services, and fines collection on behalf of the provincial government.
107
In 2003, the provincial government mandated a number of changes to ICBC’s operations in order to ensure fair competition among all insurance providers in the Optional insurance marketplace. The British Columbia Utilities Commission (BCUC) was directed to regulate ICBC’s Basic insurance rates, and ICBC was required to separately disclose information on its Basic and Optional insurance lines of business to the BCUC for Basic insurance rate setting purposes and in order to ensure appropriate cost allocation between the two lines of business.
Government also set out minimum capitalization targets for both the Basic and Optional lines of business, based on the minimum capital test for insurance companies in Canada as required by the federal Office of the Superintendent of Financial Institutions, and the timeframes by which the targets must be achieved.
Since 2003, ICBC has maintained an average 4.5 per cent growth in premium revenue, primarily due to the increasing number of vehicles in the province, higher average optional insurance sales and changes to both Basic and Optional insurance rates. Investment income has also been strong, with investment returns exceeding comparable market-based benchmarks in each of the last four years.
Rising injury claims costs are a concern throughout the automobile insurance industry. ICBC’s claims costs account for approximately 75 per cent of ICBC’s total expenditures, and injury claims costs make up 60 per cent of that amount. Injury claims costs have increased by 28 per cent since 2002, reflecting a 35 per cent increase in the cost per claim, partially offset by a decrease in the number of claims. Comparatively, material damage claims costs have increased by 2.1 per cent since 2002, with the 15 per cent increase in cost per claim being almost entirely offset by a reduction in the number of claims.
Chart 3.3 ICBC claims
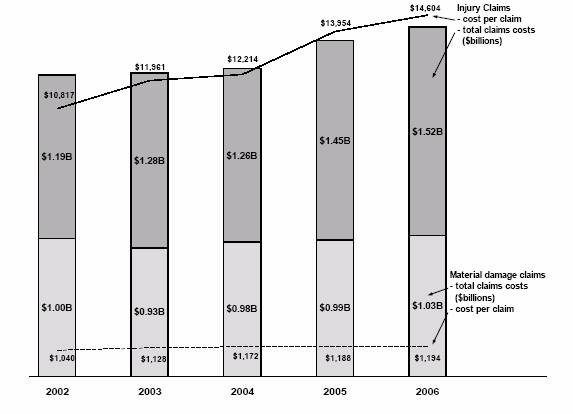
108
Due to rising injury claims costs, in July 2006 the BCUC approved a 6.5 per cent increase in Basic insurance rates, effective March 15, 2006. With the projected increase in 2007 claims costs, ICBC’s 2007 revenue requirements submission, filed with the BCUC in March 2007, recommended a 3.3 per cent increase in Basic insurance rates, which was approved on an interim basis.
ICBC continues to maintain its market share for Optional insurance products. Enabled by ongoing profitability, ICBC was able to provide approximately $41 million in refunds to Optional policyholders and $100 million in Optional insurance rate reductions in 2005 and 2006. This was followed by an additional a 3.8 per cent decrease in the average premiums for Optional insurance coverage in 2007.
BC Transmission Corporation
BCTC was established in 2003 and assigned the responsibility for managing the BC Hydro’s transmission system, which is the second largest in the Pacific Northwest with over 18,000 km of high-voltage power lines, underground and submarine cables; 20,500 steel towers; 75,000 wood poles; and 287 substations. BCTC achieved full financial independence from BC Hydro in 2005 when it received its own tariff structure (previously it recovered its costs from BC Hydro on a fee for service basis). BC Hydro continues to own the transmission assets. BCTC owns the control centre assets, which are required for operating and controlling the transmission system.
Table 3.6 | | British Columbia Transmission Corporation |
| | Five-Year Income Statement for the Years Ended March 31 |
($ millions) | | 2003 | | 2004 | | 2005 | | 2006 | | 2007 | |
Revenue | | n/a | | 42.3 | | 94.8 | | 205.3 | | 190.2 | |
Expenses: | | | | | | | | | | | |
Operations, maintenance and administration | | n/a | | 35.7 | | 71.6 | | 157.2 | | 167.7 | |
Amortization | | n/a | | 4.9 | | 17.3 | | 19.7 | | 14.2 | |
Finance charges and other costs | | n/a | | 0.8 | | 2.5 | | 6.8 | | 6.5 | |
| | | | 41.4 | | 91.4 | | 183.7 | | 188.4 | |
Operating results | | n/a | | 0.9 | | 3.4 | | 21.6 | | 1.8 | |
Net transfer (to) from regulatory accounts | | n/a | | | | | | (8.1 | ) | 1.8 | |
Net income | | n/a | | 0.9 | | 3.4 | | 13.5 | | 3.6 | |
Financial data: | | | | | | | | | | | |
Capital spending | | n/a | | 3.9 | | 13.7 | | 20.8 | | 50.6 | |
Debt (including current portion) | | n/a | | 17.2 | | 40.2 | | 37.2 | | 37.0 | |
Performance indicators: | | | | | | | | | | | |
System Average Interruption Duration Index (hours) | | n/a | | 2.74 | | 2.33 | | 2.07 | | 4.23 | |
Operating costs as a percent of revenue | | n/a | | 84.4 | | 75.5 | | 76.6 | | 88.2 | |
BCTC’s mandate is to provide open and fair access to BC’s electric transmission system, facilitate private generation investment in BC and maintain access to the Western North American wholesale electricity market. BCTC’s powers and functions are set out in the Transmission Corporation Act (2003), and in agreements with BC Hydro that have been designated under that act.
109
Separating management of the transmission system from the management of the generation and distribution systems was seen as key to developing a robust power production industry in BC. As is the case for private sector power producers, BC Hydro must contract with BCTC for access to the transmission system. Other contracts between BC Hydro and BCTC cover the terms of transmission system maintenance and expansion.
BCTC is subject to regulation by the British Columbia Utilities Commission (BCUC), which reviews BCTC’s tariff structure and proposed transmission projects. BCTC has number of transmission projects underway, including the Vancouver Island Transmission Reinforcement and a major 500-kilovolt reinforcement from the Southern Interior to the Lower Mainland. BCTC is also consolidating and modernizing its transmission control centres and systems.
Capital spending on transmission assets is reflected in BC Hydro’s financial statements. BCTC’s own capital spending primarily reflects the System Control Modernization Project.
System Average Interruption Duration Index (SAIDI) is a measure of the reliability of the transmission system that BCTC operates and manages. It includes all planned and unplanned outages, and excludes interruptions attributed to generators. It is calculated as the average amount of time in hours across all transmission delivery points that service is interrupted in a year due to planned or unplanned outages.
In the fall and winter of 2006, BC experienced eight wind and snow storms, and four of these were the most powerful in BC’s history. The storms caused extensive damage to the transmission system and accounted for 40 per cent of the total SAIDI for Fiscal 2007. Absent the unusual storm events, SAIDI was within the range of the average performance over the past five years.
Columbia Power Corporation
CPC was incorporated in 1994 as a precursor to the Columbia Basin Initiative, a unique arrangement under which the provincial government directly shared a portion of the revenue from the sale of downstream power benefits from the Columbia River Treaty with the residents of the Columbia Basin in recognition of the significant economic, environmental and social costs resulting from the construction of the three dams required by the treaty.
The Columbia Basin Initiative was launched in 1995 with the Columbia Basin Trust Act, which created Columbia Basin Trust (CBT), and the 1995 Financial Agreement between the provincial government and CBT. Under the agreement, CPC and CBT each received $250 million over 10 years to provide equity for qualifying power project developments in the region. Returns from CBT’s 50 per cent share are used by CBT to provide benefits to the people of the region, in accordance with the Columbia Basin Trust Act.
110
Table 3.7 | | Columbia Power Corporation |
| | Five-Year Income Statement for the Years Ended March 31 |
($ millions) | | 2003 | | 2004 | | 2005 | | 2006 | | 2007 | |
Revenue | | 45.4 | | 30.0 | | 29.2 | | 31.7 | | 35.0 | |
Expenses: | | | | | | | | | | | |
Water rentals | | 2.4 | | 3.5 | | 4.1 | | 4.0 | | 4.2 | |
Operations, maintenance and administration | | 2.4 | | 3.0 | | 3.2 | | 3.1 | | 3.6 | |
Amortization | | 5.0 | | 6.8 | | 6.9 | | 6.3 | | 6.4 | |
Other costs | | 16.8 | | 1.7 | | 2.4 | | 1.9 | | 1.7 | |
| | 26.6 | | 15.0 | | 16.6 | | 15.3 | | 15.9 | |
Operating results | | 18.8 | | 15.0 | | 12.6 | | 16.4 | | 19.1 | |
Finance charges | | (5.4 | ) | (6.7 | ) | (8.4 | ) | (8.9 | ) | (8.5 | ) |
Unusual items | | — | | — | | 1.5 | | (4.4 | ) | 4.2 | |
Net income | | 13.4 | | 8.3 | | 5.7 | | 3.1 | | 14.8 | |
| | | | | | | | | | | |
Financial data: | | | | | | | | | | | |
Capital spending on power projects | | 26.4 | | 50.3 | | 41.7 | | 17.2 | | 10.4 | |
Debt (including current portion) | | 106.3 | | 107.7 | | 128.4 | | 123.4 | | 118.0 | |
| | | | | | | | | | | |
Performance indicators: | | | | | | | | | | | |
Debt to Equity Ratio | | 27:73 | | 26:74 | | 30:70 | | 29:71 | | 27:73 | |
ROCE (per cent) | | 5.34 | | 3.71 | | 2.95 | | 3.87 | | 4.44 | |
CPC’s mandate is to develop the core hydroelectric projects and other qualifying power projects through joint ventures with subsidiaries of CBT, and to manage the joint ventures. CPC finances the power projects using the government’s equity contributions, retained earnings and limited-recourse project debt, without government debt guarantees.
The purchase of the Brilliant Dam in 1996 was the first investment by the joint venture partners. In addition, three projects were designated as core to the initiative: Arrow Lakes Generating Station (completed); Brilliant Expansion (in service July 2007); and Waneta Expansion (in the permitting phase). Other generation, distribution and transmission projects can be carried out by CPC and CBT, provided both parties agree and the projects meet the same commercial and other tests as the core projects.
CPC’s return on capital employed (ROCE) over the last five years reflects the timing of capital spending on Brilliant Expansion. The improvement in 2006/07 is due to reduced capital spending as Brilliant Expansion nears completion. Further improvement in the provincial government’s overall return on its investment in the Columbia Basin projects is expected once Brilliant Expansion comes into service.
CPC is a small organization, with fewer than 45 full-time equivalent positions, located in Castlegar and Victoria. The Corporation focuses on asset management activities while engaging private-sector firms to provide construction, plant operation and specialist consulting services. Through its joint ventures, CPC is one of the largest producers of electricity in British Columbia.
111
Provincial Capital Commission
The Capital Commission Act provides PCC with the authority to protect and enhance the amenity value of the Capital Improvement District (CID), which includes the City of Victoria, the municipalities of Esquimalt and Oak Bay, the Saanich Peninsula and the Western Communities. This mandate was expanded in 2003 to include the delivery of Outreach programs intended to connect British Columbians with their capital, and foster awareness of and pride in the diverse cultures and rich history of the province.
The PCC owns and manages a number of heritage and other sites in the CID, and uses net income from its property portfolio to fund its outreach programs and other initiatives. Initiatives undertaken by PCC include the recent transition of Crystal Garden operations to financial sustainability, funding of the Greenways system of bicycle and hiking trails in the Capital Regional District, which is nearing completion, and research and other studies for proposed Inner Harbour redevelopment.
Unrestricted reserves represent past earnings that are an important source of financing for PCC. The significant reduction in unrestricted reserves in 2004/05 was primarily due to $3.2 million in structural and seismic upgrades to the Crystal Garden during its transition period, and the restriction of reserves for other building remediation that was substantively completed in 2005/06.
Table 3.8 | | Provincial Capital Commission |
| | Five-Year Income Statement for the Years Ended March 31 |
($ thousands) | | 2003 | | 2004 | | 2005 | | 2006 | | 2007 | |
Revenue | | 3,340 | | 3,557 | | 3,181 | | 2,580 | | 3,089 | |
Expenses: | | | | | | | | | | | |
Operating and program costs | | 2,460 | | 3,019 | | 2,853 | | 2,159 | | 2,346 | |
Amortization | | 222 | | 262 | | 270 | | 284 | | 372 | |
| | 2,682 | | 3,281 | | 3,123 | | 2,443 | | 2,718 | |
Operating results | | 658 | | 276 | | 58 | | 137 | | 371 | |
Grants disbursed from restricted reserves | | (197 | ) | (246 | ) | (182 | ) | (106 | ) | (35 | ) |
Transition costs, Crystal Gardens | | — | | (59 | ) | (549 | ) | (51 | ) | — | |
Net income | | 461 | | (29 | ) | (673 | ) | (20 | ) | 336 | |
| | | | | | | | | | | |
Financial data: | | | | | | | | | | | |
Capital spending, net of contributions | | 725 | | 697 | | 377 | | 1,074 | | 228 | |
| | | | | | | | | | | |
Performance indicators: | | | | | | | | | | | |
Equity - unrestricted reserves | | 1,866 | | 1,299 | | 413 | | 414 | | 743 | |
112
Appendix 3
Constitutional
Framework
Appendix 3 – Constitutional Framework
Constitutional Framework
The structure of the British Columbia government is based on British parliamentary tradition and precedent. Prior to 1866, BC was composed of two British-controlled colonies, one on Vancouver Island established in 1849, and a second on the mainland established in 1858. In the Union Proclamation of 1866, the Colony of British Columbia was joined with the Colony of Vancouver Island, forming a single united Crown Colony of British Columbia. On July 20, 1871, BC entered into Confederation with Canada. Although the Colony of Vancouver Island had a parliamentary form of government as far back as 1856, the first fully elected government was not instituted in BC until the autumn after Confederation with Canada. Responsible government was achieved in late 1872, when the Lieutenant Governor acquiesced to an executive council that was responsible to the legislative assembly.
Upon entering Confederation, BC came under the authority of the British North America Act, 1867 (BNA Act), a statute of the British parliament. Until 1982, the BNA Act defined the major national institutions and established the division of authority between the federal and provincial governments. In 1982, the BNA Act was renamed the Constitution Act, 1867 and its amendments were incorporated into the Constitution Act, 1982. The Constitution Act, 1982, which also includes the Canadian Charter of Rights and Freedoms, is companion legislation to the Canada Act, 1982. With the passage of the Canada Act, 1982, the British Parliament ended its legal right to legislate for Canada. Canada, as a federal state, divides legislative powers between the federal and provincial governments.
Provincial Government
BC’s government is modeled after the British system. Functionally there are three main branches: the legislature, the executive and the judiciary.
Legislature
Legislative powers in British Columbia are exercised by a single legislative chamber, which is elected for a term of four years. BC, the first province in Canada to legislate fixed election dates, requires an election on the second Tuesday in May every four years. An election may also be called if the government loses a vote of confidence in the legislative assembly.
The legislature consists of the Lieutenant Governor and 79 elected members of the legislative assembly. The legislative assembly represents the people of BC in the conduct of the province’s affairs. The assembly is required by law to meet at least once a year with a normal session lasting several months. However, special sessions can last just a few days or many months, depending on the nature of the government’s business.
The legislature operates on a fixed schedule – the second Tuesday in February each year is reserved for the Throne Speech and the third Tuesday in February each year is reserved for the Budget Speech.
114
Executive
The executive is composed of the Lieutenant Governor and the executive council. The Lieutenant Governor, the Queen’s representative in British Columbia, holds a largely ceremonial place in the modern provincial government. By constitutional custom, the Lieutenant Governor is appointed by the Governor General of Canada for a term usually lasting five years.
The Lieutenant Governor, on the advice of the premier, appoints members of the executive council and is guided by the executive council’s advice as long as it holds the confidence of the legislative assembly. Following a general election, the Lieutenant Governor calls upon the leader of the political party with the largest number of elected members to serve as premier and to form the provincial government.
The Lieutenant Governor, on recommendation of the premier, convenes, prorogues and dissolves the legislative assembly and gives Royal Assent to all measures and bills passed by the assembly before they become law.
The executive council, or cabinet, is headed by the premier and is composed of selected members of the ruling party. Ministers are the head of government ministries, and are usually members of cabinet.
Cabinet determines government policy and is held responsible by the legislative assembly for the operation of the provincial government. Deputy ministers are the chief operating officers of ministries and are appointed by cabinet. Deputy ministers are responsible for carrying out government policies and for managing the work of their ministries.
Judiciary
The judiciary performs functions that are central to the orderly operation of society. Judges hear and give judgment in criminal prosecutions and in actions arising from disputes between private citizens or between the government and private citizens. Judges apply both judge-made law, known as “common law,” and laws made by the Parliament of Canada and provincial legislatures. The judiciary is increasingly called on to determine whether laws passed by governments conform to the values expressed in the Canadian Charter of Rights and Freedoms.
BC’s judicial system is made up of the Provincial Court of British Columbia, the Supreme Court of British Columbia and the Court of Appeal of British Columbia. The Provincial Court includes Small Claims, Adult Criminal, Youth and Family divisions. The provincial government appoints Provincial Court judges, and the federal government appoints Court of Appeal and Supreme Court judges.
The federal judicial system includes the Tax Court of Canada, the Federal Court of Canada (Appeals division and Trial division) and the Supreme Court of Canada. The Federal Court of Canada hears cases in limited areas
115
of exclusively federal jurisdiction, for example, reviewing decisions made by federal tribunals such as the Canada Labour Relations Board. The Supreme Court of Canada is the court of final resort and hears selected appeals from the Federal Court of Appeal and provincial Courts of Appeal.
Provincial Government Jurisdiction
Under Canada’s constitutional framework, BC has ownership and jurisdiction over natural resources and is responsible for education, health and social services, municipal institutions, property and civil rights, the administration of justice and other matters of purely provincial or local concern.
116