Exhibit 99.5
Public Accounts
For the Fiscal Year Ended
March 31, 2007
National Library of Canada Cataloguing in Publication Data
British Columbia. Office of the Comptroller General.
Public accounts for the year ended... – 2000/2001–
Annual.
Report year ends Mar. 31.
Continues: British Columbia. Ministry of Finance.
Public accounts. ISSN 1187–8657.
ISSN 1499–1659 = Public accounts–British Columbia.
Office of the Comptroller General
1. British Columbia–Appropriations and expenditures–Periodicals.
2. Revenue–British Columbia–Periodicals.
3. Finance, Public–British Columbia–Periodicals. 1. British Columbia. Ministry of Finance. 2. Title.
HJ13.B74 352.4’09711’05 C2001–960204–9
| July 11, 2007 |
| Victoria, British Columbia |
| |
Lieutenant Governor of the Province of British Columbia | |
MAY IT PLEASE YOUR HONOUR:
The undersigned has the honour to present the Public Accounts of the Government of the Province of British Columbia for the fiscal year ended March 31, 2007.
| CAROLE TAYLOR |
| Minister of Finance |
| |
| |
Ministry of Finance | |
Victoria, British Columbia | |
| |
| |
Honourable Carole Taylor
Minister of Finance
I have the honour to submit herewith the Public Accounts of the Government of the Province of British Columbia for the fiscal year ended March 31, 2007.
Respectfully submitted,
| CHERYL WENEZENKI–YOLLAND |
| Comptroller General |
British Columbia’s Public Accounts
Leading the Way
British Columbia is committed to leading best practices in public sector reporting. The Public Accounts are one of the more significant accountability documents of the provincial government. They demonstrate accountability to the citizens of British Columbia by providing audited financial statements and other information in a consistent, timely and understandable format. They allow the reader to see how government performed relative to its fiscal plan and provide a picture of the current financial state of the province in terms of its assets, liabilities and net debt.
The main focus of the Public Accounts is the Summary Financial Statements representing the consolidated financial results and financial position. These statements provide a whole of government view of how the province and its various organizations performed against the fiscal plan. Consistent with its legislative requirement to follow generally accepted accounting principles (GAAP), the province includes the financial balances and results of operations of school districts, universities, colleges, institutes and health organizations (the SUCH sector).
Further information is also provided through the Consolidated Revenue Fund Extracts (available on the Internet –website http://www.fin.gov.bc.ca/ocg/htm). These extracts compare actual to planned spending of ministries on an appropriation basis, which represents another significant accountability of ministries back to the Legislative Assembly.
Following inclusion of the SUCH sector in the province’s financial statements in 2004/05, the province has received, for the third year running, an audit opinion free of any audit qualifications. The province continues to improve the Public Accounts in terms of their usefulness to readers. Of particular note this year are the modifications to the financial highlights section to improve the readability and provide for a more meaningful discussion of the results achieved. Beyond editorial changes, two additional measures of government’s financial condition have been added, the change in capital stock and the surplus/deficit to gross domestic product (GDP). These financial measures help users understand: government’s ability to sustain existing government activities and infrastructure, the flexibility of government to fund additional activities, and the vulnerability of government to outside sources of funding. Trend information has been expanded to cover the four year period 2003/04 to date.
The way governments manage and deliver public service continues to evolve, therefore the accounting and reporting standards also need to evolve to recognize the new context and operational reality of public service. Emerging areas such as public private partnerships or private finance initiatives require guidance to ensure they are reported fairly and consistent with the principles of public sector accounting. While standards generally provide guidance on accounting, some of the more complex types of transactions require specific application guidance to be developed to ensure their treatment is consistent and correct across the broad entity. While determining the costs under public private partnership (P3) arrangements is easy, identifying how they should be allocated between the capital asset value and operating costs has been the subject of much debate within the accounting community.
In light of this, British Columbia has led the development of a new methodology to consistently value the costs for all provincial P3 arrangements. From the provincial perspective, the adoption of the new methodology has not resulted in any substantial changes to the way P3 assets are valued or reported. We are also working with standard setters and other jurisdictions to lead the development of international practice in the area of P3s. We will continue to revise our model and evaluate any required changes as standards develop and are adopted.
Public Sector financial accounting standards continue to evolve nationally and internationally. British Columbia remains committed to leading the development of consistent, principle based policies which are both relevant and reliable, and strive to better inform users of the government’s financial statements.
As a result of the province’s full compliance with GAAP, British Columbia continues to lead the country in terms of the organizations it includes in its reporting entity. As stated in previous years, we will continue to monitor the practices of other senior governments to determine if universities should be considered part of government in the long term. This year, there have been no significant changes to the reporting entity. There is a complete listing of the reporting entity for government on pages 71 –73.
Accounting policies are reviewed each year for continued relevance and consistency with GAAP. As GAAP changes, the province must change its policies accordingly. There have been no changes to the province’s accounting policies this year. The Province has chosen early adoption of the new disclosure guidance in the area of Asset Retirement Obligations to inform users of the future costs associated with using capital assets to deliver programs and services. Accounting policy and format changes are made in consultation with the independent Accounting Policy Advisory Committee created under the Budget Transparency and Accountability Act in 2001.
British Columbia continues to be a leader in budgeting and financial reporting based on the comparability of its Estimates and Public Accounts and the focus on “one bottom line”; that is, the Summary Financial Statements of the province. We will continue to change as accounting standards evolve and respond to the changing needs of the legislature and our financial statement readers. British Columbia’s open and transparent financial reporting has played a significant part in the decision by certain major credit rating agencies to once again increase the credit rating of the province.
I would like to thank the Select Standing Committee on Public Accounts of the Legislative Assembly, government ministries, Crown corporations, agencies, the SUCH sector and the Auditor General and his staff for their cooperation and support in preparing the 2006/07 Public Accounts. I would also like to acknowledge the dedication of staff of the Office of the Comptroller General—specifically, the Financial Reporting and Advisory Services Branch, who prepared the Public Accounts and supporting documents. The efforts of all participants were critical in an early completion date comparable with the best practitioners in Canada.
Comments or questions regarding the Public Accounts documents are encouraged and much appreciated. Please direct your comments or questions to me by mail at PO Box 9413 STN PROV GOVT, Victoria BC V8W 9V1; e–mail at: Cheryl.WenezenkiYolland@gov.bc.ca; or, by telephone at 250 387–6692, fax at 250 356–2001.
| CHERYL WENEZENKI–YOLLAND |
| Comptroller General |
PROVINCE OF BRITISH COLUMBIA
PUBLIC ACCOUNTS 2006/07
Contents | | |
| | |
Overview (Unaudited) | | |
| | |
Public Accounts Content | | 9 |
| | |
Legislative Compliance and Accounting Policy Report | | 10 |
| | |
Financial Statement Discussion and Analysis Report | | 11 |
Highlights | | 11 |
Discussion and Analysis | | 13 |
| | |
Summary Financial Statements | | |
| | |
Statement of Responsibility for the Summary Financial Statements of the Government of the Province of British Columbia | | 29 |
Report of the Auditor General of British Columbia | | 31 |
Consolidated Statement of Financial Position | | 33 |
Consolidated Statement of Operations | | 34 |
Consolidated Statement of Change in Net Liabilities | | 35 |
Consolidated Statement of Cash Flow | | 36 |
Notes to Consolidated Summary Financial Statements | | 37 |
Reporting Entity | | 70 |
Consolidated Statement of Financial Position by Sector | | 73 |
Consolidated Statement of Operations by Sector | | 77 |
Statement of Financial Position for Self–supported Crown Corporations and Agencies | | 81 |
Summary of Results of Operations and Statement of Equity for Self–supported Crown Corporations and Agencies | | 82 |
Consolidated Statement of Tangible Capital Assets | | 83 |
Consolidated Statement of Guaranteed Debt | | 84 |
| | |
Supplementary Information (Unaudited) | | |
| | |
Adjusted Net Income of Crown Corporations, Agencies and the SUCH Sector | | 88 |
SUCH Statement of Financial Position | | 91 |
SUCH Statement of Operations | | 93 |
Consolidated Staff Utilization | | 94 |
| | |
Consolidated Revenue Fund Extracts (Unaudited) | | |
| | |
Statement of Operations | | 98 |
Schedule of Net Revenue by Source | | 99 |
Schedule of Comparison of Estimated Expenses to Actual Expenses | | 101 |
Schedule of Financing Transaction Disbursements | | 103 |
Schedule of Write–offs, Extinguishments and Remissions | | 104 |
| | |
Provincial Debt Summary | | |
| | |
Overview of Provincial Debt (Unaudited) | | 108 |
Provincial Debt (Unaudited) | | 109 |
Change in Provincial Debt (Unaudited) | | 110 |
Reconciliation of Summary Financial Statements’ Surplus to Change in Taxpayer– supported Debt and Total Debt (Unaudited) | | 111 |
Reconciliation of Total Debt to the Summary Financial Statements Debt (Unaudited) | | 111 |
Change in Provincial Debt, Comparison to Budget (Unaudited) | | 112 |
Interprovincial Comparison of Taxpayer–supported Debt as a Percentage of Gross Domestic Product (Unaudited) | | 113 |
Interprovincial Comparison of Taxpayer–supported Debt Service Costs as a Percentage of Revenue (Unaudited) | | 114 |
Report of the Auditor General of British Columbia on the Summary of Provincial Debt, Key Indicators of Provincial Debt, and Summary of Performance Measures | | 116 |
Summary of Provincial Debt | | 118 |
Key Indicators of Provincial Debt | | 119 |
Summary of Performance Measures | | 120 |
| | |
Definitions (Unaudited) | | 121 |
| | |
Acronyms (Unaudited) | | 124 |
Public Accounts Content
Financial Statement Discussion and Analysis (Unaudited)—this section provides a written commentary on the Summary Financial Statements plus additional information on the financial performance of the provincial government.
Summary Financial Statements—these audited statements have been prepared to disclose the financial impact of the government’s activities. They aggregate the Consolidated Revenue Fund (CRF), the taxpayer–supported Crown corporations and agencies (government organizations), the self–supported Crown corporations and agencies (government enterprises) and the school districts, universities, colleges, institutes and health organizations (SUCH) sector.
Supplementary Information (Unaudited)—this section provides supplementary schedules containing detailed information on the results of those Crown corporations and agencies that are part of the government reporting entity and the impact of the SUCH sector on the province’s financial statements.
Consolidated Revenue Fund Extracts (Unaudited)—the CRF reflects the core operations of the province as represented by the operations of government ministries and legislative offices. Its statements are included in an abridged form. The CRF Extracts include a summary of the CRF operating result, a schedule of net revenue by source, a schedule of expenses, a schedule of financing transactions, and a schedule of write–offs, extinguishments and remissions, as required by statute.
Provincial Debt Summary–this section presents unaudited schedules and unaudited statements that provide further details on provincial debt and reconcile the Summary Financial Statements debt to the province’s total debt. Also included are the audited Summary of Provincial Debt, Key Indicators of Provincial Debt and Summary of Performance Measures.
This publication is available on the Internet at: www.fin.gov.bc.ca
Additional Information Available (Unaudited)
The following information is available only on the Internet at: www.fin.gov.bc.ca
Consolidated Revenue Fund Supplementary Schedules—this section contains schedules that provide details of financial activities of the CRF, including details of expenses by ministerial appropriations, an analysis of statutory appropriations, Special Accounts and Special Fund balances and operating statements, and financing transactions.
Consolidated Revenue Fund Detailed Schedules of Payments—this section contains detailed schedules of salaries, wages, travel expenses, grants and other payments.
Financial Statements of Government Organizations and Enterprises—this section contains links to the audited financial statements of those Crown corporations, agencies and SUCH sector entities that are included in the government reporting entity.
Summaries of Financial Statements of Corporations and Agencies to which the Financial Information Act applies—this section contains summaries of the financial statements of corporations, associations, boards, commissions, societies and public bodies required to report under the Financial Information Act (R.S.B.C. 1996, chap. 140, sec. 2).
9
Legislative Compliance and Accounting Policy Report
The focus of the province’s financial reporting is the Summary Financial Statements, which consolidate the operating and financial results of the province’s Crown corporations, agencies, school districts, universities, colleges, institutes and health organizations with the Consolidated Revenue Fund. These are general–purpose statements designed to meet, to the extent possible, the information needs of a variety of users.
The Public Accounts are prepared in accordance with the Financial Administration Act and the Budget Transparency and Accountability Act (BTAA).
The BTAA was amended in 2001 with the passing of Bill 5. Under section 20 of that Bill, the government has mandated that “all accounting policies and practices applicable to documents required to be made public under this Act for the government reporting entity must conform to generally accepted accounting principles.”
For senior governments, generally accepted accounting principles (GAAP) is generally considered to be the recommendations and guidelines of the Public Sector Accounting Board of the Canadian Institute of Chartered Accountants.
Section 4.1 of the BTAA established an Accounting Policy Advisory Committee (APAC) to advise Treasury Board on the implementation of GAAP for the government reporting entity (GRE). With the government’s transition to full GAAP for the 2004/05 year, the role of APAC changed to include the provision of advice on evolving developments in accounting standards by the accounting profession as well as emerging issues within government.
10
Financial Statement Discussion and Analysis Report
Highlights
The highlights section provides a summary of the key events affecting the financial statements.
The information contained within this section is taken from the Summary Financial Statements on pages 33–85. The budget figures are from pages 3–7 of the Estimates—Fiscal Year Ending March 31, 2007.
• The province ended the year with a surplus of $4,056 million. Taxation revenue increased by $1,589 million due to strong economic activity and personal income growth. There were also increases in one time transfers from the federal government ($561 million ) and increased earnings of self–supported Crown corporations ($465 million).
• 2006/07 also saw record investment in the infrastructure required to meet the needs of a growing economy and ensure that infrastructure is available to support current and future requirements for social programs. Total capital spending of $3,366 million, reduced by annual amortization and disposals totaling $1,496 million resulted in a net increase in infrastructure assets of $1,870 million.
• The surplus also provided for the reduction of total provincial debt by $1,038 million. The cumulative reduction in total debt in the four years since 2003/04 is $4,388 million. As reported in the financial statements (gross of sinking funds, guarantees and the direct debt of self–supported Crown corporations), debt was reduced by $1,309 million.
• In calendar year 2006 the province experienced strong economic growth of 3.6%, the second highest rate of growth among Canadian provinces.
• The financial statements of the province of British Columbia fully comply with generally accepted accounting principles for the public sector and received an unqualified audit opinion from the Office of the Auditor General.
• Recognizing governments commitment to sound financial management the province has received upgrades from all three major credit rating agencies. Dominion Bond Rating Service upgraded the province’s rating to AA (high). Standard & Poor’s and Moody’s Investors Services Inc. upgraded their ratings to AAA and Aaa respectively, their highest possible ratings.
11
Economic Highlights
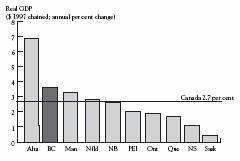
British Columbia’s economy grew by 3.6% in calendar 2006, the second strongest growth among provinces and above the national average of 2.7%, according to preliminary results from Statistics Canada. The estimated 3.6% growth last year exceeds government’s February 2006 budget forecast of 3.3%.
Real Gross Domestic Product in Calendar Year 2006
Economic growth in British Columbia was fuelled by robust domestic activity in 2006. Real business investment grew by 9.5%, with growth in both residential construction (6.6%), non–residential construction (9.2%) and machinery and equipment investment (14.9%). Real consumer spending, which accounts for about two–thirds of all economic activity in the province, grew by 5.3% in 2006.
Despite the continued rise of the Canadian dollar against the US dollar in 2006, total exports of goods and services grew by 2.4%. Imports of goods and services from other countries and other provinces grew by 6.3% in 2006.
Provincial Comparison
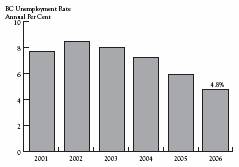
Unemployment Rate in Calendar Year 2006
British Columbia’s economic growth was accompanied by a marked drop in the annual unemployment rate to 4.8% (the lowest in 30 years) and strong labour income growth of 8.2%.
2001 to 2006
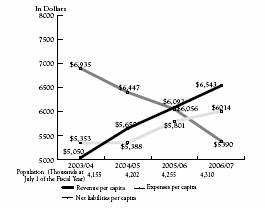
Per Capita Information
Per capita information indicates the amount of revenue received, amounts expended, and net liabilities incurred per person in the province.
2003/04 to 2006/07
12
Discussion and Analysis
The detailed analysis section provides an overview of significant trends relating to the statement of operations, statement of financial position and the provincial debt.
Summary Accounts Surplus (Deficit)
| | In Millions | | Variance | |
| | | | | | | | 2006/07 | | 2006/07 | |
| | 2006/07 | | 2006/07 | | 2005/06 | | Actual | | vs | |
| | Budget | | Actual | | Actual | | to Budget | | 2005/06 | |
| | $ | | $ | | $ | | $ | | $ | |
Taxpayer–supported Programs and Agencies | | | | | | | | | | | |
Revenue | | 33,393 | | 35,819 | | 33,753 | | 2,426 | | 2,066 | |
Expense | | (33,914 | ) | (34,448 | ) | (32,883 | ) | (534 | ) | (1,565 | ) |
Taxpayer–supported net earnings | | (521 | ) | 1,371 | | 870 | | 1,892 | | 501 | |
Self–supported Crown corporation net earnings | | 1,971 | | 2,685 | | 2,220 | | 714 | | 465 | |
Surplus (deficit) before unusual items | | 1,450 | | 4,056 | | 3,090 | | 2,606 | | 966 | |
Forecast allowance | | (850 | ) | | | | | 850 | | 0 | |
Surplus (deficit) for the year | | 600 | | 4,056 | | 3,090 | | 3,456 | | 966 | |
The province ended the year with a surplus of $4,056 million, $3,456 million higher than budget, reflecting robust economic performance, higher than anticipated federal transfers and earnings from self-supported Crown corporations. Compared to the previous year, the 2006/07 results were $966 million higher.
The higher than expected surplus over the last few years has allowed the province to invest in infrastructure while reducing provincial debt. The 2006/07 surplus of $4,056 million resulted in a net annual investment in infrastructure of $1,870 million, made up of gross capital spending of $3,366 million less amortization and disposals of $1,496 million, and a reduction in total financial statement debt of $1,309 million. The $3,090 million surplus in 2005/06 and the $4,056 million surplus in 2006/07 helped finance these projects:
• $1.66 billion for post–secondary facilities including the North Cariboo Community Campus in Quesnel, and the University of Victoria’s Engineering and Computer Science Building
• $0.61 billion for the K–12 school system including Pacific Heights Elementary school in Surrey and L’Ecole Victor Brodeur in Esquimalt
• $1.61 billion for health facilities and equipment including the Mental Health Building for Children at BC Children’s and Women’s Hospitals and cancer treatment vaults at the BC Cancer Agency’s Vancouver Centre
• $1.53 billion for roads and bridges including the Cariboo connector program, Kicking Horse Canyon Phase I and the Yoho bridge
BC will continue to invest in building and upgrading schools, universities, colleges, hospitals, roads and bridges to meet the needs of a growing economy.
Analysis of the provinces surplus also identifies risks to continued strong performances in future periods. Volatility in sources of revenue, particularly natural resources revenue, indicates that higher than expected revenues cannot be counted on in future periods. Changing demographics and a tightening labour market pose a risk to increasing GDP and an increasing tax base. Dependence on one time transfers from the Federal Government is also a risk that must be monitored closely. Mitigating these risks is the moderate rate of increase in operating expenses to ensure sustainability in the future.
13
Components of Surplus (deficit)
Revenue Analysis
Revenue analysis helps users understand the government’s finances in terms of its revenue sources and to evaluate the revenue–producing capacity of the government.
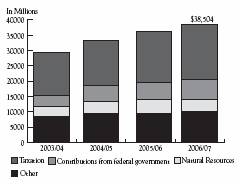
Revenue by Source
Revenue by source provides an outline of the primary sources of provincial revenue and changes between sources over time. Revenues are broken down into separate components of taxation; contributions from the federal government; natural resources and other sources, which includes contributions from self-supported Crown corporations, fees and licenses, and investment income.
| | | | In Millions | | | |
| | 2003/04 | | 2004/05 | | 2005/06 | | 2006/07 | |
| | Actual | | Actual | | Actual | | Actual | |
| | $ | | $ | | $ | | $ | |
Taxation | | 13,830 | | 14,917 | | 16,429 | | 18,018 | |
Contributions from federal government | | 3,619 | | 5,222 | | 5,825 | | 6,386 | |
Natural resources | | 3,309 | | 3,973 | | 4,567 | | 3,982 | |
Fees and licences | | 3,531 | | 3,621 | | 3,666 | | 3,791 | |
Miscellaneous | | 1,968 | | 2,240 | | 2,317 | | 2,610 | |
Net earnings of self-supported Crown corporations | | 1,955 | | 2,562 | | 2,220 | | 2,685 | |
Investment income | | 950 | | 833 | | 949 | | 1,032 | |
Total revenue | | 29,162 | | 33,368 | | 35,973 | | 38,504 | |
The province has experienced steady growth in revenues over the last four years. This growth is mainly due to strong economic performance, resulting in increased tax revenue. Federal contributions have also increased as a proportion of total revenues. Natural resource revenues have decreased in 2006/07 reversing a trend over the past several years due to a decline in natural gas prices. Average prices declined 29% in 2006/07 while volumes declined 1%.
2003/04 to 2006/07
In 2006/07 tax revenue increased by $1,589 million (10%) over the prior year and $4,188 million (30%) since 2003/04. Personal income tax, social services tax, property transfer tax and corporate income tax all increased over the previous year. The most significant increase was in personal income tax which increased by $1,067 million over 2005/06. The increase in tax revenue is a result of strong economic activity including personal and labour income growth.
Contributions from the federal government increased in 2006/07 by $561 million (10%) from 2005/06 mainly reflecting the one time payment received from the federal government to fund capital projects in British Columbia. The trend in federal government transfers has been increasing steadily since 2003/04, but one time grants based on federal surpluses may not be available in future years.
14
Natural resources revenues decreased in 2006/07 by $585 million (13%) from 2005/06 due to a decline in natural gas prices. The decrease is mostly attributable to declining natural gas royalties, which was offset by higher forestry revenues derived from the Softwood Lumber Export Tax, and higher metal prices. Natural resource revenues are volatile because they are subject to fluctuation in commodity prices.
Commercial Crown corporation income increased in 2006/07 by $465 million (21%). The increase in 2006/07 resulted from an increase in British Columbia Hydro and Power Authority’s (BC Hydro) income due to lower energy costs; the Insurance Corporation of British Columbia (ICBC) experiencing lower claim costs and higher premium revenue; and stronger casino revenues in the British Columbia Lottery Corporation (BCLC ).
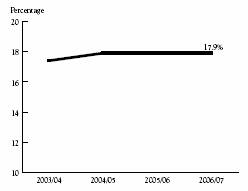
Own–source Revenue to GDP
The ratio of own–source revenue to GDP represents the amount of income government is taking from the whole provincial economy in the form of taxation, natural resource revenues, user fees and sales (own–source revenue is all revenue except for federal transfers). Own–source revenue to GDP has remained constant around 18% for the last four years. This indicates the government has not increased the proportion received from the economy to meet its obligations and fund increases to social programs and infrastructure.
2003/04 to 2006/07
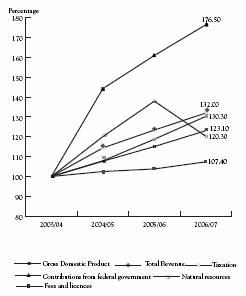
Percentage Change in Revenue
Trend analysis of revenue provides users with information about significant changes in revenue over time and between sources, enabling users to evaluate past performance and assess potential implications for the future.
Increases in total taxation revenue have been consistent with the change in gross domestic product (GDP). Fees and licences have remained steady over the last four years while natural resources have shown significant increases over two years with the current year decline reflecting a decrease in natural gas royalties. Federal transfers revenue have exceeded GDP growth over the last three years indicating an increased share of federal surplus being invested in provincial programs and infrastructure.
2003/04 to 2006/07
15
Natural Resources Revenue
Natural resource revenues are among the most volatile revenue sources for the province because they are vulnerable to market fluctuations in commodity prices.
The increasing trend in natural resource revenue from 2003/04 to 2005/06 reversed in 2006/07 as a result of a decrease in natural gas prices. Natural gas royalties decreased $714 million over 2005/06 which was offset by increases in royalties for minerals and energy and increased revenues from the Softwood Lumber Export Tax. The proportion of natural resource revenue attributable to natural gas royalties has decreased from 42% to 30% in the year.
2003/04 to 2006/07

Government–to–Government Transfers to Total Revenue
The ratio of government–to–government transfers to total revenue indicates the vulnerability of the province to changes in transfers from the federal government. The increase in the proportion of federal government transfers to total revenue outlines an increasing dependence on federal government transfers to fund provincial programs and investment in infrastructure.
The significant increase in 2004/05 reflects equalization program adjustments to the 2003/04 fiscal year. Smaller increases in subsequent years represent one time payments to fund specific provincial programs and infrastructure investments.
2003/04 to 2006/07
16
Expense Analysis
The following analysis helps users understand the impact of the government’s spending on the economy, the government’s allocation and use of resources, and the cost of government programs.
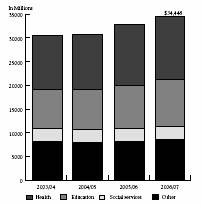
Expense by Function
Expense by function provides a summary of the major areas of government spending, and changes in spending over time. Functions are broken down into separate components of health, education, social services, which make up 75% of the province’s total operating expense, and other functions which includes interest, other, natural resources and economic development, protection of persons and property, transportation, and general government.
| | In Millions | |
| | 2003/04 | | 2004/05 | | 2005/06 | | 2006/07 | |
| | Actual | | Actual | | Actual | | Actual | |
| | $ | | $ | | $ | | $ | |
Health | | 11,250 | | 11,529 | | 12,838 | | 13,253 | |
Education | | 8,237 | | 8,512 | | 9,047 | | 9,774 | |
Social services | | 2,753 | | 2,598 | | 2,798 | | 2,892 | |
Interest | | 2,437 | | 2,294 | | 2,181 | | 2,234 | |
Other | | 1,075 | | 1,027 | | 1,094 | | 1,278 | |
Natural resources and economic development | | 1,631 | | 1,686 | | 1,630 | | 1,664 | |
Protection of persons and property | | 1,364 | | 1,206 | | 1,416 | | 1,334 | |
Transportation | | 1,120 | | 1,308 | | 1,203 | | 1,251 | |
General government | | 490 | | 505 | | 676 | | 768 | |
Total operating expense | | 30,357 | | 30,665 | | 32,883 | | 34,448 | |
Restructuring exit expense | | 123 | | | | | | | |
Total expense | | 30,480 | | 30,665 | | 32,883 | | 34,448 | |
Government spending has increased moderately since 2003/04 in line with affordability. Expenses have increased by 5% in 2006/07 while revenues increased by 10% in the same period, and GDP by 3.6%. The main increases in spending relate to increased wages and operating expense in the health sector, which were paid for partially from the funding received from the federal government; increased education funding reflecting post–secondary seat expansion; and increased funding to school districts.
2003/04 to 2006/07
In 2006/07, provincial operating expense totaled $34,448 million, a $1,565 million (5%) increase over 2005/06 operating expense and a $3,968 million (13%) increase over 2003/04. Health expense increased due to increases in salaries, operational costs and additional staffing. An increase of $727 million (8%) in education expense reflects the increase in salaries for schools, universities and colleges, including teacher and support staff bonuses; operating costs related to new research facilities for universities; increased staffing to fund smaller class sizes in schools and 4,394 new student spaces for colleges and universities. Social services costs increased $94 million from 2005/06 as a result of increased funding for social programs.
Other expenses have increased by $184 million over 2005/06; including additional spending on the 2010 Olympic venues and increased grant expense of BC Housing Management Commission.
17
Expense To GDP
The ratio of expense to GDP represents the amount of government spending in relation to the overall provincial economy. Government spending, as a percentage of GDP decreased slightly in 2006/07, after remaining constant from 2004/05 to 2005/06. This indicates that the economy is growing faster than spending in the province’s health, education and social services sectors.
2003/04 to 2006/07

Changes in Actual Results from 2005/06 to 2006/07
| | In Millions | |
| | Revenue | | Expense | | Surplus | |
| | $ | | $ | | $ | |
2005/06 Surplus | | 35,973 | | 32,883 | | 3,090 | |
Increase in taxation revenue | | 1,589 | | | | 1,589 | |
Increase in federal contributions | | 561 | | | | 561 | |
Decrease in natural resources revenue | | (585 | ) | | | (585 | ) |
Net increase in other revenue | | 501 | | | | 501 | |
Increase in self-supported Crown corporation net earnings | | 465 | | | | 465 | |
Increase in health expense | | | | 415 | | (415 | ) |
Increase in education expense | | | | 727 | | (727 | ) |
Increase in general government expense | | | | 92 | | (92 | ) |
Increase in other expenses | | | | 331 | | (331 | ) |
Subtotal of changes in actual results | | 2,531 | | 1,565 | | 966 | |
| | 38,504 | | 34,448 | | | |
2006/07 Surplus | | | | | | 4,056 | |
| | | | | | | |
2005/06 Accumulated (Deficit) | | | | | | (167 | ) |
Other comprehensive income from self-supported Crown corporation and agencies | | | | | | 447 | |
2006/07 Accumulated Surplus | | | | | | 4,336 | |
Revenue increased by $2,531 million or 7% over 2005/06 due to the increases in taxation revenue and federal transfers, as well as increases from BC Hydro, and other self–supported Crown corporations earnings. These increases were partly offset by the decline in natural gas revenues due to lower prices. Federal government contributions increased $561 million from 2005/06 due to British Columbia’s share of health transfers under the First Ministers’ Accord and a one time capital transfer of $408 million related to post secondary education, public transit, affordable housing and off–reserve housing. The increase in federal government transfers was partially offset by a decrease in equalization entitlements.
18
Personal and corporate income tax revenue rose by $1,179 million in the year. Personal income tax revenue increased by $1,067 over prior year due to a higher 2005 tax base, reflecting stronger growth in 2005 and 2006. Corporate income tax revenues increased due to improved economic conditions offset by lower instalments from the federal government as a result of lower growth in 2006 national corporate profits. The growth in personal and business incomes in 2006 combined with strong demand for residential and commercial property led to an increase of $410 million in other taxation revenues –mainly social service and property transfer taxes.
The $585 million decrease in natural resources revenue was due to a decline in natural gas royalties and lower market prices for electricity as a result of lower natural gas prices, plenty of water in the Pacific Northwest and low demand. This was offset by $156 million received under the Softwood Lumber Agreement 2006 border tax, and higher than anticipated mineral and metal prices. Revenue increases also included a $465 million increase in commercial Crown corporation net income. BC Hydro, ICBC and BCLC all experienced improvements in net income.
Expenses increased $1,565 million (5%) from 2005/06 in part due to an increase in salaries resulting from contract negotiations in 2006, increased spending on healthcare, education, and higher forest fire fighting costs.
Changes from 2006/07 Budget
| | In Millions | |
| | | | | | Forecast | | | |
| | Revenue | | Expense | | Allowance | | Surplus | |
| | $ | | $ | | $ | | $ | |
Surplus per Budget February 2006 | | 35,364 | | 33,914 | | (850 | ) | 600 | |
Increase in taxation revenue | | 1,800 | | | | | | 1,800 | |
Decreased natural resource revenue | | (870 | ) | | | | | (870 | ) |
Increased self–supported Crown corporations earnings | | 714 | | | | | | 714 | |
Increased investment earnings | | 213 | | | | | | 213 | |
Increased federal transfers | | 657 | | | | | | 657 | |
Increased other revenues | | 626 | | | | | | 626 | |
Interest savings | | | | (70 | ) | | | 70 | |
Negotiating framework incentives | | | | 264 | | | | (264 | ) |
Program spending | | | | 340 | | | | (340 | ) |
Unused forecast allowance | | | | | | 850 | | 850 | |
Subtotal of changes in actual results compared to budget | | 3,140 | | 534 | | 850 | | 3,456 | |
Actual Results | | 38,504 | | 34,448 | | 0 | | 4,056 | |
Revenue was $3,140 million (9%) higher than budget due to the effects of robust economic performance, income growth, increased earnings from self–supported Crown corporations, and increased federal transfers due to a one time transfer of infrastructure funding.
Revenue from personal and corporate income taxes was $1,259 million higher than budget, of which $684 million represented better than expected 2005 tax return results. Increases in other taxation revenues, including social service tax revenue and property transfer tax are indicators of increased consumer spending and a strong housing market.
19
Natural resource revenue was $870 million lower than budget reflecting lower gas prices. This was offset by an increase in Softwood Lumber Border Tax. Improvements over budget in earnings from self—supported Crowns are mainly derived from: higher premiums and rate increases on basic insurance from Insurance Corporation of British Columbia and higher earnings of BC Hydro resulting from lower energy costs and the inclusion of regulatory transfers in income. The increase in federal transfers included a one time payment to fund capital projects in British Columbia of $408 million.
Expenses were $534 million higher than budget including $264 million dollars spent under the incentive payments for contracts negotiated before their expiry date in 2006/07. Increased expense of $340 million in other programs was offset by interest costs being $70 million below budget.
The forecast allowance was not used as a result of the increased revenues over budget which is indicative of British Columbia’s strong and robust economy.
Net Liabilities and Accumulated Surplus (Deficit)
Analysis of net liabilities and accumulated surplus provides users with information to assess the government’s overall financial position. Net liabilities are the amounts repayable by government before financing future operations.
In accordance with Canadian generally accepted accounting principles, the government’s statement of financial position is presented on a net liabilities basis. Net liabilities represent the difference between a government’s financial assets and its liabilities and is a measure of the future revenue required to pay for past transactions and events.
| | In Millions | | Variance | |
| | | | | | | | 2006/07 | | 2006/07 | |
| | 2006/07 | | 2006/07 | | 2005/06 | | Actual | | vs | |
| | Budget | | Actual | | Actual | | to Budget | | 2005/06 | |
| | $ | | $ | | $ | | $ | | $ | |
Financial assets | | 24,285 | | 26,585 | | 25,260 | | 2,300 | | 1,325 | |
Less: liabilities | | (53,051 | ) | (49,818 | ) | (51,030 | ) | (3,233 | ) | (1,212 | ) |
| | | | | | | | | | | |
Net Liabilities | | (28,766 | ) | (23,233 | ) | (25,770 | ) | (5,533 | ) | (2,537 | ) |
Less: non–financial assets | | 27,797 | | 27,569 | | 25,603 | | (228 | ) | 1,966 | |
Accumulated surplus (deficit) | | (969 | ) | 4,336 | | (167 | ) | (5,305 | ) | (4,503 | ) |
The accumulated surplus (deficit) represents the sum of the current and prior years’ operating results. At March 31, 2007, the accumulated surplus totaled $4,336 million, $5,305 million higher than budget due to a higher than forecast surplus. The $4,503 million change from deficit to surplus from the previous year reflects the 2006/07 operating surplus plus other comprehensive income of self–supported Crown corporations.
Financial assets ended the year $2,300 million higher than budget including a $1,166 million increase in cash and temporary investments, a $732 million increase in other financial assets and accounts receivable, a $837 million increase in equity in self–supported Crown, offset by a $435 million reduction in recoverable capital loans. Liabilities were $3,233 million lower than budget and $1,212 million less than the prior year, primarily due to a reduction in taxpayer–supported debt. Other changes from budget reflect the forecast allowance that was not required, and changes in deferred revenue and self–supported debt.
Non–financial assets typically represent resources that the government can use in the future to provide services, such as tangible capital assets. Non–financial assets increased by $1,966 million over the prior year due to the government’s increased capital investment in the post–secondary education, health facilities and transportation sectors.
20
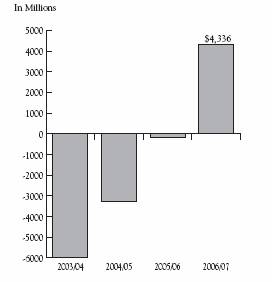
Accumulated Surplus (Deficit)
The accumulated deficit has been eliminated this fiscal year providing a strong and stable economic future for British Columbians. The province has reduced the accumulated deficit by $10,296 million over the last four years as a result of the growing economy and sound fiscal management.
The accumulated surplus (deficit) represents the sum of the current and all prior years’ operating results. As at March 31, 2007 the accumulated surplus totaled $4,336 million.
2003/04 to 2006/07
Components of Net Liabilities
Financial Assets
Analysis of financial assets provides users with information regarding the amount of resources available to the government that can be converted to cash if required to meet obligations.
| | In Millions | |
| | 2003/04 | | 2004/05 | | 2005/06 | | 2006/07 | |
| | Actual | | Actual | | Actual | | Actual | |
| | $ | | $ | | $ | | $ | |
Cash, cash equivalents and temporary investments | | 2,690 | | 3,583 | | 3,869 | | 3,367 | |
Accounts receivable | | 2,792 | | 2,607 | | 2,564 | | 2,842 | |
Equity in self-supported Crown corporations and agencies | | 3,020 | | 3,168 | | 3,448 | | 4,396 | |
Loans for purchases of assets recoverable from agencies | | 7,512 | | 6,901 | | 6,916 | | 7,170 | |
Other financial assets | | 8,120 | | 8,527 | | 8,463 | | 8,810 | |
Total financial assets | | 24,134 | | 24,786 | | 25,260 | | 26,585 | |
In 2006/07, financial assets increased by $1,325 million. The main areas resulting in the increase were the investment in self-supported Crown corporations of $948 million, which relates to the increase in earnings from self-supported Crown corporations and an increase in loans for purchase of assets recoverable from agencies of $254 million. Cash, cash equivalents and temporary investments decreased by $502 million in the year.
21
Liabilities
Analysis of liabilities provides users with information to understand and assess the demands on financial assets.
| | In Millions | |
| | 2003/04 | | 2004/05 | | 2005/06 | | 2006/07 | |
| | Actual | | Actual | | Actual | | Actual | |
| | $ | | $ | | $ | | $ | |
Taxpayer-supported debt | | 33,386 | | 32,018 | | 30,289 | | 28,841 | |
Self-supported debt | | 8,555 | | 7,889 | | 7,758 | | 7,897 | |
Total financial statement debt | | 41,941 | | 39,907 | | 38,047 | | 36,738 | |
Accounts payable and other liabilities | | 7,007 | | 6,788 | | 7,289 | | 7,094 | |
Deferred revenue | | 4,003 | | 5,181 | | 5,694 | | 5,986 | |
Total liabilities | | 52,951 | | 51,876 | | 51,030 | | 49,818 | |
Total financial statement debt decreased $1,309 million from 2005/06 and is $5,203 million lower than 2003/04. The decrease in debt is due to government’s continuing operating surplus and reduced working capital requirements. Information relating to the government’s debt management can be found in more detail in the analysis of the total provincial debt on page 24.
Non-financial Assets
Analysis of non-financial assets provides users with information to assess the management of a government’s infrastructure and long-term non-financial assets.
| | In Millions | |
| | 2003/04 | | 2004/05 | | 2005/06 | | 2006/07 | |
| | Actual | | Actual | | Actual | | Actual | |
| | $ | | $ | | $ | | $ | |
Tangible capital assets | | 22,316 | | 23,219 | | 24,756 | | 26,626 | |
Other assets | | 541 | | 614 | | 847 | | 943 | |
Total non-financial assets | | 22,857 | | 23,833 | | 25,603 | | 27,569 | |
Management of non-financial assets has a direct impact on the level and quality of services a government is able to provide to its constituents. Non-financial assets typically represent resources that government can use in the future to provide services. At March 31, 2007, non-financial assets totaled $27,569 million which was $1,966 million higher than 2005/06 and $4,712 million higher than 2003/04. The majority of the province’s non-financial assets reflects capital expenditures for tangible capital assets. The government has increased its investment in tangible capital assets by $1,870 million in 2006/07, $1,537 million in 2005/06, $903 million in 2004/05, and $610 million in 2003/04 to ensure service potential in future periods.
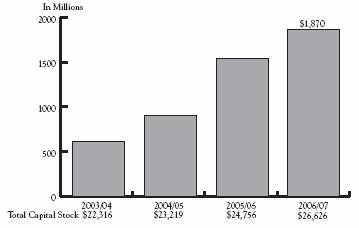
Change in Capital Stock
This measure shows the impact of net changes to the governments stock of physical capital. An increasing trend demonstrates investment in infrastructure to provide service potential in future periods. The net value of total assets is also provided to allow users to assess the significance of annual changes.
Net annual investment increased by $1,870 million in 2006/07 and by $4,920 million since 2003/04. Total capital stock has also increased steadily over that period demonstrating that capital infrastructure is available to provide service in future periods
2003/04 to 2006/07
22
Net Liabilities and Accumulated Surplus(Deficit)
| | In Millions | |
| | 2003/04 | | 2004/05 | | 2005/06 | | 2006/07 | |
| | Actual | | Actual | | Actual | | Actual | |
| | $ | | $ | | $ | | $ | |
Financial assets | | 24,134 | | 24,786 | | 25,260 | | 26,585 | |
Less: liabilities | | (52,951 | ) | (51,876 | ) | (51,030 | ) | (49,818 | ) |
| | | | | | | | | |
Net liabilities | | (28,817 | ) | (27,090 | ) | (25,770 | ) | (23,233 | ) |
Less: non-financial assets | | 22,857 | | 23,833 | | 25,603 | | 27,569 | |
Accumulated surplus (deficit) | | (5,960 | ) | (3,257 | ) | (167 | ) | 4,336 | |
Net liabilities have decreased consistently each year since 2003/04. The accumulated surplus totaling $4,336 million is a $4,503 million increase from the previous year and $10,296 million increase since 2003/04. Although the province continues to invest in capital infrastructure, successive surpluses have meant these investments did not require additional borrowing.
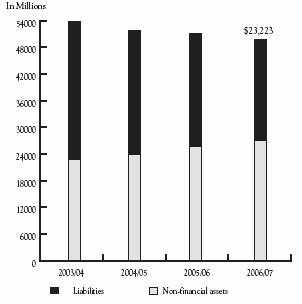
Change in Net Liabilities
Improvement in the net liabilities position provides capacity for increased capital infrastructure investment.
Net liabilities have declined steadily over the last three years and the province moved from a deficit to a surplus in 2006/07. However, the relationship between net liabilities and non-financial assets has changed significantly. Between fiscal years 2003/04 and 2006/07, a greater proportion of liabilities have arisen from government’s investment in infrastructure projects offset by the decline in the province’s accumulated operating deficit. This trend is indicative of BC’s strong economy reflected in continued surpluses.
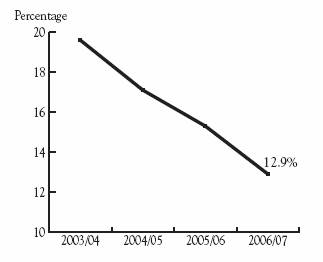
Net Liabilities to GDP
The net liabilities to GDP ratio provides an indication of the province’s ability to maintain existing programs and meet existing creditor requirements without increasing the debt burden on the economy.
The government’s net liabilities to GDP has declined consistently between 2003/04 and 2006/07, decreasing the financial burden on the provincial economy and on future taxpayers. The decrease in net liabilities to GDP indicates the province is improving its ability to sustain program spending without a negative impact on the economy.
2003/04 to 2006/07
2003/04 to 2006/07
23
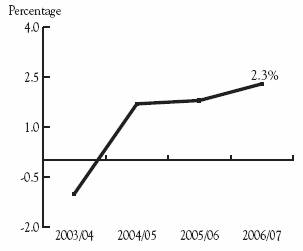
Surplus (Deficit) to GDP
The surplus (deficit) to GDP ratio is an indicator of sustainability. The consistent positive trend since 2003/04 shows that government operating requirements are decreasing at a greater rate than growth in GDP. An increasing trend means that government can maintain existing operations and reduce the debt burden or invest in infrastructure without a negative impact on the economy.
2003/04 to 2006/07
Total Provincial Debt
Analysis of total provincial debt helps users to assess the extent of long-term liabilities and the government’s ability to meet future debt obligations.
| | In Millions | |
| | 2003/04 | | 2004/05 | | 2005/06 | | 2006/07 | |
| | Actual | | Actual | | Actual | | Actual | |
| | $ | | $ | | $ | | $ | |
Gross debt | | 41,941 | | 39,907 | | 38,047 | | 36,738 | |
Less: sinking funds assets | | (4,619 | ) | (4,515 | ) | (4,059 | ) | (3,798 | ) |
Third party guarantees and non-guaranteed debt | | 413 | | 447 | | 397 | | 407 | |
Total provincial debt | | 37,735 | | 35,839 | | 34,385 | | 33,347 | |
When reporting to rating agencies, the province adds to its financial statement debt, all debt guarantees and the debt directly incurred by self-supported Crown corporations reduced by sinking fund assets. This balance is referred to as the total provincial debt.
Total provincial debt is $3,391 million lower than the amounts reported in the province’s financial statements after deducting sinking funds held to pay down the debt and the inclusion of debt guarantees and non-guaranteed debt. The debt decreased by $1,038 million in 2006/07 is primarily due to the operating surplus reducing the requirement to borrow. As at March 31, 2007, the total provincial debt was $33,347 million, $3,243 million lower than budget and $1,038 million lower than 2005/06. This includes $25,874 million of taxpayer-supported debt, which was $2,009 million lower than budget and $1,311 million lower than 2005/06.
The government is commited to maintain a downward trend in the taxpayer-supported debt to GDP ratio. A declining ratio means that debt will not grow faster than the economy, so that future generations will not be left with a debt burden that they cannot afford. The ratio of taxpayer-supported debt to GDP is a key measure used by financial analysts and investors to assess a province’s ability to repay debt and is a key measure monitored by the bond rating agencies.
24
Strong Credit Rating
Reflecting the province’s strong fiscal performance, British Columbia has received credit rating upgrades from all three credit rating agencies. In 2006/07, Moody’s Investors Service Inc. upgraded the province to Aaa (2006: Aa1); Standard and Poor’s upgraded the province to AAA (2006: AA), and Dominion Bond Rating Services upgraded the province to AA (high) (2006: AA).
Credit Ratings June 2007
Rating Agency(1)
| | Moody’s Investors | | | | Dominion Bond | |
Province | | Service Inc. | | Standard and Poor’s | | Rating Service | |
British Columbia | | Aaa | | AAA | | AA (high) | |
Alberta | | Aaa | | AAA | | AAA | |
Saskatchewan | | Aa1 | | AA | | AA(low) | |
Manitoba | | Aa1 | | AA- | | A(high | |
Ontario | | Aa1 | | AA | | AA | |
Quebec | | Aa2 | | A+ | | A(high) | |
New Brunswick | | Aa1 | | AA- | | A(high) | |
Nova Scotia | | Aa2 | | A | | A | |
Prince Edward Island | | Aa2 | | A | | A(low) | |
Newfoundland | | Aa2 | | A | | A(low) | |
Canada | | Aaa | | AAA | | AAA/AA(high) | |
(1) The rating agencies assign letter ratings to borrowers. The major categories, in descending order of credit quality, are: AAA/Aaa; AA/Aa; A; BBB/Baa; BB/Ba; and B. The “1”, “2”, “3”, “high”, “low”, “—”, and “+” modifiers show relative standing within the major categories. For example, AA+ exceeds AA.
A more comprehensive overview of provincial debt, including key debt indicators is located on pages 109.
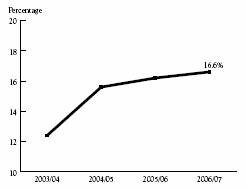
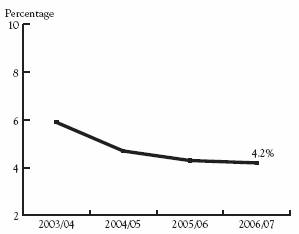
Public Debt Charges to Revenue (the Interest Bite)
The public debt charges to revenue indicator is often referred to as the “interest bite”. This provides users with the percentage of the province’s revenue used to pay interest on debt. If a decreasing proportion of provincial revenue is used to pay interest on provincial debt, more money is left to provide government services.
The interest bite has decreased over the last 3 years. In 2006/07, the province spent 4.2 cents of each revenue dollar on interest on the provincial debt.
2003/04 to 2006/07
25
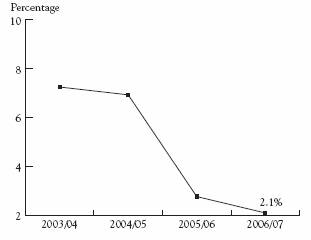
Non-Hedged Foreign Currency Debt to Total Provincial Debt
The ratio of non-hedged foreign currency debt to total provincial debt shows the degree of vulnerability of a government’s public debt position to swings in exchange rates.
Since 2003/04, the government has reduced its foreign currency debt, thereby reducing the province’s vulnerability to changes in exchange rates.
2003/04 to 2006/07
Risks and Uncertainties
The government’s main exposure to risks and uncertainties arises from variables which the government does not directly control. These include:
• economic factors such as commodity prices, personal income, retail sales, population growth, and unexpected shocks such as terrorism, avian flu and forest fires
• outcomes from litigation, arbitration and negotiations with third parties
• changes in federal transfers
• Utilization rates for government services such as health care, children and family services, or employment assistance
• exposure to interest rate fluctuations, foreign exchange rates and credit risk
• changes in generally accepted accounting principles
The following are the approximate effect of changes in some of the key variables on the surplus.
Key Fiscal Sensitivities(1)
Variable | | Increase Of | | Annual Fiscal Impact | |
| | | | ($ millions) | |
Nominal GDP | | 1% | | $150 to $250 | |
Lumber prices (US$/thousand board feet) | | $50 | | $75 to $125(2) | |
Natural gas prices (Cdn$/gigajoule) | | $1 | | $300 to $350 | |
Interest rate | | 1 percentage point | | $(90) | |
Debt | | $500 million | | $(23) | |
(1) Individual circumstances and inter-relationships between the variables may cause the actual variances to be higher or lower than the estimates shown.
(2) Sensitivity relates to stumpage revenue only. Depending on market conditions, changes in stumpage revenues may be offset by changes in border tax revenues.
Although the government is unable to directly control these variables, strategies have been implemented to mitigate these risks and uncertainties. The development of taxation, financial and corporate regulatory policy to reinforce British Columbia’s position as an attractive place to invest and create jobs will help offset the increase in competition for investment as a result of globalization of economic and financial markets. The government will continue to apply a forecast allowance in the budget to account for risks to revenue, expenditure, Crown corporation and schools, universities, colleges and health authorities (SUCH) sector forecasts. The use of forecast allowances recognizes the uncertainties in predicting future economic developments.
Risk management in relation to debt is discussed in Note 19 on page 56 of the Notes to the Consolidated Financial Statements.
26
Summary Financial Statements
Province of British Columbia
For the Fiscal Year Ended
March 31, 2007

Statement of Responsibility
for the Summary Financial Statements
of the Government of the Province of British Columbia
Responsibility for the integrity and objectivity of the Summary Financial Statements for the Government of the Province of British Columbia rests with the government. The Comptroller General prepares these financial statements in accordance with generally accepted accounting principles for senior governments as recommended by the Public Sector Accounting Board of The Canadian Institute of Chartered Accountants. The fiscal year of the government is from April 1 to March 31 of the following year.
To fulfill its accounting and reporting responsibilities, the government maintains financial management and internal control systems. These systems give due consideration to costs, benefits and risks, and are designed to provide reasonable assurance that transactions are properly authorized by the Legislative Assembly, are executed in accordance with prescribed regulations and are properly recorded. This is done to maintain accountability of public money and safeguard the assets and properties of the Province of British Columbia under government administration. The Comptroller General of British Columbia maintains the accounts of British Columbia, a centralized record of the government’s financial transactions, and obtains additional information as required from ministries, Crown corporations, agencies, school districts, universities, colleges, institutes and health organizations to meet accounting and reporting requirements.
The Auditor General of British Columbia provides an independent opinion on the financial statements prepared by the government. The duties of the Auditor General in that respect are contained in section 11 of the Auditor General Act.
Annually, the financial statements are tabled in the legislature as part of the Public Accounts, and are referred to the Select Standing Committee on Public Accounts of the Legislative Assembly. The Select Standing Committee on Public Accounts reports to the Legislative Assembly with the results of its examination and any recommendations it may have with respect to the financial statements and accompanying audit opinions.
Approved on behalf of the Government of the Province of British Columbia:

|
|
| CAROLE TAYLOR |
| Chair, Treasury Board |

| |
Report of the Auditor General
of British Columbia
| | |
| | ON THE
SUMMARY FINANCIAL STATEMENTS
OF THE GOVERNMENT OF THE
PROVINCE OF BRITISH COLUMBIA | | |
To the Legislative Assembly
of the Province of British Columbia
I have audited the summary financial statements of the Government of the Province of British Columbia consisting of the consolidated statement of financial position as at March 31, 2007, and the consolidated statements of operations, change in net liabilities, and cash flow for the year then ended. These financial statements are the responsibility of the Government. My responsibility is to express an opinion on these financial statements based on my audit.
I conducted my audit in accordance with Canadian generally accepted auditing standards. Those standards require that I plan and perform the audit to obtain reasonable assurance whether the financial statements are free of material misstatement. An audit includes examining, on a test basis, evidence supporting the amounts and disclosures in the financial statements. An audit also includes assessing the accounting principles used and significant estimates made by the Government, as well as evaluating the overall financial statement presentation.
In my opinion, these summary financial statements present fairly, in all material respects, the financial position of the Government of the Province of British Columbia as at March 31, 2007 and the results of its operations, change in net liabilities and cash flow for the year then ended, in accordance with Canadian generally accepted accounting principles.
| | 
|
Victoria, British Columbia
June 15, 2007 | | Errol Price, CA
Acting Auditor General |
Summary Financial Statements
Consolidated Statement of Financial Position
as at March 31, 2007
| | | | In Millions | |
| | Note | | 2007 | | 2006 | |
| | | | $ | | $ | |
Financial Assets | | | | | | | |
| | | | | | | |
Cash and cash equivalents | | | | 2,418 | | 2,934 | |
Temporary investments | | | | 949 | | 935 | |
Accounts receivable | | 3 | | 2,842 | | 2,564 | |
Inventories for resale | | 4 | | 75 | | 93 | |
Due from other governments | | 5 | | 881 | | 674 | |
Due from self-supported Crown corporations and agencies | | 6 | | 554 | | 443 | |
Equity in self-supported Crown corporations and agencies | | 7 | | 4,396 | | 3,448 | |
Loans, advances and mortgages receivable | | 8 | | 992 | | 951 | |
Other Investments | | 9 | | 2,510 | | 2,243 | |
Sinking fund investments | | 10 | | 3,798 | | 4,059 | |
Loans for purchase of assets, recoverable from agencies | | 11 | | 7,170 | | 6,916 | |
| | | | 26,585 | | 25,260 | |
Liabilities | | | | | | | |
| | | | | | | |
Accounts payable and accrued liabilities | | 12 | | 6,072 | | 6,230 | |
Due to other governments | | 13 | | 915 | | 913 | |
Due to Crown corporations, agencies and trust funds | | 14 | | 105 | | 144 | |
Deferred revenue | | 15 | | 5,986 | | 5,694 | |
Employee pension plans | | 16 | | 2 | | 2 | |
Taxpayer-supported debt | | 17 | | 28,841 | | 30,289 | |
Self-supported debt | | 18 | | 7,897 | | 7,758 | |
| | | | 49,818 | | 51,030 | |
Net assets (liabilities) | | 20 | | (23,233 | ) | (25,770 | ) |
| | | | | | | |
Non-financial Assets | | | | | | | |
| | | | | | | |
Tangible capital assets | | 21 | | 26,626 | | 24,756 | |
Prepaid program costs | | 22 | | 592 | | 532 | |
Other assets | | 23 | | 351 | | 315 | |
| | | | 27,569 | | 25,603 | |
Accumulated surplus (deficit) | | 24 | | 4,336 | | (167 | ) |
| | | | | | | |
Measurement uncertainty | | 2 | | | | | |
Contingencies and contractual obligations | | 25 | | | | | |
Restricted assets | | 26 | | | | | |
Significant events | | 31 | | | | | |
Subsequent events | | 34 | | | | | |
The accompanying notes and supplementary statements are an integral part of these financial statements.
Prepared in accordance with Canadian generally accepted accounting principles.
| 
| |
CHERYL WENEZENKI-YOLLAND |
Comptroller General |
33
Summary Financial Statements
Consolidated Statement of Operations
for the Fiscal Year Ended March 31, 2007
| | In Millions | |
| | 2007 | | 2006 | |
| | Estimates | | | | | |
| | (Note 32) | | Actual | | Actual | |
| | $ | | $ | | $ | |
Revenue | | | | | | | |
| | | | | | | |
Taxation (Note 27) | | 16,218 | | 18,018 | | 16,429 | |
Contributions from the federal government | | 5,729 | | 6,386 | | 5,825 | |
Natural resources | | 4,852 | | 3,982 | | 4,567 | |
Fees and licences | | 3,622 | | 3,791 | | 3,666 | |
Miscellaneous | | 2,153 | | 2,610 | | 2,317 | |
Net earnings of self-supported Crown corporations and agencies (Note 7) | | 1,971 | | 2,685 | | 2,220 | |
Investment income | | 819 | | 1,032 | | 949 | |
| | 35,364 | | 38,504 | | 35,973 | |
Expense (Note 28) | | | | | | | |
| | | | | | | |
Health | | 12,833 | | 13,253 | | 12,838 | |
Education | | 9,162 | | 9,774 | | 9,047 | |
Social services | | 3,040 | | 2,892 | | 2,798 | |
Interest | | 2,304 | | 2,234 | | 2,181 | |
Other | | 1,953 | | 1,278 | | 1,094 | |
Natural resources and economic development | | 1,483 | | 1,664 | | 1,630 | |
Protection of persons and property | | 1,301 | | 1,334 | | 1,416 | |
Transportation | | 1,173 | | 1,251 | | 1,203 | |
General government | | 665 | | 768 | | 676 | |
| | 33,914 | | 34,448 | | 32,883 | |
Surplus (deficit) for the year before unusual items | | 1,450 | | 4,056 | | 3,090 | |
Forecast allowance | | (850 | ) | | | | |
Surplus (deficit) for the year | | 600 | | 4,056 | | 3,090 | |
| | | | | | | |
Accumulated surplus (deficit)—beginning of year as restated (Note 24) | | | | (167 | ) | (3,257 | ) |
Other comprehensive income from self-supported Crown corporations and agencies (see page 83) | | | | 447 | | 0 | |
Accumulated surplus (deficit)—end of year | | | | 4,336 | | (167 | ) |
The accompanying notes and supplementary statements are an integral part of these financial statements.
34
Summary Financial Statements
Consolidated Statement of Change in Net Liabilities
for the Fiscal Year Ended March 31, 2007
| | In Millions | |
| | 2007 | | 2006 | |
| | Estimates(1) | | Actual | | Actual | |
| | $ | | $ | | $ | |
| | | | | | | |
Surplus (deficit) for the year | | 600 | | 4,056 | | 3,090 | |
Effect of change in tangible capital assets | | | | | | | |
Acquisition of tangible capital assets | | (3,488 | ) | (3,366 | ) | (3,101 | ) |
Amortization of tangible capital assets | | 1,430 | | 1,475 | | 1,376 | |
Disposals and valuation adjustments | | (98 | ) | 21 | | 187 | |
| | (2,156 | ) | (1,870 | ) | (1,538 | ) |
Effect of change in | | | | | | | |
Prepaid program costs | | 6 | | (60 | ) | (70 | ) |
Other assets | | | | (36 | ) | (164 | ) |
| | 6 | | (96 | ) | (234 | ) |
| | | | | | | |
Effect of self-supported Crown corporations and agencies other comprehensive income | | | | 447 | | | |
(Increase) decrease in net liabilities | | (1,550 | ) | 2,537 | | 1,318 | |
Net assets (liabilities)—beginning of year | | (27,216 | ) | (25,770 | ) | (27,088 | ) |
Net assets (liabilities)—end of year (Note 20) | | (28,766 | ) | (23,233 | ) | (25,770 | ) |
(1) Certain budget numbers have been restated to be consistent with the reporting of actuals on the gross basis.
The accompanying notes and supplementary statements are an integral part of these financial statements.
35
Summary Financial Statements
Consolidated Statement of Cash Flow
for the Fiscal Year Ended March 31, 2007
| | In Millions | |
| | 2007 | | 2006 | |
| | Receipts | | Disbursements | | Net | | Net | |
| | $ | | $ | | $ | | $ | |
Operating Transactions | | | | | | | | | |
| | | | | | | | | |
Surplus (deficit) for the year(1) | | | | | | 4,056 | | 3,090 | |
Non-cash items included in surplus (deficit) | | | | | | | | | |
Amortization of tangible capital assets | | | | | | 1,475 | | 1,376 | |
Amortization of public debt deferred revenue and deferred charges | | | | | | (5 | ) | (76 | ) |
Concessionary loan adjustments (decreases) | | | | | | | | (1 | ) |
Valuation adjustments | | | | | | 121 | | 215 | |
Net earnings of self-supported Crown corporations and agencies | | | | | | (2,685 | ) | (2,220 | ) |
Temporary investments decreases (increases) | | | | | | (14 | ) | 43 | |
Accounts receivable decreases (increases) | | | | | | (348 | ) | (116 | ) |
Due from other governments decreases (increases) | | | | | | (207 | ) | (40 | ) |
Due from self-supported Crown corporations and agencies (increases) decreases | | | | | | (111 | ) | 101 | |
Accounts payable increases (decreases) | | | | | | (158 | ) | 489 | |
Due to other governments increases (decreases) | | | | | | 2 | | 22 | |
Due to Crown corporations, agencies and trust funds increases (decreases) | | | | | | (39 | ) | (8 | ) |
Employee pension plans payments | | | | | | | | (1 | ) |
Items applicable to future operations increases | | | | | | 194 | | 257 | |
Contributions of self-supported Crown corporations and agencies | | | | | | 2,184 | | 1,940 | |
Cash derived from (used for) operations | | | | | | 4,465 | | 5,071 | |
| | | | | | | | | |
Capital Transactions | | | | | | | | | |
| | | | | | | | | |
Tangible capital assets (acquisitions) | | 7 | | (3,366 | ) | (3,359 | ) | (2,926 | ) |
Cash derived from (used for) capital | | 7 | | (3,366 | ) | (3,359 | ) | (2,926 | ) |
| | | | | | | | | |
Investment Transactions | | | | | | | | | |
| | | | | | | | | |
Loans, advances and mortgages receivable (issues) | | 109 | | (178 | ) | (69 | ) | (211 | ) |
Other investments—net decreases (increases) | | | | (269 | ) | (269 | ) | (258 | ) |
Sinking fund investments | | 462 | | (201 | ) | 261 | | 456 | |
Cash derived from (used for) investments | | 571 | | (648 | ) | (77 | ) | (13 | ) |
Sub-total cash (requirements) | | | | | | 1,029 | | 2,132 | |
| | | | | | | | | |
Financing Transactions(2) | | | | | | | | | |
| | | | | | | | | |
Public debt (decreases) increases | | 16,494 | | (17,774 | ) | (1,280 | ) | (1,752 | ) |
Derived from Warehouse Borrowing Program investment | | 500 | | (500 | ) | | | | |
Derived from (used for) purchase of assets, recoverable from agencies | | (4,269 | ) | 4,004 | | (265 | ) | (52 | ) |
Cash derived from (used for) financing | | 12,725 | | (14,270 | ) | (1,545 | ) | (1,804 | ) |
Increase (decrease) in cash and cash equivalents | | | | | | (516 | ) | 328 | |
Cash and cash equivalents—beginning of year | | | | | | 2,934 | | 2,606 | |
Cash and cash equivalents—end of year | | | | | | 2,418 | | 2,934 | |
| | | | | | | | | |
Cash and cash equivalents are made up of: | | | | | | | | | |
Cash | | | | | | 1,070 | | 1,265 | |
Cash equivalents | | | | | | 1,348 | | 1,669 | |
| | | | | | 2,418 | | 2,934 | |
(1) Interest received during the year was $1,013 million (2006: $944 million). Interest paid during the year was $2,167 million (2006: $2,137 million). Interest received is made up of interest income from the statement of operations in the amount of $1,032 million (2006: $949 million) less the change in accrued interest receivable in the amount of $19 million (2006: $5 million). Interest paid is made up of interest expense from the statement of operations in the amount of $2,234 million (2006: $2,181 million) less the change in accrued interest payable in the amount of $67 million (2006: $44 million).
(2) Financing transaction receipts are from debt issues and disbursements are for debt repayments.
The accompanying notes and supplementary statements are an integral part of these financial statements.
36
Notes to Consolidated Summary Financial Statements
for the Fiscal Year Ended March 31, 2007
1. Significant Accounting Policies
(a) BASIS OF ACCOUNTING
The government’s Summary Financial Statements are prepared in accordance with generally accepted accounting principles (GAAP) for senior governments as required by the Budget Transparency and Accountability Act (BTAA) and as recommended by the independent Public Sector Accounting Board of The Canadian Institute of Chartered Accountants.
(b) REPORTING ENTITY
These financial statements include the accounts of organizations that meet the criteria of control (by the province) as established under GAAP. The reporting entity also includes government partnerships.
A list of organizations included in these consolidated financial statements may be found on page 71 – 73. Trusts administered by government or government organizations are excluded from the reporting entity.
(c) PRINCIPLES OF CONSOLIDATION
Taxpayer–supported Crown corporations, agencies, and the school districts, universities, colleges, institutes, health organizations (SUCH) and the Consolidated Revenue Fund (CRF) are consolidated using the full consolidation method. The government’s interests in government partnerships are recorded on a proportional consolidation basis.
Self-supported Crown corporations, agencies, entities and government business partnerships are consolidated using the modified equity basis of consolidation.
The definitions of these consolidation methods can be found on page 122.
Adjustments are made for Crown corporations, agencies and entities whose fiscal year ends are different from the government’s fiscal year end of March 31. These Crown corporations, agencies and entities consist of the British Columbia Assessment Authority, the Insurance Corporation of British Columbia, the British Columbia Railway Company, and all school districts.
The basis for segment disclosure is the major functions of government as defined by Statistics Canada’s Financial Management System of Government Statistics. This is used to prepare the sector information found on page 74 – 81.
(d) SPECIFIC ACCOUNTING POLICIES
Revenue
All revenue is recorded on an accrual basis except when the accruals cannot be determined with a reasonable degree of certainty or when their estimation is impracticable. The exception is corporate income tax, which is recorded on a cash basis.
Government transfers are recognized as revenues in the period during which the transfer is authorized and any eligibility criteria are met. Government transfers are deferred if they are restricted for specific programs such as health transfers.
Tax credits/offsets are accrued on the same basis as the associated tax revenues and reduce gross taxation revenue but are not considered valuation allowances.
Expense
The cost of all goods consumed and services received during the year is expensed. Interest expense includes debt servicing costs such as amortization of discounts and premiums, foreign exchange gains and losses, and issue costs.
Pension expense is calculated as the cost of pension benefits earned by employees during the year, interest on the pension benefits liability, net of pension plan assets, and amortization of the government’s share of any experience gains or losses, less contributions made by members. The estimated total cost of government’s share of plan amendments related to past service is expensed in the year the plan is amended.
37
Government transfers include grants, entitlements and transfers under agreements, as defined in the definitions on page 123. Government transfers are recognized as expenses in the period in which the events giving rise to the transfer occurred, as long as the transfer is authorized, eligibility criteria have been met and a reasonable estimate of the amount can be made. Transfers are deferred if the amount represents prepaid operating expenses.
Assets
Assets are recorded to the extent they represent cash and claims upon outside parties, items held for resale to outside parties, prepaid expenses, deferred charges or tangible capital assets acquired as a result of events and transactions prior to year end.
Financial Assets
Cash and cash equivalents include cash on hand, demand deposits and short-term highly liquid investments that are readily convertible to known amounts of cash and that are subject to an insignificant risk of changes in value. These short-term investments generally have a maturity of three months or less and are held for the purpose of meeting short-term cash commitments rather than for investing.
Temporary investments and Warehouse Program Investments include short-term investments recorded at the lower of cost or market value. The fair values of short-term investments approximate their carrying values because of the short-term maturity of these instruments.
Inventories for resale include property that has been purchased, or for which development costs have been incurred, and that is held for ultimate resale or lease to outside parties. Inventories for resale are recorded at the lower of cost or net realizable value.
Equity in self-supported Crown corporations and agencies represents the province’s investment (including long-term advances) in those self-supported Crown corporations and agencies at cost, adjusted for increases/decreases in the investees’ net assets, and other comprehensive income.
Loans for purchase of assets recoverable from agencies are recorded at maturity value, less unamortized premium or discount, deferred foreign exchange gains or losses and sinking fund balances. Premium/discount is amortized on a constant yield basis.
Loans and advances are recorded at cost less adjustment for any prolonged impairment in value. Mortgages receivable are recorded at the principal amount less valuation allowance, are secured by real estate and are repayable over periods ranging up to 30 years. Concessionary loans and mortgages are recorded at net present value at issue and related present value discounts are expensed. Valuation allowances are made when collectibility is considered doubtful. Interest is recognized on an accrual basis except when collection is uncertain it is recognized on the cash basis.
Other investments are recorded at the lower of cost of acquisition (which may be adjusted by attributed income) or estimated current value. Valuation adjustments are made when the value of investments is impaired.
Sinking fund investments are cash and marketable securities held specifically for the purpose of repaying outstanding debt at maturity.
Tangible Capital Assets
Tangible capital assets are recorded at historical cost, less accumulated amortization. The recorded cost, less the residual value, is generally amortized over the estimated useful lives of the assets on a straight-line basis except for some transportation equipment which is amortized using the sinking fund method.
All significant tangible capital assets of government organizations and operations have been capitalized. Intangible assets and items inherited by right of the Crown, such as forest, water and mineral resources, are not recognized in these financial statements. Crown land is capitalized at a nominal value of one dollar.
The value of collections (artifacts, specimens and documents) has been excluded from the statement of financial position. When collections are purchased these items are expensed.
38
Liabilities
All liabilities are recorded to the extent they represent claims payable to outside parties as a result of events and transactions prior to year end. This includes probable losses on loan guarantees issued by the province, contingent liabilities (when it is likely a liability exists and the amount of the liability can be reasonably determined on an individual or portfolio basis) and unfunded pension liabilities.
Guaranteed debt includes guarantees by the minister of finance, made through specific agreements or legislation, to repay promissory notes, bank loans, line of credit, mortgages and other securities. Loss provisions on guaranteed debt are recorded when it is likely that a loss will occur. The amount of the loss provision represents the best estimate of future payments less recoveries. The loss provision is recorded as a liability and an expense in the year determined and is adjusted as necessary to ensure it equals the expected payout of the guarantee.
Employee Pension Plans (Unfunded Pension Liabilities)
The province accounts for employee pension plans by recognizing a liability and an expense in the reporting period in which the employee has provided service. The amount is calculated using the accrued benefit actuarial cost method. Where plans are in a net asset position and Joint Trusteeship Agreements restrict access to the assets, the province records the value of plan net assets as nil. Changes in net liabilities/assets, which arise as a result of actuarial gains and losses, are amortized on a straight-line basis over the average remaining service period of employees active at the date of the adjustments. Past service costs from plan amendments are recognized in full in the year of the amendment.
Unfunded pension liabilities of the Members of the Legislative Assembly Superannuation Account represent the terminal funding that would be required from the province for the difference between the present value of the obligations for future benefit entitlements and the amount of funds available in the account.
Public Debt
Public debt represents the direct debt obligations of the Province of British Columbia, including borrowings incurred for government operating purposes, the acquisition of capital assets, re-lending to authorized government bodies and borrowings in advance of future requirements under the Warehouse Borrowing Program. Public debt consists of short-term promissory notes, notes, bonds and debentures, bank loans, capital leases and mortgages payable. These obligations are recorded at principal less unamortized premium or discount and unrealized foreign exchange gains or losses.
Public debt is reported under two categories:
(i) Taxpayer-supported debt—includes direct debt used for government operating and capital purposes, the debt of those Crown corporations, agencies and SUCH sector entities who require an operating or debt servicing subsidy from the provincial government and the debt of an entity that is fully consolidated within these financial statements.
(ii) Self-supported debt—includes the portion of debt of commercial Crown corporations, agencies and entities that has been borrowed through the government’s fiscal agency loan program. It does not include all debt of commercial Crown corporations and agencies, as these entities are consolidated on the modified equity basis. Commercial Crown corporations and agencies fully fund their operations and debt from revenue generated through the sale of goods and/or services at commercial rates to buyers that are outside the government reporting entity. Self-supported debt includes debt of the Warehouse Borrowing Program.
Debt premium/discount is amortized on a constant yield basis. Unamortized premium/discount on bonds called and refinanced is amortized over the remaining life of the old debt, or the life of the new debt, whichever is shorter.
39
Foreign Currency Translation
Monetary assets and liabilities denominated in foreign currencies are translated to Canadian dollars at the exchange rate prevailing at year end. Foreign currency transactions are translated at the exchange rate prevailing at the date of the transaction unless hedged by forward contracts that specify the rate of exchange. Adjustments to revenue or expense transactions arising as a result of foreign currency translation are credited or charged to operations at the time the adjustments arise. Unrealized foreign currency gains and losses on long-term, fixed-term monetary assets and liabilities are reported as a component of sinking funds and of public debt and loans for purchase of assets, recoverable from agencies and amortized over the remaining terms of the related items on a straight-line basis. Non-monetary assets and liabilities are translated at historical rates of exchange.
Derivative Financial Instruments
The province is a party to financial instruments with off-balance sheet risk due to fluctuations in foreign currency exchange rates, interest rate fluctuations and counterparty default on financial obligations. The province does not use derivative financial instruments for speculative purposes. Off-balance sheet position data is given in the form of nominal principal amounts outstanding. Amounts earned and expenses incurred under swaps are recognized and offset against the related interest expense. Gains and losses on terminated derivative contracts are deferred and amortized over the lesser of the remaining term of the contract or the term of the related debt.
Other Comprehensive Income
In April 2005, the Canadian Institute of Chartered Accountants introduced new accounting standards in dealing with the recognition of other comprehensive income. The new standards are in effect for interim and annual financial statements relating to fiscal years beginning on or after October 1, 2006. Some Crown corporations and agencies within the government reporting entity have elected to adopt these new standards early. The GAAP for public sector accounting does not recognize other comprehensive income in relation to taxpayer-supported crowns. Therefore, any transactions relating to other comprehensive income in the taxpayer-supported Crown corporation statements have been reversed. Any recognition of other comprehensive income for self-supported Crown corporations has been reflected in the equity in self-supported Crown corporations and agencies and in the accumulated surplus (deficit).
(e) CHANGES IN ACCOUNTING TREATMENT
Change in accounting for controlled for-profit entities at universities
During the year, the universities changed their accounting policy on consolidation. In previous years, the province and the universities fully consolidated the controlled for-profit entities of universities.
Under the new accounting policy, universities have included their controlled for-profit entities in the financial statements using the equity method of accounting. The activities of these entities are not considered core to the mandate of the universities and management believes that the use of the equity method is more representative of both the relationship and business purpose of these organizations. The province makes no changes to the universities’ treatment of these for-profit entities on consolidation.
The impact of this change in accounting policy has resulted in a change in: assets $165 million decrease (2006: $83 million decrease), liabilities $165 million decrease (2006: $83 million decrease), revenue $14 million decrease (2006: $16 million decrease), expense $14 million decrease (2006: $16 million decrease).
40
2. Measurement Uncertainty
Uncertainty in the determination of the amount at which an item is recognized in the financial statements is known as measurement uncertainty. Uncertainty exists whenever estimates are used because it is reasonably possible there could be a material variance between the recognized amount and another reasonably possible amount.
Measurement uncertainty exists in these financial statements as identified in the table below for items with a variability of over $10 million:
| | In Millions | |
| | Actual(1) | | | | | |
| | Amount | | Measurement Uncertainty | | % Range | |
Program Area | | Recorded | | Minimum | | Maximum | | Minimum | | Maximum | |
| | $ | | $ | $ | | | | | | | |
Health and Social Transfer payments(2) | | 4,473 | | 4,423 | | 4,523 | | 1 | % | 1 | % |
Personal Income Tax | | 6,905 | | 6,705 | | 7,205 | | 3 | % | 4 | % |
| | | | | | | | | | | |
Variability is based on the potential differences between the estimates for the economic factors used in calculating the accruals and actual economic results | | | | | | | | | | | |
| | | | | | | | | | | |
Litigation and Arbitration | | 102 | | 87 | | 117 | | 15 | % | 15 | % |
Crime Victim Assistance Program | | 126 | | 120 | | 132 | | 5 | % | 5 | % |
| | | | | | | | | | | |
Variability exists in the outcomes of litigation and arbitration | | | | | | | | | | | |
| | | | | | | | | | | |
Provision for Doubtful Account | | 687 | | 653 | | 721 | | 5 | % | 5 | % |
Accrued Expenditure Liability | | 83 | | 75 | | 91 | | 10 | % | 10 | % |
| | | | | | | | | | | |
Variability exists in the accruals as the recorded numbers are based on the province’s best estimate of expected results | | | | | | | | | | | |
| | | | | | | | | | | |
Softwood Lumber Payments | | 156 | | 140 | | 172 | | 10 | % | 10 | % |
Variability exists in the recorded amounts due to estimates used in determining the recovery from federal government | | | | | | | | | | | |
| | | | | | | | | | | |
Logging Tax Revenue | | 64 | | 64 | | 94 | | 0 | % | 47 | % |
Variability exists in the logging tax revenue accruals due to the estimates used in determining returns of softwood lumber duties on taxpayer’s taxable income | | | | | | | | | | | |
| | | | | | | | | | | | |
See note 25 with respect to the measurement uncertainty related to environmental remediation liabilities.
(1) Actual amount recorded for each program area may not represent the entire amount in financial statement accounts.
(2) Health and Social Transfer payments are transfers from the federal government based on population estimates and the federal budget.
41
3. Accounts Receivable
| | In Millions | |
| | 2007 | | 2006 | |
| | $ | | $ | |
| | | | | |
Trade accounts receivable | | 2,050 | | 1,880 | |
Taxes receivable | | 1,250 | | 1,156 | |
Accrued interest | | 265 | | 284 | |
| | 3,565 | | 3,320 | |
Provision for doubtful accounts | | (723 | ) | (756 | ) |
| | 2,842 | | 2,564 | |
4. Inventories for Resale
| | In Millions | |
| | 2007 | | 2006 | |
| | $ | | $ | |
| | | | | |
Properties | | 20 | | 41 | |
Other | | 55 | | 52 | |
| | 75 | | 93 | |
5. Due from Other Governments
| | In Millions | |
| | 2007 | | 2006 | |
| | $ | | $ | |
| | | | | |
Government of Canada: | | | | | |
Current | | 741 | | 523 | |
Long-term | | 106 | | 119 | |
Provincial governments: | | | | | |
Current | | 19 | | 18 | |
Local governments:(1) | | | | | |
Current | | 15 | | 14 | |
| | 881 | | 674 | |
(1) Local governments are municipal units established by the provincial government which include regional and metropolitan municipalities, cities, towns, townships, districts, rural municipalities and villages.
42
6. Due from Self-supported Crown Corporations and Agencies
| | In Millions | |
| | 2007 | | 2006 | |
| | $ | | $ | |
| | | | | |
British Columbia Hydro and Power Authority | | 346 | | 265 | |
British Columbia Lottery Corporation | | 206 | | 176 | |
Columbia Power Corporation | | 2 | | 2 | |
| | 554 | | 443 | |
See Statement of Financial Position for Self-supported Crown Corporations and Agencies on page 82 for details.
7. Equity in Self-supported Crown Corporations and Agencies
| | In Millions | |
| | 2007 | | 2006 | |
| | | | | | Other | | | | | |
| | | | Unremitted | | Comprehensive | | | | | |
| | Investments | | Earnings | | Income | | Total | | Total | |
| | $ | | $ | | $ | | $ | | $ | |
| | | | | | | | | | | |
British Columbia Hydro and Power Authority | | | | 1,783 | | | | 1,783 | | 1,707 | |
British Columbia Railway Company | | 107 | | 65 | | | | 172 | | 143 | |
British Columbia Transmission Corporation | | 20 | | 19 | | | | 39 | | 37 | |
Columbia Power Corporation | | 276 | | 41 | | | | 317 | | 304 | |
Insurance Corporation of British Columbia | | | | 1,623 | | 447 | | 2,070 | | 1,242 | |
Provincial Capital Commission | | | | 15 | | | | 15 | | 15 | |
| | 403 | | 3,546 | | 447 | | 4,396 | | 3,448 | |
Change in Equity in Self-supported Crown Corporations and Agencies
Balance—beginning of year | | 403 | | 3,019 | | | | 3,422 | | 3,219 | |
Prior period adjustments | | | | 26 | | | | 26 | | (51 | ) |
Balance—beginning of year restated | | 403 | | 3,045 | | | | 3,448 | | 3,168 | |
Increase (decrease) in other comprehensive income | | | | | | 447 | | 447 | | | |
Net earnings of self-supported Crown corporations and agencies | | | | 2,685 | | | | 2,685 | | 2,220 | |
Contributions paid to the Consolidated Revenue Fund | | | | (1,941 | ) | | | (1,941 | ) | (1,727 | ) |
Adjustments to contributions paid | | | | (243 | ) | | | (243 | ) | (213 | ) |
Balance—end of year | | 403 | | 3,546 | | 447 | | 4,396 | | 3,448 | |
See Statement of Financial Position for Self-supported Crown Corporations and Agencies and Summary of Results of Operations and Statement of Equity for Self-supported Crown Corporations and Agencies on pages 82 – 83 for details.
43
8. Loans, Advances and Mortgages Receivable
| | In Millions | |
| | 2007 | | 2006 | |
| | $ | | $ | |
Loans and Advances | | | | | |
BC student loans | | 742 | | 674 | |
Land Tax Deferment loans | | 198 | | 178 | |
Construction loans to social housing projects | | 85 | | 97 | |
Industrial Development Fund commercial loans | | 67 | | 83 | |
Accountable advances | | 19 | | 34 | |
Miscellaneous | | 73 | | 60 | |
| | 1,184 | | 1,126 | |
Provision for doubtful accounts | | (247 | ) | (223 | ) |
| | 937 | | 903 | |
Mortgages Receivable | | | | | |
Reconstruction Program | | 51 | | 44 | |
Miscellaneous | | 4 | | 4 | |
| | 55 | | 48 | |
| | 992 | | 951 | |
44
The BC Student Loan Program provides loans to borrowers for higher education. Borrowers are required to repay these loans through a contracted service provider to the province, with a floating interest rate of prime plus 2.5% or a fixed rate of prime plus 5%. Amortization of the loans is usually set for 174 months, but borrowers can extend that amortization to a maximum of 234 months. Defaulted loans are due on demand with interest at a floating rate of prime plus 2.5%. The BC Student Loan Program also administers defaulted student loans issued by financial institutions under a guaranteed and risk sharing agreement with the province. Defaulted risk sharing loans arise due to bankruptcy or death of the borrower while attending school.
The Land Tax Deferment Program allows eligible owners to defer payment of all, or a portion of, annual property taxes due on principal residences. Eligible individuals are either 55 years or older, a surviving spouse, or a person with a disability. Simple interest is charged on the deferred taxes at a rate set by the minister of small business and revenue. This rate will not exceed 2.0% below the prime lending rate of the principal banker to the government. The deferred taxes, administration fees, plus outstanding interest must be repaid before the residence can be legally transferred to a new owner, other than directly to a surviving spouse.
Construction loans are provided by British Columbia Housing Management Commission (BCHMC), a taxpayer-supported Crown corporation and an approved lender under the National Housing Act. BCHMC provides construction loans for societies that are building approved projects under social housing programs. Interest is payable at the province’s weighted average borrowing rate for short-term funds, plus administration costs. Loans are repaid at substantial completion of each project from financing arranged with private lenders.
The Industrial Development Fund provided loans to assist the establishment of new industry, the introduction of new technology to existing industry, or the development of a region of British Columbia. These loans incur interest at rates ranging from 0% to 10%. The Industrial Development Fund was eliminated pursuant to the repeal of the Industrial Development Incentive Act under the Budget Measures Implementation Act, 2002. No loans were issued after March 31, 2002.
Accountable advances represent funds issued for program costs that have not yet been expended in accordance with the applicable agreements.
The Reconstruction Program provides financial assistance to homeowners to pay for repairs for homes with premature building envelope failure. The financial assistance is provided in the form of subsidized interest loans, no interest loans or deferred payment loans, and is secured by registered mortgages. This program is administered by the Homeowner Protection Office.
Miscellaneous mortgages receivable have terms ranging from less than one year to twenty years, with some loans being payable on demand. Interest rates range from 1.875% to 13.5%.
45
9. Other Investments
| | In Millions | |
| | 2007 | | 2006 | |
| | $ | | $ | |
| | | | | |
Equity investments | | 936 | | 791 | |
Municipal, corporate and other bonds | | 407 | | 480 | |
Commercial loans and investments | | 379 | | 350 | |
Government of Canada bonds | | 262 | | 223 | |
Provincial government bonds | | 241 | | 180 | |
Pooled investment portfolios | | 121 | | 107 | |
British Columbia Ferry Services Inc | | 75 | | 75 | |
Miscellaneous | | 149 | | 97 | |
| | 2,570 | | 2,303 | |
Provision for doubtful accounts | | (60 | ) | (60 | ) |
| | 2,510 | | 2,243 | |
Equity investments have a market value of $1,135 million (2006: $929 million). They include investments in Canadian, U.S. and international equity markets. Also included in equity investments are investments by the University of British Columbia and University of Victoria in subsidiaries that are reported on the equity basis. The total investment reported for these entities is $4 million (2006: $1 million).
Municipal, corporate and other bonds have a market value of $406 million (2006: $482 million) with yields ranging from 0.92% to 6.62%.
Commercial loans and investments are recorded at the lower of cost of acquisition adjusted by attributed income and market value. Commercial loans and investments include Columbia Basin Trust’s $298 million (2006: $290 million) investment in power development joint ventures, and $55 million (2006: $55 million) held by the Consolidated Revenue Fund, which a full provision has been made for.
Government of Canada bonds have a market value of $265 million (2006: $228 million), with yields ranging from 3.00% to 7.25%. Maturity dates range from June 1, 2007 to July 26, 2035.
Provincial bonds of various provinces have a market value of $257 million (2006: $186 million), with yields ranging from 3.50% to 7.60%. Maturity dates range from September 1, 2007 to March 8, 2033.
Pooled investment portfolios consist mainly of units in various funds of the British Columbia Investment Management Corporation. These funds’ investments consist primarily of debt and equity holdings of privately held companies. Pooled investment portfolios have a market value of $119 million (2006: $106 million).
As part of a secured debenture amendment and preferred share surrender agreement dated May 23, 2003, the province exchanged its interest in British Columbia Ferry Corporation for 75,477 preferred shares in British Columbia Ferry Services Inc. These non-voting preferred shares are valued at $1,000 per share and entitle the province to a fixed cumulative dividend at a rate of 8% of the issue price.
Miscellaneous investments consist of other pooled funds as well as various forms of income securities, notes and treasury bills. The market value of miscellaneous investments is $147 million (2006: $102 million).
46
10. Sinking Fund Investments
| | In Millions | |
| | 2007 | | 2006 | |
| | $ | | $ | |
| | | | | |
Taxpayer–supported sinking fund investments | | 3,065 | | 3,213 | |
Self–supported sinking fund investments | | 733 | | 846 | |
| | 3,798 | | 4,059 | |
| | In Millions | |
| | 2007 | | 2006 | |
| | $ | | $ | |
| | | | | |
Cash | | 26 | | | |
Government of Canada bonds | | 7 | | 54 | |
Provincial government bonds | | 826 | | 906 | |
Pooled investment portfolios | | 2,406 | | 2,488 | |
Local government bonds | | 433 | | 506 | |
Miscellaneous | | 100 | | 105 | |
| | 3,798 | | 4,059 | |
Government of Canada bonds have a market value of $7.1 million (par value $6.9 million), with yields ranging from 3.96% to 4.15%. Maturity dates range from October 1, 2007 to June 1, 2013.
Provincial bonds of various provinces have a market value of $907.3 million (par value $1,467.4 million), with yields ranging from 3.53% to 5.49%. Maturity dates range from June 9, 2007 to February 15, 2040.
Pooled investment portfolios consist of units in the British Columbia Investment Management Corporations’ bond funds, which mainly consist of various governments bonds and short term unitized funds that hold money market instruments.
Local government bonds mainly consist of debt issued by BC Municipal Financing Authority.
11. Loans for Purchase of Assets, Recoverable from Agencies
| | In Millions | |
| | 2007 | | 2006 | |
| | $ | | $ | |
| | | | | |
British Columbia Hydro and Power Authority | | 7,134 | | 6,882 | |
British Columbia Transmission Corporation | | 30 | | 30 | |
Improvement districts | | 6 | | 4 | |
| | 7,170 | | 6,916 | |
47
12. Accounts Payable and Accrued Liabilities
| | In Millions | |
| | 2007 | | 2006 | |
| | $ | | $ | |
| | | | | |
Trade accounts payable | | 2,419 | | 2,708 | |
Other accrued estimated liabilities(1) | | 1,450 | | 1,358 | |
Accrued employee leave entitlements (see table below) | | 1,567 | | 1,461 | |
Accrued interest on debt | | 636 | | 703 | |
| | 6,072 | | 6,230 | |
(1) Includes pending litigation, provision for guaranteed debt payout and other miscellaneous accrued claims.
| | In Millions | |
| | 2007 | | 2006 | |
| | $ | | $ | |
Accrued employee leave entitlements | | | | | |
Vacation, compensatory time off, sick bank | | 709 | | 679 | |
Worker compensation benefits | | 93 | | 82 | |
Retirement allowance | | 539 | | 474 | |
Long-term disability | | 226 | | 226 | |
| | 1,567 | | 1,461 | |
13. Due to Other Governments
| | In Millions | |
| | 2007 | | 2006 | |
| | $ | | $ | |
| | | | | |
Government of Canada: | | | | | |
Current | | 182 | | 167 | |
Long–term | | 589 | | 659 | |
Provincial governments: | | | | | |
Current | | 48 | | 35 | |
Local governments:(1) | | | | | |
Current | | 95 | | 51 | |
Long–term | | 1 | | 1 | |
| | 915 | | 913 | |
(1) Local governments are municipal units established by the provincial government that include regional and metropolitan municipalities, cities, towns, townships, districts, rural municipalities and villages.
48
14. Due to Crown Corporations, Agencies and Trust Funds
| | In Millions | |
| | 2007 | | 2006 | |
| | $ | | $ | |
| | | | | |
British Columbia Liquor Distribution Branch | | 29 | | 42 | |
Trust funds | | 76 | | 102 | |
| | 105 | | 144 | |
15. Deferred Revenue
| | In Millions | |
| | 2007 | | 2006 | |
| | $ | | $ | |
| | | | | |
Deferred contributions | | 2,151 | | 1,938 | |
Petroleum, natural gas and minerals, leases and fees | | 1,715 | | 1,517 | |
Federal contributions | | 674 | | 981 | |
Unearned lease revenue | | 265 | | 211 | |
Motor vehicle licences and permits | | 234 | | 221 | |
Federal and municipal highway project revenues | | 227 | | 149 | |
Derivative debt instruments | | 182 | | 174 | |
Tuition | | 145 | | 117 | |
Water rentals and recording fees | | 74 | | 79 | |
Medical Services Plan premiums | | 74 | | 70 | |
Forest Stand Management Fund | | 12 | | 12 | |
Miscellaneous | | 233 | | 225 | |
| | 5,986 | | 5,694 | |
16. Employee Pension Plans (Unfunded Pension Liabilities)
| | In Millions | |
| | 2007 | | 2006 | |
| | $ | | $ | |
| | | | | |
Members of the Legislative Assembly Superannuation Account | | 2 | | 2 | |
(a) Members of the Legislative Assembly Superannuation Account
The Legislative Assembly Superannuation Account (the “Account”) is administered by the British Columbia Pension Corporation (Pension Corporation). As members of the Legislative Assembly retire, the present value of the amount required to provide a legislative member’s future pension benefit is transferred from the Account to the Public Service Pension Plan from which monthly pensions are paid. The province contributes to this plan and provides additional funding when the present value of the funding exceeds the accumulated assets in the Account available to fund those members’ benefit entitlements in the plan. This plan provides basic pension benefits based on length of service, highest five-year average earnings and plan members’ age at retirement. Benefits such as group health benefits and inflation protection for the basic pension are not guaranteed and are contingent upon available funding.
49
(b) Other Pension Plans
Other pension plans represent defined benefit plans outside of the College, Public Service, Municipal, and Teachers’ Pension plans which are funded by entities within the government reporting entity. They include the Retirement Plan for Non–Teaching Employees of the Board of School Trustees of School District No. 43 (Coquitlam), the University of Victoria’s pension plan for employees other than faculty and professional staff and Simon Fraser University’s Academic Pension Plan and Administrative/Union Pension Plan. The accrued benefit obligation is $376 million, with estimated pension fund assets of $398 million, and an unamortized actuarial gain of $24 million. The accrued net obligation is $2 million.
There are additional employee pension plans in Crown corporations and agencies consolidated on the modified equity basis. Net assets or net liabilities of the pension funds are included in the investment balance of the particular Crown corporation or agency.
(c) Joint Trusteed Plans
The province contributes to four defined benefit pension plans for substantially all its employees. The four pension plans are the College Pension Plan, the Public Service Pension Plan, the Municipal Pension Plan, and the Teachers’ Pension Plan. The plans provide basic pensions based on length of service, highest five-year average earnings and plan members’ age at retirement. Benefits such as group health benefits and inflation protection for the basic pension are not guaranteed and are contingent upon available funding. No unfunded liability exists for the future indexing of pensions as the obligation is limited to the amount of available assets in separate inflation accounts.
The College, Public Service, Municipal and Teachers’ pension plans are joint trusteed plans. In joint trusteed plans, control of the plans and their assets is assumed by individual pension boards made up of government and plan member representatives. Provisions of these plans stipulate the province has no formal claim to any pension plan surplus or asset. The boards are fully responsible for the management of the plans, including investment of the assets and administration of the plans. The Pension Corporation provides benefit administrative services as an agent of the boards of trustees. The British Columbia Investment Management Corporation provides investment management services as an agent of the independent pension boards.
In the event an unfunded liability is determined by an actuarial valuation (performed every three years), the pension boards are required to address it through contribution adjustments shared equally by plan members and employers. It is expected, therefore, that any unfunded liabilities in the future will be short-term in nature.
The reported net assets of the pension plans are under joint trust arrangements which limit the province’s possible conditional share to 50%. The province has no claim on accrued asset amounts. If the individual pension boards decide to reduce or suspend employer contributions for a period of time, the province may record an asset. Therefore, the recorded value of the net assets is nil until such time such a decision is made. Also, only 70% of the pension fund assets, accrued benefit obligation, and preliminary current year employer contributions are included for the Municipal Pension Plan, reflecting the province’s interest in the plan.
The accrued benefit obligations and pension assets shown for 2006/07 are based on extrapolations of the most recent actuarial valuations as shown below. Fund assets are based on market value at the date of actuarial valuation and extrapolated using actuarial growth assumptions as shown in the table below. The expected long-term inflation rates used in these assumptions are nil, since the future indexing of pensions is limited to the amount of available assets in the pension adjustment account.
50
Key actuarial assumptions and dates:
| | Public | | | | | | | |
| | Service | | Municipal | | Teachers’ | | College | |
| | Pension Plan | | Pension Plan | | Pension Plan | | Pension Plan | |
Date of actuarial valuation | | Mar 31/05 | | Dec 31/03 | | Dec 31/05 | | Aug 31/03 | |
Date of audited financial statements | | Mar 31/06 | | Dec 31/05 | | Dec 31/05 | | Aug 31/06 | |
Expected long–term rate of return | | 6.75% | | 7.00% | | 6.85% | | 7.20% | |
Assumed rate of salary escalation | | 4.00% | | 4.50% | | 4.10% | | 4.70% | |
The audited financial statements of each pension plan listed, except the Account, may be found in the annual reports at www.pensionsbc.ca outside these audited statements.
(d) Accrued net obligation (asset) table
The estimated financial position as at March 31, 2007, for the basic pension in each plan is as follows:
| | In Millions | |
| | Public | | | | | | | | | |
| | Service | | Municipal | | Teachers’ | | College | | | |
| | Pension | | Pension | | Pension | | Pension | | | |
| | Plan | | Plan | | Plan | | Plan | | Total | |
| | $ | | $ | | $ | | $ | | $ | |
| | | | | | | | | | | |
Accrued benefit obligation | | 10,850 | | 11,570 | | 12,425 | | 1,616 | | 36,461 | |
Pension fund assets | | 11,399 | | 12,382 | | 11,196 | | 1,968 | | 36,945 | |
| | (549 | ) | (812 | ) | 1,229 | | (352 | ) | (484 | ) |
Unamortized actuarial gain (loss) | | (1,643 | ) | (737 | ) | (1,570 | ) | (136 | ) | (4,086 | ) |
Accrued net obligation (asset) | | (2,192 | ) | (1,549 | ) | (341 | ) | (488 | ) | (4,570 | ) |
(e) The preliminary overall fund rates of return reported to the pension boards as at December 31, 2006 for each plan are: College Pension Plan 14.0%, Public Service Pension Plan 14.0%, Municipal Pension Plan 15.0%, and Teachers’ Pension Plan 15.1%.
(f) The Province’s share includes contributions for all participants in the government reporting entity. Total contributions this year for each plan are (in millions): College Pension Plan $46.5, the Public Service Pension Plan $251.0, the Municipal Pension Plan $372.4, and the Teachers’ Pension Plan $300.5.
51
17.Taxpayer–supported Debt(1)
| | In Millions | |
| | | | | | | | | | | | 2007 | | 2006 | |
| | | | | | | | | | | | Canadian | | Canadian | |
| | Year of | | Canadian | | US | | Japanese | | Other | | Dollar | | Dollar | |
| | Maturity | | Dollar | | Dollar (2) | | Yen (2) | | Currencies (2) | | Total | | Total | |
| | | | $ | | $ | | $ | | $ | | $ | | $ | |
| | | | | | | | | | | | | | | |
Short–term promissory notes | | 2007 | | | | | | | | | | 0 | | 1,147 | |
| | 2008 | | 1,563 | | | | | | | | 1,563 | | 0 | |
Notes, bonds and debentures(3) | | 2007 | | | | | | | | | | 0 | | 3,215 | |
| | 2008 | | 1,012 | | 884 | | 59 | | 418 | | 2,373 | | 2,361 | |
| | 2009 | | 2,399 | | 1,076 | | | | | | 3,475 | | 3,408 | |
| | 2010 | | 1,375 | | 308 | | 94 | | 572 | | 2,349 | | 2,347 | |
| | 2011 | | 1,901 | | | | 110 | | 614 | | 2,625 | | 2,618 | |
| | 2012 | | 2,507 | | | | | | | | 2,507 | | 2,433 | |
| | 2013–2017 | | 2,726 | | 509 | | | | | | 3,235 | | 3,160 | |
| | 2018–2022 | | 1,069 | | | | | | | | 1,069 | | 906 | |
| | 2023–2027 | | 3,583 | | | | | | | | 3,583 | | 3,414 | |
| | 2028–2032 | | 3,876 | | | | | | | | 3,876 | | 3,795 | |
| | 2033–2037 | | 910 | | | | | | | | 910 | | 755 | |
| | 2038–2042 | | 942 | | | | | | | | 942 | | 415 | |
| | 2043–2047 | | 405 | | | | | | | | 405 | | 400 | |
Total debt issued at face value | | | | 24,268 | | 2,777 | | 263 | | 1,604 | | 28,912 | | 30,374 | |
| | | | | | | | | | | | | | | |
Unamortized discount | | | | | | | | (130 | ) | (147 | ) |
Unrealized foreign exchange gains | | | | | | | | 62 | | 69 | |
Amount held in the Consolidated Revenue Fund | | | | | | | | (3 | ) | (7 | ) |
Taxpayer–supported debt | | | | | | | | 28,841 | | 30,289 | |
The effective interest rates (weighted average) as at March 31 on the above debt are:
(1)The balances and interest rates reflect the impact of the related derivative contracts, presented in Note19 (Risk Management and Derivative Financial Instruments).
(2)Foreign currencies include: $1,955 million US ($2,777million Canadian); 22,000 million Japanese Yen ($263 million Canadian); 400 million Swiss Franc ($418 million Canadian); and 688 million Euro ($1,186 million Canadian).
(3)Notes, bonds and debentures include $532 million (2006: $201 million) in public–private partnership obligations, $319 million (2006: $229 million) in mortgages; $281 million (2006: $252 million) in capital leases, and $170 million (2006: $121 million) in demand loans.
52
Notes, bonds and debentures
Redeemable by the bond holder
Balances include British Columbia Savings Bonds totalling $14 million (2006: $32 million) maturing on October 15, 2007 with an effective rate of 3.85% are redeemable at par by the holder on April 15, 2007.
Redeemable by the province
Balances include debentures issued to the Canada Pension Plan totalling $3,481 million (2006: $3,467 million) at a weighted average interest rate of 7.75% (2006: 8.06%). These debentures mature at various dates from April 10, 2007 to March 12, 2037 with interest rates varying between 4.12% and 11.33%. These debentures are redeemable in whole or in part before maturity, on 30 days’ prior notice, at the option of the province. During the year, $226 million (2006: $76 million) Canada Pension Plan debentures were issued. Under Canada Pension Plan legislation, any significant amendment to benefits or contributions requires the approval of the legislature of two–thirds of the provinces.
Aggregate payments to meet sinking fund instalments and retirement provisions
Aggregate payments for the next five fiscal years to meet sinking fund instalments and retirement provisions on notes, bonds and debentures are:
| | In Millions | |
| | Canadian | |
| | Dollar | |
2008 | | 2,148 | |
2009 | | 3,273 | |
2010 | | 2,132 | |
2011 | | 2,257 | |
2012 | | 1,659 | |
53
18. Self–supported Debt(1)
| | In Millions | |
| | | | | | | | 2007 | | 2006 | |
| | | | | | | | Canadian | | Canadian | |
| | Year of | | Canadian | | US | | Dollar | | Dollar | |
| | Maturity | | Dollar | | Dollar (2) | | Total | | Total | |
| | | | $ | | $ | | $ | | $ | |
| | | | | | | | | | | |
Short–term promissory notes | | 2007 | | | | | | 0 | | 898 | |
| | 2008 | | 846 | | 260 | | 1,106 | | 0 | |
Notes, bonds and debentures | | 2007 | | | | | | 0 | | 314 | |
| | 2008 | | 9 | | 373 | | 382 | | 384 | |
| | 2009 | | 124 | | | | 124 | | 124 | |
| | 2010 | | 574 | | 58 | | 632 | | 632 | |
| | 2011 | | 150 | | | | 150 | | 150 | |
| | 2012 | | 450 | | | | 450 | | 450 | |
| | 2013–2017 | | 975 | | 290 | | 1,265 | | 1,265 | |
| | 2018–2022 | | 1,271 | | | | 1,271 | | 1,271 | |
| | 2023–2027 | | 400 | | 617 | | 1,017 | | 1,020 | |
| | 2028–2032 | | 1,100 | | | | 1,100 | | 800 | |
| | 2033–2037 | | | | 364 | | 364 | | 365 | |
Total debt issued at face value | | | | 5,899 | | 1,962 | | 7,861 | | 7,673 | |
| | | | | | | | | | | |
Unamortized discount premium/(discount) | | | | | | | | (16 | ) | 16 | |
Unrealized foreign exchange gains | | | | | | | | 52 | | 69 | |
Total self–supported debt | | | | | | | | 7,897 | | 7,758 | |
The effective interest rates (weighted average) as at March 31 on the above debt are:
(1)The balances and interest rates reflect the impact of the related derivative contracts, presented in Note 19 (Risk Management and Derivative Financial Instruments).
(2)Foreign currencies include $1,562 million US ($1,962 million Canadian).
Notes, bonds and debentures
Redeemable by the province
Balances include debentures issued to the Canada Pension Plan totalling $177 million (2006: $191 million) at a weighted average interest rate of 10.04% (2006: 10.01%). These debentures mature at various dates from August 10, 2007 to June 9, 2009 with interest rates varying between 9.62% and 10.42%. These debentures are redeemable in whole or in part before maturity, on 30 days’ prior notice, at the option of the province.
54
Aggregate payments to meet retirement provisions
Aggregate payments for the next five fiscal years to meet retirement provisions on notes, bonds and debentures are:
| | In Millions | |
| | Canadian | |
| | Dollar | |
2008 | | 355 | |
2009 | | 86 | |
2010 | | 571 | |
2011 | | 141 | |
2012 | | 417 | |
19. Risk Management and Derivative Financial Instruments
The province borrows funds in both domestic and foreign capital markets, and manages its existing debt portfolio to achieve the lowest debt costs within specified risk parameters. As a result, the province is exposed to risks associated with interest rate fluctuations, foreign exchange rate fluctuations and credit risk. In accordance with risk management policy guidelines set by the Risk Committee of the Ministry of Finance, the province uses a variety of derivative financial instruments to hedge exposure to interest and foreign exchange risks.
Derivatives used by the province include interest rate swaps, cross–currency swaps, forward foreign exchange contracts, forward rate agreements, advanced rate setting agreements and options. A derivative instrument is a financial contract with a financial institution or counterparty that is applied to effect a hedge on interest rate or foreign exchange exposure contained in the underlying provincial debt instrument. A derivative derives value from the impact of market changes on the underlying hedged debt instrument.
The following tables present maturity schedules of the province’s derivatives by type, outstanding at March 31, 2007, based on the notional amounts of the contracts.
Taxpayer–supported Debt
| | In Millions | |
| | Year of
Maturity | | Cross
Currency
Swaps | | Interest
Rate
Swaps | | Forward
Foreign
Exchange
Contracts | | Total | |
| | | | $ | | $ | | $ | | $ | |
| | | | | | | | | | | |
| | 2008 | | 1,361 | | | | | | 1,361 | |
| | 2009 | | 985 | | 776 | | 690 | | 2,451 | |
| | 2010 | | 974 | | 579 | | | | 1,553 | |
| | 2011 | | 834 | | | | | | 834 | |
| | 2012 | | | | 100 | | | | 100 | |
| | 6–10 years | | 509 | | 505 | | | | 1,014 | |
| | + 10 years | | 64 | | 774 | | | | 838 | |
Total | | | | 4,727 | | 2,734 | | 690 | | 8,151 | |
55
Self–supported Debt
| | In Millions | |
| | | | | | | | Forward | | | |
| | | | Cross | | Interest | | Foreign | | | |
| | Year of | | Currency | | Rate | | Exchange | | | |
| | Maturity | | Swaps | | Swaps | | Contracts | | Total | |
| | | | $ | | $ | | $ | | $ | |
| | | | | | | | | | | |
| | 2008 | | 200 | | 423 | | 130 | | 753 | |
| | 2010 | | | | 558 | | 57 | | 615 | |
| | 2012 | | | | 300 | | | | 300 | |
| | 6–10 years | | 290 | | 980 | | | | 1,270 | |
| | + 10 years | | | | 100 | | 719 | | 819 | |
Total | | | | 490 | | 2,361 | | 906 | | 3,757 | |
Interest rate risk
Interest rate risk is the risk that the province’s debt servicing costs will fluctuate due to changes in interest rates. The province uses derivative contracts (interest rate swaps) to manage interest rate risk by exchanging a series of interest payments, and assuming either a fixed or floating rate liability to a counterparty, based on the notional principal amount. Derivatives allow the province to alter the proportion of its debt held in fixed and floating rate form to take advantage of changes in interest rates.
The government’s current policy guidelines with respect to the provincial government direct debt portfolio, which totals $20,980 million (2006: $22,761 million), allow floating rate exposure up to 45.00% (2006: 45.00%) of this portion of the taxpayer-supported debt. At March 31, 2007, floating rate debt exposure was 25.75% (2006: 31.80%) of the government direct debt portfolio.
Under current policy guidelines for British Columbia Hydro and Power Authority (BC Hydro), the maximum floating rate exposure is 46.00% (2006: 46.00%) of their debt that totals $7,144 million (2006: $6,892 million). At March 31, 2007, floating rate debt exposure for BC Hydro was 37.60% (2006: 36.10%) of their debt.
Based on the taxpayer–supported and self–supported debt portfolios at March 31, 2007, a 1.00% change in interest rates would impact the annual debt servicing expense by $57 million (2006: $73 million) for the taxpayer-supported debt portfolio and $26 million (2006: $28 million) for the self–supported debt portfolio.
Foreign exchange risk
Foreign exchange risk is the risk that the province’s debt servicing costs and principal payments will fluctuate due to changes in foreign exchange rates. The province uses derivative contracts (cross currency swaps) to hedge foreign exchange risk by converting foreign currency principal and interest cash flows into Canadian dollar cash flows.
The government’s current policy guidelines with respect to the provincial government direct debt portfolio, which totals $20,980 million (2006: $22,761 million), allow unhedged foreign debt exposure up to 10.00% (2006: 10.00%) of this portion of the taxpayer–supported debt. At March 31, 2007, unhedged foreign debt exposure in Japanese yen was 1.69% (2006: 1.57%) of the government direct debt portfolio. At March 31, 2007, there was no unhedged foreign debt exposure in US dollars for the government direct debt portfolio (2006: nil).
56
Under current policy guidelines for BC Hydro, the maximum unhedged foreign debt exposure is 20.00% (2006: 20.00%) of their debt, which totals $7,144 million (2006: $6,892 million). At March 31, 2007, 2.30%(2006: 2.60%) of their debt was in the form of unhedged foreign debt in US dollars.
Based on the taxpayer-supported and self-supported debt portfolios at March 31, 2007, a one cent change in the Canadian dollar versus the US dollar would impact the annual debt servicing costs for the self-supported debt portfolio by $5 million (2006: $7 million). A change of one yen versus the value of the Canadian dollar (for example, from 102 yen to 101 yen) would impact the annual debt servicing costs of the taxpayer-supported debt portfolio by $1 million (2006: $1 million).
Credit risk
Credit risk is the risk that the province will incur financial loss due to a counterparty defaulting on its financial obligation to the province. In accordance with the government’s policy guidelines, the province reduces its credit risk by dealing with only highly rated counterparties. The province only enters into derivative transactions with counterparties that have a rating from Standard & Poor’s and Moody’s Investors Service Inc. of at least AA–/Aa3 or A+/A1 in the case of Canadian Schedule A banks. The province also establishes limits on individual counterparty credit exposures and monitors these exposures on a regular basis.
20. Net Liabilities
The Consolidated Statement of Change in Net Liabilities (see page 35) shows the net impact of applying the expenditure basis of accounting. The net liabilities calculation uses the expenditure, rather than the expense basis of accounting. Under the expenditure basis of accounting, tangible capital assets, prepaid program costs and other assets are recorded as expenditures when calculating the current year surplus or deficit. Under the expense basis of accounting, these items are recorded on the Consolidated Statement of Financial Position as assets and amortized over an applicable period of time.
21. Tangible Capital Assets
| | In Millions | |
| | 2007 | | 2006 | |
| | $ | | $ | |
| | | | | |
Land and land improvements | | 2,304 | | 2,099 | |
Buildings (including tenant improvements) | | 12,088 | | 11,216 | |
Highway infrastructure | | 7,424 | | 6,927 | |
Transportation equipment | | 1,967 | | 2,020 | |
Computer hardware and software | | 923 | | 778 | |
Other | | 1,920 | | 1,716 | |
| | 26,626 | | 24,756 | |
See Statement of Tangible Capital Assets on page 84.
The estimated useful lives of the more common tangible capital assets are: buildings (10–50 years); highway infrastructure (15–40 years); transportation equipment (including ferries and related infrastructure) (5–40 years); computer hardware and software (3–5 years); major software systems (9–12 years); and other (including vehicles, specialized equipment, and furniture and equipment) (5–20 years). Land improvements are amortized over 30 years (recreation areas) or 40 years (dams and water management systems). Tenant improvements are amortized over five years or the length of the relevant lease term.
57
Included in tangible capital assets of British Columbia Transit (BCT) and of Rapid Transit Project 2000 Ltd (RTP) are capital assets under lease to Greater Vancouver Transportation Authority (GVTA). These capital assets under lease consist of land, land improvements, stations, guideways and other assets related to the SkyTrain system and West Coast Express. These assets are made available to GVTA for their use under the Greater Vancouver Transportation Authority Act and an Order in Council (OIC) enacted thereunder, and represent one of the province’s contributions toward public transportation in the Greater Vancouver Regional District. The OIC–directed lease arrangements with GVTA and BCT are for one dollar per year under an initial 15–year term with additional five-year renewal periods upon the agreement of BCT and GVTA. The net book value of these assets is $896 million (2006: $916 million). A similar lease arrangement is under negotiation with GVTA for the RTP assets.
22. Prepaid Program Costs
| | In Millions | |
| | 2007 | | 2006 | |
| | $ | | $ | |
| | | | | |
Prepaid program costs(1) | | 592 | | 532 | |
(1) Includes inventories of operating material held in the Purchasing Commission and Queen’s Printer warehouses pending distribution in a subsequent fiscal year and deferred costs associated with the BC Timber Sales Program. Also includes inventories of supplies and other not–for–resale items held by taxpayer–supported Crown corporations and agencies which are charged to expense when consumed in the normal course of operations.
23. Other Assets
| | In Millions | |
| | 2007 | | 2006 | |
| | $ | | $ | |
| | | | | |
Deferred debt instrument costs | | 324 | | 277 | |
Other deferred costs | | 12 | | 21 | |
Deferred treaty costs | | 15 | | 17 | |
| | 351 | | 315 | |
58
24. Accumulated Surplus (Deficit)
| | In Millions | |
| | 2007 | | 2006 | |
| | $ | | $ | |
| | | | | |
Accumulated surplus (deficit)—beginning of year as previously reported(1) | | (124 | ) | (3,184 | ) |
Adjustments to accumulated surplus (deficit)(2),(3) | | (43 | ) | (73 | ) |
Accumulated surplus (deficit)—beginning of year as restated | | (167 | ) | (3,257 | ) |
Other comprehensive income from self-supported Crown corporations and agencies (see page 83) | | 447 | | | |
Surplus (deficit) for the year(4) | | 4,056 | | 3,090 | |
Accumulated surplus (deficit)—end of year | | 4,336 | | (167 | ) |
(1)The opening accumulated deficit figure for April 1, 2005 and April 1, 2006 are as reported in the 2005/06 Public Accounts. | |
| | | |
(2)During 2006/07, adjustments were made to the opening accumulated deficit for 2005/06 as follows: | | | |
School Districts—adjustment for land and building additions from 1998 to 2001 | | 25 | |
BC Rail restatement—adjustment for 2005 asset impairment write down and amortization adjustment | | 4 | |
Natural resources—adjustment for contractual obligations related to resource road development | | 44 | |
Forests—community access roads capitalization | | 22 | |
Vancouver Island Natural Gas Pipeline—adjustment for 2004 and 2005 rate stabilization liability | | (168 | ) |
Total | | (73 | ) |
(3)During 2006/07, adjustments were made to the opening deficit for 2006/07 for the following items: | | | |
School Districts—adjustment for land and building additions from 1998 to 2001 | | 25 | |
BC Rail restatement—adjustment for 2005 asset impairment write down and amortization adjustment | | 26 | |
Natural resources—adjustment for contractual obligations related to resource road development | | 52 | |
Forests—community access roads capitalization | | 22 | |
Vancouver Island Natural Gas Pipeline—adjustment for 2004 and 2005 rate stabilization liability | | (168 | ) |
Total | | (43 | ) |
(4)During 2006/07, adjustments were made to the reported surplus figure for the 2005/06 fiscal as follows: | | | |
Reported surplus for 2005/06 | | 3,060 | |
BC Rail restatement—adjustment for 2005 asset impairment write down and amortization adjustment | | 22 | |
Natural resources—adjustment for contractual obligations related to resource road development | | 8 | |
Total | | 3,090 | |
59
25. Contingencies and Contractual Obligations
(a) GUARANTEED DEBT
The authorized limit for loans guaranteed by the province as at March 31, 2007 was $420 million (2006: $425 million). These guarantees include amounts where indemnities have been made for explicit quantifiable loans. Guaranteed debt as at March 31, 2007, totaled $104 million (2006: $111 million). See Consolidated Statement of Guaranteed Debt on page 85 for details.
(b) CONTINGENT LIABILITIES
Litigation
The province is a defendant in legal actions and is involved in matters such as expropriation, contract and tax disputes. These matters may give rise to future liabilities.
The province has the following contingent liabilities where the estimated or known claim is or exceeds $100,000, but the likelihood of payment is uncertain.
| | In Millions | |
| | 2007 | | 2006 | |
| | $ | | $ | |
| | | | | |
Tax disputes | | | | 1,300 | |
Negligence and miscellaneous | | 205 | | 13 | |
Damage to persons or property | | 122 | | 112 | |
Contract disputes | | 12 | | 138 | |
Property access disputes | | 8 | | 118 | |
Motor vehicle accidents | | 8 | | 11 | |
Expropriation disputes | | | | 4 | |
| | 355 | | 1,696 | |
When it is determined it is likely a liability exists and the amount can be reasonably estimated, the amount is recorded as an accrued liability (see Note 12) and an expense. The accrued liability for pending litigation in process at March 31, 2007, was $66 million (2006: $56 million)
Guarantees and Indemnities
The province also has contingent liabilities in the form of indemnities, indirect guarantees and outstanding claims for amounts that are not explicit or reasonably estimable at this time.
Environmental Clean–up
The province is responsible for the environmental clean-up of numerous contaminated sites in the province. For those sites where the province has possession, a liability of $139 million (2006: $143 million) has been accrued based on preliminary environmental assessments. This liability is based on the minimum estimated clean–up costs for those sites where an estimate has been made and it has been determined the government is liable. Estimated clean-up costs, not already accrued for sites under evaluation, are approximately $40 million at March 31, 2007. In addition, the Ministry of Energy and Mines has determined possible net liabilities of $386 million for sites the province does not own. Many other sites remain to be evaluated; the future liability for all environmental clean–up costs is not currently determinable.
Aboriginal Land Claims
Treaty negotiations between the province, Canada and First Nations commenced in 1994. The province anticipates these negotiations will result in modern–day treaties defining the boundaries and nature of First Nations treaty settlement lands. As of March 31, 2007, there were 47 treaty tables in various stages of negotiation, representing two–thirds of the aboriginal people in British Columbia.
60
When final treaty agreements are ratified, the provincial cost of treaties is recorded in the Public Accounts. Depending on the substance of the final agreement, costs are expensed upfront or deferred and amortized over the time periods established in the agreement.
One Agreement in Principle (AiP) was signed in 2006/07, (In-SHUCK-ch). As at March 31, 2007, two Final Agreements (Tsawwassen and Maa-nulth) have been initialed and are pending ratification. It is expected the capital transfer components in all AiPs will be entirely provided by Canada. The current commitments of provincial Crown land for all Final Agreement tables are as follows:
(i) In–SHUCK–ch, 13,208 hectares
(ii) Lheidli T’enneh, 3,416 hectares
(iii) Maa–nulth, 22,467 hectares
(iv) Sechelt, 933 hectares
(v) Sliammon, 6,357 hectares
(vi) Tsawwassen, 434 hectares
(vii) Yale, 915 hectares
(viii) Yekooche, 5,960 hectares
The parties at the Sechelt table are having informal discussions with the objective of returning to the table to conclude a Final Agreement based on the signed AiP. An AiP was ratified by the In-SHUCK-ch Treaty Group on April 30, 2006 and is pending ratification by the Government of Canada. Upon coming into effect, treaties will also trigger implementation costs and may result in compensation to third parties. Those costs are not determinable at this time.
Eighty per cent of funding for First Nations negotiation costs is in the form of loans from Canada and is repayable from treaty settlements. The province has committed to reimburse Canada 50% of any negotiation support loans that default along with 50% of the interest accrued. The amount of any provincial liability is not determinable at this time.
Some First Nations have chosen not to negotiate through the formal British Columbia Treaty Commission process. Several First Nations have commenced litigation claiming aboriginal rights and/or title over their asserted Traditional Territories and/or challenging provincial approvals regarding resource allocation and extraction on those lands with respect to the adequacy of consultation and accommodation. The results of these actions are not determinable at this time.
Crown Corporations, Agencies and the School Districts, Universities, Colleges, Institutes and Health Organizations (SUCH)Sector
(i) The Insurance Corporation of British Columbia (ICBC) has settled some claims that require ICBC to provide claimants with periodic payments, usually for a lifetime. ICBC has purchased annuities to make these payments; however, if the annuities are insufficient, ICBC remains responsible. The present value of these settlements at December 31, 2006, was approximately $907 million (2005: $842 million).
(ii) The BC Transportation Financing Authority has contingent liabilities of $102 million remaining after deducting the estimated settlement expense currently accrued from gross claims outstanding for capital projects.
(iii) Powerex, a wholly owned subsidiary of the British Columbia Hydro and Power Authority, has been named as a defendant in a number of lawsuits regarding alleged market manipulation of energy prices in the California wholesale electricity markets. A number of issues and findings are presently on appeal and none have been the subject of final judicial action. Estimates of claims against all market participants could reach several billion US dollars. Management cannot predict the outcome of the various claims; however, Powerex states the terms of its sales were just and reasonable.
(iv) The BC Pavilion Corporation and predecessor property owners remain liable for environmental and reclamation obligations for known hazards that exist at various owned facilities. Management is actively monitoring and mitigating these hazards. Management is not aware of any existing environmental problems related to its facilities that may result in material liability to the BC Pavilion Corporation.
61
(v) The British Columbia Railway Corporation (BCRC) and BCR Properties Ltd. completed a transaction with Canadian National Railway Company (CN) on July 14, 2004. As a result of the transaction, the province and BCRC have provided commercial indemnities to the CN transaction and indemnities related to income tax attributes of BC Rail at closing. As at March 31, 2007, the maximum present value (calculated at 9%) of amounts payable under the tax indemnities related to income tax attributes (excluding any reimbursement of professional fees, tax arrears, interest on taxes payable, if any, on indemnity payments) is approximately $463 million. These indemnities remain in effect until 90 days after the last date on which a tax assessment or reassessment can be issued in respect of the income tax attributes. Management believes it is unlikely that the province or BCRC will ultimately be held liable for any amounts under the commercial and tax indemnities.
(c) COMMITMENTS
The government is involved in the following major commitments.
2010 Winter Olympics
On July 2, 2003, the International Olympic Committee (IOC) selected Vancouver to host the 2010 Olympic and Paralympic Winter Games (the Games). A comprehensive Multi–Party Agreement (MPA) among Canada, British Columbia, the City of Vancouver, the Resort Municipality of Whistler, the Canadian Olympic Committee, the Canadian Paralympic Committee, and the Vancouver 2010 Bid Corporation was signed November 14, 2002.
The MPA establishes the roles and relationships of all the parties, the contractual arrangements, financial contributions, legal responsibilities, and the sport legacies of the parties in relation to the Games. On September 30, 2003, the Vancouver Organizing Committee for the 2010 Olympic and Paralympic Winter Games (VANOC) was incorporated as the successor organization to the Vancouver 2010 Bid Corporation. The province has the power to appoint three of the 20 board members to VANOC. VANOC’s mandate is to plan, organize, finance, stage and host the Games. In addition, the province has provided a guarantee to the IOC of a potential financial shortfall of VANOC. The guarantee should not be relied on by parties other than the IOC.
The province has made a commitment to contribute $600 million towards the Games. This commitment has been allocated as follows:
• Venues and live sites $310 million
• Venues endowment legacy $55 million
• Medical and security costs $100 million
• Paralympic games $20 million
• First Nations sports and municipal legacies $38 million; and
• Olympic contingency allocations $77 million
The province spent $124 million in 2007 (2006: $8 million; previous years: $140 million) for a total to date of $272 million at March 31, 2007. Contractual obligations related to the Olympic games commitment are included in section (d) of this note.
62
Information about the Games may be found at the 2010 Olympic Games website: www.vancouver2010.com, outside these audited statements, and at the BC Olympic and Paralympic Winter Games Secretariat http://www.sbed.gov.bc.ca/2010secretariat/, outside these audited statements.
The province is also upgrading the Sea–to–Sky Highway to coincide with the Games. The province spent $187 million in 2007 (2006: $102 million). The project to date spending total is $357 million (2006: $169 million). The contractual obligations related to the Sea–to–Sky Highway are included in section (d) of this note.
Crown Corporations, Agencies and the SUCH Sector
The province has committed to the construction of the $771.2 million expansion to the Vancouver Convention Centre and other shared upgrades to adjacent facilities. The cost is to be shared by the province ($426.6 million), the government of Canada ($222.5 million), Tourism Vancouver ($90 million), up–front payments related to commercial agreements ($30 million), and a separate commitment with Western Economic Diversification Canada ($2.1 million). The contractual obligations related to the expansion of the Vancouver Convention Centre are included in section (d) of this note.
(d) CONTRACTUAL OBLIGATIONS
The government has entered into a number of multiple-year agreements for the delivery of services and the construction of assets. The following table presents the minimum amounts required to satisfy the contractual obligations, for contractual obligations that are greater than $50 million, by sector, by year.
| | In Millions | |
| | | | | | | | | | | | 2013 and | | | |
| | 2008 | | 2009 | | 2010 | | 2011 | | 2012 | | beyond | | Total | |
| | $ | | $ | | $ | | $ | | $ | | $ | | $ | |
Consolidated Revenue Fund and Taxpayer–supported Crown corporations and agencies | | | | | | | | | | | | | | | |
Health | | 983 | | 615 | | 572 | | 553 | | 560 | | 2,197 | | 5,480 | |
Education | | 200 | | 86 | | 26 | | 11 | | 2 | | 6 | | 331 | |
Social services | | 272 | | 17 | | 5 | | 1 | | | | | | 295 | |
Other | | 87 | | 97 | | 87 | | 70 | | 53 | | 247 | | 641 | |
Natural resources and economic development | | 228 | | 60 | | 100 | | 39 | | 39 | | 884 | | 1,350 | |
Protection of persons and property | | 272 | | 265 | | 265 | | 264 | | 264 | | | | 1,330 | |
Transportation | | 883 | | 594 | | 599 | | 606 | | 614 | | 11,165 | | 14,461 | |
General government | | 395 | | 380 | | 221 | | 199 | | 176 | | 337 | | 1,708 | |
| | 3,320 | | 2,114 | | 1,875 | | 1,743 | | 1,708 | | 14,836 | | 25,596 | |
| | | | | | | | | | | | | | | |
Self–supported Crown corporations and agencies | | | | | | | | | | | | | | | |
Natural resources and economic development | | 2,027 | | 1,212 | | 1,243 | | 1,304 | | 1,403 | | 22,268 | | 29,457 | |
General goverment | | 53 | | 41 | | 30 | | 19 | | 8 | | 28 | | 179 | |
| | 2,080 | | 1,253 | | 1,273 | | 1,323 | | 1,411 | | 22,296 | | 29,636 | |
Total | | 5,400 | | 3,367 | | 3,148 | | 3,066 | | 3,119 | | 37,132 | | 55,232 | |
63
26. Restricted Assets
| | In Millions | |
| | 2007 | | 2006 | |
| | $ | | $ | |
| | | | | |
Endowment funds of universities and colleges | | 1,096 | | 983 | |
Donors have placed restrictions on their contributions to the endowment funds of universities and colleges. One restriction is that the original contribution should not be spent. Another potential restriction is that any investment income of the endowment fund, that is required to offset the eroding effect of inflation or to preserve the original value of the endowment, should also not be spent.
27. Revenue
| | In Millions | |
| | 2007 | | 2006 | |
| | $ | | $ | |
Taxation revenue includes | | | | | |
Personal income | | 6,905 | | 5,838 | |
Corporate income | | 1,538 | | 1,426 | |
Social service | | 4,714 | | 4,367 | |
Property | | 1,732 | | 1,717 | |
Other | | 3,129 | | 3,081 | |
| | 18,018 | | 16,429 | |
See notes at the end of the Schedule of Net Revenue by Source on page 100 for additional information on taxation revenue.
28. Expense
| | In Millions | |
| | 2007 | | 2006 | |
| | $ | | $ | |
Total Expense by Group Account Classification | | | | | |
Salaries and benefits | | 13,926 | | 12,922 | |
Government transfers | | 7,809 | | 8,009 | |
Operating costs | | 8,527 | | 7,912 | |
Interest(1) | | 2,234 | | 2,181 | |
Amortization | | 1,475 | | 1,376 | |
Other | | 477 | | 483 | |
| | 34,448 | | 32,883 | |
(1)Includes foreign exchange gain amortization of $32 million (2006: $121 million) and self-supported debt interest of $489 million (2006: $428 million).
64
29. Valuation Allowances
| | In Millions | |
| | 2007 | | 2006 | |
| | $ | | $ | |
| | | | | |
Accounts receivable | | 70 | | 159 | |
Loans, advances and mortgages receivable | | 28 | | 31 | |
Tangible capital assets | | 14 | | 12 | |
Inventories for resale | | 7 | | 7 | |
Investments | | 2 | | 1 | |
Other assets | | | | 5 | |
| | 121 | | 215 | |
These amounts are included in “Other” of “Total expense by Group Account Classification” in Note 28, and represent the write-down of assets and liabilities in the above Consolidated Statement of Financial Position categories.
30. Trusts Under Administration
| | In Millions | |
| | 2007 | | 2006 | |
| | $ | | $ | |
| | | | | |
Public Guardian and Trustee —administered by government officials | | 647 | | 582 | |
Supreme and provincial court (Suitors’ Funds) —administered by the Courts | | 38 | | 39 | |
Credit Union Deposit Insurance Corporation of B.C. —administered by various government officials and a non–government investment corporation | | 239 | | 213 | |
Other trust funds —administered by various government officials | | 73 | | 93 | |
| | 997 | | 927 | |
31. Significant Events
Collective Bargaining Agreement Incentives
A significant proportion of the public service is made up of employees that work under collective bargaining agreements. The majority of public sector employees are represented by collective agreements that expired on or before March 31, 2006; however there were several agreements that were finalized in the 2006/07 fiscal year.
65
The province established a negotiating framework that included a one–time incentive payment to employees provided their collective agreement was negotiated on or before its expiry date. The incentive payments are paid to employees once the collective agreements are ratified. The province also paid the incentive payment to management employee and non–union members of the public service. The total amount of the budget for incentive payments for all collective agreements, management employees and non–union members of the public service was $1 billion. Approximately $710 million dollars of the incentive budget was paid for collective agreements concluded on or before March 31, 2006 as well as for management employees and non–union members of the public service. The remaining balance of $290 million relates to collective agreements that expired after, but were not concluded by, March 31, 2006. Of the remaining $290 million, $264 million was paid out in the 2006/07 fiscal year.
| | In Millions | |
| | 2007 | |
| | $ | |
Health | | 3 | |
Education | | 255 | |
Natural resources and economic development | | 1 | |
Protection of persons and property | | 5 | |
| | 264 | |
32. Comparison to Estimates
The Estimates numbers on the Statement of Operations are taken from the Estimated Statement of Operations on page 4 of the Estimates, Fiscal Year Ending March 31, 2007, presented to the Legislative Assembly February 21, 2006. They do not include supplementary spending of $290 million for incentive payments for the benefit of Public Sector employees under the negotiating framework announced on November 30, 2005, that was approved by the Legislature during the 2006/07 fiscal year.
33. Comparatives
The comparative figures for the previous year have been restated to conform with the current year’s presentation. The effect of these restatements on the previously reported operating result is disclosed in Note 24.
66
34. Subsequent Events
(a) British Columbia Railway Company
On April 3, 2007, British Columbia Railway Company (BCRC) and its subsidiaries Vancouver Wharves Limited Partnership (VWLP) and BCR Properties Ltd (BCRP) entered into a transaction with Kinder Morgan Canada Terminals ULC (KMCT) regarding the operation of the Vancouver Wharves (VW) bulk marine terminal in North Vancouver.
The transaction includes a 40 year non–renewable lease with respect to the VW lands as well as the purchase by KMCT of the VW terminal assets, which include on site rail infrastructure, dry bulk and liquid storage, and material handling systems. KMCT will pay $40 million cash on closing, which includes the prepayment of all rent on the VW lands. KMCT will assume VWLP’s asset retirement obligation to remediate the leased VW lands at the end of the lease to the same standards under which VWLP has under its current lease with BCRP. KMCT will assume VWLP’s asset retirement obligation to the Port of Vancouver. KMCT will assume certain environmental liabilities pertaining to the VW lands. KMCT has also agreed, at its cost, to transfer those VW terminal operations that are conducted on land adjacent to the VW lands to the VW lands. BCRC will retain the environmental obligations associated with the VW terminal operations that are currently conducted on land adjacent to the VW lands.
At March 31, 2007, the book value of the net assets of VW were $6.0 million (March 31, 2006: $2.0 million) and income for the year ending March 31, 2007 was $10.6 million (year ending March 31, 2006: $9.1 million loss).
BCRP, as the VW land owner, will continue to recognize the VW lands asset retirement obligations and VW lands environmental liabilities. The present value of the asset retirement obligations is $44.6 million and the book value of the environmental liability is $14 million.
(b) Vancouver Convention Centre Expansion Project
On April 11, 2007, the province approved additional funding of $86 million for the Vancouver Convention Centre Expansion Project raising the new facility’s budget to $771.2 million (and the province’s related contribution to $426.6 million).
(c) Members of the Legislative Assembly (MLA) Compensation
Legislation was passed on May 31, 2007 to provide a pay increase and pension benefits to MLA’s with options retroactive to 1996. The pension amounts are undeterminable until options are exercised to purchase past service pension benefits. The option must be exercised before July 1, 2011.
(d) Supreme Court of Canada ruling on Bill 29
On June 8, 2007 the Supreme Court of Canada issued a declaration that certain provisions of Bill 29 are unconstitutional. The Court suspended the declaration for a period of 12 months to allow the government to address the repercussions of the decision. No liabilities have been established as a result of this decision and the future financial impact, if any, of this ruling cannot be determined.
67
35. Asset Retirement Obligations(1)
| | In Millions | |
| | 2007 | | 2006 | |
| | $ | | $ | |
| | | | | |
Health | | 10 | | 1 | |
Education(2) | | 4 | | 4 | |
Other | | 4 | | 3 | |
Natural resources and economic development | | 17 | | 16 | |
Transportation | | 44 | | 42 | |
| | 79 | | 66 | |
(1)The province recognizes asset retirement obligations where a reasonable estimate of the fair value of the obligation and the future settlement date of the retirement of the asset can be determined. Legal liabilities may exist for the removal or disposal of asbestos within buildings that will undergo major renovations or demolition. The fair value of the liability for asbestos removal or disposal will be recognized in the period in which it is incurred if a reasonable estimate of fair value can be made.
(2)The information for School Districts is at June 30, 2006.
68
PROVINCE OF BRITISH COLUMBIA
PUBLIC ACCOUNTS 2006/07
Summary Financial Statements
Reporting Entity
for the Fiscal Year Ended March 31, 2007
TAXPAYER-SUPPORTED CROWN CORPORATIONS AND AGENCIES
(GOVERNMENT ORGANIZATIONS)
RECORDED ON A CONSOLIDATED BASIS
Consolidated Revenue Fund(1)
Health Sector
Bella Coola General Hospital
Canadian Blood Services(2)
Fraser Health Authority
Interior Health Authority
Louis Brier Home and Hospital
Menno Hospital
Mount St. Mary Hospital
Nisaga’a Valley Health Board
Northern Health Authority
Providence Health Care
Provincial Health Services Authority
RW Large Memorial Hospital
St Joseph’s General Hospital
St Michael’s Centre
Vancouver Coastal Health Authority
Vancouver Island Health Authority
Wrinch Memorial Hospital
Education Sector
British Columbia Institute of Technology
Camosun College
Capilano College
College of New Caledonia
College of the Rockies
Douglas College
Emily Carr Institute of Art and Design
Industry Training Authority
Institute of Indigenous Government
Justice Institute of British Columbia
Kwantlen University College
Langara College
Leading Edge Endowment Fund Society
Malaspina University College
Nicola Valley Institute of Technology
North Island College
Northern Lights College
Northwest Community College
Okanagan College
Okanagan University College
70
Open Learning Agency
Private Career Training Institutions Agency
Royal Roads University
School Districts
Selkirk College
Simon Fraser University
Thompson Rivers University
The University of British Columbia
University College of the Fraser Valley
University of Northern British Columbia
University of Victoria
Vancouver Community College
Natural Resources and Economic Development Sector
552513 BC Ltd
BC Immigrant Investment Fund Ltd
B.C. Pavilion Corporation
British Columbia Enterprise Corporation
British Columbia Innovation Council
Columbia Basin Trust
Creston Valley Wildlife Management Authority Trust Fund
Forestry Innovation Investment Ltd
Nechako–Kitamaat Development Fund Society(3)
Oil and Gas Commission
Partnerships British Columbia Inc
Tourism British Columbia
Vancouver Convention Centre Expansion Project
Transportation Sector
BC Transportation Financing Authority
British Columbia Transit
Rapid Transit Project 2000 Ltd
Protection of Persons and Property
British Columbia Securities Commission
Organized Crime Agency of British Columbia Society
Social Services Sector
Community Living British Columbia
Legal Services Society
71
Other Sector
BC Games Society
British Columbia Arts Council
British Columbia Assessment Authority
British Columbia Buildings Corporation(4)
British Columbia Housing Management Commission
First Peoples’ Heritage, Language and Culture Council
Homeowner Protection Office
Provincial Rental Housing Corporation
The Royal British Columbia Museum Corporation
SELF–SUPPORTED CROWN CORPORATIONS AND AGENCIES
(GOVERNMENT ENTERPRISES)
RECORDED ON A MODIFIED EQUITY BASIS
BCIF Management Ltd(5)
British Columbia Hydro and Power Authority(5)
British Columbia Liquor Distribution Branch(6)
British Columbia Lottery Corporation(6)
British Columbia Railway Company(7)
British Columbia Transmission Corporation(5)
Columbia Power Corporation(5)
Insurance Corporation of British Columbia(8)
Provincial Capital Commission(9)
(1) The Consolidated Revenue Fund has been allocated to the appropriate sector on the Consolidated Statement of Financial Position by Sector (page 74) and Operations by Sector (page 78).
(2) This organization reflects a government partnership amongst Canadian provinces and is proportionally consolidated based upon the province’s share (14.67%) of the total provincial contributions to the partnership.
(3) This organization was included in operations for the first time during this fiscal year.
(4) This organization wound up operations during the fiscal year.
(5) These organizations were included in the Natural Resources and Economic Development Sector results.
(6) These organizations were included in the General Government Sector results.
(7) This organization was included in the Transportation Sector results.
(8) This organization was included in the Protection of Persons and Property Sector results.
(9) This organization was included in the Other Sector results.
72
PROVINCE OF BRITISH COLUMBIA
PUBLIC ACCOUNTS 2006/07
Summary Financial Statements
Consolidated Statement of Financial Position by Sector
as at March 31, 2007
| | In Millions | |
| | Health | | Education | | Social Services | | Debt Servicing(1) | | Other(2) | |
| | 2007 | | 2006 | | 2007 | | 2006 | | 2007 | | 2006 | | 2007 | | 2006 | | 2007 | | 2006 | |
| | $ | | $ | | $ | | $ | | $ | | $ | | $ | | $ | | $ | | $ | |
Financial Assets | | | | | | | | | | | | | | | | | | | | | |
Cash and cash equivalents | | 271 | | 276 | | 1,483 | | 1,509 | | (2 | ) | 1 | | 279 | | 790 | | 71 | | 145 | |
Temporary investments | | 324 | | 369 | | 305 | | 286 | | 18 | | 21 | | | | | | 66 | | 40 | |
Accounts receivable | | 292 | | 194 | | 215 | | 163 | | 67 | | 73 | | 282 | | 313 | | 36 | | 42 | |
Inventories for resale | | 1 | | 1 | | 29 | | 29 | | | | | | | | | | 1 | | 19 | |
Due from the Province of British Columbia | | 2 | | 325 | | 17 | | 109 | | | | 3 | | | | | | | | 15 | |
Due from other governments | | 49 | | 68 | | 94 | | 102 | | 9 | | 11 | | | | | | 52 | | 94 | |
Due from self-supported Crown corporations and agencies | | | | | | | | | | | | | | | | | | | | | |
Equity in self-supported Crown corporations and agencies | | | | | | | | | | | | | | | | | | 15 | | 15 | |
Loans, advances and mortgages receivable | | 1 | | 2 | | 584 | | 538 | | 1 | | | | | | | | 141 | | 163 | |
Other investments | | 156 | | 157 | | 1,760 | | 1,510 | | 4 | | | | 15 | | 18 | | 42 | | 40 | |
Sinking fund investments | | | | | | 56 | | 73 | | | | | | 3,798 | | 4,059 | | | | 152 | |
Loans for purchase of assets, recoverable from agencies | | | | | | | | | | | | | | 10,262 | | 10,008 | | | | | |
| | | | | | | | | | | | | | | | | | | | | |
| | 1,096 | | 1,392 | | 4,543 | | 4,319 | | 97 | | 109 | | 14,636 | | 15,188 | | 424 | | 725 | |
73
| | In Millions | |
| | Natural Resources
and Economic
Development | | Protection of Persons
and Property | | Transportation | | General Government(3) | | Adjustments(4) | | Total | |
| | 2007 | | 2006 | | 2007 | | 2006 | | 2007 | | 2006 | | 2007 | | 2006 | | 2007 | | 2006 | | 2007 | | 2006 | |
| | $ | | $ | | $ | | $ | | $ | | $ | | $ | | $ | | $ | | $ | | $ | | $ | |
Financial Assets | | | | | | | | | | | | | | | | | | | | | | | | | |
Cash and cash equivalents | | 221 | | 177 | | 12 | | 9 | | 49 | | 27 | | 34 | | | | | | | | 2,418 | | 2,934 | |
Temporary investments | | 219 | | 204 | | 16 | | 15 | | 1 | | | | | | | | | | | | 949 | | 935 | |
Accounts receivable | | 612 | | 559 | | 84 | | 85 | | 28 | | 20 | | 1,308 | | 1,167 | | (82 | ) | (52 | ) | 2,842 | | 2,564 | |
Inventories for resale | | 25 | | 28 | | 9 | | 7 | | | | | | 10 | | 9 | | | | | | 75 | | 93 | |
Due from the Province of British Columbia | | 6 | | 6 | | | | | | 38 | | 37 | | | | | | (63 | ) | (495 | ) | 0 | | 0 | |
Due from other governments | | 217 | | 29 | | 39 | | 29 | | 36 | | 25 | | 385 | | 316 | | | | | | 881 | | 674 | |
Due from self-supported Crown corporations and agencies | | 348 | | 267 | | | | | | | | | | 206 | | 176 | | | | | | 554 | | 443 | |
Equity in self-supported Crown corporations and agencies | | 2,139 | | 2,048 | | 2,070 | | 1,242 | | 172 | | 143 | | | | | | | | | | 4,396 | | 3,448 | |
Loans, advances and mortgages receivable | | 94 | | 68 | | 4 | | 4 | | | | 1 | | 211 | | 192 | | (44 | ) | (17 | ) | 992 | | 951 | |
Other investments | | 467 | | 452 | | | | | | 76 | | 76 | | | | | | (10 | ) | (10 | ) | 2,510 | | 2,243 | |
Sinking fund investments | | | | | | | | | | 406 | | 414 | | | | | | (462 | ) | (639 | ) | 3,798 | | 4,059 | |
Loans for purchase of assets, recoverable from agencies | | | | | | | | | | | | | | | | | | (3,092 | ) | (3,092 | ) | 7,170 | | 6,916 | |
| | | | | | | | | | | | | | | | | | | | | | | | | |
| | 4,348 | | 3,838 | | 2,234 | | 1,391 | | 806 | | 743 | | 2,154 | | 1,860 | | (3,753 | ) | (4,305 | ) | 26,585 | | 25,260 | |
74
| | In Millions | |
| | Health | | Education | | Social Services | | Debt Servicing(1) | | Other(2) | |
| | 2007 | | 2006 | | 2007 | | 2006 | | 2007 | | 2006 | | 2007 | | 2006 | | 2007 | | 2006 | |
| | $ | | $ | | $ | | $ | | $ | | $ | | $ | | $ | | $ | | $ | |
Liabilities | | | | | | | | | | | | | | | | | | | | | |
Accounts payable and accrued liabilities | | 1,910 | | 2,009 | | 978 | | 995 | | 144 | | 204 | | 628 | | 695 | | 266 | | 257 | |
Due to other governments | | 65 | | 55 | | 23 | | 13 | | | | | | | | | | 81 | | 45 | |
Due to Crown corporations, agencies and trust funds | | 8 | | | | 2 | | | | | | | | | | | | 76 | | 102 | |
Due to the Province of British Columbia | | 17 | | 4 | | 9 | | 1 | | | | 1 | | | | | | 8 | | 3 | |
Deferred revenue | | 1,670 | | 1,854 | | 1,303 | | 1,139 | | | | 62 | | 181 | | 174 | | 108 | | 149 | |
Employee pension plans | | | | | | | | | | | | | | | | | | | | | |
Taxpayer-supported debt | | 228 | | 204 | | 715 | | 672 | | 12 | | 5 | | 27,018 | | 28,947 | | 251 | | 619 | |
Self-supported debt | | | | | | | | | | | | | | 7,897 | | 7,758 | | | | | |
| | 3,898 | | 4,126 | | 3,030 | | 2,820 | | 156 | | 272 | | 35,724 | | 37,574 | | 790 | | 1,175 | |
Net assets (liabilities) | | (2,802 | ) | (2,734 | ) | 1,513 | | 1,499 | | (59 | ) | (163 | ) | (21,088 | ) | (22,386 | ) | (366 | ) | (450 | ) |
| | | | | | | | | | | | | | | | | | | | | |
Non-financial Assets | | | | | | | | | | | | | | | | | | | | | |
Tangible capital assets | | 4,044 | | 3,734 | | 10,334 | | 9,642 | | 62 | | 43 | | | | | | 617 | | 1,070 | |
Prepaid capital advances | | | | | | 25 | | 26 | | | | | | | | | | | | | |
Prepaid program costs | | 161 | | 152 | | 22 | | 21 | | 3 | | 3 | | | | | | 13 | | 29 | |
Other assets | | 5 | | 4 | | 6 | | 7 | | | | | | 302 | | 255 | | 1 | | | |
| | 4,210 | | 3,890 | | 10,387 | | 9,696 | | 65 | | 46 | | 302 | | 255 | | 631 | | 1,099 | |
Accumulated surplus (deficit) | | 1,408 | | 1,156 | | 11,900 | | 11,195 | | 6 | | (117 | ) | (20,786 | ) | (22,131 | ) | 265 | | 649 | |
75
| | In Millions | |
| | Natural Resources | | | | | | | | | | | | | | | | | | | | | |
| | and Economic | | Protection of Persons | | | | | | | | | | | | | | | | | |
| | Development | | and Property | | Transportation | | General Government(3) | | Adjustments(4) | | Total | |
| | 2007 | | 2006 | | 2007 | | 2006 | | 2007 | | 2006 | | 2007 | | 2006 | | 2007 | | 2006 | | 2007 | | 2006 | |
| | $ | | $ | | $ | | $ | | $ | | $ | | $ | | $ | | $ | | $ | | $ | | $ | |
Liabilities | | | | | | | | | | | | | | | | | | | | | | | | | |
Accounts payable and accrued liabilities | | 938 | | 964 | | 249 | | 262 | | 307 | | 259 | | 743 | | 1,115 | | (91 | ) | (530 | ) | 6,072 | | 6,230 | |
Due to other governments | | 2 | | 3 | | 69 | | 56 | | | | | | 675 | | 741 | | | | | | 915 | | 913 | |
Due to Crown corporations, agencies and trust funds | | 1 | | | | | | | | | | | | 29 | | 42 | | (11 | ) | | | 105 | | 144 | |
Due to the Province of British Columbia | | 1 | | 1 | | | | | | 4 | | | | | | | | (39 | ) | (10 | ) | 0 | | 0 | |
Deferred revenue | | 2,099 | | 1,865 | | 291 | | 250 | | 331 | | 247 | | 32 | | | | (29 | ) | (46 | ) | 5,986 | | 5,694 | |
Employee pension plans | | | | | | | | | | | | | | 2 | | 2 | | | | | | 2 | | 2 | |
Taxpayer-supported debt | | 428 | | 328 | | 7 | | 5 | | 3,748 | | 3,205 | | 36 | | 43 | | (3,602 | ) | (3,739 | ) | 28,841 | | 30,289 | |
Self-supported debt | | | | | | | | | | | | | | | | | | | | | | 7,897 | | 7,758 | |
| | 3,469 | | 3,161 | | 616 | | 573 | | 4,390 | | 3,711 | | 1,517 | | 1,943 | | (3,772 | ) | (4,325 | ) | 49,818 | | 51,030 | |
Net assets (liabilities) | | 879 | | 677 | | 1,618 | | 818 | | (3,584 | ) | (2,968 | ) | 637 | | (83 | ) | 19 | | 20 | | (23,233 | ) | (25,770 | ) |
| | | | | | | | | | | | | | | | | | | | | | | | | |
Non–financial Assets | | | | | | | | | | | | | | | | | | | | | | | | | |
Tangible capital assets | | 1,241 | | 999 | | 63 | | 59 | | 9,461 | | 9,002 | | 813 | | 216 | | (9 | ) | (9 | ) | 26,626 | | 24,756 | |
Prepaid capital advances | | | | | | | | | | | | | | | | | | (25 | ) | (26 | ) | 0 | | 0 | |
Prepaid program costs | | 344 | | 303 | | 3 | | 1 | | 8 | | 9 | | 38 | | 14 | | | | | | 592 | | 532 | |
Other assets | | 4 | | 11 | | 14 | | 18 | | 22 | | 22 | | | | | | (3 | ) | (2 | ) | 351 | | 315 | |
| | 1,589 | | 1,313 | | 80 | | 78 | | 9,491 | | 9,033 | | 851 | | 230 | | (37 | ) | (37 | ) | 27,569 | | 25,603 | |
Accumulated surplus (deficit) | | 2,468 | | 1,990 | | 1,698 | | 896 | | 5,907 | | 6,065 | | 1,488 | | 147 | | (18 | ) | (17 | ) | 4,336 | | (167 | ) |
(1) Debt servicing represents the financial impacts of activities related to management of the public debt.
(2) Includes housing, recreation and culture, and other activities which cannot be allocated to the specific sectors.
(3) Includes the legislature, tax collection and administration, Canadian Health and Social Transfer and Equalization transfers from the federal government, liquor and gaming profits, general administration and central agency services such as accounting, auditing, budgeting, insurance and risk management to all sectors.
(4) Represents sectoral adjustments to conform to government accounting policies and to eliminate transactions between sectors.
76
PROVINCE OF BRITISH COLUMBIA
PUBLIC ACCOUNTS 2006/07
Summary Financial Statements
Consolidated Statement of Operations by Sector
for the Fiscal Year Ended March 31, 2007
| | In Millions | |
| | Health | | Education | | Social Services | | Debt Servicing(1) | | Other(2) | |
| | 2007 | | 2006 | | 2007 | | 2006 | | 2007 | | 2006 | | 2007 | | 2006 | | 2007 | | 2006 | |
| | $ | | $ | | $ | | $ | | $ | | $ | | $ | | $ | | $ | | $ | |
Revenue | | | | | | | | | | | | | | | | | | | | | |
Taxation | | | | | | | | | | | | | | | | | | 81 | | 63 | |
Contributions from the federal government | | 301 | | 426 | | 546 | | 518 | | 110 | | 81 | | | | | | 192 | | 192 | |
Natural resources | | | | | | | | | | | | | | | | | | | | | |
Fees and licences | | 1,783 | | 1,728 | | 1,082 | | 1,032 | | | | | | | | | | 24 | | 20 | |
Miscellaneous | | 668 | | 612 | | 1,266 | | 1,056 | | 32 | | 25 | | | | 1 | | 103 | | 162 | |
Contributions from the provincial government/self-supported Crown corporations and agencies | | 17 | | 363 | | 349 | | 252 | | 7 | | 36 | | | | | | 66 | | 364 | |
Investment income | | 27 | | 31 | | 173 | | 186 | | 3 | | 4 | | 914 | | 858 | | 9 | | 22 | |
Total revenue | | 2,796 | | 3,160 | | 3,416 | | 3,044 | | 152 | | 146 | | 914 | | 859 | | 475 | | 823 | |
77
| | In Millions | |
| | Natural Resources | | | | | | | | | | | | | | | | | | | | | |
| | and Economic | | Protection of Persons | | | | | | | | | | | | | | | | | |
| | Development | | and Property | | Transportation | | General Government(3) | | Adjustments(4) | | Total | |
| | 2007 | | 2006 | | 2007 | | 2006 | | 2007 | | 2006 | | 2007 | | 2006 | | 2007 | | 2006 | | 2007 | | 2006 | |
| | $ | | $ | | $ | | $ | | $ | | $ | | $ | | $ | | $ | | $ | | $ | | $ | |
Revenue | | | | | | | | | | | | | | | | | | | | | | | | | |
Taxation | | 31 | | 28 | | | | | | 466 | | 463 | | 17,440 | | 15,875 | | | | | | 18,018 | | 16,429 | |
Contributions from the federal government | | 93 | | 60 | | 85 | | 105 | | 26 | | 26 | | 5,033 | | 4,417 | | | | | | 6,386 | | 5,825 | |
Natural resources | | 3,982 | | 4,567 | | | | | | | | | | | | | | | | | | 3,982 | | 4,567 | |
Fees and licences | | 135 | | 142 | | 659 | | 627 | | 81 | | 88 | | 27 | | 29 | | | | | | 3,791 | | 3,666 | |
Miscellaneous | | 106 | | 110 | | 155 | | 189 | | 59 | | 41 | | 321 | | 137 | | (100 | ) | (16 | ) | 2,610 | | 2,317 | |
Contributions from the provincial government/self-supported Crown corporations and agencies | | 443 | | 298 | | 381 | | 191 | | 47 | | 49 | | 1,850 | | 1,715 | | (475 | ) | (1,048 | ) | 2,685 | | 2,220 | |
Investment income | | 52 | | 21 | | 1 | | 1 | | 35 | | 33 | | 11 | | 3 | | (193 | ) | (210 | ) | 1,032 | | 949 | |
Total revenue | | 4,842 | | 5,226 | | 1,281 | | 1,113 | | 714 | | 700 | | 24,682 | | 22,176 | | (768 | ) | (1,274 | ) | 38,504 | | 35,973 | |
78
| | In Millions | |
| | Health | | Education | | Social Services | | Debt Servicing(1) | | Other(2) | |
| | 2007 | | 2006 | | 2007 | | 2006 | | 2007 | | 2006 | | 2007 | | 2006 | | 2007 | | 2006 | |
| | $ | | $ | | $ | | $ | | $ | | $ | | $ | | $ | | $ | | $ | |
Expense | | | | | | | | | | | | | | | | | | | | | |
Salaries and benefits | | 5,166 | | 4,946 | | 6,754 | | 6,024 | | 364 | | 368 | | | | | | 115 | | 135 | |
Government transfers | | 3,689 | | 3,646 | | 646 | | 769 | | 1,762 | | 1,801 | | | | | | 979 | | 762 | |
Operating costs | | 4,020 | | 3,814 | | 1,683 | | 1,611 | | 774 | | 655 | | | | | | 148 | | 444 | |
Interest | | 10 | | 7 | | 36 | | 48 | | | | | | 2,181 | | 2,140 | | 16 | | 40 | |
Amortization | | 395 | | 365 | | 513 | | 481 | | 12 | | 10 | | | | | | 20 | | 46 | |
Other | | 147 | | 205 | | 207 | | 199 | | 21 | | (1 | ) | | | | | 18 | | 29 | |
Operating expense | | 13,427 | | 12,983 | | 9,839 | | 9,132 | | 2,933 | | 2,833 | | 2,181 | | 2,140 | | 1,296 | | 1,456 | |
Surplus (deficit) for the Fiscal Year ended March 31 | | (10,631 | ) | (9,823 | ) | (6,423 | ) | (6,088 | ) | (2,781 | ) | (2,687 | ) | (1,267 | ) | (1,281 | ) | (821 | ) | (633 | ) |
79
| | In Millions | |
| | Natural Resources | | | | | | | | | | | | | | | | | | | | | |
| | and Economic | | Protection of Persons | | | | | | | | | | | | | | | | | |
| | Development | | and Property | | Transportation | | General Government(3) | | Adjustments(4) | | Total | |
| | 2007 | | 2006 | | 2007 | | 2006 | | 2007 | | 2006 | | 2007 | | 2006 | | 2007 | | 2006 | | 2007 | | 2006 | |
| | $ | | $ | | $ | | $ | | $ | | $ | | $ | | $ | | $ | | $ | | $ | | $ | |
Expense | | | | | | | | | | | | | | | | | | | | | | | | | |
Salaries and benefits | | 510 | | 485 | | 552 | | 532 | | 127 | | 123 | | 338 | | 309 | | | | | | 13,926 | | 12,922 | |
Government transfers | | 293 | | 520 | | 523 | | 602 | | 73 | | 70 | | 273 | | 479 | | (429 | ) | (640 | ) | 7,809 | | 8,009 | |
Operating costs | | 768 | | 588 | | 241 | | 262 | | 666 | | 631 | | 236 | | 204 | | (9 | ) | (297 | ) | 8,527 | | 7,912 | |
Interest | | 1 | | (4 | ) | | | | | 184 | | 160 | | | | | | (194 | ) | (210 | ) | 2,234 | | 2,181 | |
Amortization | | 38 | | 35 | | 19 | | 19 | | 383 | | 368 | | 95 | | 52 | | | | | | 1,475 | | 1,376 | |
Other | | 79 | | 58 | | 15 | | 18 | | 32 | | 24 | | 94 | | 78 | | (136 | ) | (127 | ) | 477 | | 483 | |
Operating expense | | 1,689 | | 1,682 | | 1,350 | | 1,433 | | 1,465 | | 1,376 | | 1,036 | | 1,122 | | (768 | ) | (1,274 | ) | 34,448 | | 32,883 | |
Surplus (deficit) for the Fiscal Year ended March 31 | | 3,153 | | 3,544 | | (69 | ) | (320 | ) | (751 | ) | (676 | ) | 23,646 | | 21,054 | | 0 | | 0 | | 4,056 | | 3,090 | |
(1) Debt servicing represents the financial impacts of activities related to management of the public debt.
(2) Includes housing, recreation and culture, and other activities which cannot be allocated to the specific sectors.
(3) Includes the legislature, tax collection and administration, Canadian Health and Social Transfer and Equalization transfers from the federal government, liquor and gaming profits, general administration and central agency services such as accounting, auditing, budgeting, insurance and risk management to all sectors.
(4) Represents sectoral adjustments to conform to government accounting policies and to eliminate transactions between sectors.
80
PROVINCE OF BRITISH COLUMBIA
PUBLIC ACCOUNTS 2006/07
Summary Financial Statements
Statement of Financial Position
for Self-supported Crown Corporations and Agencies
as at March 31, 2007
| | In Millions | |
| | | | | | | | | | | | Economic | | 2007 | | 2006 | |
| | Utility(1) | | Insurance(2) | | Liquor(3) | | Transportation(4) | | Finance(5) | | Development(6) | | Total | | Total(7) | |
| | $ | | $ | | $ | | $ | | $ | | $ | | $ | | $ | |
Assets | | | | | | | | | | | | | | | | | |
Cash and temporary investments | | 79 | | 9,045 | | 5 | | 235 | | 108 | | 2 | | 9,474 | | 8,381 | |
Accounts receivable | | 526 | | 1,034 | | 34 | | 4 | | 82 | | | | 1,680 | | 1,496 | |
Inventories | | 137 | | | | 73 | | 28 | | 5 | | | | 243 | | 241 | |
Long–term investments | | 34 | | 63 | | | | | | | | | | 97 | | 84 | |
Sinking fund investments | | 733 | | | | | | | | | | | | 733 | | 846 | |
Tangible capital assets | | 10,760 | | 77 | | 43 | | 301 | | 120 | | 18 | | 11,319 | | 10,901 | |
Other assets | | 1,167 | | 149 | | 6 | | 36 | | 16 | | | | 1,374 | | 1,227 | |
| | 13,436 | | 10,368 | | 161 | | 604 | | 331 | | 20 | | 24,920 | | 23,176 | |
| | | | | | | | | | | | | | | | | |
Liabilities | | | | | | | | | | | | | | | | | |
Accounts payable | | 1,202 | | 6,682 | | 159 | | 150 | | 125 | | | | 8,318 | | 7,852 | |
Deferred revenue | | 1,935 | | 1,616 | | | | 282 | | | | 5 | | 3,838 | | 3,773 | |
Due to Province of BC | | 348 | | | | | | | | 206 | | | | 554 | | 443 | |
Debt due to Province of BC | | 7,687 | | | | | | | | | | | | 7,687 | | 7,526 | |
Other long–term debt | | 125 | | | | 2 | | | | | | | | 127 | | 134 | |
| | 11,297 | | 8,298 | | 161 | | 432 | | 331 | | 5 | | 20,524 | | 19,728 | |
Equity | | | | | | | | | | | | | | | | | |
Investment by the CRF | | 296 | | | | | | 107 | | | | | | 403 | | 403 | |
Other comprehensive income | | | | 447 | | | | | | | | | | 447 | | 0 | |
Unremitted earnings—end of year | | 1,843 | | 1,623 | | | | 65 | | | | 15 | | 3,546 | | 3,045 | |
| | 2,139 | | 2,070 | | 0 | | 172 | | 0 | | 15 | | 4,396 | | 3,448 | |
Total Liabilities and Equity | | 13,436 | | 10,368 | | 161 | | 604 | | 331 | | 20 | | 24,920 | | 23,176 | |
(1) British Columbia Hydro and Power Authority, British Columbia Transmission Corporation, and Columbia Power Corporation.
(2) Insurance Corporation of British Columbia.
(3) British Columbia Liquor Distribution Branch.
(4) British Columbia Railway Company.
(5) British Columbia Lottery Corporation and BCIF Management Ltd.
(6) Provincial Capital Commission.
(7) British Columbia Railway Company made revisions to prior year accounting treatments. British Columbia Railway Company reclassified assets, liabilities, revenues, and expenses related to discontinued operations. Additionally, an asset impairment write-down and an amortization adjustment recognized by British Columbia Railway Company in 2005/06 were not required. These changes have resulted in assets increasing by $26 million, equity increasing by $26 million, revenues decreasing by $54 million, and expenses decreasing by $76 million for 2005/06. BC Hydro and Power Authority made a change to their presentation of unrealized gains and losses. This change has resulted in assets decreasing by $220 million and liabilities decreasing by $220 million for 2005/06. The Insurance Corporation of British Columbia made a change in presentation of bond repurchase obligations to conform with the current period presentation. This change has resulted in assets increasing by $783 million and liabilities increasing by $783 million for 2005/06.
81
PROVINCE OF BRITISH COLUMBIA
PUBLIC ACCOUNTS 2006/07
Summary Financial Statements
Summary of Results of Operations and Statement
of Equity for Self-supported Crown Corporations and Agencies
for the Fiscal Year Ended March 31, 2007
| | In Millions | |
| | | | | | | | | | | | Economic | | 2007 | | 2006 | |
| | Utility(1) | | Insurance(2) | | Liquor(3) | | Transportation(4) | | Finance(5) | | Development(6) | | Total | | Total(8) | |
| | $ | | $ | | $ | | $ | | $ | | $ | | $ | | $ | |
Revenue | | 4,422 | | 3,890 | | 2,440 | | 53 | | 2,427 | | 3 | | 13,235 | | 12,936 | |
Expense | | 3,998 | | 3,509 | | 1,600 | | 24 | | 1,416 | | 3 | | 10,550 | | 10,716 | |
| | | | | | | | | | | | | | | | | |
Net earnings of self–supported Crown corporations & agencies. | | 424 | | 381 | | 840 | | 29 | | 1,011 | | 0 | | 2,685 | | 2,220 | |
Contributions paid to the CRF | | (333 | ) | | | (840 | ) | | | (768 | ) | | | (1,941 | ) | (1,727 | ) |
Adjustments to contributions(7) | | | | | | | | | | (243 | ) | | | (243 | ) | (213 | ) |
Increase(decrease) in unremitted earnings in self–supported Crown corporations & agencies | | 91 | | 381 | | 0 | | 29 | | 0 | | 0 | | 501 | | 280 | |
Unremitted earnings—beginning of year | | 1,752 | | 1,242 | | | | 10 | | | | 15 | | 3,019 | | 2,816 | |
Adjustments to unremitted earnings(8) | | | | | | | | 26 | | | | | | 26 | | (51 | ) |
Unremitted earnings—end of year | | 1,843 | | 1,623 | | 0 | | 65 | | 0 | | 15 | | 3,546 | | 3,045 | |
Investment by the CRF | | 296 | | | | | | 107 | | | | | | 403 | | 403 | |
Other comprehensive income | | | | 447 | | | | | | | | | | 447 | | 0 | |
Equity in self–supported Crown corporations and agencies for the year | | 2,139 | | 2,070 | | 0 | | 172 | | 0 | | 15 | | 4,396 | | 3,448 | |
(1) British Columbia Hydro and Power Authority, British Columbia Transmission Corporation, and Columbia Power Corporation.
(2) Insurance Corporation of British Columbia.
(3) British Columbia Liquor Distribution Branch.
(4) British Columbia Railway Company.
(5) British Columbia Lottery Corporation and BCIF Management Ltd.
(6) Provincial Capital Commission.
(7) The adjustments are for British Columbia Lottery Corporation transfers to charities and local governments, which is shown as a recovery by the Consolidated Revenue Fund.
(8) British Columbia Railway Company made revisions to prior year accounting treatments. British Columbia Railway Company reclassified assets, liabilities, revenues, and expenses related to discontinued operations. Additionally, an asset impairment write-down and an amortization adjustment recognized by British Columbia Railway Company in 2005/06 were not required. These changes have resulted in assets increasing by $26 million, equity increasing by $26 million, revenues decreasing by $54 million, and expenses decreasing by $76 million for 2005/06. BC Hydro and Power Authority made a change to their presentation of unrealized gains and losses. This change has resulted in assets decreasing by $220 million and liabilities decreasing by $220 million for 2005/06. The Insurance Corporation of British Columbia made a change in presentation of bond repurchase obligations to conform with the current period presentation. This change has resulted in assets increasing by $783 million and liabilities increasing by $783 million for 2005/06.
82
PROVINCE OF BRITISH COLUMBIA
PUBLIC ACCOUNTS 2006/07
Summary Financial Statements
Consolidated Statement of Tangible Capital Assets(1)
for the Fiscal Year Ended March 31, 2007
| | In Millions | |
| | | | | | | | | | Computer | | | | | | | |
| | Land and Land | | | | Highway | | Transportation | | Hardware/ | | | | 2007 | | 2006 | |
| | Improvements | | Building | | Infrastructure | | Equipment | | Software | | Other(3) | | Total | | Total | |
| | $ | | $ | | $ | | $ | | $ | | $ | | $ | | $ | |
Historical Cost(2) | | | | | | | | | | | | | | | | | |
Opening Cost | | 2,254 | | 17,248 | | 11,810 | | 2,695 | | 1,879 | | 4,773 | | 40,659 | | 38,128 | |
Additions | | 197 | | 1,366 | | 819 | | 13 | | 372 | | 599 | | 3,366 | | 3,101 | |
Disposals and valuation adjustments | | 12 | | (61 | ) | (247 | ) | (9 | ) | (101 | ) | (201 | ) | (607 | ) | (570 | ) |
| | 2,463 | | 18,553 | | 12,382 | | 2,699 | | 2,150 | | 5,171 | | 43,418 | | 40,659 | |
| | | | | | | | | | | | | | | | | |
Accumulated Amortization | | | | | | | | | | | | | | | | | |
Opening balance | | (155 | ) | (6,031 | ) | (4,883 | ) | (674 | ) | (1,102 | ) | (3,058 | ) | (15,903 | ) | (14,909 | ) |
Amortization expense | | (11 | ) | (461 | ) | (321 | ) | (59 | ) | (236 | ) | (387 | ) | (1,475 | ) | (1,376 | ) |
Effect of disposals and valuation adjustments | | 7 | | 27 | | 246 | | 1 | | 111 | | 194 | | 586 | | 382 | |
| | (159 | ) | (6,465 | ) | (4,958 | ) | (732 | ) | (1,227 | ) | (3,251 | ) | (16,792 | ) | (15,903 | ) |
Net book value for the year ended March 31, 2007 | | 2,304 | | 12,088 | | 7,424 | | 1,967 | | 923 | | 1,920 | | 26,626 | | | |
| | | | | | | | | | | | | | | | | |
Net book value for the year ended March 31, 2006 | | 2,099 | | 11,216 | | 6,927 | | 2,020 | | 778 | | 1,716 | | | | 24,756 | |
(1) This statement includes assets that are held on capital leases at March 31, 2007 at a gross value of $435 million less accumulated amortization of $(121) million for a net book value totalling $314 million (2006: gross value of $292 million less accumulated amortization of $(110) million for a net book value of $182 million) comprised of: heavy equipment gross $90 million less accumulated amortization $(59) million for a net book value of $31 million (2006: gross $77 million less accumulated amortization $(48) million for a net book value of $29 million); vehicles gross $97 million less accumulated amortization $(42) million for a net book value of $55 million (2006: gross $91 million less accumulated amortization $(50) million for a net book value of $41 million); computer hardware/software gross $78 million less accumulated amortization $(18) million for a net book value of $60 million (2006: gross $15 million less accumulated amortization $(9) million for a net book value of $6 million); buildings gross $155 million less accumulated amortization $(1) million for a net book value of $154 million (2006: gross $97 million less accumulated amortization $(2) million for a net book value $95 million); ferries gross $7 million less accumulated amortization $(1) million for a net book value of $6 million (2006: gross $7 million less accumulated amortization $0 million for a net book value of $7 million) and other assets gross $8 million less accumulated amortization $0 million for a net book value of $8 million (2006: gross $5 million less accumulated amortization $(1) million for a net book value of $4 million).
(2) Historical cost includes work-in-progress at March 31, 2007 totalling $1,925 million (2006: $2,011 million) comprised of: buildings $1,711 million (2006: $1,331 million); land improvements $31 million (2006: $23 million); highway infrastructure $47 million (2006: $524 million); transportation equipment $4 million (2006: $4 million); computer hardware/software $132 million (2006: $126 million); and specialized equipment $0 million (2006: $3 million). Work-in-progress is not amortized. Work-in-progress includes capitalized interest expense at March 31, 2007 totalling $25 million (2006: $14 million).
(3)”Other” at net book value includes office furniture and equipment $509 million (2006: $469 million), vehicles $83 million (2006: $69 million), machinery $1,123 million (2006: $980 million) and miscellaneous $205 million (2006: $198 million).
83
PROVINCE OF BRITISH COLUMBIA
PUBLIC ACCOUNTS 2006/07
Summary Financial Statements
Consolidated Statement of Guaranteed Debt(1)
as at March 31, 2007
Guaranteed debt represents the debt of organizations that has been explicitly guaranteed or indemnified by the government under the authority of a statute as to net principal or redemption provisions. These organizations may include municipalities and other governments, private enterprises and individuals, minority interests of provincial Crown corporations and agencies, and SUCH(2) sector entities.
| | In Millions | |
| | 2007 | | 2006 | |
| | Maximum | | | | Maximum | | | |
| | Guarantee | | Net | | Guarantee | | Net | |
| | Authorized | | Outstanding(1) | | Authorized | | Outstanding(1) | |
| | $ | | $ | | $ | | $ | |
Taxpayer–supported Guaranteed Debt | | | | | | | | | |
Municipalities and other local governments: | | | | | | | | | |
Municipal Act debentures | | | | | | 1 | | 1 | |
Subtotal, municipalities and other local governments | | 0 | | 0 | | 1 | | 1 | |
Government services: | | | | | | | | | |
Homeowner Protection Act loan guarantees(3) | | 375 | | 75 | | 375 | | 79 | |
Subtotal, government services | | 375 | | 75 | | 375 | | 79 | |
Health and education: | | | | | | | | | |
Financial Administration Act student aid loans | | 12 | | 12 | | 16 | | 16 | |
Subtotal, health and education | | 12 | | 12 | | 16 | | 16 | |
| | | | | | | | | |
Economic development: | | | | | | | | | |
Financial Administration Act: | | | | | | | | | |
Business Development Bank Guaranteed Program | | 1 | | 1 | | 1 | | 1 | |
Credit Enhancement Emergency Fund Guaranteed Program | | 1 | | 1 | | 1 | | 1 | |
Farm Distress Operating Loan Program | | | | | | 1 | | 1 | |
Feeder Association’s Loan Guarantee Program | | 10 | | 2 | | 10 | | 4 | |
Home Mortgage Assistance Program Act mortgages | | 10 | | 7 | | 9 | | 6 | |
Home Mortgage Assistance Program Act second mortgages(4) | | 1 | | | | 1 | | 1 | |
Subtotal, economic development | | 23 | | 11 | | 23 | | 14 | |
Total taxpayer-supported guaranteed debt | | 410 | | 98 | | 415 | | 110 | |
| | | | | | | | | |
Self–supported Guaranteed Debt | | | | | | | | | |
Total self-supported guaranteed debt(5) | | 10 | | 10 | | 10 | | 10 | |
| | | | | | | | | |
Grand total, all guaranteed debt | | 420 | | 108 | | 425 | | 120 | |
Provision for probable payout | | | | (4 | ) | | | (9 | ) |
Net total, all guaranteed debt | | 420 | | 104 | | 425 | | 111 | |
(1) Guaranteed debt includes gross principal debt less sinking fund balances of $1 million (2006: $1 million) and represents the total amount of contingent liability of the government arising from relevant guarantees.
(2) School districts, universities, colleges and health organizations.
(3) Homeowner Protection Act loan guarantees include indemnities provided to CMHC for any claims made on reconstruction loans made to homeowners for repairs to homes with premature building envelope failure.
(4) The British Columbia Second Mortgage Program was sold to the Bank of Montreal in June 1989, with the condition that the province will buy back any mortgages which may become uncollectible in future years.
(5) The government has unconditionally guaranteed the payment of principal and interest for $10 million (2006: $10 million) of debentures issued to the Canada Pension Plan Investment Fund that matures on August 9, 2024 with a coupon rate of 5.54%.
84
Supplementary Information
(Unaudited)
The following unaudited supplementary information is intended to provide additional information to financial statement readers and includes:
a) the impacts of the Crown corporations and the school districts, universities, colleges, institutes and health organizations (SUCH) sector on the province’s annual surplus (deficit);
b) the Consolidated Staff Utilization;
c) details of the Consolidated Revenue Fund; and
d) the Provincial Debt Summary.
The purpose of this information is to report organizational impacts on the Summary Financial Statements, to reflect management accountability including appropriation control and to provide greater detail on the provincial debt.
The accounting policies applied for this unaudited information are different in some cases from the generally accepted accounting principles followed for the audited Summary Financial Statements. For example, in order to reflect different management accountabilities, the Consolidated Revenue Fund records prepaid capital advances, nets recoveries against expenses, nets sinking funds against debt and nets sinking fund earnings against interest expense. The Provincial Debt Summary figures include guaranteed debt in the calculation of total debt and calculate debt, interest costs and revenue as if the modified equity enterprises were consolidated on a line–by–line basis.

PROVINCE OF BRITISH COLUMBIA
PUBLIC ACCOUNTS 2006/07
Adjusted Net Income of Crown Corporations,Agencies and the SUCH Sector(1)
for the Fiscal Year Ended March 31, 2007
(Unaudited)
| | In Millions | |
| | | | | | | | | | Contributions | | | |
| | | | | | | | | | Paid To | | | |
| | | | | | | | | | Consolidated | | | |
| | | | | | | | Policy | | Revenue | | Adjusted | |
| | Revenue | | Expense | | Net Income | | Adjustments | | Fund | | Net Income | |
| | $ | | $ | | $ | | $ | | $ | | $ | |
Taxpayer–supported (Government Organizations) | | | | | | | | | | | | | |
552513 BC Ltd | | | | | | | | | | | | | |
BC Immigrant Investment Fund Ltd | | 7 | | (2 | ) | 5 | | | | | | 5 | |
B.C. Pavilion Corporation | | 38 | | (38 | ) | | | (2 | ) | | | (2 | ) |
BC Games Society | | 2 | | (2 | ) | | | | | | | | |
BC Transportation Financing Authority | | 644 | | (611 | ) | 33 | | (155 | ) | | | (122 | ) |
British Columbia Arts Council | | | | | | | | | | | | | |
British Columbia Assessment Authority(2) | | 72 | | (71 | ) | 1 | | 16 | | | | 17 | |
British Columbia Buildings Corporation | | | | 12 | | 12 | | (24 | ) | (405 | ) | (417 | ) |
British Columbia Enterprise Corporation | | | | | | | | | | | | | |
British Columbia Housing Management Commission | | 497 | | (497 | ) | | | (15 | ) | | | (15 | ) |
British Columbia Innovation Council | | 7 | | (6 | ) | 1 | | 4 | | | | 5 | |
British Columbia Securities Commission | | 33 | | (29 | ) | 4 | | | | | | 4 | |
British Columbia Transit | | 166 | | (168 | ) | (2 | ) | | | | | (2 | ) |
Canadian Blood Services | | 129 | | (127 | ) | 2 | | | | | | 2 | |
Columbia Basin Trust | | 36 | | (26 | ) | 10 | | | | | | 10 | |
Community Living British Columbia | | 630 | | (630 | ) | | | 1 | | | | 1 | |
Creston Valley Wildlife Management Authority Trust Fund | | 1 | | (1 | ) | | | | | | | | |
First Peoples’ Heritage, Language and Culture Council | | 3 | | (3 | ) | | | (1 | ) | | | (1 | ) |
Forestry Innovation Investment Ltd | | 24 | | (24 | ) | | | | | | | | |
Homeowner Protection Office | | 28 | | (22 | ) | 6 | | | | | | 6 | |
Industry Training Authority | | 92 | | (91 | ) | 1 | | | | | | 1 | |
Leading Edge Endowment Fund Society | | 5 | | (4 | ) | 1 | | (3 | ) | | | (2 | ) |
88
| | In Millions | |
| | | | | | | | | | Contributions | | | |
| | | | | | | | | | Paid To | | | |
| | | | | | | | | | Consolidated | | | |
| | | | | | | | Policy | | Revenue | | Adjusted | |
| | Revenue | | Expense | | Net Income | | Adjustments | | Fund | | Net Income | |
| | $ | | $ | | $ | | $ | | $ | | $ | |
Taxpayer-supported (Government Organizations)—Continued | | | | | | | | | | | | | |
Legal Services Society | | 74 | | (72 | ) | 2 | | | | | | 2 | |
Nechako–Kitamaat Development Fund Society | | | | (1 | ) | (1 | ) | | | | | (1 | ) |
Oil and Gas Commission | | 31 | | (27 | ) | 4 | | (1 | ) | | | 3 | |
Organized Crime Agency of British Columbia Society | | 8 | | (9 | ) | (1 | ) | | | | | (1 | ) |
Partnerships British Columbia Inc | | 12 | | (11 | ) | 1 | | | | | | 1 | |
Private Career Training Institutions Agency | | 4 | | (2 | ) | 2 | | | | | | 2 | |
Provincial Rental Housing Corporation | | 41 | | (19 | ) | 22 | | 58 | | | | 80 | |
Rapid Transit Project 2000 Ltd | | 28 | | (28 | ) | | | | | | | | |
The Royal British Columbia Museum Corporation | | 21 | | (20 | ) | 1 | | 1 | | | | 2 | |
Tourism British Columbia | | 60 | | (59 | ) | 1 | | 7 | | | | 8 | |
Vancouver Convention Centre Expansion Project | | | | | | | | 107 | | | | 107 | |
Taxpayer–supported Crown corporations and agencies | | 2,693 | | (2,588 | ) | 105 | | (7 | ) | (405 | ) | (307 | ) |
| | | | | | | | | | | | | |
SUCH Sector | | | | | | | | | | | | | |
School Districts | | 5,399 | | (5,262 | ) | 137 | | 61 | | | | 198 | |
Universities | | 2,753 | | (2,595 | ) | 158 | | 95 | | | | 253 | |
Colleges and Institutes | | 1,410 | | (1,342 | ) | 68 | | 22 | | | | 90 | |
Health Authorities | | 8,669 | | (8,693 | ) | (24 | ) | (90 | ) | | | (114 | ) |
Hospital Societies | | 723 | | (734 | ) | (11 | ) | 2 | | | | (9 | ) |
SUCH sector | | 18,954 | | (18,626 | ) | 328 | | 90 | | 0 | | 418 | |
Net impact of taxpayer–supported Crown corporations, agencies and SUCH sector | | 21,647 | | (21,214 | ) | 433 | | 83 | | (405 | ) | 111 | |
89
| | In Millions | |
| | | | | | | | | | Contributions | | | |
| | | | | | | | | | Paid To | | | |
| | | | | | | | | | Consolidated | | | |
| | | | | | | | Policy | | Revenue | | Adjusted | |
| | Revenue | | Expense | | Net Income | | Adjustments | | Fund | | Net Income | |
| | $ | | $ | | $ | | $ | | $ | | $ | |
Self–supported (Government Enterprises) | | | | | | | | | | | | | |
BCIF Management Ltd | | | | | | | | | | | | | |
British Columbia Hydro and Power Authority | | 4,197 | | (3,790 | ) | 407 | | | | (331 | ) | 76 | |
British Columbia Liquor Distribution Branch | | 2,440 | | (1,600 | ) | 840 | | | | (840 | ) | | |
British Columbia Lottery Corporation | | 2,427 | | (1,416 | ) | 1,011 | | | | (1,011 | ) | | |
British Columbia Railway Company(2) | | 53 | | (24 | ) | 29 | | | | | | 29 | |
British Columbia Transmission Corporation | | 190 | | (187 | ) | 3 | | | | | | 3 | |
Columbia Power Corporation | | 35 | | (21 | ) | 14 | | | | (2 | ) | 12 | |
Insurance Corporation of British Columbia(2) | | 3,885 | | (3,509 | ) | 376 | | 5 | | | | 381 | |
Provincial Capital Commission | | 3 | | (3 | ) | | | | | | | | |
Net impact of self–supported Crown corporations and agencies | | 13,230 | | (10,550 | ) | 2,680 | | 5 | | (2,184 | ) | 501 | |
(1) This schedule does not include elimination entries between entities.
(2) The revenues and expenses reported for the British Columbia Assessment Authority, British Columbia Railway Company and Insurance Corporation of British Columbia include a stub period reversal of January–March 2006 and an inclusion of the stub period of January–March 2007.
90
PROVINCE OF BRITISH COLUMBIA
PUBLIC ACCOUNTS 2006/07
SUCH(1) Statement of Financial Position
as at March 31, 2007
(Unaudited)
| | In Millions | |
| | Health | | | | | | | | | | | |
| | Authorities & | | | | | | | | | | | |
| | Hospital | | | | Colleges and | | School | | 2007 | | 2006 | |
| | Societies(2) | | Universities | | Institutes | | Districts | | Total | | Total | |
| | $ | | $ | | $ | | $ | | $ | | $ | |
Financial Assets | | | | | | | | | | | | | |
| | | | | | | | | | | | | |
Cash and cash equivalents | | 249 | | 373 | | 251 | | 854 | | 1,727 | | 1,671 | |
Temporary investments | | 324 | | 56 | | 75 | | 120 | | 575 | | 675 | |
Accounts receivable | | 146 | | 90 | | 49 | | 76 | | 361 | | 270 | |
Inventories for resale | | 1 | | 17 | | 11 | | 1 | | 30 | | 28 | |
Due from Crown corporations, agencies and trust funds | | 173 | | 8 | | 14 | | 2 | | 197 | | 602 | |
Due from other governments | | 28 | | 35 | | 3 | | 5 | | 71 | | 70 | |
Loans, advances and mortgages receivable | | 1 | | 32 | | | | | | 33 | | 33 | |
Other investments | | 117 | | 1,688 | | 90 | | 6 | | 1,901 | | 1,637 | |
Sinking fund investments | | | | 49 | | 6 | | | | 55 | | 77 | |
| | | | | | | | | | | | | |
Financial assets before accounting adjustments | | 1,039 | | 2,348 | | 499 | | 1,064 | | 4,950 | | 5,063 | |
Policy accounting adjustments | | 20 | | (19 | ) | 5 | | (31 | ) | (25 | ) | 41 | |
| | | | | | | | | | | | | |
Financial assets | | 1,059 | | 2,329 | | 504 | | 1,033 | | 4,925 | | 5,104 | |
91
| | In Millions | |
| | Health | | | | | | | | | | | |
| | Authorities & | | | | | | | | | | | |
| | Hospital | | | | Colleges and | | School | | 2007 | | 2006 | |
| | Societies(2) | | Universities | | Institutes | | Districts | | Total | | Total | |
| | $ | | $ | | $ | | $ | | $ | | $ | |
Liabilities | | | | | | | | | | | | | |
| | | | | | | | | | | | | |
Accounts payable and accrued liabilities | | 1,305 | | 270 | | 203 | | 430 | | 2,208 | | 2,516 | |
Due to other governments | | 19 | | 4 | | 5 | | 11 | | 39 | | 32 | |
Due to Crown corporations, agencies and trust funds | | 9 | | 2 | | �� | | 1 | | 12 | | (12 | ) |
Deferred revenue | | 4,003 | | 2,517 | | 1,168 | | 4,305 | | 11,993 | | 11,398 | |
Taxpayer-supported debt | | 226 | | 591 | | 105 | | 17 | | 939 | | 895 | |
| | | | | | | | | | | | | |
Liabilities before accounting adjustments | | 5,562 | | 3,384 | | 1,481 | | 4,764 | | 15,191 | | 14,829 | |
Policy accounting adjustments | | (897 | ) | (533 | ) | (347 | ) | (168 | ) | (1,945 | ) | (1,956 | ) |
| | | | | | | | | | | | | |
Liabilities | | 4,665 | | 2,851 | | 1,134 | | 4,596 | | 13,246 | | 12,873 | |
| | | | | | | | | | | | | |
Net liabilities | | (3,606 | ) | (522 | ) | (630 | ) | (3,563 | ) | (8,321 | ) | (7,769 | ) |
| | | | | | | | | | | | | |
Non–financial Assets | | | | | | | | | | | | | |
| | | | | | | | | | | | | |
Tangible capital assets | | 4,140 | | 3,333 | | 1,462 | | 5,501 | | 14,436 | | 13,512 | |
Prepaid program costs | | 144 | | 11 | | 4 | | 7 | | 166 | | 159 | |
Other assets | | 2 | | 2 | | | | 4 | | 8 | | 9 | |
| | | | | | | | | | | | | |
Non–financial assets before accounting adjustments | | 4,286 | | 3,346 | | 1,466 | | 5,512 | | 14,610 | | 13,680 | |
Policy accounting adjustments | | (226 | ) | 18 | | | | | | (208 | ) | (249 | ) |
| | | | | | | | | | | | | |
Non–financial assets | | 4,060 | | 3,364 | | 1,466 | | 5,512 | | 14,402 | | 13,431 | |
| | | | | | | | | | | | | |
Accumulated surplus (deficit) | | 454 | | 2,842 | | 836 | | 1,949 | | 6,081 | | 5,662 | |
(1) School districts, universities, colleges, institutes, and health organizations.
(2) These numbers include inter–entity eliminations between Health Authorities and Hospital Societies.
92
PROVINCE OF BRITISH COLUMBIA
PUBLIC ACCOUNTS 2006/07
SUCH1 Statement of Operations
for the Fiscal Year Ended March 31, 2007
(Unaudited)
| | In Millions | |
| | Health | | | | | | | | | | | |
| | Authorities & | | | | | | | | | | | |
| | Hospital | | | | Colleges and | | School | | 2007 | | 2006 | |
| | Societies(2) | | Universities | | Institutes | | Districts | | Total | | Total | |
| | $ | | $ | | $ | | $ | | $ | | $ | |
Revenue | | | | | | | | | | | | | |
| | | | | | | | | | | | | |
Contributions from the federal government | | 14 | | 287 | | 3 | | 3 | | 307 | | 314 | |
Fees and licences | | 216 | | 599 | | 328 | | 150 | | 1,293 | | 1,231 | |
Contributions from the provincial government/ Crown corporations and agencies | | 8,225 | | 1,166 | | 847 | | 4,857 | | 15,095 | | 14,348 | |
Miscellaneous | | 381 | | 578 | | 218 | | 350 | | 1,527 | | 1,291 | |
Investment income | | 24 | | 123 | | 14 | | 39 | | 200 | | 209 | |
| | | | | | | | | | | | | |
Total revenue | | 8,860 | | 2,753 | | 1,410 | | 5,399 | | 18,422 | | 17,393 | |
| | | | | | | | | | | | | |
Expense | | | | | | | | | | | | | |
| | | | | | | | | | | | | |
Salaries and benefits | | 4,744 | | 1,558 | | 947 | | 4,225 | | 11,474 | | 10,612 | |
Government transfers | | | | 99 | | 1 | | | | 100 | | 144 | |
Operating costs | | 3,685 | | 529 | | 250 | | 828 | | 5,292 | | 5,039 | |
Interest | | 10 | | 36 | | 4 | | 1 | | 51 | | 58 | |
Amortization | | 383 | | 219 | | 85 | | 203 | | 890 | | 830 | |
Other | | 73 | | 154 | | 55 | | 5 | | 287 | | 281 | |
| | | | | | | | | | | | | |
Total operating expense | | 8,895 | | 2,595 | | 1,342 | | 5,262 | | 18,094 | | 16,964 | |
| | | | | | | | | | | | | |
Surplus (deficit) for the year before unusual items | | (35 | ) | 158 | | 68 | | 137 | | 328 | | 429 | |
Restructuring exit expense | | | | | | | | | | 0 | | (2 | ) |
| | | | | | | | | | | | | |
Surplus (deficit) for the year before accounting adjustments | | (35 | ) | 158 | | 68 | | 137 | | 328 | | 427 | |
Policy accounting adjustments | | (88 | ) | 95 | | 22 | | 61 | | 90 | | 172 | |
| | | | | | | | | | | | | |
Surplus (deficit) for the year | | (123 | ) | 253 | | 90 | | 198 | | 418 | | 599 | |
(1) School districts, universities, colleges, institutes, and health organizations.
(2) These numbers include inter-entity eliminations between Health Authorities and Hospital Societies.
93
PROVINCE OF BRITISH COLUMBIA
PUBLIC ACCOUNTS 2006/07
Summary Financial Statements
Consolidated Staff Utilization
for the Fiscal Year Ended March 31, 2007(1)
(Unaudited)
| | | | | | | | Variance | |
| | | | | | | | 2006/07 | | 2006/07 | |
| | 2006/07 (2) | | 2006/07 | | 2005/06 | | Actual | | vs | |
| | Budget | | Actual | | Actual | | To Budget | | 2005/06 | |
Consolidated Revenue Fund(3) | | 28,560 | | 28,647 | | 26,501 | | 87 | | 2,146 | |
Taxpayer-supported Crown corporations and agencies(4) | | 3,800 | | 3,917 | | 3,992 | | 117 | | (75 | ) |
Total staff utilization | | 32,360 | | 32,564 | | 30,493 | | 204 | | 2,071 | |
The table above provides a summary of full–time equivalent (FTE) employment.
(1) Staff utilization is the full–time equivalent of the number of persons employed in the fiscal year whose salaries are paid by taxpayer–supported entities within the Summary Financial Statements.
(2) The budget figures do not include any provisions for the SUCH entities or for the self–supported Crown corporations and agencies.
(3) See the unaudited Consolidated Revenue Fund schedules at www.fin.gov.bc.ca/pubs.htm for details outside these financial statements.
(4) See Financial Statements of Government Organizations and Enterprises at www.fin.gov.bc.ca/pubs.htm for details outside these financial statements.
94
Consolidated Revenue Fund
Extracts
(Unaudited)

Consolidated Revenue Fund
Statement of Operations
for the Fiscal Year Ended March 31, 2007
(Unaudited)
| | In Millions | |
| | 2007 | | 2006 | |
| | Estimated (1) | | Actual | | Actual | |
| | $ | | $ | | $ | |
Revenue | | | | | | | |
| | | | | | | |
Taxation | | 15,570 | | 17,372 | | 15,811 | |
Contributions from the federal government | | 5,040 | | 5,383 | | 5,018 | |
Natural resource | | 4,802 | | 3,942 | | 4,527 | |
Other | | 2,373 | | 2,608 | | 2,392 | |
Contributions from the Crown corporations | | 1,544 | | 1,941 | | 1,732 | |
| | 29,329 | | 31,246 | | 29,480 | |
Expense | | | | | | | |
| | | | | | | |
Health(2) | | 12,121 | | 12,473 | | 11,717 | |
Education(2) | | 7,324 | | 7,519 | | 7,178 | |
Social services | | 2,980 | | 2,862 | | 2,670 | |
Interest (2),(3) | | 618 | | 543 | | 593 | |
Other | | 1,393 | | 611 | | 501 | |
Natural resources and economic development | | 1,410 | | 1,513 | | 1,567 | |
Protection of persons and property | | 1,102 | | 1,161 | | 1,217 | |
Transportation(2) | | 810 | | 813 | | 811 | |
General government | | 462 | | 714 | | 1,138 | |
| | 28,220 | | 28,209 | | 27,392 | |
Surplus (deficit) for the year before unusual items | | 1,109 | | 3,037 | | 2,088 | |
Liquidation dividends | | | | 405 | | 15 | |
Surplus (deficit) for the year | | 1,109 | | 3,442 | | 2,103 | |
(1) The estimated amount consists of the Main Estimates presented to the Legislative Assembly on February 21, 2006. It does not contain any appropriations granted in subsequent Supplementary Estimates.
(2) For 2006/07, interest expense of $477 million (2006: $448 million) is included in education expense, $143 million (2006: $134 million) is included in health expense and $123 million (2006: $124 million) is included in transportation expense.
(3) Interest expense does not include the following: interest of $691 million (2006: $637.9 million) on cost of borrowing for relending to government bodies; interest of $1.9 million (2006: $0.6 million) on cost of unallocated borrowing under the Warehouse Borrowing Program; interest of $194 million (2006: $196 million) funded by sinking fund earnings; and, interest of $0.9 million (2006: $0.8 million) on cost of financial agreements entered into on behalf of government bodies. These amounts are not included because the interest expense and recovery are offsetting.
98
Consolidated Revenue Fund
Schedule of Net Revenue by Source
for the Fiscal Year Ended March 31, 2007
(Unaudited)
| | In Millions | |
| | 2007 | | 2006 | |
| | Estimated | | Actual | | Actual | |
| | $ | | $ | | $ | |
Taxation Revenue(1) | | | | | | | |
| | | | | | | |
Personal income | | 5,850 | | 6,908 | | 5,838 | |
Corporate income | | 1,341 | | 1,540 | | 1,428 | |
Social service | | 4,331 | | 4,673 | | 4,326 | |
Property | | 1,632 | | 1,623 | | 1,631 | |
Fuel | | 487 | | 478 | | 486 | |
Other | | 1,983 | | 2,198 | | 2,144 | |
Commissions on collection of public funds | | (36 | ) | (37 | ) | (32 | ) |
Valuation adjustments | | (18 | ) | (11 | ) | (10 | ) |
Total taxation revenue | | 15,570 | | 17,372 | | 15,811 | |
| | | | | | | |
Contributions from the Federal Government | | | | | | | |
| | | | | | | |
Canada health and social transfers | | 4,403 | | 4,473 | | 4,220 | |
Federal equalization program | | 459 | | 459 | | 590 | |
Other contributions | | 178 | | 451 | | 208 | |
Total contributions from the federal government | | 5,040 | | 5,383 | | 5,018 | |
| | | | | | | |
Natural Resource Revenue | | | | | | | |
| | | | | | | |
Petroleum, natural gas and minerals | | 3,051 | | 2,114 | | 2,689 | |
Forests | | 1,076 | | 1,269 | | 1,207 | |
Water and other | | 687 | | 564 | | 632 | |
Commissions on collection of public funds | | (1 | ) | (1 | ) | (1 | ) |
Valuation adjustments | | (11 | ) | (4 | ) | | |
Total natural resource revenue | | 4,802 | | 3,942 | | 4,527 | |
| | | | | | | |
Other Revenue | | | | | | | |
| | | | | | | |
Medical Services Plan premiums | | 1,404 | | 1,493 | | 1,461 | |
Motor vehicle licences and permits | | 411 | | 427 | | 405 | |
Other fees and licences | | 423 | | 419 | | 411 | |
Investment earnings | | 40 | | 65 | | 48 | |
Miscellaneous | | 248 | | 276 | | 223 | |
Asset dispositions | | | | 19 | | | |
Commissions on collection of public funds | | (25 | ) | (43 | ) | (23 | ) |
Valuation adjustments | | (128 | ) | (48 | ) | (133 | ) |
Total other revenue | | 2,373 | | 2,608 | | 2,392 | |
99
| | In Millions | |
| | 2007 | | 2006 | |
| | Estimated | | Actual | | Actual | |
| | $ | | $ | | $ | |
Contributions from the Crown Corporations | | | | | | | |
| | | | | | | |
Taxpayer–supported Crown corporations | | | | | | | |
Other | | | | | | 5 | |
Total contributions from taxpayer–supported Crown corporations | | 0 | | 0 | | 5 | |
Self–supported Crown corporations | | | | | | | |
British Columbia Hydro and Power Authority | | 35 | | 331 | | 223 | |
British Columbia Liquor Distribution Branch | | 798 | | 840 | | 800 | |
British Columbia Lottery Corporation | | 709 | | 768 | | 702 | |
Other | | 2 | | 2 | | 2 | |
Total contributions from self–supported Crown corporations | | 1,544 | | 1,941 | | 1,727 | |
Total contributions from the Crown corporations | | 1,544 | | 1,941 | | 1,732 | |
Net Consolidated Revenue Fund Revenue | | 29,329 | | 31,246 | | 29,480 | |
| | | | | | | |
Liquidation Dividends | | | | 405 | | 15 | |
| | | | | | | |
Revenue Collected for and Transferred to Crown Corporations, Agencies and Other Entities(2) | | | | | | | |
| | | | | | | |
Energy, Mines and Petroleum Resources | | | | | | | |
Oil and Gas Commission Act | | (33 | ) | (31 | ) | (29 | ) |
Small Business and Revenue | | | | | | | |
British Columbia Transit Act (Motor Fuel Tax) | | (8 | ) | (8 | ) | (8 | ) |
Greater Vancouver Transportation Authority Act (Motor Fuel and Social Services Taxes) | | (268 | ) | (276 | ) | (271 | ) |
Hotel Resort Tax (Hotel Room Tax Act) | | | | (6 | ) | | |
Rural Area Property Taxes | | (220 | ) | (229 | ) | (202 | ) |
Tobacco Tax Amendment Act | | (2 | ) | (2 | ) | (2 | ) |
Tourism British Columbia (Hotel Room Tax) | | (30 | ) | (31 | ) | (27 | ) |
Transportation Act (Motor Fuel and Social Services Taxes) | | (440 | ) | (427 | ) | (430 | ) |
Total | | (1,001 | ) | (1,010 | ) | (969 | ) |
(1) Personal income tax and corporate income tax revenues are recorded after adjustment for tax credits. Personal income tax revenue was reduced by $124.3 million (2006: $123.5 million) and corporate income tax revenue was reduced by $238.5 million (2006: $206.3 million). The types of tax credits adjusting personal income tax and corporation income tax revenues are for foreign taxes, logging taxes, sales taxes, venture capital, film and production services, scientific and experimental development tax and mining flow-through share.
Personal income tax revenue was also reduced by $108.7 million (2006: $120.7 million) for the BC Tax Reduction.
Personal income tax revenue was further reduced by $23.3 million (2006: $38.1 million), representing that portion of the Family Bonus program payments that effectively reduce recipients’ tax liability.
Additional personal income tax and corporate income tax refunds are issued under the International Financial Activity Act. Personal income tax refunds were $0.0 million (2006: $0.4 million) and corporate income tax refunds were $1.8 million (2006: $4.1 million).
Property tax revenue was recorded net of home owner grants of $642 million (2006: $558 million).
(2) The revenue collected for and transferred to Crown corporations, agencies and other entities has not been included in their revenue sources.
100
Consolidated Revenue Fund
Schedule of Comparison of Estimated Expenses to Actual Expenses
for the Fiscal Year Ended March 31, 2007
(Unaudited)
| | In Thousands | |
| | | | Other | | | | | |
| | Estimated | | Authorizations | | Total | | Actual | |
| | $ | | $ | | $ | | $ | |
Special Offices, Ministries and Other Appropriations | | | | | | | | | |
| | | | | | | | | |
Legislation | | 50,589 | | | | 50,589 | | 48,827 | |
Officers of the Legislature | | 26,828 | | 440 | | 27,268 | | 23,397 | |
Office of the Premier | | 12,482 | | 203 | | 12,685 | | 11,467 | |
Aboriginal Relations and Reconciliation | | 32,978 | | 9,943 | | 42,921 | | 42,898 | |
Advanced Education | | 1,981,707 | | 47,458 | | 2,029,165 | | 2,026,873 | |
Agriculture and Lands | | 226,497 | | 12,055 | | 238,552 | | 237,838 | |
Attorney General | | 475,700 | | 15,139 | | 490,839 | | 484,550 | |
Children and Family Development | | 1,836,295 | | 17,649 | | 1,853,944 | | 1,851,568 | |
Community Services | | 266,781 | | 5,897 | | 272,678 | | 267,355 | |
Economic Development | | 309,828 | | 355 | | 310,183 | | 281,908 | |
Education | | 5,195,667 | | 121,290 | | 5,316,957 | | 5,312,449 | |
Employment and Income Assistance | | 1,369,415 | | 2,717 | | 1,372,132 | | 1,358,619 | |
Energy, Mines and Petroleum Resources | | 77,234 | | 1,141 | | 78,375 | | 75,223 | |
Environment | | 193,839 | | 2,277 | | 196,116 | | 193,458 | |
Finance | | 83,612 | | 3,359 | | 86,971 | | 75,274 | |
Forests and Range | | 933,516 | | 100,909 | | 1,034,425 | | 999,886 | |
Health | | 11,915,213 | | 252,428 | | 12,167,641 | | 12,124,187 | |
Labour and Citizens’ Services | | 205,765 | | 5,432 | | 211,197 | | 209,596 | |
Public Safety and Solicitor General | | 548,012 | | 48,879 | | 596,891 | | 594,338 | |
Small Business and Revenue | | 45,225 | | 2,229 | | 47,454 | | 44,600 | |
Tourism, Sport and the Arts | | 203,695 | | 10,436 | | 214,131 | | 214,088 | |
Transportation | | 839,458 | | 3,111 | | 842,569 | | 841,954 | |
Management of Public Funds and Debt | | 617,800 | | | | 617,800 | | 543,492 | |
Contingencies (All Ministries) and New Programs(1) | | 740,000 | | (311,302 | ) | 428,698 | | 317,718 | |
BC Family Bonus | | 23,000 | | 371 | | 23,371 | | 23,371 | |
Electoral Boundaries Commission | | 3,264 | | | | 3,264 | | 2,052 | |
Commissions on Collection of Public Funds | | 1 | | | | 1 | | | |
Allowances for Doubtful Revenue Accounts | | 1 | | | | 1 | | | |
Environmental Appeal Board and Forest Appeals Commission | | 1,961 | | 18 | | 1,979 | | 1,271 | |
Forest Practices Board | | 3,637 | | 45 | | 3,682 | | 3,559 | |
Insurance and Risk Management Special Account | | | | 87 | | 87 | | (2,645 | ) |
Total expense | | 28,220,000 | | 352,566 | | 28,572,566 | | 28,209,171 | |
101
| | In Thousands | |
| | | | Other | | | | | |
| | Estimated | | Authorizations | | Total | | Actual | |
| | $ | | $ | | $ | | $ | |
Summary of Appropriations | | | | | | | | | |
| | | | | | | �� | | |
Voted expense | | 27,730,177 | | 394,417 | | 28,124,594 | | 27,766,539 | |
Statutory | | | | | | | | | |
Various Acts | | | | 1,544 | | 1,544 | | 1,544 | |
Special Accounts | | 505,147 | | 116,758 | | 621,905 | | 616,665 | |
Inter–account transfers | | (15,324 | ) | (160,153 | ) | (175,477 | ) | (175,477 | ) |
Total expense by appropriation 2006/07 | | 28,220,000 | | 352,566 | | 28,572,566 | | 28,209,271 | |
| | | | | | | | | |
Total expense by appropriation 2005/06 | | 27,038,000 | | 997,758 | | 28,035,758 | | 27,392,210 | |
(1) Some of the budget for contingencies has been reallocated to ministries with approved access.
102
Consolidated Revenue Fund
Schedule of Financing Transaction Disbursements
for the Fiscal Year Ended March 31, 2007
(Unaudited)
| | In Thousands | |
| | | | Other | | | | | |
| | Estimated | | Authorizations | | Total | | Actual | |
| | $ | | $ | | $ | | $ | |
Special Offices, Ministries and Other Appropriations | | | | | | | | | |
| | | | | | | | | |
Legislation | | 4,500 | | | | 4,500 | | 2,965 | |
Officers of the Legislature | | 1,314 | | | | 1,314 | | 902 | |
Office of the Premier | | 95 | | | | 95 | | 12 | |
Aboriginal Relations and Reconciliation | | 5,505 | | | | 5,505 | | 1,955 | |
Advanced Education | | 575,651 | | | | 575,651 | | 467,659 | |
Agriculture and Lands | | 19,027 | | | | 19,027 | | 14,442 | |
Attorney General | | 15,360 | | 414 | | 15,774 | | 10,497 | |
Children and Family Development | | 26,282 | | | | 26,282 | | 16,969 | |
Community Services | | 3,234 | | | | 3,234 | | 959 | |
Economic Development | | 2,799 | | | | 2,799 | | 2,083 | |
Education | | 190,047 | | | | 190,047 | | 185,489 | |
Employment and Income Assistance | | 18,000 | | | | 18,000 | | 9,116 | |
Energy, Mines and Petroleum Resources | | 34,401 | | | | 34,401 | | 32,006 | |
Environment | | 50,179 | | | | 50,179 | | 41,849 | |
Finance | | 6,122 | | | | 6,122 | | 3,398 | |
Forests and Range | | 83,173 | | | | 83,173 | | 62,172 | |
Health | | 401,877 | | | | 401,877 | | 384,818 | |
Labour and Citizens’ Services | | 134,912 | | | | 134,912 | | 105,711 | |
Public Safety and Solicitor General | | 11,123 | | | | 11,123 | | 9,262 | |
Small Business and Revenue | | 1,020,541 | | 27,238 | | 1,047,779 | | 1,028,347 | |
Tourism, Sport and the Arts | | 5,710 | | | | 5,710 | | 2,264 | |
Transportation | | 22,326 | | | | 22,326 | | 17,952 | |
Contingencies (All Ministries) and New Programs | | 50,000 | | | | 50,000 | | | |
Electoral Boundaries Commission | | 415 | | | | 415 | | 50 | |
Environmental Appeal Board and Forest Appeals Commission | | 15 | | | | 15 | | | |
Forest Practices Board | | 125 | | | | 125 | | 125 | |
Insurance and Risk Management Special Account | | 1,130 | | | | 1,130 | | 522 | |
Total financing transaction disbursements | | 2,683,863 | | 27,652 | | 2,711,515 | | 2,401,524 | |
| | | | | | | | | |
Summary of Appropriations | | | | | | | | | |
| | | | | | | | | |
Loans, investments and other requirements | | 429,384 | | 3,678 | | 433,062 | | 294,278 | |
Prepaid capital advances | | 791,322 | | | | 791,322 | | 788,348 | |
Revenue collected for, and transferred to, other entities | | 1,000,602 | | 23,974 | | 1,024,576 | | 1,009,776 | |
Capital expenditures | | | | | | | | | |
Land and land improvements | | 42,105 | | | | 42,105 | | 34,631 | |
Buildings and tenant improvements | | 75,275 | | | | 75,275 | | 52,276 | |
Specialized equipment | | 13,454 | | | | 13,454 | | 11,892 | |
Office furniture and equipment | | 11,312 | | | | 11,312 | | 10,278 | |
Vehicles | | 33,621 | | | | 33,621 | | 32,723 | |
Information systems | | 286,288 | | | | 286,288 | | 167,322 | |
Road, bridges and ferries | | 500 | | | | 500 | | | |
Total financing transactions by appropriation | | 2,683,863 | | 27,652 | | 2,711,515 | | 2,401,524 | |
103
Consolidated Revenue Fund
Schedule of Write–offs, Extinguishments and Remissions
for the Fiscal Year Ended March 31, 2007
(Unaudited)
| | In Millions | |
| | Assets,
Debts and
Obligations
Written Off | | Debts and
Obligations
Extinguished | | Remissions
Made | |
| | $ | | $ | | $ | |
Ministry | | | | | | | |
| | | | | | | |
Advanced Education | | | | 38 | | | |
Agriculture and Lands | | 6 | | | | | |
Economic Development | | | | 1 | | | |
Finance | | 2 | | | | | |
Employment and Income Assistance | | 26 | | 4 | | | |
Forests and Range | | 4 | | | | 4 | |
Health | | 16 | | | | | |
Labour and Citizens’ Services | | 1 | | | | | |
Public Safety and Solicitor General | | 5 | | | | | |
Small Business and Revenue | | 8 | | | | | |
Total 2006/07 | | 68 | | 43 | | 4 | |
| | | | | | | |
Total 2005/06 | | 106 | | 37 | | 4 | |
This statement includes amounts authorized by sections 17, 18 and 19 of the Financial Administration Act. Amounts authorized for write–off, forgiveness or remission by other statutes are not shown separately in these financial statements.
This schedule is produced as required under Section 9(2)(d)(ii),(iii) and (iv) of the Budget Transparency and
Accountability Act.
104
Provincial Debt
Summary

PROVINCE OF BRITISH COLUMBIA
PUBLIC ACCOUNTS 2006/07
Overview of Provincial Debt
(Unaudited)
The provincial government, its Crown corporations, agencies and government organizations incur debt to finance operations and capital projects. Borrowing for operations is required when revenues fall short of expenditures and to meet other cash requirements such as loans and investments. Borrowing for capital projects finances the building of schools, hospitals, roads, public transit and other social and economic capital assets. As these investments provide essential services over several years, the government, like the private sector, borrows to fund these projects and amortizes the cost over the asset’s useful life.
Provincial debt is reported using two basic classifications: (1) taxpayer-supported debt; and (2) self-supported debt.
Taxpayer–supported Debt—includes government direct debt, which is incurred for government operating and capital purposes, and the debt of Crown corporations, agencies, school districts, universities, colleges, institutes and health organizations that require an operating or debt service subsidy from the provincial government, and that are fully consolidated in the Summary Financial Statements. The BC Transportation Financing Authority is an example of a taxpayer-supported Crown corporation.
Self-supported Debt—includes the debt of commercial Crown corporations and agencies as well as the Warehouse Borrowing Program. Commercial Crown corporations and agencies generate sufficient revenues to cover interest costs and repay principal and may pay dividends to the province. The British Columbia Hydro and Power Authority is an example of a commercial Crown corporation. The Warehouse Borrowing Program is used to take advantage of borrowing opportunities in advance of requirements. Eventually, this debt is allocated to the province or Crown corporations and agencies. In the interim, the funds are invested at market rates.
The following provincial debt summary provides additional detailed information and related key indicators and benchmarks to allow a more informed assessment of the debt totals. A reconciliation is also provided to explain the differences between the Summary of Provincial Debt and the Summary Financial Statements.
The total provincial debt as at March 31, 2007 was $33,347 million, which consists of $32,940 million (net of $3,798 million sinking fund investments) in the Summary Financial Statements, together with $299 million in additional debt of self-supported Crown corporations and agencies and $108 million in additional guaranteed debt.
108
Provincial Debt
as at March 31, 2007
(Unaudited)
The accumulated provincial debt of $33,347 million has been incurred for various purposes as shown in Chart 1 below. Over the years, the proceeds from borrowing have contributed to economic development in the province and have provided resources to deliver health, education and social programs, and transportation infrastructure.
At March 31, 2007, taxpayer-supported debt totalled $25,874 million—including debt incurred for government operating purposes ($9,505 million), educational facilities ($7,633 million), health facilities ($2,813 million), transportation infrastructure ($5,378 million) and other debt ($545 million). Other debt is comprised mainly of debt relating to social housing, service delivery agencies and various loan guarantee programs.
At March 31, 2007, self-supported debt relating to commercial Crown corporations and agencies totalled $7,473 million. Commercial debt includes the debt incurred by British Columbia Hydro and Power Authority, debt relating to Columbia River power projects, and debt of commercial subsidiaries of certain post-secondary institutions.
Chart 1 – Provincial debt as at March 31, 2007
In Millions/Percent of Total
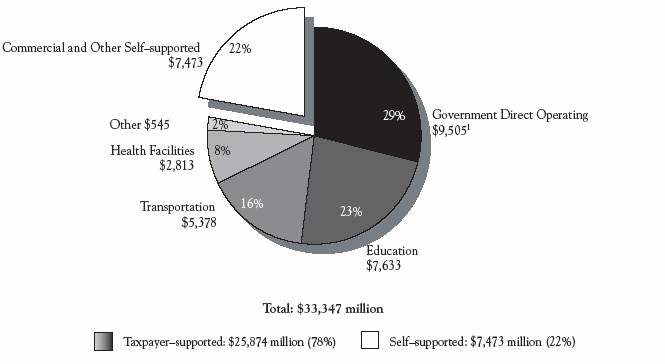
(1) Operating debt includes a portion of highway infrastructure debt incurred prior to 1994/95, ferry infrastructure debt transferred in 1999/00 and amounts required to finance operating deficits.
109
Change in Provincial Debt(1)
(Unaudited)
Provincial debt decreased by $1,038 million in 2006/07; this included a decrease in taxpayer-supported debt of $1,311 million, offset by an increase in self-supported debt of $273 million (see Chart 2 below).
Taxpayer-supported Debt—The decrease of $1,311 million was primarily due to a decrease of $2,418 million in government direct operating debt as a result of an operating surplus at the Consolidated Revenue Fund level, mainly due to higher taxation revenues and one–time revenues from federal transfers, and reduced working capital requirements, offset by increases in capital debt in the education sector ($395 million), the health sector ($366 million), and the transportation sector ($550 million). In addition, debt of other taxpayer-supported Crown corporations and agencies decreased by $204 million which was mainly due to the transfer of the debt of BC Buildings Corporation to the province as a result of the wind up of the corporation’s operations.
Self-supported Debt—The increase of $273 million consists of a $252 million increase in BC Hydro and Power Authority debt and $34 million increase in debt of commercial subsidiaries of certain post-secondary institutions, offset by decreases of $11 million for Columbia River power projects and $2 million for British Columbia Liquor Distribution Branch.
Chart 2 – Change in provincial debt for the year ended March 31, 2007

(1) Includes gross new borrowings plus changes in sinking fund balances, less debt maturities.
110
Reconciliation of Summary Financial Statements’ Surplus
to Change in Taxpayer-supported Debt and Total Debt
for the Fiscal Year Ended March 31, 2007
(Unaudited)
| | In Millions | |
| | 2007 | | 2006(1) | |
| | $ | | $ | |
(Surplus) for the year | | (4,056 | ) | (3,090 | ) |
| | | | | |
Taxpayer–supported debt decreased by: | | | | | |
Non–cash expenses included in (surplus) | | (1,631 | ) | (1,670 | ) |
Accounts receivable, accounts payable and other working capital net changes | | 165 | | (412 | ) |
| | (1,466 | ) | (2,082 | ) |
| | | | | |
Taxpayer-supported debt increased by: | | | | | |
Self-supported Crown corporation and agency earnings in excess of contributions to the Consolidated Revenue Fund | | 522 | | 269 | |
Tangible capital asset net acquisitions | | 3,359 | | 2,926 | |
Net increases in loans, advances and investments | | 330 | | 518 | |
| | 4,211 | | 3,713 | |
Net (decrease) in taxpayer-supported debt | | (1,311 | ) | (1,459 | ) |
Taxpayer-supported debt-beginning of year | | 27,185 | | 28,644 | |
Taxpayer-supported debt-end of year | | 25,874 | | 27,185 | |
Self-supported debt(1) | | 7,473 | | 7,200 | |
Total debt(2) | | 33,347 | | 34,385 | |
Reconciliation of Total Debt to the Summary Financial Statements Debt
as at March 31, 2007
(Unaudited)
| | In Millions | |
| | 2007 | | 2006(1) | |
| | $ | | $ | |
Total debt | | 33,347 | | 34,385 | |
| | | | | |
Debt included as part of equity in self-supported Crown corporations and agencies | | (299 | ) | (278 | ) |
Contingent liabilities for debt of individuals and organizations that have been guaranteed by the province | | (108 | ) | (119 | ) |
Sinking fund investments | | 3,798 | | 4,059 | |
Summary Financial Statements debt | | 36,738 | | 38,047 | |
| | | | | |
Comprised of: | | | | | |
Taxpayer-supported debt | | 28,841 | | 30,289 | |
Self-supported debt | | 7,897 | | 7,758 | |
Total debt(3) | | 36,738 | | 38,047 | |
(1) Comparative figures for the previous year have been restated.
(2) See Summary of Provincial Debt, page 119.
(3) Total debt includes debt of self-supported Crown corporations and agencies, and debt of individuals and organizations guaranteed by the province.
111
Change in Provincial Debt,
Comparison to Budget
(Unaudited)
Provincial debt decreased by $1,038 million, compared to a budgeted increase of $1,707 million (per the Budget and Fiscal Plan presented in February 2006), for an improvement of $2,745 million. Chart 3 below shows the difference between the actual change in provincial debt and the budgeted change by major category. The decrease in taxpayer–supported debt was $1,776 million better than budget and the increase in self–supported debt was $419 million better than budget. In addition, the $550 million forecast allowance included in the budget was not required.
Taxpayer–supported debt decreased by $1,311 million, compared to a budgeted increase of $465 million. The improvement of $1,776 million is due to reduced government operating debt ($1,541 million) mainly due to higher than forecast taxation revenues and one–time revenues from federal transfers, reduced working capital requirements, lower than forecast capital spending on education, health and transportation infrastructure ($145 million), and lower than expected debt of other taxpayer–supported Crown corporations and agencies ($90 million).
Self–supported debt increased by $273 million, compared to a budgeted increase of $692 million, for an improvement of $419 million. The improvement is a result of reduced debt for British Columbia Hydro and Power Authority ($412 million) mainly due to lower than forecast capital debt requirements, lower debt of British Columbia Transmission Corporation ($40 million) and British Columbia Liquor Distribution Branch ($1 million). This is offset by the increase of $34 million relating to the reclassification of the debt of commercial subsidiaries of certain post–secondary institutions from taxpayer–supported to self–supported.
Chart 3 – Change in provincial debt (actual vs budget(1)) for the year ended March 31, 2007
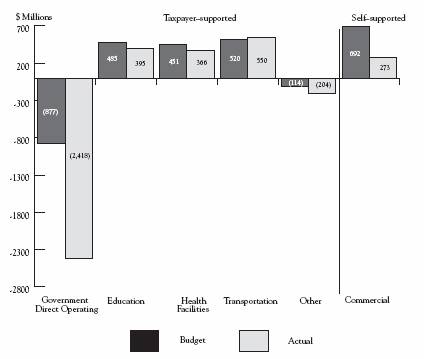
(1) The $550 million forecast allowance is not included.
112
Interprovincial Comparison of Taxpayer–supported Debt
as a Percentage of Gross Domestic Product
(Unaudited)
Chart 4 below shows the ratio of each province’s taxpayer–supported debt as a percentage of their gross domestic product (GDP). The ratio of a province’s taxpayer–supported debt relative to its GDP highlights the ability of a province to service its debt load. This ratio is often used by investors and credit rating agencies when assessing a province’s investment quality. According to the Moody’s Investors Service Inc., British Columbia’s taxpayer–supported debt ratio is one of the lowest in Canada and this translates into a strong credit rating and relatively low debt servicing costs.
Chart 4 – Interprovincial comparison of taxpayer–supported debt as % of GDP
Per cent of GDP at March 31, 2007
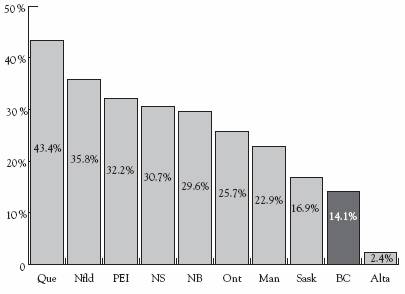
Source: Moody’s Investors Service Inc., based on May 2007 estimates.
113
Interprovincial Comparison of Taxpayer–supported Debt
Service Costs as a Percentage of Revenue
(Unaudited)
Chart 5 shows the ratio (interest bite) of each province’s taxpayer–supported debt service costs as a percentage of the revenue. The interest bite indicates how much of each dollar of provincial revenue is used to pay for taxpayer–supported debt service costs. According to Moody’s Investors Service (Moody’s), British Columbia has the second lowest taxpayer–supported debt service costs as a percentage of revenue of all provinces.
Chart 5 – Interprovincial comparison of taxpayer–supported debt service costs as a percentage of revenue
Percent of revenue, at March 31, 2007
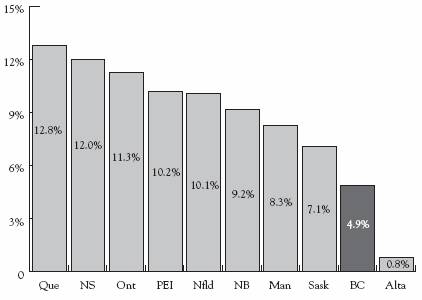
Source: Moody’s Investors Service Inc., based on May 2007 estimates.
Moody’s definition of taxpayer–supported debt is modestly different from the definition used by the Ministry of Finance. The financial community has not agreed upon a definition for taxpayer–supported debt. The definition which Moody’s uses is the closest to that employed by the ministry but, even then, there are small differences. For example, in contrast to Moody’s, the ministry classifies self–supported university debt held in the name of the university as taxpayer–supported debt because the institutions are taxpayer–supported entities. The value of presenting Moody’s debt indicators is that it provides an interprovincial comparison from a third party source, which is helpful for readers to understand the province’s relative performance and ranking.
More comprehensive information on the debt of the province and its Crown corporations and agencies is provided on the Debt Management Branch website. This detailed information can assist readers in assessing the province’s debt position. The website is available on the Internet at: www.fin.gov.bc.ca/PT/dmb/index.shtml, outside these statements.
114

| Report of the Auditor General
of British Columbia | |
ON THE
SUMMARY OF PROVINCIAL DEBT,
KEY INDICATORS OF PROVINCIAL DEBT, AND
SUMMARY OF PERFORMANCE MEASURES
To the Legislative Assembly
of the Province of British Columbia
Introduction
I have audited the debt-related statements of the Government of the Province of British Columbia consisting of the summary of provincial debt as at March 31, 2003 through 2007, the key indicators of provincial debt for the five fiscal years then ended, and the summary of performance measures for the fiscal year ended March 31, 2007. Through these statements, the Government reports on its debt management by presenting five years of information on provincial debt and debt indicators, and compares its actual results of performance measures to its target measures for the fiscal year ended March 31, 2007. The preparation of the debt-related information and the setting of performance targets are the responsibility of the Government. My responsibility is to express an opinion on this debt-related information based on my audit.
The debt-related statements are prepared using financial information that supports the Government’s summary financial statements, which are prepared in accordance with Canadian generally accepted accounting principles. However, in the debt-related statements there are some differences in the methods of compilation and presentation compared to generally accepted accounting principles. In the debt-related statements, debt is calculated net of sinking fund assets, includes debt directly incurred by modified equity enterprises and other commercial subsidiaries of taxpayer-supported entities, and includes debt incurred by others outside the government reporting entity where there is a provincial government guarantee as to the payment of principal and interest. Also, total provincial revenue and interest costs include the gross revenue and interest costs of modified equity enterprises, and total provincial interest costs are net of sinking fund earnings.
Scope
I conducted my audit in accordance with Canadian generally accepted auditing standards. Those standards require that I plan and perform the audit to obtain reasonable assurance whether the debt-related statements are free of material misstatement. My audit included examining, on a test basis, evidence supporting the amounts and disclosures in the debtrelated statements. My audit also included evaluating the overall presentation of the debtrelated statements.
Opinion
In my opinion, these statements present fairly, in all material respects, the summary of provincial debt as at March 31, 2003 through 2007, the key indicators of provincial debt for the five fiscal years then ended, and the summary of performance measures for the year ended March 31, 2007, in accordance with the basis of accounting referred to in the introduction.
| 
|
Victoria, British Columbia | Errol Price, CA |
June 15, 2007 | Acting Auditor General |
2
PROVINCE OF BRITISH COLUMBIA
PUBLIC ACCOUNTS 2006/07
Summary of Provincial Debt(1)
as at March 31
| | In Millions | |
| | 2007 | | 2006 | | 2005 | | 2004 | | 2003 | |
| | $ | | $ | | $ | | $ | | $ | |
Taxpayer-supported Debt | | | | | | | | | | | |
| | | | | | | | | | | |
Provincial government direct operating(2),(3) | | 9,505 | | 11,923 | | 14,510 | | 15,694 | | 15,447 | |
| | | | | | | | | | | |
Education(4) | | | | | | | | | | | |
Schools | | 4,724 | | 4,588 | | 4,483 | | 4,409 | | 4,333 | |
Post-secondary institutions(5) | | 2,909 | | 2,650 | | 2,284 | | 2,066 | | 1,749 | |
| | 7,633 | | 7,238 | | 6,767 | | 6,475 | | 6,082 | |
Health facilities(4) | | 2,813 | | 2,447 | | 2,112 | | 2,215 | | 2,146 | |
Highways, ferries and public transit | | | | | | | | | | | |
BC Transportation Financing Authority | | 3,237 | | 2,699 | | 2,474 | | 2,764 | | 2,661 | |
British Columbia Transit | | 96 | | 80 | | 78 | | 83 | | 87 | |
Public transit(4) | | 892 | | 904 | | 906 | | 914 | | 930 | |
SkyTrain extension(4) | | 1,153 | | 1,145 | | 1,135 | | 1,119 | | 1,105 | |
Rapid Transit Project 2000 Ltd | | | | | | | | | | 3 | |
| | 5,378 | | 4,828 | | 4,593 | | 4,880 | | 4,786 | |
Other | | | | | | | | | | | |
British Columbia Buildings Corporation(3) | | | | 246 | | 241 | | 317 | | 456 | |
Social housing(6) | | 216 | | 189 | | 133 | | 156 | | 161 | |
Homeowner Protection Office | | 110 | | 110 | | 130 | | 129 | | 123 | |
Other(7) | | 219 | | 204 | | 158 | | 116 | | 182 | |
| | 545 | | 749 | | 662 | | 718 | | 922 | |
Total taxpayer-supported debt | | 25,874 | | 27,185 | | 28,644 | | 29,982 | | 29,383 | |
Self-supported Debt | | | | | | | | | | | |
Commercial Crown corporations and agencies | | | | | | | | | | | |
British Columbia Hydro and Power Authority | | 7,144 | | 6,892 | | 6,906 | | 7,040 | | 6,784 | |
British Columbia Transmission Corporation | | 37 | | 37 | | | | | | | |
British Columbia Railway Company(2) | | | | | | | | 477 | | 494 | |
Columbia River power projects(8) | | 236 | | 247 | | 257 | | 215 | | 118 | |
Columbia Power Corporation | | | | | | | | | | 47 | |
British Columbia Liquor Distribution Branch | | 3 | | 5 | | 6 | | 7 | | 9 | |
Post secondary institutions’ subsidiaries(5) | | 53 | | 19 | | 26 | | 14 | | 18 | |
Total self-supported debt | | 7,473 | | 7,200 | | 7,195 | | 7,753 | | 7,470 | |
Total provincial debt | | 33,347 | | 34,385 | | 35,839 | | 37,735 | | 36,853 | |
(1) Debt is after deductions of sinking funds, unamortized discounts and unrealized foreign exchange gains/(losses), and excludes accrued interest. Government direct and fiscal agency debt accrued interest is reported in the government’s accounts as an accounts payable. Figures for earlier years have been restated to conform with the presentation used for 2007 and to reflect changes in underlying data.
(2) Effective July 19, 2004, the provincial government assumed responsibility for the fiscal agency loans of the British Columbia Railway Company ($463 million).
(3) Effective April 1, 2006, the provincial government assumed responsibility for the fiscal agency loans of the British Columbia Buildings Corporation ($246 million).
(4) Represents province direct debt incurred for capital financing of education and health facilities and public transit infrastructure.
(5) During fiscal 2006/2007, the University of Victoria and University of British Columbia changed their accounting policy for recording the activities of their controlled for-profit entities from full consolidation to the equity method. The long term debt of these commercial entities was reclassified as self-supported debt from taxpayer-supported debt.
(6) Includes debt of the British Columbia Housing Management Commission and the Provincial Rental Housing Corporation.
(7) Includes debt of other taxpayer-supported Crown corporations and agencies and fiscal agency loans to local governments. Also includes student loan guarantees, loan guarantees to agricultural producers, and guarantees under economic development and home mortgage assistance programs.
(8) Joint ventures of Columbia Power Corporation and Columbia Basin Trust.
118
PROVINCE OF BRITISH COLUMBIA
PUBLIC ACCOUNTS 2006/07
Key Indicators of Provincial Debt(1)
for the Fiscal Years Ended March 31
| | 2007 | | 2006 | | 2005 | | 2004 | | 2003 | |
| | Budget | | | | | | | | | | | |
| | Estimate | | Actual | | Actual | | Actual | | Actual | | Actual | |
Debt to Revenue (per cent) | | | | | | | | | | | | | |
Total provincial | | 78.9 | | 69.0 | | 74.7 | | 85.2 | | 100.6 | | 104.5 | |
Taxpayer-supported | | 80.8 | | 69.4 | | 77.6 | | 88.4 | | 107.1 | | 109.9 | |
| | | | | | | | | | | | | |
Debt per Capita ($)(2) | | | | | | | | | | | | | |
Total provincial | | 8,503 | | 7,737 | | 8,075 | | 8,527 | | 9,082 | | 8,956 | |
Taxpayer-supported | | 6,480 | | 6,003 | | 6,384 | | 6,815 | | 7,216 | | 7,140 | |
| | | | | | | | | | | | | |
Debt to GDP (per cent)(3) | | | | | | | | | | | | | |
Total provincial | | 20.7 | | 18.6 | | 20.4 | | 22.7 | | 25.9 | | 26.7 | |
Taxpayer-supported | | 15.8 | | 14.4 | | 16.1 | | 18.2 | | 20.6 | | 21.3 | |
| | | | | | | | | | | | | |
Interest Bite (cents per dollar of revenue)(4) | | | | | | | | | | | | | |
Total provincial | | 4.8 | | 4.2 | | 4.3 | | 4.7 | | 5.9 | | 6.3 | |
Taxpayer-supported | | 4.9 | | 4.1 | | 4.4 | | 5.0 | | 6.1 | | 6.2 | |
| | | | | | | | | | | | | |
Interest Costs ($ millions) | | | | | | | | | | | | | |
Total provincial | | 2,241 | | 2,033 | | 1,991 | | 1,986 | | 2,220 | | 2,237 | |
Taxpayer-supported | | 1,702 | | 1,534 | | 1,525 | | 1,622 | | 1,695 | | 1,669 | |
| | | | | | | | | | | | | |
Interest Rate (per cent)(5) | | | | | | | | | | | | | |
Taxpayer-supported | | 6.2 | | 5.8 | | 5.5 | | 5.5 | | 5.7 | | 5.9 | |
| | | | | | | | | | | | | |
Background Information Revenue ($ millions) | | | | | | | | | | | | | |
Total provincial(6) | | 46,393 | | 48,333 | | 46,026 | | 42,076 | | 37,495 | | 35,280 | |
Taxpayer-supported(7) | | 34,526 | | 37,280 | | 35,029 | | 32,391 | | 27,997 | | 26,728 | |
119
| | 2007 | | 2006 | | 2005 | | 2004 | | 2003 | |
| | Budget | | | | | | | | | | | |
| | Estimate | | Actual | | Actual | | Actual | | Actual | | Actual | |
| | | | | | | | | | | | | |
Total Debt ($ millions) | | | | | | | | | | | | | |
Total provincial | | 36,590 | | 33,347 | | 34,385 | | 35,839 | | 37,735 | | 36,853 | |
Taxpayer-supported(8) | | 27,883 | | 25,874 | | 27,185 | | 28,644 | | 29,982 | | 29,383 | |
| | | | | | | | | | | | | |
Provincial GDP ($ millions)(9) | | 176,611 | | 179,701 | | 168,855 | | 157,540 | | 145,763 | | 138,193 | |
| | | | | | | | | | | | | |
Population (thousands at July 1)(10) | | 4,303 | | 4,310 | | 4,258 | | 4,203 | | 4,155 | | 4,115 | |
(1) Figures for prior years and the 2006/07 Budget have been restated to conform with the presentation used for fiscal 2006/07 and to include the effects of changes in underlying data and statistics.
(2) The ratio of debt to population (e.g., debt at March 31, 2007 divided by population at July 1, 2006).
(3) The ratio of debt outstanding at fiscal year end to provincial nominal gross domestic product (GDP) for the calendar year ending in the fiscal year (e.g., debt at March 31, 2007 divided by 2006 GDP).
(4) The ratio of interest costs (less sinking fund interest) to revenue. Figures include capitalized interest expense in order to provide a more comparable measure to outstanding debt.
(5) Weighted average of all outstanding debt issues.
(6) Includes revenue of the Consolidated Revenue Fund (excluding dividends from enterprises) plus revenue of all government organizations and enterprises.
(7) Excludes revenue of government enterprises, but includes dividends from enterprises paid to the Consolidated Revenue Fund.
(8) Excludes debt of commercial Crown corporations and agencies and funds held under the province’s Warehouse Borrowing Program.
(9) GDP for the calendar year ending in the fiscal year (e.g., GDP for 2006 is used for the fiscal year ending March 31, 2007).
(10) Population at July 1st within the fiscal year (e.g., population at July 1, 2006 is used for the fiscal year ending March 31, 2007).
Summary of Performance Measures(1)
for the Fiscal Year Ended March 31, 2007
| | 2007 | | 2007 | | 2006 | |
| | Target | | Actual | | Actual | |
Provincial credit rating(2) | | Aa1 | | Aaa | | Aa1 | |
Taxpayer-supported debt to GDP ratio(2) | | 15.8 | % | 14.1 | % | 16.2 | % |
Taxpayer-supported debt service costs as a percentage of revenue(2) | | 2nd lowest | | 2nd lowest | | 2nd lowest | |
(1) Performance measures as presented in the Ministry of Finance Service Plan in February 2006.
(2) As per Moody’s Investors Service Inc., ratios are based on May 2007 estimates. The debt to gross domestic product (GDP) and debt service costs as a percentage of revenue performance measures represent interprovincial comparisons.
120
PROVINCE OF BRITISH COLUMBIA
PUBLIC ACCOUNTS 2006/07
Definitions
(Unaudited)
Consolidated Revenue Fund—includes the taxpayer–supported activities of the General Fund and special funds of the government through which the government delivers central government programs. It does not include the activities of government operated through Crown corporations and agencies or the school districts, universities, colleges, institutes and health organizations (SUCH) sector.
Consolidation—the methods used to combine the results of Crown corporations and agencies and the SUCH sector entities with the Consolidated Revenue Fund. The two methods used are:
(i) Full or Proportional Consolidation—the accounts of the Crown corporation, agency or SUCH sector entity are adjusted to a basis consistent with the accounting policies of the government. The operating result and financial position of the Crown and SUCH entities are combined with those of the Consolidated Revenue Fund on a “line–by–line” basis. Inter–entity accounts and transactions are eliminated upon consolidation. Proportional consolidation differs from full consolidation in that only the government’s portion of operating and financial results of a joint venture is combined with those of the Consolidated Revenue Fund on a “line–by–line” basis.
(ii) Modified Equity Consolidation—the original investment of the government in the Crown corporation, agency or SUCH sector entity is initially recorded at cost and adjusted annually to include the net earnings/losses and other net equity changes of the entity. There is no adjustment to conform to government accounting policies. Since the government ensures the ongoing activities of self–supported Crown corporations and agencies, full account is taken of losses in these entities, even when cumulative losses exceed the original investment. Accounts and transactions between self–supported entities are not eliminated; however, profit elements included in such transactions, including certain increases in contributed surplus, are eliminated.
Debt has a variety of meanings:
(i) Gross debt—the par value of the debt, unamortized discount and premiums, and unrealized foreign exchange gains or losses.
(ii) Net debt—gross debt less sinking fund investments.
(iii) Provincial debt—net debt plus guaranteed debt and debt directly incurred by modified equity entities.
Deficit—the meaning is dependent upon the statement to which it applies:
(i) Consolidated Statement of Financial Position: Accumulated Deficit—the amount by which the total liabilities of
the government exceeds its total assets.
(ii) Consolidated Statement of Operations: Annual Deficit—the amount by which the total annual expenses for the operating year exceed total annual revenues (see “Surplus” definition).
Entitlement—a government transfer that must be made if the recipient meets specified eligibility criteria. Entitlements are non–discretionary in the sense that both eligibility criteria and the amount of the payment are prescribed in a statute or regulation.
Financial assets—assets on hand at the end of the accounting period, including cash and assets that are readily convertible into cash and are not intended for consumption in the normal course of activities. These assets could be liquidated to discharge existing liabilities or finance future operations. Financial assets could include sinking fund investments held to pay debt at maturity.
Government business enterprise—a government organization that has all the following characteristics:
(i) is a separate legal entity with the power to contract in its own name and that can sue or be sued;
(ii) has been delegated the financial and operational authority to carry on a business;
(iii) sells goods and/or services to individuals and organizations outside the government reporting entity as its principal activity; and
(iv) can, in the normal course of its operation, maintain its operations and meet its liabilities from revenue received from sources outside the government reporting entity.
121
Government partnership—a contractual arrangement between the government and a party or parties outside the
government reporting entity that has all the following characteristics:
(i) the partners cooperate toward achieving significant, clearly defined common goals;
(ii) the partners make a financial investment in the government partnership;
(iii) the partners share control of decisions related to the financial and operating policies of the government partnership on an ongoing basis; and
(iv) the partners share, on an equitable basis, significant risks and benefits associated with the operation.
Government transfers—transfer of money from government to an individual, organization or another government from which the government making the transfer does not:
(i) receive any goods or services directly in return;
(ii) expect to be repaid in the future; nor
(iii) expect a financial return.
Grants—a government transfer made at the sole discretion of the government. The government has the discretion to decide whether or not to make the grant, any conditions to be complied with, the amount of the grant and the recipient of the grant.
Net liabilities—the amount by which the total liabilities of the government exceed its total financial assets. The separate calculation of this number on the Consolidated Statement of Financial Position is unique to financial statements for Canadian senior governments. This calculation excludes non–financial assets such as buildings and prepaid expenses.
Other comprehensive income (OCI)—is made up of certain unrealized gains and losses of self-supported Crown corporations that are not reported in their statement of operations, but are reported in their statement of financial position. These unrealized gains and losses will be recognized in the statement of operations when they become realized gains and losses. OCI has arisen because of the adoption of a new comprehensive income accounting standard, issued by the Canadian Institute of Chartered Accounts, for Crown corporations and agencies that have fiscal years commencing after October 1, 2006.
Provincial government direct debt—combines the government direct operating debt and the debt incurred to finance education, health facilities and public transit. This combined portfolio represents the debt for which the government has direct responsibility for the associated debt service costs.
Self-supported Crown corporations and agencies—all Crown corporations and agencies that are accountable for the administration of their financial affairs and resources either to a minister of the government or directly to the legislature and are owned or controlled by the government. In addition, they must also carry on a business that sells goods and/or services to persons outside the government reporting entity as their principal activity and maintain operations and meet liabilities from revenue received outside the government reporting entity in the normal course of operations. This also includes the government’s interest in government business enterprises.
Sinking funds—a pool of cash and investments earmarked to provide resources for the redemption of debt.
Summary accounts—the financial position and operating result of the government reporting entity including the Consolidated Revenue Fund, Crown corporations, agencies and SUCH sector entities; the amounts represented by the Summary Financial Statements of the government.
Surplus—meaning is dependent upon the statement to which it applies:
(i) Consolidated Statement of Financial Position: the accumulated surplus is the amount by which the total assets of the government exceeds its total liabilities.
(ii) Consolidated Statement of Operations: the annual surplus is the amount by which the total annual revenues for the operating year exceed total annual expenses (see “Deficit” definition).
Taxpayer-supported Crown corporations and agencies and SUCH sector entities—all Crown corporations and agencies and entities outside the Consolidated Revenue Fund that meet the criteria of control (by the province) as established by generally accepted accounting principles. In addition, they must not meet the criteria for being self-supported. This also includes the government’s interest in government partnerships that are not government business enterprises.
122
Transfers under agreements (including shared cost)—a government transfer that is a reimbursement of eligible expenditures pursuant to an agreement between the government and the recipient. The recipient usually spends the money first; however, the government has some input into how the money is spent.
123
PROVINCE OF BRITISH COLUMBIA
PUBLIC ACCOUNTS 2006/07
Acronyms
(Unaudited)
AiP | | Agreement in Principle |
APAC | | Accounting Policy Advisory Committee |
BCHMC | | British Columbia Housing Management Commission |
BCRC | | British Columbia Railway Corporation |
BCRP | | BCR Properties Ltd |
BC Hydro | | British Columbia Hydro and Power Authority |
BCT | | British Columbia Transit |
BTAA | | Budget Transparency and Accountability Act |
CHMC | | Canada Housing and Mortgage Corporation |
CHST | | Canada Health and Social Transfer |
CICA | | Canadian Institute of Chartered Accountants |
CN | | Canadian National Railway Company |
CRF | | Consolidated Revenue Fund |
ICBC | | Insurance Corporation of British Columbia |
IOC | | International Olympic Committee |
FAA | | Financial Administration Act |
FRAS | | Financial Reporting and Advisory Services |
FTE | | Full-time equivalent |
GAAP | | Generally accepted accounting principles (for senior governments as recommended by the Public Sector Accounting Board of the Canadian Institute of Chartered Accountants) |
GRE | | Government reporting entity |
GVTA | | Greater Vancouver Transportation Authority |
Health Accord | | February 2003 First Ministers’ Accord on Health Care Renewal |
KMCT | | Kinder Morgan Canada Terminals ULC |
MLA | | Members of the Legislative Assembly |
MPA | | Multi-party agreement |
OAG | | Office of the Auditor General |
OCG | | Office of the Comptroller General |
OIC | | Order in Council |
P3 | | Public private partnership |
PHSA | | Provincial Health Services Authority |
PSAB | | Public Sector Accounting Board |
RCMP | | Royal Canadian Mounted Police |
RTP | | Rapid Transit Project 2000 Ltd. |
SUCH | | School districts, universities, colleges, institutes and health organizations |
TCA | | Tangible capital assets |
124
UBC | | University of British Columbia |
VANOC | | Vancouver Organizing Committee for the 2010 Olympic and Paralympic Winter Games |
VW | | Vancouver Wharves |
VWLP | | Vancouver Wharves Limited Partnership |
125