Exhibit 99.4
2012
British Columbia
Financial and Economic
Review
72nd Edition
(July 2012)

| Ministry of Finance |
2012 Financial and Economic Review — July 2012
Table of Contents
Chapter One — Economic Review | 1 |
2011 Overview | 3 |
British Columbia Economy | 3 |
External Trade and Commodity Prices | 4 |
Population | 6 |
Labour and Income Developments | 7 |
Inflation | 7 |
Consumer Expenditure and Housing | 8 |
Tourism | 9 |
External Environment | 9 |
United States Economy | 9 |
Canadian Economy | 10 |
International Economy | 10 |
Financial Markets | 11 |
Conclusion | 12 |
| |
Charts | |
1.1 | Provincial economic growth | 3 |
1.2 | British Columbia real GDP by industry | 4 |
1.3 | Export shares by market | 5 |
1.4 | Lumber and natural gas prices | 6 |
1.5 | Retail sales | 8 |
1.6 | Visitor entries to British Columbia | 9 |
1.7 | External economic growth | 11 |
1.8 | Canadian dollar | 12 |
Map 1.1 Net interprovincial and international migration in BC, 2011 | 6 |
| | |
Tables | |
1.1 | British Columbia Population and Labour Market Statistics | 7 |
1.2 | Price and Earnings Indices | 8 |
| | |
Appendix 1 — Economic Review | 13 |
| | |
Tables | |
A1.1A | Aggregate and Labour Market Indicators | 14 |
A1.1B | Prices, Earnings and Financial Indicators | 15 |
A1.1C | Other Indicators | 16 |
A1.1D | Commodity Production Indicators | 17 |
A1.2 | British Columbia Real GDP at Market Prices, Expenditure Based | 18 |
A1.3 | British Columbia GDP at Basic Prices, by Industry | 19 |
A1.4 | British Columbia GDP, Income Based | 20 |
A1.5 | Employment by Industry in British Columbia | 21 |
A1.6 | Capital Investment by Industry | 22 |
A1.7 | British Columbia International Goods Exports by Major Market and Selected Commodities, 2011 | 23 |
A1.8 | British Columbia International Goods Exports by Market Area | 24 |
A1.9 | Historical Commodity Prices (in U.S. Dollars) | 25 |
A1.10 | British Columbia Forest Sector Economic Activity Indicators | 26 |
A1.11 | Historical Value of Mineral, Petroleum and Natural Gas Shipments | 27 |
A1.12 | Petroleum and Natural Gas Activity Indicators | 27 |
2012 Financial and Economic Review — July 2012
i
Table of Contents
A1.13 | Supply and Consumption of Electrical Energy in British Columbia | 28 |
A1.14 | Components of British Columbia Population Change | 29 |
| |
Chapter Two — Financial Review | 31 |
2011/12 Overview | 33 |
Revenue | 34 |
Expense | 40 |
Provincial Capital Spending | 42 |
Taxpayer-supported Capital Spending | 43 |
Self-supported Capital Spending | 46 |
Financing Capital Spending | 46 |
Provincial Debt | 47 |
Taxpayer-supported Debt | 48 |
Self-supported Debt | 49 |
Debt Indicators | 50 |
Credit Rating | 51 |
Statement of Financial Position | 51 |
Unfunded Pension Liabilities | 53 |
| |
Topic Box | |
Review of the Province’s Financial Condition | 55 |
| |
Charts | |
2.1 | 2011/12 deficit — major changes from Budget 2011 | 34 |
2.2 | Revenue changes from Budget 2011 | 34 |
2.3 | Expense changes from Budget 2011 | 40 |
2.4 | Capital spending, 2011/12 | 42 |
2.5 | Capital spending changes from Budget 2011 | 42 |
2.6 | Financing taxpayer-supported capital spending | 47 |
2.7 | Provincial debt components | 47 |
2.8 | Debt changes from Budget 2011 | 48 |
2.9 | Taxpayer-supported debt to GDP ratio | 48 |
2.10 | 2011/12 changes in financial position | 52 |
| |
Tables | |
2.1 | Operating Statement | 33 |
2.2 | Consumption and Other Tax Revenues Change from Budget 2011 | 35 |
2.3 | Energy and Mineral Revenues Change from Budget 2011 | 36 |
2.4 | Forest Revenues Change from Budget 2011 | 36 |
2.5 | Other Revenue Change from Budget 2011 | 36 |
2.6 | Revenue by Source | 38 |
2.7 | Expense by Ministry, Program and Agency | 39 |
2.8 | Capital Spending | 43 |
2.9 | Capital Expenditure Projects Greater Than $50 Million | 44 |
2.10 | Provincial Debt Summary | 49 |
2.11 | Key Debt Indicators — 2007/08 to 2011/12 | 50 |
2.12 | Interprovincial Comparison of Credit Ratings, July 2012 | 51 |
2.13 | Net Liabilities and Accumulated Surplus | 51 |
2.14 | Pension Plan Balances | 53 |
2012 Financial and Economic Review — July 2012
ii
Table of Contents
Appendix 2 — Financial Review | 61 |
| |
Government’s Financial Statements | 63 |
Government Reporting Entity | 63 |
Compliance with GAAP | 63 |
2011/12 Public Accounts Audit Qualification | 64 |
| |
Supplementary Schedules | 65 |
| |
Tables | |
A2.1 | 2011/12 Forecasts – Year in Review | 66 |
A2.2 | Operating Statement – 2000/01 to 2011/12 | 67 |
A2.3 | Statement of Financial Position – 2000/01 to 2011/12 | 68 |
A2.4 | Changes in Financial Position – 2001/02 to 2011/12 | 69 |
A2.5 | Revenue by Source – 2000/01 to 2011/12 | 70 |
A2.6 | Revenue by Source Supplementary Information – 2000/01 to 2011/12 | 71 |
A2.7 | Expense by Function – 2000/01 to 2011/12 | 72 |
A2.8 | Expense by Function Supplementary Information – 2000/01 to 2011/12 | 73 |
A2.9 | Full-Time Equivalents (FTEs) – 2000/01 to 2011/12 | 74 |
A2.10 | Capital Spending – 2000/01 to 2011/12 | 75 |
A2.11 | Provincial Debt – 2000/01 to 2011/12 | 76 |
A2.12 | Provincial Debt Supplementary Information – 2000/01 to 2011/12 | 77 |
A2.13 | Key Provincial Debt Indicators – 2000/01 to 2011/12 | 78 |
A2.14 | Historical Operating Statement Surplus (Deficit) | 79 |
A2.15 | Historical Provincial Debt Summary | 80 |
| | |
Chapter Three — Commercial Crown Corporations Review | 81 |
| |
Introduction | 83 |
| |
BC Hydro and Power Authority | 83 |
| |
BC Liquor Distribution Branch | 87 |
| |
BC Lottery Corporation | 89 |
| |
Insurance Corporation of BC | 92 |
| |
Columbia Power Corporation | 95 |
| |
Transportation Investment Corporation | 97 |
| |
BC Railway Company | 98 |
| |
Charts | |
3.1 | Domestic electricity supply versus demand | 85 |
3.2 | Liquor sales by category | 88 |
3.3 | Interprovincial gaming comparisons | 91 |
3.4 | ICBC bodily injury claims loss cost trend | 94 |
3.5 | ICBC collision claims loss cost trend | 95 |
Map 3.1 500 kV transmission system and major generating stations | 84 |
| |
Tables | |
3.1 | British Columbia Hydro and Power Authority Five-Year Income Statement | 86 |
3.2 | Liquor Distribution Branch Five-Year Income Statement | 87 |
3.3 | British Columbia Lottery Corporation Five-Year Income Statement | 90 |
3.4 | Insurance Corporation of British Columbia Five-Year Income Statement | 93 |
2012 Financial and Economic Review — July 2012
iii
Table of Contents
3.5 | Columbia Power Corporation Five-Year Income Statement | 96 |
3.6 | Transportation Investment Corporation Five-Year Income Statement | 97 |
3.7 | British Columbia Railway Company Five-Year Income Statement | 98 |
| |
Chapter 4 — Supplementary Information | 101 |
| |
General Description of the Province | 102 |
Geography | 102 |
Physiography | 102 |
Climate and Vegetation | 102 |
Population | 103 |
| |
Constitutional Framework | 103 |
| |
Provincial Government | 104 |
| |
Legislature | 104 |
Executive | 104 |
Judiciary | 105 |
Provincial Government Jurisdiction | 105 |
| |
The Annual Financial Cycle | 106 |
Planning and Budget Preparation | 107 |
Implementation and Reporting | 107 |
Evaluation | 107 |
Accountability | 107 |
| |
Summary of Tax Changes Announced in 2012 | 108 |
| |
Charts | |
4.1 | Financial Planning and Reporting Cycle Overview | 106 |
| | |
Tables | |
4.1 | Provincial Taxes (as of July 2012) | 115 |
4.2 | Interprovincial Comparisons of Tax Rates — 2012 | 120 |
2012 Financial and Economic Review — July 2012
iv
| Chapter One |
| |
| Economic Review (1) |
(1) Reflects information available at July 9, 2012
2012 Financial and Economic Review — July 2012
Chapter 1 — Economic Review
2011 Overview
In 2011, British Columbia’s economy performed well relative to most other Canadian provinces, with gains over 2010 in several major indicators.
Similar to last year, Statistics Canada only published real dollar industry-side GDP data in the preliminary release of its Provincial Economic Accounts in April 2012. As a result, the following analysis refers to real GDP figures at basic prices, as opposed to the usual market price definition.
BC’s economy grew by 2.9 per cent in 2011 (third highest among provinces), slightly lower than the 3.2 per cent growth observed in 2010. Despite some slowing in the latter part of the year, most indicators of economic performance through 2011 showed improvement relative to the previous year.
Chart 1.1 Provincial Economic Growth

Source: Statistics Canada, April 2012 Preliminary Industry Accounts
Externally, BC’s international merchandise exports fared well in 2011, increasing by 14.0 per cent over 2010. Shipments of manufactured goods also made strong gains in 2011, growing by 6.5 per cent on the year.
Domestically, BC housing starts fell slightly in 2011, dropping 0.3 per cent to average 26,400 annualized units for the year. Retail sales, however, climbed by 3.1 per cent, despite a drop in confidence among consumers.
British Columbia Economy(2)
BC’s real GDP grew by 2.9 per cent in 2011, after expanding by 3.2 per cent in 2010.
The improvement in 2011 reflects the BC economy’s continued recovery from the 2008/2009 recession, with annual gains in both the service-producing as well as goods-producing industries. Output in the province’s service-producing sectors increased by 2.0 per cent in 2011, down slightly from the 2.2 per cent rise recorded in 2010.
(2) Provincial and National real GDP estimates are based on Statistics Canada’s preliminary industry accounts, released in April 2012. Further information on British Columbia’s economic performance will be available in November 2012, when Statistics Canada releases revised GDP data for 2011 and previous years for the full income and expenditure accounts, including nominal data.
2012 Financial and Economic Review — July 2012
3
Chapter 1 — Economic Review
On the services side, notable real GDP growth was recorded in the transportation and warehousing sector (+4.1 per cent), finance, insurance and real estate sector (+3.2 per cent) and health care and social assistance sector (+1.9 per cent). At the same time, growth in BC’s goods-producing industries jumped 5.6 per cent in 2011, following a 6.8 per cent increase during the previous year. Major gains in 2011 were observed in construction (+6.7 per cent), mining, oil and gas extraction (+6.0 per cent) and manufacturing (+3.1 per cent).
Chart 1.2 British Columbia real GDP by industry

Source: Statistics Canada, April 2012 Preliminary Industry Accounts
External Trade and Commodity Prices
Exports by destination:
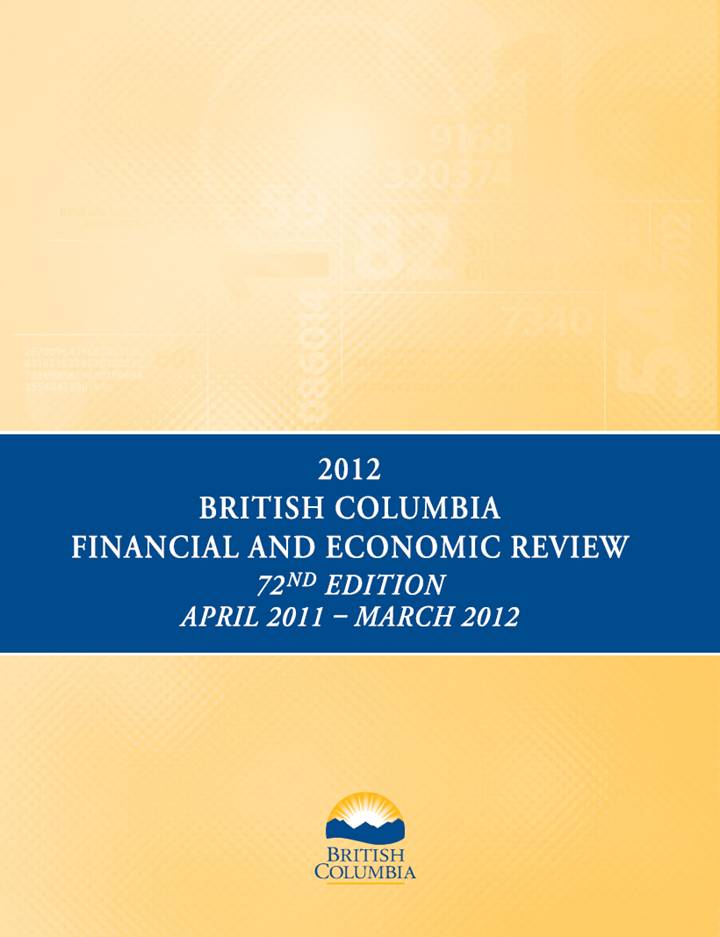
BC’s merchandise exports climbed 14.0 per cent in 2011, an even higher rate of growth than the 13.8 per cent recorded in 2010. The continued strength in exports was achieved despite ongoing weakness in the US economy. However, China continued to boost BC exports in 2011 with its steady appetite for BC lumber, as well as pulp, coal and copper.
Exports of BC goods to the US improved by 5.4 per cent in 2011, which was stronger than the 2.8 per cent increase in 2010. Despite annual gains in each of the last two years, the value of BC merchandise exports to the US in 2011 continued to hover around the low levels observed during the mid-1990s.
In contrast, China’s booming economy continued to demand a rapidly increasing amount of BC’s exports, as the total value of BC merchandise exports to China grew by 25.4 per cent in 2011. This annual gain was driven by exports of wood products (+75.7 per cent), pulp and paper products (+31.4 per cent) and metallic mineral products (+8.3 per cent). Appendix Tables A1.7 and A1.8 provide further detail on exports by major market and commodity groups.
2012 Financial and Economic Review — July 2012
4
Chapter 1 — Economic Review
The strong Canadian dollar and ongoing slow US economic recovery continued to hamper US demand for goods from BC, as just 42.7 per cent of BC’s total international goods exports went to the US in 2011 (the lowest share since 1990), and was down from 46.2 per cent in the previous year. Most of this market share was absorbed by Asian countries, particularly China and South Korea.
Chart 1.3 Export shares by market
Source: BC Stats
Commodity exports and prices:
BC saw strong export growth in 2011 for most major commodity groups, led by energy products, which increased 24.9 per cent compared to 2010. Significant annual gains were also observed in exports of wood products (+11.7 per cent), metallic minerals (+11.6 per cent), machinery and equipment (+6.6 per cent) and pulp and paper products (+6.0 per cent).
The price of natural gas remained at a low level throughout 2011, with the Plant Inlet price averaging $2.47 C/GJ during 2011. This is down from $2.94 C/GJ in 2010 — a much lower level than the prices observed in recent years.
The price of oil fluctuated through 2011, but rose on average compared to 2010. The West Texas Intermediate daily oil price averaged $94.88 US/barrel on the year, representing a lofty 19.4 per cent increase from the $79.48 US/barrel recorded in 2010.
Prices for SPF lumber remained fairly flat in 2011, falling by just 0.3 per cent for the year after climbing 40.4 per cent in 2010. The price of pulp rose slightly in 2011, up 3.3 per cent, while the price of newsprint saw a 9.5 per cent gain over 2010.
· Lumber prices averaged $254 US per thousand board feet in 2011, inching down from $255 US in the previous year;
· Pulp prices averaged $961 US per tonne, up from $930 US in 2010; and
· Newsprint prices climbed to $625 US per tonne from $571 US per tonne in 2010.
2012 Financial and Economic Review — July 2012
5
Chapter 1 — Economic Review
Chart 1.4 Lumber and natural gas prices

Source: Madison’s Lumber Reporter and Ministry of Energy and Mines
Population
BC’s population grew by 1.0 per cent as of July 1, 2011. During the 2011 calendar year, BC experienced an increase of 46,177 persons. Most of this growth was attributable to the 35,882 persons BC welcomed via net international migration. In 2011, interprovincial migration in BC was negative for the first time since 2002, as a net total of 1,920 persons left BC for other provinces. A natural increase of 12,215 persons also added to the total population of the province for 2011.
Map 1.1 Net interprovincial and international migration in BC, 2011
Net Population Movement For British Columbia
Jan 2011 to Dec 2011
Net Inflow : 33,962 Persons

Source: BC Stats
2012 Financial and Economic Review — July 2012
6
Chapter 1 — Economic Review
Labour and Income Developments
Employment growth in BC was slow in 2011, increasing by just 0.8 per cent (or 18,200 jobs) compared to 2010. Full-time employment rose by 0.5 per cent (or 9,300 jobs), while part-time employment increased by 1.7 per cent (or 8,800 jobs). BC’s unemployment rate edged down 0.1 percentage points to average 7.5 per cent in 2011, slightly higher than the national average of 7.4 per cent. Meanwhile, BC’s labour force expanded by 0.6 per cent in 2011, following an increase of 1.7 per cent in 2010.
Employment in BC’s goods-producing industries rose by 1.1 per cent (or 4,700 jobs) in 2011 after growing 0.9 per cent in the previous year. Annual job gains in the construction sector (+14,100 jobs) more than offset losses in the primary industries sector (-6,200 jobs), manufacturing sector (-1,900 jobs) and utilities sector (-1,200 jobs).
BC’s services sector saw employment grow by 0.7 per cent in 2011, adding 13,400 jobs compared to the previous year. Major job gains were observed in accommodation and food services (+19,500 jobs), professional, scientific and technical services (+7,800 jobs), transportation and warehousing (+5,500 jobs) and services to business management (+3,200 jobs) — see Appendix Table A1.5 for more details.
Table 1.1 British Columbia Population and Labour Market Statistics
| | Units | | 2007 | | 2008 | | 2009 | | 2010 | | 2011 | |
Population (as of July 1) | | (thousands) | | 4,310 | | 4,384 | | 4,460 | | 4,530 | | 4,573 | |
| | (% change) | | 1.6 | | 1.7 | | 1.7 | | 1.6 | | 1.0 | |
Net Migration | | | | | | | | | | | | | |
International | | (persons) | | 42,333 | | 54,052 | | 50,306 | | 37,349 | | 35,882 | |
Interprovincial | | (persons) | | 16,776 | | 10,849 | | 9,672 | | 4,678 | | -1,920 | |
Labour Force | | (thousands) | | 2,322 | | 2,376 | | 2,403 | | 2,443 | | 2,458 | |
| | (% change) | | 3.0 | | 2.4 | | 1.1 | | 1.7 | | 0.6 | |
Employment | | (thousands) | | 2,223 | | 2,266 | | 2,218 | | 2,257 | | 2,275 | |
| | (% change) | | 3.5 | | 2.0 | | (2.1 | ) | 1.7 | | 0.8 | |
Unemployment Rate | | (%) | | 4.3 | | 4.6 | | 7.7 | | 7.6 | | 7.5 | |
Source: Statistics Canada
Inflation
Consumer price inflation in BC rose by 2.4 per cent in 2011 compared to 2010, as increases in the inflation of non-durables and services more than offset price deflation in durable and semi-durable goods. Rising fuel, electricity and food prices pushed up prices for non-durables, while higher prices for restaurants and education provided upward inflationary pressure on the services side. Prices for durables eased in response to lower prices for home entertainment, furniture and household appliances. At the same time, lower prices for items such as clothing, footwear and household textiles led to the overall decline in the semi-durable component.
2012 Financial and Economic Review — July 2012
7
Chapter 1 — Economic Review
Table 1.2 Price and Earnings Indices
| | Units | | 2007 | | 2008 | | 2009 | | 2010 | | 2011 | |
Consumer Price Index | | (2002=100) | | 110.0 | | 112.3 | | 112.3 | | 113.8 | | 116.5 | |
(British Columbia) | | (% change) | | 1.8 | | 2.1 | | — | | 1.3 | | 2.4 | |
| | | | | | | | | | | | | |
Average weekly earnings | | ($) | | 747.1 | | 777.9 | | 797.9 | | 822.8 | | 837.4 | |
| | (% change) | | 2.9 | | 4.1 | | 2.6 | | 3.1 | | 1.8 | |
| | | | | | | | | | | | | |
Labour income (1) | | ($millions) | | 98,573 | | 102,468 | | 100,629 | | 104,630 | | n/a | |
| | (% change) | | 4.9 | | 4.0 | | (1.8 | ) | 4.0 | | n/a | |
| | | | | | | | | | | | | |
Personal income (1) | | ($millions) | | 151,620 | | 158,061 | | 157,668 | | 163,953 | | n/a | |
| | (% change) | | 6.3 | | 4.2 | | (0.2 | ) | 4.0 | | n/a | |
| | | | | | | | | | | | | |
Corporate profits (pre-tax) (1) | | ($millions) | | 21,951 | | 24,892 | | 17,778 | | 21,608 | | n/a | |
| | (% change) | | (2.0 | ) | 13.4 | | (28.6 | ) | 21.5 | | n/a | |
(1) | As of November 2011 Provincial Economic Accounts |
| Source: Statistics Canada |
Consumer Expenditure and Housing
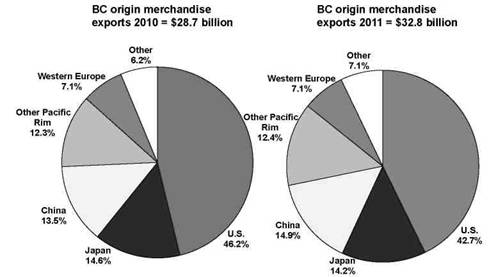
Retail sales in BC advanced by 3.1 per cent in 2011, a slower rate than the 5.4 per cent growth observed in 2010. Notable gains were achieved at gas stations, clothing stores and motor vehicle and parts dealers. Although retail activity improved in 2011, BC placed second last among provinces in retail sales growth on the year.
Following a sizable increase in 2010, BC housing starts remained fairly flat in 2011, falling just 0.3 per cent to reach 26,400 units. An annual decline of 22.6 per cent in single unit starts offset a gain of 16.8 per cent in multiple unit starts. At the same time, residential building permits (a leading indicator of potential new housing activity) dropped by 8.8 per cent in 2011 compared to 2010.
Chart 1.5 Retail sales
Source: Statistics Canada
2012 Financial and Economic Review — July 2012
8
Chapter 1 — Economic Review
Home sales in BC improved by 2.8 per cent in 2011 compared to the previous year, following a drop of 12.2 per cent in 2010. At the same time, home prices in BC continued to rise, with the average price reaching $561,000 — an increase of 11.1 per cent over 2010.
Tourism
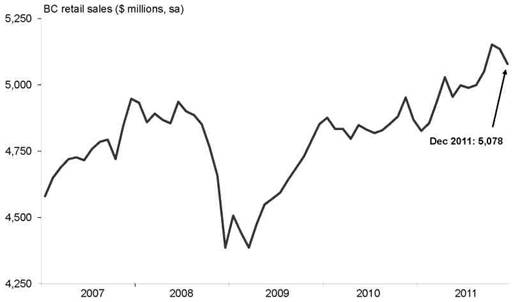
In 2011, the number of international travelers to BC fell by 4.3 per cent compared to the previous year, after climbing 3.5 per cent in 2010. Non-US visitors declined by 3.3 per cent in 2011, while travelers from the US fell by 4.7 per cent on the year. The number of travelers to BC has fallen in six of the past seven years (except for the gain in 2010), and currently resides at levels observed in the early 1990s.
Chart 1.6 Visitor entries to British Columbia
Source: Statistics Canada
External Environment
Economic uncertainty reverberated throughout the world in 2011, as the global economy continued its long recovery following the 2008/2009 recession. Overall, world economic growth advanced by 3.9 per cent in 2011, down slightly from the 5.3 per cent gain recorded in 2010. The Japanese economy contracted in 2011 after returning to growth in 2010, while the Euro area economies grew by just 1.4 per cent compared to the previous year. Meanwhile, China surged again, recording 9.2 per cent annual growth in 2011, after a gain of 10.4 per cent in 2010.
United States Economy
The US economy is currently experiencing a period of sluggish economic activity as it continues its slow recovery from the housing collapse and ensuing financial crisis that began in late 2008. US real GDP expanded by 1.7 per cent in 2011, a significant slowdown from the 3.0 per cent growth observed in 2010.
2012 Financial and Economic Review — July 2012
9
Chapter 1 — Economic Review
The US employment situation remained bleak in 2011, with 5.8 million American workers having lost their jobs since the January 2008 peak. The unemployment rate fell to 9.0 per cent from 9.6 per cent in 2010, but remained high relative to historical levels. Although about 150,000 new jobs were created on average each month in 2011, it would take about three years at this rate to regain all the jobs lost since early 2008.
The US housing market also continued to struggle in 2011, as housing starts averaged just 606,900 units on the year. Although this represents a 3.4 per cent increase from 2010, starts remained at historically low levels throughout the year.
The US current account deficit (the combined balances on trade in goods and services income, and net unilateral current transfers) widened in 2011, to reach –$466 billion from –$442 billion recorded for the previous year.
Canadian Economy
The Canadian economy grew by 2.6 per cent in 2011 following a 3.4 per cent increase in 2010, as real GDP advanced in every province on the year. Canada’s goods-producing industries improved by 3.6 per cent in 2011, which was slower than the 6.1 per cent growth recorded in 2010. At the same time, growth in the country’s service industries rose by 2.3 per cent in 2011, down from 2.7 per cent in 2010.
Canada’s current account deficit narrowed slightly in 2011 to reach –$48.4 billion after recording a balance of –$50.9 billion in 2010. The value of Canadian merchandise exports rose 12.0 per cent in 2011, posting another strong year after rising by 11.9 per cent in 2010. Meanwhile, shipments of manufactured goods also increased on the year, as the total value of Canadian shipments rose 7.8 per cent in 2011 following a gain of 8.9 per cent in 2010.
Canada’s labour market continued its steady gains in 2011, as the number of jobs improved by 265,200 jobs (or 1.6 per cent) over the previous year. At the same time, the national unemployment rate averaged 7.4 per cent in 2011, down from the 8.0 per cent observed in 2010.
Canadian housing starts also increased, climbing by 2.1 per cent to average 194,000 units, after a 27.4 per cent gain in 2010. Residential building permits grew by 2.3 per cent in 2011, following a sizeable jump of 25.2 per cent during the previous year. Further, national home sales rebounded in 2011, as sales were up by 2.4 per cent after declining by 3.9 per cent in 2010.
Canadian retail sales improved by 4.1 per cent in 2011 compared to the previous year, after a 5.6 per cent annual gain in 2010. Stronger employment gains likely aided retail sales growth, which moved upward despite a decline in consumer confidence during 2011.
International Economy
In 2011, the European sovereign debt crisis continued to shroud the global economy in uncertainty. Widespread concern over debt struggles in several nations — especially Greece, Spain, Portugal and Italy — sent domestic bond yields in these countries soaring and dampened the value of the euro currency. Overall, however, Europe’s economy expanded by 1.4 per cent in 2011 after a 1.9 per cent increase in 2010.
2012 Financial and Economic Review — July 2012
10
Chapter 1 — Economic Review
Chart 1.7 External economic growth
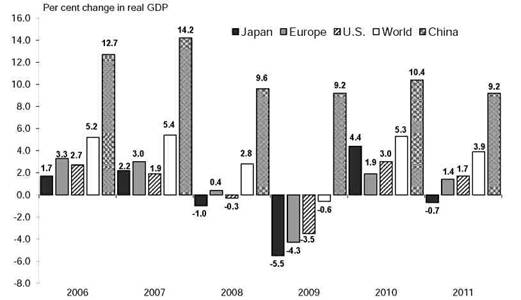
Source: International Monetary Fund, April 2012
Japan’s economy contracted 0.7 per cent in 2011, after a healthy gain of 4.4 per cent in the previous year. The drop in 2011 marks the third year in the past four in which Japanese real GDP has recorded an annual contraction.
Meanwhile, the International Monetary Fund estimates that global real GDP grew by 3.9 per cent in 2011, bolstered by sustained strength in emerging and developing economies. In particular, the Chinese economy continued its rapid growth in 2011, expanding by 9.2 per cent on the year.
Financial Markets
The Bank of Canada continued to hold the overnight target rate at 1.00 per cent in 2011, where it has remained since September 2010. On several occasions throughout the year, Bank officials cited uncertainty in the global economic outlook (brought on largely by the European debt crisis) as a central reason for its decision to remain at 1.00 per cent.
The slower than expected US economic recovery, including weakness in the labour market and stagnant housing activity, pushed the US Federal Reserve to hold its intended federal funds rate in the 0.00 to 0.25 per cent range throughout all of 2011. Reserve officials have held the rate in this highly accommodative range since December 2008.
After beginning 2011 at 100.1 US cents, the value of the Canadian dollar remained close to parity throughout the year. The loonie averaged 101.1 US cents in 2011, as the dollar’s high value was attributed to a still weak US dollar as well as strong commodity prices.
2012 Financial and Economic Review — July 2012
11
Chapter 1 — Economic Review
Chart 1.8 Canadian dollar
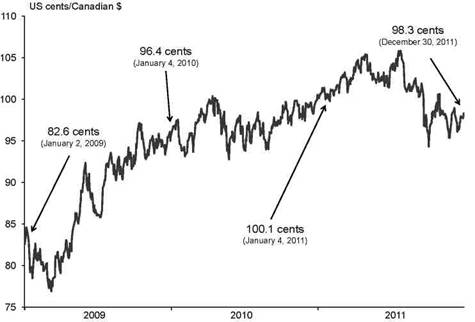
Source: Bank of Canada
Conclusion
BC’s economy slowed slightly in 2011, expanding by 2.9 per cent after growing by 3.2 per cent in 2010. The recovery was broadly based, with both the goods and services sectors experiencing gains. BC’s economic growth in 2011 fared well relative to other Canadian jurisdictions, placing third among provinces and above the national average for the year.
Domestically, employment in BC rose 0.8 per cent in 2011, an increase of 18,200 jobs, with gains in both full-time and part-time employment. Meanwhile, BC’s annual unemployment rate edged down 0.1 percentage points to average 7.5 per cent on the year, slightly higher than the national average. Following a very strong 2010, BC housing starts held fairly steady in 2011, reaching 26,400 units (a slight drop of 0.3 per cent over the previous year). BC retail sales also increased in 2011, climbing 3.1 per cent over the year.
Internationally, BC merchandise exports continued to surge in 2011, rising 14.0 per cent over the previous year, supported by strong Asian demand for resource-based commodities such as BC lumber, pulp, coal and copper. Shipments of manufactured goods also made strong gains in 2011, growing by 6.5 per cent on the year.
2012 Financial and Economic Review — July 2012
12
| Appendix 1 |
| |
| Economic Review |
2012 Financial and Economic Review — July 2012
Appendix 1 — Economic Review
Table A1.1A Aggregate and Labour Market Indicators
| | | | | | Real GDP | | Personal | | Capital | | Business | | | | | | Unemployment | |
| | Population (1) | | Nominal GDP | | (chained) | | income | | investment | | incorporations | | Labour force | | Employment | | rate | |
| | (thousands) | | ($ millions) | | ($2002 millions) | | ($ millions) | | ($ millions) | | (number) | | (thousands) | | (thousands) | | (per cent) | |
1982 | | 2,877 | | 45,024 | | 79,324 | | 40,425 | | | | | | 1,427 | | 1,253 | | 12.1 | |
1983 | | 2,908 | | 47,477 | | 79,824 | | 41,634 | | | | | | 1,446 | | 1,245 | | 13.9 | |
1984 | | 2,947 | | 49,840 | | 80,440 | | 43,734 | | | | | | 1,465 | | 1,245 | | 15.0 | |
1985 | | 2,975 | | 53,540 | | 86,026 | | 46,588 | | | | | | 1,493 | | 1,280 | | 14.3 | |
1986 | | 3,004 | | 56,547 | | 86,187 | | 48,911 | | | | | | 1,526 | | 1,332 | | 12.7 | |
1987 | | 3,049 | | 62,515 | | 91,503 | | 52,903 | | | | | | 1,567 | | 1,378 | | 12.1 | |
1988 | | 3,115 | | 69,408 | | 96,824 | | 58,298 | | | | | | 1,599 | | 1,435 | | 10.3 | |
1989 | | 3,197 | | 75,582 | | 100,007 | | 65,009 | | | | | | 1,659 | | 1,508 | | 9.1 | |
1990 | | 3,292 | | 79,350 | | 101,408 | | 72,038 | | | | | | 1,703 | | 1,560 | | 8.4 | |
1991 | | 3,374 | | 81,849 | | 101,593 | | 75,336 | | 17,370 | | | | 1,751 | | 1,578 | | 9.9 | |
1992 | | 3,469 | | 87,242 | | 104,216 | | 78,610 | | 17,979 | | | | 1,800 | | 1,617 | | 10.1 | |
1993 | | 3,568 | | 94,077 | | 108,874 | | 81,914 | | 18,875 | | | | 1,848 | | 1,668 | | 9.7 | |
1994 | | 3,676 | | 100,512 | | 111,945 | | 85,703 | | 21,353 | | | | 1,918 | | 1,743 | | 9.1 | |
1995 | | 3,777 | | 105,670 | | 114,620 | | 90,056 | | 20,591 | | | | 1,951 | | 1,786 | | 8.5 | |
1996 | | 3,874 | | 108,865 | | 117,442 | | 92,661 | | 19,408 | | 23,237 | | 1,986 | | 1,813 | | 8.7 | |
1997 | | 3,949 | | 114,383 | | 121,177 | | 95,925 | | 22,552 | | 22,958 | | 2,032 | | 1,860 | | 8.5 | |
1998 | | 3,983 | | 115,641 | | 122,766 | | 98,135 | | 20,819 | | 20,759 | | 2,038 | | 1,858 | | 8.8 | |
1999 | | 4,011 | | 120,921 | | 126,708 | | 101,465 | | 21,152 | | 21,009 | | 2,064 | | 1,894 | | 8.3 | |
2000 | | 4,039 | | 131,333 | | 132,578 | | 107,624 | | 21,799 | | 21,388 | | 2,080 | | 1,931 | | 7.2 | |
2001 | | 4,076 | | 133,514 | | 133,403 | | 110,369 | | 23,414 | | 19,474 | | 2,081 | | 1,920 | | 7.7 | |
2002 | | 4,098 | | 138,193 | | 138,193 | | 113,451 | | 23,732 | | 20,987 | | 2,134 | | 1,953 | | 8.5 | |
2003 | | 4,122 | | 145,642 | | 141,435 | | 117,126 | | 25,434 | | 22,531 | | 2,172 | | 1,998 | | 8.0 | |
2004 | | 4,155 | | 157,675 | | 146,541 | | 124,263 | | 29,665 | | 24,703 | | 2,190 | | 2,033 | | 7.2 | |
2005 | | 4,197 | | 169,664 | | 153,489 | | 131,408 | | 33,254 | | 30,937 | | 2,221 | | 2,092 | | 5.8 | |
2006 | | 4,244 | | 182,251 | | 159,729 | | 142,696 | | 39,912 | | 33,273 | | 2,255 | | 2,147 | | 4.8 | |
2007 | | 4,310 | | 192,117 | | 164,496 | | 151,620 | | 42,670 | | 34,036 | | 2,322 | | 2,223 | | 4.3 | |
2008 | | 4,384 | | 199,441 | | 165,641 | | 158,061 | | 46,936 | | 30,085 | | 2,376 | | 2,266 | | 4.6 | |
2009 | | 4,460 | | 191,863 | | 162,225 | | 157,668 | | 39,001 | | 26,431 | | 2,403 | | 2,218 | | 7.7 | |
2010 | | 4,530 | | 203,147 | | 167,140 | | 163,953 | | 42,534 | | 30,305 | | 2,443 | | 2,257 | | 7.6 | |
2011 | | 4,573 | | n/a | | n/a | | n/a | | 46,109 | | 30,847 | | 2,458 | | 2,275 | | 7.5 | |
| | | | | | | | | | | | | | | | | | | |
| | | | | | | | Personal | | Capital | | Business | | | | | | Unemployment | |
| | Population (1) | | Nominal GDP | | Real GDP | | income | | investment | | incorporations | | Labour force | | Employment | | rate | |
| | (% change) | | (% change) | | (% change) | | (% change) | | (% change) | | (% change) | | (% change) | | (% change) | | (change) | |
1983 | | 1.1 | | 5.4 | | 0.6 | | 3.0 | | — | | — | | 1.3 | | (0.7 | ) | 1.8 | |
1984 | | 1.4 | | 5.0 | | 0.8 | | 5.0 | | — | | — | | 1.3 | | 0.0 | | 1.1 | |
1985 | | 0.9 | | 7.4 | | 6.9 | | 6.5 | | — | | — | | 1.9 | | 2.8 | | (0.7 | ) |
1986 | | 1.0 | | 5.6 | | 0.2 | | 5.0 | | — | | — | | 2.2 | | 4.1 | | (1.6 | ) |
1987 | | 1.5 | | 10.6 | | 6.2 | | 8.2 | | — | | — | | 2.7 | | 3.4 | | (0.6 | ) |
1988 | | 2.2 | | 11.0 | | 5.8 | | 10.2 | | — | | — | | 2.0 | | 4.1 | | (1.8 | ) |
1989 | | 2.6 | | 8.9 | | 3.3 | | 11.5 | | — | | — | | 3.8 | | 5.1 | | (1.2 | ) |
1990 | | 3.0 | | 5.0 | | 1.4 | | 10.8 | | — | | — | | 2.6 | | 3.4 | | (0.7 | ) |
1991 | | 2.5 | | 3.1 | | 0.2 | | 4.6 | | — | | — | | 2.8 | | 1.1 | | 1.5 | |
1992 | | 2.8 | | 6.6 | | 2.6 | | 4.3 | | 3.5 | | — | | 2.8 | | 2.5 | | 0.2 | |
1993 | | 2.9 | | 7.8 | | 4.5 | | 4.2 | | 5.0 | | — | | 2.7 | | 3.1 | | (0.4 | ) |
1994 | | 3.0 | | 6.8 | | 2.8 | | 4.6 | | 13.1 | | — | | 3.8 | | 4.5 | | (0.6 | ) |
1995 | | 2.8 | | 5.1 | | 2.4 | | 5.1 | | (3.6 | ) | — | | 1.7 | | 2.4 | | (0.6 | ) |
1996 | | 2.6 | | 3.0 | | 2.5 | | 2.9 | | (5.7 | ) | — | | 1.8 | | 1.6 | | 0.2 | |
1997 | | 1.9 | | 5.1 | | 3.2 | | 3.5 | | 16.2 | | (1.2 | ) | 2.3 | | 2.6 | | (0.2 | ) |
1998 | | 0.9 | | 1.1 | | 1.3 | | 2.3 | | (7.7 | ) | (9.6 | ) | 0.3 | | (0.1 | ) | 0.3 | |
1999 | | 0.7 | | 4.6 | | 3.2 | | 3.4 | | 1.6 | | 1.2 | | 1.3 | | 1.9 | | (0.5 | ) |
2000 | | 0.7 | | 8.6 | | 4.6 | | 6.1 | | 3.1 | | 1.8 | | 0.8 | | 2.0 | | (1.1 | ) |
2001 | | 0.9 | | 1.7 | | 0.6 | | 2.6 | | 7.4 | | (8.9 | ) | 0.0 | | (0.6 | ) | 0.5 | |
2002 | | 0.5 | | 3.5 | | 3.6 | | 2.8 | | 1.4 | | 7.8 | | 2.6 | | 1.7 | | 0.8 | |
2003 | | 0.6 | | 5.4 | | 2.3 | | 3.2 | | 7.2 | | 7.4 | | 1.8 | | 2.3 | | (0.5 | ) |
2004 | | 0.8 | | 8.3 | | 3.6 | | 6.1 | | 16.6 | | 9.6 | | 0.8 | | 1.7 | | (0.8 | ) |
2005 | | 1.0 | | 7.6 | | 4.7 | | 5.7 | | 12.1 | | 25.2 | | 1.5 | | 2.9 | | (1.4 | ) |
2006 | | 1.1 | | 7.4 | | 4.1 | | 8.6 | | 20.0 | | 7.6 | | 1.5 | | 2.6 | | (1.0 | ) |
2007 | | 1.6 | | 5.4 | | 3.0 | | 6.3 | | 6.9 | | 2.3 | | 3.0 | | 3.5 | | (0.5 | ) |
2008 | | 1.7 | | 3.8 | | 0.7 | | 4.2 | | 10.0 | | (11.6 | ) | 2.4 | | 2.0 | | 0.3 | |
2009 | | 1.7 | | (3.8 | ) | (2.1 | ) | (0.2 | ) | (16.9 | ) | (12.1 | ) | 1.1 | | (2.1 | ) | 3.1 | |
2010 | | 1.6 | | 5.9 | | 3.0 | | 4.0 | | 9.1 | | 14.7 | | 1.7 | | 1.7 | | (0.1 | ) |
2011 | | 1.0 | | n/a | | n/a | | n/a | | 8.4 | | 1.8 | | 0.6 | | 0.8 | | (0.1 | ) |
(1) As at July 1. Data take into account adjustments made for net census undercount in 1996, 2001 and 2006, and non-permanent residents.
Sources: Statistics Canada and BC Stats, Ministry of Finance, based on federal, provincial and industry data.
2012 Financial and Economic Review — July 2012
14
Appendix 1 — Economic Review
Table A1.1B Prices, Earnings and Financial Indicators
| | | | | | | | | | | | Personal | | | | | | | |
| | | | | | Average | | | | | | Disposable | | | | | | Conventional | |
| | BC | | Vancouver | | weekly | | Labour | | Personal income | | Income | | Prime | | Can/US | | (5 year) | |
| | CPI | | CPI | | wage rate(1) | | income | | per capita | | per capita | | rate | | exchange rate | | mortgage rate | |
| | (2002=100) | | (2002=100) | | ($) | | ($ millions) | | (dollars) | | (dollars) | | (per cent) | | (US cents) | | (per cent) | |
1982 | | 57.3 | | 56.6 | | — | | 26,497 | | 14,053 | | 11,468 | | 15.8 | | 81.1 | | 18.0 | |
1983 | | 60.4 | | 59.7 | | — | | 27,018 | | 14,320 | | 11,580 | | 11.2 | | 81.1 | | 13.2 | |
1984 | | 62.8 | | 62.1 | | — | | 27,811 | | 14,839 | | 12,134 | | 12.1 | | 77.2 | | 13.6 | |
1985 | | 64.8 | | 64.0 | | — | | 29,100 | | 15,659 | | 12,777 | | 10.6 | | 73.2 | | 12.1 | |
1986 | | 66.7 | | 66.2 | | — | | 30,339 | | 16,284 | | 13,135 | | 10.5 | | 72.0 | | 11.2 | |
1987 | | 68.7 | | 68.2 | | — | | 32,837 | | 17,353 | | 13,860 | | 9.5 | | 75.4 | | 11.2 | |
1988 | | 71.2 | | 70.6 | | — | | 36,110 | | 18,717 | | 14,846 | | 10.8 | | 81.3 | | 11.6 | |
1989 | | 74.4 | | 73.8 | | — | | 40,295 | | 20,336 | | 16,156 | | 13.3 | | 84.5 | | 12.1 | |
1990 | | 78.4 | | 77.8 | | — | | 44,216 | | 21,882 | | 17,003 | | 14.1 | | 85.7 | | 13.4 | |
1991 | | 82.6 | | 81.9 | | — | | 46,296 | | 22,330 | | 17,309 | | 9.9 | | 87.3 | | 11.1 | |
1992 | | 84.8 | | 84.3 | | — | | 48,924 | | 22,662 | | 17,454 | | 7.5 | | 82.7 | | 9.5 | |
1993 | | 87.8 | | 87.3 | | — | | 51,312 | | 22,959 | | 17,802 | | 5.9 | | 77.5 | | 8.8 | |
1994 | | 89.5 | | 89.1 | | — | | 53,972 | | 23,314 | | 17,968 | | 6.9 | | 73.2 | | 9.5 | |
1995 | | 91.6 | | 91.3 | | — | | 56,768 | | 23,841 | | 18,300 | | 8.6 | | 72.9 | | 9.2 | |
1996 | | 92.4 | | 92.1 | | — | | 58,517 | | 23,917 | | 18,221 | | 6.1 | | 73.3 | | 7.9 | |
1997 | | 93.1 | | 92.6 | | 612.55 | | 60,681 | | 24,294 | | 18,484 | | 5.0 | | 72.2 | | 7.1 | |
1998 | | 93.4 | | 93.0 | | 620.99 | | 61,965 | | 24,638 | | 18,676 | | 6.6 | | 67.4 | | 6.9 | |
1999 | | 94.4 | | 93.9 | | 628.12 | | 64,045 | | 25,294 | | 19,298 | | 6.4 | | 67.3 | | 7.6 | |
2000 | | 96.1 | | 96.0 | | 639.18 | | 68,369 | | 26,645 | | 20,276 | | 7.3 | | 67.3 | | 8.4 | |
2001 | | 97.7 | | 97.8 | | 648.31 | | 70,044 | | 27,076 | | 20,934 | | 5.8 | | 64.6 | | 7.4 | |
2002 | | 100.0 | | 100.0 | | 668.75 | | 72,900 | | 27,683 | | 21,618 | | 4.2 | | 63.7 | | 7.0 | |
2003 | | 102.2 | | 102.0 | | 684.22 | | 75,605 | | 28,412 | | 22,197 | | 4.7 | | 71.4 | | 6.4 | |
2004 | | 104.2 | | 104.0 | | 687.15 | | 80,599 | | 29,906 | | 23,321 | | 4.0 | | 76.8 | | 6.2 | |
2005 | | 106.3 | | 106.0 | | 704.71 | | 85,805 | | 31,312 | | 24,214 | | 4.4 | | 82.5 | | 6.0 | |
2006 | | 108.1 | | 108.0 | | 725.80 | | 93,963 | | 33,626 | | 26,109 | | 5.8 | | 88.2 | | 6.7 | |
2007 | | 110.0 | | 110.2 | | 747.06 | | 98,573 | | 35,182 | | 27,287 | | 6.1 | | 93.1 | | 7.1 | |
2008 | | 112.3 | | 112.8 | | 777.88 | | 102,468 | | 36,054 | | 28,480 | | 4.7 | | 93.7 | | 7.1 | |
2009 | | 112.3 | | 112.9 | | 797.85 | | 100,629 | | 35,352 | | 28,279 | | 2.4 | | 87.6 | | 5.6 | |
2010 | | 113.8 | | 114.9 | | 822.81 | | 104,630 | | 36,195 | | 29,175 | | 2.6 | | 97.1 | | 5.6 | |
2011 | | 116.5 | | 117.5 | | 837.37 | | n/a | | n/a | | n/a | | 3.0 | | 101.1 | | 5.4 | |
| | | | | | | | | | | | | | | | | | | |
| | | | | | | | | | | | Personal | | | | | | | |
| | | | | | Average | | | | | | Disposable | | | | | | Conventional | |
| | BC | | Vancouver | | weekly | | Labour | | Personal income | | Income | | Prime | | Can/US | | (5 year) | |
| | CPI | | CPI | | wage rate(1) | | income | | per capita | | per capita | | rate | | exchange rate | | mortgage rate | |
| | (% change) | | (% change) | | (% change) | | (% change) | | (% change) | | (% change) | | (change) | | (change) | | (change) | |
1983 | | 5.4 | | 5.5 | | — | | 2.0 | | 1.9 | | 1.0 | | (4.6 | ) | 0.1 | | (4.8 | ) |
1984 | | 4.0 | | 4.0 | | — | | 2.9 | | 3.6 | | 4.8 | | 0.9 | | (3.9 | ) | 0.4 | |
1985 | | 3.2 | | 3.1 | | — | | 4.6 | | 5.5 | | 5.3 | | (1.5 | ) | (4.0 | ) | (1.5 | ) |
1986 | | 2.9 | | 3.4 | | — | | 4.3 | | 4.0 | | 2.8 | | (0.1 | ) | (1.3 | ) | (0.9 | ) |
1987 | | 3.0 | | 3.0 | | — | | 8.2 | | 6.6 | | 5.5 | | (1.0 | ) | 3.4 | | (0.0 | ) |
1988 | | 3.6 | | 3.5 | | — | | 10.0 | | 7.9 | | 7.1 | | 1.3 | | 5.8 | | 0.5 | |
1989 | | 4.5 | | 4.5 | | — | | 11.6 | | 8.6 | | 8.8 | | 2.5 | | 3.2 | | 0.4 | |
1990 | | 5.4 | | 5.4 | | — | | 9.7 | | 7.6 | | 5.2 | | 0.7 | | 1.2 | | 1.3 | |
1991 | | 5.4 | | 5.3 | | — | | 4.7 | | 2.0 | | 1.8 | | (4.1 | ) | 1.6 | | (2.2 | ) |
1992 | | 2.7 | | 2.9 | | — | | 5.7 | | 1.5 | | 0.8 | | (2.5 | ) | (4.5 | ) | (1.6 | ) |
1993 | | 3.5 | | 3.6 | | — | | 4.9 | | 1.3 | | 2.0 | | (1.5 | ) | (5.2 | ) | (0.7 | ) |
1994 | | 1.9 | | 2.1 | | — | | 5.2 | | 1.5 | | 0.9 | | 0.9 | | (4.3 | ) | 0.8 | |
1995 | | 2.3 | | 2.5 | | — | | 5.2 | | 2.3 | | 1.8 | | 1.8 | | (0.4 | ) | (0.4 | ) |
1996 | | 0.9 | | 0.9 | | — | | 3.1 | | 0.3 | | (0.4 | ) | (2.6 | ) | 0.5 | | (1.2 | ) |
1997 | | 0.8 | | 0.5 | | — | | 3.7 | | 1.6 | | 1.4 | | (1.1 | ) | (1.1 | ) | (0.9 | ) |
1998 | | 0.3 | | 0.4 | | 1.4 | | 2.1 | | 1.4 | | 1.0 | | 1.6 | | (4.8 | ) | (0.1 | ) |
1999 | | 1.1 | | 1.0 | | 1.1 | | 3.4 | | 2.7 | | 3.3 | | (0.2 | ) | (0.1 | ) | 0.6 | |
2000 | | 1.8 | | 2.2 | | 1.8 | | 6.8 | | 5.3 | | 5.1 | | 0.8 | | 0.0 | | 0.8 | |
2001 | | 1.7 | | 1.9 | | 1.4 | | 2.4 | | 1.6 | | 3.2 | | (1.5 | ) | (2.8 | ) | (0.9 | ) |
2002 | | 2.4 | | 2.2 | | 3.2 | | 4.1 | | 2.2 | | 3.3 | | (1.6 | ) | (0.9 | ) | (0.4 | ) |
2003 | | 2.2 | | 2.0 | | 2.3 | | 3.7 | | 2.6 | | 2.7 | | 0.5 | | 7.7 | | (0.6 | ) |
2004 | | 2.0 | | 2.0 | | 0.4 | | 6.6 | | 5.3 | | 5.1 | | (0.7 | ) | 5.5 | | (0.2 | ) |
2005 | | 2.0 | | 1.9 | | 2.6 | | 6.5 | | 4.7 | | 3.8 | | 0.4 | | 5.7 | | (0.2 | ) |
2006 | | 1.7 | | 1.9 | | 3.0 | | 9.5 | | 7.4 | | 7.8 | | 1.4 | | 5.6 | | 0.7 | |
2007 | | 1.8 | | 2.0 | | 2.9 | | 4.9 | | 4.6 | | 4.5 | | 0.3 | | 4.9 | | 0.4 | |
2008 | | 2.1 | | 2.4 | | 4.1 | | 4.0 | | 2.5 | | 4.4 | | (1.4 | ) | 0.6 | | (0.0 | ) |
2009 | | — | | 0.1 | | 2.6 | | (1.8 | ) | (1.9 | ) | (0.7 | ) | (2.3 | ) | (6.1 | ) | (1.4 | ) |
2010 | | 1.3 | | 1.8 | | 3.1 | | 4.0 | | 2.4 | | 3.2 | | 0.2 | | 9.5 | | (0.0 | ) |
2011 | | 2.4 | | 2.3 | | 1.8 | | n/a | | n/a | | n/a | | 0.4 | | 4.0 | | (0.2 | ) |
(1) Data prior to 1997 are not available.
Sources: Statistics Canada and BC Stats, Ministry of Finance, based on federal, provincial and industry data.
2012 Financial and Economic Review — July 2012
15
Appendix 1 — Economic Review
Table A1.1C Other Indicators
| | Manufacturing | | | | Housing | | Non-residential | | Tourism | | High-tech | | BC product | |
| | shipments | | Retail sales(1) | | starts | | building permits | | GDP(2) | | GDP(2) | | exports | |
| | ($ millions) | | ($ millions) | | (number) | | ($ millions) | | ($ millions) | | ($ millions) | | ($ millions) | |
1982 | | — | | — | | 19,807 | | 1,026 | | — | | — | | 12,353 | |
1983 | | — | | — | | 22,607 | | 775 | | — | | — | | 13,244 | |
1984 | | — | | — | | 16,169 | | 827 | | — | | — | | 15,748 | |
1985 | | — | | — | | 17,969 | | 812 | | — | | — | | 13,591 | |
1986 | | — | | — | | 20,687 | | 912 | | — | | — | | 13,033 | |
1987 | | — | | — | | 28,944 | | 999 | | — | | — | | 15,883 | |
1988 | | — | | — | | 30,487 | | 1,647 | | — | | — | | 17,822 | |
1989 | | — | | — | | 38,894 | | 1,812 | | — | | — | | 18,307 | |
1990 | | — | | — | | 36,720 | | 1,833 | | — | | — | | 16,605 | |
1991 | | — | | 25,022 | | 31,875 | | 1,803 | | — | | — | | 15,253 | |
1992 | | 24,398 | | 26,194 | | 40,621 | | 2,082 | | — | | — | | 16,336 | |
1993 | | 26,583 | | 28,463 | | 42,807 | | 1,944 | | — | | — | | 19,033 | |
1994 | | 30,333 | | 31,770 | | 39,408 | | 1,772 | | — | | — | | 22,856 | |
1995 | | 34,207 | | 34,219 | | 27,057 | | 1,966 | | — | | — | | 26,873 | |
1996 | | 32,932 | | 34,775 | | 27,641 | | 1,957 | | — | | — | | 25,717 | |
1997 | | 33,496 | | 36,591 | | 29,351 | | 1,960 | | 4,482 | | 5,193 | | 26,699 | |
1998 | | 31,757 | | 35,762 | | 19,931 | | 2,022 | | 5,668 | | 5,528 | | 25,942 | |
1999 | | 36,679 | | 36,373 | | 16,309 | | 2,104 | | 4,807 | | 5,632 | | 29,044 | |
2000 | | 40,699 | | 38,435 | | 14,418 | | 2,089 | | 5,048 | | 6,367 | | 33,639 | |
2001 | | 38,303 | | 40,719 | | 17,234 | | 2,125 | | 5,191 | | 6,388 | | 31,680 | |
2002 | | 38,610 | | 43,265 | | 21,625 | | 1,771 | | 5,238 | | 6,875 | | 28,828 | |
2003 | | 39,772 | | 44,421 | | 26,174 | | 1,880 | | 5,233 | | 7,499 | | 28,264 | |
2004 | | 41,607 | | 47,219 | | 32,925 | | 2,070 | | 5,692 | | 7,988 | | 31,008 | |
2005 | | 42,883 | | 49,379 | | 34,667 | | 3,212 | | 6,150 | | 8,568 | | 34,167 | |
2006 | | 44,480 | | 53,133 | | 36,443 | | 3,921 | | 6,510 | | 9,047 | | 33,466 | |
2007 | | 42,418 | | 56,930 | | 39,195 | | 3,933 | | 6,881 | | 10,342 | | 31,524 | |
2008 | | 39,435 | | 57,783 | | 34,321 | | 3,678 | | 7,068 | | 10,508 | | 33,124 | |
2009 | | 32,798 | | 55,222 | | 16,077 | | 3,139 | | 6,744 | | 10,461 | | 25,240 | |
2010 | | 35,542 | | 58,220 | | 26,479 | | 3,018 | | 7,197 | | n/a | | 28,721 | |
2011 | | 37,854 | | 60,005 | | 26,400 | | 3,136 | | n/a | | n/a | | 32,752 | |
| | | | | | | | | | | | | | | |
| | Manufacturing | | | | Housing | | Non-residential | | Tourism | | High-tech | | BC product | |
| | shipments | | Retail sales(1) | | starts | | building permits | | GDP(2) | | GDP(2) | | exports | |
| | (% change) | | (% change) | | (% change) | | (% change) | | (% change) | | (% change) | | (% change) | |
1983 | | — | | — | | 14.1 | | (24.5 | ) | — | | — | | 7.2 | |
1984 | | — | | — | | (28.5 | ) | 6.7 | | — | | — | | 18.9 | |
1985 | | — | | — | | 11.1 | | (1.7 | ) | — | | — | | (13.7 | ) |
1986 | | — | | — | | 15.1 | | 12.3 | | — | | — | | (4.1 | ) |
1987 | | — | | — | | 39.9 | | 9.6 | | — | | — | | 21.9 | |
1988 | | — | | — | | 5.3 | | 64.9 | | — | | — | | 12.2 | |
1989 | | — | | — | | 27.6 | | 10.0 | | — | | — | | 2.7 | |
1990 | | — | | — | | (5.6 | ) | 1.2 | | — | | — | | (9.3 | ) |
1991 | | — | | — | | (13.2 | ) | (1.6 | ) | — | | — | | (8.1 | ) |
1992 | | — | | 4.7 | | 27.4 | | 15.5 | | — | | — | | 7.1 | |
1993 | | 9.0 | | 8.7 | | 5.4 | | (6.7 | ) | — | | — | | 16.5 | |
1994 | | 14.1 | | 11.6 | | (7.9 | ) | (8.9 | ) | — | | — | | 20.1 | |
1995 | | 12.8 | | 7.7 | | (31.3 | ) | 11.0 | | — | | — | | 17.6 | |
1996 | | (3.7 | ) | 1.6 | | 2.2 | | (0.4 | ) | — | | — | | (4.3 | ) |
1997 | | 1.7 | | 5.2 | | 6.2 | | 0.1 | | — | | — | | 3.8 | |
1998 | | (5.2 | ) | (2.3 | ) | (32.1 | ) | 3.2 | | 26.5 | | 6.5 | | (2.8 | ) |
1999 | | 15.5 | | 1.7 | | (18.2 | ) | 4.0 | | (15.2 | ) | 1.9 | | 12.0 | |
2000 | | 11.0 | | 5.7 | | (11.6 | ) | (0.7 | ) | 5.0 | | 13.1 | | 15.8 | |
2001 | | (5.9 | ) | 5.9 | | 19.5 | | 1.7 | | 2.8 | | 0.3 | | (5.8 | ) |
2002 | | 0.8 | | 6.3 | | 25.5 | | (16.6 | ) | 0.9 | | 7.6 | | (9.0 | ) |
2003 | | 3.0 | | 2.7 | | 21.0 | | 6.1 | | (0.1 | ) | 9.1 | | (2.0 | ) |
2004 | | 4.6 | | 6.3 | | 25.8 | | 10.1 | | 8.8 | | 6.5 | | 9.7 | |
2005 | | 3.1 | | 4.6 | | 5.3 | | 55.2 | | 8.0 | | 7.3 | | 10.2 | |
2006 | | 3.7 | | 7.6 | | 5.1 | | 22.1 | | 5.9 | | 5.6 | | (2.1 | ) |
2007 | | (4.6 | ) | 7.1 | | 7.6 | | 0.3 | | 5.7 | | 14.3 | | (5.8 | ) |
2008 | | (7.0 | ) | 1.5 | | (12.4 | ) | (6.5 | ) | 2.7 | | 1.6 | | 5.1 | |
2009 | | (16.8 | ) | (4.4 | ) | (53.2 | ) | (14.7 | ) | (4.6 | ) | (0.4 | ) | (23.8 | ) |
2010 | | 8.4 | | 5.4 | | 64.7 | | (3.9 | ) | 6.7 | | n/a | | 13.8 | |
2011 | | 6.5 | | 3.1 | | (0.3 | ) | 3.9 | | n/a | | n/a | | 14.0 | |
(1) Retail sales data have been revised from 1991 to 2006 and are now classified under the North American Industry Classification System (NAICS 2002).
(2) Data prior to 1997 are not available.
Sources: Statistics Canada and BC Stats, Ministry of Finance, based on federal, provincial and industry data.
2012 Financial and Economic Review — July 2012
16
Appendix 1 — Economic Review
Table A1.1D Commodity Production Indicators
| | Lumber | | Timber scale | | Pulp | | Newsprint, etc | | Oil & natural | | Coal | | Solid mineral | | Electric pwr | | Farm cash | | Landed value of | |
| | production | | data | | shipments | | production | | gas production | | production | | shipments | | generated | | receipts | | seafood products | |
| | (thousand m3) | | (thousand m3) | | (000 tonnes) | | (000 tonnes) | | ($ millions) | | (000 tonnes) | | ($ millions) | | (GW.h) | | ($ millions) | | ($ millions) | |
1982 | | 23,855 | | — | | 2,662 | | 1,862 | | — | | 11,769 | | — | | 48,238 | | 962 | | 241 | |
1983 | | 30,773 | | — | | 3,221 | | 2,120 | | — | | 11,717 | | — | | 47,213 | | 917 | | 210 | |
1984 | | 30,884 | | — | | 2,836 | | 2,082 | | — | | 20,771 | | — | | 52,369 | | 1,005 | | 243 | |
1985 | | 32,994 | | — | | 3,298 | | 2,481 | | — | | 22,993 | | 2,524 | | 59,126 | | 1,061 | | 378 | |
1986 | | 31,468 | | — | | 3,628 | | 2,629 | | — | | 20,361 | | 2,512 | | 50,759 | | 1,106 | | 405 | |
1987 | | 37,336 | | — | | 4,136 | | 2,762 | | — | | 21,990 | | 2,896 | | 63,066 | | 1,122 | | 455 | |
1988 | | 36,736 | | — | | 4,141 | | 2,845 | | — | | 24,942 | | 3,325 | | 60,943 | | 1,206 | | 573 | |
1989 | | 35,952 | | — | | 4,189 | | 2,834 | | — | | 24,800 | | 3,344 | | 57,655 | | 1,255 | | 513 | |
1990 | | 33,514 | | — | | 3,547 | | 2,992 | | — | | 24,557 | | 3,092 | | 60,662 | | 1,299 | | 559 | |
1991 | | 31,406 | | — | | 4,014 | | 2,667 | | 858 | | 24,965 | | 2,950 | | 62,981 | | 1,342 | | 492 | |
1992 | | 33,396 | | — | | 3,825 | | 2,708 | | 890 | | 17,173 | | 2,577 | | 64,058 | | 1,404 | | 533 | |
1993 | | 33,935 | | — | | 4,040 | | 3,110 | | 1,089 | | 20,633 | | 2,415 | | 58,774 | | 1,446 | | 605 | |
1994 | | 33,671 | | — | | 4,763 | | 2,983 | | 1,270 | | 22,583 | | 2,632 | | 61,015 | | 1,538 | | 728 | |
1995 | | 32,611 | | 75,430 | | 4,572 | | 2,833 | | 1,040 | | 24,350 | | 3,438 | | 58,006 | | 1,586 | | 604 | |
1996 | | 32,671 | | 73,099 | | 4,390 | | 2,801 | | 1,333 | | 25,422 | | 3,004 | | 71,765 | | 1,706 | | 590 | |
1997 | | 31,562 | | 69,155 | | 4,532 | | 2,649 | | 1,588 | | 27,876 | | 3,047 | | 66,961 | | 1,738 | | 604 | |
1998 | | 30,238 | | 65,451 | | 4,462 | | 2,567 | | 1,574 | | 24,868 | | 2,893 | | 67,710 | | 1,780 | | 547 | |
1999 | | 32,397 | | 75,878 | | 4,995 | | 3,016 | | 2,091 | | 24,845 | | 2,445 | | 68,045 | | 1,885 | | 613 | |
2000 | | 34,346 | | 76,009 | | 5,152 | | 3,126 | | 4,783 | | 25,682 | | 2,891 | | 68,241 | | 2,024 | | 667 | |
2001 | | 32,606 | | 69,796 | | 4,710 | | 2,879 | | 5,666 | | 27,006 | | 2,867 | | 57,332 | | 2,201 | | 647 | |
2002 | | 35,501 | | 75,208 | | 4,477 | | 2,900 | | 4,251 | | 24,397 | | 2,864 | | 64,945 | | 2,174 | | 664 | |
2003 | | 36,031 | | 74,899 | | 4,762 | | 2,919 | | 6,230 | | 23,073 | | 2,887 | | 63,051 | | 2,248 | | 645 | |
2004 | | 39,879 | | 81,690 | | 4,724 | | 2,976 | | 6,784 | | 27,313 | | 3,740 | | 60,496 | | 2,360 | | 635 | |
2005 | | 41,013 | | 83,590 | | 4,932 | | 2,953 | | 8,967 | | 26,718 | | 5,384 | | 67,811 | | 2,388 | | 706 | |
2006 | | 41,051 | | 80,350 | | 4,736 | | 3,019 | | 7,148 | | 23,161 | | 5,991 | | 62,021 | | 2,346 | | 788 | |
2007 | | 36,677 | | 72,675 | | 4,717 | | 2,763 | | 6,912 | | 25,941 | | 5,611 | | 72,217 | | 2,391 | | 723 | |
2008 | | 28,192 | | 61,137 | | 4,021 | | 2,514 | | 9,240 | | 26,163 | | 7,403 | | 65,854 | | 2,523 | | 718 | |
2009 | | 22,975 | | 48,835 | | 3,708 | | 2,021 | | 4,129 | | 21,193 | | 5,622 | | 62,201 | | 2,532 | | 696 | |
2010 | | 27,095 | | 63,315 | | 4,277 | | 1,677 | | 4,433 | | 26,040 | | 7,166 | | 59,477 | | 2,534 | | 864 | |
2011 | | 29,137 | | 69,384 | | 4,491 | | 1,539 | | 4,835 | | 27,431 | | 8,592p | | 66,395 | | 2,636 | | n/a | |
| | | | | | | | | | | | | | | | | | | | | |
| | Lumber | | Timber scale | | Pulp | | Newsprint, etc | | Oil & natural | | Coal | | Solid mineral | | Electric pwr | | Farm cash | | Value of | |
| | production | | data | | shipments | | production | | gas production | | production | | shipments | | generated | | receipts | | seafood products | |
| | (% change) | | (% change) | | (% change) | | (% change) | | (% change) | | (% change) | | (% change) | | (% change) | | (% change) | | (% change) | |
1983 | | 29.0 | | — | | 21.0 | | 13.9 | | — | | (0.4 | ) | — | | (2.1 | ) | (4.7 | ) | (12.9 | ) |
1984 | | 0.4 | | — | | (12.0 | ) | (1.8 | ) | — | | 77.3 | | — | | 10.9 | | 9.6 | | 15.7 | |
1985 | | 6.8 | | — | | 16.3 | | 19.2 | | — | | 10.7 | | — | | 12.9 | | 5.7 | | 55.6 | |
1986 | | (4.6 | ) | — | | 10.0 | | 6.0 | | — | | (11.4 | ) | (0.5 | ) | (14.2 | ) | 4.2 | | 7.1 | |
1987 | | 18.6 | | — | | 14.0 | | 5.1 | | — | | 8.0 | | 15.3 | | 24.2 | | 1.4 | | 12.3 | |
1988 | | (1.6 | ) | — | | 0.1 | | 3.0 | | — | | 13.4 | | 14.8 | | (3.4 | ) | 7.6 | | 25.9 | |
1989 | | (2.1 | ) | — | | 1.2 | | (0.4 | ) | — | | (0.6 | ) | 0.6 | | (5.4 | ) | 4.0 | | (10.5 | ) |
1990 | | (6.8 | ) | — | | (15.3 | ) | 5.5 | | — | | (1.0 | ) | (7.5 | ) | 5.2 | | 3.5 | | 9.0 | |
1991 | | (6.3 | ) | — | | 13.2 | | (10.8 | ) | — | | 1.7 | | (4.6 | ) | 3.8 | | 3.3 | | (12.0 | ) |
1992 | | 6.3 | | — | | (4.7 | ) | 1.5 | | 3.7 | | (31.2 | ) | (12.6 | ) | 1.7 | | 4.7 | | 8.3 | |
1993 | | 1.6 | | — | | 5.6 | | 14.8 | | 22.4 | | 20.1 | | (6.3 | ) | (8.2 | ) | 3.0 | | 13.5 | |
1994 | | (0.8 | ) | — | | 17.9 | | (4.1 | ) | 16.6 | | 9.5 | | 9.0 | | 3.8 | | 6.4 | | 20.3 | |
1995 | | (3.1 | ) | — | | (4.0 | ) | (5.0 | ) | (18.1 | ) | 7.8 | | 30.6 | | (4.9 | ) | 3.1 | | (17.0 | ) |
1996 | | 0.2 | | (3.1 | ) | (4.0 | ) | (1.1 | ) | 28.2 | | 4.4 | | (12.6 | ) | 23.7 | | 7.6 | | (2.3 | ) |
1997 | | (3.4 | ) | (5.4 | ) | 3.2 | | (5.4 | ) | 19.1 | | 9.7 | | 1.4 | | (6.7 | ) | 1.9 | | 2.4 | |
1998 | | (4.2 | ) | (5.4 | ) | (1.5 | ) | (3.1 | ) | (0.9 | ) | (10.8 | ) | (5.1 | ) | 1.1 | | 2.4 | | (9.4 | ) |
1999 | | 7.1 | | 15.9 | | 11.9 | | 17.5 | | 32.8 | | (0.1 | ) | (15.5 | ) | 0.5 | | 5.9 | | 12.1 | |
2000 | | 6.0 | | 0.2 | | 3.1 | | 3.6 | | 128.7 | | 3.4 | | 18.2 | | 0.3 | | 7.4 | | 8.8 | |
2001 | | (5.1 | ) | (8.2 | ) | (8.6 | ) | (7.9 | ) | 18.5 | | 5.2 | | (0.8 | ) | (16.0 | ) | 8.7 | | (3.0 | ) |
2002 | | 8.9 | | 7.8 | | (4.9 | ) | 0.7 | | (25.0 | ) | (9.7 | ) | (0.1 | ) | 13.3 | | (1.2 | ) | 2.6 | |
2003 | | 1.5 | | (0.4 | ) | 6.4 | | 0.7 | | 46.6 | | (5.4 | ) | 0.8 | | (2.9 | ) | 3.4 | | (2.9 | ) |
2004 | | 10.7 | | 9.1 | | (0.8 | ) | 2.0 | | 8.9 | | 18.4 | | 29.5 | | (4.1 | ) | 5.0 | | (1.6 | ) |
2005 | | 2.8 | | 2.3 | | 4.4 | | (0.8 | ) | 32.2 | | (2.2 | ) | 44.0 | | 12.1 | | 1.2 | | 11.2 | |
2006 | | 0.1 | | (3.9 | ) | (4.0 | ) | 2.2 | | (20.3 | ) | (13.3 | ) | 11.3 | | (8.5 | ) | (1.7 | ) | 11.6 | |
2007 | | (10.7 | ) | (9.6 | ) | (0.4 | ) | (8.5 | ) | (3.3 | ) | 12.0 | | (6.3 | ) | 16.4 | | 1.9 | | (8.2 | ) |
2008 | | (23.1 | ) | (15.9 | ) | (14.8 | ) | (9.0 | ) | 33.7 | | 0.9 | | 31.9 | | (8.8 | ) | 5.5 | | (0.7 | ) |
2009 | | (18.5 | ) | (20.1 | ) | (7.8 | ) | (19.6 | ) | (55.3 | ) | (19.0 | ) | (24.1 | ) | (5.5 | ) | 0.3 | | (3.1 | ) |
2010 | | 17.9 | | 29.7 | | 15.3 | | (17.0 | ) | 7.4 | | 22.9 | | 25.8 | | (4.4 | ) | 0.1 | | 24.1 | |
2011 | | 7.5 | | 9.6 | | 5.0 | | (8.2 | ) | 9.1 | | 5.3 | | 25.8 | | 11.6 | | 4.0 | | n/a | |
Sources: Statistics Canada and BC Stats, Ministry of Finance, based on federal, provincial and industry data.
2012 Financial and Economic Review — July 2012
17
Appendix 1 — Economic Review
Table A1.2 British Columbia Real GDP at Market Prices, Expenditure Based
| | | | | | | | | | Machinery and | | | | | | | | | |
| | Consumer | | Government | | Residential | | Non-Residential | | Equipment | | Business | | | | | | | |
| | Expenditure | | Expenditure | | Investment | | Investment | | Investment | | Investment | | Exports | | Imports | | Real GDP | |
| | (millions of 2002 $, chained) | |
1988 | | 57,649 | | 20,887 | | 6,647 | | 4,846 | | 4,453 | | 15,844 | | 41,153 | | 40,168 | | 96,824 | |
1989 | | 61,216 | | 21,259 | | 7,651 | | 5,370 | | 5,295 | | 18,245 | | 40,426 | | 43,926 | | 100,007 | |
1990 | | 63,788 | | 22,152 | | 7,790 | | 5,325 | | 5,330 | | 18,379 | | 40,078 | | 45,889 | | 101,408 | |
1991 | | 63,972 | | 23,548 | | 7,368 | | 5,593 | | 5,254 | | 18,119 | | 40,825 | | 46,431 | | 101,593 | |
1992 | | 66,034 | | 24,415 | | 9,056 | | 4,388 | | 5,138 | | 18,674 | | 42,286 | | 48,547 | | 104,216 | |
1993 | | 68,115 | | 24,775 | | 9,289 | | 4,186 | | 5,150 | | 18,760 | | 44,034 | | 48,195 | | 108,874 | |
1994 | | 70,986 | | 24,868 | | 9,342 | | 5,388 | | 5,888 | | 20,605 | | 46,727 | | 55,624 | | 111,945 | |
1995 | | 72,960 | | 24,487 | | 8,224 | | 5,421 | | 5,972 | | 19,541 | | 49,407 | | 56,261 | | 114,620 | |
1996 | | 75,660 | | 25,144 | | 8,350 | | 4,859 | | 5,792 | | 18,981 | | 49,936 | | 55,930 | | 117,442 | |
1997 | | 78,443 | | 25,057 | | 8,783 | | 6,277 | | 6,781 | | 21,757 | | 51,917 | | 59,953 | | 121,177 | |
1998 | | 79,749 | | 25,743 | | 7,601 | | 5,099 | | 7,321 | | 20,013 | | 53,381 | | 59,318 | | 122,766 | |
1999 | | 81,984 | | 25,614 | | 7,016 | | 5,420 | | 7,652 | | 20,093 | | 58,065 | | 62,938 | | 126,708 | |
2000 | | 84,482 | | 26,672 | | 7,090 | | 5,423 | | 8,188 | | 20,713 | | 63,050 | | 67,745 | | 132,578 | |
2001 | | 86,296 | | 27,952 | | 7,752 | | 6,343 | | 8,284 | | 22,389 | | 61,927 | | 67,912 | | 133,403 | |
2002 | | 89,238 | | 28,260 | | 8,982 | | 5,890 | | 8,021 | | 22,893 | | 62,706 | | 68,144 | | 138,193 | |
2003 | | 92,250 | | 28,357 | | 9,969 | | 6,620 | | 8,133 | | 24,747 | | 63,918 | | 71,816 | | 141,435 | |
2004 | | 96,187 | | 28,346 | | 11,459 | | 7,222 | | 8,841 | | 27,587 | | 67,013 | | 77,380 | | 146,541 | |
2005 | | 100,180 | | 28,606 | | 12,184 | | 7,539 | | 10,577 | | 30,166 | | 70,162 | | 82,051 | | 153,489 | |
2006 | | 106,222 | | 29,127 | | 13,049 | | 8,861 | | 11,943 | | 33,637 | | 72,341 | | 88,328 | | 159,729 | |
2007 | | 111,787 | | 30,338 | | 13,266 | | 8,791 | | 12,983 | | 34,564 | | 74,546 | | 93,626 | �� | 164,496 | |
2008 | | 114,489 | | 31,865 | | 12,713 | | 10,019 | | 13,138 | | 35,383 | | 72,110 | | 94,602 | | 165,641 | |
2009 | | 114,834 | | 32,901 | | 11,304 | | 8,519 | | 9,553 | | 29,531 | | 66,392 | | 86,257 | | 162,225 | |
2010 | | 119,193 | | 33,433 | | 11,853 | | 10,831 | | 10,694 | | 33,631 | | 70,364 | | 94,754 | | 167,140 | |
2011 | | n/a | | n/a | | n/a | | n/a | | n/a | | n/a | | n/a | | n/a | | n/a | |
| | (annual percentage change) | |
1988 | | 5.0 | | 6.4 | | 11.4 | | 21.2 | | 30.1 | | 20.0 | | 5.8 | | 8.3 | | 5.8 | |
1989 | | 6.2 | | 1.8 | | 15.1 | | 10.8 | | 18.9 | | 15.2 | | (1.8 | ) | 9.4 | | 3.3 | |
1990 | | 4.2 | | 4.2 | | 1.8 | | (0.8 | ) | 0.7 | | 0.7 | | (0.9 | ) | 4.5 | | 1.4 | |
1991 | | 0.3 | | 6.3 | | (5.4 | ) | 5.0 | | (1.4 | ) | (1.4 | ) | 1.9 | | 1.2 | | 0.2 | |
1992 | | 3.2 | | 3.7 | | 22.9 | | (21.5 | ) | (2.2 | ) | 3.1 | | 3.6 | | 4.6 | | 2.6 | |
1993 | | 3.2 | | 1.5 | | 2.6 | | (4.6 | ) | 0.2 | | 0.5 | | 4.1 | | (0.7 | ) | 4.5 | |
1994 | | 4.2 | | 0.4 | | 0.6 | | 28.7 | | 14.3 | | 9.8 | | 6.1 | | 15.4 | | 2.8 | |
1995 | | 2.8 | | (1.5 | ) | (12.0 | ) | 0.6 | | 1.4 | | (5.2 | ) | 5.7 | | 1.1 | | 2.4 | |
1996 | | 3.7 | | 2.7 | | 1.5 | | (10.4 | ) | (3.0 | ) | (2.9 | ) | 1.1 | | (0.6 | ) | 2.5 | |
1997 | | 3.7 | | (0.3 | ) | 5.2 | | 29.2 | | 17.1 | | 14.6 | | 4.0 | | 7.2 | | 3.2 | |
1998 | | 1.7 | | 2.7 | | (13.5 | ) | (18.8 | ) | 8.0 | | (8.0 | ) | 2.8 | | (1.1 | ) | 1.3 | |
1999 | | 2.8 | | (0.5 | ) | (7.7 | ) | 6.3 | | 4.5 | | 0.4 | | 8.8 | | 6.1 | | 3.2 | |
2000 | | 3.0 | | 4.1 | | 1.1 | | 0.1 | | 7.0 | | 3.1 | | 8.6 | | 7.6 | | 4.6 | |
2001 | | 2.1 | | 4.8 | | 9.3 | | 17.0 | | 1.2 | | 8.1 | | (1.8 | ) | 0.2 | | 0.6 | |
2002 | | 3.4 | | 1.1 | | 15.9 | | (7.1 | ) | (3.2 | ) | 2.3 | | 1.3 | | 0.3 | | 3.6 | |
2003 | | 3.4 | | 0.3 | | 11.0 | | 12.4 | | 1.4 | | 8.1 | | 1.9 | | 5.4 | | 2.3 | |
2004 | | 4.3 | | (0.0 | ) | 14.9 | | 9.1 | | 8.7 | | 11.5 | | 4.8 | | 7.7 | | 3.6 | |
2005 | | 4.2 | | 0.9 | | 6.3 | | 4.4 | | 19.6 | | 9.3 | | 4.7 | | 6.0 | | 4.7 | |
2006 | | 6.0 | | 1.8 | | 7.1 | | 17.5 | | 12.9 | | 11.5 | | 3.1 | | 7.7 | | 4.1 | |
2007 | | 5.2 | | 4.2 | | 1.7 | | (0.8 | ) | 8.7 | | 2.8 | | 3.0 | | 6.0 | | 3.0 | |
2008 | | 2.4 | | 5.0 | | (4.2 | ) | 14.0 | | 1.2 | | 2.4 | | (3.3 | ) | 1.0 | | 0.7 | |
2009 | | 0.3 | | 3.3 | | (11.1 | ) | (15.0 | ) | (27.3 | ) | (16.5 | ) | (7.9 | ) | (8.8 | ) | (2.1 | ) |
2010 | | 3.8 | | 1.6 | | 4.9 | | 27.1 | | 11.9 | | 13.9 | | 6.0 | | 9.9 | | 3.0 | |
2011 | | n/a | | n/a | | n/a | | n/a | | n/a | | n/a | | n/a | | n/a | | n/a | |
Source: Statistics Canada
2012 Financial and Economic Review — July 2012
18
Appendix 1 — Economic Review
Table A1.3 British Columbia GDP at Basic Prices, by Industry
| | | | | | | | | | | | | | | | | | | | | | | | | | | |
| | Crop and | | Fishing, | | Forestry | | Mining, | | | | | | | | Transportation | | Wholesale | | Finance, | | | | | | Real GDP | |
| | Animal | | Hunting and | | and | | Oil and Gas | | | | | | | | and | | and Retail | | Insurance and | | Other | | Public | | at Basic | |
| | Production | | Trapping | | Logging | | Extraction | | Manufacturing | | Construction | | Utilities | | Warehousing | | Trade | | Real Estate | | Services | | Administration | | Prices | |
| | (millions of 2002 $, chained) | |
1998 | | 909 | | 153 | | 2,952 | | 3,324 | | 11,255 | | 6,101 | | 2,991 | | 7,273 | | 11,977 | | 25,076 | | 34,223 | | 6,339 | | 112,913 | |
1999 | | 979 | | 118 | | 2,789 | | 3,329 | | 12,840 | | 5,881 | | 3,040 | | 7,575 | | 12,158 | | 25,838 | | 34,762 | | 6,588 | | 116,307 | |
2000 | | 975 | | 135 | | 2,638 | | 3,344 | | 14,990 | | 5,795 | | 3,058 | | 8,122 | | 12,689 | | 26,284 | | 36,157 | | 6,790 | | 121,546 | |
2001 | | 1,141 | | 111 | | 2,647 | | 4,252 | | 13,667 | | 6,021 | | 2,389 | | 7,997 | | 13,055 | | 27,019 | | 37,079 | | 6,919 | | 122,848 | |
2002 | | 1,058 | | 134 | | 2,713 | | 4,383 | | 13,687 | | 6,328 | | 2,837 | | 8,072 | | 13,566 | | 28,078 | | 38,253 | | 7,128 | | 126,761 | |
2003 | | 1,053 | | 130 | | 2,761 | | 4,298 | | 13,884 | | 6,927 | | 2,844 | | 8,135 | | 14,114 | | 28,884 | | 39,272 | | 7,188 | | 130,026 | |
2004 | | 1,057 | | 150 | | 3,129 | | 4,270 | | 14,723 | | 7,675 | | 2,819 | | 8,447 | | 14,710 | | 30,503 | | 39,955 | | 7,202 | | 135,021 | |
2005 | | 1,061 | | 146 | | 3,102 | | 4,643 | | 15,435 | | 8,115 | | 3,236 | | 9,208 | | 15,436 | | 31,834 | | 41,266 | | 7,268 | | 141,339 | |
2006 | | 1,078 | | 164 | | 3,022 | | 4,645 | | 15,904 | | 8,936 | | 2,882 | | 9,390 | | 16,464 | | 33,290 | | 42,945 | | 7,506 | | 146,762 | |
2007 | | 1,134 | | 128 | | 2,855 | | 4,422 | | 15,885 | | 9,097 | | 3,268 | | 9,412 | | 17,469 | | 34,698 | | 44,533 | | 7,772 | | 150,874 | |
2008 | | 1,147 | | 107 | | 2,463 | | 4,598 | | 14,546 | | 9,501 | | 3,185 | | 9,207 | | 17,209 | | 35,201 | | 45,689 | | 8,090 | | 151,695 | |
2009 | | 1,157 | | 108 | | 2,168 | | 4,293 | | 12,657 | | 8,617 | | 3,057 | | 8,977 | | 16,360 | | 36,603 | | 45,394 | | 8,261 | | 148,300 | |
2010 | | 1,156 | | 98 | | 2,514 | | 4,595 | | 13,156 | | 9,673 | | 2,945 | | 9,234 | | 16,833 | | 37,636 | | 46,011 | | 8,409 | | 153,085 | |
2011 | | 1,128 | | 105 | | 2,797 | | 4,873 | | 13,562 | | 10,323 | | 3,219 | | 9,615 | | 17,070 | | 38,851 | | 46,505 | | 8,509 | | 157,525 | |
| | (annual percentage change) | |
1998 | | (4.8 | ) | (35.1 | ) | 0.6 | | 6.0 | | (2.2 | ) | (7.8 | ) | 2.6 | | 1.4 | | 5.2 | | 1.3 | | 2.9 | | 1.0 | | 1.2 | |
1999 | | 7.7 | | (23.0 | ) | (5.5 | ) | 0.2 | | 14.1 | | (3.6 | ) | 1.7 | | 4.1 | | 1.5 | | 3.0 | | 1.6 | | 3.9 | | 3.0 | |
2000 | | (0.4 | ) | 14.6 | | (5.4 | ) | 0.5 | | 16.7 | | (1.5 | ) | 0.6 | | 7.2 | | 4.4 | | 1.7 | | 4.0 | | 3.1 | | 4.5 | |
2001 | | 17.0 | | (17.5 | ) | 0.3 | | 27.1 | | (8.8 | ) | 3.9 | | (21.9 | ) | (1.5 | ) | 2.9 | | 2.8 | | 2.6 | | 1.9 | | 1.1 | |
2002 | | (7.3 | ) | 21.0 | | 2.5 | | 3.1 | | 0.1 | | 5.1 | | 18.7 | | 0.9 | | 3.9 | | 3.9 | | 3.2 | | 3.0 | | 3.2 | |
2003 | | (0.4 | ) | (3.0 | ) | 1.8 | | (1.9 | ) | 1.4 | | 9.5 | | 0.3 | | 0.8 | | 4.0 | | 2.9 | | 2.7 | | 0.8 | | 2.6 | |
2004 | | 0.4 | | 15.3 | | 13.3 | | (0.7 | ) | 6.0 | | 10.8 | | (0.9 | ) | 3.8 | | 4.2 | | 5.6 | | 1.7 | | 0.2 | | 3.8 | |
2005 | | 0.4 | | (2.5 | ) | (0.9 | ) | 8.7 | | 4.8 | | 5.7 | | 14.8 | | 9.0 | | 4.9 | | 4.4 | | 3.3 | | 0.9 | | 4.7 | |
2006 | | 1.6 | | 12.2 | | (2.6 | ) | 0.0 | | 3.0 | | 10.1 | | (10.9 | ) | 2.0 | | 6.7 | | 4.6 | | 4.1 | | 3.3 | | 3.8 | |
2007 | | 5.2 | | (22.2 | ) | (5.5 | ) | (4.8 | ) | (0.1 | ) | 1.8 | | 13.4 | | 0.2 | | 6.1 | | 4.2 | | 3.7 | | 3.5 | | 2.8 | |
2008 | | 1.2 | | (16.5 | ) | (13.7 | ) | 4.0 | | (8.4 | ) | 4.5 | | (2.6 | ) | (2.2 | ) | (1.5 | ) | 1.5 | | 2.6 | | 4.1 | | 0.5 | |
2009 | | 0.9 | | 1.4 | | (12.0 | ) | (6.6 | ) | (13.0 | ) | (9.3 | ) | (4.0 | ) | (2.5 | ) | (4.9 | ) | 4.0 | | (0.6 | ) | 2.1 | | (2.2 | ) |
2010 | | (0.1 | ) | (10.0 | ) | 16.0 | | 7.0 | | 3.9 | | 12.3 | | (3.7 | ) | 2.9 | | 2.9 | | 2.8 | | 1.4 | | 1.8 | | 3.2 | |
2011 | | (2.4 | ) | 7.4 | | 11.2 | | 6.0 | | 3.1 | | 6.7 | | 9.3 | | 4.1 | | 1.4 | | 3.2 | | 1.1 | | 1.2 | | 2.9 | |
Source: Statistics Canada
2012 Financial and Economic Review — July 2012
19
Appendix 1 — Economic Review
Table A1.4 British Columbia GDP, Income Based
| | | | | | | | | | | | | | | | | | | | | | | | | |
| | | | | | Interest and | | Accrued Net | | Net Income of | | | | | | Indirect | | Capital Cons. | | | | | | | |
| | | | Corporation | | Miscellaneous | | Income of | | Non-farm | | Inventory | | Net Domestic | | Taxes | | Allowances and | | | | GDP | | GDP at | |
| | Labour | | Profits before | | Investment | | Farm | | unincorporated | | Valuation | | Product at | | less | | Misc. Valuation | | Statistical | | at Market | | Basic | |
| | Income | | Taxes | | Income | | Operators | | Business | | Adjustment | | Basic Prices | | Subsidies | | Adjustments | | Discrepency | | Prices | | Prices | |
| | ($ millions) | |
1986 | | 30,339 | | 4,213 | | 4,893 | | 113 | | 3,745 | | (212 | ) | 45,603 | | 6,098 | | 7,337 | | 21 | | 56,547 | | 52,961 | |
1987 | | 32,837 | | 6,430 | | 5,085 | | 115 | | 3,954 | | (324 | ) | 50,679 | | 6,696 | | 7,517 | | 205 | | 62,515 | | 58,401 | |
1988 | | 36,110 | | 7,250 | | 5,820 | | 154 | | 4,283 | | (285 | ) | 56,076 | | 7,486 | | 8,044 | | 546 | | 69,408 | | 64,666 | |
1989 | | 40,295 | | 5,925 | | 7,183 | | 72 | | 4,580 | | (195 | ) | 60,769 | | 8,765 | | 8,748 | | 209 | | 75,582 | | 69,726 | |
1990 | | 44,216 | | 3,670 | | 7,887 | | 73 | | 4,796 | | 120 | | 63,803 | | 9,007 | | 9,590 | | (9 | ) | 79,350 | | 73,384 | |
1991 | | 46,296 | | 2,926 | | 7,650 | | 106 | | 5,067 | | (107 | ) | 64,888 | | 9,715 | | 10,016 | | 180 | | 81,849 | | 75,084 | |
1992 | | 48,924 | | 3,321 | | 7,586 | | 80 | | 5,563 | | (616 | ) | 68,325 | | 11,092 | | 10,601 | | 691 | | 87,242 | | 79,617 | |
1993 | | 51,312 | | 4,328 | | 8,035 | | 83 | | 6,034 | | (843 | ) | 72,905 | | 12,440 | | 11,258 | | 1,430 | | 94,077 | | 85,593 | |
1994 | | 53,972 | | 6,756 | | 8,649 | | 63 | | 6,665 | | (660 | ) | 79,662 | | 13,164 | | 12,043 | | (140 | ) | 100,512 | | 91,565 | |
1995 | | 56,768 | | 7,419 | | 8,808 | | 87 | | 6,758 | | (167 | ) | 83,942 | | 13,522 | | 12,882 | | (407 | ) | 105,670 | | 96,417 | |
1996 | | 58,517 | | 7,246 | | 8,731 | | 59 | | 7,173 | | (231 | ) | 85,950 | | 14,014 | | 13,494 | | (138 | ) | 108,865 | | 99,306 | |
1997 | | 60,681 | | 8,286 | | 8,444 | | 89 | | 7,780 | | 101 | | 90,040 | | 14,480 | | 14,526 | | (4 | ) | 114,383 | | 104,562 | |
1998 | | 61,965 | | 7,335 | | 8,355 | | 166 | | 8,285 | | (24 | ) | 90,860 | | 14,515 | | 15,050 | | (6 | ) | 115,641 | | 105,904 | |
1999 | | 64,045 | | 9,309 | | 8,365 | | 199 | | 8,723 | | (373 | ) | 95,125 | | 14,972 | | 15,659 | | 22 | | 120,921 | | 110,806 | |
2000 | | 68,369 | | 11,596 | | 10,184 | | 54 | | 9,078 | | (80 | ) | 104,232 | | 15,608 | | 16,526 | | (2 | ) | 131,333 | | 120,756 | |
2001 | | 70,044 | | 11,392 | | 8,834 | | 141 | | 9,637 | | 47 | | 105,163 | | 15,810 | | 17,539 | | 70 | | 133,514 | | 122,772 | |
2002 | | 72,900 | | 11,389 | | 8,828 | | 53 | | 10,591 | | (369 | ) | 108,406 | | 16,443 | | 18,341 | | 17 | | 138,193 | | 126,764 | |
2003 | | 75,605 | | 12,364 | | 9,151 | | 83 | | 11,312 | | 637 | | 114,303 | | 17,580 | | 18,956 | | (46 | ) | 145,642 | | 133,213 | |
2004 | | 80,599 | | 16,764 | | 9,708 | | 118 | | 12,256 | | (66 | ) | 124,831 | | 18,664 | | 19,720 | | (88 | ) | 157,675 | | 144,463 | |
2005 | | 85,805 | | 19,631 | | 10,418 | | 9 | | 13,061 | | 147 | | 134,821 | | 19,881 | | 20,773 | | (61 | ) | 169,664 | | 155,533 | |
2006 | | 93,963 | | 22,408 | | 9,910 | | (31 | ) | 13,702 | | (409 | ) | 145,566 | | 20,899 | | 21,895 | | (86 | ) | 182,251 | | 167,375 | |
2007 | | 98,573 | | 21,951 | | 11,128 | | (55 | ) | 14,411 | | 475 | | 152,915 | | 22,250 | | 23,346 | | 38 | | 192,117 | | 176,299 | |
2008 | | 102,468 | | 24,892 | | 12,018 | | (118 | ) | 14,507 | | (1,022 | ) | 159,496 | | 21,634 | | 25,054 | | 8 | | 199,441 | | 184,558 | |
2009 | | 100,629 | | 17,778 | | 8,784 | | (46 | ) | 16,151 | | 754 | | 150,979 | | 21,699 | | 26,007 | | 107 | | 191,863 | | 177,093 | |
2010 | | 104,630 | | 21,608 | | 8,894 | | (38 | ) | 17,609 | | 548 | | 160,401 | | 22,787 | | 27,214 | | (105 | ) | 203,147 | | 187,510 | |
2011 | | n/a | | n/a | | n/a | | n/a | | n/a | | n/a | | n/a | | n/a | | n/a | | n/a | | n/a | | n/a | |
| | (annual percentage change) | |
1986 | | 4.3 | | 21.5 | | (0.9 | ) | — | | 9.1 | | — | | 5.2 | | 3.7 | | 6.1 | | — | | 5.6 | | 5.5 | |
1987 | | 8.2 | | 52.6 | | 3.9 | | — | | 5.6 | | — | | 11.1 | | 9.8 | | 2.5 | | — | | 10.6 | | 10.3 | |
1988 | | 10.0 | | 12.8 | | 14.5 | | — | | 8.3 | | — | | 10.6 | | 11.8 | | 7.0 | | — | | 11.0 | | 10.7 | |
1989 | | 11.6 | | (18.3 | ) | 23.4 | | — | | 6.9 | | — | | 8.4 | | 17.1 | | 8.8 | | — | | 8.9 | | 7.8 | |
1990 | | 9.7 | | (38.1 | ) | 9.8 | | — | | 4.7 | | — | | 5.0 | | 2.8 | | 9.6 | | — | | 5.0 | | 5.2 | |
1991 | | 4.7 | | (20.3 | ) | (3.0 | ) | — | | 5.7 | | — | | 1.7 | | 7.9 | | 4.4 | | — | | 3.1 | | 2.3 | |
1992 | | 5.7 | | 13.5 | | (0.8 | ) | — | | 9.8 | | — | | 5.3 | | 14.2 | | 5.8 | | — | | 6.6 | | 6.0 | |
1993 | | 4.9 | | 30.3 | | 5.9 | | — | | 8.5 | | — | | 6.7 | | 12.2 | | 6.2 | | — | | 7.8 | | 7.5 | |
1994 | | 5.2 | | 56.1 | | 7.6 | | — | | 10.5 | | — | | 9.3 | | 5.8 | | 7.0 | | — | | 6.8 | | 7.0 | |
1995 | | 5.2 | | 9.8 | | 1.8 | | — | | 1.4 | | — | | 5.4 | | 2.7 | | 7.0 | | — | | 5.1 | | 5.3 | |
1996 | | 3.1 | | (2.3 | ) | (0.9 | ) | — | | 6.1 | | — | | 2.4 | | 3.6 | | 4.8 | | — | | 3.0 | | 3.0 | |
1997 | | 3.7 | | 14.4 | | (3.3 | ) | — | | 8.5 | | — | | 4.8 | | 3.3 | | 7.6 | | — | | 5.1 | | 5.3 | |
1998 | | 2.1 | | (11.5 | ) | (1.1 | ) | — | | 6.5 | | — | | 0.9 | | 0.2 | | 3.6 | | — | | 1.1 | | 1.3 | |
1999 | | 3.4 | | 26.9 | | 0.1 | | — | | 5.3 | | — | | 4.7 | | 3.1 | | 4.0 | | — | | 4.6 | | 4.6 | |
2000 | | 6.8 | | 24.6 | | 21.7 | | — | | 4.1 | | — | | 9.6 | | 4.2 | | 5.5 | | — | | 8.6 | | 9.0 | |
2001 | | 2.4 | | (1.8 | ) | (13.3 | ) | — | | 6.2 | | — | | 0.9 | | 1.3 | | 6.1 | | — | | 1.7 | | 1.7 | |
2002 | | 4.1 | | (0.0 | ) | (0.1 | ) | — | | 9.9 | | — | | 3.1 | | 4.0 | | 4.6 | | — | | 3.5 | | 3.3 | |
2003 | | 3.7 | | 8.6 | | 3.7 | | — | | 6.8 | | — | | 5.4 | | 6.9 | | 3.4 | | — | | 5.4 | | 5.1 | |
2004 | | 6.6 | | 35.6 | | 6.1 | | — | | 8.3 | | — | | 9.2 | | 6.2 | | 4.0 | | — | | 8.3 | | 8.4 | |
2005 | | 6.5 | | 17.1 | | 7.3 | | — | | 6.6 | | — | | 8.0 | | 6.5 | | 5.3 | | — | | 7.6 | | 7.7 | |
2006 | | 9.5 | | 14.1 | | (4.9 | ) | — | | 4.9 | | — | | 8.0 | | 5.1 | | 5.4 | | — | | 7.4 | | 7.6 | |
2007 | | 4.9 | | (2.0 | ) | 12.3 | | — | | 5.2 | | — | | 5.0 | | 6.5 | | 6.6 | | — | | 5.4 | | 5.3 | |
2008 | | 4.0 | | 13.4 | | 8.0 | | — | | 0.7 | | — | | 4.3 | | (2.8 | ) | 7.3 | | — | | 3.8 | | 4.7 | |
2009 | | (1.8 | ) | (28.6 | ) | (26.9 | ) | — | | 11.3 | | — | | (5.3 | ) | 0.3 | | 3.8 | | — | | (3.8 | ) | (4.0 | ) |
2010 | | 4.0 | | 21.5 | | 1.3 | | — | | 9.0 | | — | | 6.2 | | 5.0 | | 4.6 | | — | | 5.9 | | 5.9 | |
2011 | | n/a | | n/a | | n/a | | n/a | | n/a | | n/a | | n/a | | n/a | | n/a | | n/a | | n/a | | n/a | |
Source: Statistics Canada
2012 Financial and Economic Review — July 2012
20
Appendix 1 — Economic Review
Table A1.5 Employment by Industry in British Columbia
| | 2001 | | 2002 | | 2003 | | 2004 | | 2005 | | 2006 | | 2007 | | 2008 | | 2009 | | 2010 | | 2011 | |
| | (thousands) | |
Total — all industries | | 1,920 | | 1,953 | | 1,998 | | 2,033 | | 2,092 | | 2,147 | | 2,223 | | 2,266 | | 2,218 | | 2,257 | | 2,275 | |
| | | | | | | | | | | | | | | | | | | | | | | |
Primary industries | | 66 | | 67 | | 78 | | 72 | | 76 | | 78 | | 83 | | 78 | | 73 | | 73 | | 66 | |
Agriculture | | 25 | | 30 | | 33 | | 37 | | 39 | | 35 | | 36 | | 33 | | 33 | | 32 | | 26 | |
Forestry, logging & support activities | | 25 | | 25 | | 27 | | 21 | | 21 | | 21 | | 24 | | 17 | | 14 | | 16 | | 14 | |
Fishing, hunting and trapping | | 5 | | 3 | | 4 | | 3 | | 2 | | 3 | | 3 | | 2 | | 2 | | 2 | | — | |
Mining and oil & gas extraction | | 11 | | 9 | | 13 | | 11 | | 14 | | 19 | | 20 | | 25 | | 24 | | 23 | | 25 | |
| | | | | | | | | | | | | | | | | | | | | | | |
Manufacturing | | 194 | | 194 | | 203 | | 206 | | 195 | | 193 | | 199 | | 185 | | 161 | | 166 | | 164 | |
Food, beverages & tobacco | | 26 | | 27 | | 31 | | 31 | | 31 | | 24 | | 28 | | 30 | | 29 | | 27 | | 30 | |
Wood products | | 49 | | 44 | | 48 | | 46 | | 45 | | 44 | | 44 | | 34 | | 27 | | 29 | | 30 | |
Paper | | 15 | | 17 | | 14 | | 12 | | 12 | | 15 | | 15 | | 13 | | 11 | | 10 | | 9 | |
Printing & related support activities | | 9 | | 8 | | 8 | | 8 | | 8 | | 8 | | 6 | | 9 | | 8 | | 7 | | 8 | |
Primary metals | | 8 | | 6 | | 9 | | 7 | | 7 | | 7 | | 6 | | 5 | | 5 | | 7 | | 6 | |
Metal fabrication | | 13 | | 13 | | 14 | | 14 | | 18 | | 15 | | 15 | | 16 | | 13 | | 13 | | 11 | |
Transportation equipment | | 10 | | 13 | | 12 | | 11 | | 9 | | 10 | | 12 | | 10 | | 10 | | 9 | | 9 | |
Machinery manufacturing | | 7 | | 10 | | 9 | | 9 | | 10 | | 9 | | 9 | | 6 | | 6 | | 8 | | 9 | |
Other manufacturing | | 57 | | 57 | | 59 | | 67 | | 55 | | 62 | | 65 | | 59 | | 50 | | 57 | | 51 | |
| | | | | | | | | | | | | | | | | | | | | | | |
Construction | | 111 | | 117 | | 117 | | 142 | | 163 | | 174 | | 192 | | 215 | | 193 | | 191 | | 205 | |
General contractors | | 40 | | 41 | | 46 | | 50 | | 64 | | 64 | | 65 | | 83 | | 73 | | 75 | | 83 | |
Special trade contractors | | 71 | | 75 | | 71 | | 91 | | 99 | | 110 | | 127 | | 132 | | 120 | | 115 | | 122 | |
| | | | | | | | | | | | | | | | | | | | | | | |
Utilities | | 11 | | 11 | | 11 | | 9 | | 10 | | 8 | | 10 | | 13 | | 12 | | 14 | | 13 | |
| | | | | | | | | | | | | | | | | | | | | | | |
Transportation and warehousing | | 113 | | 111 | | 117 | | 117 | | 119 | | 117 | | 124 | | 124 | | 113 | | 119 | | 124 | |
Transportation | | 109 | | 106 | | 111 | | 112 | | 115 | | 110 | | 117 | | 118 | | 107 | | 112 | | 116 | |
Warehousing and storage | | 4 | | 5 | | 6 | | 5 | | 5 | | 6 | | 7 | | 6 | | 6 | | 7 | | 8 | |
| | | | | | | | | | | | | | | | | | | | | | | |
Trade | | 303 | | 320 | | 326 | | 311 | | 326 | | 343 | | 359 | | 349 | | 362 | | 370 | | 355 | |
Wholesale trade | | 67 | | 72 | | 76 | | 65 | | 78 | | 80 | | 80 | | 86 | | 86 | | 82 | | 78 | |
Retail trade | | 236 | | 247 | | 250 | | 246 | | 248 | | 263 | | 279 | | 263 | | 275 | | 288 | | 277 | |
| | | | | | | | | | | | | | | | | | | | | | | |
Finance, Insurance, Real Estate & Leasing | | 121 | | 125 | | 126 | | 129 | | 132 | | 133 | | 142 | | 143 | | 139 | | 142 | | 139 | |
Finance | | 56 | | 57 | | 60 | | 56 | | 59 | | 59 | | 67 | | 63 | | 59 | | 67 | | 54 | |
Insurance | | 25 | | 24 | | 21 | | 27 | | 26 | | 26 | | 29 | | 30 | | 28 | | 28 | | 32 | |
Real estate | | 28 | | 33 | | 34 | | 35 | | 35 | | 38 | | 37 | | 40 | | 42 | | 38 | | 44 | |
Leasing | | 12 | | 11 | | 11 | | 11 | | 13 | | 10 | | 10 | | 11 | | 10 | | 9 | | 10 | |
| | | | | | | | | | | | | | | | | | | | | | | |
Public administration | | 91 | | 90 | | 95 | | 98 | | 94 | | 90 | | 93 | | 100 | | 105 | | 111 | | 109 | |
Federal administration | | 31 | | 33 | | 37 | | 34 | | 33 | | 34 | | 34 | | 37 | | 39 | | 46 | | 44 | |
Provincial administration | | 33 | | 27 | | 29 | | 29 | | 30 | | 27 | | 26 | | 26 | | 27 | | 28 | | 25 | |
Local administration | | 27 | | 29 | | 29 | | 34 | | 32 | | 29 | | 33 | | 37 | | 40 | | 37 | | 40 | |
| | | | | | | | | | | | | | | | | | | | | | | |
Other service industries | | 910 | | 918 | | 925 | | 950 | | 977 | | 1,011 | | 1,021 | | 1,060 | | 1,060 | | 1,072 | | 1,100 | |
Education & related services | | 136 | | 136 | | 137 | | 132 | | 143 | | 152 | | 154 | | 157 | | 161 | | 167 | | 167 | |
Health & welfare services | | 196 | | 211 | | 214 | | 218 | | 212 | | 230 | | 234 | | 241 | | 257 | | 264 | | 261 | |
Professional, scientific & technical | | 139 | | 134 | | 138 | | 142 | | 159 | | 165 | | 164 | | 169 | | 164 | | 174 | | 182 | |
Information, culture & recreation | | 105 | | 106 | | 106 | | 110 | | 110 | | 111 | | 115 | | 116 | | 114 | | 108 | | 109 | |
Services to business management | | 71 | | 72 | | 79 | | 82 | | 91 | | 96 | | 96 | | 99 | | 94 | | 91 | | 94 | |
Accommodation & food services | | 166 | | 164 | | 158 | | 173 | | 173 | | 168 | | 169 | | 178 | | 170 | | 162 | | 182 | |
Miscellaneous services | | 97 | | 95 | | 93 | | 93 | | 90 | | 89 | | 87 | | 99 | | 100 | | 105 | | 104 | |
Source: Statistics Canada, Labour Force Survey (unpublished data). Totals may not add due to rounding.
2012 Financial and Economic Review — July 2012
21
Appendix 1 — Economic Review
Table A1.6 Capital Investment by Industry
| | | | | | | | | | Preliminary | | | | 2010 | | 2011 | |
| | Actual | | Actual | | Actual | | Actual | | Actual | | Intentions | | to | | to | |
| | 2007 | | 2008 | | 2009 | | 2010 | | 2011 | | 2012 | | 2011 | | 2012 | |
| | ($ millions) | | (per cent) | |
Agriculture, forestry, fishing and hunting | | 418.9 | | 420.6 | | 330.2 | | 346.8 | | 326.4 | | 339.3 | | (5.9 | ) | 4.0 | |
Mining, quarrying and oil well industries | | 5,849.1 | | 6,775.0 | | 5,024.3 | | 8,041.3 | | 10,382.9 | | 11,792.3 | | 29.1 | | 13.6 | |
Manufacturing | | 1,502.2 | | 1,455.4 | | 1,147.6 | | 1,555.0 | | 1,716.7 | | 2,474.2 | | 10.4 | | 44.1 | |
Construction | | 777.4 | | 916.4 | | 665.0 | | 809.6 | | 785.4 | | 822.2 | | (3.0 | ) | 4.7 | |
Transport and warehousing | | 3,474.2 | | 3,487.2 | | 2,619.9 | | 1,848.4 | | 2,536.9 | | 3,053.0 | | 37.2 | | 20.3 | |
Utilities | | 2033.2 | | 2,570.6 | | 3,283.2 | | 3,102.1 | | 3,293.5 | | 3,979.3 | | 6.2 | | 20.8 | |
Wholesale | | 470.8 | | 527.6 | | 428.6 | | 443.7 | | 712.6 | | 728.3 | | 60.6 | | 2.2 | |
Retail trade | | 1,508.6 | | 1,617.4 | | 1,297.8 | | 1,199.2 | | 1,303.7 | | 1,264.2 | | 8.7 | | (3.0 | ) |
Finance and insurance | | 1,710.8 | | 1,401.9 | | 947.2 | | 1,020.5 | | 1,103.6 | | 1,019.2 | | 8.1 | | (7.6 | ) |
Real estate, rental and leasing | | 1,818.1 | | 2,430.0 | | 1,973.3 | | 1,703.8 | | 1,708.0 | | 1,752.1 | | 0.2 | | 2.6 | |
Information and cultural industries | | 824.6 | | 1,199.7 | | 1,485.9 | | 1,288.9 | | 1,090.6 | | 1,126.2 | | (15.4 | ) | 3.3 | |
Professional, scientific and technical | | 408.8 | | 402.7 | | 344.8 | | 467.1 | | 486.9 | | 517.4 | | 4.2 | | 6.3 | |
Management of companies and enterprises | | 19.2 | | 42.9 | | 74.8 | | 84.0 | | 86.8 | | 76.5 | | 3.3 | | (11.9 | ) |
Admin, waste and remediation services | | 237.3 | | 252.1 | | 205.5 | | 212.5 | | 284.6 | | 248.1 | | 33.9 | | (12.8 | ) |
Arts, entertainment and recreation | | 410.5 | | 498.2 | | 351.3 | | 275.3 | | 309.4 | | 305.1 | | 12.4 | | (1.4 | ) |
Accommodation and food services | | 712.4 | | 829.3 | | 828.3 | | 690.2 | | 492.1 | | 415.1 | | (28.7 | ) | (15.6 | ) |
Education services | | 1,384.7 | | 1,243.5 | | 1,241.4 | | 1,320.6 | | 1,399.2 | | 1,246.2 | | 6.0 | | (10.9 | ) |
Health services | | 1,044.0 | | 1,349.2 | | 1,171.4 | | 1,342.6 | | 1,101.1 | | 1,195.9 | | (18.0 | ) | 8.6 | |
Public administration | | 3,361.9 | | 3,678.8 | | 3,450.9 | | 3,165.8 | | 3,348.7 | | 3,808.2 | | 5.8 | | 13.7 | |
Other services | | 197.7 | | 246.3 | | 203.3 | | 227.0 | | 256.6 | | 239.6 | | 13.0 | | (6.6 | ) |
Housing | | 14,504.5 | | 15,591.1 | | 11,926.3 | | 13,389.3 | | 13,383.5 | | 14,360.8 | | (0.0 | ) | 7.3 | |
Total | | 42,669.6 | | 46,935.8 | | 39,001.0 | | 42,533.8 | | 46,109.2 | | 50,763.3 | | 8.4 | | 10.1 | |
Public | | 8,095.3 | | 10,034.6 | | 8,832.1 | | 8,764.9 | | 9,841.3 | | 10,987.4 | | 12.3 | | 11.6 | |
Private | | 34,574.2 | | 36,901.1 | | 30,168.9 | | 33,768.9 | | 36,268.0 | | 39,775.9 | | 7.4 | | 9.7 | |
Total | | 42,669.5 | | 46,935.7 | | 39,001.0 | | 42,533.8 | | 46,109.3 | | 50,763.3 | | 8.4 | | 10.1 | |
Machinery and equipment | | 12,365.9 | | 12,864.0 | | 10,435.9 | | 11,296.8 | | 12,229.8 | | 12,444.1 | | 8.3 | | 1.8 | |
Construction | | 30,303.7 | | 34,071.8 | | 28,565.1 | | 31,237.1 | | 33,879.5 | | 38,319.2 | | 8.5 | | 13.1 | |
Total | | 42,669.6 | | 46,935.8 | | 39,001.0 | | 42,533.9 | | 46,109.3 | | 50,763.3 | | 8.4 | | 10.1 | |
Note: Totals may not add due to rounding or due to some data not being disclosed for confidentiality reasons.
Source: Statistics Canada.
2012 Financial and Economic Review — July 2012
22
Appendix 1 — Economic Review
Table A1.7 British Columbia International Goods Exports by Major Market and Selected Commodities, 2011
| | | | | | European | | Mainland | | Other | | Total - | |
Commodity | | U.S. | | Japan | | Union (1) | | China | | Markets | | All Countries | |
| | ($ millions) | |
Solid wood products | | 2,485 | | 934 | | 361 | | 1,401 | | 521 | | 5,703 | |
Lumber (softwood) | | 1,598 | | 667 | | 152 | | 1,080 | | 336 | | 3,833 | |
Cedar shakes and shingles | | 121 | | 0 | | 8 | | 0 | | 4 | | 133 | |
Plywood (softwood) | | 116 | | 17 | | 3 | | 1 | | 2 | | 138 | |
Other panel products | | 269 | | 61 | | 2 | | 6 | | 30 | | 368 | |
Selected value-added wood products | | 277 | | 31 | | 7 | | 9 | | 11 | | 334 | |
Logs | | 36 | | 109 | | 0 | | 306 | | 136 | | 587 | |
Other | | 68 | | 49 | | 190 | | 0 | | 2 | | 309 | |
| | | | | | | | | | | | | |
Pulp and paper products | | 1,340 | | 243 | | 185 | | 1,752 | | 758 | | 4,279 | |
Pulp | | 560 | | 223 | | 177 | | 1,700 | | 540 | | 3,200 | |
Newsprint | | 61 | | 7 | | 0 | | 7 | | 114 | | 189 | |
Paper, paperboard — excluding newsprint | | 612 | | 11 | | 7 | | 16 | | 96 | | 742 | |
Other | | 107 | | 1 | | 1 | | 29 | | 9 | | 148 | |
| | | | | | | | | | | | | |
Agriculture and food other than fish | | 1,138 | | 85 | | 36 | | 39 | | 315 | | 1,613 | |
Fruit and nuts | | 181 | | 11 | | 10 | | 2 | | 33 | | 236 | |
Vegetables | | 212 | | 7 | | 4 | | 0 | | 8 | | 232 | |
Other | | 746 | | 66 | | 22 | | 37 | | 274 | | 1,145 | |
| | | | | | | | | | | | | |
Fish products | | 507 | | 109 | | 38 | | 109 | | 135 | | 898 | |
Whole fish; fresh, chilled, frozen — excluding salmon | | 54 | | 22 | | 6 | | 18 | | 64 | | 165 | |
Whole salmon; fresh, chilled, frozen | | 337 | | 14 | | 7 | | 19 | | 7 | | 383 | |
Salmon; canned, smoked, etc | | 1 | | 2 | | 20 | | 0 | | 8 | | 30 | |
Other | | 115 | | 71 | | 5 | | 73 | | 56 | | 321 | |
| | | | | | | | | | | | | |
Metallic mineral products | | 841 | | 1,246 | | 109 | | 485 | | 850 | | 3,531 | |
Copper ores and concentrates | | 0 | | 950 | | 0 | | 426 | | 421 | | 1,797 | |
Molybdenum ores and concentrates | | 36 | | 61 | | 95 | | 4 | | 81 | | 276 | |
Unwrought aluminum | | 52 | | 168 | | 0 | | 9 | | 168 | | 396 | |
Unwrought zinc | | 534 | | 1 | | 0 | | 9 | | 105 | | 649 | |
Other | | 220 | | 66 | | 14 | | 37 | | 75 | | 412 | |
| | | | | | | | | | | | | |
Fabricated metal products | | 719 | | 4 | | 16 | | 111 | | 144 | | 994 | |
| | | | | | | | | | | | | |
Energy products | | 3,093 | | 1,928 | | 1,115 | | 762 | | 3,147 | | 10,044 | |
Natural gas | | 1,914 | | 0 | | 0 | | 0 | | 0 | | 1,914 | |
Coal | | 225 | | 1,927 | | 1,115 | | 721 | | 3,146 | | 7,133 | |
Electricity | | 337 | | 0 | | 0 | | 0 | | 0 | | 337 | |
Other | | 617 | | 1 | | 0 | | 41 | | 0 | | 659 | |
| | | | | | | | | | | | | |
Machinery and equipment | | 1,997 | | 27 | | 362 | | 99 | | 569 | | 3,054 | |
Motor vehicles and parts | | 198 | | 1 | | 8 | | 6 | | 44 | | 256 | |
Electrical/electronic/communications | | 405 | | 8 | | 106 | | 16 | | 113 | | 648 | |
Scientific/photographic/measuring equipment, etc. | | 244 | | 5 | | 84 | | 19 | | 95 | | 447 | |
Other | | 1,150 | | 13 | | 165 | | 58 | | 317 | | 1,703 | |
| | | | | | | | | | | | | |
Plastics and articles of plastic | | 310 | | 1 | | 8 | | 7 | | 38 | | 364 | |
Chemicals and chemical products | | 493 | | 59 | | 38 | | 76 | | 226 | | 892 | |
Apparel and accessories | | 58 | | 5 | | 8 | | 1 | | 9 | | 80 | |
Textiles | | 17 | | 0 | | 2 | | 2 | | 39 | | 60 | |
All other commodities | | 999 | | 4 | | 44 | | 22 | | 169 | | 1,238 | |
Total | | 13,999 | | 4,644 | | 2,322 | | 4,866 | | 6,921 | | 32,752 | |
(1) As of January 1, 2012, Austria, Belgium, Bulgaria, Cyprus, Czech Republic, Denmark, Estonia, Finland, France, Germany, Greece, Hungary, Ireland, Italy, Latvia, Lithuania, Luxembourg, Malta, Netherlands, Poland, Portugal, Romania, Slovakia, Slovenia, Spain, Sweden, United Kingdom.
Source: BC Stats
2012 Financial and Economic Review — July 2012
23
Appendix 1 — Economic Review
Table A1.8 British Columbia International Goods Exports by Market Area
| | | | | | | | % Change | | Percent of Total | |
| | 2009 | | 2010 | | 2011 | | 2010-2011 | | 2010 | | 2011 | |
| | ($ millions) | | (per cent) | |
United Kingdom | | 266 | | 294 | | 418 | | 42.2 | | 1.0 | | 1.3 | |
Germany | | 234 | | 379 | | 281 | | (25.9 | ) | 1.3 | | 0.9 | |
People’s Republic of China | | 2,501 | | 3,880 | | 4,866 | | 25.4 | | 13.5 | | 14.9 | |
Hong Kong | | 210 | | 238 | | 260 | | 9.3 | | 0.8 | | 0.8 | |
Taiwan | | 463 | | 494 | | 724 | | 46.5 | | 1.7 | | 2.2 | |
Japan | | 3,551 | | 4,193 | | 4,644 | | 10.8 | | 14.6 | | 14.2 | |
South Korea | | 1,664 | | 1,886 | | 2,732 | | 44.8 | | 6.6 | | 8.3 | |
India | | 77 | | 135 | | 201 | | 49.3 | | 0.5 | | 0.6 | |
Australia | | 179 | | 220 | | 274 | | 24.7 | | 0.8 | | 0.8 | |
Mexico | | 162 | | 192 | | 161 | | (16.1 | ) | 0.7 | | 0.5 | |
United States | | 12,920 | | 13,276 | | 13,999 | | 5.4 | | 46.2 | | 42.7 | |
Other | | 3,012 | | 3,534 | | 4,193 | | 18.6 | | 12.3 | | 12.8 | |
Total | | 25,240 | | 28,721 | | 32,752 | | 14.0 | | 100.0 | | 100.0 | |
Market Areas: | | | | | | | | | | | | | |
Western Europe (1) | | 1,697 | | 2,037 | | 2,332 | | 14.5 | | 7.1 | | 7.1 | |
Pacific Rim (2) | | 9,128 | | 11,620 | | 14,094 | | 21.3 | | 40.5 | | 43.0 | |
(1) Austria, Belgium, Denmark, Finland, France, Germany, Greece, Iceland, Ireland, Italy, Luxembourg, Netherlands, Norway, Portugal, Spain, Sweden, Switzerland and the United Kingdom.
(2) Australia, Brunei Darussalam, China, Fiji, Hong Kong, Indonesia, Japan, Laos, Macau, Malaysia, Mongolia, New Zealand, North Korea, Philippines, Singapore, South Korea, Taiwan, Thailand and Vietnam.
Source: BC Stats. Figures may not add due to rounding.
2012 Financial and Economic Review — July 2012
24
Appendix 1 — Economic Review
Table A1.9 Historical Commodity Prices (in US Dollars)
| | 2001 | | 2002 | | 2003 | | 2004 | | 2005 | | 2006 | | 2007 | | 2008 | | 2009 | | 2010 | | 2011 | |
Metals | | | | | | | | | | | | | | | | | | | | | | | |
Copper (London; $/lb) | | 0.72 | | 0.71 | | 0.81 | | 1.30 | | 1.67 | | 3.07 | | 3.24 | | 3.15 | | 2.35 | | 3.42 | | 3.99 | |
Lead (London; $/lb) | | 0.22 | | 0.21 | | 0.23 | | 0.40 | | 0.44 | | 0.59 | | 1.17 | | 0.94 | | 0.78 | | 0.97 | | 1.09 | |
Zinc (London; $/lb) | | 0.44 | | 0.35 | | 0.39 | | 0.48 | | 0.63 | | 1.49 | | 1.47 | | 0.85 | | 0.75 | | 0.98 | | 0.99 | |
Gold (London; $/troy oz) | | 271 | | 310 | | 363 | | 409 | | 445 | | 604 | | 697 | | 872 | | 973 | | 1225 | | 1568 | |
Silver (London; $/troy oz) | | 4.39 | | 4.60 | | 4.88 | | 6.66 | | 7.32 | | 11.55 | | 13.38 | | 14.93 | | 14.68 | | 20.15 | | 35.11 | |
Molybdenum ($/lb) | | 2.31 | | 3.59 | | 5.21 | | 15.92 | | 31.05 | | 24.46 | | 30.22 | | 28.78 | | 11.13 | | 15.77 | | 15.26 | |
Aluminum (London; $/lb) | | 0.65 | | 0.61 | | 0.65 | | 0.78 | | 0.86 | | 1.17 | | 1.20 | | 1.16 | | 0.76 | | 0.99 | | 1.08 | |
Forest Products | | | | | | | | | | | | | | | | | | | | | | | |
Lumber (Madison’s Lumber Reporter; WSPF, $/1000 bd ft) | | 247 | | 235 | | 270 | | 394 | | 355 | | 296 | | 249 | | 219 | | 182 | | 255 | | 254 | |
Pulp (Northern Europe; $/tonne; transaction price) | | 543 | | 463 | | 523 | | 616 | | 611 | | 674 | | 793 | | 853 | | 656 | | 930 | | 961 | |
Newsprint (Pulp and Paper Week; $/tonne) | | 588 | | 468 | | 501 | | 549 | | 608 | | 667 | | 597 | | 687 | | 565 | | 571 | | 625 | |
Hemlock baby squares (Madison’s Lumber Reporter; 3 9/16”) | | 583 | | 593 | | 535 | | 614 | | 540 | | 584 | | 609 | | 727 | | 767 | | 781 | | 802 | |
Other | | | | | | | | | | | | | | | | | | | | | | | |
Oil (West Texas Intermediate; $/barrel) | | 26 | | 26 | | 31 | | 42 | | 57 | | 66 | | 72 | | 100 | | 62 | | 79 | | 95 | |
Natural Gas (Inlet to WEI; $/GJ) | | 5.09 | | 3.21 | | 5.39 | | 5.54 | | 7.27 | | 5.54 | | 5.41 | | 6.91 | | 3.01 | | 2.94 | | 2.47 | |
Coal (Japan-Australia JFY FOB US$/t) | | | | | | | | | | | | | | | | | | | | | | | |
Metallurgical | | 41.50 | | 46.20 | | 43.50 | | 56.00 | | 125.00 | | 107.00 | | 89.00 | | 289.00 | | 120.00 | | 204.00 | | 277.00 | |
Low Volatile PCI | | 34.50 | | 34.30 | | 32.85 | | 46.50 | | 102.00 | | 66.00 | | 67.50 | | 245.00 | | 90.00 | | 165.00 | | 218.00 | |
Thermal | | 34.50 | | 28.85 | | 26.75 | | 44.00 | | 53.00 | | 42.50 | | 55.65 | | 125.00 | | 70.00 | | 98.00 | | 129.80 | |
Sources: Ministry of Finance; Ministry of Energy and Mines; Ministry of Forests, Lands and Natural Resource Operations
US Federal Reserve Bank
2012 Financial and Economic Review — July 2012
25
Appendix 1 — Economic Review
Table A1.10 British Columbia Forest Sector Economic Activity Indicators
| | | | | | | | | | | | Change (1) | |
Indicator | | 2007 | | 2008 | | 2009 | | 2010 | | 2011 | | 2010-2011 | |
Wood production | | (million cubic meters) | | | | | | | | | | (per cent) | |
Timber Scaled | | 72.7 | | 61.1 | | 48.8 | | 63.3 | | 69.4 | | 9.6 | |
Lumber | | 36.7 | | 28.2 | | 23.0 | | 27.1 | | 29.1 | | 7.5 | |
| | | | | | | | | | | | | |
Timber scaled by species | | (million cubic meters) | | | | | | | | | | | |
Lodgepole pine | | 32.1 | | 28.8 | | 24.8 | | 29.1 | | 29.7 | | 2.1 | |
Spruce | | 10.3 | | 8.5 | | 6.8 | | 8.9 | | 10.5 | | 18.5 | |
Hemlock | | 7.2 | | 5.6 | | 4.3 | | 6.8 | | 8.5 | | 26.0 | |
Douglas fir | | 8.7 | | 6.4 | | 5.4 | | 7.6 | | 9.1 | | 19.8 | |
Balsam | | 4.6 | | 3.6 | | 3.0 | | 4.2 | | 5.1 | | 22.5 | |
Cedar | | 5.7 | | 5.0 | | 2.7 | | 4.1 | | 3.7 | | (10.9 | ) |
All others | | 4.1 | | 3.2 | | 1.8 | | 2.7 | | 2.7 | | 3.0 | |
Total (2) | | 72.7 | | 61.1 | | 48.8 | | 63.3 | | 69.4 | | 9.6 | |
| | | | | | | | | | | | | |
Harvest volumes | | (million cubic meters) | | | | | | | | | | | |
| | 65.0 | | | | | | | | | | | |
| | (million tonnes) | | | | | | | | | | | |
Pulp and paper shipments | | 7.2 | | 6.5 | | 5.7 | | 6.0 | | 6.0 | | 1.1 | |
Market pulp | | 4.7 | | 4.0 | | 3.7 | | 4.3 | | 4.5 | | 5.0 | |
Newsprint, paper and paperboard | | 2.8 | | 2.5 | | 2.0 | | 1.7 | | 1.5 | | (8.2 | ) |
| | | | | | | | | | | | | |
Industrial product price indices | | (2000=100) | | | | | | | | | | | |
Softwood lumber — British Columbia | | 81.6 | | 77.9 | | 78.7 | | 80.2 | | 77.0 | | (4.0 | ) |
Douglas fir plywood | | 86.6 | | 80.3 | | 74.3 | | 73.2 | | 68.0 | | (7.1 | ) |
Bleached sulphate pulp | | 107.7 | | 110.0 | | 101.3 | | 109.6 | | 107.6 | | (1.8 | ) |
Newsprint for export | | 86.4 | | 95.2 | | 99.1 | | 88.5 | | 89.4 | | (9.8 | ) |
(1) Percentage change based on unrounded numbers.
(2) Total may not add due to rounding.
Sources: | Timber scaled (less waste, reject and Christmas tree products) — Ministry of Forests, Lands and Natural Resource Operations |
| Lumber and plywood production — Statistics Canada |
| Pulp and paper production — Canadian Pulp and Paper Association |
| Industrial product price indices — Statistics Canada |
2012 Financial and Economic Review — July 2012
26
Appendix 1 — Economic Review
Table A1.11 Historical Value of Mineral, Petroleum and Natural Gas Shipments
| | | | Industrial | | Construction | | | | | | Natural Gas | | Other oil | | | |
Year | | Metals | | Minerals (1) | | Aggregates (2) | | Coal | | Crude Oil (3) | | to Pipeline | | and Gas (4) | | Total | |
| | ($ millions) | | ($ millions) | | ($ millions) | | ($ millions) | | | | | | | | | |
1991 | | 1,511 | | 290 | | 159 | | 990 | | 260 | | 562 | | 36 | | 3,808 | |
1992 | | 1,502 | | 212 | | 157 | | 706 | | 260 | | 592 | | 38 | | 3,467 | |
1993 | | 1,198 | | 229 | | 166 | | 822 | | 233 | | 814 | | 42 | | 3,504 | |
1994 | | 1,354 | | 237 | | 180 | | 861 | | 235 | | 991 | | 44 | | 3,902 | |
1995 | | 2,016 | | 249 | | 204 | | 968 | | 272 | | 710 | | 58 | | 4,478 | |
1996 | | 1,537 | | 251 | | 189 | | 1,027 | | 441 | | 817 | | 75 | | 4,337 | |
1997 | | 1,495 | | 249 | | 195 | | 1,107 | | 403 | | 1,087 | | 98 | | 4,635 | |
1998 | | 1,484 | | 245 | | 208 | | 956 | | 373 | | 1,154 | | 47 | | 4,467 | |
1999 | | 1,183 | | 249 | | 219 | | 797 | | 461 | | 1,577 | | 53 | | 4,539 | |
2000 | | 1,571 | | 284 | | 224 | | 812 | | 843 | | 3,826 | | 114 | | 7,674 | |
2001 | | 1,394 | | 296 | | 217 | | 959 | | 729 | | 4,834 | | 103 | | 8,532 | |
2002 | | 1,288 | | 310 | | 231 | | 1,035 | | 714 | | 3,458 | | 79 | | 7,114 | |
2003 | | 1,353 | | 336 | | 226 | | 972 | | 718 | | 5,396 | | 116 | | 9,117 | |
2004 | | 1,956 | | 355 | | 239 | | 1,191 | | 824 | | 5,827 | | 133 | | 10,523 | |
2005 | | 2,442 | | 364 | | 278 | | 2,300 | | 973 | | 7,821 | | 173 | | 14,351 | |
2006 | | 3,248 | | 363 | | 274 | | 2,105 | | 1,013 | | 5,956 | | 179 | | 13,139 | |
2007 | | 2,887 | | 424 | | 347 | | 1,949 | | 989 | | 5,723 | | 200 | | 12,519 | |
2008 | | 2,590 | | 696 | | 378 | | 3,738 | | 1,215 | | 7,501 | | 524 | | 16,642 | |
2009 | | 1,888 | | 283 | | 303 | | 3,297 | | 719 | | 3,294 | | 116 | | 9,900 | |
2010 | | 2,191 | | 349 | | 373 | | 4,253 | | 915 | | 3,360 | | 158 | | 11,599 | |
2011e | | 2,096 | | 457 | | 349 | | 5,691 | | 1,168 | | 3,381 | | 286 | | 13,427 | |
e Estimate.
(1) Shipments of gypsum and silica to Canadian cement, lime and clay plants are not included in this table.
(2) Sand and gravel; stone.
(3) Includes Pentanes and Condensate.
(4) Liquified Petroleum Gases and Sulphur.
Sources: Natural Resources Canada and Ministry of Energy and Mines
Table A1.12 Petroleum and Natural Gas Activity Indicators
| | | | | | | | | | | | | | | | | | | | Change | |
Indicator | | Unit of Measure | | 2004 | | 2005 | | 2006 | | 2007 | | 2008 | | 2009 | | 2010 | | 2011 | | 2010-2011 | |
| | | | | | | | | | | | | | | | | | | | (per cent) | |
Natural gas production (wellhead) (1) | | (billion cubic m) | | 32.0 | | 32.8 | | 32.8 | | 32.6 | | 33.4 | | 33.0 | | 35.0 | | 38.2 | | 9.1 | |
Crude oil and condensate | | (million cubic m) | | 2.2 | | 1.9 | | 1.9 | | 1.8 | | 1.6 | | 1.6 | | 1.5 | | 1.2 | | (24.4 | ) |
Wells authorized | | (number) | | 1,698.0 | | 1,790.0 | | 1,730.0 | | 1,205.0 | | 1,412.0 | | 829.0 | | 870.0 | | 1,135.0 | | 30.5 | |
Wells drilled | | (number) | | 1,281.0 | | 1,429.0 | | 1,435.0 | | 908.0 | | 927.0 | | 626.0 | | 712.0 | | 660.0 | | (7.3 | ) |
Provincial reserves | | | | | | | | | | | | | | | | | | | | | |
Marketable gas (remaining reserves) | | (billion cubic m) | | 317.0 | | 363.0 | | 380.1 | | 394.2 | | 496.6 | | 540.5 | | 782.0 | | n/a | | n/a | |
Oil (remaining reserves) | | (million cubic m) | | 22.0 | | 20.9 | | 18.2 | | 19.7 | | 18.5 | | 19.3 | | 18.7 | | n/a | | n/a | |
Provincial government petroleum and natural gas revenue (2) | | ($ millions) | | 1,794.4 | | 2,559.0 | | 2,139.1 | | 2,352.8 | | 4,093.9 | | 1,451.0 | | 1,376.5 | | 731.3 | | (5.1 | ) |
(1) Not including gas retrieved from storage. During 2009, 0.75 billion cubic metres were produced from storage wells.
(2) Includes Crown royalties, Crown reserve disposition bonuses, fees and rentals.
Source: Ministry of Energy and Mines
2012 Financial and Economic Review — July 2012
27
Appendix 1 — Economic Review
Table A1.13 Supply and Consumption of Electrical Energy in British Columbia
| | Supply | | Consumption | | Net Exports | |
| | Net Generation | | Receipts | | | | Delivered | | | | | | | |
| | | | | | Total | | From Other | | | | To Other | | Total | | | | | |
| | | | | | Provincial | | Provinces | | Total | | Provinces | | Provincial | | Total | | | |
Year | | Hydro | | Thermal | | Generation | | and Imports | | Supply | | and Exports | | Consumption | | Demand | | | |
| | (gigawatt-hours)(1) | |
1989 | | 51,082 | | 6,573 | | 57,655 | | 4,500 | | 62,155 | | 6,583 | | 55,572 | | 62,155 | | 2,083 | |
1990 | | 57,245 | | 3,417 | | 60,662 | | 3,233 | | 63,895 | | 6,689 | | 57,206 | | 63,895 | | 3,456 | |
1991 | | 60,149 | | 2,832 | | 62,981 | | 2,272 | | 65,253 | | 7,725 | | 57,528 | | 65,253 | | 5,454 | |
1992 | | 60,555 | | 3,503 | | 64,058 | | 2,685 | | 66,743 | | 9,473 | | 57,270 | | 66,743 | | 6,788 | |
1993 | | 53,057 | | 5,716 | | 58,774 | | 5,691 | | 64,465 | | 5,605 | | 58,860 | | 64,465 | | (86 | ) |
1994 | | 53,979 | | 7,036 | | 61,015 | | 7,836 | | 68,851 | | 9,541 | | 59,311 | | 68,851 | | 1,705 | |
1995 | | 49,814 | | 8,192 | | 58,006 | | 6,385 | | 64,391 | | 3,972 | | 60,419 | | 64,391 | | (2,413 | ) |
1996 | | 67,329 | | 4,436 | | 71,765 | | 3,289 | | 75,053 | | 10,390 | | 64,664 | | 75,053 | | 7,101 | |
1997 | | 61,772 | | 5,189 | | 66,961 | | 4,316 | | 71,278 | | 12,114 | | 59,163 | | 71,278 | | 7,798 | |
1998 | | 60,849 | | 6,861 | | 67,710 | | 5,056 | | 72,766 | | 10,619 | | 62,147 | | 72,766 | | 5,563 | |
1999 | | 61,588 | | 6,457 | | 68,045 | | 6,807 | | 74,852 | | 12,529 | | 62,323 | | 74,852 | | 5,722 | |
2000 | | 59,754 | | 8,487 | | 68,241 | | 6,039 | | 74,280 | | 10,698 | | 63,582 | | 74,280 | | 4,659 | |
2001 | | 48,338 | | 8,994 | | 57,332 | | 10,154 | | 67,486 | | 6,408 | | 61,079 | | 67,486 | | (3,747 | ) |
2002 | | 58,627 | | 6,318 | | 64,945 | | 5,769 | | 70,714 | | 8,078 | | 62,636 | | 70,714 | | 2,309 | |
2003 | | 56,689 | | 6,362 | | 63,051 | | 7,084 | | 70,135 | | 9,599 | | 60,535 | | 70,135 | | 2,515 | |
2004 | | 53,281 | | 7,214 | | 60,496 | | 8,261 | | 68,757 | | 6,791 | | 61,966 | | 68,757 | | (1,470 | ) |
2005 | | 60,605 | | 7,207 | | 67,811 | | 7,226 | | 75,037 | | 9,247 | | 65,790 | | 75,037 | | 2,021 | |
2006 | | 54,772 | | 7,249 | | 62,021 | | 12,695 | | 74,716 | | 6,155 | | 68,561 | | 74,716 | | (6,540 | ) |
2007 | | 64,738 | | 7,473 | | 72,212 | | 8,027 | | 80,239 | | 10,987 | | 69,252 | | 80,239 | | 2,960 | |
2008 | | 58,774 | | 7,080 | | 65,854 | | 12,362 | | 78,216 | | 9,986 | | 68,230 | | 78,216 | | (2,376 | ) |
2009 | | 55,872 | | 6,330 | | 62,201 | | 11,771 | | 73,973 | | 8,134 | | 65,839 | | 73,973 | | (3,638 | ) |
2010 | | 52,762 | | 6,715 | | 59,477 | | 10,418 | | 69,895 | | 7,429 | | 62,467 | | 69,895 | | (2,990 | ) |
2011 | | 61,155 | | 5,240 | | 66,395 | | 10,195 | | 76,591 | | 13,106 | | 63,484 | | 76,591 | | 2,911 | |
(1) Gigawatt-hour = one million kilowatt-hours
Source: Statistics Canada
2012 Financial and Economic Review — July 2012
28
Appendix 1 — Economic Review
Table A1.14 Components of British Columbia Population Change
| | Net Migration | | Natural Increase | | Total | | Total | |
| | Inter- | | Inter- | | | | | | | | | | Population | | Population | |
Year | | provincial | | national | | Total | | Births | | Deaths | | Total | | Increase (1) | | at July 1 | |
1975 | | (2,864 | ) | 25,342 | | 22,478 | | 36,281 | | 19,151 | | 17,130 | | 39,608 | | 2,499,564 | |
1976 | | (464 | ) | 16,288 | | 15,824 | | 35,848 | | 18,788 | | 17,060 | | 32,884 | | 2,533,899 | |
1977 | | 12,452 | | 11,224 | | 23,676 | | 36,691 | | 18,596 | | 18,095 | | 41,771 | | 2,570,315 | |
1978 | | 20,106 | | 7,699 | | 27,805 | | 37,231 | | 19,058 | | 18,173 | | 45,978 | | 2,615,162 | |
1979 | | 32,541 | | 14,012 | | 46,553 | | 38,432 | | 19,204 | | 19,228 | | 65,781 | | 2,665,238 | |
1980 | | 38,773 | | 23,522 | | 62,295 | | 40,104 | | 19,371 | | 20,733 | | 83,028 | | 2,745,861 | |
1981 | | 23,270 | | 22,143 | | 45,413 | | 41,474 | | 19,857 | | 21,617 | | 67,030 | | 2,826,558 | |
1982 | | (1,129 | ) | 14,175 | | 13,046 | | 42,747 | | 20,707 | | 22,040 | | 35,086 | | 2,876,513 | |
1983 | | 3,000 | | 10,639 | | 13,639 | | 42,919 | | 19,827 | | 23,092 | | 36,731 | | 2,907,502 | |
1984 | | 3,867 | | 8,674 | | 12,541 | | 43,911 | | 20,686 | | 23,225 | | 35,766 | | 2,947,181 | |
1985 | | (3,430 | ) | 9,374 | | 5,944 | | 43,127 | | 21,302 | | 21,825 | | 27,769 | | 2,975,131 | |
1986 | | (772 | ) | 12,290 | | 11,518 | | 41,967 | | 21,213 | | 20,754 | | 32,272 | | 3,003,621 | |
1987 | | 16,588 | | 21,078 | | 37,666 | | 41,814 | | 21,814 | | 20,000 | | 57,666 | | 3,048,651 | |
1988 | | 25,829 | | 28,704 | | 54,533 | | 42,930 | | 22,546 | | 20,384 | | 74,917 | | 3,114,761 | |
1989 | | 35,711 | | 31,042 | | 66,753 | | 43,769 | | 22,997 | | 20,772 | | 87,525 | | 3,196,725 | |
1990 | | 40,088 | | 28,585 | | 68,673 | | 45,617 | | 23,577 | | 22,040 | | 90,713 | | 3,292,111 | |
1991 | | 34,600 | | 21,274 | | 55,874 | | 45,612 | | 23,977 | | 21,635 | | 77,509 | | 3,373,787 | |
1992 | | 39,578 | | 29,477 | | 69,055 | | 46,156 | | 24,615 | | 21,541 | | 90,596 | | 3,468,802 | |
1993 | | 37,595 | | 34,679 | | 72,274 | | 46,026 | | 25,764 | | 20,262 | | 92,536 | | 3,567,772 | |
1994 | | 34,449 | | 42,667 | | 77,116 | | 46,998 | | 25,939 | | 21,059 | | 98,175 | | 3,676,075 | |
1995 | | 23,414 | | 43,644 | | 67,058 | | 46,820 | | 26,375 | | 20,445 | | 87,503 | | 3,777,390 | |
1996 | | 17,798 | | 47,617 | | 65,415 | | 46,138 | | 27,538 | | 18,600 | | 84,015 | | 3,874,317 | |
1997 | | 1,980 | | 38,318 | | 40,298 | | 44,577 | | 27,412 | | 17,165 | | 57,463 | | 3,948,583 | |
1998 | | (17,521 | ) | 24,380 | | 6,859 | | 43,072 | | 27,978 | | 15,094 | | 21,953 | | 3,983,113 | |
1999 | | (12,413 | ) | 28,644 | | 16,231 | | 41,939 | | 28,017 | | 13,922 | | 30,153 | | 4,011,375 | |
2000 | | (14,783 | ) | 29,266 | | 14,483 | | 40,672 | | 27,461 | | 13,211 | | 27,694 | | 4,039,230 | |
2001 | | (7,028 | ) | 37,661 | | 30,633 | | 40,575 | | 28,362 | | 12,213 | | 42,846 | | 4,076,264 | |
2002 | | (4,445 | ) | 32,296 | | 27,851 | | 40,065 | | 28,884 | | 11,181 | | 39,032 | | 4,098,178 | |
2003 | | 3,025 | | 33,620 | | 36,645 | | 40,497 | | 29,320 | | 11,177 | | 47,822 | | 4,122,396 | |
2004 | | 7,785 | | 34,726 | | 42,511 | | 40,490 | | 29,924 | | 10,566 | | 53,077 | | 4,155,170 | |
2005 | | 7,212 | | 43,610 | | 50,822 | | 40,827 | | 30,235 | | 10,592 | | 61,414 | | 4,196,788 | |
2006 | | 12,799 | | 39,516 | | 52,315 | | 41,729 | | 30,688 | | 11,041 | | 63,356 | | 4,243,580 | |
2007 | | 16,776 | | 42,333 | | 59,109 | | 43,649 | | 31,308 | | 12,341 | | 71,450 | | 4,309,632 | |
2008 | | 10,849 | | 54,052 | | 64,901 | | 44,276 | | 32,097 | | 12,179 | | 77,080 | | 4,384,047 | |
2009 | | 9,672 | | 50,306 | | 59,978 | | 44,888 | | 31,241 | | 13,647 | | 73,625 | | 4,459,947 | |
2010 | | 4,678 | | 37,349 | | 42,027 | | 43,671 | | 31,149 | | 12,522 | | 54,549 | | 4,529,674 | |
2011 | | (1,920 | ) | 35,882 | | 33,962 | | 43,954 | | 31,739 | | 12,215 | | 46,177 | | 4,573,321 | |
(1) Components may not add to totals due to the revision of population statistics based on information collected during subsequent census years. The revisions are not distributed back to relevant components due to insufficient data.
Source: Statistics Canada.
2012 Financial and Economic Review — July 2012
29
| Chapter Two |
| |
| Financial Review (1) |
(1) Reflects 2011/12 Public Accounts released on July 25, 2012.
2012 Financial and Economic Review — July 2012
Chapter 2 — Financial Review
2011/12 Overview
Table 2.1 Operating Statement
| | Budget | | Actual | | Actual | |
($ millions) | | 2011 (1) | | 2011/12 | | 2010/11 (1) | |
Revenue | | 41,337 | | 40,998 | | 39,950 | |
Expense | | (41,912 | ) | (41,239 | ) | (40,199 | ) |
| | (575 | ) | (241 | ) | (249 | ) |
Liability for repayment of HST transition funding | | — | | (1,599 | ) | — | |
Deficit before forecast allowance | | (575 | ) | (1,840 | ) | (249 | ) |
Forecast allowance | | (350 | ) | — | | — | |
Deficit | | (925 | ) | (1,840 | ) | (249 | ) |
Capital spending: | | | | | | | |
Taxpayer-supported capital spending | | 4,105 | | 3,572 | | 4,111 | |
Self-supported capital spending | | 3,243 | | 2,947 | | 2,481 | |
| | 7,348 | | 6,519 | | 6,592 | |
Provincial Debt: | | | | | | | |
Taxpayer-supported debt | | 36,816 | | 34,692 | | 31,855 | |
Self-supported debt | | 16,271 | | 15,501 | | 13,299 | |
Total debt (including forecast allowance) | | 53,437 | | 50,193 | | 45,154 | |
Taxpayer-supported debt-to-GDP ratio | | 17.5 | % | 16.4 | % | 15.7 | % |
Economic Forecast: | | 2011 | | 2011 | (2) | 2010 | |
Real GDP growth | | 2.0 | % | 2.0 | % | 3.0 | % |
Nominal GDP growth | | 4.1 | % | 4.3 | % | 5.9 | % |
(1) Figures have been restated to reflect government accounting policies in effect at March 31, 2012.
(2) As nominal GDP at market prices for the calendar year ending 2011 is not available, the 2011 GDP projected in February 2012 has been used for the fiscal year ended March 31, 2012 for demonstration purposes.
The provincial government ended the 2011/12 fiscal year with a deficit of $1,840 million, mainly due to the liability for the repayment of HST transition funding. The liability arose as a result of the provincial referendum that rejected the HST and requires the provincial government reinstate the former PST/GST system.
Excluding the one-time HST transition funding repayment, the 2011/12 deficit was $241 million — a $684 million improvement over budget and slightly less than the previous year’s deficit (see Table 2.1).
Major changes from the 2011/12 budget included the following:
· Revenues were $339 million lower than budget primarily due to lower natural resource revenues and commercial Crown corporation net income, partially offset by high taxation revenue and federal government transfers. (See Revenue section for further details.)
· Excluding the one-time HST transition funding repayment, total government expenses were $673 million lower than budgeted mainly due to ministry savings, unused Contingencies funding, and the deferral of service delivery agency spending funded by operating grants from ministries. (See Expense section for further details.)
· The HST transition funding repayment had a one-time negative impact of $1,599 million.
2012 Financial and Economic Review — July 2012
33
Chapter 2 — Financial Review
Chart 2.1 2011/12 deficit — major Changes from Budget 2011
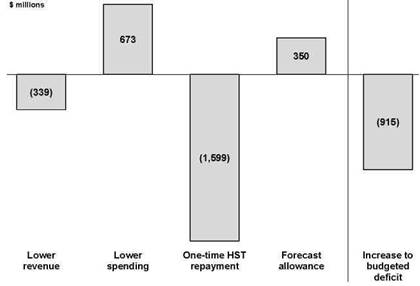
The $350 million forecast allowance absorbed a portion of the above impacts limiting the increase to the budgeted deficit to $915 million.
Financial information in this publication, including this chapter and Appendix 2, is derived from the government’s 2011/12 Public Accounts.
Revenue
In 2011/12, revenue totaled $41.0 billion, $339 million lower than budget and up 2.6 per cent from 2010/11. Compared to budget, lower revenues from natural resources, harmonized sales tax, fuel tax, miscellaneous sources and commercial Crown corporations were partially offset by higher revenue from income taxes, property transfer tax and federal contributions.
Chart 2.2 Revenue changes from Budget 2011
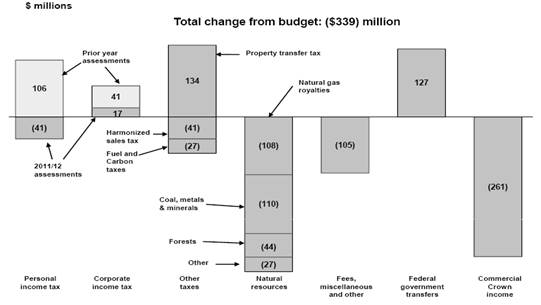
2012 Financial and Economic Review — July 2012
34
Chapter 2 — Financial Review
Major changes from the 2011/12 budget included:
· Personal income tax revenue was up $65 million reflecting the effects of stronger 2010 tax assessments and improved 2011 personal income growth. These improvements were partly offset by an assumed lower effective yield reflecting relatively weak employment growth in 2011/12.
· Corporate income tax revenue was up $58 million mainly due to higher tax assessments for prior years and increased instalment payments from the federal government, partly offset by weaker 2010 tax results. The 2010 corporate income tax base rose only 6.3 per cent annually compared to a 21.5 per cent increase in BC corporate profits, indicating the volatility associated with corporate income tax revenues.
· Revenue from harmonized sales tax (HST) was down $41 million from budget mainly due to lower input tax credits and transitional measures. This decline was partially offset by higher collections of social service tax and the tax on designated property mainly due to continued audit assessment efforts.
Table 2.2 Consumption and Other Tax Revenues Change from Budget 2011
| | Revenue | | | | | | | |
| | changes | | | | Budget | | Q3 | |
| | ($ millions) | | Indicators (annual percent change) | | 2011 | | Forecast | |
Harmonized sales | | (41 | ) | Nominal consumer expenditures | | 4.6 | % | 3.6 | % |
Social service | | 31 | | Nominal residential investment | | 3.7 | % | 4.9 | % |
Tax on designated property | | 3 | | | | | | | |
| | (7 | ) | | | | | | |
| | | | BC Consumer Price Index | | 2.0 | % | 2.5 | % |
Fuel | | (36 | ) | BC housing starts | | -5.8 | % | -0.3 | % |
Tobacco | | (40 | ) | Real GDP | | 2.0 | % | 2.0 | % |
Property transfer | | 134 | | | | | | | |
| | | | Gasoline volume growth | | 1.0 | % | -2.4 | % |
Other taxes | | 15 | | | | | | | |
· Revenue from fuel tax was $36 million lower than budget reflecting lower consumption of gasoline, likely due to higher pump prices.
· Tobacco tax revenue was $40 million below budget mainly due to a decline in consumption levels reflecting the shift in public attitudes towards smoking.
· Revenue from property transfer tax was $134 million above budget mainly reflecting property sales of higher values as the number of transactions was relatively flat. Lower than expected interest rates was a major factor influencing home purchases.
· Natural gas royalties were $108 million below budget as lower prices and production volumes were partly offset by reduced utilization of credit and royalty program offsets. The full-year average price of $2.15 ($Cdn/gigajoule, plant inlet) was 29 per cent below budget reflecting weak North American market demand and high storage levels.
· Revenue from coal, metals and other minerals was $110 million below budget due to a one-time prior year adjustment, the effects of a higher Canadian dollar and mining costs, partly offset by higher coal and metal prices.
· Receipts from electricity sales under the Columbia River Treaty were $40 million below budget due to lower electricity prices.
2012 Financial and Economic Review — July 2012
35
Chapter 2 — Financial Review
Table 2.3 Energy and Mineral Revenues Change from Budget 2011
| | Revenue | | | | | | | |
| | changes | | | | Budget | | | |
| | ($ millions) | | Indicators | | 2011 | | Actual | |
Natural gas royalties | | (108 | ) | Natural gas price ($Cdn/GJ, plant inlet) | | $ | 3.02 | | $ | 2.15 | |
| | | | Production (annual change) | | 26.7 | % | 17.5 | % |
Coal, metals and other minerals | | (110 | ) | Metallurgical coal price ($US/tonne) | | $ | 224 | | $ | 256 | |
| | | | Copper price ($US/lb) | | $ | 3.65 | | $ | 3.84 | |
Columbia River Treaty electricity sales | | (40 | ) | Electricity price ($US/Mwh) | | $ | 37.00 | | $ | 29.00 | |
| | | | Oil price ($US/bbl) | | $ | 86.46 | | $ | 97.21 | |
Petroleum royalties and other (1) | | 19 | | Bonus bid cash reciepts ($ million) | | $ | 306 | | $ | 287 | |
| | | | Bonus bid price per hectare ($) | | $ | 500 | | $ | 1,322 | |
| | (239 | ) | Hectares disposed (thousands) | | 612 | | 217 | |
(1) Includes Sale of Crown land tenures where revenue is recognized over nine years.
· Other energy-related revenue sources were $19 million above budget mainly due to the impact of higher oil prices. Cash sales of Crown land tenures were below budget due to lower hectares disposed, however, the average bid price per hectare offered by industry at $1,322 per hectare, was 164 per cent higher than assumed. This marks the fifth consecutive year that bid prices exceeded $1,000 per hectare.
Table 2.4 Forest Revenues Change from Budget 2011
| | Revenue | | | | | | | |
| | changes | | | | Budget | | | |
| | ($ millions) | | Indicators | | 2011 | | Actual | |
Stumpage from timber tenures | | (23 | ) | SPF 2x4 ($US/1000 bf, calendar year) | | $ | 263 | | $ | 255 | |
BC Timber Sales | | (21 | ) | Total stumpage rate ($/m(3) ) | | $ | 4.99 | | $ | 3.96 | |
Softwood Lumber Agreement border tax | | (24 | ) | Harvest volumes (million m(3)) | | 59.0 | | 63.3 | |
Logging tax | | 9 | | | | | | | |
Other revenue | | 15 | | US lumber exports (billion bf) | | 6.4 | | 4.8 | |
| | (44 | ) | | | | | | |
· Forests revenue was $44 million below budget as the effects of lower stumpage rates, reduced border tax collections reflecting lower US lumber exports and a higher Canadian dollar were partly offset by increased harvest volumes. Interior stumpage rates continue to be affected by the impact of the mountain pine beetle infestation on log quality.
· Other taxpayer supported revenue — including fees, licences, investment earnings and other miscellaneous sources — was $105 million below budget mainly due to a delay in the completion date for the sale of Little Mountain property to the 2012/13 fiscal year. This decline was partly offset by the improvement in fees, investment earnings and miscellaneous sources from the SUCH sector.
Table 2.5 Other Revenue Change from Budget 2011
| | Revenue | | | |
| | changes | | | |
| | ($ millions) | | | |
Fees and Miscellaneous Sources | | | | | |
Taxpayer supported crowns | | (268 | ) | mainly delayed completion date of Little Mountain property sale | |
Taxpayer supported SUCH entities | | 171 | | mainly health authorties and post secondary institutions | |
Other | | (13 | ) | | |
Investment earnings | | 5 | | | |
Total other | | (105 | ) | | |
2012 Financial and Economic Review — July 2012
36
Chapter 2 — Financial Review
· Federal government contributions were up $127 million reflecting:
· a total of $40 million increase in revenue for emergency programs mainly in relation to the 2010 floods and forest fires ($29 million) and various aboriginal treaty negotiation accumulator payments ($11 million);
· $14 million increase in vote recoveries mainly in support of labour market and immigration programs, local government services and transfers, and integrated workplace solutions;
· $70 million increase in direct funding to service delivery agencies; and
· $17 million increase in other federal contributions;
partly offset by
· $14 million decrease in Canada Health Transfer and Canada Social Transfer entitlements mainly due to a lower population share.
· Commercial Crown corporation net income of $2.7 billion was $261 million below budget and $247 million lower than 2010/11. Major changes from budget include:
· BC Hydro net income was $53 million lower than plan, mainly reflecting government recommendations arising from its 2011 Review of BC Hydro and subsequent direction on regulatory assets related to BC Hydro’s revenue requirements application to the BC Utilities Commission. (See Chapter 3 for further details.)
· Liquor Distribution Branch income was down $16 million from budget mainly due to slower provincial liquor sales in the early part of the fiscal year reflecting changes in consumer purchasing patterns.
· BC Lottery Corporation income was up $3 million from budget as higher net income from lottery operations and operating cost savings were partially offset by lower revenue from casino and gaming operations.
· ICBC results were down $188 million from budget mainly resulting from lower investment income and higher claims costs incurred.
A detailed review of revenue changes by quarter is available in Appendix Table A2.1. Further information on commercial Crown corporations is provided in Chapter 3.
2012 Financial and Economic Review — July 2012
37
Chapter 2 — Financial Review
Table 2.6 Revenue by Source
| | Budget | | Actual | | Actual | |
($ millions) | | 2011 (1) | | 2011/12 | | 2010/11 (1) | |
Taxation | | | | | | | |
Personal income | | 5,796 | | 5,861 | | 5,361 | |
Corporate income | | 1,571 | | 1,629 | | 1,658 | |
Harmonized sales | | 5,820 | | 5,779 | | 4,176 | |
Other sales (2) | | 116 | | 150 | | 1,418 | |
Fuel | | 964 | | 928 | | 940 | |
Carbon | | 950 | | 959 | | 741 | |
Tobacco | | 676 | | 636 | | 734 | |
Property | | 1,898 | | 1,911 | | 1,918 | |
Property transfer | | 810 | | 944 | | 855 | |
Corporation capital | | — | | (5 | ) | (3 | ) |
Insurance premium | | 413 | | 411 | | 399 | |
| | 19,014 | | 19,203 | | 18,197 | |
Natural resource | | | | | | | |
Natural gas royalties | | 447 | | 339 | | 312 | |
Forests | | 526 | | 482 | | 436 | |
Other natural resource (3) | | 2,127 | | 1,990 | | 1,979 | |
| | 3,100 | | 2,811 | | 2,727 | |
Other revenue | | | | | | | |
Medical Services Plan premiums | | 1,945 | | 1,919 | | 1,787 | |
Other fees (4) | | 2,762 | | 2,806 | | 2,645 | |
Investment earnings | | 1,037 | | 1,042 | | 867 | |
Miscellaneous | | 2,958 | | 2,830 | | 2,803 | |
| | 8,702 | | 8,597 | | 8,102 | |
Contributions from the federal government | | | | | | | |
Health transfer | | 3,862 | | 3,858 | | 3,689 | |
Social transfer | | 1,536 | | 1,526 | | 1,487 | |
Harmonized sales tax transition payments | | 580 | | 580 | | 769 | |
Other federal contributions | | 1,602 | | 1,743 | | 2,052 | |
| | 7,580 | | 7,707 | | 7,997 | |
Commercial Crown corporation net income | | | | | | | |
BC Hydro | | 611 | | 558 | | 591 | |
Liquor Distribution Branch | | 925 | | 909 | | 890 | |
BC Lottery Corporation (net of payments to the federal government) | | 1,096 | | 1,099 | | 1,096 | |
ICBC | | 290 | | 102 | | 326 | |
Transportation Investment Corporation (Port Mann) | | (15 | ) | (17 | ) | (7 | ) |
Other | | 34 | | 29 | | 31 | |
| | 2,941 | | 2,680 | | 2,927 | |
Total revenue | | 41,337 | | 40,998 | | 39,950 | |
(1) Figures have been restated to reflect government accounting policies in effect at March 31, 2012.
(2) Includes social service tax, the continuation of the tax on designated property and the hotel room tax in 2010/11.
(3) Columbia River Treaty, other energy and minerals, water rental and other resources.
(4) Post-secondary, healthcare-related, motor vehicle, and other fees.
2012 Financial and Economic Review — July 2012
38
Chapter 2 — Financial Review
Table 2.7 Expense by Ministry, Program and Agency
| | 2011/12 | | | |
| | Budget | | Contingencies | | Restated | | | | Actual | |
($ millions) | | 2011 (1) | | Allocation (2) | | Budget | | Actual | | 2010/11 (1) | |
Office of the Premier | | 9 | | — | | 9 | | 9 | | 9 | |
Aboriginal Relations and Reconciliation | | 80 | | 11 | | 91 | | 92 | | 95 | |
Advanced Education | | 1,980 | | — | | 1,980 | | 1,977 | | 1,975 | |
Agriculture | | 66 | | 14 | | 80 | | 74 | | 80 | |
Children and Family Development | | 1,331 | | 2 | | 1,333 | | 1,332 | | 1,334 | |
Community, Sport and Cultural Development | | 254 | | 151 | | 405 | | 404 | | 434 | |
Education | | 5,242 | | 20 | | 5,262 | | 5,264 | | 5,197 | |
Energy and Mines | | 437 | | 25 | | 462 | | 453 | | 456 | |
Environment | | 130 | | 13 | | 143 | | 143 | | 132 | |
Finance | | 173 | | 16 | | 189 | | 189 | | 235 | |
Forests, Lands and Natural Resource Operations | | 590 | | 10 | | 600 | | 562 | | 810 | |
Health | | 15,714 | | — | | 15,714 | | 15,567 | | 14,715 | |
Jobs, Tourism and Innovation | | 238 | | 24 | | 262 | | 261 | | 300 | |
Justice | | 1,043 | | 58 | | 1,101 | | 1,174 | | 1,135 | |
Labour, Citizens’ Services and Open Government | | 566 | | — | | 566 | | 562 | | 585 | |
Social Development | | 2,338 | | 89 | | 2,427 | | 2,427 | | 2,367 | |
Transportation and Infrastructure | | 807 | | — | | 807 | | 807 | | 752 | |
Total ministries and Office of the Premier | | 30,998 | | 433 | | 31,431 | | 31,297 | | 30,611 | |
Management of public funds and debt | | 1,349 | | — | | 1,349 | | 1,238 | | 1,244 | |
Contingencies | | 603 | | (444 | ) | 159 | | 22 | | 1 | |
Funding for capital expenditures | | 1,543 | | — | | 1,543 | | 1,182 | | 1,083 | |
Legislative and other appropriations | | 125 | | 11 | | 136 | | 132 | | 120 | |
| | 34,618 | | — | | 34,618 | | 33,871 | | 33,059 | |
Liability for repayment of HST transition funding | | — | | — | | — | | 1,599 | | — | |
Prior year liability adjustments | | — | | — | | — | | (99 | ) | (203 | ) |
Consolidated revenue fund expense | | 34,618 | | — | | 34,618 | | 35,371 | | 32,856 | |
Expenses recovered from external entities | | 2,651 | | — | | 2,651 | | 2,689 | | 2,924 | |
Funding provided to service delivery agencies | | (21,369 | ) | — | | (21,369 | ) | (21,199 | ) | (20,345 | ) |
Ministry and special office direct program spending | | 15,900 | | — | | 15,900 | | 16,861 | | 15,435 | |
Service delivery agency expense: | | | | | | | | | | | |
School districts | | 5,513 | | — | | 5,513 | | 5,500 | | 5,418 | |
Universities | | 3,880 | | — | | 3,880 | | 3,807 | | 3,734 | |
Colleges and institutes | | 1,063 | | — | | 1,063 | | 1,095 | | 1,064 | |
Health authorities and hospital societies | | 11,989 | | — | | 11,989 | | 12,116 | | 11,187 | |
Other service delivery agencies | | 3,567 | | — | | 3,567 | | 3,459 | | 3,361 | |
Total service delivery agency expense | | 26,012 | | — | | 26,012 | | 25,977 | | 24,764 | |
Total expense | | 41,912 | | — | | 41,912 | | 42,838 | | 40,199 | |
(1) Amounts have been restated to reflect government accounting policies and organization in effect at March 31, 2012.
(2) Includes one-time funding for cost pressures.
2012 Financial and Economic Review — July 2012
39
Chapter 2 — Financial Review
Expense
In 2011/12, government expenses totaled $42.8 billion, $926 million (2.2 per cent) higher than budget and $2.6 billion (6.6 per cent) higher than the previous year. Excluding the one-time HST transition funding repayment, total spending was $673 million less than budget.
Chart 2.3 Expense changes from Budget 2011
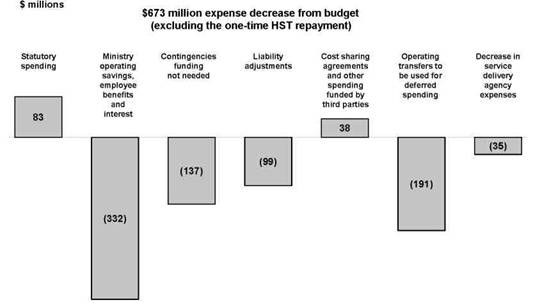
During the year, government invoked standing statutory authority to cover $83 million in unforeseen costs. These included:
· $67 million for emergency flood response costs (Ministry of Justice);
· $5 million for legal actions under the Crown Proceeding Act (Ministry of Justice);
· $5 million for costs incurred under the Public Inquiry Act (Ministry of Justice); and
· $6 million in other areas.
Excluding statutory spending above, ministries were able to realize a total of $332 million in operating savings.
· Health spending was down $147 million, mainly due to lower than anticipated take-up of new initiatives in Regional Health Services, and savings from lower MSP and PharmaCare costs (Ministry of Health).
· Costs for employee benefits and related programs were down $42 million based on updated actuarial valuations (Ministry of Finance).
· Natural resource spending was $38 million lower mainly due to lower BC timber sales and direct fire costs (Ministry of Forests, Lands and Natural Resource Operations).
· Interest costs were $111 million less due to reduced borrowing requirements (Management of Public Funds and Debt Vote).
The above ministry savings were partially offset by a net increase of $6 million in other areas of government. As well, $137 million from the Contingencies vote was not needed.
2012 Financial and Economic Review — July 2012
40
Chapter 2 — Financial Review
Liabilities accrued in prior years were adjusted downward by $99 million to reflect actuarial valuations and other updated information. These included reductions to:
· government self insurance claim costs ($29 million) and employee long term benefits obligations ($15 million) in the Ministry of Finance;
· the Health Benefits Trust liability ($12 million) and MSP cost accruals ($11 million) in the Ministry of Health; and,
· compensation for harvesting rights ($10 million), Vancouver Island natural gas pipeline ($5 million), and various agreements ($15 million) in other ministries.
Program spending funded or co-funded by parties outside of government was $38 million higher than budget, mainly due to:
· a $20 million increase in recoveries from sources mainly associated with the Medical Services Plan, Pharma Care and other health care programs;
· a $27 million increase in direct fire cost recoveries; and
· $14 million in higher payments from the federal government mainly in support of immigration programs ($11 million) and local government services and transfers ($12 million), offset by reductions in other federal payments;
partially offset by:
· a $6 million reduction in free Crown grants;
· a $14 million decrease in recoveries of fiscal agency loan interest; and
· a $3 million reduction in other external recoveries.
The impact of ministry spending on government’s total spending was reduced by $191 million due to the deferral of spending funded by operating grants transferred to government service delivery agencies to future years.
Service delivery agency spending was $35 million lower than budget, including a $51 million reduction in health organizations’ employee benefit liability. Excluding this adjustment, operating costs were $16 million higher than budget.
· School districts spending decreased by $13 million due to lower operating costs ($49 million), including lower salary and wages due to teacher strike action, partially offset by higher capital asset amortization ($22 million) and other costs ($14 million).
· Post secondary institution spending was $41 million lower than budget as a result of lower operating costs due to higher than anticipated capitalization of these expenditures ($28 million), lower capital asset amortization ($9 million), and other cost variances ($4 million).
· Health authority and hospital society spending, before a $51 million reduction adjustment in employee benefit liability, increased by $178 million due to a growing demand for healthcare services delivered by these organizations on behalf of government. This increased spending was funded by additional provincial grants and own-source revenue.
· Other service delivery agency spending was $108 million lower than budget mainly due to lower amortization expense and lower debt servicing costs for the transportation sector.
2012 Financial and Economic Review — July 2012
41
Chapter 2 — Financial Review
A detailed review of the above changes by quarter is available in Appendix Table A2.1. Further information on 2011/12 spending by function is provided in Appendix Table A2.7.
Provincial Capital Spending
Capital spending in 2011/12 totaled $6.5 billion (see Chart 2.4). Spending on power generation and transmission projects is entirely self-supported, reflecting the commercial activities of BC Hydro and Columbia Power Corporation.
Chart 2.4 Capital spending, 2011/12

Spending on highways and public transportation is a mix of taxpayer-supported and self-supported, which includes construction of the Port Mann Bridge to be funded from tolls. Spending on health facilities, schools, post-secondary institutions and by government ministries is entirely taxpayer-supported, other spending also is a mix of taxpayer-supported and self-supported.
Chart 2.5 Capital spending changes from Budget 2011
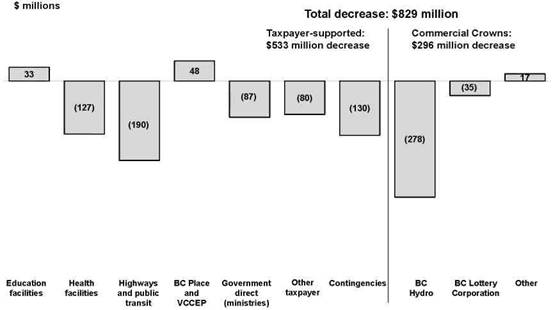
2012 Financial and Economic Review — July 2012
42
Chapter 2 — Financial Review
Taxpayer-supported Capital Spending
In 2011/12, government spent $3.6 billion on taxpayer-supported infrastructure. Spending was $0.5 billion below budget as follows:
· Education facilities — up $33 million, reflecting a $63 million increase by post-secondary institutions (mainly by universities on their self-funded projects) partially offset by a $30 million decrease by school districts. (Additional spending on facility upgrades, seismic renovations and self-funded projects, such as the new School Board office in North Vancouver, was offset by project scheduling delays for school replacements and lower direct spending on equipment.)
· Health facilities — down $127 million, reflecting scheduling changes for various projects, including the Children’s and Women’s Hospital, the Surrey Memorial Hospital’s Emergency Department/Critical Care Tower, and the Jim Pattison Outpatient Centre.
· Transportation sector — down $190 million, mainly reflecting construction scheduling changes to various projects, such as the Evergreen Line, Faregates & Smartcards, Kelowna Rapid Bus Phase II, Kamloops Bus Maintenance Facility, and a range of other transit projects.
· BC Place redevelopment project — up $47 million, mainly due to the adjusted project schedule for redevelopment and maintenance from the prior year.
Table 2.8 Capital Spending
| | | | | | Restated | | | | | |
| | Budget | | Contingencies | | Budget | | Actual | | Actual | |
($ millions) | | 2011 | | Allocation | | 2011/12 | | 2011/12 | | 2010/11 | |
Taxpayer-supported | | | | | | | | | | | |
Education | | | | | | | | | | | |
Schools (K–12) | | 520 | | 70 | | 590 | | 560 | | 433 | |
Post-secondary | | 599 | | — | | 599 | | 662 | | 925 | |
Health | | 859 | | — | | 859 | | 732 | | 916 | |
BC Transportation Financing Authority | | 986 | | — | | 986 | | 921 | | 1,080 | |
BC Transit | | 162 | | — | | 162 | | 37 | | 39 | |
Vancouver Convention Centre expansion project | | — | | — | | — | | 1 | | 10 | |
BC Place redevelopment | | 147 | | — | | 147 | | 194 | | 197 | |
Government direct (ministries) | | 332 | | — | | 332 | | 245 | | 261 | |
Other (1) | | 300 | | — | | 300 | | 220 | | 250 | |
Capital spending contingencies | | 200 | | (70 | ) | 130 | | — | | — | |
Total taxpayer-supported | | 4,105 | | — | | 4,105 | | 3,572 | | 4,111 | |
Self-supported commercial | | | | | | | | | | | |
BC Hydro | | 2,195 | | — | | 2,195 | | 1,917 | | 1,519 | |
Columbia River power projects (2) | | 98 | | — | | 98 | | 108 | | 67 | |
Transportation Investment Corporation (Port Mann Bridge/Highway 1) | | 717 | | — | | 717 | | 728 | | 742 | |
BC Rail | | 18 | | — | | 18 | | 9 | | 6 | |
Insurance Corporation of British Columbia | | 81 | | — | | 81 | | 92 | | 48 | |
BC Lottery Corporation | | 109 | | — | | 109 | | 74 | | 81 | |
Liquor Distribution Branch | | 25 | | — | | 25 | | 19 | | 18 | |
Total self-supported commercial | | 3,243 | | — | | 3,243 | | 2,947 | | 2,481 | |
Total capital spending | | 7,348 | | — | | 7,348 | | 6,519 | | 6,592 | |
(1) Includes BC Housing Management Commission, Provincial Rental Housing Corporation, and other service delivery agencies.
(2) Joint ventures of the Columbia Power Corporation and Columbia Basin Trust.
2012 Financial and Economic Review — July 2012
43
Chapter 2 — Financial Review
Table 2.9 Capital Expenditure Projects Greater Than $50 million (1)
Note: Information in bold type denotes changes from Budget 2012 tabled on February 21, 2012.
| | Projected | | Total Costs | | Projected | | Total | | Project Financing | |
| | Completion | | to | | Costs to | | Capital | | Provincial | | P3 | | Federal | | Other | |
($ millions) | | Date | | Mar. 31, 2012 | | Complete | | Costs | | Gov’t | | Liability | | Gov’t | | Contrib’ns | |
Taxpayer-supported | | | | | | | | | | | | | | | | | |
School districts | | | | | | | | | | | | | | | | | |
Revelstoke Elementary and Secondary | | Fall 2012 | | 46 | | 14 | | 60 | | 58 | | — | | — | | 2 | |
Chilliwack Secondary | | Fall 2013 | | 12 | | 46 | | 58 | | 58 | | — | | — | | — | |
Burnaby Central Secondary | | Spring 2012 | | 50 | | 10 | | 60 | | 60 | | — | | — | | — | |
Centennial Secondary | | Spring 2015 | | 1 | | 61 | | 62 | | 62 | | — | | — | | — | |
Alberni District Secondary | | Fall 2012 | | 37 | | 21 | | 58 | | 54 | | — | | — | | 4 | |
Southern Okanagan Secondary | | Fall 2013 | | 29 | | 25 | | 54 | | 52 | | — | | — | | 2 | |
Oak Bay Secondary | | Fall 2015 | | — | | 50 | | 50 | | 48 | | — | | — | | 2 | |
Kitsilano Secondary | | Fall 2015 | | — | | 58 | | 58 | | 58 | | — | | — | | — | |
Seismic mitigation program | | Spring 2021 | | — | | 1,300 | | 1,300 | | 1,300 | | — | | — | | — | |
Full-day kindergarten | | Fall 2012 | | 116 | | 18 | | 134 | | 134 | | — | | — | | — | |
Total school districts | | | | 291 | | 1,603 | | 1,894 | | 1,884 | | — | | — | | 10 | |
Post-secondary institutions | | | | | | | | | | | | | | | | | |
University of British Columbia | | | | | | | | | | | | | | | | | |
– Pharmaceutical Sciences and Centre for Drug Research & Development | | Fall 2012 | | 93 | | 40 | | 133 | | 86 | | — | | 3 | | 44 | |
Health facilities | | | | | | | | | | | | | | | | | |
Jim Pattison Outpatient Care and Surgery Centre (2), (3) | | | | | | | | | | | | | | | | | |
– Direct procurement | | Fall 2012 | | 59 | | 1 | | 60 | | 60 | | — | | — | | — | |
– P3 contract | | Spring 2011 | | 172 | | — | | 172 | | — | | 172 | | — | | — | |
Victoria Royal Jubilee Hospital — Patient Care Centre | | | | | | | | | | | | | | | | | |
– Direct procurement | | Spring 2013 | | 48 | | 21 | | 69 | | 23 | | — | | — | | 46 | |
– P3 contract | | Spring 2011 | | 280 | | — | | 280 | | — | | 199 | | — | | 81 | |
Fort St. John Hospital and Residential Care | | | | | | | | | | | | | | | | | |
– Direct procurement | | Spring 2012 | | 41 | | 12 | | 53 | | 52 | | — | | — | | 1 | |
– P3 contract | | Spring 2012 | | 239 | | 10 | | 249 | | 121 | | 33 | | — | | 95 | |
Expansions to Kelowna General and Vernon Jubilee Hospitals | | | | | | | | | | | | | | | | | |
– Direct procurement | | Spring 2012 | | 37 | | 12 | | 49 | | 25 | | — | | — | | 24 | |
– P3 contract | | Spring 2012 | | 386 | | — | | 386 | | 3 | | 158 | | — | | 225 | |
Northern Cancer Control Strategy | | | | | | | | | | | | | | | | | |
– Direct procurement | | Summer 2013 | | 21 | | 14 | | 35 | | 32 | | — | | — | | 3 | |
– P3 contract | | Summer 2012 | | 65 | | 6 | | 71 | | 54 | | 17 | | — | | — | |
Lions Gate Hospital (Mental Health) | | | | | | | | | | | | | | | | | |
Redevelopment (4) | | Fall 2013 | | 2 | | 56 | | 58 | | 34 | | — | | — | | 24 | |
Surrey Emergency/Critical Care Tower (5) | | | | | | | | | | | | | | | | | |
– Direct procurement | | Summer 2014 | | 36 | | 132 | | 168 | | 148 | | — | | — | | 20 | |
– P3 contract | | Summer 2014 | | 102 | | 216 | | 318 | | 139 | | 179 | | — | | — | |
Interior Heart and Surgical Centre (6) | | Spring 2017 | | 73 | | 271 | | 344 | | 194 | | 79 | | — | | 71 | |
Children’s and Women’s Hospital (7) | | Spring 2018 | | 21 | | 661 | | 682 | | 532 | | — | | — | | 150 | |
Total health facilities | | | | 1,582 | | 1,412 | | 2,994 | | 1,417 | | 837 | | — | | 740 | |
Transportation | | | | | | | | | | | | | | | | | |
South Fraser Perimeter Road | | | | | | | | | | | | | | | | | |
– Direct procurement | | Summer 2014 | | 816 | | 246 | | 1,062 | | 714 | | — | | 348 | | — | |
– P3 contract | | Summer 2014 | | 124 | | 78 | | 202 | | — | | 202 | | — | | — | |
Sierra Yoyo-Desan Road upgrade (8) | | Fall 2012 | | 82 | | 55 | | 137 | | 137 | | — | | — | | — | |
Total transportation | | | | 1,022 | | 379 | | 1,401 | | 851 | | 202 | | 348 | | — | |
Other | | | | | | | | | | | | | | | | | |
Vancouver Convention Centre expansion project | | Summer 2009 (3) | | 834 | | 2 | | 836 | | 494 | | — | | 222 | | 120 | |
BC Place redevelopment (9) | | Fall 2011 | | 509 | | 54 | | 563 | | 563 | | — | | — | | — | |
Integrated case management system | | Fall 2014 | | 102 | | 80 | | 182 | | 179 | | — | | 3 | | — | |
Surrey Pretrial Service Centre expansion (10) | | | | | | | | | | — | | | | | | | |
– Direct procurement | | Fall 2013 | | 7 | | 7 | | 14 | | 14 | | — | | — | | — | |
– P3 contract | | Fall 2013 | | 17 | | 73 | | 90 | | 47 | | 43 | | — | | — | |
e-Health initiative (11) | | Spring 2013 | | 248 | | 14 | | 262 | | 141 | | — | | 121 | | — | |
Total other | | | | 1,717 | | 230 | | 1,947 | | 1,438 | | 43 | | 346 | | 120 | |
Total taxpayer-supported | | | | 4,705 | | 3,664 | | 8,369 | | 5,676 | | 1,082 | | 697 | | 914 | |
2012 Financial and Economic Review — July 2012
44
Chapter 2 — Financial Review
Table 2.9 Capital Expenditure Projects Greater Than $50 million (1) (continued)
Note: Information in bold type denotes changes from Budget 2012 tabled on February 21, 2012.
| | Projected | | Total Costs | | Projected | | Total | | Project Financing | |
| | Completion | | to | | Costs to | | Capital | | Provincial | | P3 | | Federal | | Other | |
($ millions) | | Date | | Mar. 31, 2012 | | Complete | | Costs | | Gov’t | | Liability | | Gov’t | | Contrib’ns | |
Self-supported | | | | | | | | | | | | | | | | | |
Transportation | | | | | | | | | | | | | | | | | |
Port Mann Bridge / Highway 1 | | Winter 2013 | | 2,457 | | 862 | | 3,319 | | 3,319 | | — | | — | | — | |
Power generation and transmission | | | | | | | | | | | | | | | | | |
BC Hydro (12) | | | | | | | | | | | | | | | | | |
– Revelstoke Unit 5 generation | | Fall 2010 (3) | | 242 | | 3 | | 245 | | 245 | | — | | — | | — | |
– Cheakamus spillway gate reliability upgrade | | Summer 2011 (3) | | 62 | | 1 | | 63 | | 63 | | — | | — | | — | |
– Columbia Valley transmission | | Fall 2012 | | 82 | | 51 | | 133 | | 133 | | — | | — | | — | |
– Fort Nelson generating station upgrade | | Winter 2012 (3) | | 159 | | 5 | | 164 | | 164 | | — | | — | | — | |
– Stave Falls spillway gate reliability upgrade (13) | | Winter 2013 | | 34 | | 30 | | 64 | | 64 | | — | | — | | — | |
– Seymour Arm series capacitor (13) | | Winter 2013 | | 1 | | 99 | | 100 | | 100 | | — | | — | | — | |
– Vancouver City Central transmission | | Spring 2013 | | 94 | | 83 | | 177 | | 177 | | — | | — | | — | |
– Smart metering and infrastructure program | | Summer 2013 | | 308 | | 622 | | 930 | | 930 | | — | | — | | — | |
– Mica gas insulated switchgear replacement (13) | | Winter 2014 | | 109 | | 90 | | 199 | | 199 | | — | | — | | — | |
– Dawson Creek/Chetwynd area transmission (13) | | Spring 2014 | | 11 | | 239 | | 250 | | 250 | | — | | — | | — | |
– Northwest transmission line | | Spring 2014 | | 88 | | 473 | | 561 | | 234 | | — | | 130 | | 197 | |
– Hugh Keenleyside spillway gate reliability upgrade (13) | | Spring 2014 | | 27 | | 67 | | 94 | | 94 | | — | | — | | — | |
– Interior to Lower Mainland transmission line | | Winter 2015 | | 118 | | 591 | | 709 | | 709 | | — | | — | | — | |
– GM Shrum units 1 to 5 turbine upgrade (13) | | Spring 2015 | | 30 | | 258 | | 288 | | 288 | | — | | — | | — | |
– Mica units 5 and 6 project (13) | | Fall 2015 | | 159 | | 580 | | 739 | | 739 | | — | | — | | — | |
– Ruskin Dam safety and powerhouse upgrade (13) | | Winter 2018 | | 73 | | 707 | | 780 | | 780 | | — | | — | | — | |
– John Hart replacement (13) | | TBD | | 60 | | 1,290 | | 1,350 | | 1,350 | | — | | — | | — | |
Columbia River power projects (14) | | | | | | | | | | | | | | | | | |
– Waneta Dam power expansion | | May 2015 | | 149 | | 201 | | 350 | | 350 | | — | | — | | — | |
Total power generation and transmission | | | | 1,806 | | 5,390 | | 7,196 | | 6,869 | | — | | 130 | | 197 | |
Other | | | | | | | | | | | | | | | | | |
British Columbia Lottery Corporation | | | | | | | | | | | | | | | | | |
– Gaming management system | | Winter 2015 | | 9 | | 95 | | 104 | | 104 | | — | | — | | — | |
Insurance Corporation of British Columbia | | | | | | | | | | | | | | | | | |
– Business transformation program | | Fall 2016 | | 60 | | 150 | | 210 | | 210 | | — | | — | | — | |
Total other | | | | 69 | | 245 | | 314 | | 314 | | — | | — | | — | |
Total self-supported | | | | 4,332 | | 6,497 | | 10,829 | | 10,502 | | — | | 130 | | 197 | |
Total $50 million projects | | | | 9,037 | | 10,161 | | 19,198 | | 16,178 | | 1,082 | | 827 | | 1,111 | |
(1) | Only projects that receive provincial funding and have been approved by Treasury Board and/or Crown corporation boards are included in this table. Ministry service plans may include projects that still require final approval. Capital costs reflect current government accounting policy. |
(2) | Figures shown do not include an additional $2 million to establish an offsite access road to the facility. |
(3) | Assets have been put into service and only trailing costs remain. |
(4) | Figures shown do not include an approved project reserve of $4 million. |
(5) | Figures shown do not include an approved project reserve of $25 million. The Emergency Department is expected to be operational by summer 2013. |
(6) | Figures shown are based on current Treasury Board approvals and do not include an approved provincial project reserve of $24 million. |
(7) | Figures shown are based on preliminary Treasury Board approvals. These amounts will change after P3 contracts are finalized. |
(8) | Figures shown do not include a $50 million capital reserve for future oil and gas access road development in the Northern Rockies area. |
(9) | The BC Place redevelopment project achieved substantial completion in September 2011. Work to complete the project is expected to last until the summer of 2012. Remaining work items include completion and commissioning of the fixed and retractable roof components, various upgrades (e.g. mechanical and electrical upgrades), and resolution of any contractor claims. |
(10) | Figures shown do not include an approved project reserve of $9 million. |
(11) | The e-Health initiative is comprised of 7 distinct projects. Figures shown reflect the total costs of the Ministry of Health’s 7 provincially co-ordinated e-Health projects. The federal government portion is an estimate based on a signed agreement with Canada Health Infoway and the actual amount may vary, depending on eligible project costs incurred. |
(12) | BC Hydro has restated the capital cost of a number of its projects to conform with the move to International Financial Reporting Standards. For further details, please see Appendix I of the F2012-F2014 Amended Revenue Requirements Application currently before the BC Utilities Commission. |
(13) | Total costs and completion dates for these projects vary depending on the final scope. Information shown represents current assumptions. |
(14) | Joint ventures of the Columbia Power Corporation and Columbia Basin Trust. In October 2010, CPC/CBT reached an agreement for a partnership with Fortis Inc. to develop an electricity generating facility at the Waneta Dam south of Trail. Capital spending information reflects 49 per cent of the total project — CPC’s 32.5 per cent share combined with CBT’s 16.5 per cent share. |
2012 Financial and Economic Review — July 2012
45
Chapter 2 — Financial Review
· Government direct (ministries) — down $87 million due to lower than expected spending on forest service roads, government buildings and information management/technology projects.
· Other Capital Spending — down $80 million mainly due to social housing project scheduling changes, the non-utilized project reserves held by the Ministry of Finance, and lower capital spending for other service delivery agencies.
The restated budget reflects the allocation of $70 million of capital funding contingencies mainly for increased maintenance programs for various school districts. The remaining $130 million in capital contingencies was not utilized in 2011/12.
Self-supported Capital Spending
Commercial Crown corporations spent $2.9 billion on capital projects in 2011/12. This was $296 million less than budget as follows:
· BC Hydro — down $278 million mainly due to:
· a $113 million reduction in the original capital spending budget, reflecting a re-prioritization of capital projects as a result of the government review of BC Hydro (see chapter 3); and
· a $165 million reduction resulting from schedule delays in both the implementation of the Smart Metering and Infrastructure Program and the Northwest Transmission Line, Interior to Lower Mainland and Dawson Creek / Chetwynd Area Transmission projects, partially offset by schedule advancements on the Mica Unit 5 and 6 project.
· BC Lottery Corporation — down $35 million mainly reflecting delays in the gaming management system project, replacement of slot machines and other capital programs.
· The remaining commercial Crown corporations accounted for a net $17 million increase in spending, mainly due to scheduling impacts.
Significant capital projects (those with multi-year budgets totaling $50 million or more) are shown in Table 2.9. During 2011/12, $2.8 billion was invested in these larger enterprises that will provide long-term social and economic benefits for the province.
Financing Capital Spending
Provincial capital infrastructure spending is financed through a combination of sources:
· cash balances;
· partnerships with the private sector (public-private partnerships or P3s);
· cost-sharing with partners; and
· borrowing (debt financing).
Chart 2.6 shows that 52 per cent of 2011/12 taxpayer-supported capital spending was financed from direct borrowing, 27 per cent from cash balances and other working capital, 18 per cent from external capital contributions and 3 per cent from public-private partnerships.
2012 Financial and Economic Review — July 2012
46
Chapter 2 — Financial Review
Chart 2.6 Financing taxpayer-supported capital spending
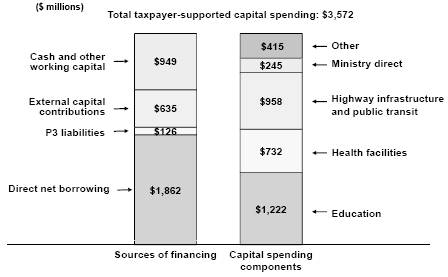
Commercial Crown corporation capital spending of $2.9 billion was financed 75 per cent from direct borrowing ($2.2 billion), and 25 per cent from operating surpluses and cash balances ($0.7 billion).
Provincial Debt
Provincial debt increased $5.0 billion to total $50.2 billion at March 31, 2012, or 23.7 per cent of provincial GDP (see Chart 2.7). Over 84 per cent of debt was incurred to finance capital spending, and 31 per cent is self-supported by the commercial activities of Crown corporations.
Chart 2.7 Provincial debt components
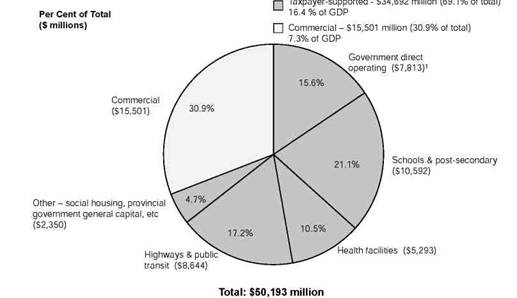
(1) Amount includes debt to finance deficits and borrowing allocated to provincial government general capital expenditures prior to fiscal 08/09 year-end.
2012 Financial and Economic Review — July 2012
47
Chapter 2 — Financial Review
Total debt was $3.2 billion below budget reflecting a lower than expected opening balance, reduced requirements for capital spending and working capital, and a non-utilized forecast allowance; partially offset by a higher than budgeted operating deficit.
Chart 2.8 Debt changes from Budget 2011
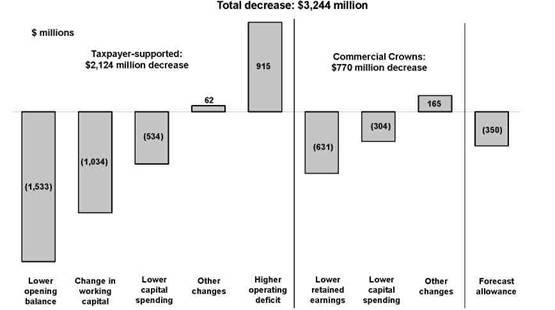
Taxpayer-supported Debt
Taxpayer-supported debt increased by $2.8 billion from the previous year to total $34.7 billion at year-end. This was $2.1 billion below budget, mainly reflecting:
· lower opening balance at March 31, 2011;
· lower borrowing requirements for government’s consolidated revenue fund due to lower cash requirements for working capital;
Chart 2.9 Taxpayer-supported debt to GDP ratio
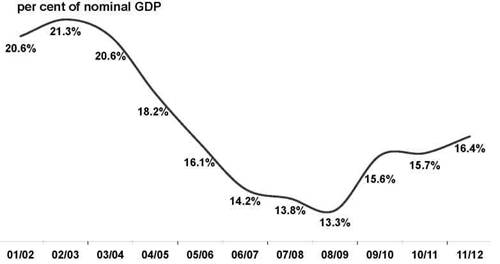
2012 Financial and Economic Review — July 2012
48
Chapter 2 — Financial Review
Table 2.10 Provincial Debt Summary (1)
| | Budget | | Actual | | Actual | |
($ millions) | | 2011 | | 2011/12 | | 2010/11 | |
Taxpayer-supported debt | | | | | | | |
Provincial government direct operating | | 8,763 | | 7,813 | | 6,964 | |
Other taxpayer-supported debt (mainly capital) | | | | | | | |
Education facilities (2) | | 10,717 | | 10,592 | | 10,108 | |
Health facilities (2) | | 5,411 | | 5,293 | | 4,895 | |
Highways and public transit | | 8,883 | | 8,644 | | 8,095 | |
Other (3) | | 3,042 | | 2,350 | | 1,793 | |
Total other taxpayer-supported debt | | 28,053 | | 26,879 | | 24,891 | |
Total taxpayer-supported debt | | 36,816 | | 34,692 | | 31,855 | |
Self-supported debt | | | | | | | |
Commercial Crown corporations and agencies | | 16,271 | | 15,501 | | 13,299 | |
Forecast allowance | | 350 | | — | | — | |
Total provincial debt | | 53,437 | | 50,193 | | 45,154 | |
(1) | Debt is after deduction of sinking funds and unamortized discounts, and excludes accrued interest. Government direct and fiscal agency accrued interest is reported in the government’s accounts as an accounts payable. |
(2) | Includes debt and guarantees incurred by the government on behalf of school districts, universities, colleges and health authorities/hospital societies (SUCH), as well as debt directly incurred by these entities. |
(3) | Includes debt of other taxpayer-supported Crown corporations and agencies and fiscal agency loans to local governments. Also includes student loan guarantees, loan guarantees to agricultural producers, guarantees under economic development and home mortgage assistance programs, and loan guarantee provisions. |
· reduced borrowing for health facilities due to lower than expected capital spending; and
· reduced borrowing for the BC Transportation Financing Authority and BC Transit mainly due to lower capital spending and scheduling changes.
The taxpayer-supported debt to GDP ratio stood at 16.4 per cent, up 0.7 percentage point from 2010/11. This ratio is a measure often used by investors and credit rating agencies when analyzing a province’s ability to manage its debt load. British Columbia’s taxpayer-supported debt to gross domestic product ratio is one of the lowest in Canada, translating into a strong credit rating and lower debt service costs.
Self-supported Debt
Self-supported debt totaled $15.5 billion at March 31, 2012 (7.3 per cent of GDP). Debt at year-end was up $2.2 billion from the previous year primarily to support capital spending on power generation and transmission infrastructure projects; construction of the Port Mann Bridge/Highway 1 project; and BC Lottery Corporation requirements for providing casino cash floats and the planned replacement of slot machines.
Self-supported debt was $0.8 billion below budget mainly due to lower than expected capital spending for power generation infrastructures.
2012 Financial and Economic Review — July 2012
49
Chapter 2 — Financial Review
Debt Indicators
Table 2.11 provides a historical summary of financial indicators depicting the province’s debt position, recent borrowing trends and related interest cost burden.
Table 2.11 Key Debt Indicators — 2007/08 to 2011/12 (1)
| | 2007/08 | | 2008/09 | | 2009/10 | | 2010/11 | | Budget
2011/12 | | Actual
2011/12 | |
Debt to revenue (per cent) | | | | | | | | | | | | | |
Total provincial | | 69.4 | | 78.0 | | 87.5 | | 89.9 | | 100.9 | | 96.5 | |
Taxpayer-supported | | 69.6 | | 71.9 | | 84.0 | | 80.4 | | 92.0 | | 86.9 | |
Debt per capita ($) (2) | | | | | | | | | | | | | |
Total provincial | | 8,037 | | 8,671 | | 9,391 | | 9,968 | | 11,623 | | 10,975 | |
Taxpayer-supported | | 6,170 | | 6,032 | | 6,731 | | 7,033 | | 8,008 | | 7,586 | |
Debt to GDP (per cent) (3) | | | | | | | | | | | | | |
Total provincial | | 18.0 | | 19.1 | | 21.8 | | 22.2 | | 25.4 | | 23.7 | |
Taxpayer-supported | | 13.8 | | 13.3 | | 15.6 | | 15.7 | | 17.5 | | 16.4 | |
Interest bite (cents per dollar of revenue) (4) | | | | | | | | | | | | | |
Total provincial | | 4.0 | | 4.4 | | 4.6 | | 4.3 | | 4.6 | | 4.4 | |
Taxpayer-supported | | 3.9 | | 4.3 | | 4.3 | | 4.0 | | 4.5 | | 4.1 | |
Interest costs ($ millions) | | | | | | | | | | | | | |
Total provincial | | 2,010 | | 2,138 | | 2,206 | | 2,163 | | 2,430 | | 2,291 | |
Taxpayer-supported | | 1,488 | | 1,570 | | 1,535 | | 1,596 | | 1,799 | | 1,625 | |
Interest rate (per cent) (5) | | | | | | | | | | | | | |
Taxpayer-supported | | 5.7 | | 5.9 | | 5.4 | | 5.2 | | 5.1 | | 4.9 | |
Background Information: | | | | | | | | | | | | | |
Revenue ($ millions) | | | | | | | | | | | | | |
Total provincial (6) | | 49,938 | | 48,761 | | 47,858 | | 50,235 | | 52,965 | | 52,018 | |
Taxpayer-supported (7) | | 38,192 | | 36,784 | | 35,748 | | 39,639 | | 40,007 | | 39,903 | |
Total debt ($ millions) | | | | | | | | | | | | | |
Total provincial | | 34,637 | | 38,014 | | 41,885 | | 45,154 | | 53,437 | | 50,193 | |
Taxpayer-supported (8) | | 26,589 | | 26,446 | | 30,021 | | 31,855 | | 36,816 | | 34,692 | |
Provincial GDP ($ millions) (9) | | 192,117 | | 199,441 | | 191,863 | | 203,147 | | 210,071 | | 211,977 | |
Population (thousands at July 1) (10) | | 4,310 | | 4,384 | | 4,460 | | 4,530 | | 4,598 | | 4,573 | |
(1) | Figures for prior years and the 2011/12 budget have been restated to conform with the presentation used for 2011/12 and to include the effects of changes in underlying data and statistics. |
(2) | The ratio of debt to population (e.g. debt at March 31, 2012 divided by population at July 1, 2011). |
(3) | The ratio of debt outstanding at fiscal year end to provincial nominal gross domestic product (GDP) for the calendar year ending in the fiscal year (e.g. debt at March 31, 2012 divided by 2011 GDP). |
(4) | The ratio of interest costs (less sinking fund interest) to revenue. Figures include capitalized interest expense in order to provide a more comparable measure to outstanding debt. |
(5) | Weighted average of all outstanding debt issues. |
(6) | Includes revenue of the consolidated revenue fund (excluding dividends from enterprises) plus revenue of all government organizations and enterprises. |
(7) | Excludes revenue of government enterprises, but includes dividends from enterprises paid to the consolidated revenue fund. |
(8) | Excludes debt of commercial Crown corporations and agencies and funds held under the province’s warehouse borrowing program. |
(9) | Nominal GDP for the calendar year ending in the fiscal year (e.g. GDP for 2011 is used for the fiscal year ended March 31, 2012). As nominal GDP for the calendar year ending in 2011 is not available, the 2011 GDP projected in February 2012 has been used for the fiscal year ended March 31, 2012 for demonstration purposes. |
(10) | Population at July 1st within the fiscal year (e.g. population at July 1, 2011 is used for the fiscal year ended March 31, 2012). |
Further details on provincial debt are provided in Appendix Tables A2.11 to A2.13.
2012 Financial and Economic Review — July 2012
50
Chapter 2 — Financial Review
Credit Rating
A credit rating is an evaluation of a borrower’s ability to pay interest and to repay principal. A credit rating affects the borrower’s debt servicing costs and the investor’s rate of return since an investor will demand a higher interest rate on a higher-risk, lower-rated security. Table 2.12 provides an interprovincial comparison of credit ratings.
Table 2.12 Interprovincial Comparison of Credit Ratings, July 2012
| | Rating Agency(1) |
| | Moody’s Investors | | | | Dominion Bond |
Province | | Service | | Standard & Poor’s | | Rating Service |
British Columbia | | Aaa | | AAA | | AA (High) |
Alberta | | Aaa | | AAA | | AAA |
Saskatchewan | | Aa1 | | AAA | | AA |
Manitoba | | Aa1 | | AA | | A (High) |
Ontario | | Aa2 | | AA- | | AA (Low) |
Quebec | | Aa2 | | A+ | | A (High) |
New Brunswick | | Aa2 | | AA- | | A (High) |
Nova Scotia | | Aa2 | | A+ | | A |
Prince Edward Island | | Aa2 | | A | | A (Low) |
Newfoundland | | Aa2 | | A+ | | A |
(1) | The rating agencies assign letter ratings to borrowers. The major categories, in descending order of credit quality are: AAA/Aaa; AA/Aa; A; BBB/Baa; BB/Ba; and B. The “1”, “2”, “3”, “high”, “low”, “+”, and “-” modifiers show relative standing within the major categories. For example, AA+ exceeds AA and Aa2 exceeds Aa3. |
BC’s fiscal outlook and its record for meeting annual budget targets has resulted in ratings of Aaa and AAA (the highest possible ratings) from Moodys and Standard & Poors respectively, while Dominion Bond Rating Service rates the province at AA (high).
Statement of Financial Position
The provincial government’s statement of financial position is presented on a net liabilities basis (1) (see Table 2.13).
Table 2.13 Net Liabilities and Accumulated Surplus
| | 2011/12 | | | | | |
| | Budget | | | | Actual | | Annual | |
($ millions) | | 2011 | | Actual | | 2010/11 (1) | | Change (2) | |
Financial assets | | 35,999 | | 34,385 | | 32,427 | | 1,958 | |
Less : liabilities | | (71,392 | ) | (70,358 | ) | (64,589 | ) | (5,769 | ) |
Net assets (liabilities) | | (35,393 | ) | (35,973 | ) | (32,162 | ) | (3,811 | ) |
Non-financial assets | | 38,262 | | 38,430 | | 36,785 | | 1,645 | |
Accumulated surplus | | 2,869 | | 2,457 | | 4,623 | | (2,166 | ) |
(1) | Comparative figures have been restated to reflect government accounting policies in effect at March 31, 2012. |
| |
(2) | Change between 2011/12 actual and 2010/11 actual. Change in accumulated surplus includes other comprehensive loss of $326 million in 2011/12, which is not included in the statement of operations. |
(1) | Other jurisdictions refer to this as the “net debt” basis. In British Columbia, the term “net liabilities” is used to avoid confusion with provincial borrowing in financial markets, which is referred to as “debt”. |
2012 Financial and Economic Review — July 2012
51
Chapter 2 — Financial Review
As a result of government operations and capital spending during 2011/12, the province’s financial assets increased by $2.0 billion and liabilities increased by $5.8 billion, resulting in an increase in net liabilities of $3.8 billion. This reflected a $1.6 billion increase in non-financial assets, mainly due to capital outlays, and a $2.2 billion reduction in the accumulated surplus.
The change in financial assets included:
· a $0.2 billion increase in cash balances and temporary investments; and
· a $1.9 billion increase in commercial Crown corporation investments’ reflecting an increase in capital infrastructure investments;
partially offset by
· a $0.1 billion decrease in receivables and miscellaneous investments.
The change in liabilities included:
· a $4.9 billion increase in debt, resulting from capital spending and requirements for direct operations, and a $1.2 billion increase in current liabilities;
partially offset by
· a $0.3 billion decrease in deferred revenue reflecting $0.4 billion decrease in other deferred revenues offsetting by $0.1 billion increase in contributions received from third parties (mainly federal government transfers for highway projects and post-secondary infrastructure).
The change in non-financial assets included an increase of $1.4 billion (net of amortization) in tangible capital assets resulting from investments in healthcare and post-secondary facilities, and improvements to highway infrastructure, a $0.1 billion increase in restricted endowment funds of universities, colleges, school districts, and taxpayer-supported Crown corporations; and a $0.1 billion increase in deferred costs.
Chart 2.10 2011/12 changes in financial position
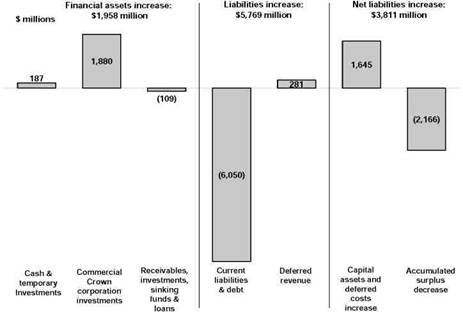
2012 Financial and Economic Review — July 2012
52
Chapter 2 — Financial Review
Further information on the statement of financial position and annual changes can be found in Appendix Tables A2.3 and A2.4. A topic box on the trends over the last 12 years for key indicators of the province’s financial condition is included at the end of this chapter.
Unfunded Pension Liabilities
The province contributes to four defined benefit pension plans (Public Service, Municipal, Teachers’ and College) for many of its employees. These pension plans are managed under joint trusteeship arrangements with the plan members. Under joint trusteeship, the provincial government has no formal claim on plan surpluses or assets; however, government is responsible for 50 per cent of any unfunded liabilities in the Public Service, Teachers’ and College plans and 35 per cent of any unfunded liability in the Municipal plan since the province’s interest in the plan is only 70 per cent.
As a result, government’s balance sheet only includes liabilities for the MLA Superannuation Account, which is not part of a joint trusteeship arrangement, and the government’s share of any unfunded pension liabilities incurred by the four pension plans under the joint trusteeship arrangements (e.g. $107 million under the Teachers’ Pension Plan in 2011/12).
In the event that a plan is determined to be in a deficit position, the pension boards, by agreement, are required to address the deficit through contribution adjustments or other measures. As a result, it is expected that any unfunded pension liability in the future would be short-term in nature. No unfunded liability exists for the future indexing of pensions, as the obligation is limited to the amount of available assets in separate inflation accounts.
The estimated financial positions of each plan (based on extrapolations of the most recent actuarial valuations) as at March 31, 2012 are shown in Table 2.14.
Table 2.14 Pension Plan Balances
| | Pension Plan | | Total | | | |
($ millions) | | Public Service | | Municipal (1) | | Teachers’ (2) | | College | | Other (3) | | 2011/12 | | 2010/11 | |
Accrued benefit obligation | | (14,768 | ) | (18,332 | ) | (16,369 | ) | (2,574 | ) | (574 | ) | (52,617 | ) | (50,048 | ) |
Pension fund assets | | 15,090 | | 17,843 | | 15,195 | | 2,644 | | 522 | | 51,294 | | 49,530 | |
Subtotal | | 322 | | (489 | ) | (1,174 | ) | 70 | | (52 | ) | (1,323 | ) | (518 | ) |
Unamortized actuarial (gain) loss | | 471 | | 1,472 | | 960 | | 177 | | 59 | | 3,139 | | 3,690 | |
Accrued net asset (obligation) | | 793 | | 983 | | (214 | ) | 247 | | 7 | | 1,816 | | 3,172 | |
(1) | The balance shown for the Municipal Pension Plan (MPP) is based on an extrapolation of the December 31, 2009 actuarial valuation. The MPP recently underwent an actuarial valuation that was not completed in time for the Public Accounts. The assessment shows the plan to be in deficit, but the amount of the deficit has yet to be finalized. Government will be making the necessary adjustments to unfunded pension liability in its financial statements once the final amount is known. |
| |
(2) | The government is responsible for 50 per cent of the unfunded pension liability incurred under the Teachers’ Pension Plan and has accrued this liability in its 2011/12 accounts. The liability will be settled in future periods through increased employer contributions. |
| |
(3) | Represents other defined benefit plans, outside of the four main pension plans, which are funded by entities within the government reporting entity. Includes the Retirement Plan for Non-Teaching Employees of the Board of School Trustees of School District No. 43 (Coquitlam), the University of Victoria’s pension plan for employees other than faculty and professional staff, and Simon Fraser University’s Academic Pension Plan and Administrative/Union Pension Plan. |
2012 Financial and Economic Review — July 2012
53
Chapter 2 — Financial Review
Actuarial valuations are performed on the pension plans normally every three years. The pension plans and the dates of their last actuarial valuation are:
· Public Service Pension Plan, March 31, 2011;
· Municipal Pension Plan, December 31, 2009;
· Teachers’ Pension Plan, December 31, 2008; and
· College Pension Plan, August 31, 2009.
Key actuarial assumptions used for valuation purposes are generally conservative. The assumptions currently being used for all of the pension plans are: long-term annual rate of return on fund assets 6.50 per cent and long-term annual salary increase 3.75 per cent.
The pension plans are administered by the BC Pension Corporation in accordance with direction received from the various pension boards. The audited financial statements of each pension plan, along with full descriptions, benefit formulas, inflation assumptions and funding polices may be found on the corporation’s website at www.pensionsbc.ca .
2012 Financial and Economic Review — July 2012
54
Chapter 2 — Financial Review
Review of the Province’s Financial Condition
Introduction
There are several indicators of government financial condition that are grouped into three broad categories:
· | Sustainability — the degree to which government is able to manage spending in order to maintain a manageable debt burden on the economy and meet debt servicing obligations. The indicators in this group include the expenditure to gross domestic product (GDP) ratio, the net liabilities to GDP ratio, the non-financial assets to net liabilities ratio, and public debt charges as a per cent of revenue. |
| |
· | Flexibility — the degree to which a government has positioned itself to be able to respond to rising commitments by creating fiscal room and maintaining infrastructure. The indicators in this group are the own source revenue (i.e. excluding federal transfers) to GDP ratio and annual growth in capital assets. |
| |
· | Vulnerability — the degree to which a government is dependent on sources of funding, or vulnerable to costs, outside its control or influence. The indicators in this group are federal government transfers as a per cent of revenue and unhedged foreign currency debt as a per cent of overall debt. |
Sustainability
Since the economic downturn in 2008, a key feature of government’s plan to bring the budget back into balance has been a management strategy of prudence and spending discipline. From 2008/09 to 2011/12, operating expenses increased an average 3.0 per cent annually, equivalent to the combined impacts of inflation and population growth. This resulted in the size of government activity relative to the size of the economy remaining fairly stable, despite slower economic growth during this period (see Chart 1).
Chart 1 Expenditures to GDP ratio
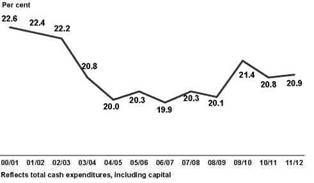
Government’s operating expense management enabled it to inject economic stimulus measures during this period by means of accelerated capital projects without creating an egregious impact on its indebtedness as demonstrated by the net liabilities to GDP ratio (see Chart 2).
Chart 2 Net liabilities to GDP ratio
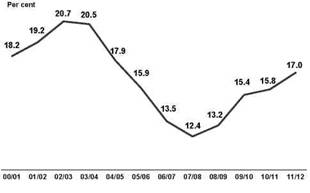
Net liabilities to GDP (1) is similar to the familiar debt to GDP ratio. Net liabilities is a more comprehensive indicator of overall indebtedness as it reflects the fact that government has financial liabilities not included in the debt figures, and also has financial assets available to offset its financial liabilities.
(1) | The CICA, and other jurisdictions, refer to this measure as net debt to GDP. In BC, the term “net debt” has been applied to borrowing from financial markets. |
2012 Financial and Economic Review — July 2012
55
Chapter 2 — Financial Review
The net liabilities to GDP ratio has increased by 5.6 percentage points since 2007/08. Capital expenditures account for 72 per cent (or 3.3 percentage points) of this increase, with the remainder reflecting operating deficits. Capital spending as the primary driver of government borrowing is further demonstrated in Chart 3, which indicates all of government operations to date and 7 per cent of its capital expenditures were funded from operating revenue.
Capital/non-financial assets relative to net liabilities indicates the proportion of government’s net liabilities that were used to acquire capital assets. Ratios less than one-to-one indicate that government’s indebtedness includes the financing of historical and ongoing operations as well as capital assets.
Chart 3 Capital/non-financial assets to net liabilities

By 2007/08, all of government’s operations and 28 per cent of its capital assets were funded from revenue rather than debt, an improvement from the low in 2003/04 where all capital and 21 per cent of operating costs were debt financed. The gradual decline in this indicator over the last four years to the point where revenue funded only 7 per cent of capital reflects the impact of operating deficits incurred during this period despite government’s stimulus measures that maintained capital spending during the economic downturn.
Despite the relatively modest increase in government’s net liabilities, the proportion of revenue used to pay taxpayer-supported interest costs remained fairly constant over the last four years since the economic downturn (see Chart 4). This reflects both a resumption of revenue growth as the economy began to recover and debt refinancing at lower interest rates. The stability in this debt burden means the increase in net liabilities has not impacted government’s ability to sustain its programs.
Chart 4 Debt charges as a per cent of revenue
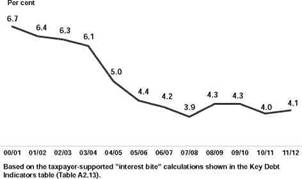
Overall, in the early years of the last decade, government indebtedness was high in relation to the size of the economy; government program spending, financed by debt, resulted in a significant debt servicing cost burden. Beginning in 2004/05, robust economic growth enabled government to reverse this situation to the point that the net liabilities to GDP ratio was reduced by 40 per cent and almost one-third of government’s capital assets had been financed from revenue rather than debt.
Over the last four years, government sought to maintain these gains in sustainability primarily through a management strategy of prudence and spending discipline. While the lingering effects of the 2008 financial crisis has weakened fiscal sustainability, to a large extent government has been successful with its strategy.
Flexibility
While a lower percentage of own source revenue to GDP generally indicates government’s capacity in a stable economic
2012 Financial and Economic Review — July 2012
56
Chapter 2 — Financial Review
environment to raise additional revenue to fund programs and services, this flexibility can be constrained by other factors such as competitiveness relative to other jurisdictions and the impact of the global economic situation on exports.
After a period of relative stability, government’s own source revenue to GDP ratio declined 6.8 per cent in 2008/09, reflecting the impact of the global economic downturn on taxation revenue. During 2009/10, this ratio declined a further 3.0 per cent, as taxation revenue remained weak and commodity prices declined (see Chart 5).
Chart 5 Own-source revenue to GDP ratio
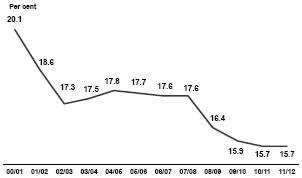
The ratio has remained at this level due to ongoing weakness in natural resource revenue and the lingering impact of the economic downturn on personal and corporate income tax revenue. These ongoing effects have constrained government’s apparent flexibility to raise revenue.
Government’s capital accumulation since 2004/05 has exceeded the combined impacts of inflation and population growth, reflecting an expansion in its capacity to provide services to British Columbians. This accumulation is demonstrated by the annual growth in capital assets (see Chart 6), which is an indicator of whether the provincial government is maintaining the infrastructure that supports program delivery and economic growth (e.g., education and health care facilities, highways and bridges).
Chart 6 Annual growth in capital assets
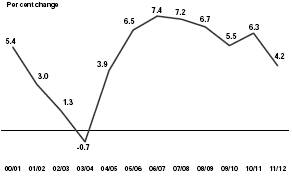
Chart 6 reflects the impact of government initiatives such as the transportation investment plan and increasing capacity in healthcare facilities and post secondary institutes. The decline in the trend over the last four years primarily reflects the broader asset base resulting from the capital program, as capital spending has remained relatively constant during this period.
Over the last eight years, the BC government has positioned itself to be able to respond to the requirements of its citizens for healthcare, education and social services by renewing and expanding the facilities where these programs are housed. Nonetheless, constrained revenue growth continues to limit the flexibility of providing additional services afforded by the expansion of infrastructure.
While taxation revenue had recovered somewhat by 2010/11, reflecting the improvement in BC’s economy, overall own source revenue continues to feel the lingering effects of the global economic downturn, especially on commodity prices. This has a corresponding impact on government’s flexibility to respond to increasing costs, including those driven by demand for services. As a consequence, government is turning to internal savings to fund cost pressures such as a demand by the public sector employees for wage increases.
2012 Financial and Economic Review — July 2012
57
Chapter 2 — Financial Review
Vulnerability
The provincial government receives transfers from the federal government in support of social programs. The majority of this funding (70 per cent) reflects commitments to health and social transfer programs. The remainder mainly reflects funding for the devolution of the delivery federal programs such as immigration and labour market development to the provinces, but may include other payments such as equalization or HST transition funding.
Overall, the importance of federal funding to government’s revenue has increased significantly since 2000/01 (see Chart 7), reflecting pressure on the federal government from provinces to help fund healthcare, education, and transportation infrastructure.
Chart 7 Federal transfers as a per cent of total revenue
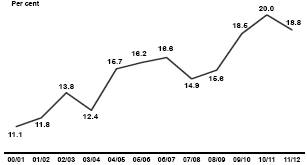
While considered fairly stable, the magnitude of the federal contributions exposes the provinces to the impacts of federal funding decisions, such as the recent one on healthcare funding. As well, the continued availability of federal funding may have an increasing influence on provincial government spending initiatives — especially if the federal funding carries a requirement for the province to provide matching funds.
The provincial government’s debt includes debt borrowed in foreign currencies. In order to protect itself from the impact of foreign exchange rate fluctuations on interest costs for this debt, the government uses financial derivative instruments such as currency swaps and forward contracts as a “hedge” around these risks.
Chart 8 Unhedged foreign currency debt as a per cent of debt
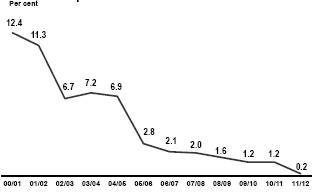
Not all foreign currency debt is protected in this manner. Some commercial Crown corporations with significant revenue derived from US sources, such as BC Hydro, have a natural hedge for their $US denominated debt resulting from their operations. Chart 8 shows that government has virtually eliminated its exposure to foreign exchange rate fluctuations.
Summary
No single indicator, or subset of indicators, gives a complete financial picture of government; rather, they should be reviewed holistically. Government has committed itself to maintaining the sustainability of its programs through an ongoing management strategy of prudence and spending discipline. This strategy is assisted by legislated financial management targets, set out in the Balanced Budget and Ministerial Accountability Act, and the use of three year fiscal plans.
While the lingering impacts from the global economic downturn in 2008 strained this sustainability, in large part government’s strategy has been successful. Government has been able to keep the proportion of revenue
2012 Financial and Economic Review — July 2012
58
Chapter 2 — Financial Review
used for interest costs low, and has limited operating cost growth to 3.0 per cent over the last four years. The increase in net indebtedness relative to the economy is primarily due to government’s expanded capital program, which served as a stimulus measure during the economic downturn and provides for future economic growth.
However, while government can sustain existing programs, it has limited flexibility to respond to demand for new programs or public sector wage increases. Own source revenue has not fully recovered, as demonstrated by an own source revenue to GDP ratio that is below previous norms (reflecting decreases that did not result from policy decisions). Furthermore, the federal government has moved to limit the annual increases in funding for healthcare and social services.
Nonetheless, government’s fiscal situation remains relatively sound, and the own source revenue situation should continue to improve with the economy. With net liabilities to GDP at 17 per cent and a continuing commitment to fiscal management targets, government is on a fiscally sustainable track and has retained sufficient flexibility to meet future challenges.
2012 Financial and Economic Review — July 2012
59
| Appendix 2 |
| |
| Financial Review |
2012 Financial and Economic Review — July 2012
Appendix 2 — Financial Review
Government’s Financial Statements
Government Reporting Entity
The provincial government conducts its activities through:
· ministries;
· service delivery agencies;
· the SUCH sector (school districts; universities; colleges, university colleges and institutes; and health authorities and hospital societies); and
· commercial Crown corporations.
The accounts relating to the ministries and other direct activities of government are contained in the Consolidated Revenue Fund (CRF), whose financial results are reported as a separate entity in the Public Accounts. The CRF comprises all money over which the legislature has direct power of appropriation. The operations of service delivery agencies, the SUCH sector entities and commercial Crown corporations are recorded in their own financial statements, which are subject to audit by the Auditor General or by private sector auditors.
The relationship between the Legislature and government’s service delivery agencies, including the SUCH sector, and commercial Crown corporations is guided by either legislation or governance agreements between the boards of directors and their responsible ministers. In general, government is moving towards adopting governance agreements as its primary guide for these relationships.
According to generally accepted accounting principles (GAAP) for senior governments as established by the Public Sector Accounting Board (PSAB) of the Canadian Institute of Chartered Accountants, the province’s financial reporting consolidates the financial results of all these entities into a single set of financial statements. The provincial government publishes its financial statements annually in the Public Accounts.
Compliance with GAAP
British Columbia’s Budget Transparency and Accountability Act (BTAA) requires all financial documents produced by the province under that legislation to fully comply with GAAP. Compliance with this requirement began with the February 2004 budget and was completed in the 2004/05 Public Accounts.
Under GAAP, the CRF must be converted from a net basis to provide gross revenues and expenses. Next, service delivery agencies are consolidated with the CRF on a line-by-line basis for both the income statement and balance sheet. Commercial Crown corporations (1) are disclosed on a modified equity basis — i.e., their net income is reported as revenue and their retained earnings as an investment.
Where the accounting policies of service delivery agencies differ from those used by the central government in preparing its own consolidated revenue fund financial statements, the service delivery agency financial statements are adjusted to conform to government’s accounting policies.
(1) Crown corporations are considered commercial if the majority of their operating revenue comes from non-government sources, and their operating revenue is sufficient to cover operating and debt service costs without the need for government grants or other forms of assistance. Otherwise they are included with the service delivery agencies.
2012 Financial and Economic Review — July 2012
63
Appendix 2 — Financial Review
The full text of government’s significant accounting policies can be found in Note 1 to the Consolidated Summary Financial Statements in the 2011/12 Public Accounts.
British Columbia is a leader in complying with GAAP and is recognized for the transparency of its budget and financial reports. However, recent pronouncements by PSAB, including its broad acceptance of International Financial Reporting Standards (IFRS) as GAAP for commercial Crown corporations, have given British Columbia’s government pause due to unresolved issues with IFRS — especially in the area of regulatory accounting.
As a result, the government of British Columbia recently passed legislation that authorizes Treasury Board to adopt different standards than those promoted by PSAB in order to ensure that British Columbia’s financial reporting reflects the policy framework within which the Crown corporations and agencies operate. Any alternate standard adopted by Treasury Board must come from other areas of Canadian GAAP, or from a widely-accepted accredited accounting standard setting body in another jurisdiction (e.g. the US Financial Accounting Standards Board).
2011/12 Public Accounts Audit Qualification
The Auditor General disagreed with BC’s Comptroller General on the application of Canadian GAAP in the 20011/12 Public Accounts in four areas:
· treatment of the Transportation Investment Corporation (TI Corp) as a taxpayer-supported entity rather than a commercial Crown corporation (i.e., government business enterprise) — government bases its accounting treatment on the multi-year business case for the project rather than annual financial results during the construction phase of the project;
· expensing deep-well royalty credits when earned by natural gas producers instead of netting them from revenue when the well becomes operational royalties become payable — government coordinates its accounting treatment with accepted accounting practice in other Canadian jurisdictions for comparability purposes;
· deferral of external capital contributions over the construction period of the assets or in accordance with stipulations imposed by the contributor rather than over the useful life of the asset — government feels PSAB guidance still supports deferral over the useful life of the asset; and
· disclosure of financial information of wholly-owned commercial subsidiaries of taxpayer-supported entities in the notes and supplementary schedules on commercial Crown corporations — government has no direct ownership of these subsidiaries and feels there is sufficient disclosure in the financial statements of the individual parent entities.
The following table shows the impact the Auditor General’s qualifications would have had on the 2011/12 Public Accounts if government had adopted his approach in these areas.
2012 Financial and Economic Review — July 2012
64
Appendix 2 — Financial Review
Financial Statement Impact of Auditor General Qualifications
| | | | Royalty | | Capital | | Disclosure of | | | |
| | TI Corp | | credits | | contributions | | subsidiaries | | Total | |
| | ($ millions) | |
Tangible capital assets | | 2,331 | | nil | | nil | | nil | | 2,331 | |
increase (decrease) | | | | | | | | | | | |
Net liabilities | | 2,428 | | 702 | | (279 | ) | nil | | 2,851 | |
increase (decrease) | | | | | | | | | | | |
Surplus (deficit) | | (97 | ) | (702 | ) | 279 | | nil | | (520 | ) |
The full text of the Auditor General’s opinion and the comments of the Comptroller General of British Columbia can be found in the 2011/12 Public Accounts.
Supplementary Schedules
The following tables provide multi-year financial information on the government of British Columbia including operating results and financial position, as well as details on revenue, expense, debt and capital spending.
2012 Financial and Economic Review — July 2012
65
Appendix 2 — Financial Review
Table A2.1 2011/12 Forecasts — Year in Review
| | Q1 | | Q2 | | Q3 | | Q4 | | Total | |
($ millions) | | Update | | Update | | Update | | Update | | Changes | |
2011/12 deficit — Budget 2011 Fiscal Plan (May 3, 2011) | | (925 | ) | | | | | | | (925 | ) |
2011/12 deficit — first Quarterly Report (September 8, 2011) | | | | (2,778 | ) | | | | | | |
2011/12 deficit — second Quarterly Report (November 28, 2011) | | | | | | (3,091 | ) | | | | |
2011/12 deficit — third Quarterly Report (February 21, 2012) | | | | | | | | (2,497 | ) | | |
Revenue changes: | | | | | | | | | | | |
Personal income tax — mainly improved 2010 results | | 32 | | 23 | | (36 | ) | 46 | | 65 | |
Corporate income tax — reflects higher prior-year taxes, changes in federal government instalments and weaker 2010 results | | 215 | | (111 | ) | (51 | ) | 5 | | 58 | |
Harmonized sales tax and other sales taxes — improved 2010 and year-to-date results, partially offset by higher rebates | | 56 | | 10 | | (50 | ) | (23 | ) | (7 | ) |
Property transfer tax — higher year-to-date results | | 50 | | 50 | | 25 | | 9 | | 134 | |
Fuel and carbon taxes — weaker year-to-date results | | 20 | | (45 | ) | 10 | | (12 | ) | (27 | ) |
Other tax sources | | (7 | ) | (1 | ) | 1 | | (27 | ) | (34 | ) |
Natural gas royalties — mainly reduced price outlook and lower volumes | | (34 | ) | (32 | ) | (14 | ) | (28 | ) | (108 | ) |
Coal, metals and minerals — mainly higher mining costs, partially offset by coal and metals price increases | | (85 | ) | 31 | | (1 | ) | (55 | ) | (110 | ) |
Forests — mainly lower stumpage rates and border tax collections, partially offset by improved harvest volumes | | (32 | ) | (18 | ) | (19 | ) | 25 | | (44 | ) |
Columbia River Treaty electricity sales — mainly lower electricity prices | | (20 | ) | (10 | ) | — | | (10 | ) | (40 | ) |
Other natural resources | | 2 | | (17 | ) | 20 | | 8 | | 13 | |
Fees and licenses | | 55 | | (69 | ) | 21 | | 11 | | 18 | |
Investment earnings — mainly the effects of volatile equity and financial markets | | (22 | ) | (41 | ) | 3 | | 65 | | 5 | |
Miscellaneous revenue — delay in the completion date of the sale of Little Mountain property, partially offset by improved SUCH sector revenue | | (198 | ) | 8 | | 58 | | 4 | | (128 | ) |
Health and social transfers — mainly lower population share | | (21 | ) | (6 | ) | 2 | | 11 | | (14 | ) |
Other federal government transfers | | 46 | | 71 | | (7 | ) | 31 | | 141 | |
Commercial Crown agencies operating results: | | | | | | | | | | | |
BC Hydro - impact of government direction on revenue requirements application | | — | | — | | — | | (53 | ) | (53 | ) |
Liquor Distribution Branch — Impact of lower sales and consumer trends | | (26 | ) | — | | — | | 10 | | (16 | ) |
BC Lottery Corporation — reflects revenue changes and operating cost savings | | (33 | ) | 5 | | — | | 31 | | 3 | |
ICBC — mainly higher claims costs and lower investment income | | (141 | ) | (149 | ) | 140 | | (38 | ) | (188 | ) |
Other commercial Crown agencies changes | | (21 | ) | (2 | ) | (1 | ) | 17 | | (7 | ) |
Revenue changes before HST transition repayment | | (164 | ) | (303 | ) | 101 | | 27 | | (339 | ) |
Liabilty for 2011 HST transition funding repayment — report as an expense | | (580 | ) | 580 | | — | | — | | — | |
Total revenue changes | | (744 | ) | 277 | | 101 | | 27 | | (339 | ) |
Less: expense increases (decreases): | | | | | | | | | | | |
Consolidated Revenue Fund changes: | | | | | | | | | | | |
Ministry operating savings — mianly lower Ministry of Health program costs | | — | | — | | (111 | ) | (110 | ) | (221 | ) |
Statutory spending — mainly emergency program flood-related costs | | 17 | | 30 | | 14 | | 22 | | 83 | |
Unallocated Contingencies and New Programs Vote | | — | | — | | — | | (137 | ) | (137 | ) |
Management of public debt (net) — mainly lower debt balances | | (19 | ) | (34 | ) | (31 | ) | (27 | ) | (111 | ) |
Liability adjustments (prior year over accruals) | | — | | — | | (24 | ) | (75 | ) | (99 | ) |
Increase (decrease) in spending funded by third party recoveries | | 70 | | (25 | ) | 43 | | (50 | ) | 38 | |
(Increase) decrease in operating transfers to service delivery agencies | | (167 | ) | 45 | | (13 | ) | (56 | ) | (191 | ) |
Changes in spending profile of service delivery agencies: | | | | | | | | | | | |
School districts — teacher strike action savings | | 13 | | — | | 6 | | (32 | ) | (13 | ) |
Universities — changes in spending related to federal research grants offset by lower operating costs | | 48 | | 13 | | (32 | ) | (102 | ) | (73 | ) |
Colleges — spending related to higher student enrolment | | 21 | | 4 | | 9 | | (2 | ) | 32 | |
Health authorities and hospital societies — higher demand for healthcare services | | 138 | | 7 | | (42 | ) | 24 | | 127 | |
Other service delivery agencies | | (31 | ) | (30 | ) | (12 | ) | (35 | ) | (108 | ) |
Expense increases (decreases) before HST transition repayment | | 90 | | 10 | | (193 | ) | (580 | ) | (673 | ) |
Liability for reimbursement of HST transition funding | | 1,019 | | 580 | | — | | — | | 1,599 | |
Total expense increases (decreases) | | 1,109 | | 590 | | (193 | ) | (580 | ) | 926 | |
Reduction in forecast allowance | | — | | — | | 300 | | 50 | | 350 | |
Total changes | | (1,853 | ) | (313 | ) | 594 | | 657 | | (915 | ) |
2011/12 deficit — first Quarterly Report | | (2,778 | ) | | | | | | | | |
2011/12 deficit — second Quarterly Report | | | | (3,091 | ) | | | | | | |
2011/12 deficit — third Quarterly Report | | | | | | (2,497 | ) | | | | |
2011/12 deficit — Public Accounts | | | | | | | | (1,840 | ) | (1,840 | ) |
2012 Financial and Economic Review — July 2012
66
Appendix 2 — Financial Review
Table A2.2 Operating Statement — 2000/01 to 2011/12 (1)
| | | | | | | | | | | | | | | | | | | | | | | | | | Average | |
| | Actual | | Actual | | Actual | | Actual | | Actual | | Actual | | Actual | | Actual | | Actual | | Actual | | Actual | | Actual | | annual | |
($ millions) | | 2000/01 | | 2001/02 | | 2002/03 | | 2003/04 | | 2004/05 | | 2005/06 | | 2006/07 | | 2007/08 | | 2008/09 | | 2009/10 | | 2010/11 | | 2011/12 | | change | |
| | | | | | | | | | | | | | | | | | | | | | | | | | (per cent) | |
Revenue | | 29,689 | | 28,169 | | 27,761 | | 29,141 | | 33,340 | | 35,908 | | 38,429 | | 39,738 | | 38,299 | | 37,463 | | 39,950 | | 40,998 | | 3.0 | |
Expense | | (28,497 | ) | (29,226 | ) | (30,409 | ) | (30,495 | ) | (30,664 | ) | (32,945 | ) | (34,456 | ) | (36,997 | ) | (38,216 | ) | (39,290 | ) | (40,199 | ) | (42,838 | ) | 3.8 | |
Surplus/(deficit) | | 1,192 | | (1,057 | ) | (2,648 | ) | (1,354 | ) | 2,676 | | 2,963 | | 3,973 | | 2,741 | | 83 | | (1,827 | ) | (249 | ) | (1,840 | ) | | |
Accumulated surplus (deficit) beginning of year, excluding other comprehensive income | | (2,219 | ) | (1,027 | ) | (2,084 | ) | (4,732 | ) | (6,086 | ) | (3,410 | ) | (447 | ) | 3,526 | | 6,267 | | 6,350 | | 4,523 | | 4,274 | | | |
Accumulated surplus (defict) before other comprehensive income | | (1,027 | ) | (2,084 | ) | (4,732 | ) | (6,086 | ) | (3,410 | ) | (447 | ) | 3,526 | | 6,267 | | 6,350 | | 4,523 | | 4,274 | | 2,434 | | | |
Accumulated other comprehensive income of commercial Crown corporations | | — | | — | | — | | — | | — | | — | | 494 | | 412 | | (20 | ) | 459 | | 349 | | 23 | | | |
Accumulated surplus (deficit), end of year | | (1,027 | ) | (2,084 | ) | (4,732 | ) | (6,086 | ) | (3,410 | ) | (447 | ) | 4,020 | | 6,679 | | 6,330 | | 4,982 | | 4,623 | | 2,457 | | | |
| | | | | | | | | | | | | | | | | | | | | | | | | | | |
Per cent of Nominal GDP: (2) | | | | | | | | | | | | | | | | | | | | | | | | | | | |
Surplus (deficit) | | 0.9 | | -0.8 | | -1.9 | | -0.9 | | 1.7 | | 1.7 | | 2.2 | | 1.4 | | 0.0 | | -1.0 | | -0.1 | | -0.9 | | | |
Per cent of revenue: | | | | | | | | | | | | | | | | | | | | | | | | | | | |
Surplus (deficit) | | 4.0 | | -3.8 | | -9.5 | | -4.6 | | 8.0 | | 8.3 | | 10.3 | | 6.9 | | 0.2 | | -4.9 | | -0.6 | | -4.5 | | | |
Per capita: (3) | | | | | | | | | | | | | | | | | | | | | | | | | | | |
Surplus (deficit) | | 295 | | (259 | ) | (646 | ) | (328 | ) | 644 | | 706 | | 936 | | 636 | | 19 | | (410 | ) | (55 | ) | (402 | ) | | |
(1) Figures have been restated to reflect government accounting policies in effect at March 31, 2012.
(2) Revenue and expense as a per cent of GDP is calculated using GDP for the calendar year ending in the fiscal year (e.g. 2011/12 amounts divided by GDP for the 2011 calendar year). As nominal GDP for the calendar year ending 2011 is not available, the 2011 GDP projected in February 2012 has been used for the fiscal year ended March 31, 2012 for demonstration purposes.
(3) Per capita revenue and expense is calculated using July 1 population (e.g. 2011/12 amounts divided by population on July 1, 2011).
2012 Financial and Economic Review — July 2012
67
Appendix 2 — Financial Review
Table A2.3 Statement of Financial Position — 2000/01 to 2011/12
| | Actual | | Actual | | Actual | | Actual | | Actual | | Actual | | Actual | | Actual | | Actual | | Actual | | Actual | | Actual | | Average
annual | |
($ millions) | | 2000/01 | | 2001/02 | | 2002/03 | | 2003/04 | | 2004/05 | | 2005/06 | | 2006/07 | | 2007/08 | | 2008/09 | | 2009/10 | | 2010/11 | | 2011/12 | | change | |
| | | | | | | | | | | | | | | | | | | | | | | | | | (per cent) | |
Financial assets: | | | | | | | | | | | | | | | | | | | | | | | | | | | |
Cash and temporary investments | | 1,970 | | 2,487 | | 2,652 | | 2,725 | | 3,623 | | 3,864 | | 3,434 | | 5,936 | | 5,168 | | 2,901 | | 3,052 | | 3,239 | | 4.6 | |
Other financial assets | | 5,199 | | 5,065 | | 4,722 | | 5,653 | | 5,930 | | 6,220 | | 7,064 | | 7,188 | | 6,205 | | 7,511 | | 8,323 | | 8,133 | | 4.2 | |
Sinking funds | | 6,000 | | 5,518 | | 5,074 | | 4,619 | | 4,516 | | 4,059 | | 3,798 | | 2,649 | | 2,134 | | 1,329 | | 1,410 | | 1,491 | | -11.9 | |
Investments in commercial Crown corporations: | | | | | | | | | | | | | | | | | | | | | | | | | | | |
Retained earnings | | 2,617 | | 2,280 | | 2,457 | | 2,875 | | 3,025 | | 3,308 | | 4,307 | | 4,972 | | 5,579 | | 7,075 | | 6,695 | | 6,676 | | 8.9 | |
Recoverable capital loans | | 7,111 | | 7,246 | | 7,231 | | 7,512 | | 6,901 | | 6,916 | | 7,170 | | 7,719 | | 9,149 | | 11,471 | | 12,947 | | 14,846 | | 6.9 | |
| | 9,728 | | 9,526 | | 9,688 | | 10,387 | | 9,926 | | 10,224 | | 11,477 | | 12,691 | | 14,728 | | 18,546 | | 19,642 | | 21,522 | | 7.5 | |
Warehouse borrowing program assets | | 1,312 | | 1,067 | | — | | — | | — | | — | | — | | — | | 2,081 | | — | | — | | — | | n/a | |
| | 24,209 | | 23,663 | | 22,136 | | 23,384 | | 23,995 | | 24,367 | | 25,773 | | 28,464 | | 30,316 | | 30,287 | | 32,427 | | 34,385 | | 3.2 | |
Liabilities: | | | | | | | | | | | | | | | | | | | | | | | | | | | |
Accounts payable & accrued liabilities | | 6,790 | | 5,730 | | 6,101 | | 7,105 | | 6,886 | | 7,454 | | 7,236 | | 8,087 | | 7,420 | | 7,013 | | 7,628 | | 8,833 | | 2.4 | |
Deferred revenue | | 2,178 | | 2,454 | | 3,117 | | 4,144 | | 5,351 | | 5,912 | | 6,249 | | 7,475 | | 9,496 | | 10,083 | | 10,852 | | 10,571 | | 15.4 | |
Debt: | | | | | | | | | | | | | | | | | | | | | | | | | | | |
Taxpayer-supported debt | | 25,104 | | 27,514 | | 29,383 | | 30,014 | | 28,668 | | 27,251 | | 25,968 | | 26,589 | | 26,446 | | 30,021 | | 31,855 | | 34,692 | | 3.0 | |
Self-supported debt | | 8,684 | | 8,568 | | 7,474 | | 7,761 | | 7,201 | | 7,206 | | 7,471 | | 8,048 | | 11,568 | | 11,864 | | 13,299 | | 15,501 | | 5.4 | |
Total provincial debt | | 33,788 | | 36,082 | | 36,857 | | 37,775 | | 35,869 | | 34,457 | | 33,439 | | 34,637 | | 38,014 | | 41,885 | | 45,154 | | 50,193 | | 3.7 | |
Add: | debt offset by sinking funds | | 6,000 | | 5,518 | | 5,074 | | 4,619 | | 4,515 | | 4,059 | | 3,798 | | 2,649 | | 2,134 | | 1,329 | | 1,410 | | 1,491 | | -11.9 | |
Less: | guarantees and non-guaranteed debt | | (602 | ) | (486 | ) | (440 | ) | (457 | ) | (479 | ) | (475 | ) | (436 | ) | (477 | ) | (480 | ) | (527 | ) | (455 | ) | (730 | ) | 1.8 | |
Financial statement debt | | 39,186 | | 41,114 | | 41,491 | | 41,937 | | 39,905 | | 38,041 | | 36,801 | | 36,809 | | 39,668 | | 42,687 | | 46,109 | | 50,954 | | 2.4 | |
| | 48,154 | | 49,298 | | 50,709 | | 53,186 | | 52,142 | | 51,407 | | 50,286 | | 52,371 | | 56,584 | | 59,783 | | 64,589 | | 70,358 | | 3.5 | |
Net liabilities | | (23,945 | ) | (25,635 | ) | (28,573 | ) | (29,802 | ) | (28,147 | ) | (27,040 | ) | (24,513 | ) | (23,907 | ) | (26,268 | ) | (29,496 | ) | (32,162 | ) | (35,973 | ) | 3.8 | |
Capital and other assets: | | | | | | | | | | | | | | | | | | | | | | | | | | | |
Tangible capital assets | | 21,750 | | 22,397 | | 22,677 | | 22,508 | | 23,397 | | 24,926 | | 26,767 | | 28,698 | | 30,612 | | 32,291 | | 34,337 | | 35,763 | | 4.6 | |
Restricted assets | | 677 | | 708 | | 739 | | 771 | | 830 | | 937 | | 1,012 | | 1,180 | | 1,228 | | 1,291 | | 1,362 | | 1,452 | | | |
Other assets | | 491 | | 446 | | 425 | | 437 | | 510 | | 730 | | 754 | | 708 | | 758 | | 896 | | 1,086 | | 1,215 | | 8.6 | |
| | 22,918 | | 23,551 | | 23,841 | | 23,716 | | 24,737 | | 26,593 | | 28,533 | | 30,586 | | 32,598 | | 34,478 | | 36,785 | | 38,430 | | 4.8 | |
Accumulated surplus (deficit) | | (1,027 | ) | (2,084 | ) | (4,732 | ) | (6,086 | ) | (3,410 | ) | (447 | ) | 4,020 | | 6,679 | | 6,330 | | 4,982 | | 4,623 | | 2,457 | | n/a | |
Per cent of Nominal GDP: (1) | | | | | | | | | | | | | | | | | | | | | | | | | | | |
Net liabilities | | 18.2 | | 19.2 | | 20.7 | | 20.5 | | 17.9 | | 15.9 | | 13.5 | | 12.4 | | 13.2 | | 15.4 | | 15.8 | | 17.0 | | -0.6 | |
Capital and other assets | | 17.5 | | 17.6 | | 17.3 | | 16.3 | | 15.7 | | 15.7 | | 15.7 | | 15.9 | | 16.3 | | 18.0 | | 18.1 | | 18.1 | | 0.3 | |
Growth rates: | | | | | | | | | | | | | | | | | | | | | | | | | | | |
Net liabilities | | -200.0 | | 7.1 | | 11.5 | | 4.3 | | -5.6 | | -3.9 | | -9.3 | | -2.5 | | 9.9 | | 12.3 | | 9.0 | | 11.8 | | 4.1 | |
Capital and other assets | | 5.4 | | 2.8 | | 1.2 | | -0.5 | | 4.3 | | 7.5 | | 7.3 | | 7.2 | | 6.6 | | 5.8 | | 6.7 | | 4.5 | | 4.8 | |
Per capita: (2) | | | | | | | | | | | | | | | | | | | | | | | | | | | |
Net liabilities | | 5,928 | | 6,289 | | 6,972 | | 7,229 | | 6,774 | | 6,443 | | 5,776 | | 5,547 | | 5,992 | | 6,613 | | 7,100 | | 7,866 | | 2.6 | |
Capital and other assets | | 5,674 | | 5,778 | | 5,817 | | 5,753 | | 5,953 | | 6,337 | | 6,724 | | 7,097 | | 7,436 | | 7,730 | | 8,121 | | 8,403 | | 3.6 | |
(1) | Net liabilities as a per cent of GDP is calculated using GDP for the calendar year ending in the fiscal year (e.g. 2011/12 amount divided by GDP for the 2011 calendar year). As nominal GDP for the calendar year ending 2011 is not available, the 2011 GDP projected in February 2012 has been used for the fiscal year ended March 31, 2012 for demonstration purposes. |
(2) | Per capita net liabilities is calculated using July 1 population (e.g. 2011/12 amount divided by population on July 1, 2011). |
2012 Financial and Economic Review — July 2012
68
Appendix 2 — Financial Review
Table A2.4 Changes in Financial Position — 2001/02 to 2011/12
| | Actual | | Actual | | Actual | | Actual | | Actual | | Actual | | Actual | | Actual | | Actual | | Actual | | Actual | | 11-Year | |
($ millions) | | 2001/02 | | 2002/03 | | 2003/04 | | 2004/05 | | 2005/06 | | 2006/07 | | 2007/08 | | 2008/09 | | 2009/10 | | 2010/11 | | 2011/12 | | Total | |
(Surplus) deficit for the year | | 1,057 | | 2,648 | | 1,354 | | (2,676 | ) | (2,963 | ) | (3,973 | ) | (2,741 | ) | (83 | ) | 1,827 | | 249 | | 1,840 | | (3,461 | ) |
Comprehensive income (increase) decrease | | — | | — | | — | | — | | — | | (494 | ) | 82 | | 432 | | (479 | ) | 110 | | 326 | | (23 | ) |
Change in accumulated (surplus) deficit | | 1,057 | | 2,648 | | 1,354 | | (2,676 | ) | (2,963 | ) | (4,467 | ) | (2,659 | ) | 349 | | 1,348 | | 359 | | 2,166 | | (3,484 | ) |
Capital and other asset changes: | | | | | | | | | | | | | | | | | | | | | | | | | |
Taxpayer-supported capital investments | | 2,093 | | 1,900 | | 2,072 | | 2,358 | | 3,142 | | 3,404 | | 3,667 | | 3,771 | | 3,722 | | 4,111 | | 3,572 | | 33,812 | |
Less: amortization and other accounting changes | | (1,446 | ) | (1,620 | ) | (2,241 | ) | (1,469 | ) | (1,613 | ) | (1,563 | ) | (1,736 | ) | (1,857 | ) | (2,043 | ) | (2,065 | ) | (2,146 | ) | (19,799 | ) |
Increase in net capital assets | | 647 | | 280 | | (169 | ) | 889 | | 1,529 | | 1,841 | | 1,931 | | 1,914 | | 1,679 | | 2,046 | | 1,426 | | 14,013 | |
Increase (decrease) in restricted assets | | 31 | | 31 | | 32 | | 59 | | 107 | | 75 | | 168 | | 48 | | 63 | | 71 | | 90 | | | |
Increase (decrease) in other assets | | (45 | ) | (21 | ) | 12 | | 73 | | 220 | | 24 | | (46 | ) | 50 | | 138 | | 190 | | 129 | | 724 | |
| | 633 | | 290 | | (125 | ) | 1,021 | | 1,856 | | 1,940 | | 2,053 | | 2,012 | | 1,880 | | 2,307 | | 1,645 | | 15,512 | |
Increase (decrease) in net liabilities | | 1,690 | | 2,938 | | 1,229 | | (1,655 | ) | (1,107 | ) | (2,527 | ) | (606 | ) | 2,361 | | 3,228 | | 2,666 | | 3,811 | | 12,028 | |
Investment and working capital changes: | | | | | | | | | | | | | | | | | | | | | | | | | |
Increase (reduction) in cash and temporary investments | | 517 | | 165 | | 73 | | 898 | | 241 | | (430 | ) | 2,502 | | (768 | ) | (2,267 | ) | 151 | | 187 | | 1,269 | |
Increase (decrease) in warehouse borrowing investments | | (245 | ) | (1,067 | ) | — | | — | | — | | — | | — | | 2,081 | | (2,081 | ) | — | | — | | (1,312 | ) |
Investment in commercial Crown corporations: | | | | | | | | | | | | | | | | | | | | | | | | | |
Increase (decrease) in retained earnings | | (337 | ) | 177 | | 418 | | 150 | | 283 | | 999 | | 665 | | 607 | | 1,496 | | (380 | ) | (19 | ) | 4,059 | |
Self-supported capital investments | | 891 | | 882 | | 783 | | 776 | | 805 | | 983 | | 1,296 | | 1,809 | | 3,353 | | 2,481 | | 2,947 | | 17,006 | |
Less: loan repayments and other accounting changes | | (756 | ) | (897 | ) | (502 | ) | (1,387 | ) | (790 | ) | (729 | ) | (747 | ) | (379 | ) | (1,031 | ) | (1,005 | ) | (1,048 | ) | (9,271 | ) |
| | (202 | ) | 162 | | 699 | | (461 | ) | 298 | | 1,253 | | 1,214 | | 2,037 | | 3,818 | | 1,096 | | 1,880 | | 11,794 | |
Other working capital changes | | 168 | | (1,821 | ) | (1,555 | ) | (814 | ) | (1,296 | ) | 464 | | (3,102 | ) | (2,852 | ) | 321 | | (491 | ) | (1,033 | ) | (12,011 | ) |
| | 238 | | (2,561 | ) | (783 | ) | (377 | ) | (757 | ) | 1,287 | | 614 | | 498 | | (209 | ) | 756 | | 1,034 | | (260 | ) |
Increase (decrease) in financial statement debt | | 1,928 | | 377 | | 446 | | (2,032 | ) | (1,864 | ) | (1,240 | ) | 8 | | 2,859 | | 3,019 | | 3,422 | | 4,845 | | 11,768 | |
(Increase) decrease in sinking fund debt | | 482 | | 444 | | 455 | | 104 | | 456 | | 261 | | 1,149 | | 515 | | 805 | | (81 | ) | (81 | ) | 4,509 | |
Increase (decrease) in guarantees and non-guaranteed debt | | (116 | ) | (46 | ) | 17 | | 22 | | (4 | ) | (39 | ) | 41 | | 3 | | 47 | | (72 | ) | 275 | | 128 | |
Increase (decrease) in total provincial debt | | 2,294 | | 775 | | 918 | | (1,906 | ) | (1,412 | ) | (1,018 | ) | 1,198 | | 3,377 | | 3,871 | | 3,269 | | 5,039 | | 16,405 | |
Represented by increase (decrease) in: | | | | | | | | | | | | | | | | | | | | | | | | | |
Taxpayer-supported debt | | 2,410 | | 1,869 | | 631 | | (1,346 | ) | (1,417 | ) | (1,283 | ) | 621 | | (143 | ) | 3,575 | | 1,834 | | 2,837 | | 9,588 | |
Self-supported debt | | (116 | ) | (1,094 | ) | 287 | | (560 | ) | 5 | | 265 | | 577 | | 3,520 | | 296 | | 1,435 | | 2,202 | | 6,817 | |
Total provincial debt | | 2,294 | | 775 | | 918 | | (1,906 | ) | (1,412 | ) | (1,018 | ) | 1,198 | | 3,377 | | 3,871 | | 3,269 | | 5,039 | | 16,405 | |
2012 Financial and Economic Review — July 2012
69
Appendix 2 — Financial Review
Table A2.5 Revenue by Source — 2000/01 to 2011/12 (1)
| | Actual | | Actual | | Actual | | Actual | | Actual | | Actual | | Actual | | Actual | | Actual | | Actual | | Actual | | Actual | | Average
annual | |
($ millions) | | 2000/01 | | 2001/02 | | 2002/03 | | 2003/04 | | 2004/05 | | 2005/06 | | 2006/07 | | 2007/08 | | 2008/09 | | 2009/10 | | 2010/11 | | 2011/12 | | change | |
| | | | | | | | | | | | | | | | | | | | | | | | | | (per cent) | |
Taxation revenue: | | | | | | | | | | | | | | | | | | | | | | | | | | | |
Personal income | | 5,963 | | 5,366 | | 4,150 | | 4,877 | | 5,050 | | 5,838 | | 6,905 | | 6,956 | | 6,093 | | 5,529 | | 5,361 | | 5,861 | | -0.2 | |
Corporate income | | 1,054 | | 1,522 | | 612 | | 775 | | 1,255 | | 1,426 | | 1,538 | | 2,250 | | 2,038 | | 1,317 | | 1,658 | | 1,629 | | 4.0 | |
Harmonized sales | | — | | — | | — | | — | | — | | — | | — | | — | | — | | — | | 4,176 | | 5,779 | | n/a | |
Other sales | | 3,742 | | 3,682 | | 3,928 | | 4,140 | | 4,282 | | 4,480 | | 4,857 | | 5,220 | | 5,101 | | 4,893 | | 1,418 | | 150 | | n/a | |
Fuel | | 715 | | 659 | | 687 | | 875 | | 904 | | 911 | | 901 | | 935 | | 891 | | 884 | | 940 | | 928 | | 2.4 | |
Carbon | | — | | — | | — | | — | | — | | — | | — | | — | | 306 | | 541 | | 741 | | 959 | | n/a | |
Tobacco | | 460 | | 499 | | 606 | | 647 | | 699 | | 701 | | 726 | | 692 | | 708 | | 682 | | 734 | | 636 | | 3.0 | |
Property | | 1,452 | | 1,481 | | 1,541 | | 1,574 | | 1,661 | | 1,717 | | 1,732 | | 1,795 | | 1,848 | | 1,885 | | 1,918 | | 1,911 | | 2.5 | |
Property transfer | | 262 | | 303 | | 407 | | 518 | | 604 | | 843 | | 914 | | 1,068 | | 715 | | 887 | | 855 | | 944 | | 12.4 | |
Corporation capital | | 459 | | 395 | | 198 | | 124 | | 160 | | 162 | | 91 | | 117 | | 108 | | 95 | | (3 | ) | (5 | ) | n/a | |
Insurance premium | | 196 | | 203 | | 223 | | 300 | | 302 | | 330 | | 353 | | 373 | | 389 | | 389 | | 399 | | 411 | | 7.0 | |
| | 14,303 | | 14,110 | | 12,352 | | 13,830 | | 14,917 | | 16,408 | | 18,017 | | 19,406 | | 18,197 | | 17,102 | | 18,197 | | 19,203 | | 2.7 | |
Natural resource revenue: | | | | | | | | | | | | | | | | | | | | | | | | | | | |
Natural gas royalties | | 1,249 | | 836 | | 1,056 | | 1,230 | | 1,439 | | 1,921 | | 1,207 | | 1,132 | | 1,314 | | 406 | | 312 | | 339 | | -11.2 | |
Crown land tenures | | 219 | | 254 | | 267 | | 320 | | 342 | | 386 | | 441 | | 569 | | 814 | | 867 | | 923 | | 928 | | 14.0 | |
Columbia River Treaty | | 632 | | 360 | | 100 | | 230 | | 258 | | 319 | | 223 | | 246 | | 231 | | 168 | | 136 | | 110 | | -14.7 | |
Other energy and minerals | | 207 | | 173 | | 202 | | 199 | | 256 | | 392 | | 456 | | 367 | | 479 | | 421 | | 514 | | 529 | | 8.9 | |
Forests | | 1,341 | | 1,253 | | 1,323 | | 1,014 | | 1,363 | | 1,214 | | 1,276 | | 1,087 | | 557 | | 387 | | 436 | | 482 | | -8.9 | |
Other resources | | 308 | | 298 | | 270 | | 300 | | 301 | | 316 | | 341 | | 340 | | 412 | | 397 | | 406 | | 423 | | 2.9 | |
| | 3,956 | | 3,174 | | 3,218 | | 3,293 | | 3,959 | | 4,548 | | 3,944 | | 3,741 | | 3,807 | | 2,646 | | 2,727 | | 2,811 | | -3.1 | |
Other revenue: | | | | | | | | | | | | | | | | | | | | | | | | | | | |
Medical Services Plan premiums | | 894 | | 954 | | 1,355 | | 1,447 | | 1,465 | | 1,482 | | 1,524 | | 1,557 | | 1,595 | | 1,666 | | 1,787 | | 1,919 | | 7.2 | |
Post-secondary education fees | | 440 | | 452 | | 580 | | 781 | | 836 | | 892 | | 928 | | 979 | | 1,039 | | 1,126 | | 1,237 | | 1,294 | | 10.3 | |
Other health-care related fees | | 211 | | 221 | | 217 | | 231 | | 228 | | 225 | | 237 | | 248 | | 257 | | 267 | | 308 | | 324 | | 4.0 | |
Motor vehicle licences and permits | | 339 | | 342 | | 351 | | 363 | | 381 | | 403 | | 424 | | 442 | | 447 | | 447 | | 465 | | 479 | | 3.2 | |
BC Ferries tolls | | 292 | | 306 | | 315 | | — | | — | | — | | — | | — | | — | | — | | — | | — | | n/a | |
Other fees and licences | | 772 | | 762 | | 737 | | 710 | | 746 | | 679 | | 690 | | 749 | | 669 | | 614 | | 635 | | 709 | | -0.8 | |
Investment earnings | | 1,476 | | 1,279 | | 1,028 | | 955 | | 836 | | 954 | | 1,040 | | 1,153 | | 821 | | 954 | | 867 | | 1,042 | | -3.1 | |
Sales of goods and services | | 1,064 | | 1,006 | | 986 | | 714 | | 741 | | 719 | | 678 | | 637 | | 694 | | 728 | | 759 | | 930 | | -1.2 | |
Miscellaneous | | 1,022 | | 1,011 | | 965 | | 1,241 | | 1,444 | | 1,550 | | 1,872 | | 1,918 | | 1,925 | | 1,981 | | 2,044 | | 1,900 | | 5.8 | |
| | 6,510 | | 6,333 | | 6,534 | | 6,442 | | 6,677 | | 6,904 | | 7,393 | | 7,683 | | 7,447 | | 7,783 | | 8,102 | | 8,597 | | 2.6 | |
Contributions from the federal government: | | | | | | | | | | | | | | | | | | | | | | | | | | | |
Health and social transfers | | 2,619 | | 2,445 | | 2,606 | | 3,044 | | 3,421 | | 4,220 | | 4,473 | | 4,614 | | 4,743 | | 4,883 | | 5,176 | | 5,384 | | 6.8 | |
Harmonized sales tax transition payments | | — | | — | | — | | — | | — | | — | | — | | — | | — | | 250 | | 769 | | 580 | | n/a | |
Equalization | | — | | 158 | | 543 | | (330 | ) | 979 | | 590 | | 459 | | — | | — | | — | | — | | — | | n/a | |
Other cost shared agreements | | 677 | | 717 | | 674 | | 905 | | 822 | | 1,015 | | 1,455 | | 1,318 | | 1,242 | | 1,784 | | 2,052 | | 1,743 | | 9.0 | |
| | 3,296 | | 3,320 | | 3,823 | | 3,619 | | 5,222 | | 5,825 | | 6,387 | | 5,932 | | 5,985 | | 6,917 | | 7,997 | | 7,707 | | 8.0 | |
Commercial Crown corporation net income: | | | | | | | | | | | | | | | | | | | | | | | | | | | |
BC Hydro | | 446 | | 403 | | 418 | | 111 | | 402 | | 266 | | 407 | | 369 | | 365 | | 447 | | 591 | | 558 | | 2.1 | |
Liquor Distribution Branch | | 642 | | 637 | | 654 | | 727 | | 779 | | 800 | | 840 | | 857 | | 891 | | 877 | | 890 | | 909 | | 3.2 | |
BC Lotteries (net of payments to federal gov’t) | | 554 | | 598 | | 663 | | 719 | | 811 | | 914 | | 1,011 | | 1,080 | | 1,082 | | 1,070 | | 1,096 | | 1,099 | | 6.4 | |
BCRC | | (7 | ) | (166 | ) | 4 | | 41 | | 183 | | 33 | | 30 | | 13 | | 36 | | 2 | | 14 | | 14 | | n/a | |
ICBC | | (14 | ) | (242 | ) | 80 | | 352 | | 383 | | 191 | | 381 | | 633 | | 512 | | 601 | | 326 | | 102 | | n/a | |
Transportation Invest. Corp. (Port Mann) | | — | | — | | — | | — | | — | | — | | — | | — | | (47 | ) | (4 | ) | (7 | ) | (17 | ) | n/a | |
Other | | 3 | | 2 | | 15 | | 7 | | 7 | | 19 | | 19 | | 24 | | 24 | | 22 | | 17 | | 15 | | 15.8 | |
| | 1,624 | | 1,232 | | 1,834 | | 1,957 | | 2,565 | | 2,223 | | 2,688 | | 2,976 | | 2,863 | | 3,015 | | 2,927 | | 2,680 | | 4.7 | |
Total revenue | | 29,689 | | 28,169 | | 27,761 | | 29,141 | | 33,340 | | 35,908 | | 38,429 | | 39,738 | | 38,299 | | 37,463 | | 39,950 | | 40,998 | | 3.0 | |
2012 Financial and Economic Review — July 2012
70
Appendix 2 — Financial Review
Table A2.6 Revenue by Source Supplementary Information — 2000/01 to 2011/12
| | Actual | | Actual | | Actual | | Actual | | Actual | | Actual | | Actual | | Actual | | Actual | | Actual | | Actual | | Actual | | Average
annual | |
($ millions) | | 2000/01 | | 2001/02 | | 2002/03 | | 2003/04 | | 2004/05 | | 2005/06 | | 2006/07 | | 2007/08 | | 2008/09 | | 2009/10 | | 2010/11 | | 2011/12 | | change | |
| | | | | | | | | | | | | | | | | | | | | | | | | | (per cent) | |
Per cent of Nominal GDP: (2) | | | | | | | | | | | | | | | | | | | | | | | | | | | |
Taxation | | 10.9 | | 10.6 | | 8.9 | | 9.5 | | 9.5 | | 9.7 | | 9.9 | | 10.1 | | 9.1 | | 8.9 | | 9.0 | | 9.1 | | -1.7 | |
Natural resources | | 3.0 | | 2.4 | | 2.3 | | 2.3 | | 2.5 | | 2.7 | | 2.2 | | 1.9 | | 1.9 | | 1.4 | | 1.3 | | 1.3 | | -7.2 | |
Other | | 5.0 | | 4.7 | | 4.7 | | 4.4 | | 4.2 | | 4.1 | | 4.1 | | 4.0 | | 3.7 | | 4.1 | | 4.0 | | 4.1 | | -1.8 | |
Contributions from the federal government | | 2.5 | | 2.5 | | 2.8 | | 2.5 | | 3.3 | | 3.4 | | 3.5 | | 3.1 | | 3.0 | | 3.6 | | 3.9 | | 3.6 | | 3.4 | |
Commercial Crown corporation net income | | 1.2 | | 0.9 | | 1.3 | | 1.3 | | 1.6 | | 1.3 | | 1.5 | | 1.5 | | 1.4 | | 1.6 | | 1.4 | | 1.3 | | 0.2 | |
Total revenue | | 22.6 | | 21.1 | | 20.1 | | 20.0 | | 21.1 | | 21.2 | | 21.1 | | 20.7 | | 19.2 | | 19.5 | | 19.7 | | 19.3 | | -1.4 | |
Growth rates: | | | | | | | | | | | | | | | | | | | | | | | | | | | |
Taxation | | 4.0 | | -1.3 | | -12.5 | | 12.0 | | 7.9 | | 10.0 | | 9.8 | | 7.7 | | -6.2 | | -6.0 | | 6.4 | | 5.5 | | 3.0 | |
Natural resources | | 43.4 | | -19.8 | | 1.4 | | 2.3 | | 20.2 | | 14.9 | | -13.3 | | -5.1 | | 1.8 | | -30.5 | | 3.1 | | 3.1 | | -2.0 | |
Other | | 9.5 | | -2.7 | | 3.2 | | -1.4 | | 3.6 | | 3.4 | | 7.1 | | 3.9 | | -3.1 | | 4.5 | | 4.1 | | 6.1 | | 2.6 | |
Contributions from the federal government | | 3.6 | | 0.7 | | 15.2 | | -5.3 | | 44.3 | | 11.5 | | 9.6 | | -7.1 | | 0.9 | | 15.6 | | 15.6 | | -3.6 | | 8.9 | |
Commercial Crown corporation net income | | 39.0 | | -24.1 | | 48.9 | | 6.7 | | 31.1 | | -13.3 | | 20.9 | | 10.7 | | -3.8 | | 5.3 | | -2.9 | | -8.4 | | 6.5 | |
Total revenue | | 10.8 | | -5.1 | | -1.4 | | 5.0 | | 14.4 | | 7.7 | | 7.0 | | 3.4 | | -3.6 | | -2.2 | | 6.6 | | 2.6 | | 3.1 | |
Per capita: (3) | | | | | | | | | | | | | | | | | | | | | | | | | | | |
Taxation | | 3,541 | | 3,462 | | 3,014 | | 3,355 | | 3,590 | | 3,910 | | 4,246 | | 4,503 | | 4,151 | | 3,835 | | 4,017 | | 4,199 | | 1.6 | |
Natural resources | | 979 | | 779 | | 785 | | 799 | | 953 | | 1,084 | | 929 | | 868 | | 868 | | 593 | | 602 | | 615 | | -4.1 | |
Other | | 1,612 | | 1,554 | | 1,594 | | 1,563 | | 1,607 | | 1,645 | | 1,742 | | 1,783 | | 1,699 | | 1,745 | | 1,789 | | 1,880 | | 1.4 | |
Contributions from the federal government | | 816 | | 814 | | 933 | | 878 | | 1,257 | | 1,388 | | 1,505 | | 1,376 | | 1,365 | | 1,551 | | 1,765 | | 1,685 | | 6.8 | |
Commercial Crown corporation net income | | 402 | | 302 | | 448 | | 475 | | 617 | | 530 | | 633 | | 691 | | 653 | | 676 | | 646 | | 586 | | 3.5 | |
Total revenue | | 7,350 | | 6,910 | | 6,774 | | 7,069 | | 8,024 | | 8,556 | | 9,056 | | 9,221 | | 8,736 | | 8,400 | | 8,820 | | 8,965 | | 1.8 | |
Real Per Capita Revenue (2011 $) (4) | | 8,910 | | 8,240 | | 7,892 | | 8,058 | | 8,971 | | 9,377 | | 9,759 | | 9,766 | | 9,063 | | 8,714 | | 9,029 | | 8,965 | | 0.1 | |
Growth rate (per cent) | | 8.1 | | -7.5 | | -4.2 | | 2.1 | | 11.3 | | 4.5 | | 4.1 | | 0.1 | | -7.2 | | -3.8 | | 3.6 | | -0.7 | | 0.9 | |
(1) | Figures have been restated to reflect government accounting policies in effect at March 31, 2012. |
(2) | Revenue as a per cent of GDP is calculated using GDP for the calendar year ending in the fiscal year (e.g. 2011/12 revenue divided by GDP for the 2011 calendar year). As nominal GDP for the calendar year ending 2011 is not available, the 2011 GDP projected in February 2012 has been used for the fiscal year ended March 31, 2012 for demonstration purposes. Totals may not add due to rounding. |
(3) | Per capita revenue is calculated using July 1 population (e.g. 2011/12 revenue divided by population on July 1, 2011). Totals may not add due to rounding. |
(4) | Revenue is converted to real (inflation-adjusted) terms using the consumer price index (CPI) for the corresponding calendar year (e.g. 2011 CPI for 2011/12 revenue). |
2012 Financial and Economic Review — July 2012
71
Appendix 2 — Financial Review
Table A2.7 Expense by Function (1) — 2000/01 to 2011/12
| | Actual | | Actual | | Actual | | Actual | | Actual | | Actual | | Actual | | Actual | | Actual | | Actual | | Actual | | Actual | | Average
annual | |
($ millions) | | 2000/01 | | 2001/02 | | 2002/03 | | 2003/04 | | 2004/05 | | 2005/06 | | 2006/07 | | 2007/08 | | 2008/09 | | 2009/10 | | 2010/11 | | 2011/12 | | change | |
| | | | | | | | | | | | | | | | | | | | | | | | | | (per cent) | |
Function: | | | | | | | | | | | | | | | | | | | | | | | | | | | |
Health: | | | | | | | | | | | | | | | | | | | | | | | | | | | |
Medical Services Plan | | 2,118 | | 2,367 | | 2,461 | | 2,540 | | 2,546 | | 2,696 | | 2,964 | | 3,263 | | 3,391 | | 3,504 | | 3,763 | | 4,004 | | 6.0 | |
Pharmacare | | 657 | | 717 | | 728 | | 723 | | 793 | | 868 | | 914 | | 955 | | 1,010 | | 1,053 | | 1,129 | | 1,147 | | 5.2 | |
Regional services | | 6,327 | | 7,107 | | 7,393 | | 7,593 | | 7,781 | | 8,346 | | 8,751 | | 9,321 | | 10,030 | | 10,273 | | 10,597 | | 11,255 | | 5.4 | |
Other healthcare expenses | | 269 | | 313 | | 328 | | 343 | | 361 | | 469 | | 565 | | 667 | | 601 | | 597 | | 625 | | 642 | | 8.2 | |
| | 9,371 | | 10,504 | | 10,910 | | 11,199 | | 11,481 | | 12,379 | | 13,194 | | 14,206 | | 15,032 | | 15,427 | | 16,114 | | 17,048 | | 5.6 | |
Education: | | | | | | | | | | | | | | | | | | | | | | | | | | | |
Elementary and secondary | | 4,318 | | 4,495 | | 4,542 | | 4,687 | | 4,757 | | 4,829 | | 5,272 | | 5,521 | | 5,740 | | 5,778 | | 5,802 | | 5,885 | | 2.9 | |
Post-secondary | | 2,703 | | 3,002 | | 3,127 | | 3,329 | | 3,536 | | 3,914 | | 4,072 | | 4,314 | | 4,554 | | 4,740 | | 4,865 | | 4,917 | | 5.6 | |
Other education expenses | | 181 | | 191 | | 211 | | 198 | | 195 | | 171 | | 147 | | 152 | | 158 | | 528 | | 504 | | 436 | | 8.3 | |
| | 7,202 | | 7,688 | | 7,880 | | 8,214 | | 8,488 | | 8,914 | | 9,491 | | 9,987 | | 10,452 | | 11,046 | | 11,171 | | 11,238 | | 4.1 | |
Social services: | | | | | | | | | | | | | | | | | | | | | | | | | | | |
Social assistance | | 1,433 | | 1,389 | | 1,404 | | 1,164 | | 1,027 | | 1,127 | | 1,254 | | 1,271 | | 1,352 | | 1,462 | | 1,512 | | 1,554 | | 0.7 | |
Child welfare | | 964 | | 1,105 | | 916 | | 774 | | 759 | | 832 | | 964 | | 925 | | 1,073 | | 1,077 | | 1,118 | | 1,112 | | 1.3 | |
Community living and other services | | 713 | | 821 | | 673 | | 725 | | 728 | | 682 | | 586 | | 756 | | 723 | | 729 | | 754 | | 769 | | 0.7 | |
| | 3,110 | | 3,315 | | 2,993 | | 2,663 | | 2,514 | | 2,641 | | 2,804 | | 2,952 | | 3,148 | | 3,268 | | 3,384 | | 3,435 | | 0.9 | |
Protection of persons and property | | 1,004 | | 1,048 | | 1,099 | | 1,217 | | 1,068 | | 1,245 | | 1,184 | | 1,429 | | 1,429 | | 1,380 | | 1,448 | | 1,512 | | 3.8 | |
Transportation | | 1,449 | | 1,427 | | 1,587 | | 1,121 | | 1,310 | | 1,197 | | 1,251 | | 1,378 | | 1,401 | | 1,453 | | 1,580 | | 1,544 | | 0.6 | |
Natural resources & economic development | | 1,680 | | 1,737 | | 1,435 | | 1,534 | | 1,578 | | 1,480 | | 1,580 | | 1,859 | | 1,656 | | 1,880 | | 1,995 | | 1,518 | | -0.9 | |
Other | | 719 | | 802 | | 812 | | 1,067 | | 1,021 | | 1,082 | | 1,235 | | 1,389 | | 1,652 | | 1,385 | | 1,211 | | 1,414 | | 6.3 | |
General government | | 924 | | 1,052 | | 971 | | 911 | | 899 | | 1,099 | | 1,183 | | 1,116 | | 1,306 | | 1,254 | | 1,044 | | 1,147 | | 2.0 | |
Interest | | 2,986 | | 2,770 | | 2,553 | | 2,446 | | 2,305 | | 2,198 | | 2,270 | | 2,237 | | 2,158 | | 2,197 | | 2,252 | | 2,383 | | -2.0 | |
Operating expense | | 28,445 | | 30,343 | | 30,240 | | 30,372 | | 30,664 | | 32,235 | | 34,192 | | 36,553 | | 38,234 | | 39,290 | | 40,199 | | 41,239 | | 3.4 | |
Unusual items: | | | | | | | | | | | | | | | | | | | | | | | | | | | |
Joint trusteeship | | 52 | | (1,464 | ) | — | | — | | — | | — | | — | | — | | — | | — | | — | | — | | | |
Restructuring exit expenses | | — | | 347 | | 169 | | 123 | | — | | — | | — | | — | | — | | — | | — | | — | | | |
Negotiating Framework incentive payments | | — | | — | | — | | — | | — | | 710 | | 264 | | 4 | | 2 | | — | | — | | — | | | |
Climate Action Dividend | | — | | — | | — | | — | | — | | — | | — | | 440 | | (20 | ) | — | | — | | — | | | |
Liability for HST transition funding repayment | | — | | — | | — | | — | | — | | — | | — | | — | | — | | — | | — | | 1,599 | | | |
Total expense | | 28,497 | | 29,226 | | 30,409 | | 30,495 | | 30,664 | | 32,945 | | 34,456 | | 36,997 | | 38,216 | | 39,290 | | 40,199 | | 42,838 | | | |
Per cent of operating expense: | | | | | | | | | | | | | | | | | | | | | | | | | | | |
Health | | 32.9 | | 34.6 | | 36.1 | | 36.9 | | 37.4 | | 38.4 | | 38.6 | | 38.9 | | 39.3 | | 39.3 | | 40.1 | | 41.3 | | 2.1 | |
Education | | 25.3 | | 25.3 | | 26.1 | | 27.0 | | 27.7 | | 27.7 | | 27.8 | | 27.3 | | 27.3 | | 28.1 | | 27.8 | | 27.3 | | 0.7 | |
Social services and housing | | 10.9 | | 10.9 | | 9.9 | | 8.8 | | 8.2 | | 8.2 | | 8.2 | | 8.1 | | 8.2 | | 8.3 | | 8.4 | | 8.3 | | -2.4 | |
Protection of persons and property | | 3.5 | | 3.5 | | 3.6 | | 4.0 | | 3.5 | | 3.9 | | 3.5 | | 3.9 | | 3.7 | | 3.5 | | 3.6 | | 3.7 | | 0.3 | |
Transportation | | 5.1 | | 4.7 | | 5.2 | | 3.7 | | 4.3 | | 3.7 | | 3.7 | | 3.8 | | 3.7 | | 3.7 | | 3.9 | | 3.7 | | -2.8 | |
Natural resources & economic development | | 5.9 | | 5.7 | | 4.7 | | 5.1 | | 5.1 | | 4.6 | | 4.6 | | 5.1 | | 4.3 | | 4.8 | | 5.0 | | 3.7 | | -4.2 | |
Other | | 2.5 | | 2.6 | | 2.7 | | 3.5 | | 3.3 | | 3.4 | | 3.6 | | 3.8 | | 4.3 | | 3.5 | | 3.0 | | 3.4 | | 2.8 | |
General government | | 3.2 | | 3.5 | | 3.2 | | 3.0 | | 2.9 | | 3.4 | | 3.5 | | 3.1 | | 3.4 | | 3.2 | | 2.6 | | 2.8 | | -1.4 | |
Interest | | 10.5 | | 9.1 | | 8.4 | | 8.1 | | 7.5 | | 6.8 | | 6.6 | | 6.1 | | 5.6 | | 5.6 | | 5.6 | | 5.8 | | -5.3 | |
| | 100.0 | | 100.0 | | 100.0 | | 100.0 | | 100.0 | | 100.0 | | 100.0 | | 100.0 | | 100.0 | | 100.0 | | 100.0 | | 100.0 | | | |
(1) Figures have been restated to reflect government accounting policies in effect at March 31, 2012.
2012 Financial and Economic Review — July 2012
72
Appendix 2 — Financial Review
Table A2.8 Expense by Function (1) Supplementary Information — 2000/01 to 2011/12
| | Actual | | Actual | | Actual | | Actual | | Actual | | Actual | | Actual | | Actual | | Actual | | Actual | | Actual | | Actual | | Average
annual | |
($ millions) | | 2000/01 | | 2001/02 | | 2002/03 | | 2003/04 | | 2004/05 | | 2005/06 | | 2006/07 | | 2007/08 | | 2008/09 | | 2009/10 | | 2010/11 | | 2011/12 | | change | |
| | | | | | | | | | | | | | | | | | | | | | | | | | (per cent) | |
Per cent of Nominal GDP: (2) | | | | | | | | | | | | | | | | | | | | | | | | | | | |
Health | | 7.1 | | 7.9 | | 7.9 | | 7.7 | | 7.3 | | 7.3 | | 7.2 | | 7.4 | | 7.5 | | 8.0 | | 7.9 | | 8.0 | | 1.1 | |
Education | | 5.5 | | 5.8 | | 5.7 | | 5.6 | | 5.4 | | 5.3 | | 5.2 | | 5.2 | | 5.2 | | 5.8 | | 5.5 | | 5.3 | | -0.3 | |
Social services and housing | | 2.4 | | 2.5 | | 2.2 | | 1.8 | | 1.6 | | 1.6 | | 1.5 | | 1.5 | | 1.6 | | 1.7 | | 1.7 | | 1.6 | | -3.4 | |
Protection of persons and property | | 0.8 | | 0.8 | | 0.8 | | 0.8 | | 0.7 | | 0.7 | | 0.7 | | 0.7 | | 0.7 | | 0.7 | | 0.7 | | 0.7 | | -0.6 | |
Transportation | | 1.1 | | 1.1 | | 1.1 | | 0.8 | | 0.8 | | 0.7 | | 0.7 | | 0.7 | | 0.7 | | 0.8 | | 0.8 | | 0.7 | | -3.7 | |
Natural resources & economic development | | 1.3 | | 1.3 | | 1.0 | | 1.1 | | 1.0 | | 0.9 | | 0.9 | | 1.0 | | 0.8 | | 1.0 | | 1.0 | | 0.7 | | -5.1 | |
Other | | 0.5 | | 0.6 | | 0.6 | | 0.7 | | 0.6 | | 0.6 | | 0.7 | | 0.7 | | 0.8 | | 0.7 | | 0.6 | | 0.7 | | 1.8 | |
General government | | 0.7 | | 0.8 | | 0.7 | | 0.6 | | 0.6 | | 0.6 | | 0.6 | | 0.6 | | 0.7 | | 0.7 | | 0.5 | | 0.5 | | -2.4 | |
Interest | | 2.3 | | 2.1 | | 1.8 | | 1.7 | | 1.5 | | 1.3 | | 1.2 | | 1.2 | | 1.1 | | 1.1 | | 1.1 | | 1.1 | | -6.2 | |
Operating expense | | 21.7 | | 22.7 | | 21.9 | | 20.9 | | 19.4 | | 19.0 | | 18.8 | | 19.0 | | 19.2 | | 20.5 | | 19.8 | | 19.5 | | -1.0 | |
Growth rates: | | | | | | | | | | | | | | | | | | | | | | | | | | | |
Health | | 7.5 | | 12.1 | | 3.9 | | 2.6 | | 2.5 | | 7.8 | | 6.6 | | 7.7 | | 5.8 | | 2.6 | | 4.5 | | 5.8 | | 5.8 | |
Education | | 8.4 | | 6.7 | | 2.5 | | 4.2 | | 3.3 | | 5.0 | | 6.5 | | 5.2 | | 4.7 | | 5.7 | | 1.1 | | 0.6 | | 4.5 | |
Social services and housing | | 4.5 | | 6.6 | | -9.7 | | -11.0 | | -5.6 | | 5.1 | | 6.2 | | 5.3 | | 6.6 | | 3.8 | | 3.5 | | 1.5 | | 1.4 | |
Protection of persons and property | | -1.9 | | 4.4 | | 4.9 | | 10.7 | | -12.2 | | 16.6 | | -4.9 | | 20.7 | | 0.0 | | -3.4 | | 4.9 | | 4.4 | | 3.7 | |
Transportation | | -8.8 | | -1.5 | | 11.2 | | -29.4 | | 16.9 | | -8.6 | | 4.5 | | 10.2 | | 1.7 | | 3.7 | | 8.7 | | -2.3 | | 0.5 | |
Natural resources & economic development | | 26.4 | | 3.4 | | -17.4 | | 6.9 | | 2.9 | | -6.2 | | 6.8 | | 17.7 | | -10.9 | | 13.5 | | 6.1 | | -23.9 | | 2.1 | |
Other | | 3.0 | | 11.5 | | 1.2 | | 31.4 | | -4.3 | | 6.0 | | 14.1 | | 12.5 | | 18.9 | | -16.2 | | -12.6 | | 16.8 | | 6.9 | |
General government | | 1.9 | | 13.9 | | -7.7 | | -6.2 | | -1.3 | | 22.2 | | 7.6 | | -5.7 | | 17.0 | | -4.0 | | -16.7 | | 9.9 | | 2.6 | |
Interest | | 1.8 | | -7.2 | | -7.8 | | -4.2 | | -5.8 | | -4.6 | | 3.3 | | -1.5 | | -3.5 | | 1.8 | | 2.5 | | 5.8 | | -1.6 | |
Operating expense | | 6.1 | | 6.7 | | -0.3 | | 0.4 | | 1.0 | | 5.1 | | 6.1 | | 6.9 | | 4.6 | | 2.8 | | 2.3 | | 2.6 | | 3.7 | |
Per capita: (3) | | | | | | | | | | | | | | | | | | | | | | | | | | | |
Health | | 2,320 | | 2,577 | | 2,662 | | 2,717 | | 2,763 | | 2,950 | | 3,109 | | 3,296 | | 3,429 | | 3,459 | | 3,557 | | 3,728 | | 4.4 | |
Education | | 1,783 | | 1,886 | | 1,923 | | 1,993 | | 2,043 | | 2,124 | | 2,237 | | 2,317 | | 2,384 | | 2,477 | | 2,466 | | 2,457 | | 3.0 | |
Social services and housing | | 770 | | 813 | | 730 | | 646 | | 605 | | 629 | | 661 | | 685 | | 718 | | 733 | | 747 | | 751 | | -0.2 | |
Protection of persons and property | | 249 | | 257 | | 268 | | 295 | | 257 | | 297 | | 279 | | 332 | | 326 | | 309 | | 320 | | 331 | | 2.6 | |
Transportation | | 359 | | 350 | | 387 | | 272 | | 315 | | 285 | | 295 | | 320 | | 320 | | 326 | | 349 | | 338 | | -0.5 | |
Natural resources & economic development | | 416 | | 426 | | 350 | | 372 | | 380 | | 353 | | 372 | | 431 | | 378 | | 422 | | 440 | | 332 | | -2.0 | |
Other | | 178 | | 197 | | 198 | | 259 | | 246 | | 258 | | 291 | | 322 | | 377 | | 311 | | 267 | | 309 | | 5.1 | |
General government | | 229 | | 258 | | 237 | | 221 | | 216 | | 262 | | 279 | | 259 | | 298 | | 281 | | 230 | | 251 | | 0.8 | |
Interest | | 739 | | 680 | | 623 | | 593 | | 555 | | 524 | | 535 | | 519 | | 492 | | 493 | | 497 | | 521 | | -3.1 | |
Operating expense | | 7,043 | | 7,444 | | 7,378 | | 7,368 | | 7,380 | | 7,682 | | 8,058 | | 8,481 | | 8,722 | | 8,811 | | 8,873 | | 9,018 | | 2.3 | |
Real Per Capita Operating Expense (2011 $) (4) | | 8,537 | | 8,876 | | 8,596 | | 8,398 | | 8,251 | | 8,418 | | 8,683 | | 8,983 | | 9,047 | | 9,139 | | 9,085 | | 9,017 | | 0.5 | |
Growth rate (per cent) | | 3.5 | | 4.0 | | -3.2 | | -2.3 | | -1.8 | | 2.0 | | 3.2 | | 3.4 | | 0.7 | | 1.0 | | -0.6 | | -0.7 | | 0.8 | |
(1) | Figures have been restated to reflect government accounting policies in effect at March 31, 2012. |
(2) | Expense as a per cent of GDP is calculated using GDP for the calendar year ending in the fiscal year (e.g. 2011/12 expense divided by GDP for the 2011 calendar year). Totals may not add due to rounding. As nominal GDP for the calendar year ending 2011 is not available, the 2011 GDP projected in February 2012 has been used for the fiscal year ended March 31, 2012 for demonstration purposes. |
(3) | Per capita expense is calculated using July 1 population (e.g. 2011/12 expense divided by population on July 1, 2011). Totals may not add due to rounding. |
(4) | Expense is converted to real (inflation-adjusted) terms using the consumer price index (CPI) for the corresponding calendar year (e.g. 2011 CPI for 2011/12 expense). |
2012 Financial and Economic Review — July 2012
73
Appendix 2 — Financial Review
Table A2.9 Full-Time Equivalents (FTEs) — 2000/01 to 2011/12
| | Actual | | Actual | | Actual | | Actual | | Actual | | Actual | | Actual | | Actual | | Actual | | Actual | | Actual | | Actual | | Average
annual | |
| | 2000/01 | | 2001/02 | | 2002/03 | | 2003/04 | | 2004/05 | | 2005/06 | | 2006/07 | | 2007/08 | | 2008/09 | | 2009/10 | | 2010/11 | | 2011/12 | | change | |
| | | | | | | | | | | | | | | | | | | | | | | | | | (per cent) | |
Taxpayer-supported programs and agencies: | | | | | | | | | | | | | | | | | | | | | | | | | | | |
Ministries and special offices (CRF) | | 33,579 | | 33,495 | | 29,751 | | 29,049 | | 27,252 | | 27,129 | | 28,647 | | 30,224 | | 31,874 | | 31,353 | | 30,221 | | 27,228 | | -1.9 | |
Service delivery agencies (1) | | 8,450 | | 8,447 | | 7,814 | | 4,570 | | 3,822 | | 3,992 | | 3,917 | | 4,128 | | 4,403 | | 4,508 | | 4,295 | | 4,346 | | -5.9 | |
Total FTEs | | 42,029 | | 41,942 | | 37,565 | | 33,619 | | 31,074 | | 31,121 | | 32,564 | | 34,352 | | 36,277 | | 35,861 | | 34,516 | | 31,574 | | -2.6 | |
Growth rates: | | | | | | | | | | | | | | | | | | | | | | | | | | | |
Ministries and special offices (CRF) | | 1.4 | | -0.3 | | -10.1 | | -2.4 | | -6.2 | | -0.5 | | 5.6 | | 5.5 | | 5.5 | | -1.6 | | -3.6 | | -9.9 | | -1.6 | |
Service delivery agencies | | -11.3 | | 0.0 | | -18.0 | | -41.5 | | -16.4 | | 4.4 | | -1.9 | | 5.4 | | 6.7 | | 2.4 | | -4.7 | | 1.2 | | -5.7 | |
Population per FTE: (2) | | | | | | | | | | | | | | | | | | | | | | | | | | | |
Total FTEs | | 96.1 | | 97.2 | | 109.1 | | 122.6 | | 133.7 | | 134.9 | | 130.3 | | 125.5 | | 120.8 | | 124.4 | | 131.2 | | 144.8 | | 3.8 | |
(1) | Service delivery agency FTE amounts do not include SUCH sector staff employment. |
(2) | Population per FTE is calculated using July 1 population (e.g. population on July 1, 2011 divided by 2011/12 FTEs). |
2012 Financial and Economic Review — July 2012
74
Appendix 2 — Financial Review
Table A2.10 Capital Spending — 2000/01 to 2011/12
| | | | | | | | | | | | | | | | | | | | | | | | | | Average | |
| | Actual | | Actual | | Actual | | Actual | | Actual | | Actual | | Actual | | Actual | | Actual | | Actual | | Actual | | Actual | | annual | |
($ millions) | | 2000/01 | | 2001/02 | | 2002/03 | | 2003/04 | | 2004/05 | | 2005/06 | | 2006/07 | | 2007/08 | | 2008/09 | | 2009/10 | | 2010/11 | | 2011/12 | | change | |
| | | | | | | | | | | | | | | | | | | | | | | | | | (per cent) | |
Taxpayer-supported: | | | | | | | | | | | | | | | | | | | | | | | | | | | |
Education | | | | | | | | | | | | | | | | | | | | | | | | | | | |
Schools (K–12) | | 595 | | 459 | | 383 | | 313 | | 239 | | 286 | | 322 | | 380 | | 413 | | 449 | | 433 | | 560 | | -0.5 | |
Post-secondary | | 254 | | 391 | | 412 | | 605 | | 696 | | 790 | | 874 | | 782 | | 658 | | 672 | | 925 | | 662 | | 9.1 | |
Health | | 459 | | 275 | | 422 | | 420 | | 568 | | 848 | | 760 | | 881 | | 892 | | 927 | | 916 | | 732 | | 4.3 | |
BC Transportation Financing Authority | | 485 | | 344 | | 275 | | 407 | | 513 | | 713 | | 821 | | 884 | | 881 | | 918 | | 1,080 | | 921 | | 6.0 | |
BC Transit | | 27 | | 19 | | 33 | | 7 | | 8 | | 24 | | 13 | | 37 | | 77 | | 150 | | 39 | | 37 | | 2.9 | |
Rapid Transit Project 2000 | | 300 | | 210 | | 35 | | 14 | | 15 | | 16 | | 15 | | — | | — | | — | | — | | — | | n/a | |
BC Ferries | | 55 | | 55 | | 58 | | — | | — | | — | | — | | — | | — | | — | | — | | — | | n/a | |
Vancouver Convention Centre expansion | | — | | — | | — | | 56 | | 51 | | 85 | | 105 | | 251 | | 242 | | 41 | | 10 | | 1 | | n/a | |
BC Place redevelopment | | — | | — | | — | | — | | — | | — | | — | | — | | 45 | | 75 | | 197 | | 194 | | n/a | |
Government operating (ministries) | | 208 | | 228 | | 208 | | 214 | | 215 | | 320 | | 355 | | 335 | | 430 | | 306 | | 261 | | 245 | | 1.5 | |
Other | | 182 | | 112 | | 74 | | 36 | | 53 | | 60 | | 139 | | 117 | | 133 | | 184 | | 250 | | 220 | | 1.7 | |
| | 2,565 | | 2,093 | | 1,900 | | 2,072 | | 2,358 | | 3,142 | | 3,404 | | 3,667 | | 3,771 | | 3,722 | | 4,111 | | 3,572 | | 3.1 | |
Self-supported: | | | | | | | | | | | | | | | | | | | | | | | | | | | |
BC Hydro | | 412 | | 531 | | 696 | | 574 | | 528 | | 610 | | 807 | | 1,076 | | 1,397 | | 2,406 | | 1,519 | | 1,917 | | 15.0 | |
BC Transmission Corporation | | — | | — | | — | | — | | — | | 21 | | 50 | | 70 | | 19 | | 12 | | — | | — | | n/a | |
Columbia River power projects | | 126 | | 118 | | 54 | | 100 | | 84 | | 30 | | 19 | | 29 | | 32 | | 16 | | 67 | | 108 | | -1.4 | |
Transportation Invest. Corp. (Port Mann) | | — | | — | | — | | — | | — | | — | | — | | — | | 215 | | 772 | | 742 | | 728 | | n/a | |
BC Railway Company | | 124 | | 78 | | 52 | | 33 | | 30 | | 15 | | 19 | | 20 | | 10 | | 14 | | 6 | | 9 | | -21.2 | |
ICBC | | 78 | | 107 | | 41 | | 26 | | 31 | | 27 | | 22 | | 23 | | 22 | | 22 | | 48 | | 92 | | 1.5 | |
BC Lottery Corporation | | 13 | | 20 | | 30 | | 49 | | 93 | | 83 | | 44 | | 60 | | 97 | | 92 | | 81 | | 74 | | 17.1 | |
Liquor Distribution Branch | | 20 | | 37 | | 9 | | 1 | | 10 | | 19 | | 22 | | 18 | | 17 | | 19 | | 18 | | 19 | | -0.5 | |
| | 773 | | 891 | | 882 | | 783 | | 776 | | 805 | | 983 | | 1,296 | | 1,809 | | 3,353 | | 2,481 | | 2,947 | | 12.9 | |
Total capital spending | | 3,338 | | 2,984 | | 2,782 | | 2,855 | | 3,134 | | 3,947 | | 4,387 | | 4,963 | | 5,580 | | 7,075 | | 6,592 | | 6,519 | | 6.3 | |
Per cent of Nominal GDP: (1) | | | | | | | | | | | | | | | | | | | | | | | | | | | |
Taxpayer-supported | | 2.0 | | 1.6 | | 1.4 | | 1.4 | | 1.5 | | 1.9 | | 1.9 | | 1.9 | | 1.9 | | 1.9 | | 2.0 | | 1.7 | | -1.3 | |
Self-supported | | 0.6 | | 0.7 | | 0.6 | | 0.5 | | 0.5 | | 0.5 | | 0.5 | | 0.7 | | 0.9 | | 1.7 | | 1.2 | | 1.4 | | 8.1 | |
Total | | 2.5 | | 2.2 | | 2.0 | | 2.0 | | 2.0 | | 2.3 | | 2.4 | | 2.6 | | 2.8 | | 3.7 | | 3.2 | | 3.1 | | 1.7 | |
Growth rates: | | | | | | | | | | | | | | | | | | | | | | | | | | | |
Taxpayer-supported | | 3.9 | | -18.4 | | -9.2 | | 9.1 | | 13.8 | | 33.2 | | 8.3 | | 7.7 | | 2.8 | | -1.3 | | 10.5 | | -13.1 | | 3.9 | |
Self-supported | | 8.3 | | 15.3 | | -1.0 | | -11.2 | | -0.9 | | 3.7 | | 22.1 | | 31.8 | | 39.6 | | 85.4 | | -26.0 | | 18.8 | | 16.1 | |
Total | | 4.9 | | -10.6 | | -6.8 | | 2.6 | | 9.8 | | 25.9 | | 11.1 | | 13.1 | | 12.4 | | 26.8 | | -6.8 | | -1.1 | | 7.0 | |
Per capita: (2) | | | | | | | | | | | | | | | | | | | | | | | | | | | |
Taxpayer-supported | | 635 | | 513 | | 464 | | 503 | | 567 | | 749 | | 802 | | 851 | | 860 | | 835 | | 908 | | 781 | | 1.9 | |
Self-supported | | 191 | | 219 | | 215 | | 190 | | 187 | | 192 | | 232 | | 301 | | 413 | | 752 | | 548 | | 644 | | 11.7 | |
Total | | 826 | | 732 | | 679 | | 693 | | 754 | | 940 | | 1,034 | | 1,152 | | 1,273 | | 1,586 | | 1,455 | | 1,425 | | 5.1 | |
Real Per Capita Capital Spending (2011 $) (3) | | 1,002 | | 873 | | 791 | | 789 | | 843 | | 1,031 | | 1,114 | | 1,220 | | 1,320 | | 1,646 | | 1,490 | | 1,425 | | 3.3 | |
Growth rate (per cent) | | 2.3 | | -12.9 | | -9.4 | | -0.2 | | 6.8 | | 22.2 | | 8.1 | | 9.5 | | 8.3 | | 24.6 | | -9.5 | | -4.3 | | 3.8 | |
(1) | Capital spending as a per cent of GDP is calculated using GDP for the calendar year ending in the fiscal year (e.g. 2011/12 amounts divided by GDP for the 2011 calendar year). As nominal GDP for the calendar year ending 2011 is not available, the 2011 GDP projected in February 2012 has been used for the fiscal year ended March 31, 2012 for demonstration purposes. Totals may not add due to rounding. |
(2) | Per capita capital spending is calculated using July 1 population (e.g. 2011/12 amounts divided by population on July 1, 2011). Totals may not add due to rounding. |
(3) | Capital spending is converted to real (inflation-adjusted) terms using the consumer price index (CPI) for the corresponding calendar year (e.g. 2011 CPI for 2011/12 capital spending). |
2012 Financial and Economic Review — July 2012
75
Appendix 2 — Financial Review
Table A2.11 Provincial Debt — 2000/01 to 2011/12
| | | | | | | | | | | | | | | | | | | | | | | | | | Average | |
| | Actual | | Actual | | Actual | | Actual | | Actual | | Actual | | Actual | | Actual | | Actual | | Actual | | Actual | | Actual | | annual | |
($ millions) | | 2000/01 | | 2001/02 | | 2002/03 | | 2003/04 | | 2004/05 | | 2005/06 | | 2006/07 | | 2007/08 | | 2008/09 | | 2009/10 | | 2010/11 | | 2011/12 | | change | |
| | | | | | | | | | | | | | | | | | | | | | | | | | (per cent) | |
Taxpayer-supported debt: | | | | | | | | | | | | | | | | | | | | | | | | | | | |
Provincial government operating | | 11,260 | | 12,811 | | 14,315 | | 14,340 | | 12,894 | | 9,952 | | 6,928 | | 5,330 | | 3,048 | | 4,663 | | 4,268 | | 5,117 | | -6.9 | |
Provincial government general capital | | 318 | | 508 | | 642 | | 840 | | 1,075 | | 1,391 | | 1,961 | | 2,274 | | 2,696 | | 2,696 | | 2,696 | | 2,696 | | n/a | |
Provincial government direct operating | | 11,578 | | 13,319 | | 14,957 | | 15,180 | | 13,969 | | 11,343 | | 8,889 | | 7,604 | | 5,744 | | 7,359 | | 6,964 | | 7,813 | | -3.5 | |
Other taxpayer-supported debt (mainly capital): | | | | | | | | | | | | | | | | | | | | | | | | | | | |
Education facilities | | | | | | | | | | | | | | | | | | | | | | | | | | | |
Schools | | 4,111 | | 4,341 | | 4,562 | | 4,649 | | 4,737 | | 4,860 | | 5,013 | | 5,216 | | 5,522 | | 5,777 | | 6,016 | | 6,407 | | 4.1 | |
Post-secondary institutions | | 1,626 | | 1,785 | | 1,842 | | 2,190 | | 2,398 | | 2,772 | | 3,024 | | 3,437 | | 3,626 | | 3,843 | | 4,092 | | 4,185 | | 9.0 | |
| | 5,737 | | 6,126 | | 6,404 | | 6,839 | | 7,135 | | 7,632 | | 8,037 | | 8,653 | | 9,148 | | 9,620 | | 10,108 | | 10,592 | | 5.7 | |
Health facilities | | 2,028 | | 2,186 | | 2,265 | | 2,343 | | 2,253 | | 2,635 | | 3,053 | | 3,511 | | 3,936 | | 4,389 | | 4,895 | | 5,293 | | 9.1 | |
Highways, ferries and public transit | | | | | | | | | | | | | | | | | | | | | | | | | | | |
BC Transportation Financing Authority | | 2,197 | | 2,514 | | 2,661 | | 2,764 | | 2,474 | | 2,699 | | 3,237 | | 3,948 | | 4,586 | | 5,211 | | 5,785 | | 6,287 | | 10.0 | |
SkyTrain extension | | 836 | | 1,044 | | 1,105 | | 1,119 | | 1,135 | | 1,145 | | 1,153 | | 1,153 | | 1,154 | | 1,154 | | 1,155 | | 1,174 | | 3.1 | |
Public transit | | 991 | | 982 | | 979 | | 965 | | 957 | | 959 | | 950 | | 958 | | 997 | | 997 | | 997 | | 1,000 | | 0.1 | |
BC Transit | | 75 | | 79 | | 87 | | 83 | | 78 | | 80 | | 96 | | 84 | | 94 | | 140 | | 158 | | 183 | | 8.4 | |
Rapid Transit Project 2000 Ltd | | 114 | | 47 | | 3 | | — | | — | | — | | — | | — | | — | | — | | — | | — | | n/a | |
BC Ferries | | 21 | | 19 | | — | | — | | — | | — | | — | | — | | — | | — | | — | | — | | n/a | |
| | 4,234 | | 4,685 | | 4,835 | | 4,931 | | 4,644 | | 4,883 | | 5,436 | | 6,143 | | 6,831 | | 7,502 | | 8,095 | | 8,644 | | 6.7 | |
Other | | | | | | | | | | | | | | | | | | | | | | | | | | | |
Social Housing | | 265 | | 299 | | 161 | | 156 | | 133 | | 189 | | 216 | | 218 | | 286 | | 305 | | 511 | | 674 | | 8.9 | |
Provincial government general capital | | — | | — | | — | | — | | — | | — | | — | | — | | — | | 294 | | 570 | | 808 | | n/a | |
BC Immigration Investment Fund | | — | | 9 | | 18 | | 29 | | 88 | | 148 | | 167 | | 256 | | 287 | | 289 | | 347 | | 398 | | n/a | |
Homeowner Protection Office | | 71 | | 113 | | 123 | | 129 | | 130 | | 110 | | 110 | | 136 | | 150 | | 144 | | — | | — | | n/a | |
BC Pavilion Corporation | | — | | — | | — | | — | | — | | — | | — | | — | | — | | 49 | | 250 | | 383 | | n/a | |
BC Buildings | | 610 | | 596 | | 456 | | 317 | | 241 | | 246 | | — | | — | | — | | — | | — | | — | | n/a | |
552513 BC Ltd. (Skeena Cellulose) | | 337 | | — | | — | | — | | — | | — | | — | | — | | — | | — | | — | | — | | n/a | |
Other | | 244 | | 181 | | 164 | | 90 | | 75 | | 65 | | 60 | | 68 | | 64 | | 70 | | 115 | | 87 | | -8.9 | |
| | 1,527 | | 1,198 | | 922 | | 721 | | 667 | | 758 | | 553 | | 678 | | 787 | | 1,151 | | 1,793 | | 2,350 | | 4.0 | |
Total other taxpayer-supported debt | | 13,526 | | 14,195 | | 14,426 | | 14,834 | | 14,699 | | 15,908 | | 17,079 | | 18,985 | | 20,702 | | 22,662 | | 24,891 | | 26,879 | | 6.4 | |
Total taxpayer-supported debt | | 25,104 | | 27,514 | | 29,383 | | 30,014 | | 28,668 | | 27,251 | | 25,968 | | 26,589 | | 26,446 | | 30,021 | | 31,855 | | 34,692 | | 3.0 | |
Self-supported debt: | | | | | | | | | | | | | | | | | | | | | | | | | | | |
Commercial Crown corporations and agencies | | | | | | | | | | | | | | | | | | | | | | | | | | | |
BC Hydro | | 6,649 | | 6,670 | | 6,784 | | 7,040 | | 6,906 | | 6,892 | | 7,144 | | 7,633 | | 9,054 | | 10,792 | | 11,710 | | 12,978 | | 6.3 | |
Transportation Invest. Corp. (Port Mann) | | — | | — | | — | | — | | — | | — | | — | | — | | 20 | | 544 | | 1,148 | | 1,779 | | n/a | |
Post-secondary institutions’ subsidiaries | | 5 | | 20 | | 22 | | 22 | | 32 | | 32 | | 58 | | 115 | | 134 | | 201 | | 173 | | 173 | | n/a | |
Columbia River power projects | | 113 | | 184 | | 165 | | 215 | | 257 | | 247 | | 236 | | 219 | | 208 | | 196 | | 183 | | 481 | | 14.1 | |
BC Transmission Corporation | | — | | — | | — | | — | | — | | 30 | | 30 | | 79 | | 70 | | 70 | | — | | — | | n/a | |
BC Lottery Corporation | | — | | — | | — | | — | | — | | — | | — | | — | | — | | 60 | | 85 | | 90 | | n/a | |
Liquor Distribution Branch | | 2 | | 13 | | 9 | | 7 | | 6 | | 5 | | 3 | | 2 | | 1 | | 1 | | — | | — | | n/a | |
BC Rail | | 603 | | 614 | | 494 | | 477 | | — | | — | | — | | — | | — | | — | | — | | — | | n/a | |
| | 7,372 | | 7,501 | | 7,474 | | 7,761 | | 7,201 | | 7,206 | | 7,471 | | 8,048 | | 9,487 | | 11,864 | | 13,299 | | 15,501 | | 7.0 | |
Warehouse borrowing program | | 1,312 | | 1,067 | | — | | — | | — | | — | | — | | — | | 2,081 | | — | | — | | — | | n/a | |
Total self-supported debt | | 8,684 | | 8,568 | | 7,474 | | 7,761 | | 7,201 | | 7,206 | | 7,471 | | 8,048 | | 11,568 | | 11,864 | | 13,299 | | 15,501 | | 5.4 | |
Total provincial debt | | 33,788 | | 36,082 | | 36,857 | | 37,775 | | 35,869 | | 34,457 | | 33,439 | | 34,637 | | 38,014 | | 41,885 | | 45,154 | | 50,193 | | 3.7 | |
2012 Financial and Economic Review — July 2012
76
Appendix 2 — Financial Review
Table A2.12 Provincial Debt Supplementary Information — 2000/01 to 2011/12
| | | | | | | | | | | | | | | | | | | | | | | | | | Average | |
| | Actual | | Actual | | Actual | | Actual | | Actual | | Actual | | Actual | | Actual | | Actual | | Actual | | Actual | | Actual | | annual | |
($ millions) | | 2000/01 | | 2001/02 | | 2002/03 | | 2003/04 | | 2004/05 | | 2005/06 | | 2006/07 | | 2007/08 | | 2008/09 | | 2009/10 | | 2010/11 | | 2011/12 | | change | |
| | | | | | | | | | | | | | | | | | | | | | | | | | (per cent) | |
Per cent of Nominal GDP: (1) | | | | | | | | | | | | | | | | | | | | | | | | | | | |
Taxpayer-supported debt: | | | | | | | | | | | | | | | | | | | | | | | | | | | |
Provincial government direct operating | | 8.8 | | 10.0 | | 10.8 | | 10.4 | | 8.9 | | 6.7 | | 4.9 | | 4.0 | | 2.9 | | 3.8 | | 3.4 | | 3.7 | | -7.6 | |
Education facilities | | 4.4 | | 4.6 | | 4.6 | | 4.7 | | 4.5 | | 4.5 | | 4.4 | | 4.5 | | 4.6 | | 5.0 | | 5.0 | | 5.0 | | 1.2 | |
Health facilities | | 1.5 | | 1.6 | | 1.6 | | 1.6 | | 1.4 | | 1.6 | | 1.7 | | 1.8 | | 2.0 | | 2.3 | | 2.4 | | 2.5 | | 4.5 | |
Highways, ferries and public transit | | 3.2 | | 3.5 | | 3.5 | | 3.4 | | 2.9 | | 2.9 | | 3.0 | | 3.2 | | 3.4 | | 3.9 | | 4.0 | | 4.1 | | 2.2 | |
Other | | 1.2 | | 0.9 | | 0.7 | | 0.5 | | 0.4 | | 0.4 | | 0.3 | | 0.4 | | 0.4 | | 0.6 | | 0.9 | | 1.1 | | -0.4 | |
Total taxpayer-supported debt | | 19.1 | | 20.6 | | 21.3 | | 20.6 | | 18.2 | | 16.1 | | 14.2 | | 13.8 | | 13.3 | | 15.6 | | 15.7 | | 16.4 | | -1.4 | |
Self-supported debt: | | | | | | | | | | | | | | | | | | | | | | | | | | | |
Commercial Crown corporations & agencies | | 5.6 | | 5.6 | | 5.4 | | 5.3 | | 4.6 | | 4.2 | | 4.1 | | 4.2 | | 4.8 | | 6.2 | | 6.5 | | 7.3 | | 2.4 | |
Warehouse borrowing program | | 1.0 | | 0.8 | | — | | — | | — | | — | | — | | — | | 1.0 | | — | | — | | — | | n/a | |
Total self-supported debt | | 6.6 | | 6.4 | | 5.4 | | 5.3 | | 4.6 | | 4.2 | | 4.1 | | 4.2 | | 5.8 | | 6.2 | | 6.5 | | 7.3 | | 0.9 | |
Total provincial debt | | 25.7 | | 27.0 | | 26.7 | | 25.9 | | 22.7 | | 20.3 | | 18.3 | | 18.0 | | 19.1 | | 21.8 | | 22.2 | | 23.7 | | -0.8 | |
Growth rates: | | | | | | | | | | | | | | | | | | | | | | | | | | | |
Taxpayer-supported debt: | | | | | | | | | | | | | | | | | | | | | | | | | | | |
Provincial government direct operating | | -12.9 | | 15.0 | | 12.3 | | 1.5 | | -8.0 | | -18.8 | | -21.6 | | -14.5 | | -24.5 | | 28.1 | | -5.4 | | 12.2 | | -2.1 | |
Education facilities | | 5.7 | | 6.8 | | 4.5 | | 6.8 | | 4.3 | | 7.0 | | 5.3 | | 7.7 | | 5.7 | | 5.2 | | 5.1 | | 4.8 | | 5.7 | |
Health facilities | | 20.8 | | 7.8 | | 3.6 | | 3.4 | | -3.8 | | 17.0 | | 15.9 | | 15.0 | | 12.1 | | 11.5 | | 11.5 | | 8.1 | | 9.3 | |
Highways, ferries and public transit | | 20.0 | | 10.7 | | 3.2 | | 2.0 | | -5.8 | | 5.1 | | 11.3 | | 13.0 | | 11.2 | | 9.8 | | 7.9 | | 6.8 | | 6.8 | |
Other | | 19.7 | | -21.5 | | -23.0 | | -21.8 | | -7.5 | | 13.6 | | -27.0 | | 22.6 | | 16.1 | | 46.3 | | 55.8 | | 31.1 | | 7.7 | |
Total taxpayer-supported debt | | -0.4 | | 9.6 | | 6.8 | | 2.1 | | -4.5 | | -4.9 | | -4.7 | | 2.4 | | -0.5 | | 13.5 | | 6.1 | | 8.9 | | 3.2 | |
Self-supported debt: | | | | | | | | | | | | | | | | | | | | | | | | | | | |
Commercial Crown corporations & agencies | | -6.8 | | 1.7 | | -0.4 | | 3.8 | | -7.2 | | 0.1 | | 3.7 | | 7.7 | | 17.9 | | 25.1 | | 12.1 | | 16.6 | | 7.4 | |
Warehouse borrowing program | | -0.6 | | -18.7 | | -100.0 | | — | | — | | — | | — | | — | | — | | -100.0 | | — | | — | | n/a | |
Total self-supported debt | | -5.9 | | -1.3 | | -12.8 | | 3.8 | | -7.2 | | 0.1 | | 3.7 | | 7.7 | | 43.7 | | 2.6 | | 12.1 | | 16.6 | | 6.3 | |
Total provincial debt | | -1.9 | | 6.8 | | 2.1 | | 2.5 | | -5.0 | | -3.9 | | -3.0 | | 3.6 | | 9.7 | | 10.2 | | 7.8 | | 11.2 | | 3.8 | |
Per capita: (2) | | | | | | | | | | | | | | | | | | | | | | | | | | | |
Taxpayer-supported debt: | | | | | | | | | | | | | | | | | | | | | | | | | | | |
Provincial government direct operating | | 2,866 | | 3,267 | | 3,650 | | 3,682 | | 3,362 | | 2,703 | | 2,095 | | 1,764 | | 1,310 | | 1,650 | | 1,537 | | 1,708 | | -4.6 | |
Education facilities | | 1,420 | | 1,503 | | 1,563 | | 1,659 | | 1,717 | | 1,819 | | 1,894 | | 2,008 | | 2,087 | | 2,157 | | 2,232 | | 2,316 | | 4.5 | |
Health facilities | | 502 | | 536 | | 553 | | 568 | | 542 | | 628 | | 719 | | 815 | | 898 | | 984 | | 1,081 | | 1,157 | | 7.9 | |
Highways, ferries and public transit | | 1,048 | | 1,149 | | 1,180 | | 1,196 | | 1,118 | | 1,164 | | 1,281 | | 1,425 | | 1,558 | | 1,682 | | 1,787 | | 1,890 | | 5.5 | |
Other | | 378 | | 294 | | 225 | | 175 | | 161 | | 181 | | 130 | | 157 | | 180 | | 258 | | 396 | | 514 | | 2.8 | |
Total taxpayer-supported debt | | 6,215 | | 6,750 | | 7,170 | | 7,281 | | 6,899 | | 6,493 | | 6,119 | | 6,170 | | 6,032 | | 6,731 | | 7,033 | | 7,586 | | 1.8 | |
Self-supported debt: | | | | | | | | | | | | | | | | | | | | | | | | | | | |
Commercial Crown corporations & agencies | | 1,825 | | 1,840 | | 1,824 | | 1,883 | | 1,733 | | 1,717 | | 1,761 | | 1,867 | | 2,164 | | 2,660 | | 2,936 | | 3,389 | | 5.8 | |
Warehouse borrowing program | | 325 | | 262 | | — | | — | | — | | — | | — | | — | | 475 | | — | | — | | — | | n/a | |
Total self-supported debt | | 2,150 | | 2,102 | | 1,824 | | 1,883 | | 1,733 | | 1,717 | | 1,761 | | 1,867 | | 2,639 | | 2,660 | | 2,936 | | 3,389 | | 4.2 | |
Total provincial debt | | 8,365 | | 8,852 | | 8,994 | | 9,163 | | 8,632 | | 8,210 | | 7,880 | | 8,037 | | 8,671 | | 9,391 | | 9,968 | | 10,975 | | 2.5 | |
Real Per Capita Provincial Debt (2011 $) (3) | | 10,141 | | 10,555 | | 10,477 | | 10,446 | | 9,651 | | 8,998 | | 8,492 | | 8,512 | | 8,995 | | 9,743 | | 10,205 | | 10,975 | | 0.7 | |
Growth rate (per cent) | | -4.3 | | 4.1 | | -0.7 | | -0.3 | | -7.6 | | -6.8 | | -5.6 | | 0.2 | | 5.7 | | 8.3 | | 4.7 | | 7.5 | | 0.9 | |
(1) | Debt as a per cent of GDP is calculated using GDP for the calendar year ending in the fiscal year (e.g. 2011/12 debt divided by GDP for the 2011 calendar year). As nominal GDP for the calendar year ending in 2011 is not available, the 2011 GDP projected in February 2012 has been used for the fiscal year ended March 31, 2012 for demonstration purposes. Totals may not add due to rounding. |
| |
(2) | Per capita debt is calculated using July 1 population (e.g. 2011/12 debt divided by population on July 1, 2011). Totals may not add due to rounding. |
| |
(3) | Debt is converted to real (inflation-adjusted) terms using the consumer price index (CPI) for the corresponding calendar year (e.g. 2011 CPI for 2011/12 debt). |
2012 Financial and Economic Review — July 2012
77
Appendix 2 — Financial Review
Table A2.13 Key Provincial Debt Indicators — 2000/2001 to 2011/12 (1)
| | | | | | | | | | | | | | | | | | | | | | | | | | Average | |
| | Actual | | Actual | | Actual | | Actual | | Actual | | Actual | | Actual | | Actual | | Actual | | Actual | | Actual | | Actual | | annual | |
| | 2000/01 | | 2001/02 | | 2002/03 | | 2003/04 | | 2004/05 | | 2005/06 | | 2006/07 | | 2007/08 | | 2008/09 | | 2009/10 | | 2010/11 | | 2011/12 | | change | |
| | | | | | | | | | | | | | | | | | | | | | | | | | (per cent) | |
Debt to revenue (per cent) | | | | | | | | | | | | | | | | | | | | | | | | | | | |
Total provincial | | 81.3 | | 92.1 | | 104.4 | | 100.7 | | 85.2 | | 74.9 | | 69.2 | | 69.4 | | 78.0 | | 87.5 | | 89.9 | | 96.5 | | 1.6 | |
Taxpayer-supported | | 88.1 | | 100.2 | | 110.0 | | 107.3 | | 88.6 | | 77.9 | | 69.8 | | 69.6 | | 71.9 | | 84.0 | | 80.4 | | 86.9 | | -0.1 | |
Debt per capita ($) (2) | | | | | | | | | | | | | | | | | | | | | | | | | | | |
Total provincial | | 8,365 | | 8,852 | | 8,994 | | 9,163 | | 8,632 | | 8,210 | | 7,880 | | 8,037 | | 8,671 | | 9,391 | | 9,968 | | 10,975 | | 2.5 | |
Taxpayer-supported | | 6,215 | | 6,750 | | 7,170 | | 7,281 | | 6,899 | | 6,493 | | 6,119 | | 6,170 | | 6,032 | | 6,731 | | 7,033 | | 7,586 | | 1.8 | |
Debt to nominal GDP (per cent) (3) | | | | | | | | | | | | | | | | | | | | | | | | | | | |
Total provincial | | 25.7 | | 27.0 | | 26.7 | | 25.9 | | 22.7 | | 20.3 | | 18.3 | | 18.0 | | 19.1 | | 21.8 | | 22.2 | | 23.7 | | -0.8 | |
Taxpayer-supported | | 19.1 | | 20.6 | | 21.3 | | 20.6 | | 18.2 | | 16.1 | | 14.2 | | 13.8 | | 13.3 | | 15.6 | | 15.7 | | 16.4 | | -1.4 | |
Interest bite (cents per dollar of revenue) (4) | | | | | | | | | | | | | | | | | | | | | | | | | | | |
Total provincial | | 6.4 | | 6.3 | | 6.4 | | 5.9 | | 4.7 | | 4.4 | | 4.3 | | 4.0 | | 4.4 | | 4.6 | | 4.3 | | 4.4 | | -3.3 | |
Taxpayer-supported | | 6.7 | | 6.4 | | 6.3 | | 6.1 | | 5.0 | | 4.4 | | 4.2 | | 3.9 | | 4.3 | | 4.3 | | 4.0 | | 4.1 | | -4.4 | |
Interest costs ($ millions) | | | | | | | | | | | | | | | | | | | | | | | | | | | |
Total provincial | | 2,646 | | 2,456 | | 2,258 | | 2,228 | | 1,997 | | 2,007 | | 2,069 | | 2,010 | | 2,138 | | 2,206 | | 2,163 | | 2,291 | | -1.3 | |
Taxpayer-supported | | 1,913 | | 1,758 | | 1,690 | | 1,703 | | 1,633 | | 1,542 | | 1,570 | | 1,488 | | 1,570 | | 1,535 | | 1,596 | | 1,625 | | -1.5 | |
Interest rate (per cent) (5) | | | | | | | | | | | | | | | | | | | | | | | | | | | |
Taxpayer-supported | | 7.6 | | 6.7 | | 5.9 | | 5.7 | | 5.6 | | 5.5 | | 5.9 | | 5.7 | | 5.9 | | 5.4 | | 5.2 | | 4.9 | | -3.9 | |
Background Information: | | | | | | | | | | | | | | | | | | | | | | | | | | | |
Revenue ($ millions) | | | | | | | | | | | | | | | | | | | | | | | | | | | |
Total provincial (6) | | 41,566 | | 39,163 | | 35,307 | | 37,519 | | 42,112 | | 46,029 | | 48,340 | | 49,938 | | 48,761 | | 47,858 | | 50,235 | | 52,018 | | 2.1 | |
Taxpayer-supported (7) | | 28,502 | | 27,457 | | 26,714 | | 27,974 | | 32,361 | | 34,961 | | 37,203 | | 38,192 | | 36,784 | | 35,748 | | 39,639 | | 39,903 | | 3.1 | |
Debt ($ millions) | | | | | | | | | | | | | | | | | | | | | | | | | | | |
Total provincial | | 33,788 | | 36,082 | | 36,857 | | 37,775 | | 35,869 | | 34,457 | | 33,439 | | 34,637 | | 38,014 | | 41,885 | | 45,154 | | 50,193 | | 3.7 | |
Taxpayer-supported (8) | | 25,104 | | 27,514 | | 29,383 | | 30,014 | | 28,668 | | 27,251 | | 25,968 | | 26,589 | | 26,446 | | 30,021 | | 31,855 | | 34,692 | | 3.0 | |
Provincial nominal GDP ($ millions) (9) | | 131,333 | | 133,514 | | 138,193 | | 145,642 | | 157,675 | | 169,664 | | 182,251 | | 192,117 | | 199,441 | | 191,863 | | 203,147 | | 211,977 | | 4.4 | |
Population (thousands at July 1) (10) | | 4,039 | | 4,076 | | 4,098 | | 4,122 | | 4,155 | | 4,197 | | 4,244 | | 4,310 | | 4,384 | | 4,460 | | 4,530 | | 4,573 | | 1.1 | |
(1) | Includes fiscal data of school districts, post-secondary institutions and regional health authorities/societies (SUCH). |
(2) | The ratio of debt to population (e.g. 2011/12 debt divided by population at July 1, 2011). |
(3) | The ratio of debt outstanding at fiscal year end to provincial nominal gross domestic product (GDP) for the calendar year ending in the fiscal year (e.g. 2011/12 debt divided by 2011 nominal GDP). As nominal GDP for the calendar year ending 2011 is not available, the 2011 GDP projected in February 2012 has been used for the fiscal year ended March 31, 2012 for demonstration purposes. |
(4) | The ratio of interest costs (less sinking fund interest) to revenue. Figures include capitalized interest expense in order to provide a more comparable measure to outstanding debt. |
(5) | Weighted average of all outstanding debt issues. |
(6) | Includes revenue of the consolidated revenue fund (excluding dividends from enterprises) plus revenue of all government organizations and enterprises. |
(7) | Excludes revenue of government enterprises, but includes dividends from enterprises paid to the consolidated revenue fund. |
(8) | Excludes debt of commercial Crown corporations and agencies and funds held under the province’s warehouse borrowing program. |
(9) | Nominal GDP for the calendar year ending in the fiscal year (e.g. Nominal GDP for 2011 is used for the fiscal year ended March 31, 2012). As nominal GDP for the calendar year ending 2011 is not available, the 2011 GDP projected in February 2012 has been used for the fiscal year ended March 31, 2012 for demonstration purposes. |
(10) | Population at July 1st within the fiscal year (e.g. population at July 1, 2011 is used for the fiscal year ended March 31, 2012). |
2012 Financial and Economic Review — July 2012
78
Appendix 2 — Financial Review
Table A2.14 Historical Operating Statement Surplus (Deficit)
| | | | | | | | Crown | | SUCH | | | | | | Surplus | |
| | | | | | | | Corporations | | Sector & | | | | | | (Deficit) | |
| | Consolidated Revenue Fund | | and | | Regional | | Other | | Surplus | | as a Per Cent | |
($ millions) | | Revenue | | Expenditure | | Balance | | Agencies | | Authorities | | Adjustments | | (Deficit) (1) | | of GDP | |
1969/70 | | 1,248 | | 1,244 | | 4 | | — | | — | | — | | — | | 0.0 | |
1970/71 | | 1,373 | | 1,274 | | 99 | | — | | — | | — | | — | | 1.0 | |
1971/72 | | 1,558 | | 1,474 | | 84 | | — | | — | | — | | — | | 0.8 | |
1972/73 | | 1,772 | | 1,675 | | 97 | | — | | — | | — | | — | | 0.8 | |
1973/74 | | 2,217 | | 2,071 | | 146 | | — | | — | | — | | — | | 0.9 | |
1974/75 | | 2,769 | | 2,779 | | (10 | ) | — | | — | | — | | — | | (0.1 | ) |
1975/76 | | 3,124 | | 3,534 | | (410 | ) | — | | — | | — | | — | | (2.1 | ) |
1976/77 | | 3,785 | | 3,691 | | 94 | | — | | — | | — | | — | | 0.4 | |
1977/78 | | 4,372 | | 4,168 | | 204 | | — | | — | | — | | — | | 0.8 | |
1978/79 | | 4,853 | | 4,582 | | 271 | | — | | — | | — | | — | | 0.9 | |
1979/80 (1) | | 5,860 | | 5,318 | | 542 | | (88 | ) | — | | — | | 454 | | 1.3 | |
1980/81 | | 5,982 | | 6,239 | | (257 | ) | 45 | | — | | — | | (212 | ) | (0.5 | ) |
1981/82 | | 7,139 | | 7,323 | | (184 | ) | 43 | | — | | — | | (141 | ) | (0.3 | ) |
1982/83 | | 7,678 | | 8,662 | | (984 | ) | (257 | ) | — | | — | | (1,241 | ) | (2.8 | ) |
1983/84 | | 8,335 | | 9,347 | | (1,012 | ) | 49 | | — | | — | | (963 | ) | (2.0 | ) |
1984/85 | | 8,807 | | 9,801 | | (994 | ) | 172 | | — | | — | | (822 | ) | (1.6 | ) |
1985/86 | | 9,160 | | 10,127 | | (967 | ) | 110 | | — | | — | | (857 | ) | (1.6 | ) |
1986/87 | | 9,463 | | 10,624 | | (1,161 | ) | 526 | | — | | — | | (635 | ) | (1.1 | ) |
1987/88 | | 11,007 | | 11,055 | | (48 | ) | 119 | | — | | — | | 71 | | 0.1 | |
1988/89 | | 12,570 | | 11,834 | | 736 | | 194 | | — | | — | | 930 | | 1.3 | |
1989/90 | | 13,656 | | 13,200 | | 456 | | 40 | | — | | — | | 496 | | 0.7 | |
1990/91 | | 14,236 | | 15,010 | | (774 | ) | 107 | | — | | — | | (667 | ) | (0.8 | ) |
1991/92 | | 14,570 | | 17,101 | | (2,531 | ) | 192 | | — | | — | | (2,339 | ) | (2.9 | ) |
1992/93 | | 16,172 | | 17,858 | | (1,686 | ) | 210 | | — | | — | | (1,476 | ) | (1.7 | ) |
1993/94 | | 17,923 | | 18,833 | | (910 | ) | 11 | | — | | — | | (899 | ) | (1.0 | ) |
1994/95 | | 19,506 | | 19,953 | | (447 | ) | 219 | | — | | — | | (228 | ) | (0.2 | ) |
1995/96 | | 19,698 | | 20,054 | | (356 | ) | 38 | | — | | — | | (318 | ) | (0.3 | ) |
1996/97 | | 20,126 | | 20,241 | | (115 | ) | (270 | ) | — | | — | | (385 | ) | (0.4 | ) |
1997/98 | | 20,216 | | 20,135 | | 81 | | (248 | ) | — | | — | | (167 | ) | (0.1 | ) |
1998/99 | | 20,312 | | 20,527 | | (215 | ) | (689 | ) | (56 | ) | — | | (960 | ) | (0.8 | ) |
1999/2000 | | 21,836 | | 22,157 | | (321 | ) | 345 | | (40 | ) | — | | (16 | ) | 0.0 | |
2000/01 | | 23,773 | | 22,496 | | 1,277 | | (171 | ) | 138 | | (52 | )(3) | 1,192 | | 0.9 | |
2001/02 | | 22,747 | | 24,737 | | (1,990 | )(2) | (711 | )(2) | 180 | | 1,464 | (3) | (1,057 | ) | (0.8 | ) |
2002/03 | | 22,041 | | 25,000 | | (2,959 | ) | (216 | ) | 527 | | — | | (2,648 | ) | (1.9 | ) |
2003/04 | | 23,221 | | 25,290 | | (2,069 | ) | 347 | | 368 | | — | | (1,354 | ) | (0.9 | ) |
2004/05 | | 27,341 | | 26,085 | | 1,256 | | 1,035 | | 385 | | — | | 2,676 | | 1.7 | |
2005/06 | | 29,485 | | 26,948 | | 2,537 | | 550 | | 586 | | (710 | )(4) | 2,963 | | 1.7 | |
2006/07 | | 31,252 | | 28,252 | | 3,000 | | 841 | | 396 | | (264 | )(4) | 3,973 | | 2.2 | |
2007/08 | | 32,028 | | 30,276 | | 1,752 | | 996 | | 437 | | (444 | )(4),(5) | 2,741 | | 1.4 | |
2008/09 | | 30,517 | | 31,623 | | (1,106 | ) | 981 | | 190 | | 18 | (4),(5) | 83 | | 0.0 | |
2009/10 | | 28,620 | | 31,760 | | (3,140 | ) | 804 | | 509 | | — | | (1,827 | ) | (1.0 | ) |
2010/11 | | 32,086 | | 32,856 | | (770 | ) | (195 | ) | 716 | | — | | (249 | ) | (0.1 | ) |
2011/12 | | 32,451 | | 33,772 | | (1,321 | ) | 257 | | 823 | | (1,599 | )(6) | (1,840 | ) | (0.9 | ) |
(1) The provincial government began publishing summary financial statements in 1979/80. Figures for prior years are unavailable. For 1969/70 to 1978/79, the CRF balance is used in place of the summary accounts surplus/(deficit).
(2) Does not include the $256 million transfer to the CRF for the wind-up of Forest Renewal BC and Fisheries Renewal BC.
(3) Impact of move to joint trusteeship for public service pension plans.
(4) Negotiating framework incentive payments.
(5) Climate Action Dividend.
(6) Onetime HST transition repayment
2012 Financial and Economic Review — July 2012
79
Appendix 2 — Financial Review
Table A2.15 Historical Provincial Debt Summary (1)
| | Taxpayer-Supported Debt | | | | | | | | | |
| | Provincial | | Education | | Health | | | | | | Total | | | | | | | | Taxpayer- | |
| | Government | | Facilities | | Facilities | | Highways, | | | | Taxpayer- | | Self- | | Total | | Total Debt | | Supported | |
| | Direct | | Capital | | Capital | | Ferries and | | | | Supported | | Supported | | Provincial | | as a Per | | Debt as a Per | |
Year | | Operating | | Financing | | Financing | | Public Transit | | Other (2) | | Debt | | Debt (3) | | Debt | | Cent of GDP | | Cent of GDP | |
| | | | | | | | | | (millions) | | | | | | | | (per cent) | |
1969/70 | | — | | 338 | | 42 | | 142 | | 100 | | 622 | | 1,661 | | 2,283 | | 24.7 | | 6.7 | |
1970/71 | | — | | 362 | | 64 | | 172 | | 99 | | 697 | | 1,808 | | 2,505 | | 25.6 | | 7.1 | |
1971/72 | | — | | 380 | | 85 | | 233 | | 95 | | 793 | | 1,948 | | 2,741 | | 24.9 | | 7.2 | |
1972/73 | | — | | 408 | | 105 | | 288 | | 87 | | 888 | | 2,062 | | 2,950 | | 23.8 | | 7.2 | |
1973/74 | | — | | 425 | | 117 | | 340 | | 145 | | 1,027 | | 2,228 | | 3,255 | | 21.1 | | 6.7 | |
1974/75 | | — | | 485 | | 133 | | 386 | | 149 | | 1,153 | | 2,650 | | 3,803 | | 21.3 | | 6.5 | |
1975/76 | | — | | 557 | | 178 | | 544 | | 145 | | 1,424 | | 3,144 | | 4,568 | | 23.1 | | 7.2 | |
1976/77 | | 261 | | 658 | | 236 | | 649 | | 188 | | 1,992 | | 3,787 | | 5,779 | | 24.4 | | 8.4 | |
1977/78 | | 261 | | 710 | | 291 | | 656 | | 215 | | 2,133 | | 4,464 | | 6,597 | | 24.9 | | 8.1 | |
1978/79 | | 261 | | 778 | | 334 | | 653 | | 91 | | 2,117 | | 4,838 | | 6,955 | | 23.3 | | 7.1 | |
1979/80 | | 235 | | 836 | | 401 | | 730 | | 195 | | 2,397 | | 5,704 | | 8,101 | | 23.3 | | 6.9 | |
1980/81 | | 209 | | 919 | | 461 | | 729 | | 270 | | 2,588 | | 5,956 | | 8,544 | | 21.6 | | 6.5 | |
1981/82 | | 183 | | 1,067 | | 561 | | 844 | | 291 | | 2,946 | | 7,227 | | 10,173 | | 22.7 | | 6.6 | |
1982/83 | | 883 | | 1,204 | | 660 | | 1,024 | | 894 | | 4,665 | | 7,692 | | 12,357 | | 27.4 | | 10.4 | |
1983/84 | | 1,596 | | 1,321 | | 712 | | 1,392 | | 1,174 | | 6,195 | | 8,440 | | 14,635 | | 30.8 | | 13.0 | |
1984/85 | | 2,476 | | 1,308 | | 717 | | 691 | | 1,276 | | 6,468 | | 9,082 | | 15,550 | | 31.2 | | 13.0 | |
1985/86 | | 3,197 | | 1,276 | | 680 | | 1,034 | | 1,376 | | 7,563 | | 8,990 | | 16,553 | | 30.9 | | 14.1 | |
1986/87 | | 4,802 | | 1,268 | | 681 | | 1,097 | | 812 | | 8,660 | | 8,485 | | 17,145 | | 30.3 | | 15.3 | |
1987/88 | | 5,017 | | 1,278 | | 716 | | 1,192 | | 660 | | 8,863 | | 8,149 | | 17,012 | | 27.2 | | 14.2 | |
1988/89 | | 4,919 | | 1,322 | | 763 | | 1,213 | | 842 | | 9,059 | | 7,396 | | 16,455 | | 23.7 | | 13.1 | |
1989/90 | | 4,209 | | 1,367 | | 837 | | 1,244 | | 1,262 | | 8,919 | | 7,340 | | 16,259 | | 21.5 | | 11.8 | |
1990/91 | | 4,726 | | 1,565 | | 959 | | 1,287 | | 1,281 | | 9,818 | | 7,444 | | 17,262 | | 21.8 | | 12.4 | |
1991/92 | | 6,611 | | 1,939 | | 1,040 | | 1,527 | | 1,431 | | 12,548 | | 7,493 | | 20,041 | | 24.5 | | 15.3 | |
1992/93 | | 8,969 | | 2,426 | | 1,141 | | 1,719 | | 1,641 | | 15,896 | | 7,526 | | 23,422 | | 26.8 | | 18.2 | |
1993/94 | | 10,257 | | 3,054 | | 1,181 | | 1,862 | | 1,627 | | 17,981 | | 7,946 | | 25,927 | | 27.6 | | 19.1 | |
1994/95 | | 10,181 | | 3,631 | | 1,318 | | 2,158 | | 1,749 | | 19,037 | | 8,013 | | 27,050 | | 26.9 | | 18.9 | |
1995/96 | | 10,237 | | 3,990 | | 1,399 | | 2,598 | | 1,695 | | 19,919 | | 8,847 | | 28,766 | | 27.2 | | 18.9 | |
1996/97 | | 11,030 | | 4,230 | | 1,431 | | 3,144 | | 1,440 | | 21,275 | | 8,096 | | 29,371 | | 27.0 | | 19.5 | |
1997/98 | | 11,488 | | 4,352 | | 1,417 | | 3,463 | | 1,431 | | 22,151 | | 8,204 | | 30,355 | | 26.5 | | 19.4 | |
Information from 1998/99 onwards has been restated to include the SUCH sector and re-allocation of sinking fund. |
1998/99 | | 11,707 | | 5,023 | | 1,494 | | 3,678 | | 1,330 | | 23,232 | | 8,910 | | 32,142 | | 27.8 | | 20.1 | |
1999/2000 | | 13,295 | | 5,429 | | 1,679 | | 3,527 | | 1,276 | | 25,206 | | 9,232 | | 34,438 | | 28.5 | | 20.8 | |
2000/01 | | 11,578 | | 5,737 | | 2,028 | | 4,234 | | 1,527 | | 25,104 | | 8,684 | | 33,788 | | 25.7 | | 19.1 | |
2001/02 | | 13,319 | | 6,126 | | 2,186 | | 4,685 | | 1,198 | | 27,514 | | 8,568 | | 36,082 | | 27.0 | | 20.6 | |
2002/03 | | 14,957 | | 6,404 | | 2,265 | | 4,835 | | 922 | | 29,383 | | 7,474 | | 36,857 | | 26.7 | | 21.3 | |
2003/04 | | 15,180 | | 6,839 | | 2,343 | | 4,931 | | 721 | | 30,014 | | 7,761 | | 37,775 | | 25.9 | | 20.6 | |
2004/05 | | 13,969 | | 7,135 | | 2,253 | | 4,644 | | 667 | | 28,668 | | 7,201 | | 35,869 | | 22.7 | | 18.2 | |
2005/06 | | 11,343 | | 7,632 | | 2,635 | | 4,883 | | 758 | | 27,251 | | 7,206 | | 34,457 | | 20.3 | | 16.1 | |
2006/07 | | 8,889 | | 8,037 | | 3,053 | | 5,436 | | 553 | | 25,968 | | 7,471 | | 33,439 | | 18.3 | | 14.2 | |
2007/08 | | 7,604 | | 8,653 | | 3,511 | | 6,143 | | 678 | | 26,589 | | 8,048 | | 34,637 | | 18.0 | | 13.8 | |
2008/09 | | 5,744 | | 9,148 | | 3,936 | | 6,831 | | 787 | | 26,446 | | 11,568 | | 38,014 | | 19.1 | | 13.3 | |
2009/10 (4) | | 7,359 | | 9,620 | | 4,389 | | 7,502 | | 1,151 | | 30,021 | | 11,864 | | 41,885 | | 21.8 | | 15.6 | |
2010/11 | | 6,964 | | 10,108 | | 4,895 | | 8,095 | | 1,793 | | 31,855 | | 13,299 | | 45,154 | | 22.2 | | 15.7 | |
2011/12 | | 7,813 | | 10,592 | | 5,293 | | 8,644 | | 2,350 | | 34,692 | | 15,501 | | 50,193 | | 23.7 | | 16.4 | |
(1) Debt is after deduction of sinking funds, unamortized discounts and unrealized foreign exchange gains/(losses), and excludes accrued interest. Government direct and fiscal agency debt accrued interest is reported in the government’s accounts as an accounts payable. Figures for 1998/99 onwards have been restated to conform with the presentation used for 2006 and to reflect changes in underlying data.
(2) Includes BC Buildings, BC Housing Management Commission, Provincial Rental Housing Corporation, other taxpayer-supported Crown agencies, and loan guarantee provisions.
(3) Includes commercial Crown corporations and agencies and funds held under the province’s warehouse borrowing program.
(4) In 2009/10, sinking funds for government debt related to schools, post-secondary education, health care and public transit were liquidated and the proceeds ($763 million) used to offset direct operating borrowings requirements. Figures for prior years have been restated to reflect this decision.
2012 Financial and Economic Review — July 2012
80
| Chapter Three |
| |
| Commercial Crown |
| Corporations Review |
2012 Financial and Economic Review — July 2012
Chapter 3 — Commercial Crown Corporations Review
Introduction
Over the years, British Columbia’s governments have created or acquired a number of commercial Crown corporations as a means of combining public policy goals with private sector management practices. The Crown corporations vary greatly in terms of size and scope, from large companies such as the BC Hydro and Power Authority and the Insurance Corporation of British Columbia to the more limited scope of entities such as the Transportation Investment Corporation.
The provincial government’s commercial Crown corporations report on their operations through the usual corporate publications such as audited financial statements and annual reports. However, under the Budget Transparency and Accountability Act, they are also required to table annually in the BC Legislature a three-year Service Plan outlining financial and non-financial performance targets, as well as an Annual Service Plan Report on the results achieved in relation to the previous year’s Service Plan. The Service Plan is based on the Shareholder’s Letter of Expectation, a document which serves as the basis of understanding between the government and each Crown agency on high-level performance expectations, public policy issues and strategic priorities.
In general, the Service Plans are tabled each February in conjunction with the provincial government’s Budget and Fiscal Plan. The Annual Service Plan Reports are tabled at the same time as, or shortly after, the release of the provincial government’s Public Accounts. The commercial Crown corporations also post the above reports on their websites.
BC Hydro and Power Authority
BC Hydro is one of North America’s leading providers of clean, renewable energy, and the largest electric utility in British Columbia, serving 95 per cent of the province’s population and approximately 1.9 million customers. Residential clients account for 89 per cent of BC Hydro’s accounts while the remaining 11 per cent is made up of commercial or industrial operations. Each of these three groups consume roughly one-third of the electricity supplied by BC Hydro.
The utility operates and maintains 75 dams at 41 sites mainly on the Peace and Columbia River Systems and on the Pacific Coast. Over 95 per cent of BC Hydro’s 12,000 MW generating capacity is produced at 31 hydroelectric facilities, while the remaining capacity comes from 3 thermal generating plants. Power is delivered to customers through a network consisting of more than 75,000 kilometres of transmission and distribution lines.
BC Hydro’s mandate includes generating, manufacturing, conserving, supplying, purchasing and selling electricity to meet the need in British Columbia in a cost-effective and reliable manner. BC Hydro’s general powers and governance are established under the terms of the Hydro and Power Authority Act. The BC Hydro Public Power Legacy and Heritage Contract Act provides further direction with respect to BC Hydro’s assets. The act ensures public ownership of BC Hydro’s heritage resources, which includes BC Hydro’s transmission and distribution systems, and all of BC Hydro’s existing generation and storage assets. As well, BC Hydro is regulated by the British Columbia Utilities Commission (BCUC) under the terms of the Utilities Commission Act. The BCUC is responsible for ensuring that energy utilities under its jurisdiction charge fair, just and reasonable rates for energy, and provide safe, adequate and secure service to customers.
BC Hydro participates in the western North America energy trade market through the activities of its subsidiary Powerex Corp. BC Hydro uses the energy trade market to make
2012 Financial and Economic Review — July 2012
83
Chapter 3 — Commercial Crown Corporations Review
Map 3.1 500 kV transmission system and major generating stations
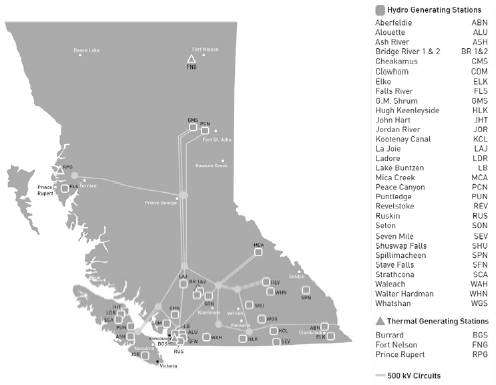
the best financial use of its generation capacity by selling power when energy prices are high, and acquiring electricity for domestic demand or later re-sale when energy prices are low.
BC Hydro’s ability to both meet domestic demand and maximize long-term net revenue from its hydroelectric generation capability is largely dependent on water inflows into reservoirs. Inflows into system reservoirs can vary significantly from year to year, depending on the amount of precipitation, and this variability has a large impact on the amount of energy that BC Hydro generates at its hydroelectric facilities. BC Hydro operates its large reservoirs to maximize the value of the system and to maintain adequate domestic supply through several consecutive drought years. It does this by assessing inflows and market prices and making decisions on when to buy energy from the market and when to generate energy at its own facilities.
System water supply for hydroelectric generation in 2011/12 was approximately 108 per cent of the average inflows over the 1981 to 2010 period. This follows inflows in 2009/10 and 2010/11 that were among the lowest on record.
Under the provincial government’s 2007 Energy Plan, increasing demand is to be met with conservation and demand management, upgrades to BC Hydro’s existing facilities, increased purchases from independent power producers and, potentially, new larger-scale projects such as construction of the Site C dam and generating facility on the Peace River. In addition, the Clean Energy Act provides a framework for electrical self-sufficiency and reduced greenhouse gas emissions powered by investments in clean, renewable energy across the province. In 2012, the provincial government adjusted the self-sufficiency requirements in the Act, eliminating BC Hydro’s requirement to acquire an extra 3,000 gigawatt hours of insurance energy by 2020.
2012 Financial and Economic Review — July 2012
84
Chapter 3 — Commercial Crown Corporations Review
Chart 3.1 Domestic electricity supply versus demand

BC Hydro’s capital spending reflects both efforts to improve and expand the province’s aging electrical generation facilities that were primarily constructed in the 1950s, 1960s and 1970s as well as to expand the province’s electrical generation capacity to meet the demands of population growth and an expanding economy.
Capital spending totaled $1.9 billion during 2011/12, up from $1.5 billion in 2010/11 as BC Hydro renewed and expanded generation facilities and transmission infrastructure and began the implementation phase of the Smart Metering and Infrastructure Program. As compared to 2010/11, there were increased expenditures in 2011/12 on the installations of Mica Units 5 and 6, the Fort Nelson generating station upgrade (completed in 2011/12), the Northwest Transmission Line project, the Interior to Lower Mainland project, and the Vancouver City Central Transmission project. The Cheakamus spillway gate upgrade was also completed in 20011/12. Table 2.9 in Chapter 2 provides more information on projects greater than $50 million.
In 2011/12, a government-appointed panel conducted a review of BC Hydro operations, including an assessment of its costs and governance structures, with the objective of minimizing anticipated electricity rate increases. The 124-page report released by the Review Panel in August 2011 made 56 specific recommendations to both BC Hydro and the provincial government, including operating cost reductions and deferral of some capital spending in order to reduce projected rate increases.
BC Hydro agreed with all of the panel’s recommendations and subsequently incorporated its response into an amended Revenue Requirements Application (RRA) submitted to the British Columbia Utilities Commission (BCUC) in November 2011. In addition to implementing the Review Panel recommendations, BC Hydro amended other aspects of it application, including extending the amortization period of its demand side management regulatory account and updating its interest and trade income projections. As a result, the amended RRA was able to request lower rate increases.
The review of the RRA by the BCUC was brought to an early close in May 2012 with the provincial government directing the BCUC to set overall rates increases over the 2011/12 to 2013/14 period that are generally in line with BC Hydro’s amended RRA. The government direction also confirmed BCUC’s decision to set the Deferral Account
2012 Financial and Economic Review — July 2012
85
Chapter 3 — Commercial Crown Corporations Review
Table 3.1 British Columbia Hydro and Power Authority
Five-Year Income Statement for the Years Ended March 31
($ millions, unless otherwise indicated) | | 2008 | | 2009 | | 2010 (1) | | 2011 (1), (2) | | 2012 | |
Domestic energy revenue | | 2,944 | | 2,814 | | 3,289 | | 3,438 | | 3,709 | |
Domestic energy costs | | (948 | ) | (1,236 | ) | (1,145 | ) | (1,049 | ) | (1,100 | ) |
| | 1,996 | | 1,578 | | 2,144 | | 2,389 | | 2,609 | |
Trade margin | | 157 | | 298 | | 263 | | 212 | | 206 | |
Revenue net of energy costs | | 2,153 | | 1,876 | | 2,407 | | 2,601 | | 2,815 | |
Other operating expenses (2) | | (942 | ) | (915 | ) | (795 | ) | (860 | ) | (869 | ) |
Amortization and depreciation | | (368 | ) | (395 | ) | (487 | ) | (533 | ) | (721 | ) |
EBIT | | 843 | | 566 | | 1,125 | | 1,208 | | 1,225 | |
Interest and taxes | | (616 | ) | (639 | ) | (678 | ) | (619 | ) | (667 | ) |
Operating results | | 227 | | (73 | ) | 447 | | 589 | | 558 | |
Net transfer (to) from regulatory accounts | | 142 | | 438 | | — | | — | | — | |
Net income | | 369 | | 365 | | 447 | | 589 | | 558 | |
Financial data: | | | | | | | | | | | |
Shareholder’s dividend | | 288 | | — | | 47 | | 463 | | 230 | |
Capital expenditures | | 1,076 | | 1,397 | | 2,406 | | 1,519 | | 1,917 | |
Property, plant and equipment (including intangible assets) | | 11,154 | | 12,099 | | 13,995 | | 15,546 | | 16,832 | |
Debt (including current portion) | | 7,519 | | 9,135 | | 10,696 | | 11,520 | | 12,795 | |
Debt to equity ratio | | 70:30 | | 81:19 | | 80:20 | | 80:20 | | 80:20 | |
Performance indicators: | | | | | | | | | | | |
Winter Generation Availability Index (per cent) | | 96.2 | | 96.4 | | 97.6 | | 94.4 | | 96.8 | |
Customer Average Interruption Duration Index (hours) (3) | | 2.24 | | 2.47 | | 2.28 | | 2.20 | | 2.27 | |
(1) In 2010/11, BC Hydro changed its presentation of the impact of regulation on its statement of operations. Regulatory Transfers were previously a single line item whereas in the current period they are netted against the corresponding expense or revenue line item. 2009/10 is restated to conform to the current presentation. Amounts in prior years were not restated.
(2) Changed in 2010/11 to present operating costs based on the nature of the expenditures. Amounts previously presented as operations, maintenance and administration expenses are now classified by the nature of the expense, including personnel, materials and external services and other operating costs. 2009/10 is restated to conform to the current presentation. Amounts in prior years were not restated.
(3) Excludes major events.
Rate Rider at 5.00 per cent for all of 2012/13 and 2013/14, compared to BC Hydro’s request for a DARR of 2.50 per cent over the same period.
As a result of the government direction, hydro rate increases were limited to 8.00 per cent in 2011/12, 3.91 per cent in 2012/13 and 1.44 per cent in 2013/14 (plus a 2.50 percent increase in the DARR), compared to BC Hydro’s initial request for annual increases of 9.73 per cent over the same period. Government also authorized BC Hydro to immediately expense costs related to BC Hydro’s Procurement Enhancement Initiative and outsourcing implementation, resulting in a $53 million reduction in BC Hydro’s 2011/12 net income compared to its budget forecast.
Each year BC Hydro establishes a number of financial and non-financial targets to evaluate its performance in a balanced framework. In 2011/12, BC Hydro met or exceeded its targets for customer satisfaction, environmental impacts and economic development. However, BC Hydro did not meet two of its seven performance targets related to safety, reliability and electricity security. BC Hydro met or exceeded three of its four financial targets for 2011/12, only failing to achieve its net income target primarily due to the government direction to the BCUC and BC Hydro discussed above. More information about BC Hydro’s financial results and performance measures are provided in the corporation’s annual report available at its website: www.bchydro.com.
2012 Financial and Economic Review — July 2012
86
Chapter 3 — Commercial Crown Corporations Review
BC Liquor Distribution Branch
LDB is responsible for the importation, distribution and retailing of beverage alcohol in British Columbia and the operation of government liquor stores and distribution centres in the province. LDB, under the authority of the Liquor Distribution Act, has the sole right to purchase beverage alcohol, both in and out of British Columbia, in accordance with the Importation of Intoxicating Liquors Act (Canada).
Table 3.2 Liquor Distribution Branch
Five-Year Income Statement for the Years Ended March 31
($ millions) | | 2008 | | 2009 | | 2010 | | 2011 (1) | | 2012 | |
Provincial liquor sales | | 2,679.5 | | 2,794.5 | | 2,854.1 | | 2,810.1 | | 2,889.9 | |
Less: commissions and discounts | | 180.0 | | 190.5 | | 198.3 | | 179.7 | | 187.6 | |
Net sales | | 2,499.5 | | 2,604.0 | | 2,655.8 | | 2,630.4 | | 2,702.3 | |
Cost of sales | | 1,396.4 | | 1,451.2 | | 1,515.3 | | 1,469.8 | | 1,510.8 | |
Gross margin | | 1,103.1 | | 1,152.8 | | 1,140.5 | | 1,160.6 | | 1,191.5 | |
Operating expenses | | (256.1 | ) | (270.0 | ) | (275.9 | ) | (281.6 | ) | (291.0 | ) |
Other income | | 10.2 | | 8.3 | | 12.7 | | 11.3 | | 10.6 | |
Net income | | 857.2 | | 891.1 | | 877.3 | | 890.3 | | 911.1 | |
Financial data: | | | | | | | | | | | |
Commissions as a per cent of total sales | | 6.72 | | 6.82 | | 6.95 | | 6.39 | | 6.49 | |
Gross margin percentage | | 41.17 | | 41.25 | | 39.96 | | 41.30 | | 41.23 | |
Retail results — percentage of net income | | 43.05 | | 44.16 | | 46.43 | | 46.42 | | 47.52 | |
Wholesale results — percentage of net income | | 56.95 | | 55.84 | | 53.57 | | 53.58 | | 52.48 | |
Retail results — percentage of sales | | 34.01 | | 34.63 | | 35.10 | | 35.49 | | 36.52 | |
Wholesale results — percentage of sales | | 30.62 | | 30.01 | | 27.75 | | 28.81 | | 28.06 | |
Performance indicators: | | | | | | | | | | | |
Operating costs per dollar of revenue (2) (cents) | | 9.56 | | 9.66 | | 9.67 | | 10.02 | | 10.07 | |
Sales per square foot (dollars) (3) | | 1,224 | | 1,269 | | 1,270 | | 1,259 | | 1,262 | |
Inventory turnover (times per year) | | 18 | | 17 | | 17 | | 17 | | 18 | |
(1) Amounts for 2010/11 have been restated to reflect the adoption of International Financial Reporting Standards (see note 22 in LDB’s financial statement for details). Years prior to 2010/11 continue to be reported on a Canadian Generally Accepted Accounting Principles basis.
(2) Excludes the impact of restructuring accruals.
(3) Excludes stores that exclusively deal in wholesale transactions.
LDB has a workforce of approximately 3,500 full and part-time employees, and manages its retail and wholesale business through the operation of 197 government liquor stores throughout the province; two distribution centres located in Vancouver and Kamloops; and a head office facility in Vancouver.
Since 2002, when liquor sales were made through 786 retail outlets with 75 per cent of sales through 224 government stores, consumer access has expanded to over 1,400 retail outlets, and diversified to allow sales through licensed agents, manufacturers and private retail outlets such as rural agency stores and duty free stores. This policy change reflects a move to bring more private sector competition into the liquor marketplace. As at March 31, 2012 the sales network consisted of:
· 197 government liquor stores;
· 672 licensee retail stores (private stores licensed to sell all beverage alcohol products);
· 220 rural agency stores (general merchandise stores in rural communities licensed to sell beverage alcohol products);
2012 Financial and Economic Review — July 2012
87
Chapter 3 — Commercial Crown Corporations Review
· 260 on-site manufacturer stores (outlets at wineries, breweries and distilleries that sell the products that they manufacture);
· 35 off-site manufacturer stores (outlets operated by the BC wine industry that sell BC winery products);
· 12 private wine stores; and
· 11 duty-free stores.
In addition to retail stores there were about 8,000 bars, restaurants and other licensed on-premise establishments.
In 2011/12, approximately 48 per cent of LDB’s net income resulted from retail operations (counter sales) while 52 per cent was derived through wholesale activities (including direct deliveries, and revenue from sales through licensed agents). However, net income as a percentage of sales was 37 per cent for the retail channel compared to 28 per cent for wholesale operations. This reflects product discounts ranging from 10 to 30 per cent for sales through wholesale activities.
In 2011/12, beer (packaged and draught) accounted for 38.3 per cent of sales revenue followed by wine (31.1 per cent) and spirits (26.0 per cent). The percentage of sales from spirits, ciders and coolers has remained relatively constant over the last nine years (see Chart 3.2), there has been an ongoing change in consumer preference from beer to wine.
Chart 3.2 Liquor sales by category
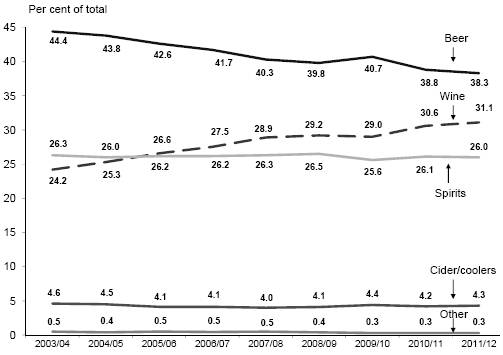
Source: BC Liquor Distribution Branch
A significant portion of the increase in wine sales comes from an expansion in the number of BC land-based winery stores, which increased by more than 10 per cent in 20011/12 alone. The increase in direct retailing by BC wineries puts downward pressure on LDB net income as LDB does not retain the markup on 100 per cent BC product wines sold by BC wineries; this markup accrues to the BC wineries.
2012 Financial and Economic Review — July 2012
88
Chapter 3 — Commercial Crown Corporations Review
LDB experienced a number of policy changes over the last decade that affected its operating ratios. In addition to the increase in their numbers, Licensee retail stores (LRS) were permitted to sell spirits as well as beer and wine beverages, and their product discounts were increased to 16 per cent from 10 per cent ten years ago. As well, a number of government liquor stores were consolidated into larger “Signature” retail outlets, and LDB began direct shipments to LRSs from its warehouses instead of routing them through the local liquor stores.
Other policy changes included moving from a percentage to a flat markup on beer products in 2003/04. The flat markup was not indexed (i.e., formula driven annual increases), which meant any subsequent product price increases accrued entirely to the industry. Indexing would have mitigated the impact of decreases in beer product sales volumes on LDB’s revenue.
In 2011/12, LDB adopted International Financial Reporting Standards (IFRS) as the basis for presenting its financial statements. Information for 2010/11 was restated for the new presentation, while prior years remain on a Canadian generally accepted accounting principles basis. Although the overall impact of the 2010/11 restatement lowered net income by a modest $0.1 million, transitioning to IFRS resulted in $10.3 million in lower sales and $11.5 million in higher costs of merchandise sold, offset by $21.8 million in lower commissions and discounts.
More information about LDB’s financial results and performance measures are provided in the corporation’s annual report available at its website: www.bcldb.com.
BC Lottery Corporation
British Columbia’s gaming industry is operated and regulated under the authority and direction of the provincial government under the terms of the Criminal Code of Canada. Under the Gaming Control Act (2002), BCLC is designated as the agent of the Crown responsible for conducting, managing and operating all forms of lottery, casino and commercial bingo gaming in the province. BCLC also participates in the marketing of nationwide and regional lottery games in association with other Canadian provinces.
BCLC has two corporate offices — Kamloops (finance, information technology and administration) and Vancouver (sales and marketing) — and a workforce of over 850 FTEs. Retail operations and gaming are provided by a network of licensed and regulated service providers, over 4,000 lottery retailers, 17 casinos, 17 community gaming centres, and 10 commercial bingo halls. It is estimated that the gaming industry in BC directly or indirectly employs 37,000 people.
At its inception, BCLC operated within a limited, traditional lottery market. A number of policy changes in the late 1990s — including the introduction of slot machines in 1997/98 and full casino gaming in 1998/99 — provided opportunity for gaming growth in the province. In 2004/05, BCLC expanded into online gaming with the introduction of its internet platform PlayNow.com . BCLC expects eGaming to be a major contributor to revenue growth over the next few years.
In 2011/12, BCLC had gross gaming receipts of $2.7 billion, while its net income amounted to $1.1 billion. Net income exceeded budgeted amounts by $2.4 million and the prior year by $1.7 million reflecting continued growth in consumer discretionary income coupled with game enhancements, record lottery jackpots and expansion of casino style games on PlayNow.com .
2012 Financial and Economic Review — July 2012
89
Chapter 3 — Commercial Crown Corporations Review
Table 3.3 British Columbia Lottery Corporation
Five-Year Income Statement for the Years Ended March 31
($ millions) | | 2008 | | 2009 | | 2010 | | 2011 (1) | | 2012 | |
Gaming revenue: | | | | | | | | | | | |
Lottery operations: | | | | | | | | | | | |
Lottery products | | 958.2 | | 930.7 | | 904.3 | | 1,019.5 | | 995.8 | |
eGaming | | 18.7 | | 23.5 | | 33.6 | | 42.9 | | 65.6 | |
Casino and community gaming operations: | | | | | | | | | | | |
Slot machines | | 1,060.6 | | 1,087.4 | | 1,098.6 | | 1,126.6 | | 1,140.7 | |
Table games, poker and bingo | | 521.7 | | 508.6 | | 480.8 | | 489.7 | | 499.3 | |
Total gaming revenue | | 2,559.2 | | 2,550.2 | | 2,517.3 | | 2,678.7 | | 2,701.4 | |
Prizes | | 647.1 | | 599.7 | | 577.6 | | 652.3 | | 641.9 | |
Net win | | 1,912.1 | | 1,950.5 | | 1,939.7 | | 2,026.4 | | 2,059.5 | |
Expenses: | | | | | | | | | | | |
Direct expenses | | 596.3 | | 619.8 | | 606.8 | | 619.9 | | 630.3 | |
Gaming support costs & operating expenses | | 186.9 | | 206.2 | | 216.2 | | 220.5 | | 234.9 | |
Taxes | | 40.0 | | 33.8 | | 37.6 | | 80.3 | | 86.9 | |
Total expenses | | 823.2 | | 859.8 | | 860.6 | | 920.7 | | 952.1 | |
Net income before payment to the federal gov’t | | 1,088.9 | | 1,090.7 | | 1,079.1 | | 1,105.7 | | 1,107.4 | |
Financial data: | | | | | | | | | | | |
Total net income as a percent of net win | | 56.9 | % | 55.9 | % | 55.6 | % | 54.6 | % | 53.8 | % |
Lottery operations | | 60.8 | % | 59.3 | % | 61.7 | % | 60.2 | % | 58.1 | % |
Casino and community gaming | | 55.8 | % | 55.0 | % | 53.9 | % | 52.8 | % | 52.5 | % |
Debt ($ millions) | | — | | — | | 60.0 | | 85.0 | | 90.0 | |
Capital spending ($ millions) | | 60.5 | | 97.4 | | 92.5 | | 81.3 | | 74.4 | |
Performance indicators: | | | | | | | | | | | |
Gaming support costs & operating expenses as a percent of net win | | 9.8 | % | 10.6 | % | 11.1 | % | 10.9 | % | 11.4 | % |
Allocation of net income | | | | | | | | | | | |
Government of Canada | | 8.5 | | 8.7 | | 8.7 | | 8.9 | | 9.2 | |
Transfers to charities/local governments | | 255.6 | | 255.7 | | 225.9 | | 234.3 | | 235.7 | |
Contribution to provincial revenue | | 824.8 | | 826.3 | | 844.5 | | 862.5 | | 862.5 | |
Total allocation | | 1,088.9 | | 1,090.7 | | 1,079.1 | | 1,105.7 | | 1,107.4 | |
(1) Amounts for 2010/11 have been restated to reflect the adoption of International Financial Reporting Standards (see note 26 in BCLC’s financial statement for details). Years prior to 2010/11 continue to be reported on a Canadian Generally Accepted Accounting Principles basis.
BCLC’s revenue is grouped into two main sources — lottery (including eGaming), and casinos/community gaming. In 2011/12, casino/community gaming operations accounted for 75 per cent of BCLC’s net income and lotteries 25 per cent.
· Net income from lottery operations was up $1.7 million from budget but down $10.4 million from the prior year. Compared to budget, the results reflect a higher number of lottery jackpots (LOTTO MAX reached its $50 million maximum 12 times), rejuvenation of the instant win and hospitality (pubs and bars) products, and strong performance from casino style games on the PlayNow.com platform. The positive results were partially offset by lower than expected revenue from ePoker (down $8.8 million from budget).
Over the past five years revenue from traditional lottery products has grown 3.9 per cent reflecting the recovery in consumer discretionary spending and the appeal of refreshed lottery products. Growth in eGaming has surged 250 per cent over the same period as the variety of games available on PlayNow.com increased. Strong growth in eGaming revenue is expected over the next few years reflecting continued enhancement of the gaming platform.
2012 Financial and Economic Review — July 2012
90
Chapter 3 — Commercial Crown Corporations Review
· Net income from casino/community gaming operations was up $0.7 million from budget and $12.1 million from the prior year. Compared to budget, lower revenue from slot machines and bingo was offset by increased income from table games, and lower costs for prizes, gaming support and operating expenses.
Revenue from casino/community gaming operations has increased 3.6 per cent over the past five years as higher income from slot machines was partially offset by lower earnings from table games and bingo. The increased revenue reflects the slot machine refreshment program.
· Total expenses (excluding prizes) were down $41.3 million from budget and up $31.4 million from the prior year. Compared to budget, lower expenses were mainly due to reduced amortization expenses (reflecting delays in the gaming management system project, replacement of slot machines, and other capital programs) and operating efficiencies.
Expenses have increased 15.7 per cent over the past five years mainly due to increased commissions paid to service providers and retailers (as a result of revenue growth), and higher regulatory expenses and gaming support costs related to the development of internet gaming. Higher taxes in the past two fiscal years will return to prior levels as the government reverts to a PST/GST taxation structure.
Each year, a portion of BCLC’s net income is redistributed by the provincial government to charities and local governments. In 2011/12, this redistribution amounted to $236 million or 21 per cent of total net income.
BCLC continued its commitment to socially responsible gambling by:
· expanding GameSense, a program that provides an easily accessible range of materials — including interactive kiosks in all BCLC casinos and community gaming centres, and responsible gambling television ads — that help players make informed decisions about gaming products;
· training BCLC staff and service providers to make proactive responses to problem gambling;
Chart 3.3 Interprovincial gaming comparisons

Source: Canadian Partnership for Responsible Gambling – Canadian Gambling Digest 2010-2011.
2012 Financial and Economic Review — July 2012
91
Chapter 3 — Commercial Crown Corporations Review
· achieving Responsible Gambling Council certification at nine facilities with plans to certify all venues within three years;
· improving its anti-money laundering program; and
· enhancing the voluntary self-exclusion program.
According to the Canadian Partnership for Responsible Gambling (CPRG) — a group of non-profit organizations, gaming providers and gaming regulators — BC’s gaming revenue, net of prizes paid out, on a per capita basis (persons 18+ years old) was $551 compared to a national average of $547 for the 2010/11 fiscal year (the latest data available). CPRG also calculates that BC derives 2.8 per cent of its total provincial revenue from gaming proceeds compared to a national average of 2.3 per cent. BC ranked 4th out of the 10 provinces in per capita revenue and 3rd in proceeds from gaming revenue (see Chart 3.3).
More information about BCLC’s financial results and performance measures are provided in the corporation’s annual report available at its website: www.bclc.com .
Insurance Corporation of BC
ICBC is one of BC’s largest corporations and one of Canada’s largest property and casualty insurers. ICBC earns approximately $3.7 billion in insurance premiums from over 3.3 million policies sold annually, and currently holds an $11.5 billion investment portfolio. ICBC offers automobile insurance products and services through a province-wide network of approximately 900 independent brokers, government agents and appointed agents. ICBC processes over 900,000 claims per year through its 24-hour telephone claims handling facility, province-wide network of 38 claim service locations and other claims handling facilities, and corporate website: www.icbc.com .
ICBC was established in 1973 under the Insurance Corporation Act to provide universal property and casualty liability (i.e. Basic) automobile insurance to BC motorists, which was made compulsory. At the time it was established, ICBC was designated the sole provider of all automobile insurance coverage in British Columbia, both Basic and Optional. Soon afterwards, the legislation was amended to allow private insurance companies to compete in the sale of non-compulsory Optional automobile insurance products. As part of its mandate, ICBC also provides driver licensing services, vehicle licensing and registration services, and fines collection on behalf of the provincial government.
In 2003, the provincial government mandated a number of changes to ICBC’s operations in order to ensure fair competition among all insurance providers in the Optional insurance marketplace. The British Columbia Utilities Commission (BCUC) was directed to regulate ICBC’s Basic insurance rates, and ICBC was required to separately disclose information on its Basic insurance line of business to the BCUC for Basic insurance rate setting purposes and in order to ensure appropriate cost allocation between the Basic insurance and Optional insurance lines of business.
Government also set out minimum capitalization targets for both the Basic and Optional lines of business, based on the minimum capital test (MCT) for insurance companies in Canada as required by the federal Office of the Superintendent of Financial Institutions (OSFI). ICBC’s financial performance has resulted in the corporation being well capitalized since the regulatory framework was put into place.
2012 Financial and Economic Review — July 2012
92
Chapter 3 — Commercial Crown Corporations Review
Table 3.4 Insurance Corporation of British Columbia
Five-Year Income Statement for the Years Ended December 31
($ millions) | | 2007 | | 2008 | | 2009 | | 2010 (1) | | 2011 | |
Revenue: | | | | | | | | | | | |
Net premiums | | 3,482.4 | | 3,631.2 | | 3,650.0 | | 3,667.3 | | 3,673.2 | |
Investment income | | 611.6 | | 280.4 | | 532.5 | | 530.3 | | 441.5 | |
Service fees | | 66.0 | | 69.2 | | 58.8 | | 54.6 | | 50.3 | |
| | 4,160.0 | | 3,980.8 | | 4,241.3 | | 4,252.2 | | 4,165.0 | |
Claims and expenses: | | | | | | | | | | | |
Claims incurred | | 2,646.4 | | 2,646.2 | | 2,648.2 | | 2,754.1 | | 2,880.1 | |
Prior years’ claims adjustments | | (33.8 | ) | (136.4 | ) | 2.4 | | (2.0 | ) | (14.4 | ) |
Net claims incurred | | 2,612.6 | | 2,509.8 | | 2,650.6 | | 2,752.1 | | 2,865.7 | |
Claims services and operations | | 450.8 | | 457.7 | | 488.7 | | 540.6 | | 529.1 | |
Insurance premium taxes and commissions | | 407.0 | | 429.0 | | 432.0 | | 446.0 | | 457.5 | |
Deferred premium acquisition cost adjustments (negative amounts are favourable) | | (26.5 | ) | (16.9 | ) | 2.8 | | 31.2 | | 59.9 | |
Non-insurance operating costs | | 92.9 | | 103.8 | | 104.3 | | 110.1 | | 112.7 | |
| | 3,536.8 | | 3,483.4 | | 3,678.4 | | 3,880.0 | | 4,024.9 | |
Income before unusual items | | 623.2 | | 497.4 | | 562.9 | | 372.2 | | 140.1 | |
Unusual items | | 19.1 | (2) | — | | — | | — | | — | |
Net income | | 642.3 | | 497.4 | | 562.9 | | 372.2 | | 140.1 | |
Financial data: | | | | | | | | | | | |
Average premium ($) | | 1,094 | | 1,108 | | 1,100 | | 1,092 | | 1,079 | |
Claims incurred per thousand earned policies (3) | | 319 | | 302 | | 293 | | 273 | | 271 | |
Average cost per claim incurred ($) (4) | | 2,668 | | 2,745 | | 2,799 | | 3,077 | | 3,200 | |
Performance indicators (per cent): | | | | | | | | | | | |
Loss ratio | | 83.7 | | 77.6 | | 81.4 | | 84.0 | | 86.8 | |
Insurance expense ratio | | 16.0 | | 15.9 | | 16.4 | | 17.0 | | 17.3 | |
Combined ratio | | 101.0 | | 95.9 | | 100.8 | | 105.8 | | 109.6 | |
Minimum capital test | | 188.0 | | 209.0 | | 240.0 | | 209.0 | | 189.0 | |
Return on investments (5) | | 6.0 | | 4.8 | | 5.1 | | 4.6 | | 4.3 | |
(1) Amounts for 2010 have been restated to reflect the adoption of International Financial Reporting Standards (see note 4 in ICBC’s financial statement for details). Years prior to 2010 continue to be reported on a Canadian Generally Accepted Accounting Principles basis.
(2) Gain on sale of property and equipment.
(3) Represents the number of claims reported per thousand policies earned during the year.
(4) Average claims incurred cost per claims reported.
(5) Four-year annualized return.
In 2010, government revised legislation to further reinforce that ICBC’s Basic and Optional lines of business were governed by separate processes. The BCUC role was restricted to reviewing only Basic operations and rates. BCUC was free to establish a Basic MCT target for these operations as long as it did not fall below the regulatory minimum of 100 per cent. Recent injury claims cost trends and lower prevailing investment returns have negatively impacted the Basic business resulting in reduced capitalization of ICBC’s Basic business to near the regulatory target minimum.
ICBC was directed to use OSFI guidance in setting its Optional MCT target, removing direct government influence on this metric. In 2010, government revised legislation enabling Optional capital in excess of the OSFI-derived MCT management target (as determined by ICBC’s actuaries and validated by an independent actuary as required by OSFI) to be transferred to government in support of core services. Treasury Board was given the authority to reduce the amount of the transfer. All Basic capitalization was to remain in ICBC to mitigate Basic rate increases.
2012 Financial and Economic Review — July 2012
93
Chapter 3 — Commercial Crown Corporations Review
As of June 30, 2012, ICBC has transferred $677 million in excess Optional capital to government’s consolidated revenue fund. Approximately half of this amount reflected accumulated Optional over-capitalization to the end of 2009, with the remainder derived from ICBC’s operations in 2010 and 2011. This amount is net of $400 million that Treasury Board directed remain in ICBC to fund its Transformation Program (see below).
Since 2007, ICBC has experienced some growth in premium revenue, primarily due to the increasing number of vehicles in the province, higher average optional insurance sales and changes to both Basic and Optional insurance rates. Investment returns have been a strong source of income with returns exceeding comparable market-based benchmarks. Investment returns continue to be an important source of revenue, but are not expected to contribute as much in future as in past years due to recent economic and investment market conditions.
Between 2007 and 2011, ICBC’s net claims incurred costs comprised an average 72 per cent of ICBC’s total annual expenses. Between 2007 and 2011, ICBC’s cost per claim increased by 20 per cent, most of this increase occurring in the last two years. However, net claims incurred costs only increased 9.7 per cent over the same period, as declining claims frequency partially mitigated increases in claim severity, mainly in the area of bodily injury claims.
Rising bodily injury claims costs are a concern throughout the automobile insurance industry. As seen in Chart 3.4, up until 2009 the declining frequency trend for bodily injury claims offset the severity trend, keeping overall bodily injury loss cost increases low or even negative. In 2010, the frequency trend began to increase along with an increase in the severity trend, resulting in relatively high loss cost increases and driving the cost per claim upward.
Chart 3.4 ICBC bodily injury claims loss cost trend
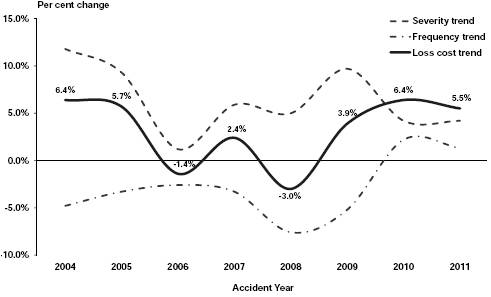
Similarly, up until 2009 the collision claims frequency trend offset the severity trend to the extent that collision claims loss cost increases have been negative over the last four years. For the most part, during this period collision claims loss cost increases were offset by decreases in the bodily injury claims loss costs, and vice versa, keeping annual cost per claim increases close to inflation.
2012 Financial and Economic Review — July 2012
94
Chapter 3 — Commercial Crown Corporations Review
Chart 3.5 ICBC collision claims loss cost trend
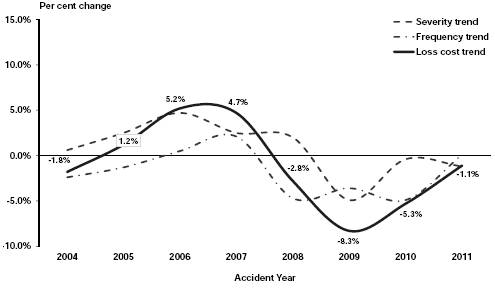
However, as is the case with bodily injury claims, the collision claims loss cost trend in this area increased significantly over the last two years. If the trend continues and this metric becomes positive, it too will contribute to the increase in cost per claim.
In response to the loss cost trends, BCUC ordered a 2.4 per cent decrease in Basic rates in November 2010. As well, ICBC lowered its Optional rates by 3 per cent — the fourth such decrease in as many years. However, the significant change in claims frequency trends put upward pressure on rates. By November 2011, ICBC filed a rate application with BCUC asking for an 11.2 per cent increase to Basic rates. ICBC partially offset this increase with a 6.0 per cent decrease to Optional rates; however the trend in collision claims loss costs may restrict ICBC’s ability to offer future Optional rate decreases.
In 2010 ICBC commenced a multi-year $400 million Transformation Program that is expected to have a customer-based risk pricing model resulting in better rates for safer drivers; simplified systems and processes to facilitate better support for customers and business partners with less paperwork; and more efficient business practices. The Transformation Program will be funded entirely from Optional insurance capital so as to not impact Basic insurance rates.
More information about ICBC’s financial results and performance measures are provided in the corporation’s annual report available at its website: www.icbc.com.
Columbia Power Corporation
CPC was incorporated in 1994 as a precursor to the Columbia Basin Initiative, a unique arrangement under which the provincial government directly shared a portion of the revenue from the sale of downstream power benefits from the Columbia River Treaty with the residents of the Columbia Basin in recognition of the significant economic, environmental and social costs resulting from the construction of the three dams required by the treaty.
The Columbia Basin Initiative was launched in 1995 with the Columbia Basin Trust Act, which created Columbia Basin Trust (CBT), and the 1995 Financial Agreement between the provincial government and CBT. Under the agreement, CPC and CBT each received $250 million over 10 years to provide equity for qualifying power project developments
2012 Financial and Economic Review — July 2012
95
Chapter 3 — Commercial Crown Corporations Review
Table 3.5 Columbia Power Corporation
Five-Year Income Statement for the Years Ended March 31
($ millions) | | 2008 | | 2009 | | 2010 | | 2011 (1) | | 2012 | |
Revenue | | 41.8 | | 49.5 | | 51.6 | | 21.8 | | 20.1 | |
Expenses: | | | | | | | | | | | |
Water rentals | | 4.5 | | 4.6 | | 5.5 | | — | | — | |
Operations, maintenance and administration | | 5.4 | | 7.4 | | 7.3 | | 3.3 | | 3.0 | |
Amortization | | 7.9 | | 9.2 | | 9.6 | | 0.6 | | 0.6 | |
Other costs | | 3.7 | | 1.9 | | 1.9 | | 0.6 | | 0.7 | |
| | 21.5 | | 23.1 | | 24.3 | | 4.5 | | 4.3 | |
Operating results | | 20.3 | | 26.4 | | 27.3 | | 17.3 | | 15.8 | |
Finance charges | | (8.3 | ) | (8.0 | ) | (7.5 | ) | — | | (1.1 | ) |
Unusual items | | 3.9 | | (0.1 | ) | — | | — | | — | |
Net income | | 15.9 | | 18.3 | | 19.8 | | 17.3 | | 14.7 | |
Financial data: | | | | | | | | | | | |
Capital spending on power projects | | 15.2 | | 16.2 | | 6.9 | | 39.0 | | 66.0 | |
Debt (including current portion) | | 112.4 | | 106.4 | | 100.0 | | 93.2 | (2) | 240.3 | (2) |
Performance indicators: | | | | | | | | | | | |
Debt to Equity Ratio | | 25:75 | | 23:77 | | 21:79 | | 18:82 | | 36:64 | |
ROCE (per cent) | | 4.66 | | 5.93 | | 5.96 | | 4.15 | | 3.52 | |
(1) Amounts for 2010/11 have been restated to reflect the adoption of International Financial Reporting Standards (see note 26 in CPC’s financial statement for details). Years prior to 2010/11 continue to be reported on a Canadian Generally Accepted Accounting Principles basis.
(2) Under IFRS, the equity method is used to account for investments in joint ventures. Under this presentation debt was offset against associated capital assets to determine CPC’s share of its investments in Columbia Basin power projects. These amounts reflect CPC’s portion of debt incurred to build the power assets.
in the region. Returns from CBT’s 50 per cent share are used by CBT to provide benefits to the people of the region, in accordance with the Columbia Basin Trust Act.
CPC’s mandate is to efficiently develop and operate commercially viable, environmentally sound and safe power project investments through joint ventures with subsidiaries of CBT, and to manage the joint ventures. CPC finances the power projects using the government’s equity contributions, retained earnings and limited-recourse project debt, without government debt guarantees.
CPC is a small organization, with fewer than 50 full-time equivalent positions, located in Castlegar. The corporation focuses on asset management activities while engaging private sector firms to provide construction, plant operation and specialist consulting services. Through its joint ventures, CPC is one of the largest producers of electricity in British Columbia.
The purchase of the Brilliant Dam in 1996 was the first investment by the joint venture partners. In addition, three projects were designated as core to the initiative: Arrow Lakes Generating Station (completed); Brilliant Expansion (completed); and Waneta Expansion (in progress).
The Waneta Expansion Project involves the construction of a second powerhouse immediately downstream of the existing Waneta Dam on the Pend d’Oreille River south of Trail, and a 10 kilometre transmission line from the new facility to the Selkirk substation. The project will generate 335 megawatts of power when it is completed in 2015. Construction of the project is undertaken through a public-private partnership between Fortis Inc. (51 per cent share), CPC (32.5 per cent share) and CBT (16.5 per cent share).
2012 Financial and Economic Review — July 2012
96
Chapter 3 — Commercial Crown Corporations Review
Other generation, distribution and transmission projects can be carried out by CPC and CBT, provided both parties agree and the projects meet the same commercial and other tests as the core projects.
More information about CPC’s financial results and performance measures are provided in the corporation’s annual report available at its website: www.columbiapower.org.
Transportation Investment Corporation
The Transportation Investment Corporation was established in June 2008 under the Transportation Investment Act to implement the Port Mann Bridge/Highway 1 Improvement Project.
Table 3.6 Transportation Investment Corporation
Five-Year Income Statement for the Years Ended March 31
($ thousands) | | 2008 | | 2009 (1) | | 2010 | | 2011 (2) | | 2012 | |
Revenue | | — | | 21 | | 219 | | — | | — | |
Expenses: | | | | | | | | | | | |
Operating and program costs | | — | | 7,779 | | 4,626 | | 7,110 | | 16,537 | |
Amortization | | — | | — | | 58 | | 136 | | 182 | |
| | — | | 7,779 | | 4,684 | | 7,246 | | 16,719 | |
Operating results | | — | | (7,758 | ) | (4,465 | ) | (7,246 | ) | (16,719 | ) |
Effective hedging loss | | — | | — | | (26,338 | ) | (74,455 | ) | (135,273 | ) |
Comprehensive results | | — | | (7,758 | ) | (30,803 | ) | (81,701 | ) | (151,992 | ) |
(1) Reflects the period June 25, 2008 to March 31, 2009.
(2) Amounts for 2010/11 have been restated to reflect the adoption of International Financial Reporting Standards (see note 24 in TI Corp’s financial statement for details). Years prior to 2010/11 continue to be reported on a Canadian Generally Accepted Accounting Principles basis.
TI Corp’s mandate includes managing the construction of a new Port Mann Bridge, widening Highway 1, upgrading interchanges, and improving access and safety along the highway corridor. The project spans a distance of 37 kilometres from the McGill Street Interchange in Vancouver to 216 Street in Langley. In addition, TI Corp is responsible for the implementation and management of tolling operations.
The project was established as part of government’s overall Gateway Program to address the problem of growing regional congestion and to improve the movement of people, goods and transit. The Port Mann Bridge/Highway 1 corridor is Metro Vancouver’s primary goods movement and commuting route, serving up to 150,000 vehicles daily through six municipalities, with key connections to the region’s remaining 14 communities.
The total project cost is estimated at $3.3 billion, including construction ($2.46 billion), operating and maintenance, rehabilitation, and interest. All costs will be recovered by electronic tolls of approximately $3 for cars on opening day.
The project includes congestion-reduction measures such as high occupancy vehicle lanes, transit and commercial vehicle priority measures and improvements to the cycling network. As well, the new bridge will allow for bus service for the first time in more than 20 years connecting Langley with the Lougheed SkyTrain station in Burnaby in less than 25 minutes.
2012 Financial and Economic Review — July 2012
97
Chapter 3 — Commercial Crown Corporations Review
Construction began in August 2008 and the new Port Mann Bridge is expected to be operational by December 2012, at which time electronic tolling operations will begin. With design work nearing completion and construction proceeding at an accelerated pace, the project is now more than 75 per cent complete and will be substantially finished by December 2013.
More information about the Port Mann Bridge/Highway 1 project is available at its website: www.pmh1project.com.
British Columbia Railway Company
The British Columbia Railway Company (BCRC) is governed by two principal pieces of legislation. The British Columbia Railway Act establishes the corporation’s structure, responsibilities and accountabilities. The British Columbia Railway Finance Act establishes the borrowing and investment framework for BCRC.
Table 3.7 British Columbia Railway Company
Five-Year Income Statement for the Years Ended
($ millions) | | Dec. 31
2007 | | Dec. 31
2008 | | Dec. 31
2009 | | Mar. 31
2011 (1) | | Mar. 31
2012 | |
Revenue | | 18.2 | | 23.8 | | 20.2 | | 20.8 | | 17.1 | |
Expenses | | 35.4 | | 25.3 | | 37.7 | | 17.5 | | 12.8 | |
Income (loss) | | (17.2 | ) | (1.5 | ) | (17.5 | ) | 3.3 | | 4.3 | |
Non-operating income (expenses) (2) | | 17.0 | | 11.9 | | 3.0 | | (0.2 | ) | (1.0 | ) |
Income before special items | | (0.2 | ) | 10.4 | | (14.5 | ) | 3.1 | | 3.3 | |
Gain on sale of assets | | 19.8 | | 27.3 | | 15.7 | | 14.4 | | 10.3 | |
Net income (loss) | | 19.6 | | 37.7 | | 1.2 | | 17.5 | | 13.6 | |
(1) BCRC changed its year end from December 31 to March 31 in 2010/11. The figures reported in 2010/11 reflect the company’s 15 month results from January 1, 2010 to March 31, 2011. Amounts for 2010/11 have been restated to reflect the adoption of International Financial Reporting Standards (see note 26 in BCRC’s financial statement for details). Years prior to 2010/11 continue to be reported on a Canadian Generally Accepted Accounting Principles basis.
(2) Includes gain (loss) from discontinued operations in 2007.
BCRC’s original mandate was to construct and operate a freight railway in British Columbia. Significant expansion of the corporation occurred in the 1990s, as it added to its rail network and acquired a telecommunications company, deep-sea bulk loading facilities in the Port of Vancouver, and barge operations in northern BC. BCRC also diversified into real estate development, and formed a joint venture management company. At its peak, BCRC was Canada’s fourth largest railway, operating 2,314 kilometres of mainline track and 638 kilometres of industrial and yard track.
In 2002, the provincial government decided to wind down the operations of BCRC. The main initiative was the BC Rail Investment Partnership (BCRIP) agreement with CN, completed in July 2004. Under the agreement, BCRC’s rail operations (with the exception of its Port Subdivision subsidiary — the 24 mile railway line accessing the port terminals at Roberts Bank) were sold to CN. BCRC retained ownership of the railway right-of-way, rail bed, and track infrastructure.
BCRC also divested itself of its North Vancouver ports operations and is in the process of selling surplus real estate holdings not required to support its operations.
2012 Financial and Economic Review — July 2012
98
Chapter 3 — Commercial Crown Corporations Review
BCRC’s current mandate is to support and facilitate the British Columbia Ports Strategy and Pacific Gateway Strategy by providing consulting advice, acquiring and holding railway corridor and strategic port lands, and making related infrastructure investments for the province. BCRC’s mandate includes the ongoing management of the CN agreement, a 40 year non-renewable operating lease agreement with Kinder Morgan Canada Terminals, other port related holdings and the Port Subdivision as part of the provincial government’s overall Pacific Gateway Strategy.
Effective April 1, 2010, the shares of BCRC were transferred to the BC Transportation Financing Authority. This consolidation promotes operational efficiencies while continuing to facilitate strategic priorities. BCRC remains a separate entity and retains its legal and legislative authorities and agreements. The ongoing core functions and mandate of BCRC continue.
More information about BCRC’s financial results and performance measures are provided in the corporation’s website: www.bcrco.com and in the Ministry of Transportation and Infrastructure website: www.th.gov.bc.ca/bcrail .
2012 Financial and Economic Review — July 2012
99
| Chapter 4 |
| |
| Supplementary Information |
| |
| · General Description of the Province |
| · Constitutional Framework |
| · Provincial Government |
| · Financial Cycle |
| · Provincial Taxes |
2012 Financial and Economic Review — July 2012
Chapter 4 — Supplementary Information
General Description of the Province
British Columbia is located on Canada’s Pacific coast, and has a land and freshwater area of 95 million hectares. It is Canada’s third largest province and comprises 9.5 per cent of the country’s total land area.
Geography
The province is nearly four times the size of Great Britain, 2.5 times larger than Japan and larger than any American state except Alaska. BC’s 7,022-kilometre coastline supports a large shipping industry through ice-free, deep-water ports. The province has about 8.5 million hectares of grazing land, 1.8 million hectares of lakes and rivers, and 950,000 hectares of agricultural land that is capable of supporting a wide range of crops.
Physiography
BC is characterized by mountainous topography, but also has substantial areas of lowland and plateau country. The province has four basic regions, a northwesterly trending mountain system on the coast, a similar mountain system on the east, and an extensive area of plateau country between the two. The northeastern corner of the province is lowland, a segment of the continent’s Great Plains.
The western system of mountains averages about 300 kilometres in width and extends along the entire BC coast and the Alaska panhandle. The Coast Mountains contain some of the tallest peaks in the province. The western system includes the Insular Mountains that form the basis of Vancouver Island and Haida Gwaii (previously known as the Queen Charlotte Islands). These islands help to shelter the waters off the mainland coast of BC, which form an important transportation route for people and products.
The interior of the province is a plateau of rolling forest and grassland, 600 to 1,200 metres in average elevation. North of Prince George the interior becomes mountainous, but plateau terrain returns just south of the Yukon boundary in the area drained by the Liard River. The southern interior’s water system is dominated by the Fraser River, which has a drainage area covering about one-quarter of the province. The Rocky Mountains, in the eastern mountain system, rise abruptly on the southern BC—Alberta boundary and are cut by passes that provide dramatic overland transportation routes into the province. The Rocky Mountain Trench lies immediately to the west of the Rockies. This extensive valley, the longest in North America, is a geological fault zone separating different earth plates. It is the source of many of BC’s major rivers, including the Peace, Columbia and Fraser.
Climate and Vegetation
Coastal BC has abundant rainfall and mild temperatures associated with a maritime climate. The Pacific coast has an average annual rainfall of between 155 and 440 centimetres, while the more sheltered coasts of eastern Vancouver Island and the mainland along the Strait of Georgia average between 65 and 150 centimetres. Canada’s longest frost-free periods of over 180 days per year are enjoyed along the edges of the coastal zone and far inland along the Fraser River valley. Temperatures fall quickly up the steep slopes of the Coast Mountains. The predominant trees in this coastal region are the western hemlock, western red cedar and balsam (amabilis fir) in the wetter parts, and Douglas fir and grand fir in the drier areas.
2012 Financial and Economic Review — July 2012
102
Chapter 4 — Supplementary Information
BC’s interior region has a mainly continental type of climate, although not as severe as that of the Canadian prairies. Considerable variation in climate occurs, especially in winter, as mild Pacific storms bring relief from cold spells. The southern interior has the driest and warmest climate of the province. In the valleys, annual precipitation ranges from less than 30 centimetres to 50 centimetres, while daily temperatures can average over 20 degrees Celsius in July and just under freezing in January. The climate becomes more extreme further north and precipitation increases. The frost-free period in the north is short and variable. Lodgepole pine is the dominant tree of commercial value in the interior.
The northeast region of the province is an extension of the western prairie region of Alberta. It has a continental climate that is more extreme than that of the northern interior region. However, it does have long hot summers and a frost-free period long enough to grow grain, forage and other crops.
Population
BC is the third largest Canadian province in terms of population, which was estimated at 4.6 million persons or about 13.3 per cent of Canadians on July 1, 2011. BC’s population grew at an average annual compound rate of 1.2 per cent between 2001 and 2011, slightly faster than the annual growth rate of the overall Canadian population which averaged 1.1 per cent for the same period.
Vancouver, a major Canadian shipping, manufacturing and services centre, had the largest urban population in BC with 2,763,628 persons in 2011. Victoria, the province’s capital, is located on Vancouver Island and its regional district had a population of 374,675 persons in 2011.
Constitutional Framework
The structure of the British Columbia government is based on British parliamentary tradition and precedent. Prior to 1866, BC was composed of two British-controlled colonies — the Colony of Vancouver Island was established in 1849, and the Colony of British Columbia was established in 1858 on the mainland. In the Union Proclamation of 1866, the two colonies were joined to form the single united Crown Colony of British Columbia. On July 20, 1871, BC entered into Confederation with Canada. Although the Colony of Vancouver Island had a parliamentary form of government as far back as 1856, the first fully elected government was not instituted in BC until the autumn after Confederation with Canada. Responsible government was achieved in late 1872, when the Lieutenant Governor acquiesced to an executive council that was responsible to the legislative assembly.
Upon entering Confederation, BC came under the authority of the British North America Act, 1867 (BNA Act), a statute of the British parliament. Until 1982, the BNA Act defined the major national institutions and established the division of authority between the federal and provincial governments. In 1982, the BNA Act was renamed the Constitution Act, 1867 and its amendments were incorporated into the Constitution Act, 1982. The Constitution Act, 1982, which also includes the Canadian Charter of Rights and Freedoms, is companion legislation to the Canada Act, 1982. With the passage of the Canada Act, 1982, the British Parliament ended its legal right to legislate for Canada. Canada, as a federal state, divides legislative powers between the federal and provincial governments.
2012 Financial and Economic Review — July 2012
103
Chapter 4 — Supplementary Information
Provincial Government
BC’s government is modeled after the British system. Functionally there are three main branches: the legislature, the executive and the judiciary.
Legislature
Legislative powers in British Columbia are exercised by a single legislative chamber, which is elected for a term of four years. BC, the first province in Canada to legislate fixed election dates, requires an election on the second Tuesday in May every four years. An election may also be called if the government loses a vote of confidence in the legislative assembly.
The legislature consists of the Lieutenant Governor and 85 elected members of the legislative assembly. The legislative assembly represents the people of BC in the conduct of the province’s affairs. The assembly is required by law to meet at least once a year with a normal session lasting several months. However, special sessions can last just a few days or many months, depending on the nature of the government’s business.
The legislature operates on a fixed schedule — the second Tuesday in February each year is usually reserved for the Throne Speech and the third Tuesday in February each year is reserved for the Budget Speech. After an election, a new budget must be tabled within 90 days of the post-election appointment of the Executive Council.
Executive
The executive is composed of the Lieutenant Governor and the executive council. The Lieutenant Governor, the Queen’s representative in British Columbia, holds a largely ceremonial place in the modern provincial government. By constitutional custom, the Lieutenant Governor is appointed by the Governor General of Canada for a term usually lasting five years.
The Lieutenant Governor, on the advice of the premier, appoints members of the executive council and is guided by the executive council’s advice as long as it holds the confidence of the legislative assembly. Following a general election, the Lieutenant Governor calls upon the leader of the political party with the largest number of elected members to serve as premier and to form the provincial government.
The Lieutenant Governor, on recommendation of the premier, convenes, prorogues and dissolves the legislative assembly and gives Royal Assent to all measures and bills passed by the assembly before they become law.
The executive council, or cabinet, is headed by the premier and is composed of selected members of the ruling party. Ministers are the head of government ministries, and are usually members of cabinet.
Cabinet determines government policy and is held responsible by the legislative assembly for the operation of the provincial government. Deputy ministers are the chief operating officers of ministries and are appointed by cabinet. Deputy ministers are responsible for carrying out government policies and for managing the work of their ministries.
2012 Financial and Economic Review — July 2012
104
Chapter 4 — Supplementary Information
Judiciary
The judiciary performs functions that are central to the orderly operation of society. Judges hear and give judgment in criminal prosecutions and in actions arising from disputes between private citizens or between the government and private citizens. Judges apply both judge-made law, known as “common law,” and laws made by the Parliament of Canada and provincial legislatures. The judiciary is increasingly called on to determine whether laws passed by governments conform to the values expressed in the Canadian Charter of Rights and Freedoms.
BC’s judicial system is made up of the Provincial Court of British Columbia, the Supreme Court of British Columbia and the Court of Appeal of British Columbia. The Provincial Court includes Small Claims, Adult Criminal, Youth and Family divisions. The provincial government appoints Provincial Court judges, and the federal government appoints Court of Appeal and Supreme Court judges.
The federal judicial system includes the Tax Court of Canada, the Federal Court of Canada (Appeals division and Trial division) and the Supreme Court of Canada. The Federal Court of Canada hears cases in limited areas of exclusively federal jurisdiction, for example, reviewing decisions made by federal tribunals such as the Canada Labour Relations Board. The Supreme Court of Canada is the court of final resort and hears selected appeals from the Federal Court of Appeal and provincial Courts of Appeal.
Provincial Government Jurisdiction
Under Canada’s constitutional framework, BC has ownership and jurisdiction over natural resources and is responsible for education, health and social services, municipal institutions, property and civil rights, the administration of justice and other matters of purely provincial or local concern.
2012 Financial and Economic Review — July 2012
105
Chapter 4 — Supplementary Information
The Annual Financial Cycle(1)
British Columbia’s Budget Transparency and Accountability Act (BTAA) outlines the province’s reporting requirements during the financial cycle and imposes specific reporting deadlines or release dates for these publications. In particular, fixed dates for presentation of the Throne Speech and budget, as well as dates for quarterly and annual reports, are set by law.
Under the BTAA, the provincial government focuses its budgeting and reporting on a summary accounts basis. The BTAA requirements include reporting on the advice of the Economic Forecast Council; presentation of the annual Estimates, Budget and Fiscal Plan, Quarterly Reports, and Public Accounts in accordance with GAAP as set by a recognized standard setting organization and determined by Treasury Board (see page 63); publication of Quarterly Reports with revised forecasts; annual three-year service plans and service plan reports for each ministry and government organization; and an annual three-year government strategic plan and report.
Chart 4.1 summarizes the annual financial process of the province. This process consists of four main stages.
Chart 4.1 Financial Planning and Reporting Cycle Overview
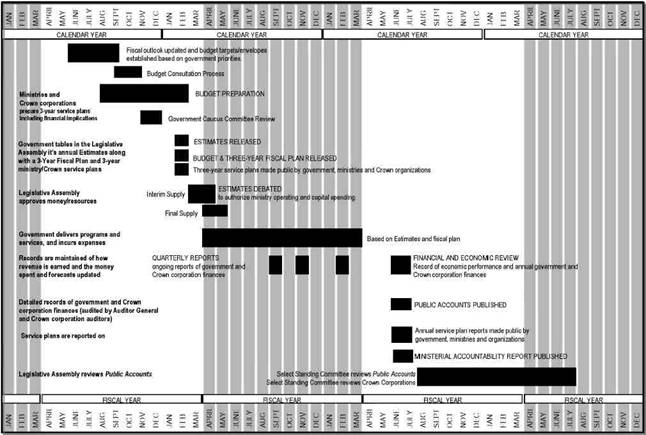
(1) Reflects the financial cycle for normal years.
2012 Financial and Economic Review — July 2012
106
Chapter 4 — Supplementary Information
Planning and Budget Preparation
Treasury Board reviews longer-term estimates of revenue, expense, capital and debt, and establishes a preliminary fiscal plan within the framework of the government’s overall strategic plan. Ministries, service delivery agencies and Crown corporations prepare three-year service plans, including performance measures and targets, and operating and capital budgets, for review by Treasury Board and/or government Caucus committees. Treasury Board makes decisions on budget allocations for ministries and agencies, and assesses commercial Crown corporation net income benchmarks, within the context of the fiscal plan. Included as inputs into this process are a consultation paper published by September 15th that invites public comment on issues for consideration as government develops its fiscal and service plans, and province-wide public hearings held by a committee of the legislature. A report outlining the results of the budget consultation process is made public by November 15th of each year.
Implementation and Reporting
The government’s revenue, expense and capital plans for the next three fiscal years, as well as other information on the government’s finances, are presented to the Legislative Assembly by the Minister of Finance in a budget document called the Budget and Fiscal Plan. The financial plan for the next fiscal year is also included in the document called the Estimates, which describes the individual appropriations to be voted on by the Legislative Assembly. Government’s strategic plan, service plans and a report on major capital projects (those where government contribution exceeds $50 million) must also be tabled. Throughout the year, the authorized funding as specified in the Estimates and ministry service plans is spent on programs and services. Crown corporations follow approved service plans under the direction of their own Boards of Directors. Quarterly Reports, including full-year forecasts, are published by legislated dates, thereby providing regular updates to the public on the government’s finances.
Evaluation
At the end of the fiscal year, the Public Accounts are prepared by the Comptroller General and examined by the Auditor General to ensure that the financial statements fairly present the government’s financial position. The Public Accounts are augmented by the British Columbia Financial and Economic Review, which provides an overview of annual and historical financial and economic results. In addition, annual service plan reports are made public that compare actual results with ministry and Crown corporation performance targets.
Accountability
The Public Accounts are presented to the Legislative Assembly and are reviewed by two committees of the Legislative Assembly (the Select Standing Committee on the Public Accounts and the Select Standing Committee on Crown corporations). At the same time, the Ministerial Accountability Report is published detailing the individual and collective financial performance of cabinet ministers, and the performance and revenue results achieved by the Ministers of State and the Minister of Finance. The Minister of Finance also presents to the Legislative Assembly plans, reports and statements related to the revenue-neutrality objectives of the Carbon Tax Act. In addition, at the same time as, or shortly after, the Public Accounts are tabled, ministries and most Crown corporations release their service plan reports detailing results for the previous fiscal year. A report on the government’s strategic plan is also presented.
2012 Financial and Economic Review — July 2012
107
Chapter 4 — Supplementary Information
Summary of Tax Changes Announced in 2012
Income Tax Act
BC Seniors’ Home Renovation Tax Credit Introduced
Effective for the 2012 and future tax years, the government has introduced a Seniors’ Home Renovation Tax Credit. The credit is a new refundable personal income tax credit to assist with the cost of permanent home renovations that provide individuals age 65 and over with increased independence, allowing them the flexibility to remain in their own homes longer.
The maximum credit is $1,000 annually calculated as 10 per cent of eligible expenditures. The credit is available to individuals who incur eligible expenditures on or after April 1, 2012. The credit can be claimed by seniors, whether they own their home or rent, and by individuals who share a home with a senior relative.
The credit is claimed when individuals file their personal income tax return.
Children’s Fitness Credit and Children’s Arts Credit Introduced
Effective for the 2012 and future tax years, a new Children’s Fitness Credit and a new Children’s Arts Credit have been introduced.
The Children’s Fitness Credit is a non-refundable tax credit of 5.06 per cent of eligible expenditures up to $500 for each child, providing a benefit of up to $25 per child. The Children’s Arts Credit is a non-refundable tax credit of 5.06 per cent of eligible expenditures up to $500 for each child, providing a benefit of up to $25 per child.
For both the Children’s Fitness Credit and the Children’s Arts Credit, eligible expenditures are those that qualify for the federal children’s fitness credit and children’s arts credit.
Medical Expense Credit Expenditure Limit for Other Dependents Removed
Effective for the 2012 and future tax years, the $10,000 limit that applied to medical expenses claimed in respect of dependents, other than a spouse or minor child, is eliminated.
Enhanced Dividend Tax Credit Rate Increased
Effective for the 2012 and future tax years, the dividend tax credit rate on eligible dividends is increased from 9.76 per cent to 10 per cent.
BC Training Tax Credits Extended
As announced on September 21, 2011, the BC Training Tax Credits are extended for an additional three years to the end of 2014.
Training Tax Credits for Shipbuilding and Ship Repair Industry Employers Introduced
To support British Columbia’s shipbuilding and ship repair industry efforts under the National Shipbuilding Procurement Strategy and to support marine industry jobs, new training tax credits are introduced for eligible employers that employ apprentices in the British Columbia shipbuilding and ship repair industry.
Eligible shipbuilding and ship repair industry employers can receive a refundable tax credit of 20 per cent of wages paid per year, up to $5,250, per eligible apprentice in the first 24 months of an eligible apprenticeship program and can also receive similar credits based on an apprentice’s completion of higher training levels.
Shipbuilding and ship repair industry employer tax credits are enhanced by 50 per cent in respect of apprentices who are First Nations individuals or persons with disabilities.
Eligible shipbuilding and ship repair industry employers that claim the new training tax credits
2012 Financial and Economic Review — July 2012
108
Chapter 4 — Supplementary Information
will not be eligible to claim training tax credits under the existing training tax credit program. The training tax credits for shipbuilding and ship repair industry employers will be made effective by regulation and will expire at the end of 2019.
Book Publishing Tax Credit Extended
The corporate income tax Book Publishing Tax Credit is extended for an additional five years to March 31, 2017.
Full Film Incentive BC Tax Credits for Eligible Interprovincial Co-productions Allowed
Under the Film Incentive BC tax credit, interprovincial co-productions are subject to a reduction in the credit when corporations own less than 100 per cent of the copyright. This copyright grind is removed and copyright ownership requirements for interprovincial co-productions are amended for productions with principal photography starting on or after January 1, 2012.
Tax Credits for Cutscene Productions Clarified
Regulations are amended to clarify that cutscene productions are eligible activities under the Interactive Digital Media Tax Credit, provided all other requirements of the credit are met, and effective September 1, 2010, the regulations are clarified to exclude cutscene productions from British Columbia’s film tax credits.
Generally, cutscenes are non-interactive animated or live action scenes included in a video game to provide storyline, character development or context.
Small Business Venture Capital Act
Equity Tax Credit Budget Increased
As announced on September 21, 2011, effective for the 2012 program year, the budget for the Small Business Venture Capital Program is increased by $3 million to provide tax credits for direct investments in eligible new corporations.
Under the Program, eligible investors can receive an income tax credit of 30 per cent of their investment in eligible business corporations up to an annual limit of $60,000. An eligible new corporation must:
· qualify as an eligible business corporation under the Act,
· have been incorporated for less than two years, and
· must be doing business in a targeted sector: community diversification; development of interactive digital media products; clean technology; prescribed manufacturing and processing; destination tourism; or research and development of proprietary technology.
The $3 million increase will allow for up to $10 million in additional equity financing for qualifying new businesses in 2012, 2013 and 2014.
Medicare Protection Act
Medical Services Plan Premiums Increased and Premium Assistance Enhanced
Medical Service Plan premiums are increased effective January 1, 2013, to help fund health care for British Columbians.
Maximum monthly premium rates will increase by about 4 per cent or $2.50 per month to $66.50 for single persons, by $4.50 per month to $120.50 for two person families and by $5 per month to $133 for families of three or more persons.
2012 Financial and Economic Review — July 2012
109
Chapter 4 — Supplementary Information
Also effective January 1, 2013, premium assistance is enhanced to ensure those receiving assistance will not be affected by the increase.
Carbon Tax Act
Carbon Tax Rates Clarified
Carbon tax rates are scheduled to increase on July 1, 2012 to be equivalent to $30 per tonne of carbon dioxide equivalent (CO2e). The Act is amended to clarify that the carbon tax continues beyond June 30, 2013 at the same rate of $30 per tonne of CO2e.
Commercial Marine Services Refunds Clarified
Effective February 22, 2012, amendments are made to clarify the distinction between an intra-provincial leg and an inter-jurisdictional leg of a marine trip by a commercial marine service to ensure that refunds of carbon tax are only provided for fuel used inter-jurisdictionally.
Carbon Tax Act and Motor Fuel Tax Act
Obligations Related to Fuel Imported by Ship Streamlined
Effective May 1, 2012, the obligations of collectors, retail dealers, and purchasers for fuel imported by ship into British Columbia are amended to be generally more consistent with the federal obligations regarding fuel imported by ship. These amendments streamline the compliance burden on importers.
Motor Fuel Tax Act
Jet Fuel used in International Flights Exempted
Effective April 1, 2012, the refund for jet fuel used for the cargo portion of a flight that begins or ends outside North America is expanded to provide an exemption and refund for jet fuel used in all international passenger and cargo flights, including flights to the United States.
Insurance Premium Tax Act
Classes of Insurance Definitions Clarified
Effective July 1, 2012, an amendment to the Act introduced by the Insurance Amendment Act, 2009 is brought into force. The amendment repeals classes of insurance definitions and allows those classes to be defined by regulation. The regulation will reference the new Classes of Insurance Regulation under the Financial Institutions Act, which is also effective July 1, 2012. This does not change the application of tax.
Home Owner Grant Act
Threshold for Home Owner Grant Phase-out Increased
As announced on January 3, 2012, the threshold for the phase-out of the home owner grant is increased from $1,150,000 to $1,285,000 for the 2012 tax year. This increase ensures that at least 95 per cent of homeowners are eligible for the full grant, consistent with longstanding government policy.
For properties valued above the threshold of $1,285,000, the grant is reduced by $5 for every $1,000 of assessed value in excess of the threshold.
Thresholds for Income-Tested Home Owner Grant Raised
The home owner grant allows low-income seniors and certain other low-income individuals to qualify for the full home owner grant despite the value of their homes.
2012 Financial and Economic Review — July 2012
110
Chapter 4 — Supplementary Information
Effective for the 2012 tax year, the income threshold below which home owners may qualify for the full benefit is increased from $28,000 to $30,000. The income threshold for a partial benefit is increased from $30,000 to $32,000. The income threshold is based on adjusted net income as defined by regulation.
Low-Income Veteran’s Supplement Introduced
As announced on November 10, 2011, effective for the 2012 and future tax years, the Act is amended to create a veteran’s supplement for qualifying low-income veterans under the age of 65 who have served in the Canadian Forces as officers or non-commissioned members.
The supplement is intended to provide low-income veterans with the same home owner grant enhancements that already apply to seniors, some persons with disabilities and their families, and certain veterans of older conflicts and their spouses.
Eligible low-income veterans will receive a home owner grant supplement which:
· is up to $275 (the difference between the current basic and senior’s grant amounts);
· effectively lowers the minimum tax payable before enhanced benefits begin from $350 to $100; and
· replaces some or all of any reduction in the basic grant amount related to high-valued homes.
The income test is based on the previous year’s income. The income threshold below which veterans may qualify for the full supplement is $30,000. The income threshold for a partial supplement is $32,000. The income threshold is based on adjusted net income as defined by regulation.
A veteran will be required to apply through the local property tax collector for the basic home owner grant. After this application is approved, a separate application for the supplement must be made directly to the Home Owner Grant Administrator. For more information on the application procedure, please see http://www.sbr.gov.bc.ca/msbr/budget/budget.html.
Home Owner Grant Extended for Individuals Moving into a Residential Facility
Effective for the 2012 and future tax years, the Act is amended to allow qualifying homeowners who have moved into a residential facility to apply for the Home Owner Grant for one additional year. The grant can only be claimed on the home that they continue to own and that qualified in the previous year.
School Act
Provincial Residential School Property Tax Rates Set
The longstanding rate setting policy is that average residential school property taxes, before application of the home owner grant, will increase by the previous year’s provincial inflation rate. This rate setting policy has been in place since 2003 and will continue in 2012.
Provincial Non-Residential School Property Tax Rates Set
A single province-wide rate is set for each of the non-residential property classes. Consistent with longstanding policy, the rates for 2012, except the rate for the major industry property class, will be set so that non-residential school tax revenue will increase by inflation plus new construction.
The major industry class tax rate will be set to be the same as the business class tax rate, consistent with the policy announced in Budget 2008.
2012 Financial and Economic Review — July 2012
111
Chapter 4 — Supplementary Information
Taxation (Rural Area) Act
Provincial Rural Area Property Tax Rates Set
A single rural area residential property tax rate applies province-wide. The longstanding rate setting policy that average residential rural property taxes increase by the previous year’s provincial inflation rate will continue for 2012.
Consistent with longstanding policy, non-residential rural area property tax rates will be set so that total non-residential rural area tax revenue will increase by inflation plus new construction.
Exemption for Property Held in Trust for a First Nation Clarified
Effective for the 2012 and future tax years, the Act is amended to clarify that the exemption for property held in trust for a First Nation only applies with respect to property held by the Crown.
Taxation (Rural Area) Act and School Act
Authority for Certain Partial Property Tax Exemptions Provided
In some cases the Crown, which is exempt from tax, is a registered owner of property together with one or more taxable owners. Under the Acts, if one or more registered owners of a property are taxable, the entire property is taxable. The Acts are amended to provide the authority to exempt from property tax the proportion of a property owned by the Crown or its agent.
Police Act
Approval of Police Tax Administration Fee Streamlined
Municipalities receive an administration fee for collecting the police tax within their boundaries on behalf of the province. Currently, the minister approves the fee each year even though the fee has not changed since the police tax was introduced. The Act is amended so that the minister only has to approve changes to the fee.
Land Tax Deferment Act
Fire Insurance Requirement Removed for Homeowners with Sufficient Equity
Homeowners must have a minimum amount of equity in their property to be eligible to defer their property taxes under the province’s property tax deferment program. Currently, homeowners must also have fire insurance on their home to be eligible for the program. These requirements are intended to ensure that the province can secure the deferred taxes.
Effective for the 2012 and future tax years, the Act is amended to remove the fire insurance requirement and to replace it with a more general requirement. In calculating whether the homeowner has a minimum amount of equity in the property, the calculation will now exclude uninsured improvements to the property.
Eligibility of Leaseholders to Defer Tax Clarified
The property tax deferment program is intended to apply to property owners who have sufficient equity in their property to secure the deferred taxes. Some leaseholders on Crown or municipal land have qualified to defer taxes in the past. The Act is amended to clarify that beginning in 2012 no new leaseholders will be eligible to defer taxes. Any leaseholders who currently defer taxes will be grandparented and will not be affected by this change.
2012 Financial and Economic Review — July 2012
112
Chapter 4 — Supplementary Information
Property Transfer Tax Act
New General Refund Provision Introduced
The Act is amended to provide the administrator with authority to refund an amount paid under the Act in circumstances where there was no legal obligation for the tax to be paid.
Re-registration of Certain Life Estates Exempted
A life estate is an interest in property that is registered on title and that entitles a person to live on a property even though the person is not the registered owner. If the property owner wishes to register a mortgage against the property, the land title office requires the life estate to be removed from the title to give the mortgage priority over other interests in the property. No exemption currently exists if the life estate is then re-registered on title.
The Act is amended to provide an exemption for the re-registration of a life estate following the registration of a mortgage. The exemption only applies if the re-registration of the life estate involves the same owner, the same life estate holder, the same property and the same terms as the initial life estate.
Transition to Provincial Sales Tax
Provincial Sales Tax Act
As of April 1, 2013, British Columbia will return to the Provincial Sales Tax (PST)/Goods and Services Tax (GST) system, with a general PST rate of seven per cent and a federal GST rate of five per cent.
Until the PST is re-implemented, the provincial portion of the Harmonized Sales Tax (HST) will continue at a rate of seven per cent, for a combined federal-provincial HST rate of 12 per cent in British Columbia. Subject to the approval of the Parliament of Canada, the HST will be eliminated effective April 1, 2013.
For more information about the elimination of the HST and re-implementation of the PST, please see the Return to PST topic box on page 69 of Budget 2012 at http://www.bcbudget. gov.bc.ca/2012/bfp/2012_Budget_Fiscal_Plan.pdf.
Income Tax Act
BC HST Credit Eliminated
As a result of the HST referendum, the government will eliminate the BC HST Credit of up to $230 annually per family member with the elimination of the HST. The final quarterly BC HST payment will be issued in January 2013.
BC Sales Tax Credit Re-Implemented
Effective for the 2013 and future tax years, the government will re-implement the BC Sales Tax Credit. The BC Sales Tax Credit will have the same eligibility criteria and benefit calculation as existed prior to its replacement by the BC HST Credit. The maximum annual tax credit will be $75 per adult. The maximum credit will be reduced by two per cent of family net income over $15,000 for single individuals and over $18,000 for couples.
Eligible taxpayers will be able to claim the BC Sales Tax Credit when they file their 2013 income tax return.
Basic Personal Amount Tax Credit Enhancement Reversed
As part of HST implementation, the basic personal amount tax credit was increased from $9,373 in 2009 to $11,000 in 2010. As a result of the HST referendum, the government will reverse this enhancement with the re-implementation of the PST on April 1, 2013.
2012 Financial and Economic Review — July 2012
113
Chapter 4 — Supplementary Information
The revised credit amount will be set at $9,373 plus any inflation indexing that has occurred since 2009.
For the 2013 tax year only, the basic personal amount tax credit will be set at a blended amount to reflect the higher credit amount for the first three months of 2013 in which the HST applies and the lower credit amount for the nine months in 2013 in which the PST applies. The exact 2013 credit amount will be available in late 2012 when the 2013 provincial inflation indexing factor is available.
BC First-Time New Home Buyers’ Bonus Introduced
Effective for the period from February 21, 2012 to March 31, 2013, the government has introduced a temporary BC First-Time New Home Buyers’ Bonus. The BC First-Time New Home Buyers’ Bonus is a refundable income tax credit for first-time home buyers who purchase a newly constructed home.
The credit is calculated as 5 per cent of the purchase price of the home up to a maximum credit of $10,000. The credit is phased out at a rate of 20 per cent of net income in excess of $150,000 for single individuals and at a rate of 10 per cent of family net income in excess of $150,000 for couples. Only one credit will be claimable per home.
The credit is available in respect of purchases of newly constructed housing where both the HST applies and where a written agreement of purchase and sale was entered into on or after February 21, 2012. The credit is not available in respect of homes where an individual entered into an agreement of purchase and sale before February 21, 2012.
Eligibility criteria for the credit include the following:
· the home must be a newly constructed home located in BC;
· it must be an individual’s and their spouse or common-law partner’s first home; and
· the home must be intended as the individual’s primary residence.
Individuals must apply for the credit through the BC government. For more information about the credit and to get an application form please see http://www.sbr.gov.bc.ca/ individuals/Income_Taxes/Personal_Income_ Tax/tax_credits/fthb_bonus.htm.
Motor Fuel Tax Act
Motor Fuel Tax on Propane Re-implemented
With the implementation of the HST, an exemption from motor fuel tax for propane used in motor vehicles was provided because propane was not eligible for the BC HST point-of-sale rebate for motor fuels. With the elimination of the HST, the government intends to re-implement the tax on propane used in motor vehicles. The tax rate will be 2.7 cents per litre, the same rate as prior to harmonization.
Tobacco Tax Act
Tobacco Tax Rates Adjusted
With the elimination of the HST, the provincial portion of the HST on tobacco products will be eliminated. To offset this reduction, the government intends to adjust tobacco tax rates to generally keep the overall tax on tobacco constant.
2012 Financial and Economic Review — July 2012
114
Chapter 4 — Supplementary Information
Table 4.1 Provincial Taxes (as of July 2012)
Type and | | | | | | |
Statute Reference | | Tax Base | | Tax Rate | | Characteristics and Exemptions |
Income — Income Tax Act | | Taxable Income (1) Corporate. | | 10% of taxable income (small business rate: 2.5%). | | The Canada Revenue Agency administers BC’s personal and corporate taxes under an agreement between the province and the federal government. Corporate tax credits include the scientific research and experimental development tax credit, book publishing tax credit and the film tax credits. In addition, the political contributions tax credit, royalty tax credit, mining exploration tax credit, logging tax credit, training tax credits and venture capital tax credits are available to both individuals and corporations. |
| | | | | | |
| | (2) Personal. | | Tax rates of 5.06%, 7.7%, 10.5%, 12.29% and 14.7% corresponding to tax brackets of up to $37,013, $37,013.01 to $74,028, $74,028.01 to $84,993, $84,993.01 to $103,205 and over $103,205. | | BC provides a set of non-refundable credits similar to most federal non-refundable credits. BC Family Bonus and BC Earned Income Benefit are combined with the federal government’s Canada Child Tax Benefit in a single monthly payment to families. Tax credits include training tax credits, political contributions tax credit, BC Low Income Climate Action Tax Credit, BC HST Credit, the mining flow-through share tax credit and employee venture capital tax credits. |
| | | | | | |
Real Property Transfers — Property Transfer Tax Act | | Fair market value of property or interest in property transferred; for presold strata units purchased at arm’s length, total consideration for the strata unit. | | 1% on the first $200,000 of value transferred and 2% on amounts in excess of $200,000. | | Exemptions include: transfers of principal residences, recreational residences and family farms to related individuals; transfers of property between spouses pursuant to written separation agreements or court orders; transfers of property to local governments, registered charities and educational institutions; transfers of property to veterans under the Veterans’ Land Act (Canada); transfers of land to be protected, preserved, conserved or kept in a natural state; and transfers of leases less than 31 years in duration. A number of technical exemptions are also provided. Eligible first time home-buyers are exempt from tax on transfers of eligible properties. |
| | | | | | |
Retail Sales — Social Service Tax Act | | NA | | NA | | The provincial sales tax (PST) was eliminated with the implementation of the harmonized sales tax (HST). The HST was implemented effective July 1, 2010. As of April 1, 2013, the HST will be eliminated (subject to the approval of the Parliament of Canada) and the PST will be re-implemented substantially as it was. |
| | | | | | |
Private Sales of vehicles, boats and aircraft — Consumption Tax Rebate and Transition Act | | Purchase of a vehicle, boat or aircraft at a private sale | | 12% of purchase price. | | Tax paid by purchasers either to ICBC when a vehicle is registered or licensed or is self assessed. Exemptions and refunds are either to prevent double taxation where the harmonized sales tax (HST) would apply or to continue exemptions and refunds previously available under the Social Service Tax Act. As of April 1, 2013 the Provincial Sales Tax (PST) will be re-implemented. The tax on private sales of vehicles, boats and aircraft will continue under the PST legislation, instead of under the separate Consumption Tax Rebate and Transition Act. |
| | | | | | |
Harmonized Sales Tax—Excise Tax Act (federal) | | Supply of most goods and services | | 7% provincial rate The Harmonized Sales Tax (HST) will be eliminated (subject to the approval of the Parliament of Canada) effective April 1, 2013. The Provincial Sales Tax (PST) will be re-implemented at 7% as of April 1, 2013. | | The Harmonized Sales Tax (HST) is imposed under the federal Excise Tax Act and is administered by the Canada Revenue Agency. The Comprehensive Integrated Tax Coordination Agreement (CITCA) sets out the terms of BC’s harmonization agreement with the federal government. The HST in British Columbia has a 7% provincial rate and a 5% federal rate for a combined rate of 12%. The HST applies to the supply of most goods and services in British Columbia. Certain goods and services are exempt from HST or zero-rated (0% tax). Examples of exempt and zero-rated supplies are most health, dental, education, and financial services, residential rent, basic groceries, prescription drugs, medical devices and exports. |
2012 Financial and Economic Review — July 2012
115
Chapter 4 — Supplementary Information
Table 4.1 Provincial Taxes (as of July 2012) — Continued
Type and | | | | | | |
Statute Reference | | Tax Base | | Tax Rate | | Characteristics and Exemptions |
Harmonized Sales Tax—Excise Tax Act (federal) (Continued) | | Supply of most goods and services | | | | As of April 1, 2013, the HST will be eliminated (subject to the approval of the Parliament of Canada) and the Provincial Sales Tax (PST) will be re-implemented substantially as it was. |
| | | | | | |
| | | | A temporary new housing transition tax of 2% will apply to purchases of new housing in certain circumstances. The tax will apply after March 31,2013 and before April 1, 2015. | | A temporary new housing transition tax of 2% will apply to purchases of newly constructed or substantially renovated housing that is not subject to HST and where construction was completed or partially completed prior to the re-implementation of the PST. A related housing transition rebate is provided for builders who pay PST on construction materials used in housing that is subject to the temporary transition tax. There are also point-of-sale rebates of the provincial portion of the HST on motor fuels, books, children-sized clothing and footwear, children’s car seats and car booster seats, children’s diapers and feminine hygiene products. There is a provincial credit equal to the provincial portion of the HST on residential energy. There are also partial HST new housing and new rental housing rebates and partial HST rebates for public service bodies (municipalities, school authorities, hospital authorities, universities, public colleges, registered charities, qualifying non-profits). Businesses making taxable or zero-rated supplies are able to claim input tax credits to recover the HST they pay on their business inputs. Those making exempt supplies do not collect tax on their supplies but are not eligible for input tax credits. |
| | | | | | |
Accommodation — Hotel Room Tax Act | | Purchase of accommodation in local areas | | Local governments or prescribed eligible entities may apply to have the province levy a tax of up to 2% of purchase price on their behalf. | | The 8% provincial hotel room tax was eliminated with the implementation of the harmonized sales tax (HST). Under the HST accommodation is taxed at 7%. The HST was implemented effective July 1, 2010. The 8% provincial tax on short-term accommodation will return with the re-implementation of the Provincial Sales Tax (PST) on April 1, 2013. Accommodation will be taxed under the PST legislation instead of under separate hotel room tax legislation. The up to 2% Municipal and Regional District Hotel Room Tax will be integrated into the PST under the same terms and conditions as exist under the current hotel room tax. The up to 2% tax for local governments or prescribed eligible entities continues to be collected by the province on behalf of local governments or entities that have successfully applied for the tax. |
| | | | | | |
Tobacco — Tobacco Tax Act | | By cigarette, cigar retail price, and weight on other tobacco products. | | 18.5 cents per cigarette or tobacco stick and per gram of loose tobacco; 77% of taxable price on cigars to a maximum tax of $6 per cigar. | | Tax is payable on tobacco by purchasers at the time of retail purchase. Tobacco is subject to a security scheme. Security is payable by wholesale dealers registered under the Act when tobacco is delivered to them. |
| | | | | | |
Carbon Dioxide Equivalent Emissions from combustion of fuels and combustibles — Carbon Tax Act | | Purchase, use or, in certain circumstances, transfer or importation of · Aviation Fuel · Gasoline · Heavy Fuel Oil · Jet Fuel · Kerosene · Light Fuel Oil · Methanol (not produced from biomass) · Naphtha · Butane · Coke Oven Gas · Ethane · Pentane Plus · Gas Liquids · Natural Gas · Propane | | Tax rates vary by type of fuel or combustible based on carbon dioxide equivalent emitted by each fuel or combustible. Tax rates effective July 1, 2012 are equivalent to $30 per tonne of carbon dioxide equivalent. | | Tax is payable on fuels by purchasers at the time of retail purchase. Fuels, other than natural gas, are subject to a security scheme similar to the security scheme under the Motor Fuel Tax Act. Security is payable by collectors registered under the Act when fuel is sold in British Columbia for the first time after manufacture or importation. Tax on the purchase of natural gas is collected and remitted at the retail level. Tax on use, transfer and import is self-assessed. Tax on the burning of combustibles is self-assessed. Exemptions include fuels which are exported for use outside of British Columbia, fuel used for certain non-energy purposes, and fuel used for eligible inter-jurisdictional transportation because the resulting emissions are generally not considered as domestic emissions under the federal National Inventory Report. There are also minor exemptions similar to exemptions in other consumption tax Acts for administrative and technical reasons. |
2012 Financial and Economic Review — July 2012
116
Chapter 4 — Supplementary Information
Table 4.1 Provincial Taxes (as of July 2012) — Continued
Type and
Statute Reference | | Tax Base | | Tax Rate | | Characteristics and Exemptions |
Carbon Dioxide Equivalent Emissions from combustion of fuels and combustibles — Carbon Tax Act (Continued) | | · Refinery Gas · High Heat Value Coal · Low Heat Value Coal · Coke · Petroleum Coke · Also combustion of peat and tires (whole or shredded) when used to produce heat or energy (combustibles). | | | | |
| | | | | | |
Motor Fuel — Motor Fuel Tax Act | | Purchase, use, or in certain circumstances, transfer or importation of | | | | Tax generally applies to all fuels purchased for use, or used in internal combustion engines. Tax is payable on fuels by purchasers at the time of retail purchase. Most fuels are subject to a security scheme similar to the security scheme under the Carbon Tax Act. Security is payable by collectors registered under the Act when fuel is sold in British Columbia for the first time after manufacture or importation. Qualifying persons with disabilities who own or lease a vehicle are entitled to refunds of provincial tax paid up to an annual maximum of $500. The additional tax collected in the South Coast BC Transportation Service Region, on behalf of TransLink, helps fund regional transportation costs. The additional tax collected in the Victoria Regional Transit Service Area, on behalf of BC Transit, helps fund the public transit system. |
| | | | | | |
| | Clear gasoline | | General rate: 14.5 cents per litre (includes 6.75 cents per litre collected on behalf of the BC Transportation Financing Authority). South Coast BC Transportation Service Region: 25.5 cents per litre (includes 6.75 cents per litre collected on behalf of the BC Transportation Financing Authority and 17 cents per litre collected on behalf of TransLink). Victoria Regional Transit Service Area: 18 cents per litre (includes 6.75 cents per litre collected on behalf of the BC Transportation Financing Authority and 3.5 cents per litre collected on behalf of BC Transit). | | |
| | | | | | |
| | Motive fuel. | | General rate: 15 cents per litre (includes 6.75 cents per litre collected on behalf of the BC Transportation Financing Authority). South Coast BC Transportation Service Region: 26 cents per litre (includes 6.75 cents per litre collected on behalf of the BC Transportation Financing Authority and 17 cents per litre collected on behalf of TransLink). Victoria Regional Transit Service Area: 18.5 cents per litre (includes 6.75 cents per litre collected on behalf of the BC Transportation Financing Authority and 3.5 cents per litre collected on behalf of BC Transit). | | Tax applies to diesel fuel but does not include alternative motor fuels or coloured fuels. Refunds of 0.5 cents per litre are available for motive fuel used in private passenger vehicles. |
2012 Financial and Economic Review — July 2012
117
Chapter 4 — Supplementary Information
Table 4.1 Provincial Taxes (as of July 2012) — Continued
Type and | | | | | | |
Statute Reference | | Tax Base | | Tax Rate | | Characteristics and Exemptions |
Motor Fuel — Motor Fuel Tax Act (Continued) | | Alternative motor fuels. (Natural Gas, Propane, Hydrogen, Methanol (M85+)) | | Exempt. | | Natural gas and propane, when used as a motor fuel, are exempt from tax. Certain hydrogen is exempt from tax. Fuels comprised of at least 85% methanol are also exempt from tax. With the elimination of the Harmonized Sales Tax (HST) and the re-implementation of the Provincial Sales Tax (PST) on April 1, 2013, the motor fuel tax exemption for propane will also be eliminated. Effective April 1, 2013, the tax on propane will be 2.7 cents per litre, the same rate as prior to harmonization. |
| | | | | | |
| | Coloured fuel, marine diesel fuel. | | 3 cents per litre. | | Coloured fuel may be used in all vehicles not licensed to operate on a highway and in specific industrial vehicles. Bona fide farmers are exempt from paying the tax when fuel is used for farming purposes. Farm vehicles with A or G license plates are allowed to use tax-exempt coloured fuel for farming purposes on a highway. |
| | | | | | |
| | Locomotive fuel. | | 3 cents per litre. | | Tax applies to fuel specifically for use in locomotives. |
| | | | | | |
| | Aviation fuel. | | 2 cents per litre. | | Aviation fuel tax applies to fuel produced specifically for use in a non-turbine aircraft engine. |
| | | | | | |
| | Jet fuel. | | 2 cents per litre. Exempt for international flights. | | Jet fuel tax applies to fuel produced specifically for use in a turbine aircraft engine. As of April 1, 2012, jet fuel used for international flights is exempt. Previously only the cargo portion of flights beginning or ending outside of North America were exempt. |
| | | | | | |
| | Natural gas used in stationary engines. | | 7% of price if purchased. 1.1 cents per 810.32 litres if used but not purchased. | | Tax applies to natural gas used in stationary engines other than pipeline compressors. |
| | | | | | |
| | Natural gas used in pipeline compressors to transmit marketable gas. | | 1.9 cents per 810.32 litres. | | Tax applies to natural gas used in a stationary engine at a pipeline compressor station. |
| | | | | | |
| | Natural gas used in pipeline compressors to extract and transmit raw gas from wells to processing plants. | | Exempt | | |
| | | | | | |
| | Natural gas used in compressors to re-inject sour gas into depleted wells. | | Exempt. | | |
| | | | | | |
| | Marine bunker. | | Exempt | | Exemption applies to bunker fuel, or a combination of bunker and other fuels used as fuel in a ship. |
| | | | | | |
| | Marine gas oil. | | Exempt | | Exemption applies to marine gas oil when used in primary gas turbine engines to propel passenger and cargo vessels. |
| | | | | | |
Natural resources — Logging Tax Act | | Net income from logging in BC. | | 10% (fully recoverable against federal and provincial corporation and personal income tax). | | Net income from logging after deducting non-forestry income and a processing allowance. |
| | | | | | |
— Mineral Land Tax Act | | Assessed value of freehold mineral land and production areas. | | Undesignated mineral land — $1.25 to $4.94 per hectare. Designated production areas — $4.94 per hectare. | | Rates of tax set on sliding scale, dependent on size and designation of land. |
| | | | | | |
—Mineral Tax Act | | Cash flow from individual metal and coal mines (other than placer gold mines). | | 2% of net current proceeds (NCP). 13% of net revenue (NR). | | Tax calculated on a mine-by-mine basis. NCP tax paid on current operating cash flow until all current and capital costs, plus any investment allowance, are recovered. NR tax paid thereafter on cumulative cash flow. NCP tax creditable against NR tax. |
| | | | | | |
| | Volume of production of limestone, dolomite, marble, shale, clay, volcanic ash, diatomaceous earth, sandstone, quartzite and dimension stone. | | $0.15 per tonne removed from all quarries operated. | | An operator may deduct 25,000 tonnes from the total number of tonnes removed from all quarries operated by that operator. However the amount deducted from any one quarry by all operators of that quarry must not exceed 25,000 tonnes. |
| | | | | | |
| | Value of minerals sold by placer gold mines. | | 0.5% of value of minerals sold. | | |
2012 Financial and Economic Review — July 2012
118
Chapter 4 — Supplementary Information
Table 4.1 Provincial Taxes (as of July 2012) — Continued
Type and | | | | | | |
Statute Reference | | Tax Base | | Tax Rate | | Characteristics and Exemptions |
Insurance — Insurance Premium Tax Act | | BC premiums. | | 4.4% for vehicle and property insurance; 2% for life, sickness, personal accident and loss of salary and wages insurance, 4% for other insurance, and 7% for all contracts with unlicensed insurers. | | Exemptions — benefit societies; mutual corporations with 50% of income from farm or 100% from religious, educational or charitable institutions; marine, except pleasure craft; approved medical or hospitalization plans. |
| | | | | | |
Real property — Taxation (Rural Area) Act | | Assessed value of land and improvements in rural areas (outside municipalities). Assessment determined under the Assessment Act. | | Rates are set annually as a percentage of assessed value. For residential properties the rates are set to increase average residential rural taxes by the rate of inflation. For 2012, the rates were set so that total non-residential rural tax revenues increase by inflation plus new construction. For 2012, the rates are 0.052% for farms; 0.051% for managed forest lands; 0.053% for residential; 0.089% for recreational property/non-profit organizations; 0.287% for light industry, business and other property not contained in any other class; 0.400% for utilities; 0.497% for major industry and 0.01% for supportive housing. | | Some exemptions apply under various statutes. |
| | | | | | |
Residential school tax — School Act | | Assessed value of residential land and improvements. Assessment determined under the Assessment Act. | | Rates are set annually to increase average gross residential taxes by the rate of inflation. The rates vary by school district. For 2012 rates range from about 0.118% to 0.547%; weighted average 0.203%. | | Basic rates are calculated using a formula to moderate effects of varying average assessments on school district taxes. School districts may levy additional tax on residential class property if authorized by local referendum. Amendments to the School Act in 2002 allow the Minister of Finance to apply different tax rates within a school district. Tofino is the only municipality with a rate that differs from the rest of the school district. |
| | | | | | |
Non-residential school tax — School Act | | Assessed value of non- residential land and improvements. Assessment determined under the Assessment Act. | | Rates are set annually. For 2012, except for the major industry property class, the rates are set so that total non-residential school tax revenues increase by inflation plus new construction. The major industry property class rate is set to be the same as the business property class rates. For 2012 the rates are 0.34% for recreational property/non-profit organizations; 0.22% for managed forest land; 0.69% for farms; 0.64% for light industry, major industry, business and other property not contained in any other class 1.42% for utilities and 0.01% for supportive housing. | | Some exemptions apply under various statutes. Effective for the 2009 and subsequent taxation years, an Industrial Property Tax Credit was introduced to reduce provincial school property tax on major industrial (class 4) and light industrial (class 5) properties. The rate is 60% for 2011 and subsequent taxation years. The Industrial Property Tax Credit applies to British Columbia manufacturing, mining, forestry and other major and light industries. Effective in 2011, a 50% Provincial Farm Land Property Tax Credit reduces the provincial school property tax on farm land (class 9). |
| | | | | | |
Police Tax — Police Act | | Assessed value of land and improvements in municipalities under 5,000 population and in rural areas. Assessment determined under the Assessment Act. | | Rates are set annually to raise up to 50% of the cost of rural and small community policing. Rates are set for each of the nine property classes in each municipality under 5,000 population, in each electoral area of the province and in the area of the province outside a regional district. | | Basic rates are calculated using a formula that moderates the effect of variations in assessed value in the province by adjusting for population. Adjustments are made to the rates to reflect the contribution taxpayers in the rural areas make to policing costs through the rural area property tax. Adjustments are also made to account for traffic fine revenue sharing and for payments in lieu of taxes from the federal and provincial governments. |
2012 Financial and Economic Review — July 2012
119
Chapter 4 — Supplementary Information
Table 4.2 Interprovincial Comparisons of Tax Rates — 2012
(Rates known as of July 1, 2012) (1)
| | British | | | | Saskat- | | | | | | | | New | | Nova | | Prince
Edward | | New- | |
Tax | | Columbia | | Alberta | | chewan | | Manitoba | | Ontario | | Quebec | | Brunswick | | Scotia | | Island | | foundland | |
Corporation income tax (2) (per cent of taxable income) | | | | | | | | | | | | | | | | | | | | | |
General rate | | 10 | | 10 | | 12 | | 12 | | 11.5 | | 11.9 | | 10 | | 16 | | 16 | | 14 | |
Manufacturing rate | | 10 | | 10 | | 10 | | 12 | | 10 | | 11.9 | | 10 | | 16 | | 16 | | 5 | |
Small business rate | | 2.5 | | 3 | | 2 | | 0 | | 4.5 | | 8.0 | | 4.5 | | 4 | | 1 | | 4 | |
Small business threshold ($000s) | | 500 | | 500 | | 500 | | 400 | | 500 | | 500 | | 500 | | 400 | | 500 | | 500 | |
Corporation capital tax (3) | | | | | | | | | | | | | | | | | | | | | |
Non-financial | | Nil | | Nil | | Nil | | Nil | | Nil | | Nil | | Nil | | 0.05 | | Nil | | Nil | |
Financial | | Nil | | Nil | | .7/3.25 | | 4.0 | | Nil | | .25 | | 4.0 | | 4.0 | | 5.0 | | 4.0 | |
Health care premiums (4) | | | | | | | | | | | | | | | | | | | | | |
Individual/family | | 64/128 | | Nil | | Nil | | Nil | | Nil | | 16.67/33.33 | | Nil | | Nil | | Nil | | Nil | |
Payroll tax (per cent) (5) | | Nil | | Nil | | Nil | | 2.15 | | 1.95 | | 4.26 | | Nil | | Nil | | Nil | | 2.0 | |
Insurance premium tax (per cent) (6) | | 2-4.4 | | 2-3 | | 3-4 | | 2-3 | | 2-3.5 | | 2-3 | | 2-3 | | 3-4 | | 3.5 | | 4 | |
Fuel tax (cents per litre) (7) | | | | | | | | | | | | | | | | | | | | | |
Gasoline | | 21.17 | | 9.0 | | 15.0 | | 14.0 | | 23.1 | | 29.6 | | 22.6 | | 26.7 | | 15.8 | | 25.9 | |
Diesel | | 22.67 | | 9.0 | | 15.0 | | 14.0 | | 23.2 | | 30.3 | | 28.4 | | 26.4 | | 20.2 | | 25.9 | |
Sales tax (per cent) (8) | | | | | | | | | | | | | | | | | | | | | |
General rate | | 7 | | Nil | | 5 | | 7 | | 8 | | 9.5 | | 8 | | 10 | | 10 | | 8 | |
Tobacco tax (dollars per carton of 200 cigarettes) (9) | | 42.80 | | 40.00 | | 46.40 | | 56.70 | | 30.40 | | 21.80 | | 40.40 | | 51.90 | | 50.80 | | 44.70 | |
(1) | Rates shown are those known as of July 1, 2012 and that are in effect for 2012. |
| |
(2) | Ontario announced in Budget 2012 that the general corporate income tax rate will remain at 11.5 per cent. The rate was scheduled to fall to 11 per cent on July 1, 2012, and to 10 per cent on July 1, 2013. British Columbia intends to increase its general corporate income tax rate to 11 per cent effective April 1, 2014. Nova Scotia will reduce the small business tax rate from 4 per cent to 3.5 per cent effective January 1, 2013. |
| |
(3) | Manitoba increased its capital tax rate on financial institutions to 4 per cent for financial institutions with tax years ending after April 17, 2012. Quebec levies a 0.25 per cent compensation tax on the paid-up capital of financial institutions. |
| |
(4) | British Columbia has a two-person rate of $116; rates will increase effective January 1, 2013. British Columbia provides premium assistance in the form of lower rates or an exemption from premiums for lower income individuals and families. Quebec levies a Health Contribution of up to $200 annually per adult. Ontario levies a health premium as part of provincial personal income taxes payable. |
| |
(5) | Provinces with payroll taxes provide payroll tax relief for small businesses. Quebec also levies a compensation tax of up to 3.9 per cent on salaries and wages paid by financial institutions. |
| |
(6) | The lower rate applies to premiums for life, sickness and accident insurance; the higher rate applies to premiums for property insurance including automobile insurance. In Ontario, Quebec and Newfoundland specific sales taxes also apply to insurance premiums, except those related to individual life and health. |
| |
(7) | Tax rate is for regular fuel used on highways and includes all provincial taxes payable by consumers at the pump. The British Columbia rate includes 6.75 cents per litre dedicated to the BC Transportation Financing Authority and the carbon tax rates of 6.67 cents per litre for gasoline and 7.67 cents per litre for diesel. The British Columbia rates do not include regional taxes that effectively increase the gasoline and diesel tax rates by 11 cents per litre in the South Coast British Columbia transportation service region and by 3.5 cents per litre in the Capital Regional District. The tax rates for Ontario, Quebec, New Brunswick, Nova Scotia and Newfoundland include provincial sales tax based on average pump prices as of June 2012. In British Columbia, gasoline and diesel fuel are eligible for a point of sale rebate of the provincial portion of the HST. (Note: the HST in British Columbia will be eliminated (subject to the approval of the Parliament of Canada) effective April 1, 2013.) The Prince Edward Island rate consists of an ad valorem tax rate capped at 8.7 cents per litre and a volume-based motor fuel tax rate set at 7.1 cents per litre for gasoline and 11.5 cents per litre for diesel fuel. |
| |
(8) | The rates shown are statutory rates. Quebec and Prince Edward Island impose tax on the purchase price including GST. British Columbia, Ontario, Nova Scotia, New Brunswick and Newfoundland have harmonized their sales taxes with the federal GST. Prince Edward Island plans to adopt the HST and lower its provincial rate to 9 per cent effective April 1, 2013. Alberta imposes a 4 per cent tax on short-term rental accommodation. BC will return to a retail sales tax (PST) effective April 1, 2013. |
| |
(9) | Includes estimated provincial sales tax in all provinces except Alberta, Quebec and Prince Edward Island. |
2012 Financial and Economic Review — July 2012
120