Exhibit 99.4
2015
British Columbia
Financial and Economic
Review
75th Edition
(July 2015)

2015 Financial and Economic Review — July 2015
Table of Contents
Part One — Economic Review | | 1 |
| 2014 Overview | | 3 |
| British Columbia Economy | | 3 |
| External Trade and Commodity Prices | | 5 |
| Population | | 7 |
| Labour Developments | | 7 |
| Inflation | | 8 |
| Consumer Expenditure and Housing | | 8 |
| Tourism | | 9 |
| External Environment | | 10 |
| United States | | 10 |
| Canada | | 10 |
| International Economy | | 11 |
| Financial Markets | | 12 |
| Conclusion | | 13 |
| | | |
| Charts | | |
| 1.1 Provincial economic growth | | 3 |
| 1.2 Composition of British Columbia real GDP by industry | | 4 |
| 1.3 British Columbia real GDP growth by industry | | 4 |
| 1.4 Export shares by market | | 5 |
| 1.5 Lumber and natural gas prices | | 6 |
| 1.6 Retail sales | | 9 |
| 1.7 Travellers to British Columbia | | 9 |
| 1.8 External economic growth | | 12 |
| 1.9 Canadian dollar | | 12 |
| | | |
| Map | | |
| 1.1 Net interprovincial and international migration in BC, 2014 | | 7 |
| | | |
| Tables | | |
| 1.1 British Columbia Population and Labour Market Statistics | | 7 |
| 1.2 Price and Earnings Indices | | 8 |
| | | |
Part Two — Financial Review | | 15 |
| 2014/15 Overview | | 17 |
| Revenue | | 18 |
| Expense | | 26 |
| Provincial Capital Spending | | 29 |
| Provincial Debt | | 35 |
| Pension Plans | | 40 |
| Contractual Obligations | | 42 |
| 2014/15 Public Accounts Audit Qualification | | 43 |
| | | |
| Charts | | |
| 2.1 2014/15 surplus — major changes from Budget 2014 | | 18 |
| 2.2 Revenue changes from Budget 2014 | | 18 |
| 2.3 Expense changes from Budget 2014 | | 26 |
| 2.4 Capital spending, 2014/15 | | 29 |
| 2.5 Capital spending changes from Budget 2014 | | 31 |
| 2.6 Financing taxpayer-supported capital spending | | 34 |
| | | | |
2015 Financial and Economic Review — July 2015
i
Table of Contents
| 2.7 Provincial debt components | | 35 |
| 2.8 Debt changes from updated Budget 2014 | | 37 |
| 2.9 Reconciliation of surplus to change in debt | | 38 |
| | | |
| Tables | | |
| 2.1 Operating Statement | | 17 |
| 2.2 Corporate Income Tax Revenue Changes from Budget 2014 | | 19 |
| 2.3 Consumption and Other Tax Revenue Changes from Budget 2014 | | 19 |
| 2.4 Energy and Mineral Revenue Changes from Budget 2014 | | 20 |
| 2.5 Forest Revenue Changes from Budget 2014 | | 21 |
| 2.6 Other Revenue Changes from Budget 2014 | | 21 |
| 2.7 Revenue by Source | | 24 |
| 2.8 Expense by Ministry, Program and Agency | | 25 |
| 2.9 Capital Spending | | 30 |
| 2.10 Capital Expenditure Projects Greater Than $50 Million | | 32 |
| 2.11 Provincial Debt Summary | | 36 |
| 2.12 Key Debt Indicators | | 39 |
| 2.13 Interprovincial Comparison of Credit Ratings, July 2015 | | 40 |
| 2.14 Pension Plan Balances | | 41 |
| 2.15 Taxpayer-supported Contractual Obligations | | 42 |
| | | |
Part 3 — Supplementary Information | | 45 |
| General Description of the Province | | 47 |
| Geography | | 47 |
| Physiography | | 47 |
| Climate and Vegetation | | 47 |
| Population | | 48 |
| Constitutional Framework | | 48 |
| Provincial Government | | 49 |
| Legislature | | 49 |
| Executive | | 49 |
| Judiciary | | 50 |
| Provincial Government Jurisdiction | | 50 |
| Annual Financial Cycle | | 50 |
| Planning and Budget Preparation | | 51 |
| Implementation and Reporting | | 51 |
| Evaluation | | 52 |
| Accountability | | 52 |
| Government’s Financial Statements | | 52 |
| Government Reporting Entity | | 52 |
| Compliance with GAAP | | 53 |
| | | |
| Topic Box | | |
| Summary of Tax Changes Announced in Budget 2015 | | 54 |
| | | |
| Charts | | |
| 3.1 Financial Planning and Reporting Cycle Overview | | 51 |
| | | | |
2015 Financial and Economic Review — July 2015
ii
Table of Contents
| Tables | | |
| 3.1 Provincial Taxes (as of July 2015) | | 58 |
| 3.2 Interprovincial Comparisons of Tax Rates — 2015 | | 63 |
| | | |
Appendix 1 — Economic Review Supplementary Tables | | 65 |
| | | |
| Tables | | |
| A1.1A Aggregate and Labour Market Indicators | | 66 |
| A1.1B Prices, Earnings and Financial Indicators | | 67 |
| A1.1C Other Indicators | | 68 |
| A1.1D Commodity Production Indicators | | 69 |
| A1.2 British Columbia Real GDP at Market Prices, Expenditure Based | | 70 |
| A1.3 British Columbia GDP at Basic Prices, by Industry | | 71 |
| A1.4 British Columbia GDP, Income Based | | 72 |
| A1.5 Employment by Industry in British Columbia | | 73 |
| A1.6 Capital Investment by Industry | | 74 |
| A1.7 British Columbia International Goods Exports by Major Market by Selected Commodities, 2014 | | 75 |
| A1.8 British Columbia International Goods Exports by Market Area | | 76 |
| A1.9 Historical Commodity Prices (in US Dollars) | | 77 |
| A1.10 British Columbia Forest Sector Economic Activity Indicators | | 78 |
| A1.11 Historical Value of Mineral, Petroleum and Natural Gas Shipments | | 79 |
| A1.12 Petroleum and Natural Gas Activity Indicators | | 79 |
| A1.13 Supply and Consumption of Electrical Energy in British Columbia | | 80 |
| A1.14 Components of British Columbia Population Change | | 81 |
| | | |
Appendix 2 — Financial Review Supplementary Tables | | 83 |
| | |
| Tables | | |
| A2.1 2014/15 Financial Forecasts — Year in Review | | 84 |
| A2.2 Operating Statement — 2003/04 to 2014/15 | | 85 |
| A2.3 Statement of Financial Position — 2003/04 to 2014/15 | | 86 |
| A2.4 Changes in Financial Position — 2003/04 to 2014/15 | | 87 |
| A2.5 Revenue by Source — 2003/04 to 2014/15 | | 88 |
| A2.6 Revenue by Source Supplementary Information — 2003/04 to 2014/15 | | 89 |
| A2.7 Expense by Function — 2003/04 to 2014/15 | | 90 |
| A2.8 Expense by Function Supplementary Information — 2003/04 to 2014/15 | | 91 |
| A2.9 Full-Time Equivalents (FTEs) — 2003/04 to 2014/15 | | 92 |
| A2.10 Capital Spending — 2003/04 to 2014/15 | | 93 |
| A2.11 Provincial Debt — 2003/04 to 2014/15 | | 94 |
| A2.12 Provincial Debt Supplementary Information — 2003/04 to 2014/15 | | 95 |
| A2.13 Key Provincial Debt Indicators — 2003/04 to 2014/15 | | 96 |
| A2.14 Historical Operating Statement Surplus (Deficit) | | 97 |
| A2.15 Historical Provincial Debt Summary | | 98 |
| | | | |
2015 Financial and Economic Review — July 2015
iii
| Part One |
| |
| |
| Economic Review 1 |
1 Reflects information available as of June 22, 2015
2015 Financial and Economic Review — July 2015
Part 1 — Economic Review
2014 Overview
British Columbia’s economy continued to improve in 2014, with its annual performance outpacing the Canadian average.
Similar to previous years, Statistics Canada published only real dollar industry-side GDP data in the preliminary release of its Provincial Economic Accounts in April 2015. As a result, the following analysis refers to real GDP figures at basic prices, as opposed to the usual market price definition.
BC’s economy grew by 2.6 per cent in 2014 (the second highest rate among provinces), which was greater than the 2.1 per cent growth observed in 2013.
Chart 1.1 Provincial economic growth2
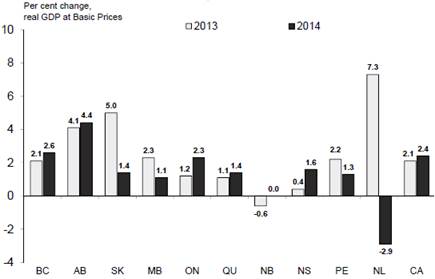
Source: Statistics Canada, April 2015 Preliminary Industry Accounts
Strong external demand for BC products pushed the value of BC’s international merchandise exports up by 7.1 per cent in 2014 compared to 2013. Meanwhile, shipments of manufactured goods grew by 6.7 per cent on the year.
Domestically, BC employment rose by 0.6 per cent in 2014 and the unemployment rate fell to 6.1 per cent. Meanwhile, BC’s housing starts advanced by 4.8 per cent in 2014 to reach about 28,400 units, roughly in line with the average rate of construction observed over the past couple of decades. Retail sales grew by 5.6 per cent last year, while consumer prices rose by 1.0 per cent compared to 2013.
British Columbia Economy
In 2014, service-producing industries represented about 75 per cent of BC’s real GDP and goods-producing industries accounted for around 25 per cent. Last year, the real estate, rental and leasing sector formed the largest share of the provincial economy (17.7 per cent). At the same time, construction made up the largest share of the goods-producing sector and accounted for 8.1 per cent of BC’s total real GDP in 2014.
2 Provincial and National real GDP estimates are based on Statistics Canada’s preliminary industry accounts, released in April 2015. Further information on British Columbia’s economic performance will be available in November 2015, when Statistics Canada releases revised GDP data for 2014 and previous years for the full income and expenditure accounts, including nominal data.
2015 Financial and Economic Review — July 2015
3
Part 1 — Economic Review
Chart 1.2 Composition of British Columbia real GDP by industry

Source: Statistics Canada (numbers may not add to 100 per cent due to rounding)
In total, BC’s real GDP increased by 2.6 per cent in 2014 after growing by 2.1 per cent in 2013. Annual gains were observed in both goods and service producing industries compared to 2013.
Real GDP in BC’s service-producing sectors increased by 2.6 per cent in 2014, up from the 2.2 per cent gain recorded in 2013. Notable annual growth was recorded in wholesale and retail trade (+4.4 per cent), in the real estate, rental and leasing sector (+3.9 per cent) as well as in transportation and warehousing (+3.6 per cent).
Meanwhile, output in BC’s goods-producing industries increased 2.4 per cent in 2014, following 1.5 per cent growth observed in 2013. Annual gains were broad-based, led by the construction sector (+3.1 per cent).
Chart 1.3 British Columbia real GDP growth by industry
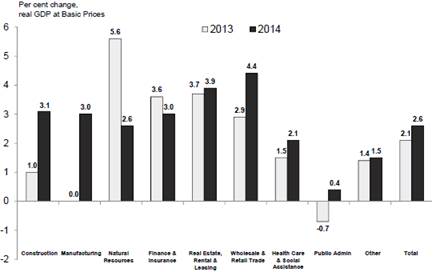
Source: Statistics Canada, April 2015 Preliminary Industry Accounts
Note: Other includes: transportation and warehousing, educational services, and professional, scientific and technical services
2015 Financial and Economic Review — July 2015
4
Part 1 — Economic Review
External Trade and Commodity Prices
Exports by destination:
Despite a subdued global economic backdrop, the value of BC’s international merchandise exports reached a record high in 2014, up 7.1 per cent compared to the previous year, following annual growth of 6.2 per cent in 2013.
The value of BC goods exports to the US climbed 15.7 per cent in 2014, following annual growth of 10.6 per cent in 2013. Last year’s advance in exports to the US reflected broad-based gains, led by a 46.4 per cent jump in natural gas exports and a 19.2 per cent rise in softwood lumber exports.
By contrast, the value of BC merchandise exports to China decreased by 2.7 per cent in 2014 following eight consecutive years of double-digit growth. The annual decline in 2014 was primarily due to a sharp drop in coal (-33.4 per cent) exports, which more than offset annual gains in pulp (+7.9 per cent), machinery and equipment (+44.7 per cent), and copper ores and concentrates (+2.4 per cent) exports to China. Appendix Tables A1.7 and A1.8 provide further detail on exports by major market and commodity groups.
With the US economy gradually improving, the share of BC’s total goods exports to the US continued to increase in 2014, with 50.2 per cent sent south of the border. Meanwhile, exports to Pacific Rim destinations accounted for 42.9 per cent of BC’s total merchandise exports in 2014.
Chart 1.4 Export shares by market
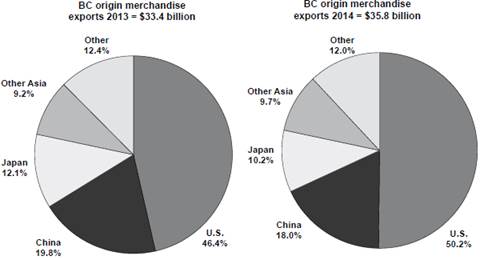
Source: BC Stats
Note: Other Asia includes Hong Kong, Taiwan, South Korea and India
Commodity exports and prices:
Last year, significant gains were observed in exports of metallic mineral products (+19.1 per cent), machinery and equipment (+12.7 per cent) and wood products (+5.0 per cent). Meanwhile, exports of energy products fell for a third straight year, down 1.9 per cent (as a substantial decline in coal exports offset a gain in natural gas exports).
2015 Financial and Economic Review — July 2015
5
Part 1 — Economic Review
The Plant Inlet price of natural gas averaged $3.11 C/GJ in 2014, an increase of $1.08 C/GJ over 2013. Natural gas prices spiked during the cold winter months of early 2014 and then dropped fairly steadily through the course of the year.
Oil prices fell 50.5 per cent from mid-June to the end of 2014 due to a surging supply of oil in the global market alongside slowing energy demand. The daily West Texas Intermediate crude oil price averaged $93.17 US/barrel in 2014, a decline of $4.81 US/barrel compared to the previous year. For context, the WTI oil price ended the year at $53.45 US/barrel on December 31, 2014.
Lumber and newsprint prices moderated somewhat throughout 2014. At the same time, the price of pulp continued to improve on the year.
· following two years of double-digit growth, the price of lumber averaged $353 US/000 board feet in 2014, a slight decrease from $358 US/000 board observed in 2013;
· the price of pulp averaged $928 US per tonne in 2014, up from $864 US per tonne in 2013; and
· the price of newsprint dropped to $581 US per tonne in 2014 from $598 US per tonne in 2013.
Manufacturing shipments:
Shipments of BC’s manufactured goods grew by 6.7 per cent in 2014 following a gain of 3.1 per cent in 2013. Notable annual increases occurred for shipments of paper products (+8.8 per cent), wood products (+4.0 per cent) and food products (+6.6 per cent), while declines were observed for shipments of primary metal products (-4.8 per cent) and electrical equipment, appliance and components (-7.5 per cent).
Chart 1.5 Lumber and natural gas prices
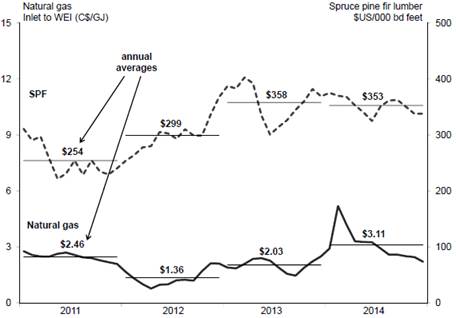
Source: Madison’s Lumber Reporter and Ministry of Natural Gas Development
2015 Financial and Economic Review — July 2015
6
Part 1 — Economic Review
Population
BC’s population on July 1, 2014 was 4.63 million people, an increase of 1.1 per cent from the same date in 2013. In 2014, BC welcomed 33,890 persons via net international migration. Meanwhile, interprovincial migration in 2014 brought a net total of 10,042 persons into BC from other provinces, following two consecutive years of net outflows. A natural increase of 10,620 persons also added to the province’s growing population in 2014.
Map 1.1 Net interprovincial and international migration in BC, 2014
Net Population Movement For British Columbia
Jan 2014 to Dec 2014
Net Inflow : 43,932 Persons

Source: BC Stats
Labour Developments
Employment activity in the province continued to grow modestly in 2014 after a 0.1 per cent gain in 2013. BC’s economy created 12,800 jobs in 2014 (an annual increase of 0.6 per cent), with gains of around 6,100 full-time jobs and about 6,800 part-time jobs. BC’s unemployment rate averaged 6.1 per cent in 2014, down from 6.6 per cent in 2013. This decline was partly due to slow labour force growth, which remained relatively flat in 2014 compared to 2013.
Table 1.1 British Columbia Population and Labour Market Statistics
| | Units | | 2010 | | 2011 | | 2012 | | 2013 | | 2014 | |
| | | | | | | | | | | | | |
Population (as of July 1) | | (thousands) | | 4,466 | | 4,499 | | 4,543 | | 4,583 | | 4,631 | |
| | (% change) | | 1.3 | | 0.7 | | 1.0 | | 0.9 | | 1.1 | |
| | | | | | | | | | | | | |
Net Migration | | | | | | | | | | | | | |
International | | (persons) | | 33,385 | | 30,860 | | 31,345 | | 34,457 | | 33,890 | |
Interprovincial | | (persons) | | 6,212 | | 699 | | (4,596 | ) | (832 | ) | 10,042 | |
Labour Force | | (thousands) | | 2,405 | | 2,409 | | 2,429 | | 2,425 | | 2,425 | |
| | (% change) | | 1.3 | | 0.2 | | 0.8 | | (0.1 | ) | 0.0 | |
Employment | | (thousands) | | 2,223 | | 2,228 | | 2,263 | | 2,266 | | 2,278 | |
| | (% change) | | 1.4 | | 0.2 | | 1.6 | | 0.1 | | 0.6 | |
Unemployment Rate | | (%) | | 7.6 | | 7.5 | | 6.8 | | 6.6 | | 6.1 | |
Sources: BC Stats, Statistics Canada (CANSIM Tables 051-0001, 051-0037, 282-0002 – accessed June 2015)
2015 Financial and Economic Review — July 2015
7
Part 1 — Economic Review
BC’s goods-producing sectors led overall job growth in 2014, adding 7,800 jobs (or 1.8 per cent) compared to 2013. Significant gains in manufacturing (+9,700 jobs) more than offset annual declines in construction (-3,900 jobs) and natural resource (-500 jobs) sectors.
Employment in BC’s service industries increased by 5,000 jobs (or 0.3 per cent) in 2014 compared to 2013, led by gains in transportation and warehousing (+6,500 jobs) and accommodation and food services (+5,800 jobs). These improvements helped to offset weaker employment in areas such as business, building and other support services (-10,900 jobs) and retail and wholesale trade (-2,500 jobs) — see Appendix Table A1.5 for more details.
Inflation
After declining by 0.1 per cent in 2013, consumer price inflation in BC rose by 1.0 per cent in 2014. In 2014, prices increased for semi-durables, non-durables and services but remained flat for durable goods. Rising clothing prices contributed to the increase in semi-durables, while higher prices for rent, property taxes, home and mortgage insurance and water provided upward inflationary pressure on the services side. The aggregate price for non-durables also increased in 2014, as rising prices for items such as food and electricity offset falling gasoline prices (which declined steadily in the latter half of the year in-step with falling oil prices). Meanwhile, prices for durables remained unchanged in 2014 as lower prices for items such as household appliances offset higher prices for items such as passenger vehicles.
Table 1.2 Price and Earnings Indices
| | Units | | 2010 | | 2011 | | 2012 | | 2013 | | 2014 | |
| | | | | | | | | | | | | |
Consumer Price Index | | (2002=100) | | 113.8 | | 116.5 | | 117.8 | | 117.7 | | 118.9 | |
(British Columbia) | | (% change) | | 1.3 | | 2.4 | | 1.1 | | (0.1 | ) | 1.0 | |
| | | | | | | | | | | | | |
Average Weekly Wage Rate | | ($) | | 820.5 | | 838.2 | | 853.5 | | 879.8 | | 882.2 | |
| | (% change) | | 2.4 | | 2.2 | | 1.8 | | 3.1 | | 0.3 | |
| | | | | | | | | | | | | |
Compensation of Employees 1 | | ($ millions) | | 102,467 | | 106,964 | | 110,527 | | 114,898 | | n/a | |
| | (% change) | | 2.1 | | 4.4 | | 3.3 | | 4.0 | | n/a | |
| | | | | | | | | | | | | |
Primary Household Income 1 | | ($ millions) | | 142,110 | | 149,810 | | 155,744 | | 163,498 | | n/a | |
| | (% change) | | 2.9 | | 5.4 | | 4.0 | | 5.0 | | n/a | |
| | | | | | | | | | | | | |
Net Operating Surplus (corporations) 1 | | ($ millions) | | 22,421 | | 25,869 | | 23,090 | | 21,849 | | n/a | |
| | (% change) | | 31.0 | | 15.4 | | (10.7 | ) | (5.4 | ) | n/a | |
1 As of November 2014 Provincial Economic Accounts
Source: Statistics Canada (CANSIM Tables 326-0021, 282-0072, 384-0040, 384-0037 - accessed June 2015)
Consumer Expenditure and Housing
BC retail sales grew by 5.6 per cent in 2014. Growth was widespread, with the largest gains occurring in sales at automobile dealers (+9.7 per cent), food and beverage stores (+4.7 per cent) and general merchandise stores (+8.6 per cent). Strong consumer growth was partly due to increased tourism and interprovincial migration to the province during the year and a release of pent up demand from the previous year.
After contracting by 1.5 per cent in 2013, BC housing starts advanced by 4.8 per cent in 2014 to reach about 28,400 units —roughly in line with the average rate of construction observed over the past couple of decades. Annual growth was largely driven by single-detached houses, while starts of multiple-unit dwellings (such as condominiums) experienced smaller gains compared to 2013. Residential building permits (a leading indicator of potential new housing activity) grew by 7.0 per cent in 2014 over 2013.
2015 Financial and Economic Review — July 2015
8
Part 1 — Economic Review
Chart 1.6 Retail sales
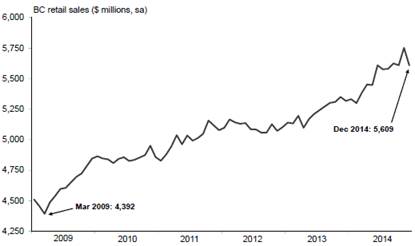
Source: Statistics Canada (CANSIM table 080-0020 – accessed June 2015)
Like new home construction, home sales in BC benefited from a low interest rate environment in 2014. Home sales grew by 15.2 per cent in 2014 compared to the previous year, following a 7.8 per cent annual increase in 2013. Meanwhile, the average price for BC homes rose by 5.8 per cent in 2014 to reach about $568,400.
Tourism
The number of international travellers to BC improved by 4.3 per cent in 2014, compared to the previous year, following 2.9 per cent growth in 2013. The number of non-US visitors advanced for a third straight year in 2014 and rose 9.0 per cent over 2013. At the same time, total US travellers increased for the second straight year and rose by 2.8 per cent in 2014, following annual growth of 2.1 per cent in 2013.
Chart 1.7 Travellers to British Columbia
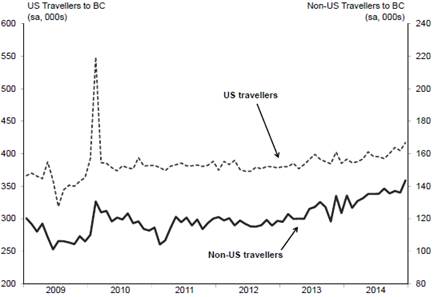
Source: Statistics Canada (CANSIM table 427-0005 – accessed June 2015)
2015 Financial and Economic Review — July 2015
9
Part 1 — Economic Review
External Environment
The global economy continued its slow recovery in 2014 from the financial crisis that occurred in 2008/09. Overall, the world economy grew by 3.4 per cent in 2014, matching the gain recorded in 2013. Real GDP in the euro area rose 0.9 per cent in 2014, following two years of decline. Chinese real GDP growth slowed to 7.4 in 2014 following 7.8 per cent growth in 2013. Meanwhile, the Japanese economy contracted by 0.1 per cent in 2014 compared to 2013. US real GDP advanced by 2.4 per cent in 2014, a slight improvement from 2.2 per cent growth observed in 2013.
United States
US economic growth fluctuated significantly in 2014, with a weather-related contraction in the January to March quarter followed by an outsized expansion two quarters later. Overall, US real GDP expanded by 2.4 per cent in 2014, compared with an increase of 2.2 per cent in 2013. The slight increase in real GDP growth in 2014 primarily reflected a rise in non-residential fixed investment, an up-tick in consumer spending and a rise in state and local government spending compared to 2013. These improvements were partially offset by a decline in residential fixed investment and an increase to imports on the year.
US employment grew steadily throughout 2014 as the economy regained all of the jobs that were lost during the 2008/09 recession. Approximately 260,000 jobs were created on average each month in 2014, resulting in a 1.9 per cent increase in annual employment over 2013 levels. The unemployment rate dropped to average 6.2 per cent in 2014 from 7.4 per cent in 2013, but did so alongside falling labour force participation. In fact, last year the participation rate fell to its lowest rate since 1977, with an average of only 62.9 per cent of Americans who were eligible to work participating in the labour market.
The American housing market continued its gradual recovery in 2014, as housing starts grew by 8.7 per cent over 2013 to reach 1.01 million units — the highest level since 2007. However, US home sales struggled in 2014, with new home sales up just 1.9 per cent compared to the previous year while existing home sales fell by 2.9 per cent compared to 2013. Despite soft sales, national home prices rose by 6.6 per cent on the year.
The US current account deficit (the combined balances on trade in goods and services income, and net unilateral current transfers) increased from $376.8 billion in 2013 to reach $389.5 billion in 2014.
Canada
The Canadian economy grew by 2.4 per cent in 2014 following a 2.1 per cent increase in 2013, as real GDP advanced in every province except for New Brunswick (0.0 per cent) and Newfoundland and Labrador (-2.9 per cent). Canada’s services-producing industries output improved by 2.3 per cent in 2014, a slightly greater pace than the 2.0 per cent growth registered the previous year. At the same time, output in the country’s goods-producing sector increased by 2.6 per cent last year, up from 2.4 per cent in 2013.
2015 Financial and Economic Review — July 2015
10
Part 1 — Economic Review
Canada’s current account deficit narrowed for a second straight year in 2014 to reach $41.5 billion, after recording a balance of $56.3 billion the previous year. Renewed US demand and a reduced exchange rate helped support Canada’s trade sector last year, as the value of Canadian merchandise exports jumped 11.0 per cent compared to 2013. The increase in 2014 reflected broad-based gains, led by advances in exports of energy products (+16.7 per cent), consumer goods (12.8 per cent) and motor vehicles and parts (+8.8 per cent). Meanwhile, national manufacturing shipments rose 5.3 per cent in 2014 following an annual gain of just 0.3 per cent in 2013.
Canada’s labour market grew modestly in 2014, as national employment increased by 0.6 per cent (or 111,100 jobs) over 2013, making 2014 the slowest year for Canadian job creation since 2009. At the same time, the national unemployment rate ticked down 0.2 percentage points in 2014 to average 6.9 per cent for the year.
The number of Canadian housing starts edged up 0.7 per cent in 2014 to about 189,000 units, after falling 12.5 per cent in 2013. Further, residential building permits increased by 5.3 per cent on the year, following no growth in 2013. Canadian home sales advanced by 5.1 per cent compared to 2013, while the average home price rose 6.7 per cent to average $408,087 in 2014.
Canadian retail sales advanced by 4.6 per cent in 2014 compared to the previous year, improving on the 3.2 per cent annual increase that occurred in 2013. Nationally, consumer prices rose by 2.0 per cent over the previous year following an annual increase of just 0.9 per cent in 2013.
International Economy
Ongoing troubles in Europe weighed on economic growth and confidence throughout 2014. The euro area’s real GDP rose a modest 0.9 per cent in 2014 following two years of negative growth. Germany led overall growth, with an increase of 1.6 per cent in real GDP over 2013 while economic growth in France increased by just 0.4 per cent in 2014 compared to 2013. Meanwhile, Italy’s economy contracted for a third straight year, falling 0.4 per cent compared to 2013. In addition, euro area unemployment remained elevated throughout 2014 and the region slipped into deflation in December of that year.
Japanese real GDP faltered in 2014 as the economy struggled to weather the impact of a sales tax hike, which was implemented in April. The Japanese economy contracted by 0.1 per cent in 2014 following growth of 1.6 per cent in 2013. The deceleration was largely attributable to annual declines in both private consumption and private residential investment compared to the previous year. In addition, public investment was a notable soft spot, while exports had a positive impact on GDP.
China’s annual rate of economic growth continued to ease in 2014, increasing by 7.4 per cent, compared to the previous year, following 7.8 per cent growth in 2013. Although this pace is considerably faster than most other nations, it is slower than the annual growth rates observed in recent years.
2015 Financial and Economic Review — July 2015
11
Part 1 — Economic Review
Overall, the International Monetary Fund estimates that global real GDP expanded by 3.4 per cent in 2014, the same annual pace of growth observed in the previous two years. Five years after the global financial crisis, several nations continue to endure a long slow period of economic recovery.
Chart 1.8 External economic growth
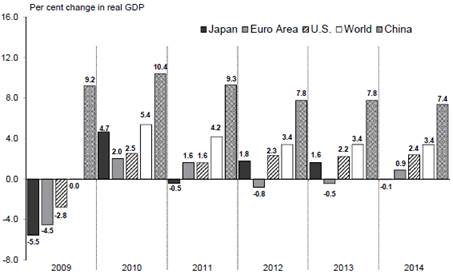
Source: International Monetary Fund, April 2015
Financial Markets
The Bank of Canada held the overnight target rate at 1.00 per cent throughout 2014, where it had remained since September 2010. As reasons for holding the rate at 1.00 per cent, the Bank noted that Canada’s increase in inflation in 2014 was largely due to temporary effects. Further, the Bank cautioned that Canadian household imbalances presented a significant risk to financial stability.
Chart 1.9 Canadian Dollar
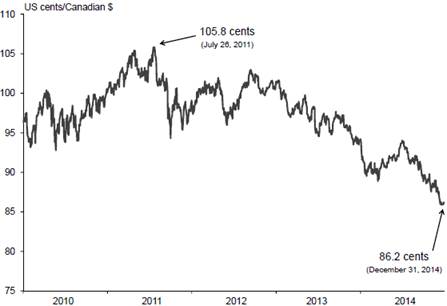
Source: Bank of Canada
2015 Financial and Economic Review — July 2015
12
Part 1 — Economic Review
The US Federal Reserve held its intended federal funds rate in the 0.00 to 0.25 per cent range throughout 2014. Reserve officials have maintained the rate in this highly accommodative range since December 2008. In December 2014, the Fed acknowledged that economic conditions may warrant keeping the target federal funds rate below levels historically viewed as normal for some time.
After beginning the year at 94.0 US cents, the Canadian dollar weakened in 2014, reflecting the combined effect of a stronger US dollar and slumping oil prices. Overall, the Canadian dollar averaged 90.5 US cents in 2014, down 6.6 US cents from 2013 — the largest annual drop since the late 1970s.
Conclusion
BC’s diverse economy continued to expand in 2014, as the province’s real GDP rose by 2.6 per cent on the year after growing by 2.1 per cent in 2013. BC’s economic growth in 2014 ranked second among Canadian provinces (behind Alberta) and outperformed the national average.
Domestically, employment in BC rose a modest 0.6 per cent in 2014, or by 12,800 jobs, reflecting an increase of around 6,100 full-time positions and about 6,800 part-time jobs. Meanwhile, BC’s annual unemployment rate dropped 0.5 percentage points to average 6.1 per cent on the year, lower than the national average of 6.9 per cent. This decline was partly due to slow labour force growth, which remained relatively flat on the year. Meanwhile, BC housing starts increased by 4.8 per cent in 2014 to reach about 28,400 units and BC retail sales saw solid gains of 5.6 per cent on the year.
Despite unbalanced global demand, the value of BC international merchandise exports climbed by 7.1 per cent in 2014 compared to 2013, driven by a pick-up in exports to the US. Shipments of manufactured goods also improved in 2014, growing by 6.7 per cent on the year after a 3.1 per cent gain in 2013.
2015 Financial and Economic Review — July 2015
13
2015 Financial and Economic Review — July 2015
Part 2 — Financial Review
2014/15 Overview
Table 2.1 Operating Statement
| | Budget | | Actual | | Actual | |
($ millions) | | 2014 1 | | 2014/15 | | 2013/14 1 | |
Revenue | | 44,800 | | 46,122 | | 43,728 | |
Expense | | (44,416 | ) | (44,439 | ) | (43,401 | ) |
Surplus before forecast allowance | | 384 | | 1,683 | | 327 | |
Forecast allowance | | (200 | ) | — | | — | |
Surplus | | 184 | | 1,683 | | 327 | |
| | | | | | | |
Capital spending: | | | | | | | |
Taxpayer-supported capital spending | | 4,030 | | 3,407 | | 3,151 | |
Self-supported capital spending | | 2,590 | | 2,488 | | 2,519 | |
| | 6,620 | | 5,895 | | 5,670 | |
Provincial Debt: | | | | | | | |
Taxpayer-supported debt | | 43,075 | | 41,880 | | 41,068 | |
Self-supported debt | | 21,463 | | 21,040 | | 19,625 | |
Total debt (including forecast allowance) | | 64,738 | | 62,920 | | 60,693 | |
Key debt affordability metrics: | | | | | | | |
Taxpayer-supported debt-to-revenue ratio | | 98.1 | % | 94.1 | % | 96.1 | % |
Taxpayer-supported debt-to-GDP ratio: | | | | | | | |
As previously reported | | 18.4 | % | | | 18.2 | % |
Impact of Statistics Canada update | | -0.3 | % | | | -0.3 | % |
| | 18.1 | % | 17.5 | % | 17.9 | % |
1 Figures have been restated to reflect government accounting policies in effect at March 31, 2015, and the impact of Statistics Canada methodology change for measuring economic growth.
The provincial government ended the 2014/15 fiscal year with a surplus of $1.7 billion, $1.5 billion higher than budget and up $1.4 billion from the previous year (see Table 2.1).
Revenues were $1,322 million higher than budget, mainly due to increased personal and corporate income tax revenues totaling $872 million, as well as a $405 million improvement in the net income from ICBC. (See Revenue section for further details.)
Total government expenses were $23 million higher than budget, as $326 million of statutory spending, predominately for natural disaster related costs and accrued pension liabilities, were partly offset by ministry savings, prior year liability adjustments, lower debt servicing costs, and other expense reductions totaling $303 million. (See Expense section for further details.)
As the revenue increases exceeded the expense increases, the $200 million budgeted forecast allowance was not required.
Taxpayer-supported infrastructure spending on hospitals, schools, post-secondary institutions, transit, roads and social housing of $3.4 billion was $623 million less than budget, mainly due to project scheduling delays. This spending has been deferred to future years.
Similarly, self-supported capital spending on hydroelectric and transportation projects, and in support of other commercial activities, was $102 million less than budget mainly due to timing differences on expenditures on BC Hydro’s power generation and transmission projects. (See Capital section for further details.)
2015 Financial and Economic Review — July 2015
17
Part 2 — Financial Review
Chart 2.1 2014/15 surplus — major changes from Budget 2014
Overall, government debt increased by $2.2 billion in 2014/15, compared to a budgeted increase of $3.1 billion. The lower increase is primarily due to improved operating results and weaker than anticipated capital spending. (See Debt section for further details.)
Financial information in this publication, including this chapter and Appendix 2, is sourced from the government’s 2014/15 Public Accounts.
Revenue
In 2014/15, revenue totaled $46.1 billion — $1.3 billion (or 3.0 per cent) higher than budget and up 5.5 per cent from 2013/14. Compared to budget, higher revenues from personal income, corporate income, and property transfer taxes, fees, investment earnings and commercial Crown corporation net income were partially offset by lower revenue from sales and other taxes, natural resources, miscellaneous sources and federal government transfers.
Chart 2.2 Revenue changes from Budget 2014
2015 Financial and Economic Review — July 2015
18
Part 2 — Financial Review
Income Tax Revenue
Personal income tax revenue was up $585 million mainly due to the effects of stronger 2013 tax assessments unknown at the end of 2013/14. This was partially offset by the effects of lower estimated 2014 and 2015 household income growth, reflecting relatively weak employment growth in 2014 and in the first three months of 2015. The Canada Revenue Agency administers the personal and corporate income taxes on behalf of the province and its tax assessments are finalized 12 months after year end. The higher 2013 assessments resulted in a one-time revenue gain of $386 million reflecting an under accrual in 2013/14.
Corporate income tax revenue was up $287 million mainly due to strong 2013 tax assessments which had the effect of increasing the settlement payment for 2013 as well as 2014/15 instalment payments from the federal government. The 2013 assessments reflected a 6.2 per cent increase in the BC corporate income tax base compared to a 5.4 per cent decline in BC net operating surplus.
Table 2.2 Corporate Income Tax Revenue Changes from Budget 2014
| | Revenue | | | | | | | |
| | changes | | | | Budget | | | |
| | ($ millions) | | Indicators ($ billions) | | 2014 | | Actual | |
Prior-year adjustment | | 116 | | 2013 BC corporate tax base | | 29.3 | | 30.6 | |
Advance instalments | | 177 | | 2013 National corporate tax base | | 263.4 | | 267.5 | |
International Business Activity Act | | | | | | | | | |
refunds | | (6 | ) | | | | | | |
| | 287 | | | | | | | |
Consumption and Other Tax Revenue
Harmonized sales tax (HST) revenue incurred a one-time $91 million loss related to entitlement for the 2010/11 to 2012/13 period based on updated information received from the federal government. Annual adjustments to HST revenue will continue until 2019/20; however it is expected that the impacts will diminish over time.
Provincial sales tax revenue was down $111 million from budget. The 2014/15 budget estimate was based on projected economic growth applied to a forecast of 2013/14 that was higher than actual results. The carry forward impacts of weaker 2013/14 results was partly offset by stronger sales activity during the year.
Table 2.3 Consumption and Other Tax Revenue Changes from Budget 2014
| | Revenue | | | | | | 2014/15 | |
| | changes | | | | Budget | | Public | |
| | ($ millions) | | Indicators (annual percent change) | | 2014 | | Accounts | |
Harmonized sales | | (91 | ) | Nominal consumer expenditures | | 4.2 | % | 4.7 | % |
Provincial sales | | (111 | ) | Nominal business investment | | 4.4 | % | 5.6 | % |
Total sales | | (202 | ) | | | | | | |
| | | | | | | | | |
Carbon | | (30 | ) | | | | | | |
Tobacco | | (28 | ) | BC consumer price index | | 1.5 | % | 1.0 | % |
Property transfer | | 261 | | BC housing starts | | -7.8 | % | 4.8 | % |
Insurance premium | | 32 | | Real GDP | | 2.0 | % | 2.2 | % |
Fuel | | (4 | ) | Nominal GDP | | 3.6 | % | 3.9 | % |
Property | | (2 | ) | | | | | | |
2015 Financial and Economic Review — July 2015
19
Part 2 — Financial Review
Carbon tax revenue was down $30 million from budget due to weaker sales across most fuel types — in particular, natural gas volumes.
Tobacco tax revenue was down $28 million from budget reflecting a decline in consumption volumes.
Insurance premium tax revenue was $32 million above budget due to higher than expected activity.
Property transfer tax revenue was $261 million higher than budget due to the effects of a strong housing market including the impact of increases in average property prices and the number of transactions.
Other tax revenues comprising of fuel and property were $6 million below budget.
Natural Resources Revenue
Natural gas royalties were $52 million above budget mainly due to higher production volumes, partly offset by a complementary increase in the utilization of royalty credit programs. Natural gas prices averaged $2.48 during 2014/15 ($Cdn/gigajoule, plant inlet), slightly higher than the budget estimate of $2.45.
Table 2.4 Energy and Mineral Revenue Changes from Budget 2014
| | Revenue | | | | | | | |
| | changes | | | | Budget | | | |
| | ($ millions) | | Indicators | | 2014 | | Actual | |
Natural gas royalties | | 52 | | Natural gas price ($Cdn/GJ, plant inlet) | | $ | 2.45 | | $ | 2.48 | |
| | | | Production (annual change) | | 8.2 | % | 9.3 | % |
Coal, metals and other minerals | | (85 | ) | Metallurgical coal price ($US/tonne) | | $ | 176 | | $ | 124 | |
| | | | Copper price ($US/lb) | | $ | 3.16 | | $ | 2.97 | |
Columbia River Treaty electricity sales | | (30 | ) | Electricity price ($US/Mwh) | | $ | 39.82 | | $ | 31.51 | |
| | | | Oil price ($US/bbl) | | $ | 95.12 | | $ | 80.85 | |
Sales of Crown land leases 1 | | 28 | | Bonus bid cash receipts ($ million) | | $ | 75 | | $ | 335 | |
| | | | Bonus bid price per hectare ($) | | $ | 750 | | $ | 2,544 | |
Other | | 5 | | Hectares disposed (thousands) | | 100 | | 132 | |
1 Sales of Crown land tenures are recognized over nine years.
Coal, metals and other minerals revenue was $85 million below budget, mainly due to the effects of lower-than-expected coal and copper prices and weaker production volumes.
Receipts from electricity sales under the Columbia River Treaty were $30 million below budget due to lower electricity prices.
Other energy-related revenue sources were $33 million above budget mainly due to higher sales of Crown land leases reflecting industry’s willingness to invest in BC through strong average bid prices.
2015 Financial and Economic Review — July 2015
20
Part 2 — Financial Review
Table 2.5 Forest Revenue Changes from Budget 2014
| | Revenue | | | | | | | |
| | changes | | | | Budget | | | |
| | ($ millions) | | Indicators | | 2014 | | Actual | |
Stumpage from timber tenures | | (101 | ) | SPF 2x4 ($US/1000 bf, calendar year) | | $ | 345 | | $ | 353 | |
BC Timber Sales | | 45 | | Total stumpage rate ($/m3 ) | | $ | 10.78 | | $ | 11.15 | |
Softwood Lumber Agreement border tax | | (7 | ) | Harvest volumes (million m3) | | 65.0 | | 57.6 | |
Vote recoveries | | 10 | | Export tax rate (percent) | | 0.8 | | 0.0 | |
Logging tax and other receipts | | 22 | | US lumber exports (billion bf)1 | | 6.9 | | 6.5 | |
| | (31 | ) | | | | | | |
1 Source: Department of Foreign Affairs, Trade and Development
Forests revenue was down $31 million from budget mainly due to lower stumpage revenue, reflecting lower Crown harvest volumes, interior stumpage rates and reduced entitlement of the federal government border tax collections. BC’s entitlement of border tax collections under the Softwood Lumber Agreement, 2006 was $7 million below budget as the effects of higher than expected lumber prices resulted in a zero export tax rate during the year. These declines were partly offset by higher BC Timber Sales stumpage rates and logging taxes as well as increased forest related recoveries.
Other natural resources revenue, comprising of water rentals and hunting and fishing licences, was $12 million below budget.
Other Taxpayer supported Sources
Other taxpayer supported revenue which includes fees, licences, investment earnings and other miscellaneous sources was up $47 million from budget mainly due to higher than expected revenue from SUCH sector entities, partly offset by lower sales of surplus assets.
Table 2.6 Other Revenue Changes from Budget 2014
| | Revenue | | | | | | | |
| | changes | | | | | | | |
| | ($ millions) | | | | | | | |
Fees | | 89 | | mainly higher revenue from SUCH sector entities | |
Miscellaneous sources | | (79 | ) | mainly lower revenue from SUCH sector and Crown agencies | |
Investment earnings | | 112 | | mainly higher earnings in general revenue and from SUCH sector and Crown agencies | |
Release of surplus assets | | (75 | ) | | | | | | |
Total other | | 47 | | | | | | | |
Federal Government Transfers
Federal government contributions were down $37 million reflecting a $24 million decline in other federal government transfers mainly due to lower funding to Crown agencies and for disaster financial assistance, partly offset by higher transfers to SUCH sector agencies. There is a further $13 million decrease in the Canada Health Transfer and Canada Social Transfer entitlements mainly with respect to prior years.
2015 Financial and Economic Review — July 2015
21
Part 2 — Financial Review
Commercial Crown Corporations
Commercial Crown corporation net income of $3.4 billion was $486 million higher than budgeted, and $670 million higher than 2013/14.
British Columbia Hydro and Power Authority
BC Hydro net income of $581 million was $1 million lower than plan.
In compliance with BC Utilities Commission (BCUC) orders, BC Hydro uses several regulatory accounts to better match costs and benefits for different generations of customers, smooth out the rate impact of large non-recurring costs, and defer to future periods differences between forecast and actual costs or revenues. At March 31, 2015 BC Hydro had 28 regulatory accounts totaling $5.4 billion — up $734 million from the prior year. The increase is mainly attributed to higher capital-like deferred balances ($373 million), higher non-current pension costs due to actuarial valuations ($317 million), higher energy deferral accounts due to lower domestic loads and lower surplus sales ($310 million), and impacts of rate smoothing over the 10-year rate plan ($166 million), partially offset by amortization of balances in the year ($491 million), and other changes. BC Hydro has mechanisms in place to collect 24 of the 26 regulatory accounts with balances remaining after year end (representing approximately 90 per cent of the total balances).
BC Hydro pays a dividend to government equivalent to 85 per cent of net income unless the payment would result in BC Hydro’s debt to equity ratio falling below 80:20. In such cases the payment is reduced until the ratio is restored. In 2014/15, the corporation’s dividend to government was $264 million (45 per cent of net income). BC Hydro has not paid a full dividend since 2005/06. Government has put in place a plan to phase out the payment of dividends by BC Hydro within five years as part of a ten-year plan to stabilize rate increases and that will eventually improve BC Hydro’s capital structure to a 60:40 debt to equity ratio.
More information about BC Hydro’s financial results and performance measures is provided in the corporation’s annual report available at its website: www.bchydro.com.
British Columbia Liquor Distribution Branch
LDB net income of $935 million was $73 million higher than plan, and $58 million over the prior year. The improved result was due to stronger volume sales across product categories, as well as a $37 million gain relating to the sale of the Vancouver Distribution Centre property not included in LDB’s budget plan. Excluding the gain on this sale, LDB’s results were 4.2 per cent ahead of plan.
LDB continues to support government’s plan to modernize the liquor industry in the province. As a part of this effort, LDB has updated systems and business processes, increased the separation between retail and wholesale operations, and implemented a new wholesale pricing model effective April 1, 2015.
More information about LDB’s financial results and performance measures is provided in the corporation’s annual report available at its website: www.bcldb.com.
2015 Financial and Economic Review — July 2015
22
Part 2 — Financial Review
British Columbia Lottery Corporation
BCLC net income of $1,245 million (net of payments to the federal government) was $62 million higher than plan reflecting higher net income from casino and community gaming operations, partially offset by lower net income from lottery and eGaming channels.
Casino and community gaming operations reported net income is $69 million higher than plan, mainly due to higher revenue from all table play including poker ($123 million up), partially offset by higher direct expenses ($56 million up) and other changes ($2 million up).
By contrast, lottery and eGaming operations reported net income is $8 million below plan driven mainly due to lower lottery revenue ($32 million down) offset by higher eGaming revenues ($12 million up) and other better-than-budget results ($12 million).
More information about BCLC’s financial results and performance measures is provided in the corporation’s annual report available at its website: www.bclc.com.
Insurance Corporation of British Columbia
On government’s fiscal year basis, ICBC’s net income of $657 million was $405 million higher than plan, and $521 million over the prior year. The improvement over plan is primarily attributed to higher investment earnings in the second half of the year (up $336 million) and higher earned premiums (up $85 million) due to vehicle growth and premiums written at a higher average rate as the result of the 2014 Basic rate increase of 5.2 per cent, effective November 1, 2014.
More information about ICBC’s financial results and performance measures is provided in the corporation’s annual report available at its website: www.icbc.com.
Other commercial Crown entities
The Transportation Investment Corporation’s net loss of $89 million was $10 million higher than the Budget 2014 plan, due to an extended and longer than anticipated period of traffic fluctuation following the introduction of tolling and the expiry of the introductory 50 per cent discount.
Net income from other commercial Crown entities was $43 million below plan mainly due to the reclassification of LDB’s Vancouver warehouse property gain ($37 million had been included in other commercial Crown corporation revenue for Budget 2014).
A detailed review of revenue changes by quarter is available in Appendix Table A2.1. Multi-year trends in provincial government revenue sources can be found in Appendix Tables A2.5 and A2.6.
2015 Financial and Economic Review — July 2015
23
Part 2 — Financial Review
Table 2.7 Revenue by Source
| | Budget | | Actual | | Actual | |
($ millions) | | 2014 1 | | 2014/15 | | 2013/14 1 | |
Taxation | | | | | | | |
Personal income | | 7,491 | | 8,076 | | 6,862 | |
Corporate income | | 2,348 | | 2,635 | | 2,427 | |
Sales 2 | | 5,964 | | 5,762 | | 5,303 | |
Fuel | | 936 | | 932 | | 917 | |
Carbon | | 1,228 | | 1,198 | | 1,222 | |
Tobacco | | 780 | | 752 | | 724 | |
Property | | 2,156 | | 2,154 | | 2,080 | |
Property transfer | | 804 | | 1,065 | | 937 | |
Insurance premium | | 450 | | 482 | | 458 | |
| | 22,157 | | 23,056 | | 20,930 | |
Natural resource | | | | | | | |
Natural gas royalties | | 441 | | 493 | | 445 | |
Other energy and minerals | | 1,313 | | 1,231 | | 1,298 | |
Forests | | 785 | | 754 | | 719 | |
Other natural resource 3 | | 471 | | 459 | | 493 | |
| | 3,010 | | 2,937 | | 2,955 | |
Other revenue | | | | | | | |
Medical Services Plan premiums | | 2,271 | | 2,254 | | 2,158 | |
Other fees 4 | | 3,065 | | 3,171 | | 3,052 | |
Investment earnings | | 1,091 | | 1,203 | | 1,113 | |
Miscellaneous | | 2,758 | | 2,679 | | 2,884 | |
Release of surplus assets | | 200 | | 125 | | 433 | |
| | 9,385 | | 9,432 | | 9,640 | |
Contributions from the federal government | | | | | | | |
Health transfer | | 4,200 | | 4,186 | | 4,280 | |
Social transfer | | 1,640 | | 1,641 | | 1,589 | |
Other federal contributions | | 1,523 | | 1,499 | | 1,633 | |
| | 7,363 | | 7,326 | | 7,502 | |
Commercial Crown corporation net income | | | | | | | |
BC Hydro | | 582 | | 581 | | 549 | |
Liquor Distribution Branch | | 862 | | 935 | | 877 | |
BC Lottery Corporation (net of payments to the federal government) | | 1,183 | | 1,245 | | 1,165 | |
ICBC | | 252 | | 657 | | 136 | |
Transportation Investment Corporation (Port Mann) | | (79 | ) | (89 | ) | (88 | ) |
Other 5 | | 85 | | 42 | | 62 | |
| | 2,885 | | 3,371 | | 2,701 | |
Total revenue | | 44,800 | | 46,122 | | 43,728 | |
1 Figures have been restated to reflect government accounting policies in effect at March 31, 2015.
2 Includes provincial sales tax and harmonized sales tax/social services tax/hotel room tax related to prior years.
3 Water rental and other resources.
4 Post-secondary, healthcare-related, motor vehicle, and other fees.
5 Includes Columbia Power Corporation, BC Railway Company, Columbia Basin Trust power projects, and post-secondary institutions self-supported subsidiaries.
2015 Financial and Economic Review — July 2015
24
Part 2 — Financial Review
Table 2.8 Expense by Ministry, Program and Agency
| | 2014/15 | | | |
| | Budget | | | | Actual | |
($ millions) | | 2014 1 | | Actual 2 | | 2013/14 1 | |
Office of the Premier | | 9 | | 8 | | 9 | |
Aboriginal Relations and Reconciliation | | 82 | | 84 | | 83 | |
Advanced Education | | 1,973 | | 1,971 | | 1,950 | |
Agriculture | | 80 | | 78 | | 76 | |
Children and Family Development | | 1,356 | | 1,355 | | 1,343 | |
Community, Sport and Cultural Development | | 221 | | 222 | | 181 | |
Education | | 5,387 | | 5,395 | | 5,370 | |
Energy and Mines | | 21 | | 30 | | 28 | |
Environment | | 134 | | 133 | | 130 | |
Finance | | 202 | | 247 | | 239 | |
Forests, Lands and Natural Resource Operations | | 593 | | 835 | | 619 | |
Health | | 16,936 | | 16,917 | | 16,387 | |
International Trade | | 34 | | 34 | | 37 | |
Jobs, Tourism and Skills Training | | 199 | | 199 | | 196 | |
Justice | | 1,155 | | 1,156 | | 1,155 | |
Natural Gas Development | | 401 | | 401 | | 371 | |
Social Development and Social Innovation | | 2,530 | | 2,529 | | 2,488 | |
Technology, Innovation and Citizens’ Services | | 490 | | 488 | | 525 | |
Transportation and Infrastructure | | 812 | | 812 | | 806 | |
Total ministries and Office of the Premier | | 32,615 | | 32,894 | | 31,993 | |
Management of public funds and debt | | 1,286 | | 1,198 | | 1,237 | |
Contingencies | | 300 | | 264 | | 202 | |
Funding for capital expenditures | | 1,048 | | 860 | | 740 | |
Refundable tax credit transfers | | 778 | | 864 | | 730 | |
Legislative and other appropriations | | 130 | | 125 | | 150 | |
| | 36,157 | | 36,205 | | 35,052 | |
Elimination of transactions between appropriations 3 | | (17 | ) | (17 | ) | (2 | ) |
Prior year liability adjustments | | — | | (130 | ) | (159 | ) |
Consolidated revenue fund expense | | 36,140 | | 36,058 | | 34,891 | |
Expenses recovered from external entities | | 2,599 | | 2,668 | | 2,883 | |
Funding provided to service delivery agencies | | (22,016 | ) | (21,734 | ) | (21,504 | ) |
Ministry and special office direct program spending | | 16,723 | | 16,992 | | 16,270 | |
Service delivery agency expense: | | | | | | | |
School districts | | 5,667 | | 5,339 | | 5,661 | |
Universities | | 4,152 | | 4,119 | | 4,079 | |
Colleges and institutes | | 1,125 | | 1,151 | | 1,137 | |
Health authorities and hospital societies | | 13,108 | | 13,154 | | 12,802 | |
Other service delivery agencies | | 3,743 | | 3,684 | | 3,452 | |
Total service delivery agency expense | | 27,795 | | 27,447 | | 27,131 | |
Subtotal expense | | 44,518 | | 44,439 | | 43,401 | |
Expenditure management | | (76 | ) | — | | — | |
Core Review | | (26 | ) | — | | — | |
Total expense | | 44,416 | | 44,439 | | 43,401 | |
1 Amounts have been restated to reflect government accounting policies and organization in effect at March 31, 2015.
2 Actual results for ministries and special offices reflect the accountabilities in the Balanced Budget and Ministerial Accountability Act . Under BBMAA, spending funded by the Contingencies Vote is not attributed to the various ministries, but is shown as a seperate accountability of the Minister of Finance.
3 Reflects payments made under an agreement where an expense from a voted appropriation is recorded as revenue by a special account.
2015 Financial and Economic Review — July 2015
25
Part 2 — Financial Review
Expense
In 2014/15, government expenses totaled $44.4 billion; $23 million higher than Budget 2014 and $1.0 billion (2.3 per cent) higher than the previous year.
Chart 2.3 Expense changes from Budget 2014
Consolidated Revenue Fund
Government’s continued fiscal discipline resulted in meeting core review and expenditure management objectives during 2014/15. Excluding statutory spending (discussed below) overall ministry spending was $47 million under budget. These savings include achieving the core review mandate of $26 million for the year, as well as savings elsewhere in ministry spending. In addition, fiscal plan improvements identified in the first Quarterly Report allowed government to remove the $76 million in expenditure management initiative for the year.
In addition to the ministry specific savings above, other expense reductions in the Consolidated Revenue Fund included $88 million in interest cost savings due to lower borrowing rates and revisions to timing of borrowing (Management of Public Funds and Debt Vote, net of eliminations), $36 million in unused allocations for Contingencies, and $5 million lower legislative and other appropriation spending. These savings were partially offset by higher tax credit transfers (mainly for film production and mining exploration) totaling $86 million.
Government used the Contingencies Vote as a prudent budgeting tool to fund priority initiatives and manage both current and future budget pressures. A total of $264 million of the $300 million allocation was spent on a variety of pressures, including:
· $64 million for various agreements with First Nations, including treaty and non-treaty related costs and LNG benefits amounts (Ministry of Aboriginal Relations and Reconciliation);
2015 Financial and Economic Review — July 2015
26
Part 2 — Financial Review
· $49 million in programs paid to communities including infrastructure projects, grants to community organizations, and the traffic fine revenue sharing and small community grant program (Ministry of Community, Sport, and Cultural Development);
· $65 million in payments to agencies outside the government reporting entity (Ministry of Education);
· $18 million for court related costs, provincial policing costs under the RCMP contract, and the Immediate Roadside Prohibition Program (Ministry of Justice);
· $18 million to manage income assistance case load pressures (Ministry of Social Development and Social Innovation);
· $15 million for Geoscience BC, costs related to the Mount Polley incident and other mining related costs (Ministry of Energy and Mines);
· $13 million in overseas and related initiatives (Ministry of International Trade);
· $6 million for the purchase of the Grace Islet property (Ministry of Forests, Lands and Natural Resource Operations); and
· $9 million in other areas.
As well, $7 million was paid directly from the Contingencies Vote to First Nations for accommodation costs related to government’s release of assets for its economic generation initiative.
During the year, government invoked standing statutory authority to cover $326 million in unforeseen costs. These included:
· $235 million in direct fire response costs (Ministry of Forests, Lands and Natural Resource Operations);
· $47 million for the amortization of the unfunded actuarial liability in the Teachers’ Pension Plan (Ministry of Finance);
· $13 million for emergency flood response costs under the Emergency Program Act (Ministry of Justice);
· $9 million in relation to the Clean Energy Fund (Ministry of Energy and Mines); and
· $22 million in other areas.
Liabilities accrued in prior years were adjusted downward by $130 million to reflect actuarial valuations and other updated information. These included reductions of:
· $59 million in the Ministry of Finance, primarily related to improved investment returns in relation to the long term disability benefits and self-insurance program reported as lower expenses;
· $50 million in the Ministry of Health, primarily related to accrued expenses for MSP payables and regional operations;
· $8 million in the Ministry of Aboriginal Relations and Reconciliation related to lower revenue sharing following lower mineral tax revenues;
· $4 million in the Ministry of Forests, Lands and Natural Resource Operations, primarily related to accrued costs for competitiveness and innovation initiatives; and
· $9 million of other adjustments.
2015 Financial and Economic Review — July 2015
27
Part 2 — Financial Review
Recovered Expenses
Program spending funded or co-funded by parties outside of government was $69 million higher than budget. The change reflects:
· $45 million increase in recoverable healthcare costs related to PharmaCare costs under Product Listing Agreements with drug companies and regional services provided to non-resident clients;
· $22 million in higher interest cost recoveries from commercial crowns due to impacts of foreign exchange rate changes;
· $14 million for immigration spending funded by the federal government;
· $11 million for higher than anticipated highway expansion and rehabilitation costs recovered from municipalities for work on their assets; and
· $13 million in other cost recovered program spending
partially offset by
· $25 million in lower recoveries in relation to employee health benefits managed for external parties; and
· $11 million reduction in free crown grants.
The above spending changes are offset by an equal net increase in revenue and as a result have no net impact on the fiscal plan.
Operating Transfers
Operating grants paid to government agencies were $95 million lower than budget. Contributing factors include a net reduction of $234 million in grants to school districts being impacted by strike action and a subsequent labour settlement, $31 million in lower payments to other service delivery agencies, and $5 million lower grants to post-secondary institutions, offset by $175 million in higher payments to health authorities and hospital societies to meet increased demands in the sector.
Service Delivery Agency Spending
Service delivery agency spending was $348 million lower than budget, representing a 1.3 per cent reduction in total budgeted expenses by agencies.
Lower spending by government agencies is largely attributed to lower spending by school districts. This occurred because of strike savings associated with the teacher labour disruption, partially offset by additional funding provided from the negotiated settlement reached in September 2014. Actual spending for the education sector was $328 million less than budget.
Post-secondary institution spending was $7 million lower than budget, reflecting a $33 million reduction in university spending, mainly due to reduced third party research grants, partially offset by a $26 million increase in college expenses, mainly in the area of operating costs and grants to third parties.
Health authority and hospital society spending was $46 million higher than projected; however the increase is net of a $90 million positive adjustment to the employee benefit
2015 Financial and Economic Review — July 2015
28
Part 2 — Financial Review
liability. Excluding the liability adjustment, spending was $136 million higher than planned, which was funded by the increase in grants provided to the health authorities identified in the Operating Transfers section above. The spending increase is mainly due to higher staffing and operating costs incurred to meet the growing demand for healthcare services delivered by these organizations.
An overall reduction of $59 million in other service delivery agency spending reflected lower transportation infrastructure spending ($44 million), lower housing subsidy costs ($10 million), and other net spending decreases ($5 million).
A detailed review of the above changes by quarter is available in Appendix Table A2.1. Further information on 2014/15 spending by function is provided in Appendix Table A2.7.
Provincial Capital Spending
Capital spending in 2014/15 totaled $5.9 billion — $3.4 billion on taxpayer-supported infrastructure and $2.5 billion on the self-supported infrastructure of commercial Crown corporations.
Spending on government direct capital (i.e. government ministry infrastructure, including IT systems, court houses and correctional institutions) as well as health and education facilities comprised an aggregate 40 per cent of total capital spending in 2014/15. While this spending is predominantly taxpayer financed, a portion is funded from third party contributions.
Chart 2.4 Capital spending, 2014/15
Spending on highways and public transportation is primarily taxpayer-supported, and reflects government’s transportation and transit investment plan. Roughly 8 per cent of total government spending in this category in 2014/15 was for the Port Mann Bridge replacement and associated Highway 1 improvements, which is a self-supported commercial project to be funded from tolls. This project is essentially complete.
2015 Financial and Economic Review — July 2015
29
Part 2 — Financial Review
Table 2.9 Capital Spending
| | Budget | | Actual | | Actual | |
($ millions) | | 2014 | | 2014/15 | | 2013/14 | |
Taxpayer-supported | | | | | | | |
Education facilities | | 1,394 | | 1,138 | | 973 | |
Health facilities | | 847 | | 900 | | 690 | |
Highways and public transit | | 1,180 | | 905 | | 1,097 | |
Government direct (ministries) | | 382 | | 326 | | 298 | |
Other | | 177 | | 138 | | 93 | |
Capital spending contingencies | | 50 | | — | | — | |
| | 4,030 | | 3,407 | | 3,151 | |
Self-supported commercial | | | | | | | |
Power generation and transmission | | 2,288 | | 2,197 | | 2,088 | |
Highways and public transit | | 83 | | 76 | | 202 | |
Other | | 219 | | 215 | | 229 | |
| | 2,590 | | 2,488 | | 2,519 | |
Total capital spending | | 6,620 | | 5,895 | | 5,670 | |
Spending on power generation and transmission projects is the largest single category of capital spending and is entirely self-supported. The spending primarily reflects BC Hydro’s refurbishment and expansion of its generating and transmission assets, as well as the Waneta Dam power expansion project undertaken by the Columbia Power Corporation (CPC).
Other capital spending includes taxpayer-supported spending on social housing, as well as spending by other commercial Crown corporations on IT systems and equipment.
Taxpayer-supported Capital Spending
In 2014/15, government spending on taxpayer-supported infrastructure was $623 million below budget.
Education facilities spending was $256 million less than budget reflecting:
· a $91 million decrease by school districts due to changes to project schedules, requiring the reprofiling of capital spending for several projects including Moody Middle School, Ecole Des Pionniers, Lord Nelson Elementary School, and the Lord Strathcona Elementary School seismic upgrade; and
· a $165 million decrease by post-secondary institutions, which is mainly attributed to project schedule and spending adjustments to contributor-funded projects, including the University of British Columbia’s Ponderosa and Orchard Commons Student Residences, Undergrad Teaching Labs and the Global Student Centre projects.
Health facilities spending was $53 million higher than budget, reflecting scheduling changes for various projects, including the Clinical and Systems Transformation, Children’s and Women’s Hospital, and North Island Hospitals projects.
Highways and public transit spending was $275 million less than budget, mainly due to changes to project planning and construction schedules, as well as changes in the timing of federal contributions towards project costs.
2015 Financial and Economic Review — July 2015
30
Part 2 — Financial Review
Chart 2.5 Capital spending changes from Budget 2014
Government direct spending was $106 million less than budget due to schedule and spending changes for various projects and unused project reserves. Other taxpayer-supported spending was $39 million lower than planned, partially due to social housing project scheduling changes.
The above scheduling changes do not represent a reduction in capital spending; rather, the spending has been deferred to future years.
Self-supported Capital Spending
Commercial Crown corporation spending on capital projects in 2014/15 was $102 million less than budget.
Power generation and transmission spending was $91 million less than planned mainly due to differences in the timing of expenditures on BC Hydro’s generation replacements and expansion initiative, various technology projects, and building development programs.
Highways spending by TI Corp on the Port Mann Bridge project was $7 million less than planned, mainly reflecting the contractor’s rescheduling of capital spending into 2015/16.
Other self-supported spending was $4 million less than budget, mainly reflecting lower spending by the BC Lottery Corporation on its gaming management system project and equipment replacement (down $21 million) and scheduling changes by other commercial Crown corporations (down $11 million). This lower spending was partially offset by higher than expected ($28 million) residential and commercial building investments on the UBC and Great Northern Way campuses.
Further details on capital spending are provided in Appendix Table A2.10.
Major Capital Projects
Significant capital projects (those with multi-year budgets totaling $50 million or more) are shown in Table 2.10. During 2014/15, $2.4 billion was invested in these larger projects that will provide long-term social and economic benefits for the province.
2015 Financial and Economic Review — July 2015
31
Part 2 — Financial Review
Table 2.10 Capital Expenditure Projects Greater Than $50 million 1
| | | | Project | | Estimated | | Anticipated | | Project Financing | |
| | Year of | | Cost to | | Cost to | | Total | | Internal/ | | P3 | | Federal | | Other | |
($ millions) | | Completion | | Mar 31, 2015 | | Complete | | Cost | | Borrowing | | Liability | | Gov’t | | Contrib’ns | |
Taxpayer-supported | |
School districts | | | | | | | | | | | | | | | | | |
Centennial Secondary | | 2015 | | 18 | | 43 | | 61 | | 61 | | — | | — | | — | |
Oak Bay Secondary | | 2015 | | 40 | | 12 | | 52 | | 50 | | — | | — | | 2 | |
Kitsilano Secondary | | 2015 | | 21 | | 43 | | 64 | | 60 | | — | | — | | 4 | |
Belmont Secondary | | 2015 | | 36 | | 20 | | 56 | | 30 | | — | | — | | 26 | |
Clayton North Secondary | | 2017 | | 1 | | 54 | | 55 | | 45 | | — | | — | | 10 | |
Seismic mitigation program | | 2023 | | 35 | | 1,265 | | 1,300 | | 1,300 | | — | | — | | — | |
Total school districts | | | | 151 | | 1,437 | | 1,588 | | 1,546 | | — | | — | | 42 | |
Post-secondary institutions | | | | | | | | | | | | | | | | | |
Emily Carr University of Art and Design – | | | | | | | | | | | | | | | | | |
Campus redevelopment at Great Northern Way | | | | | | | | | | | | | | | | | |
– Direct procurement | | 2017 | | 11 | | 52 | | 63 | | 42 | | | | — | | 21 | |
– P3 contract | | 2017 | | 7 | | 53 | | 60 | | — | | 60 | | — | | — | |
Total post secondary institutions | | | | 18 | | 105 | | 123 | | 42 | | 60 | | — | | 21 | |
Health facilities | | | | | | | | | | | | | | | | | |
Northern Cancer Control Strategy 2 | | | | | | | | | | | | | | | | | |
– Direct procurement | | 2014 | | 29 | | 1 | | 30 | | 27 | | — | | — | | 3 | |
– P3 contract | | 2012 | | 71 | | — | | 71 | | 54 | | 17 | | — | | — | |
Lions Gate Hospital (Mental Health) 2 | | | | | | | | | | | | | | | | | |
Redevelopment | | 2014 | | 47 | | 15 | | 62 | | 38 | | — | | — | | 24 | |
Lakes District Hospital | | 2015 | | 48 | | 7 | | 55 | | 46 | | — | | — | | 9 | |
Queen Charlotte/Haida Gwaii Hospital | | 2016 | | 21 | | 29 | | 50 | | 31 | | — | | — | | 19 | |
Surrey Emergency/Critical Care Tower | | | | | | | | | | | | | | | | | |
– Direct procurement | | 2016 | | 136 | | 58 | | 194 | | 174 | | — | | — | | 20 | |
– P3 contract | | 2014 | | 318 | | — | | 318 | | 139 | | 179 | | — | | — | |
Royal Inland Hospital | | 2016 | | 19 | | 61 | | 80 | | 47 | | — | | — | | 33 | |
North Island Hospitals | | | | | | | | | | | | | | | | | |
– Direct procurement | | 2017 | | 20 | | 106 | | 126 | | 73 | | — | | — | | 53 | |
– P3 contract | | 2017 | | 120 | | 360 | | 480 | | 60 | | 232 | | — | | 188 | |
Interior Heart and Surgical Centre | | | | | | | | | | | | | | | | | |
– Direct procurement | | 2017 | | 119 | | 129 | | 248 | | 213 | | — | | — | | 35 | |
– P3 contract | | 2015 | | 122 | | 11 | | 133 | | 4 | | 79 | | — | | 50 | |
Vancouver General Hospital – Joseph and Rosalie Segal Family Health Centre | | 2017 | | 17 | | 65 | | 82 | | 57 | | — | | — | | 25 | |
Children’s and Women’s Hospital | | | | | | | | | | | | | | | | | |
– Direct procurement | | 2019 | | 78 | | 231 | | 309 | | 177 | | — | | — | | 132 | |
– P3 contract | | 2017 | | 83 | | 286 | | 369 | | 168 | | 187 | | — | | 14 | |
Penticton Regional Hospital – Patient Care | | | | | | | | | | | | | | | | | |
Tower | | 2019 | | 2 | | 323 | | 325 | | 168 | | — | | — | | 157 | |
Clinical and systems transformation | | 2023 | | 130 | | 350 | | 480 | | 480 | | — | | — | | — | |
Total health facilities | | | �� | 1,380 | | 2,032 | | 3,412 | | 1,956 | | 694 | | — | | 762 | |
Transportation | | | | | | | | | | | | | | | | | |
South Fraser Perimeter Road | | | | | | | | | | | | | | | | | |
– Direct procurement | | 2014 | | 1,076 | | — | | 1,076 | | 728 | | — | | 348 | | — | |
– P3 contract | | 2014 | | 188 | | — | | 188 | | — | | 188 | | — | | — | |
Sierra Yoyo Desan Road upgrade | | 2015 | | 150 | | — | | 150 | | 150 | | — | | — | | — | |
Evergreen Line Rapid Transit | | | | | | | | | | | | | | | | | |
– Direct procurement | | 2016 | | 257 | | 278 | | 535 | | 320 | | — | | 74 | | 141 | |
– P3 contract | | 2016 | | 640 | | 256 | | 896 | | — | | 266 | | 350 | | 280 | |
Total transportation | | | | 2,311 | | 534 | | 2,845 | | 1,198 | | 454 | | 772 | | 421 | |
2015 Financial and Economic Review — July 2015
32
Part 2 — Financial Review
Table 2.10 Capital Expenditure Projects Greater Than $50 million 1 (continued)
| | | | Project | | Estimated | | Anticipated | | Project Financing | |
| | Year of | | Cost to | | Cost to | | Total | | Internal/ | | P3 | | Federal | | Other | |
($ millions) | | Completion | | Mar 31, 2015 | | Complete | | Cost | | Borrowing | | Liability | | Gov’t | | Contrib’ns | |
Other taxpayer-supported | | | | | | | | | | | | | | | | | |
Integrated Case Management system | | 2014 | | 182 | | — | | 182 | | 179 | | — | | 3 | | — | |
Single Room Occupancy Hotel renewal initiative | | | | | | | | | | | | | | | | | |
– Direct procurement | | 2016 | | 12 | | 13 | | 25 | | 23 | | — | | 2 | | — | |
– P3 contract | | 2016 | | 80 | | 38 | | 118 | | — | | 91 | | 27 | | — | |
Okanagan Correctional Centre | | | | | | | | | | | | | | | | | |
– Direct procurement | | 2016 | | 42 | | 49 | | 91 | | 91 | | — | | — | | — | |
– P3 contract | | 2016 | | 48 | | 81 | | 129 | | 8 | | 121 | | — | | — | |
Total other | | | | 364 | | 181 | | 545 | | 301 | | 212 | | 32 | | — | |
Total taxpayer-supported | | | | 4,224 | | 4,289 | | 8,513 | | 5,043 | | 1,420 | | 804 | | 1,246 | |
Self-supported | |
Transportation | | | | | | | | | | | | | | | | | |
Port Mann Bridge / Highway 1 | | 2017 | | 3,275 | | 44 | | 3,319 | | 3,319 | | — | | — | | — | |
Power generation and transmission | | | | | | | | | | | | | | | | | |
BC Hydro | | | | | | | | | | | | | | | | | |
– Vancouver City Central transmission 2 | | 2014 | | 171 | | 1 | | 172 | | 172 | | — | | — | | — | |
– Mica SF6 gas insulated switchgear replacement 2 | | 2014 | | 178 | | 21 | | 199 | | 199 | | — | | — | | — | |
– Northwest transmission line 2 | | 2014 | | 680 | | 36 | | 716 | | 329 | | — | | 130 | | 257 | |
– Iskut extension project 2 | | 2014 | | 164 | | 5 | | 169 | | 105 | | — | | — | | 64 | |
– Merritt area transmission | | 2015 | | 44 | | 21 | | 65 | | 65 | | — | | — | | — | |
– Smart metering and infrastructure program | | 2015 | | 728 | | 202 | | 930 | | 930 | | — | | — | | — | |
– Interior to Lower Mainland transmission line | | 2015 | | 616 | | 109 | | 725 | | 725 | | — | | — | | — | |
– GM Shrum units 1 to 5 turbine replacement | | 2015 | | 154 | | 118 | | 272 | | 272 | | — | | — | | — | |
– Surrey area substation project | | 2015 | | 45 | | 49 | | 94 | | 94 | | — | | — | | — | |
– Hugh Keenleyside spillway gate reliability upgrade | | 2015 | | 91 | | 32 | | 123 | | 123 | | — | | — | | — | |
– Upper Columbia capacity additions at Mica units 5 and 6 project | | 2015 | | 518 | | 196 | | 714 | | 714 | | — | | — | | — | |
– Long Beach area reinforcement | | 2015 | | 26 | | 30 | | 56 | | 56 | | — | | — | | — | |
– Dawson Creek/Chetwynd area transmission | | 2016 | | 221 | | 75 | | 296 | | 296 | | — | | — | | — | |
– Big Bend substation | | 2017 | | 19 | | 37 | | 56 | | 56 | | — | | — | | — | |
– Ruskin Dam safety and powerhouse upgrade | | 2017 | | 310 | | 438 | | 748 | | 748 | | — | | — | | — | |
– John Hart generating station replacement | | 2019 | | 281 | | 812 | | 1,093 | | 1,093 | | — | | — | | — | |
– Cheakamus Unit 1 and Unit 2 generator replacement | | 2019 | | 5 | | 69 | | 74 | | 74 | | — | | — | | — | |
– Peace River Site C clean energy project | | 2024 | | 444 | | 8,331 | | 8,775 | | 8,775 | | — | | — | | — | |
Columbia River power projects | | | | | | | | | | | | | | | | | |
– Waneta Dam power expansion 3 | 2018 | | 322 | | 28 | | 350 | | 350 | | — | | — | | — | |
Total power generation and transmission | | | | 5,017 | | 10,610 | | 15,627 | | 15,176 | | — | | 130 | | 321 | |
Other | | | | | | | | | | | | | | | | | |
British Columbia Lottery Corporation | | | | | | | | | | | | | | | | | |
– Gaming management system | | 2015 | | 93 | | 1 | | 94 | | 94 | | — | | — | | — | |
Insurance Corporation of British Columbia | | | | | | | | | | | | | | | | | |
– Business transformation program | | 2016 | | 232 | | 39 | | 271 | | 271 | | — | | — | | — | |
Total other | | | | 325 | | 40 | | 365 | | 365 | | — | | — | | — | |
Total self-supported | | | | 8,617 | | 10,694 | | 19,311 | | 18,860 | | — | | 130 | | 321 | |
Total $50 million projects | | | | 12,841 | | 14,983 | | 27,824 | | 23,903 | | 1,420 | | 934 | | 1,567 | |
1 | Only projects that receive provincial funding and have been approved by Treasury Board and/or Crown corporation boards are included in this table. Ministry service plans may highlight projects that still require final approval. Capital costs reflect current government accounting policy. |
| |
2 | Assets have been put into service and only trailing costs remain. |
| |
3 | Reflects the combined shares of Columbia Power Corporation (32.5 per cent) and Columbia Basin Trust (16.5 per cent) in their partnership with Fortis Inc. for the development of an electricity generating facility at the Waneta Dam south of Trail. |
2015 Financial and Economic Review — July 2015
33
Part 2 — Financial Review
As projects are completed, or new ones receive approval, the projects are removed or added from the $50 million table. During the fiscal year the following projects were completed:
· K–12 schools – Revelstoke Elementary and Secondary, Alberni District Secondary, Southern Okanagan Secondary, and Chilliwack Secondary;
· University of Victoria’s Superconducting electron accelerator at TRIUMF;
· Surrey Pretrial Service Centre expansion;
· e-Health initiative; and
· Seymour Arms series capacitor.
The following projects were added:
· Clayton North Secondary ($55 million);
· Penticton Regional Hospital patient care tower ($325 million);
· Cheakamus Unit 1 and Unit 2 generator replacement ($74 million) and
· Peace River Site C clean energy project ($8.8 billion).
Financing Capital Spending
Provincial capital infrastructure spending is financed through a combination of sources:
· operating cash flows (i.e. cash derived from the operating surplus and management of operating accounts);
· partnerships with the private sector (public-private partnerships or P3s);
· cost-sharing with partners; and
· borrowing (debt financing).
Chart 2.6 Financing taxpayer-supported capital spending
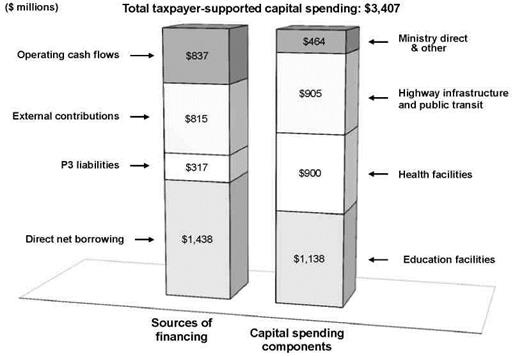
2015 Financial and Economic Review — July 2015
34
Part 2 — Financial Review
Chart 2.6 shows that 42 per cent of 2014/15 taxpayer-supported capital spending was financed from direct borrowing, 25 per cent from operating cash flows, 24 per cent from external capital contributions and 9 per cent from public-private partnerships.
Commercial Crown capital spending of $2.5 billion was financed 57 per cent from direct borrowing ($1.4 billion), and 43 per cent from internal cash flows ($1.1 billion).
Provincial Debt
As at March 31, 2015, total provincial debt totaled $62.9 billion. The primary driver for borrowing is capital spending, with over 85 per cent of debt incurred to finance infrastructure. As well, 33 per cent of the total debt is self-supported through the commercial activities of Crown corporations.
The taxpayer-supported debt to GDP ratio, a measure often used by investors and credit rating agencies to analyze a government’s ability to manage its debt load, stood at 17.5 per cent. This is lower by 0.4 percentage points from 2013/14. British Columbia’s taxpayer-supported debt to GDP is one of the lowest in Canada, translating into a strong credit rating and lower debt service costs. In addition, the debt to revenue track stood at 94.1 per cent, 2.0 percentage points lower than that in 2013/14.
Chart 2.7 Provincial debt components

Government direct operating debt is the cumulative borrowing incurred to finance core government operations when operating spending by ministries and special offices exceeds CRF revenue. This includes both net spending on direct program delivery and on operating grants provided to service delivery agencies, but does not include the issuance of capital grants. There is a standing legislative requirement to retire this debt before government can use supplementary appropriations to authorize additional spending during a year.
2015 Financial and Economic Review — July 2015
35
Part 2 — Financial Review
For the most part, debt for schools, post-secondary institutions and health facilities was incurred by government as a result of the direct funding of this infrastructure through capital grants, whereas highways and public transit debt primarily reflects direct borrowing by government controlled agencies, such as the BC Transportation Financing Authority and the Transportation Investment Corporation (TI Corp). TI Corp, whose debt accounts for just over one-fifth of the highways and public transit debt, is a commercial enterprise that operates and maintains the Port Mann Bridge under a tolling regime.
Power generation and transmission debt is entirely commercial in nature and is predominantly the debt of BC Hydro. A small portion of this debt reflects borrowing for the Columbia River power projects managed by the Columbia Power Corporation.
Other debt includes government borrowing for direct capital (post-2008/09), government’s obligations under the immigrant investor program, and borrowing to finance the reconstruction of the BC Place stadium roof (all taxpayer-supported debt). It also includes the commercial borrowing of the BC Lottery Corporation (BCLC) for gaming equipment and gaming management software as well as the debt of post-secondary institution commercial subsidiaries.
Table 2.11 Provincial Debt Summary 1
| | | | Opening | | Updated | | | | | |
| | Budget | | Balance | | Budget | | Actual | | Actual | |
($ millions) | | 2014 | | Adjustment 2 | | 2014 | | 2014/15 | | 2013/14 | |
Taxpayer-supported debt | | | | | | | | | | | |
Provincial government direct operating | | 9,828 | | (703 | ) | 9,125 | | 9,280 | | 10,223 | |
Other taxpayer-supported debt (mainly capital) | | | | | | | | | | | |
Education facilities | | 12,265 | | (48 | ) | 12,217 | | 12,118 | | 11,631 | |
Health facilities | | 6,516 | | (7 | ) | 6,509 | | 6,522 | | 6,038 | |
Highways and public transit | | 11,048 | | (2 | ) | 11,046 | | 10,725 | | 10,229 | |
Other | | 3,418 | | (47 | ) | 3,371 | | 3,235 | | 2,947 | |
| | 33,247 | | (104 | ) | 33,143 | | 32,600 | | 30,845 | |
| | 43,075 | | (807 | ) | 42,268 | | 41,880 | | 41,068 | |
Self-supported debt | | | | | | | | | | | |
Power generation and transmission | | 17,320 | | (79 | ) | 17,241 | | 17,308 | | 16,029 | |
Highways and public transit | | 3,420 | | (57 | ) | 3,363 | | 3,335 | | 3,209 | |
Other | | 723 | | (7 | ) | 716 | | 397 | | 387 | |
| | 21,463 | | (143 | ) | 21,320 | | 21,040 | | 19,625 | |
Forecast allowance | | 200 | | — | | 200 | | — | | — | |
Total provincial debt | | 64,738 | | (950 | ) | 63,788 | | 62,920 | | 60,693 | |
Debt to GDP | | | | | | | | | | | |
Taxpayer-supported | | 18.4 | | | | 17.7 | 3 | 17.5 | | 17.9 | |
Total | | 27.7 | | | | 26.7 | 3 | 26.4 | | 26.4 | |
1 Debt is after deduction of sinking funds and unamortized discounts; it includes the current portion, but excludes accrued interest, which is reported on government’s statement of financial position as an accounts payable.
2 The opening balance adjustment reflects actual balances at March 31, 2014 (the Budget 2014 projection was based on a forecast for 2013/14).
3 Revised to reflect Statistics Canada’s Provincial Economic Accounts Update released on November 5, 2014.
Total debt increased by $2.2 billion in 2014/15 — an $868 million improvement over the $3.1 billion increase for the year projected in Budget 2014 (adjusted to reflect actual rather than forecast debt balances at March 31, 2014), due in part to government’s ongoing strategic debt management efforts. The improvement reflected a $388 million reduction in taxpayer-supported borrowing, a $280 million reduction in self-supported borrowing, and the expiry of the $200 million forecast allowance included in the budget projection for total debt.
2015 Financial and Economic Review — July 2015
36
Part 2 — Financial Review
Chart 2.8 Debt changes from updated Budget 2014
Lower borrowing requirements for taxpayer-supported debt primarily reflected $623 million lower than expected capital spending and partially offset by the higher internal cash flow requirements of $155 million and the impact of lower capital contributions from third parties ($80 million).
For self-supported debt, the $280 million reduction in borrowing from the updated Budget 2014 projection reflects the impacts of lower capital spending and reduced requirements for operating cash inflows on the part of commercial Crown corporations.
Surplus Versus Change in Debt
2014/15 was the first year to show an annual decline in direct operating debt in conjunction with an operating surplus, while the majority of government’s borrowing in 2014/15 financed its capital program.
The $1.7 billion surplus together with negative operating cash flows of $740 million, results in an overall $943 million decrease in direct operating debt. The negative cash flows were a result of:
· $323 million in other net positive cash flows, mainly resulting from non-cash amounts in the surplus (e.g. capital asset amortization net of deferred revenue recognition and commercial Crown corporation retained earnings); and
· a $207 million decrease in accounts receivable (i.e. a delay in the collection of revenue), primarily in the area of taxation revenues;
offset by:
· an increase in cash position of $1,122 million, primarily due to borrowing to meet requirements in early 2015/16.
· a $148 million decrease in current liabilities mainly reflecting amounts paid to the federal government relating to the reimbursement of the HST transition funding.
2015 Financial and Economic Review — July 2015
37
Part 2 — Financial Review
Chart 2.9 Reconciliation of surplus to change in debt
The $1.8 billion increase in taxpayer-supported capital debt reflects the net financing requirements of the $3.4 billion infrastructure program. The $1.7 billion in capital spending not financed by debt was funded by $307 million in capital contributions from the federal government, $508 million in capital contributions from other external organizations, and by the use of $837 million of operating cash flows by service delivery agencies for capital purposes.
The $1.4 billion increase in self-supported debt primarily reflects the capital spending of BC Hydro, TI Corp and BCLC, which is financed through the fiscal agency loan program. A portion of this infrastructure spending and the capital spending of the other commercial Crown corporations was funded by $1.1 billion in net operating cash flows.
Debt Indicators
Table 2.12 provides a historical summary of financial indicators depicting the province’s debt position, recent borrowing trends and related interest cost burden.
Further details on provincial debt are provided in Appendix Tables A2.11 to A2.13.
2015 Financial and Economic Review — July 2015
38
Part 2 — Financial Review
Table 2.12 Key Debt Indicators1
| | Budget | | Actual | | Actual | |
| | 2014 | | 2014/15 | | 2013/14 | |
| | | | | | | |
Debt to revenue (per cent) | | | | | | | |
Total provincial | | 111.9 | | 106.4 | | 107.6 | |
Taxpayer-supported | | 98.1 | | 94.1 | | 96.1 | |
Debt per capita ($) 2 | | | | | | | |
Total provincial | | 13,987 | | 13,586 | | 13,244 | |
Taxpayer-supported | | 9,306 | | 9,043 | | 8,962 | |
Debt to GDP (per cent) 3 | | | | | | | |
Total provincial | | 27.7 | | 26.4 | | 26.4 | |
Taxpayer-supported | | 18.4 | | 17.5 | | 17.9 | |
Interest bite (cents per dollar of revenue) 4 | | | | | | | |
Total provincial | | 4.6 | | 4.2 | | 4.5 | |
Taxpayer-supported | | 4.0 | | 3.6 | | 3.9 | |
Interest costs ($ millions) | | | | | | | |
Total provincial | | 2,662 | | 2,465 | | 2,547 | |
Taxpayer-supported | | 1,773 | | 1,591 | | 1,686 | |
Interest rate (per cent) 5 | | | | | | | |
Taxpayer-supported | | 4.2 | | 3.8 | | 4.3 | |
Background Information: | | | | | | | |
Revenue ($ millions) | | | | | | | |
Total provincial 6 | | 57,842 | | 59,136 | | 56,402 | |
Taxpayer-supported 7 | | 43,903 | | 44,483 | | 42,725 | |
Total debt ($ millions) | | | | | | | |
Total provincial | | 64,738 | | 62,920 | | 60,693 | |
Taxpayer-supported 8 | | 43,075 | | 41,880 | | 41,068 | |
Provincial GDP ($ millions) 9 | | 234,033 | | 238,726 | | 229,685 | |
Population (thousands at July 1) 10 | | 4,629 | | 4,631 | | 4,583 | |
1 Figures for prior year have been restated to conform with the presentation used for 2014/15 and to include the effects of changes in underlying data and statistics.
2 The ratio of debt to population (e.g. debt at March 31, 2015 divided by population at July 1, 2014).
3 The ratio of debt outstanding at fiscal year end to provincial nominal gross domestic product (GDP) for the calendar year ending in the fiscal year (e.g. debt at March 31, 2015 divided by 2014 GDP).
4 The ratio of interest costs (less sinking fund interest) to revenue. Figures include capitalized interest expense in order to provide a more comparable measure to outstanding debt.
5 Weighted average of all outstanding debt issues.
6 Includes revenue of the consolidated revenue fund (excluding dividends from enterprises) plus revenue of all government organizations and enterprises.
7 Excludes revenue of government enterprises, but includes dividends from enterprises paid to the consolidated revenue fund.
8 Excludes debt of commercial Crown corporations and agencies and funds held under the province’s warehouse borrowing program.
9 Nominal GDP for the calendar year ending in the fiscal year (e.g. GDP for 2014 is used for the fiscal year ended March 31, 2015). As nominal GDP for the calendar year ending in 2014 is not available, the 2014 GDP projected in February 2015 has been used for the fiscal year ended March 31, 2015 for demonstration purposes.
10 Population at July 1st within the fiscal year (e.g. population at July 1, 2014 is used for the fiscal year ended March 31, 2015).
2015 Financial and Economic Review — July 2015
39
Part 2 — Financial Review
Credit Rating
A credit rating reflects a borrower’s ability to pay interest and to repay principal. It impacts the borrower’s debt servicing costs and the investor’s rate of return since an investor will demand a higher interest rate on a higher-risk, lower-rated security. Table 2.13 provides an interprovincial comparison of credit ratings.
Table 2.13 Interprovincial Comparison of Credit Ratings, July 2015
| | Rating Agency1 |
| | Moody’s Investors | | | | Dominion Bond |
Province | | Service | | Standard & Poor’s | | Rating Service |
British Columbia | | Aaa | | | AAA | | | AA (High) |
Alberta | | Aaa | | | AAA | | | AAA |
Saskatchewan | | Aaa | | | AAA | | | AA |
Manitoba | | Aa2 | | | AA | | | A (High) |
Ontario | | Aa2 | | | A+ | | | AA (Low) |
Quebec | | Aa2 | | | A+ | | | A (High) |
New Brunswick | | Aa2 | | | A+ | | | A (High) |
Nova Scotia | | Aa2 | | | A+ | | | A (High) |
Prince Edward Island | | Aa2 | | | A | | | A (Low) |
Newfoundland | | Aa2 | | | A+ | | | A |
1 The rating agencies assign letter ratings to borrowers. The major categories, in descending order of credit quality are: AAA/Aaa; AA/Aa; A; BBB/Baa; BB/Ba; and B. The “1”, “2”, “3”, “high”, “low”, “+”, and “-” modifiers show relative standing within the major categories. For example, AA+ exceeds AA and Aa2 exceeds Aa3.
BC’s fiscal outlook and its record for meeting annual budget targets has resulted in ratings of AAA (the highest possible ratings) from Standard & Poors and AA (high) from Dominion Bond Rating Service. In addition, Moody’s confirmed BC’s rating of AAA (highest possible rating) and raised its outlook from negative to stable, providing further validation of government’s continued fiscal discipline.
Pension Plans
The province contributes to four defined benefit pension plans (Public Service, Municipal, Teachers’ and College) for many of its employees. These pension plans are managed under joint trusteeship arrangements with the plan members. Under joint trusteeship, the provincial government has no formal claim on plan surpluses or assets; however, government is responsible for 50 per cent of any unfunded liabilities in the Public Service, Teachers’ and College plans and 35 per cent of any unfunded liability in the Municipal plan since the province’s interest in the plan is only 70 per cent.
The four plans are well funded with funded positions ranging from 96 per cent to 101 per cent. The joint trust agreements require any unfunded liability to be addressed through contribution adjustments shared equally between the employee and employer, or other means. These rate increases are set for future years such that the plan is fully funded for actuarial purposes on the going concern basis.
Government’s balance sheet only includes its share of any unfunded pension liabilities by the four pension plans under the joint trusteeship arrangements determined for accounting purposes (e.g. $260 million under the Teachers’ Pension Plan (TPP) in 2014/15), as well as the entire liability for the MLA Superannuation Account, which is not part of a joint trusteeship arrangement.
2015 Financial and Economic Review — July 2015
40
Part 2 — Financial Review
Table 2.14 Pension Plan Balances
| | Pension Plan | | Total | | | |
($ millions) | | Public Service | | Municipal 1 | | Teachers’ 2 | | College | | Other 3 | | 2014/15 | | 2013/14 | |
Accrued benefit obligation | | (16,635 | ) | (21,697 | ) | (18,049 | ) | (3,082 | ) | (674 | ) | (60,137 | ) | (57,779 | ) |
Pension fund assets | | 17,510 | | 20,738 | | 16,499 | | 3,042 | | 735 | | 58,524 | | 55,275 | |
Subtotal | | 875 | | (959 | ) | (1,550 | ) | (40 | ) | 61 | | (1,613 | ) | (2,504 | ) |
Unamortized actuarial (gain) loss | | 349 | | 1,662 | | 1,031 | | 138 | | (84 | ) | 3,096 | | 4,421 | |
Accrued net asset (obligation) | | 1,224 | | 703 | | (519 | ) | 98 | | (23 | ) | 1,483 | | 1,917 | |
1 The balance shown for the Municipal Pension Plan (MPP) is based on an extrapolation of the December 31, 2012 actuarial valuation. The MPP recently underwent an actuarial valuation that was not completed in time for the Public Accounts. The assessment shows the plan to be in deficit, but the amount of the deficit has yet to be finalized. Government will be making the necessary adjustments to unfunded pension liability in its financial statements once the final amount is known.
2 The government is responsible for 50 per cent of the unfunded pension liability incurred under the Teachers’ Pension Plan and has accrued this liability in its 2013/14 accounts. The liability will be settled in future periods through increased employer contributions.
3 Represents other defined benefit plans, outside of the four main pension plans, which are funded by entities within the government reporting entity. Includes the Retirement Plan for Non-Teaching Employees of the Board of School Trustees of School District No. 43 (Coquitlam), the University of Victoria’s pension plan for employees other than faculty and professional staff, and Simon Fraser University’s Academic Pension Plan and Administrative/Union Pension Plan.
The pension valuations do not include future indexing of pensions, as this is a non-guaranteed supplemental benefit to the plans that is determined by the amount of available assets in separate inflation accounts. The estimated financial positions of each plan (based on extrapolations of the most recent actuarial valuations) as at March 31, 2015 are shown in Table 2.14.
Actuarial valuations are performed on the pension plans normally every three years with the resulting reports released nine months after the valuation date. The pension plans and the dates of their last actuarial valuation are:
· Public Service Pension Plan, March 31, 2014;
· Municipal Pension Plan, December 31, 2012;
· Teachers’ Pension Plan, December 31, 2011; and
· College Pension Plan, August 31, 2012.
Key actuarial assumptions used for valuation purposes are generally conservative. Currently the valuations of each of the pension plans assume a long-term annual rate of return on fund assets of 6.50 per cent and a long-term salary escalation rate of 3.75 per cent.
The pension plans are administered by the BC Pension Corporation in accordance with direction received from the various pension boards. The audited financial statements of each pension plan, along with full descriptions, benefit formulas, inflation assumptions and funding polices may be found on the corporation’s website at www.pensionsbc.ca.
2015 Financial and Economic Review — July 2015
41
Part 2 — Financial Review
Contractual Obligations
Contractual obligations represent the annual nominal future cash payments for multi-year contracts for the delivery of services and construction of assets — except in the case of P3 contracts, where the initial obligations represent the accrued liabilities as the assets are constructed despite no cash outlay on the part of government.
As at March 31, 2015, taxpayer-supported entities have incurred $42.9 billion in contractual obligations, and self-supported Crown corporations and subsidiaries have incurred $60.0 billion in contractual obligations, for a total of $103.0 billion in contract payments that will be made over the next up to 50 years, depending on the terms of the contract.
Contractual obligations represent ongoing program costs where the projected expense has been quantified in an agreement. They are not off-balance sheet debt; nor are they unfunded costs. Rather, these annual costs have been incorporated into the overall program budgets of the contracting ministries and other entities similar to other future-oriented government program costs such as legislated entitlements and capital asset amortization. In the case of self-supported Crown corporations and subsidiaries, the payments will be made from future revenue streams.
Table 2.15 Taxpayer-supported Contractual Obligations
($ millions) | | 2015/16 | | 2016/17 | | 2017/18 | | 2018/19 | | 2019/20 | | 2020/21+ | |
Coastal ferry services agreement | | 194 | | 194 | | 194 | | 194 | | 195 | | 8,342 | |
Capital construction and maintenance P3s | | 592 | | 692 | | 320 | | 338 | | 341 | | 6,528 | |
Provincial policing contracts | | 343 | | 343 | | 343 | | 333 | | 335 | | 4,012 | |
Housing subsidy agreements | | 350 | | 293 | | 216 | | 209 | | 202 | | 4,133 | |
Program delivery agreements | | 2,002 | | 543 | | 519 | | 210 | | 166 | | 1,264 | |
Operating and maintenance agreements | | 496 | | 412 | | 350 | | 299 | | 111 | | 663 | |
Service delivery agreements | | 786 | | 741 | | 662 | | 586 | | 328 | | 615 | |
Capital and economic development agreements | | 495 | | 274 | | 149 | | 146 | | 105 | | 478 | |
| | 5,258 | | 3,492 | | 2,753 | | 2,315 | | 1,783 | | 26,035 | |
Taxpayer-supported contractual obligations can be grouped into eight categories (see Table 2.15) as follows:
· Coastal ferry services agreement — annual operating subsidy provided by the Ministry of Transportation and Infrastructure to BC Ferry Services Inc. in support of its smaller routes.
· Capital construction and maintenance P3s — the initial two years reflect accrued liabilities for projects under construction, the annual amounts smooth out in later years to reflect the annual service payments that will be made to maintain the asset and retire the liabilities.
· Provincial policing contracts — annual operating cost of the policing contract with the RCMP (aside from major cities such as Vancouver, which have their own police forces, policing in British Columbia is provided by the RCMP under contract).
· Housing subsidy agreements — annual operating cost of the subsidy agreements between BC Housing Management Commission and cooperative subsidized housing associations.
2015 Financial and Economic Review — July 2015
42
Part 2 — Financial Review
· Program delivery agreements — annual operating cost of agreements with third-party entities that provide services to the public on behalf of government, such as care homes. Some agreements are for one year only.
· Operating and maintenance agreements — annual operating cost of agreements with third-party entities that operate and maintain government infrastructure on behalf of government. Over three-fourths of this category relates to the road and bridge maintenance agreements with the Ministry of Transportation and Infrastructure.
· Service delivery agreements — annual operating cost of agreements with third-party entities that provide services directly to government, such as the Telecommunications Service Master Agreement with Telus.
· Capital and economic development agreements — annual cost of agreements to build infrastructure, such as Columbia Basin Trust’s share of the Waneta expansion project, or to share economic benefits, such as First Nations agreements with the Ministry of Forests, Lands and Natural Resource Operations.
Almost all (94 per cent or $56.2 billion) of the contractual obligations for self-supported Crown corporations and subsidiaries are for BC Hydro power purchase agreements with independent power producers (IPPs). This ongoing cost of energy is factored into BC Hydro’s financial statement projections in the fiscal plan, although any contractual increases to the tariffs paid to the IPPs will have to be recovered from future electricity rate increases.
The remaining contractual obligations for self-supported Crown corporations and subsidiaries relate to maintenance and service agreements, whose costs also are factored into government fiscal plan projections.
2014/15 Public Accounts Audit Qualification
The Auditor General issued one qualification on the application of Canadian GAAP in the 2014/15 Public Accounts relating to the reporting of transfers received from the federal government and/or non-government sources for the purchase and construction of assets.
Rather than deferring the transfers and amortizing the amount to revenue on the same basis as the amortization of the related expenditure, the Auditor General advocates reporting transfers as revenue in the period the transfers are made, unless the transfer establishes a financial liability on the part of the recipient. The Comptroller General feels PSAB guidance still supports deferral in situations where use of the funds is externally restricted to expenditures of this nature.
Under the Auditor General’s approach to transfers, liabilities (i.e. deferred revenue) would have been reduced by $4.2 billion, and the surplus would have been $191 million higher. The full text of the Auditor General’s opinion and the comments of the Comptroller General of British Columbia can be found in the 2014/15 Public Accounts.
2015 Financial and Economic Review — July 2015
43
| Part 3 |
| |
| Supplementary Information |
| |
| · General Description of the Province |
| · Constitutional Framework |
| · Provincial Government |
| · Annual Financial Cycle |
| · Government’s Financial Statements |
| · Provincial Taxes |
2015 Financial and Economic Review — July 2015
Part 3 — Supplementary Information
General Description of the Province
British Columbia is located on Canada’s Pacific coast, and has a land and freshwater area of 95 million hectares. It is Canada’s third largest province and comprises 9.5 per cent of the country’s total land area.
Geography
The province is nearly four times the size of Great Britain, 2.5 times larger than Japan and larger than any American state except Alaska. BC’s 7,022-kilometre coastline supports a large shipping industry through ice-free, deep-water ports. The province has about 8.5 million hectares of grazing land, 1.8 million hectares of lakes and rivers, and 950,000 hectares of agricultural land that is capable of supporting a wide range of crops.
Physiography
BC is characterized by mountainous topography, but also has substantial areas of lowland and plateau country. The province has four basic regions, a northwesterly trending mountain system on the coast, a similar mountain system on the east, and an extensive area of plateau country between the two. The northeastern corner of the province is lowland, a segment of the continent’s Great Plains.
The western system of mountains averages about 300 kilometres in width and extends along the entire BC coast and the Alaska panhandle. The Coast Mountains contain some of the tallest peaks in the province. The western system includes the Insular Mountains that form the basis of Vancouver Island and Haida Gwaii (previously known as the Queen Charlotte Islands). These islands help to shelter the waters off the mainland coast of BC, which form an important transportation route for people and products.
The interior of the province is a plateau of rolling forest and grassland, 600 to 1,200 metres in average elevation. North of Prince George the interior becomes mountainous, but plateau terrain returns just south of the Yukon boundary in the area drained by the Liard River. The southern interior’s water system is dominated by the Fraser River, which has a drainage area covering about one-quarter of the province. The Rocky Mountains, in the eastern mountain system, rise abruptly on the southern BC—Alberta boundary and are cut by passes that provide dramatic overland transportation routes into the province. The Rocky Mountain Trench lies immediately to the west of the Rockies. This extensive valley, the longest in North America, is a geological fault zone separating different earth plates. It is the source of many of BC’s major rivers, including the Peace, Columbia and Fraser.
Climate and Vegetation
Coastal BC has abundant rainfall and mild temperatures associated with a maritime climate. The Pacific coast has an average annual rainfall of between 155 and 440 centimetres, while the more sheltered coasts of eastern Vancouver Island and the mainland along the Strait of Georgia average between 65 and 150 centimetres. Canada’s longest frost-free periods of over 180 days per year are enjoyed along the edges of the coastal zone and far inland along the Fraser River valley. Temperatures fall quickly up the steep slopes of the Coast Mountains. The predominant trees in this coastal region are the western hemlock, western red cedar and balsam (amabilis fir) in the wetter parts, and Douglas fir and grand fir in the drier areas.
2015 Financial and Economic Review — July 2015
47
Part 3 — Supplementary Information
BC’s interior region has a mainly continental type of climate, although not as severe as that of the Canadian prairies. Considerable variation in climate occurs, especially in winter, as mild Pacific storms bring relief from cold spells. The southern interior has the driest and warmest climate of the province. In the valleys, annual precipitation ranges from less than 30 centimetres to 50 centimetres, while daily temperatures can average over 20 degrees Celsius in July and just under freezing in January. The climate becomes more extreme further north and precipitation increases. The frost-free period in the north is short and variable. Lodgepole pine is the dominant tree of commercial value in the interior.
The northeast region of the province is an extension of the western prairie region of Alberta. It has a continental climate that is more extreme than that of the northern interior region. However, it does have long hot summers and a frost-free period long enough to grow grain, forage and other crops.
Population
BC is the third largest province in terms of population, which was estimated at 4.6 million people—accounting for 13.0 per cent of Canada’s population on July 1, 2014. BC’s population grew at an annual compound rate of 1.1 per cent between 2004 and 2014, equivalent to the rate of the overall Canadian population for the same period.
Greater Vancouver, a major Canadian shipping, manufacturing and services centre, had the largest urban population in BC with 2,474,123 persons in 2014. Victoria, the province’s capital, is located on Vancouver Island and its regional district had a population of 372,463 persons in 2014.
Constitutional Framework
The structure of the British Columbia government is based on British parliamentary tradition and precedent. Prior to 1866, BC was composed of two British-controlled colonies — the Colony of Vancouver Island was established in 1849, and the Colony of British Columbia was established in 1858 on the mainland. In the Union Proclamation of 1866, the two colonies were joined to form the single united Crown Colony of British Columbia. On July 20, 1871, BC entered into Confederation with Canada. Although the Colony of Vancouver Island had a parliamentary form of government as far back as 1856, the first fully elected government was not instituted in BC until the autumn after Confederation with Canada. Responsible government was achieved in late 1872, when the Lieutenant Governor acquiesced to an executive council that was responsible to the legislative assembly.
Upon entering Confederation, BC came under the authority of the British North America Act, 1867 (BNA Act), a statute of the British parliament. Until 1982, the BNA Act defined the major national institutions and established the division of authority between the federal and provincial governments. In 1982, the BNA Act was renamed the Constitution Act, 1867 and its amendments were incorporated into the Constitution Act, 1982. The Constitution Act, 1982, which also includes the Canadian Charter of Rights and Freedoms, is companion legislation to the Canada Act, 1982. With the passage of the Canada Act, 1982, the British Parliament ended its legal right to legislate for Canada. Canada, as a federal state, divides legislative powers between the federal and provincial governments.
2015 Financial and Economic Review — July 2015
48
Part 3 — Supplementary Information
Provincial Government
BC’s government is modeled after the British system. Functionally there are three main branches: the legislature, the executive and the judiciary.
Legislature
Legislative powers in British Columbia are exercised by a single legislative chamber, which is elected for a term of four years. BC, the first province in Canada to legislate fixed election dates, requires an election on the second Tuesday in May every four years. An election may also be called if the government loses a vote of confidence in the legislative assembly.
The legislature consists of the Lieutenant Governor and 85 elected members of the legislative assembly. The legislative assembly represents the people of BC in the conduct of the province’s affairs. The assembly is required by law to meet at least once a year with a normal session lasting several months. However, special sessions can last just a few days or many months, depending on the nature of the government’s business.
The legislature operates on a fixed schedule — the second Tuesday in February each year is usually reserved for the Throne Speech and the third Tuesday in February each year is reserved for the Budget Speech. After an election, a new budget must be tabled within 90 days of the post-election appointment of the Executive Council.
Executive
The executive is composed of the Lieutenant Governor and the executive council. The Lieutenant Governor, the Queen’s representative in British Columbia, holds a largely ceremonial place in the modern provincial government. By constitutional custom, the Lieutenant Governor is appointed by the Governor General of Canada for a term usually lasting five years.
The Lieutenant Governor, on the advice of the premier, appoints members of the executive council and is guided by the executive council’s advice as long as it holds the confidence of the legislative assembly. Following a general election, the Lieutenant Governor calls upon the leader of the political party with the largest number of elected members to serve as premier and to form the provincial government.
The Lieutenant Governor, on recommendation of the premier, convenes, prorogues and dissolves the legislative assembly and gives Royal Assent to all measures and bills passed by the assembly before they become law.
The executive council, or cabinet, is headed by the premier and is composed of selected members of the ruling party. Ministers are the head of government ministries, and are usually members of cabinet.
Cabinet determines government policy and is held responsible by the legislative assembly for the operation of the provincial government. Deputy ministers are the chief operating officers of ministries and are appointed by cabinet. Deputy ministers are responsible for carrying out government policies and for managing the work of their ministries.
2015 Financial and Economic Review — July 2015
49
Part 3 — Supplementary Information
Judiciary
The judiciary performs functions that are central to the orderly operation of society. Judges hear and give judgment in criminal prosecutions and in actions arising from disputes between private citizens or between the government and private citizens. Judges apply both judge-made law, known as ‘‘common law,’’ and laws made by the Parliament of Canada and provincial legislatures. The judiciary is increasingly called on to determine whether laws passed by governments conform to the values expressed in the Canadian Charter of Rights and Freedoms.
BC’s judicial system is made up of the Provincial Court of British Columbia, the Supreme Court of British Columbia and the Court of Appeal of British Columbia. The Provincial Court includes Small Claims, Adult Criminal, Youth and Family divisions. The provincial government appoints Provincial Court judges, and the federal government appoints Court of Appeal and Supreme Court judges.
The federal judicial system includes the Tax Court of Canada, the Federal Court of Canada (Appeals division and Trial division) and the Supreme Court of Canada. The Federal Court of Canada hears cases in limited areas of exclusively federal jurisdiction, for example, reviewing decisions made by federal tribunals such as the Canada Labour Relations Board. The Supreme Court of Canada is the court of final resort and hears selected appeals from the Federal Court of Appeal and provincial Courts of Appeal.
Provincial Government Jurisdiction
Under Canada’s constitutional framework, BC has ownership and jurisdiction over natural resources and is responsible for education, health and social services, municipal institutions, property and civil rights, the administration of justice and other matters of purely provincial or local concern.
Annual Financial Cycle1
British Columbia’s Budget Transparency and Accountability Act (BTAA) outlines the province’s reporting requirements during the financial cycle and imposes specific reporting deadlines or release dates for these publications. In particular, fixed dates for presentation of the Throne Speech and budget, as well as dates for quarterly and annual reports, are set by law.
Under the BTAA, the provincial government focuses its budgeting and reporting on a summary accounts basis. The BTAA requirements include reporting on the advice of the Economic Forecast Council; presentation of the annual Estimates, Budget and Fiscal Plan, Quarterly Reports, and Public Accounts in accordance with GAAP as set by a recognized standard setting organization and determined by Treasury Board (see page 53); publication of Quarterly Reports with revised forecasts; annual three-year service plans and service plan reports for each ministry and government organization; and an annual three-year government strategic plan and report.
Chart 3.1 summarizes the annual financial process of the province. This process consists of four main stages.
1 Reflects the financial cycle for normal years.
2015 Financial and Economic Review — July 2015
50
Part 3 — Supplementary Information
Chart 3.1 Financial Planning and Reporting Cycle Overview
Planning and Budget Preparation
Treasury Board, a committee of the Executive Council (i.e. Cabinet) reviews longer-term estimates of revenue, expense, capital and debt, and establishes a preliminary fiscal plan within the framework of the government’s overall strategic plan. Ministries, service delivery agencies and Crown corporations prepare three-year service plans, including performance measures and targets, and operating and capital budgets, for review by government. Treasury Board makes recommendations to Cabinet on budget allocations for ministries and agencies, and assesses commercial Crown corporation net income benchmarks, within the context of the fiscal plan. Included as inputs into this process are a consultation paper published by September 15th that invites public comment on issues for consideration as government develops its fiscal and service plans, and province-wide public hearings held by a committee of the legislature. A report outlining the results of the budget consultation process is made public by November 15th of each year.
Implementation and Reporting
The government’s revenue, expense and capital plans for the next three fiscal years, as well as other information on the government’s finances, are presented to the Legislative Assembly by the Minister of Finance in a budget document called the Budget and Fiscal Plan. The financial plan for the next fiscal year is also included in the document called the Estimates, which describes the individual appropriations to be voted on by the Legislative Assembly. Government’s strategic plan, service plans and a report on major
2015 Financial and Economic Review — July 2015
51
Part 3 — Supplementary Information
capital projects (those where government contribution exceeds $50 million) must also be tabled in the Legislature. Throughout the year, the authorized funding as specified in the Estimates and ministry service plans is spent on programs and services. Crown corporations follow approved service plans under the direction of their own Boards of Directors. Quarterly Reports, including full-year forecasts, are published by legislated dates, thereby providing regular updates to the public on the government’s finances.
Evaluation
At the end of the fiscal year, the Public Accounts are prepared by the Comptroller General and examined by the Auditor General to ensure that the financial statements fairly present the government’s financial position. The Public Accounts are augmented by the British Columbia Financial and Economic Review, which provides an overview of annual and historical financial and economic results. In addition, annual service plan reports are made public that compare actual results with ministry and Crown corporation performance targets.
Accountability
The Public Accounts are presented to the Legislative Assembly and are reviewed by two committees of the Legislative Assembly (the Select Standing Committee on the Public Accounts and the Select Standing Committee on Crown corporations). At the same time, the Ministerial Accountability Report is published detailing the individual and collective financial performance of cabinet ministers, and the performance and revenue results achieved by the Ministers of State and the Minister of Finance. The Minister of Finance also presents to the Legislative Assembly plans, reports and statements related to the revenue-neutrality objectives of the Carbon Tax Act. In addition, at the same time as, or shortly after, the Public Accounts are tabled, ministries and most Crown corporations release their service plan reports detailing results for the previous fiscal year. A report on the government’s strategic plan is also presented.
Government’s Financial Statements
Government Reporting Entity
The provincial government conducts its activities through:
· ministries;
· service delivery agencies;
· the SUCH sector (school districts; universities; colleges, university colleges and institutes; and health authorities and hospital societies); and
· commercial Crown corporations.
The accounts relating to the ministries and other direct activities of government are contained in the Consolidated Revenue Fund (CRF), whose financial results are reported as a separate entity in the Public Accounts. The CRF comprises all money over which the legislature has direct power of appropriation. The operations of service delivery agencies, the SUCH sector entities and commercial Crown corporations are recorded in their own financial statements, which are subject to audit by the Auditor General or by private sector auditors.
2015 Financial and Economic Review — July 2015
52
Part 3 — Supplementary Information
The relationship between the Legislature and government’s service delivery agencies, including the SUCH sector, and commercial Crown corporations is guided by either legislation or governance agreements between the boards of directors and their responsible ministers. In general, government is moving towards adopting governance agreements as its primary guide for these relationships.
According to generally accepted accounting principles (GAAP) for senior governments as established by the Public Sector Accounting Board (PSAB) of the Canadian Institute of Chartered Accountants, the province’s financial reporting consolidates the financial results of all these entities into a single set of financial statements. The provincial government publishes its financial statements annually in the Public Accounts.
Compliance with GAAP
British Columbia’s Budget Transparency and Accountability Act (BTAA) requires all financial documents produced by the province under that legislation to fully comply with GAAP. Compliance with this requirement began with the February 2004 budget and was completed in the 2004/05 Public Accounts.
Under GAAP, the CRF must be converted from a net basis to provide gross revenues and expenses. Next, service delivery agencies are consolidated with the CRF on a line-by-line basis for both the income statement and balance sheet. Commercial Crown corporations2 and commercial subsidiaries owned by service delivery agencies are disclosed on a modified equity basis — i.e. their net income is reported as revenue and their retained earnings as an investment.
Where the accounting policies of service delivery agencies differ from those used by the central government in preparing its own consolidated revenue fund financial statements, the service delivery agency financial statements are adjusted to conform to government’s accounting policies.
While PSAB GAAP makes specific pronouncements for fully consolidated entities, it prescribes adherence to International Financial Reporting Standards for entities consolidated on a modified equity basis. Modified equity means that there are no adjustments for differences between the accounting policies used by the entity being consolidated and the parent organization.
The BTAA authorizes Treasury Board to adopt different standards than those promoted by PSAB in order to ensure that British Columbia’s financial reporting reflects the policy framework within which the Crown corporations and agencies operate. Any alternate standard adopted by Treasury Board must come from other areas of Canadian GAAP, or from a widely-accepted accredited accounting standard setting body in another jurisdiction (e.g. the US Financial Accounting Standards Board). As authorized by the BTAA, Treasury Board mandated one variance from IFRS — the use of regulatory accounting by BC Hydro — to ensure financial reporting reflects the policy framework within which the Crown corporation operates.
The full text of government’s significant accounting policies can be found in Note 1 to the Consolidated Summary Financial Statements in the 2014/15 Public Accounts.
2 Crown corporations are considered commercial if the majority of their operating revenue comes from non-government sources, and their operating revenue is sufficient to cover operating and debt service costs without the need for government grants or other forms of assistance. Otherwise they are included with the service delivery agencies.
2015 Financial and Economic Review — July 2015
53
Part 3 — Supplementary information
Summary of Tax Changes Announced in Budget 2015
Income Tax Act
BC Tax Reduction Credit Enhanced
Effective for the 2015 tax year, the BC tax reduction credit is increased from $412 to $432 and the credit phase-out threshold is increased from $18,327 to $19,000. The credit phase-out rate is also increased from 3.2 per cent to 3.5 per cent of net income.
The enhancement increases the amount of income an individual can earn before they start paying provincial income tax, benefiting about 500,000 taxpayers.
Children’s Fitness Equipment Credit Introduced
Effective for the 2015 tax year, a new non-refundable children’s fitness equipment credit is introduced.
Parents can already claim the BC children’s fitness credit in respect of registration fees paid for a child’s participation in an eligible program of physical activity. With this budget, a parent can now claim an additional credit in respect of fitness equipment purchased for the child. The new credit is calculated as 50 per cent of the existing BC children’s fitness credit amount claimed. Parents are not required to keep receipts for equipment purchases. The credit provides a benefit of up to $12.65 per child.
BC Education Coaching Tax Credit Introduced
Effective for the 2015 tax year, a new non-refundable BC education coaching tax credit is introduced. The tax credit is available to teachers and teaching assistants who carry out at least ten hours of extracurricular coaching activity in the tax year.
The credit amount is $500, providing a tax benefit of up to $25.30 per eligible taxpayer. The credit is available for the 2015, 2016 and 2017 tax years, at which time the credit will be reviewed.
BC Training Tax Credits Extended
As announced on December 30, 2014, the BC training tax credits are extended for an additional three years to the end of 2017.
BC Mining Flow-Through Share Tax Credit Extended
The BC mining flow-through share tax credit is extended to the end of 2015.
BC Interactive Digital Media Tax Credit Extended
The BC interactive digital media tax credit is extended for an additional three years to August 31, 2018.
Digital Animation or Visual Effects Tax Credit Expanded
The digital animation or visual effects (DAVE) tax credit is expanded to include eligible post-production activities. The credit will apply to eligible post-production expenditures and will be available for productions where principal photography begins on or after March 1, 2015.
Medicare Protection Act
Medical Services Plan Premiums Increased and Premium Assistance Enhanced
Effective January 1, 2016, Medical Services Plan premiums are increased to help fund health care for British Columbians.
Maximum monthly premium rates will increase by about four per cent or by $3.00 per month to a total of $75.00 for single persons, $5.50 per month to a total of $136.00 for two person families and $6.00 per month to a total of $150.00 for families of three or more persons.
2015 Financial and Economic Review — July 2015
54
Part 3 — Supplementary Information
Also effective January 1, 2016, premium assistance is enhanced to ensure those receiving assistance will not be affected by the increase. Further details on the premium assistance enhancement will be available later in 2015.
Mineral Tax Act
New Mine Allowance Extended
The new mine allowance is extended for four years to December 31, 2019.
Small Business Venture Capital Act
Equity Tax Credit Budget Increased
The budget for the small business venture capital tax credit is increased by $3 million for direct investments in eligible new corporations, allowing for up to $10 million in additional equity financing for qualifying new corporations in 2015.
This effectively continues the $3 million budget for eligible new corporations, which expired at the end of 2014.
Carbon Tax Act and Motor Fuel Tax Act
Obligations Related to Fuel Imported by Ship Further Streamlined
Building on the amendments made in Budget 2012, the obligations of collectors, retail dealers and purchasers for fuel imported by ship into British Columbia are amended to further streamline the compliance burden on importers.
Motor Fuel Tax Act
Due Date for Natural Gas Returns Extended
The due date for natural gas returns in respect of tax payable on natural gas used in a stationary internal combustion engine during a month is moved from the 15th day of the following month to the last day of the following month.
Authorized Use of Coloured Fuel Expanded
Coloured fuel may only be purchased and used for a specifically authorized purpose. Effective July 1, 2015, use of coloured fuel to operate a locomotive is an authorized coloured fuel purpose.
Obligations Related to Coloured Fuel Enhanced
Effective July 1, 2015, a purchaser of coloured fuel in certain circumstances who fails to provide a declaration, at or before the time of the sale, that the fuel will be used for an authorized coloured fuel purpose, is required to pay the tax that would have been payable on the fuel if it had not been coloured fuel.
A purchaser may be eligible for a refund of the difference between the tax paid and the tax payable on coloured fuel, if they demonstrate the fuel was used for an authorized coloured fuel purpose.
Refunds of security for deputy collectors and retail dealers in respect of coloured fuel are also clarified.
Additional Penalty for the Unauthorized Use of Coloured Fuel Imposed
A person who purchases or uses coloured fuel for an unauthorized purpose may be subject to a penalty equal to the greater of the current penalty of three times the tax that would have been payable on the fuel if it had not been coloured, or a new fixed amount penalty not to exceed $1,000.
Provincial Sales Tax Act
Taxation of Tangible Personal Property Used to Make Other Tangible Personal Property Clarified
Effective February 18, 2015, the use of tangible personal property includes using tangible personal property that is brought, sent or delivered into British Columbia to
2015 Financial and Economic Review — July 2015
55
Part 3 — Supplementary information
make other tangible personal property that is then transported outside of British Columbia for the purpose of fulfilling a contract for improvements to real property situated outside of British Columbia. This ensures the same tax treatment for tangible personal property used to make other tangible personal property that is used for the purpose of fulfilling a contract for improvements to real property regardless of whether the tangible personal property is purchased in British Columbia or brought, sent or delivered into British Columbia.
A refund of tax will be provided for tax paid on tangible personal property purchased in British Columbia or brought, sent or delivered into British Columbia that is used to make other tangible personal property that is then transported outside of British Columbia for the purpose of fulfilling a contract for improvements to real property situated outside of British Columbia, if sales tax is paid under the laws of another jurisdiction in respect of the other tangible personal property and there is no eligibility for a refund, credit or rebate.
Exemption for Lift Chairs Sold on Prescription Provided
Effective February 18, 2015, lift chairs designed to facilitate standing up or sitting down are exempt from provincial sales tax if the lift chair is sold on the prescription of a practitioner.
Multijurisdictional Vehicle Tax Clarified
Consistent with full reciprocity under the International Registration Plan, the tax payable on multijurisdictional vehicles licensed on or after January 1, 2015, will be calculated using a set travel ratio for each jurisdiction for new fleets and the actual travel ratio for existing fleets.
Registration Obligations Extended
Effective September 1, 2015, a person located outside of British Columbia that in the ordinary course of business:
· accepts orders for tangible personal property from a location in British Columbia;
· sells or provides tangible personal property to a person in British Columbia; and
· holds that tangible personal property in inventory in British Columbia at the time it is sold;
must be registered for the purposes of levying, collecting and remitting provincial sales tax at the time of the sale.
Voluntary registrations will be accepted before September 1, 2015, and a person may be subject to failure-to-register penalties if they are not registered as required on or after September 1, 2015.
Maximum Tax Rate for Municipal and Regional District Tax Program Increased
The Municipal and Regional District Tax Program imposes tax on the purchase of accommodation in designated accommodation areas to raise revenue for municipalities, regional districts and eligible entities primarily for local tourism marketing, programs and projects.
The maximum tax rate on the purchase of accommodation under the Municipal and Regional District Tax Program that may be imposed in a designated accommodation area is increased from two per cent to three per cent of the purchase price of accommodation.
Municipalities, regional districts and eligible entities will be required to request the government increase the tax rate in their designated accommodation area and details of the application requirements will be made available later in 2015.
2015 Financial and Economic Review — July 2015
56
Part 3 — Supplementary Information
Purchasers of accommodation in a designated accommodation area who have received written confirmation of reservation, entered into a written contract for accommodation or paid a deposit, for a specified number of days of accommodation before the effective date of a tax rate increase, may be entitled to a refund of the difference between the tax paid and the tax that would have been payable if the tax rate had not increased.
Tobacco Tax Act
Security Scheme Clarified
Effective February 18, 2015, security is payable on tobacco that a wholesale dealer has brought or sent into British Columbia.
The Tobacco Tax Act is further amended to clarify the application of the security scheme for wholesale and retail dealers.
Home Owner Grant Act
Threshold for Home Owner Grant Phase-out Maintained
The threshold for the phase-out of the home owner grant is maintained at $1,100,000 for the 2015 tax year. For properties valued above the threshold, the grant is reduced by $5 for every $1,000 of assessed value in excess of the threshold.
This year, 93 per cent of homes are below the threshold.
School Act
Provincial Residential School Property Tax Rates Set
The longstanding rate-setting policy is that average residential school property taxes, before application of the home owner grant, increase by the previous year’s provincial inflation rate. This rate-setting policy has been in place since 2003 and will continue in 2015. The rates will be set when revised assessment roll data are available in the spring.
Provincial Non-Residential School Property Tax Rates Set
A single province-wide school tax rate is set for each of the non-residential property classes. Consistent with longstanding policy, the rates for 2015, except the rate for the industrial property classes, will be set so that non-residential school tax revenue will increase by inflation plus new construction. This general approach to setting non-residential school tax rates has been in place since 2005. The rates will be set when revised assessment roll data are available in the spring.
The major industry class tax rate and the light industry class tax rate will be set at the same rate as the business class tax rate, consistent with the policy announced in Budget 2008.
Taxation (Rural Area) Act
Provincial Rural Area Property Tax Rates Set
A single rural area residential property tax rate applies province-wide. The longstanding rate-setting policy that average residential rural property taxes increase by the previous year’s provincial inflation rate will continue for 2015.
Consistent with longstanding policy, non-residential rural area property tax rates will be set so that total non-residential rural area tax revenue will increase by inflation plus new construction. The rates will be set when revised assessment roll data are available in the spring.
2015 Financial and Economic Review — July 2015
57
Part 3 — Supplementary Information
Table 3.1 Provincial Taxes (as of July 2015)
Type and | | | | | | |
Statute Reference | | Tax Base | | Tax Rate | | Characteristics and Exemptions |
Income —
Income Tax Act | | Taxable Income
(1) Corporate | | The general corporate income tax rate increased from 10% to 11% of taxable income effective April 1, 2013. The small business corporate income tax rate is 2.5%. | | The Canada Revenue Agency administers BC’s personal and corporate taxes under the Tax Collection Agreement between the province and the federal government. Corporate tax credits include the scientific research and experimental development tax credit, book publishing tax credit and the film tax credits. In addition, the political contributions tax credit, mining exploration tax credit, logging tax credit, training tax credits and venture capital tax credits are available to both individuals and corporations. |
| | | | | | |
| | (2) Personal | | Tax rates of 5.06%, 7.7%, 10.5%, 12.29%, 14.7% and 16.8% corresponding to tax brackets of up to $37,869, $37,869.01 to $75,740, $75,740.01 to $86,958, $86,958.01 to $105,592, $105,59201.01 to $151,050 and over $151,050. The top rate of 16.8%, which is applied to taxable income over $150,000 (indexed to $151,050 in 2015), is a temporary measure for the 2014 and 2015 tax years only. | | BC provides a set of non-refundable credits similar to most federal non-refundable credits. Personal tax credits include the BC Low Income Climate Action Tax Credit, BC Sales Tax Credit, the BC Early Childhood Tax Benefit, and other credits available to individuals who meet specific eligibility criteria. |
| | | | | | |
Real Property Transfers —
Property Transfer Tax Act | | Fair market value of property or interest in property transferred; for presold strata units purchased at arm’s length, total consideration for the strata unit. | | 1% on the first $200,000 of value transferred and 2% on amounts in excess of $200,000. | | Exemptions include: transfers of principal residences, recreational residences and family farms to related individuals; transfers of property between spouses pursuant to written separation agreements or court orders; transfers of property to local governments, registered charities and educational institutions; transfers of property to veterans under the Veterans’ Land Act (Canada); transfers of land to be protected, preserved, conserved or kept in a natural state; and transfers of leases less than 31 years in duration. A number of technical exemptions are also provided. Eligible first time home-buyers are exempt from tax on transfers of eligible properties. |
| | | | | | |
Retail Sales Tax Provincial Sales Tax Act | | Purchase and lease of tangible personal property Purchase of software, accommodation, related services, telecommunication services and legal services Gifts of vehicles, boats and aircraft | | General rate 7% Liquor 10% Accommodation 8% Vehicles 7% to 12% Boats and aircraft 7% or 12% Manufactured buildings reduced rate of tax. | | Collected through businesses required to be registered under the Act and paid by purchasers and lessees. Major consumer exemptions include, but are not limited to: · Food for human consumption (all food including prepared food) · Residential energy · Children’s clothing and footwear (child-sized clothing and adult-sized clothing for children under 15 years of age) · Basic cable and residential land-line telephone services · Vitamins, drugs, and household medical aids. Major business exemptions include, but are not limited to: · Goods acquired solely for re-sale or re-lease · Goods purchased to be incorporated into goods for sale or lease · Certain production machinery and equipment purchased by major industries (manufacturers, logging, mining, oil and gas) for qualifying activities at qualifying locations. |
2015 Financial and Economic Review — July 2015
58
Part 3 — Supplementary Information
Table 3.1 Provincial Taxes (as of July 2015) — Continued
Type and | | | | | | |
Statute Reference | | Tax Base | | Tax Rate | | Characteristics and Exemptions |
Tobacco —
Tobacco Tax Act | | By cigarette, cigar retail price, and weight on other tobacco products. | | 23.9 cents per cigarette or tobacco stick and per gram of loose tobacco; 90.5% of taxable price on cigars to a maximum tax of $7 per cigar. | | Tax is payable on tobacco by purchasers at the time of retail purchase. Tobacco is subject to a security scheme. Security is payable by wholesale dealers registered under the Act when tobacco is delivered to them. |
| | | | | | |
Carbon Dioxide Equivalent Emissions from combustion of fuels and combustibles —
Carbon Tax Act | | Purchase, use or, in certain circumstances, transfer or importation of · Aviation Fuel · Gasoline · Heavy Fuel Oil · Jet Fuel · Kerosene · Light Fuel Oil · Methanol (not produced from biomass) · Naphtha · Butane · Coke Oven Gas · Ethane · Pentane Plus · Gas Liquids · Natural Gas · Propane · Refinery Gas · High Heat Value Coal · Low Heat Value Coal · Coke · Petroleum Coke · Also combustion of peat and tires (whole or shredded) when used to produce heat or energy (combustibles). | | Tax rates vary by type of fuel or combustible based on carbon dioxide equivalent emitted by each fuel or combustible. Tax rates are equivalent to $30 per tonne of carbon dioxide equivalent. | | Tax is payable on fuels by purchasers at the time of retail purchase. Fuels, other than natural gas, are subject to a security scheme similar to the security scheme under the Motor Fuel Tax Act. Security is payable by collectors registered under the Act when fuel is sold in British Columbia for the first time after manufacture or importation. Tax on the purchase of natural gas is collected and remitted at the retail level. Tax on use, transfer and import is self-assessed. Tax on the burning of combustibles is self-assessed. Exemptions include fuels which are exported for use outside of British Columbia, fuel used for certain non-energy purposes, and fuel used for eligible inter-jurisdictional transportation because the resulting emissions are generally not considered as domestic emissions under the federal National Inventory Report. There are also minor exemptions similar to exemptions in other consumption tax Acts for administrative and technical reasons. |
| | | | | | |
Motor Fuel —
Motor Fuel Tax Act | | Purchase, use, or in certain circumstances, transfer or importation of motor fuels. | | | | Tax generally applies to all fuels purchased for use, or used in internal combustion engines. Tax is payable on fuels by purchasers at the time of retail purchase. Most fuels are subject to a security scheme similar to the security scheme under the Carbon Tax Act. Security is payable by collectors registered under the Act when fuel is sold in British Columbia for the first time after manufacture or importation. The additional tax collected in the South Coast BC Transportation Service Region, on behalf of TransLink, helps fund regional transportation costs. The additional tax collected in the Victoria Regional Transit Service Area, on behalf of BC Transit, helps fund the public transit system. |
2015 Financial and Economic Review — July 2015
59
Part 3 — Supplementary Information
Table 3.1 Provincial Taxes (as of July 2015) — Continued
Type and | | | | | | |
Statute Reference | | Tax Base | | Tax Rate | | Characteristics and Exemptions |
Motor Fuel —
Motor Fuel Tax Act (continued) | | Clear gasoline | | General rate: 14.5 cents per litre (includes 6.75 cents per litre collected on behalf of the BC Transportation Financing Authority). South Coast BC Transportation Service Region: 25.5 cents per litre (includes 6.75 cents per litre collected on behalf of the BC Transportation Financing Authority and 17 cents per litre collected on behalf of TransLink). Victoria Regional Transit Service Area: 18 cents per litre (includes 6.75 cents per litre collected on behalf of the BC Transportation Financing Authority and 3.5 cents per litre collected on behalf of BC Transit). | | |
| | | | | | |
| | Motive fuel | | General rate: 15 cents per litre (includes 6.75 cents per litre collected on behalf of the BC Transportation Financing Authority). South Coast BC Transportation Service Region: 26 cents per litre (includes 6.75 cents per litre collected on behalf of the BC Transportation Financing Authority and 17 cents per litre collected on behalf of TransLink). Victoria Regional Transit Service Area: 18.5 cents per litre (includes 6.75 cents per litre collected on behalf of the BC Transportation Financing Authority and 3.5 cents per litre collected on behalf of BC Transit). | | Tax applies to diesel fuel but does not include alternative motor fuels or coloured fuels. |
| | | | | | |
| | Alternative motor fuels (natural gas, hydrogen and methanol (M85+)) | | Exempt. | | Natural gas, when used as a motor fuel, is exempt from tax. Certain hydrogen is exempt from tax. Fuels comprised of at least 85% methanol are also exempt from tax. |
| | | | | | |
| | Coloured fuel, marine diesel fuel | | 3 cents per litre. | | Coloured fuel may be used in all vehicles not licensed to operate on a highway and in specific industrial vehicles. Bona fide farmers are exempt from paying the tax when fuel is used for farming purposes. Farm vehicles with A or G license plates are allowed to use tax-exempt coloured fuel for farming purposes on a highway. |
| | | | | | |
| | Locomotive fuel | | 3 cents per litre. | | Tax applies to fuel specifically for use in locomotives. |
2015 Financial and Economic Review — July 2015
60
Part 3 — Supplementary Information
Table 3.1 Provincial Taxes (as of July 2015) — Continued
Type and | | | | | | |
Statute Reference | | Tax Base | | Tax Rate | | Characteristics and Exemptions |
| | | | | | |
Motor Fuel —
Motor Fuel Tax Act (continued) | | Propane | | 2.7 cents per litre. | | Propane tax applies to all uses of propane. There are exemptions for propane used as residential energy in a residential dwelling or used by qualifying farmers solely for a farm purpose and for small containers of propane. |
| | | | | | |
| | Aviation fuel | | 2 cents per litre. | | Aviation fuel tax applies to fuel produced specifically for use in a non-turbine aircraft engine. |
| | | | | | |
| | Jet fuel | | 2 cents per litre. | | Jet fuel tax applies to fuel produced specifically for use in a turbine aircraft engine. Jet fuel used for international flights is exempt. |
| | | | | | |
| | Natural gas used in stationary engines, other than listed below | | 1.1 cents per 810.32 litres. | | |
| | | | | | |
| | Natural gas used in pipeline compressors to transmit marketable gas | | 1.9 cents per 810.32 litres. | | |
| | | | | | |
| | Natural gas used in pipeline compressors to extract and transmit raw gas from wells to processing plants | | Exempt. | | |
| | | | | | |
| | Natural gas used in compressors to re-inject sour gas into depleted wells | | Exempt. | | |
| | | | | | |
| | Marine bunker fuel | | Exempt. | | Exemption applies to bunker fuel, or a combination of bunker and other fuels used as fuel in a ship. |
| | | | | | |
| | Marine gas oil | | Exempt. | | Exemption applies to marine gas oil when used in primary gas turbine engines to propel passenger and cargo vessels. |
| | | | | | |
Natural resources — Logging Tax Act | | Net income from logging in BC. | | 10% (fully recoverable against federal and provincial corporation and personal income tax). | | Net income from logging after deducting non-forestry income and a processing allowance. |
| | | | | | |
— Mineral Land Tax Act | | Assessed value of freehold mineral land and production areas. | | Undesignated mineral land — $1.25 to $4.94 per hectare. Designated production areas — $4.94 per hectare. | | Rates of tax set on sliding scale, dependent on size and designation of land. |
| | | | | | |
—Mineral Tax Act | | Cash flow from individual metal and coal mines (other than placer gold mines). | | 2% of net current proceeds (NCP). 13% of net revenue (NR). | | Tax calculated on a mine-by-mine basis. NCP tax paid on current operating cash flow until all current and capital costs, plus any investment allowance, are recovered. NR tax paid thereafter on cumulative cash flow. NCP tax creditable against NR tax. |
| | | | | | |
| | Volume of production of limestone, dolomite, marble, shale, clay, volcanic ash, diatomaceous earth, sandstone, quartzite and dimension stone. | | $0.15 per tonne removed from all quarries operated. | | An operator may deduct 25,000 tonnes from the total number of tonnes removed from all quarries operated by that operator. However the amount deducted from any one quarry by all operators of that quarry must not exceed 25,000 tonnes. |
| | | | | | |
| | Value of minerals sold by placer gold mines. | | 0.5% of value of minerals sold. | | |
| | | | | | |
Insurance — Insurance Premium Tax Act | | BC premiums. | | 4.4% for vehicle and property insurance; 2% for life, sickness, personal accident and loss of salary and wages insurance, 4% for other insurance, and 7% for all contracts with unlicensed insurers. | | Exemptions — benefit societies; mutual corporations with 50% of income from farm or 100% from religious, educational or charitable institutions; marine, except pleasure craft; approved medical or hospitalization plans. |
2015 Financial and Economic Review — July 2015
61
Part 3 — Supplementary Information
Table 3.1 Provincial Taxes (as of July 2015) — Continued
Type and | | | | | | |
Statute Reference | | Tax Base | | Tax Rate | | Characteristics and Exemptions |
Real property — Taxation (Rural Area) Act | | Assessed value of land and improvements in rural areas (outside municipalities). Assessment determined under the Assessment Act. | | Rates are set annually as a percentage of assessed value. For residential properties the rates are set to increase average residential rural taxes by the rate of inflation. For 2015, the rates were set so that total non- residential rural tax revenues increase by inflation plus new construction. For 2015, the rates are 0.052% for farms; 0.052% for managed forest lands; 0.057% for residential; 0.096% for recreational property/non-profit organizations; 0.292% for light industry, business and other property not contained in any other class; 0.386% for utilities; 0.550% for major industry and 0.01% for supportive housing. | | Some exemptions apply under various statutes. |
| | | | | | |
Residential school tax — School Act | | Assessed value of residential land and improvements. Assessment determined under the Assessment Act. | | Rates are set annually to increase average gross residential taxes by the rate of inflation. The rates vary by school district. For 2015 rates range from about 0.113% to 0.562%. | | Basic rates are calculated using a formula to moderate effects of varying average assessments on school district taxes. School districts may levy additional tax on residential class property if authorized by local referendum. Amendments to the School Act in 2002 allow the Minister of Finance to apply different tax rates within a school district. Tofino is the only municipality with a rate that differs from the rest of the school district. |
| | | | | | |
Non-residential school tax — School Act | | Assessed value of non- residential land and improvements. Assessment determined under the Assessment Act. | | Rates are set annually. For 2015, except for the major and light industry property classes, the rates are set so that total non-residential school tax revenues increase by inflation plus new construction. The major industry property class rate is set to be the same as the business property class rates. For 2015 the rates are 0.33% for recreational property/non- profit organizations; 0.22% for managed forest land; 0.69% for farms; 0.58% for light industry, major industry, business and other property not contained in any other class; 1.36% for utilities and 0.01% for supportive housing. | | Some exemptions apply under various statutes. Effective for the 2009 and subsequent taxation years, an Industrial Property Tax Credit was introduced to reduce provincial school property tax on major industrial (class 4) and light industrial (class 5) properties. The rate is 60% for 2011 and subsequent taxation years. The Industrial Property Tax Credit applies to British Columbia manufacturing, mining, forestry and other major and light industries. In Budget 2013, government announced its intention to phase out the Industrial Property Tax Credit for light industrial properties over two years. In 2013 the benefit of the credit for class 5 was halved through the setting of the class 5 school tax rate. The credit was completely phased out in Budget 2014. Effective in 2011, a 50% Provincial Farm Land Property Tax Credit reduces the provincial school property tax on farm land (class 9). |
| | | | | | |
Police Tax — Police Act | | Assessed value of land and improvements in municipalities under 5,000 population and in rural areas. Assessment determined under the Assessment Act. | | Rates are set annually to raise up to 50% of the cost of rural and small community policing. Rates are set for each of the nine property classes in each municipality under 5,000 population, in each electoral area of the province and in the area of the province outside a regional district. | | Basic rates are calculated using a formula that moderates the effect of variations in assessed value in the province by adjusting for population. Adjustments are made to the rates to reflect the contribution taxpayers in the rural areas make to policing costs through the rural area property tax. Adjustments are also made to account for traffic fine revenue sharing and for payments in lieu of taxes from the federal and provincial governments. |
2015 Financial and Economic Review — July 2015
62
Part 3 — Supplementary Information
Table 3.2 Interprovincial Comparisons of Tax Rates — 2015
(Rates known and in effect as of July 1, 2015)
Tax | | British
Columbia | | Alberta | | Saskat-
chewan | | Manitoba | | Ontario | | Quebec | | New
Brunswick | | Nova
Scotia | | Prince
Edward
Island | | Newfound-
land and
Labrador | |
Corporation income tax (per cent of taxable income) | | | | | | | | | | | | | | | | | | | | | |
General rate 1 | | 11 | | 12 | | 12 | | 12 | | 11.5 | | 11.9 | | 12 | | 16 | | 16 | | 14 | |
Manufacturing rate 2 | | 11 | | 12 | | 10 | | 12 | | 10 | | 11.9 | | 12 | | 16 | | 16 | | 5 | |
Small business rate | | 2.5 | | 3 | | 2 | | 0 | | 4.5 | | 8 | | 4 | | 3 | | 4.5 | | 3 | |
Small business threshold ($000s) | | 500 | | 500 | | 500 | | 425 | | 500 | | 500 | | 500 | | 350 | | 500 | | 500 | |
Corporation capital tax | | | | | | | | | | | | | | | | | | | | | |
Non-financial | | Nil | | Nil | | Nil | | Nil | | Nil | | Nil | | Nil | | Nil | | Nil | | Nil | |
Financial | | Nil | | Nil | | .7/3.25 | | 6 | | Nil | | Nil | | 4 | | 4 | | 5 | | 5 | |
Health care premiums/month 3 | | | | | | | | | | | | | | | | | | | | | |
Individual/family | | 72/144 | | Nil | | Nil | | Nil | | Nil | | up to
83/167 | | Nil | | Nil | | Nil | | Nil | |
Payroll tax (per cent) 4 | | Nil | | Nil | | Nil | | 2.15 | | 1.95 | | 4.26 | | Nil | | Nil | | Nil | | 2.0 | |
Insurance premium tax (per cent) 5 | | 2-4.4 | | 3-4 | | 3-4 | | 2-3 | | 2-3.5 | | 2.3-3.3 | | 2-3 | | 3-4 | | 3.5 | | 4 | |
Fuel tax (cents per litre) 6 | | | | | | | | | | | | | | | | | | | | | |
Gasoline | | 21.17 | | 13.0 | | 15.0 | | 14.0 | | 22.8 | | 29.8 | | 23.6 | | 25.6 | | 22.3 | | 24.9 | |
Diesel | | 22.67 | | 13.0 | | 15.0 | | 14.0 | | 22.3 | | 30.7 | | 29.7 | | 24.9 | | 28.8 | | 24.9 | |
Sales tax (per cent) 7 | | | | | | | | | | | | | | | | | | | | | |
General rate | | 7 | | Nil | | 5 | | 8 | | 8 | | 9.975 | | 8 | | 10 | | 9 | | 8 | |
Tobacco tax (dollars per carton of 200 cigarettes) 8 | | 47.80 | | 45.00 | | 55.00 | | 67.72 | | 34.19 | | 29.80 | | 45.04 | | 61.15 | | 59.00 | | 54.76 | |
1 Effective July 1, 2015, the corporate income tax rate in Alberta increases from 10.0% to 12.0%.
2 In British Columbia (and some other provinces) the general rate applies to income from manufacturing and processing. In Quebec, the rate for manufacturing corporations eligible for the small business rate is 4 per cent; the rate for other manufacturing corporations is 11.9 per cent.
3 British Columbia has a two-person rate of $130.50; rates will increase effective January 1, 2016 to $75.00 per month for single persons, $136.00 for two- person families, and $150.00 for families of three or more persons. British Columbia provides premium assistance in the form of lower rates or an exemption from premiums for lower income individuals and families. Quebec levies a health contribution that varies with income. Quebec’s health contribution is capped at $150 annually per adult for modest income earners and increases to a maximum of $1,000 annually per adult for high income earners. Ontario levies a health premium as part of its provincial personal income tax system, of up to $900 per year.
4 Provinces with payroll taxes provide payroll tax relief for small businesses. Quebec also levies a compensation tax of up to 4.48 per cent on salaries and wages paid by financial institutions.
5 The lower rate applies to premiums for life, sickness and accident insurance; the higher rate applies to premiums for property insurance including automobile insurance. In Ontario, Quebec and Newfoundland and Labrador, specific sales taxes also apply to insurance premiums, except those related to individual life and health.
6 Tax rate is for regular fuel used on highways and includes all provincial taxes payable by consumers at the pump. The British Columbia rate includes 6.75 cents per litre dedicated to the BC Transportation Financing Authority and the carbon tax rates of 6.67 cents per litre for gasoline and 7.67 cents per litre for diesel. The British Columbia rates do not include regional taxes that effectively increase the gasoline and diesel tax rates by 11 cents per litre in the South Coast British Columbia transportation service region and by 3.5 cents per litre in the Capital Regional District. The tax rates for Ontario, Quebec, New Brunswick, Nova Scotia, Newfoundland and Labrador, and Prince Edward Island include provincial sales tax based on average pump prices as of January 2014. Quebec’s tax rates do not include increased or reduced regional tax rates, such as an additional tax of 3 cents per litre on gasoline for the Montreal area.
7 The rates shown are statutory rates. Ontario, Quebec, Nova Scotia, New Brunswick, Newfoundland and Labrador and Prince Edward Island have harmonized their sales taxes with the federal GST. Alberta imposes a four per cent tax on short-term rental accommodation.
8 Includes estimated provincial sales tax in all provinces except Alberta, British Columbia and Quebec.
2015 Financial and Economic Review — July 2015
63
| Appendix 1 |
| |
| |
| Economic Review |
| |
| |
| Supplementary Tables |
2015 Financial and Economic Review — July 2015
Appendix 1 — Economic Review
Table A1.1A Aggregate and Labour Market Indicators
| | | | | | Real GDP | | Primary | | Gross fixed | | Business | | | | | | Unemployment | |
| | Population 1 | | Nominal GDP | | (chained) | | household income | | capital formation | | incorporations | | Labour force | | Employment | | rate | |
| | (thousands) | | ($ millions) | | ($2007 millions) | | ($ millions) | | ($ millions) | | (number) | | (thousands) | | (thousands) | | (per cent) | |
1982 | | 2,877 | | 45,986 | | 93,159 | | 34,412 | | 11,063 | | — | | 1,427 | | 1,253 | | 12.1 | |
1983 | | 2,908 | | 48,587 | | 93,751 | | 34,600 | | 10,905 | | — | | 1,446 | | 1,245 | | 13.9 | |
1984 | | 2,947 | | 50,977 | | 94,582 | | 36,250 | | 10,725 | | — | | 1,465 | | 1,245 | | 15.0 | |
1985 | | 2,975 | | 54,753 | | 101,117 | | 38,907 | | 11,575 | | — | | 1,493 | | 1,280 | | 14.3 | |
1986 | | 3,004 | | 57,627 | | 101,840 | | 41,140 | | 11,013 | | — | | 1,526 | | 1,332 | | 12.7 | |
1987 | | 3,049 | | 63,713 | | 108,212 | | 44,859 | | 12,608 | | — | | 1,567 | | 1,378 | | 12.1 | |
1988 | | 3,115 | | 70,853 | | 114,724 | | 49,701 | | 15,211 | | — | | 1,599 | | 1,435 | | 10.3 | |
1989 | | 3,197 | | 77,178 | | 118,401 | | 55,863 | | 18,750 | | — | | 1,659 | | 1,508 | | 9.1 | |
1990 | | 3,292 | | 81,074 | | 120,153 | | 61,800 | | 19,394 | | 19,550 | | 1,703 | | 1,560 | | 8.4 | |
1991 | | 3,374 | | 83,638 | | 120,424 | | 64,261 | | 19,285 | | 18,528 | | 1,751 | | 1,578 | | 9.9 | |
1992 | | 3,469 | | 89,168 | | 123,754 | | 67,144 | | 20,550 | | 20,406 | | 1,800 | | 1,617 | | 10.1 | |
1993 | | 3,568 | | 95,761 | | 129,522 | | 69,756 | | 21,437 | | 22,955 | | 1,848 | | 1,668 | | 9.7 | |
1994 | | 3,676 | | 102,262 | | 133,172 | | 73,291 | | 24,402 | | 25,774 | | 1,918 | | 1,743 | | 9.1 | |
1995 | | 3,777 | | 107,745 | | 136,607 | | 77,112 | | 23,079 | | 23,846 | | 1,951 | | 1,786 | | 8.5 | |
1996 | | 3,874 | | 111,108 | | 140,114 | | 79,356 | | 22,789 | | 23,237 | | 1,986 | | 1,813 | | 8.7 | |
1997 | | 3,949 | | 116,727 | | 144,305 | | 82,043 | | 24,820 | | 22,958 | | 2,032 | | 1,860 | | 8.5 | |
1998 | | 3,983 | | 117,872 | | 146,112 | | 84,255 | | 23,173 | | 20,759 | | 2,038 | | 1,858 | | 8.8 | |
1999 | | 4,011 | | 123,150 | | 150,649 | | 87,742 | | 23,280 | | 21,009 | | 2,064 | | 1,894 | | 8.3 | |
2000 | | 4,039 | | 133,724 | | 157,515 | | 92,434 | | 24,151 | | 21,388 | | 2,080 | | 1,931 | | 7.2 | |
2001 | | 4,077 | | 135,884 | | 158,509 | | 95,037 | | 26,195 | | 19,474 | | 2,081 | | 1,920 | | 7.7 | |
2002 | | 4,100 | | 140,525 | | 164,116 | | 99,054 | | 26,818 | | 20,987 | | 2,134 | | 1,953 | | 8.5 | |
2003 | | 4,124 | | 148,540 | | 168,011 | | 102,647 | | 29,095 | | 22,531 | | 2,172 | | 1,998 | | 8.0 | |
2004 | | 4,155 | | 161,114 | | 174,591 | | 109,425 | | 34,336 | | 24,703 | | 2,186 | | 2,028 | | 7.2 | |
2005 | | 4,196 | | 173,641 | | 183,235 | | 116,594 | | 39,442 | | 30,937 | | 2,220 | | 2,090 | | 5.9 | |
2006 | | 4,242 | | 186,772 | | 191,101 | | 127,737 | | 45,677 | | 33,273 | | 2,248 | | 2,141 | | 4.8 | |
2007 | | 4,291 | | 197,072 | | 197,072 | | 134,986 | | 49,131 | | 34,036 | | 2,304 | | 2,206 | | 4.3 | |
2008 | | 4,349 | | 203,951 | | 199,270 | | 139,718 | | 52,263 | | 30,085 | | 2,349 | | 2,242 | | 4.6 | |
2009 | | 4,411 | | 195,966 | | 194,214 | | 138,117 | | 45,950 | | 26,431 | | 2,375 | | 2,192 | | 7.7 | |
2010 | | 4,466 | | 205,996 | | 200,628 | | 142,110 | | 49,127 | | 30,305 | | 2,405 | | 2,223 | | 7.6 | |
2011 | | 4,499 | | 217,460 | | 206,225 | | 149,810 | | 50,966 | | 30,853 | | 2,409 | | 2,228 | | 7.5 | |
2012 | | 4,543 | | 222,565 | | 211,124 | | 155,744 | | 55,635 | | 31,066 | | 2,429 | | 2,263 | | 6.8 | |
2013 | | 4,583 | | 229,685 | | 215,218 | | 163,498 | | 55,735 | | 32,225 | | 2,425 | | 2,266 | | 6.6 | |
2014 | | 4,631 | | n/a | | n/a | | n/a | | n/a | | 34,951 | | 2,425 | | 2,278 | | 6.1 | |
| | | | | | | | | | | | | | | | | | | |
(annual percentage change)2 | |
1983 | | 1.1 | | 5.7 | | 0.6 | | 0.5 | | (1.4 | ) | — | | 1.3 | | (0.7 | ) | 1.8 | |
1984 | | 1.4 | | 4.9 | | 0.9 | | 4.8 | | (1.7 | ) | — | | 1.3 | | 0.0 | | 1.1 | |
1985 | | 0.9 | | 7.4 | | 6.9 | | 7.3 | | 7.9 | | — | | 1.9 | | 2.8 | | (0.7 | ) |
1986 | | 1.0 | | 5.2 | | 0.7 | | 5.7 | | (4.9 | ) | — | | 2.2 | | 4.1 | | (1.6 | ) |
1987 | | 1.5 | | 10.6 | | 6.3 | | 9.0 | | 14.5 | | — | | 2.7 | | 3.4 | | (0.6 | ) |
1988 | | 2.2 | | 11.2 | | 6.0 | | 10.8 | | 20.6 | | — | | 2.0 | | 4.1 | | (1.8 | ) |
1989 | | 2.6 | | 8.9 | | 3.2 | | 12.4 | | 23.3 | | — | | 3.8 | | 5.1 | | (1.2 | ) |
1990 | | 3.0 | | 5.0 | | 1.5 | | 10.6 | | 3.4 | | — | | 2.6 | | 3.4 | | (0.7 | ) |
1991 | | 2.5 | | 3.2 | | 0.2 | | 4.0 | | (0.6 | ) | (5.2 | ) | 2.8 | | 1.1 | | 1.5 | |
1992 | | 2.8 | | 6.6 | | 2.8 | | 4.5 | | 6.6 | | 10.1 | | 2.8 | | 2.5 | | 0.2 | |
1993 | | 2.9 | | 7.4 | | 4.7 | | 3.9 | | 4.3 | | 12.5 | | 2.7 | | 3.1 | | (0.4 | ) |
1994 | | 3.0 | | 6.8 | | 2.8 | | 5.1 | | 13.8 | | 12.3 | | 3.8 | | 4.5 | | (0.6 | ) |
1995 | | 2.8 | | 5.4 | | 2.6 | | 5.2 | | (5.4 | ) | (7.5 | ) | 1.7 | | 2.4 | | (0.6 | ) |
1996 | | 2.6 | | 3.1 | | 2.6 | | 2.9 | | (1.3 | ) | (2.6 | ) | 1.8 | | 1.6 | | 0.2 | |
1997 | | 1.9 | | 5.1 | | 3.0 | | 3.4 | | 8.9 | | (1.2 | ) | 2.3 | | 2.6 | | (0.2 | ) |
1998 | | 0.9 | | 1.0 | | 1.3 | | 2.7 | | (6.6 | ) | (9.6 | ) | 0.3 | | (0.1 | ) | 0.3 | |
1999 | | 0.7 | | 4.5 | | 3.1 | | 4.1 | | 0.5 | | 1.2 | | 1.3 | | 1.9 | | (0.5 | ) |
2000 | | 0.7 | | 8.6 | | 4.6 | | 5.3 | | 3.7 | | 1.8 | | 0.8 | | 2.0 | | (1.1 | ) |
2001 | | 0.9 | | 1.6 | | 0.6 | | 2.8 | | 8.5 | | (8.9 | ) | 0.0 | | (0.6 | ) | 0.5 | |
2002 | | 0.6 | | 3.4 | | 3.5 | | 4.2 | | 2.4 | | 7.8 | | 2.6 | | 1.7 | | 0.8 | |
2003 | | 0.6 | | 5.7 | | 2.4 | | 3.6 | | 8.5 | | 7.4 | | 1.8 | | 2.3 | | (0.5 | ) |
2004 | | 0.8 | | 8.5 | | 3.9 | | 6.6 | | 18.0 | | 9.6 | | 0.6 | | 1.5 | | (0.8 | ) |
2005 | | 1.0 | | 7.8 | | 5.0 | | 6.6 | | 14.9 | | 25.2 | | 1.5 | | 3.0 | | (1.3 | ) |
2006 | | 1.1 | | 7.6 | | 4.3 | | 9.6 | | 15.8 | | 7.6 | | 1.3 | | 2.4 | | (1.1 | ) |
2007 | | 1.2 | | 5.5 | | 3.1 | | 5.7 | | 7.6 | | 2.3 | | 2.5 | | 3.0 | | (0.5 | ) |
2008 | | 1.4 | | 3.5 | | 1.1 | | 3.5 | | 6.4 | | (11.6 | ) | 2.0 | | 1.6 | | 0.3 | |
2009 | | 1.4 | | (3.9 | ) | (2.5 | ) | (1.1 | ) | (12.1 | ) | (12.1 | ) | 1.1 | | (2.2 | ) | 3.1 | |
2010 | | 1.3 | | 5.1 | | 3.3 | | 2.9 | | 6.9 | | 14.7 | | 1.3 | | 1.4 | | (0.1 | ) |
2011 | | 0.7 | | 5.6 | | 2.8 | | 5.4 | | 3.7 | | 1.8 | | 0.2 | | 0.2 | | (0.1 | ) |
2012 | | 1.0 | | 2.3 | | 2.4 | | 4.0 | | 9.2 | | 0.7 | | 0.8 | | 1.6 | | (0.7 | ) |
2013 | | 0.9 | | 3.2 | | 1.9 | | 5.0 | | 0.2 | | 3.7 | | (0.1 | ) | 0.1 | | (0.2 | ) |
2014 | | 1.1 | | — | | — | | — | | — | | 8.5 | | 0.0 | | 0.6 | | (0.5 | ) |
1 As at July 1. Data take into account adjustments made for net census undercount in 1996, 2001, 2006, 2011 and non-permanent residents.
2 Annual unemployment rate expressed as percentage point difference.
Sources: Statistics Canada (CANSIM tables 051-0005, 384-0038, 384-0040, 282-0002 - accessed May 2015) and BC Stats, based on federal, provincial and industry data.
2015 Financial and Economic Review — July 2015
66
Appendix 1 — Economic Review
Table A1.1B Prices, Earnings and Financial Indicators
| | | | | | | | | | Primary | | Household | | | | | | | |
| | | | | | Average | | Compensation | | household | | disposable | | | | | | Conventional | |
| | BC | | Vancouver | | weekly | | of | | income | | income | | Prime | | Can/US | | (5 year) | |
| | CPI | | CPI | | wage rate1 | | employees | | per capita | | per capita | | rate | | exchange rate | | mortgage rate | |
| | (2002=100) | | (2002=100) | | ($) | | ($ millions) | | (current $) | | (current $) | | (per cent) | | (US cents) | | (per cent)2 | |
1982 | | 57.3 | | 56.6 | | — | | 26,380 | | 11,963 | | 10,675 | | 15.8 | | 81.1 | | 18.0 | |
1983 | | 60.4 | | 59.7 | | — | | 26,834 | | 11,900 | | 10,687 | | 11.2 | | 81.1 | | 13.2 | |
1984 | | 62.8 | | 62.1 | | — | | 27,748 | | 12,300 | | 11,254 | | 12.1 | | 77.2 | | 13.6 | |
1985 | | 64.8 | | 64.0 | | — | | 29,303 | | 13,077 | | 11,922 | | 10.6 | | 73.2 | | 12.1 | |
1986 | | 66.7 | | 66.2 | | — | | 30,408 | | 13,697 | | 12,350 | | 10.5 | | 72.0 | | 11.2 | |
1987 | | 68.7 | | 68.2 | | — | | 33,177 | | 14,714 | | 13,156 | | 9.5 | | 75.4 | | 11.2 | |
1988 | | 71.2 | | 70.6 | | — | | 36,537 | | 15,957 | | 14,092 | | 10.8 | | 81.3 | | 11.6 | |
1989 | | 74.4 | | 73.8 | | — | | 40,711 | | 17,475 | | 15,343 | | 13.3 | | 84.5 | | 12.1 | |
1990 | | 78.4 | | 77.8 | | — | | 44,655 | | 18,772 | | 16,153 | | 14.1 | | 85.7 | | 13.4 | |
1991 | | 82.6 | | 81.9 | | — | | 46,771 | | 19,047 | | 16,572 | | 9.9 | | 87.3 | | 11.1 | |
1992 | | 84.8 | | 84.3 | | — | | 49,429 | | 19,357 | | 16,759 | | 7.5 | | 82.7 | | 9.5 | |
1993 | | 87.8 | | 87.3 | | — | | 51,780 | | 19,552 | | 17,161 | | 5.9 | | 77.5 | | 8.8 | |
1994 | | 89.5 | | 89.1 | | — | | 54,489 | | 19,937 | | 17,343 | | 6.9 | | 73.2 | | 9.5 | |
1995 | | 91.6 | | 91.3 | | — | | 57,211 | | 20,414 | | 17,575 | | 8.6 | | 72.9 | | 9.2 | |
1996 | | 92.4 | | 92.1 | | — | | 58,683 | | 20,483 | | 17,486 | | 6.1 | | 73.3 | | 7.9 | |
1997 | | 93.1 | | 92.6 | | 612.55 | | 60,603 | | 20,778 | | 17,665 | | 5.0 | | 72.2 | | 7.1 | |
1998 | | 93.4 | | 93.0 | | 620.99 | | 62,068 | | 21,153 | | 17,904 | | 6.6 | | 67.4 | | 6.9 | |
1999 | | 94.4 | | 93.9 | | 628.12 | | 63,939 | | 21,873 | | 18,728 | | 6.4 | | 67.3 | | 7.6 | |
2000 | | 96.1 | | 96.0 | | 639.18 | | 68,507 | | 22,884 | | 19,379 | | 7.3 | | 67.3 | | 8.4 | |
2001 | | 97.7 | | 97.8 | | 648.27 | | 70,204 | | 23,311 | | 20,019 | | 5.8 | | 64.6 | | 7.4 | |
2002 | | 100.0 | | 100.0 | | 668.48 | | 73,345 | | 24,159 | | 21,133 | | 4.2 | | 63.7 | | 7.0 | |
2003 | | 102.2 | | 102.0 | | 683.79 | | 75,985 | | 24,891 | | 21,705 | | 4.7 | | 71.4 | | 6.4 | |
2004 | | 104.2 | | 104.0 | | 687.32 | | 81,052 | | 26,336 | | 22,783 | | 4.0 | | 76.8 | | 6.2 | |
2005 | | 106.3 | | 106.0 | | 704.05 | | 86,160 | | 27,789 | | 23,727 | | 4.4 | | 82.5 | | 6.0 | |
2006 | | 108.1 | | 108.0 | | 725.69 | | 94,491 | | 30,115 | | 25,737 | | 5.8 | | 88.2 | | 6.7 | |
2007 | | 110.0 | | 110.2 | | 748.41 | | 99,458 | | 31,458 | | 26,827 | | 6.1 | | 93.1 | | 7.1 | |
2008 | | 112.3 | | 112.8 | | 779.76 | | 103,598 | | 32,123 | | 28,099 | | 4.7 | | 93.7 | | 7.1 | |
2009 | | 112.3 | | 112.9 | | 801.18 | | 101,327 | | 31,314 | | 27,963 | | 2.4 | | 87.6 | | 5.6 | |
2010 | | 113.8 | | 114.9 | | 820.49 | | 103,719 | | 31,821 | | 28,580 | | 2.6 | | 97.1 | | 5.6 | |
2011 | | 116.5 | | 117.5 | | 838.19 | | 108,964 | | 33,297 | | 29,626 | | 3.0 | | 101.1 | | 5.4 | |
2012 | | 117.8 | | 119.0 | | 853.48 | | 112,943 | | 34,286 | | 30,425 | | 3.0 | | 100.1 | | 5.3 | |
2013 | | 117.7 | | 119.2 | | 879.80 | | 117,444 | | 35,678 | | 31,647 | | 3.0 | | 97.1 | | 5.2 | |
2014 | | 118.9 | | 120.5 | | 882.22 | | n/a | | n/a | | n/a | | 3.0 | | 90.5 | | 4.9 | |
| | | | | | | | | | | | | | | | | | | |
(annual percentage change)3 | |
1983 | | 5.4 | | 5.5 | | — | | 1.7 | | (0.5 | ) | 0.1 | | (4.6 | ) | 0.1 | | (4.8 | ) |
1984 | | 4.0 | | 4.0 | | — | | 3.4 | | 3.4 | | 5.3 | | 0.9 | | (3.9 | ) | 0.4 | |
1985 | | 3.2 | | 3.1 | | — | | 5.6 | | 6.3 | | 5.9 | | (1.5 | ) | (4.0 | ) | (1.5 | ) |
1986 | | 2.9 | | 3.4 | | — | | 3.8 | | 4.7 | | 3.6 | | (0.1 | ) | (1.3 | ) | (0.9 | ) |
1987 | | 3.0 | | 3.0 | | — | | 9.1 | | 7.4 | | 6.5 | | (1.0 | ) | 3.4 | | (0.0 | ) |
1988 | | 3.6 | | 3.5 | | — | | 10.1 | | 8.4 | | 7.1 | | 1.3 | | 5.8 | | 0.5 | |
1989 | | 4.5 | | 4.5 | | — | | 11.4 | | 9.5 | | 8.9 | | 2.5 | | 3.2 | | 0.4 | |
1990 | | 5.4 | | 5.4 | | — | | 9.7 | | 7.4 | | 5.3 | | 0.7 | | 1.2 | | 1.3 | |
1991 | | 5.4 | | 5.3 | | — | | 4.7 | | 1.5 | | 2.6 | | (4.1 | ) | 1.6 | | (2.2 | ) |
1992 | | 2.7 | | 2.9 | | — | | 5.7 | | 1.6 | | 1.1 | | (2.5 | ) | (4.5 | ) | (1.6 | ) |
1993 | | 3.5 | | 3.6 | | — | | 4.8 | | 1.0 | | 2.4 | | (1.5 | ) | (5.2 | ) | (0.7 | ) |
1994 | | 1.9 | | 2.1 | | — | | 5.2 | | 2.0 | | 1.1 | | 0.9 | | (4.3 | ) | 0.8 | |
1995 | | 2.3 | | 2.5 | | — | | 5.0 | | 2.4 | | 1.3 | | 1.8 | | (0.4 | ) | (0.4 | ) |
1996 | | 0.9 | | 0.9 | | — | | 2.6 | | 0.3 | | (0.5 | ) | (2.6 | ) | 0.5 | | (1.2 | ) |
1997 | | 0.8 | | 0.5 | | — | | 3.3 | | 1.4 | | 1.0 | | (1.1 | ) | (1.1 | ) | (0.9 | ) |
1998 | | 0.3 | | 0.4 | | 1.4 | | 2.4 | | 1.8 | | 1.4 | | 1.6 | | (4.8 | ) | (0.1 | ) |
1999 | | 1.1 | | 1.0 | | 1.1 | | 3.0 | | 3.4 | | 4.6 | | (0.2 | ) | (0.1 | ) | 0.6 | |
2000 | | 1.8 | | 2.2 | | 1.8 | | 7.1 | | 4.6 | | 3.5 | | 0.8 | | 0.0 | | 0.8 | |
2001 | | 1.7 | | 1.9 | | 1.4 | | 2.5 | | 1.9 | | 3.3 | | (1.5 | ) | (2.8 | ) | (0.9 | ) |
2002 | | 2.4 | | 2.2 | | 3.1 | | 4.5 | | 3.6 | | 5.6 | | (1.6 | ) | (0.9 | ) | (0.4 | ) |
2003 | | 2.2 | | 2.0 | | 2.3 | | 3.6 | | 3.0 | | 2.7 | | 0.5 | | 7.7 | | (0.6 | ) |
2004 | | 2.0 | | 2.0 | | 0.5 | | 6.7 | | 5.8 | | 5.0 | | (0.7 | ) | 5.5 | | (0.2 | ) |
2005 | | 2.0 | | 1.9 | | 2.4 | | 6.3 | | 5.5 | | 4.1 | | 0.4 | | 5.7 | | (0.2 | ) |
2006 | | 1.7 | | 1.9 | | 3.1 | | 9.7 | | 8.4 | | 8.5 | | 1.4 | | 5.6 | | 0.7 | |
2007 | | 1.8 | | 2.0 | | 3.1 | | 5.3 | | 4.5 | | 4.2 | | 0.3 | | 4.9 | | 0.4 | |
2008 | | 2.1 | | 2.4 | | 4.2 | | 4.2 | | 2.1 | | 4.7 | | (1.4 | ) | 0.6 | | (0.0 | ) |
2009 | | — | | 0.1 | | 2.7 | | (2.2 | ) | (2.5 | ) | (0.5 | ) | (2.3 | ) | (6.1 | ) | (1.4 | ) |
2010 | | 1.3 | | 1.8 | | 2.4 | | 2.4 | | 1.6 | | 2.2 | | 0.2 | | 9.5 | | (0.0 | ) |
2011 | | 2.4 | | 2.3 | | 2.2 | | 5.1 | | 4.6 | | 3.7 | | 0.4 | | 4.0 | | (0.2 | ) |
2012 | | 1.1 | | 1.3 | | 1.8 | | 3.7 | | 3.0 | | 2.7 | | — | | (1.0 | ) | (0.1 | ) |
2013 | | (0.1 | ) | 0.1 | | 3.1 | | 4.0 | | 4.1 | | 4.0 | | — | | (3.0 | ) | (0.1 | ) |
2014 | | 1.0 | | 1.1 | | 0.3 | | — | | — | | — | | — | | (6.6 | ) | (0.3 | ) |
1 Data prior to 1997 are not available.
2 The most typical of those offered by the major chartered banks
3 Prime rate, exchange rate and conventional (5 year) mortgage rates expressed as percentage point difference.
Sources: Statistics Canada (CANSIM tables 326-0020, 282-0072, 384-0040, 176-0043, 176-0064 - accessed May 2015) and BC Stats, based on federal, provincial and industry data.
2015 Financial and Economic Review — July 2015
67
Appendix 1 — Economic Review
Table A1.1C Other Indicators
| | Manufacturing | | | | Housing | | Non-residential | | Tourism | | High-tech | | BC product | |
| | shipments | | Retail sales | | starts | | building permits | | GDP1 | | GDP1 | | exports | |
| | ($ millions) | | ($ millions) | | (number) | | ($ millions) | | ($ millions) | | ($ millions) | | ($ millions) | |
1982 | | — | | — | | 19,807 | | 1,026 | | — | | — | | 12,353 | |
1983 | | — | | — | | 22,607 | | 775 | | — | | — | | 13,244 | |
1984 | | — | | — | | 16,169 | | 827 | | — | | — | | 15,748 | |
1985 | | — | | — | | 17,969 | | 812 | | — | | — | | 13,591 | |
1986 | | — | | — | | 20,687 | | 912 | | — | | — | | 13,033 | |
1987 | | — | | — | | 28,944 | | 999 | | — | | — | | 15,883 | |
1988 | | — | | — | | 30,487 | | 1,647 | | — | | — | | 17,405 | |
1989 | | — | | — | | 38,894 | | 1,812 | | — | | — | | 17,775 | |
1990 | | — | | — | | 36,720 | | 1,833 | | — | | — | | 16,607 | |
1991 | | — | | 25,022 | | 31,875 | | 1,803 | | — | | — | | 15,253 | |
1992 | | 24,398 | | 26,194 | | 40,621 | | 2,082 | | — | | — | | 16,336 | |
1993 | | 26,583 | | 28,463 | | 42,807 | | 1,944 | | — | | — | | 19,034 | |
1994 | | 30,333 | | 31,770 | | 39,408 | | 1,772 | | — | | — | | 22,856 | |
1995 | | 34,207 | | 34,219 | | 27,057 | | 1,966 | | — | | — | | 26,874 | |
1996 | | 32,932 | | 34,775 | | 27,641 | | 1,957 | | — | | — | | 25,717 | |
1997 | | 33,496 | | 36,591 | | 29,351 | | 1,960 | | — | | — | | 26,699 | |
1998 | | 31,757 | | 35,762 | | 19,931 | | 2,022 | | — | | — | | 25,942 | |
1999 | | 36,679 | | 36,373 | | 16,309 | | 2,104 | | — | | — | | 29,044 | |
2000 | | 40,699 | | 38,435 | | 14,418 | | 2,089 | | — | | — | | 33,640 | |
2001 | | 38,303 | | 40,719 | | 17,234 | | 2,125 | | — | | — | | 31,680 | |
2002 | | 38,610 | | 43,265 | | 21,625 | | 1,771 | | — | | — | | 28,828 | |
2003 | | 39,772 | | 44,421 | | 26,174 | | 1,880 | | — | | — | | 28,265 | |
2004 | | 41,607 | | 47,219 | | 32,925 | | 2,070 | | — | | — | | 31,008 | |
2005 | | 42,883 | | 49,380 | | 34,667 | | 3,212 | | — | | — | | 34,167 | |
2006 | | 44,480 | | 53,136 | | 36,443 | | 3,921 | | — | | — | | 33,466 | |
2007 | | 42,418 | | 56,936 | | 39,195 | | 3,933 | | 6,835 | | 11,665 | | 31,524 | |
2008 | | 39,435 | | 57,794 | | 34,321 | | 3,678 | | 6,845 | | 11,879 | | 33,124 | |
2009 | | 32,964 | | 55,288 | | 16,077 | | 3,139 | | 6,805 | | 11,602 | | 25,240 | |
2010 | | 35,702 | | 58,251 | | 26,479 | | 3,018 | | 7,285 | | 11,955 | | 28,646 | |
2011 | | 38,226 | | 60,090 | | 26,400 | | 3,136 | | 7,470 | | 12,790 | | 32,671 | |
2012 | | 38,914 | | 61,255 | | 27,465 | | 4,048 | | 7,620 | | 13,297 | | 31,484 | |
2013 | | 40,118 | | 62,734 | | 27,054 | | 3,108 | | 7,850 | | 13,920 | | 33,426 | |
2014 | | 42,818 | | 66,273 | | 28,356 | | 3,729 | | n/a | | n/a | | 35,790 | |
| |
(annual percentage change) | |
1983 | | — | | — | | 14.1 | | (24.5 | ) | — | | — | | 7.2 | |
1984 | | — | | — | | (28.5 | ) | 6.7 | | — | | — | | 18.9 | |
1985 | | — | | — | | 11.1 | | (1.7 | ) | — | | — | | (13.7 | ) |
1986 | | — | | — | | 15.1 | | 12.3 | | — | | — | | (4.1 | ) |
1987 | | — | | — | | 39.9 | | 9.6 | | — | | — | | 21.9 | |
1988 | | — | | — | | 5.3 | | 64.9 | | — | | — | | 9.6 | |
1989 | | — | | — | | 27.6 | | 10.0 | | — | | — | | 2.1 | |
1990 | | — | | — | | (5.6 | ) | 1.2 | | — | | — | | (6.6 | ) |
1991 | | — | | — | | (13.2 | ) | (1.6 | ) | — | | — | | (8.2 | ) |
1992 | | — | | 4.7 | | 27.4 | | 15.5 | | — | | — | | 7.1 | |
1993 | | 9.0 | | 8.7 | | 5.4 | | (6.7 | ) | — | | — | | 16.5 | |
1994 | | 14.1 | | 11.6 | | (7.9 | ) | (8.9 | ) | — | | — | | 20.1 | |
1995 | | 12.8 | | 7.7 | | (31.3 | ) | 11.0 | | — | | — | | 17.6 | |
1996 | | (3.7 | ) | 1.6 | | 2.2 | | (0.4 | ) | — | | — | | (4.3 | ) |
1997 | | 1.7 | | 5.2 | | 6.2 | | 0.1 | | — | | — | | 3.8 | |
1998 | | (5.2 | ) | (2.3 | ) | (32.1 | ) | 3.2 | | — | | — | | (2.8 | ) |
1999 | | 15.5 | | 1.7 | | (18.2 | ) | 4.0 | | — | | — | | 12.0 | |
2000 | | 11.0 | | 5.7 | | (11.6 | ) | (0.7 | ) | — | | — | | 15.8 | |
2001 | | (5.9 | ) | 5.9 | | 19.5 | | 1.7 | | — | | — | | (5.8 | ) |
2002 | | 0.8 | | 6.3 | | 25.5 | | (16.6 | ) | — | | — | | (9.0 | ) |
2003 | | 3.0 | | 2.7 | | 21.0 | | 6.1 | | — | | — | | (2.0 | ) |
2004 | | 4.6 | | 6.3 | | 25.8 | | 10.1 | | — | | — | | 9.7 | |
2005 | | 3.1 | | 4.6 | | 5.3 | | 55.2 | | — | | — | | 10.2 | |
2006 | | 3.7 | | 7.6 | | 5.1 | | 22.1 | | — | | — | | (2.1 | ) |
2007 | | (4.6 | ) | 7.2 | | 7.6 | | 0.3 | | — | | — | | (5.8 | ) |
2008 | | (7.0 | ) | 1.5 | | (12.4 | ) | (6.5 | ) | 0.1 | | 1.8 | | 5.1 | |
2009 | | (16.4 | ) | (4.3 | ) | (53.2 | ) | (14.7 | ) | (0.6 | ) | (2.3 | ) | (23.8 | ) |
2010 | | 8.3 | | 5.4 | | 64.7 | | (3.9 | ) | 7.1 | | 3.0 | | 13.5 | |
2011 | | 7.1 | | 3.2 | | (0.3 | ) | 3.9 | | 2.5 | | 7.0 | | 14.1 | |
2012 | | 1.8 | | 1.9 | | 4.0 | | 29.1 | | 2.0 | | 4.0 | | (3.6 | ) |
2013 | | 3.1 | | 2.4 | | (1.5 | ) | (23.2 | ) | 3.0 | | 4.7 | | 6.2 | |
2014 | | 6.7 | | 5.6 | | 4.8 | | 20.0 | | — | | — | | 7.1 | |
1 Data prior to 2007 are not available.
Sources: Statistics Canada (CANSIM Tables 304-0015, 080-0020, 027-0008, 026-0003 - accessed May 2015) and BC Stats, based on federal, provincial and industry data.
2015 Financial and Economic Review — July 2015
68
Appendix 1 — Economic Review
Table A1.1D Commodity Production Indicators
| | Lumber | | Timber scale | | Pulp | | Newsprint, etc | | Oil & natural | | Coal | | Solid mineral | | Electric pwr | | Farm cash | | Landed value of | |
| | production | | data | | shipments | | production | | gas production | | production | | shipments | | generated | | receipts | | seafood products | |
| | (thousand m3) | | (thousand m3) | | (000 tonnes) | �� | (000 tonnes) | | ($ millions) | | (000 tonnes) | | ($ millions) | | (GW.h) | | ($ millions) | | ($ millions) | |
1982 | | 23,855 | | — | | 2,662 | | 1,862 | | — | | 11,769 | | 2,037 | | 48,238 | | 962 | | 241 | |
1983 | | 30,773 | | — | | 3,221 | | 2,120 | | — | | 11,717 | | 2,078 | | 47,213 | | 917 | | 210 | |
1984 | | 30,884 | | — | | 2,836 | | 2,082 | | — | | 20,771 | | 2,429 | | 52,369 | | 1,005 | | 243 | |
1985 | | 32,994 | | 76,869 | | 3,298 | | 2,481 | | — | | 22,993 | | 2,524 | | 59,126 | | 1,061 | | 378 | |
1986 | | 31,468 | | 77,503 | | 3,628 | | 2,629 | | — | | 20,361 | | 2,512 | | 50,759 | | 1,106 | | 405 | |
1987 | | 37,336 | | 90,592 | | 4,136 | | 2,762 | | — | | 21,990 | | 2,896 | | 63,066 | | 1,122 | | 455 | |
1988 | | 36,736 | | 86,808 | | 4,141 | | 2,845 | | — | | 24,942 | | 3,325 | | 60,943 | | 1,206 | | 573 | |
1989 | | 35,952 | | 86,793 | | 4,189 | | 2,834 | | 585 | | 24,800 | | 3,344 | | 57,655 | | 1,255 | | 513 | |
1990 | | 33,514 | | 78,045 | | 3,547 | | 2,992 | | 902 | | 24,557 | | 3,092 | | 60,662 | | 1,299 | | 559 | |
1991 | | 31,406 | | 73,449 | | 4,014 | | 2,667 | | 858 | | 24,965 | | 2,950 | | 62,981 | | 1,342 | | 492 | |
1992 | | 33,396 | | 73,937 | | 3,825 | | 2,708 | | 890 | | 17,173 | | 2,577 | | 64,058 | | 1,404 | | 533 | |
1993 | | 33,935 | | 79,232 | | 4,040 | | 3,110 | | 1,089 | | 20,633 | | 2,415 | | 58,774 | | 1,446 | | 605 | |
1994 | | 33,671 | | 75,639 | | 4,763 | | 2,983 | | 1,270 | | 22,583 | | 2,632 | | 61,015 | | 1,538 | | 728 | |
1995 | | 32,611 | | 75,430 | | 4,572 | | 2,833 | | 1,040 | | 24,350 | | 3,438 | | 58,006 | | 1,586 | | 604 | |
1996 | | 32,671 | | 73,099 | | 4,390 | | 2,801 | | 1,333 | | 25,422 | | 3,004 | | 71,765 | | 1,706 | | 590 | |
1997 | | 31,562 | | 69,155 | | 4,532 | | 2,649 | | 1,588 | | 27,876 | | 3,047 | | 66,961 | | 1,738 | | 604 | |
1998 | | 30,238 | | 65,451 | | 4,462 | | 2,567 | | 1,574 | | 24,868 | | 2,893 | | 67,710 | | 1,780 | | 547 | |
1999 | | 32,397 | | 75,878 | | 4,995 | | 3,016 | | 2,091 | | 24,845 | | 2,445 | | 68,045 | | 1,885 | | 613 | |
2000 | | 34,346 | | 76,009 | | 5,152 | | 3,126 | | 4,783 | | 25,682 | | 2,891 | | 68,241 | | 2,024 | | 667 | |
2001 | | 32,606 | | 69,796 | | 4,710 | | 2,879 | | 5,666 | | 27,006 | | 2,867 | | 57,332 | | 2,201 | | 647 | |
2002 | | 35,501 | | 75,208 | | 4,477 | | 2,900 | | 4,251 | | 24,397 | | 2,864 | | 64,945 | | 2,174 | | 664 | |
2003 | | 36,052 | | 74,899 | | 4,762 | | 2,919 | | 6,230 | | 23,073 | | 2,887 | | 63,051 | | 2,248 | | 645 | |
2004 | | 39,951 | | 81,679 | | 4,724 | | 2,976 | | 6,784 | | 27,313 | | 3,740 | | 60,496 | | 2,360 | | 635 | |
2005 | | 41,129 | | 83,590 | | 4,932 | | 2,953 | | 8,967 | | 26,718 | | 5,384 | | 67,811 | | 2,389 | | 706 | |
2006 | | 41,198 | | 80,350 | | 4,736 | | 3,019 | | 7,148 | | 23,161 | | 5,991 | | 62,021 | | 2,346 | | 788 | |
2007 | | 36,811 | | 72,684 | | 4,717 | | 2,763 | | 6,912 | | 25,941 | | 5,611 | | 72,217 | | 2,381 | | 727 | |
2008 | | 28,263 | | 61,137 | | 4,021 | | 2,514 | | 9,240 | | 26,163 | | 7,403 | | 65,854 | | 2,522 | | 718 | |
2009 | | 22,935 | | 48,822 | | 3,708 | | 2,021 | | 4,129 | | 21,193 | | 5,622 | | 62,201 | | 2,525 | | 700 | |
2010 | | 26,831 | | 63,336 | | 4,277 | | 1,677 | | 4,433 | | 26,040 | | 7,166 | | 59,477 | | 2,505 | | 873 | |
2011 | | 28,414 | | 69,574 | | 4,491 | | 1,539 | | 4,835 | | 27,431 | | 8,982 | | 66,205 | | 2,605 | | 813 | |
2012 | | 29,164 | | 68,135 | | 4,486 | | 1,453 | | 3,386 | | 28,777 | | 7,826 | | 69,783 | | 2,752 | | 669 | |
2013 | | 30,023 | | 71,004 | | 4,210 | | 1,413 | | 4,671 | | 31,132 | | 7,112 | | 63,707 | | 2,792 | | n/a | |
2014 | | 29,812 | | 66,058 | | 4,113 | | 1,424 | | 6,972 | | x | | 6,984 | | 59,814 | | 2,920 | | n/a | |
| | | | | | | | | | | | | | | | | | | | | |
(annual percentage change) | |
1983 | | 29.0 | | — | | 21.0 | | 13.9 | | — | | (0.4 | ) | 2.0 | | (2.1 | ) | (4.7 | ) | (12.9 | ) |
1984 | | 0.4 | | — | | (12.0 | ) | (1.8 | ) | — | | 77.3 | | 16.9 | | 10.9 | | 9.6 | | 15.7 | |
1985 | | 6.8 | | — | | 16.3 | | 19.2 | | — | | 10.7 | | 3.9 | | 12.9 | | 5.7 | | 55.6 | |
1986 | | (4.6 | ) | 0.8 | | 10.0 | | 6.0 | | — | | (11.4 | ) | (0.5 | ) | (14.2 | ) | 4.2 | | 7.1 | |
1987 | | 18.6 | | 16.9 | | 14.0 | | 5.1 | | — | | 8.0 | | 15.3 | | 24.2 | | 1.4 | | 12.3 | |
1988 | | (1.6 | ) | (4.2 | ) | 0.1 | | 3.0 | | — | | 13.4 | | 14.8 | | (3.4 | ) | 7.6 | | 25.9 | |
1989 | | (2.1 | ) | (0.0 | ) | 1.2 | | (0.4 | ) | — | | (0.6 | ) | 0.6 | | (5.4 | ) | 4.0 | | (10.5 | ) |
1990 | | (6.8 | ) | (10.1 | ) | (15.3 | ) | 5.5 | | 54.0 | | (1.0 | ) | (7.5 | ) | 5.2 | | 3.5 | | 9.0 | |
1991 | | (6.3 | ) | (5.9 | ) | 13.2 | | (10.8 | ) | (4.8 | ) | 1.7 | | (4.6 | ) | 3.8 | | 3.3 | | (12.0 | ) |
1992 | | 6.3 | | 0.7 | | (4.7 | ) | 1.5 | | 3.7 | | (31.2 | ) | (12.6 | ) | 1.7 | | 4.7 | | 8.3 | |
1993 | | 1.6 | | 7.2 | | 5.6 | | 14.8 | | 22.4 | | 20.1 | | (6.3 | ) | (8.2 | ) | 3.0 | | 13.5 | |
1994 | | (0.8 | ) | (4.5 | ) | 17.9 | | (4.1 | ) | 16.6 | | 9.5 | | 9.0 | | 3.8 | | 6.4 | | 20.3 | |
1995 | | (3.1 | ) | (0.3 | ) | (4.0 | ) | (5.0 | ) | (18.1 | ) | 7.8 | | 30.6 | | (4.9 | ) | 3.1 | | (17.0 | ) |
1996 | | 0.2 | | (3.1 | ) | (4.0 | ) | (1.1 | ) | 28.2 | | 4.4 | | (12.6 | ) | 23.7 | | 7.6 | | (2.3 | ) |
1997 | | (3.4 | ) | (5.4 | ) | 3.2 | | (5.4 | ) | 19.1 | | 9.7 | | 1.4 | | (6.7 | ) | 1.9 | | 2.4 | |
1998 | | (4.2 | ) | (5.4 | ) | (1.5 | ) | (3.1 | ) | (0.9 | ) | (10.8 | ) | (5.1 | ) | 1.1 | | 2.4 | | (9.4 | ) |
1999 | | 7.1 | | 15.9 | | 11.9 | | 17.5 | | 32.8 | | (0.1 | ) | (15.5 | ) | 0.5 | | 5.9 | | 12.1 | |
2000 | | 6.0 | | 0.2 | | 3.1 | | 3.6 | | 128.7 | | 3.4 | | 18.2 | | 0.3 | | 7.4 | | 8.8 | |
2001 | | (5.1 | ) | (8.2 | ) | (8.6 | ) | (7.9 | ) | 18.5 | | 5.2 | | (0.8 | ) | (16.0 | ) | 8.7 | | (3.0 | ) |
2002 | | 8.9 | | 7.8 | | (4.9 | ) | 0.7 | | (25.0 | ) | (9.7 | ) | (0.1 | ) | 13.3 | | (1.2 | ) | 2.6 | |
2003 | | 1.6 | | (0.4 | ) | 6.4 | | 0.7 | | 46.6 | | (5.4 | ) | 0.8 | | (2.9 | ) | 3.4 | | (2.9 | ) |
2004 | | 10.8 | | 9.1 | | (0.8 | ) | 2.0 | | 8.9 | | 18.4 | | 29.5 | | (4.1 | ) | 5.0 | | (1.6 | ) |
2005 | | 2.9 | | 2.3 | | 4.4 | | (0.8 | ) | 32.2 | | (2.2 | ) | 44.0 | | 12.1 | | 1.3 | | 11.2 | |
2006 | | 0.2 | | (3.9 | ) | (4.0 | ) | 2.2 | | (20.3 | ) | (13.3 | ) | 11.3 | | (8.5 | ) | (1.8 | ) | 11.6 | |
2007 | | (10.6 | ) | (9.5 | ) | (0.4 | ) | (8.5 | ) | (3.3 | ) | 12.0 | | (6.3 | ) | 16.4 | | 1.5 | | (7.7 | ) |
2008 | | (23.2 | ) | (15.9 | ) | (14.8 | ) | (9.0 | ) | 33.7 | | 0.9 | | 31.9 | | (8.8 | ) | 5.9 | | (1.2 | ) |
2009 | | (18.9 | ) | (20.1 | ) | (7.8 | ) | (19.6 | ) | (55.3 | ) | (19.0 | ) | (24.1 | ) | (5.5 | ) | 0.1 | | (2.5 | ) |
2010 | | 17.0 | | 29.7 | | 15.3 | | (17.0 | ) | 7.4 | | 22.9 | | 27.5 | | (4.4 | ) | (0.8 | ) | 24.8 | |
2011 | | 5.9 | | 9.8 | | 5.0 | | (8.2 | ) | 9.1 | | 5.3 | | 25.3 | | 11.3 | | 4.0 | | (7.0 | ) |
2012 | | 2.6 | | (2.1 | ) | (0.1 | ) | (5.6 | ) | (30.0 | ) | 4.9 | | (12.9 | ) | 5.4 | | 5.7 | | (17.7 | ) |
2013 | | 2.9 | | 4.2 | | (6.2 | ) | (2.8 | ) | 38.0 | | 8.2 | | (9.1 | ) | (8.7 | ) | 1.4 | | — | |
2014 | | (0.7 | ) | (7.0 | ) | (2.3 | ) | 0.8 | | 49.3 | | x | | (1.8 | ) | (6.1 | ) | 4.6 | | n/a | |
Sources: Statistics Canada (CANSIM Tables 303-0064, 135-0002, 127-0003, 002-0002 - accessed May 2015), Ministry of Forests, Lands and Natural Resource Operations, Ministry of Environment, Ministry of Natural Gas Development, Natural Resources Canada and BC Stats, based on federal, provincial and industry data.
x Suppressed to meet the confidentiality requirements of the Statistics Act.
2015 Financial and Economic Review — July 2015
69
Appendix 1 — Economic Review
Table A1.2 British Columbia Real GDP at Market Prices, Expenditure Based
| | | | General | | | | | | | | | | | | | | | | | |
| | Household | | Governments | | | | | | | | | | Business | | | | | | | |
| | Final | | Final | | | | Non- | | Machinery | | Intellectual | | Gross Fixed | | | | | | | |
| | Consumption | | Consumption | | Residential | | residential | | and | | Property | | Capital | | | | | | | |
| | Expenditure | | Expenditure | | Structures | | Structures | | Equipment | | Products | | Formation | | Exports | | Imports | | Real GDP | |
(millions of 2007 $, chained) | |
1982 | | 50,602 | | 23,166 | | 5,932 | | 7,030 | | 1,947 | | 429 | | 14,379 | | 29,076 | | 26,308 | | 93,159 | |
1983 | | 50,844 | | 23,066 | | 6,293 | | 7,483 | | 1,450 | | 463 | | 13,852 | | 30,621 | | 28,244 | | 93,751 | |
1984 | | 52,180 | | 22,682 | | 5,982 | | 6,483 | | 1,557 | | 554 | | 13,230 | | 32,848 | | 30,611 | | 94,582 | |
1985 | | 54,148 | | 23,137 | | 6,468 | | 6,095 | | 1,761 | | 589 | | 13,777 | | 36,079 | | 31,579 | | 101,117 | |
1986 | | 55,262 | | 23,489 | | 7,125 | | 4,742 | | 1,677 | | 575 | | 13,006 | | 37,977 | | 32,729 | | 101,840 | |
1987 | | 58,295 | | 23,786 | | 8,477 | | 4,971 | | 2,051 | | 625 | | 15,019 | | 41,204 | | 35,541 | | 108,212 | |
1988 | | 61,169 | | 25,155 | | 9,446 | | 5,957 | | 2,752 | | 806 | | 18,140 | | 43,531 | | 38,506 | | 114,724 | |
1989 | | 64,732 | | 25,656 | | 10,871 | | 6,630 | | 3,303 | | 900 | | 20,933 | | 42,780 | | 42,111 | | 118,401 | |
1990 | | 67,444 | | 26,547 | | 11,059 | | 6,449 | | 3,337 | | 1,118 | | 21,224 | | 42,350 | | 43,948 | | 120,153 | |
1991 | | 67,791 | | 28,221 | | 10,446 | | 6,817 | | 3,421 | | 1,123 | | 21,166 | | 42,996 | | 44,429 | | 120,424 | |
1992 | | 69,866 | | 29,234 | | 12,842 | | 5,327 | | 3,415 | | 1,120 | | 22,043 | | 45,300 | | 46,572 | | 123,754 | |
1993 | | 72,057 | | 29,640 | | 13,165 | | 4,880 | | 3,314 | | 1,457 | | 22,142 | | 47,160 | | 46,243 | | 129,522 | |
1994 | | 74,989 | | 29,780 | | 13,240 | | 5,943 | | 3,764 | | 2,098 | | 24,354 | | 50,152 | | 53,431 | | 133,172 | |
1995 | | 77,310 | | 29,416 | | 11,641 | | 6,515 | | 3,846 | | 1,662 | | 23,124 | | 53,103 | | 54,059 | | 136,607 | |
1996 | | 80,127 | | 30,088 | | 11,821 | | 5,755 | | 3,940 | | 1,681 | | 22,841 | | 53,372 | | 53,740 | | 140,114 | |
1997 | | 83,132 | | 29,805 | | 12,401 | | 7,668 | | 4,359 | | 1,784 | | 25,704 | | 55,534 | | 57,606 | | 144,305 | |
1998 | | 84,242 | | 30,336 | | 10,735 | | 5,859 | | 4,821 | | 2,197 | | 23,937 | | 56,988 | | 57,059 | | 146,112 | |
1999 | | 86,386 | | 30,128 | | 9,961 | | 6,503 | | 4,843 | | 1,896 | | 23,600 | | 61,970 | | 60,562 | | 150,649 | |
2000 | | 89,108 | | 31,084 | | 10,022 | | 6,297 | | 5,250 | | 2,271 | | 24,492 | | 67,395 | | 65,228 | | 157,515 | |
2001 | | 91,071 | | 32,176 | | 11,033 | | 7,261 | | 5,158 | | 2,901 | | 26,721 | | 66,607 | | 65,338 | | 158,509 | |
2002 | | 94,286 | | 32,469 | | 12,860 | | 6,804 | | 5,019 | | 2,469 | | 27,151 | | 66,746 | | 65,387 | | 164,116 | |
2003 | | 97,725 | | 32,702 | | 13,853 | | 7,429 | | 5,032 | | 2,911 | | 29,065 | | 68,523 | | 68,962 | | 168,011 | |
2004 | | 102,095 | | 32,577 | | 16,236 | | 8,197 | | 5,655 | | 3,329 | | 33,173 | | 72,043 | | 74,399 | | 174,591 | |
2005 | | 106,254 | | 33,146 | | 17,412 | | 8,617 | | 6,800 | | 3,559 | | 36,303 | | 75,563 | | 78,862 | | 183,235 | |
2006 | | 112,489 | | 33,474 | | 18,663 | | 10,206 | | 7,886 | | 3,778 | | 40,503 | | 78,505 | | 85,087 | | 191,101 | |
2007 | | 118,260 | | 35,388 | | 19,077 | | 9,669 | | 8,625 | | 4,404 | | 41,775 | | 80,343 | | 89,824 | | 197,072 | |
2008 | | 121,109 | | 37,555 | | 18,035 | | 11,115 | | 8,619 | | 4,612 | | 42,400 | | 77,978 | | 90,381 | | 199,270 | |
2009 | | 121,407 | | 37,778 | | 16,202 | | 9,825 | | 6,542 | | 3,798 | | 36,374 | | 72,973 | | 84,234 | | 194,214 | |
2010 | | 125,798 | | 38,823 | | 16,524 | | 10,535 | | 7,710 | | 4,196 | | 38,971 | | 78,949 | | 91,576 | | 200,628 | |
2011 | | 128,665 | | 39,454 | | 17,139 | | 11,859 | | 7,956 | | 4,259 | | 41,272 | | 82,019 | | 94,921 | | 206,225 | |
2012 | | 131,333 | | 40,155 | | 18,407 | | 13,109 | | 8,603 | | 3,844 | | 44,024 | | 82,837 | | 98,649 | | 211,124 | |
2013 | | 134,641 | | 40,383 | | 18,373 | | 13,426 | | 7,982 | | 3,863 | | 43,808 | | 84,881 | | 99,448 | | 215,218 | |
2014 | | n/a | | n/a | | n/a | | n/a | | n/a | | n/a | | n/a | | n/a | | n/a | | n/a | |
| |
(annual percentage change) | |
1982 | | (5.2 | ) | 2.7 | | (25.8 | ) | (17.2 | ) | (18.7 | ) | (23.4 | ) | (20.7 | ) | (5.3 | ) | (12.2 | ) | (6.1 | ) |
1983 | | 0.5 | | (0.4 | ) | 6.1 | | 6.4 | | (25.5 | ) | 7.9 | | (3.7 | ) | 5.3 | | 7.4 | | 0.6 | |
1984 | | 2.6 | | (1.7 | ) | (4.9 | ) | (13.4 | ) | 7.4 | | 19.7 | | (4.5 | ) | 7.3 | | 8.4 | | 0.9 | |
1985 | | 3.8 | | 2.0 | | 8.1 | | (6.0 | ) | 13.1 | | 6.3 | | 4.1 | | 9.8 | | 3.2 | | 6.9 | |
1986 | | 2.1 | | 1.5 | | 10.2 | | (22.2 | ) | (4.8 | ) | (2.4 | ) | (5.6 | ) | 5.3 | | 3.6 | | 0.7 | |
1987 | | 5.5 | | 1.3 | | 19.0 | | 4.8 | | 22.3 | | 8.7 | | 15.5 | | 8.5 | | 8.6 | | 6.3 | |
1988 | | 4.9 | | 5.8 | | 11.4 | | 19.8 | | 34.2 | | 29.0 | | 20.8 | | 5.6 | | 8.3 | | 6.0 | |
1989 | | 5.8 | | 2.0 | | 15.1 | | 11.3 | | 20.0 | | 11.7 | | 15.4 | | (1.7 | ) | 9.4 | | 3.2 | |
1990 | | 4.2 | | 3.5 | | 1.7 | | (2.7 | ) | 1.0 | | 24.2 | | 1.4 | | (1.0 | ) | 4.4 | | 1.5 | |
1991 | | 0.5 | | 6.3 | | (5.5 | ) | 5.7 | | 2.5 | | 0.4 | | (0.3 | ) | 1.5 | | 1.1 | | 0.2 | |
1992 | | 3.1 | | 3.6 | | 22.9 | | (21.9 | ) | (0.2 | ) | (0.3 | ) | 4.1 | | 5.4 | | 4.8 | | 2.8 | |
1993 | | 3.1 | | 1.4 | | 2.5 | | (8.4 | ) | (3.0 | ) | 30.1 | | 0.4 | | 4.1 | | (0.7 | ) | 4.7 | |
1994 | | 4.1 | | 0.5 | | 0.6 | | 21.8 | | 13.6 | | 44.0 | | 10.0 | | 6.3 | | 15.5 | | 2.8 | |
1995 | | 3.1 | | (1.2 | ) | (12.1 | ) | 9.6 | | 2.2 | | (20.8 | ) | (5.1 | ) | 5.9 | | 1.2 | | 2.6 | |
1996 | | 3.6 | | 2.3 | | 1.5 | | (11.7 | ) | 2.4 | | 1.1 | | (1.2 | ) | 0.5 | | (0.6 | ) | 2.6 | |
1997 | | 3.8 | | (0.9 | ) | 4.9 | | 33.2 | | 10.6 | | 6.1 | | 12.5 | | 4.1 | | 7.2 | | 3.0 | |
1998 | | 1.3 | | 1.8 | | (13.4 | ) | (23.6 | ) | 10.6 | | 23.2 | | (6.9 | ) | 2.6 | | (0.9 | ) | 1.3 | |
1999 | | 2.5 | | (0.7 | ) | (7.2 | ) | 11.0 | | 0.5 | | (13.7 | ) | (1.4 | ) | 8.7 | | 6.1 | | 3.1 | |
2000 | | 3.2 | | 3.2 | | 0.6 | | (3.2 | ) | 8.4 | | 19.8 | | 3.8 | | 8.8 | | 7.7 | | 4.6 | |
2001 | | 2.2 | | 3.5 | | 10.1 | | 15.3 | | (1.8 | ) | 27.7 | | 9.1 | | (1.2 | ) | 0.2 | | 0.6 | |
2002 | | 3.5 | | 0.9 | | 16.6 | | (6.3 | ) | (2.7 | ) | (14.9 | ) | 1.6 | | 0.2 | | 0.1 | | 3.5 | |
2003 | | 3.6 | | 0.7 | | 7.7 | | 9.2 | | 0.3 | | 17.9 | | 7.0 | | 2.7 | | 5.5 | | 2.4 | |
2004 | | 4.5 | | (0.4 | ) | 17.2 | | 10.3 | | 12.4 | | 14.4 | | 14.1 | | 5.1 | | 7.9 | | 3.9 | |
2005 | | 4.1 | | 1.7 | | 7.2 | | 5.1 | | 20.2 | | 6.9 | | 9.4 | | 4.9 | | 6.0 | | 5.0 | |
2006 | | 5.9 | | 1.0 | | 7.2 | | 18.4 | | 16.0 | | 6.2 | | 11.6 | | 3.9 | | 7.9 | | 4.3 | |
2007 | | 5.1 | | 5.7 | | 2.2 | | (5.3 | ) | 9.4 | | 16.6 | | 3.1 | | 2.3 | | 5.6 | | 3.1 | |
2008 | | 2.4 | | 6.1 | | (5.5 | ) | 15.0 | | (0.1 | ) | 4.7 | | 1.5 | | (2.9 | ) | 0.6 | | 1.1 | |
2009 | | 0.2 | | 0.6 | | (10.2 | ) | (11.6 | ) | (24.1 | ) | (17.6 | ) | (14.2 | ) | (6.4 | ) | (6.8 | ) | (2.5 | ) |
2010 | | 3.6 | | 2.8 | | 2.0 | | 7.2 | | 17.9 | | 10.5 | | 7.1 | | 8.2 | | 8.7 | | 3.3 | |
2011 | | 2.3 | | 1.6 | | 3.7 | | 12.6 | | 3.2 | | 1.5 | | 5.9 | | 3.9 | | 3.7 | | 2.8 | |
2012 | | 2.1 | | 1.8 | | 7.4 | | 10.5 | | 8.1 | | (9.7 | ) | 6.7 | | 1.0 | | 3.9 | | 2.4 | |
2013 | | 2.5 | | 0.6 | | (0.2 | ) | 2.4 | | (7.2 | ) | 0.5 | | (0.5 | ) | 2.5 | | 0.8 | | 1.9 | |
2014 | | n/a | | n/a | | n/a | | n/a | | n/a | | n/a | | n/a | | n/a | | n/a | | n/a | |
Source: Statistics Canada (CANSIM Table 384-0038 — accessed May 2015).
2015 Financial and Economic Review — July 2015
70
Appendix 1 — Economic Review
Table A1.3 British Columbia GDP at Basic Prices, by Industry
| | Crop and | | Fishing, | | Forestry | | Support Activities | | Mining, Quarrying | | | | | | | | Transportation | | Wholesale | | Finance | | Real Estate | | | | | | Real GDP | |
| | Animal | | Hunting and | | and | | for Agriculture | | Oil and Gas | | | | | | | | and | | and Retail | | and | | and Rental | | Other | | Public | | at Basic | |
| | Production | | Trapping | | Logging | | and Forestry | | Extraction | | Manufacturing | | Construction | | Utilities | | Warehousing | | Trade | | Insurance | | and Leasing | | Services | | Administration | | Prices | |
| | (millions of 2007 $, chained) | |
1997 | | 912 | | 293 | | 2,058 | | 734 | | 6,910 | | 11,313 | | 9,983 | | 3,409 | | 7,640 | | 12,298 | | 8,396 | | 19,813 | | 41,206 | | 8,762 | | 134,041 | |
1998 | | 870 | | 190 | | 2,067 | | 749 | | 7,328 | | 11,060 | | 9,210 | | 3,499 | | 7,742 | | 12,937 | | 8,061 | | 20,329 | | 42,574 | | 8,831 | | 135,671 | |
1999 | | 938 | | 146 | | 1,953 | | 718 | | 7,318 | | 12,609 | | 8,882 | | 3,557 | | 8,063 | | 13,135 | | 8,468 | | 20,902 | | 43,095 | | 9,154 | | 139,702 | |
2000 | | 934 | | 167 | | 1,847 | | 830 | | 7,357 | | 14,728 | | 8,751 | | 3,577 | | 8,645 | | 13,710 | | 8,200 | | 21,611 | | 44,878 | | 9,431 | | 146,076 | |
2001 | | 1,095 | | 141 | | 1,853 | | 772 | | 9,347 | | 13,506 | | 9,086 | | 2,796 | | 8,512 | | 14,108 | | 8,198 | | 22,360 | | 46,070 | | 9,601 | | 147,741 | |
2002 | | 1,017 | | 167 | | 1,898 | | 695 | | 9,630 | | 13,415 | | 9,548 | | 3,320 | | 8,593 | | 14,680 | | 8,315 | | 23,353 | | 47,595 | | 9,868 | | 152,299 | |
2003 | | 1,009 | | 163 | | 1,931 | | 739 | | 9,431 | | 13,625 | | 10,451 | | 3,328 | | 8,661 | | 15,275 | | 8,515 | | 24,140 | | 48,876 | | 9,929 | | 156,309 | |
2004 | | 1,015 | | 187 | | 2,187 | | 714 | | 9,375 | | 14,553 | | 11,580 | | 3,296 | | 8,993 | | 15,924 | | 9,317 | | 25,229 | | 49,889 | | 9,940 | | 162,546 | |
2005 | | 1,021 | | 182 | | 2,168 | | 757 | | 10,184 | | 15,242 | | 12,240 | | 3,783 | | 9,803 | | 16,715 | | 9,615 | | 26,499 | | 51,632 | | 10,032 | | 170,241 | |
2006 | | 1,030 | | 204 | | 2,113 | | 727 | | 10,195 | | 15,722 | | 13,477 | | 3,370 | | 9,998 | | 17,816 | | 10,405 | | 27,399 | | 53,787 | | 10,340 | | 176,774 | |
2007 | | 1,084 | | 159 | | 1,998 | | 685 | | 9,727 | | 15,653 | | 13,722 | | 3,827 | | 10,022 | | 18,896 | | 10,803 | | 28,657 | | 55,654 | | 10,686 | | 181,571 | |
2008 | | 1,085 | | 137 | | 1,776 | | 608 | | 10,014 | | 14,465 | | 14,573 | | 3,855 | | 9,958 | | 18,658 | | 10,622 | | 29,333 | | 57,071 | | 11,129 | | 183,334 | |
2009 | | 1,085 | | 144 | | 1,212 | | 604 | | 8,853 | | 12,586 | | 13,961 | | 3,690 | | 9,812 | | 17,769 | | 10,429 | | 30,421 | | 56,274 | | 11,616 | | 178,610 | |
2010 | | 1,086 | | 166 | | 1,509 | | 635 | | 10,196 | | 13,303 | | 14,339 | | 3,691 | | 10,098 | | 18,736 | | 10,921 | | 31,383 | | 56,633 | | 11,899 | | 184,509 | |
2011 | | 1,121 | | 156 | | 1,683 | | 697 | | 11,049 | | 13,687 | | 14,289 | | 3,999 | | 10,387 | | 19,123 | | 11,258 | | 32,593 | | 57,581 | | 12,086 | | 189,599 | |
2012 | | 1,156 | | 130 | | 1,697 | | 665 | | 11,046 | | 14,294 | | 15,832 | | 4,030 | | 10,624 | | 19,639 | | 11,406 | | 33,486 | | 58,404 | | 12,008 | | 194,265 | |
2013 | | 1,184 | | 117 | | 1,801 | | 693 | | 11,721 | | 14,295 | | 15,988 | | 3,894 | | 10,786 | | 20,202 | | 11,819 | | 34,737 | | 59,385 | | 11,921 | | 198,278 | |
2014 | | 1,161 | | 137 | | 1,654 | | 706 | | 12,266 | | 14,723 | | 16,483 | | 3,839 | | 11,173 | | 21,095 | | 12,171 | | 36,082 | | 60,218 | | 11,970 | | 203,335 | |
| | | | | | | | | | | | | | | | | | | | | | | | | | | | | | | |
(annual percentage change) | |
1998 | | (4.7 | ) | (35.2 | ) | 0.4 | | 2.1 | | 6.0 | | (2.2 | ) | (7.7 | ) | 2.6 | | 1.3 | | 5.2 | | (4.0 | ) | 2.6 | | 3.3 | | 0.8 | | 1.2 | |
1999 | | 7.9 | | (22.9 | ) | (5.5 | ) | (4.1 | ) | (0.1 | ) | 14.0 | | (3.6 | ) | 1.6 | | 4.1 | | 1.5 | | 5.1 | | 2.8 | | 1.2 | | 3.7 | | 3.0 | |
2000 | | (0.4 | ) | 14.4 | | (5.4 | ) | 15.5 | | 0.5 | | 16.8 | | (1.5 | ) | 0.6 | | 7.2 | | 4.4 | | (3.2 | ) | 3.4 | | 4.1 | | 3.0 | | 4.6 | |
2001 | | 17.2 | | (15.9 | ) | 0.3 | | (7.0 | ) | 27.0 | | (8.3 | ) | 3.8 | | (21.9 | ) | (1.5 | ) | 2.9 | | (0.0 | ) | 3.5 | | 2.7 | | 1.8 | | 1.1 | |
2002 | | (7.1 | ) | 18.8 | | 2.5 | | (10.0 | ) | 3.0 | | (0.7 | ) | 5.1 | | 18.8 | | 1.0 | | 4.1 | | 1.4 | | 4.4 | | 3.3 | | 2.8 | | 3.1 | |
2003 | | (0.8 | ) | (2.8 | ) | 1.7 | | 6.3 | | (2.1 | ) | 1.6 | | 9.5 | | 0.3 | | 0.8 | | 4.1 | | 2.4 | | 3.4 | | 2.7 | | 0.6 | | 2.6 | |
2004 | | 0.5 | | 15.0 | | 13.3 | | (3.3 | ) | (0.6 | ) | 6.8 | | 10.8 | | (1.0 | ) | 3.8 | | 4.2 | | 9.4 | | 4.5 | | 2.1 | | 0.1 | | 4.0 | |
2005 | | 0.6 | | (2.6 | ) | (0.9 | ) | 6.0 | | 8.6 | | 4.7 | | 5.7 | | 14.7 | | 9.0 | | 5.0 | | 3.2 | | 5.0 | | 3.5 | | 0.9 | | 4.7 | |
2006 | | 0.9 | | 12.2 | | (2.5 | ) | (4.0 | ) | 0.1 | | 3.1 | | 10.1 | | (10.9 | ) | 2.0 | | 6.6 | | 8.2 | | 3.4 | | 4.2 | | 3.1 | | 3.8 | |
2007 | | 5.2 | | (22.2 | ) | (5.4 | ) | (5.7 | ) | (4.6 | ) | (0.4 | ) | 1.8 | | 13.6 | | 0.2 | | 6.1 | | 3.8 | | 4.6 | | 3.5 | | 3.3 | | 2.7 | |
2008 | | 0.1 | | (13.7 | ) | (11.1 | ) | (11.2 | ) | 3.0 | | (7.6 | ) | 6.2 | | 0.7 | | (0.6 | ) | (1.3 | ) | (1.7 | ) | 2.4 | | 2.5 | | 4.1 | | 1.0 | |
2009 | | 0.0 | | 4.9 | | (31.7 | ) | (0.7 | ) | (11.6 | ) | (13.0 | ) | (4.2 | ) | (4.3 | ) | (1.5 | ) | (4.8 | ) | (1.8 | ) | 3.7 | | (1.4 | ) | 4.4 | | (2.6 | ) |
2010 | | 0.1 | | 15.2 | | 24.5 | | 5.0 | | 15.2 | | 5.7 | | 2.7 | | 0.0 | | 2.9 | | 5.4 | | 4.7 | | 3.2 | | 0.6 | | 2.4 | | 3.3 | |
2011 | | 3.2 | | (6.2 | ) | 11.6 | | 9.8 | | 8.4 | | 2.9 | | (0.4 | ) | 8.4 | | 2.9 | | 2.1 | | 3.1 | | 3.9 | | 1.7 | | 1.6 | | 2.8 | |
2012 | | 3.1 | | (16.3 | ) | 0.8 | | (4.6 | ) | (0.0 | ) | 4.4 | | 10.8 | | 0.8 | | 2.3 | | 2.7 | | 1.3 | | 2.7 | | 1.4 | | (0.6 | ) | 2.5 | |
2013 | | 2.4 | | (10.4 | ) | 6.1 | | 4.3 | | 6.1 | | 0.0 | | 1.0 | | (3.4 | ) | 1.5 | | 2.9 | | 3.6 | | 3.7 | | 1.7 | | (0.7 | ) | 2.1 | |
2014 | | (1.9 | ) | 17.6 | | (8.1 | ) | 1.9 | | 4.6 | | 3.0 | | 3.1 | | (1.4 | ) | 3.6 | | 4.4 | | 3.0 | | 3.9 | | 1.4 | | 0.4 | | 2.6 | |
Source: Statistics Canada (CANSIM Table 379-0030 — accessed May 2015).
2015 Financial and Economic Review — July 2015
71
Appendix 1 — Economic Review
Table A1.4 British Columbia GDP, Income Based
| | | | | | Net | | | | Consumption of | | | | | | Consumption of | | | | Taxes less | | | | | |
| | | | Gross | | Operating | | Consumption of | | Fixed Capital: | | Gross | | Net | | Fixed Capital: | | Taxes less | | subsidies on | | | | GDP | |
| | Compensation | | Operating | | Surplus: | | Fixed Capital: | | Government & | | Mixed | | Mixed | | Unincorporated | | subsidies on | | Products & | | Statistical | | at Market | |
| | of Employees | | Surplus | | Corporations | | Corporations | | NPOs | | Income | | Income | | Businesses | | Production | | Imports | | Discrepency | | Prices | |
| | ($ millions) | |
1982 | | 26,496 | | 8,011 | | 2,065 | | 4,658 | | 1,288 | | 6,243 | | 4,793 | | 1,450 | | 2,403 | | 2,765 | | 68 | | 45,986 | |
1983 | | 27,018 | | 9,521 | | 3,276 | | 4,868 | | 1,377 | | 6,617 | | 5,103 | | 1,514 | | 2,679 | | 2,785 | | (33 | ) | 48,587 | |
1984 | | 27,811 | | 10,931 | | 4,442 | | 5,059 | | 1,430 | | 7,104 | | 5,473 | | 1,631 | | 2,508 | | 3,156 | | (533 | ) | 50,977 | |
1985 | | 29,101 | | 12,383 | | 5,356 | | 5,551 | | 1,476 | | 7,821 | | 6,098 | | 1,723 | | 2,540 | | 3,334 | | (426 | ) | 54,753 | |
1986 | | 30,339 | | 13,015 | | 5,966 | | 5,444 | | 1,605 | | 8,469 | | 6,715 | | 1,754 | | 2,509 | | 3,582 | | (287 | ) | 57,627 | |
1987 | | 32,837 | | 15,251 | | 8,229 | | 5,389 | | 1,633 | | 9,043 | | 7,201 | | 1,842 | | 2,578 | | 4,096 | | (92 | ) | 63,713 | |
1988 | | 36,110 | | 16,751 | | 9,169 | | 5,767 | | 1,815 | | 9,985 | | 7,987 | | 1,998 | | 2,737 | | 4,718 | | 552 | | 70,853 | |
1989 | | 40,296 | | 16,964 | | 8,665 | | 6,334 | | 1,965 | | 11,118 | | 8,913 | | 2,205 | | 2,891 | | 5,851 | | 58 | | 77,178 | |
1990 | | 44,216 | | 15,464 | | 6,412 | | 6,852 | | 2,200 | | 12,235 | | 9,866 | | 2,369 | | 3,030 | | 5,972 | | 157 | | 81,074 | |
1991 | | 46,296 | | 14,174 | | 5,042 | | 6,908 | | 2,224 | | 13,229 | | 10,747 | | 2,482 | | 2,941 | | 6,782 | | 216 | | 83,638 | |
1992 | | 48,924 | | 14,035 | | 4,393 | | 7,273 | | 2,369 | | 14,193 | | 11,549 | | 2,644 | | 3,467 | | 7,574 | | 975 | | 89,168 | |
1993 | | 51,312 | | 15,716 | | 5,516 | | 7,706 | | 2,494 | | 14,885 | | 12,032 | | 2,853 | | 3,956 | | 8,413 | | 1,479 | | 95,761 | |
1994 | | 53,972 | | 19,450 | | 8,464 | | 8,354 | | 2,632 | | 15,835 | | 12,811 | | 3,024 | | 4,217 | | 8,877 | | (89 | ) | 102,262 | |
1995 | | 56,768 | | 21,604 | | 9,825 | | 8,977 | | 2,802 | | 16,474 | | 13,314 | | 3,160 | | 4,269 | | 9,196 | | (566 | ) | 107,745 | |
1996 | | 58,517 | | 21,829 | | 9,453 | | 9,429 | | 2,947 | | 16,898 | | 13,656 | | 3,242 | | 4,455 | | 9,502 | | (93 | ) | 111,108 | |
1997 | | 60,569 | | 24,241 | | 11,224 | | 9,909 | | 3,108 | | 17,248 | | 13,894 | | 3,354 | | 4,658 | | 9,791 | | 220 | | 116,727 | |
1998 | | 61,849 | | 24,022 | | 10,003 | | 10,806 | | 3,213 | | 17,840 | | 14,370 | | 3,470 | | 4,777 | | 9,722 | | (338 | ) | 117,872 | |
1999 | | 63,797 | | 25,901 | | 11,335 | | 11,251 | | 3,315 | | 18,541 | | 15,058 | | 3,483 | | 4,857 | | 10,091 | | (37 | ) | 123,150 | |
2000 | | 68,126 | | 30,685 | | 15,355 | | 11,811 | | 3,519 | | 18,981 | | 15,355 | | 3,626 | | 5,030 | | 10,987 | | (85 | ) | 133,724 | |
2001 | | 69,851 | | 29,559 | | 13,353 | | 12,526 | | 3,680 | | 20,057 | | 16,221 | | 3,836 | | 5,113 | | 11,279 | | 25 | | 135,884 | |
2002 | | 72,549 | | 29,442 | | 12,759 | | 12,926 | | 3,757 | | 21,271 | | 17,244 | | 4,027 | | 5,053 | | 12,335 | | (125 | ) | 140,525 | |
2003 | | 75,122 | | 32,769 | | 15,778 | | 13,138 | | 3,853 | | 22,444 | | 18,422 | | 4,022 | | 5,174 | | 13,058 | | (27 | ) | 148,540 | |
2004 | | 80,104 | | 38,218 | | 20,503 | | 13,625 | | 4,090 | | 23,864 | | 19,685 | | 4,179 | | 5,458 | | 13,412 | | 58 | | 161,114 | |
2005 | | 85,308 | | 42,958 | | 23,985 | | 14,528 | | 4,445 | | 25,360 | | 20,986 | | 4,374 | | 5,767 | | 14,104 | | 144 | | 173,641 | |
2006 | | 93,513 | | 45,243 | | 24,376 | | 15,969 | | 4,898 | | 27,126 | | 22,566 | | 4,560 | | 6,047 | | 14,762 | | 81 | | 186,772 | |
2007 | | 98,216 | | 47,065 | | 24,282 | | 17,439 | | 5,344 | | 29,322 | | 23,095 | | 6,227 | | 6,710 | | 15,552 | | 207 | | 197,072 | |
2008 | | 102,192 | | 50,034 | | 24,922 | | 19,169 | | 5,943 | | 29,997 | | 23,268 | | 6,729 | | 7,052 | | 14,739 | | (63 | ) | 203,951 | |
2009 | | 100,335 | | 42,927 | | 17,110 | | 19,735 | | 6,082 | | 31,440 | | 24,657 | | 6,783 | | 6,881 | | 14,291 | | 92 | | 195,966 | |
2010 | | 102,467 | | 48,406 | | 22,421 | | 19,729 | | 6,256 | | 33,293 | | 26,359 | | 6,934 | | 7,152 | | 14,909 | | (231 | ) | 205,996 | |
2011 | | 106,964 | | 53,151 | | 25,869 | | 20,617 | | 6,665 | | 34,759 | | 27,578 | | 7,181 | | 7,075 | | 15,536 | | (25 | ) | 217,460 | |
2012 | | 110,527 | | 52,402 | | 23,090 | | 22,286 | | 7,026 | | 36,571 | | 29,044 | | 7,527 | | 7,313 | | 15,900 | | (148 | ) | 222,565 | |
2013 | | 114,898 | | 52,644 | | 21,849 | | 23,515 | | 7,280 | | 38,492 | | 30,577 | | 7,915 | | 7,393 | | 16,340 | | (82 | ) | 229,685 | |
2014 | | n/a | | n/a | | n/a | | n/a | | n/a | | n/a | | n/a | | n/a | | n/a | | n/a | | n/a | | n/a | |
| | | | | | | | | | | | | | | | | | | | | | | | | |
(annual percentage change) | |
1983 | | 2.0 | | 18.8 | | 58.6 | | 4.5 | | 6.9 | | 6.0 | | 6.5 | | 4.4 | | 11.5 | | 0.7 | | (148.5 | ) | 5.7 | |
1984 | | 2.9 | | 14.8 | | 35.6 | | 3.9 | | 3.8 | | 7.4 | | 7.3 | | 7.7 | | (6.4 | ) | 13.3 | | (1,515.2 | ) | 4.9 | |
1985 | | 4.6 | | 13.3 | | 20.6 | | 9.7 | | 3.2 | | 10.1 | | 11.4 | | 5.6 | | 1.3 | | 5.6 | | 20.1 | | 7.4 | |
1986 | | 4.3 | | 5.1 | | 11.4 | | (1.9 | ) | 8.7 | | 8.3 | | 10.1 | | 1.8 | | (1.2 | ) | 7.4 | | 32.6 | | 5.2 | |
1987 | | 8.2 | | 17.2 | | 37.9 | | (1.0 | ) | 1.7 | | 6.8 | | 7.2 | | 5.0 | | 2.8 | | 14.3 | | 67.9 | | 10.6 | |
1988 | | 10.0 | | 9.8 | | 11.4 | | 7.0 | | 11.1 | | 10.4 | | 10.9 | | 8.5 | | 6.2 | | 15.2 | | 700.0 | | 11.2 | |
1989 | | 11.6 | | 1.3 | | (5.5 | ) | 9.8 | | 8.3 | | 11.3 | | 11.6 | | 10.4 | | 5.6 | | 24.0 | | (89.5 | ) | 8.9 | |
1990 | | 9.7 | | (8.8 | ) | (26.0 | ) | 8.2 | | 12.0 | | 10.0 | | 10.7 | | 7.4 | | 4.8 | | 2.1 | | 170.7 | | 5.0 | |
1991 | | 4.7 | | (8.3 | ) | (21.4 | ) | 0.8 | | 1.1 | | 8.1 | | 8.9 | | 4.8 | | (2.9 | ) | 13.6 | | 37.6 | | 3.2 | |
1992 | | 5.7 | | (1.0 | ) | (12.9 | ) | 5.3 | | 6.5 | | 7.3 | | 7.5 | | 6.5 | | 17.9 | | 11.7 | | 351.4 | | 6.6 | |
1993 | | 4.9 | | 12.0 | | 25.6 | | 6.0 | | 5.3 | | 4.9 | | 4.2 | | 7.9 | | 14.1 | | 11.1 | | 51.7 | | 7.4 | |
1994 | | 5.2 | | 23.8 | | 53.4 | | 8.4 | | 5.5 | | 6.4 | | 6.5 | | 6.0 | | 6.6 | | 5.5 | | (106.0 | ) | 6.8 | |
1995 | | 5.2 | | 11.1 | | 16.1 | | 7.5 | | 6.5 | | 4.0 | | 3.9 | | 4.5 | | 1.2 | | 3.6 | | (536.0 | ) | 5.4 | |
1996 | | 3.1 | | 1.0 | | (3.8 | ) | 5.0 | | 5.2 | | 2.6 | | 2.6 | | 2.6 | | 4.4 | | 3.3 | | 83.6 | | 3.1 | |
1997 | | 3.5 | | 11.0 | | 18.7 | | 5.1 | | 5.5 | | 2.1 | | 1.7 | | 3.5 | | 4.6 | | 3.0 | | 336.6 | | 5.1 | |
1998 | | 2.1 | | (0.9 | ) | (10.9 | ) | 9.1 | | 3.4 | | 3.4 | | 3.4 | | 3.5 | | 2.6 | | (0.7 | ) | (253.6 | ) | 1.0 | |
1999 | | 3.1 | | 7.8 | | 13.3 | | 4.1 | | 3.2 | | 3.9 | | 4.8 | | 0.4 | | 1.7 | | 3.8 | | 89.1 | | 4.5 | |
2000 | | 6.8 | | 18.5 | | 35.5 | | 5.0 | | 6.2 | | 2.4 | | 2.0 | | 4.1 | | 3.6 | | 8.9 | | (129.7 | ) | 8.6 | |
2001 | | 2.5 | | (3.7 | ) | (13.0 | ) | 6.1 | | 4.6 | | 5.7 | | 5.6 | | 5.8 | | 1.7 | | 2.7 | | 129.4 | | 1.6 | |
2002 | | 3.9 | | (0.4 | ) | (4.4 | ) | 3.2 | | 2.1 | | 6.1 | | 6.3 | | 5.0 | | (1.2 | ) | 9.4 | | (600.0 | ) | 3.4 | |
2003 | | 3.5 | | 11.3 | | 23.7 | | 1.6 | | 2.6 | | 5.5 | | 6.8 | | (0.1 | ) | 2.4 | | 5.9 | | 78.4 | | 5.7 | |
2004 | | 6.6 | | 16.6 | | 29.9 | | 3.7 | | 6.2 | | 6.3 | | 6.9 | | 3.9 | | 5.5 | | 2.7 | | 314.8 | | 8.5 | |
2005 | | 6.5 | | 12.4 | | 17.0 | | 6.6 | | 8.7 | | 6.3 | | 6.6 | | 4.7 | | 5.7 | | 5.2 | | 148.3 | | 7.8 | |
2006 | | 9.6 | | 5.3 | | 1.6 | | 9.9 | | 10.2 | | 7.0 | | 7.5 | | 4.3 | | 4.9 | | 4.7 | | (43.8 | ) | 7.6 | |
2007 | | 5.0 | | 4.0 | | (0.4 | ) | 9.2 | | 9.1 | | 8.1 | | 2.3 | | 36.6 | | 11.0 | | 5.4 | | (155.6 | ) | 5.5 | |
2008 | | 4.0 | | 6.3 | | 2.6 | | 9.9 | | 11.2 | | 2.3 | | 0.7 | | 8.1 | | 5.1 | | (5.2 | ) | (130.4 | ) | 3.5 | |
2009 | | (1.8 | ) | (14.2 | ) | (31.3 | ) | 3.0 | | 2.3 | | 4.8 | | 6.0 | | 0.8 | | (2.4 | ) | (3.0 | ) | 246.0 | | (3.9 | ) |
2010 | | 2.1 | | 12.8 | | 31.0 | | (0.0 | ) | 2.9 | | 5.9 | | 6.9 | | 2.2 | | 3.9 | | 4.3 | | (351.1 | ) | 5.1 | |
2011 | | 4.4 | | 9.8 | | 15.4 | | 4.5 | | 6.5 | | 4.4 | | 4.6 | | 3.6 | | (1.1 | ) | 4.2 | | 89.2 | | 5.6 | |
2012 | | 3.3 | | (1.4 | ) | (10.7 | ) | 8.1 | | 5.4 | | 5.2 | | 5.3 | | 4.8 | | 3.4 | | 2.3 | | (492.0 | ) | 2.3 | |
2013 | | 4.0 | | 0.5 | | (5.4 | ) | 5.5 | | 3.6 | | 5.3 | | 5.3 | | 5.2 | | 1.1 | | 2.8 | | 44.6 | | 3.2 | |
2014 | | n/a | | n/a | | n/a | | n/a | | n/a | | n/a | | n/a | | n/a | | n/a | | n/a | | n/a | | n/a | |
Source: Statistics Canada (CANSIM Table 384-0037 - accessed May 2015).
2015 Financial and Economic Review — July 2015
72
Appendix 1 — Economic Review
Table A1.5 Employment by Industry in British Columbia
| | 2002 | | 2003 | | 2004 | | 2005 | | 2006 | | 2007 | | 2008 | | 2009 | | 2010 | | 2011 | | 2012 | | 2013 | | 2014 | |
| | (thousands) | |
Total — all industries | | 1,952 | | 1,998 | | 2,028 | | 2,090 | | 2,141 | | 2,206 | | 2,242 | | 2,192 | | 2,223 | | 2,228 | | 2,263 | | 2,266 | | 2,278 | |
| | | | | | | | | | | | | | | | | | | | | | | | | | | |
Primary industries | | 67 | | 78 | | 72 | | 76 | | 78 | | 82 | | 78 | | 71 | | 71 | | 65 | | 67 | | 75 | | 74 | |
Agriculture | | 30 | | 33 | | 36 | | 38 | | 35 | | 35 | | 34 | | 32 | | 30 | | 26 | | 24 | | 28 | | 24 | |
Forestry, logging & support activities | | 25 | | 27 | | 22 | | 22 | | 22 | | 24 | | 17 | | 14 | | 16 | | 15 | | 16 | | 18 | | 19 | |
Fishing, hunting and trapping | | 3 | | 5 | | 3 | | 2 | | 3 | | 3 | | 2 | | 2 | | 2 | | — | | 2 | | 2 | | 2 | |
Mining and oil & gas extraction | | 9 | | 13 | | 11 | | 14 | | 19 | | 20 | | 25 | | 24 | | 23 | | 25 | | 25 | | 28 | | 29 | |
| | | | | | | | | | | | | | | | | | | | | | | | | | | |
Manufacturing | | 198 | | 207 | | 208 | | 193 | | 191 | | 197 | | 178 | | 155 | | 155 | | 157 | | 165 | | 152 | | 161 | |
Food, beverages & tobacco | | 27 | | 31 | | 31 | | 31 | | 24 | | 27 | | 29 | | 27 | | 25 | | 29 | | 29 | | 27 | | 28 | |
Wood products | | 45 | | 49 | | 46 | | 45 | | 43 | | 43 | | 33 | | 26 | | 27 | | 29 | | 25 | | 26 | | 29 | |
Paper | | 17 | | 14 | | 12 | | 12 | | 15 | | 15 | | 13 | | 10 | | 9 | | 9 | | 11 | | 11 | | 12 | |
Printing & related support activities | | 9 | | 8 | | 8 | | 8 | | 8 | | 6 | | 8 | | 7 | | 6 | | 7 | | 8 | | 7 | | 6 | |
Primary metals | | 6 | | 9 | | 7 | | 7 | | 7 | | 6 | | 5 | | 5 | | 7 | | 6 | | 6 | | 5 | | 2 | |
Metal fabrication | | 13 | | 14 | | 15 | | 18 | | 15 | | 15 | | 16 | | 12 | | 12 | | 11 | | 14 | | 11 | | 12 | |
Transportation equipment | | 14 | | 12 | | 12 | | 9 | | 9 | | 12 | | 9 | | 10 | | 9 | | 9 | | 11 | | 9 | | 10 | |
Machinery manufacturing | | 10 | | 9 | | 10 | | 10 | | 9 | | 9 | | 6 | | 6 | | 7 | | 9 | | 10 | | 9 | | 9 | |
Other manufacturing | | 58 | | 60 | | 69 | | 55 | | 63 | | 65 | | 59 | | 51 | | 53 | | 48 | | 51 | | 48 | | 54 | |
| | | | | | | | | | | | | | | | | | | | | | | | | | | |
Construction | | 117 | | 118 | | 142 | | 166 | | 175 | | 192 | | 218 | | 204 | | 198 | | 197 | | 199 | | 204 | | 201 | |
General contractors | | 41 | | 47 | | 51 | | 65 | | 64 | | 65 | | 84 | | 77 | | 79 | | 79 | | 78 | | 85 | | 91 | |
Special trade contractors | | 76 | | 71 | | 92 | | 101 | | 110 | | 127 | | 134 | | 127 | | 120 | | 118 | | 120 | | 119 | | 110 | |
| | | | | | | | | | | | | | | | | | | | | | | | | | | |
Utilities | | 11 | | 11 | | 9 | | 10 | | 8 | | 10 | | 13 | | 12 | | 12 | | 11 | | 11 | | 11 | | 14 | |
| | | | | | | | | | | | | | | | | | | | | | | | | | | |
Transportation and warehousing | | 110 | | 115 | | 113 | | 116 | | 116 | | 122 | | 124 | | 114 | | 118 | | 122 | | 129 | | 127 | | 134 | |
Transportation | | 105 | | 109 | | 108 | | 112 | | 109 | | 115 | | 119 | | 108 | | 112 | | 115 | | 119 | | 118 | | 125 | |
Warehousing and storage | | 5 | | 6 | | 5 | | 5 | | 6 | | 7 | | 5 | | 6 | | 6 | | 8 | | 11 | | 9 | | 9 | |
| | | | | | | | | | | | | | | | | | | | | | | | | | | |
Trade | | 319 | | 326 | | 313 | | 330 | | 343 | | 353 | | 352 | | 359 | | 369 | | 354 | | 347 | | 361 | | 358 | |
Wholesale trade | | 72 | | 76 | | 66 | | 79 | | 80 | | 79 | | 86 | | 86 | | 82 | | 78 | | 82 | | 82 | | 81 | |
Retail trade | | 246 | | 249 | | 248 | | 251 | | 263 | | 274 | | 267 | | 274 | | 288 | | 277 | | 265 | | 279 | | 278 | |
| | | | | | | | | | | | | | | | | | | | | | | | | | | |
Finance, Insurance, Real Estate | | | | | | | | | | | | | | | | | | | | | | | | | | | |
& Leasing | | 124 | | 126 | | 128 | | 131 | | 133 | | 141 | | 139 | | 133 | | 140 | | 140 | | 137 | | 140 | | 137 | |
Finance | | 57 | | 60 | | 55 | | 59 | | 59 | | 67 | | 61 | | 57 | | 66 | | 54 | | 62 | | 59 | | 62 | |
Insurance | | 24 | | 21 | | 27 | | 26 | | 26 | | 29 | | 28 | | 27 | | 28 | | 32 | | 26 | | 29 | | 27 | |
Real estate | | 32 | | 35 | | 35 | | 34 | | 38 | | 37 | | 39 | | 39 | | 37 | | 45 | | 43 | | 44 | | 40 | |
Leasing | | 11 | | 11 | | 11 | | 13 | | 10 | | 9 | | 10 | | 9 | | 8 | | 9 | | 6 | | 8 | | 8 | |
| | | | | | | | | | | | | | | | | | | | | | | | | | | |
Public administration | | 90 | | 95 | | 99 | | 93 | | 90 | | 95 | | 101 | | 106 | | 105 | | 106 | | 101 | | 99 | | 98 | |
Federal administration | | 33 | | 37 | | 35 | | 32 | | 34 | | 35 | | 37 | | 39 | | 43 | | 43 | | 42 | | 35 | | 32 | |
Provincial administration | | 28 | | 29 | | 30 | | 29 | | 27 | | 26 | | 26 | | 27 | | 27 | | 25 | | 27 | | 28 | | 29 | |
Local administration | | 29 | | 29 | | 35 | | 32 | | 29 | | 34 | | 37 | | 40 | | 36 | | 38 | | 31 | | 36 | | 37 | |
| | | | | | | | | | | | | | | | | | | | | | | | | | | |
Other service industries | | 918 | | 924 | | 944 | | 974 | | 1,006 | | 1,014 | | 1,040 | | 1,040 | | 1,055 | | 1,075 | | 1,108 | | 1,097 | | 1,102 | |
Education & related services | | 137 | | 137 | | 132 | | 143 | | 153 | | 154 | | 153 | | 147 | | 152 | | 155 | | 165 | | 167 | | 166 | |
Health & welfare services | | 211 | | 214 | | 217 | | 213 | | 228 | | 232 | | 241 | | 257 | | 264 | | 263 | | 275 | | 267 | | 270 | |
Professional, scientific & technical | | 134 | | 136 | | 143 | | 159 | | 164 | | 164 | | 166 | | 160 | | 163 | | 174 | | 170 | | 178 | | 182 | |
Information, culture & recreation | | 105 | | 105 | | 110 | | 109 | | 109 | | 114 | | 112 | | 112 | | 112 | | 108 | | 109 | | 107 | | 108 | |
Services to business management | | 72 | | 79 | | 80 | | 90 | | 96 | | 96 | | 103 | | 98 | | 95 | | 95 | | 97 | | 99 | | 88 | |
Accommodation & food services | | 163 | | 159 | | 170 | | 172 | | 167 | | 169 | | 171 | | 171 | | 172 | | 183 | | 183 | | 180 | | 185 | |
Miscellaneous services | | 96 | | 94 | | 93 | | 88 | | 89 | | 86 | | 95 | | 95 | | 96 | | 97 | | 110 | | 99 | | 102 | |
Source: Statistics Canada, Labour Force Survey (unpublished data). Totals may not add due to rounding.
2015 Financial and Economic Review — July 2015
73
Appendix 1 — Economic Review
Table A1.6 Capital Investment by Industry
| | | | | | | | | | Preliminary | | | | 2012 | | 2013 | |
| | Actual | | Actual | | Actual | | Actual | | Actual | | Intentions | | to | | to | |
| | 2009 | | 2010 | | 2011 | | 2012 | | 2013 | | 2014 | | 2013 | | 2014 | |
| | ($ millions) | | (per cent) | |
Agriculture, forestry, fishing and hunting | | 330.2 | | 346.8 | | 374.0 | | 383.5 | | 406.1 | | 399.6 | | 5.9 | | (1.6 | ) |
Mining and oil and gas extraction | | 5,024.3 | | 8,041.3 | | 8,802.7 | | 8,732.4 | | 8,431.4 | | 7,325.9 | | (3.4 | ) | (13.1 | ) |
Manufacturing | | 1,147.6 | | 1,555.0 | | 1,309.2 | | 1,591.9 | | 2,363.2 | | 2,486.9 | | 48.5 | | 5.2 | |
Construction | | 665.0 | | 809.6 | | 942.7 | | 718.4 | | 811.5 | | 841.2 | | 13.0 | | 3.7 | |
Transportation and warehousing | | 2,619.9 | | 1,848.4 | | 2,062.1 | | 2,661.5 | | 2,758.9 | | 2,904.0 | | 3.7 | | 5.3 | |
Utilities | | 3283.2 | | 3,102.1 | | 3,657.5 | | 4,060.4 | | 3,763.9 | | 4,074.5 | | (7.3 | ) | 8.3 | |
Wholesale trade | | 428.6 | | 443.7 | | 446.6 | | 749.1 | | 734.4 | | 866.9 | | (2.0 | ) | 18.0 | |
Retail trade | | 1,297.8 | | 1,199.2 | | 1,244.1 | | 1,295.2 | | 1,359.7 | | 1,261.4 | | 5.0 | | (7.2 | ) |
Finance and insurance | | 947.2 | | 1,020.5 | | 1,036.6 | | 1,066.6 | | 930.2 | | 1,029.8 | | (12.8 | ) | 10.7 | |
Real estate, rental and leasing | | 1,973.3 | | 1,703.8 | | 1,559.2 | | 1,610.0 | | 1,433.5 | | 1,319.2 | | (11.0 | ) | (8.0 | ) |
Information and cultural industries | | 1,485.9 | | 1,288.9 | | 1,260.6 | | 1,313.0 | | 1,272.0 | | 1,326.9 | | (3.1 | ) | 4.3 | |
Professional, scientific and technical services | | 344.8 | | 467.1 | | 474.8 | | 496.0 | | 421.3 | | 448.0 | | (15.1 | ) | 6.3 | |
Management of companies and enterprises | | 74.8 | | 84.0 | | 87.9 | | 102.6 | | 88.4 | | 88.4 | | (13.8 | ) | — | |
Admin, waste and remediation services | | 205.5 | | 212.5 | | 237.2 | | 338.2 | | 285.1 | | 312.4 | | (15.7 | ) | 9.6 | |
Arts, entertainment and recreation | | 351.3 | | 275.3 | | 280.4 | | 276.9 | | 264.8 | | 319.0 | | (4.4 | ) | 20.5 | |
Accommodation and food services | | 828.3 | | 690.2 | | 446.2 | | 464.3 | | 587.4 | | 573.5 | | 26.5 | | (2.4 | ) |
Educational services | | 1,241.4 | | 1,320.6 | | 1,133.5 | | 1,199.8 | | 1,272.6 | | 1,340.6 | | 6.1 | | 5.3 | |
Health care and social assistance | | 1,171.4 | | 1,342.6 | | 1,223.7 | | 1,351.7 | | 1,217.8 | | 1,001.3 | | (9.9 | ) | (17.8 | ) |
Public administration | | 3,450.9 | | 3,165.8 | | 2,748.8 | | 3,842.8 | | 3,762.6 | | 3,757.2 | | (2.1 | ) | (0.1 | ) |
Other services | | 203.3 | | 227.0 | | 306.4 | | 263.4 | | 264.2 | | 274.4 | | 0.3 | | 3.9 | |
Housing | | 11,926.3 | | 13,389.3 | | 13,908.0 | | 15,261.5 | | 15,054.5 | | 15,504.1 | | (1.4 | ) | 3.0 | |
Total | | 39,001.0 | | 42,533.8 | | 43,542.1 | | 47,779.3 | | 47,483.5 | | 47,455.2 | | (0.6 | ) | (0.1 | ) |
| | | | | | | | | | | | | | | | | |
Public | | 8,832.1 | | 8,764.9 | | 9,062.0 | | 9,847.3 | | 10,159.3 | | 10,620.5 | | 3.2 | | 4.5 | |
Private | | 30,168.9 | | 33,768.9 | | 34,480.1 | | 37,932.0 | | 37,324.2 | | 36,834.7 | | (1.6 | ) | (1.3 | ) |
Total | | 39,001.0 | | 42,533.8 | | 43,542.1 | | 47,779.3 | | 47,483.5 | | 47,455.2 | | (0.6 | ) | (0.1 | ) |
| | | | | | | | | | | | | | | | | |
Machinery and equipment | | 10,435.9 | | 11,296.8 | | 10,867.9 | | 11,428.4 | | 10,794.7 | | 10,854.3 | | (5.5 | ) | 0.6 | |
Construction | | 28,565.1 | | 31,237.1 | | 32,674.2 | | 36,350.9 | | 36,688.8 | | 36,600.8 | | 0.9 | | (0.2 | ) |
Total | | 39,001.0 | | 42,533.8 | | 43,542.1 | | 47,779.3 | | 47,483.5 | | 47,455.2 | | (0.6 | ) | (0.1 | ) |
Note: Totals may not add due to rounding or due to some data not being disclosed for confidentiality reasons.
Source: Statistics Canada (CANSIM Tables 029-0005, 029-0024, 032-0002 — accessed May 2015).
2015 Financial and Economic Review — July 2015
74
Appendix 1 — Economic Review
Table A1.7 British Columbia International Goods Exports by Major Market and Selected Commodities, 2014
| | | | | | European | | Mainland | | Other | | Total - | |
Commodity | | U.S. | | Japan | | Union 1 | | China | | Markets | | All Countries | |
| | ($ millions) | |
| | | | | | | | | | | | | |
Solid wood products | | 4,307 | | 1,045 | | 331 | | 1,840 | | 610 | | 8,132 | |
Lumber (softwood) | | 3,048 | | 731 | | 141 | | 1,409 | | 425 | | 5,754 | |
Cedar shakes and shingles | | 157 | | 0 | | 10 | | 0 | | 6 | | 173 | |
Plywood (softwood) | | 259 | | 3 | | 5 | | 2 | | 4 | | 274 | |
Other panel products | | 311 | | 54 | | 7 | | 12 | | 21 | | 405 | |
Selected value-added wood products | | 385 | | 25 | | 2 | | 2 | | 9 | | 423 | |
Logs | | 56 | | 194 | | 0 | | 415 | | 120 | | 784 | |
Other | | 91 | | 38 | | 166 | | 1 | | 24 | | 320 | |
| | | | | | | | | | | | | |
Pulp and paper products | | 1,225 | | 212 | | 131 | | 1,920 | | 777 | | 4,265 | |
Pulp | | 417 | | 202 | | 128 | | 1,853 | | 521 | | 3,121 | |
Newsprint | | 128 | | 3 | | 1 | | 17 | | 174 | | 324 | |
Paper, paperboard — excluding newsprint | | 594 | | 5 | | 1 | | 15 | | 75 | | 689 | |
Other | | 86 | | 2 | | 1 | | 35 | | 6 | | 131 | |
| | | | | | | | | | | | | |
Agriculture and food other than fish | | 1,502 | | 98 | | 47 | | 209 | | 422 | | 2,277 | |
Fruit and nuts | | 247 | | 10 | | 9 | | 17 | | 28 | | 311 | |
Vegetables | | 248 | | 4 | | 3 | | 1 | | 4 | | 260 | |
Vegetable oils | | 10 | | 4 | | 0 | | 124 | | 139 | | 277 | |
Bread, pastry, prepared cereals, pasta, etc. | | 179 | | 3 | | 0 | | 1 | | 3 | | 185 | |
Meat and prepared meat products | | 14 | | 36 | | 2 | | 15 | | 65 | | 131 | |
Other | | 805 | | 40 | | 33 | | 51 | | 183 | | 1,113 | |
| | | | | | | | | | | | | |
Fish products | | 528 | | 108 | | 43 | | 178 | | 106 | | 964 | |
Whole fish; fresh, chilled, frozen — excluding salmon | | 51 | | 18 | | 4 | | 37 | | 28 | | 138 | |
Whole salmon; fresh, chilled, frozen | | 342 | | 28 | | 16 | | 10 | | 11 | | 406 | |
Salmon; canned, smoked, etc | | 15 | | 3 | | 17 | | 0 | | 8 | | 43 | |
Other | | 120 | | 59 | | 7 | | 131 | | 59 | | 377 | |
| | | | | | | | | | | | | |
Metallic mineral products | | 1,060 | | 1,162 | | 70 | | 903 | | 1,372 | | 4,566 | |
Copper ores and concentrates | | 0 | | 1,003 | | 0 | | 842 | | 1,071 | | 2,916 | |
Molybdenum ores and concentrates | | 156 | | 1 | | 39 | | 2 | | 23 | | 221 | |
Zinc ores and concentrates | | 0 | | 12 | | 18 | | 14 | | 44 | | 87 | |
Unwrought aluminum | | 29 | | 117 | | 0 | | 0 | | 145 | | 292 | |
Unwrought zinc | | 614 | | 0 | | 0 | | 2 | | 68 | | 683 | |
Unwrought lead | | 193 | | 3 | | 0 | | 0 | | 0 | | 196 | |
Other | | 67 | | 26 | | 13 | | 43 | | 21 | | 171 | |
| | | | | | | | | | | | | |
Fabricated metal products | | 792 | | 8 | | 21 | | 119 | | 119 | | 1,059 | |
| | | | | | | | | | | | | |
Energy products | | 4,067 | | 909 | | 422 | | 883 | | 1,522 | | 7,803 | |
Natural gas | | 2,558 | | 0 | | 0 | | 0 | | 0 | | 2,558 | |
Coal | | 20 | | 907 | | 422 | | 845 | | 1,466 | | 3,660 | |
Electricity | | 389 | | 0 | | 0 | | 0 | | 0 | | 389 | |
Other | | 1,101 | | 2 | | 0 | | 37 | | 57 | | 1,197 | |
| | | | | | | | | | | | | |
Machinery and equipment | | 2,696 | | 54 | | 405 | | 238 | | 698 | | 4,091 | |
Motor vehicles and parts | | 278 | | 2 | | 7 | | 89 | | 36 | | 412 | |
Electrical/electronic/communications | | 527 | | 12 | | 127 | | 29 | | 163 | | 858 | |
Scientific/photographic/measuring equipment, etc. | | 325 | | 13 | | 95 | | 29 | | 107 | | 569 | |
Aircraft and parts | | 220 | | 4 | | 10 | | 0 | | 75 | | 310 | |
Other | | 1,346 | | 23 | | 167 | | 90 | | 317 | | 1,942 | |
| | | | | | | | | | | | | |
Plastics and articles of plastic | | 347 | | 1 | | 5 | | 6 | | 22 | | 380 | |
Chemicals and chemical products | | 587 | | 48 | | 70 | | 74 | | 185 | | 964 | |
Apparel and accessories | | 90 | | 3 | | 8 | | 1 | | 10 | | 111 | |
Textiles | | 13 | | 0 | | 3 | | 0 | | 45 | | 62 | |
| | | | | | | | | | | | | |
All other commodities | | 739 | | 8 | | 36 | | 57 | | 274 | | 1,115 | |
| | | | | | | | | | | | | |
Total | | 17,953 | | 3,656 | | 1,591 | | 6,427 | | 6,162 | | 35,790 | |
1 As of July 1, 2013, Austria, Belgium, Bulgaria, Croatia, Cyprus, Czech Republic, Denmark, Estonia, Finland, France, Germany, Greece, Hungary, Ireland, Italy, Latvia, Lithuania, Luxembourg, Malta, Netherlands, Poland, Portugal, Romania, Slovakia, Slovenia, Spain, Sweden, United Kingdom.
Source: BC Stats
2015 Financial and Economic Review — July 2015
75
Appendix 1 — Economic Review
Table A1.8 British Columbia International Goods Exports by Market Area
| | | | | | | | % Change | | Percent of Total | |
| | 2012 | | 2013 | | 2014 | | 2013-2014 | | 2013 | | 2014 | |
| | | | ($ millions) | | | | | | (per cent) | | | |
United Kingdom | | 328 | | 336 | | 384 | | 14.0 | | 1.0 | | 1.1 | |
Germany | | 248 | | 224 | | 252 | | 12.3 | | 0.7 | | 0.7 | |
Mainland China | | 5,752 | | 6,607 | | 6,427 | | (2.7 | ) | 19.8 | | 18.0 | |
Hong Kong | | 219 | | 201 | | 250 | | 24.3 | | 0.6 | | 0.7 | |
Taiwan | | 656 | | 600 | | 543 | | (9.6 | ) | 1.8 | | 1.5 | |
Japan | | 4,139 | | 4,051 | | 3,656 | | (9.7 | ) | 12.1 | | 10.2 | |
South Korea | | 1,891 | | 1,816 | | 2,089 | | 15.0 | | 5.4 | | 5.8 | |
India | | 322 | | 468 | | 590 | | 26.1 | | 1.4 | | 1.6 | |
Australia | | 371 | | 310 | | 321 | | 3.6 | | 0.9 | | 0.9 | |
Mexico | | 101 | | 125 | | 111 | | (10.9 | ) | 0.4 | | 0.3 | |
United States | | 14,031 | | 15,522 | | 17,953 | | 15.7 | | 46.4 | | 50.2 | |
Other | | 3,426 | | 3,165 | | 3,214 | | 1.5 | | 9.5 | | 9.0 | |
Total | | 31,484 | | 33,426 | | 35,790 | | 7.1 | | 100.0 | | 100.0 | |
| | | | | | | | | | | | | |
Market Areas: | | | | | | | | | | | | | |
Western Europe 1 | | 1,802 | | 1,525 | | 1,520 | | (0.3 | ) | 4.6 | | 4.2 | |
Pacific Rim 2 | | 13,651 | | 14,338 | | 14,236 | | (0.7 | ) | 42.9 | | 39.8 | |
1 Austria, Belgium, Denmark, Finland, France, Germany, Greece, Iceland, Ireland, Italy, Luxembourg, Malta, Monaco, Netherlands, Norway, Portugal, Spain, Sweden, Switzerland and the United Kingdom.
2 Australia, Brunei Darussalam, China, Fiji, Hong Kong, Indonesia, Japan, Laos, Macau, Malaysia, Mongolia, New Zealand, North Korea, Philippines, Singapore, South Korea, Taiwan, Thailand and Vietnam.
Source: Statistics Canada, International Trade Statistics custom extract, May 2015. Figures may not add due to rounding.
2015 Financial and Economic Review — July 2015
76
Appendix 1 — Economic Review
Table A1.9 Historical Commodity Prices (in US Dollars)
| | 2004 | | 2005 | | 2006 | | 2007 | | 2008 | | 2009 | | 2010 | | 2011 | | 2012 | | 2013 | | 2014 | |
Metals | | | | | | | | | | | | | | | | | | | | | | | |
Copper (London; $/lb) | | 1.30 | | 1.67 | | 3.07 | | 3.24 | | 3.15 | | 2.35 | | 3.42 | | 4.00 | | 3.61 | | 3.32 | | 3.10 | |
Lead (London; $/lb) | | 0.40 | | 0.44 | | 0.59 | | 1.17 | | 0.94 | | 0.78 | | 0.97 | | 1.09 | | 0.93 | | 0.97 | | 0.95 | |
Zinc (London; $/lb) | | 0.48 | | 0.63 | | 1.49 | | 1.47 | | 0.85 | | 0.78 | | 1.02 | | 0.99 | | 0.88 | | 0.86 | | 0.98 | |
Gold (London; $/troy oz) | | 409 | | 445 | | 604 | | 697 | | 872 | | 973 | | 1,225 | | 1,572 | | 1,667 | | 1,407 | | 1,266 | |
Silver (London; $/troy oz) | | 6.66 | | 7.32 | | 11.55 | | 13.38 | | 14.93 | | 14.68 | | 20.17 | | 35.12 | | 31.12 | | 23.72 | | 19.07 | |
Molybdenum ($/lb) | | 15.92 | | 31.05 | | 24.46 | | 30.22 | | 29.22 | | 11.05 | | 15.68 | | 15.47 | | 12.80 | | 10.33 | | 11.39 | |
Aluminum (London; $/lb) | | 0.78 | | 0.86 | | 1.17 | | 1.20 | | 1.16 | | 0.76 | | 0.98 | | 1.09 | | 0.92 | | 0.93 | | 0.85 | |
Forest Products | | | | | | | | | | | | | | | | | | | | | | | |
Lumber (Madison’s Lumber Reporter; WSPF, 2x4, $/1000 bd ft) | | 394 | | 355 | | 296 | | 249 | | 219 | | 182 | | 255 | | 254 | | 299 | | 358 | | 353 | |
Pulp (Northern Europe; $/tonne; transaction price) | | 616 | | 611 | | 674 | | 793 | | 853 | | 656 | | 930 | | 961 | | 814 | | 857 | | 925 | |
Newsprint (U.S. Eastcoast; $/tonne) | | 531 | | 580 | | 634 | | 581 | | 671 | | 578 | | 582 | | 625 | | 621 | | 599 | | 581 | |
Cedar (Madison’s Lumber Reporter 2x4, $/1000 bd ft) | | 653 | | 641 | | 620 | | 620 | | 674 | | 623 | | 650 | | 636 | | 769 | | 895 | | 957 | |
Other | | | | | | | | | | | | | | | | | | | | | | | |
Oil (West Texas Intermediate; $/barrel) | | 42 | | 57 | | 66 | | 72 | | 100 | | 62 | | 79 | | 95 | | 94 | | 98 | | 93 | |
Natural Gas (Inlet to WEI; $/GJ) | | 5.54 | | 7.27 | | 5.54 | | 5.41 | | 6.90 | | 3.03 | | 2.95 | | 2.46 | | 1.36 | | 2.03 | | 3.11 | |
Coal (Japan-Australia JFY FOB US$/t) Metallurgical | | 56 | | 125 | | 107 | | 89 | | 289 | | 120 | | 204 | | 277 | | 204 | | 155 | | 124 | |
Low Volatile PCI | | 47 | | 102 | | 66 | | 68 | | 245 | | 90 | | 165 | | 218 | | 153 | | 125 | | 104 | |
Thermal | | 44 | | 53 | | 43 | | 56 | | 125 | | 70 | | 98 | | 130 | | 114 | | 95 | | 82 | |
Sources: Ministry of Finance; Ministry of Energy and Mines; Ministry of Natural Gas Development; Ministry of Forests, Lands and Natural Resource Operations; US Dept of Energy.
2015 Financial and Economic Review — July 2015
77
Appendix 1 — Economic Review
Table A1.10 British Columbia Forest Sector Economic Activity Indicators
| | | | | | | | | | | | | | Change 1 | |
Indicator | | 2009 | | 2010 | | 2011 | | 2012 | | 2013 | | 2014 | | 2013-2014 | |
| | (million cubic meters) | | (per cent) | |
Wood production | | | | | | | | | | | | | | | |
Lumber | | 22.9 | | 26.8 | | 28.4 | | 29.2 | | 30.1 | | 29.8 | | (0.9 | ) |
Timber Scaled by species | | | | | | | | | | | | | | | |
Lodgepole pine | | 24.8 | | 29.1 | | 29.8 | | 27.7 | | 26.7 | | 23.1 | | (13.3 | ) |
Spruce | | 6.8 | | 8.9 | | 10.5 | | 11.5 | | 12.6 | | 11.5 | | (8.5 | ) |
Hemlock | | 4.3 | | 6.8 | | 8.6 | | 7.7 | | 8.5 | | 8.1 | | (5.0 | ) |
Douglas fir | | 5.4 | | 7.6 | | 9.2 | | 8.9 | | 9.8 | | 10.1 | | 2.6 | |
Balsam | | 3.0 | | 4.2 | | 5.1 | | 5.5 | | 6.1 | | 6.1 | | 0.6 | |
Cedar | | 2.7 | | 4.1 | | 3.7 | | 4.3 | | 4.6 | | 4.4 | | (4.6 | ) |
All others | | 1.8 | | 2.7 | | 2.7 | | 2.6 | | 2.7 | | 2.7 | | 1.1 | |
Total 2 | | 48.8 | | 63.3 | | 69.6 | | 68.1 | | 71.0 | | 66.1 | | (7.0 | ) |
| | | | | | | | | | | | | | | |
| | (million cubic meters) | | | |
Harvest volumes | | 48.0 | | 62.2 | | 69.2 | | 68.8 | | 71.1 | | n/a | | n/a | |
| | | | | | | | | | | | | | | |
| | (million tonnes) | | | |
Pulp and paper shipments | | 5.7 | | 6.0 | | 6.0 | | 5.9 | | 5.6 | | 5.5 | | (1.4 | ) |
Market pulp | | 3.7 | | 4.3 | | 4.5 | | 4.5 | | 4.2 | | 4.1 | | (2.4 | ) |
Newsprint, paper and paperboard | | 2.0 | | 1.7 | | 1.5 | | 1.5 | | 1.4 | | 1.4 | | 0.8 | |
| | | | | | | | | | | | | | | |
Industrial product price indices | | | | | | (2010=100) | | | | | | | | | |
Softwood lumber | | 94.0 | | 100.0 | | 96.5 | | 106.6 | | 125.6 | | 133.6 | | 6.4 | |
Spruce-Pine-Fir lumber (BC) | | n/a | | 100.0 | | 96.1 | | 104.8 | | 123.1 | | 130.4 | | 5.9 | |
Hemlock lumber (BC) | | 92.4 | | 100.0 | | 98.8 | | 112.0 | | 139.7 | | 150.0 | | 7.4 | |
Douglas fir and Western larch (BC) | | 98.2 | | 100.0 | | 100.0 | | 103.8 | | 115.8 | | 125.7 | | 8.5 | |
Veneer and plywood | | 101.9 | | 100.0 | | 95.8 | | 104.0 | | 104.9 | | 112.7 | | 7.4 | |
Wood pulp | | 92.8 | | 100.0 | | 95.8 | | 94.7 | | 98.5 | | 98.0 | | (0.5 | ) |
Newsprint for export | | 111.9 | | 100.0 | | 101.0 | | 101.8 | | 102.4 | | 105.4 | | 2.9 | |
1 Percentage change based on unrounded numbers.
2 Total may not add due to rounding.
Sources: Timber scaled — Ministry of Forests, Lands, and Natural Resource Operations.
Harvest volumes — Natural Resources Canada (National Forestry Database).
Lumber production — Statistics Canada (CANSIM Table 303-0064 — accessed May 2015).
Pulp and paper production — Forest Products Association of Canada.
Industrial product price indices — Statistics Canada (CANSIM Tables 329-0075 and 329-0076 — accessed May 2015).
Timber scaled data includes all logs, special forest products, species and grades billed to crown, private and federal land. Waste, reject, and Christmas trees are excluded.
For all scale invoiced as of date of reporting — May 1, 2015.
2015 Financial and Economic Review — July 2015
78
Appendix 1 – Economic Review
Table A1.11 Historical Value of Mineral, Petroleum and Natural Gas Shipments
| | | | Industrial | | Construction | | | | | | Natural Gas | | Other oil | | | |
Year | | Metals | | Minerals 1 | | Aggregates 2 | | Coal | | Crude Oil 3 | | to Pipeline | | and Gas 4 | | Total | |
| | ($ millions) | |
1991 | | 1,511 | | 290 | | 159 | | 990 | | 260 | | 562 | | 36 | | 3,808 | |
1992 | | 1,502 | | 212 | | 157 | | 706 | | 260 | | 592 | | 38 | | 3,467 | |
1993 | | 1,198 | | 229 | | 166 | | 822 | | 233 | | 814 | | 42 | | 3,504 | |
1994 | | 1,354 | | 237 | | 180 | | 861 | | 235 | | 991 | | 44 | | 3,902 | |
1995 | | 2,016 | | 249 | | 204 | | 968 | | 272 | | 710 | | 58 | | 4,478 | |
1996 | | 1,537 | | 251 | | 189 | | 1,027 | | 441 | | 817 | | 75 | | 4,337 | |
1997 | | 1,495 | | 249 | | 195 | | 1,107 | | 403 | | 1,087 | | 98 | | 4,635 | |
1998 | | 1,484 | | 245 | | 208 | | 956 | | 373 | | 1,154 | | 47 | | 4,467 | |
1999 | | 1,183 | | 246 | | 219 | | 797 | | 461 | | 1,577 | | 53 | | 4,536 | |
2000 | | 1,571 | | 284 | | 224 | | 812 | | 843 | | 3,826 | | 114 | | 7,674 | |
2001 | | 1,394 | | 296 | | 217 | | 959 | | 729 | | 4,834 | | 103 | | 8,533 | |
2002 | | 1,288 | | 310 | | 231 | | 1,035 | | 714 | | 3,458 | | 79 | | 7,115 | |
2003 | | 1,353 | | 348 | | 228 | | 972 | | 718 | | 5,396 | | 116 | | 9,130 | |
2004 | | 1,956 | | 355 | | 239 | | 1,191 | | 824 | | 5,827 | | 133 | | 10,524 | |
2005 | | 2,442 | | 364 | | 278 | | 2,300 | | 973 | | 7,821 | | 173 | | 14,351 | |
2006 | | 3,248 | | 363 | | 274 | | 2,105 | | 1,013 | | 5,956 | | 179 | | 13,139 | |
2007 | | 2,887 | | 424 | | 347 | | 1,949 | | 989 | | 5,723 | | 200 | | 12,519 | |
2008 | | 2,590 | | 696 | | 378 | | 3,738 | | 1,215 | | 7,501 | | 524 | | 16,641 | |
2009 | | 1,888 | | 283 | | 306 | | 3,297 | | 719 | | 3,294 | | 116 | | 9,903 | |
2010 | | 2,191 | | 349 | | 373 | | 4,253 | | 915 | | 3,360 | | 158 | | 11,599 | |
2011 | | 2,131 | | 454 | | 325 | | 6,073 | | 1,168 | | 3,381 | | 286 | | 13,816 | |
2012 | | 2,360 | | 461 | | 370 | | 4,635 | | 1,185 | | 1,935 | | 266 | | 11,212 | |
2013 | | 2,578 | | 450 | | 388 | | 3,696 | | 1,290 | | 3,130 | | 250 | | 11,782 | |
2014 | | 3,397 | | | x | 366 | | | x | 1,535 | | 5,128 | | 309 | | 10,735 | |
1 Shipments of gypsum and silica to Canadian cement, lime and clay plants are not included in this table.
2 Sand and gravel; stone.
3 Includes pentanes and condensate.
4 Liquefied petroleum gases and sulphur.
x Suppressed to meet the confidentiality requirements of the Statistics Act.
Sources: Natural Resources Canada, Ministry of Natural Gas Development.
Table A1.12 Petroleum and Natural Gas Activity Indicators
| | | | | | | | | | | | | | | | | | | | | | | | | | Change | |
Indicator | | Unit of Measure | | 2004 | | 2005 | | 2006 | | 2007 | | 2008 | | 2009 | | 2010 | | 2011 | | 2012 | | 2013 | | 2014 | | 2013-2014 | |
| | | | | | | | | | | | | | | | | | | | | | | | | | (per cent) | |
Natural gas production (wellhead) | | (billion cubic m) | | 32.0 | | 32.8 | | 32.8 | | 32.6 | | 33.4 | | 33.0 | | 35.0 | | 38.2 | | 41.2 | | 44.7 | | 45.1 | | 0.9 | |
Crude oil and condensate | | (million cubic m) | | 2.2 | | 1.9 | | 1.9 | | 1.8 | | 1.6 | | 1.6 | | 1.5 | | 1.2 | | 1.6 | | 1.5 | | 1.7 | | 14.1 | |
Wells authorized | | (number) | | 1,698 | | 1,790 | | 1,730 | | 1,205 | | 1,412 | | 829 | | 870 | | 1,135 | | 647 | | 907 | | 1,254 | | 38.3 | |
Wells drilled | | (number) | | 1,281 | | 1,429 | | 1,435 | | 908 | | 927 | | 626 | | 713 | | 661 | | 484 | | 568 | | 695 | | 22.4 | |
Provincial reserves | | | | | | | | | | | | | | | | | | | | | | | | | | | |
Raw gas (remaining reserves) | | (billion cubic m) | | 389.7 | | 444.6 | | 462.4 | | 482.9 | | 605.3 | | 657.9 | | 932.0 | | 974.9 | | 1,138.5 | | 1,197.2 | | n/a | | n/a | |
Oil (remaining reserves) | | (million cubic m) | | 22.0 | | 20.9 | | 18.2 | | 19.7 | | 18.5 | | 19.3 | | 18.7 | | 18.2 | | 19.1 | | 19.3 | | n/a | | n/a | |
Provincial government petroleum and natural gas revenue 1 | | ($ millions) | | 1,794.4 | | 2,559.0 | | 2,139.1 | | 2,352.8 | | 4,093.9 | | 1,451.0 | | 1,376.5 | | 731.3 | | 439.5 | | 672.8 | | 1,188.4 | | 76.6 | |
1 Includes Crown royalties, Crown reserve disposition bonuses, fees and rentals.
Source: Ministry of Natural Gas Development
2015 Financial and Economic Review – July 2015
79
Appendix 1 – Economic Review
Table A1.13 Supply and Consumption of Electrical Energy in British Columbia
| | Supply | | Consumption | | Net Exports | |
| | Net Generation | | Receipts | | | | Delivered | | | | | | | |
| | | | | | Total | | From Other | | | | To Other | | Total | | | | | |
| | | | | | Provincial | | Provinces | | Total | | Provinces | | Provincial | | Total | | | |
Year | | Hydro | | Thermal | | Generation | | and Imports | | Supply | | and Exports | | Consumption | | Demand | | | |
| | (gigawatt-hours)1 | |
1989 | | 51,082 | | 6,573 | | 57,655 | | 4,500 | | 62,155 | | 6,583 | | 55,572 | | 62,155 | | 2,083 | |
1990 | | 57,245 | | 3,417 | | 60,662 | | 3,233 | | 63,895 | | 6,689 | | 57,206 | | 63,895 | | 3,456 | |
1991 | | 60,149 | | 2,832 | | 62,981 | | 2,272 | | 65,253 | | 7,725 | | 57,528 | | 65,253 | | 5,454 | |
1992 | | 60,555 | | 3,503 | | 64,058 | | 2,685 | | 66,743 | | 9,473 | | 57,270 | | 66,743 | | 6,788 | |
1993 | | 53,057 | | 5,716 | | 58,774 | | 5,691 | | 64,465 | | 5,605 | | 58,860 | | 64,465 | | (86 | ) |
1994 | | 53,979 | | 7,036 | | 61,015 | | 7,836 | | 68,851 | | 9,541 | | 59,311 | | 68,851 | | 1,705 | |
1995 | | 49,814 | | 8,192 | | 58,006 | | 6,385 | | 64,391 | | 3,972 | | 60,419 | | 64,391 | | (2,413 | ) |
1996 | | 67,329 | | 4,436 | | 71,765 | | 3,289 | | 75,053 | | 10,390 | | 64,664 | | 75,053 | | 7,101 | |
1997 | | 61,772 | | 5,189 | | 66,961 | | 4,316 | | 71,278 | | 12,114 | | 59,163 | | 71,278 | | 7,798 | |
1998 | | 60,849 | | 6,861 | | 67,710 | | 5,056 | | 72,766 | | 10,619 | | 62,147 | | 72,766 | | 5,563 | |
1999 | | 61,588 | | 6,457 | | 68,045 | | 6,807 | | 74,852 | | 12,529 | | 62,323 | | 74,852 | | 5,722 | |
2000 | | 59,754 | | 8,487 | | 68,241 | | 6,039 | | 74,280 | | 10,698 | | 63,582 | | 74,280 | | 4,659 | |
2001 | | 48,338 | | 8,994 | | 57,332 | | 10,154 | | 67,486 | | 6,408 | | 61,079 | | 67,486 | | (3,747 | ) |
2002 | | 58,627 | | 6,318 | | 64,945 | | 5,769 | | 70,714 | | 8,078 | | 62,636 | | 70,714 | | 2,309 | |
2003 | | 56,689 | | 6,362 | | 63,051 | | 7,084 | | 70,135 | | 9,599 | | 60,535 | | 70,135 | | 2,515 | |
2004 | | 53,281 | | 7,214 | | 60,496 | | 8,261 | | 68,757 | | 6,791 | | 61,966 | | 68,757 | | (1,470 | ) |
2005 | | 60,605 | | 7,207 | | 67,811 | | 7,226 | | 75,037 | | 9,247 | | 65,790 | | 75,037 | | 2,021 | |
2006 | | 54,772 | | 7,249 | | 62,021 | | 12,695 | | 74,716 | | 6,155 | | 68,561 | | 74,716 | | (6,540 | ) |
2007 | | 64,738 | | 7,473 | | 72,212 | | 8,027 | | 80,239 | | 10,987 | | 69,252 | | 80,239 | | 2,960 | |
2008 | | 58,774 | | 7,080 | | 65,854 | | 12,362 | | 78,216 | | 9,986 | | 68,230 | | 78,216 | | (2,376 | ) |
2009 | | 55,872 | | 6,330 | | 62,201 | | 11,771 | | 73,973 | | 8,134 | | 65,839 | | 73,973 | | (3,638 | ) |
2010 | | 52,762 | | 6,715 | | 59,477 | | 10,418 | | 69,895 | | 7,429 | | 62,467 | | 69,895 | | (2,990 | ) |
2011 | | 60,966 | | 5,240 | | 66,205 | | 10,195 | | 76,401 | | 13,106 | | 63,294 | | 76,401 | | 2,911 | |
2012 | | 64,217 | | 5,567 | | 69,783 | | 8,079 | | 77,862 | | 14,068 | | 63,794 | | 77,862 | | 5,990 | |
2013 | | 57,846 | | 5,860 | | 63,707 | | 8,697 | | 72,403 | | 9,007 | | 63,396 | | 72,403 | | 311 | |
2014 | | 54,068 | | 5,746 | | 59,814 | | 10,084 | | 69,898 | | 8,706 | | 61,192 | | 69,898 | | (1,378 | ) |
1 Gigawatt-hour = one million kilowatt-hours
Source: Statistics Canada (CANSIM Table 127-0003 – accessed May 2015).
2015 Financial and Economic Review – July 2015
80
Appendix 1 – Economic Review
Table A1.14 Components of British Columbia Population Change
| | Net Migration | | Natural Increase | | Total | | Total | |
| | Inter- | | Inter- | | | | | | Population | | Population | |
Year | | provincial | | national | | Total | | Births | | Deaths | | Total | | Increase 1 | | at July 1 | |
1975 | | (2,864 | ) | 25,342 | | 22,478 | | 36,281 | | 19,151 | | 17,130 | | 39,608 | | 2,499,564 | |
1976 | | (464 | ) | 16,288 | | 15,824 | | 35,848 | | 18,788 | | 17,060 | | 32,884 | | 2,533,899 | |
1977 | | 12,452 | | 11,224 | | 23,676 | | 36,691 | | 18,596 | | 18,095 | | 41,771 | | 2,570,315 | |
1978 | | 20,106 | | 7,699 | | 27,805 | | 37,231 | | 19,058 | | 18,173 | | 45,978 | | 2,615,162 | |
1979 | | 32,541 | | 14,012 | | 46,553 | | 38,432 | | 19,204 | | 19,228 | | 65,781 | | 2,665,238 | |
1980 | | 38,773 | | 23,522 | | 62,295 | | 40,104 | | 19,371 | | 20,733 | | 83,028 | | 2,745,861 | |
1981 | | 23,270 | | 22,143 | | 45,413 | | 41,474 | | 19,857 | | 21,617 | | 67,030 | | 2,826,558 | |
1982 | | (1,129 | ) | 14,175 | | 13,046 | | 42,747 | | 20,707 | | 22,040 | | 35,086 | | 2,876,513 | |
1983 | | 3,000 | | 10,639 | | 13,639 | | 42,919 | | 19,827 | | 23,092 | | 36,731 | | 2,907,502 | |
1984 | | 3,867 | | 8,674 | | 12,541 | | 43,911 | | 20,686 | | 23,225 | | 35,766 | | 2,947,181 | |
1985 | | (3,430 | ) | 9,374 | | 5,944 | | 43,127 | | 21,302 | | 21,825 | | 27,769 | | 2,975,131 | |
1986 | | (772 | ) | 12,290 | | 11,518 | | 41,967 | | 21,213 | | 20,754 | | 32,272 | | 3,003,621 | |
1987 | | 16,588 | | 21,078 | | 37,666 | | 41,814 | | 21,814 | | 20,000 | | 57,666 | | 3,048,651 | |
1988 | | 25,829 | | 28,704 | | 54,533 | | 42,930 | | 22,546 | | 20,384 | | 74,917 | | 3,114,761 | |
1989 | | 35,711 | | 31,042 | | 66,753 | | 43,769 | | 22,997 | | 20,772 | | 87,525 | | 3,196,725 | |
1990 | | 40,088 | | 28,585 | | 68,673 | | 45,617 | | 23,577 | | 22,040 | | 90,713 | | 3,292,111 | |
1991 | | 34,600 | | 21,274 | | 55,874 | | 45,612 | | 23,977 | | 21,635 | | 77,509 | | 3,373,787 | |
1992 | | 39,578 | | 29,477 | | 69,055 | | 46,156 | | 24,615 | | 21,541 | | 90,596 | | 3,468,802 | |
1993 | | 37,595 | | 34,679 | | 72,274 | | 46,026 | | 25,764 | | 20,262 | | 92,536 | | 3,567,772 | |
1994 | | 34,449 | | 42,667 | | 77,116 | | 46,998 | | 25,939 | | 21,059 | | 98,175 | | 3,676,075 | |
1995 | | 23,414 | | 43,644 | | 67,058 | | 46,820 | | 26,375 | | 20,445 | | 87,503 | | 3,777,390 | |
1996 | | 17,798 | | 47,617 | | 65,415 | | 46,138 | | 27,538 | | 18,600 | | 84,015 | | 3,874,317 | |
1997 | | 1,980 | | 38,318 | | 40,298 | | 44,577 | | 27,412 | | 17,165 | | 57,463 | | 3,948,583 | |
1998 | | (17,521 | ) | 24,380 | | 6,859 | | 43,072 | | 27,978 | | 15,094 | | 21,953 | | 3,983,113 | |
1999 | | (12,413 | ) | 28,644 | | 16,231 | | 41,939 | | 28,017 | | 13,922 | | 30,153 | | 4,011,375 | |
2000 | | (14,783 | ) | 29,266 | | 14,483 | | 40,672 | | 27,461 | | 13,211 | | 27,694 | | 4,039,230 | |
2001 | | (7,028 | ) | 34,803 | | 27,775 | | 40,575 | | 28,362 | | 12,213 | | 39,988 | | 4,076,881 | |
2002 | | (4,445 | ) | 28,662 | | 24,217 | | 40,065 | | 28,884 | | 11,181 | | 35,398 | | 4,100,161 | |
2003 | | 3,025 | | 27,976 | | 31,001 | | 40,497 | | 29,320 | | 11,177 | | 42,178 | | 4,123,937 | |
2004 | | 7,785 | | 28,734 | | 36,519 | | 40,490 | | 29,924 | | 10,566 | | 47,085 | | 4,155,017 | |
2005 | | 7,212 | | 39,152 | | 46,364 | | 40,827 | | 30,235 | | 10,592 | | 56,956 | | 4,195,764 | |
2006 | | 12,799 | | 35,437 | | 48,236 | | 41,729 | | 30,688 | | 11,041 | | 59,277 | | 4,241,691 | |
2007 | | 16,776 | | 36,944 | | 53,720 | | 43,649 | | 31,308 | | 12,341 | | 66,061 | | 4,290,988 | |
2008 | | 10,849 | | 50,805 | | 61,654 | | 44,276 | | 32,097 | | 12,179 | | 73,833 | | 4,349,412 | |
2009 | | 9,672 | | 47,661 | | 57,333 | | 44,993 | | 31,440 | | 13,553 | | 70,886 | | 4,410,679 | |
2010 | | 6,212 | | 33,385 | | 39,597 | | 43,826 | | 31,324 | | 12,502 | | 52,099 | | 4,465,924 | |
2011 | | 699 | | 30,860 | | 31,559 | | 44,129 | | 31,964 | | 12,165 | | 43,724 | | 4,499,139 | |
2012 | | (4,596 | ) | 31,345 | | 26,749 | | 44,028 | | 32,358 | | 11,670 | | 38,419 | | 4,542,508 | |
2013 | | (832 | ) | 34,457 | | 33,625 | | 43,700 | | 33,051 | | 10,649 | | 44,274 | | 4,582,625 | |
2014 | | 10,042 | | 33,890 | | 43,932 | | 44,194 | | 33,574 | | 10,620 | | 54,552 | | 4,631,302 | |
1 Components may not add to totals due to the revision of population statistics based on information collected during subsequent census years. The revisions are not distributed back to relevant components due to insufficient data.
Source: Statistics Canada (CANSIM Tables 051-0017, 051-0037, 053-0001, 051-0005 – accessed May 2015).
2015 Financial and Economic Review – July 2015
81
| Appendix 2 |
| |
| Financial Review |
| |
| Supplementary Tables |
2015 Financial and Economic Review – July 2015
Appendix 2 – Financial Review Supplementary Tables
Table A2.1 2014/15 Financial Forecasts – Year in Review
| | ($ millions) | |
2014/15 surplus – Budget 2014 (February 18, 2014) | | 184 | | | | | | | | 184 | |
2014/15 surplus – first Quarterly Report (September 9, 2014) | | | | 266 | | | | | | | |
2014/15 surplus – second Quarterly Report (November 26, 2014) | | | | | | 444 | | | | | |
2014/15 surplus – third Quarterly Report (February 17, 2015) | | | | | | | | 879 | | | |
| | Q1 | | Q2 | | Q3 | | Q4 | | Total | |
| | Update | | Update | | Update | | Update | | Changes | |
Revenue changes: | | | | | | | | | | | |
Personal income tax – mainly higher 2013 tax assessments | | 337 | | — | | 235 | | 13 | | 585 | |
Corporate income tax – increased federal government instalments and prior-year adjustment, reflecting higher 2013 tax assessments | | 119 | | 18 | | 151 | | (1 | ) | 287 | |
Provincial sales tax – carry forward impact of lower 2013/14 results | | (218 | ) | — | | 20 | | 87 | | (111 | ) |
Harmonized sales tax – prior year results | | — | | — | | (94 | ) | 3 | | (91 | ) |
Property transfer tax – stronger year-to-date sales results | | 50 | | 100 | | 85 | | 26 | | 261 | |
Other taxation sources | | (13 | ) | (11 | ) | 2 | | (10 | ) | (32 | ) |
Natural gas royalties – mainly higher prices, partially offset by lower production volumes and higher utilization of royalty programs | | 202 | | 12 | | (113 | ) | (49 | ) | 52 | |
Forests – mainly reduced harvest volumes | | 46 | | (31 | ) | (43 | ) | (3 | ) | (31 | ) |
Coal, metals and minerals – lower coal prices and mining profits | | (98 | ) | (8 | ) | (12 | ) | 33 | | (85 | ) |
Other natural resources | | 6 | | (11 | ) | 2 | | (6 | ) | (9 | ) |
Fees – mainly improved SUCH sector projections | | 44 | | 8 | | 20 | | 17 | | 89 | |
Investment earnings – higher SUCH and taxpayer supported Crown agencies’ forecasts | | 5 | | 22 | | 9 | | 76 | | 112 | |
Miscellaneous – reduced SUCH sector outlook and reprofiling property transfers to non-profit societies to support building capacity in the non-profit sector | | (100 | ) | 17 | | (80 | ) | 84 | | (79 | ) |
Release of surplus assets – reprofiling to 2015/16 | | — | | — | | (79 | ) | 4 | | (75 | ) |
Federal government contributions – lower Disaster Financial Assistance transfers, health and social transfers in respect of prior years and Crown agencies’ forecast | | 14 | | 9 | | (7 | ) | (53 | ) | (37 | ) |
Commercial Crown agencies operating results: | | | | | | | | | | | |
ICBC – mainly claims cost savings and higher investment income | | 111 | | 71 | | 166 | | 57 | | 405 | |
Other commercial Crown agencies changes | | 10 | | (2 | ) | 1 | | 72 | | 81 | |
Total revenue changes | | 515 | | 194 | | 263 | | 350 | | 1,322 | |
Less : expense increases (decreases): | | | | | | | | | | | |
Consolidated Revenue Fund changes: | | | | | | | | | | | |
Statutory spending: | | | | | | | | | | | |
Direct fire costs | | 287 | | (50 | ) | — | | (2 | ) | 235 | |
Emergency program flood-related costs | | 14 | | 1 | | — | | (2 | ) | 13 | |
Teachers’ Pension Plan liability adjustment | | 66 | | — | | — | | (19 | ) | 47 | |
BC Training and Education Savings Program - higher eligibility volumes | | 8 | | — | | — | | — | | 8 | |
Innovative Clean Energy Fund | | — | | — | | 9 | | — | | 9 | |
Elections BC | | 3 | | — | | — | | 2 | | 5 | |
BC Timber Sales | | — | | 3 | | 2 | | 2 | | 7 | |
Other statutory spending | | — | | — | | 4 | | (2 | ) | 2 | |
Refundable tax credit transfers | | (6 | ) | 46 | | 30 | | 16 | | 86 | |
Other CRF underspend | | — | | — | | — | | (63 | ) | (63 | ) |
Prior year liability adjustments | | — | | (15 | ) | (50 | ) | (65 | ) | (130 | ) |
Management of public debt (net) – reflects lower interest rates and revisions to scheduled borrowing | | (15 | ) | (14 | ) | (36 | ) | (23 | ) | (88 | ) |
Spending funded by third party recoveries | | 8 | | 13 | | (2 | ) | 50 | | 69 | |
(Increase) decrease in operating transfers to service delivery agencies | | 34 | | 91 | | (6 | ) | (24 | ) | 95 | |
Changes in spending profile of service delivery agencies: | | | | | | | | | | | |
School districts – lower operating expenses due to job action | | (163 | ) | (97 | ) | — | | (68 | ) | (328 | ) |
Universities – lower grants to third parties and amortization expenses | | 14 | | (1 | ) | 12 | | (58 | ) | (33 | ) |
Colleges – primarily higher amortization costs | | (10 | ) | 20 | | 3 | | 13 | | 26 | |
Health authorities and hospital societies – increasing demand for healthcare services | | 110 | | 26 | | (2 | ) | (88 | ) | 46 | |
Other service delivery agencies | | 7 | | (7 | ) | (36 | ) | (23 | ) | (59 | ) |
Removal of expenditure management targets from fiscal plan | | 76 | | — | | — | | — | | 76 | |
Total expense increases (decreases) | | 433 | | 16 | | (72 | ) | (354 | ) | 23 | |
Subtotal | | 82 | | 178 | | 335 | | 704 | | 1,299 | |
Reduction in forecast allowance | | — | | — | | 100 | | 100 | | 200 | |
Total changes | | 82 | | 178 | | 435 | | 804 | | 1,499 | |
2014/15 surplus – first Quarterly Report | | 266 | | | | | | | | | |
2014/15 surplus – second Quarterly Report | | | | 444 | | | | | | | |
2014/15 surplus – third Quarterly Report | | | | | | 879 | | | | | |
2014/15 surplus – Public Accounts | | | | | | | | 1,683 | | 1,683 | |
2015 Financial and Economic Review – July 2015
84
Appendix 2 – Financial Review Supplementary Tables
Table A2.2 Operating Statement – 2003/04 to 2014/15 1
| | | | | | | | | | | | | | | | | | | | | | | | | | Average | |
($ millions) | | Actual
2003/04 | | Actual
2004/05 | | Actual
2005/06 | | Actual
2006/07 | | Actual
2007/08 | | Actual
2008/09 | | Actual
2009/10 | | Actual
2010/11 | | Actual
2011/12 | | Actual
2012/13 | | Actual
2013/14 | | Actual
2014/15 | | annual
change | |
| | | | | | | | | | | | | | | | | | | | | | | | | | (per cent) | |
Revenue | | 29,325 | | 33,565 | | 36,138 | | 38,685 | | 40,023 | | 38,720 | | 37,978 | | 40,679 | | 41,796 | | 42,036 | | 43,728 | | 46,122 | | 4.2 | |
Expense | | (30,677 | ) | (30,880 | ) | (33,166 | ) | (34,703 | ) | (37,277 | ) | (38,647 | ) | (39,790 | ) | (40,926 | ) | (43,646 | ) | (43,204 | ) | (43,401 | ) | (44,439 | ) | 3.4 | |
Surplus/(deficit) | | (1,352 | ) | 2,685 | | 2,972 | | 3,982 | | 2,746 | | 73 | | (1,812 | ) | (247 | ) | (1,850 | ) | (1,168 | ) | 327 | | 1,683 | | | |
Accumulated surplus (deficit) beginning of year, excluding other comprehensive income | | (5,010 | ) | (6,362 | ) | (3,677 | ) | (705 | ) | 3,277 | | 6,023 | | 6,096 | | 4,284 | | 4,037 | | 2,187 | | 1,019 | | 1,346 | | | |
Accumulated surplus (deficit) before other comprehensive income | | (6,362 | ) | (3,677 | ) | (705 | ) | 3,277 | | 6,023 | | 6,096 | | 4,284 | | 4,037 | | 2,187 | | 1,019 | | 1,346 | | 3,029 | | | |
Accumulated other comprehensive income of commercial Crown corporations | | — | | — | | — | | 494 | | 412 | | (25 | ) | 456 | | 360 | | 73 | | 154 | | 481 | | 223 | | | |
Accumulated surplus (deficit), end of year | | (6,362 | ) | (3,677 | ) | (705 | ) | 3,771 | | 6,435 | | 6,071 | | 4,740 | | 4,397 | | 2,260 | | 1,173 | | 1,827 | | 3,252 | | | |
| | | | | | | | | | | | | | | | | | | | | | | | | | | |
Per cent of Nominal GDP: 2 | | | | | | | | | | | | | | | | | | | | | | | | | | | |
Surplus (deficit) | | -0.9 | | 1.7 | | 1.7 | | 2.1 | | 1.4 | | 0.0 | | -0.9 | | -0.1 | | -0.9 | | -0.5 | | 0.1 | | 0.7 | | | |
Per cent of revenue: | | | | | | | | | | | | | | | | | | | | | | | | | | | |
Surplus (deficit) | | -4.6 | | 8.0 | | 8.2 | | 10.3 | | 6.9 | | 0.2 | | -4.8 | | -0.6 | | -4.4 | | -2.8 | | 0.7 | | 3.6 | | | |
Per capita ($): 3 | | | | | | | | | | | | | | | | | | | | | | | | | | | |
Surplus (deficit) | | (328 | ) | 646 | | 708 | | 939 | | 640 | | 17 | | (411 | ) | (55 | ) | (411 | ) | (257 | ) | 71 | | 363 | | | |
1 Figures have been restated to reflect government accounting policies in effect at March 31, 2015.
2 Revenue and expense as a per cent of GDP is calculated using GDP for the calendar year ending in the fiscal year (e.g. 2014/15 amounts divided by GDP for the 2014 calendar year). As nominal GDP for the calendar year ending 2014 is not available, the 2014 GDP projected in the February 2015 budget has been used for the fiscal year ended March 31, 2015 for demonstration purposes.
3 Per capita revenue and expense is calculated using July 1 population (e.g. 2014/15 amounts divided by population on July 1, 2014).
2015 Financial and Economic Review – July 2015
85
Appendix 2 – Financial Review Supplementary Tables
Table A2.3 Statement of Financial Position – 2003/04 to 2014/15
| | | | | | | | | | | | | | | | | | | | | | | | | | Average | |
($ millions) | | Actual
2003/04 | | Actual
2004/05 | | Actual
2005/06 | | Actual
2006/07 | | Actual
2007/08 | | Actual
2008/09 | | Actual
2009/10 | | Actual
2010/11 | | Actual
2011/12 | | Actual
2012/13 | | Actual
2013/14 | | Actual
2014/15 | | Annual
Change | |
| | | | | | | | | | | | | | | | | | | | | | | | | | (per cent) | |
Financial assets: | | | | | | | | | | | | | | | | | | | | | | | | | | | |
Cash and temporary investments | | 2,725 | | 3,623 | | 3,882 | | 3,452 | | 5,954 | | 5,185 | | 2,911 | | 3,060 | | 3,235 | | 3,174 | | 2,802 | | 3,676 | | 2.8 | |
Other financial assets | | 5,411 | | 5,662 | | 5,956 | | 6,760 | | 6,862 | | 5,875 | | 7,171 | | 7,990 | | 7,938 | | 8,186 | | 9,336 | | 9,136 | | 4.9 | |
Sinking funds | | 4,619 | | 4,516 | | 4,059 | | 3,798 | | 2,649 | | 2,134 | | 1,329 | | 1,410 | | 1,491 | | 1,778 | | 835 | | 977 | | -13.2 | |
Investments in commercial Crown corporations: | | | | | | | | | | | | | | | | | | | | | | | | | | | |
Retained earnings | | 3,159 | | 3,330 | | 3,637 | | 4,661 | | 5,329 | | 5,952 | | 7,458 | | 7,092 | | 6,998 | | 7,541 | | 7,839 | | 8,271 | | 9.1 | |
Recoverable capital loans | | 7,512 | | 6,901 | | 6,916 | | 7,170 | | 7,719 | | 9,149 | | 11,471 | | 12,947 | | 14,846 | | 16,907 | | 18,921 | | 20,317 | | 9.5 | |
| | 10,671 | | 10,231 | | 10,553 | | 11,831 | | 13,048 | | 15,101 | | 18,929 | | 20,039 | | 21,844 | | 24,448 | | 26,760 | | 28,588 | | 9.4 | |
Warehouse borrowing program assets | | — | | — | | — | | — | | — | | 2,081 | | — | | — | | — | | — | | — | | — | | n/a | |
| | 23,426 | | 24,032 | | 24,450 | | 25,841 | | 28,513 | | 30,376 | | 30,340 | | 32,499 | | 34,508 | | 37,586 | | 39,733 | | 42,377 | | 5.5 | |
Liabilities: | | | | | | | | | | | | | | | | | | | | | | | | | | | |
Accounts payable & accrued liabilities | | 7,383 | | 7,162 | | 7,728 | | 7,510 | | 8,353 | | 7,695 | | 7,286 | | 7,919 | | 9,119 | | 9,150 | | 8,298 | | 8,312 | | 1.1 | |
Deferred revenue | | 4,147 | | 5,345 | | 5,897 | | 6,202 | | 7,421 | | 9,433 | | 10,002 | | 10,750 | | 10,459 | | 9,895 | | 9,718 | | 9,809 | | 8.1 | |
Debt: | | | | | | | | | | | | | | | | | | | | | | | | | | | |
Taxpayer-supported debt | | 30,000 | | 28,648 | | 27,215 | | 25,937 | | 26,549 | | 26,402 | | 29,968 | | 31,821 | | 34,659 | | 38,182 | | 41,068 | | 41,880 | | 3.1 | |
Self-supported debt | | 7,775 | | 7,221 | | 7,242 | | 7,502 | | 8,088 | | 11,612 | | 11,917 | | 13,333 | | 15,534 | | 17,634 | | 19,625 | | 21,040 | | 9.5 | |
Total provincial debt | | 37,775 | | 35,869 | | 34,457 | | 33,439 | | 34,637 | | 38,014 | | 41,885 | | 45,154 | | 50,193 | | 55,816 | | 60,693 | | 62,920 | | 4.7 | |
Add: debt offset by sinking funds | | 4,619 | | 4,515 | | 4,059 | | 3,798 | | 2,649 | | 2,134 | | 1,329 | | 1,410 | | 1,491 | | 1,778 | | 835 | | 977 | | -13.2 | |
Less: guarantees and non-guaranteed debt | | (467 | ) | (492 | ) | (495 | ) | (447 | ) | (492 | ) | (496 | ) | (546 | ) | (455 | ) | (730 | ) | (755 | ) | (726 | ) | (739 | ) | 4.3 | |
Financial statement debt | | 41,927 | | 39,892 | | 38,021 | | 36,790 | | 36,794 | | 39,652 | | 42,668 | | 46,109 | | 50,954 | | 56,839 | | 60,802 | | 63,158 | | 3.8 | |
| | 53,457 | | 52,399 | | 51,646 | | 50,502 | | 52,568 | | 56,780 | | 59,956 | | 64,778 | | 70,532 | | 75,884 | | 78,818 | | 81,279 | | 3.9 | |
Net liabilities | | (30,031 | ) | (28,367 | ) | (27,196 | ) | (24,661 | ) | (24,055 | ) | (26,404 | ) | (29,616 | ) | (32,279 | ) | (36,024 | ) | (38,298 | ) | (39,085 | ) | (38,902 | ) | 2.4 | |
Capital and other assets: | | | | | | | | | | | | | | | | | | | | | | | | | | | |
Tangible capital assets | | 22,461 | | 23,350 | | 24,874 | | 26,716 | | 28,652 | | 30,539 | | 32,219 | | 34,278 | | 35,692 | | 36,762 | | 37,778 | | 39,028 | | 5.2 | |
Restricted assets | | 771 | | 830 | | 887 | | 962 | | 1,130 | | 1,178 | | 1,241 | | 1,312 | | 1,377 | | 1,442 | | 1,493 | | 1,553 | | 6.6 | |
Other assets | | 437 | | 510 | | 730 | | 754 | | 708 | | 758 | | 896 | | 1,086 | | 1,215 | | 1,267 | | 1,641 | | 1,573 | | 12.3 | |
| | 23,669 | | 24,690 | | 26,491 | | 28,432 | | 30,490 | | 32,475 | | 34,356 | | 36,676 | | 38,284 | | 39,471 | | 40,912 | | 42,154 | | 5.4 | |
Accumulated surplus (deficit) | | (6,362 | ) | (3,677 | ) | (705 | ) | 3,771 | | 6,435 | | 6,071 | | 4,740 | | 4,397 | | 2,260 | | 1,173 | | 1,827 | | 3,252 | | n/a | |
Per cent of Nominal GDP: 1 | | | | | | | | | | | | | | | | | | | | | | | | | | | |
Net liabilities | | 20.2 | | 17.6 | | 15.7 | | 13.2 | | 12.2 | | 12.9 | | 15.1 | | 15.7 | | 16.6 | | 17.2 | | 17.0 | | 16.3 | | -1.9 | |
Capital and other assets | | 15.9 | | 15.3 | | 15.3 | | 15.2 | | 15.5 | | 15.9 | | 17.5 | | 17.8 | | 17.6 | | 17.7 | | 17.8 | | 17.7 | | 0.9 | |
Growth rates: | | | | | | | | | | | | | | | | | | | | | | | | | | | |
Net liabilities | | 4.3 | | -5.5 | | -4.1 | | -9.3 | | -2.5 | | 9.8 | | 12.2 | | 9.0 | | 11.6 | | 6.3 | | 2.1 | | -0.5 | | 2.6 | |
Capital and other assets | | -0.5 | | 4.3 | | 7.3 | | 7.3 | | 7.2 | | 6.5 | | 5.8 | | 6.8 | | 4.4 | | 3.1 | | 3.7 | | 3.0 | | 5.4 | |
Per capita: 2 | | | | | | | | | | | | | | | | | | | | | | | | | | | |
Net liabilities | | 7,282 | | 6,827 | | 6,482 | | 5,814 | | 5,606 | | 6,071 | | 6,715 | | 7,228 | | 8,007 | | 8,431 | | 8,529 | | 8,400 | | 1.3 | |
Capital and other assets | | 5,739 | | 5,942 | | 6,314 | | 6,703 | | 7,106 | | 7,467 | | 7,789 | | 8,212 | | 8,509 | | 8,689 | | 8,928 | | 9,102 | | 4.3 | |
1 Net liabilities as a per cent of GDP is calculated using GDP for the calendar year ending in the fiscal year (e.g. 2014/15 amount divided by GDP for the 2014 calendar year). As nominal GDP for the calendar year ending 2014 is not available, the 2014 GDP projected in the February 2015 budget has been used for the fiscal year ended March 31, 2015 for demonstration purposes.
2 Per capita net liabilities is calculated using July 1 population (e.g. 2014/15 amount divided by population on July 1, 2014).
2015 Financial and Economic Review – July 2015
86
Appendix 2 – Financial Review Supplementary Tables
Table A2.4 Changes in Financial Position – 2003/04 to 2014/15
| | Actual | | Actual | | Actual | | Actual | | Actual | | Actual | | Actual | | Actual | | Actual | | Actual | | Actual | | Actual | | 12-Year | |
($ millions) | | 2003/04 | | 2004/05 | | 2005/06 | | 2006/07 | | 2007/08 | | 2008/09 | | 2009/10 | | 2010/11 | | 2011/12 | | 2012/13 | | 2013/14 | | 2014/15 | | Total | |
(Surplus) deficit for the year | | 1,352 | | (2,685 | ) | (2,972 | ) | (3,982 | ) | (2,746 | ) | (73 | ) | 1,812 | | 247 | | 1,850 | | 1,168 | | (327 | ) | (1,683 | ) | (8,039 | ) |
Comprehensive income (increase) decrease | | — | | — | | — | | (494 | ) | 82 | | 437 | | (481 | ) | 96 | | 287 | | (81 | ) | (327 | ) | 258 | | (223 | ) |
Change in accumulated (surplus) deficit | | 1,352 | | (2,685 | ) | (2,972 | ) | (4,476 | ) | (2,664 | ) | 364 | | 1,331 | | 343 | | 2,137 | | 1,087 | | (654 | ) | (1,425 | ) | (8,262 | ) |
| | | | | | | | | | | | | | | | | | | | | | | | | | | |
Capital and other asset changes: | | | | | | | | | | | | | | | | | | | | | | | | | | | |
Taxpayer-supported capital investments | | 2,068 | | 2,357 | | 3,136 | | 3,404 | | 3,664 | | 3,743 | | 3,719 | | 4,110 | | 3,565 | | 3,279 | | 3,151 | | 3,407 | | 39,603 | |
Less: | amortization and other accounting changes | | (2,237 | ) | (1,468 | ) | (1,612 | ) | (1,562 | ) | (1,728 | ) | (1,856 | ) | (2,039 | ) | (2,051 | ) | (2,151 | ) | (2,209 | ) | (2,135 | ) | (2,157 | ) | (23,205 | ) |
Increase in net capital assets | | (169 | ) | 889 | | 1,524 | | 1,842 | | 1,936 | | 1,887 | | 1,680 | | 2,059 | | 1,414 | | 1,070 | | 1,016 | | 1,250 | | 16,398 | |
Increase (decrease) in restricted assets | | 32 | | 59 | | 57 | | 75 | | 168 | | 48 | | 63 | | 71 | | 65 | | 65 | | 51 | | 60 | | | |
Increase (decrease) in other assets | | 12 | | 73 | | 220 | | 24 | | (46 | ) | 50 | | 138 | | 190 | | 129 | | 52 | | 374 | | (68 | ) | 1,148 | |
| | (125 | ) | 1,021 | | 1,801 | | 1,941 | | 2,058 | | 1,985 | | 1,881 | | 2,320 | | 1,608 | | 1,187 | | 1,441 | | 1,242 | | 18,360 | |
Increase (decrease) in net liabilities | | 1,227 | | (1,664 | ) | (1,171 | ) | (2,535 | ) | (606 | ) | 2,349 | | 3,212 | | 2,663 | | 3,745 | | 2,274 | | 787 | | (183 | ) | 10,098 | |
| | | | | | | | | | | | | | | | | | | | | | | | | | | |
Investment and working capital changes: | | | | | | | | | | | | | | | | | | | | | | | | | | | |
Increase (reduction) in cash and temporary investments | | 73 | | 898 | | 259 | | (430 | ) | 2,502 | | (769 | ) | (2,274 | ) | 149 | | 175 | | (61 | ) | (372 | ) | 874 | | 1,024 | |
Increase (decrease) in warehouse borrowing investments | | — | | — | | — | | — | | — | | 2,081 | | (2,081 | ) | — | | — | | — | | — | | — | | — | |
Investment in commercial Crown corporations: | | | | | | | | | | | | | | | | | | | | | | | | | | | |
Increase (decrease) in retained earnings | | 441 | | 171 | | 307 | | 1,024 | | 668 | | 623 | | 1,506 | | (366 | ) | (94 | ) | 543 | | 298 | | 432 | | 5,553 | |
Self-supported capital investments | | 787 | | 777 | | 811 | | 983 | | 1,299 | | 1,810 | | 3,362 | | 2,470 | | 2,744 | | 2,765 | | 2,519 | | 2,488 | | 22,815 | |
Less: | loan repayments and other accounting changes | | (506 | ) | (1,388 | ) | (796 | ) | (729 | ) | (750 | ) | (380 | ) | (1,040 | ) | (994 | ) | (845 | ) | (704 | ) | (505 | ) | (1,092 | ) | (9,729 | ) |
| | 722 | | (440 | ) | 322 | | 1,278 | | 1,217 | | 2,053 | | 3,828 | | 1,110 | | 1,805 | | 2,604 | | 2,312 | | 1,828 | | 18,639 | |
Other working capital changes | | (1,576 | ) | (829 | ) | (1,281 | ) | 456 | | (3,109 | ) | (2,856 | ) | 331 | | (481 | ) | (880 | ) | 1,068 | | 1,236 | | (163 | ) | (8,084 | ) |
| | (781 | ) | (371 | ) | (700 | ) | 1,304 | | 610 | | 509 | | (196 | ) | 778 | | 1,100 | | 3,611 | | 3,176 | | 2,539 | | 11,579 | |
Increase (decrease) in financial statement debt | | 446 | | (2,035 | ) | (1,871 | ) | (1,231 | ) | 4 | | 2,858 | | 3,016 | | 3,441 | | 4,845 | | 5,885 | | 3,963 | | 2,356 | | 21,677 | |
(Increase) decrease in sinking fund debt | | 455 | | 104 | | 456 | | 261 | | 1,149 | | 515 | | 805 | | (81 | ) | (81 | ) | (287 | ) | 943 | | (142 | ) | 4,097 | |
Increase (decrease) in guarantees | | 10 | | (32 | ) | (3 | ) | (54 | ) | 8 | | (9 | ) | (14 | ) | (31 | ) | (27 | ) | (14 | ) | (6 | ) | (6 | ) | (178 | ) |
Increase (decrease) in non-guaranteed debt | | 7 | | 57 | | 6 | | 6 | | 37 | | 13 | | 64 | | (60 | ) | 302 | | 39 | | (23 | ) | 19 | | 467 | |
Increase (decrease) in total provincial debt | | 918 | | (1,906 | ) | (1,412 | ) | (1,018 | ) | 1,198 | | 3,377 | | 3,871 | | 3,269 | | 5,039 | | 5,623 | | 4,877 | | 2,227 | | 26,063 | |
Represented by increase (decrease) in: | | | | | | | | | | | | | | | | | | | | | | | | | | | |
Taxpayer-supported debt | | 630 | | (1,352 | ) | (1,433 | ) | (1,278 | ) | 612 | | (147 | ) | 3,566 | | 1,853 | | 2,838 | | 3,523 | | 2,886 | | 812 | | 12,510 | |
Self-supported debt | | 288 | | (554 | ) | 21 | | 260 | | 586 | | 3,524 | | 305 | | 1,416 | | 2,201 | | 2,100 | | 1,991 | | 1,415 | | 13,553 | |
Total provincial debt | | 918 | | (1,906 | ) | (1,412 | ) | (1,018 | ) | 1,198 | | 3,377 | | 3,871 | | 3,269 | | 5,039 | | 5,623 | | 4,877 | | 2,227 | | 26,063 | |
2015 Financial and Economic Review – July 2015
87
Appendix 2 – Financial Review Supplementary Tables
Table A2.5 Revenue by Source - 2003/04 to 2014/15 1
| | | | | | | | | | | | | | | | | | | | | | | | | | Average | |
($ millions) | | Actual
2003/04 | | Actual
2004/05 | | Actual
2005/06 | | Actual
2006/07 | | Actual
2007/08 | | Actual
2008/09 | | Actual
2009/10 | | Actual
2010/11 | | Actual
2011/12 | | Actual
2012/13 | | Actual
2013/14 | | Actual
2014/15 | | annual
change | |
| | | | | | | | | | | | | | | | | | | | | | | | | | (per cent) | |
Taxation revenue: | | | | | | | | | | | | | | | | | | | | | | | | | | | |
Personal income | | 5,014 | | 5,184 | | 5,960 | | 7,020 | | 7,074 | | 6,309 | | 5,769 | | 5,805 | | 6,427 | | 6,977 | | 6,862 | | 8,076 | | 4.4 | |
Corporate income | | 874 | | 1,388 | | 1,587 | | 1,732 | | 2,477 | | 2,294 | | 1,625 | | 2,026 | | 2,002 | | 2,204 | | 2,427 | | 2,635 | | 10.6 | |
Harmonized sales | | — | | — | | — | | — | | — | | — | | — | | 4,176 | | 5,779 | | 5,950 | | (226 | ) | (91 | ) | n/a | |
Other sales | | 4,165 | | 4,309 | | 4,507 | | 4,886 | | 5,248 | | 5,137 | | 4,945 | | 1,438 | | 151 | | 118 | | 5,529 | | 5,853 | | n/a | |
Fuel | | 875 | | 904 | | 911 | | 901 | | 935 | | 891 | | 884 | | 940 | | 928 | | 890 | | 917 | | 932 | | 0.6 | |
Carbon | | — | | — | | — | | — | | — | | 306 | | 541 | | 741 | | 959 | | 1,120 | | 1,222 | | 1,198 | | n/a | |
Tobacco | | 647 | | 699 | | 702 | | 727 | | 693 | | 709 | | 683 | | 735 | | 636 | | 614 | | 724 | | 752 | | 1.4 | |
Property | | 1,576 | | 1,663 | | 1,719 | | 1,734 | | 1,797 | | 1,850 | | 1,887 | | 1,920 | | 1,913 | | 1,985 | | 2,080 | | 2,154 | | 2.9 | |
Property transfer | | 518 | | 604 | | 843 | | 914 | | 1,068 | | 715 | | 887 | | 855 | | 944 | | 758 | | 937 | | 1,065 | | 6.8 | |
Corporation capital | | 124 | | 160 | | 162 | | 91 | | 117 | | 108 | | 95 | | (3 | ) | (5 | ) | 1 | | — | | (1 | ) | n/a | |
Insurance premium | | 300 | | 302 | | 330 | | 353 | | 373 | | 389 | | 389 | | 399 | | 411 | | 433 | | 458 | | 483 | | 4.4 | |
| | 14,093 | | 15,213 | | 16,721 | | 18,358 | | 19,782 | | 18,708 | | 17,705 | | 19,032 | | 20,145 | | 21,050 | | 20,930 | | 23,056 | | 4.6 | |
Natural resource revenue: | | | | | | | | | | | | | | | | | | | | | | | | | | | |
Natural gas royalties | | 1,230 | | 1,439 | | 1,921 | | 1,207 | | 1,132 | | 1,314 | | 406 | | 313 | | 339 | | 169 | | 445 | | 493 | | -8.0 | |
Crown land tenures | | 320 | | 342 | | 386 | | 441 | | 569 | | 814 | | 867 | | 923 | | 928 | | 868 | | 859 | | 834 | | 9.1 | |
Columbia River Treaty | | 230 | | 258 | | 319 | | 223 | | 246 | | 231 | | 168 | | 136 | | 110 | | 89 | | 170 | | 130 | | -5.1 | |
Other energy and minerals | | 199 | | 256 | | 392 | | 456 | | 367 | | 479 | | 421 | | 514 | | 529 | | 306 | | 269 | | 267 | | 2.7 | |
Forests | | 1,014 | | 1,363 | | 1,214 | | 1,276 | | 1,087 | | 557 | | 387 | | 436 | | 482 | | 562 | | 719 | | 754 | | -2.7 | |
Other resources | | 301 | | 302 | | 317 | | 342 | | 341 | | 413 | | 398 | | 406 | | 424 | | 479 | | 493 | | 459 | | 3.9 | |
| | 3,294 | | 3,960 | | 4,549 | | 3,945 | | 3,742 | | 3,808 | | 2,647 | | 2,728 | | 2,812 | | 2,473 | | 2,955 | | 2,937 | | -1.0 | |
Other revenue: | | | | | | | | | | | | | | | | | | | | | | | | | | | |
Medical Services Plan premiums | | 1,453 | | 1,472 | | 1,482 | | 1,524 | | 1,557 | | 1,595 | | 1,666 | | 1,787 | | 1,919 | | 2,047 | | 2,158 | | 2,254 | | 4.1 | |
Post-secondary education fees | | 781 | | 836 | | 892 | | 928 | | 979 | | 1,036 | | 1,123 | | 1,235 | | 1,291 | | 1,345 | | 1,445 | | 1,544 | | 6.4 | |
Other healthcare related fees | | 231 | | 228 | | 225 | | 237 | | 248 | | 257 | | 267 | | 308 | | 324 | | 327 | | 333 | | 358 | | 4.1 | |
Motor vehicle licences and permits | | 367 | | 385 | | 405 | | 427 | | 445 | | 450 | | 449 | | 467 | | 479 | | 489 | | 504 | | 499 | | 2.8 | |
BC Ferries tolls | | — | | — | | — | | — | | — | | — | | — | | — | | — | | — | | — | | — | | n/a | |
Other fees and licences | | 713 | | 749 | | 682 | | 692 | | 750 | | 670 | | 616 | | 643 | | 722 | | 699 | | 770 | | 770 | | 0.7 | |
Investment earnings | | 947 | | 830 | | 951 | | 1,023 | | 1,133 | | 818 | | 930 | | 843 | | 1,022 | | 1,173 | | 1,236 | | 1,203 | | 2.2 | |
Sales of goods and services | | 714 | | 741 | | 719 | | 678 | | 637 | | 694 | | 728 | | 759 | | 930 | | 942 | | 946 | | 967 | | 2.8 | |
Miscellaneous | | 1,147 | | 1,349 | | 1,452 | | 1,774 | | 1,813 | | 1,809 | | 1,887 | | 1,928 | | 1,743 | | 1,671 | | 2,248 | | 1,837 | | 4.4 | |
| | 6,353 | | 6,590 | | 6,808 | | 7,283 | | 7,562 | | 7,329 | | 7,666 | | 7,970 | | 8,430 | | 8,693 | | 9,640 | | 9,432 | | 3.7 | |
Contributions from the federal government: | | | | | | | | | | | | | | | | | | | | | | | | | | | |
Health and social transfers | | 3,044 | | 3,421 | | 4,220 | | 4,473 | | 4,614 | | 4,743 | | 4,883 | | 5,176 | | 5,384 | | 5,442 | | 5,869 | | 5,827 | | 6.1 | |
Harmonized sales tax transition payments | | — | | — | | — | | — | | — | | — | | 250 | | 769 | | 580 | | — | | — | | — | | n/a | |
Equalization | | (330 | ) | 979 | | 590 | | 459 | | — | | — | | — | | — | | — | | — | | — | | — | | n/a | |
Other cost shared agreements | | 907 | | 832 | | 1,025 | | 1,465 | | 1,328 | | 1,252 | | 1,794 | | 2,064 | | 1,754 | | 1,602 | | 1,633 | | 1,499 | | 4.7 | |
| | 3,621 | | 5,232 | | 5,835 | | 6,397 | | 5,942 | | 5,995 | | 6,927 | | 8,009 | | 7,718 | | 7,044 | | 7,502 | | 7,326 | | 6.6 | |
Commercial Crown corporation net income: | | | | | | | | | | | | | | | | | | | | | | | | | | | |
BC Hydro | | 111 | | 402 | | 266 | | 407 | | 369 | | 365 | | 447 | | 591 | | 558 | | 509 | | 549 | | 581 | | 16.2 | |
Liquor Distribution Branch | | 724 | | 779 | | 800 | | 840 | | 858 | | 891 | | 877 | | 891 | | 909 | | 930 | | 877 | | 935 | | 2.4 | |
BC Lotteries (net of payments to federal gov’t) | | 719 | | 811 | | 914 | | 1,011 | | 1,080 | | 1,082 | | 1,070 | | 1,097 | | 1,102 | | 1,116 | | 1,165 | | 1,245 | | 5.1 | |
BC Railway Company | | 41 | | 183 | | 33 | | 30 | | 13 | | 36 | | 2 | | 15 | | 14 | | 6 | | 13 | | 5 | | n/a | |
ICBC | | 352 | | 383 | | 191 | | 381 | | 633 | | 512 | | 601 | | 315 | | 84 | | 231 | | 136 | | 657 | | n/a | |
Transportation Investment Corp. (Port Mann) | | — | | — | | — | | — | | — | | (47 | ) | (4 | ) | (7 | ) | (17 | ) | (60 | ) | (88 | ) | (89 | ) | n/a | |
Other | | 17 | | 12 | | 21 | | 33 | | 42 | | 41 | | 40 | | 38 | | 41 | | 44 | | 49 | | 37 | | 7.3 | |
| | 1,964 | | 2,570 | | 2,225 | | 2,702 | | 2,995 | | 2,880 | | 3,033 | | 2,940 | | 2,691 | | 2,776 | | 2,701 | | 3,371 | | 5.0 | |
Total revenue | | 29,325 | | 33,565 | | 36,138 | | 38,685 | | 40,023 | | 38,720 | | 37,978 | | 40,679 | | 41,796 | | 42,036 | | 43,728 | | 46,122 | | 4.2 | |
2015 Financial and Economic Review – July 2015
88
Appendix 2 – Financial Review Supplementary Tables
Table A2.6 Revenue by Source Supplementary Information – 2003/04 to 2014/15
| | | | | | | | | | | | | | | | | | | | | | | | | | Average | |
| | Actual
2003/04 | | Actual
2004/05 | | Actual
2005/06 | | Actual
2006/07 | | Actual
2007/08 | | Actual
2008/09 | | Actual
2009/10 | | Actual
2010/11 | | Actual
2011/12 | | Actual
2012/13 | | Actual
2013/14 | | Actual
2014/15 | | annual
change | |
| | | | | | | | | | | | | | | | | | | | | | | | | | (per cent) | |
Per cent of Nominal GDP: 3 | | | | | | | | | | | | | | | | | | | | | | | | | | | |
Taxation | | 9.5 | | 9.4 | | 9.6 | | 9.8 | | 10.0 | | 9.2 | | 9.0 | | 9.2 | | 9.3 | | 9.5 | | 9.1 | | 9.7 | | 0.2 | |
Natural resources | | 2.2 | | 2.5 | | 2.6 | | 2.1 | | 1.9 | | 1.9 | | 1.4 | | 1.3 | | 1.3 | | 1.1 | | 1.3 | | 1.2 | | -5.2 | |
Other | | 4.3 | | 4.1 | | 3.9 | | 3.9 | | 3.8 | | 3.6 | | 3.9 | | 3.9 | | 3.9 | | 3.9 | | 4.2 | | 4.0 | | -0.7 | |
Contributions from the federal government | | 2.4 | | 3.2 | | 3.4 | | 3.4 | | 3.0 | | 2.9 | | 3.5 | | 3.9 | | 3.5 | | 3.2 | | 3.3 | | 3.1 | | 2.1 | |
Commercial Crown corporation net income | | 1.3 | | 1.6 | | 1.3 | | 1.4 | | 1.5 | | 1.4 | | 1.5 | | 1.4 | | 1.2 | | 1.2 | | 1.2 | | 1.4 | | 0.6 | |
Total revenue | | 19.7 | | 20.8 | | 20.8 | | 20.7 | | 20.3 | | 19.0 | | 19.4 | | 19.7 | | 19.2 | | 18.9 | | 19.0 | | 19.3 | | -0.2 | |
Growth rates (per cent): | | | | | | | | | | | | | | | | | | | | | | | | | | | |
Taxation | | 11.9 | | 7.9 | | 9.9 | | 9.8 | | 7.8 | | -5.4 | | -5.4 | | 7.5 | | 5.8 | | 4.5 | | -0.6 | | 10.2 | | n/a | |
Natural resources | | 2.3 | | 20.2 | | 14.9 | | -13.3 | | -5.1 | | 1.8 | | -30.5 | | 3.1 | | 3.1 | | -12.1 | | 19.5 | | -0.6 | | n/a | |
Other | | -1.3 | | 3.7 | | 3.3 | | 7.0 | | 3.8 | | -3.1 | | 4.6 | | 4.0 | | 5.8 | | 3.1 | | 10.9 | | -2.2 | | n/a | |
Contributions from the federal government | | -5.3 | | 44.5 | | 11.5 | | 9.6 | | -7.1 | | 0.9 | | 15.5 | | 15.6 | | -3.6 | | -8.7 | | 6.5 | | -2.3 | | n/a | |
Commercial Crown corporation net income | | 6.3 | | 30.9 | | -13.4 | | 21.4 | | 10.8 | | -3.8 | | 5.3 | | -3.1 | | -8.5 | | 3.2 | | -2.7 | | 24.8 | | n/a | |
Total revenue | | 5.0 | | 14.5 | | 7.7 | | 7.0 | | 3.5 | | -3.3 | | -1.9 | | 7.1 | | 2.7 | | 0.6 | | 4.0 | | 5.5 | | n/a | |
Per capita ($): 4 | | | | | | | | | | | | | | | | | | | | | | | | | | | |
Taxation | | 3,417 | | 3,661 | | 3,985 | | 4,328 | | 4,610 | | 4,301 | | 4,014 | | 4,262 | | 4,478 | | 4,634 | | 4,567 | | 4,978 | | 3.5 | |
Natural resources | | 799 | | 953 | | 1,084 | | 930 | | 872 | | 876 | | 600 | | 611 | | 625 | | 544 | | 645 | | 634 | | -2.1 | |
Other | | 1,541 | | 1,586 | | 1,623 | | 1,717 | | 1,762 | | 1,685 | | 1,738 | | 1,785 | | 1,874 | | 1,914 | | 2,104 | | 2,037 | | 2.6 | |
Contributions from the federal government | | 878 | | 1,259 | | 1,391 | | 1,508 | | 1,385 | | 1,378 | | 1,571 | | 1,793 | | 1,715 | | 1,551 | | 1,637 | | 1,582 | | 5.5 | |
Commercial Crown corporation net income | | 476 | | 619 | | 530 | | 637 | | 698 | | 662 | | 688 | | 658 | | 598 | | 611 | | 589 | | 728 | | 3.9 | |
Total revenue | | 7,111 | | 8,078 | | 8,613 | | 9,120 | | 9,327 | | 8,902 | | 8,610 | | 9,109 | | 9,290 | | 9,254 | | 9,542 | | 9,959 | | 3.1 | |
| | | | | | | | | | | | | | | | | | | | | | | | | | | |
Real Per Capita Revenue (2014 $) 5 | | 8,273 | | 9,218 | | 9,634 | | 10,031 | | 10,082 | | 9,426 | | 9,117 | | 9,517 | | 9,481 | | 9,340 | | 9,639 | | 9,959 | | 1.7 | |
Growth rate (per cent) | | 2.2 | | 11.4 | | 4.5 | | 4.1 | | 0.5 | | -6.5 | | -3.3 | | 4.4 | | -0.4 | | -1.5 | | 3.2 | | 3.3 | | 1.8 | |
1 Figures have been restated to reflect government accounting policies in effect at March 31, 2015.
2 Includes social service tax, hotel room tax, provincial sales tax, tax on designated properties and housing transition tax.
3 Revenue as a per cent of GDP is calculated using GDP for the calendar year ending in the fiscal year (e.g. 2014/15 revenue divided by GDP for the 2014 calendar year). As nominal GDP for the calendar year ending 2014 is not available, the 2014 GDP projected in the February 2015 budget has been used for the fiscal year ended March 31, 2015 for demonstration purposes. Totals may not add due to rounding.
4 Per capita revenue is calculated using July 1 population (e.g. 2014/15 revenue divided by population on July 1, 2014). Totals may not add due to rounding.
5 Revenue is converted to real (inflation-adjusted) terms using the consumer price index (CPI) for the corresponding calendar year (e.g. 2014 CPI for 2014/15 revenue).
2015 Financial and Economic Review – July 2015
89
Appendix 2 – Financial Review Supplementary Tables
Table A2.7 Expense by Function 1 – 2003/04 to 2014/15
| | | | | | | | | | | | | | | | | | | | | | | | | | Average | |
($ millions) | | Actual
2003/04 | | Actual
2004/05 | | Actual
2005/06 | | Actual
2006/07 | | Actual
2007/08 | | Actual
2008/09 | | Actual
2009/10 | | Actual
2010/11 | | Actual
2011/12 | | Actual
2012/13 | | Actual
2013/14 | | Actual
2014/15 | | annual
change | |
| | | | | | | | | | | | | | | | | | | | | | | | | | (per cent) | |
Function: | | | | | | | | | | | | | | | | | | | | | | | | | | | |
Health: | | | | | | | | | | | | | | | | | | | | | | | | | | | |
Medical Services Plan | | 2,451 | | 2,458 | | 2,601 | | 2,869 | | 3,168 | | 3,282 | | 3,407 | | 3,641 | | 3,873 | | 3,906 | | 4,114 | | 4,136 | | 4.9 | |
Pharmacare | | 723 | | 793 | | 868 | | 914 | | 955 | | 1,010 | | 1,053 | | 1,129 | | 1,147 | | 1,122 | | 1,130 | | 1,120 | | 4.1 | |
Regional services | | 7,593 | | 7,781 | | 8,346 | | 8,751 | | 9,321 | | 10,030 | | 10,273 | | 10,597 | | 11,255 | | 11,784 | | 11,960 | | 12,410 | | 4.6 | |
Other healthcare expenses | | 343 | | 361 | | 469 | | 565 | | 667 | | 601 | | 597 | | 625 | | 642 | | 690 | | 658 | | 704 | | 6.8 | |
| | 11,110 | | 11,393 | | 12,284 | | 13,099 | | 14,111 | | 14,923 | | 15,330 | | 15,992 | | 16,917 | | 17,502 | | 17,862 | | 18,370 | | 4.7 | |
Education: | | | | | | | | | | | | | | | | | | | | | | | | | | | |
Elementary and secondary | | 4,687 | | 4,757 | | 4,829 | | 5,272 | | 5,521 | | 5,740 | | 5,778 | | 5,802 | | 5,885 | | 6,002 | | 6,133 | | 6,064 | | 2.4 | |
Post-secondary | | 3,327 | | 3,534 | | 3,912 | | 4,068 | | 4,307 | | 4,573 | | 4,732 | | 4,859 | | 4,907 | | 5,103 | | 5,284 | | 5,349 | | 4.4 | |
Other education expenses | | 198 | | 195 | | 171 | | 147 | | 152 | | 158 | | 528 | | 504 | | 436 | | 423 | | 410 | | 414 | | 6.9 | |
| | 8,212 | | 8,486 | | 8,912 | | 9,487 | | 9,980 | | 10,471 | | 11,038 | | 11,165 | | 11,228 | | 11,528 | | 11,827 | | 11,827 | | 3.4 | |
Social services: | | | | | | | | | | | | | | | | | | | | | | | | | | | |
Social assistance | | 1,084 | | 970 | | 1,089 | | 1,231 | | 1,255 | | 1,339 | | 1,454 | | 1,506 | | 1,550 | | 1,552 | | 1,572 | | 1,589 | | 3.5 | |
Child welfare | | 774 | | 759 | | 832 | | 964 | | 925 | | 1,073 | | 1,077 | | 1,118 | | 1,112 | | 1,098 | | 1,097 | | 1,129 | | 3.5 | |
Low income tax credit transfers | | 195 | | 168 | | 135 | | 101 | | 85 | | 188 | | 216 | | 408 | | 509 | | 534 | | 279 | | 248 | | | |
Community living and other services | | 725 | | 728 | | 682 | | 586 | | 756 | | 723 | | 729 | | 754 | | 769 | | 806 | | 857 | | 881 | | 1.8 | |
| | 2,778 | | 2,625 | | 2,738 | | 2,882 | | 3,021 | | 3,323 | | 3,476 | | 3,786 | | 3,940 | | 3,990 | | 3,805 | | 3,847 | | 3.0 | |
Protection of persons and property | | 1,217 | | 1,068 | | 1,245 | | 1,184 | | 1,429 | | 1,429 | | 1,380 | | 1,448 | | 1,512 | | 1,539 | | 1,520 | | 1,451 | | 1.6 | |
Transportation | | 1,121 | | 1,310 | | 1,197 | | 1,251 | | 1,378 | | 1,401 | | 1,453 | | 1,580 | | 1,545 | | 1,555 | | 1,580 | | 1,608 | | 3.3 | |
Natural resources & economic development | | 1,648 | | 1,722 | | 1,651 | | 1,782 | | 2,073 | | 1,886 | | 2,159 | | 2,349 | | 1,873 | | 2,092 | | 1,755 | | 2,191 | | 2.6 | |
Other | | 1,064 | | 1,018 | | 1,079 | | 1,232 | | 1,386 | | 1,649 | | 1,382 | | 1,208 | | 1,414 | | 1,346 | | 1,184 | | 1,288 | | 1.8 | |
General government | | 958 | | 953 | | 1,152 | | 1,252 | | 1,218 | | 1,425 | | 1,375 | | 1,146 | | 1,235 | | 1,262 | | 1,386 | | 1,359 | | 3.2 | |
Interest | | 2,446 | | 2,305 | | 2,198 | | 2,270 | | 2,237 | | 2,158 | | 2,197 | | 2,252 | | 2,383 | | 2,390 | | 2,482 | | 2,498 | | 0.2 | |
Operating expense | | 30,554 | | 30,880 | | 32,456 | | 34,439 | | 36,833 | | 38,665 | | 39,790 | | 40,926 | | 42,047 | | 43,204 | | 43,401 | | 44,439 | | 3.5 | |
Unusual items: | | | | | | | | | | | | | | | | | | | | | | | | | | | |
Joint trusteeship | | — | | — | | — | | — | | — | | — | | — | | — | | — | | — | | — | | — | | | |
Restructuring exit expenses | | 123 | | — | | — | | — | | — | | — | | — | | — | | — | | — | | — | | — | | | |
Negotiating Framework incentive payments | | — | | — | | 710 | | 264 | | 4 | | 2 | | — | | — | | — | | — | | — | | — | | | |
Climate Action Dividend | | — | | — | | — | | — | | 440 | | (20 | ) | — | | — | | — | | — | | — | | — | | | |
Liability for HST transition funding repayment | | — | | — | | — | | — | | — | | — | | — | | — | | 1,599 | | — | | — | | — | | | |
Total expense | | 30,677 | | 30,880 | | 33,166 | | 34,703 | | 37,277 | | 38,647 | | 39,790 | | 40,926 | | 43,646 | | 43,204 | | 43,401 | | 44,439 | | | |
| | | | | | | | | | | | | | | | | | | | | | | | | | | |
Per cent of operating expense: | | | | | | | | | | | | | | | | | | | | | | | | | | | |
Health | | 36.4 | | 36.9 | | 37.8 | | 38.0 | | 38.3 | | 38.6 | | 38.5 | | 39.1 | | 40.2 | | 40.5 | | 41.2 | | 41.3 | | 1.2 | |
Education | | 26.9 | | 27.5 | | 27.5 | | 27.5 | | 27.1 | | 27.1 | | 27.7 | | 27.3 | | 26.7 | | 26.7 | | 27.3 | | 26.6 | | -0.1 | |
Social services and housing | | 9.1 | | 8.5 | | 8.4 | | 8.4 | | 8.2 | | 8.6 | | 8.7 | | 9.3 | | 9.4 | | 9.2 | | 8.8 | | 8.7 | | -0.4 | |
Protection of persons and property | | 4.0 | | 3.5 | | 3.8 | | 3.4 | | 3.9 | | 3.7 | | 3.5 | | 3.5 | | 3.6 | | 3.6 | | 3.5 | | 3.3 | | -1.8 | |
Transportation | | 3.7 | | 4.2 | | 3.7 | | 3.6 | | 3.7 | | 3.6 | | 3.7 | | 3.9 | | 3.7 | | 3.6 | | 3.6 | | 3.6 | | -0.1 | |
Natural resources & economic development | | 5.4 | | 5.6 | | 5.1 | | 5.2 | | 5.6 | | 4.9 | | 5.4 | | 5.7 | | 4.5 | | 4.8 | | 4.0 | | 4.9 | | -0.8 | |
Other | | 3.5 | | 3.3 | | 3.3 | | 3.6 | | 3.8 | | 4.3 | | 3.5 | | 3.0 | | 3.4 | | 3.1 | | 2.7 | | 2.9 | | -1.7 | |
General government | | 3.1 | | 3.1 | | 3.5 | | 3.6 | | 3.3 | | 3.7 | | 3.5 | | 2.8 | | 2.9 | | 2.9 | | 3.2 | | 3.1 | | -0.2 | |
Interest | | 8.0 | | 7.5 | | 6.8 | | 6.6 | | 6.1 | | 5.6 | | 5.5 | | 5.5 | | 5.7 | | 5.5 | | 5.7 | | 5.6 | | -3.2 | |
| | 100.0 | | 100.0 | | 100.0 | | 100.0 | | 100.0 | | 100.0 | | 100.0 | | 100.0 | | 100.0 | | 100.0 | | 100.0 | | 100.0 | | | |
1 Figures have been restated to reflect government accounting policies in effect at March 31, 2015.
2015 Financial and Economic Review – July 2015
90
Appendix 2 — Financial Review Supplementary Tables
Table A2.8 Expense by Function 1 Supplementary Information — 2003/04 to 2014/15
| | Actual
2003/04 | | Actual
2004/05 | | Actual
2005/06 | | Actual
2006/07 | | Actual
2007/08 | | Actual
2008/09 | | Actual
2009/10 | | Actual
2010/11 | | Actual
2011/12 | | Actual
2012/13 | | Actual
2013/14 | | Actual
2014/15 | | Average
annual
change | |
| | | | | | | | | | | | | | | | | | | | | | | | | | (per cent) | |
Per cent of Nominal GDP: 2 | | | | | | | | | | | | | | | | | | | | | | | | | | | |
Health | | 7.5 | | 7.1 | | 7.1 | | 7.0 | | 7.2 | | 7.3 | | 7.8 | | 7.8 | | 7.8 | | 7.9 | | 7.8 | | 7.7 | | 0.3 | |
Education | | 5.5 | | 5.3 | | 5.1 | | 5.1 | | 5.1 | | 5.1 | | 5.6 | | 5.4 | | 5.2 | | 5.2 | | 5.1 | | 5.0 | | -1.0 | |
Social services | | 1.9 | | 1.6 | | 1.6 | | 1.5 | | 1.5 | | 1.6 | | 1.8 | | 1.8 | | 1.8 | | 1.8 | | 1.7 | | 1.6 | | -1.3 | |
Protection of persons and property | | 0.8 | | 0.7 | | 0.7 | | 0.6 | | 0.7 | | 0.7 | | 0.7 | | 0.7 | | 0.7 | | 0.7 | | 0.7 | | 0.6 | | -2.7 | |
Transportation | | 0.8 | | 0.8 | | 0.7 | | 0.7 | | 0.7 | | 0.7 | | 0.7 | | 0.8 | | 0.7 | | 0.7 | | 0.7 | | 0.7 | | -1.0 | |
Natural resources & economic development | | 1.1 | | 1.1 | | 1.0 | | 1.0 | | 1.1 | | 0.9 | | 1.1 | | 1.1 | | 0.9 | | 0.9 | | 0.8 | | 0.9 | | -1.7 | |
Other | | 0.7 | | 0.6 | | 0.6 | | 0.7 | | 0.7 | | 0.8 | | 0.7 | | 0.6 | | 0.7 | | 0.6 | | 0.5 | | 0.5 | | -2.5 | |
General government | | 0.6 | | 0.6 | | 0.7 | | 0.7 | | 0.6 | | 0.7 | | 0.7 | | 0.6 | | 0.6 | | 0.6 | | 0.6 | | 0.6 | | -1.1 | |
Interest | | 1.6 | | 1.4 | | 1.3 | | 1.2 | | 1.1 | | 1.1 | | 1.1 | | 1.1 | | 1.1 | | 1.1 | | 1.1 | | 1.0 | | -4.0 | |
Operating expense | | 20.6 | | 19.2 | | 18.7 | | 18.4 | | 18.7 | | 19.0 | | 20.3 | | 19.9 | | 19.3 | | 19.4 | | 18.9 | | 18.6 | | -0.9 | |
Growth rates (per cent): | | | | | | | | | | | | | | | | | | | | | | | | | | | |
Health | | 2.7 | | 2.5 | | 7.8 | | 6.6 | | 7.7 | | 5.8 | | 2.7 | | 4.3 | | 5.8 | | 3.5 | | 2.1 | | 2.8 | | n/a | |
Education | | 4.2 | | 3.3 | | 5.0 | | 6.5 | | 5.2 | | 4.9 | | 5.4 | | 1.2 | | 0.6 | | 2.7 | | 2.6 | | 0.0 | | n/a | |
Social services | | -10.9 | | -5.5 | | 4.3 | | 5.3 | | 4.8 | | 10.0 | | 4.6 | | 8.9 | | 4.1 | | 1.3 | | -4.6 | | 1.1 | | n/a | |
Protection of persons and property | | 10.7 | | -12.2 | | 16.6 | | -4.9 | | 20.7 | | 0.0 | | -3.4 | | 4.9 | | 4.4 | | 1.8 | | -1.2 | | -4.5 | | n/a | |
Transportation | | -29.4 | | 16.9 | | -8.6 | | 4.5 | | 10.2 | | 1.7 | | 3.7 | | 8.7 | | -2.2 | | 0.6 | | 1.6 | | 1.8 | | n/a | |
Natural resources & economic development | | 8.1 | | 4.5 | | -4.1 | | 7.9 | | 16.3 | | -9.0 | | 14.5 | | 8.8 | | -20.3 | | 11.7 | | -16.1 | | 24.8 | | n/a | |
Other | | 31.5 | | -4.3 | | 6.0 | | 14.2 | | 12.5 | | 19.0 | | -16.2 | | -12.6 | | 17.1 | | -4.8 | | -12.0 | | 8.8 | | n/a | |
General government | | -5.4 | | -0.5 | | 20.9 | | 8.7 | | -2.7 | | 17.0 | | -3.5 | | -16.7 | | 7.8 | | 2.2 | | 9.8 | | -1.9 | | n/a | |
Interest | | -4.2 | | -5.8 | | -4.6 | | 3.3 | | -1.5 | | -3.5 | | 1.8 | | 2.5 | | 5.8 | | 0.3 | | 3.8 | | 0.6 | | n/a | |
Operating expense | | 0.5 | | 1.1 | | 5.1 | | 6.1 | | 7.0 | | 5.0 | | 2.9 | | 2.9 | | 2.7 | | 2.8 | | 0.5 | | 2.4 | | n/a | |
Per capita ($):3 | | | | | | | | | | | | | | | | | | | | | | | | | | | |
Health | | 2,694 | | 2,742 | | 2,928 | | 3,088 | | 3,289 | | 3,431 | | 3,476 | | 3,581 | | 3,760 | | 3,853 | | 3,898 | | 3,966 | | 3.6 | |
Education | | 1,991 | | 2,042 | | 2,124 | | 2,237 | | 2,326 | | 2,407 | | 2,503 | | 2,500 | | 2,496 | | 2,538 | | 2,581 | | 2,554 | | 2.3 | |
Social services | | 674 | | 632 | | 653 | | 679 | | 704 | | 764 | | 788 | | 848 | | 876 | | 878 | | 830 | | 831 | | 1.9 | |
Protection of persons and property | | 295 | | 257 | | 297 | | 279 | | 333 | | 329 | | 313 | | 324 | | 336 | | 339 | | 332 | | 313 | | 0.5 | |
Transportation | | 272 | | 315 | | 285 | | 295 | | 321 | | 322 | | 329 | | 354 | | 343 | | 342 | | 345 | | 347 | | 2.2 | |
Natural resources & economic development | | 400 | | 414 | | 393 | | 420 | | 483 | | 434 | | 489 | | 526 | | 416 | | 461 | | 383 | | 473 | | 1.5 | |
Other | | 258 | | 245 | | 257 | | 290 | | 323 | | 379 | | 313 | | 270 | | 314 | | 296 | | 258 | | 278 | | 0.7 | |
General government | | 232 | | 229 | | 275 | | 295 | | 284 | | 328 | | 312 | | 257 | | 274 | | 278 | | 302 | | 293 | | 2.1 | |
Interest | | 593 | | 555 | | 524 | | 535 | | 521 | | 496 | | 498 | | 504 | | 530 | | 526 | | 542 | | 539 | | -0.9 | |
Operating expense | | 7,409 | | 7,431 | | 7,736 | | 8,118 | | 8,584 | | 8,890 | | 9,021 | | 9,164 | | 9,345 | | 9,511 | | 9,471 | | 9,594 | | 2.4 | |
Real Per Capita Operating Expense (2014 $) 4 | | 8,620 | | 8,480 | | 8,652 | | 8,930 | | 9,278 | | 9,412 | | 9,551 | | 9,575 | | 9,538 | | 9,600 | | 9,567 | | 9,595 | | 1.0 | |
Growth rate (per cent) | | -2.2 | | -1.6 | | 2.0 | | 3.2 | | 3.9 | | 1.4 | | 1.5 | | 0.2 | | -0.4 | | 0.6 | | -0.3 | | 0.3 | | 0.7 | |
1 Figures have been restated to reflect government accounting policies in effect at March 31, 2015.
2 Expense as a per cent of GDP is calculated using GDP for the calendar year ending in the fiscal year (e.g. 2014/15 expense divided by GDP for the 2014 calendar year). As nominal GDP for the calendar year ending 2014 is not available, the 2014 GDP projected in the February 2015 budget has been used for the fiscal year ended March 31, 2015 for demonstration purposes. Totals may not add due to rounding.
3 Per capita expense is calculated using July 1 population (e.g. 2014/15 expense divided by population on July 1, 2014). Totals may not add due to rounding.
4 Expense is converted to real (inflation-adjusted) terms using the consumer price index (CPI) for the corresponding calendar year (e.g. 2014 CPI for 2014/15 expense).
2015 Financial and Economic Review — July 2015
91
Appendix 2 — Financial Review Supplementary Tables
Table A2.9 Full-Time Equivalents (FTEs) — 2003/04 to 2014/15
| | Actual
2003/04 | | Actual
2004/05 | | Actual
2005/06 | | Actual
2006/07 | | Actual
2007/08 | | Actual
2008/09 | | Actual
2009/10 | | Actual
2010/11 | | Actual
2011/12 | | Actual
2012/13 | | Actual
2013/14 | | Actual
2014/15 | | Average
annual
change | |
| | | | | | | | | | | | | | | | | | | | | | | | | | (per cent) | |
Taxpayer-supported programs and agencies: | | | | | | | | | | | | | | | | | | | | | | | | | | | |
Ministries and special offices (CRF) | | 29,049 | | 27,252 | | 27,129 | | 28,647 | | 30,224 | | 31,874 | | 31,353 | | 30,221 | | 27,228 | | 27,326 | | 26,526 | | 26,679 | | -0.8 | |
Service delivery agencies 1 | | 4,570 | | 3,822 | | 3,992 | | 3,917 | | 4,128 | | 4,403 | | 4,508 | | 4,295 | | 4,346 | | 4,508 | | 4,640 | | 4,798 | | 0.4 | |
Total FTEs | | 33,619 | | 31,074 | | 31,121 | | 32,564 | | 34,352 | | 36,277 | | 35,861 | | 34,516 | | 31,574 | | 31,834 | | 31,166 | | 31,477 | | -0.6 | |
Growth rates: | | | | | | | | | | | | | | | | | | | | | | | | | | | |
Ministries and special offices (CRF) | | -2.4 | | -6.2 | | -0.5 | | 5.6 | | 5.5 | | 5.5 | | -1.6 | | -3.6 | | -9.9 | | 0.4 | | -2.9 | | 0.6 | | -0.7 | |
Service delivery agencies | | -41.5 | | -16.4 | | 4.4 | | -1.9 | | 5.4 | | 6.7 | | 2.4 | | -4.7 | | 1.2 | | 3.7 | | 2.9 | | 3.4 | | 0.7 | |
Population per FTE: 2 | | | | | | | | | | | | | | | | | | | | | | | | | | | |
Total FTEs | | 122.7 | | 133.7 | | 134.8 | | 130.3 | | 124.9 | | 119.9 | | 123.0 | | 129.4 | | 142.5 | | 142.7 | | 147.0 | | 147.1 | | 1.7 | |
1 Service delivery agency FTE amounts do not include SUCH sector staff employment.
2 Population per FTE is calculated using July 1 population (e.g. population on July 1, 2014 divided by 2014/15 FTEs).
2015 Financial and Economic Review — July 2015
92
Appendix 2 — Financial Review Supplementary Tables
Table A2.10 Capital Spending — 2003/04 to 2014/15
($ millions) | | Actual
2003/04 | | Actual
2004/05 | | Actual
2005/06 | | Actual
2006/07 | | Actual
2007/08 | | Actual
2008/09 | | Actual
2009/10 | | Actual
2010/11 | | Actual
2011/12 | | Actual
2012/13 | | Actual
2013/14 | | Actual
2014/15 | | Average
annual
change | |
| | | | | | | | | | | | | | | | | | | | | | | | | | (per cent) | |
Taxpayer-supported: | | | | | | | | | | | | | | | | | | | | | | | | | | | |
Education | | | | | | | | | | | | | | | | | | | | | | | | | | | |
Schools (K–12) | | 313 | | 239 | | 286 | | 322 | | 380 | | 413 | | 449 | | 433 | | 560 | | 509 | | 466 | | 420 | | 2.7 | |
Post-secondary | | 601 | | 695 | | 784 | | 874 | | 779 | | 630 | | 669 | | 924 | | 655 | | 591 | | 507 | | 718 | | 1.6 | |
Health | | 420 | | 568 | | 848 | | 760 | | 881 | | 892 | | 927 | | 916 | | 732 | | 742 | | 690 | | 900 | | 7.2 | |
BC Transportation Financing Authority | | 407 | | 513 | | 713 | | 821 | | 884 | | 881 | | 918 | | 1,080 | | 921 | | 1,005 | | 1,017 | | 822 | | 6.6 | |
BC Transit | | 7 | | 8 | | 24 | | 13 | | 37 | | 77 | | 150 | | 39 | | 37 | | 48 | | 80 | | 83 | | 25.2 | |
Rapid Transit Project 2000 | | 14 | | 15 | | 16 | | 15 | | — | | — | | — | | — | | — | | — | | — | | — | | n/a | |
Vancouver Convention Centre expansion | | 56 | | 51 | | 85 | | 105 | | 251 | | 242 | | 41 | | 10 | | 1 | | — | | — | | — | | n/a | |
BC Place redevelopment | | — | | — | | — | | — | | — | | 45 | | 75 | | 197 | | 194 | | 6 | | — | | — | | n/a | |
Government operating (ministries) | | 214 | | 215 | | 320 | | 355 | | 335 | | 430 | | 306 | | 261 | | 245 | | 267 | | 298 | | 326 | | 3.9 | |
Other | | 36 | | 53 | | 60 | | 139 | | 117 | | 133 | | 184 | | 250 | | 220 | | 111 | | 93 | | 138 | | 13.0 | |
| | 2,068 | | 2,357 | | 3,136 | | 3,404 | | 3,664 | | 3,743 | | 3,719 | | 4,110 | | 3,565 | | 3,279 | | 3,151 | | 3,407 | | 4.6 | |
Self-supported: | | | | | | | | | | | | | | | | | | | | | | | | | | | |
BC Hydro | | 574 | | 529 | | 610 | | 807 | | 1,076 | | 1,397 | | 2,406 | | 1,519 | | 1,703 | | 1,929 | | 2,036 | | 2,169 | | 12.8 | |
BC Transmission Corporation | | — | | — | | 21 | | 50 | | 70 | | 19 | | 12 | | — | | — | | — | | — | | — | | n/a | |
Columbia River power projects | | 100 | | 84 | | 30 | | 19 | | 29 | | 32 | | 16 | | 67 | | 108 | | 94 | | 52 | | 28 | | -10.9 | |
Transportation Invest. Corp. (Port Mann) | | — | | — | | — | | — | | — | | 215 | | 778 | | 730 | | 734 | | 540 | | 202 | | 76 | | n/a | |
BC Railway Company | | 33 | | 30 | | 15 | | 19 | | 20 | | 10 | | 14 | | 6 | | 9 | | 10 | | 8 | | 5 | | -15.8 | |
ICBC | | 26 | | 31 | | 27 | | 22 | | 23 | | 22 | | 22 | | 48 | | 92 | | 73 | | 82 | | 88 | | 11.7 | |
BC Lottery Corporation | | 49 | | 93 | | 83 | | 44 | | 60 | | 97 | | 92 | | 81 | | 74 | | 97 | | 100 | | 69 | | 3.2 | |
Liquor Distribution Branch | | 1 | | 10 | | 19 | | 22 | | 18 | | 17 | | 19 | | 18 | | 19 | | 10 | | 13 | | 25 | | 34.0 | |
Other | | 4 | | — | | 6 | | — | | 3 | | 1 | | 3 | | 1 | | 5 | | 12 | | 26 | | 28 | | 19.4 | |
| | 787 | | 777 | | 811 | | 983 | | 1,299 | | 1,810 | | 3,362 | | 2,470 | | 2,744 | | 2,765 | | 2,519 | | 2,488 | | 11.0 | |
Total capital spending | | 2,855 | | 3,134 | | 3,947 | | 4,387 | | 4,963 | | 5,553 | | 7,081 | | 6,580 | | 6,309 | | 6,044 | | 5,670 | | 5,895 | | 6.8 | |
Per cent of Nominal GDP: 1 | | | | | | | | | | | | | | | | | | | | | | | | | | | |
Taxpayer-supported | | 1.4 | | 1.5 | | 1.8 | | 1.8 | | 1.9 | | 1.8 | | 1.9 | | 2.0 | | 1.6 | | 1.5 | | 1.4 | | 1.4 | | 0.2 | |
Self-supported | | 0.5 | | 0.5 | | 0.5 | | 0.5 | | 0.7 | | 0.9 | | 1.7 | | 1.2 | | 1.3 | | 1.2 | | 1.1 | | 1.0 | | 6.3 | |
Total | | 1.9 | | 1.9 | | 2.3 | | 2.3 | | 2.5 | | 2.7 | | 3.6 | | 3.2 | | 2.9 | | 2.7 | | 2.5 | | 2.5 | | 2.3 | |
Growth rates: | | | | | | | | | | | | | | | | | | | | | | | | | | | |
Taxpayer-supported | | 9.4 | | 14.0 | | 33.1 | | 8.5 | | 7.6 | | 2.2 | | -0.6 | | 10.5 | | -13.3 | | -8.0 | | -3.9 | | 8.1 | | 5.3 | |
Self-supported | | -11.7 | | -1.3 | | 4.4 | | 21.2 | | 32.1 | | 39.3 | | 85.7 | | -26.5 | | 11.1 | | 0.8 | | -8.9 | | -1.2 | | 14.2 | |
Total | | 2.6 | | 9.8 | | 25.9 | | 11.1 | | 13.1 | | 11.9 | | 27.5 | | -7.1 | | -4.1 | | -4.2 | | -6.2 | | 4.0 | | 7.4 | |
Per capita: 2 | | | | | | | | | | | | | | | | | | | | | | | | | | | |
Taxpayer-supported | | 501 | | 567 | | 747 | | 803 | | 854 | | 861 | | 843 | | 920 | | 792 | | 722 | | 688 | | 736 | | 3.6 | |
Self-supported | | 191 | | 187 | | 193 | | 232 | | 303 | | 416 | | 762 | | 553 | | 610 | | 609 | | 550 | | 537 | | 9.9 | |
Total | | 692 | | 754 | | 941 | | 1,034 | | 1,157 | | 1,277 | | 1,605 | | 1,473 | | 1,402 | | 1,331 | | 1,237 | | 1,273 | | 5.7 | |
| | | | | | | | | | | | | | | | | | | | | | | | | | | |
Real Per Capita Capital Spending (2014 $) 3 | | 805 | | 861 | | 1,052 | | 1,138 | | 1,250 | | 1,352 | | 1,700 | | 1,539 | | 1,431 | | 1,343 | | 1,250 | | 1,273 | | 4.2 | |
Growth rate (per cent) | | -0.2 | | 6.9 | | 22.3 | | 8.1 | | 9.9 | | 8.1 | | 25.7 | | -9.4 | | -7.0 | | -6.2 | | -6.9 | | 1.8 | | 4.4 | |
1 Capital spending as a per cent of GDP is calculated using GDP for the calendar year ending in the fiscal year (e.g. 2014/15 amounts divided by GDP for the 2014 calendar year). As nominal GDP for the calendar year ending 2014 is not available, the 2014 GDP projected in the February 2015 budget has been used for the fiscal year ended March 31, 2015 for demonstration purposes. Totals may not add due to rounding.
2 Per capita capital spending is calculated using July 1 population (e.g. 2014/15 amounts divided by population on July 1, 2014). Totals may not add due to rounding.
3 Capital spending is converted to real (inflation-adjusted) terms using the consumer price index (CPI)for the corresponding calendar year (e.g. 2014 CPI for 2014/15 capital spending).
2015 Financial and Economic Review — July 2015
93
Appendix 2 — Financial Review Supplementary Tables
Table A2.11 Provincial Debt — 2003/04 to 2014/15
($ millions) | | Actual
2003/04 | | Actual
2004/05 | | Actual
2005/06 | | Actual
2006/07 | | Actual
2007/08 | | Actual
2008/09 | | Actual
2009/10 | | Actual
2010/11 | | Actual
2011/12 | | Actual
2012/13 | | Actual
2013/14 | | Actual
2014/15 | | Average
annual
change | |
| | | | | | | | | | | | | | | | | | | | | | | | | | (per cent) | |
Taxpayer-supported debt: | | | | | | | | | | | | | | | | | | | | | | | | | | | |
Provincial government direct operating | | 15,180 | | 13,969 | | 11,343 | | 8,889 | | 7,604 | | 5,744 | | 7,359 | | 6,964 | | 7,813 | | 9,408 | | 10,223 | | 9,280 | | -4.4 | |
| | | | | | | | | | | | | | | | | | | | | | | | | | | |
Other taxpayer-supported debt (mainly capital): | | | | | | | | | | | | | | | | | | | | | | | | | | | |
Education facilities | | | | | | | | | | | | | | | | | | | | | | | | | | | |
Post-secondary institutions | | 2,180 | | 2,385 | | 2,752 | | 3,013 | | 3,422 | | 3,611 | | 3,824 | | 4,092 | | 4,185 | | 4,315 | | 4,386 | | 4,518 | | 6.8 | |
Schools | | 4,649 | | 4,737 | | 4,860 | | 5,013 | | 5,216 | | 5,522 | | 5,777 | | 6,016 | | 6,407 | | 6,830 | | 7,245 | | 7,600 | | 4.6 | |
| | 6,829 | | 7,122 | | 7,612 | | 8,026 | | 8,638 | | 9,133 | | 9,601 | | 10,108 | | 10,592 | | 11,145 | | 11,631 | | 12,118 | | 5.4 | |
Health facilities | | 2,343 | | 2,253 | | 2,635 | | 3,053 | | 3,511 | | 3,936 | | 4,389 | | 4,895 | | 5,293 | | 5,691 | | 6,038 | | 6,522 | | 9.8 | |
Highways, ferries and public transit | | | | | | | | | | | | | | | | | | | | | | | | | | | |
BC Transit | | 83 | | 78 | | 80 | | 96 | | 84 | | 94 | | 140 | | 158 | | 183 | | 163 | | 143 | | 123 | | 3.6 | |
BC Transportation Financing Authority | | 2,764 | | 2,474 | | 2,699 | | 3,237 | | 3,948 | | 4,586 | | 5,211 | | 5,785 | | 6,287 | | 7,084 | | 7,912 | | 8,428 | | 10.7 | |
Public transit | | 965 | | 957 | | 959 | | 950 | | 958 | | 997 | | 997 | | 997 | | 1,000 | | 1,000 | | 1,000 | | 1,000 | | 0.3 | |
SkyTrain extension | | 1,119 | | 1,135 | | 1,145 | | 1,153 | | 1,153 | | 1,154 | | 1,154 | | 1,155 | | 1,174 | | 1,174 | | 1,174 | | 1,174 | | 0.4 | |
| | 4,931 | | 4,644 | | 4,883 | | 5,436 | | 6,143 | | 6,831 | | 7,502 | | 8,095 | | 8,644 | | 9,421 | | 10,229 | | 10,725 | | 7.3 | |
Other | | | | | | | | | | | | | | | | | | | | | | | | | | | |
BC Buildings | | 317 | | 241 | | 246 | | — | | — | | — | | — | | — | | — | | — | | — | | — | | n/a | |
BC Immigration Investment Fund | | 29 | | 88 | | 148 | | 167 | | 256 | | 287 | | 289 | | 347 | | 398 | | 363 | | 440 | | 414 | | 27.3 | |
BC Pavilion Corporation | | — | | — | | — | | — | | — | | — | | 49 | | 250 | | 383 | | 383 | | 382 | | 381 | | n/a | |
Homeowner Protection Office | | 129 | | 130 | | 110 | | 110 | | 136 | | 150 | | 144 | | — | | — | | — | | — | | — | | n/a | |
Provincial government general capital | | — | | — | | — | | — | | — | | — | | 294 | | 570 | | 808 | | 1,073 | | 1,372 | | 1,698 | | n/a | |
Social Housing | | 156 | | 133 | | 189 | | 216 | | 218 | | 286 | | 305 | | 511 | | 674 | | 658 | | 719 | | 715 | | 14.8 | |
Other | | 86 | | 68 | | 49 | | 40 | | 43 | | 35 | | 36 | | 81 | | 54 | | 40 | | 34 | | 27 | | -10.0 | |
| | 717 | | 660 | | 742 | | 533 | | 653 | | 758 | | 1,117 | | 1,759 | | 2,317 | | 2,517 | | 2,947 | | 3,235 | | 14.7 | |
Total other taxpayer-supported debt | | 14,820 | | 14,679 | | 15,872 | | 17,048 | | 18,945 | | 20,658 | | 22,609 | | 24,857 | | 26,846 | | 28,774 | | 30,845 | | 32,600 | | 7.4 | |
Total taxpayer-supported debt | | 30,000 | | 28,648 | | 27,215 | | 25,937 | | 26,549 | | 26,402 | | 29,968 | | 31,821 | | 34,659 | | 38,182 | | 41,068 | | 41,880 | | 3.1 | |
| | | | | | | | | | | | | | | | | | | | | | | | | | | |
Self-supported debt: | | | | | | | | | | | | | | | | | | | | | | | | | | | |
Commercial Crown corporations and agencies | | | | | | | | | | | | | | | | | | | | | | | | | | | |
BC Hydro | | 7,040 | | 6,906 | | 6,892 | | 7,144 | | 7,633 | | 9,054 | | 10,792 | | 11,710 | | 12,978 | | 14,167 | | 15,559 | | 16,544 | | 8.1 | |
BC Lottery Corporation | | — | | — | | — | | — | | — | | — | | 60 | | 85 | | 90 | | 132 | | 155 | | 140 | | n/a | |
BC Rail | | 477 | | — | | — | | — | | — | | — | | — | | — | | — | | — | | — | | — | | n/a | |
BC Transmission Corporation | | — | | — | | 30 | | 30 | | 79 | | 70 | | 70 | | — | | — | | — | | — | | — | | n/a | |
Columbia Power Corporation | | — | | — | | — | | — | | — | | — | | — | | — | | — | | — | | — | | 300 | | n/a | |
Columbia River power projects | | 215 | | 257 | | 247 | | 236 | | 219 | | 208 | | 196 | | 183 | | 481 | | 475 | | 470 | | 464 | | 7.2 | |
Post-secondary institutions’ subsidiaries | | 32 | | 45 | | 52 | | 69 | | 130 | | 149 | | 220 | | 173 | | 173 | | 215 | | 198 | | 222 | | 19.3 | |
Transportation Invest. Corp. (Port Mann) | | — | | — | | — | | — | | — | | 20 | | 544 | | 1,148 | | 1,779 | | 2,610 | | 3,209 | | 3,335 | | n/a | |
Other | | 11 | | 13 | | 21 | | 23 | | 27 | | 30 | | 35 | | 34 | | 33 | | 35 | | 34 | | 35 | | 11.1 | |
| | 7,775 | | 7,221 | | 7,242 | | 7,502 | | 8,088 | | 9,531 | | 11,917 | | 13,333 | | 15,534 | | 17,634 | | 19,625 | | 21,040 | | 9.5 | |
Warehouse borrowing program | | — | | — | | — | | — | | — | | 2,081 | | — | | — | | — | | — | | — | | — | | n/a | |
Total self-supported debt | | 7,775 | | 7,221 | | 7,242 | | 7,502 | | 8,088 | | 11,612 | | 11,917 | | 13,333 | | 15,534 | | 17,634 | | 19,625 | | 21,040 | | 9.5 | |
Total provincial debt | | 37,775 | | 35,869 | | 34,457 | | 33,439 | | 34,637 | | 38,014 | | 41,885 | | 45,154 | | 50,193 | | 55,816 | | 60,693 | | 62,920 | | 4.7 | |
2015 Financial and Economic Review — July 2015
94
Appendix 2 — Financial Review Supplementary Tables
Table A2.12 Provincial Debt Supplementary Information — 2003/04 to 2014/15
($ millions) | | Actual
2003/04 | | Actual
2004/05 | | Actual
2005/06 | | Actual
2006/07 | | Actual
2007/08 | | Actual
2008/09 | | Actual
2009/10 | | Actual
2010/11 | | Actual
2011/12 | | Actual
2012/13 | | Actual
2013/14 | | Actual
2014/15 | | Average
annual
change | |
| | | | | | | | | | | | | | | | | | | | | | | | | | (per cent) | |
Per cent of Nominal GDP: 1 | | | | | | | | | | | | | | | | | | | | | | | | | | | |
Taxpayer-supported debt: | | | | | | | | | | | | | | | | | | | | | | | | | | | |
Provincial government direct operating | | 10.2 | | 8.7 | | 6.5 | | 4.8 | | 3.9 | | 2.8 | | 3.8 | | 3.4 | | 3.6 | | 4.2 | | 4.5 | | 3.9 | | -8.4 | |
Education facilities | | 4.6 | | 4.4 | | 4.4 | | 4.3 | | 4.4 | | 4.5 | | 4.9 | | 4.9 | | 4.9 | | 5.0 | | 5.1 | | 5.1 | | 0.9 | |
Health facilities | | 1.6 | | 1.4 | | 1.5 | | 1.6 | | 1.8 | | 1.9 | | 2.2 | | 2.4 | | 2.4 | | 2.6 | | 2.6 | | 2.7 | | 5.1 | |
Highways, ferries and public transit | | 3.3 | | 2.9 | | 2.8 | | 2.9 | | 3.1 | | 3.3 | | 3.8 | | 3.9 | | 4.0 | | 4.2 | | 4.5 | | 4.5 | | 2.8 | |
Other | | 0.5 | | 0.4 | | 0.4 | | 0.3 | | 0.3 | | 0.4 | | 0.6 | | 0.9 | | 1.1 | | 1.1 | | 1.3 | | 1.4 | | 9.8 | |
Total taxpayer-supported debt | | 20.2 | | 17.8 | | 15.7 | | 13.9 | | 13.5 | | 12.9 | | 15.3 | | 15.4 | | 15.9 | | 17.2 | | 17.9 | | 17.5 | | -1.3 | |
Self-supported debt: | | | | | | | | | | | | | | | | | | | | | | | | | | | |
Commercial Crown corporations & agencies | | 5.2 | | 4.5 | | 4.2 | | 4.0 | | 4.1 | | 4.7 | | 6.1 | | 6.5 | | 7.1 | | 7.9 | | 8.5 | | 8.8 | | 4.9 | |
Warehouse borrowing program | | — | | — | | — | | — | | — | | 1.0 | | — | | — | | — | | — | | — | | — | | n/a | |
Total self-supported debt | | 5.2 | | 4.5 | | 4.2 | | 4.0 | | 4.1 | | 5.7 | | 6.1 | | 6.5 | | 7.1 | | 7.9 | | 8.5 | | 8.8 | | 4.9 | |
Total provincial debt | | 25.4 | | 22.3 | | 19.8 | | 17.9 | | 17.6 | | 18.6 | | 21.4 | | 21.9 | | 23.1 | | 25.1 | | 26.4 | | 26.4 | | 0.3 | |
Growth rates: | | | | | | | | | | | | | | | | | | | | | | | | | | | |
Taxpayer-supported debt: | | | | | | | | | | | | | | | | | | | | | | | | | | | |
Provincial government direct operating | | 1.5 | | -8.0 | | -18.8 | | -21.6 | | -14.5 | | -24.5 | | 28.1 | | -5.4 | | 12.2 | | 20.4 | | 8.7 | | -9.2 | | -3.0 | |
Education facilities | | 6.8 | | 4.3 | | 6.9 | | 5.4 | | 7.6 | | 5.7 | | 5.1 | | 5.3 | | 4.8 | | 5.2 | | 4.4 | | 4.2 | | 5.4 | |
Health facilities | | 3.4 | | -3.8 | | 17.0 | | 15.9 | | 15.0 | | 12.1 | | 11.5 | | 11.5 | | 8.1 | | 7.5 | | 6.1 | | 8.0 | | 9.9 | |
Highways, ferries and public transit | | 2.0 | | -5.8 | | 5.1 | | 11.3 | | 13.0 | | 11.2 | | 9.8 | | 7.9 | | 6.8 | | 9.0 | | 8.6 | | 4.8 | | 7.4 | |
Other | | -22.0 | | -7.9 | | 12.4 | | -28.2 | | 22.5 | | 16.1 | | 47.4 | | 57.5 | | 31.7 | | 8.6 | | 17.1 | | 9.8 | | 17.0 | |
Total taxpayer-supported debt | | 2.1 | | -4.5 | | -5.0 | | -4.7 | | 2.4 | | -0.6 | | 13.5 | | 6.2 | | 8.9 | | 10.2 | | 7.6 | | 2.0 | | 3.3 | |
Self-supported debt: | | | | | | | | | | | | | | | | | | | | | | | | | | | |
Commercial Crown corporations & agencies | | 3.8 | | -7.1 | | 0.3 | | 3.6 | | 7.8 | | 17.8 | | 25.0 | | 11.9 | | 16.5 | | 13.5 | | 11.3 | | 7.2 | | 9.8 | |
Warehouse borrowing program | | — | | — | | — | | — | | — | | — | | -100.0 | | — | | — | | — | | — | | — | | n/a | |
Total self-supported debt | | 3.8 | | -7.1 | | 0.3 | | 3.6 | | 7.8 | | 43.6 | | 2.6 | | 11.9 | | 16.5 | | 13.5 | | 11.3 | | 7.2 | | 10.1 | |
Total provincial debt | | 2.5 | | -5.0 | | -3.9 | | -3.0 | | 3.6 | | 9.7 | | 10.2 | | 7.8 | | 11.2 | | 11.2 | | 8.7 | | 3.7 | | 4.9 | |
Per capita: 2 | | | | | | | | | | | | | | | | | | | | | | | | | | | |
Taxpayer-supported debt: | | | | | | | | | | | | | | | | | | | | | | | | | | | |
Provincial government direct operating | | 3,681 | | 3,362 | | 2,703 | | 2,096 | | 1,772 | | 1,321 | | 1,668 | | 1,559 | | 1,737 | | 2,071 | | 2,231 | | 2,004 | | -5.4 | |
Education facilities | | 1,656 | | 1,714 | | 1,814 | | 1,892 | | 2,013 | | 2,100 | | 2,177 | | 2,263 | | 2,354 | | 2,453 | | 2,538 | | 2,617 | | 4.2 | |
Health facilities | | 568 | | 542 | | 628 | | 720 | | 818 | | 905 | | 995 | | 1,096 | | 1,176 | | 1,253 | | 1,318 | | 1,408 | | 8.6 | |
Highways, ferries and public transit | | 1,196 | | 1,118 | | 1,164 | | 1,282 | | 1,432 | | 1,571 | | 1,701 | | 1,813 | | 1,921 | | 2,074 | | 2,232 | | 2,316 | | 6.2 | |
Other | | 174 | | 159 | | 177 | | 126 | | 152 | | 174 | | 253 | | 394 | | 515 | | 554 | | 643 | | 699 | | 13.5 | |
Total taxpayer-supported debt | | 7,275 | | 6,895 | | 6,486 | | 6,115 | | 6,187 | | 6,070 | | 6,794 | | 7,125 | | 7,703 | | 8,405 | | 8,962 | | 9,043 | | 2.0 | |
Self-supported debt: | | | | | | | | | | | | | | | | | | | | | | | | | | | |
Commercial Crown corporations & agencies | | 1,885 | | 1,738 | | 1,726 | | 1,769 | | 1,885 | | 2,191 | | 2,702 | | 2,985 | | 3,453 | | 3,882 | | 4,282 | | 4,543 | | 8.3 | |
Warehouse borrowing program | | — | | — | | — | | — | | — | | 478 | | — | | — | | — | | — | | — | | — | | n/a | |
Total self-supported debt | | 1,885 | | 1,738 | | 1,726 | | 1,769 | | 1,885 | | 2,670 | | 2,702 | | 2,985 | | 3,453 | | 3,882 | | 4,282 | | 4,543 | | 8.3 | |
Total provincial debt | | 9,160 | | 8,633 | | 8,212 | | 7,883 | | 8,072 | | 8,740 | | 9,496 | | 10,111 | | 11,156 | | 12,287 | | 13,244 | | 13,586 | | 3.6 | |
Real Per Capita Provincial Debt (2014 $) 3 | | 10,657 | | 9,851 | | 9,186 | | 8,671 | | 8,725 | | 9,254 | | 10,054 | | 10,564 | | 11,386 | | 12,402 | | 13,379 | | 13,586 | | 2.2 | |
Growth rate (per cent) | | -0.3 | | -7.6 | | -6.7 | | -5.6 | | 0.6 | | 6.1 | | 8.7 | | 5.1 | | 7.8 | | 8.9 | | 7.9 | | 1.5 | | 2.4 | |
1 Debt as a per cent of GDP is calculated using GDP for the calendar year ending in the fiscal year (e.g. 2014/15 debt divided by GDP for the 2014 calendar year). As nominal GDP for the calendar year ending in 2014 is not available, the 2014 GDP projected in the February 2015 budget has been used for the fiscal year ended March 31, 2015 for demonstration purposes. Totals may not add due to rounding.
2 Per capita debt is calculated using July 1 population (e.g. 2014/15 debt divided by population on July 1, 2014). Totals may not add due to rounding.
3 Debt is converted to real (inflation-adjusted) terms using the consumer price index (CPI) for the corresponding calendar year (e.g. 2014 CPI for 2014/15 debt).
2015 Financial and Economic Review — July 2015
95
Appendix 2 — Financial Review Supplementary Tables
Table A2.13 Key Provincial Debt Indicators — 2003/04 to 2014/15 1
| | Actual
2003/04 | | Actual
2004/05 | | Actual
2005/06 | | Actual
2006/07 | | Actual
2007/08 | | Actual
2008/09 | | Actual
2009/10 | | Actual
2010/11 | | Actual
2011/12 | | Actual
2012/13 | | Actual
2013/14 | | Actual
2014/15 | | Average
annual
change | |
| | | | | | | | | | | | | | | | | | | | | | | | | | (per cent) | |
Debt to revenue (per cent) | | | | | | | | | | | | | | | | | | | | | | | | | | | |
Total provincial | | 100.1 | | 84.7 | | 74.4 | | 68.8 | | 68.9 | | 77.2 | | 86.5 | | 88.5 | | 94.7 | | 104.1 | | 107.6 | | 106.4 | | 0.6 | |
Taxpayer-supported | | 106.5 | | 87.9 | | 77.3 | | 69.2 | | 69.0 | | 71.0 | | 82.6 | | 78.8 | | 85.1 | | 93.7 | | 96.1 | | 94.1 | | -1.1 | |
Debt per capita ($) 2 | | | | | | | | | | | | | | | | | | | | | | | | | | | |
Total provincial | | 9,160 | | 8,633 | | 8,212 | | 7,883 | | 8,072 | | 8,740 | | 9,496 | | 10,111 | | 11,156 | | 12,287 | | 13,244 | | 13,586 | | 3.6 | |
Taxpayer-supported | | 7,275 | | 6,895 | | 6,486 | | 6,115 | | 6,187 | | 6,070 | | 6,794 | | 7,125 | | 7,703 | | 8,405 | | 8,962 | | 9,043 | | 2.0 | |
Debt to nominal GDP (per cent) 3 | | | | | | | | | | | | | | | | | | | | | | | | | | | |
Total provincial | | 25.4 | | 22.3 | | 19.8 | | 17.9 | | 17.6 | | 18.6 | | 21.4 | | 21.9 | | 23.1 | | 25.1 | | 26.4 | | 26.4 | | 0.3 | |
Taxpayer-supported | | 20.2 | | 17.8 | | 15.7 | | 13.9 | | 13.5 | | 12.9 | | 15.3 | | 15.4 | | 15.9 | | 17.2 | | 17.9 | | 17.5 | | -1.3 | |
Interest bite (cents per dollar of revenue) 4 | | | | | | | | | | | | | | | | | | | | | | | | | | | |
Total provincial | | 5.9 | | 4.7 | | 4.3 | | 4.3 | | 4.0 | | 4.3 | | 4.6 | | 4.2 | | 4.3 | | 4.4 | | 4.5 | | 4.2 | | -3.1 | |
Taxpayer-supported | | 6.0 | | 5.0 | | 4.4 | | 4.2 | | 3.9 | | 4.2 | | 4.2 | | 4.0 | | 4.0 | | 3.9 | | 3.9 | | 3.6 | | -4.7 | |
Interest costs ($ millions) | | | | | | | | | | | | | | | | | | | | | | | | | | | |
Total provincial | | 2,228 | | 1,997 | | 2,007 | | 2,069 | | 2,010 | | 2,138 | | 2,205 | | 2,155 | | 2,300 | | 2,336 | | 2,547 | | 2,465 | | 0.9 | |
Taxpayer-supported | | 1,703 | | 1,633 | | 1,542 | | 1,570 | | 1,488 | | 1,570 | | 1,534 | | 1,596 | | 1,625 | | 1,590 | | 1,686 | | 1,591 | | -0.6 | |
Interest rate (per cent) 5 | | | | | | | | | | | | | | | | | | | | | | | | | | | |
Taxpayer-supported | | 5.7 | | 5.6 | | 5.5 | | 5.9 | | 5.7 | | 5.9 | | 5.4 | | 5.2 | | 4.9 | | 4.4 | | 4.3 | | 3.8 | | -3.6 | |
Background Information: | | | | | | | | | | | | | | | | | | | | | | | | | | | |
Revenue ($ millions) | | | | | | | | | | | | | | | | | | | | | | | | | | | |
Total provincial 6 | | 37,727 | | 42,365 | | 46,294 | | 48,628 | | 50,262 | | 49,224 | | 48,438 | | 51,035 | | 52,993 | | 53,613 | | 56,402 | | 59,136 | | 4.2 | |
Taxpayer-supported 7 | | 28,158 | | 32,586 | | 35,191 | | 37,459 | | 38,477 | | 37,205 | | 36,272 | | 40,385 | | 40,734 | | 40,744 | | 42,725 | | 44,483 | | 4.2 | |
Debt ($ millions) | | | | | | | | | | | | | | | | | | | | | | | | | | | |
Total provincial | | 37,775 | | 35,869 | | 34,457 | | 33,439 | | 34,637 | | 38,014 | | 41,885 | | 45,154 | | 50,193 | | 55,816 | | 60,693 | | 62,920 | | 4.7 | |
Taxpayer-supported 8 | | 30,000 | | 28,648 | | 27,215 | | 25,937 | | 26,549 | | 26,402 | | 29,968 | | 31,821 | | 34,659 | | 38,182 | | 41,068 | | 41,880 | | 3.1 | |
Provincial nominal GDP ($ millions) 9 | | 148,540 | | 161,114 | | 173,641 | | 186,772 | | 197,072 | | 203,951 | | 195,966 | | 205,996 | | 217,460 | | 222,565 | | 229,685 | | 238,726 | | 4.4 | |
Population (thousands at July 1) 10 | | 4,124 | | 4,155 | | 4,196 | | 4,242 | | 4,291 | | 4,349 | | 4,411 | | 4,466 | | 4,499 | | 4,543 | | 4,583 | | 4,631 | | 1.1 | |
1 Figures for prior years have been restated to conform with the presentation used for 2014/15 and to include the effects of changes in underlying data and statistics.
2 The ratio of debt to population (e.g. 2014/15 debt divided by population at July 1, 2014).
3 The ratio of debt outstanding at fiscal year end to provincial nominal gross domestic product (GDP) for the calendar year ending in the fiscal year (e.g. 2014/15 debt divided by 2014 nominal GDP). As nominal GDP for the calendar year ending 2014 is not available, the 2014 GDP projected in the February 2015 budget has been used for the fiscal year ended March 31, 2015 for demonstration purposes.
4 The ratio of interest costs (less sinking fund interest) to revenue. Figures include capitalized interest expense in order to provide a more comparable measure to outstanding debt.
5 Weighted average of all outstanding debt issues.
6 Includes revenue of the consolidated revenue fund (excluding dividends from enterprises) plus revenue of all government organizations and enterprises.
7 Excludes revenue of government enterprises, but includes dividends from enterprises paid to the consolidated revenue fund.
8 Excludes debt of commercial Crown corporations and agencies and funds held under the province’s warehouse borrowing program.
9 Nominal GDP for the calendar year ending in the fiscal year (e.g. Nominal GDP for 2014 is used for the fiscal year ended March 31, 2015). As nominal GDP for the calendar year ending 2014 is not available, the 2014 GDP projected in the February 2015 budget has been used for the fiscal year ended March 31, 2015 for demonstration purposes.
10 Population at July 1st within the fiscal year (e.g. population at July 1, 2014 is used for the fiscal year ended March 31, 2015).
2015 Financial and Economic Review — July 2015
96
Appendix 2 — Financial Review Supplementary Tables
Table A2.14 Historical Operating Statement Surplus (Deficit)
| | | | | | | | Crown | | SUCH | | | | | | Surplus | |
| | | | | | | | Corporations | | Sector & | | | | | | (Deficit) | |
| | Consolidated Revenue Fund | | and | | Regional | | Other | | Surplus | | as a Per Cent | |
($ millions) | | Revenue | | Expenditure | | Balance | | Agencies | | Authorities | | Adjustments | | (Deficit) 1 | | of GDP | |
1969/70 | | 1,248 | | 1,244 | | 4 | | — | | — | | — | | — | | 0.0 | |
1970/71 | | 1,373 | | 1,274 | | 99 | | — | | — | | — | | — | | 1.0 | |
1971/72 | | 1,558 | | 1,474 | | 84 | | — | | — | | — | | — | | 0.8 | |
1972/73 | | 1,772 | | 1,675 | | 97 | | — | | — | | — | | — | | 0.8 | |
1973/74 | | 2,217 | | 2,071 | | 146 | | — | | — | | — | | — | | 0.9 | |
1974/75 | | 2,769 | | 2,779 | | (10 | ) | — | | — | | — | | — | | (0.1 | ) |
1975/76 | | 3,124 | | 3,534 | | (410 | ) | — | | — | | — | | — | | (2.1 | ) |
1976/77 | | 3,785 | | 3,691 | | 94 | | — | | — | | — | | — | | 0.4 | |
1977/78 | | 4,372 | | 4,168 | | 204 | | — | | — | | — | | — | | 0.8 | |
1978/79 | | 4,853 | | 4,582 | | 271 | | — | | — | | — | | — | | 0.9 | |
1979/80 1 | | 5,860 | | 5,318 | | 542 | | (88 | ) | — | | — | | 454 | | 1.3 | |
1980/81 | | 5,982 | | 6,239 | | (257 | ) | 45 | | — | | — | | (212 | ) | (0.5 | ) |
1981/82 | | 7,139 | | 7,323 | | (184 | ) | 43 | | — | | — | | (141 | ) | (0.3 | ) |
1982/83 | | 7,678 | | 8,662 | | (984 | ) | (257 | ) | — | | — | | (1,241 | ) | (2.7 | ) |
1983/84 | | 8,335 | | 9,347 | | (1,012 | ) | 49 | | — | | — | | (963 | ) | (2.0 | ) |
1984/85 | | 8,807 | | 9,801 | | (994 | ) | 172 | | — | | — | | (822 | ) | (1.6 | ) |
1985/86 | | 9,160 | | 10,127 | | (967 | ) | 110 | | — | | — | | (857 | ) | (1.6 | ) |
1986/87 | | 9,463 | | 10,624 | | (1,161 | ) | 526 | | — | | — | | (635 | ) | (1.1 | ) |
1987/88 | | 11,007 | | 11,055 | | (48 | ) | 119 | | — | | — | | 71 | | 0.1 | |
1988/89 | | 12,570 | | 11,834 | | 736 | | 194 | | — | | — | | 930 | | 1.3 | |
1989/90 | | 13,656 | | 13,200 | | 456 | | 40 | | — | | — | | 496 | | 0.6 | |
1990/91 | | 14,236 | | 15,010 | | (774 | ) | 107 | | — | | — | | (667 | ) | (0.8 | ) |
1991/92 | | 14,570 | | 17,101 | | (2,531 | ) | 192 | | — | | — | | (2,339 | ) | (2.8 | ) |
1992/93 | | 16,172 | | 17,858 | | (1,686 | ) | 210 | | — | | — | | (1,476 | ) | (1.7 | ) |
1993/94 | | 17,923 | | 18,833 | | (910 | ) | 11 | | — | | — | | (899 | ) | (0.9 | ) |
1994/95 | | 19,506 | | 19,953 | | (447 | ) | 219 | | — | | — | | (228 | ) | (0.2 | ) |
1995/96 | | 19,698 | | 20,054 | | (356 | ) | 38 | | — | | — | | (318 | ) | (0.3 | ) |
1996/97 | | 20,126 | | 20,241 | | (115 | ) | (270 | ) | — | | — | | (385 | ) | (0.3 | ) |
1997/98 | | 20,216 | | 20,368 | | (152 | ) | (258 | ) | — | | — | | (410 | ) | (0.4 | ) |
1998/99 | | 20,312 | | 20,526 | | (214 | ) | (689 | ) | (55 | ) | — | | (958 | ) | (0.8 | ) |
1999/2000 | | 21,836 | | 22,157 | | (321 | ) | 345 | | (40 | ) | — | | (16 | ) | 0.0 | |
2000/01 | | 23,948 | | 22,671 | | 1,277 | | (171 | ) | 138 | | (52 | )3 | 1,192 | | 0.9 | |
2001/02 | | 22,987 | | 24,977 | | (1,990 | )2 | (711 | )2 | 180 | | 1,464 | 3 | (1,057 | ) | (0.8 | ) |
2002/03 | | 22,205 | | 25,164 | | (2,959 | ) | (216 | ) | 527 | | — | | (2,648 | ) | (1.9 | ) |
2003/04 | | 23,408 | | 25,477 | | (2,069 | ) | 347 | | 370 | | — | | (1,352 | ) | (0.9 | ) |
2004/05 | | 27,562 | | 26,306 | | 1,256 | | 1,035 | | 394 | | — | | 2,685 | | 1.7 | |
2005/06 | | 29,711 | | 27,174 | | 2,537 | | 550 | | 595 | | (710 | )4 | 2,972 | | 1.7 | |
2006/07 | | 31,506 | | 28,506 | | 3,000 | | 841 | | 405 | | (264 | )4 | 3,982 | | 2.1 | |
2007/08 | | 32,317 | | 30,565 | | 1,752 | | 995 | | 443 | | (444 | )4,5 | 2,746 | | 1.4 | |
2008/09 | | 30,926 | | 32,032 | | (1,106 | ) | 975 | | 186 | | 18 | 4,5 | 73 | | 0.0 | |
2009/10 | | 29,133 | | 32,273 | | (3,140 | ) | 803 | | 525 | | — | | (1,812 | ) | (0.9 | ) |
2010/11 | | 32,807 | | 33,577 | | (770 | ) | (219 | ) | 742 | | — | | (247 | ) | (0.1 | ) |
2011/12 | | 33,269 | | 34,590 | | (1,321 | ) | 239 | | 831 | | (1,599 | )6 | (1,850 | ) | (0.9 | ) |
2012/13 | | 33,363 | | 35,120 | | (1,757 | ) | 95 | | 494 | | — | | (1,168 | ) | (0.5 | ) |
2013/14 | | 34,657 | | 34,891 | | (234 | ) | 157 | | 404 | | — | | 327 | | 0.1 | |
2014/15 | | 36,802 | | 36,058 | | 744 | | 203 | | 736 | | — | | 1,683 | | 0.7 | |
1 The provincial government began publishing summary financial statements in 1979/80. Figures for prior years are unavailable. For 1969/70 to 1978/79, the CRF balance is used in place of the summary accounts surplus/(deficit).
2 Does not include the $256 million transfer to the CRF for the wind-up of Forest Renewal BC and Fisheries Renewal BC.
3 Impact of move to joint trusteeship for public service pension plans.
4 Negotiating framework incentive payments.
5 Climate Action Dividend.
6 Onetime HST transition repayment
2015 Financial and Economic Review — July 2015
97
Appendix 2 — Financial Review Supplementary Tables
Table A2.15 Historical Provincial Debt Summary 1
| | Taxpayer-Supported Debt | | | | | | | | | |
| | Provincial | | Education | | Health | | | | | | Total | | | | | | | | Taxpayer- | |
Year | | Government | | Facilities | | Facilities | | Highways, | | Other 2 | | Taxpayer- | | Self- | | Total | | Total Debt | | Supported | |
| | Direct | | Capital | | Capital | | Ferries and | | | | Supported | | Supported | | Provincial | | as a Per | | Debt as a Per | |
| | Operating | | Financing | | Financing | | Public Transit | | | | Debt | | Debt 3 | | Debt | | Cent of GDP | | Cent of GDP | |
| | | | | | | | | | (millions) | | | | | | | | (per cent) | |
1969/70 | | — | | 338 | | 42 | | 142 | | 100 | | 622 | | 1,661 | | 2,283 | | 24.7 | | 6.7 | |
1970/71 | | — | | 362 | | 64 | | 172 | | 99 | | 697 | | 1,808 | | 2,505 | | 25.6 | | 7.1 | |
1971/72 | | — | | 380 | | 85 | | 233 | | 95 | | 793 | | 1,948 | | 2,741 | | 24.9 | | 7.2 | |
1972/73 | | — | | 408 | | 105 | | 288 | | 87 | | 888 | | 2,062 | | 2,950 | | 23.8 | | 7.2 | |
1973/74 | | — | | 425 | | 117 | | 340 | | 145 | | 1,027 | | 2,228 | | 3,255 | | 21.1 | | 6.7 | |
1974/75 | | — | | 485 | | 133 | | 386 | | 149 | | 1,153 | | 2,650 | | 3,803 | | 21.3 | | 6.5 | |
1975/76 | | — | | 557 | | 178 | | 544 | | 145 | | 1,424 | | 3,144 | | 4,568 | | 23.1 | | 7.2 | |
1976/77 | | 261 | | 658 | | 236 | | 649 | | 188 | | 1,992 | | 3,787 | | 5,779 | | 24.4 | | 8.4 | |
1977/78 | | 261 | | 710 | | 291 | | 656 | | 215 | | 2,133 | | 4,464 | | 6,597 | | 24.9 | | 8.1 | |
1978/79 | | 261 | | 778 | | 334 | | 653 | | 91 | | 2,117 | | 4,838 | | 6,955 | | 23.3 | | 7.1 | |
1979/80 | | 235 | | 836 | | 401 | | 730 | | 195 | | 2,397 | | 5,704 | | 8,101 | | 23.3 | | 6.9 | |
1980/81 | | 209 | | 919 | | 461 | | 729 | | 270 | | 2,588 | | 5,956 | | 8,544 | | 21.6 | | 6.5 | |
1981/82 | | 183 | | 1,067 | | 561 | | 844 | | 291 | | 2,946 | | 7,227 | | 10,173 | | 22.2 | | 6.4 | |
1982/83 | | 883 | | 1,204 | | 660 | | 1,024 | | 894 | | 4,665 | | 7,692 | | 12,357 | | 26.9 | | 10.1 | |
1983/84 | | 1,596 | | 1,321 | | 712 | | 1,392 | | 1,174 | | 6,195 | | 8,440 | | 14,635 | | 30.1 | | 12.8 | |
1984/85 | | 2,476 | | 1,308 | | 717 | | 691 | | 1,276 | | 6,468 | | 9,082 | | 15,550 | | 30.5 | | 12.7 | |
1985/86 | | 3,197 | | 1,276 | | 680 | | 1,034 | | 1,376 | | 7,563 | | 8,990 | | 16,553 | | 30.2 | | 13.8 | |
1986/87 | | 4,802 | | 1,268 | | 681 | | 1,097 | | 812 | | 8,660 | | 8,485 | | 17,145 | | 29.8 | | 15.0 | |
1987/88 | | 5,017 | | 1,278 | | 716 | | 1,192 | | 660 | | 8,863 | | 8,149 | | 17,012 | | 26.7 | | 13.9 | |
1988/89 | | 4,919 | | 1,322 | | 763 | | 1,213 | | 842 | | 9,059 | | 7,396 | | 16,455 | | 23.2 | | 12.8 | |
1989/90 | | 4,209 | | 1,367 | | 837 | | 1,244 | | 1,262 | | 8,919 | | 7,340 | | 16,259 | | 21.1 | | 11.6 | |
1990/91 | | 4,726 | | 1,565 | | 959 | | 1,287 | | 1,281 | | 9,818 | | 7,444 | | 17,262 | | 21.3 | | 12.1 | |
1991/92 | | 6,611 | | 1,939 | | 1,040 | | 1,527 | | 1,431 | | 12,548 | | 7,493 | | 20,041 | | 24.0 | | 15.0 | |
1992/93 | | 8,969 | | 2,426 | | 1,141 | | 1,719 | | 1,641 | | 15,896 | | 7,526 | | 23,422 | | 26.3 | | 17.8 | |
1993/94 | | 10,257 | | 3,054 | | 1,181 | | 1,862 | | 1,627 | | 17,981 | | 7,946 | | 25,927 | | 27.1 | | 18.8 | |
1994/95 | | 10,181 | | 3,631 | | 1,318 | | 2,158 | | 1,749 | | 19,037 | | 8,013 | | 27,050 | | 26.5 | | 18.6 | |
1995/96 | | 10,237 | | 3,990 | | 1,399 | | 2,598 | | 1,695 | | 19,919 | | 8,847 | | 28,766 | | 26.7 | | 18.5 | |
1996/97 | | 11,030 | | 4,230 | | 1,431 | | 3,144 | | 1,440 | | 21,275 | | 8,096 | | 29,371 | | 26.4 | | 19.1 | |
1997/98 | | 11,488 | | 4,352 | | 1,417 | | 3,463 | | 1,431 | | 22,151 | | 8,204 | | 30,355 | | 26.0 | | 19.0 | |
1998/99 | | 11,707 | | 5,023 | | 1,494 | | 3,678 | | 1,330 | | 23,232 | | 8,910 | | 32,142 | | 27.3 | | 19.7 | |
1999/2000 | | 13,295 | | 5,429 | | 1,679 | | 3,527 | | 1,276 | | 25,206 | | 9,232 | | 34,438 | | 28.0 | | 20.5 | |
2000/01 | | 11,578 | | 5,737 | | 2,028 | | 4,234 | | 1,527 | | 25,104 | | 8,684 | | 33,788 | | 25.3 | | 18.8 | |
2001/02 | | 13,319 | | 6,118 | | 2,186 | | 4,685 | | 1,196 | | 27,504 | | 8,578 | | 36,082 | | 26.6 | | 20.2 | |
2002/03 | | 14,957 | | 6,394 | | 2,265 | | 4,835 | | 919 | | 29,370 | | 7,487 | | 36,857 | | 26.2 | | 20.9 | |
2003/04 | | 15,180 | | 6,829 | | 2,343 | | 4,931 | | 717 | | 30,000 | | 7,775 | | 37,775 | | 25.4 | | 20.2 | |
2004/05 | | 13,969 | | 7,122 | | 2,253 | | 4,644 | | 660 | | 28,648 | | 7,221 | | 35,869 | | 22.3 | | 17.8 | |
2005/06 | | 11,343 | | 7,612 | | 2,635 | | 4,883 | | 742 | | 27,215 | | 7,242 | | 34,457 | | 19.8 | | 15.7 | |
2006/07 | | 8,889 | | 8,026 | | 3,053 | | 5,436 | | 533 | | 25,937 | | 7,502 | | 33,439 | | 17.9 | | 13.9 | |
2007/08 | | 7,604 | | 8,638 | | 3,511 | | 6,143 | | 653 | | 26,549 | | 8,088 | | 34,637 | | 17.6 | | 13.5 | |
2008/09 | | 5,744 | | 9,133 | | 3,936 | | 6,831 | | 758 | | 26,402 | | 11,612 | | 38,014 | | 18.6 | | 12.9 | |
2009/10 | | 7,359 | | 9,601 | | 4,389 | | 7,502 | | 1,117 | | 29,968 | | 11,917 | | 41,885 | | 21.4 | | 15.3 | |
2010/11 | | 6,964 | | 10,108 | | 4,895 | | 8,095 | | 1,759 | | 31,821 | | 13,333 | | 45,154 | | 21.9 | | 15.4 | |
2011/12 | | 7,813 | | 10,592 | | 5,293 | | 8,644 | | 2,317 | | 34,659 | | 15,534 | | 50,193 | | 23.1 | | 15.9 | |
2012/13 | | 9,408 | | 11,145 | | 5,691 | | 9,421 | | 2,517 | | 38,182 | | 17,634 | | 55,816 | | 25.1 | | 17.2 | |
2013/14 | | 10,223 | | 11,631 | | 6,038 | | 10,229 | | 2,947 | | 41,068 | | 19,625 | | 60,693 | | 26.4 | | 17.9 | |
2014/15 | | 9,280 | | 12,118 | | 6,522 | | 10,725 | | 3,235 | | 41,880 | | 21,040 | | 62,920 | | 26.4 | | 17.5 | |
1 Debt is after deduction of sinking funds, unamortized discounts and unrealized foreign exchange gains/(losses), and excludes accrued interest. Government direct and fiscal agency debt accrued interest is reported in the government’s accounts as an accounts payable.
2 Includes BC Buildings, BC Housing Management Commission, Provincial Rental Housing Corporation, other taxpayer-supported Crown agencies, and loan guarantee provisions.
3 Includes commercial Crown corporations and agencies and funds held under the province’s warehouse borrowing program.
2015 Financial and Economic Review — July 2015
98