Budget and Fiscal Plan
2016/17 – 2018/19
February 16, 2016

National Library of Canada Cataloguing in Publication Data
British Columbia.
Budget and fiscal plan. –- 2002/03/2004/05-
Annual
Also available on the Internet.
Continues: British Columbia. Ministry of Finance and
Corporate Relations. Budget ... reports. ISSN 1207-5841
ISSN 1705-6071 = Budget and fiscal plan — British Columbia.
1. Budget — British Columbia — Periodicals. 2. British
Columbia — Appropriations and expenditures — Periodicals.
I. British Columbia. Ministry of Finance. II. Title.
HJ12.B742 352.48’09711’05 C2003-960048-3
TABLE OF CONTENTS
Budget and Fiscal Plan 2016/17 — 2018/19 | | February 16, 2016 |
Attestation by the Secretary to Treasury Board
Summary | 1 |
| |
Part 1: Three Year Fiscal Plan | |
Introduction | 5 |
Revenue | 8 |
Major Revenue Sources | 10 |
Expense | 18 |
Consolidated Revenue Fund Spending | 18 |
Management of the BC Public Service | 24 |
Recovered Expenses | 25 |
Operating Transfers | 26 |
Service Delivery Agency Spending | 26 |
Capital Spending | 26 |
Taxpayer-supported Capital Spending | 26 |
Self-supported Capital Spending | 31 |
Projects over $50 million | 32 |
Provincial Debt | 36 |
Risks to the Fiscal Plan | 38 |
Tables: | |
1.1 | Three Year Fiscal Plan | 5 |
1.2 | Comparison of Major Factors Underlying Revenue | 9 |
1.3 | Personal Income Tax Revenue | 10 |
1.4 | Corporate Income Tax Revenue | 11 |
1.5 | Sales Taxes Revenue | 11 |
1.6 | Crown Land Tenure Revenue | 12 |
1.7 | Federal Government Contributions | 14 |
1.8 | Revenue by Source | 16 |
1.9 | Expense by Ministry, Program and Agency | 17 |
1.10 | Health Per Capita Costs and Outcomes: Canadian Comparisons | 19 |
1.11 | Additional Support for Children, Families and Individuals in Need | 20 |
1.12 | Investments in Community Safety | 21 |
1.13 | Funding for Economic, Community and Skills Development | 23 |
1.14 | Encouraging Natural Resource Development | 23 |
1.15 | Capital Spending | 27 |
1.16 | Provincial Transportation Investments | 30 |
1.17 | Capital Expenditure Projects Greater Than $50 Million | 33 |
1.18 | Provincial Debt Summary | 36 |
1.19 | Provincial Borrowing Requirements | 37 |
1.20 | Reconciliation of Summary Results to Provincial Debt Changes | 38 |
1.21 | Key Fiscal Sensitivities | 38 |
Budget and Fiscal Plan — 2016/17 to 2018/19
Table of Contents
Topic Boxes: | |
BC Prosperity Fund | 43 |
Liquefied Natural Gas — Update | 44 |
Direct Operating Debt | 46 |
Increasing Income Assistance Rates for Persons With Disabilities | 48 |
| |
Part 2: Tax Measures | |
Tax Measures — Supplementary Information | 50 |
Tables: | |
2.1 Summary of Tax Measures | 49 |
2.2 Impact of Medical Services Plan Premium Changes | 52 |
Topic Box: | |
Carbon Tax Report and Plan | 56 |
Commission on Tax Competitiveness | 59 |
Film and Television Tax Credits | 60 |
Housing Affordability | 62 |
Part 3: British Columbia Economic Review and Outlook | |
Summary | 67 |
British Columbia Economic Activity and Outlook | 67 |
The Labour Market | 68 |
Consumer Spending and Housing | 69 |
Business and Government | 71 |
External Trade and Commodity Markets | 71 |
Demographics | 73 |
Inflation | 73 |
Risks to the Economic Outlook | 74 |
External Outlook | 74 |
United States | 74 |
Canada | 76 |
Europe | 78 |
China | 79 |
Financial Markets | 80 |
Interest Rates | 80 |
Exchange Rate | 81 |
Tables: | |
3.1 | British Columbia Economic Indicators | 68 |
3.2 | US Real GDP Forecast: Consensus vs Ministry of Finance | 76 |
3.3 | Canadian Real GDP Forecast: Consensus vs Ministry of Finance | 78 |
3.4 | Private Sector Canadian Interest Rate Forecasts | 81 |
3.5 | Private Sector Exchange Rate Forecasts | 82 |
3.6.1 | Gross Domestic Product: British Columbia | 83 |
3.6.2 | Selected Nominal Income and Other Indicators: British Columbia | 84 |
3.6.3 | Labour Market Indicators: British Columbia | 84 |
3.6.4 | Major Economic Assumptions | 85 |
Topic Box: | |
The Economic Forecast Council, 2016 | 86 |
Budget and Fiscal Plan — 2016/17 to 2018/19
ii
Table of Contents
Part 4: 2015/16 Updated Financial Forecast (Third Quarterly Report) | |
Introduction | 91 |
Revenue | 93 |
Expense | 93 |
Contingencies | 94 |
Government Employment (FTEs) | 94 |
Provincial Capital Spending | 94 |
Provincial Debt | 95 |
Risks to the Fiscal Forecast | 96 |
Supplementary Schedules | 97 |
Tables: | | |
4.1 | 2015/16 Forecast Update | 91 |
4.2 | 2015/16 Financial Forecast Changes | 92 |
4.3 | 2015/16 Capital Spending Update | 94 |
4.4 | 2015/16 Provincial Debt Update | 95 |
4.5 | 2015/16 Operating Statement | 97 |
4.6 | 2015/16 Revenue by Source | 98 |
4.7 | 2015/16 Expense by Ministry, Program and Agency | 99 |
4.8 | 2015/16 Expense by Function | 100 |
4.9 | 2015/16 Capital Spending | 101 |
4.10 | 2015/16 Provincial Debt | 102 |
4.11 | 2015/16 Statement of Financial Position | 103 |
| | |
Appendix | | 105 |
Budget and Fiscal Plan — 2016/17 to 2018/19
iii

| February 16, 2016 |
As required by Section 7(d) of the Budget Transparency and Accountability Act (BTAA), and Section 4a(v) of the Carbon Tax Act, I confirm that Budget 2016 contains the following elements:
· Fiscal forecasts for 2016/17 to 2018/19 (provided in Part 1) and economic forecasts for 2016 to 2020 (provided in Part 3).
· A report on the advice received from the Economic Forecast Council (EFC) in late November 2015 (updated January 2016) on the economic growth outlook for British Columbia, including a range of forecasts for 2016 and 2017 (see Part 3, page 86).
· Material economic, demographic, fiscal, accounting policy and other assumptions and risks underlying Budget 2016 economic and fiscal forecasts. In particular:
· The economic forecast reflects stable economic growth for British Columbia in an environment where the global economic situation remains mixed. While the US economy remains relatively stable, Europe’s economy is fragile, growth in China is slowing, and low commodity prices continue to weigh on the Canadian economy. Accordingly, the economic projections assumed in Budget 2016 are prudent relative to the average of the forecasts provided by the Economic Forecast Council.
· Personal and corporate income tax revenue forecasts include the preliminary 2014 income tax assessments and the latest projections for national corporate taxable income received from the federal government. The property transfer tax forecast assumes the level of housing activity in 2015/16 does not fully carry forward.
· Natural gas royalty forecasts continue to adopt a lower natural gas price forecast compared to the private sector average in order to maintain prudence against volatility.
· The economic and revenue forecasts both do not reflect any incremental activity or revenue from liquefied natural gas development; and also both do not assume either a continuation of the 2006 Softwood Lumber Agreement between Canada and the US or any potential litigation that could arise after the expiry of the US commitment not to launch countervailing duty or anti-dumping litigation before October 2016.
· Ministry budgets include base increases for the costs of collective agreements signed under government’s current wage mandate, including costs arising from the Economic Stability Dividend portion of the mandate.
· Forecast prudence totals $800 million in 2016/17 and $750 million in each of 2017/18 and 2018/19, being the sum of the Contingencies vote and the forecast allowance in each fiscal year.
· Budget 2016 includes spending projections for the Site C dam project and initial funding for planning costs for the George Massey Tunnel Replacement Project. Full spending projections for the George Massey Tunnel Replacement Project will be added to the capital plan upon approval of the final project business case by Treasury Board.
· The fiscal plan includes three-year financial projections for school districts, post-secondary institutions and health authorities, as provided by the Ministries of Education, Advanced Education and Health, respectively, based on plans submitted to the ministries by those entities, and for the other service delivery agencies and the commercial Crown corporations, as submitted directly to the Ministry of Finance by those organizations.
· A Revenue Neutral Carbon Tax Report for 2014/15 and 2015/16, and the Revenue Neutral Carbon Tax Plan for 2016/17 to 2018/19 (see Part 2: Tax Measures, page 56).
To the best of my knowledge, the three-year fiscal plan contained in Budget 2016 conforms to the standards and guidelines of generally accepted accounting principles for senior governments as outlined in Note 1 of the 2014/15 Public Accounts.
| /s/ Kim Henderson |
| Kim Henderson |
| Deputy Minister and |
| Secretary to Treasury Board |
| |
Budget and Fiscal Plan — 2016/17to 2018/19
Summary: BUDGET AND FISCAL PLAN — 2016/17 to 2018/19
| | Updated | | Budget | | | | | |
| | Forecast | | Estimate | | Plan | | Plan | |
($ millions) | | 2015/16 | | 2016/17 | | 2017/18 | | 2018/19 | |
Revenue | | 46,992 | | 48,066 | | 49,034 | | 50,141 | |
Expense | | (46,365 | ) | (47,452 | ) | (48,397 | ) | (49,418 | ) |
Allocation to the BC Prosperity Fund | | (100 | ) | — | | — | | — | |
Surplus before the BC Prosperity Fund and forecast allowance | | 527 | | 614 | | 637 | | 723 | |
BC Prosperity Fund | | 100 | | — | | — | | — | |
Forecast allowance | | (250 | ) | (350 | ) | (350 | ) | (350 | ) |
Surplus | | 377 | | 264 | | 287 | | 373 | |
Capital spending: | | | | | | | | | |
Taxpayer-supported capital spending | | 3,631 | | 4,251 | | 3,843 | | 3,872 | |
Self-supported capital spending | | 2,604 | | 3,108 | | 2,659 | | 2,886 | |
| | 6,235 | | 7,359 | | 6,502 | | 6,758 | |
Provincial Debt: | | | | | | | | | |
Taxpayer-supported debt | | 42,709 | | 43,227 | | 44,242 | | 45,089 | |
Self-supported debt | | 22,331 | | 24,113 | | 25,294 | | 26,452 | |
Total debt (including forecast allowance) | | 65,290 | | 67,690 | | 69,886 | | 71,891 | |
Taxpayer-supported debt-to-GDP ratio | | 17.4 | % | 17.0 | % | 16.7 | % | 16.3 | % |
Taxpayer-supported debt-to-revenue ratio | | 92.7 | % | 92.4 | % | 93.1 | % | 93.0 | % |
| | | | | | | | | |
| | 2015 | | 2016 | | 2017 | | 2018 | |
Economic Forecast: | | | | | | | | | |
Real GDP growth | | 2.4 | % | 2.4 | % | 2.3 | % | 2.3 | % |
Nominal GDP growth | | 3.3 | % | 4.0 | % | 4.3 | % | 4.3 | % |
Maintaining Balanced Results
Budget 2016 provides significant new investments in core programs while maintaining government’s ongoing commitment to disciplined and prudent fiscal planning. Government is presenting balanced budget results in each year of the fiscal plan for the fourth year in a row.
Over the fiscal plan period, government has committed $1.6 billion in funding increases to social supports, community safety and economic development, as well as fully funding the Economic Stability Dividend public sector compensation increases, while maintaining modest surpluses in all years of the fiscal plan. Key areas for increased expenditures in Budget 2016 over the next three years include:
· $673 million in additional support for children, families, and individuals in need;
· $128 million in operating costs for the new Okanagan Correctional Centre;
· $75 million for the Rural Dividend Program; and
· $213 million for the Economic Stability Dividend for all provincial public sector employees who have reached labour settlements.
Government is able to make these new commitments within a balanced budget framework due to improving revenues, as well as sizeable savings in debt servicing costs resulting from government’s success under its strategic debt management initiative. Over the three year fiscal plan period, interest costs are almost $500 million lower than forecasted in Budget 2015.
Budget 2016 will establish the BC Prosperity Fund, with an inaugural commitment of $100 million from the forecasted 2015/16 surplus. The BC Prosperity Fund will be a long-term legacy intended to:
· help eliminate the Province’s debt over time;
· make investments in health care, education, transportation, family supports and other priorities that provide future benefits to British Columbia; and
· preserve a share of today’s prosperity for future generations.
Budget and Fiscal Plan — 2016/17 to 2018/19
Summary
In order to achieve social policy and economic development objectives, government will initiate a number of tax policy measures in Budget 2016, including:
· introduction of a property transfer tax exemption for newly constructed homes up to $750,000 in value, effective February 17, 2016;
· introduction of a new farmers’ food donation tax credit, effective February 17, 2016;
· expansion of the seniors’ home renovation tax credit to persons with disabilities, effective February 17, 2016;
· extension of the BC mining flow-through share tax credit to the end of 2016;
· extension of the mining exploration tax credit for an additional three years to the end of 2019; and
· increase of the small business venture capital tax credit budget by $5 million.
Effective January 1, 2017, government is also making changes to the structure of Medical Services Plan premiums, including the exemption of children from the calculation of premiums. Premium assistance will also be enhanced by $70 million annually.
Steady Economic Growth
Following an estimated increase of 2.4 per cent in 2015, the Ministry of Finance forecasts British Columbia’s economy to grow by 2.4 per cent in 2016, 2.3 per cent in 2017 and 2.3 per cent per year in the medium-term.
Prudent economic forecast
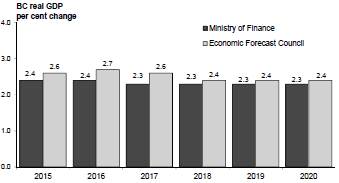
The Ministry’s estimate for BC real GDP growth is 0.3 percentage points lower, in both 2016 and 2017, than the outlook provided by the Economic Forecast Council. This prudence acknowledges the downside risks to the economic forecast and is one of the levels of prudence built into the fiscal plan.
The Ministry’s estimate for 2015 is slightly higher than expected in Budget 2015 as growth in retail sales, housing starts and employment exceeded expectations. While some of that domestic momentum is expected to continue into 2016, lower than expected commodity prices and dampened external demand are weighing on exports growth. As such, the Ministry’s real GDP outlook for 2016 and 2017 is relatively unchanged from Budget 2015.
Downside risks to BC’s economic outlook include:
· potential for a slowdown in domestic and Canadian economic activity;
· renewed weakness in the US economy, particularly as interest rates increase;
· fragility in Europe as governments and the financial system deal with elevated sovereign debt alongside weak economic growth;
· slower than anticipated economic activity in Asia, particularly in China, resulting in weaker demand for BC’s exports and downward pressure on global commodity prices;
· weaker than expected inflation; and
· exchange rate uncertainty.
Capital Spending
Taxpayer-supported infrastructure spending on hospitals, schools, post-secondary facilities, transit, and roads will total $12.0 billion over the fiscal plan period, and will be financed by $8.2 billion in borrowing with the remainder funded by third parties, such as the federal government, and from internal cash flows.
Self-supported spending on power projects, transportation infrastructure, and other capital assets will total $8.6 billion over the fiscal plan period, and will be financed by $5.2 billion in borrowing, with the remainder funded internally.
Strategic Debt Management
Government’s key debt affordability metric, taxpayer-supported debt to GDP ratio, continues its downward trend. The ratio is forecasted to be 17.4 per cent at the end of 2015/16, declining to 16.3 per cent over the fiscal plan period. This track is on average 0.2 percentage points below that estimated in Budget 2015.
Budget and Fiscal Plan — 2016/17 to 2018/19
2
Summary
Debt to GDP trend stable and improved
Government’s other debt affordability metric, taxpayer-supported debt to revenue, is also below that estimated at Budget 2015.
Debt to revenue below Budget 2015
Risks to the Fiscal Plan
The main risks to the government’s fiscal plan include:
· risks to the BC economic outlook, largely due to the continued uncertainty surrounding global economic activity;
· assumptions underlying revenue, including Crown corporation income forecasts, such as economic factors, commodity prices and weather conditions;
· potential changes to federal government allocations for health and social transfers and cost-sharing agreements, as well as impacts on the provincial income taxes arising from federal government tax policy changes;
· utilization rates for government services such as health care, children and family services, and income assistance;
· impacts of the expiration of the 2006 Softwood Lumber Agreement between Canada and the US; and
· the outcome of litigation, arbitrations, and negotiations with third parties, including the appeal of the BC Supreme Court decision on the teachers’ contract issue.
Government incorporates four main levels of prudence in its projections to mitigate the risks to the fiscal plan:
· The Ministry outlook for BC’s real GDP growth is lower than the outlook provided by the Economic Forecast Council (0.3 percentage points lower in 2016 and 0.3 percentage points lower in 2017).
· The natural gas revenue forecast incorporates additional prudence by using a price forecast that is within the 20th percentile of the private sector forecasts.
· Government has included a forecast allowance of $350 million in each year of the fiscal plan to guard against volatility including revenue changes.
· The fiscal plan also includes a Contingencies vote allocation of $450 million in 2016/17, and $400 million in each of 2017/18 and 2018/19, to help manage unexpected pressures and fund priority initiatives.
Conclusion
In summary, Budget 2016:
· provides a sustainable balanced budget framework built on disciplined fiscal planning and modest economic growth;
· reflects the benefits of a focus on debt management in the form of lower debt servicing costs providing affordable and new funding in key areas of government services;
· introduces tax measures targeted towards achieving social policy objectives and supporting government’s balanced budget commitment;
· makes investments in government’s capital infrastructure in support of government initiatives and service delivery; and
· continues strategic debt management in order to achieve lower costs, maintain debt affordability and support a AAA credit rating.
Budget and Fiscal Plan — 2016/17 to 2018/19
3
Part 1: THREE YEAR FISCAL PLAN
Table 1.1 Three Year Fiscal Plan
| | Updated | | Budget | | | | | |
| | Forecast | | Estimate | | Plan | | Plan | |
($ millions) | | 2015/16 | | 2016/17 | | 2017/18 | | 2018/19 | |
Revenue | | 46,992 | | 48,066 | | 49,034 | | 50,141 | |
Expense | | (46,365 | ) | (47,452 | ) | (48,397 | ) | (49,418 | ) |
Allocation to the BC Prosperity Fund | | (100 | ) | — | | — | | — | |
Surplus before the BC Prosperity Fund and forecast allowance | | 527 | | 614 | | 637 | | 723 | |
BC Prosperity Fund | | 100 | | — | | — | | — | |
Forecast allowance | | (250 | ) | (350 | ) | (350 | ) | (350 | ) |
Surplus | | 377 | | 264 | | 287 | | 373 | |
Capital spending: | | | | | | | | | |
Taxpayer-supported capital spending | | 3,631 | | 4,251 | | 3,843 | | 3,872 | |
Self-supported capital spending | | 2,604 | | 3,108 | | 2,659 | | 2,886 | |
| | 6,235 | | 7,359 | | 6,502 | | 6,758 | |
Provincial Debt: | | | | | | | | | |
Taxpayer-supported debt | | 42,709 | | 43,227 | | 44,242 | | 45,089 | |
Self-supported debt | | 22,331 | | 24,113 | | 25,294 | | 26,452 | |
Total debt (including forecast allowance) | | 65,290 | | 67,690 | | 69,886 | | 71,891 | |
Taxpayer-supported debt-to-GDP ratio | | 17.4 | % | 17.0 | % | 16.7 | % | 16.3 | % |
Taxpayer-supported debt-to-revenue ratio | | 92.7 | % | 92.4 | % | 93.1 | % | 93.0 | % |
Introduction
Budget 2016 presents significant new investments in core programs while continuing government’s practice of fiscal prudence. Excluding health care, government is providing $1.6 billion in additional funding compared to Budget 2015, including increases to social services, community safety and economic development, as well as fully funding the Economic Stability Dividend compensation increases, while maintaining modest surpluses in each year of the fiscal plan.
These new funding commitments are affordable within a balanced budget framework due to improving revenues to core government as well as sizeable interest cost savings resulting from the success of government’s strategic debt management efforts. Debt servicing costs over the three year fiscal plan are approximately $500 million less than forecasted at Budget 2015, and interest costs as a portion of revenue remains at historically low levels, averaging 3.7 cents per dollar of revenue.
Budget 2016 will establish the BC Prosperity Fund, with an inaugural commitment of $100 million from the forecasted 2015/16 surplus. The BC Prosperity Fund will be a long-term legacy intended to:
· help eliminate the Province’s debt over time;
· make investments in health care, education, transportation, family supports and other priorities that provide future benefits to British Columbia, and
· preserve a share of today’s prosperity for future generations.
Budget and Fiscal Plan — 2016/17 to 2018/19
Three Year Fiscal Plan
While this inaugural $100 million investment is modest, government may increase this amount when the final 2015/16 surplus is known. In addition, future government surpluses, which will include LNG revenues, will help grow the fund over time.
Government’s strategic debt management initiatives since Budget 2014 also ensure important infrastructure investments proceed while remaining within debt affordability constraints. Taxpayer-supported capital investments in hospitals, schools, post-secondary facilities, transit, and roads will total $12.0 billion over the fiscal plan period, a 12 per cent increase over Budget 2015 levels.
Self-supported spending on power projects, transportation infrastructure and other capital assets will total $8.6 billion over the fiscal plan period, and will be financed by $5.2 billion in borrowing, with the remainder funded internally. More information on the three year capital spending plan is found on page 26.
While total provincial debt is projected to be $71.9 billion by 2018/19, direct operating debt is projected to decline to $2.7 billion, the lowest level since 1984/85. Additional information on the debt outlook can be found in the Direct Operating Debt topic box on page 46.
Government continues to place emphasis on improving debt affordability. Debt to GDP continues its stable downward trend and is on average, 0.2 percentage points below the Budget 2015 forecasted track.
Chart 1.1 Debt to GDP trend stable and improved
The other key debt affordability metric, taxpayer-support debt to revenue, is also well under Budget 2015 estimates.
The major risks to the fiscal plan stem from changes in factors that government does not directly control. These include:
· risks to the BC economic outlook, largely due to the continued uncertainty surrounding global economic activity;
Budget and Fiscal Plan — 2016/17 to 2018/19
6
Three Year Fiscal Plan
Chart 1.2 Debt to revenue below Budget 2015
· assumptions underlying revenue, including commercial Crown corporation forecasts, such as economic factors, commodity prices and weather conditions;
· potential changes to federal government transfer allocations, cost-sharing agreements with the federal government and impacts on the provincial income taxes arising from federal government tax policy and budget changes;
· utilization rates for government services such as health care, children and family services, and income assistance;
· impacts of the expiration of the 2006 Softwood Lumber Agreement between Canada and the US; and
· the outcome of litigation, arbitrations, and negotiations with third parties, including the appeal of the Supreme Court of Canada decision on the teachers’ contract issue.
Government incorporates four main levels of prudence in its projections to mitigate the risks to the fiscal plan:
· The Ministry outlook for BC’s real GDP growth is lower than the outlook provided by the Economic Forecast Council (0.3 percentage points lower in 2016 and 2017).
· The natural gas revenue forecast incorporates additional prudence by using a price forecast that is within the 20th percentile of the private sector forecasts.
· Government has included a forecast allowance of $350 million in all years of the fiscal plan to guard against volatility including changes to revenue.
· The fiscal plan includes a Contingencies vote allocation of $450 million in 2016/17, and $400 million in 2017/18 and 2018/19, to help manage unexpected pressures and fund priority initiatives.
A complete discussion of the risks to the fiscal plan can be found beginning on page 38. Economic risks are discussed in Part 3: British Columbia Economic Review and Outlook.
Budget and Fiscal Plan — 2016/17 to 2018/19
7
Three Year Fiscal Plan
Revenue
Chart 1.3 Revenue trends
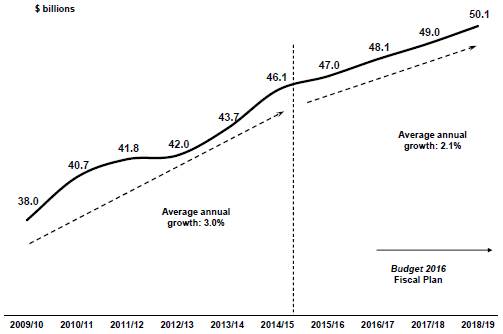
Total revenue growth is expected to average 2.1 per cent annually over the four-year period to 2018/19. This reflects the impacts of 4.0 per cent average annual nominal GDP growth on taxation revenues and projected increases in fee revenues, investment earnings and federal government contributions. These improvements are partly offset by an expected declining trend in natural resource revenues.
In 2016/17, taxation revenue is forecast to grow only 0.3 per cent compared to 2015/16 due to the effects of one-time income and property transfer tax revenues recorded in 2015/16 that are not expected to fully carry forward and the termination of the temporary tax rate increase on individuals earning over $150,000. The two-year temporary tax rate increase was implemented effective January 1, 2014 and rescinded effective December 31, 2015. Over the next two years, taxation revenue sources are projected to average 3.4 per cent annual growth, consistent with the Ministry of Finance economic growth projections for nominal GDP, household income, net operating surplus, consumer expenditures and housing starts. The forecast also includes the impacts of tax measures detailed in Part 2: Tax Measures.
Natural resource revenue is forecast to decline 7.2 per cent in 2016/17 compared to 2015/16 mainly due to reduced revenue from the sale of Crown land leases, the impacts of lower commodity prices, and the effect of the expiration of the Canada-US 2006 Softwood Lumber Agreement, effective October 12, 2015. Over the next two years, average annual change in natural resource revenues is projected to decline 4.8 per cent as the effects of falling revenue from the sale of Crown land leases offsets the impacts of increasing commodity prices. Excluding Crown land tenures, natural resource revenue is expected to average 4.1 per cent annual growth over the next two years, in line with expected rising prices for natural gas, petroleum, lumber, coal and other mining commodities.
Revenue from fees, investment earnings and other miscellaneous sources is expected to average 2.2 per cent annual growth over the next three years, reflecting projected Medical Services Plan premium rate increases; measures to enhance premium assistance; and rising projections for post-secondary fee revenue and investment earnings. The revenue forecast incorporates estimates provided by ministries and taxpayer-supported agencies.
Budget and Fiscal Plan — 2016/17 to 2018/19
8
Three Year Fiscal Plan
Chart 1.4 Revenue forecast
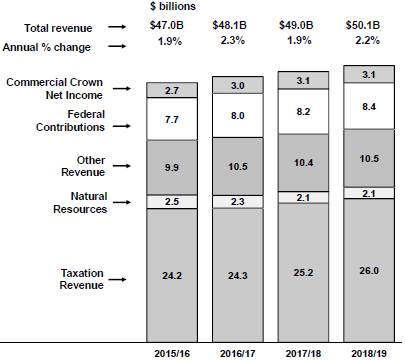
Federal government contributions are forecast to average 3.2 per cent annual growth over the next three years mainly due to expected increases in the Canada Health Transfer (CHT) and Canada Social Transfer (CST) disbursements.
Excluding ICBC, commercial Crown net income is expected to average 1.8 per cent annual growth over the next three years mainly reflecting relatively stable growth in the net income for BC Hydro, Liquor Distribution Branch and BC Lottery Corporation. More details on commercial Crown corporation net income are provided beginning on page 14.
Table 1.2 Comparison of Major Factors Underlying Revenue
Calendar Year | | February 16, 2016 | | February 17, 2015 | |
Per cent growth unless otherwise indicated | | 2015 | | 2016 | | 2017 | | 2018 | | 2015 | | 2016 | | 2017 | | 2018 | |
Real GDP | | 2.4 | | 2.4 | | 2.3 | | 2.3 | | 2.3 | | 2.4 | | 2.3 | | 2.3 | |
Nominal GDP | | 3.3 | | 4.0 | | 4.3 | | 4.3 | | 3.8 | | 4.3 | | 4.3 | | 4.3 | |
Household income | | 3.2 | | 3.6 | | 3.9 | | 3.9 | | 3.5 | | 3.8 | | 4.0 | | 4.0 | |
Net operating surplus | | -1.3 | | 3.7 | | 5.0 | | 5.0 | | 3.3 | | 6.3 | | 5.8 | | 5.8 | |
Consumer expenditures | | 5.2 | | 4.8 | | 4.7 | | 4.5 | | 4.3 | | 4.5 | | 4.5 | | 4.6 | |
Consumer expenditures on durable goods | | 8.7 | | 2.5 | | 1.9 | | 1.8 | | 1.3 | | 1.6 | | 1.5 | | 1.5 | |
Business investment | | 7.9 | | 5.6 | | 5.1 | | 4.6 | | 3.9 | | 4.5 | | 4.6 | | 4.7 | |
Residential investment | | 10.5 | | 6.8 | | 6.0 | | 4.8 | | 3.4 | | 4.7 | | 4.9 | | 4.9 | |
Retail sales | | 6.5 | | 4.3 | | 3.7 | | 3.6 | | 3.3 | | 3.7 | | 3.6 | | 3.6 | |
Employment | | 1.2 | | 1.2 | | 1.2 | | 1.2 | | 1.0 | | 1.2 | | 1.2 | | 1.2 | |
BC Housing starts | | 10.9 | | -6.5 | | -4.6 | | -3.6 | | -2.7 | | -0.2 | | -1.9 | | 0.0 | |
US Housing starts | | 10.8 | | -1.0 | | 0.0 | | 0.0 | | -0.6 | | 2.5 | | 2.4 | | 0.0 | |
SPF 2x4 price ($US/thousand board feet) | | $ | 282 | | $ | 288 | | $ | 300 | | $ | 300 | | $ | 344 | | $ | 340 | | $ | 340 | | $ | 340 | |
Pulp ($US/tonne) | | $ | 852 | | $ | 840 | | $ | 825 | | $ | 825 | | $ | 888 | | $ | 838 | | $ | 825 | | $ | 825 | |
Exchange rate (US cents/Canadian dollar) | | 78.2 | | 73.1 | | 76.8 | | 79.7 | | 85.3 | | 85.5 | | 87.0 | | 87.2 | |
Fiscal Year | | 2015/16 | | 2016/17 | | 2017/18 | | 2018/19 | | 2015/16 | | 2016/17 | | 2017/18 | | 2018/19 | |
Natural gas price ($Cdn/GJ at plant inlet) | | $ | 1.31 | | $ | 1.04 | | $ | 1.34 | | $ | 1.61 | | $ | 2.09 | | $ | 2.32 | | $ | 2.54 | | $ | 2.85 | |
Bonus bid average bid price per hectare ($) | | $ | 183 | | $ | 252 | | $ | 290 | | $ | 388 | | $ | 1,000 | | $ | 1,025 | | $ | 1,100 | | $ | 1,150 | |
Electricity price ($US/mega-watt hour, Mid-C) | | $ | 26 | | $ | 24 | | $ | 26 | | $ | 29 | | $ | 28 | | $ | 31 | | $ | 35 | | $ | 39 | |
Metallurgical coal price ($US/tonne, fob west coast) | | $ | 95 | | $ | 85 | | $ | 93 | | $ | 105 | | $ | 128 | | $ | 138 | | $ | 138 | | $ | 138 | |
Copper price ($US/lb) | | $ | 2.36 | | $ | 2.27 | | $ | 2.48 | | $ | 2.58 | | $ | 3.02 | | $ | 3.05 | | $ | 3.04 | | $ | 3.03 | |
Crown harvest volumes (million cubic metres) | | 62.0 | | 62.0 | | 62.0 | | 62.0 | | 63.0 | | 63.0 | | 64.0 | | 64.0 | |
Budget and Fiscal Plan — 2016/17 to 2018/19
9
Three Year Fiscal Plan
Major Revenue Sources
Key assumptions and sensitivities relating to revenue are provided in Appendix Table A5. The assumptions and factors that are the major drivers for preparing projections of individual revenue sources include sensitivities to provide the reader with a sense of potential impacts to revenue projections if there are changes to these underlying assumptions and factors. The following text references the forecasts of these assumptions and factors in explaining individual revenue sources. The 2016 Financial and Economic Review will include an estimation of the historical volatility of the economic assumptions. The major revenue components are:
Taxation revenue
Personal income tax base revenue (excluding tax measures and accounting adjustments for prior years) is forecast to average 4.5 per cent annual growth over the next three years, consistent with Budget 2016 projections of household and employee compensation income growth.
Table 1.3 Personal Income Tax Revenue
($ millions) | | 2015/16 | | 2016/17 | | 2017/18 | | 2018/19 | |
Base personal income tax revenue | | 7,834 | | 8,189 | | 8,585 | | 8,952 | |
Annual growth | | 2.2 | % | 4.5 | % | 4.8 | % | 4.3 | % |
Measures: | | | | | | | | | |
– temporary personal income tax rate increase for individuals with income over $150,000 (2 year limit) | | 210 | | — | | — | | — | |
– Budget 2016 tax measures | | (5 | ) | (4 | ) | (1 | ) | (4 | ) |
– Federal tax measures | | 25 | | 31 | | 27 | | 23 | |
Prior-Year adjustment | | 312 | | — | | — | | — | |
Budget 2016 revenue | | 8,376 | | 8,216 | | 8,611 | | 8,971 | |
Annual growth | | 3.7 | % | -1.9 | % | 4.8 | % | 4.2 | % |
Household income growth (calendar year) | | 3.2 | % | 3.6 | % | 3.9 | % | 3.9 | % |
Employee compensation income growth (calendar year) | | 3.3 | % | 3.9 | % | 4.0 | % | 4.1 | % |
Elasticity1 (calendar year basis, policy neutral) | | 0.6 | | 1.2 | | 1.3 | | 1.1 | |
1 Per cent growth in current year tax relative to per cent growth in personal income.
Due to the effects of prior-year adjustments in 2015/16 and the termination of the temporary tax rate increase effective December 31, 2015, personal income tax revenue is expected to decrease 1.9 per cent in 2016/17, followed by growth of 4.8 per cent and 4.2 per cent in the next two years.
Corporate income tax revenue forecasts are based on cash received from the federal government and annual projections reflect instalments and settlement adjustments for prior years. The revenue forecast is relatively unchanged in 2016/17 as the increase in instalments is offset by a reduction in the settlement payment for prior-years. Average annual growth over the next two years is forecast at 3.7 per cent mainly due to increases in instalments as national corporate taxable income and BC’s payment share are both projected to rise.
Budget and Fiscal Plan — 2016/17 to 2018/19
10
Three Year Fiscal Plan
The revenue forecast incorporates the federal government’s latest projections of national corporate taxable income and assumes that the general corporate income tax rate and the small business income tax rate remain at 11.0 per cent and 2.5 per cent, respectively. Further, calendar-year corporate income tax entitlement is forecast to rise in line with projected growth in the net operating surplus.
Table 1.4 Corporate Income Tax Revenue
($ millions) | | 2015/16 | | 2016/17 | | 2017/18 | | 2018/19 | |
Advance instalments from the federal government: | | | | | | | | | |
– Payment share | | 11.5 | % | 11.6 | % | 12.0 | % | 12.1 | % |
– Instalments | | 2,598 | | 2,729 | | 2,870 | | 2,964 | |
International Business Activity Act refunds | | (20 | ) | (20 | ) | (25 | ) | (25 | ) |
Prior-years’ settlement payment | | 210 | | 82 | | 114 | | 65 | |
Corporate income tax revenue | | 2,788 | | 2,791 | | 2,959 | | 3,004 | |
Annual per cent growth | | 5.8 | % | 0.1 | % | 6.0 | % | 1.5 | % |
Provincial sales tax revenue growth is expected to average 4.3 per cent annually over the next three years (excluding the one-time $50 million HST repayment in 2015/16), in line with expected increases in nominal GDP and consumer expenditures on taxable goods and services.
Table 1.5 Sales Taxes Revenue
($ millions) | | 2015/16 | | 2016/17 | | 2017/18 | | 2018/19 | |
Provincial sales taxes | | 5,956 | 1 | 6,296 | | 6,554 | | 6,819 | |
Annual per cent change (calendar year) | | 2015 | | 2016 | | 2017 | | 2018 | |
Consumer expenditures | | 5.2 | % | 4.8 | % | 4.7 | % | 4.5 | % |
Residential investment | | 10.5 | % | 6.8 | % | 6.0 | % | 4.8 | % |
Government expenditures | | 4.6 | % | 2.1 | % | 2.5 | % | 3.2 | % |
Nominal GDP | | 3.3 | % | 4.0 | % | 4.3 | % | 4.3 | % |
Retail sales | | 6.5 | % | 4.3 | % | 3.7 | % | 3.6 | % |
1 2015/16 forecast includes a —$50 million harmonized sales tax adjustment related to prior years.
Carbon tax revenue is forecast to average 1.6 per cent annual growth over the next three years. The forecast assumes that purchased volumes of natural gas will grow in line with real GDP and that consumption of gasoline is expected to remain flat. Carbon tax revenue is fully returned to taxpayers through tax reductions and credits. For more details on carbon tax recycling, see the Carbon Tax Report and Plan topic box on page 56.
Property tax revenue is expected to grow by an average of 4.3 per cent annually over the three year plan, in line with the outlook for BC housing starts and inflation. The forecast incorporates the impact of increasing the threshold for the phase-out of the home owner grant to $1.2 million from $1.1 million for the 2016 tax year.
Property transfer tax revenue is forecast to decline 16.8 per cent in 2016/17 reflecting an anticipated slowing of market activity and assuming a portion of the strong revenues received in 2015/16 do not carry forward. This decline is expected to be followed by an average annual decline of 3.7 per cent over the next two years in line with the outlook for BC housing starts.
More information on tax measures are detailed in Part 2: Tax Measures.
Budget and Fiscal Plan — 2016/17 to 2018/19
11
Three Year Fiscal Plan
Natural resource revenue
Natural gas royalties are expected to decline 15.2 per cent in 2016/17 mainly due to the impact of a lower natural gas price forecast. The royalties are forecast to increase at a 38.9 per cent average annual rate over the next two years, reflecting projections for higher prices and production volumes, partially offset by increased utilization of royalty programs and credits.
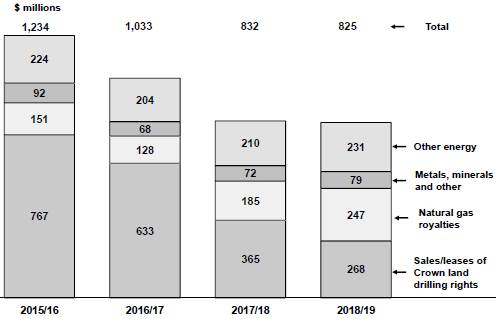
Chart 1.5 Revenue from energy, metals and minerals
The forecast assumes an average price of $1.04 ($Cdn/gigajoule, plant inlet) in 2016/17, down from $1.31 in 2015/16. The 2016/17 assumption is within the 20th percentile of the private sector forecasters, continuing the prudence incorporated in recent budgets. Prices are expected to rise in the next two years, averaging $1.34 in 2017/18 and $1.61 in 2018/19, in line with the growth of the average of the private sector forecasters. Natural gas royalty rates are sensitive to prices in the $1.25 and $2.75 range, hence the net effective royalty rate is expected to rise as natural gas prices increase.
See Appendix Table A6 for more details regarding natural gas price forecasts.
Sales and leases of Crown land drilling rights revenue: Over the next three years, revenue from the sale of Crown land tenures is forecast to decline 65 per cent from $767 million in 2015/16 to $268 million in 2018/19. Crown land tenure revenue has three main components:
· deferred cash sales representing one-ninth of the cash from the annual bonus bid auction sales in each of the previous eight years;
Table 1.6 Crown Land Tenure Revenue
($ millions) | | 2014/15 | | 2015/16 | | 2016/17 | | 2017/18 | | 2018/19 | |
Bonus bid auction sales: | | | | | | | | | | | |
Deferred revenue | | 732 | | 702 | | 568 | | 300 | | 202 | |
Current-year cash (one-ninth) | | 37 | | 2 | | 2 | | 2 | | 3 | |
Fees and rentals | | 65 | | 63 | | 63 | | 63 | | 63 | |
Total revenue | | 834 | | 767 | | 633 | | 365 | | 268 | |
Budget and Fiscal Plan — 2016/17 to 2018/19
12
Three Year Fiscal Plan
· one-ninth of the cash receipts from the current year bonus bid auction sales; and
· annual fees and rentals
Revenue is expected to decrease over the fiscal plan period reflecting declining amounts of deferred revenue recognition. This is a result of the very large bonus bid cash sales (occurring in the 2007/08 to 2009/10 period) being fully amortized over nine years compared to lower sales results in the past six years and a forecast for relatively weak sales over the next three years.
Mining and minerals: Revenue from mineral tax, fees and miscellaneous mining receipts is expected to decrease 26.1 per cent in 2016/17 mainly due to an outlook for lower metal and coal prices. Average annual revenue growth over the next two years is forecast at 7.8 per cent based on an expected recovery in mining commodity prices.
Other energy: Other energy revenue is comprised of electricity sales under the Columbia River Treaty, petroleum royalties and fees collected by the Oil and Gas Commission. These revenues are expected to fall 8.9 per cent in 2016/17 due to the effects of lower Mid-C electricity and oil prices, followed by an average annual increase of 6.4 per cent over the next two years as prices are forecast to rise.
Forests revenue is forecast to decline 2.5 per cent in 2016/17 mainly due to the impact of the expiry of the 2006 Softwood Lumber Agreement partially offset by higher stumpage revenue. Revenue growth is expected to average 1.0 per cent annually over the next two years mainly due to the impacts of higher stumpage rates. Total Crown land harvest levels are projected to be stable at 62 million cubic metres over the 2015/16 to 2018/19 period.
Other natural resource revenue is comprised of water rentals and fees for hunting and fishing licenses collected under the Wildlife Act. These sources are expected to increase by an annual average rate of 0.6 percent over the next three years.
Other revenue
Fees and licenses: Revenue growth is expected to average 3.3 per cent annually over the three year fiscal plan, mainly due to projected increases to Medical Services Plan premium rates in support of rising healthcare spending and increases in fee revenue collected by post-secondary institutions.
Investment earnings are projected to grow at a 5.4 per cent average annual rate over the three year fiscal plan, mainly due to increased earnings from fiscal agency loans. Investment income from fiscal agency loans has an offsetting expense resulting in no impact to the bottom line.
Miscellaneous revenue is forecast to decline an average 1.5 per cent annually over the next three years. Miscellaneous revenue includes the projected gains on sales of surplus properties. As well, the transfer of selected lands and buildings to non-profit societies in support of building housing capacity in the non-profit sector and ensuring its long term sustainability will result in the net value of the properties being reported as gains when transferred.
Budget and Fiscal Plan — 2016/17 to 2018/19
13
Three Year Fiscal Plan
Federal government transfers
Health and social transfers are expected to average 4.0 per cent annual growth over the three years of the fiscal plan, mainly reflecting increasing national cash transfers and a rising BC population share. The plan assumes the national CHT cash disbursement increases 6.0 per cent in 2016/17 followed by increases of 3.0 per cent and 3.4 per cent in last two years of the plan. The national CHT cash disbursement in 2017/18 will be based on a three year average (2015 to 2017) of Canada’s nominal GDP growth, subject to a minimum annual growth rate of 3.0 per cent. The national CST cash disbursement is projected to increase 3.0 per cent annually, consistent with the federal government forecast.
Table 1.7 Federal Government Contributions
($ millions) | | 2015/16 | | 2016/17 | | 2017/18 | | 2018/19 | |
Canada Health Transfer | | 4,444 | | 4,721 | | 4,875 | | 5,054 | |
Deferred health equipment grants | | 7 | | 3 | | — | | — | |
Canada Social Transfer | | 1,695 | | 1,747 | | 1,804 | | 1,863 | |
Total health and social transfers | | 6,146 | | 6,471 | | 6,679 | | 6,917 | |
Ministry cost recoveries | | 541 | | 529 | | 524 | | 524 | |
Transfers to post-secondary institutions | | 513 | | 514 | | 516 | | 519 | |
Transfers to taxpayer-supported Crown corporations | | 230 | | 238 | | 233 | | 202 | |
Transfers to other SUCH sector agencies | | 91 | | 93 | | 89 | | 89 | |
Disaster financial assistance contributions | | 1 | | 27 | | 18 | | 23 | |
Other transfers | | 137 | | 136 | | 136 | | 136 | |
Total other contributions | | 1,513 | | 1,537 | | 1,516 | | 1,493 | |
Total Federal Government Contributions | | 7,659 | | 8,008 | | 8,195 | | 8,410 | |
Other federal contributions are expected to decline 0.4 per cent annually, on average, over the next three years. Reduced funding includes projected contributions to the BC Housing Management Commission and ministry vote recoveries.
Commercial Crown corporations
British Columbia Hydro and Power Authority: BC Hydro’s net income is forecast to be $692 million in 2016/17. In accordance with it’s 10 Year Plan for rates, 2016/17 is the last year BC Hydro’s net income is calculated as an 11.84 per cent allowed return on deemed equity. Beginning in 2017/18, net income will increase at the forecast rate of increase in the British Columbia consumer price index, currently estimated to be 2 per cent, resulting in forecast net income of $706 million and $720 million for 2017/18 and 2018/19 respectively. BC Hydro forecasts include annual rate increases of 4 per cent, 3.5 per cent and 3 per cent from 2016/17 to 2018/19, pursuant to the rate caps laid out in the 10 Year Plan.
British Columbia Liquor Distribution Branch: LDB’s net income is projected to be $983 million in 2016/17, increasing to $1.0 billion by 2018/19. The increase reflects average annual growth of 1.6 per cent in net sales revenue over the fiscal plan period.
Budget and Fiscal Plan — 2016/17 to 2018/19
14
Three Year Fiscal Plan
British Columbia Lottery Corporation: BCLC reflects moderate net income growth over the fiscal plan period, from $1.2 billion in 2015/16 to $1.3 billion by 2018/19. Net income growth is attributed to Casino and Community Gaming and e-Gaming segments, with annual growth in net win at 0.9 per cent and 8.2 per cent, respectively. The corporation’s long-term health and profitability is being managed through a focus on strategic investments and continuous improvements in cost management.
For each year of the fiscal plan, government will distribute approximately $250 million (or approximately 20 per cent of the dividend) of its gaming income to charities and local governments. As well, $147 million of the gaming income retained by government will be allocated each year to the Health Special Account in support of health services.
Insurance Corporation of British Columbia: ICBC’s net income is forecast to average $125 million annually over the fiscal plan period. The outlook assumes average annual growth of 1.7 per cent in the number of insured vehicles and a 4.5 per cent average annual increase in current year claims costs.
ICBC is in its seventh year of a multi-year $400 million Transformation Program that is designed to promote upgraded systems and processes to facilitate better support for customers and business partners with less paperwork; and more efficient business practices. The Transformation Program, forecast to be complete in the fall of 2016, is being funded entirely from Optional insurance capital and therefore does not impact Basic insurance rates.
Transportation Investment Corporation: TI Corp manages the TReO toll system on the Port Mann Bridge and highway operations for 37 kilometers of Highway 1 between Langley and Vancouver. Bridge and highway construction was completed in 2015. Some construction continues off-highway and is scheduled to be completed on time in 2016/17 and within the $3.3 billion project budget.
The corporation is forecasting losses for the fiscal plan period, but will be profitable in future years and will recover capital costs for the improvement project through tolling over the longer term. Traffic forecasts indicate long term traffic growth on the Port Mann Bridge and TI Corp is expected to repay the project debt and meet all financial obligations by 2050.
Budget and Fiscal Plan — 2016/17 to 2018/19
15
Three Year Fiscal Plan
Table 1.8 Revenue by Source
| | Updated | | Budget | | | | | |
| | Forecast | | Estimate | | Plan | | Plan | |
($ millions) | | 2015/16 | | 2016/17 | | 2017/18 | | 2018/19 | |
Taxation revenue | | | | | | | | | |
Personal income | | 8,376 | | 8,216 | | 8,611 | | 8,971 | |
Corporate income | | 2,788 | | 2,791 | | 2,959 | | 3,004 | |
Sales 1 | | 5,956 | | 6,296 | | 6,554 | | 6,819 | |
Fuel | | 941 | | 948 | | 955 | | 963 | |
Carbon | | 1,216 | | 1,234 | | 1,252 | | 1,275 | |
Tobacco | | 755 | | 755 | | 755 | | 755 | |
Property | | 2,206 | | 2,305 | | 2,399 | | 2,504 | |
Property transfer | | 1,490 | | 1,239 | | 1,184 | | 1,150 | |
Insurance premium | | 510 | | 520 | | 530 | | 540 | |
| | 24,238 | | 24,304 | | 25,199 | | 25,981 | |
Natural resource revenue | | | | | | | | | |
Natural gas royalties | | 151 | | 128 | | 185 | | 247 | |
Forests | | 833 | | 812 | | 814 | | 828 | |
Other natural resources 2 | | 1,546 | | 1,407 | | 1,113 | | 1,050 | |
| | 2,530 | | 2,347 | | 2,112 | | 2,125 | |
Other revenue | | | | | | | | | |
Medical Services Plan premiums | | 2,425 | | 2,549 | | 2,665 | | 2,780 | |
Other fees and licences 3 | | 3,350 | | 3,446 | | 3,511 | | 3,589 | |
Investment earnings | | 1,143 | | 1,200 | | 1,276 | | 1,337 | |
Miscellaneous 4 | | 2,946 | | 3,210 | | 2,975 | | 2,812 | |
| | 9,864 | | 10,405 | | 10,427 | | 10,518 | |
Contributions from the federal government | | | | | | | | | |
Health and social transfers | | 6,146 | | 6,471 | | 6,679 | | 6,917 | |
Other federal government contributions 5 | | 1,513 | | 1,537 | | 1,516 | | 1,493 | |
| | 7,659 | | 8,008 | | 8,195 | | 8,410 | |
Commercial Crown corporation net income | | | | | | | | | |
BC Hydro | | 653 | | 692 | | 706 | | 720 | |
Liquor Distribution Branch | | 970 | | 983 | | 994 | | 1,003 | |
BC Lottery Corporation (net of payments to federal government) | | 1,221 | | 1,233 | | 1,250 | | 1,250 | |
ICBC | | (125 | ) | 95 | | 148 | | 130 | |
Transportation Investment Corporation (Port Mann) | | (86 | ) | (102 | ) | (106 | ) | (101 | ) |
Other 6 | | 68 | | 101 | | 109 | | 105 | |
| | 2,701 | | 3,002 | | 3,101 | | 3,107 | |
Total revenue | | 46,992 | | 48,066 | | 49,034 | | 50,141 | |
1 Includes provincial sales tax, HST/PST housing transition tax and harmonized sales tax related to prior years.
2 Columbia River Treaty, Crown land tenures, other energy and minerals, water rental and other resources.
3 Post-secondary, healthcare-related, motor vehicle, and other fees.
4 Includes reimbursements for healthcare and other services provided to external agencies, and other recoveries.
5 Includes contributions for health, education, community development, housing and social service programs, and transportation projects.
6 Includes Columbia Power Corporation, BC Railway Company, Columbia Basin Trust power projects, and post-secondary institutions self-supported subsidiaries.
Budget and Fiscal Plan — 2016/17 to 2018/19
16
Three Year Fiscal Plan
Table 1.9 Expense by Ministry, Program and Agency
| | Updated | | Budget | | | | | |
| | Forecast | | Estimate | | Plan | | Plan | |
($ millions) | | 2015/16 1 | | 2016/17 | | 2017/18 | | 2018/19 | |
| | | | | | | | | |
Office of the Premier | | 9 | | 9 | | 9 | | 9 | |
Aboriginal Relations and Reconciliation | | 87 | | 86 | | 88 | | 89 | |
Advanced Education | | 1,961 | | 1,986 | | 2,014 | | 2,042 | |
Agriculture | | 80 | | 81 | | 82 | | 82 | |
Children and Family Development | | 1,379 | | 1,451 | | 1,472 | | 1,486 | |
Community, Sport and Cultural Development | | 228 | | 259 | | 264 | | 264 | |
Education | | 5,549 | | 5,609 | | 5,667 | | 5,728 | |
Energy and Mines | | 41 | | 28 | | 28 | | 29 | |
Environment | | 150 | | 150 | | 149 | | 149 | |
Finance | | 262 | | 253 | | 279 | | 282 | |
Forests, Lands and Natural Resource Operations | | 922 | | 671 | | 671 | | 682 | |
Health | | 17,445 | | 17,968 | | 18,505 | | 19,065 | |
International Trade | | 49 | | 50 | | 51 | | 52 | |
Jobs, Tourism and Skills Training | | 196 | | 197 | | 198 | | 198 | |
Justice | | 475 | | 491 | | 498 | | 504 | |
Natural Gas Development | | 444 | | 453 | | 457 | | 459 | |
Public Safety and Solicitor General | | 668 | | 681 | | 708 | | 711 | |
Small Business and Red Tape Reduction | | 3 | | 4 | | 4 | | 4 | |
Social Development and Social Innovation | | 2,593 | | 2,739 | | 2,830 | | 2,868 | |
Technology, Innovation and Citizens’ Services | | 479 | | 492 | | 501 | | 503 | |
Transportation and Infrastructure | | 924 | | 858 | | 862 | | 867 | |
Total ministries and Office of the Premier | | 33,944 | | 34,516 | | 35,337 | | 36,073 | |
Management of public funds and debt | | 1,188 | | 1,168 | | 1,214 | | 1,241 | |
Contingencies | | 350 | | 450 | | 400 | | 400 | |
Funding for capital expenditures | | 855 | | 1,303 | | 1,262 | | 1,437 | |
Refundable tax credit transfers | | 1,071 | | 1,039 | | 1,043 | | 1,047 | |
Legislative and other appropriations | | 136 | | 132 | | 141 | | 134 | |
Total appropriations | | 37,544 | | 38,608 | | 39,397 | | 40,332 | |
Elimination of transactions between appropriations 2 | | (16 | ) | (16 | ) | (31 | ) | (47 | ) |
Prior year liability adjustments | | (33 | ) | — | | — | | — | |
Consolidated revenue fund expense | | 37,495 | | 38,592 | | 39,366 | | 40,285 | |
Expenses recovered from external entities | | 2,689 | | 2,790 | | 2,807 | | 2,885 | |
Funding provided to service delivery agencies | | (22,463 | ) | (23,185 | ) | (23,540 | ) | (24,085 | ) |
Ministry and special office direct program spending | | 17,721 | | 18,197 | | 18,633 | | 19,085 | |
Service delivery agency expense: | | | | | | | | | |
School districts | | 5,828 | | 5,861 | | 5,910 | | 5,975 | |
Universities | | 4,279 | | 4,426 | | 4,554 | | 4,680 | |
Colleges and institutes | | 1,167 | | 1,160 | | 1,177 | | 1,200 | |
Health authorities and hospital societies | | 13,584 | | 13,798 | | 14,126 | | 14,364 | |
Other service delivery agencies | | 3,786 | | 4,010 | | 3,997 | | 4,114 | |
Total service delivery agency expense | | 28,644 | | 29,255 | | 29,764 | | 30,333 | |
Total expense | | 46,365 | | 47,452 | | 48,397 | | 49,418 | |
1 Restated to reflect government’s current organization and accounting policies.
2 Reflects payments made under an agreement where an expense from a voted appropriation is recorded as revenue by a special account.
Budget and Fiscal Plan — 2016/17 to 2018/19
17
Three Year Fiscal Plan
Expense
Budget 2016 provides for new investments while maintaining government’s commitment to disciplined and prudent fiscal management. Excluding the budget increase for the Ministry of Health in 2018/19, program spending includes new commitments of $1.6 billion over the three year fiscal plan compared to Budget 2015. The average annual growth in spending is expected to be 2.7 per cent and remains within the balanced budget obligation.
Chart 1.6 Expense trends
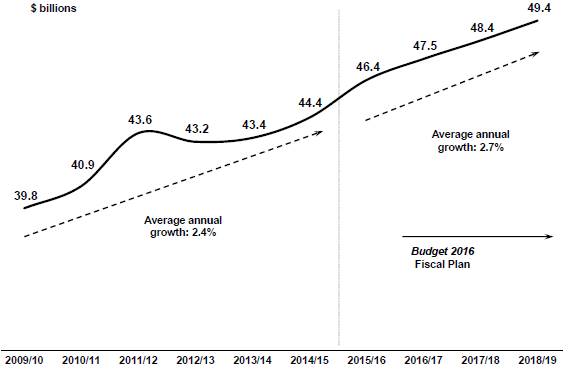
Government is able to provide funding increases now largely due to the benefits of controlled spending and the success of strategic debt management initiatives. Over the fiscal plan period, debt servicing costs are approximately $500 million less than forecasted in Budget 2015. It is these savings, working in concert with revenue improvements that have allowed for significant, targeted investments in key areas of importance to British Columbians.
Consolidated Revenue Fund Spending
Key expenditure priorities being addressed by Budget 2016, include those in the Ministry of Health, the Ministry of Social Development and Social Innovation and the Ministry of Children and Family Development. Expenditures are also higher in the Ministry of Forests, Lands and Natural Resource Operations, primarily to accommodate the Rural Dividend, which is a key government commitment announced at the Union of British Columbia Municipalities convention. A further annual expenditure across all ministries is for the Economic Stability Dividend wage increase, discussed in more detail below. The three year growth rate for the Ministry of Health in Budget 2016 is 3.0 per cent, which compares to an average 2.0 per cent annually for the remaining ministries.
Budget and Fiscal Plan — 2016/17 to 2018/19
18
Three Year Fiscal Plan
Health and Education
Health Care — Stable Annual Funding Increases
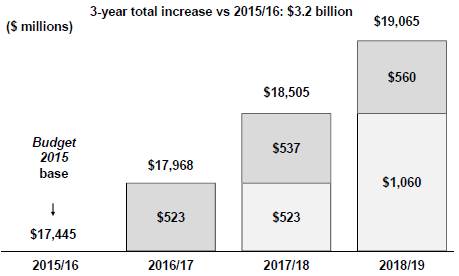
The Ministry of Health’s annual budget will increase by $523 million in 2016/17, and the ministry’s budget is targeted to reach over $19 billion by 2018/19. As noted above, the average rate of growth over the three year fiscal plan will be 3.0 per cent. These increases include funding for the health sector’s portion of the Economic Stability Dividend that will increase salaries for health care workers.
Chart 1.7 Ministry of Health budget increases
BC still leads the nation in important health outcomes while continuing to be third lowest in per capita health costs compared to other Canadian provinces, at $3,983 per person. BC also continues to rank best in terms of Life Expectancy, Cancer Mortality, and Mortality related to Diseases of the Heart and second best for Infant Mortality, according to the most recently available data.
Table 1.10 Health Per Capita Costs and Outcomes: Canadian Comparisons
| | 2015 Per | | Life | | Infant Mortality | | Cancer Mortality Rate | | Diseases of the Heart | |
| | Capita Health | | Expectancy at | | per 1000 Live | | per 100,000 | | Mortality Rate per | |
Province | | Care Costs ($) | | Birth (Years) | | Births | | Population | | 100,000 Population | |
Quebec | | 3,656 | | 81.8 | | 5.0 | | 170.1 | | 84.8 | |
Ontario | | 3,752 | | 82.0 | | 4.9 | | 148.1 | | 88.4 | |
British Columbia | | 3,983 | | 82.2 | | 3.8 | | 140.4 | | 83.7 | |
New Brunswick | | 4,175 | | 81.1 | | 5.7 | | 157.4 | | 100.4 | |
Prince Edward Island | | 4,282 | | 80.1 | | 3.5 | | 171.1 | | 105.9 | |
Nova Scotia | | 4,315 | | 80.2 | | 4.6 | | 174.1 | | 98.5 | |
Saskatchewan | | 4,621 | | 79.7 | | 5.5 | | 152.7 | | 113.3 | |
Manitoba | | 4,720 | | 79.8 | | 5.9 | | 159.3 | | 110.9 | |
Alberta | | 4,862 | | 81.3 | | 4.3 | | 142.2 | | 111.2 | |
Newfoundland | | 5,181 | | 79.9 | | 5.5 | | 175.0 | | 121.0 | |
Sources: Canadian Institute for Health Information, 2015 (cost data) and Statistics Canada (outcomes data).
Note: Outcomes data for Life Expectancy is of 2011; all other outcome data are as of 2012, which is the most recent data available.
Budget and Fiscal Plan — 2016/17 to 2018/19
19
Three Year Fiscal Plan
Post-Secondary Sector — Additional Funding for Educators
Budget 2016 increases funding for post-secondary institutions during the fiscal plan period. The rising three year track for the Ministry of Advanced Education reflects both Budget 2015’s increases for the 2014 Economic Stability Mandate wage funding for universities and colleges, as well as new funding in this year’s fiscal plan for the Economic Stability Dividend. In total, Budget 2016 adds $34 million over three years in the Ministry of Advanced Education’s allocation to fund the Dividend.
K-12 Education — Continued Increases to Fund Labour Agreements
The factors influencing the funding growth in Budget 2016 for the Province’s K-12 school system are consistent with those for the post-secondary sector. Budget 2015 presented a rising Ministry of Education three year budget track due to funding added for the 2014 BCTF and CUPE settlements, in addition to increases for independent schools enrolment. Budget 2016 includes new funding for the Economic Stability Dividend for public school teachers and unionized support staff. This amount totals $54 million over the period 2016/17 to 2018/19, and will increase remuneration for thousands of public school and school district employees.
Further, beginning in the 2018/19 fiscal year and consistent with the BCTF agreement, an additional $4.4 million ($6.25 million on a school year basis) is added to the Learning Improvement Fund (LIF), which currently is budgeted at $100 million annually. The LIF was established as part of Budget 2012 at $75 million, to provide additional resources to school districts to help address complex classroom needs.
Supporting Families and Others in Need
Budget 2016 provides an additional $673 million over the next three years for the Ministry of Social Development and Social Innovation and for the Ministry of Children and Family Development to support families and individuals most in need, as detailed in Table 1.11 and as described below.
Table 1.11 Additional Support for Children, Families and Individuals in Need
($ millions) | | 2016/17 | | 2017/18 | | 2018/19 | |
Income Assistance supports for those in need | | 44 | | 103 | | 103 | |
Increase to monthly Persons With Disabilities income assistance rates | | 36 | | 65 | | 69 | |
Increased contribution provided to Community Living BC | | 12 | | 2 | | 22 | |
Services and programs for children, youth, and their families | | 66 | | 74 | | 77 | |
Total | | 158 | | 244 | | 271 | |
Income Assistance
As a component of the $673 million, Budget 2016 provides an additional $250 million over the next three years for individuals and families in need to address caseload pressures for temporary income assistance, disability assistance, and related supplementary benefits.
Increase to Income Assistance Rates for Persons with Disabilities
In support of goals established in Accessibility 2024 — government’s plan to make BC the most progressive province in Canada for people with disabilities — and through
Budget and Fiscal Plan — 2016/17 to 2018/19
20
Three Year Fiscal Plan
consultations with British Columbians, Budget 2016 provides a three year total of $170 million to increase income assistance rates for Persons with Disabilities. The rate increase will take effect September 1, 2016.
Community Living BC
In Budget 2016, government’s contribution to Community Living BC will increase by $36 million over the fiscal plan period. The additional funding will support services for individuals with developmental disabilities and their families, and to address continued caseload growth and demand for services.
Caring for Children and Families
As part of the emphasis on responding to the needs of vulnerable children and families, Budget 2016 includes an additional $217 million over the next three years for the Ministry of Children and Family Development as follows:
· $152 million to strengthen programs and services which provide for the welfare of children and youth including: child protection, children and youth in care, and family supports;
· $11 million to support child care centres;
· $51 million for children and youth in care with special needs, and autism programs in recognition of increasing demand for services, and;
· $3 million for facilitating the adoption of children in care, including recruitment of adoptive families, promoting adoption, planning for permanency, and post adoptive assistance.
These new investments will fund 100 more front-line social workers, resources for further training, quality assurance, and technology, and responds to recommendations from the Plecas review of BC’s child welfare system.
Community Safety
Budget 2016 provides $128 million in new operating funding over the next three years for the new Okanagan Correctional Centre, including funding for over 240 additional corrections and other staff, once fully operational. This facility near Oliver is expected to be completed in late 2016 with operations beginning in early 2017. The Okanagan Correctional Centre will more than double corrections capacity in the BC interior.
A further $3 million over three years is added to Emergency Management BC’s budget in the Ministry of Transportation and Infrastructure in order to provide for increased planning and outreach related to potential natural disasters, such as earthquakes and floods.
Table 1.12 Investments in Community Safety | | | | | | | |
| | | | | | | |
($ millions) | | 2016/17 | | 2017/18 | | 2018/19 | |
Okanagan Correctional Centre Operating Costs: | | | | | | | |
Ministry of Public Safety and Solicitor General | | 10 | | 33 | | 33 | |
Ministry of Technology, Innovation and Citizens’ Services | | 12 | | 20 | | 20 | |
Emergency Management BC Planning and Outreach | | 1 | | 1 | | 1 | |
Total | | 23 | | 54 | | 54 | |
Budget and Fiscal Plan — 2016/17 to 2018/19
21
Three Year Fiscal Plan
Supporting Economic and Skills Development
A total of $143 million over three years is added to ministries in Budget 2016 in order to enhance key areas of the BC economy.
Rural Communities in Transition
The new Rural Dividend Program will provide $75 million over three years to help small communities strengthen and diversify their economies. Funding will be available to eligible communities with a population of 25,000 or under.
Venture Capital
As part of its innovation agenda, in December 2015 government created the $100 million BC Tech Fund to encourage venture capital investment and help deliver on BC’s Technology Strategy. In order to ensure appropriate governance and oversight of the investment strategies to be pursued, almost $3 million in new funding over three years is included in Budget 2016.
Marketing BC’s Forest Products
Continued support to expand overseas markets for the province’s more traditional export products is also important to the BC economy. Therefore Budget 2016 provides Forestry Innovation Investment Ltd. (FII), a Crown corporation, with an additional $5 million over three years for enhanced forest product marketing activities in India. This follows several years of similar work by FII in China, where sales of BC forest products have grown considerably over the last decade.
Tourism Investments
To help support tourism in rural communities, it is critical to maintain key assets. Budget 2016 adds almost $6 million during the fiscal plan period for maintenance of historic sites.
Investing in Transportation
A further $36 million over three years is added for highways maintenance activities and contract cost increases. The latter investment is also integral to ensuring efficient movement of goods and people throughout the province. Within communities, people also need to move efficiently, and therefore an incremental $7 million in funding is provided to BC Transit over the fiscal plan period for service expansion outside of Metro Vancouver.
Agricultural Land Commission
Budget 2016 provides an additional $3 million over three years to support the Agricultural Land Commission, which oversees the Agricultural Land Reserve, a provincial land use zone that recognizes agriculture as a priority use and guides non-agricultural uses. This additional funding will be directed to providing more efficient application reviews, enhanced compliance and enforcement activities, and increased support for the operation of regional panels.
Budget and Fiscal Plan — 2016/17 to 2018/19
22
Three Year Fiscal Plan
Youth Skills Training
Enhancing the skills of young people is also key to growing the economy. As part of the Skills and Jobs Blueprint Strategy agenda, Budget 2016 adds $8 million over three years to the funding provided to the Industry Training Authority to increase youth trades training spaces in programs such as Accelerated Credit Enrolment in Industry Training (ACE-IT).
Table 1.13 Funding for Economic, Community and Skills Development |
($ millions) | | 2016/17 | | 2017/18 | | 2018/19 | |
Rural Dividend Program | | 25 | | 25 | | 25 | |
Managing Government’s Venture Capital Initiative | | 1 | | 1 | | 1 | |
Marketing BC Forest Products in India | | 1 | | 2 | | 2 | |
Maintaining Heritage Tourism Properties | | 2 | | 2 | | 2 | |
Increased Funding for Highways Maintenance | | 12 | | 12 | | 12 | |
Additional Funding for BC Transit | | — | | 2 | | 5 | |
Increased Funding for the Agricultural Land Commission | | 1 | | 1 | | 1 | |
Additional Support for Youth Trades Training | | 2 | | 3 | | 3 | |
Total | | 44 | | 48 | | 51 | |
Encouraging Resource Development
The natural resource industries continue to be the backbone of BC’s rural economies. Providing the social license for resource development is critical to the province’s economic prosperity, and government continues to work seriously towards the development of a Liquefied Natural Gas (LNG) industry. To support this commitment, Budget 2016 provides $19 million over three years to support ongoing activities related to the responsible use of natural resources in the province, in particular for oil and gas development, as companies from around the world continue to pursue investment opportunities in BC.
This funding is provided to the Ministries of Aboriginal Relations and Reconciliation, Environment, Forests Lands and Natural Resource Operations, and Natural Gas Development to support a stable and predictable environment for investment decisions.
More specifically, the funding will facilitate:
· First Nations engagement, consultation and negotiations to complete agreements that support resource development;
· coordinated and timely processing with respect to the Province’s regulatory and permitting requirements;
· engagement and consultation with industry, community and other stakeholders; and
· activities related to land disposition, parks and protected areas management, and environmental stewardship.
Table 1.14 Encouraging Natural Resource Development |
($ millions) | | 2016/17 | | 2017/18 | | 2018/19 | |
Ministry of Aboriginal Relations and Reconciliation | | 2 | | 2 | | 1 | |
Ministry of Environment | | 1 | | 1 | | 1 | |
Ministry of Forests, Lands and Natural Resource Operations | | 3 | | 3 | | 2 | |
Ministry of Natural Gas Development | | 1 | | 1 | | 1 | |
Total | | 7 | | 7 | | 5 | |
Budget and Fiscal Plan — 2016/17 to 2018/19
23
Three Year Fiscal Plan
Open and Transparent Government
In support of government’s commitment to openness and transparency, and to specifically help address recommendations from the Office of the Information and Privacy Commissioner and David Loukadelis’ F15-03 investigative report, Budget 2016 provides $9 million over the next three years for a new corporate information and records management office.
Measures for the Environment
A further $13 million has been identified in 2015/16 within the Innovative Clean Energy Fund, in support of government’s energy and environmental priorities. This includes additional funding for the Clean Energy Vehicle Program to provide British Columbians incentives when considering the greener choices for their transportation needs.
Management of the BC Public Service
Full-time equivalent (FTE) staff utilization is projected to increase from 27,000 FTEs in 2015/16 to 27,400 FTEs in 2016/17 based primarily on the need to hire additional social workers, as well as additional staff required for the new Okanagan Correctional Centre.
Going forward, FTE utilization is projected to increase again in 2017/18 to 27,600 due to continued hiring of new social workers and finalizing hiring for the new correctional centre, before stabilizing in 2018/19.
Chart 1.8 Managing FTEs
Public Sector Compensation: The Economic Stability Dividend
There are about 313,000 members covered by more than 180 collective agreements throughout the BC public sector. Over 80 per cent of these individuals have now reached either tentative or ratified settlements under the 2014 Economic Stability Mandate. Remaining groups yet to conclude new agreements include several in the post-secondary sector, a small number of Crown agencies, as well as nurses in the health sector — government is working towards concluding settlements for 100 per cent of these groups by March 31, 2016.
To date, ministry budgets have been adjusted to reflect funding needs of the 2014 Economic Stability Mandate. In Budget 2016, increases totaling $205 million have been added to ministry budgets in 2018/19 to fund general wage increases for the fifth and final year of the 2014 Economic Stability Mandate.
Budget and Fiscal Plan — 2016/17 to 2018/19
24
Three Year Fiscal Plan
A key opportunity provided to encourage negotiated settlements within the 2014 Economic Stability Mandate is the commitment for additional wage increases if actual annual provincial real economic growth (GDP) exceeds the independent Economic Forecast Council’s forecasted growth for that year as published in provincial budgets. There is potential for further GDP-dependent increases during the last four years of negotiated agreements.
In Budget 2014, the Council’s forecast was for 2.3 per cent real GDP growth for 2014, while actual 2014 growth reported by Statistics Canada in November 2015 was 3.2 per cent. As a result, all individuals in the provincial public sector who have reached finalized labour agreements are entitled to an additional general wage increase equivalent to one-half of the 0.9 percentage point positive difference, or an ongoing wage increase of 0.45 per cent annually.
In Budget 2016, all ministries have received collective budget increases totaling $213 million over the three year fiscal plan to fund the Economic Stability Dividend in respect of 2014.
Going forward, the Council’s forecast of 2.6 per cent real GDP growth for 2015, as published in Budget 2015, will be the benchmark for comparing against Statistics Canada results in November 2016 and consequently the eligibility for an Economic Stability Dividend in respect of 2015. As shown in the topic box on page 86, the Council estimates that BC’s real economic growth in 2015 was 2.6 per cent, unchanged from its previous forecast year ago. However, should actual growth turn out to be higher than the Council’s forecast, any resultant costs will be managed within the fiscal plan.
Recovered Expenses
Government projects it will incur $8.5 billion in program spending over the fiscal plan period whose costs will be recovered from third parties.
Recovered costs include an estimated $3.0 billion in interest payments from commercial Crown corporations through the fiscal agency loan program and from sinking fund investment returns.
A total of $1.6 billion of programs will be delivered with funding from the federal government, such as the Labour Market Development Agreement, the Canada Jobs Fund, integrated workplace solutions, and child and family support programs.
$1.5 billion in government spending is supported by other miscellaneous sources, including hospital expansion costs recovered from regional health boards, MSP and PharmaCare costs paid by agencies and other jurisdictions, and employee health benefits costs collected from participating government agencies.
$2.4 billion in remaining cost recoveries will be invested in a variety of programs, including industry-funded regulatory programs recovered through fees, and fees recovered for collections services rendered.
Government reports the expenses incurred and the recoveries as revenue. The offsetting nature of these amounts results in no net impact to government’s fiscal plan.
Budget and Fiscal Plan — 2016/17 to 2018/19
25
Three Year Fiscal Plan
Operating Transfers
Approximately 60 per cent of ministry spending takes the form of transfers paid to service delivery agencies for the provision of services on behalf of government. These transfers will total $70.8 billion over the three year fiscal plan period and will support education, health care, social services, housing, and transportation programs delivered by the agencies. These service delivery agencies include the SUCH sector (schools, universities, colleges and health organizations), Community Living BC, BC Housing Management Commission, BC Transit, and the BC Transportation Financing Authority.
Service Delivery Agency Spending
Service delivery agency spending is projected to total $30.3 billion by 2018/19, reflecting an increase of $1.7 billion over the fiscal plan period.
School district spending is projected to rise from $5.8 billion in 2015/16 to $6.0 billion by 2018/19 — an increase of $147 million, or 2.5 per cent over the three year period. This spending increase is primarily due to salary and benefits cost increases relating to the agreements reached under government’s negotiating mandates, partially offset by savings anticipated in the areas of administration and support services.
Post-secondary institutions spending is projected to rise from $5.4 billion in 2015/16 to $5.9 billion by 2018/19 — an increase of $434 million, or 8.0 per cent over the three year period. The spending increase is primarily due to increased salary costs relating to the Economic Stability Mandate agreements, higher amortization costs in line with ongoing capital asset investments, and inflationary pressure on operating costs.
Health authority and hospital society spending is projected to rise from $13.6 billion in 2015/16 to $14.4 billion by 2018/19 — an increase of $780 million, or 5.7 per cent over the three year period. This spending increase is mainly due to additional staffing and operating costs incurred to meet the projected volume growth in healthcare services delivered by these organizations.
Projected spending by other service delivery agencies is forecast to increase by $328 million by 2018/19. This 8.7 per cent increase is largely due to increased debt servicing costs and higher spending in transportation and social services sectors.
Capital Spending
In Budget 2016 capital spending on schools, hospitals, roads, bridges, hydro-electric projects and other infrastructure across the province is expected to total $20.6 billion over the fiscal plan period. These investments will support the ongoing implementation of the BC Jobs Plan, and key infrastructure needs in communities across the province.
Taxpayer-supported Capital Spending
Taxpayer-supported capital spending over the next three years will total $12 billion, and includes completion of existing approved projects along with new investments to expand and sustain provincial infrastructure including schools, post-secondary facilities, roads and hospitals.
Budget and Fiscal Plan — 2016/17 to 2018/19
26
Three Year Fiscal Plan
Table 1.15 Capital Spending |
| | Updated | | Budget | | | | | |
| | Forecast | | Estimate | | Plan | | Plan | |
($ millions) | | 2015/16 | | 2016/17 | | 2017/18 | | 2018/19 | |
Taxpayer-supported | | | | | | | | | |
Education | | | | | | | | | |
Schools (K–12) | | 486 | | 520 | | 617 | | 523 | |
Post-secondary institutions | | 748 | | 921 | | 842 | | 727 | |
Health | | 1,003 | | 1,193 | | 815 | | 896 | |
BC Transportation Financing Authority | | 892 | | 952 | | 870 | | 1,075 | |
BC Transit | | 53 | | 66 | | 84 | | 95 | |
Government ministries | | 354 | | 434 | | 475 | | 385 | |
Housing 1 | | 66 | | 115 | | 103 | | 132 | |
Other 2 | | 29 | | 50 | | 37 | | 39 | |
Total taxpayer-supported | | 3,631 | | 4,251 | | 3,843 | | 3,872 | |
Self-supported | | | | | | | | | |
BC Hydro | | 2,337 | | 2,832 | | 2,448 | | 2,713 | |
Columbia River power projects 3 | | 19 | | 9 | | 16 | | 6 | |
Transportation Investment Corporation (Port Mann) | | 36 | | 16 | | 4 | | 4 | |
BC Railway Company | | 4 | | 4 | | 2 | | 1 | |
ICBC | | 99 | | 92 | | 40 | | 40 | |
BC Lotteries | | 75 | | 90 | | 90 | | 90 | |
Liquor Distribution Branch | | 34 | | 65 | | 59 | | 32 | |
Total self-supported commercial | | 2,604 | | 3,108 | | 2,659 | | 2,886 | |
Total capital spending | | 6,235 | | 7,359 | | 6,502 | | 6,758 | |
1 Includes BC Housing Management Commission and Provincial Rental Housing Corporation.
2 Includes BC Pavilion Corporation and other service delivery agencies.
3 Joint ventures of the Columbia Power Corporation and Columbia Basin Trust.
Investments in Schools
Over the three years of the capital plan, $1.7 billion will be invested to maintain, replace, renovate or expand K—12 facilities, including continued investment in new school space to accommodate increasing enrolment in growth districts, and continued investment in the program to seismically upgrade or replace schools.
Current and planned capital investments in Budget 2016 include:
· A new Clayton North Secondary School in Surrey, which will provide 1,500 student spaces and will be complete in 2017. Enrolment in this part of Surrey School District has grown substantially and the new school will alleviate pressures at other district secondary schools, particularly Lord Tweedsmuir which is operating over its capacity.
· Smiling Creek Elementary in Coquitlam will provide 430 student spaces, as well as a Neighbourhood Learning Centre. In addition, students will be able to access a new park and sports field next to the school through an agreement with the city. The new school is expected to open in September 2018.
· A new elementary school in the northwest area of Fort St. John with a capacity of 365 students is expected to be completed by the end of 2017. The school will include a Neighbourhood Learning Centre, a StrongStart classroom and a large community gymnasium.
Budget and Fiscal Plan — 2016/17 to 2018/19
27
Three Year Fiscal Plan
· A seismic upgrade to Alpha Secondary in Burnaby will include the replacement of two classroom wings with more efficient and modern space. It is expected that the project will be completed in 2018.
Spending to Support Post-secondary Education
Budget 2016 includes $2.5 billion in capital spending over the next three years by post-secondary institutions across the province. Projects include the replacement and renewal of existing infrastructure to address deferred maintenance and protect the Province’s investment in capital assets.
In addition, investments in priority projects will build capacity and help meet the province’s future workforce needs in key sectors, as outlined in BC’s Skills for Jobs Blueprint. A significant portion of this capital investment is funded through other sources, including foundations, donations, cash balances, federal funding and revenues generated from services.
Current and planned investments in the post-secondary sector include:
· Redevelopment of the Life Sciences Teaching Laboratories at the University of British Columbia, to provide an upgraded learning environment for about 2,157 existing and 445 new students.
· Renovation and renewal of the trades facilities at Selkirk College in Nelson to improve the current delivery of trades education and meet future trades training requirements for the region.
· A new campus for Emily Carr University at Great Northern Way in Vancouver, which will include a state-of-the-art visual, media and design art facility with a capacity for 1,800 students.
· Support for research infrastructure through the British Columbia Knowledge Development Fund, with external funding leveraged from the federal Canada Foundation for Innovation and non-provincial government partners. Research investments include:
· Development of a computer-based simulation model for sustainable community development at Royal Roads University in Victoria.
· Creation of a mobile mass spectrometry facility that will provide precise measurements of chemical determinants of environmental and human health at Vancouver Island University in Nanaimo.
· A program at the University of Victoria that combines health and environmental research by collecting x-ray diffraction data from single protein crystals to better understand their role in the production of renewable energy sources and impacts on human health.
Expanding and Upgrading Health Facilities
Capital spending on infrastructure in the health sector will total $2.9 billion over the next three years. These investments support new major construction projects and upgrading of health facilities, medical and diagnostic equipment, and information management/ technology systems. These investments are supported by funding from the Province as well as other sources, such as regional hospital districts and foundations.
Budget and Fiscal Plan — 2016/17 to 2018/19
28
Three Year Fiscal Plan
Key capital investments in the health sector include:
· A new patient care tower, including a surgical services centre, at the Penticton Regional Hospital will improve patient experience and outcomes. Construction on the new patient care tower is expected to begin in 2016.
· Redevelopment of Children’s and Women’s Hospital including the new Teck Acute Care Centre to replace 179 acute care beds and expand service to 221 beds, plus expand the emergency department, maternity, pediatric operating rooms and diagnostic imaging and procedures areas. Construction of the Teck Acute Care Centre is underway with completion planned for summer 2017.
· Construction of two new hospitals (one located in Courtenay/Comox and one in Campbell River) to replace existing North Island hospitals and provide a total of 248 patient beds, an increase of 62 beds on the North Island. Construction of both hospitals commenced in August 2014 and is scheduled for completion in 2017.
· A new clinical services building for Royal Inland Hospital in Kamloops, which will include outpatient services and teaching space for medical students along with improved parking and access to the hospital. The new clinical services building is scheduled to open in 2016.
· Construction of the new Joseph and Rosalie Segal Family Health Centre to replace and consolidate specialized mental health services at Vancouver General Hospital.
Investing in social housing
Budget 2016 includes new taxpayer-supported capital spending of $355 million by the BC Housing Management Commission over the next five years, representing reinvestment of net-cash proceeds received under the Non-Profit Asset Transfer program into social housing. A new Provincial Investment in Affordable Housing program will increase the supply of housing across the province by more than 2,000 units, through the construction and renovation of affordable housing for people with low to moderate incomes.
Supporting the Transportation Investment Plan
Budget 2016 includes continued investments in government’s Transportation Investment Plan. The Province has secured federal cost sharing on projects and has also leveraged investments through partnerships with private partners. Over the coming months BC will continue to work with the federal and municipal governments to identify priorities and confirm details around project criteria, timelines and cost-sharing arrangements for the new federal infrastructure funding.
The public and private sector will provide a total of $3.4 billion for transportation investments over the next three years, including:
· $2.7 billion of provincial investment in transportation infrastructure; and
· $0.7 billion of investment leveraged through federal cost sharing and partnerships with private partners, local governments and other agencies.
Further information is provided in Table 1.16.
Budget and Fiscal Plan — 2016/17 to 2018/19
29
Three Year Fiscal Plan
Table 1.16 Provincial Transportation Investments
| | Updated | | | | | | | | | |
| | Forecast | | | | | | | | 3-Year | |
($ millions) | | 2015/16 | | 2016/17 | | 2017/18 | | 2018/19 | | Total | |
Provincial investments: | | | | | | | | | | | |
– Highway rehabilitation | | 216 | | 210 | | 213 | | 215 | | 638 | |
– Side road improvement program | | 90 | | 90 | | 90 | | 90 | | 270 | |
– Natural gas road upgrade program | | 20 | | 20 | | 20 | | 20 | | 60 | |
– Highway 1 (Kamloops to Alberta border) | | 49 | | 48 | | 57 | | 101 | | 206 | |
– George Massey Tunnel replacement project 1 | | 24 | | 7 | | — | | — | | 7 | |
– Okanagan Valley corridor | | 42 | | 35 | | 50 | | 31 | | 116 | |
– Cariboo connector program | | 36 | | 40 | | 35 | | 40 | | 115 | |
– Major highway corridors and roads | | 112 | | 188 | | 171 | | 262 | | 621 | |
– Other transportation programs | | 42 | | 98 | | 65 | | 62 | | 225 | |
– Transit infrastructure | | 176 | | 158 | | 157 | | 136 | | 451 | |
Total provincial investment 2 | | 807 | | 894 | | 858 | | 957 | | 2,709 | |
Investments funded through contributions from other partners | | 259 | | 240 | | 159 | | 271 | | 670 | |
Total investment in transportation infrastructure | | 1,066 | | 1,134 | | 1,017 | | 1,228 | | 3,379 | |
| | | | | | | | | | | |
Transportation Investment Corporation | | | | | | | | | | | |
Port Mann Bridge/Highway 1: | | | | | | | | | | | |
– Capital project | | 34 | | 10 | | — | | — | | 10 | |
– Rehabilitation | | 2 | | 6 | | 4 | | 4 | | 14 | |
Total investments | | 36 | | 16 | | 4 | | 4 | | 24 | |
Total investment in transportation infrastructure including investments from the Transportation Investment Corporation | | 1,102 | | 1,150 | | 1,021 | | 1,232 | | 3,403 | |
1 Subject to Treasury Board approval of the final project business case.
2 Total provincial investment includes operating and capital spending.
Ministry Capital Spending
Budget 2016 includes $1.3 billion in capital spending by government ministries over the plan period. This will support investments in maintaining, upgrading or expanding infrastructure such as courthouses, correctional centres, office buildings, and information systems.
Capital investments made by government ministries include development of the new Okanagan Correctional Centre near Oliver. This facility is expected to be completed in late 2016 and will more than double correctional centre capacity in British Columbia’s Interior. A new facility will also be constructed in Coquitlam to accommodate the Maples Adolescent Treatment Centre and the Provincial Assessment Centre.
Capital Project Reserves
The Province has included $231 million in project reserves in its three year capital plan as a prudent planning measure. In addition to covering risks from higher than expected costs, the reserves will be used to fund emerging government priorities.
Budget and Fiscal Plan — 2016/17 to 2018/19
30
Three Year Fiscal Plan
Financing Capital Projects
Provincial capital infrastructure spending is financed through a combination of sources:
· cash balances within the organizations;
· partnerships with the private sector (public-private partnerships, or P3s);
· cost sharing with partners (e.g. federal government, regional hospital districts); and
· debt.
The sale of BC Transportation Financing Authority sinking funds in 2013/14 provided significant levels of cash as a source of capital financing in 2014/15 and 2015/16. The increase in debt financing in 2016/17 reflects the utilization of this resource and the return to historical levels of capital financing from each source.
Chart 1.9 Financing government’s capital plan
Self-supported Capital Spending
Self-supported capital spending is projected to total $8.6 billion over the fiscal plan period, including:
· $8.0 billion (92 per cent) of total self-supported capital spending will be used for electrical generation, transmission and distribution projects to meet growing customer demand and to enhance reliability. Included in this total is initial construction of a third power facility on the Peace River through the Site C Clean Energy Project.
The majority of BC Hydro’s hydroelectric system was built between the 1960s and early 1980s and provides over 95 per cent of the total electricity generated by the corporation. This vast system is ageing and requires a broad range of investments to maintain reliability — from seismic and safety improvements at dams, to expanding and strengthening the transmission system, to upgrading the metering system. Roughly half of BC Hydro’s capital spending represents measures to address ageing infrastructure.
· �� $24 million will be used to complete the Port Mann Bridge replacement and Highway 1 Improvement project, as well as performing routine rehabilitation.
Budget and Fiscal Plan — 2016/17 to 2018/19
31
Three Year Fiscal Plan
· $270 million will be used for BC Lottery Corporation projects including the modernization of business systems, expansion of the lottery distribution network, and acquisition of gaming equipment to support lottery, PlayNow internet gaming, casino and community gaming activities.
· $172 million will be used for ICBC projects including investment in its Transformation Program as well as other information technology and facility maintenance and upgrades.
· $156 million will be invested by the Liquor Distribution Branch for costs related to updates and improvements to retail stores, technology-related projects and ongoing operating equipment replacements.
Table 1.17 provides information on major capital projects, and further details on provincial capital investments are shown in the service plans of ministries and Crown agencies.
Projects Over $50 Million
Approved major capital projects with multi-year budgets totaling $50 million or more, including provincial funding, are shown in Table 1.17. Annual allocations of the full budget for these projects are included as part of the provincial government’s capital spending shown in Table 1.15.
In addition to financing through provincial sources, major projects may be cost-shared with the federal government, municipalities and regional districts, and/or the private sector. Total capital spending for these major projects is $26.9 billion, reflecting provincial financing of $24.6 billion including internal sources and P3 liabilities, as well as $2.3 billion in contributions from the federal government and other sources including private donations.
Major capital investments include:
· $1.6 billion for school replacement projects including Oak Bay Secondary, Belmont Secondary, Centennial Secondary, Kitsilano Secondary, Clayton North Secondary, and continuation of the seismic mitigation program;
· $123 million for the Emily Carr University of Art and Design campus redevelopment project at Great Northern Way;
· $3.8 billion for health facilities including the Northern Cancer Control Strategy, Lions Gate Hospital redevelopment, the Lakes District Hospital in Burns Lake, the Queen Charlotte/Haida Gwaii Hospital, the Surrey Memorial Hospital — Emergency Department/Critical Care Tower, Royal Inland Hospital redevelopment, the North Island hospitals, the Interior Heart and Surgical Centre in Kelowna, the Joseph and Rosalie Segal Family Health Centre at Vancouver General Hospital, the Children’s and Women’s Hospital redevelopment, the Penticton Regional Hospital patient care tower, the first phase of the redevelopment of Royal Columbian Hospital, the Centre for Mental Health and Addictions in Coquitlam, and the clinical and systems transformation project;
· $5.0 billion for major transportation capital infrastructure including Highway 1 widening from Monte Creek to Pritchard, the Evergreen Line Rapid Transit project, Highway 97 widening from Highway 33 to Edwards Road, the Highway 1 Widening and 216th Street Interchange project, the Highway 1 Admirals Road/McKenzie Avenue Interchange project, and the Port Mann Bridge/Highway 1 project;
Budget and Fiscal Plan — 2016/17 to 2018/19
32
Three Year Fiscal Plan
Table 1.17 Capital Expenditure Projects Greater Than $50 million 1
Note: Information in bold type denotes changes from the 2015/16 second Quarterly Report released on November 24, 2015.
| | | | Project | | Estimated | | Anticipated | | Project Financing | |
| | Year of | | Cost to | | Cost to | | Total | | Internal/ | | P3 | | Federal | | Other | |
($ millions) | | Completion | | Dec 31, 2015 | | Complete | | Cost | | Borrowing | | Liability | | Gov’t | | Contrib’ns | |
| | Taxpayer-supported | |
School districts | | | | | | | | | | | | | | | | | |
Oak Bay Secondary 2 | | 2015 | | 50 | | 2 | | 52 | | 50 | | — | | — | | 2 | |
Belmont Secondary 2 | | 2015 | | 52 | | 4 | | 56 | | 30 | | — | | — | | 26 | |
Centennial Secondary | | 2016 | | 32 | | 29 | | 61 | | 61 | | — | | — | | — | |
Kitsilano Secondary | | 2017 | | 35 | | 30 | | 65 | | 61 | | — | | — | | 4 | |
Clayton North Secondary | | 2017 | | 2 | | 53 | | 55 | | 45 | | — | | — | | 10 | |
Seismic mitigation program | | 2023 | | 68 | | 1,232 | | 1,300 | | 1,300 | | — | | — | | — | |
Total school districts | | | | 239 | | 1,350 | | 1,589 | | 1,547 | | — | | — | | 42 | |
Post-secondary institutions | | | | | | | | | | | | | | | | | |
Emily Carr University of Art and Design — Campus redevelopment at Great Northern Way | | | | | | | | | | | | | | | | | |
– Direct procurement | | 2017 | | 17 | | 46 | | 63 | | 42 | | — | | — | | 21 | |
– P3 contract | | 2017 | | 7 | | 53 | | 60 | | — | | 60 | | — | | — | |
Total post secondary institutions | | | | 24 | | 99 | | 123 | | 42 | | 60 | | — | | 21 | |
Health facilities | | | | | | | | | | | | | | | | | |
Northern Cancer Control Strategy 2 | | | | | | | | | | | | | | | | | |
– Direct procurement | | 2014 | | 29 | | 1 | | 30 | | 27 | | — | | — | | 3 | |
– P3 contract | | 2012 | | 71 | | — | | 71 | | 54 | | 17 | | — | | — | |
Lions Gate Hospital (Mental Health) Redevelopment 2 | | 2014 | | 47 | | 15 | | 62 | | 38 | | — | | — | | 24 | |
Lakes District Hospital 2 | | 2015 | | 49 | | 6 | | 55 | | 46 | | — | | — | | 9 | |
Queen Charlotte/Haida Gwaii Hospital | | 2016 | | 28 | | 22 | | 50 | | 31 | | — | | — | | 19 | |
Surrey Emergency/Critical Care Tower | | | | | | | | | | | | | | | | | |
– Direct procurement | | 2016 | | 141 | | 53 | | 194 | | 174 | | — | | — | | 20 | |
– P3 contract | | 2014 | | 318 | | — | | 318 | | 139 | | 179 | | — | | — | |
Royal Inland Hospital | | 2016 | | 25 | | 55 | | 80 | | 47 | | — | | — | | 33 | |
North Island Hospitals | | | | | | | | | | | | | | | | | |
– Direct procurement | | 2017 | | 21 | | 105 | | 126 | | 73 | | — | | — | | 53 | |
– P3 contract | | 2017 | | 267 | | 213 | | 480 | | 60 | | 232 | | — | | 188 | |
Interior Heart and Surgical Centre | | | | | | | | | | | | | | | | | |
– Direct procurement | | 2017 | | 124 | | 124 | | 248 | | 213 | | — | | — | | 35 | |
– P3 contract | | 2015 | | 130 | | 3 | | 133 | | 4 | | 79 | | — | | 50 | |
Vancouver General Hospital — Joseph and Rosalie Segal Family Health Centre | | 2017 | | 25 | | 57 | | 82 | | 57 | | — | | — | | 25 | |
Children’s and Women’s Hospital | | | | | | | | | | | | | | | | | |
– Direct procurement | | 2019 | | 81 | | 228 | | 309 | | 177 | | — | | — | | 132 | |
– P3 contract | | 2017 | | 147 | | 222 | | 369 | | 168 | | 187 | | — | | 14 | |
Penticton Regional Hospital — Patient Care Tower | | 2019 | | 3 | | 322 | | 325 | | 168 | | — | | — | | 157 | |
Royal Columbian Hospital | | 2019 | | — | | 259 | | 259 | | 250 | | — | | — | | 9 | |
Centre for Mental Health and Addictions | | 2019 | | — | | 101 | | 101 | | 101 | | — | | — | | — | |
Clinical and systems transformation | | 2023 | | 140 | | 340 | | 480 | | 480 | | — | | — | | — | |
Total health facilities | | | | 1,646 | | 2,126 | | 3,772 | | 2,307 | | 694 | | — | | 771 | |
Transportation | | | | | | | | | | | | | | | | | |
Highway 1 — Monte Creek to Pritchard 2 | | 2016 | | 61 | | 8 | | 69 | | 52 | | — | | 17 | | — | |
Evergreen Line Rapid Transit | | | | | | | | | | | | | | | | | |
– Direct procurement | | 2017 | | 310 | | 221 | | 531 | | 316 | | — | | 74 | | 141 | |
– P3 contract | | 2017 | | 823 | | 77 | | 900 | | — | | 270 | | 350 | | 280 | |
Highway 97 widening from Highway 33 to Edwards Road | | 2017 | | 13 | | 47 | | 60 | | 42 | | — | | 18 | | — | |
Highway 1 widening and 216th Street Interchange | | 2018 | | 4 | | 55 | | 59 | | 23 | | — | | 22 | | 14 | |
Highway 1 — Admirals Road/McKenzie Avenue Interchange | | 2019 | | 2 | | 83 | | 85 | | 52 | | — | | 33 | | — | |
Total transportation | | | | 1,213 | | 491 | | 1,704 | | 485 | | 270 | | 514 | | 435 | |

Budget and Fiscal Plan — 2016/17 to 2018/19
33
Three Year Fiscal Plan
Table 1.17 Capital Expenditure Projects Greater Than $50 million 1 (continued )
Note: Information in bold type denotes changes from the 2015/16 second Quarterly Report released on November 24, 2015.
| | | | Project | | Estimated | | Anticipated | | Project Financing | |
| | Year of | | Cost to | | Cost to | | Total | | Internal/ | | P3 | | Federal | | Other | |
($ millions) | | Completion | | Dec 31, 2015 | | Complete | | Cost | | Borrowing | | Liability | | Gov’t | | Contrib’ns | |
Other taxpayer-supported | | | | | | | | | | | | | | | | | |
Single Room Occupancy Hotel renewal initiative | | | | | | | | | | | | | | | | | |
– Direct procurement | | 2016 | | 15 | | 10 | | 25 | | 23 | | — | | 2 | | — | |
– P3 contract | | 2016 | | 105 | | 13 | | 118 | | — | | 91 | | 27 | | — | |
Okanagan Correctional Centre | | | | | | | | | | | | | | | | | |
– Direct procurement | | 2016 | | 64 | | 27 | | 91 | | 91 | | — | | — | | — | |
– P3 contract | | 2016 | | 83 | | 46 | | 129 | | 8 | | 121 | | — | | — | |
Natural Resource Permitting Project 3 | | 2018 | | 31 | | 26 | | 57 | | 57 | | — | | — | | — | |
Maples Adolescent Treatment Centre and Provincial Assessment Centre | | 2019 | | — | | 75 | | 75 | | 75 | | — | | — | | — | |
Total other | | | | 298 | | 197 | | 495 | | 254 | | 212 | | 29 | | — | |
Total taxpayer-supported | | | | 3,420 | | 4,263 | | 7,683 | | 4,635 | | 1,236 | | 543 | | 1,269 | |
Self-supported
Transportation | | | | | | | | | | | | | | | | | |
Port Mann Bridge / Highway 1 2 | | 2017 | | 3,296 | | 23 | | 3,319 | | 3,319 | | — | | — | | — | |
Power generation and transmission | | | | | | | | | | | | | | | | | |
BC Hydro | | | | | | | | | | | | | | | | | |
– Mica SF6 gas insulated switchgear replacement 2 | | 2014 | | 179 | | 12 | | 191 | | 191 | | — | | — | | — | |
– Northwest transmission line 2 | | 2014 | | 690 | | 26 | | 716 | | 329 | | — | | 130 | | 257 | |
– Iskut extension project 2 | | 2014 | | 167 | | 2 | | 169 | | 110 | | — | | — | | 59 | |
– Merritt area transmission 2 | | 2015 | | 55 | | 10 | | 65 | | 65 | | — | | — | | — | |
– Smart metering and infrastructure program 2 | | 2015 | | 762 | | 18 | | 780 | | 780 | | — | | — | | — | |
– Interior to Lower Mainland transmission line 2 | | 2015 | | 699 | | 44 | | 743 | | 743 | | — | | — | | — | |
– GM Shrum units 1 to 5 turbine replacement 2 | | 2015 | | 167 | | 18 | | 185 | | 185 | | — | | — | | — | |
– Hugh Keenleyside spillway gate reliability upgrade 2 | | 2015 | | 106 | | 17 | | 123 | | 123 | | — | | — | | — | |
– Upper Columbia capacity additions at Mica units 5 and 6 project 2 | | 2015 | | 557 | | 157 | | 714 | | 714 | | — | | — | | — | |
– Long Beach area reinforcement 2 | | 2015 | | 35 | | 21 | | 56 | | 56 | | — | | — | | — | |
– Dawson Creek/Chetwynd area transmission 2 | | 2015 | | 280 | | 16 | | 296 | | 296 | | — | | — | | — | |
– Surrey area substation project | | 2016 | | 72 | | 22 | | 94 | | 94 | | — | | — | | — | |
– Big Bend substation | | 2017 | | 31 | | 36 | | 67 | | 67 | | — | | — | | — | |
– Ruskin Dam safety and powerhouse upgrade | | 2017 | | 390 | | 358 | | 748 | | 748 | | — | | — | | — | |
– Horne Payne Substation project | | 2018 | | 3 | | 90 | | 93 | | 93 | | | | | | | |
– John Hart generating station replacement | | 2019 | | 403 | | 690 | | 1,093 | | 1,093 | | — | | — | | — | |
– Cheakamus Unit 1 and Unit 2 generator replacement | | 2019 | | 5 | | 69 | | 74 | | 74 | | — | | — | | — | |
– Fort St. John and Taylor Electrical Supply | | 2019 | | — | | 53 | | 53 | | 53 | | | | | | | |
– G.M. Shrum G1-G10 Control System upgrade 4 | | 2021 | | 7 | | 53 | | 60 | | 60 | | — | | — | | — | |
– Site C clean energy project | | 2024 | | 694 | | 8,081 | | 8,775 | | 8,775 | | — | | — | | — | |
Columbia River power projects | | | | | | | | | | | | | | | | | |
– Waneta Dam power expansion 2, 5 | | 2018 | | 322 | | 23 | | 345 | | 345 | | — | | — | | — | |
Total power generation and transmission | | | | 5,624 | | 9,816 | | 15,440 | | 14,994 | | — | | 130 | | 316 | |

Budget and Fiscal Plan — 2016/17 to 2018/19
34
Three Year Fiscal Plan
Table 1.17 Capital Expenditure Projects Greater Than $50 million 1 (continued )
Note: Information in bold type denotes changes from the 2015/16 second Quarterly Report released on November 24, 2015.
| | | | Project | | Estimated | | Anticipated | | Project Financing | |
| | Year of | | Cost to | | Cost to | | Total | | Internal/ | | P3 | | Federal | | Other | |
($ millions) | | Completion | | Dec 31, 2015 | | Complete | | Cost | | Borrowing | | Liability | | Gov’t | | Contrib’ns | |
Other self-supported | | | | | | | | | | | | | | | | | |
British Columbia Lottery Corporation | | | | | | | | | | | | | | | | | |
– Gaming management system 2 | | 2015 | | 93 | | 1 | | 94 | | 94 | | — | | — | | — | |
– Insurance Corporation of British Columbia | | | | | | | | | | | | | | | | | |
– Business transformation program | | 2016 | | 269 | | 49 | | 318 | | 318 | | — | | — | | — | |
Total other | | | | 362 | | 50 | | 412 | | 412 | | — | | — | | — | |
Total self-supported | | | | 9,282 | | 9,889 | | 19,171 | | 18,725 | | — | | 130 | | 316 | |
Total $50 million projects | | | | 12,702 | | 14,152 | | 26,854 | | 23,360 | | 1,236 | | 673 | | 1,585 | |
1 Only projects that receive provincial funding and have been approved by Treasury Board and/or Crown corporation boards are included in this table. Ministry service plans may highlight projects that still require final approval. Capital costs reflect current government accounting policy.
2 Assets have been put into service and only trailing costs remain.
3 Reflects approved capital costs to date, subject to change if future phases are approved by government.
4 This project has three phases. The total authorized capital amount of $60M represents partial implementation funding as at December 31, 2015 for phases 1 and 2 and definition funding for phase 3.
5 Reflects the combined shares of Columbia Power Corporation (32.5 per cent) and Columbia Basin Trust (16.5 per cent) in their partnership with Fortis Inc. for the development of an electricity generating facility at the Waneta Dam south of Trail.
· $495 million for projects in other sectors including the upgrade of 13 Single Room Occupancy hotels in Vancouver’s Downtown Eastside, the new Okanagan Correctional Centre, the Natural Resource Permitting Project, and the Maples Adolescent Treatment Centre and Provincial Assessment Centre in Coquitlam;
· $15.4 billion primarily for power generation and transmission capital projects by BC Hydro and for Columbia River power projects including construction of a dam and generating facilities at Site C on the Peace River and a 49 per cent share in the expansion of the Waneta Dam (a public-private partnership with Fortis Inc.);
· $94 million for the replacement of the BC Lottery Corporation gaming management system that supports the generation of over $1.7 billion in annual revenue from 36 casinos and community gaming centres operating more than 12,800 slot machines and 500 table games; and
· $318 million for the capital component of ICBC’s $400 million business transformation program, that will upgrade its claims, insurance, customer, and business processes and technologies.
The following changes have occurred since the second Quarterly Report :
· Completion of Centennial Secondary school is extended to 2016 from 2015.
· A $101 million Centre for Mental Health and Addictions has been added in the health sector.
· Two projects have been added in the transportation sector. A $69 million Highway 1 widening project from Monte Creek to Pritchard and a $60 million Highway 97 widening project in Kelowna from Highway 33 to Edwards Road.
· Completion of the Evergreen Line Rapid Transit project is extended to 2017 from 2016.
· A $75 million project to replace the Maples Adolescent Treatment Centre and Community Living British Columbia’s Provincial Assessment Centre has been added.
Budget and Fiscal Plan — 2016/17 to 2018/19
35
Three Year Fiscal Plan
· BC Hydro’s Vancouver City Central transmission project was completed; the Fort St. John and Taylor Electrical Supply transmission line project was added; the Dawson Creek/Chetwynd area transmission line project completion date is now 2015; and the Surrey Area Substation project completion date is now 2016.
· Reductions in total anticipated capital spending for four BC Hydro projects:
· Smart metering and infrastructure program reduced by $150 million;
· G.M. Shrum Units 1 to 5 turbine replacement reduced by $87 million;
· Horne Payne Substation project reduced by $1 million; and
· G.M. Shrum G1-G10 Control System upgrade reduced by $3 million.
· Anticipated spending for the capital portion of ICBC’s business transformation program decreased by $1 million reflecting a reallocation of costs between capital and operating expense. The overall program budget which includes both capital and operating expense components remains unchanged at $400 million
Provincial Debt
Total provincial debt will increase by $6.6 billion over the fiscal plan period to reach $71.9 billion by 2018/19. The rate of growth in debt declines each year, from 3.7 per cent in 2016/17, to 2.9 per cent in 2018/19.
Table 1.18 Provincial Debt Summary 1
| | Updated | | Budget | | | | | |
| | Forecast | | Estimate | | Plan | | Plan | |
($ millions unless otherwise indicated) | | 2015/16 | | 2016/17 | | 2017/18 | | 2018/19 | |
Taxpayer-supported debt | | | | | | | | | |
Provincial government direct operating | | 8,068 | | 6,215 | | 4,659 | | 2,703 | |
Other taxpayer-supported debt (mainly capital) | | | | | | | | | |
Education 2 | | 12,706 | | 13,400 | | 14,288 | | 15,075 | |
Health 3 | | 6,962 | | 7,552 | | 8,031 | | 8,651 | |
Highways and public transit 4 | | 11,583 | | 12,475 | | 13,404 | | 14,616 | |
Other 5 | | 3,390 | | 3,585 | | 3,860 | | 4,044 | |
Total other taxpayer-supported debt | | 34,641 | | 37,012 | | 39,583 | | 42,386 | |
Total taxpayer-supported debt | | 42,709 | | 43,227 | | 44,242 | | 45,089 | |
Self-supported debt | | 22,331 | | 24,113 | | 25,294 | | 26,452 | |
Total debt before forecast allowance | | 65,040 | | 67,340 | | 69,536 | | 71,541 | |
Forecast allowance 6 | | 250 | | 350 | | 350 | | 350 | |
Total provincial debt | | 65,290 | | 67,690 | | 69,886 | | 71,891 | |
Debt as a per cent of GDP | | | | | | | | | |
Provincial government direct operating | | 3.3 | % | 2.4 | % | 1.8 | % | 1.0 | % |
Taxpayer-supported | | 17.4 | % | 17.0 | % | 16.7 | % | 16.3 | % |
Total provincial | | 26.7 | % | 26.6 | % | 26.3 | % | 25.9 | % |
Taxpayer-supported debt per capita ($) | | 9,120 | | 9,117 | | 9,214 | | 9,272 | |
Taxpayer-supported interest bite (cents per dollar of revenue) | | 3.6 | | 3.6 | | 3.8 | | 3.8 | |
1 Debt is after deduction of sinking funds and unamortized discounts, and excludes accrued interest. Government direct and fiscal agency accrued interest is reported in the government’s accounts as an accounts payable.
2 Post-secondary institutions’ debt includes public-private partnership obligations of $24 million for fiscal 2015/16, $60 million for fiscal 2016/17, $60 million for fiscal 2017/18, and $60 million for fiscal 2018/19.
3 Health facilities’ debt includes public-private partnership obligations of $1,433 million for fiscal 2015/16, $1,590 million for fiscal 2016/17, $1,647 million for fiscal 2017/18, and $1,658 million for fiscal 2018/19.
4 BC Transportation Financing Authority’s debt includes public-private partnership obligations of $1,159 million for fiscal 2015/16, $824 million for fiscal 2016/17, $783 million for fiscal 2017/18, and $752 million for fiscal 2018/19.
5 Social housing’s debt includes public-private partnership obligations of $88 million for fiscal 2015/16, $76 million for fiscal 2016/17, $67 million for fiscal 2017/18, and $58 million for fiscal 2018/19.
6 Reflects the operating statement forecast allowance for each year (amounts are not cumulative). Since it is unknown as to which agency would require this debt, the forecast allowance is shown as a separate item over the plan.
Budget and Fiscal Plan — 2016/17 to 2018/19
36
Three Year Fiscal Plan
Government’s borrowing requirements over the fiscal plan period will total $16.1 billion. This total is required to finance government’s taxpayer-supported and self-supported capital investments ($13.5 billion) and to refinance existing debt maturities ($2.6 billion). In addition to outstanding debt needs, $6.9 billion in maturing debt will be retired by government’s debt management strategy and the reduction of P3 liabilities through annual service payments, resulting in the net increase in total debt of $6.6 billion noted above (see Table 1.19).
Table 1.19 Provincial Borrowing Requirements
| | Updated | | Budget | | | | | |
| | Forecast | | Estimate | | Plan | | Plan | |
($ millions) | | 2015/16 | | 2016/17 | | 2017/18 | | 2018/19 | |
Total provincial debt 1 at beginning of year | | 62,920 | | 65,290 | | 67,690 | | 69,886 | |
New borrowing 2 | | 4,974 | | 4,425 | | 5,443 | | 5,827 | |
Direct borrowing by Crown corporations and agencies | | 284 | | 216 | | 84 | | 40 | |
Retirement provision 3 requiring refinancing | | (1,833 | ) | 977 | | (1,705 | ) | (1,891 | ) |
Retirement provision 3 funded internally | | (1,305 | ) | (3,318 | ) | (1,626 | ) | (1,971 | ) |
Change in forecast allowance | | 250 | | 100 | | — | | — | |
Net change in total debt | | 2,370 | | 2,400 | | 2,196 | | 2,005 | |
Total provincial debt 1 at year end | | 65,290 | | 67,690 | | 69,886 | | 71,891 | |
Annual growth in debt (per cent) | | 3.8 | | 3.7 | | 3.2 | | 2.9 | |
1 Debt is after deduction of sinking funds and unamortized discounts, and excludes accrued interest which is reported in the financial statements as an accounts payable.
2 New long-term borrowing plus net change in short-term debt.
3 Sinking fund contributions, sinking fund earnings and net maturities of long-term debt (after deduction of sinking fund balances for maturing issues).
Taxpayer-supported debt is forecast to increase to $45.1 billion by 2018/19, up $2.3 billion from 2015/16. The increase is attributed to significant investment in capital infrastructure over the next three years, including an increase in debt of $4.1 billion for education and health facilities, $3.0 billion for transportation sector projects, and a $0.6 billion increase for other initiatives over the three year period. These increases are partially offset by a $5.4 billion reduction in government direct operating debt over the same period, and which by 2018/19 will be at its lowest point since 1984/85.
The self-supported debt of commercial Crown corporations is forecast to increase to $26.5 billion by 2018/19, up $4.1 billion from 2015/16. The increase is primarily due to $4.0 billion in financing requirements for capital investments related to improving and expanding British Columbia’s hydro generation assets and capital spending for other self-supported Crown corporations ($0.1 billion).
Additional details on government’s outstanding debt are provided in Appendix Tables A17 to A19.
Relationship between surplus and debt
In addition to operating results, the change in debt is impacted by reductions in cash and other working capital changes as well as the debt financing requirements of government’s capital plan. Table 1.20 reconciles the forecast surpluses with changes in debt.
Budget and Fiscal Plan — 2016/17 to 2018/19
37
Three Year Fiscal Plan
Table 1.20 Reconciliation of Summary Results to Provincial Debt Changes
| | Updated | | Budget | | | | | |
| | Forecast | | Estimate | | Plan | | Plan | |
($ millions) | | 2015/16 | | 2016/17 | | 2017/18 | | 2018/19 | |
Taxpayer-supported debt: | | | | | | | | | |
Annual surplus (before forecast allowance) | | (627 | ) | (614 | ) | (637 | ) | (723 | ) |
Reduction in cash balances | | (679 | ) | (658 | ) | (29 | ) | (179 | ) |
Other working capital changes | | 594 | | (260 | ) | 58 | | 85 | |
Net increase in capital and other assets | | 1,541 | | 2,050 | | 1,623 | | 1,664 | |
| | 829 | | 518 | | 1,015 | | 847 | |
Self-supported debt: | | | | | | | | | |
Commercial Crown corporation capital financing | | 1,299 | | 1,798 | | 1,198 | | 1,175 | |
Other commercial debt | | (8 | ) | (16 | ) | (17 | ) | (17 | ) |
| | 1,291 | | 1,782 | | 1,181 | | 1,158 | |
Annual change in forecast allowance | | 250 | | 100 | | — | | — | |
Annual increase in total provincial debt | | 2,370 | | 2,400 | | 2,196 | | 2,005 | |
Risks to the Fiscal Plan
Table 1.21 provides the estimated fiscal impacts of the identified sensitivities for some of the key variables in the fiscal plan projections on an individual basis. However, inter-relationships between the variables may cause the actual variances to be higher or lower than the estimates shown in the table. For example, an increase in the US/CDN dollar exchange rate may be offset by higher commodity prices.
Table 1.21 Key Fiscal Sensitivities
| | | | Annual Fiscal Impact | |
Variable | | Increases of | | ($ millions) | |
Nominal GDP | | 1% | | $150 – $250 | |
Lumber prices (US$/thousand board feet) | | $50 | | $120 – $140 1 | |
Natural gas prices (Cdn$/gigajoule) | | 25 cents | | $25 – $35 2 | |
US exchange rate (US cent/Cdn $) | | 1 cent | | -$25 to -$50 | |
Interest rates | | 1 percentage point | | -$86 | |
Debt | | $500 million | | -$12 | |
1 Sensitivity relates to stumpage revenue only.
2 Sensitivities can vary significantly especially at lower prices.
The assumptions and risk sensitivities for individual revenue sources and major program areas can be found in Appendix Tables A5 and A6, beginning on page 115.
Own Source Revenue
The main areas that may affect own source revenue forecasts are BC’s overall economic performance, the relative health of its major trading partners, the exchange rate and commodity prices.
Revenues are sensitive to economic performance. For example, taxation and other revenue sources are driven by economic factors such as household income, consumer expenditures, housing starts, employment, population growth and the exchange rate. The revenue forecast contained in the fiscal plan is based on the economic forecast detailed in Part 3:
Budget and Fiscal Plan — 2016/17 to 2018/19
38
Three Year Fiscal Plan
British Columbia Economic Review and Outlook. As well, it incorporates commodity price forecasts developed by the Ministry of Forests, Lands and Natural Resource Operations, the Ministry of Energy and Mines, and the Ministry of Natural Gas Development based on private sector information.
Income tax revenue forecasts are based on projections of household income and net operating surplus. The forecasts are updated from reports on tax assessments provided by the Canada Revenue Agency. As a result, revenue estimates can be affected by timing lags in the reporting of current and prior year tax assessments by the Canada Revenue Agency.
Adjustments to the harmonized sales tax entitlements for the years 2010/11 to 2012/13 will continue until 2019/20. These changes, determined by the federal government could affect the revenue forecast over the three-year plan, however it is expected that the size of changes will diminish over time.
Revenues in British Columbia can also be volatile, largely due to the influence of the cyclical natural resource sector in the economy and the importance of natural resource revenues in the Province’s revenue base. Changes in commodity prices such as natural gas, lumber or coal may have a significant effect on natural resource revenues.
Details on major assumptions and sensitivities resulting from changes to those assumptions are outlined in Appendix Table A5.
Softwood Lumber Agreement
The economic and fiscal projections do not assume either a continuation of the 2006 Softwood Lumber Agreement between Canada and the US or any potential litigation that could arise after October 12, 2016. The 2006 Softwood Lumber Agreement expired on October 12, 2015. As part of that agreement, the US committed not to launch countervailing duty or anti-dumping (CVD/AD) litigation against Canadian lumber products before October 2016. Since October 13, 2015 there have been no trade restrictions on Canadian lumber to the US. BC and Canada support discussions between the two countries to find a new managed trade agreement and avoid the market uncertainty that US CVD/AD litigation against Canadian lumber imports to the US would bring. If an agreement cannot be reached and the US launches litigation, Canada, Canadian provinces and Canadian lumber producers could face a costly dispute where the US alleges subsidy and dumping of Canadian lumber products. Canada has the ability to appeal US decisions through NAFTA and WTO dispute settlement processes. The BC government is supporting Canada’s efforts to negotiate with the US, preparing its defense for any new litigation, and continuing to develop other markets for BC forest products.
Federal Government Contributions
Potential policy changes regarding federal government allocations, including health and social transfers and cost-sharing agreements, could affect the revenue forecast.
Crown Corporations
Crown corporations have provided their own forecasts. These forecasts, as well as their statements of assumptions, were used to prepare the fiscal plan. The boards of those corporations and agencies have also included these forecasts, along with further details on assumptions and risks, in the service plans being released with the budget.
Budget and Fiscal Plan — 2016/17 to 2018/19
39
Three Year Fiscal Plan
SUCH Sector
Health authorities have submitted balanced financial plans for 2016/17 to 2018/19 based on policy assumptions provided by the Ministry of Health. These plans have been signed off by the board chairs of the respective health authorities. The Ministry of Health will continue to work with the health authorities to manage any emerging revenue and spending risks and spending pressures.
Forecasts for the universities, colleges, and institutions have been signed off by chairs of the board or audit committee and lead financial officers.
Forecasts for the combined school districts have been compiled by the Ministry of Education based on the requirements of the School Act, the current year plans developed by the school districts, and ministry policy assumptions respecting future funding allocations. Variances from these assumptions could impact the fiscal plan.
Spending
Government funds a number of demand-driven programs, including those delivered through third party delivery agencies, such as health care, K-12 and post-secondary education, income assistance, and community social services. The budgets for these programs reflect reasonable estimates of demand and other factors such as price inflation. If demand is higher than estimated, this will result in a spending pressure to be managed.
The spending plans for the Ministry of Forests, Lands and Natural Resource Operations and the Ministry of Transportation include base amounts to fight wildfires and deal with other emergencies such as floods. Unanticipated or unpredictable occurrences may affect expenses in these ministries.
Details on major assumptions and sensitivities resulting from changes to those assumptions are shown in Appendix Table A7 and in ministry service plans.
Contingencies Vote
The Contingencies vote is a prudent budgeting measure that protects the fiscal plan from unforeseen and unbudgeted costs that may arise as well as pressures for costs that are currently budgeted based on estimates whose final values are impacted by external events or prices.
Budget 2016 includes a Contingencies vote allocation of $450 million in 2016/17, and $400 million in each of 2017/18 and 2018/19, respectively, to help manage unexpected costs and pressures and to fund priority initiatives.
Treaty Negotiations and the New Relationship
BC continues to negotiate treaties and incremental treaty agreements with a number of First Nations. While implementation and settlement costs associated with existing Final Agreements have been accounted for in the fiscal plan, the outcomes of other treaty negotiations and their ratification process would need to be managed within the fiscal plan.
Budget and Fiscal Plan — 2016/17 to 2018/19
40
Three Year Fiscal Plan
Government is also committed to negotiating new revenue-sharing agreements and other reconciliation agreements with First Nations to streamline consultation on natural resource decisions, provide increased certainty for investors, and provide new economic opportunities to First Nations communities. Where agreements have been concluded, the costs of those agreements have been accounted for in the fiscal plan. Any future agreements will need to be accommodated within the fiscal plan.
The Province is also involved in litigation with First Nations relating to aboriginal rights. Settlement of these issues, either in or out of court, may result in additional costs to government.
Capital Risks
The capital spending forecasts included in the fiscal plan may be affected by subsequent planning (i.e. design development) and procurement activities (i.e. receipt/review of construction bids) resulting in project costs that are higher than the initial approved budgets. For large capital projects, government will review the budget and scope risks, and the strategies to mitigate these risks.
Other risks impacting capital spending forecasts include:
· weather and geotechnical conditions, including the outcome of environmental impact studies, causing project delays and/or unexpected costs;
· changes in market conditions, including service demand, the impact of inflation on building material costs, the availability of and wage rates for skilled workers, and borrowing costs;
· the accuracy of capital project budget and construction schedule forecasts;
· the successful negotiation/timing of cost-sharing agreements with the federal government and other funding partners; and
· the timing and outcomes of public-private sector partnership negotiations.
Pending Litigation
The spending plan for the Ministry of Justice contains provisions for payments under the Crown Proceeding Act based on estimates of expected claims, judgments, and related costs of settlements likely to be incurred. Litigation developments may occur that are beyond the assumptions used in the plan (for example, higher-than-expected volumes, or size of claim amounts and timing of judgments and settlements). These developments may affect government revenues and/or expenditures in other ministries.
On January 14, 2016 the Supreme Court of Canada (SCC) announced it will hear an appeal of the BC Court of Appeal judgment from 2015 that was in favour of the Province over the BC Teachers’ Federation (BCTF). The SCC has tentatively set the hearing for November 2016. Potential cost implications stemming from the hearing will not be known until the SCC makes a final ruling on the BCTF’s appeal and whether further bargaining is required in accordance with the current collective agreement.
Write-downs and Other Adjustments
Ministry budgets provide for anticipated levels of asset or loan write-downs where estimates can be reasonably predicted. The overall spending forecast does not make allowance for extraordinary items other than the amount provided in the Contingencies vote.
Budget and Fiscal Plan — 2016/17 to 2018/19
41
Three Year Fiscal Plan
Prudence and Risk
The economic, financial and external variables and factors that impact the estimates of revenues, expenditures, capital spending and debt will change throughout the year as new information becomes available with potentially material impacts. As a result, the actual operating surplus, capital expenditure and debt figures may differ from the current forecast. Government will continue to update the fiscal plan throughout the year in its first, second and third Quarterly Reports.
Government incorporates four main levels of prudence to help mitigate risks to the budget plan projections:
· The Ministry of Finance’s economic outlook is lower than the average of the forecasts provided by the members of the Economic Forecast Council (EFC). The Budget 2016 plan assumes real GDP growth of 2.4 per cent in 2015 and 2016 and 2.3 per cent over the medium term. This is lower than the EFC average by 0.2 percentage points in 2015, 0.3 percentage points in 2016 and 2017 and 0.1 percentage point over the medium term. The prudent outlook compared to the private sector acknowledges the downside risks to the economic forecast over the forecast horizon.
· The Budget 2016 natural gas price forecast is lower than the private sector average over the next three years reflecting the recommendation of Dr. Tim O’Neill to adopt more caution in preparing the natural gas royalty forecast. Over the next three years, the Budget 2016 natural gas price projections average 39 cents lower than the average of the private sector forecasters (see Table A6 for details).
· Budget 2016 includes forecast allowances of $250 million in 2015/16, rising to $350 million in each of the next three years. The forecast allowance helps guard against unanticipated revenue volatility and statutory spending such as additional costs to fight wildfires, to deal with other emergencies such as floods and for litigation developments under the Crown Proceeding Act.
· The Budget 2016 expense forecast also includes a Contingencies vote allocation of $350 million in 2015/16, $450 million in 2016/17 and $400 million in each of the next two years. The Contingencies vote is a prudent measure to help protect the plan from unforeseen and unbudgeted costs that may arise and to fund priority initiatives.
In its deliberations throughout the year, Cabinet and Treasury Board consider the impacts of its decisions on debt affordability and the levels of prudence and the operating surplus. The Minister of Finance meets with the EFC annually to discuss issues facing the global economy and BC’s economic outlook including areas of concern, risks and opportunities for the BC economy. The Minister of Finance consults with staff and colleagues on the various levels of prudence incorporated in the fiscal plan, tax policy initiatives for consideration and the potential risks that could arise over the next three years. Since the risks could be ongoing or one-time in nature and could impact both revenues and expenditures, consideration is given to both the forecast allowance and Contingencies vote allocations. However, since a number of these risks are not readily quantifiable, there is no specific formulaic approach in the determination of the forecast allowance and Contingencies vote allocations. Following advice provided by staff and colleagues, the Minister of Finance determines the levels of additional prudence to incorporate in the Forecast Allowance and Contingencies vote; the type of tax policy measures to implement; and a credible level of operating surplus underlying the budget and fiscal plan. The determination of the level of any of these is not done in isolation as all of the above elements must be considered in the fiscal plan projections. A discussion of fiscal risks is included in this section of the budget document and risks to the economic outlook are summarized on page 74. See Part 2: Tax Measures for a discussion on tax policy initiatives in Budget 2016.
Budget and Fiscal Plan — 2016/17 to 2018/19
42
Three Year Fiscal Plan
BC Prosperity Fund
BC Prosperity Fund to benefit future generations
The Government of British Columbia has introduced three consecutive balanced budgets, and Budget 2016 presents a fiscal plan forecasting three further consecutive balanced budgets. Government’s track record of fiscal discipline has been consistently noted by credit rating agencies. Supported by consistent and stable economic growth, the government’s fiscal management is reducing direct operating debt accumulated by past deficits. This approach is reducing the government’s need to borrow and the cost of managing taxpayer-supported debt, freeing approximately $500 million over three years. Continued discipline in reducing operating debt will increasingly make available taxpayer spending for key priorities that would otherwise have gone to pay interest on debt.
Some of the money that derives from this fiscal discipline has been allocated in Budget 2016 to support, enhance and expand programs and services for BC taxpayers, reflecting a dividend from fiscal discipline for those who rely on these services. In addition, an opportunity exists to consider what investments could benefit British Columbians over the long term. Many commodity-based economies have established long-term funds to preserve some of the wealth generated by strong economies — countries like Norway, Chile and Australia, and sub-national jurisdictions such as Alberta and Alaska. Accordingly, the BC government will apply a portion of this dividend to undertake a commitment made with the first of the series of balanced budgets in 2013/14.
Budget 2016 will establish the BC Prosperity Fund, with an inaugural commitment of $100 million from the forecast 2015/16 surplus. The BC Prosperity Fund will be a long-term legacy intended to:
· help eliminate the Province’s debt over time;
· make investments in health care, education, transportation, family supports and other priorities that provide future benefits to British Columbia; and
· preserve a share of today’s prosperity for future generations.
The BC Prosperity Fund will be established in legislation as a Special Fund that will be included as part of the government’s bottom line. Each year, government will allocate an amount of the available final surplus and deposit it in the fund, with the balance of the surplus available to reduce future borrowing requirements and retire debt. Assets will remain in the fund to earn investment income to be available for priorities in future years.
Government has identified its lead priority for the BC Prosperity Fund as taxpayer-supported debt, followed by retiring debt of other entities in accordance with government’s strategic direction. Government will allocate a minimum of 50 per cent of cash flowing into the fund to debt retirement, and a minimum of 25 per cent will be saved to accumulate earnings. The remainder will be available for core government priorities in the future.
While this inaugural $100 million investment is modest, government may increase this amount when the final 2015/16 surplus is known. In addition, future government surpluses, which will include LNG revenues, will help grow the fund over time.
Budget and Fiscal Plan — 2016/17 to 2018/19
43
Three Year Fiscal Plan
Liquefied Natural Gas — Update
Long Term Outlook for LNG
According to the most recent International Energy Agency forecast, global natural gas use continues its upward trend and is expected to be the fastest growing fossil fuel over the next 25 years. By 2040 it is anticipated that the consumption of gas will be on parity with oil and coal in the global energy mix.
China and the Middle East are expected to be the main centres of gas demand growth. With that, the global trade in natural gas is set to continue expanding, and it is anticipated that LNG will increase more rapidly than pipeline gas. As outlined in Chart 1, between 2014 and 2030 the demand for LNG is forecast to double. As older LNG facilities around the world wind down production, the gap between global LNG demand and the available or anticipated supply is expected to grow.
Chart 1 Global LNG supply-demand gap 2000 to 2035
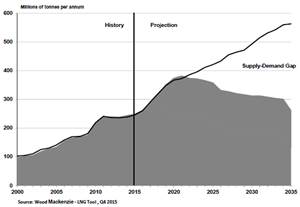
With its close proximity to Asia, LNG facilities in British Columbia would be well positioned to help meet this growing demand.
Activity Update
Despite market conditions declining throughout 2015, oil and gas companies from around the world continue to pursue LNG investment opportunities in British Columbia. Eighteen companies/partnerships have now been approved by the Canadian National Energy Board for export licenses (January 2016). Four LNG export facilities have been granted provincial environmental assessment (EA) certificates, while another four are at various stages of the EA process. Also, four of the natural gas pipelines proposed to support LNG facilities have been granted EA certificates.
Over 40 First Nations are affected by LNG projects in British Columbia. To date the Province and proponents have negotiated over 105 agreements with First Nations.
The Province is continuing its consultations with First Nations, local and Federal governments as each of them have an important role in the province’s LNG future.
Liquefied Natural Gas Income Tax
In Budget 2014, the Province committed to develop and implement all elements of a competitive tax and policy environment to assist with LNG development in the Province and to introduce an income tax applicable to the LNG industry in the fall of 2014.
As reported in Budget 2015, the Liquefied Natural Gas Income Tax Act that set out the key components of the LNG Income Tax received Royal Assent on November 27, 2014. The legislation also included an amendment to the Income Tax Act to introduce a Natural Gas Tax Credit for LNG income tax taxpayers with a permanent establishment in British Columbia. The amount of the credit is based on the cost under the Liquefied Natural Gas Income Tax Act of natural gas at an LNG facility inlet.
The Province completed its commitment when the Liquefied Natural Gas Income Tax Amendment Act, 2015, that sets out the administration and enforcement elements of the LNG income tax, received Royal Assent on May 14, 2015 and when regulations supporting the legislation were subsequently deposited.
Project Development Agreements
LNG is a capital intensive industry that requires substantial investment. LNG proponents have asked for assurance that the Province will not increase industry-specific taxes or regulatory requirements once the LNG facility has been constructed and the substantial investment made.
Budget and Fiscal Plan — 2016/17 to 2018/19
44
Three Year Fiscal Plan
On July 21, 2015, the Liquefied Natural Gas Project Agreements Act received Royal Assent. The Act gives the Minister of Finance authority to enter into project development agreements with the LNG industry.
Project development agreements provide financial security to industry from changes to three industry-specific taxes and changes to industry-specific greenhouse gas requirements.
If government makes changes to any of these very specific taxes or regulatory requirements and if those changes are material, the Province may be required to provide compensation under the project development agreements.
The specific types of changes that could trigger compensation are:
· Changes to the LNG income tax;
· Changes to the natural gas tax credit (which is only available to LNG income tax taxpayers);
· Changes to the carbon tax that apply exclusively to liquefaction activities; and
· Changes to the Greenhouse Gas Industrial Reporting and Control Act and its regulations that apply to liquefaction activities or to the LNG Incentive Program (a program that encourages LNG facilities to lower emissions).
As of Budget 2016, the Province has signed a project development agreement with Pacific NorthWest LNG.
Greenhouse Gas Emissions
B.C.’s new Greenhouse Gas Industrial Reporting and Control Act came into force on January 1, 2016, ensuring LNG facilities in BC will have an emissions cap making them the cleanest in the world. The new act combines several pieces of existing greenhouse gas legislation into a single legislative framework. It includes the ability to set a greenhouse gas emissions intensity benchmark for regulated industries, including LNG facilities and enables the benchmark to be met through flexible options, such as purchasing offsets or paying a set price per tonne of greenhouse gas emissions that would be dedicated to a technology fund.
To manage cost implications of greenhouse gas compliance and address competitiveness of the BC LNG industry, the BC Government has created an LNG Environmental Incentive Program. By incenting investment in advanced technology and rewarding achievement of world-leading performance, the program will help ensure the development of the cleanest LNG facilities in the world consistent with government’s commitment.
LNG Environmental Stewardship Initiative
The LNG Environmental Stewardship Initiative was launched in 2014 as a response to First Nations seeking a government commitment to more collaborative ways of dealing with environmental concerns related to LNG and resource development in traditional territories. The LNG Environmental Stewardship Initiative has made positive progress since its launch with about 30 First Nations engaged in Regional Stewardship Forums that have been established in the Skeena, Omineca, Northeast and North Coast to carry out stewardship projects aimed at creating positive environmental legacies from the development of a safe and sustainable LNG industry. The initiative complements the existing regulatory process and advances the collaborative relationship between First Nations, governments and industry on key environmental management topics.
Environmental Assessment
The Province has high expectations that industrial projects must be responsibly developed and safely operated in this province while ensuring the Province meets its constitutional obligations to First Nations. This is addressed within the BC Environmental Assessment and permitting processes. To date provincial environmental assessment certificates have been issued for eight LNG projects — four export facilities and four natural gas pipelines — with others under review. This is a clear sign of progress in this emerging industry for British Columbia.
Budget and Fiscal Plan — 2016/17 to 2018/19
45
Three Year Fiscal Plan
Direct Operating Debt
Introduction
Government prepares its fiscal plan based on financial projections of the government reporting entity, the composition of which is prescribed by accounting policies. If you break down the fiscal plan by organizational component, it is the sum of the projected operating results of core government, the adjusted net income of taxpayer-supported government organizations and the retained earnings of commercial Crown corporations.
Core government is comprised of the ministries and special offices whose operations are financed from the consolidated revenue fund (CRF). Core government counts as income the dividends paid by commercial Crown corporations into the CRF.
For debt management purposes, government classifies its debt into two main categories: taxpayer-supported and self-supported. Taxpayer-supported debt is debt owed by or borrowed on behalf of core government and government organizations, such as school districts and health authorities, which are dependent on government funding for some or all of their revenues. Self-supported debt is debt owed by or borrowed on behalf of government enterprises, such as BC Hydro, whose revenues come from their commercial operations.
The origins of direct operating debt
A portion of taxpayer-supported debt, unique to core government, is direct operating debt. Most taxpayer-supported debt is borrowed to finance the construction of schools, hospitals, bridges, roads and other infrastructure for future use; direct operating debt was borrowed to finance the past day to day operations of core government.
The level of direct operating debt in any year mainly is equivalent to the accumulated past operating results of core government (see Chart 1). Each annual loss adds to debt;
Chart 1 Direct operating debt vs accumulated operating losses 1
balancing the budget and keeping spending below available revenue reduces debt.
Other factors can impact direct operating debt, such as borrowing to finance a student loan program or a property tax deferral program. While not directly the result of ongoing ministry operations, these are core government policy initiatives. Capital funding transfers are excluded from the calculations in Chart 1 as they are a form of infrastructure debt and not part of the day to day operations of core government.
Once it resumed balancing the budget, government stopped borrowing for operations, and its goal is to eliminate the direct operating debt as soon as practicable.
The benefits of eliminating direct operating debt
As is demonstrated in Chart 1, continuous operating losses in the past created a mountain of debt that carried significant costs. At its peak of $15.2 billion in 2003/04, direct operating debt cost core government $859 million in debt servicing costs, or 3.4 per cent of core government spending for the year (see Chart 2). By 2008/09, direct operating debt had been reduced by almost two thirds, and debt servicing costs of $394 million represented only 1.3 per cent of core government spending.
Budget and Fiscal Plan — 2016/17 to 2018/19
46
Three Year Fiscal Plan
Chart 2 Fiscal benefits of eliminating the direct operating debt
More importantly, the reduction in direct operating debt enabled government to redirect almost half a billion dollars annually from servicing the direct operating debt towards financing the health care, education and social support services that British Columbians depend upon. While the economic downturn in late 2008 and subsequent slow economic recovery resulted in a period of direct operating debt increases, by 2013/14 core government eliminated its operating losses and resumed paying down direct operating debt.
By 2018/19, direct operating debt is projected to be at its lowest level since 1984/85. The cost of servicing this debt is projected to drop to $135 million, or 0.3 per cent of core government operating expenses — an annual reduction of $724 million compared to 2003/04. This reduction is a financial resource which government has redirected towards financing core services.
Summary
Balancing the budget, keeping expenses at or below available revenues, does not constrain program spending. Rather, balancing the budget enables the elimination of direct operating debt and frees core government to direct its resources towards the core services of health care, education and social supports.
Over the sixteen year period from 2003/04 to 2018/19 (inclusive), government has or will have redirected $4.7 billion in revenue from servicing the direct operating debt towards funding core services. It is the accumulation of direct operating debt that constrains program spending through ever increasing debt servicing costs.
Budget and Fiscal Plan — 2016/17 to 2018/19
47
Three Year Fiscal Plan
Increasing Income Assistance Rates for Persons With Disabilities
Supporting Those in Need
British Columbia continues to make progress on Accessibility 2024, the Province’s 10-year plan to make BC the most progressive place for persons with disabilities in Canada.
During the development of Accessibility 2024, British Columbians with disabilities, their families, and members of the public, identified increases in disability assistance as a priority.
Sharing In the Benefit of a Strong Economy
British Columbia’s record of fiscal prudence and discipline affords the opportunity to further support those in need. Budget 2016 advances government’s commitment in Accessibility 2024 by providing $170 million over the next three years to increase persons with disabilities’ income assistance rates.
Effective September 1, 2016, the rate for individuals receiving disability assistance will increase by $77 to $983 from $906.
Improving Equity and Choice
There are approximately 100,000 British Columbians with a disability assistance designation. Of those, some receive a subsidized bus pass of about $52 a month, while others receive a special transportation subsidy. Almost half do not receive any form of transportation assistance.
To ensure people on disability assistance are getting the supports they need in a fair and equitable way, the Ministry of Social Development and Social Innovation is changing how it administers transportation assistance.
Beginning September 1, 2016, people with a disability assistance designation on assistance will all receive the $77 monthly rate increase. From this, they can choose how they want to spend their money on transportation, including the option to keep or purchase a bus pass from the ministry at the existing subsidized rate of $52 a month.
Building on Recent Accomplishments
The Budget 2016 increase in disability income assistance rates builds on other recent accomplishments that improve financial security and make progress on the Accessibility 2024 goal of an assistance system that recognizes the unique circumstances of persons with disabilities. Key highlights include:
· Becoming the first province to ensure people receiving disability assistance will be able to calculate their earnings on an annual basis instead of monthly. Annualized Earnings Exemptions for individuals increased to $9,600 per year from $500 per month.
· Becoming the first province to fully exempt child-support payments for families receiving disability income assistance.
· Increasing asset levels for individuals to $100,000 from $5,000.
· Permitting families, friends and communities to provide gifts without impacting income assistance amounts.
Budget and Fiscal Plan — 2016/17 to 2018/19
48
Part 2: TAX MEASURES
Table 2.1 Summary of Tax Measures
| | | | Taxpayer Impacts | |
| | Effective Date | | 2016/17 | | 2017/18 | |
| | | | ($ millions) | |
Income Tax Act | | | | | | | |
· Enhance BC tax reduction credit | | January 1, 2016 | | (2 | ) | (2 | ) |
· Introduce farmers’ food donation tax credit | | February 17, 2016 | | (1 | ) | (1 | ) |
· Expand BC seniors’ home renovation tax credit to persons with disabilities | | February 17, 2016 | | (1 | ) | (1 | ) |
· Extend BC mining flow-through share tax credit | | January 1, 2016 | | (4 | ) | (1 | ) |
· Extend mining exploration tax credit | | January 1, 2017 | | (10 | ) | (41 | ) |
· Parallel federal changes to taxation of trusts and estates | | January 1, 2016 | | 8 | | 8 | |
· Clarify regional and distant location tax credits for animation productions | | June 27, 2015 | | * | | * | |
Medicare Protection Act | | | | | | | |
Medical Services Plan Premiums and Premium Assistance | | | | | | | |
· Increase Medical Services Plan premiums | | January 1, 2017 | | 25 | | 101 | |
· Structural changes to Medical Services Plan premiums | | January 1, 2017 | | 12 | | 46 | |
· Enhance premium assistance | | January 1, 2017 | | (18 | ) | (70 | ) |
Small Business Venture Capital Act | | | | | | | |
· Increase equity tax credit budget | | Regulation | | (5 | ) | (5 | ) |
Provincial Sales Tax Act | | | | | | | |
· Expand exemption for qualifying farmers to include telescopic handlers, skid steers and polycarbonate greenhouse panels | | February 17, 2016 | | (1 | ) | (1 | ) |
Carbon Tax Act and Motor Fuel Tax Act | | | | | | | |
· Provide exemptions from security in certain circumstances | | March 1, 2016 | | — | | — | |
Property Transfer Tax Act | | | | | | | |
· Introduce exemption for newly constructed homes up to $750,000 in value | | February 17, 2016 | | (75 | ) | (75 | ) |
· Increase the property transfer tax to 3 per cent from 2 per cent on the portion of fair market value in excess of $2 million | | February 17, 2016 | | 75 | | 75 | |
· Collect data on citizenship and bare trusts | | Regulation | | — | | — | |
Home Owner Grant Act | | | | | | | |
· Increase threshold for home owner grant phase-out | | 2016 tax year | | (12 | ) | (12 | ) |
Tourist Accommodation (Assessment Relief) Act | | | | | | | |
· Increase assessment relief in rural areas | | 2017 tax year | | * | | (1 | ) |
School Act | | | | | | | |
· Set provincial residential school property tax rates | | 2016 tax year | | * | | * | |
· Set provincial non-residential school property tax rates | | 2016 tax year | | * | | * | |
Taxation (Rural Area) Act | | | | | | | |
· Set provincial rural area property tax rates | | 2016 tax year | | * | | * | |
Total | | | | (9 | ) | 20 | |
* Denotes measures that have no material impact on taxpayers.
Budget and Fiscal Plan — 2016/17 to 2018/19
Tax Measures
Tax Measures — Supplementary Information
For more details on tax changes see:
www.gov.bc.ca/budgettaxchanges
Income Tax Act
BC Tax Reduction Credit Enhanced
Effective for the 2016 tax year, the BC tax reduction credit phase-out threshold is increased to $19,400 from $19,000. The credit phase-out rate is also increased to 3.56 per cent from 3.5 per cent.
The enhancement increases the amount of income an individual can earn before they start paying provincial income tax, benefiting about 500,000 taxpayers.
Farmers’ Food Donation Tax Credit Introduced
Effective February 17, 2016, a new non-refundable farmers’ food donation tax credit is introduced. The tax credit is available to individuals and corporations that carry on the business of farming and donate a qualifying agricultural product to a registered charity that provides food to those in need or helps to operate a school meal program.
The credit is worth 25 per cent of the fair market value of the qualifying agricultural product and must be claimed in the same year that a charitable donation tax credit or deduction is claimed for the donation. The credit is available for the 2016, 2017 and 2018 tax years, after which the credit will be reviewed.
BC Seniors’ Home Renovation Tax Credit Expanded to Persons with Disabilities
Effective for the 2016 tax year, the BC seniors’ home renovation tax credit is expanded to persons with disabilities who are eligible to claim the federal disability tax credit. The expanded credit will be available in respect of eligible expenditures made on or after February 17, 2016. The refundable personal income tax credit assists with the cost of certain permanent home renovations to improve accessibility or to help an individual be more functional or mobile at home.
BC Mining Flow-Through Share Tax Credit Extended
As announced on January 25, 2016, the BC mining flow-through share tax credit is extended to the end of 2016.
Mining Exploration Tax Credit Extended
As announced on January 25, 2016, the mining exploration tax credit is extended for an additional three years to the end of 2019. The credit is available to both individuals and corporations that undertake mining exploration in the province. The credit is calculated as 20 per cent of eligible BC mining exploration expenditures, or 30 per cent if exploration is in the mountain-pine-beetle-affected area.
Budget and Fiscal Plan — 2016/17 to 2018/19
50
Tax Measures
Federal Changes to Taxation of Trusts and Estates Paralleled
The recent federal changes to the taxation of trusts and estates are paralleled. Effective for tax years ending after December 31, 2015, graduated personal income tax rates will only apply to trusts that are “graduated rate estates” or “qualified disability trusts,” as announced in the federal 2014 budget. The top marginal personal income tax rate of 14.7 per cent will apply to all other trusts and estates in BC.
These changes effectively maintain graduated rate taxation for eligible estates for the first 36 months after an individual’s death. They also maintain graduated rate taxation for testamentary trusts that are for the benefit of individuals who are eligible for the federal disability tax credit.
This will improve tax fairness by reducing tax planning opportunities arising from beneficiaries effectively accessing more than one set of graduated rates.
Regional and Distant Location Tax Credits for Animation Productions Clarified
As announced on June 26, 2015, the regional and distant location tax credits for animation productions are clarified to ensure the credits are based on the amount of eligible labour expenditures incurred in the regional or distant location areas. The change applies to both the production services tax credit and the Film Incentive BC tax credit for animation productions where principal photography begins after June 26, 2015.
Medicare Protection Act
Medical Services Plan Premiums and Premium Assistance
Effective January 1, 2017, Medical Services Plan (MSP) premiums are increased by about 4 per cent to help fund health care for British Columbians. Maximum premium rates will increase by $3 per month per adult.
Two changes will also be made to the MSP premium rate structure effective January 1, 2017.
First, the calculation of MSP premiums will no longer include children. This change will ensure all children are treated the same, regardless of family composition. The measure will provide a significant benefit to single parent families, who will pay up to $72 per month less than they pay in 2016. This change will benefit about 70,000 single parent families.
Second, the MSP premium rate paid by couples will be set at twice the MSP premium rate paid by single adults. This change will ensure adults pay the same maximum premium rate, regardless of family composition. Currently, couples pay less than twice the amount paid by single adults. This change will result in a $14 per month increase in premiums for about 530,000 couples, in addition to the 4 per cent increase.
Additionally, effective January 1, 2017, MSP premium assistance is enhanced. The income threshold up to which a household receives full premium assistance is increased by $2,000.
Budget and Fiscal Plan — 2016/17 to 2018/19
51
Tax Measures
Table 2.2 Impact of Medical Services Plan Premium Changes
(For premium and premium assistance changes effective January 1, 2017)
| | Monthly | | Monthly | | Monthly | | Annual | |
| | Premiums in | | Premiums in | | (Decrease) | | (Decrease) | |
Annual Household Net Income | | 2016 | | 2017 | | Increase | | Increase | |
| | $ | |
Single Adult | | | | | | | | | |
Up to $22,000 | | 0.00 | | 0.00 | | 0.00 | | 0.00 | |
$22,001 to $24,000 | | 12.80 | | 0.00 | | (12.80 | ) | (153.60 | ) |
$24,001 to $26,000 | | 25.60 | | 12.00 | | (13.60 | ) | (163.20 | ) |
$26,001 to $28,000 | | 38.40 | | 24.00 | | (14.40 | ) | (172.80 | ) |
$28,001 to $30,000 | | 51.20 | | 36.00 | | (15.20 | ) | (182.40 | ) |
$30,001 to $34,000 | | 75.00 | | 48.00 | | (27.00 | ) | (324.00 | ) |
$34,001 to $38,000 | | 75.00 | | 58.00 | | (17.00 | ) | (204.00 | ) |
$38,001 to $42,000 | | 75.00 | | 68.00 | | (7.00 | ) | (84.00 | ) |
Over $42,000 | | 75.00 | | 78.00 | | 3.00 | | 36.00 | |
| | | | | | | | | |
Couple | | | | | | | | | |
Up to $25,000 | | 0.00 | | 0.00 | | 0.00 | | 0.00 | |
$25,001 to $27,000 | | 23.20 | | 0.00 | | (23.20 | ) | (278.40 | ) |
$27,001 to $29,000 | | 46.40 | | 24.00 | | (22.40 | ) | (268.80 | ) |
$29,001 to $31,000 | | 69.60 | | 48.00 | | (21.60 | ) | (259.20 | ) |
$31,001 to $33,000 | | 92.80 | | 72.00 | | (20.80 | ) | (249.60 | ) |
$33,001 to $37,000 | | 136.00 | | 96.00 | | (40.00 | ) | (480.00 | ) |
$37,001 to $41,000 | | 136.00 | | 116.00 | | (20.00 | ) | (240.00 | ) |
$41,001 to $45,000 | | 136.00 | | 136.00 | | 0.00 | | 0.00 | |
Over $45,000 | | 136.00 | | 156.00 | | 20.00 | | 240.00 | |
| | | | | | | | | |
Senior Couple | | | | | | | | | |
Up to $31,000 | | 0.00 | | 0.00 | | 0.00 | | 0.00 | |
$31,001 to $33,000 | | 23.20 | | 0.00 | | (23.20 | ) | (278.40 | ) |
$33,001 to $35,000 | | 46.40 | | 24.00 | | (22.40 | ) | (268.80 | ) |
$35,001 to $37,000 | | 69.60 | | 48.00 | | (21.60 | ) | (259.20 | ) |
$37,001 to $39,000 | | 92.80 | | 72.00 | | (20.80 | ) | (249.60 | ) |
$39,001 to $43,000 | | 136.00 | | 96.00 | | (40.00 | ) | (480.00 | ) |
$43,001 to $47,000 | | 136.00 | | 116.00 | | (20.00 | ) | (240.00 | ) |
$47,001 to $51,000 | | 136.00 | | 136.00 | | 0.00 | | 0.00 | |
Over $51,000 | | 136.00 | | 156.00 | | 20.00 | | 240.00 | |
| | | | | | | | | |
Single Parent — Two Children * | | | | | | | | | |
Up to $28,000 | | 0.00 | | 0.00 | | 0.00 | | 0.00 | |
$28,001 to $30,000 | | 25.60 | | 0.00 | | (25.60 | ) | (307.20 | ) |
$30,001 to $32,000 | | 51.20 | | 12.00 | | (39.20 | ) | (470.40 | ) |
$32,001 to $34,000 | | 76.80 | | 24.00 | | (52.80 | ) | (633.60 | ) |
$34,001 to $36,000 | | 102.40 | | 36.00 | | (66.40 | ) | (796.80 | ) |
$36,001 to $40,000 | | 150.00 | | 48.00 | | (102.00 | ) | (1,224.00 | ) |
$40,001 to $44,000 | | 150.00 | | 58.00 | | (92.00 | ) | (1,104.00 | ) |
$44,001 to $48,000 | | 150.00 | | 68.00 | | (82.00 | ) | (984.00 | ) |
Over $48,000 | | 150.00 | | 78.00 | | (72.00 | ) | (864.00 | ) |
| | | | | | | | | |
Couple — Two Children * | | | | | | | | | |
Up to $31,000 | | 0.00 | | 0.00 | | 0.00 | | 0.00 | |
$31,001 to $33,000 | | 25.60 | | 0.00 | | (25.60 | ) | (307.20 | ) |
$33,001 to $35,000 | | 51.20 | | 24.00 | | (27.20 | ) | (326.40 | ) |
$35,001 to $37,000 | | 76.80 | | 48.00 | | (28.80 | ) | (345.60 | ) |
$37,001 to $39,000 | | 102.40 | | 72.00 | | (30.40 | ) | (364.80 | ) |
$39,001 to $43,000 | | 150.00 | | 96.00 | | (54.00 | ) | (648.00 | ) |
$43,001 to $47,000 | | 150.00 | | 116.00 | | (34.00 | ) | (408.00 | ) |
$47,001 to $51,000 | | 150.00 | | 136.00 | | (14.00 | ) | (168.00 | ) |
Over $51,000 | | 150.00 | | 156.00 | | 6.00 | | 72.00 | |
* Income thresholds may vary for families who claim child care expenses on their tax returns.
Budget and Fiscal Plan — 2016/17 to 2018/19
52
Tax Measures
Partial premium assistance is enhanced for all households paying partial premiums and the income threshold at which a household starts to pay full premiums is increased by $12,000.
Combined, the above changes will mean MSP premiums are reduced for 335,000 British Columbians and an additional 45,000 people will no longer pay premiums at all. A single adult receiving premium assistance will see their premiums reduced by up to $27 per month compared to 2016 rates, while a couple with two children will see their premiums reduced by up to $54 per month.
Small Business Venture Capital Act
Equity Tax Credit Budget Increased
Beginning in 2016, the budget for the small business venture capital tax credit is increased by $5 million, $3 million of which will be for direct investments in eligible new corporations. This allows for up to $16.7 million annually in additional equity financing for qualifying corporations.
Provincial Sales Tax Act
Exemption for Qualifying Farmers Expanded to Include Telescopic Handlers, Skid Steers and Polycarbonate Greenhouse Panels
Effective February 17, 2016, telescopic handlers, skid steers and polycarbonate greenhouse panels obtained by qualifying farmers for use solely for a farm purpose are exempt from provincial sales tax. To qualify for this exemption, polycarbonate greenhouse panels must be purchased in a minimum quantity of 500 square metres.
Carbon Tax Act and Motor Fuel Tax Act
Exemptions from Security in Certain Circumstances Provided
Effective March 1, 2016, the following exemptions from security are provided with respect to both carbon tax and motor fuel tax to replace a refund of security in the following circumstances.
A collector is exempt from the requirement to pay security to the government on the sale of fuel in BC if the fuel is sold to a person who is exempt from the requirement to pay security in respect of that fuel.
A deputy collector is exempt from the requirement to pay security on fuel bought in BC if the fuel is to be sold outside of BC by the deputy collector and the fuel is to be removed from BC:
· by the person who sold the fuel to the deputy collector;
· by a person acting on behalf of the person who sold the fuel to the deputy collector;
· by a common carrier, if the contract with the common carrier for the removal of the fuel has been entered into at the time the deputy collector buys the fuel; or
· in prescribed circumstances.
Budget and Fiscal Plan — 2016/17 to 2018/19
53
Tax Measures
Property Transfer Tax Act
Exemption for Newly Constructed Homes up to $750,000 in Value Introduced
Effective February 17, 2016, an exemption from property transfer tax for newly constructed homes used as a principal residence is introduced. The buyer does not have to be a first-time owner of residential property. The full exemption is available for homes with a fair market value up to $750,000, with a partial exemption available for homes up to $800,000.
Property Transfer Tax Increased to 3 Per Cent from 2 Per Cent on the Portion of Fair Market Value in Excess of $2 Million
Effective February 17, 2016, the property transfer tax rate is increased to 3 per cent from 2 per cent on the portion of a property’s fair market value above $2 million. Rates of 1 per cent on the first $200,000 of a property’s fair market value and 2 per cent on the fair market value between $200,000 and $2 million will continue to apply.
Data on Citizenship and Bare Trusts Collected
The Property Transfer Tax Act is amended to require disclosure of citizenship, on registration of a taxable transaction, by individuals who are not Canadian citizens or permanent residents of Canada. Corporations will also be required to disclose, on registration of a taxable transaction, the citizenship of any director who is not a Canadian citizen or permanent resident of Canada. The amendments will also require the disclosure of the names, addresses, and citizenship information of settlors and beneficiaries of bare trusts. The new disclosure requirements will come into effect in spring 2016.
Home Owner Grant Act
Threshold for Home Owner Grant Phase-Out Increased
As announced on January 5, 2016, the threshold for the phase-out of the home owner grant is increased to $1,200,000 from $1,100,000 for the 2016 tax year. For properties valued above the threshold, the grant is reduced by $5 for every $1,000 of assessed value in excess of the threshold.
Tourist Accommodation (Assessment Relief) Act
Assessment Relief in Rural Areas Increased
Effective for the 2017 tax year, the reduction in assessed value for eligible short-term accommodation property located outside municipalities is increased. The maximum reduction in assessed value is increased to $500,000 from $150,000 and the assessed value at which the phase-out of the benefit begins is increased to $4 million from $2 million.
Budget and Fiscal Plan — 2016/17 to 2018/19
54
Tax Measures
School Act
Provincial Residential School Property Tax Rates Set
The longstanding rate-setting policy is that average residential school property taxes, before application of the home owner grant, increase by the previous year’s provincial inflation rate. This rate-setting policy has been in place since 2003 and will continue in 2016. The rates will be set when revised assessment roll data are available in the spring.
Provincial Non-Residential School Property Tax Rates Set
A single province-wide school tax rate is set for each of the non-residential property classes. Consistent with longstanding policy, the rates for 2016, except the rate for the industrial property classes, will be set so that non-residential school tax revenue will increase by inflation plus new construction. This rate-setting policy has been in place since 2005. The rates will be set when revised assessment roll data are available in the spring.
The major industry class tax rate and the light industry class tax rate will be set at the same rate as the business class tax rate, consistent with the policy announced in Budget 2008.
Taxation (Rural Area) Act
Provincial Rural Area Property Tax Rates Set
A single rural area residential property tax rate applies province-wide. The longstanding rate-setting policy that average residential rural property taxes increase by the previous year’s provincial inflation rate will continue for 2016.
Consistent with longstanding policy, non-residential rural area property tax rates will be set so that total non-residential rural area tax revenue will increase by inflation plus new construction. The rates will be set when revised assessment roll data are available in the spring.
Budget and Fiscal Plan — 2016/17 to 2018/19
55
Tax Measures
Carbon Tax Report and Plan
As required under Part 2 of the Carbon Tax Act, the following tables show the Revenue Neutral Carbon Tax Report for 2014/15 and 2015/16 and the Revenue Neutral Carbon Tax Plan for 2016/17 to 2018/19.
Material Assumptions and Policy Decisions
In the Report and the Plan the estimates and forecasts of carbon tax revenue and the cost of tax reductions to return revenues to taxpayers are consistent with, and have the same material assumptions and policy decisions underlying them, as the revenue estimates and forecasts prepared for Budget 2016. The only material assumption specific to the Revenue Neutral Carbon Tax Report and Plan is that the cost of the revenue reductions due to personal income tax rate cuts increase with increases in personal income tax revenues for each year.
Revenue Neutral Carbon Tax Report
Revenue neutrality means that tax reductions must be provided that fully return the estimated revenue from the carbon tax to taxpayers in each fiscal year. Table 1, Revenue Neutral Carbon Tax Report for 2014/15 and 2015/16, reports the carbon tax revenues
Table 1 Revenue Neutral Carbon Tax Report 2014/15 and 2015/16
| | | | Revised | |
| | | | Forecast | |
| | 2014/15 1 | | 2015/16 | |
| | $ millions | |
Carbon tax revenue 2 | | 1,198 | | 1,216 | |
Reduction in provincial revenues due to designated measures 3 | | | | | |
Personal tax measures: | | | | | |
· Low income climate action tax credit of $115.50 per adult plus $34.50 per child effective July 1, 2011 | | (193 | ) | (192 | ) |
· Reduction of 5% in the first two personal income tax rates | | (269 | ) | (283 | ) |
· Northern and rural home owner benefit of $200 4 | | (83 | ) | (83 | ) |
· BC seniors’ home renovation tax credit | | — | | (1 | ) |
· Children’s fitness credit and children’s arts credit | | (8 | ) | (8 | ) |
· Small business venture capital tax credit budget increased | | (3 | ) | (3 | ) |
· Training tax credit extended — individuals | | (9 | ) | (9 | ) |
Total personal tax measures | | (565 | ) | (579 | ) |
Business tax measures: | | | | | |
· General corporate income tax rate reduced from 12% to 11% effective July 1, 2008, to 10.5% effective January 1, 2010, to 10% effective January 1, 2011 and increased to 11% effective April 1, 2013 | | (216 | ) | (218 | ) |
· Small business corporate income tax rate reduced from 4.5% to 3.5% effective July 1, 2008 and to 2.5% effective December 1, 2008 | | (229 | ) | (226 | ) |
· Corporate income tax small business threshold increased from $400,000 to $500,000 | | (21 | ) | (21 | ) |
· Industrial property tax credit of 60% of school property taxes payable by major industry | | (23 | ) | (24 | ) |
· School property taxes reduced by 50% for land classified as “farm” | | (2 | ) | (2 | ) |
· Interactive digital media tax credit | | (37 | ) | (33 | ) |
· Training tax credit extended — businesses | | (6 | ) | (5 | ) |
· Scientific research and experimental development tax credit extended in 2014 | | (82 | ) | (131 | ) |
· Film Incentive BC tax credit extended in 2009 and enhanced in 2010 | | (78 | ) | (106 | ) |
· Production services tax credit extended in 2009 and enhanced in 2010 | | (265 | ) | (385 | ) |
Total business tax measures | | (959 | ) | (1,151 | ) |
Total designated revenue measures | | (1,524 | ) | (1,730 | ) |
1 Based on 2014/15 Public Accounts.
2 The carbon tax applies to fuels and combustibles at rates based on the carbon dioxide equivalent emission of each particular fuel or combustible.
3 Designated measures are measures designated to return carbon tax to taxpayers. Designated measures for 2014/15 are set out in the Carbon Tax Plan presented with Budget 2014 and designated measures for 2015/16 are set out in the Carbon Tax Plan presented with Budget 2015.
4 Eligible homeowners are those in areas outside the Capital, Greater Vancouver and Fraser Valley Regional Districts.
Budget and Fiscal Plan — 2016/17 to 2018/19
56
Tax Measures
and the cost of the tax reductions for the 2014/15 and 2015/16 fiscal years. For the 2014/15 fiscal year, this report is based on the 2014/15 Public Accounts. For the 2015/16 fiscal year, this report is based on preliminary actuals for the fiscal year.
Carbon tax revenues for 2014/15 are $1,198 million. The tax reductions for 2014/15 are those that were designated in the Revenue Neutral Carbon Tax Plan presented with Budget 2014. The personal tax measures are the BC low income climate action tax credit, the five per cent reductions in rates for the first two tax brackets, the northern and rural home owner benefit, the BC seniors’ home renovation tax credit, the children’s fitness credit and children’s arts credit, the increase in the small business venture capital tax credit, and the extension of the training tax credits for individuals. The business tax measures are the reductions in each of the general and small business corporate income tax rates, the corporate income tax small business threshold increase from $400,000 to $500,000, the 50 per cent reduction in school property tax for land classified as “farm,” the interactive digital media tax credit, the extension of the training tax credit for businesses, the extension of the Scientific research and experimental development tax credit, the 2009 extension and 2010 enhancement of the Film Incentive BC tax credit, and a portion of the 2009 extension and 2010 enhancement of the production services tax credit.
The estimated reduction in provincial revenues for 2014/15 as a result of the designated revenue measures is $565 million for the personal tax measures and $959 million for the business tax measures, for a total reduction of $1,524 million. Based on these revenue and tax reduction estimates, revenue neutrality has been met for 2014/15. In fact, the reduction in provincial revenue exceeds the $1,198 million in carbon tax revenue by $326 million.
Carbon tax revenues for 2015/16 are estimated to be $1,216 million.
The tax reductions shown for the 2015/16 fiscal year are those that were designated in the Revenue Neutral Carbon Tax Plan presented with Budget 2015. The personal tax measures are the BC low income climate action tax credit, the five per cent reductions in rates for the first two tax brackets, the northern and rural home owner benefit, the BC seniors’ home renovation tax credit, the children’s fitness credit and children’s arts credit, the increase in the small business venture capital tax credit, and the extension of the training tax credits for individuals. The business tax measures are the reductions in each of the general and small business corporate income tax rates, the corporate income tax small business threshold increase from $400,000 to $500,000, the industrial school property tax credit for major industry, the 50 per cent reduction in school property tax for land classified as “farm,” the interactive digital media tax credit, the extension of the training tax credit for businesses, the extension of the scientific research and experimental development tax credit, the 2009 extension and 2010 enhancement of the Film Incentive BC tax credit, and the 2009 extension and 2010 enhancement of the production services tax credit.
The estimated reduction in provincial revenues for 2015/16 as a result of the designated revenue measures is $579 million for the personal tax measures and $1,151 million for the business tax measures, for a total reduction of $1,730 million. Based on these revenue and tax reduction estimates, revenue neutrality has been met for 2015/16. In fact, the reduction in provincial revenue exceeds the $1,216 million in carbon tax revenue by $514 million. The Budget 2017 Revenue Neutral Carbon Tax Report for 2015/16 will be based on actual carbon tax revenues for 2015/16 as reported in the 2015/16 Public Accounts.
Budget and Fiscal Plan — 2016/17 to 2018/19
57
Tax Measures
Revenue Neutral Carbon Tax Plan
Table 2, the Revenue Neutral Carbon Tax Plan 2016/17 to 2018/19, shows carbon tax revenue and tax reduction cost estimates for the revenue measures designated as those that return the carbon tax revenues to taxpayers for 2016/17 to 2018/19.
Carbon tax revenues for 2016/17 to 2018/19 are now forecast to be slightly lower than estimated when Budget 2015 was prepared.
The three-year fiscal plan for Budget 2016 assumes the cost of tax measures with sunset dates continues, for purposes of the plan, beyond their expiry dates. The Carbon Tax Plan presented in Table 2 reflects this assumption.
As shown in Table 2, revenue from the carbon tax and the cost of the tax reductions are now estimated to be $1,234 million and $1,733 million, respectively, for 2016/17. Carbon tax revenues are now estimated at $1,252 million in 2017/18 and $1,275 million in 2018/19. This means the Carbon Tax Plan is revenue neutral for all years, with the tax cuts in 2017/18 and 2018/19 exceeding the carbon tax revenues by $533 million and $540 million, respectively.
Table 2 Revenue Neutral Carbon Tax Plan 2016/17 to 2018/19
| | Forecast | |
| | 2016/17 | | 2017/18 | | 2018/19 | |
| | $ millions | |
Carbon tax revenue 1 | | 1,234 | | 1,252 | | 1,275 | |
Designated revenue measures: 2 | | | | | | | |
Personal tax measures: | | | | | | | |
· Low income climate action tax credit of $115.50 per adult plus $34.50 per child effective July 1, 2011 | | (195 | ) | (195 | ) | (195 | ) |
· Reduction of 5% in the first two personal income tax rates | | (288 | ) | (302 | ) | (315 | ) |
· Northern and rural home owner benefit of up to $200 3 | | (83 | ) | (84 | ) | (84 | ) |
· BC seniors’ home renovation tax credit | | (2 | ) | (2 | ) | (2 | ) |
· Children’s fitness credit and children’s arts credit | | (8 | ) | (8 | ) | (8 | ) |
· Small business venture capital tax credit budget increased | | (5 | ) | (5 | ) | (5 | ) |
· Training tax credit extended — individuals 2 | | (20 | ) | (20 | ) | (20 | ) |
Total personal tax measures | | (601 | ) | (616 | ) | (629 | ) |
Business tax measures: | | | | | | | |
· General corporate income tax rate reduced from 12% to 11% effective July 1, 2008, to 10.5% effective January 1, 2010, to 10% effective January 1, 2011 and increased to 11% effective April 1, 2013 | | (236 | ) | (250 | ) | (253 | ) |
· Small business corporate income tax rate reduced from 4.5% to 3.5% effective July 1, 2008 and to 2.5% effective December 1, 2008 | | (244 | ) | (256 | ) | (260 | ) |
· Corporate income tax small business threshold increased from $400,000 to $500,000 | | (21 | ) | (21 | ) | (21 | ) |
· Industrial property tax credit of 60% of school property taxes payable by major industry | | (24 | ) | (25 | ) | (25 | ) |
· School property taxes reduced by 50% for land classified as “farm” | | (2 | ) | (2 | ) | (2 | ) |
· Interactive digital media tax credit | | (45 | ) | (45 | ) | (45 | ) |
· Training tax credit extended — businesses 2 | | (10 | ) | (10 | ) | (10 | ) |
· Scientific research and experimental development tax credit extended in 2014 2 | | (150 | ) | (160 | ) | (170 | ) |
· Film Incentive BC tax credit extended in 2009 and enhanced in 2010 | | (90 | ) | (90 | ) | (90 | ) |
· Production services tax credit extended in 2009 and enhanced in 2010 | | (310 | ) | (310 | ) | (310 | ) |
Total business tax measures | | (1,132 | ) | (1,169 | ) | (1,186 | ) |
Total revenue measures | | (1,733 | ) | (1,785 | ) | (1,815 | ) |
1 The carbon tax applies to fuels and combustibles at rates based on the carbon dioxide equivalent emission of each particular fuel or combustible.
2 The Plan assumes that the cost of tax measures with sunset dates continues beyond their expiry dates.
3 Eligible homeowners are those in areas outside the Capital, Greater Vancouver and Fraser Valley Regional Districts.
Budget and Fiscal Plan — 2016/17 to 2018/19
58
Tax Measures
Commission on Tax Competitiveness
British Columbia’s economy is changing. Services are increasingly becoming a more important segment of the economy. Advances in technology are changing the way business is conducted and the way services are provided: banking can be undertaken from one’s smartphone; a person can buy most goods and services online; and some services that used to require a person’s physical presence can be delivered remotely. British Columbia’s population is also changing, getting older. These changes in British Columbia are taking place against the backdrop of a rapidly changing global economy.
British Columbia must continue to prosper in the face of these changes. It must be able to grow - to attract and retain new investment. To do so, it must have a competitive taxation environment.
Some of the Province’s taxes were designed early in the 20th century, for the 20th century British Columbia economy. It is timely to examine if the Province’s taxation regime has kept pace with its changing economy and whether current tax policy encourages business investment and growth as the Province moves further into the 21st century.
The Minister of Finance is establishing a Commission on Tax Competitiveness to examine these questions. The Commission will identify the ways in which the Province’s economy is changing and evaluate the current tax structure within the context of those changes. The Commission will consult with British Columbians and it will make recommendations to government in the fall of 2016.
The names of the members of the Commission, its Chair and the terms of reference for the Commission’s work will be announced following Budget 2016. The terms of reference will allow the Commission to consider a range of options to encourage competitiveness. The scope of the work will explicitly exclude consideration of a return to the harmonized sales tax.
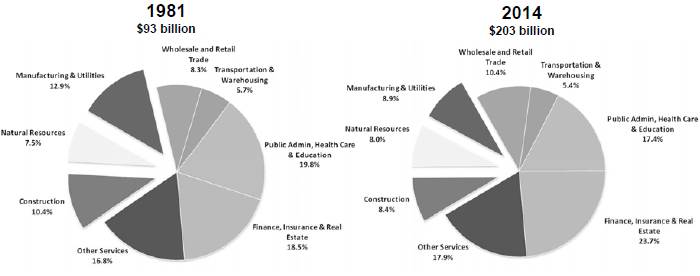
Source: Statistics Canada (2014 GDP at basic prices, chained $2007); BC Stats estimate (1981 GDP at basic prices, chained $2007)
Note: May not add to 100 per cent due to rounding.
Budget and Fiscal Plan — 2016/17 to 2018/19
59
Tax Measures
Film and Television Tax Credits
British Columbia has developed a robust film and television industry over the last 30 years. The industry now employs about 20,000 people, one of the largest skilled labour forces in the sector in Canada. British Columbia has eight major studios with more than 1 million square feet of studio space and diverse filming locations. British Columbia attracts interest from around the world, including Bollywood, the Hindi-language film industry based in Mumbai.
Foreign film and television productions, the vast majority of which are developed for Hollywood, represent about 80 per cent of the total production spending in the province with the remainder being domestic productions meeting Canadian content specifications. Despite incentives in other jurisdictions, British Columbia has long been considered a favoured destination by Hollywood for film and television production because of the province’s skilled and experienced workforce, the certainty and simplicity of British Columbia’s suite of tax credit incentives and a shared time zone with California.
The province’s film tax credits are labour-based credits. That is, the tax credit rate applies to a production’s British Columbia labour costs, thereby effectively reducing labour costs. For productions meeting Canadian content requirements, the basic tax credit
Chart 1 Exchange rate and film tax credit costs
rate is 35 per cent of British Columbia labour spending, and for other productions, the basic tax credit rate is 33 per cent of British Columbia labour spending. Productions can qualify for additional British Columbia tax credits for work done outside the Vancouver area, or for digital animation, visual effects or post-production work. The federal government also provides tax credits worth 25 per cent of labour expenditures for productions meeting Canadian content requirements, and 16 per cent for other productions.
Chart 1 shows that from 2010/11 to 2013/14, the provincial tax credits averaged about $255 million per year when the Canadian and US dollars were near parity. However, with the recent weakening of the Canadian dollar, foreign production activity has increased by over 50 per cent from about $1.1 billion to $1.6 billion in 2014/15. Consequently, the cost of the province’s film tax credits is increasing and is estimated at $493 million in 2015/16.
Chart 2 Breakdown of cost advantage
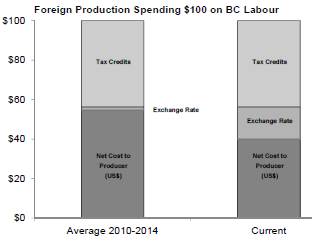
Chart 2 shows the cost advantage for an American production in British Columbia due to the tax credits and the exchange rate. The first bar shows that the net cost to the producer of $100 in spending on British Columbia labour was $58 US from 2010 to 2014. With the Canadian dollar at $0.71 US, the net cost to the producer is only about $40. As an example, at the current exchange rate,
Budget and Fiscal Plan — 2016/17 to 2018/19
60
Tax Measures
the provincial tax credit rate could be reduced by over 50 per cent and still ensure a net cost of British Columbia labour that is less than during the period from 2010 to 2014.
Other jurisdictions have addressed the cost of film tax credits in various ways. Saskatchewan eliminated its tax credits in 2012. Ontario, which noted its increased tax credit cost due to the low Canadian dollar, as well as Quebec and New Brunswick, have reduced their tax credits in recent years. In the US, jurisdictions such as California and New Mexico cap the cost of their tax credits, while North Carolina eliminated its film tax credit altogether in 2015. When industry size is taken into account, British Columbia offers very generous credits, given that the British Columbia industry accounted for approximately $2 billion Canadian in productions in 2014/15, with a tax credit cost of approximately $343 million Canadian. California’s industry is about $17 billion US annually, and the state spends $330 million US on tax credits.
Representatives of the film industry have recognized the pressure the rising cost of film tax credits are having on the government’s fiscal capacity and have approached the government to work together to seek ways to address this pressure. The government has accepted the industry’s offer and will work collaboratively to develop solutions that can be implemented this year. With input from the film industry, the government will limit the growth of film tax credits across 2016/17 through 2018/19, but the cost of the credits will still be the highest amount ever budgeted.
Budget and Fiscal Plan — 2016/17 to 2018/19
61
Tax Measures
Housing Affordability
Housing Affordability
Housing markets in the Vancouver area have historically been expensive due to the pressures of supply and demand. The Metro Vancouver area had a population of about 2.5 million in 2015, is constrained by mountains to the north and east, the border to the south, and the Strait of Georgia to the west.
Population has grown faster in Greater Vancouver than in the rest of the province since the mid-1980s, and the provincial population has grown faster than the rest of Canada. The population of Greater Vancouver in particular has increased 70 per cent over that period, compared to 35 per cent in the rest of Canada. Since 2001, BC economic growth has averaged 2.6 per cent annually, compared to the rest of Canada’s growth rate of 1.9 per cent. The twenty-year trend of declining mortgage rates has made it easier for buyers to carry their mortgage costs.
Chart 1 Housing stock — Vancouver Census Metropolitan Area
In response to these market forces, housing types are changing. As late as the 1980s, more than half of the housing starts in the Vancouver Census Metropolitan Area (Greater Vancouver, excluding Mission and Abbotsford to the east) were single detached units. By 2015, only 22 per cent of new units were single detached units, and the percentage had been even lower in the preceding years. Land for new single family housing is scarce, and some older single-family housing stock is being replaced by townhouses and condominium developments. The most recent data show there are about as many single family dwellings in the Census Metropolitan Area as there were in 1991, but the number of townhouse and condominium units doubled during that time.
Chart 2 MLS Residential Sales — Metro Vancouver 2015
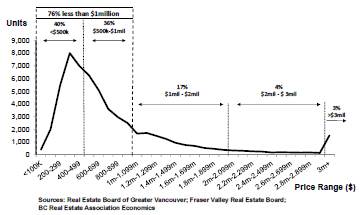
With increasing demand and restricted supply of single-family properties, prices for single family homes in most areas of Greater Vancouver have increased between 45 per cent and 70 per cent over the past five years, while prices for multi-family homes have increased between 15 per cent and 40 per cent.
Any long-term mitigation of housing prices and housing affordability in the Lower Mainland must address adequate supply of affordable new construction, particularly multi-family housing. Without an increase in housing supply, there will simply be more buyers competing in the same market, ultimately driving prices even higher. Increased densification is a tool local governments can employ to promote the construction of affordably priced housing and offset the factors driving prices, such as low interest rates, economic activity, rising population due to in-migration, and in the Lower Mainland especially, a constrained geography.
Budget and Fiscal Plan — 2016/17 to 2018/19
62
Tax Measures
Measures to support the supply of affordably priced homes
In Budget 2016, in order to assist purchasers and help stimulate the housing market to supply moderately priced homes, the government is introducing a full exemption from property transfer tax for purchases of newly built homes up to $750,000 for use as the purchaser’s principal residence. This exemption is directed at Canadian citizens or permanent residents, whether or not they have previously owned residential property. Newly constructed housing eligible for the exemption includes the first purchase of a new housing unit or of a newly subdivided unit. The purchase of land without a home, on which the new owner builds or finishes a home and moves into it within one year, would qualify for a refund of property transfer tax, rather than an exemption at the time of registration.
To get the full exemption or refund, the purchaser will be required to live in the home as a principal residence until one year after the purchase date, and the value of the finished property must be below $750,000. Partial exemptions or refunds are available for properties with a fair market value up to $800,000. The exemption will be available for transfers registered on or after February 17, 2016. A purchaser who buys a home and leaves it vacant is not eligible, and the property will not be eligible for the exemption on a subsequent sale.
The exemption or refund will not be limited to those who have lived in the province for a period of time before purchasing: other Canadians and permanent residents who move to take jobs, start companies, or simply live in British Columbia will be eligible for the New Housing exemption.
The government estimates that approximately 22,000 new homes in British Columbia will be eligible to benefit from the New Housing exemption in 2016. Many of those new homes will be in the Vancouver area. As of January 2016, the price of a typical condominium in Vancouver East is $396,000 and in Vancouver West is $617,000. The typical price of a townhome in Vancouver East is $663,000 and in Vancouver West is $910,000. In Greater Vancouver as a whole, the typical price of a condominium unit is $456,000 and a townhome is $564,000.
The New Housing exemption is a provincial tax tool that directly targets creation of new housing supply at a price-point that is affordable for most purchasers. A purchaser of a new $400,000 home would save $6,000 in property transfer tax while a purchaser of a new $750,000 home would save $13,000. Based on current trends, government estimates the New Housing exemption could save purchasers approximately $75 million in property transfer tax annually.
The cost of this measure will be largely financed by a new, higher property transfer tax rate on high-priced properties. Budget 2016 introduces a third property transfer tax rate of 3 per cent on the value of a property above $2 million. The 1 per cent rate continues to apply on the first $200,000 of property value, the 2 per cent rate continues to apply on the value of a property between $200,000 and $2 million. The new tax rate will apply to transfers registered on or after February 17, 2016. The new tax rate applies on all types of taxable transactions above $2 million, and will raise about $75 million — the approximate cost of the New Housing exemption. In 2014/15, about 2,900 residential transactions and 560 non-residential transactions had fair market values above the new threshold.
Balancing supply and demand in an era of strong net in-migration from elsewhere in Canada and around the world requires a new focus on the efficient support of new housing supply at as low a cost as possible. BC Housing will conduct a study on the key factors affecting housing affordability in British Columbia, which may then contribute to policy making across all levels of government. Government is also exploring ways to make the components of the cost of new housing, such as municipal
Budget and Fiscal Plan — 2016/17 to 2018/19
63
Tax Measures
costs and fees, more transparent to home buyers. The province urges municipal leaders and regional directors, who are responsible for planning, zoning and development regulation, to use the broader tools at their disposal to support the province’s efforts and further the creation of new housing supply.
Affordable housing for lower-income earners
Budget 2016 includes new taxpayer-supported capital spending of $175 million over the three-year fiscal plan, leading to an anticipated total of $355 million over five years by the BC Housing Management Commission. This new spending is anticipated to support more than 2,000 units, helping increase the supply of housing across the province through the construction and renovation of affordable housing for people with low to moderate incomes.
Government has identified a number of projects through the Provincial Investment in Affordable Housing Initiative that can proceed quickly, and are aimed to help those at risk of homelessness, low-income families and individuals, seniors and aboriginals.
Since 2001, government has invested $4.4 billion and added more than 21,000 new units of affordable housing.
Rental-stock housing
Market demand generally determines how much rental housing is built. However, the BC government is actively partnering with municipalities, non-profit societies and other community groups to find innovative ways to create more affordable housing for British Columbians.
For example, the Community Partnership Initiatives program provides development advice and low interest financing to non-profit societies to help them develop affordable housing. So far, that program has contributed to over 3,300 new units of affordable housing.
Government also supports renters accessing housing through programs to help low-income working families and low-income elderly residents afford to pay rent in the private market.
The First Time Home Buyers’ Program
Since the property transfer tax was introduced in 1987, legislatures have been concerned about the effect the tax would have on people trying to purchase their first home. Since 1994, the First Time Home Buyers’ Program has exempted Canadian Citizens and permanent residents who have lived in British Columbia for at least a year and are first-time buyers of moderately priced homes. In fiscal year 2015/16, a total of 22,500 exemptions are projected, up from 21,402 the previous year, with the value of total exemptions approaching a new high of $100 million. The current threshold provides an exemption for first time home buyers who are buying an entry level home. Even in Greater Vancouver, the price of a typical condominium unit is below the threshold.
Other programs available
The Province has a number of programs in place to alleviate some of the financial pressure of home ownership in BC, including: the First Time Home Buyers’ Program, the Home Owner Grant, low-income grant supplements for low-income individuals who lose their additional home owner grant because of the value of their home, and the Property Tax Deferment Program.
Improving data collection to better understand cost drivers
There has been widespread dissatisfaction with the quality of the data pertaining to foreign purchases of real estate property within British Columbia and in the Lower Mainland
Budget and Fiscal Plan — 2016/17 to 2018/19
64
Tax Measures
in particular. BC law allows non-residents to own property in British Columbia, and we welcome those who choose to move to British Columbia, make their lives here and contribute to the economic and social well-being of the province, as these new arrivals have made us stronger and more diverse.
Individuals who purchase property will need to disclose whether or not they are Canadian citizens or permanent residents of Canada. Individuals who are not Canadian citizens or permanent residents of Canada will need to disclose their home country or state. If a property is registered in the name of a corporation, the transferee must disclose the total number of directors, the number of those who are Canadian citizens or permanent residents of Canada, and the name, address and citizenship of all foreign directors.
The province previously collected information on citizenship under the Land Title Act but stopped collecting those data in 1998, largely because of the compliance costs to those who registered property and the fact that the data was seldom if ever used. There is now a consensus that the data are required.
There have also been questions about transfers involving the use of bare trusts, because subsequent transfers are accomplished through revisions to trust documents and share transfers rather than registrations in a land titles office, and as a result these subsequent transfers are not subject to property transfer tax. When the tax was first introduced, the decision was made to tax only registrations in a land title office, and that has remained the construct of the tax. However, in order to better understand the use of this structure, going forward the province will require transferees acting as bare trustees to declare information in relation to settlors and beneficiaries of a trust. For settlors and beneficiaries who are individuals, that will include names, addresses and citizenship. For settlors and beneficiaries which are corporations, that will include the name and address of each director, and their citizenship.
Data collection will begin shortly after the amendments to the Property Transfer Tax Act are in place in order to ensure that the data collection is compliant with other provincial statutes and will allow lawyers and notaries who practice real estate conveyancing to prepare for the new information requirements. Data that is collected will be shared with the Canada Revenue Agency under the existing information exchange agreement between British Columbia and Canada. Previously, information on Canadian citizenship or permanent resident status has only been required in the Property Transfer Tax Act for the administration of certain exemptions such as that for related individuals or under the First Time Home Buyers’ Program.
Budget and Fiscal Plan — 2016/17 to 2018/19
65
Part 3: BRITISH COLUMBIA ECONOMIC REVIEW AND OUTLOOK 1
Summary
Following an estimated increase of 2.4 per cent in 2015, the Ministry of Finance forecasts British Columbia’s economy to grow by 2.4 per cent in 2016 and by 2.3 per cent annually from 2017 to 2020.
The Ministry’s forecast is 0.3 percentage points below the projections provided by the Economic Forecast Council for both 2016 and 2017. This prudence acknowledges the downside risks to the economic forecast and is one of the levels of prudence built into the fiscal plan.
Chart 3.1 British Columbia’s economic outlook
Downside risks to BC’s economic outlook include the potential for a slowdown in North American economic activity, ongoing fragility in Europe, and slower than anticipated Asian demand, particularly in China. Additional risks include uncertainty in the outlook for the Canadian dollar and weak inflation.
British Columbia Economic Activity and Outlook
Indicators of BC’s economic performance in 2015 reveal increased domestic activity relative to 2014, with the exception of non-residential building permits (see Table 3.1). Most indicators show that BC performed well compared to other provinces in 2015 and, as such, an average of six private sector forecasters2 estimate that BC experienced the strongest growth in real GDP among provinces last year. The same private sector forecasters expect BC’s economic growth to rank first among provinces again in 2016 and then tie for first in 2017 (with Ontario). However, provincial outlooks are uncertain, depending in part on the future path of oil prices.
1 Reflects information available as of February 5, 2016, unless otherwise indicated.
2 A subset of the Economic Forecast Council that regularly forecasts economic performance in all provinces (Bank of Montreal, RBC, CIBC, TD, Scotiabank, IHS Global Insight), as of February 5, 2016.
Budget and Fiscal Plan — 2016/17 to 2018/19
British Columbia Economic Review and Outlook
Table 3.1 British Columbia Economic Indicators
| | Third Quarter | | Fourth Quarter | | Annual | |
| | Jul. to Sep. 2015 | | Oct. to Dec. 2015 | | Jan. to Dec. 2015 | |
Data seasonally adjusted unless | | change from | | change from | | change from | |
otherwise noted | | Apr. to Jun. 2015 | | Jul. to Sep. 2015 | | Jan. to Dec. 2014 | |
| | Per cent change | |
Employment | | 1.1 | | 1.1 | | 1.2 | * |
Manufacturing shipments1 | | 0.2 | | -0.7 | | 2.2 | |
Exports | | -0.3 | | -2.1 | | 0.3 | * |
Retail sales1 | | 1.1 | | 1.2 | | 6.8 | |
Housing starts | | -5.0 | | 4.6 | | 10.9 | * |
Non-residential building permits1 | | 2.6 | | -8.9 | | -0.6 | |
* annual non-seasonally adjusted data 1 data to November
The Labour Market
Employment activity in BC picked up in 2015, following a 0.6 per cent gain in 2014. Employment in the province grew by 1.2 per cent (or 27,800 jobs) in 2015, as a gain of 42,100 full-time jobs more than offset a decline of 14,400 part-time jobs. Significant gains were observed in health care and social assistance (+17,600 jobs), manufacturing (+11,100 jobs) and information, culture and recreation (+6,800 jobs), while losses were concentrated in finance, insurance, real estate, rental and leasing (-8,600 jobs), accommodation and food services (-7,800 jobs), and wholesale and retail trade (-5,100 jobs).
The provincial unemployment rate averaged 6.2 per cent in 2015, up 0.1 percentage points from 2014. BC’s labour force increased 1.3 per cent in 2015, its fastest annual rate of growth since 2010.
In January 2016, BC’s economy created 1,200 jobs compared to the previous month (an increase of 0.1 per cent), while the monthly unemployment rate fell 0.1 percentage points to 6.6 per cent. BC’s labour force decreased by 200 persons compared to December 2015.
Chart 3.4 BC employment

Budget and Fiscal Plan — 2016/17 to 2018/19
68
British Columbia Economic Review and Outlook
Outlook
The Ministry forecasts employment in BC to increase by 1.2 per cent in 2016, or approximately 26,900 jobs. The pace of employment growth is expected to remain steady at 1.2 per cent each year from 2017 to 2020. The province’s unemployment rate is expected to average 6.2 per cent in both 2016 and 2017. The rate is then forecast to edge up to around 6.4 per cent over the medium-term.
Consumer Spending and Housing
Momentum continued in BC retail sales in 2015, as sales grew by a solid 6.8 per cent year-to-date to November compared to the same period of 2014 after growing by 5.6 per cent the year before. Among retail segments, the strongest year-to-date gains occurred at motor vehicle and parts dealers, food and beverage stores, and building material and garden equipment and supplies dealers, while the only retail segment to lose ground was gasoline stations (as lower gasoline prices weighed on sales values). In general, BC retail sales were supported by steady employment growth, increased tourism, and a relatively high level of interprovincial migration to the province last year.
Chart 3.3 BC retail sales
BC housing starts grew by 10.9 per cent in 2015 to reach 31,446 units. The pace of housing construction was uneven through the year, with a 16.7 per cent jump in activity in the April to June quarter followed by a 5.0 per cent contraction in the next quarter. More recently, housing starts rose 4.6 per cent in the October to December quarter of 2015. Residential building permits (a leading indicator of future home construction) grew 26.6 per cent year-to-date to November 2015 compared to the first eleven months of 2014.
Budget and Fiscal Plan — 2016/17 to 2018/19
69
British Columbia Economic Review and Outlook
Chart 3.4 BC housing starts

Like new home construction, home sales in BC benefitted from steady employment and population growth amid low interest rates in 2015. Home sales grew 22.0 per cent in 2015 compared to 2014, and home prices rose 12.0 per cent to reach an average of $636,627 last year. While Greater Vancouver and the Fraser Valley recorded the highest growth in home prices among BC regions in 2015, gains were concentrated in the single family component (up 11.3 per cent across the two markets), while price growth was more modest for townhouses and apartments (up 4.5 per cent and 5.9 per cent, respectively). Improving housing activity has helped support the provincial economy in recent years. However, momentum is expected to ease when interest rates eventually rise.
The value of non-residential building permits, which tend to be volatile, fell 0.6 per cent year-to-date to November 2015 compared to the same period of the previous year, after registering an annual increase of 20.0 per cent in 2014. The slight year-to-date decline reflected a 27.5 per cent decrease in the institutional and government category, which was not entirely offset by gains of 65.6 per cent and 3.0 per cent in industrial and commercial permits, respectively.
Outlook
The Ministry forecasts real household consumption of goods and services to increase by 3.0 per cent in 2016 after growing by an estimated 4.1 per cent in 2015. A 2.7 per cent increase in real household spending is expected for 2017, followed by further annual gains of around 2.6 per cent over the medium-term.
Following last year’s estimated increase of 6.5 per cent in BC retail sales, a gain of 4.3 per cent is forecast for 2016. Retail sales are then expected to grow by 3.7 per cent in 2017 and by 3.6 per cent annually from 2018 to 2020.
A slight moderation in residential construction activity is projected this year, as the Ministry forecasts housing starts to total about 29,400 units in 2016 — a decrease of 6.5 per cent from 2015. Starts are expected to slow further in 2017, reaching about 28,000 units, and then average around 27,000 units per year from 2018 to 2020.
Budget and Fiscal Plan — 2016/17 to 2018/19
70
British Columbia Economic Review and Outlook
Business and Government
Real business investment is estimated to have grown by 5.2 per cent in 2015, with a solid increase in residential investment and supporting gains in non-residential, machinery and equipment, and intellectual property investment.
Total real expenditures by federal, provincial and municipal governments are estimated to have increased by 3.1 per cent in 2015, following a slight decline of 0.3 per cent in 2014.
Outlook
Real business investment is projected to rise by 3.8 per cent in 2016, with gains in all investment categories (residential, non-residential, machinery and equipment, and intellectual property). Total business investment is forecast to increase again by 3.8 per cent in 2017, and then soften to around 3.3 per cent growth per year in the medium-term.
The Ministry expects the net operating surplus of corporations to grow by 3.7 per cent in 2016, after an estimated decrease of 1.3 per cent in 2015. Stronger annual growth of 5.0 per cent is forecast in 2017 and 2018, followed by 5.4 per cent growth in each of the next two years.
Combined real spending by the three levels of government (federal, provincial and municipal) on goods and services is expected to increase by 0.4 per cent in 2016, followed by a gain of 0.6 per cent in 2017. Government spending growth is then projected to average about 0.9 per cent annually in the medium-term.
External Trade and Commodity Markets
Unbalanced global demand and declining commodity prices took a toll on the value of BC international merchandise exports in 2015, which increased just 0.3 per cent compared to 2014. While exports to the US grew 3.8 per cent, exports to other major markets — such as China, Japan and South Korea — declined on the year. At the same time, gains were observed in exports of agriculture and food other than fish (+20.6 per cent) and machinery and equipment (+17.6 per cent), while exports declined for energy products (-25.4 per cent) and metallic mineral products (-2.9 per cent).
Chart 3.5 BC exports
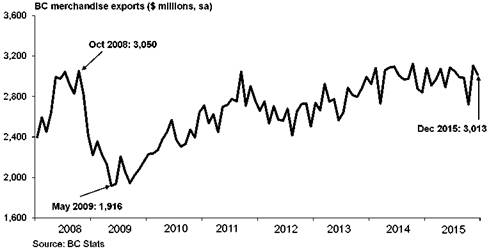
Budget and Fiscal Plan — 2016/17 to 2018/19
71
British Columbia Economic Review and Outlook
Shipments of manufactured goods from BC were modest through the first eleven months of 2015, up 2.2 per cent compared to the same period of the prior year. Notable year-to-date gains were recorded in shipments of furniture and related products (+17.0 per cent), computer and electronic products (+10.2 per cent) and food (+9.6 per cent). During the same period, year-to-date losses occurred in paper (-0.7 per cent) and fabricated metal products (-0.7 per cent).
Widespread declines occurred in forestry, energy and metal prices in 2015. The price of Western spruce-pine-fir (SPF) 2x4 lumber started the year at $332 US/000 board feet in January and finished at $268 US/000 board feet in December. Overall, the price fell 20.0 per cent in 2015 compared to 2014, averaging $282 US/000 board feet for the year.
The price of pulp fell fairly steadily throughout the year, starting at $915 US per tonne in January and reaching $800 US per tonne in December. The annual pulp price averaged $852 US per tonne in 2015, a decrease of 7.9 per cent from 2014.
After falling by roughly 50 per cent in the second half of 2014, oil prices retreated further in 2015 as increases in global oil supply continued to outstrip growth in demand. On average, the daily West Texas Intermediate crude oil price was $48.66 US/barrel in 2015, a decrease of 47.8 per cent compared to the average price of $93.17 US/barrel observed in 2014. Energy sector analysts expect further increases in oil production in 2016 with the easing of economic sanctions on Iran. While a lower price for oil decreases energy costs for BC businesses and households, it negatively impacts Alberta and Saskatchewan — two of BC’s interprovincial trading partners.
The Plant Inlet price of natural gas dropped fairly steadily throughout last year, falling from an average of $3.11 C/GJ in 2014 to $1.38 C/GJ in 2015. The prices of metals and minerals also fared poorly in 2015. Annual declines were observed in prices for molybdenum (-40.9 per cent), copper (-19.9 per cent), silver (-17.8 per cent), lead (-14.8 per cent), aluminum (-11.1 per cent), zinc (-10.9 per cent) and gold (-8.4 per cent).
Outlook
Real exports of goods and services are forecast to rise by 1.5 per cent in 2016, following an estimated increase of 0.3 per cent in 2015. Real exports are then expected to grow by 2.2 per cent in 2017 and around 2.5 per cent per year over the medium-term.
The price of lumber is projected to firm up in 2016, averaging $288 US/000 board feet for the year. The price is then forecast to average $300 US/000 board feet per year from 2017 to 2020.
The price of natural gas is expected to drop to $1.04 C/GJ this fiscal year and then rise gradually over the rest of the forecast horizon to reach $1.61 C/GJ in 2018/19.
Commodity prices may be volatile in the near-term due to ongoing global economic uncertainty, the potential for further slowing of the Chinese economy, and fluctuations in petroleum markets.
Budget and Fiscal Plan — 2016/17 to 2018/19
72
British Columbia Economic Review and Outlook
Demographics
BC’s population on July 1, 2015 was 4.68 million people, 1.0 per cent higher than the 4.64 million people counted on the same date in 2014. During the first three quarters of 2015, BC saw a net inflow of 30,018 people, as the province welcomed 17,038 individuals from other countries and 12,980 individuals from other provinces.
Outlook
The forecast calls for BC’s July 1st population to increase by 1.2 per cent in 2016 (to reach a total of 4.74 million people), by 1.3 per cent in 2017, and by around 1.3 per cent each year over the medium-term.
Total net migration is expected to rise in 2016 to reach a net inflow of about 48,200 persons. Net entry of about 13,000 people from other provinces is forecast in 2016, along with an anticipated net gain of about 35,200 people from other countries. For 2017, the Ministry forecasts a total net inflow of around 51,600 individuals, followed by continued net inflows averaging about 51,600 individuals per year over the medium-term.
Inflation
Consumer prices in BC increased by 1.1 per cent in 2015 compared to the previous year, with rising prices for services as well as durable, semi-durable, and non-durable goods. Rising prices at restaurants supported the overall price of services and rising prices for automobiles lifted the price of durables, while higher clothing and footwear prices provided upward inflationary pressure for semi-durable goods. Meanwhile, the price for non-durables increased in 2015 as substantial price gains for items such as food and electricity more than offset falling prices for gasoline and natural gas.
Chart 3.6 BC inflation
Outlook
Consumer price inflation in BC is forecast to be 1.9 per cent in 2016, and then 2.0 per cent each year from 2017 to 2020. The Canadian rate of inflation is assumed to be 2.0 per cent annually from 2016 to 2020, in line with the Bank of Canada’s inflation target.
Budget and Fiscal Plan — 2016/17 to 2018/19
73
British Columbia Economic Review and Outlook
Risks to the Economic Outlook
Risks to the BC economic outlook continue to be weighted to the downside. The main risks to the current outlook include the following:
· potential for a slowdown in domestic and Canadian economic activity;
· renewed weakness in the US economy, particularly as interest rates increase;
· fragility in Europe as governments and the financial system deal with elevated sovereign debt alongside weak economic growth;
· slower than anticipated economic activity in Asia, particularly in China, resulting in weaker demand for BC’s exports and downward pressure on global commodity prices;
· weaker than expected inflation; and
· exchange rate uncertainty.
External Outlook
United States
The US economy grew in each quarter of 2015. However, the pace of growth moderated towards the end of the year, growing by 0.7 per cent in the October to December quarter. For 2015 as a whole, US real GDP grew by 2.4 per cent, unchanged from the annual gain observed in 2014. Improving personal consumption expenditures on goods and services, residential investment, and investment in intellectual property products supported US real GDP growth for the year. Meanwhile, decreasing goods exports, national defense spending and fixed investment in non-residential structures, along with increasing imports (which detract from GDP), weighed on growth.
Chart 3.7 US economic growth
Budget and Fiscal Plan — 2016/17 to 2018/19
74
British Columbia Economic Review and Outlook
The US labour market continued to strengthen in 2015. The economy added about 228,000 jobs each month on average, resulting in a 2.1 per cent annual increase in US employment. At the same time, the unemployment rate decreased to 5.3 per cent from an average of 6.2 per cent in 2014 and average hourly earnings grew 2.3 per cent in 2015 after increasing 2.1 per cent the year prior. However, the labour force participation rate continued to retreat for a seventh consecutive year, with only 62.7 per cent of Americans who were eligible to work choosing to participate in the labour market in 2015 (a 38 year low).
Activity in the American housing market was somewhat uneven through 2015, although annual gains were observed in all major indicators. US existing home sales grew 6.3 per cent annually despite declining sales in the October to December quarter. New home sales grew 14.6 per cent on the year despite a downward monthly trend from February through September. Similarly, while homebuilding increased 10.8 per cent year-over-year to reach 1.11 million new homes in 2015, the monthly pace of homebuilding was relatively flat through the second half of last year. However, US residential building permits increased by 12.0 per cent in 2015 compared to 2014, with a solid 7.4 per cent gain in the final quarter of the year, suggesting that US homebuilding will continue to recover heading into 2016.
Chart 3.8 US housing starts
Retail activity in the US increased by only 2.1 per cent in 2015 following a gain of 3.9 per cent the previous year, as very weak annual price inflation (of only 0.1 per cent in 2015) weighed on the value of retail sales. Meanwhile, after posting steady increases through 2014, confidence among American consumers remained relatively flat in 2015 with consumers generally more optimistic about their present conditions than their future economic prospects.
Budget and Fiscal Plan — 2016/17 to 2018/19
75
British Columbia Economic Review and Outlook
Chart 3.9 US Consensus outlook for 2016
Outlook
The January 2016 Consensus forecasts the US economy to grow by 2.4 per cent this year, lower than earlier forecasts partly due to the growing challenges for export-oriented businesses and the energy sector from a strong currency and weak commodity prices, respectively. For 2017, Consensus pegs US growth at 2.5 per cent.
In recognition of ongoing downside risks, the Ministry’s assumptions for US growth are prudent compared to the January 2016 Consensus. The Ministry assumes that US real GDP will expand by 2.2 per cent in 2016 and then 2.3 per cent per year through the remainder of the forecast horizon.
Table 3.2 US Real GDP Forecast: Consensus vs Ministry of Finance
| | 2016 | | 2017 | |
| | Per cent change in real GDP | |
Ministry of Finance | | 2.2 | | 2.3 | |
Consensus Economics (January 2016) | | 2.4 | | 2.5 | |
Canada
The low commodity price environment weighed heavily on the Canadian economy in 2015, leading to a recession (with two consecutive quarters of negative real GDP growth) in the first half of the year. A pickup in goods exports alongside relatively steady growth in household final consumption expenditure helped the economy return to positive growth in the July to September quarter of 2015. However, business gross fixed capital formation declined through all three quarters of the year, an indication of the ongoing negative impact of low oil and other commodity prices.
Budget and Fiscal Plan — 2016/17 to 2018/19
76
British Columbia Economic Review and Outlook
Chart 3.10 Canadian economic growth

Following an annual gain of 111,100 jobs (or 0.6 per cent) in 2014, Canadian employment increased by 144,400 jobs (or 0.8 per cent) in 2015. Job gains were concentrated in the services-producing sector (+171,100 jobs), while the goods-producing sector experienced significant jobs losses (-26,700 jobs). The national unemployment rate trended upwards through 2015, reversing the reductions observed in late 2014. As such, the unemployment rate averaged 6.9 per cent in both years. In January 2016, the Canadian labour market lost 5,700 jobs compared to December 2015, while the unemployment rate edged up to 7.2 per cent from 7.1 per cent the previous month.
Also domestically, retail sales grew 2.2 per cent year-to-date to November 2015, a notable deceleration from the 4.6 per cent annual growth observed in 2014. Annual residential construction activity increased 3.3 per cent, with Canadian builders breaking ground on 195,500 new homes in 2015. Home sales also advanced in 2015, up 5.5 per cent over the previous year despite double-digit declines in Alberta (-21.3 per cent) and Saskatchewan (-10.7 per cent). Meanwhile, Canadian home prices rose 8.5 per cent in 2015 compared to 2014.
Declining commodity prices and slowing growth in many international economies weakened Canadian exports in 2015, more than outweighing the support provided by improving US demand and a lower exchange rate. Overall, Canadian exports dropped 2.5 per cent in 2015 compared to 2014. Weakness was concentrated in exports of energy products (-31.3 per cent), while significant gains occurred in exports of consumer products (+18.1 per cent) and motor vehicles and parts (+15.2 per cent). Canadian manufacturing shipments were also weak in the first eleven months of 2015, falling 1.6 per cent year-to-date to November compared to the same period of 2014. Major year-to-date losses were observed in shipments of petroleum and coal products (-28.8 per cent) and primary metals (-6.0 per cent).
Budget and Fiscal Plan — 2016/17 to 2018/19
77
British Columbia Economic Review and Outlook
Chart 3.11 Consensus outlook for Canada in 2016
Outlook
Consensus forecasts for Canadian real GDP growth in 2016 were steady through most of 2015 at around 2.1 per cent. However, the forecast was revised down in recent months to reach 1.7 per cent in January 2016, in part reflecting the release of weak monthly industrial GDP reports for September and October alongside continued declines in oil prices. According to the January 2016 Consensus, Canadian real GDP is expected to grow by 2.2 per cent for 2017.
Due to the potential for greater than anticipated weakness in commodity markets and the global economy, the Ministry assumes that the Canadian economy will expand by 1.4 per cent in 2016, 1.9 per cent in 2017, and then 2.1 per cent per year over the medium-term.
Table 3.3 Canadian Real GDP Forecast: Consensus vs Ministry of Finance
| | 2016 | | 2017 | |
| | Per cent change in real GDP | |
Ministry of Finance | | 1.4 | | 1.9 | |
Consensus Economics (January 2016) | | 1.7 | | 2.2 | |
Europe
The pace of economic growth in Europe softened through 2015, starting at 2.2 per cent annualized growth in the January to March quarter, then slowing to 1.6 per cent the next quarter and 1.2 per cent in the July to September quarter. Nevertheless, real GDP growth in 2015 is on track to beat the 0.9 per cent and -0.3 per cent annual growth recorded in 2014 and 2013, respectively. Similarly, euro zone industrial production grew 1.5 per cent year-to-date to November 2015 compared to the same period the year before,
Budget and Fiscal Plan — 2016/17 to 2018/19
78
British Columbia Economic Review and Outlook
an improvement from the 0.8 per cent growth in 2014 and 0.7 per cent contraction in 2013. However, economic conditions continue to vary widely across the currency union, with unemployment rates ranging from 4.5 per cent in Germany and the Czech Republic (as of December 2015) to 24.5 per cent in Greece (as of October 2015, the latest data available). Furthermore, consumer price inflation remains very low, averaging 0.2 per cent year-over-year across the euro zone in December 2015 despite years of aggressive monetary stimulus.
In response to persistently slow inflation, the European Central Bank (ECB) lowered the interest rate on the deposit facility (the rate paid on banks’ deposits with the central bank) by 10 basis points to -0.30 per cent in December 2015, after first lowering it into negative territory the year prior. Also in December 2015, the ECB extended the anticipated timeframe of its asset purchase program — first introduced in 2014 then expanded in early 2015 — by an additional six months to at least the end of March 2017. While no further actions were taken by the ECB in January 2016, the Bank suggested that additional stimulus measures may be introduced later in the year.
Chart 3.12 Consensus outlook for the euro zone in 2016
Outlook
Consensus expectations for euro zone economic growth in 2016 remained relatively steady over the past year, registering at 1.6 per cent in January 2015 and then 1.7 per cent one year later. For 2017, the January 2016 Consensus pegged euro zone real GDP growth at 1.7 per cent as well. Meanwhile, the Ministry prudently assumes that the euro zone’s economy will expand by 1.4 per cent in both 2016 and 2017.
China
Growth of the Chinese economy continued to slow in 2015. Real investment in fixed assets grew 12.0 per cent in 2015, 2.9 percentage points slower than the year before, while manufacturing sector surveys indicated falling factory activity for ten consecutive months through to December 2015. At the same time, the total value of Chinese exports and imports fell on the year, down 1.8 per cent and 13.2 per cent, respectively,
Budget and Fiscal Plan — 2016/17 to 2018/19
79
British Columbia Economic Review and Outlook
compared to 2014. However, retail sales advanced by 10.7 per cent in 2015 and the share of final consumption expenditure in the economy rose to 66.4 per cent of GDP in 2015 (up 15.4 percentage points from 2014) — consistent with the Chinese government’s goal of rebalancing the economy towards domestic consumption. Altogether, Chinese real GDP expanded by 6.9 per cent in 2015, on par with the official target of “near 7.0 per cent” but registering the lowest annual rate of growth since 1990 and the fifth consecutive slowdown in the annual pace of economic activity.
Slowing economic growth prompted various stimulus measures from Chinese authorities over the past year or so. Measures included successive interest rate cuts, reductions in bank reserve requirements, infrastructure spending programs and currency market interventions. Official data indicate that these measures helped temper the rate of economic deceleration in China. However, significant fluctuations in Chinese equity and currency markets occurred during the year. Although the outlook for the economy remains uncertain, Chinese officials expect growth of more than 6.5 per cent over the medium-term.
Outlook
The January 2016 Consensus forecasts China’s real GDP to grow by 6.5 per cent in 2016 and 6.3 per cent in 2017. Due to the potential for greater-than-expected slowing in the Chinese economy, the Ministry assumes that China’s real GDP will expand by 6.2 per cent in 2016 and then 6.1 per cent the following year.
Financial Markets
Interest rates
After holding at 1.00 per cent since September 2010, the Bank of Canada lowered its target for the overnight rate by 25 basis points in both January and July 2015 largely in response to the negative impacts of falling oil prices on the Canadian economy. The rate has been held at 0.50 per cent since July. In its January Monetary Policy Report, the Bank pointed to resilient national employment alongside ongoing declines in oil prices and weaker business investment as explanations for its decision to hold the target rate at its current level. The Bank also noted that the Canadian economy is undergoing a long process of reorientation towards non-resource sectors. Looking ahead, the central bank expects Canadian price inflation to return to its target rate of 2.0 per cent by early 2017.
In contrast to easing measures by the Bank of Canada, the US Federal Reserve increased its intended federal funds rate from the 0.00 to 0.25 per cent range to the 0.25 to 0.50 per cent range in December 2015 — the first change in the fed funds rate since December 2008. In its accompanying press release, the Fed noted further improvement in the labour market along with increased household spending and business fixed investment despite soft net exports and inflation. More recently, the Fed opted to leave the fed funds rate unchanged in January 2016 and reiterated its expectation that future rate increases will be gradual.
Outlook
Based on the average of six private sector forecasts as of January 4, 2016, the Ministry assumes that the Bank of Canada will hold the overnight target rate at 0.5 per cent until the last quarter of 2016. The rate is expected to average 0.5 per cent in 2016 and 1.0 per cent in 2017.
Budget and Fiscal Plan — 2016/17 to 2018/19
80
British Columbia Economic Review and Outlook
Chart 3.13 Interest rate forecasts
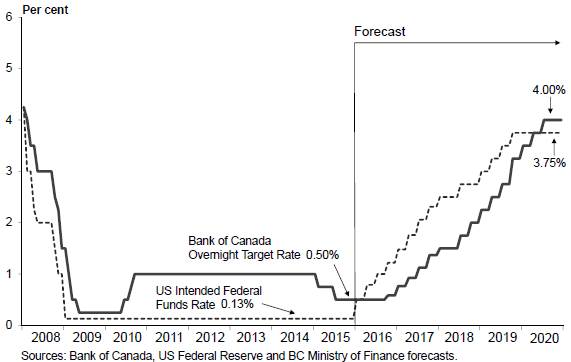
The same six private sector forecasters anticipate that the fed funds rate will increase slowly through 2016 and 2017. They forecast the fed funds rate to average 0.9 per cent in 2016 and 1.9 per cent in 2017.
Canadian three month Treasury bill interest rates are expected to average 0.5 per cent in 2016 and 1.1 per cent in 2017, according to the same six private sector forecasters. Meanwhile, ten-year Government of Canada bond rates are forecast at 1.8 per cent in 2016 and 2.5 per cent in 2017 on average.
Table 3.4 Private Sector Canadian Interest Rate Forecasts
| | 3-month Treasury Bill | | 10-year Government Bond | |
Average annual interest rate (per cent) | | 2016 | | 2017 | | 2016 | | 2017 | |
IHS Global Insight | | 0.5 | | 1.4 | | 1.8 | | 2.3 | |
CIBC | | 0.4 | | 0.7 | | 1.7 | | 2.3 | |
Bank of Montreal | | 0.5 | | na | | 1.6 | | na | |
Scotiabank | | 0.5 | | 1.1 | | 2.0 | | 2.9 | |
TD | | 0.5 | | 0.5 | | 1.8 | | 2.2 | |
RBC | | 0.6 | | 1.6 | | 2.0 | | 2.9 | |
Average (as of January 4, 2016) | | 0.5 | | 1.1 | | 1.8 | | 2.5 | |
Exchange rate
The Canadian dollar averaged 78.2 US cents in 2015, down 12.3 US cents (or almost 14 per cent) from 2014. This depreciation continued a trend underway since late 2012 when the dollar was near parity with its US counterpart. However, the pace of depreciation accelerated in the final months of 2014 and through 2015 alongside a sustained pullback in commodity prices, an improving US economy, and an emerging divergence in Canadian and US monetary policy (with two rate cuts by the Bank of Canada and a rate increase by the US Federal Reserve). The loonie continued to trend lower through the first few weeks of 2016, reaching 68.5 US cents on January 20, before rising to 72.1 US cents as of February 5, 2016.
Budget and Fiscal Plan — 2016/17 to 2018/19
81
British Columbia Economic Review and Outlook
Chart 3.14 Private sector expectations for the Canadian dollar

Outlook
On average, six private sector forecasters as of January 4, 2016 expect the Canadian dollar to average 73.1 US cents in 2016 and 76.8 US cents in 2017. The Ministry’s exchange rate outlook is based on these private sector forecasts.
Table 3.5 Private Sector Exchange Rate Forecasts
Average annual exchange rate (US cents/Can $) | | 2016 | | 2017 | |
IHS Global Insight | | 75.2 | | 79.9 | |
CIBC | | 73.0 | | 75.4 | |
Bank of Montreal | | 71.4 | | 75.6 | |
Scotiabank | | 72.4 | | 75.5 | |
TD | | 73.1 | | 76.7 | |
RBC | | 73.3 | | 77.5 | |
Average (as of January 4, 2016) | | 73.1 | | 76.8 | |
Budget and Fiscal Plan — 2016/17 to 2018/19
82
British Columbia Economic Review and Outlook
Table 3.6.1 Gross Domestic Product (GDP): British Columbia
| | | | | | Forecast | |
| | 2014 | | 2015 e | | 2016 | | 2017 | | 2018 | | 2019 | | 2020 | |
| | | | | | | | | | | | | | | |
Gross Domestic Product at Market Prices: | | | | | | | | | | | | | | | |
– Real (chained 2007 $ billions) | | 222.9 | | 228.2 | | 233.6 | | 239.1 | | 244.7 | | 250.3 | | 256.0 | |
(% change) | | 3.2 | | 2.4 | | 2.4 | | 2.3 | | 2.3 | | 2.3 | | 2.3 | |
– Nominal (current prices, $ billions) | | 237.2 | | 245.0 | | 254.8 | | 265.7 | | 277.0 | | 289.0 | | 301.4 | |
(% change) | | 4.7 | | 3.3 | | 4.0 | | 4.3 | | 4.3 | | 4.3 | | 4.3 | |
– GDP price deflator (2007 = 100) | | 106.4 | | 107.4 | | 109.1 | | 111.1 | | 113.2 | | 115.5 | | 117.7 | |
(% change) | | 1.4 | | 0.9 | | 1.6 | | 1.9 | | 1.9 | | 2.0 | | 2.0 | |
Real GDP per person (chained 2007 $) | | 48,048 | | 48,723 | | 49,281 | | 49,793 | | 50,310 | | 50,838 | | 51,364 | |
(% change) | | 2.0 | | 1.4 | | 1.1 | | 1.0 | | 1.0 | | 1.0 | | 1.0 | |
Real GDP per employed person (% change) | | 2.6 | | 1.1 | | 1.2 | | 1.1 | | 1.1 | | 1.1 | | 1.1 | |
Unit labour cost1 (% change) | | 0.6 | | 0.9 | | 1.5 | | 1.7 | | 1.7 | | 1.7 | | 1.7 | |
| | | | | | | | | | | | | | | |
Components of Real GDP at Market Prices (chained 2007 $ billions) | | | | | | | |
| | | | | | | | | | | | | | | |
Household expenditure on goods and services | | 140.4 | | 146.2 | | 150.5 | | 154.6 | | 158.6 | | 162.6 | | 166.9 | |
(% change) | | 3.5 | | 4.1 | | 3.0 | | 2.7 | | 2.5 | | 2.6 | | 2.6 | |
– Goods | | 56.5 | | 59.6 | | 61.2 | | 62.6 | | 63.9 | | 65.3 | | 66.6 | |
(% change) | | 4.2 | | 5.4 | | 2.7 | | 2.3 | | 2.1 | | 2.1 | | 2.1 | |
– Services | | 83.8 | | 86.5 | | 89.3 | | 92.0 | | 94.5 | | 97.2 | | 100.1 | |
(% change) | | 3.1 | | 3.3 | | 3.1 | | 3.0 | | 2.8 | | 2.9 | | 2.9 | |
NPISH2 expenditure on goods and services | | 3.4 | | 3.4 | | 3.4 | | 3.4 | | 3.4 | | 3.5 | | 3.5 | |
(% change) | | 0.1 | | 0.4 | | 0.6 | | 0.9 | | 0.9 | | 0.9 | | 0.9 | |
Government expenditure on goods and services | | 39.1 | | 40.3 | | 40.5 | | 40.7 | | 41.2 | | 41.5 | | 41.8 | |
(% change) | | -0.3 | | 3.1 | | 0.4 | | 0.6 | | 1.2 | | 0.7 | | 0.7 | |
Investment in fixed capital | | 50.9 | | 53.4 | | 55.5 | | 56.8 | | 58.4 | | 60.0 | | 61.6 | |
(% change) | | 6.2 | | 5.0 | | 3.9 | | 2.4 | | 2.8 | | 2.8 | | 2.7 | |
Final domestic demand | | 233.6 | | 243.1 | | 249.7 | | 255.4 | | 261.3 | | 267.3 | | 273.4 | |
(% change) | | 3.4 | | 4.1 | | 2.7 | | 2.3 | | 2.3 | | 2.3 | | 2.3 | |
Exports of goods and services | | 90.3 | | 90.6 | | 91.9 | | 93.9 | | 96.2 | | 98.7 | | 101.3 | |
(% change) | | 2.7 | | 0.3 | | 1.5 | | 2.2 | | 2.4 | | 2.5 | | 2.7 | |
Imports of goods and services | | 101.4 | | 104.7 | | 107.1 | | 109.4 | | 112.0 | | 115.0 | | 118.1 | |
(% change) | | 4.7 | | 3.2 | | 2.3 | | 2.2 | | 2.4 | | 2.6 | | 2.8 | |
Inventory change | | 1.5 | | 0.2 | | 0.1 | | 0.2 | | 0.1 | | 0.2 | | 0.3 | |
Statistical discrepancy | | 0.2 | | 0.2 | | 0.2 | | 0.2 | | 0.2 | | 0.2 | | 0.2 | |
Real GDP at market prices | | 222.9 | | 228.2 | | 233.6 | | 239.1 | | 244.7 | | 250.3 | | 256.0 | |
(% change) | | 3.2 | | 2.4 | | 2.4 | | 2.3 | | 2.3 | | 2.3 | | 2.3 | |
1 Unit labour cost is the nominal cost of labour incurred to produce one unit of real output.
2 Non-profit institutions serving households.
e Ministry of Finance estimate.
Budget and Fiscal Plan — 2016/17 to 2018/19
83
British Columbia Economic Review and Outlook
Table 3.6.2 Selected Nominal Income and Other Indicators: British Columbia
| | | | | | Forecast | |
| | 2014 | | 2015 | | 2016 | | 2017 | | 2018 | | 2019 | | 2020 | |
Compensation of employees1 ($ millions) | | 118,947 | | 122,872 | e | 127,710 | | 132,865 | | 138,313 | | 143,977 | | 149,825 | |
(% change) | | 3.9 | | 3.3 | | 3.9 | | 4.0 | | 4.1 | | 4.1 | | 4.1 | |
Household income ($ millions) | | 210,217 | | 216,925 | e | 224,743 | | 233,565 | | 242,619 | | 252,073 | | 261,843 | |
(% change) | | 3.2 | | 3.2 | | 3.6 | | 3.9 | | 3.9 | | 3.9 | | 3.9 | |
Net operating surplus ($ millions) | | 22,374 | | 22,080 | e | 22,893 | | 24,042 | | 25,238 | | 26,609 | | 28,042 | |
(% change) | | 8.4 | | -1.3 | | 3.7 | | 5.0 | | 5.0 | | 5.4 | | 5.4 | |
Retail sales ($ millions) | | 66,273 | | 70,577 | e | 73,577 | | 76,295 | | 79,029 | | 81,847 | | 84,768 | |
(% change) | | 5.6 | | 6.5 | | 4.3 | | 3.7 | | 3.6 | | 3.6 | | 3.6 | |
Housing starts (units) | | 28,356 | | 31,446 | | 29,403 | | 28,039 | | 27,037 | | 27,036 | | 27,037 | |
(% change) | | 4.8 | | 10.9 | | -6.5 | | -4.6 | | -3.6 | | 0.0 | | 0.0 | |
Consumer price index (2002 = 100) | | 118.9 | | 120.2 | | 122.5 | | 124.9 | | 127.5 | | 130.0 | | 132.7 | |
(% change) | | 1.0 | | 1.1 | | 1.9 | | 2.0 | | 2.0 | | 2.0 | | 2.0 | |
1 Domestic basis; wages, salaries and employers’ social contributions.
e Ministry of Finance estimate.
Table 3.6.3 Labour Market Indicators: British Columbia
| | | | | | Forecast | |
| | 2014 | | 2015 | | 2016 | | 2017 | | 2018 | | 2019 | | 2020 | |
Population (thousands at July 1) | | 4,638 | | 4,683 | | 4,741 | | 4,802 | | 4,863 | | 4,924 | | 4,984 | |
(% change) | | 1.2 | | 1.0 | | 1.2 | | 1.3 | | 1.3 | | 1.3 | | 1.2 | |
| | | | | | | | | | | | | | | |
Net migration (thousands) | | | | | | | | | | | | | | | |
– International1,4 | | 34.0 | | 32.1 | e | 35.2 | | 39.1 | | 39.3 | | 39.5 | | 40.0 | |
– Interprovincial4 | | 12.6 | | 13.5 | e | 13.0 | | 12.5 | | 12.0 | | 12.0 | | 12.0 | |
– Total | | 46.6 | | 45.6 | e | 48.2 | | 51.6 | | 51.3 | | 51.5 | | 52.0 | |
Labour force population2 (thousands) | | 3,830 | | 3,877 | | 3,929 | | 3,981 | | 4,034 | | 4,085 | | 4,137 | |
(% change) | | 1.1 | | 1.2 | | 1.3 | | 1.3 | | 1.3 | | 1.3 | | 1.3 | |
Labour force (thousands) | | 2,425 | | 2,458 | | 2,488 | | 2,517 | | 2,550 | | 2,585 | | 2,615 | |
(% change) | | 0.0 | | 1.3 | | 1.2 | | 1.2 | | 1.3 | | 1.4 | | 1.2 | |
Participation rate3 (%) | | 63.3 | | 63.4 | | 63.3 | | 63.2 | | 63.2 | | 63.3 | | 63.2 | |
Employment (thousands) | | 2,278 | | 2,306 | | 2,333 | | 2,360 | | 2,390 | | 2,419 | | 2,448 | |
(% change) | | 0.6 | | 1.2 | | 1.2 | | 1.2 | | 1.2 | | 1.2 | | 1.2 | |
Unemployment rate (%) | | 6.1 | | 6.2 | | 6.2 | | 6.2 | | 6.3 | | 6.4 | | 6.4 | |
1 International migration includes net non-permanent residents and returning emigrants less net temporary residents abroad.
2 The civilian, non-institutionalized population 15 years of age and over.
3 Percentage of the labour force population in the labour force.
4 Components may not sum to total due to rounding.
e BC Stats estimate.
Budget and Fiscal Plan — 2016/17 to 2018/19
84
British Columbia Economic Review and Outlook
Table 3.6.4 Major Economic Assumptions
| | | | | | Forecast | |
| | 2014 | | 2015 | | 2016 | | 2017 | | 2018 | | 2019 | | 2020 | |
Real GDP | | | | | | | | | | | | | | | |
Canada (chained 2007 $ billions) | | 1,748 | | 1,769 | e | 1,793 | | 1,828 | | 1,866 | | 1,905 | | 1,945 | |
(% change) | | 2.5 | | 1.2 | | 1.4 | | 1.9 | | 2.1 | | 2.1 | | 2.1 | |
US (chained 2009 US$ billions) | | 15,962 | | 16,342 | | 16,701 | | 17,085 | | 17,478 | | 17,880 | | 18,292 | |
(% change) | | 2.4 | | 2.4 | | 2.2 | | 2.3 | | 2.3 | | 2.3 | | 2.3 | |
Japan (chained 2005 Yen trillions) | | 526 | | 529 | e | 533 | | 535 | | 541 | | 546 | | 552 | |
(% change) | | -0.1 | | 0.6 | | 0.8 | | 0.4 | | 1.0 | | 1.0 | | 1.0 | |
China (constant 2005 US$ billions) | | 5,274 | | 5,638 | | 5,988 | | 6,353 | | 6,740 | | 7,152 | | 7,588 | |
(% change) | | 7.4 | | 6.9 | | 6.2 | | 6.1 | | 6.1 | | 6.1 | | 6.1 | |
Euro zone1 (% change) | | 0.9 | | 1.4 | e | 1.4 | | 1.4 | | 1.4 | | 1.4 | | 1.4 | |
Industrial production index | | | | | | | | | | | | | | | |
US (2012 = 100) | | 105.7 | | 107.1 | | 108.4 | | 110.8 | | 113.4 | | 116.1 | | 118.9 | |
(% change) | | 3.7 | | 1.3 | | 1.2 | | 2.2 | | 2.4 | | 2.4 | | 2.4 | |
Japan (2010 = 100) | | 98.8 | | 97.8 | | 98.8 | | 99.7 | | 100.7 | | 101.8 | | 102.8 | |
(% change) | | 1.9 | | -1.0 | | 1.0 | | 1.0 | | 1.0 | | 1.0 | | 1.0 | |
China (% change) | | 8.3 | | 6.1 | | 5.6 | | 5.3 | | 5.5 | | 5.5 | | 5.5 | |
Euro zone1 (2010 = 100) | | 101.0 | | 102.3 | e | 103.8 | | 105.2 | | 106.7 | | 108.2 | | 109.7 | |
(% change) | | 0.8 | | 1.3 | | 1.4 | | 1.4 | | 1.4 | | 1.4 | | 1.4 | |
Housing starts2 (thousands) | | | | | | | | | | | | | | | |
Canada | | 189 | | 196 | | 175 | | 170 | | 180 | | 180 | | 180 | |
(% change) | | 0.7 | | 3.3 | | -10.5 | | -2.9 | | 5.9 | | 0.0 | | 0.0 | |
US | | 1,003 | | 1,111 | | 1,100 | | 1,100 | | 1,100 | | 1,100 | | 1,100 | |
(% change) | | 8.5 | | 10.8 | | -1.0 | | 0.0 | | 0.0 | | 0.0 | | 0.0 | |
Japan | | 894 | | 909 | | 910 | | 860 | | 880 | | 880 | | 880 | |
(% change) | | -8.8 | | 1.8 | | 0.1 | | -5.5 | | 2.3 | | 0.0 | | 0.0 | |
Consumer price index | | | | | | | | | | | | | | | |
Canada (2002 = 100) | | 125.2 | | 126.6 | | 129.1 | | 131.7 | | 134.3 | | 137.0 | | 139.8 | |
(% change) | | 2.0 | | 1.1 | | 2.0 | | 2.0 | | 2.0 | | 2.0 | | 2.0 | |
Canadian interest rates (%) | | | | | | | | | | | | | | | |
3-month treasury bills | | 0.9 | | 0.5 | | 0.5 | | 1.1 | | 1.7 | | 2.7 | | 3.8 | |
10-year government bonds | | 2.2 | | 1.5 | | 1.8 | | 2.5 | | 3.4 | | 4.4 | | 5.0 | |
United States interest rates (%) | | | | | | | | | | | | | | | |
3-month treasury bills | | 0.0 | | 0.1 | | 0.7 | | 1.8 | | 2.6 | | 3.3 | | 3.6 | |
10-year government bonds | | 2.5 | | 2.1 | | 2.6 | | 3.1 | | 3.9 | | 4.8 | | 5.0 | |
Exchange rate (US cents / Canadian $) | | 90.5 | | 78.2 | | 73.1 | | 76.8 | | 79.7 | | 81.8 | | 82.8 | |
British Columbia goods and services | | | | | | | | | | | | | | | |
Export price deflator (% change) | | 3.2 | | 2.6 | e | 3.7 | | 3.1 | | 2.9 | | 2.8 | | 2.6 | |
1 Euro zone (18) is Austria, Belgium, Cyprus, Estonia, Finland, France, Germany, Greece, Ireland, Italy, Latvia, Luxembourg, Malta, Netherlands, Portugal, Slovakia, Slovenia and Spain.
2 British Columbia housing starts appear in Table 3.6.2.
e Ministry of Finance estimate.
Budget and Fiscal Plan — 2016/17 to 2018/19
85
British Columbia Economic Review and Outlook
The Economic Forecast Council, 2016
Introduction
In accordance with the Budget Transparency and Accountability Act, the Minister of Finance, in preparing each year’s provincial budget, consults the Economic Forecast Council (the Council) on British Columbia’s economic outlook. The Council is comprised of 13 leading economists from several of Canada’s major banks and private research institutions.
The most recent meeting between the Minister and Council occurred on November 27, 2015, with forecasters presenting their estimates for economic performance in 2015 as well as their forecasts for 2016 and beyond. The main issues discussed by the Council included BC’s housing market, natural resource development in the province, the outlook for commodity prices amid slowing growth in China, and the continued uneven performance of external economies.
Subsequent to the meeting in November, participants were welcome to submit revised forecasts until January 6, 2016 (10 of the 13 members chose to revise). Forecast details from the Council surveys are summarized in the table at the end of this topic box.
British Columbia Outlook
On average, the Council estimates that BC’s economic growth in 2015 was 2.6 per cent, unchanged from its previous forecast from one year ago. Council members now forecast BC’s economy to grow by 2.7 per cent in 2016, 2.6 per cent in 2017 and by an average of 2.4 per cent annually from 2018 to 2020. Compared to its January 2015 projections, the Council’s forecasts are higher for 2017 and lower for 2016 and over the medium term (see Chart 1).
Chart 1 — EFC Outlook for BC Economy
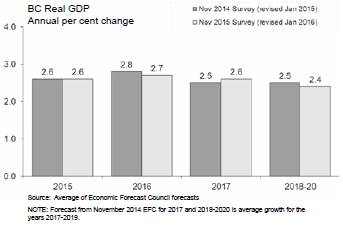
Council members, on average, estimate that BC’s economy grew faster than Canada’s in 2015 and expect BC’s economic growth to continue to outpace the national average throughout the forecast horizon (see Chart 2).
Chart 2 - EFC Outlook for BC and Canada
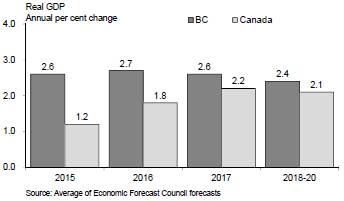
The Council was upbeat about several aspects of BC’s economy, including retail sales and net interprovincial migration. Some members credited the weakening Canadian dollar for helping boost retail sales (due to increased tourism and reduced cross border shopping), while slowing growth in Alberta was identified as a factor behind increased interprovincial population flows to BC. Several members noted that the recent resilience of the domestic economy — as evidenced by better-than-expected real GDP growth of 3.2 per cent in 2014 and rising consumer confidence in 2015 – is expected to provide momentum to economic growth going forward.
Budget and Fiscal Plan — 2016/17 to 2018/19
86
British Columbia Economic Review and Outlook
BC’s housing market was discussed at length by the Council. Members generally agreed that the ongoing strength in home sales and construction activity is based on fundamental factors, such as low interest rates, in-migration to the province and constrained land supply in some regional markets. Many members highlighted the need for reliable national data on foreign residential investment, and advised that any public policy action should follow a data-driven and incremental approach. Some members noted that initiatives to increase the supply and density of housing in the Greater Vancouver region could help improve affordability. Others noted that additional government policy measures may not be warranted since housing activity is expected to slow in response to eventual increases in Canadian interest rates.
Discussions were mixed regarding BC’s natural resource sector. Most members expected liquefied natural gas (LNG) development to occur in the province, but were unsure about the timing and extent of development. The Council expressed concern about the persistently low prices of many of BC’s major commodities (including copper and natural gas) and the resulting pullback in mining production, commodity exports and investment in the natural resource sector.
With regard to BC’s forestry sector, several members noted uncertainty due to the upcoming Softwood Lumber Agreement negotiations while others discussed long-term fibre supply constraints due to the Mountain Pine Beetle. However, members generally agreed that continued improvements in the US housing market should support the forestry industry. Furthermore, a couple of members noted that BC’s diversified economy has enabled recent strength in other sectors (such as manufacturing, trade and film) to help counterbalance the challenges faced by some of BC’s resource sectors.
Other topics discussed by the Council include BC’s improving labour market (according to the Labour Force Survey), rising asset and debt levels among households, and the slowdown in international migration to the province in recent quarters. The Council also noted BC’s prudent budgeting approach and relatively strong fiscal position compared to other provinces, and advised maintaining a broadly based competitive tax environment.
British Columbia Economic Forecast Council:
Summary of BC real GDP Forecasts, annual per cent change
| | | | | | | | | | Average | |
Participant | | Organization | | 2015 | | 2016 | | 2017 | | 2018-2020 | |
Earl Sweet | | Bank of Montreal 1 | | 2.5 | | 2.5 | | 2.4 | | 2.0 | |
Cameron Muir | | BC Real Estate Association 1 | | 2.7 | | 2.8 | | 3.0 | | 2.9 | |
Ken Peacock | | Business Council of BC 1 | | 2.6 | | 2.8 | | 3.0 | | 2.7 | |
Helmut Pastrick | | Central 1 Credit Union 1 | | 3.3 | | 3.0 | | 3.1 | | 3.2 | |
Avery Shenfeld | | CIBC 1 | | 2.2 | | 2.6 | | 2.5 | | 2.2 | |
Marie-Christine Bernard | | Conference Board 1 | | 3.1 | | 2.8 | | 2.9 | | 2.1 | |
Arlene Kish | | IHS Global Insight | | 2.2 | | 2.3 | | 2.3 | | 2.5 | |
Sébastien Lavoie | | Laurentian Bank Securities 1 | | 2.4 | | 2.3 | | 2.4 | | 2.6 | |
Warren Lovely | | National Bank 1 | | 2.4 | | 2.4 | | 2.3 | | na | |
Craig Wright | | RBC 1 | | 2.9 | | 2.8 | | 2.9 | | 2.2 | |
Warren Jestin | | Scotiabank 1 | | 2.3 | | 2.3 | | 2.4 | | 2.5 | |
Ernie Stokes | | Stokes Economic Consulting | | 2.5 | | 3.6 | | 2.8 | | 1.9 | |
Derek Burleton | | TD | | 2.5 | | 2.4 | | 2.1 | | 2.0 | |
Average | | | | 2.6 | | 2.7 | | 2.6 | | 2.4 | |
Standard Deviation | | | | 0.3 | | 0.4 | | 0.3 | | 0.4 | |
1 Updated subsequent to the November 27, 2015 meeting.
Budget and Fiscal Plan — 2016/17 to 2018/19
87
British Columbia Economic Review and Outlook
Canadian Outlook
The Council’s estimates for growth in Canadian real GDP average 1.2 per cent in 2015, while its forecasts average 1.8 per cent for 2016, 2.2 per cent for 2017 and 2.1 per cent annually from 2018 to 2020.
Members expect real GDP growth in Canada to lag behind both BC and the US in the coming years, in part due to ongoing weakness and restructuring in the oil industry. Many Council members identified upcoming federal fiscal policies and infrastructure projects as key medium-term issues for BC and highlighted opportunities for negotiations between the federal and provincial governments going forward. Members also discussed topics related to Canada’s aging population, including retirement savings, health transfers, and an expected slowdown in the long-term potential output (productive capacity) of provincial economies.
International Outlook
On average, Council members estimate that US real GDP increased by 2.4 per cent in 2015 and forecast growth of 2.6 per cent for 2016, 2.5 per cent for 2017 and 2.3 per cent on average during the 2018 to 2020 period.
Similar to last year, participants noted a divergence between the economic performance of the US and the rest of the world. Several members assessed the outlook for the US economy to be considerably brighter than other major economies and, as a result, expect the Federal Reserve to increase US interest rates while other countries’ central banks cut rates or expand quantitative easing programs in an attempt to stimulate their economies. A couple of members noted that the resulting impact on global capital flows and exchange rates poses a potential risk to some emerging markets that had previously benefitted from global investor funds when the US economy had been relatively weak.
China was discussed as well, with members expecting real GDP growth to continue to slow over the medium-term as the economy transitions from investment and exports towards domestic consumption as the main driver of growth. While the Council noted that slowing growth in China will likely weigh on global commodity prices and demand for BC exports, a couple of members pointed out that the Trans-Pacific Partnership agreement presents substantial opportunities for BC in the coming years as Canada’s Pacific gateway.
Canadian Dollar
Consistent with previous forecasts, participants produced divergent forecasts for the value of the Canadian dollar in 2016, with estimates ranging from 69.0 US cents to 79.2 US cents. For 2017, projections ranged from 70.0 US cents to 82.0 US cents and from 75.0 US cents to 87.0 US cents over the 2018 to 2020 period.
Chart 3 — EFC Outlook for the Dollar
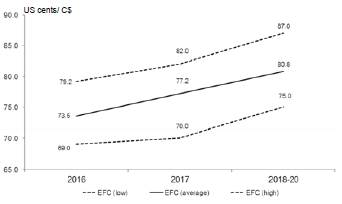
Budget and Fiscal Plan — 2016/17 to 2018/19
88
British Columbia Economic Review and Outlook
Forecast Survey – Participants’ Opinions
All figures are based | | 2015 | | 2016 | | 2017 | | 2018 to 2020 | |
on annual averages | | Range | | Average 1,2 | | Range | | Average 1,2 | | Range | | Average 1,2 | | Range | | Average 1,2,3 | |
British Columbia | | | | | | | | | | | | | | | | | |
Real GDP (% change) | | 2.2 – 3.3 | | 2.6 (13 | ) | 2.3 – 3.6 | | 2.7 (13 | ) | 2.1 – 3.1 | | 2.6 (13 | ) | 1.9 – 3.2 | | 2.4 (12 | ) |
Nominal GDP (% change) | | 2.0 – 5.5 | | 3.8 (13 | ) | 3.7 – 4.7 | | 4.3 (13 | ) | 4.2 – 5.2 | | 4.8 (13 | ) | 3.7 – 5.5 | | 4.5 (12 | ) |
GDP Deflator (% change) | | -0.3 – 2.3 | | 1.2 (13 | ) | 0.7 – 2.1 | | 1.7 (13 | ) | 1.9 – 2.8 | | 2.1 (13 | ) | 1.6 – 2.6 | | 2.1 (12 | ) |
Real business non-residential investment (% change) | | -14.3 – 3.5 | | -1.2 (8 | ) | 1.2 – 29.6 | | 9.8 (8 | ) | 2.1 – 20.8 | | 8.6 (8 | ) | -1.5 – 9.0 | | 4.0 (8 | ) |
Real business machinery and equipment investment (% change) | | -3.0 – 3.7 | | -1.0 (7 | ) | 1.5 – 13.4 | | 5.3 (7 | ) | 2.5 – 10.5 | | 5.9 (7 | ) | 0.7 – 7.0 | | 3.7 (7 | ) |
Household Income (% change) | | 3.2 – 5.3 | | 4.1 (9 | ) | 3.5 – 5.6 | | 4.3 (9 | ) | 3.5 – 5.6 | | 4.5 (9 | ) | 3.2 – 5.5 | | 4.3 (9 | ) |
Net Migration (thousand persons) | | 27.0 – 45.0 | | 35.6 (9 | ) | 37.5 – 48.0 | | 41.7 (9 | ) | 36.0 – 49.1 | | 43.3 (9 | ) | 35.0 – 54.3 | | 45.1 (9 | ) |
Employment (% change) | | 0.7 – 1.4 | | 1.1 (13 | ) | 0.7 – 2.0 | | 1.4 (13 | ) | 0.7 – 2.0 | | 1.3 (13 | ) | 0.9 – 2.0 | | 1.3 (12 | ) |
Unemployment rate (%) | | 5.9 – 6.2 | | 6.0 (13 | ) | 5.7 �� 6.4 | | 6.0 (13 | ) | 5.5 – 6.1 | | 5.8 (13 | ) | 4.2 – 6.0 | | 5.5 (12 | ) |
Net operating surplus of corporations (% change) | | -18.5 – 17.8 | | 0.3 (5 | ) | -1.7 – 8.9 | | 3.0 (5 | ) | 0.0 – 9.0 | | 3.8 (5 | ) | -1.6 – 5.5 | | 3.0 (5 | ) |
Housing starts (thousand units) | | 29.8 – 33.1 | | 31.4 (13 | ) | 28.7 – 33.9 | | 30.9 (13 | ) | 26.7 – 34.7 | | 29.5 (13 | ) | 240 – 34.0 | | 28.7 (12 | ) |
Retail sales (% change) | | 5.4 – 7.5 | | 6.7 (11 | ) | 3.8 – 6.2 | | 4.8 (11 | ) | 2.8 – 5.3 | | 4.2 (11 | ) | 3.1 – 5.5 | | 4.1 (11 | ) |
Consumer price index (% change) | | 0.9 – 1.3 | | 1.1 (13 | ) | 1.5 – 2.1 | | 1.8 (13 | ) | 1.6 – 2.2 | | 1.9 (13 | ) | 1.7 – 2.2 | | 2.0 (12 | ) |
United States | | | | | | | | | | | | | | | | | |
Real GDP (% change) | | 2.2 – 2.5 | | 2.4 (13 | ) | 2.3 – 2.9 | | 2.6 (13 | ) | 2.0 – 3.0 | | 2.5 (13 | ) | 2.0 – 2.7 | | 2.3 (12 | ) |
Intended Federal Funds rate (%) | | 0.06 – 0.31 | | 0.20 (12 | ) | 0.60 – 1.13 | | 0.85 (12 | ) | 1.12 – 2.75 | | 1.66 (12 | ) | 2.00 – 3.50 | | 2.87 (11 | ) |
Housing starts (million units) | | 1.11 – 1.17 | | 1.13 (11 | ) | 1.15 – 1.46 | | 1.29 (11 | ) | 1.30 – 1.75 | | 1.42 (11 | ) | 1.30 – 1.90 | | 1.49 (11 | ) |
Canada | | | | | | | | | | | | | | | | | |
Real GDP (% change) | | 1.0 – 1.3 | | 1.2 (13 | ) | 1.6 – 2.1 | | 1.8 (13 | ) | 1.7 – 2.6 | | 2.2 (13 | ) | 1.8 – 2.5 | | 2.1 (12 | ) |
Bank of Canada overnight target rate (%) | | 0.48 – 0.69 | | 0.61 (12 | ) | 0.40 – 0.63 | | 0.51 (12 | ) | 0.50 – 1.69 | | 0.92 (12 | ) | 1.10 – 3.42 | | 2.37 (11 | ) |
Exchange rate (US cents/C$) | | 76.9 – 79.0 | | 78.2 (13 | ) | 69.0 – 79.2 | | 73.5 (13 | ) | 70.0 – 82.0 | | 77.2 (13 | ) | 75.0 – 87.0 | | 80.8 (12 | ) |
Housing starts (million units) | | 0.18 – 0.20 | | 0.19 (13 | ) | 0.18 – 0.20 | | 0.19 (13 | ) | 0.16 – 0.21 | | 0.18 (13 | ) | 0.17 – 0.21 | | 0.18 (11 | ) |
Consumer price index (% change) | | 1.0 – 1.4 | | 1.1 (13 | ) | 1.6 – 2.2 | | 1.9 (13 | ) | 1.6 – 2.2 | | 2.0 (13 | ) | 1.9 – 2.1 | | 2.0 (12 | ) |
1 Based on responses from participants providing forecasts.
2 Number of respondents shown in parenthesis.
3 Participants provided an average forecast for 2018 to 2020.
Budget and Fiscal Plan — 2016/17 to 2018/19
89
Part 4: 2015/16 UPDATED FINANCIAL FORECAST
(THIRD QUARTERLY REPORT)
Introduction
Table 4.1 2015/16 Forecast Update
| | | | First | | Second | | Third | |
| | Budget | | Quarterly | | Quarterly | | Quarterly | |
($ millions) | | 2015 | | Report | | Report | | Report | |
Revenue | | 46,365 | | 46,739 | | 46,743 | | 46,992 | |
Expense | | (45,831 | ) | (46,212 | ) | (46,228 | ) | (46,365 | ) |
Allocation to the BC Prosperity Fund | | — | | — | | — | | (100 | ) |
Surplus before the BC Prosperity Fund and forecast allowance | | 534 | | 527 | | 515 | | 527 | |
BC Prosperity Fund | | — | | — | | — | | 100 | |
Forecast allowance | | (250 | ) | (250 | ) | (250 | ) | (250 | ) |
Surplus | | 284 | | 277 | | 265 | | 377 | |
Capital spending: | | | | | | | | | |
Taxpayer-supported capital spending | | 3,731 | | 3,867 | | 3,693 | | 3,631 | |
Self-supported capital spending | | 2,518 | | 2,537 | | 2,522 | | 2,604 | |
| | 6,249 | | 6,404 | | 6,215 | | 6,235 | |
Provincial Debt: | | | | | | | | | |
Taxpayer-supported debt | | 43,182 | | 42,325 | | 42,121 | | 42,709 | |
Self-supported debt | | 22,528 | | 22,189 | | 22,211 | | 22,331 | |
Total debt (including forecast allowance) | | 65,960 | | 64,764 | | 64,582 | | 65,290 | |
Taxpayer-supported debt to GDP ratio: | | | | | | | | | |
As previously forecast | | 17.4 | % | 17.2 | % | | | | |
Impact of Statistics Canada update | | 0.1 | % | 0.1 | % | | | | |
Restated and updated projections | | 17.5 | % | 17.3 | % | 17.2 | % | 17.4 | % |
Taxpayer-supported debt to revenue ratio | | 95.4 | % | 92.5 | % | 92.1 | % | 92.7 | % |
The third quarter fiscal outlook for 2015/16 forecasts a surplus of $377 million — $112 million higher than the projection in the second Quarterly Report. The improved outlook is largely due to forecasted increase in taxation revenue with partially offsetting impacts in other revenue sources and new spending on priority initiatives over the remainder of the fiscal year.
Chart 4.1 2015/16 operating results – changes from second Quarterly Report Surplus increased by $112 million
$ millions
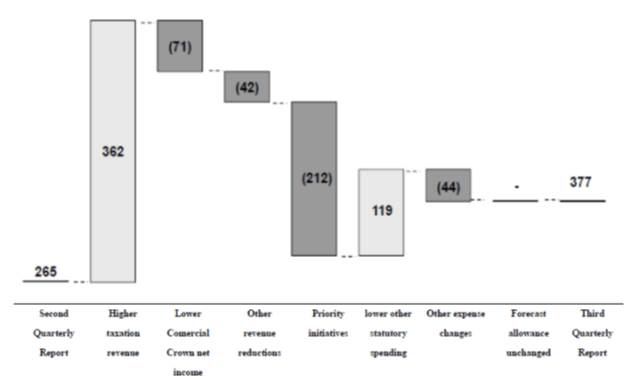
Budget and Fiscal Plan — 2016/17 to 2018/19
2015/16 Updated Financial Forecast (Third Quarterly Report)
Table 4.2 2015/16 Financial Forecast Changes
| | ($ millions) | |
2015/16 surplus — Budget 2015 (February 17, 2015) | | 284 | | | | | | 284 | |
2015/16 surplus — first Quarterly Report (September 15, 2015) | | | | 277 | | | | | |
2015/16 surplus — second Quarterly Report (November 24, 2015) | | | | | | 265 | | | |
| | Q1 | | Q2 | | Q3 | | Total | |
| | Update | | Update | | Update | | Changes | |
Revenue changes: | | | | | | | | | |
Personal income tax — mainly higher 2014 tax assessments | | 246 | | (3 | ) | 185 | | 428 | |
Corporate income tax — changes in federal government instalments and prior-year adjustment, reflecting 2014 tax assessments | | 128 | | 18 | | 12 | | 158 | |
Provincial sales tax — higher 2014/15 actual and year-to-date results | | 40 | | (5 | ) | 1 | | 36 | |
Harmonized sales tax — related to prior years | | — | | — | | (50 | ) | (50 | ) |
Property transfer tax — stronger year-to-date sales results | | 200 | | 150 | | 212 | | 562 | |
Other taxation sources | | (24 | ) | — | | 2 | | (22 | ) |
Natural gas royalties — lower prices, partially offset by lower utilization of royalty programs | | (124 | ) | (35 | ) | (34 | ) | (193 | ) |
Coal, metals and minerals — mainly lower coal prices and production | | (20 | ) | — | | 4 | | (16 | ) |
Forests — higher Softwood Lumber Agreement border tax and logging tax revenue, partly offset by lower timber tenure stumpage rates | | 45 | | (38 | ) | (9 | ) | (2 | ) |
Other natural resources | | 4 | | (12 | ) | (8 | ) | (16 | ) |
Fees, investment earnings and miscellaneous sources — lower revenue from investment earnings and miscellaneous revenue partly offset by higher fee revenue | | (50 | ) | (17 | ) | (1 | ) | (68 | ) |
Health and social transfers — mainly changes in BC share of the total population and prior years entitlement | | (11 | ) | 12 | | 3 | | 4 | |
Other federal government transfers — mainly changes in transfers to taxpayer supported Crowns and SUCH sector entities | | 19 | | (13 | ) | 3 | | 9 | |
Commercial Crown agencies operating results: | | | | | | | | | |
ICBC — mainly increased claims costs | | (101 | ) | (98 | ) | (136 | ) | (335 | ) |
Other commercial Crown agencies changes | | 22 | | 45 | | 65 | | 132 | |
Total revenue changes | | 374 | | 4 | | 249 | | 627 | |
Less: expense increases (decreases): | | | | | | | | | |
Consolidated Revenue Fund changes: | | | | | | | | | |
Statutory spending: | | | | | | | | | |
Direct Fire / fire management costs | | 317 | | (95 | ) | 88 | | 310 | |
Emergency program related costs | | 13 | | 3 | | 64 | | 80 | |
BC Training and Education Savings grant — higher anticipated eligibility | | 9 | | — | | 42 | | 51 | |
Teachers’ Pension Plan liability adjustment | | 60 | | — | | (60 | ) | — | |
Elections BC | | 3 | | — | | — | | 3 | |
BC Timber Sales | | — | | 6 | | (2 | ) | 4 | |
Innovative Clean Energy Fund | | — | | — | | 13 | | 13 | |
Other statutory spending | | — | | — | | 14 | | 14 | |
Refundable tax credit transfers | | 65 | | 97 | | (66 | ) | 96 | |
Prior year liability adjustments | | — | | (13 | ) | (20 | ) | (33 | ) |
Management of public debt (net) — reflects lower interest rates and revisions to scheduled borrowing | | (78 | ) | (1 | ) | — | | (79 | ) |
Eliminations between appropriations and spending funded by third party recoveries | | (38 | ) | 20 | | 45 | | 27 | |
(Increase) decrease in operating transfers to service delivery agencies | | (30 | ) | (51 | ) | (45 | ) | (126 | ) |
Changes in spending profile of service delivery agencies: | | | | | | | | | |
School districts — higher operating expenses due to enrollment | | (3 | ) | — | | 45 | | 42 | |
Universities — higher amortization and operating costs | | 23 | | — | | 4 | | 27 | |
Colleges — higher amortization, operating and wage settlement costs | | 11 | | — | | 26 | | 37 | |
Health authorities and hospital societies | | 75 | | 52 | | 11 | | 138 | |
Other service delivery agencies | | (46 | ) | (2 | ) | (22 | ) | (70 | ) |
Total expense increases | | 381 | | 16 | | 137 | | 534 | |
Subtotal | | (7 | ) | (12 | ) | 112 | | 93 | |
Reduction in forecast allowance | | — | | — | | — | | — | |
Total changes | | (7 | ) | (12 | ) | 112 | | 93 | |
2015/16 surplus — first Quarterly Report | | 277 | | | | | | | |
2015/16 surplus — second Quarterly Report | | | | 265 | | | | | |
2015/16 surplus — third Quarterly Report | | | | | | 112 | | 377 | |
Budget and Fiscal Plan — 2016/17 to 2018/19
92
2015/16 Updated Financial Forecast (Third Quarterly Report)
Other changes from the second Quarterly Report discussed below include a $20 million increase in capital spending and a $588 million increase in taxpayer-supported debt.
Revenue
Total government revenue is now forecast to be $249 million higher than the second Quarterly Report. Major changes include:
· a $362 million improvement in taxation revenue, mainly in personal income tax due to higher 2014 tax assessment results and property transfer tax due to stronger housing sales, partially offset by a reduced HST entitlement for prior years;
· a $47 million reduction in natural resource revenue, mainly reflecting lower natural gas and Mid-C electricity prices as well as lower forest stumpage rates;
· a $71 million decrease in commercial Crown corporations’ net incomes, resulting from a further reduction in ICBC’s net income as a result of continuing increases in estimated claims costs, partially offset by higher net income from Liquor Distribution Branch; and
· a $5 million increase in federal transfers and other taxpayer- supported revenue.
Table 4.2 provides a detailed breakdown of changes in the revenue by quarter from Budget 2015.
Expense
Total government spending is now forecast to be $137 million higher than the second Quarterly Report. The spending changes include $212 million in new priority initiatives partially enabled by the proposed Budget Measures Implementation Act 2016. These include:
· $95 million for new wildfire management initiatives;
· $65 million in new spending for emergency prevention and preparedness;
· $39 million to expand the eligibility under the BC Training and Education Savings Program to include children born in 2006; and
· $13 million in program spending under the Innovative Clean Energy Fund.
Separate from these targeted initiatives, there is a net reduction in expenses of $85 million relating to:
· $119 million in lower statutory spending, including lower tax credits ($66 million), the removal of the Teacher’s Pension Plan liability adjustment due to improved results in the latest actuarial report ($60 million), and other changes (up $7 million); and
· $20 million in prior year liability adjustments;
partially offset by:
· $45 million increase in spending recovered from third parties; and
· $19 million in net service delivery agency spending changes (increased spending offset by higher operating transfers from government).
Table 4.2 provides a detailed breakdown of changes in the operating results by quarter from Budget 2015.
Budget and Fiscal Plan — 2016/17 to 2018/19
93
2015/16 Updated Financial Forecast (Third Quarterly Report)
Contingencies
Budget 2015 included a Contingencies vote allocation of $350 million in 2015/16 to help manage unexpected costs and pressures as well as fund priority initiatives. The Contingencies forecast is unchanged in the third Quarterly Report forecast.
Government Employment (FTEs)
The level of government employment for 2015/16 remains unchanged at 27,000 from the second Quarterly Report.
Provincial Capital Spending
Capital spending is projected to total $6.2 billion in 2015/16 — $20 million higher than the forecast in the second Quarterly Report (see Table 4.3).
Taxpayer-supported capital spending is $62 million lower than in the second Quarterly Report, mainly due to changes in the timing of capital expenditures in government ministries, health and self-funded post-secondary projects.
The reduction in spending on taxpayer-supported projects was more than offset by an increase in self-supported capital spending, which was up $82 million from the second Quarterly Report forecast, mainly due to a shift in timing of capital spending for BC Hydro’s Site C Clean Energy project.
Table 4.3 2015/16 Capital Spending Update
| | ($ millions) | |
2015/16 capital spending — Budget 2015 (February 17, 2015) | | 6,249 | | | | | | 6,249 | |
2015/16 capital spending — first Quarterly Report (September 15, 2015) | | | | 6,404 | | | | | |
2015/16 capital spending — second Quarterly Report (November 24, 2015) | | | | | | 6,215 | | | |
| | Q1 | | Q2 | | Q3 | | Total | |
| | Update | | Update | | Update | | Changes | |
Taxpayer-supported changes: | | | | | | | | | |
Primarily higher routine capital maintenance spending by health authorities | | 109 | | — | | — | | 109 | |
Self-funded post-secondary institution spending | | 103 | | (29 | ) | (17 | ) | 57 | |
Lower BC Transit spending due to timing changes | | (60 | ) | — | | — | | (60 | ) |
Health project scheduling changes | | — | | (55 | ) | (33 | ) | (88 | ) |
Primarily timing of Federal contributions to transportation projects | | — | | (61 | ) | — | | (61 | ) |
Scheduling changes for government ministry projects | | — | | — | | (37 | ) | (37 | ) |
Other net adjustments to capital project schedules | | (16 | ) | (29 | ) | 25 | | (20 | ) |
Total taxpayer-supported | | 136 | | (174 | ) | (62 | ) | (100 | ) |
Self-supported changes: | | | | | | | | | |
Project scheduling changes on the Port Mann Bridge/Highway 1 | | 19 | | — | | — | | 19 | |
BC Lotteries — shift to operating expense reflecting revised technology solutions | | — | | (15 | ) | — | | (15 | ) |
BC Hydro — shift in timing of capital spending on Site C Clean Energy project | | — | | — | | 103 | | 103 | |
ICBC — lower capital spending due to a shift in timing of capital expenditures | | — | | — | | (16 | ) | (16 | ) |
Other self-supported capital spending changes | | — | | — | | (5 | ) | (5 | ) |
Total self-supported | | 19 | | (15 | ) | 82 | | 86 | |
Total changes | | 155 | | (189 | ) | 20 | | (14 | ) |
2015/16 capital spending — first Quarterly Report | | 6,404 | | | | | | | |
2015/16 capital spending — second Quarterly Report | | | | 6,215 | | | | | |
2015/16 capital spending — third Quarterly Report | | | | | | 6,235 | | 6,235 | |
Budget and Fiscal Plan — 2016/17 to 2018/19
94
2015/16 Updated Financial Forecast (Third Quarterly Report)
Provincial Debt
The provincial debt, including the $250 million forecast allowance, is projected to total $65.3 billion by the end of the fiscal year — $708 million higher than the projection in the second Quarterly Report.
Table 4.4 2015/16 Provincial Debt Update
| | ($ millions) | |
2015/16 provincial debt — Budget 2015 (February 17, 2015) | | 65,960 | | | | | | 65,960 | |
2015/16 provincial debt — first Quarterly Report (September 15, 2015) | | | | 64,764 | | | | | |
2015/16 provincial debt — second Quarterly Report (November 24, 2015) | | | | | | 64,582 | | | |
| | Q1 | | Q2 | | Q3 | | Total | |
| | Update | | Update | | Update | | Changes | |
Taxpayer-supported changes: | | | | | | | | | |
Government operating: | | | | | | | | | |
– lower debt level from 2014/15 | | (161 | ) | — | | — | | (161 | ) |
– higher opening cash balance | | (421 | ) | — | | — | | (421 | ) |
– improved CRF operating results and cash flows | | (112 | ) | (160 | ) | (41 | ) | (313 | ) |
– improvement in cash management | | — | | — | | (120 | ) | (120 | ) |
– other changes | | (51 | ) | (16 | ) | 30 | | (37 | ) |
– net financing requirements prior to year end | | — | | — | | 700 | | 700 | |
Total operating debt changes | | (745 | ) | (176 | ) | 569 | | (352 | ) |
Capital debt: | | | | | | | | | |
– Net reduction due to lower 2014/15 debt levels and timing changes | | (125 | ) | — | | — | | (125 | ) |
– lower contributions from external parties | | 108 | | 7 | | 58 | | 173 | |
– changes in internal financing and project schedules | | (95 | ) | (35 | ) | (39 | ) | (169 | ) |
Total capital debt changes | | (112 | ) | (28 | ) | 19 | | (121 | ) |
Total taxpayer-supported | | (857 | ) | (204 | ) | 588 | | (473 | ) |
Self-supported changes: | | | | | | | | | |
– lower debt level from 2014/15 | | (388 | ) | — | | — | | (388 | ) |
– change in capital spending | | 19 | | (15 | ) | 82 | | 86 | |
– changes in internal financing | | 30 | | 37 | | 38 | | 105 | |
Total self-supported | | (339 | ) | 22 | | 120 | | (197 | ) |
Total changes | | (1,196 | ) | (182 | ) | 708 | | (670 | ) |
2015/16 provincial debt — first Quarterly Report | | 64,764 | | | | | | | |
2015/16 provincial debt — second Quarterly Report | | | | 64,582 | | | | | |
2015/16 provincial debt — third Quarterly Report | | | | | | 65,290 | | 65,290 | |
Taxpayer-supported debt is projected to be $42.7 billion – $588 million higher than the projection in the second Quarterly Report. The increase is mainly due to higher financing needs prior to year-end in anticipation of borrowing requirements early in 2016/17.
Taxpayer-supported capital debt is now forecasted to end the fiscal year $19 million higher compared to the second Quarterly Report. The increase is mainly due to lower contributions from external parties, partially offset by net changes in internal financing sources and capital project spending due to project scheduling changes.
Self-supported debt is projected to be $22.3 billion - $120 million higher than the projection in the second Quarterly Report mainly due to accelerated capital spending on power generation projects partly offset by lower borrowing requirements due to improvements to operating cash flows in the transportation sector.
Budget and Fiscal Plan — 2016/17 to 2018/19
95
2015/16 Updated Financial Forecast (Third Quarterly Report)
The forecast allowance of $250 million remains unchanged from the second Quarterly Report to mitigate risks of fluctuations for the remainder of the fiscal year.
Details on changes in provincial debt by quarter are shown in Table 4.4.
Risks to the Fiscal Forecast
There are a number of risks and pressures to the fiscal plan including risks to the BC economic outlook, which are largely due to the continued uncertainty surrounding global economic activity. Forecasted revenues, expenditures, capital spending and debt are estimates based on a number of economic, financial and external factors. Variables will change throughout the year as new information becomes available, with potentially material impacts.
Revenues can be volatile due in part to the influence of the cyclical nature of the natural resource sector in the economy. Changes in energy or commodity prices, such as natural gas and lumber, may have a significant effect on revenue and the fiscal forecast. In addition, personal and corporate income tax assessments for the 2014 tax year will not be finalized until March 2016 and could result in further revenue and tax credit transfer spending adjustments.
The spending forecast contained in the fiscal plan is based on ministry and service delivery agency plans and strategies. Changes to planning assumptions, such as utilization or demand rates for government services in the health care, education, or community social services sectors, and costs associated with natural disaster response represent the main spending risks.
In addition, capital spending and debt figures may be influenced by a number of factors including design development, procurement activity, weather, geotechnical conditions and interest rates. As a result, the actual operating surplus, capital expenditure and debt figures may differ from the current forecast throughout the remainder of the fiscal year.
The potential fiscal impact from these risks is covered by the $350 million Contingencies vote and the $250 million forecast allowance.
Budget and Fiscal Plan — 2016/17 to 2018/19
96
2015/16 Updated Financial Forecast (Third Quarterly Report)
Supplementary Schedules
The following tables provide the financial results for the nine months ended December 31, 2015 and the 2015/16 full-year forecast.
Table 4.5 2015/16 Operating Statement
| | Year-to-Date to December 31 | | Full Year | |
| | 2015/16 | | Actual | | 2015/16 | | Actual | |
($ millions) | | Budget | | Actual | | Variance | | 2014/15 | | Budget | | Forecast | | Variance | | 2014/15 | |
Revenue | | 34,162 | | 34,795 | | 633 | | 33,755 | | 46,365 | | 46,992 | | 627 | | 46,122 | |
Expense | | (33,356 | ) | (33,442 | ) | (86 | ) | (32,031 | ) | (45,831 | ) | (46,365 | ) | (534 | ) | (44,439 | ) |
Allocation to the BC Prosperity Fund | | — | | — | | — | | — | | — | | (100 | ) | (100 | ) | — | |
Surplus before the BC Prosperity Fund and forecast allowance | | 806 | | 1,353 | | 547 | | 1,724 | | 534 | | 527 | | (7 | ) | 1,683 | |
BC Prosperity Fund | | — | | — | | — | | — | | — | | 100 | | 100 | | — | |
Forecast allowance | | — | | — | | — | | — | | (250 | ) | (250 | ) | — | | — | |
Surplus | | 806 | | 1,353 | | 547 | | 1,724 | | 284 | | 377 | | 93 | | 1,683 | |
Accumulated surplus beginning of the year | | 2,602 | | 3,252 | | 650 | | 1,346 | | 2,602 | | 3,252 | | 650 | | 1,346 | |
Accumulated surplus before comprehensive income | | 3,408 | | 4,605 | | 1,197 | | 3,070 | | 2,886 | | 3,629 | | 743 | | 3,029 | |
Accumulated other comprehensive income from self-supported Crown agencies | | 23 | | (675 | ) | (698 | ) | 97 | | 30 | | (901 | ) | (931 | ) | 223 | |
Accumulated surplus end of period | | 3,431 | | 3,930 | | 500 | | 3,167 | | 2,916 | | 2,728 | | (188 | ) | 3,252 | |
Budget and Fiscal Plan — 2016/17 to 2018/19
97
2015/16 Updated Financial Forecast (Third Quarterly Report)
Table 4.6 2015/16 Revenue by Source
| | Year-to-Date to December 31 | | Full Year | |
| | 2015/16 | | Actual | | 2015/16 | | Actual | |
($ millions) | | Budget | | Actual | | Variance | | 2014/15 | | Budget | | Forecast | | Variance | | 2014/15 | |
Taxation | | | | | | | | | | | | | | | | | |
Personal income | | 5,944 | | 6,176 | | 232 | | 5,900 | | 7,948 | | 8,376 | | 428 | | 8,076 | |
Corporate income | | 1,697 | | 1,768 | | 71 | | 1,698 | | 2,630 | | 2,788 | | 158 | | 2,635 | |
Sales 1 | | 4,616 | | 4,677 | | 61 | | 4,389 | | 5,970 | | 5,956 | | (14 | ) | 5,762 | |
Fuel | | 725 | | 730 | | 5 | | 714 | | 934 | | 941 | | 7 | | 932 | |
Carbon | | 899 | | 866 | | (33 | ) | 873 | | 1,261 | | 1,216 | | (45 | ) | 1,198 | |
Tobacco | | 591 | | 577 | | (14 | ) | 583 | | 770 | | 755 | | (15 | ) | 752 | |
Property | | 1,666 | | 1,645 | | (21 | ) | 1,577 | | 2,225 | | 2,206 | | (19 | ) | 2,154 | |
Property transfer | | 748 | | 1,149 | | 401 | | 847 | | 928 | | 1,490 | | 562 | | 1,065 | |
Insurance premium | | 345 | | 383 | | 38 | | 343 | | 460 | | 510 | | 50 | | 482 | |
| | 17,231 | | 17,971 | | 740 | | 16,924 | | 23,126 | | 24,238 | | 1,112 | | 23,056 | |
Natural resources | | | | | | | | | | | | | | | | | |
Natural gas royalties | | 256 | | 129 | | (127 | ) | 439 | | 344 | | 151 | | (193 | ) | 493 | |
Forests | | 564 | | 626 | | 62 | | 506 | | 835 | | 833 | | (2 | ) | 754 | |
Other natural resources 2 | | 1,129 | | 1,173 | | 44 | | 1,281 | | 1,578 | | 1,546 | | (32 | ) | 1,690 | |
| | 1,949 | | 1,928 | | (21 | ) | 2,226 | | 2,757 | | 2,530 | | (227 | ) | 2,937 | |
Other revenue | | | | | | | | | | | | | | | | | |
Medical Services Plan premiums | | 1,784 | | 1,809 | | 25 | | 1,691 | | 2,399 | | 2,425 | | 26 | | 2,254 | |
Other fees and licences 3 | | 2,298 | | 2,421 | | 123 | | 2,274 | | 3,235 | | 3,350 | | 115 | | 3,171 | |
Investment earnings | | 939 | | 802 | | (137 | ) | 861 | | 1,137 | | 1,143 | | 6 | | 1,203 | |
Miscellaneous 4 | | 2,180 | | 2,165 | | (15 | ) | 1,910 | | 3,161 | | 2,946 | | (215 | ) | 2,804 | |
| | 7,201 | | 7,197 | | (4 | ) | 6,736 | | 9,932 | | 9,864 | | (68 | ) | 9,432 | |
Contributions from the federal government | | | | | | | | | | | | | | | | | |
Health and social transfers | | 4,606 | | 4,610 | | 4 | | 4,366 | | 6,142 | | 6,146 | | 4 | | 5,827 | |
Other federal government contributions 5 | | 1,080 | | 966 | | (114 | ) | 931 | | 1,504 | | 1,513 | | 9 | | 1,499 | |
| | 5,686 | | 5,576 | | (110 | ) | 5,297 | | 7,646 | | 7,659 | | 13 | | 7,326 | |
Commercial Crown corporation net income | | | | | | | | | | | | | | | | | |
BC Hydro | | 330 | | 349 | | 19 | | 368 | | 653 | | 653 | | — | | 581 | |
Liquor Distribution Branch | | 712 | | 816 | | 104 | | 762 | | 881 | | 970 | | 89 | | 935 | |
BC Lotteries (net of payments to the federal government) | | 898 | | 992 | | 94 | | 929 | | 1,206 | | 1,221 | | 15 | | 1,245 | |
ICBC 6 | | 176 | | (19 | ) | (195 | ) | 533 | | 210 | | (125 | ) | (335 | ) | 657 | |
Transportation Investment Corporation (Port Mann) | | (72 | ) | (56 | ) | 16 | | (59 | ) | (101 | ) | (86 | ) | 15 | | (89 | ) |
Other 7 | | 51 | | 41 | | (10 | ) | 39 | | 55 | | 68 | | 13 | | 42 | |
| | 2,095 | | 2,123 | | 28 | | 2,572 | | 2,904 | | 2,701 | | (203 | ) | 3,371 | |
Total revenue | | 34,162 | | 34,795 | | 633 | | 33,755 | | 46,365 | | 46,992 | | 627 | | 46,122 | |
1 Includes provincial sales tax and harmonized sales tax/social services tax/hotel room tax related to prior years.
2 Columbia River Treaty, other energy and minerals, water rental and other resources.
3 Post-secondary, healthcare-related, motor vehicle, and other fees.
4 Includes reimbursements for health care and other services provided to external agencies, and other recoveries.
5 Includes contributions for health, education, community development, housing and social service programs, and transportation projects.
6 Amount represent ICBC’s earnings during government’s fiscal year.
7 Includes Columbia Power Corporation, BC Railway Company, Columbia Basin Trust power projects, and post-secondary institutions self-supported subsidiaries.
Budget and Fiscal Plan — 2016/17 to 2018/19
98
2015/16 Updated Financial Forecast (Third Quarterly Report)
Table 4.7 2015/16 Expense by Ministry, Program and Agency 1
| | Year-to-Date to December 31 | | Full Year | |
| | 2015/16 | | Actual | | 2015/16 | | Actual | |
($ millions) | | Budget | | Actual | | Variance | | 2014/15 2 | | Budget | | Forecast | | Variance | | 2014/15 2 | |
Office of the Premier | | 7 | | 7 | | — | | 7 | | 9 | | 9 | | — | | 8 | |
Aboriginal Relations and Reconciliation | | 55 | | 77 | | 22 | | 65 | | 87 | | 87 | | — | | 84 | |
Advanced Education | | 1,439 | | 1,436 | | (3 | ) | 1,470 | | 1,961 | | 1,961 | | — | | 2,007 | |
Agriculture | | 67 | | 57 | | (10 | ) | 65 | | 80 | | 80 | | — | | 78 | |
Children and Family Development | | 1,008 | | 1,011 | | 3 | | 974 | | 1,379 | | 1,379 | | — | | 1,338 | |
Community, Sport and Cultural Development | | 193 | | 207 | | 14 | | 189 | | 228 | | 228 | | — | | 222 | |
Education | | 4,100 | | 4,087 | | (13 | ) | 3,894 | | 5,498 | | 5,549 | | 51 | | 5,395 | |
Energy and Mines | | 19 | | 20 | | 1 | | 21 | | 28 | | 41 | | 13 | | 30 | |
Environment | | 103 | | 106 | | 3 | | 95 | | 150 | | 150 | | — | | 133 | |
Finance | | 144 | | 101 | | (43 | ) | 96 | | 234 | | 248 | | 14 | | 247 | |
Forests, Lands and Natural Resource Operations | | 461 | | 643 | | 182 | | 637 | | 608 | | 922 | | 314 | | 836 | |
Health | | 13,021 | | 12,849 | | (172 | ) | 12,479 | | 17,444 | | 17,444 | | — | | 16,934 | |
International Trade | | 39 | | 38 | | (1 | ) | 38 | | 49 | | 49 | | — | | 33 | |
Jobs, Tourism and Skills Training | | 146 | | 153 | | 7 | | 140 | | 196 | | 196 | | — | | 196 | |
Justice | | 357 | | 362 | | 5 | | 344 | | 473 | | 473 | | — | | 458 | |
Natural Gas Development | | 367 | | 330 | | (37 | ) | 299 | | 444 | | 444 | | — | | 401 | |
Public Safety and Solicitor General | | 500 | | 498 | | (2 | ) | 479 | | 669 | | 669 | | — | | 657 | |
Small Business and Red Tape Reduction | | 3 | | 2 | | (1 | ) | 1 | | 3 | | 3 | | — | | 3 | |
Social Development and Social Innovation | | 1,931 | | 1,964 | | 33 | | 1,898 | | 2,594 | | 2,594 | | — | | 2,529 | |
Technology, Innovation and Citizens’ Services | | 352 | | 356 | | 4 | | 324 | | 479 | | 479 | | — | | 452 | |
Transportation and Infrastructure | | 625 | | 627 | | 2 | | 612 | | 844 | | 924 | | 80 | | 853 | |
Total ministries and Office of the Premier | | 24,937 | | 24,931 | | (6 | ) | 24,127 | | 33,457 | | 33,929 | | 472 | | 32,894 | |
Management of public funds and debt | | 961 | | 883 | | (78 | ) | 924 | | 1,267 | | 1,188 | | (79 | ) | 1,198 | |
Contingencies | | — | | 4 | | 4 | | — | | 350 | | 350 | | — | | 264 | |
Funding for capital expenditures | | 537 | | 427 | | (110 | ) | 509 | | 1,001 | | 855 | | (146 | ) | 860 | |
Refundable tax credit transfers | | 728 | | 869 | | 141 | | 619 | | 975 | | 1,071 | | 96 | | 864 | |
Legislative and other appropriations | | 100 | | 90 | | (10 | ) | 87 | | 133 | | 136 | | 3 | | 125 | |
Subtotal | | 27,263 | | 27,204 | | (59 | ) | 26,266 | | 37,183 | | 37,529 | | 346 | | 36,205 | |
Elimination of transactions between appropriations 3 | | (11 | ) | (11 | ) | — | | (28 | ) | (20 | ) | (16 | ) | 4 | | (17 | ) |
Prior year liability adjustments | | — | | (8 | ) | (8 | ) | (17 | ) | — | | (33 | ) | (33 | ) | (130 | ) |
Consolidated revenue fund expense | | 27,252 | | 27,185 | | (67 | ) | 26,221 | | 37,163 | | 37,480 | | 317 | | 36,058 | |
Expenses recovered from external entities | | 1,943 | | 2,003 | | 60 | | 1,854 | | 2,675 | | 2,704 | | 29 | | 2,668 | |
Funding provided to service delivery agencies | | (16,522 | ) | (16,439 | ) | 83 | | (15,846 | ) | (22,477 | ) | (22,463 | ) | 14 | | (21,734 | ) |
Total direct program spending | | 12,673 | | 12,749 | | 76 | | 12,229 | | 17,361 | | 17,721 | | 360 | | 16,992 | |
Service delivery agency expense | | | | | | | | | | | | | | | | | |
School districts | | 4,148 | | 4,227 | | 79 | | 3,687 | | 5,786 | | 5,828 | | 42 | | 5,339 | |
Universities | | 3,072 | | 2,991 | | (81 | ) | 2,976 | | 4,252 | | 4,279 | | 27 | | 4,119 | |
Colleges and institutes | | 806 | | 836 | | 30 | | 821 | | 1,130 | | 1,167 | | 37 | | 1,151 | |
Health authorities and hospital societies | | 9,885 | | 9,928 | | 43 | | 9,670 | | 13,446 | | 13,584 | | 138 | | 13,154 | |
Other service delivery agencies | | 2,772 | | 2,711 | | (61 | ) | 2,648 | | 3,856 | | 3,786 | | (70 | ) | 3,684 | |
Total service delivery agency expense | | 20,683 | | 20,693 | | 10 | | 19,802 | | 28,470 | | 28,644 | | 174 | | 27,447 | |
Total expense | | 33,356 | | 33,442 | | 86 | | 32,031 | | 45,831 | | 46,365 | | 534 | | 44,439 | |
1 Reflects government’s organization that was in effect at December 31, 2015.
2 Restated to reflect government’s current accounting policies.
3 Reflects payments made under an agreement where an expense from a voted appropriation is recorded as revenue by a special account.
Budget and Fiscal Plan — 2016/17 to 2018/19
99
2015/16 Updated Financial Forecast (Third Quarterly Report)
Table 4.8 2015/16 Expense By Function
| | Year-to-Date to December 31 | | Full Year | |
| | 2015/16 | | Actual | | 2015/16 | | Actual | |
($ millions) | | Budget | | Actual | | Variance | | 2014/15 1 | | Budget | | Forecast | | Variance | | 2014/15 1 | |
Health: | | | | | | | | | | | | | | | | | |
Medical Services Plan | | 3,102 | | 3,100 | | (2 | ) | 3,013 | | 4,282 | | 4,267 | | (15 | ) | 4,136 | |
Pharmacare | | 984 | | 1,051 | | 67 | | 887 | | 1,144 | | 1,144 | | — | | 1,120 | |
Regional services | | 9,657 | | 9,465 | | (192 | ) | 9,158 | | 12,849 | | 12,877 | | 28 | | 12,404 | |
Other healthcare expenses 2 | | 572 | | 510 | | (62 | ) | 520 | | 786 | | 792 | | 6 | | 699 | |
| | 14,315 | | 14,126 | | (189 | ) | 13,578 | | 19,061 | | 19,080 | | 19 | | 18,359 | |
Education: | | | | | | | | | | | | | | | | | |
Elementary and secondary | | 4,404 | | 4,462 | | 58 | | 4,149 | | 6,259 | | 6,345 | | 86 | | 6,064 | |
Post-secondary | | 3,833 | | 3,804 | | (29 | ) | 3,729 | | 5,454 | | 5,487 | | 33 | | 5,349 | |
Other education expenses 3 | | 323 | | 267 | | (56 | ) | 305 | | 477 | | 476 | | (1 | ) | 414 | |
| | 8,560 | | 8,533 | | (27 | ) | 8,183 | | 12,190 | | 12,308 | | 118 | | 11,827 | |
Social services: | | | | | | | | | | | | | | | | | |
Social assistance 2,3 | | 1,186 | | 1,220 | | 34 | | 1,196 | | 1,605 | | 1,605 | | — | | 1,589 | |
Child welfare 2 | | 922 | | 964 | | 42 | | 814 | | 1,258 | | 1,256 | | (2 | ) | 1,144 | |
Low income tax credit transfers | | 184 | | 184 | | — | | 183 | | 245 | | 237 | | (8 | ) | 248 | |
Community living and other services | | 681 | | 674 | | (7 | ) | 649 | | 901 | | 905 | | 4 | | 881 | |
| | 2,973 | | 3,042 | | 69 | | 2,842 | | 4,009 | | 4,003 | | (6 | ) | 3,862 | |
Protection of persons and property | | 1,108 | | 1,081 | | (27 | ) | 1,034 | | 1,423 | | 1,511 | | 88 | | 1,446 | |
Transportation | | 1,215 | | 1,197 | | (18 | ) | 1,152 | | 1,713 | | 1,679 | | (34 | ) | 1,608 | |
Natural resources and economic development | | 1,359 | | 1,694 | | 335 | | 1,475 | | 1,867 | | 2,333 | | 466 | | 2,191 | |
Other | | 948 | | 907 | | (41 | ) | 912 | | 1,290 | | 1,244 | | (46 | ) | 1,288 | |
Contingencies | | — | | — | | — | | — | | 350 | | 350 | | — | | — | |
General government | | 978 | | 972 | | (6 | ) | 982 | | 1,280 | | 1,279 | | (1 | ) | 1,360 | |
Debt servicing | | 1,900 | | 1,890 | | (10 | ) | 1,873 | | 2,648 | | 2,578 | | (70 | ) | 2,498 | |
Total expense | | 33,356 | | 33,442 | | 86 | | 32,031 | | 45,831 | | 46,365 | | 534 | | 44,439 | |
1 Restated to reflect government’s current organization and accounting policies.
2 Payments for healthcare services by the Ministry of Social Development and Social Innovation and the Ministry of Children and Family Development made on behalf of their clients are reported in the Health function.
3 Payments for training costs by the Ministry of Social Development and Social Innovation made on behalf of its clients are reported in the Education function.
Budget and Fiscal Plan — 2016/17 to 2018/19
100
2015/16 Updated Financial Forecast (Third Quarterly Report)
Table 4.9 2015/16 Capital Spending
| | Year-to-Date to December 31 | | Full Year | |
| | 2015/16 | | Actual | | 2015/16 | | Actual | |
($ millions) | | Budget | | Actual | | Variance | | 2014/15 | | Budget | | Forecast | | Variance | | 2014/15 | |
Taxpayer-supported | | | | | | | | | | | | | | | | | |
Education | | | | | | | | | | | | | | | | | |
School districts | | 361 | | 306 | | (55 | ) | 318 | | 481 | | 486 | | 5 | | 420 | |
Post-secondary institutions | | 518 | | 413 | | (105 | ) | 382 | | 691 | | 748 | | 57 | | 718 | |
Health | | 737 | | 415 | | (322 | ) | 471 | | 983 | | 1,003 | | 20 | | 900 | |
BC Transportation Financing Authority | | 706 | | 710 | | 4 | | 673 | | 941 | | 892 | | (49 | ) | 822 | |
BC Transit | | 89 | | 42 | | (47 | ) | 47 | | 119 | | 53 | | (66 | ) | 83 | |
Government operating (ministries) | | 257 | | 152 | | (105 | ) | 198 | | 392 | | 354 | | (38 | ) | 326 | |
Housing 1 | | 65 | | 82 | | 17 | | — | | 87 | | 66 | | (21 | ) | 107 | |
Other 2 | | 28 | | 18 | | (10 | ) | 87 | | 37 | | 29 | | (8 | ) | 31 | |
Total taxpayer-supported | | 2,761 | | 2,138 | | (623 | ) | 2,176 | | 3,731 | | 3,631 | | (100 | ) | 3,407 | |
| | | | | | | | | | | | | | | | | |
Self-supported | | | | | | | | | | | | | | | | | |
BC Hydro | | 1,715 | | 1,567 | | (148 | ) | 1,589 | | 2,234 | | 2,337 | | 103 | | 2,169 | |
Columbia River power projects 3 | | 18 | | 13 | | (5 | ) | 18 | | 24 | | 19 | | (5 | ) | 28 | |
Transportation Investment Corporation (Port Mann) | | 12 | | 21 | | 9 | | 66 | | 16 | | 36 | | 20 | | 76 | |
BC Rail | | 4 | | 3 | | (1 | ) | 3 | | 5 | | 4 | | (1 | ) | 5 | |
ICBC | | 85 | | 72 | | (13 | ) | 66 | | 115 | | 99 | | (16 | ) | 88 | |
BC Lottery Corporation | | 68 | | 50 | | (18 | ) | 47 | | 90 | | 75 | | (15 | ) | 69 | |
Liquor Distribution Branch | | 25 | | 11 | | (14 | ) | 13 | | 34 | | 34 | | — | | 25 | |
Other 4 | | — | | — | | — | | — | | — | | — | | — | | 28 | |
Total self-supported | | 1,927 | | 1,737 | | (190 | ) | 1,802 | | 2,518 | | 2,604 | | 86 | | 2,488 | |
Total capital spending | | 4,688 | | 3,875 | | (813 | ) | 3,978 | | 6,249 | | 6,235 | | (14 | ) | 5,895 | |
1 Includes BC Housing Management Commission and Provincial Rental Housing Corporation.
2 Includes BC Pavilion Corporation and other service delivery agencies.
3 Joint ventures of the Columbia Power Corporation and Columbia Basin Trust.
4 Includes post-secondary institutions self-supported subsidiaries.
Budget and Fiscal Plan — 2016/17 to 2018/19
101
2015/16 Updated Financial Forecast (Third Quarterly Report)
Table 4.10 2015/16 Provincial Debt 1
| | Year-to-Date to December 31 | | Full Year | |
| | 2015/16 | | Actual | | 2015/16 | | Actual | |
($ millions) | | Budget | | Actual | | Variance | | 2014/15 | | Budget | | Forecast | | Variance | | 2014/15 | |
Taxpayer-supported debt | | | | | | | | | | | | | | | | | |
Provincial government operating | | 9,245 | | 7,325 | | (1,920 | ) | 8,055 | | 8,420 | | 8,068 | | (352 | ) | 9,280 | |
Other taxpayer-supported debt (mainly capital) | | | | | | | | | | | | | | | | | |
Education 2 | | | | | | | | | | | | | | | | | |
Post-secondary institutions 3 | | 4,651 | | 4,615 | | (36 | ) | 4,445 | | 4,686 | | 4,715 | | 29 | | 4,518 | |
School districts | | 7,870 | | 7,904 | | 34 | | 7,497 | | 7,956 | | 7,991 | | 35 | | 7,600 | |
| | 12,521 | | 12,519 | | (2 | ) | 11,942 | | 12,642 | | 12,706 | | 64 | | 12,118 | |
Health 2,4 | | 6,911 | | 6,764 | | (147 | ) | 6,312 | | 7,036 | | 6,962 | | (74 | ) | 6,522 | |
Highways and public transit BC Transit | | 157 | | 107 | | (50 | ) | 126 | | 168 | | 157 | | (11 | ) | 123 | |
BC Transportation Financing Authority 5 | | 9,110 | | 9,030 | | (80 | ) | 8,393 | | 9,312 | | 9,252 | | (60 | ) | 8,428 | |
Public transit | | 1,000 | | 1,000 | | — | | 1,000 | | 1,000 | | 1,000 | | — | | 1,000 | |
SkyTrain extension | | 1,174 | | 1,174 | | — | | 1,174 | | 1,174 | | 1,174 | | — | | 1,174 | |
| | 11,441 | | 11,311 | | (130 | ) | 10,693 | | 11,654 | | 11,583 | | (71 | ) | 10,725 | |
Other | | | | | | | | | | | | | | | | | |
BC Immigrant Investment Fund | | 341 | | 321 | | (20 | ) | 433 | | 311 | | 300 | | (11 | ) | 414 | |
BC Pavilion Corporation | | 386 | | 379 | | (7 | ) | 381 | | 387 | | 383 | | (4 | ) | 381 | |
Provincial government general capital | | 1,932 | | 1,848 | | (84 | ) | 1,564 | | 1,995 | | 1,912 | | (83 | ) | 1,698 | |
Social housing 6 | | 726 | | 719 | | (7 | ) | 774 | | 706 | | 769 | | 63 | | 715 | |
Other 7 | | 31 | | 26 | | (5 | ) | 30 | | 31 | | 26 | | (5 | ) | 27 | |
| | 3,416 | | 3,293 | | (123 | ) | 3,182 | | 3,430 | | 3,390 | | (40 | ) | 3,235 | |
Total other taxpayer-supported | | 34,289 | | 33,887 | | (402 | ) | 32,129 | | 34,762 | | 34,641 | | (121 | ) | 32,600 | |
Total taxpayer-supported debt | | 43,534 | | 41,212 | | (2,322 | ) | 40,184 | | 43,182 | | 42,709 | | (473 | ) | 41,880 | |
Self-supported debt | | | | | | | | | | | | | | | | | |
Commercial Crown corporations | | | | | | | | | | | | | | | | | |
BC Hydro | | 17,562 | | 17,713 | | 151 | | 16,599 | | 18,013 | | 17,815 | | (198 | ) | 16,544 | |
BC Lotteries | | 155 | | 220 | | 65 | | 156 | | 155 | | 146 | | (9 | ) | 140 | |
Columbia Power Corporation | | 300 | | 296 | | (4 | ) | 300 | | 293 | | 296 | | 3 | | 300 | |
Columbia River power projects 8 | | 457 | | 447 | | (10 | ) | 464 | | 457 | | 457 | | — | | 464 | |
Post-secondary institutions’ subsidiaries | | 198 | | 225 | | 27 | | 200 | | 198 | | 222 | | 24 | | 222 | |
Transportation Investment Corporation (Port Mann) | | 3,362 | | 3,412 | | 50 | | 3,328 | | 3,371 | | 3,361 | | (10 | ) | 3,335 | |
Other | | 43 | | 34 | | (9 | ) | 44 | | 41 | | 34 | | (7 | ) | 35 | |
Total self-supported debt | | 22,077 | | 22,347 | | 270 | | 21,091 | | 22,528 | | 22,331 | | (197 | ) | 21,040 | |
Forecast allowance | | — | | — | | — | | — | | 250 | | 250 | | — | | — | |
Total provincial debt | | 65,611 | | 63,559 | | (2,052 | ) | 61,275 | | 65,960 | | 65,290 | | (670 | ) | 62,920 | |
1 Debt is after deduction of sinking funds and unamortized discounts, and excludes accrued interest. Government direct and fiscal agency accrued interest is reported in the government’s accounts as an accounts payable.
2 Includes debt and guarantees incurred by the government on behalf of school districts, universities, colleges and health authorities/hospital societies (SUCH), and debt directly incurred by these entities.
3 Post-secondary institutions’ debt includes public-private partnership obligations of $nil for the nine months ended December 31, 2014, $15 million for the nine months ended December 31, 2015, $7 million for fiscal 2014/15 and $24 million for fiscal 2015/16.
4 Health facilities’ debt includes public-private partnership obligations of $1,233 million for the nine months ended December 31, 2014, $1,350 million for the nine months ended December 31, 2015, $1,272 million for fiscal 2014/15 and $1,433 million for fiscal 2015/16.
5 BC Transportation Financing Authority debt includes public-private partnership obligations of $1,104 million for the nine months ended December 31, 2014, $1,166 million for the nine months ended December 31, 2015, $1,130 million for fiscal 2014/15 and $1,159 million for fiscal 2015/16.
6 Includes the BC Housing Management Commission and the Provincial Rental Housing Corporation. Social housing debt includes public-private partnership obligations of $61 million for the nine months ended December 31, 2014, $85 million for the nine months ended December 31, 2015, $66 million for fiscal 2014/15 and $88 million for fiscal 2015/16.
7 Includes service delivery agencies, student loan guarantees, loan guarantees to agricultural producers, guarantees issued under economic development and home mortgage assistance programs and loan guarantee provisions.
8 Joint ventures of the Columbia Power Corporation and Columbia Basin Trust.
Budget and Fiscal Plan — 2016/17 to 2018/19
102
2015/16 Updated Financial Forecast (Third Quarterly Report)
Table 4.11 2015/16 Statement of Financial Position
| | Actual | | Year-to-Date | | Forecast | |
| | March 31, | | December 31, | | March 31, | |
($ millions) | | 2015 | | 2015 | | 2016 | |
Financial assets | | | | | | | |
Cash and temporary investments | | 3,676 | | 2,499 | | 2,997 | |
Other financial assets | | 9,136 | | 9,146 | | 9,342 | |
Sinking funds | | 977 | | 1,024 | | 1,678 | |
Investments in commercial Crown corporations: | | | | | | | |
Retained earnings | | 8,271 | | 7,695 | | 7,352 | |
Recoverable capital loans | | 20,317 | | 21,639 | | 21,616 | |
| | 28,588 | | 29,334 | | 28,968 | |
| | 42,377 | | 42,003 | | 42,985 | |
Liabilities | | | | | | | |
Accounts payable and accrued liabilities | | 8,312 | | 7,231 | | 8,354 | |
Deferred revenue | | 9,809 | | 9,784 | | 9,360 | |
Debt: | | | | | | | |
Taxpayer-supported debt | | 41,880 | | 41,212 | | 42,709 | |
Self-supported debt | | 21,040 | | 22,347 | | 22,331 | |
Forecast allowance | | — | | — | | 250 | |
Total provincial debt | | 62,920 | | 63,559 | | 65,290 | |
Add: debt offset by sinking funds | | 977 | | 1,024 | | 1,678 | |
Less: guarantees and non-guaranteed debt | | (739 | ) | (723 | ) | (730 | ) |
Financial statement debt | | 63,158 | | 63,860 | | 66,238 | |
| | 81,279 | | 80,875 | | 83,952 | |
Net liabilities | | (38,902 | ) | (38,872 | ) | (40,967 | ) |
Capital and other non-financial assets | | | | | | | |
Tangible capital assets | | 39,028 | | 39,621 | | 40,505 | |
Other non-financial assets | | 3,126 | | 3,181 | | 3,190 | |
| | 42,154 | | 42,802 | | 43,695 | |
Accumulated surplus | | 3,252 | | 3,930 | | 2,728 | |
| | | | | | | |
Changes in Financial Position
| | Year-to-Date | | Forecast | |
| | December 31, | | March 31, | |
($ millions) | | 2015 | | 2016 | |
| | | | | |
(Surplus) deficit for the period | | (1,353 | ) | (377 | ) |
Comprehensive income (increase) decrease | | 675 | | 901 | |
(Increase) decrease in accumulated surplus | | (678 | ) | 524 | |
Capital and other non-financial asset changes: | | | | | |
Increase in taxpayer-supported capital investments | | 2,138 | | 3,631 | |
Less: amortization and other accounting changes | | (1,545 | ) | (2,154 | ) |
Change in net capital assets | | 593 | | 1,477 | |
Increase (decrease) in other non-financial assets | | 55 | | 64 | |
| | 648 | | 1,541 | |
Increase (decrease) in net liabilities | | (30 | ) | 2,065 | |
Investment and working capital changes: | | | | | |
Increase (reduction) in cash and temporary investments | | (1,177 | ) | (679 | ) |
Increase in total investment in commercial Crown corporations: | | | | | |
Increase (decrease) in retained earnings | | (576 | ) | (919 | ) |
Self-supported capital investments | | 1,737 | | 2,604 | |
Less: loan repayments and other accounting changes | | (415 | ) | (1,305 | ) |
| | 746 | | 380 | |
Other working capital changes | | 1,163 | | 1,314 | |
| | 732 | | 1,015 | |
Increase (decrease) in financial statement debt | | 702 | | 3,080 | |
(Increase) decrease in sinking fund debt | | (47 | ) | (701 | ) |
Increase (decrease) in guarantees and non-guaranteed debt | | (16 | ) | (9 | ) |
Increase (decrease) in total provincial debt | | 639 | | 2,370 | |
Budget and Fiscal Plan — 2016/17 to 2018/19
103
APPENDIX
A1 | Tax Expenditures | 106 |
A1.1 | Personal Income Tax — Tax Expenditures | 108 |
A1.2 | Corporate Income Tax — Tax Expenditures | 109 |
A1.3 | Property Taxes — Tax Expenditures | 109 |
A1.4 | Consumption Taxes — Tax Expenditures | 110 |
A2 | Interprovincial Comparisons of Tax Rates — 2016 | 111 |
A3 | Comparison of Provincial and Federal Taxes by Province — 2016 | 112 |
A4 | Interprovincial Comparisons of Provincial Personal Income Taxes Payable — 2016 | 114 |
A5 | Material Assumptions — Revenue | 115 |
A6 | Natural Gas Price Forecasts — 2016/17 to 2018/19 | 120 |
A7 | Material Assumptions — Expense | 121 |
A8 | Operating Statement — 2009/10 to 2018/19 | 123 |
A9 | Revenue by Source — 2009/10 to 2018/19 | 124 |
A10 | Revenue by Source Supplementary Information — 2009/10 to 2018/19 | 125 |
A11 | Expense by Function — 2009/10 to 2018/19 | 126 |
A12 | Expense by Function Supplementary Information — 2009/10 to 2018/19 | 127 |
A13 | Full-Time Equivalents (FTEs) 2009/10 to 2018/19 | 128 |
A14 | Capital Spending — 2009/10 to 2018/19 | 129 |
A15 | Statement of Financial Position — 2009/10 to 2018/19 | 130 |
A16 | Changes in Financial Position — 2009/10 to 2018/19 | 131 |
A17 | Provincial Debt — 2009/10 to 2018/19 | 132 |
A18 | Provincial Debt Supplementary Information — 2009/10 to 2018/19 | 133 |
A19 | Key Provincial Debt Indicators — 2009/10 to 2018/19 | 134 |
Budget and Fiscal Plan — 2016/17 to 2018/19
Appendix
A1: Tax Expenditures
Introduction
A tax expenditure is the reduction in revenues from delivering government programs or benefits through the tax system. Tax expenditures are usually made by offering special tax rates, exemptions, or tax credits. Governments introduce tax expenditures primarily to achieve social policy objectives such as transfers to lower-income families or to promote economic development and job creation.
Reporting tax expenditures improves government accountability by providing a more complete picture of government activities. The tax expenditure appendix does not include tax expenditures introduced or expanded in Budget 2016. These are described in Part 2: Tax Measures. Beginning with Budget 2012, refundable tax transfers are accounted for in a voted appropriation. This change does not affect the reporting of tax expenditure costs in the following tables.
The Role of Tax Expenditure Programs
Using the tax system to deliver programs can reduce administration costs and compliance costs for recipients. In certain situations, the tax system allows intended beneficiaries to be readily identified from information that is already collected. In these cases, setting up a separate expenditure program would result in costly overlap and duplication of effort. An example is the BC low income climate action tax credit, which is delivered through the income tax system. If this were a direct provincial expenditure program, a provincial agency or office would have to be established to duplicate much of the work already done by the Canada Revenue Agency. In addition, it would require individuals to undertake a separate, time-consuming application process to qualify for the benefit.
There are, however, several potential drawbacks to tax expenditure programs. First, their overall cost often receives less public scrutiny than is the case for spending programs because annual budget appropriations by the legislature are not typically required. Second, tax expenditure programs do not always effectively target those who are intended to benefit from them. Some tax expenditure programs that are intended to provide tax relief for lower-income earners may, in reality, confer the greatest benefit on higher-income earners who pay the most taxes. Finally, costs are often more difficult to control under a tax expenditure program because the benefits tend to be more open-ended and enforcement is often more difficult than for spending programs.
Tax Expenditure Reporting
Not all tax reductions, credits, exemptions and refunds are classed as tax expenditures.
The emphasis is on tax reductions, credits, exemptions and refunds that are close equivalents to spending programs. By implication, the list does not include tax measures designed to meet broad tax policy objectives such as improving fairness in the tax system, or measures designed to simplify the administration of a tax. The list also does not include anything that is not intended to be part of a tax base.
Tax expenditures that cost less than $2 million are generally not included. Where practical, smaller items have been presented together as an aggregate figure.
Budget and Fiscal Plan — 2016/17 to 2018/19
106
Appendix
British Columbia Tax Expenditures
The following tables report tax expenditure estimates.
The cost of individual tax expenditures cannot be added together to reach a total tax expenditure figure for two reasons:
· in some cases the programs interact with one another so that eliminating one program could increase or decrease the cost of another; and
· eliminating certain tax expenditure programs could change the choices taxpayers make, which in turn would affect the cost estimates.
The estimates for each tax expenditure are based on a static analysis of the costs and do not take into account any behavioural changes, which could change the costs over time. In addition, estimates are generally recalculated each year using current data sources and using refinements to the methods of estimation that can result in significant changes to the value of a given tax expenditure from prior years’ reports.
In Table A1.1, Personal Income Tax — Tax Expenditures, the list of tax expenditures delivered through the income tax system has been separated into two sub-categories.
· Provincial Measures: This includes all major tax expenditures that are under provincial policy control.
· Federal Measures: British Columbia shares the cost of some federal income tax expenditure programs because, under the tax collection agreement between British Columbia and the federal government, the Province has agreed to maintain a consistent income tax base with the federal government in the interest of reducing administration and compliance costs.
Budget and Fiscal Plan — 2016/17 to 2018/19
107
Appendix
Table A1.1 Personal Income Tax — Tax Expenditures
| | | 2015/16 | |
| | | Estimated Cost | |
| | | ($ millions) | |
Personal Income Tax | | | | |
Provincial Measures | | | | |
BC early childhood tax benefit | | | 137 | |
BC low income climate action tax credit | | | 192 | |
Sales tax credit | | | 54 | |
Training tax credit | | | 9 | |
Venture capital tax credit | | | 21 | |
BC mining flow-through share tax credit | | | 10 | |
Political contributions tax credit | | | 4 | |
BC seniors’ home renovation tax credit | | | 1 | |
Provincial non-refundable credits: 1 | | | | |
· Charitable donations tax credit | | | 200 | |
· Tax credits for tuition and education | | | 47 | |
· Tax credits for persons with disability and medical expenses | | | 79 | |
· Pension income tax credit | | | 25 | |
· Credit for persons age 65 and older | | | 68 | |
· Married and equivalent-to-married credits | | | 86 | |
· Tax credit for Canada Pension Plan contributions | | | 162 | |
· Tax credit for Employment Insurance premiums paid | | | 56 | |
· Children’s fitness and arts tax credits | | | 8 | |
Federal Measures 2 | | | | |
· Pension income splitting | | | 67 | |
· Child care expense deduction | | | 48 | |
· Exemption from capital gains for small businesses and family farms | | | 71 | |
· Deduction for residents of northern and isolated areas | | | 10 | |
· Non-taxation of business-paid health and dental benefits | | | 98 | |
· Tax-Free Savings Accounts | | | 29 | |
· Registered Retirement Savings Plans: 3 | | | | |
· exemption for | – contributions | 385 | | | |
| – investment earnings | 506 | | | |
· taxation of | – withdrawals | (264 | ) | | |
| Total | | | 627 | |
· Registered Pension Plans: 3 | | | | |
· exemption for | – contributions | 685 | | | |
| – investment earnings | 735 | | | |
· taxation of | – withdrawals | (399 | ) | | |
| Total | | | 1,021 | |
1 Provincial non-refundable credits are generally based on estimates of credit claims by British Columbia residents.
2 These measures are federal measures but the estimates show only the provincial revenue loss. Each measure is calculated from the 2014 federal costs as reported in the Government of Canada’s Tax Expenditures and Evaluations 2014 by applying British Columbia residents’ share of the measure and the relevant tax rates, and increasing by projected household income growth. Certain tax expenditure items have been excluded where no data were available or the amounts were immaterial.
3 Registered retirement savings plans and registered pension plans are treated in the same way as in the federal tax expenditure report. The tax expenditure associated with these plans is presented as the amount of tax that would otherwise be paid in the year of deferral, were the deferral not available. However, this type of estimate overstates the true costs of these preferences because taxes are eventually paid, including tax on investment earnings. An estimate that does not overstate these costs would, however, be difficult to develop and would require some largely speculative assumptions.
Budget and Fiscal Plan — 2016/17 to 2018/19
108
Appendix
Table A1.2 Corporate Income Tax — Tax Expenditures
| | | | 2015/16 | |
| | | | Estimated Cost | |
| | | | ($ millions) | |
Corporate Income Tax 1 | | | | | |
Charitable donations deduction 2 | | | | 36 | |
Training tax credit 3 | | | | 5 | |
Film and television tax credits: | | | | | |
· Film Incentive BC tax credit 4 | | 106 | | | |
· Production services tax credit 5 | | 385 | | | |
Total | | | | 491 | |
International business activities tax refund 6 | | | | 20 | |
Scientific research and experimental development tax credit 7 | | | | 131 | |
Mining exploration tax credit 8 | | | | 1 | |
Interactive digital media tax credit 9 | | | | 33 | |
1 Includes prior year adjustments for refundable tax credits.
2 The deduction offered for corporate charitable donations is a federal measure, but the estimate shows only the provincial revenue loss. This is calculated from the 2014 federal cost as reported in Government of Canada’s Tax Expenditures and Evaluations 2014 by applying British Columbia’s share of corporate taxable income and the relevant tax rates to the federal estimate and increasing it by corporate income tax revenue growth.
3 Includes prior year adjustment of -$5 million.
4 Includes prior year adjustment of +$16 million.
5 Includes prior year adjustment of +$53 million.
6 Includes employee income tax refunds.
7 Includes prior year adjustment of -$7 million.
8 Includes prior year adjustment of -$39 million.
9 Includes prior year adjustment of -$12 million.
Table A1.3 Property Taxes — Tax Expenditures
| | 2015/16 | |
| | Estimated Cost | |
| | ($ millions) | |
School and Rural Area Property Tax | | | |
Assessment exemption of $10,000 for industrial and business properties 1 | | 8 | |
Overnight tourist accommodation assessment relief 1 | | 3 | |
Home owner grant 2 | | 804 | |
| | | |
Property Transfer Tax | | | |
Exemption for first-time home buyers | | 99 | |
Exemptions for the following: | | | |
· Property transfers between related individuals | | 93 | |
· Property transfers to municipalities, regional districts, hospital districts, library boards, school boards, water districts and educational institutions | | 11 | |
· Property transfers to charities registered under the Income Tax Act (Canada) | | 9 | |
1 Estimates are for the 2015 calendar year and include only school and rural area property taxes levied by the Province.
2 The home owner grant includes the northern and rural home owner benefit.
Budget and Fiscal Plan — 2016/17 to 2018/19
109
Appendix
Table A1.4 Consumption Taxes — Tax Expenditures
| | 2015/16 | |
| | Estimated Cost | |
| | ($ millions) | |
Fuel Tax 1 | | | |
Tax exemption for alternative fuels | | 15 | |
Tax exemption for international flights (jet fuel) | | 16 | |
Tax exemptions for farmers 2 | | 8 | |
| | | |
Provincial Sales Tax 1 | | | |
Exemptions for the following items: | | | |
· Food (basic groceries, snack foods, candies, soft drinks and restaurant meals) | | 1,154 | |
· Residential energy (electricity, natural gas, fuel oil, etc.) | | 236 | |
· Prescription and non-prescription drugs, vitamins and certain other health care products | | 206 | |
· Children’s clothing and footwear | | 45 | |
· Clothing patterns, fabrics and notions | | 9 | |
· Specified school supplies | | 25 | |
· Books, magazines and newspapers | | 39 | |
· Basic telephone and cable service | | 72 | |
· “1-800” and equivalent telephone services | | 2 | |
· Specified safety equipment | | 24 | |
· Labour to repair major household appliances, clothing and footwear | | 9 | |
· Livestock for human consumption, and feed, seed and fertilizer | | 52 | |
· Specified energy conservation equipment | | 17 | |
· Bicycles | | 12 | |
1 Estimates are based on Statistics Canada data and/or administrative data.
2�� Estimate accounts for both motor fuel tax and carbon tax.
Budget and Fiscal Plan — 2016/17 to 2018/19
110
Appendix
Table A2 Interprovincial Comparisons of Tax Rates — 2016 | | | |
(Rates known and in effect as of February 3, 2016) | | | | |
| | | | |
Tax | | British
Columbia | | Alberta | | Saskat-chewan | | Manitoba | | Ontario | | Quebec | | New
Brunswick | | Nova
Scotia | | Prince
Edward
Island | | Newfound-land and
Labrador | |
| | | | | | | | | | | | | | | | | | | | | |
Corporate income tax (per cent of taxable income) | | | | | | | | | | | | | | | | | | | | | |
General rate 1 | | 11 | | 12 | | 12 | | 12 | | 11.5 | | 11.9 | | 12 | | 16 | | 16 | | 14 | |
Manufacturing rate 2 | | 11 | | 10 | | 10 | | 12 | | 10 | | 11.9 | | 12 | | 16 | | 16 | | 5 | |
Small business rate | | 2.5 | | 3 | | 2 | | 0 | | 4.5 | | 8 | | 4 | | 3 | | 4.5 | | 3 | |
Small business threshold ($000s) | | 500 | | 500 | | 500 | | 450 | | 500 | | 500 | | 500 | | 350 | | 500 | | 500 | |
Corporation capital tax (per cent) | | | | | | | | | | | | | | | | | | | | | |
Non-financial | | Nil | | Nil | | Nil | | Nil | | Nil | | Nil | | Nil | | Nil | | Nil | | Nil | |
Financial | | Nil | | Nil | | 0.7/3.25 | | 6 | | Nil | | Nil | | 4 | | 4 | | 5 | | 5 | |
Health care premiums/month ($) | | | | | | | | | | | | | | | | | | | | | |
Individual/family 3 | | 75/150 | | Nil | | Nil | | Nil | | Nil | | up to 83/167 | | Nil | | Nil | | Nil | | Nil | |
Payroll tax (per cent) 4 | | Nil | | Nil | | Nil | | 2.15 | | 1.95 | | 4.26 | | Nil | | Nil | | Nil | | 2 | |
Insurance premium tax (per cent) 5 | | 2-4.4 | | 2-3 | | 3-4 | | 2-3 | | 2-3.5 | | 3.48 | | 2-3 | | 3-4 | | 3.5 | | 4 | |
Fuel tax (cents per litre) 6 | | | | | | | | | | | | | | | | | | | | | |
Gasoline | | 21.17 | | 13.0 | | 15.0 | | 14.0 | | 21.2 | | 28.1 | | 22.1 | | 23.7 | | 20.5 | | 23.1 | |
Diesel | | 22.67 | | 13.0 | | 15.0 | | 14.0 | | 21.0 | | 29.3 | | 28.7 | | 23.3 | | 28.0 | | 23.8 | |
Sales tax (per cent) 7 | | | | | | | | | | | | | | | | | | | | | |
General rate | | 7 | | Nil | | 5 | | 8 | | 8 | | 9.975 | | 8 | | 10 | | 9 | | 8 | |
Tobacco tax (dollars per carton of 200 cigarettes) 8 | | 47.80 | | 50.00 | | 55.05 | | 67.80 | | 34.27 | | 29.80 | | 52.16 | | 61.25 | | 59.09 | | 54.84 | |
1 Effective April 1, 2016, New Brunswick will increase its general corporate income tax rate to 14 per cent.
2 In British Columbia (and some other provinces) the general rate applies to income from manufacturing and processing. In Quebec, the rate for manufacturing corporations eligible for the small business rate is 4 per cent; the rate for other manufacturing corporations is the general rate. Effective April 1, 2016, New Brunswick will increase its manufacturing rate to 14 per cent.
3 British Columbia has a two-person rate of $136 in 2016. Effective beginning January 1, 2017, the calculation of MSP premiums will no longer include children. Rates will be based on the number of adults in a household. The rate for a single adult will be $78 and the rate for a couple will be $156. British Columbia provides premium assistance in the form of lower rates or an exemption from premiums for lower-income individuals and families. Quebec levies a health contribution that varies with income and is capped at a maximum of $1,000 annually per adult for higher-income earners. The Quebec health contribution will be phased out beginning in 2017 and will be completely eliminated by 2019. Ontario levies a health premium, as part of its provincial personal income tax system, of up to $900 per year.
4 Provinces with payroll taxes provide payroll tax relief for small businesses. Quebec also levies a compensation tax of up to 4.48 per cent on salaries and wages paid by financial institutions.
5 Lower rates apply to premiums for life, sickness and accident insurance; higher rates apply to premiums for property insurance including automobile insurance. In Manitoba, Ontario, Quebec, and Newfoundland and Labrador, specific sales taxes also apply to certain insurance premiums, except, generally those related to individual life and health.
6 Tax rates are for regular fuel used on highways and include all provincial taxes payable by consumers at the pump. The British Columbia rate includes 6.75 cents per litre dedicated to the BC Transportation Financing Authority and the carbon tax rates of 6.67 cents per litre for gasoline and 7.67 cents per litre for diesel. The British Columbia rates do not include regional taxes that effectively increase the gasoline and diesel tax rates by 11 cents per litre in the South Coast British Columbia transportation service region and by 3.5 cents per litre in the Capital Regional District. The tax rates for Ontario, Quebec, New Brunswick, Nova Scotia, Prince Edward Island, and Newfoundland and Labrador include provincial sales tax based on average pump prices as of January 2016. Quebec’s tax rates do not include increased or reduced regional tax rates, such as an additional tax of 3 cents per litre on gasoline for the Montreal area.
7 Tax rates shown are statutory rates. Ontario, Quebec, New Brunswick, Nova Scotia, Prince Edward Island, and Newfoundland and Labrador have harmonized their sales taxes with the federal GST. New Brunswick will increase its provincial portion of HST to 10 per cent July 1, 2016. Alberta imposes a 4 per cent tax on short-term rental accommodation.
8 Includes estimated provincial sales tax in all provinces except British Columbia, Alberta and Quebec.
Budget and Fiscal Plan — 2016/17 to 2018/19
111
Appendix
Table A3 Comparison of Provincial and Federal Taxes by Province — 2016
| | | | | | | | | | | | | | | | | | | | | | New- | |
| | | | | | | | | | | | | | | | | | | | Prince | | foundland | |
| | | | | | | | Saskat- | | | | | | | | New | | Nova | | Edward | | and | |
Tax | | British Columbia | | Alberta | | chewan | | Manitoba | | Ontario | | Quebec | | Brunswick | | Scotia | | Island | | Labrador | |
Two Income Family of Four - $90,000 | | ($) | |
1. | | Provincial Income Tax | | 3,164 | | 4,152 | | 3,850 | | 5,861 | | 3,697 | | 7,451 | | 5,995 | | 6,829 | | 6,855 | | 5,351 | |
| | Net Child Benefits | | (660 | ) | 68 | | 0 | | — | | 0 | | (2,222 | ) | 0 | | 0 | | — | | 0 | |
2. | | Property Tax - Gross | | 4,014 | | 3,406 | | 4,826 | | 3,812 | | 5,339 | | 5,418 | | 5,244 | | 4,405 | | 3,716 | | 3,046 | |
| | | - Net | | 3,444 | | 3,406 | | 4,826 | | 3,112 | | 5,339 | | 5,418 | | 5,244 | | 4,405 | | 3,716 | | 3,046 | |
3. | | Sales Tax | | 1,514 | | 0 | | 1,205 | | 1,838 | | 2,145 | | 2,711 | | 2,159 | | 2,607 | | 2,113 | | 2,109 | |
4. | | Fuel Tax | | 218 | | 195 | | 225 | | 210 | | 318 | | 422 | | 332 | | 356 | | 308 | | 347 | |
5. | | Net Carbon Tax | | 236 | | — | | — | | — | | — | | — | | — | | — | | — | | — | |
6. | | Provincial Direct Taxes | | 7,916 | | 7,821 | | 10,107 | | 11,021 | | 11,498 | | 13,780 | | 13,729 | | 14,197 | | 12,992 | | 10,852 | |
7. | | Health Care Premiums/Payroll Tax | | 1,800 | | — | | — | | 1,935 | | 1,755 | | 4,134 | | — | | — | | — | | 1,800 | |
8. | | Total Provincial Tax | | 9,716 | | 7,821 | | 10,107 | | 12,956 | | 13,253 | | 17,914 | | 13,729 | | 14,197 | | 12,992 | | 12,652 | |
9. | | Federal Income Tax | | 8,023 | | 8,023 | | 8,023 | | 8,023 | | 8,023 | | 7,998 | | 8,023 | | 8,023 | | 8,023 | | 8,023 | |
10. | | Net Federal GST | | 1,427 | | 1,513 | | 1,467 | | 1,328 | | 1,376 | | 1,294 | | 1,359 | | 1,314 | | 1,359 | | 1,328 | |
11. | | Total Tax | | 19,165 | | 17,357 | | 19,597 | | 22,308 | | 22,652 | | 27,205 | | 23,112 | | 23,534 | | 22,374 | | 22,003 | |
Two Income Family of Four - $60,000 | | | | | | | | | | | | | | | | | | | | | |
1. | | Provincial Income Tax | | 1,295 | | 1,657 | | 870 | | 2,729 | | 1,006 | | 3,345 | | 3,251 | | 3,531 | | 3,788 | | 2,836 | |
| | Net Child Benefits | | (660 | ) | (705 | ) | 0 | | — | | 0 | | (3,322 | ) | 0 | | 0 | | — | | 0 | |
2. | | Property Tax - Gross | | 2,922 | | 2,764 | | 3,216 | | 3,082 | | 3,830 | | 3,724 | | 2,916 | | 2,764 | | 2,956 | | 2,096 | |
| | | - Net | | 2,352 | | 2,764 | | 3,216 | | 2,382 | | 3,830 | | 3,724 | | 2,916 | | 2,764 | | 2,956 | | 2,096 | |
3. | | Sales Tax | | 1,234 | | 0 | | 1,012 | | 1,543 | | 1,769 | | 2,388 | | 1,782 | | 2,173 | | 1,672 | | 1,746 | |
4. | | Fuel Tax | | 218 | | 195 | | 225 | | 210 | | 318 | | 422 | | 332 | | 356 | | 308 | | 347 | |
5. | | Net Carbon Tax | | 208 | | — | | — | | — | | — | | — | | — | | — | | — | | — | |
6. | | Provincial Direct Taxes | | 4,646 | | 3,911 | | 5,322 | | 6,863 | | 6,923 | | 6,557 | | 8,280 | | 8,823 | | 8,724 | | 7,025 | |
7. | | Health Care Premiums/Payroll Tax | | 1,800 | | — | | — | | 1,290 | | 1,170 | | 2,693 | | — | | — | | — | | 1,200 | |
8. | | Total Provincial Tax | | 6,446 | | 3,911 | | 5,322 | | 8,153 | | 8,093 | | 9,250 | | 8,280 | | 8,823 | | 8,724 | | 8,225 | |
9. | | Federal Income Tax | | 4,230 | | 4,230 | | 4,230 | | 4,230 | | 4,230 | | 4,213 | | 4,230 | | 4,230 | | 4,230 | | 4,230 | |
10. | | Net Federal GST | | 1,163 | | 1,277 | | 1,232 | | 1,115 | | 1,155 | | 1,146 | | 1,122 | | 1,095 | | 1,128 | | 1,100 | |
11. | | Total Tax | | 11,838 | | 9,418 | | 10,784 | | 13,498 | | 13,478 | | 14,608 | | 13,631 | | 14,148 | | 14,081 | | 13,554 | |
Two Income Family of Four - $30,000 | | | | | | | | | | | | | | | | | | | | | |
1. | | Provincial Income Tax | | 0 | | 0 | | (680 | ) | (449 | ) | (643 | ) | (3,179 | ) | 33 | | 364 | | 724 | | 0 | |
| | Net Child Benefits | | (660 | ) | (2,023 | ) | 0 | | — | | (2,019 | ) | (3,587 | ) | (52 | ) | 0 | | — | | 0 | |
2. | | Property Tax - Gross | | 2,922 | | 2,764 | | 3,216 | | 3,082 | | 3,830 | | 3,724 | | 2,916 | | 2,764 | | 2,956 | | 2,096 | |
| | | - Net | | 2,352 | | 2,764 | | 3,216 | | 2,382 | | 3,830 | | 3,724 | | 2,916 | | 2,764 | | 2,956 | | 2,096 | |
3. | | Sales Tax | | 976 | | 0 | | 771 | | 1,236 | | 418 | | 2,133 | | 1,410 | | 1,710 | | 1,227 | | 1,381 | |
4. | | Fuel Tax | | 145 | | 130 | | 150 | | 140 | | 212 | | 281 | | 221 | | 237 | | 205 | | 231 | |
5. | | Net Carbon Tax | | (126 | ) | — | | — | | — | | — | | — | | — | | — | | — | | — | |
6. | | Provincial Direct Taxes | | 2,687 | | 871 | | 3,456 | | 3,309 | | 1,796 | | (628 | ) | 4,527 | | 5,075 | | 5,112 | | 3,709 | |
7. | | Health Care Premiums/Payroll Tax | | 0 | | — | | — | | 645 | | 585 | | 1,278 | | — | | — | | — | | 600 | |
8. | | Total Provincial Tax | | 2,687 | | 871 | | 3,456 | | 3,954 | | 2,381 | | 650 | | 4,527 | | 5,075 | | 5,112 | | 4,309 | |
9. | | Federal Income Tax | | 496 | | 496 | | 496 | | 496 | | 496 | | 488 | | 496 | | 496 | | 496 | | 496 | |
10. | | Net Federal GST | | 84 | | 180 | | 102 | | 58 | | 144 | | 194 | | 52 | | 26 | | 50 | | 34 | |
11. | | Total Tax | | 3,267 | | 1,547 | | 4,054 | | 4,508 | | 3,021 | | 1,331 | | 5,075 | | 5,597 | | 5,658 | | 4,839 | |
Unattached Individual - $25,000 | | | | | | | | | | | | | | | | | | | | | |
1. | | Provincial Income Tax | | 327 | | 366 | | 445 | | 702 | | 266 | | (162 | ) | 672 | | 943 | | 1,412 | | 1,025 | |
2. | | Property Tax | | — | | — | | — | | — | | — | | — | | — | | — | | — | | — | |
3. | | Sales Tax | | 469 | | 0 | | 388 | | 596 | | 496 | | 927 | | 730 | | 881 | | 589 | | 690 | |
4. | | Fuel Tax | | 145 | | 130 | | 150 | | 140 | | 212 | | 281 | | 221 | | 237 | | 205 | | 231 | |
5. | | Net Carbon Tax | | (49 | ) | — | | — | | — | | — | | — | | — | | — | | — | | — | |
6. | | Provincial Direct Taxes | | 892 | | 496 | | 983 | | 1,438 | | 974 | | 1,046 | | 1,623 | | 2,062 | | 2,206 | | 1,946 | |
7. | | Health Care Premiums/Payroll Tax | | 154 | | — | | — | | 538 | | 488 | | 1,165 | | — | | — | | — | | 500 | |
8. | | Total Provincial Tax | | 1,045 | | 496 | | 983 | | 1,976 | | 1,462 | | 2,211 | | 1,623 | | 2,062 | | 2,206 | | 2,446 | |
9. | | Federal Income Tax | | 1,422 | | 1,422 | | 1,422 | | 1,422 | | 1,422 | | 1,415 | | 1,422 | | 1,422 | | 1,422 | | 1,422 | |
10. | | Net Federal GST | | 56 | | 87 | | 67 | | 33 | | 48 | | 35 | | 43 | | 27 | | 31 | | 18 | |
11. | | Total Tax | | 2,524 | | 2,006 | | 2,472 | | 3,431 | | 2,932 | | 3,661 | | 3,088 | | 3,511 | | 3,659 | | 3,886 | |

Budget and Fiscal Plan — 2016/17 to 2018/19
112
Appendix
Table A3 Comparison of Provincial and Federal Taxes by Province — 2016
| | | | | | | | | | | | | | | | | | | | | | New- | |
| | | | | | | | | | | | | | | | | | | | Prince | | foundland | |
| | | | | | | | Saskat- | | | | | | | | New | | Nova | | Edward | | and | |
Tax | | British Columbia | | Alberta | | chewan | | Manitoba | | Ontario | | Quebec | | Brunswick | | Scotia | | Island | | Labrador | |
Unattached Individual - $80,000 | | ($) | |
1. | | Provincial Income Tax | | 3,982 | | 5,175 | | 6,561 | | 7,039 | | 5,108 | | 9,000 | | 7,558 | | 8,392 | | 8,075 | | 6,605 | |
2. | | Property Tax - Gross | | 1,999 | | 2,736 | | 3,489 | | 4,553 | | 3,712 | | 4,944 | | 2,371 | | 3,631 | | 2,724 | | 2,151 | |
| | | - Net | | 1,429 | | 2,736 | | 3,489 | | 3,853 | | 3,712 | | 4,944 | | 2,371 | | 3,631 | | 2,724 | | 2,151 | |
3. | | Sales Tax | | 1,114 | | 0 | | 880 | | 1,342 | | 1,656 | | 1,938 | | 1,637 | | 1,966 | | 1,588 | | 1,608 | |
4. | | Fuel Tax | | 218 | | 195 | | 225 | | 210 | | 318 | | 422 | | 332 | | 356 | | 308 | | 347 | |
5. | | Net Carbon Tax | | 186 | | — | | — | | — | | — | | — | | — | | — | | — | | — | |
6. | | Provincial Direct Taxes | | 6,928 | | 8,106 | | 11,155 | | 12,444 | | 10,794 | | 16,303 | | 11,897 | | 14,344 | | 12,695 | | 10,711 | |
7. | | Health Care Premiums/Payroll Tax | | 900 | | — | | — | | 1,720 | | 1,560 | | 3,608 | | — | | — | | — | | 1,600 | |
8. | | Total Provincial Tax | | 7,828 | | 8,106 | | 11,155 | | 14,164 | | 12,354 | | 19,911 | | 11,897 | | 14,344 | | 12,695 | | 12,311 | |
9. | | Federal Income Tax | | 10,198 | | 10,198 | | 10,198 | | 10,198 | | 10,198 | | 10,166 | | 10,198 | | 10,198 | | 10,198 | | 10,198 | |
10. | | Net Federal GST | | 1,127 | | 1,184 | | 1,100 | | 1,016 | | 1,060 | | 932 | | 1,034 | | 993 | | 1,035 | | 1,016 | |
11. | | Total Tax | | 19,153 | | 19,487 | | 22,453 | | 25,377 | | 23,613 | | 31,010 | | 23,129 | | 25,535 | | 23,928 | | 23,525 | |
| | | | | | | | | | | | | | | | | | | | | | | |
Senior Couple with Equal Pension Incomes - $30,000 | | | | | | | | | | | | | | | | | | | |
1. | | Provincial Income Tax | | 0 | | 0 | | (489 | ) | (1,116 | ) | (1,583 | ) | (1,227 | ) | 0 | | (255 | ) | 0 | | 0 | |
2. | | Property Tax - Gross | | 2,922 | | 2,764 | | 3,216 | | 3,082 | | 3,830 | | 3,724 | | 2,916 | | 2,764 | | 2,956 | | 2,096 | |
| | | - Net | | 2,077 | | 2,764 | | 3,216 | | 2,240 | | 3,830 | | 3,724 | | 2,916 | | 2,764 | | 2,956 | | 2,096 | |
3. | | Sales Tax | | 858 | | 0 | | 676 | | 1,174 | | 861 | | 1,674 | | 1,314 | | 1,638 | | 1,137 | | 1,353 | |
4. | | Fuel Tax | | 145 | | 130 | | 150 | | 140 | | 212 | | 281 | | 221 | | 237 | | 205 | | 231 | |
5. | | Net Carbon Tax | | (57 | ) | — | | — | | — | | — | | — | | — | | — | | — | | — | |
6. | | Provincial Direct Taxes | | 3,023 | | 2,894 | | 3,552 | | 2,438 | | 3,320 | | 4,453 | | 4,451 | | 4,384 | | 4,298 | | 3,680 | |
7. | | Health Care Premiums/Payroll Tax | | 0 | | — | | — | | — | | — | | — | | — | | — | | — | | — | |
8. | | Total Provincial Tax | | 3,023 | | 2,894 | | 3,552 | | 2,438 | | 3,320 | | 4,453 | | 4,451 | | 4,384 | | 4,298 | | 3,680 | |
9. | | Federal Income Tax | | 0 | | 0 | | 0 | | 0 | | 0 | | 0 | | 0 | | 0 | | 0 | | 0 | |
10. | | Net Federal GST | | 321 | | 349 | | 318 | | 350 | | 318 | | 279 | | 282 | | 280 | | 298 | | 307 | |
11. | | Total Tax | | 3,345 | | 3,243 | | 3,870 | | 2,788 | | 3,638 | | 4,732 | | 4,733 | | 4,664 | | 4,595 | | 3,987 | |
Personal Income Tax
· Income tax is based on basic personal credits, applicable credits and typical major deductions at each income level. Quebec residents pay federal income tax less an abatement of 16.5 per cent of basic federal tax. This abatement has been used to reduce Quebec provincial tax rather than federal tax, for comparative purposes. The two income family of four with $60,000 annual income is assumed to have one spouse earning $40,000 and the other $20,000, the family with $90,000 income is assumed to have one spouse earning $50,000 and the other $40,000, the family with $30,000 is assumed to have each spouse earning $15,000 and each senior is assumed to receive $15,000. All representative families are assumed to have employment income except the senior couple.
Net Child Benefits
· Net child benefits are provincial measures affecting payments to families with children. Provincial child benefit measures are available in British Columbia (BC Early Childhood Tax Benefit, BC Family Bonus), Alberta (Alberta Child Benefit, Family Employment Credit), Saskatchewan (Child Benefit), Ontario (Child Benefit), Quebec (Child Assistance Payments), New Brunswick (Child Tax Benefit), Nova Scotia (Child Benefit) and Newfoundland and Labrador (Child Benefit). In addition, the Alberta government has chosen to vary the amount of the basic federal child tax benefit that its residents receive (shown as a net amount).
Property Tax
· It is assumed that the individual at $25,000 rents accommodation; the family at $30,000, and at $60,000, and the senior couple own bungalows; the family at $90,000 owns a two-storey executive style home; and the single at $80,000 owns a luxury condominium, in a major city for each province. Net local and provincial property taxes are estimated as taxes owing, after credits provided through the property tax system are subtracted.
Sales, Fuel and Carbon Tax Estimates
· Includes sales tax on meals, liquor and accommodation. Estimates are based on expenditure patterns from the Survey of Household Spending. In estimating individual and family taxable consumption, disposable income is reduced by 20 per cent to reflect housing (mortgage and property taxes or rent) costs. The senior couple is assumed to own their home and have no mortgage costs. For each province, disposable income is further reduced by estimated federal income taxes, estimated provincial income taxes and health care premiums/payroll taxes if applicable. In addition, the single individual with $80,000 annual income and the family with $90,000 annual income are assumed to have savings equal to 5 per cent of their disposable income. For each family, disposable income is distributed among expenditures using the consumption pattern of a typical family with the relevant characteristics as estimated using family expenditure data, and the relevant sales tax component is extracted. Sales tax includes provincial retail sales taxes in British Columbia, Saskatchewan, and Manitoba, Quebec’s value added tax, the provincial component of the HST in Ontario, New Brunswick, Nova Scotia, Prince Edward Island and Newfoundland and Labrador, and Alberta’s Tourism Levy. Sales tax estimates have been reduced by sales tax credits where applicable.
· Fuel tax is based on annual consumption: 1,000 litres of unleaded fuel for the single at $25,000, the family at $30,000 and the senior couple; others are assumed to consume 1,500 litres.
· Carbon tax applies in British Columbia to household consumption of gasoline, natural gas and home heating fuel. Estimated carbon tax liabilities are based on natural gas and home heating fuel consumption amounts from the Survey of Household Spending and the assumed fuel consumption noted above. Net carbon tax is estimated as carbon tax liabilities less the BC low income climate action tax credit where applicable. In previous years, the 5 per cent personal income tax cut in the first two tax bracket rates was shown as a reduction in carbon tax.
Health Care Premiums/Payroll Tax
· A health care premium is levied in British Columbia and Quebec only. Payroll taxes, in the four provinces that levy them, are paid by the employer. Employer-paid payroll taxes and employer-paid health care premiums are generally reflected in reduced wages.
Effective Tax Rates
· British Columbia taxes have been calculated using rates in effect for 2016. Taxes for other provinces were calculated using rates that were announced prior to February 1, 2016, and that come into effect during 2016.
Budget and Fiscal Plan — 2016/17 to 2018/19
113
Appendix
Table A4 Interprovincial Comparisons of Provincial Personal Income Taxes Payable 1 — 2016
(Rates known as of February 1, 2016)
| | | | | | | | | | | | | | | | | | | | New- | |
| | | | | | | | | | | | | | | | | | Prince | | foundland | |
| | British | | | | Saskat- | | | | | | | | New | | Nova | | Edward | | and | |
Taxable income | | Columbia | | Alberta | | chewan | | Manitoba | | Ontario | | Quebec 2 | | Brunswick | | Scotia | | Island | | Labrador | |
| Annual provincial taxes payable 3 ($) | |
$ | 10,000 | | 0 | | 0 | | 0 | | 0 | | 0 | | 0 | | 0 | | 0 | | 0 | | 0 | |
$ | 20,000 | | 30 | | 36 | | 326 | | 1,016 | | 426 | | 285 | | 355 | | 858 | | 938 | | 224 | |
$ | 30,000 | | 857 | | 967 | | 1,351 | | 2,051 | | 1,215 | | 1,655 | | 1,557 | | 1,752 | | 2,001 | | 1,488 | |
$ | 40,000 | | 1,434 | | 1,899 | | 2,376 | | 3,233 | | 1,835 | | 3,185 | | 2,680 | | 3,187 | | 3,234 | | 2,438 | |
$ | 50,000 | | 2,170 | | 2,831 | | 3,509 | | 4,434 | | 2,803 | | 4,881 | | 4,070 | | 4,622 | | 4,548 | | 3,636 | |
$ | 60,000 | | 2,927 | | 3,805 | | 4,780 | | 5,681 | | 3,705 | | 6,549 | | 5,527 | | 6,108 | | 5,902 | | 4,866 | |
$ | 70,000 | | 3,697 | | 4,805 | | 6,080 | | 7,096 | | 4,620 | | 8,211 | | 7,009 | | 7,775 | | 7,457 | | 6,116 | |
$ | 80,000 | | 4,567 | | 5,805 | | 7,380 | | 8,836 | | 5,775 | | 9,873 | | 8,491 | | 9,442 | | 9,127 | | 7,443 | |
$ | 100,000 | | 6,886 | | 7,805 | | 9,980 | | 12,316 | | 8,871 | | 13,674 | | 11,779 | | 12,834 | | 12,467 | | 10,103 | |
$ | 125,000 | | 10,404 | | 10,305 | | 13,230 | | 16,666 | | 13,223 | | 18,964 | | 15,909 | | 17,209 | | 17,056 | | 13,428 | |
$ | 150,000 | | 14,079 | | 13,305 | | 16,932 | | 21,016 | | 17,576 | | 24,282 | | 20,281 | | 21,584 | | 21,649 | | 16,998 | |
| | Provincial personal income taxes as a per cent of taxable income (%) | |
$ | 10,000 | | 0.0 | | 0.0 | | 0.0 | | 0.0 | | 0.0 | | 0.0 | | 0.0 | | 0.0 | | 0.0 | | 0.0 | |
$ | 20,000 | | 0.1 | | 0.2 | | 1.6 | | 5.1 | | 2.1 | | 1.4 | | 1.8 | | 4.3 | | 4.7 | | 1.1 | |
$ | 30,000 | | 2.9 | | 3.2 | | 4.5 | | 6.8 | | 4.0 | | 5.5 | | 5.2 | | 5.8 | | 6.7 | | 5.0 | |
$ | 40,000 | | 3.6 | | 4.7 | | 5.9 | | 8.1 | | 4.6 | | 8.0 | | 6.7 | | 8.0 | | 8.1 | | 6.1 | |
$ | 50,000 | | 4.3 | | 5.7 | | 7.0 | | 8.9 | | 5.6 | | 9.8 | | 8.1 | | 9.2 | | 9.1 | | 7.3 | |
$ | 60,000 | | 4.9 | | 6.3 | | 8.0 | | 9.5 | | 6.2 | | 10.9 | | 9.2 | | 10.2 | | 9.8 | | 8.1 | |
$ | 70,000 | | 5.3 | | 6.9 | | 8.7 | | 10.1 | | 6.6 | | 11.7 | | 10.0 | | 11.1 | | 10.7 | | 8.7 | |
$ | 80,000 | | 5.7 | | 7.3 | | 9.2 | | 11.0 | | 7.2 | | 12.3 | | 10.6 | | 11.8 | | 11.4 | | 9.3 | |
$ | 100,000 | | 6.9 | | 7.8 | | 10.0 | | 12.3 | | 8.9 | | 13.7 | | 11.8 | | 12.8 | | 12.5 | | 10.1 | |
$ | 125,000 | | 8.3 | | 8.2 | | 10.6 | | 13.3 | | 10.6 | | 15.2 | | 12.7 | | 13.8 | | 13.6 | | 10.7 | |
$ | 150,000 | | 9.4 | | 8.9 | | 11.3 | | 14.0 | | 11.7 | | 16.2 | | 13.5 | | 14.4 | | 14.4 | | 11.3 | |
1 Calculated for a single individual with wage income and claiming credits for Canada Pension Plan and Quebec Pension Plan contributions, Employment Insurance premiums, Quebec Parental Insurance Plan premiums, and the basic personal amount.
2 Quebec residents pay federal tax less an abatement of 16.5 per cent of federal tax. In the table, the Quebec abatement has been used to reduce Quebec provincial personal income tax for comparative purposes.
3 Includes provincial low income reductions, surtaxes payable in Ontario and Prince Edward Island, and the Ontario Health Premium tax. Excludes credits for sales and property tax credits.
Budget and Fiscal Plan — 2016/17 to 2018/19
114
Appendix
Table A5 Material Assumptions — Revenue
| | Updated | | Budget | | | | | | | |
Revenue Source and Assumptions | | Forecast | | Estimate | | Plan | | Plan | | | |
($ millions unless otherwise specified) | | 2015/16 | | 2016/17 | | 2017/18 | | 2018/19 | | 2016/17 Sensitivities | |
Personal income tax * | | $ | 8,376 | | $ | 8,216 | | $ | 8,611 | | $ | 8,971 | | | |
Current calendar year assumptions | | | | | | | | | | | |
Household income growth | | 3.2 | % | 3.6 | % | 3.9 | % | 3.9 | % | +/- 1% point change in 2016 BC | |
Compensation of employees growth | | 3.3 | % | 3.9 | % | 4.0 | % | 4.1 | % | household income growth | |
Tax base growth | | 1.4 | % | 3.4 | % | 4.2 | % | 3.4 | % | equals +/- $90 to $110 million | |
Average tax yield | | 5.38 | % | 5.24 | % | 5.28 | % | 5.32 | % | | |
Current-year tax | | $ | 7,834 | | $ | 7,896 | | $ | 8,294 | | $ | 8,640 | | | |
Prior year’s tax assessments | | $ | 350 | | $ | 360 | | $ | 370 | | $ | 380 | | | |
Unapplied taxes | | $ | 90 | | $ | 90 | | $ | 90 | | $ | 90 | | | |
BC Tax Reduction | | -$ | 146 | | -$ | 151 | | -$ | 154 | | -$ | 157 | | | |
Non-refundable BC tax credits | | -$ | 89 | | -$ | 90 | | -$ | 85 | | -$ | 85 | | | |
Policy neutral elasticity ** | | 0.6 | | 1.2 | | 1.3 | | 1.1 | | +/- 0.5 change in 2016 BC | |
Fiscal year assumptions | | | | | | | | | | policy neutral elasticity | |
Prior-year adjustment | | $ | 312 | | | | | | | | equals +/- $130 to $150 million | |
| | | | | | | | | | | |
2014 Tax-year | | 2014 Assumptions | | | | | | | |
Household income growth | | 3.2 | % | | | | | | | +/- 1% point change in 2015 BC | |
Tax base growth | | 3.7 | % | | | | | | | household or taxable income | |
Average 2014 tax yield | | 5.32 | % | | | | | | | growth equals +/- $90 to $100 | |
2014 tax | | $ | 7,633 | | | | | | | | million one-time effect | |
2013 & prior year’s tax assessments | | $ | 306 | | | | | | | | (prior-year adjustment) | |
Unapplied taxes | | $ | 80 | | | | | | | | and could result in an | |
BC Tax Reduction | | -$140 | | | | | | | | additional +/-$70 to $90 million | |
Non-refundable BC tax credits | | -$74 | | | | | | | | base change in 2016/17 | |
Policy neutral elasticity ** | | 1.7 | | | | | | | | | |
| | | | | | | | | | | | | | | | | | | |
* Reflects information as at January 20, 2016.
** Ratio of annual per cent change in current-year revenue to annual per cent change in personal income (calendar year).
Corporate income tax * | | $ | 2,788 | | $ | 2,791 | | $ | 2,959 | | $ | 3,004 | | | |
Components of revenue (fiscal year) | | | | | | | | | | | |
Instalments - subject to general rate | | $ | 2,406 | | $ | 2,530 | | $ | 2,663 | | $ | 2,754 | | | |
Instalments - subject to small business rate | | $ | 281 | | $ | 295 | | $ | 309 | | $ | 318 | | | |
Non-refundable BC tax credits | | -$ | 89 | | -$ | 96 | | -$ | 102 | | -$ | 108 | | | |
Advance instalments | | $ | 2,598 | | $ | 2,729 | | $ | 2,870 | | $ | 2,964 | | | |
International Business Activity Act refunds | | -$ | 20 | | -$ | 20 | | -$ | 25 | | -$ | 25 | | | |
Prior-year settlement payment | | $ | 210 | | $ | 82 | | $ | 114 | | $ | 65 | | | |
Current calendar year assumptions | | | | | | | | | | | |
National tax base ($ billions) | | $ | 285.8 | | $ | 293.6 | | $ | 302.1 | | $ | 307.7 | | +/- 1% change in the 2016 | |
BC instalment share of national tax base | | 11.5 | % | 11.6 | % | 12.0 | % | 12.1 | % | national tax base equals | |
Effective tax rates (general/small business) | | 11.0 / 2.5 | | 11.0 / 2.5 | | 11.0 / 2.5 | | 11.0 / 2.5 | | +/- $20 to $30 million | |
Share of the BC tax base subject to small business rate | | 34.0 | % | 33.9 | % | 33.8 | % | 33.7 | % | +/- 1% point change in the 2016 | |
BC tax base growth (post federal measures) | | 3.3 | % | 4.5 | % | 4.5 | % | 3.5 | % | small business share equals | |
BC net operating surplus growth | | -1.3 | % | 3.7 | % | 5.0 | % | 5.0 | % | -/+ $20 to $30 million | |
| | | | | | | | | | | |
2014 Tax-year | | 2014 Assumptions | | | | | | +/- 1% change in the 2015 | |
BC tax base growth (post federal measures) | | 7.4 | % | | | | | | | BC tax base equals +/- $30 | |
BC net operating surplus growth | | 8.4 | % | | | | | | | to $40 million in 2016/17 | |
Gross 2014 tax | | $ | 2,718 | | | | | | | | | |
Prior-year settlement payment | | $ | 210 | | | | | | | | | |
Prior years losses/gains (included in above) | | $ | 67 | | | | | | | | | |
Non-refundable BC tax credits | | -$ | 82 | | | | | | | | | |
| | | | | | | | | | | | | | | | | | | |
* Reflects information as at January 21, 2016.
Net cash received from the federal government and cash refunds under the International Business Activity Act are used as the basis for estimating revenue. Due to lags in the federal collection and instalment systems, changes to the BC net operating surplus and tax base forecasts affect revenue in the succeeding year. The 2016/17 instalments from the federal government reflects two-third of payments related to the 2016 tax year (paid during Apr-July 2016 and adjusted in Sept and Dec) and one-third of 2017 payments. Instalments for the 2016 (2017) tax year are based on BC’s share of the national tax base for the 2014 (2015) tax year and a forecast of the 2016 (2017) national tax base. BC’s share of the 2014 national tax base was 11.60%, based on tax assessments as of December 31, 2015. Cash adjustments for any under/over payments from the federal government in respect of 2015 will be received/paid on March 31, 2017.

Budget and Fiscal Plan — 2016/17 to 2018/19
115
Appendix
Table A5 Material Assumptions — Revenue (continued)
| | Updated | | Budget | | | | | | | |
Revenue Source and Assumptions | | Forecast | | Estimate | | Plan | | Plan | | | |
($ millions unless otherwise specified) | | 2015/16 | | 2016/17 | | 2017/18 | | 2018/19 | | 2016/17 Sensitivities | |
Provincial sales tax | | $ | 5,956 | | $ | 6,296 | | $ | 6,554 | | $ | 6,819 | | | |
Provincial sales tax base growth (fiscal year) | | 3.9 | % | 4.8 | % | 4.2 | % | 4.1 | % | +/- 1% point change in the 2016 | |
Calendar Year | | | | | | | | | | consumer expenditure growth | |
Nominal consumer expenditure | | 5.2 | % | 4.8 | % | 4.7 | % | 4.5 | % | equals up to +/- $30 million | |
Nominal business investment | | 7.9 | % | 5.6 | % | 5.1 | % | 4.6 | % | | |
Other expenditures | | 3.4 | % | 4.9 | % | 4.3 | % | 4.8 | % | | |
Components of Provincial sales tax revenue | | | | | | | | | | +/- 1% point change in the 2016 | |
Consolidated Revenue Fund | | $ | 5,949 | | $ | 6,289 | | $ | 6,547 | | $ | 6,812 | | busines investment growth equals | |
BC Transportation Financing Authority | | $ | 7 | | $ | 7 | | $ | 7 | | $ | 7 | | up to +/- $10 million | |
Fuel and carbon taxes | | $ | 2,157 | | $ | 2,182 | | $ | 2,207 | | $ | 2,238 | | | |
Calendar Year | | | | | | | | | | | |
Real GDP | | 2.4 | % | 2.4 | % | 2.3 | % | 2.3 | % | | |
Gasoline volumes | | 0.0 | % | 0.0 | % | 0.0 | % | 0.0 | % | | |
Diesel volumes | | 2.0 | % | 2.0 | % | 2.0 | % | 2.0 | % | | |
Natural gas volumes | | 2.4 | % | 2.4 | % | 2.3 | % | 2.3 | % | | |
Carbon tax rates (July 1) | | | | | | | | | | | |
Carbon dioxide equivalent emissions ($/tonne) | | $ | 30 | | $ | 30 | | $ | 30 | | $ | 30 | | | |
Natural gas (cents/gigajoule) | | 148.98 | ¢ | 148.98 | ¢ | 148.98 | ¢ | 148.98 | ¢ | | |
Gasoline (cents/litre) | | 6.67 | ¢ | 6.67 | ¢ | 6.67 | ¢ | 6.67 | ¢ | | |
Light fuel oil (cents/litre) | | 7.67 | ¢ | 7.67 | ¢ | 7.67 | ¢ | 7.67 | ¢ | | |
| | | | | | | | | | | |
Carbon tax revenue | | $ | 1,216 | | $ | 1,234 | | $ | 1,252 | | $ | 1,275 | | | |
| | | | | | | | | | | |
Components of fuel tax revenue | | | | | | | | | | | |
Consolidated Revenue Fund | | $ | 509 | | $ | 513 | | $ | 517 | | $ | 522 | | | |
BC Transit | | $ | 12 | | $ | 12 | | $ | 12 | | $ | 12 | | | |
BC Transportation Financing Authority | | $ | 420 | | $ | 423 | | $ | 426 | | $ | 429 | | | |
| | $ | 941 | | $ | 948 | | $ | 955 | | $ | 963 | | | |
Property taxes | | $ | 2,206 | | $ | 2,305 | | $ | 2,399 | | $ | 2,504 | | | |
Calendar Year | | | | | | | | | | | |
Consumer Price Index | | 1.1 | % | 1.9 | % | 2.0 | % | 2.0 | % | +/- 1% point change in 2016 new | |
Housing starts | | 31,446 | | 29,403 | | 28,039 | | 27,037 | | construction & inflation growth | |
Home owner grants (fiscal year) | | $ | 804 | | $ | 825 | | $ | 837 | | $ | 850 | | equals up to +/- $20 million in | |
Components of revenue | | | | | | | | | | residential property taxation revenue | |
Residential (net of home owner grants) | | $ | 766 | | $ | 782 | | $ | 808 | | $ | 836 | | | |
Non-residential | | $ | 1,151 | | $ | 1,211 | | $ | 1,266 | | $ | 1,324 | | +/- 1% change in 2016 total | |
Rural area | | $ | 95 | | $ | 97 | | $ | 99 | | $ | 102 | | business property assessment | |
Police | | $ | 34 | | $ | 36 | | $ | 37 | | $ | 39 | | value equals up to +/- $20 million | |
BC Assessment Authority | | $ | 85 | | $ | 88 | | $ | 89 | | $ | 92 | | in non-residential property | |
BC Transit | | $ | 75 | | $ | 91 | | $ | 100 | | $ | 111 | | taxation revenue | |
Other taxes | | $ | 2,755 | | $ | 2,514 | | $ | 2,469 | | $ | 2,445 | | | |
Calendar Year | | | | | | | | | | | |
Population | | 1.0 | % | 1.2 | % | 1.3 | % | 1.3 | % | | |
Consumer Price Index | | 1.1 | % | 1.9 | % | 2.0 | % | 2.0 | % | | |
Housing starts | | 10.9 | % | -6.5 | % | -4.6 | % | -3.6 | % | | |
Real GDP | | 2.4 | % | 2.4 | % | 2.3 | % | 2.3 | % | | |
Nominal GDP | | 3.3 | % | 4.0 | % | 4.3 | % | 4.3 | % | | |
Components of revenue | | | | | | | | | | +/- 5% change to 2016 housing | |
Property transfer | | $ | 1,490 | | $ | 1,239 | | $ | 1,184 | | $ | 1,150 | | starts equals +/- $30 to 50 million | |
Tobacco | | $ | 755 | | $ | 755 | | $ | 755 | | $ | 755 | | in property transfer revenue, | |
Insurance premium | | $ | 510 | | $ | 520 | | $ | 530 | | $ | 540 | | depending on property values | |
Budget and Fiscal Plan — 2016/17 to 2018/19
116
Appendix
Table A5 Material Assumptions — Revenue (continued)
| | Updated | | Budget | | | | | | | |
Revenue Source and Assumptions | | Forecast | | Estimate | | Plan | | Plan | | | |
($ millions unless otherwise specified) | | 2015/16 | | 2016/17 | | 2017/18 | | 2018/19 | | 2016/17 Sensitivities | |
Energy, sales of Crown land tenures, metals, minerals and other * | | $ | 1,234 | | $ | 1,033 | | $ | 832 | | $ | 825 | | | |
Natural gas price | | | | | | | | | | +/- $0.25 change in the natural gas | |
Plant inlet, $Cdn/gigajoule | | $ | 1.31 | | $ | 1.04 | | $ | 1.34 | | $ | 1.61 | | price equals +/- $25 to 35 million, | |
Sumas, $US/ MMBtu | | $ | 2.30 | | $ | 1.96 | | $ | 2.31 | | $ | 2.64 | | including impacts on production | |
Natural gas production volumes | | | | | | | | | | volumes and royalty program | |
Billions of cubic metres | | 44.0 | | 44.0 | | 46.2 | | 49.7 | | credits, but excluding any | |
Petajoules | | 1,748 | | 1,748 | | 1,835 | | 1,973 | | changes from byproducts revenue | |
Annual per cent change | | 2.2 | % | 0.0 | % | 5.0 | % | 7.5 | % | (e.g. butane, ethane, propane) | |
| | | | | | | | | | Sensitivities can also vary | |
Oil price ($US/bbl at Cushing, Ok) | | $ | 45.25 | | $ | 45.17 | | $ | 52.54 | | $ | 58.34 | | significantly at different price levels. | |
| | | | | | | | | | +/- 1% change in natural gas | |
Auctioned land base (000 hectares) | | 76 | | 60 | | 60 | | 60 | | volumes equals +/- $1 million | |
Average bid price/hectare ($) | | $ | 183 | | $ | 252 | | $ | 290 | | $ | 388 | | on natural gas royalties | |
Cash sales of Crown land tenures | | $ | 14 | | $ | 15 | | $ | 17 | | $ | 23 | | +/- 1 cent change in the | |
Metallurgical coal price ($US/tonne, fob west coast) | | $ | 95 | | $ | 85 | | $ | 93 | | $ | 105 | | exchange rate equals +/- $3 million | |
Copper price ($US/lb) | | $ | 2.36 | | $ | 2.27 | | $ | 2.48 | | $ | 2.58 | | on natural gas royalties | |
Annual electricity volumes set by treaty | | 4.1 | | 4.1 | | 4.0 | | 4.0 | | +/- US$10 change in the average | |
(million mega-watt hours) | | | | | | | | | | Metallurgical coal price | |
Mid-Columbia electricity price | | $ | 26 | | $ | 24 | | $ | 26 | | $ | 29 | | equals +/- $30 to $40 million | |
($US/mega-watt hour) | | | | | | | | | | +/- 10% change in the average | |
| | | | | | | | | | Mid-Columbia electricity price | |
Exchange rate (US¢/ Cdn$, calendar year) | | 78.2 | | 73.1 | | 76.8 | | 79.7 | | equals +/- $13 million | |
Components of revenue | | | | | | | | | | | |
Natural gas royalties | | $ | 151 | | $ | 128 | | $ | 185 | | $ | 247 | | Based on a recommendation | |
Bonus bids, fees and rentals | | $ | 767 | | $ | 633 | | $ | 365 | | $ | 268 | | from the Auditor General to be | |
Petroleum royalties | | $ | 53 | | $ | 46 | | $ | 46 | | $ | 51 | | consistent with generally | |
Columbia River Treaty electricity sales | | $ | 123 | | $ | 111 | | $ | 116 | | $ | 128 | | accepted accounting principles, | |
Oli and Gas Commission fees and levies | | $ | 48 | | $ | 47 | | $ | 48 | | $ | 52 | | bonus bid revenue recognition | |
Coal mineral tax | | $ | 46 | | $ | 28 | | $ | 32 | | $ | 40 | | reflects nine-year deferral of | |
Net metals and other minerals tax | | $ | 11 | | $ | 4 | | $ | 3 | | $ | 2 | | cash receipts from the sale of | |
Economic Community Development | | | | | | | | | | Crown land tenures | |
Agreement recoveries related to metal mines | | $ | 9 | | $ | 11 | | $ | 12 | | $ | 12 | | | |
Coal tenures | | $ | 8 | | $ | 8 | | $ | 8 | | $ | 8 | | | |
Miscellaneous mining revenue | | $ | 18 | | $ | 17 | | $ | 17 | | $ | 17 | | | |
| | | | | | | | | | | |
Royalty programs and infrastructure credits | | | | | | | | | | | |
Deep drilling | | -$ | 128 | | -$ | 90 | | -$ | 139 | | -$ | 254 | | | |
Road and pipeline infrastructure | | -$ | 58 | | -$ | 42 | | -$ | 55 | | -$ | 79 | | | |
Total | | -$ | 186 | | -$ | 132 | | -$ | 194 | | -$ | 333 | | | |
Implicit average natural gas royalty rate | | 6.6 | % | 7.0 | % | 7.4 | % | 7.8 | % | | |
| | | | | | | | | | | | | | | | | | | |
Royalty program (marginal, low productivity and ultra marginal drilling) adjustments reflect reduced royalty rates. Natural gas royalties incorporate royalty programs and Treasury Board approved infrastructure credits.
* Reflects information as at January 15, 2016.
Budget and Fiscal Plan — 2016/17 to 2018/19
117
Appendix
Table A5 Material Assumptions — Revenue (continued)
| | Updated | | Budget | | | | | | | |
Revenue Source and Assumptions | | Forecast | | Estimate | | Plan | | Plan | | | |
($ millions unless otherwise specified) | | 2015/16 | | 2016/17 | | 2017/18 | | 2018/19 | | 2016/17 Sensitivities | |
Forests * | | $ | 833 | | $ | 812 | | $ | 814 | | $ | 828 | | | |
Prices (calendar year average) | | | | | | | | | | +/- US$50 change in SPF | |
SPF 2x4 ($US/thousand board feet) | | $ | 282 | | $ | 288 | | $ | 300 | | $ | 300 | | price equals +/- $120 to | |
Random Lengths Composite | | | | | | | | | | $140 million | |
($US/thousand board feet) | | $ | 332 | | $ | 323 | | $ | 330 | | $ | 330 | | +/- US$50 change in pulp price | |
Pulp ($US/tonne) | | $ | 852 | | $ | 840 | | $ | 825 | | $ | 825 | | equals +/-$5 to $10 million | |
Coastal log ($Cdn/cubic metre); | | | | | | | | | | +/- Cdn$10 change in average | |
Vancouver Log Market) | | $ | 105 | | $ | 100 | | $ | 100 | | $ | 100 | | log price equals +/-$10 to | |
| | | | | | | | | | $20 million | |
Crown harvest volumes (million cubic metres) | | | | | | | | | | | |
Interior | | 49.3 | | 48.8 | | 48.6 | | 48.5 | | +/- 10% change in Interior | |
Coast | | 12.7 | | 13.2 | | 13.4 | | 13.5 | | harvest volumes equals | |
Total | | 62.0 | | 62.0 | | 62.0 | | 62.0 | | +/- $50 to $65 million | |
BC Timber Sales (included in above) | | 11.2 | | 11.8 | | 11.8 | | 11.8 | | +/- 10% change in Coastal | |
| | | | | | | | | | harvest volumes equals | |
Stumpage rates ($Cdn/cubic metre) | | | | | | | | | | +/- $10 to $15 million | |
Total stumpage rates | | $ | 10.44 | | $ | 11.34 | | $ | 11.45 | | $ | 11.68 | | +/- 1 cent change in | |
Components of revenue | | | | | | | | | | exchange rate equals | |
Tenures | | $ | 390 | | $ | 448 | | $ | 457 | | $ | 474 | | +/- $20 to $25 million on | |
BC Timber Sales | | $ | 280 | | $ | 277 | | $ | 275 | | $ | 272 | | stumpage revenue | |
Federal border tax (SLA 2006) | | $ | 73 | | $ | 0 | | $ | 0 | | $ | 0 | | | |
Logging tax | | $ | 45 | | $ | 45 | | $ | 40 | | $ | 40 | | | |
Other CRF revenue | | $ | 20 | | $ | 19 | | $ | 19 | | $ | 19 | | The above sensitivities relate | |
Recoveries | | $ | 25 | | $ | 23 | | $ | 23 | | $ | 23 | | to stumpage revenue only. | |
|
|
* Reflects information as at January 8, 2016. |
|
Other natural resources | | $ | 463 | | $ | 502 | | $ | 466 | | $ | 472 | | | |
Components of revenue | | | | | | | | | | | |
Water rental and licences* | | $ | 391 | | $ | 430 | | $ | | | $ | 407 | | | |
Recoveries | | $ | 50 | | $ | 50 | | $ | 48 | | $ | 43 | | | |
Angling and hunting permits and licences | | $ | 11 | | $ | 11 | | $ | 11 | | $ | 11 | | | |
Recoveries | | $ | 11 | | $ | 11 | | $ | 11 | | $ | 11 | | | |
|
|
* Water rentals for power purposes are indexed to Consumer Price Index. |
Other revenue | | $ | 9,864 | | $ | 10,405 | | $ | 10,427 | | $ | 10,518 | | | |
Components of revenue | | | | | | | | | | | |
Fees and licences | | | | | | | | | | +/- 1% point change in BC’s | |
Medical Services Plan (MSP) premiums | | $ | 2,425 | | $ | 2,549 | | $ | 2,665 | | $ | 2,780 | | population growth equals | |
Consolidated Revenue Fund | | $ | 2,358 | | $ | 2,479 | | $ | 2,601 | | $ | 2,716 | | +/- $20 to $30 million on MSP | |
MSP recoveries | | $ | 67 | | $ | 70 | | $ | 64 | | $ | 64 | | premium revenue | |
Motor vehicle licences and permits | | $ | 521 | | $ | 527 | | $ | 534 | | $ | 542 | | MSP rates are assumed to | |
Other Consolidated Revenue Fund | | $ | 383 | | $ | 383 | | $ | 386 | | $ | 371 | | increase 4 percent annually | |
Summary consolidation eliminations | | $ | -15 | | $ | -17 | | $ | -17 | | $ | -17 | | | |
Other recoveries | | $ | 107 | | $ | 110 | | $ | 104 | | $ | 102 | | | |
Crown corporations and agencies | | $ | 109 | | $ | 105 | | $ | 80 | | $ | 80 | | | |
Post-secondary education fees | | $ | 1,667 | | $ | 1,751 | | $ | 1,833 | | $ | 1,920 | | | |
Other healthcare-related fees | | $ | 356 | | $ | 357 | | $ | 361 | | $ | 361 | | | |
School Districts | | $ | 222 | | $ | 230 | | $ | 230 | | $ | 230 | | | |
Investment earnings | | | | | | | | | | | |
Consolidated Revenue Fund | | $ | 45 | | $ | 84 | | $ | 122 | | $ | 135 | | | |
Fiscal agency loans & sinking funds earnings | | $ | 965 | | $ | 995 | | $ | 1,050 | | $ | 1,112 | | | |
Summary consolidation eliminations | | $ | -51 | | $ | -54 | | $ | -72 | | $ | -91 | | | |
Crown corporations and agencies | | $ | 35 | | $ | 24 | | $ | 18 | | $ | 20 | | | |
SUCH sector agencies | | $ | 149 | | $ | 151 | | $ | 158 | | $ | 161 | | | |
Sales of goods and services | | $ | 935 | | $ | 951 | | $ | 957 | | $ | 971 | | | |
Miscellaneous | | $ | 2,011 | | $ | 2,259 | | $ | 2,018 | | $ | 1,841 | | | |
| | | | | | | | | | | | | | | | | | | | | | |

Budget and Fiscal Plan — 2016/17 to 2018/19
118
Appendix
Table A5 Material Assumptions — Revenue (continued)
| | Updated | | Budget | | | | | | | |
Revenue Source and Assumptions | | Forecast | | Estimate | | Plan | | Plan | | | |
($ millions unless otherwise specified) | | 2015/16 | | 2016/17 | | 2017/18 | | 2018/19 | | 2016/17 Sensitivities | |
Health and social transfers | | $ | 6,146 | | $ | 6,471 | | $ | 6,679 | | $ | 6,917 | | | |
National Cash Transfers | | | | | | | | | | | |
Canada Health Transfer (CHT) | | $ | 34,026 | | $ | 36,068 | | $ | 37,150 | | $ | 38,413 | | +/- 0.1% point change in BC’s | |
Canada Social Transfer (CST) | | $ | 12,959 | | $ | 13,348 | | $ | 13,748 | | $ | 14,161 | | population share equals | |
BC share of national population (June 1) | | 13.07 | % | 13.09 | % | 13.12 | % | 13.16 | % | +/- $50 million | |
BC health and social transfers revenue | | | | | | | | | | | |
CHT | | $ | 4,446 | | $ | 4,721 | | $ | 4,875 | | $ | 5,054 | | | |
CST | | $ | 1,693 | | $ | 1,747 | | $ | 1,804 | | $ | 1,863 | | | |
Prior-year adjustments | | | | | | | | | | | |
Health | | $ | (2 | ) | | | | | | | | |
Social | | $ | 2 | | | | | | | | | |
Health deferral | | | | | | | | | | | |
Medical Equipment Trust | | $ | 7 | | $ | 3 | | — | | — | | | |
2017/18 National CHT amount is assumed to increase at the minimum 3 per cent annual change |
Other federal contributions | | $ | 1,513 | | $ | 1,537 | | $ | 1,516 | | $ | 1,493 | | | |
Components of revenue | | | | | | | | | | | |
Disaster Financial Assistance | | $ | 1 | | $ | 27 | | $ | 18 | | $ | 23 | | | |
Other Consolidated Revenue Fund | | $ | 137 | | $ | 136 | | $ | 136 | | $ | 136 | | | |
Labour Market Development Agreement | | $ | 300 | | $ | 300 | | $ | 300 | | $ | 300 | | | |
Labour Market and Skills Training Program | | $ | 77 | | $ | 69 | | $ | 65 | | $ | 65 | | | |
Family Support and Children in Care | | $ | 49 | | $ | 49 | | $ | 49 | | $ | 49 | | | |
Youth Justice Services | | $ | 18 | | $ | 18 | | $ | 18 | | $ | 18 | | | |
Emergency Management | | $ | 5 | | $ | 2 | | $ | 1 | | $ | 1 | | | |
Other recoveries | | $ | 92 | | $ | 91 | | $ | 91 | | $ | 91 | | | |
Crown corporations and agencies | | $ | 230 | | $ | 238 | | $ | 233 | | $ | 202 | | | |
Post-secondary institutions | | $ | 513 | | $ | 514 | | $ | 516 | | $ | 519 | | | |
Other SUCH sector agencies | | $ | 91 | | $ | 93 | | $ | 89 | | $ | 89 | | | |
Service delivery agency direct revenue | | $ | 6,287 | | $ | 6,428 | | $ | 6,262 | | $ | 6,301 | | | |
School districts | | $ | 560 | | $ | 570 | | $ | 572 | | $ | 574 | | | |
Post-secondary institutions | | $ | 3,233 | | $ | 3,334 | | $ | 3,437 | | $ | 3,543 | | | |
Health authorities and hospital societies | | $ | 1,082 | | $ | 829 | | $ | 842 | | $ | 842 | | | |
BC Transportation Financing Authority | | $ | 490 | | $ | 523 | | $ | 521 | | $ | 497 | | | |
Other service delivery agencies | | $ | 922 | | $ | 1,172 | | $ | 890 | | $ | 845 | | | |
Commercial Crown corporation net income | | $ | 2,701 | | $ | 3,002 | | $ | 3,101 | | $ | 3,107 | | | |
BC Hydro | | $ | 653 | | $ | 692 | | $ | 706 | | $ | 720 | | | |
reservoir water inflows | | 94 | % | 100 | % | 100 | % | 100 | % | +/-1% in hydro generation = +/-$10 million +/-10% = -/+$1 million | |
| | | | | | | | | | = +/-$10 million +/-10% = -/+$1 million | |
mean gas price | | 2.44 | | 2.46 | | 2.62 | | 2.78 | | | |
(Sumas, $US/MMbtu — BC Hydro forecast based on NYMEX forward selling prices) |
electricity prices | | 25.93 | | 24.15 | | 25.34 | | 26.79 | | +/-10% change in electricity trade | |
(Mid-C, $US/MWh) | | | | | | | | | | margins = +/-$20 million | |
ICBC | | $ | (125 | ) | $ | 95 | | $ | 148 | | $ | 130 | | | |
vehicle growth | | +3.5 | % | +1.8 | % | +1.7 | % | +1.7 | % | +/-1% = +/-$48 million | |
current claims cost percentage change | | +13.1 | % | +5.4 | % | +1.3 | % | +5.5 | % | +/-1% = -/+$40 million | |
unpaid claims balance ($ billions) | | $ | 9.1 | | $ | 9.8 | | $ | 10.3 | | $ | 10.9 | | +/-1% = -/+$91 to $98 million | |
investment return | | 6.5 | % | 2.5 | % | 2.5 | % | 2.6 | % | +/-1% return = +/-$148 to $155 million | |
loss ratio | | 100.8 | % | 88.3 | % | 86.7 | % | 87.4 | % | | |
Budget and Fiscal Plan — 2016/17 to 2018/19
119
Appendix
Table A6 Natural Gas Price Forecasts — 2016/17 to 2018/19
| | | | | | | | Adjusted to fiscal years and | |
| | | | | | | | $C/gigajoule at plant inlet | |
Private sector forecasts (calendar year) | | 2016 | | 2017 | | 2018 | | 2016/17 | | 2017/18 | | 2018/19 | |
GLJ Henry Hub US$/MMBtu (Jan. 1, 2015) | | 2.60 | | 3.10 | | 3.30 | | 1.39 | | 1.81 | | 2.02 | |
Sproule Henry Hub US$/MMBtu (Dec. 31, 2015) | | 2.25 | | 3.00 | | 3.50 | | 1.08 | | 1.80 | | 2.33 | |
McDaniel Henry Hub US$/MMBtu (Jan. 1, 2016) | | 2.50 | | 2.95 | | 3.40 | | 1.27 | | 1.73 | | 2.16 | |
Deloitte Henry Hub US$/Mcf (Dec. 31, 2015) | | 2.40 | | 2.80 | | 3.10 | | 1.04 | | 1.41 | | 1.71 | |
GLJ Alberta AECO-C Spot CDN$/MMBtu (Jan. 1, 2015) | | 2.76 | | 3.27 | | 3.45 | | 1.73 | | 2.13 | | 2.30 | |
Sproule Alberta AECO-C Spot CDN$/MMBtu (Dec. 31, 2015) | | 2.25 | | 2.95 | | 3.42 | | 1.30 | | 1.90 | | 2.35 | |
McDaniel AECO-C Spot C$/MMBtu (Jan. 1, 2016) | | 2.70 | | 3.20 | | 3.55 | | 1.67 | | 2.11 | | 2.43 | |
Deloitte AECO-C Spot C$/Mcf (Dec. 31, 2015) | | 2.45 | | 2.85 | | 3.10 | | 1.33 | | 1.65 | | 1.91 | |
GLJ Sumas Spot US$/MMBtu (Jan. 1, 2015) | | 2.40 | | 2.90 | | 3.10 | | 1.32 | | 1.74 | | 1.96 | |
Sproule Sumas Spot CDN$/MMBtu (Dec. 31, 2015) | | 2.35 | | 3.05 | | 3.52 | | 0.94 | | 1.54 | | 1.99 | |
GLJ BC Spot Plant Gate CDN$/MMBtu (Jan. 1, 2015) | | 1.83 | | 2.58 | | 2.86 | | 0.98 | | 1.56 | | 1.84 | |
Sproule BC Station 2 CDN$/MMBtu (Dec. 31, 2015) | | 1.45 | | 2.55 | | 3.02 | | 0.60 | | 1.47 | | 1.92 | |
McDaniel BC Avg Plant Gate C$MMBtu (Jan. 1, 2016) | | 2.10 | | 2.60 | | 3.15 | | 1.17 | | 1.65 | | 2.11 | |
Deloitte BC Station 2 C$MMBtu (Dec. 31, 2015) | | 1.70 | | 2.35 | | 2.60 | | 0.76 | | 1.25 | | 1.50 | |
GLJ Midwest Chicago US$/MMBtu (Jan. 1, 2015) | | 2.70 | | 3.20 | | 3.40 | | 1.25 | | 1.67 | | 1.88 | |
Sproule Alliance Plant Gate CDN$/MMBtu (Dec. 31, 2015) | | 3.10 | | 3.85 | | 4.32 | | 2.12 | | 2.76 | | 3.21 | |
EIA Henry Hub US$/MMBtu (Dec. 8, 2015) | | 2.84 | | — | | — | | — | | — | | — | |
TD Economics Henry Hub FuturesUS$/MMBtu (Nov. 16, 2015) | | 2.81 | | 3.24 | | — | | 2.02 | | — | | — | |
Scotiabank Group Henry Hub US$/MMBtu (Dec. 3, 2015) | | 2.70 | | 3.00 | | — | | 1.44 | | — | | — | |
BMO Alberta Empress US$/MMBtu (Dec. 17, 2015) | | 2.30 | | 2.80 | | — | | 1.52 | | — | | — | |
CIBC World Markets Inc. Henry Hub US$/MMBtu (Sept, 2015) | | 3.50 | | 3.75 | | — | | 2.31 | | — | | — | |
InSite Petroleum Consultants Ltd Henry Hub US$/MMBtu (Dec. 31, 2015) | | 2.50 | | 3.00 | | 3.50 | | 1.28 | | 1.80 | | 2.26 | |
NYMEX Forward Market converted to Plant Inlet CDN$/GJ (Jan. 4, 2016) | | | | | | | | 1.24 | | 1.46 | | 1.55 | |
Average all minus high/low | | | | | | | | 1.35 | | 1.73 | | 2.08 | |
Average one forecast per consultant minus high/low | | | | | | | | 1.31 | | 1.56 | | 1.96 | |
Natural gas royalty price forecast | | | | | | | | 1.04 | | 1.34 | | 1.61 | |
GLJ: Gilbert Laustsen Jung Petroleum Consultants Ltd US EIA: US Energy Information Administration AECO: Alberta Energy Company |
Deloitte/AJM: Deloitte L.L.P acquired Ashton Jenkins Mann Petroleum Consultants McDaniel: McDaniel & Associates Consultants Ltd |
Natural Gas Prices
Budget and Fiscal Plan — 2016/17 to 2018/19
120
Appendix
Table A7 Material Assumptions — Expense
| | Updated | | Budget | | | | | | | |
Ministry Programs and Assumptions | | Forecast | | Estimate | | Plan | | Plan | | | |
($ millions unless otherwise specified) | | 2015/16 | | 2016/17 | | 2017/18 | | 2018/19 | | Sensitivities 2016/17 | |
Advanced Education | | 1,961 | | 1,986 | | 2,014 | | 2,042 | | | |
Student spaces in public institutions | | 200,851 | | 200,153 | | 200,153 | | 200,153 | | The number of student spaces may vary depending on the financial and other policies of post-secondary institutions. | |
(# FTEs) | | | | | | | | | | | |
Children and Family Development | | 1,379 | | 1,451 | | 1,472 | | 1,486 | | | |
Average children-in-care caseload (#) | | 7,360 | | 7,250 | | 7,200 | | 7,100 | | A 1% increase in the cost per case or a 1% increase in the average funded caseload will affect expenditures by approximately $2 million (excluding Delegated Aboriginal Agencies) | |
Average annual residential cost per child in care ($) | | 43,100 | | 44,800 | | 46,600 | | 48,500 | | |
Education | | 5,549 | | 5,609 | | 5,667 | | 5,728 | | | |
Public School Enrolment (# of FTEs) | | 542,805 | | 543,490 | | 545,735 | | 549,491 | | Enrolment figures are based on BC Stats and school district enrollment trends, to which the ministry has added forecasts for distributed learning, adult education and summer learning. | |
School age (K—12) | | 521,447 | | 522,132 | | 524,377 | | 528,133 | | |
Distributed Learning (online) | | 11,354 | | 11,354 | | 11,354 | | 11,354 | | |
Summer | | 6,401 | | 6,401 | | 6,401 | | 6,401 | | |
Adults | | 3,603 | | 3,603 | | 3,603 | | 3,603 | | | |
Forests, Lands and Natural Resource Operations | | 922 | | 671 | | 671 | | 682 | | | |
|
BC Timber Sales | | 168 | | 182 | | 175 | | 182 | | Targets can be impacted by changes to actual inventory costs incurred. There is a lag of approximately 1.5 years between when inventory costs are incurred and when they are expensed. Volume harvested can also impact targets. For example, if volume harvested is less than projected in any year, then capitalized expenses will also be reduced in that year. | |
| | | | | | | | | | |
| | | | | | | | | | |
| | | | | | | | | | |
| | | | | | | | | | |
| | | | | | | | | | |
| | | | | | | | | | |
| | | | | | | | | | |
Fire Management | | 373 | | 63 | | 63 | | 63 | | For authorized expenditures under the Wildfire Act . Over the past several years, wildfire fighting costs have ranged from a low of $47 million in 2006 to a high of $382 million in 2010. | |
| | | | | | | | | | |
| | | | | | | | | | |
| | | | | | | | | | |
Health | | 17,445 | | 17,968 | | 18,505 | | 19,065 | | | |
Pharmacare | | 1,103 | | 1,175 | | 1,175 | | 1,175 | | A 1% change in utilization or prices affects costs by approximately $10 million. | |
Medical Services Plan (MSP) | | 4,117 | | 4,300 | | 4,465 | | 4,647 | | A 1% increase in volume of services provided by fee-for-service physicians affects costs by approximately $25 million. | |
| | | | | | | | | | |
| | | | | | | | | | |
| | | | | | | | | | |
Regional Services | | 11,949 | | 12,214 | | 12,582 | | 12,958 | | | |
Justice | | 475 | | 491 | | 498 | | 504 | | | |
New cases filed/processed (# for all courts) | | 240,000 | | 240,000 | | 240,000 | | 240,000 | | The number of criminal cases proceeded on by the provincial and federal Crown (including appeals to higher courts in BC), the number of civil and family litigation cases, the number of violation tickets disputed, and the number of municipal bylaw tickets disputes which would go to court for resolution. | |
Crown Proceeding Act (CPA) | | 25 | | 25 | | 25 | | 25 | | The number of new cases, and the difference between estimated settlements and actual settlements. | |
| | | | | | | | | | |
| | | | | | | | | | |
Public Safety and Solicitor General | | 668 | | 681 | | 708 | | 711 | | | |
Policing, Victim Services and Corrections | | 617 | | 629 | | 654 | | 657 | | The volume and severity of criminal activity, the number of inmate beds occupied and the number of offenders under community supervision. | |
|
|
|

Budget and Fiscal Plan — 2016/17 to 2018/19
121
Appendix
Table A7 Material Assumptions — Expense (continued)
| | Updated | | Budget | | | | | | | |
Ministry Programs and Assumptions | | Forecast | | Estimate | | Plan | | Plan | | | |
($ millions unless otherwise specified) | | 2015/16 | | 2016/17 | | 2017/18 | | 2018/19 | | Sensitivities 2016/17 | |
Social Development and Social Innovation | | 2,593 | | 2,739 | | 2,830 | | 2,868 | | | |
Temporary Assistance
annual average caseload (#) | | 43,200 | | 39,800 | | 39,200 | | 38,600 | | The expected to work caseload is sensitive to fluctuations in economic and employment trends. Costs are driven by changes in the cost per case and caseload. Cost per case fluctuations occur from changes in the needed supports required by clients. | |
|
| | | | | | | | | | |
| | | | | | | | | | |
| | | | | | | | | | |
| | | | | | | | | | |
| | | | | | | | | | | |
Disability Assistance
annual average caseload (#) | | 94,200 | | 97,900 | | 102,500 | | 102,900 | | The caseload for persons with disabilities is sensitive to the aging of the population and longer life expectancy for individuals with disabilities. Cost per case fluctuations are driven by primarily by earning exemption policy exemptions which are dependent on the level of income earned by clients. | |
|
| | | | | | | | | | |
| | | | | | | | | | |
| | | | | | | | | | |
| | | | | | | | | | |
| | | | | | | | | | |
| | | | | | | | | | | |
Adult Community Living: | | | | | | | | | | The adult community living caseload is sensitive to an aging population and to the level of service required. Cost per case fluctuations are driven by the proportion of clients receiving certain types of services at differing costs. For example, residential care is significantly more costly than day programs. | |
Developmental Disabilities Programs Average caseload (#) | | 17,230 | | 18,130 | | 18,980 | | 19,810 | | |
|
Average cost per client ($) | | 45,000 | | 44,700 | | 43,700 | | 43,300 | | |
Personal Supports Initiative | | | | | | | | | | |
Average caseload (#) | | 1,050 | | 1,310 | | 1,580 | | 1,860 | | |
Average cost per client ($) | | 19,500 | | 18,100 | | 16,200 | | 15,200 | | |
Transportation and Infrastructure | | 924 | | 858 | | 862 | | 867 | | | |
Emergency Program Act (EPA) | | 95 | | 15 | | 15 | | 15 | | For authorized expenditures under the Emergency Program Act , including those for further disasters, and the difference between initial estimates for disaster response and recovery costs and final project costs. | |
| | | | | | | | | | |
| | | | | | | | | | |
| | | | | | | | | | |
| | | | | | | | | | |
Tax Transfers | | 1,071 | | 1,039 | | 1,043 | | 1,047 | | | |
Individuals | | 484.0 | | 475.0 | | 475.0 | | 475.0 | | These tax transfers are now expensed as required under generally accepted accounting principles. | |
Low Income Climate Action | | 192.3 | | 195.0 | | 195.0 | | 195.0 | | |
Early Childhood Tax Benefit | | 136.5 | | 145.0 | | 145.0 | | 145.0 | | |
Sales Tax | | 54.4 | | 55.0 | | 55.0 | | 55.0 | | |
Small Business Venture Capital | | 21.1 | | 27.0 | | 27.0 | | 27.0 | | | |
BC Senior’s Home Renovation | | 1.2 | | 2.0 | | 2.0 | | 2.0 | | | |
Other tax transfers to individuals | | 78.3 | | 50.8 | | 50.8 | | 50.8 | | | |
Family Bonus Program | | 0.2 | | 0.2 | | 0.2 | | 0.2 | | | |
Corporations | | 587.0 | | 564.0 | | 568.0 | | 572.0 | | | |
Film and Television | | 106.0 | | 90.0 | | 90.0 | | 90.0 | | | |
Production Services | | 385.3 | | 310.0 | | 310.0 | | 310.0 | | | |
Scientific Research & Experimental | | | | | | | | | | | |
Development | | 54.6 | | 66.0 | | 70.0 | | 74.0 | | | |
Interactive Digital Media | | 32.9 | | 45.0 | | 45.0 | | 45.0 | | | |
Mining Exploration | | 1.2 | | 40.0 | | 40.0 | | 40.0 | | | |
Other tax transfers to corporations | | 7.0 | | 13.0 | | 13.0 | | 13.0 | | | |
2015/16 tax transfer forecast incorporates adjustments relating to prior years. | | | | |
Management of Public Funds and Debt | | 1,188 | | 1,168 | | 1,214 | | 1,241 | | | |
Interest rates for new provincial borrowing: | | | | | | | | | | Full year impact on MoPD on interest costs of a 1% change in interest rates equals $58.1 million; $100 million increase in debt level equals $2.4 million. | |
Short-term | | 0.64 | % | 0.72 | % | 1.40 | % | 2.03 | % |
Long-term | | 2.52 | % | 2.96 | % | 3.67 | % | 4.60 | % |
CDN/US exchange rate (cents) | | 131.2 | | 135.5 | | 128.5 | | 124.7 | |
| | | | | | | | | | | |
Service delivery agency net spending | | 6,231 | | 6,125 | | 6,282 | | 6,309 | | | |
School districts | | 386 | | 311 | | 215 | | 330 | | | |
Post-secondary institutions | | 3,112 | | 3,108 | | 3,251 | | 3,331 | | | |
Health authorities and hospital societies | | 800 | | 598 | | 726 | | 483 | | | |
BC Transportation Financing Authority | | 1,070 | | 1,187 | | 1,223 | | 1,307 | | | |
Other service delivery agencies | | 863 | | 921 | | 867 | | 858 | | | |
Budget and Fiscal Plan — 2016/17 to 2018/19
122
Appendix
Table A8 Operating Statement — 2009/10 to 2018/19
| | | | | | | | | | | | | | Updated | | Budget | | | | | | Average | |
| | Actual | | Actual | | Actual | | Actual | | Actual | | Actual | | Forecast | | Estimate | | Plan | | Plan | | annual | |
($ millions) | | 2009/10 | | 2010/11 | | 2011/12 | | 2012/13 | | 2013/14 | | 2014/15 | | 2015/16 | | 2016/17 | | 2017/18 | | 2018/19 | | change | |
| | | | | | | | | | | | | | | | | | | | | | (per cent) | |
Revenue | | 37,978 | | 40,679 | | 41,796 | | 42,036 | | 43,728 | | 46,122 | | 46,992 | | 48,066 | | 49,034 | | 50,141 | | 3.1 | |
Expense | | (39,790 | ) | (40,926 | ) | (42,047 | ) | (43,204 | ) | (43,401 | ) | (44,439 | ) | (46,365 | ) | (47,452 | ) | (48,397 | ) | (49,418 | ) | 2.4 | |
Allocation to the BC Prosperity Fund | | — | | — | | — | | — | | — | | — | | (100 | ) | — | | — | | — | | | |
Surplus (deficit) before the BC Prosperity Fund and unusual items | | (1,812 | ) | (247 | ) | (251 | ) | (1,168 | ) | 327 | | 1,683 | | 527 | | 614 | | 637 | | 723 | | | |
BC Prosperity Fund | | — | | — | | — | | — | | — | | — | | 100 | | — | | — | | — | | | |
Forecast allowance | | — | | — | | — | | — | | — | | — | | (250 | ) | (350 | ) | (350 | ) | (350 | ) | | |
Liability for HST transition funding repayment | | — | | — | | (1,599 | ) | — | | — | | — | | — | | — | | — | | — | | | |
Surplus (deficit) | | (1,812 | ) | (247 | ) | (1,850 | ) | (1,168 | ) | 327 | | 1,683 | | 377 | | 264 | | 287 | | 373 | | | |
| | | | | | | | | | | | | | | | | | | | | | | |
Per cent of GDP: 1 | | | | | | | | | | | | | | | | | | | | | | | |
Surplus (deficit) | | -0.9 | | -0.1 | | -0.9 | | -0.5 | | 0.1 | | 0.7 | | 0.2 | | 0.1 | | 0.1 | | 0.1 | | | |
Per cent of revenue: | | | | | | | | | | | | | | | | | | | | | | | |
Surplus (deficit) | | -4.8 | | -0.6 | | -4.4 | | -2.8 | | 0.7 | | 3.6 | | 0.8 | | 0.5 | | 0.6 | | 0.7 | | | |
Per capita ($): 2 | | | | | | | | | | | | | | | | | | | | | | | |
Surplus (deficit) | | (411 | ) | (55 | ) | (411 | ) | (257 | ) | 71 | | 363 | | 81 | | 56 | | 60 | | 77 | | | |
1 Surplus (deficit) as a per cent of GDP is calculated using GDP for the calendar year ending in the fiscal year (e.g. 2016/17 amounts divided by GDP for the 2016 calendar year).
2 Per capita revenue and expense is calculated using July 1 population (e.g. 2016/17 amounts divided by population on July 1, 2016).
Budget and Fiscal Plan — 2016/17 to 2018/19
123
Appendix
Table A9 Revenue by Source — 2009/10 to 2018/19
| | | | | | | | | | | | | | Updated | | Budget | | | | | | Average | |
| | Actual | | Actual | | Actual | | Actual | | Actual | | Actual | | Forecast | | Estimate | | Plan | | Plan | | annual | |
($ millions) | | 2009/10 | | 2010/11 | | 2011/12 | | 2012/13 | | 2013/14 | | 2014/15 | | 2015/16 | | 2016/17 | | 2017/18 | | 2018/19 | | change | |
| | | | | | | | | | | | | | | | | | | | | | (per cent) | |
Taxation revenue: | | | | | | | | | | | | | | | | | | | | | | | |
Personal income | | 5,769 | | 5,805 | | 6,427 | | 6,977 | | 6,862 | | 8,076 | | 8,376 | | 8,216 | | 8,611 | | 8,971 | | 5.0 | |
Corporate income | | 1,625 | | 2,026 | | 2,002 | | 2,204 | | 2,427 | | 2,635 | | 2,788 | | 2,791 | | 2,959 | | 3,004 | | 7.1 | |
Sales | | 4,945 | | 5,614 | | 5,930 | | 6,068 | | 5,303 | | 5,762 | | 5,956 | | 6,296 | | 6,554 | | 6,819 | | 3.6 | |
Fuel | | 884 | | 940 | | 928 | | 890 | | 917 | | 932 | | 941 | | 948 | | 955 | | 963 | | 1.0 | |
Carbon | | 541 | | 741 | | 959 | | 1,120 | | 1,222 | | 1,198 | | 1,216 | | 1,234 | | 1,252 | | 1,275 | | n/a | |
Tobacco | | 683 | | 735 | | 636 | | 614 | | 724 | | 752 | | 755 | | 755 | | 755 | | 755 | | 1.1 | |
Property | | 1,887 | | 1,920 | | 1,913 | | 1,985 | | 2,080 | | 2,154 | | 2,206 | | 2,305 | | 2,399 | | 2,504 | | 3.2 | |
Property transfer | | 887 | | 855 | | 944 | | 758 | | 937 | | 1,065 | | 1,490 | | 1,239 | | 1,184 | | 1,150 | | 2.9 | |
Corporation capital | | 95 | | (3 | ) | (5 | ) | 1 | | — | | (1 | ) | — | | — | | — | | — | | n/a | |
Insurance premium | | 389 | | 399 | | 411 | | 433 | | 458 | | 483 | | 510 | | 520 | | 530 | | 540 | | 3.7 | |
| | 17,705 | | 19,032 | | 20,145 | | 21,050 | | 20,930 | | 23,056 | | 24,238 | | 24,304 | | 25,199 | | 25,981 | | 4.4 | |
Natural resource revenue: | | | | | | | | | | | | | | | | | | | | | | | |
Natural gas royalties | | 406 | | 313 | | 339 | | 169 | | 445 | | 493 | | 151 | | 128 | | 185 | | 247 | | -5.4 | |
Crown land tenures | | 867 | | 923 | | 928 | | 868 | | 859 | | 834 | | 767 | | 633 | | 365 | | 268 | | -12.2 | |
Columbia River Treaty | | 168 | | 136 | | 110 | | 89 | | 170 | | 130 | | 123 | | 111 | | 116 | | 128 | | -3.0 | |
Mining and minerals | | 311 | | 387 | | 384 | | 173 | | 128 | | 116 | | 92 | | 68 | | 72 | | 79 | | -14.1 | |
Other energy | | 110 | | 127 | | 145 | | 133 | | 141 | | 151 | | 101 | | 93 | | 94 | | 103 | | -0.7 | |
Forests | | 387 | | 436 | | 482 | | 562 | | 719 | | 754 | | 833 | | 812 | | 814 | | 828 | | 8.8 | |
Other natural resources | | 398 | | 406 | | 424 | | 479 | | 493 | | 459 | | 463 | | 502 | | 466 | | 472 | | 1.9 | |
| | 2,647 | | 2,728 | | 2,812 | | 2,473 | | 2,955 | | 2,937 | | 2,530 | | 2,347 | | 2,112 | | 2,125 | | -2.4 | |
Other revenue: | | | | | | | | | | | | | | | | | | | | | | | |
Medical Services Plan premiums | | 1,666 | | 1,787 | | 1,919 | | 2,047 | | 2,158 | | 2,254 | | 2,425 | | 2,549 | | 2,665 | | 2,780 | | 5.9 | |
Post-secondary education fees | | 1,123 | | 1,235 | | 1,291 | | 1,345 | | 1,445 | | 1,544 | | 1,667 | | 1,751 | | 1,833 | | 1,920 | | 6.1 | |
Other health-care related fees | | 267 | | 308 | | 324 | | 327 | | 333 | | 358 | | 356 | | 357 | | 361 | | 361 | | 3.4 | |
Motor vehicle licences and permits | | 449 | | 467 | | 479 | | 489 | | 504 | | 499 | | 521 | | 527 | | 534 | | 542 | | 2.1 | |
Other fees and licences | | 616 | | 643 | | 722 | | 699 | | 770 | | 770 | | 806 | | 811 | | 783 | | 766 | | 2.5 | |
Investment earnings | | 930 | | 843 | | 1,022 | | 1,173 | | 1,113 | | 1,203 | | 1,143 | | 1,200 | | 1,276 | | 1,337 | | 4.1 | |
Sales of goods and services | | 728 | | 759 | | 930 | | 942 | | 946 | | 967 | | 935 | | 951 | | 957 | | 971 | | 3.3 | |
Miscellaneous | | 1,887 | | 1,928 | | 1,743 | | 1,671 | | 2,371 | | 1,837 | | 2,011 | | 2,259 | | 2,018 | | 1,841 | | -0.3 | |
| | 7,666 | | 7,970 | | 8,430 | | 8,693 | | 9,640 | | 9,432 | | 9,864 | | 10,405 | | 10,427 | | 10,518 | | 3.6 | |
Contributions from the federal government: | | | | | | | | | | | | | | | | | | | | | | | |
Health and social transfers | | 4,883 | | 5,176 | | 5,384 | | 5,442 | | 5,869 | | 5,827 | | 6,146 | | 6,471 | | 6,679 | | 6,917 | | 3.9 | |
Harmonized sales tax transition payments | | 250 | | 769 | | 580 | | — | | — | | — | | — | | — | | — | | — | | n/a | |
Other federal government contributions | | 1,794 | | 2,064 | | 1,754 | | 1,602 | | 1,633 | | 1,499 | | 1,513 | | 1,537 | | 1,516 | | 1,493 | | -2.0 | |
| | 6,927 | | 8,009 | | 7,718 | | 7,044 | | 7,502 | | 7,326 | | 7,659 | | 8,008 | | 8,195 | | 8,410 | | 2.2 | |
Commercial Crown corporation net income: | | | | | | | | | | | | | | | | | | | | | | | |
BC Hydro | | 447 | | 591 | | 558 | | 509 | | 549 | | 581 | | 653 | | 692 | | 706 | | 720 | | 5.4 | |
Liquor Distribution Branch | | 877 | | 891 | | 909 | | 930 | | 877 | | 935 | | 970 | | 983 | | 994 | | 1,003 | | 1.5 | |
BC Lotteries (net of payments to federal gov’t) | | 1,070 | | 1,097 | | 1,102 | | 1,116 | | 1,165 | | 1,245 | | 1,221 | | 1,233 | | 1,250 | | 1,250 | | 1.7 | |
ICBC | | 601 | | 315 | | 84 | | 231 | | 136 | | 657 | | (125 | ) | 95 | | 148 | | 130 | | -15.6 | |
BC Railway Company | | 2 | | 15 | | 14 | | 6 | | 13 | | 5 | | 5 | | 6 | | 6 | | 7 | | 14.9 | |
Transportation Invest. Corp. (Port Mann) | | (4 | ) | (7 | ) | (17 | ) | (60 | ) | (88 | ) | (89 | ) | (86 | ) | (102 | ) | (106 | ) | (101 | ) | n/a | |
Other | | 40 | | 38 | | 41 | | 44 | | 49 | | 37 | | 63 | | 95 | | 103 | | 98 | | 10.5 | |
| | 3,033 | | 2,940 | | 2,691 | | 2,776 | | 2,701 | | 3,371 | | 2,701 | | 3,002 | | 3,101 | | 3,107 | | 0.3 | |
Total revenue | | 37,978 | | 40,679 | | 41,796 | | 42,036 | | 43,728 | | 46,122 | | 46,992 | | 48,066 | | 49,034 | | 50,141 | | 3.1 | |
Budget and Fiscal Plan — 2016/17 to 2018/19
124
Appendix
Table A10 Revenue by Source Supplementary Information — 2009/10 to 2018/19
| | | | | | | | | | | | | | Updated | | Budget | | | | | | Average | |
| | Actual | | Actual | | Actual | | Actual | | Actual | | Actual | | Forecast | | Estimate | | Plan | | Plan | | annual | |
| | 2009/10 | | 2010/11 | | 2011/12 | | 2012/13 | | 2013/14 | | 2014/15 | | 2015/16 | | 2016/17 | | 2017/18 | | 2018/19 | | change | |
| | | | | | | | | | | | | | | | | | | | | | (per cent) | |
Per cent of nominal GDP: 1 | | | | | | | | | | | | | | | | | | | | | | | |
Taxation | | 9.0 | | 9.3 | | 9.3 | | 9.5 | | 9.2 | | 9.7 | | 9.9 | | 9.5 | | 9.5 | | 9.4 | | 0.4 | |
Natural resources | | 1.3 | | 1.3 | | 1.3 | | 1.1 | | 1.3 | | 1.2 | | 1.0 | | 0.9 | | 0.8 | | 0.8 | | -6.1 | |
Other | | 3.9 | | 3.9 | | 3.9 | | 3.9 | | 4.3 | | 4.0 | | 4.0 | | 4.1 | | 3.9 | | 3.8 | | -0.3 | |
Contributions from the federal government | | 3.5 | | 3.9 | | 3.6 | | 3.2 | | 3.3 | | 3.1 | | 3.1 | | 3.1 | | 3.1 | | 3.0 | | -1.7 | |
Commercial Crown corporation net income | | 1.5 | | 1.4 | | 1.2 | | 1.3 | | 1.2 | | 1.4 | | 1.1 | | 1.2 | | 1.2 | | 1.1 | | -3.5 | |
Total revenue | | 19.4 | | 19.8 | | 19.3 | | 19.0 | | 19.3 | | 19.4 | | 19.2 | | 18.9 | | 18.5 | | 18.1 | | -0.7 | |
Growth rates (per cent): | | | | | | | | | | | | | | | | | | | | | | | |
Taxation | | -5.4 | | 7.5 | | 5.8 | | 4.5 | | -0.6 | | 10.2 | | 5.1 | | 0.3 | | 3.7 | | 3.1 | | n/a | |
Natural resources | | -30.5 | | 3.1 | | 3.1 | | -12.1 | | 19.5 | | -0.6 | | -13.9 | | -7.2 | | -10.0 | | 0.6 | | n/a | |
Other | | 4.6 | | 4.0 | | 5.8 | | 3.1 | | 10.9 | | -2.2 | | 4.6 | | 5.5 | | 0.2 | | 0.9 | | n/a | |
Contributions from the federal government | | 15.5 | | 15.6 | | -3.6 | | -8.7 | | 6.5 | | -2.3 | | 4.5 | | 4.6 | | 2.3 | | 2.6 | | n/a | |
Commercial Crown corporation net income | | 5.3 | | -3.1 | | -8.5 | | 3.2 | | -2.7 | | 24.8 | | -19.9 | | 11.1 | | 3.3 | | 0.2 | | n/a | |
Total revenue | | -1.9 | | 7.1 | | 2.7 | | 0.6 | | 4.0 | | 5.5 | | 1.9 | | 2.3 | | 2.0 | | 2.3 | | n/a | |
Per capita ($): 2 | | | | | | | | | | | | | | | | | | | | | | | |
Taxation | | 4,014 | | 4,262 | | 4,478 | | 4,634 | | 4,567 | | 4,971 | | 5,176 | | 5,126 | | 5,248 | | 5,343 | | 3.2 | |
Natural resources | | 600 | | 611 | | 625 | | 544 | | 645 | | 633 | | 540 | | 495 | | 440 | | 437 | | -3.5 | |
Other | | 1,738 | | 1,785 | | 1,874 | | 1,914 | | 2,104 | | 2,033 | | 2,106 | | 2,195 | | 2,172 | | 2,163 | | 2.5 | |
Contributions from the federal government | | 1,571 | | 1,793 | | 1,715 | | 1,551 | | 1,637 | | 1,579 | | 1,635 | | 1,689 | | 1,707 | | 1,729 | | 1.1 | |
Commercial Crown corporation net income | | 688 | | 658 | | 598 | | 611 | | 589 | | 727 | | 577 | | 633 | | 646 | | 639 | | -0.8 | |
Total revenue | | 8,610 | | 9,109 | | 9,290 | | 9,254 | | 9,542 | | 9,943 | | 10,034 | | 10,138 | | 10,212 | | 10,311 | | 2.0 | |
| | | | | | | | | | | | | | | | | | | | | | | |
Real Per Capita Revenue (2015 $) 3 | | 9,216 | | 9,621 | | 9,585 | | 9,442 | | 9,745 | | 10,052 | | 10,034 | | 9,948 | | 9,820 | | 9,720 | | 0.6 | |
Growth rate (per cent) | | -3.3 | | 4.4 | | -0.4 | | -1.5 | | 3.2 | | 3.2 | | -0.2 | | -0.9 | | -1.3 | | -1.0 | | 0.2 | |
1 Revenue as a per cent of GDP is calculated using nominal GDP for the calendar year ending in the fiscal year (e.g. 2016/17 revenue divided by nominal GDP for the 2016 calendar year).
2 Per capita revenue is calculated using July 1 population (e.g. 2016/17 revenue divided by population on July 1, 2016).
3 Revenue is converted to real (inflation-adjusted) terms using the consumer price index (CPI) for the corresponding calendar year (e.g. 2016 CPI for 2016/17 revenue).
Budget and Fiscal Plan — 2016/17 to 2018/19
125
Appendix
Table A11 Expense by Function — 2009/10 to 2018/19 1
| | | | | | | | | | | | | | Updated | | Budget | | | | | | Average | |
| | Actual | | Actual | | Actual | | Actual | | Actual | | Actual | | Forecast | | Estimate | | Plan | | Plan | | annual | |
($ millions) | | 2009/10 | | 2010/11 | | 2011/12 | | 2012/13 | | 2013/14 | | 2014/15 | | 2015/16 | | 2016/17 | | 2017/18 | | 2018/19 | | change | |
| | | | | | | | | | | | | | | | | | | | | | (per cent) | |
Function: | | | | | | | | | | | | | | | | | | | | | | | |
Health: | | | | | | | | | | | | | | | | | | | | | | | |
Medical Services Plan | | 3,407 | | 3,641 | | 3,873 | | 3,906 | | 4,114 | | 4,136 | | 4,267 | | 4,476 | | 4,645 | | 4,832 | | 4.0 | |
Pharmacare | | 1,053 | | 1,129 | | 1,147 | | 1,122 | | 1,130 | | 1,120 | | 1,144 | | 1,216 | | 1,216 | | 1,216 | | 1.6 | |
Regional services | | 10,259 | | 10,585 | | 11,243 | | 11,772 | | 11,953 | | 12,404 | | 12,877 | | 13,194 | | 13,570 | | 13,943 | | 3.5 | |
Other healthcare expenses | | 593 | | 620 | | 637 | | 685 | | 653 | | 699 | | 792 | | 752 | | 758 | | 762 | | 2.8 | |
| | 15,312 | | 15,975 | | 16,900 | | 17,485 | | 17,850 | | 18,359 | | 19,080 | | 19,638 | | 20,189 | | 20,753 | | 3.4 | |
Education: | | | | | | | | | | | | | | | | | | | | | | | |
Elementary and secondary | | 5,778 | | 5,802 | | 5,885 | | 6,002 | | 6,133 | | 6,064 | | 6,345 | | 6,350 | | 6,417 | | 6,484 | | 1.3 | |
Post-secondary | | 4,732 | | 4,859 | | 4,907 | | 5,103 | | 5,284 | | 5,349 | | 5,487 | | 5,665 | | 5,811 | | 5,959 | | 2.6 | |
Other education expenses | | 528 | | 504 | | 436 | | 423 | | 410 | | 414 | | 476 | | 461 | | 457 | | 458 | | -1.6 | |
| | 11,038 | | 11,165 | | 11,228 | | 11,528 | | 11,827 | | 11,827 | | 12,308 | | 12,476 | | 12,685 | | 12,901 | | 1.7 | |
Social services: | | | | | | | | | | | | | | | | | | | | | | | |
Social assistance | | 1,454 | | 1,506 | | 1,550 | | 1,552 | | 1,572 | | 1,589 | | 1,605 | | 1,689 | | 1,758 | | 1,763 | | 2.2 | |
Child welfare | | 1,079 | | 1,123 | | 1,117 | | 1,122 | | 1,112 | | 1,144 | | 1,256 | | 1,372 | | 1,391 | | 1,403 | | 3.0 | |
Low income tax credit transfers | | 216 | | 408 | | 509 | | 534 | | 279 | | 248 | | 237 | | 250 | | 250 | | 250 | | 1.6 | |
Community living and other services | | 729 | | 754 | | 769 | | 806 | | 857 | | 881 | | 905 | | 957 | | 978 | | 1,009 | | 3.7 | |
| | 3,478 | | 3,791 | | 3,945 | | 4,014 | | 3,820 | | 3,862 | | 4,003 | | 4,268 | | 4,377 | | 4,425 | | 2.7 | |
Protection of persons and property | | 1,396 | | 1,460 | | 1,524 | | 1,532 | | 1,517 | | 1,446 | | 1,511 | | 1,468 | | 1,453 | | 1,462 | | 0.5 | |
Transportation | | 1,453 | | 1,580 | | 1,545 | | 1,555 | | 1,580 | | 1,608 | | 1,679 | | 1,846 | | 1,792 | | 1,836 | | 2.6 | |
Natural resources & economic development | | 2,159 | | 2,349 | | 1,873 | | 2,092 | | 1,755 | | 2,191 | | 2,333 | | 2,018 | | 2,019 | | 2,040 | | -0.6 | |
Other | | 1,382 | | 1,208 | | 1,414 | | 1,346 | | 1,184 | | 1,288 | | 1,244 | | 1,343 | | 1,336 | | 1,319 | | -0.5 | |
Contingencies | | — | | — | | — | | — | | — | | — | | 350 | | 450 | | 400 | | 400 | | n/a | |
General government | | 1,375 | | 1,146 | | 1,235 | | 1,262 | | 1,386 | | 1,360 | | 1,279 | | 1,310 | | 1,353 | | 1,352 | | -0.2 | |
Debt servicing | | 2,197 | | 2,252 | | 2,383 | | 2,390 | | 2,482 | | 2,498 | | 2,578 | | 2,635 | | 2,793 | | 2,930 | | 3.3 | |
Operating expense | | 39,790 | | 40,926 | | 42,047 | | 43,204 | | 43,401 | | 44,439 | | 46,365 | | 47,452 | | 48,397 | | 49,418 | | 2.4 | |
Unusual items: | | | | | | | | | | | | | | | | | | | | | | | |
HST transition funding repayment | | — | | — | | 1,599 | | — | | — | | — | | — | | — | | — | | — | | | |
Total expense | | 39,790 | | 40,926 | | 43,646 | | 43,204 | | 43,401 | | 44,439 | �� | 46,365 | | 47,452 | | 48,397 | | 49,418 | | | |
Per cent of operating expense: | | | | | | | | | | | | | | | | | | | | | | | |
Health | | 38.5 | | 39.0 | | 40.2 | | 40.5 | | 41.1 | | 41.3 | | 41.2 | | 41.4 | | 41.7 | | 42.0 | | 1.0 | |
Education | | 27.7 | | 27.3 | | 26.7 | | 26.7 | | 27.3 | | 26.6 | | 26.5 | | 26.3 | | 26.2 | | 26.1 | | -0.7 | |
Social services and housing | | 8.7 | | 9.3 | | 9.4 | | 9.3 | | 8.8 | | 8.7 | | 8.6 | | 9.0 | | 9.0 | | 9.0 | | 0.3 | |
Protection of persons and property | | 3.5 | | 3.6 | | 3.6 | | 3.5 | | 3.5 | | 3.3 | | 3.3 | | 3.1 | | 3.0 | | 3.0 | | -1.9 | |
Transportation | | 3.7 | | 3.9 | | 3.7 | | 3.6 | | 3.6 | | 3.6 | | 3.6 | | 3.9 | | 3.7 | | 3.7 | | 0.2 | |
Natural resources & economic development | | 5.4 | | 5.7 | | 4.5 | | 4.8 | | 4.0 | | 4.9 | | 5.0 | | 4.3 | | 4.2 | | 4.1 | | -3.0 | |
Other | | 3.5 | | 3.0 | | 3.4 | | 3.1 | | 2.7 | | 2.9 | | 2.7 | | 2.8 | | 2.8 | | 2.7 | | -2.9 | |
Contingencies | | — | | — | | — | | — | | — | | — | | 0.8 | | 0.9 | | 0.8 | | 0.8 | | n/a | |
General government | | 3.5 | | 2.8 | | 2.9 | | 2.9 | | 3.2 | | 3.1 | | 2.8 | | 2.8 | | 2.8 | | 2.7 | | -2.6 | |
Debt servicing | | 5.5 | | 5.5 | | 5.7 | | 5.5 | | 5.7 | | 5.6 | | 5.6 | | 5.6 | | 5.8 | | 5.9 | | 0.8 | |
| | 100.0 | | 100.0 | | 100.0 | | 100.0 | | 100.0 | | 100.0 | | 100.0 | | 100.0 | | 100.0 | | 100.0 | | | |
1 Figures reflect government accounting policies used in the most recent Public Accounts audited financial statements.
Budget and Fiscal Plan — 2016/17 to 2018/19
126
Appendix
Table A12 Expense by Function Supplementary Information — 2009/10 to 2018/19
| | | | | | | | | | | | | | Updated | | Budget | | | | | | Average | |
| | Actual | | Actual | | Actual | | Actual | | Actual | | Actual | | Forecast | | Estimate | | Plan | | Plan | | annual | |
| | 2009/10 | | 2010/11 | | 2011/12 | | 2012/13 | | 2013/14 | | 2014/15 | | 2015/16 | | 2016/17 | | 2017/18 | | 2018/19 | | change | |
| | | | | | | | | | | | | | | | | | | | | | (per cent) | |
Per cent of nominal GDP: 1 | | | | | | | | | | | | | | | | | | | | | | | |
Health | | 7.8 | | 7.8 | | 7.8 | | 7.9 | | 7.9 | | 7.7 | | 7.8 | | 7.7 | | 7.6 | | 7.5 | | -0.5 | |
Education | | 5.6 | | 5.4 | | 5.2 | | 5.2 | | 5.2 | | 5.0 | | 5.0 | | 4.9 | | 4.8 | | 4.7 | | -2.1 | |
Social services | | 1.8 | | 1.8 | | 1.8 | | 1.8 | | 1.7 | | 1.6 | | 1.6 | | 1.7 | | 1.6 | | 1.6 | | -1.1 | |
Protection of persons and property | | 0.7 | | 0.7 | | 0.7 | | 0.7 | | 0.7 | | 0.6 | | 0.6 | | 0.6 | | 0.5 | | 0.5 | | -3.3 | |
Transportation | | 0.7 | | 0.8 | | 0.7 | | 0.7 | | 0.7 | | 0.7 | | 0.7 | | 0.7 | | 0.7 | | 0.7 | | -1.2 | |
Natural resources & economic development | | 1.1 | | 1.1 | | 0.9 | | 0.9 | | 0.8 | | 0.9 | | 1.0 | | 0.8 | | 0.8 | | 0.7 | | -4.4 | |
Other | | 0.7 | | 0.6 | | 0.7 | | 0.6 | | 0.5 | | 0.5 | | 0.5 | | 0.5 | | 0.5 | | 0.5 | | -4.3 | |
Contingencies | | — | | — | | — | | — | | — | | — | | 0.1 | | 0.2 | | 0.2 | | 0.1 | | n/a | |
General government | | 0.7 | | 0.6 | | 0.6 | | 0.6 | | 0.6 | | 0.6 | | 0.5 | | 0.5 | | 0.5 | | 0.5 | | -3.9 | |
Debt servicing | | 1.1 | | 1.1 | | 1.1 | | 1.1 | | 1.1 | | 1.1 | | 1.1 | | 1.0 | | 1.1 | | 1.1 | | -0.6 | |
Operating expense | | 20.3 | | 20.0 | | 19.4 | | 19.5 | | 19.2 | | 18.7 | | 18.9 | | 18.6 | | 18.2 | | 17.8 | | -1.4 | |
Growth rates (per cent): | | | | | | | | | | | | | | | | | | | | | | | |
Health | | 2.6 | | 4.3 | | 5.8 | | 3.5 | | 2.1 | | 2.9 | | 3.9 | | 2.9 | | 2.8 | | 2.8 | | n/a | |
Education | | 5.4 | | 1.2 | | 0.6 | | 2.7 | | 2.6 | | 0.0 | | 4.1 | | 1.4 | | 1.7 | | 1.7 | | n/a | |
Social services | | 4.7 | | 9.0 | | 4.1 | | 1.7 | | -4.8 | | 1.1 | | 3.7 | | 6.6 | | 2.6 | | 1.1 | | n/a | |
Protection of persons and property | | -2.3 | | 4.6 | | 4.4 | | 0.5 | | -1.0 | | -4.7 | | 4.5 | | -2.8 | | -1.0 | | 0.6 | | n/a | |
Transportation | | 3.7 | | 8.7 | | -2.2 | | 0.6 | | 1.6 | | 1.8 | | 4.4 | | 9.9 | | -2.9 | | 2.5 | | n/a | |
Natural resources & economic development | | 14.5 | | 8.8 | | -20.3 | | 11.7 | | -16.1 | | 24.8 | | 6.5 | | -13.5 | | 0.0 | | 1.0 | | n/a | |
Other | | -16.2 | | -12.6 | | 17.1 | | -4.8 | | -12.0 | | 8.8 | | -3.4 | | 8.0 | | -0.5 | | -1.3 | | n/a | |
General government | | -3.5 | | -16.7 | | 7.8 | | 2.2 | | 9.8 | | -1.9 | | -6.0 | | 2.4 | | 3.3 | | -0.1 | | n/a | |
Debt servicing | | 1.8 | | 2.5 | | 5.8 | | 0.3 | | 3.8 | | 0.6 | | 3.2 | | 2.2 | | 6.0 | | 4.9 | | n/a | |
Operating expense | | 2.9 | | 2.9 | | 2.7 | | 2.8 | | 0.5 | | 2.4 | | 4.3 | | 2.3 | | 2.0 | | 2.1 | | n/a | |
Per capita ($): 2 | | | | | | | | | | | | | | | | | | | | | | | |
Health | | 3,472 | | 3,577 | | 3,756 | | 3,849 | | 3,895 | | 3,958 | | 4,074 | | 4,142 | | 4,205 | | 4,268 | | 2.3 | |
Education | | 2,503 | | 2,500 | | 2,496 | | 2,538 | | 2,581 | | 2,550 | | 2,628 | | 2,631 | | 2,642 | | 2,653 | | 0.6 | |
Social services | | 789 | | 849 | | 877 | | 884 | | 834 | | 833 | | 855 | | 900 | | 912 | | 910 | | 1.6 | |
Protection of persons and property | | 317 | | 327 | | 339 | | 337 | | 331 | | 312 | | 323 | | 310 | | 303 | | 301 | | -0.6 | |
Transportation | | 329 | | 354 | | 343 | | 342 | | 345 | | 347 | | 359 | | 389 | | 373 | | 378 | | 1.6 | |
Natural resources & economic development | | 489 | | 526 | | 416 | | 461 | | 383 | | 472 | | 498 | | 426 | | 420 | | 419 | | -1.7 | |
Other | | 313 | | 270 | | 314 | | 296 | | 258 | | 278 | | 266 | | 283 | | 278 | | 271 | | -1.6 | |
Contingencies | | — | | — | | — | | — | | — | | — | | 75 | | 95 | | 83 | | 82 | | n/a | |
General government | | 312 | | 257 | | 274 | | 278 | | 302 | | 293 | | 273 | | 276 | | 282 | | 278 | | -1.3 | |
Debt servicing | | 498 | | 504 | | 530 | | 526 | | 542 | | 539 | | 550 | | 556 | | 582 | | 603 | | 2.1 | |
Operating expense | | 9,022 | | 9,164 | | 9,345 | | 9,511 | | 9,471 | | 9,582 | | 9,901 | | 10,008 | | 10,080 | | 10,163 | | 1.3 | |
Real Per Capita Operating Expense (2015 $) 3 | | 9,656 | | 9,679 | | 9,642 | | 9,705 | | 9,672 | | 9,685 | | 9,900 | | 9,821 | | 9,692 | | 9,580 | | -0.1 | |
Growth rate (per cent) | | 1.5 | | 0.2 | | -0.4 | | 0.6 | | -0.3 | | 0.1 | | 2.2 | | -0.8 | | -1.3 | | -1.2 | | 0.1 | |
1 Expense as a per cent of GDP is calculated using nominal GDP for the calendar year ending in the fiscal year (e.g. 2016/17 expense divided by nominal GDP for the 2016 calendar year).
2 Per capita expense is calculated using July 1 population (e.g. 2016/17 expense divided by population on July 1, 2016).
3 Expense is converted to real (inflation-adjusted) terms using the consumer price index (CPI) for the corresponding calendar year (e.g. 2016 CPI for 2016/17 expense).
Budget and Fiscal Plan — 2016/17 to 2018/19
127
Appendix
Table A13 Full-Time Equivalents (FTEs) — 2009/10 to 2018/19 1
| | | | | | | | | | | | | | Updated | | Budget | | | | | | Average | |
| | Actual | | Actual | | Actual | | Actual | | Actual | | Actual | | Forecast | | Estimate | | Plan | | Plan | | annual | |
| | 2009/10 | | 2010/11 | | 2011/12 | | 2012/13 | | 2013/14 | | 2014/15 | | 2015/16 | | 2016/17 | | 2017/18 | | 2018/19 | | change | |
| | | | | | | | | | | | | | | | | | | | | | (per cent) | |
Taxpayer-supported programs and agencies: | | | | | | | | | | | | | | | | | | | | | | | |
Ministries and special offices (CRF) 2 | | 31,353 | | 30,221 | | 27,228 | | 27,326 | | 26,526 | | 26,679 | | 27,000 | | 27,400 | | 27,600 | | 27,600 | | -0.7 | |
Service delivery agencies 3 | | 4,508 | | 4,295 | | 4,346 | | 4,508 | | 4,640 | | 4,798 | | 4,784 | | 4,823 | | 4,573 | | 4,573 | | 0.1 | |
Total FTEs | | 35,861 | | 34,516 | | 31,574 | | 31,834 | | 31,166 | | 31,477 | | 31,784 | | 32,223 | | 32,173 | | 32,173 | | -0.6 | |
Growth rates: | | | | | | | | | | | | | | | | | | | | | | | |
Ministries and special offices (CRF) | | -1.6 | | -3.6 | | -9.9 | | 0.4 | | -2.9 | | 0.6 | | 1.2 | | 1.5 | | 0.7 | | 0.0 | | -1.4 | |
Service delivery agencies | | 2.4 | | -4.7 | | 1.2 | | 3.7 | | 2.9 | | 3.4 | | -0.3 | | 0.8 | | -5.2 | | 0.0 | | 0.4 | |
Population per FTE: 4 | | | | | | | | | | | | | | | | | | | | | | | |
Total FTEs | | 123.0 | | 129.4 | | 142.5 | | 142.7 | | 147.0 | | 147.4 | | 147.3 | | 147.1 | | 149.2 | | 151.2 | | 1.1 | |
1 Full-time equivalents (FTEs) are a measure of staff employment. FTEs are calculated by dividing the total hours of employment paid for in a given period by the number of hours an individual, full-time person would normally work in that period. This does not equate to the physical number of employees. For example, two half-time employees would equal one FTE, or alternatively, three FTEs may represent two full-time employees who have worked sufficient overtime hours to equal an additional FTE.
2 The ministry 2011/12 FTE total includes a reduction of about 3,200 FTEs reflecting the shift of BC Ambulance Service oversight from the Ministry of Health to the Provincial Health Services Authority.
3 Service delivery agency FTE amounts do not include SUCH sector staff employment.
4 Population per FTE is calculated using July 1 population (e.g. population on July 1, 2016 divided by 2016/17 FTEs).
Budget and Fiscal Plan — 2016/17 to 2018/19
128
Appendix
Table A14 Capital Spending — 2009/10 to 2018/19
| | | | | | | | | | | | | | Updated | | Budget | | | | | | Average | |
| | Actual | | Actual | | Actual | | Actual | | Actual | | Actual | | Forecast | | Estimate | | Plan | | Plan | | annual | |
($ millions) | | 2009/10 | | 2010/11 | | 2011/12 | | 2012/13 | | 2013/14 | | 2014/15 | | 2015/16 | | 2016/17 | | 2017/18 | | 2018/19 | | change | |
| | | | | | | | | | | | | | | | | | | | | | (per cent) | |
Taxpayer-supported: | | | | | | | | | | | | | | | | | | | | | | | |
Education | | | | | | | | | | | | | | | | | | | | | | | |
Schools districts | | 449 | | 433 | | 560 | | 509 | | 466 | | 420 | | 486 | | 520 | | 617 | | 523 | | 1.7 | |
Post-secondary institutions | | 669 | | 924 | | 655 | | 591 | | 507 | | 718 | | 748 | | 921 | | 842 | | 727 | | 0.9 | |
Health | | 927 | | 916 | | 732 | | 742 | | 690 | | 900 | | 1,003 | | 1,193 | | 815 | | 896 | | -0.4 | |
BC Transportation Financing Authority | | 918 | | 1,080 | | 921 | | 1,005 | | 1,017 | | 822 | | 892 | | 952 | | 870 | | 1,075 | | 1.8 | |
BC Transit | | 150 | | 39 | | 37 | | 48 | | 80 | | 83 | | 53 | | 66 | | 84 | | 95 | | -4.9 | |
Vancouver Convention Centre expansion | | 41 | | 10 | | 1 | | — | | — | | — | | — | | — | | — | | — | | n/a | |
BC Place redevelopment | | 75 | | 197 | | 194 | | 6 | | — | | — | | — | | — | | — | | — | | n/a | |
Government direct (ministries) | | 306 | | 261 | | 245 | | 267 | | 298 | | 326 | | 354 | | 434 | | 475 | | 385 | | 2.6 | |
Housing | | 137 | | 230 | | 196 | | 92 | | 65 | | 107 | | 66 | | 115 | | 103 | | 132 | | | |
Other | | 47 | | 20 | | 24 | | 19 | | 28 | | 31 | | 29 | | 50 | | 37 | | 39 | | -2.1 | |
| | 3,719 | | 4,110 | | 3,565 | | 3,279 | | 3,151 | | 3,407 | | 3,631 | | 4,251 | | 3,843 | | 3,872 | | 0.4 | |
Self-supported: | | | | | | | | | | | | | | | | | | | | | | | |
BC Hydro | | 2,406 | | 1,519 | | 1,703 | | 1,929 | | 2,036 | | 2,169 | | 2,337 | | 2,832 | | 2,448 | | 2,713 | | 1.3 | |
BC Transmission Corporation | | 12 | | — | | — | | — | | — | | — | | — | | — | | — | | — | | n/a | |
Columbia River power projects | | 16 | | 67 | | 108 | | 94 | | 52 | | 28 | | 19 | | 9 | | 16 | | 6 | | -10.3 | |
Transportation Invest. Corp. (Port Mann) | | 778 | | 730 | | 734 | | 540 | | 202 | | 76 | | 36 | | 16 | | 4 | | 4 | | n/a | |
BC Railway Company | | 14 | | 6 | | 9 | | 10 | | 8 | | 5 | | 4 | | 4 | | 2 | | 1 | | -25.4 | |
ICBC | | 22 | | 48 | | 92 | | 73 | | 82 | | 88 | | 99 | | 92 | | 40 | | 40 | | 6.9 | |
BC Lotteries | | 92 | | 81 | | 74 | | 97 | | 100 | | 69 | | 75 | | 90 | | 90 | | 90 | | -0.2 | |
Liquor Distribution Branch | | 19 | | 18 | | 19 | | 10 | | 13 | | 25 | | 34 | | 65 | | 59 | | 32 | | 6.0 | |
Other 1 | | 3 | | 1 | | 5 | | 12 | | 26 | | 28 | | — | | — | | — | | — | | n/a | |
| | 3,362 | | 2,470 | | 2,744 | | 2,765 | | 2,519 | | 2,488 | | 2,604 | | 3,108 | | 2,659 | | 2,886 | | -1.7 | |
Total capital spending | | 7,081 | | 6,580 | | 6,309 | | 6,044 | | 5,670 | | 5,895 | | 6,235 | | 7,359 | | 6,502 | | 6,758 | | -0.5 | |
Per cent of nominal GDP: 2 | | | | | | | | | | | | | | | | | | | | | | | |
Taxpayer-supported | | 1.9 | | 2.0 | | 1.6 | | 1.5 | | 1.4 | | 1.4 | | 1.5 | | 1.7 | | 1.4 | | 1.4 | | -3.3 | |
Self-supported | | 1.7 | | 1.2 | | 1.3 | | 1.2 | | 1.1 | | 1.0 | | 1.1 | | 1.2 | | 1.0 | | 1.0 | | -5.4 | |
Total | | 3.6 | | 3.2 | | 2.9 | | 2.7 | | 2.5 | | 2.5 | | 2.5 | | 2.9 | | 2.4 | | 2.4 | | -4.3 | |
Growth rates: | | | | | | | | | | | | | | | | | | | | | | | |
Taxpayer-supported | | -0.6 | | 10.5 | | -13.3 | | -8.0 | | -3.9 | | 8.1 | | 6.6 | | 17.1 | | -9.6 | | 0.8 | | 0.8 | |
Self-supported | | 85.7 | | -26.5 | | 11.1 | | 0.8 | | -8.9 | | -1.2 | | 4.7 | | 19.4 | | -14.4 | | 8.5 | | 7.9 | |
Total | | 27.5 | | -7.1 | | -4.1 | | -4.2 | | -6.2 | | 4.0 | | 5.8 | | 18.0 | | -11.6 | | 3.9 | | 2.6 | |
Per capita: 3 | | | | | | | | | | | | | | | | | | | | | | | |
Taxpayer-supported | | 843 | | 920 | | 792 | | 722 | | 688 | | 735 | | 775 | | 897 | | 800 | | 796 | | -0.6 | |
Self-supported | | 762 | | 553 | | 610 | | 609 | | 550 | | 536 | | 556 | | 656 | | 554 | | 593 | | -2.7 | |
Total | | 1,605 | | 1,473 | | 1,402 | | 1,331 | | 1,237 | | 1,271 | | 1,331 | | 1,552 | | 1,354 | | 1,390 | | -1.6 | |
| | | | | | | | | | | | | | | | | | | | | | | |
Real Per Capita Capital Spending (2015 $) 4 | | 1,718 | | 1,556 | | 1,447 | | 1,358 | | 1,264 | | 1,285 | | 1,331 | | 1,523 | | 1,302 | | 1,310 | | -3.0 | |
Growth rate (per cent) | | 25.7 | | -9.4 | | -7.0 | | -6.2 | | -6.9 | | 1.7 | | 3.6 | | 14.4 | | -14.5 | | 0.6 | | 0.2 | |
1 Includes post-secondary institutions self-supported subsidiaries.
2 Capital spending as a per cent of GDP is calculated using nominal GDP for the calendar year ending in the fiscal year (e.g. 2016/17 amounts divided by nominal GDP for the 2016 calendar year).
3 Per capita capital spending is calculated using July 1 population (e.g. 2016/17 amounts divided by population on July 1, 2016).
4 Capital spending is converted to real (inflation-adjusted) terms using the consumer price index (CPI) for the corresponding calendar year (e.g. 2016 CPI for 2016/17 capital spending).
Budget and Fiscal Plan — 2016/17 to 2018/19
129
Appendix
Table A15 Statement of Financial Position — 2009/10 to 2018/19
($ millions) | | Actual
2009/10 | | Actual
2010/11 | | Actual
2011/12 | | Actual
2012/13 | | Actual
2013/14 | | Actual
2014/15 | | Updated
Forecast
2015/16 | | Budget
Estimate
2016/17 | | Plan
2017/18 | | Plan
2018/19 | | Average
annual
change | |
| | | | | | | | | | | | | | | | | | | | | | (per cent) | |
Financial assets: | | | | | | | | | | | | | | | | | | | | | | | |
Cash and temporary investments | | 2,911 | | 3,060 | | 3,235 | | 3,174 | | 2,802 | | 3,676 | | 2,997 | | 2,339 | | 2,310 | | 2,131 | | -2.8 | |
Other financial assets | | 7,171 | | 7,990 | | 7,938 | | 8,186 | | 9,336 | | 9,136 | | 9,342 | | 9,408 | | 9,106 | | 8,852 | | 1.9 | |
Sinking funds | | 1,329 | | 1,410 | | 1,491 | | 1,778 | | 835 | | 977 | | 1,678 | | 1,069 | | 1,106 | | 484 | | -8.8 | |
Investments in commercial Crown corporations: | | | | | | | | | | | | | | | | | | | | | | | |
Retained earnings | | 7,458 | | 7,092 | | 6,998 | | 7,541 | | 7,839 | | 8,271 | | 7,352 | | 8,213 | | 8,631 | | 9,195 | | 1.9 | |
Recoverable capital loans | | 11,471 | | 12,947 | | 14,846 | | 16,907 | | 18,921 | | 20,317 | | 21,616 | | 23,414 | | 24,612 | | 25,787 | | 7.6 | |
| | 18,929 | | 20,039 | | 21,844 | | 24,448 | | 26,760 | | 28,588 | | 28,968 | | 31,627 | | 33,243 | | 34,982 | | 5.7 | |
Warehouse borrowing program assets | | — | | — | | — | | — | | — | | — | | — | | — | | — | | — | | n/a | |
| | 30,340 | | 32,499 | | 34,508 | | 37,586 | | 39,733 | | 42,377 | | 42,985 | | 44,443 | | 45,765 | | 46,449 | | 3.9 | |
Liabilities: | | | | | | | | | | | | | | | | | | | | | | | |
Accounts payable & accrued liabilities | | 7,286 | | 7,919 | | 9,119 | | 9,150 | | 8,298 | | 8,312 | | 8,354 | | 9,638 | | 10,015 | | 10,449 | | 3.3 | |
Deferred revenue | | 10,002 | | 10,750 | | 10,459 | | 9,895 | | 9,718 | | 9,809 | | 9,360 | | 8,945 | | 8,986 | | 9,116 | | -0.8 | |
Debt: | | | | | | | | | | | | | | | | | | | | | | | |
Taxpayer-supported debt | | 29,968 | | 31,821 | | 34,659 | | 38,182 | | 41,068 | | 41,880 | | 42,709 | | 43,227 | | 44,242 | | 45,089 | | 3.8 | |
Self-supported debt | | 11,917 | | 13,333 | | 15,534 | | 17,634 | | 19,625 | | 21,040 | | 22,331 | | 24,113 | | 25,294 | | 26,452 | | 7.5 | |
Forecast allowance | | — | | — | | — | | — | | — | | — | | 250 | | 350 | | 350 | | 350 | | n/a | |
Total provincial debt | | 41,885 | | 45,154 | | 50,193 | | 55,816 | | 60,693 | | 62,920 | | 65,290 | | 67,690 | | 69,886 | | 71,891 | | 5.0 | |
Add: debt offset by sinking funds | | 1,329 | | 1,410 | | 1,491 | | 1,778 | | 835 | | 977 | | 1,678 | | 1,069 | | 1,106 | | 484 | | -8.8 | |
Less: guarantees and non-guaranteed debt | | (546 | ) | (455 | ) | (730 | ) | (755 | ) | (726 | ) | (739 | ) | (730 | ) | (714 | ) | (698 | ) | (680 | ) | 2.0 | |
Financial statement debt | | 42,668 | | 46,109 | | 50,954 | | 56,839 | | 60,802 | | 63,158 | | 66,238 | | 68,045 | | 70,294 | | 71,695 | | 4.8 | |
| | 59,956 | | 64,778 | | 70,532 | | 75,884 | | 78,818 | | 81,279 | | 83,952 | | 86,628 | | 89,295 | | 91,260 | | 3.9 | |
Net liabilities | | (29,616 | ) | (32,279 | ) | (36,024 | ) | (38,298 | ) | (39,085 | ) | (38,902 | ) | (40,967 | ) | (42,185 | ) | (43,530 | ) | (44,811 | ) | 3.8 | |
Capital and other assets: | | | | | | | | | | | | | | | | | | | | | | | |
Tangible capital assets | | 32,219 | | 34,278 | | 35,692 | | 36,762 | | 37,778 | | 39,028 | | 40,505 | | 42,500 | | 44,068 | | 45,676 | | 3.2 | |
Restricted assets | | 1,241 | | 1,312 | | 1,377 | | 1,442 | | 1,493 | | 1,553 | | 1,609 | | 1,664 | | 1,720 | | 1,775 | | | |
Other assets | | 896 | | 1,086 | | 1,215 | | 1,267 | | 1,641 | | 1,573 | | 1,581 | | 1,581 | | 1,580 | | 1,581 | | 5.3 | |
| | 34,356 | | 36,676 | | 38,284 | | 39,471 | | 40,912 | | 42,154 | | 43,695 | | 45,745 | | 47,368 | | 49,032 | | 3.3 | |
Accumulated surplus (deficit) | | 4,740 | | 4,397 | | 2,260 | | 1,173 | | 1,827 | | 3,252 | | 2,728 | | 3,560 | | 3,838 | | 4,221 | | n/a | |
Per cent of nominal GDP: 1 | | | | | | | | | | | | | | | | | | | | | | | |
Net liabilities | | 15.1 | | 15.7 | | 16.6 | | 17.3 | | 17.2 | | 16.4 | | 16.7 | | 16.6 | | 16.4 | | 16.2 | | 0.6 | |
Capital and other assets | | 17.5 | | 17.9 | | 17.7 | | 17.8 | | 18.1 | | 17.8 | | 17.8 | | 18.0 | | 17.8 | | 17.7 | | 0.1 | |
Growth rates: | | | | | | | | | | | | | | | | | | | | | | | |
Net liabilities | | 12.2 | | 9.0 | | 11.6 | | 6.3 | | 2.1 | | -0.5 | | 5.3 | | 3.0 | | 3.2 | | 2.9 | | 4.8 | |
Capital and other assets | | 5.8 | | 6.8 | | 4.4 | | 3.1 | | 3.7 | | 3.0 | | 3.7 | | 4.7 | | 3.5 | | 3.5 | | 4.0 | |
Per capita: 2 | | | | | | | | | | | | | | | | | | | | | | | |
Net liabilities | | 6,715 | | 7,228 | | 8,007 | | 8,431 | | 8,529 | | 8,387 | | 8,748 | | 8,898 | | 9,066 | | 9,215 | | 2.9 | |
Capital and other assets | | 7,789 | | 8,212 | | 8,509 | | 8,689 | | 8,928 | | 9,088 | | 9,330 | | 9,649 | | 9,865 | | 10,083 | | 2.4 | |
1 Net liabilities as a per cent of GDP is calculated using GDP for the calendar year ending in the fiscal year (e.g. 2016/17 amount divided by GDP for the 2016 calendar year).
2 Per capita net liabilities is calculated using July 1 population (e.g. 2016/17 amount divided by population on July 1, 2016).
Budget and Fiscal Plan — 2016/17 to 2018/19
130
Appendix
Table A16 Changes in Financial Position — 2009/10 to 2018/19
| | | | | | | | | | | | | | Updated | | Budget | | | | | | | |
| | Actual | | Actual | | Actual | | Actual | | Actual | | Actual | | Forecast | | Estimate | | Plan | | Plan | | 10-Year | |
($ millions) | | 2009/10 | | 2010/11 | | 2011/12 | | 2012/13 | | 2013/14 | | 2014/15 | | 2015/16 | | 2016/17 | | 2017/18 | | 2018/19 | | Total | |
(Surplus) deficit for the year | | 1,812 | | 247 | | 1,850 | | 1,168 | | (327 | ) | (1,683 | ) | (377 | ) | (264 | ) | (287 | ) | (373 | ) | 1,766 | |
Comprehensive income (increase) decrease | | (481 | ) | 96 | | 287 | | (81 | ) | (327 | ) | 258 | | 901 | | (568 | ) | 9 | | (10 | ) | 84 | |
Change in accumulated (surplus) deficit | | 1,331 | | 343 | | 2,137 | | 1,087 | | (654 | ) | (1,425 | ) | 524 | | (832 | ) | (278 | ) | (383 | ) | 1,850 | |
Capital and other asset changes: | | | | | | | | | | | | | | | | | | | | | | | |
Taxpayer-supported capital investments | | 3,719 | | 4,110 | | 3,565 | | 3,279 | | 3,151 | | 3,407 | | 3,631 | | 4,251 | | 3,843 | | 3,872 | | 36,828 | |
Less: amortization and other accounting changes | | (2,039 | ) | (2,051 | ) | (2,151 | ) | (2,209 | ) | (2,135 | ) | (2,157 | ) | (2,154 | ) | (2,256 | ) | (2,275 | ) | (2,264 | ) | (21,691 | ) |
Increase in net capital assets | | 1,680 | | 2,059 | | 1,414 | | 1,070 | | 1,016 | | 1,250 | | 1,477 | | 1,995 | | 1,568 | | 1,608 | | 15,137 | |
Increase (decrease) in restricted assets | | 63 | | 71 | | 65 | | 65 | | 51 | | 60 | | 56 | | 55 | | 56 | | 55 | | 597 | |
Increase (decrease) in other assets | | 138 | | 190 | | 129 | | 52 | | 374 | | (68 | ) | 8 | | — | | (1 | ) | 1 | | 823 | |
| | 1,881 | | 2,320 | | 1,608 | | 1,187 | | 1,441 | | 1,242 | | 1,541 | | 2,050 | | 1,623 | | 1,664 | | 16,557 | |
Increase (decrease) in net liabilities | | 3,212 | | 2,663 | | 3,745 | | 2,274 | | 787 | | (183 | ) | 2,065 | | 1,218 | | 1,345 | | 1,281 | | 18,407 | |
Investment and working capital changes: | | | | | | | | | | | | | | | | | | | | | | | |
Increase (reduction) in cash and temporary investments | | (2,274 | ) | 149 | | 175 | | (61 | ) | (372 | ) | 874 | | (679 | ) | (658 | ) | (29 | ) | (179 | ) | (3,054 | ) |
Increase (decrease) in warehouse borrowing investments | | (2,081 | ) | — | | — | | — | | — | | — | | — | | — | | — | | — | | (2,081 | ) |
Investment in commercial Crown corporations: | | | | | | | | | | | | | | | | | | | | | | | |
Increase (decrease) in retained earnings | | 1,506 | | (366 | ) | (94 | ) | 543 | | 298 | | 432 | | (919 | ) | 861 | | 418 | | 564 | | 3,243 | |
Self-supported capital investments | | 3,362 | | 2,470 | | 2,744 | | 2,765 | | 2,519 | | 2,488 | | 2,604 | | 3,108 | | 2,659 | | 2,886 | | 27,605 | |
Less: loan repayments and other accounting changes | | (1,040 | ) | (994 | ) | (845 | ) | (704 | ) | (505 | ) | (1,092 | ) | (1,305 | ) | (1,310 | ) | (1,461 | ) | (1,711 | ) | (10,967 | ) |
| | 3,828 | | 1,110 | | 1,805 | | 2,604 | | 2,312 | | 1,828 | | 380 | | 2,659 | | 1,616 | | 1,739 | | 19,881 | |
Other working capital changes | | 331 | | (481 | ) | (880 | ) | 1,068 | | 1,236 | | (163 | ) | 1,314 | | (1,412 | ) | (683 | ) | (1,440 | ) | (1,110 | ) |
| | (196 | ) | 778 | | 1,100 | | 3,611 | | 3,176 | | 2,539 | | 1,015 | | 589 | | 904 | | 120 | | 13,636 | |
Increase (decrease) in financial statement debt | | 3,016 | | 3,441 | | 4,845 | | 5,885 | | 3,963 | | 2,356 | | 3,080 | | 1,807 | | 2,249 | | 1,401 | | 32,043 | |
(Increase) decrease in sinking fund debt | | 805 | | (81 | ) | (81 | ) | (287 | ) | 943 | | (142 | ) | (701 | ) | 609 | | (37 | ) | 622 | | 1,650 | |
Increase (decrease) in guarantees | | (14 | ) | (31 | ) | (27 | ) | (14 | ) | (6 | ) | (6 | ) | (1 | ) | — | | 1 | | (1 | ) | (99 | ) |
Increase ( decrease) in non-guaranteed debt | | 64 | | (60 | ) | 302 | | 39 | | (23 | ) | 19 | | (8 | ) | (16 | ) | (17 | ) | (17 | ) | 283 | |
Increase (decrease) in total provincial debt | | 3,871 | | 3,269 | | 5,039 | | 5,623 | | 4,877 | | 2,227 | | 2,370 | | 2,400 | | 2,196 | | 2,005 | | 33,877 | |
Represented by increase (decrease) in: | | | | | | | | | | | | | | | | | | | | | | | |
Taxpayer-supported debt | | 3,566 | | 1,853 | | 2,838 | | 3,523 | | 2,886 | | 812 | | 829 | | 518 | | 1,015 | | 847 | | 18,687 | |
Self-supported debt | | 305 | | 1,416 | | 2,201 | | 2,100 | | 1,991 | | 1,415 | | 1,291 | | 1,782 | | 1,181 | | 1,158 | | 14,840 | |
Forecast allowance | | — | | — | | — | | — | | — | | — | | 250 | | 100 | | — | | — | | 350 | |
Total provincial debt | | 3,871 | | 3,269 | | 5,039 | | 5,623 | | 4,877 | | 2,227 | | 2,370 | | 2,400 | | 2,196 | | 2,005 | | 33,877 | |
Budget and Fiscal Plan — 2016/17 to 2018/19
131
Appendix
Table A17 Provincial Debt — 2009/10 to 2018/19
| | | | | | | | | | | | | | Updated | | Budget | | | | | | Average | |
| | Actual | | Actual | | Actual | | Actual | | Actual | | Actual | | Forecast | | Estimate | | Plan | | Plan | | annual | |
($ millions) | | 2009/10 | | 2010/11 | | 2011/12 | | 2012/13 | | 2013/14 | | 2014/15 | | 2015/16 | | 2016/17 | | 2017/18 | | 2018/19 | | change | |
Taxpayer-supported debt: | | | | | | | | | | | | | | | | | | | | | | (per cent) | |
Provincial government direct operating | | 7,359 | | 6,964 | | 7,813 | | 9,408 | | 10,223 | | 9,280 | | 8,068 | | 6,215 | | 4,659 | | 2,703 | | -10.5 | |
Other taxpayer-supported debt (mainly capital): | | | | | | | | | | | | | | | | | | | | | | | |
Education facilities | | | | | | | | | | | | | | | | | | | | | | | |
Post-secondary institutions | | 3,824 | | 4,092 | | 4,185 | | 4,315 | | 4,386 | | 4,518 | | 4,715 | | 5,008 | | 5,337 | | 5,640 | | 4.4 | |
School districts | | 5,777 | | 6,016 | | 6,407 | | 6,830 | | 7,245 | | 7,600 | | 7,991 | | 8,392 | | 8,951 | | 9,435 | | 5.6 | |
| | 9,601 | | 10,108 | | 10,592 | | 11,145 | | 11,631 | | 12,118 | | 12,706 | | 13,400 | | 14,288 | | 15,075 | | 5.1 | |
Health facilities | | 4,389 | | 4,895 | | 5,293 | | 5,691 | | 6,038 | | 6,522 | | 6,962 | | 7,552 | | 8,031 | | 8,651 | | 7.8 | |
Highways, ferries and public transit | | | | | | | | | | | | | | | | | | | | | | | |
BC Transit | | 140 | | 158 | | 183 | | 163 | | 143 | | 123 | | 157 | | 183 | | 205 | | 242 | | 6.3 | |
BC Transportation Financing Authority | | 5,211 | | 5,785 | | 6,287 | | 7,084 | | 7,912 | | 8,428 | | 9,252 | | 10,118 | | 11,025 | | 12,200 | | 9.9 | |
Public transit | | 997 | | 997 | | 1,000 | | 1,000 | | 1,000 | | 1,000 | | 1,000 | | 1,000 | | 1,000 | | 1,000 | | 0.0 | |
SkyTrain extension | | 1,154 | | 1,155 | | 1,174 | | 1,174 | | 1,174 | | 1,174 | | 1,174 | | 1,174 | | 1,174 | | 1,174 | | 0.2 | |
| | 7,502 | | 8,095 | | 8,644 | | 9,421 | | 10,229 | | 10,725 | | 11,583 | | 12,475 | | 13,404 | | 14,616 | | 7.7 | |
Other | | | | | | | | | | | | | | | | | | | | | | | |
BC Immigrant Investment Fund | | 289 | | 347 | | 398 | | 363 | | 440 | | 414 | | 300 | | 212 | | 152 | | 35 | | -20.9 | |
BC Pavilion Corporation | | 49 | | 250 | | 383 | | 383 | | 382 | | 381 | | 383 | | 393 | | 401 | | 408 | | n/a | |
Homeowner Protection Office | | 144 | | — | | — | | — | | — | | — | | — | | — | | — | | — | | n/a | |
Provincial government general capital | | 294 | | 570 | | 808 | | 1,073 | | 1,372 | | 1,698 | | 1,912 | | 2,238 | | 2,613 | | 2,902 | | n/a | |
Social Housing | | 305 | | 511 | | 674 | | 658 | | 719 | | 715 | | 769 | | 716 | | 668 | | 673 | | 9.2 | |
Other | | 36 | | 81 | | 54 | | 40 | | 34 | | 27 | | 26 | | 26 | | 26 | | 26 | | -3.6 | |
| | 1,117 | | 1,759 | | 2,317 | | 2,517 | | 2,947 | | 3,235 | | 3,390 | | 3,585 | | 3,860 | | 4,044 | | 15.4 | |
Total other taxpayer-supported debt | | 22,609 | | 24,857 | | 26,846 | | 28,774 | | 30,845 | | 32,600 | | 34,641 | | 37,012 | | 39,583 | | 42,386 | | 7.2 | |
Total taxpayer-supported debt | | 29,968 | | 31,821 | | 34,659 | | 38,182 | | 41,068 | | 41,880 | | 42,709 | | 43,227 | | 44,242 | | 45,089 | | 4.6 | |
| | | | | | | | | | | | | | | | | | | | | | | |
Self-supported debt: | | | | | | | | | | | | | | | | | | | | | | | |
Commercial Crown corporations and agencies | | | | | | | | | | | | | | | | | | | | | | | |
BC Hydro | | 10,792 | | 11,710 | | 12,978 | | 14,167 | | 15,559 | | 16,544 | | 17,815 | | 19,560 | | 20,719 | | 21,858 | | 8.2 | |
BC Lotteries | | 60 | | 85 | | 90 | | 132 | | 155 | | 140 | | 146 | | 156 | | 166 | | 179 | | n/a | |
BC Transmission Corporation | | 70 | | — | | — | | — | | — | | — | | — | | — | | — | | — | | n/a | |
Columbia Power Corportation | | — | | — | | — | | — | | — | | 300 | | 296 | | 291 | | 285 | | 279 | | | |
Columbia River power projects | | 196 | | 183 | | 481 | | 475 | | 470 | | 464 | | 457 | | 443 | | 428 | | 411 | | 8.6 | |
Post-secondary institution subsidiaries | | 220 | | 173 | | 173 | | 215 | | 198 | | 222 | | 222 | | 222 | | 222 | | 222 | | 0.1 | |
Transportation Invest. Corp. (Port Mann) | | 544 | | 1,148 | | 1,779 | | 2,610 | | 3,209 | | 3,335 | | 3,361 | | 3,409 | | 3,444 | | 3,473 | | n/a | |
Other | | 35 | | 34 | | 33 | | 35 | | 34 | | 35 | | 34 | | 32 | | 30 | | 30 | | -1.7 | |
Total self-supported debt | | 11,917 | | 13,333 | | 15,534 | | 17,634 | | 19,625 | | 21,040 | | 22,331 | | 24,113 | | 25,294 | | 26,452 | | 9.3 | |
Forecast allowance | | — | | — | | — | | — | | — | | — | | 250 | | 350 | | 350 | | 350 | | n/a | |
Total provincial debt | | 41,885 | | 45,154 | | 50,193 | | 55,816 | | 60,693 | | 62,920 | | 65,290 | | 67,690 | | 69,886 | | 71,891 | | 6.2 | |
Budget and Fiscal Plan — 2016/17 to 2018/19
132
Appendix
Table A18 Provincial Debt Supplementary Information — 2009/10 to 2018/19 1
| | | | | | | | | | | | | | Updated | | Budget | | | | | | Average | |
| | Actual | | Actual | | Actual | | Actual | | Actual | | Actual | | Forecast | | Estimate | | Plan | | Plan | | annual | |
($ millions) | | 2009/10 | | 2010/11 | | 2011/12 | | 2012/13 | | 2013/14 | | 2014/15 | | 2015/16 | | 2016/17 | | 2017/18 | | 2018/19 | | change | |
| | | | | | | | | | | | | | | | | | | | | | (per cent) | |
Per cent of nominal GDP: 2 | | | | | | | | | | | | | | | | | | | | | | | |
Taxpayer-supported debt: | | | | | | | | | | | | | | | | | | | | | | | |
Provincial government direct operating | | 3.8 | | 3.4 | | 3.6 | | 4.2 | | 4.5 | | 3.9 | | 3.3 | | 2.4 | | 1.8 | | 1.0 | | -13.9 | |
Education facilities | | 4.9 | | 4.9 | | 4.9 | | 5.0 | | 5.1 | | 5.1 | | 5.2 | | 5.3 | | 5.4 | | 5.4 | | 1.2 | |
Health facilities | | 2.2 | | 2.4 | | 2.4 | | 2.6 | | 2.7 | | 2.8 | | 2.8 | | 3.0 | | 3.0 | | 3.1 | | 3.8 | |
Highways, ferries and public transit | | 3.8 | | 3.9 | | 4.0 | | 4.3 | | 4.5 | | 4.5 | | 4.7 | | 4.9 | | 5.0 | | 5.3 | | 3.6 | |
Other | | 0.6 | | 0.9 | | 1.1 | | 1.1 | | 1.3 | | 1.4 | | 1.4 | | 1.4 | | 1.5 | | 1.5 | | 11.0 | |
Total taxpayer-supported debt | | 15.3 | | 15.5 | | 16.0 | | 17.2 | | 18.1 | | 17.7 | | 17.4 | | 17.0 | | 16.7 | | 16.3 | | 0.7 | |
Self-supported debt: | | | | | | | | | | | | | | | | | | | | | | | |
Commercial Crown corporations & agencies | | 6.1 | | 6.5 | | 7.2 | | 8.0 | | 8.7 | | 8.9 | | 9.1 | | 9.5 | | 9.5 | | 9.5 | | 5.2 | |
Total self-supported debt | | 6.1 | | 6.5 | | 7.2 | | 8.0 | | 8.7 | | 8.9 | | 9.1 | | 9.5 | | 9.5 | | 9.5 | | 5.2 | |
Total provincial debt | | 21.3 | | 22.0 | | 23.2 | | 25.2 | | 26.8 | | 26.5 | | 26.7 | | 26.6 | | 26.3 | | 25.9 | | 2.2 | |
Growth rates: | | | | | | | | | | | | | | | | | | | | | | | |
Taxpayer-supported debt: | | | | | | | | | | | | | | | | | | | | | | | |
Provincial government direct operating | | 28.1 | | -5.4 | | 12.2 | | 20.4 | | 8.7 | | -9.2 | | -13.1 | | -23.0 | | -25.0 | | -42.0 | | -4.8 | |
Education facilities | | 5.1 | | 5.3 | | 4.8 | | 5.2 | | 4.4 | | 4.2 | | 4.9 | | 5.5 | | 6.6 | | 5.5 | | 5.1 | |
Health facilities | | 11.5 | | 11.5 | | 8.1 | | 7.5 | | 6.1 | | 8.0 | | 6.7 | | 8.5 | | 6.3 | | 7.7 | | 8.2 | |
Highways, ferries and public transit | | 9.8 | | 7.9 | | 6.8 | | 9.0 | | 8.6 | | 4.8 | | 8.0 | | 7.7 | | 7.4 | | 9.0 | | 7.9 | |
Other | | 47.4 | | 57.5 | | 31.7 | | 8.6 | | 17.1 | | 9.8 | | 4.8 | | 5.8 | | 7.7 | | 4.8 | | 19.5 | |
Total taxpayer-supported debt | | 13.5 | | 6.2 | | 8.9 | | 10.2 | | 7.6 | | 2.0 | | 2.0 | | 1.2 | | 2.3 | | 1.9 | | 5.6 | |
Self-supported debt: | | | | | | | | | | | | | | | | | | | | | | | |
Commercial Crown corporations & agencies | | 25.0 | | 11.9 | | 16.5 | | 13.5 | | 11.3 | | 7.2 | | 6.1 | | 8.0 | | 4.9 | | 4.6 | | 10.9 | |
Warehouse borrowing program | | -100.0 | | — | | — | | — | | — | | — | | — | | — | | — | | — | | n/a | |
Total self-supported debt | | 2.6 | | 11.9 | | 16.5 | | 13.5 | | 11.3 | | 7.2 | | 6.1 | | 8.0 | | 4.9 | | 4.6 | | 8.7 | |
Total provincial debt | | 10.2 | | 7.8 | | 11.2 | | 11.2 | | 8.7 | | 3.7 | | 3.8 | | 3.7 | | 3.2 | | 2.9 | | 6.6 | |
Per capita: 3 | | | | | | | | | | | | | | | | | | | | | | | |
Taxpayer-supported debt: | | | | | | | | | | | | | | | | | | | | | | | |
Provincial government direct operating | | 1,668 | | 1,559 | | 1,737 | | 2,071 | | 2,231 | | 2,001 | | 1,723 | | 1,311 | | 970 | | 556 | | -11.5 | |
Education facilities | | 2,177 | | 2,263 | | 2,354 | | 2,453 | | 2,538 | | 2,613 | | 2,713 | | 2,826 | | 2,976 | | 3,100 | | 4.0 | |
Health facilities | | 995 | | 1,096 | | 1,176 | | 1,253 | | 1,318 | | 1,406 | | 1,487 | | 1,593 | | 1,673 | | 1,779 | | 6.7 | |
Highways, ferries and public transit | | 1,701 | | 1,813 | | 1,921 | | 2,074 | | 2,232 | | 2,312 | | 2,473 | | 2,631 | | 2,792 | | 3,006 | | 6.5 | |
Other | | 253 | | 394 | | 515 | | 554 | | 643 | | 697 | | 724 | | 756 | | 804 | | 832 | | 14.1 | |
Total taxpayer-supported debt | | 6,794 | | 7,125 | | 7,703 | | 8,405 | | 8,962 | | 9,029 | | 9,120 | | 9,117 | | 9,214 | | 9,272 | | 3.5 | |
Self-supported debt: | | | | | | | | | | | | | | | | | | | | | | | |
Commercial Crown corporations & agencies | | 2,702 | | 2,985 | | 3,453 | | 3,882 | | 4,282 | | 4,536 | | 4,768 | | 5,086 | | 5,268 | | 5,439 | | 8.1 | |
Total self-supported debt | | 2,702 | | 2,985 | | 3,453 | | 3,882 | | 4,282 | | 4,536 | | 4,768 | | 5,086 | | 5,268 | | 5,439 | | 8.1 | |
Total provincial debt | | 9,496 | | 10,111 | | 11,156 | | 12,287 | | 13,244 | | 13,565 | | 13,942 | | 14,277 | | 14,555 | | 14,783 | | 5.0 | |
Real Per Capita Provincial Debt (2015 $) 4 | | 10,164 | | 10,679 | | 11,510 | | 12,538 | | 13,526 | | 13,713 | | 13,942 | | 14,009 | | 13,996 | | 13,937 | | 3.6 | |
Growth rate (per cent) | | 8.7 | | 5.1 | | 7.8 | | 8.9 | | 7.9 | | 1.4 | | 1.7 | | 0.5 | | -0.1 | | -0.4 | | 4.1 | |
1 Numbers may not add due to rounding.
2 Debt as a per cent of GDP is calculated using nominal GDP for the calendar year ending in the fiscal year (e.g. 2016/17 debt divided by nominal GDP for the 2016 calendar year).
3 Per capita debt is calculated using July 1 population (e.g. 2016/17 debt divided by population on July 1, 2016).
4 Debt is converted to real (inflation-adjusted) terms using the consumer price index (CPI) for the corresponding calendar year (e.g. 2016 CPI for 2016/17 debt).
Budget and Fiscal Plan — 2016/17 to 2018/19
133
Appendix
Table A19 Key Provincial Debt Indicators — 2009/10 to 2018/19
| | | | | | | | | | | | | | Updated | | Budget | | | | | | Average | |
| | Actual | | Actual | | Actual | | Actual | | Actual | | Actual | | Forecast | | Estimate | | Plan | | Plan | | annual | |
| | 2009/10 | | 2010/11 | | 2011/12 | | 2012/13 | | 2013/14 | | 2014/15 | | 2015/16 | | 2016/17 | | 2017/18 | | 2018/19 | | change | |
| | | | | | | | | | | | | | | | | | | | | | (per cent) | |
Debt to revenue (per cent) | | | | | | | | | | | | | | | | | | | | | | | |
Total provincial | | 86.5 | | 88.5 | | 94.7 | | 104.1 | | 107.6 | | 106.4 | | 107.6 | | 109.6 | | 110.8 | | 111.3 | | 2.8 | |
Taxpayer-supported | | 82.6 | | 78.8 | | 85.1 | | 93.7 | | 96.1 | | 94.1 | | 92.7 | | 92.4 | | 93.1 | | 93.0 | | 1.3 | |
Debt per capita ($) 1 | | | | | | | | | | | | | | | | | | | | | | | |
Total provincial | | 9,496 | | 10,111 | | 11,156 | | 12,287 | | 13,244 | | 13,565 | | 13,942 | | 14,277 | | 14,555 | | 14,783 | | 5.0 | |
Taxpayer-supported | | 6,794 | | 7,125 | | 7,703 | | 8,405 | | 8,962 | | 9,029 | | 9,120 | | 9,117 | | 9,214 | | 9,272 | | 3.5 | |
Debt to nominal GDP (per cent) 2 | | | | | | | | | | | | | | | | | | | | | | | |
Total provincial | | 21.3 | | 22.0 | | 23.2 | | 25.2 | | 26.8 | | 26.5 | | 26.7 | | 26.6 | | 26.3 | | 25.9 | | 2.2 | |
Taxpayer-supported | | 15.3 | | 15.5 | | 16.0 | | 17.2 | | 18.1 | | 17.7 | | 17.4 | | 17.0 | | 16.7 | | 16.3 | | 0.7 | |
Interest bite (cents per dollar of revenue) 3 | | | | | | | | | | | | | | | | | | | | | | | |
Total provincial | | 4.6 | | 4.2 | | 4.3 | | 4.4 | | 4.5 | | 4.2 | | 4.4 | | 4.2 | | 4.5 | | 4.6 | | 0.1 | |
Taxpayer-supported | | 4.2 | | 4.0 | | 4.0 | | 3.9 | | 3.9 | | 3.6 | | 3.6 | | 3.6 | | 3.8 | | 3.8 | | -1.1 | |
Interest costs ($ millions) | | | | | | | | | | | | | | | | | | | | | | | |
Total provincial | | 2,206 | | 2,155 | | 2,300 | | 2,336 | | 2,547 | | 2,465 | | 2,663 | | 2,607 | | 2,829 | | 2,979 | | 3.4 | |
Taxpayer-supported | | 1,535 | | 1,596 | | 1,625 | | 1,590 | | 1,686 | | 1,591 | | 1,660 | | 1,683 | | 1,796 | | 1,859 | | 2.2 | |
Interest rate (per cent) 4 | | | | | | | | | | | | | | | | | | | | | | | |
Taxpayer-supported | | 5.4 | | 5.2 | | 4.9 | | 4.4 | | 4.3 | | 3.8 | | 3.9 | | 3.9 | | 4.1 | | 4.2 | | -2.9 | |
Background Information: | | | | | | | | | | | | | | | | | | | | | | | |
Revenue ($ millions) | | | | | | | | | | | | | | | | | | | | | | | |
Total provincial 5 | | 48,438 | | 51,035 | | 52,993 | | 53,613 | | 56,402 | | 59,136 | | 60,652 | | 61,738 | | 63,079 | | 64,572 | | 3.2 | |
Taxpayer-supported 6 | | 36,272 | | 40,385 | | 40,734 | | 40,744 | | 42,725 | | 44,483 | | 46,048 | | 46,763 | | 47,535 | | 48,458 | | 3.3 | |
Debt ($ millions) | | | | | | | | | | | | | | | | | | | | | | | |
Total provincial. | | 41,885 | | 45,154 | | 50,193 | | 55,816 | | 60,693 | | 62,920 | | 65,290 | | 67,690 | | 69,886 | | 71,891 | | 6.2 | |
Taxpayer-supported 7 | | 29,968 | | 31,821 | | 34,659 | | 38,182 | | 41,068 | | 41,880 | | 42,709 | | 43,227 | | 44,242 | | 45,089 | | 4.6 | |
Provincial nominal GDP ($ millions) 8 | | 196,250 | | 205,117 | | 216,786 | | 221,414 | | 226,605 | | 237,188 | | 244,990 | | 254,839 | | 265,672 | | 277,045 | | 3.9 | |
Population (thousands at July 1) 9 | | 4,411 | | 4,466 | | 4,499 | | 4,543 | | 4,583 | | 4,638 | | 4,683 | | 4,741 | | 4,802 | | 4,863 | | 1.1 | |
1 The ratio of debt to population (e.g. 2016/17 debt divided by population at July 1, 2016).
2 The ratio of debt outstanding at fiscal year end to provincial nominal gross domestic product (GDP) for the calendar year ending in the fiscal year (e.g. 2016/17 debt divided by 2016 nominal GDP).
3 The ratio of interest costs (less sinking fund interest) to revenue. Figures include capitalized interest expense in order to provide a more comparable measure to outstanding debt.
4 Weighted average of all outstanding debt issues.
5 Includes revenue of the consolidated revenue fund (excluding dividends from enterprises) plus revenue of all government organizations and enterprises.
6 Excludes revenue of government enterprises, but includes dividends from enterprises paid to the consolidated revenue fund.
7 Excludes debt of commercial Crown corporations and agencies and funds held under the province’s warehouse borrowing program.
8 Nominal GDP for the calendar year ending in the fiscal year (e.g. Nominal GDP for 2016 is used for the fiscal year ended March 31, 2017). 2015 GDP is a Ministry of Finance estimate.
9 Population at July 1st within the fiscal year (e.g. population at July 1, 2016 is used for the fiscal year ended March 31, 2017).
Budget and Fiscal Plan — 2016/17 to 2018/19
134