Exhibit 99.11
BUDGET 2024 Taking Action For You FIRST QUARTERLY REPORT SEPTEMBER 2024 BRITISH COLUMBIA StrongerBC for everyone

This page intentionally left blank

First Quarterly Report Fiscal Plan Update 2024/25 – 2026/272024/25 Economic Outlook and Financial Forecast & Three Month Results April - June 2024 BRITISH COLUMBIA Ministry of Finance
British Columbia Cataloguing in Publication Data
British Columbia. Ministry of Finance.
Quarterly report on the economy, fiscal situation and Crown corporations. — ongoing—
Quarterly.
Title on cover: Quarterly report.
Continues: British Columbia. Ministry of Finance.
Quarterly financial report. ISSN 0833-1375.
ISSN 1192-2176 — Quarterly Report on the economy, fiscal situation and Crown corporations.
1. Finance, Public — British Columbia — Accounting — Periodicals.
2. British Columbia — Economic conditions — 1945— — Periodicals.*
3. Corporations, Government — British Columbia — Accounting — Periodicals. I. Title.
HJ13.B77 354.711’007231’05
| 2024/25 First Quarterly Report September 10, 2024 | TABLE OF CONTENTS |
| Updated Fiscal Plan 2024/25 to 2026/27 | |
| Tables: | |
| Updated Fiscal Plan 2024/25 to 2026/27 | 1 |
| Part One — Updated 2024/25 Financial Forecast | |
| Introduction | 5 |
| Revenue | 7 |
| Expense | 10 |
| Consolidated Revenue Fund (CRF) Spending | 11 |
| Service Delivery Agency Spending | 12 |
| Full-Time Equivalents for the BC Public Service | 12 |
| Provincial Capital Spending | 12 |
| Projects Over $50 million | 13 |
| Provincial Debt | 18 |
| Risks to the Fiscal Forecast | 20 |
| Supplementary Schedules | 21 |
| Tables: | |
| 1.1 Forecast Update | 5 |
| 1.2 Financial Forecast Changes | 6 |
| 1.3 Comparison of Major Factors Underlying Revenue | 8 |
| 1.4 Capital Spending Update | 12 |
| 1.5 Provincial Debt Update | 18 |
| 1.6 Operating Statement | 21 |
| 1.7 Revenue by Source | 22 |
| 1.8 Expense by Ministry, Program and Agency | 23 |
| 1.9 Expense by Function | 24 |
| 1.10 Capital Spending | 25 |
| 1.11 Projects Over $50 million | 26 |
| 1.12 Provincial Debt | 31 |
| 1.13 Statement of Financial Position | 32 |
| First Quarterly Report 2024/25 | | i |
Table of Contents
| Part Two — Economic Review and Outlook | ||
| Summary | 33 | |
| British Columbia Economic Activity and Outlook | 34 | |
| Labour Market | 35 | |
| Demographics | 36 | |
| Consumer Spending and Inflation | 37 | |
| Housing | 39 | |
| Business and Government | 41 | |
| External Trade and Commodity Markets | 42 | |
| Risks to the Economic Outlook | 44 | |
| External Outlook | 45 | |
| United States | 45 | |
| Canada | 48 | |
| Asia | 50 | |
| Europe | 51 | |
| Financial Markets | 52 | |
| Interest Rates | 52 | |
| Exchange Rates | 53 | |
| Tables: | ||
| 2.1 | British Columbia Economic Indicators | 34 |
| 2.2 | U.S. Real GDP Forecast: Consensus vs B.C. Ministry of Finance | 47 |
| 2.3 | Canadian Real GDP Forecast: Consensus vs B.C. Ministry of Finance | 49 |
| 2.4 | Private Sector Canadian Interest Rate Forecasts | 53 |
| 2.5 | Private Sector Exchange Rate Forecasts | 54 |
| 2.6.1 | Gross Domestic Product (GDP): British Columbia | 55 |
| 2.6.2 | Selected Nominal Income and Other Indicators: British Columbia | 56 |
| 2.6.3 | Labour Market Indicators: British Columbia | 56 |
| 2.6.4 | Major Economic Assumptions | 57 |
| ii | | First Quarterly Report 2024/25 |
Table of Contents
| Appendix — Fiscal Plan Update | ||
| Tables: | ||
| A1 | Material Assumptions – Revenue | 59 |
| A2 | Natural Gas Price Forecasts – 2024/25 to 2026/27 | 64 |
| A3 | Material Assumptions – Expense | 66 |
| A4 | Operating Statement – 2017/18 to 2026/27 | 69 |
| A5 | Revenue by Source – 2017/18 to 2026/27 | 70 |
| A6 | Revenue by Source Supplementary Information – 2017/18 to 2026/27 | 71 |
| A7 | Expense by Function – 2017/18 to 2026/27 | 72 |
| A8 | Expense by Function Supplementary Information – 2017/18 to 2026/27 | 73 |
| A9 | Full-Time Equivalents (FTEs) – 2017/18 to 2026/27 | 74 |
| A10 | Capital Spending – 2017/18 to 2026/27 | 75 |
| A11 | Statement of Financial Position – 2017/18 to 2026/27 | 76 |
| A12 | Changes in Financial Position – 2017/18 to 2026/27 | 77 |
| A13 | Provincial Debt – 2017/18 to 2026/27 | 78 |
| A14 | Provincial Debt Supplementary Information – 2017/18 to 2026/27 | 79 |
| A15 | Key Provincial Debt Indicators – 2017/18 to 2026/27 | 80 |
| First Quarterly Report 2024/25 | | iii |
UPDATED FISCAL PLAN – 2024/25 to 2026/27
| ($ millions) | 2024/25 | 2025/26 | 2026/27 | |||||||||
| Deficit - Budget 2024 | (7,911 | ) | (7,773 | ) | (6,288 | ) | ||||||
| Fiscal Plan Updates: | ||||||||||||
| Personal income tax revenue | 480 | 383 | 413 | |||||||||
| Corporate income tax revenue | (638 | ) | 442 | (398 | ) | |||||||
| Sales tax revenue | (54 | ) | (58 | ) | (116 | ) | ||||||
| Employer health tax revenue | 159 | 164 | 171 | |||||||||
| Property transfer tax revenue | 25 | 70 | 106 | |||||||||
| Other taxation revenue | 5 | (21 | ) | (36 | ) | |||||||
| Natural gas royalties revenue | (49 | ) | 285 | 248 | ||||||||
| Forest revenue | (103 | ) | (65 | ) | (68 | ) | ||||||
| Other natural resources revenue | (147 | ) | (130 | ) | (44 | ) | ||||||
| Contributions from the federal government | 115 | 111 | 109 | |||||||||
| Other revenue | 454 | 336 | 276 | |||||||||
| Fire management costs | (653 | ) | - | - | ||||||||
| Debt servicing costs | (344 | ) | (180 | ) | (188 | ) | ||||||
| Other spending changes | (318 | ) | (264 | ) | (280 | ) | ||||||
| Deficit - First Quarterly Report | (8,979 | ) | (6,700 | ) | (6,095 | ) | ||||||
| Contingencies Vote Levels: | ||||||||||||
| General Contingencies | 3,500 | 1,700 | 1,600 | |||||||||
| CleanBC | 385 | 320 | 130 | |||||||||
| Priority spending initiatives and caseload pressures | - | 1,000 | 2,000 | |||||||||
| 3,885 | 3,020 | 3,730 | ||||||||||
| Capital Spending Levels: | ||||||||||||
| Taxpayer-supported capital spending | 13,609 | 15,313 | 14,538 | |||||||||
| Self-supported capital spending | 4,418 | 4,285 | 4,769 | |||||||||
| 18,027 | 19,598 | 19,307 | ||||||||||
| Provincial Debt Levels and Metrics: | ||||||||||||
| Taxpayer-supported debt | 93,346 | 113,790 | 133,364 | |||||||||
| Self-supported debt | 35,264 | 37,185 | 39,568 | |||||||||
| Total provincial debt | 128,610 | 150,975 | 172,932 | |||||||||
| Taxpayer-supported debt-to-GDP ratio | 22.0 | % | 25.7 | % | 28.8 | % | ||||||
| Taxpayer-supported debt-to-revenue ratio | 117.1 | % | 139.1 | % | 158.0 | % |
Financial Outlook
The First Quarterly Report shows an increased deficit forecast for 2024/25 mainly due to higher spending for wildfire management and interest costs. There are many changes across various revenue sources that have offsetting impacts and as a result, overall revenue remains largely unchanged since budget. The deficit projection is lower in 2025/26 and 2026/27 reflecting improved revenue forecasts for personal income tax and natural gas royalties as well as changes in other revenue streams, as outlined in this report.
Compared to Budget 2024, revenue forecasts are higher by $247 million in 2024/25, $1.5 billion in 2025/26 and $661 million in 2026/27.
Expense projections are higher by $1.3 billion in 2024/25, $444 million in 2025/26 and $468 million in 2026/27. These changes result in forecast deficits of $9.0 billion, $6.7 billion and $6.1 billion in each respective fiscal year, as shown in the table above.
Personal income taxation revenue is higher by $1.3 billion over the fiscal plan period mainly reflecting stronger household incomes and federal budget measures. Corporate income tax projections have been updated to reflect the federal government's updated forecast of national corporate taxable income, with a reduction in 2024/25 and an increase in 2025/26.
| First Quarterly Report 2024/25 | | 1 | |
Updated Fiscal Plan – 2024/25 to 2026/27
Over the three years, natural resource revenue is forecast to be largely consistent with Budget 2024 projections with only a net reduction of $73 million. Natural gas royalties reflect changes in prices, volumes, natural gas liquids royalties and utilization of royal and infrastructure programs and credits. The forecast includes the impacts of an extended transition period for the new royalty system. Forestry revenues are expected to decline across the fiscal plan reflecting lower stumpage revenues due to decreased lumber prices. Columbia River Treaty electricity sales are lower due to anticipated reduced volumes under the new Agreement-in-Principle between Canada and the United States, partially offset by annual payments for flood risk management.
Contributions from the federal government are forecast to increase over the plan period mainly for Canada health and social transfers to reflect higher population growth in British Columbia.
Compared to budget, expenses in 2024/25 are expected to be higher mainly as a result of wildfire response costs and higher interest costs due to higher opening debt balances and accelerated timing of borrowing in-year. The updated expense outlook also includes higher net spending by government organizations and other statutory spending.
Economic Outlook
The First Quarterly Report forecast for B.C.'s economy is generally in line with Budget 2024 expectations, with B.C. real GDP growth in 2024 revised up slightly to 1.0 per cent from 0.8 per cent, and the forecast for 2025 revised down to 2.0 per cent from 2.3 per cent. These revisions reflect increases in government spending and investment as reported in Budget 2024, and weaker exports and the impact of high interest rates over a longer than expected period.
Employment has exceeded expectations so far this year, while retail sales and exports have underperformed. High interest rates have continued to weigh on home sales but home construction remains strong and government's capital spending plans are expected to support economic activity. Inflation has continued to trend toward the Bank of Canada's target range, but shelter prices remain elevated. Despite ongoing global economic uncertainty, the province benefits from a diverse economy and is well positioned to weather ongoing global, national, and local economic challenges.
British Columbia's Real GDP Outlook
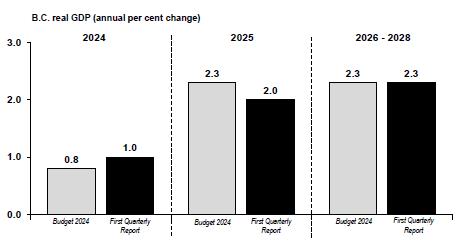
B.C.’s economy is expected to see solid growth from 2026 to 2028, with average annual real GDP growth of 2.3 per cent, similar to the Budget 2024 forecast.
Capital Investments
Taxpayer-supported capital spending on hospitals, education facilities, transportation infrastructure, housing and other projects is financed through a combination of provincial borrowing, funding provided by third parties, and from internal cash flows. Taxpayer-supported capital spending is forecast to total $43.5 billion over the fiscal plan period, which is $191 million higher than the Budget 2024 forecast mainly due to changes in the timing of capital projects.
Over the three years, self-supported infrastructure spending by commercial Crown corporations totals $13.5 billion.
| 2 | | First Quarterly Report 2024/25 | |
Updated Fiscal Plan – 2024/25 to 2026/27
Debt Affordability
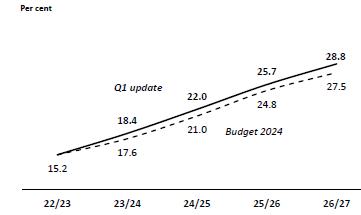
Taxpayer-supported debt is now projected at $133.4 billion by 2026/27, $6.9 billion higher than budget, mainly due to higher debt balances at the end of fiscal 2023/24 carrying forward over the fiscal plan period. As a result, government’s key debt affordability metric, the taxpayer-supported debt-to-GDP ratio, is forecast to be higher than Budget 2024 across the three years – reaching 28.8 per cent by 2026/27. B.C. continues to have one of the lowest debt-affordability metrics relative to other Canadian provinces.
Taxpayer-Supported Debt-to-GDP
Including the self-supported debt of commercial Crown corporations, total provincial debt is projected at $172.9 billion by the end of 2026/27.
Risks to the Fiscal Plan
The main risks to the government’s fiscal plan include:
| ● | risks to the B.C. economic outlook, such as uncertainty surrounding global economic activity, potential for interest rates to remain elevated for longer, and uncertainty in immigration levels; |
| ● | assumptions underlying revenue and Crown corporation forecasts such as economic factors and commodity prices; |
| ● | increased spending which may include wildfire and floods response and increased demand and costs for government services such as health care and social services; and |
| ● | potential changes to federal government transfer allocations, cost-sharing agreements with the federal government, and impacts on the provincial income tax bases arising from federal tax policy and budget changes. |
To mitigate against unexpected and unknown costs, the Contingencies Vote includes budget allocations of $3.9 billion in 2024/25, $3.0 billion in 2025/26, and $3.7 billion in 2026/27. This includes funding to address caseload pressures and priority initiatives. There are no changes to the Contingencies Vote forecast compared to Budget 2024 at this time.
Conclusion
B.C.’s fiscal forecast for 2024/25 shows a higher deficit from budget in 2024/25, mainly as a result of higher spending for wildfire response and debt servicing costs, but with improvements in 2025/26 and 2026/27 due to increasing revenue outlooks. The province’s economy continues to be resilient, and taxpayer-supported debt remains affordable compared to its peers.
Government continues to make investments to tackle priorities outlined in Budget 2024, including cost of living, housing, health and public services and a clean economy.
| First Quarterly Report 2024/25 | | 3 | |

This page intentionally left blank
PART 1 | UPDATED 2024/25 FINANCIAL FORECAST
Introduction
| Table 1.1 2024/25 Forecast Update |
| ($ millions) | Budget 2024 | First Quarterly Report | Change | |||||||||
| Revenue | 81,523 | 81,770 | 247 | |||||||||
| Expense | (89,434 | ) | (90,749 | ) | (1,315 | ) | ||||||
| Deficit | (7,911 | ) | (8,979 | ) | (1,068 | ) | ||||||
| Capital Spending: | ||||||||||||
| Taxpayer-supported capital spending | 14,104 | 13,609 | (495 | ) | ||||||||
| Self-supported capital spending | 4,652 | 4,418 | (234 | ) | ||||||||
| 18,756 | 18,027 | (729 | ) | |||||||||
| Provincial Debt: | ||||||||||||
| Taxpayer-supported debt | 88,639 | 93,346 | 4,707 | |||||||||
| Self-supported debt | 34,628 | 35,264 | 636 | |||||||||
| Total provincial debt | 123,267 | 128,610 | 5,343 | |||||||||
| Taxpayer-supported debt-to-GDP ratio | 21.0 | % | 22.0 | % | 1.0 | % | ||||||
| Taxpayer-supported debt-to-revenue ratio | 111.8 | % | 117.1 | % | 5.3 | % | ||||||
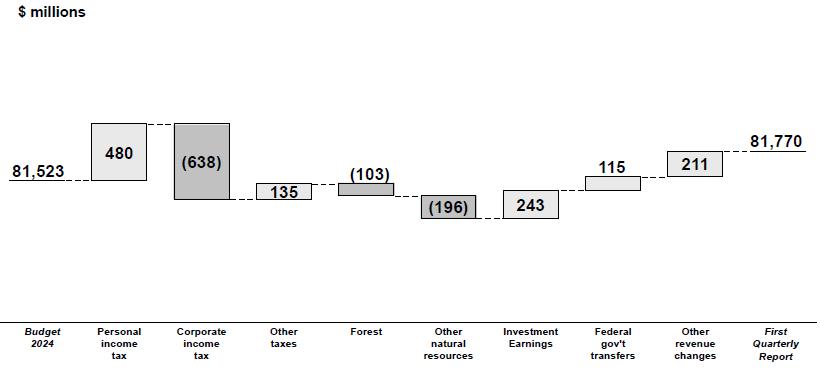
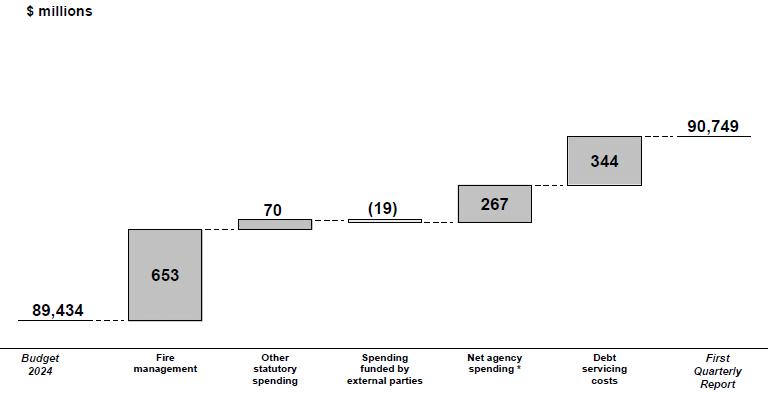
The first quarter update for 2024/25 shows an increase in spending and a slight improvement in revenue resulting in a deficit of $9.0 billion, up $1.1 billion from the budget deficit forecast of $7.9 billion. The forecast for revenue is lower for corporate income tax, and natural resources, offset by increases from personal income tax and investment earnings. The expense forecast is higher mainly due to the wildfire response and higher interest costs.
Details of the revenue and expense forecast changes from Budget 2024 are shown in Chart 1.1 and Table 1.2.
Chart 1.1 2024/25 Deficit – Major Changes from Budget 2024

| First Quarterly Report 2024/25 | | 5 | |
Updated 2024/25 Financial Forecast
| Table 1.2 2024/25 Financial Forecast Changes |
| ($ millions) | ||||
| 2024/25 deficit at Budget 2024 (February 22, 2024) | (7,911 | ) | ||
| Revenue1 changes: | ||||
| Personal income tax – reflecting improved household income and the effects of the federal budget tax measures | 480 | |||
| Corporate income tax – lower prior-year settlement payment, and decrease in advance instalments reflecting a revised federal outlook of 2024 national corporate taxable income | (638 | ) | ||
| Provincial sales tax – slower year-to-date sales activity | (54 | ) | ||
| Property transfer tax – reflecting slightly higher than expected year-to-date sales results | 25 | |||
| Fuel tax – lower sales volume in most fuel types reflecting prior year and year-to-date results | (51 | ) | ||
| Tobacco tax – reflecting lower prior year and year-to-date sales results | (40 | ) | ||
| Employer health tax – reflecting higher prior year results and improved in wages and salaries growth | 159 | |||
| Other taxation sources – mainly reflecting the impacts of the 2023/24 year-end and year-to-date results | 96 | |||
| Natural gas royalties – lower prices and natural gas liquids royalties, partly offset by higher volumes, byproduct prices and decreased utilization of royalty and infrastructure programs and credits | (49 | ) | ||
| Mining – higher coal and copper prices, coal production and the effect of a stronger US dollar, partly offset by higher mine operating and capital costs | 12 | |||
| Electricity sales under the Columbia River Treaty – decrease in anticipated volume resulting from the new Agreement-in-Principle, partly offset by annual cash payment for Flood Risk Management | (126 | ) | ||
| Forests – mainly lower stumpage rates, lumber prices and logging tax | (103 | ) | ||
| Other natural resources – mainly lower water rental revenues | (33 | ) | ||
| Fees, licences, investment earnings and miscellaneous revenue: | ||||
| Investment earnings – mainly reflecting interest income on higher cash balances | 243 | |||
| Other sources – mainly higher revenue from fees and miscellaneous sources | 243 | |||
| Canada health and social transfers – mainly higher B.C. share of the national population | 23 | |||
| Other federal government transfers – mainly higher recoveries reflecting additional Long Term Care funding and higher transfers to SUCH 2 sector entities | 92 | |||
| Commercial Crown corporation net income - unplanned power outage at Columbia Power project facilities | (32 | ) | ||
| Total revenue changes | 247 | |||
| Less: expense1 increases (decreases): | ||||
| Consolidated Revenue Fund changes: | ||||
| Statutory spending: | ||||
| Fire management costs | 653 | |||
| Other statutory spending | 61 | |||
| Refundable tax credits | 9 | |||
| Other expense changes – mainly higher interest costs | 344 | |||
| Spending funded by third party recoveries | (19 | ) | ||
| Changes in spending profile of service delivery agencies: | ||||
| School districts | 98 | |||
| Universities | 49 | |||
| Colleges and institutes | 47 | |||
| Health authorities and hospital societies | 854 | |||
| Other service delivery agencies3 | (70 | ) | ||
| (Increase) decrease in transfers to service delivery agencies - accounting elimination | (711 | ) | ||
| Total expense changes | 1,315 | |||
| Total changes | (1,068 | ) | ||
| 2024/25 deficit at the First Quarterly Report | (8,979 | ) | ||
1 Detailed descriptions of changes are provided in the revenue and expense sections of this report.
2 SUCH: school districts, universities, colleges and institutes, and health organizations.
3 Includes BC Transportation Financing Authority, BC Transit, BC Housing Management Commission, Community Living BC, and other entities.
| 6 | | First Quarterly Report 2024/25 | |
Updated 2024/25 Financial Forecast
Projected taxpayer-supported capital spending in 2024/25 is $13.6 billion, which is $495 million lower than forecast in Budget 2024, due to timing changes for capital projects in the transportation, health and post-secondary sectors. The self-supported capital spending forecast is $4.4 billion, which is $234 million lower than budget mainly due to timing of power generation and transmission projects.
The taxpayer-supported debt at the end of 2024/25 is forecast at $93.3 billion, which is higher by $4.7 billion compared to the Budget 2024 forecast as a result of higher debt balances at the end of fiscal 2023/24. Self-supported debt is forecast to be $35.3 billion, an increase of $636 million since Budget 2024 mainly due to changes in internal financing.
Revenue
Revenue for 2024/25 is forecast to be $81.8 billion — $247 million higher than the projection in Budget 2024. Higher revenue from federal government contributions, fees, investment earnings and miscellaneous sources is partly offset by lower revenue from taxation, natural resources and net income from commercial Crowns. The slight decrease to the taxation revenue forecast is mainly due to lower corporate and consumption tax revenues partly offset by the effects of the First Quarterly economic update, federal budget tax measures, the impacts of final 2023/24 revenue that carry forward and year-to-date results in 2024/25. Corporate income tax revenue includes an updated federal government outlook of national corporate taxable income. Lower natural resource revenue forecast is mainly due to the impacts of lower energy commodity prices.
Chart 1.2 Revenue Changes from Budget 2024
Total revenue increases by $247 million
Detailed revenue projections are disclosed in Table 1.7, and key assumptions and sensitivities relating to revenue are provided in Table A1. An analysis on historical volatility of major economic drivers can be found in the 2024 B.C. Financial and Economic Review (pages 17-18). For 2024/25, major changes from the Budget 2024 forecast are discussed starting on page 8.
| First Quarterly Report 2024/25 | | 7 | |
Updated 2024/25 Financial Forecast
Table 1.3 Comparison of Major Factors Underlying Revenue
| Calendar Year | First Quarterly Report | Budget 2024 | ||||||||||||||||||||||||||||||
| Per cent growth unless otherwise indicated | 2023 | 2024 | 2025 | 2026 | 2023 | 2024 | 2025 | 2026 | ||||||||||||||||||||||||
| Real GDP | 1.5 | 1.0 | 2.0 | 2.3 | 1.0 | 0.8 | 2.3 | 2.4 | ||||||||||||||||||||||||
| Nominal GDP | 3.7 | 3.5 | 4.3 | 4.6 | 3.2 | 3.3 | 4.4 | 4.5 | ||||||||||||||||||||||||
| Household income | 7.8 | 5.9 | 4.4 | 4.0 | 6.9 | 4.4 | 4.3 | 4.1 | ||||||||||||||||||||||||
| Wages and salaries | 7.2 | 6.8 | 4.9 | 4.2 | 6.7 | 5.5 | 4.9 | 4.2 | ||||||||||||||||||||||||
| Corporations net operating surplus | -15.0 | -14.9 | -1.5 | 5.5 | -14.9 | -9.5 | 0.8 | 4.4 | ||||||||||||||||||||||||
| Employment | 1.6 | 2.3 | 1.1 | 1.1 | 1.6 | 0.9 | 1.5 | 1.5 | ||||||||||||||||||||||||
| Consumer expenditures on durable goods | 0.3 | 1.2 | 1.7 | 3.4 | 1.9 | 0.8 | 2.9 | 4.5 | ||||||||||||||||||||||||
| Consumer expenditures on goods and services | 5.3 | 5.3 | 4.7 | 4.2 | 5.3 | 5.2 | 4.4 | 4.4 | ||||||||||||||||||||||||
| Business investment | 8.8 | 2.0 | 6.7 | 6.4 | 8.3 | 1.2 | 6.7 | 6.6 | ||||||||||||||||||||||||
| Residential investment | 1.2 | 3.5 | 8.0 | 7.6 | 3.3 | 4.4 | 6.9 | 7.8 | ||||||||||||||||||||||||
| Retail sales | -0.1 | 1.0 | 2.5 | 3.5 | 0.8 | 2.3 | 3.4 | 3.8 | ||||||||||||||||||||||||
| Consumer Price Index | 3.9 | 2.7 | 2.2 | 2.0 | 3.9 | 2.7 | 2.2 | 2.0 | ||||||||||||||||||||||||
| Residential sales value | -11.6 | 4.5 | 15.9 | 9.1 | -11.6 | 12.7 | 10.2 | 7.7 | ||||||||||||||||||||||||
| B.C. Housing starts | 8.1 | -7.5 | 3.8 | 3.1 | 8.1 | -8.7 | 2.7 | 4.7 | ||||||||||||||||||||||||
| U.S. Housing starts | -8.5 | -3.5 | 2.2 | 0.0 | -9.0 | -4.1 | 3.3 | 0.0 | ||||||||||||||||||||||||
| SPF 2x4 price ($US/thousand board feet) | $ | 398 | $ | 390 | $ | 400 | $ | 425 | $ | 398 | $ | 425 | $ | 450 | $ | 450 | ||||||||||||||||
| Exchange rate (US cents/Canadian dollar) | 74.1 | 73.0 | 73.5 | 76.3 | 74.1 | 73.6 | 76.8 | 78.6 | ||||||||||||||||||||||||
| Fiscal Year | 2023/24 | 2024/25 | 2025/26 | 2026/27 | 2023/24 | 2024/25 | 2025/26 | 2026/27 | ||||||||||||||||||||||||
| Natural gas price ($Cdn/GJ at plant inlet) | $ | 1.30 | $ | 0.75 | $ | 1.85 | $ | 2.21 | $ | 1.03 | $ | 1.26 | $ | 1.75 | $ | 1.96 | ||||||||||||||||
| Bonus bid average bid price per hectare ($) | $ | 0 | $ | 200 | $ | 200 | $ | 300 | $ | 0 | $ | 200 | $ | 300 | $ | 300 | ||||||||||||||||
| Electricity price ($US/mega-watt hour, Mid-C) | $ | 86 | $ | 79 | $ | 88 | $ | 87 | $ | 90 | $ | 93 | $ | 94 | $ | 92 | ||||||||||||||||
| Metallurgical coal price ($US/tonne, fob Australia) | $ | 282 | $ | 256 | $ | 234 | $ | 233 | $ | 276 | $ | 243 | $ | 220 | $ | 205 | ||||||||||||||||
| Copper price ($US/lb) | $ | 3.79 | $ | 4.37 | $ | 4.37 | $ | 4.39 | $ | 3.77 | $ | 3.88 | $ | 4.04 | $ | 4.14 | ||||||||||||||||
| Average stumpage rates ($Cdn/cubic metre) | $ | 17.88 | $ | 15.63 | $ | 17.67 | $ | 19.71 | $ | 18.70 | $ | 18.06 | $ | 19.70 | $ | 21.16 | ||||||||||||||||
| Crown harvest volumes (million cubic metres) | 32.1 | 32.0 | 32.0 | 32.0 | 32.0 | 32.0 | 32.0 | 32.0 | ||||||||||||||||||||||||
Income Tax Revenue
Personal income tax revenue is up $480 million from budget mainly reflecting improved household income and the effects of the federal budget tax measures.
Corporate income tax revenue is down $638 million mainly due to lower advance instalments from the federal government and prior-year settlement payments. The decline in instalments reflects a change in the federal government’s forecast for 2024 national corporate taxable income, which is now expected to increase by 7.8 per cent compared to a higher growth forecast of 14.1 per cent assumed in Budget 2024.
Other Tax Revenue
Provincial sales tax revenue is down $54 million mainly due to lower year-to-date sales results reflecting a lower tax base consistent with lower consumer expenditures on taxable goods.
Property transfer tax revenue is up $25 million mainly due to slightly higher than expected activity in the housing market.
Tobacco tax revenues are down $40 million due to lower year-to-date sales.
Fuel tax revenues are down $51 million due to lower sales volumes in most fuel types reflecting prior year and year-to-date sales results.
| 8 | | First Quarterly Report 2024/25 | |
Updated 2024/25 Financial Forecast
Employer health tax revenues are up $159 million due to the impacts of 2023/24 final results and a higher payroll base consistent with improved growth in wages and salaries.
Other taxation revenues are up $96 million due to higher revenue from property and insurance premium taxes reflecting the impacts of 2023/24 results.
Natural Resources Revenue
Natural resource revenues are $299 million lower than budget with declines in most sources.
Revenue from natural gas royalties is down $49 million mainly due to lower prices for natural gas and lower natural gas liquids royalties, partially offset by slightly higher natural gas volumes and by-product prices as well as decreased utilization of royalty and infrastructure program credits. The updated natural gas price forecast is $0.75 ($Cdn/gigajoule, plant inlet), down from the Budget 2024 outlook ($1.26). The price assumption is within the 20th percentile of the private sector forecasters, continuing the prudence incorporated since 2013/14. Natural gas royalty rates are sensitive to prices in the $1.22 to $2.42 range. Hence, the effective royalty rate is generally expected to fall as prices decrease, depending on the take up of royalty program credits. The forecast includes the impacts of an extended transition period for the new royalty system and changes to the existing transition regulation for treatment of oil and gas wells.
Revenue from coal, metals, minerals and other mining-related sources is up $12 million mainly due to improved coal and copper prices, coal production and a stronger US dollar, partly offset by higher operating and capital costs for mines.
Revenue from electricity sales under the Columbia River Treaty is down $126 million reflecting an overall decrease in volume resulting from the new Agreement-in-Principle (AIP) for the Columbia River Treaty, partly offset by a separate annual cash payment for Flood Risk Management included in the AIP. In addition, Mid-C electricity prices, now forecast to be $79.15 US/mega-watt hour, are down 15 per cent from the budget outlook.
Forest revenue is down $103 million mainly due to lower stumpage revenue reflecting regular updates to the market pricing system and lower lumber prices as well as lower logging tax revenue. Total stumpage rates, now forecast to be $15.63 Cdn/cubic metre, are down 13 per cent from the budget.
Revenue from other natural resources is down $33 million mainly due to decreased water rentals collected under the Water Sustainability Act reflecting reduced inflows to reservoirs due to near record low snowpack and drought conditions.
Other Taxpayer-Supported Revenue
Other taxpayer-supported revenue consists of revenue from fees, licences, investment earnings and miscellaneous sources. These revenue sources are now expected to total $11.9 billion, up $486 million from budget.
The updated forecast for fee revenues totals $5.5 billion, up $33 million. The revised forecast for investment earnings is $1.7 billion, up $243 million from budget mainly due to higher interest income on higher cash balances.
| First Quarterly Report 2024/25 | | 9 | |
Updated 2024/25 Financial Forecast
The miscellaneous revenue outlook of $4.7 billion is up $210 million from budget mainly due to increased projections from taxpayer-supported SUCH sector entities.
Federal Government Transfers
Federal government contributions are expected to be $14.6 billion, up $115 million from budget.
Canada health and social transfers have increased by $23 million, mainly due to an improved B.C. share of the national population.
Other federal government contributions are up $92 million mainly due to higher recoveries related to additional Long Term Care funding and increased transfers to SUCH sector entities.
Commercial Crown Net Incomes
Net income reported by government business enterprises (commercial Crown corporations) is down $32 million due mainly to unplanned outages for the Columbia Power project facilities at Arrow Lake generating station. There are no changes from budget to forecast net income for BC Hydro, Liquor Distribution Branch, BC Lottery Corporation, or the Insurance Corporation of BC.
Expense
The First Quarterly Report expense forecast for 2024/25 is $1.3 billion higher than Budget 2024 mainly due to higher spending for wildfire response and increased debt servicing costs.
Chart 1.3 Expense Changes from Budget 2024
Total expense increases by $1.3 billion
*Net agency spending reflects changes to total spending of SUCH sector and other agencies, net of changes to provincial funding. For details, see table 1.2
| 10 | | First Quarterly Report 2024/25 | |
Updated 2024/25 Financial Forecast |
Consolidated Revenue Fund (CRF) Spending
Statutory spending is projected at $723 million in 2024/25 and includes the following:
| · | $653 million for fire management costs — this is in addition to the $233 million in the fire management voted appropriation, for a total spending forecast of $886 million; |
| · | $50 million to fund an increased number of agriculture claims under the Production Insurance special account; and |
| · | $20 million in other statutory spending. |
Other changes in CRF spending include a $344 million increase in debt servicing costs due to higher opening debt level, higher interest rates and accelerated timing of in-year borrowing.
Contingencies
Budget 2024 includes a Contingencies Vote allocation of $3.9 billion in 2024/25, with $3.5 billion allocated to General Programs and Climate & Emergency Response and nearly $400 million for CleanBC initiatives. The Contingencies Vote helps fund unexpected costs that are difficult to forecast such as flood recovery, wage mandate, increased demands for government services, and emerging priorities. The forecast for these allocations remain unchanged in the First Quarterly Report.
Spending Recovered from External Parties
Expenses funded by external parties are forecast to decrease by $19 million mainly due to lower recoveries from the natural resources sector and lower interest expenses recovered from commercial Crown corporations. This is partly offset by an additional $76 million in health funding received from the federal government.
The recovered spending changes are offset by an equal change in revenue and as a result have no net impact on government's financial results.
Operating Transfers to Service Delivery Agencies
Operating transfers to service delivery agencies are forecast to be $711 million higher than Budget 2024 mainly due to higher grants to health organizations ($571 million) and the education sector ($170 million), partly offset by net decrease in grants to various other service delivery agencies ($30 million).
Operating transfers provided to service delivery agencies are eliminated on consolidation, for accounting purposes. These funding increases are related to spending forecast changes noted below.
| First Quarterly Report 2024/25 | | 11 | |
Updated 2024/25 Financial Forecast |
Service Delivery Agency Spending
Service delivery agency expenses are forecast to increase by $978 million in 2024/25 compared to Budget 2024.
| · | School district expense forecasts are higher by $98 million mainly to reflect salary increases under the Shared Recovery Mandate and higher operating costs. |
| · | Post-secondary sector expenses are forecast to increase by $96 million mainly due to salary increases under the Shared Recovery Mandate. |
| · | The health authority and hospital society expense forecast is $854 million higher than Budget 2024, mainly due to higher salary and operating costs. |
| · | Other service delivery agency spending is forecast to decrease by $70 million since budget mainly due to lower amortization and interest expenses by the BC Transportation Financing Authority to reflect a revised schedule for capital projects. This is partly offset by various updates across a number of other agencies. |
Higher service delivery agency spending is funded primarily by increased operating transfers provided by government as noted above.
Detailed expense projections are disclosed in Table 1.8. Key spending assumptions and sensitivities are provided in the appendix Table A3.
Full-Time Equivalents for the BC Public Service
The forecast of full-time equivalent (FTE) staff utilization for 2024/25 is 38,900, which is an increase of 1,600 FTEs since budget. Additional hiring in 2024/25 is to support the continued response to wildfires. The growth is also related to implementation of key expanded government priorities (rural resource permitting, safety and justice services), and in response to increased demand for government services such as child care and children and youth supports.
Provincial Capital Spending
Capital spending is projected to total $18.0 billion in 2024/25 — $729 million lower than the forecast in Budget 2024 (see Tables 1.4 and 1.10).
| Table 1.4 2024/25 Capital Spending Update | ||||
| ($ millions) | ||||
| Taxpayer-supported capital spending at Budget 2024 | 14,104 | |||
| Changes: | ||||
| Higher school district spending | 38 | |||
| Timing of post-secondary institution spending | (145 | ) | ||
| Timing of health authority spending | (144 | ) | ||
| Timing of transportation sector spending | (328 | ) | ||
| Higher social housing spending | 35 | |||
| Other net adjustments to capital schedules | 49 | |||
| Total taxpayer-supported changes | (495 | ) | ||
| Taxpayer-supported capital spending - updated forecast | 13,609 | |||
| Self-supported capital spending at Budget 2024 | 4,652 | |||
| Timing of BC Hydro spending | (233 | ) | ||
| Timing of other spending | (1 | ) | ||
| Total self-supported changes | (234 | ) | ||
| Self-supported capital spending - updated forecast | 4,418 | |||
| 2024/25 provincial capital spending at the First Quarterly Report | 18,027 | |||
| 12 | | First Quarterly Report 2024/25 | |
Updated 2024/25 Financial Forecast |
Taxpayer-supported capital spending is projected at $13.6 billion. The $495 million decrease since Budget 2024 is primarily due to timing changes in capital spending on transportation, health and post-secondary projects. This is partially offset by timing changes in capital spending on K-12 and social housing projects.
At $4.4 billion, self-supported capital spending is $234 million lower than Budget 2024 primarily due to changes in the timing of BC Hydro expenditures.
Projects Over $50 million
Capital spending on projects greater than $50 million is presented in Table 1.11.
Since Budget 2024, the following projects have been added to the table:
| · | Cameron Elementary School ($68 million); |
| · | Henry Hudson Elementary School ($60 million); |
| · | Fleetwood Park Secondary School ($79 million); |
| · | John Diefenbaker Elementary School ($53 million); |
| · | Mission Secondary School ($176 million); |
| · | Montgomery Middle School ($87 million); |
| · | Olympic Village Elementary School ($151 million); |
| · | Pitt Meadows Secondary School ($144 million); |
| · | Smith Middle and Secondary Schools ($306 million); |
| · | Camosun College - Student Housing ($155 million); |
| · | Capilano University – Squamish Student Housing ($55 million); |
| · | Okanagan College – Centre for Food, Wine and Tourism ($56 million); |
| · | Simon Fraser University – Digital Research Infrastructure Refresh - CEDAR ($82 million); |
| · | Simon Fraser University – Student Housing Phase 3 ($188 million); |
| · | The University of British Columbia – Student Housing - Lower Mall Precinct ($560 million); |
| · | Chilliwack Long-Term Care ($274 million); |
| · | Cottonwoods Long-Term Care Replacement ($187 million); |
| · | Immunization BC Digital Platform ($75 million); |
| · | Kamloops Cancer Centre ($359 million); |
| · | Nanaimo Cancer Centre ($289 million); |
| · | Squamish (Hilltop) Long-Term Care ($286 million); |
| · | Surrey Memorial Hospital – Hemodialysis Renal Centre ($85 million); |
| · | Surrey Memorial Hospital – Interventional Cardiology and Interventional Radiology ($97 million); |
| First Quarterly Report 2024/25 | | 13 | |
Updated 2024/25 Financial Forecast |
| · | University Hospital of Northern BC Redevelopment Phase 2 — Acute Care Tower ($1.579 billion); |
| · | Highway 1 Bus on Shoulder McKenzie to Colwood Interchange ($95 million); |
| · | Highway 1 Fraser Valley Corridor Improvements Mount Lehman Road to Highway 11 ($2.651 billion); |
| · | 1410 E King Edward Ave housing project ($79 million); |
| · | 1451 Bertram St housing project ($120 million); |
| · | 2086-2098 W 7th Ave housing project ($108 million); |
| · | 300 Angela Drive housing project ($204 million); |
| · | 926 & 930 Pandora Ave housing project ($140 million); |
| · | Connect the Basin – high-speed internet infrastructure in the Columbia Basin region ($76 million); |
| · | BC Hydro – Bridge River 1 - penstock concrete foundation refurbishment project ($72 million); |
| · | BC Hydro – Fleetwood - Distribution load interconnection (SLS Servicing) project ($158 million); |
| · | BC Hydro – Long Lake terminal station - transmission load interconnection project ($80 million); |
| · | BC Hydro – Northwest - substations outage mitigation project ($89 million); and |
| · | BC Hydro – Minette - transmission load interconnection project ($72 million). |
Since Budget 2024, the Highway 1 Illecillewaet Four-Laning and Brake Check Improvements project was completed and is no longer listed in the table.
Changes since Budget 2024 for existing projects include:
| · | Cowichan Secondary project's year of completion was amended from 2024 to 2025 to align with revised project schedule; |
| · | Grandview Heights Secondary project's anticipated total cost decreased from $83 million to $79 million to reflect final project cost. Internal borrowing decreased from $63 million to $59 million; |
| · | British Columbia Institute of Technology – Trades and Technology Complex project's anticipated total cost increased from $178 million to $218 million to reflect revised project cost. Internal borrowing increased from $152 million to $186 million and contributions from other sources increased from $26 million to $32 million; |
| · | Capilano University – Student Housing project's year of completion was amended from 2024 to 2025 to align with revised project schedule; |
| · | Douglas College – Academic and Student Housing project's anticipated total cost increased from $293 million to $332 million to reflect revised project cost. Internal borrowing increased from $203 million to $232 million and contributions from other sources increased from $90 million to $100 million; |
| · | Royal Roads University – West Shore Learning Centre project's anticipated total cost increased from $106 million to $112 million to reflect revised project cost. Contributions from other sources increased from $26 million to $32 million; |
| 14 | | First Quarterly Report 2024/25 | |
Updated 2024/25 Financial Forecast |
| · | Simon Fraser University – Student Housing project's anticipated total cost increased from $111 million to $116 million to reflect final project cost. Other contributions increased from $38 million to $43 million; |
| · | University of Victoria – Student Housing project's anticipated total cost increased from $241 million to $243 million to reflect final project cost. Contributions from other sources increased from $113 million to $115 million; |
| · | The University of British Columbia – The Gateway Building project's year of completion was amended from 2024 to 2025 to align with revised project schedule; |
| · | Vancouver Community College – Centre for Clean Energy & Automotive Innovation project's anticipated total cost increased from $291 million to $315 million to reflect revised project cost. Internal borrowing increased from $271 million to $295 million; |
| · | Vancouver Island University – Student Housing project's anticipated total cost increased from $88 million to $107 million. Internal borrowing increased from $87 million to $106 million. Project's year of completion was amended from 2026 to 2027 to align with revised project schedule; |
| · | Burnaby Hospital Redevelopment – Phase 1 project's anticipated total cost increased from $683 million to $717 million to reflect revised project cost. Internal borrowing increased from $633 million to $667 million; |
| · | Centre for Children and Youth Living with Health Complexity project's anticipated total cost increased from $267 million to $310 million to reflect the updated post-tender budget. Other contributions increased from $43 million to $86 million; |
| · | Clinical and Systems Transformation project's anticipated total cost increased from $799 million to $803 million to reflect revised project cost. Other contributions increased from $97 million to $101 million; |
| · | Lions Gate Hospital – New Acute Care Facility project's anticipated total cost increased from $310 million to $326 million to reflect revised project cost. Internal borrowing increased from $144 million to $160 million; |
| · | Royal Inland Hospital Phil and Jennie Gaglardi Tower project's anticipated total cost increased from $417 million to $457 million to reflect revised project cost. Internal borrowing increased from $39 million to $79 million; |
| · | Richmond Hospital Redevelopment project's anticipated total cost increased from $861 million to $1.959 billion to reflect revised project cost. Internal borrowing increased from $791 million to $1.889 billion. Project's year of completion was amended from 2031 to 2033 to align with revised project schedule; |
| · | University Hospital of Northern BC Redevelopment Phase 1 – Site Preparation project's year of completion was amended from 2025 to 2026 to align with revised project schedule; |
| · | Highway 1 Corridor – Nicomen Bridge project's internal borrowing decreased from $144 million to $109 million to reflect federal contribution of $35 million; |
| · | Highway 5 Corridor project's internal borrowing decreased from $350 million to $141 million to reflect federal contribution of $209 million; |
| · | Highway 99 10-Mile Slide project's anticipated total cost increased from $84 million to $88 million to reflect final project cost. Internal borrowing increased from $84 million to $88 million; |
| First Quarterly Report 2024/25 | | 15 | |
Updated 2024/25 Financial Forecast |
| · | Kootenay Lake ferry service upgrade project's anticipated total cost increased from $85 million to $117 million to reflect revised project cost. Internal borrowing increased from $68 million to $100 million. Project's year of completion was amended from 2025 to 2026 to align with revised project schedule; |
| · | Surrey Langley SkyTrain project's anticipated total cost increased from $4.010 billion to $5.996 billion to reflect revised project cost. Internal borrowing increased from $2.476 billion to $4.441 billion. Other contributions increased from $228 million to $249 million. Project's year of completion was amended from 2028 to 2029 to align with revised project schedule; |
| · | Highway 4 Kennedy Hill Safety Improvements project's anticipated total cost increased from $54 million to $67 million to reflect revised project cost. Internal borrowing increased from $40 million to $53 million; |
| · | Highway 1 216th St. to 264th St. widening project's internal borrowing increased from $226 million to $249 million to account for the replacement of previously committed funding from the Township of Langley; |
| · | Highway 1 Corridor – Falls Creek project's internal borrowing decreased from $143 million to $82 million to reflect federal contribution of $61 million; |
| · | Highway 1 Corridor – Nicomen Bridge project's internal borrowing decreased from $144 million to $109 million to reflect federal contribution of $35 million; |
| · | Cottonwood Hill at Highway 97 Slide project’s internal borrowing decreased from $335 million to $330 million to reflect federal contribution of $5 million; |
| · | Highway 1 R.W. Bruhn Bridge project’s anticipated total cost increased from $255 million to $260 million to align with the post-tender final budget. Internal borrowing increased from $164 million to $169 million; |
| · | Broadway Subway project’s year of completion was amended from 2026 to 2027 to align with revised project schedule. Public private partnerships (P3) liability of $450 million was reclassified to internal borrowing to reflect the adoption of the new Public Sector Accounting Standards for P3; |
| · | Pattullo Bridge Replacement project’s year of completion was amended from 2024 to 2025 to align with revised project schedule. Public private partnerships (P3) liability of $301 million was reclassified to internal borrowing to reflect the adoption of the new Public Sector Accounting Standards for P3; |
| · | West Fraser Road Realignment project’s internal borrowing decreased from $94 million to $82 million to reflect federal contribution of $12 million; |
| · | Pattullo Bridge Replacement and Broadway Subway projects – design-build-finance arrangements reclassified from P3 liability to internal borrowing to reflect the adoption of the new Public Sector Accounting Standards for public private partnerships (P3); |
| · | BC Hydro – Street light replacement program’s anticipated total cost was reduced from $63 million to $60 million as the program contingency was not required; |
| · | BC Hydro – Various Sites - NERC Critical Infrastructure Protection implementation project for cyber assets anticipated total cost increased from $56 million to $58 million due to further improvements to physical security measures and increased development Costs; |
| 16 | | First Quarterly Report 2024/25 | |
Updated 2024/25 Financial Forecast |
| · | BC Hydro – Lake Buntzen 1 Coquitlam tunnel gates refurbishment project’s anticipated total cost increased from $67 million to $74 million to reflect additional costs identified through the implementation phase; |
| · | BC Hydro – Capilano substation upgrade project’s anticipated total cost decreased from $87 million to $79 million as the contingency was not required; |
| · | BC Hydro – Ruskin - left abutment slope sinkhole remediation project’s year of completion was amended from 2025 to 2026 due to remediation design changes and additional scope to address underground void discovered during construction; |
| · | BC Hydro – Treaty Creek Terminal - transmission load interconnection (KSM) project’s anticipated total cost increased from $109 million to $168 million due to higher construction and material costs and customer driven schedule delays. Project’s year of completion was amended from 2027 to 2028 due to customer driven schedule delays; |
| · | BC Hydro – Burrard switchyard - control building upgrade project’s year of completion was amended from 2026 to 2029 to manage reactive power needs on BC Hydro’s transmission system, in connection with the Lower Mainland Reactive Power Reinforcement projects; |
| · | BC Hydro – John Hart dam seismic upgrade project’s anticipated total cost decreased from $913 million to $912 million to reflect revised project cost; and |
| · | ICBC – Head Office Relocation project’s anticipated total cost decreased from $164 million to $162 million to reflect revised estimate for the leasehold improvements. |
| First Quarterly Report 2024/25 | | 17 | |
| Updated 2024/25 Financial Forecast |
Provincial Debt
The provincial debt is projected to total $128.6 billion by the end of the fiscal year — $5.3 billion higher than the forecast in Budget 2024, primarily due to a higher debt balance from fiscal 2023/24 and higher operating deficit for 2024/25.
| Table 1.5 2024/25 Provincial Debt Update 1 | ||||
| ($ millions) | ||||
| Taxpayer-supported debt forecast at Budget 2024 | 88,639 | |||
| Changes: | ||||
| Higher debt level from 2023/24 | 3,539 | |||
| Changes in operating results | 1,068 | |||
| Non-cash items | 78 | |||
| Changes in cash balances 2 | (1,919 | ) | ||
| Changes in other working capital balances 3 | 2,436 | |||
| Taxpayer-supported capital spending | (495 | ) | ||
| Total taxpayer-supported changes | 4,707 | |||
| Taxpayer-supported debt – updated forecast | 93,346 | |||
| Self-supported debt forecast at Budget 2024 | 34,628 | |||
| Changes: | ||||
| Higher debt level from 2023/24 | 140 | |||
| Lower capital spending | (234 | ) | ||
| Changes in internal financing | 730 | |||
| Total self-supported changes | 636 | |||
| Self-supported debt – updated forecast | 35,264 | |||
| 2024/25 provincial debt forecast at the First Quarterly Report | 128,610 | |||
| 1 | Provincial debt is prepared in accordance with Generally Accepted Accounting Principles and presented consistent with the Debt Summary Report included in the Public Accounts. Debt is shown net of sinking funds and unamortized discounts, excludes accrued interest, and includes non-guaranteed debt directly incurred by commercial Crown corporations and debt guaranteed by the Province. | |
| 2 | Reflects changes in cash balances at April 1, 2024 and includes all cash balances from the Consolidated Revenue Fund, School Districts, Universities, Colleges, Health Authorities, Hospital Societies and other taxpayer-supported agencies. | |
| 3 | Changes in other working capital balances include changes in accounts receivables, accounts payable, accrued liabilities, deferred revenue, investments, restricted assets and other assets. |
Taxpayer-supported debt is forecast to be $93.3 billion at the end of 2024/25, $4.7 billion higher than forecast in Budget 2024. This increase reflects a higher opening balance of $3.5 billion, higher operating deficit of $1.1 billion, and changes in cash and other working capital balances of $0.6 billion, partly offset by lower capital spending of $0.5 billion.
The taxpayer-supported debt-to-GDP ratio is projected to end 2024/25 at 22.0 per cent, 1.0 percentage point higher than forecast in Budget 2024. The taxpayer-supported debt-to-revenue ratio is forecast to end the fiscal year at 117.1 per cent, 5.3 percentage points higher than forecast at budget.
Self-supported debt is forecast to be $35.3 billion at the end of 2024/25, $636 million higher than the forecast in Budget 2024, mainly due to a higher opening balance and changes in internal financing.
| 18 | | First Quarterly Report 2024/25 | |
Updated 2024/25 Financial Forecast |
Chart 1.4 Debt Affordability
Interest bite for Taxpayer-Supported Debt
(cents per dollar of revenue) 1
1 The ratio of interest costs (less sinking fund interest) to revenue. Figures include capitalized interest expense in order to provide a more comparable measure to outstanding debt.
While the Province’s debt level is expected to increase by $21.1 billion over the year, the B.C. government is able to borrow at relatively low interest rates, with debt affordability remaining at levels that are lower than they have been historically. The Province’s taxpayer-supported interest bite is 4.2 cents per dollar of revenue. In addition, the Province continues to have one of the lowest debt affordability metrics relative to other Canadian provinces.
Chart 1.5 Debt Affordability Among Provinces
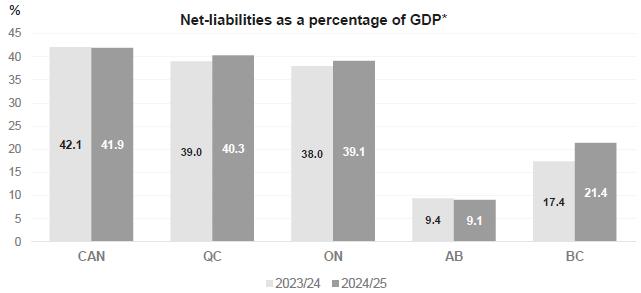
* Figures for 2023/24 were sourced from each jurisdiction’s Public Accounts or Budget document (if Public Accounts is not available). 2024/25 forecast figures were sourced from each jurisdiction’s Budget or Quarterly update published from February 2024 through September 2024.
| First Quarterly Report 2024/25 | | 19 | |
Updated 2024/25 Financial Forecast |
Details on provincial debt are shown in Table 1.12.
Total provincial debt is presented consistent with the Debt Summary Report included in the Public Accounts. Debt is shown net of sinking fund investments and unamortized discounts, excludes accrued interest, and includes non-guaranteed debt directly incurred by commercial Crown corporations and debt guaranteed by the Province.
A reconciliation between provincial debt and the financial statement debt is shown in Table 1.13.
Risks to the Fiscal Forecast
The major risks to the updated economic and fiscal forecasts include persistent price pressures leading to higher than anticipated interest rates for longer and weaker global demand. Other risks include climate change impacts, housing affordability, and volatility in commodity markets.
Personal and corporate income tax revenues take over a year to finalize. This data lag may cause more volatility in revenue projections. Property transfer tax and provincial sales tax revenues are impacted by the number of residential transactions, average home sale prices and the amount of taxable purchases of goods and services. Natural resource revenues are affected by international commodity prices, and the health of B.C.’s major trading partners.
The spending forecast contained in the fiscal plan is based on ministry and service delivery agency plans. Risks include changes in planning assumptions such as demand for government services in the health care, education, and community social services sectors, as well as costs associated with fighting forest fires and responding to other natural disasters.
Capital spending may be influenced by several factors including design development, procurement activity, labour shortages, ongoing supply chain issues, inflation, weather, geotechnical conditions and interest rates.
As a result of these uncertainties, the actual operating result, capital spending, and debt levels may differ from the current forecast. Government will continue to update the fiscal outlook throughout the year in the second and third quarterly reports.
The potential fiscal impacts from these risks may be partly offset by assuming lower growth assumptions than the private sector for B.C.’s major trading partners and the $3.9 billion contingencies vote allocation.
| 20 | | First Quarterly Report 2024/25 | |
Updated 2024/25 Financial Forecast |
Supplementary Schedules
The following tables provide the financial results for the three months ended June 30, 2024 and the 2024/25 full-year forecast.
| Table 1.6 2024/25 Operating Statement | ||||||||||||||||||||||||||||||||
| Year-to-Date to June 30 | Full Year | |||||||||||||||||||||||||||||||
| 2024/25 | Actual | 2024/25 | Actual | |||||||||||||||||||||||||||||
| ($ millions) | Budget | Actual | Variance | 2023/24 1 | Budget | Forecast | Variance | 2023/24 | ||||||||||||||||||||||||
| Revenue | 20,755 | 21,077 | 322 | 20,760 | 81,523 | 81,770 | 247 | 79,623 | ||||||||||||||||||||||||
| Expense | (20,781 | ) | (20,900 | ) | (119 | ) | (18,405 | ) | (89,434 | ) | (90,749 | ) | (1,315 | ) | (84,658 | ) | ||||||||||||||||
| Surplus (deficit) | (26 | ) | 177 | 203 | 2,355 | (7,911 | ) | (8,979 | ) | (1,068 | ) | (5,035 | ) | |||||||||||||||||||
| Accumulated surplus (deficit) beginning of the year before remeasurement gains (losses) | (3,175 | ) | (1,213 | ) | 1,962 | 3,822 | (3,175 | ) | (1,213 | ) | 1,962 | 3,822 | ||||||||||||||||||||
| Accumulated surplus (deficit) before remeasurement gains (losses) | (3,201 | ) | (1,036 | ) | 2,165 | 6,177 | (11,086 | ) | (10,192 | ) | 894 | (1,213 | ) | |||||||||||||||||||
| Effect of remeasurement gains (losses) | (36 | ) | (721 | ) | (685 | ) | (454 | ) | (36 | ) | (408 | ) | (372 | ) | (408 | ) | ||||||||||||||||
| Accumulated surplus (deficit) end of period | (3,237 | ) | (1,757 | ) | 1,480 | 5,723 | (11,122 | ) | (10,600 | ) | 522 | (1,621 | ) | |||||||||||||||||||
1 Restated to reflect government's current accounting policies.
| First Quarterly Report 2024/25 | | 21 | |
Updated 2024/25 Financial Forecast |
| Table 1.7 2024/25 Revenue by Source | ||||||||||||||||||||||||||||||||
| Year-to-Date to June 30 | Full Year | |||||||||||||||||||||||||||||||
| 2024/25 | Actual | 2024/25 | Actual | |||||||||||||||||||||||||||||
| ($ millions) | Budget | Actual | Variance | 2023/24 1 | Budget | Forecast | Variance | 2023/24 | ||||||||||||||||||||||||
| Taxation | ||||||||||||||||||||||||||||||||
| Personal income | 4,105 | 4,100 | (5 | ) | 3,942 | 16,638 | 17,118 | 480 | 16,443 | |||||||||||||||||||||||
| Corporate income | 3,395 | 3,395 | - | 3,533 | 8,236 | 7,598 | (638 | ) | 6,085 | |||||||||||||||||||||||
| Employer health | 698 | 782 | 84 | 679 | 2,803 | 2,962 | 159 | 2,886 | ||||||||||||||||||||||||
| Sales 2 | 2,749 | 2,751 | 2 | 2,709 | 10,762 | 10,708 | (54 | ) | 10,330 | |||||||||||||||||||||||
| Fuel | 260 | 242 | (18 | ) | 239 | 1,020 | 969 | (51 | ) | 982 | ||||||||||||||||||||||
| Carbon | 644 | 613 | (31 | ) | 708 | 2,565 | 2,565 | - | 2,642 | |||||||||||||||||||||||
| Tobacco | 130 | 113 | (17 | ) | 123 | 510 | 470 | (40 | ) | 477 | ||||||||||||||||||||||
| Property | 934 | 943 | 9 | 861 | 3,779 | 3,850 | 71 | 3,605 | ||||||||||||||||||||||||
| Property transfer | 537 | 611 | 74 | 555 | 2,055 | 2,080 | 25 | 1,993 | ||||||||||||||||||||||||
| Insurance premium and other | 208 | 222 | 14 | 194 | 846 | 871 | 25 | 853 | ||||||||||||||||||||||||
| 13,660 | 13,772 | 112 | 13,543 | 49,214 | 49,191 | (23 | ) | 46,296 | ||||||||||||||||||||||||
| Natural resource | ||||||||||||||||||||||||||||||||
| Natural gas royalties | 172 | 133 | (39 | ) | 193 | 754 | 705 | (49 | ) | 823 | ||||||||||||||||||||||
| Forests | 111 | 114 | 3 | 149 | 689 | 586 | (103 | ) | 657 | |||||||||||||||||||||||
| Other natural resource revenues 3 | 389 | 351 | (38 | ) | 482 | 1,707 | 1,560 | (147 | ) | 1,663 | ||||||||||||||||||||||
| 672 | 598 | (74 | ) | 824 | 3,150 | 2,851 | (299 | ) | 3,143 | |||||||||||||||||||||||
| Other revenue | ||||||||||||||||||||||||||||||||
| Post-secondary education fees | 499 | 538 | 39 | 483 | 2,937 | 2,914 | (23 | ) | 2,840 | |||||||||||||||||||||||
| Other Fees and licenses 4 | 584 | 650 | 66 | 622 | 2,531 | 2,587 | 56 | 2,427 | ||||||||||||||||||||||||
| Investment earnings | 383 | 455 | 72 | 415 | 1,424 | 1,667 | 243 | 1,718 | ||||||||||||||||||||||||
| Miscellaneous 5 | 1,051 | 1,297 | 246 | 1,090 | 4,508 | 4,718 | 210 | 4,988 | ||||||||||||||||||||||||
| 2,517 | 2,940 | 423 | 2,610 | 11,400 | 11,886 | 486 | 11,973 | |||||||||||||||||||||||||
| Contributions from the federal government | ||||||||||||||||||||||||||||||||
| Health and social transfers | 2,369 | 2,369 | - | 2,516 | 9,475 | 9,498 | 23 | 9,390 | ||||||||||||||||||||||||
| Other federal government contributions 6 | 881 | 496 | (385 | ) | 531 | 4,971 | 5,063 | 92 | 4,344 | |||||||||||||||||||||||
| 3,250 | 2,865 | (385 | ) | 3,047 | 14,446 | 14,561 | 115 | 13,734 | ||||||||||||||||||||||||
| Commercial Crown corporation net income | ||||||||||||||||||||||||||||||||
| BC Hydro | 68 | 45 | (23 | ) | (4 | ) | 712 | 712 | - | 323 | ||||||||||||||||||||||
| Liquor Distribution Branch | 287 | 288 | 1 | 304 | 1,090 | 1,090 | - | 1,148 | ||||||||||||||||||||||||
| BC Lottery Corporation 7 | 260 | 268 | 8 | 292 | 1,323 | 1,323 | - | 1,429 | ||||||||||||||||||||||||
| ICBC | (9 | ) | 258 | 267 | 95 | - | - | - | 1,399 | |||||||||||||||||||||||
| Other 8 | 50 | 43 | (7 | ) | 49 | 188 | 156 | (32 | ) | 178 | ||||||||||||||||||||||
| 656 | 902 | 246 | 736 | 3,313 | 3,281 | (32 | ) | 4,477 | ||||||||||||||||||||||||
| Total revenue | 20,755 | 21,077 | 322 | 20,760 | 81,523 | 81,770 | 247 | 79,623 | ||||||||||||||||||||||||
| 1 | Restated to reflect government's current accounting policies. |
| 2 | Includes provincial sales tax and HST/PST housing transition tax related to prior years. |
| 3 | Columbia River Treaty, other energy and minerals, water rental and other resources. |
| 4 | Healthcare-related, motor vehicle, and other fees. |
| 5 | Includes reimbursements for health care and other services provided to external agencies, and other recoveries. |
| 6 | Includes contributions for health, education, community development, housing and social service programs, and transportation projects. |
| 7 | Net of payments to the federal government and payments to the BC First Nations Gaming Revenue Sharing Limited Partnership in accordance with section 14.3 of the Gaming Control Act (B.C.). |
| 8 | Includes Columbia Power Corporation, BC Railway Company, Columbia Basin power projects, and post-secondary institutions' self-supported subsidiaries. |
| 22 | | First Quarterly Report 2024/25 | |
Updated 2024/25 Financial Forecast
Table 1.8 2024/25 Expense by Ministry, Program and Agency
| Year-to-Date to June 30 | Full Year | |||||||||||||||||||||||||||||||
| 2024/25 | Actual | 2024/25 | Actual | |||||||||||||||||||||||||||||
| ($ millions) | Budget | Actual | Variance | 2023/24 1 | Budget | Forecast | Variance | 2023/24 | ||||||||||||||||||||||||
| Office of the Premier | 4 | 5 | 1 | 4 | 17 | 17 | - | 16 | ||||||||||||||||||||||||
| Agriculture and Food | 21 | 59 | 38 | 25 | 130 | 180 | 50 | 259 | ||||||||||||||||||||||||
| Attorney General | 213 | 253 | 40 | 219 | 877 | 877 | - | 1,069 | ||||||||||||||||||||||||
| Children and Family Development | 607 | 589 | (18 | ) | 451 | 2,121 | 2,121 | - | 2,152 | |||||||||||||||||||||||
| Citizens' Services | 185 | 196 | 11 | 191 | 705 | 705 | - | 733 | ||||||||||||||||||||||||
| Education and Child Care | 2,727 | 2,893 | 166 | 2,587 | 9,615 | 9,615 | - | 9,172 | ||||||||||||||||||||||||
| Emergency Management and Climate Readiness | 24 | 31 | 7 | 27 | 116 | 116 | - | 593 | ||||||||||||||||||||||||
| Energy, Mines and Low Carbon Innovation | 22 | 22 | - | 18 | 141 | 152 | 11 | 358 | ||||||||||||||||||||||||
| Environment and Climate Change Strategy | 63 | 83 | 20 | 66 | 244 | 244 | - | 785 | ||||||||||||||||||||||||
| Finance | 358 | 269 | (89 | ) | 472 | 1,670 | 1,670 | - | 3,153 | |||||||||||||||||||||||
| Forests | 196 | 268 | 72 | 266 | 851 | 1,504 | 653 | 1,750 | ||||||||||||||||||||||||
| Health | 7,901 | 7,706 | (195 | ) | 6,464 | 32,857 | 32,857 | - | 30,504 | |||||||||||||||||||||||
| Housing | 264 | 259 | (5 | ) | 214 | 1,046 | 1,046 | - | 915 | |||||||||||||||||||||||
| Indigenous Relations and Reconciliation | 39 | 51 | 12 | 38 | 160 | 160 | - | 361 | ||||||||||||||||||||||||
| Jobs, Economic Development and Innovation | 29 | 58 | 29 | 34 | 116 | 116 | - | 209 | ||||||||||||||||||||||||
| Labour | 6 | 8 | 2 | 9 | 25 | 25 | - | 46 | ||||||||||||||||||||||||
| Mental Health and Addictions | 16 | 5 | (11 | ) | 4 | 41 | 41 | - | 88 | |||||||||||||||||||||||
| Municipal Affairs | 197 | 197 | - | 175 | 288 | 288 | - | 310 | ||||||||||||||||||||||||
| Post-Secondary Education and Future Skills | 897 | 898 | 1 | 755 | 3,371 | 3,371 | - | 3,321 | ||||||||||||||||||||||||
| Public Safety and Solicitor General | 265 | 278 | 13 | 243 | 1,084 | 1,084 | - | 1,089 | ||||||||||||||||||||||||
| Social Development and Poverty Reduction | 1,312 | 1,391 | 79 | 1,162 | 5,176 | 5,176 | - | 4,745 | ||||||||||||||||||||||||
| Tourism, Arts, Culture and Sport | 49 | 50 | 1 | 55 | 187 | 187 | - | 252 | ||||||||||||||||||||||||
| Transportation and Infrastructure | 281 | 278 | (3 | ) | 240 | 1,136 | 1,136 | - | 1,074 | |||||||||||||||||||||||
| Water, Land and Resource Stewardship | 48 | 74 | 26 | 61 | 214 | 214 | - | 440 | ||||||||||||||||||||||||
| Total ministries and Office of the Premier | 15,724 | 15,921 | 197 | 13,780 | 62,188 | 62,902 | 714 | 63,394 | ||||||||||||||||||||||||
| Management of public funds and debt | 486 | 545 | 59 | 346 | 1,976 | 2,320 | 344 | 1,588 | ||||||||||||||||||||||||
| Contingencies - General programs, CleanBC and Climate & Emergency Response | - | - | - | - | 3,885 | 3,885 | - | 11 | ||||||||||||||||||||||||
| Funding for capital expenditures | 628 | 508 | (120 | ) | 382 | 6,665 | 6,152 | (513 | ) | 3,551 | ||||||||||||||||||||||
| Refundable tax credit transfers | 775 | 775 | - | 664 | 3,492 | 3,501 | 9 | 2,885 | ||||||||||||||||||||||||
| Legislative Assembly and other appropriations | 60 | 52 | (8 | ) | 46 | 313 | 313 | - | 215 | |||||||||||||||||||||||
| Total appropriations | 17,673 | 17,801 | 128 | 15,218 | 78,519 | 79,073 | 554 | 71,644 | ||||||||||||||||||||||||
| Elimination of transactions between appropriations 2 | - | - | - | (8 | ) | (32 | ) | (32 | ) | - | (32 | ) | ||||||||||||||||||||
| Prior year liability adjustments | - | - | - | - | - | - | - | (75 | ) | |||||||||||||||||||||||
| Consolidated revenue fund expense | 17,673 | 17,801 | 128 | 15,210 | 78,487 | 79,041 | 554 | 71,537 | ||||||||||||||||||||||||
| Expenses recovered from external entities | 1,111 | 768 | (343 | ) | 879 | 5,841 | 5,822 | (19 | ) | 5,819 | ||||||||||||||||||||||
| Elimination of funding provided to service delivery agencies | (11,200 | ) | (10,502 | ) | 698 | (9,133 | ) | (48,863 | ) | (49,061 | ) | (198 | ) | (44,172 | ) | |||||||||||||||||
| Total direct program spending | 7,584 | 8,067 | 483 | 6,956 | 35,465 | 35,802 | 337 | 33,184 | ||||||||||||||||||||||||
| Service delivery agency expense | ||||||||||||||||||||||||||||||||
| School districts | 2,643 | 2,675 | 32 | 2,460 | 9,111 | 9,209 | 98 | 8,659 | ||||||||||||||||||||||||
| Universities | 1,583 | 1,640 | 57 | 1,493 | 6,906 | 6,955 | 49 | 6,630 | ||||||||||||||||||||||||
| Colleges and institutes | 439 | 461 | 22 | 385 | 1,816 | 1,863 | 47 | 1,792 | ||||||||||||||||||||||||
| Health authorities and hospital societies | 6,515 | 6,262 | (253 | ) | 5,379 | 26,639 | 27,493 | 854 | 26,272 | |||||||||||||||||||||||
| Other service delivery agencies | 2,017 | 1,795 | (222 | ) | 1,732 | 9,497 | 9,427 | (70 | ) | 8,121 | ||||||||||||||||||||||
| Total service delivery agency expense | 13,197 | 12,833 | (364 | ) | 11,449 | 53,969 | 54,947 | 978 | 51,474 | |||||||||||||||||||||||
| Total expense | 20,781 | 20,900 | 119 | 18,405 | 89,434 | 90,749 | 1,315 | 84,658 | ||||||||||||||||||||||||
1 Restated to reflect government's current organization and accounting policies.
2 Reflects payments made under an agreement where an expense from a voted appropriation is recorded as revenue by a special account.
| First Quarterly Report 2024/25 | | 23 | |
Updated 2024/25 Financial Forecast
Table 1.9 2024/25 Expense by Function
| Year-to-Date to June 30 | Full Year | |||||||||||||||||||||||||||||||
| 2024/25 | Actual | 2024/25 | Actual | |||||||||||||||||||||||||||||
| ($ millions) | Budget | Actual | Variance | 2023/24 1 | Budget | Forecast | Variance | 2023/24 | ||||||||||||||||||||||||
| Health 2 | 8,741 | 8,625 | (116 | ) | 7,217 | 35,944 | 36,622 | 678 | 34,863 | |||||||||||||||||||||||
| Education 3 | 5,025 | 5,103 | 78 | 4,686 | 19,479 | 19,172 | (307 | ) | 18,479 | |||||||||||||||||||||||
| Social services | 2,570 | 2,525 | (45 | ) | 2,061 | 10,473 | 10,458 | (15 | ) | 9,284 | ||||||||||||||||||||||
| Protection of persons and property | 605 | 655 | 50 | 558 | 2,557 | 2,556 | (1 | ) | 3,101 | |||||||||||||||||||||||
| Transportation | 634 | 603 | (31 | ) | 618 | 2,775 | 2,738 | (37 | ) | 2,379 | ||||||||||||||||||||||
| Natural resources and economic development | 805 | 1,048 | 243 | 950 | 4,441 | 5,171 | 730 | 6,704 | ||||||||||||||||||||||||
| Other | 947 | 844 | (103 | ) | 1,009 | 3,707 | 3,707 | - | 4,215 | |||||||||||||||||||||||
| Contingencies - General programs, CleanBC and Climate & Emergency Response 4 | - | - | - | - | 3,885 | 3,885 | - | - | ||||||||||||||||||||||||
| General government | 514 | 533 | 19 | 527 | 2,068 | 2,067 | (1 | ) | 2,341 | |||||||||||||||||||||||
| Debt servicing | 940 | 964 | 24 | 779 | 4,105 | 4,373 | 268 | 3,292 | ||||||||||||||||||||||||
| Total expense | 20,781 | 20,900 | 119 | 18,405 | 89,434 | 90,749 | 1,315 | 84,658 | ||||||||||||||||||||||||
| 1 | Figures have been restated to reflect government's current accounting policies. |
| 2 | Payments for healthcare services by the Ministry of Social Development and Poverty Reduction and the Ministry of Children and Family Development made on behalf of their clients are reported in the Health function. |
| 3 | Payments for training costs by the Ministry of Social Development and Poverty Reduction made on behalf of its clients are reported in the Education function. |
| 4 | Contingencies for the prior fiscal year are reported in the relevant functions; the current year forecast is not yet allocated to functions. |
| 24 | | First Quarterly Report 2024/25 | |
Updated 2024/25 Financial Forecast
Table 1.10 2024/25 Capital Spending
| Year-to-Date to June 30 | Full Year | |||||||||||||||||||||||||||||||
| 2024/25 | Actual | 2024/25 | Actual | |||||||||||||||||||||||||||||
| ($ millions) | Budget | Actual | Variance | 2023/24 | Budget | Forecast | Variance | 2023/24 | ||||||||||||||||||||||||
| Taxpayer-supported | ||||||||||||||||||||||||||||||||
| Education | ||||||||||||||||||||||||||||||||
| School districts | 249 | 295 | 46 | 184 | 1,183 | 1,221 | 38 | 874 | ||||||||||||||||||||||||
| Post-secondary institutions | 393 | 292 | (101 | ) | 219 | 2,200 | 2,055 | (145 | ) | 1,227 | ||||||||||||||||||||||
| Health | 286 | 231 | (55 | ) | 195 | 4,397 | 4,253 | (144 | ) | 2,998 | ||||||||||||||||||||||
| BC Transportation Financing Authority | 703 | 720 | 17 | 392 | 4,060 | 3,959 | (101 | ) | 2,263 | |||||||||||||||||||||||
| BC Transit | 72 | 18 | (54 | ) | 22 | 516 | 289 | (227 | ) | 158 | ||||||||||||||||||||||
| Government ministries | 128 | 106 | (22 | ) | 97 | 707 | 704 | (3 | ) | 537 | ||||||||||||||||||||||
| Social housing 1 | 321 | 131 | (190 | ) | 232 | 811 | 846 | 35 | 587 | |||||||||||||||||||||||
| Other | 34 | 36 | 2 | 19 | 230 | 282 | 52 | 128 | ||||||||||||||||||||||||
| Total taxpayer-supported | 2,186 | 1,829 | (357 | ) | 1,360 | 14,104 | 13,609 | (495 | ) | 8,772 | ||||||||||||||||||||||
| Self-supported | ||||||||||||||||||||||||||||||||
| BC Hydro | 1,160 | 1,018 | (142 | ) | 1,099 | 4,430 | 4,197 | (233 | ) | 4,263 | ||||||||||||||||||||||
| Columbia Basin power projects 2 | 4 | 4 | 0 | 5 | 14 | 15 | 1 | 8 | ||||||||||||||||||||||||
| BC Railway Company | 1 | 2 | 1 | 1 | 5 | 6 | 1 | 4 | ||||||||||||||||||||||||
| ICBC | 17 | 11 | (6 | ) | 8 | 69 | 66 | (3 | ) | 64 | ||||||||||||||||||||||
| BC Lottery Corporation 3 | 28 | 7 | (21 | ) | 6 | 100 | 100 | - | 84 | |||||||||||||||||||||||
| Liquor Distribution Branch | 8 | 5 | (3 | ) | 2 | 34 | 34 | - | 18 | |||||||||||||||||||||||
| Other 4 | - | - | - | - | - | - | - | 143 | ||||||||||||||||||||||||
| Total self-supported | 1,218 | 1,047 | (171 | ) | 1,121 | 4,652 | 4,418 | (234 | ) | 4,584 | ||||||||||||||||||||||
| Total capital spending | 3,404 | 2,876 | (528 | ) | 2,481 | 18,756 | 18,027 | (729 | ) | 13,356 | ||||||||||||||||||||||
| 1 | Includes BC Housing Management Commission (BCHMC) and Provincial Rental Housing Corporation which is now a subsidiary of BCHMC. |
| 2 | Joint ventures of the Columbia Power Corporation and Columbia Basin Trust. |
| 3 | Excludes right-of-use assets except for 2023/24 full year actual. |
| 4 | Includes post-secondary institutions' self-supported subsidiaries. |
| First Quarterly Report 2024/25 | | 25 | |
Updated 2024/25 Financial Forecast
Table 1.11 Capital Expenditure Projects Greater Than $50 million1
Note: Information in bold type denotes changes from Budget 2024 released on February 22, 2024
| Project | Estimated | Anticipated | Project Financing | ||||||||||||||||||||||||||||
| Year of | Cost to | Cost to | Total | Internal/ | P3 | Federal | Other | ||||||||||||||||||||||||
| ($ millions) | Completion | Jun. 30, 2024 | Complete | Cost | Borrowing | Liability | Gov't | Contrib'ns | |||||||||||||||||||||||
| Schools | |||||||||||||||||||||||||||||||
| Centennial Secondary 2 | 2017 | 59 | 2 | 61 | 61 | - | - | - | |||||||||||||||||||||||
| Grandview Heights Secondary 2 | 2021 | 79 | - | 79 | 59 | - | - | 20 | |||||||||||||||||||||||
| New Westminster Secondary 2 | 2021 | 95 | 12 | 107 | 107 | - | - | - | |||||||||||||||||||||||
| Handsworth Secondary 2 | 2022 | 68 | 1 | 69 | 69 | - | - | - | |||||||||||||||||||||||
| Pexsisen Elementary and Centre Mountain Lellum Middle2 | 2022 | 89 | - | 89 | 89 | - | - | - | |||||||||||||||||||||||
| Quesnel Junior School 2 | 2022 | 47 | 5 | 52 | 52 | - | - | - | |||||||||||||||||||||||
| Stitó:s Lá:lém totí:lt Elementary Middle School 2 | 2022 | 52 | 2 | 54 | 49 | - | - | 5 | |||||||||||||||||||||||
| Coast Salish Elementary 2,3 | 2023 | 26 | 17 | 43 | 38 | - | - | 5 | |||||||||||||||||||||||
| Burnaby North Secondary 2 | 2024 | 108 | - | 108 | 99 | - | - | 9 | |||||||||||||||||||||||
| Eric Hamber Secondary | 2024 | 88 | 18 | 106 | 94 | - | - | 12 | |||||||||||||||||||||||
| Victoria High School 2 | 2024 | 98 | 2 | 100 | 97 | - | - | 3 | |||||||||||||||||||||||
| Cedar Hill Middle | 2025 | 13 | 41 | 54 | 50 | - | - | 4 | |||||||||||||||||||||||
| Cowichan Secondary | 2025 | 70 | 16 | 86 | 84 | - | - | 2 | |||||||||||||||||||||||
| Henry Hudson Elementary | 2025 | 22 | 38 | 60 | 49 | - | - | 11 | |||||||||||||||||||||||
| North East Latimer Elementary | 2025 | 6 | 46 | 52 | 52 | - | - | - | |||||||||||||||||||||||
| Burke Mountain Secondary | 2026 | 32 | 128 | 160 | 135 | - | - | 25 | |||||||||||||||||||||||
| Carson Elementary | 2026 | 5 | 56 | 61 | 61 | - | - | - | |||||||||||||||||||||||
| New East Side Elementary | 2026 | 1 | 58 | 59 | 59 | - | - | - | |||||||||||||||||||||||
| New Cloverley Elementary | 2026 | 2 | 62 | 64 | 61 | - | - | 3 | |||||||||||||||||||||||
| Snine Elementary (formerly Pineview Valley Elementary) | 2026 | 4 | 61 | 65 | 65 | - | - | - | |||||||||||||||||||||||
| George Pringle Secondary (formerly Westside Secondary) | 2027 | 15 | 109 | 124 | 121 | - | - | 3 | |||||||||||||||||||||||
| La Vallee (Pemberton) Elementary | 2027 | 1 | 65 | 66 | 66 | - | - | - | |||||||||||||||||||||||
| Prince Rupert Middle | 2027 | 2 | 125 | 127 | 127 | - | - | - | |||||||||||||||||||||||
| Smith Middle and Secondary | 2027 | - | 306 | 306 | 306 | - | - | - | |||||||||||||||||||||||
| Cameron Elementary | 2028 | - | 68 | 68 | 68 | - | - | - | |||||||||||||||||||||||
| Fleetwood Park Secondary | 2028 | - | 79 | 79 | 79 | - | - | - | |||||||||||||||||||||||
| Guildford Park Secondary | 2028 | 1 | 64 | 65 | 60 | - | - | 5 | |||||||||||||||||||||||
| John Diefenbaker Elementary | 2028 | - | 53 | 53 | 53 | - | - | - | |||||||||||||||||||||||
| Mission Secondary | 2028 | - | 176 | 176 | 175 | - | - | 1 | |||||||||||||||||||||||
| Montgomery Middle | 2028 | - | 87 | 87 | 87 | - | - | - | |||||||||||||||||||||||
| Pitt Meadows Secondary | 2028 | - | 144 | 144 | 144 | - | - | - | |||||||||||||||||||||||
| Tamanawis Secondary | 2028 | 1 | 56 | 57 | 52 | - | - | 5 | |||||||||||||||||||||||
| Olympic Village Elementary | 2029 | - | 151 | 151 | 151 | - | - | - | |||||||||||||||||||||||
| Seismic mitigation program 4 | 2030 | 1,673 | 353 | 2,026 | 2,026 | - | - | - | |||||||||||||||||||||||
| Total schools | 2,657 | 2,401 | 5,058 | 4,945 | - | - | 113 | ||||||||||||||||||||||||
| Post-secondary institutions | - | - | - | ||||||||||||||||||||||||||||
| Simon Fraser University – Student Housing 2 | 2023 | 114 | 2 | 116 | 73 | - | - | 43 | |||||||||||||||||||||||
| University of Victoria – Student Housing 2 | 2023 | 242 | 1 | 243 | 128 | - | - | 115 | |||||||||||||||||||||||
| Okanagan College – Student Housing | 2024 | 55 | 20 | 75 | 74 | - | - | 1 | |||||||||||||||||||||||
| The University of British Columbia | - | - | - | ||||||||||||||||||||||||||||
| –Brock Commons Phase 2- Student Housing | 2024 | 153 | 12 | 165 | 2 | - | - | 163 | |||||||||||||||||||||||
| – Recreation Centre North | 2024 | 43 | 25 | 68 | - | - | - | 68 | |||||||||||||||||||||||
| British Columbia Institute of Technology – Student Housing | 2025 | 79 | 63 | 142 | 129 | - | - | 13 | |||||||||||||||||||||||
| Capilano University – Student Housing | 2025 | 15 | 43 | 58 | 41 | - | - | 17 | |||||||||||||||||||||||
| North Island College – Student Housing | 2025 | 24 | 54 | 78 | 76 | - | - | 2 | |||||||||||||||||||||||
| Royal Roads University – West Shore Learning Centre | 2025 | 62 | 50 | 112 | 80 | - | - | 32 | |||||||||||||||||||||||
| Simon Fraser University | |||||||||||||||||||||||||||||||
| – Digital Research Infrastructure Refresh - CEDAR | 2025 | - | 82 | 82 | 25 | - | 41 | 16 | |||||||||||||||||||||||
| Post-secondary institutions projects are continued on the next page | |
 |
| 26 | | First Quarterly Report 2024/25 | |
Updated 2024/25 Financial Forecast
Table 1.11 Capital Expenditure Projects Greater Than $50 million1
Note: Information in bold type denotes changes from Budget 2024 released on February 22, 2024
| Project | Estimated | Anticipated | Project Financing | ||||||||||||||||||||||||||||
| Year of | Cost to | Cost to | Total | Internal/ | P3 | Federal | Other | ||||||||||||||||||||||||
| ($ millions) | Completion | Jun. 30, 2024 | Complete | Cost | Borrowing | Liability | Gov't | Contrib'ns | |||||||||||||||||||||||
| Post-secondary institutions projects continued | |||||||||||||||||||||||||||||||
| The University of British Columbia | |||||||||||||||||||||||||||||||
| – School of Biomedical Engineering | 2025 | 86 | 53 | 139 | 25 | - | - | 114 | |||||||||||||||||||||||
| – The Gateway Building | 2025 | 104 | 91 | 195 | - | - | - | 195 | |||||||||||||||||||||||
| University of the Fraser Valley – Student Housing | 2025 | 15 | 90 | 105 | 88 | - | - | 17 | |||||||||||||||||||||||
| Capilano University – Squamish Student Housing | 2026 | 43 | 12 | 55 | 48 | - | - | 7 | |||||||||||||||||||||||
| Okanagan College – Centre for Food, Wine and Tourism | 2026 | 1 | 55 | 56 | 52 | - | - | 4 | |||||||||||||||||||||||
| The University of British Columbia | |||||||||||||||||||||||||||||||
| – x̌əl sic snpax̌ nwixʷtn - UBCO | 2026 | 21 | 98 | 119 | - | - | - | 119 | |||||||||||||||||||||||
| University of Victoria | |||||||||||||||||||||||||||||||
| – Engineering and Computer Science Building Expansion | 2026 | 14 | 136 | 150 | 97 | - | - | 53 | |||||||||||||||||||||||
| British Columbia Institute of Technology | |||||||||||||||||||||||||||||||
| – Trades and Technology Complex | 2027 | 6 | 212 | 218 | 186 | - | - | 32 | |||||||||||||||||||||||
| Camosun College - Student Housing | 2027 | - | 155 | 155 | 152 | - | - | 3 | |||||||||||||||||||||||
| Douglas College – Academic and Student Housing | 2027 | 18 | 314 | 332 | 232 | - | - | 100 | |||||||||||||||||||||||
| Simon Fraser University – Student Housing Phase 3 | 2027 | - | 188 | 188 | 132 | - | - | 56 | |||||||||||||||||||||||
| The University of British Columbia | |||||||||||||||||||||||||||||||
| – Sauder School of Business Power House Expansion | 2027 | 3 | 144 | 147 | - | - | - | 147 | |||||||||||||||||||||||
| – UBCO Downtown Kelowna Project | 2027 | 22 | 32 | 54 | - | - | - | 54 | |||||||||||||||||||||||
| Vancouver Community College | |||||||||||||||||||||||||||||||
| – Centre for Clean Energy & Automotive Innovation | 2027 | - | 315 | 315 | 295 | - | - | 20 | |||||||||||||||||||||||
| Vancouver Island University – Student Housing and Dining | 2027 | 2 | 105 | 107 | 106 | - | - | 1 | |||||||||||||||||||||||
| The University of British Columbia | |||||||||||||||||||||||||||||||
| – Student Housing - Lower Mall Precinct | 2029 | - | 560 | 560 | 300 | - | - | 260 | |||||||||||||||||||||||
| Total post-secondary institutions | 1,122 | 2,912 | 4,034 | 2,341 | - | 41 | 1,652 | ||||||||||||||||||||||||
| Health facilities | |||||||||||||||||||||||||||||||
| Royal Columbian Hospital Redevelopment – Phase 1 2 | 2020 | 247 | 4 | 251 | 242 | - | - | 9 | |||||||||||||||||||||||
Red Fish Healing Centre for Mental Health and Addiction - θəqiʔ ɫəwʔənəq leləm 2 | 2021 | 129 | 2 | 131 | 131 | - | - | - | |||||||||||||||||||||||
| Peace Arch Hospital Renewal 2 | 2022 | 87 | - | 87 | 8 | - | - | 79 | |||||||||||||||||||||||
| Penticton Regional Hospital Patient Care Tower 2 | |||||||||||||||||||||||||||||||
| – Direct procurement | 2022 | 65 | 11 | 76 | 18 | - | - | 58 | |||||||||||||||||||||||
| – P3 contract | 2019 | 232 | - | 232 | - | 139 | - | 93 | |||||||||||||||||||||||
| Dogwood Lodge Long-term Care Home Replacement 2 | 2023 | 63 | 2 | 65 | - | - | - | 65 | |||||||||||||||||||||||
| Lions Gate Hospital – New Acute Care Facility | 2024 | 265 | 61 | 326 | 160 | - | - | 166 | |||||||||||||||||||||||
| Stuart Lake Hospital Replacement | 2024 | 132 | 26 | 158 | 140 | - | - | 18 | |||||||||||||||||||||||
| Clinical and Systems Transformation | 2025 | 803 | - | 803 | 702 | - | - | 101 | |||||||||||||||||||||||
| iHealth Project – Vancouver Island Health Authority | 2025 | 151 | 4 | 155 | 55 | - | - | 100 | |||||||||||||||||||||||
| Nanaimo Regional General Hospital – ICU/HAU Redevelopment | 2025 | 38 | 22 | 60 | 22 | - | - | 38 | |||||||||||||||||||||||
| Surrey Memorial Hospital | |||||||||||||||||||||||||||||||
| - Hemodialysis Renal Centre | 2025 | - | 85 | 85 | 84 | - | - | 1 | |||||||||||||||||||||||
| - Interventional Cardiology and Interventional Radiology | 2025 | - | 97 | 97 | 97 | - | - | - | |||||||||||||||||||||||
| Mills Memorial Hospital Replacement | 2026 | 563 | 70 | 633 | 513 | - | - | 120 | |||||||||||||||||||||||
| Royal Columbian Hospital Redevelopment Phases 2 & 3 | 2026 | 716 | 528 | 1,244 | 1,182 | - | - | 62 | |||||||||||||||||||||||
| University Hospital of Northern BC Redevelopment Phase 1 – Site Preparation | 2026 | 2 | 101 | 103 | 62 | - | - | 41 | |||||||||||||||||||||||
| Abbotsford Long-Term Care | 2027 | 22 | 189 | 211 | 157 | - | - | 54 | |||||||||||||||||||||||
| Health projects are continued on the next page | |
| | |
| First Quarterly Report 2024/25 | | 27 | |
Updated 2024/25 Financial Forecast
Table 1.11 Capital Expenditure Projects Greater Than $50 million 1
Note: Information in bold type denotes changes from Budget 2024 released on February 22, 2024
| Project | Estimated | Anticipated | Project Financing | ||||||||||||||||||||||||||||
| ($ millions) | Year of Completion | Cost to Jun. 30, 2024 | Cost to Complete | Total Cost | Internal/ Borrowing | P3 Liability | Federal Gov't | Other Contrib'ns | |||||||||||||||||||||||
| Health projects continued | |||||||||||||||||||||||||||||||
| Campbell River Long-Term Care | 2027 | - | 134 | 134 | 80 | - | - | 54 | |||||||||||||||||||||||
| Cowichan District Hospital Replacement | 2027 | 327 | 1,119 | 1,446 | 1,148 | - | - | 298 | |||||||||||||||||||||||
| Dawson Creek and District Hospital Replacement | 2027 | 122 | 468 | 590 | 413 | - | - | 177 | |||||||||||||||||||||||
| Delta Long-Term Care | 2027 | 1 | 179 | 180 | 162 | - | - | 18 | |||||||||||||||||||||||
| Immunization BC Digital Platform | 2027 | 53 | 22 | 75 | 75 | - | - | - | |||||||||||||||||||||||
| Nanaimo Long-Term Care | 2027 | - | 286 | 286 | 172 | - | - | 114 | |||||||||||||||||||||||
| New St. Paul's Hospital | 2027 | 1,132 | 1,048 | 2,180 | 1,327 | - | - | 853 | |||||||||||||||||||||||
| Richmond Long-Term Care | 2027 | - | 178 | 178 | 178 | - | - | - | |||||||||||||||||||||||
| Royal Inland Hospital Phil and Jennie Gaglardi Tower | |||||||||||||||||||||||||||||||
| – Direct procurement | 2027 | 106 | 63 | 169 | 79 | - | - | 90 | |||||||||||||||||||||||
| – P3 contract | 2022 | 288 | - | 288 | - | 164 | - | 124 | |||||||||||||||||||||||
| Western Communities Long-Term Care | 2027 | 1 | 223 | 224 | 157 | - | - | 67 | |||||||||||||||||||||||
| Burnaby Hospital Redevelopment – Phase 1 | 2028 | 213 | 504 | 717 | 667 | - | - | 50 | |||||||||||||||||||||||
| Centre for Children and Youth Living with Health Complexity | 2028 | 6 | 304 | 310 | 224 | - | - | 86 | |||||||||||||||||||||||
| Kamloops Cancer Centre | 2028 | - | 359 | 359 | 314 | - | - | 45 | |||||||||||||||||||||||
| Nanaimo Cancer Centre | 2028 | - | 289 | 289 | 277 | - | - | 12 | |||||||||||||||||||||||
| St. Vincent's Heather Long-Term Care | 2028 | 4 | 203 | 207 | 207 | - | - | - | |||||||||||||||||||||||
| Cariboo Memorial Hospital Redevelopment | 2029 | 73 | 294 | 367 | 257 | - | - | 110 | |||||||||||||||||||||||
| Chilliwack Long-Term Care | 2029 | - | 274 | 274 | 246 | - | - | 28 | |||||||||||||||||||||||
| Cottonwoods Long-Term Care Replacement | 2029 | - | 187 | 187 | 112 | - | - | 75 | |||||||||||||||||||||||
| Dr. F.W. Green Memorial Home | 2029 | - | 156 | 156 | 94 | - | - | 62 | |||||||||||||||||||||||
| New Surrey Hospital and BC Cancer Centre | 2029 | 444 | 2,437 | 2,881 | 2,816 | - | - | 65 | |||||||||||||||||||||||
| St. Paul's Hospital Clinical Support and Research Centre | 2029 | 7 | 631 | 638 | 332 | - | - | 306 | |||||||||||||||||||||||
| Vancouver General Hospital – Operating Rooms Renewal - Phase 2 | 2029 | 39 | 293 | 332 | 312 | - | - | 20 | |||||||||||||||||||||||
| Burnaby Hospital Redevelopment – Phase 2 and BC Cancer Centre | 2030 | 4 | 1,727 | 1,731 | 1,703 | - | - | 28 | |||||||||||||||||||||||
| Squamish (Hilltop) Long-Term Care | 2030 | - | 286 | 286 | 286 | - | - | - | |||||||||||||||||||||||
| University Hospital of Northern BC Redevelopment Phase 2 – Acute Care Tower | 2031 | - | 1,579 | 1,579 | 1,246 | - | - | 333 | |||||||||||||||||||||||
| Richmond Hospital Redevelopment | 2033 | 23 | 1,936 | 1,959 | 1,889 | - | - | 70 | |||||||||||||||||||||||
| Total health facilities | 6,358 | 16,381 | 22,739 | 18,346 | 303 | - | 4,090 | ||||||||||||||||||||||||
| Transportation | |||||||||||||||||||||||||||||||
| Highway 91 Alex Fraser Bridge Capacity Improvements 2 | 2019 | 70 | - | 70 | 37 | - | 33 | - | |||||||||||||||||||||||
| Highway 99 10-Mile Slide 2 | 2021 | 83 | 5 | 88 | 88 | - | - | - | |||||||||||||||||||||||
| Highway 4 Kennedy Hill Safety Improvements 2 | 2022 | 56 | 11 | 67 | 53 | - | 14 | - | |||||||||||||||||||||||
| Highway 14 Corridor improvements 2 | 2023 | 75 | 2 | 77 | 48 | - | 29 | - | |||||||||||||||||||||||
| Highway 91 to Highway 17 and Deltaport Way Corridor improvements 2 | 2023 | 243 | 17 | 260 | 87 | - | 82 | 91 | |||||||||||||||||||||||
| West Fraser Road Realignment 2 | 2023 | 76 | 18 | 94 | 82 | - | 12 | - | |||||||||||||||||||||||
| Highway 1 Corridor – Falls Creek | 2024 | 65 | 78 | 143 | 82 | - | 61 | - | |||||||||||||||||||||||
| Highway 1 Kicking Horse Canyon Phase 4 2 | 2024 | 587 | 14 | 601 | 386 | - | 215 | - | |||||||||||||||||||||||
| Highway 1 Quartz Creek Bridge Replacement | 2024 | 85 | 34 | 119 | 69 | - | 50 | - | |||||||||||||||||||||||
| Highway 5 Corridor | 2024 | 232 | 118 | 350 | 141 | - | 209 | - | |||||||||||||||||||||||
| BC Transit Victoria HandyDART Facility | 2025 | 47 | 37 | 84 | 41 | - | 21 | 22 | |||||||||||||||||||||||
| Highway 1 Chase Four-Laning 5 | 2025 | 123 | 73 | 196 | 184 | - | 12 | - | |||||||||||||||||||||||
Transportation projects are continued on the next page

| 28 | | First Quarterly Report 2024/25 | |
Updated 2024/25 Financial Forecast
Table 1.11 Capital Expenditure Projects Greater Than $50 million 1
Note: Information in bold type denotes changes from Budget 2024 released on February 22, 2024
| Project | Estimated | Anticipated | Project Financing | ||||||||||||||||||||||||||||
| ($ millions) | Year of Completion | Cost to Jun. 30, 2024 | Cost to Complete | Total Cost | Internal/ Borrowing | P3 Liability | Federal Gov't | Other Contrib'ns | |||||||||||||||||||||||
| Transportation projects continued | |||||||||||||||||||||||||||||||
| Highway 1 Corridor – Nicomen Bridge | 2025 | 45 | 99 | 144 | 109 | - | 35 | - | |||||||||||||||||||||||
| Highway 1 Salmon Arm West 6 | 2025 | 92 | 48 | 140 | 109 | - | 31 | - | |||||||||||||||||||||||
| Highway 7 Widening – 266th St. to 287th St. | 2025 | 54 | 76 | 130 | 101 | - | 29 | - | |||||||||||||||||||||||
| Highway 17 Keating Cross Overpass | 2025 | 38 | 39 | 77 | 58 | - | 17 | 2 | |||||||||||||||||||||||
| Highway 99 / Steveston Interchange, Transit & Cycling Improvements | 2025 | 62 | 75 | 137 | 137 | - | - | - | |||||||||||||||||||||||
| Pattullo Bridge Replacement | 2025 | 948 | 429 | 1,377 | 1,377 | - | - | - | |||||||||||||||||||||||
| Blackwater North Fraser Slide | 2026 | 5 | 198 | 203 | 200 | - | 3 | - | |||||||||||||||||||||||
| Cottonwood Hill at Highway 97 Slide | 2026 | 7 | 328 | 335 | 330 | - | 5 | - | |||||||||||||||||||||||
| Highway 1 216th St. to 264th St. widening | 2026 | 61 | 284 | 345 | 249 | - | 96 | - | |||||||||||||||||||||||
| Highway 1 Ford Road to Tappen Valley Road Four-Laning | 2026 | 85 | 158 | 243 | 161 | - | 82 | - | |||||||||||||||||||||||
| Highway 1 Selkirk | 2026 | 6 | 123 | 129 | 97 | - | 32 | - | |||||||||||||||||||||||
| Highway 95 Bridge Replacement | 2026 | 5 | 85 | 90 | 61 | - | 29 | - | |||||||||||||||||||||||
| Kootenay Lake ferry service upgrade | 2026 | 63 | 54 | 117 | 100 | - | 17 | - | |||||||||||||||||||||||
| Belleville Terminal Redevelopment | 2027 | 10 | 294 | 304 | 262 | - | 42 | - | |||||||||||||||||||||||
| Broadway Subway 7 | 2027 | 1,553 | 1,274 | 2,827 | 1,830 | - | 897 | 100 | |||||||||||||||||||||||
| Highway 1 Bus on Shoulder McKenzie to Colwood Interchange | 2027 | 2 | 93 | 95 | 68 | - | 27 | - | |||||||||||||||||||||||
| Highway 1 Goldstream Safety Improvements | 2027 | 16 | 146 | 162 | 162 | - | - | ||||||||||||||||||||||||
| Highway 1 Jumping Creek to MacDonald | 2027 | 14 | 231 | 245 | 199 | - | 46 | - | |||||||||||||||||||||||
| Highway 1 R.W. Bruhn Bridge | 2027 | 42 | 218 | 260 | 169 | - | 91 | - | |||||||||||||||||||||||
| Highway 1 Fraser Valley Corridor Improvements 264th St. to Mount Lehman Road | 2028 | 99 | 2,241 | 2,340 | 2,340 | - | - | - | |||||||||||||||||||||||
| Surrey Langley SkyTrain Project | 2029 | 556 | 5,440 | 5,996 | 4,441 | - | 1,306 | 249 | |||||||||||||||||||||||
| Fraser River Tunnel Project 8 | 2030 | 96 | 4,052 | 4,148 | 4,148 | - | - | - | |||||||||||||||||||||||
| Highway 1 Fraser Valley Corridor Improvements Mount Lehman Road to Highway 11 | 2031 | 31 | 2,620 | 2,651 | 2,651 | - | - | - | |||||||||||||||||||||||
| Total transportation | 5,632 | 19,012 | 24,644 | 20,657 | - | 3,523 | 464 | ||||||||||||||||||||||||
| Housing | |||||||||||||||||||||||||||||||
| Stanley New Fountain 2 | 2023 | 77 | 1 | 78 | 9 | - | - | 69 | |||||||||||||||||||||||
| Crosstown | 2024 | 64 | 8 | 72 | 61 | - | - | 11 | |||||||||||||||||||||||
| 58 W Hastings | 2024 | 99 | 59 | 158 | 67 | - | 19 | 72 | |||||||||||||||||||||||
| 1015 Hastings St. Development | 2025 | 44 | 107 | 151 | 110 | - | 22 | 19 | |||||||||||||||||||||||
| 128 to 134 East Cordova St. | 2025 | 10 | 156 | 166 | 36 | - | 27 | 103 | |||||||||||||||||||||||
| 320 Hastings St. E. Redevelopment | 2025 | - | 86 | 86 | 49 | - | 5 | 32 | |||||||||||||||||||||||
| Clark & 1st Ave | 2026 | 9 | 100 | 109 | 75 | - | - | 34 | |||||||||||||||||||||||
| 1410 E King Edward Ave | 2026 | 3 | 76 | 79 | 73 | - | - | 6 | |||||||||||||||||||||||
| 2086-2098 W 7th Ave | 2026 | 3 | 105 | 108 | 92 | - | - | 16 | |||||||||||||||||||||||
| 300 Angela Drive | 2026 | 59 | 145 | 204 | 164 | - | 37 | 3 | |||||||||||||||||||||||
| 1451 Bertram St | 2028 | 1 | 119 | 120 | 120 | - | - | - | |||||||||||||||||||||||
| 926 & 930 Pandora Ave | 2029 | 1 | 139 | 140 | 130 | - | - | 10 | |||||||||||||||||||||||
| Total housing | 370 | 1,101 | 1,471 | 986 | - | 110 | 375 | ||||||||||||||||||||||||
| Other taxpayer-supported | |||||||||||||||||||||||||||||||
| Connect the Basin – high-speed internet infrastructure | 2027 | 1 | 75 | 76 | 43 | - | 29 | 4 | |||||||||||||||||||||||
| Nanaimo Correctional Centre Replacement | 2024 | 171 | 10 | 181 | 181 | - | - | - | |||||||||||||||||||||||
| Royal BC Museum – Collections and Research Building | 2025 | 88 | 182 | 270 | 270 | - | - | - | |||||||||||||||||||||||
| Total other taxpayer-supported | 260 | 267 | 527 | 494 | - | 29 | 4 | ||||||||||||||||||||||||
| Total taxpayer-supported | 16,399 | 42,074 | 58,473 | 47,769 | 303 | 3,703 | 6,698 | ||||||||||||||||||||||||
| |
| First Quarterly Report 2024/25 | | 29 | |
Updated 2024/25 Financial Forecast
Table 1.11 Capital Expenditure Projects Greater Than $50 million 1
Note: Information in bold type denotes changes from Budget 2024 released on February 22, 2024
| Project | Estimated | Anticipated | Project Financing | ||||||||||||||||||||||||||||
| ($ millions) | Year of Completion | Cost to Jun. 30, 2024 | Cost to Complete | Total Cost | Internal/ Borrowing | P3 Liability | Federal Gov't | Other Contrib'ns | |||||||||||||||||||||||
| Power generation and transmission | |||||||||||||||||||||||||||||||
| BC Hydro | |||||||||||||||||||||||||||||||
| – LNG Canada load interconnection project 2 | 2021 | 82 | - | 82 | 58 | - | - | 24 | |||||||||||||||||||||||
| – Mica replace units 1 - 4 generator transformers project 2 | 2022 | 77 | 12 | 89 | 89 | - | - | - | |||||||||||||||||||||||
| – 5L063 Telkwa relocation project 2 | 2023 | 51 | 2 | 53 | 53 | - | - | - | |||||||||||||||||||||||
| – Street light replacement program 2 | 2023 | 59 | 1 | 60 | 60 | - | - | - | |||||||||||||||||||||||
| – Various Sites - NERC Critical Infrastructure Protection implementation project for cyber assets 2 | 2023 | 53 | 5 | 58 | 58 | - | - | - | |||||||||||||||||||||||
| – Lake Buntzen 1 Coquitlam Tunnel Gates Refurbishment project 2 | 2023 | 61 | 13 | 74 | 74 | - | - | - | |||||||||||||||||||||||
| – Wahleach refurbish generator project 2 | 2023 | 56 | 5 | 61 | 61 | - | - | - | |||||||||||||||||||||||
| – Capilano substation upgrade project 2 | 2024 | 71 | 8 | 79 | 79 | - | - | - | |||||||||||||||||||||||
| – G.M. Shrum G1 to 10 control system upgrade 2 | 2024 | 70 | 5 | 75 | 75 | - | - | - | |||||||||||||||||||||||
| – Mica modernize controls project | 2024 | 53 | 3 | 56 | 56 | - | - | - | |||||||||||||||||||||||
| – Vancouver Island radio system project | 2024 | 49 | 4 | 53 | 53 | - | - | - | |||||||||||||||||||||||
| – Bridge River 1 - penstock concrete foundation refurbishment project | 2025 | 48 | 24 | 72 | 72 | - | - | - | |||||||||||||||||||||||
| – Natal - 60-138 kV switchyard upgrade project | 2025 | 60 | 41 | 101 | 101 | - | - | - | |||||||||||||||||||||||
| – Site C project 9 | 2025 | 13,530 | 2,470 | 16,000 | 16,000 | - | - | - | |||||||||||||||||||||||
| – Mainwaring station upgrade project | 2026 | 41 | 113 | 154 | 154 | - | - | - | |||||||||||||||||||||||
| – Ruskin - left abutment slope sinkhole remediation project | 2026 | 27 | 44 | 71 | 71 | - | - | - | |||||||||||||||||||||||
| – Sperling substation metalclad switchgear replacement project | 2026 | 52 | 24 | 76 | 76 | - | - | - | |||||||||||||||||||||||
| – Fleetwood - Distribution load interconnection (SLS Servicing) project | 2027 | 1 | 157 | 158 | 77 | - | - | 81 | |||||||||||||||||||||||
| – Long Lake terminal station - transmission load interconnection project | 2027 | 3 | 77 | 80 | 79 | - | - | 1 | |||||||||||||||||||||||
| – Minette - transmission load interconnection project | 2027 | 3 | 69 | 72 | 52 | - | - | 20 | |||||||||||||||||||||||
| – Treaty Creek Terminal - Transmission Load Interconnection (KSM) project | 2028 | 45 | 123 | 168 | 81 | - | - | 87 | |||||||||||||||||||||||
| – Kootenay Canal modernize controls project | 2028 | 10 | 51 | 61 | 61 | - | - | - | |||||||||||||||||||||||
| – Northwest - substations outage mitigation project | 2028 | 14 | 75 | 89 | 87 | - | - | 2 | |||||||||||||||||||||||
| – Peace to Kelly Lake stations sustainment project | 2028 | 70 | 274 | 344 | 344 | - | - | - | |||||||||||||||||||||||
| – Prince George to Terrace capacitors project | 2028 | 45 | 537 | 582 | 481 | - | 97 | 4 | |||||||||||||||||||||||
| – Burrard switchyard - control building upgrade project | 2029 | 5 | 52 | 57 | 57 | - | - | - | |||||||||||||||||||||||
| – John Hart dam seismic upgrade project | 2029 | 232 | 680 | 912 | 912 | - | - | - | |||||||||||||||||||||||
| – Bridge River 1 replace units 1-4 generators/governors project | 2030 | 17 | 296 | 313 | 313 | - | - | - | |||||||||||||||||||||||
| Total power generation and transmission | 14,885 | 5,165 | 20,050 | 19,734 | - | 97 | 219 | ||||||||||||||||||||||||
| Other self-supported | |||||||||||||||||||||||||||||||
| ICBC Head Office Relocation | 2028 | - | 162 | 162 | 162 | - | - | - | |||||||||||||||||||||||
| Total self-supported | 14,885 | 5,327 | 20,212 | 19,896 | - | 97 | 219 | ||||||||||||||||||||||||
| Total projects over $50 million | 31,284 | 47,401 | 78,685 | 67,665 | 303 | 3,800 | 6,917 | ||||||||||||||||||||||||
| 1 | Only projects that receive provincial funding and have been approved by Treasury Board and/or Crown corporation boards are included in this table. Ministry service plans may highlight projects that still require final approval. Capital costs reflect current government accounting policy. | |
| 2 | Assets have been put into service and only trailing costs remain. |
| 3 | The anticipated total cost was previously reported as $52 million and has been reduced to $43 million to reflect current estimates. | |
| 4 | The Seismic Mitigation Program consists of spending to date on Phase 2 of the program and may include spending on projects greater than $50 million included in the table. | |
| 5 | Project is delivered in two segments, the Chase Creek Road to Chase West reached substantial completion in 2023 and the Chase West to Chase Creek Bridge is expected to complete in 2025. | |
| 6 | Project is delivered in two segments, the Salmon Arm West 1st Ave to 10th Ave reached substantial completion in 2023 and the Salmon Arm West 10th Ave to 10th St. is expected to complete in 2025. | |
| 7 | The Broadway Subway Project forecast and value of costs incurred to date include the City of Vancouver in-kind contribution of land rights, in keeping with the approved project budget. Under current government accounting, purchased intangible assets are given accounting recognition, and contributed intangible assets, such as land use rights or licenses are not. | |
| 8 | The Fraser River Tunnel is forecasted to open to the public in 2030 with the removal of the existing tunnel to follow. | |
| 9 | The approved project cost estimate (June 2021) is $16 billion, with a project in-service date of 2025 (first and last generating unit in-service in December 2024 and 2025, respectively). The anticipated project cost and cost to date include capital costs, charges subject to regulatory deferral and certain operating expenditures. |
| 30 | | First Quarterly Report 2024/25 | |
Updated 2024/25 Financial Forecast
Table 1.12 2024/25 Provincial Debt 1
| Year-to-Date to June 30 | Full Year | |||||||||||||||||||||||||||||||
| 2024/25 | Actual | 2024/25 | Actual | |||||||||||||||||||||||||||||
| ($ millions) | Budget | Actual | Variance | 2023/24 | Budget | Forecast | Variance | 2023/24 | ||||||||||||||||||||||||
| Taxpayer-supported debt | ||||||||||||||||||||||||||||||||
| Provincial government | ||||||||||||||||||||||||||||||||
| Operating | 9,000 | 21,127 | 12,127 | - | 10,275 | 16,495 | 6,220 | 8,729 | ||||||||||||||||||||||||
| Capital 2 | 42,018 | 41,309 | (709 | ) | 37,366 | 46,439 | 46,364 | (75 | ) | 40,582 | ||||||||||||||||||||||
| Total provincial government | 51,018 | 62,436 | 11,418 | 37,366 | 56,714 | 62,859 | 6,145 | 49,311 | ||||||||||||||||||||||||
| Taxpayer-supported entities | ||||||||||||||||||||||||||||||||
| BC Transportation Financing Authority | 22,045 | 22,208 | 163 | 19,570 | 26,066 | 25,264 | (802 | ) | 21,286 | |||||||||||||||||||||||
| Health authorities and hospital societies | 2,374 | 2,379 | 5 | 2,047 | 2,332 | 2,340 | 8 | 2,387 | ||||||||||||||||||||||||
| Post-secondary institutions | 918 | 900 | (18 | ) | 909 | 981 | 979 | (2 | ) | 897 | ||||||||||||||||||||||
| Social housing 3 | 1,354 | 1,152 | (202 | ) | 1,044 | 1,872 | 1,249 | (623 | ) | 1,182 | ||||||||||||||||||||||
| Other | 423 | 382 | (41 | ) | 297 | 674 | 655 | (19 | ) | 339 | ||||||||||||||||||||||
| Total taxpayer-supported entities | 27,114 | 27,021 | (93 | ) | 23,867 | 31,925 | 30,487 | (1,438 | ) | 26,091 | ||||||||||||||||||||||
| Total taxpayer-supported debt | 78,132 | 89,457 | 11,325 | 61,233 | 88,639 | 93,346 | 4,707 | 75,402 | ||||||||||||||||||||||||
| Self-supported debt | 33,425 | 33,024 | (401 | ) | 30,347 | 34,628 | 35,264 | 636 | 32,060 | |||||||||||||||||||||||
| Total provincial debt | 111,557 | 122,481 | 10,924 | 91,580 | 123,267 | 128,610 | 5,343 | 107,462 | ||||||||||||||||||||||||
| 1 | Provincial debt is prepared in accordance with Generally Accepted Accounting Principles and presented consistent with the Debt Summary Report included in the Public Accounts. Debt is shown net of sinking funds and unamortized discounts, excludes accrued interest, and includes non-guaranteed debt directly incurred by commercial Crown corporations and debt guaranteed by the Province. |
| 2 | Includes debt incurred by the government to fund the building of capital assets in the education, health, social housing and other sectors. |
| 3 | Includes debt incurred by BC Housing Management Commission (BCHMC) and the Provincial Rental Housing Corporation (now a subsidiary of BCHMC) to fund investments in affordable housing. The debt forecast reflects projects that have been approved as of June 2024. |
| First Quarterly Report 2024/25 | | 31 | |
Updated 2024/25 Financial Forecast
Table 1.13 2024/25 Statement of Financial Position
| Actual March 31, | Year-to-Date June 30, | Forecast March 31, | ||||||||||
| ($ millions) | 2024 | 2024 | 2025 | |||||||||
| Financial assets: | ||||||||||||
| Cash and temporary investments | 6,768 | 16,821 | 4,600 | |||||||||
| Other financial assets | 22,057 | 23,260 | 21,670 | |||||||||
| Sinking funds | 491 | 518 | 561 | |||||||||
| Investments in commercial Crown corporations: | ||||||||||||
| Retained earnings | 14,677 | 15,015 | 15,403 | |||||||||
| Recoverable capital loans | 30,572 | 31,721 | 33,877 | |||||||||
| Total investments in commercial Crown corporations | 45,249 | 46,736 | 49,280 | |||||||||
| Total financial assets | 74,565 | 87,335 | 76,111 | |||||||||
| Liabilities: | ||||||||||||
| Accounts payable, accrued liabilities and others | 23,798 | 22,093 | 22,427 | |||||||||
| Deferred revenue | 15,053 | 15,805 | 16,154 | |||||||||
| Debt: | ||||||||||||
| Taxpayer-supported debt | 75,402 | 89,457 | 93,346 | |||||||||
| Self-supported debt | 32,060 | 33,024 | 35,264 | |||||||||
| Total provincial debt | 107,462 | 122,481 | 128,610 | |||||||||
| Add: debt offset by sinking funds | 491 | 518 | 561 | |||||||||
| Add: foreign exchange adjustments | 494 | 650 | 700 | |||||||||
| Less : guarantees and non-guaranteed debt | (1,476 | ) | (1,542 | ) | (1,592 | ) | ||||||
| Financial statement debt | 106,971 | 122,107 | 128,279 | |||||||||
| Total liabilities | 145,822 | 160,005 | 166,860 | |||||||||
| Net liabilities | (71,257 | ) | (72,670 | ) | (90,749 | ) | ||||||
| Capital and other non-financial assets: | ||||||||||||
| Tangible capital assets | 65,583 | 66,666 | 76,100 | |||||||||
| Other non-financial assets | 4,053 | 4,247 | 4,049 | |||||||||
| Total capital and other non-financial assets | 69,636 | 70,913 | 80,149 | |||||||||
| Accumulated surplus (deficit) | (1,621 | ) | (1,757 | ) | (10,600 | ) | ||||||
Changes in Financial Position
| Year-to-Date June 30, | Forecast March 31, | |||||||
| ($ millions) | 2024 | 2025 | ||||||
| Deficit (surplus) for the period | (177 | ) | 8,979 | |||||
| Change in remeasurement (gains) losses and other adjustments | 313 | - | ||||||
| Decrease in accumulated surplus | 136 | 8,979 | ||||||
| Capital and other non-financial asset changes: | ||||||||
| Taxpayer-supported capital investments | 1,829 | 13,609 | ||||||
| Less: amortization and other accounting changes | (746 | ) | (3,092 | ) | ||||
| Increase in net capital assets | 1,083 | 10,517 | ||||||
| Increase (decrease) in other non-financial assets | 194 | (4 | ) | |||||
| Increase in capital and other non-financial assets | 1,277 | 10,513 | ||||||
| Increase in net liabilities | 1,413 | 19,492 | ||||||
| Investment and working capital changes: | ||||||||
| Investment in commercial Crown corporations: | ||||||||
| Increase in retained earnings | 338 | 726 | ||||||
| Self-supported capital investments | 1,047 | 4,418 | ||||||
| Less: loan repayments and other accounting changes | 102 | (1,113 | ) | |||||
| Increase in investment in commercial Crown corporations | 1,487 | 4,031 | ||||||
| Increase (decrease) in cash and temporary investments | 10,053 | (2,168 | ) | |||||
| Increase (decrease) in other working capital | 2,183 | (47 | ) | |||||
| Increase in investment and working capital | 13,723 | 1,816 | ||||||
| Increase in financial statement debt | 15,136 | 21,308 | ||||||
| Change in sinking fund debt and foreign exchange adjustments | (183 | ) | (276 | ) | ||||
| Increase (decrease) in guarantees and non-guaranteed debt | 66 | 116 | ||||||
| Increase in total provincial debt | 15,019 | 21,148 | ||||||
| 32 | | First Quarterly Report 2024/25 | |
PART 2 | ECONOMIC REVIEW AND OUTLOOK 1
Summary
B.C.'s economic outlook has improved slightly this year, with strong employment and population growth, while exports and retail sales have been weak. High interest rates have weighed on home sales but home construction remains strong, and government capital plans are expected to support economic activity. Inflation has continued to trend down toward the Bank of Canada's target range, but shelter prices remain elevated. Despite ongoing global economic uncertainty, the province benefits from a diverse economy and is well positioned to weather ongoing global, national, and local economic challenges.
The Ministry of Finance (Ministry) estimates that B.C.'s economy grew by 1.5 per cent in 2023. The Ministry forecasts economic growth to slow to 1.0 per cent in 2024 and then pick up to 2.0 per cent in 2025. The impact of high interest rates across the globe is expected to slow economic growth in 2024, affecting both domestic and foreign demand, particularly weakening international trade. As interest rates decline and these factors subside, economic growth is expected to strengthen in 2025, supported by higher investment, tightening labour markets, stronger consumer spending, and a recovery in exports. Over the medium-term (2026 to 2028), real GDP growth is expected to average 2.3 per cent annually. Overall, the Ministry's forecast for B.C. real GDP growth is within the range of private sector forecasters.
The main downside risks to B.C.'s economic outlook include persistent price pressures leading to interest rates remaining elevated for longer, an extended slowdown in housing markets, and uncertainty about immigration levels. Other risks include weaker global demand, climate change impacts, the economic impacts of international geopolitical conflicts, as well as commodity market volatility.
Chart 2.1 Ministry's Outlook for B.C. Compared to Private Sector
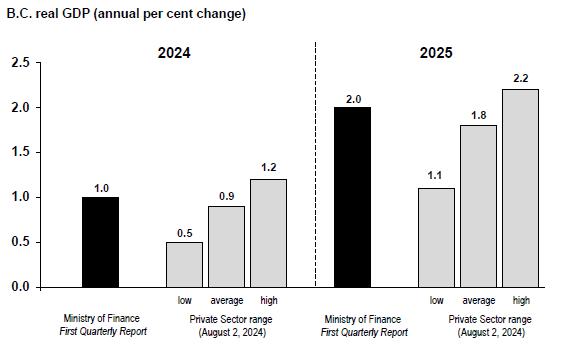
Sources: B.C. Ministry of Finance; Private Sector range (low/average/high of Economic Forecast Council subset consisting of BMO, CIBC, National Bank, RBC, Scotiabank and TD).
1 Reflects data available as of August 21, 2024, unless otherwise indicated.
| First Quarterly Report 2024/25 | | 33 | |
| Economic Review and Outlook |
British Columbia Economic Activity and Outlook
At a high level, B.C.'s economic performance has been generally in line with expectations from Budget 2024. The Ministry's forecast for B.C. real GDP growth in 2024 has been revised up slightly to 1.0 per cent from 0.8 per cent, reflecting increases in government spending and investment as reported in Budget 2024. Employment has exceeded expectations this year, while retail sales and exports have underperformed. The forecast for 2025 has been lowered to 2.0 per cent from 2.3 per cent. This revision reflects weaker exports that year and the impact of high interest rates over a longer than expected period. Nominal GDP growth for 2024 has been revised up slightly to 3.5 per cent from 3.3 per cent, and in 2025 down slightly to 4.3 per cent from 4.4 per cent, reflecting changes in real GDP. B.C.'s economy is expected to see solid growth from 2026 to 2028, with average annual real GDP growth of 2.3 per cent and average annual nominal GDP growth of 4.7 per cent, similar to the Budget 2024 forecast.
Table 2.1 British Columbia Economic Indicators
| First Quarter | Second Quarter | Year-to-date | ||||||||||
| All data seasonally adjusted, per cent change | Jan. to Mar. 2024 change from Oct. to Dec. 2023 | Apr. to Jun. 2024 change from Jan. to Mar. 2024 | Jan. to Jun. 2024 change from Jan. to Jun. 2023 | |||||||||
| Employment | +0.6 | +0.7 | +2.8 | |||||||||
| Manufacturing shipments | -4.8 | +2.1 | -2.8 | |||||||||
| Exports | +1.4 | -5.0 | -3.7 | |||||||||
| Retail sales1 | -1.3 | +0.6 | -0.3 | |||||||||
| Consumer price index2 | +2.8 | +2.8 | +2.8 | |||||||||
| Housing starts | -2.9 | -8.5 | -9.5 | |||||||||
| Residential sales units | +6.6 | +0.7 | -2.2 | |||||||||
| Residential average sale price | -0.2 | +1.5 | +3.4 | |||||||||
| Non-residential building permits | +39.3 | -3.9 | -8.0 | |||||||||
1 Data to May
2 Quarterly calculations for CPI are year-over-year, e.g. First Quarter is Jan. to Mar. 2024 change from Jan. to Mar. 2023
B.C.'s labour market is expected to see strong growth in the near-term, supported by high population growth, before slowing in 2025 and 2026 as population growth is expected to ease in response to the federal government's announcement earlier this year to introduce a cap on international study permits. The unemployment rate is expected to remain fairly steady over the next couple of years before trending down over the forecast horizon, supported by steady job gains in the medium-term. After a period of near-term weakness, consumer spending is forecast to grow moderately over the forecast horizon. Inflation is forecast to average 2.7 per cent in 2024 and average 2.2 per cent in 2025, close to the Bank of Canada's target of 2 per cent. Residential construction activity is expected to ease somewhat from the high levels seen in 2022 and 2023, and then strengthen over the medium-term, supported by lower borrowing costs and recent government housing policies that are expected to boost the industry's productive capacity. Meanwhile, home sales activity is expected to normalize in response to interest rate cuts and rising supply. On the trade front, weak global demand and energy prices are expected to weigh on exports in the near-term, with higher export growth over the medium-term supported by liquefied natural gas (LNG) production from three projects (LNG Canada, Woodfibre LNG, and Cedar LNG).
| 34 | | First Quarterly Report 2024/25 | |
| Economic Review and Outlook |
Labour Market
Labour market growth has picked up in 2024 supported by strong international migration. Despite declines in recent months, employment grew by 2.7 per cent (around +75,000 jobs) year-to-date to July 2024 compared to the same period last year. The composition of jobs remained positive, as full-time employment increased by 62,400 jobs and part-time employment increased by 12,700 jobs on a year-to-date basis. During this period, the number of jobs created was strong for the public sector (+38,800 jobs), private sector (+25,700 jobs), and for self-employed workers (+10,400 jobs).
On an industry basis, year-to-date employment gains were concentrated in the service sector (+84,100 jobs), led by health care and social assistance (+39,100 jobs); professional, scientific, and technical services (+15,500 jobs); and transportation and warehousing (+13,200 jobs). During this period, employment in the goods sector was lower than the same period last year (-9,000 jobs), where growth in forestry, fishing, mining, oil, and gas (+4,500 jobs) was offset by job losses in agriculture (-7,600 jobs) and construction (-7,100 jobs).
The provincial unemployment rate has risen against a backdrop of elevated interest rates and strong population growth, as labour force growth is outpacing job gains. However, the unemployment rate remains in line with the pre-pandemic average. B.C.'s unemployment rate reached 5.5 per cent in July 2024 and averaged 5.3 per cent year-to-date, 0.8 percentage points below the national average. Meanwhile, the job vacancy rate declined compared to the first five months of 2023, reaching 3.8 per cent in May 2024, similar to pre-pandemic levels.
Chart 2.2 B.C. Employment
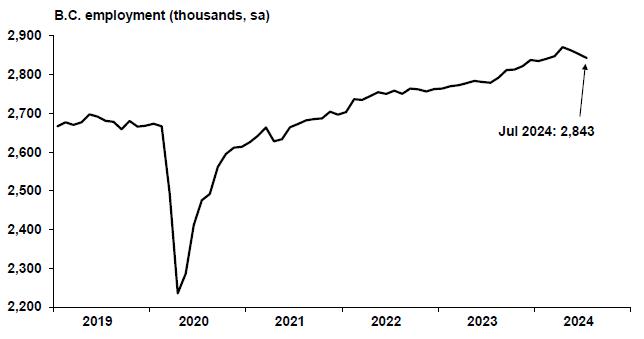
Sources: Statistics Canada (Labour Force Survey); Haver Analytics
The size of B.C.'s labour force increased by 3.0 per cent year-to-date to July 2024, supported by strong population growth. Landed immigrants accounted for the majority of the growth in the labour force so far this year. B.C.'s labour force participation rate averaged 65.0 per cent so far this year, relatively unchanged from the first seven months of 2023. While the labour force participation rate for the prime-age group has surpassed its pre-pandemic five-year average, there has been a decline in the labour force participation rate among the 55+ years age group. An aging population poses a challenge for labour markets in B.C. and across the country.
| First Quarterly Report 2024/25 | | 35 | |
| Economic Review and Outlook |
Employee compensation (i.e., aggregate wages, salaries, and employers' social contributions) in B.C. increased by 8.4 per cent year-to-date to March 2024 compared to the same period of 2023, reflecting job gains and rising wages. So far this year, the average hourly wage rate rose by 7.0 per cent compared to the first seven months of 2023. Wages grew faster than the consumer price index for B.C., which increased by 2.8 per cent over the same period.
Outlook
In the near-term, solid growth is expected for employment, supported by strong immigration. The Ministry forecasts employment in B.C. to increase by 2.3 per cent in 2024 (approximately +64,200 jobs), followed by annual growth of 1.1 per cent in 2025 (approximately +30,500 jobs) as immigration is expected to slow. Over the medium-term, employment growth is forecast to average 1.3 per cent annually.
The province's unemployment rate is expected to average 5.4 per cent in 2024 and 2025, reflecting the balance between job gains and labour force growth. B.C.'s unemployment rate is forecast to trend down over the medium-term to 5.1 per cent in 2028.
Employee compensation is expected to rise by 6.8 per cent in 2024, reflecting both strong wage and job growth. Over the balance of the forecast horizon, employee compensation is projected to grow by between 4.1 per cent and 4.9 per cent annually.
Demographics
On April 1, 2024, B.C.'s population was 5.65 million people, up 3.3 per cent from the same date in 2023 and the highest growth rate since 1972. During the January to March period of 2024, the province welcomed 37,705 net migrants, up 2.3 per cent compared to the same period in 2023.
Underlying the increase in net migration in the first quarter was higher net international migration (from +37,830 persons to +40,271 persons), with a significant increase in the number of net non-permanent (temporary) residents (from +16,020 persons to +25,272 persons). This follows a record high year for the number of temporary residents in 2023. The rise in international migration to B.C. and other provinces reflects higher immigration targets for permanent residents introduced by the federal government in recent years, and an expansion of federal immigration programs for temporary residents.
The rise in net international migration offset a decline in net interprovincial migration (from -962 persons to -2,566 persons). B.C. has experienced an outflow of interprovincial migrants in the last seven consecutive quarters, largely due to out migration to Alberta, and is the most significant period of interprovincial outflows since the 1997 to 2002 period.
| 36 | | First Quarterly Report 2024/25 | |
| Economic Review and Outlook |
Outlook
B.C.’s July 1 population is projected to increase by 3.0 per cent in 2024, 1.2 per cent in 2025, and then by 1.5 per cent on average over the 2026 to 2028 period. Total net migration is expected to be about 113,600 persons in 2024 and 62,000 persons in 2025. In 2024 and 2025, B.C. is expected to continue to see a net loss of interprovincial migrants while international migrants are the sole driver of growth in total net migration. From 2026 to 2028, total net migration is expected to average 90,300 persons. The moderation in the total net migration forecast largely reflects a slowdown in temporary residents, specifically for international students, in response to the federal government's announcement in early 2024 to cap the number of international students granted admission into Canada in the next two years. International migrants are expected to account for approximately 90 per cent of total migrants over the medium-term.
Consumer Spending and Inflation
Consumer spending has weakened so far this year amid high prices and elevated interest rates, which have reduced consumers' purchasing power. Year-to-date to May, B.C. nominal retail sales declined by 0.3 per cent, while consumer prices rose by 2.8 per cent, indicating an even lower volume of sales. Year-to-date sales declines were led by lower spending at gasoline stations and fuel vendors (-4.7 per cent) and sporting goods, hobby, musical instrument, book and miscellaneous retailers (-6.8 per cent). Partially offsetting these declines was growth in spending at building material and garden equipment and supplies dealers (+10.7 per cent) and at health and personal care retailers (+6.7 per cent).
Sales at food services and drinking places in B.C., a component of the service sector, rose by 3.6 per cent year-to-date to May 2024 compared to the same period of 2023, partly due to higher prices.
Weakness has persisted for consumer sentiment in B.C., weighed down by higher interest rates and elevated prices. The Conference Board of Canada's consumer confidence index for B.C. was slightly lower in the first eight months of 2024, compared to the same period last year, and was below historical averages. The Bank of Canada's latest Canadian Survey of Consumer Expectations released in July 2024 finds similar concerns at the national level, as sentiment remained weak due to elevated interest rates and higher prices, and most consumers reported spending less.
Chart 2.3 B.C. Retail Sales
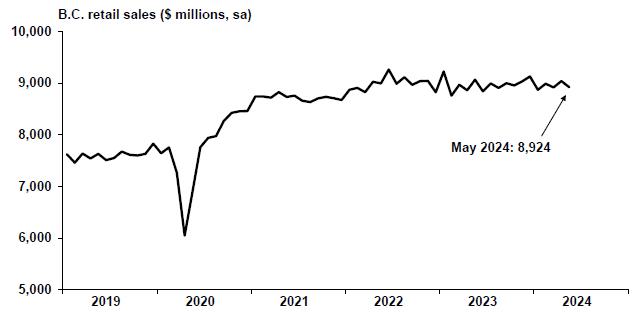
Sources: Statistics Canada; Haver Analytics
| First Quarterly Report 2024/25 | | 37 | |
| Economic Review and Outlook |
Inflation in B.C. has continued trending towards the Bank of Canada's target range since hitting a peak of 8.1 per cent in May 2022. After recording a 3.9 per cent increase in 2023, inflation has averaged 2.8 per cent in the first seven months of 2024. Price growth this year was led by shelter (+6.6 per cent) and food (+3.3 per cent). Higher shelter prices reflect faster growth for mortgage costs and rent, as mortgages were initiated or renewed at higher borrowing rates while strong immigration and high homeownership costs for potential homebuyers put upward pressure on rental demand. Food inflation has decelerated from its high of 10.2 per cent in January 2023, reaching 2.8 per cent in July, the same as headline inflation. Declining prices for household operations and furnishings, clothing and footwear, and gasoline prices drove the deceleration of inflation in the first seven months of 2024.
Chart 2.4 B.C. Inflation
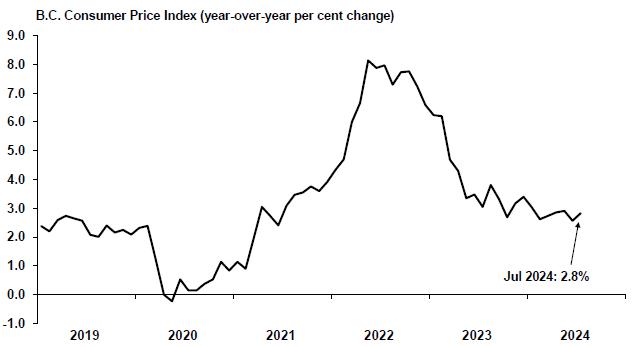
Sources: Statistics Canada; Haver Analytics
Outlook
The Ministry forecasts that real household consumption will increase by 2.5 per cent in 2024, supported by spending on services, followed by a 2.4 per cent gain in 2025. Annual growth is then expected to be between 2.1 per cent and 2.9 per cent over the 2026 to 2028 period.
Nominal retail sales are expected to remain subdued in the near-term as high interest rates and lower household purchasing power weigh on consumer demand for goods. The Ministry forecasts nominal retail sales to grow by 1.0 per cent in 2024, 2.5 per cent in 2025, and by annual growth of 3.7 per cent on average over the 2026 to 2028 period.
Consumer price growth is expected to continue its downward trend, but some price pressures, particularly for shelter, are anticipated to persist in the near-term. Consumer price inflation in B.C. is forecast to be 2.7 per cent in 2024 and is expected to fall to 2.2 per cent in 2025 and 2.0 per cent in 2026 and for the balance of the forecast horizon, as monetary policy works to bring inflation down to the Bank of Canada's target of around 2 per cent.
| 38 | | First Quarterly Report 2024/25 | |
| Economic Review and Outlook |
Housing
So far this year, B.C.'s housing market activity has been subdued as borrowing costs remained elevated. Year-to-date to July, MLS home sales decreased by 4.0 per cent compared to the first seven months of 2023, and was below the ten-year historical average. Sales were down in most regions over this period, falling in Okanagan-Mainline (-12.4 per cent), Greater Vancouver (-4.6 per cent), and the Fraser Valley (-5.4 per cent), while sales were higher in Victoria (+1.8 per cent).
Despite lower overall demand for home purchases, the MLS average home sale price in B.C. rose so far this year. Year-to-date to July, the MLS average home sale price increased 2.8 per cent compared to the same period last year.
Chart 2.5 Home Sales and Price
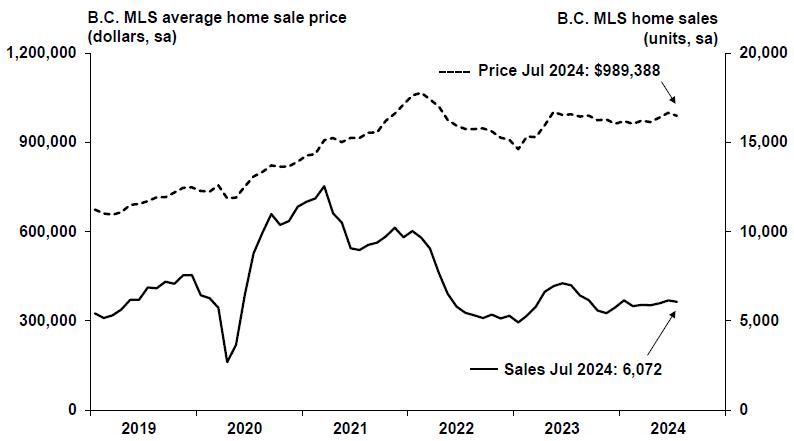
Sources: Canadian Real Estate Association; Haver Analytics
Moderate price increases were also observed in the MLS composite benchmark house prices (which incorporates benchmark attributes by dwelling type in each region). Benchmark prices increased in most major markets in B.C. compared to the first seven months of 2023, rising in Vancouver Island (+3.8 per cent), Greater Vancouver (+2.7 per cent), and the Fraser Valley (+1.6 per cent), while benchmark prices were relatively flat in Victoria (+0.3 per cent) and decreased in the Okanagan Valley (-1.9 per cent).
| First Quarterly Report 2024/25 | | 39 | |
| Economic Review and Outlook |
Chart 2.6 Greater Vancouver HPI Benchmark Price

Sources: Canadian Real Estate Association; Haver Analytics
Homebuilding has trended lower so far this year following record high levels in 2023, but remained resilient to elevated interest rates, skilled-labour shortages, and high construction costs. While housing starts decreased 8.3 per cent year-to-date to July 2024, they averaged 46,810 annualized units over this period, well above the ten-year historical average of 41,434 units. Compositionally, single-family housing starts fell by 23.1 per cent over this period, while multiples decreased by 4.8 per cent. Among Census Metropolitan Areas (CMA) in B.C., homebuilding in Vancouver was lower (-17.9 per cent) than the first seven months of 2023, while homebuilding was higher in Kelowna (+70.5 per cent), and Abbotsford (+30.4 per cent). Housing starts in Victoria (-0.5 per cent) were down slightly. However, home completions were broadly higher year-to-date to July 2024, with increases in Vancouver, Victoria, and Abbotsford while Kelowna saw a decline.
Residential building permits (a leading indicator of home construction) saw continued moderation in the first six months of 2024, following lower permitting in 2023. Year-to-date to June, the value of residential building permits declined 7.0 per cent compared to the same period of 2023, and the number of residential units permitted fell 9.6 per cent. This was driven by lower multiple-dwelling permits, while single-dwelling permits also decreased. Among CMAs, residential building permits were lower for each of the largest areas, driven by lower permitting in Vancouver and Kelowna.
| 40 | | First Quarterly Report 2024/25 | |
| Economic Review and Outlook |
Chart 2.7 B.C. Housing Starts

Sources: Canada Mortgage and Housing Corporation; Haver Analytics
* Historical average from Jan. 2014 to Dec. 2023
Outlook
The Ministry expects home sales activity to remain subdued in 2024 following slow activity in 2023. The Ministry forecasts unit home sales to increase by 2.0 per cent in 2024, remaining below historically typical levels, and then rebound by 12.7 per cent in 2025 as the effects of higher interest rates fade. Home sales are expected to average 2.9 per cent growth annually in the 2026 to 2028 period. The average home sales price in B.C. is expected to rise by 2.4 per cent in 2024, followed by growth of 2.9 per cent in 2025, and 2.5 per cent average annual growth in the medium-term. Putting unit sales and prices together, the total value of home sales are forecast to increase by 4.5 per cent in 2024 and 15.9 per cent in 2025, and then average 5.5 per cent growth over the 2026 to 2028 period.
The Ministry expects B.C. housing starts to total approximately 46,700 units in 2024, down from 2023's record high, reflecting market conditions, but above the ten-year historical average. Home construction is then expected to pick back up to 48,500 units in 2025 and then average around 51,000 units per year over the medium-term, supported by population growth, private and public sector investment, and legislative actions introduced to encourage more homebuilding in the province.
Business and Government
Non-residential permitting declined in the first six months of this year. The total value of non-residential building permits fell by 8.0 per cent year-to-date to June 2024 compared to the same period of 2023. The decline was driven by lower permit issuance for institutional and governmental building (-43.6 per cent). The value of permit issuance for commercial building (+8.5 per cent) and industrial building (+23.1 per cent) was higher than the first six months of 2023.
| First Quarterly Report 2024/25 | | 41 | |
| Economic Review and Outlook |
Small business confidence in B.C. was unchanged so far this year compared to the first seven months of 2023, but remained broadly positive. Year-to-date to July, the Canadian Federation of Independent Business' 12-month small business confidence index indicated that slightly more small business owners were expecting stronger performance over the next year than those expecting weaker performance. In July, respondents across Canada reported that labour shortages have eased and that the main limitation to sales or production growth was due to insufficient domestic or foreign demand.
B.C.’s tourism sector has continued to rise following a return to pre-pandemic levels in 2023. International travelers entering B.C. rose by 10.6 per cent year-to-date to May 2024 compared to the same period of 2023. While the number of U.S. visitors reached a new high in May 2024, the number of non-U.S. visitors has yet to return to pre-pandemic levels, despite rising 15.9 per cent in the first five months of this year. In the first five months of 2024, the monthly average of 692,250 international travelers entering B.C. was close to the roughly 700,000 visitors seen in an average month prior to the pandemic.
Outlook
The Ministry forecasts total real investment in B.C. to rise by 3.5 per cent in 2024 and 4.7 per cent in 2025, supported by strong government investment. The Ministry forecasts moderate growth in the medium-term, averaging around 1.5 per cent annually over the 2026 to 2028 period.
In the near-term, real business investment is projected to decrease by 2.1 per cent in 2024 and then increase by 3.3 per cent in 2025, reflecting the dampening effects of interest rates and the subsequent rebound as interest rates decline. Over the 2026 to 2028 period, real business investment growth is expected to range between 1.5 per cent and 3.5 per cent annually, supported by overall growth in all categories, particularly residential construction, and LNG related investment.
Real expenditure on goods and services by all levels of government is forecast to slow to 0.3 per cent in 2024 and then rise by 1.0 per cent in 2025. The Ministry expects real government spending to grow between 0.2 per cent and 0.8 per cent over the 2026 to 2028 period.
The Ministry expects nominal net operating surplus of corporations (an approximation of corporate profits) to decrease by 14.9 per cent in 2024 and by 1.5 per cent in 2025, amid weak domestic and global economic activity. Net operating surplus is forecast to increase between 5.5 per cent and 7.4 per cent in the 2026 to 2028 period.
External Trade and Commodity Markets
So far this year, subdued global demand and lower energy prices have weighed on B.C. merchandise exports. During the first six months of 2024, the value of B.C. goods exports decreased by 3.7 per cent compared to the same period of 2023. Year-to-date performance across industries was mixed. The decrease was driven by lower exports of energy products (-17.4 per cent). Meanwhile, increased exports of metal ores and non-metallic minerals (+16.2 per cent) and farm, fishing and intermediate food products (+13.3 per cent) partially offset the decline.
| 42 | | First Quarterly Report 2024/25 | |
| Economic Review and Outlook |
Merchandise exports to the U.S. accounted for 50.1 per cent of B.C.'s total goods exports in the first six months of 2024. During this period, goods exports to the U.S. fell by 8.7 per cent, largely due to a decline in energy products (-45.2 per cent), primarily natural gas. Meanwhile, total goods exports to non-U.S. destinations increased by 1.8 per cent, driven by higher exports to China. Higher exports to non-U.S. destinations was led by metal ores and non-metallic minerals (+18.0 per cent).
Chart 2.8 B.C. Exports
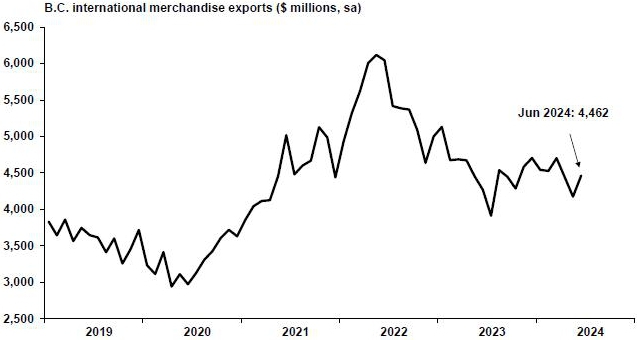
Source: BC Stats
Similar to merchandise exports, B.C.'s manufacturing shipments decreased by 2.8 per cent year-to-date to June 2024 compared to the same period of 2023, mainly due to reduced shipments of fabricated metal products (-13.8 per cent).
Following periods of high volatility from 2020 to 2022, the price of Western spruce-pine-fir (SPF) has returned closer to historical average levels throughout last year and so far in 2024. Despite declining since April 2024, the price for SPF 2x4 increased 4.1 per cent in the first seven months of 2024 compared to the same period of 2023, averaging $409 US/000 board feet so far in 2024.
Oil prices have crept up following declines seen in 2023, amid opposing factors of uncertainty from geopolitical conflicts and softening global demand. In the first seven months of 2024, the West Texas Intermediate (WTI) oil price averaged $79.95 per barrel, up 6.5 per cent from the same period of 2023. Meanwhile, as inventories have risen due to strong increases in U.S. natural gas production and milder winter weather, the plant inlet price of natural gas fell 60.8 per cent year-to-date, averaging $0.79 C/GJ in the first seven months of 2024.
The average metallurgical coal price fell by 5.3 per cent year-to-date to July 2024 compared to the same period of 2023, along with prices for zinc (-4.1 per cent) and molybdenum (-20.8 per cent). Meanwhile, the price of lead was flat (0.0 per cent); the price of copper rose 5.4 per cent; and the price for gold and silver increased by 15.3 per cent and 13.4 per cent, respectively.
| First Quarterly Report 2024/25 | | 43 | |
| Economic Review and Outlook |
Outlook
Real exports of goods and services are forecast to decline by 0.9 per cent in 2024, reflecting lower prices for key commodities and weak global demand, and are expected to rise by 2.4 per cent in 2025. Over the 2026 to 2028 period, real exports of goods and services are expected to grow between 3.2 per cent and 4.3 per cent annually. The anticipated production of LNG, by LNG Canada by mid-2025 and in the latter years of the forecast horizon by Woodfibre LNG and Cedar LNG, provides support to the outlook.
The price of lumber is forecast to average $390 US/000 board feet in 2024 before rising to $400 US/000 board feet in 2025, $425 US/000 board feet in 2026, and then average $450 US/000 board feet in 2027 and 2028. The plant inlet price for natural gas is expected to average $0.75 C/GJ in 2024/25, $1.85 C/GJ in 2025/26, and $2.21 C/GJ in 2026/27.
Risks to the Economic Outlook
B.C.'s economic outlook faces uncertainties related to inflation, interest rates, immigration levels, the global economy, and disruptions from geopolitical and climate-related factors. Potential upsides include interest rates easing sooner than expected, increased economic activity and productivity from a growing population, as well as a less pronounced slowing of the global economy. Downside risks to B.C.'s economic outlook include the following:
| · | persistent high inflation leading to elevated interest rates over a longer period, weighing on consumer spending and business investment; |
| · | higher mortgage costs and rent reducing affordability and disposable income; |
| · | aging demographics and housing affordability weighing on the supply of labour; |
| · | severe climate-related events disrupting the lives and livelihoods of British Columbians, destroying productive capital, and impacting economic activity; |
| · | uncertainty about immigration levels impacting the supply of labour and consumer spending, potentially exacerbating fluctuations in economic activity; |
| · | weaker than expected global economic activity and broader economic challenges in Europe and Asia; |
| · | lower prices for B.C.'s major commodity exports, such as lumber, pulp, natural gas, copper, and coal; |
| · | geopolitical conflicts weighing on trade as well as leading to higher commodity prices and inflation; |
| · | higher volatility in international foreign exchange, stock, and bond markets; and |
| · | timing of investment, operations and exports related to LNG projects in the province, similar to the risks that exist for other major capital projects. |
| 44 | | First Quarterly Report 2024/25 | |
| Economic Review and Outlook |
External Outlook
The external economic outlook for most of B.C.'s major trading partners has improved for 2024 and has remained relatively unchanged for 2025 compared to Budget 2024. While global inflation has generally been easing and moving towards most central bank's target ranges, price pressures remain elevated, particularly in services, and risks of accelerating consumer prices have kept central banks cautious about cutting interest rates. So far this year, lower growth, rising unemployment rates and slowing inflation led the Bank of Canada to two consecutive 25 basis point cuts to its overnight rate, while the European Central bank lowered their deposit rate by 25 basis points. Despite economic growth in Canada picking up recently, it remains relatively weak considering the rise in population growth. While the U.S. economy continued to beat expectations in the first half of 2024, rising unemployment rates, persistent inflation and moderating consumer spending present risks to growth for the rest of 2024. Looking ahead to 2025, slower growth is anticipated for some of B.C.'s major trading partners, in part due to the lagged impacts from high interest rates. The continuation of ongoing geopolitical tensions, volatile energy prices and supply chain disruptions could create additional headwinds to the global outlook.
United States
The U.S. economy continued to beat expectations in the first half of 2024. Despite ongoing restrictive monetary policy, U.S. real GDP expanded by an annualized rate of 2.8 per cent in the second quarter (April to June) of 2024, an acceleration from the 1.4 per cent increase in the first quarter (January to March). Growth in the second quarter was primarily driven by increases in consumer spending, both from services and goods; inventory accumulation; and from investment increases in equipment and intellectual property. GDP growth was partially offset by increases in imports, which subtract from GDP growth, and declines in non-residential structures and residential investment.
Chart 2.9 U.S. Real GDP
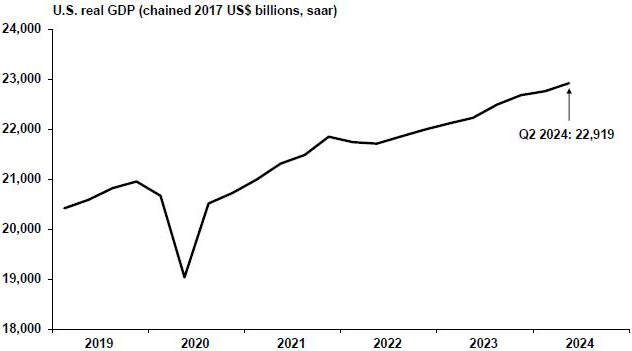
Sources: U.S. Bureau of Economic Analysis; Haver Analytics
| First Quarterly Report 2024/25 | | 45 | |
| Economic Review and Outlook |
The U.S. labour market has continued to expand in 2024 recording net payroll job gains for 43 consecutive months, as of July 2024. Year-to-date to July, total nonfarm employment has increased by 1.7 per cent (+2.7 million jobs) compared to the same period last year. The unemployment rate was 4.3 per cent in July 2024 and was 0.4 percentage points higher on average in the first seven months of 2024 compared to the same period in 2023. Average hourly earnings growth increased 4.0 per cent year-to-date to July.
High interest rates continue to take their toll on the U.S. housing market, with existing home sales declining in the first half of 2024. Year-to-date to June 2024, existing home sales fell by 3.0 per cent while new single-family home sales decreased by 1.1 per cent compared to the same period last year. Year-to-date to June 2024, median prices increased 5.0 per cent for existing homes and declined slightly (-0.4 per cent) for new single-family homes. Additionally, U.S. homebuilding declined 4.7 per cent in the first seven months of 2024 compared to the same period of 2023, driven by a 33.8 per cent decline in multi-family starts, while gains in single-family starts (+12.2 per cent) provided some offset. Furthermore, U.S. residential building permits, an indicator of future building activity, declined by 2.9 per cent in the first seven months of 2024 compared to the same period last year.
Chart 2.10 U.S. Housing Starts
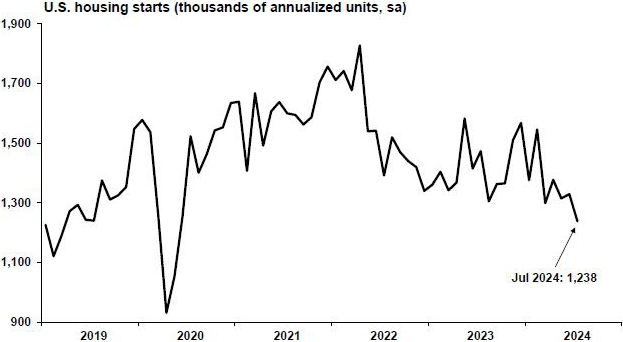
Sources: U.S. Census Bureau; Haver Analytics
Year-to-date to July 2024, U.S. nominal retail sales were up by 2.3 per cent compared to the first seven months of 2023, led by growth from non-store retailers as well as food services and drinking places. However, these sales (measured in nominal dollars) were somewhat inflated due to high prices and estimates of real retail sales growth were negative in the first seven months of 2024. U.S. consumer price index inflation has fallen from the highs seen in 2022 but has remained within the 2.9 to 3.7 per cent range since June 2023 and was 2.9 per cent in July 2024. Like Canada, shelter inflation in the U.S. remains persistent while energy prices, specifically gasoline, continue to put downward pressure on CPI. The Conference Board U.S. consumer confidence index has declined in four of the last six months and year-to-date to July 2024, U.S. consumer sentiment was lower than last year.
| 46 | | First Quarterly Report 2024/25 | |
| Economic Review and Outlook |
Outlook
In July 2024, Consensus Economics (Consensus) projected U.S. economic growth of 2.3 per cent in 2024 compared to 1.4 per cent in the January 2024 Consensus survey. Meanwhile for 2025, Consensus forecasts growth of 1.7 per cent.
Table 2.2 U.S. Real GDP Forecast: Consensus versus B.C. Ministry of Finance
| 2024 | 2025 | |||||||
| Per cent change in real GDP | ||||||||
| B.C. Ministry of Finance | 2.4 | 1.6 | ||||||
| Consensus Economics (July 2024*) | 2.3 | 1.7 | ||||||
* Comparable month to B.C. Ministry of Finance forecast.
While the U.S. economy has exceeded expectations recently, risks remain for the second half of 2024 and into 2025. These risks include moderating job growth and consumer spending, rising unemployment, still-elevated inflation, and ongoing geopolitical tensions. Given uncertainty in the outlook, the Ministry assumes that U.S. real GDP will grow by 2.4 per cent in 2024 (slightly higher than the July Consensus, which was released prior to the strong second quarter data) and by 1.6 per cent in 2025, with growth averaging around 1.7 per cent annually over the medium-term.
Chart 2.11 Consensus Outlook for the U.S. in 2024
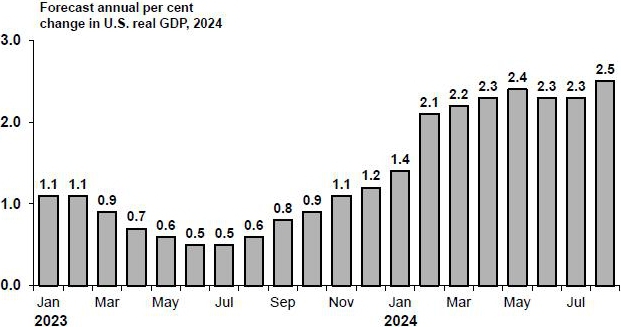
Source: Consensus Economics
The chart above represents forecasts for U.S. real GDP growth in 2024 as polled on specific dates. For example, forecasters surveyed on January 9, 2023 had an average 2024 U.S. real GDP growth forecast of 1.1 per cent, while on August 12, 2024 they forecast 2024 U.S. real GDP to grow by 2.5 per cent.
| First Quarterly Report 2024/25 | | 47 | |
| Economic Review and Outlook |
Canada
The Canadian economy grew by 1.7 per cent (annualized) in the first quarter of 2024, following modest growth of 0.1 per cent in the fourth (October to December) quarter of 2023. Real GDP growth in the first quarter was driven by gains in consumer spending, growing by 3.0 per cent, primarily from an increase in household spending on services (+4.3 per cent). Exports of goods and services grew by 1.9 per cent in the first quarter, supported by increased shipments of precious metals. Business investment grew 3.1 per cent in the first quarter, driven by gains in machinery and equipment and intellectual property, while growth was moderated by a slowdown in inventory accumulation. Overall, Canada's real GDP has increased by 0.5 per cent year-to-date to the first quarter of 2024 compared to the same period from 2023.
Chart 2.12 Canadian Real GDP

Sources: Statistics Canada; Haver Analytics
Following growth of 2.4 per cent in 2023, Canadian employment continued to grow in 2024, but at a slower pace. Year-to-date to July 2024, employment was up by 1.8 per cent (+358,000 jobs) compared to the same period last year. The unemployment rate was 6.4 per cent in July and has increased by 1.3 percentage points since April 2023, reflecting the labour force growing at a faster pace than employment, supported by strong immigration and population growth. Year-to-date to July, the unemployment rate was 0.9 percentage points higher compared to the first seven months of 2023 and averaged 6.1 per cent. Meanwhile, the unemployment rate for youth (ages 15-24) increased even higher, rising to 14.2 per cent in July 2024, from 10.6 per cent in July 2023. Furthermore, job vacancies have fallen 24.8 per cent year-to-date to May 2024.
Canadian home sales have remained subdued so far in 2024, mainly as a result of high interest rates. Year-to-date to July, Canadian home sales have increased by 3.6 per cent but remain at a relatively low level. Soft demand and an increase in listings have limited price growth in the first seven months of 2024 resulting in the national average home sale price increasing only 0.5 per cent year-to-date to July 2024.
Following an 8.2 per cent decline in 2023, housing starts averaged 252,364 annualized units in the first seven months of 2024, up 6.7 per cent compared to the same period last year. Despite high borrowing costs for developers and skilled-labour shortages, starts have remained elevated in response to strong population growth. Within housing categories, multi-family starts increased by 9.2 per cent, while single-family starts were up 0.3 per cent. Regionally, the increase in housing starts in 2024 so far has been primarily driven by more construction in the urban centers of Montreal (+46.1 per cent), Edmonton (+54.4 per cent), and Calgary (+40.5 per cent), partially offset by declines in Toronto (-9.5 per cent) and Vancouver (-17.9 per cent).
| 48 | | First Quarterly Report 2024/25 | |
| Economic Review and Outlook |
Consumer price inflation in Canada has eased to 2.5 per cent in July 2024, down from 3.4 per cent in December 2023 and the 8.1 per cent high in June 2022. Since the start of 2024, inflation has fluctuated between 2.5 per cent and 2.9 per cent, within the Bank of Canada's (BoC) target range, but persistent price pressures remain. In July, shelter (+5.7 per cent) prices contributed the most upward pressure on national inflation.
Despite strong immigration, the pace of consumer spending has not matched population growth. Canadian nominal retail sales were up only 0.9 per cent year-to-date to May compared to the same period last year, while in real terms (which exclude price effects), they were up 1.0 per cent.
After declining 2.1 per cent in 2023, Canadian nominal goods exports were flat in the first half of 2024 (0.0 per cent) compared to the same period last year. Year-to-date to June, strength in exports of energy products (+4.3 per cent) and metal and non-metallic minerals (+4.3 per cent) was offset by large declines in farm, fishing and intermediate food products (-11.0 per cent) and metal ores and non-metallic minerals (-16.7 per cent). Meanwhile, service exports have continued to recover, growing 5.2 per cent year-to-date to June, primarily driven by the rise in commercial service exports.
Outlook
The July 2024 Consensus forecasts Canadian real GDP to rise by 1.0 per cent in 2024 (0.6 percentage points higher than the January 2024 survey) and by 1.8 per cent in 2025.
Table 2.3 Canadian Real GDP Forecast: Consensus versus B.C. Ministry of Finance
| 2024 | 2025 | |||||||
| Per cent change in real GDP | ||||||||
| B.C. Ministry of Finance | 0.9 | 1.7 | ||||||
| Consensus Economics (July 2024*) | 1.0 | 1.8 | ||||||
* Comparable month to B.C. Ministry of Finance forecast.
The impact from high interest rates is expected to continue to moderate consumer spending in 2024 with households spending a larger share of income on servicing debt. In their July Monetary Policy Report, the BoC expected that Canadian economic growth will strengthen as interest rates ease. The Ministry prudently assumes that the Canadian economy will grow by 0.9 per cent in 2024, 1.7 per cent in 2025 and then average 1.8 per cent annual growth over the 2026 to 2028 period.
| First Quarterly Report 2024/25 | | 49 | |
| Economic Review and Outlook |
Chart 2.13 Consensus Outlook for Canada in 2024
Forecast annual per cent
change in Canadian real GDP, 2024
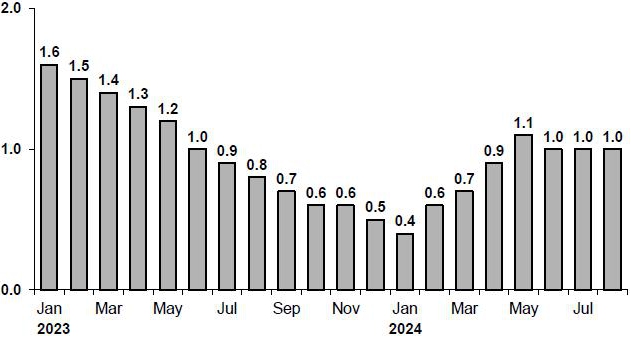
Source: Consensus Economics
The chart above represents forecasts for Canadian real GDP growth in 2024 as polled on specific dates. For example, forecasters surveyed on January 9, 2023 had an average 2024 Canadian real GDP growth forecast of 1.6 per cent, while on August 12, 2024 they forecast 2024 Canadian real GDP to grow by 1.0 per cent.
Asia
Restrained consumer spending and turmoil in China's property sector continues to lead to economic volatility in 2024, with second quarter real GDP declining by an annualized rate of 2.0 per cent, following an increase of 12.5 per cent in the previous quarter. Despite ongoing fiscal support from the Chinese government, weak consumer spending and confidence along with the prolonged downturn in property sales and investment have persistently dampened real GDP growth. However, China's economy continues to benefit from strong exports, while industrial production exceeded expectations and helped offset softening domestic demand. Overall, China's real GDP grew by 5.0 per cent year-to-date to the second quarter of 2024 compared to the same period in 2023.
Japan's economy expanded at an annualized rate of 3.1 per cent in the second quarter of 2024, following a 2.3 per cent contraction in the first quarter. The expansion in second quarter real GDP was driven by increased consumption and investment, while net trade detracted from growth. Year-to-date to the second quarter of 2024, Japan's real GDP has declined by 0.9 per cent compared to the first half of 2023. In July, the Bank of Japan raised its benchmark interest rate to its highest level since 2008.
| 50 | | First Quarterly Report 2024/25 | |
Economic Review and Outlook
Outlook
The July 2024 Consensus forecasted that China's real GDP will grow by 4.9 per cent in 2024 and 4.4 per cent in 2025. However, ongoing geopolitical and trade tensions, the extended downturn in the property sector, weak consumer spending and domestic confidence could create headwinds for China's economy. The Ministry prudently forecasts that China's economy will expand by 4.7 per cent in 2024, 4.2 per cent in 2025, and average 4.2 per cent annual growth over the 2026 to 2028 period.
The July 2024 Consensus projects Japan real GDP growth of 0.1 per cent in 2024 and 1.3 per cent in 2025. While consumer spending and the labour market have improved recently, uncertainty remains if these trends will persist with the Bank of Japan's recent increases to their interest rates, as well as additional risk of rising food and energy prices along with a weak Yen. Given uncertainty in the outlook, the Ministry assumes a slightly more moderate pace of growth in Japan's real GDP. The Ministry prudently forecasts economic activity to remain flat in 2024 and grow by 1.1 per cent in 2025, and average 0.5 per cent annual growth over the 2026 to 2028 period.
Europe
Euro zone economic growth in the first half of 2024 remains modest but has beat expectations, expanding by 1.2 per cent (annualized) in the second quarter, following a 1.1 per cent expansion in the first quarter. Among the larger member states, Spain and France were major contributors to the second quarter gain, with Spain's growth driven by strong consumer spending and exports, while France saw a boost from exports.
A contraction in economic growth from Germany, Europe's largest economy, contributed to the overall moderate growth for the euro zone.
With inflationary pressures starting to ease, the European Central Bank (ECB) cut rates on June 6, 2024, after holding rates steady for the past nine months. So far, the ECB has cut rates by 25 basis points. As of July 2024, inflation in the euro zone had fallen by 2.7 percentage points since July 2023 and stood at 2.6 per cent. Meanwhile, the euro zone's unemployment rate reached record lows of 6.4 per cent in April and May before increasing to 6.5 per cent in June.
Outlook
The July 2024 Consensus forecasted that the euro zone economy would grow by 0.7 per cent in 2024 and 1.4 per cent in 2025. Real GDP is expected to get a boost as inflationary pressures ease and consumer spending increases with gains in disposable income and rising consumer confidence. However, given the uncertainty associated with easing inflationary pressures, the war in Ukraine and other geopolitical tensions, as well as future monetary policy decisions by the ECB, the Ministry's forecast for euro zone real GDP growth is prudent compared to the Consensus forecast. As such, the Ministry forecasts real GDP to grow by 0.6 per cent in 2024, followed by 1.2 per cent in 2025, and 1.2 per cent annually on average over the medium-term.
| First Quarterly Report 2024/25 | | 51 | |
Economic Review and Outlook
Financial Markets
Interest Rates
In 2024, many central banks have responded to easing inflation by cutting interest rates including the Bank of Canada (BoC), the European Central Bank and the Bank of England. The Federal Reserve (the Fed) has yet to cut rates but the first is anticipated in September.
The Fed has held the target range for the federal funds rate at 5.25 to 5.50 per cent from July 2023 to August 2024, reflecting modest inflationary progress, and robust economic and jobs figures. At the beginning of 2024, many forecasters expected at least one rate cut by August. The Fed has instead taken a cautious approach, due to inflation sitting between 2.9 and 3.7 per cent every month since June 2023. The Fed has reiterated its willingness to adjust policies if necessary to sustain its long-term inflation goal and support maximum employment.
Following rate increases in both June and July of 2023, the BoC kept the overnight rate steady at 5.00 per cent until June 2024. In June and July, the BoC reduced rates by 25 basis points in each month to bring the rate to 4.50 per cent, reflecting diminishing excess demand, a slowdown in economic activity, and easing inflationary pressures. The gap between the BoC overnight rate and the Fed funds rate is now 1 percentage point reflecting the underlying differences between the United States and Canada in inflation levels, inflation expectations, and economic activity. Furthermore, the BoC has stated that further rate cuts can be expected as long as inflation continues to ease.
Chart 2.14 Interest Rate Forecasts

| 52 | | First Quarterly Report 2024/25 | |
Economic Review and Outlook
Outlook
The future path of interest rates remains uncertain. However, both Canada and the United States are getting closer to their inflationary target rates and there are expectations of slow economic activity this year. This points to continued rate cuts by the BoC and the first cuts by the Fed in the second half of 2024. Based on the average of six private sector forecasts as of July 19, 2024, the Ministry assumes the U.S. federal funds rate will average 5.40 per cent in 2024 and 4.36 per cent in 2025. By comparison, the Bank of Canada's overnight target rate is expected to average 4.68 per cent in 2024 and 3.42 per cent in 2025.
Table 2.4 Private Sector Canadian Interest Rate Forecasts
| 3-month Treasury Bill | 10-year Government Bond | |||||||||||||||
| Average annual interest rate (per cent) | 2024 | 2025 | 2024 | 2025 | ||||||||||||
| BMO | 4.58 | 3.54 | 3.43 | 3.29 | ||||||||||||
| CIBC | 4.62 | 3.16 | 3.39 | 3.11 | ||||||||||||
| National Bank | 4.58 | 3.16 | 3.42 | 3.04 | ||||||||||||
| RBC | 4.57 | 3.32 | 3.37 | 2.98 | ||||||||||||
| Scotiabank | 4.52 | 3.38 | 3.47 | 3.59 | ||||||||||||
| TD | 4.64 | 3.21 | 3.45 | 3.07 | ||||||||||||
| Average (as of July 19, 2024) | 4.58 | 3.29 | 3.42 | 3.18 | ||||||||||||
Exchange Rates
The Canadian dollar is slightly down against the US dollar in 2024 compared with 2023. It averaged 73.5 US cents between January and July 2024, compared with an average of 74.4 US cents during the same period in 2023, and has exhibited relatively low volatility. The slight decline was primarily influenced by the interest rate cuts in Canada while the U.S. maintained a higher rate and stronger economic activity. The exchange rate stability marked a shift from the volatility experienced between the beginning of 2020 and 2023 when investors sought safe-haven assets such as the US dollar amid the onset of new geopolitical tensions and uncertainties regarding global inflationary pressures.
| First Quarterly Report 2024/25 | | 53 | |
Economic Review and Outlook
Chart 2.15 Private Sector Expectations for the Canadian Dollar
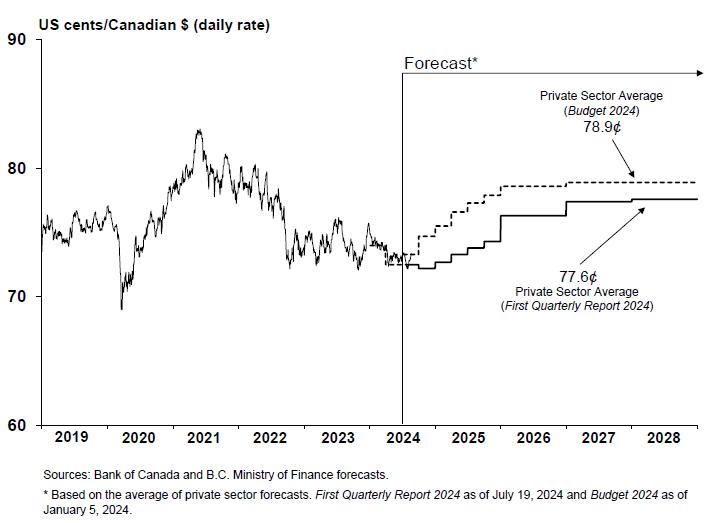
Outlook
Based on the average of six private sector forecasts as of July 19, 2024, the Ministry assumes the Canadian dollar will average 73.0 US cents in 2024 and 73.5 US cents in 2025.
Table 2.5 Private Sector Exchange Rate Forecasts
| Average annual exchange rate (US cents/Canadian $) | 2024 | 2025 | ||||||
| BM0 | 73.4 | 75.6 | ||||||
| CIBC | 73.0 | 73.8 | ||||||
| National Bank | 72.4 | 72.1 | ||||||
| RBC | 72.9 | 70.9 | ||||||
| Scotiabank | 73.2 | 75.3 | ||||||
| TD | 72.9 | 73.3 | ||||||
| Average (as of July 19, 2024) | 73.0 | 73.5 | ||||||
| 54 | | First Quarterly Report 2024/25 | |
Economic Review and Outlook
Table 2.6.1 Gross Domestic Product (GDP): British Columbia
| Forecast | ||||||||||||||||||||||||||||
| 2022 | 2023 e | 2024 | 2025 | 2026 | 2027 | 2028 | ||||||||||||||||||||||
| Gross Domestic Product at Market Prices: | ||||||||||||||||||||||||||||
| – Real (chained 2017 $billions) | 322.9 | 327.8 | 331.1 | 337.8 | 345.5 | 353.3 | 361.5 | |||||||||||||||||||||
| (% change) | 3.8 | 1.5 | 1.0 | 2.0 | 2.3 | 2.3 | 2.3 | |||||||||||||||||||||
| – Nominal (current prices, $billions) | 395.2 | 409.9 | 424.1 | 442.2 | 462.7 | 484.6 | 507.6 | |||||||||||||||||||||
| (% change) | 11.0 | 3.7 | 3.5 | 4.3 | 4.6 | 4.7 | 4.7 | |||||||||||||||||||||
| – GDP price deflator (2017 = 100) | 122.4 | 125.0 | 128.1 | 130.9 | 133.9 | 137.2 | 140.4 | |||||||||||||||||||||
| (% change) | 7.0 | 2.1 | 2.4 | 2.2 | 2.3 | 2.4 | 2.4 | |||||||||||||||||||||
| Real GDP per person (chained 2017 $) | 60,277 | 59,393 | 58,249 | 58,720 | 59,342 | 59,716 | 60,115 | |||||||||||||||||||||
| (% change) | 1.3 | -1.5 | -1.9 | 0.8 | 1.1 | 0.6 | 0.7 | |||||||||||||||||||||
| Real GDP per employed person (% change) | 0.6 | -0.1 | -1.3 | 1.0 | 1.2 | 0.9 | 0.9 | |||||||||||||||||||||
| Components of Real GDP at Market Prices (chained 2017 $billions) | ||||||||||||||||||||||||||||
| Household expenditure on goods and services | 200.1 | 202.7 | 207.7 | 212.7 | 217.3 | 223.5 | 229.8 | |||||||||||||||||||||
| (% change) | 4.0 | 1.3 | 2.5 | 2.4 | 2.1 | 2.9 | 2.8 | |||||||||||||||||||||
| – Goods | 78.3 | 76.6 | 77.7 | 79.0 | 80.3 | 81.7 | 83.2 | |||||||||||||||||||||
| (% change) | -2.0 | -2.2 | 1.5 | 1.6 | 1.6 | 1.9 | 1.7 | |||||||||||||||||||||
| – Services | 122.0 | 126.4 | 130.2 | 134.0 | 137.3 | 142.0 | 146.8 | |||||||||||||||||||||
| (% change) | 8.5 | 3.5 | 3.1 | 2.9 | 2.4 | 3.4 | 3.4 | |||||||||||||||||||||
| NPISH1 expenditure on goods and services | 5.1 | 5.2 | 5.3 | 5.5 | 5.6 | 5.7 | 5.8 | |||||||||||||||||||||
| (% change) | 3.6 | 1.3 | 2.7 | 2.5 | 2.5 | 2.2 | 2.0 | |||||||||||||||||||||
| Government expenditure on goods and services | 60.5 | 63.9 | 64.1 | 64.7 | 64.8 | 65.1 | 65.7 | |||||||||||||||||||||
| (% change) | 4.1 | 5.6 | 0.3 | 1.0 | 0.2 | 0.4 | 0.8 | |||||||||||||||||||||
| Investment in fixed capital | 85.1 | 87.6 | 90.6 | 94.8 | 96.7 | 97.4 | 99.0 | |||||||||||||||||||||
| (% change) | -2.1 | 2.9 | 3.5 | 4.7 | 2.0 | 0.7 | 1.7 | |||||||||||||||||||||
| Final domestic demand | 350.7 | 359.3 | 367.7 | 377.9 | 384.6 | 391.8 | 400.2 | |||||||||||||||||||||
| (% change) | 2.4 | 2.4 | 2.3 | 2.8 | 1.8 | 1.9 | 2.2 | |||||||||||||||||||||
| Exports of goods and services | 121.1 | 121.3 | 120.2 | 123.1 | 128.3 | 132.5 | 137.0 | |||||||||||||||||||||
| (% change) | 6.4 | 0.2 | -0.9 | 2.4 | 4.3 | 3.2 | 3.5 | |||||||||||||||||||||
| Imports of goods and services | 156.9 | 155.9 | 158.7 | 163.5 | 168.2 | 171.5 | 176.3 | |||||||||||||||||||||
| (% change) | 8.0 | -0.7 | 1.8 | 3.0 | 2.9 | 2.0 | 2.8 | |||||||||||||||||||||
| Inventory change | 9.3 | 4.6 | 3.4 | 2.0 | 2.5 | 2.1 | 2.0 | |||||||||||||||||||||
| Statistical discrepancy | 0.1 | 0.1 | 0.1 | 0.1 | 0.1 | 0.1 | 0.1 | |||||||||||||||||||||
| Real GDP at market prices | 322.9 | 327.8 | 331.1 | 337.8 | 345.5 | 353.3 | 361.5 | |||||||||||||||||||||
| (% change) | 3.8 | 1.5 | 1.0 | 2.0 | 2.3 | 2.3 | 2.3 | |||||||||||||||||||||
1 Non-profit institutions serving households.
e B.C. Ministry of Finance estimate.
| First Quarterly Report 2024/25 | | 55 | |
Economic Review and Outlook
Table 2.6.2 Selected Nominal Income and Other Indicators: British Columbia
| Forecast | ||||||||||||||||||||||||||||
| 2022 | 2023 | 2024 | 2025 | 2026 | 2027 | 2028 | ||||||||||||||||||||||
| Compensation of employees1 ($millions) | 188,707 | 202,207 | 216,033 | 226,517 | 235,956 | 245,543 | 255,946 | |||||||||||||||||||||
| (% change) | 9.7 | 7.2 | 6.8 | 4.9 | 4.2 | 4.1 | 4.2 | |||||||||||||||||||||
| Household income ($millions) | 326,447 | 351,849 e | 372,717 | 388,940 | 404,487 | 421,416 | 439,730 | |||||||||||||||||||||
| (% change) | 6.8 | 7.8 | 5.9 | 4.4 | 4.0 | 4.2 | 4.3 | |||||||||||||||||||||
| Net operating surplus ($millions) | 53,368 | 45,342 e | 38,598 | 38,008 | 40,083 | 43,036 | 45,993 | |||||||||||||||||||||
| (% change) | 9.3 | -15.0 | -14.9 | -1.5 | 5.5 | 7.4 | 6.9 | |||||||||||||||||||||
| Retail sales ($millions) | 107,889 | 107,766 | 108,844 | 111,608 | 115,485 | 119,923 | 124,324 | |||||||||||||||||||||
| (% change) | 3.1 | -0.1 | 1.0 | 2.5 | 3.5 | 3.8 | 3.7 | |||||||||||||||||||||
| Housing starts (units) | 46,721 | 50,490 | 46,711 | 48,504 | 50,023 | 51,112 | 51,964 | |||||||||||||||||||||
| (% change) | -1.9 | 8.1 | -7.5 | 3.8 | 3.1 | 2.2 | 1.7 | |||||||||||||||||||||
| Residential sales ($millions) | 80,263 | 70,946 | 74,128 | 85,923 | 93,757 | 97,997 | 100,860 | |||||||||||||||||||||
| (% change) | -30.2 | -11.6 | 4.5 | 15.9 | 9.1 | 4.5 | 2.9 | |||||||||||||||||||||
| Residential sales (units) | 80,519 | 73,088 | 74,574 | 84,040 | 89,405 | 91,242 | 91,612 | |||||||||||||||||||||
| (% change) | -35.1 | -9.2 | 2.0 | 12.7 | 6.4 | 2.1 | 0.4 | |||||||||||||||||||||
| Residential average sale price ($) | 996,818 | 970,689 | 994,027 | 1,022,414 | 1,048,677 | 1,074,034 | 1,100,940 | |||||||||||||||||||||
| (% change) | 7.5 | -2.6 | 2.4 | 2.9 | 2.6 | 2.4 | 2.5 | |||||||||||||||||||||
| Consumer price index (2002 = 100) | 145.5 | 151.2 | 155.3 | 158.8 | 162.0 | 165.2 | 168.5 | |||||||||||||||||||||
| (% change) | 6.9 | 3.9 | 2.7 | 2.2 | 2.0 | 2.0 | 2.0 | |||||||||||||||||||||
1 Domestic basis; wages, salaries and employers' social contributions.
e B.C. Ministry of Finance estimate.
Table 2.6.3 Labour Market Indicators: British Columbia
| Forecast | ||||||||||||||||||||||||||||
| 2022 | 2023 | 2024 | 2025 | 2026 | 2027 | 2028 | ||||||||||||||||||||||
| Population (thousands at July 1) | 5,356 | 5,519 | 5,684 | 5,753 | 5,823 | 5,917 | 6,014 | |||||||||||||||||||||
| (% change) | 2.5 | 3.0 | 3.0 | 1.2 | 1.2 | 1.6 | 1.6 | |||||||||||||||||||||
| Net migration (thousands) | ||||||||||||||||||||||||||||
| – International 1,4 | 142.2 | 190.2 | 120.0 | 66.0 | 76.6 | 83.7 | 82.9 | |||||||||||||||||||||
| – Interprovincial4 | 6.5 | -8.6 | -6.4 | -4.0 | 6.4 | 9.8 | 11.5 | |||||||||||||||||||||
| – Total | 148.7 | 181.6 | 113.6 | 62.0 | 82.9 | 93.5 | 94.5 | |||||||||||||||||||||
| Labour force population2 (thousands) | 4,426 | 4,517 | 4,648 | 4,716 | 4,785 | 4,870 | 4,957 | |||||||||||||||||||||
| (% change) | 1.7 | 2.1 | 2.9 | 1.5 | 1.5 | 1.8 | 1.8 | |||||||||||||||||||||
| Labour force (thousands) | 2,881 | 2,944 | 3,019 | 3,052 | 3,082 | 3,119 | 3,160 | |||||||||||||||||||||
| (% change) | 1.0 | 2.2 | 2.5 | 1.1 | 1.0 | 1.2 | 1.3 | |||||||||||||||||||||
| Participation rate3 (%) | 65.1 | 65.2 | 64.9 | 64.7 | 64.4 | 64.0 | 63.7 | |||||||||||||||||||||
| Employment (thousands) | 2,748 | 2,792 | 2,856 | 2,887 | 2,918 | 2,956 | 2,997 | |||||||||||||||||||||
| (% change) | 3.2 | 1.6 | 2.3 | 1.1 | 1.1 | 1.3 | 1.4 | |||||||||||||||||||||
| Unemployment rate (%) | 4.6 | 5.2 | 5.4 | 5.4 | 5.3 | 5.2 | 5.1 | |||||||||||||||||||||
1 International migration includes net non-permanent residents and returning emigrants less net temporary residents abroad.
2 The civilian, non-institutionalized population 15 years of age and over.
3 Percentage of the labour force population in the labour force.
4 Components may not sum to total due to rounding.
| 56 | | First Quarterly Report 2024/25 | |
Economic Review and Outlook
Table 2.6.4 Major Economic Assumptions
| Forecast | ||||||||||||||||||||||||||||
| 2022 | 2023 | 2024 | 2025 | 2026 | 2027 | 2028 | ||||||||||||||||||||||
| Real GDP | ||||||||||||||||||||||||||||
| Canada (chained 2017 $billions) | 2,327 | 2,356 | 2,377 | 2,417 | 2,463 | 2,507 | 2,553 | |||||||||||||||||||||
| (% change) | 3.8 | 1.2 | 0.9 | 1.7 | 1.9 | 1.8 | 1.8 | |||||||||||||||||||||
| U.S. (chained 2017 US$billions) | 21,822 | 22,377 | 22,914 | 23,281 | 23,700 | 24,103 | 24,512 | |||||||||||||||||||||
| (% change) | 1.9 | 2.5 | 2.4 | 1.6 | 1.8 | 1.7 | 1.7 | |||||||||||||||||||||
| Japan (chained 2015 Yen trillions) | 550 | 559 | 559 | 566 | 569 | 572 | 575 | |||||||||||||||||||||
| (% change) | 1.2 | 1.7 | 0.0 | 1.1 | 0.6 | 0.5 | 0.5 | |||||||||||||||||||||
| China (constant 2010 US$billions) | 13,152 | 13,843 | 14,493 | 15,102 | 15,736 | 16,397 | 17,086 | |||||||||||||||||||||
| (% change) | 3.0 | 5.2 | 4.7 | 4.2 | 4.2 | 4.2 | 4.2 | |||||||||||||||||||||
| Euro zone1 (chained 2015 Euro billions) | 11,778 | 11,839 | 11,910 | 12,053 | 12,198 | 12,344 | 12,493 | |||||||||||||||||||||
| (% change) | 3.5 | 0.5 | 0.6 | 1.2 | 1.2 | 1.2 | 1.2 | |||||||||||||||||||||
| Industrial production index (% change) | ||||||||||||||||||||||||||||
| U.S. | 3.4 | 0.2 | 0.0 | 1.2 | 1.7 | 1.7 | 1.7 | |||||||||||||||||||||
| Japan | 0.1 | -1.5 | -1.5 | 1.9 | 0.8 | 0.8 | 0.8 | |||||||||||||||||||||
| China | 3.8 | 4.3 | 4.9 | 3.8 | 3.8 | 3.8 | 3.8 | |||||||||||||||||||||
| Euro zone1 | 2.3 | -2.3 | -1.5 | 1.6 | 1.2 | 1.2 | 1.2 | |||||||||||||||||||||
| Housing starts (thousands) | ||||||||||||||||||||||||||||
| Canada | 262 | 240 | 240 | 240 | 230 | 230 | 230 | |||||||||||||||||||||
| (% change) | -3.4 | -8.2 | -0.1 | 0.0 | -4.2 | 0.0 | 0.0 | |||||||||||||||||||||
| U.S. | 1,553 | 1,420 | 1,370 | 1,400 | 1,400 | 1,400 | 1,400 | |||||||||||||||||||||
| (% change) | -3.0 | -8.5 | -3.5 | 2.2 | 0.0 | 0.0 | 0.0 | |||||||||||||||||||||
| Japan | 860 | 820 | 795 | 795 | 840 | 860 | 860 | |||||||||||||||||||||
| (% change) | 0.4 | -4.6 | -3.0 | 0.0 | 5.7 | 2.4 | 0.0 | |||||||||||||||||||||
| Consumer price index | ||||||||||||||||||||||||||||
| Canada (2002 = 100) | 151.2 | 157.1 | 161.2 | 164.7 | 168.0 | 171.4 | 174.8 | |||||||||||||||||||||
| (% change) | 6.8 | 3.9 | 2.6 | 2.2 | 2.0 | 2.0 | 2.0 | |||||||||||||||||||||
| Canadian interest rates (%) | ||||||||||||||||||||||||||||
| 3-month Treasury bills | 2.30 | 4.81 | 4.58 | 3.29 | 2.88 | 2.75 | 2.75 | |||||||||||||||||||||
| 10-year government bonds | 2.77 | 3.36 | 3.42 | 3.18 | 3.15 | 3.15 | 3.15 | |||||||||||||||||||||
| United States interest rates (%) | ||||||||||||||||||||||||||||
| 3-month Treasury bills | 2.08 | 5.28 | 5.28 | 4.11 | 3.25 | 3.00 | 3.00 | |||||||||||||||||||||
| 10-year government bonds | 2.95 | 3.96 | 4.27 | 3.95 | 3.75 | 3.65 | 3.65 | |||||||||||||||||||||
| Exchange rate (US cents / Canadian $) | 76.8 | 74.1 | 73.0 | 73.5 | 76.3 | 77.4 | 77.6 | |||||||||||||||||||||
| British Columbia goods and services | ||||||||||||||||||||||||||||
| Export price deflator (% change) | 14.5 | -3.2 e | 1.0 | 4.4 | 2.1 | 2.1 | 1.7 | |||||||||||||||||||||
1 Euro zone (20) is Austria, Belgium, Croatia, Cyprus, Estonia, Finland, France, Germany, Greece, Ireland, Italy, Latvia, Lithuania, Luxembourg, Malta, Netherlands, Portugal, Slovakia, Slovenia and Spain.
e B.C. Ministry of Finance estimate.
| First Quarterly Report 2024/25 | | 57 | |
 This page intentionally left blank
APPENDIX | FISCAL PLAN UPDATE
Table A1 Material Assumptions – Revenue
Revenue Source and Assumptions ($ millions unless otherwise specified) | Budget Estimate 2024/25 | Updated Forecast 2024/25 | Plan 2025/26 | Plan 2026/27 | 2024/25 Sensitivities | |||||||||||||
| Personal income tax * | 16,638 | 17,118 | 17,867 | 18,741 | ||||||||||||||
| Current calendar year assumptions | ||||||||||||||||||
| Household income growth | 4.4 | % | 5.9 | % | 4.4 | % | 4.0 | % | +/- 1 percentage point change in 2024 B.C. | |||||||||
| Employee compensation growth | 5.5 | % | 6.8 | % | 4.9 | % | 4.2 | % | household income growth equals +/- $150 to | |||||||||
| Tax base growth | 4.7 | % | 7.4 | % | 4.4 | % | 3.8 | % | $160 million in revenue | |||||||||
| Average tax yield | 6.39 | % | 6.38 | % | 6.43 | % | 6.49 | % | ||||||||||
| Current-year tax | 16,072 | 16,452 | 17,296 | 18,136 | ||||||||||||||
| Prior year’s tax assessments | 570 | 570 | 580 | 590 | ||||||||||||||
| Unapplied taxes | 150 | 150 | 150 | 150 | ||||||||||||||
| B.C. Tax Reduction | (195 | ) | (195 | ) | (199 | ) | (203 | ) | ||||||||||
| Non-refundable B.C. tax credits | (176 | ) | (176 | ) | (176 | ) | (176 | ) | ||||||||||
| Policy neutral elasticity ** | 1.1 | 1.2 | 1.2 | 1.2 | +/- 0.5 change in 2024 B.C. policy neutral | |||||||||||||
| Fiscal year assumptions | elasticity equals +/- $330 to $350 million | |||||||||||||||||
| Prior-year adjustment | - | |||||||||||||||||
| 2023 Tax-year | 2023 Assumptions | |||||||||||||||||
| Household income growth | 6.9 | % | 7.8 | % | +/- 1 percentage point change in 2023 B.C. | |||||||||||||
| Tax base growth | 5.6 | % | 6.0 | % | household or taxable income growth equals | |||||||||||||
| Average 2023 tax yield | 6.38 | % | 6.37 | % | +/- $170 to $180 million one-time effect (prior- | |||||||||||||
| 2023 tax | 15,322 | 15,299 | year adjustment) and could result in an | |||||||||||||||
| 2022 & prior year’s tax assessments | 560 | 560 | additional +/- $150 to $160 million base change | |||||||||||||||
| Unapplied taxes | 150 | 150 | in 2024/25 | |||||||||||||||
| B.C. Tax Reduction | (190 | ) | (190 | ) | ||||||||||||||
| Non-refundable B.C. tax credits | (176 | ) | (176 | ) | ||||||||||||||
| Policy neutral elasticity ** | 0.8 | 0.7 | ||||||||||||||||
| * Reflects information as at August 8, 2024 | ||||||||||||||||||
| ** Per cent growth in current year tax revenue (excluding policy measures) relative to per cent growth in household income (calendar year). | ||||||||||||||||||
| Corporate income tax * | 8,236 | 7,598 | 6,428 | 6,540 | ||||||||||||||
| Components of revenue (fiscal year) | ||||||||||||||||||
| Installments – subject to general rate | 7,718 | 7,155 | 6,946 | 6,865 | ||||||||||||||
| Installments – subject to small business rate | 363 | 362 | 346 | 342 | ||||||||||||||
| Non-refundable B.C. tax credits | (193 | ) | (193 | ) | (198 | ) | (203 | ) | ||||||||||
| Advance installments | 7,888 | 7,324 | 7,094 | 7,004 | ||||||||||||||
| Prior-year settlement payment | 348 | 274 | (666 | ) | (464 | ) | ||||||||||||
| Current calendar year assumptions | ||||||||||||||||||
| National tax base ($ billions) | 520.8 | 570.8 | 610.8 | 641.3 | +/- 1% change in the 2024 national tax base | |||||||||||||
| B.C. installment share of national tax base | 15.0 | % | 13.1 | % | 12.4 | % | 11.7 | % | equals +/- $60 to $70 million | |||||||||
| Effective percentage tax rates (% general/small business) | 12.0 / 2.0 | 12.0 / 2.0 | 12.0 / 2.0 | 12.0 / 2.0 | ||||||||||||||
| Share of the B.C. tax base subject to the small business rate | 22.0 | % | 23.0 | % | 23.0 | % | 23.0 | % | +/- 1 percentage point change in the 2024 small | |||||||||
| B.C. tax base growth (post federal measures) | 2.6 | % | 3.7 | % | 1.0 | % | 4.9 | % | business share equals -1+ $80 to $90 million | |||||||||
| B.C. net operating surplus growth | -9.5 | % | -14.9 | % | -1.5 | % | 5.5 | % | ||||||||||
| 2023 Tax-year | 2023 Assumptions | |||||||||||||||||
| B.C. tax base growth (post federal measures) | -7.1 | % | -7.9 | % | ||||||||||||||
| Share of the B.C. tax base subject to small business rate | 22.5 | % | 23.5 | % | +/- 1% change in the 2023 B.C. tax base equals | |||||||||||||
| B.C. net operating surplus growth | -14.9 | % | -15.0 | % | +/- $60 to $80 million one-time effect (prior-year | |||||||||||||
| Gross 2023 tax | 6,736 | 6,612 | adjustment) and could result in an additional | |||||||||||||||
| Prior-year settlement payment | 348 | 274 | installments payments of +/- $100 to $120 | |||||||||||||||
| Prior years losses/gains (included in above) | (250 | ) | (200 | ) | million in 2024/25 | |||||||||||||
| Non-refundable B.C. tax credits | (186 | ) | (186 | ) | ||||||||||||||
| * Reflects information as at August 16, 2024 |
| Cash received from the federal government is used as the basis for estimating revenue. Due to lags in the federal collection and installment systems, changes to the B.C. net operating surplus and tax base forecasts affect revenue in the succeeding year. The 2024/25 installments from the federal government reflects two-third of payments related to the 2024 tax year (paid during Apr-July 2024 and adjusted in Sept and Dec) and one-third of 2025 payments. Installments for the 2024 (2025) tax year are based on B.C.'s share of the national tax base for the 2023 (2024) tax year and a forecast of the 2024 (2025) national tax base. B.C.'s share of the 2022 national tax base was 13.7%, based on tax assessments as of December 31, 2023. Cash adjustments for any under/over payments from the federal government in respect of 2023 will be received/paid on March 31, 2025. |

| First Quarterly Report 2024/25 | | 59 | |
Appendix - Fiscal Plan Update
Table A1 Material Assumptions – Revenue (continued)
Revenue Source and Assumptions ($ millions unless otherwise specified) | Budget Estimate 2024/25 | Updated Forecast 2024/25 | Plan 2025/26 | Plan 2026/27 | 2024/25 Sensitivities | |||||||||||||
| Employer health tax | 2,803 | 2,962 | 3,110 | 3,239 | ||||||||||||||
| Employee compensation growth | 5.5 | % | 6.8 | % | 4.9 | % | 4.2 | % | +/- 1 percentage point change in the 2024 employee compensation growth equals up to +/- $30 million | |||||||||
| Provincial sales tax | 10,762 | 10,708 | 11,196 | 11,647 | ||||||||||||||
| Provincial sales tax base growth (fiscal year) | 3.8 | % | -2.0 | % | 4.6 | % | 4.1 | % | +/- 1 percentage point change in the | |||||||||
| Calendar Year nominal expenditure | 2024 consumer expenditure growth | |||||||||||||||||
| Consumer expenditures on durable goods | 0.8 | % | 1.2 | % | 1.7 | % | 3.4 | % | equals up to +/- $25 to $30 million | |||||||||
| Consumer expenditures on goods and services | 5.2 | % | 5.3 | % | 4.7 | % | 4.2 | % | ||||||||||
| Business investment | 1.2 | % | 2.0 | % | 6.7 | % | 6.4 | % | ||||||||||
| Other | 3.2 | % | 3.7 | % | 6.8 | % | 4.8 | % | ||||||||||
| Components of Provincial sales tax revenue | +/- 1 percentage point change in the | |||||||||||||||||
| Consolidated Revenue Fund | 10,754 | 10,700 | 11,188 | 11,639 | 2024 business investment growth | |||||||||||||
| BC Transportation Financing Authority | 8 | 8 | 8 | 8 | equals up to +/- $10 to $20 million | |||||||||||||
| Fuel and carbon taxes | 3,585 | 3,534 | 3,983 | 4,425 | ||||||||||||||
| Calendar Year | ||||||||||||||||||
| Real GDP | 0.8 | % | 1.0 | % | 2.0 | % | 2.3 | % | ||||||||||
| Gasoline volumes | -1.0 | % | -1.0 | % | -2.0 | % | -3.0 | % | ||||||||||
| Diesel volumes | 2.0 | % | 2.0 | % | 2.0 | % | -2.0 | % | ||||||||||
| Natural gas volumes | 1.0 | % | 1.0 | % | -1.0 | % | -2.0 | % | ||||||||||
| Carbon tax rates (April 1) | ||||||||||||||||||
| Carbon dioxide equivalent emissions ($/tonne) | 80 | 80 | 95 | 110 | ||||||||||||||
| Natural gas (cents/gigajoule) | 397.28 | ¢ | 397.28 | ¢ | 471.77 | ¢ | 546.26 | ¢ | ||||||||||
| Gasoline (cents/litre) | 17.61 | ¢ | 17.61 | ¢ | 20.91 | ¢ | 24.22 | ¢ | ||||||||||
| Light fuel oil (cents/litre) | 20.74 | ¢ | 20.74 | ¢ | 24.62 | ¢ | 28.51 | ¢ | ||||||||||
| Components of revenue * | ||||||||||||||||||
| Consolidated Revenue Fund | 541 | 500 | 491 | 483 | ||||||||||||||
| BC Transit | 18 | 18 | 18 | 17 | ||||||||||||||
| BC Transportation Financing Authority | 461 | 451 | 447 | 435 | ||||||||||||||
| Fuel tax revenue | 1,020 | 969 | 956 | 935 | ||||||||||||||
| Carbon tax revenue | 2,565 | 2,565 | 3,027 | 3,490 | ||||||||||||||
| Property taxes | 3,779 | 3,850 | 4,074 | 4,281 | ||||||||||||||
| Calendar Year | ||||||||||||||||||
| Consumer Price Index | 2.7 | % | 2.7 | % | 2.2 | % | 2.0 | % | +/- 1 percentage point change in 2024 new | |||||||||
| Housing starts (units) | 46,107 | 46,711 | 48,504 | 50,023 | construction & inflation growth equals up to +/- | |||||||||||||
| Home owner grants (fiscal year) | 926 | 919 | 938 | 956 | $30 million in residential property taxation revenue | |||||||||||||
| Components of revenue | ||||||||||||||||||
| Residential (net of home owner grants) | 1,625 | 1,621 | 1,720 | 1,813 | ||||||||||||||
| Speculation and vacancy | 90 | 86 | 90 | 90 | ||||||||||||||
| Non-residential | 1,630 | 1,686 | 1,772 | 1,854 | +/-1% change in 2024 total | |||||||||||||
| Rural area | 153 | 158 | 163 | 171 | business property assessment | |||||||||||||
| Police | 40 | 43 | 45 | 48 | value equals up to +/- $20 million | |||||||||||||
| BC Assessment Authority | 115 | 119 | 121 | 123 | in non-residential property | |||||||||||||
| BC Transit | 126 | 137 | 163 | 182 | taxation revenue | |||||||||||||
| Other taxes | 3,411 | 3,421 | 3,717 | 3,923 | ||||||||||||||
| Calendar Year | ||||||||||||||||||
| Population | 2.8 | % | 3.0 | % | 1.2 | % | 1.2 | % | ||||||||||
| Residential sales value | 12.7 | % | 4.5 | % | 15.9 | % | 9.1 | % | ||||||||||
| Real GDP | 0.8 | % | 1.0 | % | 2.0 | % | 2.3 | % | ||||||||||
| Nominal GDP | 3.3 | % | 3.5 | % | 4.3 | % | 4.6 | % | ||||||||||
| Components of revenue | +/- 1% change to 2024 residential | |||||||||||||||||
| Property transfer | 2,055 | 2,080 | 2,334 | 2,530 | sales value equals +/- $20 million | |||||||||||||
| Additional Property Transfer Tax (included in above) | 40 | 40 | 40 | 40 | in property transfer revenue, | |||||||||||||
| Tobacco | 510 | 470 | 470 | 470 | depending on property values | |||||||||||||
| Insurance premium | 835 | 860 | 870 | 880 | ||||||||||||||
| Tax targeting home flipping activity | 11 | 11 | 43 | 43 | ||||||||||||||
| 60 | | First Quarterly Report 2024/25 | |
Appendix - Fiscal Plan Update
Table A1 Material Assumptions – Revenue (continued)
| Revenue Source and Assumptions ($ millions unless otherwise specified) | Budget Estimate 2024/25 | Updated Forecast 2024/25 | Plan 2025/26 | Plan 2026/27 | 2024/25 Sensitivities | |||||||||||||
| Energy, sales of Crown land tenures, metals, minerals and other * | 1,951 | 1,792 | 2,319 | 2,563 | ||||||||||||||
| Natural gas price | +/- $0.25 change in the natural gas | |||||||||||||||||
| Plant inlet, $C/gigajoule | 1.26 | 0.75 | 1.85 | 2.21 | price equals +/- $60 to $120 million, | |||||||||||||
| Sumas, $US/MMBtu | 2.54 | 1.99 | 2.90 | 3.28 | including impacts on production | |||||||||||||
| Natural gas production volumes | volumes and royalty program | |||||||||||||||||
| Billions of cubic metres | 72.7 | 74.8 | 75.8 | 77.9 | credits, but excluding any | |||||||||||||
| Petajoules | 3,024 | 3,097 | 3,140 | 3,228 | changes from natural gas liquids | |||||||||||||
| Annual per cent change | 3.2 | % | 5.4 | % | 1.4 | % | 2.8 | % | revenue (e.g. butane, pentanes) | |||||||||
| Oil price ($US/bbl at Cushing, OK) | 77.34 | 80.31 | 76.39 | 75.94 | Sensitivities can also vary | |||||||||||||
| significantly at different price levels | ||||||||||||||||||
| Auctioned land base (000 hectares) | 20 | 20 | 20 | 20 | ||||||||||||||
| Average bid price/hectare ($) | 200 | 200 | 200 | 300 | +/- 1% change in natural gas | |||||||||||||
| Cash sales of Crown land tenures | 4 | 4 | 4 | 6 | volumes equals +/- $10 million | |||||||||||||
| Metallurgical coal price ($US/tonne, fob Australia) | 243 | 256 | 234 | 233 | in natural gas royalties | |||||||||||||
| Copper price ($US/lb) | 3.88 | 4.37 | 4.37 | 4.39 | ||||||||||||||
| Annual electricity volumes set by treaty (million mega-watt hours) | 3.8 | 3.0 | 2.6 | 2.6 | +/- 1 cent change in the exchange rate equals +/-$10 million in natural gas royalties | |||||||||||||
| Mid-Columbia electricity price | 93.37 | 79.15 | 87.99 | 87.01 | ||||||||||||||
| ($US/mega-watt hour) | +/- $10/bbl change in petroleum price | |||||||||||||||||
| equals +/- $5 million in petroleum royalties | ||||||||||||||||||
| Exchange rate (US¢/C$, calendar year) | 73.6 | 73.0 | 73.5 | 76.3 | ||||||||||||||
| +/- 13% change in natural gas liquids | ||||||||||||||||||
| Components of revenue | (equivalent to +/- $10/bbl oil price) prices | |||||||||||||||||
| Bonus bid cash sales | 4 | 4 | 4 | 6 | equals +/- $110 to $150 million in natural gas | |||||||||||||
| Fees and rentals | 36 | 38 | 36 | 36 | liquids royalties | |||||||||||||
| Total bonus bids, fees and rentals | 40 | 42 | 40 | 42 | ||||||||||||||
| Natural gas royalties after deductions and allowances | 754 | 705 | 1,356 | 1,676 | +/- 10% change in the average Mid-Columbia | |||||||||||||
| Petroleum royalties | 50 | 53 | 46 | 41 | electricity price equals +/- $50 million | |||||||||||||
| Columbia River Treaty electricity sales | 484 | 358 | 356 | 357 | ||||||||||||||
| BC Energy Regulator fees and levies | 75 | 74 | 76 | 77 | +/- US$20 change in the average | |||||||||||||
| Coal, metals and other minerals revenue: | metallurgical coal price | |||||||||||||||||
| Coal tenures | 8 | 8 | 8 | 8 | equals +/- $50 to $80 million | |||||||||||||
| Net coal mineral tax | 355 | 320 | 216 | 171 | ||||||||||||||
| Net metals and other minerals tax | 55 | 102 | 107 | 92 | In accordance with updated accounting | |||||||||||||
| Recoveries relating to revenue sharing payments to First Nations | 112 | 112 | 96 | 81 | standards, bonus bid revenue is recognized in full at the time an authorization for the sale of | |||||||||||||
| Miscellaneous mining revenue | 18 | 18 | 18 | 18 | Crown land tenure is awarded. | |||||||||||||
| Total coal, metals and other minerals revenue | 548 | 560 | 445 | 370 | ||||||||||||||
| Gross royalties prior to deductions and allowances | ||||||||||||||||||
| Gross natural gas revenue | 392 | 235 | 991 | 1,235 | ||||||||||||||
| Gross natural gas liquids royalties revenue | 771 | 755 | 814 | 857 | ||||||||||||||
| Royalty programs and infrastructure credits | ||||||||||||||||||
| Deep drilling | (131 | ) | (84 | ) | (122 | ) | (51 | ) | ||||||||||
| Road, pipeline, Clean Growth Infrastructure Royalty and other infrastructure programs | (100 | ) | (113 | ) | (158 | ) | (121 | ) | ||||||||||
| Total | (231 | ) | (197 | ) | (280 | ) | (172 | ) | ||||||||||
| Implicit average natural gas royalty rate | 13.6 | % | 32.8 | % | 23.4 | % | 21.3 | % | ||||||||||
| Natural gas royalties incorporate royalty programs and Treasury Board approved infrastructure credits. | ||||||||||||||||||
| *Reflects information as at August 8, 2024. | ||||||||||||||||||
| First Quarterly Report 2024/25 | | 61 | |
Appendix - Fiscal Plan Update
Table A1 Material Assumptions – Revenue (continued)
Revenue Source and Assumptions ($millions unless otherwise specified) | Budget Estimate 2024/25 | Updated Forecast 2024/25 | Plan 2025/26 | Plan 2026/27 | 2024/25 Sensitivities | |||||||||||||
| Forests * | 689 | 586 | 675 | 742 | ||||||||||||||
| Prices (calendar year average) | +/- US$50 change in SPF price equals +/- $100 | |||||||||||||||||
| SPF 2x4 ($US/thousand board feet) | 425 | 390 | 400 | 425 | to $125 million | |||||||||||||
| Crown harvest volumes (million cubic metres) | ||||||||||||||||||
| Interior | 24.0 | 24.0 | 24.0 | 24.0 | +/- 10% change in Interior harvest volumes | |||||||||||||
| Coast | 8.0 | 8.0 | 8.0 | 8.0 | equals +/- $40 to $50 million | |||||||||||||
| Total | 32.0 | 32.0 | 32.0 | 32.0 | ||||||||||||||
| B.C. Timber Sales (included in above) | 4.0 | 4.0 | 4.9 | 5.9 | +/- 10% change in Coastal harvest volumes | |||||||||||||
| equals +/- $10 to $20 million | ||||||||||||||||||
| Stumpage rates ($Cdn/cubic metre) | ||||||||||||||||||
| Total stumpage rates | 18.06 | 15.63 | 17.67 | 19.71 | +/- 1 cent change in exchange rate | |||||||||||||
| equals +/- $20 to $30 million in | ||||||||||||||||||
| Components of revenue | stumpage revenue | |||||||||||||||||
| Timber tenures (net of revenue sharing recoveries) | 206 | 128 | 209 | 252 | ||||||||||||||
| Recoveries relating to revenue sharing payments to First Nations | 177 | 177 | 124 | 94 | ||||||||||||||
| B.C. Timber Sales | 214 | 214 | 251 | 304 | The above sensitivities relate | |||||||||||||
| Logging tax | 50 | 25 | 50 | 50 | to stumpage revenue only. | |||||||||||||
| Other CRF revenue | 31 | 31 | 31 | 31 | ||||||||||||||
| Other recoveries | 11 | 11 | 10 | 11 | ||||||||||||||
| * Reflects information as at August 6, 2024 | ||||||||||||||||||
| Other natural resource | 510 | 473 | 528 | 600 | ||||||||||||||
| Components of revenue | ||||||||||||||||||
| Water rental and licences* | 437 | 400 | 455 | 527 | +/- 5% change in water power production | |||||||||||||
| Recoveries | 50 | 50 | 50 | 50 | equals +/- $20 to $25 million | |||||||||||||
| Angling and hunting permits and licences | 10 | 10 | 10 | 10 | ||||||||||||||
| Recoveries | 13 | 13 | 13 | 13 | ||||||||||||||
| * Water rentals for power purposes are indexed to Consumer Price Index. | ||||||||||||||||||
| Total natural resource recoveries relating to revenue sharing payments to First Nations | 376 | 351 | 265 | 217 | Revenue sharing from natural gas royalties, mineral tax, electricity sales under the Columbia River Treaty and forest stumpage revenues. | |||||||||||||
| Other revenue | 11,400 | 11,886 | 11,784 | 11,880 | ||||||||||||||
| Components of revenue | ||||||||||||||||||
| Fees and licences | ||||||||||||||||||
| Motor vehicle licences and permits | 629 | 652 | 662 | 673 | ||||||||||||||
| International student health fees | 80 | 90 | 80 | 80 | ||||||||||||||
| Other Consolidated Revenue Fund | 484 | 512 | 502 | 506 | ||||||||||||||
| Summary consolidation eliminations | (15 | ) | (15 | ) | (15 | ) | (15 | ) | ||||||||||
| Ministry vote recoveries | 285 | 285 | 114 | 115 | ||||||||||||||
| Taxpayer-supported Crown corporations | 219 | 222 | 233 | 239 | ||||||||||||||
| Post-secondary education fees | 2,937 | 2,914 | 2,984 | 3,069 | ||||||||||||||
| Other healthcare-related fees | 584 | 575 | 582 | 588 | ||||||||||||||
| School Districts | 265 | 266 | 282 | 298 | ||||||||||||||
| Investment earnings | ||||||||||||||||||
| Consolidated Revenue Fund | 175 | 385 | 155 | 155 | ||||||||||||||
| Fiscal agency loans & sinking funds earnings | 1,159 | 1,089 | 1,198 | 1,259 | ||||||||||||||
| Summary consolidation eliminations | (202 | ) | (159 | ) | (123 | ) | (122 | ) | ||||||||||
| Taxpayer-supported Crown corporations | 43 | 52 | 45 | 46 | ||||||||||||||
| SUCH sector agencies | 249 | 300 | 310 | 293 | ||||||||||||||
| Sales of goods and services | ||||||||||||||||||
| SUCH sector agencies | 1,087 | 1,109 | 1,161 | 1,218 | ||||||||||||||
| BC Infrastructure Benefits Inc | 255 | 258 | 300 | 149 | ||||||||||||||
| Other taxpayer-supported Crown corporations | 127 | 144 | 135 | 144 | ||||||||||||||
| Miscellaneous | 3,039 | 3,207 | 3,179 | 3,185 | ||||||||||||||
| 62 | | First Quarterly Report 2024/25 | |
Appendix - Fiscal Plan Update
Table A1 Material Assumptions – Revenue (continued)
| Revenue Source and Assumptions ($ millions unless otherwise specified) | Budget Estimate 2024/25 | Updated Forecast 2024/25 | Plan 2025/26 | Plan 2026/27 | 2024/25 Sensitivities | |||||||||||||
| Health and social transfers | 9,475 | 9,498 | 9,900 | 10,345 | ||||||||||||||
| National Cash Transfers | 52,081 | 52,081 | 54,685 | 57,419 | ||||||||||||||
| Canada Health Transfer (CHT) | ||||||||||||||||||
| Annual growth | 5.4 | % | 5.4 | % | 5.0 | % | 5.0 | % | ||||||||||
| Canada Social Transfer (CST) | 16,909 | 16,909 | 17,416 | 17,939 | ||||||||||||||
| B.C.'s share of national population (July 1) | 13.74 | % | 13.77 | % | 13.73 | % | 13.73 | % | +/- 0.1 percentage point change in B.C.'s population share equals +/- $70 million | |||||||||
| B.C. health and social transfers revenue | ||||||||||||||||||
| CHT | 7,153 | 7,170 | 7,509 | 7,882 | ||||||||||||||
| CST | 2,322 | 2,328 | 2,391 | 2,463 | ||||||||||||||
| Prior-year adjustments: | ||||||||||||||||||
| CHT | - | |||||||||||||||||
| CST | - | |||||||||||||||||
| Other federal contributions | 4,971 | 5,063 | 5,100 | 4,438 | ||||||||||||||
| Components of revenue | ||||||||||||||||||
| Disaster Financial Assistance Arrangements | 1,013 | 985 | 822 | 784 | ||||||||||||||
| B.C.'s share of the federal cannabis excise tax | 110 | 110 | 110 | 110 | ||||||||||||||
| Other Consolidated Revenue Fund | 110 | 117 | 119 | 121 | ||||||||||||||
| Vote Recoveries: | ||||||||||||||||||
| Labour Market Development Agreement | 296 | 296 | 296 | 296 | ||||||||||||||
| Labour Market and Skills Training Program | 98 | 98 | 98 | 98 | ||||||||||||||
| Home Care | 82 | 82 | 82 | 82 | ||||||||||||||
| Mental Health | 82 | 82 | 82 | 82 | ||||||||||||||
| Additional health funding | 326 | 326 | 326 | - | ||||||||||||||
| Long Term Care | - | 76 | 108 | 111 | ||||||||||||||
| Child Care | 1,036 | 1,036 | 1,161 | 1,161 | ||||||||||||||
| Child Safety, Family Support, Children in Care and with special needs | 87 | 87 | 87 | 87 | ||||||||||||||
| Public Transit | 229 | 229 | 245 | 29 | ||||||||||||||
| Local government services and transfers | 197 | 197 | 232 | 117 | ||||||||||||||
| Other recoveries | 153 | 153 | 153 | 153 | ||||||||||||||
| Taxpayer-supported Crown corporations | 368 | 369 | 347 | 364 | ||||||||||||||
| Post-secondary institutions | 652 | 676 | 690 | 701 | ||||||||||||||
| Other SUCH sector agencies | 132 | 144 | 142 | 142 | ||||||||||||||
| Service delivery agency direct revenue | 9,519 | 9,802 | 9,983 | 10,053 | ||||||||||||||
| School districts | 689 | 732 | 741 | 755 | ||||||||||||||
| Post-secondary institutions | 5,225 | 5,257 | 5,438 | 5,585 | ||||||||||||||
| Health authorities and hospital societies | 1,306 | 1,463 | 1,404 | 1,417 | ||||||||||||||
| BC Transportation Financing Authority | 579 | 552 | 554 | 547 | ||||||||||||||
| Other service delivery agencies | 1,720 | 1,798 | 1,846 | 1,749 | ||||||||||||||
| Commercial Crown corporation net income | 3,313 | 3,281 | 3,674 | 3,705 | ||||||||||||||
| BC Hydro | 712 | 712 | 712 | 712 | Sensitivities impacts shown below are before regulatory account transfers | |||||||||||||
| Reservoir water inflows | 100 | % | 79 | % | 100 | % | 100 | % | +/-1% in hydro generation equals +/- $55 million | |||||||||
| Mean gas price | 5.58 | 3.98 | 4.81 | 4.98 | +/-1% equals +/-$0.1 million | |||||||||||||
| (Sumas, $US/MMbtu – BC Hydro forecast based on NYMEX forward selling prices) | ||||||||||||||||||
| Electricity prices (Mid-C, $US/MWh) | 87.41 | 68.30 | 79.44 | 75.04 | +/-1% change in electricity/gas trade income equals +/- $5 million | |||||||||||||
| ICBC | - | - | 400 | 400 | ||||||||||||||
| Vehicle growth | 1.3 | % | 1.3 | % | 1.8 | % | 1.8 | % | +/-1% equals +/-$61 million | |||||||||
| Current claims cost percentage change | 10.8 | % | 21.4 | % | 6.8 | % | 6.7 | % | +/-1% equals +/-$50 million | |||||||||
| Unpaid claims balance ($ billions) | 10.4 | 9.6 | 8.7 | 8.3 | +/-1% equals +/-$96 to $108 million | |||||||||||||
| Investment return | 2.3 | % | 2.3 | % | 4.8 | % | 4.6 | % | +/-1% return equals +/-$171 to $181 million | |||||||||
| Loss ratio | 87.9 | % | 87.9 | % | 86.6 | % | 86.5 | % | ||||||||||
| First Quarterly Report 2024/25 | | 63 | |
Appendix – Fiscal Plan Update
Table A2 Natural Gas Price Forecasts — 2024/25 to 2026/27
| Private sector forecasts (calendar year) | Adjusted to fiscal years and $C/gigajoule at plant inlet | |||||||||||||||||||||||
| 2024 | 2025 | 2026 | 2024/25 | 2025/26 | 2026/27 | |||||||||||||||||||
| GLJ Henry Hub US$/MMBtu (Jul 1, 2024) | 2.74 | 3.75 | 4.16 | 1.59 | 2.23 | 2.49 | ||||||||||||||||||
| Sproule Henry Hub US$/MMBtu (June 30, 2024) | 2.48 | 3.75 | 4.00 | 1.26 | 2.17 | 2.29 | ||||||||||||||||||
| McDaniel Henry Hub US$/MMBtu (Jul 1, 2024) | 2.43 | 3.32 | 3.90 | 1.10 | 1.74 | 2.17 | ||||||||||||||||||
| Deloitte Henry Hub US$/Mcf (June 30, 2024) | 2.55 | 3.55 | 4.15 | 1.23 | 1.88 | 2.30 | ||||||||||||||||||
| GLJ Alberta AECO-C Spot CDN$/MMBtu (Jul 1, 2024) | 1.60 | 3.00 | 3.83 | 0.75 | 1.84 | 2.57 | ||||||||||||||||||
| Sproule Alberta AECO-C Spot CDN$/MMBtu (June 30, 2024) | 1.70 | 3.48 | 3.95 | 0.92 | 2.20 | 2.54 | ||||||||||||||||||
| McDaniel AECO-C Spot C$/MMBtu (Jul 1, 2024) | 1.75 | 3.06 | 3.90 | 0.82 | 1.90 | 2.50 | ||||||||||||||||||
| Deloitte AECO-C Spot C$/Mcf (June 30, 2024) | 1.51 | 3.05 | 3.90 | 0.58 | 1.79 | 2.37 | ||||||||||||||||||
| GLJ Sumas Spot US$/MMBtu (Jul 1, 2024) | 2.58 | 3.65 | 4.06 | 2.11 | 2.94 | 3.21 | ||||||||||||||||||
| Sproule Sumas Spot CDN$/MMBtu (June 30, 2024) | 3.12 | 5.42 | 5.92 | 1.84 | 3.42 | 3.80 | ||||||||||||||||||
| GLJ BC Spot Plant Gate CDN$/MMBtu (Jul 1, 2024) | 1.02 | 2.63 | 3.46 | 0.74 | 1.87 | 2.59 | ||||||||||||||||||
| Sproule BC Station 2 CDN$/MMBtu (June 30, 2024) | 1.50 | 3.38 | 3.84 | 0.88 | 2.19 | 2.52 | ||||||||||||||||||
| McDaniel BC Avg Plant Gate C$MMBtu (Jul 1, 2024) | 1.23 | 2.55 | 3.38 | 0.73 | 1.79 | 2.38 | ||||||||||||||||||
| Deloitte BC Station 2 C$MMBtu (June 30, 2024) | 2.75 | 2.75 | 3.60 | 0.64 | 1.89 | 2.46 | ||||||||||||||||||
| GLJ Midwest Chicago US$/MMBtu (Jul 1, 2024) | 3.60 | 4.01 | 4.01 | 2.14 | 2.99 | 3.26 | ||||||||||||||||||
| Sproule Alliance Plant Gate CDN$/MMBtu (June 30, 2024) | 2.99 | 4.91 | 5.18 | 2.20 | 3.51 | 3.71 | ||||||||||||||||||
| EIA Henry Hub US$/MMBtu (Jul 2024) | 2.49 | 3.27 | 1.02 | |||||||||||||||||||||
| TD Economics Henry Hub Futures US$/MMBtu (May 2024) | 2.41 | 3.10 | 0.82 | |||||||||||||||||||||
| Scotiabank Group Henry Hub US$/MMBtu (Jun 2024) | 2.60 | 3.75 | 1.42 | |||||||||||||||||||||
| BMO Henry Hub US$/MMBtu (June 2024) | 2.50 | 3.25 | 1.10 | |||||||||||||||||||||
| InSite Petroleum Consultants Ltd BC Spot C$/Mcf (June 2024) | 1.75 | 3.35 | 3.95 | 0.90 | 2.11 | 2.56 | ||||||||||||||||||
| NYMEX Forward Market converted to Plant Inlet CDN$/GJ (Jul 8, 2024) | 0.97 | 1.88 | 2.04 | |||||||||||||||||||||
| Average all minus high/low | 1.16 | 2.21 | 2.65 | |||||||||||||||||||||
| Average one forecast per consultant minus high/low | 0.88 | 1.96 | 2.52 | |||||||||||||||||||||
| Natural gas royalty price forecast | 0.75 | 1.85 | 2.21 | |||||||||||||||||||||
GLJ: Gilbert Laustsen Jung Petroleum Consultants Ltd US EIA: US Energy Information Administration AECO: Alberta Energy Company
Deloitte/AJM: Deloitte L.L.P acquired Ashton Jenkins Mann Petroleum Consultants McDaniel: McDaniel & Associates Consultants Ltd
| 64 | | First Quarterly Report 2024/25 | |
Appendix – Fiscal Plan Update
Natural Gas Prices

| First Quarterly Report 2024/25 | | 65 | |
Appendix – Fiscal Plan Update
Table A3 Material Assumptions — Expense
| Ministry Programs and Assumptions ($ millions unless otherwise specified) | Budget 2024/25 | Updated 2024/25 | Plan 2025/26 | Plan 2026/27 | 2024/25 Sensitivities | |||||||||||||
| Attorney General | 877 | 877 | 878 | 880 | ||||||||||||||
| New cases filed/processed (# for all courts) | 235,000 | 242,000 | 242,000 | 242,000 | The number of criminal cases proceeded on by the provincial and federal Crown (including appeals to higher courts in BC), the number of civil and family litigation cases, the number of violation tickets disputed, and the number of municipal bylaw tickets disputed which would go to court for resolution. | |||||||||||||
| Crown Proceeding Act (CPA) | 25 | 25 | 25 | 25 | CPA forecast is subject to significant volatility due to unpredictable nature of timing and value of court settlements, judgments and pending litigation accruals. | |||||||||||||
| Children and Family Development | 2,121 | 2,121 | 2,117 | 2,117 | ||||||||||||||
| Average children-in-care caseload (#) | 4,822 | 4,837 | 4,828 | 4,798 | The average number of children-in-care is decreasing as a result of ministry efforts to keep children in family settings where safe and feasible. | |||||||||||||
| Average annual residential cost per child in care ($) | 154,040 | 166,454 | 187,367 | 192,144 | The average cost per child in care is projected to increase based on the higher cost of contracted residential services and an increasing acuity of need for children in care. A 1% increase in the cost per case or a 1% increase in the average caseload will affect expenditures by $4.1 million (excluding Indigenous CFS Agencies). | |||||||||||||
| Education and Child Care | 9,615 | 9,615 | 9,667 | 9,667 | ||||||||||||||
| Public School Enrolment (# of FTEs) | 596,212 | 614,894 | 611,416 | 606,213 | Updated forecast enrolment figures are based on submissions from school districts of their actual enrolment as at September 29, 2023 for the 2023/24 school year and projected enrolment for February and May 2024. Projections are based on the Ministry of Education and Child Care's enrolment forecasting model. | |||||||||||||
| School age (K—12) | 572,954 | 591,046 | 587,616 | 582,484 | ||||||||||||||
| Continuing Education | 786 | 772 | 772 | 772 | ||||||||||||||
| Distributed Learning (online) | 14,063 | 13,965 | 13,917 | 13,846 | ||||||||||||||
| Summer | 6,305 | 7,036 | 7,036 | 7,036 | ||||||||||||||
| Adults | 2,105 | 2,076 | 2,076 | 2,076 |
| |||||||||||||
| Emergency Management and Climate Readiness | 116 | 116 | 125 | 125 | ||||||||||||||
| Emergency and Disaster Management Act | 39 | 39 | 39 | 39 | Emergency disaster relief is unpredictable. There are a number of factors that could impact the timing of delivering recovery projects resulting from the Emergency Events. | |||||||||||||
| Forests | 851 | 1,504 | 871 | 888 | ||||||||||||||
| BC Timber Sales | 204 | 204 | 219 | 236 | Targets can be impacted by changes to actual inventory costs incurred. There is a lag of approximately 1.5 years between when inventory costs are incurred and when they are expensed. Volume harvested can also impact targets. For example, if volume harvested is less than projected in any year, then capitalized expenses will also be reduced in that year. | |||||||||||||
| Fire Management | 233 | 886 | 238 | 238 | Costs are driven by length of season and severity of weather conditions, severity of fires, proportion of interface fires and size of fires. Costs have ranged from a low of $47 million in 2006 to a high of $1.094 billion in 2023/24 (Fire season 2023). | |||||||||||||

| 66 | | First Quarterly Report 2024/25 | |
Appendix – Fiscal Plan Update
Table A3 Material Assumptions — Expense (continued)
| Ministry Programs and Assumptions | Budget Estimate | Updated Forecast | Plan | Plan | ||||||||||||||
| ($ millions unless otherwise specified) | 2024 /25 | 2024 /25 | 2025 /26 | 2026/27 | 2024/25 Sensitivities | |||||||||||||
| Health | 32,857 | 32,857 | 33,752 | 34,594 | ||||||||||||||
| Pharmacare | 1,801 | 1,801 | 1,788 | 1,788 | A 1% change in PharmaCare utilization or prices affects costs by approximately $18 million. | |||||||||||||
| Medical Services Plan (MSP) | 7,609 | 7,609 | 7,700 | 7,849 | A 1% increase in volume of services provided by fee-for-service physicians affects costs by approximately $47 million. | |||||||||||||
| Regional Services | 23,020 | 23,020 | 23,851 | 24,545 | A 1% increase in volume of services provided by Health Authorities is estimated to be $240 million. | |||||||||||||
| Post-Secondary Education and Future Skills | 3,371 | 3,371 | 3,414 | 3,414 | ||||||||||||||
| Student spaces in public institutions | 207,882 | 207,882 | 208,791 | 208,847 | Student enrolments may fluctuate due to a number of factors including economic changes and labour market needs. | |||||||||||||
| Public Safety and Solicitor General | 1,084 | 1,084 | 1,086 | 1,088 | ||||||||||||||
| Policing, Victim Services and Corrections | 947 | 947 | 949 | 950 | Policing, Victim Services and Corrections costs are sensitive to the volume and severity of criminal activity, the number of inmate beds occupied and the number of offenders under community supervision. | |||||||||||||
| Social Development and Poverty Reduction | 5,176 | 5,176 | 5,241 | 5,241 | ||||||||||||||
| Temporary Assistance annual average caseload (#) | 53,400 | 66,290 | 52,700 | 52,700 | The expected to work caseload is sensitive to fluctuations in economic and employment trends. | |||||||||||||
| Costs are driven by changes to cost per case and caseload. Cost per case fluctuations result from changes in the needed supports required by clients, as well as caseload composition. | ||||||||||||||||||
| Disability Assistance annual average caseload (#) | 125,700 | 126,083 | 127,300 | 127,300 | The caseload for persons with disabilities is sensitive to the aging of the population and longer life expectancy for individuals with disabilities. Cost per case fluctuations are driven primarily by earnings exemptions which is dependent on the level of income earned by clients. | |||||||||||||
| Adult Community Living: | ||||||||||||||||||
| Developmental Disabilities Programs | The adult community living caseload is sensitive to an aging population and to the level of service required. Cost per case fluctuations are driven by the proportion of clients receiving certain types of services at differing costs. For example, residential care services are significantly more costly than day programs. | |||||||||||||||||
| Average caseload (#) | 25,060 | 25,100 | 25,560 | 26,460 | ||||||||||||||
| Average cost per client ($) | 59,800 | 61,300 | 60,200 | 58,300 | ||||||||||||||
| Personal Supports Initiative (PSI) | ||||||||||||||||||
| Average caseload (#) | 3,510 | 3,500 | 3,650 | 3,950 | ||||||||||||||
| Average cost per client ($) | 16,100 | 18,100 | 16,200 | 15,000 | ||||||||||||||
| First Quarterly Report 2024/25 | | 67 | |
Appendix – Fiscal Plan Update
Table A3 Material Assumptions — Expense (continued)
| Ministry Programs and Assumptions ($ millions unless otherwise specified) | Budget 2024/25 | Updated 2024/25 | Plan 2025/26 | Plan 2026/27 | 2024/25 Sensitivities | |||||||||||||
| Tax Transfers | 3,492 | 3,501 | 3,663 | 3,763 | ||||||||||||||
| Individuals | 2,223.0 | 2,203.0 | 2,281.0 | 2,288.0 | ||||||||||||||
| Climate Action Tax Credit | 1,022.0 | 1,002.0 | 1,191.0 | 1,257.0 | These tax transfers are now expensed as required | |||||||||||||
| BC Family Benefit | 478.8 | 478.8 | 490.0 | 490.0 | under generally accepted accounting principles. | |||||||||||||
| BC Family Benefit Bonus (temporary increase)* | 186.0 | 186.0 | 62.0 | - | ||||||||||||||
| Renter's Tax Credit | 279.0 | 279.0 | 281.0 | 284.0 | ||||||||||||||
| Sales Tax | 50.0 | 50.0 | 50.0 | 50.0 | ||||||||||||||
| Small Business Venture Capital | 40.0 | 40.0 | 40.0 | 40.0 | ||||||||||||||
| BC Senior's Home Renovation | 3.0 | 3.0 | 3.0 | 3.0 | ||||||||||||||
| Other tax transfers to individuals | 164.2 | 164.2 | 164.0 | 164.0 | ||||||||||||||
| Changes in 2023 tax transfers will result in one¬time | ||||||||||||||||||
| Corporations | 1,269.0 | 1,298.0 | 1,382.0 | 1,475.0 | effect (prior-year adjustment) and could result in an | |||||||||||||
| Film and Television | 162.5 | 162.5 | 172.5 | 182.5 | additional base change in 2024/25. Production services | |||||||||||||
| Production Services | 746.8 | 776.3 | 845.0 | 923.5 | tax credit is the most volatile of all tax transfers and is | |||||||||||||
| Scientific Research & Experimental | influenced by several factors including delay in filing | |||||||||||||||||
| Development | 116.3 | 116.3 | 121.3 | 126.3 | returns and assessment of claims, length of projects and | |||||||||||||
| Interactive Digital Media | 140.0 | 140.0 | 140.0 | 140.0 | changes in the exchange rates. | |||||||||||||
| Mining Exploration | 60.0 | 60.0 | 60.0 | 60.0 | ||||||||||||||
| Other tax transfers to corporations | 43.4 | 42.9 | 43.2 | 42.7 | ||||||||||||||
| Prior-year adjustment (included above)* | ||||||||||||||||||
| Individuals | - | |||||||||||||||||
| Corporations | 5.8 | |||||||||||||||||
| 2023 Tax-year | 2023 Assumptions | |||||||||||||||||
| Tax Transfers | 2,876.0 | 2,829.0 | ||||||||||||||||
| Individuals | 1,578.0 | 1,531.0 | ||||||||||||||||
| Corporations | 1,298.0 | 1,298.0 | ||||||||||||||||
| Film and Television | 160.0 | 160.0 | ||||||||||||||||
| Production Services | 785.0 | 785.0 | ||||||||||||||||
| Scientific Research & Experimental Development | 110.0 | 110.0 | ||||||||||||||||
| Interactive Digital Media | 140.0 | 140.0 | ||||||||||||||||
| Other tax transfers to corporations | 103.0 | 103.0 | ||||||||||||||||
| *BC Family Benefit Bonus is a temporary increase to the BC Family Benefit for the 2024/25 benefit year with payments starting July 2024. | ||||||||||||||||||
| *2024/25 tax transfer forecast incorporates adjustments relating to prior years. | ||||||||||||||||||
| Management of Public Funds and Debt | 1,976 | 2,320 | 2,651 | 3,209 | ||||||||||||||
| Interest rates for new provincial borrowing: | Full year impact on MoPD on interest costs of a 1% | |||||||||||||||||
| Short-term | 4.06 | % | 4.30 | % | 3.16 | % | 2.85 | % | change in interest rates equals $10.7 million; $100 million | |||||||||
| Long-term | 4.27 | % | 4.42 | % | 4.34 | % | 4.34 | % | increase in debt level equals $4.4 million. | |||||||||
| CDN/US exchange rate (cents) | 135.1 | 137.7 | 134.4 | 130.6 | ||||||||||||||
| Service delivery agency net spending | 9,902 | 10,063 | 10,568 | 10,992 | ||||||||||||||
| School districts | 662 | 696 | 706 | 716 | ||||||||||||||
| Post-secondary institutions | 5,079 | 5,023 | 5,232 | 5,412 | Agency expenses, net of Provincial funding. These are | |||||||||||||
| Health authorities and hospital societies | 1,241 | 1,469 | 1,338 | 1,361 | mainly funded through revenue from other sources. | |||||||||||||
| BC Transportation Financing Authority | 2,270 | 2,031 | 2,336 | 2,475 | ||||||||||||||
| BC Infrastructure Benefits Inc | 254 | 258 | 300 | 149 | ||||||||||||||
| Other service delivery agencies | 396 | 586 | 656 | 879 | ||||||||||||||
| 68 | | First Quarterly Report 2024/25 | |
Appendix – Fiscal Plan Update
| Table A4 Operating Statement – 2017/18 to 2026/27 1 | ||||||||||||||||||||||||||||||||||||||||||||
| ($ millions) | Actual 2017/18 | Actual 2018/19 | Actual 2019/20 | Actual 2020/21 | Actual 2021/22 | Actual 2022/23 | Actual 2023/24 | Updated Forecast 2024/25 | Plan 2025/26 | Plan 2026/27 | Average annual change | |||||||||||||||||||||||||||||||||
| (per cent) | ||||||||||||||||||||||||||||||||||||||||||||
| Revenue | 51,940 | 56,950 | 58,493 | 62,047 | 72,391 | 81,790 | 79,623 | 81,770 | 84,355 | 87,069 | 5.9 | |||||||||||||||||||||||||||||||||
| Expense | (51,744 | ) | (55,634 | ) | (59,024 | ) | (67,662 | ) | (71,129 | ) | (80,834 | ) | (84,658 | ) | (90,749 | ) | (91,055 | ) | (93,164 | ) | 6.8 | |||||||||||||||||||||||
| Surplus (deficit) | 196 | 1,316 | (531 | ) | (5,615 | ) | 1,262 | 956 | (5,035 | ) | (8,979 | ) | (6,700 | ) | (6,095 | ) | ||||||||||||||||||||||||||||
| Per cent of nominal GDP: 2 | ||||||||||||||||||||||||||||||||||||||||||||
| Surplus (deficit) | 0.1 | 0.4 | -0.2 | -1.8 | 0.4 | 0.2 | -1.2 | -2.1 | -1.5 | -1.3 | ||||||||||||||||||||||||||||||||||
| Per cent of revenue: | ||||||||||||||||||||||||||||||||||||||||||||
| Surplus (deficit) | 0.4 | 2.3 | -0.9 | -9.0 | 1.7 | 1.2 | -6.3 | -11.0 | -7.9 | -7.0 | ||||||||||||||||||||||||||||||||||
| Per capita ($): 3 | ||||||||||||||||||||||||||||||||||||||||||||
| Surplus (deficit) | 40 | 262 | (104 | ) | (1,085 | ) | 241 | 178 | (912 | ) | (1,580 | ) | (1,165 | ) | (1,047 | ) | ||||||||||||||||||||||||||||
1 Figures have been restated to reflect government current accounting policies.
2 Surplus (deficit) as a per cent of nominal GDP is calculated using nominal GDP for the calendar year ending in the fiscal year (e.g. 2024/25 amounts divided by nominal GDP for the 2024 calendar year).
3 Per capita revenue and expense is calculated using July 1 population (e.g. 2024/25 amounts divided by population on July 1, 2024).
| First Quarterly Report 2024/25 | | 69 | |
Appendix – Fiscal Plan Update
Table A5 Revenue by Source – 2017/18 to 2026/27
| Updated | Average | |||||||||||||||||||||||||||||||||||||||||||
| Actual | Actual | Actual | Actual | Actual | Actual | Actual | Forecast | Plan | Plan | annual | ||||||||||||||||||||||||||||||||||
| ($ millions) | 2017/18 | 2018/19 | 2019/20 | 2020/21 | 2021/22 | 2022/23 | 2023/24 | 2024/25 | 2025/26 | 2026/27 | change | |||||||||||||||||||||||||||||||||
| (per cent) | ||||||||||||||||||||||||||||||||||||||||||||
| Taxation revenue: | ||||||||||||||||||||||||||||||||||||||||||||
| Personal income | 8,923 | 11,364 | 10,657 | 11,118 | 13,704 | 17,268 | 16,443 | 17,118 | 17,867 | 18,741 | 8.6 | |||||||||||||||||||||||||||||||||
| Corporate income | 4,165 | 5,180 | 5,011 | 4,805 | 5,053 | 9,156 | 6,085 | 7,598 | 6,428 | 6,540 | 5.1 | |||||||||||||||||||||||||||||||||
| Employer health | - | 464 | 1,897 | 2,156 | 2,443 | 2,720 | 2,886 | 2,962 | 3,110 | 3,239 | n/a | |||||||||||||||||||||||||||||||||
| Sales | 7,131 | 7,369 | 7,374 | 7,694 | 8,731 | 9,818 | 10,330 | 10,708 | 11,196 | 11,647 | 5.6 | |||||||||||||||||||||||||||||||||
| Fuel | 1,010 | 1,015 | 1,008 | 936 | 1,022 | 1,021 | 982 | 969 | 956 | 935 | -0.9 | |||||||||||||||||||||||||||||||||
| Carbon | 1,255 | 1,465 | 1,682 | 1,683 | 2,011 | 2,161 | 2,642 | 2,565 | 3,027 | 3,490 | 12.0 | |||||||||||||||||||||||||||||||||
| Tobacco | 727 | 781 | 729 | 711 | 708 | 531 | 477 | 470 | 470 | 470 | -4.7 | |||||||||||||||||||||||||||||||||
| Property | 2,367 | 2,617 | 2,608 | 2,313 | 3,012 | 3,253 | 3,605 | 3,850 | 4,074 | 4,281 | 6.8 | |||||||||||||||||||||||||||||||||
| Property transfer | 2,141 | 1,826 | 1,609 | 2,098 | 3,327 | 2,293 | 1,993 | 2,080 | 2,334 | 2,530 | 1.9 | |||||||||||||||||||||||||||||||||
| Insurance premium and other taxes | 602 | 633 | 691 | 652 | 706 | 804 | 853 | 871 | 913 | 923 | 4.9 | |||||||||||||||||||||||||||||||||
| 28,321 | 32,714 | 33,266 | 34,166 | 40,717 | 49,025 | 46,296 | 49,191 | 50,375 | 52,796 | 7.2 | ||||||||||||||||||||||||||||||||||
| Natural resource revenue: | ||||||||||||||||||||||||||||||||||||||||||||
| Natural gas royalties | 161 | 199 | 118 | 196 | 920 | 2,255 | 823 | 705 | 1,356 | 1,676 | 29.7 | |||||||||||||||||||||||||||||||||
| Bonus bids, rents on drilling rights and leases | 196 | 106 | 60 | 45 | 45 | 41 | 42 | 42 | 40 | 42 | -15.7 | |||||||||||||||||||||||||||||||||
| Columbia River Treaty | 111 | 202 | 119 | 117 | 231 | 437 | 448 | 358 | 356 | 357 | 13.9 | |||||||||||||||||||||||||||||||||
| Other energy and minerals | 619 | 557 | 386 | 191 | 795 | 979 | 637 | 687 | 567 | 488 | -2.6 | |||||||||||||||||||||||||||||||||
| Forests | 1,065 | 1,406 | 988 | 1,304 | 1,893 | 1,887 | 657 | 586 | 675 | 742 | -3.9 | |||||||||||||||||||||||||||||||||
| Other resources | 463 | 465 | 432 | 433 | 499 | 518 | 536 | 473 | 528 | 600 | 2.9 | |||||||||||||||||||||||||||||||||
| 2,615 | 2,935 | 2,103 | 2,286 | 4,383 | 6,117 | 3,143 | 2,851 | 3,522 | 3,905 | 4.6 | ||||||||||||||||||||||||||||||||||
| Other revenue: | ||||||||||||||||||||||||||||||||||||||||||||
| Medical Services Plan premiums | 2,266 | 1,360 | 1,063 | (4 | ) | 1 | (1 | ) | (1 | ) | - | - | - | n/a | ||||||||||||||||||||||||||||||
| Post-secondary education fees | 2,034 | 2,275 | 2,451 | 2,418 | 2,536 | 2,651 | 2,840 | 2,914 | 2,984 | 3,069 | 4.7 | |||||||||||||||||||||||||||||||||
| Other health-care related fees | 429 | 441 | 475 | 372 | 417 | 519 | 591 | 575 | 582 | 588 | 3.6 | |||||||||||||||||||||||||||||||||
| Motor vehicle licences and permits | 557 | 563 | 576 | 581 | 622 | 621 | 630 | 652 | 662 | 673 | 2.1 | |||||||||||||||||||||||||||||||||
| Other fees and licences | 963 | 949 | 1,004 | 970 | 1,025 | 1,146 | 1,217 | 1,360 | 1,196 | 1,223 | 2.7 | |||||||||||||||||||||||||||||||||
| Investment earnings | 1,101 | 1,243 | 1,263 | 1,264 | 1,306 | 1,314 | 1,708 | 1,667 | 1,585 | 1,631 | 4.5 | |||||||||||||||||||||||||||||||||
| Sales of goods and services | 1,133 | 1,164 | 1,162 | 741 | 1,059 | 1,396 | 1,548 | 1,511 | 1,596 | 1,511 | 3.3 | |||||||||||||||||||||||||||||||||
| Miscellaneous | 2,410 | 2,249 | 2,676 | 2,395 | 2,851 | 3,049 | 3,440 | 3,207 | 3,179 | 3,185 | 3.1 | |||||||||||||||||||||||||||||||||
| 10,893 | 10,244 | 10,670 | 8,737 | 9,817 | 10,695 | 11,973 | 11,886 | 11,784 | 11,880 | 1.0 | ||||||||||||||||||||||||||||||||||
| Contributions from the federal government: | ||||||||||||||||||||||||||||||||||||||||||||
| Canada Health Transfer | 4,994 | 5,182 | 5,523 | 5,701 | 6,431 | 6,432 | 7,117 | 7,170 | 7,509 | 7,882 | 5.2 | |||||||||||||||||||||||||||||||||
| Canada Social Transfer | 1,854 | 1,908 | 1,971 | 2,042 | 2,110 | 2,174 | 2,273 | 2,328 | 2,391 | 2,463 | 3.2 | |||||||||||||||||||||||||||||||||
| Other cost shared agreements | 2,207 | 1,962 | 2,041 | 5,151 | 3,439 | 3,921 | 4,344 | 5,063 | 5,100 | 4,438 | 8.1 | |||||||||||||||||||||||||||||||||
| 9,055 | 9,052 | 9,535 | 12,894 | 11,980 | 12,527 | 13,734 | 14,561 | 15,000 | 14,783 | 5.6 | ||||||||||||||||||||||||||||||||||
| Commercial Crown corporation net income: | ||||||||||||||||||||||||||||||||||||||||||||
| BC Hydro 1 | 683 | (428 | ) | 705 | 688 | 668 | 360 | 323 | 712 | 712 | 712 | 0.5 | ||||||||||||||||||||||||||||||||
| Liquor Distribution Branch | 1,119 | 1,104 | 1,107 | 1,161 | 1,189 | 1,199 | 1,148 | 1,090 | 1,032 | 1,020 | -1.0 | |||||||||||||||||||||||||||||||||
| BC Lottery Corporation 2 | 1,391 | 1,405 | 1,336 | 420 | 1,211 | 1,584 | 1,429 | 1,323 | 1,336 | 1,377 | -0.1 | |||||||||||||||||||||||||||||||||
| ICBC | (1,327 | ) | (1,153 | ) | (376 | ) | 1,528 | 2,286 | 131 | 1,399 | - | 400 | 400 | -187.5 | ||||||||||||||||||||||||||||||
| Other | 140 | 127 | 147 | 167 | 140 | 152 | 178 | 156 | 194 | 196 | 3.8 | |||||||||||||||||||||||||||||||||
| Accounting adjustment 1 | (950 | ) | 950 | - | - | - | - | - | - | - | - | n/a | ||||||||||||||||||||||||||||||||
| 1,056 | 2,005 | 2,919 | 3,964 | 5,494 | 3,426 | 4,477 | 3,281 | 3,674 | 3,705 | 15.0 | ||||||||||||||||||||||||||||||||||
| Total revenue | 51,940 | 56,950 | 58,493 | 62,047 | 72,391 | 81,790 | 79,623 | 81,770 | 84,355 | 87,069 | 5.9 | |||||||||||||||||||||||||||||||||
1 BC Hydro's loss for 2018/19 includes a write-off of a regulatory account. At the summary level, the Province recognized a $950 million adjustment in fiscal 2017/18 with respect to BC Hydro's deferred regulatory accounts.
2 Net of federal government payments and beginning in 2021/22, is also net of payments to the BC First Nations Gaming Revenue Sharing Limited Partnership in accordance with section 14.3 of the Gaming Control Act (B.C.).
| 70 | | First Quarterly Report 2024/25 | |
Appendix – Fiscal Plan Update
| Table A6 Revenue by Source Supplementary Information – 2017/18 to 2026/27 1 | ||||||||||||||||||||||||||||||||||||||||||||
| Actual 2017/18 | Actual 2018/19 | Actual 2019/20 | Actual 2020/21 | Actual 2021/22 | Actual 2022/23 | Actual 2023/24 | Updated Forecast 2024/25 | Plan 2025/26 | Plan 2026/27 | Average annual change | ||||||||||||||||||||||||||||||||||
| (per cent) | ||||||||||||||||||||||||||||||||||||||||||||
| Per cent of nominal GDP: 2 | ||||||||||||||||||||||||||||||||||||||||||||
| Taxation and Medical Services Plan premiums | 10.8 | 11.5 | 11.1 | 11.1 | 11.4 | 12.4 | 11.3 | 11.6 | 11.4 | 11.4 | 0.6 | |||||||||||||||||||||||||||||||||
| Taxation | 10.0 | 11.0 | 10.8 | 11.1 | 11.4 | 12.4 | 11.3 | 11.6 | 11.4 | 11.4 | 1.4 | |||||||||||||||||||||||||||||||||
| Medical Services Plan premiums | 0.8 | 0.5 | 0.3 | - | - | - | - | - | - | n/a | ||||||||||||||||||||||||||||||||||
| Natural resources | 0.9 | 1.0 | 0.7 | 0.7 | 1.2 | 1.5 | 0.8 | 0.7 | 0.8 | 0.8 | -1.0 | |||||||||||||||||||||||||||||||||
| Other | 3.9 | 3.4 | 3.5 | 2.8 | 2.8 | 2.7 | 2.9 | 2.8 | 2.7 | 2.6 | -4.4 | |||||||||||||||||||||||||||||||||
| Other excluding | ||||||||||||||||||||||||||||||||||||||||||||
| Medical Services Plan premiums | 3.1 | 3.0 | 3.1 | 2.8 | 2.8 | 2.7 | 2.9 | 2.8 | 2.7 | 2.6 | -1.9 | |||||||||||||||||||||||||||||||||
| Contributions from the federal government | 3.2 | 3.0 | 3.1 | 4.2 | 3.4 | 3.2 | 3.4 | 3.4 | 3.4 | 3.2 | 0.0 | |||||||||||||||||||||||||||||||||
| Commercial Crown corporation net income | 0.4 | 0.7 | 0.9 | 1.3 | 1.5 | 0.9 | 1.1 | 0.8 | 0.8 | 0.8 | 8.8 | |||||||||||||||||||||||||||||||||
| Total revenue | 18.4 | 19.2 | 18.9 | 20.2 | 20.3 | 20.7 | 19.4 | 19.3 | 19.1 | 18.8 | 0.2 | |||||||||||||||||||||||||||||||||
| Growth rates (per cent): | ||||||||||||||||||||||||||||||||||||||||||||
| Taxation | 4.5 | 15.5 | 1.7 | 2.7 | 19.2 | 20.4 | -5.6 | 6.3 | 2.4 | 4.8 | n/a | |||||||||||||||||||||||||||||||||
| Natural resources | -3.5 | 12.2 | -28.3 | 8.7 | 91.7 | 39.6 | -48.6 | -9.3 | 23.5 | 10.9 | n/a | |||||||||||||||||||||||||||||||||
| Other | -0.5 | -6.0 | 4.2 | -18.1 | 12.4 | 8.9 | 11.9 | -0.7 | -0.9 | 0.8 | n/a | |||||||||||||||||||||||||||||||||
| Other excluding | ||||||||||||||||||||||||||||||||||||||||||||
| Medical Services Plan premiums | 2.8 | 3.0 | 8.1 | -9.0 | 12.3 | 9.0 | 11.9 | -0.7 | -0.9 | 0.8 | n/a | |||||||||||||||||||||||||||||||||
| Contributions from the federal government | 10.9 | 0.0 | 5.3 | 35.2 | -7.1 | 4.6 | 9.6 | 6.0 | 3.0 | -1.4 | n/a | |||||||||||||||||||||||||||||||||
| Commercial Crown corporation net income | -58.2 | 89.9 | 45.6 | 35.8 | 38.6 | -37.6 | 30.7 | -26.7 | 12.0 | 0.8 | n/a | |||||||||||||||||||||||||||||||||
| Total revenue | 1.0 | 9.6 | 2.7 | 6.1 | 16.7 | 13.0 | -2.6 | 2.7 | 3.2 | 3.2 | n/a | |||||||||||||||||||||||||||||||||
| Per capita ($): 3 | ||||||||||||||||||||||||||||||||||||||||||||
| Taxation | 5,740 | 6,515 | 6,509 | 6,601 | 7,790 | 9,153 | 8,388 | 8,655 | 8,757 | 9,067 | 5.2 | |||||||||||||||||||||||||||||||||
| Natural resources | 530 | 585 | 411 | 442 | 839 | 1,142 | 569 | 502 | 612 | 671 | 2.7 | |||||||||||||||||||||||||||||||||
| Other | 2,208 | 2,040 | 2,088 | 1,688 | 1,878 | 1,997 | 2,169 | 2,091 | 2,048 | 2,040 | -0.9 | |||||||||||||||||||||||||||||||||
| Other excluding | ||||||||||||||||||||||||||||||||||||||||||||
| Medical Services Plan premiums | 1,748 | 1,769 | 1,880 | 1,689 | 1,878 | 1,997 | 2,170 | 2,091 | 2,048 | 2,040 | 1.7 | |||||||||||||||||||||||||||||||||
| Contributions from the federal government | 1,835 | 1,803 | 1,866 | 2,491 | 2,292 | 2,339 | 2,488 | 2,562 | 2,608 | 2,539 | 3.7 | |||||||||||||||||||||||||||||||||
| Commercial Crown corporation net income | 214 | 399 | 571 | 766 | 1,051 | 640 | 811 | 577 | 639 | 636 | 12.9 | |||||||||||||||||||||||||||||||||
| Total revenue | 10,527 | 11,342 | 11,444 | 11,987 | 13,850 | 15,270 | 14,427 | 14,387 | 14,664 | 14,953 | 4.0 | |||||||||||||||||||||||||||||||||
| Real Per Capita Revenue (2023 $) 4 | 12,732 | 13,356 | 13,169 | 13,689 | 15,386 | 15,868 | 14,427 | 14,004 | 13,963 | 13,955 | 1.0 | |||||||||||||||||||||||||||||||||
| Growth rate (per cent) | 8.1 | 4.9 | -1.4 | 4.0 | 12.4 | 3.1 | -9.1 | -2.9 | -0.3 | -0.1 | 1.9 | |||||||||||||||||||||||||||||||||
1 Numbers may not add due to rounding.
2 Revenue as a per cent of GDP is calculated using nominal GDP for the calendar year ending in the fiscal year (e.g. 2024/25 revenue divided by nominal GDP for the 2024 calendar year).
3 Per capita revenue is calculated using July 1 population (e.g. 2024/25 revenue divided by population on July 1, 2024).
4 Revenue is converted to real (inflation-adjusted) terms using the consumer price index (CPI) for the corresponding calendar year (e.g. 2024 CPI for 2024/25 revenue).
| First Quarterly Report 2024/25 | | 71 | |
Appendix – Fiscal Plan Update
Table A7 Expense by Function – 2017/18 to 2026/27 1,2
| ($ millions) | Actual 2017/18 | Actual 2018/19 | Actual 2019/20 | Actual 2020/21 | Actual 2021/22 | Actual 2022/23 | Actual 2023/24 | Updated Forecast 2024/25 | Plan 2025/26 | Plan 2026/27 | Average annual change | |||||||||||||||||||||||||||||||||
| (per cent) | ||||||||||||||||||||||||||||||||||||||||||||
| Function: | ||||||||||||||||||||||||||||||||||||||||||||
| Health: | ||||||||||||||||||||||||||||||||||||||||||||
| Medical Services Plan | 4,623 | 4,861 | 5,013 | 5,145 | 5,776 | 6,006 | 7,071 | 7,836 | 7,927 | 8,076 | 6.4 | |||||||||||||||||||||||||||||||||
| Pharmacare | 1,400 | 1,494 | 1,517 | 1,501 | 1,579 | 1,711 | 1,906 | 2,101 | 2,088 | 2,088 | 4.5 | |||||||||||||||||||||||||||||||||
| Regional services | 14,101 | 15,002 | 16,054 | 18,290 | 19,574 | 21,715 | 25,261 | 25,607 | 26,418 | 26,790 | 7.4 | |||||||||||||||||||||||||||||||||
| Other healthcare expenses | 810 | 800 | 872 | 677 | 662 | 890 | 625 | 1,078 | 1,056 | 1,030 | 2.7 | |||||||||||||||||||||||||||||||||
| Total health | 20,934 | 22,157 | 23,456 | 25,613 | 27,591 | 30,322 | 34,863 | 36,622 | 37,489 | 37,984 | 6.8 | |||||||||||||||||||||||||||||||||
| Education: | ||||||||||||||||||||||||||||||||||||||||||||
| Elementary and secondary | 6,919 | 7,255 | 7,584 | 7,444 | 8,085 | 8,585 | 9,285 | 9,782 | 9,851 | 9,868 | 4.0 | |||||||||||||||||||||||||||||||||
| Post-secondary | 6,002 | 6,398 | 6,846 | 6,872 | 7,357 | 7,517 | 8,403 | 8,929 | 9,187 | 9,489 | 5.2 | |||||||||||||||||||||||||||||||||
| Other education expenses | 176 | 442 | 312 | 630 | 361 | 891 | 791 | 461 | 464 | 463 | 11.3 | |||||||||||||||||||||||||||||||||
| Total education | 13,097 | 14,095 | 14,742 | 14,946 | 15,803 | 16,993 | 18,479 | 19,172 | 19,502 | 19,820 | 4.7 | |||||||||||||||||||||||||||||||||
| Social services: | ||||||||||||||||||||||||||||||||||||||||||||
| Social assistance | 1,988 | 2,202 | 2,342 | 3,141 | 2,910 | 3,157 | 3,009 | 3,359 | 3,383 | 3,383 | 6.1 | |||||||||||||||||||||||||||||||||
| Child welfare | 1,507 | 1,652 | 1,940 | 2,226 | 2,254 | 3,168 | 3,941 | 4,260 | 4,268 | 4,206 | 12.1 | |||||||||||||||||||||||||||||||||
| Low income tax credit transfers | 239 | 414 | 435 | 1,131 | 754 | 1,746 | 733 | 1,052 | 1,241 | 1,307 | 20.8 | |||||||||||||||||||||||||||||||||
| Community living and other services | 1,003 | 1,075 | 1,170 | 1,291 | 1,350 | 1,581 | 1,601 | 1,787 | 1,834 | 1,835 | 6.9 | |||||||||||||||||||||||||||||||||
| Total social services | 4,737 | 5,343 | 5,887 | 7,789 | 7,268 | 9,652 | 9,284 | 10,458 | 10,726 | 10,731 | 9.5 | |||||||||||||||||||||||||||||||||
| Protection of persons and property | 1,930 | 2,004 | 2,126 | 2,258 | 2,937 | 3,483 | 3,101 | 2,556 | 2,574 | 2,583 | 3.3 | |||||||||||||||||||||||||||||||||
| Transportation | 1,931 | 2,021 | 2,126 | 3,362 | 4,453 | 3,320 | 2,379 | 2,738 | 2,786 | 2,717 | 3.9 | |||||||||||||||||||||||||||||||||
| Natural resources & economic development | 3,374 | 3,825 | 3,779 | 4,191 | 5,213 | 6,284 | 6,704 | 5,171 | 4,312 | 4,245 | 2.6 | |||||||||||||||||||||||||||||||||
| Other | 1,574 | 1,831 | 2,524 | 2,862 | 3,082 | 5,736 | 4,215 | 3,707 | 3,657 | 3,509 | 9.3 | |||||||||||||||||||||||||||||||||
| Contingencies - general programs and CleanBC | - | - | - | - | - | - | - | 3,885 | 2,020 | 1,730 | n/a | |||||||||||||||||||||||||||||||||
| Priority spending initiatives and caseload pressures | - | - | - | - | - | - | - | - | 1,000 | 2,000 | n/a | |||||||||||||||||||||||||||||||||
| General government | 1,544 | 1,674 | 1,657 | 3,919 | 2,040 | 2,325 | 2,341 | 2,067 | 1,981 | 1,984 | 2.8 | |||||||||||||||||||||||||||||||||
| Debt servicing | 2,623 | 2,684 | 2,727 | 2,722 | 2,742 | 2,719 | 3,292 | 4,373 | 5,008 | 5,861 | 9.3 | |||||||||||||||||||||||||||||||||
| Total expense | 51,744 | 55,634 | 59,024 | 67,662 | 71,129 | 80,834 | 84,658 | 90,749 | 91,055 | 93,164 | ||||||||||||||||||||||||||||||||||
| Per cent of operating expense: | ||||||||||||||||||||||||||||||||||||||||||||
| Health | 40.5 | 39.8 | 39.7 | 37.9 | 38.8 | 37.5 | 41.2 | 40.4 | 41.2 | 40.8 | 0.1 | |||||||||||||||||||||||||||||||||
| Education | 25.3 | 25.3 | 25.0 | 22.1 | 22.2 | 21.0 | 21.8 | 21.1 | 21.4 | 21.3 | -1.9 | |||||||||||||||||||||||||||||||||
| Social services | 9.2 | 9.6 | 10.0 | 11.5 | 10.2 | 11.9 | 11.0 | 11.5 | 11.8 | 11.5 | 2.6 | |||||||||||||||||||||||||||||||||
| Protection of persons and property | 3.7 | 3.6 | 3.6 | 3.3 | 4.1 | 4.3 | 3.7 | 2.8 | 2.8 | 2.8 | -3.2 | |||||||||||||||||||||||||||||||||
| Transportation | 3.7 | 3.6 | 3.6 | 5.0 | 6.3 | 4.1 | 2.8 | 3.0 | 3.1 | 2.9 | -2.7 | |||||||||||||||||||||||||||||||||
| Natural resources & economic development | 6.5 | 6.9 | 6.4 | 6.2 | 7.3 | 7.8 | 7.9 | 5.7 | 4.7 | 4.6 | -3.9 | |||||||||||||||||||||||||||||||||
| Other | 3.0 | 3.3 | 4.3 | 4.2 | 4.3 | 7.1 | 5.0 | 4.1 | 4.0 | 3.8 | 2.4 | |||||||||||||||||||||||||||||||||
| Contingencies - general programs and CleanBC | - | - | - | - | - | - | - | 4.3 | 2.2 | 1.9 | n/a | |||||||||||||||||||||||||||||||||
| Priority spending initiatives and caseload pressures | - | - | - | - | - | - | - | - | 1.1 | 2.1 | n/a | |||||||||||||||||||||||||||||||||
| General government | 3.0 | 3.0 | 2.8 | 5.8 | 2.9 | 2.9 | 2.8 | 2.3 | 2.2 | 2.1 | -3.7 | |||||||||||||||||||||||||||||||||
| Debt servicing | 5.1 | 4.8 | 4.6 | 4.0 | 3.9 | 3.4 | 3.9 | 4.8 | 5.5 | 6.3 | 2.4 | |||||||||||||||||||||||||||||||||
| Operating expense | 100.0 | 100.0 | 100.0 | 100.0 | 100.0 | 100.0 | 100.0 | 100.0 | 100.0 | 100.0 | ||||||||||||||||||||||||||||||||||
1 Figures reflect government accounting policies used in the 2023/24 Public Accounts audited financial statements.
2 Numbers may not add due to rounding.
| 72 | | First Quarterly Report 2024/25 | |
Appendix – Fiscal Plan Update
Table A8 Expense by Function Supplementary Information – 2017/18 to 2026/27 1
| Actual 2017/18 | Actual 2018/19 | Actual 2019/20 | Actual 2020/21 | Actual 2021/22 | Actual 2022/23 | Actual 2023/24 | Updated Forecast 2024/25 | Plan 2025/26 | Plan 2026/27 | Average annual change | ||||||||||||||||||||||||||||||||||
| (per cent) | ||||||||||||||||||||||||||||||||||||||||||||
| Per cent of nominal GDP: 2 | ||||||||||||||||||||||||||||||||||||||||||||
| Health | 7.4 | 7.5 | 7.6 | 8.3 | 7.8 | 7.7 | 8.5 | 8.6 | 8.5 | 8.2 | 1.1 | |||||||||||||||||||||||||||||||||
| Education | 4.6 | 4.7 | 4.8 | 4.9 | 4.4 | 4.3 | 4.5 | 4.5 | 4.4 | 4.3 | -0.9 | |||||||||||||||||||||||||||||||||
| Social services | 1.7 | 1.8 | 1.9 | 2.5 | 2.0 | 2.4 | 2.3 | 2.5 | 2.4 | 2.3 | 3.7 | |||||||||||||||||||||||||||||||||
| Protection of persons and property | 0.7 | 0.7 | 0.7 | 0.7 | 0.8 | 0.9 | 0.8 | 0.6 | 0.6 | 0.6 | -2.2 | |||||||||||||||||||||||||||||||||
| Transportation | 0.7 | 0.7 | 0.7 | 1.1 | 1.3 | 0.8 | 0.6 | 0.6 | 0.6 | 0.6 | -1.7 | |||||||||||||||||||||||||||||||||
| Natural resources & economic development | 1.2 | 1.3 | 1.2 | 1.4 | 1.5 | 1.6 | 1.6 | 1.2 | 1.0 | 0.9 | -2.9 | |||||||||||||||||||||||||||||||||
| Other | 0.6 | 0.6 | 0.8 | 0.9 | 0.9 | 1.5 | 1.0 | 0.9 | 0.8 | 0.8 | 3.5 | |||||||||||||||||||||||||||||||||
| Contingencies - general programs and CleanBC | - | - | - | - | - | - | - | 0.9 | 0.5 | 0.4 | n/a | |||||||||||||||||||||||||||||||||
| Priority spending initiatives and caseload pressures | - | - | - | - | - | - | - | - | 0.3 | 0.6 | n/a | |||||||||||||||||||||||||||||||||
| General government | 0.5 | 0.6 | 0.5 | 1.3 | 0.6 | 0.6 | 0.6 | 0.5 | 0.4 | 0.4 | -2.7 | |||||||||||||||||||||||||||||||||
| Debt servicing | 0.9 | 0.9 | 0.9 | 0.9 | 0.8 | 0.7 | 0.8 | 1.0 | 1.1 | 1.3 | 3.5 | |||||||||||||||||||||||||||||||||
| Operating expense | 18.3 | 18.7 | 19.1 | 22.0 | 20.0 | 20.5 | 20.7 | 21.4 | 20.6 | 20.3 | 1.1 | |||||||||||||||||||||||||||||||||
| Growth rates (per cent): | ||||||||||||||||||||||||||||||||||||||||||||
| Health | 6.3 | 5.8 | 5.9 | 9.2 | 7.7 | 9.9 | 15.0 | 5.0 | 2.4 | 1.3 | n/a | |||||||||||||||||||||||||||||||||
| Education | 5.0 | 7.6 | 4.6 | 1.4 | 5.7 | 7.5 | 8.7 | 3.8 | 1.7 | 1.6 | n/a | |||||||||||||||||||||||||||||||||
| Social services | 11.6 | 12.8 | 10.2 | 32.3 | -6.7 | 32.8 | -3.8 | 12.6 | 2.6 | 0.0 | n/a | |||||||||||||||||||||||||||||||||
| Protection of persons and property | 16.6 | 3.8 | 6.1 | 6.2 | 30.1 | 18.6 | -11.0 | -17.6 | 0.7 | 0.3 | n/a | |||||||||||||||||||||||||||||||||
| Transportation | 8.2 | 4.7 | 5.2 | 58.1 | 32.5 | -25.4 | -28.3 | 15.1 | 1.8 | -2.5 | n/a | |||||||||||||||||||||||||||||||||
| Natural resources & economic development | 36.9 | 13.4 | -1.2 | 10.9 | 24.4 | 20.5 | 6.7 | -22.9 | -16.6 | -1.6 | n/a | |||||||||||||||||||||||||||||||||
| Other | -31.0 | 16.3 | 37.8 | 13.4 | 7.7 | 86.1 | -26.5 | -12.1 | -1.3 | -4.0 | n/a | |||||||||||||||||||||||||||||||||
| Contingencies - general programs and CleanBC | - | - | - | - | - | - | - | - | -48.0 | -14.4 | n/a | |||||||||||||||||||||||||||||||||
| Priority spending initiatives and caseload pressures | - | - | - | - | - | - | - | - | - | 100.0 | n/a | |||||||||||||||||||||||||||||||||
| General government | 0.5 | 8.4 | -1.0 | 136.5 | -47.9 | 14.0 | 0.7 | -11.7 | -4.2 | 0.2 | n/a | |||||||||||||||||||||||||||||||||
| Debt servicing | 1.4 | 2.3 | 1.6 | -0.2 | 0.7 | -0.8 | 21.1 | 32.8 | 14.5 | 17.0 | n/a | |||||||||||||||||||||||||||||||||
| Operating expense | 6.2 | 7.5 | 6.1 | 14.6 | 5.1 | 13.6 | 4.7 | 7.2 | 0.3 | 2.3 | n/a | |||||||||||||||||||||||||||||||||
| Per capita ($): 3 | ||||||||||||||||||||||||||||||||||||||||||||
| Health | 4,243 | 4,413 | 4,589 | 4,948 | 5,279 | 5,661 | 6,317 | 6,443 | 6,517 | 6,523 | 4.9 | |||||||||||||||||||||||||||||||||
| Education | 2,654 | 2,807 | 2,884 | 2,888 | 3,024 | 3,173 | 3,348 | 3,373 | 3,390 | 3,404 | 2.8 | |||||||||||||||||||||||||||||||||
| Social services | 960 | 1,064 | 1,152 | 1,505 | 1,391 | 1,802 | 1,682 | 1,840 | 1,865 | 1,843 | 7.5 | |||||||||||||||||||||||||||||||||
| Protection of persons and property | 391 | 399 | 416 | 436 | 562 | 650 | 562 | 450 | 447 | 444 | 1.4 | |||||||||||||||||||||||||||||||||
| Transportation | 391 | 403 | 416 | 650 | 852 | 620 | 431 | 482 | 484 | 467 | 2.0 | |||||||||||||||||||||||||||||||||
| Natural resources & economic development | 684 | 762 | 739 | 810 | 997 | 1,173 | 1,215 | 910 | 750 | 729 | 0.7 | |||||||||||||||||||||||||||||||||
| Other | 319 | 365 | 494 | 553 | 590 | 1,071 | 764 | 652 | 636 | 603 | 7.3 | |||||||||||||||||||||||||||||||||
| Contingencies - general programs and CleanBC | - | - | - | - | - | - | - | 684 | 351 | 297 | n/a | |||||||||||||||||||||||||||||||||
| Priority spending initiatives and caseload pressures | - | - | - | - | - | - | - | - | 174 | 343 | n/a | |||||||||||||||||||||||||||||||||
| General government | 313 | 333 | 324 | 757 | 390 | 434 | 424 | 364 | 344 | 341 | 1.0 | |||||||||||||||||||||||||||||||||
| Debt servicing | 532 | 535 | 534 | 526 | 525 | 508 | 596 | 769 | 871 | 1,007 | 7.3 | |||||||||||||||||||||||||||||||||
| Operating expense | 10,487 | 11,081 | 11,548 | 13,073 | 13,610 | 15,092 | 15,339 | 15,967 | 15,829 | 16,001 | 4.8 | |||||||||||||||||||||||||||||||||
| Real Per Capita Operating Expense (2023 $) 4 | 12,685 | 13,048 | 13,289 | 14,929 | 15,119 | 15,682 | 15,339 | 15,543 | 15,072 | 14,933 | 1.8 | |||||||||||||||||||||||||||||||||
| Growth rate (per cent) | 6.4 | 2.9 | 1.8 | 12.3 | 1.3 | 3.7 | -2.2 | 1.3 | -3.0 | -0.9 | 2.4 | |||||||||||||||||||||||||||||||||
| 1 | Numbers may not add due to rounding. |
| 2 | Expense as a per cent of GDP is calculated using nominal GDP for the calendar year ending in the fiscal year (e.g. 2024/25 expense divided by nominal GDP for the 2024 calendar year). |
| 3 | Per capita expense is calculated using July 1 population (e.g. 2024/25 expense divided by population on July 1, 2024). |
| 4 | Expense is converted to real (inflation-adjusted) terms using the consumer price index (CPI) for the corresponding calendar year (e.g. 2024 CPI for 2024/25 expense). |
| First Quarterly Report 2024/25 | | 73 | |
Appendix – Fiscal Plan Update
Table A9 Full-Time Equivalents (FTEs) – 2017/18 to 2026/27 1
| Actual 2017/18 | Actual 2018/19 | Actual 2019/20 | Actual 2020/21 | Actual 2021/22 | Actual 2022/23 | Actual 2023/24 | Updated Forecast 2024/25 | Plan 2025/26 | Plan 2026/27 | Average annual change | ||||||||||||||||||||||||||||||||||
| (per cent) | ||||||||||||||||||||||||||||||||||||||||||||
| Taxpayer-supported programs and agencies: | ||||||||||||||||||||||||||||||||||||||||||||
| Ministries and special offices (CRF) | 29,291 | 30,891 | 31,774 | 32,672 | 33,400 | 33,696 | 37,008 | 38,900 | 38,900 | 38,900 | 3.2 | |||||||||||||||||||||||||||||||||
| Service delivery agencies 2 | 5,076 | 5,258 | 5,985 | 6,042 | 6,767 | 7,746 | 8,666 | 9,217 | 9,387 | 9,623 | 7.4 | |||||||||||||||||||||||||||||||||
| Total FTEs | 34,367 | 36,149 | 37,759 | 38,714 | 40,167 | 41,442 | 45,674 | 48,117 | 48,287 | 48,523 | 3.9 | |||||||||||||||||||||||||||||||||
| Growth rates (per cent): | ||||||||||||||||||||||||||||||||||||||||||||
| Ministries and special offices (CRF) | 4.8 | 5.5 | 2.9 | 2.8 | 2.2 | 0.9 | 9.8 | 5.1 | 0.0 | 0.0 | 3.4 | |||||||||||||||||||||||||||||||||
| Service delivery agencies | 4.7 | 3.6 | 13.8 | 1.0 | 12.0 | 14.5 | 11.9 | 6.4 | 1.8 | 2.5 | 7.2 | |||||||||||||||||||||||||||||||||
| Population per FTE: 3 | ||||||||||||||||||||||||||||||||||||||||||||
| Total FTEs | 143.6 | 138.9 | 135.4 | 133.7 | 130.1 | 129.2 | 120.8 | 118.1 | 119.1 | 120.0 | -2.0 | |||||||||||||||||||||||||||||||||
| 1 | Full-time equivalents (FTEs) are a measure of staff employment. FTEs are calculated by dividing the total hours of employment paid for in a given period by the number of hours an individual, full-time person would normally work in that period. This does not equate to the physical number of employees. For example, two half-time employees would equal one FTE, or alternatively, three FTEs may represent two full-time employees who have worked sufficient overtime hours to equal an additional FTE. |
| 2 | Service delivery agency FTE amounts do not include SUCH sector staff employment. |
| 3 | Population per FTE is calculated using July 1 population (e.g. population on July 1, 2024 divided by 2024/25 FTEs). |
| 74 | | First Quarterly Report 2024/25 | |
Appendix – Fiscal Plan Update
Table A10 Capital Spending — 2017/18 to 2026/27
| ($ millions) | Actual 2017/18 | Actual 2018/19 | Actual 2019/20 | Actual 2020/21 | Actual 2021/22 | Actual 2022/23 | Actual 2023/24 | Updated Forecast 2024/25 | Plan 2025/26 | Plan 2026/27 | Average annual change | |||||||||||||||||||||||||||||||||
| (per cent) | ||||||||||||||||||||||||||||||||||||||||||||
| Taxpayer-supported: | ||||||||||||||||||||||||||||||||||||||||||||
| Education | ||||||||||||||||||||||||||||||||||||||||||||
| Schools districts | 578 | 626 | 877 | 944 | 1,001 | 934 | 874 | 1,221 | 1,463 | 1,535 | 11.5 | |||||||||||||||||||||||||||||||||
| Post-secondary institutions | 968 | 1,024 | 936 | 904 | 899 | 1,071 | 1,227 | 2,055 | 2,058 | 1,858 | 7.5 | |||||||||||||||||||||||||||||||||
| Health | 890 | 904 | 1,009 | 1,162 | 1,555 | 1,915 | 2,998 | 4,253 | 4,777 | 4,365 | 19.3 | |||||||||||||||||||||||||||||||||
| BC Transportation Financing Authority 1 | 717 | 853 | 955 | 1,285 | 1,364 | 1,823 | 2,263 | 3,959 | 5,019 | 5,075 | 24.3 | |||||||||||||||||||||||||||||||||
| BC Transit | 115 | 85 | 73 | 107 | 67 | 100 | 158 | 289 | 606 | 268 | 9.9 | |||||||||||||||||||||||||||||||||
| Government direct (ministries) | 430 | 421 | 520 | 389 | 386 | 470 | 537 | 704 | 554 | 566 | 3.1 | |||||||||||||||||||||||||||||||||
| Social Housing | 169 | 483 | 355 | 572 | 642 | 357 | 587 | 846 | 714 | 796 | 18.8 | |||||||||||||||||||||||||||||||||
| Other | 41 | 56 | 47 | 65 | 88 | 85 | 128 | 282 | 122 | 75 | 6.9 | |||||||||||||||||||||||||||||||||
| Total taxpayer-supported | 3,908 | 4,452 | 4,772 | 5,428 | 6,002 | 6,755 | 8,772 | 13,609 | 15,313 | 14,538 | 15.7 | |||||||||||||||||||||||||||||||||
| Self-supported: | ||||||||||||||||||||||||||||||||||||||||||||
| BC Hydro | 2,473 | 3,826 | 3,082 | 3,207 | 3,475 | 3,919 | 4,263 | 4,197 | 4,051 | 4,411 | 6.6 | |||||||||||||||||||||||||||||||||
| Columbia Basin power projects | 1 | 2 | 994 | 7 | 9 | 10 | 8 | 15 | 21 | 20 | 39.5 | |||||||||||||||||||||||||||||||||
| Transportation Investment Corporation 1 | 4 | - | - | - | - | - | - | - | - | - | n/a | |||||||||||||||||||||||||||||||||
| BC Railway Company | 11 | 33 | 6 | 1 | 2 | 6 | 4 | 6 | 5 | 4 | -10.6 | |||||||||||||||||||||||||||||||||
| ICBC | 54 | 66 | 62 | 100 | 54 | 41 | 64 | 66 | 76 | 199 | 15.6 | |||||||||||||||||||||||||||||||||
| BC Lottery Corporation 2 | 82 | 75 | 102 | 73 | 90 | 95 | 84 | 100 | 105 | 105 | 2.8 | |||||||||||||||||||||||||||||||||
| Liquor Distribution Branch | 48 | 60 | 36 | 22 | 22 | 16 | 18 | 34 | 27 | 30 | -5.1 | |||||||||||||||||||||||||||||||||
| Other3 | 56 | 44 | 104 | 65 | 78 | 78 | 143 | - | - | - | n/a | |||||||||||||||||||||||||||||||||
| Total self-supported | 2,729 | 4,106 | 4,386 | 3,475 | 3,730 | 4,165 | 4,584 | 4,418 | 4,285 | 4,769 | 6.4 | |||||||||||||||||||||||||||||||||
| Total capital spending | 6,637 | 8,558 | 9,158 | 8,903 | 9,732 | 10,920 | 13,356 | 18,027 | 19,598 | 19,307 | 12.6 | |||||||||||||||||||||||||||||||||
| Per cent of nominal GDP: 4 | ||||||||||||||||||||||||||||||||||||||||||||
| Taxpayer-supported | 1.4 | 1.5 | 1.5 | 1.8 | 1.7 | 1.7 | 2.1 | 3.2 | 3.5 | 3.1 | 9.5 | |||||||||||||||||||||||||||||||||
| Self-supported | 1.0 | 1.4 | 1.4 | 1.1 | 1.0 | 1.1 | 1.1 | 1.0 | 1.0 | 1.0 | 0.7 | |||||||||||||||||||||||||||||||||
| Total | 2.4 | 2.9 | 3.0 | 2.9 | 2.7 | 2.8 | 3.3 | 4.3 | 4.4 | 4.2 | 6.6 | |||||||||||||||||||||||||||||||||
| Growth rates: | ||||||||||||||||||||||||||||||||||||||||||||
| Taxpayer-supported | 6.8 | 13.9 | 7.2 | 13.7 | 10.6 | 12.5 | 29.9 | 55.1 | 12.5 | -5.1 | n/a | |||||||||||||||||||||||||||||||||
| Self-supported | 0.1 | 50.5 | 6.8 | -20.8 | 7.3 | 11.7 | 10.1 | -3.6 | -3.0 | 11.3 | 62.0 | |||||||||||||||||||||||||||||||||
| Total | 4.0 | 28.9 | 7.0 | -2.8 | 9.3 | 12.2 | 22.3 | 35.0 | 8.7 | -1.5 | n/a | |||||||||||||||||||||||||||||||||
| Per capita: 5 | ||||||||||||||||||||||||||||||||||||||||||||
| Taxpayer-supported | 792 | 887 | 934 | 1,049 | 1,148 | 1,261 | 1,589 | 2,394 | 2,662 | 2,497 | 13.6 | |||||||||||||||||||||||||||||||||
| Self-supported | 553 | 818 | 858 | 671 | 714 | 778 | 831 | 777 | 745 | 819 | 4.5 | |||||||||||||||||||||||||||||||||
| Total | 1,345 | 1,704 | 1,792 | 1,720 | 1,862 | 2,039 | 2,420 | 3,172 | 3,407 | 3,316 | 10.5 | |||||||||||||||||||||||||||||||||
| Real Per Capita Capital Spending (2023 $) 6 | 1,627 | 2,007 | 2,062 | 1,964 | 2,069 | 2,119 | 2,420 | 3,088 | 3,244 | 3,095 | 7.4 | |||||||||||||||||||||||||||||||||
| Growth rate (per cent) | 0.3 | 23.4 | 2.7 | -4.7 | 5.3 | 2.4 | 14.2 | 27.6 | 5.1 | -4.6 | n/a | |||||||||||||||||||||||||||||||||
| 1 | Includes Transportation Investment Plan capital spending and, beginning in 2017/18, Transportation Investment Corporation rehabilitation costs for the Port Mann Bridge due to reclassification from self-supported commercial Crown corporation to a taxpayer-supported agency in response to the cancellation of tolls. Effective April 1, 2018, Transportation Investment Corporation became a subsidiary of BCTFA. |
| 2 | Forecasted amounts exclude right-of-use assets. |
| 3 | Includes post-secondary institutions' self-supported subsidiaries |
| 4 | Capital spending as a per cent of GDP is calculated using nominal GDP for the calendar year ending in the fiscal year (e.g. 2024/25 amounts divided by nominal GDP for the 2024 calendar year). |
| 5 | Per capita capital spending is calculated using July 1 population (e.g. 2024/25 amounts divided by population on July 1, 2024). |
| 6 | Capital spending is converted to real (inflation-adjusted) terms using the consumer price index (CPI) for the corresponding calendar year (e.g. 2024 CPI for 2024/25 capital spending). |
| First Quarterly Report 2024/25 | | 75 | |
Appendix – Fiscal Plan Update
Table A11 Statement of Financial Position – 2017/18 to 2026/27 1
| ($ millions) | Actual 2017/18 | Actual 2018/19 | Actual 2019/20 | Actual 2020/21 | Actual 2021/22 | Actual 2022/23 | Actual 2023/24 | Updated Forecast 2024/25 | Plan 2025/26 | Plan 2026/27 | Average annual change | |||||||||||||||||||||||||||||||||
| (per cent) | ||||||||||||||||||||||||||||||||||||||||||||
| Financial assets: | ||||||||||||||||||||||||||||||||||||||||||||
| Cash and temporary investments | 3,440 | 3,029 | 3,985 | 6,560 | 7,142 | 8,247 | 6,768 | 4,600 | 4,526 | 4,458 | 2.4 | |||||||||||||||||||||||||||||||||
| Other financial assets | 11,749 | 12,646 | 12,413 | 15,413 | 17,109 | 19,074 | 22,057 | 21,670 | 23,971 | 26,104 | 7.5 | |||||||||||||||||||||||||||||||||
| Sinking funds | 1,348 | 752 | 692 | 492 | 510 | 521 | 491 | 561 | 377 | 385 | -10.8 | |||||||||||||||||||||||||||||||||
| Investments in commercial Crown corporations: | ||||||||||||||||||||||||||||||||||||||||||||
| Retained earnings | 6,134 | 5,738 | 6,523 | 9,632 | 12,426 | 12,926 | 14,677 | 15,403 | 16,541 | 17,678 | 10.1 | |||||||||||||||||||||||||||||||||
| Recoverable capital loans | 20,534 | 22,547 | 24,768 | 26,301 | 27,218 | 28,037 | 30,572 | 33,877 | 35,824 | 38,101 | 5.8 | |||||||||||||||||||||||||||||||||
| 26,668 | 28,285 | 31,291 | 35,933 | 39,644 | 40,963 | 45,249 | 49,280 | 52,365 | 55,779 | 6.9 | ||||||||||||||||||||||||||||||||||
| Total financial assets | 43,205 | 44,712 | 48,381 | 58,398 | 64,405 | 68,805 | 74,565 | 76,111 | 81,239 | 86,726 | 6.5 | |||||||||||||||||||||||||||||||||
| Liabilities: | ||||||||||||||||||||||||||||||||||||||||||||
| Accounts payable, accrued liabilities & others | 11,278 | 12,137 | 13,100 | 14,733 | 18,509 | 25,400 | 23,798 | 22,427 | 23,410 | 24,021 | 7.1 | |||||||||||||||||||||||||||||||||
| Deferred revenue | 8,967 | 9,620 | 9,895 | 11,557 | 12,796 | 14,494 | 15,053 | 16,154 | 17,563 | 18,657 | 6.9 | |||||||||||||||||||||||||||||||||
| Debt: | ||||||||||||||||||||||||||||||||||||||||||||
| Taxpayer-supported debt | 43,607 | 42,681 | 46,229 | 59,750 | 62,341 | 59,888 | 75,402 | 93,346 | 113,790 | 133,364 | 10.7 | |||||||||||||||||||||||||||||||||
| Self-supported debt | 21,312 | 23,281 | 25,932 | 27,350 | 28,325 | 29,492 | 32,060 | 35,264 | 37,185 | 39,568 | 5.8 | |||||||||||||||||||||||||||||||||
| Total provincial debt | 64,919 | 65,962 | 72,161 | 87,100 | 90,666 | 89,380 | 107,462 | 128,610 | 150,975 | 172,932 | 9.3 | |||||||||||||||||||||||||||||||||
| Add: debt offset by sinking funds | 1,348 | 752 | 692 | 492 | 510 | 521 | 491 | 561 | 377 | 385 | -10.8 | |||||||||||||||||||||||||||||||||
| Add: foreign exchange adjustments | - | - | - | - | - | 472 | 494 | 700 | 201 | (444 | ) | n/a | ||||||||||||||||||||||||||||||||
| Less: guarantees & non-guaranteed debt | (896 | ) | (850 | ) | (1,337 | ) | (1,335 | ) | (1,402 | ) | (1,523 | ) | (1,476 | ) | (1,592 | ) | (1,766 | ) | (2,072 | ) | 7.9 | |||||||||||||||||||||||
| Financial statement debt | 65,371 | 65,864 | 71,516 | 86,257 | 89,774 | 88,850 | 106,971 | 128,279 | 149,787 | 170,801 | 9.1 | |||||||||||||||||||||||||||||||||
| Total liabilities | 85,616 | 87,621 | 94,511 | 112,547 | 121,079 | 128,744 | 145,822 | 166,860 | 190,760 | 213,479 | 8.7 | |||||||||||||||||||||||||||||||||
| Net liabilities | (42,411 | ) | (42,909 | ) | 46,130 | ) | (54,149 | ) | (56,674 | ) | (59,939 | ) | (71,257 | ) | 90,749 | ) | (109,521 | ) | (126,753 | ) | 10.5 | |||||||||||||||||||||||
| Capital and other assets: | ||||||||||||||||||||||||||||||||||||||||||||
| Tangible capital assets | 45,915 | 47,909 | 50,104 | 52,861 | 56,142 | 59,818 | 65,583 | 76,100 | 88,091 | 99,143 | 7.2 | |||||||||||||||||||||||||||||||||
| Restricted assets | 1,768 | 1,834 | 1,931 | 2,003 | 2,147 | 2,224 | 2,352 | 2,427 | 2,502 | 2,579 | 3.5 | |||||||||||||||||||||||||||||||||
| Other assets | 932 | 952 | 1,100 | 1,582 | 1,791 | 1,347 | 1,701 | 1,622 | 1,628 | 1,636 | 5.2 | |||||||||||||||||||||||||||||||||
| Total capital and other assets | 48,615 | 50,695 | 53,135 | 56,446 | 60,080 | 63,389 | 69,636 | 80,149 | 92,221 | 103,358 | 7.1 | |||||||||||||||||||||||||||||||||
| Accumulated surplus (deficit) | 6,204 | 7,786 | 7,005 | 2,297 | 3,406 | 3,450 | (1,621 | ) | (10,600 | ) | (17,300 | ) | (23,395 | ) | ||||||||||||||||||||||||||||||
| Per cent of Nominal GDP: 2 | ||||||||||||||||||||||||||||||||||||||||||||
| Net liabilities | 15.0 | 14.4 | 14.9 | 17.6 | 15.9 | 15.2 | 17.4 | 21.4 | 24.8 | 27.4 | 5.6 | |||||||||||||||||||||||||||||||||
| Capital and other assets | 17.2 | 17.0 | 17.2 | 18.4 | 16.9 | 16.0 | 17.0 | 18.9 | 20.9 | 22.3 | 2.4 | |||||||||||||||||||||||||||||||||
| Growth rates: | ||||||||||||||||||||||||||||||||||||||||||||
| Net liabilities | 10.9 | 1.2 | 7.5 | 17.4 | 4.7 | 5.8 | 18.9 | 27.4 | 20.7 | 15.7 | n/a | |||||||||||||||||||||||||||||||||
| Capital and other assets | 10.0 | 4.3 | 4.8 | 6.2 | 6.4 | 5.5 | 9.9 | 15.1 | 15.1 | 12.1 | n/a | |||||||||||||||||||||||||||||||||
| Per capita: 3 | ||||||||||||||||||||||||||||||||||||||||||||
| Net liabilities | 8,595 | 8,546 | 9,026 | 10,461 | 10,843 | 11,190 | 12,911 | 15,966 | 19,039 | 21,768 | 8.8 | |||||||||||||||||||||||||||||||||
| Capital and other assets | 9,853 | 10,097 | 10,396 | 10,905 | 11,495 | 11,835 | 12,617 | 14,101 | 16,031 | 17,751 | 5.5 | |||||||||||||||||||||||||||||||||
| 1 | Figures have been restated to reflect government's current accounting policies. |
| 2 | Net liabilities as a per cent of GDP is calculated using nominal GDP for the calendar year ending in the fiscal year (e.g. 2024/25 amount divided by GDP for the 2024 calendar year). |
| 3 | Per capita net liabilities is calculated using July 1 population (e.g. 2024/25 amount divided by population on July 1, 2024). |
| 76 | | First Quarterly Report 2024/25 | |
Appendix – Fiscal Plan Update
Table A12 Changes in Financial Position – 2017/18 to 2026/27
| ($ millions) | Actual 2017/18 | Actual 2018/19 | Actual 2019/20 | Actual 2020/21 | Actual 2021/22 | Actual 2022/23 | Actual 2023/24 | Updated Forecast | Plan 2025/26 | Plan 2026/27 | 10-Year Total | ||||||||||||||||||||||
| (Surplus) deficit for the year | (196 | ) | (1,316 | ) | 531 | 5,615 | (1,262 | ) | (956 | ) | 5,035 | 8,979 | 6,700 | 6,095 | 29,225 | ||||||||||||||||||
| Change in remeasurement (gains) losses | (36 | ) | (266 | ) | 250 | (907 | ) | 153 | 912 | 36 | - | - | - | 142 | |||||||||||||||||||
| Change in accumulated (surplus) deficit | (232 | ) | (1,582 | ) | 781 | 4,708 | (1,109 | ) | (44 | ) | 5,071 | 8,979 | 6,700 | 6,095 | 26,909 | ||||||||||||||||||
| Capital and other asset changes: | |||||||||||||||||||||||||||||||||
| Taxpayer-supported capital investments | 3,908 | 4,452 | 4,772 | 5,428 | 6,002 | 6,755 | 8,772 | 13,609 | 15,313 | 14,538 | 83,549 | ||||||||||||||||||||||
Less: amortization and other accounting changes | 625 | (2,458 | ) | (2,577 | ) | (2,671 | ) | (2,721 | ) | (3,079 | ) | (3,007 | ) | (3,092 | ) | (3,322 | ) | (3,486 | ) | (25,788 | ) | ||||||||||||
| Increase in net capital assets | 4,533 | 1,994 | 2,195 | 2,757 | 3,281 | 3,676 | 5,765 | 10,517 | 11,991 | 11,052 | 57,761 | ||||||||||||||||||||||
| Increase (decrease) in restricted assets | 73 | 66 | 97 | 72 | 144 | 77 | 128 | 75 | 75 | 77 | 884 | ||||||||||||||||||||||
| Increase (decrease) in other assets | (194 | ) | 20 | 148 | 482 | 209 | (444 | ) | 354 | (79 | ) | 6 | 8 | 510 | |||||||||||||||||||
| Change in capital and other assets | 4,412 | 2,080 | 2,440 | 3,311 | 3,634 | 3,309 | 6,247 | 10,513 | 12,072 | 11,137 | 59,155 | ||||||||||||||||||||||
| Increase (decrease) in net liabilities | 4,180 | 498 | 3,221 | 8,019 | 2,525 | 3,265 | 11,318 | 19,492 | 18,772 | 17,232 | 88,522 | ||||||||||||||||||||||
| Investment and working capital changes: | |||||||||||||||||||||||||||||||||
| Investment in commercial Crown corporations: | |||||||||||||||||||||||||||||||||
| Increase (decrease) in retained earnings | (1,383) | (396 | ) | 785 | 3,109 | 2,794 | 500 | 1,751 | 726 | 1,138 | 1,137 | 10,161 | |||||||||||||||||||||
| Self-supported capital investments | 2,729 | 4,106 | 4,386 | 3,475 | 3,730 | 4,165 | 4,584 | 4,418 | 4,285 | 4,769 | 40,647 | ||||||||||||||||||||||
Less: loan repayments and other accounting changes | (6,004 | ) | (2,093 | ) | (2,165 | ) | (1,942 | ) | (2,813 | ) | (3,346 | ) | (2,049 | ) | (1,113 | ) | (2,338 | ) | (2,492 | ) | (26,355 | ) | |||||||||||
| Change in investment | (4,658 | ) | 1,617 | 3,006 | 4,642 | 3,711 | 1,319 | 4,286 | 4,031 | 3,085 | 3,414 | 24,453 | |||||||||||||||||||||
Increase (decrease) in cash and temporary investments | (792 | ) | (411 | ) | 956 | 2,575 | 582 | 1,105 | (1,479 | ) | (2,168 | ) | (74 | ) | (68 | ) | 226 | ||||||||||||||||
| Other working capital changes 1 | 552 | (1,211 | ) | (1,531 | ) | (495 | ) | (3,301 | ) | (6,613 | ) | 3,996 | (47 | ) | (275 | ) | 436 | (8,489 | ) | ||||||||||||||
| Change in investment and working capital | (4,898 | ) | (5 | ) | 2,431 | 6,722 | 992 | (4,189 | ) | 6,803 | 1,816 | 2,736 | 3,782 | 16,190 | |||||||||||||||||||
Increase (decrease) in financial statement debt | (718 | ) | 493 | 5,652 | 14,741 | 3,517 | (924 | ) | 18,121 | 21,308 | 21,508 | 21,014 | 104,712 | ||||||||||||||||||||
| (Increase) decrease in sinking fund debt | (261 | ) | 596 | 60 | 200 | (18 | ) | (11 | ) | 30 | (70 | ) | 184 | (8 | ) | 702 | |||||||||||||||||
| (Increase) decrease in foreign exchange | - | - | - | - | - | (472 | ) | (22 | ) | (206 | ) | 499 | 645 | 444 | |||||||||||||||||||
| Increase (decrease) in guarantees | (188 | ) | (2 | ) | 57 | 113 | 9 | (227 | ) | (80 | ) | 217 | 200 | 200 | 299 | ||||||||||||||||||
| Increase (decrease) in non-guaranteed debt | 249 | (44 | ) | 430 | (115 | ) | 58 | 348 | 33 | (101 | ) | (26 | ) | 106 | 938 | ||||||||||||||||||
| Increase (decrease) in total provincial debt | (918 | ) | 1,043 | 6,199 | 14,939 | 3,566 | (1,286 | ) | 18,082 | 21,148 | 22,365 | 21,957 | 107,095 | ||||||||||||||||||||
| Represented by increase (decrease) in: | |||||||||||||||||||||||||||||||||
| Taxpayer-supported debt | 2,108 | (926 | ) | 3,548 | 13,521 | 2,591 | (2,453 | ) | 15,514 | 17,944 | 20,444 | 19,574 | 91,865 | ||||||||||||||||||||
| Self-supported debt | (3,026 | ) | 1,969 | 2,651 | 1,418 | 975 | 1,167 | 2,568 | 3,204 | 1,921 | 2,383 | 15,230 | |||||||||||||||||||||
| Total provincial debt | (918 | ) | 1,043 | 6,199 | 14,939 | 3,566 | (1,286 | ) | 18,082 | 21,148 | 22,365 | 21,957 | 107,095 |
1 Includes changes in other financial assets, sinking funds, accounts payable, deferred revenue and other accrued liabilities.
| First Quarterly Report 2024/25 | | 77 | |
Appendix – Fiscal Plan Update
Table A13 Provincial Debt – 2017/18 to 2026/27
| ($ millions) | Actual 2017/18 | Actual 2018/19 | Actual 2019/20 | Actual 2020/21 | Actual 2021/22 | Actual 2022/23 | Actual 2023/24 | Updated Forecast 2024/25 | Plan 2025/26 | Plan 2026/27 | Average annual change | |||||||||||||
| (per cent) | ||||||||||||||||||||||||
| Taxpayer-supported debt: | ||||||||||||||||||||||||
Provincial government | ||||||||||||||||||||||||
| Operating | 1,156 | - | - | 8,746 | 7,233 | - | 8,729 | 16,495 | 23,256 | 29,715 | 43.4 | |||||||||||||
| Capital 1 | ||||||||||||||||||||||||
| K-12 education | 8,891 | 8,885 | 9,757 | 10,529 | 11,342 | 10,893 | 11,643 | 12,550 | 13,760 | 14,939 | 5.9 | |||||||||||||
| Post-secondary institutions | 4,584 | 4,607 | 4,917 | 5,426 | 5,732 | 5,502 | 5,979 | 6,792 | 7,849 | 8,767 | 7.5 | |||||||||||||
| Health facilities | 6,141 | 6,173 | 6,705 | 7,484 | 8,223 | 8,286 | 10,109 | 12,872 | 16,377 | 19,636 | 13.8 | |||||||||||||
| Ministries general capital | 2,718 | 2,363 | 3,133 | 3,702 | 4,087 | 4,549 | 5,084 | 5,614 | 6,067 | 6,533 | 10.2 | |||||||||||||
| Transportation | 5,682 | 5,401 | 5,401 | 5,401 | 5,401 | 5,391 | 5,391 | 5,391 | 5,391 | 5,391 | -0.6 | |||||||||||||
| Social housing | 619 | 619 | 805 | 1,062 | 1,424 | 1,648 | 2,024 | 2,662 | 3,252 | 3,870 | 22.6 | |||||||||||||
| Other | 242 | 242 | 252 | 268 | 278 | 269 | 352 | 483 | 526 | 536 | 9.2 | |||||||||||||
| Total capital | 28,877 | 28,290 | 30,970 | 33,872 | 36,487 | 36,538 | 40,582 | 46,364 | 53,222 | 59,672 | 8.4 | |||||||||||||
| Total provincial government | 30,033 | 28,290 | 30,970 | 42,618 | 43,720 | 36,538 | 49,311 | 62,859 | 76,478 | 89,387 | 12.9 | |||||||||||||
| Taxpayer-supported entities: | ||||||||||||||||||||||||
| BC Pavilion Corporation | 141 | 138 | 135 | 132 | 129 | 126 | 123 | 119 | 116 | 112 | -2.5 | |||||||||||||
| BC Transit | 84 | 73 | 65 | 60 | 56 | 53 | 109 | 141 | 245 | 318 | 15.9 | |||||||||||||
| BC Transportation Financing Authority | 10,388 | 11,293 | 12,193 | 13,321 | 14,615 | 18,946 | 21,286 | 25,264 | 30,405 | 36,013 | 14.8 | |||||||||||||
| Health Authorities and Hospital Societies | 1,762 | 1,795 | 1,802 | 1,875 | 1,839 | 1,983 | 2,387 | 2,340 | 2,289 | 2,234 | 2.7 | |||||||||||||
| InBC Investment Corp | 161 | 70 | 45 | 37 | 19 | 21 | 60 | 153 | 267 | 331 | 8.3 | |||||||||||||
| Post-secondary institutions | 744 | 763 | 753 | 882 | 922 | 910 | 897 | 979 | 971 | 955 | 2.8 | |||||||||||||
| School districts | 17 | 19 | 18 | 24 | 25 | 21 | 19 | 14 | 9 | 5 | -12.7 | |||||||||||||
| Social housing | 259 | 225 | 222 | 770 | 974 | 1,241 | 1,182 | 1,249 | 2,581 | 3,380 | 33.0 | |||||||||||||
| Other | 18 | 15 | 26 | 31 | 42 | 49 | 28 | 228 | 429 | 629 | 48.4 | |||||||||||||
| Total taxpayer-supported entities | 13,574 | 14,391 | 15,259 | 17,132 | 18,621 | 23,350 | 26,091 | 30,487 | 37,312 | 43,977 | 14.0 | |||||||||||||
| Total taxpayer-supported debt | 43,607 | 42,681 | 46,229 | 59,750 | 62,341 | 59,888 | 75,402 | 93,346 | 113,790 | 133,364 | 13.2 | |||||||||||||
| Self-supported debt: | ||||||||||||||||||||||||
| Commercial Crown corporations and agencies | ||||||||||||||||||||||||
| BC Hydro | 19,990 | 22,064 | 23,238 | 24,650 | 25,611 | 26,707 | 29,351 | 32,514 | 34,442 | 36,708 | 7.0 | |||||||||||||
| BC Liquor Distribution Branch | - | - | 210 | 233 | 230 | 242 | 233 | 163 | 171 | 180 | n/a | |||||||||||||
| BC Lottery Corporation | 155 | 100 | 233 | 228 | 195 | 201 | 169 | 218 | 233 | 247 | 5.3 | |||||||||||||
| Columbia Basin power projects | 433 | 418 | 1,387 | 1,349 | 1,319 | 1,298 | 1,265 | 1,237 | 1,205 | 1,181 | 11.8 | |||||||||||||
| Columbia Power Corporation | 286 | 282 | 276 | 271 | 266 | 270 | 266 | 260 | 251 | 242 | -1.8 | |||||||||||||
| Post-secondary institution subsidiaries | 418 | 387 | 504 | 520 | 615 | 685 | 682 | 775 | 775 | 775 | 7.1 | |||||||||||||
| Other | 30 | 30 | 84 | 99 | 89 | 89 | 94 | 97 | 108 | 235 | 25.7 | |||||||||||||
| Total self-supported debt | 21,312 | 23,281 | 25,932 | 27,350 | 28,325 | 29,492 | 32,060 | 35,264 | 37,185 | 39,568 | 7.1 | |||||||||||||
| Total provincial debt | 64,919 | 65,962 | 72,161 | 87,100 | 90,666 | 89,380 | 107,462 | 128,610 | 150,975 | 172,932 | 11.5 | |||||||||||||
1 Includes debt incurred by the government to fund the building and construction of capital assets in the education, health, social housing and other sectors.
| 78 | | First Quarterly Report 2024/25 | |
Appendix – Fiscal Plan Update
Table A14 Provincial Debt Supplementary Information – 2017/18 to 2026/271
| ($ millions) | Actual 2017/18 | Actual 2018/19 | Actual 2019/20 | Actual 2020/21 | Actual 2021/22 | Actual 2022/23 | Actual 2023/24 | Updated Forecast | Plan 2025/26 | Plan 2026/27 | Average annual change | ||||||||||||
| (per cent) | |||||||||||||||||||||||
| Per cent of nominal GDP: 2 | |||||||||||||||||||||||
| Taxpayer-supported debt: | |||||||||||||||||||||||
| Provincial government direct operating | 0.4 | - | - | 2.8 | 2.0 | - | 2.1 | 3.9 | 5.3 | 6.4 | 35.8 | ||||||||||||
| Provincial government capital | 10.2 | 9.5 | 10.0 | 11.0 | 10.3 | 9.2 | 9.9 | 10.9 | 12.0 | 12.9 | 2.6 | ||||||||||||
| Total provincial government | 10.6 | 9.5 | 10.0 | 13.9 | 12.3 | 9.2 | 12.0 | 14.8 | 17.3 | 19.3 | 6.9 | ||||||||||||
| Taxpayer-supported entities | 4.8 | 4.8 | 4.9 | 5.6 | 5.2 | 5.9 | 6.4 | 7.2 | 8.4 | 9.5 | 7.9 | ||||||||||||
| Total taxpayer-supported debt | 15.4 | 14.4 | 15.0 | 19.4 | 17.5 | 15.2 | 18.4 | 22.0 | 25.7 | 28.8 | 7.2 | ||||||||||||
| Self-supported debt: | |||||||||||||||||||||||
| Commercial Crown corporations & agencies | 7.6 | 7.8 | 8.4 | 8.9 | 8.0 | 7.5 | 7.8 | 8.3 | 8.4 | 8.6 | 1.4 | ||||||||||||
| Total provincial debt | 23.0 | 22.2 | 23.4 | 28.3 | 25.5 | 22.6 | 26.2 | 30.3 | 34.1 | 37.4 | 5.5 | ||||||||||||
| Growth rates (per cent): | |||||||||||||||||||||||
| Taxpayer-supported debt: | |||||||||||||||||||||||
| Provincial government direct operating | -75.1 | -100.0 | - | - | -17.3 | -100.0 | - | 89.0 | 41.0 | 27.8 | n/a | ||||||||||||
| Provincial government capital | 21.7 | -2.0 | 9.5 | 9.4 | 7.7 | 0.1 | 11.1 | 14.2 | 14.8 | 12.1 | -6.3 | ||||||||||||
| Taxpayer-supported entities | 3.4 | 6.0 | 6.0 | 12.3 | 8.7 | 25.4 | 11.7 | 16.8 | 22.4 | 17.9 | 20.3 | ||||||||||||
| Total taxpayer-supported debt | 5.1 | -2.1 | 8.3 | 29.2 | 4.3 | -3.9 | 25.9 | 23.8 | 21.9 | 17.2 | 14.5 | ||||||||||||
| Self-supported debt: | |||||||||||||||||||||||
| Commercial Crown corporations & agencies | 1.8 | 9.2 | 11.4 | 5.5 | 3.6 | 4.1 | 8.7 | 10.0 | 5.4 | 6.4 | n/a | ||||||||||||
| Total provincial debt | 4.0 | 1.6 | 9.4 | 20.7 | 4.1 | -1.4 | 20.2 | 19.7 | 17.4 | 14.5 | n/a | ||||||||||||
Per capita: 3 | |||||||||||||||||||||||
| Taxpayer-supported debt: | |||||||||||||||||||||||
| Provincial government direct operating | 234 | - | - | 1,690 | 1,384 | - | 1,582 | 2,902 | 4,043 | 5,103 | 40.8 | ||||||||||||
| Provincial government capital | 5,852 | 5,634 | 6,059 | 6,544 | 6,981 | 6,822 | 7,353 | 8,157 | 9,252 | 10,248 | 6.4 | ||||||||||||
| Taxpayer-supported entities | 2,751 | 2,866 | 2,986 | 3,310 | 3,563 | 4,359 | 4,727 | 5,364 | 6,486 | 7,553 | 11.9 | ||||||||||||
| Total taxpayer-supported debt | 8,838 | 8,501 | 9,045 | 11,543 | 11,927 | 11,181 | 13,662 | 16,423 | 19,781 | 22,904 | 11.2 | ||||||||||||
| Self-supported debt: | |||||||||||||||||||||||
| Commercial Crown corporations & agencies | 4,319 | 4,637 | 5,074 | 5,284 | 5,419 | 5,506 | 5,809 | 6,204 | 6,464 | 6,795 | 5.2 | ||||||||||||
| Total provincial debt | 13,157 | 13,137 | 14,119 | 16,827 | 17,347 | 16,687 | 19,471 | 22,628 | 26,245 | 29,699 | 9.5 | ||||||||||||
| Real Per Capita Provincial Debt (2023 $) 4 | 15,915 | 15,470 | 16,246 | 19,217 | 19,271 | 17,341 | 19,471 | 22,027 | 24,991 | 27,718 | 6.4 | ||||||||||||
| Growth rate (per cent) | 0.3 | -2.8 | 5.0 | 18.3 | 0.3 | -10.0 | 12.3 | 13.1 | 13.5 | 10.9 | n/a |
1 Numbers may not add due to rounding.
2 Debt as a per cent of GDP is calculated using nominal GDP for the calendar year ending in the fiscal year (e.g. 2024/25 debt divided by nominal GDP for the 2024 calendar year).
3 Per capita debt is calculated using July 1 population (e.g. 2024/25 debt divided by population on July 1, 2024).
4 Debt is converted to real (inflation-adjusted) terms using the consumer price index (CPI) for the corresponding calendar year (e.g. 2024 CPI for 2024/25 debt).
| First Quarterly Report 2024/25 | | 79 | |
Appendix – Fiscal Plan Update
Table A15 Key Provincial Debt Indicators – 2017/18 to 2026/27
| Actual 2017/18 | Actual 2018/19 | Actual 2019/20 | Actual 2020/21 | Actual 2021/22 | Actual 2022/23 | Actual 2023/24 | Updated Forecast | Plan 2025/26 | Plan 2026/27 | Average annual change | |||||||||||||
| (per cent) | |||||||||||||||||||||||
| Debt to revenue (per cent) | |||||||||||||||||||||||
| Total provincial | 94.8 | 89.7 | 95.9 | 115.2 | 104.4 | 90.7 | 113.4 | 130.4 | 147.4 | 163.2 | 6.2 | ||||||||||||
| Taxpayer-supported | 82.6 | 75.3 | 80.6 | 101.4 | 90.9 | 74.3 | 97.9 | 117.1 | 139.1 | 158.0 | 7.5 | ||||||||||||
| Debt per capita ($) 1 | |||||||||||||||||||||||
| Total provincial | 13,157 | 13,137 | 14,119 | 16,827 | 17,347 | 16,687 | 19,471 | 22,628 | 26,245 | 29,699 | 9.5 | ||||||||||||
| Taxpayer-supported | 8,838 | 8,501 | 9,045 | 11,543 | 11,927 | 11,181 | 13,662 | 16,423 | 19,781 | 22,904 | 11.2 | ||||||||||||
| Debt to nominal GDP (per cent) 2 | |||||||||||||||||||||||
| Total provincial | 23.0 | 22.2 | 23.4 | 28.3 | 25.5 | 22.6 | 26.2 | 30.3 | 34.1 | 37.4 | 5.5 | ||||||||||||
| Taxpayer-supported | 15.4 | 14.4 | 15.0 | 19.4 | 17.5 | 15.2 | 18.4 | 22.0 | 25.7 | 28.8 | 7.2 | ||||||||||||
| Interest bite (cents per dollar of revenue) 3 | |||||||||||||||||||||||
| Total provincial | 4.0 | 3.8 | 3.8 | 3.7 | 3.3 | 3.2 | 3.7 | 4.7 | 5.1 | 5.8 | 4.1 | ||||||||||||
| Taxpayer-supported | 3.3 | 3.2 | 3.1 | 3.1 | 2.8 | 2.5 | 3.2 | 4.2 | 4.8 | 5.6 | 6.2 | ||||||||||||
| Interest costs ($ millions) | |||||||||||||||||||||||
| Total provincial | 2,759 | 2,786 | 2,872 | 2,817 | 2,848 | 3,116 | 3,518 | 4,679 | 5,261 | 6,150 | 9.3 | ||||||||||||
| Taxpayer-supported | 1,725 | 1,793 | 1,807 | 1,832 | 1,896 | 2,032 | 2,446 | 3,349 | 3,909 | 4,727 | 11.9 | ||||||||||||
| Interest rate (per cent) 4 | |||||||||||||||||||||||
Taxpayer-supported | 4.1 | 4.2 | 4.1 | 3.5 | 3.1 | 3.3 | 3.6 | 4.0 | 3.8 | 3.8 | -0.6 | ||||||||||||
| Background Information: | |||||||||||||||||||||||
| Revenue ($ millions) | |||||||||||||||||||||||
| Total provincial 5 | 68,471 | 73,556 | 75,283 | 75,583 | 86,832 | 98,583 | 94,769 | 98,641 | 102,408 | 105,951 | 5.0 | ||||||||||||
| Taxpayer-supported 6 | 52,786 | 56,703 | 57,386 | 58,925 | 68,587 | 80,575 | 77,043 | 79,690 | 81,780 | 84,414 | 5.4 | ||||||||||||
| Debt ($ millions) | |||||||||||||||||||||||
| Total provincial | 64,919 | 65,962 | 72,161 | 87,100 | 90,666 | 89,380 | 107,462 | 128,610 | 150,975 | 172,932 | 11.5 | ||||||||||||
| Taxpayer-supported 7 | 43,607 | 42,681 | 46,229 | 59,750 | 62,341 | 59,888 | 75,402 | 93,346 | 113,790 | 133,364 | 13.2 | ||||||||||||
| Provincial nominal GDP ($ millions) 8 | 282,283 | 297,392 | 308,993 | 307,412 | 355,937 | 395,215 | 409,874 | 424,051 | 442,228 | 462,735 | 5.6 | ||||||||||||
| Population (thousands at July 1) 9 | 4,934 | 5,021 | 5,111 | 5,176 | 5,227 | 5,356 | 5,519 | 5,684 | 5,753 | 5,823 | 1.9 |
1 The ratio of debt to population (e.g. 2024/25 debt divided by population at July 1, 2024).
2 The ratio of debt outstanding at fiscal year end to provincial nominal gross domestic product (GDP) for the calendar year ending in the fiscal year (e.g. 2024/25 debt divided by 2024 nominal GDP).
3 The ratio of interest costs (less sinking fund interest) to revenue. Figures include capitalized interest expense in order to provide a more comparable measure to outstanding debt.
4 Weighted average of all outstanding debt issues.
5 Includes revenue of the consolidated revenue fund (excluding dividends from enterprises) plus revenue of all government organizations and enterprises.
6 Excludes revenue of government enterprises, but includes dividends from enterprises paid to the consolidated revenue fund.
7 Excludes debt of commercial Crown corporations and agencies and funds held under the province's warehouse borrowing program.
8 Nominal GDP for the calendar year ending in the fiscal year (e.g. nominal GDP for 2024 is used for the fiscal year ended March 31, 2025).
9 Population at July 1st within the fiscal year (e.g. population at July 1, 2024 is used for the fiscal year ended March 31, 2025).
| 80 | | First Quarterly Report 2024/25 | |

This page intentionally left blank
This page intentionally left blank
This page intentionally left blank

WWW.GOV.BC.CA/FIN