UNITED STATES
SECURITIES AND EXCHANGE COMMISSION
WASHINGTON, D.C. 20549
FORM N-CSR
CERTIFIED SHAREHOLDER REPORT OF REGISTERED
MANAGEMENT INVESTMENT COMPANIES
Investment Company Act file number: 811-05617
SCM Trust
(Exact name of registrant as specified in charter)
1875 Lawrence Street, Suite 300
Denver, CO 80202-1805
(Address of principal executive offices) (Zip code)
Stephen C. Rogers
1875 Lawrence Street, Suite 300
Denver, CO 80202-1805
(Name and address of agent for service)
Registrant’s telephone number, including area code: (800) 955-9988.
Date of fiscal year end: September 30
Date of reporting period: September 30, 2020
ITEM 1. REPORTS TO STOCKHOLDERS


ANNUAL REPORT
September 30, 2020
ICON Consumer Select Fund
ICON Equity Fund
ICON Equity Income Fund
ICON Flexible Bond Fund
ICON Health and Information Technology Fund
ICON Natural Resources and Infrastructure Fund
ICON Utilities and Income Fund
Shelton Emerging Markets Fund
The Securities and Exchange Commission (the “SEC”) has not approved or disapproved these securities or passed on whether the information in this prospectus is adequate or accurate. Any representation to the contrary is a criminal offense. The Funds are not bank deposits and are not guaranteed, endorsed or insured by any financial institution or government entity such as the Federal Deposit Insurance Corporation (“FDIC”). Some funds or classes in this Prospectus may not be available in your state. Please check with your advisor to determine those funds and share classes available for sale in your state. The information contained in this Prospectus relates to all classes of shares of the Funds unless otherwise noted.
Beginning on May 1, 2021, as permitted by regulations adopted by the U.S. Securities and Exchange Commission, paper copies of the Funds’ annual and semi-annual shareholder reports will no longer be sent by mail, unless you specifically request paper copies of the reports. Instead, the reports will be made available on the Funds’ website at www.sheltoncap.com for the Shelton Emerging Markets Fund and www.iconfunds.com for each other Fund listed above and you will be notified by mail each time a report is posted and provided with a website link to access the report.
You may, notwithstanding the availability of shareholder reports online, elect to receive all future shareholder reports in paper free of charge. If you invest through a financial intermediary, you can contact your financial intermediary to request that you continue to receive paper copies of your shareholder reports. If you invest directly with the Funds, you can call (800) 764-0442 to let the Funds know you wish to continue receiving paper copies of your shareholder reports. If you already elected to receive shareholder reports electronically, you will not be affected by this change and you need not take any action. You may elect to receive shareholder reports and other communications from the Funds electronically anytime by contacting your financial intermediary (such as a broker-dealer or bank) or, if you are a direct investor, by enrolling at (800) 764-0442.
Table of Contents | September 30, 2020 |
Historical Performance and Manager’s Discussion | 1 |
About Your Fund’s Expenses | 11 |
Top Holdings and Sector Breakdown | 13 |
Portfolio of Investments | 15 |
Statements of Assets and Liabilities | 22 |
Statements of Operations | 24 |
Statements of Changes in Net Assets | 26 |
Financial Highlights | 32 |
Notes to Financial Statements | 40 |
Report of Independent Registered Public Accounting Firm | 50 |
Additional Information | 51 |
Board Approval of the Investment Advisory Agreement | 51 |
Board of Trustees and Executive Officers | 54 |
Historical Performance and Manager’s Discussion (Unaudited) | September 30, 2020 |
Equity Market Review, Craig Callahan, DBA, Founder and CEO of ICON Advisers, Inc.:
During the fiscal year, stocks, on average, have been priced below ICON Advisers, Inc.’s (“ICON”), estimate of intrinsic value. Accordingly, prices moved higher from September 2019 through February 2020. Then in 23 trading days, the market crashed as investors realized we would have to shut down the economy to contain the outbreak of COVID-19 (“COVID”). Off of the market low on March 23, 2020, the S&P 1500 Index gained 51.7% through September 30, 2020. We believe the rebound is the beginning of a new bull market that could last at least two to three more years.
Sector performance during the rebound is very sensible based on ICON valuation readings. Economically sensitive, cyclical sectors like Consumer Discretionary, Information Technology, Materials and Industrials are leading while defensive, while so called recession proof sectors like Utilities, Consumer Staples and Telecommunication Services are lagging. We believe this theme is sustainable.
Fixed Income Market Review, Jerry Paul, CFA, Senior Vice President of Fixed Income at ICON Advisers, Inc.:
Over the past 12 months the fixed income market was dominated by COVID concerns and Federal Reserve actions. In response to actions taken by the Federal Reserve to overcome the dramatic negative economic impact of the actions taken to stem the spread of COVID interest rates fell to levels not previously seen in the United States.
Subsequent to the July 10 reorganization, the ICON Flexible Bond Fund’s performance continued to recover as credit spreads continued to improve. Also helping performance was the price recovery in several securities which had previously been negatively impacted by the crisis.
The US Treasury 10 year yield ranged from a high of 1.94% a year ago to a recent low of .50% over the past 12 months. As September 30, 2020 it is trading in the area of .75%-.85%. The Federal Reserve has strongly indicated the intention to keep interest rates lower longer and to accept a higher level of inflation than had previously been indicated. In addition, several members, including Chairman Powell, have expressed the view that additional fiscal response is required to assure economic progress.
The volatility of investment grade and high yield corporate bonds was dramatic surrounding the initial COVID actions to slow the pandemic. Yield spreads (the yield in excess of comparable US Treasuries) rose dramatically driving down the value of credit oriented fixed income assets. Liquidity virtually dried up in these assets for a brief time until the Federal Reserve announced asset purchase plans which for the first time included buying investment grade and high yield corporate bonds. This quickly stabilized these markets and subsequently caused the yield spreads to decline back to near normal.
ICON Fund Review (as of September 30, 2020):
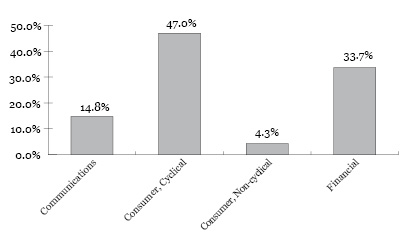
ICON Consumer Select Fund – Since the reorganization of three series of ICON Funds into the ICON Consumer Select Fund on July 10, 2020, this fund has been overweight Consumer Discretionary, underweight Financials and void Consumer Staples through September 30, 2020. In addition, it has a few stocks from the Information Technology sector that are related to consumer spending.
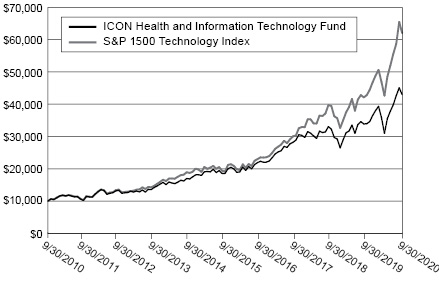
ICON Health & Information Technology Fund – Since the reorganization of two series of ICON Funds into the fund on July 10, 2020, this fund is overweight Information Technology and underweight Healthcare through September 30, 2020.
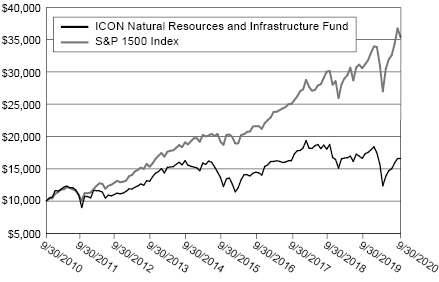
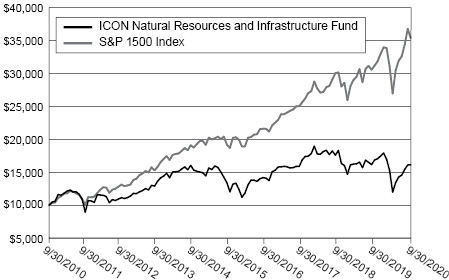
ICON Natural Resources and Infrastructure – Since the reorganization of three series of ICON Funds into the fund on July 10, 2020, this fund is overweight Materials and Industrials and underweight in the Energy sector through September 30, 2020. The Materials and Industrial sectors have outperformed the Energy sector this year, before and after the fund merger.
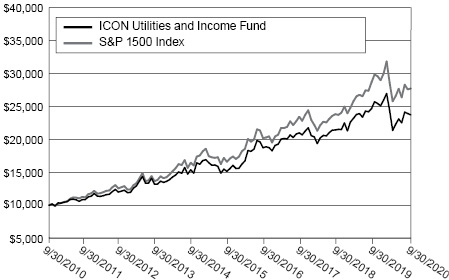
ICON Utilities and Income Fund – As of September 30, 2020, the fund’s largest industry positions are Electric, Utilities, and Multi-Utilities through September 30, 2020. In addition, the fund holds a few stocks from the Industrials sector, companies that make products used by utilities.
1
Historical Performance and Manager’s Discussion (Unaudited) (Continued) | September 30, 2020 |
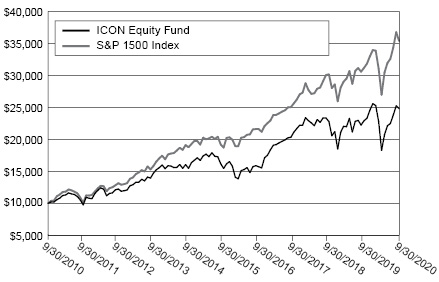
ICON Equity Fund – This fund has held a strong tilt toward economically sensitive, cyclical sectors through September 30, 2020. It has been underweighted or even void defensive, recession proof sectors. That position caused the fund to go down more than the market during the crash, but has enabled it to gain more than the broad market during advances.
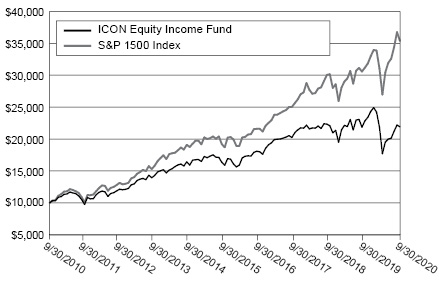
ICON Equity Income Fund – The Dow Jones Dividend Index, as a proxy for dividend paying stocks, dropped more than the broad market during the crash of the first quarter and was then more sluggish then the market during the rebound. The fund attempted to combat those headwinds with a thematic sector tilt, yet still emphasizing yield. The four largest sector positions have been Consumer Discretionary, Financials, Industrials and Information Technology. As of September 30, 2020 the fund also has credit risk and experienced downward price pressure from a widening yield spread.
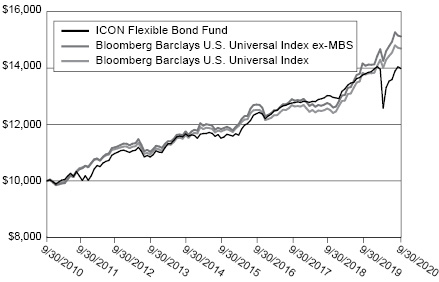
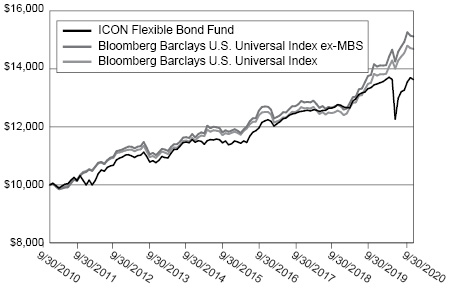
Flexible Bond Fund – The fund was adversely impacted by the COVID pandemic. Initially our credit risk-oriented portfolio experienced downward price pressure resulting from the yield spread widening. Most of this was subsequently recovered, however, as of September 30, 2020, the fund holds two bonds involved with aircraft leasing. We believe these holdings are most likely permanently impaired. We believe our event driven, value-oriented strategy continues to be otherwise successful with an abundance of the closed end fund arbitrage available and many yield to call opportunities. During the COVID induced crisis we improved the portfolio’s call protection, primarily with non-callable investment grade preferred stocks.
Historical Performance (Expressed in U.S. Dollars) (Unaudited) | September 30, 2020 |
All of the returns in this report represent past performance, which is not a guarantee of future results that may be achieved by the fund. Current performance may be lower or higher than the performance data cited. For more recent performance information, visit our website at www.iconfunds.com. Note, too, that both investment returns and principal value can fluctuate widely, so an investor’s shares, when sold, could be worth more or less than their original cost. The returns shown do not reflect taxes that a shareholder would pay on fund distributions or on the sale of fund shares.

INSTITUTIONAL SHARES*
Average Annual Total Returns
for years ended 9/30/20
Fund/ | One | Five Year | Ten Year | Since |
ICON Consumer Select Fund | -10.29% | 4.90% | 6.38% | 3.83% |
S&P 1500 Financial Sector Index | -13.25% | 7.40% | 9.54% | 4.71% |
INVESTOR SHARES*
Average Annual Total Returns
for years ended 9/30/20
Fund/ | One | Five Year | Ten Year | Since |
ICON Consumer Select Fund | -10.46% | 4.57% | 6.06% | 6.06% |
S&P 1500 Financial Sector Index | -13.25% | 7.40% | 9.54% | 9.54% |
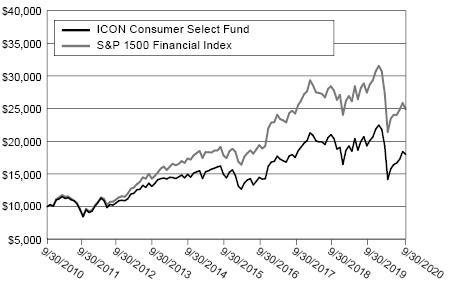
* | Performance prior to July 10, 2020 is that of the predecessor fund, the ICON Financials Fund, which was the accounting and performance survivor of the |
2
Historical Performance (Expressed in U.S. Dollars) (Unaudited) | September 30, 2020 |
All of the returns in this report represent past performance, which is not a guarantee of future results that may be achieved by the fund. Current performance may be lower or higher than the performance data cited. For more recent performance information, visit our website at www.iconfunds.com. Note, too, that both investment returns and principal value can fluctuate widely, so an investor’s shares, when sold, could be worth more or less than their original cost. The returns shown do not reflect taxes that a shareholder would pay on fund distributions or on the sale of fund shares.
INSTITUTIONAL SHARES*
Average Annual Total Returns
for years ended 9/30/20
Fund/ | One | Five Year | Ten Year | Since |
ICON Equity Fund | 8.27% | 9.92% | 9.51% | 5.60% |
S&P 1500 Sector Index | 13.42% | 13.58% | 13.46% | 9.20% |
INVESTOR SHARES*
Average Annual Total Returns
for years ended 9/30/20
Fund/ | One | Five Year | Ten Year | Since |
ICON Equity Fund | 7.97% | 9.61% | 9.18% | 4.22% |
S&P 1500 Sector Index | 13.42% | 13.58% | 13.46% | 9.17% |
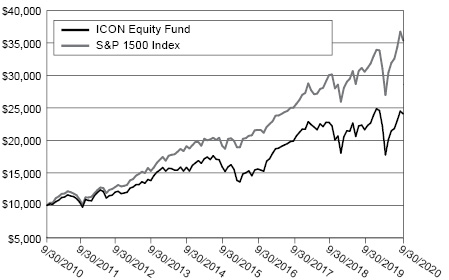
* | Performance prior to July 10, 2020 is that of the predecessor fund, the ICON Long/Short Fund, which was the accounting and performance survivor of the |
3
Historical Performance (Expressed in U.S. Dollars) (Unaudited) | September 30, 2020 |
All of the returns in this report represent past performance, which is not a guarantee of future results that may be achieved by the fund. Current performance may be lower or higher than the performance data cited. For more recent performance information, visit our website at www.iconfunds.com. Note, too, that both investment returns and principal value can fluctuate widely, so an investor’s shares, when sold, could be worth more or less than their original cost. The returns shown do not reflect taxes that a shareholder would pay on fund distributions or on the sale of fund shares.
INSTITUTIONAL SHARES*
Average Annual Total Returns
for years ended 9/30/20
Fund/ | One | Five Year | Ten Year | Since |
ICON Equity Income Fund | -4.03% | 6.63% | 8.17% | 6.28% |
S&P 1500 Sector Index | 13.42% | 13.58% | 13.46% | 9.38% |
INVESTOR SHARES*
Average Annual Total Returns
for years ended 9/30/20
Fund/ | One | Five Year | Ten Year | Since |
ICON Equity Income Fund | -4.33% | 6.35% | 7.89% | 5.20% |
S&P 1500 Sector Index | 13.42% | 13.58% | 13.46% | 9.17% |

* | Performance prior to July 10, 2020 is that of the predecessor fund, the ICON Equity Income Fund, which was the accounting and performance survivor of the |
4
Historical Performance (Expressed in U.S. Dollars) (Unaudited) | September 30, 2020 |
All of the returns in this report represent past performance, which is not a guarantee of future results that may be achieved by the fund. Current performance may be lower or higher than the performance data cited. For more recent performance information, visit our website at www.iconfunds.com. Note, too, that both investment returns and principal value can fluctuate widely, so an investor’s shares, when sold, could be worth more or less than their original cost. The returns shown do not reflect taxes that a shareholder would pay on fund distributions or on the sale of fund shares.
INSTITUTIONAL SHARES*
Average Annual Total Returns
for years ended 9/30/20
Fund/ | One | Five Year | Ten Year | Since |
ICON Flexible Bond Fund | 1.32% | 3.89% | 3.41% | 4.25% |
Bloomberg Barclays US Universal Index ex-MBS | 7.37% | 4.95% | 4.22% | 4.90% |
INVESTOR SHARES*
Average Annual Total Returns
for years ended 9/30/20
Fund/ | One | Five Year | Ten Year | Since |
ICON Flexible Bond Fund | 1.12% | 3.60% | 3.15% | 3.15% |
Bloomberg Barclays US Universal Index ex-MBS | 7.37% | 4.95% | 4.22% | 4.22% |
* | Performance prior to July 10, 2020 is that of the predecessor fund, the ICON Flexible Bond Fund, which was the accounting and performance survivor of the |
5
Historical Performance (Expressed in U.S. Dollars) (Unaudited) | September 30, 2020 |
All of the returns in this report represent past performance, which is not a guarantee of future results that may be achieved by the fund. Current performance may be lower or higher than the performance data cited. For more recent performance information, visit our website at www.iconfunds.com. Note, too, that both investment returns and principal value can fluctuate widely, so an investor’s shares, when sold, could be worth more or less than their original cost. The returns shown do not reflect taxes that a shareholder would pay on fund distributions or on the sale of fund shares.
INSTITUTIONAL SHARES*
Average Annual Total Returns
for years ended 9/30/20
Fund/ | One | Five Year | Ten Year | Since |
ICON Health and Information Technology | 26.59% | 18.27% | 15.70% | 10.24% |
S&P 1500 Technology Sector Index | 44.92% | 26.46% | 20.02% | 10.94% |
INVESTOR SHARES*
Average Annual Total Returns
for years ended 9/30/20
Fund/ | One | Five Year | Ten Year | Since |
ICON Health and Information Technology | 26.31% | 17.93% | 15.29% | 15.29% |
S&P 1500 Technology Sector Index | 44.92% | 26.46% | 20.02% | 20.02% |

* | Performance prior to July 10, 2020 is that of the predecessor fund, the ICON Information Technology Fund, which was the accounting and performance |
6
Historical Performance (Expressed in U.S. Dollars) (Unaudited) | September 30, 2020 |
All of the returns in this report represent past performance, which is not a guarantee of future results that may be achieved by the fund. Current performance may be lower or higher than the performance data cited. For more recent performance information, visit our website at www.iconfunds.com. Note, too, that both investment returns and principal value can fluctuate widely, so an investor’s shares, when sold, could be worth more or less than their original cost. The returns shown do not reflect taxes that a shareholder would pay on fund distributions or on the sale of fund shares.
INSTITUTIONAL SHARES*
Average Annual Total Returns
for years ended 9/30/20
Fund/ | One | Five Year | Ten Year | Since |
ICON Natural Resources and Infrastructure Fund | -4.21% | 6.25% | 5.19% | 4.24% |
S&P 1500 Sector Index | 13.42% | 13.58% | 13.46% | 8.36% |
INVESTOR SHARES*
Average Annual Total Returns
for years ended 9/30/20
Fund/ | One | Five Year | Ten Year | Since |
ICON Natural Resources and Infrastructure Fund | -4.40% | 6.00% | 4.89% | 4.89% |
S&P 1500 Sector Index | 13.42% | 13.58% | 13.46% | 13.46% |
* | Performance prior to July 10, 2020 is that of the predecessor fund, the ICON Natural Resources Fund, which was the accounting and performance survivor |
7
Historical Performance (Expressed in U.S. Dollars) (Unaudited) | September 30, 2020 |
All of the returns in this report represent past performance, which is not a guarantee of future results that may be achieved by the fund. Current performance may be lower or higher than the performance data cited. For more recent performance information, visit our website at www.iconfunds.com. Note, too, that both investment returns and principal value can fluctuate widely, so an investor’s shares, when sold, could be worth more or less than their original cost. The returns shown do not reflect taxes that a shareholder would pay on fund distributions or on the sale of fund shares.

INSTITUTIONAL SHARES*
Average Annual Total Returns
for years ended 9/30/20
Fund/ | One | Five Year | Ten Year | Since |
ICON Utilities and Income Fund | -7.35% | 9.11% | 9.34% | 8.06% |
S&P 1500 Utilities Sector Index | -7.06% | 10.16% | 10.73% | 8.32% |
INVESTOR SHARES*
Average Annual Total Returns
for years ended 9/30/20
Fund/ | One | Five Year | Ten Year | Since |
ICON Utilities and Income Fund | -7.69% | 8.80% | 9.02% | 9.02% |
S&P 1500 Utilities Sector Index | -7.06% | 10.16% | 10.73% | 10.73% |
* | Performance prior to July 10, 2020 is that of the predecessor fund, the ICON Utilities Fund, which was the accounting and performance survivor of the recent |
8
Historical Performance and Manager’s Discussion (Unaudited) | September 30, 2020 |
SHELTON EMERGING MARKETS FUND (Portfolio Manager: Andrew Manton)
The Shelton Emerging Markets Fund (the “Fund”, EMSQX/EMSLX) is the successor fund to the ICON Emerging Markets Fund (the “Predecessor Emerging Markets Fund”). Since June 2020, when the Predecessor Emerging Markets Fund was reorganized into the Fund, the Portfolio Management team has been investing using rigorous, bottom-up, fundamental stock selection to deliver attractive risk-adjusted returns for our investors.
For the Fund, which is managed by the same Portfolio Management team as the Shelton International Select Equity Fund (SISLX/ SISEX), a separate series of SCM Trust, our investment philosophy is centered around the concept of the competitive corporate life cycle. Our framework seeks to establish a level global playing field from which to assess a company’s ability to create value for shareholders. We recognize that companies evolve over time, and that the risks they face and the opportunities they capitalize on will differ at the various stages of their development. We directly measure this relationship between a company’s competitive opportunities and challenges, its economic performance, and its valuation in the equity market as it travels along the corporate life cycle.
Market Overview
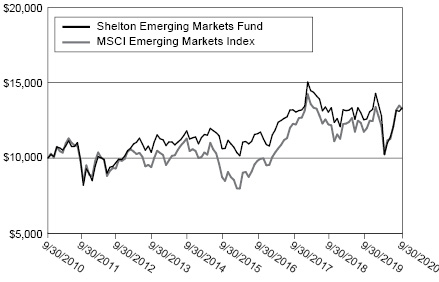
For emerging-market equity investors, the 12-month period ending September 30, 2020 was dominated by Covid-19. Due to the pandemic and the world’s reaction to it, the MSCI Emerging Markets Index collapsed in February and March, then rallied over the summer, and finally finished these 12 months up 8.09%. As for the three months ending September 30, 2020, the first full quarter under the new management, the Index returned 8.73%.
Covid-19 began in Wuhan, China, but China’s underlying economy came out less scathed than other economies. In the first (March-ending) quarter of 2020, China’s GDP contracted by 6.8% Year over Year (“YoY”) as the Communist Party imposed a draconian lockdown and brought much economic activity to a standstill. That appears to have arrested the spread of the virus, as a result of which China began opening up at the end of the first quarter.
GDP grew 3.2% in the second quarter and then 4.9% in the third. PMIs went back into expansion territory by the third quarter, both because of the reopening and because of the fiscal stimulus, worth 4.7% of GDP, that Beijing pumped into the economy. Unlike in the West, though, these stimulus measures did not target consumers and the poor directly.
The last 12 months also witnessed the sharpest deterioration of China’s relations with the outside world in recent memory. This was not just because of the virus, though many blame the Communist Party for initially hiding news about the virus. The Party shocked the world in June by taking away the autonomy it had promised Hong Kong in the 1980s-90s. And it picked fights with India (skirmishes along the India-China border), Australia (blocking imports and detaining journalists), and the European Union (regarding Hong Kong and Taiwan). Most of all, its rhetoric against the U.S. got uglier. We believe this could have future implications for Chinese trade and investment.
In India, Covid-19 began affecting the economy only in late March, but the impact is still palpable. The number of new Covid-19 cases kept rising until mid-September. The government put in place a strong and long lockdown starting late March. As a result, GDP in India contracted by 23.9% YoY in the second quarter (ending June), the first contraction since 1980.
In response, New Delhi pushed a fiscal package worth 10% of GDP that included spending on lower-income households plus public investment, while the central bank also relaxed policy in various ways. This has provided some relief, most measures of economic activity rebounding in the third quarter. However, the employment and labor participation rates still have not come back to pre-Covid levels, according to surveys by the Centre for Monitoring Indian Economy as of October. Separately, the government has announced liberalizations in labor, agriculture and information technology, which could help long-term job creation.
Brazil also encountered Covid-19 later than China or the major industrialized countries. Daily new cases hit its peak in late July-early August. The pandemic and the ensuing lockdown left GDP declining by 11.4% YoY in the second quarter. But because of the fall in new cases since then, consumer and business confidence has been on the uptick. Fiscal measures amounted to 12% of GDP, including temporary cash transfers to vulnerable households and lower taxes, besides monetary easing.
In terms of sectors, Consumer Discretionary-which includes the e-commerce beneficiaries of the Covid-19 era-was the best performing for the 12 months ending September, followed by Healthcare and Information Technology. Energy and Financials performed the worst, as the oil price crashed and as Covid-19 raised the specter of bad loans.
In the three months ending September, too, Consumer Discretionary performed the best, followed by Information Technology and Materials. Energy and Financials were again the worst.
Performance Review
In the three months ending September 30, 2020, the first full quarter under the new management, the Fund returned 10.37% (Institutional class) and 10.14% (Investor class). Both outperformed its benchmark MSCI Emerging Markets Index.
9
Historical Performance (Expressed in U.S. Dollars) (Unaudited) | September 30, 2020 |
All of the returns in this report represent past performance, which is not a guarantee of future results that may be achieved by the fund. Current performance may be lower or higher than the performance data cited. For more recent performance information, visit our website at www.sheltoncap.com. Note, too, that both investment returns and principal value can fluctuate widely, so an investor’s shares, when sold, could be worth more or less than their original cost. The returns shown do not reflect taxes that a shareholder would pay on fund distributions or on the sale of fund shares.
INSTITUTIONAL SHARES*
Average Annual Total Returns
for years ended 9/30/20
Fund/ | One | Five Year | Ten Year | Since |
Shelton Emerging Markets Fund | 5.78% | 4.62% | 2.91% | 3.00% |
MSCI Emerging Markets Index | 10.84% | 9.37% | 2.86% | 5.68% |
INVESTOR SHARES*
Average Annual Total Returns
for years ended 9/30/20
Fund/ | One | Five Year | Ten Year | Since |
Shelton Emerging Markets Fund | 5.48% | 4.34% | 2.67% | 2.47% |
MSCI Emerging Markets Index | 10.84% | 9.37% | 2.86% | 5.40% |

* | Performance prior to July 10, 2020 is that of the predecessor fund, the ICON Emerging Markets Fund, which was the accounting and performance survivor |
10
About Your Fund’s Expenses (Unaudited) | September 30, 2020 |
As a shareholder of the Funds, you incur two types of costs: (1) transaction costs, including sales charges (loads) on purchase payments, reinvested dividends, or other distributions, redemption fees, and exchange fees; and (2) ongoing costs, including management fees, distribution fees and other Fund expenses. This example is intended to help you understand your ongoing cost (in dollars) of investing in the Funds and to compare these costs with the ongoing costs of investing in other mutual funds. The examples are based on an investment of $1,000 invested at the beginning of the period and held for the entire period from April 1, 2020 to September 30, 2020.
Actual Expenses
The first line of the tables below provides information about actual account values and actual expenses. You may use the information in this line, together with the amount you invested, to estimate the expenses you have paid over the period. Simply divide your account value by $1,000 (for example, an $8,600 account value divided by $1,000 = 8.6), then multiply the result by the number in the first line under the heading entitled “Expenses Paid During Period” to estimate the expenses you paid on your account during this period.
Hypothetical Example for Comparison Purposes
The second line of the table provides information about hypothetical account values and hypothetical expenses based on the Funds’ actual expense ratio and an assumed rate of return of 5% per year before expenses, which is not the Funds’ actual return. The hypothetical account values and expenses may not be used to estimate the actual ending account balance or expenses you paid for the period. You may use this information to compare the ongoing costs of investing in the Funds and other funds. To do so, compare this 5% hypothetical example with the 5% hypothetical examples that appear in the shareholder reports of the other funds. Please note that the expenses shown in the tables are meant to highlight your ongoing costs only and do not reflect any transactional cost, such as sales charges (loads), redemption fees, or exchange fees. Therefore, the second line of the tables are useful in comparing ongoing costs only, and will not help you determine the relative total costs of owning different funds. In addition, if these transactional costs were included, your costs would have been higher. The calculations assume no shares were bought or sold during the period.
Beginning | Ending | Expenses Paid | Net Annual | |
ICON Consumer Select Fund | ||||
Institutional Shares | ||||
Based on Actual Fund Return | $ 1,000 | $ 1,273 | $ 8.61 | 1.52% |
Based on Hypothetical 5% Return before expenses | $ 1,000 | $ 1,017 | $ 7.64 | 1.52% |
Investor Shares | ||||
Based on Actual Fund Return | $ 1,000 | $ 1,271 | $ 10.19 | 1.80% |
Based on Hypothetical 5% Return before expenses | $ 1,000 | $ 1,016 | $ 9.05 | 1.80% |
ICON Equity Fund | ||||
Institutional Shares | ||||
Based on Actual Fund Return | $ 1,000 | $ 1,357 | $ 7.17 | 1.22% |
Based on Hypothetical 5% Return before expenses | $ 1,000 | $ 1,019 | $ 6.14 | 1.22% |
Investor Shares | ||||
Based on Actual Fund Return | $ 1,000 | $ 1,355 | $ 8.57 | 1.46% |
Based on Hypothetical 5% Return before expenses | $ 1,000 | $ 1,018 | $ 7.35 | 1.46% |
ICON Equity Income Fund | ||||
Institutional Shares | ||||
Based on Actual Fund Return | $ 1,000 | $ 1,238 | $ 5.86 | 1.05% |
Based on Hypothetical 5% Return before expenses | $ 1,000 | $ 1,020 | $ 5.29 | 1.05% |
Investor Shares | ||||
Based on Actual Fund Return | $ 1,000 | $ 1,235 | $ 7.19 | 1.29% |
Based on Hypothetical 5% Return before expenses | $ 1,000 | $ 1,019 | $ 6.49 | 1.29% |
ICON Flexible Bond Fund | ||||
Institutional Shares | ||||
Based on Actual Fund Return | $ 1,000 | $ 1,111 | $ 4.21 | 0.80% |
Based on Hypothetical 5% Return before expenses | $ 1,000 | $ 1,021 | $ 4.03 | 0.80% |
Investor Shares | ||||
Based on Actual Fund Return | $ 1,000 | $ 1,111 | $ 5.53 | 1.05% |
Based on Hypothetical 5% Return before expenses | $ 1,000 | $ 1,020 | $ 5.29 | 1.05% |
11
About Your Fund’s Expenses (Unaudited) (Continued) | September 30, 2020 |
Beginning | Ending | Expenses Paid | Net Annual | |
ICON Health and Information Technology Fund | ||||
Institutional Shares | ||||
Based on Actual Fund Return | $ 1,000 | $ 1,387 | $ 8.69 | 1.46% |
Based on Hypothetical 5% Return before expenses | $ 1,000 | $ 1,018 | $ 7.35 | 1.46% |
Investor Shares | ||||
Based on Actual Fund Return | $ 1,000 | $ 1,385 | $ 10.47 | 1.76% |
Based on Hypothetical 5% Return before expenses | $ 1,000 | $ 1,016 | $ 8.85 | 1.76% |
ICON Natural Resources and Infrastructure Fund | ||||
Institutional Shares | ||||
Based on Actual Fund Return | $ 1,000 | $ 1,112 | $ 7.79 | 1.48% |
Based on Hypothetical 5% Return before expenses | $ 1,000 | $ 1,018 | $ 7.45 | 1.48% |
Investor Shares | ||||
Based on Actual Fund Return | $ 1,000 | $ 1,343 | $ 10.22 | 1.75% |
Based on Hypothetical 5% Return before expenses | $ 1,000 | $ 1,016 | $ 8.80 | 1.75% |
ICON Utilities and Income Fund | ||||
Institutional Shares | ||||
Based on Actual Fund Return | $ 1,000 | $ 1,112 | $ 8.53 | 1.62% |
Based on Hypothetical 5% Return before expenses | $ 1,000 | $ 1,017 | $ 8.15 | 1.62% |
Investor Shares | ||||
Based on Actual Fund Return | $ 1,000 | $ 1,111 | $ 8.05 | 1.53% |
Based on Hypothetical 5% Return before expenses | $ 1,000 | $ 1,017 | $ 7.69 | 1.53% |
Shelton Emerging Markets Fund | ||||
Institutional Shares | ||||
Based on Actual Fund Return | $ 1,000 | $ 1,299 | $ 7.34 | 1.28% |
Based on Hypothetical 5% Return before expenses | $ 1,000 | $ 1,019 | $ 6.44 | 1.28% |
Investor Shares | ||||
Based on Actual Fund Return | $ 1,000 | $ 1,297 | $ 8.76 | 1.53% |
Based on Hypothetical 5% Return before expenses | $ 1,000 | $ 1,017 | $ 7.69 | 1.53% |
* | Expenses are equal to the Fund’s annualized expense ratio listed in the “Net Annual Expense Ratio” column, multiplied by the average account value over the period, multiplied by 183/366 (to reflect the one-half year period). |
12
Top Holdings and Sector Breakdown (Unaudited) | September 30, 2020 |
ICON Consumer Select Fund
| Security | Market Value (in U.S. Dollars) | Percentage of Total Investment | |||||||||
| 1 | Amazon.com Inc | $4,165,770 | 8.1% |
| |||||||
| 2 | NIKE Inc | 2,598,678 | 5.1% | ||||||||
| 3 | Mastercard Inc | 2,536,275 | 4.9% | ||||||||
| 4 | Global Payments Inc | 2,201,992 | 4.3% | ||||||||
| 5 | LGI Homes Inc | 2,021,358 | 3.9% | ||||||||
| 6 | Five Below Inc | 1,955,800 | 3.8% | ||||||||
| 7 | Monarch Casino & Resort Inc | 1,886,580 | 3.7% | ||||||||
| 8 | Ulta Beauty Inc | 1,814,238 | 3.5% | ||||||||
| 9 | Voya Financial Inc | 1,754,238 | 3.4% | ||||||||
| 10 | Green Brick Partners Inc | 1,706,729 | 3.3% |
ICON Equity Fund
| Security | Market Value (in U.S. Dollars) | Percentage of Total Investment | 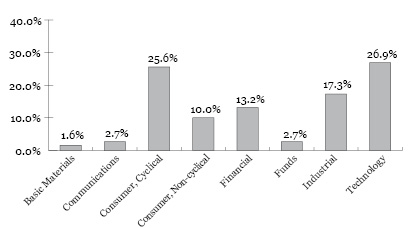 | ||||||||
| 1 | Skyworks Solutions Inc | $4,795,098 | 7.4% | ||||||||
| 2 | Mastercard Inc | 3,932,579 | 6.1% | ||||||||
| 3 | EPAM Systems Inc | 3,847,032 | 6.0% | ||||||||
| 4 | NIKE Inc | 3,377,026 | 5.2% | ||||||||
| 5 | Global Payments Inc | 3,349,514 | 5.2% | ||||||||
| 6 | Bank of America Corp | 2,753,198 | 4.3% | ||||||||
| 7 | Adobe Inc | 2,648,322 | 4.1% | ||||||||
| 8 | Martin Marietta Materials Inc | 2,400,672 | 3.7% | ||||||||
| 9 | Ebix Inc | 2,183,600 | 3.4% | ||||||||
| 10 | Lowe’s Cos Inc | 2,073,250 | 3.2% |
ICON Equity Income Fund
| Security | Market Value (in U.S. Dollars) | Percentage of Total Investment | 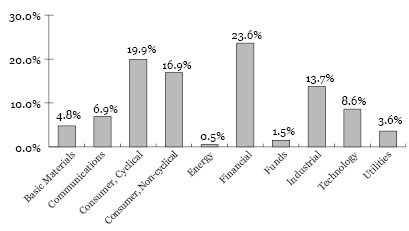 | |||||||
| 1 | QUALCOMM Inc | $3,765,760 | 4.7% | |||||||
| 2 | Whirlpool Corp | 3,457,132 | 4.3% | |||||||
| 3 | Bristol-Myers Squibb Co | 3,141,109 | 3.9% | |||||||
| 4 | Union Pacific Corp | 2,781,576 | 3.5% | |||||||
| 5 | Cummins Inc | 2,766,196 | 3.5% | |||||||
| 6 | MDC Holdings Inc | 2,694,120 | 3.4% | |||||||
| 7 | Lockheed Martin Corp | 2,606,304 | 3.3% | |||||||
| 8 | Rent-A-Center Inc | 2,421,090 | 3.0% | |||||||
| 9 | ViacomCBS Inc | 2,355,641 | 2.9% | |||||||
| 10 | JPMorgan Chase & Co | 2,344,463 | 2.9% |
ICON Flexible Bond Fund
| Security | Market Value (in U.S. Dollars) | Percentage of Total Investment | 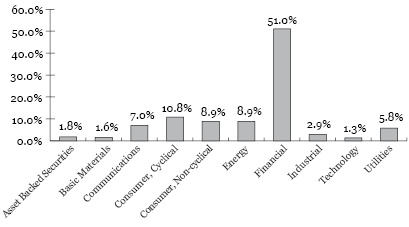 | ||||||||
| 1 | Argo Group US Inc, 6.500% | $9,224,363 | 6.2% | ||||||||
| 2 | Delta Air Lines 2007-1 Class A Pass Through Trust, 6.821%, 8/10/2022 | 8,332,065 | 5.6% | ||||||||
| 3 | Principal Financial Group Inc, 3M US LIBOR + 3.090%, 5/15/2055 | 6,361,317 | 4.3% | ||||||||
| 4 | JPMorgan Chase & Co, 3M US LIBOR + 3.504% | 6,153,050 | 4.1% | ||||||||
| 5 | Fifth Third Bancorp, 3M US LIBOR + 3.115% | 5,928,098 | 4.0% | ||||||||
| 6 | MPLX LP, 6.250%, 10/15/2022 | 4,982,405 | 3.3% | ||||||||
| 7 | Wells Fargo & Co, 7.500% | 4,656,914 | 3.1% | ||||||||
| 8 | PacifiCorp, 8.069%, 9/9/2022 | 4,153,320 | 2.8% | ||||||||
| 9 | Foot Locker Inc, 8.500%, 1/15/2022 | 3,993,653 | 2.7% | ||||||||
| 10 | Bank of America Corp, 7.250% | 3,660,480 | 2.5% |
13
| Top Holdings and Sector Breakdown (Unaudited) (Continued) | September 30, 2020 |
ICON Health and Information Technology Fund
| Security | Market Value (in U.S. Dollars) | Percentage of Total Investment |  | |||||||
| 1 | Apple Inc | $8,616,264 | 7.7% | |||||||
| 2 | Microsoft Corp | 7,634,979 | 6.8% | |||||||
| 3 | UnitedHealth Group Inc | 5,424,798 | 4.9% | |||||||
| 4 | Global Payments Inc | 5,361,673 | 4.8% | |||||||
| 5 | Mastercard Inc | 5,038,733 | 4.5% | |||||||
| 6 | EPAM Systems Inc | 4,978,512 | 4.5% | |||||||
| 7 | Adobe Inc | 4,855,257 | 4.3% | |||||||
| 8 | Thermo Fisher Scientific Inc | 4,363,101 | 3.9% | |||||||
| 9 | Skyworks Solutions Inc | 3,726,255 | 3.3% | |||||||
| 10 | Zoetis Inc | 3,702,304 | 3.3% |
ICON Natural Resources and Infrastructure Fund
| Security | Market Value (in U.S. Dollars) | Percentage of Total Investment | 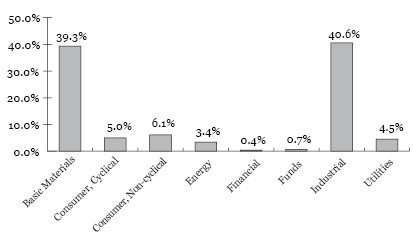 | |||||||
| 1 | International Paper Co | $5,959,380 | 5.8% | |||||||
| 3 | Packaging Corp of America | 5,561,550 | 5.4% | |||||||
| 4 | Gold Fields Ltd | 4,916,000 | 4.7% | |||||||
| 5 | Wheaton Precious Metals Corp | 4,269,090 | 4.1% | |||||||
| 6 | Newmont Corp | 4,187,700 | 4.0% | |||||||
| 7 | Masco Corp | 4,134,750 | 4.0% | |||||||
| 8 | Celanese Corp | 4,083,100 | 3.9% | |||||||
| 9 | The AES Corp | 3,751,722 | 3.6% | |||||||
| 10 | Chart Industries Inc | 3,731,337 | 3.6% | |||||||
| 11 | Quaker Chemical Corp | 3,594,200 | 3.5% |
ICON Utilities and Income Fund
| Security | Market Value (in U.S. Dollars) | Percentage of Total Investment |  | |||||||
| 1 | Xcel Energy Inc | $2,518,865 | 8.4% | |||||||
| 2 | Duke Energy Corp | 2,187,432 | 7.3% | |||||||
| 3 | Sempra Energy | 2,059,464 | 6.9% | |||||||
| 4 | Ameren Corp | 1,977,000 | 6.6% | |||||||
| 5 | MDU Resources Group Inc | 1,912,500 | 6.4% | |||||||
| 6 | Union Pacific Corp | 1,712,769 | 5.7% | |||||||
| 7 | Atlantica Sustainable Infrastructure PLC | 1,659,380 | 5.6% | |||||||
| 8 | NextEra Energy Inc | 1,554,336 | 5.2% | |||||||
| 9 | American Electric Power Co Inc | 1,544,697 | 5.2% | |||||||
| 10 | Public Service Enterprise Group Inc | 1,510,025 | 5.1% |
Shelton Emerging Markets Fund
| Security | Market Value (in U.S. Dollars) | Percentage of Total Investment |  | |||||||
| 1 | Samsung Electronics Co Ltd | $1,877,145 | 8.5% | |||||||
| 2 | Taiwan Semiconductor Manufacturing Co Ltd | 1,715,025 | 7.8% | |||||||
| 3 | Xinyi Solar Holdings Ltd | 1,554,393 | 7.1% | |||||||
| 4 | Accton Technology Corp | 1,415,813 | 6.4% | |||||||
| 5 | Samsung SDI Co Ltd | 1,108,255 | 5.0% | |||||||
| 6 | Bank Rakyat Indonesia Persero Tbk PT | 1,106,726 | 5.0% | |||||||
| 7 | HDFC Bank Ltd | 1,032,224 | 4.7% | |||||||
| 8 | MediaTek Inc | 974,693 | 4.4% | |||||||
| 9 | MercadoLibre Inc | 974,232 | 4.4% | |||||||
| 10 | Haier Electronics Group Co Ltd | 945,237 | 4.3% |
14
ICON Consumer Select Fund Portfolio of Investments September 30, 2020 |
Security Description | Shares | Value | ||||||
Common Stock (100.02%) | ||||||||
| ||||||||
Communications (14.87%) | ||||||||
Alphabet Inc* | 1,000 | $ | 1,469,600 | |||||
Amazon.com Inc* | 1,323 | 4,165,770 | ||||||
Comcast Corp | 11,900 | 550,494 | ||||||
eBay Inc | 27,700 | 1,443,170 | ||||||
Total Communications | 7,629,034 | |||||||
Consumer, Cyclical (47.11%) | ||||||||
Brunswick Corp | 22,500 | 1,325,475 | ||||||
Dollar General Corp | 6,700 | 1,404,454 | ||||||
Dorman Products Inc* | 15,600 | 1,409,928 | ||||||
Five Below Inc* | 15,400 | 1,955,800 | ||||||
Green Brick Partners Inc* | 106,008 | 1,706,729 | ||||||
LGI Homes Inc* | 17,400 | 2,021,358 | ||||||
LKQ Corp* | 50,700 | 1,405,911 | ||||||
Lowe’s Cos Inc | 9,100 | 1,509,326 | ||||||
Lululemon Athletica Inc* | 4,900 | 1,613,913 | ||||||
Monarch Casino & Resort Inc* | 42,300 | 1,886,580 | ||||||
NIKE Inc | 20,700 | 2,598,678 | ||||||
O’Reilly Automotive Inc* | 2,700 | 1,244,916 | ||||||
PulteGroup Inc | 34,500 | 1,597,005 | ||||||
Ulta Beauty Inc* | 8,100 | 1,814,238 | ||||||
VF Corp | 9,700 | 681,425 | ||||||
Total Consumer, Cyclical | 24,175,736 | |||||||
Consumer, Non-Cyclical (4.29%) | ||||||||
Global Payments Inc | 12,400 | 2,201,992 | ||||||
Financial (33.75%) | ||||||||
Ally Financial Inc | 36,400 | 912,548 | ||||||
American Express Co | 10,700 | 1,072,675 | ||||||
Assurant Inc | 8,700 | 1,055,397 | ||||||
Security Description | Shares | Value | ||||||
Bank of America Corp | 54,800 | $ | 1,320,132 | |||||
Citigroup Inc | 17,500 | 754,425 | ||||||
Encore Capital Group Inc* | 34,100 | 1,315,919 | ||||||
The Goldman Sachs Group Inc | 4,400 | 884,268 | ||||||
JPMorgan Chase & Co | 17,700 | 1,703,979 | ||||||
Marsh & McLennan Cos Inc | 4,700 | 539,090 | ||||||
Mastercard Inc | 7,500 | 2,536,275 | ||||||
Morgan Stanley | 29,100 | 1,406,985 | ||||||
Visa Inc | 8,500 | 1,699,745 | ||||||
Voya Financial Inc | 36,600 | 1,754,238 | ||||||
Essent Group Ltd | 9,700 | 358,997 | ||||||
Total Financial | 17,314,673 | |||||||
Total Common Stock (Cost $41,787,396) | 51,321,435 | |||||||
| Par Value |
| ||||||
Money Market Funds (0.21%) | ||||||||
First American Government Obligations Fund (Cost $115,335) | $ | 115,335 | 115,335 | |||||
Total Investments (Cost $41,902,731)(a) (100.23%) | 51,436,770 | |||||||
Liabilities in Excess of Other Assets (-0.23%) | (121,025 | ) | ||||||
Net Assets (100.00%) | $ | 51,315,745 | ||||||
* | Non-income producing security. |
(a) | Aggregate cost for federal income tax purpose is $42,091,580. |
At September 30, 2020, unrealized appreciation/(depreciation) of securities for federal income tax purposes is as follows:
Unrealized appreciation | $ | 10,179,973 | ||
Unrealized depreciation | (834,783 | ) | ||
Net unrealized appreciation | $ | 9,345,190 |
ICON Equity Fund Portfolio of Investments September 30, 2020 |
Security Description | Shares | Value | ||||||
Common Stock (97.59%) | ||||||||
| ||||||||
Basic Materials (1.58%) | ||||||||
The Chemours Co | 23,000 | $ | 480,930 | |||||
Ferro Corp* | 43,200 | 535,680 | ||||||
Total Basic Materials | 1,016,610 | |||||||
Communications (2.75%) | ||||||||
Extreme Networks Inc* | 261,700 | 1,052,034 | ||||||
Perficient Inc* | 16,700 | 713,758 | ||||||
Total Communications | 1,765,792 | |||||||
Consumer, Cyclical (25.67%) | ||||||||
Brunswick Corp | 12,600 | 742,266 | ||||||
Dollar General Corp | 7,300 | 1,530,226 | ||||||
Five Below Inc* | 9,900 | 1,257,300 | ||||||
The Home Depot Inc | 4,500 | 1,249,695 | ||||||
KB Home | 24,800 | 952,072 | ||||||
LGI Homes Inc* | 13,700 | 1,591,529 | ||||||
Lowe’s Cos Inc | 12,500 | 2,073,250 | ||||||
Magna International Inc | 28,200 | $ | 1,290,150 | |||||
Monarch Casino & Resort Inc* | 31,100 | 1,387,060 | ||||||
NIKE Inc | 26,900 | 3,377,026 | ||||||
Ulta Beauty Inc* | 4,700 | 1,052,706 | ||||||
Total Consumer, Cyclical | 16,503,280 | |||||||
Consumer, Non-Cyclical (10.08%) | ||||||||
Bristol-Myers Squibb Co | 23,900 | 1,440,931 | ||||||
Euronet Worldwide Inc* | 13,350 | 1,216,185 | ||||||
Global Payments Inc | 18,862 | 3,349,514 | ||||||
United Rentals Inc* | 2,700 | 471,150 | ||||||
Total Consumer, Non-Cyclical | 6,477,780 | |||||||
Financial (13.27%) | ||||||||
Bank of America Corp | 114,288 | 2,753,198 | ||||||
Mastercard Inc | 11,629 | 3,932,579 | ||||||
Signature Bank | 4,600 | 381,754 | ||||||
Voya Financial Inc | 30,500 | 1,461,865 | ||||||
Total Financial | 8,529,396 | |||||||
See accompanying notes to financial statements.
15
ICON Equity Fund Portfolio of Investments September 30, 2020 |
Security Description | Shares | Value | ||||||
Industrial (17.25%) | ||||||||
Armstrong World Industries Inc | 18,000 | $ | 1,238,580 | |||||
CSX Corp | 12,700 | 986,409 | ||||||
Chart Industries Inc* | 22,000 | 1,545,940 | ||||||
Kansas City Southern | 11,100 | 2,007,213 | ||||||
L3Harris Technologies Inc | 8,000 | 1,358,720 | ||||||
Martin Marietta Materials Inc | 10,200 | 2,400,672 | ||||||
Northrop Grumman Corp | 4,900 | 1,545,901 | ||||||
Total Industrial | 11,083,435 | |||||||
Technology (26.99%) | ||||||||
Adobe Inc* | 5,400 | 2,648,322 | ||||||
Ebix Inc | 106,000 | 2,183,600 | ||||||
EPAM Systems Inc* | 11,900 | 3,847,032 | ||||||
Microsoft Corp | 7,000 | 1,472,310 | ||||||
Qorvo Inc* | 6,100 | 786,961 | ||||||
Skyworks Solutions Inc | 32,956 | 4,795,098 | ||||||
NXP Semiconductors NV | 12,900 | 1,610,049 | ||||||
Total Technology | 17,343,372 | |||||||
Total Common Stock (Cost $43,323,916) | 62,719,665 | |||||||
Funds (3.81%) | ||||||||
Exchange-Traded Funds (2.74%) | ||||||||
DIREXION DLY SM CAP BULL | 3,800 | 116,280 | ||||||
DIREXION DLY S&P 500 BULL | 18,094 | 952,830 | ||||||
Total Exchange-Traded Funds | 1,069,110 | |||||||
Money Market Funds (1.07%) | ||||||||
First American Government Obligations Fund | 690,332 | $ | 690,332 | |||||
Total Funds (Cost $1,393,856) | 1,759,442 | |||||||
Total Investments (Cost $44,717,771)(a) (100.35%) | 64,479,106 | |||||||
Liabilities in Excess of Other Assets (-0.35%) | (223,130 | ) | ||||||
Net Assets (100.00%) | $ | 64,255,976 | ||||||
* | Non-income producing security. |
(a) | Aggregate cost for federal income tax purpose is $44,740,942. |
At September 30, 2020, unrealized appreciation/(depreciation) of securities for federal income tax purposes is as follows:
Unrealized appreciation | $ | 21,391,184 | ||
Unrealized depreciation | (1,653,020 | ) | ||
Net unrealized appreciation | $ | 19,738,164 |
ICON Equity Income Fund Portfolio of Investments September 30, 2020 |
Security Description | Shares | Value | ||||||
Common Stock (89.08%) | ||||||||
Basic Materials (4.53%) | ||||||||
Eastman Chemical Co | 21,100 | $ | 1,648,332 | |||||
International Paper Co | 49,100 | 1,990,514 | ||||||
Total Basic Materials | 3,638,846 | |||||||
Communications (6.73%) | ||||||||
Juniper Networks Inc | 104,700 | 2,251,050 | ||||||
Nexstar Media Group Inc | 8,800 | 791,384 | ||||||
ViacomCBS Inc | 84,100 | 2,355,641 | ||||||
Total Consumer, Cyclical | 5,398,075 | |||||||
Consumer, Cyclical (18.98%) | ||||||||
Best Buy Co Inc | 20,900 | 2,325,961 | ||||||
Cummins Inc | 13,100 | 2,766,196 | ||||||
Leggett & Platt Inc | 45,400 | 1,869,118 | ||||||
MDC Holdings Inc | 57,200 | 2,694,120 | ||||||
VF Corp | 30,000 | 2,107,500 | ||||||
Whirlpool Corp | 18,800 | 3,457,132 | ||||||
Total Consumer, Cyclical | 15,220,027 | |||||||
Consumer, Non-Cyclical (15.64%) | ||||||||
AbbVie Inc | 22,561 | 1,976,118 | ||||||
Altria Group Inc | 25,700 | 993,048 | ||||||
Bristol-Myers Squibb Co | 52,100 | 3,141,109 | ||||||
Conagra Brands Inc | 31,900 | 1,139,149 | ||||||
Philip Morris International Inc | 15,000 | 1,124,850 | ||||||
Security Description | Shares | Value | ||||||
Rent-A-Center Inc | 81,000 | $ | 2,421,090 | |||||
UnitedHealth Group Inc | 5,600 | 1,745,912 | ||||||
Total Consumer, Non-Cyclical | 12,541,276 | |||||||
Financial (17.99%) | ||||||||
Air Lease Corp | 9,485 | 279,049 | ||||||
Bank of America Corp | 65,500 | 1,577,895 | ||||||
Fifth Third Bancorp | 49,500 | 1,055,340 | ||||||
JPMorgan Chase & Co | 24,353 | 2,344,463 | ||||||
KeyCorp | 21,031 | 250,900 | ||||||
Lincoln National Corp | 70,800 | 2,218,164 | ||||||
Mastercard Inc | 2,029 | 686,147 | ||||||
Morgan Stanley | 36,400 | 1,759,940 | ||||||
Navient Corp | 125,600 | 1,061,320 | ||||||
Prudential Financial Inc | 31,500 | 2,000,880 | ||||||
US Bancorp | 14,800 | 530,580 | ||||||
Webster Financial Corp | 24,900 | 657,609 | ||||||
Total Financial | 14,422,287 | |||||||
Industrial (12.96%) | ||||||||
Graphic Packaging Holding Co | 25,667 | 361,648 | ||||||
Hubbell Inc | 16,200 | 2,216,808 | ||||||
Lockheed Martin Corp | 6,800 | 2,606,304 | ||||||
Packaging Corp of America | 15,800 | 1,722,990 | ||||||
Raytheon Technologies Corp | 12,171 | 700,319 | ||||||
Union Pacific Corp | 14,129 | 2,781,576 | ||||||
Total Industrial | 10,389,645 | |||||||
See accompanying notes to financial statements.
16
ICON Equity Income Fund Portfolio of Investments September 30, 2020 |
Security Description | Shares | Value | ||||||
Technology (8.62%) | ||||||||
International Business Machines Corp | 5,900 | $ | 717,853 | |||||
NetApp Inc | 11,500 | 504,160 | ||||||
Infosys Ltd | 81,200 | 1,121,372 | ||||||
QUALCOMM Inc | 32,000 | 3,765,760 | ||||||
Texas Instruments Inc | 5,600 | 799,624 | ||||||
Total Technology | 6,908,769 | |||||||
Utilities (3.63%) | ||||||||
Avangrid Inc | 12,200 | 615,612 | ||||||
Evergy Inc | 14,500 | 736,890 | ||||||
Otter Tail Corp | 43,100 | 1,558,928 | ||||||
Total Utilities | 2,911,430 | |||||||
Total Common Stock (Cost $69,414,261) | 71,430,355 | |||||||
Preferred Stock (1.20%) | ||||||||
Financial (1.20%) | ||||||||
Annaly Capital Management Inc, 6.750% | 2,395 | 54,941 | ||||||
Annaly Capital Management Inc, 6.950% | 4,000 | 90,080 | ||||||
Argo Group US Inc, 6.500% | 17,717 | 453,732 | ||||||
Wells Fargo & Co, 7.500% | 100 | 134,205 | ||||||
Wells Fargo & Co, 6.000% | 9,100 | 230,594 | ||||||
Total Preferred Stock (Cost $962,145) | 963,552 | |||||||
| Par Value |
| ||||||
Corporate Debt (4.74%) | ||||||||
Basic Materials (0.23%) | ||||||||
CVR Partners LP / CVR Nitrogen Finance Corp, 9.250%, 6/15/2023 (144A) | $ | 200,000 | 185,000 | |||||
Communications (0.17%) | ||||||||
AT&T Inc, 6.450%, 6/15/2034 | 100,000 | 137,541 | ||||||
Consumer, Cyclical (0.87%) | ||||||||
Foot Locker Inc, 8.500%, 1/15/2022 | 650,000 | 692,234 | ||||||
Consumer, Non-Cyclical (1.17%) | ||||||||
Central Garden & Pet Co, 6.125%, 11/15/2023 | 600,000 | 611,250 | ||||||
Conagra Brands Inc, 7.125%, 10/1/2026 | 175,000 | 223,118 | ||||||
Bausch Health Cos Inc, 7.000%, 3/15/2024 (144A) | 100,000 | 103,500 | ||||||
Total Consumer, Non-Cyclical | 937,868 | |||||||
Energy (0.52%) | ||||||||
Aker BP ASA, 5.875%, 3/31/2025 (144A) | 100,000 | 103,982 | ||||||
MPLX LP, 6.250%, 10/15/2022 | 314,000 | 314,341 | ||||||
Total Energy | 418,323 | |||||||
Financial (1.19%) | ||||||||
Avation Capital SA, 6.500%, 5/15/2021 (144A) | 300,000 | 203,250 | ||||||
Global Atlantic Fin Co, 8.625%, 4/15/2021 | 100,000 | 103,218 | ||||||
JPMorgan Chase & Co, 3M US LIBOR + 3.504%(a),(b) | 170,000 | 163,007 | ||||||
Principal Financial Group Inc, 3M US LIBOR + 3.090%, 5/15/2055(a),(b) | 250,000 | 223,675 | ||||||
Prudential Financial Inc, 3M US LIBOR + 5.641%, 9/15/2042(a),(b) | 250,000 | 263,302 | ||||||
Total Financial | 956,452 | |||||||
Security Description | Par Value | Value | ||||||
Industrial (0.59%) | ||||||||
TransDigm Inc, 6.500%, 7/15/2024 | $ | 200,000 | $ | 199,500 | ||||
USG Corp, 5.500%, 3/1/2025 (144A) | 275,000 | 276,375 | ||||||
Total Industrial | 475,875 | |||||||
Total Corporate Debt (Cost $3,911,801) | 3,803,293 | |||||||
Funds (4.63%) | ||||||||
Mutual Funds (3.12%) | ||||||||
BlackRock New York Municipal Bond Trust | 11,534 | 181,430 | ||||||
Duff & Phelps Utility and Corporate Bond Trust Inc | 52,038 | 480,311 | ||||||
Eaton Vance Floating-Rate Income Plus Fund | 18,787 | 263,394 | ||||||
First Trust Aberdeen Global Opportunity Income Fund | 43,739 | 418,583 | ||||||
Nuveen New York Municipal Value Fund 2 | 26,391 | 390,587 | ||||||
Pioneer Diversified High Income Trust | 30,596 | 413,352 | ||||||
Western Asset Global High Income Fund Inc | 11,261 | 108,556 | ||||||
Western Asset Corporate Loan Fund Inc | 26,100 | 241,686 | ||||||
Total Mutual Funds | 2,497,899 | |||||||
Exchange-Traded Funds (1.11%) | ||||||||
iShares iBoxx $ Investment Grade Corporate Bond ETF | 2,000 | 269,420 | ||||||
SPDR Bloomberg Barclays Short Term High Yield Bond ETF | 24,000 | 620,880 | ||||||
Total Exchange-Traded Funds | 890,300 | |||||||
Money Market Funds (0.41%) | ||||||||
First American Government Obligations Fund | 312,231 | 312,231 | ||||||
Total Funds (Cost $3,767,069) | 3,700,430 | |||||||
Total Investments (Cost $78,100,180)(c) (99.65%) | 79,897,630 | |||||||
Other Net Assets (0.35%) | 288,667 | |||||||
Net Assets (100.00%) | $ | 80,186,297 | ||||||
3M US LIBOR - 3 Month LIBOR as of September 30, 2020 was 0.234%
* | Non-income producing security. |
(a) | This security has no contractual maturity date, is not redeemable and contractually pays an indefinite stream of interest. |
(b) | Floating or variable rate security. The reference rate is described above. The rate in effect as of September 30, 2020 is based on the reference rate plus the displayed spread as of the security’s last reset date. |
(c) | Aggregate cost for federal income tax purpose is $78,284,984. |
At FYE, unrealized appreciation/(depreciation) of securities for federal income tax purposes is as follows:
Unrealized appreciation | $ | 6,984,154 | ||
Unrealized depreciation | (5,371,508 | ) | ||
Net unrealized appreciation | $ | 1,612,646 |
See accompanying notes to financial statements.
17
ICON Flexible Bond Fund Portfolio of Investments September 30, 2020 |
Security Description | Shares | Value | ||||||
Corporate Debt (70.19%) | ||||||||
Basic Materials (1.52%) | ||||||||
CVR Partners LP / CVR Nitrogen Finance Corp, 9.250%, 6/15/2023 (144A) | 2,500,000 | $ | 2,312,500 | |||||
Communications (6.92%) | ||||||||
AT&T Inc, 6.450%, 6/15/2034 | 1,900,000 | 2,613,288 | ||||||
Cincinnati Bell Telephone Co LLC, 6.300%, 12/1/2028 | 1,500,000 | 1,533,750 | ||||||
Expedia Group Inc, 7.000%, 5/1/2025 (144A) | 2,500,000 | 2,703,918 | ||||||
The Walt Disney Co, 7.750%, 2/1/2024 | 3,000,000 | 3,651,082 | ||||||
Total Communications | 10,502,038 | |||||||
Consumer, Cyclical (10.56%) | ||||||||
Century Communities Inc, 5.875%, 7/15/2025 | 1,655,000 | 1,720,373 | ||||||
Delta Air Lines 2007-1 Class A Pass Through Trust, 6.821%, 8/10/2022 | 8,331,265 | 8,332,064 | ||||||
Foot Locker Inc, 8.500%, 1/15/2022 | 3,750,000 | 3,993,653 | ||||||
Meritor Inc, 6.250%, 2/15/2024 | 1,000,000 | 1,020,000 | ||||||
The New Home Co Inc, 7.250%, 4/1/2022 | 775,000 | 769,188 | ||||||
Nexteer Automotive Group Ltd, 5.875%, 11/15/2021 (144A) | 200,000 | 200,362 | ||||||
Total Consumer, Cyclical | 16,035,640 | |||||||
Consumer, Non-Cyclical (8.75%) | ||||||||
Bausch Health Cos Inc, 7.000%, 3/15/2024 (144A) | 500,000 | 517,500 | ||||||
Central Garden & Pet Co, 6.125%, 11/15/2023 | 2,550,000 | 2,597,813 | ||||||
Conagra Brands Inc, 7.125%, 10/1/2026 | 1,150,000 | 1,466,207 | ||||||
Cooke Omega Investments Inc / Alpha VesselCo Holdings Inc, 8.500%, 12/15/2022 (144A) | 2,000,000 | 2,065,000 | ||||||
The Nielsen Co Luxembourg SARL, 5.500%, 10/1/2021 (144A) | 340,000 | 340,000 | ||||||
Polaris Intermediate Corp, 8.500%, 12/1/2022 (144A) | 3,500,000 | 3,561,250 | ||||||
RR Donnelley & Sons Co, 8.250%, 7/1/2027 | 1,679,000 | 1,695,790 | ||||||
Simmons Foods Inc, 7.750%, 1/15/2024 (144A) | 1,000,000 | 1,047,500 | ||||||
Total Consumer, Non-Cyclical | 13,291,060 | |||||||
Energy (8.73%) | ||||||||
Aker BP ASA, 5.875%, 3/31/2025 (144A) | 900,000 | 935,838 | ||||||
Andeavor Logistics LP / Tesoro Logistics Finance Corp, 6.250%, 10/15/2022 | 1,775,000 | 1,775,227 | ||||||
Diamondback Energy Inc, 5.375%, 5/31/2025 | 1,350,000 | 1,401,765 | ||||||
Marathon Petroleum Corp, 3.625%, 9/15/2024 | 2,000,000 | 2,138,085 | ||||||
MPLX LP, 6.250%, 10/15/2022 | 4,977,000 | 4,982,405 | ||||||
Noble Energy Inc, 3.250%, 10/15/2029 | 1,000,000 | 1,105,447 | ||||||
Occidental Petroleum Corp, 7.150%, 5/15/2028 | 1,000,000 | 910,000 | ||||||
Total Energy | 13,248,767 | |||||||
Financial (23.86%) | ||||||||
Avation Capital SA, 6.500%, 5/15/2021 (144A) | 1,050,000 | 711,375 | ||||||
BAC Capital Trust XIV, 3M US LIBOR + 3.766%(a),(b) | 1,500,000 | 1,482,366 | ||||||
Security Description | Shares | Value | ||||||
BGC Partners Inc, 4.375%, 12/15/2025 (144A) | 1,000,000 | $ | 1,020,214 | |||||
Fidelity & Guaranty Life Holdings Inc, 5.500%, 5/1/2025 | 1,000,000 | 1,121,250 | ||||||
Fifth Third Bancorp, 3M US LIBOR + 3.115%(a),(b) | 6,718,000 | 5,928,097 | ||||||
Global Atlantic Fin Co, 8.625%, 4/15/2021 (144A) | 1,500,000 | 1,548,273 | ||||||
GLP Capital LP / GLP Financing II Inc, 5.250%, 6/1/2025 | 2,000,000 | 2,171,640 | ||||||
Icahn Enterprises LP / Icahn Enterprises Finance Corp, 6.750%, 2/1/2024 | 500,000 | 512,888 | ||||||
JPMorgan Chase & Co, 3M US LIBOR + 3.504%(a),(b) | 6,417,000 | 6,153,050 | ||||||
MPT Operating Partnership LP / MPT Finance Corp, 6.375%, 3/1/2024 | 1,700,000 | 1,745,900 | ||||||
Principal Financial Group Inc, 3M US LIBOR + 3.090%, 5/15/2055(a),(b) | 7,110,000 | 6,361,317 | ||||||
Prudential Financial Inc, 3M US LIBOR + 5.641%, 9/15/2042(a),(b) | 2,800,000 | 2,948,986 | ||||||
QBE Capital Funding III Ltd, 3M US LIBOR + 7.016%, 5/24/2041 (144A)(a),(b) | 1,795,000 | 1,851,632 | ||||||
Tyco International Finance SA, 3.900%, 2/14/2026 | 1,100,000 | 1,175,209 | ||||||
Voyager Aviation Holdings LLC / Voyager Finance Co, 8.500%, 8/15/2021 (144A) | 3,000,000 | 1,492,500 | ||||||
Total Financial | 36,224,697 | |||||||
Industrial (2.87%) | ||||||||
Fluor Corp, 3.500%, 12/15/2024 | 2,000,000 | 1,744,140 | ||||||
TransDigm Inc, 6.500%, 7/15/2024 | 600,000 | 598,500 | ||||||
USG Corp, 5.500%, 3/1/2025 (144A) | 2,000,000 | 2,010,000 | ||||||
Total Industrial | 4,352,640 | |||||||
Technology (1.28%) | ||||||||
Dell International LLC / EMC Corp, 7.125%, 6/15/2024 (144A) | 1,352,000 | 1,406,337 | ||||||
j2 Cloud Services LLC / j2 Cloud Co-Obligor Inc, 6.000%, 7/15/2025 (144A) | 500,000 | 520,000 | ||||||
Total Technology | 1,926,337 | |||||||
Utilities (5.70%) | ||||||||
Pacific Gas and Electric Co, 3.500%, 6/15/2025 | 1,500,000 | 1,578,262 | ||||||
PacifiCorp, 8.069%, 9/9/2022 | 3,685,000 | 4,153,320 | ||||||
Vistra Operations Co LLC, 5.500%, 9/1/2026 (144A) | 1,350,000 | 1,409,063 | ||||||
Vistra Operations Co LLC, 5.000%, 7/31/2027 (144A) | 1,460,000 | 1,530,080 | ||||||
Total Utilities | 8,670,725 | |||||||
Total Corporate Debt (Cost $109,217,951) | 106,564,404 | |||||||
Asset Backed Securities (1.77%) | ||||||||
SMB Private Education Loan Trust 2014-A, 4.500%, 9/15/2045 (144A) (Cost $2,900,001) | 3,000,000 | 2,690,555 | ||||||
Preferred Stock (16.49%) | ||||||||
Annaly Capital Management Inc, 6.950% | 139,397 | 3,139,220 | ||||||
Argo Group US Inc, 6.500% | 360,186 | 9,224,363 | ||||||
Bank of America Corp, 7.250% | 2,460 | 3,660,480 | ||||||
Equity Commonwealth, 6.500% | 89,676 | 2,605,088 | ||||||
See accompanying notes to financial statements.
18
ICON Flexible Bond Fund Portfolio of Investments September 30, 2020 |
Security Description | Shares | Value | ||||||
Wells Fargo & Co, 6.000% | 69,188 | $ | 1,753,224 | |||||
Wells Fargo & Co, 7.500% | 3,470 | 4,656,914 | ||||||
Total Preferred Stock (Cost $24,298,322) | 25,039,289 | |||||||
| Par Value |
| ||||||
Funds (9.71%) | ||||||||
Mutual Funds (9.68%) | ||||||||
BlackRock New York Municipal Bond Trust | $ | 3,400 | 53,482 | |||||
Duff & Phelps Utility and Corporate Bond Trust Inc | 249,268 | 2,300,744 | ||||||
Eaton Vance Floating-Rate Income Plus Fund | 146,929 | 2,059,945 | ||||||
First Trust Aberdeen Global Opportunity Income Fund | 378,663 | 3,623,805 | ||||||
Nuveen New York Municipal Value Fund 2 | 29,955 | 443,334 | ||||||
Pioneer Diversified High Income Trust | 248,151 | 3,352,520 | ||||||
Western Asset Global High Income Fund Inc | 59,604 | 574,583 | ||||||
Western Asset Corporate Loan Fund Inc | 244,606 | 2,265,052 | ||||||
Total Mutual Funds | 14,673,465 | |||||||
Security Description | Par Value | Value | ||||||
Money Market Funds (0.03%) | ||||||||
First American Government Obligations Fund | $ | 52,350 | $ | 52,350 | ||||
Total Funds (Cost $15,383,392) | 14,725,815 | |||||||
Total Investments (Cost $151,799,666)(c) (98.15%) | 149,020,062 | |||||||
Other Net Assets (1.85%) | 2,798,679 | |||||||
Net Assets (100.00%) | $ | 151,818,741 | ||||||
3M US LIBOR - 3 Month LIBOR as of September 30, 2020 was 0.234%
(144A) Security was purchased pursuant to Rule 144A or Section 4(a)(2) under the Securities Act of 1933 and may be resold in transactions exempt from registration only to qualified institutional buyers. As of September 30, 2020, these securities had a total aggregate market value of $29,873,897, which represented approximately 19.68% of net assets.
(a) | Floating or variable rate security. The reference rate is described above. The rate in effect as of September 30, 2020 is based on the reference rate plus the displayed spread as of the security’s last reset date. |
(b) | This security has no contractual maturity date, is not redeemable and contractually pays an indefinite stream of interest. |
(c) | Aggregate cost for federal income tax purpose is $152,460,627. |
At September 30, 2020, unrealized appreciation/(depreciation) of securities for federal income tax purposes is as follows:
Unrealized appreciation | $ | 1,594,704 | ||
Unrealized depreciation | (5,035,269 | ) | ||
Net unrealized depreciation | $ | (3,440,565 | ) |
ICON Health and Information Technology Fund Portfolio of Investments September 30, 2020 |
Security Description | Shares | Value | ||||||
Common Stock (99.10%) | ||||||||
| ||||||||
Communications (10.04%) | ||||||||
Alphabet Inc* | 1,500 | $ | 2,204,400 | |||||
Amazon.com Inc* | 1,000 | 3,148,730 | ||||||
Extreme Networks Inc* | 786,057 | 3,159,949 | ||||||
Perficient Inc* | 65,100 | 2,782,374 | ||||||
Total Communications | 11,295,453 | |||||||
Consumer, Non-Cyclical (37.86%) | ||||||||
AbbVie Inc | 39,265 | 3,439,221 | ||||||
Anthem Inc | 9,100 | 2,444,169 | ||||||
Automatic Data Processing Inc | 12,700 | 1,771,523 | ||||||
Booz Allen Hamilton Holding Corp | 31,000 | 2,572,380 | ||||||
Bristol-Myers Squibb Co | 59,393 | 3,580,804 | ||||||
Euronet Worldwide Inc* | 31,900 | 2,906,090 | ||||||
Global Payments Inc | 30,193 | 5,361,673 | ||||||
Humana Inc | 5,500 | 2,276,395 | ||||||
IQVIA Holdings Inc* | 10,538 | 1,661,105 | ||||||
Regeneron Pharmaceuticals Inc* | 4,400 | 2,463,032 | ||||||
Henry Schein Inc* | 11,200 | 658,336 | ||||||
Thermo Fisher Scientific Inc | 9,882 | 4,363,101 | ||||||
UnitedHealth Group Inc | 17,400 | 5,424,798 | ||||||
Zoetis Inc | 22,388 | 3,702,304 | ||||||
Total Consumer, Non-Cyclical | 42,624,931 | |||||||
Security Description | Shares | Value | ||||||
Financial (7.60%) | ||||||||
Mastercard Inc | 14,900 | $ | 5,038,733 | |||||
Visa Inc | 17,580 | 3,515,473 | ||||||
Total Financial | 8,554,206 | |||||||
Industrial (5.26%) | ||||||||
Jabil Inc | 52,400 | 1,795,224 | ||||||
II-VI Inc* | 79,900 | 3,240,744 | ||||||
TE Connectivity Ltd | 9,000 | 879,660 | ||||||
Total Industrial | 5,915,628 | |||||||
Technology (38.34%) | ||||||||
Adobe Inc* | 9,900 | 4,855,257 | ||||||
Apple Inc | 74,400 | 8,616,264 | ||||||
Autodesk Inc* | 14,300 | 3,303,443 | ||||||
Ebix Inc | 141,000 | 2,904,600 | ||||||
EPAM Systems Inc* | 15,400 | 4,978,512 | ||||||
Microsoft Corp | 36,300 | 7,634,979 | ||||||
Qorvo Inc* | 21,900 | 2,825,319 | ||||||
Skyworks Solutions Inc | 25,610 | 3,726,255 | ||||||
Genpact Ltd | 22,200 | 864,690 | ||||||
NXP Semiconductors NV | 27,687 | 3,455,614 | ||||||
Total Technology | 43,164,933 | |||||||
Total Common Stock (Cost $76,949,887) | 111,555,151 | |||||||
See accompanying notes to financial statements.
19
ICON Health and Information Technology Fund Portfolio of Investments September 30, 2020 |
Security Description | Par Value | Value | ||||||
Money Market Funds (0.15%) | ||||||||
First American Government Obligations Fund (Cost $169,953) | $ | 169,953 | $ | 169,953 | ||||
Total Investments (Cost $77,119,840)(a) (99.25%) | 111,725,104 | |||||||
Other Net Assets (0.75%) | 841,472 | |||||||
Net Assets (100.00%) | $ | 112,566,576 | ||||||
* | Non-income producing security. |
(a) | Aggregate cost for federal income tax purpose is $77,119,840. |
At September 30, 2020, unrealized appreciation/(depreciation) of securities for federal income tax purposes is as follows:
Unrealized appreciation | $ | 36,247,553 | ||
Unrealized depreciation | (1,642,289 | ) | ||
Net unrealized appreciation | $ | 34,605,264 |
ICON Natural Resources and Infrastructure Fund Portfolio of Investments September 30, 2020 |
Security Description | Shares | Value | ||||||
Common Stock (99.17%) | ||||||||
| ||||||||
Basic Materials (39.29%) | ||||||||
Cabot Corp | 56,300 | $ | 2,028,489 | |||||
Celanese Corp | 38,000 | 4,083,100 | ||||||
The Chemours Co | 132,300 | 2,766,393 | ||||||
Gold Fields Ltd | 400,000 | 4,916,000 | ||||||
Huntsman Corp | 86,700 | 1,925,607 | ||||||
International Paper Co | 147,000 | 5,959,380 | ||||||
Newmont Corp | 66,000 | 4,187,700 | ||||||
Quaker Chemical Corp | 20,000 | 3,594,200 | ||||||
RPM International Inc | 43,000 | 3,562,120 | ||||||
The Sherwin Williams Co | 5,000 | 3,483,700 | ||||||
Wheaton Precious Metals Corp | 87,000 | 4,269,090 | ||||||
Total Basic Materials | 40,775,779 | |||||||
Consumer, Cyclical (5.01%) | ||||||||
Allison Transmission Holdings Inc | 5,000 | 175,700 | ||||||
Cummins Inc | 2,750 | 580,690 | ||||||
Fastenal Co | 47,000 | 2,119,230 | ||||||
WW Grainger Inc | 6,500 | 2,319,005 | ||||||
Total Consumer, Cyclical | 5,194,625 | |||||||
Consumer, Non-Cyclical (6.10%) | ||||||||
Avery Dennison Corp | 45,000 | 5,752,800 | ||||||
Herc Holdings Inc* | 3,900 | 154,479 | ||||||
United Rentals Inc* | 2,400 | 418,800 | ||||||
Total Consumer, Non-Cyclical | 6,326,079 | |||||||
Energy (3.35%) | ||||||||
The Williams Cos Inc | 75,000 | 1,473,750 | ||||||
Atlantica Sustainable Infrastructure PLC | 70,000 | 2,002,700 | ||||||
Total Energy | 3,476,450 | |||||||
Financial (0.37%) | ||||||||
Air Lease Corp | 12,906 | 379,695 | ||||||
Industrial (40.55%) | ||||||||
Altra Industrial Motion Corp | 4,100 | 151,577 | ||||||
Armstrong World Industries Inc | 30,000 | 2,064,300 | ||||||
CSX Corp | 9,750 | 757,283 | ||||||
Canadian Pacific Railway Ltd | 1,700 | 517,531 | ||||||
Chart Industries Inc* | 53,100 | 3,731,337 | ||||||
Eagle Materials Inc | 26,100 | 2,252,952 | ||||||
EMCOR Group Inc | 18,300 | 1,239,093 | ||||||
Security Description | Shares | Value | ||||||
Fortune Brands Home & Security Inc | 7,000 | $ | 605,640 | |||||
Jacobs Engineering Group Inc | 3,400 | 315,418 | ||||||
Kansas City Southern | 3,000 | 542,490 | ||||||
Louisiana-Pacific Corp | 47,000 | 1,386,970 | ||||||
Martin Marietta Materials Inc | 10,700 | 2,518,352 | ||||||
Masco Corp | 75,000 | 4,134,749 | ||||||
MasTec Inc* | 53,395 | 2,253,269 | ||||||
Old Dominion Freight Line Inc | 11,500 | 2,080,580 | ||||||
PGT Innovations Inc* | 35,000 | 613,200 | ||||||
Packaging Corp of America | 51,000 | 5,561,550 | ||||||
Saia Inc* | 16,500 | 2,081,310 | ||||||
Sealed Air Corp | 32,000 | 1,241,920 | ||||||
A O Smith Corp | 13,000 | 686,400 | ||||||
Union Pacific Corp | 16,600 | 3,268,042 | ||||||
United Parcel Service Inc | 8,500 | 1,416,355 | ||||||
Trane Technologies PLC | 22,000 | 2,667,500 | ||||||
Total Industrial | 42,087,818 | |||||||
Utilities (4.50%) | ||||||||
The AES Corp | 207,163 | 3,751,722 | ||||||
NRG Energy Inc | 30,000 | 922,200 | ||||||
Total Utilities | 4,673,922 | |||||||
Total Common Stock (Cost $94,599,704) | 102,914,368 | |||||||
| Par Value |
| ||||||
Money Market Funds (0.65%) | ||||||||
First American Government Obligations Fund (Cost $691,839) | $ | 691,839 | 691,839 | |||||
Total Investments (Cost $95,291,543)(a) (99.82%) | 103,606,207 | |||||||
Other Net Assets (0.18%) | 180,276 | |||||||
Net Assets (100.00%) | $ | 103,786,483 | ||||||
* | Non-income producing security. |
(a) | Aggregate cost for federal income tax purpose is $95,352,570. |
At September 30, 2020, unrealized appreciation/(depreciation) of securities for federal income tax purposes is as follows:
Unrealized appreciation | $ | 10,812,146 | ||
Unrealized depreciation | (2,558,509 | ) | ||
Net unrealized appreciation | $ | 8,253,637 |
See accompanying notes to financial statements.
20
ICON Utilities and Income Fund Portfolio of Investments September 30, 2020 |
Security Description | Shares | Value | ||||||
Common Stock (99.71%) | ||||||||
| ||||||||
Communications (4.58%) | ||||||||
ViacomCBS Inc | 48,800 | $ | 1,366,888 | |||||
Energy (5.56%) | ||||||||
Atlantica Sustainable Infrastructure PLC | 58,000 | 1,659,380 | ||||||
Industrial (18.75%) | ||||||||
Crane Co | 15,000 | 751,950 | ||||||
Hubbell Inc | 8,900 | 1,217,876 | ||||||
MDU Resources Group Inc | 85,000 | 1,912,500 | ||||||
Union Pacific Corp | 8,700 | 1,712,769 | ||||||
Total Industrial | 5,595,095 | |||||||
Utilities (70.82%) | ||||||||
The AES Corp | 30,200 | 546,922 | ||||||
Ameren Corp | 25,000 | 1,977,000 | ||||||
American Electric Power Co Inc | 18,900 | 1,544,697 | ||||||
Black Hills Corp | 15,600 | 834,444 | ||||||
DTE Energy Co | 8,200 | 943,328 | ||||||
Duke Energy Corp | 24,700 | 2,187,432 | ||||||
Evergy Inc | 28,800 | 1,463,616 | ||||||
NextEra Energy Inc | 5,600 | 1,554,336 | ||||||
NiSource Inc | 43,800 | 963,600 | ||||||
OGE Energy Corp | 44,400 | 1,331,556 | ||||||
Security Description | Shares | Value | ||||||
PPL Corp | 26,500 | $ | 721,065 | |||||
Pinnacle West Capital Corp | 13,000 | 969,150 | ||||||
Public Service Enterprise Group Inc | 27,500 | 1,510,025 | ||||||
Sempra Energy | 17,400 | 2,059,464 | ||||||
Xcel Energy Inc | 36,500 | 2,518,865 | ||||||
Total Utilities | 21,125,500 | |||||||
Total Common Stock (Cost $29,328,194) | 29,746,863 | |||||||
| Par Value |
| ||||||
Money Market Funds (0.25%) | ||||||||
First American Government Obligations Fund (Cost $75,694) | $ | 75,694 | 75,694 | |||||
Total Investments (Cost $29,403,888)(a) (99.96%) | 29,822,557 | |||||||
Other Net Assets (0.04%) | 12,557 | |||||||
Net Assets (100.00%) | $ | 29,835,114 | ||||||
(a) | Aggregate cost for federal income tax purpose is $29,480,834. |
At September 30, 2020, unrealized appreciation/(depreciation) of securities for federal income tax purposes is as follows:
Unrealized appreciation | $ | 2,728,709 | ||
Unrealized depreciation | (2,386,986 | ) | ||
Net unrealized appreciation | $ | 341,723 |
Shelton Emerging Markets Fund Portfolio of Investments September 30, 2020 |
Security Description | Shares | Value | ||||||
Common Stock (93.91%) | ||||||||
Argentina (4.28%) | ||||||||
MercadoLibre Inc* | 900 | $ | 974,232 | |||||
Brazil (3.77%) | ||||||||
Sul America SA | 122,125 | 858,326 | ||||||
China (22.90%) | ||||||||
Alibaba Group Holding Ltd* | 3,000 | 881,940 | ||||||
Autohome Inc | 6,300 | 604,800 | ||||||
New Oriental Education & Technology Group Inc* | 4,400 | 657,800 | ||||||
Ping An Insurance Group Co of China Ltd | 84,000 | 871,991 | ||||||
Xinyi Solar Holdings Ltd | 975,000 | 1,554,393 | ||||||
China Meidong Auto Holdings Ltd | 168,000 | 647,232 | ||||||
Total China | 5,218,156 | |||||||
Hong Kong (4.15%) | ||||||||
Haier Electronics Group Co Ltd | 260,000 | 945,237 | ||||||
India (8.65%) | ||||||||
HDFC Bank Ltd* | 20,661 | 1,032,224 | ||||||
Infosys Ltd | 67,898 | 937,671 | ||||||
Total India | 1,969,895 | |||||||
Indonesia (13.94%) | ||||||||
Bank Rakyat Indonesia Persero Tbk PT | 5,394,600 | 1,106,726 | ||||||
Indofood CBP Sukses Makmur Tbk PT | 930,000 | 630,364 | ||||||
Ace Hardware Indonesia Tbk PT | 7,000,000 | 751,130 | ||||||
Sarana Menara Nusantara Tbk PT | 9,866,900 | 689,111 | ||||||
Total Indonesia | 3,177,331 | |||||||
Mexico (2.31%) | ||||||||
Regional SAB de CV* | 223,800 | 527,428 | ||||||
Security Description | Shares | Value | ||||||
South Korea (13.10%) | ||||||||
Samsung SDI Co Ltd | 3,000 | $ | 1,108,255 | |||||
Samsung Electronics Co Ltd | 37,812 | 1,877,145 | ||||||
Total South Korea | 2,985,400 | |||||||
Taiwan (18.02%) | ||||||||
Accton Technology Corp | 183,000 | 1,415,813 | ||||||
MediaTek Inc | 46,000 | 974,693 | ||||||
Taiwan Semiconductor Manufacturing Co Ltd | 114,000 | 1,715,025 | ||||||
Total Taiwan | 4,105,531 | |||||||
Thailand (2.79%) | ||||||||
Bangkok Bank PCL | 209,000 | 636,177 | ||||||
Total Common Stock (Cost $16,589,278) | 21,397,713 | |||||||
United States Treasury Bills (2.63%) | ||||||||
0.095%, 1/14/21 (Cost $599,815) | 600,000 | 599,821 | ||||||
Total Investments (Cost $17,189,093)(a) (96.54%) | 21,997,534 | |||||||
Other Net Assets (3.46%) | 752,519 | |||||||
Net Assets (100.00%) | $ | 22,750,053 | ||||||
* | Non-income producing security. |
(a) | Aggregate cost for federal income tax purpose is $17,189,093. |
At September 30, 2020, unrealized appreciation/(depreciation) of securities for federal income tax purposes is as follows:
Unrealized appreciation | $ | 5,945,365 | ||
Unrealized depreciation | (1,136,924 | ) | ||
Net unrealized appreciation | $ | 4,808,441 |
See accompanying notes to financial statements.
21
Statements of Assets and Liabilities September 30, 2020 |
ICON | ICON | ICON | ICON | |||||||||||||
Assets | ||||||||||||||||
Investments in securities | ||||||||||||||||
Cost of investments | $ | 41,902,731 | $ | 44,717,771 | $ | 78,055,276 | $ | 151,799,666 | ||||||||
Market value of investments (Note 1) | 51,436,770 | 64,479,106 | 79,897,630 | 149,020,062 | ||||||||||||
Cash | — | — | 9,364 | — | ||||||||||||
Cash denominated in foreign currencies | — | — | — | — | ||||||||||||
Interest receivable | 8 | 8 | 66,781 | 1,507,120 | ||||||||||||
Dividend receivable | 9,440 | 15,142 | 171,717 | 68,469 | ||||||||||||
Receivable for fund shares sold | 19,155 | 884 | 505,992 | 112,431 | ||||||||||||
Receivable for investment securities Sold | — | — | 3,787,170 | 1,660,286 | ||||||||||||
Prepaid expenses | 22,151 | 28,280 | 30,025 | 27,995 | ||||||||||||
Total assets | $ | 51,487,524 | $ | 64,523,420 | $ | 84,468,679 | $ | 152,396,363 | ||||||||
Liabilities | ||||||||||||||||
Payable to investment advisor | 42,885 | 40,233 | 43,903 | 61,013 | ||||||||||||
Payable for investments purchased | — | — | 3,407,224 | — | ||||||||||||
Payable for fund shares purchased | 60,701 | 164,577 | 696,806 | 406,544 | ||||||||||||
Distributions payable | — | — | 19,631 | 25,129 | ||||||||||||
Accrued 12b-1 fees | 121 | 302 | 21,381 | 176 | ||||||||||||
Accrued administration fees | 3,622 | 4,551 | 438 | 10,845 | ||||||||||||
Accrued CCO fees | 566 | 702 | 661 | 1,659 | ||||||||||||
Accrued custody fees | 2,071 | 1,522 | 2,547 | 3,467 | ||||||||||||
Accrued fund accounting fees | 3,051 | 3,967 | 6,731 | 10,232 | ||||||||||||
Accrued printing fees | 1,786 | 6,714 | 4,922 | 7,220 | ||||||||||||
Accrued state registration fees | 3,083 | 2,186 | — | — | ||||||||||||
Accrued transfer agent fees | 16,510 | 6,260 | 23,800 | 2,690 | ||||||||||||
Accrued trustee fees | 1,385 | 1,616 | 4,202 | 5,024 | ||||||||||||
Accrued expenses | 35,998 | 34,814 | 50,136 | 43,623 | ||||||||||||
Total liabilities | 171,779 | 267,444 | 4,282,382 | 577,622 | ||||||||||||
Net assets | $ | 51,315,745 | $ | 64,255,976 | $ | 80,186,297 | $ | 151,818,741 | ||||||||
Net assets at September 30, 2020 consist of | ||||||||||||||||
Paid-in capital | 47,286,857 | 47,914,450 | 82,200,946 | 160,524,268 | ||||||||||||
Distributable earnings/(loss) | 4,028,888 | 16,341,526 | (2,014,649 | ) | (8,705,527 | ) | ||||||||||
Total net assets | $ | 51,315,745 | $ | 64,255,976 | $ | 80,186,297 | $ | 151,818,741 | ||||||||
Net assets | ||||||||||||||||
Institutional Shares | $ | 48,831,709 | $ | 45,176,403 | $ | 42,623,508 | $ | 141,158,086 | ||||||||
Investor Shares | $ | 2,484,036 | $ | 19,079,573 | $ | 37,562,789 | $ | 10,660,655 | ||||||||
Shares outstanding | ||||||||||||||||
Institutional Shares (no par value, unlimited shares authorized) | 5,161,107 | 1,609,637 | 2,593,111 | 15,562,509 | ||||||||||||
Investor Shares (no par value, unlimited shares authorized) | 263,254 | 709,597 | 2,287,207 | 1,182,076 | ||||||||||||
Net asset value per share | ||||||||||||||||
Institutional Shares | $ | 9.46 | $ | 28.07 | $ | 16.44 | $ | 9.07 | ||||||||
Investor Shares | $ | 9.44 | $ | 26.89 | $ | 16.42 | $ | 9.02 | ||||||||
See accompanying notes to financial statements.
22
Statements of Assets and Liabilities September 30, 2020 |
ICON Health | ICON Natural | ICON Utilities | Shelton | |||||||||||||
Assets | ||||||||||||||||
Investments in securities | ||||||||||||||||
Cost of investments | $ | 77,119,840 | $ | 95,291,543 | $ | 29,403,888 | $ | 17,189,093 | ||||||||
Market value of investments (Note 1) | 111,725,104 | 103,606,207 | 29,822,557 | 21,997,534 | ||||||||||||
Cash | — | — | — | 807,266 | ||||||||||||
Cash denominated in foreign currencies | — | 429,023 | — | — | ||||||||||||
Interest receivable | 26 | 43 | 2 | — | ||||||||||||
Dividend receivable | 29,487 | 110,070 | 87,410 | 38,140 | ||||||||||||
Receivable for fund shares sold | 9,519 | 32,096 | 9,831 | 13,416 | ||||||||||||
Receivable for investment securities Sold | 1,010,525 | — | — | — | ||||||||||||
Prepaid expenses | 20,750 | 40,282 | 11,178 | 26,934 | ||||||||||||
Total assets | $ | 112,795,411 | $ | 104,217,721 | $ | 29,930,978 | $ | 22,883,290 | ||||||||
Liabilities | ||||||||||||||||
Payable to investment advisor | 92,460 | 86,475 | 19,638 | 18,283 | ||||||||||||
Payable for investments purchased | — | — | — | — | ||||||||||||
Payable for fund shares purchased | 53,332 | 204,305 | 10,341 | 49,502 | ||||||||||||
Distributions payable | — | — | 18,158 | — | ||||||||||||
Accrued 12b-1 fees | 76 | 105 | 81 | 288 | ||||||||||||
Accrued administration fees | 7,837 | 7,335 | 2,107 | 1,546 | ||||||||||||
Accrued CCO fees | 1,186 | 1,128 | 332 | 95 | ||||||||||||
Accrued custody fees | 2,789 | 3,283 | 937 | 8,208 | ||||||||||||
Accrued fund accounting fees | 8,492 | 7,486 | 4,208 | 5,644 | ||||||||||||
Accrued printing fees | 6,944 | 8,959 | 3,191 | 4,166 | ||||||||||||
Accrued state registration fees | — | — | 3,985 | — | ||||||||||||
Accrued transfer agent fees | 15,424 | 62,477 | 7,989 | 18,000 | ||||||||||||
Accrued trustee fees | 3,190 | 3,086 | 1,141 | 507 | ||||||||||||
Accrued expenses | 37,105 | 46,599 | 23,756 | 26,998 | ||||||||||||
Total liabilities | 228,835 | 431,238 | 95,864 | 133,237 | ||||||||||||
Net assets | $ | 112,566,576 | $ | 103,786,483 | $ | 29,835,114 | $ | 22,750,053 | ||||||||
Net assets at September 30, 2020 consist of | ||||||||||||||||
Paid-in capital | 75,280,283 | 344,414,862 | 28,735,988 | 24,324,921 | ||||||||||||
Distributable earnings/(loss) | 37,286,293 | (240,628,379 | ) | 1,099,126 | (1,574,868 | ) | ||||||||||
Total net assets | $ | 112,566,576 | $ | 103,786,483 | $ | 29,835,114 | $ | 22,750,053 | ||||||||
Net assets | ||||||||||||||||
Institutional Shares | $ | 109,618,613 | $ | 98,785,699 | $ | 25,037,835 | $ | 21,318,034 | ||||||||
Investor Shares | $ | 2,947,963 | $ | 5,000,784 | $ | 4,797,279 | $ | 1,432,019 | ||||||||
Shares outstanding | ||||||||||||||||
Institutional Shares (no par value, unlimited shares authorized) | 5,845,583 | 8,383,586 | 2,784,886 | 1,390,974 | ||||||||||||
Investor Shares (no par value, unlimited shares authorized) | 165,643 | 429,805 | 543,005 | 94,194 | ||||||||||||
Net asset value per share | ||||||||||||||||
Institutional Shares | $ | 18.75 | $ | 11.78 | $ | 8.99 | $ | 15.33 | ||||||||
Investor Shares | $ | 17.80 | $ | 11.64 | $ | 8.83 | $ | 15.20 | ||||||||
See accompanying notes to financial statements.
23
Statements of Operations |
ICON | ICON | ICON | ICON | |||||||||||||
Investment income | ||||||||||||||||
Interest income | $ | 148 | $ | 37 | $ | 159,862 | $ | 5,107,140 | ||||||||
Dividend income (net of foreign tax witheld: $—, $4,856, $—, and $— respectively) | 682,935 | 322,972 | 2,283,992 | 3,089,617 | ||||||||||||
Other Income | — | — | 3,000 | 75,443 | ||||||||||||
Income from securities lending, net | 905 | 2,094 | 10,901 | 29,991 | ||||||||||||
Total | 683,988 | 325,103 | 2,457,755 | 8,302,191 | ||||||||||||
Expenses | ||||||||||||||||
Management fees (Note 2) | $ | 370,177 | $ | 230,893 | $ | 514,182 | $ | 954,414 | ||||||||
Administration fees (Note 2) | 23,048 | 19,742 | 41,498 | 95,238 | ||||||||||||
Interest Expense | 1,555 | 379 | 725 | 62 | ||||||||||||
Transfer agent fees | 59,985 | 47,551 | 110,034 | 168,187 | ||||||||||||
Accounting services | 22,381 | 16,579 | 41,993 | 90,548 | ||||||||||||
Custodian fees | 3,910 | 4,240 | 5,783 | 18,414 | ||||||||||||
Legal and audit fees | 20,659 | 20,424 | 28,970 | 47,162 | ||||||||||||
CCO fees (Note 2) | 1,291 | 1,687 | 1,527 | 3,984 | ||||||||||||
Trustees fees | 8,568 | 4,699 | 18,324 | 38,660 | ||||||||||||
Insurance | 4,757 | 3,188 | 9,932 | 19,267 | ||||||||||||
Printing | 11,220 | 5,147 | 18,156 | 26,821 | ||||||||||||
Registration and dues | 28,228 | 36,796 | 41,814 | 48,213 | ||||||||||||
Reorganization expense | 19,316 | 10,735 | 39,069 | 83,211 | ||||||||||||
Misc. fees and expense | 9,862 | 7,565 | 17,416 | 33,395 | ||||||||||||
Investor Class 12b-1 fees (Note 2) | 3,820 | 20,090 | 31,821 | 17,194 | ||||||||||||
Class C 12b-1 fees (Note 2) | — | 20,095 | 130,238 | 32,284 | ||||||||||||
Total expenses | $ | 588,777 | $ | 449,810 | $ | 1,051,482 | $ | 1,677,054 | ||||||||
Less reimbursement from manager (Note 2) | (22,691 | ) | (54,753 | ) | (167,804 | ) | (346,806 | ) | ||||||||
Net expenses | $ | 566,086 | $ | 395,057 | $ | 883,678 | $ | 1,330,248 | ||||||||
Net investment income/(loss) | $ | 117,902 | $ | (69,954 | ) | $ | 1,574,077 | $ | 6,971,943 | |||||||
Realized and unrealized gain (loss) on investments | ||||||||||||||||
Net realized gain/(loss) from security transactions and foreign currency | $ | (1,302,968 | ) | $ | (2,102,548 | ) | $ | (2,803,532 | ) | $ | (2,700,973 | ) | ||||
Change in unrealized appreciation/(depreciation) of investments | (1,298,319 | ) | 7,898,128 | (3,055,329 | ) | (3,591,635 | ) | |||||||||
Net realized and unrealized gain/(loss) on investments | $ | (2,601,287 | ) | $ | 5,795,580 | $ | (5,858,861 | ) | $ | (6,292,609 | ) | |||||
Net increase/(decrease) in net assets resulting from operations | $ | (2,483,385 | ) | $ | 5,725,626 | $ | (4,284,784 | ) | $ | 679,335 | ||||||
See accompanying notes to financial statements.
24
Statements of Operations |
ICON Health | ICON Natural | ICON Utilities | Shelton | |||||||||||||
Investment income | ||||||||||||||||
Interest income | $ | 112 | $ | 112 | $ | 101 | $ | 541 | ||||||||
Dividend income (net of foreign tax witheld: $2,024, $5,465, $4,392 and $56,830 respectively) | 630,137 | 1,326,596 | 1,405,840 | 539,112 | ||||||||||||
Other Income | — | 83 | — | — | ||||||||||||
Income from securities lending, net | 1,138 | 260 | 208 | 3,616 | ||||||||||||
Total | 631,387 | 1,327,051 | 1,406,149 | 543,269 | ||||||||||||
Expenses | ||||||||||||||||
Management fees (Note 2) | $ | 684,511 | $ | 614,201 | $ | 433,121 | $ | 304,623 | ||||||||
Administration fees (Note 2) | 44,386 | 39,842 | 24,958 | 17,464 | ||||||||||||
Interest Expense | 888 | 1,581 | 617 | 4,210 | ||||||||||||
Transfer agent fees | 94,242 | 136,486 | 91,757 | 85,269 | ||||||||||||
Accounting services | 36,217 | 33,033 | 27,198 | 23,056 | ||||||||||||
Custodian fees | 5,435 | 4,214 | 3,812 | 25,052 | ||||||||||||
Legal and audit fees | 28,644 | 26,718 | 21,901 | 22,747 | ||||||||||||
CCO fees (Note 2) | 2,921 | 2,688 | 819 | 684 | ||||||||||||
Trustees fees | 13,611 | 12,705 | 12,010 | 9,363 | ||||||||||||
Insurance | 7,883 | 7,447 | 5,480 | 5,354 | ||||||||||||
Printing | 18,027 | 26,585 | 11,229 | 15,019 | ||||||||||||
Registration and dues | 30,483 | 35,480 | 30,375 | 32,295 | ||||||||||||
Reorganization expense | 30,220 | 27,630 | 24,839 | 17,696 | ||||||||||||
Misc. fees and expense | 13,682 | 13,459 | 12,246 | 17,554 | ||||||||||||
Investor Class 12b-1 fees (Note 2) | 4,653 | 6,767 | 13,488 | 4,379 | ||||||||||||
Class C 12b-1 fees (Note 2) | — | 6,098 | — | — | ||||||||||||
Total expenses | $ | 1,015,803 | $ | 994,934 | $ | 713,850 | $ | 584,765 | ||||||||
Less reimbursement from manager (Note 2) | (6,324 | ) | (70,498 | ) | (146,591 | ) | (91,558 | ) | ||||||||
Net expenses | $ | 1,009,479 | $ | 924,436 | $ | 567,259 | $ | 493,207 | ||||||||
Net investment income/(loss) | $ | (378,092 | ) | $ | 402,615 | $ | 838,890 | $ | 50,062 | |||||||
Realized and unrealized gain (loss) on investments | ||||||||||||||||
Net realized gain/(loss) from security transactions and foreign currency | $ | 4,942,975 | $ | (34,405,685 | ) | $ | 861,306 | $ | (3,886,642 | ) | ||||||
Change in unrealized appreciation/(depreciation) of investments | 12,027,242 | 38,453,067 | (6,169,332 | ) | 4,945,157 | |||||||||||
Net realized and unrealized gain/(loss) on investments | $ | 16,970,217 | $ | 4,047,382 | $ | (5,308,026 | ) | $ | 1,058,515 | |||||||
Net increase/(decrease) in net assets resulting from operations | $ | 16,592,125 | $ | 4,449,997 | $ | (4,469,136 | ) | $ | 1,108,577 | |||||||
See accompanying notes to financial statements.
25
Statements of Changes in Net Assets |
ICON Consumer Select Fund(a) | ICON Equity Fund(b) | |||||||||||||||
Year Ended | Year Ended | Year Ended | Year Ended | |||||||||||||
Operations | ||||||||||||||||
Net investment income/(loss) | $ | 117,902 | $ | 299,328 | $ | (69,954 | ) | $ | (71,066 | ) | ||||||
Net realized gain/(loss) on investments and foreign currency | (1,302,968 | ) | 37,433 | (2,102,548 | ) | 1,069,156 | ||||||||||
Net realized gain/(loss) on long-term capital gain distributions from other investment companies | — | — | — | — | ||||||||||||
Change in unrealized appreciation/(depreciation) of investments | (1,298,319 | ) | (1,312,468 | ) | 7,898,128 | (2,025,675 | ) | |||||||||
Net increase/(decrease) in net assets resulting from operations | (2,483,385 | ) | (975,707 | ) | 5,725,626 | (1,027,585 | ) | |||||||||
Distributions to shareholders | ||||||||||||||||
Distributions | ||||||||||||||||
Institutional Shares(c) | (781,560 | ) | (236,071 | ) | (458,387 | ) | (171,949 | ) | ||||||||
Investor Shares(d) | (25,869 | ) | (8,439 | ) | (180,913 | ) | (69,039 | ) | ||||||||
Class C Shares | — | — | (117,821 | ) | (71,048 | ) | ||||||||||
Capital share transactions | ||||||||||||||||
Increase/(decrease) in net assets resulting from capital share transactions | 18,541,459 | (7,726,699 | ) | 38,767,407 | (7,107,488 | ) | ||||||||||
Total increase/(decrease) | 15,250,645 | (8,946,916 | ) | 43,735,912 | (8,447,109 | ) | ||||||||||
Net assets | ||||||||||||||||
Beginning of year | 36,065,100 | 45,012,016 | 20,520,064 | 28,967,173 | ||||||||||||
End of year | $ | 51,315,745 | $ | 36,065,100 | $ | 64,255,976 | $ | 20,520,064 | ||||||||
ICON Equity Income Fund(e) | ICON Flexible Bond Fund(f) | |||||||||||||||
Year Ended | Year Ended | Year Ended | Year Ended | |||||||||||||
Operations | ||||||||||||||||
Net investment income/(loss) | $ | 1,574,077 | $ | 2,061,313 | $ | 6,971,943 | $ | 5,012,349 | ||||||||
Net realized gain/(loss) on investments and foreign currency | (2,803,532 | ) | 784,773 | (2,700,973 | ) | 867,501 | ||||||||||
Net realized gain/(loss) on long-term capital gain distributions from other investment companies | — | 1,745 | — | — | ||||||||||||
Change in unrealized appreciation/(depreciation) of investments | (3,055,329 | ) | (482,995 | ) | (3,591,635 | ) | 1,919,858 | |||||||||
Net increase/(decrease) in net assets resulting from operations | (4,284,784 | ) | 2,364,836 | 679,335 | 7,799,708 | |||||||||||
Distributions to shareholders | ||||||||||||||||
Distributions | ||||||||||||||||
Institutional Shares(c) | (2,270,542 | ) | (1,555,574 | ) | (6,627,115 | ) | (5,760,922 | ) | ||||||||
Investor Shares(d) | (549,194 | ) | (282,374 | ) | (287,378 | ) | (207,550 | ) | ||||||||
Class C Shares | (630,549 | ) | (368,185 | ) | (148,073 | ) | (154,050 | ) | ||||||||
Capital share transactions | ||||||||||||||||
Increase/(decrease) in net assets resulting from capital share transactions | 6,943,667 | 1,488,831 | 4,162,276 | 48,102,160 | ||||||||||||
Total increase/(decrease) | (791,402 | ) | 1,647,534 | (2,220,955 | ) | 49,779,346 | ||||||||||
Net assets | ||||||||||||||||
Beginning of year | 80,977,699 | 79,330,165 | 154,039,696 | 104,260,350 | ||||||||||||
End of year | $ | 80,186,297 | $ | 80,977,699 | $ | 151,818,741 | $ | 154,039,696 | ||||||||
(a) | For periods prior to the reorganization on July 10, 2020, this information reflects the ICON Financials Fund, the accounting and performance survivor. For more details, see Note 6 of the Financial Statements. |
(b) | For periods prior to the reorganization on July 10, 2020, this information reflects the ICON Long/Short Fund, the accounting and performance survivor. For more details, see Note 6 of the Financial Statements. |
(c) | Formerly Class S Shares. |
(d) | Formerly Class A Shares. |
(e) | For periods prior to the reorganization on July 10, 2020, this information reflects the ICON Equity Income Fund, the accounting and performance survivor. For more details, see Note 6 of the Financial Statements. |
(f) | For periods prior to the reorganization on July 10, 2020, this information reflects the ICON Flexible Bond Fund, the accounting and performance survivor. For more details, see Note 6 of the Financial Statements. |
See accompanying notes to financial statements.
26
Statements of Changes in Net Assets (Continued) |
ICON Health and Information | ICON Natural Resources and | |||||||||||||||
Year Ended | Year Ended | Year Ended | Year Ended | |||||||||||||
Operations | ||||||||||||||||
Net investment income/(loss) | $ | (378,092 | ) | $ | (142,931 | ) | $ | 402,615 | $ | 928,192 | ||||||
Net realized gain/(loss) on investments and foreign currency | 4,942,975 | 2,451,694 | (34,405,685 | ) | (5,401,806 | ) | ||||||||||
Net realized gain/(loss) on long-term capital gain distributions from other investment companies | — | — | — | — | ||||||||||||
Change in unrealized appreciation/(depreciation) of investments | 12,027,242 | (70,871 | ) | 38,453,067 | (2,827,298 | ) | ||||||||||
Net increase/(decrease) in net assets resulting from operations | 16,592,125 | 2,237,892 | 4,449,997 | (7,300,912 | ) | |||||||||||
Distributions to shareholders | ||||||||||||||||
Distributions | ||||||||||||||||
Institutional Shares(c) | (2,400,424 | ) | (7,045,061 | ) | (860,865 | ) | (10,265,181 | ) | ||||||||
Investor Shares(d) | (68,657 | ) | (238,720 | ) | (42,308 | ) | (489,958 | ) | ||||||||
Class C Shares | — | — | (14,111 | ) | (184,114 | ) | ||||||||||
Capital share transactions | ||||||||||||||||
Increase/(decrease) in net assets resulting from capital share transactions | 42,717,600 | (2,802,731 | ) | 41,250,272 | (5,079,461 | ) | ||||||||||
Total increase/(decrease) | 56,840,644 | (7,848,620 | ) | 44,782,985 | (23,319,626 | ) | ||||||||||
Net assets | ||||||||||||||||
Beginning of year | 55,725,932 | 63,574,552 | 59,003,498 | 82,323,124 | ||||||||||||
End of year | $ | 112,566,576 | $ | 55,725,932 | $ | 103,786,483 | $ | 59,003,498 | ||||||||
ICON Utilities and | Shelton Emerging | |||||||||||||||
Year Ended | Year Ended | Year Ended | Year Ended | |||||||||||||
Operations | ||||||||||||||||
Net investment income/(loss) | $ | 838,890 | $ | 1,164,574 | $ | 50,062 | $ | 1,007,407 | ||||||||
Net realized gain/(loss) on investments and foreign currency | 861,306 | 1,720,446 | (3,886,642 | ) | (2,531,415 | ) | ||||||||||
Net realized gain/(loss) on long-term capital gain distributions from other investment companies | — | — | — | — | ||||||||||||
Change in unrealized appreciation/(depreciation) of investments | (6,169,332 | ) | 4,843,813 | 4,945,157 | (1,803,262 | ) | ||||||||||
Net increase/(decrease) in net assets resulting from operations | (4,469,136 | ) | 7,728,833 | 1,108,577 | (3,327,270 | ) | ||||||||||
Distributions to shareholders | ||||||||||||||||
Distributions | ||||||||||||||||
Institutional Shares(c) | (2,221,845 | ) | (1,256,680 | ) | (802,092 | ) | (1,423,899 | ) | ||||||||
Investor Shares(d) | (280,239 | ) | (184,092 | ) | (49,976 | ) | (158,692 | ) | ||||||||
Class C Shares | — | — | — | — | ||||||||||||
Capital share transactions | ||||||||||||||||
Increase/(decrease) in net assets resulting from capital share transactions | (15,251,500 | ) | 9,346,538 | (21,276,449 | ) | (8,652,967 | ) | |||||||||
Total increase/(decrease) | (22,222,720 | ) | 15,634,599 | (21,019,939 | ) | (13,562,828 | ) | |||||||||
Net assets | ||||||||||||||||
Beginning of year | 52,057,834 | 36,423,235 | 43,769,992 | 57,332,820 | ||||||||||||
End of year | $ | 29,835,114 | $ | 52,057,834 | $ | 22,750,053 | $ | 43,769,992 | ||||||||
(a) | For periods prior to the reorganization on July 10, 2020, this information reflects the ICON Information Technology Fund, the accounting and performance survivor. For more details, see Note 6 of the Financial Statements. |
(a) | For periods prior to the reorganization on July 10, 2020, this information reflects the ICON Natural Resoources Fund, the accounting and performance survivor. For more details, see Note 6 of the Financial Statements. |
(c) | Formerly Class S Shares. |
(d) | Formerly Class A Shares. |
(e) | For periods prior to the reorganization on July 10, 2020, this information reflects the ICON Utilities Fund, the accounting and performance survivor. For more details, see Note 6 of the Financial Statements. |
(f) | For periods prior to the reorganization on June 26, 2020, this information reflects the ICON Emerging Markets Fund, the accounting and performance survivor. For more details, see Note 6 of the Financial Statements. |
See accompanying notes to financial statements.
27
Statements of Changes in Net Assets (Continued) |
ICON Consumer Select Fund | Institutional Shares | |||||||||||||||
Year Ended | Year Ended | |||||||||||||||
Shares | Value | Shares | Value | |||||||||||||
Shares sold | 729,367 | $ | 8,113,245 | 429,351 | $ | 4,334,883 | ||||||||||
Shares issued in reinvestment of distributions | 64,552 | 760,428 | 26,477 | 230,086 | ||||||||||||
Shares issued in connection with reorganization | 2,619,242 | 23,056,150 | N/A | N/A | ||||||||||||
Shares repurchased | (1,468,232 | ) | (14,471,065 | ) | (1,205,530 | ) | (12,300,293 | ) | ||||||||
Net increase/(decrease) | 1,944,929 | $ | 17,458,758 | (749,702 | ) | $ | (7,735,324 | ) | ||||||||
Investor Shares | ||||||||||||||||
Year Ended | Year Ended | |||||||||||||||
Shares | Value | Shares | Value | |||||||||||||
Shares sold | 17,235 | $ | 179,686 | 33,708 | $ | 343,890 | ||||||||||
Shares issued in reinvestment of distributions | 2,161 | 25,451 | 876 | 7,617 | ||||||||||||
Shares issued in connection with reorganization | 188,420 | 1,683,467 | N/A | N/A | ||||||||||||
Shares repurchased | (82,945 | ) | (805,903 | ) | (33,917 | ) | (342,882 | ) | ||||||||
Net increase/(decrease) | 124,871 | $ | 1,082,701 | 667 | $ | 8,625 | ||||||||||
ICON Equity Fund | Institutional Shares | |||||||||||||||
Year Ended | Year Ended | |||||||||||||||
Shares | Value | Shares | Value | |||||||||||||
Shares sold | 88,061 | $ | 2,281,246 | 235,961 | $ | 6,025,489 | ||||||||||
Shares issued in reinvestment of distributions | 11,579 | 332,661 | 7,355 | 158,276 | ||||||||||||
Shares issued in connection with reorganization | 1,405,548 | 35,818,141 | N/A | N/A | ||||||||||||
Shares repurchased | (371,304 | ) | (9,451,813 | ) | (453,031 | ) | (10,957,390 | ) | ||||||||
Net increase/(decrease) | 1,133,884 | $ | 28,980,235 | (209,715 | ) | $ | (4,773,625 | ) | ||||||||
Investor Shares | ||||||||||||||||
Year Ended | Year Ended | |||||||||||||||
Shares | Value | Shares | Value | |||||||||||||
Shares sold | 4,011 | $ | 100,130 | 55,777 | $ | 1,338,348 | ||||||||||
Shares issued in reinvestment of distributions | 5,916 | 163,167 | 2,960 | 61,419 | ||||||||||||
Shares issued in connection with reorganization | 537,772 | 13,134,931 | N/A | N/A | ||||||||||||
Transfers in from class C reorganization | 94,965 | 2,319,492 | N/A | N/A | ||||||||||||
Shares repurchased | (122,686 | ) | (3,236,280 | ) | (73,637 | ) | (1,800,039 | ) | ||||||||
Net increase/(decrease) | 519,978 | $ | 12,481,440 | (14,900 | ) | $ | (400,272 | ) | ||||||||
Class C | ||||||||||||||||
Year Ended | Year Ended | |||||||||||||||
Shares | Value | Shares | Value | |||||||||||||
Shares sold | 198 | $ | 4,837 | 7,566 | $ | 147,661 | ||||||||||
Shares issued in reinvestment of distributions | 4,610 | 113,084 | 3,651 | 68,168 | ||||||||||||
Transfers out for class C reorganization | (107,242 | ) | (2,319,492 | ) | N/A | N/A | ||||||||||
Shares repurchased | (21,508 | ) | (492,697 | ) | (100,419 | ) | (2,149,420 | ) | ||||||||
Net increase/(decrease) | (123,942 | ) | $ | (2,694,268 | ) | (89,202 | ) | $ | (1,933,591 | ) | ||||||
See accompanying notes to financial statements.
28
Statements of Changes in Net Assets (Continued) |
ICON Equity Income Fund | Institutional Shares | |||||||||||||||
Year Ended | Year Ended | |||||||||||||||
Shares | Value | Shares | Value | |||||||||||||
Shares sold | 404,960 | $ | 6,749,354 | 1,023,897 | $ | 17,828,923 | ||||||||||
Shares issued in reinvestment of distributions | 122,717 | 2,140,586 | 87,302 | 1,487,328 | ||||||||||||
Shares issued in connection with reorganization | 445,319 | 7,274,057 | N/A | N/A | ||||||||||||
Shares repurchased | (1,260,129 | ) | (20,414,175 | ) | (1,080,145 | ) | (18,671,913 | ) | ||||||||
Net increase/(decrease) | (287,133 | ) | $ | (4,250,178 | ) | 31,054 | $ | 644,338 | ||||||||
Investor Shares | ||||||||||||||||
Year Ended | Year Ended | |||||||||||||||
Shares | Value | Shares | Value | |||||||||||||
Shares sold | 33,726 | $ | 552,171 | 193,061 | $ | 3,328,557 | ||||||||||
Shares issued in reinvestment of distributions | 29,133 | 504,628 | 14,587 | 247,336 | ||||||||||||
Shares issued in connection with reorganization | 977,450 | 15,916,988 | N/A | N/A | ||||||||||||
Transfers in from class C reorganization | 905,454 | 13,688,996 | N/A | N/A | ||||||||||||
Shares repurchased | (262,824 | ) | (4,220,319 | ) | (199,576 | ) | (3,451,831 | ) | ||||||||
Net increase/(decrease) | 1,682,939 | $ | 26,442,464 | 8,072 | $ | 124,062 | ||||||||||
Class C | ||||||||||||||||
Year Ended | Year Ended | |||||||||||||||
Shares | Value | Shares | Value | |||||||||||||
Shares sold | 16,805 | $ | 324,838 | 211,997 | $ | 3,726,772 | ||||||||||
Shares issued in reinvestment of distributions | 28,330 | 533,743 | 20,165 | 343,543 | ||||||||||||
Transfers out for class C reorganization | (894,086 | ) | (13,688,996 | ) | N/A | N/A | ||||||||||
Shares repurchased | (156,494 | ) | (2,418,204 | ) | (189,853 | ) | (3,349,884 | ) | ||||||||
Net increase/(decrease) | (1,005,445 | ) | $ | (15,248,619 | ) | 42,309 | $ | 720,431 | ||||||||
ICON Flexible Bond Fund | Institutional Shares | |||||||||||||||
Year Ended | Year Ended | |||||||||||||||
Shares | Value | Shares | Value | |||||||||||||
Shares sold | 6,840,816 | $ | 62,398,427 | 8,777,894 | $ | 81,218,276 | ||||||||||
Shares issued in reinvestment of distributions | 677,781 | 6,157,571 | 575,324 | 5,335,911 | ||||||||||||
Shares repurchased | (7,301,000 | ) | (65,053,730 | ) | (4,515,936 | ) | (41,792,561 | ) | ||||||||
Net increase/(decrease) | 217,597 | $ | 3,502,268 | 4,837,282 | $ | 44,761,626 | ||||||||||
Investor Shares | ||||||||||||||||
Year Ended | Year Ended | |||||||||||||||
Shares | Value | Shares | Value | |||||||||||||
Shares sold | 288,798 | $ | 2,621,924 | 271,269 | $ | 2,504,061 | ||||||||||
Shares issued in reinvestment of distributions | 29,009 | 262,179 | 21,050 | 194,232 | ||||||||||||
Transfers in from class C reorganization | 499,394 | 4,442,281 | N/A | N/A | ||||||||||||
Shares repurchased | (250,623 | ) | (2,250,280 | ) | (76,734 | ) | (707,527 | ) | ||||||||
Net increase/(decrease) | 566,578 | $ | 5,076,104 | 215,585 | $ | 1,990,766 | ||||||||||
See accompanying notes to financial statements.
29
Statements of Changes in Net Assets (Continued) |
ICON Flexible Bond Fund (Continued) | Class C | |||||||||||||||
Year Ended | Year Ended | |||||||||||||||
Shares | Value | Shares | Value | |||||||||||||
Shares sold | 110,222 | $ | 1,034,719 | 243,879 | $ | 2,266,664 | ||||||||||
Shares issued in reinvestment of distributions | 6,711 | 62,681 | 14,191 | 132,038 | ||||||||||||
Transfers out for class C reorganization | (495,326 | ) | (4,442,281 | ) | N/A | N/A | ||||||||||
Shares repurchased | (119,361 | ) | (1,071,215 | ) | (112,492 | ) | (1,048,934 | ) | ||||||||
Net increase/(decrease) | (497,754 | ) | $ | (4,416,096 | ) | 145,578 | $ | 1,349,768 | ||||||||
ICON Health and Information Technology Fund | Institutional Shares | |||||||||||||||
Year Ended | Year Ended | |||||||||||||||
Shares | Value | Shares | Value | |||||||||||||
Shares sold | 240,217 | $ | 3,996,694 | 187,406 | $ | 2,706,351 | ||||||||||
Shares issued in reinvestment of distributions | 142,055 | 2,326,868 | 567,857 | 6,871,071 | ||||||||||||
Shares issued in connection with reorganization | 3,034,144 | 53,595,126 | — | — | ||||||||||||
Shares repurchased | (1,081,373 | ) | (18,313,702 | ) | (820,983 | ) | (11,955,339 | ) | ||||||||
Net increase/(decrease) | 2,335,043 | $ | 41,604,986 | (65,720 | ) | $ | (2,377,917 | ) | ||||||||
Investor Shares | ||||||||||||||||
Year Ended | Year Ended | |||||||||||||||
Shares | Value | Shares | Value | |||||||||||||
Shares sold | 14,429 | $ | 223,822 | 19,663 | $ | 285,579 | ||||||||||
Shares issued in reinvestment of distributions | 4,157 | 64,770 | 17,953 | 207,711 | ||||||||||||
Shares issued in connection with reorganization | 93,171 | 1,563,188 | — | — | ||||||||||||
Shares repurchased | (45,376 | ) | (739,166 | ) | (65,328 | ) | (918,104 | ) | ||||||||
Net increase/(decrease) | 66,381 | $ | 1,112,614 | (27,712 | ) | $ | (424,814 | ) | ||||||||
ICON Natural Resources and Infrastructure Fund | Institutional Shares | |||||||||||||||
Year Ended | Year Ended | |||||||||||||||
Shares | Value | Shares | Value | |||||||||||||
Shares sold | 704,577 | $ | 8,087,116 | 1,082,418 | $ | 13,570,652 | ||||||||||
Shares issued in reinvestment of distributions | 64,260 | 836,659 | 915,154 | 9,920,274 | ||||||||||||
Shares issued in connection with reorganization | 5,604,395 | 58,579,943 | N/A | N/A | ||||||||||||
Shares repurchased | (2,420,027 | ) | (27,529,677 | ) | (2,241,524 | ) | (28,012,211 | ) | ||||||||
Net increase/(decrease) | 3,953,205 | $ | 39,974,041 | (243,952 | ) | $ | (4,521,285 | ) | ||||||||
Investor Shares | ||||||||||||||||
Year Ended | Year Ended | |||||||||||||||
Shares | Value | Shares | Value | |||||||||||||
Shares sold | 12,736 | $ | 142,860 | 47,089 | $ | 639,333 | ||||||||||
Shares issued in reinvestment of distributions | 3,101 | 39,945 | 42,097 | 452,538 | ||||||||||||
Shares issued in connection with reorganization | 344,815 | 3,561,866 | N/A | N/A | ||||||||||||
Transfers in from class C reorganization | 40,930 | 422,797 | N/A | N/A | ||||||||||||
Shares repurchased | (192,860 | ) | (2,140,173 | ) | (128,484 | ) | (1,680,312 | ) | ||||||||
Net increase/(decrease) | 208,722 | $ | 2,027,295 | (39,298 | ) | $ | (588,441 | ) | ||||||||
See accompanying notes to financial statements.
30
Statements of Changes in Net Assets (Continued) |
ICON Natural Resources and Infrastructure Fund (Continued) | Class C | |||||||||||||||
Year Ended | Year Ended | |||||||||||||||
Shares | Value | Shares | Value | |||||||||||||
Shares sold | 4,544 | $ | 55,590 | 45,808 | $ | 531,929 | ||||||||||
Shares issued in reinvestment of distributions | 1,100 | 13,490 | 16,255 | 167,425 | ||||||||||||
Transfers out for class C reorganization | (43,184 | ) | (422,797 | ) | N/A | N/A | ||||||||||
Shares repurchased | (40,355 | ) | (397,347 | ) | (59,755 | ) | (669,089 | ) | ||||||||
Net increase/(decrease) | (77,895 | ) | $ | (751,064 | ) | 2,308 | $ | 30,265 | ||||||||
ICON Utilities and Income Fund | Institutional Shares | |||||||||||||||
Year Ended | Year Ended | |||||||||||||||
Shares | Value | Shares | Value | |||||||||||||
Shares sold | 873,929 | $ | 8,530,658 | 2,789,173 | $ | 26,190,608 | ||||||||||
Shares issued in reinvestment of distributions | 223,698 | 2,143,258 | 131,427 | 1,217,775 | ||||||||||||
Shares repurchased | (2,799,408 | ) | (25,388,551 | ) | (1,923,279 | ) | (17,698,891 | ) | ||||||||
Net increase/(decrease) | (1,701,781 | ) | $ | (14,714,635 | ) | 997,321 | $ | 9,709,492 | ||||||||
Investor Shares | ||||||||||||||||
Year Ended | Year Ended | |||||||||||||||
Shares | Value | Shares | Value | |||||||||||||
Shares sold | 43,120 | $ | 402,945 | 218,778 | $ | 1,997,184 | ||||||||||
Shares issued in reinvestment of distributions | 14,170 | 133,179 | 8,767 | 79,606 | ||||||||||||
Shares repurchased | (115,456 | ) | (1,072,989 | ) | (263,469 | ) | (2,439,744 | ) | ||||||||
Net increase/(decrease) | (58,166 | ) | $ | (536,865 | ) | (35,924 | ) | $ | (362,954 | ) | ||||||
Shelton Emerging Markets Fund | Institutional Shares | |||||||||||||||
Year Ended | Year Ended | |||||||||||||||
Shares | Value | Shares | Value | |||||||||||||
Shares sold | 361,269 | $ | 5,104,041 | 1,126,509 | $ | 17,253,254 | ||||||||||
Shares issued in reinvestment of distributions | 47,764 | 772,818 | 97,521 | 1,374,068 | ||||||||||||
Shares repurchased | (1,842,250 | ) | (26,676,989 | ) | (1,537,333 | ) | (23,122,177 | ) | ||||||||
Net increase/(decrease) | (1,433,217 | ) | $ | (20,800,130 | ) | (313,303 | ) | $ | (4,494,855 | ) | ||||||
Investor Shares | ||||||||||||||||
Year Ended | Year Ended | |||||||||||||||
Shares | Value | Shares | Value | |||||||||||||
Shares sold | 14,115 | $ | 217,500 | 179,903 | $ | 2,780,869 | ||||||||||
Shares issued in reinvestment of distributions | 2,782 | 44,734 | 10,133 | 142,269 | ||||||||||||
Shares repurchased | (53,368 | ) | (738,553 | ) | (459,642 | ) | (7,081,250 | ) | ||||||||
Net increase/(decrease) | (36,471 | ) | $ | (476,319 | ) | (269,606 | ) | $ | (4,158,112 | ) | ||||||
See accompanying notes to financial statements.
31
Financial Highlights For a Share Outstanding Throughout Each Year |
Icon Consumer Select Fund | ||||||||||||||||||||
Institutional Shares(a) | Year Ended | Year Ended | Year Ended | Year Ended | Year Ended | |||||||||||||||
Net asset value, beginning of year | $ | 10.75 | $ | 10.97 | $ | 9.95 | $ | 7.67 | $ | 7.74 | ||||||||||
INCOME FROM INVESTMENT OPERATIONS | ||||||||||||||||||||
Net investment income/(loss)(b) | 0.03 | 0.08 | 0.05 | 0.03 | 0.08 | |||||||||||||||
Net gain/(loss) on securities (both realized and unrealized) | (1.09 | ) | (0.23 | ) | 0.99 | 2.34 | (0.15 | ) | ||||||||||||
Total from investment operations | (1.06 | ) | (0.15 | ) | 1.04 | 2.37 | (0.07 | ) | ||||||||||||
LESS DISTRIBUTIONS | ||||||||||||||||||||
Dividends from net investment income | (0.08 | ) | (0.07 | ) | (0.02 | ) | (0.09 | ) | — | |||||||||||
Distributions from capital gains | (0.15 | ) | — | — | — | — | ||||||||||||||
Total distributions | (0.23 | ) | (0.07 | ) | (0.02 | ) | (0.09 | ) | — | |||||||||||
Net asset value, end of year or period | $ | 9.46 | $ | 10.75 | $ | 10.97 | $ | 9.95 | $ | 7.67 | ||||||||||
Total return | (10.29 | )% | (1.26 | )% | 10.48 | % | 30.96 | % | (0.90 | )% | ||||||||||
RATIOS / SUPPLEMENTAL DATA | ||||||||||||||||||||
Net assets, end of year or period (000s) | $ | 48,832 | $ | 34,578 | $ | 43,500 | $ | 39,072 | $ | 43,354 | ||||||||||
Ratio of expenses to average net assets: | ||||||||||||||||||||
Before expense reimbursements | 1.56 | % | 1.54 | % | 1.44 | % | 1.40 | % | 1.40 | % | ||||||||||
After expense reimbursements(c) | 1.52 | % | 1.50 | % | 1.44 | % | 1.40 | % | 1.40 | % | ||||||||||
Ratio of net investment income/(loss) to average net assets | ||||||||||||||||||||
Before expense reimbursements | 0.28 | % | 0.77 | % | 0.41 | % | 0.28 | % | 1.00 | % | ||||||||||
After expense reimbursements | 0.33 | % | 0.81 | % | 0.41 | % | 0.28 | % | 1.00 | % | ||||||||||
Portfolio turnover | 82 | % | 28 | % | 44 | % | 68 | % | 49 | % | ||||||||||
Icon Consumer Select Fund | ||||||||||||||||||||
Investor Shares(d) | Year Ended | Year Ended | Year Ended | Year Ended | Year Ended | |||||||||||||||
Net asset value, beginning of year | $ | 10.74 | $ | 10.98 | $ | 9.99 | $ | 7.71 | $ | 7.82 | ||||||||||
INCOME FROM INVESTMENT OPERATIONS | ||||||||||||||||||||
Net investment income/(loss)(b) | — | 0.06 | 0.01 | (0.01 | ) | 0.05 | ||||||||||||||
Net gain/(loss) on securities (both realized and unrealized) | (1.08 | ) | (0.24 | ) | 0.99 | 2.37 | (0.16 | ) | ||||||||||||
Total from investment operations | (1.08 | ) | (0.18 | ) | 1.00 | 2.36 | (0.11 | ) | ||||||||||||
LESS DISTRIBUTIONS | ||||||||||||||||||||
Dividends from net investment income | (0.07 | ) | (0.06 | ) | (0.01 | ) | (0.08 | ) | — | |||||||||||
Distributions from capital gains | (0.15 | ) | — | — | — | — | ||||||||||||||
Total distributions | (0.22 | ) | (0.06 | ) | (0.01 | ) | (0.08 | ) | — | |||||||||||
Net asset value, end of year or period | $ | 9.44 | $ | 10.74 | $ | 10.98 | $ | 9.99 | $ | 7.71 | ||||||||||
Total return(e) | (10.46 | )% | (1.51 | )% | 10.04 | % | 30.68 | % | (1.41 | )% | ||||||||||
RATIOS / SUPPLEMENTAL DATA | ||||||||||||||||||||
Net assets, end of year or period (000s) | $ | 2,484 | $ | 1,487 | $ | 1,512 | $ | 2,119 | $ | 2,542 | ||||||||||
Ratio of expenses to average net assets: | ||||||||||||||||||||
Before expense reimbursements | 2.17 | % | 2.24 | % | 1.98 | % | 2.05 | % | 2.12 | % | ||||||||||
After expense reimbursements(c) | 1.80% | 1.75 | % | 1.75 | % | 1.75 | % | 1.75 | % | |||||||||||
Ratio of net investment income/(loss) to average net assets | ||||||||||||||||||||
Before expense reimbursements | (0.41 | )% | 0.06 | % | (0.13 | )% | (0.37 | )% | 0.26 | % | ||||||||||
After expense reimbursements | (0.04 | )% | 0.55 | % | 0.10 | % | (0.07 | )% | 0.63 | % | ||||||||||
Portfolio turnover | 82 | % | 28 | % | 44 | % | 68 | % | 49 | % | ||||||||||
(a) | Information prior to the reorganization date of July 10, 2020 is that of the accounting and performance survior, ICON Financials Fund - Class S. |
(b) | Calculated based upon average shares outstanding. |
(c) | Effective for the year ended September 30, 2020, CCO Fees and reorganization costs are not included in the expense limitation. For all years presented, interest expense, when applicable, is not included in the expense limitation. |
(d) | Information prior to the reorganization date of July 10, 2020 is that of the accounting and performance survior, ICON Financials Fund - Class A. |
(e) | The total return calculation excludes and sales charge. |
See accompanying notes to financial statements.
32
Financial Highlights For a Share Outstanding Throughout Each Year |
Icon Equity Fund | ||||||||||||||||||||
Institutional Shares(a) | Year Ended | Year Ended | Year Ended | Year Ended | Year Ended | |||||||||||||||
Net asset value, beginning of year | $ | 26.83 | $ | 27.11 | $ | 25.13 | $ | 18.70 | $ | 18.39 | ||||||||||
INCOME FROM INVESTMENT OPERATIONS | ||||||||||||||||||||
Net investment income/(loss)(b) | (0.03 | ) | (0.02 | ) | (0.06 | ) | (0.04 | ) | 0.04 | |||||||||||
Net gain/(loss) on securities (both realized and unrealized) | 2.27 | 0.09 | 2.04 | 6.47 | 0.27 | |||||||||||||||
Total from investment operations | 2.24 | 0.07 | 1.98 | 6.43 | 0.31 | |||||||||||||||
LESS DISTRIBUTIONS | ||||||||||||||||||||
Distributions from capital gains | (1.00 | ) | (0.35 | ) | — | — | — | |||||||||||||
Total distributions | (1.00 | ) | (0.35 | ) | — | — | — | |||||||||||||
Net asset value, end of year or period | $ | 28.07 | $ | 26.83 | $ | 27.11 | $ | 25.13 | $ | 18.70 | ||||||||||
Total return | 8.27 | % | 0.56 | % | 7.88 | % | 34.39 | % | 1.69 | % | ||||||||||
RATIOS / SUPPLEMENTAL DATA | ||||||||||||||||||||
Net assets, end of year or period (000s) | $ | 45,176 | $ | 12,764 | $ | 18,580 | $ | 11,259 | $ | 7,114 | ||||||||||
Ratio of expenses to average net assets: | ||||||||||||||||||||
Before expense reimbursements | 1.35 | % | 1.53 | % | 1.38 | % | 1.50 | % | 1.63 | % | ||||||||||
After expense reimbursements(c) | 1.22 | % | 1.25 | % | 1.25 | % | 1.25 | % | 1.28 | % | ||||||||||
Ratio of net investment income/(loss) to average net assets | ||||||||||||||||||||
Before expense reimbursements | (0.23 | )% | (0.36 | )% | (0.33 | )% | (0.43 | )% | (0.11 | )% | ||||||||||
After expense reimbursements | (0.10 | )% | (0.08 | )% | (0.20 | )% | (0.18 | )% | 0.24 | % | ||||||||||
Portfolio turnover | 65 | % | 31 | % | 36 | % | 24 | % | 20 | % | ||||||||||
Icon Equity Fund | ||||||||||||||||||||
Investor Shares(d) | Year Ended | Year Ended | Year Ended | Year Ended | Year Ended | |||||||||||||||
Net asset value, beginning of year | $ | 25.81 | $ | 26.16 | $ | 24.33 | $ | 18.16 | $ | 17.91 | ||||||||||
INCOME FROM INVESTMENT OPERATIONS | ||||||||||||||||||||
Net investment income/(loss)(b) | (0.09 | ) | (0.09 | ) | (0.14 | ) | (0.11 | ) | (0.01 | ) | ||||||||||
Net gain/(loss) on securities (both realized and unrealized) | 2.17 | 0.09 | 1.97 | 6.28 | 0.26 | |||||||||||||||
Total from investment operations | 2.08 | — | 1.83 | 6.17 | 0.25 | |||||||||||||||
LESS DISTRIBUTIONS | ||||||||||||||||||||
Distributions from capital gains | (1.00 | ) | (0.35 | ) | — | — | — | |||||||||||||
Total distributions | (1.00 | ) | (0.35 | ) | — | — | — | |||||||||||||
Net asset value, end of year or period | $ | 26.89 | $ | 25.81 | $ | 26.16 | $ | 24.33 | $ | 18.16 | ||||||||||
Total return(e) | 7.97 | % | 0.31 | % | 7.52 | % | 33.98 | % | 1.40 | % | ||||||||||
RATIOS / SUPPLEMENTAL DATA | ||||||||||||||||||||
Net assets, end of year or period (000s) | $ | 19,080 | $ | 4,894 | $ | 5,351 | $ | 7,003 | $ | 5,316 | ||||||||||
Ratio of expenses to average net assets: | ||||||||||||||||||||
Before expense reimbursements | 1.67 | % | 2.08 | % | 1.83 | % | 1.93 | % | 1.95 | % | ||||||||||
After expense reimbursements(c) | 1.46 | % | 1.55 | % | 1.55 | % | 1.55 | % | 1.58 | % | ||||||||||
Ratio of net investment income/(loss) to average net assets | ||||||||||||||||||||
Before expense reimbursements | (0.54 | )% | (0.92 | )% | (0.80 | )% | (0.87 | )% | (0.40 | )% | ||||||||||
After expense reimbursements | (0.34 | )% | (0.39 | )% | (0.52 | )% | (0.49 | )% | (0.03 | )% | ||||||||||
Portfolio turnover | 65 | % | 31 | % | 36 | % | 24 | % | 20 | % | ||||||||||
(a) | Information prior to the reorganization date of July 10, 2020 is that of the accounting and performance survior, ICON Long/Short Fund - Class S. |
(b) | Calculated based upon average shares outstanding. |
(c) | Effective for the year ended September 30, 2020, CCO Fees and reorganization costs are not included in the expense limitation. For all years presented, interest expense, when applicable, is not included in the expense limitation. |
(d) | Information prior to the reorganization date of July 10, 2020 is that of the accounting and performance survior, ICON Long/Short Fund - Class A. |
(e) | The total return calculation excludes and sales charge. |
See accompanying notes to financial statements.
33
Financial Highlights For a Share Outstanding Throughout Each Year |
Icon Equity Income Fund | ||||||||||||||||||||
Institutional Shares(a) | Year Ended | Year Ended | Year Ended | Year Ended | Year Ended | |||||||||||||||
Net asset value, beginning of year | $ | 18.00 | $ | 17.96 | $ | 17.61 | $ | 15.62 | $ | 14.36 | ||||||||||
INCOME FROM INVESTMENT OPERATIONS | ||||||||||||||||||||
Net investment income/(loss)(b) | 0.43 | 0.50 | 0.53 | 0.61 | 0.60 | |||||||||||||||
Net gain/(loss) on securities (both realized and unrealized) | (1.12 | ) | 0.09 | 0.38 | 1.95 | 1.27 | ||||||||||||||
Total from investment operations | (0.69 | ) | 0.59 | 0.91 | 2.56 | 1.87 | ||||||||||||||
LESS DISTRIBUTIONS | ||||||||||||||||||||
Dividends from net investment income | (0.58 | ) | (0.53 | ) | (0.56 | ) | (0.57 | ) | (0.61 | ) | ||||||||||
Distributions from capital gains | (0.29 | ) | (0.02 | ) | — | — | — | |||||||||||||
Total distributions | (0.87 | ) | (0.55 | ) | (0.56 | ) | (0.57 | ) | (0.61 | ) | ||||||||||
Net asset value, end of year or period | $ | 16.44 | $ | 18.00 | $ | 17.96 | $ | 17.61 | $ | 15.62 | ||||||||||
Total return | (4.03 | )% | 3.45 | % | 5.19 | % | 16.53 | % | 13.30 | % | ||||||||||
RATIOS / SUPPLEMENTAL DATA | ||||||||||||||||||||
Net assets, end of year or period (000s) | $ | 42,624 | $ | 51,853 | $ | 51,185 | $ | 57,062 | $ | 37,868 | ||||||||||
Ratio of expenses to average net assets: | ||||||||||||||||||||
Before expense reimbursements | 1.30 | % | 1.21 | % | 1.16 | % | 1.15 | % | 1.24 | % | ||||||||||
After expense reimbursements(c) | 1.05% | 0.99 | % | 0.99 | % | 1.05 | %(d) | 1.20 | % | |||||||||||
Ratio of net investment income/(loss) to average net assets | ||||||||||||||||||||
Before expense reimbursements | 2.28 | % | 2.66 | % | 2.76 | % | 3.50 | % | 3.91 | % | ||||||||||
After expense reimbursements | 2.53 | % | 2.88 | % | 2.93 | % | 3.60 | % | 3.95 | % | ||||||||||
Portfolio turnover | 78 | % | 117 | % | 171 | % | 206 | % | 145 | % | ||||||||||
Icon Equity Income Fund | ||||||||||||||||||||
Investor Shares(e) | Year Ended | Year Ended | Year Ended | Year Ended | Year Ended | |||||||||||||||
Net asset value, beginning of year | $ | 17.96 | $ | 17.92 | $ | 17.56 | $ | 15.58 | $ | 14.29 | ||||||||||
INCOME FROM INVESTMENT OPERATIONS | ||||||||||||||||||||
Net investment income/(loss)(b) | 0.38 | 0.46 | 0.49 | 0.54 | 0.56 | |||||||||||||||
Net gain/(loss) on securities (both realized and unrealized) | (1.12 | ) | 0.08 | 0.38 | 1.96 | 1.26 | ||||||||||||||
Total from investment operations | (0.74 | ) | 0.54 | 0.87 | 2.50 | 1.82 | ||||||||||||||
LESS DISTRIBUTIONS | ||||||||||||||||||||
Dividends from net investment income | (0.51 | ) | (0.48 | ) | (0.51 | ) | (0.52 | ) | (0.53 | ) | ||||||||||
Distributions from capital gains | (0.29 | ) | (0.02 | ) | — | — | — | |||||||||||||
Total distributions | (0.80 | ) | (0.50 | ) | (0.51 | ) | (0.52 | ) | (0.53 | ) | ||||||||||
Net asset value, end of year or period | $ | 16.42 | $ | 17.96 | $ | 17.92 | $ | 17.56 | $ | 15.58 | ||||||||||
Total return(f) | (4.33 | )% | 3.20 | % | 4.98 | % | 16.20 | % | 12.97 | % | ||||||||||
RATIOS / SUPPLEMENTAL DATA | ||||||||||||||||||||
Net assets, end of year or period (000s) | $ | 37,563 | $ | 10,852 | $ | 10,685 | $ | 14,206 | $ | 16,775 | ||||||||||
Ratio of expenses to average net assets: | ||||||||||||||||||||
Before expense reimbursements | 1.50 | % | 1.50 | % | 1.45 | % | 1.45 | % | 1.54 | % | ||||||||||
After expense reimbursements(c) | 1.29 | % | 1.24 | % | 1.24 | % | 1.31 | %(g) | 1.45 | % | ||||||||||
Ratio of net investment income/(loss) to average net assets | ||||||||||||||||||||
Before expense reimbursements | 2.08 | % | 2.38 | % | 2.48 | % | 3.06 | % | 3.64 | % | ||||||||||
After expense reimbursements | 2.29 | % | 2.64 | % | 2.69 | % | 3.20 | % | 3.73 | % | ||||||||||
Portfolio turnover | 78 | % | 117 | % | 171 | % | 206 | % | 145 | % | ||||||||||
(a) | Formerly named ICON Equity Income Fund - Class S. |
(b) | Calculated based upon average shares outstanding. |
(c) | Effective for the year ended September 30, 2020, CCO Fees and reorganization costs are not included in the expense limitation. For all years presented, interest expense, when applicable, is not included in the expense limitation. |
(d) | Effective January 26, 2017, the annual expense limitation rate changed from 1.20% to 0.99%. |
(e) | Formerly named ICON Equity Income Fund - Class A |
(f) | The total return calculation excludes any sales charges. |
(g) | Effective January 26, 2017, the annual expense limitation rate changed from 1.45% to 1.24%. |
See accompanying notes to financial statements.
34
Financial Highlights For a Share Outstanding Throughout Each Year |
Icon Flexible Bond Fund | ||||||||||||||||||||
Institutional Shares(a) | Year Ended | Year Ended | Year Ended | Year Ended | Year Ended | |||||||||||||||
Net asset value, beginning of year | $ | 9.36 | $ | 9.26 | $ | 9.43 | $ | 9.55 | $ | 9.20 | ||||||||||
INCOME FROM INVESTMENT OPERATIONS | ||||||||||||||||||||
Net investment income/(loss)(c) | 0.40 | 0.36 | 0.36 | 0.37 | 0.34 | |||||||||||||||
Net gain/(loss) on securities (both realized and unrealized) | (0.28 | ) | 0.18 | (0.19 | ) | (0.11 | ) | 0.34 | ||||||||||||
Total from investment operations | 0.12 | 0.54 | 0.17 | 0.26 | 0.68 | |||||||||||||||
LESS DISTRIBUTIONS | ||||||||||||||||||||
Dividends from net investment income | (0.41 | ) | (0.44 | ) | (0.34 | ) | (0.38 | ) | (0.33 | ) | ||||||||||
Distributions from capital gains | — | — | — | — | — | |||||||||||||||
Total distributions | (0.41 | ) | (0.44 | ) | (0.34 | ) | (0.38 | ) | (0.33 | ) | ||||||||||
Net asset value, end of year or period | $ | 9.07 | $ | 9.36 | $ | 9.26 | $ | 9.43 | $ | 9.55 | ||||||||||
Total return | 1.32 | % | 6.02 | % | 1.89 | % | 2.82 | % | 7.54 | % | ||||||||||
RATIOS / SUPPLEMENTAL DATA | ||||||||||||||||||||
Net assets, end of year or period (000s) | $ | 141,158 | $ | 143,633 | $ | 97,303 | $ | 80,467 | $ | 76,656 | ||||||||||
Ratio of expenses to average net assets: | ||||||||||||||||||||
Before expense reimbursements | 1.01 | % | 0.96 | % | 0.92 | % | 0.91 | % | 0.93 | % | ||||||||||
After expense reimbursements(d) | 0.80% | 0.75 | % | 0.75 | % | 0.75 | % | 0.75 | % | |||||||||||
Ratio of net investment income/(loss) to average net assets | ||||||||||||||||||||
Before expense reimbursements | 4.20 | % | 3.70 | % | 3.65 | % | 3.80 | % | 3.43 | % | ||||||||||
After expense reimbursements | 4.41 | % | 3.91 | % | 3.82 | % | 3.96 | % | 3.61 | % | ||||||||||
Portfolio turnover | 133 | % | 144 | % | 153 | % | 169 | % | 141 | % | ||||||||||
Icon Flexible Bond Fund | ||||||||||||||||||||
Investor Shares(e) | Year Ended | Year Ended | Year Ended | Year Ended | Year Ended | |||||||||||||||
Net asset value, beginning of year | $ | 9.31 | $ | 9.21 | $ | 9.39 | $ | 9.51 | $ | 9.17 | ||||||||||
INCOME FROM INVESTMENT OPERATIONS | ||||||||||||||||||||
Net investment income/(loss)(c) | 0.38 | 0.34 | 0.33 | 0.33 | 0.31 | |||||||||||||||
Net gain/(loss) on securities (both realized and unrealized) | (0.28 | ) | 0.18 | (0.19 | ) | (0.10 | ) | 0.34 | ||||||||||||
Total from investment operations | 0.10 | 0.52 | 0.14 | 0.23 | 0.65 | |||||||||||||||
LESS DISTRIBUTIONS | ||||||||||||||||||||
Dividends from net investment income | (0.39 | ) | (0.42 | ) | (0.32 | ) | (0.35 | ) | (0.31 | ) | ||||||||||
Distributions from capital gains | — | — | — | — | — | |||||||||||||||
Total distributions | (0.39 | ) | (0.42 | ) | (0.32 | ) | (0.35 | ) | (0.31 | ) | ||||||||||
Net asset value, end of year or period | $ | 9.02 | $ | 9.31 | $ | 9.21 | $ | 9.39 | $ | 9.51 | ||||||||||
Total return(f) | 1.12 | % | 5.76 | % | 1.55 | % | 2.48 | % | 7.25 | % | ||||||||||
RATIOS / SUPPLEMENTAL DATA | ||||||||||||||||||||
Net assets, end of year or period (000s) | $ | 10,661 | $ | 5,733 | $ | 3,685 | $ | 3,859 | $ | 6,100 | ||||||||||
Ratio of expenses to average net assets: | ||||||||||||||||||||
Before expense reimbursements | 1.32 | % | 1.39 | % | 1.45 | % | 1.41 | % | 1.38 | % | ||||||||||
After expense reimbursements(d) | 1.05% | 1.00 | % | 1.00 | % | 1.00 | % | 1.00 | % | |||||||||||
Ratio of net investment income/(loss) to average net assets | ||||||||||||||||||||
Before expense reimbursements | 3.90 | % | 3.29 | % | 3.13 | % | 3.13 | % | 2.98 | % | ||||||||||
After expense reimbursements | 4.17 | % | 3.68 | % | 3.58 | % | 3.54 | % | 3.36 | % | ||||||||||
Portfolio turnover | 133 | % | 144 | % | 153 | % | 169 | % | 141 | % | ||||||||||
(a) | Formerly named ICON Flexible Bond Fund - Class S. |
(b) | Prior to January 23, 2018, the ICON Flexible Bond Fund was known as the ICON Bond Fund. |
(c) | Calculated based upon average shares outstanding. |
(d) | Effective for the year ended September 30, 2020, CCO Fees and reorganization costs are not included in the expense limitation. For all years presented, interest expense, when applicable, is not included in the expense limitation. |
(e) | Formerly named ICON Flexible Bond Fund - Class A. |
(f) | The total return calculation excludes any sales charges. |
See accompanying notes to financial statements.
35
Financial Highlights For a Share Outstanding Throughout Each Year |
Icon Health and Information Technology Fund | ||||||||||||||||||||
Institutional Shares(a) | Year Ended | Year Ended | Year Ended | Year Ended | Year Ended | |||||||||||||||
Net asset value, beginning of year | $ | 15.46 | $ | 17.19 | $ | 19.14 | $ | 17.96 | $ | 14.95 | ||||||||||
INCOME FROM INVESTMENT OPERATIONS | ||||||||||||||||||||
Net investment income/(loss)(b) | (0.09 | ) | (0.04 | ) | (0.10 | ) | (0.10 | ) | (0.07 | ) | ||||||||||
Net gain/(loss) on securities (both realized and unrealized) | 4.10 | 0.35 | 2.09 | 4.53 | 3.08 | |||||||||||||||
Total from investment operations | 4.01 | 0.31 | 1.99 | 4.43 | 3.01 | |||||||||||||||
LESS DISTRIBUTIONS | ||||||||||||||||||||
Dividends from net investment income | — | — | (0.08 | ) | — | — | ||||||||||||||
Distributions from capital gains | (0.72 | ) | (2.04 | ) | (3.86 | ) | (3.25 | ) | — | |||||||||||
Total distributions | (0.72 | ) | (2.04 | ) | (3.94 | ) | (3.25 | ) | — | |||||||||||
Net asset value, end of year or period | $ | 18.75 | $ | 15.46 | $ | 17.19 | $ | 19.14 | $ | 17.96 | ||||||||||
Total return | 26.59 | % | 5.12 | % | 11.82 | % | 29.46 | % | 20.13 | % | ||||||||||
RATIOS / SUPPLEMENTAL DATA | ||||||||||||||||||||
Net assets, end of year or period (000s) | $ | 109,619 | $ | 54,263 | $ | 61,474 | $ | 71,249 | $ | 48,953 | ||||||||||
Ratio of expenses to average net assets: | ||||||||||||||||||||
Before expense reimbursements | 1.46 | % | 1.49 | % | 1.41 | % | 1.42 | % | 1.49 | % | ||||||||||
After expense reimbursements(c) | 1.46 | % | 1.49 | % | 1.41 | % | 1.42 | % | 1.49 | % | ||||||||||
Ratio of net investment income/(loss) to average net assets | ||||||||||||||||||||
Before expense reimbursements | (0.54 | )% | (0.25 | )% | (0.60 | )% | (0.58 | )% | (0.46 | )% | ||||||||||
After expense reimbursements | (0.54 | )% | (0.25 | )% | (0.60 | )% | (0.58 | )% | (0.46 | )% | ||||||||||
Portfolio turnover | 67 | % | 92 | % | 98 | % | 116 | % | 94 | % | ||||||||||
Icon Health and Information Technology Fund | ||||||||||||||||||||
Investor Shares(d) | Year Ended | Year Ended | Year Ended | Year Ended | Year Ended | |||||||||||||||
Net asset value, beginning of year | $ | 14.74 | $ | 16.55 | $ | 18.55 | $ | 17.55 | $ | 14.65 | ||||||||||
INCOME FROM INVESTMENT OPERATIONS | ||||||||||||||||||||
Net investment income/(loss)(b) | (0.13 | ) | (0.07 | ) | (0.16 | ) | (0.15 | ) | (0.11 | ) | ||||||||||
Net gain/(loss) on securities (both realized and unrealized) | 3.91 | 0.30 | 2.02 | 4.40 | 3.01 | |||||||||||||||
Total from investment operations | 3.78 | 0.23 | 1.86 | 4.25 | 2.90 | |||||||||||||||
LESS DISTRIBUTIONS | ||||||||||||||||||||
Dividends from net investment income | — | — | (0.00 | )(e) | — | — | ||||||||||||||
Distributions from capital gains | (0.72 | ) | (2.04 | ) | (3.86 | ) | (3.25 | ) | — | |||||||||||
Total distributions | (0.72 | ) | (2.04 | ) | (3.86 | ) | (3.25 | ) | — | |||||||||||
Net asset value, end of year or period | $ | 17.80 | $ | 14.74 | $ | 16.55 | $ | 18.55 | $ | 17.55 | ||||||||||
Total return(f) | 26.31 | % | 4.79 | % | 11.43 | % | 29.08 | % | 19.80 | % | ||||||||||
RATIOS / SUPPLEMENTAL DATA | ||||||||||||||||||||
Net assets, end of year or period (000s) | $ | 2,948 | $ | 1,463 | $ | 2,101 | $ | 2,836 | $ | 2,631 | ||||||||||
Ratio of expenses to average net assets: | ||||||||||||||||||||
Before expense reimbursements | 2.13 | % | 2.30 | % | 2.00 | % | 2.01 | % | 2.17 | % | ||||||||||
After expense reimbursements(c) | 1.76 | % | 1.75 | % | 1.75 | % | 1.75 | % | 1.75 | % | ||||||||||
Ratio of net investment income/(loss) to average net assets | ||||||||||||||||||||
Before expense reimbursements | (1.21 | )% | (1.05 | )% | (1.20 | )% | (1.16 | )% | (1.12 | )% | ||||||||||
After expense reimbursements | (0.83 | )% | (0.50 | )% | (0.95 | )% | (0.90 | )% | (0.70 | )% | ||||||||||
Portfolio turnover | 67 | % | 92 | % | 98 | % | 116 | % | 94 | % | ||||||||||
(a) | Information prior to the reorganization date of July 10, 2020 is that of the accounting and performance survior, ICON Information Technology Fund - Class S. |
(b) | Calculated based upon average shares outstanding. |
(c) | Effective for the year ended September 30, 2020, CCO Fees and reorganization costs are not included in the expense limitation. For all years presented, interest expense, when applicable, is not included in the expense limitation. |
(d) | Information prior to the reorganization date of July 10, 2020 is that of the accounting and performance survior, ICON Information Technology Fund - Class A. |
(e) | Amount less than $(0.005). |
(f) | The total return calculation excludes any sales charges. |
See accompanying notes to financial statements.
36
Financial Highlights For a Share Outstanding Throughout Each Year |
Icon Natural Resources and Infrastructure Fund | ||||||||||||||||||||
Institutional Shares(a) | Year Ended | Year Ended | Year Ended | Year Ended | Year Ended | |||||||||||||||
Net asset value, beginning of year | $ | 12.49 | $ | 16.45 | $ | 15.32 | $ | 12.82 | $ | 11.86 | ||||||||||
INCOME FROM INVESTMENT OPERATIONS | ||||||||||||||||||||
Net investment income/(loss)(c) | 0.08 | 0.19 | 0.31 | 0.01 | 0.10 | |||||||||||||||
Net gain/(loss) on securities (both realized and unrealized) | (0.59 | ) | (1.80 | ) | 1.01 | 2.56 | 1.80 | |||||||||||||
Total from investment operations | (0.51 | ) | (1.61 | ) | 1.32 | 2.57 | 1.90 | |||||||||||||
LESS DISTRIBUTIONS | ||||||||||||||||||||
Dividends from net investment income | (0.20 | ) | (0.33 | ) | — | (0.07 | ) | (0.06 | ) | |||||||||||
Distributions from capital gains | — | (2.02 | ) | (0.19 | ) | — | (0.88 | ) | ||||||||||||
Total distributions | (0.20 | ) | (2.35 | ) | (0.19 | ) | (0.07 | ) | (0.94 | ) | ||||||||||
Net asset value, end of year or period | $ | 11.78 | $ | 12.49 | $ | 16.45 | $ | 15.32 | $ | 12.82 | ||||||||||
Total return | (4.21 | )% | (7.63 | )% | 8.68 | % | 20.13 | % | 17.24 | % | ||||||||||
RATIOS / SUPPLEMENTAL DATA | ||||||||||||||||||||
Net assets, end of year or period (000s) | $ | 98,786 | $ | 55,353 | $ | 76,916 | $ | 69,444 | $ | 65,787 | ||||||||||
Ratio of expenses to average net assets: | ||||||||||||||||||||
Before expense reimbursements | 1.58 | % | 1.70 | % | 1.58 | % | 1.52 | % | 1.59 | % | ||||||||||
After expense reimbursements(d) | 1.48 | % | 1.50 | % | 1.50 | % | 1.50 | % | 1.50 | % | ||||||||||
Ratio of net investment income/(loss) to average net assets | ||||||||||||||||||||
Before expense reimbursements | 0.58 | % | 1.33 | % | 1.86 | % | 0.06 | % | 0.70 | % | ||||||||||
After expense reimbursements | 0.68 | % | 1.53 | % | 1.94 | % | 0.08 | % | 0.79 | % | ||||||||||
Portfolio turnover | 134 | % | 111 | % | 117 | % | 68 | % | 81 | % | ||||||||||
Icon Natural Resources and Infrastructure Fund | ||||||||||||||||||||
Investor Shares(e) | Year Ended | Year Ended | Year Ended | Year Ended | Year Ended | |||||||||||||||
Net asset value, beginning of year | $ | 12.36 | $ | 16.25 | $ | 15.17 | $ | 12.73 | $ | 11.75 | ||||||||||
INCOME FROM INVESTMENT OPERATIONS | ||||||||||||||||||||
Net investment income/(loss)(c) | 0.05 | 0.16 | 0.29 | (0.03 | ) | 0.06 | ||||||||||||||
Net gain/(loss) on securities (both realized and unrealized) | (0.57 | ) | (1.78 | ) | 0.98 | 2.54 | 1.81 | |||||||||||||
Total from investment operations | (0.52 | ) | (1.62 | ) | 1.27 | 2.51 | 1.87 | |||||||||||||
LESS DISTRIBUTIONS | ||||||||||||||||||||
Dividends from net investment income | (0.20 | ) | (0.25 | ) | — | (0.07 | ) | (0.01 | ) | |||||||||||
Distributions from capital gains | — | (2.02 | ) | (0.19 | ) | — | (0.88 | ) | ||||||||||||
Total distributions | (0.20 | ) | (2.27 | ) | (0.19 | ) | (0.07 | ) | (0.89 | ) | ||||||||||
Net asset value, end of year or period | $ | 11.64 | $ | 12.36 | $ | 16.25 | $ | 15.17 | $ | 12.73 | ||||||||||
Total return(f) | (4.40 | )% | (7.92 | )% | 8.43 | % | 19.81 | % | 17.05 | % | ||||||||||
RATIOS / SUPPLEMENTAL DATA | ||||||||||||||||||||
Net assets, end of year or period (000s) | $ | 5,001 | $ | 2,733 | $ | 4,231 | $ | 5,629 | $ | 4,451 | ||||||||||
Ratio of expenses to average net assets: | ||||||||||||||||||||
Before expense reimbursements | 2.10 | % | 2.19 | % | 1.86 | % | 1.91 | % | 2.02 | % | ||||||||||
After expense reimbursements(d) | 1.75 | % | 1.75 | % | 1.75 | % | 1.75 | % | 1.75 | % | ||||||||||
Ratio of net investment income/(loss) to average net assets | ||||||||||||||||||||
Before expense reimbursements | 0.07 | % | 0.85 | % | 1.71 | % | (0.35 | )% | 0.24 | % | ||||||||||
After expense reimbursements | 0.42 | % | 1.29 | % | 1.82 | % | (0.19 | )% | 0.51 | % | ||||||||||
Portfolio turnover | 134 | % | 111 | % | 117 | % | 68 | % | 81 | % | ||||||||||
(a) | Information prior to the reorganization date of July 10, 2020 is that of the accounting and performance survior, ICON Natural Resources Fund - Class S. |
(b) | Prior to January 22, 2016, the ICON Natural Resources Fund was known as the ICON Materials Fund. |
(c) | Calculated based upon average shares outstanding. |
(d) | Effective for the year ended September 30, 2020, CCO Fees and reorganization costs are not included in the expense limitation. For all years presented, interest expense, when applicable, is not included in the expense limitation. |
(e) | Information prior to the reorganization date of July 10, 2020 is that of the accounting and performance survior, ICON Natural Resources Fund - Class A. |
(f) | The total return calculation excludes any sales charges. |
See accompanying notes to financial statements.
37
Financial Highlights For a Share Outstanding Throughout Each Year |
Icon Utilities and Income Fund(a) | ||||||||||||||||||||
Institutional Shares(b) | Year Ended | Year Ended | Year Ended | Year Ended | Year Ended | |||||||||||||||
Net asset value, beginning of year | $ | 10.25 | $ | 8.85 | $ | 9.29 | $ | 9.49 | $ | 8.03 | ||||||||||
INCOME FROM INVESTMENT OPERATIONS | ||||||||||||||||||||
Net investment income/(loss)(c) | 0.18 | 0.26 | 0.28 | 0.27 | 0.30 | |||||||||||||||
Net gain/(loss) on securities (both realized and unrealized) | (0.91 | ) | 1.45 | 0.07 | 0.59 | 1.43 | ||||||||||||||
Total from investment operations | (0.73 | ) | 1.71 | 0.35 | 0.86 | 1.73 | ||||||||||||||
LESS DISTRIBUTIONS | ||||||||||||||||||||
Dividends from net investment income | (0.20 | ) | (0.26 | ) | (0.31 | ) | (0.27 | ) | (0.27 | ) | ||||||||||
Distributions from capital gains | (0.33 | ) | (0.05 | ) | (0.48 | ) | (0.79 | ) | — | |||||||||||
Total distributions | (0.53 | ) | (0.31 | ) | (0.79 | ) | (1.06 | ) | (0.27 | ) | ||||||||||
Net asset value, end of year or period | $ | 8.99 | $ | 10.25 | $ | 8.85 | $ | 9.29 | $ | 9.49 | ||||||||||
Total return | (7.35 | )% | 19.76 | % | 4.17 | % | 9.88 | % | 21.74 | % | ||||||||||
RATIOS / SUPPLEMENTAL DATA | ||||||||||||||||||||
Net assets, end of year or period (000s) | $ | 25,038 | $ | 46,006 | $ | 30,883 | $ | 35,816 | $ | 43,864 | ||||||||||
Ratio of expenses to average net assets: | ||||||||||||||||||||
Before expense reimbursements | 1.63 | % | 1.57 | % | 1.60 | % | 1.54 | % | 1.59 | % | ||||||||||
After expense reimbursements(d) | 1.28 | % | 1.22 | % | 1.22 | % | 1.44 | %(e) | 1.50 | % | ||||||||||
Ratio of net investment income/(loss) to average net assets | ||||||||||||||||||||
Before expense reimbursements | 1.62 | % | 2.38 | % | 2.82 | % | 2.83 | % | 3.15 | % | ||||||||||
After expense reimbursements | 1.97 | % | 2.73 | % | 3.20 | % | 2.93 | % | 3.24 | % | ||||||||||
Portfolio turnover | 24 | % | 144 | % | 156 | % | 160 | % | 168 | % | ||||||||||
Icon Utilities and Income Fund(a) | ||||||||||||||||||||
Investor Shares(f) | Year Ended | Year Ended | Year Ended | Year Ended | Year Ended | |||||||||||||||
Net asset value, beginning of year | $ | 10.07 | $ | 8.70 | $ | 9.14 | $ | 9.35 | $ | 7.92 | ||||||||||
INCOME FROM INVESTMENT OPERATIONS | ||||||||||||||||||||
Net investment income/(loss)(c) | 0.16 | 0.23 | 0.25 | 0.24 | 0.28 | |||||||||||||||
Net gain/(loss) on securities (both realized and unrealized) | (0.91 | ) | 1.43 | 0.08 | 0.59 | 1.40 | ||||||||||||||
Total from investment operations | (0.75 | ) | 1.66 | 0.33 | 0.83 | 1.68 | ||||||||||||||
LESS DISTRIBUTIONS | ||||||||||||||||||||
Dividends from net investment income | (0.16 | ) | (0.24 | ) | (0.29 | ) | (0.25 | ) | (0.25 | ) | ||||||||||
Distributions from capital gains | (0.33 | ) | (0.05 | ) | (0.48 | ) | (0.79 | ) | — | |||||||||||
Total distributions | (0.49 | ) | (0.29 | ) | (0.77 | ) | (1.04 | ) | (0.25 | ) | ||||||||||
Net asset value, end of year or period | $ | 8.83 | $ | 10.07 | $ | 8.70 | $ | 9.14 | $ | 9.35 | ||||||||||
Total return(g) | (7.69 | )% | 19.47 | % | 3.97 | % | 9.63 | % | 21.29 | % | ||||||||||
RATIOS / SUPPLEMENTAL DATA | ||||||||||||||||||||
Net assets, end of year (000s) | $ | 4,797 | $ | 6,052 | $ | 5,540 | $ | 8,293 | $ | 15,868 | ||||||||||
Ratio of expenses to average net assets: | ||||||||||||||||||||
Before expense reimbursements | 1.83 | % | 1.77 | % | 1.73 | % | 1.84 | % | 1.79 | % | ||||||||||
After expense reimbursements(d) | 1.53 | % | 1.47 | % | 1.47 | % | 1.69 | %(h) | 1.75 | % | ||||||||||
Ratio of net investment income/(loss) to average net assets | ||||||||||||||||||||
Before expense reimbursements | 1.45 | % | 2.20 | % | 2.62 | % | 2.48 | % | 3.10 | % | ||||||||||
After expense reimbursements | 1.75 | % | 2.50 | % | 2.88 | % | 2.63 | % | 3.14 | % | ||||||||||
Portfolio turnover | 24 | % | 144 | % | 156 | % | 160 | % | 168 | % | ||||||||||
(a) | Formerly named ICON Utilities Fund. |
(b) | Formerly named ICON Utilities Fund - Class S. |
(c) | Calculated based upon average shares outstanding. |
(d) | Effective for the year ended September 30, 2020, CCO Fees and reorganization costs are not included in the expense limitation. For all years presented, interest expense, when applicable, is not included in the expense limitation. |
(e) | Effective July 1, 2017, the annual expense limitation rate changed from 1.50% to 1.22%. |
(f) | Formerly named ICON Utilities Fund - Class A. |
(g) | The total return calculation excludes any sales charges. |
(h) | Effective July 1, 2017, the annual expense limitation rate changed from 1.75% to 1.47%. |
See accompanying notes to financial statements.
38
Financial Highlights For a Share Outstanding Throughout Each Year |
Shelton Emerging Markets Fund(a) | ||||||||||||||||||||
Institutional Shares(b) | Year Ended | Year Ended | Year Ended | Year Ended | Year Ended | |||||||||||||||
Net asset value, beginning of year | $ | 14.82 | $ | 16.22 | $ | 15.90 | $ | 14.28 | $ | 12.95 | ||||||||||
INCOME FROM INVESTMENT OPERATIONS | ||||||||||||||||||||
Net investment income/(loss)(c) | 0.03 | 0.31 | 0.31 | 0.07 | (0.00 | )(d) | ||||||||||||||
Net gain/(loss) on securities (both realized and unrealized) | 0.85 | (1.24 | ) | 0.04 | 1.55 | 1.33 | ||||||||||||||
Total from investment operations | 0.88 | (0.93 | ) | 0.35 | 1.62 | 1.33 | ||||||||||||||
LESS DISTRIBUTIONS | ||||||||||||||||||||
Dividends from net investment income | (0.37 | ) | (0.31 | ) | (0.03 | ) | — | — | ||||||||||||
Distributions from capital gains | — | (0.16 | ) | — | — | — | ||||||||||||||
Total distributions | (0.37 | ) | (0.47 | ) | (0.03 | ) | — | — | ||||||||||||
Net asset value, end of year or period | $ | 15.33 | $ | 14.82 | $ | 16.22 | $ | 15.90 | $ | 14.28 | ||||||||||
Total return | 5.78 | % | (5.60 | )% | 2.21 | % | 11.34 | % | 10.27 | % | ||||||||||
RATIOS / SUPPLEMENTAL DATA | ||||||||||||||||||||
Net assets, end of year (000s) | $ | 21,318 | $ | 41,845 | $ | 50,897 | $ | 51,833 | $ | 45,786 | ||||||||||
Ratio of expenses to average net assets: | ||||||||||||||||||||
Before expense reimbursements | 1.89 | % | 1.78 | % | 1.61 | % | 1.72 | % | 1.85 | % | ||||||||||
After expense reimbursements(e) | 1.61 | % | 1.56 | % | 1.55 | % | 1.55 | % | 1.55 | % | ||||||||||
Ratio of net investment income/(loss) to average net assets | ||||||||||||||||||||
Before expense reimbursements | (0.11 | )% | 1.81 | % | 1.83 | % | 0.29 | % | (0.32 | )% | ||||||||||
After expense reimbursements | 0.17 | % | 2.03 | % | 1.89 | % | 0.46 | % | (0.32 | )% | ||||||||||
Portfolio turnover | 59 | % | 78 | % | 63 | % | 169 | % | 156 | % | ||||||||||
Shelton Emerging Markets Fund(a) | ||||||||||||||||||||
Investor Shares(f) | Year Ended | Year Ended | Year Ended | Year Ended | Year Ended | |||||||||||||||
Net asset value, beginning of year | $ | 14.73 | $ | 16.08 | $ | 15.77 | $ | 14.20 | $ | 12.91 | ||||||||||
INCOME FROM INVESTMENT OPERATIONS | ||||||||||||||||||||
Net investment income/(loss)(c) | 0.01 | 0.14 | 0.24 | 0.06 | (0.01 | ) | ||||||||||||||
Net gain/(loss) on securities (both realized and unrealized) | 0.82 | (1.10 | ) | 0.07 | 1.51 | 1.30 | ||||||||||||||
Total from investment operations | 0.83 | (0.96 | ) | 0.31 | 1.57 | 1.29 | ||||||||||||||
LESS DISTRIBUTIONS | ||||||||||||||||||||
Dividends from net investment income | (0.36 | ) | (0.23 | ) | (0.00 | )(d) | — | — | ||||||||||||
Distributions from capital gains | — | (0.16 | ) | — | — | — | ||||||||||||||
Total distributions | (0.36 | ) | (0.39 | ) | (0.00 | ) | — | — | ||||||||||||
Net asset value, end of year or period | $ | 15.20 | $ | 14.73 | $ | 16.08 | $ | 15.77 | $ | 14.20 | ||||||||||
Total return(g) | 5.48 | % | (5.87 | )% | 1.97 | % | 11.06 | % | 9.99 | % | ||||||||||
RATIOS / SUPPLEMENTAL DATA | ||||||||||||||||||||
Net assets, end of year (000s) | $ | 1,432 | $ | 1,925 | $ | 6,436 | $ | 12,887 | $ | 9,072 | ||||||||||
Ratio of expenses to average net assets: | ||||||||||||||||||||
Before expense reimbursements | 2.54 | % | 2.26 | % | 1.96 | % | 2.12 | % | 2.16 | % | ||||||||||
After expense reimbursements(e) | 1.89 | % | 1.81 | % | 1.80 | % | 1.80 | % | 1.80 | % | ||||||||||
Ratio of net investment income/(loss) to average net assets | ||||||||||||||||||||
Before expense reimbursements | (0.61 | )% | 0.45 | % | 1.32 | % | 0.08 | % | (0.43 | )% | ||||||||||
After expense reimbursements | 0.04 | % | 0.90 | % | 1.48 | % | 0.40 | % | (0.02 | )% | ||||||||||
Portfolio turnover | 59 | % | 78 | % | 63 | % | 169 | % | 156 | % | ||||||||||
(a) | Formerly named ICON Emerging Markets Fund. |
(b) | Formerly named ICON Emerging Markets Fund - Class S. |
(c) | Calculated based upon average shares outstanding. |
(d) | Amount less than $(0.005). |
(e) | Effective for the year ended September 30, 2020, CCO Fees and reorganization costs are not included in the expense limitation. For all years presented, interest expense, when applicable, is not included in the expense limitation. |
(f) | Formerly named ICON Emerging Markets Fund - Class A. |
(g) | The total return calculation excludes any sales charges. |
See accompanying notes to financial statements.
39
ICON Funds | Notes to Financial Statements | September 30, 2020 |
NOTE 1 – SUMMARY OF SIGNIFICANT ACCOUNTING POLICIES
SCM Trust (the “Trust”), a Massachusetts business trust formed in July 1988 is registered as an investment company under the Investment Company Act of 1940, as amended. The Trust consists of twelve separate series, eight of which are included in these financial statements. On August 13, 2020, the fiscal year end of the ICON Equity Fund, the ICON Equity Income Fund, the ICON Consumer Select Fund, the ICON Flexible Bond Fund, ICON Health and Information Technology Fund, The ICON Natural Resources Fund, the ICON Utilities and Income Fund, and the Shelton Emerging Markets Fund was changed from September 30 to December 31, effective December 31, 2020.
ICON Consumer Select Fund is an open-end non-diversified series of the Trust. The inception date of the Fund is July 10, 2020. The Fund’s investment objective is to seek long-term capital appreciation. The Fund is the successor fund to three series of ICON Funds, the ICON Consumer Discretionary Fund, the ICON Financial Fund, and the ICON Consumer Staples Fund. The ICON Consumer Discretionary Fund and the ICON Financial Fund were reorganized into the Fund pursuant to a reorganization that that took place after the close of business on July 10, 2020. The ICON Consumer Staples Fund was reorganized into the Fund pursuant to a reorganization that took place after the close of business on July 31, 2020. All historic performance and financial information presented is that of the ICON Financial Fund, which was the accounting and performance survivor of the reorganizations. Historic information presented for the Institutional Class and Investor Classes shares is based on that of the Class S and Class A shares, respectively, of the ICON Financial Fund.
ICON Equity Fund is an open-end diversified series of the Trust. The inception date of the Fund is July 10, 2020. The Fund’s investment objective is to seek capital appreciation, with a secondary objective of capital preservation to provide long-term growth. The Fund is the successor fund to three series of ICON Funds, the ICON Fund, the ICON Long/Short Fund, and the ICON Opportunities Fund, pursuant to a reorganization that that took place after the close of business on July 10, 2020. All historic performance and financial information presented is that of the ICON Long/Short Fund, which was the accounting and performance survivor of the reorganizations. Historic information presented for the Institutional Class and Investor Classes shares is based on that of the Class S and Class A shares, respectively, of the ICON Long/Short Fund. The ICON Fund and the ICON Long/Short Fund each also had Class C shares, each of which were reorganized into the Investor Class of the ICON Equity Fund.
ICON Equity Income Fund is an open-end diversified series of the Trust. The inception date of the Fund is July 10, 2020. The Fund’s investment objective is to seek modest capital appreciation and income. The Fund is the successor fund to two series of ICON Funds, the ICON Equity Income Fund (the “Predecessor Equity Income Fund”) and the ICON Risk-Managed Balanced Fund, pursuant to reorganizations that that took place after the close of business on July 10, 2020 and September 25, 2020, respectively. All historic performance and financial information presented is that of the Predecessor Equity Income Fund, which was the accounting and performance survivor of the reorganizations. Historic information presented for the Institutional Class and Investor Classes shares is based on that of the Class S and Class A shares, respectively, of the Predecessor Equity Income Fund. The Predecessor Equity Income Fund and the ICON Risk-Managed Balanced Fund each also had Class C shares, each of which were reorganized into the Investor Class of the ICON Equity Income Fund.
ICON Flexible Bond Fund is an open-end diversified series of the Trust. The inception date of the Fund is July 10, 2020. The Fund’s investment objective is to seek maximum total return. The Fund is the successor fund to the ICON Flexible Bond Fund, a series of ICON Funds (the “Predecessor Flexible Bond Fund”), pursuant to a reorganization that that took place after the close of business on July 10, 2020. All historic performance and financial information presented is that of the Predecessor Flexible Bond Fund, which was the accounting and performance survivor of the reorganization. Historic information presented for the Institutional Class and Investor Classes shares is based on that of the Class S and Class A shares, respectively, of the Predecessor Flexible Bond Fund. The Predecessor Flexible Bond Fund also had Class C shares, each of which were reorganized into the Investor Class of the ICON Flexible Bond Fund.
ICON Health and Information Technology Fund is an open-end non-diversified series of the Trust. The inception date of the Fund is July 10, 2020. The Fund’s investment objective is to seek long-term capital appreciation. The Fund is the successor fund to two series of ICON Funds, the ICON Information Technology Fund and the ICON Healthcare Fund pursuant to a reorganization that that took place after the close of business on July 10, 2020. All historic performance and financial information presented is that of the ICON Information Technology Fund, which was the accounting and performance survivor of the reorganizations. Historic information presented for the Institutional Class and Investor Classes shares is based on that of the Class S and Class A shares, respectively, of the ICON Information Technology Fund.
ICON Natural Resources and Infrastructure Fund is an open-end non-diversified series of the Trust. The inception date of the Fund is July 10, 2020. The Fund’s investment objective is to seek long-term capital appreciation. The Fund is the successor fund to three series of ICON Funds, the ICON Energy Fund, the ICON Natural Resources Fund, and the ICON Industrials Fund, pursuant to a reorganization that that took place after the close of business on July 10, 2020. All historic performance and financial information presented is that of the ICON Natural Resources Fund, which was the accounting and performance survivor of the reorganizations. Historic information presented for the Institutional Class and Investor Classes shares is based on that of the Class S and Class A shares, respectively, of the ICON Natural Resources Fund. The ICON Energy Fund and the ICON Natural Resources Fund each also had Class C shares, each of which were reorganized into the Investor Class of the ICON Natural Resources and Infrastructure Fund.
ICON Utilities and Income Fund is an open-end non-diversified series of the Trust. The inception date of the Fund is July 10, 2020. The Fund’s investment objective is to seek long-term capital appreciation. The Fund is the successor fund to the ICON Utilities Fund, a series of ICON Funds, pursuant to a reorganization that occurred after the close of business on July 10, 2020. All historic performance and financial information presented is that of the ICON Utilities Fund, which was the accounting and performance survivor of the reorganizations. Historic information presented for the Institutional Class and Investor Classes shares is based on that of the Class S and Class A shares, respectively, of the ICON Utilities Fund.
The Shelton Emerging Markets Fund is an open-end diversified series of the Trust. The inception date of the Fund is June 26, 2020. The Fund’s investment objective is to seek long-term capital appreciation. The Fund is the successor fund to the ICON Emerging Markets Fund, a series of ICON Funds, pursuant to a reorganization that occurred after the close of business on June 26, 2020. All historic performance and financial information presented is that of the ICON Emerging Markets Fund, which was the accounting and performance survivor of the reorganizations. Historic information presented for the Institutional Class and Investor Classes shares is based on that of the Class S and Class A shares, respectively, of the ICON Emerging Markets Fund.
The Trust follows the investment company accounting and reporting guidance of the Financial Accounting Standards Board (“FASB”) Accounting Standards Codification Topic 946, “Financial Services – Investment Companies”.
40
ICON Funds | Notes to Financial Statements (Continued) | September 30, 2020 |
(a) Security Valuation — Inputs used to value corporate debt securities generally include relative credit information, observed market movements, sector news, U.S. Treasury yield curve or relevant benchmark curve, and other market information, which may include benchmark yields, reported trades, broker-dealer quotes, issuer spreads, benchmark securities, bids, offers, and reference data, such as market research publications, when available (“Other Market Information”). Equity securities listed on a national or international exchange are valued at the last reported sales price. Futures contracts are valued at the settle price, depending on the exchange the contract trades on, typically as of 4:15 p.m., Eastern Time. Municipal securities are valued by an independent pricing service at a price determined by a matrix pricing method. This technique generally considers such factors as yields or prices of bonds of comparable quality, type of issue, coupon, maturity, ratings and general market conditions. U.S. government securities for which market quotations are readily available are valued at the mean between the closing bid and asked prices provided by an independent pricing service. U.S. agency securities consisting of mortgage pass-through certificates are valued using dealer quotations provided by an independent pricing service. U.S. Treasury Bills are valued at amortized cost which approximates market value. Securities with remaining maturities of 60 days or less are valued on the amortized cost basis as reflecting fair value.
Securities for which market quotes are not readily available from the Trust’s third-party pricing service are valued at fair value, determined in good faith and in accordance with procedures adopted by the Board of Trustees. The Board has delegated to the Advisor’s Pricing Committee the responsibility for determining the fair value, subject to the Board oversight and the review of the pricing decisions at its quarterly meetings. For a description of the Advisor, see Note 2.
(b) Federal Income Taxes — No provision is considered necessary for federal income taxes. The Funds intend to qualify for and elect the tax treatment applicable to regulated investment companies under the Internal Revenue Code and to distribute all their taxable income to shareholders.
(c) Short Sales — Short sales are transactions under which a Fund sells a security it does not own in anticipation of a decline in the value of that security. To complete such a transaction, the Fund must borrow the security to make delivery to the buyer. The Fund then is obligated to replace the security borrowed by purchasing the security at market price at the time of replacement. The price at such time may be more or less than the price at which the security was sold by the Fund. When a security is sold short a decrease in the value of the security will be recognized as a gain and an increase in the value of the security will be recognized as a loss, which is potentially limitless. Until the security is replaced, the Fund is required to pay the lender amounts equal to dividend or interest that accrue during the period of the loan which is recorded as an expense. To borrow the security, the Fund also may be required to pay a premium or an interest fee, which are recorded as interest expense. Cash or securities are segregated for the broker to meet the necessary margin requirements. The Fund is subject to the risk that it may not always be able to close out a short position at a particular time or at an acceptable price.
(d) Municipal Bonds — Municipal bonds are debt obligations issued by the states, possessions, or territories of the United States (including the District of Columbia) or a political subdivision, public instrumentality, agency, public authority or other governmental unit of such states, possessions, or territories (e.g., counties, cities, towns, villages, districts and authorities). Municipal bonds may be issued as taxable securities, or as federally tax-exempt securities. States, possessions, territories and municipalities may issue municipal bonds to raise funds for various public purposes such as airports, housing, hospitals, mass transportation, schools, water and sewer works, gas, and electric utilities. They may also issue municipal bonds to refund outstanding obligations and to meet general operating expenses. Municipal bonds may be general obligation bonds or revenue bonds. General obligation bonds are secured by the issuer’s pledge of its full faith, credit and taxing power for the payment of principal and interest. Revenue bonds are payable from revenues derived from particular facilities, from the proceeds of a special excise tax or from other specific revenue sources. They are not usually payable from the general taxing power of a municipality. In addition, certain types of “private activity” bonds may be issued by public authorities to obtain funding for privately operated facilities, such as housing and pollution control facilities, for industrial facilities and for water supply, gas, electricity and waste disposal facilities. Other types of private activity bonds are used to finance the construction, repair or improvement of, or to obtain equipment for, privately operated industrial or commercial facilities. Current federal tax laws place substantial limitations on the size of certain of such issues. In certain cases, the interest on a private activity bond may not be exempt from federal income tax or the alternative minimum tax.
(e) Security Transactions, Investment Income and Distributions to Shareholders — Security transactions are recorded on the trade date. Interest income is recorded on the accrual basis. Dividend income is recorded on the ex-dividend date. Withholding taxes on foreign dividends have been provided for, in accordance with the Trust’s understanding of the applicable country’s tax rules and rates. Discounts or premiums on debt securities are accreted or amortized to interest income over the lives of the respective securities using the effective interest method. Distributions to shareholders are recorded on the ex-dividend date for the Funds. Income distributions and capital gain distributions are determined in accordance with income tax regulations which may differ from accounting principles generally accepted in the United States of America. These differences are primarily due to differing treatments for PFICs, wash sales, REIT adjustments and post-October capital losses.
Distributions received from investments in securities that represent a return of capital or capital gains are recorded as a reduction of cost of investment or as a realized gain, respectively. The calendar year-end amounts of ordinary income, capital gains, and return of capital included in distributions received from a Fund’s investments in real estate investment trusts (“REITs”) are reported to the Fund after the end of the calendar year; accordingly, the Funds estimate these amounts for accounting purposes until the characterization of REIT distributions is reported to the Fund after the end of the calendar year. Estimates are based on the most recent REIT distribution information available.
These “Book/tax” differences are considered either temporary (i.e., deferred losses, capital loss carry forwards) or permanent in nature. To the extent these differences are permanent in nature, such amounts are reclassified within the composition of net assets based on their federal tax basis treatment; temporary differences do not require reclassification.
(f) Foreign Currency Translation — Investment securities and other assets and liabilities denominated in foreign currencies are translated into U.S. dollar amounts at the date of valuation. Purchases and sales of investment securities and income and expense items denominated in foreign currencies are translated into U.S. dollar amounts on the respective dates of such transactions. The Trust does not isolate that portion of the results of operations resulting from changes in foreign exchange rates on investments from the fluctuations arising from changes in market prices of securities held. Such fluctuations are included with the net realized and unrealized gain or loss from investments.
Reported net realized foreign exchange gains or losses arise from sales of foreign currencies, currency gains or losses realized between the trade and settlement dates on securities transactions, and the difference between the amounts of dividends, interest, and foreign withholding taxes recorded on the company’s books and the U.S. dollar equivalent of the amounts actually received or paid. Net unrealized foreign exchange gains and losses arise from changes in the fair values of assets and liabilities, other than investments in securities at fiscal period end, resulting from changes in exchange rates.
41
ICON Funds | Notes to Financial Statements (Continued) | September 30, 2020 |
(g) Concentration — Cash & Cash Equivalents: The Funds consider their investment in a Federal Deposit Insurance Corporation (“FDIC”) insured interest bearing account to be cash and cash equivalents. Cash and cash equivalents are valued at cost plus any accrued interest. The Funds maintain cash balances, which, at times may exceed federally insured limits. The Funds maintain these balances with a high-quality financial institution.
Concentration of Credit Risk: Each Fund places its cash with a banking institution, which is insured by FDIC. The FDIC limit is $250,000. At various times throughout the year, the amount on deposit may exceed the FDIC limit and subject the Funds to a credit risk. The Funds do not believe that such deposits are subject to any unusual risk associated with investment activities.
(h) Use of Estimates in Financial Statements — In preparing financial statements in conformity with accounting principles generally accepted in the United States of America, Shelton Capital makes estimates and assumptions that affect the reported amounts of assets and liabilities at the date of the financial statements, as well as the reported amounts of income and expense during the year. Actual results may differ from these estimates.
(i) Share Valuations — The net asset value (“NAV”) per share of each Fund is calculated by dividing the sum of the value of the securities held by the Fund, plus cash or other assets, minus all liabilities (including estimated accrued expenses) by the total number of shares outstanding of the Fund, rounded to the nearest cent. A Fund’s shares will not be priced on the days on which the NYSE is closed for trading. The offering and redemption price per share of each Fund is equal to a Fund’s NAV per share.
(j) Accounting for Uncertainty in Income Taxes — The Funds recognize the tax benefits of uncertain tax positions only where the position is “more likely than not” to be sustained assuming examination by tax authorities. Shelton Capital has analyzed the Fund’s tax positions, and has concluded that no liability for unrecognized tax benefits should be recorded related to uncertain tax positions taken on returns filed for open tax years (2017-2019) or expected to be taken in the Fund’s 2020 tax returns. The Funds identify its major tax jurisdictions as U.S. Federal, however the Funds are not aware of any tax positions for which it is reasonably possible that the total amounts of unrecognized tax benefits will change materially in the next twelve months.
(k) Fair Value Measurements — The Funds utilize various methods to measure the fair value of most of its investments on a recurring basis. U.S. GAAP establishes a hierarchy that prioritizes inputs to valuation methods. The three levels of inputs are:
Level 1 – Unadjusted quoted prices in active markets for identical assets or liabilities that the company has the ability to access.
Level 2 – Observable inputs other than quoted prices included in Level 1 that are observable for the asset or liability, either directly or indirectly. These inputs may include quoted prices for the identical instrument on an inactive market, prices for similar instruments, interest rates, prepayment speeds, credit risk, yield curves, default rates and similar data.
Level 3 – Unobservable inputs for the asset or liability, to the extent relevant observable inputs are not available, representing the Fund’s own assumptions about the assumptions a market participant would use in valuing the asset or liability, and would be based on the best information available.
The availability of observable inputs can vary from security to security and is affected by a wide variety of factors, including, for example, the type of security, whether the security is new and not yet established in the marketplace, the liquidity of markets, and other characteristics particular to the security. To the extent that valuation is based on models or inputs that are less observable or unobservable in the market, the determination of fair value requires more judgment. Accordingly, the degree of judgment exercised in determining fair value is greatest for instruments categorized in Level 3.
The inputs used to measure fair value may fall into different levels of the fair value hierarchy. In such cases, for disclosure purposes, the level in the fair value hierarchy within which the fair value measurement falls in its entirety, is determined based on the lowest level input that is significant to the fair value measurement in its entirety.
The following table summarizes the valuation of the Trust’s securities at September 30, 2020 using fair value hierarchy:
Level 1(a) | Level 2(a) | Level 3(a) | ||||||||||||||
Fund | Investments in | Investments in | Investments | Total | ||||||||||||
ICON Consumer Select Fund | 51,436,770 | — | — | 51,436,770 | ||||||||||||
ICON Equity Fund | 64,479,106 | — | — | 64,479,106 | ||||||||||||
ICON Equity Income Fund | 76,094,337 | 3,803,293 | — | 79,897,630 | ||||||||||||
ICON Flexible Bond Fund | 39,765,103 | 109,254,959 | — | 149,020,062 | ||||||||||||
ICON Health and Information Technology Fund | 111,725,104 | — | — | 111,725,104 | ||||||||||||
ICON Natural Resources & Infrastructure Fund | 103,606,207 | — | — | 103,606,207 | ||||||||||||
ICON Utilities and Income Fund | 29,822,557 | — | — | 29,822,557 | ||||||||||||
Shelton Emerging Markets Fund | 6,474,422 | 15,523,112 | — | 21,997,534 | ||||||||||||
(a) | It is the Fund’s policy to recognize transfers between levels on the last day of the fiscal reporting period. There were no transfers in or out of Level 1, Level 2, and Level 3 as of FYE |
(b) | All publicly traded common stocks and preferred stocks held in the Funds are Level 1 securities. For a detailed break-out of equity securities by major industry classification, please refer to the Portfolio of Investments. |
(c) | All fixed income securities held in the Funds are Level 2 securities. For a detailed break-out of fixed income securities by type, please refer to the Portfolio of Investments. |
(l) Disclosure about Derivative Instruments and Hedging Activities — The Fund has adopted enhanced disclosure regarding derivative and hedging activity intended to improve financial reporting of derivative instruments by enabling investors to understand how and why an entity uses derivatives, how derivatives are accounted for, and how derivative instruments affect an entity’s results of operations and financial position.
(m) LIBOR Transition Risk — The United Kingdom’s Financial Conduct Authority announced a phase out of the London Interbank Offered Rate (“LIBOR”) by the end of 2021, and it is expected that LIBOR Will cease to be published after that time. The Funds may be exposed to financial instruments tied to LIBOR to determine payment obligations, financing terms, hedging strategies or investment value. The transition process away from LIBOR might lead to increased volatility and illiquidity in markets for, and reduce the effectiveness of new hedges placed against, instruments whose terms currently include LIBOR. The ultimate effect of the LIBOR transition process on the Funds Is uncertain.
42
ICON Funds | Notes to Financial Statements (Continued) | September 30, 2020 |
(n) COVID-19 Risks — A recent outbreak of respiratory disease caused by a novel coronavirus was first detected in December 2019 and has now been detected internationally. This coronavirus has resulted in closing borders, enhanced health screenings, healthcare service preparation and delivery, quarantines, cancellations, disruptions to supply chains and customer activity, as well as general concern and uncertainty. The impact of this coronavirus, and other epidemics and pandemics that may arise in the future, could affect the economies of many nations, individual companies and the market in general in ways that cannot necessarily be foreseen at the present time. In addition, the impact of infectious diseases in developing or emerging market countries may be greater due to less established health care systems. Health crises caused by the recent coronavirus outbreak may exacerbate other pre-existing political, social and economic risks in certain countries. The impact of the outbreak may be short term or may last for an extended period of time.
NOTE 2 – INVESTMENT MANAGEMENT FEE AND OTHER RELATED PARTY TRANSACTIONS
Shelton provides each Fund with management and administrative services pursuant to investment management and administration servicing agreements.
In accordance with the terms of the management agreement, the Advisor receives compensation at the following annual rates:
Fund | % of Net Assets | |||
ICON Consumer Select Fund | 1.00 | % | ||
ICON Equity Fund | 0.75 | % | ||
ICON Equity Income Fund | 0.75 | % | ||
ICON Flexible Bond Fund | 0.60 | % | ||
ICON Health and Information Technology Fund | 1.00 | % | ||
ICON Natural Resources & Infrastructure Fund | 1.00 | % | ||
ICON Utilities and Income Fund | 1.00 | % | ||
Shelton Emerging Markets Fund | 1.00 | % | ||
The Advisor contractually agreed to reduce total operating expense to certain Funds of the Trust. This additional contractual reimbursement (excluding certain compliance costs, extraordinary expenses such as litigation or merger and reorganization expenses, for example) is effective until the dates listed below, unless renewed, and is subject to recoupment within three fiscal years following reimbursement. Recoupment is limited to the extent the reimbursement does not exceed any applicable expense limit and the effect of the reimbursement is measured after all ordinary operating expenses are calculated; any such reimbursement is subject to the Board of Trustees’ review and approval. Reimbursements from the Advisor to affected Funds, and the expense limits, for the period ended September 30, 2020 are as follows:
Expense Limitation | ||||||||||||
Fund | Institutional | Investor | Expiration | |||||||||
ICON Consumer Select Fund | 1.50 | % | 1.75 | % | 5/20/21 | |||||||
ICON Equity Fund | 1.25 | % | 1.50 | % | 5/20/21 | |||||||
ICON Equity Income Fund | 0.99 | % | 1.24 | % | 5/20/21 | |||||||
ICON Flexible Bond Fund | 0.75 | % | 1.00 | % | 5/20/21 | |||||||
ICON Health and Information Technology Fund | 1.50 | % | 1.75 | % | 5/20/21 | |||||||
ICON Natural Resources & Infrastructure Fund | 1.50 | % | 1.75 | % | 5/20/21 | |||||||
ICON Utilities and Income Fund | 1.22 | % | 1.47 | % | 5/20/21 | |||||||
Shelton Emerging Markets Fund | 1.55 | % | 1.80 | % | 5/20/21 | |||||||
As compensation for administrative duties not covered by the management agreement, Shelton receives an administration fee, which was revised on January 1, 2011. The administration fee is based on assets held, in aggregate, by the SCM Trust and other funds within the same “family” of investment companies managed and administered by Shelton. The fee rates are 0.10% on the first $500 million, 0.08% on the next $500 million, and 0.06% on combined assets over $1 billion. Administration fees are disclosed in the Statement of Operations.
Certain officers and trustees of the Trust are also partners of Shelton. Steve Rogers has served as a trustee and Chairman of the Board of Trustees of the Trust since 1998, and President of the Trust since 1999. Mr. Rogers is also Chief Executive Officer of the Adviser. Gregory T. Pusch has served as the Chief Compliance Officer (“CCO”) of the Trust since March 2017. Mr. Pusch is also employed by Shelton, the Advisor and Administrator to the Trust. The Trust is responsible for the portion of his salary allocated to his duties as the CCO of the Trust during his employment, and Shelton is reimbursed by the Trust for this portion of his salary. The level of reimbursement is reviewed and determined by the Board of Trustees at least annually.
The Trust has adopted a Distribution Plan (the “Plan”), as amended July 29, 2017, pursuant to Rule 12b-1 under the Investment Company Act of 1940, whereby the Investor Shares of each Fund pays RFS Partners, the Funds’ distributor (the “Distributor”), an affiliate of the Advisor, for expenses that relate to the promotion and distribution of shares. Under the Plan, the Investor Shares of the Funds will pay the Distributor a fee at an annual rate of 0.25%, payable monthly, of the daily net assets attributable to such Fund’s Investor Shares.
43
ICON Funds | Notes to Financial Statements (Continued) | September 30, 2020 |
For the period ended September 30, 2020 the following were paid:
Fund | Investor Class | |||
ICON Consumer Select Fund | $ | 3,820 | ||
ICON Equity Fund | $ | 20,090 | ||
ICON Equity Income Fund | $ | 31,821 | ||
ICON Flexible Bond Fund | $ | 17,194 | ||
ICON Health and Information Technology Fund | $ | 4,653 | ||
ICON Natural Resources & Infrastructure Fund | $ | 6,767 | ||
ICON Utilities and Income Fund | $ | 13,488 | ||
Shelton Emerging Markets Fund | $ | 4,379 | ||
Management fees, administration fees, expense reimbursement from the Advisor, CCO fees and Trustees fees incurred during the period are included in the Statement of Operations.
NOTE 3 – PURCHASES AND SALES OF SECURITIES
Purchases and sales of securities other than short-term instruments for the period ended September 30, 2020 were as follows:
Fund | Purchases | Sales | Purchases | Sales | ||||||||||||
ICON Consumer Select Fund | $ | 43,552,859 | * | $ | 30,026,391 | $ | 43,552,859 | $ | 30,026,391 | |||||||
ICON Equity Fund | 48,265,520 | * | 19,039,711 | 48,265,520 | 19,039,711 | |||||||||||
ICON Equity Income Fund | 58,341,189 | * | 54,106,627 | 58,341,189 | 54,106,627 | |||||||||||
ICON Flexible Bond Fund | 212,247,431 | 204,564,362 | 212,247,431 | 204,564,362 | ||||||||||||
ICON Health and Information Technology Fund | 74,472,432 | * | 46,560,292 | 74,472,432 | 46,560,292 | |||||||||||
ICON Natural Resources & Infrastructure Fund | 153,095,186 | * | 82,408,025 | 153,065,186 | 82,408,025 | |||||||||||
ICON Utilities and Income Fund | 10,279,023 | 26,999,127 | 10,279,023 | 26,999,127 | ||||||||||||
Shelton Emerging Markets Fund | 17,021,705 | 40,799,540 | 17,021,705 | 40,799,540 | ||||||||||||
* | Includes investments of merged Funds. |
NOTE 4 – TAX CHARACTER
Reclassifications: Accounting principles generally accepted in the United States of America require certain components of net assets be reclassified between financial and tax reporting. These reclassifications have no effect on net assets or net asset value per share. The reclassification was as follows:
| Increase/ | Increase/ | ||||||
ICON Consumer Select Fund | $ | (2,949 | ) | $ | 2,949 | |||
ICON Equity Fund | (93,820 | ) | 93,820 | |||||
Tax Basis of Distributable Earnings: The tax character of distributable earnings at September 30, 2020 was as follows:
Undistributed | Undistributed | Capital | Unrealized | Post October | Total | |||||||||||||||||||
ICON Consumer Select Fund | $ | — | $ | — | $ | (3,676,923 | ) | $ | 9,345,190 | $ | (1,639,379 | ) | $ | 4,028,888 | ||||||||||
ICON Equity Fund | — | — | (1,371,803 | ) | 19,738,164 | (2,024,835 | ) | 16,341,526 | ||||||||||||||||
ICON Equity Income Fund | 434,371 | (10,782 | ) | 1,612,648 | (4,050,886 | ) | (2,014,649 | ) | ||||||||||||||||
ICON Flexible Bond Fund | 52,550 | — | (2,755,352 | ) | (3,440,565 | ) | (2,562,160 | ) | (8,705,527 | ) | ||||||||||||||
ICON Health and Information Technology Fund | — | 4,328,901 | (1,558,987 | ) | 34,605,264 | (88,885 | ) | 37,286,293 | ||||||||||||||||
ICON Natural Resources & Infrastructure Fund | 349,995 | — | (214,746,473 | ) | 8,265,390 | (34,497,291 | ) | (240,628,379 | ) | |||||||||||||||
ICON Utilities and Income Fund | 326,138 | 431,266 | — | 341,722 | — | 1,099,126 | ||||||||||||||||||
Shelton Emerging Markets Fund | 50,001 | — | (2,323,999 | ) | 4,807,228 | (4,108,098 | ) | (1,574,868 | ) | |||||||||||||||
The difference between book basis and tax basis unrealized appreciation/(depreciation) is attributable primarily to wash sales and PFICs.
44
ICON Funds | Notes to Financial Statements (Continued) | September 30, 2020 |
Capital Losses: Capital loss carry forwards, as of[DATE], available to offset future capital gains, if any, are as follows:
Expiring | ICON Consumer | ICON | ICON Equity | ICON Flexible | ||||||||||||
Long Term with No Expiration | $ | — | $ | (88,783 | ) | $ | (6,106 | ) | $ | (1,856,825 | ) | |||||
Short Term with No Expiration | — | (33,365 | ) | (4,676 | ) | (898,527 | ) | |||||||||
Long Term with Expiration | (1,077,051 | ) | (1,249,655 | ) | — | — | ||||||||||
Short Term with Expiration | (2,599,872 | ) | — | — | — | |||||||||||
Total | $ | (3,676,923 | ) | $ | (1,371,803 | ) | $ | (10,782 | ) | $ | (2,755,352 | ) | ||||
Expiring | ICON Health | ICON Natural | ICON Utilities | Shelton | ||||||||||||
Long Term with No Expiration | $ | — | $ | (1,403,121 | ) | $ | — | $ | (1,446,259 | ) | ||||||
Short Term with No Expiration | — | (4,454,852 | ) | — | (877,740 | ) | ||||||||||
Long Term with Expiration | — | (119,947,054 | ) | — | — | |||||||||||
Short Term with Expiration | (1,558,987 | ) | (88,941,446 | ) | — | — | ||||||||||
Total | $ | (1,558,987 | ) | $ | (214,746,473 | ) | $ | — | $ | (2,323,999 | ) | |||||
* | Subject to an annual limitation of $270,264 under §382 of the Code through 2033, year 14 limit is $269,025 and year 15 is $164,730. |
** | Subject to an annual limitation of $133,945 under §382 of the Code through 2030, year 11 limit is $44,150. |
*** | Subject to an annual limittion of $601,938 under §382 of the Code through 2023 and year 4 limit is $355,111. |
**** | Subject to an annual limittion of $678,984 under §382 of the Code through 2027, year 8 limit is $670,153 and an annual limitation if $577,350 thereafter. |
Distributions to Shareholders: Income distributions and capital gain distributions are determined in accordance with income tax regulations, which may differ from U.S. generally accepted accounting principles. These differences are primarily due to differing treatments of income and gains on various investment securities held by each Fund, timing differences and differing characterization of distributions made by each Fund.
The tax character of distributions paid during the years ended September 30, 2020 and September 30, 2019 are as follows:
Fund | Year | Return of | Ordinary | Long-Term | Exempt-Interest | Total | |||||||||||||||
ICON Consumer Select Fund | 2019 | $ | — | $ | 244,510 | $ | — | $ | — | $ | 244,510 | ||||||||||
2020 | — | 336,028 | 471,401 | — | 807,429 | ||||||||||||||||
ICON Equity Fund | 2019 | — | — | 312,036 | — | 312,036 | |||||||||||||||
2020 | — | — | 757,121 | — | 757,121 | ||||||||||||||||
ICON Equity Income Fund | 2019 | — | 2,166,210 | 39,923 | — | 2,206,133 | |||||||||||||||
2020 | — | 2,533,730 | 916,555 | — | 3,450,285 | ||||||||||||||||
ICON Flexible Bond Fund | 2019 | — | 6,122,522 | — | — | 6,122,522 | |||||||||||||||
2020 | — | 7,062,566 | — | — | 7,062,566 | ||||||||||||||||
ICON Health and Information Technology Fund | 2019 | — | 5,119,639 | 2,164,142 | — | 7,283,781 | |||||||||||||||
2020 | — | — | 2,469,081 | — | 2,469,081 | ||||||||||||||||
ICON Natural Resources & Infrastructure Fund | 2019 | — | 5,186,377 | 5,752,876 | — | 10,939,253 | |||||||||||||||
2020 | — | 917,284 | — | — | 917,284 | ||||||||||||||||
ICON Utilities and Income Fund | 2019 | — | 1,276,398 | 164,374 | — | 1,440,772 | |||||||||||||||
2020 | — | 1,935,482 | 566,602 | — | 2,502,084 | ||||||||||||||||
Shelton Emerging Markets Fund | 2019 | — | 1,506,869 | 75,722 | — | 1,582,591 | |||||||||||||||
2020 | — | 852,068 | — | — | 852,068 | ||||||||||||||||
(a) | The Funds designate Long-Term Capital Gain dividends pursuant to Section 852(b)(3) of the Internal Revenue Code for the year ended September 30, 2020. |
45
ICON Funds | Notes to Financial Statements (Continued) | September 30, 2020 |
NOTE 5 – BORROWINGS
The ICON Trust entered into an uncommitted, unsecured, revolving Line of Credit agreement/arrangement with State Street Bank to provide temporary funding for redemption requests. The maximum borrowing limit was $30 million. Interest on domestic borrowings is charged at a rate quoted and determined by State Street. The Line of Credit agreement/arrangement expired on March 16, 2020.
For the year ended September 30, the average outstanding loan by Fund was as follows:
Fund | Interest Expense | Maximum | Average | Average Interest | ||||||||||||
ICON Consumer Select Fund | $ | 1,555 | $ | 4,343,303 | $ | 738,886 | 2.88 | % | ||||||||
ICON Equity Fund | 379 | 226,544 | 66,961 | 3.01 | % | |||||||||||
ICON Equity Income Fund | 725 | 1,288,382 | 431,507 | 2.88 | % | |||||||||||
ICON Flexible Bond Fund | 62 | 406,749 | 406,749 | 2.86 | % | |||||||||||
ICON Healthcare and Information Technology Fund | 888 | 1,840,663 | 324,672 | 2.90 | % | |||||||||||
ICON Natural Resources and Infrastructure Fund | 1,581 | 2,069,506 | 392,536 | 2.85 | % | |||||||||||
ICON Utilities and Income Fund | 617 | 1,920,299 | 355,797 | 2.85 | % | |||||||||||
Shelton Emerging Markets Fund | 4,210 | 2,858,805 | 749,212 | 2.99 | % | |||||||||||
* | The average is calculated based on the actual number of days with outstanding borrowings. |
NOTE 6 – REORGANIZATIONS
On June 3, 2020, the shareholders of the ICON Consumer Discretionary Fund approved the agreement and plan of reorganization providing for the transfer of assets and assumption of liabilities into the ICON Consumer Select Fund. ICON Consumer Select Fund is the performance and accounting survivor of the reorganization, as well as the legal and tax survivor. The reorganization was effective as of the close of business on July 10, 2020. The following table illustrates the specifics of the Fund’s reorganization:
ICON Consumer | New Shares issued | Consumer Select | Combined Net Assets | Tax Status of Transfer |
$18,792,740(a) | 2,150,511 | $25,279,178 | $44,071,918 | Non-taxable |
(a) | Includes accumulated realized losses and unrealized appreciation in the amounts of $(2,884,684) and $3,674,286, respectively, from the merged fund. |
As of close of business on July 10, 2020, the classes were converted at the following rates:
Pre-Merger Class | Pre-Merger | Rate | Shares | Dollars | Post-Merger | Post Merger Class | |||||||||||||||
ICON Consumer Discretionary Fund– A Class | $ | 13.13 | 1.5057 | 60,322 | $ | 526,159 | $ | 8.72 | ICON Consumer Select Fund – Investor Class | ||||||||||||
ICON Consumer Discretionary Fund– S Class | $ | 13.88 | 1.5880 | 2,090,189 | $ | 18,266,581 | $ | 8.74 | ICON Consumer Select Fund – Institutional Class | ||||||||||||
On June 16, 2020, the shareholders of the ICON Fund approved the agreement and plan of reorganization providing for the transfer of assets and assumption of liabilities into the ICON Equity Fund. The ICON Equity Fund is the performance and accounting survivor of the reorganization, as well as the legal and tax survivor. The reorganization was effective as of the close of business on July 10, 2020. The following table illustrates the specifics of the Fund’s reorganization:
ICON Fund Pre- | New Shares issued | ICON Equity Fund | Combined Net Assets | Tax Status of Transfer |
$36,394,016(a) | 1,450,487 | $14,773,317 | $63,726,389(b) | Non-taxable |
(a) | Includes appreciation in the amount of $8,350,876 from the merged fund. |
(b) | Combined net assets include the reorganization net assets of the ICON Fund and ICON Opportunities Fund. |
46
ICON Funds | Notes to Financial Statements (Continued) | September 30, 2020 |
As of close of business on July 10, 2020, the classes were converted at the following rates:
Pre-Merger Class | Pre-Merger | Rate | Shares | Dollars | Post-Merger | Post Merger Class | |||||||||||||||
ICON Fund– A Class | $ | 16.76 | 0.6860 | 282,617 | $ | 6,902,840 | $ | 24.42 | ICON Equity Fund – Investor Class | ||||||||||||
ICON Fund– C Class | $ | 15.10 | 0.6184 | 255,155 | $ | 6,232,091 | $ | 24.42 | ICON Equity Fund – Investor Class | ||||||||||||
ICON Fund– S Class | $ | 18.05 | 0.7084 | 912,715 | $ | 23,259,085 | $ | 25.48 | ICON Equity Fund – Institutional Class | ||||||||||||
On June 3, 2020, the shareholders of the ICON Opportunities Fund approved the agreement and plan of reorganization providing for the transfer of assets and assumption of liabilities into the ICON Equity Fund. The ICON Equity Fund is the performance and accounting survivor of the reorganization, as well as the legal and tax survivor. The reorganization was effective as of the close of business on July 10, 2020. The following table illustrates the specifics of the Fund’s reorganization:
ICON Opportunities | New Shares issued to | ICON Equity Fund | Combined Net Assets | Tax Status of Transfer |
$12,559,056(a) | 492,833 | $14,773,317 | $63,726,389(b) | Non-taxable |
(a) | Includes accumulated realized losses and unrealized depreciation in the amounts of $(1,285,585) and $(97,689), respectively, from the merged fund. |
(b) | Combined net assets include the reorganization net assets of the ICON Fund and ICON Opportunities Fund. |
As of close of business on July 10, 2020, the classes were converted at the following rates:
Pre-Merger Class | Pre-Merger | Rate | Shares | Dollars | Post-Merger | Post Merger Class | |||||||||||||||
ICON Opportunities Fund– S Class | $ | 11.67 | 0.4580 | 492,833 | $ | 12,559,056 | $ | 25.48 | ICON Equity Fund – Institutional Class | ||||||||||||
On July 10, 2020, the shareholders of the ICON Energy Fund approved the agreement and plan of reorganization providing for the transfer of assets and assumption of liabilities into the ICON Natural Resources and Infrastructure Fund. The ICON Natural Resources and Infrastructure Fund is the performance and accounting survivor of the reorganization, as well as the legal and tax survivor. The reorganization was effective as of the close of business on July 10, 2020. The following table illustrates the specifics of the Fund’s reorganization:
ICON Energy Fund Pre- | New Shares issued | ICON Natural Resources | Combined Net Assets | Tax Status of Transfer |
$52,836,082(a) | 5,058,302 | $38,697,651 | $100,389,461(b) | Non-taxable |
(a) | Includes accumulated realized losses and unrealized depreciation in the amounts of $(208,827,696) and $(30,537,973), respectively, from the merged fund. |
(b) | Combined net assets include the reorganization net assets of the ICON Energy Fund and ICON Industrials Fund. |
As of close of business on July 10, 2020, the classes were converted at the following rates:
Pre-Merger Class | Pre-Merger | Rate | Shares | Dollars | Post-Merger | Post Merger Class | |||||||||||||||
ICON Energy Fund– A Class | $ | 5.72 | 0.5543 | 147,022 | $ | 1,518,698 | $ | 10.33 | ICON Natural Resources and Infrastructure Fund – Investor Class | ||||||||||||
ICON Energy Fund– C Class | $ | 5.42 | 0.5245 | 144,933 | $ | 1,497,135 | $ | 10.33 | ICON Natural Resources and Infrastructure Fund – Investor Class | ||||||||||||
ICON Energy Fund– S Class | $ | 5.78 | 0.5534 | 4,766,347 | $ | 49,820,249 | $ | 10.45 | ICON Natural Resources and Infrastructure Fund – Institutional Class | ||||||||||||
47
ICON Funds | Notes to Financial Statements (Continued) | September 30, 2020 |
On June 3, 2020, the shareholders of the ICON Industrials Fund approved the agreement and plan of reorganization providing for the transfer of assets and assumption of liabilities into the ICON Natural Resources and Infrastructure Fund. The ICON Natural Resources and Infrastructure Fund is the performance and accounting survivor of the reorganization, as well as the legal and tax survivor. The reorganization was effective as of the close of business on July 10, 2020. The following table illustrates the specifics of the Fund’s reorganization:
ICON Industrials Fund Pre- | New Shares issued to | ICON Natural Resources | Combined Net Assets | Tax Status of Transfer |
$9,305,728(a) | 890,908 | $38,697,651 | $100,389,461(b) | Non-taxable |
(a) | Includes accumulated realized losses and unrealized appreciation in the amounts of $(728,016) and $103,405, respectively, from the merged fund. |
(b) | Combined net assets include the reorganization net assets of the ICON Energy Fund and ICON Industrials Fund. |
As of close of business on July 10, 2020, the classes were converted at the following rates:
Pre-Merger Class | Pre-Merger | Rate | Shares | Dollars | Post-Merger | Post Merger Class | |||||||||||||||
ICON Industrials Fund– A Class | $ | 13.29 | 1.2869 | 52,860 | $ | 546,034 | $ | 10.33 | ICON Natural Resources and Infrastructure Fund – Investor Class | ||||||||||||
ICON Industrials Fund– S Class | $ | 13.54 | 1.2958 | 838,048 | $ | 8,759,694 | $ | 10.45 | ICON Natural Resources and Infrastructure Fund – Institutional Class | ||||||||||||
On July 10, 2020, the shareholders of the ICON Healthcare Fund approved the agreement and plan of reorganization providing for the transfer of assets and assumption of liabilities into the ICON Healthcare and Information Technology Fund. ICON Healthcare and Information Technology Fund is the performance and accounting survivor of the reorganization, as well as the legal and tax survivor. The reorganization was effective as of the close of business on July 10, 2020. The following table illustrates the specifics of the Fund’s reorganization:
ICON Healthcare Fund Pre- | New Shares issued to | ICON Healthcare and | Combined Net Assets | Tax Status of Transfer |
$55,158,314(a) | 3,127,315 | $55,902,415 | $111,060,729 | Non-taxable |
(a) | Includes accumulated realized losses and unrealized appreciation in the amounts of $(1,709,471) and $11,006,000, respectively, from the merged fund. |
As of close of business on July 10, 2020, the classes were converted at the following rates:
Pre-Merger Class | Pre-Merger | Rate | Shares | Dollars | Post-Merger | Post Merger Class | |||||||||||||||
ICON Healthcare Fund – A Class | $ | 16.62 | 0.9910 | 93,171 | $ | 1,563,188 | $ | 16.78 | ICON Healthcare and Information Technology Fund – Investor Class | ||||||||||||
ICON Healthcare Fund – S Class | $ | 17.54 | 0.9930 | 3,034,144 | $ | 53,595,126 | $ | 17.66 | ICON Healthcare and Information Technology Fund – Institutional Class | ||||||||||||
On July 24, 2020, the shareholders of the ICON Consumer Staples Fund approved the agreement and plan of reorganization providing for the transfer of assets and assumption of liabilities into the ICON Consumer Select Fund. ICON Consumer Select Fund is the performance and accounting survivor of the reorganization, as well as the legal and tax survivor. The reorganization was effective as of the close of business on July 31, 2020. The following table illustrates the specifics of the Fund’s reorganization:
ICON Consumer Staples | New Shares issued to | Consumer Select | Combined Net Assets | Tax Status of Transfer |
$5,946,877(a) | 657,151 | $45,061,186 | $51,008,063 | Non-taxable |
(a) | Includes accumulated realized losses and unrealized appreciation in the amounts of $(886,480) and $642,576, respectively, from the merged fund. |
48
ICON Funds | Notes to Financial Statements (Continued) | September 30, 2020 |
As of close of business on July 31, 2020, the classes were converted at the following rates:
Pre-Merger Class | Pre-Merger | Rate | Shares | Dollars | Post-Merger | Post Merger Class | |||||||||||||||
ICON Consumer Staples Fund– A Class | $ | 6.69 | 0.7405 | 128,098 | $ | 1,157,308 | $ | 9.03 | ICON Consumer Select Fund – Investor Class | ||||||||||||
ICON Consumer Staples Fund– S Class | $ | 6.74 | 0.7440 | 529,053 | $ | 4,789,569 | $ | 9.05 | ICON Consumer Select Fund – Institutional Class | ||||||||||||
On August 20th, 2020, the shareholders of the ICON Risk-Managed Balanced Fund approved the agreement and plan of reorganization providing for the transfer of assets and assumption of liabilities into the ICON Equity Income Fund. The ICON Equity Income Fund is the performance and accounting survivor of the reorganization, as well as the legal and tax survivor. The reorganization was effective as of the close of business on September 25, 2020. The following table illustrates the specifics of the Fund’s reorganization:
ICON Risk-Managed | New Shares issued | ICON Equity Income | Combined Net Assets | Tax Status of Transfer |
$23,191,045(a) | 1,422,769 | $56,406,450 | $79,597,495 | Non-taxable |
(a) | Includes accumulated realized losses and unrealized appreciation in the amounts of $(43,667) and $1,000,554, respectively, from the merged fund. |
As of close of business on September 25, 2020, the classes were converted at the following rates:
Pre-Merger Class | Pre-Merger | Rate | Shares | Dollars | Post-Merger | Post Merger Class | |||||||||||||||
ICON Risk-Managed Balanced Fund – A Class | $ | 15.03 | 0.9230 | 152,538 | $ | 2,483,964 | $ | 16.28 | ICON Equity Income Fund – Investor Class | ||||||||||||
ICON Risk-Managed Balanced Fund – C Class | $ | 14.00 | 0.8599 | 824,912 | $ | 13,433,024 | $ | 16.28 | ICON Equity Income Fund – Investor Class | ||||||||||||
ICON Risk-Managed Balanced Fund – S Class | $ | 15.43 | 0.9449 | 445,319 | $ | 7,274,057 | $ | 16.33 | ICON Equity Income Fund – Institutional Class | ||||||||||||
Assuming the reorganizations had been completed on October 1, 2019, the beginning of the reporting period for each of the reorganizations, the pro forma results of operations for the year ended September 30, 2020, would be as follows:
| ICON Consumer | ICON Equity Fund | ICON Health | ICON Natural | ||||||||||||
Net investment income/(loss) | $ | 16,351 | $ | (181,960 | ) | $ | (516,488 | ) | $ | 1,704,171 | ||||||
Net realized gain/loss on investments | (2,394,731 | ) | (1,462,864 | ) | 3,555,717 | (47,358,723 | ) | |||||||||
Change in unrealized appreciation/(depreciation) on investments | 1,428,108 | 4,049,456 | 20,800,850 | 16,294,264 | ||||||||||||
Net increase/(decrease) in net assets resulting from operations | $ | (950,272 | ) | $ | 2,404,632 | $ | 23,840,079 | $ | (29,360,288 | ) | ||||||
NOTE 7 – SUBSEQUENT EVENTS
Subsequent events after the date of the Statements of Assets and Liabilities have been evaluated through the date the financial statements were issued.
49
Report of Independent Registered Public Accounting Firm |
To the Shareholders and Board of Trustees
of SCM Trust
Opinion on the Financial Statements
We have audited the accompanying statements of assets and liabilities of the ICON Consumer Select Fund, ICON Equity Fund, ICON Equity Income Fund, ICON Flexible Bond Fund, ICON Health and Information Technology Fund, ICON Natural Resources and Infrastructure Fund, ICON Utilities and Income Fund, and Shelton Emerging Markets Fund (the successor funds to the Funds formerly known as ICON Financial Fund, ICON Long/Short Fund, ICON Equity Income Fund, ICON Flexible Bond Fund, ICON Information Technology Fund, ICON Natural Resources Fund, ICON Utilities Fund, and ICON Emerging Markets Fund, respectively, the “Predecessor Funds”) (the “Funds”), each a series of SCM Trust (the “Trust”), including the schedules of investments, as of September 30, 2020, the related statements of operations, the statements of changes in net assets, and the financial highlights for the year then ended, and the related notes (collectively referred to as the “financial statements”). In our opinion, the financial statements present fairly, in all material respects, the financial position of the Funds as of September 30, 2020, the results of their operations, the changes in their net assets, and their financial highlights for the year then ended, in conformity with accounting principles generally accepted in the United States of America. The statement of changes in net assets for the year ended September 30, 2019 and the financial highlights for each of the four years in the period ended September 30, 2019 of the Predecessor Funds were audited by other auditors, and in their opinion dated November 25, 2019, they expressed an unqualified opinion on such financial statements and financial highlights.
Basis for Opinion
These financial statements are the responsibility of the Funds’ management. Our responsibility is to express an opinion on the Funds’ financial statements based on our audits. We are a public accounting firm registered with the Public Company Accounting Oversight Board (United States) (“PCAOB”) and are required to be independent with respect to the Funds in accordance with the U.S. federal securities laws and the applicable rules and regulations of the Securities and Exchange Commission and the PCAOB. We have served as the auditor of one or more of the funds in the Trust since 2011.
We conducted our audits in accordance with the standards of the PCAOB. Those standards require that we plan and perform the audits to obtain reasonable assurance about whether the financial statements are free of material misstatement, whether due to error or fraud. The Funds are not required to have, nor were we engaged to perform, an audit of the Funds’ internal control over financial reporting. As part of our audits we are required to obtain an understanding of internal control over financial reporting, but not for the purpose of expressing an opinion on the effectiveness of the Funds’ internal control over financial reporting. Accordingly, we express no such opinion.
Our audits included performing procedures to assess the risks of material misstatement of the financial statements, whether due to error or fraud, and performing procedures that respond to those risks. Such procedures included examining, on a test basis, evidence regarding the amounts and disclosures in the financial statements. Our audits also included evaluating the accounting principles used and significant estimates made by management, as well as evaluating the overall presentation of the financial statements. Our procedures included confirmation of securities owned as of September 30, 2020 by correspondence with the custodian and brokers, or through other appropriate auditing procedures when replies from brokers were unable to be obtained. We believe that our audits provide a reasonable basis for our opinion.

TAIT, WELLER & BAKER LLP
Philadelphia, Pennsylvania
November 30, 2020
50
ICON Funds | Additional Information | September 30, 2020 |
Fund Holdings
The Fund holdings shown in this report are as of September 30, 2020. Holdings are subject to change at any time, so holdings shown in the report may not reflect current Fund holdings. The Funds’ Form N-PORT filings, when available, will be available on the SEC’s website at www.sec.gov. The information filed in the Form N-PORT, when available, also may be obtained by calling (800) 955-9988.
Proxy Voting Policy
The Fund’s Statement of Additional Information (“SAI”) containing a description of the policies and procedures that the SCM Trust uses to determine how to vote proxies relating to portfolio securities, is available upon request, at no charge, at the phone number above, or on the SEC’s website at www.sec.gov. Because the Funds are newly organized, the Funds did not vote any proxies prior to June 30, 2020 and have not filed a proxy voting record. When available, the Funds’ proxy voting records relating to portfolio securities held during the 12-month period ended June 30, 2021 will be available upon request, at no charge, at the phone number above, or on the SEC’s website at www.sec.gov.
Board Approval of the Investment Advisory Agreement (Unaudited) |
The Investment Company Act of 1940 (the “1940 Act”) requires that the full board of the SCM Trust (the “Board”) and a majority of the Independent Trustees approve:
● | the Investment Advisory Agreement between SCM Trust, on behalf of the funds listed below, and CCM Partners d/b/a Shelton Capital Management (“Shelton Capital” or “SCM”) (the “Advisory Agreement”); |
o | ICON Consumer Select Fund; |
o | ICON Equity Fund; |
o | ICON Equity Income Fund; |
o | ICON Flexible Bond Fund; |
o | ICON Health and Information Technology Fund; |
o | ICON Natural Resources and Infrastructure Fund; and |
o | ICON Utilities and Income Fund (collectively, the “ICON-Branded Funds”). |
● | the Investment Advisory Agreement between SCM Trust, on behalf of the Shelton Emerging Markets Fund, and SCM (the “Emerging Markets Advisory Agreement”); and |
● | the Sub-Advisory Agreement, between ICON Advisers, Inc. (“ICON”), SCM and SCM Trust (the “Sub-Advisory Agreement” and collectively with the Investment Advisory Agreement and the Emerging Markets Investment Advisory Agreement, each an “Advisory Agreement” and collectively, the “Advisory Agreements”). |
At a meeting held in-person on February 5-6, 2020, the Board, including a majority of the Independent Trustees, considered and approved each Advisory and Sub-Advisory Agreement for an initial two-year period.
Prior to the Meeting, the Independent Trustees requested information from Shelton Capital, ICON and third-party sources. This information, together with other information provided by SCM and ICON formed the primary (but not exclusive) basis for the Board’s determinations, as summarized below. In addition to the information identified above, other material factors and conclusions that formed the basis for the Board’s subsequent approval are described below.
Information Received
Materials Received. In anticipation of and as part of the process to consider the approval of the Investment Advisory Agreements between the ICON-Branded Funds and the Shelton Emerging Markets Fund and Shelton Capital, as well as the investment sub-advisory agreement between ICON and Shelton Capital with respect to the ICON-Branded Funds, legal counsel to the Independent Trustees requested certain information from Shelton Capital and ICON. In response to these requests, the Trustees received reports from Shelton Capital and ICON that addressed specific factors to be considered by the Trustees. The Trustees also received from independent legal counsel memoranda regarding the Trustees’ responsibilities pertaining to the approval of advisory and sub-advisory contracts.
Review Process. The Board received assistance and advice regarding legal and industry standards from independent legal counsel to the Independent Trustees and fund counsel. The Board discussed the approval of the advisory agreement and ICON Sub-Advisory Agreement with SCM and ICON representatives, and in a private session with independent legal counsel at which representatives of SCM and ICON were not present. In deciding to approve the Advisory Agreement and ICON Sub-Advisory Agreement, the Independent Trustees considered the total mix of information requested by and made available to them and did not identify any single issue or particular information that, in isolation, was the controlling factor. This summary describes the most important, but not all, of the factors considered by the Board.
Nature, Extent and Quality of Services
SCM, its personnel and its resources. The Board considered the depth and quality of SCM’s investment management process; the experience, capability and integrity of its senior management and other personnel; operating performance and the overall financial strength and stability of its organization. The Board also considered that SCM makes available to its investment professionals a variety of resources relating to investment management, compliance, trading, performance and portfolio accounting. The Board further considered SCM’s continuing need to attract and retain qualified personnel and, noting SCM’s additions over recent years, determined that SCM was in a position to adequately manage matters related to the ICON-Branded Funds.
51
Board Approval of the Investment Advisory Agreement (Unaudited) (Continued) |
ICON, its personnel and its resources. The Board considered the depth and quality of ICON’s investment management process; the experience, capability and integrity of its management and other personnel; operating performance and the overall financial strength and stability of its organization. The Board also considered the operations and compliance environment at ICON. The Board determined that ICON was in a position to adequately manage matters related to the applicable Funds.
Other Services. The Board considered, in connection with the investment management services that would be provided by SCM and ICON to the Funds, including SCM’s and ICON’s policies, procedures and systems to ensure compliance with applicable laws and regulations and each of their commitment to these programs. As a point of comparison, the Board also considered the nature, extent, quality and cost of certain non-investment related administrative services that would be provided by SCM to the Funds under the administration servicing agreements.
The Board concluded that SCM and ICON had the quality and depth of personnel and investment methods essential to performing its duties under the applicable advisory agreement and the ICON Sub-Advisory Agreement, and that the nature, extent and overall quality of such services to be provided by SCM and ICON, respectively, are satisfactory and reliable.
Investment Performance
The Trustees noted that since the ICON-Branded Funds and the Shelton Emerging Markets Fund have not yet begun operations, there was no performance information to be reviewed or analyzed at this time, but that performance information with respect to each fund within ICON Funds that, subject to shareholder approval, would be reorganized into the relevant ICON-Branded Funds or the Shelton Emerging Markets Fund (each, an “Acquired Fund”) compared to the performance of other funds in the industry that are found within the same performance group as defined by a third-party independent service provider for various periods ended May 31, 2019 was provided for the Board’s consideration. The Board considered the following with respect to the intended reorganizations where a single series within ICON Fund would be reorganized into an ICON-Branded Fund or the Shelton Emerging Markets Fund, as applicable for the periods ended May 31, 2019:
● | The Acquired ICON Utilities Fund’s performance was in the top quintile over the 1-year and 5-year periods, the third quintile over the 10-year period, and the fourth quintile over the 3-year period; |
● | The Acquired ICON Flexible Bond Fund’s performance was in the second quintile for the 3-year period, the third quintile for the 5-year period, the fifth quintile for the 1-year period and ranked fifth out of five funds over the 10-year period. |
● | The Acquired ICON Emerging Markets Fund’s performance was in the top quintile over the 5-year and 10-year periods, the fourth quintile over the 1-year period and the fifth quintile over the 3-year period. |
With respect to each Reorganization where multiple Acquired ICON Funds would be reorganized into a single ICON-Branded Fund, keeping in mind the limitations of comparing the proposed combined fund following the Reorganizations with each individual Acquired Fund, the Board considered the following:
● | With respect to the Acquiring ICON Equity Fund, the Board noted that the performance of the Acquired ICON Long/Short Fund, the proposed performance survivor of Acquiring Fund following the Reorganization, was in the top quintile over the 3-year and 5-year periods, the third quintile over the 1-year period and ranked first out of two funds; |
● | With respect to the Acquiring ICON Equity Income Fund, the performance of the Acquired ICON Equity Income Fund, the proposed performance survivor of the Acquiring Fund following the Reorganization, was in the third quintile with respect to the 5-year period, the fourth quintile with respect to the 1-year and 3-year periods, and ranked third out of four funds for the 10-year period; |
● | With respect to the Acquiring ICON Consumer Select Fund, the performance of the Acquired ICON Financial Fund, the proposed performance survivor of the Acquiring Fund following the Reorganization, was in the fourth quintile with respect to its performance group for the 1-year and 3-year periods and in the fifth quintile with respect to its performance group for the 5-year and 10-year periods; |
● | With respect to the Acquiring ICON Natural Resources and Infrastructure Fund, the performance of the Acquired ICON Natural Resources Fund, the proposed performance survivor of the Acquiring Fund following the Reorganization, was in the top quintile with respect to its performance group for the 3-year, 5-year and 10-year periods, and in the second quintile with respect to its performance group for the 1-year period; |
● | With respect to the Acquiring ICON Health and Information Technology Fund, the performance of the Acquired ICON Information Technology Fund, the proposed performance survivor following the Reorganization, was in the fourth quintile with respect to its performance for the 1-year, 5-year and 10-year periods, and in the fifth quintile with respect to its performance group for the 3-year period. |
Management Fees and Total Annual Operating Expense Ratios
The Board reviewed the management fees and total operating expenses of each Acquired Fund and compared such amounts with the management fees and total operating expenses of other funds in the industry that are found within the same style category as defined by a third-party independent service provider. The Board considered the advisory fees and total fees and expenses of each Acquired Fund in comparison to the advisory fees and other fees and expenses of other funds in each Acquired Fund’s style category. The Trustees considered both the gross advisory fee rates, as well as the effective advisory rates to be charged by Shelton Capital after taking into consideration the proposed expense limitation arrangements with respect to the ICON-Branded Funds and the Emerging Markets Fund. The Board also considered supplemental data from another third-party independent service provider supplied by ICON.
The Board noted that the actual management fees charged to each Acquired Fund were generally higher than the industry median for comparable funds.
The Board also observed that each Fund’s total annual operating expense ratios, after taking into account the expense limitations and waivers applicable to certain Acquired Funds, were generally above the industry median for other comparable funds.
The Board also considered that Shelton Capital had contractually agreed to limit the ICON-Branded Funds’ and Shelton Emerging Markets Fund’s total annual operating expense ratios, which would be in effect through May 20, 2021 and could not be terminated by Shelton Capital without the consent of the Board.
52
Board Approval of the Investment Advisory Agreement (Unaudited) (Continued) |
In its consideration of fees to be paid to ICON for investment sub-advisory services it would provide to each ICON-Branded Fund, the Board noted that Shelton Capital would compensate ICON for sub-advisory services provided to the ICON-Branded Funds, and that the shareholders of each such ICON-Branded Fund would not pay a separate or additional fee to ICON under the ICON Sub-Advisory Agreement.
Comparable Accounts
The Board noted certain information provided by Shelton Capital and ICON regarding fees charged to other clients utilizing a strategy similar to that to be employed by the ICON-Branded Funds and the Shelton Emerging Markets Fund. ICON noted that there were no such comparable accounts. The Board determined that, bearing in mind the limitations of comparing different types of managed accounts and the different levels of service typically associated with such accounts, the fee structures applicable to Shelton Capital’s other clients employing a comparable strategy to each ICON-Branded Fund was not indicative of any unreasonableness with respect to the advisory fee to be payable by such ICON-Branded Fund.
Cost Structure, Level of Profits, Economies of Scale and Ancillary Benefits
The Board reviewed information regarding Shelton Capital’s and ICON’s projected costs to provide services to the ICON-Branded Funds and the Shelton Emerging Markets Fund, as applicable. The Board also reviewed the resulting projected level of profits to Shelton Capital and ICON, respectively, including the cost allocation methodologies used to calculate such profits. The Independent Trustees received financial and other information from Shelton Capital and ICON.
The Board noted its intention to monitor assets under management, and the resulting impact on Shelton Capital’s and ICON’s profitability, in order to ensure that each has sufficient resources to continue to provide the services that shareholders in the ICON-Branded Funds and the Shelton Emerging Markets Fund, as applicable, require. The Board considered that there were currently no economies of scale accruing to SCM as the Funds have not yet launched. The Trustees also noted that Shelton Capital has contractually agreed to limit its advisory fees on the ICON-Branded Funds and Shelton Emerging Markets Fund so that those Funds do not exceed their respective specified operating expense limitations.
The Board also considered that Shelton Capital and ICON statements that each would not receive material indirect benefits from managing the applicable Funds.
Based on the foregoing, together with the other information provided to it at the Meeting, the Board concluded that the Shelton Emerging Markets Fund’s and each ICON-Branded Fund’s cost structure and projected level of profits for Shelton Capital and ICON, respectively, as applicable, were reasonable and that economies of scale and ancillary benefits, to the extent present with respect to a Fund, were not material.
Conclusions
The Board indicated that the information presented and the discussion of the information were adequate for making a determination regarding the approval of the advisory agreement between Shelton Capital and each ICON-Branded Fund and the Shelton Emerging Markets Fund and the ICON Sub-Advisory Agreement. During the review process, the Board noted certain instances where clarification or follow-up was appropriate and others where the Board determined that further clarification or follow-up was not necessary. In those instances where clarification or follow-up was requested, the Board determined that in each case either information responsive to its requests had been provided, or where any request was outstanding in whole or in part, given the totality of the information provided with respect to the Advisory Agreement and ICON Sub-Advisory Agreement, the Board had received sufficient information to renew and approve the applicable Agreement.
Based on their review, including but not limited to their consideration of each of the factors referred to above, the Board concluded that the Advisory Agreements and ICON Sub-Advisory Agreement, taking into account the separate administration fees, is and would be fair and reasonable to the Emerging Market Fund and each ICON-Branded Fund and its shareholders, that the Shelton Emerging Markets Fund’s and each ICON-Branded Fund’s shareholders should receive reasonable value in return for the advisory fees and other amounts paid to Shelton Capital by the Shelton Emerging Markets Fund and the ICON-Branded Funds, and that the approval of the Advisory Agreements and the ICON Sub-Advisory Agreement was in the best interests of each Fund and its shareholders, as applicable.
53
Board of Trustees and Executive Officers |
Overall responsibility for management of the Funds rests with the Board of Trustees. The Trustees serve during the lifetime of the Trust and until its termination, or until death, resignation, retirement or removal. The Trustees, in turn, elect the officers of the Fund to actively supervise its day-to-day operations. The officers have been elected for an annual term. The following are the Trustees and Executive Officers of the Funds:
Name | Address | Year of Birth | Position Held with the Trust | Length of Time Served |
Stephen C. Rogers | 1875 Lawrence Street, Suite 300 Denver, CO, 80202 | 1966 | Chairman of the Board, | Since August 1999, |
Kevin T. Kogler | 1875 Lawrence Street, Suite 300 Denver, CO, 80202 | 1966 | Trustee | Since May 2006 |
Marco L. Quazzo | 1875 Lawrence Street, Suite 300 Denver, CO, 80202 | 1962 | Trustee | Since August 2014 |
Stephen H. Sutro | 1875 Lawrence Street, Suite 300 Denver, CO, 80202 | 1969 | Trustee | Since May 2006 |
William P. Mock | 1875 Lawrence Street, Suite 300 Denver, CO, 80202 | 1966 | Treasurer | Since February 2010 |
Gregory T. Pusch | 1875 Lawrence Street, Suite 300 Denver, CO, 80202 | 1966 | Chief Compliance Officer, | Since March 2017 |
Each Trustee oversees the Trust’s ten Funds. The principal occupations of the Trustees and Executive Officers of the Funds during the past five years and public directorships held by the Trustees are set forth below:
Stephen C. Rogers* | Chief Executive Officer, Shelton Capital Management, 1999 to present. |
Kevin T. Kogler | President & Founder of MicroBiz, LLC, 2012 to present; Principal, Robertson Piper Software Group, 2006 to 2012; Senior Vice President, Investment Banking, Friedman, Billings Ramsey, 2003 to 2006. |
Marco L. Quazzo | Principal, Bartko Zankel Bunzel & Miller, March 2015-Present; Partner, Barg Coffin Lewis & Trapp LLP (law firm), 2008 to March 2015. |
Stephen H. Sutro | Managing Partner, Duane Morris, LLP (law firm) 2014 to present; Partner, Duane Morris LLP (law firm), 2003 to present. |
William P. Mock | Portfolio Manager, Shelton Capital Management, 2010 to present. |
Gregory T. Pusch | Principal Occupations Past five years: Global Head of Risk & Compliance, Matthews Asia 2015-2016; Head of Legal & Regulatory Compliance / CCO, HarbourVest Partners 2012-2015. |
Additional information about the Trustees may be found in the SAI, which is available without charge by calling (800) 955-9988. |
* | Trustee deemed to be an “interested person” of the Trust, as defined in the Investment Company Act of 1940. Mr. Rogers is an interested person because he is the CEO of Shelton Capital Management, the Trust’s Advisor and Administrator. |
54

ITEM 2. CODE OF ETHICS.
| (a) | The Registrant has adopted a code of ethics that applies to its principal executive officers and principal financial and accounting officer. |
| (c) | Not applicable |
| (d) | Not applicable |
| (e) | Not applicable |
| (f) | A copy of its code of ethics that applies to its principal executive officer and principal financial and accounting officer. A copy of the code of ethics is available upon request, at no charge, at 1(800) 955-9988. |
ITEM 3. AUDIT COMMITTEE FINANCIAL EXPERT.
| (a)(1) | As of the end of the Reporting Period, Registrant does not have a named audit committee financial expert serving on its audit committee. |
| (a)(2) | Not applicable |
| (a)(3) | Since April 2011, no single independent trustee meets the criteria of "audit committee financial expert". The Board has determined that the collective skills of the audit committee members are sufficient to satisfy the requirements. |
ITEM 4. PRINCIPAL ACCOUNTANT FEES AND SERVICES.
| (a)-(d) | This Form N-CSR relates to certain series of SCM Trust into which series of ICON Funds were reorganized. The earliest of such reorganizations occurred on June 26, 2020. The series of SCM Trust for which ICON Advisers, Inc. currently serves as investment sub-adviser are referred to herein as the “ICON Funds.” The other series of SCM Trust covered by this Form N-CSR is referred to herein as the “Emerging Markets Fund.” |
The following table presents the aggregate fees billed to the registrant with respect to the ICON Funds and the Emerging Markets Fund for the fiscal year that commenced on June 26, 2020, the date on which the earliest reorganization occurred, and ended September 30, 2020, for professional services rendered for the audit of the annual financial statements or services provided by the accountant in connection with statutory and regulatory filings or engagements for the fiscal year.
| 9/30/20 | ||||
| Audit Fees | $ | 102,000 | ||
| Audit-Related Fees | 0 | |||
| Tax Fees * | 24,000 | |||
| All Other Fees | 0 | |||
| Total | $ | 126,000 | ||
| * | Tax Fees consist of the aggregate fees billed for professional services rendered to the ICON Funds and Shelton Emerging Markets Fund, series of SCM Trust, by the principal accountant for tax compliance, tax advice, and tax planning and specifically include fees for review or preparation of U.S. federal, state, local and excise tax returns; U.S. federal, state and local tax planning, advice and assistance regarding statutory, regulatory or administrative developments, and tax advice regarding tax qualification. |
| (e)(1) | In accordance with the Audit Committee Charter, the Audit Committee shall pre-approve the engagement of the auditor, including the fees to be paid to the auditor, to provide any audit or non-audit services to the registrant and any non-audit services to the registrant’s investment adviser or any entity controlling, controlled by or under common control with the investment adviser that provides on-going services to the registrant if the engagement relates directly to the operations and financial reporting of the registrant. The Chairman of the Audit Committee may pre-approve certain services to be provided by the auditor to the registrant. All such delegated pre-approvals shall be presented to the Audit Committee no later than the next Audit Committee meeting. |
| (e) (2) | All of the services provided to the Registrant described in paragraphs (b)-(d) of Item 4 were pre-approved by the audit committee. |
| (f) | N/A |
| (g) | The aggregate non-audit fees billed by the registrant’s accountant with respect to the ICON Funds and Emerging Markets Fund for services rendered to the registrant and to the registrant’s investment adviser and any entity controlling, controlled by, or under common control with the investment adviser that provides ongoing services to the registrant, for the fiscal year that commenced on June 26, 2020, the date on which the earliest reorganization occurred (as further described in Item 4), and ended September 30, 2020 is $0. |
| (h) | N/A |
ITEM 5. AUDIT COMMITTEE OF LISTED REGISTRANTS.
Not applicable.
ITEM 6. SCHEDULE OF INVESTMENTS.
| (a) | Investments in securities of unaffiliated issuers as of the close of the reporting period are included as part of the report to shareholders filed under Item 1 of this Form N-CSR. |
| (b) | Not applicable. |
ITEM 7. DISCLOSURE OF PROXY VOTING POLICIES AND PROCEDURES FOR CLOSED-END MANAGEMENT INVESTMENT COMPANIES.
Not applicable.
ITEM 8. PORTFOLIO MANAGERS OF CLOSED-END MANAGEMENT INVESTMENT COMPANIES.
Not applicable.
ITEM 9. PURCHASES OF EQUITY SECURITIES BY CLOSED-END MANAGEMENT INVESTMENT COMPANY AND AFFILIATED PURCHASERS.
Not applicable.
ITEM 10. SUBMISSION OF MATTERS TO A VOTE OF SECURITY HOLDERS.
There have been no material changes to the procedures by which the shareholders may recommend nominees to the Registrant's board of trustees since the Registrant last provided disclosure in response to the requirements of Item 7(d)(2)(ii)(G) of Schedule 14A or this Item.
ITEM 11. CONTROLS AND PROCEDURES.
| (a) | The Registrant's principal executive and principal financial officers, or persons performing similar functions, have concluded that the Registrant's disclosure controls and procedures (as defined in Rule 30a-3(c) under the Investment Company Act of 1940, as amended (the "1940 Act") (17 CFR 270.30a-3(c)) are effective as of a date within 90 days of the filing date of the report that includes the disclosure required by this paragraph, based on their evaluation of these controls and procedures required by Rule 30a-3(b) under the 1940 Act (17 CFR 270.30a-3(b)) and Rules 13a-15(b) or 15d-15(b) under the Securities Exchange Act of 1934, as amended (17 CFR 240.13a-15(b) or 240.15d-15(b)). |
| (b) | There were no changes in the Registrant's internal control over financial reporting (as defined in Rule 30a-3(d) under the 1940 Act that occurred during the Registrant's last fiscal half-year (the Registrant's second fiscal half- year in the case of an annual report) that has materially affected, or is reasonably likely to materially affect, the Registrant's internal control over financial reporting |
ITEM 12. DISCLOSURE OF SECURITIES LENDING ACTIVITIES FOR CLOSED-ENDED MANAGEMENT INVESTMENT COMPANIES
Not applicable.
ITEM 13. EXHIBITS.
SIGNATURES
Pursuant to the requirements of the Securities Exchange Act of 1934 and the Investment Company Act of 1940, the registrant has duly caused this report to be signed on its behalf by the undersigned, thereunto duly authorized.
SCM Trust
| By | /s/ Stephen C. Rogers | |
| Stephen C. Rogers, Chairman | ||
| Date: December 4, 2020 |
Pursuant to the requirements of the Securities Exchange Act of 1934 and the Investment Company Act of 1940, this report has been signed below by the following persons on behalf of the Registrant and in the capacities and on the dates indicated.
| By | /s/ Stephen C. Rogers | |
| Stephen C. Rogers, Chairman | ||
| Date: December 4, 2020 | ||
| By | /s/ William P. Mock | |
| William P. Mock, Treasurer | ||
| Date: December 4, 2020 |