| | |
| UNITED STATES
SECURITIES AND EXCHANGE COMMISSION |
| | |
| CERTIFIED SHAREHOLDER REPORT OF REGISTERED
MANAGEMENT INVESTMENT COMPANIES
|
| | |
| Investment Company Act file number: | (811–05635) |
| | |
| Exact name of registrant as specified in charter: | Putnam Diversified Income Trust |
| | |
| Address of principal executive offices: | 100 Federal Street, Boston, Massachusetts 02110 |
| | |
| Name and address of agent for service: | Robert T. Burns, Vice President
100 Federal Street
Boston, Massachusetts 02110 |
| | |
| Copy to: | Bryan Chegwidden, Esq.
Ropes & Gray LLP
1211 Avenue of the Americas
New York, New York 10036 |
| | |
| Registrant's telephone number, including area code: | (617) 292–1000 |
| | |
| Date of fiscal year end: | September 30, 2020 |
| | |
| Date of reporting period: | October 1, 2019 — March 31, 2020 |
| | |
|
Item 1. Report to Stockholders: | |
| | |
| The following is a copy of the report transmitted to stockholders pursuant to Rule 30e-1 under the Investment Company Act of 1940: | |

Putnam
Diversified Income
Trust
Semiannual report
3|31|20
IMPORTANT NOTICE: Delivery of paper fund reports
In accordance with regulations adopted by the Securities and Exchange Commission, beginning on January 1, 2021, reports like this one will no longer be sent by mail unless you specifically request it. Instead, they will be on Putnam’s website, and you will be notified by mail whenever a new one is available, and provided with a website link to access the report.
If you wish to stop receiving paper reports sooner, or if you wish to continue to receive paper reports free of charge after January 1, 2021, please see the back cover or insert for instructions. If you invest through a bank or broker, your choice will apply to all funds held in your account. If you invest directly with Putnam, your choice will apply to all Putnam funds in your account.
If you already receive these reports electronically, no action is required.
Message from the Trustees
May 8, 2020
Dear Fellow Shareholder:
After a period of gains and relative tranquility, global financial markets encountered considerable challenges in early 2020 as COVID-19, the disease caused by the coronavirus, spread around the world. By mid-March, major U.S. indexes had fallen into bear market territory, defined as a 20% drop from a previous high. As often happens when stocks decline sharply, bonds generally provided better results. As investors rushed to safe havens, the yield on the benchmark 10-year U.S. Treasury note fell to historic lows.
Central banks and governments worldwide have enacted measures to inject liquidity into the markets and restore confidence. It is still unclear what the costs will be and how long the effects of the COVID-19 pandemic will last, but history has shown that markets recover from downturns. For investors, we believe the most important course of action is to remember your long-term goals and consult with your financial advisor. At Putnam, our investment professionals remain focused on actively managing fund portfolios with a research-intensive approach that includes risk management strategies.
We would like to take this opportunity to announce the arrival of Mona K. Sutphen to your fund’s Board of Trustees. Ms. Sutphen brings extensive professional and directorship experience to her role as a Trustee, and we are pleased to welcome her.
Thank you for investing with Putnam.

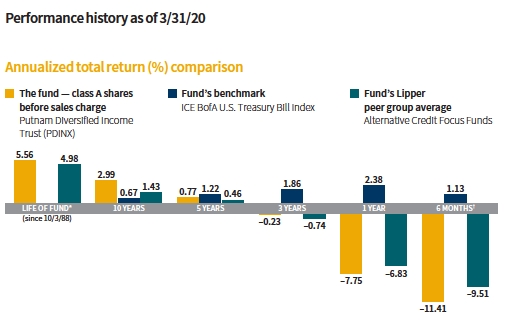
Current performance may be lower or higher than the quoted past performance, which cannot guarantee future results. Share price, principal value, and return will fluctuate, and you may have a gain or a loss when you sell your shares.Performance of class A shares assumes reinvestment of distributions and does not account for taxes. Fund returns in the bar chart do not reflect a sales charge of 4.00%; had they, returns would have been lower. See below and pages 9–10 for additional performance information. For a portion of the periods, the fund had expense limitations, without which returns would have been lower. To obtain the most recent month-end performance, visit putnam.com.
*The fund’s benchmark, the ICE BofA U.S. Treasury Bill Index, was introduced on 6/30/92, which post-dates the inception of the fund.
†Returns for the six-month period are not annualized, but cumulative.
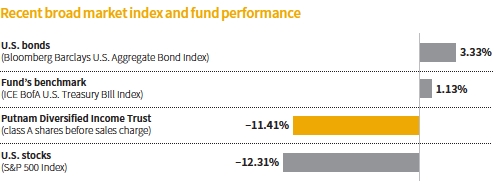
This comparison shows your fund’s performance in the context of broad market indexes for the six months ended 3/31/20. See above and pages 9–10 for additional fund performance information. Index descriptions can be found on page 15.
|
| 2 Diversified Income Trust |


Bill, what was the fund’s investment environment like during the reporting period?
For much of the period, the environment was generally favorable for corporate and mortgage credit, and risk assets overall. The U.S. Federal Reserve [Fed] followed its August 2019 interest-rate cut with additional reductions in September and October. Sentiment toward global trade improved as the United States and China agreed to cooperate on an initial round of trade measures. And uncertainty over Brexit was alleviated when U.K. Prime Minister Boris Johnson’s Conservative party won a parliamentary majority.
The market environment changed dramatically in late February. Rapidly growing concerns about the economic impact of the corona-virus outbreak sparked a global sell-off in risk assets. The sharp turn in sentiment reverberated across markets, as global equities fell, developed-market government-bond yields declined, and credit spreads widened. A dispute between Russia and Saudi Arabia over oil production levels further unnerved investors. Due to heightened oil market uncertainty, U.S. crude prices dropped more than 66% during
|
| Diversified Income Trust 3 |
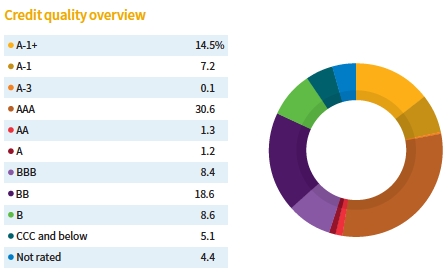
Credit qualities are shown as a percentage of the fund’s net assets as of 3/31/20. A bond rated BBB or higher (A-3 or higher, for short-term debt) is considered investment grade. This chart reflects the highest security rating provided by one or more of Standard & Poor’s, Moody’s, and Fitch. To-be-announced (TBA) mortgage commitments, if any, are included based on their issuer ratings. Ratings may vary over time.
Cash, derivative instruments, and net other assets are shown in the not-rated category. Payables and receivables for TBA mortgage commitments are included in the not-rated category and may result in negative weights. The fund itself has not been rated by an independent rating agency.

the first calendar quarter of 2020 to $20.48 per barrel on March 31. The rapid decline in oil prices added considerable pressure across corporate supply chains.
An escalating economic crisis elicited unprecedented measures from policy makers. The Trump administration signed a $2 trillion stimulus package into law — the largest economic relief package in U.S. history. The Fed quickly unveiled six new lending facilities designed to help corporations facing a cash flow crisis avoid defaulting on their debt. These programs also provide support for money market funds and commercial debt markets. Dozens of other central banks across Europe, Asia, and elsewhere also announced emergency stimulus measures. Markets that were most directly influenced by this policy support stabilized during the final week of the quarter. Investors were hopeful that massive government stimulus programs would help reduce the severity and duration of an economic recession.
A flight-to-safety pushed the yields on U.S. Treasuries lower. The benchmark 10-year U.S. Treasury yield plunged to a closing low of 0.54% on March 9, 2020, and ended the six-month period at 0.70%, after beginning the period at 1.65%. The spreads on investment-grade bonds, or the risk premiums investors demand to hold these securities rather than U.S. Treasuries, widened to levels not seen since the financial crisis.
Which holdings and strategies hampered the fund’s performance?
Mortgage-credit investments were the biggest detractor for the period. Our exposure to commercial mortgage-backed securities [CMBS] — both cash bonds and synthetic exposure to the BBB-rated tranche within CMBX — performed poorly as spreads widened substantially. [Bond prices fall as spreads widen and rise as spreads tighten.] CMBX is an index that references a basket of CMBS issued in a particular year. Investors became increasingly
|
| 4 Diversified Income Trust |
concerned that the escalating coronavirus pandemic could severely impact cash flows in various segments of the market, particularly retail and lodging. Public health policies that curtail shopping and travel for millions of people have been constraining the revenues for many malls and travel destinations.
In the residential mortgage market, our positions in agency credit-risk transfer securities [CRTs] struggled amid growing uncertainty about the effect of mortgage-payment forbearance on CRT cash flows.
Our corporate-credit holdings also worked against performance this period. As market sentiment soured, high-yield bond prices fell and spreads more than doubled, ending the period at about 9.6 percentage points over U.S. Treasuries. This was the highest spread level since early 2016 and was well above the 20-year average of 6.1 percentage points.
Smaller allocations to convertible securities and investment-grade credit holdings modestly detracted, as spreads also widened in those markets.
It was a similar story with emerging-market debt, as our positions in Mexico, Argentina, and Egypt were further notable detractors. The sector declined along with other risk assets.
Strategies targeting prepayment risk also dampened performance this period. Lower interest rates and indiscriminate selling by investors proved to be material headwinds for our positions in agency interest-only collateralized mortgage obligations [IO CMOs], inverse IO securities, and reverse-mortgage IOs. The negative result here was partially offset by favorable tactical mortgage basis positioning. Mortgage basis is a strategy that seeks to exploit the yield differential between current-coupon
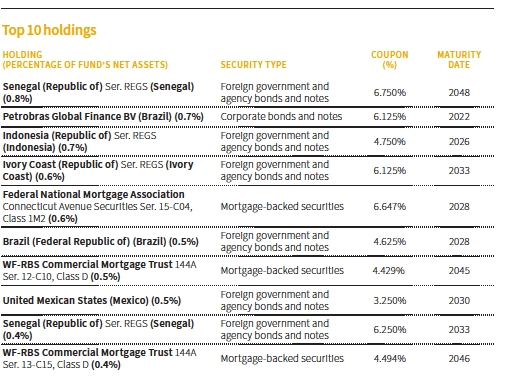
This table shows the fund’s top 10 individual holdings and the percentage of the fund’s net assets that each represented as of 3/31/20. Short-term investments, TBA commitments, and derivatives, if any, are excluded. Holdings may vary over time.
|
| Diversified Income Trust 5 |
30-year agency pass-throughs and 30-year U.S. Treasuries.
How did the fund’s interest-rate and yield-curve positioning fare during the period?
Our strategy here was the lone contributor for the period. During the fourth quarter of 2019, we shifted the portfolio’s duration to close to zero, then moved it to modestly positive during the first quarter of 2020. This positioning aided results as rates fell sharply across the curve during the latter part of the period.
How did you use derivatives during the period?
We used credit default swaps to gain exposure to CMBS via CMBX, and also to hedge the fund’s credit and market risks. We used interest-rate swaps to take tactical positions at various points along the yield curve and to hedge the risk associated with the fund’s curve positioning. We employed interest-rate swaps to gain exposure to rates in various countries. We also utilizedoptions to hedge the fund’s interest-rate risk, to isolate the prepayment risk associated with our CMO holdings, and to help manage overall downside risk.
What is your near-term outlook?
As the period concluded, the number of coronavirus infections was still rising worldwide. We think greater clarity regarding the trajectory of coronavirus infections and deaths is needed before the economic effects can be more clearly assessed. We will continue to monitor the impact of the pandemic on global supply chains and demand dynamics.
Given the overwhelming policy responses and dramatic actions by the Fed, we think U.S. Treasury yields will remain low across the curve for an extended period. We also believe low oil prices will exert significant disinflationary pressure on the economy.
We plan to take a cautious approach to increasing portfolio risk over the near term. That said, given the compelling valuations resulting from substantially wider yield spreads, we will
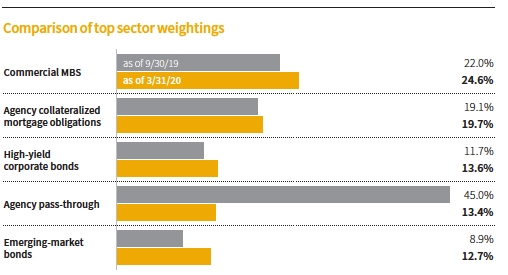
This chart shows how the fund’s top weightings have changed over the past six months. Allocations are shown as a percentage of the fund’s net assets. Current period summary information may differ from the portfolio schedule included in the financial statements due to the inclusion of derivative securities, any interest accruals, the use of different classifications of securities for presentation purposes, and rounding. Holdings and allocations may vary over time.
|
| 6 Diversified Income Trust |
seek to capitalize on what we believe are attractive investment opportunities once markets show signs of stabilizing.

How was the fund positioned going forward?
Prior to March 31, 2020, we took steps to reduce risk in the portfolio on the view that volatility was likely to rise and valuations in certain sectors, particularly corporate credit, were becoming increasingly unattractive.
Reflecting the fund’s relatively cautious overall positioning, we continue to hold securities across sectors that have less price sensitivity to changes in yield spreads.
Within corporate credit, high yield remained the fund’s largest allocation. We also have modest allocations in investment-grade credit and convertible securities.
In CMBS, we continue to have exposure to CMBX tranches referencing bonds rated A and BBB-. In our view, hotel and retail properties will be negatively affected by the coronavirus and the public health measures intended to contain its spread. However, the portfolio’s CMBS exposure is diversified by property type, and we believe CMBX continues to offer the fund a unique investment opportunity.
Within prepayment-sensitive areas of the market, we plan to maintain the fund’s positions in agency IO CMOs and inverse IOs backed by more seasoned loans. We believe this segment of these markets will have less sensitivity to refinancing risk in a low-interest-rate environment.
Thanks for your time and for bringing us up to date, Bill.
ABOUT DERIVATIVES
Derivatives are an increasingly common type of investment instrument, the performance of which isderivedfrom an underlying security, index, currency, or other area of the capital markets. Derivatives employed by the fund’s managers generally serve one of two main purposes: to implement a strategy that may be difficult or more expensive to invest in through traditional securities, or to hedge unwanted risk associated with a particular position.
For example, the fund’s managers might use currency forward contracts to capitalize on an anticipated change in exchange rates between two currencies. This approach would require a significantly smaller outlay of capital than purchasing traditional bonds denominated in the underlying currencies. In another example, the managers may identify a bond that they believe is undervalued relative to its risk of default, but may seek to reduce the interest-rate risk of that bond by using interest-rate swaps, a derivative through which two parties “swap” payments based on the movement of certain rates.
Like any other investment, derivatives may not appreciate in value and may lose money. Derivatives may amplify traditional investment risks through the creation of leverage and may be less liquid than traditional securities. And because derivatives typically represent contractual agreements between two financial institutions, derivatives entail “counterparty risk,” which is the risk that the other party is unable or unwilling to pay. Putnam monitors the counterparty risks we assume. For example, Putnam often enters into collateral agreements that require the counterparties to post collateral on a regular basis to cover their obligations to the fund. Counterparty risk for exchange-traded futures and centrally cleared swaps is mitigated by the daily exchange of margin and other safeguards against default through their respective clearinghouses.
|
| Diversified Income Trust 7 |
The views expressed in this report are exclusively those of Putnam Management and are subject to change. They are not meant as investment advice.
Please note that the holdings discussed in this report may not have been held by the fund for theentire period. Portfolio composition is subject to review in accordance with the fund’s investment strategy and may vary in the future. Current and future portfolio holdings are subject to risk.
|
| 8 Diversified Income Trust |
Your fund’s performance
This section shows your fund’s performance, price, and distribution information for periods ended March 31, 2020, the end of the first half of its current fiscal year. In accordance with regulatory requirements for mutual funds, we also include expense information taken from the fund’s current prospectus. Performance should always be considered in light of a fund’s investment strategy. Data represent past performance. Past performance does not guarantee future results. More recent returns may be less or more than those shown. Investment return and principal value will fluctuate, and you may have a gain or a loss when you sell your shares. Performance information does not reflect any deduction for taxes a shareholder may owe on fund distributions or on the redemption of fund shares. For the most recent month-end performance, please visit the Individual Investors section at putnam.com or call Putnam at 1-800-225-1581. Class R, R6, and Y shares are not available to all investors. See the Terms and definitions section in this report for definitions of the share classes offered by your fund.
| | | | | | | | | |
| Fund performanceTotal return for periods ended 3/31/20 | | | | |
| | Annual | | | | | | | | |
| | average | | Annual | | Annual | | Annual | | |
| | (life of fund) | 10 years | average | 5 years | average | 3 years | average | 1 year | 6 months |
| Class A(10/3/88) | | | | | | | | | |
| Before sales charge | 5.56% | 34.30% | 2.99% | 3.90% | 0.77% | –0.69% | –0.23% | –7.75% | –11.41% |
| After sales charge | 5.43 | 28.93 | 2.57 | –0.26 | –0.05 | –4.66 | –1.58 | –11.44 | –14.95 |
| Class B(3/1/93) | | | | | | | | | |
| Before CDSC | 5.35 | 26.44 | 2.37 | –0.08 | –0.02 | –3.08 | –1.04 | –8.55 | –11.86 |
| After CDSC | 5.35 | 26.44 | 2.37 | –1.69 | –0.34 | –5.65 | –1.92 | –12.96 | –16.20 |
| Class C(2/1/99) | | | | | | | | | |
| Before CDSC | 5.31 | 24.58 | 2.22 | 0.01 | 0.00 | –3.01 | –1.01 | –8.47 | –11.82 |
| After CDSC | 5.31 | 24.58 | 2.22 | 0.01 | 0.00 | –3.01 | –1.01 | –9.36 | –12.69 |
| Class M(12/1/94) | | | | | | | | | |
| Before sales charge | 5.27 | 30.91 | 2.73 | 2.59 | 0.51 | –1.60 | –0.54 | –8.11 | –11.60 |
| After sales charge | 5.16 | 26.65 | 2.39 | –0.74 | –0.15 | –4.80 | –1.63 | –11.10 | –14.48 |
| Class R(12/1/03) | | | | | | | | | |
| Net asset value | 5.28 | 30.78 | 2.72 | 2.47 | 0.49 | –1.64 | –0.55 | –8.08 | –11.67 |
| Class R6(11/1/13) | | | | | | | | | |
| Net asset value | 5.76 | 38.31 | 3.30 | 5.59 | 1.09 | 0.19 | 0.06 | –7.51 | –11.37 |
| Class Y(7/1/96) | | | | | | | | | |
| Net asset value | 5.75 | 37.60 | 3.24 | 5.21 | 1.02 | 0.02 | 0.01 | –7.47 | –11.29 |
Current performance may be lower or higher than the quoted past performance, which cannot guarantee future results. After-sales-charge returns for class A and M shares reflect the deduction of the maximum 4.00% and 3.25% sales charge, respectively, levied at the time of purchase. Class B share returns after contingent deferred sales charge (CDSC) reflect the applicable CDSC, which is 5% in the first year, declining over time to 1% in the sixth year, and is eliminated thereafter. Class C share returns after CDSC reflect a 1% CDSC for the first year that is eliminated thereafter.Class R, R6, and Y shares have no initial sales charge or CDSC. Performance for class B, C, M, R, and Y shares before their inception is derived from the historical performance of class A shares, adjusted for the applicable sales charge (or CDSC) and the higher operating expenses for such shares, except for class Y shares, for which 12b-1 fees are not applicable. Performance for class R6 shares prior to their inception is derived from the historical performance of class Y shares and has not been adjusted for the lower investor servicing fees applicable to class R6 shares; had it, returns would have been higher.
For a portion of the periods, the fund had expense limitations, without which returns would have been lower.
|
| Diversified Income Trust 9 |
Class B share performance reflects conversion to class A shares after eight years.
Class C share performance reflects conversion to class A shares after 10 years.
| | | | | | | | | |
| Comparative index returnsFor periods ended 3/31/20 | | | | | |
| |
| �� | Annual | | | | | | | | |
| | average | | Annual | | Annual | | Annual | | |
| | (life of fund) | 10 years | average | 5 years | average | 3 years | average | 1 year | 6 months |
| ICE BofA U.S. | | | | | | | | | |
| Treasury Bill Index | —* | 6.90% | 0.67% | 6.26% | 1.22% | 5.69% | 1.86% | 2.38% | 1.13% |
| Lipper Alternative | | | | | | | | | |
| Credit Focus Funds | 4.98% | 16.75 | 1.43 | 2.67 | 0.46 | –1.98 | –0.74 | –6.83 | –9.51 |
| category average† | | | | | | | | | |
Index and Lipper results should be compared with fund performance before sales charge, before CDSC, or at net asset value.
*The fund’s benchmark, the ICE BofA U.S. Treasury Bill Index, was introduced on 6/30/92, which post-dates the inception of the fund.
†Over the 6-month, 1-year, 3-year, 5-year, 10-year, and life-of-fund periods ended 3/31/20, there were 132, 128, 119, 90, 26, and 3 funds, respectively, in this Lipper category.
| | | | | | | | | |
| Fund price and distribution informationFor the six-month period ended 3/31/20 | |
| Distributions | Class A | Class B | Class C | Class M | Class R | Class R6 | Class Y |
| Number | 6 | 6 | 6 | 6 | 6 | 6 | 6 |
| Income | $0.138 | $0.113 | $0.113 | $0.131 | $0.131 | $0.150 | $0.146 |
| Capital gains | — | — | — | — | — | — | — |
| Total | $0.138 | $0.113 | $0.113 | $0.131 | $0.131 | $0.150 | $0.146 |
| | Before | After | Net | Net | Before | After | Net | Net | Net |
| | sales | sales | asset | asset | sales | sales | asset | asset | asset |
| Share value | charge | charge | value | value | charge | charge | value | value | value |
| 9/30/19 | $6.99 | $7.28 | $6.91 | $6.85 | $6.84 | $7.07 | $6.89 | $6.92 | $6.91 |
| 3/31/20 | 6.07 | 6.32 | 5.99 | 5.94 | 5.93 | 6.13 | 5.97 | 6.00 | 6.00 |
| | Before | After | Net | Net | Before | After | Net | Net | Net |
| Current rate | sales | sales | asset | asset | sales | sales | asset | asset | asset |
| (end of period) | charge | charge | value | value | charge | charge | value | value | value |
| Current dividend | | | | | | | | | |
| rate1 | 4.55% | 4.37% | 3.81% | 3.84% | 4.45% | 4.31% | 4.42% | 5.00% | 5.00% |
| Current 30-day | | | | | | | | | |
| SEC yield2 | N/A | 4.35 | 3.73 | 3.73 | N/A | 4.12 | 4.27 | 4.89 | 4.78 |
The classification of distributions, if any, is an estimate. Before-sales-charge share value and current dividend rate for class A and M shares, if applicable, do not take into account any sales charge levied at the time of purchase. After-sales-charge share value, current dividend rate, and current 30-day SEC yield, if applicable, are calculated assuming that the maximum sales charge (4.00% for class A shares and 3.25% for class M shares) was levied at the time of purchase. Final distribution information will appear on your year-end tax forms.
1Most recent distribution, including any return of capital and excluding capital gains, annualized and divided by share price before or after sales charge at period-end.
2Based only on investment income and calculated using the maximum offering price for each share class, in accordance with SEC guidelines.
| |
| 10 Diversified Income Trust |
Your fund’s expenses
As a mutual fund investor, you pay ongoing expenses, such as management fees, distribution fees (12b-1 fees), and other expenses. Using the following information, you can estimate how these expenses affect your investment and compare them with the expenses of other funds. You may also pay one-time transaction expenses, including sales charges (loads) and redemption fees, which are not shown in this section and would have resulted in higher total expenses. For more information, see your fund’s prospectus or talk to your financial representative.
| | | | | | | |
| Expense ratios | | | | | | | |
| | Class A | Class B | Class C | Class M | Class R | Class R6 | Class Y |
| Total annual operating expenses for the | | | | | | | |
| fiscal year ended 9/30/19 | 0.98% | 1.73% | 1.73% | 1.23% | 1.23% | 0.64% | 0.73% |
| Annualized expense ratio for the | | | | | | | |
| six-month period ended 3/31/20 | 0.98% | 1.73% | 1.73% | 1.23% | 1.23% | 0.64% | 0.73% |
Fiscal year expense information in this table is taken from the most recent prospectus, is subject to change, and may differ from that shown for the annualized expense ratio and in the financial highlights of this report.
Expenses are shown as a percentage of average net assets.
Expenses per $1,000
The following table shows the expenses you would have paid on a $1,000 investment in each class of the fund from 10/1/19 to 3/31/20. It also shows how much a $1,000 investment would be worth at the close of the period, assumingactual returnsand expenses.
| | | | | | | |
| | Class A | Class B | Class C | Class M | Class R | Class R6 | Class Y |
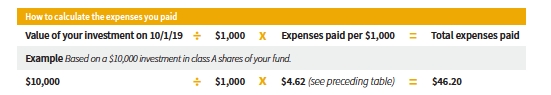
| Expenses paid per $1,000*† | $4.62 | $8.14 | $8.14 | $5.79 | $5.79 | $3.02 | $3.44 |
| Ending value (after expenses) | $885.90 | $881.40 | $881.80 | $884.00 | $883.30 | $886.30 | $887.10 |
*Expenses for each share class are calculated using the fund’s annualized expense ratio for each class, which represents the ongoing expenses as a percentage of average net assets for the six months ended 3/31/20. The expense ratio may differ for each share class.
†Expenses are calculated by multiplying the expense ratio by the average account value for the period; then multiplying the result by the number of days in the period; and then dividing that result by the number of days in the year.
|
| Diversified Income Trust 11 |
Estimate the expenses you paid
To estimate the ongoing expenses you paid for the six months ended 3/31/20, use the following calculation method. To find the value of your investment on 10/1/19, call Putnam at 1-800-225-1581.
Compare expenses using the SEC’s method
The Securities and Exchange Commission (SEC) has established guidelines to help investors assess fund expenses. Per these guidelines, the following table shows your fund’s expenses based on a $1,000 investment, assuming ahypothetical 5% annualized return. You can use this information to compare the ongoing expenses (but not transaction expenses or total costs) of investing in the fund with those of other funds. All mutual fund shareholder reports will provide this information to help you make this comparison. Please note that you cannot use this information to estimate your actual ending account balance and expenses paid during the period.
| | | | | | | |
| | Class A | Class B | Class C | Class M | Class R | Class R6 | Class Y |
| Expenses paid per $1,000*† | $4.95 | $8.72 | $8.72 | $6.21 | $6.21 | $3.23 | $3.69 |
| Ending value (after expenses) | $1,020.10 | $1,016.35 | $1,016.35 | $1,018.85 | $1,018.85 | $1,021.80 | $1,021.35 |
*Expenses for each share class are calculated using the fund’s annualized expense ratio for each class, which represents the ongoing expenses as a percentage of average net assets for the six months ended 3/31/20. The expense ratio may differ for each share class.
†Expenses are calculated by multiplying the expense ratio by the average account value for the six-month period; then multiplying the result by the number of days in the six-month period; and then dividing that result by the number of days in the year.
| |
| 12 Diversified Income Trust |
Consider these risks before investing
Emerging-market securities carry illiquidity and volatility risks. Lower-rated bonds may offer higher yields in return for more risk. Funds that invest in government securities are not guaranteed. Mortgage-backed investments, unlike traditional debt investments, are subject to prepayment risk, which means that they may increase in value less than other bonds when interest rates decline and decline in value more than other bonds when interest rates rise. Bond investments are subject to interest-rate risk (the risk of bond prices falling if interest rates rise) and credit risk (the risk of an issuer defaulting on interest or principal payments). Interest-rate risk is generally greater for longer-term bonds, and credit risk is generally greater for below-investment-grade bonds. Risks associated with derivatives include increased investment exposure (which may be considered leverage) and, in the case of over-the-counter instruments, the potential inability to terminate or sell derivatives positions and the potential failure of the other party to the instrument to meet its obligations. Unlike bonds, funds that invest in bonds have fees and expenses. The value of investments in the fund’s portfolio may fall or fail to rise over extended periods of time for a variety of reasons, including general economic, political, or financial market conditions; investor sentiment and market perceptions; government actions; geopolitical events or changes; and factors related to a specific issuer, geography, industry, or sector. International investing involves currency, economic, and political risks. These and other factors may lead to increased volatility and reduced liquidity in the fund’s portfolio holdings. You can lose money by investing in the fund.
|
| Diversified Income Trust 13 |
Terms and definitions
Important terms
Total returnshows how the value of the fund’s shares changed over time, assuming you held the shares through the entire period and reinvested all distributions in the fund.
Before sales charge, or net asset value, is the price, or value, of one share of a mutual fund, without a sales charge. Before-sales-charge figures fluctuate with market conditions, and are calculated by dividing the net assets of each class of shares by the number of outstanding shares in the class.
After sales chargeis the price of a mutual fund share plus the maximum sales charge levied at the time of purchase. After-sales-charge performance figures shown here assume the 4.00% maximum sales charge for class A shares and 3.25% for class M shares.
Contingent deferred sales charge (CDSC)is generally a charge applied at the time of the redemption of class B or C shares and assumes redemption at the end of the period. Your fund’s class B CDSC declines over time from a 5% maximum during the first year to 1% during the sixth year. After the sixth year, the CDSC no longer applies. The CDSC for class C shares is 1% for one year after purchase.
Share classes
Class A sharesare generally subject to an initial sales charge and no CDSC (except on certain redemptions of shares bought without an initial sales charge).
Class B sharesare closed to new investments and are only available by exchange from another Putnam fund or through dividend and/ or capital gains reinvestment. They are not subject to an initial sales charge and may be subject to a CDSC.
Class C sharesare not subject to an initial sales charge and are subject to a CDSC only if the shares are redeemed during the first year.
Class M shareshave a lower initial sales charge and a higher 12b-1 fee than class A shares and no CDSC.
Class R sharesare not subject to an initial sales charge or CDSC and are only available to employer-sponsored retirement plans.
Class R6 sharesare not subject to an initial sales charge or CDSC and carry no 12b-1 fee. They are generally only available to employer-sponsored retirement plans, corporate and institutional clients, and clients in other approved programs.
Class Y sharesare not subject to an initial sales charge or CDSC and carry no 12b-1 fee. They are generally only available to corporate and institutional clients and clients in other approved programs.
Fixed-income terms
Current rateis the annual rate of return earned from dividends or interest of an investment. Current rate is expressed as a percentage of the price of a security, fund share, or principal investment.
Mortgage-backed security (MBS), also known as a mortgage “pass-through,” is a type of asset-backed security that is secured by a mortgage or collection of mortgages. The following are types of MBSs:
•Agency credit-risk transfer security (CRT)is backed by a reference pool of agency mortgages. Unlike a regular agency pass-through, the principal invested in a CRT is not backed by a U.S. government agency. To compensate investors for this risk, a CRT typically offers a higher yield than conventional pass-through securities. Similar to a CMBS, a CRT is structured into various tranches for investors, offering different levels of risk and yield based on the underlying reference pool.
•Agency “pass-through”has its principal and interest backed by a U.S. government
| |
| 14 Diversified Income Trust |
agency, such as the Federal National Mortgage Association (Fannie Mae), Government National Mortgage Association (Ginnie Mae), and Federal Home Loan Mortgage Corporation (Freddie Mac).
•Collateralized mortgage obligation (CMO)represents claims to specific cash flows from pools of home mortgages. The streams of principal and interest payments on the mortgages are distributed to the different classes of CMO interests in “tranches.” Each tranche may have different principal balances, coupon rates, prepayment risks, and maturity dates. A CMO is highly sensitive to changes in interest rates and any resulting change in the rate at which homeowners sell their properties, refinance, or otherwise prepay loans. CMOs are subject to prepayment, market, and liquidity risks.
°Interest-only (IO) securityis a type of CMO in which the underlying asset is the interest portion of mortgage, Treasury, or bond payments.
•Non-agency residential mortgage-backed security (RMBS)is an MBS not backed by Fannie Mae, Ginnie Mae, or Freddie Mac. One type of RMBS is an Alt-A mortgage-backed security.
•Commercial mortgage-backed security (CMBS)is secured by the loan on a commercial property.
Yield curveis a graph that plots the yields of bonds with equal credit quality against their differing maturity dates, ranging from shortest to longest. It is used as a benchmark for other debt, such as mortgage or bank lending rates.
Comparative indexes
Bloomberg Barclays U.S. Aggregate Bond Indexis an unmanaged index of U.S. investment-grade fixed-income securities.
CMBX Indexis an unmanaged index that tracks the performance of a basket of CMBS issued in a particular year.
ICE BofA (Intercontinental Exchange Bank of America) U.S. Treasury Bill Indexis an unmanaged index that tracks the performance of U.S. dollar-denominated U.S. Treasury Bills publicly issued in the U.S. domestic market. Qualifying securities must have a remaining term of at least one month to final maturity and a minimum amount outstanding of $1 billion.
S&P 500 Indexis an unmanaged index of common stock performance.
Indexes assume reinvestment of all distributions and do not account for fees. Securities and performance of a fund and an index will differ. You cannot invest directly in an index.
ICE Data Indices, LLC (“ICE BofA”), used with permission. ICE BofA permits use of the ICE BofA indices and related data on an “as is” basis; makes no warranties regarding same; does not guarantee the suitability, quality, accuracy, timeliness, and/or completeness of the ICE BofA indices or any data included in, related to, or derived therefrom; assumes no liability in connection with the use of the foregoing; and does not sponsor, endorse, or recommend Putnam Investments, or any of its products or services.
Lipperis a third-party industry-ranking entity that ranks mutual funds. Its rankings do not reflect sales charges. Lipper rankings are based on total return at net asset value relative to other funds that have similar current investment styles or objectives as determined by Lipper. Lipper may change a fund’s category assignment at its discretion. Lipper category averages reflect performance trends for funds within a category.
|
| Diversified Income Trust 15 |
Other information for shareholders
Important notice regarding delivery of shareholder documents
In accordance with Securities and Exchange Commission (SEC) regulations, Putnam sends a single copy of annual and semiannual shareholder reports, prospectuses, and proxy statements to Putnam shareholders who share the same address, unless a shareholder requests otherwise. If you prefer to receive your own copy of these documents, please call Putnam at 1-800-225-1581, and Putnam will begin sending individual copies within 30 days.
Proxy voting
Putnam is committed to managing our mutual funds in the best interests of our shareholders. The Putnam funds’ proxy voting guidelines and procedures, as well as information regarding how your fund voted proxies relating to portfolio securities during the 12-month period ended June 30, 2019, are available in the Individual Investors section of putnam.com and on the SEC’s website, www.sec.gov. If you have questions about finding forms on the SEC’s website, you may call the SEC at 1-800-SEC-0330. You may also obtain the Putnam funds’ proxy voting guidelines andprocedures at no charge by calling Putnam’s Shareholder Services at 1-800-225-1581.
Fund portfolio holdings
The fund will file a complete schedule of its portfolio holdings with the SEC for the first and third quarters of each fiscal year on Form N-PORT within 60 days of the end of such fiscal quarter. Shareholders may obtain the fund’s Form N-PORT on the SEC’s website at www.sec.gov.
Prior to its use of Form N-PORT, the fund filed its complete schedule of its portfolio holdings with the SEC on Form N-Q, which is available online at www.sec.gov.
Trustee and employee fund ownership
Putnam employees and members of the Board of Trustees place their faith, confidence, and, most importantly, investment dollars in Putnam mutual funds. As of March 31, 2020, Putnam employees had approximately $402,000,000 and the Trustees had approximately $66,000,000 invested in Putnam mutual funds. These amounts include investments by the Trustees’ and employees’ immediate family members as well as investments through retirement and deferred compensation plans.
|
| 16 Diversified Income Trust |
Financial statements
These sections of the report, as well as the accompanying Notes, constitute the fund’s financial statements.
The fund’s portfoliolists all the fund’s investments and their values as of the last day of the reporting period. Holdings are organized by asset type and industry sector, country, or state to show areas of concentration and diversification.
Statement of assets and liabilitiesshows how the fund’s net assets and share price are determined. All investment and non-investment assets are added together. Any unpaid expenses and other liabilities are subtracted from this total. The result is divided by the number of shares to determine the net asset value per share, which is calculated separately for each class of shares. (For funds with preferred shares, the amount subtracted from total assets includes the liquidation preference of preferred shares.)
Statement of operationsshows the fund’s net investment gain or loss. This is done by first adding up all the fund’s earnings — from dividends and interest income — and subtracting its operating expenses to determine net investment income (or loss). Then, any net gain or loss the fund realized on the sales of its holdings — as well as any unrealized gains or losses over the period — is added toor subtracted from the net investment result to determine the fund’s net gain or loss for the fiscal period.
Statement of changes in net assetsshows how the fund’s net assets were affected by the fund’s net investment gain or loss, by distributions to shareholders, and by changes in the number of the fund’s shares. It lists distributions and their sources (net investment income or realized capital gains) over the current reporting period and the most recent fiscal year-end. The distributions listed here may not match the sources listed in the Statement of operations because the distributions are determined on a tax basis and may be paid in a different period from the one in which they were earned. Dividend sources are estimated at the time of declaration. Actual results may vary. Any non-taxable return of capital cannot be determined until final tax calculations are completed after the end of the fund’s fiscal year.
Financial highlightsprovide an overview of the fund’s investment results, per-share distributions, expense ratios, net investment income ratios, and portfolio turnover in one summary table, reflecting the five most recent reporting periods. In a semiannual report, the highlights table also includes the current reporting period.
|
| Diversified Income Trust 17 |
| | |
| The fund’s portfolio3/31/20 (Unaudited) | | |
| |
| U.S. GOVERNMENT AND AGENCY | Principal | |
| MORTGAGE OBLIGATIONS (124.5%)* | amount | Value |
| U.S. Government Guaranteed Mortgage Obligations (2.9%) | | |
| Government National Mortgage Association Pass-Through Certificates | | |
| 6.50%, 11/20/38 | $161,922 | $189,252 |
| 5.00%, 3/20/50 | 40,000 | 44,370 |
| 4.50%, TBA, 4/1/50 | 25,000,000 | 26,503,905 |
| 4.00%, TBA, 4/1/50 | 63,000,000 | 66,927,659 |
| 3.50%, TBA, 4/1/50 | 1,000,000 | 1,054,453 |
| 3.50%, with due dates from 9/20/49 to 11/20/49 | 157,764 | 170,097 |
| 3.00%, 11/20/49 i | 2,889,956 | 3,073,187 |
| | | 97,962,923 |
| U.S. Government Agency Mortgage Obligations (121.6%) | | |
| Federal Home Loan Mortgage Corporation Pass-Through Certificates | | |
| 3.00%, 7/1/49 ## | 433,320 | 441,513 |
| 3.00%, 7/1/49 ## | 642,370 | 654,514 |
| Federal National Mortgage Association Pass-Through Certificates | | |
| 3.50%, 9/1/49 ## | 1,000,000 | 1,057,453 |
| 3.00%, 9/1/49 ## | 199,600 | 209,278 |
| Uniform Mortgage-Backed Securities | | |
| 5.50%, TBA, 4/1/50 | 23,000,000 | 25,183,204 |
| 5.00%, TBA, 4/1/50 | 8,000,000 | 8,633,125 |
| 4.50%, TBA, 4/1/50 | 2,000,000 | 2,150,313 |
| 4.00%, TBA, 4/1/50 | 367,000,000 | 391,600,450 |
| 3.50%, TBA, 4/1/50 | 462,000,000 | 488,420,625 |
| 3.00%, TBA, 4/1/50 | 818,000,000 | 857,366,250 |
| 2.50%, TBA, 4/1/50 | 2,234,000,000 | 2,313,935,201 |
| | | 4,089,651,926 |
| Total U.S. government and agency mortgage obligations (cost $4,114,590,252) | $4,187,614,849 |
| |
| | Principal | |
| U.S. TREASURY OBLIGATIONS (0.7%)* | amount | Value |
| U.S. Treasury Bonds 2.75%, 11/15/47 i | $5,474,000 | $7,267,228 |
| U.S. Treasury Inflation Index Notes 1.125%, 1/15/21 i | 577,705 | 574,037 |
| U.S. Treasury Notes | | |
| 2.625%, 5/15/21 i | 165,000 | 171,168 |
| 2.50%, 1/15/22 i | 646,000 | 675,238 |
| 2.375%, 12/31/20 i | 294,000 | 300,840 |
| 2.25%, 11/15/25 i | 1,061,000 | 1,173,296 |
| 2.25%, 7/31/21 i | 1,078,000 | 1,111,396 |
| 2.125%, 12/31/22 i | 1,857,000 | 1,960,101 |
| 2.125%, 9/30/21 i | 1,944,000 | 1,997,654 |
| 2.125%, 1/31/21 i | 1,792,000 | 1,829,391 |
| 2.00%, 8/15/25 i | 300,000 | 325,149 |
| 2.00%, 2/15/25 i | 18,000 | 19,424 |
| 1.75%, 2/28/22 i | 1,706,000 | 1,756,276 |
| 1.75%, 10/31/20 i | 989,000 | 1,005,900 |
| 1.625%, 9/30/26 i | 3,792,000 | 4,052,700 |
| 1.625%, 5/15/26 i | 167,000 | 178,996 |
| 1.50%, 10/31/24 i | 367,000 | 388,007 |
| Total U.S. treasury obligations (cost $24,786,801) | | $24,786,801 |
|
| 18 Diversified Income Trust |
| | |
| | Principal | |
| MORTGAGE-BACKED SECURITIES (33.7%)* | amount | Value |
| Agency collateralized mortgage obligations (19.1%) | | |
| Federal Home Loan Mortgage Corporation | | |
| REMICs IFB Ser. 3408, Class EK, ((-4.024 x 1 Month US LIBOR) | | |
| + 25.79%), 22.958%, 4/15/37 | $156,020 | $283,756 |
| REMICs Ser. 4509, Class CI, IO, 6.00%, 9/15/45 | 19,107,670 | 4,266,858 |
| REMICs IFB Ser. 3919, Class SA, IO, ((-1 x 1 Month US LIBOR) | | |
| + 6.50%), 5.795%, 9/15/41 | 11,908,724 | 2,064,232 |
| REMICs IFB Ser. 4742, Class S, IO, ((-1 x 1 Month US LIBOR) | | |
| + 6.20%), 5.495%, 12/15/47 | 44,779,002 | 5,471,994 |
| REMICs IFB Ser. 4731, Class QS, IO, ((-1 x 1 Month US LIBOR) | | |
| + 6.20%), 5.495%, 11/15/47 | 23,146,181 | 3,823,435 |
| REMICs IFB Ser. 4839, Class WS, IO, ((-1 x 1 Month US LIBOR) | | |
| + 6.10%), 5.395%, 8/15/56 | 3,149,766 | 677,200 |
| REMICs IFB Ser. 4678, Class MS, IO, ((-1 x 1 Month US LIBOR) | | |
| + 6.10%), 5.395%, 4/15/47 | 13,261,733 | 2,309,130 |
| REMICs IFB Ser. 4265, Class SD, IO, ((-1 x 1 Month US LIBOR) | | |
| + 6.10%), 5.395%, 1/15/35 | 39,807,788 | 7,730,020 |
| REMICs IFB Ser. 4937, Class 4937, IO, ((-1 x 1 Month US LIBOR) | | |
| + 6.05%), 5.345%, 12/25/49 | 1,824,033 | 329,457 |
| Strips IFB Ser. 326, Class S2, IO, ((-1 x 1 Month US LIBOR) + 5.95%), | | |
| 5.245%, 3/15/44 | 10,959,886 | 1,652,975 |
| Strips IFB Ser. 311, Class S1, IO, ((-1 x 1 Month US LIBOR) + 5.95%), | | |
| 5.245%, 8/15/43 | 10,628,931 | 1,950,041 |
| REMICs Ser. 4077, Class IK, IO, 5.00%, 7/15/42 | 9,130,207 | 1,431,580 |
| REMICs Ser. 4122, Class TI, IO, 4.50%, 10/15/42 | 6,586,687 | 915,062 |
| REMICs Ser. 4000, Class PI, IO, 4.50%, 1/15/42 | 8,563,492 | 1,147,876 |
| REMICs Ser. 4024, Class PI, IO, 4.50%, 12/15/41 | 10,487,355 | 987,929 |
| REMICs Ser. 4635, Class PI, IO, 4.00%, 12/15/46 | 23,305,290 | 2,268,001 |
| REMICs Ser. 4193, Class PI, IO, 4.00%, 3/15/43 | 25,344,266 | 2,516,311 |
| REMICs Ser. 4213, Class GI, IO, 4.00%, 11/15/41 | 23,877,643 | 1,558,852 |
| REMICs Ser. 4020, Class IA, IO, 4.00%, 3/15/27 | 6,480,590 | 463,751 |
| REMICs Ser. 4484, Class TI, IO, 3.50%, 11/15/44 | 12,063,270 | 787,924 |
| REMICs Ser. 4105, Class HI, IO, 3.50%, 7/15/41 | 4,538,084 | 354,537 |
| REMICs Ser. 4199, Class CI, IO, 3.50%, 12/15/37 | 13,697,858 | 240,328 |
| REMICs Ser. 4801, Class IG, IO, 3.00%, 6/15/48 | 27,625,687 | 1,909,819 |
| REMICs Ser. 4165, Class TI, IO, 3.00%, 12/15/42 | 15,745,782 | 1,130,075 |
| REMICs Ser. 4210, Class PI, IO, 3.00%, 12/15/41 | 6,950,247 | 236,200 |
| Structured Pass-Through Certificates FRB Ser. 57, Class 1AX, IO, | | |
| 0.375%, 7/25/43 W | 8,338,607 | 83,386 |
| REMICs Ser. 3314, PO, zero %, 11/15/36 | 8,404 | 8,396 |
| REMICs Ser. 3326, Class WF, zero %, 10/15/35 W | 31,675 | 28,507 |
| REMICs Ser. 1208, Class F, PO, zero %, 2/15/22 | 1,734 | 1,665 |
| Federal National Mortgage Association | | |
| REMICs IFB Ser. 06-8, Class HP, ((-3.667 x 1 Month US LIBOR) | | |
| + 24.57%), 21.096%, 3/25/36 | 434,008 | 748,344 |
| REMICs IFB Ser. 05-83, Class QP, ((-2.6 x 1 Month US LIBOR) | | |
| + 17.39%), 14.933%, 11/25/34 | 104,729 | 126,126 |
| Grantor Trust Ser. 98-T2, Class A4, IO, 6.50%, 10/25/36 | 12,039 | 1,154 |
| REMICs Ser. 16-3, Class NI, IO, 6.00%, 2/25/46 | 15,090,443 | 3,104,385 |
| REMICs Ser. 15-69, IO, 6.00%, 9/25/45 | 17,455,056 | 3,804,172 |
| REMICs Ser. 15-58, Class KI, IO, 6.00%, 3/25/37 | 25,626,001 | 5,266,861 |
|
| Diversified Income Trust 19 |
| | |
| | Principal | |
| MORTGAGE-BACKED SECURITIES (33.7%)*cont. | amount | Value |
| Agency collateralized mortgage obligationscont. | | |
| Federal National Mortgage Association | | |
| REMICs IFB Ser. 12-36, Class SN, IO, ((-1 x 1 Month US LIBOR) | | |
| + 6.45%), 5.503%, 4/25/42 | $6,330,417 | $1,228,753 |
| Interest Strip Ser. 399, Class 2, IO, 5.50%, 11/25/39 | 26,415 | 5,194 |
| Interest Strip Ser. 374, Class 6, IO, 5.50%, 8/25/36 | 1,045,685 | 165,157 |
| REMICs Ser. 16-3, Class MI, IO, 5.50%, 2/25/46 | 46,471,140 | 8,306,716 |
| REMICs Ser. 15-30, IO, 5.50%, 5/25/45 | 2,025,375 | 382,290 |
| REMICs IFB Ser. 10-35, Class SG, IO, ((-1 x 1 Month US LIBOR) | | |
| + 6.40%), 5.453%, 4/25/40 | 8,782,214 | 1,724,521 |
| REMICs IFB Ser. 18-44, Class SA, IO, ((-1 x 1 Month US LIBOR) | | |
| + 6.20%), 5.253%, 6/25/48 | 33,206,994 | 4,258,388 |
| REMICs IFB Ser. 15-42, Class LS, IO, ((-1 x 1 Month US LIBOR) | | |
| + 6.20%), 5.253%, 6/25/45 | 3,572,432 | 632,106 |
| REMICs IFB Ser. 13-18, Class SB, IO, ((-1 x 1 Month US LIBOR) | | |
| + 6.15%), 5.203%, 10/25/41 | 9,039,653 | 519,003 |
| REMICs IFB Ser. 17-32, Class SA, IO, ((-1 x 1 Month US LIBOR) | | |
| + 6.15%), 5.203%, 5/25/47 | 110,577 | 18,177 |
| REMICs IFB Ser. 19-5, Class SA, IO, ((-1 x 1 Month US LIBOR) | | |
| + 6.10%), 5.153%, 3/25/49 | 3,081,910 | 533,158 |
| REMICs IFB Ser. 18-86, Class DS, IO, ((-1 x 1 Month US LIBOR) | | |
| + 6.10%), 5.153%, 12/25/48 | 1,728,719 | 213,929 |
| REMICs IFB Ser. 16-96, Class ST, IO, ((-1 x 1 Month US LIBOR) | | |
| + 6.10%), 5.153%, 12/25/46 | 52,245,179 | 10,737,170 |
| REMICs IFB Ser. 16-62, Class GS, IO, ((-1 x 1 Month US LIBOR) | | |
| + 6.10%), 5.153%, 9/25/46 | 36,650,899 | 6,849,320 |
| REMICs IFB Ser. 16-82, Class SG, IO, ((-1 x 1 Month US LIBOR) | | |
| + 6.10%), 5.153%, 11/25/46 | 32,047 | 6,438 |
| REMICs IFB Ser. 19-73, Class 73, IO, ((-1 x 1 Month US LIBOR) | | |
| + 6.05%), 5.103%, 12/25/49 | 2,592,973 | 334,529 |
| REMICs IFB Ser. 19-57, Class KS, IO, ((-1 x 1 Month US LIBOR) | | |
| + 6.05%), 5.103%, 10/25/49 | 6,133,919 | 915,836 |
| REMICs IFB Ser. 19-43, Class JS, IO, ((-1 x 1 Month US LIBOR) | | |
| + 6.05%), 5.103%, 8/25/49 | 2,994,250 | 431,847 |
| REMICs IFB Ser. 19-47, Class SA, IO, ((-1 x 1 Month US LIBOR) | | |
| + 6.05%), 5.103%, 8/25/49 | 35,480,682 | 5,696,487 |
| REMICs IFB Ser. 19-34, Class SL, IO, ((-1 x 1 Month US LIBOR) | | |
| + 6.05%), 5.103%, 7/25/49 | 39,149,101 | 5,336,080 |
| REMICs IFB Ser. 19-38, Class 38, IO, ((-1 x 1 Month US LIBOR) | | |
| + 6.05%), 5.103%, 7/25/49 | 1,526,063 | 292,333 |
| REMICs Ser. 13-107, Class SB, IO, ((-1 x 1 Month US LIBOR) | | |
| + 5.95%), 5.003%, 2/25/43 | 15,279 | 3,132 |
| Interest Strip Ser. 378, Class 19, IO, 5.00%, 6/25/35 | 1,177,632 | 178,820 |
| REMICs Ser. 12-151, Class IN, IO, 5.00%, 1/25/43 | 16,071,845 | 2,370,597 |
| REMICs IFB Ser. 11-101, Class SA, IO, ((-1 x 1 Month US LIBOR) | | |
| + 5.90%), 4.953%, 10/25/41 | 21,965,748 | 3,410,038 |
| Interest Strip Ser. 404, Class 2, IO, 4.50%, 5/25/40 | 95,149 | 14,066 |
| Interest Strip Ser. 366, Class 22, IO, 4.50%, 10/25/35 | 13,763 | 130 |
| REMICs Ser. 18-58, Class AI, IO, 4.50%, 8/25/48 | 35,941,815 | 5,854,677 |
| REMICs Ser. 12-127, Class BI, IO, 4.50%, 11/25/42 | 7,415,063 | 1,258,357 |
| REMICs Ser. 12-30, Class HI, IO, 4.50%, 12/25/40 | 7,466,038 | 463,469 |
| Interest Strip Ser. 405, Class 2, IO, 4.00%, 10/25/40 | 112,876 | 21,049 |
| |
| 20 Diversified Income Trust |
| | |
| | Principal | |
| MORTGAGE-BACKED SECURITIES (33.7%)*cont. | amount | Value |
| Agency collateralized mortgage obligationscont. | | |
| Federal National Mortgage Association | | |
| REMICs Ser. 19-70, Class 70, IO, 4.00%, 12/25/49 | $43,071,418 | $1,911,510 |
| REMICs Ser. 18-3, Class PI, IO, 4.00%, 2/25/48 | 21,486,138 | 1,489,192 |
| REMICs Ser. 17-65, Class LI, IO, 4.00%, 8/25/47 | 14,036,840 | 947,487 |
| REMICs Ser. 15-88, Class QI, IO, 4.00%, 10/25/44 | 8,901,208 | 634,705 |
| REMICs Ser. 15-83, IO, 4.00%, 10/25/43 | 2,791,055 | 296,335 |
| REMICs Ser. 13-41, Class IP, IO, 4.00%, 5/25/43 | 15,384,546 | 1,624,916 |
| REMICs Ser. 13-115, Class CI, IO, 4.00%, 2/25/43 | 11,369,425 | 534,752 |
| REMICs Ser. 13-44, Class PI, IO, 4.00%, 1/25/43 | 6,268,139 | 596,208 |
| REMICs Ser. 13-60, Class IP, IO, 4.00%, 10/25/42 | 7,292,631 | 733,238 |
| REMICs Ser. 16-70, Class QI, IO, 3.50%, 10/25/46 | 38,252,333 | 2,667,335 |
| REMICs Ser. 13-18, Class IN, IO, 3.50%, 3/25/43 | 22,905,249 | 2,023,874 |
| REMICs Ser. 13-70, Class CI, IO, 3.50%, 1/25/43 | 5,341,384 | 271,658 |
| REMICs Ser. 13-49, Class IP, IO, 3.50%, 12/25/42 | 17,422,517 | 915,553 |
| REMICs Ser. 13-40, Class YI, IO, 3.50%, 6/25/42 | 17,100,989 | 1,156,988 |
| REMICs Ser. 12-123, Class DI, IO, 3.50%, 5/25/41 | 22,978,263 | 1,606,916 |
| REMICs Ser. 12-151, Class PI, IO, 3.00%, 1/25/43 | 29,866,459 | 2,442,927 |
| REMICs Ser. 12-145, Class TI, IO, 3.00%, 11/25/42 | 6,069,014 | 249,546 |
| REMICs Ser. 13-35, Class IP, IO, 3.00%, 6/25/42 | 6,078,564 | 284,544 |
| REMICs Ser. 13-35, Class PI, IO, 3.00%, 2/25/42 | 16,986,013 | 673,886 |
| REMICs Ser. 13-53, Class JI, IO, 3.00%, 12/25/41 | 13,901,838 | 805,055 |
| REMICs Ser. 13-30, Class IP, IO, 3.00%, 10/25/41 | 7,434,256 | 248,739 |
| Grantor Trust Ser. 00-T6, IO, 0.717%, 11/25/40 W | 3,696,391 | 78,548 |
| REMICs FRB Ser. 01-50, Class B1, IO, 0.377%, 10/25/41 W | 133,898 | 575 |
| Trust FRB Ser. 02-W8, Class 1, IO, 0.302%, 6/25/42 W | 5,653,071 | 45,711 |
| REMICs Ser. 99-51, Class N, PO, zero %, 9/17/29 | 26,109 | 23,825 |
| Government National Mortgage Association | | |
| IFB Ser. 13-9, Class S, IO, ((-1 x 1 Month US LIBOR) + 6.75%), | | |
| 5.977%, 1/20/43 | 35,294,994 | 7,594,046 |
| IFB Ser. 10-68, Class SD, IO, ((-1 x 1 Month US LIBOR) + 6.58%), | | |
| 5.807%, 6/20/40 | 1,781,842 | 367,791 |
| Ser. 17-104, Class MI, IO, 5.50%, 7/16/47 | 15,830,061 | 3,955,918 |
| Ser. 17-79, Class IB, IO, 5.50%, 5/20/47 | 6,481,714 | 1,364,399 |
| Ser. 17-52, Class DI, IO, 5.50%, 4/20/47 | 8,413,858 | 1,518,167 |
| IFB Ser. 18-105, Class SG, IO, ((-1 x 1 Month US LIBOR) + 6.25%), | | |
| 5.477%, 8/20/48 | 48,295,198 | 6,961,991 |
| IFB Ser. 18-91, Class SH, IO, ((-1 x 1 Month US LIBOR) + 6.25%), | | |
| 5.477%, 7/20/48 | 33,097,876 | 4,910,144 |
| IFB Ser. 18-104, Class SD, IO, ((-1 x 1 Month US LIBOR) + 6.20%), | | |
| 5.427%, 8/20/48 | 45,174,657 | 7,394,143 |
| IFB Ser. 18-100, Class S, IO, ((-1 x 1 Month US LIBOR) + 6.20%), | | |
| 5.427%, 7/20/48 | 38,250,514 | 6,367,640 |
| IFB Ser. 18-89, Class LS, IO, ((-1 x 1 Month US LIBOR) + 6.20%), | | |
| 5.427%, 6/20/48 | 29,055,511 | 4,255,861 |
| IFB Ser. 18-67, Class SC, IO, ((-1 x 1 Month US LIBOR) + 6.20%), | | |
| 5.427%, 5/20/48 | 30,421,966 | 4,474,132 |
| IFB Ser. 17-160, Class S, IO, ((-1 x 1 Month US LIBOR) + 6.20%), | | |
| 5.427%, 10/20/43 | 38,371,125 | 7,180,542 |
| IFB Ser. 13-99, Class VS, IO, ((-1 x 1 Month US LIBOR) + 6.10%), | | |
| 5.395%, 7/16/43 | 7,690,269 | 1,345,797 |
|
| Diversified Income Trust 21 |
| | |
| | Principal | |
| MORTGAGE-BACKED SECURITIES (33.7%)*cont. | amount | Value |
| Agency collateralized mortgage obligationscont. | | |
| Government National Mortgage Association | | |
| IFB Ser. 13-129, Class SN, IO, ((-1 x 1 Month US LIBOR) + 6.15%), | | |
| 5.377%, 9/20/43 | $6,804,557 | $1,301,371 |
| IFB Ser. 16-77, Class SL, IO, ((-1 x 1 Month US LIBOR) + 6.15%), | | |
| 5.377%, 3/20/43 | 2,733,024 | 313,764 |
| IFB Ser. 13-152, Class SJ, IO, ((-1 x 1 Month US LIBOR) + 6.15%), | | |
| 5.377%, 5/20/41 | 28,764,902 | 5,788,315 |
| IFB Ser. 10-20, Class SC, IO, ((-1 x 1 Month US LIBOR) + 6.15%), | | |
| 5.377%, 2/20/40 | 7,453,843 | 1,388,278 |
| IFB Ser. 19-96, Class SY, IO, ((-1 x 1 Month US LIBOR) + 6.10%), | | |
| 5.327%, 8/20/49 | 4,550,631 | 691,150 |
| IFB Ser. 19-83, Class SY, IO, ((-1 x 1 Month US LIBOR) + 6.10%), | | |
| 5.327%, 7/20/49 | 5,316,836 | 721,069 |
| IFB Ser. 18-164, Class AS, IO, ((-1 x 1 Month US LIBOR) + 6.10%), | | |
| 5.327%, 12/20/48 | 68,909,347 | 10,574,812 |
| IFB Ser. 16-77, Class SC, IO, ((-1 x 1 Month US LIBOR) + 6.10%), | | |
| 5.327%, 10/20/45 | 24,262,789 | 5,186,479 |
| IFB Ser. 14-58, Class SA, IO, ((-1 x 1 Month US LIBOR) + 6.10%), | | |
| 5.327%, 4/20/44 | 8,500,025 | 1,741,177 |
| IFB Ser. 14-60, Class SE, IO, ((-1 x 1 Month US LIBOR) + 6.10%), | | |
| 5.327%, 4/20/44 | 12,517,993 | 2,273,280 |
| IFB Ser. 14-46, Class SA, IO, ((-1 x 1 Month US LIBOR) + 6.10%), | | |
| 5.327%, 3/20/44 | 13,695,793 | 2,811,917 |
| IFB Ser. 14-4, Class SG, IO, ((-1 x 1 Month US LIBOR) + 6.10%), | | |
| 5.327%, 1/20/44 | 24,258,415 | 4,490,194 |
| IFB Ser. 13-182, Class SY, IO, ((-1 x 1 Month US LIBOR) + 6.10%), | | |
| 5.327%, 12/20/43 | 9,131,378 | 1,947,422 |
| IFB Ser. 20-7, Class SK, IO, ((-1 x 1 Month US LIBOR) + 6.05%), | | |
| 5.277%, 1/20/50 | 53,707,009 | 10,254,907 |
| IFB Ser. 19-125, Class SG, IO, ((-1 x 1 Month US LIBOR) + 6.05%), | | |
| 5.277%, 10/20/49 | 12,872,259 | 3,669,675 |
| IFB Ser. 19-99, Class KS, IO, ((-1 x 1 Month US LIBOR) + 6.05%), | | |
| 5.277%, 8/20/49 | 9,252,872 | 1,190,987 |
| IFB Ser. 19-78, Class SJ, IO, ((-1 x 1 Month US LIBOR) + 6.05%), | | |
| 5.277%, 6/20/49 | 12,140,762 | 1,575,989 |
| IFB Ser. 19-89, Class JS, IO, ((-1 x 1 Month US LIBOR) + 6.05%), | | |
| 5.277%, 4/20/49 | 1,804,216 | 269,083 |
| IFB Ser. 20-15, Class CS, IO, ((-1 x 1 Month US LIBOR) + 6.05%), | | |
| 5.277%, 12/2/21 | 15,850,492 | 2,025,375 |
| Ser. 19-119, Class IN, IO, 5.00%, 9/20/49 | 54,255,975 | 6,928,350 |
| Ser. 18-37, IO, 5.00%, 3/20/48 | 19,335,660 | 2,808,399 |
| Ser. 17-179, Class WI, IO, 5.00%, 12/20/47 | 10,408,266 | 1,863,445 |
| Ser. 17-38, Class DI, IO, 5.00%, 3/16/47 | 8,452,526 | 1,468,626 |
| Ser. 16-126, Class PI, IO, 5.00%, 2/20/46 | 15,895,071 | 2,761,769 |
| Ser. 18-127, Class ID, IO, 5.00%, 7/20/45 | 15,270,665 | 1,880,797 |
| Ser. 15-167, Class MI, IO, 5.00%, 6/20/45 | 26,886,747 | 4,730,750 |
| Ser. 18-127, Class IC, IO, 5.00%, 10/20/44 | 3,521,945 | 651,422 |
| Ser. 14-132, IO, 5.00%, 9/20/44 | 10,609,372 | 1,926,679 |
| Ser. 14-163, Class NI, IO, 5.00%, 2/20/44 | 11,081,272 | 1,687,692 |
| Ser. 13-3, Class IT, IO, 5.00%, 1/20/43 | 4,178,496 | 772,880 |
| Ser. 12-146, IO, 5.00%, 12/20/42 | 7,538,985 | 1,375,865 |
| |
| 22 Diversified Income Trust |
| | |
| | Principal | |
| MORTGAGE-BACKED SECURITIES (33.7%)*cont. | amount | Value |
| Agency collateralized mortgage obligationscont. | | |
| Government National Mortgage Association | | |
| Ser. 10-35, Class UI, IO, 5.00%, 3/20/40 | $30,482,527 | $5,586,389 |
| Ser. 10-20, Class UI, IO, 5.00%, 2/20/40 | 9,558,095 | 1,771,869 |
| Ser. 10-9, Class UI, IO, 5.00%, 1/20/40 | 46,151,788 | 8,510,080 |
| Ser. 09-121, Class UI, IO, 5.00%, 12/20/39 | 28,767,282 | 5,142,152 |
| Ser. 17-26, Class MI, IO, 5.00%, 11/20/39 | 2,083,852 | 380,961 |
| Ser. 15-105, Class LI, IO, 5.00%, 10/20/39 | 14,502,659 | 2,501,709 |
| Ser. 15-79, Class GI, IO, 5.00%, 10/20/39 | 12,887,391 | 2,386,896 |
| IFB Ser. 14-119, Class SA, IO, ((-1 x 1 Month US LIBOR) + 5.60%), | | |
| 4.827%, 8/20/44 | 21,361,471 | 3,634,941 |
| Ser. 18-94, Class AI, IO, 4.50%, 7/20/48 | 4,847,584 | 604,651 |
| Ser. 17-160, Class AI, IO, 4.50%, 10/20/47 | 13,946,516 | 2,244,887 |
| Ser. 18-127, Class IB, IO, 4.50%, 6/20/45 | 7,232,072 | 627,439 |
| Ser. 16-17, Class IA, IO, 4.50%, 3/20/45 | 18,427,402 | 2,943,280 |
| Ser. 13-182, Class IQ, IO, 4.50%, 12/16/43 | 11,695,448 | 1,948,879 |
| Ser. 13-34, Class IH, IO, 4.50%, 3/20/43 | 12,762,756 | 1,753,906 |
| Ser. 13-183, Class JI, IO, 4.50%, 2/16/43 | 10,648,745 | 931,624 |
| Ser. 14-108, Class IP, IO, 4.50%, 12/20/42 | 2,592,268 | 230,271 |
| Ser. 17-42, Class IC, IO, 4.50%, 8/20/41 | 15,308,420 | 2,800,571 |
| Ser. 13-167, IO, 4.50%, 9/20/40 | 5,280,888 | 888,866 |
| Ser. 10-35, Class AI, IO, 4.50%, 3/20/40 | 7,487,836 | 711,941 |
| Ser. 10-35, Class QI, IO, 4.50%, 3/20/40 | 21,705,775 | 3,402,728 |
| Ser. 10-20, Class BI, IO, 4.50%, 2/16/40 | 15,686,250 | 2,774,584 |
| Ser. 10-9, Class QI, IO, 4.50%, 1/20/40 | 11,381,317 | 1,861,915 |
| Ser. 14-71, Class PI, IO, 4.50%, 12/20/39 | 14,645,037 | 1,629,260 |
| Ser. 16-138, Class DI, IO, 4.00%, 10/20/46 | 16,525,307 | 2,091,443 |
| Ser. 15-89, Class IP, IO, 4.00%, 2/20/45 | 33,996,067 | 3,416,669 |
| Ser. 15-64, Class YI, IO, 4.00%, 11/20/44 | 20,696,909 | 2,315,570 |
| Ser. 15-79, Class MI, IO, 4.00%, 5/20/44 | 7,539,787 | 670,254 |
| Ser. 14-4, Class BI, IO, 4.00%, 1/20/44 | 11,242,407 | 1,924,269 |
| Ser. 14-4, Class IC, IO, 4.00%, 1/20/44 | 9,596,781 | 1,315,608 |
| Ser. 14-163, Class PI, IO, 4.00%, 10/20/43 | 8,384,633 | 402,228 |
| Ser. 13-165, Class IL, IO, 4.00%, 3/20/43 | 6,370,156 | 814,943 |
| Ser. 13-27, Class IJ, IO, 4.00%, 2/20/43 | 7,101,464 | 940,944 |
| Ser. 13-24, Class PI, IO, 4.00%, 11/20/42 | 3,732,390 | 391,775 |
| Ser. 12-106, Class QI, IO, 4.00%, 7/20/42 | 11,334,494 | 1,521,962 |
| Ser. 12-56, Class IB, IO, 4.00%, 4/20/42 | 4,239,568 | 633,075 |
| Ser. 12-8, Class PI, IO, 4.00%, 5/20/41 | 13,461,365 | 1,228,530 |
| Ser. 19-110, Class PI, IO, 3.50%, 9/20/49 | 48,980,354 | 3,110,252 |
| Ser. 18-21, Class AI, IO, 3.50%, 2/20/48 | 12,756,442 | 471,086 |
| Ser. 17-139, Class IG, IO, 3.50%, 9/20/47 | 10,853,760 | 569,822 |
| Ser. 16-156, Class PI, IO, 3.50%, 11/20/46 | 25,486,313 | 670,927 |
| Ser. 16-79, IO, 3.50%, 6/20/46 | 20,378,266 | 1,477,424 |
| Ser. 15-131, Class CI, IO, 3.50%, 9/20/45 | 20,695,663 | 1,317,999 |
| Ser. 15-131, Class MI, IO, 3.50%, 9/20/45 | 32,528,456 | 2,624,253 |
| Ser. 16-75, Class EI, IO, 3.50%, 8/20/45 | 35,339,286 | 2,418,706 |
| Ser. 13-102, Class IP, IO, 3.50%, 6/20/43 | 7,384,770 | 236,440 |
| Ser. 13-76, IO, 3.50%, 5/20/43 | 22,682,231 | 2,395,697 |
| Ser. 15-168, Class IG, IO, 3.50%, 3/20/43 | 17,751,485 | 1,551,667 |
|
| Diversified Income Trust 23 |
| | |
| | Principal | |
| MORTGAGE-BACKED SECURITIES (33.7%)*cont. | amount | Value |
| Agency collateralized mortgage obligationscont. | | |
| Government National Mortgage Association | | |
| Ser. 13-28, IO, 3.50%, 2/20/43 | $6,139,970 | $613,278 |
| Ser. 13-54, Class JI, IO, 3.50%, 2/20/43 | 14,461,968 | 1,373,887 |
| Ser. 13-37, Class JI, IO, 3.50%, 1/20/43 | 14,189,755 | 1,339,229 |
| Ser. 13-27, Class PI, IO, 3.50%, 12/20/42 | 6,312,708 | 583,925 |
| Ser. 12-140, Class IC, IO, 3.50%, 11/20/42 | 27,483,178 | 3,648,062 |
| Ser. 12-128, Class IA, IO, 3.50%, 10/20/42 | 20,185,863 | 2,987,394 |
| Ser. 12-92, Class AI, IO, 3.50%, 4/20/42 | 6,925,716 | 236,044 |
| Ser. 18-127, Class IA, IO, 3.50%, 4/20/42 | 11,898,870 | 773,426 |
| Ser. 13-37, Class LI, IO, 3.50%, 1/20/42 | 16,899,501 | 1,167,570 |
| Ser. 15-131, Class BI, IO, 3.50%, 6/20/41 | 18,818,262 | 690,580 |
| Ser. 15-52, Class KI, IO, 3.50%, 11/20/40 | 24,971,127 | 1,912,364 |
| Ser. 15-17, Class LI, IO, 3.50%, 5/16/40 | 16,175,718 | 842,107 |
| Ser. 13-79, Class XI, IO, 3.50%, 11/20/39 | 20,524,562 | 1,090,981 |
| Ser. 15-134, Class LI, IO, 3.50%, 5/20/39 | 11,680,954 | 494,971 |
| Ser. 12-48, Class AI, IO, 3.50%, 2/20/36 | 5,997,523 | 256,482 |
| Ser. 15-H10, Class BI, IO, 2.807%, 4/20/65 W | 35,627,390 | 3,045,999 |
| Ser. 15-H15, Class BI, IO, 2.721%, 6/20/65 W | 70,135,928 | 5,819,038 |
| Ser. 16-H17, Class KI, IO, 2.718%, 7/20/66 W | 27,769,365 | 2,805,122 |
| Ser. 15-H18, Class BI, IO, 2.644%, 7/20/65 W | 40,008,826 | 3,208,708 |
| Ser. 16-H23, Class NI, IO, 2.51%, 10/20/66 W | 109,455,228 | 9,391,258 |
| Ser. 17-H03, Class EI, IO, 2.483%, 1/20/67 W | 29,771,714 | 4,051,484 |
| Ser. 17-H16, Class JI, IO, 2.469%, 8/20/67 W | 42,860,477 | 5,485,841 |
| Ser. 17-H02, Class BI, IO, 2.466%, 1/20/67 W | 24,718,385 | 2,582,256 |
| Ser. 16-H22, Class AI, IO, 2.431%, 10/20/66 W | 47,365,367 | 4,735,163 |
| Ser. 17-H16, IO, 2.421%, 8/20/67 W | 40,154,397 | 5,135,948 |
| Ser. 17-H06, Class BI, IO, 2.409%, 2/20/67 W | 57,361,962 | 6,115,175 |
| Ser. 17-H18, Class FI, IO, 2.407%, 9/20/67 W | 45,044,289 | 5,905,802 |
| Ser. 16-H16, Class EI, IO, 2.403%, 6/20/66 W | 41,360,762 | 3,403,991 |
| Ser. 16-H04, Class HI, IO, 2.382%, 7/20/65 W | 58,150,109 | 3,913,502 |
| Ser. 18-H02, Class EI, IO, 2.375%, 1/20/68 W | 86,788,385 | 10,089,150 |
| Ser. 18-H01, IO, 2.375%, 12/20/67 W | 29,509,896 | 3,180,843 |
| Ser. 18-H02, Class HI, IO, 2.347%, 1/20/68 W | 72,811,095 | 8,646,318 |
| Ser. 15-H24, Class AI, IO, 2.347%, 9/20/65 W | 34,629,718 | 2,909,000 |
| Ser. 18-H01, Class XI, IO, 2.336%, 1/20/68 W | 42,817,237 | 5,876,623 |
| Ser. 18-H03, Class XI, IO, 2.319%, 2/20/68 W | 101,564,038 | 9,760,304 |
| Ser. 17-H11, Class TI, IO, 2.318%, 4/20/67 W | 32,749,564 | 3,494,346 |
| Ser. 17-H20, Class HI, IO, 2.303%, 10/20/67 W | 40,956,181 | 4,972,572 |
| Ser. 16-H24, Class JI, IO, 2.302%, 11/20/66 W | 23,324,198 | 2,716,522 |
| Ser. 17-H05, Class CI, IO, 2.27%, 2/20/67 W | 33,597,489 | 3,984,259 |
| Ser. 17-H06, Class MI, IO, 2.246%, 2/20/67 W | 48,154,401 | 4,684,749 |
| Ser. 15-H20, Class BI, IO, 2.215%, 8/20/65 W | 47,043,191 | 3,645,848 |
| Ser. 16-H08, Class AI, IO, 2.20%, 8/20/65 W | 50,546,289 | 3,396,003 |
| Ser. 17-H12, Class QI, IO, 2.169%, 5/20/67 W | 52,044,934 | 5,440,778 |
| Ser. 16-H27, Class EI, IO, 2.028%, 12/20/66 W | 40,487,048 | 3,595,210 |
| Ser. 15-H23, Class DI, IO, 1.929%, 9/20/65 W | 35,921,080 | 2,949,516 |
| Ser. 15-H12, Class AI, IO, 1.923%, 5/20/65 W | 81,322,323 | 6,012,647 |
| Ser. 15-H15, Class AI, IO, 1.888%, 6/20/65 W | 45,494,691 | 3,403,003 |
| Ser. 17-H11, Class DI, IO, 1.884%, 5/20/67 W | 32,208,115 | 3,347,196 |
| |
| 24 Diversified Income Trust |
| | |
| | Principal | |
| MORTGAGE-BACKED SECURITIES (33.7%)*cont. | amount | Value |
| Agency collateralized mortgage obligationscont. | | |
| Government National Mortgage Association | | |
| FRB Ser. 15-H08, Class CI, IO, 1.862%, 3/20/65 W | $60,486,508 | $4,450,295 |
| Ser. 18-H15, Class EI, IO, 1.857%, 8/20/68 W | 78,948,706 | 5,289,563 |
| Ser. 17-H06, Class DI, IO, 1.838%, 2/20/67 W | 33,815,130 | 2,123,590 |
| Ser. 17-H09, IO, 1.818%, 4/20/67 W | 47,164,177 | 4,252,086 |
| Ser. 15-H23, Class BI, IO, 1.81%, 9/20/65 W | 69,675,958 | 4,410,488 |
| Ser. 15-H03, Class CI, IO, 1.782%, 1/20/65 W | 67,379,997 | 4,763,362 |
| Ser. 14-H25, Class BI, IO, 1.755%, 12/20/64 W | 47,891,812 | 3,385,567 |
| Ser. 16-H14, IO, 1.745%, 6/20/66 W | 47,980,014 | 3,222,386 |
| Ser. 16-H18, IO, 1.719%, 8/20/66 W | 52,199,128 | 3,466,596 |
| Ser. 16-H12, Class AI, IO, 1.719%, 7/20/65 W | 52,665,934 | 3,606,142 |
| Ser. 17-H10, Class MI, IO, 1.715%, 4/20/67 W | 93,963,512 | 6,840,544 |
| Ser. 17-H08, Class NI, IO, 1.715%, 3/20/67 W | 60,536,422 | 4,921,611 |
| Ser. 16-H06, Class CI, IO, 1.656%, 2/20/66 W | 43,453,287 | 2,771,668 |
| Ser. 15-H01, Class BI, IO, 1.626%, 1/20/65 W | 37,127,961 | 2,317,527 |
| Ser. 17-H03, Class HI, IO, 1.562%, 1/20/67 W | 77,014,017 | 4,831,398 |
| Ser. 14-H06, Class BI, IO, 1.535%, 2/20/64 W | 42,853,979 | 1,957,098 |
| Ser. 12-H29, Class AI, IO, 1.506%, 10/20/62 W | 22,871,814 | 691,872 |
| Ser. 12-H29, Class FI, IO, 1.506%, 10/20/62 W | 22,871,814 | 691,872 |
| Ser. 18-H04, IO, 1.463%, 2/20/68 W | 52,760,890 | 5,923,782 |
| Ser. 18-H05, Class BI, IO, 1.364%, 2/20/68 W | 81,336,478 | 9,455,366 |
| Ser. 18-H05, Class AI, IO, 1.329%, 2/20/68 W | 63,851,529 | 7,502,555 |
| Ser. 06-36, Class OD, PO, zero %, 7/16/36 | 8,263 | 7,382 |
| | | 641,247,184 |
| Commercial mortgage-backed securities (5.9%) | | |
| Banc of America Merrill Lynch Commercial Mortgage, Inc. | | |
| FRB Ser. 05-1, Class B, 5.482%, 11/10/42 W | 5,406,396 | 4,865,756 |
| FRB Ser. 05-1, Class C, 5.482%, 11/10/42 W | 8,629,000 | 3,451,600 |
| Bear Stearns Commercial Mortgage Securities Trust | | |
| FRB Ser. 07-T26, Class AJ, 5.437%, 1/12/45 W | 483,000 | 338,100 |
| Ser. 05-PWR7, Class B, 5.117%, 2/11/41 W | 116,423 | 115,259 |
| Ser. 05-PWR7, Class C, 5.117%, 2/11/41 W | 4,945,000 | 5,287,437 |
| Ser. 05-PWR7, Class D, 5.117%, 2/11/41 W | 4,190,000 | 3,771,000 |
| Bear Stearns Commercial Mortgage Securities Trust 144A | | |
| FRB Ser. 06-PW11, Class C, 5.749%, 3/11/39 (In default) †W | 4,050,658 | 202,533 |
| FRB Ser. 07-T28, Class D, 5.349%, 9/11/42 W | 4,680,000 | 2,517,746 |
| CFCRE Commercial Mortgage Trust 144A FRB Ser. 11-C2, Class E, | | |
| 5.744%, 12/15/47 W | 13,980,000 | 12,715,620 |
| COMM Mortgage Trust 144A | | |
| FRB Ser. 14-CR17, Class E, 4.848%, 5/10/47 W | 226,000 | 181,116 |
| FRB Ser. 12-CR3, Class E, 4.752%, 10/15/45 W | 7,769,000 | 5,826,750 |
| Ser. 12-LC4, Class E, 4.25%, 12/10/44 | 10,009,000 | 7,803,677 |
| FRB Ser. 13-CR9, Class D, 4.245%, 7/10/45 W | 5,143,000 | 2,952,853 |
| Credit Suisse Commercial Mortgage Trust FRB Ser. 06-C5, Class AX, | | |
| IO, 0.675%, 12/15/39 W | 9,229,584 | 41,395 |
| Credit Suisse Commercial Mortgage Trust 144A | | |
| FRB Ser. 07-C4, Class C, 5.719%, 9/15/39 W | 168,163 | 166,145 |
| FRB Ser. 08-C1, Class AJ, 5.61%, 2/15/41 W | 10,781,406 | 4,959,447 |
|
| Diversified Income Trust 25 |
| | |
| | Principal | |
| MORTGAGE-BACKED SECURITIES (33.7%)*cont. | amount | Value |
| Commercial mortgage-backed securitiescont. | | |
| Crest, Ltd. 144A Ser. 03-2A, Class E2, 8.00%, 12/28/38 | | |
| (Cayman Islands) | $769,291 | $771,898 |
| CSAIL Commercial Mortgage Trust 144A FRB Ser. 15-C1, Class D, | | |
| 3.771%, 4/15/50 W | 6,587,000 | 5,491,917 |
| Federal National Mortgage Association 144A Multifamily | | |
| Connecticut Avenue Securities Trust FRB Ser. 20-01, Class M10, | | |
| 4.65%, 3/25/50 | 12,088,000 | 8,501,532 |
| GS Mortgage Securities Trust 144A FRB Ser. 14-GC24, Class D, | | |
| 4.532%, 9/10/47 W | 17,168,000 | 11,803,364 |
| JPMBB Commercial Mortgage Securities Trust 144A | | |
| FRB Ser. 14-C18, Class D, 4.804%, 2/15/47 W | 11,861,000 | 8,125,806 |
| FRB Ser. 14-C18, Class E, 4.304%, 2/15/47 W | 7,852,000 | 4,826,954 |
| FRB Ser. 14-C25, Class D, 3.946%, 11/15/47 W | 10,691,000 | 6,617,932 |
| Ser. 14-C25, Class E, 3.332%, 11/15/47 W | 15,725,000 | 7,530,293 |
| JPMorgan Chase Commercial Mortgage Securities Trust FRB | | |
| Ser. 13-LC11, Class D, 4.168%, 4/15/46 W | 431,000 | 350,766 |
| JPMorgan Chase Commercial Mortgage Securities Trust 144A FRB | | |
| Ser. 13-LC11, Class E, 3.25%, 4/15/46 W | 13,371,809 | 8,821,730 |
| Mezz Cap Commercial Mortgage Trust 144A FRB Ser. 07-C5, Class X, | | |
| IO, 5.395%, 12/15/49 W | 570,266 | 6 |
| Morgan Stanley Bank of America Merrill Lynch Trust 144A | | |
| FRB Ser. 13-C11, Class D, 4.353%, 8/15/46 W | 650,000 | 337,587 |
| FRB Ser. 13-C10, Class F, 4.083%, 7/15/46 W | 254,000 | 179,713 |
| Ser. 14-C17, Class E, 3.50%, 8/15/47 | 9,096,000 | 5,074,541 |
| Morgan Stanley Capital I Trust | | |
| Ser. 07-HQ11, Class C, 5.558%, 2/12/44 W | 5,559,616 | 1,111,924 |
| Ser. 06-HQ10, Class B, 5.448%, 11/12/41 W | 3,862,129 | 3,807,750 |
| Morgan Stanley Capital I Trust 144A FRB Ser. 12-C4, Class E, | | |
| 5.419%, 3/15/45 W | 7,066,000 | 5,185,737 |
| TIAA Real Estate CDO, Ltd. 144A Ser. 03-1A, Class E, 8.00%, | | |
| 12/28/38 (In default) † | 4,414,162 | 106,823 |
| UBS-Barclays Commercial Mortgage Trust 144A | | |
| Ser. 12-C2, Class F, 4.888%, 5/10/63 W | 6,847,000 | 1,224,490 |
| Ser. 13-C6, Class E, 3.50%, 4/10/46 | 8,520,000 | 5,796,386 |
| Wells Fargo Commercial Mortgage Trust 144A | | |
| FRB Ser. 13-LC12, Class D, 4.283%, 7/15/46 W | 14,132,111 | 10,234,308 |
| Ser. 14-LC16, Class D, 3.938%, 8/15/50 | 11,010,000 | 6,777,064 |
| WF-RBS Commercial Mortgage Trust 144A | | |
| Ser. 11-C3, Class E, 5.00%, 3/15/44 W | 8,644,000 | 5,788,878 |
| FRB Ser. 12-C9, Class E, 4.811%, 11/15/45 W | 5,985,000 | 4,408,563 |
| FRB Ser. 13-C15, Class D, 4.494%, 8/15/46 W | 22,811,996 | 14,395,590 |
| FRB Ser. 12-C10, Class D, 4.429%, 12/15/45 W | 21,439,000 | 17,025,370 |
| | | 199,493,356 |
| Residential mortgage-backed securities (non-agency) (8.7%) | | |
| American Home Mortgage Investment Trust FRB Ser. 07-1, | | |
| Class GA1C, (1 Month US LIBOR + 0.19%), 1.817%, 5/25/47 | 9,241,476 | 4,686,532 |
| BCAP, LLC Trust 144A FRB Ser. 11-RR3, Class 3A6, 3.76%, 11/27/36 W | 9,087,435 | 7,269,948 |
| Bear Stearns Alt-A Trust | | |
| FRB Ser. 05-7, Class 21A1, 4.253%, 9/25/35 W | 2,534,782 | 2,148,799 |
| FRB Ser. 05-8, Class 21A1, 3.762%, 10/25/35 W | 98,055 | 82,978 |
| |
| 26 Diversified Income Trust |
| | |
| | Principal | |
| MORTGAGE-BACKED SECURITIES (33.7%)*cont. | amount | Value |
| Residential mortgage-backed securities (non-agency)cont. | | |
| Bear Stearns Mortgage Funding Trust FRB Ser. 06-AR2, Class 2A1, | | |
| (1 Month US LIBOR + 0.23%), 1.177%, 9/25/46 | $5,376,185 | $5,187,518 |
| Bellemeade Re, Ltd. 144A | | |
| FRB Ser. 17-1, Class B1, (1 Month US LIBOR + 4.75%), 5.697%, | | |
| 10/25/27 (Bermuda) | 2,376,000 | 1,646,288 |
| FRB Ser. 19-4A, Class B1, (1 Month US LIBOR + 3.85%), 4.797%, | | |
| 10/25/29 (Bermuda) | 3,034,000 | 2,060,082 |
| FRB Ser. 18-2A, Class B1, (1 Month US LIBOR + 2.65%), 3.597%, | | |
| 8/25/28 (Bermuda) | 730,000 | 572,045 |
| Chevy Chase Funding, LLC Mortgage-Backed Certificates | | |
| 144A FRB Ser. 06-4A, Class A2, (1 Month US LIBOR + 0.18%), | | |
| 1.127%, 11/25/47 | 3,764,388 | 2,823,910 |
| Citigroup Mortgage Loan Trust, Inc. | | |
| FRB Ser. 07-AMC3, Class A2D, (1 Month US LIBOR + 0.35%), | | |
| 1.297%, 3/25/37 | 10,042,683 | 8,156,897 |
| FRB Ser. 07-AMC3, Class A2B, (1 Month US LIBOR + 0.18%), | | |
| 1.127%, 3/25/37 | 1,385,872 | 1,105,672 |
| Countrywide Alternative Loan Trust | | |
| FRB Ser. 06-OA10, Class 1A1, (1 Month US LIBOR + 0.96%), | | |
| 2.926%, 8/25/46 | 3,727,334 | 3,185,462 |
| FRB Ser. 06-OA7, Class 1A2, (1 Month US LIBOR + 0.94%), | | |
| 2.906%, 6/25/46 | 8,955,350 | 7,328,023 |
| FRB Ser. 06-OA7, Class 1A1, 2.852%, 6/25/46 W | 2,719,030 | 2,102,626 |
| FRB Ser. 05-38, Class A3, (1 Month US LIBOR + 0.35%), | | |
| 1.297%, 9/25/35 | 889,585 | 730,229 |
| FRB Ser. 06-OA10, Class 2A1, (1 Month US LIBOR + 0.19%), | | |
| 1.137%, 8/25/46 | 3,373,301 | 3,204,637 |
| FRB Ser. 06-OA10, Class 3A1, (1 Month US LIBOR + 0.19%), | | |
| 1.137%, 8/25/46 | 5,831,224 | 4,548,355 |
| FRB Ser. 06-OA10, Class 4A1, (1 Month US LIBOR + 0.19%), | | |
| 1.137%, 8/25/46 | 11,935,494 | 9,755,254 |
| FRB Ser. 05-59, Class 1A1, (1 Month US LIBOR + 0.33%), | | |
| 1.103%, 11/20/35 | 16,452,025 | 13,378,125 |
| Deutsche Alt-A Securities Mortgage Loan Trust FRB Ser. 06-AR4, | | |
| Class A2, (1 Month US LIBOR + 0.19%), 1.137%, 12/25/36 | 10,177,455 | 5,339,347 |
| Eagle Re, Ltd. 144A FRB Ser. 20-1, Class B1, (1 Month US LIBOR | | |
| + 2.85%), 4.926%, 1/25/30 | 686,000 | 424,416 |
| Federal Home Loan Mortgage Corporation | | |
| Structured Agency Credit Risk Debt FRN Ser. 15-HQA2, Class B, | | |
| (1 Month US LIBOR + 10.50%), 11.447%, 5/25/28 | 6,319,569 | 4,124,310 |
| Structured Agency Credit Risk Debt FRN Ser. 16-DNA1, Class B, | | |
| (1 Month US LIBOR + 10.00%), 10.947%, 7/25/28 | 2,094,768 | 1,351,351 |
| Structured Agency Credit Risk Debt FRN Ser. 15-DNA3, Class B, | | |
| (1 Month US LIBOR + 9.35%), 10.297%, 4/25/28 | 10,616,412 | 6,875,437 |
| Structured Agency Credit Risk Debt FRN Ser. 15-DNA2, Class B, | | |
| (1 Month US LIBOR + 7.55%), 8.497%, 12/25/27 | 11,187,197 | 7,280,533 |
| Structured Agency Credit Risk Debt FRN Ser. 17-DNA2, Class B1, | | |
| (1 Month US LIBOR + 5.15%), 6.097%, 10/25/29 | 1,935,000 | 1,044,978 |
| Structured Agency Credit Risk Debt FRN Ser. 16-HQA2, Class M3, | | |
| (1 Month US LIBOR + 5.15%), 6.097%, 11/25/28 | 2,950,000 | 2,831,060 |
| Structured Agency Credit Risk Debt FRN Ser. 17-DNA1, Class B1, | | |
| (1 Month US LIBOR + 4.95%), 5.897%, 7/25/29 | 3,062,000 | 1,672,141 |
|
| Diversified Income Trust 27 |
| | |
| | Principal | |
| MORTGAGE-BACKED SECURITIES (33.7%)*cont. | amount | Value |
| Residential mortgage-backed securities (non-agency)cont. | | |
| Federal Home Loan Mortgage Corporation | | |
| Structured Agency Credit Risk Debt FRN Ser. 14-HQ3, Class M3, | | |
| (1 Month US LIBOR + 4.75%), 5.697%, 10/25/24 | $670,343 | $650,214 |
| Structured Agency Credit Risk Debt FRN Ser. 17-DNA3, Class B1, | | |
| (1 Month US LIBOR + 4.45%), 5.397%, 3/25/30 | 1,590,000 | 820,611 |
| Structured Agency Credit Risk Debt FRN Ser. 16-HQA3, Class M3, | | |
| (1 Month US LIBOR + 3.85%), 4.797%, 3/25/29 | 3,145,000 | 2,990,559 |
| Seasoned Credit Risk Transfer Trust Ser. 19-3, Class M, | | |
| 4.75%, 10/25/58 W | 1,710,000 | 1,473,194 |
| Structured Agency Credit Risk Debt FRN Ser. 15-HQ1, Class M3, | | |
| (1 Month US LIBOR + 3.80%), 4.747%, 3/25/25 | 540,986 | 515,618 |
| Structured Agency Credit Risk Debt FRN Ser. 18-DNA1, Class B1, | | |
| (1 Month US LIBOR + 3.15%), 4.097%, 7/25/30 | 1,547,000 | 749,662 |
| Structured Agency Credit Risk Debt FRN Ser. 18-HQA1, Class M2, | | |
| (1 Month US LIBOR + 2.30%), 3.247%, 9/25/30 | 2,298,998 | 1,949,766 |
| Federal Home Loan Mortgage Corporation 144A | | |
| Structured Agency Credit Risk Trust FRB Ser. 19-HQA1, Class B2, | | |
| (1 Month US LIBOR + 12.25%), 13.197%, 2/25/49 | 570,000 | 228,951 |
| Structured Agency Credit Risk Trust FRB Ser. 19-HQA2, Class B2, | | |
| (1 Month US LIBOR + 11.25%), 12.197%, 4/25/49 | 1,150,000 | 453,682 |
| Structured Agency Credit Risk Trust FRB Ser. 18-HQA2, Class B2, | | |
| (1 Month US LIBOR + 11.00%), 11.947%, 10/25/48 | 2,435,000 | 1,413,834 |
| Structured Agency Credit Risk Trust FRB Ser. 19-DNA1, Class B2, | | |
| (1 Month US LIBOR + 10.75%), 11.697%, 1/25/49 | 2,342,000 | 1,343,154 |
| Structured Agency Credit Risk Trust FRB Ser. 19-DNA2, Class B2, | | |
| (1 Month US LIBOR + 10.50%), 11.447%, 3/25/49 | 2,996,000 | 1,700,824 |
| Structured Agency Credit Risk Trust FRB Ser. 19-DNA3, Class B2, | | |
| (1 Month US LIBOR + 8.15%), 9.097%, 7/25/49 | 1,763,000 | 931,081 |
| Structured Agency Credit Risk Trust FRB Ser. 18-DNA3, Class B2, | | |
| (1 Month US LIBOR + 7.75%), 8.697%, 9/25/48 | 2,911,000 | 1,053,258 |
| Structured Agency Credit Risk Trust FRB Ser. 19-FTR3, | | |
| Class FTR3, (1 Month US LIBOR + 4.80%), 6.427%, 9/25/47 | 1,290,000 | 476,037 |
| Structured Agency Credit Risk Trust FRB Ser. 19-DNA2, Class B1, | | |
| (1 Month US LIBOR + 4.35%), 5.297%, 3/25/49 | 880,000 | 416,580 |
| Structured Agency Credit Risk Trust FRB Ser. 18-HQA2, Class B1, | | |
| (1 Month US LIBOR + 4.25%), 5.197%, 10/25/48 | 1,753,000 | 878,451 |
| Seasoned Credit Risk Transfer Trust Ser. 19-2, Class M, | | |
| 4.75%, 8/25/58 W | 5,008,000 | 3,875,535 |
| Seasoned Credit Risk Transfer Trust Ser. 19-1, Class M, | | |
| 4.75%, 7/25/58 W | 1,850,000 | 1,603,723 |
| Structured Agency Credit Risk Trust FRB Ser. 18-DNA2, Class B1, | | |
| (1 Month US LIBOR + 3.70%), 4.647%, 12/25/30 | 6,635,000 | 3,185,830 |
| Structured Agency Credit Risk Debt FRN Ser. 19-HQA3, Class B1, | | |
| (1 Month US LIBOR + 3.00%), 3.947%, 9/25/49 | 1,146,000 | 510,591 |
| Structured Agency Credit Risk Trust FRB Ser. 19-DNA1, Class M2, | | |
| (1 Month US LIBOR + 2.65%), 3.597%, 1/25/49 | 202,000 | 177,758 |
| Structured Agency Credit Risk Trust FRB Ser. 19-DNA2, Class M2, | | |
| (1 Month US LIBOR + 2.45%), 3.397%, 3/25/49 | 149,128 | 114,147 |
| Structured Agency Credit Risk Trust FRB Ser. 19-HQA1, Class M2, | | |
| (1 Month US LIBOR + 2.35%), 3.297%, 2/25/49 | 56,585 | 47,362 |
| |
| 28 Diversified Income Trust |
| | |
| | Principal | |
| MORTGAGE-BACKED SECURITIES (33.7%)*cont. | amount | Value |
| Residential mortgage-backed securities (non-agency)cont. | | |
| Federal Home Loan Mortgage Corporation 144A | | |
| Structured Agency Credit Risk Trust FRB Ser. 18-HQA2, Class M2, | | |
| (1 Month US LIBOR + 2.30%), 3.247%, 10/25/48 | $644,400 | $529,706 |
| Structured Agency Credit Risk Trust FRB Ser. 18-DNA2, Class M2, | | |
| (1 Month US LIBOR + 2.15%), 3.097%, 12/25/30 | 464,000 | 382,326 |
| Federal National Mortgage Association | | |
| Connecticut Avenue Securities FRB Ser. 16-C02, Class 1B, | | |
| (1 Month US LIBOR + 12.25%), 13.197%, 9/25/28 | 14,125,493 | 9,306,834 |
| Connecticut Avenue Securities FRB Ser. 16-C03, Class 1B, | | |
| (1 Month US LIBOR + 11.75%), 12.697%, 10/25/28 | 7,712,152 | 5,029,601 |
| Connecticut Avenue Securities FRB Ser. 16-C01, Class 1B, | | |
| (1 Month US LIBOR + 11.75%), 12.697%, 8/25/28 | 5,436,843 | 3,570,666 |
| Connecticut Avenue Securities FRB Ser. 16-C05, Class 2B, | | |
| (1 Month US LIBOR + 10.75%), 11.697%, 1/25/29 | 444,850 | 282,178 |
| Connecticut Avenue Securities FRB Ser. 16-C04, Class 1B, | | |
| (1 Month US LIBOR + 10.25%), 11.197%, 1/25/29 | 995,639 | 554,777 |
| Connecticut Avenue Securities FRB Ser. 16-C06, Class 1B, | | |
| (1 Month US LIBOR + 9.25%), 10.197%, 4/25/29 | 3,122,129 | 1,639,646 |
| Connecticut Avenue Securities FRB Ser. 16-C03, Class 2M2, | | |
| (1 Month US LIBOR + 5.90%), 6.847%, 10/25/28 | 714,638 | 700,743 |
| Connecticut Avenue Securities FRB Ser. 15-C04, Class 1M2, | | |
| (1 Month US LIBOR + 5.70%), 6.647%, 4/25/28 | 19,897,964 | 19,644,496 |
| Connecticut Avenue Securities FRB Ser. 17-C02, Class 2B1, | | |
| (1 Month US LIBOR + 5.50%), 6.447%, 9/25/29 | 18,272,300 | 10,267,428 |
| Connecticut Avenue Securities FRB Ser. 16-C03, Class 1M2, | | |
| (1 Month US LIBOR + 5.30%), 6.247%, 10/25/28 | 2,420,320 | 2,356,293 |
| Connecticut Avenue Securities FRB Ser. 15-C03, Class 1M2, | | |
| (1 Month US LIBOR + 5.00%), 5.947%, 7/25/25 | 10,447,486 | 9,924,388 |
| Connecticut Avenue Securities FRB Ser. 15-C03, Class 2M2, | | |
| (1 Month US LIBOR + 5.00%), 5.947%, 7/25/25 | 607,594 | 550,751 |
| Connecticut Avenue Securities FRB Ser. 17-C03, Class 1B1, | | |
| (1 Month US LIBOR + 4.85%), 5.797%, 10/25/29 | 4,947,000 | 2,723,843 |
| Connecticut Avenue Securities FRB Ser. 15-C01, Class 2M2, | | |
| (1 Month US LIBOR + 4.55%), 5.497%, 2/25/25 | 2,240,682 | 2,082,148 |
| Connecticut Avenue Securities FRB Ser. 18-C04, Class 2B1, | | |
| (1 Month US LIBOR + 4.50%), 5.447%, 12/25/30 | 385,000 | 195,820 |
| Connecticut Avenue Securities FRB Ser. 17-C07, Class 2B1, | | |
| (1 Month US LIBOR + 4.45%), 5.397%, 5/25/30 | 1,200,000 | 630,765 |
| Connecticut Avenue Securities FRB Ser. 17-C06, Class 2B1, | | |
| (1 Month US LIBOR + 4.45%), 5.397%, 2/25/30 | 3,018,000 | 1,623,684 |
| Connecticut Avenue Securities FRB Ser. 16-C05, Class 2M2, | | |
| (1 Month US LIBOR + 4.45%), 5.397%, 1/25/29 | 94,459 | 90,153 |
| Connecticut Avenue Securities FRB Ser. 15-C01, Class 1M2, | | |
| (1 Month US LIBOR + 4.30%), 5.247%, 2/25/25 | 175,358 | 170,020 |
| Connecticut Avenue Securities FRB Ser. 18-C05, Class 1B1, | | |
| (1 Month US LIBOR + 4.25%), 5.197%, 1/25/31 | 425,000 | 213,436 |
| Connecticut Avenue Securities FRB Ser. 18-C06, Class 2B1, | | |
| (1 Month US LIBOR + 4.10%), 5.047%, 3/25/31 | 1,624,000 | 804,007 |
| Connecticut Avenue Securities FRB Ser. 18-C02, Class 2B1, | | |
| (1 Month US LIBOR + 4.00%), 4.947%, 8/25/30 | 2,208,000 | 1,127,823 |
| Connecticut Avenue Securities FRB Ser. 17-C07, Class 1B1, | | |
| (1 Month US LIBOR + 4.00%), 4.947%, 5/25/30 | 1,626,000 | 843,714 |
|
| Diversified Income Trust 29 |
| | |
| | Principal | |
| MORTGAGE-BACKED SECURITIES (33.7%)*cont. | amount | Value |
| Residential mortgage-backed securities (non-agency)cont. | | |
| Federal National Mortgage Association | | |
| Connecticut Avenue Securities FRB Ser. 15-C02, Class 1M2, | | |
| (1 Month US LIBOR + 4.00%), 4.947%, 5/25/25 | $575,590 | $556,500 |
| Connecticut Avenue Securities FRB Ser. 15-C02, Class 2M2, | | |
| (1 Month US LIBOR + 4.00%), 4.947%, 5/25/25 | 1,409,481 | 1,284,593 |
| Connecticut Avenue Securities FRB Ser. 18-C06, Class 1B1, | | |
| (1 Month US LIBOR + 3.75%), 4.697%, 3/25/31 | 1,245,000 | 611,423 |
| Connecticut Avenue Securities FRB Ser. 18-C03, Class 1B1, | | |
| (1 Month US LIBOR + 3.75%), 4.697%, 10/25/30 | 500,000 | 248,022 |
| Connecticut Avenue Securities FRB Ser. 17-C05, Class 1B1, | | |
| (1 Month US LIBOR + 3.60%), 4.547%, 1/25/30 | 1,140,000 | 601,534 |
| Connecticut Avenue Securities FRB Ser. 18-C01, Class 1B1, | | |
| (1 Month US LIBOR + 3.55%), 4.497%, 7/25/30 | 7,218,000 | 3,511,290 |
| Connecticut Avenue Securities FRB Ser. 17-C06, Class 2M2, | | |
| (1 Month US LIBOR + 2.80%), 3.747%, 2/25/30 | 4,769,398 | 3,831,354 |
| Connecticut Avenue Securities FRB Ser. 17-C07, Class 2M2, | | |
| (1 Month US LIBOR + 2.50%), 3.447%, 5/25/30 | 1,558,480 | 1,245,055 |
| Connecticut Avenue Securities FRB Ser. 18-C01, Class 1M2, | | |
| (1 Month US LIBOR + 2.25%), 3.197%, 7/25/30 | 82,000 | 70,629 |
| Connecticut Avenue Securities FRB Ser. 18-C02, Class 2M2, | | |
| (1 Month US LIBOR + 2.20%), 3.147%, 8/25/30 | 2,132,505 | 1,776,543 |
| Connecticut Avenue Securities FRB Ser. 18-C06, Class 2M2, | | |
| (1 Month US LIBOR + 2.10%), 3.047%, 3/25/31 | 1,067,912 | 897,031 |
| Federal National Mortgage Association 144A | | |
| Connecticut Avenue Securities Trust FRB Ser. 19-HRP1, Class B1, | | |
| (1 Month US LIBOR + 9.25%), 10.197%, 11/25/39 | 8,200,000 | 4,264,000 |
| Connecticut Avenue Securities Trust FRB Ser. 20-SBT1, | | |
| Class 1B1, (1 Month US LIBOR + 6.75%), 6.75%, 2/25/40 | 1,645,000 | 953,394 |
| Connecticut Avenue Securities FRB Ser. 17-C01, Class 1B1, | | |
| (1 Month US LIBOR + 5.75%), 6.697%, 7/25/29 | 4,084,000 | 2,329,395 |
| Connecticut Avenue Securities Trust FRB Ser. 19-R04, Class 2B1, | | |
| (1 Month US LIBOR + 5.25%), 6.197%, 6/25/39 | 4,367,000 | 1,990,002 |
| Connecticut Avenue Securities Trust FRB Ser. 19-R06, Class 2B1, | | |
| (1 Month US LIBOR + 3.75%), 4.697%, 9/25/39 | 4,134,000 | 1,749,227 |
| Connecticut Avenue Securities Trust FRB Ser. 20-R02, Class 2B1, | | |
| (1 Month US LIBOR + 3.00%), 4.661%, 1/25/40 | 1,483,000 | 600,931 |
| Connecticut Avenue Securities Trust FRB Ser. 20-R01, Class 1B1, | | |
| (1 Month US LIBOR + 3.25%), 4.197%, 1/25/40 | 4,865,000 | 2,619,925 |
| Connecticut Avenue Securities Trust FRB Ser. 19-R01, Class 2M2, | | |
| (1 Month US LIBOR + 2.45%), 3.397%, 7/25/31 | 785,882 | 606,112 |
| GSAA Home Equity Trust FRB Ser. 06-8, Class 2A2, (1 Month | | |
| US LIBOR + 0.18%), 1.127%, 5/25/36 | 10,920,091 | 3,738,088 |
| GSR Mortgage Loan Trust FRB Ser. 07-OA1, Class 2A3A, (1 Month | | |
| US LIBOR + 0.31%), 1.257%, 5/25/37 | 6,641,949 | 5,181,494 |
| HarborView Mortgage Loan Trust FRB Ser. 05-2, Class 1A, (1 Month | | |
| US LIBOR + 0.52%), 1.27%, 5/19/35 | 20,208,657 | 10,115,461 |
| Home Re, Ltd. 144A FRB Ser. 19-1, Class M2, (1 Month US LIBOR | | |
| + 3.25%), 4.197%, 5/25/29 (Bermuda) | 2,000,000 | 1,440,000 |
| JPMorgan Alternative Loan Trust FRB Ser. 07-A2, Class 12A1, IO, | | |
| (1 Month US LIBOR + 0.20%), 1.147%, 6/25/37 | 5,107,798 | 2,179,611 |
| Morgan Stanley Re-REMIC Trust 144A FRB Ser. 10-R4, Class 4B, | | |
| (1 Month US LIBOR + 0.23%), 3.065%, 2/26/37 | 227,848 | 194,736 |
| |
| 30 Diversified Income Trust |
| | |
| | Principal | |
| MORTGAGE-BACKED SECURITIES (33.7%)*cont. | amount | Value |
| Residential mortgage-backed securities (non-agency)cont. | | |
| Oaktown Re II, Ltd. 144A FRB Ser. 18-1A, Class M2, (1 Month | | |
| US LIBOR + 2.85%), 3.797%, 7/25/28 (Bermuda) | $17,300,000 | $12,915,941 |
| Oaktown Re III, Ltd. 144A | | |
| FRB Ser. 19-1A, Class B1B, (1 Month US LIBOR + 4.35%), 5.297%, | | |
| 7/25/29 (Bermuda) | 383,000 | 261,478 |
| FRB Ser. 19-1A, Class B1A, (1 Month US LIBOR + 3.50%), 4.447%, | | |
| 7/25/29 (Bermuda) | 317,000 | 214,704 |
| Oaktown Re, Ltd. 144A FRB Ser. 17-1A, Class M2, (1 Month US LIBOR | | |
| + 4.00%), 4.947%, 4/25/27 (Bermuda) | 1,639,241 | 1,504,008 |
| Structured Asset Mortgage Investments II Trust FRB Ser. 06-AR7, | | |
| Class A1A, (1 Month US LIBOR + 0.21%), 1.157%, 8/25/36 | 11,005,794 | 9,464,983 |
| WaMu Mortgage Pass-Through Certificates Trust | | |
| FRB Ser. 05-AR10, Class 1A3, 4.121%, 9/25/35 W | 391,590 | 344,726 |
| FRB Ser. 05-AR14, Class 1A2, 3.835%, 12/25/35 W | 90,583 | 82,675 |
| FRB Ser. 05-AR13, Class A1C3, (1 Month US LIBOR + 0.49%), | | |
| 1.437%, 10/25/45 | 209,094 | 189,820 |
| Wells Fargo Mortgage Backed Securities Trust FRB Ser. 06-AR5, | | |
| Class 1A1, 4.208%, 4/25/36 W | 177,711 | 183,931 |
| | | 291,481,237 |
| Total mortgage-backed securities (cost $1,348,671,069) | | $1,132,221,777 |
| |
| | Principal | |
| CORPORATE BONDS AND NOTES (18.7%)* | amount | Value |
| Basic materials (2.2%) | | |
| Allegheny Technologies, Inc. sr. unsec. sub. notes 5.875%, 12/1/27 | $190,000 | $158,175 |
| Allegheny Technologies, Inc. sr. unsec. unsub. notes | | |
| 7.875%, 8/15/23 | 2,845,000 | 2,744,600 |
| Axalta Coating Systems, LLC 144A company guaranty sr. unsec. | | |
| unsub. notes 4.875%, 8/15/24 | 1,365,000 | 1,310,400 |
| Beacon Roofing Supply, Inc. 144A company guaranty sr. notes | | |
| 4.50%, 11/15/26 | 765,000 | 705,942 |
| Beacon Roofing Supply, Inc. 144A company guaranty sr. unsec. | | |
| notes 4.875%, 11/1/25 | 487,000 | 439,518 |
| Big River Steel, LLC/BRS Finance Corp. 144A company guaranty sr. | | |
| notes 7.25%, 9/1/25 | 1,651,000 | 1,502,410 |
| BMC East, LLC 144A company guaranty sr. notes 5.50%, 10/1/24 | 3,009,000 | 2,903,685 |
| Boise Cascade Co. 144A company guaranty sr. unsec. notes | | |
| 5.625%, 9/1/24 | 4,267,000 | 4,042,983 |
| Builders FirstSource, Inc. 144A sr. notes 6.75%, 6/1/27 | 1,269,000 | 1,243,620 |
| Cemex Finance, LLC 144A company guaranty sr. notes 6.00%, | | |
| 4/1/24 (Mexico) | 1,300,000 | 1,118,000 |
| Cemex SAB de CV 144A company guaranty sr. notes 6.125%, | | |
| 5/5/25 (Mexico) | 800,000 | 709,992 |
| Cemex SAB de CV 144A company guaranty sr. notes 5.45%, | | |
| 11/19/29 (Mexico) | 1,330,000 | 1,085,280 |
| Cemex SAB de CV 144A company guaranty sr. sub. notes 5.70%, | | |
| 1/11/25 (Mexico) | 1,675,000 | 1,394,438 |
| Chemours Co. (The) company guaranty sr. unsec. notes | | |
| 5.375%, 5/15/27 | 640,000 | 489,504 |
| Chemours Co. (The) company guaranty sr. unsec. unsub. notes | | |
| 7.00%, 5/15/25 | 1,139,000 | 948,218 |
|
| Diversified Income Trust 31 |
| | | |
| | | Principal | |
| CORPORATE BONDS AND NOTES (18.7%)*cont. | | amount | Value |
| Basic materialscont. | | | |
| Compass Minerals International, Inc. 144A company guaranty sr. | | | |
| unsec. notes 6.75%, 12/1/27 | | $2,915,000 | $2,631,516 |
| Compass Minerals International, Inc. 144A company guaranty sr. | | | |
| unsec. notes 4.875%, 7/15/24 | | 85,000 | 79,900 |
| Constellium NV 144A company guaranty sr. unsec. notes 5.875%, | | | |
| 2/15/26 (France) | | 1,400,000 | 1,191,750 |
| First Quantum Minerals, Ltd. 144A company guaranty sr. unsec. | | | |
| notes 6.875%, 3/1/26 (Canada) | | 1,095,000 | 878,738 |
| Freeport-McMoRan, Inc. company guaranty sr. unsec. unsub. | | | |
| notes 5.45%, 3/15/43 (Indonesia) | | 1,119,000 | 1,001,505 |
| GCP Applied Technologies, Inc. 144A sr. unsec. notes | | | |
| 5.50%, 4/15/26 | | 4,461,000 | 4,148,730 |
| Greif, Inc. 144A company guaranty sr. unsec. notes 6.50%, 3/1/27 | | 1,892,000 | 1,814,617 |
| Ingevity Corp. 144A sr. unsec. notes 4.50%, 2/1/26 | | 2,830,000 | 2,646,050 |
| James Hardie International Finance DAC 144A sr. unsec. bonds | | | |
| 5.00%, 1/15/28 (Ireland) | | 1,910,000 | 1,804,950 |
| Joseph T Ryerson & Son, Inc. 144A sr. notes 11.00%, 5/15/22 | | 857,000 | 797,010 |
| Kraton Polymers, LLC/Kraton Polymers Capital Corp. 144A | | | |
| company guaranty sr. unsec. notes 7.00%, 4/15/25 | | 593,000 | 524,805 |
| Louisiana-Pacific Corp. company guaranty sr. unsec. unsub. notes | | | |
| 4.875%, 9/15/24 | | 2,158,000 | 1,861,275 |
| Mauser Packaging Solutions Holding Co. 144A sr. notes | | | |
| 5.50%, 4/15/24 | | 40,000 | 36,800 |
| Mercer International, Inc. sr. unsec. notes 7.375%, | | | |
| 1/15/25 (Canada) | | 298,000 | 248,088 |
| Mercer International, Inc. sr. unsec. notes 6.50%, 2/1/24 (Canada) | | 1,351,000 | 1,148,350 |
| Mercer International, Inc. sr. unsec. notes 5.50%, 1/15/26 (Canada) | | 1,190,000 | 904,222 |
| Novelis Corp. 144A company guaranty sr. unsec. bonds | | | |
| 5.875%, 9/30/26 | | 1,425,000 | 1,398,445 |
| Novelis Corp. 144A company guaranty sr. unsec. notes | | | |
| 4.75%, 1/30/30 | | 494,000 | 439,660 |
| OCI NV 144A company guaranty sr. notes 5.25%, | | | |
| 11/1/24 (Netherlands) | | 755,000 | 715,363 |
| PQ Corp. 144A company guaranty sr. unsec. notes 5.75%, 12/15/25 | | 2,864,000 | 2,577,600 |
| Resideo Funding, Inc. 144A company guaranty sr. unsec. notes | | | |
| 6.125%, 11/1/26 | | 1,390,000 | 1,212,776 |
| Smurfit Kappa Treasury Funding DAC company guaranty sr. unsec. | | | |
| unsub. notes 7.50%, 11/20/25 (Ireland) | | 4,086,000 | 4,882,770 |
| Starfruit Finco BV/Starfruit US Holdco, LLC 144A sr. unsec. notes | | | |
| 8.00%, 10/1/26 (Netherlands) | | 1,365,000 | 1,199,494 |
| Starfruit Finco BV/Starfruit US Holdco, LLC 144A sr. unsec. notes | | | |
| Ser. REGS, 6.50%, 10/1/26 (Netherlands) | EUR | 400,000 | 348,129 |
| Steel Dynamics, Inc. company guaranty sr. unsec. unsub. notes | | | |
| 5.50%, 10/1/24 | | $1,985,000 | 1,929,602 |
| Syngenta Finance NV 144A company guaranty sr. unsec. unsub. | | | |
| notes 5.182%, 4/24/28 (Switzerland) | | 2,765,000 | 2,359,205 |
| Syngenta Finance NV 144A company guaranty sr. unsec. unsub. | | | |
| notes 4.892%, 4/24/25 (Switzerland) | | 2,090,000 | 2,049,219 |
| TopBuild Corp. 144A company guaranty sr. unsec. notes | | | |
| 5.625%, 5/1/26 | | 2,556,000 | 2,351,520 |
| Tronox Finance PLC 144A company guaranty sr. unsec. notes | | | |
| 5.75%, 10/1/25 (United Kingdom) | | 901,000 | 804,143 |
|
| 32 Diversified Income Trust |
| | | |
| | | Principal | |
| CORPORATE BONDS AND NOTES (18.7%)*cont. | | amount | Value |
| Basic materialscont. | | | |
| Tronox, Inc. 144A company guaranty sr. unsec. notes | | | |
| 6.50%, 4/15/26 | | $30,000 | $27,000 |
| U.S. Concrete, Inc. company guaranty sr. unsec. unsub. notes | | | |
| 6.375%, 6/1/24 | | 2,064,000 | 1,862,760 |
| Univar Solutions USA, Inc. 144A company guaranty sr. unsec. notes | | | |
| 5.125%, 12/1/27 | | 2,380,000 | 2,165,800 |
| Valvoline, Inc. 144A company guaranty sr. unsec. unsub. notes | | | |
| 4.25%, 2/15/30 | | 2,775,000 | 2,601,285 |
| WR Grace & Co.- Conn. 144A company guaranty sr. unsec. notes | | | |
| 5.625%, 10/1/24 | | 2,345,000 | 2,309,121 |
| | | | 73,748,963 |
| Capital goods (1.7%) | | | |
| Allison Transmission, Inc. 144A company guaranty sr. unsec. notes | | | |
| 4.75%, 10/1/27 | | 3,649,000 | 3,357,080 |
| Amsted Industries, Inc. 144A company guaranty sr. unsec. sub. | | | |
| notes 5.625%, 7/1/27 | | 65,000 | 63,239 |
| Amsted Industries, Inc. 144A sr. unsec. bonds 4.625%, 5/15/30 | | 1,925,000 | 1,718,063 |
| ARD Finance SA 144A sr. notes Ser. REGS, 6.50%, 6/30/27 | | | |
| (Luxembourg) ‡‡ | | 1,500,000 | 1,288,350 |
| Ardagh Packaging Finance PLC/Ardagh Holdings USA, Inc. 144A | | | |
| company guaranty sr. sub. notes 4.125%, 8/15/26 (Ireland) | | 865,000 | 860,675 |
| Ardagh Packaging Finance PLC/Ardagh Holdings USA, Inc. 144A | | | |
| company guaranty sr. unsec. notes 5.25%, 8/15/27 (Ireland) | | 1,865,000 | 1,911,625 |
| ATS Automation Tooling Systems, Inc. 144A sr. unsec. notes 6.50%, | | | |
| 6/15/23 (Canada) | | 78,000 | 77,025 |
| Berry Global Escrow Corp. 144A notes 5.625%, 7/15/27 | | 45,000 | 46,490 |
| Berry Global Escrow Corp. 144A sr. notes 4.875%, 7/15/26 | | 45,000 | 45,450 |
| Berry Global, Inc. company guaranty unsub. notes 5.125%, 7/15/23 | | 2,010,000 | 2,014,422 |
| Berry Global, Inc. 144A notes 4.50%, 2/15/26 | | 1,990,000 | 1,920,350 |
| Clean Harbors, Inc. 144A sr. unsec. bonds 5.125%, 7/15/29 | | 735,000 | 683,550 |
| Clean Harbors, Inc. 144A sr. unsec. notes 4.875%, 7/15/27 | | 1,290,000 | 1,262,781 |
| Crown Americas, LLC/Crown Americas Capital Corp. VI company | | | |
| guaranty sr. unsec. notes 4.75%, 2/1/26 | | 1,965,000 | 2,013,536 |
| Crown Cork & Seal Co., Inc. company guaranty sr. unsec. bonds | | | |
| 7.375%, 12/15/26 | | 2,765,000 | 2,834,125 |
| GFL Environmental, Inc. 144A sr. notes 5.125%, 12/15/26 (Canada) | | 1,925,000 | 1,876,875 |
| Great Lakes Dredge & Dock Corp. company guaranty sr. unsec. | | | |
| notes 8.00%, 5/15/22 | | 2,685,000 | 2,627,938 |
| Grupo Antolin-Irausa SA company guaranty notes Ser. REGS, | | | |
| 3.25%, 4/30/24 (Spain) | EUR | 500,000 | 354,224 |
| Husky III Holding, Ltd. 144A sr. unsec. notes 13.00%, 2/15/25 | | | |
| (Canada) ‡‡ | | $2,590,000 | 1,902,304 |
| Moog, Inc. 144A company guaranty sr. unsec. notes | | | |
| 4.25%, 12/15/27 | | 785,000 | 708,463 |
| Panther BF Aggregator 2 LP/Panther Finance Co., Inc. 144A | | | |
| company guaranty sr. notes 6.25%, 5/15/26 | | 1,963,000 | 1,855,035 |
| Panther BF Aggregator 2 LP/Panther Finance Co., Inc. 144A | | | |
| company guaranty sr. unsec. notes 8.50%, 5/15/27 | | 1,820,000 | 1,587,768 |
| Park-Ohio Industries, Inc. company guaranty sr. unsec. notes | | | |
| 6.625%, 4/15/27 | | 2,894,000 | 2,287,461 |
|
| Diversified Income Trust 33 |
| | |
| | Principal | |
| CORPORATE BONDS AND NOTES (18.7%)*cont. | amount | Value |
| Capital goodscont. | | |
| RBS Global, Inc./Rexnord, LLC 144A sr. unsec. notes | | |
| 4.875%, 12/15/25 | $1,680,000 | $1,570,800 |
| Staples, Inc. 144A sr. notes 7.50%, 4/15/26 | 2,275,000 | 2,010,531 |
| Stevens Holding Co, Inc. 144A company guaranty sr. unsec. notes | | |
| 6.125%, 10/1/26 | 3,518,000 | 3,475,485 |
| Tennant Co. company guaranty sr. unsec. unsub. notes | | |
| 5.625%, 5/1/25 | 1,791,000 | 1,723,838 |
| Titan Acquisition, Ltd./Titan Co-Borrower, LLC 144A sr. unsec. | | |
| notes 7.75%, 4/15/26 (Canada) | 1,360,000 | 1,135,600 |
| TransDigm, Inc. company guaranty sr. unsec. sub. notes | | |
| 6.375%, 6/15/26 | 2,380,000 | 2,278,851 |
| TransDigm, Inc. 144A company guaranty sr. notes 6.25%, 3/15/26 | 4,134,000 | 4,118,498 |
| TransDigm, Inc. 144A company guaranty sr. unsec. sub. notes | | |
| 5.50%, 11/15/27 | 2,930,000 | 2,629,675 |
| Trivium Packaging Finance BV 144A company guaranty sr. unsec. | | |
| notes 8.50%, 8/15/27 (Netherlands) | 1,195,000 | 1,200,975 |
| Waste Pro USA, Inc. 144A sr. unsec. notes 5.50%, 2/15/26 | 2,656,000 | 2,464,237 |
| | | 55,905,319 |
| Communication services (2.0%) | | |
| Altice Financing SA 144A company guaranty sr. notes 5.00%, | | |
| 1/15/28 (Luxembourg) | 1,240,000 | 1,097,400 |
| Altice France SA 144A company guaranty sr. notes 5.50%, | | |
| 1/15/28 (France) | 820,000 | 772,850 |
| CCO Holdings, LLC/CCO Holdings Capital Corp. 144A company | | |
| guaranty sr. unsec. bonds 5.50%, 5/1/26 | 4,195,000 | 4,257,925 |
| CCO Holdings, LLC/CCO Holdings Capital Corp. 144A sr. unsec. | | |
| bonds 5.375%, 6/1/29 | 13,831,000 | 14,212,736 |
| CCO Holdings, LLC/CCO Holdings Capital Corp. 144A sr. unsec. | | |
| bonds 4.50%, 5/1/32 | 1,420,000 | 1,384,784 |
| CCO Holdings, LLC/CCO Holdings Capital Corp. 144A sr. unsec. | | |
| bonds 4.50%, 8/15/30 | 990,000 | 970,200 |
| CCO Holdings, LLC/CCO Holdings Capital Corp. 144A sr. unsec. | | |
| notes 5.00%, 2/1/28 | 3,292,000 | 3,300,231 |
| CommScope Technologies, LLC 144A company guaranty sr. unsec. | | |
| notes 6.00%, 6/15/25 | 1,573,000 | 1,439,610 |
| CSC Holdings, LLC sr. unsec. unsub. bonds 5.25%, 6/1/24 | 1,965,000 | 1,969,893 |
| CSC Holdings, LLC sr. unsec. unsub. notes 6.75%, 11/15/21 | 1,025,000 | 1,055,750 |
| CSC Holdings, LLC 144A sr. unsec. unsub. notes 7.50%, 4/1/28 | 1,390,000 | 1,480,934 |
| DISH DBS Corp. company guaranty sr. unsec. unsub. notes | | |
| 5.875%, 11/15/24 | 593,000 | 576,693 |
| Equinix, Inc. sr. unsec. notes 5.375%, 5/15/27 R | 76,000 | 75,156 |
| Equinix, Inc. sr. unsec. unsub. notes 5.875%, 1/15/26 R | 25,000 | 25,509 |
| Front Range BidCo., Inc. 144A sr. notes 4.00%, 3/1/27 | 395,000 | 377,719 |
| Front Range BidCo., Inc. 144A sr. unsec. notes 6.125%, 3/1/28 | 1,495,000 | 1,420,250 |
| Frontier Communications Corp. 144A company guaranty notes | | |
| 8.50%, 4/1/26 | 829,000 | 760,608 |
| Level 3 Financing, Inc. company guaranty sr. unsec. unsub. notes | | |
| 5.625%, 2/1/23 | 51,000 | 50,745 |
| Level 3 Financing, Inc. company guaranty sr. unsec. unsub. notes | | |
| 5.25%, 3/15/26 | 3,130,000 | 3,128,044 |
| |
| 34 Diversified Income Trust |
| | | |
| | | Principal | |
| CORPORATE BONDS AND NOTES (18.7%)*cont. | | amount | Value |
| Communication servicescont. | | | |
| Level 3 Financing, Inc. 144A company guaranty sr. unsec. notes | | | |
| 4.625%, 9/15/27 | | $2,060,000 | $2,047,435 |
| Sprint Capital Corp. company guaranty sr. unsec. unsub. notes | | | |
| 6.875%, 11/15/28 | | 1,032,000 | 1,178,751 |
| Sprint Corp. company guaranty sr. unsec. notes 7.625%, 3/1/26 | | 2,175,000 | 2,461,665 |
| Sprint Corp. company guaranty sr. unsec. sub. notes | | | |
| 7.875%, 9/15/23 | | 4,624,000 | 5,075,210 |
| Sprint Corp. company guaranty sr. unsec. sub. notes | | | |
| 7.25%, 9/15/21 | | 1,795,000 | 1,850,106 |
| Sprint Corp. 144A company guaranty sr. unsec. notes | | | |
| 7.25%, 2/1/28 | | 870,000 | 874,350 |
| Sprint Spectrum Co., LLC/Sprint Spectrum Co. II, LLC/Sprint | | | |
| Spectrum Co. III, LLC 144A company guaranty sr. notes | | | |
| 3.36%, 9/20/21 | | 556,875 | 554,091 |
| T-Mobile USA, Inc. company guaranty sr. unsec. notes | | | |
| 6.375%, 3/1/25 | | 2,852,000 | 2,912,691 |
| T-Mobile USA, Inc. company guaranty sr. unsec. notes | | | |
| 6.00%, 3/1/23 | | 1,889,000 | 1,899,408 |
| T-Mobile USA, Inc. company guaranty sr. unsec. notes | | | |
| 5.375%, 4/15/27 | | 677,000 | 697,310 |
| T-Mobile USA, Inc. company guaranty sr. unsec. notes | | | |
| 4.00%, 4/15/22 | | 28,000 | 28,070 |
| T-Mobile USA, Inc. company guaranty sr. unsec. unsub. bonds | | | |
| 4.75%, 2/1/28 | | 1,088,000 | 1,133,479 |
| T-Mobile USA, Inc. company guaranty sr. unsec. unsub. notes | | | |
| 4.50%, 2/1/26 | | 730,000 | 746,426 |
| Videotron, Ltd. company guaranty sr. unsec. unsub. notes 5.00%, | | | |
| 7/15/22 (Canada) | | 2,015,000 | 2,015,000 |
| Videotron, Ltd./Videotron Ltee. 144A sr. unsec. notes 5.125%, | | | |
| 4/15/27 (Canada) | | 2,073,000 | 2,073,000 |
| Virgin Media Finance PLC 144A company guaranty sr. unsec. | | | |
| unsub. notes 4.50%, 1/15/25 (United Kingdom) | EUR | 3,165,000 | 3,255,056 |
| Virgin Media Secured Finance PLC 144A company guaranty sr. | | | |
| bonds 5.00%, 4/15/27 (United Kingdom) | GBP | 1,350,000 | 1,586,740 |
| | | | 68,745,825 |
| Consumer cyclicals (3.2%) | | | |
| American Builders & Contractors Supply Co., Inc. 144A company | | | |
| guaranty sr. unsec. notes 5.875%, 5/15/26 | | $580,000 | 552,450 |
| American Builders & Contractors Supply Co., Inc. 144A sr. notes | | | |
| 4.00%, 1/15/28 | | 45,000 | 40,950 |
| Boyd Gaming Corp. company guaranty sr. unsec. notes | | | |
| 6.00%, 8/15/26 | | 985,000 | 847,100 |
| Boyd Gaming Corp. 144A company guaranty sr. unsec. notes | | | |
| 4.75%, 12/1/27 | | 965,000 | 796,125 |
| Brookfield Residential Properties, Inc./Brookfield Residential | | | |
| US Corp. 144A company guaranty sr. unsec. notes 6.25%, | | | |
| 9/15/27 (Canada) | | 40,000 | 34,696 |
| Brookfield Residential Properties, Inc./Brookfield Residential | | | |
| US Corp. 144A company guaranty sr. unsec. notes 4.875%, | | | |
| 2/15/30 (Canada) | | 585,000 | 444,425 |
| Carriage Services, Inc. 144A sr. unsec. notes 6.625%, 6/1/26 | | 965,000 | 945,700 |
|
| Diversified Income Trust 35 |
| | | |
| | | Principal | |
| CORPORATE BONDS AND NOTES (18.7%)*cont. | | amount | Value |
| Consumer cyclicalscont. | | | |
| Cinemark USA, Inc. company guaranty sr. unsec. notes | | | |
| 5.125%, 12/15/22 | | $6,000 | $4,740 |
| Cinemark USA, Inc. company guaranty sr. unsec. sub. notes | | | |
| 4.875%, 6/1/23 | | 2,061,000 | 1,540,598 |
| Clear Channel Outdoor Holdings, Inc. 144A company guaranty sr. | | | |
| notes 5.125%, 8/15/27 | | 795,000 | 752,269 |
| Codere Finance 2 Luxembourg SA company guaranty sr. notes | | | |
| Ser. REGS, 6.75%, 11/1/21 (Luxembourg) | EUR | 1,250,000 | 461,839 |
| Cornerstone Building Brands, Inc. 144A company guaranty sr. | | | |
| unsec. sub. notes 8.00%, 4/15/26 | | $2,870,000 | 2,486,138 |
| CRC Escrow Issuer, LLC/CRC Finco, Inc. 144A company guaranty sr. | | | |
| unsec. notes 5.25%, 10/15/25 | | 2,790,000 | 2,014,938 |
| Diamond Sports Group, LLC/Diamond Sports Finance Co. 144A sr. | | | |
| notes 5.375%, 8/15/26 | | 1,336,000 | 1,085,527 |
| Diamond Sports Group, LLC/Diamond Sports Finance Co. 144A sr. | | | |
| unsec. notes 6.625%, 8/15/27 | | 2,951,000 | 1,973,481 |
| eG Global Finance PLC 144A company guaranty sr. notes 6.75%, | | | |
| 2/7/25 (United Kingdom) | | 1,985,000 | 1,627,700 |
| Eldorado Resorts, Inc. company guaranty sr. unsec. notes | | | |
| 6.00%, 9/15/26 | | 15,000 | 13,538 |
| Eldorado Resorts, Inc. company guaranty sr. unsec. unsub. notes | | | |
| 7.00%, 8/1/23 | | 1,394,000 | 1,251,129 |
| Entercom Media Corp. 144A company guaranty notes | | | |
| 6.50%, 5/1/27 | | 2,028,000 | 1,759,290 |
| Entercom Media Corp. 144A company guaranty sr. unsec. notes | | | |
| 7.25%, 11/1/24 | | 1,660,000 | 1,386,100 |
| Gartner, Inc. 144A company guaranty sr. unsec. notes | | | |
| 5.125%, 4/1/25 | | 940,000 | 918,850 |
| Gray Television, Inc. 144A sr. unsec. notes 7.00%, 5/15/27 | | 3,035,000 | 3,019,825 |
| GW B-CR Security Corp. 144A sr. unsec. notes 9.50%, | | | |
| 11/1/27 (Canada) | | 1,495,000 | 1,336,381 |
| Hanesbrands, Inc. 144A company guaranty sr. unsec. unsub. notes | | | |
| 4.625%, 5/15/24 | | 70,000 | 69,300 |
| Hilton Worldwide Finance, LLC/Hilton Worldwide Finance Corp. | | | |
| company guaranty sr. unsec. notes 4.875%, 4/1/27 | | 1,226,000 | 1,164,700 |
| Howard Hughes Corp. (The) 144A sr. unsec. notes 5.375%, 3/15/25 | | 2,831,000 | 2,738,993 |
| iHeartCommunications, Inc. company guaranty sr. notes | | | |
| 6.375%, 5/1/26 | | 71,812 | 67,953 |
| iHeartCommunications, Inc. company guaranty sr. unsec. notes | | | |
| 8.375%, 5/1/27 | | 4,547,592 | 3,959,225 |
| IHS Markit, Ltd. sr. unsec. sub. bonds 4.75%, 8/1/28 | | | |
| (United Kingdom) | | 45,000 | 46,575 |
| IHS Markit, Ltd. 144A company guaranty notes 4.75%, 2/15/25 | | | |
| (United Kingdom) | | 1,345,000 | 1,385,350 |
| IHS Markit, Ltd. 144A company guaranty sr. unsec. notes 4.00%, | | | |
| 3/1/26 (United Kingdom) | | 450,000 | 434,250 |
| Installed Building Products, Inc. 144A company guaranty sr. unsec. | | | |
| notes 5.75%, 2/1/28 | | 385,000 | 365,750 |
| Iron Mountain, Inc. 144A company guaranty sr. unsec. bonds | | | |
| 5.25%, 3/15/28 R | | 2,705,000 | 2,671,999 |
| Iron Mountain, Inc. 144A company guaranty sr. unsec. notes | | | |
| 4.875%, 9/15/27 R | | 1,402,000 | 1,359,940 |
|
| 36 Diversified Income Trust |
| | |
| | Principal | |
| CORPORATE BONDS AND NOTES (18.7%)*cont. | amount | Value |
| Consumer cyclicalscont. | | |
| JC Penney Corp., Inc. company guaranty sr. unsec. unsub. bonds | | |
| 7.40%, 4/1/37 | $1,361,000 | $136,100 |
| Jeld-Wen, Inc. 144A company guaranty sr. unsec. notes | | |
| 4.875%, 12/15/27 | 1,050,000 | 926,625 |
| Jeld-Wen, Inc. 144A company guaranty sr. unsec. notes | | |
| 4.625%, 12/15/25 | 1,200,000 | 1,056,000 |
| L Brands, Inc. company guaranty sr. unsec. bonds 6.75%, | | |
| perpetual maturity | 1,043,000 | 750,960 |
| L Brands, Inc. company guaranty sr. unsec. notes 7.50%, | | |
| perpetual maturity | 1,225,000 | 966,403 |
| Lennar Corp. company guaranty sr. unsec. sub. notes | | |
| 5.875%, 11/15/24 | 1,029,000 | 1,040,834 |
| Lions Gate Capital Holdings, LLC 144A company guaranty sr. | | |
| unsec. notes 5.875%, 11/1/24 | 817,000 | 698,535 |
| Lions Gate Capital Holdings, LLC 144A sr. unsec. notes | | |
| 6.375%, 2/1/24 | 1,810,000 | 1,592,800 |
| Live Nation Entertainment, Inc. 144A company guaranty sr. unsec. | | |
| notes 4.875%, 11/1/24 | 2,091,000 | 1,903,563 |
| Live Nation Entertainment, Inc. 144A company guaranty sr. unsec. | | |
| sub. notes 5.625%, 3/15/26 | 1,832,000 | 1,703,760 |
| Masonite International Corp. 144A company guaranty sr. unsec. | | |
| notes 5.375%, 2/1/28 | 730,000 | 717,444 |
| Mattamy Group Corp. 144A sr. unsec. notes 5.25%, | | |
| 12/15/27 (Canada) | 2,880,000 | 2,678,400 |
| Mattamy Group Corp. 144A sr. unsec. notes 4.625%, | | |
| 3/1/30 (Canada) | 2,360,000 | 2,029,600 |
| Mattel, Inc. 144A company guaranty sr. unsec. notes | | |
| 5.875%, 12/15/27 | 2,129,000 | 2,188,186 |
| Meredith Corp. company guaranty sr. unsec. notes 6.875%, 2/1/26 | 1,535,000 | 1,346,656 |
| Navistar International Corp. 144A sr. unsec. notes 6.625%, 11/1/25 | 3,882,000 | 3,231,765 |
| Nexstar Broadcasting, Inc. 144A company guaranty sr. unsec. | | |
| notes 5.625%, 8/1/24 | 1,382,000 | 1,300,794 |
| Nexstar Escrow, Inc. 144A sr. unsec. notes 5.625%, 7/15/27 | 660,000 | 645,151 |
| Nielsen Co. Luxembourg SARL (The) 144A company guaranty sr. | | |
| unsec. notes 5.00%, 2/1/25 (Luxembourg) | 1,826,000 | 1,693,615 |
| Nielsen Finance, LLC/Nielsen Finance Co. 144A company guaranty | | |
| sr. unsec. sub. notes 5.00%, 4/15/22 | 1,815,000 | 1,673,103 |
| Outfront Media Capital, LLC/Outfront Media Capital Corp. | | |
| company guaranty sr. unsec. sub. notes 5.625%, 2/15/24 | 246,000 | 236,160 |
| Outfront Media Capital, LLC/Outfront Media Capital Corp. 144A sr. | | |
| unsec. bonds 4.625%, 3/15/30 | 583,000 | 518,870 |
| Owens Corning company guaranty sr. unsec. notes 4.20%, 12/1/24 | 2,207,000 | 2,249,768 |
| Penske Automotive Group, Inc. company guaranty sr. unsec. sub. | | |
| notes 5.75%, 10/1/22 | 4,243,000 | 3,924,775 |
| Penske Automotive Group, Inc. company guaranty sr. unsec. sub. | | |
| notes 5.50%, 5/15/26 | 38,000 | 34,664 |
| Penske Automotive Group, Inc. company guaranty sr. unsec. sub. | | |
| notes 5.375%, 12/1/24 | 1,901,000 | 1,565,873 |
| Prime Security Services Borrower, LLC/Prime Finance, Inc. 144A | | |
| notes 6.25%, 1/15/28 | 1,950,000 | 1,681,875 |
| PulteGroup, Inc. company guaranty sr. unsec. unsub. notes | | |
| 7.875%, 6/15/32 | 1,889,000 | 2,077,900 |
|
| Diversified Income Trust 37 |
| | |
| | Principal | |
| CORPORATE BONDS AND NOTES (18.7%)*cont. | amount | Value |
| Consumer cyclicalscont. | | |
| Refinitiv US Holdings, Inc. 144A company guaranty sr. notes | | |
| 6.25%, 5/15/26 | $32,000 | $33,040 |
| Scientific Games International, Inc. 144A company guaranty sr. | | |
| unsec. notes 7.25%, 11/15/29 | 1,495,000 | 934,375 |
| Scientific Games International, Inc. 144A company guaranty sr. | | |
| notes 5.00%, 10/15/25 | 1,095,000 | 952,650 |
| Scotts Miracle-Gro, Co. (The) company guaranty sr. unsec. notes | | |
| 4.50%, 10/15/29 | 2,813,000 | 2,679,383 |
| Sinclair Television Group, Inc. 144A company guaranty sr. unsec. | | |
| bonds 5.50%, 3/1/30 | 1,920,000 | 1,588,800 |
| Sirius XM Radio, Inc. 144A sr. unsec. bonds 5.50%, 7/1/29 | 2,335,000 | 2,381,700 |
| Sirius XM Radio, Inc. 144A sr. unsec. bonds 5.00%, 8/1/27 | 1,340,000 | 1,350,051 |
| Six Flags Entertainment Corp. 144A company guaranty sr. unsec. | | |
| bonds 5.50%, 4/15/27 | 1,449,000 | 1,220,783 |
| Spectrum Brands, Inc. company guaranty sr. unsec. unsub. notes | | |
| 6.125%, 12/15/24 | 75,000 | 71,625 |
| Spectrum Brands, Inc. 144A company guaranty sr. unsec. bonds | | |
| 5.00%, 10/1/29 | 45,000 | 38,250 |
| Standard Industries, Inc. 144A sr. unsec. notes 6.00%, 10/15/25 | 2,834,000 | 2,785,255 |
| Standard Industries, Inc. 144A sr. unsec. notes 5.375%, 11/15/24 | 1,416,000 | 1,366,440 |
| Standard Industries, Inc. 144A sr. unsec. notes 4.75%, 1/15/28 | 145,000 | 133,538 |
| Station Casinos, LLC 144A sr. unsec. notes 4.50%, 2/15/28 | 1,955,000 | 1,583,550 |
| Univision Communications, Inc. 144A company guaranty sr. sub. | | |
| notes 5.125%, 2/15/25 | 100,000 | 85,250 |
| Weekley Homes, LLC/Weekley Finance Corp. sr. unsec. notes | | |
| 6.00%, 2/1/23 | 1,745,000 | 1,640,300 |
| Werner FinCo LP/Werner FinCo, Inc. 144A company guaranty sr. | | |
| unsec. notes 8.75%, 7/15/25 | 1,380,000 | 1,214,400 |
| Wolverine World Wide, Inc. 144A company guaranty sr. unsec. | | |
| bonds 5.00%, 9/1/26 | 1,220,000 | 1,163,880 |
| Wyndham Hotels & Resorts, Inc. 144A company guaranty sr. unsec. | | |
| notes 5.375%, 4/15/26 | 1,630,000 | 1,418,100 |
| Wynn Las Vegas, LLC/Wynn Las Vegas Capital Corp. 144A company | | |
| guaranty sr. unsec. sub. notes 5.25%, 5/15/27 | 2,068,000 | 1,871,540 |
| Wynn Resorts Finance, LLC/Wynn Resorts Capital Corp. 144A sr. | | |
| unsec. bonds 5.125%, 10/1/29 | 2,395,000 | 2,179,450 |
| | | 106,820,363 |
| Consumer staples (1.1%) | | |
| 1011778 BC ULC/New Red Finance, Inc. 144A company guaranty | | |
| notes 5.00%, 10/15/25 (Canada) | 1,635,000 | 1,577,775 |
| 1011778 BC ULC/New Red Finance, Inc. 144A company guaranty | | |
| notes 4.375%, 1/15/28 (Canada) | 1,351,000 | 1,248,189 |
| 1011778 BC ULC/New Red Finance, Inc. 144A company guaranty sr. | | |
| notes 3.875%, 1/15/28 (Canada) | 685,000 | 650,750 |
| Albertsons Cos., Inc./Safeway, Inc./New Albertsons LP/Albertsons, | | |
| LLC 144A company guaranty sr. unsec. notes 4.875%, 2/15/30 | 580,000 | 578,551 |
| Albertsons Cos., Inc./Safeway, Inc./New Albertsons LP/Albertsons, | | |
| LLC 144A company guaranty sr. unsec. notes 4.625%, 1/15/27 | 2,405,000 | 2,392,975 |
| Ashtead Capital, Inc. 144A bonds 4.25%, 11/1/29 | 1,345,000 | 1,139,289 |
| Energizer Holdings, Inc. 144A company guaranty sr. unsec. notes | | |
| 7.75%, 1/15/27 | 165,000 | 170,561 |
| |
| 38 Diversified Income Trust |
| | | |
| | | Principal | |
| CORPORATE BONDS AND NOTES (18.7%)*cont. | | amount | Value |
| Consumer staplescont. | | | |
| Energizer Holdings, Inc. 144A company guaranty sr. unsec. sub. | | | |
| notes 6.375%, 7/15/26 | | $30,000 | $30,300 |
| Europcar Mobility Group notes Ser. REGS, 4.125%, | | | |
| 11/15/24 (France) | EUR | 843,000 | 413,736 |
| Go Daddy Operating Co, LLC/GD Finance Co., Inc. 144A company | | | |
| guaranty sr. unsec. notes 5.25%, 12/1/27 | | $45,000 | 45,414 |
| Golden Nugget, Inc. 144A company guaranty sr. unsec. sub. notes | | | |
| 8.75%, 10/1/25 | | 1,386,000 | 706,860 |
| Golden Nugget, Inc. 144A sr. unsec. notes 6.75%, 10/15/24 | | 3,633,000 | 2,288,391 |
| Itron, Inc. 144A company guaranty sr. unsec. notes 5.00%, 1/15/26 | | 2,987,000 | 2,837,650 |
| KFC Holding Co./Pizza Hut Holdings, LLC/Taco Bell of America, LLC | | | |
| 144A company guaranty sr. unsec. notes 5.25%, 6/1/26 | | 1,680,000 | 1,677,648 |
| KFC Holding Co./Pizza Hut Holdings, LLC/Taco Bell of America, LLC | | | |
| 144A company guaranty sr. unsec. notes 5.00%, 6/1/24 | | 1,680,000 | 1,646,400 |
| KFC Holding Co./Pizza Hut Holdings, LLC/Taco Bell of America, LLC | | | |
| 144A company guaranty sr. unsec. notes 4.75%, 6/1/27 | | 54,000 | 50,760 |
| Kraft Heinz Co. (The) company guaranty sr. unsec. notes | | | |
| 5.00%, 7/15/35 | | 1,723,000 | 1,713,021 |
| Kraft Heinz Co. (The) company guaranty sr. unsec. notes | | | |
| 3.00%, 6/1/26 | | 2,968,000 | 2,883,640 |
| Lamb Weston Holdings, Inc. 144A company guaranty sr. unsec. | | | |
| unsub. notes 4.875%, 11/1/26 | | 1,799,000 | 1,830,266 |
| Lamb Weston Holdings, Inc. 144A company guaranty sr. unsec. | | | |
| unsub. notes 4.625%, 11/1/24 | | 22,000 | 21,670 |
| Match Group, Inc. 144A sr. unsec. bonds 5.00%, 12/15/27 | | 4,067,000 | 3,883,985 |
| Netflix, Inc. sr. unsec. notes 6.375%, 5/15/29 | | 1,055,000 | 1,149,634 |
| Netflix, Inc. sr. unsec. notes 5.875%, 2/15/25 | | 715,000 | 755,040 |
| Netflix, Inc. sr. unsec. notes 4.875%, 4/15/28 | | 1,595,000 | 1,642,850 |
| Netflix, Inc. sr. unsec. unsub. notes 5.875%, 11/15/28 | | 2,335,000 | 2,494,948 |
| Netflix, Inc. 144A sr. unsec. bonds 5.375%, 11/15/29 | | 50,000 | 51,883 |
| Netflix, Inc. 144A sr. unsec. bonds 4.875%, 6/15/30 | | 575,000 | 583,712 |
| Newell Brands, Inc. sr. unsec. unsub. notes 4.45%, 4/1/26 | | 730,000 | 716,712 |
| Prestige Brands, Inc. 144A company guaranty sr. unsec. notes | | | |
| 5.125%, 1/15/28 | | 390,000 | 386,217 |
| Yum! Brands, Inc. 144A sr. unsec. bonds 4.75%, 1/15/30 | | 935,000 | 878,900 |
| Yum! Brands, Inc. 144A sr. unsec. notes 7.75%, 4/1/25 | | 370,000 | 388,500 |
| | | | 36,836,227 |
| Energy (3.0%) | | | |
| Aker BP ASA 144A sr. unsec. notes 6.00%, 7/1/22 (Norway) | | 2,750,000 | 2,475,000 |
| Aker BP ASA 144A sr. unsec. notes 3.75%, 1/15/30 (Norway) | | 2,095,000 | 1,566,403 |
| Antero Resources Corp. company guaranty sr. unsec. sub. notes | | | |
| 5.375%, 11/1/21 | | 2,334,000 | 1,697,985 |
| Antero Resources Corp. company guaranty sr. unsec. sub. notes | | | |
| 5.125%, 12/1/22 | | 56,000 | 29,120 |
| Apergy Corp. company guaranty sr. unsec. notes 6.375%, 5/1/26 | | 2,079,000 | 1,600,830 |
| Ascent Resources Utica Holdings, LLC/ARU Finance Corp. 144A sr. | | | |
| unsec. notes 10.00%, 4/1/22 | | 74,000 | 43,290 |
| Cenovus Energy, Inc. sr. unsec. bonds 6.75%, 11/15/39 (Canada) | | 1,531,000 | 733,486 |
| Cheniere Corpus Christi Holdings, LLC company guaranty sr. notes | | | |
| 5.875%, 3/31/25 | | 89,000 | 74,549 |
|
| Diversified Income Trust 39 |
| | |
| | Principal | |
| CORPORATE BONDS AND NOTES (18.7%)*cont. | amount | Value |
| Energycont. | | |
| Cheniere Corpus Christi Holdings, LLC company guaranty sr. notes | | |
| 5.125%, 6/30/27 | $5,640,000 | $5,008,933 |
| Comstock Resources, Inc. 144A company guaranty sr. unsec. notes | | |
| 7.50%, 5/15/25 | 954,000 | 620,100 |
| DCP Midstream Operating LP 144A company guaranty sr. unsec. | | |
| unsub. bonds 6.75%, 9/15/37 | 899,000 | 485,460 |
| Denbury Resources, Inc. 144A company guaranty notes | | |
| 9.25%, 3/31/22 | 302,000 | 72,480 |
| Denbury Resources, Inc. 144A company guaranty notes | | |
| 9.00%, 5/15/21 | 4,805,000 | 1,405,463 |
| Diamondback Energy, Inc. company guaranty sr. unsec. unsub. | | |
| notes 5.375%, 5/31/25 | 2,489,000 | 1,835,137 |
| Endeavor Energy Resources LP/EER Finance, Inc. 144A sr. unsec. | | |
| bonds 5.75%, 1/30/28 | 3,176,000 | 2,159,680 |
| Energy Transfer Operating LP jr. unsec. sub. FRB Ser. B, 6.625%, | | |
| perpetual maturity | 5,627,000 | 2,785,365 |
| Hess Midstream Operations LP 144A company guaranty sr. unsec. | | |
| sub. notes 5.625%, 2/15/26 | 4,186,000 | 2,955,588 |
| Hess Midstream Operations LP 144A sr. unsec. notes | | |
| 5.125%, 6/15/28 | 1,054,000 | 740,751 |
| Holly Energy Partners LP/Holly Energy Finance Corp. 144A | | |
| company guaranty sr. unsec. notes 5.00%, 2/1/28 | 975,000�� | 816,563 |
| Indigo Natural Resources, LLC 144A sr. unsec. notes | | |
| 6.875%, 2/15/26 | 1,161,000 | 766,260 |
| MEG Energy Corp. 144A company guaranty sr. unsec. notes 7.00%, | | |
| 3/31/24 (Canada) | 58,000 | 26,753 |
| MEG Energy Corp. 144A notes 6.50%, 1/15/25 (Canada) | 1,802,000 | 1,139,766 |
| MEG Energy Corp. 144A sr. unsec. notes 7.125%, 2/1/27 (Canada) | 642,000 | 317,225 |
| Nabors Industries, Inc. company guaranty sr. unsec. notes | | |
| 5.75%, 2/1/25 | 3,067,000 | 674,740 |
| Nabors Industries, Ltd. 144A company guaranty sr. unsec. notes | | |
| 7.50%, 1/15/28 | 2,455,000 | 785,600 |
| Nabors Industries, Ltd. 144A company guaranty sr. unsec. notes | | |
| 7.25%, 1/15/26 | 965,000 | 328,100 |
| Newfield Exploration Co. sr. unsec. unsub. notes 5.75%, 1/30/22 | 130,000 | 88,508 |
| Nine Energy Service, Inc. 144A sr. unsec. notes 8.75%, 11/1/23 | 1,005,000 | 251,351 |
| Noble Holding International, Ltd. company guaranty sr. unsec. | | |
| unsub. notes 7.75%, 1/15/24 | 735,000 | 66,150 |
| Oasis Petroleum, Inc. company guaranty sr. unsec. unsub. notes | | |
| 6.875%, 3/15/22 | 929,000 | 183,478 |
| Oasis Petroleum, Inc. 144A sr. unsec. notes 6.25%, 5/1/26 | 1,657,000 | 265,120 |
| Petrobras Global Finance BV company guaranty sr. unsec. unsub. | | |
| bonds 7.375%, 1/17/27 (Brazil) | 6,941,000 | 7,112,998 |
| Petrobras Global Finance BV company guaranty sr. unsec. unsub. | | |
| notes 6.25%, 3/17/24 (Brazil) | 4,451,000 | 4,345,289 |
| Petrobras Global Finance BV company guaranty sr. unsec. unsub. | | |
| notes 6.125%, 1/17/22 (Brazil) | 23,947,000 | 23,707,530 |
| Petrobras Global Finance BV company guaranty sr. unsec. unsub. | | |
| notes 5.999%, 1/27/28 (Brazil) | 3,006,000 | 2,863,216 |
| Petrobras Global Finance BV company guaranty sr. unsec. unsub. | | |
| notes 5.299%, 1/27/25 (Brazil) | 3,525,000 | 3,313,500 |
| |
| 40 Diversified Income Trust |
| | |
| | Principal | |
| CORPORATE BONDS AND NOTES (18.7%)*cont. | amount | Value |
| Energycont. | | |
| Petroleos de Venezuela SA company guaranty sr. unsec. bonds | | |
| Ser. REGS, 6.00%, 11/15/26 (Venezuela) (In default) † | $1,537,000 | $92,220 |
| Petroleos de Venezuela SA company guaranty sr. unsec. unsub. | | |
| notes 5.375%, 4/12/27 (Venezuela) (In default) † | 4,617,000 | 323,190 |
| Petroleos de Venezuela SA 144A company guaranty sr. unsec. | | |
| notes 6.00%, 11/15/26 (Venezuela) (In default) † | 24,565,000 | 1,473,900 |
| Petroleos Mexicanos company guaranty sr. unsec. unsub. notes | | |
| 6.50%, 3/13/27 (Mexico) | 2,660,000 | 1,966,810 |
| Petroleos Mexicanos 144A company guaranty sr. unsec. bonds | | |
| 7.69%, 1/23/50 (Mexico) | 8,180,000 | 5,644,200 |
| Petroleos Mexicanos 144A company guaranty sr. unsec. bonds | | |
| 6.84%, 1/23/30 (Mexico) | 1,135,000 | 821,195 |
| Petroleos Mexicanos 144A company guaranty sr. unsec. unsub. | | |
| notes 5.95%, 1/28/31 (Mexico) | 9,697,000 | 6,725,063 |
| Precision Drilling Corp. 144A company guaranty sr. unsec. notes | | |
| 7.125%, 1/15/26 (Canada) | 1,713,000 | 565,290 |
| Regency Energy Partners LP/Regency Energy Finance Corp. | | |
| company guaranty sr. unsec. notes 5.00%, 10/1/22 | 1,655,000 | 1,507,095 |
| SM Energy Co. sr. unsec. notes 6.625%, 1/15/27 | 2,955,000 | 860,097 |
| SM Energy Co. sr. unsec. sub. notes 5.00%, 1/15/24 | 1,571,000 | 518,430 |
| SM Energy Co. sr. unsec. unsub. notes 6.75%, 9/15/26 | 1,480,000 | 444,000 |
| Tallgrass Energy Partners LP/Tallgrass Energy Finance Corp. 144A | | |
| company guaranty sr. unsec. notes 5.50%, 1/15/28 | 2,924,000 | 1,520,480 |
| Targa Resources Partners LP/Targa Resources Partners Finance | | |
| Corp. company guaranty sr. unsec. notes 6.875%, 1/15/29 | 560,000 | 450,800 |
| Targa Resources Partners LP/Targa Resources Partners Finance | | |
| Corp. company guaranty sr. unsec. notes 6.50%, 7/15/27 | 40,000 | 34,100 |
| Targa Resources Partners LP/Targa Resources Partners Finance | | |
| Corp. company guaranty sr. unsec. unsub. notes 5.00%, 1/15/28 | 65,000 | 52,394 |
| Targa Resources Partners LP/Targa Resources Partners Finance | | |
| Corp. 144A sr. unsec. bonds 5.50%, 3/1/30 | 575,000 | 444,130 |
| Transocean Pontus, Ltd. 144A company guaranty sr. notes 6.125%, | | |
| 8/1/25 (Cayman Islands) | 893,450 | 723,694 |
| Transocean Poseidon, Ltd. 144A company guaranty sr. notes | | |
| 6.875%, 2/1/27 | 1,453,000 | 1,176,930 |
| Valaris PLC sr. unsec. notes 7.75%, 2/1/26 (United Kingdom) | 904,000 | 83,620 |
| Viper Energy Partners LP 144A company guaranty sr. unsec. notes | | |
| 5.375%, 11/1/27 | 580,000 | 487,200 |
| WPX Energy, Inc. sr. unsec. notes 8.25%, 8/1/23 | 317,000 | 232,995 |
| WPX Energy, Inc. sr. unsec. notes 5.75%, 6/1/26 | 1,743,000 | 993,510 |
| WPX Energy, Inc. sr. unsec. notes 4.50%, 1/15/30 | 35,000 | 19,005 |
| WPX Energy, Inc. sr. unsec. sub. notes 5.25%, 10/15/27 | 1,674,000 | 920,700 |
| | | 101,422,815 |
| Financials (2.5%) | | |
| AG Issuer, LLC 144A sr. notes 6.25%, 3/1/28 | 1,830,000 | 1,537,200 |
| Alliant Holdings Intermediate, LLC/Alliant Holdings Co-Issuer 144A | | |
| sr. unsec. notes 6.75%, 10/15/27 | 1,490,000 | 1,395,236 |
| Ally Financial, Inc. company guaranty sr. unsec. notes | | |
| 8.00%, 11/1/31 | 5,676,000 | 6,576,781 |
| Ally Financial, Inc. sub. unsec. notes 5.75%, 11/20/25 | 60,000 | 58,692 |
|
| Diversified Income Trust 41 |
| | | |
| | | Principal | |
| CORPORATE BONDS AND NOTES (18.7%)*cont. | | amount | Value |
| Financialscont. | | | |
| American International Group, Inc. jr. unsec. sub. FRB | | | |
| 8.175%, 5/15/58 | | $1,221,000 | $1,428,570 |
| Bank of America Corp. jr. unsec. sub. FRN Ser. Z, 6.50%, | | | |
| perpetual maturity | | 1,350,000 | 1,424,250 |
| CIT Group, Inc. sr. unsec. sub. notes 5.00%, 8/1/23 | | 2,180,000 | 2,081,900 |
| CIT Group, Inc. sr. unsec. unsub. notes 5.25%, 3/7/25 | | 1,087,000 | 1,059,825 |
| CIT Group, Inc. sr. unsec. unsub. notes 5.00%, 8/15/22 | | 781,000 | 757,570 |
| CNO Financial Group, Inc. sr. unsec. notes 5.25%, 5/30/29 | | 1,645,000 | 1,596,111 |
| CNO Financial Group, Inc. sr. unsec. unsub. notes 5.25%, 5/30/25 | | 2,735,000 | 2,846,108 |
| Credit Acceptance Corp. company guaranty sr. unsec. notes | | | |
| 6.625%, 3/15/26 | | 40,000 | 37,988 |
| Credit Acceptance Corp. 144A sr. unsec. notes 5.125%, 12/31/24 | | 965,000 | 878,150 |
| Credit Suisse Group AG 144A jr. unsec. sub. FRB 5.10%, perpetual | | | |
| maturity (Switzerland) | | 755,000 | 583,238 |
| Credit Suisse Group AG 144A jr. unsec. sub. FRN 6.25%, perpetual | | | |
| maturity (Switzerland) | | 905,000 | 851,831 |
| Dresdner Funding Trust I jr. unsec. sub. notes 8.151%, 6/30/31 | | 3,250,000 | 3,781,180 |
| Dresdner Funding Trust I 144A jr. unsec. sub. notes 8.151%, 6/30/31 | | 1,223,000 | 1,422,887 |
| ESH Hospitality, Inc. 144A company guaranty sr. unsec. notes | | | |
| 5.25%, 5/1/25 R | | 1,140,000 | 957,600 |
| Fairfax Financial Holdings, Ltd. sr. unsec. notes 4.85%, | | | |
| 4/17/28 (Canada) | | 1,155,000 | 1,251,951 |
| Freedom Mortgage Corp. 144A sr. unsec. notes 8.125%, 11/15/24 | | 886,000 | 713,753 |
| GLP Capital LP/GLP Financing II, Inc. company guaranty sr. unsec. | | | |
| notes 5.25%, 6/1/25 | | 1,735,000 | 1,604,875 |
| GLP Capital LP/GLP Financing II, Inc. company guaranty sr. unsec. | | | |
| unsub. notes 5.375%, 4/15/26 | | 56,000 | 49,638 |
| goeasy, Ltd. 144A company guaranty sr. unsec. notes 5.375%, | | | |
| 12/1/24 (Canada) | | 1,925,000 | 1,794,485 |
| Icahn Enterprises LP/Icahn Enterprises Finance Corp. company | | | |
| guaranty sr. unsec. notes 6.75%, 2/1/24 | | 120,000 | 115,800 |
| Icahn Enterprises LP/Icahn Enterprises Finance Corp. company | | | |
| guaranty sr. unsec. notes 6.25%, 5/15/26 | | 910,000 | 859,950 |
| Icahn Enterprises LP/Icahn Enterprises Finance Corp. company | | | |
| guaranty sr. unsec. notes 5.25%, 5/15/27 | | 1,155,000 | 1,066,931 |
| Icahn Enterprises LP/Icahn Enterprises Finance Corp. company | | | |
| guaranty sr. unsec. notes 4.75%, 9/15/24 | | 1,115,000 | 1,025,477 |
| Intesa Sanpaolo SpA 144A company guaranty jr. unsec. sub. FRB | | | |
| 7.70%, perpetual maturity (Italy) | | 1,370,000 | 1,173,063 |
| iStar, Inc. sr. unsec. notes 4.75%, 10/1/24 R | | 2,580,000 | 2,167,200 |
| iStar, Inc. sr. unsec. notes 4.25%, 8/1/25 R | | 2,671,000 | 2,196,630 |
| iStar, Inc. sr. unsec. unsub. notes 5.25%, 9/15/22 R | | 750,000 | 691,875 |
| Ladder Capital Finance Holdings, LLLP/Ladder Capital Finance | | | |
| Corp. 144A sr. unsec. notes 4.25%, 2/1/27 R | | 950,000 | 750,500 |
| Lloyds Bank PLC jr. unsec. sub. FRN Ser. EMTN, 13.00%, perpetual | | | |
| maturity (United Kingdom) | GBP | 100,000 | 213,538 |
| LPL Holdings, Inc. 144A company guaranty sr. unsec. notes | | | |
| 5.75%, 9/15/25 | | $4,036,000 | 3,874,560 |
| MetLife, Inc. 144A jr. unsec. sub. bonds 9.25%, 4/8/38 | | 935,000 | 1,155,894 |
| MGM Growth Properties Operating Partnership LP/MGP Finance | | | |
| Co-Issuer, Inc. company guaranty sr. unsec. notes 4.50%, 1/15/28 R | | 680,000 | 578,000 |
| |
| 42 Diversified Income Trust |
| | | |
| | | Principal | |
| CORPORATE BONDS AND NOTES (18.7%)*cont. | | amount | Value |
| Financialscont. | | | |
| Miller Homes Group Holdings PLC company guaranty sr. notes | | | |
| Ser. REGS, 5.50%, 10/15/24 (United Kingdom) | GBP | 1,075,000 | $1,177,818 |
| Nationstar Mortgage Holdings, Inc. 144A company guaranty sr. | | | |
| unsec. notes 9.125%, 7/15/26 | | $25,000 | 22,688 |
| Nationstar Mortgage Holdings, Inc. 144A company guaranty sr. | | | |
| unsec. notes 8.125%, 7/15/23 | | 1,570,000 | 1,534,676 |
| Nationstar Mortgage Holdings, Inc. 144A company guaranty sr. | | | |
| unsec. notes 6.00%, 1/15/27 | | 980,000 | 833,000 |
| Provident Funding Associates LP/PFG Finance Corp. 144A sr. | | | |
| unsec. notes 6.375%, 6/15/25 | | 2,185,000 | 1,835,400 |
| Royal Bank of Scotland Group PLC jr. unsec. sub. FRB 8.00%, | | | |
| perpetual maturity (United Kingdom) | | 1,370,000 | 1,280,101 |
| Royal Bank of Scotland Group PLC jr. unsec. sub. FRB 7.648%, | | | |
| perpetual maturity (United Kingdom) | | 2,445,000 | 3,123,488 |
| Royal Bank of Scotland Group PLC jr. unsec. sub. FRB 7.50%, | | | |
| perpetual maturity (United Kingdom) | | 1,430,000 | 1,311,138 |
| Royal Bank of Scotland Group PLC sr. unsec. unsub. notes 3.875%, | | | |
| 9/12/23 (United Kingdom) | | 1,580,000 | 1,621,621 |
| Springleaf Finance Corp. company guaranty sr. unsec. sub. notes | | | |
| 7.125%, 3/15/26 | | 1,045,000 | 1,034,550 |
| Springleaf Finance Corp. company guaranty sr. unsec. unsub. | | | |
| notes 6.875%, 3/15/25 | | 1,408,000 | 1,418,025 |
| Springleaf Finance Corp. company guaranty sr. unsec. unsub. | | | |
| notes 5.375%, 11/15/29 | | 145,000 | 132,675 |
| Starwood Property Trust, Inc. sr. unsec. notes 4.75%, 3/15/25 R | | 2,020,000 | 1,777,600 |
| Stearns Holdings, LLC/Stearns Co-Issuer, Inc. 144A notes | | | |
| 5.00%, 11/5/24 | | 26,576 | 17,407 |
| Taylor Morrison Communities, Inc. 144A sr. unsec. notes | | | |
| 5.75%, 1/15/28 | | 920,000 | 821,482 |
| TMX Finance, LLC/TitleMax Finance Corp. 144A sr. notes | | | |
| 11.125%, 4/1/23 | | 2,667,000 | 2,006,918 |
| UBS Group Funding Switzerland AG company guaranty jr. unsec. | | | |
| sub. FRN Ser. REGS, 6.875%, perpetual maturity (Switzerland) | | 1,400,000 | 1,326,455 |
| VTB Bank OJSC Via VTB Capital SA 144A unsec. sub. bonds 6.95%, | | | |
| 10/17/22 (Russia) | | 10,740,000 | 10,659,450 |
| | | | 82,493,729 |
| Health care (1.6%) | | | |
| Bausch Health Americas, Inc. 144A sr. unsec. notes 8.50%, 1/31/27 | | 2,444,000 | 2,553,980 |
| Bausch Health Cos., Inc. company guaranty sr. unsec. notes | | | |
| Ser. REGS, 4.50%, 5/15/23 | EUR | 1,145,000 | 1,205,374 |
| Bausch Health Cos., Inc. 144A company guaranty sr. notes | | | |
| 5.50%, 11/1/25 | | $1,220,000 | 1,232,566 |
| Bausch Health Cos., Inc. 144A company guaranty sr. unsec. bonds | | | |
| 5.25%, 1/30/30 | | 35,000 | 33,095 |
| Bausch Health Cos., Inc. 144A company guaranty sr. unsec. notes | | | |
| 7.25%, 5/30/29 | | 1,715,000 | 1,779,827 |
| Bausch Health Cos., Inc. 144A company guaranty sr. unsec. notes | | | |
| 7.00%, 1/15/28 | | 855,000 | 877,572 |
| Bausch Health Cos., Inc. 144A company guaranty sr. unsec. notes | | | |
| 6.125%, 4/15/25 | | 3,185,000 | 3,137,225 |
| Bausch Health Cos., Inc. 144A company guaranty sr. unsec. notes | | | |
| 5.00%, 1/30/28 | | 35,000 | 33,135 |
|
| Diversified Income Trust 43 |
| | |
| | Principal | |
| CORPORATE BONDS AND NOTES (18.7%)*cont. | amount | Value |
| Health carecont. | | |
| Bausch Health Cos., Inc. 144A company guaranty sr. unsub. notes | | |
| 7.00%, 3/15/24 | $1,985,000 | $2,022,199 |
| Bausch Health Cos., Inc. 144A company guaranty sr. unsub. notes | | |
| 6.50%, 3/15/22 | 34,000 | 34,340 |
| Centene Corp. sr. unsec. unsub. notes 4.75%, 5/15/22 | 74,000 | 74,370 |
| Centene Corp. 144A sr. unsec. bonds 4.625%, 12/15/29 | 2,620,000 | 2,633,100 |
| Centene Corp. 144A sr. unsec. notes 5.375%, 8/15/26 | 835,000 | 851,700 |
| Centene Corp. 144A sr. unsec. notes 5.25%, 4/1/25 | 955,000 | 959,775 |
| Centene Escrow I Corp. 144A sr. unsec. notes 5.375%, 6/1/26 | 950,000 | 978,604 |
| CHS/Community Health Systems, Inc. company guaranty sr. notes | | |
| 6.25%, 3/31/23 | 4,519,000 | 4,290,226 |
| CHS/Community Health Systems, Inc. company guaranty sr. | | |
| unsec. notes 6.875%, 2/1/22 | 1,380,000 | 1,035,000 |
| CHS/Community Health Systems, Inc. 144A company guaranty sr. | | |
| notes 8.00%, 3/15/26 | 915,000 | 869,250 |
| Elanco Animal Health, Inc. sr. unsec. notes Ser. WI, 5.65%, 8/28/28 | 1,495,000 | 1,576,256 |
| HCA, Inc. company guaranty sr. bonds 5.25%, 6/15/26 | 1,642,000 | 1,722,078 |
| HCA, Inc. company guaranty sr. unsec. notes 5.375%, 9/1/26 | 3,915,000 | 4,032,450 |
| HCA, Inc. company guaranty sr. unsec. notes 3.50%, 9/1/30 | 45,000 | 40,825 |
| Kinetic Concepts, Inc./KCI USA, Inc. 144A company guaranty sub. | | |
| notes 12.50%, 11/1/21 | 1,367,000 | 1,363,583 |
| Molina Healthcare, Inc. company guaranty sr. unsec. notes | | |
| 5.375%, 11/15/22 | 1,175,000 | 1,145,625 |
| Molina Healthcare, Inc. 144A company guaranty sr. unsec. notes | | |
| 4.875%, 6/15/25 | 395,000 | 385,125 |
| Service Corp. International sr. unsec. bonds 5.125%, 6/1/29 | 2,545,000 | 2,595,900 |
| Service Corp. International sr. unsec. notes 4.625%, 12/15/27 | 600,000 | 600,000 |
| Service Corp. International sr. unsec. unsub. notes 5.375%, 5/15/24 | 2,792,000 | 2,840,860 |
| Tenet Healthcare Corp. company guaranty sr. notes | | |
| 4.625%, 7/15/24 | 1,135,000 | 1,083,925 |
| Tenet Healthcare Corp. 144A company guaranty notes | | |
| 6.25%, 2/1/27 | 900,000 | 877,500 |
| Tenet Healthcare Corp. 144A company guaranty sr. notes | | |
| 5.125%, 11/1/27 | 3,855,000 | 3,671,888 |
| Tenet Healthcare Corp. 144A company guaranty sr. notes | | |
| 4.875%, 1/1/26 | 4,236,000 | 4,034,791 |
| Teva Pharmaceutical Finance Netherlands III BV company | | |
| guaranty sr. unsec. notes 6.75%, 3/1/28 (Israel) | 1,520,000 | 1,447,800 |
| Teva Pharmaceutical Finance Netherlands III BV company | | |
| guaranty sr. unsec. notes 6.00%, 4/15/24 (Israel) | 1,890,000 | 1,856,906 |
| Teva Pharmaceutical Finance Netherlands III BV 144A company | | |
| guaranty sr. unsec. notes 7.125%, 1/31/25 (Israel) | 795,000 | 787,050 |
| | | 54,663,900 |
| Technology (0.6%) | | |
| CommScope Finance, LLC 144A sr. notes 6.00%, 3/1/26 | 55,000 | 54,918 |
| CommScope Finance, LLC 144A sr. notes 5.50%, 3/1/24 | 545,000 | 551,540 |
| Diamond 1 Finance Corp./Diamond 2 Finance Corp. 144A | | |
| company guaranty sr. notes 6.02%, 6/15/26 | 7,040,000 | 7,265,855 |
| Diamond 1 Finance Corp./Diamond 2 Finance Corp. 144A | | |
| company guaranty sr. unsec. notes 7.125%, 6/15/24 | 2,271,000 | 2,344,808 |
| Dun & Bradstreet Corp. (The) 144A sr. notes 6.875%, 8/15/26 | 45,000 | 46,800 |
| |
| 44 Diversified Income Trust |
| | |
| | Principal | |
| CORPORATE BONDS AND NOTES (18.7%)*cont. | amount | Value |
| Technologycont. | | |
| Nutanix, Inc. cv. sr. unsec. notes zero %, 1/15/23 | $1,378,000 | $1,122,209 |
| Plantronics, Inc. 144A company guaranty sr. unsec. notes | | |
| 5.50%, 5/31/23 | 5,398,000 | 3,927,046 |
| Qorvo, Inc. company guaranty sr. unsec. unsub. notes | | |
| 5.50%, 7/15/26 | 645,000 | 674,187 |
| SS&C Technologies, Inc. 144A company guaranty sr. unsec. notes | | |
| 5.50%, 9/30/27 | 1,172,000 | 1,221,811 |
| Tempo Acquisition, LLC/Tempo Acquisition Finance Corp. 144A sr. | | |
| unsec. notes 6.75%, 6/1/25 | 1,485,000 | 1,358,864 |
| TTM Technologies, Inc. 144A company guaranty sr. unsec. notes | | |
| 5.625%, 10/1/25 | 2,810,000 | 2,360,400 |
| Western Digital Corp. company guaranty sr. unsec. notes | | |
| 4.75%, 2/15/26 | 630,000 | 639,450 |
| | | 21,567,888 |
| Transportation (0.1%) | | |
| Watco Cos., LLC/Watco Finance Corp. 144A company guaranty sr. | | |
| unsec. notes 6.375%, 4/1/23 | 3,638,000 | 3,547,050 |
| | | 3,547,050 |
| Utilities and power (0.7%) | | |
| AES Corp./Virginia (The) sr. unsec. unsub. notes 5.50%, 4/15/25 | 3,414,000 | 3,328,650 |
| AES Corp./Virginia (The) sr. unsec. unsub. notes 5.125%, 9/1/27 | 810,000 | 812,009 |
| AES Corp./Virginia (The) sr. unsec. unsub. notes 4.875%, 5/15/23 | 41,000 | 39,565 |
| AES Corp./Virginia (The) sr. unsec. unsub. notes 4.50%, 3/15/23 | 40,000 | 39,200 |
| Buckeye Partners LP sr. unsec. bonds 5.85%, 11/15/43 | 924,000 | 618,803 |
| Buckeye Partners LP sr. unsec. notes 3.95%, 12/1/26 | 509,000 | 417,227 |
| Buckeye Partners LP 144A sr. unsec. notes 4.50%, 3/1/28 | 785,000 | 643,700 |
| Calpine Corp. 144A company guaranty sr. notes 5.25%, 6/1/26 | 1,105,000 | 1,049,750 |
| Calpine Corp. 144A company guaranty sr. notes 4.50%, 2/15/28 | 1,620,000 | 1,570,185 |
| Colorado Interstate Gas Co., LLC company guaranty sr. unsec. | | |
| notes 6.85%, 6/15/37 | 2,495,000 | 2,796,347 |
| NRG Energy, Inc. company guaranty sr. unsec. notes | | |
| 7.25%, 5/15/26 | 62,000 | 64,945 |
| NRG Energy, Inc. company guaranty sr. unsec. notes | | |
| 6.625%, 1/15/27 | 413,000 | 429,520 |
| NRG Energy, Inc. company guaranty sr. unsec. notes | | |
| 5.75%, 1/15/28 | 2,235,000 | 2,279,700 |
| NRG Energy, Inc. 144A company guaranty sr. bonds 4.45%, 6/15/29 | 1,265,000 | 1,279,841 |
| NRG Energy, Inc. 144A company guaranty sr. notes 3.75%, 6/15/24 | 2,904,000 | 2,870,258 |
| NRG Energy, Inc. 144A sr. unsec. bonds 5.25%, 6/15/29 | 709,000 | 730,270 |
| Vistra Energy Corp. 144A company guaranty sr. unsec. notes | | |
| 8.125%, 1/30/26 | 999,000 | 1,037,712 |
| Vistra Operations Co., LLC 144A company guaranty sr. unsec. notes | | |
| 5.00%, 7/31/27 | 60,000 | 60,900 |
| Vistra Operations Co., LLC 144A sr. bonds 4.30%, 7/15/29 | 830,000 | 735,886 |
| Vistra Operations Co., LLC 144A sr. notes 3.55%, 7/15/24 | 485,000 | 455,821 |
| Vistra Operations Co., LLC 144A sr. unsec. notes 5.625%, 2/15/27 | 52,000 | 53,625 |
| Vistra Operations Co., LLC 144A sr. unsec. notes 5.50%, 9/1/26 | 2,863,000 | 2,948,890 |
| | | 24,262,804 |
| Total corporate bonds and notes (cost $727,616,280) | | $630,014,883 |
|
| Diversified Income Trust 45 |
| | | |
| FOREIGN GOVERNMENT AND AGENCY | | Principal | |
| BONDS AND NOTES (10.2%)* | | amount | Value |
| Argentina (Republic of) sr. unsec. unsub. notes 7.50%, | | | |
| 4/22/26 (Argentina) | | $20,405,000 | $5,764,617 |
| Argentina (Republic of) sr. unsec. unsub. notes 4.625%, | | | |
| 1/11/23 (Argentina) | | 16,490,000 | 4,575,975 |
| Argentina (Republic of) 144A sr. unsec. notes 7.125%, | | | |
| 8/1/27 (Argentina) | | 12,495,000 | 5,607,256 |
| Brazil (Federal Republic of) sr. unsec. unsub. bonds 4.625%, | | | |
| 1/13/28 (Brazil) | | 16,593,000 | 17,445,615 |
| Brazil (Federal Republic of) sr. unsec. unsub. notes 4.25%, | | | |
| 1/7/25 (Brazil) | | 9,160,000 | 9,583,650 |
| Buenos Aires (Province of) sr. unsec. unsub. bonds Ser. REGS, | | | |
| 7.875%, 6/15/27 (Argentina) | | 12,708,000 | 3,227,832 |
| Buenos Aires (Province of) sr. unsec. unsub. notes Ser. REGS, | | | |
| 6.50%, 2/15/23 (Argentina) | | 740,000 | 186,480 |
| Buenos Aires (Province of) unsec. FRN (Argentina Deposit Rates | | | |
| BADLAR + 3.83%), 33.929%, 5/31/22 (Argentina) | ARS | 99,370,000 | 834,361 |
| Buenos Aires (Province of) 144A sr. unsec. unsub. bonds 7.875%, | | | |
| 6/15/27 (Argentina) | | $12,315,000 | 3,128,010 |
| Buenos Aires (Province of) 144A sr. unsec. unsub. notes 9.125%, | | | |
| 3/16/24 (Argentina) | | 10,597,000 | 2,696,937 |
| Cordoba (Province of) sr. unsec. unsub. notes Ser. REGS, 7.45%, | | | |
| 9/1/24 (Argentina) | | 20,752,000 | 8,197,040 |
| Cordoba (Province of) 144A sr. unsec. unsub. notes 7.125%, | | | |
| 6/10/21 (Argentina) | | 150,000 | 97,314 |
| Dominican (Republic of) sr. unsec. unsub. bonds Ser. REGS, 7.45%, | | | |
| 4/30/44 (Dominican Republic) | | 2,550,000 | 2,371,500 |
| Dominican (Republic of) sr. unsec. unsub. bonds Ser. REGS, | | | |
| 5.875%, 1/30/60 (Dominican Republic) | | 7,888,000 | 6,614,656 |
| Dominican (Republic of) sr. unsec. unsub. notes 7.50%, 5/6/21 | | | |
| (Dominican Republic) | | 2,690,000 | 2,690,000 |
| Dominican (Republic of) sr. unsec. unsub. notes Ser. REGS, 8.625%, | | | |
| 4/20/27 (Dominican Republic) | | 5,272,000 | 5,482,880 |
| Dominican (Republic of) sr. unsec. unsub. notes Ser. REGS, 6.875%, | | | |
| 1/29/26 (Dominican Republic) | | 11,318,000 | 11,091,640 |
| Dominican (Republic of) sr. unsec. unsub. notes Ser. REGS, 6.00%, | | | |
| 7/19/28 (Dominican Republic) | | 5,839,000 | 5,488,718 |
| Dominican (Republic of) sr. unsec. unsub. notes Ser. REGS, 5.95%, | | | |
| 1/25/27 (Dominican Republic) | | 2,244,000 | 2,086,920 |
| Dominican (Republic of) sr. unsec. unsub. notes Ser. REGS, 5.875%, | | | |
| 4/18/24 (Dominican Republic) | | 1,551,000 | 1,504,470 |
| Dominican (Republic of) sr. unsec. unsub. notes Ser. REGS, 5.50%, | | | |
| 1/27/25 (Dominican Republic) | | 7,440,000 | 6,993,600 |
| Dominican (Republic of) 144A sr. unsec. notes 4.50%, 1/30/30 | | | |
| (Dominican Republic) | | 2,200,000 | 1,914,000 |
| Ecuador (Republic of) 144A sr. unsec. notes 9.50%, | | | |
| 3/27/30 (Ecuador) | | 10,472,000 | 3,059,321 |
| Egypt (Arab Republic of) sr. unsec. bonds Ser. REGS, 7.053%, | | | |
| 1/15/32 (Egypt) | | 11,840,000 | 9,486,918 |
| Egypt (Arab Republic of) sr. unsec. notes Ser. REGS, 7.60%, | | | |
| 3/1/29 (Egypt) | | 3,011,000 | 2,666,822 |
| Egypt (Arab Republic of) sr. unsec. unsub. notes Ser. REGS, 5.875%, | | | |
| 6/11/25 (Egypt) | | 7,155,000 | 6,395,139 |
|
| 46 Diversified Income Trust |
| | | |
| FOREIGN GOVERNMENT AND AGENCY | | Principal | |
| BONDS AND NOTES (10.2%)*cont. | | amount | Value |
| Egypt (Arab Republic of) 144A sr. unsec. bonds 7.053%, | | | |
| 1/15/32 (Egypt) | | $6,810,000 | $5,502,752 |
| El Salvador (Republic of) sr. unsec. unsub. bonds Ser. REGS, | | | |
| 7.625%, 2/1/41 (El Salvador) | | 4,165,000 | 3,415,342 |
| El Salvador (Republic of) sr. unsec. unsub. notes Ser. REGS, 6.375%, | | | |
| 1/18/27 (El Salvador) | | 2,898,000 | 2,535,750 |
| El Salvador (Republic of) sr. unsec. unsub. notes Ser. REGS, 5.875%, | | | |
| 1/30/25 (El Salvador) | | 4,150,000 | 3,641,625 |
| Indonesia (Republic of) sr. unsec. unsub. bonds 2.85%, | | | |
| 2/14/30 (Indonesia) | | 6,607,000 | 6,408,572 |
| Indonesia (Republic of) sr. unsec. unsub. notes Ser. REGS, 5.875%, | | | |
| 1/15/24 (Indonesia) | | 2,705,000 | 2,934,893 |
| Indonesia (Republic of) sr. unsec. unsub. notes Ser. REGS, 4.75%, | | | |
| 1/8/26 (Indonesia) | | 21,200,000 | 22,126,864 |
| Indonesia (Republic of) 144A sr. unsec. unsub. bonds 6.625%, | | | |
| 2/17/37 (Indonesia) | | 3,055,000 | 3,826,174 |
| Indonesia (Republic of) 144A sr. unsec. unsub. notes 4.35%, | | | |
| 1/8/27 (Indonesia) | | 12,420,000 | 12,885,936 |
| Indonesia (Republic of) 144A sr. unsec. unsub. notes 3.375%, | | | |
| 4/15/23 (Indonesia) | | 5,860,000 | 5,852,734 |
| Ivory Coast (Republic of) sr. unsec. unsub. bonds Ser. REGS, | | | |
| 6.125%, 6/15/33 (Ivory Coast) | | 23,275,000 | 20,307,438 |
| Ivory Coast (Republic of) sr. unsec. unsub. bonds Ser. REGS, 5.75%, | | | |
| 12/31/32 (Ivory Coast) | | 10,371,150 | 9,308,108 |
| Ivory Coast (Republic of) sr. unsec. unsub. bonds Ser. REGS, 5.25%, | | | |
| 3/22/30 (Ivory Coast) | EUR | 3,940,000 | 3,706,559 |
| Ivory Coast (Republic of) sr. unsec. unsub. notes Ser. REGS, 6.375%, | | | |
| 3/3/28 (Ivory Coast) | | $3,920,000 | 3,596,561 |
| Ivory Coast (Republic of) sr. unsec. unsub. notes Ser. REGS, 5.375%, | | | |
| 7/23/24 (Ivory Coast) | | 6,251,000 | 5,649,342 |
| Ivory Coast (Republic of) 144A sr. unsec. unsub. bonds 5.25%, | | | |
| 3/22/30 (Ivory Coast) | EUR | 4,445,000 | 4,189,188 |
| Jamaica (Government of) sr. unsec. unsub. bonds 8.00%, | | | |
| 3/15/39 (Jamaica) | | $1,119,000 | 1,219,721 |
| Jamaica (Government of) sr. unsec. unsub. notes 6.75%, | | | |
| 4/28/28 (Jamaica) | | 400,000 | 414,004 |
| Mexico (Government of) sr. unsec. bonds 5.55%, 1/21/45 (Mexico) | | 1,637,000 | 1,847,764 |
| Oman (Sultanate of) sr. unsec. notes Ser. REGS, 6.00%, | | | |
| 8/1/29 (Oman) | | 5,769,000 | 4,131,989 |
| Senegal (Republic of) sr. unsec. unsub. bonds Ser. REGS, 6.75%, | | | |
| 3/13/48 (Senegal) | | 30,930,000 | 25,362,600 |
| Senegal (Republic of) unsec. bonds Ser. REGS, 6.25%, | | | |
| 5/23/33 (Senegal) | | 16,640,000 | 14,892,800 |
| South Africa (Republic of) sr. unsec. unsub. bonds 6.30%, 6/22/48 | | | |
| (South Africa) | | 5,020,000 | 3,890,319 |
| South Africa (Republic of) sr. unsec. unsub. notes 5.875%, 9/16/25 | | | |
| (South Africa) | | 5,970,000 | 5,726,723 |
| South Africa (Republic of) sr. unsec. unsub. notes 4.85%, 9/27/27 | | | |
| (South Africa) | | 6,485,000 | 5,658,066 |
| Turkey (Republic of) sr. unsec. unsub. notes 6.35%, | | | |
| 8/10/24 (Turkey) | | 11,628,000 | 11,016,135 |
| United Mexican States sr. unsec. notes 4.00%, 10/2/23 (Mexico) | | 5,520,000 | 5,474,780 |
|
| Diversified Income Trust 47 |
| | |
| FOREIGN GOVERNMENT AND AGENCY | Principal | |
| BONDS AND NOTES (10.2%)*cont. | amount | Value |
| United Mexican States sr. unsec. unsub. bonds 3.25%, | | |
| 4/16/30 (Mexico) | $16,395,000 | $15,411,300 |
| Venezuela (Bolivarian Republic of) sr. unsec. bonds 7.00%, | | |
| 3/31/38 (Venezuela) | 2,900,000 | 261,000 |
| Venezuela (Republic of) sr. unsec. notes 9.00%, 5/7/23 (Venezuela) | | |
| (In default) † | 13,582,000 | 1,358,200 |
| Venezuela (Republic of) sr. unsec. notes 7.65%, 4/21/25 | | |
| (Venezuela) (In default) † | 2,093,000 | 209,300 |
| Venezuela (Republic of) sr. unsec. unsub. notes 8.25%, 10/13/24 | | |
| (Venezuela) (In default) † | 21,992,000 | 2,199,200 |
| Vietnam (Republic of) 144A sr. unsec. bonds 4.80%, | | |
| 11/19/24 (Vietnam) | 600,000 | 593,963 |
| Total foreign government and agency bonds and notes (cost $466,948,772) | $344,747,373 |
| | | |
| | | Principal | |
| CONVERTIBLE BONDS AND NOTES (4.6%)* | | amount | Value |
| Basic materials (0.1%) | | | |
| BASF SE cv. sr. unsec. notes 0.925%, 3/9/23 (Germany) | | $500,000 | $465,615 |
| Cellnex Telecom, SA cv. sr. unsec. unsub. notes 1.50%, | | | |
| 1/16/26 (Spain) | EUR | 400,000 | 602,546 |
| Sika AG cv. sr. unsec. notes Ser. REGS, 0.15%, 6/5/25 (Switzerland) | CHF | 640,000 | 705,350 |
| Symrise AG cv. sr. unsec. notes 0.238%, 6/20/24 (Germany) | EUR | 200,000 | 254,798 |
| | | | 2,028,309 |
| Capital goods (0.2%) | | | |
| Airbus SE cv. sr. unsec. unsub. notes zero %, 6/14/21 (France) | EUR | 700,000 | 748,622 |
| Fortive Corp. cv. company guaranty sr. unsec. notes | | | |
| 0.875% 2/15/22 | | $2,959,000 | 2,742,623 |
| II-VI, Inc. cv. sr. unsec. notes 0.25%, 9/1/22 | | 1,851,000 | 1,695,059 |
| MTU Aero Engines AG cv. sr. unsec. unsub. notes 0.125%, | | | |
| 5/17/23 (Germany) | EUR | 100,000 | 122,979 |
| | | | 5,309,283 |
| Communication services (0.3%) | | | |
| 8x8, Inc. cv. sr. unsec. notes 0.50%, 2/1/24 | | $924,000 | 804,814 |
| America Movil SAB de CV cv. sr. unsec. unsub. notes zero %, | | | |
| 5/28/20 (Mexico) | EUR | 800,000 | 873,840 |
| DISH Network Corp. cv. sr. unsec. notes 3.375%, 8/15/26 | | $2,584,000 | 2,097,824 |
| GCI Liberty, Inc. 144A cv. sr. unsec. bonds 1.75%, 9/30/46 | | 2,456,000 | 3,091,534 |
| Liberty Media Corp. cv. sr. unsec. bonds 1.375%, 10/15/23 | | 986,000 | 931,770 |
| Liberty Media Corp. 144A cv. sr. unsec. unsub. bonds | | | |
| 2.75%, 12/1/49 | | 3,103,000 | 2,647,295 |
| Telefonica Participaciones SAU cv. company guaranty sr. unsec. | | | |
| unsub. notes zero %, 3/9/21 (Spain) | EUR | 400,000 | 429,857 |
| Vodafone Group PLC cv. sr. unsec. unsub. notes zero %, 11/26/20 | | | |
| (United Kingdom) | GBP | 200,000 | 244,761 |
| Vonage Holdings Corp. 144A cv. sr. unsec. notes 1.75%, 6/1/24 | | $1,494,000 | 1,205,348 |
| | | | 12,327,043 |
| Consumer cyclicals (0.5%) | | | |
| adidas AG 144A cv. sr. unsec. notes 0.05%, 9/12/23 (Germany) | EUR | 400,000 | 462,732 |
| Archer Obligations cv. sr. unsec. notes Ser. KER, zero %, | | | |
| 3/31/23 (France) | EUR | 100,000 | 140,556 |
| Compagnie Generale des Etablissements Michelin SCA cv. sr. | | | |
| unsec. unsub. notes zero %, 1/10/22 (France) | | $400,000 | 379,644 |
| |
| 48 Diversified Income Trust |
| | | |
| | | Principal | |
| CONVERTIBLE BONDS AND NOTES (4.6%)*cont. | | amount | Value |
| Consumer cyclicalscont. | | | |
| FTI Consulting, Inc. cv. sr. unsec. notes 2.00%, 8/15/23 | | $1,283,000 | $1,673,396 |
| Horizon Global Corp. cv. sr. unsec. unsub. notes 2.75%, 7/1/22 | | 283,000 | 220,395 |
| Liberty Interactive, LLC 144A cv. sr. unsec. bonds 1.75%, 9/30/46 | | 195,000 | 261,544 |
| Liberty Media Corp. cv. sr. unsec. notes 1.00%, 1/30/23 | | 1,384,000 | 1,306,075 |
| Live Nation Entertainment, Inc. cv. sr. unsec. notes 2.50%, 3/15/23 | | 2,898,000 | 2,754,636 |
| LVMH Moet Hennessy Louis Vuitton SA cv. sr. unsec. notes zero %, | | | |
| 2/16/21 (Units) (France) | | 596 | 240,839 |
| Marriott Vacations Worldwide Corp. cv. sr. unsec. notes | | | |
| 1.50%, 9/15/22 | | 2,004,000 | 1,565,625 |
| Nexity SA cv. sr. unsec. notes 0.25%, 3/2/25 (Units) (France) | EUR | 2,850 | 189,322 |
| Priceline Group, Inc. (The) cv. sr. unsec. bonds 0.90%, 9/15/21 | | $2,702,000 | 2,693,624 |
| RH 144A cv. sr. unsec. notes zero %, 9/15/24 | | 2,265,000 | 1,652,657 |
| Square, Inc. 144A cv. sr. unsec. notes 0.125%, 3/1/25 | | 1,565,000 | 1,352,908 |
| Tesla Motors, Inc. cv. sr. unsec. notes 2.00%, 5/15/24 | | 135,000 | 247,050 |
| Winnebago Industries, Inc. 144A cv. sr. unsec. notes 1.50%, 4/1/25 | | 972,000 | 728,392 |
| | | | 15,869,395 |
| Consumer staples (0.3%) | | | |
| Chegg, Inc. 144A cv. sr. unsec. notes 0.125%, 3/15/25 | | 1,543,000 | 1,458,907 |
| Etsy, Inc. 144A cv. sr. unsec. notes 0.125%, 10/1/26 | | 2,997,000 | 2,466,938 |
| IAC Financeco 2, Inc. 144A cv. company guaranty sr. unsec. notes | | | |
| 0.875%, 6/15/26 | | 4,123,000 | 3,793,454 |
| Luckin Coffee, Inc. 144A cv. sr. unsec. notes 0.75%, 1/15/25 (China) | | 249,000 | 189,927 |
| Pinduoduo, Inc. 144A cv. sr. unsec. notes zero %, 10/1/24 (China) | | 389,000 | 423,854 |
| Wayfair, Inc. cv. sr. unsec. notes 1.125%, 11/1/24 | | 1,735,000 | 1,186,128 |
| Zillow Group, Inc. 144A cv. sr. unsec. sub. notes 1.375%, 9/1/26 | | 2,695,000 | 2,750,089 |
| | | | 12,269,297 |
| Energy (0.1%) | | | |
| BP Capital Markets PLC cv. company guaranty sr. unsec. unsub. | | | |
| notes 1.00%, 4/28/23 (United Kingdom) | GBP | 300,000 | 372,041 |
| CHC Group, LLC/CHC Finance, Ltd. cv. notes Ser. AI, zero %, 10/1/20 | | | |
| (acquired 2/2/17, cost $393,884) | | $566,658 | 113,332 |
| Cheniere Energy, Inc. cv. sr. unsec. unsub. notes 4.25%, 3/15/45 | | 326,000 | 195,541 |
| Oasis Petroleum, Inc. cv. sr. unsec. notes 2.625%, 9/15/23 | | 614,000 | 92,566 |
| RAG-Stiftung cv. sr. unsec. unsub. notes zero %, 2/18/21 (Germany) | EUR | 400,000 | 420,986 |
| TOTAL SA cv. sr. unsec. unsub. notes 0.50%, 12/2/22 (France) | | $800,000 | 750,720 |
| Transocean, Inc. cv. company guaranty sr. unsec. sub. notes | | | |
| 0.50%, 1/30/23 | | 1,277,000 | 443,842 |
| | | | 2,389,028 |
| Financials (0.2%) | | | |
| Blackstone Mortgage Trust, Inc. cv. sr. unsec. notes 4.75%, 3/15/23 R | | 1,300,000 | 1,020,500 |
| Deutsche Wohnen SE cv. sr. unsec. unsub. notes 0.60%, | | | |
| 1/5/26 (Germany) | EUR | 600,000 | 626,694 |
| Encore Capital Group, Inc. cv. company guaranty sr. unsec. unsub. | | | |
| notes 3.25%, 3/15/22 | | $1,088,000 | 955,735 |
| IH Merger Sub, LLC cv. company guaranty sr. unsec. notes | | | |
| 3.50%, 1/15/22 R | | 1,400,000 | 1,491,333 |
| JPMorgan Chase Financial Co., LLC cv. company guaranty sr. | | | |
| unsec. notes 0.25%, 5/1/23 | | 2,092,000 | 1,950,791 |
| Redfin Corp. cv. sr. unsec. notes 1.75%, 7/15/23 | | 663,000 | 599,961 |
| | | | 6,645,014 |
|
| Diversified Income Trust 49 |
| | | |
| | | Principal | |
| CONVERTIBLE BONDS AND NOTES (4.6%)*cont. | | amount | Value |
| Health care (0.6%) | | | |
| Bayer AG cv. sr. unsec. unsub. notes 0.05%, 6/15/20 (Germany) | EUR | 400,000 | $436,810 |
| BioMarin Pharmaceutical, Inc. cv. sr. unsec. sub. notes | | | |
| 0.599%, 8/1/24 | | $1,796,000 | 1,882,087 |
| CONMED Corp. cv. sr. unsec. notes 2.625%, 2/1/24 | | 1,061,000 | 982,129 |
| DexCom, Inc. cv. sr. unsec. unsub. notes 0.75%, 12/1/23 | | 916,000 | 1,591,714 |
| Exact Sciences Corp. cv. sr. unsec. notes 0.375%, 3/15/27 | | 5,117,000 | 4,299,423 |
| Illumina, Inc. cv. sr. unsec. notes zero %, 8/15/23 | | 1,064,000 | 1,018,312 |
| Insulet Corp. 144A cv. sr. unsec. notes 0.375%, 9/1/26 | | 756,000 | 763,835 |
| Integra LifeSciences Holdings Corp. 144A cv. sr. unsec. notes | | | |
| 0.50%, 8/15/25 | | 1,117,000 | 986,961 |
| Ironwood Pharmaceuticals, Inc. 144A cv. sr. unsec. notes | | | |
| 1.50%, 6/15/26 | | 970,000 | 975,432 |
| Ironwood Pharmaceuticals, Inc. 144A cv. sr. unsec. notes | | | |
| 0.75%, 6/15/24 | | 883,000 | 898,453 |
| Jazz Investments I, Ltd. cv. company guaranty sr. unsec. sub. notes | | | |
| 1.50%, 8/15/24 (Ireland) | | 2,046,000 | 1,788,662 |
| Neurocrine Biosciences, Inc. cv. sr. unsec. notes 2.25%, 5/15/24 | | 783,000 | 999,539 |
| Pacira Pharmaceuticals, Inc./Delaware cv. sr. unsec. sub. notes | | | |
| 2.375%, 4/1/22 | | 1,216,000 | 1,171,878 |
| QIAGEN NV cv. sr. unsec. unsub. notes Ser. REGS, 1.00%, | | | |
| 11/13/24 (Netherlands) | | 200,000 | 224,937 |
| Tabula Rasa HealthCare, Inc. 144A cv. sr. unsec. sub. notes | | | |
| 1.75%, 2/15/26 | | 1,114,000 | 1,089,632 |
| Teladoc Health, Inc. cv. sr. unsec. notes 1.375%, 5/15/25 | | 124,000 | 360,530 |
| | | | 19,470,334 |
| Technology (2.2%) | | | |
| Akamai Technologies, Inc. cv. sr. unsec. notes 0.125%, 5/1/25 | | 3,892,000 | 4,343,576 |
| Akamai Technologies, Inc. 144A cv. sr. unsec. notes 0.375%, 9/1/27 | | 2,286,000 | 2,276,749 |
| Blackline, Inc. 144A cv. sr. unsec. notes 0.125%, 8/1/24 | | 1,586,000 | 1,551,786 |
| Coupa Software, Inc. 144A cv. sr. unsec. notes 0.125%, 6/15/25 | | 457,000 | 505,842 |
| Cree, Inc. cv. sr. unsec. notes 0.875%, 9/1/23 | | 1,935,000 | 1,765,477 |
| CyberArk Software, Ltd. 144A cv. sr. unsec. notes zero %, | | | |
| 11/15/24 (Israel) | | 1,478,000 | 1,280,496 |
| DocuSign, Inc. cv. sr. unsec. notes 0.50%, 9/15/23 | | 1,772,000 | 2,489,079 |
| Envestnet, Inc. cv. sr. unsec. notes 1.75%, 6/1/23 | | 1,696,000 | 1,733,376 |
| Everbridge, Inc. 144A cv. sr. unsec. notes 0.125%, 12/15/24 | | 259,000 | 293,803 |
| Guidewire Software, Inc. cv. sr. unsec. sub. notes 1.25%, 3/15/25 | | 1,119,000 | 1,078,139 |
| HubSpot, Inc. cv. sr. unsec. notes 0.25%, 6/1/22 | | 116,000 | 174,688 |
| Inphi Corp. cv. sr. unsec. notes 0.75%, 9/1/21 | | 775,000 | 1,130,550 |
| iQIYI, Inc. 144A cv. sr. unsec. notes 2.00%, 4/1/25 (China) | | 220,000 | 193,738 |
| j2 Global, Inc. 144A cv. sr. unsec. notes 1.75%, 11/1/26 | | 1,596,000 | 1,456,351 |
| LivePerson, Inc. 144A cv. sr. unsec. notes 0.75%, 3/1/24 | | 637,000 | 583,910 |
| Lumentum Holdings, Inc. 144A cv. sr. unsec. notes 0.50%, 12/15/26 | | 3,861,000 | 3,928,569 |
| Microchip Technology, Inc. cv. sr. unsec. sub. notes | | | |
| 1.625%, 2/15/27 | | 1,460,000 | 1,503,800 |
| MongoDB, Inc. 144A cv. sr. unsec. notes 0.25%, 1/15/26 | | 498,000 | 482,749 |
| New Relic, Inc. cv. sr. unsec. notes 0.50%, 5/1/23 | | 1,160,000 | 976,277 |
| Nuance Communications, Inc. cv. sr. unsec. notes 1.25%, 4/1/25 | | 3,709,000 | 3,993,815 |
| Okta, Inc. 144A cv. sr. unsec. notes 0.125%, 9/1/25 | | 623,000 | 595,354 |
|
| 50 Diversified Income Trust |
| | | |
| | | Principal | |
| CONVERTIBLE BONDS AND NOTES (4.6%)*cont. | | amount | Value |
| Technologycont. | | | |
| ON Semiconductor Corp. cv. company guaranty sr. unsec. unsub. | | | |
| notes 1.625%, 10/15/23 | | $2,235,000 | $2,219,856 |
| Palo Alto Networks, Inc. cv. sr. unsec. notes 0.75%, 7/1/23 | | 5,316,000 | 5,130,967 |
| Pegasystems, Inc. 144A cv. sr. unsec. notes 0.75%, 3/1/25 | | 982,000 | 858,176 |
| Pluralsight, Inc. 144A cv. sr. unsec. notes 0.375%, 3/1/24 | | 1,495,000 | 1,101,068 |
| Proofpoint, Inc. 144A cv. sr. unsec. unsub. notes 0.25%, 8/15/24 | | 2,522,000 | 2,367,528 |
| Q2 Holdings, Inc. 144A cv. sr. unsec. unsub. notes 0.75%, 6/1/26 | | 1,381,000 | 1,230,260 |
| RingCentral, Inc. 144A cv. sr. unsec. notes zero %, 3/1/25 | | 2,449,000 | 2,268,759 |
| SailPoint Technologies Holding, Inc. 144A cv. sr. unsec. notes | | | |
| 0.125%, 9/15/24 | | 975,000 | 831,188 |
| Sea, Ltd. 144A cv. sr. unsec. notes 1.00%, 12/1/24 (Thailand) | | 471,000 | 522,865 |
| ServiceNow, Inc. cv. sr. unsec. unsub. notes zero %, 6/1/22 | | 150,000 | 319,295 |
| Silicon Laboratories, Inc. cv. sr. unsec. notes 1.375%, 3/1/22 | | 767,000 | 848,575 |
| Snap, Inc. 144A cv. sr. unsec. notes 0.75%, 8/1/26 | | 3,466,000 | 3,044,975 |
| Splunk, Inc. cv. sr. unsec. notes 1.125%, 9/15/25 | | 6,253,000 | 6,909,565 |
| STMicroelectronics NV cv. sr. unsec. notes 0.25%, 7/3/24 (France) | | 600,000 | 732,420 |
| STMicroelectronics NV cv. sr. unsec. notes zero %, 7/3/22 (France) | | 200,000 | 238,866 |
| Talend SA 144A cv. sr. unsec. notes 1.75%, 9/1/24 | EUR | 200,000 | 185,894 |
| Twilio, Inc. cv. sr. unsec. notes 0.25%, 6/1/23 (acquired 11/8/18 and | | | |
| 12/20/19, cost $1,052,829) | | $681,000 | 950,176 |
| Twitter, Inc. cv. sr. unsec. unsub. bonds 1.00%, 9/15/21 | | 3,011,000 | 2,845,581 |
| Verint Systems, Inc. cv. sr. unsec. notes 1.50%, 6/1/21 | | 1,161,000 | 1,119,394 |
| Viavi Solutions, Inc. cv. sr. unsec. unsub. notes 1.00%, 3/1/24 | | 1,012,000 | 1,066,964 |
| Western Digital Corp. cv. company guaranty sr. unsec. notes | | | |
| 1.50%, 2/1/24 | | 193,000 | 167,876 |
| Wix.com, Ltd. cv. sr. unsec. notes zero %, 7/1/23 (Israel) | | 1,411,000 | 1,391,988 |
| Workday, Inc. cv. sr. unsec. notes 0.25%, 10/1/22 | | 1,416,000 | 1,568,221 |
| Xero Investments, Ltd. cv. sr. unsec. notes Ser. REGS, 2.375%, | | | |
| 10/4/23 (New Zealand) | | 200,000 | 227,010 |
| Zendesk, Inc. cv. sr. unsec. notes 0.25%, 3/15/23 | | 1,146,000 | 1,353,880 |
| Zynga, Inc. 144A cv. sr. unsec. notes 0.25%, 6/1/24 | | 1,642,000 | 1,683,921 |
| | | | 73,523,392 |
| Transportation (—%) | | | |
| Air Transport Services Group, Inc. cv. sr. unsec. notes | | | |
| 1.125%, 10/15/24 | | 1,242,000 | 1,049,490 |
| DP World, Ltd. cv. sr. unsec. unsub. notes 1.75%, 6/19/24 | | | |
| (United Arab Emirates) | | 200,000 | 198,050 |
| | | | 1,247,540 |
| Utilities and power (0.1%) | | | |
| Eni SpA cv. sr. unsec. unsub. notes zero %, 4/13/22 (Italy) | EUR | 200,000 | 209,273 |
| Iberdrola International BV cv. company guaranty sr. unsec. unsub. | | | |
| notes zero %, 11/11/22 (Spain) | EUR | 300,000 | 388,732 |
| NRG Energy, Inc. cv. company guaranty sr. unsec. bonds | | | |
| 2.75%, 6/1/48 | | $2,662,000 | 2,535,556 |
| | | | 3,133,561 |
| Total convertible bonds and notes (cost $173,500,202) | | | $154,212,196 |
|
| Diversified Income Trust 51 |
| | | | |
| PURCHASED SWAP OPTIONS OUTSTANDING (4.2%)* | | | | |
| Counterparty | | | Notional/ | |
| Fixed right % to receive or (pay)/ | Expiration | | contract | |
| Floating rate index/Maturity date | date/strike | | amount | Value |
| Bank of America N.A. | | | | |
| (1.465)/3 month USD-LIBOR-BBA/Apr-50 | Apr-20/1.465 | | $43,976,200 | $3,078 |
| Citibank, N.A. | | | | |
| 1.629/3 month USD-LIBOR-BBA/Jan-26 | Jan-21/1.629 | | 103,968,200 | 5,751,521 |
| 1.996/3 month USD-LIBOR-BBA/Jan-26 | Jan-21/1.996 | | 103,968,200 | 5,487,442 |
| 1.316/3 month USD-LIBOR-BBA/Oct-21 | Oct-20/1.316 | | 536,553,400 | 5,381,631 |
| (1.996)/3 month USD-LIBOR-BBA/Jan-26 | Jan-21/1.996 | | 103,968,200 | 300,468 |
| (1.629)/3 month USD-LIBOR-BBA/Jan-26 | Jan-21/1.629 | | 103,968,200 | 66,540 |
| (1.316)/3 month USD-LIBOR-BBA/Oct-21 | Oct-20/1.316 | | 536,553,400 | 537 |
| Goldman Sachs International | | | | |
| 2.988/3 month USD-LIBOR-BBA/Feb-39 | Feb-29/2.988 | | 44,570,700 | 8,792,908 |
| (2.988)/3 month USD-LIBOR-BBA/Feb-39 | Feb-29/2.988 | | 44,570,700 | 738,091 |
| (2.983)/3 month USD-LIBOR-BBA/May-52 | May-22/2.983 | | 77,778,300 | 503,226 |
| JPMorgan Chase Bank N.A. | | | | |
| 2.795/3 month USD-LIBOR-BBA/Dec-37 | Dec-27/2.795 | | 35,772,300 | 6,493,746 |
| 2.7575/3 month USD-LIBOR-BBA/Dec-37 | Dec-27/2.7575 | | 35,772,300 | 6,385,713 |
| 1.101/3 month USD-LIBOR-BBA/Mar-31 | Mar-21/1.101 | | 123,520,600 | 6,058,685 |
| (1.042)/3 month USD-LIBOR-BBA/Sep-50 | Sep-20/1.042 | | 93,055,300 | 4,791,417 |
| 1.33/3 month USD-LIBOR-BBA/Oct-21 | Oct-20/1.33 | | 415,873,100 | 4,241,906 |
| (2.7575)/3 month USD-LIBOR-BBA/Dec-37 | Dec-27/2.7575 | | 35,772,300 | 614,926 |
| (2.795)/3 month USD-LIBOR-BBA/Dec-37 | Dec-27/2.795 | | 35,772,300 | 598,113 |
| Morgan Stanley & Co. International PLC | | | | |
| 3.00/3 month USD-LIBOR-BBA/Apr-72 | Apr-47/3.00 | | 44,214,400 | 21,290,118 |
| 3.00/3 month USD-LIBOR-BBA/Feb-73 | Feb-48/3.00 | | 44,214,400 | 21,185,330 |
| 2.75/3 month USD-LIBOR-BBA/May-73 | May-48/2.75 | | 44,214,400 | 18,890,160 |
| 1.613/3 month USD-LIBOR-BBA/Aug-34 | Aug-24/1.613 | | 58,978,200 | 5,383,530 |
| 2.75/3 month USD-LIBOR-BBA/Dec-71 | Dec-46/2.75 | | 10,000,000 | 4,306,400 |
| (1.613)/3 month USD-LIBOR-BBA/Aug-34 | Aug-24/1.613 | | 58,978,200 | 1,680,289 |
| (0.01)/6 month EUR-EURIBOR-Reuters/Apr-30 | Apr-20/0.01 | EUR | 49,595,500 | 440,873 |
| (2.904)/3 month USD-LIBOR-BBA/May-51 | May-21/2.904 | | $33,333,500 | 78,667 |
| (1.719)/3 month USD-LIBOR-BBA/Apr-50 | Apr-20/1.719 | | 23,695,500 | 11,374 |
| Toronto-Dominion Bank | | | | |
| (1.04)/3 month USD-LIBOR-BBA/Mar-55 (Canada) | Mar-25/1.04 | | 7,791,000 | 1,042,903 |
| (1.12625)/3 month USD-LIBOR-BBA/Apr-30 (Canada) | Apr-20/1.12625 | | 116,134,000 | 112,650 |
| UBS AG | | | | |
| 1.5025/3 month USD-LIBOR-BBA/Oct-21 | Oct-20/1.5025 | | 558,015,100 | 6,640,380 |
| 0.153/6 month EUR-EURIBOR-Reuters/Sep-29 | Sep-24/0.153 | EUR | 83,593,200 | 2,168,425 |
| (0.153)/6 month EUR-EURIBOR-Reuters/Sep-29 | Sep-24/0.153 | EUR | 83,593,200 | 2,114,952 |
| (0.895)/3 month USD-LIBOR-BBA/Apr-30 | Apr-20/0.895 | | $36,925,000 | 111,142 |
| (1.5025)/3 month USD-LIBOR-BBA/Oct-21 | Oct-20/1.5025 | | 558,015,100 | 558 |
| Total purchased swap options outstanding (cost $71,073,752) | | | $141,667,699 |
|
| 52 Diversified Income Trust |
| | | | | |
| PURCHASED OPTIONS | Expiration | | | | |
| OUTSTANDING (1.4%)* | date/strike | Notional | | Contract | |
| Counterparty | price | amount | | amount | Value |
| Bank of America N.A. | | | | | |
| USD/JPY (Put) | Jun-20/JPY 108.00 | $63,289,450 | | $63,289,450 | $1,539,453 |
| USD/JPY (Put) | Apr-20/JPY 106.00 | 63,289,450 | | 63,289,450 | 467,329 |
| Barclays Bank PLC | | | | | |
| GBP/USD (Call) | Apr-20/$1.34 | 69,521,082 | GBP | 55,970,600 | 70 |
| Citibank, N.A. | | | | | |
| USD/CHF (Put) | Jun-20/CHF 0.91 | 73,125,950 | | $73,125,950 | 227,641 |
| USD/JPY (Put) | Jun-20/JPY 108.00 | 63,289,450 | | 63,289,450 | 1,539,453 |
| Goldman Sachs International | | | | | |
| EUR/NOK (Put) | Apr-20/NOK 9.60 | 109,184,453 | EUR | 98,997,600 | 109 |
| USD/CHF (Put) | Jun-20/CHF 0.94 | 73,125,950 | | $73,125,950 | 530,017 |
| USD/JPY (Put) | Jun-20/JPY 108.00 | 63,289,450 | | 63,289,450 | 1,539,453 |
| JPMorgan Chase Bank N.A. | | | | | |
| Uniform Mortgage-Backed | | | | | |
| Securities 30 yr 2.50% TBA | | | | | |
| commitments (Call) | May-20/$102.81 | 2,234,000,000 | | 2,234,000,000 | 16,064,694 |
| Uniform Mortgage-Backed | | | | | |
| Securities 30 yr 3.00% TBA | | | | | |
| commitments (Call) | Apr-20/102.94 | 580,000,000 | | 580,000,000 | 10,962,000 |
| Uniform Mortgage-Backed | | | | | |
| Securities 30 yr 3.00% TBA | | | | | |
| commitments (Call) | Apr-20/103.00 | 266,000,000 | | 266,000,000 | 4,861,150 |
| Uniform Mortgage-Backed | | | | | |
| Securities 30 yr 3.50% TBA | | | | | |
| commitments (Call) | Apr-20/103.13 | 250,000,000 | | 250,000,000 | 6,521,250 |
| Uniform Mortgage-Backed | | | | | |
| Securities 30 yr 3.50% TBA | | | | | |
| commitments (Call) | Apr-20/104.03 | 69,000,000 | | 69,000,000 | 1,174,725 |
| UBS AG | | | | | |
| GBP/USD (Call) | Apr-20/1.34 | 69,521,082 | GBP | 55,970,600 | 2,919 |
| Total purchased options outstanding (cost $21,098,241) | | | $45,430,263 |
| | |
| | Principal | |
| SENIOR LOANS (1.7%)*c | amount | Value |
| Basic materials (0.2%) | | |
| Alpha 3 BV bank term loan FRN Ser. B1, (BBA LIBOR USD 3 Month | | |
| + 3.00%), 4.45%, 1/31/24 | $1,044,397 | $950,402 |
| Diamond BC BV bank term loan FRN (BBA LIBOR USD 3 Month | | |
| + 3.00%), 4.777%, 9/6/24 | 1,306,757 | 980,068 |
| Messer Industries USA, Inc. bank term loan FRN Ser. B, (BBA LIBOR | | |
| USD 3 Month + 2.50%), 3.95%, 3/1/26 | 567,988 | 504,090 |
| Solenis International, LLC bank term loan FRN (BBA LIBOR USD | | |
| 3 Month + 8.50%), 10.831%, 6/26/26 | 1,028,000 | 678,480 |
| Solenis International, LLC bank term loan FRN (BBA LIBOR USD | | |
| 3 Month + 4.00%), 5.612%, 6/26/25 | 1,977,076 | 1,552,005 |
| | | 4,665,045 |
| Capital goods (0.4%) | | |
| Berry Global, Inc. bank term loan FRN Ser. Y, (BBA LIBOR USD | | |
| 3 Month + 2.00%), 3.899%, 7/1/26 | 818,788 | 763,929 |
| BWAY Corp. bank term loan FRN Ser. B, (BBA LIBOR USD 3 Month | | |
| + 3.25%), 5.084%, 4/3/24 | 1,974,473 | 1,604,259 |
|
| Diversified Income Trust 53 |
| | |
| | Principal | |
| SENIOR LOANS (1.7%)*ccont. | amount | Value |
| Capital goodscont. | | |
| GFL Environmental, Inc. bank term loan FRN Ser. B, (BBA LIBOR | | |
| USD 3 Month + 3.00%), 3.991%, 5/31/25 | $1,864,046 | $1,801,134 |
| Reynolds Group Holdings, Inc. bank term loan FRN (BBA LIBOR | | |
| USD 3 Month + 3.00%), 4.463%, 2/5/23 | 1,626,146 | 1,534,675 |
| Titan Acquisition, Ltd. (United Kingdom) bank term loan FRN | | |
| Ser. B, (BBA LIBOR USD 3 Month + 3.00%), 4.45%, 3/28/25 | 1,717,098 | 1,433,777 |
| Vertiv Group Corp. bank term loan FRN Ser. B, (1 Month US LIBOR | | |
| + 3.00%), 4.655%, 3/2/27 | 7,155,000 | 6,403,725 |
| | | 13,541,499 |
| Communication services (0.2%) | | |
| Asurion, LLC bank term loan FRN Ser. B7, (BBA LIBOR USD 3 Month | | |
| + 3.00%), 3.989%, 11/3/24 | 817,070 | 757,151 |
| Front Range BidCo, Inc. bank term loan FRN (1 Month US LIBOR | | |
| + 3.00%), 4.668%, 3/9/27 | 970,000 | 897,250 |
| Intelsat Jackson Holdings SA bank term loan FRN Ser. B3, | | |
| (BBA LIBOR USD 3 Month + 3.75%), 5.682%, 11/27/23 | 290,000 | 264,625 |
| Sprint Communications, Inc. bank term loan FRN Ser. B, | | |
| (BBA LIBOR USD 3 Month + 3.00%), 4.00%, 2/3/24 | 4,068,797 | 4,004,376 |
| | | 5,923,402 |
| Consumer cyclicals (0.6%) | | |
| Clear Channel Outdoor Holdings, Inc. bank term loan FRN Ser. B, | | |
| (BBA LIBOR USD 3 Month + 3.50%), 4.489%, 8/21/26 | 1,393,000 | 1,243,252 |
| CPG International, Inc. bank term loan FRN (BBA LIBOR USD | | |
| 3 Month + 3.75%), 4.719%, 5/5/24 | 2,019,674 | 1,666,232 |
| Diamond Sports Group, LLC bank term loan FRN Ser. B, | | |
| (BBA LIBOR USD 3 Month + 3.25%), 4.18%, 8/24/26 | 74,625 | 57,461 |
| Garda World Security Corp. bank term loan FRN Ser. B, (BBA LIBOR | | |
| USD 3 Month + 4.75%), 6.69%, 10/23/26 | 1,381,001 | 1,298,141 |
| Golden Nugget, Inc. bank term loan FRN Ser. B, (1 Month US LIBOR | | |
| + 2.50%), 4.081%, 10/4/23 | 1,412,701 | 1,087,779 |
| iHeartCommunications, Inc. bank term loan FRN Ser. B, | | |
| (BBA LIBOR USD 3 Month + 3.00%), 4.66%, 4/29/26 | 862,838 | 727,804 |
| Jo-Ann Stores, LLC bank term loan FRN (BBA LIBOR USD 3 Month | | |
| + 9.25%), 10.25%, 5/21/24 | 2,702,083 | 337,760 |
| Jo-Ann Stores, LLC bank term loan FRN (BBA LIBOR USD 3 Month | | |
| + 5.00%), 6.00%, 10/16/23 | 1,123,368 | 424,072 |
| Navistar, Inc. bank term loan FRN Ser. B, (BBA LIBOR USD 3 Month | | |
| + 3.50%), 4.28%, 11/6/24 | 5,204,725 | 4,476,064 |
| PetSmart, Inc. bank term loan FRN Ser. B, (BBA LIBOR USD 3 Month | | |
| + 4.00%), 5.00%, 3/11/22 | 1,541,305 | 1,477,726 |
| Refinitiv US Holdings, Inc. bank term loan FRN Ser. B, (BBA LIBOR | | |
| USD 3 Month + 3.25%), 4.239%, 10/1/25 | 1,781,789 | 1,704,578 |
| Robertshaw Holdings Corp. bank term loan FRN (BBA LIBOR USD | | |
| 3 Month + 8.00%), 9.00%, 2/28/26 | 1,360,000 | 748,000 |
| Robertshaw Holdings Corp. bank term loan FRN (BBA LIBOR USD | | |
| 3 Month + 3.25%), 4.25%, 2/28/25 | 1,991,696 | 1,195,018 |
| Scientific Games International, Inc. bank term loan FRN Ser. B5, | | |
| (BBA LIBOR USD 3 Month + 2.75%), 4.246%, 8/14/24 | 89,316 | 71,676 |
| Talbots, Inc. (The) bank term loan FRN Ser. B, (BBA LIBOR USD | | |
| 3 Month + 7.00%), 8.45%, 11/28/22 | 2,050,795 | 1,538,096 |
| |
| 54 Diversified Income Trust |
| | |
| | Principal | |
| SENIOR LOANS (1.7%)*ccont. | amount | Value |
| Consumer cyclicalscont. | | |
| Terrier Media Buyer, Inc. bank term loan FRN Ser. B, (BBA LIBOR | | |
| USD 3 Month + 4.25%), 5.99%, 12/17/26 | $1,177,050 | $1,003,435 |
| Werner Finco LP bank term loan FRN Ser. B, (BBA LIBOR USD | | |
| 3 Month + 4.00%), 5.00%, 7/24/24 | 1,761,991 | 1,532,932 |
| | | 20,590,026 |
| Consumer staples (0.3%) | | |
| Ascend Learning, LLC bank term loan FRN Ser. B, (BBA LIBOR USD | | |
| 3 Month + 3.00%), 4.00%, 7/12/24 | 2,669,620 | 2,362,613 |
| Brand Industrial Services, Inc. bank term loan FRN (BBA LIBOR | | |
| USD 3 Month + 4.25%), 6.085%, 6/21/24 | 3,391,200 | 2,712,959 |
| CEC Entertainment, Inc. bank term loan FRN (BBA LIBOR USD | | |
| 3 Month + 6.50%), 7.572%, 8/30/26 | 4,522,275 | 2,396,806 |
| IRB Holding Corp. bank term loan FRN Ser. B, (BBA LIBOR USD | | |
| 3 Month + 2.75%), 4.41%, 2/5/25 | 1,628,384 | 1,253,856 |
| Revlon Consumer Products Corp. bank term loan FRN Ser. B, | | |
| (BBA LIBOR USD 3 Month + 3.50%), 5.113%, 9/7/23 | 1,600,154 | 608,058 |
| | | 9,334,292 |
| Energy (—%) | | |
| California Resources Corp. bank term loan FRN (BBA LIBOR USD | | |
| 3 Month + 4.75%), 6.363%, 12/31/22 | 684,000 | 184,680 |
| Lower Cadence Holdings, LLC bank term loan FRN Ser. B, | | |
| (BBA LIBOR USD 3 Month + 4.00%), 4.989%, 5/22/26 | 1,059,486 | 642,755 |
| | | 827,435 |
| Financials (—%) | | |
| HUB International, Ltd. bank term loan FRN Ser. B, (BBA LIBOR USD | | |
| 3 Month + 4.00%), 5.927%, 4/25/25 | 733,163 | 674,510 |
| | | 674,510 |
| Health care (—%) | | |
| Elanco Animal Health, Inc. bank term loan FRN Ser. B, (BBA LIBOR | | |
| USD 3 Month + 1.75%), 3.404%, 2/4/27 | 1,110,000 | 1,051,725 |
| Ortho-Clinical Diagnostics, Inc. bank term loan FRN Ser. B, | | |
| (BBA LIBOR USD 3 Month + 3.25%), 4.765%, 6/1/25 | 140,419 | 118,093 |
| | | 1,169,818 |
| Technology (—%) | | |
| Kronos, Inc./MA bank term loan FRN Ser. B, (BBA LIBOR USD | | |
| 3 Month + 3.00%), 4.763%, 11/1/23 | 604,447 | 552,690 |
| Rackspace Hosting, Inc. bank term loan FRN (BBA LIBOR USD | | |
| 3 Month + 3.00%), 4.763%, 11/3/23 | 41,250 | 36,919 |
| | | 589,609 |
| Transportation (—%) | | |
| Genesee & Wyoming, Inc. bank term loan FRN (BBA LIBOR USD | | |
| 3 Month + 2.00%), 3.774%, 11/5/26 | 615,000 | 586,556 |
| | | 586,556 |
| Total senior loans (cost $73,352,495) | | $57,902,192 |
|
| Diversified Income Trust 55 |
| | |
| | Principal | |
| ASSET-BACKED SECURITIES (0.8%)* | amount | Value |
| Cascade Funding Mortgage Trust 144A FRB Ser. 19-HB1, Class HB1, | | |
| 6.00%, 12/25/29 W | $1,054,000 | $737,800 |
| Finance of America Structured Securities Trust 144A Ser. 19-HB1, | | |
| Class M5, 6.00%, 4/25/29 W | 7,185,000 | 5,029,500 |
| Mello Warehouse Securitization Trust 144A | | |
| FRB Ser. 18-W1, Class A, (1 Month US LIBOR + 0.85%), | | |
| 1.797%, 11/25/51 | 2,216,667 | 2,216,667 |
| FRB Ser. 19-1, Class A, (1 Month US LIBOR + 0.80%), | | |
| 1.747%, 6/25/52 | 2,676,000 | 2,676,000 |
| Nationstar HECM Loan Trust 144A | | |
| Ser. 18-2A, Class M5, 6.00%, 7/25/28 W | 2,739,000 | 2,701,629 |
| Ser. 19-2A, Class M4, 5.682%, 11/26/29 W | 9,376,000 | 9,351,660 |
| RMF Buyout Issuance Trust 144A | | |
| Ser. 20-1, Class M5, 6.00%, 2/25/30 W | 1,935,000 | 1,538,410 |
| Ser. 19-1, Class M5, 6.00%, 7/25/29 W | 324,000 | 333,888 |
| Station Place Securitization Trust 144A | | |
| FRB Ser. 20-2, Class A, (1 Month US LIBOR + 0.83%), | | |
| 1.755%, 3/26/21 | 457,000 | 457,000 |
| FRB Ser. 19-11, Class A, (1 Month US LIBOR + 0.75%), | | |
| 1.679%, 10/24/20 | 465,000 | 465,000 |
| FRB Ser. 19-7, Class A, (1 Month US LIBOR + 0.70%), | | |
| 1.629%, 9/24/20 | 947,000 | 947,000 |
| FRB Ser. 19-3, Class A, (1 Month US LIBOR + 0.70%), | | |
| 1.629%, 6/24/20 | 946,000 | 946,000 |
| FRB Ser. 19-WL1, Class A, (1 Month US LIBOR + 0.65%), | | |
| 1.597%, 8/25/52 | 179,333 | 179,333 |
| Total asset-backed securities (cost $29,963,299) | | $27,579,887 |
| | | | |
| | Expiration | Strike | | |
| WARRANTS (—%)* | date | price | Warrants | Value |
| Stearns Holdings, LLC Class B †F | 11/5/39 | $0.01 | 74,331 | $74,331 |
| Total warrants (cost $74,331) | | | | $74,331 |
| |
| COMMON STOCKS (—%)* | | | Shares | Value |
| Nine Point Energy F | | | 35,852 | $— |
| Total common stocks (cost $474,672) | | | | $— |
| |
| SHORT-TERM INVESTMENTS (33.5%)* | | Principal amount | Value |
| Alpine Securitization, LLC asset-backed commercial paper | | | |
| 1.894%, 4/8/20 | | $10,000,000 | $9,998,013 |
| American Electric Power Co., Inc. commercial paper | | | |
| 1.352%, 4/9/20 | | | 11,600,000 | 11,591,555 |
| American Express Credit Corp. commercial paper 1.940%, 4/3/20 | | 17,000,000 | 16,999,398 |
| Aon Corp. commercial paper 1.383%, 5/4/20 | | | 10,000,000 | 9,968,833 |
| Barclays Bank PLC CCP asset-backed commercial paper | | | |
| 1.715%, 8/21/20 | | | 10,000,000 | 9,937,318 |
| Bell Canada, Inc. commercial paper 1.939%, 4/2/20 | | 10,000,000 | 9,999,809 |
| Bell Canada, Inc. commercial paper 1.910%, 4/14/20 | | 5,750,000 | 5,747,051 |
| Broadcom, Inc. commercial paper 1.502%, 4/2/20 | | | 5,000,000 | 4,999,257 |
| |
| 56 Diversified Income Trust |
| | | |
| | Principal amount/ | |
| SHORT-TERM INVESTMENTS (33.5%)*cont. | | shares | Value |
| Collateralized Commercial Paper V Co., LLC asset-backed | | | |
| commercial paper 1.919%, 4/27/20 | | $10,000,000 | $9,990,078 |
| Enbridge US, Inc. commercial paper 1.838%, 5/5/20 | | 5,000,000 | 4,983,958 |
| Enbridge US, Inc. commercial paper 1.806%, 4/15/20 | | 7,000,000 | 6,990,521 |
| ENGIE SA commercial paper 1.982%, 4/15/20 | | 15,000,000 | 14,992,812 |
| ENGIE SA commercial paper 1.786%, 8/11/20 | | 10,000,000 | 9,947,465 |
| ENGIE SA commercial paper 1.376%, 6/24/20 | | 10,000,000 | 9,960,026 |
| Export Development Canada commercial paper 1.816%, 5/20/20 | | 10,000,000 | 9,982,917 |
| Interest in $97,350,000 tri-party repurchase agreement dated | | | |
| 3/31/20 with Citigroup Global Markets, Inc. due 4/1/20 — | | | |
| maturity value of $97,350,054 for an effective yield of 0.020% | | | |
| (collateralized by various U.S. Treasury notes with coupon rates | | | |
| ranging from 1.250% to 2.875% and due dates ranging from | | | |
| 9/30/21 to 10/31/21, valued at $99,321,706) | | 97,350,000 | 97,350,000 |
| Keurig Dr Pepper, Inc. commercial paper 1.764%, 4/13/20 | | 10,250,000 | 10,238,385 |
| Marriott International, Inc./MD commercial paper | | | |
| 1.775%, 4/28/20 | | 12,450,000 | 12,418,258 |
| Matchpoint Finance PLC asset-backed commercial paper | | | |
| 1.946%, 5/15/20 | | 15,000,000 | 14,970,188 |
| MetLife Short Term Funding, LLC asset-backed commercial paper | | | |
| 1.813%, 5/1/20 | | 6,000,000 | 5,993,051 |
| National Grid USA commercial paper 1.758%, 6/1/20 | | 10,000,000 | 9,933,083 |
| Nutrien, Ltd. commercial paper 1.753%, 4/7/20 | | 10,000,000 | 9,994,458 |
| Old Line Funding, LLC asset-backed commercial paper | | | |
| 1.113%, 9/9/20 | | 10,000,000 | 10,000,000 |
| Putnam Short Term Investment Fund 0.92% L | Shares | 285,270,627 | 285,270,627 |
| Rogers Communications, Inc. commercial paper 1.372%, 4/13/20 | | $10,000,000 | 9,988,697 |
| Sheffield Receivables Co., LLC asset-backed commercial paper | | | |
| 2.014%, 4/16/20 | | 10,000,000 | 9,993,076 |
| State Street Institutional U.S. Government Money Market Fund, | | | |
| Premier Class 0.32% P | Shares | 103,846,000 | 103,846,000 |
| U.S. Treasury Bills 1.650%, 4/2/20 # ∆ ⦶ | | $48,291,000 | 48,291,000 |
| U.S. Treasury Bills 1.634%, 4/9/20 # ∆ | | 10,552,000 | 10,551,791 |
| U.S. Treasury Bills 1.571%, 5/21/20 Ƥ | | 16,247,000 | 16,245,533 |
| U.S. Treasury Bills 1.564%, 5/7/20 ∆ ⦶ | | 11,136,000 | 11,135,290 |
| U.S. Treasury Bills 1.552%, 6/4/20 Ƥ | | 2,842,000 | 2,841,634 |
| U.S. Treasury Bills 1.381%, 6/18/20 Ƥ | | 7,089,000 | 7,087,575 |
| U.S. Treasury Bills 1.197%, 6/11/20 ∆⦶§ | | 47,051,000 | 47,042,509 |
| U.S. Treasury Bills 0.595%, 4/7/20 ∆ | | 7,680,000 | 7,679,915 |
| U.S. Treasury Bills 0.502%, 5/5/20 # ∆ ⦶ | | 34,501,000 | 34,498,923 |
| U.S. Treasury Bills 0.463%, 4/28/20 ∆ ⦶ | | 7,686,000 | 7,685,797 |
| U.S. Treasury Bills 0.310%, 7/23/20 ∆⦶§ | | 25,387,000 | 25,380,526 |
| U.S. Treasury Bills 0.203%, 7/9/20 ∆ | | 13,592,000 | 13,589,141 |
| U.S. Treasury Bills 0.170%, 6/25/20 ∆ ⦶§ | | 10,764,000 | 10,762,310 |
| U.S. Treasury Bills 0.024%, 9/3/20 ⦶§ | | 11,446,000 | 11,441,244 |
| U.S. Treasury Bills 0.019%, 9/24/20 #⦶ | | 21,928,000 | 21,917,923 |
| U.S. Treasury Bills 0.015%, 9/10/20 # ∆ ⦶§ | | 45,117,000 | 45,093,855 |
| U.S. Treasury Bills 0.011%, 8/6/20 ∆ ⦶ | | 24,472,000 | 24,464,640 |
| U.S. Treasury Bills zero%, 12/3/20 i | | 151,000 | 150,894 |
| U.S. Treasury Bills zero%, 8/20/20 ∆⦶§ | | 26,431,000 | 26,421,942 |
|
| Diversified Income Trust 57 |
| | |
| SHORT-TERM INVESTMENTS (33.5%)*cont. | Principal amount | Value |
| U.S. Treasury Bills zero%, 8/13/20 | $20,255,000 | $20,249,138 |
| UDR, Inc. commercial paper 1.372%, 4/3/20 | 10,000,000 | 9,997,853 |
| Total short-term investments (cost $1,128,511,068) | | $1,128,614,267 |
| |
| TOTAL INVESTMENTS | | |
| Total investments (cost $8,180,661,234) | | $7,874,866,518 |
| |
| Key to holding’s currency abbreviations |
| ARS | Argentine Peso |
| AUD | Australian Dollar |
| CAD | Canadian Dollar |
| CHF | Swiss Franc |
| CZK | Czech Koruna |
| EUR | Euro |
| GBP | British Pound |
| JPY | Japanese Yen |
| NOK | Norwegian Krone |
| NZD | New Zealand Dollar |
| SEK | Swedish Krona |
| USD/$ | United States Dollar |
| |
| Key to holding’s abbreviations |
| bp | Basis Points |
| DAC | Designated Activity Company |
| EMTN | Euro Medium Term Notes |
| FRB | Floating Rate Bonds: the rate shown is the current interest rate at the close of the reporting period. Rates may |
| | be subject to a cap or floor. For certain securities, the rate may represent a fixed rate currently in place at the |
| | close of the reporting period. |
| FRN | Floating Rate Notes: the rate shown is the current interest rate or yield at the close of the reporting period. |
| | Rates may be subject to a cap or floor. For certain securities, the rate may represent a fixed rate currently in |
| | place at the close of the reporting period. |
| IFB | Inverse Floating Rate Bonds, which are securities that pay interest rates that vary inversely to changes in the |
| | market interest rates. As interest rates rise, inverse floaters produce less current income. The rate shown is |
| | the current interest rate at the close of the reporting period. Rates may be subject to a cap or floor. |
| IO | Interest Only |
| OJSC | Open Joint Stock Company |
| OTC | Over-the-counter |
| PO | Principal Only |
| REGS | Securities sold under Regulation S may not be offered, sold or delivered within the United States except |
| | pursuant to an exemption from, or in a transaction not subject to, the registration requirements of the |
| | Securities Act of 1933. |
| TBA | To Be Announced Commitments |
Notes to the fund’s portfolio
Unless noted otherwise, the notes to the fund’s portfolio are for the close of the fund’s reporting period, which ran from October 1, 2019 through March 31, 2020 (the reporting period). Within the following notes to the portfolio, references to “Putnam Management” represent Putnam Investment Management, LLC, the fund’s manager, an indirect wholly-owned subsidiary of Putnam Investments, LLC and references to “ASC 820” represent Accounting Standards Codification 820Fair Value Measurements and Disclosures.
*Percentages indicated are based on net assets of $3,364,636,515.
|
| 58 Diversified Income Trust |
†This security is non-income-producing.
∆∆This security is restricted with regard to public resale. The total fair value of this security and any other restricted securities (excluding 144A securities), if any, held at the close of the reporting period was $1,063,508, or less than 0.1% of net assets.
‡‡Income may be received in cash or additional securities at the discretion of the issuer. The rate shown in parenthesis is the rate paid in kind, if applicable.
#This security, in part or in entirety, was pledged and segregated with the broker to cover margin requirements for futures contracts at the close of the reporting period. Collateral at period end totaled $9,232,501 and is included in Investments in securities on the Statement of assets and liabilities (Notes 1 and 9).
∆This security, in part or in entirety, was pledged and segregated with the custodian for collateral on certain derivative contracts at the close of the reporting period. Collateral at period end totaled $142,437,433 and is included in Investments in securities on the Statement of assets and liabilities (Notes 1 and 9).
⦶This security, in part or in entirety, was pledged and segregated with the custodian for collateral on certain TBA commitments at the close of the reporting period. Collateral at period end totaled $48,178,896 and is included in Investments in securities on the Statement of assets and liabilities (Notes 1 and 9).
§This security, in part or in entirety, was pledged and segregated with the custodian for collateral on the initial margin on certain centrally cleared derivative contracts at the close of the reporting period. Collateral at period end totaled $80,308,702 and is included in Investments in securities on the Statement of assets and liabilities (Notes 1 and 9).
##Forward commitment, in part or in entirety (Note 1).
cSenior loans are exempt from registration under the Securities Act of 1933, as amended, but contain certain restrictions on resale and cannot be sold publicly. These loans pay interest at rates which adjust periodically. The interest rates shown for senior loans are the current interest rates at the close of the reporting period. Senior loans are also subject to mandatory and/or optional prepayment which cannot be predicted. As a result, the remaining maturity may be substantially less than the stated maturity shown (Notes 1 and 7).
FThis security is valued by Putnam Management at fair value following procedures approved by the Trustees. Securities are classified as Level 3 for ASC 820 based on the securities’ valuation inputs (Note 1).
iThis security was pledged, or purchased with cash that was pledged, to the fund for collateral on certain derivative contracts (Note 1).
LAffiliated company (Note 5). The rate quoted in the security description is the annualized 7-day yield of the fund at the close of the reporting period.
PThis security was pledged, or purchased with cash that was pledged, to the fund for collateral on certain derivative contracts and TBA commitments. The rate quoted in the security description is the annualized 7-day yield of the fund at the close of the reporting period.
RReal Estate Investment Trust.
WThe rate shown represents the weighted average coupon associated with the underlying mortgage pools. Rates may be subject to a cap or floor.
At the close of the reporting period, the fund maintained liquid assets totaling $2,534,135,374 to cover certain derivative contracts and delayed delivery securities.
Unless otherwise noted, the rates quoted in Short-term investments security descriptions represent the weighted average yield to maturity.
Debt obligations are considered secured unless otherwise indicated.
144A after the name of an issuer represents securities exempt from registration under Rule 144A of the Securities Act of 1933, as amended. These securities may be resold in transactions exempt from registration, normally to qualified institutional buyers.
See Note 1 to the financial statements regarding TBA commitments.
The dates shown on debt obligations are the original maturity dates.
|
| Diversified Income Trust 59 |
| | | | | | |
| FORWARD CURRENCY CONTRACTS at 3/31/20 (aggregate face value $1,710,900,084) (Unaudited) |
| | | | | | | Unrealized |
| | | Contract | Delivery | | Aggregate | appreciation/ |
| Counterparty | Currency | type* | date | Value | face value | (depreciation) |
| Bank of America N.A. | | | | | |
| | Australian Dollar | Buy | 4/15/20 | $7,765,731 | $8,693,170 | $(927,439) |
| | British Pound | Sell | 6/17/20 | 169,648 | 176,309 | 6,661 |
| | Canadian Dollar | Sell | 4/15/20 | 12,454,043 | 13,306,544 | 852,501 |
| | Chinese Yuan (Offshore) | Buy | 5/20/20 | 354,011 | 282,076 | 71,935 |
| | Czech Koruna | Buy | 6/17/20 | 4,423,212 | 4,668,387 | (245,175) |
| | Euro | Sell | 6/17/20 | 10,181,910 | 10,285,888 | 103,978 |
| | Hong Kong Dollar | Sell | 5/20/20 | 18,499,262 | 18,453,788 | (45,474) |
| | Japanese Yen | Sell | 5/20/20 | 10,616,060 | 10,462,969 | (153,091) |
| | Mexican Peso | Buy | 4/15/20 | 15,063,655 | 18,677,756 | (3,614,101) |
| | Mexican Peso | Sell | 4/15/20 | 15,063,655 | 18,567,754 | 3,504,099 |
| | New Taiwan Dollar | Sell | 5/20/20 | 419,908 | 139,334 | (280,574) |
| | New Zealand Dollar | Buy | 4/15/20 | 8,683,781 | 9,384,853 | (701,072) |
| | Norwegian Krone | Buy | 6/17/20 | 10,072,035 | 12,029,158 | (1,957,123) |
| | Swedish Krona | Sell | 6/17/20 | 4,482,031 | 5,522,329 | 1,040,298 |
| Barclays Bank PLC | | | | | |
| | Australian Dollar | Sell | 4/15/20 | 5,117,363 | 5,586,319 | 468,956 |
| | British Pound | Buy | 6/17/20 | 5,297,775 | 4,677,235 | 620,540 |
| | Canadian Dollar | Sell | 4/15/20 | 310,006 | 328,326 | 18,320 |
| | Euro | Sell | 6/17/20 | 33,550,459 | 33,236,995 | (313,464) |
| | Hong Kong Dollar | Buy | 5/20/20 | 5,029,574 | 5,020,869 | 8,705 |
| | Japanese Yen | Buy | 5/20/20 | 24,668,691 | 26,578,679 | (1,909,988) |
| | New Zealand Dollar | Buy | 4/15/20 | 13,565,670 | 14,236,660 | (670,990) |
| | Norwegian Krone | Buy | 6/17/20 | 9,848,711 | 8,871,814 | 976,897 |
| | Swedish Krona | Sell | 6/17/20 | 13,384,592 | 13,506,069 | 121,477 |
| | Swiss Franc | Sell | 6/17/20 | 2,388,689 | 2,455,979 | 67,290 |
| Citibank, N.A. | | | | | | |
| | Australian Dollar | Buy | 4/15/20 | 3,950,624 | 3,319,475 | 631,149 |
| | British Pound | Buy | 6/17/20 | 107,460 | 107,590 | (130) |
| | Canadian Dollar | Sell | 4/15/20 | 15,896,874 | 16,284,062 | 387,188 |
| | Euro | Sell | 6/17/20 | 20,878,932 | 20,595,197 | (283,735) |
| | Japanese Yen | Buy | 5/20/20 | 4,887,932 | 4,729,099 | 158,833 |
| | Mexican Peso | Buy | 4/15/20 | 7,531,830 | 9,329,849 | (1,798,019) |
| | Mexican Peso | Sell | 4/15/20 | 7,531,830 | 9,274,740 | 1,742,910 |
| | New Zealand Dollar | Sell | 4/15/20 | 12,762,324 | 14,008,236 | 1,245,912 |
| | Norwegian Krone | Sell | 6/17/20 | 4,836,564 | 4,267,827 | (568,737) |
| | Swedish Krona | Buy | 6/17/20 | 7,920,679 | 7,547,726 | 372,953 |
| | Swiss Franc | Sell | 6/17/20 | 10,289,254 | 10,225,137 | (64,117) |
| Credit Suisse International | | | | | |
| | Australian Dollar | Buy | 7/15/20 | 6,937,130 | 6,912,629 | 24,501 |
| | Australian Dollar | Buy | 4/15/20 | 4,250,997 | 4,781,596 | (530,599) |
| | Australian Dollar | Sell | 4/15/20 | 4,419,668 | 4,729,064 | 309,396 |
| | British Pound | Buy | 6/17/20 | 3,804,025 | 3,521,034 | 282,991 |
| | Canadian Dollar | Sell | 7/15/20 | 6,916,672 | 6,893,289 | (23,383) |
| | Euro | Buy | 6/17/20 | 4,021,573 | 4,145,271 | (123,698) |
| |
| 60 Diversified Income Trust |
| | | | | | |
| FORWARD CURRENCY CONTRACTS at 3/31/20 (aggregate face value $1,710,900,084) (Unaudited)cont. |
| | | | | | | Unrealized |
| | | Contract | Delivery | | Aggregate | appreciation/ |
| Counterparty | Currency | type* | date | Value | face value | (depreciation) |
| Credit Suisse Internationalcont. | | | | | |
| | New Zealand Dollar | Buy | 4/15/20 | $7,278,983 | $7,078,666 | $200,317 |
| | Norwegian Krone | Sell | 6/17/20 | 16,521,014 | 14,889,714 | (1,631,300) |
| | Swedish Krona | Buy | 6/17/20 | 6,980,382 | 6,702,047 | 278,335 |
| Goldman Sachs International | | | | | |
| | Australian Dollar | Buy | 4/15/20 | 23,077,528 | 22,434,755 | 642,773 |
| | British Pound | Buy | 6/17/20 | 10,070,561 | 9,726,445 | 344,116 |
| | Canadian Dollar | Buy | 4/15/20 | 57,403,860 | 57,469,650 | (65,790) |
| | Chinese Yuan (Offshore) | Buy | 5/20/20 | 354,011 | 289,697 | 64,314 |
| | Euro | Sell | 6/17/20 | 36,026,473 | 36,135,142 | 108,669 |
| | Hong Kong Dollar | Buy | 5/20/20 | 6,727,816 | 6,712,172 | 15,644 |
| | Indian Rupee | Sell | 5/20/20 | 1,384,352 | 1,463,372 | 79,020 |
| | Japanese Yen | Sell | 5/20/20 | 11,236,410 | 10,909,610 | (326,800) |
| | New Taiwan Dollar | Buy | 5/20/20 | 18,530,328 | 18,786,165 | (255,837) |
| | New Taiwan Dollar | Sell | 5/20/20 | 18,530,328 | 18,495,329 | (34,999) |
| | New Zealand Dollar | Sell | 4/15/20 | 8,179,638 | 9,691,834 | 1,512,196 |
| | Norwegian Krone | Buy | 6/17/20 | 8,056,081 | 12,113,876 | (4,057,795) |
| | Russian Ruble | Buy | 6/17/20 | 15,359,361 | 18,971,283 | (3,611,922) |
| | Russian Ruble | Sell | 6/17/20 | 15,359,361 | 18,428,978 | 3,069,617 |
| | Swedish Krona | Buy | 6/17/20 | 20,071,911 | 18,760,660 | 1,311,251 |
| | Swiss Franc | Buy | 6/17/20 | 17,287,022 | 17,668,492 | (381,470) |
| HSBC Bank USA, National Association | | | | | |
| | Australian Dollar | Sell | 4/15/20 | 10,206,059 | 10,966,057 | 759,998 |
| | Australian Dollar | Buy | 7/15/20 | 6,937,069 | 6,912,585 | 24,484 |
| | British Pound | Sell | 6/17/20 | 1,869,363 | 2,266,963 | 397,600 |
| | Canadian Dollar | Sell | 4/15/20 | 4,445,054 | 6,065,899 | 1,620,845 |
| | Canadian Dollar | Sell | 7/15/20 | 6,916,743 | 6,894,816 | (21,927) |
| | Euro | Buy | 6/17/20 | 16,770,197 | 17,297,206 | (527,009) |
| | Hong Kong Dollar | Sell | 5/20/20 | 16,756,412 | 16,691,699 | (64,713) |
| | Japanese Yen | Sell | 5/20/20 | 2,023,513 | 1,600,618 | (422,895) |
| | New Zealand Dollar | Sell | 4/15/20 | 4,529,646 | 4,630,077 | 100,431 |
| | New Zealand Dollar | Sell | 7/15/20 | 13,677,089 | 13,754,422 | 77,333 |
| | Norwegian Krone | Sell | 6/17/20 | 2,227,927 | 855,290 | (1,372,637) |
| | Swedish Krona | Sell | 6/17/20 | 32,283,168 | 33,489,763 | 1,206,595 |
| | Swiss Franc | Sell | 6/17/20 | 1,532,815 | 1,537,155 | 4,340 |
| JPMorgan Chase Bank N.A. | | | | | |
| | Australian Dollar | Buy | 4/15/20 | 829,150 | 1,777,721 | (948,571) |
| | British Pound | Buy | 6/17/20 | 8,470,471 | 7,591,913 | 878,558 |
| | Canadian Dollar | Sell | 4/15/20 | 9,210,493 | 9,842,653 | 632,160 |
| | Euro | Buy | 6/17/20 | 114,350,921 | 116,157,496 | (1,806,575) |
| | Japanese Yen | Sell | 5/20/20 | 5,984,084 | 5,836,742 | (147,342) |
| | New Zealand Dollar | Buy | 4/15/20 | 25,302,229 | 26,626,898 | (1,324,669) |
| | New Zealand Dollar | Sell | 4/15/20 | 25,224,728 | 27,027,979 | 1,803,251 |
| | Norwegian Krone | Sell | 6/17/20 | 17,904,513 | 14,195,841 | (3,708,672) |
|
| Diversified Income Trust 61 |
| | | | | | |
| FORWARD CURRENCY CONTRACTS at 3/31/20 (aggregate face value $1,710,900,084) (Unaudited)cont. |
| | | | | | | Unrealized |
| | | Contract | Delivery | | Aggregate | appreciation/ |
| Counterparty | Currency | type* | date | Value | face value | (depreciation) |
| JPMorgan Chase Bank N.A.cont. | | | | | |
| | Singapore Dollar | Buy | 5/20/20 | $35,752,809 | $36,581,215 | $(828,406) |
| | Singapore Dollar | Sell | 5/20/20 | 35,698,524 | 37,172,881 | 1,474,357 |
| | Swedish Krona | Sell | 6/17/20 | 3,485,235 | 4,532,010 | 1,046,775 |
| | Swiss Franc | Sell | 6/17/20 | 1,680,986 | 1,198,641 | (482,345) |
| NatWest Markets PLC | | | | | |
| | Australian Dollar | Buy | 4/15/20 | 9,149,308 | 9,502,222 | (352,914) |
| | British Pound | Buy | 6/17/20 | 6,401,733 | 6,277,923 | 123,810 |
| | Canadian Dollar | Buy | 4/15/20 | 5,842,713 | 5,313,991 | 528,722 |
| | Euro | Sell | 6/17/20 | 10,839,599 | 10,605,842 | (233,757) |
| | Japanese Yen | Sell | 5/20/20 | 188,345 | 190,450 | 2,105 |
| | New Zealand Dollar | Buy | 4/15/20 | 9,946,583 | 10,619,611 | (673,028) |
| | Norwegian Krone | Buy | 6/17/20 | 22,323,169 | 26,375,790 | (4,052,621) |
| | Swedish Krona | Sell | 6/17/20 | 10,474,962 | 11,465,020 | 990,058 |
| State Street Bank and Trust Co. | | | | | |
| | Australian Dollar | Sell | 4/15/20 | 45,752,815 | 48,749,286 | 2,996,471 |
| | British Pound | Sell | 6/17/20 | 19,203,457 | 20,316,107 | 1,112,650 |
| | Canadian Dollar | Sell | 4/15/20 | 93,856,797 | 101,223,684 | 7,366,887 |
| | Euro | Sell | 6/17/20 | 964,190 | 625,126 | (339,064) |
| | Hong Kong Dollar | Sell | 5/20/20 | 36,998,525 | 36,902,970 | (95,555) |
| | Japanese Yen | Sell | 5/20/20 | 61,619,722 | 60,950,898 | (668,824) |
| | New Zealand Dollar | Buy | 4/15/20 | 15,465,781 | 17,443,512 | (1,977,731) |
| | Norwegian Krone | Buy | 6/17/20 | 28,171,941 | 31,173,375 | (3,001,434) |
| | Swedish Krona | Sell | 6/17/20 | 40,666,027 | 43,146,843 | 2,480,816 |
| | Swiss Franc | Sell | 6/17/20 | 2,539,468 | 2,500,164 | (39,304) |
| Toronto-Dominion Bank | | | | | |
| | Australian Dollar | Buy | 4/15/20 | 3,806,988 | 3,617,217 | 189,771 |
| | British Pound | Buy | 6/17/20 | 5,755,851 | 5,444,167 | 311,684 |
| | Canadian Dollar | Sell | 4/15/20 | 9,177,232 | 10,304,154 | 1,126,922 |
| | Euro | Sell | 6/17/20 | 8,072,901 | 7,828,123 | (244,778) |
| | Hong Kong Dollar | Sell | 5/20/20 | 9,249,605 | 9,224,131 | (25,474) |
| | New Zealand Dollar | Buy | 4/15/20 | 3,463,072 | 3,496,039 | (32,967) |
| | Norwegian Krone | Sell | 6/17/20 | 3,764,330 | 3,529,499 | (234,831) |
| | Swedish Krona | Buy | 6/17/20 | 1,590,578 | 792,520 | 798,058 |
| UBS AG | | | | | | |
| | Australian Dollar | Sell | 4/15/20 | 9,492,926 | 12,482,065 | 2,989,139 |
| | Canadian Dollar | Sell | 4/15/20 | 2,115,105 | 2,681,305 | 566,200 |
| | Euro | Buy | 6/17/20 | 16,844,194 | 17,387,712 | (543,518) |
| | Hong Kong Dollar | Sell | 5/20/20 | 10,545,623 | 10,506,478 | (39,145) |
| | Japanese Yen | Sell | 5/20/20 | 2,302,774 | 2,267,885 | (34,889) |
| | Mexican Peso | Buy | 4/15/20 | 7,531,826 | 9,362,396 | (1,830,570) |
| | Mexican Peso | Sell | 4/15/20 | 7,531,826 | 9,269,404 | 1,737,578 |
| | New Zealand Dollar | Buy | 4/15/20 | 27,733,090 | 29,338,529 | (1,605,439) |
| | Norwegian Krone | Buy | 6/17/20 | 384,262 | 370,138 | 14,124 |
| | Swedish Krona | Sell | 6/17/20 | 6,736,226 | 7,446,673 | 710,447 |
| |
| 62 Diversified Income Trust |
| | | | | | |
| FORWARD CURRENCY CONTRACTS at 3/31/20 (aggregate face value $1,710,900,084) (Unaudited)cont. |
| | | | | | | Unrealized |
| | | Contract | Delivery | | Aggregate | appreciation/ |
| Counterparty | Currency | type* | date | Value | face value | (depreciation) |
| WestPac Banking Corp. | | | | | |
| | Australian Dollar | Buy | 4/15/20 | $3,757,715 | $3,516,497 | $241,218 |
| | Canadian Dollar | Sell | 4/15/20 | 3,767,690 | 3,757,677 | (10,013) |
| | Euro | Buy | 6/17/20 | 6,796,457 | 6,777,551 | 18,906 |
| | Japanese Yen | Sell | 5/20/20 | 4,860,650 | 4,702,399 | (158,251) |
| | New Zealand Dollar | Buy | 4/15/20 | 8,637,603 | 9,361,203 | (723,600) |
| Unrealized appreciation | | | | | 54,976,035 |
| Unrealized (depreciation) | | | | | (53,150,290) |
| Total | | | | | | $1,825,745 |
*The exchange currency for all contracts listed is the United States Dollar.
| | | | | |
| FUTURES CONTRACTS OUTSTANDING at 3/31/20 (Unaudited) | | | |
| | | | | | Unrealized |
| | Number of | Notional | | Expiration | appreciation/ |
| | contracts | amount | Value | date | (depreciation) |
| Euro-Schatz 2 yr (Short) | 649 | $80,303,594 | $80,303,551 | Jun-20 | $156,184 |
| U.S. Treasury Bond Ultra 30 yr (Long) | 133 | 29,509,375 | 29,509,375 | Jun-20 | 2,535,107 |
| U.S. Treasury Note 2 yr (Short) | 7,541 | 1,661,906,785 | 1,661,906,785 | Jun-20 | (657,378) |
| U.S. Treasury Note 5 yr (Short) | 1,223 | 153,314,516 | 153,314,516 | Jun-20 | (4,666,572) |
| U.S. Treasury Note 10 yr (Long) | 5,140 | 712,853,750 | 712,853,750 | Jun-20 | 10,429,060 |
| Unrealized appreciation | | | | | 13,120,351 |
| Unrealized (depreciation) | | | | | (5,323,950) |
| Total | | | | | $7,796,401 |
| | | | |
| WRITTEN SWAP OPTIONS OUTSTANDING at 3/31/20 (premiums $99,214,899) (Unaudited) | |
| Counterparty | | | Notional/ | |
| Fixed Obligation % to receive or (pay)/ | Expiration | | contract | |
| Floating rate index/Maturity date | date/strike | | amount | Value |
| Bank of America N.A. | | | | |
| 1.17/3 month USD-LIBOR-BBA/Apr-25 | Apr-20/1.17 | | $227,003,900 | $227 |
| Citibank, N.A. | | | | |
| 1.805/3 month USD-LIBOR-BBA/Jan-31 | Jan-21/1.805 | | 103,968,200 | 296,309 |
| 1.865/3 month USD-LIBOR-BBA/Oct-39 | Oct-29/1.865 | | 53,655,100 | 2,073,770 |
| (1.865)/3 month USD-LIBOR-BBA/Oct-39 | Oct-29/1.865 | | 53,655,100 | 6,181,068 |
| (1.805)/3 month USD-LIBOR-BBA/Jan-31 | Jan-21/1.805 | | 103,968,200 | 11,119,399 |
| Goldman Sachs International | | | | |
| 2.823/3 month USD-LIBOR-BBA/May-27 | May-22/2.823 | | 311,113,500 | 255,113 |
| 1.722/3 month GBP-LIBOR-BBA/Feb-39 | Feb-29/1.722 | GBP | 28,942,000 | 1,173,011 |
| (1.722)/3 month GBP-LIBOR-BBA/Feb-39 | Feb-29/1.722 | GBP | 28,942,000 | 4,626,259 |
| JPMorgan Chase Bank N.A. | | | | |
| 1.333/3 month USD-LIBOR-BBA/Jan-24 | Jan-23/1.333 | | $60,301,600 | 66,332 |
| (1.333)/3 month USD-LIBOR-BBA/Jan-24 | Jan-23/1.333 | | 60,301,600 | 549,348 |
| 1.07/3 month USD-LIBOR-BBA/Mar-32 | Mar-27/1.07 | | 27,236,800 | 820,100 |
| (1.07)/3 month USD-LIBOR-BBA/Mar-32 | Mar-27/1.07 | | 27,236,800 | 907,258 |
| (0.968)/3 month USD-LIBOR-BBA/Mar-35 | Mar-25/0.968 | | 17,076,600 | 929,309 |
| 0.968/3 month USD-LIBOR-BBA/Mar-35 | Mar-25/0.968 | | 17,076,600 | 940,750 |
|
| Diversified Income Trust 63 |
| | | | |
| WRITTEN SWAP OPTIONS OUTSTANDING at 3/31/20 (premiums $99,214,899) (Unaudited)cont. |
| Counterparty | | | Notional/ | |
| Fixed Obligation % to receive or (pay)/ | Expiration | | contract | |
| Floating rate index/Maturity date | date/strike | | amount | Value |
| JPMorgan Chase Bank N.A.cont. | | | | |
| 1.667/6 month EUR-EURIBOR-Reuters/Feb-36 | Feb-26/1.667 | EUR | 63,672,400 | $1,232,436 |
| (0.83)/3 month USD-LIBOR-BBA/Oct-21 | Oct-20/0.83 | | $415,873,100 | 2,195,810 |
| (0.442)/3 month USD-LIBOR-BBA/Sep-50 | Sep-20/0.442 | | 93,055,300 | 2,344,994 |
| (0.7785)/3 month USD-LIBOR-BBA/Mar-31 | Mar-21/0.7785 | | 247,041,200 | 7,277,834 |
| (1.667)/6 month EUR-EURIBOR-Reuters/Feb-36 | Feb-26/1.667 | EUR | 63,672,400 | 10,398,813 |
| Morgan Stanley & Co. International PLC | | | | |
| 1.529/3 month USD-LIBOR-BBA/Apr-30 | Apr-20/1.529 | | $60,616,700 | 7,274 |
| 2.664/3 month USD-LIBOR-BBA/May-26 | May-21/2.664 | | 133,334,500 | 18,667 |
| 0.4285/6 month EUR-EURIBOR-Reuters/Apr-50 | Apr-20/0.4285 | EUR | 17,082,800 | 218,363 |
| 3.01/3 month USD-LIBOR-BBA/Feb-36 | Feb-26/3.01 | | $22,892,700 | 238,084 |
| 2.97/3 month USD-LIBOR-BBA/Feb-36 | Feb-26/2.97 | | 22,892,700 | 244,494 |
| 1.512/3 month USD-LIBOR-BBA/Aug-32 | Aug-22/1.512 | | 58,978,200 | 1,099,943 |
| (2.75)/3 month USD-LIBOR-BBA/Dec-47 | Dec-24/2.75 | | 10,000,000 | 3,872,300 |
| (2.97)/3 month USD-LIBOR-BBA/Feb-36 | Feb-26/2.97 | | 22,892,700 | 4,509,633 |
| (3.01)/3 month USD-LIBOR-BBA/Feb-36 | Feb-26/3.01 | | 22,892,700 | 4,586,095 |
| (1.512)/3 month USD-LIBOR-BBA/Aug-32 | Aug-22/1.512 | | 58,978,200 | 4,840,931 |
| (2.75)/3 month USD-LIBOR-BBA/May-49 | May-25/2.75 | | 44,214,400 | 17,789,664 |
| (3.00)/3 month USD-LIBOR-BBA/Jan-49 | Jan-24/3.00 | | 44,214,400 | 20,855,048 |
| (3.00)/3 month USD-LIBOR-BBA/Apr-48 | Apr-23/3.00 | | 44,214,400 | 20,991,229 |
| Toronto-Dominion Bank | | | | |
| 0.92/3 month USD-LIBOR-BBA/Apr-22 | Apr-20/0.92 | | 557,444,700 | 557 |
| (1.17)/3 month USD-LIBOR-BBA/Mar-55 | Mar-25/1.17 | | 2,531,000 | 445,026 |
| 1.17/3 month USD-LIBOR-BBA/Mar-55 | Mar-25/1.17 | | 5,061,900 | 600,240 |
| 1.05/3 month USD-LIBOR-BBA/Mar-27 | Mar-25/1.05 | | 102,767,000 | 932,097 |
| UBS AG | | | | |
| (0.895)/3 month USD-LIBOR-BBA/Apr-30 | Apr-20/0.895 | | 36,925,000 | 770,256 |
| (0.7275)/3 month USD-LIBOR-BBA/Apr-30 | Apr-20/0.7275 | | 91,676,000 | 910,342 |
| 1.9875/3 month USD-LIBOR-BBA/Oct-36 | Oct-26/1.9875 | | 62,240,100 | 1,728,408 |
| 0.385/6 month EUR-EURIBOR-Reuters/Sep-34 | Sep-24/0.385 | EUR | 41,796,700 | 2,236,194 |
| (0.385)/6 month EUR-EURIBOR-Reuters/Sep-34 | Sep-24/0.385 | EUR | 41,796,700 | 2,502,638 |
| (1.9875)/3 month USD-LIBOR-BBA/Oct-36 | Oct-26/1.9875 | | $62,240,100 | 7,437,065 |
| Total | | | | $150,222,688 |
| | | | |
| WRITTEN OPTIONS OUTSTANDING at 3/31/20 (premiums $16,802,244) (Unaudited) | |
| | Expiration | Notional | Contract | |
| Counterparty | date/strike price | amount | amount | Value |
| Bank of America N.A. | | | | |
| USD/JPY (Put) | Apr-20/JPY 103.00 | $63,289,450 | $63,289,450 | $182,970 |
| USD/JPY (Put) | Jun-20/JPY 105.00 | 63,289,450 | 63,289,450 | 925,798 |
| Citibank, N.A. | | | | |
| USD/JPY (Put) | Jun-20/JPY 105.00 | 63,289,450 | 63,289,450 | 925,798 |
| Goldman Sachs International | | | | |
| USD/CHF (Put) | Jun-20/CHF 0.91 | 146,251,850 | 146,251,850 | 455,282 |
| USD/JPY (Put) | Jun-20/JPY 105.00 | 63,289,450 | 63,289,450 | 925,798 |
| |
| 64 Diversified Income Trust |
| | | | |
| WRITTEN OPTIONS OUTSTANDING at 3/31/20 (premiums $16,802,244) (Unaudited)cont. | |
| | Expiration | Notional | Contract | |
| Counterparty | date/strike price | amount | amount | Value |
| JPMorgan Chase Bank N.A. | | | | |
| Uniform Mortgage-Backed | | | | |
| Securities 30 yr 2.50% TBA | | | | |
| commitments (Put) | May-20/$102.81 | $2,234,000,000 | $2,234,000,000 | $2,826,010 |
| Uniform Mortgage-Backed | | | | |
| Securities 30 yr 3.00% TBA | | | | |
| commitments (Put) | Apr-20/102.94 | 580,000,000 | 580,000,000 | 580 |
| Uniform Mortgage-Backed | | | | |
| Securities 30 yr 3.00% TBA | | | | |
| commitments (Put) | Apr-20/103.00 | 266,000,000 | 266,000,000 | 266 |
| Uniform Mortgage-Backed | | | | |
| Securities 30 yr 3.50% TBA | | | | |
| commitments (Put) | Apr-20/103.13 | 250,000,000 | 250,000,000 | 250 |
| Uniform Mortgage-Backed | | | | |
| Securities 30 yr 3.50% TBA | | | | |
| commitments (Put) | Apr-20/104.03 | 69,000,000 | 69,000,000 | 69 |
| Total | | | | $6,242,821 |
| | | | | |
| FORWARD PREMIUM SWAP OPTION CONTRACTS OUTSTANDING at 3/31/20 (Unaudited) | |
| Counterparty | | | | | |
| Fixed right or obligation % to receive | | | Notional/ | Premium | Unrealized |
| or (pay)/Floating rate index/ | Expiration | | contract | receivable/ | appreciation/ |
| Maturity date | date/strike | | amount | (payable) | (depreciation) |
| Bank of America N.A. | | | | | |
| 2.2275/3 month USD-LIBOR-BBA/ | | | | | |
| May-24 (Purchased) | May-22/2.2275 | | $357,636,500 | $(3,299,197) | $9,166,224 |
| 1.304/6 month EUR-EURIBOR- | | | | | |
| Reuters/Jun-54 (Purchased) | Jun-24/1.304 | EUR | 30,236,900 | (4,900,197) | 7,526,706 |
| 1.053/6 month EUR-EURIBOR- | | | | | |
| Reuters/Jun-54 (Purchased) | Jun-24/1.053 | EUR | 15,990,750 | (3,647,054) | 3,680,851 |
| 1.275/3 month USD-LIBOR-BBA/ | | | | | |
| Mar-50 (Purchased) | Mar-30/1.275 | | $24,024,100 | (3,129,139) | 669,071 |
| (0.925)/3 month USD-LIBOR-BBA/ | | | | | |
| Mar-40 (Purchased) | Mar-30/0.925 | | 54,490,500 | (3,901,520) | 289,345 |
| (0.85)/3 month USD-LIBOR-BBA/ | | | | | |
| Mar-40 (Purchased) | Mar-30/0.85 | | 27,749,600 | (2,025,721) | 207,012 |
| (0.003)/6 month JPY-LIBOR-BBA/ | | | | | |
| Feb-31 (Purchased) | Feb-21/0.003 | JPY | 1,690,202,100 | (133,072) | 40,870 |
| 0.003/6 month JPY-LIBOR-BBA/ | | | | | |
| Feb-31 (Purchased) | Feb-21/0.003 | JPY | 1,690,202,100 | (133,072) | (4,873) |
| 2.3075/3 month USD-LIBOR-BBA/ | | | | | |
| Jun-52 (Purchased) | Jun-22/2.3075 | | $18,018,000 | (7,231,766) | (196,396) |
| (2.3075)/3 month USD-LIBOR-BBA/ | | | | | |
| Jun-52 (Purchased) | Jun-22/2.3075 | | 18,018,000 | (537,596) | (229,009) |
| 0.925/3 month USD-LIBOR-BBA/ | | | | | |
| Mar-40 (Purchased) | Mar-30/0.925 | | 54,490,500 | (3,901,520) | (236,489) |
| 0.85/3 month USD-LIBOR-BBA/ | | | | | |
| Mar-40 (Purchased) | Mar-30/0.85 | | 27,749,600 | (2,025,721) | (250,856) |
| (1.275)/3 month USD-LIBOR-BBA/ | | | | | |
| Mar-50 (Purchased) | Mar-30/1.275 | | 24,024,100 | (3,129,139) | (505,467) |
|
| Diversified Income Trust 65 |
| | | | | |
| FORWARD PREMIUM SWAP OPTION CONTRACTS OUTSTANDING at 3/31/20 (Unaudited)cont. | |
| Counterparty | | | | | |
| Fixed right or obligation % to receive | | | Notional/ | Premium | Unrealized |
| or (pay)/Floating rate index/ | Expiration | | contract | receivable/ | appreciation/ |
| Maturity date | date/strike | | amount | (payable) | (depreciation) |
| Bank of America N.A.cont. | | | | | |
| (1.053)/6 month EUR-EURIBOR- | | | | | |
| Reuters/Jun-54 (Purchased) | Jun-24/1.053 | EUR | 15,990,750 | $(3,647,054) | $(859,412) |
| (1.304)/6 month EUR-EURIBOR- | | | | | |
| Reuters/Jun-54 (Purchased) | Jun-24/1.304 | EUR | 30,236,900 | (2,450,099) | (1,115,500) |
| (2.2275)/3 month USD-LIBOR-BBA/ | | | | | |
| May-24 (Purchased) | May-22/2.2275 | | $357,636,500 | (3,299,197) | (3,168,659) |
| Barclays Bank PLC | | | | | |
| 1.11125/6 month JPY-LIBOR-BBA/ | | | | | |
| Aug-43 (Purchased) | Aug-23/1.11125 | JPY | 1,758,437,400 | (889,457) | 2,294,105 |
| (1.11125)/6 month JPY-LIBOR-BBA/ | | | | | |
| Aug-43 (Purchased) | Aug-23/1.11125 | JPY | 1,758,437,400 | (889,457) | (870,347) |
| Citibank, N.A. | | | | | |
| 1.765/3 month USD-LIBOR-BBA/ | | | | | |
| Jun-25 (Purchased) | Jun-20/1.765 | | $335,284,100 | (4,492,807) | 16,801,086 |
| 2.689/3 month USD-LIBOR-BBA/ | | | | | |
| Nov-49 (Purchased) | Nov-24/2.689 | | 11,217,000 | (1,444,189) | 3,119,896 |
| (2.689)/3 month USD-LIBOR-BBA/ | | | | | |
| Nov-49 (Purchased) | Nov-24/2.689 | | 11,217,000 | (1,444,189) | (1,207,061) |
| (1.765)/3 month USD-LIBOR-BBA/ | | | | | |
| Jun-25 (Purchased) | Jun-20/1.765 | | 335,284,100 | (4,492,807) | (4,492,807) |
| 1.245/3 month USD-LIBOR-BBA/ | | | | | |
| Aug-24 (Written) | Aug-22/1.245 | | 250,345,100 | 2,290,658 | 1,732,388 |
| (1.245)/3 month USD-LIBOR-BBA/ | | | | | |
| Aug-24 (Written) | Aug-22/1.245 | | 250,345,100 | 2,290,658 | (1,784,961) |
| Goldman Sachs International | | | | | |
| 1.755/3 month USD-LIBOR-BBA/ | | | | | |
| Jun-25 (Purchased) | Jun-20/1.755 | | 335,284,100 | (4,509,571) | 16,616,680 |
| 1.727/3 month USD-LIBOR-BBA/ | | | | | |
| Jan-55 (Purchased) | Jan-25/1.727 | | 15,897,000 | (1,457,755) | 2,884,034 |
| 2.8175/3 month USD-LIBOR-BBA/ | | | | | |
| Mar-47 (Purchased) | Mar-27/2.8175 | | 8,348,800 | (1,054,036) | 1,908,118 |
| (2.8175)/3 month USD-LIBOR-BBA/ | | | | | |
| Mar-47 (Purchased) | Mar-27/2.8175 | | 8,348,800 | (1,054,036) | (827,533) |
| (2.13)/3 month USD-LIBOR-BBA/ | | | | | |
| Dec-30 (Purchased) | Dec-20/2.13 | | 64,047,900 | (904,677) | (835,825) |
| (1.727)/3 month USD-LIBOR-BBA/ | | | | | |
| Jan-55 (Purchased) | Jan-25/1.727 | | 15,897,000 | (2,376,602) | (1,286,703) |
| (1.755)/3 month USD-LIBOR-BBA/ | | | | | |
| Jun-25 (Purchased) | Jun-20/1.755 | | 335,284,100 | (4,509,571) | (4,506,218) |
| 0.555/6 month EUR-EURIBOR- | | | | | |
| Reuters/Mar-40 (Written) | Mar-30/0.555 | EUR | 45,408,600 | 3,428,622 | 56,091 |
| (0.445)/6 month EUR-EURIBOR- | | | | | |
| Reuters/Mar-40 (Written) | Mar-30/0.445 | EUR | 22,704,400 | 1,777,082 | 18,781 |
| 0.445/6 month EUR-EURIBOR- | | | | | |
| Reuters/Mar-40 (Written) | Mar-30/0.445 | EUR | 22,704,400 | 1,777,082 | (78,127) |
| (0.555)/6 month EUR-EURIBOR- | | | | | |
| Reuters/Mar-40 (Written) | Mar-30/0.555 | EUR | 45,408,600 | 3,428,622 | (322,523) |
|
| 66 Diversified Income Trust |
| | | | | |
| FORWARD PREMIUM SWAP OPTION CONTRACTS OUTSTANDING at 3/31/20 (Unaudited)cont. | |
| Counterparty | | | | | |
| Fixed right or obligation % to receive | | | Notional/ | Premium | Unrealized |
| or (pay)/Floating rate index/ | Expiration | | contract | receivable/ | appreciation/ |
| Maturity date | date/strike | | amount | (payable) | (depreciation) |
| JPMorgan Chase Bank N.A. | | | | | |
| 3.162/3 month USD-LIBOR-BBA/ | | | | | |
| Nov-33 (Purchased) | Nov-20/3.162 | | $196,939,100 | $(27,971,260) | $30,677,204 |
| 2.8325/3 month USD-LIBOR-BBA/ | | | | | |
| Feb-52 (Purchased) | Feb-22/2.8325 | | 41,743,200 | (5,828,394) | 16,060,279 |
| 1.921/6 month EUR-EURIBOR- | | | | | |
| Reuters/Oct-48 (Purchased) | Oct-28/1.921 | EUR | 29,488,100 | (3,771,047) | 7,957,587 |
| 2.032/3 month USD-LIBOR-BBA/ | | | | | |
| Jan-55 (Purchased) | Jan-25/2.032 | | $22,444,300 | (2,592,317) | 4,938,195 |
| 2.902/3 month USD-LIBOR-BBA/ | | | | | |
| Nov-49 (Purchased) | Nov-24/2.902 | | 11,217,000 | (1,734,148) | 3,324,831 |
| 2.50/3 month USD-LIBOR-BBA/ | | | | | |
| Nov-39 (Purchased) | Nov-29/2.50 | | 18,696,100 | (1,080,635) | 1,949,442 |
| 1.692/6 month AUD-BBR-BBSW/ | | | | | |
| Jan-35 (Purchased) | Jan-25/1.692 | AUD | 19,590,000 | (611,186) | 320,886 |
| 1.445/6 month AUD-BBR-BBSW/ | | | | | |
| Mar-40 (Purchased) | Mar-30/1.445 | AUD | 25,226,900 | (945,635) | 202,963 |
| (1.692)/6 month AUD-BBR-BBSW/ | | | | | |
| Jan-35 (Purchased) | Jan-25/1.692 | AUD | 19,590,000 | (611,186) | (181,952) |
| (1.445)/6 month AUD-BBR-BBSW/ | | | | | |
| Mar-40 (Purchased) | Mar-30/1.445 | AUD | 25,226,900 | (945,635) | (196,601) |
| (3.162)/3 month USD-LIBOR-BBA/ | | | | | |
| Nov-33 (Purchased) | Nov-20/3.162 | | $196,939,100 | (240,266) | (224,511) |
| (2.902)/3 month USD-LIBOR-BBA/ | | | | | |
| Nov-49 (Purchased) | Nov-24/2.902 | | 11,217,000 | (1,203,584) | (1,015,251) |
| (2.50)/3 month USD-LIBOR-BBA/ | | | | | |
| Nov-39 (Purchased) | Nov-29/2.50 | | 18,696,100 | (1,944,394) | (1,397,720) |
| (2.032)/3 month USD-LIBOR-BBA/ | | | | | |
| Jan-55 (Purchased) | Jan-25/2.032 | | 22,444,300 | (2,592,317) | (1,486,262) |
| (1.921)/6 month EUR-EURIBOR- | | | | | |
| Reuters/Oct-48 (Purchased) | Oct-28/1.921 | EUR | 29,488,100 | (3,771,047) | (2,780,342) |
| (2.8325)/3 month USD-LIBOR-BBA/ | | | | | |
| Feb-52 (Purchased) | Feb-22/2.8325 | | $41,743,200 | (5,828,394) | (5,540,992) |
| 3.229/3 month USD-LIBOR-BBA/ | | | | | |
| Nov-33 (Written) | Nov-23/3.229 | | 196,939,100 | 2,160,422 | 1,392,359 |
| 2.975/3 month USD-LIBOR-BBA/ | | | | | |
| Nov-23 (Written) | Nov-20/2.975 | | 196,939,100 | 19,694 | 19,694 |
| (2.975)/3 month USD-LIBOR-BBA/ | | | | | |
| Nov-23 (Written) | Nov-20/2.975 | | 196,939,100 | 7,597,910 | (7,649,115) |
| (3.229)/3 month USD-LIBOR-BBA/ | | | | | |
| Nov-33 (Written) | Nov-23/3.229 | | 196,939,100 | 22,352,588 | (22,000,067) |
| Morgan Stanley & Co. International PLC | | | | | |
| 3.27/3 month USD-LIBOR-BBA/ | | | | | |
| Oct-53 (Purchased) | Oct-23/3.27 | | 28,548,700 | (3,257,407) | 14,758,821 |
| 1.5775/3 month USD-LIBOR-BBA/ | | | | | |
| Sep-22 (Purchased) | Sep-20/1.5775 | | 258,104,600 | (1,422,156) | 4,996,905 |
| 2.505/3 month USD-LIBOR-BBA/ | | | | | |
| Nov-49 (Purchased) | Nov-24/2.505 | | 11,217,000 | (1,206,949) | 2,939,191 |
|
| Diversified Income Trust 67 |
| | | | | |
| FORWARD PREMIUM SWAP OPTION CONTRACTS OUTSTANDING at 3/31/20 (Unaudited)cont. | |
| Counterparty | | | | | |
| Fixed right or obligation % to receive | | | Notional/ | Premium | Unrealized |
| or (pay)/Floating rate index/ | Expiration | | contract | receivable/ | appreciation/ |
| Maturity date | date/strike | | amount | (payable) | (depreciation) |
| Morgan Stanley & Co. International PLCcont. | | | | |
| 2.7725/3 month USD-LIBOR-BBA/ | | | | | |
| Feb-31 (Purchased) | Feb-21/2.7725 | | $83,940,300 | $(16,115,496) | $545,612 |
| 2.764/3 month USD-LIBOR-BBA/ | | | | | |
| Feb-31 (Purchased) | Feb-21/2.764 | | 83,940,300 | (16,383,608) | 221,602 |
| (2.764)/3 month USD-LIBOR-BBA/ | | | | | |
| Feb-31 (Purchased) | Feb-21/2.764 | | 83,940,300 | (137,604) | (102,407) |
| (2.7725)/3 month USD-LIBOR-BBA/ | | | | | |
| Feb-31 (Purchased) | Feb-21/2.7725 | | 83,940,300 | (162,783) | (123,392) |
| (1.5775)/3 month USD-LIBOR-BBA/ | | | | | |
| Sep-22 (Purchased) | Sep-20/1.5775 | | 258,104,600 | (1,422,156) | (1,422,156) |
| (2.505)/3 month USD-LIBOR-BBA/ | | | | | |
| Nov-49 (Purchased) | Nov-24/2.505 | | 11,217,000 | (1,718,444) | (1,428,485) |
| (3.27)/3 month USD-LIBOR-BBA/ | | | | | |
| Oct-53 (Purchased) | Oct-23/3.27 | | 28,548,700 | (3,257,407) | (2,999,612) |
| 2.39/3 month USD-LIBOR-BBA/ | | | | | |
| Jun-34 (Written) | Jun-24/2.39 | | 116,296,100 | 6,122,990 | 4,666,962 |
| (2.39)/3 month USD-LIBOR-BBA/ | | | | | |
| Jun-34 (Written) | Jun-24/2.39 | | 116,296,100 | 6,122,990 | (11,384,225) |
| UBS AG | | | | | |
| 1.6125/3 month USD-LIBOR-BBA/ | | | | | |
| Aug-34 (Purchased) | Aug-24/1.6125 | | 58,978,200 | (1,617,772) | 3,765,758 |
| 1.175/3 month GBP-LIBOR-BBA/ | | | | | |
| Jan-40 (Purchased) | Jan-30/1.175 | GBP | 27,985,900 | (2,544,046) | 1,066,476 |
| 0.762/3 month GBP-LIBOR-BBA/ | | | | | |
| Aug-39 (Purchased) | Aug-29/0.762 | GBP | 11,981,800 | (1,105,033) | (27,384) |
| (0.762)/3 month GBP-LIBOR-BBA/ | | | | | |
| Aug-39 (Purchased) | Aug-29/0.762 | GBP | 11,981,800 | (1,105,033) | (120,847) |
| (1.175)/3 month GBP-LIBOR-BBA/ | | | | | |
| Jan-40 (Purchased) | Jan-30/1.175 | GBP | 27,985,900 | (2,544,046) | (546,447) |
| (1.6125)/3 month USD-LIBOR-BBA/ | | | | | |
| Aug-34 (Purchased) | Aug-24/1.6125 | | $58,978,200 | (4,312,781) | (2,626,889) |
| 1.30/3 month USD-LIBOR-BBA/ | | | | | |
| Aug-26 (Written) | Aug-21/1.30 | | 125,328,500 | 3,722,994 | 3,212,169 |
| 1.01/6 month EUR-EURIBOR-Reuters/ | | | | | |
| Jan-40 (Written) | Jan-30/1.01 | EUR | 33,583,000 | 2,366,351 | 571,507 |
| (0.43)/6 month EUR-EURIBOR- | | | | | |
| Reuters/Aug-39 (Written) | Aug-29/0.43 | EUR | 11,145,900 | 893,551 | 71,421 |
| 0.43/6 month EUR-EURIBOR-Reuters/ | | | | | |
| Aug-39 (Written) | Aug-29/0.43 | EUR | 11,145,900 | 893,551 | 123 |
| (1.01)/6 month EUR-EURIBOR- | | | | | |
| Reuters/Jan-40 (Written) | Jan-30/1.01 | EUR | 33,583,000 | 2,366,351 | (1,437,842) |
| (1.30)/3 month USD-LIBOR-BBA/ | | | | | |
| Aug-26 (Written) | Aug-21/1.30 | | $125,328,500 | 1,001,891 | (3,887,689) |
| Unrealized appreciation | | | | | 170,671,245 |
| Unrealized (depreciation) | | | | | (91,358,954) |
| Total | | | | | $79,312,291 |
| |
| 68 Diversified Income Trust |
| | | |
| TBA SALE COMMITMENTS OUTSTANDING at 3/31/20 (proceeds receivable $3,699,434,883) (Unaudited) |
| | Principal | Settlement | |
| Agency | amount | date | Value |
| Government National Mortgage Association, 5.00%, 4/1/50 | $5,000,000 | 4/21/20 | $5,298,828 |
| Government National Mortgage Association, 3.50%, 4/1/50 | 4,000,000 | 4/21/20 | 4,217,812 |
| Uniform Mortgage-Backed Securities, 5.00%, 4/1/50 | 3,000,000 | 4/15/20 | 3,237,422 |
| Uniform Mortgage-Backed Securities, 4.50%, 4/1/50 | 3,000,000 | 4/15/20 | 3,225,469 |
| Uniform Mortgage-Backed Securities, 3.50%, 4/1/50 | 250,000,000 | 4/15/20 | 264,296,875 |
| Uniform Mortgage-Backed Securities, 3.00%, 4/1/50 | 1,119,000,000 | 4/15/20 | 1,172,851,875 |
| Uniform Mortgage-Backed Securities, 2.50%, 4/1/50 | 2,234,000,000 | 4/15/20 | 2,313,935,201 |
| Total | | | $3,767,063,482 |
| | | | | | |
| CENTRALLY CLEARED INTEREST RATE SWAP CONTRACTS OUTSTANDING at 3/31/20 (Unaudited) |
| | | Upfront | | | | |
| | | premium | | | | Unrealized |
| | | received | Termination | Payments | Payments | appreciation/ |
| Notional amount | Value | (paid) | date | made by fund | received by fund | (depreciation) |
| $22,861,000 | $14,498,721 | $(780) | 11/8/48 | 3 month USD- | 3.312% — | $14,742,538 |
| | | | | LIBOR-BBA — | Semiannually | |
| | | | | Quarterly | | |
| 196,939,100 | 40,589,149 | (2,789) | 1/3/29 | 3.065% — | 3 month USD- | (41,138,302) |
| | | | | Semiannually | LIBOR-BBA — | |
| | | | | | Quarterly | |
| 108,710,600 | 22,895,648 | (1,539) | 3/4/29 | 3 month USD- | 3.073% — | 23,038,652 |
| | | | | LIBOR-BBA — | Semiannually | |
| | | | | Quarterly | | |
| 157,551,500 | 35,711,883 | (3,478,069) | 12/3/29 | 3 month USD- | 3.096% — | 33,647,000 |
| | | | | LIBOR-BBA — | Semiannually | |
| | | | | Quarterly | | |
| 14,277,900 | 599,843E | (80) | 2/2/24 | 3 month USD- | 2.5725% — | 599,764 |
| | | | | LIBOR-BBA — | Semiannually | |
| | | | | Quarterly | | |
| 36,954,400 | 1,519,787E | (206) | 2/2/24 | 2.528% — | 3 month USD- | (1,519,992) |
| | | | | Semiannually | LIBOR-BBA — | |
| | | | | | Quarterly | |
| 28,359,200 | 4,940,258 | (376) | 2/13/29 | 2.6785% — | 3 month USD- | (4,977,359) |
| | | | | Semiannually | LIBOR-BBA — | |
| | | | | | Quarterly | |
| 61,047,700 | 11,850,763 | 1,243,037 | 2/20/30 | 2.7225% — | 3 month USD- | (10,679,190) |
| | | | | Semiannually | LIBOR-BBA — | |
| | | | | | Quarterly | |
| 61,047,700 | 11,853,632 | 1,246,853 | 3/2/30 | 2.715% — | 3 month USD- | (10,659,897) |
| | | | | Semiannually | LIBOR-BBA — | |
| | | | | | Quarterly | |
| 77,357,200 | 4,972,676E | (15,655) | 12/2/23 | 3 month USD- | 2.536% — | 4,957,020 |
| | | | | LIBOR-BBA — | Semiannually | |
| | | | | Quarterly | | |
| 26,743,500 | 1,122,211E | (4,569) | 2/2/24 | 3 month USD- | 2.57% — | 1,117,641 |
| | | | | LIBOR-BBA — | Semiannually | |
| | | | | Quarterly | | |
| 12,348,596 | 2,513,742 | (175) | 3/5/30 | 3 month USD- | 2.806% — | 2,526,420 |
| | | | | LIBOR-BBA — | Semiannually | |
| | | | | Quarterly | | |
|
| Diversified Income Trust 69 |
| | | | | | |
| CENTRALLY CLEARED INTEREST RATE SWAP CONTRACTS OUTSTANDING at 3/31/20 (Unaudited)cont. |
| | | Upfront | | | | |
| | | premium | | | | Unrealized |
| | | received | Termination | Payments | Payments | appreciation/ |
| Notional amount | Value | (paid) | date | made by fund | received by fund | (depreciation) |
| $23,163,600 | $4,397,447 | $(328) | 3/16/30 | 2.647% — | 3 month USD- | $(4,415,699) |
| | | | | Semiannually | LIBOR-BBA — | |
| | | | | | Quarterly | |
| 14,581,700 | 6,853,137E | (497) | 3/28/52 | 2.67% — | 3 month USD- | (6,853,634) |
| | | | | Semiannually | LIBOR-BBA — | |
| | | | | | Quarterly | |
| 48,182,300 | 1,769,929E | (268) | 2/2/24 | 3 month USD- | 2.3075% — | 1,769,660 |
| | | | | LIBOR-BBA — | Semiannually | |
| | | | | Quarterly | | |
| 70,726,400 | 2,610,865E | (394) | 2/9/24 | 3 month USD- | 2.32% — | 2,610,471 |
| | | | | LIBOR-BBA — | Semiannually | |
| | | | | Quarterly | | |
| 22,405,400 | 11,011,403E | (764) | 11/29/53 | 2.793% — | 3 month USD- | (11,012,167) |
| | | | | Semiannually | LIBOR-BBA — | |
| | | | | | Quarterly | |
| 10,843,800 | 1,525,744E | (241) | 11/20/39 | 3 month USD- | 2.55% — | 1,525,503 |
| | | | | LIBOR-BBA — | Semiannually | |
| | | | | Quarterly | | |
| 45,032,800 | 6,347,598E | (638) | 12/7/30 | 2.184% — | 3 month USD- | (6,348,236) |
| | | | | Semiannually | LIBOR-BBA — | |
| | | | | | Quarterly | |
| 23,564,200 | 1,552,881E | (265) | 6/5/29 | 3 month USD- | 2.2225% — | 1,552,616 |
| | | | | LIBOR-BBA — | Semiannually | |
| | | | | Quarterly | | |
| 1,970,500 | 729,193E | (67) | 6/22/52 | 2.3075% — | 3 month USD- | (729,261) |
| | | | | Semiannually | LIBOR-BBA — | |
| | | | | | Quarterly | |
| 52,911,000 | 6,997,427E | (749) | 6/22/30 | 2.0625% — | 3 month USD- | (6,998,176) |
| | | | | Semiannually | LIBOR-BBA — | |
| | | | | | Quarterly | |
| 20,211,100 | 2,482,529E | (286) | 7/6/30 | 1.9665% — | 3 month USD- | (2,482,816) |
| | | | | Semiannually | LIBOR-BBA — | |
| | | | | | Quarterly | |
| 7,702,200 | 2,727,981E | (263) | 7/5/52 | 2.25% — | 3 month USD- | (2,728,243) |
| | | | | Semiannually | LIBOR-BBA — | |
| | | | | | Quarterly | |
| 63,381,600 | 1,599,942E | (353) | 2/7/24 | 1.733% — | 3 month USD- | (1,600,295) |
| | | | | Semiannually | LIBOR-BBA — | |
| | | | | | Quarterly | |
| 36,072,000 | 4,522,238E | (511) | 1/22/31 | 2.035% — | 3 month USD- | (4,522,749) |
| | | | | Semiannually | LIBOR-BBA — | |
| | | | | | Quarterly | |
| 36,675,000 | 13,160,530E | (1,251) | 7/22/52 | 2.2685% — | 3 month USD- | (13,161,781) |
| | | | | Semiannually | LIBOR-BBA — | |
| | | | | | Quarterly | |
| 14,737,600 | 3,890,785E | (503) | 8/8/52 | 1.9185% — | 3 month USD- | (3,891,288) |
| | | | | Semiannually | LIBOR-BBA — | |
| | | | | | Quarterly | |
| |
| 70 Diversified Income Trust |
| | | | | | |
| CENTRALLY CLEARED INTEREST RATE SWAP CONTRACTS OUTSTANDING at 3/31/20 (Unaudited)cont. |
| | | Upfront | | | | |
| | | premium | | | | Unrealized |
| | | received | Termination | Payments | Payments | appreciation/ |
| Notional amount | Value | (paid) | date | made by fund | received by fund | (depreciation) |
| $85,083,500 | $3,624,132 | $(803) | 9/18/24 | 1.43125% — | 3 month USD- | $(3,639,482) |
| | | | | Semiannually | LIBOR-BBA — | |
| | | | | | Quarterly | |
| 85,083,500 | 3,600,478 | (803) | 9/18/24 | 1.425% — | 3 month USD- | (3,615,636) |
| | | | | Semiannually | LIBOR-BBA — | |
| | | | | | Quarterly | |
| 13,211,500 | 2,437,284E | (451) | 9/12/52 | 1.626% — | 3 month USD- | (2,437,734) |
| | | | | Semiannually | LIBOR-BBA — | |
| | | | | | Quarterly | |
| 335,284,100 | 15,051,574 | (2,712) | 9/30/24 | 1.50% — | 3 month USD- | (15,042,651) |
| | | | | Semiannually | LIBOR-BBA — | |
| | | | | | Quarterly | |
| 335,284,100 | 15,461,626 | (2,712) | 10/1/24 | 1.53% — | 3 month USD- | (16,428,800) |
| | | | | Semiannually | LIBOR-BBA — | |
| | | | | | Quarterly | |
| 71,509,000 | 3,893,665 | (579) | 12/13/24 | 1.6445% — | 3 month USD- | (4,217,878) |
| | | | | Semiannually | LIBOR-BBA — | |
| | | | | | Quarterly | |
| 7,541,700 | 177,056 | 6,350 | 3/18/22 | 3 month USD- | 1.60% — | 185,156 |
| | | | | LIBOR-BBA — | Semiannually | |
| | | | | Quarterly | | |
| 159,501,500 | 3,744,617 | (135,992) | 3/18/22 | 1.60% — | 3 month USD- | (3,917,599) |
| | | | | Semiannually | LIBOR-BBA — | |
| | | | | | Quarterly | |
| 49,635,800 | 14,991,699 | (1,137,496) | 3/18/50 | 3 month USD- | 2.00% — | 13,872,884 |
| | | | | LIBOR-BBA — | Semiannually | |
| | | | | Quarterly | | |
| 481,596,200 | 48,987,002 | 3,613,905 | 3/18/30 | 3 month USD- | 1.75% — | 52,738,679 |
| | | | | LIBOR-BBA — | Semiannually | |
| | | | | Quarterly | | |
| 68,985,000 | 7,405,747 | (914) | 12/17/29 | 1.8252% — | 3 month USD- | (7,746,171) |
| | | | | Semiannually | LIBOR-BBA — | |
| | | | | | Quarterly | |
| 71,509,000 | 3,850,402 | (579) | 12/17/24 | 1.632% — | 3 month USD- | (4,163,000) |
| | | | | Semiannually | LIBOR-BBA — | |
| | | | | | Quarterly | |
| 3,415,500 | 182,640 | 44,198 | 3/18/25 | 1.58% — | 3 month USD- | (139,209) |
| | | | | Semiannually | LIBOR-BBA — | |
| | | | | | Quarterly | |
| 70,480,000 | 20,900,914 | 2,969,616 | 3/18/50 | 1.98% — | 3 month USD- | (17,957,315) |
| | | | | Semiannually | LIBOR-BBA — | |
| | | | | | Quarterly | |
| 13,552,500 | 1,351,984 | 30,263 | 3/18/30 | 3 month USD- | 1.73% — | 1,386,026 |
| | | | | LIBOR-BBA — | Semiannually | |
| | | | | Quarterly | | |
| 95,679,000 | 9,984,678 | (1,269) | 12/18/29 | 3 month USD- | 1.7945% — | 10,441,558 |
| | | | | LIBOR-BBA — | Semiannually | |
| | | | | Quarterly | | |
|
| Diversified Income Trust 71 |
| | | | | | |
| CENTRALLY CLEARED INTEREST RATE SWAP CONTRACTS OUTSTANDING at 3/31/20 (Unaudited)cont. |
| | | Upfront | | | | |
| | | premium | | | | Unrealized |
| | | received | Termination | Payments | Payments | appreciation/ |
| Notional amount | Value | (paid) | date | made by fund | received by fund | (depreciation) |
| $71,509,000 | $4,012,442 | $(579) | 12/18/24 | 1.6815% — | 3 month USD- | $(4,332,314) |
| | | | | Semiannually | LIBOR-BBA — | |
| | | | | | Quarterly | |
| 1,503,151,200 | 83,722,516 | (4,318,184) | 3/18/25 | 1.625% — | 3 month USD- | (88,402,861) |
| | | | | Semiannually | LIBOR-BBA — | |
| | | | | | Quarterly | |
| 19,214,300 | 2,130,674E | (272) | 12/21/30 | 3 month USD- | 1.88% — | 2,130,402 |
| | | | | LIBOR-BBA — | Semiannually | |
| | | | | Quarterly | | |
| 36,588,700 | 3,606,073 | (485) | 1/8/30 | 1.744% — | 3 month USD- | (3,593,836) |
| | | | | Semiannually | LIBOR-BBA — | |
| | | | | | Quarterly | |
| 120,090,100 | 11,324,136 | (257,785) | 1/28/30 | 3 month USD- | 1.698% — | 11,039,897 |
| | | | | LIBOR-BBA — | Semiannually | |
| | | | | Quarterly | | |
| 2,460,200 | 700,682E | (84) | 1/16/55 | 2.032% — | 3 month USD- | (700,766) |
| | | | | Semiannually | LIBOR-BBA — | |
| | | | | | Quarterly | |
| 48,582,000 | 4,917,616 | (16,177) | 1/16/30 | 1.771% — | 3 month USD- | (4,924,056) |
| | | | | Semiannually | LIBOR-BBA — | |
| | | | | | Quarterly | |
| 89,451,500 | 8,891,747 | (1,186) | 1/31/30 | 1.7505% — | 3 month USD- | (8,884,548) |
| | | | | Semiannually | LIBOR-BBA — | |
| | | | | | Quarterly | |
| 70,283,300 | 6,969,362 | (932) | 1/31/30 | 1.748% — | 3 month USD- | (6,963,413) |
| | | | | Semiannually | LIBOR-BBA — | |
| | | | | | Quarterly | |
| 159,734,800 | 14,912,841 | (257,694) | 1/31/30 | 3 month USD- | 1.688% — | 14,623,533 |
| | | | | LIBOR-BBA — | Semiannually | |
| | | | | Quarterly | | |
| 60,870,010 | 4,674,817 | (278,115) | 3/18/27 | 3 month USD- | 1.70% — | 4,413,014 |
| | | | | LIBOR-BBA — | Semiannually | |
| | | | | Quarterly | | |
| 953,900 | 257,656E | (33) | 1/24/55 | 3 month USD- | 1.977% — | 257,623 |
| | | | | LIBOR-BBA — | Semiannually | |
| | | | | Quarterly | | |
| 33,741,000 | 3,084,197 | (447) | 1/27/30 | 3 month USD- | 1.668% — | 3,074,503 |
| | | | | LIBOR-BBA — | Semiannually | |
| | | | | Quarterly | | |
| 88,067,100 | 6,431,981 | (597,822) | 2/18/30 | 1.4765% — | 3 month USD- | (7,007,161) |
| | | | | Semiannually | LIBOR-BBA — | |
| | | | | | Quarterly | |
| 85,585,000 | 6,573,270 | (1,135) | 2/12/30 | 3 month USD- | 1.516% — | 6,549,172 |
| | | | | LIBOR-BBA — | Semiannually | |
| | | | | Quarterly | | |
| 3,797,800 | 341,627E | (130) | 3/4/52 | 1.265% — | 3 month USD- | (341,757) |
| | | | | Semiannually | LIBOR-BBA — | |
| | | | | | Quarterly | |
| |
| 72 Diversified Income Trust |
| | | | | | |
| CENTRALLY CLEARED INTEREST RATE SWAP CONTRACTS OUTSTANDING at 3/31/20 (Unaudited)cont. |
| | | Upfront | | | | |
| | | premium | | | | Unrealized |
| | | received | Termination | Payments | Payments | appreciation/ |
| Notional amount | Value | (paid) | date | made by fund | received by fund | (depreciation) |
| $16,469,700 | $546,349E | $(233) | 3/4/31 | 3 month USD- | 1.101% — | $546,116 |
| | | | | LIBOR-BBA — | Semiannually | |
| | | | | Quarterly | | |
| 503,853,000 | 1,815,382E | (1,900) | 9/8/21 | 0.68% — | 3 month USD- | (1,817,282) |
| | | | | Semiannually | LIBOR-BBA — | |
| | | | | | Quarterly | |
| 1,089,717,400 | 2,807,112E | (4,108) | 10/15/21 | 0.571% — | 3 month USD- | (2,811,220) |
| | | | | Semiannually | LIBOR-BBA — | |
| | | | | | Quarterly | |
| 41,830,000 | 2,043,228E | (1,426) | 1/27/47 | 3 month USD- | 1.27% — | 2,041,802 |
| | | | | LIBOR-BBA — | Semiannually | |
| | | | | Quarterly | | |
| 3,533,000 | 169,778E | (120) | 3/7/50 | 1.275% — | 3 month USD- | (169,899) |
| | | | | Semiannually | LIBOR-BBA — | |
| | | | | | Quarterly | |
| 6,437,300 | 105,784E | (220) | 3/10/52 | 0.8725% — | 3 month USD- | 105,565 |
| | | | | Semiannually | LIBOR-BBA — | |
| | | | | | Quarterly | |
| 60,638,000 | 8,065 | (804) | 3/11/30 | 0.70792% — | 3 month USD- | 10,583 |
| | | | | Semiannually | LIBOR-BBA — | |
| | | | | | Quarterly | |
| 60,638,000 | 42,750 | (804) | 3/11/30 | 0.7165% — | 3 month USD- | (40,521) |
| | | | | Semiannually | LIBOR-BBA — | |
| | | | | | Quarterly | |
| 8,859,800 | 518,803E | (302) | 3/11/52 | 0.717% — | 3 month USD- | 518,501 |
| | | | | Semiannually | LIBOR-BBA — | |
| | | | | | Quarterly | |
| 2,819,000 | 129,006 | (96) | 3/12/50 | 0.73081% — | 3 month USD- | 129,051 |
| | | | | Semiannually | LIBOR-BBA — | |
| | | | | | Quarterly | |
| 22,301,000 | 1,373,541 | (760) | 3/16/50 | 0.6725% — | 3 month USD- | 1,373,871 |
| | | | | Semiannually | LIBOR-BBA — | |
| | | | | | Quarterly | |
| 14,868,000 | 813,919E | (507) | 4/16/50 | 0.7025% — | 3 month USD- | 813,412 |
| | | | | Semiannually | LIBOR-BBA — | |
| | | | | | Quarterly | |
| 21,905,000 | 157,826 | (177) | 3/16/25 | 0.638% — | 3 month USD- | (156,617) |
| | | | | Semiannually | LIBOR-BBA — | |
| | | | | | Quarterly | |
| 15,932,000 | 143,914 | (129) | 3/16/25 | 0.675% — | 3 month USD- | (143,280) |
| | | | | Semiannually | LIBOR-BBA — | |
| | | | | | Quarterly | |
| 108,801,000 | 1,615,368 | (1,442) | 3/16/30 | 0.86% — | 3 month USD- | (1,619,991) |
| | | | | Semiannually | LIBOR-BBA — | |
| | | | | | Quarterly | |
| 20,825,000 | 198,108 | (710) | 3/16/50 | 0.8625% — | 3 month USD- | 196,768 |
| | | | | Semiannually | LIBOR-BBA — | |
| | | | | | Quarterly | |
|
| Diversified Income Trust 73 |
| | | | | | |
| CENTRALLY CLEARED INTEREST RATE SWAP CONTRACTS OUTSTANDING at 3/31/20 (Unaudited)cont. |
| | | Upfront | | | | |
| | | premium | | | | Unrealized |
| | | received | Termination | Payments | Payments | appreciation/ |
| Notional amount | Value | (paid) | date | made by fund | received by fund | (depreciation) |
| $225,000 | $2,315E | $(359) | 6/17/25 | 3 month USD- | 0.70% — | $1,956 |
| | | | | LIBOR-BBA — | Semiannually | |
| | | | | Quarterly | | |
| 85,551,000 | 702,545E | (130,290) | 6/17/30 | 0.80% — | 3 month USD- | (832,834) |
| | | | | Semiannually | LIBOR-BBA — | |
| | | | | | Quarterly | |
| 77,103,000 | 943,741 | (624) | 3/17/25 | 0.744% — | 3 month USD- | (939,587) |
| | | | | Semiannually | LIBOR-BBA — | |
| | | | | | Quarterly | |
| 77,103,000 | 1,010,358 | (624) | 3/17/25 | 0.7615% — | 3 month USD- | (1,006,728) |
| | | | | Semiannually | LIBOR-BBA — | |
| | | | | | Quarterly | |
| 37,470,000 | 460,469 | (303) | 3/17/25 | 0.745% — | 3 month USD- | (458,464) |
| | | | | Semiannually | LIBOR-BBA — | |
| | | | | | Quarterly | |
| 10,073,100 | 188,115E | (143) | 3/17/32 | 3 month USD- | 1.03% — | 187,973 |
| | | | | LIBOR-BBA — | Semiannually | |
| | | | | Quarterly | | |
| 77,103,000 | 964,636 | (624) | 3/17/25 | 0.7495% — | 3 month USD- | (960,646) |
| | | | | Semiannually | LIBOR-BBA — | |
| | | | | | Quarterly | |
| 77,103,000 | 1,008,430 | (624) | 3/17/25 | 0.761% — | 3 month USD- | (1,004,785) |
| | | | | Semiannually | LIBOR-BBA — | |
| | | | | | Quarterly | |
| 77,103,000 | 1,057,930 | (624) | 3/17/25 | 0.774% — | 3 month USD- | (1,054,676) |
| | | | | Semiannually | LIBOR-BBA — | |
| | | | | | Quarterly | |
| 356,741,000 | 402,404E | (502,272) | 6/17/22 | 3 month USD- | 0.40% — | (99,868) |
| | | | | LIBOR-BBA — | Semiannually | |
| | | | | Quarterly | | |
| 75,662,000 | 398,133 | (612) | 3/18/25 | 0.6045% — | 3 month USD- | (389,092) |
| | | | | Semiannually | LIBOR-BBA — | |
| | | | | | Quarterly | |
| 32,815,000 | 1,277,652 | (1,119) | 3/19/50 | 3 month USD- | 0.7575% — | (1,282,950) |
| | | | | LIBOR-BBA — | Semiannually | |
| | | | | Quarterly | | |
| 32,815,000 | 1,120,173 | (1,119) | 3/19/50 | 3 month USD- | 0.775% — | (1,125,279) |
| | | | | LIBOR-BBA — | Semiannually | |
| | | | | Quarterly | | |
| 35,399,000 | 747,308 | (1,207) | 3/19/50 | 3 month USD- | 0.8225% — | (752,256) |
| | | | | LIBOR-BBA — | Semiannually | |
| | | | | Quarterly | | |
| 179,760,000 | 2,151,368 | (1,454) | 3/19/25 | 0.747% — | 3 month USD- | (2,129,301) |
| | | | | Semiannually | LIBOR-BBA — | |
| | | | | | Quarterly | |
| 93,457,000 | 969,523 | (756) | 3/20/25 | 0.717% — | 3 month USD- | (955,995) |
| | | | | Semiannually | LIBOR-BBA — | |
| | | | | | Quarterly | |
|
| 74 Diversified Income Trust |
| | | | | | |
| CENTRALLY CLEARED INTEREST RATE SWAP CONTRACTS OUTSTANDING at 3/31/20 (Unaudited)cont. |
| | | Upfront | | | | |
| | | premium | | | | Unrealized |
| | | received | Termination | Payments | Payments | appreciation/ |
| Notional amount | Value | (paid) | date | made by fund | received by fund | (depreciation) |
| $92,983,000 | $1,010,539 | $(752) | 3/20/25 | 0.727% — | 3 month USD- | $(997,364) |
| | | | | Semiannually | LIBOR-BBA — | |
| | | | | | Quarterly | |
| 52,028,100 | 2,030,605 | (690) | 3/27/30 | 3 month USD- | 1.1175% — | 2,027,219 |
| | | | | LIBOR-BBA — | Semiannually | |
| | | | | Quarterly | | |
| 52,028,300 | 1,890,188 | (690) | 3/27/30 | 1.09% — | 3 month USD- | (1,888,024) |
| | | | | Semiannually | LIBOR-BBA — | |
| | | | | | Quarterly | |
| 1,548,400 | 52,481 | (21) | 4/2/30 | 3 month USD- | 1.07% — | 52,461 |
| | | | | LIBOR-BBA — | Semiannually | |
| | | | | Quarterly | | |
| 28,309,000 | 837,805 | (375) | 3/23/30 | 1.02% — | 3 month USD- | (836,139) |
| | | | | Semiannually | LIBOR-BBA — | |
| | | | | | Quarterly | |
| 28,309,000 | 782,263 | (375) | 3/23/30 | 1.00% — | 3 month USD- | (780,471) |
| | | | | Semiannually | LIBOR-BBA — | |
| | | | | | Quarterly | |
| 28,309,000 | 726,720 | (375) | 3/23/30 | 0.98% — | 3 month USD- | (724,803) |
| | | | | Semiannually | LIBOR-BBA — | |
| | | | | | Quarterly | |
| 1,665,000 | 19,907 | (13) | 3/23/25 | 0.7525% — | 3 month USD- | (19,701) |
| | | | | Semiannually | LIBOR-BBA — | |
| | | | | | Quarterly | |
| 1,665,000 | 19,039 | (13) | 3/23/25 | 0.742% — | 3 month USD- | (18,830) |
| | | | | Semiannually | LIBOR-BBA — | |
| | | | | | Quarterly | |
| 4,902,600 | 11,992E | (60) | 3/24/32 | 3 month USD- | 1.07% — | 11,932 |
| | | | | LIBOR-BBA — | Semiannually | |
| | | | | Quarterly | | |
| 2,774,900 | 1,260E | (42) | 3/24/35 | 3 month USD- | 0.968% — | (1,302) |
| | | | | LIBOR-BBA — | Semiannually | |
| | | | | Quarterly | | |
| 45,321,000 | 205,531 | (601) | 3/25/30 | 0.6725% — | 3 month USD- | 210,563 |
| | | | | Semiannually | LIBOR-BBA — | |
| | | | | | Quarterly | |
| 135,750,000 | 228,332 | (1,800) | 3/27/30 | 3 month USD- | 0.73705% — | 213,761 |
| | | | | LIBOR-BBA — | Semiannually | |
| | | | | Quarterly | | |
| 67,875,000 | 36,788 | (900) | 3/27/30 | 3 month USD- | 0.71439% — | (44,245) |
| | | | | LIBOR-BBA — | Semiannually | |
| | | | | Quarterly | | |
| 67,875,000 | 14,050 | (900) | 3/27/30 | 3 month USD- | 0.7178% — | (21,154) |
| | | | | LIBOR-BBA — | Semiannually | |
| | | | | Quarterly | | |
| 33,170,000 | 577,390 | (1,131) | 3/30/50 | 3 month USD- | 0.8385% — | (580,282) |
| | | | | LIBOR-BBA — | Semiannually | |
| | | | | Quarterly | | |
|
| Diversified Income Trust 75 |
| | | | | | | |
| CENTRALLY CLEARED INTEREST RATE SWAP CONTRACTS OUTSTANDING at 3/31/20 (Unaudited)cont. |
| | | | Upfront | | | | |
| | | | premium | | | | Unrealized |
| | | | received | Termination | Payments | Payments | appreciation/ |
| Notional amount | Value | (paid) | date | made by fund | received by fund | (depreciation) |
| | $3,671,000 | $5,316 | $(49) | 3/30/30 | 3 month USD- | 0.7375% — | $5,062 |
| | | | | | LIBOR-BBA — | Semiannually | |
| | | | | | Quarterly | | |
| | 65,038,000 | 444,990 | (862) | 3/31/30 | 3 month USD- | 0.655% — | (448,472) |
| | | | | | LIBOR-BBA — | Semiannually | |
| | | | | | Quarterly | | |
| | 3,810,000 | 36,744 | (51) | 4/1/30 | 3 month USD- | 0.62658% — | (36,794) |
| | | | | | LIBOR-BBA — | Semiannually | |
| | | | | | Quarterly | | |
| | 35,974,000 | 1,517,096E | (1,227) | 5/1/50 | 3 month USD- | 0.7475% — | (1,518,322) |
| | | | | | LIBOR-BBA — | Semiannually | |
| | | | | | Quarterly | | |
| | 134,072,000 | 91,571 | (506) | 4/1/22 | 3 month USD- | 0.495% — | 91,066 |
| | | | | | LIBOR-BBA — | Semiannually | |
| | | | | | Quarterly | | |
| | 129,291,000 | 80,936 | (488) | 4/1/22 | 3 month USD- | 0.4921% — | 80,449 |
| | | | | | LIBOR-BBA — | Semiannually | |
| | | | | | Quarterly | | |
| | 112,524,000 | 229,549 | (911) | 4/1/25 | 3 month USD- | 0.4825% — | (230,459) |
| | | | | | LIBOR-BBA — | Semiannually | |
| | | | | | Quarterly | | |
| | 49,452,000 | 51,430 | (656) | 4/2/30 | 0.71% — | 3 month USD- | 50,774 |
| | | | | | Semiannually | LIBOR-BBA — | |
| | | | | | | Quarterly | |
| | 48,305,000 | 77,771 | (640) | 4/2/30 | 0.70418% — | 3 month USD- | 77,131 |
| | | | | | Semiannually | LIBOR-BBA — | |
| | | | | | | Quarterly | |
| | 50,608,000 | 70,345 | (671) | 4/2/30 | 0.7065% — | 3 month USD- | 69,674 |
| | | | | | Semiannually | LIBOR-BBA — | |
| | | | | | | Quarterly | |
| AUD | 194,599,000 | 798,385 | (499) | 10/30/21 | 0.80% — | 3 month AUD- | (779,677) |
| | | | | | Quarterly | BBR-BBSW — | |
| | | | | | | Quarterly | |
| AUD | 40,343,000 | 997,761 | (364) | 10/30/29 | 6 month AUD- | 1.305% — | 1,024,634 |
| | | | | | BBR-BBSW — | Semiannually | |
| | | | | | Semiannually | | |
| AUD | 195,126,000 | 819,510 | (500) | 10/30/21 | 0.81% — | 3 month AUD- | (802,892) |
| | | | | | Quarterly | BBR-BBSW — | |
| | | | | | | Quarterly | |
| AUD | 40,343,000 | 1,044,289 | (364) | 10/30/29 | 6 month AUD- | 1.325% — | 1,073,444 |
| | | | | | BBR-BBSW — | Semiannually | |
| | | | | | Semiannually | | |
| AUD | 1,119,500 | 29,080E | (11) | 1/30/35 | 1.692% — | 6 month AUD- | (29,091) |
| | | | | | Semiannually | BBR-BBSW — | |
| | | | | | | Semiannually | |
| AUD | 3,719,600 | 48,630E | (37) | 3/5/35 | 1.47% — | 6 month AUD- | (48,667) |
| | | | | | Semiannually | BBR-BBSW — | |
| | | | | | | Semiannually | |
| |
| 76 Diversified Income Trust |
| | | | | | | |
| CENTRALLY CLEARED INTEREST RATE SWAP CONTRACTS OUTSTANDING at 3/31/20 (Unaudited)cont. |
| | | | Upfront | | | | |
| | | | premium | | | | Unrealized |
| | | | received | Termination | Payments | Payments | appreciation/ |
| Notional amount | Value | (paid) | date | made by fund | received by fund | (depreciation) |
| AUD | 65,510,000 | $1,132,537E | $(41,477) | 6/17/30 | 6 month AUD- | 1.20% — | $1,091,060 |
| | | | | | BBR-BBSW — | Semiannually | |
| | | | | | Semiannually | | |
| AUD | 1,312,000 | 12,713E | 1,542 | 6/17/25 | 6 month AUD- | 0.90% — | 14,254 |
| | | | | | BBR-BBSW — | Semiannually | |
| | | | | | Semiannually | | |
| AUD | 1,399,700 | 12,793E | (12) | 3/25/35 | 1.4025% — | 6 month AUD- | (12,805) |
| | | | | | Semiannually | BBR-BBSW — | |
| | | | | | | Semiannually | |
| AUD | 2,018,200 | 32,381E | (24) | 3/28/40 | 1.445% — | 6 month AUD- | (32,404) |
| | | | | | Semiannually | BBR-BBSW — | |
| | | | | | | Semiannually | |
| AUD | 7,680,600 | 8,867E | (92) | 4/1/40 | 1.1685% — | 6 month AUD- | (8,959) |
| | | | | | Semiannually | BBR-BBSW — | |
| | | | | | | Semiannually | |
| CAD | 364,459,000 | 2,983,421 | (1,027) | 8/15/21 | 3 month CAD- | 1.61 % — | 2,871,630 |
| | | | | | BA-CDOR — | Semiannually | |
| | | | | | Semiannually | | |
| CAD | 38,278,000 | 915,620 | (380) | 8/15/29 | 1.4925% — | 3 month CAD- | (900,503) |
| | | | | | Semiannually | BA-CDOR — | |
| | | | | | | Semiannually | |
| CAD | 113,033,500 | 2,473,436 | (799) | 9/18/24 | 3 month CAD- | 1.638% — | 2,478,320 |
| | | | | | BA-CDOR — | Semiannually | |
| | | | | | Semiannually | | |
| CAD | 113,033,500 | 2,445,003 | (799) | 9/18/24 | 3 month CAD- | 1.63 % — | 2,449,644 |
| | | | | | BA-CDOR — | Semiannually | |
| | | | | | Semiannually | | |
| CAD | 18,871,000 | 703,080 | (187) | 10/9/29 | 1.6875% — | 3 month CAD- | (680,818) |
| | | | | | Semiannually | BA-CDOR — | |
| | | | | | | Semiannually | |
| CAD | 179,024,000 | 1,964,519 | (508) | 2/24/22 | 3 month CAD- | 1.621% — | 1,921,914 |
| | | | | | BA-CDOR — | Semiannually | |
| | | | | | Semiannually | | |
| CAD | 37,715,000 | 1,180,118 | (376) | 2/24/30 | 1.60% — | 3 month CAD- | (1,199,978) |
| | | | | | Semiannually | BA-CDOR — | |
| | | | | | | Semiannually | |
| CAD | 34,993,000 | 2,324,015 | (865) | 3/11/50 | 3 month CAD- | 1.134% — | (2,321,501) |
| | | | | | BA-CDOR — | Semiannually | |
| | | | | | Semiannually | | |
| CAD | 17,539,000 | 165,220E | (36,937) | 6/17/30 | 3 month CAD- | 1.00% — | (202,157) |
| | | | | | BA-CDOR — | Semiannually | |
| | | | | | Semiannually | | |
| CAD | 13,263,000 | 25,003E | (47,266) | 6/17/25 | 0.90% — | 3 month CAD- | (22,263) |
| | | | | | Semiannually | BA-CDOR — | |
| | | | | | | Semiannually | |
| CHF | 53,914,000 | 790,365 | (446) | 8/9/24 | 0.8475% plus | — | (1,041,155) |
| | | | | | 6 month CHF- | | |
| | | | | | LIBOR-BBA — | | |
| | | | | | Semiannually | | |
|
| Diversified Income Trust 77 |
| | | | | | | |
| CENTRALLY CLEARED INTEREST RATE SWAP CONTRACTS OUTSTANDING at 3/31/20 (Unaudited)cont. |
| | | | Upfront | | | | |
| | | | premium | | | | Unrealized |
| | | | received | Termination | Payments | Payments | appreciation/ |
| Notional amount | Value | (paid) | date | made by fund | received by fund | (depreciation) |
| CHF | 26,202,000 | $277,755 | $(214) | 9/13/24 | 0.765% plus | — | $(379,062) |
| | | | | | 6 month CHF- | | |
| | | | | | LIBOR-BBA — | | |
| | | | | | Semiannually | | |
| CHF | 32,398,000 | 255,313E | 31,862 | 6/17/25 | 0.60% plus | — | (223,452) |
| | | | | | 6 month CHF- | | |
| | | | | | LIBOR-BBA — | | |
| | | | | | Semiannually | | |
| CHF | 29,589,000 | 412,248E | (88,760) | 6/17/30 | 0.30% plus | — | (501,007) |
| | | | | | 6 month CHF- | | |
| | | | | | LIBOR-BBA — | | |
| | | | | | Semiannually | | |
| CZK | 1,301,918,000 | 5,336,037 | (757) | 3/19/29 | 1.948% — | 6 month CZK- | (5,338,983) |
| | | | | | Annually | PRIBOR — | |
| | | | | | | Semiannually | |
| CZK | 1,243,451,000 | 952,918 | (435) | 8/9/24 | 6 month CZK- | 1.28 % — | 1,235,678 |
| | | | | | PRIBOR — | Annually | |
| | | | | | Semiannually | | |
| EUR | 7,235,600 | 3,084,230E | (277) | 11/29/58 | 1.484% — | 6 month EUR- | (3,084,507) |
| | | | | | Annually | EURIBOR- | |
| | | | | | | REUTERS — | |
| | | | | | | Semiannually | |
| EUR | 9,840,300 | 3,784,905 | (381) | 2/19/50 | 6 month | 1.354% — | 3,806,095 |
| | | | | | EUR-EURIBOR- | Annually | |
| | | | | | REUTERS — | | |
| | | | | | Semiannually | | |
| EUR | 10,864,000 | 3,880,280 | (415) | 3/11/50 | 1.267% — | 6 month EUR- | (3,892,024) |
| | | | | | Annually | EURIBOR- | |
| | | | | | | REUTERS — | |
| | | | | | | Semiannually | |
| EUR | 11,002,000 | 3,730,534 | (420) | 3/12/50 | 1.2115% — | 6 month EUR- | (3,741,604) |
| | | | | | Annually | EURIBOR- | |
| | | | | | | REUTERS — | |
| | | | | | | Semiannually | |
| EUR | 13,678,600 | 4,191,228 | (528) | 3/26/50 | 1.113% — | 6 month EUR- | (4,194,867) |
| | | | | | Annually | EURIBOR- | |
| | | | | | | REUTERS — | |
| | | | | | | Semiannually | |
| EUR | 13,443,000 | 5,108,663E | (509) | 11/29/58 | 6 month | 1.343% — | 5,108,154 |
| | | | | | EUR-EURIBOR- | Annually | |
| | | | | | REUTERS — | | |
| | | | | | Semiannually | | |
| EUR | 14,233,000 | 4,054,778 | (541) | 2/19/50 | 1.051% — | 6 month EUR- | (4,080,982) |
| | | | | | Annually | EURIBOR- | |
| | | | | | | REUTERS — | |
| | | | | | | Semiannually | |
| EUR | 10,466,600 | 2,890,867E | (401) | 6/7/54 | 1.054% — | 6 month EUR- | (2,891,268) |
| | | | | | Annually | EURIBOR- | |
| | | | | | | REUTERS — | |
| | | | | | | Semiannually | |
| |
| 78 Diversified Income Trust |
| | | | | | | |
| CENTRALLY CLEARED INTEREST RATE SWAP CONTRACTS OUTSTANDING at 3/31/20 (Unaudited)cont. |
| | | | Upfront | | | | |
| | | | premium | | | | Unrealized |
| | | | received | Termination | Payments | Payments | appreciation/ |
| Notional amount | Value | (paid) | date | made by fund | received by fund | (depreciation) |
| EUR | 9,550,400 | $2,257,040 | $(367) | 2/19/50 | 0.9035% — | 6 month EUR- | $(2,272,819) |
| | | | | | Annually | EURIBOR- | |
| | | | | | | REUTERS — | |
| | | | | | | Semiannually | |
| EUR | 8,829,000 | 1,785,751 | (337) | 2/21/50 | 0.80% — | 6 month EUR- | (1,798,549) |
| | | | | | Annually | EURIBOR- | |
| | | | | | | REUTERS — | |
| | | | | | | Semiannually | |
| EUR | 22,091,800 | 1,998,202E | (840) | 8/8/54 | 0.49% — | 6 month EUR- | (1,999,042) |
| | | | | | Annually | EURIBOR- | |
| | | | | | | REUTERS — | |
| | | | | | | Semiannually | |
| EUR | 12,792,500 | 34,651E | (483) | 6/6/54 | 6 month | 0.207% — | (35,134) |
| | | | | | EUR-EURIBOR- | Annually | |
| | | | | | REUTERS — | | |
| | | | | | Semiannually | | |
| EUR | 20,383,200 | 317,989 | (766) | 2/19/50 | 0.233% — | 6 month EUR- | (334,094) |
| | | | | | Annually | EURIBOR- | |
| | | | | | | REUTERS — | |
| | | | | | | Semiannually | |
| EUR | 1,260,000 | 1,680 | 1,741 | 12/18/21 | — | 0.401% plus | 3,637 |
| | | | | | | 6 month EUR- | |
| | | | | | | EURIBOR- | |
| | | | | | | REUTERS — | |
| | | | | | | Annually | |
| EUR | 900,000 | 5,251 | (6,609) | 12/18/24 | — | 0.351% plus | (1,346) |
| | | | | | | 6 month EUR- | |
| | | | | | | EURIBOR- | |
| | | | | | | REUTERS — | |
| | | | | | | Semiannually | |
| EUR | 80,872,000 | 646,387 | (713) | 10/11/24 | — | 0.4047% plus | 651,528 |
| | | | | | | 6 month EUR- | |
| | | | | | | EURIBOR- | |
| | | | | | | REUTERS — | |
| | | | | | | Semiannually | |
| EUR | 70,039,500 | 9,439,298 | (2,643) | 2/19/50 | 6 month | 0.595% — | 9,521,926 |
| | | | | | EUR-EURIBOR- | Annually | |
| | | | | | REUTERS — | | |
| | | | | | Semiannually | | |
| EUR | 94,639,000 | 871,342E | (1,174) | 1/27/30 | 6 month | 0.352% — | 870,168 |
| | | | | | EUR-EURIBOR- | Annually | |
| | | | | | REUTERS — | | |
| | | | | | Semiannually | | |
| EUR | 8,796,100 | 234,546E | (329) | 3/4/54 | 0.134% — | 6 month EUR- | 234,218 |
| | | | | | Annually | EURIBOR- | |
| | | | | | | REUTERS — | |
| | | | | | | Semiannually | |
|
| Diversified Income Trust 79 |
| | | | | | | |
| CENTRALLY CLEARED INTEREST RATE SWAP CONTRACTS OUTSTANDING at 3/31/20 (Unaudited)cont. |
| | | | Upfront | | | | |
| | | | premium | | | | Unrealized |
| | | | received | Termination | Payments | Payments | appreciation/ |
| Notional amount | Value | (paid) | date | made by fund | received by fund | (depreciation) |
| EUR | 4,363,500 | $635,924E | $(168) | 3/13/54 | — | 0.2275% | $635,756 |
| | | | | | | plus 6 month | |
| | | | | | | EUR-EURIBOR- | |
| | | | | | | REUTERS — | |
| | | | | | | Semiannually | |
| EUR | 189,542,000 | 916,457E | 1,072,415 | 6/17/25 | 0.30% plus | — | 155,958 |
| | | | | | 6 month | | |
| | | | | | EUR-EURIBOR- | | |
| | | | | | REUTERS — | | |
| | | | | | Semiannually | | |
| EUR | 45,646,000 | 794,613E | 1,231,441 | 6/17/30 | 0.15% plus | — | 436,827 |
| | | | | | 6 month | | |
| | | | | | EUR-EURIBOR- | | |
| | | | | | REUTERS — | | |
| | | | | | Semiannually | | |
| GBP | 1,050,000 | 3,939 | (1,016) | 12/18/21 | 0.701% — | 6 month GBP- | (4,354) |
| | | | | | Semiannually | LIBOR-BBA — | |
| | | | | | | Semiannually | |
| GBP | 220,000 | 2,803 | 255 | 12/18/24 | 0.751% — | 6 month GBP- | (2,463) |
| | | | | | Semiannually | LIBOR-BBA — | |
| | | | | | | Semiannually | |
| GBP | 110,056,000 | 945,831E | (800) | 1/10/24 | 6 month GBP- | 0.855% — | 945,031 |
| | | | | | LIBOR-BBA — | Semiannually | |
| | | | | | Semiannually | | |
| GBP | 111,120,000 | 940,483E | (1,003) | 1/10/26 | 0.965% — | 6 month GBP- | (941,486) |
| | | | | | Semiannually | LIBOR-BBA — | |
| | | | | | | Semiannually | |
| GBP | 207,352,000 | 1,474,742E | (1,508) | 1/13/24 | 6 month GBP- | 0.795% — | 1,473,234 |
| | | | | | LIBOR-BBA — | Semiannually | |
| | | | | | Semiannually | | |
| GBP | 210,545,000 | 1,573,292E | (1,903) | 1/15/26 | 0.926% — | 6 month GBP- | (1,575,195) |
| | | | | | Semiannually | LIBOR-BBA — | |
| | | | | | | Semiannually | |
| GBP | 44,088,000 | 151,142E | (50,959) | 6/17/25 | Sterling Over- | 0.30% — | 100,183 |
| | | | | | night Index | Annually | |
| | | | | | Average — | | |
| | | | | | Annually | | |
| GBP | 27,477,000 | 310,576E | (213,236) | 6/17/30 | Sterling Over- | 0.40% — | 97,340 |
| | | | | | night Index | Annually | |
| | | | | | Average — | | |
| | | | | | Annually | | |
| JPY | 732,682,200 | 772,667E | (213) | 8/29/43 | 0.7495% — | 6 month JPY- | (772,881) |
| | | | | | Semiannually | LIBOR-BBA — | |
| | | | | | | Semiannually | |
| JPY | 12,457,000,000 | 975,127E | (1,274) | 1/16/30 | 6 month JPY- | 0.245% — | 973,854 |
| | | | | | LIBOR-BBA — | Semiannually | |
| | | | | | Semiannually | | |
| JPY | 6,399,000,000 | 1,941,214E | (1,139) | 1/16/40 | 0.565% — | 6 month JPY- | (1,942,352) |
| | | | | | Semiannually | LIBOR-BBA — | |
| | | | | | | Semiannually | |
| |
| 80 Diversified Income Trust |
| | | | | | | |
| CENTRALLY CLEARED INTEREST RATE SWAP CONTRACTS OUTSTANDING at 3/31/20 (Unaudited)cont. |
| | | | Upfront | | | | |
| | | | premium | | | | Unrealized |
| | | | received | Termination | Payments | Payments | appreciation/ |
| Notional amount | Value | (paid) | date | made by fund | received by fund | (depreciation) |
| JPY | 929,267,100 | $25,875E | $(280) | 8/29/43 | 0.194% — | 6 month JPY- | $(26,155) |
| | | | | | Semiannually | LIBOR-BBA — | |
| | | | | | | Semiannually | |
| NOK | 999,023,000 | 3,617,506 | (947) | 7/1/24 | 1.735% — | 6 month NOK- | (4,519,736) |
| | | | | | Annually | NIBOR-NIBR — | |
| | | | | | | Semiannually | |
| NOK | 523,975,000 | 3,484,716 | (815) | 7/1/29 | 6 month NOK- | 1.82% — | 3,993,232 |
| | | | | | NIBOR-NIBR — | Annually | |
| | | | | | Semiannually | | |
| NOK | 2,472,275,000 | 2,953,713E | (1,032) | 1/25/22 | 1.8075% — | 3 month NOK- | (2,954,744) |
| | | | | | Annually | NIBOR-NIBR — | |
| | | | | | | Quarterly | |
| NOK | 61,322,000 | 140,275E | (64,177) | 6/17/30 | 6 month NOK- | 1.30% — | 76,098 |
| | | | | | NIBOR-NIBR — | Annually | |
| | | | | | Semiannually | | |
| NOK | 545,923,000 | 1,008,202E | 209,921 | 6/17/25 | 1.20% — | 6 month NOK- | (798,281) |
| | | | | | Annually | NIBOR-NIBR — | |
| | | | | | | Semiannually | |
| NOK | 288,988,000 | 388,321 | (371) | 3/19/30 | 6 month NOK- | 1.195% — | 387,275 |
| | | | | | NIBOR-NIBR — | Annually | |
| | | | | | Semiannually | | |
| NZD | 82,168,000 | 1,688,483 | (433) | 12/13/24 | 3 month NZD- | 1.3625% — | 1,881,473 |
| | | | | | BBR-FRA — | Semiannually | |
| | | | | | Quarterly | | |
| NZD | 82,168,000 | 1,778,060 | (436) | 12/17/24 | 3 month NZD- | 1.39% — | 1,976,843 |
| | | | | | BBR-FRA — | Semiannually | |
| | | | | | Quarterly | | |
| NZD | 82,168,000 | 1,708,144 | (436) | 12/18/24 | 3 month NZD- | 1.36% — | 1,900,922 |
| | | | | | BBR-FRA — | Semiannually | |
| | | | | | Quarterly | | |
| NZD | 30,819,000 | 266,706E | (98,029) | 6/17/30 | 3 month NZD- | 1.10% — | 168,676 |
| | | | | | BBR-FRA — | Semiannually | |
| | | | | | Quarterly | | |
| NZD | 54,985,000 | 424,260E | 122,502 | 6/17/25 | 0.90% — | 3 month NZD- | (301,759) |
| | | | | | Semiannually | BBR-FRA — | |
| | | | | | | Quarterly | |
| SEK | 1,249,428,000 | 161,538E | (494) | 1/21/22 | 3 month SEK- | 0.24% — | 161,044 |
| | | | | | STIBOR-SIDE — | Annually | |
| | | | | | Quarterly | | |
| SEK | 2,498,856,000 | 342,273E | (985) | 1/25/22 | 3 month SEK- | 0.2475% — | 341,288 |
| | | | | | STIBOR-SIDE — | Annually | |
| | | | | | Quarterly | | |
| SEK | 1,523,985,000 | 177,932E | (599) | 1/28/22 | 3 month SEK- | 0.2275% — | 177,334 |
| | | | | | STIBOR-SIDE — | Annually | |
| | | | | | Quarterly | | |
| SEK | 261,110,000 | 179,958 | (354) | 3/2/30 | 0.3125% — | 3 month SEK- | 161,197 |
| | | | | | Annually | STIBOR-SIDE — | |
| | | | | | | Quarterly | |
|
| Diversified Income Trust 81 |
| | | | | | | |
| CENTRALLY CLEARED INTEREST RATE SWAP CONTRACTS OUTSTANDING at 3/31/20 (Unaudited)cont. |
| | | | Upfront | | | | |
| | | | premium | | | | Unrealized |
| | | | received | Termination | Payments | Payments | appreciation/ |
| Notional amount | Value | (paid) | date | made by fund | received by fund | (depreciation) |
| SEK | 1,298,324,000 | $128,880 | $(500) | 3/2/22 | 3 month SEK- | 0.07% — | $(63,740) |
| | | | | | STIBOR-SIDE — | Annually | |
| | | | | | Quarterly | | |
| SEK | 261,110,000 | 248,664 | (357) | 3/3/30 | 0.286% — | 3 month SEK- | 231,081 |
| | | | | | Annually | STIBOR-SIDE — | |
| | | | | | | Quarterly | |
| SEK | 1,298,324,000 | 153,160 | (504) | 3/3/22 | 3 month SEK- | 0.06% — | (91,296) |
| | | | | | STIBOR-SIDE — | Annually | |
| | | | | | Quarterly | | |
| SEK | 787,000 | 1,169E | (200) | 6/17/30 | 0.25% — | 3 month SEK- | 970 |
| | | | | | Annually | STIBOR-SIDE — | |
| | | | | | | Quarterly | |
| SEK | 663,926,000 | 328,253E | (95,240) | 6/17/25 | 0.10% — | 3 month SEK- | 233,012 |
| | | | | | Annually | STIBOR-SIDE — | |
| | | | | | | Quarterly | |
| Total | | $(152,653) | | | | $(154,438,603) |
EExtended effective date.
| | | | | | |
| OTC TOTAL RETURN SWAP CONTRACTS OUTSTANDING at 3/31/20 (Unaudited) | |
| | | Upfront | | | | |
| | | premium | Termina- | Payments | Total return | Unrealized |
| Swap counterparty/ | | received | tion | received (paid) | received by | appreciation/ |
| Notional amount | Value | (paid) | date | by fund | or paid by fund | (depreciation) |
| Bank of America N.A. | | | | | | |
| $770,391 | $650,582 | $— | 1/12/41 | 4.50% (1 month | Synthetic TRS | $(109,982) |
| | | | | USD-LIBOR) — | Index 4.50% 30 year | |
| | | | | Monthly | Fannie Mae pools — | |
| | | | | | Monthly | |
| Barclays Bank PLC | | | | | | |
| 6,205,573 | 6,230,906 | — | 1/12/40 | 4.00% (1 month | Synthetic MBX | 34,759 |
| | | | | USD-LIBOR) — | Index 4.00% 30 year | |
| | | | | Monthly | Fannie Mae pools — | |
| | | | | | Monthly | |
| 1,882,429 | 1,890,113 | — | 1/12/40 | 4.00% (1 month | Synthetic MBX | 10,544 |
| | | | | USD-LIBOR) — | Index 4.00% 30 year | |
| | | | | Monthly | Fannie Mae pools — | |
| | | | | | Monthly | |
| 950,523 | 954,403 | — | 1/12/40 | 4.00% (1 month | Synthetic MBX | 5,324 |
| | | | | USD-LIBOR) — | Index 4.00% 30 year | |
| | | | | Monthly | Fannie Mae pools — | |
| | | | | | Monthly | |
| 949,346 | 953,221 | — | 1/12/40 | 4.00% (1 month | Synthetic MBX | 5,318 |
| | | | | USD-LIBOR) — | Index 4.00% 30 year | |
| | | | | Monthly | Fannie Mae pools — | |
| | | | | | Monthly | |
| 4,890,290 | 4,878,376 | — | 1/12/40 | 4.50% (1 month | Synthetic MBX | (3,466) |
| | | | | USD-LIBOR) — | Index 4.50% 30 year | |
| | | | | Monthly | Fannie Mae pools — | |
| | | | | | Monthly | |
| |
| 82 Diversified Income Trust |
| | | | | | |
| OTC TOTAL RETURN SWAP CONTRACTS OUTSTANDING at 3/31/20 (Unaudited)cont. | |
| | | Upfront | | | | |
| | | premium | Termina- | Payments | Total return | Unrealized |
| Swap counterparty/ | | received | tion | received (paid) | received by | appreciation/ |
| Notional amount | Value | (paid) | date | by fund | or paid by fund | (depreciation) |
| Barclays Bank PLCcont. | | | | | |
| $682,131 | $680,094 | $— | 1/12/41 | 4.50% (1 month | Synthetic MBX | $(870) |
| | | | | USD-LIBOR) — | Index 4.50% 30 year | |
| | | | | Monthly | Fannie Mae pools — | |
| | | | | | Monthly | |
| 462,432 | 461,305 | — | 1/12/40 | 4.50% (1 month | Synthetic MBX | (328) |
| | | | | USD-LIBOR) — | Index 4.50% 30 year | |
| | | | | Monthly | Fannie Mae pools — | |
| | | | | | Monthly | |
| 59,221,504 | 58,647,427 | — | 1/12/41 | 5.00% (1 month | Synthetic MBX | (460,258) |
| | | | | USD-LIBOR) — | Index 5.00% 30 year | |
| | | | | Monthly | Fannie Mae pools — | |
| | | | | | Monthly | |
| 9,800,935 | 9,705,767 | — | 1/12/40 | 5.00% (1 month | Synthetic MBX | (76,292) |
| | | | | USD-LIBOR) — | Index 5.00% 30 year | |
| | | | | Monthly | Fannie Mae pools — | |
| | | | | | Monthly | |
| 843,619 | 842,893 | — | 1/12/41 | 5.00% (1 month | Synthetic MBX Index | 938 |
| | | | | USD-LIBOR) — | 5.00% 30 year Ginnie | |
| | | | | Monthly | Mae II pools — | |
| | | | | | Monthly | |
| 324,952 | 320,786 | — | 1/12/39 | (5.50%) 1 month | Synthetic MBX | 3,471 |
| | | | | USD-LIBOR — | Index 5.50% 30 year | |
| | | | | Monthly | Fannie Mae pools — | |
| | | | | | Monthly | |
| 2,196,965 | 2,201,139 | — | 1/12/39 | (6.00%) 1 month | Synthetic MBX | (9,224) |
| | | | | USD-LIBOR — | Index 6.00% 30 year | |
| | | | | Monthly | Fannie Mae pools — | |
| | | | | | Monthly | |
| 37,413,932 | 37,863,877 | — | 1/12/38 | (6.50%) 1 month | Synthetic MBX | (540,459) |
| | | | | USD-LIBOR — | Index 6.50% 30 year | |
| | | | | Monthly | Fannie Mae pools — | |
| | | | | | Monthly | |
| 164,212 | 138,961 | — | 1/12/41 | 3.50% (1 month | Synthetic TRS | (23,399) |
| | | | | USD-LIBOR) — | Index 3.50% 30 year | |
| | | | | Monthly | Fannie Mae pools — | |
| | | | | | Monthly | |
| 470,247 | 404,770 | — | 1/12/42 | 4.00% (1 month | Synthetic TRS | (59,945) |
| | | | | USD-LIBOR) — | Index 4.00% 30 year | |
| | | | | Monthly | Fannie Mae pools — | |
| | | | | | Monthly | |
| 1,857,705 | 1,585,970 | — | 1/12/41 | (4.00%) 1 month | Synthetic TRS | 249,481 |
| | | | | USD-LIBOR — | Index 4.00% 30 year | |
| | | | | Monthly | Fannie Mae pools — | |
| | | | | | Monthly | |
| 4,432,322 | 3,783,987 | — | 1/12/41 | (4.00%) 1 month | Synthetic TRS | 595,239 |
| | | | | USD-LIBOR — | Index 4.00% 30 year | |
| | | | | Monthly | Fannie Mae pools — | |
| | | | | | Monthly | |
|
| Diversified Income Trust 83 |
| | | | | | |
| OTC TOTAL RETURN SWAP CONTRACTS OUTSTANDING at 3/31/20 (Unaudited)cont. | |
| | | Upfront | | | | |
| | | premium | Termina- | Payments | Total return | Unrealized |
| Swap counterparty/ | | received | tion | received (paid) | received by | appreciation/ |
| Notional amount | Value | (paid) | date | by fund | or paid by fund | (depreciation) |
| Barclays Bank PLCcont. | | | | | |
| $119,641 | $103,418 | $— | 1/12/41 | 5.00% (1 month | Synthetic TRS | $(14,646) |
| | | | | USD-LIBOR) — | Index 5.00% 30 year | |
| | | | | Monthly | Fannie Mae pools — | |
| | | | | | Monthly | |
| 1,005,030 | 868,755 | — | 1/12/41 | (5.00%) 1 month | Synthetic TRS | 123,029 |
| | | | | USD-LIBOR — | Index 5.00% 30 year | |
| | | | | Monthly | Fannie Mae pools — | |
| | | | | | Monthly | |
| 585,871 | 525,324 | — | 1/12/41 | 5.00% (1 month | Synthetic TRS Index | (53,455) |
| | | | | USD-LIBOR) — | 5.00% 30 year Ginnie | |
| | | | | Monthly | Mae II pools — | |
| | | | | | Monthly | |
| 447,341 | 401,110 | — | 1/12/41 | 5.00% (1 month | Synthetic TRS Index | (40,815) |
| | | | | USD-LIBOR) — | 5.00% 30 year Ginnie | |
| | | | | Monthly | Mae II pools — | |
| | | | | | Monthly | |
| 352,707 | 316,256 | — | 1/12/41 | 5.00% (1 month | Synthetic TRS Index | (32,181) |
| | | | | USD-LIBOR) — | 5.00% 30 year Ginnie | |
| | | | | Monthly | Mae II pools — | |
| | | | | | Monthly | |
| 140,857 | 126,300 | — | 1/12/41 | 5.00% (1 month | Synthetic TRS Index | (12,852) |
| | | | | USD-LIBOR) — | 5.00% 30 year Ginnie | |
| | | | | Monthly | Mae II pools — | |
| | | | | | Monthly | |
| 332,227 | 296,631 | — | 1/12/39 | 6.00% (1 month | Synthetic TRS | (31,599) |
| | | | | USD-LIBOR) — | Index 6.00% 30 year | |
| | | | | Monthly | Fannie Mae pools — | |
| | | | | | Monthly | |
| 5,687 | 5,078 | — | 1/12/39 | (6.00%)1 month | Synthetic TRS | (541) |
| | | | | USD-LIBOR — | Index 6.00% 30 year | |
| | | | | Monthly | Fannie Mae pools — | |
| | | | | | Monthly | |
| 785,384 | 726,701 | — | 1/12/38 | 6.50% (1 month | Synthetic TRS | (49,350) |
| | | | | USD-LIBOR) — | Index 6.50% 30 year | |
| | | | | Monthly | Fannie Mae pools — | |
| | | | | | Monthly | |
| 112,689 | 104,269 | — | 1/12/38 | 6.50% (1 month | Synthetic TRS | (7,081) |
| | | | | USD-LIBOR) — | Index 6.50% 30 year | |
| | | | | Monthly | Fannie Mae pools — | |
| | | | | | Monthly | |
| 57,344 | 53,060 | — | 1/12/38 | 6.50% (1 month | Synthetic TRS | (3,603) |
| | | | | USD-LIBOR) — | Index 6.50% 30 year | |
| | | | | Monthly | Fannie Mae pools — | |
| | | | | | Monthly | |
|
| 84 Diversified Income Trust |
| | | | | | |
| OTC TOTAL RETURN SWAP CONTRACTS OUTSTANDING at 3/31/20 (Unaudited)cont. | |
| | | Upfront | | | | |
| | | premium | Termina- | Payments | Total return | Unrealized |
| Swap counterparty/ | | received | tion | received (paid) | received by | appreciation/ |
| Notional amount | Value | (paid) | date | by fund | or paid by fund | (depreciation) |
| Citibank, N.A. | | | | | | |
| $934,082 | $925,028 | $— | 1/12/41 | 5.00% (1 month | Synthetic MBX | $(7,259) |
| | | | | USD-LIBOR) — | Index 5.00% 30 year | |
| | | | | Monthly | Fannie Mae pools — | |
| | | | | | Monthly | |
| 313,148 | 310,112 | — | 1/12/41 | 5.00% (1 month | Synthetic MBX | (2,434) |
| | | | | USD-LIBOR) — | Index 5.00% 30 year | |
| | | | | Monthly | Fannie Mae pools — | |
| | | | | | Monthly | |
| Credit Suisse International | | | | | |
| 3,299,187 | 3,267,205 | — | 1/12/41 | 5.00% (1 month | Synthetic MBX | (25,641) |
| | | | | USD-LIBOR) — | Index 5.00% 30 year | |
| | | | | Monthly | Fannie Mae pools — | |
| | | | | | Monthly | |
| 687,331 | 680,668 | — | 1/12/41 | 5.00% (1 month | Synthetic MBX | (5,342) |
| | | | | USD-LIBOR) — | Index 5.00% 30 year | |
| | | | | Monthly | Fannie Mae pools — | |
| | | | | | Monthly | |
| 1,715,307 | 1,538,037 | — | 1/12/41 | 5.00% (1 month | Synthetic MBX Index | (156,504) |
| | | | | USD-LIBOR) — | 5.00% 30 year Ginnie | |
| | | | | Monthly | Mae II pools — | |
| | | | | | Monthly | |
| 363,116 | 286,972 | — | 1/12/44 | 3.00% (1 month | Synthetic TRS | (72,430) |
| | | | | USD-LIBOR) — | Index 3.00% 30 year | |
| | | | | Monthly | Fannie Mae pools — | |
| | | | | | Monthly | |
| 338,555 | 255,781 | — | 1/12/43 | 3.00% (1 month | Synthetic TRS | (79,326) |
| | | | | USD-LIBOR) — | Index 3.00% 30 year | |
| | | | | Monthly | Fannie Mae pools — | |
| | | | | | Monthly | |
| 3,230,839 | 2,671,891 | — | 1/12/43 | 3.50% (1 month | Synthetic TRS | (524,096) |
| | | | | USD-LIBOR) — | Index 3.50% 30 year | |
| | | | | Monthly | Fannie Mae pools — | |
| | | | | | Monthly | |
| 833,282 | 644,326 | — | 1/12/45 | 3.50% (1 month | Synthetic TRS | (179,270) |
| | | | | USD-LIBOR) — | Index 3.50% 30 year | |
| | | | | Monthly | Fannie Mae pools — | |
| | | | | | Monthly | |
| 569,942 | 471,340 | — | 1/12/43 | 3.50% (1 month | Synthetic TRS | (92,454) |
| | | | | USD-LIBOR) — | Index 3.50% 30 year | |
| | | | | Monthly | Fannie Mae pools — | |
| | | | | | Monthly | |
| 4,700,193 | 3,711,148 | — | 1/12/45 | 4.00% (1 month | Synthetic TRS | (930,970) |
| | | | | USD-LIBOR) — | Index 4.00% 30 year | |
| | | | | Monthly | Fannie Mae pools — | |
| | | | | | Monthly | |
| 2,962,630 | 2,339,214 | — | 1/12/45 | 4.00% (1 month | Synthetic TRS | (586,810) |
| | | | | USD-LIBOR) — | Index 4.00% 30 year | |
| | | | | Monthly | Fannie Mae pools — | |
| | | | | | Monthly | |
|
| Diversified Income Trust 85 |
| | | | | | |
| OTC TOTAL RETURN SWAP CONTRACTS OUTSTANDING at 3/31/20 (Unaudited)cont. | |
| | | Upfront | | | | |
| | | premium | Termina- | Payments | Total return | Unrealized |
| Swap counterparty/ | | received | tion | received (paid) | received by | appreciation/ |
| Notional amount | Value | (paid) | date | by fund | or paid by fund | (depreciation) |
| Credit Suisse Internationalcont. | | | | | |
| $2,067,185 | $1,764,809 | $— | 1/12/41 | 4.00% (1 month | Synthetic TRS | $(277,613) |
| | | | | USD-LIBOR) — | Index 4.00% 30 year | |
| | | | | Monthly | Fannie Mae pools — | |
| | | | | | Monthly | |
| 337,976 | 288,539 | — | 1/12/41 | 4.00% (1 month | Synthetic TRS | (45,389) |
| | | | | USD-LIBOR) — | Index 4.00% 30 year | |
| | | | | Monthly | Fannie Mae pools — | |
| | | | | | Monthly | |
| 259,050 | 221,158 | — | 1/12/41 | 4.00% (1 month | Synthetic TRS | (34,789) |
| | | | | USD-LIBOR) — | Index 4.00% 30 year | |
| | | | | Monthly | Fannie Mae pools — | |
| | | | | | Monthly | |
| 264,994 | 209,232 | — | 1/12/45 | 4.00% (1 month | Synthetic TRS | (52,487) |
| | | | | USD-LIBOR) — | Index 4.00% 30 year | |
| | | | | Monthly | Fannie Mae pools — | |
| | | | | | Monthly | |
| 2,230,331 | 1,904,091 | — | 1/12/41 | (4.00%) 1 month | Synthetic TRS | 299,523 |
| | | | | USD-LIBOR — | Index 4.00% 30 year | |
| | | | | Monthly | Fannie Mae pools — | |
| | | | | | Monthly | |
| 163,053 | 138,562 | — | 1/12/42 | 4.50% (1 month | Synthetic TRS | (22,509) |
| | | | | USD-LIBOR) — | Index 4.50% 30 year | |
| | | | | Monthly | Fannie Mae pools — | |
| | | | | | Monthly | |
| 7,523 | 6,517 | — | 1/12/40 | 5.00% (1 month | Synthetic TRS | (907) |
| | | | | USD-LIBOR) — | Index 5.00% 30 year | |
| | | | | Monthly | Fannie Mae pools — | |
| | | | | | Monthly | |
| 1,028,360 | 888,921 | — | 1/12/41 | (5.00%) 1 month | Synthetic TRS | 125,885 |
| | | | | USD-LIBOR — | Index 5.00% 30 year | |
| | | | | Monthly | Fannie Mae pools — | |
| | | | | | Monthly | |
| 1,261,348 | 1,090,318 | — | 1/12/41 | (5.00%) 1 month | Synthetic TRS | 154,405 |
| | | | | USD-LIBOR — | Index 5.00% 30 year | |
| | | | | Monthly | Fannie Mae pools — | |
| | | | | | Monthly | |
| 1,040,332 | 932,818 | — | 1/12/41 | 5.00% (1 month | Synthetic TRS Index | (94,920) |
| | | | | USD-LIBOR) — | 5.00% 30 year Ginnie | |
| | | | | Monthly | Mae II pools — | |
| | | | | | Monthly | |
| Deutsche Bank AG | | | | | | |
| 534,963 | 537,147 | — | 1/12/40 | 4.00% (1 month | Synthetic MBX | 2,996 |
| | | | | USD-LIBOR) — | Index 4.00% 30 year | |
| | | | | Monthly | Fannie Mae pools — | |
| | | | | | Monthly | |
| 3,304,747 | 3,344,490 | — | 1/12/38 | (6.50%) 1 month | Synthetic MBX | (47,738) |
| | | | | USD-LIBOR — | Index 6.50% 30 year | |
| | | | | Monthly | Fannie Mae pools — | |
| | | | | | Monthly | |
| |
| 86 Diversified Income Trust |
| | | | | | |
| OTC TOTAL RETURN SWAP CONTRACTS OUTSTANDING at 3/31/20 (Unaudited)cont. | |
| | | Upfront | | | | |
| | | premium | Termina- | Payments | Total return | Unrealized |
| Swap counterparty/ | | received | tion | received (paid) | received by | appreciation/ |
| Notional amount | Value | (paid) | date | by fund | or paid by fund | (depreciation) |
| Goldman Sachs International | | | | | |
| $879,117 | $876,975 | $— | 1/12/40 | (4.50%) 1 month | Synthetic MBX | $623 |
| | | | | USD-LIBOR — | Index 4.50% 30 year | |
| | | | | Monthly | Fannie Mae pools — | |
| | | | | | Monthly | |
| 1,045,316 | 1,035,166 | — | 1/12/40 | (5.00%) 1 month | Synthetic MBX | 8,137 |
| | | | | USD-LIBOR — | Index 5.00% 30 year | |
| | | | | Monthly | Fannie Mae pools — | |
| | | | | | Monthly | |
| 425,457 | 420,003 | — | 1/12/39 | 5.50% (1 month | Synthetic MBX | (4,544) |
| | | | | USD-LIBOR) — | Index 5.50% 30 year | |
| | | | | Monthly | Fannie Mae pools — | |
| | | | | | Monthly | |
| 503,275 | 504,231 | — | 1/12/39 | 6.00%) 1 month | Synthetic MBX | (2,113) |
| | | | | USD-LIBOR — | Index 6.00% 30 year | |
| | | | | Monthly | Fannie Mae pools — | |
| | | | | | Monthly | |
| 716,028 | 724,640 | — | 1/12/38 | 6.50% (1 month | Synthetic MBX | 10,343 |
| | | | | USD-LIBOR) — | Index 6.50% 30 year | |
| | | | | Monthly | Fannie Mae pools — | |
| | | | | | Monthly | |
| 103,301 | 104,543 | — | 1/12/38 | (6.50%) 1 month | Synthetic MBX | (1,492) |
| | | | | USD-LIBOR — | Index 6.50% 30 year | |
| | | | | Monthly | Fannie Mae pools — | |
| | | | | | Monthly | |
| 113,380 | 114,744 | — | 1/12/38 | (6.50%) 1 month | Synthetic MBX | (1,638) |
| | | | | USD-LIBOR — | Index 6.50% 30 year | |
| | | | | Monthly | Fannie Mae pools — | |
| | | | | | Monthly | |
| 302,467 | 306,104 | — | 1/12/38 | (6.50%) 1 month | Synthetic MBX | (4,369) |
| | | | | USD-LIBOR — | Index 6.50% 30 year | |
| | | | | Monthly | Fannie Mae pools — | |
| | | | | | Monthly | |
| 413,093 | 418,061 | — | 1/12/39 | (6.50%) 1 month | Synthetic MBX | (5,967) |
| | | | | USD-LIBOR — | Index 6.50% 30 year | |
| | | | | Monthly | Fannie Mae pools — | |
| | | | | | Monthly | |
| 624,349 | 631,858 | — | 1/12/38 | (6.50%) 1 month | Synthetic MBX | (9,019) |
| | | | | USD-LIBOR — | Index 6.50% 30 year | |
| | | | | Monthly | Fannie Mae pools — | |
| | | | | | Monthly | |
| 853,726 | 863,993 | — | 1/12/38 | (6.50%) 1 month | Synthetic MBX | (12,332) |
| | | | | USD-LIBOR — | Index 6.50% 30 year | |
| | | | | Monthly | Fannie Mae pools — | |
| | | | | | Monthly | |
| 1,237,352 | 1,252,233 | — | 1/12/38 | (6.50%) 1 month | Synthetic MBX | (17,874) |
| | | | | USD-LIBOR — | Index 6.50% 30 year | |
| | | | | Monthly | Fannie Mae pools — | |
| | | | | | Monthly | |
|
| Diversified Income Trust 87 |
| | | | | | |
| OTC TOTAL RETURN SWAP CONTRACTS OUTSTANDING at 3/31/20 (Unaudited)cont. | |
| | | Upfront | | | | |
| | | premium | Termina- | Payments | Total return | Unrealized |
| Swap counterparty/ | | received | tion | received (paid) | received by | appreciation/ |
| Notional amount | Value | (paid) | date | by fund | or paid by fund | (depreciation) |
| Goldman Sachs Internationalcont. | | | | |
| $1,484,878 | $1,502,735 | $— | 1/12/38 | (6.50%) 1 month | Synthetic MBX | $(21,450) |
| | | | | USD-LIBOR — | Index 6.50% 30 year | |
| | | | | Monthly | Fannie Mae pools — | |
| | | | | | Monthly | |
| 1,661,930 | 1,681,916 | — | 1/12/38 | (6.50%) 1 month | Synthetic MBX | (24,007) |
| | | | | USD-LIBOR — | Index 6.50% 30 year | |
| | | | | Monthly | Fannie Mae pools — | |
| | | | | | Monthly | |
| 2,276,668 | 2,304,047 | — | 1/12/38 | (6.50%) 1 month | Synthetic MBX | (32,887) |
| | | | | USD-LIBOR — | Index 6.50% 30 year | |
| | | | | Monthly | Fannie Mae pools — | |
| | | | | | Monthly | |
| 1,351,880 | 1,068,399 | — | 1/12/44 | (3.00%) 1 month | Synthetic TRS | 269,656 |
| | | | | USD-LIBOR — | Index 3.00% 30 year | |
| | | | | Monthly | Fannie Mae pools — | |
| | | | | | Monthly | |
| 3,800,781 | 3,143,231 | — | 1/12/43 | (3.50%) 1 month | Synthetic TRS | 616,550 |
| | | | | USD-LIBOR — | Index 3.50% 30 year | |
| | | | | Monthly | Fannie Mae pools — | |
| | | | | | Monthly | |
| 2,953,673 | 2,332,142 | — | 1/12/45 | 4.00% (1 month | Synthetic TRS | (585,036) |
| | | | | USD-LIBOR) — | Index 4.00% 30 year | |
| | | | | Monthly | Fannie Mae pools — | |
| | | | | | Monthly | |
| 2,640,175 | 2,253,985 | — | 1/12/41 | 4.00% (1 month | Synthetic TRS | (354,563) |
| | | | | USD-LIBOR) — | Index 4.00% 30 year | |
| | | | | Monthly | Fannie Mae pools — | |
| | | | | | Monthly | |
| 2,010,030 | 1,587,067 | — | 1/12/45 | 4.00% (1 month | Synthetic TRS | (398,128) |
| | | | | USD-LIBOR) — | Index 4.00% 30 year | |
| | | | | Monthly | Fannie Mae pools — | |
| | | | | | Monthly | |
| 1,668,228 | 1,435,943 | — | 1/12/42 | 4.00% (1 month | Synthetic TRS | (212,658) |
| | | | | USD-LIBOR) — | Index 4.00% 30 year | |
| | | | | Monthly | Fannie Mae pools — | |
| | | | | | Monthly | |
| 1,280,292 | 1,102,024 | — | 1/12/42 | 4.00% (1 month | Synthetic TRS | (163,205) |
| | | | | USD-LIBOR) — | Index 4.00% 30 year | |
| | | | | Monthly | Fannie Mae pools — | |
| | | | | | Monthly | |
| 1,175,257 | 1,011,613 | — | 1/12/42 | 4.00% (1 month | Synthetic TRS | (149,816) |
| | | | | USD-LIBOR) — | Index 4.00% 30 year | |
| | | | | Monthly | Fannie Mae pools — | |
| | | | | | Monthly | |
| 1,175,257 | 1,011,613 | — | 1/12/42 | 4.00% (1 month | Synthetic TRS | (149,816) |
| | | | | USD-LIBOR) — | Index 4.00% 30 year | |
| | | | | Monthly | Fannie Mae pools — | |
| | | | | | Monthly | |
|
| 88 Diversified Income Trust |
| | | | | | |
| OTC TOTAL RETURN SWAP CONTRACTS OUTSTANDING at 3/31/20 (Unaudited)cont. | |
| | | Upfront | | | | |
| | | premium | Termina- | Payments | Total return | Unrealized |
| Swap counterparty/ | | received | tion | received (paid) | received by | appreciation/ |
| Notional amount | Value | (paid) | date | by fund | or paid by fund | (depreciation) |
| Goldman Sachs Internationalcont. | | | | |
| $784,823 | $670,024 | $— | 1/12/41 | 4.00% (1 month | Synthetic TRS | $(105,398) |
| | | | | USD-LIBOR) — | Index 4.00% 30 year | |
| | | | | Monthly | Fannie Mae pools — | |
| | | | | | Monthly | |
| 703,590 | 616,528 | — | 1/12/40 | 4.00% (1 month | Synthetic TRS | (78,666) |
| | | | | USD-LIBOR) — | Index 4.00% 30 year | |
| | | | | Monthly | Fannie Mae pools — | |
| | | | | | Monthly | |
| 302,470 | 258,226 | — | 1/12/41 | 4.00% (1 month | Synthetic TRS | (40,620) |
| | | | | USD-LIBOR) — | Index 4.00% 30 year | |
| | | | | Monthly | Fannie Mae pools — | |
| | | | | | Monthly | |
| 133,682 | 114,128 | — | 1/12/41 | 4.00% (1 month | Synthetic TRS | (17,953) |
| | | | | USD-LIBOR) — | Index 4.00% 30 year | |
| | | | | Monthly | Fannie Mae pools — | |
| | | | | | Monthly | |
| 12,994 | 11,093 | — | 1/12/41 | 4.00% (1 month | Synthetic TRS | (1,745) |
| | | | | USD-LIBOR) — | Index 4.00% 30 year | |
| | | | | Monthly | Fannie Mae pools — | |
| | | | | | Monthly | |
| 838,629 | 708,208 | — | 1/12/41 | 4.50% (1 month | Synthetic TRS | (119,724) |
| | | | | USD-LIBOR) — | Index 4.50% 30 year | |
| | | | | Monthly | Fannie Mae pools — | |
| | | | | | Monthly | |
| 111,683 | 94,315 | — | 1/12/41 | 4.50% (1 month | Synthetic TRS | (15,944) |
| | | | | USD-LIBOR) — | Index 4.50% 30 year | |
| | | | | Monthly | Fannie Mae pools — | |
| | | | | | Monthly | |
| 2,444,643 | 2,113,166 | — | 1/12/41 | (5.00%) 1 month | Synthetic TRS | 299,256 |
| | | | | USD-LIBOR — | Index 5.00% 30 year | |
| | | | | Monthly | Fannie Mae pools — | |
| | | | | | Monthly | |
| 23,042 | 20,661 | — | 1/12/41 | 5.00% (1 month | Synthetic TRS Index | (2,102) |
| | | | | USD-LIBOR) — | 5.00% 30 year Ginnie | |
| | | | | Monthly | Mae II pools — | |
| | | | | | Monthly | |
| 698,027 | 623,238 | — | 1/12/39 | 6.00% (1 month | Synthetic TRS | (66,392) |
| | | | | USD-LIBOR) — | Index 6.00% 30 year | |
| | | | | Monthly | Fannie Mae pools — | |
| | | | | | Monthly | |
| 487,298 | 435,087 | — | 1/12/39 | 6.00% (1 month | Synthetic TRS | (46,349) |
| | | | | USD-LIBOR) — | Index 6.00% 30 year | |
| | | | | Monthly | Fannie Mae pools — | |
| | | | | | Monthly | |
| 316,822 | 282,877 | — | 1/12/39 | 6.00% (1 month | Synthetic TRS | (30,134) |
| | | | | USD-LIBOR) — | Index 6.00% 30 year | |
| | | | | Monthly | Fannie Mae pools — | |
| | | | | | Monthly | |
|
| Diversified Income Trust 89 |
| | | | | | |
| OTC TOTAL RETURN SWAP CONTRACTS OUTSTANDING at 3/31/20 (Unaudited)cont. | |
| | | Upfront | | | | |
| | | premium | Termina- | Payments | Total return | Unrealized |
| Swap counterparty/ | | received | tion | received (paid) | received by | appreciation/ |
| Notional amount | Value | (paid) | date | by fund | or paid by fund | (depreciation) |
| Goldman Sachs Internationalcont. | | | | |
| $244,545 | $218,343 | $— | 1/12/39 | 6.00% (1 month | Synthetic TRS | $(23,260) |
| | | | | USD-LIBOR) — | Index 6.00% 30 year | |
| | | | | Monthly | Fannie Mae pools — | |
| | | | | | Monthly | |
| 77,851 | 69,509 | — | 1/12/39 | 6.00% (1 month | Synthetic TRS | (7,405) |
| | | | | USD-LIBOR) — | Index 6.00% 30 year | |
| | | | | Monthly | Fannie Mae pools — | |
| | | | | | Monthly | |
| 346,699 | 320,794 | — | 1/12/38 | 6.50% (1 month | Synthetic TRS | (21,785) |
| | | | | USD-LIBOR) — | Index 6.50% 30 year | |
| | | | | Monthly | Fannie Mae pools — | |
| | | | | | Monthly | |
| 267,145 | 247,184 | — | 1/12/38 | 6.50% (1 month | Synthetic TRS | (16,786) |
| | | | | USD-LIBOR) — | Index 6.50% 30 year | |
| | | | | Monthly | Fannie Mae pools — | |
| | | | | | Monthly | |
| 178,607 | 165,262 | — | 1/12/38 | 6.50% (1 month | Synthetic TRS | (11,223) |
| | | | | USD-LIBOR) — | Index 6.50% 30 year | |
| | | | | Monthly | Fannie Mae pools — | |
| | | | | | Monthly | |
| 1,023 | 947 | — | 1/12/38 | 6.50% (1 month | Synthetic TRS | (64) |
| | | | | USD-LIBOR) — | Index 6.50% 30 year | |
| | | | | Monthly | Fannie Mae pools — | |
| | | | | | Monthly | |
| JPMorgan Chase Bank N.A. | | | | | |
| 1,758,753 | 1,501,493 | — | 1/12/41 | 4.00% (1 month | Synthetic TRS | (236,192) |
| | | | | USD-LIBOR) — | Index 4.00% 30 year | |
| | | | | Monthly | Fannie Mae pools — | |
| | | | | | Monthly | |
| 223,250 | 190,594 | — | 1/12/41 | 4.00% (1 month | Synthetic TRS | (29,981) |
| | | | | USD-LIBOR) — | Index 4.00% 30 year | |
| | | | | Monthly | Fannie Mae pools — | |
| | | | | | Monthly | |
| 2,444,643 | 2,113,166 | — | 1/12/41 | (5.00%) 1 month | Synthetic TRS | 299,256 |
| | | | | USD-LIBOR — | Index 5.00% 30 year | |
| | | | | Monthly | Fannie Mae pools — | |
| | | | | | Monthly | |
| JPMorgan Securities LLC | | | | | |
| 2,805,019 | 2,515,132 | — | 1/12/41 | (5.00%) 1 month | Synthetic MBX Index | 255,929 |
| | | | | USD-LIBOR — | 5.00% 30 year Ginnie | |
| | | | | Monthly | Mae II pools — | |
| | | | | | Monthly | |
| 900,669 | 776,100 | — | 1/12/44 | 4.00% (1 month | Synthetic TRS | (113,903) |
| | | | | USD-LIBOR) — | Index 4.00% 30 year | |
| | | | | Monthly | Fannie Mae pools — | |
| | | | | | Monthly | |
| |
| 90 Diversified Income Trust |
| | | | | | |
| OTC TOTAL RETURN SWAP CONTRACTS OUTSTANDING at 3/31/20 (Unaudited)cont. | |
| | | Upfront | | | | |
| | | premium | Termina- | Payments | Total return | Unrealized |
| Swap counterparty/ | | received | tion | received (paid) | received by | appreciation/ |
| Notional amount | Value | (paid) | date | by fund | or paid by fund | (depreciation) |
| JPMorgan Securities LLCcont. | | | | | |
| $5,769,281 | $4,965,964 | $— | 1/12/42 | (4.00%) 1 month | Synthetic TRS | $735,440 |
| | | | | USD-LIBOR — | Index 4.00% 30 year | |
| | | | | Monthly | Fannie Mae pools — | |
| | | | | | Monthly | |
| 327,337 | 276,430 | — | 1/12/41 | (4.50%) 1 month | Synthetic TRS | 46,731 |
| | | | | USD-LIBOR — | Index 4.50% 30 year | |
| | | | | Monthly | Fannie Mae pools — | |
| | | | | | Monthly | |
| Upfront premium received | — | | Unrealized appreciation | 4,152,833 |
| Upfront premium (paid) | — | | Unrealized (depreciation) | (7,905,774) |
| Total | | $— | | Total | | $(3,752,941) |
| | | | | | | |
| CENTRALLY CLEARED TOTAL RETURN SWAP CONTRACTS OUTSTANDING at 3/31/20 (Unaudited) |
| | | | Upfront | | | | |
| | | | premium | Termina- | Payments | Total return | Unrealized |
| | | | received | tion | received (paid) | received by | appreciation/ |
| Notional amount | Value | (paid) | date | by fund | or paid by fund | (depreciation) |
| EUR | 64,796,000 | $14,019,640 | $(1,564) | 8/15/37 | 1.7138% — At | Eurostat Eurozone | $14,018,076 |
| | | | | | maturity | HICP excluding | |
| | | | | | | tobacco — At | |
| | | | | | | maturity | |
| EUR | 25,667,000 | 5,607,445 | — | 7/15/37 | 1.71% — At | Eurostat Eurozone | 5,607,445 |
| | | | | | maturity | HICP excluding | |
| | | | | | | tobacco — At | |
| | | | | | | maturity | |
| EUR | 25,667,000 | 2,435,037 | — | 7/15/27 | (1.40%) — At | Eurostat Eurozone | (2,435,037) |
| | | | | | maturity | HICP excluding | |
| | | | | | | tobacco — At | |
| | | | | | | maturity | |
| EUR | 64,796,000 | 6,212,966 | (834) | 8/15/27 | (1.4275%) — At | Eurostat Eurozone | (6,213,800) |
| | | | | | maturity | HICP excluding | |
| | | | | | | tobacco — At | |
| | | | | | | maturity | |
| EUR | 114,037,000 | 7,227,077 | (1,328) | 9/15/23 | (1.4375%) — At | Eurostat Eurozone | (7,228,405) |
| | | | | | maturity | HICP excluding | |
| | | | | | | tobacco — At | |
| | | | | | | maturity | |
| EUR | 114,037,000 | 7,252,482 | (1,335) | 9/15/23 | (1.44125%) — At | Eurostat Eurozone | (7,253,817) |
| | | | | | maturity | HICP excluding | |
| | | | | | | tobacco — At | |
| | | | | | | maturity | |
| EUR | 114,037,000 | 7,260,909 | (1,343) | 9/15/23 | (1.4425%) — At | Eurostat Eurozone | (7,262,252) |
| | | | | | maturity | HICP excluding | |
| | | | | | | tobacco — At | |
| | | | | | | maturity | |
| EUR | 114,037,000 | 7,269,462 | (1,341) | 9/15/23 | (1.44375%) — At | Eurostat Eurozone | (7,270,803) |
| | | | | | maturity | HICP excluding | |
| | | | | | | tobacco — At | |
| | | | | | | maturity | |
|
| Diversified Income Trust 91 |
| | | | | | | |
| CENTRALLY CLEARED TOTAL RETURN SWAP CONTRACTS OUTSTANDING at 3/31/20 (Unaudited)cont. |
| | | | Upfront | | | | |
| | | | premium | Termina- | Payments | Total return | Unrealized |
| | | | received | tion | received (paid) | received by | appreciation/ |
| Notional amount | Value | (paid) | date | by fund | or paid by fund | (depreciation) |
| GBP | 51,907,000 | $4,193,175 | $(1,109) | 12/15/28 | 3.665% — At | GBP Non-revised UK | $4,192,066 |
| | | | | | maturity | Retail Price Index — | |
| | | | | | | At maturity | |
| GBP | 73,607,000 | 1,891,081 | (961) | 11/15/24 | 3.385% — At | GBP Non-revised UK | 1,890,120 |
| | | | | | maturity | Retail Price Index — | |
| | | | | | | At maturity | |
| GBP | 58,136,000 | 1,749,666 | (1,369) | 3/15/28 | 3.34% — At | GBP Non-revised UK | 1,748,297 |
| | | | | | maturity | Retail Price Index — | |
| | | | | | | At maturity | |
| GBP | 40,490,000 | 1,632,448 | (937) | 3/15/28 | 3.4025% — At | GBP Non-revised UK | 1,631,512 |
| | | | | | maturity | Retail Price Index — | |
| | | | | | | At maturity | |
| GBP | 31,146,000 | 1,037,725 | (728) | 2/15/28 | 3.34% — At | GBP Non-revised UK | 1,036,997 |
| | | | | | maturity | Retail Price Index — | |
| | | | | | | At maturity | |
| GBP | 37,299,000 | 947,800 | (486) | 11/15/24 | 3.381% — At | GBP Non-revised UK | 947,314 |
| | | | | | maturity | Retail Price Index — | |
| | | | | | | At maturity | |
| GBP | 37,299,000 | 862,184 | — | 12/15/24 | 3.42% — At | GBP Non-revised UK | 862,184 |
| | | | | | maturity | Retail Price Index — | |
| | | | | | | At maturity | |
| GBP | 14,535,000 | 550,284 | (339) | 3/15/28 | 3.3875% — At | GBP Non-revised UK | 549,945 |
| | | | | | maturity | Retail Price Index — | |
| | | | | | | At maturity | |
| GBP | 15,612,000 | 8,486,588 | (822) | 7/15/49 | (3.4425%) — At | GBP Non-revised UK | (8,487,410) |
| | | | | | maturity | Retail Price Index — | |
| | | | | | | At maturity | |
| | $213,544,000 | 1,522,355 | (3,588) | 3/11/30 | 1.165% — At | USA Non Revised | 1,518,768 |
| | | | | | maturity | Consumer Price | |
| | | | | | | Index-Urban | |
| | | | | | | (CPI-U) — At | |
| | | | | | | maturity | |
| | 53,382,000 | 406,397 | (539) | 3/18/25 | (0.41%) — At | USA Non Revised | 405,858 |
| | | | | | maturity | Consumer Price | |
| | | | | | | Index-Urban | |
| | | | | | | (CPI-U) — At | |
| | | | | | | maturity | |
| | 53,382,000 | 812,261 | (897) | 3/18/30 | 0.95% — At | USA Non Revised | (813,157) |
| | | | | | maturity | Consumer Price | |
| | | | | | | Index-Urban | |
| | | | | | | (CPI-U) — At | |
| | | | | | | maturity | |
| | 213,544,000 | 2,193,310 | (2,157) | 3/11/25 | (0.77%) — At | USA Non Revised | (2,195,467) |
| | | | | | maturity | Consumer Price | |
| | | | | | | Index-Urban | |
| | | | | | | (CPI-U) — At | |
| | | | | | | maturity | |
| |
| 92 Diversified Income Trust |
| | | | | | |
| CENTRALLY CLEARED TOTAL RETURN SWAP CONTRACTS OUTSTANDING at 3/31/20 (Unaudited)cont. |
| | | Upfront | | | | |
| | | premium | Termina- | Payments | Total return | Unrealized |
| | | received | tion | received (paid) | received by | appreciation/ |
| Notional amount | Value | (paid) | date | by fund | or paid by fund | (depreciation) |
| $52,949,000 | $2,824,882 | $(535) | 11/29/24 | (1.703%) — At | USA Non Revised | $(2,825,417) |
| | | | | maturity | Consumer Price | |
| | | | | | Index-Urban | |
| | | | | | (CPI-U) — At | |
| | | | | | maturity | |
| 52,949,000 | 3,036,837 | (535) | 12/10/24 | (1.7625%) — At | USA Non Revised | (3,037,372) |
| | | | | maturity | Consumer Price | |
| | | | | | Index-Urban | |
| | | | | | (CPI-U) — At | |
| | | | | | maturity | |
| 105,911,000 | 5,686,362 | (1,070) | 11/21/24 | (1.71%) — At | USA Non Revised | (5,687,433) |
| | | | | maturity | Consumer Price | |
| | | | | | Index-Urban | |
| | | | | | (CPI-U) — At | |
| | | | | | maturity | |
| Total | | $(23,817) | | | | $(26,301,788) |
| | | | | | | |
| OTC CREDIT DEFAULT CONTRACTS OUTSTANDING — PROTECTION SOLD at 3/31/20 (Unaudited) |
| | | Upfront | | | | | |
| | | premium | | | Termi- | Payments | Unrealized |
| Swap counterparty/ | | received | Notional | | nation | received | appreciation/ |
| Referenced debt* | Rating*** | (paid)** | amount | Value | date | by fund | (depreciation) |
| Bank of America N.A. | | | | | | |
| CMBX NA BBB–.6 | BBB–/P | $39,713 | $581,000 | $128,575 | 5/11/63 | 300 bp — | $(88,523) |
| Index | | | | | | Monthly | |
| CMBX NA BBB–.6 | BBB–/P | 79,608 | 1,321,000 | 292,337 | 5/11/63 | 300 bp — | (211,959) |
| Index | | | | | | Monthly | |
| CMBX NA BBB–.6 | BBB–/P | 163,473 | 2,648,000 | 586,002 | 5/11/63 | 300 bp — | (420,985) |
| Index | | | | | | Monthly | |
| CMBX NA BBB–.6 | BBB–/P | 155,838 | 2,734,000 | 605,034 | 5/11/63 | 300 bp — | (447,602) |
| Index | | | | | | Monthly | |
| Citigroup Global Markets, Inc. | | | | | | |
| CMBX NA BB.6 | BB–/P | 3,092,664 | 21,559,000 | 8,420,945 | 5/11/63 | 500 bp — | (5,307,321) |
| Index | | | | | | Monthly | |
| CMBX NA BB.7 | BB/P | 596,583 | 11,690,000 | 3,923,164 | 1/17/47 | 500 bp — | (3,315,215) |
| Index | | | | | | Monthly | |
| CMBX NA BBB–.6 | BBB–/P | 1,999 | 25,000 | 5,533 | 5/11/63 | 300 bp — | (3,519) |
| Index | | | | | | Monthly | |
| CMBX NA BBB–.6 | BBB–/P | 139,685 | 2,123,000 | 469,820 | 5/11/63 | 300 bp — | (328,897) |
| Index | | | | | | Monthly | |
| CMBX NA BBB–.6 | BBB–/P | 191,694 | 2,907,000 | 643,319 | 5/11/63 | 300 bp — | (449,929) |
| Index | | | | | | Monthly | |
| CMBX NA BBB–.6 | BBB–/P | 270,815 | 3,978,000 | 880,331 | 5/11/63 | 300 bp — | (607,196) |
| Index | | | | | | Monthly | |
| CMBX NA BBB–.6 | BBB–/P | 9,007,067 | 141,445,000 | 31,301,779 | 5/11/63 | 300 bp — | (22,212,202) |
| Index | | | | | | Monthly | |
|
| Diversified Income Trust 93 |
| | | | | | | |
| OTC CREDIT DEFAULT CONTRACTS OUTSTANDING — PROTECTION SOLD at 3/31/20 (Unaudited)cont. |
| | | Upfront | | | | | |
| | | premium | | | Termi- | Payments | Unrealized |
| Swap counterparty/ | | received | Notional | | nation | received | appreciation/ |
| Referenced debt* | Rating*** | (paid)** | amount | Value | date | by fund | (depreciation) |
| Credit Suisse International | | | | | | |
| CMBX NA BB.7 | BB/P | $369,046 | $2,759,000 | $925,920 | 1/17/47 | 500 bp — | $(554,193) |
| Index | | | | | | Monthly | |
| CMBX NA BBB–.6 | BBB–/P | 281,868 | 2,551,000 | 564,536 | 5/11/63 | 300 bp — | (281,180) |
| Index | | | | | | Monthly | |
| CMBX NA BBB–.6 | BBB–/P | 511,694 | 4,631,000 | 1,024,840 | 5/11/63 | 300 bp — | (510,445) |
| Index | | | | | | Monthly | |
| CMBX NA BBB–.6 | BBB–/P | 18,738,743 | 199,428,000 | 44,133,416 | 5/11/63 | 300 bp — | (25,278,340) |
| Index | | | | | | Monthly | |
| CMBX NA BBB–.7 | BBB–/P | 3,286,994 | 44,470,000 | 8,040,176 | 1/17/47 | 300 bp — | (4,727,241) |
| Index | | | | | | Monthly | |
| Deutsche Bank AG | | | | | | | |
| CMBX NA BBB–.6 | BBB–/P | 54,693 | 513,000 | 113,527 | 5/11/63 | 300 bp — | (58,535) |
| Index | | | | | | Monthly | |
| Goldman Sachs International | | | | | | |
| CMBX NA BBB–.6 | BBB–/P | 350,890 | 2,265,000 | 501,245 | 5/11/63 | 300 bp — | (149,033) |
| Index | | | | | | Monthly | |
| CMBX NA BB.6 | BB–/P | 9,903 | 63,000 | 24,608 | 5/11/63 | 500 bp — | (14,644) |
| Index | | | | | | Monthly | |
| CMBX NA BB.6 | BB–/P | 125,982 | 887,000 | 346,462 | 5/11/63 | 500 bp — | (219,618) |
| Index | | | | | | Monthly | |
| CMBX NA BB.6 | BB–/P | 267,878 | 2,292,000 | 895,255 | 5/11/63 | 500 bp — | (625,149) |
| Index | | | | | | Monthly | |
| CMBX NA BB.6 | BB–/P | 307,597 | 2,570,000 | 1,003,842 | 5/11/63 | 500 bp — | (693,746) |
| Index | | | | | | Monthly | |
| CMBX NA BB.6 | BB–/P | 530,835 | 4,591,000 | 1,793,245 | 5/11/63 | 500 bp — | (1,257,947) |
| Index | | | | | | Monthly | |
| CMBX NA BBB–.6 | BBB–/P | 1,061 | 14,000 | 3,098 | 5/11/63 | 300 bp — | (2,029) |
| Index | | | | | | Monthly | |
| CMBX NA BBB–.6 | BBB–/P | 1,683 | 21,000 | 4,647 | 5/11/63 | 300 bp — | (2,952) |
| Index | | | | | | Monthly | |
| CMBX NA BBB–.6 | BBB–/P | 4,131 | 29,000 | 6,418 | 5/11/63 | 300 bp — | (2,270) |
| Index | | | | | | Monthly | |
| CMBX NA BBB–.6 | BBB–/P | 9,908 | 74,000 | 16,376 | 5/11/63 | 300 bp — | (6,425) |
| Index | | | | | | Monthly | |
| CMBX NA BBB–.6 | BBB–/P | 9,848 | 74,000 | 16,376 | 5/11/63 | 300 bp — | (6,485) |
| Index | | | | | | Monthly | |
| CMBX NA BBB–.6 | BBB–/P | 10,927 | 130,000 | 28,769 | 5/11/63 | 300 bp — | (17,765) |
| Index | | | | | | Monthly | |
| CMBX NA BBB–.6 | BBB–/P | 8,498 | 164,000 | 36,293 | 5/11/63 | 300 bp — | (27,700) |
| Index | | | | | | Monthly | |
| CMBX NA BBB–.6 | BBB–/P | 13,121 | 178,000 | 39,391 | 5/11/63 | 300 bp — | (26,166) |
| Index | | | | | | Monthly | |
| CMBX NA BBB–.6 | BBB–/P | 13,043 | 178,000 | 39,391 | 5/11/63 | 300 bp — | (26,245) |
| Index | | | | | | Monthly | |
| CMBX NA BBB–.6 | BBB–/P | 24,289 | 209,000 | 46,252 | 5/11/63 | 300 bp — | (21,841) |
| Index | | | | | | Monthly | |
|
| 94 Diversified Income Trust |
| | | | | | | |
| OTC CREDIT DEFAULT CONTRACTS OUTSTANDING — PROTECTION SOLD at 3/31/20 (Unaudited)cont. |
| | | Upfront | | | | | |
| | | premium | | | Termi- | Payments | Unrealized |
| Swap counterparty/ | | received | Notional | | nation | received | appreciation/ |
| Referenced debt* | Rating*** | (paid)** | amount | Value | date | by fund | (depreciation) |
| Goldman Sachs Internationalcont. | | | | | |
| CMBX NA BBB–.6 | BBB–/P | $32,064 | $505,000 | $111,757 | 5/11/63 | 300 bp — | $(79,398) |
| Index | | | | | | Monthly | |
| CMBX NA BBB–.6 | BBB–/P | 40,545 | 534,000 | 118,174 | 5/11/63 | 300 bp — | (77,317) |
| Index | | | | | | Monthly | |
| CMBX NA BBB–.6 | BBB–/P | 47,965 | 542,000 | 119,945 | 5/11/63 | 300 bp — | (71,663) |
| Index | | | | | | Monthly | |
| CMBX NA BBB–.6 | BBB–/P | 30,859 | 633,000 | 140,083 | 5/11/63 | 300 bp — | (108,855) |
| Index | | | | | | Monthly | |
| CMBX NA BBB–.6 | BBB–/P | 64,149 | 639,000 | 141,411 | 5/11/63 | 300 bp — | (76,888) |
| Index | | | | | | Monthly | |
| CMBX NA BBB–.6 | BBB–/P | 112,874 | 813,000 | 179,917 | 5/11/63 | 300 bp — | (66,569) |
| Index | | | | | | Monthly | |
| CMBX NA BBB–.6 | BBB–/P | 44,671 | 872,000 | 192,974 | 5/11/63 | 300 bp — | (147,793) |
| Index | | | | | | Monthly | |
| CMBX NA BBB–.6 | BBB–/P | 107,255 | 1,069,000 | 236,570 | 5/11/63 | 300 bp — | (128,692) |
| Index | | | | | | Monthly | |
| CMBX NA BBB–.6 | BBB–/P | 101,718 | 1,174,000 | 259,806 | 5/11/63 | 300 bp — | (157,404) |
| Index | | | | | | Monthly | |
| CMBX NA BBB–.6 | BBB–/P | 105,653 | 1,252,000 | 277,068 | 5/11/63 | 300 bp — | (170,684) |
| Index | | | | | | Monthly | |
| CMBX NA BBB–.6 | BBB–/P | 157,809 | 1,410,000 | 312,033 | 5/11/63 | 300 bp — | (153,401) |
| Index | | | | | | Monthly | |
| CMBX NA BBB–.6 | BBB–/P | 110,705 | 1,625,000 | 359,613 | 5/11/63 | 300 bp — | (247,959) |
| Index | | | | | | Monthly | |
| CMBX NA BBB–.6 | BBB–/P | 184,883 | 1,672,000 | 370,014 | 5/11/63 | 300 bp — | (184,155) |
| Index | | | | | | Monthly | |
| CMBX NA BBB–.6 | BBB–/P | 156,201 | 1,851,000 | 409,626 | 5/11/63 | 300 bp — | (252,345) |
| Index | | | | | | Monthly | |
| CMBX NA BBB–.6 | BBB–/P | 153,735 | 1,855,000 | 410,512 | 5/11/63 | 300 bp — | (255,694) |
| Index | | | | | | Monthly | |
| CMBX NA BBB–.6 | BBB–/P | 211,483 | 1,898,000 | 420,027 | 5/11/63 | 300 bp — | (207,437) |
| Index | | | | | | Monthly | |
| CMBX NA BBB–.6 | BBB–/P | 222,998 | 2,053,000 | 454,329 | 5/11/63 | 300 bp — | (230,133) |
| Index | | | | | | Monthly | |
| CMBX NA BBB–.6 | BBB–/P | 222,137 | 2,053,000 | 454,329 | 5/11/63 | 300 bp — | (230,994) |
| Index | | | | | | Monthly | |
| CMBX NA BBB–.6 | BBB–/P | 251,962 | 2,258,000 | 499,695 | 5/11/63 | 300 bp — | (246,416) |
| Index | | | | | | Monthly | |
| CMBX NA BBB–.6 | BBB–/P | 251,962 | 2,258,000 | 499,695 | 5/11/63 | 300 bp — | (246,416) |
| Index | | | | | | Monthly | |
| CMBX NA BBB–.6 | BBB–/P | 111,130 | 2,297,000 | 508,326 | 5/11/63 | 300 bp — | (395,856) |
| Index | | | | | | Monthly | |
| CMBX NA BBB–.6 | BBB–/P | 267,527 | 2,431,000 | 537,980 | 5/11/63 | 300 bp — | (269,036) |
| Index | | | | | | Monthly | |
| CMBX NA BBB–.6 | BBB–/P | 193,626 | 2,447,000 | 541,521 | 5/11/63 | 300 bp — | (346,468) |
| Index | | | | | | Monthly | |
|
| Diversified Income Trust 95 |
| | | | | | | |
| OTC CREDIT DEFAULT CONTRACTS OUTSTANDING — PROTECTION SOLD at 3/31/20 (Unaudited)cont. |
| | | Upfront | | | | | |
| | | premium | | | Termi- | Payments | Unrealized |
| Swap counterparty/ | | received | Notional | | nation | received | appreciation/ |
| Referenced debt* | Rating*** | (paid)** | amount | Value | date | by fund | (depreciation) |
| Goldman Sachs Internationalcont. | | | | | |
| CMBX NA BBB–.6 | BBB–/P | $292,059 | $2,489,000 | $550,816 | 5/11/63 | 300 bp — | $(257,305) |
| Index | | | | | | Monthly | |
| CMBX NA BBB–.6 | BBB–/P | 151,736 | 2,909,000 | 643,762 | 5/11/63 | 300 bp — | (490,329) |
| Index | | | | | | Monthly | |
| CMBX NA BBB–.6 | BBB–/P | 416,852 | 3,062,000 | 677,621 | 5/11/63 | 300 bp — | (258,982) |
| Index | | | | | | Monthly | |
| CMBX NA BBB–.6 | BBB–/P | 327,157 | 3,109,000 | 688,022 | 5/11/63 | 300 bp — | (359,051) |
| Index | | | | | | Monthly | |
| CMBX NA BBB–.6 | BBB–/P | 156,347 | 3,152,000 | 697,538 | 5/11/63 | 300 bp — | (539,352) |
| Index | | | | | | Monthly | |
| CMBX NA BBB–.6 | BBB–/P | 484,654 | 3,296,000 | 729,405 | 5/11/63 | 300 bp — | (242,828) |
| Index | | | | | | Monthly | |
| CMBX NA BBB–.6 | BBB–/P | 376,979 | 3,482,000 | 770,567 | 5/11/63 | 300 bp — | (391,556) |
| Index | | | | | | Monthly | |
| CMBX NA BBB–.6 | BBB–/P | 179,679 | 3,660,000 | 809,958 | 5/11/63 | 300 bp — | (628,144) |
| Index | | | | | | Monthly | |
| CMBX NA BBB–.6 | BBB–/P | 597,823 | 3,894,000 | 861,742 | 5/11/63 | 300 bp — | (261,648) |
| Index | | | | | | Monthly | |
| CMBX NA BBB–.6 | BBB–/P | 202,429 | 4,008,000 | 886,970 | 5/11/63 | 300 bp — | (682,204) |
| Index | | | | | | Monthly | |
| CMBX NA BBB–.6 | BBB–/P | 459,364 | 4,109,000 | 909,322 | 5/11/63 | 300 bp — | (447,561) |
| Index | | | | | | Monthly | |
| CMBX NA BBB–.6 | BBB–/P | 718,374 | 4,321,000 | 956,237 | 5/11/63 | 300 bp — | (235,343) |
| Index | | | | | | Monthly | |
| CMBX NA BBB–.6 | BBB–/P | 529,485 | 4,803,000 | 1,062,904 | 5/11/63 | 300 bp — | (530,617) |
| Index | | | | | | Monthly | |
| CMBX NA BBB–.6 | BBB–/P | 530,599 | 5,080,000 | 1,124,204 | 5/11/63 | 300 bp — | (590,641) |
| Index | | | | | | Monthly | |
| CMBX NA BBB–.6 | BBB–/P | 930,682 | 6,242,000 | 1,381,355 | 5/11/63 | 300 bp — | (447,031) |
| Index | | | | | | Monthly | |
| CMBX NA BBB–.6 | BBB–/P | 947,810 | 6,289,000 | 1,391,756 | 5/11/63 | 300 bp — | (440,277) |
| Index | | | | | | Monthly | |
| CMBX NA BBB–.7 | BBB–/P | 77,611 | 1,050,000 | 189,840 | 1/17/47 | 300 bp — | (111,617) |
| Index | | | | | | Monthly | |
| CMBX NA BBB–.7 | BBB–/P | 636,466 | 5,501,000 | 994,581 | 1/17/47 | 300 bp — | (354,906) |
| Index | | | | | | Monthly | |
| JPMorgan Securities LLC | | | | | | |
| CMBX NA BB.10 | BB–/P | 281,476 | 3,508,000 | 1,617,890 | 5/11/63 | 500 bp — | (1,333,003) |
| Index | | | | | | Monthly | |
| CMBX NA BB.6 | BB–/P | 583,224 | 4,089,000 | 1,597,163 | 5/11/63 | 500 bp — | (1,009,964) |
| Index | | | | | | Monthly | |
| CMBX NA BB.7 | BB/P | 138,385 | 2,664,000 | 894,038 | 1/17/47 | 500 bp — | (753,063) |
| Index | | | | | | Monthly | |
| CMBX NA BB.7 | BB/P | 988,256 | 3,178,000 | 1,066,537 | 1/17/47 | 500 bp — | (75,191) |
| Index | | | | | | Monthly | |
| CMBX NA BBB–.6 | BBB–/P | 20,680 | 88,000 | 15,910 | 5/11/63 | 300 bp — | 4,770 |
| Index | | | | | | Monthly | |
| |
| 96 Diversified Income Trust |
| | | | | | | |
| OTC CREDIT DEFAULT CONTRACTS OUTSTANDING — PROTECTION SOLD at 3/31/20 (Unaudited)cont. |
| | | Upfront | | | | | |
| | | premium | | | Termi- | Payments | Unrealized |
| Swap counterparty/ | | received | Notional | | nation | received | appreciation/ |
| Referenced debt* | Rating*** | (paid)** | amount | Value | date | by fund | (depreciation) |
| JPMorgan Securities LLCcont. | | | | | | |
| CMBX NA BBB–.6 | BBB–/P | $24,667 | $286,000 | $63,292 | 5/11/63 | 300 bp — | $(38,459) |
| Index | | | | | | Monthly | |
| CMBX NA BBB–.6 | BBB–/P | 47,835 | 550,000 | 121,715 | 5/11/63 | 300 bp — | (73,560) |
| Index | | | | | | Monthly | |
| CMBX NA BBB–.6 | BBB–/P | 12,863,133 | 207,290,000 | 45,873,277 | 5/11/63 | 300 bp — | (32,889,225) |
| Index | | | | | | Monthly | |
| Merrill Lynch International | | | | | | |
| CMBX NA BB.6 | BB–/P | 1,226 | 6,000 | 2,344 | 5/11/63 | 500 bp — | (1,112) |
| Index | | | | | | Monthly | |
| CMBX NA BB.6 | BB–/P | 397,626 | 3,556,000 | 1,388,974 | 5/11/63 | 500 bp — | (987,890) |
| Index | | | | | | Monthly | |
| CMBX NA BBB–.6 | BBB–/P | 12,426 | 173,000 | 38,285 | 5/11/63 | 300 bp — | (25,758) |
| Index | | | | | | Monthly | |
| CMBX NA BBB–.6 | BBB–/P | 14,449 | 196,000 | 43,375 | 5/11/63 | 300 bp — | (28,812) |
| Index | | | | | | Monthly | |
| CMBX NA BBB–.6 | BBB–/P | 48,434 | 550,000 | 121,715 | 5/11/63 | 300 bp — | (72,960) |
| Index | | | | | | Monthly | |
| CMBX NA BBB–.6 | BBB–/P | 71,265 | 977,000 | 216,210 | 5/11/63 | 300 bp — | (144,375) |
| Index | | | | | | Monthly | |
| CMBX NA BBB–.6 | BBB–/P | 75,400 | 1,173,000 | 259,585 | 5/11/63 | 300 bp — | (183,501) |
| Index | | | | | | Monthly | |
| CMBX NA BBB–.6 | BBB–/P | 166,585 | 2,184,000 | 483,319 | 5/11/63 | 300 bp — | (315,460) |
| Index | | | | | | Monthly | |
| CMBX NA BBB–.6 | BBB–/P | 231,978 | 2,564,000 | 567,413 | 5/11/63 | 300 bp — | (333,939) |
| Index | | | | | | Monthly | |
| CMBX NA BBB–.6 | BBB–/P | 3,679,134 | 41,204,000 | 9,118,445 | 5/11/63 | 300 bp — | (5,415,276) |
| Index | | | | | | Monthly | |
| Morgan Stanley & Co. International PLC | | | | | |
| CMBX NA A.6 | A/P | (2,272) | 296,000 | 31,198 | 5/11/63 | 200 bp — | (33,355) |
| Index | | | | | | Monthly | |
| CMBX NA A.6 | A/P | 36,348 | 469,000 | 49,433 | 5/11/63 | 200 bp — | (13,085) |
| Index | | | | | | Monthly | |
| CMBX NA BB.6 | BB–/P | 5,423 | 30,000 | 11,718 | 5/11/63 | 500 bp — | (6,266) |
| Index | | | | | | Monthly | |
| CMBX NA BB.6 | BB–/P | 63,456 | 522,000 | 203,893 | 5/11/63 | 500 bp — | (139,930) |
| Index | | | | | | Monthly | |
| CMBX NA BB.6 | BB–/P | 548,361 | 2,233,000 | 872,210 | 5/11/63 | 500 bp — | (321,677) |
| Index | | | | | | Monthly | |
| CMBX NA BB.6 | BB–/P | 1,100,225 | 4,465,000 | 1,744,029 | 5/11/63 | 500 bp — | (639,463) |
| Index | | | | | | Monthly | |
| CMBX NA BBB–.6 | BBB–/P | 2,506 | 30,000 | 6,639 | 5/11/63 | 300 bp — | (4,116) |
| Index | | | | | | Monthly | |
| CMBX NA BBB–.6 | BBB–/P | 5,130 | 64,000 | 14,163 | 5/11/63 | 300 bp — | (8,996) |
| Index | | | | | | Monthly | |
| CMBX NA BBB–.6 | BBB–/P | 5,394 | 72,000 | 15,934 | 5/11/63 | 300 bp — | (10,498) |
| Index | | | | | | Monthly | |
|
| Diversified Income Trust 97 |
| | | | | | | |
| OTC CREDIT DEFAULT CONTRACTS OUTSTANDING — PROTECTION SOLD at 3/31/20 (Unaudited)cont. |
| | | Upfront | | | | | |
| | | premium | | | Termi- | Payments | Unrealized |
| Swap counterparty/ | | received | Notional | | nation | received | appreciation/ |
| Referenced debt* | Rating*** | (paid)** | amount | Value | date | by fund | (depreciation) |
| Morgan Stanley & Co. International PLCcont. | | | | | |
| CMBX NA BBB–.6 | BBB–/P | $26,126 | $356,000 | $78,783 | 5/11/63 | 300 bp — | $(52,450) |
| Index | | | | | | Monthly | |
| CMBX NA BBB–.6 | BBB–/P | 155,534 | 2,369,000 | 524,260 | 5/11/63 | 300 bp — | (367,344) |
| Index | | | | | | Monthly | |
| CMBX NA BBB–.6 | BBB–/P | 157,194 | 2,381,000 | 526,915 | 5/11/63 | 300 bp — | (368,333) |
| Index | | | | | | Monthly | |
| CMBX NA BBB–.6 | BBB–/P | 12,309,656 | 185,807,000 | 41,119,089 | 5/11/63 | 300 bp — | (28,701,045) |
| Index | | | | | | Monthly | |
| Upfront premium received | 83,933,320 | Unrealized appreciation | | 4,770 |
| Upfront premium (paid) | (2,272) | Unrealized (depreciation) | | (153,872,368) |
| Total | | $83,931,048 | Total | | | | $(153,867,598) |
*Payments related to the referenced debt are made upon a credit default event.
**Upfront premium is based on the difference between the original spread on issue and the market spread on day of execution.
***Ratings for an underlying index represent the average of the ratings of all the securities included in that index. The Moody’s, Standard & Poor’s or Fitch ratings are believed to be the most recent ratings available at March 31, 2020.
Securities rated by Putnam are indicated by “/P.” The Putnam rating categories are comparable to the Standard & Poor’s classifications.
| | | | | | |
| OTC CREDIT DEFAULT CONTRACTS OUTSTANDING — PROTECTION PURCHASED at 3/31/20 (Unaudited) |
| | Upfront | | | | | |
| | premium | | | Termi- | Payments | Unrealized |
| Swap counterparty/ | received | Notional | | nation | (paid) | appreciation/ |
| Referenced debt* | (paid)** | amount | Value | date | by fund | (depreciation) |
| Citigroup Global Markets, Inc. | | | | | | |
| CMBX NA A.6 Index | $2,540 | $296,000 | $31,198 | 5/11/63 | (200 bp) — | $33,623 |
| | | | | | Monthly | |
| CMBX NA BB.10 Index | (166,877) | 1,599,000 | 737,459 | 11/17/59 | (500 bp) — | 569,027 |
| | | | | | Monthly | |
| CMBX NA BB.10 Index | (138,486) | 1,263,000 | 582,496 | 11/17/59 | (500 bp) — | 442,782 |
| | | | | | Monthly | |
| CMBX NA BB.11 Index | (598,827) | 4,622,000 | 2,219,484 | 11/18/54 | (500 bp) — | 1,616,163 |
| | | | | | Monthly | |
| CMBX NA BB.11 Index | (158,925) | 1,686,000 | 809,617 | 11/18/54 | (500 bp) — | 649,052 |
| | | | | | Monthly | |
| CMBX NA BB.11 Index | (69,512) | 1,340,000 | 643,468 | 11/18/54 | (500 bp) — | 572,653 |
| | | | | | Monthly | |
| CMBX NA BB.11 Index | (68,351) | 1,340,000 | 643,468 | 11/18/54 | (500 bp) — | 573,815 |
| | | | | | Monthly | |
| CMBX NA BB.11 Index | (45,097) | 656,000 | 315,011 | 11/18/54 | (500 bp) — | 269,276 |
| | | | | | Monthly | |
| CMBX NA BB.11 Index | (11,409) | 158,000 | 75,872 | 11/18/54 | (500 bp) — | 64,309 |
| | | | | | Monthly | |
| CMBX NA BB.12 Index | (96,121) | 1,120,000 | 550,592 | 8/17/61 | (500 bp) — | 453,382 |
| | | | | | Monthly | |
| CMBX NA BB.12 Index | (96,121) | 1,120,000 | 550,592 | 8/17/61 | (500 bp) — | 453,382 |
| | | | | | Monthly | |
| |
| 98 Diversified Income Trust |
| | | | | | |
| OTC CREDIT DEFAULT CONTRACTS OUTSTANDING — PROTECTION PURCHASED at 3/31/20 (Unaudited)cont. |
| | Upfront | | | | | |
| | premium | | | Termi- | Payments | Unrealized |
| Swap counterparty/ | received | Notional | | nation | (paid) | appreciation/ |
| Referenced debt* | (paid)** | amount | Value | date | by fund | (depreciation) |
| Citigroup Global Markets, Inc.cont. | | | | | |
| CMBX NA BB.8 Index | $(13,907) | $112,000 | $53,290 | 10/17/57 | (500 bp) — | $39,275 |
| | | | | | Monthly | |
| CMBX NA BB.8 Index | (176) | 1,000 | 476 | 10/17/57 | (500 bp) — | 299 |
| | | | | | Monthly | |
| CMBX NA BB.9 Index | (2,875,393) | 27,857,000 | 11,098,229 | 9/17/58 | (500 bp) — | 8,195,752 |
| | | | | | Monthly | |
| CMBX NA BB.9 Index | (210,270) | 3,259,000 | 1,298,386 | 9/17/58 | (500 bp) — | 1,084,947 |
| | | | | | Monthly | |
| CMBX NA BB.9 Index | (125,133) | 3,104,000 | 1,236,634 | 9/17/58 | (500 bp) — | 1,108,482 |
| | | | | | Monthly | |
| CMBX NA BB.9 Index | (52,793) | 1,345,000 | 535,848 | 9/17/58 | (500 bp) — | 481,748 |
| | | | | | Monthly | |
| CMBX NA BB.9 Index | (45,931) | 1,267,000 | 504,773 | 9/17/58 | (500 bp) — | 457,610 |
| | | | | | Monthly | |
| CMBX NA BB.9 Index | (9,097) | 141,000 | 56,174 | 9/17/58 | (500 bp) — | 46,940 |
| | | | | | Monthly | |
| CMBX NA BBB–.7 Index | (212) | 42,000 | 7,594 | 1/17/47 | (300 bp) — | 7,357 |
| | | | | | Monthly | |
| Credit Suisse International | | | | | | |
| CMBX NA BB.10 Index | (467,516) | 3,504,000 | 1,616,045 | 11/17/59 | (500 bp) — | 1,145,121 |
| | | | | | Monthly | |
| CMBX NA BB.10 Index | (415,378) | 3,493,000 | 1,610,972 | 11/17/59 | (500 bp) — | 1,192,198 |
| | | | | | Monthly | |
| CMBX NA BB.10 Index | (227,964) | 1,834,000 | 845,841 | 11/17/59 | (500 bp) — | 616,094 |
| | | | | | Monthly | |
| CMBX NA BB.8 Index | (350) | 2,000 | 952 | 10/17/57 | (500 bp) — | 599 |
| | | | | | Monthly | |
| CMBX NA BB.9 Index | (2,404,623) | 23,987,000 | 9,556,421 | 9/17/58 | (500 bp) — | 7,128,477 |
| | | | | | Monthly | |
| CMBX NA BBB–.7 Index | (83,041) | 1,059,000 | 191,467 | 1/17/47 | (300 bp) — | 107,808 |
| | | | | | Monthly | |
| Goldman Sachs International | | | | | | |
| CMBX NA BB.7 Index | (605) | 4,000 | 1,342 | 1/17/47 | (500 bp) — | 733 |
| | | | | | Monthly | |
| CMBX NA BB.12 Index | (272,051) | 743,000 | 365,259 | 8/17/61 | (500 bp) — | 92,485 |
| | | | | | Monthly | |
| CMBX NA BB.7 Index | (349,448) | 1,721,000 | 577,568 | 1/17/47 | (500 bp) — | 226,446 |
| | | | | | Monthly | |
| CMBX NA BB.7 Index | (224,362) | 1,229,000 | 412,452 | 1/17/47 | (500 bp) — | 186,895 |
| | | | | | Monthly | |
| CMBX NA BB.7 Index | (17,367) | 106,000 | 35,574 | 1/17/47 | (500 bp) — | 18,103 |
| | | | | | Monthly | |
| CMBX NA BB.8 Index | (4,192) | 37,000 | 17,605 | 10/17/57 | (500 bp) — | 13,377 |
| | | | | | Monthly | |
| CMBX NA BB.9 Index | (356,757) | 2,241,000 | 892,814 | 9/17/58 | (500 bp) — | 533,880 |
| | | | | | Monthly | |
|
| Diversified Income Trust 99 |
| | | | | | |
| OTC CREDIT DEFAULT CONTRACTS OUTSTANDING — PROTECTION PURCHASED at 3/31/20 (Unaudited)cont. |
| | Upfront | | | | | |
| | premium | | | Termi- | Payments | Unrealized |
| Swap counterparty/ | received | Notional | | nation | (paid) | appreciation/ |
| Referenced debt* | (paid)** | amount | Value | date | by fund | (depreciation) |
| Goldman Sachs Internationalcont. | | | | | |
| CMBX NA BB.9 Index | $(41,245) | $1,062,000 | $423,101 | 9/17/58 | (500 bp) — | $380,823 |
| | | | | | Monthly | |
| CMBX NA BB.9 Index | (164,938) | 1,044,000 | 415,930 | 9/17/58 | (500 bp) — | 249,977 |
| | | | | | Monthly | |
| CMBX NA BB.9 Index | (166,438) | 1,042,000 | 415,133 | 9/17/58 | (500 bp) — | 247,682 |
| | | | | | Monthly | |
| CMBX NA BB.9 Index | (2,380) | 20,000 | 7,968 | 9/17/58 | (500 bp) — | 5,569 |
| | | | | | Monthly | |
| CMBX NA BB.9 Index | (2,155) | 20,000 | 7,968 | 9/17/58 | (500 bp) — | 5,793 |
| | | | | | Monthly | |
| CMBX NA BB.9 Index | (2,407) | 20,000 | 7,968 | 9/17/58 | (500 bp) — | 5,542 |
| | | | | | Monthly | |
| CMBX NA BBB–.7 Index | (410,020) | 5,000,000 | 904,000 | 1/17/47 | (300 bp) — | 491,063 |
| | | | | | Monthly | |
| JPMorgan Securities LLC | | | | | | |
| CMBX NA BB.11 Index | (161,892) | 2,197,000 | 1,054,999 | 11/18/54 | (500 bp) — | 890,972 |
| | | | | | Monthly | |
| CMBX NA BB.11 Index | (125,981) | 1,848,000 | 887,410 | 11/18/54 | (500 bp) — | 759,632 |
| | | | | | Monthly | |
| CMBX NA BB.11 Index | (65,455) | 1,293,000 | 620,899 | 11/18/54 | (500 bp) — | 554,186 |
| | | | | | Monthly | |
| CMBX NA BB.11 Index | (83,987) | 1,232,000 | 591,606 | 11/18/54 | (500 bp) — | 506,421 |
| | | | | | Monthly | |
| CMBX NA BB.11 Index | (63,246) | 1,119,000 | 537,344 | 11/18/54 | (500 bp) — | 473,010 |
| | | | | | Monthly | |
| CMBX NA BB.11 Index | (5,729) | 53,000 | 25,451 | 11/18/54 | (500 bp) — | 19,670 |
| | | | | | Monthly | |
| CMBX NA BB.11 Index | (3,087) | 31,000 | 14,886 | 11/18/54 | (500 bp) — | 11,769 |
| | | | | | Monthly | |
| CMBX NA BB.11 Index | (2,984) | 30,000 | 14,406 | 11/18/54 | (500 bp) — | 11,393 |
| | | | | | Monthly | |
| CMBX NA BB.11 Index | (2,670) | 26,000 | 12,485 | 11/18/54 | (500 bp) — | 9,790 |
| | | | | | Monthly | |
| CMBX NA BB.12 Index | (319,886) | 3,508,000 | 1,724,533 | 8/17/61 | (500 bp) — | 1,401,236 |
| | | | | | Monthly | |
| CMBX NA BB.12 Index | (52,522) | 567,000 | 278,737 | 8/17/61 | (500 bp) — | 225,664 |
| | | | | | Monthly | |
| CMBX NA BB.6 Index | (1,194,928) | 2,612,000 | 1,020,247 | 5/11/63 | (500 bp) — | (177,221) |
| | | | | | Monthly | |
| CMBX NA BB.6 Index | (58,622) | 411,000 | 160,537 | 5/11/63 | (500 bp) — | 101,515 |
| | | | | | Monthly | |
| CMBX NA BB.7 Index | (3,000,610) | 23,711,000 | 7,957,412 | 1/17/47 | (500 bp) — | 4,933,749 |
| | | | | | Monthly | |
| CMBX NA BB.9 Index | (503,334) | 3,189,000 | 1,270,498 | 9/17/58 | (500 bp) — | 764,063 |
| | | | | | Monthly | |
| CMBX NA BB.9 Index | (358,651) | 2,534,000 | 1,009,546 | 9/17/58 | (500 bp) — | 648,431 |
| | | | | | Monthly | |
|
| 100 Diversified Income Trust |
| | | | | | |
| OTC CREDIT DEFAULT CONTRACTS OUTSTANDING — PROTECTION PURCHASED at 3/31/20 (Unaudited)cont. |
| | Upfront | | | | | |
| | premium | | | Termi- | Payments | Unrealized |
| Swap counterparty/ | received | Notional | | nation | (paid) | appreciation/ |
| Referenced debt* | (paid)** | amount | Value | date | by fund | (depreciation) |
| JPMorgan Securities LLCcont. | | | | | | |
| CMBX NA BB.9 Index | $(84,624) | $1,998,000 | $796,003 | 9/17/58 | (500 bp) — | $709,436 |
| | | | | | Monthly | |
| CMBX NA BB.9 Index | (248,369) | 1,592,000 | 634,253 | 9/17/58 | (500 bp) — | 384,336 |
| | | | | | Monthly | |
| CMBX NA BB.9 Index | (90,406) | 1,568,000 | 624,691 | 9/17/58 | (500 bp) — | 532,760 |
| | | | | | Monthly | |
| CMBX NA BB.9 Index | (220,460) | 1,561,000 | 621,902 | 9/17/58 | (500 bp) — | 399,925 |
| | | | | | Monthly | |
| CMBX NA BB.9 Index | (50,440) | 1,119,000 | 445,810 | 9/17/58 | (500 bp) — | 394,282 |
| | | | | | Monthly | |
| CMBX NA BB.9 Index | (45,843) | 299,000 | 119,122 | 9/17/58 | (500 bp) — | 72,987 |
| | | | | | Monthly | |
| CMBX NA BBB–.6 Index | (2,684,509) | 10,915,000 | 2,415,490 | 5/11/63 | (300 bp) — | (275,387) |
| | | | | | Monthly | |
| CMBX NA BBB–.7 Index | (723,701) | 19,073,000 | 3,448,398 | 1/17/47 | (300 bp) — | 2,713,572 |
| | | | | | Monthly | |
| CMBX NA BBB–.7 Index | (77,814) | 1,645,000 | 297,416 | 1/17/47 | (300 bp) — | 218,642 |
| | | | | | Monthly | |
| CMBX NA BBB–.7 Index | (47,118) | 1,298,000 | 234,678 | 1/17/47 | (300 bp) — | 186,802 |
| | | | | | Monthly | |
| Merrill Lynch International | | | | | | |
| CMBX NA BB.10 Index | (181,851) | 3,196,000 | 1,473,995 | 11/17/59 | (500 bp) — | 1,289,038 |
| | | | | | Monthly | |
| CMBX NA BB.11 Index | (156,797) | 2,925,000 | 1,404,585 | 11/18/54 | (500 bp) — | 1,244,944 |
| | | | | | Monthly | |
| CMBX NA BB.11 Index | (3,008) | 30,000 | 14,406 | 11/18/54 | (500 bp) — | 11,369 |
| | | | | | Monthly | |
| CMBX NA BB.7 Index | (9,888) | 57,000 | 19,129 | 1/17/47 | (500 bp) — | 9,185 |
| | | | | | Monthly | |
| CMBX NA BB.9 Index | (1,078,954) | 27,696,000 | 11,034,086 | 9/17/58 | (500 bp) — | 9,928,206 |
| | | | | | Monthly | |
| CMBX NA BBB–.7 Index | (89,077) | 1,087,000 | 196,530 | 1/17/47 | (300 bp) — | 106,819 |
| | | | | | Monthly | |
| Morgan Stanley & Co. International PLC | | | | | |
| CMBX NA BBB–.7 Index | (7,132) | 70,000 | 12,656 | 1/17/47 | (300 bp) — | 5,483 |
| | | | | | Monthly | |
| CMBX NA BB.10 Index | (167,698) | 1,599,000 | 737,459 | 11/17/59 | (500 bp) — | 568,206 |
| | | | | | Monthly | |
| CMBX NA BB.11 Index | (4,288) | 45,000 | 21,609 | 11/18/54 | (500 bp) — | 17,277 |
| | | | | | Monthly | |
| CMBX NA BB.11 Index | (3,535) | 36,000 | 17,287 | 11/18/54 | (500 bp) — | 13,717 |
| | | | | | Monthly | |
| CMBX NA BB.12 Index | (125,112) | 2,369,000 | 1,164,600 | 8/17/61 | (500 bp) — | 1,037,185 |
| | | | | | Monthly | |
| CMBX NA BB.12 Index | (111,821) | 1,564,000 | 768,862 | 8/17/61 | (500 bp) — | 655,521 |
| | | | | | Monthly | |
|
| Diversified Income Trust 101 |
| | | | | | |
| OTC CREDIT DEFAULT CONTRACTS OUTSTANDING — PROTECTION PURCHASED at 3/31/20 (Unaudited)cont. |
| | Upfront | | | | | |
| | premium | | | Termi- | Payments | Unrealized |
| Swap counterparty/ | received | Notional | | nation | (paid) | appreciation/ |
| Referenced debt* | (paid)** | amount | Value | date | by fund | (depreciation) |
| Morgan Stanley & Co. International PLCcont. | | | | | |
| CMBX NA BB.12 Index | $(76,301) | $1,045,000 | $513,722 | 8/17/61 | (500 bp) — | $436,404 |
| | | | | | Monthly | |
| CMBX NA BB.12 Index | (65,821) | 933,000 | 458,663 | 8/17/61 | (500 bp) — | 391,935 |
| | | | | | Monthly | |
| CMBX NA BB.12 Index | (22,625) | 277,000 | 136,173 | 9/17/58 | (500 bp) — | 113,278 |
| | | | | | Monthly | |
| CMBX NA BB.7 Index | (627,449) | 3,120,000 | 1,047,072 | 1/17/47 | (500 bp) — | 416,590 |
| | | | | | Monthly | |
| CMBX NA BB.7 Index | (372,184) | 1,989,000 | 667,508 | 1/17/47 | (500 bp) — | 293,391 |
| | | | | | Monthly | |
| CMBX NA BB.7 Index | (223,682) | 1,160,000 | 389,296 | 1/17/47 | (500 bp) — | 164,487 |
| | | | | | Monthly | |
| CMBX NA BB.7 Index | (158,631) | 786,000 | 263,782 | 1/17/47 | (500 bp) — | 104,387 |
| | | | | | Monthly | |
| CMBX NA BB.9 Index | (83,998) | 2,381,000 | 948,590 | 9/17/58 | (500 bp) — | 862,277 |
| | | | | | Monthly | |
| CMBX NA BB.9 Index | (318,081) | 2,115,000 | 842,616 | 9/17/58 | (500 bp) — | 522,479 |
| | | | | | Monthly | |
| CMBX NA BB.9 Index | (255,968) | 1,923,000 | 766,123 | 9/17/58 | (500 bp) — | 508,285 |
| | | | | | Monthly | |
| CMBX NA BB.9 Index | (258,098) | 1,900,000 | 756,960 | 9/17/58 | (500 bp) — | 497,016 |
| | | | | | Monthly | |
| CMBX NA BB.9 Index | (268,247) | 1,862,000 | 741,821 | 9/17/58 | (500 bp) — | 471,764 |
| | | | | | Monthly | |
| CMBX NA BB.9 Index | (250,750) | 1,834,000 | 730,666 | 9/17/58 | (500 bp) — | 478,133 |
| | | | | | Monthly | |
| CMBX NA BB.9 Index | (273,099) | 1,810,000 | 721,104 | 9/17/58 | (500 bp) — | 446,245 |
| | | | | | Monthly | |
| CMBX NA BB.9 Index | (273,908) | 1,760,000 | 701,184 | 9/17/58 | (500 bp) — | 425,565 |
| | | | | | Monthly | |
| CMBX NA BB.9 Index | (61,945) | 1,541,000 | 613,934 | 9/17/58 | (500 bp) — | 550,491 |
| | | | | | Monthly | |
| CMBX NA BB.9 Index | (54,571) | 1,101,000 | 438,638 | 9/17/58 | (500 bp) — | 382,997 |
| | | | | | Monthly | |
| CMBX NA BB.9 Index | (67,339) | 1,094,000 | 435,850 | 9/17/58 | (500 bp) — | 367,448 |
| | | | | | Monthly | |
| CMBX NA BB.9 Index | (39,523) | 1,011,000 | 402,782 | 9/17/58 | (500 bp) — | 362,276 |
| | | | | | Monthly | |
| CMBX NA BB.9 Index | (57,696) | 949,000 | 378,082 | 9/17/58 | (500 bp) — | 319,463 |
| | | | | | Monthly | |
| CMBX NA BB.9 Index | (58,369) | 949,000 | 378,082 | 9/17/58 | (500 bp) — | 318,790 |
| | | | | | Monthly | |
| CMBX NA BB.9 Index | (134,108) | 886,000 | 352,982 | 9/17/58 | (500 bp) — | 218,014 |
| | | | | | Monthly | |
| CMBX NA BB.9 Index | (134,108) | 886,000 | 352,982 | 9/17/58 | (500 bp) — | 218,014 |
| | | | | | Monthly | |
|
| 102 Diversified Income Trust |
| | | | | | |
| OTC CREDIT DEFAULT CONTRACTS OUTSTANDING — PROTECTION PURCHASED at 3/31/20 (Unaudited)cont. |
| | Upfront | | | | | |
| | premium | | | Termi- | Payments | Unrealized |
| Swap counterparty/ | received | Notional | | nation | (paid) | appreciation/ |
| Referenced debt* | (paid)** | amount | Value | date | by fund | (depreciation) |
| Morgan Stanley & Co. International PLCcont. | | | | | |
| CMBX NA BB.9 Index | $(42,227) | $782,000 | $311,549 | 9/17/58 | (500 bp) — | $268,561 |
| | | | | | Monthly | |
| CMBX NA BB.9 Index | (10,443) | 139,000 | 55,378 | 9/17/58 | (500 bp) — | 44,799 |
| | | | | | Monthly | |
| CMBX NA BB.9 Index | (5,627) | 64,000 | 25,498 | 9/17/58 | (500 bp) — | 19,809 |
| | | | | | Monthly | |
| CMBX NA BB.9 Index | (5,302) | 62,000 | 24,701 | 9/17/58 | (500 bp) — | 19,338 |
| | | | | | Monthly | |
| CMBX NA BB.9 Index | (4,850) | 40,000 | 15,936 | 9/17/58 | (500 bp) — | 11,047 |
| | | | | | Monthly | |
| CMBX NA BB.9 Index | (2,425) | 20,000 | 7,968 | 9/17/58 | (500 bp) — | 5,524 |
| | | | | | Monthly | |
| CMBX NA BBB–.7 Index | (187,305) | 2,950,000 | 533,360 | 1/17/47 | (300 bp) — | 344,340 |
| | | | | | Monthly | |
| Upfront premium received | 2,540 | Unrealized appreciation | | 71,162,879 |
| Upfront premium (paid) | (27,006,584) | Unrealized (depreciation) | | (452,608) |
| Total | $(27,004,044) | Total | | | | $70,710,271 |
*Payments related to the referenced debt are made upon a credit default event.
**Upfront premium is based on the difference between the original spread on issue and the market spread on day of execution.
|
| Diversified Income Trust 103 |
ASC 820 establishes a three-level hierarchy for disclosure of fair value measurements. The valuation hierarchy is based upon the transparency of inputs to the valuation of the fund’s investments. The three levels are defined as follows:
Level 1: Valuations based on quoted prices for identical securities in active markets.
Level 2: Valuations based on quoted prices in markets that are not active or for which all significant inputs are observable, either directly or indirectly.
Level 3: Valuations based on inputs that are unobservable and significant to the fair value measurement.
| | | |
| The following is a summary of the inputs used to value the fund’s net assets as of the close of the reporting period: |
| |
| | | Valuation inputs |
| Investments in securities: | Level 1 | Level 2 | Level 3 |
| Common stocks*: | | | |
| Energy | $— | $— | $— |
| Total common stocks | — | — | — |
| Asset-backed securities | — | 27,579,887 | — |
| Convertible bonds and notes | — | 154,212,196 | — |
| Corporate bonds and notes | — | 630,014,883 | — |
| Foreign government and agency bonds and notes | — | 344,747,373 | — |
| Mortgage-backed securities | — | 1,132,221,777 | — |
| Purchased options outstanding | — | 45,430,263 | — |
| Purchased swap options outstanding | — | 141,667,699 | — |
| Senior loans | — | 57,902,192 | — |
| U.S. government and agency mortgage obligations | — | 4,187,614,849 | — |
| U.S. treasury obligations | — | 24,786,801 | — |
| Warrants | — | — | 74,331 |
| Short-term investments | 389,116,627 | 739,497,640 | — |
| Totals by level | $389,116,627 | $7,485,675,560 | $74,331 |
| | | |
| | | Valuation inputs |
| Other financial instruments: | Level 1 | Level 2 | Level 3 |
| Forward currency contracts | $— | $1,825,745 | $— |
| Futures contracts | 7,796,401 | — | — |
| Written options outstanding | — | (6,242,821) | — |
| Written swap options outstanding | — | (150,222,688) | — |
| Forward premium swap option contracts | — | 79,312,291 | — |
| TBA sale commitments | — | (3,767,063,482) | — |
| Interest rate swap contracts | — | (154,285,950) | — |
| Total return swap contracts | — | (30,030,912) | — |
| Credit default contracts | — | (140,084,331) | — |
| Totals by level | $7,796,401 | $(4,166,792,148) | $— |
*Common stock classifications are presented at the sector level, which may differ from the fund’s portfolio presentation.
At the start and close of the reporting period, Level 3 investments in securities represented less than 1% of the fund’s net assets and were not considered a significant portion of the fund’s portfolio.
The accompanying notes are an integral part of these financial statements.
|
| 104 Diversified Income Trust |
| |
| Statement of assets and liabilities3/31/20 (Unaudited) | |
| ASSETS | |
| Investment in securities, at value (Notes 1 and 9): | |
| Unaffiliated issuers (identified cost $7,895,390,607) | $7,589,595,891 |
| Affiliated issuers (identified cost $285,270,627) (Note 5) | 285,270,627 |
| Cash | 20,031,342 |
| Foreign currency (cost $391,894) (Note 1) | 387,991 |
| Interest and other receivables | 30,966,075 |
| Receivable for shares of the fund sold | 8,837,785 |
| Receivable for investments sold | 15,214,368 |
| Receivable for sales of TBA securities (Note 1) | 2,376,640,737 |
| Receivable for variation margin on futures contracts (Note 1) | 369,581 |
| Receivable for variation margin on centrally cleared swap contracts (Note 1) | 30,225,506 |
| Unrealized appreciation on forward currency contracts (Note 1) | 54,976,035 |
| Unrealized appreciation on forward premium swap option contracts (Note 1) | 170,671,245 |
| Unrealized appreciation on OTC swap contracts (Note 1) | 75,320,482 |
| Premium paid on OTC swap contracts (Note 1) | 27,008,856 |
| Prepaid assets | 100,511 |
| Total assets | 10,685,617,032 |
| |
| LIABILITIES | |
| Payable for investments purchased | 19,086,080 |
| Payable for purchases of delayed delivery securities (Note 1) | 5,481,579 |
| Payable for purchases of TBA securities (Note 1) | 2,786,758,842 |
| Payable for shares of the fund repurchased | 25,702,926 |
| Payable for compensation of Manager (Note 2) | 1,756,711 |
| Payable for custodian fees (Note 2) | 396,806 |
| Payable for investor servicing fees (Note 2) | 985,608 |
| Payable for Trustee compensation and expenses (Note 2) | 792,110 |
| Payable for administrative services (Note 2) | 7,187 |
| Payable for distribution fees (Note 2) | 1,062,849 |
| Payable for variation margin on futures contracts (Note 1) | 1,153,361 |
| Payable for variation margin on centrally cleared swap contracts (Note 1) | 31,205,319 |
| Unrealized depreciation on forward currency contracts (Note 1) | 53,150,290 |
| Unrealized depreciation on forward premium swap option contracts (Note 1) | 91,358,954 |
| Written options outstanding, at value (premiums $116,017,143) (Note 1) | 156,465,509 |
| TBA sale commitments, at value (proceeds receivable $3,699,434,883) (Note 1) | 3,767,063,482 |
| Unrealized depreciation on OTC swap contracts (Note 1) | 162,230,750 |
| Premium received on OTC swap contracts (Note 1) | 83,935,860 |
| Collateral on certain derivative contracts and TBA commitments, at value (Notes 1 and 9) | 131,856,882 |
| Other accrued expenses | 529,412 |
| Total liabilities | 7,320,980,517 |
| | |
| Net assets | $3,364,636,515 |
(Continued on next page)
|
| Diversified Income Trust 105 |
| |
| Statement of assets and liabilitiescont. | |
| REPRESENTED BY | |
| Paid-in capital (Unlimited shares authorized) (Notes 1 and 4) | $4,959,981,409 |
| Total distributable earnings (Note 1) | (1,595,344,894) |
| Total — Representing net assets applicable to capital shares outstanding | $3,364,636,515 |
| |
| COMPUTATION OF NET ASSET VALUE AND OFFERING PRICE | |
| Net asset value and redemption price per class A share | |
| ($879,040,368 divided by 144,934,720 shares) | $6.07 |
| Offering price per class A share(100/96.00 of $6.07)* | $6.32 |
| Net asset value and offering price per class B share($14,871,640 divided by 2,483,052 shares)** | $5.99 |
| Net asset value and offering price per class C share($376,062,379 divided by 63,334,137 shares)** | $5.94 |
| Net asset value and redemption price per class M share | |
| ($82,660,159 divided by 13,940,927 shares) | $5.93 |
| Offering price per class M share(100/96.75 of $5.93)† | $6.13 |
| Net asset value, offering price and redemption price per class R share | |
| ($2,105,858 divided by 352,525 shares) | $5.97 |
| Net asset value, offering price and redemption price per class R6 share | |
| ($20,200,589 divided by 3,368,155 shares) | $6.00 |
| Net asset value, offering price and redemption price per class Y share | |
| ($1,989,695,522 divided by 331,814,331 shares) | $6.00 |
*On single retail sales of less than $100,000. On sales of $100,000 or more the offering price is reduced.
**Redemption price per share is equal to net asset value less any applicable contingent deferred sales charge.
†On single retail sales of less than $50,000. On sales of $50,000 or more the offering price is reduced.
The accompanying notes are an integral part of these financial statements.
|
| 106 Diversified Income Trust |
| |
| Statement of operationsSix months ended 3/31/20 (Unaudited) | |
| INVESTMENT INCOME | |
| Interest (including interest income of $2,172,683 from investments in affiliated issuers) (Note 5) | $102,512,352 |
| Total investment income | 102,512,352 |
| |
| EXPENSES | |
| Compensation of Manager (Note 2) | 11,575,798 |
| Investor servicing fees (Note 2) | 2,971,575 |
| Custodian fees (Note 2) | 235,008 |
| Trustee compensation and expenses (Note 2) | 76,557 |
| Distribution fees (Note 2) | 4,025,859 |
| Administrative services (Note 2) | 69,382 |
| Other | 711,850 |
| Total expenses | 19,666,029 |
| | |
| Expense reduction (Note 2) | (3,416) |
| Net expenses | 19,662,613 |
| | |
| Net investment income | 82,849,739 |
| |
| REALIZED AND UNREALIZED GAIN (LOSS) | |
| Net realized gain (loss) on: | |
| Securities from unaffiliated issuers (Notes 1 and 3) | 53,178,872 |
| Foreign currency transactions (Note 1) | 173,498 |
| Forward currency contracts (Note 1) | (11,884,552) |
| Futures contracts (Note 1) | 5,442,738 |
| Swap contracts (Note 1) | 9,322,167 |
| Written options (Note 1) | 4,950,120 |
| Total net realized gain | 61,182,843 |
| | |
| Change in net unrealized appreciation (depreciation) on: | |
| Securities from unaffiliated issuers and TBA sale commitments | (339,937,440) |
| Assets and liabilities in foreign currencies | 337,545 |
| Forward currency contracts | 3,380,401 |
| Futures contracts | 11,651,664 |
| Swap contracts | (246,787,749) |
| Written options | (48,788,489) |
| Total change in net unrealized depreciation | (620,144,068) |
| | |
| Net loss on investments | (558,961,225) |
| |
| Net decrease in net assets resulting from operations | $(476,111,486) |
The accompanying notes are an integral part of these financial statements.
|
| Diversified Income Trust 107 |
| | |
| Statement of changes in net assets | | |
| DECREASE IN NET ASSETS | Six months ended 3/31/20* | Year ended 9/30/19 |
| Operations | | |
| Net investment income | $82,849,739 | $174,662,374 |
| Net realized gain (loss) on investments | | |
| and foreign currency transactions | 61,182,843 | (81,715,960) |
| Change in net unrealized appreciation (depreciation) | | |
| of investments and assets and liabilities | | |
| in foreign currencies | (620,144,068) | 102,352,778 |
| Net increase (decrease) in net assets resulting | | |
| from operations | (476,111,486) | 195,299,192 |
| Distributions to shareholders (Note 1): | | |
| From ordinary income | | |
| Net investment income | | |
| Class A | (21,591,854) | (50,747,095) |
| Class B | (302,597) | (877,836) |
| Class C | (7,653,234) | (20,466,799) |
| Class M | (1,944,975) | (4,927,142) |
| Class R | (45,346) | (109,563) |
| Class R6 | (433,124) | (772,371) |
| Class Y | (55,436,328) | (114,392,908) |
| Decrease from capital share transactions (Note 4) | (346,519,141) | (448,810,918) |
| Total decrease in net assets | (910,038,085) | (445,805,440) |
| |
| NET ASSETS | | |
| Beginning of period | 4,274,674,600 | 4,720,480,040 |
| End of period | $3,364,636,515 | $4,274,674,600 |
*Unaudited.
The accompanying notes are an integral part of these financial statements.
|
| 108 Diversified Income Trust |
|
| This page left blank intentionally. |
|
| Diversified Income Trust 109 |
| | | | | | | | | | | | |
| Financial highlights(For a common share outstanding throughout the period) | | | | | | | | |
| |
| | INVESTMENT OPERATIONS | | | LESS DISTRIBUTIONS | | | | RATIOS AND SUPPLEMENTAL DATA | | |
| | | | | | | | | | | | Ratio | |
| | | | Net realized | | | | | | | | of net investment | |
| | Net asset value, | | and unrealized | Total from | From net | | | Total return | Net assets, | Ratio of expenses | income (loss) | Portfolio |
| | beginning | Net investment | gain (loss) | investment | investment | Total | Net asset value, | at net asset value | end of period | to average | to average | turnover |
| Period ended | of period | income (loss)a | on investments | operations | income | distributions | end of period | (%)b | (in thousands) | net assets (%)c | net assets (%) | (%)d |
| Class A | | | | | | | | | | | | |
| March 31, 2020** | $6.99 | .13 | (.91) | (.78) | (.14) | (.14) | $6.07 | (11.41)* | $879,040 | .49* | 1.87* | 524* |
| September 30, 2019 | 6.96 | .28 | .06 | .34 | (.31) | (.31) | 6.99 | 5.00 | 1,109,333 | .98 | 4.05 | 701 |
| September 30, 2018 | 7.07 | .31 | (.04) | .27 | (.38) | (.38) | 6.96 | 3.81 | 1,293,136 | .98 | 4.39 | 580 |
| September 30, 2017 | 6.86 | .32 | .29 | .61 | (.40) | (.40) | 7.07 | 9.04 | 1,210,996 | .99 | 4.54 | 937 |
| September 30, 2016 | 7.08 | .37 | (.22) | .15 | (.37) | (.37) | 6.86 | 2.25 | 1,238,618 | 1.00e | 5.48e | 835 |
| September 30, 2015 | 7.89 | .32 | (.79) | (.47) | (.34) | (.34) | 7.08 | (6.16) | 1,834,125 | .97 | 4.22 | 725 |
| Class B | | | | | | | | | | | | |
| March 31, 2020** | $6.91 | .10 | (.91) | (.81) | (.11) | (.11) | $5.99 | (11.86)* | $14,872 | .86* | 1.46* | 524* |
| September 30, 2019 | 6.88 | .23 | .05 | .28 | (.25) | (.25) | 6.91 | 4.26 | 19,923 | 1.73 | 3.31 | 701 |
| September 30, 2018 | 6.99 | .25 | (.04) | .21 | (.32) | (.32) | 6.88 | 3.05 | 29,465 | 1.73 | 3.65 | 580 |
| September 30, 2017 | 6.79 | .26 | .28 | .54 | (.34) | (.34) | 6.99 | 8.17 | 43,182 | 1.74 | 3.79 | 937 |
| September 30, 2016 | 7.01 | .32 | (.22) | .10 | (.32) | (.32) | 6.79 | 1.52 | 54,180 | 1.75e | 4.74e | 835 |
| September 30, 2015 | 7.81 | .26 | (.78) | (.52) | (.28) | (.28) | 7.01 | (6.81) | 67,948 | 1.72 | 3.47 | 725 |
| Class C | | | | | | | | | | | | |
| March 31, 2020** | $6.85 | .10 | (.90) | (.80) | (.11) | (.11) | $5.94 | (11.82)* | $376,062 | .86* | 1.51* | 524* |
| September 30, 2019 | 6.82 | .22 | .07 | .29 | (.26) | (.26) | 6.85 | 4.31 | 484,676 | 1.73 | 3.33 | 701 |
| September 30, 2018 | 6.94 | .25 | (.04) | .21 | (.33) | (.33) | 6.82 | 3.00 | 600,600 | 1.73 | 3.65 | 580 |
| September 30, 2017 | 6.75 | .26 | .27 | .53 | (.34) | (.34) | 6.94 | 8.07 | 607,113 | 1.74 | 3.80 | 937 |
| September 30, 2016 | 6.96 | .32 | (.21) | .11 | (.32) | (.32) | 6.75 | 1.68 | 649,723 | 1.75e | 4.74e | 835 |
| September 30, 2015 | 7.76 | .26 | (.78) | (.52) | (.28) | (.28) | 6.96 | (6.85) | 954,682 | 1.72 | 3.48 | 725 |
| Class M | | | | | | | | | | | | |
| March 31, 2020** | $6.84 | .12 | (.90) | (.78) | (.13) | (.13) | $5.93 | (11.60)* | $82,660 | .61* | 1.70* | 524* |
| September 30, 2019 | 6.82 | .25 | .06 | .31 | (.29) | (.29) | 6.84 | 4.75 | 111,949 | 1.23 | 3.76 | 701 |
| September 30, 2018 | 6.94 | .28 | (.04) | .24 | (.36) | (.36) | 6.82 | 3.53 | 118,582 | 1.23 | 4.11 | 580 |
| September 30, 2017 | 6.75 | .29 | .28 | .57 | (.38) | (.38) | 6.94 | 8.67 | 129,640 | 1.24 | 4.26 | 937 |
| September 30, 2016 | 6.97 | .35 | (.22) | .13 | (.35) | (.35) | 6.75 | 2.11 | 137,777 | 1.25e | 5.21e | 835 |
| September 30, 2015 | 7.77 | .29 | (.77) | (.48) | (.32) | (.32) | 6.97 | (6.37) | 163,795 | 1.22 | 3.95 | 725 |
| Class R | | | | | | | | | | | | |
| March 31, 2020** | $6.89 | .12 | (.91) | (.79) | (.13) | (.13) | $5.97 | (11.67)* | $2,106 | .61* | 1.74* | 524* |
| September 30, 2019 | 6.87 | .25 | .06 | .31 | (.29) | (.29) | 6.89 | 4.70 | 2,423 | 1.23 | 3.74 | 701 |
| September 30, 2018 | 6.98 | .29 | (.04) | .25 | (.36) | (.36) | 6.87 | 3.64 | 2,404 | 1.23 | 4.13 | 580 |
| September 30, 2017 | 6.78 | .30 | .28 | .58 | (.38) | (.38) | 6.98 | 8.74 | 2,559 | 1.24 | 4.29 | 937 |
| September 30, 2016 | 7.00 | .35 | (.22) | .13 | (.35) | (.35) | 6.78 | 2.08 | 3,398 | 1.25e | 5.26e | 835 |
| September 30, 2015 | 7.80 | .30 | (.79) | (.49) | (.31) | (.31) | 7.00 | (6.38) | 3,786 | 1.22 | 3.98 | 725 |
See notes to financial highlights at the end of this section.
The accompanying notes are an integral part of these financial statements.
| |
| 110 Diversified Income Trust | Diversified Income Trust 111 |
| | | | | | | | | | | | |
| Financial highlightscont. | | | | | | | | | | | | |
| |
| | INVESTMENT OPERATIONS | | | LESS DISTRIBUTIONS | | | | RATIOS AND SUPPLEMENTAL DATA | | |
| | | | | | | | | | | | Ratio | |
| | | | Net realized | | | | | | | | of net investment | |
| | Net asset value, | | and unrealized | Total from | From net | | | Total return | Net assets, | Ratio of expenses | income (loss) | Portfolio |
| | beginning | Net investment | gain (loss) | investment | investment | Total | Net asset value, | at net asset value | end of period | to average | to average | turnover |
| Period ended | of period | income (loss)a | on investments | operations | income | distributions | end of period | (%)b | (in thousands) | net assets (%)c | net assets (%) | (%)d |
| Class R6 | | | | | | | | | | | | |
| March 31, 2020** | $6.92 | .14 | (.91) | (.77) | (.15) | (.15) | $6.00 | (11.37)* | $20,201 | .32* | 2.07* | 524* |
| September 30, 2019 | 6.89 | .30 | .06 | .36 | (.33) | (.33) | 6.92 | 5.42 | 17,243 | .64 | 4.38 | 701 |
| September 30, 2018 | 7.00 | .33 | (.04) | .29 | (.40) | (.40) | 6.89 | 4.20 | 14,848 | .64 | 4.75 | 580 |
| September 30, 2017 | 6.80 | .34 | .28 | .62 | (.42) | (.42) | 7.00 | 9.34 | 11,032 | .65 | 4.90 | 937 |
| September 30, 2016 | 7.02 | .40 | (.23) | .17 | (.39) | (.39) | 6.80 | 2.64 | 10,097 | .65e | 5.88e | 835 |
| September 30, 2015 | 7.82 | .34 | (.78) | (.44) | (.36) | (.36) | 7.02 | (5.79) | 10,357 | .63 | 4.58 | 725 |
| Class Y | | | | | | | | | | | | |
| March 31, 2020** | $6.91 | .14 | (.90) | (.76) | (.15) | (.15) | $6.00 | (11.29)* | $1,989,696 | .36* | 2.03* | 524* |
| September 30, 2019 | 6.88 | .29 | .06 | .35 | (.32) | (.32) | 6.91 | 5.30 | 2,529,128 | .73 | 4.33 | 701 |
| September 30, 2018 | 7.00 | .32 | (.05) | .27 | (.39) | (.39) | 6.88 | 3.95 | 2,661,444 | .73 | 4.64 | 580 |
| September 30, 2017 | 6.80 | .33 | .28 | .61 | (.41) | (.41) | 7.00 | 9.24 | 1,592,134 | .74 | 4.79 | 937 |
| September 30, 2016 | 7.01 | .39 | (.22) | .17 | (.38) | (.38) | 6.80 | 2.66 | 966,548 | .75e | 5.73e | 835 |
| September 30, 2015 | 7.82 | .34 | (.79) | (.45) | (.36) | (.36) | 7.01 | (5.94) | 2,219,013 | .72 | 4.50 | 725 |
*Not annualized.
**Unaudited.
aPer share net investment income (loss) has been determined on the basis of the weighted average number of shares outstanding during the period.
bTotal return assumes dividend reinvestment and does not reflect the effect of sales charges.
cIncludes amounts paid through expense offset and/or brokerage/service arrangements, if any (Note 2). Also excludes acquired fund fees and expenses, if any.
dPortfolio turnover includes TBA purchase and sale commitments.
eReflects a voluntary waiver of certain fund expenses in effect during the period. As a result of such waiver, the expenses of each class reflect a reduction of less than 0.01% as a percentage of average net assets.
The accompanying notes are an integral part of these financial statements.
| |
| 112 Diversified Income Trust | Diversified Income Trust 113 |
Notes to financial statements3/31/20 (Unaudited)
Within the following Notes to financial statements, references to “State Street” represent State Street Bank and Trust Company, references to “the SEC” represent the Securities and Exchange Commission, references to “Putnam Management” represent Putnam Investment Management, LLC, the fund’s manager, an indirect wholly-owned subsidiary of Putnam Investments, LLC and references to “OTC”, if any, represent over-the-counter. Unless otherwise noted, the “reporting period” represents the period from October 1, 2019 through March 31, 2020.
Putnam Diversified Income Trust (the fund) is a Massachusetts business trust, which is registered under the Investment Company Act of 1940, as amended, as a diversified open-end management investment company. The goal of the fund is to seek as high a level of current income as Putnam Management believes is consistent with preservation of capital. The fund invests mainly in bonds that are securitized debt instruments (such as mortgage-backed investments) and other obligations of companies and governments worldwide, are either investment-grade or below-investment-grade in quality (sometimes referred to as “junk bonds”) and have intermediate- to long-term maturities (three years or longer). Putnam Management may consider, among other factors, credit, interest rate and prepayment risks, as well as general market conditions, when deciding whether to buy or sell investments. The fund typically uses to a significant extent derivatives, such as futures, options, certain foreign currency transactions and swap contracts, for both hedging and non-hedging purposes.
The fund offers class A, class B, class C, class M, class R, class R6 and class Y shares. Effective November 25, 2019, all class M shares (excluding those purchased from Japanese distributors) were converted to class A shares and are no longer able to be purchased. Purchases of class B shares are closed to new and existing investors except by exchange from class B shares of another Putnam fund or through dividend and/or capital gains reinvest-ment. Class A and class M shares are sold with a maximum front-end sales charge of 4.00% and 3.25%, respectively. Class A shares generally are not subject to a contingent deferred sales charge, and class M, class R, class R6 and class Y shares are not subject to a contingent deferred sales charge. Class B shares, which convert to class A shares after approximately eight years, are not subject to a front-end sales charge and are subject to a contingent deferred sales charge if those shares are redeemed within six years of purchase. Class C shares are subject to a one-year 1.00% contingent deferred sales charge and generally convert to class A shares after approximately ten years. Class R shares, which are not available to all investors, are sold at net asset value. The expenses for class A, class B, class C, class M and class R shares may differ based on the distribution fee of each class, which is identified in Note 2. Class R6 and class Y shares, which are sold at net asset value, are generally subject to the same expenses as class A, class B, class C, class M and class R shares, but do not bear a distribution fee, and in the case of class R6 shares, bear a lower investor servicing fee, which is identified in Note 2. Class R6 and class Y shares are not available to all investors.
In the normal course of business, the fund enters into contracts that may include agreements to indemnify another party under given circumstances. The fund’s maximum exposure under these arrangements is unknown as this would involve future claims that may be, but have not yet been, made against the fund. However, the fund’s management team expects the risk of material loss to be remote.
The fund has entered into contractual arrangements with an investment adviser, administrator, distributor, shareholder servicing agent and custodian, who each provide services to the fund. Unless expressly stated otherwise, shareholders are not parties to, or intended beneficiaries of these contractual arrangements, and these contractual arrangements are not intended to create any shareholder right to enforce them against the service providers or to seek any remedy under them against the service providers, either directly or on behalf of the fund.
Under the fund’s Amended and Restated Agreement and Declaration of Trust, any claims asserted against or on behalf of the Putnam Funds, including claims against Trustees and Officers, must be brought in state and federal courts located within the Commonwealth of Massachusetts.
Note 1: Significant accounting policies
The following is a summary of significant accounting policies consistently followed by the fund in the preparation of its financial statements. The preparation of financial statements is in conformity with accounting principles generally accepted in the United States of America and requires management to make estimates and assumptions that affect the reported amounts of assets and liabilities in the financial statements and the reported amounts of increases and decreases in net assets from operations. Actual results could differ from those estimates. Subsequent events after the Statement of assets and liabilities date through the date that the financial statements were issued have been evaluated in the preparation of the financial statements.
|
| 114 Diversified Income Trust |
Investment income, realized and unrealized gains and losses and expenses of the fund are borne pro-rata based on the relative net assets of each class to the total net assets of the fund, except that each class bears expenses unique to that class (including the distribution fees applicable to such classes). Each class votes as a class only with respect to its own distribution plan or other matters on which a class vote is required by law or determined by the Trustees. If the fund were liquidated, shares of each class would receive their pro-rata share of the net assets of the fund. In addition, the Trustees declare separate dividends on each class of shares.
Security valuationPortfolio securities and other investments are valued using policies and procedures adopted by the Board of Trustees. The Trustees have formed a Pricing Committee to oversee the implementation of these procedures and have delegated responsibility for valuing the fund’s assets in accordance with these procedures to Putnam Management. Putnam Management has established an internal Valuation Committee that is responsible for making fair value determinations, evaluating the effectiveness of the pricing policies of the fund and reporting to the Pricing Committee.
Investments for which market quotations are readily available are valued at the last reported sales price on their principal exchange, or official closing price for certain markets, and are classified as Level 1 securities under Accounting Standards Codification 820Fair Value Measurements and Disclosures(ASC 820). If no sales are reported, as in the case of some securities that are traded OTC, a security is valued at its last reported bid price and is generally categorized as a Level 2 security.
Investments in open-end investment companies (excluding exchange-traded funds), if any, which can be classified as Level 1 or Level 2 securities, are valued based on their net asset value. The net asset value of such investment companies equals the total value of their assets less their liabilities and divided by the number of their outstanding shares.
Market quotations are not considered to be readily available for certain debt obligations (including short-term investments with remaining maturities of 60 days or less) and other investments; such investments are valued on the basis of valuations furnished by an independent pricing service approved by the Trustees or dealers selected by Putnam Management. Such services or dealers determine valuations for normal institutional-size trading units of such securities using methods based on market transactions for comparable securities and various relationships, generally recognized by institutional traders, between securities (which consider such factors as security prices, yields, maturities and ratings). These securities will generally be categorized as Level 2.
Many securities markets and exchanges outside the U.S. close prior to the scheduled close of the New York Stock Exchange and therefore the closing prices for securities in such markets or on such exchanges may not fully reflect events that occur after such close but before the scheduled close of the New York Stock Exchange. Accordingly, on certain days, the fund will fair value certain foreign equity securities taking into account multiple factors including movements in the U.S. securities markets, currency valuations and comparisons to the valuation of American Depository Receipts, exchange-traded funds and futures contracts. The foreign equity securities, which would generally be classified as Level 1 securities, will be transferred to Level 2 of the fair value hierarchy when they are valued at fair value. The number of days on which fair value prices will be used will depend on market activity and it is possible that fair value prices will be used by the fund to a significant extent. Securities quoted in foreign currencies, if any, are translated into U.S. dollars at the current exchange rate.
To the extent a pricing service or dealer is unable to value a security or provides a valuation that Putnam Management does not believe accurately reflects the security’s fair value, the security will be valued at fair value by Putnam Management in accordance with policies and procedures approved by the Trustees. Certain investments, including certain restricted and illiquid securities and derivatives, are also valued at fair value following procedures approved by the Trustees. These valuations consider such factors as significant market or specific security events such as interest rate or credit quality changes, various relationships with other securities, discount rates, U.S. Treasury, U.S. swap and credit yields, index levels, convexity exposures, recovery rates, sales and other multiples and resale restrictions. These securities are classified as Level 2 or as Level 3 depending on the priority of the significant inputs.
To assess the continuing appropriateness of fair valuations, the Valuation Committee reviews and affirms the reasonableness of such valuations on a regular basis after considering all relevant information that is reasonably available. Such valuations and procedures are reviewed periodically by the Trustees. Certain securities may be valued on the basis of a price provided by a single source. The fair value of securities is generally determined as the amount that the fund could reasonably expect to realize from an orderly disposition of such securities over a reasonable period of time. By its nature, a fair value price is a good faith estimate of the value of a security in a current sale and does not reflect an actual market price, which may be different by a material amount.
|
| Diversified Income Trust 115 |
Joint trading accountPursuant to an exemptive order from the SEC, the fund may transfer uninvested cash balances into a joint trading account along with the cash of other registered investment companies and certain other accounts managed by Putnam Management. These balances may be invested in issues of short-term investments having maturities of up to 90 days.
Repurchase agreementsThe fund, or any joint trading account, through its custodian, receives delivery of the underlying securities, the fair value of which at the time of purchase is required to be in an amount at least equal to the resale price, including accrued interest. Collateral for certain tri-party repurchase agreements, which totaled $99,321,706 at the end of the reporting period, is held at the counterparty’s custodian in a segregated account for the benefit of the fund and the counterparty. Putnam Management is responsible for determining that the value of these underlying securities is at all times at least equal to the resale price, including accrued interest. In the event of default or bankruptcy by the other party to the agreement, retention of the collateral may be subject to legal proceedings.
Security transactions and related investment incomeSecurity transactions are recorded on the trade date (the date the order to buy or sell is executed). Gains or losses on securities sold are determined on the identified cost basis.
Interest income, net of any applicable withholding taxes and including amortization and accretion of premiums and discounts on debt securities, is recorded on the accrual basis.
The fund may have earned certain fees in connection with its senior loan purchasing activities. These fees, if any, are treated as market discount and are amortized into income in the Statement of operations.
Securities purchased or sold on a forward commitment or delayed delivery basis may be settled at a future date beyond customary settlement time; interest income is accrued based on the terms of the securities. Losses may arise due to changes in the fair value of the underlying securities or if the counterparty does not perform under the contract.
Stripped securitiesThe fund may invest in stripped securities which represent a participation in securities that may be structured in classes with rights to receive different portions of the interest and principal. Interest-only securities receive all of the interest and principal-only securities receive all of the principal. If the interest-only securities experience greater than anticipated prepayments of principal, the fund may fail to recoup fully its initial investment in these securities. Conversely, principal-only securities increase in value if prepayments are greater than anticipated and decline if prepayments are slower than anticipated. The fair value of these securities is highly sensitive to changes in interest rates.
Foreign currency translationThe accounting records of the fund are maintained in U.S. dollars. The fair value of foreign securities, currency holdings, and other assets and liabilities is recorded in the books and records of the fund after translation to U.S. dollars based on the exchange rates on that day. The cost of each security is determined using historical exchange rates. Income and withholding taxes are translated at prevailing exchange rates when earned or incurred. The fund does not isolate that portion of realized or unrealized gains or losses resulting from changes in the foreign exchange rate on investments from fluctuations arising from changes in the market prices of the securities. Such gains and losses are included with the net realized and unrealized gain or loss on investments. Net realized gains and losses on foreign currency transactions represent net realized exchange gains or losses on disposition of foreign currencies, currency gains and losses realized between the trade and settlement dates on securities transactions and the difference between the amount of investment income and foreign withholding taxes recorded on the fund’s books and the U.S. dollar equivalent amounts actually received or paid. Net unrealized appreciation and depreciation of assets and liabilities in foreign currencies arise from changes in the value of assets and liabilities other than investments at the period end, resulting from changes in the exchange rate.
Options contractsThe fund uses options contracts to hedge duration and convexity, to isolate prepayment risk and to manage downside risks.
The potential risk to the fund is that the change in value of options contracts may not correspond to the change in value of the hedged instruments. In addition, losses may arise from changes in the value of the underlying instruments if there is an illiquid secondary market for the contracts, if interest or exchange rates move unexpectedly or if the counterparty to the contract is unable to perform. Realized gains and losses on purchased options are included in realized gains and losses on investment securities. If a written call option is exercised, the premium originally received is recorded as an addition to sales proceeds. If a written put option is exercised, the premium originally received is recorded as a reduction to the cost of investments.
|
| 116 Diversified Income Trust |
Exchange-traded options are valued at the last sale price or, if no sales are reported, the last bid price for purchased options and the last ask price for written options. OTC traded options are valued using prices supplied by dealers.
Options on swaps are similar to options on securities except that the premium paid or received is to buy or grant the right to enter into a previously agreed upon interest rate or credit default contract. Forward premium swap option contracts include premiums that have extended settlement dates. The delayed settlement of the premiums is factored into the daily valuation of the option contracts. In the case of interest rate cap and floor contracts, in return for a premium, ongoing payments between two parties are based on interest rates exceeding a specified rate, in the case of a cap contract, or falling below a specified rate in the case of a floor contract.
Written option contracts outstanding at period end, if any, are listed after the fund’s portfolio.
Futures contractsThe fund uses futures contracts for hedging treasury term structure risk and for yield curve positioning.
The potential risk to the fund is that the change in value of futures contracts may not correspond to the change in value of the hedged instruments. In addition, losses may arise from changes in the value of the underlying instruments, if there is an illiquid secondary market for the contracts, if interest or exchange rates move unexpectedly or if the counterparty to the contract is unable to perform. With futures, there is minimal counterparty credit risk to the fund since futures are exchange traded and the exchange’s clearinghouse, as counterparty to all exchange traded futures, guarantees the futures against default. Risks may exceed amounts recognized on the Statement of assets and liabilities. When the contract is closed, the fund records a realized gain or loss equal to the difference between the value of the contract at the time it was opened and the value at the time it was closed.
Futures contracts are valued at the quoted daily settlement prices established by the exchange on which they trade. The fund and the broker agree to exchange an amount of cash equal to the daily fluctuation in the value of the futures contract. Such receipts or payments are known as “variation margin.”
Futures contracts outstanding at period end, if any, are listed after the fund’s portfolio.
Forward currency contractsThe fund buys and sells forward currency contracts, which are agreements between two parties to buy and sell currencies at a set price on a future date. These contracts are used for hedging currency exposures and to gain exposure to currencies.
The U.S. dollar value of forward currency contracts is determined using current forward currency exchange rates supplied by a quotation service. The fair value of the contract will fluctuate with changes in currency exchange rates. The contract is marked to market daily and the change in fair value is recorded as an unrealized gain or loss. The fund records a realized gain or loss equal to the difference between the value of the contract at the time it was opened and the value at the time it was closed when the contract matures or by delivery of the currency. The fund could be exposed to risk if the value of the currency changes unfavorably, if the counterparties to the contracts are unable to meet the terms of their contracts or if the fund is unable to enter into a closing position. Risks may exceed amounts recognized on the Statement of assets and liabilities.
Forward currency contracts outstanding at period end, if any, are listed after the fund’s portfolio.
Interest rate swap contractsThe fund entered into OTC and/or centrally cleared interest rate swap contracts, which are arrangements between two parties to exchange cash flows based on a notional principal amount, for hedging term structure risk, for yield curve positioning and for gaining exposure to rates in various countries.
An OTC and centrally cleared interest rate swap can be purchased or sold with an upfront premium. For OTC interest rate swap contracts, an upfront payment received by the fund is recorded as a liability on the fund’s books. An upfront payment made by the fund is recorded as an asset on the fund’s books. OTC and centrally cleared interest rate swap contracts are marked to market daily based upon quotations from an independent pricing service or market makers. Any change is recorded as an unrealized gain or loss on OTC interest rate swaps. Daily fluctuations in the value of centrally cleared interest rate swaps are settled through a central clearing agent and are recorded in variation margin on the Statement of assets and liabilities and recorded as unrealized gain or loss. Payments, including upfront premiums, received or made are recorded as realized gains or losses at the reset date or the closing of the contract. Certain OTC and centrally cleared interest rate swap contracts may include extended effective dates. Payments related to these swap contracts are accrued based on the terms of the contract.
The fund could be exposed to credit or market risk due to unfavorable changes in the fluctuation of interest rates or if the counterparty defaults, in the case of OTC interest rate contracts, or the central clearing agency or a
|
| Diversified Income Trust 117 |
clearing member defaults, in the case of centrally cleared interest rate swap contracts, on its respective obligation to perform under the contract. The fund’s maximum risk of loss from counterparty risk or central clearing risk is the fair value of the contract. This risk may be mitigated for OTC interest rate swap contracts by having a master netting arrangement between the fund and the counterparty and for centrally cleared interest rate swap contracts through the daily exchange of variation margin. There is minimal counterparty risk with respect to centrally cleared interest rate swap contracts due to the clearinghouse guarantee fund and other resources that are available in the event of a clearing member default. Risk of loss may exceed amounts recognized on the Statement of assets and liabilities.
OTC and centrally cleared interest rate swap contracts outstanding, including their respective notional amounts at period end, if any, are listed after the fund’s portfolio.
Total return swap contractsThe fund entered into OTC and/or centrally cleared total return swap contracts, which are arrangements to exchange a market-linked return for a periodic payment, both based on a notional principal amount, to hedge sector exposure, for gaining exposure to specific sectors, for hedging inflation and for gaining exposure to inflation.
To the extent that the total return of the security, index or other financial measure underlying the transaction exceeds or falls short of the offsetting interest rate obligation, the fund will receive a payment from or make a payment to the counterparty. OTC and/or centrally cleared total return swap contracts are marked to market daily based upon quotations from an independent pricing service or market maker. Any change is recorded as an unrealized gain or loss on OTC total return swaps. Daily fluctuations in the value of centrally cleared total return swaps are settled through a central clearing agent and are recorded in variation margin on the Statement of assets and liabilities and recorded as unrealized gain or loss. Payments received or made are recorded as realized gains or losses. Certain OTC and/or centrally cleared total return swap contracts may include extended effective dates. Payments related to these swap contracts are accrued based on the terms of the contract. The fund could be exposed to credit or market risk due to unfavorable changes in the fluctuation of interest rates or in the price of the underlying security or index, the possibility that there is no liquid market for these agreements or that the counterparty may default on its obligation to perform. The fund’s maximum risk of loss from counterparty risk or central clearing risk is the fair value of the contract. This risk may be mitigated for OTC total return swap contracts by having a master netting arrangement between the fund and the counterparty and for centrally cleared total return swap contracts through the daily exchange of variation margin. There is minimal counterparty risk with respect to centrally cleared total return swap contracts due to the clearinghouse guarantee fund and other resources that are available in the event of a clearing member default. Risk of loss may exceed amounts recognized on the Statement of assets and liabilities.
OTC and/or centrally cleared total return swap contracts outstanding, including their respective notional amounts at period end, if any, are listed after the fund’s portfolio.
Credit default contractsThe fund entered into OTC and/or centrally cleared credit default contracts to hedge credit risk, for gaining liquid exposure to individual names, to hedge market risk and for gaining exposure to specific sectors.
In OTC and centrally cleared credit default contracts, the protection buyer typically makes a periodic stream of payments to a counterparty, the protection seller, in exchange for the right to receive a contingent payment upon the occurrence of a credit event on the reference obligation or all other equally ranked obligations of the reference entity. Credit events are contract specific but may include bankruptcy, failure to pay, restructuring and obligation acceleration. For OTC credit default contracts, an upfront payment received by the fund is recorded as a liability on the fund’s books. An upfront payment made by the fund is recorded as an asset on the fund’s books. Centrally cleared credit default contracts provide the same rights to the protection buyer and seller except the payments between parties, including upfront premiums, are settled through a central clearing agent through variation margin payments. Upfront and periodic payments received or paid by the fund for OTC and centrally cleared credit default contracts are recorded as realized gains or losses at the reset date or close of the contract. The OTC and centrally cleared credit default contracts are marked to market daily based upon quotations from an independent pricing service or market makers. Any change in value of OTC credit default contracts is recorded as an unrealized gain or loss. Daily fluctuations in the value of centrally cleared credit default contracts are recorded in variation margin on the Statement of assets and liabilities and recorded as unrealized gain or loss. Upon the occurrence of a credit event, the difference between the par value and fair value of the reference obligation, net of any proportional amount of the upfront payment, is recorded as a realized gain or loss.
In addition to bearing the risk that the credit event will occur, the fund could be exposed to market risk due to unfavorable changes in interest rates or in the price of the underlying security or index or the possibility that
|
| 118 Diversified Income Trust |
the fund may be unable to close out its position at the same time or at the same price as if it had purchased the underlying reference obligations. In certain circumstances, the fund may enter into offsetting OTC and centrally cleared credit default contracts which would mitigate its risk of loss. Risks of loss may exceed amounts recognized on the Statement of assets and liabilities. The fund’s maximum risk of loss from counterparty risk, either as the protection seller or as the protection buyer, is the fair value of the contract. This risk may be mitigated for OTC credit default contracts by having a master netting arrangement between the fund and the counterparty and for centrally cleared credit default contracts through the daily exchange of variation margin. Counterparty risk is further mitigated with respect to centrally cleared credit default swap contracts due to the clearinghouse guarantee fund and other resources that are available in the event of a clearing member default. Where the fund is a seller of protection, the maximum potential amount of future payments the fund may be required to make is equal to the notional amount.
OTC and centrally cleared credit default contracts outstanding, including their respective notional amounts at period end, if any, are listed after the fund’s portfolio.
TBA commitmentsThe fund may enter into TBA (to be announced) commitments to purchase securities for a fixed unit price at a future date beyond customary settlement time. Although the unit price and par amount have been established, the actual securities have not been specified. However, it is anticipated that the amount of the commitments will not significantly differ from the principal amount. The fund holds, and maintains until settlement date, cash or high-grade debt obligations in an amount sufficient to meet the purchase price, or the fund may enter into offsetting contracts for the forward sale of other securities it owns. Income on the securities will not be earned until settlement date.
The fund may also enter into TBA sale commitments to hedge its portfolio positions, to sell mortgage-backed securities it owns under delayed delivery arrangements or to take a short position in mortgage-backed securities. Proceeds of TBA sale commitments are not received until the contractual settlement date. During the time a TBA sale commitment is outstanding, either equivalent deliverable securities or an offsetting TBA purchase commitment deliverable on or before the sale commitment date are held as “cover” for the transaction, or other liquid assets in an amount equal to the notional value of the TBA sale commitment are segregated. If the TBA sale commitment is closed through the acquisition of an offsetting TBA purchase commitment, the fund realizes a gain or loss. If the fund delivers securities under the commitment, the fund realizes a gain or a loss from the sale of the securities based upon the unit price established at the date the commitment was entered into.
TBA commitments, which are accounted for as purchase and sale transactions, may be considered securities themselves, and involve a risk of loss due to changes in the value of the security prior to the settlement date as well as the risk that the counterparty to the transaction will not perform its obligations. Counterparty risk is mitigated by having a master agreement between the fund and the counterparty.
Unsettled TBA commitments are valued at their fair value according to the procedures described under “Security valuation” above. The contract is marked to market daily and the change in fair value is recorded by the fund as an unrealized gain or loss. Based on market circumstances, Putnam Management will determine whether to take delivery of the underlying securities or to dispose of the TBA commitments prior to settlement.
TBA purchase commitments outstanding at period end, if any, are listed within the fund’s portfolio and TBA sale commitments outstanding at period end, if any, are listed after the fund’s portfolio.
Master agreementsThe fund is a party to ISDA (International Swaps and Derivatives Association, Inc.) Master Agreements that govern OTC derivative and foreign exchange contracts and Master Securities Forward Transaction Agreements that govern transactions involving mortgage-backed and other asset-backed securities that may result in delayed delivery (Master Agreements) with certain counterparties entered into from time to time. The Master Agreements may contain provisions regarding, among other things, the parties’ general obligations, representations, agreements, collateral requirements, events of default and early termination. With respect to certain counterparties, in accordance with the terms of the Master Agreements, collateral posted to the fund is held in a segregated account by the fund’s custodian and, with respect to those amounts which can be sold or repledged, are presented in the fund’s portfolio.
Collateral pledged by the fund is segregated by the fund’s custodian and identified in the fund’s portfolio. Collateral can be in the form of cash or debt securities issued by the U.S. Government or related agencies or other securities as agreed to by the fund and the applicable counterparty. Collateral requirements are determined based on the fund’s net position with each counterparty.
With respect to ISDA Master Agreements, termination events applicable to the fund may occur upon a decline in the fund’s net assets below a specified threshold over a certain period of time. Termination events applicable
|
| Diversified Income Trust 119 |
to counterparties may occur upon a decline in the counterparty’s long-term or short-term credit ratings below a specified level. In each case, upon occurrence, the other party may elect to terminate early and cause settlement of all derivative and foreign exchange contracts outstanding, including the payment of any losses and costs resulting from such early termination, as reasonably determined by the terminating party. Any decision by one or more of the fund’s counterparties to elect early termination could impact the fund’s future derivative activity.
At the close of the reporting period, the fund had a net liability position of $130,335,362 on open derivative contracts subject to the Master Agreements. Collateral posted by the fund at period end for these agreements totaled $142,437,433 and may include amounts related to unsettled agreements.
Interfund lendingThe fund, along with other Putnam funds, may participate in an interfund lending program pursuant to an exemptive order issued by the SEC. This program allows the fund to borrow from or lend to other Putnam funds that permit such transactions. Interfund lending transactions are subject to each fund’s investment policies and borrowing and lending limits. Interest earned or paid on the interfund lending transaction will be based on the average of certain current market rates. During the reporting period, the fund did not utilize the program.
Lines of creditThe fund participates, along with other Putnam funds, in a $317.5 million unsecured committed line of credit and a $235.5 million unsecured uncommitted line of credit, both provided by State Street. Borrowings may be made for temporary or emergency purposes, including the funding of shareholder redemption requests and trade settlements. Interest is charged to the fund based on the fund’s borrowing at a rate equal to 1.25% plus the higher of (1) the Federal Funds rate and (2) the overnight LIBOR for the committed line of credit and the Federal Funds rate plus 1.30% for the uncommitted line of credit. A closing fee equal to 0.04% of the committed line of credit and 0.04% of the uncommitted line of credit has been paid by the participating funds. In addition, a commitment fee of 0.21% per annum on any unutilized portion of the committed line of credit is allocated to the participating funds based on their relative net assets and paid quarterly. During the reporting period, the fund had no borrowings against these arrangements.
Federal taxesIt is the policy of the fund to distribute all of its taxable income within the prescribed time period and otherwise comply with the provisions of the Internal Revenue Code of 1986, as amended (the Code), applicable to regulated investment companies. It is also the intention of the fund to distribute an amount sufficient to avoid imposition of any excise tax under Section 4982 of the Code.
The fund is subject to the provisions of Accounting Standards Codification 740Income Taxes(ASC 740). ASC 740 sets forth a minimum threshold for financial statement recognition of the benefit of a tax position taken or expected to be taken in a tax return. The fund did not have a liability to record for any unrecognized tax benefits in the accompanying financial statements. No provision has been made for federal taxes on income, capital gains or unrealized appreciation on securities held nor for excise tax on income and capital gains. Each of the fund’s federal tax returns for the prior three fiscal years remains subject to examination by the Internal Revenue Service.
The fund may also be subject to taxes imposed by governments of countries in which it invests. Such taxes are generally based on either income or gains earned or repatriated. The fund accrues and applies such taxes to net investment income, net realized gains and net unrealized gains as income and/or capital gains are earned. In some cases, the fund may be entitled to reclaim all or a portion of such taxes, and such reclaim amounts, if any, are reflected as an asset on the fund’s books. In many cases, however, the fund may not receive such amounts for an extended period of time, depending on the country of investment.
Under the Regulated Investment Company Modernization Act of 2010, the fund will be permitted to carry forward capital losses incurred for an unlimited period and the carry forwards will retain their character as either short-term or long-term capital losses. At September 30, 2019, the fund had the following capital loss carryover available, to the extent allowed by the Code, to offset future net capital gain, if any:
| | |
| | Loss carryover | |
| Short-term | Long-term | Total |
| $685,290,484 | $242,111,805 | $927,402,289 |
Tax cost of investments includes adjustments to net unrealized appreciation (depreciation) which may not necessarily be final tax cost basis adjustments, but closely approximate the tax basis unrealized gains and losses that may be realized and distributed to shareholders. The aggregate identified cost on a tax basis is $4,507,096,567, resulting in gross unrealized appreciation and depreciation of $698,487,920 and $1,489,713,716, respectively, or net unrealized depreciation of $791,225,796.
|
| 120 Diversified Income Trust |
Distributions to shareholdersDistributions to shareholders from net investment income are recorded by the fund on the ex-dividend date. Distributions from capital gains, if any, are recorded on the ex-dividend date and paid at least annually. The amount and character of income and gains to be distributed are determined in accordance with income tax regulations, which may differ from generally accepted accounting principles. Dividend sources are estimated at the time of declaration. Actual results may vary. Any non-taxable return of capital cannot be determined until final tax calculations are completed after the end of the fund’s fiscal year. Reclassifications are made to the fund’s capital accounts to reflect income and gains available for distribution (or available capital loss carryovers) under income tax regulations.
Note 2: Management fee, administrative services and other transactions
The fund pays Putnam Management a management fee (based on the fund’s average net assets and computed and paid monthly) at annual rates that may vary based on the average of the aggregate net assets of all open-end mutual funds sponsored by Putnam Management (excluding net assets of funds that are invested in, or that are invested in by, other Putnam funds to the extent necessary to avoid “double counting” of those assets). Such annual rates may vary as follows:
| | | | |
| 0.700% | of the first $5 billion, | | 0.500% | of the next $50 billion, |
| 0.650% | of the next $5 billion, | | 0.480% | of the next $50 billion, |
| 0.600% | of the next $10 billion, | | 0.470% | of the next $100 billion and |
| 0.550% | of the next $10 billion, | | 0.465% | of any excess thereafter. |
For the reporting period, the management fee represented an effective rate (excluding the impact from any expense waivers in effect) of 0.269% of the fund’s average net assets.
Putnam Management has contractually agreed, through January 30, 2021, to waive fees and/or reimburse the fund’s expenses to the extent necessary to limit the cumulative expenses of the fund, exclusive of brokerage, interest, taxes, investment-related expenses, extraordinary expenses, acquired fund fees and expenses and payments under the fund’s investor servicing contract, investment management contract and distribution plans, on a fiscal year-to-date basis to an annual rate of 0.20% of the fund’s average net assets over such fiscal year-to-date period. During the reporting period, the fund’s expenses were not reduced as a result of this limit.
Putnam Investments Limited (PIL), an affiliate of Putnam Management, is authorized by the Trustees to manage a separate portion of the assets of the fund as determined by Putnam Management from time to time. PIL did not manage any portion of the assets of the fund during the reporting period. If Putnam Management were to engage the services of PIL, Putnam Management would pay a quarterly sub-management fee to PIL for its services at an annual rate of 0.40% of the average net assets of the portion of the fund managed by PIL.
The fund reimburses Putnam Management an allocated amount for the compensation and related expenses of certain officers of the fund and their staff who provide administrative services to the fund. The aggregate amount of all such reimbursements is determined annually by the Trustees.
Custodial functions for the fund’s assets are provided by State Street. Custody fees are based on the fund’s asset level, the number of its security holdings and transaction volumes.
Putnam Investor Services, Inc., an affiliate of Putnam Management, provides investor servicing agent functions to the fund. Putnam Investor Services, Inc. received fees for investor servicing for class A, class B, class C, class M, class R and class Y shares that included (1) a per account fee for each direct and underlying non-defined contribution account (retail account) of the fund; (2) a specified rate of the fund’s assets attributable to defined contribution plan accounts; and (3) a specified rate based on the average net assets in retail accounts. Putnam Investor Services, Inc. has agreed that the aggregate investor servicing fees for each fund’s retail and defined contribution accounts for these share classes will not exceed an annual rate of 0.25% of the fund’s average assets attributable to such accounts.
Class R6 shares paid a monthly fee based on the average net assets of class R6 shares at an annual rate of 0.05%.
|
| Diversified Income Trust 121 |
| | | | |
| During the reporting period, the expenses for each class of shares related to investor servicing fees were as follows: | |
| | | | |
| Class A | $753,116 | | Class R | 1,642 |
| Class B | 12,756 | | Class R6 | 4,991 |
| Class C | 319,503 | | Class Y | 1,810,052 |
| Class M | 69,515 | | Total | $2,971,575 |
The fund has entered into expense offset arrangements with Putnam Investor Services, Inc. and State Street whereby Putnam Investor Services, Inc.’s and State Street’s fees are reduced by credits allowed on cash balances. For the reporting period, the fund’s expenses were reduced by $3,416 under the expense offset arrangements.
Each Independent Trustee of the fund receives an annual Trustee fee, of which $3,056, as a quarterly retainer, has been allocated to the fund, and an additional fee for each Trustees meeting attended. Trustees also are reimbursed for expenses they incur relating to their services as Trustees.
The fund has adopted a Trustee Fee Deferral Plan (the Deferral Plan) which allows the Trustees to defer the receipt of all or a portion of Trustees fees payable on or after July 1, 1995. The deferred fees remain invested in certain Putnam funds until distribution in accordance with the Deferral Plan.
The fund has adopted an unfunded noncontributory defined benefit pension plan (the Pension Plan) covering all Trustees of the fund who have served as a Trustee for at least five years and were first elected prior to 2004. Benefits under the Pension Plan are equal to 50% of the Trustee’s average annual attendance and retainer fees for the three years ended December 31, 2005. The retirement benefit is payable during a Trustee’s lifetime, beginning the year following retirement, for the number of years of service through December 31, 2006. Pension expense for the fund is included in Trustee compensation and expenses in the Statement of operations. Accrued pension liability is included in Payable for Trustee compensation and expenses in the Statement of assets and liabilities. The Trustees have terminated the Pension Plan with respect to any Trustee first elected after 2003.
The fund has adopted distribution plans (the Plans) with respect to the following share classes pursuant to Rule 12b–1 under the Investment Company Act of 1940. The purpose of the Plans is to compensate Putnam Retail Management Limited Partnership, an indirect wholly-owned subsidiary of Putnam Investments, LLC, for services provided and expenses incurred in distributing shares of the fund. The Plans provide payments by the fund to Putnam Retail Management Limited Partnership at an annual rate of up to the following amounts (Maximum %) of the average net assets attributable to each class. The Trustees have approved payment by the fund at the following annual rate (Approved %) of the average net assets attributable to each class. During the reporting period, the class-specific expenses related to distribution fees were as follows:
| | | |
| | Maximum % | Approved % | Amount |
| Class A | 0.35% | 0.25% | $1,361,984 |
| Class B | 1.00% | 1.00% | 92,401 |
| Class C | 1.00% | 1.00% | 2,313,864 |
| Class M | 1.00% | 0.50% | 251,673 |
| Class R | 1.00% | 0.50% | 5,937 |
| Total | | | $4,025,859 |
For the reporting period, Putnam Retail Management Limited Partnership, acting as underwriter, received net commissions of $63,628 and $8 from the sale of class A and class M shares, respectively, and received $1,791 and $453 in contingent deferred sales charges from redemptions of class B and class C shares, respectively.
A deferred sales charge of up to 1.00% is assessed on certain redemptions of class A shares. For the reporting period, Putnam Retail Management Limited Partnership, acting as underwriter, received $308 on class A redemptions.
|
| 122 Diversified Income Trust |
Note 3: Purchases and sales of securities
| | |
| During the reporting period, the cost of purchases and the proceeds from sales, excluding short-term |
| investments, were as follows: | | |
| |
| | Cost of purchases | Proceeds from sales |
| Investments in securities, including TBA commitments (Long-term) | $25,870,566,361 | $27,582,909,749 |
| U.S. government securities (Long-term) | — | — |
| Total | $25,870,566,361 | $27,582,909,749 |
The fund may purchase or sell investments from or to other Putnam funds in the ordinary course of business, which can reduce the fund’s transaction costs, at prices determined in accordance with SEC requirements and policies approved by the Trustees. During the reporting period, purchases or sales of long-term securities from or to other Putnam funds, if any, did not represent more than 5% of the fund’s total cost of purchases and/or total proceeds from sales.
Note 4: Capital shares
At the close of the reporting period, there were an unlimited number of shares of beneficial interest authorized. Transactions, including, if applicable, direct exchanges pursuant to share conversions, in capital shares were as follows:
| | | | |
| | SIX MONTHS ENDED 3/31/20 | YEAR ENDED 9/30/19 |
| Class A | Shares | Amount | Shares | Amount |
| Shares sold | 17,981,776 | $125,970,159 | 33,296,954 | $229,294,508 |
| Shares issued in connection with | | | | |
| reinvestment of distributions | 2,868,863 | 19,765,362 | 6,787,200 | 46,621,920 |
| | 20,850,639 | 145,735,521 | 40,084,154 | 275,916,428 |
| Shares repurchased | (34,575,729) | (233,297,249) | (67,237,251) | (460,794,363) |
| Net decrease | (13,725,090) | $(87,561,728) | (27,153,097) | $(184,877,935) |
| |
| | SIX MONTHS ENDED 3/31/20 | YEAR ENDED 9/30/19 |
| Class B | Shares | Amount | Shares | Amount |
| Shares sold | 45,874 | $310,063 | 130,303 | $881,848 |
| Shares issued in connection with | | | | |
| reinvestment of distributions | 39,864 | 271,327 | 115,614 | 784,429 |
| | 85,738 | 581,390 | 245,917 | 1,666,277 |
| Shares repurchased | (487,237) | (3,314,829) | (1,642,658) | (11,166,903) |
| Net decrease | (401,499) | $(2,733,439) | (1,396,741) | $(9,500,626) |
| |
| | SIX MONTHS ENDED 3/31/20 | YEAR ENDED 9/30/19 |
| Class C | Shares | Amount | Shares | Amount |
| Shares sold | 4,002,507 | $27,520,565 | 8,630,911 | $58,090,334 |
| Shares issued in connection with | | | | |
| reinvestment of distributions | 995,005 | 6,712,653 | 2,684,665 | 18,061,559 |
| | 4,997,512 | 34,233,218 | 11,315,576 | 76,151,893 |
| Shares repurchased | (12,435,179) | (83,447,505) | (28,567,497) | (192,427,698) |
| Net decrease | (7,437,667) | $(49,214,287) | (17,251,921) | $(116,275,805) |
|
| Diversified Income Trust 123 |
| | | | |
| | SIX MONTHS ENDED 3/31/20 | YEAR ENDED 9/30/19 |
| Class M | Shares | Amount | Shares | Amount |
| Shares sold | 13,364 | $91,541 | 163,220 | $1,094,815 |
| Shares issued in connection with | | | | |
| reinvestment of distributions | 11,888 | 81,315 | 85,287 | 573,484 |
| | 25,252 | 172,856 | 248,507 | 1,668,299 |
| Shares repurchased | (2,450,540) | (16,790,523) | (1,273,084) | (8,560,112) |
| Net decrease | (2,425,288) | $(16,617,667) | (1,024,577) | $(6,891,813) |
| |
| | SIX MONTHS ENDED 3/31/20 | YEAR ENDED 9/30/19 |
| Class R | Shares | Amount | Shares | Amount |
| Shares sold | 42,388 | $287,248 | 126,225 | $835,680 |
| Shares issued in connection with | | | | |
| reinvestment of distributions | 6,516 | 44,177 | 14,490 | 98,171 |
| | 48,904 | 331,425 | 140,715 | 933,851 |
| Shares repurchased | (48,049) | (331,871) | (139,203) | (943,069) |
| Net increase (decrease) | 855 | $(446) | 1,512 | $(9,218) |
| |
| | SIX MONTHS ENDED 3/31/20 | YEAR ENDED 9/30/19 |
| Class R6 | Shares | Amount | Shares | Amount |
| Shares sold | 1,716,983 | $11,904,526 | 820,265 | $5,561,116 |
| Shares issued in connection with | | | | |
| reinvestment of distributions | 60,684 | 411,580 | 113,536 | 772,215 |
| | 1,777,667 | 12,316,106 | 933,801 | 6,333,331 |
| Shares repurchased | (901,792) | (6,141,366) | (596,757) | (4,068,953) |
| Net increase | 875,875 | $6,174,740 | 337,044 | $2,264,378 |
| |
| | SIX MONTHS ENDED 3/31/20 | YEAR ENDED 9/30/19 |
| Class Y | Shares | Amount | Shares | Amount |
| Shares sold | 89,453,137 | $618,460,006 | 179,084,930 | $1,216,257,690 |
| Shares issued in connection with | | | | |
| reinvestment of distributions | 6,808,297 | 46,379,733 | 13,964,796 | 94,887,383 |
| | 96,261,434 | 664,839,739 | 193,049,726 | 1,311,145,073 |
| Shares repurchased | (130,239,838) | (861,406,053) | (213,916,599) | (1,444,664,972) |
| Net decrease | (33,978,404) | $(196,566,314) | (20,866,873) | $(133,519,899) |
|
| 124 Diversified Income Trust |
Note 5: Affiliated transactions
| | | | | |
| Transactions during the reporting period with any company which is under common ownership or control were as follows: |
| | | | | |
| |
| | | | | | Shares |
| | | | | | outstanding |
| | | | | | and fair |
| | Fair value as | Purchase | Sale | Investment | value as |
| Name of affiliate | of 9/30/19 | cost | proceeds | income | of 3/31/20 |
| Short-term investments | | | | | |
| Putnam Short Term | | | | | |
| Investment Fund** | $257,136,539 | $546,950,686 | $518,816,598 | $2,172,683 | $285,270,627 |
| Total Short-term | | | | | |
| investments | $257,136,539 | $546,950,686 | $518,816,598 | $2,172,683 | $285,270,627 |
**Management fees charged to Putnam Short Term Investment Fund have been waived by Putnam Management.There were no realized or unrealized gains or losses during the period.
Note 6: Market, credit and other risks
In the normal course of business, the fund trades financial instruments and enters into financial transactions where risk of potential loss exists due to changes in the market (market risk) or failure of the contracting party to the transaction to perform (credit risk). The fund may be exposed to additional credit risk that an institution or other entity with which the fund has unsettled or open transactions will default. Investments in foreign securities involve certain risks, including those related to economic instability, unfavorable political developments, and currency fluctuations. The fund may invest in higher-yielding, lower-rated bonds that may have a higher rate of default. The fund may invest a significant portion of its assets in securitized debt instruments, including mortgage-backed and asset-backed investments. The yields and values of these investments are sensitive to changes in interest rates, the rate of principal payments on the underlying assets and the market’s perception of the issuers. The market for these investments may be volatile and limited, which may make them difficult to buy or sell.
On July 27, 2017, the United Kingdom’s Financial Conduct Authority (“FCA”), which regulates LIBOR, announced a desire to phase out the use of LIBOR by the end of 2021. LIBOR has historically been a common benchmark interest rate index used to make adjustments to variable-rate loans. It is used throughout global banking and financial industries to determine interest rates for a variety of financial instruments and borrowing arrangements. The transition process might lead to increased volatility and illiquidity in markets that currently rely on LIBOR to determine interest rates. It could also lead to a reduction in the value of some LIBOR-based investments and reduce the effectiveness of new hedges placed against existing LIBOR-based investments. While some LIBOR-based instruments may contemplate a scenario where LIBOR is no longer available by providing for an alternative rate-setting methodology, not all may have such provisions and there may be significant uncertainty regarding the effectiveness of any such alternative methodologies. Since the usefulness of LIBOR as a benchmark could deteriorate during the transition period, these effects could occur prior to the end of 2021.
Beginning in January 2020, global financial markets have experienced, and may continue, to experience significant volatility resulting from the spread of a virus known as COVID–19. The outbreak of COVID–19 has resulted in travel and border restrictions, quarantines, supply chain disruptions, lower consumer demand, and general market uncertainty. The effects of COVID–19 have adversely affected, and may continue to adversely affect, the global economy, the economies of certain nations, and individual issuers, all of which may negatively impact the fund’s performance.
Note 7: Senior loan commitments
Senior loans are purchased or sold on a when-issued or delayed delivery basis and may be settled a month or more after the trade date, which from time to time can delay the actual investment of available cash balances; interest income is accrued based on the terms of the securities. Senior loans can be acquired through an agent, by assignment from another holder of the loan, or as a participation interest in another holder’s portion of the loan. When the fund invests in a loan or participation, the fund is subject to the risk that an intermediate participant between the fund and the borrower will fail to meet its obligations to the fund, in addition to the risk that the borrower under the loan may default on its obligations.
|
| Diversified Income Trust 125 |
Note 8: Summary of derivative activity
The volume of activity for the reporting period for any derivative type that was held during the period is listed below and was based on an average of the holdings at the end of each fiscal quarter:
| |
| Purchased TBA commitment option contracts (contract amount) | $1,807,100,000 |
| Purchased currency option contracts (contract amount) | $517,500,000 |
| Purchased swap option contracts (contract amount) | $8,967,800,000 |
| Written TBA commitment option contracts (contract amount) | $1,966,100,000 |
| Written currency option contracts (contract amount) | $231,100,000 |
| Written swap option contracts (contract amount) | $5,333,400,000 |
| Futures contracts (number of contracts) | 9,000 |
| Forward currency contracts (contract amount) | $2,703,900,000 |
| Centrally cleared interest rate swap contracts (notional) | $15,875,700,000 |
| OTC total return swap contracts (notional) | $242,800,000 |
| Centrally cleared total return swap contracts (notional) | $1,601,100,000 |
| OTC credit default contracts (notional) | $1,261,000,000 |
| Centrally cleared credit default contracts (notional) | $21,300,000 |
| Warrants (number of warrants) | 32,000 |
The following is a summary of the fair value of derivative instruments as of the close of the reporting period:
| | | | |
| Fair value of derivative instruments as of the close of the reporting period | |
| | ASSET DERIVATIVES | LIABILITY DERIVATIVES |
| Derivatives not | | | | |
| accounted for as | Statement of | | Statement of | |
| hedging instruments | assets and | | assets and | |
| under ASC 815 | liabilities location | Fair value | liabilities location | Fair value |
| Credit contracts | Receivables | $97,714,315 | Payables | $237,798,646 |
| Foreign exchange | | | | |
| contracts | Investments, Receivables | 60,822,479 | Payables | 56,565,936 |
| Equity contracts | Investments | 74,331 | Payables | — |
| | Investments, | | | |
| | Receivables, Net | | | |
| | assets — Unrealized | | Payables, Net assets — | |
| Interest rate contracts | appreciation | 674,313,003* | Unrealized depreciation | 743,319,518* |
| Total | | $832,924,128 | | $1,037,684,100 |
*Includes cumulative appreciation/depreciation of futures contracts and/or centrally cleared swaps as reported in the fund’s portfolio. Only current day’s variation margin is reported within the Statement of assets and liabilities.
|
| 126 Diversified Income Trust |
The following is a summary of realized and change in unrealized gains or losses of derivative instruments in the Statement of operations for the reporting period (Note 1):
| | | | | |
| Amount of realized gain or (loss) on derivatives recognized in net gain or (loss) on investments |
| Derivatives not accounted | | | Forward | | |
| for as hedging instruments | | | currency | | |
| under ASC 815 | Options | Futures | contracts | Swaps | Total |
| Credit contracts | $— | $— | $— | $33,956,701 | $33,956,701 |
| Foreign exchange contracts | (1,665,077) | — | (11,884,552) | — | $(13,549,629) |
| Interest rate contracts | 85,333,220 | 5,442,738 | — | (24,634,534) | $66,141,424 |
| Total | $83,668,143 | $5,442,738 | $(11,884,552) | $9,322,167 | $86,548,496 |
| | | | | | |
| Change in unrealized appreciation or (depreciation) on derivatives recognized in net gain or (loss) |
| on investments | | | | | | |
| Derivatives not | | | | | | |
| accounted for as | | | | | | |
| hedging | | | | Forward | | |
| instruments under | | | | currency | | |
| ASC 815 | Warrants | Options | Futures | contracts | Swaps | Total |
| Credit contracts | $— | $— | $— | $— | $(103,970,825) | $(103,970,825) |
| Foreign exchange | | | | | | |
| contracts | — | (2,131,997) | — | 3,380,401 | — | $1,248,404 |
| Interest | | | | | | |
| rate contracts | — | 63,533,802 | 11,651,664 | — | (142,816,924) | $(67,631,458) |
| Total | $— | $61,401,805 | $11,651,664 | $3,380,401 | $(246,787,749) | $(170,353,879) |
|
| Diversified Income Trust 127 |
Note 9: Offsetting of financial and derivative assets and liabilities
The following table summarizes any derivatives, repurchase agreements and reverse repurchase agreements, at the end of the reporting period, that are subject to an enforceable master netting agreement or similar agreement. For securities lending transactions or borrowing transactions associated with securities sold short, if any, see Note 1. For financial reporting purposes, the fund does not offset financial assets and financial liabilities that are subject to the master netting agreements in the Statement of assets and liabilities.
| | | | | | | | | | | | | | | | | | | | | |
| | Bank of America N.A. | Barclays Bank PLC | Barclays
Capital, Inc. (clearing
broker) | BofA
Securities,
Inc. | Citibank, N.A. | Citigroup
Global
Markets, Inc. | Credit Suisse International | Deutsche
Bank AG | Goldman
Sachs
International | HSBC Bank USA, National Association | JPMorgan
Chase Bank N.A. | JPMorgan
Securities LLC | Merrill Lynch International | Morgan
Stanley & Co. International
PLC | NatWest
Markets PLC | State Street Bank and
Trust Co. | Toronto-Dominion
Bank | UBS AG | Wells Fargo Bank, N.A. | WestPac
Banking Corp. | Total |
| Assets: | | | | | | | | | | | | | | | | | | | | | |
| Centrally cleared interest | | | | | | | | | | | | | | | | | | | | | |
| rate swap contracts§ | $— | $— | $28,557,657 | $— | $— | $— | $— | $— | $— | $— | $— | $— | $— | $— | $— | $— | $— | $— | $— | $— | $28,557,657 |
| OTC Total return | | | | | | | | | | | | | | | | | | | | | |
| swap contracts*# | — | 1,028,103 | — | — | — | — | 579,813 | 2,996 | 1,204,565 | — | 299,256 | 1,038,100 | — | — | — | — | — | — | — | — | 4,152,833 |
| Centrally cleared total | | | | | | | | | | | | | | | | | | | | | |
| return swap contracts§ | — | — | 1,667,849 | — | — | — | — | — | — | — | — | — | — | — | — | — | — | — | — | — | 1,667,849 |
| OTC Credit default | | | | | | | | | | | | | | | | | | | | | |
| contracts — protection | | | | | | | | | | | | | | | | | | | | | |
| sold*# | — | — | — | — | — | — | — | — | — | — | — | — | — | — | — | — | — | — | — | — | — |
| OTC Credit default | | | | | | | | | | | | | | | | | | | | | |
| contracts — protection | | | | | | | | | | | | | | | | | | | | | |
| purchased*# | — | — | — | — | — | 21,899,972 | 13,789,169 | — | 4,472,733 | — | — | 26,748,503 | 14,109,136 | 16,694,802 | — | — | — | — | — | — | 97,714,315 |
| Futures contracts§ | — | — | — | — | — | — | — | — | — | — | — | 369,581 | — | — | — | — | — | — | — | — | 369,581 |
| Forward currency | | | | | | | | | | | | | | | | | | | | | |
| contracts# | 5,579,472 | 2,282,185 | — | — | 4,538,945 | — | 1,095,540 | — | 7,147,600 | 4,191,626 | 5,835,101 | — | — | — | 1,644,695 | 13,956,824 | 2,426,435 | 6,017,488 | — | 260,124 | 54,976,035 |
| Forward premium swap | | | | | | | | | | | | | | | | | | | | | |
| option contracts# | 21,580,079 | 2,294,105 | — | — | 21,653,370 | — | — | — | 21,483,704 | — | 66,843,440 | — | — | 28,129,093 | — | — | — | 8,687,454 | — | — | 170,671,245 |
| Purchased swap | | | | | | | | | | | | | | | | | | | | | |
| options**# | 3,078 | — | — | — | 16,988,139 | — | — | — | 10,034,225 | — | 29,184,506 | — | — | 73,266,741 | — | — | 1,155,553 | 11,035,457 | — | — | 141,667,699 |
| Purchased options**# | 2,006,782 | 70 | — | — | 1,767,094 | — | — | — | 2,069,579 | — | 39,583,819 | — | — | — | — | — | — | 2,919 | — | — | 45,430,263 |
| Repurchase agreements** | — | — | — | — | — | 97,350,000 | — | — | — | — | — | — | — | — | — | — | — | — | — | — | 97,350,000 |
| Total Assets | $29,169,411 | $5,604,463 | $30,225,506 | $— | $44,947,548 | $119,249,972 | $15,464,522 | $2,996 | $46,412,406 | $4,191,626 | $141,746,122 | $28,156,184 | $14,109,136 | $118,090,636 | $1,644,695 | $13,956,824 | $3,581,988 | $25,743,318 | $— | $260,124 | $642,557,477 |
| Liabilities: | | | | | | | | | | | | | | | | | | | | | |
| Centrally cleared interest | | | | | | | | | | | | | | | | | | | | | |
| rate swap contracts§ | $— | $— | $28,678,438 | $— | $— | $— | $— | $— | $— | $— | $— | $— | $— | $— | $— | $— | $— | $— | $— | $— | $28,678,438 |
| OTC Total return | | | | | | | | | | | | | | | | | | | | | |
| swap contracts*# | 109,982 | 1,420,364 | — | — | 9,693 | — | 3,181,457 | 47,738 | 2,756,464 | — | 266,173 | 113,903 | — | — | — | — | — | — | — | — | 7,905,774 |
| Centrally cleared total | | | | | | | | | | | | | | | | | | | | | |
| return swap contracts§ | — | — | 2,526,881 | — | — | — | — | — | — | — | — | — | — | — | — | — | — | — | — | — | 2,526,881 |
| OTC Credit default | | | | | | | | | | | | | | | | | | | | | |
| contracts — protection | | | | | | | | | | | | | | | | | | | | | |
| sold*# | 1,607,701 | — | — | — | — | 45,524,786 | 54,539,744 | 113,228 | 27,610,591 | — | — | 51,115,351 | 12,207,606 | 45,079,639 | — | — | — | — | — | — | 237,798,646 |
| OTC Credit default | | | | | | | | | | | | | | | | | | | | | |
| contracts — protection | | | | | | | | | | | | | | | | | | | | | |
| purchased*# | — | — | — | — | — | — | — | — | — | — | — | — | — | — | — | — | — | — | — | — | — |
| Futures contracts§ | — | — | — | — | — | — | — | — | — | — | — | 1,153,361 | — | — | — | — | — | — | — | — | 1,153,361 |
| Forward currency | | | | | | | | | | | | | | | | | | | | | |
| contracts# | 7,924,049 | 2,894,442 | — | — | 2,714,738 | — | 2,308,980 | — | 8,734,613 | 2,409,181 | 9,246,580 | — | — | — | 5,312,320 | 6,121,912 | 538,050 | 4,053,561 | — | 891,864 | 53,150,290 |
| |
| 128 Diversified Income Trust | Diversified Income Trust 129 |
| | | | | | | | | | | | | | | | | | | | | |
| | Bank of America N.A. | Barclays Bank PLC | Barclays
Capital, Inc. (clearing
broker) | BofA
Securities, Inc. | Citibank, N.A. | Citigroup
Global
Markets, Inc. | Credit Suisse International | Deutsche
Bank AG | Goldman
Sachs
International | HSBC Bank USA, National Association | JPMorgan
Chase Bank N.A. | JPMorgan
Securities LLC | Merrill Lynch International | Morgan
Stanley & Co. International
PLC | NatWest
Markets PLC | State Street Bank and
Trust Co. | Toronto- Dominion
Bank | UBS AG | Wells Fargo Bank, N.A. | WestPac
Banking
Corp. | Total |
| Forward premium swap | | | | | | | | | | | | | | | | | | | | | |
| option contracts# | $6,566,661 | $870,347 | $— | $— | $7,484,829 | $— | $— | $— | $7,856,929 | $— | $42,472,813 | $— | $— | $17,460,277 | $— | $— | $— | $8,647,098 | $— | $— | $91,358,954 |
| Written swap options# | 227 | — | — | — | 19,670,546 | — | — | — | 6,054,383 | — | 27,662,984 | — | — | 79,271,725 | — | — | 1,977,920 | 15,584,903 | — | — | 150,222,688 |
| Written options# | 1,108,768 | — | — | — | 925,798 | — | — | — | 1,381,080 | — | 2,827,175 | — | — | — | — | — | — | — | — | — | 6,242,821 |
| Total Liabilities | $17,317,388 | $5,185,153 | $31,205,319 | $— | $30,805,604 | $45,524,786 | $60,030,181 | $160,966 | $54,394,060 | $2,409,181 | $82,475,725 | $52,382,615 | $12,207,606 | $141,811,641 | $5,312,320 | $6,121,912 | $2,515,970 | $28,285,562 | $— | $891,864 | $579,037,853 |
| Total Financial and | | | | | | | | | | | | | | | | | | | | | |
| Derivative Net Assets | $11,852,023 | $419,310 | $(979,813) | $— | $14,141,944 | $73,725,186 | $(44,565,659) | $(157,970) | $(7,981,654) | $1,782,445 | $59,270,397 | $(24,226,431) | $1,901,530 | $(23,721,005) | $(3,667,625) | $7,834,912 | $1,066,018 | $(2,542,244) | $— | $(631,740) | $63,519,624 |
| Total collateral received | | | | | | | | | | | | | | | | | | | | | |
| (pledged)†## | $11,852,023 | $419,310 | $— | $— | $14,066,000 | $73,725,186 | $(44,565,659) | $(143,000) | $(7,981,654) | $1,782,445 | $59,270,397 | $(24,226,431) | $1,901,530 | $(23,721,005) | $(3,667,625) | $7,834,912 | $1,066,018 | $(2,542,244) | $— | $— | |
| Net amount | $— | $— | $(979,813) | $— | $75,944 | $— | $— | $(14,970) | $— | $— | $— | $— | $— | $— | $— | $— | $— | $— | $— | $(631,740) | |
| Controlled collateral | | | | | | | | | | | | | | | | | | | | | |
| received (including | | | | | | | | | | | | | | | | | | | | | |
| TBA commitments)** | $14,057,125 | $724,931 | $— | $7,289,000 | $14,066,000 | $— | $— | $— | $— | $2,386,954 | $81,002,000 | $— | $1,960,101 | $— | $— | $9,050,603 | $1,149,000 | $— | $171,168 | $— | $131,856,882 |
| Uncontrolled collateral | | | | | | | | | | | | | | | | | | | | | |
| received | $— | $— | $— | $— | $— | $99,321,706 | $— | $— | $— | $— | $— | $— | $— | $— | $— | $— | $— | $— | $— | $— | $99,321,706 |
| Collateral (pledged) | | | | | | | | | | | | | | | | | | | | | |
| (including TBA | | | | | | | | | | | | | | | | | | | | | |
| commitments)** | $— | $— | $— | $— | $— | $(24,698,012) | $(46,863,687) | $(143,000) | $(9,109,366) | $— | $— | $(74,504,196) | $— | $(28,238,289) | $(3,857,450) | $— | $— | $(3,202,329) | $— | $— | $(190,616,329) |
*Excludes premiums, if any. Included in unrealized appreciation and depreciation on OTC swap contracts on the Statement of assets and liabilities.
**Included with Investments in securities on the Statement of assets and liabilities.
†Additional collateral may be required from certain brokers based on individual agreements.
#Covered by master netting agreement (Note 1).
##Any over-collateralization of total financial and derivative net assets is not shown. Collateral may include amounts related to unsettled agreements.
§Includes current day’s variation margin only as reported on the Statement of assets and liabilities, which is not collateralized. Cumulative appreciation/(depreciation) for futures contracts and centrally cleared swap contracts is represented in the tables listed after the fund’s portfolio. Collateral pledged for initial margin on futures contracts and centrally cleared swap contracts, which is not included in the table above, amounted to $9,232,501 and $80,308,702, respectively.
Note 10: New accounting pronouncements
In March 2017, the Financial Accounting Standards Board issued Accounting Standards Update (ASU) No. 2017–08,Receivables — Nonrefundable Fees and Other Costs(Subtopic 310–20):Premium Amortization on Purchased Callable Debt Securities. The amendments in the ASU shorten the amortization period for certain callable debt securities held at a premium, to be amortized to the earliest call date. The ASU is effective for fiscal years and interim periods within those fiscal years beginning after December 15, 2018. The adoption of these amendments is not material to the financial statements.
Note 11: Change in independent accountants
On March 20, 2020, the Audit, Compliance and Distributions Committee of the Trustees of the Putnam Funds approved and recommended the decision to change the Fund’s independent accountant and to not retain KPMG LLP, and on April 3, 2020, upon request of the Putnam Funds, KPMG LLP provided a letter of resignation. During the two previous fiscal years, KPMG LLP audit reports contained no adverse opinion or disclaimer of opinion; nor were its reports qualified or modified as to uncertainty, audit scope, or accounting principle. Further, in connection with its audits for the two previous fiscal years and the subsequent interim period through April 3, 2020: (i) there were no disagreements with KPMG LLP on any matter of accounting principles or practices, financial statement disclosure, or auditing scope or procedure, which disagreements if not resolved to the satisfaction of KPMG LLP would have caused it to make reference to the subject matter of the disagreements in its report on the Fund’s financial statements for such years, and (ii) there were no “reportable events” of the kind described in Item 304(a)(1)(v) of Regulation S-K under the Securities Act of 1933, as amended, and the Securities Exchange Act of 1934, as amended.
On April 17, 2020, the Audit, Compliance and Distributions Committee of the Trustees of the Putnam Funds approved and recommended the decision to appoint PricewaterhouseCoopers LLP as the Fund’s independent accountant.
| |
| 130 Diversified Income Trust | Diversified Income Trust 131 |
Services for shareholders
Investor services
Systematic investment planTell us how much you wish to invest regularly — weekly, semimonthly, or monthly — and the amount you choose will be transferred automatically from your checking or savings account. There’s no additional fee for this service, and you can suspend it at any time. This plan may be a great way to save for college expenses or to plan for your retirement.
Please note that regular investing does not guarantee a profit or protect against loss in a declining market. Before arranging a systematic investment plan, consider your financial ability to continue making purchases in periods when prices are low.
Systematic exchangeYou can make regular transfers from one Putnam fund to another Putnam fund. There are no additional fees for this service, and you can cancel or change your options at any time.
Dividends PLUSYou can choose to have the dividend distributions from one of your Putnam funds automatically reinvested in another Putnam fund at no additional charge.
Free exchange privilegeYou can exchange money between Putnam funds free of charge, as long as they are the same class of shares. A signature guarantee is required if you are exchanging more than $500,000. The fund reserves the right to revise or terminate the exchange privilege.
Reinstatement privilegeIf you’ve sold Putnam shares or received a check for a dividend or capital gain, you may reinvest the proceeds with Putnam within 90 days of thetransaction and they will be reinvested at the fund’s current net asset value — with no sales charge. However, reinstatement of class B shares may have special tax consequences. Ask your financial or tax representative for details.
Check-writing serviceYou have ready access to many Putnam accounts. It’s as simple as writing a check, and there are no special fees or service charges. For more information about the check-writing service, call Putnam or visit our website.
Dollar cost averagingWhen you’re investing for long-term goals, it’s time, not timing, that counts. Investing on a systematic basis is a better strategy than trying to figure out when the markets will go up or down. This means investing the same amount of money regularly over a long period. This method of investing is called dollar cost averaging. When a fund’s share price declines, your investment dollars buy more shares at lower prices. When it increases, they buy fewer shares. Over time, you will pay a lower average price per share.
For more information
Visit the Individual Investors section at putnam.comA secure section of our website contains complete information on your account, including balances and transactions, updated daily. You may also conduct transactions, such as exchanges, additional investments, and address changes. Log on today to get your password.
Call us toll free at 1-800-225-1581Ask a helpful Putnam representative or your financial advisor for details about any of these or other services, or see your prospectus.
|
| 132 Diversified Income Fund |
Fund information
Founded over 80 years ago, Putnam Investments was built around the concept that a balance between risk and reward is the hallmark of a well-rounded financial program. We manage funds across income, value, blend, growth, sustainable, asset allocation, absolute return, and global sector categories.
| | |
| Investment Manager | Trustees | Michael J. Higgins |
| Putnam Investment | Kenneth R. Leibler,Chair | Vice President, Treasurer, |
| Management, LLC | Liaquat Ahamed | and Clerk |
| 100 Federal Street | Ravi Akhoury | |
| Boston, MA 02110 | Barbara M. Baumann | Jonathan S. Horwitz |
| | Katinka Domotorffy | Executive Vice President, |
| Investment Sub-Advisor | Catharine Bond Hill | Principal Executive Officer, |
| Putnam Investments Limited | Paul L. Joskow | and Compliance Liaison |
| 16 St James’s Street | Robert E. Patterson | |
| London, England SW1A 1ER | George Putnam, III | Richard T. Kircher |
| | Robert L. Reynolds | Vice President and BSA |
| Marketing Services | Manoj P. Singh | Compliance Officer |
| Putnam Retail Management | Mona K. Sutphen | |
| 100 Federal Street | | Susan G. Malloy |
| Boston, MA 02110 | Officers | Vice President and |
| | Robert L. Reynolds | Assistant Treasurer |
| Custodian | President | |
| State Street Bank | | Denere P. Poulack |
| and Trust Company | Robert T. Burns | Assistant Vice President, Assistant |
| | Vice President and | Clerk, and Assistant Treasurer |
| Legal Counsel | Chief Legal Officer | |
| Ropes & Gray LLP | | Janet C. Smith |
| | James F. Clark | Vice President, |
| Vice President, Chief Compliance | Principal Financial Officer, |
| | Officer, and Chief Risk Officer | Principal Accounting Officer, |
| | | and Assistant Treasurer |
| | Nancy E. Florek | |
| | Vice President, Director of | Mark C. Trenchard |
| | Proxy Voting and Corporate | Vice President |
| | Governance, Assistant Clerk, | |
| | and Assistant Treasurer | |
| | | |
This report is for the information of shareholders of Putnam Diversified Income Trust. It may also be used as sales literature when preceded or accompanied by the current prospectus, the most recent copy of Putnam’s Quarterly Performance Summary, and Putnam’s Quarterly Ranking Summary. For more recent performance, please visit putnam.com. Investors should carefully consider the investment objectives, risks, charges, and expenses of a fund, which are described in its prospectus. For this and other information or to request a prospectus or summary prospectus, call 1-800-225-1581 toll free. Please read the prospectus carefully before investing. The fund’s Statement of Additional Information contains additional information about the fund’s Trustees and is available without charge upon request by calling 1-800-225-1581.
| |
|
Item 3. Audit Committee Financial Expert: |
| |
|
Item 4. Principal Accountant Fees and Services: |
| |
|
Item 5. Audit Committee of Listed Registrants |
| |
|
Item 6. Schedule of Investments: |
| |
| The registrant's schedule of investments in unaffiliated issuers is included in the report to shareholders in Item 1 above. |
| |
| Item 7. Disclosure of Proxy Voting Policies and Procedures For Closed-End Management Investment Companies: |
| |
|
Item 8. Portfolio Managers of Closed-End Investment Companies |
| |
|
Item 9. Purchases of Equity Securities by Closed-End Management Investment Companies and Affiliated Purchasers: |
| |
|
Item 10. Submission of Matters to a Vote of Security Holders: |
| |
|
Item 11. Controls and Procedures: |
| |
|
(a) The registrant's principal executive officer and principal financial officer have concluded, based on their evaluation of the effectiveness of the design and operation of the registrant's disclosure controls and procedures as of a date within 180 days of the filing date of this report, that the design and operation of such procedures are generally effective to provide reasonable assurance that information required to be disclosed by the registrant in this report is recorded, processed, summarized and reported within the time periods specified in the Commission's rules and forms. |
| |
| (b) Changes in internal control over financial reporting: Not applicable |
| |
|
Item 12. Disclosures of Securities Lending Activities for Closed-End Investment Companies: |
| |
| Pursuant to the requirements of the Securities Exchange Act of 1934 and the Investment Company Act of 1940, the registrant has duly caused this report to be signed on its behalf by the undersigned, thereunto duly authorized. |
| |
| Putnam Diversified Income Trust |
| |
| By (Signature and Title): |
| |
| /s/ Janet C. Smith
Janet C. Smith
Principal Accounting Officer
|
| |
| Pursuant to the requirements of the Securities Exchange Act of 1934 and the Investment Company Act of 1940, this report has been signed below by the following persons on behalf of the registrant and in the capacities and on the dates indicated. |
| |
| By (Signature and Title): |
| |
| /s/ Jonathan S. Horwitz
Jonathan S. Horwitz
Principal Executive Officer
|
| |
| By (Signature and Title): |
| |
| /s/ Janet C. Smith
Janet C. Smith
Principal Financial Officer
|