UNITED STATES
SECURITIES AND EXCHANGE COMMISSION
Washington, D.C. 20549
FORM N-CSR
CERTIFIED SHAREHOLDER REPORT OF REGISTERED
MANAGEMENT INVESTMENT COMPANIES
Investment Company Act file number 811-05583
Franklin Templeton Variable Insurance Products Trust
(Exact name of registrant as specified in charter)
One Franklin Parkway,
San Mateo, CA 94403-1906
(Address of principal executive offices) (Zip code)
Craig S. Tyle,
One Franklin Parkway,
San Mateo, CA 94403-1906
(Name and address of agent for service)
Registrant’s telephone number, including area code: (650) 312-2000
Date of fiscal year end: 12/31
Date of reporting period: 12/31/11
| Item 1. | Reports to Stockholders. |

DECEMBER 31, 2011
FRANKLIN TEMPLETON
VARIABLE INSURANCE PRODUCTS TRUST
ANNUAL
REPORT

FRANKLIN TEMPLETON VARIABLE INSURANCE
PRODUCTS TRUST ANNUAL REPORT
TABLEOF CONTENTS
| | | | |
Important Notes to Performance Information | | | i | |
*Prospectus Supplement for all Funds | | | P-1 | |
*Statement of Additional Information Supplement for all Funds | | | SAI-1 | |
Fund Summaries | | | | |
Franklin Global Real Estate Securities Fund | | | FGR-1 | |
Franklin Growth and Income Securities Fund | | | FGI-1 | |
Franklin High Income Securities Fund | | | FH-1 | |
Franklin Income Securities Fund | | | FI-1 | |
Franklin Large Cap Growth Securities Fund | | | FLG-1 | |
Franklin Rising Dividends Securities Fund | | | FRD-1 | |
Franklin Small Cap Value Securities Fund | | | FSV-1 | |
Franklin Small-Mid Cap Growth Securities Fund | | | FSC-1 | |
Franklin Strategic Income Securities Fund | | | FSI-1 | |
Franklin Templeton VIP Founding Funds Allocation Fund | | | FFA-1 | |
Franklin U.S. Government Fund | | | FUS-1 | |
Mutual Global Discovery Securities Fund | | | MGD-1 | |
Mutual Shares Securities Fund | | | MS-1 | |
Templeton Developing Markets Securities Fund | | | TD-1 | |
Templeton Foreign Securities Fund | | | TF-1 | |
Templeton Global Bond Securities Fund | | | TGB-1 | |
*Prospectus Supplement | | | TGB-10 | |
Templeton Growth Securities Fund | | | TG-1 | |
Index Descriptions | | | I-1 | |
Board Members and Officers | | | BOD-1 | |
Shareholder Information | | | SI-1 | |
*Not part of the annual report
NOT FDIC INSURED | MAY LOSE VALUE | NO BANK GUARANTEE
MASTER CLASS – 1
IMPORTANT NOTESTOPERFORMANCE INFORMATION
Performance data is historical and cannot predict or guarantee future results. Principal value and investment return will fluctuate with market conditions, and you may have a gain or loss when you withdraw your money. Inception dates of the funds may have preceded the effective dates of the subaccounts, contracts, or their availability in all states.
When reviewing the index comparisons, please keep in mind that indexes have a number of inherent performance differentials over the funds. First, unlike the funds, which must hold a minimum amount of cash to maintain liquidity, indexes do not have a cash component. Second, the funds are actively managed and, thus, are subject to management fees to cover salaries of securities analysts or portfolio managers in addition to other expenses. Indexes are unmanaged and do not include any commissions or other expenses typically associated with investing in securities. Third, indexes often contain a different mix of securities than the fund to which they are compared. Additionally, please remember that indexes are simply a measure of performance and cannot be invested in directly.
i
SUPPLEMENT DATED JANUARY 3, 2012
TOTHE PROSPECTUS
DATED MAY 1, 2011
(Franklin Templeton Variable Insurance Products Trust)
In the section titled “Additional Information, All Funds” the following replaces all text under the heading “Market Timing Trading Policy”:
The board of trustees has adopted the following policies and procedures with respect to market timing (Market Timing Trading Policy):
Market timing generally. The Fund discourages and does not intend to accommodate short-term or frequent purchases and redemptions of fund shares, often referred to as “market timing,” and asks its Fund of Fund investors and participating Insurers for their cooperation in trying to discourage such activity in their separate accounts by Contract Owners and their financial advisors. The Fund intends to seek to restrict or reject such trading or take other action, as described below, if in the judgment of the Fund manager or transfer agent such trading may interfere with the efficient management of the Fund’s portfolio, may materially increase the Fund’s transaction costs, administrative costs or taxes, or may otherwise be detrimental to the interests of the Fund and its shareholders.
Market timing consequences. If information regarding trading activity in the Fund or in any other Franklin Templeton fund or non-Franklin Templeton fund is brought to the attention of the Fund’s manager or transfer agent and based on that information the Fund or its manager or transfer agent in their sole discretion conclude that such trading may be detrimental to the Fund as described in this Market Timing Trading Policy, the Fund may temporarily or permanently bar future purchases into the Fund or, alternatively, may limit the amount, number or frequency of any future purchases and/or the method by which an Insurer or a Fund of Funds may request future purchases and redemptions (including purchases and/or redemptions by an exchange or transfer between the Fund and any other mutual fund). In determining what actions should be taken, the Fund’s transfer agent may consider a variety of factors, including the potential impact of such remedial actions on the Fund and its shareholders. If the Fund is a “fund of funds,” the Fund’s transfer agent may take into account the impact of the trading activity and of any proposed remedial action on both the Fund and the underlying funds in which the Fund invests.
In considering trading activity, the Fund may consider, among other factors, trading history both directly and, if known, through financial intermediaries, in the Fund, in other Franklin Templeton funds, in non-Franklin Templeton mutual funds, or in accounts under common control or ownership.
Market timing through Insurers. As a Contract Owner you are also subject to this policy. An Insurer’s order for purchases and/or redemptions pursuant to a Contract Owner’s instructions (including purchases and/or redemptions by an exchange or transfer between the Fund and any mutual fund) are submitted pursuant to aggregated orders (Aggregated Orders). A fund of fund’s order for purchases and/or redemptions pursuant to its investors’ instructions are also submitted pursuant to Aggregated Orders. While the Fund will encourage Insurers and funds of funds to apply the Fund’s Market Timing Trading Policy to their investors, the Fund is limited in its ability to monitor the trading activity or enforce the Fund’s Market Timing
P-1
Trading Policy because Insurers and funds of funds have the relationships with, and are responsible for maintaining the account records of, the individual investors. For example, should it occur, the Fund may not be able to detect market timing that may be facilitated by financial intermediaries or made difficult to identify in the Aggregated Orders used by Insurers and Fund of Fund investors.
Therefore, the Fund or its agent selectively monitor the Aggregated Orders used by Insurers and Fund of Fund investors for purchases, exchange and redemptions in respect of all their investors and seek the cooperation of Insurers and Fund of Fund investors to apply the Fund’s Market Timing Trading Policy. There may be legal and technological limitations on the ability of an Insurer or Fund of Fund to impose trading restrictions and to apply the Fund’s Market Timing Trading Policy to their investors through such methods as implementing short-term trading limitations or restrictions, assessing the Fund’s redemption fee (if applicable) and monitoring trading activity for what might be market timing. As a result, the Fund may not be able to determine whether trading by Insurers or funds of funds in respect of their investors is contrary to the Fund’s Market Timing Trading Policy.
Risks from market timers. Depending on various factors, including the size of the Fund, the amount of assets the portfolio manager typically maintains in cash or cash equivalents and the dollar amount and number and frequency of trades and the types of securities in which the Fund typically invests, short-term or frequent trading may interfere with the efficient management of the Fund’s portfolio, increase the Fund’s transaction costs, administrative costs and taxes and/or impact Fund performance.
In addition, if the nature of the Fund’s portfolio holdings exposes the Fund to “arbitrage market timers,” the value of the Fund’s shares may be diluted if redeeming shareholders receive proceeds (and buying shareholders receive shares) based upon net asset values which do not reflect appropriate fair value prices. Arbitrage market timing occurs when an investor seeks to take advantage of the possible delay between the change in the value of a mutual fund’s portfolio holdings and the reflection of the change in the fund’s net asset value per share. A fund that invests significantly in foreign securities may be particularly vulnerable to arbitrage market timing. Arbitrage market timing in foreign investments may occur because of time zone differences between the foreign markets on which the Fund’s international portfolio securities trade and the time as of which the Fund’s NAV is calculated. Arbitrage market timers may purchase shares of the Fund based on events occurring after foreign market closing prices are established, but before calculation of the Fund’s NAV. One of the objectives of the Trust’s fair value pricing procedures is to minimize the possibilities of this type of arbitrage market timing (please see “Valuation – Foreign Securities – Potential Impact of Time Zones and Market Holidays”).
Since the Fund may invest significantly in securities that are, or may be, restricted, unlisted, traded infrequently, thinly traded, or relatively illiquid (relatively illiquid securities), the Fund may be particularly vulnerable to arbitrage market timing. An arbitrage market timer may seek to take advantage of a possible differential between the last available market prices for one or more of these relatively illiquid securities that are used to calculate the Fund’s net asset value and the latest indications of market values for those securities. One of the objectives of the Fund’s fair value pricing procedures is to minimize the possibilities of this type of arbitrage market timing (please see “Fair Valuation – Individual Securities” under the heading “Fund Account Policies”, below).
P-2
The Fund is currently using several methods to reduce the risk of market timing. These methods include:
| • | | seeking the cooperation of Insurers and funds of funds to assist the Fund in identifying potential market timing activity; |
| • | | committing staff to selectively review on a continuing basis recent trading activity in order to identify trading activity that may be contrary to the Fund’s Market Timing Trading Policy; |
| • | | monitoring potential price differentials following the close of trading in foreign markets to determine whether the application of fair value pricing procedures is warranted; and |
| • | | seeking the cooperation of financial intermediaries to assist the Fund in identifying market timing activity. |
Though these methods involve judgments that are inherently subjective and involve some selectivity in their application, the Fund seeks to make judgments and applications that are consistent with the interests of the Fund’s shareholders. There is no assurance that the Fund or its agents will gain access to any or all information necessary to detect market timing in Insurers’ separate accounts. While the Fund will seek to take actions (directly and with the assistance of Insurers) that will detect market timing, it cannot represent that such trading activity can be minimized or completely eliminated.
Revocation of market timing trades. Transactions placed in violation of a Fund’s Market Timing Trading Policy or exchange limit guidelines are not necessarily deemed accepted by the Fund and may be cancelled or revoked by the Fund, in full or in part, as soon as practicable following receipt by the Fund and prompt inquiry of the intermediary.
Please keep this supplement for future reference.
P-3
SUPPLEMENT DATED JANUARY 3, 2012
TOTHE STATEMENTOF ADDITIONAL INFORMATION
DATED MAY 1, 2011
(Franklin Templeton Variable Insurance Products Trust)
The Statement of Additional Information is amended as follows:
I. The section entitled “Glossary of Investments, Techniques, Strategies and Their Risks – Derivative instruments – Credit default swaps” is revised to read as follows:
Credit default swaps. The “buyer” of protection in a credit default swap agreement is obligated to pay the “seller” a periodic stream of payments over the term of the agreement in return for a payment by the “seller” that is contingent upon the occurrence of a credit event with respect to a specific underlying reference debt obligation (whether as a single debt instrument or as part of an index of debt instruments). The contingent payment by the seller generally is the face amount of the debt obligation, in return for the buyer’s obligation to make periodic cash payments and deliver in physical form the reference debt obligation or a cash payment equal to the then-current market value of that debt obligation at the time of the credit event. If no credit event occurs, the seller would receive a fixed rate of income throughout the term of the contract, while the buyer would lose the amount of its payments and recover nothing. The buyer is also subject to the risk that the seller will not satisfy its contingent payment obligation, if and when due.
Purchasing protection through a credit default swap may be used to attempt to hedge against a decline in the value of debt security or securities due to a credit event. The seller of protection under a credit default swap receives periodic payments from the buyer but is exposed to the risk that the value of the reference debt obligation declines due to a credit event and that it will have to pay the face amount of the reference obligation to the buyer. Selling protection under a credit default swap may also permit the seller to gain exposure that is similar to owning the reference debt obligation directly. As the seller of protection, the Fund would effectively add leverage to its portfolio because, in addition to its total assets, the Fund would be subject to the risk that there would be a credit event and the Fund would have to make a substantial payment in the future.
Generally, a credit event means bankruptcy, failure to timely pay interest or principal, obligation acceleration, or modified restructuring of the reference debt obligation. There may be disputes between the buyer or seller of a credit default swap agreement or within the swaps market as a whole as to whether or not a credit event has occurred or what the payout should be which could result in litigation. In some instances where there is a dispute in the credit default swap market, a regional Determinations Committee set up by ISDA may make an official binding determination regarding the existence of credit events under the terms of the ISDA Master Agreement.
ISDA’s Determination Committees are comprised principally of dealers in the OTC derivatives markets which may have a conflicting interest in the determination regarding the existence of a particular credit event. In addition, in the sovereign debt market, a credit default swap agreement may not provide the protection generally anticipated because the government issuer of the sovereign debt instruments may be able to restructure or renegotiate the debt in such a manner as to avoid triggering a credit event.
SAI-1
Moreover, (1) sovereign debt obligations may not incorporate common, commercially acceptable provisions, such as collective action clauses, or (2) the negotiated restructuring of the sovereign debt may be deemed non-mandatory on all holders. As a result, the determination committee might then not be able to determine, or may be able to avoid having to determine, that a credit event under the credit default agreement has occurred.
For these and other reasons, the buyer of protection in a credit default swap agreement is subject to the risk that certain occurrences, such as particular restructuring events affecting the value of the underlying reference debt obligation, or the restructuring of sovereign debt, may not be deemed credit events under the credit default swap agreement. Therefore, if the credit default swap was purchased as a hedge or to take advantage of an anticipated increase in the value of credit protection for the underlying reference obligation, it may not provide any hedging benefit or otherwise increase in value as anticipated. Similarly, the seller of protection in a credit default swap agreement is subject to the risk that certain occurrences may be deemed to be credit events under the credit default swap agreement, even if these occurrences do not adversely impact the value or creditworthiness of the underlying reference debt obligation.
Please keep this supplement for future reference.
SAI-2
FRANKLIN GLOBAL REAL ESTATE SECURITIES FUND
This annual report for Franklin Global Real Estate Securities Fund covers the fiscal year ended December 31, 2011.
Performance Summary as of 12/31/11
Average annual total return of Class 1 shares* represents the average annual change in value, assuming reinvestment of dividends and capital gains. Average returns smooth out variations in returns, which can be significant; they are not the same as year-by-year results.
Periods ended 12/31/11
| | | | | | | | | | | | |
| | | 1-Year | | | 5-Year | | | 10-Year | |
Average Annual Total Return | | | -5.45% | | | | -8.90% | | | | +4.73% | |
*The investment manager and administrator have contractually agreed to waive or limit their respective fees so that the increase in investment management and fund administration fees paid by the Fund is phased in over a five-year period, starting on 5/1/07, with there being no increase in the rate of such fees for the first year ended 4/30/08. For each of four years thereafter through 4/30/12, the investment manager and administrator will receive one-fifth of the increase in the rate of fees. Beginning 5/1/12, the full new investment management and administration fees will then be in effect. If the manager and administrator had not waived fees, the Fund’s total returns would have been lower.
Total Return Index Comparison
for a Hypothetical $10,000 Investment (1/1/02–12/31/11)
The graph below shows the change in value of a hypothetical $10,000 investment in the Fund over the indicated period and includes reinvestment of any income or distributions. The Fund’s performance* is compared to the performance of the FTSE® EPRA/NAREIT Developed Index and the Standard & Poor’s® (S&P®) Global REIT Index. One cannot invest directly in an index, and an index is not representative of the Fund’s portfolio. Please see Important Notes to Performance Information preceding the Fund Summaries.
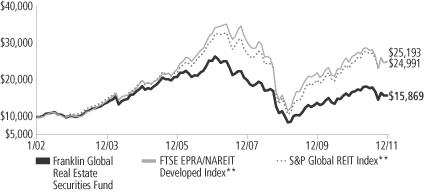
**Source: © 2012 Morningstar. Please see Index Descriptions following the Fund Summaries.
Franklin Global Real
Estate Securities Fund
Class 1
Performance reflects the Fund’s Class 1 operating expenses, but does not include any contract fees, expenses or sales charges. If they had been included, performance would be lower. These charges and deductions, particularly for variable life policies, can have a significant effect on contract values and insurance benefits. See the contract prospectus for a complete description of these expenses, including sales charges.
Performance data represent past performance, which does not guarantee future results. Investment return and principal value will fluctuate, and you may have a gain or loss when you sell your shares.
Current performance may differ from figures shown.
FGR-1
Fund Goal and Main Investments: Franklin Global Real Estate Securities Fund seeks high total return. The Fund normally invests at least 80% of its net assets in investments of companies located anywhere in the world that operate in the real estate sector.
Performance Overview
You can find the Fund’s one-year total return in the Performance Summary. The Fund’s new benchmark, the FTSE EPRA/NAREIT Developed Index, had a -5.82% total return.1 The Fund’s previous benchmark, the S&P Global REIT Index, posted a +1.70% total return for the same period.1 The FTSE EPRA/NAREIT Developed Index replaced the S&P Global REIT Index as the Fund’s benchmark because we believe the new index provides a better comparison with the Fund’s portfolio composition.
Economic and Market Overview
Global stocks declined in 2011 as deepening sovereign debt, political paralysis and economic growth concerns led to escalating investor anxiety and severe market volatility. Stocks entered the year supported by positive momentum in corporate earnings and renewed economic stimulus measures in the developed world. However, a number of events interrupted the market’s rise early in 2011, including a severe natural disaster and nuclear crisis in Japan and populist uprisings across the oil-and-gas-producing regions of the Middle East and North Africa. Global markets recovered quickly from these setbacks but soon faced more significant turmoil as Europe’s sovereign debt crisis worsened in the summer. Portugal, Greece and Ireland received bailouts and had their credit ratings slashed to junk grade, while rising bond yields in the larger economies of Italy and Spain, and eventually in the critical core economies of Germany and France, threatened the survival of the European Monetary Union. The U.S.’s sovereign debt issues and political dysfunction, accompanied by the downgrade of its AAA credit rating to AA+, further pressured investor sentiment during the summer months. Additionally, the precarious state of the global banking system as well as emerging signs of a renewed global economic slowdown and possible hard landing in China weighed on the markets.
Despite these global challenges, corporate profits remained remarkably resilient, some signs of U.S. economic improvement emerged toward
1. Source: © 2012 Morningstar. One cannot invest directly in an index, and an index is not representative of the Fund’s portfolio. Please see Index Descriptions following the Fund Summaries.
Fund Risks: All investments involve risks. As a nondiversified Fund that invests at least 80% of its assets in companies located anywhere in the world that operate in the real estate sector, the Fund carries much greater risk of adverse developments affecting that sector than a fund that invests more broadly. REITs may be affected by any change in the value of the properties owned and by their location, rental income, financing and management. Stock prices fluctuate, sometimes rapidly and dramatically, due to factors affecting individual companies, particular industries or sectors, or general market conditions. Foreign investing involves additional risks, including currency fluctuations, economic instability, market volatility, and political and social instability. Derivative instruments may be volatile and illiquid, may give rise to leverage and may involve a small investment relative to the risk assumed. The Fund is actively managed but there is no guarantee that the manager’s investment decisions will produce the desired results. The Fund’s prospectus also includes a description of the main investment risks.
FGR-2
year-end, and European policymakers ultimately stepped up their response to their sovereign debt and banking crisis. Greek and Italian prime ministers were replaced with technocrats tasked with arresting a debt spiral, the European Central Bank cut short-term interest rates and expanded bank lending facilities, and six key global central banks agreed to lower dollar funding costs for Europe’s distressed commercial banks. Meanwhile, the Federal Reserve Board increased purchases of long-dated bonds to reduce key borrowing costs and hinted at “additional policy accommodation.” Chinese policymakers lowered commercial bank reserve requirements and the International Monetary Fund revamped its credit line and eased its lending terms. Commodities initially rallied due to the coordinated monetary stimulus, but most ultimately declined as global economic prospects weakened. Gold and oil, however, made annual gains. In currency markets, the euro declined with escalating weakness at year-end, while the dollar ultimately rose after a late surge. Amid general global market declines, perceived safe-haven currencies such as the Japanese yen and Swiss franc rallied strongly, and U.S. Treasuries posted their best one-year return since 2008.
Global Real Estate Market Overview
Most global real estate markets fell during the reporting period, as real estate securities in many countries were affected by concerns about the European sovereign debt crisis and slowing global economic growth. According to the FTSE EPRA/NAREIT Developed Index, in U.S. dollar terms, Canada, New Zealand and the U.S. led developed country real estate markets. Switzerland also posted strong results. Many markets represented in the index lost value, however, such as Spain, Italy, Greece and Norway.
Investment Strategy
We are research-driven, fundamental investors. We seek to limit price volatility by investing across markets and property types. We also seek strong total return performance. We center our active investment strategy on the belief that unsynchronized regional economic activity within the global economy can provide consistent, attractive return opportunities in the global real estate markets. We use a bottom-up, value-oriented stock selection process that incorporates macro-level views in the evaluation process. We use top-down macro overlays to provide country/regional, property type, and company size perspectives in identifying international/local cyclical and thematic trends that highlight
FGR-3
investment opportunities. We may use currency forward contracts from time to time to help manage currency risk and the Fund’s exposure to various currencies.
Manager’s Discussion
During the 12 months under review, major contributors to the Fund’s performance relative to the FTSE EPRA/NAREIT Developed Index included U.S.-based office REIT Boston Properties and two U.S.-based shopping mall operators, Simon Property Group and Taubman Centers. Boston Properties’ share price rose sharply during the year because the REIT’s office buildings, which are concentrated in a few major U.S. cities such as Boston, New York City and Washington, DC, benefited from higher occupancy and rents that, in turn, helped boost the company’s profits, which generally beat analyst earnings estimates. During the period, overweighting and stock selection in retail REITs that operate shopping malls boosted the Fund’s performance relative to the benchmark index. Within the sector, shares of Simon Property Group, the largest U.S. shopping mall owner, and luxury mall owner Taubman Centers rallied as sales for tenant stores at the better quality shopping centers held up well despite moderate U.S. economic growth during 2011. Late in the period under review, managements at Taubman Centers and Simon Property Group raised their guidance for funds from operation (FFO) in 2011. FFO per share, calculated primarily by adding back depreciation and amortization expenses to earnings, is used as a barometer of performance by REITs instead of earnings per share, the measure used by publicly traded companies in other sectors.
Significant detractors from relative Fund performance included Singapore-based Keppel Land, Hong Kong-based Hang Lung Properties and Japan-based Mitsui Fudosan. The stocks of these diversified property companies, which have been generally more volatile than stocks of more specialized landlords, were negatively affected by market uncertainties stemming largely from the European sovereign debt crisis. Keppel Land performed poorly due to the Singapore government’s policy to increase the land supply for residential development. Hang Lung Properties continued to generate robust profits from its core business, property leasing in Hong Kong and mainland China, but the company’s shares underperformed due to concerns about the impact of rising mortgage interest rates on property sales. Mitsui Fudosan’s share price fell because of Japan’s March earthquake and subsequent economic slowdown, and to some degree, the strengthening of Japanese yen.
What is a currency forward contract?
A currency forward contract is an agreement between the Fund and a counterparty to buy or sell a foreign currency for a specific exchange rate on a future date.
FGR-4
It is important to recognize the effect of currency movements on the Fund’s performance. In general, if the value of the U.S. dollar goes up compared with a foreign currency, an investment traded in that foreign currency will go down in value because it will be worth fewer U.S. dollars. This can have a negative effect on Fund performance. Conversely, when the U.S. dollar weakens in relation to a foreign currency, an investment traded in that foreign currency will increase in value, which can contribute to Fund performance. For the 12 months ended December 31, 2011, the U.S. dollar rose in value relative to most currencies. As a result, the Fund’s performance was negatively affected by the portfolio’s substantial investment in securities with non-U.S. currency exposure.
Thank you for your participation in Franklin Global Real Estate Securities Fund. We look forward to serving your future investment needs.
The foregoing information reflects our analysis, opinions and portfolio holdings as of December 31, 2011, the end of the reporting period. The way we implement our main investment strategies and the resulting portfolio holdings may change depending on factors such as market and economic conditions. These opinions may not be relied upon as investment advice or an offer for a particular security. The information is not a complete analysis of every aspect of any market, country, industry, security or the Fund. Statements of fact are from sources considered reliable, but the investment manager makes no representation or warranty as to their completeness or accuracy. Although historical performance is no guarantee of future results, these insights may help you understand our investment management philosophy.
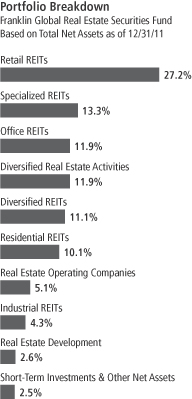
Top 10 Holdings
Franklin Global Real Estate Securities Fund 12/31/11
| | | | |
Company
Sector/Industry,
Country | | % of Total
Net Assets | |
| Simon Property Group Inc. | | | 6.0% | |
| Retail REITs, U.S. | |
| Sun Hung Kai Properties Ltd. | | | 3.7% | |
| Diversified Real Estate Activities, Hong Kong | |
| Unibail-Rodamco SE | | | 3.4% | |
| Retail REITs, France | |
| Boston Properties Inc. | | | 2.9% | |
| Office REITs, U.S. | |
| Public Storage | | | 2.9% | |
| Specialized REITs, U.S. | |
| Mitsubishi Estate Co. Ltd. | | | 2.8% | |
| Diversified Real Estate Activities, Japan | |
| Equity Residential | | | 2.8% | |
| Residential REITs, U.S. | |
| Mitsui Fudosan Co. Ltd. | | | 2.7% | |
| Diversified Real Estate Activities, Japan | |
| Westfield Group | | | 2.4% | |
| Retail REITs, Australia | |
| Prologis Inc. | | | 2.2% | |
| Industrial REITs, U.S. | |
The dollar value, number of shares or principal amount, and names of all portfolio holdings are listed in the Fund’s Statement of Investments.
FGR-5
Fund Expenses
As an investor in a variable insurance contract (Contract) that indirectly provides for investment in an underlying mutual fund, you can incur transaction and/or ongoing expenses at both the Fund level and the Contract level.
| • | | Transaction expenses can include sales charges (loads) on purchases, redemption fees, surrender fees, transfer fees and premium taxes. |
| • | | Ongoing expenses can include management fees, distribution and service (12b-1) fees, contract fees, annual maintenance fees, mortality and expense risk fees and other fees and expenses. All mutual funds and Contracts have some types of ongoing expenses. |
The expenses shown in the table are meant to highlight ongoing expenses at the Fund level only and do not include ongoing expenses at the Contract level, or transaction expenses at either the Fund or Contract level. While the Fund does not have transaction expenses, if the transaction and ongoing expenses at the Contract level were included, the expenses shown would be higher. You should consult your Contract prospectus or disclosure document for more information.
The table shows Fund-level ongoing expenses and can help you understand these expenses and compare them with those of other mutual funds offered through the Contract. The table assumes a $1,000 investment held for the six months indicated. Please refer to the Fund prospectus for additional information on operating expenses.
Actual Fund Expenses
The first line (Actual) of the table provides actual account values and expenses. The “Ending Account Value” is derived from the Fund’s actual return, which includes the effect of ongoing Fund expenses, but does not include the effect of ongoing Contract expenses.
You can estimate the Fund-level expenses you incurred during the period by following these steps. Of course, your account value and expenses will differ from those in this illustration:
| 1. | Divide your account value by $1,000. |
If an account had an $8,600 value, then $8,600 ÷ $1,000 = 8.6.
| 2. | Multiply the result by the number under the heading “Fund-Level Expenses Incurred During Period.” |
If Fund-Level Expenses Incurred During Period were $7.50, then 8.6 x $7.50 = $64.50.
In this illustration, the estimated expenses incurred this period at the Fund level are $64.50.
Franklin Global Real
Estate Securities Fund
Class 1
FGR-6
Hypothetical Example for Comparison with Other Mutual Funds
Information in the second line (Hypothetical) of the table can help you compare ongoing expenses of the Fund with those of other mutual funds offered through the Contract. This information may not be used to estimate the actual ending account balance or expenses you incurred during the period. The hypothetical “Ending Account Value” is based on the Fund’s actual expense ratio and an assumed 5% annual rate of return before expenses, which does not represent the Fund’s actual return. The figure under the heading “Fund-Level Expenses Incurred During Period” shows the hypothetical expenses your account would have incurred under this scenario. You can compare this figure with the 5% hypothetical examples that appear in shareholder reports of other funds offered through a Contract.
| | | | | | | | | | | | |
| Class 1 | | Beginning
Account Value 7/1/11 | | | Ending
Account
Value 12/31/11 | | | Fund-Level Expenses Incurred
During Period*
7/1/11–12/31/11 | |
Actual | | $ | 1,000 | | | $ | 887.10 | | | $ | 4.85 | |
Hypothetical (5% return before expenses) | | $ | 1,000 | | | $ | 1,020.06 | | | $ | 5.19 | |
*Expenses are calculated using the most recent six-month annualized expense ratio, net of expense waivers, for the Fund’s Class 1 shares (1.02%), which does not include any ongoing expenses of the Contract for which the Fund is an investment option, multiplied by the average account value over the period, multiplied by 184/365 to reflect the one-half year period.
FGR-7
Franklin Templeton Variable Insurance Products Trust
Financial Highlights
Franklin Global Real Estate Securities Fund
| | | | | | | | | | | | | | | | | | | | |
| | | Year Ended December 31, | |
| Class 1 | | 2011 | | | 2010 | | | 2009 | | | 2008 | | | 2007 | |
| | | | |
Per share operating performance | | | | | | | | | | | | | | | | | | | | |
(for a share outstanding throughout the year) | | | | | | | | | | | | | | | | | | | | |
Net asset value, beginning of year | | $ | 13.12 | | | $ | 11.16 | | | $ | 10.84 | | | $ | 25.42 | | | $ | 35.25 | |
| | | | |
Income from investment operationsa: | | | | | | | | | | | | | | | | | | | | |
Net investment incomeb | | | 0.21 | | | | 0.38 | | | | 0.30 | | | | 0.62 | | | | 0.80 | |
Net realized and unrealized gains (losses) | | | (0.83 | ) | | | 1.94 | | | | 1.36 | | | | (9.10 | ) | | | (7.56 | ) |
| | | | |
Total from investment operations | | | (0.62 | ) | | | 2.32 | | | | 1.66 | | | | (8.48 | ) | | | (6.76 | ) |
| | | | |
Less distributions from: | | | | | | | | | | | | | | | | | | | | |
Net investment income and net foreign currency gains | | | (1.03 | ) | | | (0.36 | ) | | | (1.34 | ) | | | (0.32 | ) | | | (0.81 | ) |
Net realized gains | | | — | | | | — | | | | — | | | | (5.78 | ) | | | (2.26 | ) |
| | | | |
Total distributions | | | (1.03 | ) | | | (0.36 | ) | | | (1.34 | ) | | | (6.10 | ) | | | (3.07 | ) |
| | | | |
Net asset value, end of year | | $ | 11.47 | | | $ | 13.12 | | | $ | 11.16 | | | $ | 10.84 | | | $ | 25.42 | |
| | | | |
| | | | | |
Total returnc | | | (5.45)% | | | | 21.24% | | | | 19.41% | | | | (42.22)% | | | | (20.65)% | |
Ratios to average net assets | | | | | | | | | | | | | | | | | | | | |
Expenses before waiver and payments by affiliates | | | 1.12% | | | | 1.11% | | | | 1.11% | | | | 1.08% | | | | 0.84% | |
Expenses net of waiver and payments by affiliates | | | 0.98% | | | | 0.86% | | | | 0.76% | d | | | 0.60% | d | | | 0.52% | d |
Net investment income | | | 1.64% | | | | 3.24% | | | | 3.13% | | | | 3.41% | | | | 2.57% | |
| | | | | |
Supplemental data | | | | | | | | | | | | | | | | | | | | |
Net assets, end of year (000’s) | | $ | 33,670 | | | $ | 40,430 | | | $ | 38,486 | | | $ | 39,018 | | | $ | 83,250 | |
Portfolio turnover rate | | | 28.95% | | | | 76.52% | | | | 87.34% | | | | 77.28% | | | | 121.84% | |
aThe amount shown for a share outstanding throughout the period may not correlate with the Statement of Operations for the period due to the timing of sales and repurchases of the Fund shares in relation to income earned and/or fluctuating market value of the investments of the Fund.
bBased on average daily shares outstanding.
cTotal return does not include fees, charges or expenses imposed by the variable annuity and life insurance contracts for which the Franklin Templeton Variable Insurance Products Trust serves as an underlying investment vehicle.
dBenefit of expense reduction rounds to less than 0.01%.
The accompanying notes are an integral part of these financial statements.
FGR-8
Franklin Templeton Variable Insurance Products Trust
Financial Highlights (continued)
Franklin Global Real Estate Securities Fund
| | | | | | | | | | | | | | | | | | | | |
| | | Year Ended December 31, | |
| Class 2 | | 2011 | | | 2010 | | | 2009 | | | 2008 | | | 2007 | |
| | | | |
Per share operating performance | | | | | | | | | | | | | | | | | | | | |
(for a share outstanding throughout the year) | | | | | | | | | | | | | | | | | | | | |
Net asset value, beginning of year | | $ | 12.83 | | | $ | 10.92 | | | $ | 10.61 | | | $ | 24.97 | | | $ | 34.67 | |
| | | | |
Income from investment operationsa: | | | | | | | | | | | | | | | | | | | | |
Net investment incomeb | | | 0.17 | | | | 0.34 | | | | 0.27 | | | | 0.56 | | | | 0.72 | |
Net realized and unrealized gains (losses) | | | (0.81 | ) | | | 1.90 | | | | 1.33 | | | | (8.93 | ) | | | (7.43 | ) |
| | | | |
Total from investment operations | | | (0.64 | ) | | | 2.24 | | | | 1.60 | | | | (8.37 | ) | | | (6.71 | ) |
| | | | |
Less distributions from: | | | | | | | | | | | | | | | | | | | | |
Net investment income and net foreign currency gains | | | (0.99 | ) | | | (0.33 | ) | | | (1.29 | ) | | | (0.21 | ) | | | (0.73 | ) |
Net realized gains | | | — | | | | — | | | | — | | | | (5.78 | ) | | | (2.26 | ) |
| | | | |
Total distributions | | | (0.99 | ) | | | (0.33 | ) | | | (1.29 | ) | | | (5.99 | ) | | | (2.99 | ) |
| | | | |
Net asset value, end of year | | $ | 11.20 | | | $ | 12.83 | | | $ | 10.92 | | | $ | 10.61 | | | $ | 24.97 | |
| | | | |
| | | | | |
Total returnc | | | (5.65)% | | | | 20.97% | | | | 19.08% | | | | (42.39)% | | | | (20.86)% | |
Ratios to average net assets | | | | | | | | | | | | | | | | | | | | |
Expenses before waiver and payments by affiliates | | | 1.37% | | | | 1.36% | | | | 1.36% | | | | 1.33% | | | | 1.09% | |
Expenses net of waiver and payments by affiliates | | | 1.23% | | | | 1.11% | | | | 1.01% | d | | | 0.85% | d | | | 0.77% | d |
Net investment income | | | 1.39% | | | | 2.99% | | | | 2.88% | | | | 3.16% | | | | 2.32% | |
| | | | | |
Supplemental data | | | | | | | | | | | | | | | | | | | | |
Net assets, end of year (000’s) | | $ | 292,356 | | | $ | 352,854 | | | $ | 345,445 | | | $ | 343,701 | | | $ | 893,837 | |
Portfolio turnover rate | | | 28.95% | | | | 76.52% | | | | 87.34% | | | | 77.28% | | | | 121.84% | |
aThe amount shown for a share outstanding throughout the period may not correlate with the Statement of Operations for the period due to the timing of sales and repurchases of the Fund shares in relation to income earned and/or fluctuating market value of the investments of the Fund.
bBased on average daily shares outstanding.
cTotal return does not include fees, charges or expenses imposed by the variable annuity and life insurance contracts for which the Franklin Templeton Variable Insurance Products Trust serves as an underlying investment vehicle.
dBenefit of expense reduction rounds to less than 0.01%.
The accompanying notes are an integral part of these financial statements.
FGR-9
Franklin Templeton Variable Insurance Products Trust
Statement of Investments, December 31, 2011
| | | | | | | | | | |
| Franklin Global Real Estate Securities Fund | | Country | | Shares | | | Value | |
Common Stocks 97.2% | | | | | | | | | | |
Diversified Real Estate Activities 11.9% | | | | | | | | | | |
City Developments Ltd. | | Singapore | | | 69,000 | | | $ | 473,441 | |
Hang Lung Properties Ltd. | | Hong Kong | | | 1,636,000 | | | | 4,655,267 | |
Mitsubishi Estate Co. Ltd. | | Japan | | | 599,600 | | | | 8,959,137 | |
Mitsui Fudosan Co. Ltd. | | Japan | | | 598,000 | | | | 8,717,677 | |
Sun Hung Kai Properties Ltd. | | Hong Kong | | | 962,000 | | | | 12,058,134 | |
The Wharf Holdings Ltd. | | Hong Kong | | | 887,500 | | | | 4,022,352 | |
| | | | | | | | | | |
| | | | | | | | | 38,886,008 | |
| | | | | | | | | | |
Diversified REITs 11.1% | | | | | | | | | | |
American Assets Trust Inc. | | United States | | | 82,300 | | | | 1,687,973 | |
British Land Co. PLC | | United Kingdom | | | 584,600 | | | | 4,195,098 | |
Canadian REIT | | Canada | | | 68,900 | | | | 2,393,230 | |
Colonial Properties Trust | | United States | | | 142,800 | | | | 2,978,808 | |
Dexus Property Group | | Australia | | | 945,626 | | | | 802,961 | |
GPT Group | | Australia | | | 1,232,072 | | | | 3,869,647 | |
H&R REIT | | Canada | | | 157,400 | | | | 3,592,331 | |
Kenedix Realty Investment Corp. | | Japan | | | 583 | | | | 1,696,771 | |
Land Securities Group PLC | | United Kingdom | | | 525,762 | | | | 5,191,787 | |
Liberty Property Trust | | United States | | | 35,000 | | | | 1,080,800 | |
Shaftesbury PLC | | United Kingdom | | | 175,400 | | | | 1,273,112 | |
Stockland | | Australia | | | 428,136 | | | | 1,397,235 | |
Vornado Realty Trust | | United States | | | 78,727 | | | | 6,050,957 | |
| | | | | | | | | | |
| | | | | | | | | 36,210,710 | |
| | | | | | | | | | |
Industrial REITs 4.3% | | | | | | | | | | |
Ascendas REIT | | Singapore | | | 838,000 | | | | 1,182,284 | |
Goodman Group | | Australia | | | 4,146,121 | | | | 2,417,763 | |
Japan Logistics Fund Inc. | | Japan | | | 193 | | | | 1,672,591 | |
Mapletree Logistics Trust | | Singapore | | | 1,302,280 | | | | 848,375 | |
aMapletree Logistics Trust, 144A | | Singapore | | | 986,100 | | | | 642,398 | |
Prologis Inc. | | United States | | | 254,972 | | | | 7,289,649 | |
| | | | | | | | | | |
| | | | | | | | | 14,053,060 | |
| | | | | | | | | | |
Office REITs 11.9% | | | | | | | | | | |
Alexandria Real Estate Equities Inc. | | United States | | | 47,500 | | | | 3,276,075 | |
Boston Properties Inc. | | United States | | | 95,900 | | | | 9,551,640 | |
CapitaCommercial Trust | | Singapore | | | 3,027,000 | | | | 2,462,019 | |
Champion REIT | | Hong Kong | | | 4,390,196 | | | | 1,656,230 | |
Commonwealth Property Office Fund | | Australia | | | 3,205,864 | | | | 3,132,170 | |
Derwent London PLC | | United Kingdom | | | 47,060 | | | | 1,137,738 | |
Digital Realty Trust Inc. | | United States | | | 26,000 | | | | 1,733,420 | |
Douglas Emmett Inc. | | United States | | | 52,000 | | | | 948,480 | |
Great Portland Estates PLC | | United Kingdom | | | 484,136 | | | | 2,431,541 | |
Highwoods Properties Inc. | | United States | | | 82,600 | | | | 2,450,742 | |
Japan Real Estate Investment Co. | | Japan | | | 355 | | | | 2,767,492 | |
Kilroy Realty Corp. | | United States | | | 80,600 | | | | 3,068,442 | |
Silic | | France | | | 12,500 | | | | 1,212,274 | |
SL Green Realty Corp. | | United States | | | 47,000 | | | | 3,132,080 | |
| | | | | | | | | | |
| | | | | | | | | 38,960,343 | |
| | | | | | | | | | |
Real Estate Development 2.6% | | | | | | | | | | |
Agile Property Holdings Ltd. | | China | | | 1,040,000 | | | | 931,991 | |
China Overseas Land & Investment Ltd. | | China | | | 1,412,000 | | | | 2,359,818 | |
Evergrande Real Estate Group Ltd. | | China | | | 3,934,000 | | | | 1,631,020 | |
FGR-10
Franklin Templeton Variable Insurance Products Trust
Statement of Investments, December 31, 2011 (continued)
| | | | | | | | | | |
| Franklin Global Real Estate Securities Fund | | Country | | Shares | | | Value | |
Common Stocks (continued) | | | | | | | | | | |
Real Estate Development (continued) | | | | | | | | | | |
Keppel Land Ltd. | | Singapore | | | 952,000 | | | $ | 1,629,358 | |
Soho China Ltd. | | China | | | 2,253,500 | | | | 1,502,991 | |
bSunac China Holdings Ltd. | | China | | | 2,428,000 | | | | 503,319 | |
| | | | | | | | | | |
| | | | | | | | | 8,558,497 | |
| | | | | | | | | | |
Real Estate Operating Companies 5.1% | | | | | | | | | | |
Brookfield Office Properties Inc. | | Canada | | | 193,600 | | | | 3,033,697 | |
Deutsche Euroshop AG | | Germany | | | 22,930 | | | | 733,885 | |
Fastighets AB Hufvudstaden, A | | Sweden | | | 302,080 | | | | 3,075,348 | |
a,bGlobal Logistic Properties Ltd., 144A | | Singapore | | | 1,378,000 | | | | 1,864,459 | |
bGSW Immobilien AG | | Germany | | | 20,180 | | | | 585,065 | |
a,bGSW Immobilien AG, 144A | | Germany | | | 17,399 | | | | 504,437 | |
Hysan Development Co. Ltd. | | Hong Kong | | | 930,000 | | | | 3,053,460 | |
PSP Swiss Property AG | | Switzerland | | | 27,700 | | | | 2,320,264 | |
Sponda OYJ | | Finland | | | 332,080 | | | | 1,341,011 | |
| | | | | | | | | | |
| | | | | | | | | 16,511,626 | |
| | | | | | | | | | |
Residential REITs 10.1% | | | | | | | | | | |
American Campus Communities Inc. | | United States | | | 68,500 | | | | 2,874,260 | |
AvalonBay Communities Inc. | | United States | | | 36,890 | | | | 4,817,834 | |
Boardwalk REIT | | Canada | | | 47,100 | | | | 2,331,084 | |
Camden Property Trust | | United States | | | 54,700 | | | | 3,404,528 | |
Canadian Apartment Properties REIT | | Canada | | | 76,000 | | | | 1,663,700 | |
Equity Lifestyle Properties Inc. | | United States | | | 29,800 | | | | 1,987,362 | |
Equity Residential | | United States | | | 157,000 | | | | 8,953,710 | |
Essex Property Trust Inc. | | United States | | | 23,180 | | | | 3,257,022 | |
Nippon Accommodations Fund Inc. | | Japan | | | 231 | | | | 1,554,706 | |
UDR Inc. | | United States | | | 78,670 | | | | 1,974,617 | |
| | | | | | | | | | |
| | | | | | | | | 32,818,823 | |
| | | | | | | | | | |
Retail REITs 27.2% | | | | | | | | | | |
CFS Retail Property Trust | | Australia | | | 477,976 | | | | 823,954 | |
Charter Hall Retail REIT | | Australia | | | 617,827 | | | | 2,022,617 | |
Corio NV | | Netherlands | | | 26,831 | | | | 1,167,013 | |
DDR Corp. | | United States | | | 266,276 | | | | 3,240,579 | |
Eurocommercial Properties NV | | Netherlands | | | 50,850 | | | | 1,614,446 | |
Federal Realty Investment Trust | | United States | | | 43,600 | | | | 3,956,700 | |
Frontier Real Estate Investment Corp. | | Japan | | | 187 | | | | 1,516,118 | |
General Growth Properties | | United States | | | 82,000 | | | | 1,231,640 | |
Hammerson PLC | | United Kingdom | | | 550,260 | | | | 3,076,034 | |
Japan Retail Fund Investment Corp. | | Japan | | | 1,279 | | | | 1,894,446 | |
aJapan Retail Fund Investment Corp., 144A | | Japan | | | 324 | | | | 479,906 | |
Kimco Realty Corp. | | United States | | | 144,700 | | | | 2,349,928 | |
The Link REIT | | Hong Kong | | | 1,329,100 | | | | 4,894,324 | |
The Macerich Co. | | United States | | | 98,990 | | | | 5,008,894 | |
Regency Centers Corp. | | United States | | | 23,900 | | | | 899,118 | |
RioCan REIT | | Canada | | | 144,900 | | | | 3,757,746 | |
Simon Property Group Inc. | | United States | | | 150,744 | | | | 19,436,931 | |
Suntec REIT | | Singapore | | | 1,825,000 | | | | 1,512,509 | |
Tanger Factory Outlet Centers Inc. | | United States | | | 81,600 | | | | 2,392,512 | |
Taubman Centers Inc. | | United States | | | 68,800 | | | | 4,272,480 | |
Unibail-Rodamco SE | | France | | | 61,603 | | | | 11,074,881 | |
Westfield Group | | Australia | | | 982,190 | | | | 7,847,719 | |
FGR-11
Franklin Templeton Variable Insurance Products Trust
Statement of Investments, December 31, 2011 (continued)
| | | | | | | | | | |
| Franklin Global Real Estate Securities Fund | | Country | | Shares | | | Value | |
Common Stocks (continued) | | | | | | | | | | |
Retail REITs (continued) | | | | | | | | | | |
Westfield Retail Trust | | Australia | | | 1,596,065 | | | $ | 4,065,807 | |
| | | | | | | | | | |
| | | | | | | | | 88,536,302 | |
| | | | | | | | | | |
Specialized REITs 13.0% | | | | | | | | | | |
CDL Hospitality Trusts | | Singapore | | | 1,468,000 | | | | 1,748,562 | |
HCP Inc. | | United States | | | 141,100 | | | | 5,845,773 | |
Health Care REIT Inc. | | United States | | | 106,200 | | | | 5,791,086 | |
Host Hotels & Resorts Inc. | | United States | | | 379,439 | | | | 5,604,314 | |
bHyatt Hotels Corp. | | United States | | | 31,960 | | | | 1,202,974 | |
LaSalle Hotel Properties | | United States | | | 69,700 | | | | 1,687,437 | |
Pebblebrook Hotel Trust | | United States | | | 70,130 | | | | 1,345,093 | |
Public Storage | | United States | | | 69,700 | | | | 9,371,862 | |
Senior Housing Properties Trust | | United States | | | 79,000 | | | | 1,772,760 | |
Starwood Hotels & Resorts Worldwide Inc. | | United States | | | 55,840 | | | | 2,678,645 | |
Ventas Inc. | | United States | | | 97,550 | | | | 5,377,932 | |
| | | | | | | | | | |
| | | | | | | | | 42,426,438 | |
| | | | | | | | | | |
Total Common Stocks (Cost $254,454,597) | | | | | | | | | 316,961,807 | |
| | | | | | | | | | |
Convertible Preferred Stocks (Cost $910,000) 0.3% | | | | | | | | | | |
Specialized REITs 0.3% | | | | | | | | | | |
Health Care REIT Inc., 6.50%, cvt. pfd. | | United States | | | 18,200 | | | | 931,294 | |
| | | | | | | | | | |
Total Investments before Short Term Investments
(Cost $255,364,597) | | | | | | | | | 317,893,101 | |
| | | | | | | | | | |
| | | |
| | | | | Principal
Amount | | | | |
Short Term Investments 2.3% | | | | | | | | | | |
Repurchase Agreements (Cost $7,452,478) 2.3% | | | | | | | | | | |
cJoint Repurchase Agreement, 0.011%, 1/03/12 (Maturity Value $7,452,487) | | United States | | $ | 7,452,478 | | | | 7,452,478 | |
BNP Paribas Securities Corp. (Maturity Value $901,751) | | | | | | | | | | |
Credit Suisse Securities (USA) LLC (Maturity Value $1,082,027) | | | | | | | | | | |
Deutsche Bank Securities Inc. (Maturity Value $1,140,454) | | | | | | | | | | |
HSBC Securities (USA) Inc. (Maturity Value $1,803,501) | | | | | | | | | | |
Merrill Lynch, Pierce, Fenner & Smith Inc. (Maturity Value $1,082,027) | | | | | | | | | | |
Morgan Stanley & Co. LLC (Maturity Value $360,700) | | | | | | | | | | |
UBS Securities LLC (Maturity Value $1,082,027) | | | | | | | | | | |
Collateralized by U.S. Government Agency Securities, 0.16% - 5.25%, 6/07/12 - 2/05/14; dU.S. Treasury Bills, 1/12/12 - 9/20/12; U.S. Treasury Bonds, 0.50% - 11.25%, 5/31/13 - 2/15/16; and U.S. Treasury Notes, 0.125% - 4.875%, 12/31/11 - 5/15/19 (valued at $7,605,466) | | | | | | | | | | |
| | | | | | | | | | |
Total Investments (Cost $262,817,075) 99.8% | | | | | | | | | 325,345,579 | |
Other Assets, less Liabilities 0.2% | | | | | | | | | 681,290 | |
| | | | | | | | | | |
Net Assets 100.0% | | | | | | | | $ | 326,026,869 | |
| | | | | | | | | | |
See Abbreviations on page FGR-22.
aSecurity was purchased pursuant to Rule 144A under the Securities Act of 1933 and may be sold in transactions exempt from registration only to qualified institutional buyers or in a public offering registered under the Securities Act of 1933. These securities have been deemed liquid under guidelines approved by the Trust’s Board of Trustees. At December 31, 2011, the aggregate value of these securities was $3,491,200, representing 1.07% of net assets.
bNon-income producing.
cSee Note 1(c) regarding joint repurchase agreement.
dThe security is traded on a discount basis with no stated coupon rate.
The accompanying notes are an integral part of these financial statements.
FGR-12
Franklin Templeton Variable Insurance Products Trust
Financial Statements
Statement of Assets and Liabilities
December 31, 2011
| | | | |
| | | Franklin Global
Real Estate
Securities Fund | |
Assets: | | | | |
Investments in securities: | | | | |
Cost - Unaffiliated issuers | | $ | 255,364,597 | |
Cost - Repurchase agreements | | | 7,452,478 | |
| | | | |
Total cost of investments | | $ | 262,817,075 | |
| | | | |
Value - Unaffiliated issuers | | $ | 317,893,101 | |
Value - Repurchase agreements | | | 7,452,478 | |
| | | | |
Total value of investments | | | 325,345,579 | |
Cash | | | 34,524 | |
Receivables: | | | | |
Capital shares sold | | | 28,457 | |
Dividends | | | 1,443,423 | |
Other assets | | | 11 | |
| | | | |
Total assets | | | 326,851,994 | |
| | | | |
Liabilities: | | | | |
Payables: | | | | |
Capital shares redeemed | | | 282,694 | |
Affiliates | | | 381,939 | |
Reports to shareholders | | | 78,819 | |
Professional fees | | | 56,742 | |
Accrued expenses and other liabilities | | | 24,931 | |
| | | | |
Total liabilities | | | 825,125 | |
| | | | |
Net assets, at value | | $ | 326,026,869 | |
| | | | |
Net assets consist of: | | | | |
Paid-in capital | | $ | 643,452,325 | |
Distributions in excess of net investment income | | | (8,310,736 | ) |
Net unrealized appreciation (depreciation) | | | 62,526,082 | |
Accumulated net realized gain (loss) | | | (371,640,802 | ) |
| | | | |
Net assets, at value | | $ | 326,026,869 | |
| | | | |
Class 1: | | | | |
Net assets, at value | | $ | 33,670,438 | |
| | | | |
Shares outstanding | | | 2,934,971 | |
| | | | |
Net asset value and maximum offering price per share | | $ | 11.47 | |
| | | | |
Class 2: | | | | |
Net assets, at value | | $ | 292,356,431 | |
| | | | |
Shares outstanding | | | 26,098,110 | |
| | | | |
Net asset value and maximum offering price per share | | $ | 11.20 | |
| | | | |
The accompanying notes are an integral part of these financial statements.
FGR-13
Franklin Templeton Variable Insurance Products Trust
Financial Statements (continued)
Statement of Operations
for the year ended December 31, 2011
| | | | |
| | | Franklin Global
Real Estate
Securities Fund | |
Investment income: | | | | |
Dividends (net of foreign taxes $488,671) | | $ | 9,654,992 | |
Interest | | | 5,186 | |
| | | | |
Total investment income | | | 9,660,178 | |
| | | | |
Expenses: | | | | |
Management fees (Note 3a) | | | 2,955,116 | |
Administrative fees (Note 3b) | | | 923,474 | |
Distribution fees: (Note 3c) | | | | |
Class 2 | | | 828,198 | |
Class 4 | | | 2 | |
Unaffiliated transfer agent fees | | | 712 | |
Custodian fees (Note 4) | | | 63,679 | |
Reports to shareholders | | | 89,572 | |
Professional fees | | | 72,368 | |
Trustees’ fees and expenses | | | 1,441 | |
Other | | | 27,309 | |
| | | | |
Total expenses | | | 4,961,871 | |
Expenses waived/paid by affiliates (Note 3e) | | | (532,532 | ) |
| | | | |
Net expenses | | | 4,429,339 | |
| | | | |
Net investment income | | | 5,230,839 | |
| | | | |
Realized and unrealized gains (losses): | | | | |
Net realized gain (loss) from: | | | | |
Investments | | | 17,392,948 | |
Realized gain distributions from REITs | | | 993,312 | |
Foreign currency transactions | | | 12,306 | |
| | | | |
Net realized gain (loss) | | | 18,398,566 | |
| | | | |
Net change in unrealized appreciation (depreciation) on: | | | | |
Investments | | | (42,848,199 | ) |
Translation of other assets and liabilities denominated in foreign currencies | | | 20,657 | |
| | | | |
Net change in unrealized appreciation (depreciation) | | | (42,827,542 | ) |
| | | | |
Net realized and unrealized gain (loss) | | | (24,428,976 | ) |
| | | | |
Net increase (decrease) in net assets resulting from operations | | $ | (19,198,137 | ) |
| | | | |
The accompanying notes are an integral part of these financial statements.
FGR-14
Franklin Templeton Variable Insurance Products Trust
Financial Statements (continued)
Statements of Changes in Net Assets
| | | | | | | | |
| | | Franklin Global Real Estate
Securities Fund | |
| | | Year Ended December 31, | |
| | | 2011 | | | 2010 | |
| | | | |
Increase (decrease) in net assets: | | | | | | | | |
Operations: | | | | | | | | |
Net investment income | | $ | 5,230,839 | | | $ | 11,368,681 | |
Net realized gain (loss) from investments, realized gain distributions from REITs and foreign currency transactions | | | 18,398,566 | | | | 30,326,027 | |
Net change in unrealized appreciation (depreciation) on investments and translation of other assets and liabilities denominated in foreign currencies | | | (42,827,542 | ) | | | 30,011,274 | |
| | | | |
Net increase (decrease) in net assets resulting from operations | | | (19,198,137 | ) | | | 71,705,982 | |
| | | | |
Distributions to shareholders from net investment income and net foreign currency gains: | | | | | | | | |
Class 1 | | | (2,965,988 | ) | | | (1,153,555 | ) |
Class 2 | | | (25,849,452 | ) | | | (9,661,113 | ) |
Class 4 | | | — | | | | (70 | ) |
| | | | |
Total distributions to shareholders | | | (28,815,440 | ) | | | (10,814,738 | ) |
| | | | |
Capital share transactions: (Note 2) | | | | | | | | |
Class 1 | | | (1,885,405 | ) | | | (4,330,791 | ) |
Class 2 | | | (17,357,651 | ) | | | (47,207,542 | ) |
Class 4 | | | (2,896 | ) | | | — | |
| | | | |
Total capital share transactions | | | (19,245,952 | ) | | | (51,538,333 | ) |
| | | | |
Net increase (decrease) in net assets | | | (67,259,529 | ) | | | 9,352,911 | |
Net assets: | | | | | | | | |
Beginning of year | | | 393,286,398 | | | | 383,933,487 | |
| | | | |
End of year | | $ | 326,026,869 | | | $ | 393,286,398 | |
| | | | |
Undistributed net investment income (distributions in excess of net investment income) included in net assets: | | | | | | | | |
End of year | | $ | (8,310,736 | ) | | $ | 9,740,793 | |
| | | | |
The accompanying notes are an integral part of these financial statements.
FGR-15
Franklin Templeton Variable Insurance Products Trust
Notes to Financial Statements
Franklin Global Real Estate Securities Fund
1. ORGANIZATION AND SIGNIFICANT ACCOUNTING POLICIES
Franklin Templeton Variable Insurance Products Trust (Trust) is registered under the Investment Company Act of 1940, as amended, (1940 Act) as an open-end investment company, consisting of twenty separate funds. The Franklin Global Real Estate Securities Fund (Fund) is included in this report. The financial statements of the remaining funds in the Trust are presented separately. Shares of the Fund are generally sold only to insurance company separate accounts to fund the benefits of variable life insurance policies or variable annuity contracts. At December 31, 2011, 60.21% of the Fund’s shares were held through one insurance company. The Fund two offers classes of shares: Class 1 and Class 2. On March 4, 2011, the Fund liquidated Class 4. Each class of shares differs by its distribution fees, voting rights on matters affecting a single class and its exchange privilege.
The following summarizes the Fund’s significant accounting policies.
a. Financial Instrument Valuation
The Fund’s investments in securities and other financial instruments are carried at fair value daily. Fair value is the price that would be received to sell an asset or paid to transfer a liability in an orderly transaction between market participants on the measurement date. Under procedures approved by the Trust’s Board of Trustees, the Fund may utilize independent pricing services, quotations from securities and financial instrument dealers, and other market sources to determine fair value.
Equity securities listed on an exchange or on the NASDAQ National Market System are valued at the last quoted sale price or the official closing price of the day, respectively. Foreign equity securities are valued as of the close of trading on the foreign stock exchange on which the security is primarily traded, or the NYSE, whichever is earlier. The value is then converted into its U.S. dollar equivalent at the foreign exchange rate in effect at the close of the NYSE on the day that the value of the security is determined. Over-the-counter securities are valued within the range of the most recent quoted bid and ask prices. Securities that trade in multiple markets or on multiple exchanges are valued according to the broadest and most representative market. Certain equity securities are valued based upon fundamental characteristics or relationships to similar securities. Repurchase agreements are valued at cost, which approximates market value.
The Fund has procedures to determine the fair value of securities and other financial instruments for which market prices are not readily available or which may not be reliably priced. Under these procedures, the Fund primarily employs a market-based approach which may use related or comparable assets or liabilities, recent transactions, market multiples, book values, and other relevant information for the investment to determine the fair value of the investment. The Fund may also use an income-based valuation approach in which the anticipated future cash flows of the investment are discounted to calculate fair value. Discounts may also be applied due to the nature or duration of any restrictions on the disposition of the investments. Due to the inherent uncertainty of valuations of such investments, the fair values may differ significantly from the values that would have been used had an active market existed.
Trading in securities on foreign securities stock exchanges and over-the-counter markets may be completed before the daily close of business on the NYSE. Occasionally, events occur between the time at which trading in a foreign security is completed and the close of the NYSE that might call into question the reliability of the value of a portfolio security held by the Fund. As a result, differences may arise between the value of the Fund’s portfolio securities as determined at the foreign market close and the latest indications of value at the close of the NYSE. In order to minimize the potential for these differences, the investment manager monitors price movements following the close of trading in foreign stock markets through a series of country specific market proxies (such as baskets of American Depositary Receipts, futures contracts and exchange traded funds). These price movements are measured against established trigger thresholds for each specific market proxy to assist in determining if an event has occurred that may call into question the reliability of the values of the foreign securities held by the Fund. If such an event occurs, the securities may be valued using fair value procedures, which may include the use of independent pricing services.
FGR-16
Franklin Templeton Variable Insurance Products Trust
Notes to Financial Statements (continued)
Franklin Global Real Estate Securities Fund
1. ORGANIZATION AND SIGNIFICANT ACCOUNTING POLICIES (continued)
b. Foreign Currency Translation
Portfolio securities and other assets and liabilities denominated in foreign currencies are translated into U.S. dollars based on the exchange rate of such currencies against U.S. dollars on the date of valuation. The Fund may enter into foreign currency exchange contracts to facilitate transactions denominated in a foreign currency. Purchases and sales of securities, income and expense items denominated in foreign currencies are translated into U.S. dollars at the exchange rate in effect on the transaction date. Portfolio securities and assets and liabilities denominated in foreign currencies contain risks that those currencies will decline in value relative to the U.S. dollar. Occasionally, events may impact the availability or reliability of foreign exchange rates used to convert the U.S. dollar equivalent value. If such an event occurs, the foreign exchange rate will be valued at fair value using procedures established and approved by the Trust’s Board of Trustees.
The Fund does not separately report the effect of changes in foreign exchange rates from changes in market prices on securities held. Such changes are included in net realized and unrealized gain or loss from investments on the Statement of Operations.
Realized foreign exchange gains or losses arise from sales of foreign currencies, currency gains or losses realized between the trade and settlement dates on securities transactions and the difference between the recorded amounts of dividends, interest, and foreign withholding taxes and the U.S. dollar equivalent of the amounts actually received or paid. Net unrealized foreign exchange gains and losses arise from changes in foreign exchange rates on foreign denominated assets and liabilities other than investments in securities held at the end of the reporting period.
c. Joint Repurchase Agreement
The Fund enters into a joint repurchase agreement whereby its uninvested cash balance is deposited into a joint cash account with other funds managed by the investment manager or an affiliate of the investment manager and is used to invest in one or more repurchase agreements. The value and face amount of the joint repurchase agreement are allocated to the funds based on their pro-rata interest. A repurchase agreement is accounted for as a loan by the fund to the seller, collateralized by securities which are delivered to the fund’s custodian. The market value, including accrued interest, of the initial collateralization is required to be at least 102% of the dollar amount invested by the funds, with the value of the underlying securities marked to market daily to maintain coverage of at least 100%. The joint repurchase agreement held by the Fund at year end had been entered into on December 30, 2011.
d. Income Taxes
It is the Fund’s policy to qualify as a regulated investment company under the Internal Revenue Code. The Fund intends to distribute to shareholders substantially all of its taxable income and net realized gains to relieve it from federal income and excise taxes. As a result, no provision for U.S. federal income taxes is required.
The Fund may be subject to foreign taxation related to income received, capital gains on the sale of securities and certain foreign currency transactions in the foreign jurisdictions in which it invests. Foreign taxes, if any, are recorded based on the tax regulations and rates that exist in the foreign markets in which the Fund invests. When a capital gain tax is determined to apply the Fund records an estimated deferred tax liability in an amount that would be payable if the securities were disposed of on the valuation date.
The Fund recognizes the tax benefits of uncertain tax positions only when the position is “more likely than not” to be sustained upon examination by the tax authorities based on the technical merits of the tax position. As of December 31, 2011, and for all open tax years, the Fund has determined that no liability for unrecognized tax benefits is required in the Fund’s financial statements related to uncertain tax positions taken on a tax return (or expected to be taken on future tax returns). Open tax years are those that remain subject to examination and are based on each tax jurisdiction statute of limitation.
FGR-17
Franklin Templeton Variable Insurance Products Trust
Notes to Financial Statements (continued)
Franklin Global Real Estate Securities Fund
1. ORGANIZATION AND SIGNIFICANT ACCOUNTING POLICIES (continued)
e. Security Transactions, Investment Income, Expenses and Distributions
Security transactions are accounted for on trade date. Realized gains and losses on security transactions are determined on a specific identification basis. Interest income and estimated expenses are accrued daily. Dividend income is recorded on the ex-dividend date except that certain dividends from foreign securities are recognized as soon as the Fund is notified of the ex-dividend date. Distributions to shareholders are recorded on the ex-dividend date and are determined according to income tax regulations (tax basis). Distributable earnings determined on a tax basis may differ from earnings recorded in accordance with accounting principles generally accepted in the United States of America. These differences may be permanent or temporary. Permanent differences are reclassified among capital accounts to reflect their tax character. These reclassifications have no impact on net assets or the results of operations. Temporary differences are not reclassified, as they may reverse in subsequent periods.
Common expenses incurred by the Trust are allocated among the funds based on the ratio of net assets of each fund to the combined net assets of the Trust. Fund specific expenses are charged directly to the fund that incurred the expense.
Realized and unrealized gains and losses and net investment income, not including class specific expenses, are allocated daily to each class of shares based upon the relative proportion of net assets of each class. Differences in per share distributions, by class, are generally due to differences in class specific expenses.
Distributions received by the Fund from certain securities may be a return of capital (ROC). Such distributions reduce the cost basis of the securities, and any distributions in excess of the cost basis are recognized as capital gains.
f. Accounting Estimates
The preparation of financial statements in accordance with accounting principles generally accepted in the United States of America requires management to make estimates and assumptions that affect the reported amounts of assets and liabilities at the date of the financial statements and the amounts of income and expenses during the reporting period. Actual results could differ from those estimates.
g. Guarantees and Indemnifications
Under the Trust’s organizational documents, its officers and trustees are indemnified by the Trust against certain liabilities arising out of the performance of their duties to the Trust. Additionally, in the normal course of business, the Trust, on behalf of the Fund, enters into contracts with service providers that contain general indemnification clauses. The Trust’s maximum exposure under these arrangements is unknown as this would involve future claims that may be made against the Trust that have not yet occurred. Currently, the Trust expects the risk of loss to be remote.
2. SHARES OF BENEFICIAL INTEREST
At December 31, 2011, there were an unlimited number of shares authorized (without par value). Transactions in the Fund’s shares were as follows:
| | | | | | | | | | | | | | | | |
| | | Year Ended December 31, | |
| | | 2011a | | | 2010b | |
| Class 1 Shares: | | Shares | | | Amount | | | Shares | | | Amount | |
Shares sold | | | 55,042 | | | $ | 671,863 | | | | 33,091 | | | $ | 392,138 | |
Shares issued in reinvestment of distributions | | | 235,958 | | | | 2,965,988 | | | | 100,659 | | | | 1,153,555 | |
Shares redeemed | | | (438,527 | ) | | | (5,523,256 | ) | | | (500,801 | ) | | | (5,876,484 | ) |
| | | | |
Net increase (decrease) | | | (147,527 | ) | | $ | (1,885,405 | ) | | | (367,051 | ) | | $ | (4,330,791 | ) |
| | | | |
FGR-18
Franklin Templeton Variable Insurance Products Trust
Notes to Financial Statements (continued)
Franklin Global Real Estate Securities Fund
2. SHARES OF BENEFICIAL INTEREST (continued)
| | | | | | | | | | | | | | | | |
| | | Year Ended December 31, | |
| | | 2011a | | | 2010b | |
| Class 2 Shares: | | Shares | | | Amount | | | Shares | | | Amount | |
Shares sold | | | 620,268 | | | $ | 7,524,987 | | | | 398,129 | | | $ | 4,697,314 | |
Shares issued in reinvestment of distributions | | | 2,103,291 | | | | 25,849,452 | | | | 860,295 | | | | 9,661,113 | |
Shares redeemed | | | (4,127,293 | ) | | | (50,732,090 | ) | | | (5,381,053 | ) | | | (61,565,969 | ) |
| | | | |
Net increase (decrease) | | | (1,403,734 | ) | | $ | (17,357,651 | ) | | | (4,122,629 | ) | | $ | (47,207,542 | ) |
| | | | |
Class 4 Shares: | | | | | | | | | | | | | | | | |
Shares redeemed | | | (214 | ) | | $ | (2,896 | ) | | | | | | | | |
| | | | | | | | | | |
Net increase (decrease) | | | (214 | ) | | $ | (2,896 | ) | | | | | | | | |
| | | | | | | | | | |
| a | Effective March 4, 2011, Class 4 was liquidated. |
| b | During the year Class 4 did not report any share transactions |
3. TRANSACTIONS WITH AFFILIATES
Franklin Resources, Inc. is the holding company for various subsidiaries that together are referred to as Franklin Templeton Investments. Certain officers and trustees of the Fund are also officers and/or directors of the following subsidiaries:
| | |
| Subsidiary | | Affiliation |
Franklin Templeton Institutional, LLC (FT Institutional) | | Investment manager |
Franklin Templeton Services, LLC (FT Services) | | Administrative manager |
Franklin Templeton Distributors, Inc. (Distributors) | | Principal underwriter |
Franklin Templeton Investor Services, LLC (Investor Services) | | Transfer agent |
a. Management Fees
The Fund pays an investment management fee to FT Institutional based on the average daily net assets of the Fund as follows:
| | |
| Annualized Fee Rate | | Net Assets |
| 0.800% | | Up to and including $500 million |
| 0.700% | | Over $500 million, up to and including $1 billion |
| 0.650% | | Over $1 billion, up to and including $1.5 billion |
| 0.600% | | Over $1.5 billion, up to and including $6.5 billion |
| 0.580% | | Over $6.5 billion, up to and including $11.5 billion |
| 0.560% | | Over $11.5 billion, up to and including $16.5 billion |
| 0.540% | | Over $16.5 billion, up to and including $19 billion |
| 0.530% | | Over $19 billion, up to and including $21.5 billion |
| 0.520% | | In excess of $21.5 billion |
b. Administrative Fees
The Fund pays an administrative fee to FT Services of 0.25% per year of the average daily net assets of the Fund.
c. Distribution Fees
The Fund’s Board of Trustees has adopted a distribution plan for Class 2 and Class 4 shares pursuant to Rule 12b-1 under the 1940 Act. Under the Fund’s compensation distribution plans, the Fund pays Distributors for costs incurred in connection with
FGR-19
Franklin Templeton Variable Insurance Products Trust
Notes to Financial Statements (continued)
Franklin Global Real Estate Securities Fund
3. TRANSACTIONS WITH AFFILIATES (continued)
c. Distribution Fees (continued)
the servicing, sale and distribution of the Fund’s shares up to 0.35% per year of its average daily net assets of each class. The Board of Trustees has agreed to limit the current rate to 0.25% per year for Class 2.
d. Transfer Agent Fees
Investor Services, under terms of an agreement, performs shareholder servicing for the Fund and is not paid by the Fund for the services.
e. Waiver and Expense Reimbursements
FT Services and FT Institutional have contractually agreed in advance to waive or limit their respective fees so that the increase in the Fund’s investment management and fund administration fees that became effective May 1, 2007 is phased in over a five year period, with there being no increase in the rate of such fees for the first year ending April 30, 2008. For each of the four years thereafter through April 30, 2012, the manager and administrator will receive one-fifth of the increase in the rate of fees. Beginning May 1, 2012, the full new investment management and administration fees will then be in effect.
4. EXPENSE OFFSET ARRANGEMENT
The Fund has entered into an arrangement with its custodian whereby credits realized as a result of uninvested cash balances are used to reduce a portion of the Fund’s custodian expenses. During the year ended December 31, 2011, there were no credits earned.
5. INCOME TAXES
For tax purposes, capital losses may be carried over to offset future capital gains, if any. Under the Regulated Investment Company Modernization Act of 2010, capital losses incurred by the Fund in taxable years beginning after December 22, 2010 are not subject to expiration and such losses retain their character as either short-term or long-term, rather than being considered short-term as under previous law. Post-enactment capital losses must be fully utilized prior to utilizing any losses incurred in pre-enactment tax years.
At December 31, 2011, capital loss carryforwards were as follows:
| | | | |
Capital loss carryforwards expiring in: | | | | |
2016 | | $ | 147,540,830 | |
2017 | | | 207,448,609 | |
2018 | | | 2,192,369 | |
| | | | |
| | $ | 357,181,808 | |
| | | | |
During the year ended December 31, 2011, the Fund utilized $3,694,108 of capital loss carryforwards.
The tax character of distributions paid during the years ended December 31, 2011 and 2010, was as follows:
| | | | | | | | |
| | | 2011 | | | 2010 | |
Distributions paid from ordinary income | | $ | 28,815,440 | | | $ | 10,814,738 | |
FGR-20
Franklin Templeton Variable Insurance Products Trust
Notes to Financial Statements (continued)
Franklin Global Real Estate Securities Fund
5. INCOME TAXES (continued)
At December 31, 2011, the cost of investments, net unrealized appreciation (depreciation), and undistributed ordinary income for income tax purposes were as follows:
| | | | |
Cost of investments | | $ | 286,181,312 | |
| | | | |
| |
Unrealized appreciation | | $ | 68,134,292 | |
Unrealized depreciation | | | (28,970,025 | ) |
| | | | |
Net unrealized appreciation (depreciation) | | $ | 39,164,267 | |
| | | | |
Distributable earnings – undistributed ordinary income | | $ | 594,502 | |
| | | | |
Differences between income and/or capital gains as determined on a book basis and a tax basis are primarily due to differing treatments of passive foreign investment company shares and wash sales.
6. INVESTMENT TRANSACTIONS
Purchases and sales of investments (excluding short term securities) for the year ended December 31, 2011, aggregated $105,857,790 and $141,517,101, respectively.
7. CONCENTRATION OF RISK
Investing in foreign securities may include certain risks and considerations not typically associated with investing in U.S. securities, such as fluctuating currency values and changing local and regional economic, political and social conditions, which may result in greater market volatility. In addition, certain foreign securities may not be as liquid as U.S. securities.
8. CREDIT FACILITY
The Fund, together with other U.S. registered and foreign investment funds (collectively, Borrowers), managed by Franklin Templeton Investments, are borrowers in a joint syndicated senior unsecured credit facility totaling $750 million (Global Credit Facility) which matured on January 20, 2012. This Global Credit Facility provides a source of funds to the Borrowers for temporary and emergency purposes, including the ability to meet future unanticipated or unusually large redemption requests. Effective January 20, 2012, the Borrowers renewed the Global Credit Facility for a total of $1.5 billion, maturing January 18, 2013.
Under the terms of the Global Credit Facility, the Fund shall, in addition to interest charged on any borrowings made by the Fund and other costs incurred by the Fund, pay its share of fees and expenses incurred in connection with the implementation and maintenance of the Global Credit Facility, based upon its relative share of the aggregate net assets of all of the Borrowers, including an annual commitment fee of 0.08% based upon the unused portion of the Global Credit Facility, which is reflected in other expenses on the Statement of Operations. During the year ended December 31, 2011, the Fund did not use the Global Credit Facility.
9. FAIR VALUE MEASUREMENTS
The Fund follows a fair value hierarchy that distinguishes between market data obtained from independent sources (observable inputs) and the Fund’s own market assumptions (unobservable inputs). These inputs are used in determining the value of the Fund’s investments and are summarized in the following fair value hierarchy:
| | • | | Level 1 – quoted prices in active markets for identical securities |
| | • | | Level 2 – other significant observable inputs (including quoted prices for similar securities, interest rates, prepayment speed, credit risk, etc.) |
FGR-21
Franklin Templeton Variable Insurance Products Trust
Notes to Financial Statements (continued)
Franklin Global Real Estate Securities Fund
9. FAIR VALUE MEASUREMENTS (continued)
| | • | | Level 3 – significant unobservable inputs (including the Fund’s own assumptions in determining the fair value of investments) |
The inputs or methodology used for valuing securities are not an indication of the risk associated with investing in those securities.
For movements between the levels within the fair value hierarchy, the Fund has adopted a policy of recognizing the transfers as of the date of the underlying event which caused the movement.
The following is a summary of the inputs used as of December 31, 2011, in valuing the Fund’s assets and liabilities carried at fair value:
| | | | | | | | | | | | | | | | |
| | | Level 1 | | | Level 2 | | | Level 3 | | | Total | |
| | | | |
Assets: | | | | | | | | | | | | | | | | |
Investments in Securities: | | | | | | | | | | | | | | | | |
Equity Investmentsa,b | | $ | 317,893,101 | | | $ | — | | | $ | — | | | $ | 317,893,101 | |
Short Term Investments | | | — | | | | 7,452,478 | | | | — | | | | 7,452,478 | |
| | | | |
Total Investments in Securities | | $ | 317,893,101 | | | $ | 7,452,478 | | | $ | — | | | $ | 325,345,579 | |
| | | | |
aIncludes common and convertible preferred stocks.
bFor detailed categories, see the accompanying Statement of Investments.
10. NEW ACCOUNTING PRONOUNCEMENTS
In May 2011, the Financial Accounting Standards Board (FASB) issued Accounting Standards Update (ASU) No. 2011-04, Fair Value Measurement (Topic 820): Amendments to Achieve Common Fair Value Measurement and Disclosure Requirements in U.S. GAAP and IFRSs. The amendments in the ASU will improve the comparability of fair value measurements presented and disclosed in financial statements prepared in accordance with U.S. GAAP (Generally Accepted Accounting Principles) and IFRS (International Financial Reporting Standards) and include new guidance for certain fair value measurement principles and disclosure requirements. The ASU is effective for interim and annual periods beginning after December 15, 2011. The Fund believes the adoption of this ASU will not have a material impact on its financial statements.
11. SUBSEQUENT EVENTS
The Fund has evaluated subsequent events through the issuance of the financial statements and determined that no events have occurred that require disclosure other than those already disclosed in the financial statements.
|
ABBREVIATIONS |
| Selected Portfolio |
|
| REIT - Real Estate Investment Trust |
FGR-22
Franklin Templeton Variable Insurance Products Trust
Franklin Global Real Estate Securities Fund
Report of Independent Registered Public Accounting Firm
To the Board of Trustees and Shareholders of Franklin Templeton Variable Insurance Products Trust
In our opinion, the accompanying statement of assets and liabilities, including the statement of investments, and the related statements of operations and of changes in net assets and the financial highlights present fairly, in all material respects, the financial position of Franklin Global Real Estate Securities Fund (the “Fund”) at December 31, 2011, the results of its operations for the year then ended, the changes in its net assets for each of the two years in the period then ended and the financial highlights for each of the five years in the period then ended, in conformity with accounting principles generally accepted in the United States of America. These financial statements and financial highlights (hereafter referred to as “financial statements”) are the responsibility of the Fund’s management. Our responsibility is to express an opinion on these financial statements based on our audits. We conducted our audits of these financial statements in accordance with the standards of the Public Company Accounting Oversight Board (United States). Those standards require that we plan and perform the audit to obtain reasonable assurance about whether the financial statements are free of material misstatement. An audit includes examining, on a test basis, evidence supporting the amounts and disclosures in the financial statements, assessing the accounting principles used and significant estimates made by management, and evaluating the overall financial statement presentation. We believe that our audits, which included confirmation of securities at December 31, 2011 by correspondence with the custodian and brokers, provide a reasonable basis for our opinion.
PricewaterhouseCoopers LLP
San Francisco, California
February 13, 2012
FGR-23
Franklin Templeton Variable Insurance Products Trust
Tax Information (unaudited)
Franklin Global Real Estate Securities Fund
At December 31, 2011, more than 50% of the Fund’s total assets were invested in securities of foreign issuers. In most instances, foreign taxes were withheld from income paid to the Fund on these investments. The Fund elects to treat foreign taxes paid as allowed under Section 853 of the Internal Revenue Code. This election will allow shareholders of record as of the 2012 distribution date, to treat their proportionate share of foreign taxes paid by the Fund as having been paid directly by them. The shareholder shall consider these amounts as foreign taxes paid in the tax year in which they receive the Fund distribution.
FGR-24
FRANKLIN GROWTHAND INCOME SECURITIES FUND
We are pleased to bring you Franklin Growth and Income Securities Fund’s annual report for the fiscal year ended December 31, 2011.
Performance Summary as of 12/31/11
Average annual total return of Class 1 shares represents the average annual change in value, assuming reinvestment of dividends and capital gains. Average returns smooth out variations in returns, which can be significant; they are not the same as year-by-year results.
Periods ended 12/31/11
| | | | | | | | | | | | |
| | | 1-Year | | | 5-Year | | | 10-Year | |
Average Annual Total Return | | | +2.64% | | | | -0.90% | | | | +3.20% | |
Total Return Index Comparison
for a Hypothetical $10,000 Investment (1/1/02–12/31/11)
The graph below shows the change in value of a hypothetical $10,000 investment in the Fund over the indicated period and includes reinvestment of any income or distributions. The Fund’s performance is compared to the performance of the Standard & Poor’s 500® Index (S&P 500®), the Lipper VIP Equity Income Funds Classification Average and the Consumer Price Index (CPI). One cannot invest directly in an index, and an index is not representative of the Fund’s portfolio. Please see Important Notes to Performance Information preceding the Fund Summaries.
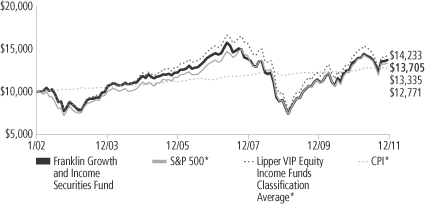
*Source: © 2012 Morningstar. Please see Index Descriptions following the Fund Summaries.
Franklin Growth and
Income Securities Fund
Class 1
Performance reflects the Fund’s Class 1 operating expenses, but does not include any contract fees, expenses or sales charges. If they had been included, performance would be lower. These charges and deductions, particularly for variable life policies, can have a significant effect on contract values and insurance benefits. See the contract prospectus for a complete description of these expenses, including sales charges.
Performance data represent past performance, which does not guarantee future results. Investment return and principal value will fluctuate, and you may have a gain or loss when you sell your shares.
Current performance may differ from figures shown.
FGI-1
Fund Goals and Main Investments: Franklin Growth and Income Securities Fund seeks capital appreciation with current income as a secondary goal. The Fund normally invests predominantly in equity securities, including securities convertible into common stock.
Performance Overview
You can find the Fund’s one-year total return in the Performance Summary. The Fund outperformed its benchmark, the S&P 500, which produced a +2.11% total return.1 The Fund also outperformed its peers as measured by the Lipper VIP Equity Income Funds Classification Average, which posted a +1.23% return for the same period.2 Please note that the Fund invests primarily in stocks with above average dividend yields. As a result, its holdings and returns may differ from those of the S&P 500, which include nondividend-paying stocks and do not focus on dividend yield.
Economic and Market Overview
The U.S. economy improved steadily but modestly in 2011 despite geopolitical, employment and housing pressures. The U.S. manufacturing sector helped power the domestic economy and led global manufacturing output heading into 2012. Although manufacturing growth slowed in the second half of the year as high commodity prices reduced purchasing power and demand ebbed, the trend began to reverse near year-end. U.S. gross domestic product (GDP) growth advanced each quarter, and the nation’s unemployment rate fell from 9.4% to 8.5%.3
The U.S. financial system and household balance sheets continued to improve, but the country still faced persistently high unemployment, a prolonged housing market slump and massive national debt. The U.S. Federal Reserve Board (Fed) cut the country’s growth forecast partly due to the heightened potential for recession in Europe and cooling GDP trends across much of Asia. Inflation rose for much of the world but stayed relatively contained in the U.S., even slowing toward year-end amid declining energy and food prices. The Fed sought to boost economic growth by maintaining its accommodative monetary policy and undertook a second round of quantitative easing that ended on June 30. Subsequently, the Fed continued to purchase Treasuries with proceeds from maturing debt in an effort to support economic growth.
1. Source: © 2012 Morningstar.
2. Source: Lipper Inc.
One cannot invest directly in an index, and an index is not representative of the Fund’s portfolio. Please see Index Descriptions following the Fund Summaries.
3. Source: Bureau of Labor Statistics.
Fund Risks: All investments involve risks. Stock prices fluctuate, sometimes rapidly and dramatically, due to factors affecting individual companies, particular industries or sectors, or general market conditions. The value of convertible securities may rise and fall with the market value of the underlying stock or, like a debt security, vary with changes in interest rates and the credit quality of the issuer. The Fund may have significant investments in particular sectors from time to time, such as financial services, energy, health care/pharmaceuticals, technology and telecommunications, and industrials, and may be at greater risk of adverse developments in a sector than a fund that invests more broadly. Changes in the financial strength of a debt issuer or in the rating of its securities may affect the securities’ value and, as a result, impact Fund performance. Investments in high yield, lower rated (junk) bonds, generally have greater price swings and higher risk of default and loss of principal than investment-grade bonds. Foreign investing, especially in developing markets, involves additional risks, including currency fluctuations, economic instability, market volatility, and political and social instability. Derivative instruments may be volatile and illiquid, may give rise to leverage and may involve a small investment relative to the risk assumed. The Fund is actively managed but there is no guarantee that the manager’s investment decisions will produce the desired results. The Fund’s prospectus also includes a description of the main investment risks.
FGI-2
Although U.S. stock markets rallied in the spring, worrisome global events and slowing global growth dampened investor sentiment and market volatility surged. Risk-averse investors sought perceived safe havens and seemed to ignore that many U.S. companies generated record profits. Despite large swings, U.S. stocks as measured by the S&P 500 Index gained 2.11% in 2011.1 The Dow Jones Industrial Average rose 8.38%, reflecting investors’ general preference for large, established U.S. companies.1 Notably, the U.S. was a global market leader in 2011 as the country continued to be a relative haven. During the year, sector performance varied widely. Noncyclical, income-producing sectors such as utilities, consumer staples and health care led the market, while economically sensitive sectors such as materials and industrials lagged. Financials in the S&P 500 experienced the worst sector decline, as U.S. bank stocks generally tracked their European peers. Against this backdrop, growth stocks fared better than their value counterparts; large-capitalization stocks advanced slightly as a group, with modestly negative results for most small- and mid-sized company stocks, as measured by Russell capitalization-based indexes.
Investment Strategy
We invest in a broadly diversified portfolio of equity securities that we consider to be financially strong. To help identify such companies, we use a current relative yield analysis that focuses on a company’s dividend yield (calculated by dividing a stock’s annual per share dividends by its per share market price). This results in a relative yield range for each company that can assist us in determining whether we believe a stock is attractively priced for purchase or sale. A higher relative dividend yield is frequently accompanied by a lower stock price. Therefore, we seek to buy a stock when its relative dividend yield is high and to sell a stock when its relative dividend yield is low, which may be caused by an increase in the price of the stock.
Manager’s Discussion
The Fund’s absolute performance during 2011 was aided primarily by its investments in the health care, energy and utilities sectors. Within the health care sector, pharmaceuticals giants Pfizer and Roche Holding were key contributors, driven in part by strong free cash flow and dividend yields we found attractive. Natural gas infrastructure company Spectra Energy supported the Fund’s strong results within the energy sector, as did major oil conglomerates Chevron and Exxon Mobil. Among utilities stocks, the Fund benefited from positions in Southern
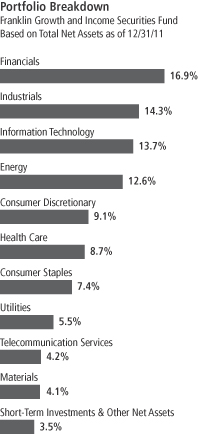
FGI-3
Company, one of the U.S.’s largest electricity distributors serving more than 4.4 million electricity customers in the southeast, and Progress Energy, a utility serving the Carolinas and Florida that agreed to be acquired by Duke Energy in 2011.
The Fund also had some disappointments, most notably within the economically sensitive financials and materials sectors. Financials stocks were key Fund detractors and included large institutions such as Bank of America and JPMorgan Chase & Co., as well as insurers such as MetLife, QBE Insurance Group and Aflac. Among the large detractors in the materials sector was Freeport-McMoRan Copper & Gold. Even though gold bullion prices rose considerably, shares of related mining stocks fared poorly. The gulf between the fortunes of physical gold and mining companies such as Freeport-McMoRan was primarily the result of rising mining costs, investor concerns over more aggressive government taxation of resources companies, and broad-based selling of stocks during a turbulent year for equities. The Fund’s position in Anglogold Ashanti Holdings also declined for similar reasons. With softening global growth forecast for 2012, these companies’ share prices also suffered generally from a perceived weakening in demand for copper and gold following all-time highs for both metals earlier in 2011. Furthermore, with a slowing global economy and reduced orders for steel — especially out of China where manufacturing and construction activity was ebbing toward year-end — the metal’s price retreated along with those of copper and other industrial metals, causing the Fund’s shares of steelmakers such as ArcelorMittal to fall in value and detract from our overall results.
Thank you for your participation in Franklin Growth and Income Securities Fund. We look forward to serving your future investment needs.
The foregoing information reflects our analysis, opinions and portfolio holdings as of December 31, 2011, the end of the reporting period. The way we implement our main investment strategies and the resulting portfolio holdings may change depending on factors such as market and economic conditions. These opinions may not be relied upon as investment advice or an offer for a particular security. The information is not a complete analysis of every aspect of any market, country, industry, security or the Fund. Statements of fact are from sources considered reliable, but the investment manager makes no representation or warranty as to their completeness or accuracy. Although historical performance is no guarantee of future results, these insights may help you understand our investment management philosophy.
FGI-4
Top 10 Holdings
Franklin Growth and Income Securities Fund 12/31/11
| | | | |
Company
Sector/Industry | | % of Total
Net Assets | |
| Verizon Communications Inc. | | | 2.6% | |
| Telecommunication Services | | | | |
| Wells Fargo & Co. | | | 2.5% | |
| Financials | | | | |
| Intel Corp. | | | 2.3% | |
| Information Technology | | | | |
| NIKE Inc. | | | 2.3% | |
| Consumer Discretionary | | | | |
| Merck & Co. Inc. | | | 2.1% | |
| Health Care | | | | |
| International Business Machines Corp. | | | 2.1% | |
| Information Technology | | | | |
| General Electric Co. | | | 2.1% | |
| Industrials | | | | |
| Chevron Corp. | | | 2.1% | |
| Energy | | | | |
| PepsiCo Inc. | | | 2.0% | |
| Consumer Staples | | | | |
| Microchip Technology Inc. | | | 1.9% | |
| Information Technology | | | | |
The dollar value, number of shares or principal amount, and names of all portfolio holdings are listed in the Fund’s Statement of Investments.
Fund Expenses
As an investor in a variable insurance contract (Contract) that indirectly provides for investment in an underlying mutual fund, you can incur transaction and/or ongoing expenses at both the Fund level and the Contract level.
| • | | Transaction expenses can include sales charges (loads) on purchases, redemption fees, surrender fees, transfer fees and premium taxes. |
| • | | Ongoing expenses can include management fees, distribution and service (12b-1) fees, contract fees, annual maintenance fees, mortality and expense risk fees and other fees and expenses. All mutual funds and Contracts have some types of ongoing expenses. |
The expenses shown in the table are meant to highlight ongoing expenses at the Fund level only and do not include ongoing expenses at the Contract level, or transaction expenses at either the Fund or Contract level. While the Fund does not have transaction expenses, if the transaction and ongoing expenses at the Contract level were included, the expenses shown would be higher. You should consult your Contract prospectus or disclosure document for more information.
The table shows Fund-level ongoing expenses and can help you understand these expenses and compare them with those of other mutual funds offered through the Contract. The table assumes a $1,000 investment held for the six months indicated. Please refer to the Fund prospectus for additional information on operating expenses.
Actual Fund Expenses
The first line (Actual) of the table provides actual account values and expenses. The “Ending Account Value” is derived from the Fund’s actual return, which includes the effect of ongoing Fund expenses, but does not include the effect of ongoing Contract expenses.
You can estimate the Fund-level expenses you incurred during the period by following these steps. Of course, your account value and expenses will differ from those in this illustration:
| 1. | Divide your account value by $1,000. |
If an account had an $8,600 value, then $8,600 ÷ $1,000 = 8.6.
| 2. | Multiply the result by the number under the heading “Fund-Level Expenses Incurred During Period.” |
If Fund-Level Expenses Incurred During Period were $7.50, then 8.6 x $7.50 = $64.50.
In this illustration, the estimated expenses incurred this period at the Fund level are $64.50.
Franklin Growth and
Income Securities Fund
Class 1
FGI-5
Hypothetical Example for Comparison with Other Mutual Funds
Information in the second line (Hypothetical) of the table can help you compare ongoing expenses of the Fund with those of other mutual funds offered through the Contract. This information may not be used to estimate the actual ending account balance or expenses you incurred during the period. The hypothetical “Ending Account Value” is based on the Fund’s actual expense ratio and an assumed 5% annual rate of return before expenses, which does not represent the Fund’s actual return. The figure under the heading “Fund-Level Expenses Incurred During Period” shows the hypothetical expenses your account would have incurred under this scenario. You can compare this figure with the 5% hypothetical examples that appear in shareholder reports of other funds offered through a Contract.
| | | | | | | | | | | | |
| Class 1 | | Beginning
Account Value 7/1/11 | | | Ending
Account
Value 12/31/11 | | | Fund-Level Expenses Incurred
During Period* 7/1/11–12/31/11 | |
Actual | | $ | 1,000 | | | $ | 975.60 | | | $ | 2.94 | |
Hypothetical (5% return before expenses) | | $ | 1,000 | | | $ | 1,022.23 | | | $ | 3.01 | |
*Expenses are calculated using the most recent six-month annualized expense ratio for the Fund’s Class 1 shares (0.59%), which does not include any ongoing expenses of the Contract for which the Fund is an investment option, multiplied by the average account value over the period, multiplied by 184/365 to reflect the one-half year period.
FGI-6
Franklin Templeton Variable Insurance Products Trust
Financial Highlights
Franklin Growth and Income Securities Fund
| | | | | | | | | | | | | | | | | | | | |
| | | Year Ended December 31, | |
| Class 1 | | 2011 | | | 2010 | | | 2009 | | | 2008 | | | 2007 | |
| | | | |
Per share operating performance | | | | | | | | | | | | | | | | | | | | |
(for a share outstanding throughout the year) | | | | | | | | | | | | | | | | | | | | |
Net asset value, beginning of year | | $ | 11.76 | | | $ | 10.47 | | | $ | 8.72 | | | $ | 15.07 | | | $ | 16.83 | |
| | | | |
Income from investment operationsa: | | | | | | | | | | | | | | | | | | | | |
Net investment incomeb | | | 0.33 | | | | 0.38 | | | | 0.31 | | | | 0.39 | | | | 0.41 | |
Net realized and unrealized gains (losses) | | | (0.03 | ) | | | 1.32 | | | | 1.92 | | | | (5.17 | ) | | | (0.82 | ) |
| | | | |
Total from investment operations | | | 0.30 | | | | 1.70 | | | | 2.23 | | | | (4.78 | ) | | | (0.41 | ) |
| | | | |
Less distributions from: | | | | | | | | | | | | | | | | | | | | |
Net investment income | | | (0.46 | ) | | | (0.41 | ) | | | (0.48 | ) | | | (0.45 | ) | | | (0.42 | ) |
Net realized gains | | | — | | | | — | | | | — | | | | (1.12 | ) | | | (0.93 | ) |
| | | | |
Total distributions | | | (0.46 | ) | | | (0.41 | ) | | | (0.48 | ) | | | (1.57 | ) | | | (1.35 | ) |
| | | | |
Net asset value, end of year | | $ | 11.60 | | | $ | 11.76 | | | $ | 10.47 | | | $ | 8.72 | | | $ | 15.07 | |
| | | | |
| | | | | |
Total returnc | | | 2.64% | | | | 16.93% | | | | 26.82% | | | | (34.95)% | | | | (3.46)% | |
Ratios to average net assets | | | | | | | | | | | | | | | | | | | | |
Expenses | | | 0.59% | | | | 0.59% | | | | 0.60% | d | | | 0.55% | d | | | 0.52% | d |
Net investment income | | | 2.80% | | | | 3.62% | | | | 3.46% | | | | 3.17% | | | | 2.47% | |
| | | | | |
Supplemental data | | | | | | | | | | | | | | | | | | | | |
Net assets, end of year (000’s) | | $ | 156,830 | | | $ | 176,590 | | | $ | 174,403 | | | $ | 162,936 | | | $ | 306,691 | |
Portfolio turnover rate | | | 32.93% | | | | 26.83% | | | | 51.05% | | | | 30.66% | | | | 36.66% | |
aThe amount shown for a share outstanding throughout the period may not correlate with the Statement of Operations for the period due to the timing of sales and repurchases of the Fund shares in relation to income earned and/or fluctuating market value of the investments of the Fund.
bBased on average daily shares outstanding.
cTotal return does not include fees, charges or expenses imposed by the variable annuity and life insurance contracts for which the Franklin Templeton Variable Insurance Products Trust serves as an underlying investment vehicle.
dBenefit of expense reduction rounds to less than 0.01%.
The accompanying notes are an integral part of these financial statements.
FGI-7
Franklin Templeton Variable Insurance Products Trust
Financial Highlights (continued)
Franklin Growth and Income Securities Fund
| | | | | | | | | | | | | | | | | | | | |
| | | Year Ended December 31, | |
| Class 2 | | 2011 | | | 2010 | | | 2009 | | | 2008 | | | 2007 | |
| | | | |
Per share operating performance | | | | | | | | | | | | | | | | | | | | |
(for a share outstanding throughout the year) | | | | | | | | | | | | | | | | | | | | |
Net asset value, beginning of year | | $ | 11.60 | | | $ | 10.33 | | | $ | 8.59 | | | $ | 14.86 | | | $ | 16.62 | |
| | | | |
Income from investment operationsa: | | | | | | | | | | | | | | | | | | | | |
Net investment incomeb | | | 0.29 | | | | 0.35 | | | | 0.28 | | | | 0.35 | | | | 0.37 | |
Net realized and unrealized gains (losses) | | | (0.02 | ) | | | 1.31 | | | | 1.90 | | | | (5.10 | ) | | | (0.82 | ) |
| | | | |
Total from investment operations | | | 0.27 | | | | 1.66 | | | | 2.18 | | | | (4.75 | ) | | | (0.45 | ) |
| | | | |
Less distributions from: | | | | | | | | | | | | | | | | | | | | |
Net investment income | | | (0.43 | ) | | | (0.39 | ) | | | (0.44 | ) | | | (0.40 | ) | | | (0.38 | ) |
Net realized gains | | | — | | | | — | | | | — | | | | (1.12 | ) | | | (0.93 | ) |
| | | | |
Total distributions | | | (0.43 | ) | | | (0.39 | ) | | | (0.44 | ) | | | (1.52 | ) | | | (1.31 | ) |
| | | | |
Net asset value, end of year | | $ | 11.44 | | | $ | 11.60 | | | $ | 10.33 | | | $ | 8.59 | | | $ | 14.86 | |
| | | | |
| | | | | |
Total returnc | | | 2.41% | | | | 16.68% | | | | 26.55% | | | | (35.14)% | | | | (3.71)% | |
Ratios to average net assets | | | | | | | | | | | | | | | | | | | | |
Expenses | | | 0.84% | | | | 0.84% | | | | 0.85% | d | | | 0.80% | d | | | 0.77% | d |
Net investment income | | | 2.55% | | | | 3.37% | | | | 3.21% | | | | 2.92% | | | | 2.22% | |
| | | | | |
Supplemental data | | | | | | | | | | | | | | | | | | | | |
Net assets, end of year (000’s) | | $ | 129,309 | | | $ | 151,481 | | | $ | 152,077 | | | $ | 141,359 | | | $ | 312,692 | |
Portfolio turnover rate | | | 32.93% | | | | 26.83% | | | | 51.05% | | | | 30.66% | | | | 36.66% | |
aThe amount shown for a share outstanding throughout the period may not correlate with the Statement of Operations for the period due to the timing of sales and repurchases of the Fund shares in relation to income earned and/or fluctuating market value of the investments of the Fund.
bBased on average daily shares outstanding.
cTotal return does not include fees, charges or expenses imposed by the variable annuity and life insurance contracts for which the Franklin Templeton Variable Insurance Products Trust serves as an underlying investment vehicle.
dBenefit of expense reduction rounds to less than 0.01%.
The accompanying notes are an integral part of these financial statements.
FGI-8
Franklin Templeton Variable Insurance Products Trust
Statement of Investments, December 31, 2011
| | | | | | | | | | |
| Franklin Growth and Income Securities Fund | | Country | | Shares | | | Value | |
Common Stocks 82.9% | | | | | | | | | | |
Consumer Discretionary 8.2% | | | | | | | | | | |
Comcast Corp., A | | United States | | | 139,080 | | | $ | 3,297,587 | |
Limited Brands Inc. | | United States | | | 110,200 | | | | 4,446,570 | |
Lowe’s Cos. Inc. | | United States | | | 142,100 | | | | 3,606,498 | |
NIKE Inc., B | | United States | | | 68,500 | | | | 6,601,345 | |
Target Corp. | | United States | | | 105,000 | | | | 5,378,100 | |
| | | | | | | | | | |
| | | | | | | | | 23,330,100 | |
| | | | | | | | | | |
Consumer Staples 7.4% | | | | | | | | | | |
The Coca-Cola Co. | | United States | | | 46,500 | | | | 3,253,605 | |
Diageo PLC, ADR | | United Kingdom | | | 53,400 | | | | 4,668,228 | |
PepsiCo Inc. | | United States | | | 85,200 | | | | 5,653,020 | |
The Procter & Gamble Co. | | United States | | | 53,400 | | | | 3,562,314 | |
Unilever NV, N.Y. shs. | | Netherlands | | | 114,700 | | | | 3,942,239 | |
| | | | | | | | | | |
| | | | | | | | | 21,079,406 | |
| | | | | | | | | | |
Energy 10.0% | | | | | | | | | | |
Chevron Corp. | | United States | | | 55,200 | | | | 5,873,280 | |
ConocoPhillips | | United States | | | 65,000 | | | | 4,736,550 | |
Exxon Mobil Corp. | | United States | | | 54,544 | | | | 4,623,150 | |
Royal Dutch Shell PLC, A, ADR | | Netherlands | | | 75,000 | | | | 5,481,750 | |
Schlumberger Ltd. | | United States | | | 48,900 | | | | 3,340,359 | |
Spectra Energy Corp. | | United States | | | 150,500 | | | | 4,627,875 | |
| | | | | | | | | | |
| | | | | | | | | 28,682,964 | |
| | | | | | | | | | |
Financials 12.4% | | | | | | | | | | |
Aflac Inc. | | United States | | | 122,900 | | | | 5,316,654 | |
Bank of America Corp. | | United States | | | 228,400 | | | | 1,269,904 | |
BlackRock Inc. | | United States | | | 26,700 | | | | 4,759,008 | |
JPMorgan Chase & Co. | | United States | | | 139,770 | | | | 4,647,352 | |
Marsh & McLennan Cos. Inc. | | United States | | | 117,500 | | | | 3,715,350 | |
People’s United Financial Inc. | | United States | | | 250,000 | | | | 3,212,500 | |
QBE Insurance Group Ltd. | | Australia | | | 275,000 | | | | 3,643,337 | |
T. Rowe Price Group Inc. | | United States | | | 81,100 | | | | 4,618,645 | |
Wells Fargo & Co. | | United States | | | 161,000 | | | | 4,437,160 | |
| | | | | | | | | | |
| | | | | | | | | 35,619,910 | |
| | | | | | | | | | |
Health Care 8.1% | | | | | | | | | | |
Abbott Laboratories | | United States | | | 65,200 | | | | 3,666,196 | |
Johnson & Johnson | | United States | | | 77,800 | | | | 5,102,124 | |
Merck & Co. Inc. | | United States | | | 161,261 | | | | 6,079,540 | |
Pfizer Inc. | | United States | | | 209,900 | | | | 4,542,236 | |
Roche Holding AG | | Switzerland | | | 22,300 | | | | 3,783,407 | |
| | | | | | | | | | |
| | | | | | | | | 23,173,503 | |
| | | | | | | | | | |
Industrials 14.3% | | | | | | | | | | |
3M Co. | | United States | | | 55,500 | | | | 4,536,015 | |
The Boeing Co. | | United States | | | 35,800 | | | | 2,625,930 | |
Caterpillar Inc. | | United States | | | 36,600 | | | | 3,315,960 | |
Emerson Electric Co. | | United States | | | 114,600 | | | | 5,339,214 | |
General Dynamics Corp. | | United States | | | 63,600 | | | | 4,223,676 | |
General Electric Co. | | United States | | | 330,000 | | | | 5,910,300 | |
Honeywell International Inc. | | United States | | | 60,000 | | | | 3,261,000 | |
J.B. Hunt Transport Services Inc. | | United States | | | 64,500 | | | | 2,907,015 | |
Republic Services Inc. | | United States | | | 135,200 | | | | 3,724,760 | |
FGI-9
Franklin Templeton Variable Insurance Products Trust
Statement of Investments, December 31, 2011 (continued)
| | | | | | | | | | |
| Franklin Growth and Income Securities Fund | | Country | | Shares | | | Value | |
Common Stocks (continued) | | | | | | | | | | |
Industrials (continued) | | | | | | | | | | |
United Parcel Service Inc., B | | United States | | | 70,800 | | | $ | 5,181,852 | |
| | | | | | | | | | |
| | | | | | | | | 41,025,722 | |
| | | | | | | | | | |
Information Technology 11.1% | | | | | | | | | | |
Intel Corp. | | United States | | | 273,000 | | | | 6,620,250 | |
International Business Machines Corp. | | United States | | | 32,900 | | | | 6,049,652 | |
Microchip Technology Inc. | | United States | | | 151,800 | | | | 5,560,434 | |
Microsoft Corp. | | United States | | | 172,400 | | | | 4,475,504 | |
Paychex Inc. | | United States | | | 143,000 | | | | 4,305,730 | |
Xerox Corp. | | United States | | | 587,400 | | | | 4,675,704 | |
| | | | | | | | | | |
| | | | | | | | | 31,687,274 | |
| | | | | | | | | | |
Materials 2.6% | | | | | | | | | | |
E. I. du Pont de Nemours and Co. | | United States | | | 101,800 | | | | 4,660,404 | |
Freeport-McMoRan Copper & Gold Inc., B | | United States | | | 80,738 | | | | 2,970,351 | |
| | | | | | | | | | |
| | | | | | | | | 7,630,755 | |
| | | | | | | | | | |
Telecommunication Services 4.2% | | | | | | | | | | |
AT&T Inc. | | United States | | | 146,497 | | | | 4,430,069 | |
Verizon Communications Inc. | | United States | | | 185,200 | | | | 7,430,224 | |
| | | | | | | | | | |
| | | | | | | | | 11,860,293 | |
| | | | | | | | | | |
Utilities 4.6% | | | | | | | | | | |
Progress Energy Inc. | | United States | | | 65,000 | | | | 3,641,300 | |
Sempra Energy | | United States | | | 92,242 | | | | 5,073,310 | |
The Southern Co. | | United States | | | 96,700 | | | | 4,476,243 | |
| | | | | | | | | | |
| | | | | | | | | 13,190,853 | |
| | | | | | | | | | |
Total Common Stocks (Cost $193,973,682) | | | | | | | | | 237,280,780 | |
| | | | | | | | | | |
aEquity-Linked Securities 4.0% | | | | | | | | | | |
Energy 1.4% | | | | | | | | | | |
Credit Suisse AG into Halliburton Co., 8.00% | | United States | | | 110,000 | | | | 4,038,650 | |
| | | | | | | | | | |
Information Technology 2.6% | | | | | | | | | | |
bGoldman Sachs Group Inc. into Cisco Systems Inc., 5.00%, 144A | | United States | | | 300,000 | | | | 5,461,200 | |
bMorgan Stanley into Apple Inc., 7.50%, 144A | | United States | | | 5,000 | | | | 1,911,820 | |
| | | | | | | | | | |
| | | | | | | | | 7,373,020 | |
| | | | | | | | | | |
Total Equity-Linked Securities (Cost $14,295,900) | | | | | | | | | 11,411,670 | |
| | | | | | | | | | |
Convertible Preferred Stocks 9.0% | | | | | | | | | | |
Consumer Discretionary 0.9% | | | | | | | | | | |
General Motors Co., 4.75%, cvt. pfd., B | | United States | | | 77,000 | | | | 2,637,250 | |
| | | | | | | | | | |
Energy 1.2% | | | | | | | | | | |
bChesapeake Energy Corp., 5.75%, cvt. pfd., 144A | | United States | | | 3,500 | | | | 3,534,265 | |
| | | | | | | | | | |
Financials 4.3% | | | | | | | | | | |
Bank of America Corp., 7.25%, cvt. pfd., L | | United States | | | 4,100 | | | | 3,230,882 | |
Hartford Financial Services Group Inc., 7.25%, cvt. pfd. | | United States | | | 97,000 | | | | 1,821,660 | |
MetLife Inc., 5.00%, cvt. pfd. | | United States | | | 71,100 | | | | 4,381,182 | |
Wells Fargo & Co., 7.50%, cvt. pfd., A | | United States | | | 2,700 | | | | 2,851,200 | |
| | | | | | | | | | |
| | | | | | | | | 12,284,924 | |
| | | | | | | | | | |
FGI-10
Franklin Templeton Variable Insurance Products Trust
Statement of Investments, December 31, 2011 (continued)
| | | | | | | | | | |
| Franklin Growth and Income Securities Fund | | Country | | Shares | | | Value | |
Convertible Preferred Stocks (continued) | | | | | | | | | | |
Health Care 0.6% | | | | | | | | | | |
Tenet Healthcare Corp., 7.00%, cvt. pfd. | | United States | | | 1,900 | | | $ | 1,624,500 | |
| | | | | | | | | | |
Materials 1.1% | | | | | | | | | | |
AngloGold Ashanti Holdings Finance PLC, 6.00%, cvt. pfd. | | South Africa | | | 65,000 | | | | 3,102,450 | |
| | | | | | | | | | |
Utilities 0.9% | | | | | | | | | | |
Great Plains Energy Inc., 12.00%, cvt. pfd. | | United States | | | 40,000 | | | | 2,664,400 | |
| | | | | | | | | | |
Total Convertible Preferred Stocks (Cost $27,209,036) | | | | | | | | | 25,847,789 | |
| | | | | | | | | | |
Preferred Stocks (Cost $8,133,100) 0.2% | | | | | | | | | | |
Financials 0.2% | | | | | | | | | | |
cFannie Mae, 8.25%, pfd. | | United States | | | 325,000 | | | | 448,500 | |
| | | | | | | | | | |
| | | |
| | | | | Principal
Amount* | | | | |
Convertible Bonds (Cost $1,000,000) 0.4% | | | | | | | | | | |
Materials 0.4% | | | | | | | | | | |
ArcelorMittal, cvt., senior note, 5.00%, 5/15/14 | | Luxembourg | | $ | 1,000,000 | | | | 1,056,250 | |
| | | | | | | | | | |
Total Investments before Short Term Investments
(Cost $244,611,718) | | | | | | | | | 276,044,989 | |
| | | | | | | | | | |
Short Term Investments (Cost $10,099,486) 3.5% | | | | | | | | | | |
Repurchase Agreements 3.5% | | | | | | | | | | |
dJoint Repurchase Agreement, 0.011%, 1/03/12 (Maturity Value $10,099,498) | | United States | | | 10,099,486 | | | | 10,099,486 | |
BNP Paribas Securities Corp. (Maturity Value $1,222,039) | | | | | | | | | | |
Credit Suisse Securities (USA) LLC (Maturity Value $1,466,346) | | | | | | | | | | |
Deutsche Bank Securities Inc. (Maturity Value $1,545,526) | | | | | | | | | | |
HSBC Securities (USA) Inc. (Maturity Value $2,444,079) | | | | | | | | | | |
Merrill Lynch, Pierce, Fenner & Smith Inc. (Maturity Value $1,466,346) | | | | | | | | | | |
Morgan Stanley & Co. LLC (Maturity Value $488,816) | | | | | | | | | | |
UBS Securities LLC (Maturity Value $1,466,346) | | | | | | | | | | |
Collateralized by U.S. Government Agency Securities, 0.16% - 5.25%, 6/07/12 - 2/05/14; eU.S. Treasury Bills, 1/12/12 - 9/20/12; U.S. Treasury Bonds, 0.50% -11.25%,
5/31/13 - 2/15/16; and U.S. Treasury Notes, 0.125% - 4.875%, 12/31/11 - 5/15/19 (valued at $10,306,814) | | | | | | | | | | |
| | | | | | | | | | |
Total Investments (Cost $254,711,204) 100.0% | | | | | | | | | 286,144,475 | |
Other Assets, less Liabilities (0.0)%† | | | | | | | | | (5,807 | ) |
| | | | | | | | | | |
Net Assets 100.0% | | | | | | | | $ | 286,138,668 | |
| | | | | | | | | | |
See Abbreviations on page FGI-22.
†Rounds to less than 0.1% of net assets.
*The principal amount is stated in U.S. dollars unless otherwise indicated.
aSee Note 1(d) regarding equity-linked securities.
bSecurity was purchased pursuant to Rule 144A under the Securities Act of 1933 and may be sold in transactions exempt from registration only to qualified institutional buyers or in a public offering registered under the Securities Act of 1933. These securities have been deemed liquid under guidelines approved by the Trust’s Board of Trustees. At December 31, 2011, the aggregate value of these securities was $10,907,285, representing 3.81% of net assets.
cNon-income producing.
dSee Note 1(c) regarding joint repurchase agreement.
eThe security is traded on a discount basis with no stated coupon rate.
The accompanying notes are an integral part of these financial statements.
FGI-11
Franklin Templeton Variable Insurance Products Trust
Financial Statements
Statement of Assets and Liabilities
December 31, 2011
| | | | |
| | | Franklin Growth
and Income
Securities Fund | |
Assets: | | | | |
Investments in securities: | | | | |
Cost - Unaffiliated issuers | | $ | 244,611,718 | |
Cost - Repurchase agreements | | | 10,099,486 | |
| | | | |
Total cost of investments | | $ | 254,711,204 | |
| | | | |
Value - Unaffiliated issuers | | $ | 276,044,989 | |
Value - Repurchase agreements | | | 10,099,486 | |
| | | | |
Total value of investments | | | 286,144,475 | |
Receivables: | | | | |
Capital shares sold | | | 118,373 | |
Dividends and interest | | | 650,683 | |
Other assets | | | 9 | |
| | | | |
Total assets | | | 286,913,540 | |
| | | | |
Liabilities: | | | | |
Payables: | | | | |
Capital shares redeemed | | | 495,054 | |
Affiliates | | | 183,093 | |
Reports to shareholders | | | 59,750 | |
Accrued expenses and other liabilities | | | 36,975 | |
| | | | |
Total liabilities | | | 774,872 | |
| | | | |
Net assets, at value | | $ | 286,138,668 | |
| | | | |
Net assets consist of: | | | | |
Paid-in capital | | $ | 304,716,090 | |
Undistributed net investment income | | | 8,605,551 | |
Net unrealized appreciation (depreciation) | | | 31,436,192 | |
Accumulated net realized gain (loss) | | | (58,619,165 | ) |
| | | | |
Net assets, at value | | $ | 286,138,668 | |
| | | | |
Class 1: | | | | |
Net assets, at value | | $ | 156,830,095 | |
| | | | |
Shares outstanding | | | 13,519,588 | |
| | | | |
Net asset value and maximum offering price per share | | $ | 11.60 | |
| | | | |
Class 2: | | | | |
Net assets, at value | | $ | 129,308,573 | |
| | | | |
Shares outstanding | | | 11,308,095 | |
| | | | |
Net asset value and maximum offering price per share | | $ | 11.44 | |
| | | | |
The accompanying notes are an integral part of these financial statements.
FGI-12
Franklin Templeton Variable Insurance Products Trust
Financial Statements (continued)
Statement of Operations
for the year ended December 31, 2011
| | | | |
| | | Franklin Growth
and Income
Securities Fund | |
Investment income: | | | | |
Dividends | | $ | 10,179,500 | |
Interest | | | 153,488 | |
| | | | |
Total investment income | | | 10,332,988 | |
| | | | |
Expenses: | | | | |
Management fees (Note 3a) | | | 1,622,410 | |
Distribution fees: (Note 3c) | | | | |
Class 2 | | | 346,320 | |
Class 4 | | | 2 | |
Unaffiliated transfer agent fees | | | 197 | |
Custodian fees (Note 4) | | | 6,540 | |
Reports to shareholders | | | 101,226 | |
Professional fees | | | 40,738 | |
Trustees’ fees and expenses | | | 1,172 | |
Other | | | 17,076 | |
| | | | |
Total expenses | | | 2,135,681 | |
| | | | |
Net investment income | | | 8,197,307 | |
| | | | |
Realized and unrealized gains (losses): | | | | |
Net realized gain (loss) from: | | | | |
Investments | | | 24,188,456 | |
Foreign currency transactions | | | 2,471 | |
| | | | |
Net realized gain (loss) | | | 24,190,927 | |
| | | | |
Net change in unrealized appreciation (depreciation) on: | | | | |
Investments | | | (24,900,763 | ) |
Translation of other assets and liabilities denominated in foreign currencies | | | 12 | |
| | | | |
Net change in unrealized appreciation (depreciation) | | | (24,900,751 | ) |
| | | | |
Net realized and unrealized gain (loss) | | | (709,824 | ) |
| | | | |
Net increase (decrease) in net assets resulting from operations | | $ | 7,487,483 | �� |
| | | | |
The accompanying notes are an integral part of these financial statements.
FGI-13
Franklin Templeton Variable Insurance Products Trust
Financial Statements (continued)
Statements of Changes in Net Assets
| | | | | | | | |
| | | Franklin Growth and Income
Securities Fund | |
| | | Year Ended December 31, | |
| | | 2011 | | | 2010 | |
| | | | |
Increase (decrease) in net assets: | | | | | | | | |
Operations: | | | | | | | | |
Net investment income | | $ | 8,197,307 | | | $ | 10,986,035 | |
Net realized gain (loss) from investments and foreign currency transactions | | | 24,190,927 | | | | 12,697,955 | |
Net change in unrealized appreciation (depreciation) on investments and translation of other assets and liabilities denominated in foreign currencies | | | (24,900,751 | ) | | | 25,059,009 | |
| | | | |
Net increase (decrease) in net assets resulting from operations | | | 7,487,483 | | | | 48,742,999 | |
| | | | |
Distributions to shareholders from: | | | | | | | | |
Net investment income: | | | | | | | | |
Class 1 | | | (6,502,022 | ) | | | (6,417,296 | ) |
Class 2 | | | (5,102,769 | ) | | | (5,249,987 | ) |
Class 4 | | | — | | | | (134 | ) |
| | | | |
Total distributions to shareholders | | | (11,604,791 | ) | | | (11,667,417 | ) |
| | | | |
Capital share transactions: (Note 2) | | | | | | | | |
Class 1 | | | (17,555,780 | ) | | | (17,785,745 | ) |
Class 2 | | | (20,259,007 | ) | | | (17,698,877 | ) |
Class 4 | | | (4,301 | ) | | | — | |
| | | | |
Total capital share transactions | | | (37,819,088 | ) | | | (35,484,622 | ) |
| | | | |
Net increase (decrease) in net assets | | | (41,936,396 | ) | | | 1,590,960 | |
Net assets: | | | | | | | | |
Beginning of year | | | 328,075,064 | | | | 326,484,104 | |
| | | | |
End of year | | $ | 286,138,668 | | | $ | 328,075,064 | |
| | | | |
Undistributed net investment income included in net assets: | | | | | | | | |
End of year | | $ | 8,605,551 | | | $ | 11,818,534 | |
| | | | |
The accompanying notes are an integral part of these financial statements.
FGI-14
Franklin Templeton Variable Insurance Products Trust
Notes to Financial Statements
Franklin Growth and Income Securities Fund
1. ORGANIZATION AND SIGNIFICANT ACCOUNTING POLICIES
Franklin Templeton Variable Insurance Products Trust (Trust) is registered under the Investment Company Act of 1940, as amended, (1940 Act) as an open-end investment company, consisting of twenty separate funds. The Franklin Growth and Income Securities Fund (Fund) is included in this report. The financial statements of the remaining funds in the Trust are presented separately. Shares of the Fund are generally sold only to insurance company separate accounts to fund the benefits of variable life insurance policies or variable annuity contracts. At December 31, 2011, 75.64% of the Fund’s shares were held through one insurance company. The Fund offers two classes of shares: Class 1 and Class 2. On March 4, 2011, the Fund liquidated Class 4. Each class of shares differs by its distribution fees, voting rights on matters affecting a single class and its exchange privilege.
The following summarizes the Fund’s significant accounting policies.
a. Financial Instrument Valuation
The Fund’s investments in securities and other financial instruments are carried at fair value daily. Fair value is the price that would be received to sell an asset or paid to transfer a liability in an orderly transaction between market participants on the measurement date. Under procedures approved by the Trust’s Board of Trustees, the Fund may utilize independent pricing services, quotations from securities and financial instrument dealers, and other market sources to determine fair value.
Equity securities listed on an exchange or on the NASDAQ National Market System are valued at the last quoted sale price or the official closing price of the day, respectively. Foreign equity securities are valued as of the close of trading on the foreign stock exchange on which the security is primarily traded, or the NYSE, whichever is earlier. The value is then converted into its U.S. dollar equivalent at the foreign exchange rate in effect at the close of the NYSE on the day that the value of the security is determined. Over-the-counter securities are valued within the range of the most recent quoted bid and ask prices. Securities that trade in multiple markets or on multiple exchanges are valued according to the broadest and most representative market. Certain equity securities are valued based upon fundamental characteristics or relationships to similar securities.
Debt and certain preferred securities generally trade in the over-the-counter market rather than on a securities exchange. The Fund’s pricing services use multiple valuation techniques to determine fair value. In instances where sufficient market activity exists, the pricing services may utilize a market-based approach through which quotes from market makers are used to determine fair value. In instances where sufficient market activity may not exist or is limited, the pricing services also utilize proprietary valuation models which may consider market characteristics such as benchmark yield curves, option-adjusted spreads, credit spreads, estimated default rates, coupon rates, anticipated timing of principal repayments, underlying collateral, and other unique security features in order to estimate the relevant cash flows, which are then discounted to calculate the fair value. Securities denominated in a foreign currency are converted into their U.S. dollar equivalent at the foreign exchange rate in effect at the close of the NYSE on the date that the values of the foreign debt securities are determined. Repurchase agreements are valued at cost, which approximates market value.
The Fund has procedures to determine the fair value of securities and other financial instruments for which market prices are not readily available or which may not be reliably priced. Under these procedures, the Fund primarily employs a market-based approach which may use related or comparable assets or liabilities, recent transactions, market multiples, book values, and other relevant information for the investment to determine the fair value of the investment. The Fund may also use an income-based valuation approach in which the anticipated future cash flows of the investment are discounted to calculate fair value. Discounts may also be applied due to the nature or duration of any restrictions on the disposition of the investments. Due to the inherent uncertainty of valuations of such investments, the fair values may differ significantly from the values that would have been used had an active market existed.
Trading in securities on foreign securities stock exchanges and over-the-counter markets may be completed before the daily close of business on the NYSE. Occasionally, events occur between the time at which trading in a foreign security is completed and the close of the NYSE that might call into question the reliability of the value of a portfolio security held by the Fund. As a result,
FGI-15
Franklin Templeton Variable Insurance Products Trust
Notes to Financial Statements (continued)
Franklin Growth and Income Securities Fund
1. ORGANIZATION AND SIGNIFICANT ACCOUNTING POLICIES (continued)
a. Financial Instrument Valuation (continued)
differences may arise between the value of the Fund’s portfolio securities as determined at the foreign market close and the latest indications of value at the close of the NYSE. In order to minimize the potential for these differences, the investment manager monitors price movements following the close of trading in foreign stock markets through a series of country specific market proxies (such as baskets of American Depositary Receipts, futures contracts and exchange traded funds). These price movements are measured against established trigger thresholds for each specific market proxy to assist in determining if an event has occurred that may call into question the reliability of the values of the foreign securities held by the Fund. If such an event occurs, the securities may be valued using fair value procedures, which may include the use of independent pricing services.
b. Foreign Currency Translation
Portfolio securities and other assets and liabilities denominated in foreign currencies are translated into U.S. dollars based on the exchange rate of such currencies against U.S. dollars on the date of valuation. The Fund may enter into foreign currency exchange contracts to facilitate transactions denominated in a foreign currency. Purchases and sales of securities, income and expense items denominated in foreign currencies are translated into U.S. dollars at the exchange rate in effect on the transaction date. Portfolio securities and assets and liabilities denominated in foreign currencies contain risks that those currencies will decline in value relative to the U.S. dollar. Occasionally, events may impact the availability or reliability of foreign exchange rates used to convert the U.S. dollar equivalent value. If such an event occurs, the foreign exchange rate will be valued at fair value using procedures established and approved by the Trust’s Board of Trustees.
The Fund does not separately report the effect of changes in foreign exchange rates from changes in market prices on securities held. Such changes are included in net realized and unrealized gain or loss from investments on the Statement of Operations.
Realized foreign exchange gains or losses arise from sales of foreign currencies, currency gains or losses realized between the trade and settlement dates on securities transactions and the difference between the recorded amounts of dividends, interest, and foreign withholding taxes and the U.S. dollar equivalent of the amounts actually received or paid. Net unrealized foreign exchange gains and losses arise from changes in foreign exchange rates on foreign denominated assets and liabilities other than investments in securities held at the end of the reporting period.
c. Joint Repurchase Agreement
The Fund enters into a joint repurchase agreement whereby its uninvested cash balance is deposited into a joint cash account with other funds managed by the investment manager or an affiliate of the investment manager and is used to invest in one or more repurchase agreements. The value and face amount of the joint repurchase agreement are allocated to the funds based on their pro-rata interest. A repurchase agreement is accounted for as a loan by the fund to the seller, collateralized by securities which are delivered to the fund’s custodian. The market value, including accrued interest, of the initial collateralization is required to be at least 102% of the dollar amount invested by the funds, with the value of the underlying securities marked to market daily to maintain coverage of at least 100%. The joint repurchase agreement held by the Fund at year end had been entered into on December 30, 2011.
d. Equity-Linked Securities
The Fund invests in equity-linked securities. Equity-linked securities are hybrid financial instruments that generally combine both debt and equity characteristics into a single note form. Income received from equity linked securities is recorded as realized gains in the Statement of Operations and may be based on the performance of an underlying equity security, an equity index, or an option position. The risks of investing in equity-linked securities include unfavorable price movements in the underlying security and the credit risk of the issuing financial institution. There may be no guarantee of a return of
FGI-16
Franklin Templeton Variable Insurance Products Trust
Notes to Financial Statements (continued)
Franklin Growth and Income Securities Fund
1. ORGANIZATION AND SIGNIFICANT ACCOUNTING POLICIES (continued)
d. Equity-Linked Securities (continued)
principal with equity linked securities and the appreciation potential may be limited. Equity-linked securities may be more volatile and less liquid than other investments held by the Fund.
e. Income Taxes
It is the Fund’s policy to qualify as a regulated investment company under the Internal Revenue Code. The Fund intends to distribute to shareholders substantially all of its taxable income and net realized gains to relieve it from federal income and excise taxes. As a result, no provision for U.S. federal income taxes is required.
The Fund may be subject to foreign taxation related to income received, capital gains on the sale of securities and certain foreign currency transactions in the foreign jurisdictions in which it invests. Foreign taxes, if any, are recorded based on the tax regulations and rates that exist in the foreign markets in which the Fund invests. When a capital gain tax is determined to apply the Fund records an estimated deferred tax liability in an amount that would be payable if the securities were disposed of on the valuation date.
The Fund recognizes the tax benefits of uncertain tax positions only when the position is “more likely than not” to be sustained upon examination by the tax authorities based on the technical merits of the tax position. As of December 31, 2011, and for all open tax years, the Fund has determined that no liability for unrecognized tax benefits is required in the Fund’s financial statements related to uncertain tax positions taken on a tax return (or expected to be taken on future tax returns). Open tax years are those that remain subject to examination and are based on each tax jurisdiction statute of limitation.
f. Security Transactions, Investment Income, Expenses and Distributions
Security transactions are accounted for on trade date. Realized gains and losses on security transactions are determined on a specific identification basis. Interest income and estimated expenses are accrued daily. Amortization of premium and accretion of discount on debt securities are included in interest income. Dividend income is recorded on the ex-dividend date except that certain dividends from foreign securities are recognized as soon as the Fund is notified of the ex-dividend date. Distributions to shareholders are recorded on the ex-dividend date and are determined according to income tax regulations (tax basis). Distributable earnings determined on a tax basis may differ from earnings recorded in accordance with accounting principles generally accepted in the United States of America. These differences may be permanent or temporary. Permanent differences are reclassified among capital accounts to reflect their tax character. These reclassifications have no impact on net assets or the results of operations. Temporary differences are not reclassified, as they may reverse in subsequent periods.
Common expenses incurred by the Trust are allocated among the funds based on the ratio of net assets of each fund to the combined net assets of the Trust. Fund specific expenses are charged directly to the fund that incurred the expense.
Realized and unrealized gains and losses and net investment income, not including class specific expenses, are allocated daily to each class of shares based upon the relative proportion of net assets of each class. Differences in per share distributions, by class, are generally due to differences in class specific expenses.
g. Accounting Estimates
The preparation of financial statements in accordance with accounting principles generally accepted in the United States of America requires management to make estimates and assumptions that affect the reported amounts of assets and liabilities at the date of the financial statements and the amounts of income and expenses during the reporting period. Actual results could differ from those estimates.
FGI-17
Franklin Templeton Variable Insurance Products Trust
Notes to Financial Statements (continued)
Franklin Growth and Income Securities Fund
1. ORGANIZATION AND SIGNIFICANT ACCOUNTING POLICIES (continued)
h. Guarantees and Indemnifications
Under the Trust’s organizational documents, its officers and trustees are indemnified by the Trust against certain liabilities arising out of the performance of their duties to the Trust. Additionally, in the normal course of business, the Trust, on behalf of the Fund, enters into contracts with service providers that contain general indemnification clauses. The Trust’s maximum exposure under these arrangements is unknown as this would involve future claims that may be made against the Trust that have not yet occurred. Currently, the Trust expects the risk of loss to be remote.
2. SHARES OF BENEFICIAL INTEREST
At December 31, 2011, there were an unlimited number of shares authorized (without par value). Transactions in the Fund’s shares were as follows:
| | | | | | | | | | | | | | | | |
| | | Year Ended December 31, | |
| | | 2011a | | | 2010b | |
| Class 1 Shares: | | Shares | | | Amount | | | Shares | | | Amount | |
Shares sold | | | 187,427 | | | $ | 2,361,235 | | | | 71,404 | | | $ | 762,743 | |
Shares issued in reinvestment of distributions | | | 570,854 | | | | 6,502,022 | | | | 641,089 | | | | 6,417,296 | |
Shares redeemed | | | (2,250,738 | ) | | | (26,419,037 | ) | | | (2,352,373 | ) | | | (24,965,784 | ) |
| | | | |
Net increase (decrease) | | | (1,492,457 | ) | | $ | (17,555,780 | ) | | | (1,639,880 | ) | | $ | (17,785,745 | ) |
| | | | |
Class 2 Shares: | | | | | | | | | | | | | | | | |
Shares sold | | | 624,568 | | | $ | 7,137,921 | | | | 846,978 | | | $ | 8,699,858 | |
Shares issued in reinvestment of distributions | | | 453,579 | | | | 5,102,769 | | | | 530,838 | | | | 5,249,987 | |
Shares redeemed | | | (2,828,839 | ) | | | (32,499,697 | ) | | | (3,035,560 | ) | | | (31,648,722 | ) |
| | | | |
Net increase (decrease) | | | (1,750,692 | ) | | $ | (20,259,007 | ) | | | (1,657,744 | ) | | $ | (17,698,877 | ) |
| | | | |
Class 4 Shares: | | | | | | | | | | | | | | | | |
Shares redeemed | | | (353 | ) | | $ | (4,301 | ) | | | | | | | | |
| | | | | | | | | | |
Net increase (decrease) | | | (353 | ) | | $ | (4,301 | ) | | | | | | | | |
| | | | | | | | | | |
| aEffective | March 4, 2011, Class 4 was liquidated. |
| bDuring | the year Class 4 did not report any share transactions. |
3. TRANSACTIONS WITH AFFILIATES
Franklin Resources, Inc. is the holding company for various subsidiaries that together are referred to as Franklin Templeton Investments. Certain officers and trustees of the Fund are also officers and/or directors of the following subsidiaries:
| | |
| Subsidiary | | Affiliation |
Franklin Advisers, Inc. (Advisers) | | Investment manager |
Franklin Templeton Services, LLC (FT Services) | | Administrative manager |
Franklin Templeton Distributors, Inc. (Distributors) | | Principal underwriter |
Franklin Templeton Investor Services, LLC (Investor Services) | | Transfer agent |
FGI-18
Franklin Templeton Variable Insurance Products Trust
Notes to Financial Statements (continued)
Franklin Growth and Income Securities Fund
3. TRANSACTIONS WITH AFFILIATES (continued)
a. Management Fees
The Fund pays an investment management fee to Advisers based on the average daily net assets of the Fund as follows:
| | |
| Annualized Fee Rate | | Net Assets |
| 0.625% | | Up to and including $100 million |
| 0.500% | | Over $100 million, up to and including $250 million |
| 0.450% | | Over $250 million, up to and including $7.5 billion |
| 0.440% | | Over $7.5 billion, up to and including $10 billion |
| 0.430% | | Over $10 billion, up to and including $12.5 billion |
| 0.420% | | Over $12.5 billion, up to and including $15 billion |
| 0.400% | | In excess of $15 billion |
b. Administrative Fees
Under an agreement with Advisers, FT Services provides administrative services to the Fund. The fee is paid by Advisers based on average daily net assets, and is not an additional expense of the Fund.
c. Distribution Fees
The Fund’s Board of Trustees has adopted distribution plans for Class 2 and Class 4 shares pursuant to Rule 12b-1 under the 1940 Act. Under the Fund’s compensation distribution plans, the Fund pays Distributors for costs incurred in connection with the servicing, sale and distribution of the Fund’s shares up to 0.35% per year of its average daily net assets of each class. The Board of Trustees has agreed to limit the current rate to 0.25% per year for Class 2.
d. Transfer Agent Fees
Investor Services, under terms of an agreement, performs shareholder servicing for the Fund and is not paid by the Fund for the services.
4. EXPENSE OFFSET ARRANGEMENT
The Fund has entered into an arrangement with its custodian whereby credits realized as a result of uninvested cash balances are used to reduce a portion of the Fund’s custodian expenses. During the year ended December 31, 2011, there were no credits earned.
5. INCOME TAXES
For tax purposes, capital losses may be carried over to offset future capital gains, if any. Under the Regulated Investment Company Modernization Act of 2010, capital losses incurred by the Fund in taxable years beginning after December 22, 2010 are not subject to expiration and such losses retain their character as either short-term or long-term, rather than being considered short-term as under previous law. Post-enactment capital losses must be fully utilized prior to utilizing any losses incurred in pre-enactment tax years.
At December 31, 2011, the Fund had capital loss carryforwards of $58,122,192 expiring in 2017. During the year ended December 31, 2011, the Fund utilized $24,108,895 of capital loss carryforwards.
FGI-19
Franklin Templeton Variable Insurance Products Trust
Notes to Financial Statements (continued)
Franklin Growth and Income Securities Fund
5. INCOME TAXES (continued)
The tax character of distributions paid during the years ended December 31, 2011 and 2010, was as follows:
| | | | | | | | |
| | | 2011 | | | 2010 | |
Distributions paid from ordinary income | | $ | 11,604,791 | | | $ | 11,667,417 | |
| | | | |
At December 31, 2011, the cost of investments, net unrealized appreciation (depreciation), and undistributed ordinary income for income tax purposes were as follows:
| | | | |
Cost of investments | | $ | 255,261,073 | |
| | | | |
| |
Unrealized appreciation | | $ | 52,490,725 | |
Unrealized depreciation | | | (21,607,323 | ) |
| | | | |
Net unrealized appreciation (depreciation) | | $ | 30,883,402 | |
| | | | |
Distributable earnings – undistributed ordinary income | | $ | 8,792,149 | |
| | | | |
Differences between income and/or capital gains as determined on a book basis and a tax basis are primarily due to differing treatments of bond discounts and premiums, and wash sales.
6. INVESTMENT TRANSACTIONS
Purchases and sales of investments (excluding short term securities) for the year ended December 31, 2011, aggregated $98,347,520 and $141,755,009, respectively.
7. CREDIT RISK
At December 31, 2011, the Fund had 10.65% of its portfolio invested in high yield or other securities rated below investment grade. These securities may be more sensitive to economic conditions causing greater price volatility and are potentially subject to a greater risk of loss due to default than higher rated securities.
8. CREDIT FACILITY
The Fund, together with other U.S. registered and foreign investment funds (collectively, Borrowers), managed by Franklin Templeton Investments, are borrowers in a joint syndicated senior unsecured credit facility totaling $750 million (Global Credit Facility) which matured on January 20, 2012. This Global Credit Facility provides a source of funds to the Borrowers for temporary and emergency purposes, including the ability to meet future unanticipated or unusually large redemption requests. Effective January 20, 2012, the Borrowers renewed the Global Credit Facility for a total of $1.5 billion, maturing January 18, 2013.
Under the terms of the Global Credit Facility, the Fund shall, in addition to interest charged on any borrowings made by the Fund and other costs incurred by the Fund, pay its share of fees and expenses incurred in connection with the implementation and maintenance of the Global Credit Facility, based upon its relative share of the aggregate net assets of all of the Borrowers, including an annual commitment fee of 0.08% based upon the unused portion of the Global Credit Facility, which is reflected in other expenses on the Statement of Operations. During the year ended December 31, 2011, the Fund did not use the Global Credit Facility.
FGI-20
Franklin Templeton Variable Insurance Products Trust
Notes to Financial Statements (continued)
Franklin Growth and Income Securities Fund
9. FAIR VALUE MEASUREMENTS
The Fund follows a fair value hierarchy that distinguishes between market data obtained from independent sources (observable inputs) and the Fund’s own market assumptions (unobservable inputs). These inputs are used in determining the value of the Fund’s investments and are summarized in the following fair value hierarchy:
| | • | | Level 1 – quoted prices in active markets for identical securities |
| | • | | Level 2 – other significant observable inputs (including quoted prices for similar securities, interest rates, prepayment speed, credit risk, etc.) |
| | • | | Level 3 – significant unobservable inputs (including the Fund’s own assumptions in determining the fair value of investments) |
The inputs or methodology used for valuing securities are not an indication of the risk associated with investing in those securities.
For movements between the levels within the fair value hierarchy, the Fund has adopted a policy of recognizing the transfers as of the date of the underlying event which caused the movement.
The following is a summary of the inputs used as of December 31, 2011, in valuing the Fund’s assets and liabilities carried at fair value:
| | | | | | | | | | | | | | | | |
| | | Level 1 | | | Level 2 | | | Level 3 | | | Total | |
| | | | |
Assets: | | | | | | | | | | | | | | | | |
Investments in Securities: | | | | | | | | | | | | | | | | |
Equity Investments:a | | | | | | | | | | | | | | | | |
Energy | | $ | 28,682,964 | | | $ | 3,534,265 | | | $ | — | | | $ | 32,217,229 | |
Financials | | | 45,502,134 | | | | 2,851,200 | | | | — | | | | 48,353,334 | |
Health Care | | | 23,173,503 | | | | 1,624,500 | | | | — | | | | 24,798,003 | |
Utilities | | | 13,190,853 | | | | 2,664,400 | | | | — | | | | 15,855,253 | |
All Other Equity Investmentsb | | | 142,353,250 | | | | — | | | | — | | | | 142,353,250 | |
Equity-Linked Securities | | | — | | | | 11,411,670 | | | | — | | | | 11,411,670 | |
Convertible Bonds | | | — | | | | 1,056,250 | | | | — | | | | 1,056,250 | |
Short Term Investments | | | — | | | | 10,099,486 | | | | — | | | | 10,099,486 | |
| | | | |
Total Investments in Securities | | $ | 252,902,704 | | | $ | 33,241,771 | | | $ | — | | | $ | 286,144,475 | |
| | | | |
aIncludes common, preferred and convertible preferred stocks as well as other equity investments.
bFor detailed categories, see the accompanying Statement of Investments.
10. NEW ACCOUNTING PRONOUNCEMENTS
In May 2011, the Financial Accounting Standards Board (FASB) issued Accounting Standards Update (ASU) No. 2011-04, Fair Value Measurement (Topic 820): Amendments to Achieve Common Fair Value Measurement and Disclosure Requirements in U.S. GAAP and IFRSs. The amendments in the ASU will improve the comparability of fair value measurements presented and disclosed in financial statements prepared in accordance with U.S. GAAP (Generally Accepted Accounting Principles) and IFRS (International Financial Reporting Standards) and include new guidance for certain fair value measurement principles and disclosure requirements. The ASU is effective for interim and annual periods beginning after December 15, 2011. The Fund believes the adoption of this ASU will not have a material impact on its financial statements.
FGI-21
Franklin Templeton Variable Insurance Products Trust
Notes to Financial Statements (continued)
Franklin Growth and Income Securities Fund
11. SUBSEQUENT EVENTS
The Fund has evaluated subsequent events through the issuance of the financial statements and determined that no events have occurred that require disclosure other than those already disclosed in the financial statements.
| | | | |
ABBREVIATIONS | | | | |
| Selected Portfolio | | | | |
| | | | |
| ADR - American Depositary Receipt | | | | |
FGI-22
Franklin Templeton Variable Insurance Products Trust
Franklin Growth and Income Securities Fund
Report of Independent Registered Public Accounting Firm
To the Board of Trustees and Shareholders of
Franklin Templeton Variable Insurance Products Trust
In our opinion, the accompanying statement of assets and liabilities, including the statement of investments, and the related statements of operations and of changes in net assets and the financial highlights present fairly, in all material respects, the financial position of Franklin Growth and Income Securities Fund (the “Fund”) at December 31, 2011, the results of its operations for the year then ended, the changes in its net assets for each of the two years in the period then ended and the financial highlights for each of the five years in the period then ended, in conformity with accounting principles generally accepted in the United States of America. These financial statements and financial highlights (hereafter referred to as “financial statements”) are the responsibility of the Fund’s management. Our responsibility is to express an opinion on these financial statements based on our audits. We conducted our audits of these financial statements in accordance with the standards of the Public Company Accounting Oversight Board (United States). Those standards require that we plan and perform the audit to obtain reasonable assurance about whether the financial statements are free of material misstatement. An audit includes examining, on a test basis, evidence supporting the amounts and disclosures in the financial statements, assessing the accounting principles used and significant estimates made by management, and evaluating the overall financial statement presentation. We believe that our audits, which included confirmation of securities at December 31, 2011 by correspondence with the custodian and brokers, provide a reasonable basis for our opinion.
PricewaterhouseCoopers LLP
San Francisco, California
February 13, 2012
FGI-23
Franklin Templeton Variable Insurance Products Trust
Tax Information (unaudited)
Franklin Growth and Income Securities Fund
Under Section 854(b)(1)(A) of the Internal Revenue Code, the Fund hereby reports 68.24% of the ordinary income dividends as income qualifying for the dividends received deduction for the fiscal year ended December 31, 2011.
FGI-24
FRANKLIN HIGH INCOME SECURITIES FUND
This annual report for Franklin High Income Securities Fund covers the fiscal year ended December 31, 2011.
Performance Summary as of 12/31/11
Average annual total return of Class 1 shares represents the average annual change in value, assuming reinvestment of dividends and capital gains. Average returns smooth out variations in returns, which can be significant; they are not the same as year-by-year results.
Periods ended 12/31/11
| | | | | | | | | | | | |
| | | 1-Year | | | 5-Year | | | 10-Year | |
Average Annual Total Return | | | +4.63% | | | | +6.13% | | | | +7.18% | |
Total Return Index Comparison for a Hypothetical $10,000 Investment (1/1/02–12/31/11)
The graph below shows the change in value of a hypothetical $10,000 investment in the Fund over the indicated period and includes reinvestment of any income or distributions. The Fund’s performance is compared to the performance of the Credit Suisse (CS) High Yield Index and the Lipper VIP High Current Yield Funds Classification Average. One cannot invest directly in an index, and an index is not representative of the Fund’s portfolio. Please see Important Notes to Performance Information preceding the Fund Summaries.
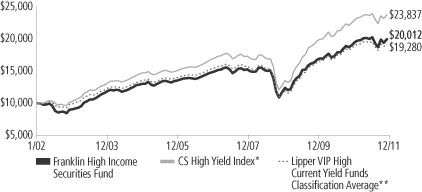
*Source: © 2012 Morningstar. Please see Index Descriptions following the Fund Summaries.
**Source: Lipper Inc. Please see Index Descriptions following the Fund Summaries.
Franklin High Income Securities Fund – Class 1
Performance reflects the Fund’s Class 1 operating expenses, but does not include any contract fees, expenses or sales charges. If they had been included, performance would be lower. These charges and deductions, particularly for variable life policies, can have a significant effect on contract values and insurance benefits. See the contract prospectus for a complete description of these expenses, including sales charges.
Performance data represent past performance, which does not guarantee future results. Investment return and principal value will fluctuate, and you may have a gain or loss when you sell your shares.
Current performance may differ from figures shown.
FH-1
Fund Goals and Main Investments: Franklin High Income Securities Fund seeks a high level of current income with capital appreciation as a secondary goal. The Fund normally invests primarily to predominantly in high yield, lower rated debt securities and preferred stocks.
Performance Overview
You can find the Fund’s one-year total return in the Performance Summary. The Fund underperformed the +5.47% total return of its benchmark, the Credit Suisse (CS) High Yield Index.1 The Fund outperformed the +3.35% total return of its peers, as measured by the Lipper VIP High Current Yield Funds Classification Average.2
Economic and Market Overview
During the 12 months under review, Federal Reserve Board (Fed) policymakers maintained historically low interest rates while adopting a more restrained view of the economy largely because of the European sovereign debt crisis and signs the U.S. economic expansion lacked momentum. To promote a stronger recovery and help maintain inflation levels the Fed believed consistent with its dual mandate to foster maximum employment and price stability, the Fed undertook a second round of quantitative easing consisting of a $600 billion purchase of longer term U.S. Treasuries, which ended on June 30. Subsequently, the Fed continued to purchase U.S. Treasuries with proceeds from maturing debt in an effort to support economic growth. In September, the Fed announced plans designed to boost the economy by driving down long-term interest rates. The Fed intends to sell $400 billion in short-term securities over the next year and purchase an equal amount of long-term securities. The Fed also anticipated it would keep short-term rates near zero through mid-2013.
The economy grew more slowly than expected, and unemployment remained high. Home foreclosures increased, but federal lawmakers made efforts to strengthen the real estate market by removing some eligibility restrictions and changes associated with refinancing. After showing improvement early in the reporting period, manufacturing activity weakened partly because of global supply-chain disruptions following Japan’s natural disasters. Geopolitical instability in some oil-producing regions drove up oil prices for much of the period. However, investor concerns over weak economic data contributed to a drop
1. Source: © 2012 Morningstar.
2. Source: Lipper Inc.
One cannot invest directly in an index, and an index is not representative of the Fund’s portfolio. Please see Index Descriptions following the Fund Summaries.
Fund Risks: All investments involve risks. Because the Fund invests in bonds and other debt obligations, its share price and yield will be affected by interest rate movements. Bond prices generally move in the opposite direction of interest rates. Thus, as prices of bonds in the Fund adjust to a rise in interest rates, the Fund’s share price may decline. The Fund invests primarily to predominantly in high yield, lower rated (junk) bonds, which generally have greater price swings and higher risk of default and loss of principal than investment-grade bonds. Foreign investing, especially in developing markets, involves additional risks including currency fluctuations, economic instability, market volatility, and political and social instability. Derivative instruments may be volatile and illiquid, may give rise to leverage and may involve a small investment relative to the risk assumed. Bank loans, corporate loans and loan participations involve credit, interest rate and illiquidity risks. The Fund is actively managed, but there is no guarantee that the manager’s investment decisions will produce the desired results. The Fund’s prospectus also includes a description of the main investment risks.
FH-2
in crude oil prices from their 12-month high of $114 per barrel on April 29 to $99 at period-end. Storms and droughts in several states reduced crop yields, pushing up grain prices. As oil and food prices rose, the pace of inflation accelerated during the period. By year-end, various U.S. economic gauges began to show some improvement, leading some economists to become more optimistic near year-end about the economy’s prospects.
Generally favorable economic improvements and positive corporate earnings reports somewhat eased investor concerns. During the 12 months under review, fixed income markets, as measured by the BC U.S. Aggregate Index, and U.S. stocks, as measured by the Standard & Poor’s® 500 Index, posted gains.1 Heightened volatility, however, roiled global financial markets amid U.S. lawmakers’ protracted debate and eventual compromise on the debt limit, independent credit rating agency Standard & Poor’s downgrade of the long-term U.S. credit rating to AA+ from AAA, and fears of sovereign debt crisis contagion in Europe. In November, the unemployment rate fell to its lowest level in more than two years, which helped consumer confidence climb to its highest level in more than eight years. During the final six months of 2011, however, investors sought the perceived safety of U.S. Treasuries, which drove their prices higher and yields lower for the 12-month period under review. This flight to perceived safety during the latter half of 2011 resulted in a wide disparity in performance between the BC U.S. Treasury Index, which returned +7.43% for the six months ended December 31, 2011, and the CS High Yield Index, which returned +0.60% for the same period.1
Investment Strategy
We are research-driven, fundamental investors who rely on a team of analysts to provide in-depth industry expertise and use qualitative and quantitative analyses to evaluate companies. As bottom-up investors, we focus primarily on individual securities. We also consider sectors when choosing investments. In selecting securities for the Fund’s investment portfolio, we do not rely principally on ratings assigned by rating agencies, but perform our own independent analysis to evaluate an issuer’s creditworthiness. We consider a variety of factors, including an issuer’s experience and managerial strength, its sensitivity to economic conditions and its current financial condition. We may also enter into various transactions involving certain currency-, interest rate- or credit-related derivative instruments for hedging purposes, to enhance returns or to obtain exposure to various market sectors.
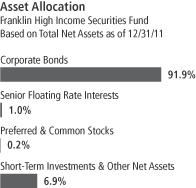
FH-3
Manager’s Discussion
The Fund generated the majority of its one-year positive return during the first half of the year as the market gained steadily through late May. June proved to be volatile, however, as weak U.S. housing data and high unemployment weighed on consumer confidence and the stock market. As a result, some investors pared exposure to higher-risk asset classes, including the high yield corporate bond market, pressuring prices in the sector. In early August, Europe’s increasing discord, combined with the downgrade of U.S. long-term debt by a rating agency, weighed on sentiment and the markets sharply declined. However, actions intended to stem the European crisis helped restore confidence, allowing the market to begin to recover by year-end.
Throughout 2011’s market volatility, which we believe was partly due to technical supply and demand factors, high yield bond valuations experienced a fair degree of fluctuation, even as corporate balance sheets remained healthy. We sought to take advantage of alternating periods of relative strength and weakness to reposition the Fund on an individual security level. Consistent with our disciplined approach, we drew on our fundamental research process to adjust industry positioning within the Fund. As a result of our analysis, we over- and underweighted certain industries relative to the CS High Yield Index. Overall, we maintained a neutral beta stance, though by year-end the Fund had a somewhat more aggressive positioning.
We remained cautious regarding the strength of the consumer recovery throughout the year and underweighted the retail industry.3 Despite periods of relative strength, the retail industry underperformed the benchmark for the year, aiding the Fund’s relative performance. We also had little confidence in a paper industry rebound as it faced declining demand and above-average input costs.4 We therefore maintained our underweighted position in this industry. With the industry also underperforming the benchmark, our relatively low exposure proved beneficial to the Fund. In this industry, the Fund held the bonds of NewPage, a large coated paper manufacturer that filed for bankruptcy in 2011. However, the Fund held the company’s senior secured bonds, and the company paid the December coupon for this tranche5 of bonds. Although the Fund’s position in Texas Competitive Electric Holdings, a
3. Retail holdings are part of food and staples retailing and retailing in the SOI.
4. Paper holdings are part of materials in the SOI.
5. A tranche is a portion of a debt financing. Although the tranches are provided by the same issuer, each tranche has a different level of risk, reward and/or maturity based on priority of payment.
Top 10 Sectors/Industries
Franklin High Income Securities Fund
% of Total Net Assets
12/31/11
| | | | |
| Energy | | | 18.7% | |
| Telecommunication Services | | | 9.9% | |
| Media | | | 9.1% | |
| Materials | | | 8.0% | |
| Health Care Equipment & Services | | | 5.1% | |
| Consumer Services | | | 4.7% | |
| Automobiles & Components | | | 4.3% | |
| Capital Goods | | | 4.2% | |
| Diversified Financials | | | 3.6% | |
| Pharmaceuticals, Biotechnology & Life Sciences | | | 2.8% | |
The dollar value, number of shares or principal amount, and names of all portfolio holdings are listed in the Fund’s Statement of Investments (SOI).
FH-4
Texas independent utility provider, was a drag on returns as the company continued to manage a heavy debt load, the utilities industry allocation, as well as the relative performance of certain individual utility bond holdings, helped drive a positive contribution.
In contrast, the Fund’s exposure to American Airlines (AMR), which entered into Chapter 11 protection in 2011, weighed on relative performance. Although the AMR bonds were secured, the bonds traded lower during the year, hampering relative performance. Our low exposure to the building industry was positive for relative performance. The Fund’s position in Cemex, a large Mexico-based building materials supplier, detracted from relative performance as its bonds declined in value amid refinancing concerns given the pullback in construction spending over the past three years.6 Conversely, we were more positive toward the wireless telecommunications industry and held a small overweighted position versus the index.7 However, the industry underperformed during a period of heavy competitive pricing pressures and turmoil among the largest constituents, which affected the remainder of the industry. The Fund’s overweighted allocation resulted in a drag on relative performance.
Thank you for your participation in Franklin High Income Securities Fund. We look forward to serving your future investment needs.
6. Building holdings are part of materials in the SOI.
7. Wireless telecommunications are part of telecommunications services in the SOI.
The foregoing information reflects our analysis, opinions and portfolio holdings as of December 31, 2011, the end of the reporting period. The way we implement our main investment strategies and the resulting portfolio holdings may change depending on factors such as market and economic conditions. These opinions may not be relied upon as investment advice or an offer for a particular security. The information is not a complete analysis of every aspect of any market, country, industry, security or the Fund. Statements of fact are from sources considered reliable, but the investment manager makes no representation or warranty as to their completeness or accuracy. Although historical performance is no guarantee of future results, these insights may help you understand our investment management philosophy.
FH-5
Fund Expenses
As an investor in a variable insurance contract (Contract) that indirectly provides for investment in an underlying mutual fund, you can incur transaction and/or ongoing expenses at both the Fund level and the Contract level.
| • | | Transaction expenses can include sales charges (loads) on purchases, redemption fees, surrender fees, transfer fees and premium taxes. |
| • | | Ongoing expenses can include management fees, distribution and service (12b-1) fees, contract fees, annual maintenance fees, mortality and expense risk fees and other fees and expenses. All mutual funds and Contracts have some types of ongoing expenses. |
The expenses shown in the table are meant to highlight ongoing expenses at the Fund level only and do not include ongoing expenses at the Contract level, or transaction expenses at either the Fund or Contract level. While the Fund does not have transaction expenses, if the transaction and ongoing expenses at the Contract level were included, the expenses shown would be higher. You should consult your Contract prospectus or disclosure document for more information.
The table shows Fund-level ongoing expenses and can help you understand these expenses and compare them with those of other mutual funds offered through the Contract. The table assumes a $1,000 investment held for the six months indicated. Please refer to the Fund prospectus for additional information on operating expenses.
Actual Fund Expenses
The first line (Actual) of the table provides actual account values and expenses. The “Ending Account Value” is derived from the Fund’s actual return, which includes the effect of ongoing Fund expenses, but does not include the effect of ongoing Contract expenses.
You can estimate the Fund-level expenses you incurred during the period by following these steps. Of course, your account value and expenses will differ from those in this illustration:
| 1. | Divide your account value by $1,000. |
If an account had an $8,600 value, then $8,600 ÷ $1,000 = 8.6.
| 2. | Multiply the result by the number under the heading “Fund-Level Expenses Incurred During Period.” |
If Fund-Level Expenses Incurred During Period were $7.50, then
8.6 x $7.50 = $64.50.
In this illustration, the estimated expenses incurred this period at the Fund level are $64.50.
Franklin High Income Securities Fund – Class 1
FH-6
Hypothetical Example for Comparison with Other Mutual Funds
Information in the second line (Hypothetical) of the table can help you compare ongoing expenses of the Fund with those of other mutual funds offered through the Contract. This information may not be used to estimate the actual ending account balance or expenses you incurred during the period. The hypothetical “Ending Account Value” is based on the Fund’s actual expense ratio and an assumed 5% annual rate of return before expenses, which does not represent the Fund’s actual return. The figure under the heading “Fund-Level Expenses Incurred During Period” shows the hypothetical expenses your account would have incurred under this scenario. You can compare this figure with the 5% hypothetical examples that appear in shareholder reports of other funds offered through a Contract.
| | | | | | | | | | | | |
| Class 1 | | Beginning
Account Value 7/1/11 | | | Ending
Account Value 12/31/11 | | | Fund-Level
Expenses Incurred
During Period*
7/1/11–12/31/11 | |
Actual | | $ | 1,000 | | | $ | 988.50 | | | $ | 2.92 | |
Hypothetical (5% return before expenses) | | $ | 1,000 | | | $ | 1,022.28 | | | $ | 2.96 | |
*Expenses are calculated using the most recent six-month annualized expense ratio for the Fund’s Class 1 shares (0.58%), which does not include any ongoing expenses of the Contract for which the Fund is an investment option, multiplied by the average account value over the period, multiplied by 184/365 to reflect the one-half year period.
FH-7
Franklin Templeton Variable Insurance Products Trust
Financial Highlights
Franklin High Income Securities Fund
| | | | | | | | | | | | | | | | | | | | |
| | | Year Ended December 31, | |
| Class 1 | | 2011 | | | 2010 | | | 2009 | | | 2008 | | | 2007 | |
| | | | |
Per share operating performance | | | | | | | | | | | | | | | | | | | | |
(for a share outstanding throughout the year) | | | | | | | | | | | | | | | | | | | | |
Net asset value, beginning of year | | $ | 6.63 | | | $ | 6.26 | | | $ | 4.68 | | | $ | 6.72 | | | $ | 6.96 | |
| | | | |
Income from investment operationsa: | | | | | | | | | | | | | | | | | | | | |
Net investment incomeb | | | 0.50 | | | | 0.49 | | | | 0.46 | | | | 0.50 | | | | 0.51 | |
Net realized and unrealized gains (losses) | | | (0.19 | ) | | | 0.32 | | | | 1.50 | | | | (1.92 | ) | | | (0.30 | ) |
| | �� | | |
Total from investment operations | | | 0.31 | | | | 0.81 | | | | 1.96 | | | | (1.42 | ) | | | 0.21 | |
| | | | |
Less distributions from net investment income | | | (0.42 | ) | | | (0.44 | ) | | | (0.38 | ) | | | (0.62 | ) | | | (0.45 | ) |
| | | | |
Net asset value, end of year | | $ | 6.52 | | | $ | 6.63 | | | $ | 6.26 | | | $ | 4.68 | | | $ | 6.72 | |
| | | | |
| | | | | |
Total returnc | | | 4.63% | | | | 13.71% | | | | 42.99% | | | | (23.16)% | | | | 3.02% | |
Ratios to average net assets | | | | | | | | | | | | | | | | | | | | |
Expenses | | | 0.58% | | | | 0.61% | | | | 0.63% | d | | | 0.66% | d | | | 0.61% | d |
Net investment income | | | 7.52% | | | | 7.71% | | | | 8.33% | | | | 8.30% | | | | 7.38% | |
| | | | | |
Supplemental data | | | | | | | | | | | | | | | | | | | | |
Net assets, end of year (000’s) | | $ | 41,971 | | | $ | 48,051 | | | $ | 48,855 | | | $ | 38,225 | | | $ | 61,286 | |
Portfolio turnover rate | | | 45.11% | | | | 60.80% | | | | 26.41% | | | | 21.75% | | | | 40.65% | |
aThe amount shown for a share outstanding throughout the period may not correlate with the Statement of Operations for the period due to the timing of sales and repurchases of the Fund shares in relation to income earned and/or fluctuating market value of the investments of the Fund.
bBased on average daily shares outstanding.
cTotal return does not include fees, charges or expenses imposed by the variable annuity and life insurance contracts for which the Franklin Templeton Variable Insurance Products Trust serves as an underlying investment vehicle.
dBenefit of expense reduction rounds to less than 0.01%.
The accompanying notes are an integral part of these financial statements.
FH-8
Franklin Templeton Variable Insurance Products Trust
Financial Highlights (continued)
Franklin High Income Securities Fund
| | | | | | | | | | | | | | | | | | | | |
| | | Year Ended December 31, | |
| Class 2 | | 2011 | | | 2010 | | | 2009 | | | 2008 | | | 2007 | |
| | | | |
Per share operating performance | | | | | | | | | | | | | | | | | | | | |
(for a share outstanding throughout the year) | | | | | | | | | | | | | | | | | | | | |
Net asset value, beginning of year | | $ | 6.47 | | | $ | 6.13 | | | $ | 4.59 | | | $ | 6.60 | | | $ | 6.85 | |
| | | | |
Income from investment operationsa: | | | | | | | | | | | | | | | | | | | | |
Net investment incomeb | | | 0.47 | | | | 0.47 | | | | 0.44 | | | | 0.47 | | | | 0.48 | |
Net realized and unrealized gains (losses) | | | (0.18 | ) | | | 0.30 | | | | 1.47 | | | | (1.88 | ) | | | (0.29 | ) |
| | | | |
Total from investment operations | | | 0.29 | | | | 0.77 | | | | 1.91 | | | | (1.41 | ) | | | 0.19 | |
| | | | |
Less distributions from net investment income | | | (0.40 | ) | | | (0.43 | ) | | | (0.37 | ) | | | (0.60 | ) | | | (0.44 | ) |
| | | | |
Net asset value, end of year | | $ | 6.36 | | | $ | 6.47 | | | $ | 6.13 | | | $ | 4.59 | | | $ | 6.60 | |
| | | | |
| | | | | |
Total returnc | | | 4.56% | | | | 13.26% | | | | 42.70% | | | | (23.38)% | | | | 2.72% | |
Ratios to average net assets | | | | | | | | | | | | | | | | | | | | |
Expenses | | | 0.83% | | | | 0.86% | | | | 0.88% | d | | | 0.91% | d | | | 0.86% | d |
Net investment income | | | 7.27% | | | | 7.46% | | | | 8.08% | | | | 8.05% | | | | 7.13% | |
| | | | | |
Supplemental data | | | | | | | | | | | | | | | | | | | | |
Net assets, end of year (000’s) | | $ | 249,452 | | | $ | 239,824 | | | $ | 198,567 | | | $ | 84,396 | | | $ | 155,777 | |
Portfolio turnover rate | | | 45.11% | | | | 60.80% | | | | 26.41% | | | | 21.75% | | | | 40.65% | |
aThe amount shown for a share outstanding throughout the period may not correlate with the Statement of Operations for the period due to the timing of sales and repurchases of the Fund shares in relation to income earned and/or fluctuating market value of the investments of the Fund.
bBased on average daily shares outstanding.
cTotal return does not include fees, charges or expenses imposed by the variable annuity and life insurance contracts for which the Franklin Templeton Variable Insurance Products Trust serves as an underlying investment vehicle.
dBenefit of expense reduction rounds to less than 0.01%.
The accompanying notes are an integral part of these financial statements.
FH-9
Franklin Templeton Variable Insurance Products Trust
Financial Highlights (continued)
Franklin High Income Securities Fund
| | | | | | | | | | | | | | | | |
| | | Year Ended December 31, | |
| Class 4 | | 2011 | | | 2010 | | | 2009 | | | 2008a | |
| | | | |
Per share operating performance | | | | | | | | | | | | | | | | |
(for a share outstanding throughout the year) | | | | | | | | | | | | | | | | |
Net asset value, beginning of year | | $ | 6.57 | | | $ | 6.22 | | | $ | 4.67 | | | $ | 6.55 | |
| | | | |
Income from investment operationsb: | | | | | | | | | | | | | | | | |
Net investment incomec | | | 0.47 | | | | 0.47 | | | | 0.45 | | | | 0.39 | |
Net realized and unrealized gains (losses) | | | (0.18 | ) | | | 0.31 | | | | 1.48 | | | | (1.65 | ) |
| | | | |
Total from investment operations | | | 0.29 | | | | 0.78 | | | | 1.93 | | | | (1.26 | ) |
| | | | |
Less distributions from net investment income | | | (0.40 | ) | | | (0.43 | ) | | | (0.38 | ) | | | (0.62 | ) |
| | | | |
Net asset value, end of year | | $ | 6.46 | | | $ | 6.57 | | | $ | 6.22 | | | $ | 4.67 | |
| | | | |
| | | | |
Total returnd | | | 4.39% | | | | 13.31% | | | | 42.36% | | | | (21.34)% | |
Ratios to average net assetse | | | | | | | | | | | | | | | | |
Expenses | | | 0.93% | | | | 0.96% | | | | 0.98% | f | | | 1.01% | f |
Net investment income | | | 7.17% | | | | 7.36% | | | | 7.98% | | | | 7.95% | |
| | | | |
Supplemental data | | | | | | | | | | | | | | | | |
Net assets, end of year (000’s) | | $ | 27,055 | | | $ | 25,934 | | | $ | 15,105 | | | $ | 2,244 | |
Portfolio turnover rate | | | 45.11% | | | | 60.80% | | | | 26.41% | | | | 21.75% | |
aFor the period February 29, 2008 (effective date) to December 31, 2008.
bThe amount shown for a share outstanding throughout the period may not correlate with the Statement of Operations for the period due to the timing of sales and repurchases of the Fund shares in relation to income earned and/or fluctuating market value of the investments of the Fund.
cBased on average daily shares outstanding.
dTotal return does not include fees, charges or expenses imposed by the variable annuity and life insurance contracts for which the Franklin Templeton Variable Insurance Products Trust serves as an underlying investment vehicle. Total return is not annualized for periods less than one year.
eRatios are annualized for periods less than one year.
fBenefit of expense reduction rounds to less than 0.01%.
The accompanying notes are an integral part of these financial statements.
FH-10
Franklin Templeton Variable Insurance Products Trust
Statement of Investments, December 31, 2011
| | | | | | | | | | |
| Franklin High Income Securities Fund | | Country | | Shares | | | Value | |
Common Stocks (Cost $865,221) 0.0%† | | | | | | | | | | |
Media 0.0%† | | | | | | | | | | |
a,bDex One Corp. | | United States | | | 27,909 | | | $ | 46,329 | |
| | | | | | | | | | |
Preferred Stocks (Cost $770,000) 0.2% | | | | | | | | | | |
Diversified Financials 0.2% | | | | | | | | | | |
GMAC Capital Trust I, 8.125%, pfd. | | United States | | | 30,800 | | | | 595,672 | |
| | | | | | | | | | |
| | | |
| | | | | Principal
Amount* | | | | |
Corporate Bonds 91.9% | | | | | | | | | | |
Automobiles & Components 4.3% | | | | | | | | | | |
cAllison Transmission Holdings Inc., senior note, 144A, 7.125%, 5/15/19 | | United States | | | 1,000,000 | | | | 985,000 | |
cChrysler Group LLC/CG Co-Issuer Inc., senior secured note, 144A, 8.25%, 6/15/21 | | United States | | | 1,500,000 | | | | 1,372,500 | |
Exide Technologies, senior secured note, 8.625%, 2/01/18 | | United States | | | 800,000 | | | | 620,000 | |
Ford Motor Credit Co. LLC, senior note, | | | | | | | | | | |
7.00%, 4/15/15 | | United States | | | 2,000,000 | | | | 2,155,000 | |
6.625%, 8/15/17 | | United States | | | 1,000,000 | | | | 1,090,098 | |
5.00%, 5/15/18 | | United States | | | 1,000,000 | | | | 1,004,822 | |
8.125%, 1/15/20 | | United States | | | 1,000,000 | | | | 1,180,461 | |
5.75%, 2/01/21 | | United States | | | 1,000,000 | | | | 1,044,263 | |
The Goodyear Tire & Rubber Co., senior note, 8.25%, 8/15/20 | | United States | | | 2,800,000 | | | | 3,066,000 | |
cInternational Automotive Components Group SL, senior secured note, 144A, 9.125%, 6/01/18 | | United States | | | 1,400,000 | | | | 1,277,500 | |
| | | | | | | | | | |
| | | | | | | | | 13,795,644 | |
| | | | | | | | | | |
Banks 2.3% | | | | | | | | | | |
cCIT Group Inc., secured bond, 144A, 7.00%, 5/02/17 | | United States | | | 6,000,000 | | | | 6,000,000 | |
Regions Bank, sub. note, 7.50%, 5/15/18 | | United States | | | 1,250,000 | | | | 1,246,875 | |
| | | | | | | | | | |
| | | | | | | | | 7,246,875 | |
| | | | | | | | | | |
Capital Goods 4.2% | | | | | | | | | | |
cAbengoa Finance SAU, senior note, 144A, 8.875%, 11/01/17 | | Spain | | | 3,000,000 | | | | 2,880,000 | |
The Manitowoc Co. Inc., senior note, | | | | | | | | | | |
9.50%, 2/15/18 | | United States | | | 1,400,000 | | | | 1,498,000 | |
8.50%, 11/01/20 | | United States | | | 500,000 | | | | 529,375 | |
Meritor Inc., senior note, 10.625%, 3/15/18 | | United States | | | 1,900,000 | | | | 1,795,500 | |
RBS Global & Rexnord Corp., senior note, 8.50%, 5/01/18 | | United States | | | 2,500,000 | | | | 2,662,500 | |
RSC Equipment Rental Inc./RSC Holdings III LLC, senior note, 10.25%, 11/15/19 | | United States | | | 1,000,000 | | | | 1,095,000 | |
United Rentals North America Inc., senior sub. note, 8.375%, 9/15/20 | | United States | | | 2,900,000 | | | | 2,842,000 | |
| | | | | | | | | | |
| | | | | | | | | 13,302,375 | |
| | | | | | | | | | |
Commercial & Professional Services 0.2% | | | | | | | | | | |
d,eGoss Graphic Systems Inc., senior sub. note, 12.25%, 11/19/05 | | United States | | | 1,912,374 | | | | 191 | |
Interactive Data Corp., senior note, 10.25%, 8/01/18 | | United States | | | 500,000 | | | | 549,150 | |
| | | | | | | | | | |
| | | | | | | | | 549,341 | |
| | | | | | | | | | |
Consumer Durables & Apparel 2.4% | | | | | | | | | | |
KB Home, senior note, 6.25%, 6/15/15 | | United States | | | 2,000,000 | | | | 1,850,000 | |
M/I Homes Inc., senior note, 8.625%, 11/15/18 | | United States | | | 1,500,000 | | | | 1,335,000 | |
cShea Homes LP/Funding Corp., senior secured note, 144A, 8.625%, 5/15/19 | | United States | | | 1,600,000 | | | | 1,500,000 | |
Visant Corp., senior note, 10.00%, 10/01/17 | | United States | | | 3,100,000 | | | | 2,852,000 | |
| | | | | | | | | | |
| | | | | | | | | 7,537,000 | |
| | | | | | | | | | |
Consumer Services 4.7% | | | | | | | | | | |
cCityCenter Holdings/Finance, senior secured note, 144A, 7.625%, 1/15/16 | | United States | | | 200,000 | | | | 206,000 | |
ClubCorp Club Operations Inc., senior note, 10.00%, 12/01/18 | | United States | | | 2,200,000 | | | | 2,123,000 | |
FH-11
Franklin Templeton Variable Insurance Products Trust
Statement of Investments, December 31, 2011 (continued)
| | | | | | | | | | |
| Franklin High Income Securities Fund | | Country | | Principal
Amount* | | | Value | |
Corporate Bonds (continued) | | | | | | | | | | |
Consumer Services (continued) | | | | | | | | | | |
c,dFontainebleau Las Vegas, 144A, 11.00%, 6/15/15 | | United States | | | 1,700,000 | | | $ | 1,062 | |
Harrah’s Operating Co. Inc., senior secured note, 11.25%, 6/01/17 | | United States | | | 3,000,000 | | | | 3,198,750 | |
MGM Resorts International, | | | | | | | | | | |
senior note, 6.625%, 7/15/15 | | United States | | | 2,000,000 | | | | 1,910,000 | |
senior note, 6.875%, 4/01/16 | | United States | | | 1,200,000 | | | | 1,116,000 | |
senior secured note, 9.00%, 3/15/20 | | United States | | | 600,000 | | | | 667,500 | |
NCL Corp. Ltd., senior note, 9.50%, 11/15/18 | | United States | | | 1,000,000 | | | | 1,047,500 | |
Pinnacle Entertainment Inc., | | | | | | | | | | |
senior note, 8.625%, 8/01/17 | | United States | | | 2,200,000 | | | | 2,337,500 | |
senior sub. note, 7.50%, 6/15/15 | | United States | | | 400,000 | | | | 398,000 | |
cShingle Springs Tribal Gaming Authority, senior note, 144A, 9.375%, 6/15/15 | | United States | | | 1,300,000 | | | | 741,000 | |
cSugarhouse HSP Gaming Prop Mezz LP/Finance Corp., senior secured note, 144A, 8.625%, 4/15/16 | | United States | | | 1,200,000 | | | | 1,236,000 | |
| | | | | | | | | | |
| | | | | | | | | 14,982,312 | |
| | | | | | | | | | |
Diversified Financials 3.6% | | | | | | | | | | |
Ally Financial Inc., senior note, 7.50%, 9/15/20 | | United States | | | 1,500,000 | | | | 1,520,625 | |
fBank of America Corp., pfd., sub. bond, M, 8.125% to 5/15/18, FRN thereafter, Perpetual | | United States | | | 2,500,000 | | | | 2,246,875 | |
GMAC Inc., | | | | | | | | | | |
senior note, 6.875%, 8/28/12 | | United States | | | 2,000,000 | | | | 2,030,000 | |
sub. note, 8.00%, 12/31/18 | | United States | | | 800,000 | | | | 790,000 | |
International Lease Finance Corp., | | | | | | | | | | |
senior note, 8.25%, 12/15/20 | | United States | | | 1,200,000 | | | | 1,215,000 | |
senior note, R, 5.65%, 6/01/14 | | United States | | | 2,800,000 | | | | 2,688,000 | |
csenior secured note, 144A, 6.75%, 9/01/16 | | United States | | | 1,200,000 | | | | 1,236,000 | |
| | | | | | | | | | |
| | | | | | | | | 11,726,500 | |
| | | | | | | | | | |
Energy 18.7% | | | | | | | | | | |
Alpha Natural Resources Inc., senior note, | | | | | | | | | | |
6.00%, 6/01/19 | | United States | | | 1,100,000 | | | | 1,072,500 | |
6.25%, 6/01/21 | | United States | | | 1,100,000 | | | | 1,072,500 | |
Antero Resources Finance Corp., senior note, | | | | | | | | | | |
9.375%, 12/01/17 | | United States | | | 2,600,000 | | | | 2,821,000 | |
c144A, 7.25%, 8/01/19 | | United States | | | 200,000 | | | | 206,000 | |
cArch Coal Inc., senior note, 144A, | | | | | | | | | | |
7.00%, 6/15/19 | | United States | | | 700,000 | | | | 717,500 | |
7.25%, 6/15/21 | | United States | | | 1,000,000 | | | | 1,032,500 | |
cAtlas Pipeline Partners LP/Finance Corp., senior note, 144A, 8.75%, 6/15/18 | | United States | | | 1,500,000 | | | | 1,575,000 | |
cCalumet Specialty Products Partners LP/Finance Corp., senior note, 144A, 9.375%, | | | | | | | | | | |
5/01/19 | | United States | | | 900,000 | | | | 877,500 | |
5/01/19 | | United States | | | 800,000 | | | | 772,000 | |
cCarrizo Oil & Gas Inc., senior note, 144A, 8.625%, 10/15/18 | | United States | | | 1,000,000 | | | | 1,010,000 | |
Chaparral Energy Inc., senior note, | | | | | | | | | | |
9.875%, 10/01/20 | | United States | | | 1,400,000 | | | | 1,519,000 | |
8.25%, 9/01/21 | | United States | | | 600,000 | | | | 610,500 | |
cCHC Helicopter SA, senior secured note, 144A, 9.25%, 10/15/20 | | Canada | | | 3,500,000 | | | | 3,167,500 | |
Chesapeake Energy Corp., senior note, | | | | | | | | | | |
6.625%, 8/15/20 | | United States | | | 2,900,000 | | | | 3,124,750 | |
6.125%, 2/15/21 | | United States | | | 1,000,000 | | | | 1,032,500 | |
cClayton Williams Energy Inc., senior note, 144A, 7.75%, 4/01/19 | | United States | | | 1,400,000 | | | | 1,344,000 | |
Compagnie Generale de Geophysique-Veritas, senior note, 6.50%, 6/01/21 | | France | | | 2,500,000 | | | | 2,437,500 | |
FH-12
Franklin Templeton Variable Insurance Products Trust
Statement of Investments, December 31, 2011 (continued)
| | | | | | | | | | |
| Franklin High Income Securities Fund | | Country | | Principal
Amount* | | | Value | |
Corporate Bonds (continued) | | | | | | | | | | |
Energy (continued) | | | | | | | | | | |
CONSOL Energy Inc., senior note, | | | | | | | | | | |
8.00%, 4/01/17 | | United States | | | 500,000 | | | $ | 550,000 | |
8.25%, 4/01/20 | | United States | | | 500,000 | | | | 555,000 | |
c144A, 6.375%, 3/01/21 | | United States | | | 300,000 | | | | 304,500 | |
cEagle Rock Energy Partners LP/Finance Corp., senior note, 144A, 8.375%, 6/01/19 | | United States | | | 1,400,000 | | | | 1,407,000 | |
Energy Transfer Equity LP, senior note, 7.50%, 10/15/20 | | United States | | | 1,200,000 | | | | 1,317,000 | |
Energy XXI Gulf Coast Inc., senior note, 9.25%, 12/15/17 | | United States | | | 2,500,000 | | | | 2,725,000 | |
gEnterprise Products Operating LLC, junior sub. note, FRN, 7.034%, 1/15/68 | | United States | | | 1,500,000 | | | | 1,561,908 | |
cExpro Finance Luxembourg, senior secured note, 144A, 8.50%, 12/15/16 | | United Kingdom | | | 3,000,000 | | | | 2,655,000 | |
cGoodrich Petroleum Corp., senior note, 144A, 8.875%, 3/15/19 | | United States | | | 1,700,000 | | | | 1,708,500 | |
cKinder Morgan Finance Co. LLC, senior secured note, 144A, 6.00%, 1/15/18 | | United States | | | 1,500,000 | | | | 1,533,750 | |
cKodiak Oil & Gas Corp., senior note, 144A, 8.125%, 12/01/19 | | United States | | | 900,000 | | | | 938,250 | |
Linn Energy LLC/Finance Corp., senior note, | | | | | | | | | | |
8.625%, 4/15/20 | | United States | | | 2,000,000 | | | | 2,180,000 | |
7.75%, 2/01/21 | | United States | | | 700,000 | | | | 731,500 | |
c144A, 6.50%, 5/15/19 | | United States | | | 600,000 | | | | 598,500 | |
Martin Midstream Partners LP, senior note, 8.875%, 4/01/18 | | United States | | | 1,500,000 | | | | 1,552,500 | |
Oasis Petroleum Inc., senior note, 6.50%, 11/01/21 | | United States | | | 900,000 | | | | 897,750 | |
Offshore Group Investment Ltd., senior secured note, 11.50%, 8/01/15 | | United States | | | 1,700,000 | | | | 1,846,625 | |
Peabody Energy Corp., senior note, 6.50%, 9/15/20 | | United States | | | 1,700,000 | | | | 1,793,500 | |
cPetroplus Finance Ltd., senior note, 144A, 6.75%, 5/01/14 | | Switzerland | | | 1,600,000 | | | | 872,000 | |
Plains Exploration & Production Co., senior note, 7.625%, 6/01/18 | | United States | | | 2,200,000 | | | | 2,343,000 | |
Quicksilver Resources Inc., senior note, | | | | | | | | | | |
8.25%, 8/01/15 | | United States | | | 2,000,000 | | | | 2,080,000 | |
9.125%, 8/15/19 | | United States | | | 300,000 | | | | 319,500 | |
SandRidge Energy Inc., senior note, | | | | | | | | | | |
8.75%, 1/15/20 | | United States | | | 300,000 | | | | 311,250 | |
7.50%, 3/15/21 | | United States | | | 400,000 | | | | 399,000 | |
c144A, 8.00%, 6/01/18 | | United States | | | 2,500,000 | | | | 2,537,500 | |
cW&T Offshore Inc., senior note, 144A, 8.50%, 6/15/19 | | United States | | | 1,500,000 | | | | 1,560,000 | |
| | | | | | | | | | |
| | | | | | | | | 59,670,783 | |
| | | | | | | | | | |
Food & Staples Retailing 1.0% | | | | | | | | | | |
Rite Aid Corp., senior secured note, | | | | | | | | | | |
9.75%, 6/12/16 | | United States | | | 1,800,000 | | | | 1,980,000 | |
8.00%, 8/15/20 | | United States | | | 1,000,000 | | | | 1,110,000 | |
| | | | | | | | | | |
| | | | | | | | | 3,090,000 | |
| | | | | | | | | | |
Food, Beverage & Tobacco 2.6% | | | | | | | | | | |
cCEDC Finance Corp. International Inc., senior secured note, 144A, 9.125%, 12/01/16 | | Poland | | | 700,000 | | | | 498,750 | |
Del Monte Corp., senior note, 7.625%, 2/15/19 | | United States | | | 2,500,000 | | | | 2,412,500 | |
Dean Foods Co., senior note, 9.75%, 12/15/18 | | United States | | | 2,800,000 | | | | 2,996,000 | |
Pinnacle Foods Finance LLC, senior note, | | | | | | | | | | |
9.25%, 4/01/15 | | United States | | | 1,300,000 | | | | 1,340,625 | |
8.25%, 9/01/17 | | United States | | | 1,000,000 | | | | 1,045,000 | |
| | | | | | | | | | |
| | | | | | | | | 8,292,875 | |
| | | | | | | | | | |
Health Care Equipment & Services 5.1% | | | | | | | | | | |
Amerigroup Corp., senior note, 7.50%, 11/15/19 | | United States | | | 1,600,000 | | | | 1,656,000 | |
Aviv Healthcare Properties LP, senior note, 7.75%, 2/15/19 | | United States | | | 2,000,000 | | | | 1,970,000 | |
Community Health Systems Inc., senior note, 8.875%, 7/15/15 | | United States | | | 1,927,000 | | | | 1,994,445 | |
Emergency Medical Services Corp., senior note, 8.125%, 6/01/19 | | United States | | | 1,000,000 | | | | 1,002,500 | |
cExamWorks Group Inc., senior note, 144A, 9.00%, 7/15/19 | | United States | | | 700,000 | | | | 637,000 | |
FH-13
Franklin Templeton Variable Insurance Products Trust
Statement of Investments, December 31, 2011 (continued)
| | | | | | | | | | |
| Franklin High Income Securities Fund | | Country | | Principal
Amount* | | | Value | |
Corporate Bonds (continued) | | | | | | | | | | |
Health Care Equipment & Services (continued) | | | | | | | | | | |
HCA Inc., | | | | | | | | | | |
senior note, 7.50%, 2/15/22 | | United States | | | 800,000 | | | $ | 820,000 | |
senior secured bond, 7.25%, 9/15/20 | | United States | | | 900,000 | | | | 954,000 | |
senior secured note, 7.875%, 2/15/20 | | United States | | | 1,000,000 | | | | 1,085,000 | |
cHealth Management Associates Inc., senior note, 144A, 7.375%, 1/15/20 | | United States | | | 400,000 | | | | 417,000 | |
MedAssets Inc., senior note, 8.00%, 11/15/18 | | United States | | | 2,000,000 | | | | 1,970,000 | |
hUnited Surgical Partners International Inc., senior sub. note, PIK, 9.25%, 5/01/17 | | United States | | | 2,300,000 | | | | 2,323,000 | |
Vanguard Health Holding Co. II LLC/Inc., senior note, 8.00%, 2/01/18 | | United States | | | 1,300,000 | | | | 1,296,750 | |
Vanguard Health Systems Inc., senior note, zero cpn., 2/01/16 | | United States | | | 64,000 | | | | 40,320 | |
| | | | | | | | | | |
| | | | | | | | | 16,166,015 | |
| | | | | | | | | | |
Materials 8.0% | | | | | | | | | | |
Atkore International Inc., senior secured note, 9.875%, 1/01/18 | | United States | | | 1,600,000 | | | | 1,540,000 | |
cCemex SAB de CV, senior secured note, 144A, 9.00%, 1/11/18 | | Mexico | | | 3,500,000 | | | | 2,814,577 | |
cEuramax International Inc., senior secured note, 144A, 9.50%, 4/01/16 | | United States | | | 2,000,000 | | | | 1,570,000 | |
cExopack Holding Corp., senior note, 144A, 10.00%, 6/01/18 | | United States | | | 1,400,000 | | | | 1,407,000 | |
cFMG Resources August 2006 Pty. Ltd., senior note, 144A, | | | | | | | | | | |
7.00%, 11/01/15 | | Australia | | | 800,000 | | | | 795,500 | |
6.875%, 2/01/18 | | Australia | | | 2,000,000 | | | | 1,925,000 | |
8.25%, 11/01/19 | | Australia | | | 500,000 | | | | 511,250 | |
cIneos Finance PLC, senior secured note, 144A, 9.00%, 5/15/15 | | United Kingdom | | | 200,000 | | | | 204,000 | |
cIneos Group Holdings Ltd., senior secured note, 144A, 8.50%, 2/15/16 | | United Kingdom | | | 2,000,000 | | | | 1,600,000 | |
cKinove German Bondco GmbH, senior secured note, 144A, 9.625%, 6/15/18 | | Germany | | | 1,600,000 | | | | 1,491,197 | |
cMacDermid Inc., senior sub. note, 144A, 9.50%, 4/15/17 | | United States | | | 2,500,000 | | | | 2,500,000 | |
dNewPage Corp., senior secured note, 11.375%, 12/31/14 | | United States | | | 2,500,000 | | | | 1,720,313 | |
Novelis Inc., senior note, 8.75%, 12/15/20 | | Canada | | | 1,300,000 | | | | 1,400,750 | |
cReynolds Group Issuer Inc./LLC/SA, senior note, 144A, | | | | | | | | | | |
9.00%, 5/15/18 | | United States | | | 2,800,000 | | | | 2,695,000 | |
9.00%, 4/15/19 | | United States | | | 200,000 | | | | 191,000 | |
9.875%, 8/15/19 | | United States | | | 200,000 | | | | 195,000 | |
8.25%, 2/15/21 | | United States | | | 400,000 | | | | 356,000 | |
cSealed Air Corp., senior note, 144A, | | | | | | | | | | |
8.125%, 9/15/19 | | United States | | | 800,000 | | | | 880,000 | |
8.375%, 9/15/21 | | United States | | | 400,000 | | | | 444,000 | |
Solo Cup Co., senior sub. note, 8.50%, 2/15/14 | | United States | | | 1,500,000 | | | | 1,387,500 | |
| | | | | | | | | | |
| | | | | | | | | 25,628,087 | |
| | | | | | | | | | |
Media 8.4% | | | | | | | | | | |
cBresnan Broadband Holdings LLC, senior note, 144A, 8.00%, 12/15/18 | | United States | | | 1,200,000 | | | | 1,254,000 | |
Cablevision Systems Corp., senior note, 7.75%, 4/15/18 | | United States | | | 1,000,000 | | | | 1,065,000 | |
CCO Holdings LLC/Capital Corp., senior note, | | | | | | | | | | |
8.125%, 4/30/20 | | United States | | | 700,000 | | | | 770,000 | |
6.50%, 4/30/21 | | United States | | | 2,200,000 | | | | 2,238,500 | |
Clear Channel Communications Inc., senior note, 9.00%, 3/01/21 | | United States | | | 4,000,000 | | | | 3,390,000 | |
Clear Channel Worldwide Holdings Inc., senior note, B, 9.25%, 12/15/17 | | United States | | | 1,000,000 | | | | 1,085,000 | |
cCSC Holdings Inc., senior note, 144A, 6.75%, 11/15/21 | | United States | | | 1,500,000 | | | | 1,586,250 | |
cCumulus Media Inc., senior note, 144A, 7.75%, 5/01/19 | | United States | | | 700,000 | | | | 624,750 | |
DISH DBS Corp., senior note, | | | | | | | | | | |
7.125%, 2/01/16 | | United States | | | 3,000,000 | | | | 3,247,500 | |
6.75%, 6/01/21 | | United States | | | 1,500,000 | | | | 1,623,750 | |
cLive Nation Entertainment Inc., senior note, 144A, 8.125%, 5/15/18 | | United States | | | 2,500,000 | | | | 2,531,250 | |
Media General Inc., senior secured note, 11.75%, 2/15/17 | | United States | | | 1,400,000 | | | | 1,344,000 | |
hRadio One Inc., senior sub. note, PIK, 9.00%, 5/24/16 | | United States | | | 1,603,544 | | | | 1,137,463 | |
FH-14
Franklin Templeton Variable Insurance Products Trust
Statement of Investments, December 31, 2011 (continued)
| | | | | | | | | | | | |
| Franklin High Income Securities Fund | | Country | | | Principal
Amount* | | | Value | |
Corporate Bonds (continued) | | | | | | | | | | | | |
Media (continued) | | | | | | | | | | | | |
cUnitymedia Hessen/NRW, senior secured note, 144A, 8.125%, 12/01/17 | | | Germany | | | | 1,500,000 | | | $ | 1,578,750 | |
cUnivision Communications Inc., senior secured note, 144A, | | | | | | | | | | | | |
6.875%, 5/15/19 | | | United States | | | | 1,500,000 | | | | 1,455,000 | |
7.875%, 11/01/20 | | | United States | | | | 700,000 | | | | 714,000 | |
cUPCB Finance III Ltd., senior secured note, 144A, 6.625%, 7/01/20 | | | Netherlands | | | | 1,000,000 | | | | 990,000 | |
| | | | | | | | | | | | |
| | | | | | | | | | | 26,635,213 | |
| | | | | | | | | | | | |
Pharmaceuticals, Biotechnology & Life Sciences 2.8% | | | | | | | | | | | | |
Endo Pharmaceuticals Holdings Inc., senior note, 7.00%, | | | | | | | | | | | | |
7/15/19 | | | United States | | | | 600,000 | | | | 642,000 | |
12/15/20 | | | United States | | | | 1,000,000 | | | | 1,067,500 | |
Giant Funding Corp., senior secured note, 8.25%, 2/01/18 | | | Spain | | | | 1,800,000 | | | | 1,899,000 | |
cinVentiv Health Inc., senior note, 144A, 10.00%, 8/15/18 | | | United States | | | | 2,400,000 | | | | 2,208,000 | |
cJaguar Holding Co. II/Merger Sub Inc., senior note, 144A, 9.50%, 12/01/19 | | | United States | | | | 700,000 | | | | 738,500 | |
cMylan Inc., senior note, 144A, 7.875%, 7/15/20 | | | United States | | | | 2,200,000 | | | | 2,439,250 | |
| | | | | | | | | | | | |
| | | | | | | | | | | 8,994,250 | |
| | | | | | | | | | | | |
Real Estate 0.6% | | | | | | | | | | | | |
Forest City Enterprises Inc., senior note, | | | | | | | | | | | | |
7.625%, 6/01/15 | | | United States | | | | 1,800,000 | | | | 1,777,500 | |
6.50%, 2/01/17 | | | United States | | | | 300,000 | | | | 282,000 | |
| | | | | | | | | | | | |
| | | | | | | | | | | 2,059,500 | |
| | | | | | | | | | | | |
Retailing 2.4% | | | | | | | | | | | | |
cAcademy Ltd./Finance Corp., senior note, 144A, 9.25%, 8/01/19 | | | United States | | | | 1,200,000 | | | | 1,191,000 | |
Asbury Automotive Group Inc., senior sub. note, 8.375%, 11/15/20 | | | United States | | | | 1,400,000 | | | | 1,442,000 | |
Michaels Stores Inc., senior note, 7.75%, 11/01/18 | | | United States | | | | 1,500,000 | | | | 1,522,500 | |
cNeedle Merger Sub Corp., senior note, 144A, 8.125%, 3/15/19 | | | United States | | | | 900,000 | | | | 861,750 | |
cPetco Animal Supplies Inc., senior note, 144A, 9.25%, 12/01/18 | | | United States | | | | 2,500,000 | | | | 2,693,750 | |
| | | | | | | | | | | | |
| | | | | | | | | | | 7,711,000 | |
| | | | | | | | | | | | |
Semiconductors & Semiconductor Equipment 1.7% | | | | | | | | | | | | |
Advanced Micro Devices Inc., senior note, | | | | | | | | | | | | |
8.125%, 12/15/17 | | | United States | | | | 500,000 | | | | 521,250 | |
7.75%, 8/01/20 | | | United States | | | | 1,000,000 | | | | 1,032,500 | |
Freescale Semiconductor Inc., senior note, | | | | | | | | | | | | |
10.125%, 12/15/16 | | | United States | | | | 200,000 | | | | 211,500 | |
8.05%, 2/01/20 | | | United States | | | | 1,200,000 | | | | 1,134,000 | |
10.75%, 8/01/20 | | | United States | | | | 1,104,000 | | | | 1,156,440 | |
cNXP BV/NXP Funding LLC, senior secured note, 144A, 9.75%, 8/01/18 | | | Netherlands | | | | 1,100,000 | | | | 1,214,125 | |
| | | | | | | | | | | | |
| | | | | | | | | | | 5,269,815 | |
| | | | | | | | | | | | |
Software & Services 2.4% | | | | | | | | | | | | |
First Data Corp., | | | | | | | | | | | | |
csenior bond, 144A, 12.625%, 1/15/21 | | | United States | | | | 808,000 | | | | 707,000 | |
senior note, 9.875%, 9/24/15 | | | United States | | | | 71,000 | | | | 66,740 | |
senior note, 9.875%, 9/24/15 | | | United States | | | | 111,000 | | | | 104,895 | |
csenior secured bond, 144A, 8.25%, 1/15/21 | | | United States | | | | 2,500,000 | | | | 2,250,000 | |
Sitel LLC/Finance Corp., senior note, 11.50%, 4/01/18 | | | United States | | | | 1,300,000 | | | | 965,250 | |
cSterling Merger Inc., senior note, 144A, 11.00%, 10/01/19 | | | United States | | | | 1,200,000 | | | | 1,176,000 | |
SunGard Data Systems Inc., senior note, 7.625%, 11/15/20 | | | United States | | | | 2,300,000 | | | | 2,374,750 | |
| | | | | | | | | | | | |
| | | | | | | | | | | 7,644,635 | |
| | | | | | | | | | | | |
FH-15
Franklin Templeton Variable Insurance Products Trust
Statement of Investments, December 31, 2011 (continued)
| | | | | | | | | | |
| Franklin High Income Securities Fund | | Country | | Principal
Amount* | | | Value | |
Corporate Bonds (continued) | | | | | | | | | | |
Technology Hardware & Equipment 1.6% | | | | | | | | | | |
CDW LLC/Finance Corp., senior note, 8.50%, 4/01/19 | | United States | | | 2,600,000 | | | $ | 2,632,500 | |
cCommScope Inc., senior note, 144A, 8.25%, 1/15/19 | | United States | | | 2,300,000 | | | | 2,311,500 | |
| | | | | | | | | | |
| | | | | | | | | 4,944,000 | |
| | | | | | | | | | |
Telecommunication Services 9.9% | | | | | | | | | | |
Cricket Communications Inc., senior note, 7.75%, 10/15/20 | | United States | | | 3,500,000 | | | | 3,071,250 | |
Crown Castle International Corp., | | | | | | | | | | |
senior bond, 7.125%, 11/01/19 | | United States | | | 600,000 | | | | 651,000 | |
senior note, 9.00%, 1/15/15 | | United States | | | 2,000,000 | | | | 2,177,500 | |
cDigicel Group Ltd., senior note, 144A, 8.875%, 1/15/15 | | Jamaica | | | 2,000,000 | | | | 1,980,000 | |
ceAccess Ltd., senior note, 144A, 8.25%, 4/01/18 | | Japan | | | 1,800,000 | | | | 1,710,000 | |
Frontier Communications Corp., senior note, | | | | | | | | | | |
8.25%, 4/15/17 | | United States | | | 400,000 | | | | 411,000 | |
8.50%, 4/15/20 | | United States | | | 2,000,000 | | | | 2,057,500 | |
8.75%, 4/15/22 | | United States | | | 900,000 | | | | 895,500 | |
cIntegra Telecom Inc., senior secured note, 144A, 10.75%, 4/15/16 | | United States | | | 2,200,000 | | | | 1,804,000 | |
Intelsat Jackson Holdings SA, senior note, | | | | | | | | | | |
7.25%, 10/15/20 | | Luxembourg | | | 900,000 | | | | 920,250 | |
c144A, 7.50%, 4/01/21 | | Luxembourg | | | 3,800,000 | | | | 3,852,250 | |
MetroPCS Wireless Inc., senior note, 7.875%, 9/01/18 | | United States | | | 1,500,000 | | | | 1,528,125 | |
Sprint Nextel Corp., senior note, | | | | | | | | | | |
8.375%, 8/15/17 | | United States | | | 3,000,000 | | | | 2,703,750 | |
c144A, 9.00%, 11/15/18 | | United States | | | 3,000,000 | | | | 3,157,500 | |
West Corp., senior note, 7.875%, 1/15/19 | | United States | | | 3,000,000 | | | | 2,992,500 | |
cWind Acquisition Finance SA, senior secured note, 144A, 11.75%, 7/15/17 | | Italy | | | 1,500,000 | | | | 1,335,938 | |
c,hWind Acquisition Holdings Finance SA, senior secured note, 144A, PIK, 12.25%, 7/15/17 | | Italy | | | 482,691 | EUR | | | 430,942 | |
| | | | | | | | | | |
| | | | | | | | | 31,679,005 | |
| | | | | | | | | | |
Transportation 2.5% | | | | | | | | | | |
c,dAmerican Airlines Inc., senior secured note, 144A, 7.50%, 3/15/16 | | United States | | | 3,300,000 | | | | 2,376,000 | |
cCeva Group PLC, senior secured note, 144A, | | | | | | | | | | |
11.625%, 10/01/16 | | United Kingdom | | | 200,000 | | | | 199,500 | |
8.375%, 12/01/17 | | United Kingdom | | | 500,000 | | | | 478,750 | |
11.50%, 4/01/18 | | United Kingdom | | | 1,800,000 | | | | 1,662,482 | |
Hertz Corp., senior note, | | | | | | | | | | |
7.50%, 10/15/18 | | United States | | | 1,100,000 | | | | 1,155,000 | |
6.75%, 4/15/19 | | United States | | | 2,000,000 | | | | 2,015,000 | |
| | | | | | | | | | |
| | | | | | | | | 7,886,732 | |
| | | | | | | | | | |
Utilities 2.5% | | | | | | | | | | |
cCalpine Corp., senior secured note, 144A, | | | | | | | | | | |
7.875%, 7/31/20 | | United States | | | 800,000 | | | | 866,000 | |
7.50%, 2/15/21 | | United States | | | 1,500,000 | | | | 1,612,500 | |
7.875%, 1/15/23 | | United States | | | 1,000,000 | | | | 1,080,000 | |
cIntergen NV, senior secured note, 144A, 9.00%, 6/30/17 | | Netherlands | | | 2,000,000 | | | | 2,115,000 | |
Texas Competitive Electric Holdings Co. LLC, senior note, A, 10.25%, 11/01/15 | | United States | | | 1,000,000 | | | | 360,000 | |
Texas Competitive Electric Holdings Co. LLC/Texas Competitive Electric Holdings Finance Inc., senior secured note,
c144A, 11.50%, 10/01/20 | | United States | | | 1,500,000 | | | | 1,280,625 | |
B, 15.00%, 4/01/21 | | United States | | | 852,000 | | | | 472,860 | |
| | | | | | | | | | |
| | | | | | | | | 7,786,985 | |
| | | | | | | | | | |
Total Corporate Bonds (Cost $298,184,214) | | | | | | | | | 292,598,942 | |
| | | | | | | | | | |
FH-16
Franklin Templeton Variable Insurance Products Trust
Statement of Investments, December 31, 2011 (continued)
| | | | | | | | | | |
| Franklin High Income Securities Fund | | Country | | Principal
Amount* | | | Value | |
g,iSenior Floating Rate Interests 1.0% | | | | | | | | | | |
Media 0.7% | | | | | | | | | | |
Cumulus Media Holdings Inc., Second Lien Term Loan, 7.50%, 9/16/19 | | United States | | | 1,500,000 | | | $ | 1,457,500 | |
Univision Communications Inc., Initial Term Loan, 2.296%, 9/29/14 | | United States | | | 874,148 | | | | 836,875 | |
| | | | | | | | | | |
| | | | | | | | | 2,294,375 | |
| | | | | | | | | | |
Utilities 0.3% | | | | | | | | | | |
Texas Competitive Electric Holdings Co. LLC, 2017 Term Loan, 4.776%, 10/10/17 | | United States | | | 1,431,288 | | | | 911,254 | |
| | | | | | | | | | |
Total Senior Floating Rate Interests (Cost $3,439,126) | | | | | | | | | 3,205,629 | |
| | | | | | | | | | |
Total Investments before Short Term Investments
(Cost $303,258,561) | | | | | | | | | 296,446,572 | |
| | | | | | | | | | |
Short Term Investments (Cost $14,047,563) 4.4% | | | | | | | | | | |
Repurchase Agreements 4.4% | | | | | | | | | | |
jJoint Repurchase Agreement, 0.011%, 1/03/12 (Maturity Value $14,047,580) | | | | | 14,047,563 | | | | 14,047,563 | |
BNP Paribas Securities Corp. (Maturity Value $1,699,757) | | | | | | | | | | |
Credit Suisse Securities (USA) LLC (Maturity Value $2,039,568) | | | | | | | | | | |
Deutsche Bank Securities Inc. (Maturity Value $2,149,701) | | | | | | | | | | |
HSBC Securities (USA) Inc. (Maturity Value $3,399,515) | | | | | | | | | | |
Merrill Lynch, Pierce, Fenner & Smith Inc. (Maturity Value $2,039,568) | | | | | | | | | | |
Morgan Stanley & Co. LLC (Maturity Value $679,903) | | | | | | | | | | |
UBS Securities LLC (Maturity Value $2,039,568) | | | | | | | | | | |
Collateralized by U.S. Government Agency Securities, 0.16% - 5.25%, 6/07/12 - 2/05/14;
kU.S. Treasury Bills, 1/12/12 - 9/20/12; U.S. Treasury Bonds, 0.50% - 11.25%, 5/31/13 - 2/15/16; and U.S. Treasury Notes, 0.125% - 4.875%, 12/31/11 - 5/15/19 (valued at $14,335,939) | | | | | | | | | | |
| | | | | | | | | | |
Total Investments (Cost $317,306,124) 97.5% | | | | | | | | | 310,494,135 | |
Other Assets, less Liabilities 2.5% | | | | | | | | | 7,984,364 | |
| | | | | | | | | | |
Net Assets 100.0% | | | | | | | | $ | 318,478,499 | |
| | | | | | | | | | |
†Rounds to less than 0.1% of net assets.
*The principal amount is stated in U.S. dollars unless otherwise indicated.
aNon-income producing.
bAt December 31, 2011, pursuant to the Fund’s policies and the requirements of applicable securities law, the Fund may be restricted from trading this security for a limited or extended period of time due to ownership limits and/or potential possession of material non-public information.
cSecurity was purchased pursuant to Rule 144A under the Securities Act of 1933 and may be sold in transactions exempt from registration only to qualified institutional buyers or in a public offering registered under the Securities Act of 1933. These securities have been deemed liquid under guidelines approved by the Trust’s Board of Trustees. At December 31, 2011, the aggregate value of these securities was $117,850,698, representing 37.00% of net assets.
dSee Note 7 regarding defaulted securities.
eSecurity has been deemed illiquid because it may not be able to be sold within seven days. At December 31, 2011, the value of this security was $191, representing less than 0.01% of net assets.
fPerpetual security with no stated maturity date.
gThe coupon rate shown represents the rate at period end.
hIncome may be received in additional securities and/or cash.
iSee Note 1(e) regarding senior floating rate interests.
jSee Note 1(c) regarding joint repurchase agreement.
kThe security is traded on a discount basis with no stated coupon rate.
FH-17
Franklin Templeton Variable Insurance Products Trust
Statement of Investments, December 31, 2011 (continued)
| | | | |
| Franklin High Income Securities Fund | | | | |
| | | | |
Forward Exchange Contracts
At December 31, 2011, the Fund had the following forward exchange contracts outstanding. See Note 1(d).
| | | | | | | | | | | | | | | | | | | | | | | | | | | | |
| Currency | | Counterparty | | | Type | | | Quantity | | | Contract
Amount | | | Settlement
Date | | | Unrealized
Appreciation | | | Unrealized
Depreciation | |
Euro | | | DBAB | | | | Sell | | | | 400,000 | | | $ | 525,560 | | | | 12/17/12 | | | $ | 4,852 | | | $ | — | |
| | | | | | | | | | | | | | | | | | | | | | | | |
See Abbreviations on page FH-30.
The accompanying notes are an integral part of these financial statements.
FH-18
Franklin Templeton Variable Insurance Products Trust
Financial Statements
Statement of Assets and Liabilities
December 31, 2011
| | | | |
| | | Franklin High
Income
Securities Fund | |
Assets: | | | | |
Investments in securities: | | | | |
Cost - Unaffiliated issuers | | $ | 303,258,561 | |
Cost - Repurchase agreements | | | 14,047,563 | |
| | | | |
Total cost of investments | | $ | 317,306,124 | |
| | | | |
Value - Unaffiliated issuers | | $ | 296,446,572 | |
Value - Repurchase agreements | | | 14,047,563 | |
| | | | |
Total value of investments | | | 310,494,135 | |
Receivables: | | | | |
Investment securities sold | | | 112,163 | |
Capital shares sold | | | 2,229,214 | |
Interest | | | 6,019,340 | |
Unrealized appreciation on forward exchange contracts | | | 4,852 | |
Other assets | | | 9 | |
| | | | |
Total assets | | | 318,859,713 | |
| | | | |
Liabilities: | | | | |
Payables: | | | | |
Capital shares redeemed | | | 29,867 | |
Affiliates | | | 256,316 | |
Reports to shareholders | | | 53,047 | |
Professional fees | | | 38,983 | |
Accrued expenses and other liabilities | | | 3,001 | |
| | | | |
Total liabilities | | | 381,214 | |
| | | | |
Net assets, at value | | $ | 318,478,499 | |
| | | | |
Net assets consist of: | | | | |
Paid-in capital | | $ | 341,237,526 | |
Undistributed net investment income | | | 22,720,819 | |
Net unrealized appreciation (depreciation) | | | (6,807,137 | ) |
Accumulated net realized gain (loss) | | | (38,672,709 | ) |
| | | | |
Net assets, at value | | $ | 318,478,499 | |
| | | | |
Class 1: | | | | |
Net assets, at value | | $ | 41,970,915 | |
| | | | |
Shares outstanding | | | 6,435,826 | |
| | | | |
Net asset value and maximum offering price per share | | $ | 6.52 | |
| | | | |
Class 2: | | | | |
Net assets, at value | | $ | 249,452,363 | |
| | | | |
Shares outstanding | | | 39,245,742 | |
| | | | |
Net asset value and maximum offering price per share | | $ | 6.36 | |
| | | | |
Class 4: | | | | |
Net assets, at value | | $ | 27,055,221 | |
| | | | |
Shares outstanding | | | 4,189,342 | |
| | | | |
Net asset value and maximum offering price per share | | $ | 6.46 | |
| | | | |
The accompanying notes are an integral part of these financial statements.
FH-19
Franklin Templeton Variable Insurance Products Trust
Financial Statements (continued)
Statement of Operations
for the year ended December 31, 2011
| | | | |
| | | Franklin High
Income
Securities Fund | |
Investment income: | | | | |
Dividends | | $ | 121,755 | |
Interest | | | 26,829,693 | |
| | | | |
Total investment income | | | 26,951,448 | |
| | | | |
Expenses: | | | | |
Management fees (Note 3a) | | | 1,747,002 | |
Distribution fees: (Note 3c) | | | | |
Class 2 | | | 650,086 | |
Class 4 | | | 95,354 | |
Custodian fees (Note 4) | | | 4,894 | |
Reports to shareholders | | | 103,248 | |
Professional fees | | | 42,266 | |
Trustees’ fees and expenses | | | 1,218 | |
Other | | | 25,496 | |
| | | | |
Total expenses | | | 2,669,564 | |
| | | | |
Net investment income | | | 24,281,884 | |
| | | | |
Realized and unrealized gains (losses): | | | | |
Net realized gain (loss) from: | | | | |
Investments | | | 7,078,870 | |
Foreign currency transactions | | | 9,098 | |
| | | | |
Net realized gain (loss) | | | 7,087,968 | |
| | | | |
Net change in unrealized appreciation (depreciation) on: | | | | |
Investments | | | (18,165,861 | ) |
Translation of other assets and liabilities denominated in foreign currencies | | | 6,034 | |
| | | | |
Net change in unrealized appreciation (depreciation) | | | (18,159,827 | ) |
| | | | |
Net realized and unrealized gain (loss) | | | (11,071,859 | ) |
| | | | |
Net increase (decrease) in net assets resulting from operations | | $ | 13,210,025 | |
| | | | |
The accompanying notes are an integral part of these financial statements.
FH-20
Franklin Templeton Variable Insurance Products Trust
Financial Statements (continued)
Statements of Changes in Net Assets
| | | | | | | | |
| | | Franklin High Income
Securities Fund | |
| | | Year Ended December 31, | |
| | | 2011 | | | 2010 | |
| | | | |
Increase (decrease) in net assets: | | | | | | | | |
Operations: | | | | | | | | |
Net investment income | | $ | 24,281,884 | | | $ | 20,367,704 | |
Net realized gain (loss) from investments and foreign currency transactions | | | 7,087,968 | | | | 8,248,722 | |
Net change in unrealized appreciation (depreciation) on investments and translation of other assets and liabilities denominated in foreign currencies | | | (18,159,827 | ) | | | 5,468,339 | |
| | | | |
Net increase (decrease) in net assets resulting from operations | | | 13,210,025 | | | | 34,084,765 | |
| | | | |
Distributions to shareholders from: | | | | | | | | |
Net investment income: | | | | | | | | |
Class 1 | | | (2,826,791 | ) | | | (3,172,829 | ) |
Class 2 | | | (16,984,105 | ) | | | (12,418,978 | ) |
Class 4 | | | (1,620,002 | ) | | | (1,394,573 | ) |
| | | | |
Total distributions to shareholders | | | (21,430,898 | ) | | | (16,986,380 | ) |
| | | | |
Capital share transactions: (Note 2) | | | | | | | | |
Class 1 | | | (5,339,666 | ) | | | (3,710,324 | ) |
Class 2 | | | 16,598,368 | | | | 28,368,422 | |
Class 4 | | | 1,632,254 | | | | 9,525,024 | |
| | | | |
Total capital share transactions | | | 12,890,956 | | | | 34,183,122 | |
| | | | |
Net increase (decrease) in net assets | | | 4,670,083 | | | | 51,281,507 | |
Net assets: | | | | | | | | |
Beginning of year | | | 313,808,416 | | | | 262,526,909 | |
| | | | |
End of year | | $ | 318,478,499 | | | $ | 313,808,416 | |
| | | | |
Undistributed net investment income included in net assets: | | | | | | | | |
End of year | | $ | 22,720,819 | | | $ | 19,700,126 | |
| | | | |
The accompanying notes are an integral part of these financial statements.
FH-21
Franklin Templeton Variable Insurance Products Trust
Notes to Financial Statements
Franklin High Income Securities Fund
1. ORGANIZATION AND SIGNIFICANT ACCOUNTING POLICIES
Franklin Templeton Variable Insurance Products Trust (Trust) is registered under the Investment Company Act of 1940, as amended, (1940 Act) as an open-end investment company, consisting of twenty separate funds. The Franklin High Income Securities Fund (Fund) is included in this report. The financial statements of the remaining funds in the Trust are presented separately. Shares of the Fund are generally sold only to insurance company separate accounts to fund the benefits of variable life insurance policies or variable annuity contracts. At December 31, 2011, 87.29% of the Fund’s shares were held through one insurance company. The Fund offers three classes of shares: Class 1, Class 2, and Class 4. Each class of shares differs by its distribution fees, voting rights on matters affecting a single class and its exchange privilege.
The following summarizes the Fund’s significant accounting policies.
a. Financial Instrument Valuation
The Fund’s investments in securities and other financial instruments are carried at fair value daily. Fair value is the price that would be received to sell an asset or paid to transfer a liability in an orderly transaction between market participants on the measurement date. Under procedures approved by the Trust’s Board of Trustees, the Fund may utilize independent pricing services, quotations from securities and financial instrument dealers, and other market sources to determine fair value.
Equity securities listed on an exchange or on the NASDAQ National Market System are valued at the last quoted sale price or the official closing price of the day, respectively. Over-the-counter securities are valued within the range of the most recent quoted bid and ask prices. Securities that trade in multiple markets or on multiple exchanges are valued according to the broadest and most representative market. Certain equity securities are valued based upon fundamental characteristics or relationships to similar securities.
Debt securities generally trade in the over-the-counter market rather than on a securities exchange. The Fund’s pricing services use multiple valuation techniques to determine fair value. In instances where sufficient market activity exists, the pricing services may utilize a market-based approach through which quotes from market makers are used to determine fair value. In instances where sufficient market activity may not exist or is limited, the pricing services also utilize proprietary valuation models which may consider market characteristics such as benchmark yield curves, option-adjusted spreads, credit spreads, estimated default rates, coupon rates, anticipated timing of principal repayments, underlying collateral, and other unique security features in order to estimate the relevant cash flows, which are then discounted to calculate the fair value. Securities denominated in a foreign currency are converted into their U.S. dollar equivalent at the foreign exchange rate in effect at the close of the NYSE on the date that the values of the foreign debt securities are determined. Repurchase agreements are valued at cost, which approximates market value.
Certain derivative financial instruments (derivatives) trade in the over-the-counter market. The Fund’s pricing services use various techniques including industry standard option pricing models and proprietary discounted cash flow models to determine the fair value of those instruments. The Fund’s net benefit or obligation under the derivative contract, as measured by the fair market value of the contract, is included in net assets.
The Fund has procedures to determine the fair value of securities and other financial instruments for which market prices are not readily available or which may not be reliably priced. Under these procedures, the Fund primarily employs a market-based approach which may use related or comparable assets or liabilities, recent transactions, market multiples, book values, and other relevant information for the investment to determine the fair value of the investment. The Fund may also use an income-based valuation approach in which the anticipated future cash flows of the investment are discounted to calculate fair value. Discounts may also be applied due to the nature or duration of any restrictions on the disposition of the investments. Due to the inherent uncertainty of valuations of such investments, the fair values may differ significantly from the values that would have been used had an active market existed.
FH-22
Franklin Templeton Variable Insurance Products Trust
Notes to Financial Statements (continued)
Franklin High Income Securities Fund
1. ORGANIZATION AND SIGNIFICANT ACCOUNTING POLICIES (continued)
b. Foreign Currency Translation
Portfolio securities and other assets and liabilities denominated in foreign currencies are translated into U.S. dollars based on the exchange rate of such currencies against U.S. dollars on the date of valuation. The Fund may enter into foreign currency exchange contracts to facilitate transactions denominated in a foreign currency. Purchases and sales of securities, income and expense items denominated in foreign currencies are translated into U.S. dollars at the exchange rate in effect on the transaction date. Portfolio securities and assets and liabilities denominated in foreign currencies contain risks that those currencies will decline in value relative to the U.S. dollar. Occasionally, events may impact the availability or reliability of foreign exchange rates used to convert the U.S. dollar equivalent value. If such an event occurs, the foreign exchange rate will be valued at fair value using procedures established and approved by the Trust’s Board of Trustees.
The Fund does not separately report the effect of changes in foreign exchange rates from changes in market prices on securities held. Such changes are included in net realized and unrealized gain or loss from investments on the Statement of Operations.
Realized foreign exchange gains or losses arise from sales of foreign currencies, currency gains or losses realized between the trade and settlement dates on securities transactions and the difference between the recorded amounts of dividends, interest, and foreign withholding taxes and the U.S. dollar equivalent of the amounts actually received or paid. Net unrealized foreign exchange gains and losses arise from changes in foreign exchange rates on foreign denominated assets and liabilities other than investments in securities held at the end of the reporting period.
c. Joint Repurchase Agreement
The Fund enters into a joint repurchase agreement whereby its uninvested cash balance is deposited into a joint cash account with other funds managed by the investment manager or an affiliate of the investment manager and is used to invest in one or more repurchase agreements. The value and face amount of the joint repurchase agreement are allocated to the funds based on their pro-rata interest. A repurchase agreement is accounted for as a loan by the fund to the seller, collateralized by securities which are delivered to the fund’s custodian. The market value, including accrued interest, of the initial collateralization is required to be at least 102% of the dollar amount invested by the funds, with the value of the underlying securities marked to market daily to maintain coverage of at least 100%. The joint repurchase agreement held by the Fund at year end had been entered into on December 30, 2011.
d. Derivative Financial Instruments
The Fund invested in derivatives in order to manage risk or gain exposure to various other investments or markets. Derivatives are financial contracts based on an underlying or notional amount, require no initial investment or an initial net investment that is smaller than would normally be required to have a similar response to changes in market factors, and require or permit net settlement. Derivatives contain various risks including the potential inability of the counterparty to fulfill their obligations under the terms of the contract, the potential for an illiquid secondary market, and/or the potential for market movements which expose the Fund to gains or losses in excess of the amounts shown on the Statement of Assets and Liabilities. Realized gain and loss and unrealized appreciation and depreciation on these contracts for the period are included in the Statement of Operations.
The Fund entered into forward exchange contracts primarily to manage and/or gain exposure to certain foreign currencies. A forward exchange contract is an agreement between the Fund and a counterparty to buy or sell a foreign currency for a specific exchange rate on a future date. Pursuant to the terms of the forward exchange contracts, cash or securities may be required to be deposited as collateral. Unrestricted cash may be invested according to the Fund’s investment objectives.
See Note 8 regarding other derivative information.
FH-23
Franklin Templeton Variable Insurance Products Trust
Notes to Financial Statements (continued)
Franklin High Income Securities Fund
1. ORGANIZATION AND SIGNIFICANT ACCOUNTING POLICIES (continued)
e. Senior Floating Rate Interests
The Fund invests in senior secured corporate loans that pay interest at rates which are periodically reset by reference to a base lending rate plus a spread. These base lending rates are generally the prime rate offered by a designated U.S. bank or the London InterBank Offered Rate (LIBOR). Senior secured corporate loans often require prepayment of principal from excess cash flows or at the discretion of the borrower. As a result, actual maturity may be substantially less than the stated maturity.
Senior secured corporate loans in which the Fund invests are generally readily marketable, but may be subject to some restrictions on resale.
f. Income Taxes
It is the Fund’s policy to qualify as a regulated investment company under the Internal Revenue Code. The Fund intends to distribute to shareholders substantially all of its taxable income and net realized gains to relieve it from federal income and excise taxes. As a result, no provision for U.S. federal income taxes is required.
The Fund recognizes the tax benefits of uncertain tax positions only when the position is “more likely than not” to be sustained upon examination by the tax authorities based on the technical merits of the tax position. As of December 31, 2011, and for all open tax years, the Fund has determined that no liability for unrecognized tax benefits is required in the Fund’s financial statements related to uncertain tax positions taken on a tax return (or expected to be taken on future tax returns). Open tax years are those that remain subject to examination and are based on each tax jurisdiction statute of limitation.
g. Security Transactions, Investment Income, Expenses and Distributions
Security transactions are accounted for on trade date. Realized gains and losses on security transactions are determined on a specific identification basis. Interest income and estimated expenses are accrued daily. Amortization of premium and accretion of discount on debt securities are included in interest income. Facility fees are recognized as income over the expected term of the loan. Dividend income is recorded on the ex-dividend date except that certain dividends from foreign securities are recognized as soon as the Fund is notified of the ex-dividend date. Distributions to shareholders are recorded on the ex-dividend date and are determined according to income tax regulations (tax basis). Distributable earnings determined on a tax basis may differ from earnings recorded in accordance with accounting principles generally accepted in the United States of America. These differences may be permanent or temporary. Permanent differences are reclassified among capital accounts to reflect their tax character. These reclassifications have no impact on net assets or the results of operations. Temporary differences are not reclassified, as they may reverse in subsequent periods.
Common expenses incurred by the Trust are allocated among the funds based on the ratio of net assets of each fund to the combined net assets of the Trust. Fund specific expenses are charged directly to the fund that incurred the expense.
Realized and unrealized gains and losses and net investment income, not including class specific expenses, are allocated daily to each class of shares based upon the relative proportion of net assets of each class. Differences in per share distributions, by class, are generally due to differences in class specific expenses.
h. Accounting Estimates
The preparation of financial statements in accordance with accounting principles generally accepted in the United States of America requires management to make estimates and assumptions that affect the reported amounts of assets and liabilities at the date of the financial statements and the amounts of income and expenses during the reporting period. Actual results could differ from those estimates.
FH-24
Franklin Templeton Variable Insurance Products Trust
Notes to Financial Statements (continued)
Franklin High Income Securities Fund
1. ORGANIZATION AND SIGNIFICANT ACCOUNTING POLICIES (continued)
i. Guarantees and Indemnifications
Under the Trust’s organizational documents, its officers and trustees are indemnified by the Trust against certain liabilities arising out of the performance of their duties to the Trust. Additionally, in the normal course of business, the Trust, on behalf of the Fund, enters into contracts with service providers that contain general indemnification clauses. The Trust’s maximum exposure under these arrangements is unknown as this would involve future claims that may be made against the Trust that have not yet occurred. Currently, the Trust expects the risk of loss to be remote.
2. SHARES OF BENEFICIAL INTEREST
At December 31, 2011, there were an unlimited number of shares authorized (without par value). Transactions in the Fund’s shares were as follows:
| | | | | | | | | | | | | | | | |
| | | Year Ended December 31, | |
| | | 2011 | | | 2010 | |
| | | Shares | | | Amount | | | Shares | | | Amount | |
Class 1 Shares: | | | | | | | | | | | | | | | | |
Shares sold | | | 351,292 | | | $ | 2,313,979 | | | | 472,188 | | | $ | 3,062,794 | |
Shares issued in reinvestment of distributions | | | 434,223 | | | | 2,826,791 | | | | 533,249 | | | | 3,172,829 | |
Shares redeemed | | | (1,598,692 | ) | | | (10,480,436 | ) | | | (1,559,378 | ) | | | (9,945,947 | ) |
| | | | |
Net increase (decrease) | | | (813,177 | ) | | $ | (5,339,666 | ) | | | (553,941 | ) | | $ | (3,710,324 | ) |
| | | | |
Class 2 Shares: | | | | | | | | | | | | | | | | |
Shares sold | | | 12,499,502 | | | $ | 81,812,457 | | | | 12,032,804 | | | $ | 75,255,716 | |
Shares issued in reinvestment of distributions | | | 2,674,662 | | | | 16,984,105 | | | | 2,133,845 | | | | 12,418,978 | |
Shares redeemed | | | (12,968,695 | ) | | | (82,198,194 | ) | | | (9,532,012 | ) | | | (59,306,272 | ) |
| | | | |
Net increase (decrease) | | | 2,205,469 | | | $ | 16,598,368 | | | | 4,634,637 | | | $ | 28,368,422 | |
| | | | |
Class 4 Shares: | | | | | | | | | | | | | | | | |
Shares sold | | | 337,849 | | | $ | 2,262,900 | | | | 1,337,992 | | | $ | 8,481,976 | |
Shares issued on reinvestment of distributions | | | 250,774 | | | | 1,620,002 | | | | 235,968 | | | | 1,394,573 | |
Shares redeemed | | | (344,910 | ) | | | (2,250,648 | ) | | | (55,035 | ) | | | (351,525 | ) |
| | | | |
Net increase (decrease) | | | 243,713 | | | $ | 1,632,254 | | | | 1,518,925 | | | $ | 9,525,024 | |
| | | | |
3. TRANSACTIONS WITH AFFILIATES
Franklin Resources, Inc. is the holding company for various subsidiaries that together are referred to as Franklin Templeton Investments. Certain officers and trustees of the Fund are also officers and/or directors of the following subsidiaries:
| | |
| Subsidiary | | Affiliation |
Franklin Advisers, Inc. (Advisers) | | Investment manager |
Franklin Templeton Services, LLC (FT Services) | | Administrative manager |
Franklin Templeton Distributors, Inc. (Distributors) | | Principal underwriter |
Franklin Templeton Investor Services, LLC (Investor Services) | | Transfer agent |
FH-25
Franklin Templeton Variable Insurance Products Trust
Notes to Financial Statements (continued)
Franklin High Income Securities Fund
3. TRANSACTIONS WITH AFFILIATES (continued)
a. Management Fees
The Fund pays an investment management fee to Advisers based on the average daily net assets of the Fund as follows:
| | |
| Annualized Fee Rate | | Net Assets |
| 0.625% | | Up to and including $100 million |
| 0.500% | | Over $100 million, up to and including $250 million |
| 0.450% | | Over $250 million, up to and including $7.5 billion |
| 0.440% | | Over $7.5 billion, up to and including $10 billion |
| 0.430% | | Over $10 billion, up to and including $12.5 billion |
| 0.420% | | Over $12.5 billion, up to and including $15 billion |
| 0.400% | | In excess of $15 billion |
b. Administrative Fees
Under an agreement with Advisers, FT Services provides administrative services to the Fund. The fee is paid by Advisers based on average daily net assets, and is not an additional expense of the Fund.
c. Distribution Fees
The Fund’s Board of Trustees has adopted distribution plans for Class 2 and Class 4 shares pursuant to Rule 12b-1 under the 1940 Act. Under the Fund’s compensation distribution plans, the Fund pays Distributors for costs incurred in connection with the servicing, sale and distribution of the Fund’s shares up to 0.35% per year of its average daily net assets of each class. The Board of Trustees has agreed to limit the current rate to 0.25% per year for Class 2.
d. Transfer Agent Fees
Investor Services, under terms of an agreement, performs shareholder servicing for the Fund and is not paid by the Fund for the services.
4. EXPENSE OFFSET ARRANGEMENT
The Fund has entered into an arrangement with its custodian whereby credits realized as a result of uninvested cash balances are used to reduce a portion of the Fund’s custodian expenses. During the year ended December 31, 2011, there were no credits earned.
5. INCOME TAXES
For tax purposes, capital losses may be carried over to offset future capital gains, if any. Under the Regulated Investment Company Modernization Act of 2010, capital losses incurred by the Fund in taxable years beginning after December 22, 2010 are not subject to expiration and such losses retain their character as either short-term or long-term, rather than being considered short-term as under previous law. Post-enactment capital losses must be fully utilized prior to utilizing any losses incurred in pre-enactment tax years.
FH-26
Franklin Templeton Variable Insurance Products Trust
Notes to Financial Statements (continued)
Franklin High Income Securities Fund
5. INCOME TAXES (continued)
At December 31, 2011, capital loss carryforwards were as follows:
| | | | |
Capital loss carryforwards expiring in: | | | | |
2012 | | $ | 9,009,590 | |
2013 | | $ | 6,321,190 | |
2014 | | $ | 40,420 | |
2015 | | $ | 4,493,289 | |
2016 | | $ | 8,150,741 | |
2017 | | $ | 10,621,353 | |
| | | | |
| | $ | 38,636,583 | |
| | | | |
During the year ended December 31, 2011, the Fund utilized $7,004,581 of capital loss carryforwards.
On December 31, 2011, the Fund had expired pre-enactment capital loss carryforwards of $17,707,335, which were reclassified to paid-in capital.
The tax character of distributions paid during the years ended December 31, 2011 and 2010, was as follows:
| | | | | | | | |
| | | 2011 | | | 2010 | |
Distributions paid from ordinary income | | $ | 21,430,898 | | | $ | 16,986,380 | |
At December 31, 2011, the cost of investments, net unrealized appreciation (depreciation), and undistributed ordinary income for income tax purposes were as follows:
| | | | |
Cost of investments | | $ | 318,024,335 | |
| | | | |
| |
Unrealized appreciation | | $ | 9,233,778 | |
Unrealized depreciation | | $ | (16,763,978 | ) |
| | | | |
Net unrealized appreciation (depreciation) | | $ | (7,530,200 | ) |
| | | | |
Distributable earnings – undistributed ordinary income | | $ | 23,525,282 | |
| | | | |
Differences between income and/or capital gains as determined on a book basis and a tax basis are primarily due to differing treatments of foreign currency transactions, defaulted securities, payments-in-kind, bond discounts and premiums, and wash sales.
6. INVESTMENT TRANSACTIONS
Purchases and sales of investments (excluding short term securities) for the year ended December 31, 2011, aggregated $160,372,973 and $143,212,881, respectively.
7. CREDIT RISK AND DEFAULTED SECURITIES
At December 31, 2011, the Fund had 95.48% of its portfolio invested in high yield securities, senior secured floating rate notes, or other securities rated below investment grade. These securities may be more sensitive to economic conditions causing greater price volatility and are potentially subject to a greater risk of loss due to default than higher rated securities.
The Fund held defaulted securities and/or other securities for which the income has been deemed uncollectible. At December 31, 2011, the aggregate value of these securities was $4,097,566, representing 1.29% of the Fund’s net assets. The Fund discontinues accruing income on securities for which income has been deemed uncollectible and provides an estimate for losses on interest receivable. The securities have been identified on the accompanying Statement of Investments.
FH-27
Franklin Templeton Variable Insurance Products Trust
Notes to Financial Statements (continued)
Franklin High Income Securities Fund
8. OTHER DERIVATIVE INFORMATION
At December 31, 2011, the Fund has invested in derivative contracts which are reflected on the Statement of Assets and Liabilities as follows:
| | | | | | | | | | | | |
| | | Asset Derivatives | | | Liability Derivatives | |
Derivative Contracts Not Accounted
for as Hedging Instruments | | Statement of Assets and
Liabilities Location | | Fair
Value
Amount | | | Statement of Assets and
Liabilities Location | | Fair
Value
Amount | |
Foreign exchange contracts | | Unrealized appreciation on forward exchange contracts | | $ | 4,852 | | | Unrealized depreciation on forward exchange contracts | | $ | — | |
For the period ended December 31, 2011, the effect of derivative contracts on the Fund’s Statement of Operations was as follows:
| | | | | | | | | | |
Derivative Contracts Not Accounted
for as Hedging Instruments | | Statement of Operations Locations | | Realized Gain
(Loss) for the
Year | | | Change in
Unrealized
Appreciation
(Depreciation)
for the
Year | |
Foreign exchange contracts | | Net realized gain (loss) from foreign currency transactions / Net change in unrealized appreciation (depreciation) on translation of other assets and liabilities denominated in foreign currencies | | $ | 8,667 | | | $ | 5,776 | |
For the year ended December 31, 2011, the average month end market value of derivatives represented 0.01% of average month end net assets. The average month end number of open derivative contracts for the year was two.
See Note 1(d) regarding derivative financial instruments.
9. CREDIT FACILITY
The Fund, together with other U.S. registered and foreign investment funds (collectively, Borrowers), managed by Franklin Templeton Investments, are borrowers in a joint syndicated senior unsecured credit facility totaling $750 million (Global Credit Facility) which matured on January 20, 2012. This Global Credit Facility provides a source of funds to the Borrowers for temporary and emergency purposes, including the ability to meet future unanticipated or unusually large redemption requests. Effective January 20, 2012, the Borrowers renewed the Global Credit Facility for a total of $1.5 billion, maturing January 18, 2013.
Under the terms of the Global Credit Facility, the Fund shall, in addition to interest charged on any borrowings made by the Fund and other costs incurred by the Fund, pay its share of fees and expenses incurred in connection with the implementation and maintenance of the Global Credit Facility, based upon its relative share of the aggregate net assets of all of the Borrowers, including an annual commitment fee of 0.08% based upon the unused portion of the Global Credit Facility, which is reflected in other expenses on the Statement of Operations. During the year ended December 31, 2011, the Fund did not use the Global Credit Facility.
FH-28
Franklin Templeton Variable Insurance Products Trust
Notes to Financial Statements (continued)
Franklin High Income Securities Fund
10. FAIR VALUE MEASUREMENTS
The Fund follows a fair value hierarchy that distinguishes between market data obtained from independent sources (observable inputs) and the Fund’s own market assumptions (unobservable inputs). These inputs are used in determining the value of the Fund’s investments and are summarized in the following fair value hierarchy:
| | • | | Level 1 – quoted prices in active markets for identical securities |
| | • | | Level 2 – other significant observable inputs (including quoted prices for similar securities, interest rates, prepayment speed, credit risk, etc.) |
| | • | | Level 3 – significant unobservable inputs (including the Fund’s own assumptions in determining the fair value of investments) |
The inputs or methodology used for valuing securities are not an indication of the risk associated with investing in those securities.
For movements between the levels within the fair value hierarchy, the Fund has adopted a policy of recognizing the transfers as of the date of the underlying event which caused the movement.
The following is a summary of the inputs used as of December 31, 2011, in valuing the Fund’s assets and liabilities carried at fair value:
| | | | | | | | | | | | | | | | |
| | | Level 1 | | | Level 2 | | | Level 3 | | | Total | |
| | | | |
Assets: | | | | | | | | | | | | | | | | |
Investments in Securities: | | | | | | | | | | | | | | | | |
Equity Investmentsa,b | | $ | 642,001 | | | $ | — | | | $ | — | | | $ | 642,001 | |
Corporate Bonds | | | — | | | | 292,598,751 | | | | 191 | | | | 292,598,942 | |
Senior Floating Rate Interests | | | — | | | | 3,205,629 | | | | — | | | | 3,205,629 | |
Short Term Investments | | | — | | | | 14,047,563 | | | | — | | | | 14,047,563 | |
| | | | |
Total Investments in Securities | | $ | 642,001 | | | $ | 309,851,943 | | | $ | 191 | | | $ | 310,494,135 | |
| | | | |
Forward Exchange Contracts | | | — | | | | 4,852 | | | | — | | | | 4,852 | |
aFor detailed categories, see the accompanying Statement of Investments.
bIncludes common and preferred stocks.
11. NEW ACCOUNTING PRONOUNCEMENTS
In May 2011, the Financial Accounting Standards Board (FASB) issued Accounting Standards Update (ASU) No. 2011-04, Fair Value Measurement (Topic 820): Amendments to Achieve Common Fair Value Measurement and Disclosure Requirements in U.S. GAAP and IFRSs. The amendments in the ASU will improve the comparability of fair value measurements presented and disclosed in financial statements prepared in accordance with U.S. GAAP (Generally Accepted Accounting Principles) and IFRS (International Financial Reporting Standards) and include new guidance for certain fair value measurement principles and disclosure requirements. The ASU is effective for interim and annual periods beginning after December 15, 2011. The Fund believes the adoption of this ASU will not have a material impact on its financial statements.
12. SUBSEQUENT EVENTS
The Fund has evaluated subsequent events through the issuance of the financial statements and determined that no events have occurred that require disclosure other than those already disclosed in the financial statements.
FH-29
Franklin Templeton Variable Insurance Products Trust
Notes to Financial Statements (continued)
Franklin High Income Securities Fund
| | | | |
ABBREVIATIONS | | | | |
| Counterparty | | Currency | | Selected Portfolio |
| | | | |
| DBAB - Deutsche Bank AG | | EUR - Euro | | FRN - Floating Rate Note |
| | | | PIK - Payment-In-Kind |
FH-30
Franklin Templeton Variable Insurance Products Trust
Franklin High Income Securities Fund
Report of Independent Registered Public Accounting Firm
To the Board of Trustees and Shareholders of Franklin Templeton Variable Insurance Products Trust
In our opinion, the accompanying statement of assets and liabilities, including the statement of investments, and the related statements of operations and of changes in net assets and the financial highlights present fairly, in all material respects, the financial position of Franklin High Income Securities Fund (the “Fund”) at December 31, 2011, the results of its operations for the year then ended, the changes in its net assets for each of the two years in the period then ended and the financial highlights for each of the periods presented, in conformity with accounting principles generally accepted in the United States of America. These financial statements and financial highlights (hereafter referred to as “financial statements”) are the responsibility of the Fund’s management. Our responsibility is to express an opinion on these financial statements based on our audits. We conducted our audits of these financial statements in accordance with the standards of the Public Company Accounting Oversight Board (United States). Those standards require that we plan and perform the audit to obtain reasonable assurance about whether the financial statements are free of material misstatement. An audit includes examining, on a test basis, evidence supporting the amounts and disclosures in the financial statements, assessing the accounting principles used and significant estimates made by management, and evaluating the overall financial statement presentation. We believe that our audits, which included confirmation of securities at December 31, 2011 by correspondence with the custodian and brokers, provide a reasonable basis for our opinion.
PricewaterhouseCoopers LLP
San Francisco, California
February 13, 2012
FH-31
FRANKLIN INCOME SECURITIES FUND
This annual report for Franklin Income Securities Fund covers the fiscal year ended December 31, 2011.
Performance Summary as of 12/31/11
Average annual total return of Class 1 shares represents the average annual change in value, assuming reinvestment of dividends and capital gains. Average returns smooth out variations in returns, which can be significant; they are not the same as year-by-year results.
Periods ended 12/31/11
| | | | | | | | | | | | |
| | | 1-Year | | | 5-Year | | | 10-Year | |
Average Annual Total Return | | | +2.71% | | | | +2.95% | | | | +7.68% | |
Total Return Index Comparison for a Hypothetical $10,000 Investment (1/1/02–12/31/11)
The graph below shows the change in value of a hypothetical $10,000 investment in the Fund over the indicated period and includes reinvestment of any income or distributions. The Fund’s performance is compared to the performance of the Standard & Poor’s® 500 Index (S&P 500®) and the Barclays Capital (BC) U.S. Aggregate Index. One cannot invest directly in an index, and an index is not representative of the Fund’s portfolio. Please see Important Notes to Performance Information preceding the Fund Summaries.
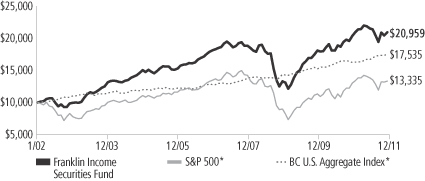
*Source: © 2012 Morningstar. Please see Index Descriptions following the Fund Summaries.
Franklin Income Securities Fund – Class 1
Performance reflects the Fund’s Class 1 operating expenses, but does not include any contract fees, expenses or sales charges. If they had been included, performance would be lower. These charges and deductions, particularly for variable life policies, can have a significant effect on contract values and insurance benefits. See the contract prospectus for a complete description of these expenses, including sales charges.
Performance data represent past performance, which does not guarantee future results. Investment return and principal value will fluctuate, and you may have a gain or loss when you sell your shares.
Current performance may differ from figures shown.
FI-1
Fund Goal and Main Investments: Franklin Income Securities Fund seeks to maximize income while maintaining prospects for capital appreciation. The Fund normally invests in equity and debt securities.
Performance Overview
You can find the Fund’s one-year total return in the Performance Summary. The Fund outperformed its equity benchmark, the S&P 500, which posted a +2.11% total return, but underperformed its fixed income benchmark, the BC U.S. Aggregate Index, which produced a +7.84% total return for the same period.1
Economic and Market Overview
The U.S. economy improved steadily but modestly in 2011 despite geopolitical, employment and housing pressures. The U.S. manufacturing sector helped power the domestic economy and led global manufacturing output heading into 2012. Although manufacturing growth slowed in the second half of the year as high commodity prices reduced purchasing power and demand ebbed, the trend began to reverse near year-end. U.S. gross domestic product (GDP) growth advanced each quarter, and the nation’s unemployment rate fell from 9.4% to 8.5%.2
The U.S. financial system and household balance sheets continued to improve, but the country still faced persistently high unemployment, a prolonged housing market slump and massive national debt. The U.S. Federal Reserve Board (Fed) cut the country’s growth forecast partly due to the heightened potential for recession in Europe and cooling GDP trends across much of Asia. Inflation rose for much of the world but stayed relatively contained in the U.S., even slowing toward year-end amid declining energy and food prices. The Fed sought to boost economic growth by maintaining its accommodative monetary policy and undertook a second round of quantitative easing that ended on June 30. Subsequently, the Fed continued to purchase Treasuries with proceeds from maturing debt in an effort to support economic growth.
Although U.S. stock markets rallied in the spring, worrisome global events and slowing global growth dampened investor sentiment and market volatility surged. Risk-averse investors sought perceived safe havens and seemed to ignore that many U.S. companies generated
1. Source: © 2012 Morningstar. One cannot invest directly in an index, and an index is not representative of the Fund’s portfolio. Please see Index Descriptions following the Fund Summaries.
2. Source: Bureau of Labor Statistics.
Fund Risks: All investments involve risks. Stock prices fluctuate, sometimes rapidly and dramatically, due to factors affecting individual companies, particular industries or sectors, or general market conditions. Changes in the financial strength of a debt issuer or in the rating of its securities may affect the securities’ value and, as a result, impact Fund performance. Because the Fund invests in bonds and other debt obligations, its share price and yield will be affected by interest rate movements. Bond prices generally move in the opposite direction of interest rates. Thus, as prices of bonds in the Fund adjust to a rise in interest rates, the Fund’s share price may decline. The Fund may invest all of its assets in high yield, lower rated (junk) bonds, which generally have greater price swings and higher risk of default and loss of principal than investment-grade bonds. The Fund may from time to time have significant investments in particular sectors, which can be highly volatile. Foreign investing involves additional risks, including currency fluctuations, economic instability, market volatility, and political and social instability. Derivative instruments may be volatile and illiquid, may give rise to leverage and may involve a small investment relative to the risk assumed. The Fund is actively managed but there is no guarantee that the manager’s investment decisions will produce the desired results. The Fund’s prospectus also includes a description of the main investment risks.
FI-2
record profits. During the 12 months under review, fixed income markets, as measured by the BC U.S. Aggregate Index, and U.S. stocks, as measured by the S&P 500, posted gains.1 Heightened volatility, however, roiled global financial markets amid U.S. lawmakers’ protracted debate and eventual compromise on the debt limit, independent credit rating agency Standard & Poor’s downgrade of the long-term U.S. credit rating to AA+ from AAA, and fears of sovereign debt crisis contagion in Europe. In November, the unemployment rate fell to its lowest level in more than two years, which helped consumer confidence climb to its highest level in more than eight years. Overall for the period, however, investors sought the perceived safety of U.S. Treasuries, which drove their prices higher and yields lower.
Investment Strategy
We search for undervalued or out-of-favor securities we believe offer opportunities for income today and growth tomorrow. We generally perform independent analysis of the debt securities being considered for the Fund’s portfolio, rather than relying principally on ratings assigned by rating agencies. In analyzing debt and equity securities, we consider a variety of factors, including: a security’s relative value based on such factors as anticipated cash flow, interest or dividend coverage, asset coverage, and earnings prospects; the experience and strength of a company’s management; a company’s sensitivity to changes in interest rates and business conditions; a company’s debt maturity schedules and borrowing requirements; and a company’s changing financial condition and market recognition of the change.
Manager’s Discussion
Continued investor uncertainty regarding regulatory reform, increased regulation and mortgage market weakness impacted Fund performance during the 12 months under review. The Fund outperformed its equity benchmark, but lagged its fixed income benchmark.
The Fund’s allocations to equity and fixed income did not change significantly for the year. However, within fixed income, our communications and capital goods allocations rose while transportation and banking declined.3 Among stock allocations, health care increased while utilities and energy decreased.
3. Communications fixed income holdings are part of telecommunication services in the SOI. Capital goods fixed income holdings are part of industrials and materials in the SOI. Transportation fixed income holdings are part of industrials in the SOI. Banking fixed income holdings are part of financials in the SOI.
Portfolio Breakdown
Franklin Income Securities Fund
12/31/11
| | | | |
| | | % of Total
Net Assets | |
Equity | | | 40.7% | |
| Utilities | | | 10.1% | |
| Financials | | | 8.3% | |
| Health Care | | | 6.6% | |
| Energy | | | 5.9% | |
| Telecommunication Services | | | 2.8% | |
| Other | | | 7.0% | |
Fixed Income* | | | 56.0% | |
| Financials | | | 9.5% | |
| Consumer Discretionary | | | 9.1% | |
| Information Technology | | | 8.7% | |
| Energy | | | 7.5% | |
| Utilities | | | 7.5% | |
| Health Care | | | 4.6% | |
| Industrials | | | 3.2% | |
| Materials | | | 2.9% | |
| Other | | | 3.0% | |
| Short-Term Investments & Other Net Assets | | | 3.3% | |
*Does not include convertible bonds.
FI-3
We largely focused on corporate bonds within fixed income during the period, given the potential for higher yields and long-term total return relative to other fixed income securities. We maintained significant diversification with holdings across a range of sectors including financials, consumer non-cyclicals and technology.4 While sector diversification remains important, we emphasize bottom-up fundamental research to identify what we believe are the most attractive investment opportunities to help us meet the Fund’s objective.
Within fixed income, key individual contributors included financing solutions specialist CIT Group; oil and natural gas producer Chesapeake Energy; and payment processing company First Data. Major fixed income detractors included electricity provider Texas Competitive Electric Holdings, petroleum refiner Petroplus Finance and marketing solutions provider Dex One.
Within equity, the utilities, health care and energy sectors contributed to performance, and select holdings in financials and materials detracted from results. Utility holdings including The Southern Co., Progress Energy and Dominion Resources generated strong gains during the period. Many utilities benefited from stable and regulated operations, limited exposure to foreign economies and high dividend yields. Although our utilities exposure declined modestly following some profit-taking, the sector remained the Fund’s largest sector weighting with PG&E among the largest holdings. Top health care contributors included major pharmaceutical companies Roche Holding, Pfizer and Merck & Co., which benefited from stable operations, continued strong free cash flow generation and high dividend yields. Oil and gas producer Exxon Mobil in the energy sector was another notable equity contributor. Within equity convertible securities, we maintained positions in select financials including Wells Fargo & Co., Bank of America and iStar Financial.
Financial stocks generally were hurt by concerns about the European sovereign debt crisis. Notable equity detractors among financials included Bank of America, CitiGroup and JPMorgan Chase. Barrick Gold in the materials sector lost value due to investor concerns related to signs of rising mining costs and labor unrest.
4. Consumer non-cyclical fixed income holdings are part of consumer discretionary, consumer staples, financials and health care in the SOI. Technology holdings are in information technology in the SOI.
Top Five Equity Holdings
Franklin Income Securities Fund
12/31/11
| | | | |
Company
Sector/Industry | | % of Total
Net Assets | |
| Roche Holding AG (Switzerland) | | | 2.1% | |
| Health Care | | | | |
| Merck & Co. Inc. | | | 2.0% | |
| Health Care | | | | |
| Johnson & Johnson | | | 1.3% | |
| Health Care | | | | |
| Canadian Oil Sands Ltd. (Canada) | | | 1.1% | |
| Energy | | | | |
| Vodafone Group PLC (U.K.) | | | 1.0% | |
| Telecommunication Services | | | | |
Top Five Fixed Income and Senior Floating Rate Interests Holdings*
Franklin Income Securities Fund
12/31/11
| | | | |
Issuer
Sector/Industry | | % of Total
Net Assets | |
| CIT Group Inc. | | | 4.6% | |
| Financials | | | | |
| First Data Corp. | | | 4.0% | |
| Information Technology | | | | |
| Texas Competitive Electric Holdings Co. LLC | | | 3.9% | |
| Utilities | | | | |
| Freescale Semiconductor Inc. | | | 2.4% | |
| Information Technology | | | | |
| HCA Inc. | | | 1.9% | |
| Health Care | | | | |
*Does not include convertible bonds.
The dollar value, number of shares or principal amount, and names of all portfolio holdings are listed in the Fund’s Statement of Investments (SOI).
FI-4
The Fund’s equity exposure continued to focus on dividend paying common stocks and convertible securities. We continued to seek what we considered attractive current yield as well as those companies with potential favorable outlooks for dividend growth. Convertible securities remained attractive to us given the possible opportunity for both high current income and the potential to participate in the appreciation of the underlying common stock. At period-end, we had limited holdings in other equity securities including preferred stocks and warrants. We remain largely focused on U.S. securities.
Thank you for your participation in Franklin Income Securities Fund. We look forward to serving your future investment needs.
The foregoing information reflects our analysis, opinions and portfolio holdings as of December 31, 2011, the end of the reporting period. The way we implement our main investment strategies and the resulting portfolio holdings may change depending on factors such as market and economic conditions. These opinions may not be relied upon as investment advice or an offer for a particular security. The information is not a complete analysis of every aspect of any market, country, industry, security or the Fund. Statements of fact are from sources considered reliable, but the investment manager makes no representation or warranty as to their completeness or accuracy. Although historical performance is no guarantee of future results, these insights may help you understand our investment management philosophy.
FI-5
Fund Expenses
As an investor in a variable insurance contract (Contract) that indirectly provides for investment in an underlying mutual fund, you can incur transaction and/or ongoing expenses at both the Fund level and the Contract level.
| • | | Transaction expenses can include sales charges (loads) on purchases, redemption fees, surrender fees, transfer fees and premium taxes. |
| • | | Ongoing expenses can include management fees, distribution and service (12b-1) fees, contract fees, annual maintenance fees, mortality and expense risk fees and other fees and expenses. All mutual funds and Contracts have some types of ongoing expenses. |
The expenses shown in the table are meant to highlight ongoing expenses at the Fund level only and do not include ongoing expenses at the Contract level, or transaction expenses at either the Fund or Contract level. While the Fund does not have transaction expenses, if the transaction and ongoing expenses at the Contract level were included, the expenses shown would be higher. You should consult your Contract prospectus or disclosure document for more information.
The table shows Fund-level ongoing expenses and can help you understand these expenses and compare them with those of other mutual funds offered through the Contract. The table assumes a $1,000 investment held for the six months indicated. Please refer to the Fund prospectus for additional information on operating expenses.
Actual Fund Expenses
The first line (Actual) of the table provides actual account values and expenses. The “Ending Account Value” is derived from the Fund’s actual return, which includes the effect of ongoing Fund expenses, but does not include the effect of ongoing Contract expenses.
You can estimate the Fund-level expenses you incurred during the period by following these steps. Of course, your account value and expenses will differ from those in this illustration:
| 1. | Divide your account value by $1,000. |
If an account had an $8,600 value, then $8,600 ÷ $1,000 = 8.6.
| 2. | Multiply the result by the number under the heading “Fund-Level Expenses Incurred During Period.” |
If Fund-Level Expenses Incurred During Period were $7.50, then 8.6 x $7.50 = $64.50.
In this illustration, the estimated expenses incurred this period at the Fund level are $64.50.
Franklin Income Securities Fund – Class 1
FI-6
Hypothetical Example for Comparison with Other Mutual Funds
Information in the second line (Hypothetical) of the table can help you compare ongoing expenses of the Fund with those of other mutual funds offered through the Contract. This information may not be used to estimate the actual ending account balance or expenses you incurred during the period. The hypothetical “Ending Account Value” is based on the Fund’s actual expense ratio and an assumed 5% annual rate of return before expenses, which does not represent the Fund’s actual return. The figure under the heading “Fund-Level Expenses Incurred During Period” shows the hypothetical expenses your account would have incurred under this scenario. You can compare this figure with the 5% hypothetical examples that appear in shareholder reports of other funds offered through a Contract.
| | | | | | | | | | | | |
| Class 1 | | Beginning
Account Value 7/1/11 | | | Ending
Account
Value 12/31/11 | | | Fund-Level
Expenses Incurred
During Period*
7/1/11–12/31/11 | |
Actual | | $ | 1,000 | | | $ | 972.80 | | | $ | 2.39 | |
Hypothetical (5% return before expenses) | | $ | 1,000 | | | $ | 1,022.79 | | | $ | 2.45 | |
*Expenses are calculated using the most recent six-month annualized expense ratio for the Fund’s Class 1 shares (0.48%), which does not include any ongoing expenses of the Contract for which the Fund is an investment option, multiplied by the average account value over the period, multiplied by 184/365 to reflect the one-half year period.
FI-7
Franklin Templeton Variable Insurance Products Trust
Financial Highlights
Franklin Income Securities Fund
| | | | | | | | | | | | | | | | | | | | |
| | | Year Ended December 31, | |
| Class 1 | | 2011 | | | 2010 | | | 2009 | | | 2008 | | | 2007 | |
| | | | |
Per share operating performance | | | | | | | | | | | | | | | | | | | | |
(for a share outstanding throughout the year) | | | | | | | | | | | | | | | | | | | | |
Net asset value, beginning of year | | $ | 15.16 | | | $ | 14.43 | | | $ | 11.53 | | | $ | 17.63 | | | $ | 17.65 | |
| | | | |
Income from investment operationsa: | | | | | | | | | | | | | | | | | | | | |
Net investment incomeb | | | 0.96 | | | | 0.89 | | | | 0.91 | | | | 1.10 | | | | 1.03 | |
Net realized and unrealized gains (losses) | | | (0.54 | ) | | | 0.85 | | | | 3.08 | | | | (5.99 | ) | | | (0.31 | ) |
| | | | |
Total from investment operations | | | 0.42 | | | | 1.74 | | | | 3.99 | | | | (4.89 | ) | | | 0.72 | |
| | | | |
Less distributions from: | | | | | | | | | | | | | | | | | | | | |
Net investment income | | | (0.90 | ) | | | (1.01 | ) | | | (1.09 | ) | | | (0.86 | ) | | | (0.63 | ) |
Net realized gains | | | — | | | | — | | | | — | | | | (0.35 | ) | | | (0.11 | ) |
| | | | |
Total distributions | | | (0.90 | ) | | | (1.01 | ) | | | (1.09 | ) | | | (1.21 | ) | | | (0.74 | ) |
| | | | |
Net asset value, end of year | | $ | 14.68 | | | $ | 15.16 | | | $ | 14.43 | | | $ | 11.53 | | | $ | 17.63 | |
| | | | |
| | | | | |
Total returnc | | | 2.71% | | | | 12.87% | | | | 35.88% | | | | (29.41)% | | | | 4.01% | |
Ratios to average net assets | | | | | | | | | | | | | | | | | | | | |
Expensesd | | | 0.47% | | | | 0.47% | | | | 0.47% | | | | 0.47% | | | | 0.47% | |
Net investment income | | | 6.35% | | | | 6.28% | | | | 7.23% | | | | 7.28% | | | | 5.77% | |
| | | | | |
Supplemental data | | | | | | | | | | | | | | | | | | | | |
Net assets, end of year (000’s) | | $ | 1,300,935 | | | $ | 1,449,028 | | | $ | 910,504 | | | $ | 433,370 | | | $ | 455,932 | |
Portfolio turnover rate | | | 28.65% | | | | 41.65% | | | | 42.30% | | | | 43.89% | | | | 32.11% | |
aThe amount shown for a share outstanding throughout the period may not correlate with the Statement of Operations for the period due to the timing of sales and repurchases of the Fund shares in relation to income earned and/or fluctuating market value of the investments of the Fund.
bBased on average daily shares outstanding.
cTotal return does not include fees, charges or expenses imposed by the variable annuity and life insurance contracts for which the Franklin Templeton Variable Insurance Products Trust serves as an underlying investment vehicle.
dBenefit of expense reduction rounds to less than 0.01%.
The accompanying notes are an integral part of these financial statements.
FI-8
Franklin Templeton Variable Insurance Products Trust
Financial Highlights (continued)
Franklin Income Securities Fund
| | | | | | | | | | | | | | | | | | | | |
| | | Year Ended December 31, | |
| Class 2 | | 2011 | | | 2010 | | | 2009 | | | 2008 | | | 2007 | |
| | | | |
Per share operating performance | | | | | | | | | | | | | | | | | | | | |
(for a share outstanding throughout the year) | | | | | | | | | | | | | | | | | | | | |
Net asset value, beginning of year | | $ | 14.82 | | | $ | 14.12 | | | $ | 11.30 | | | $ | 17.31 | | | $ | 17.36 | |
| | | | |
Income from investment operationsa: | | | | | | | | | | | | | | | | | | | | |
Net investment incomeb | | | 0.90 | | | | 0.86 | | | | 0.86 | | | | 1.04 | | | | 0.97 | |
Net realized and unrealized gains (losses) | | | (0.53 | ) | | | 0.82 | | | | 3.01 | | | | (5.87 | ) | | | (0.30 | ) |
| | | | |
Total from investment operations | | | 0.37 | | | | 1.68 | | | | 3.87 | | | | (4.83 | ) | | | 0.67 | |
| | | | |
Less distributions from: | | | | | | | | | | | | | | | | | | | | |
Net investment income | | | (0.87 | ) | | | (0.98 | ) | | | (1.05 | ) | | | (0.83 | ) | | | (0.61 | ) |
Net realized gains | | | — | | | | — | | | | — | | | | (0.35 | ) | | | (0.11 | ) |
| | | | |
Total distributions | | | (0.87 | ) | | | (0.98 | ) | | | (1.05 | ) | | | (1.18 | ) | | | (0.72 | ) |
| | | | |
Net asset value, end of year | | $ | 14.32 | | | $ | 14.82 | | | $ | 14.12 | | | $ | 11.30 | | | $ | 17.31 | |
| | | | |
| | | | | |
Total returnc | | | 2.38% | | | | 12.67% | | | | 35.59% | | | | (29.66)% | | | | 3.76% | |
Ratios to average net assets | | | | | | | | | | | | | | | | | | | | |
Expensesd | | | 0.72% | | | | 0.72% | | | | 0.72% | | | | 0.72% | | | | 0.72% | |
Net investment income | | | 6.10% | | | | 6.03% | | | | 6.98% | | | | 7.03% | | | | 5.52% | |
| | | | | |
Supplemental data | | | | | | | | | | | | | | | | | | | | |
Net assets, end of year (000’s) | | $ | 5,915,637 | | | $ | 6,309,207 | | | $ | 6,114,898 | | | $ | 4,944,457 | | | $ | 7,429,064 | |
Portfolio turnover rate | | | 28.65% | | | | 41.65% | | | | 42.30% | | | | 43.89% | | | | 32.11% | |
aThe amount shown for a share outstanding throughout the period may not correlate with the Statement of Operations for the period due to the timing of sales and repurchases of the Fund shares in relation to income earned and/or fluctuating market value of the investments of the Fund.
bBased on average daily shares outstanding.
cTotal return does not include fees, charges or expenses imposed by the variable annuity and life insurance contracts for which the Franklin Templeton Variable Insurance Products Trust serves as an underlying investment vehicle.
dBenefit of expense reduction rounds to less than 0.01%.
The accompanying notes are an integral part of these financial statements.
FI-9
Franklin Templeton Variable Insurance Products Trust
Financial Highlights (continued)
Franklin Income Securities Fund
| | | | | | | | | | | | | | | | |
| | | Year Ended December 31, | |
| Class 4 | | 2011 | | | 2010 | | | 2009 | | | 2008a | |
| | | | |
Per share operating performance | | | | | | | | | | | | | | | | |
(for a share outstanding throughout the year) | | | | | | | | | | | | | | | | |
Net asset value, beginning of year | | $ | 15.04 | | | $ | 14.33 | | | $ | 11.49 | | | $ | 16.90 | |
| | | | |
Income from investment operationsb: | | | | | | | | | | | | | | | | |
Net investment incomec | | | 0.90 | | | | 0.85 | | | | 0.86 | | | | 0.87 | |
Net realized and unrealized gains (losses) | | | (0.54 | ) | | | 0.84 | | | | 3.06 | | | | (5.07 | ) |
| | | | |
Total from investment operations | | | 0.36 | | | | 1.69 | | | | 3.92 | | | | (4.20 | ) |
| | | | |
Less distributions from: | | | | | | | | | | | | | | | | |
Net investment income | | | (0.86 | ) | | | (0.98 | ) | | | (1.08 | ) | | | (0.86 | ) |
Net realized gains | | | — | | | | — | | | | — | | | | (0.35 | ) |
| | | | |
Total distributions | | | (0.86 | ) | | | (0.98 | ) | | | (1.08 | ) | | | (1.21 | ) |
| | | | |
Net asset value, end of year | | $ | 14.54 | | | $ | 15.04 | | | $ | 14.33 | | | $ | 11.49 | |
| | | | |
| | | | |
Total returnd | | | 2.29% | | | | 12.54% | | | | 35.37% | | | | (26.61)% | |
Ratios to average net assetse | | | | | | | | | | | | | | | | |
Expensesf | | | 0.82% | | | | 0.82% | | | | 0.82% | | | | 0.82% | |
Net investment income | | | 6.00% | | | | 5.93% | | | | 6.88% | | | | 6.93% | |
| | | | |
Supplemental data | | | | | | | | | | | | | | | | |
Net assets, end of year (000’s) | | $ | 431,435 | | | $ | 415,541 | | | $ | 347,733 | | | $ | 135,360 | |
Portfolio turnover rate | | | 28.65% | | | | 41.65% | | | | 42.30% | | | | 43.89% | |
aFor the period February 29, 2008 (effective date) to December 31, 2008.
bThe amount shown for a share outstanding throughout the period may not correlate with the Statement of Operations for the period due to the timing of sales and repurchases of the Fund shares in relation to income earned and/or fluctuating market value of the investments of the Fund.
cBased on average daily shares outstanding.
dTotal return does not include fees, charges or expenses imposed by the variable annuity and life insurance contracts for which the Franklin Templeton Variable Insurance Products Trust serves as an underlying investment vehicle. Total return is not annualized for periods less than one year.
eRatios are annualized for periods less than one year.
fBenefit of expense reduction rounds to less than 0.01%.
The accompanying notes are an integral part of these financial statements.
FI-10
Franklin Templeton Variable Insurance Products Trust
Statement of Investments, December 31, 2011
| | | | | | | | | | |
| Franklin Income Securities Fund | | Country | | Shares/ Warrants | | | Value | |
Common Stocks and Other Equity Interests 34.6% | | | | | | | | | | |
Consumer Discretionary 1.2% | | | | | | | | | | |
aCharter Communications Inc., A | | United States | | | 500,000 | | | $ | 28,470,000 | |
aCharter Communications Inc., wts., 11/30/14 | | United States | | | 311,018 | | | | 5,411,713 | |
Comcast Corp., A | | United States | | | 900,000 | | | | 21,339,000 | |
a,b,cDex One Corp. | | United States | | | 2,642,381 | | | | 4,386,353 | |
aGeneral Motors Co. | | United States | | | 6,485 | | | | 131,451 | |
aGeneral Motors Co., wts., 7/10/16 | | United States | | | 129,731 | | | | 1,521,745 | |
aGeneral Motors Co., wts., 7/10/19 | | United States | | | 129,731 | | | | 1,014,496 | |
Lowe’s Cos. Inc. | | United States | | | 400,000 | | | | 10,152,000 | |
aSuperMedia Inc., Litigation Trust | | United States | | | 3,472,135 | | | | 8,680 | |
Target Corp. | | United States | | | 453,900 | | | | 23,248,758 | |
| | | | | | | | | | |
| | | | | | | | | 95,684,196 | |
| | | | | | | | | | |
Consumer Staples 0.9% | | | | | | | | | | |
Diageo PLC | | United Kingdom | | | 1,150,000 | | | | 25,127,894 | |
PepsiCo Inc. | | United States | | | 672,500 | | �� | | 44,620,375 | |
| | | | | | | | | | |
| | | | | | | | | 69,748,269 | |
| | | | | | | | | | |
Energy 5.4% | | | | | | | | | | |
aAlpha Natural Resources Inc. | | United States | | | 135,000 | | | | 2,758,050 | |
BP PLC, ADR | | United Kingdom | | | 1,300,000 | | | | 55,562,000 | |
aCallon Petroleum Co. | | United States | | | 782,594 | | | | 3,889,492 | |
Canadian Oil Sands Ltd. | | Canada | | | 3,700,000 | | | | 84,408,576 | |
Chesapeake Energy Corp. | | United States | | | 400,000 | | | | 8,916,000 | |
Chevron Corp. | | United States | | | 250,000 | | | | 26,600,000 | |
ConocoPhillips | | United States | | | 1,000,000 | | | | 72,870,000 | |
Exxon Mobil Corp. | | United States | | | 804,650 | | | | 68,202,134 | |
a,dGreen Field Energy Services Inc., wts., 144A, 11/15/21 | | United States | | | 3,400 | | | | 156,400 | |
Royal Dutch Shell PLC, A, ADR | | Netherlands | | | 591,700 | | | | 43,247,353 | |
Schlumberger Ltd. | | United States | | | 251,000 | | | | 17,145,810 | |
Spectra Energy Corp. | | United States | | | 500,000 | | | | 15,375,000 | |
aWeatherford International Ltd. | | United States | | | 1,000,000 | | | | 14,640,000 | |
| | | | | | | | | | |
| | | | | | | | | 413,770,815 | |
| | | | | | | | | | |
Financials 4.6% | | | | | | | | | | |
Banco Santander SA | | Spain | | | 2,072,213 | | | | 15,743,723 | |
Bank of America Corp. | | United States | | | 8,000,000 | | | | 44,480,000 | |
Barclays PLC | | United Kingdom | | | 4,000,000 | | | | 10,934,879 | |
aCIT Group Inc. | | United States | | | 691,600 | | | | 24,116,092 | |
Citigroup Inc. | | United States | | | 580,000 | | | | 15,259,800 | |
aFannie Mae | | United States | | | 1,928,019 | | | | 387,917 | |
HSBC Holdings PLC | | United Kingdom | | | 5,000,000 | | | | 38,140,052 | |
JPMorgan Chase & Co. | | United States | | | 1,850,000 | | | | 61,512,500 | |
M&T Bank Corp. | | United States | | | 500,000 | | | | 38,170,000 | |
QBE Insurance Group Ltd. | | Australia | | | 1,000,000 | | | | 13,248,498 | |
Wells Fargo & Co. | | United States | | | 2,750,000 | | | | 75,790,000 | |
Westfield Retail Trust | | Australia | | | 6,384,600 | | | | 16,264,096 | |
| | | | | | | | | | |
| | | | | | | | | 354,047,557 | |
| | | | | | | | | | |
Health Care 6.4% | | | | | | | | | | |
Johnson & Johnson | | United States | | | 1,500,000 | | | | 98,370,000 | |
Merck & Co. Inc. | | United States | | | 4,000,000 | | | | 150,800,000 | |
Pfizer Inc. | | United States | | | 3,518,775 | | | | 76,146,291 | |
FI-11
Franklin Templeton Variable Insurance Products Trust
Statement of Investments, December 31, 2011 (continued)
| | | | | | | | | | |
| Franklin Income Securities Fund | | Country | | Shares/ Warrants | | | Value | |
Common Stocks and Other Equity Interests (continued) | | | | | | | | | | |
Health Care (continued) | | | | | | | | | | |
Roche Holding AG | | Switzerland | | | 950,000 | | | $ | 161,176,533 | |
| | | | | | | | | | |
| | | | | | | | | 486,492,824 | |
| | | | | | | | | | |
Industrials 1.3% | | | | | | | | | | |
The Boeing Co. | | United States | | | 250,000 | | | | 18,337,500 | |
Caterpillar Inc. | | United States | | | 80,000 | | | | 7,248,000 | |
General Electric Co. | | United States | | | 3,994,700 | | | | 71,545,077 | |
| | | | | | | | | | |
| | | | | | | | | 97,130,577 | |
| | | | | | | | | | |
Information Technology 1.3% | | | | | | | | | | |
Cisco Systems Inc. | | United States | | | 1,000,000 | | | | 18,080,000 | |
Intel Corp. | | United States | | | 2,500,000 | | | | 60,625,000 | |
Xerox Corp. | | United States | | | 2,260,000 | | | | 17,989,600 | |
| | | | | | | | | | |
| | | | | | | | | 96,694,600 | |
| | | | | | | | | | |
Materials 0.6% | | | | | | | | | | |
Barrick Gold Corp. | | Canada | | | 700,000 | | | | 31,675,000 | |
Freeport-McMoRan Copper & Gold Inc., B | | United States | | | 237,286 | | | | 8,729,752 | |
LyondellBasell Industries NV, A | | Netherlands | | | 250,000 | | | | 8,122,500 | |
| | | | | | | | | | |
| | | | | | | | | 48,527,252 | |
| | | | | | | | | | |
Telecommunication Services 2.8% | | | | | | | | | | |
AT&T Inc. | | United States | | | 2,000,000 | | | | 60,480,000 | |
CenturyLink Inc. | | United States | | | 500,000 | | | | 18,600,000 | |
France Telecom SA | | France | | | 528,500 | | | | 8,300,796 | |
Frontier Communications Corp. | | United States | | | 988,047 | | | | 5,088,442 | |
SK Telecom Co. Ltd., ADR | | South Korea | | | 505,100 | | | | 6,874,411 | |
aSprint Nextel Corp. | | United States | | | 1,500,000 | | | | 3,510,000 | |
Telstra Corp. Ltd. | | Australia | | | 10,000,000 | | | | 34,067,566 | |
Vodafone Group PLC | | United Kingdom | | | 27,500,000 | | | | 76,437,370 | |
| | | | | | | | | | |
| | | | | | | | | 213,358,585 | |
| | | | | | | | | | |
Utilities 10.1% | | | | | | | | | | |
AGL Resources Inc. | | United States | | | 450,000 | | | | 19,017,000 | |
American Electric Power Co. Inc. | | United States | | | 1,523,800 | | | | 62,948,178 | |
Dominion Resources Inc. | | United States | | | 600,000 | | | | 31,848,000 | |
Duke Energy Corp. | | United States | | | 1,000,000 | | | | 22,000,000 | |
aDynegy Inc. | | United States | | | 2,200,000 | | | | 6,094,000 | |
Entergy Corp. | | United States | | | 850,000 | | | | 62,092,500 | |
FirstEnergy Corp. | | United States | | | 750,000 | | | | 33,225,000 | |
NextEra Energy Inc. | | United States | | | 1,000,000 | | | | 60,880,000 | |
PG&E Corp. | | United States | | | 1,750,000 | | | | 72,135,000 | |
Pinnacle West Capital Corp. | | United States | | | 300,000 | | | | 14,454,000 | |
PPL Corp. | | United States | | | 1,250,000 | | | | 36,775,000 | |
Progress Energy Inc. | | United States | | | 1,200,000 | | | | 67,224,000 | |
Public Service Enterprise Group Inc. | | United States | | | 2,100,000 | | | | 69,321,000 | |
Sempra Energy | | United States | | | 1,100,000 | | | | 60,500,000 | |
The Southern Co. | | United States | | | 1,000,000 | | | | 46,290,000 | |
TECO Energy Inc. | | United States | | | 2,500,000 | | | | 47,850,000 | |
Xcel Energy Inc. | | United States | | | 2,070,464 | | | | 57,227,625 | |
| | | | | | | | | | |
| | | | | | | | | 769,881,303 | |
| | | | | | | | | | |
Total Common Stocks and Other Equity Interests
(Cost $2,533,292,651) | | | | | | | | | 2,645,335,978 | |
| | | | | | | | | | |
FI-12
Franklin Templeton Variable Insurance Products Trust
Statement of Investments, December 31, 2011 (continued)
| | | | | | | | | | |
| Franklin Income Securities Fund | | Country | | Shares/ Warrants | | | Value | |
eEquity-Linked Securities 1.5% | | | | | | | | | | |
Consumer Discretionary 0.2% | | | | | | | | | | |
dJPMorgan Chase & Co. into Target Corp., 6.25%, 144A | | United States | | | 300,000 | | | $ | 15,540,990 | |
| | | | | | | | | | |
Energy 0.2% | | | | | | | | | | |
dDeutsche Bank AG into Chesapeake Energy Corp., 8.50%, 144A | | United States | | | 500,000 | | | | 11,578,550 | |
| | | | | | | | | | |
Industrials 0.2% | | | | | | | | | | |
Citgroup Funding Inc. into General Electric Co., 8.00% | | United States | | | 358,000 | | | | 6,433,153 | |
dJPMorgan Chase & Co. into General Electric Co., 7.50%, 144A | | United States | | | 500,000 | | | | 9,049,350 | |
| | | | | | | | | | |
| | | | | | | | | 15,482,503 | |
| | | | | | | | | | |
Information Technology 0.4% | | | | | | | | | | |
Credit Suisse into Intel Corp., 9.00% | | United States | | | 750,000 | | | | 17,960,400 | |
dMorgan Stanley into Apple Inc., 7.50%, 144A | | United States | | | 40,000 | | | | 15,294,560 | |
| | | | | | | | | | |
| | | | | | | | | 33,254,960 | |
| | | | | | | | | | |
Materials 0.5% | | | | | | | | | | |
dBarclays Bank PLC into Nucor Corp., 8.00%, 144A | | United States | | | 300,000 | | | | 11,875,350 | |
dUBS AG into Newmont Mining Corp., 8.00%, 144A | | United States | | | 400,000 | | | | 24,160,920 | |
| | | | | | | | | | |
| | | | | | | | | 36,036,270 | |
| | | | | | | | | | |
Total Equity-Linked Securities (Cost $114,856,400) | | | | | | | | | 111,893,273 | |
| | | | | | | | | | |
Convertible Preferred Stocks 3.1% | | | | | | | | | | |
Consumer Discretionary 0.1% | | | | | | | | | | |
General Motors Co., 4.75%, cvt. pfd., B | | United States | | | 322,400 | | | | 11,042,200 | |
| | | | | | | | | | |
Energy 0.3% | | | | | | | | | | |
ATP Oil & Gas Corp., 8.00%, cvt. pfd., B | | United States | | | 50,000 | | | | 1,900,000 | |
Sandridge Energy Inc., 7.00%, cvt. pfd. | | United States | | | 190,000 | | | | 22,681,250 | |
| | | | | | | | | | |
| | | | | | | | | 24,581,250 | |
| | | | | | | | | | |
Financials 2.4% | | | | | | | | | | |
Bank of America Corp., 7.25%, cvt. pfd., L | | United States | | | 90,000 | | | | 70,921,800 | |
Citigroup Inc., 7.50%, cvt. pfd. | | United States | | | 54,200 | | | | 4,403,750 | |
aFannie Mae, 5.375%, cvt. pfd. | | United States | | | 600 | | | | 3,000,000 | |
Felcor Lodging Trust Inc., 7.80%, cvt. pfd., A | | United States | | | 400,000 | | | | 8,888,000 | |
MetLife Inc., 5.00%, cvt. pfd. | | United States | | | 525,000 | | | | 32,350,500 | |
Wells Fargo & Co., 7.50%, cvt. pfd., A | | United States | | | 61,000 | | | | 64,416,000 | |
| | | | | | | | | | |
| | | | | | | | | 183,980,050 | |
| | | | | | | | | | |
Health Care 0.2% | | | | | | | | | | |
Tenet Healthcare Corp., 7.00%, cvt. pfd. | | United States | | | 13,500 | | | | 11,542,500 | |
| | | | | | | | | | |
Materials 0.1% | | | | | | | | | | |
AngloGold Ashanti Holdings Finance PLC, 6.00%, cvt. pfd. | | South Africa | | | 200,000 | | | | 9,546,000 | |
| | | | | | | | | | |
Total Convertible Preferred Stocks (Cost $302,876,866) | | | | | | | | | 240,692,000 | |
| | | | | | | | | | |
Preferred Stocks 0.4% | | | | | | | | | | |
Consumer Discretionary 0.0%† | | | | | | | | | | |
aMotors Liquidation Co., Escrow pfd., C | | United States | | | 1,400,000 | | | | 354,900 | |
| | | | | | | | | | |
Financials 0.4% | | | | | | | | | | |
Ally Financial Inc., 8.50%, pfd., A | | United States | | | 75,000 | | | | 1,379,250 | |
aFannie Mae, 6.75%, pfd. | | United States | | | 500,000 | | | | 515,000 | |
aFannie Mae, 7.625%, pfd., R | | United States | | | 800,000 | | | | 912,000 | |
aFannie Mae, 8.25%, pfd. | | United States | | | 851,500 | | | | 1,175,070 | |
FI-13
Franklin Templeton Variable Insurance Products Trust
Statement of Investments, December 31, 2011 (continued)
| | | | | | | | | | |
| Franklin Income Securities Fund | | Country | | Shares/ Warrants | | | Value | |
Preferred Stocks (continued) | | | | | | | | | | |
Financials (continued) | | | | | | | | | | |
aFreddie Mac, 8.375%, pfd., Z | | United States | | | 1,549,200 | | | $ | 2,060,436 | |
dGMAC Inc., 7.00%, pfd., 144A | | United States | | | 36,265 | | | | 25,998,607 | |
| | | | | | | | | | |
| | | | | | | | | 32,040,363 | |
| | | | | | | | | | |
Total Preferred Stocks (Cost $109,243,385) | | | | | | | | | 32,395,263 | |
| | | | | | | | | | |
| | | |
| | | | | Principal
Amount* | | | | |
Convertible Bonds 1.1% | | | | | | | | | | |
Financials 0.9% | | | | | | | | | | |
dForest City Enterprises Inc., cvt., senior note, 144A, 4.25%, 8/15/18 | | United States | | | 20,000,000 | | | | 17,550,000 | |
fiStar Financial Inc., cvt., senior note, FRN, 0.872%, 10/01/12 | | United States | | | 57,500,000 | | | | 51,750,000 | |
| | | | | | | | | | |
| | | | | | | | | 69,300,000 | |
| | | | | | | | | | |
Materials 0.2% | | | | | | | | | | |
dCemex SAB de CV, cvt., sub. note, 144A, | | | | | | | | | | |
3.25%, 3/15/16 | | Mexico | | | 9,100,000 | | | | 5,971,875 | |
3.75%, 3/15/18 | | Mexico | | | 7,920,000 | | | | 5,177,700 | |
| | | | | | | | | | |
| | | | | | | | | 11,149,575 | |
| | | | | | | | | | |
Total Convertible Bonds (Cost $88,781,641) | | | | | | | | | 80,449,575 | |
| | | | | | | | | | |
Corporate Bonds 47.2% | | | | | | | | | | |
Consumer Discretionary 7.2% | | | | | | | | | | |
dAcademy Ltd./Finance Corp., senior note, 144A, 9.25%, 8/01/19 | | United States | | | 5,300,000 | | | | 5,260,250 | |
Cablevision Systems Corp., senior note, | | | | | | | | | | |
7.75%, 4/15/18 | | United States | | | 35,000,000 | | | | 37,275,000 | |
8.00%, 4/15/20 | | United States | | | 27,500,000 | | | | 29,631,250 | |
CCH II LLC/CCH II Capital Corp., senior note, 13.50%, 11/30/16 | | United States | | | 42,829,272 | | | | 49,681,956 | |
CCO Holdings LLC/Capital Corp., senior note, | | | | | | | | | | |
8.125%, 4/30/20 | | United States | | | 11,450,000 | | | | 12,595,000 | |
6.50%, 4/30/21 | | United States | | | 20,000,000 | | | | 20,350,000 | |
dCequel Communications Holdings I LLC, senior note, 144A, 8.625%, 11/15/17 | | United States | | | 10,000,000 | | | | 10,650,000 | |
dChrysler Group LLC/CG Co-Issuer Inc., senior secured note, 144A, | | | | | | | | | | |
8.00%, 6/15/19 | | United States | | | 25,000,000 | | | | 23,000,000 | |
8.25%, 6/15/21 | | United States | | | 12,800,000 | | | | 11,712,000 | |
dCityCenter Holdings/Finance, senior secured note, 144A, | | | | | | | | | | |
7.625%, 1/15/16 | | United States | | | 4,100,000 | | | | 4,223,000 | |
gPIK, 11.50%, 1/15/17 | | United States | | | 6,755,733 | | | | 6,642,385 | |
Clear Channel Communications Inc., senior note, | | | | | | | | | | |
10.75%, 8/01/16 | | United States | | | 12,000,000 | | | | 8,100,000 | |
9.00%, 3/01/21 | | United States | | | 69,100,000 | | | | 58,562,250 | |
Clear Channel Worldwide Holdings Inc., senior note, B, 9.25%, 12/15/17 | | United States | | | 17,000,000 | | | | 18,445,000 | |
ClubCorp Club Operations Inc., senior note, 10.00%, 12/01/18 | | United States | | | 15,000,000 | | | | 14,475,000 | |
dCSC Holdings Inc., senior note, 144A, 6.75%, 11/15/21 | | United States | | | 25,000,000 | | | | 26,437,500 | |
dCumulus Media Inc., senior note, 144A, 7.75%, 5/01/19 | | United States | | | 10,000,000 | | | | 8,925,000 | |
b,c,gDex One Corp., senior sub. note, PIK, 7.00%, 1/29/17 | | United States | | | 32,511,674 | | | | 7,396,406 | |
DISH DBS Corp., senior note, 6.75%, 6/01/21 | | United States | | | 10,000,000 | | | | 10,825,000 | |
Ford Motor Credit Co. LLC, senior note, 12.00%, 5/15/15 | | United States | | | 12,900,000 | | | | 15,901,378 | |
hThe Goodyear Tire & Rubber Co., senior note, 8.25%, 8/15/20 | | United States | | | 9,700,000 | | | | 10,621,500 | |
Harrah’s Operating Co. Inc., senior secured note, 11.25%, 6/01/17 | | United States | | | 10,000,000 | | | | 10,662,500 | |
Host Hotels & Resorts LP, senior note, T, 9.00%, 5/15/17 | | United States | | | 10,000,000 | | | | 10,925,000 | |
dJaguar Land Rover PLC, 144A, 8.125%, 5/15/21 | | United Kingdom | | | 2,118,000 | | | | 2,022,690 | |
FI-14
Franklin Templeton Variable Insurance Products Trust
Statement of Investments, December 31, 2011 (continued)
| | | | | | | | | | |
| Franklin Income Securities Fund | | Country | | Principal
Amount* | | | Value | |
Corporate Bonds (continued) | | | | | | | | | | |
Consumer Discretionary (continued) | | | | | | | | | | |
KB Home, senior note, | | | | | | | | | | |
5.75%, 2/01/14 | | United States | | | 6,500,000 | | | $ | 6,272,500 | |
6.25%, 6/15/15 | | United States | | | 15,000,000 | | | | 13,875,000 | |
7.25%, 6/15/18 | | United States | | | 10,600,000 | | | | 9,593,000 | |
MGM Resorts International, senior note, | | | | | | | | | | |
6.75%, 4/01/13 | | United States | | | 7,500,000 | | | | 7,584,375 | |
6.625%, 7/15/15 | | United States | | | 5,000,000 | | | | 4,775,000 | |
10.00%, 11/01/16 | | United States | | | 20,000,000 | | | | 21,100,000 | |
dShea Homes LP/Funding Corp., senior secured note, 144A, 8.625%, 5/15/19 | | United States | | | 11,700,000 | | | | 10,968,750 | |
dUnitymedia Hessen/NRW, senior secured note, 144A, 8.125%, | | | | | | | | | | |
12/01/17 | | Germany | | | 6,300,000 | | | | 6,630,750 | |
12/01/17 | | Germany | | | 5,500,000 | EUR | | | 7,393,181 | |
dUPC Germany GmbH, senior secured note, 144A, 9.625%, 12/01/19 | | Germany | | | 3,000,000 | EUR | | | 4,009,094 | |
dUPCB Finance III Ltd., senior secured note, 144A, 6.625%, 7/01/20 | | Netherlands | | | 12,500,000 | | | | 12,375,000 | |
Virgin Media Secured Finance, senior secured note, 7.00%, 1/15/18 | | United Kingdom | | | 2,100,000 | GBP | | | 3,436,398 | |
Visant Corp., senior note, 10.00%, 10/01/17 | | United States | | | 32,800,000 | | | | 30,176,000 | |
| | | | | | | | | | |
| | | | | | | | | 552,509,113 | |
| | | | | | | | | | |
Consumer Staples 0.7% | | | | | | | | | | |
dBoparan Holdings Ltd., senior note, 144A, | | | | | | | | | | |
9.75%, 4/30/18 | | United Kingdom | | | 7,000,000 | EUR | | | 7,361,331 | |
9.875%, 4/30/18 | | United Kingdom | | | 7,500,000 | GBP | | | 9,494,240 | |
JBS USA LLC/Finance Inc., senior note, | | | | | | | | | | |
11.625%, 5/01/14 | | Brazil | | | 10,000,000 | | | | 11,362,500 | |
d144A, 7.25%, 6/01/21 | | Brazil | | | 7,500,000 | | | | 7,031,250 | |
SUPERVALU Inc., senior note, 8.00%, 5/01/16 | | United States | | | 17,500,000 | | | | 18,156,250 | |
| | | | | | | | | | |
| | | | | | | | | 53,405,571 | |
| | | | | | | | | | |
Energy 7.5% | | | | | | | | | | |
Antero Resources Finance Corp., senior note, | | | | | | | | | | |
9.375%, 12/01/17 | | United States | | | 14,600,000 | | | | 15,841,000 | |
d144A, 7.25%, 8/01/19 | | United States | | | 3,900,000 | | | | 4,017,000 | |
dArch Coal Inc., senior note, 144A, 7.25%, 6/15/21 | | United States | | | 11,100,000 | | | | 11,460,750 | |
ATP Oil & Gas Corp., senior secured note, 11.875%, 5/01/15 | | United States | | | 15,000,000 | | | | 9,937,500 | |
Callon Petroleum Co., senior secured note, 13.00%, 9/15/16 | | United States | | | 7,765,750 | | | | 7,959,894 | |
dCHC Helicopter SA, senior secured note, 144A, 9.25%, 10/15/20 | | Canada | | | 25,000,000 | | | | 22,625,000 | |
Chesapeake Energy Corp., senior note, | | | | | | | | | | |
9.50%, 2/15/15 | | United States | | | 5,300,000 | | | | 6,095,000 | |
6.50%, 8/15/17 | | United States | | | 34,000,000 | | | | 36,380,000 | |
6.875%, 8/15/18 | | United States | | | 16,200,000 | | | | 17,415,000 | |
7.25%, 12/15/18 | | United States | | | 33,000,000 | | | | 36,630,000 | |
Compagnie Generale de Geophysique-Veritas, senior note, 6.50%, 6/01/21 | | France | | | 12,500,000 | | | | 12,187,500 | |
dConnacher Oil and Gas Ltd., secured note, 144A, 8.50%, 8/01/19 | | Canada | | | 7,000,000 | | | | 6,370,000 | |
CONSOL Energy Inc., senior note, 8.25%, 4/01/20 | | United States | | | 1,800,000 | | | | 1,998,000 | |
El Paso Corp., senior note, MTN, 7.75%, 1/15/32 | | United States | | | 22,000,000 | | | | 25,520,000 | |
Energy Transfer Equity LP, senior note, 7.50%, 10/15/20 | | United States | | | 5,900,000 | | | | 6,475,250 | |
Energy XXI Gulf Coast Inc., senior note, 9.25%, 12/15/17 | | United States | | | 15,000,000 | | | | 16,350,000 | |
EXCO Resources Inc., senior note, 7.50%, 9/15/18 | | United States | | | 10,500,000 | | | | 9,975,000 | |
dExpro Finance Luxembourg, senior secured note, 144A, 8.50%, 12/15/16 | | United Kingdom | | | 27,500,000 | | | | 24,337,500 | |
dGreen Field Energy Services Inc., senior secured note, 144A, 13.00%, 11/15/16 | | United States | | | 3,400,000 | | | | 3,315,000 | |
Linn Energy LLC/Finance Corp., senior note, 8.625%, 4/15/20 | | United States | | | 20,000,000 | | | | 21,800,000 | |
dOGX Petroleo E Gas Participacoes SA, senior note, 144A, 8.50%, 6/01/18 | | Brazil | | | 15,000,000 | | | | 14,718,750 | |
dPeabody Energy Corp, senior note, 144A, 6.25%, 11/15/21 | | United States | | | 6,000,000 | | | | 6,240,000 | |
FI-15
Franklin Templeton Variable Insurance Products Trust
Statement of Investments, December 31, 2011 (continued)
| | | | | | | | | | |
| Franklin Income Securities Fund | | Country | | Principal
Amount* | | | Value | |
Corporate Bonds (continued) | | | | | | | | | | |
Energy (continued) | | | | | | | | | | |
dPetroplus Finance Ltd., senior note, 144A,
6.75%, 5/01/14 | | Switzerland | | | 17,515,000 | | | $ | 9,545,675 | |
7.00%, 5/01/17 | | Switzerland | | | 30,000,000 | | | | 15,300,000 | |
9.375%, 9/15/19 | | Bermuda | | | 5,000,000 | | | | 2,600,000 | |
Quicksilver Resources Inc., senior note, 9.125%, 8/15/19 | | United States | | | 20,000,000 | | | | 21,300,000 | |
Sabine Pass LNG LP, senior secured note,
7.25%, 11/30/13 | | United States | | | 10,000,000 | | | | 10,150,000 | |
7.50%, 11/30/16 | | United States | | | 35,000,000 | | | | 35,350,000 | |
SandRidge Energy Inc., senior note,
8.75%, 1/15/20 | | United States | | | 25,000,000 | | | | 25,937,500 | |
7.50%, 3/15/21 | | United States | | | 13,300,000 | | | | 13,266,750 | |
d144A, 9.875%, 5/15/16 | | United States | | | 18,700,000 | | | | 20,102,500 | |
d144A, 8.00%, 6/01/18 | | United States | | | 21,800,000 | | | | 22,127,000 | |
SESI LLC, senior note, 6.875%, 6/01/14 | | United States | | | 18,500,000 | | | | 18,685,000 | |
Tesoro Corp., senior note, 9.75%, 6/01/19 | | United States | | | 10,400,000 | | | | 11,726,000 | |
dW&T Offshore Inc., senior note, 144A, 8.50%, 6/15/19 | | United States | | | 40,500,000 | | | | 42,120,000 | |
dWestern Refining Inc., senior secured note, 144A, 11.25%, 6/15/17 | | United States | | | 5,000,000 | | | | 5,712,500 | |
| | | | | | | | | | |
| | | | | | | | | 571,571,069 | |
| | | | | | | | | | |
Financials 8.2% | | | | | | | | | | |
Ally Financial Inc., senior note, | | | | | | | | | | |
6.25%, 12/01/17 | | United States | | | 10,000,000 | | | | 9,685,830 | |
8.00%, 3/15/20 | | United States | | | 10,000,000 | | | | 10,275,000 | |
iBank of America Corp., pfd., sub. bond, M, 8.125% to 5/15/18, FRN thereafter, Perpetual | | United States | | | 5,000,000 | | | | 4,493,750 | |
dCIT Group Inc., secured bond, 144A, 7.00%, | | | | | | | | | | |
5/04/15 | | United States | | | 72,500,000 | | | | 72,681,250 | |
5/02/16 | | United States | | | 155,000,000 | | | | 155,193,750 | |
5/02/17 | | United States | | | 125,000,000 | | | | 125,000,000 | |
CNL Income Properties Inc., senior note, 7.25%, 4/15/19 | | United States | | | 15,000,000 | | | | 13,950,000 | |
FelCor Lodging LP, senior secured note, 10.00%, 10/01/14 | | United States | | | 10,003,000 | | | | 11,003,300 | |
Hexion U.S. Finance Corp., senior secured note, 8.875%, 2/01/18 | | United States | | | 8,000,000 | | | | 7,540,000 | |
International Lease Finance Corp., senior note, | | | | | | | | | | |
8.75%, 3/15/17 | | United States | | | 20,000,000 | | | | 20,650,000 | |
8.875%, 9/01/17 | | United States | | | 20,000,000 | | | | 20,800,000 | |
iJPMorgan Chase & Co., junior sub. note, 1, 7.90% to 4/30/18, FRN thereafter, Perpetual | | United States | | | 110,000,000 | | | | 117,511,020 | |
dKinetic Concepts Inc./USA, secured note, 144A, 10.50%, 11/01/18 | | United States | | | 4,000,000 | | | | 3,930,000 | |
d,fLiberty Mutual Group, junior sub. note, 144A, FRN, 10.75%, 6/15/88 | | United States | | | 25,000,000 | | | | 31,625,000 | |
d,iM&T Bank Corp., 144A, 6.875% to 6/15/16, FRN thereafter, Perpetual | | United States | | | 12,000,000 | | | | 11,760,000 | |
Morgan Stanley, senior note, 5.50%, 1/26/20 | | United States | | | 15,000,000 | | | | 13,671,390 | |
| | | | | | | | | | |
| | | | | | | | | 629,770,290 | |
| | | | | | | | | | |
Health Care 4.2% | | | | | | | | | | |
Community Health Systems Inc., senior note, 8.875%, 7/15/15 | | United States | | | 33,118,000 | | | | 34,277,130 | |
Giant Funding Corp., senior secured note, 8.25%, 2/01/18 | | Spain | | | 4,900,000 | | | | 5,169,500 | |
HCA Holdings Inc., senior note, 7.75%, 5/15/21 | | United States | | | 10,000,000 | | | | 10,225,000 | |
HCA Inc.,
senior note, 6.375%, 1/15/15 | | United States | | | 5,000,000 | | | | 5,118,750 | |
senior note, 6.50%, 2/15/16 | | United States | | | 20,000,000 | | | | 20,400,000 | |
senior note, 8.00%, 10/01/18 | | United States | | | 12,000,000 | | | | 12,720,000 | |
senior note, 7.50%, 2/15/22 | | United States | | | 34,500,000 | | | | 35,362,500 | |
senior secured note, 8.50%, 4/15/19 | | United States | | | 20,000,000 | | | | 22,000,000 | |
senior secured note, 6.50%, 2/15/20 | | United States | | | 30,000,000 | | | | 31,200,000 | |
senior secured note, 7.875%, 2/15/20 | | United States | | | 20,000,000 | | | | 21,700,000 | |
FI-16
Franklin Templeton Variable Insurance Products Trust
Statement of Investments, December 31, 2011 (continued)
| | | | | | | | | | |
| Franklin Income Securities Fund | | Country | | Principal
Amount* | | | Value | |
Corporate Bonds (continued) | | | | | | | | | | |
Health Care (continued) | | | | | | | | | | |
dHealth Management Associates Inc., senior note, 144A, 7.375%, 1/15/20 | | United States | | | 4,300,000 | | | $ | 4,482,750 | |
dMylan Inc., senior note, 144A, 6.00%, 11/15/18 | | United States | | | 3,500,000 | | | | 3,618,125 | |
Tenet Healthcare Corp.,
senior note, 8.00%, 8/01/20 | | United States | | | 24,600,000 | | | | 24,753,750 | |
fsenior note, FRN, 9.25%, 2/01/15 | | United States | | | 13,500,000 | | | | 14,259,375 | |
senior secured note, 10.00%, 5/01/18 | | United States | | | 41,250,000 | | | | 47,334,375 | |
Vanguard Health Holding Co. II LLC/Inc., senior note, | | | | | | | | | | |
8.00%, 2/01/18 | | United States | | | 23,100,000 | | | | 23,042,250 | |
7.75%, 2/01/19 | | United States | | | 4,000,000 | | | | 3,860,000 | |
Vanguard Health Systems Inc., senior note, zero cpn., 2/01/16 | | United States | | | 228,000 | | | | 143,640 | |
| | | | | | | | | | |
| | | | | | | | | 319,667,145 | |
| | | | | | | | | | |
Industrials 2.7% | | | | | | | | | | |
dAbengoa Finance SAU, senior note, 144A, 8.875%, 11/01/17 | | Spain | | | 11,900,000 | | | | 11,424,000 | |
d,jAmerican Airlines Inc., senior secured note, 144A, 7.50%, 3/15/16 | | United States | | | 25,000,000 | | | | 18,000,000 | |
dCeva Group PLC, senior secured note, 144A, | | | | | | | | | | |
8.375%, 12/01/17 | | United Kingdom | | | 7,500,000 | | | | 7,181,250 | |
11.50%, 4/01/18 | | United Kingdom | | | 30,300,000 | | | | 27,985,109 | |
dDelta Air Lines Inc., senior secured note, 144A, 9.50%, 9/15/14 | | United States | | | 9,568,000 | | | | 9,902,880 | |
Hertz Corp., senior note, | | | | | | | | | | |
8.875%, 1/01/14 | | United States | | | 6,951,000 | | | | 7,020,510 | |
6.75%, 4/15/19 | | United States | | | 7,500,000 | | | | 7,556,250 | |
Interactive Data Corp., senior note, 10.25%, 8/01/18 | | United States | | | 5,000,000 | | | | 5,491,500 | |
The Manitowoc Co. Inc., senior note, 9.50%, 2/15/18 | | United States | | | 10,000,000 | | | | 10,700,000 | |
RBS Global & Rexnord Corp.,
senior note, 8.50%, 5/01/18 | | United States | | | 28,900,000 | | | | 30,778,500 | |
senior sub. note, 11.75%, 8/01/16 | | United States | | | 13,500,000 | | | | 14,242,500 | |
Terex Corp., senior sub. note, 8.00%, 11/15/17 | | United States | | | 45,000,000 | | | | 44,325,000 | |
Tomkins LLC/Inc., senior secured note, 9.25%, 10/01/18 | | United States | | | 3,212,000 | | | | 3,577,365 | |
United Rentals North America Inc., senior sub. note, 8.375%, 9/15/20 | | United States | | | 9,800,000 | | | | 9,604,000 | |
| | | | | | | | | | |
| | | | | | | | | 207,788,864 | |
| | | | | | | | | | |
Information Technology 7.0% | | | | | | | | | | |
Advanced Micro Devices Inc., senior note, 8.125%, 12/15/17 | | United States | | | 4,100,000 | | | | 4,274,250 | |
CDW LLC/Finance Corp., | | | | | | | | | | |
senior note, 11.00%, 10/12/15 | | United States | | | 442,000 | | | | 466,310 | |
senior note, 8.50%, 4/01/19 | | United States | | | 28,725,000 | | | | 29,084,062 | |
senior sub. note, 12.535%, 10/12/17 | | United States | | | 5,000,000 | | | | 5,050,000 | |
Ceridian Corp., senior note, 11.25%, 11/15/15 | | United States | | | 20,000,000 | | | | 15,700,000 | |
dCommScope Inc., senior note, 144A, 8.25%, 1/15/19 | | United States | | | 4,000,000 | | | | 4,020,000 | |
First Data Corp.,
dsenior bond, 144A, 12.625%, 1/15/21 | | United States | | | 80,000,000 | | | | 70,000,000 | |
senior note, 9.875%, 9/24/15 | | United States | | | 4,645,000 | | | | 4,366,300 | |
senior note, 9.875%, 9/24/15 | | United States | | | 5,000,000 | | | | 4,725,000 | |
gsenior note, PIK, 10.55%, 9/24/15 | | United States | | | 13,500,000 | | | | 12,943,125 | |
dsenior secured bond, 144A, 8.25%, 1/15/21 | | United States | | | 45,000,000 | | | | 40,500,000 | |
dsenior secured note, 144A, 8.875%, 8/15/20 | | United States | | | 3,000,000 | | | | 3,015,000 | |
d,gsenior secured note, 144A, PIK, 8.75%, 1/15/22 | | United States | | | 33,188,000 | | | | 28,707,620 | |
senior sub. note, 11.25%, 3/31/16 | | United States | | | 57,000,000 | | | | 47,595,000 | |
Freescale Semiconductor Inc., | | | | | | | | | | |
senior note, 10.125%, 12/15/16 | | United States | | | 20,000,000 | | | | 21,150,000 | |
senior note, 8.05%, 2/01/20 | | United States | | | 35,000,000 | | | | 33,075,000 | |
senior note, 10.75%, 8/01/20 | | United States | | | 64,846,000 | | | | 67,926,185 | |
FI-17
Franklin Templeton Variable Insurance Products Trust
Statement of Investments, December 31, 2011 (continued)
| | | | | | | | | | |
| Franklin Income Securities Fund | | Country | | Principal
Amount* | | | Value | |
Corporate Bonds (continued) | | | | | | | | | | |
Information Technology (continued) | | | | | | | | | | |
Freescale Semiconductor Inc., (continued) | | | | | | | | | | |
dsenior secured note, 144A, 10.125%, 3/15/18 | | United States | | | 4,438,000 | | | $ | 4,859,610 | |
dsenior secured note, 144A, 9.25%, 4/15/18 | | United States | | | 51,700,000 | | | | 55,512,875 | |
dNXP BV/NXP Funding LLC, senior secured note, 144A, 9.75%, 8/01/18 | | Netherlands | | | 8,600,000 | | | | 9,492,250 | |
Sanmina-SCI Corp.,
dsenior note, 144A, 7.00%, 5/15/19 | | United States | | | 15,000,000 | | | | 14,700,000 | |
senior sub. note, 8.125%, 3/01/16 | | United States | | | 10,600,000 | | | | 10,997,500 | |
dSterling Merger Inc., senior note, 144A, 11.00%, 10/01/19 | | United States | | | 7,500,000 | | | | 7,350,000 | |
SunGard Data Systems Inc.,
senior note, 10.625%, 5/15/15 | | United States | | | 7,500,000 | | | | 8,025,000 | |
senior note, 7.625%, 11/15/20 | | United States | | | 10,000,000 | | | | 10,325,000 | |
senior sub. note, 10.25%, 8/15/15 | | United States | | | 14,500,000 | | | | 15,098,125 | |
dUPCB Finance Ltd., senior secured note, 144A, 7.25%, 11/15/21 | | Netherlands | | | 6,000,000 | | | | 6,105,000 | |
| | | | | | | | | | |
| | | | | | | | | 535,063,212 | |
| | | | | | | | | | |
Materials 2.9% | | | | | | | | | | |
Berry Plastics Corp., senior secured note, 9.75%, 1/15/21 | | United States | | | 5,000,000 | | | | 5,012,500 | |
dBuilding Materials Corp. of America, senior note, 144A, 6.75%, 5/01/21 | | United States | | | 8,300,000 | | | | 8,735,750 | |
dCemex Finance LLC, senior secured note, 144A, 9.50%, 12/14/16 | | United States | | | 3,000,000 | | | | 2,647,500 | |
dCemex SAB de CV, senior secured note, 144A, 9.00%, 1/11/18 | | Mexico | | | 20,000,000 | | | | 16,083,300 | |
dDynacast International LLC/Finance Inc., secured note, 144A, 9.25%, 7/15/19 | | United States | | | 10,000,000 | | | | 9,450,000 | |
dFMG Resources August 2006 Pty. Ltd., senior note, 144A, | | | | | | | | | | |
7.00%, 11/01/15 | | Australia | | | 14,000,000 | | | | 13,921,250 | |
6.875%, 2/01/18 | | Australia | | | 11,900,000 | | | | 11,453,750 | |
8.25%, 11/01/19 | | Australia | | | 15,000,000 | | | | 15,337,500 | |
Huntsman International LLC, senior note, 5.50%, 6/30/16 | | United States | | | 1,750,000 | | | | 1,723,750 | |
dIneos Group Holdings Ltd., | | | | | | | | | | |
senior note, 144A, 7.875%, 2/15/16 | | United Kingdom | | | 30,000,000 | EUR | | | 28,927,605 | |
senior secured note, 144A, 8.50%, 2/15/16 | | United Kingdom | | | 5,000,000 | | | | 4,000,000 | |
dKerling PLC, senior secured note, 144A, 10.625%, 1/28/17 | | United Kingdom | | | 9,400,000 | EUR | | | 10,807,857 | |
dKinove German Bondco GmbH, | | | | | | | | | | |
senior secured bond, 144A, 10.00%, 6/15/18 | | Germany | | | 9,900,000 | EUR | | | 11,468,145 | |
senior secured note, 144A, 9.625%, 6/15/18 | | Germany | | | 13,100,000 | | | | 12,209,174 | |
dReynolds Group Issuer Inc./LLC/SA, | | | | | | | | | | |
senior note, 144A, 9.00%, 4/15/19 | | United States | | | 5,000,000 | | | | 4,775,000 | |
senior note, 144A, 9.875%, 8/15/19 | | United States | | | 7,400,000 | | | | 7,215,000 | |
senior note, 144A, 8.25%, 2/15/21 | | United States | | | 5,200,000 | | | | 4,628,000 | |
senior secured note, 144A, 7.875%, 8/15/19 | | United States | | | 10,000,000 | | | | 10,500,000 | |
senior secured note, 144A, 6.875%, 2/15/21 | | United States | | | 10,000,000 | | | | 10,000,000 | |
dSealed Air Corp., senior note, 144A, | | | | | | | | | | |
8.125%, 9/15/19 | | United States | | | 5,000,000 | | | | 5,500,000 | |
8.375%, 9/15/21 | | United States | | | 2,400,000 | | | | 2,664,000 | |
Vulcan Materials Co., senior note, | | | | | | | | | | |
6.50%, 12/01/16 | | United States | | | 11,200,000 | | | | 11,620,000 | |
7.50%, 6/15/21 | | United States | | | 13,500,000 | | | | 14,681,250 | |
| | | | | | | | | | |
| | | | | | | | | 223,361,331 | |
| | | | | | | | | | |
Telecommunication Services 1.8% | | | | | | | | | | |
Cricket Communications Inc., senior note, 7.75%, 10/15/20 | | United States | | | 45,000,000 | | | | 39,487,500 | |
Frontier Communications Corp., senior note, | | | | | | | | | | |
8.25%, 4/15/17 | | United States | | | 1,200,000 | | | | 1,233,000 | |
8.50%, 4/15/20 | | United States | | | 12,900,000 | | | | 13,270,875 | |
dIntelsat Jackson Holdings SA, senior note, 144A, 7.50%, 4/01/21 | | Luxembourg | | | 18,400,000 | | | | 18,653,000 | |
FI-18
Franklin Templeton Variable Insurance Products Trust
Statement of Investments, December 31, 2011 (continued)
| | | | | | | | | | |
| Franklin Income Securities Fund | | Country | | Principal
Amount* | | | Value | |
Corporate Bonds (continued) | | | | | | | | | | |
Telecommunication Services (continued) | | | | | | | | | | |
Sprint Nextel Corp., | | | | | | | | | | |
d144A, 11.50%, 11/15/21 | | United States | | | 30,000,000 | | | $ | 29,775,000 | |
senior note, 8.375%, 8/15/17 | | United States | | | 12,700,000 | | | | 11,445,875 | |
dsenior note, 144A, 9.00%, 11/15/18 | | United States | | | 25,000,000 | | | | 26,312,500 | |
| | | | | | | | | | |
| | | | | | | | | 140,177,750 | |
| | | | | | | | | | |
Utilities 5.0% | | | | | | | | | | |
dAES Corp., senior note, 144A, 7.375%, 7/01/21 | | United States | | | 5,800,000 | | | | 6,278,500 | |
dCalpine Corp., senior secured note, 144A, | | | | | | | | | | |
7.25%, 10/15/17 | | United States | | | 5,000,000 | | | | 5,275,000 | |
7.875%, 7/31/20 | | United States | | | 10,700,000 | | | | 11,582,750 | |
7.50%, 2/15/21 | | United States | | | 15,000,000 | | | | 16,125,000 | |
7.875%, 1/15/23 | | United States | | | 15,000,000 | | | | 16,200,000 | |
c,jDynegy Holdings Inc., senior note, | | | | | | | | | | |
7.50%, 6/01/15 | | United States | | | 20,000,000 | | | | 13,300,000 | |
7.50%, 6/01/15 | | United States | | | 15,000,000 | | | | 9,450,000 | |
8.375%, 5/01/16 | | United States | | | 64,699,000 | | | | 43,348,330 | |
7.75%, 6/01/19 | | United States | | | 50,000,000 | | | | 33,000,000 | |
Energy Future Holdings Corp., senior note, R, 6.55%, 11/15/34 | | United States | | | 35,000,000 | | | | 15,050,000 | |
GenOn Energy Inc., senior note, | | | | | | | | | | |
7.625%, 6/15/14 | | United States | | | 9,500,000 | | | | 9,547,500 | |
7.875%, 6/15/17 | | United States | | | 25,000,000 | | | | 24,250,000 | |
dIntergen NV, senior secured note, 144A, 9.00%, 6/30/17 | | Netherlands | | | 7,500,000 | | | | 7,931,250 | |
Niska Gas Storage U.S./Canada, senior note, 8.875%, 3/15/18 | | United States | | | 15,000,000 | | | | 14,737,500 | |
Texas Competitive Electric Holdings Co. LLC, senior note, | | | | | | | | | | |
A, 10.25%, 11/01/15 | | United States | | | 152,939,000 | | | | 55,058,040 | |
B, 10.25%, 11/01/15 | | United States | | | 64,193,000 | | | | 22,467,550 | |
gPIK, 11.25%, 11/01/16 | | United States | | | 14,503,647 | | | | 5,160,804 | |
Texas Competitive Electric Holdings Co. LLC/Texas Competitive Electric Holdings Finance Inc., senior secured note, | | | | | | | | | | |
d144A, 11.50%, 10/01/20 | | United States | | | 17,800,000 | | | | 15,196,750 | |
B, 15.00%, 4/01/21 | | United States | | | 100,125,000 | | | | 55,569,375 | |
| | | | | | | | | | |
| | | | | | | | | 379,528,349 | |
| | | | | | | | | | |
Total Corporate Bonds (Cost $3,728,398,607) | | | | | | | | | 3,612,842,694 | |
| | | | | | | | | | |
f,kSenior Floating Rate Interests 8.0% | | | | | | | | | | |
Consumer Discretionary 1.9% | | | | | | | | | | |
Chrysler Group LLC, Tranche B Term Loan, 6.00%, 5/24/17 | | United States | | | 44,476,500 | | | | 42,197,079 | |
Clear Channel Communications Inc., Tranche B Term Loan, 3.946%, 1/29/16 | | United States | | | 72,254,969 | | | | 53,609,141 | |
ClubCorp Club Operations Inc., Term B Loan, 6.00%, 11/30/16 | | United States | | | 9,900,000 | | | | 9,904,128 | |
Cumulus Media Holdings Inc., Second Lien Term Loan, 7.50%, 9/16/19 | | United States | | | 40,000,000 | | | | 38,866,680 | |
bDex Media West LLC, Term Loan B, 7.25%, 10/24/14 | | United States | | | 4,265,968 | | | | 2,396,941 | |
SuperMedia Inc., Exit Term Loan, 11.00%, 12/31/15 | | United States | | | 2,525,383 | | | | 1,195,046 | |
| | | | | | | | | | |
| | | | | | | | | 148,169,015 | |
| | | | | | | | | | |
Consumer Staples 0.2% | | | | | | | | | | |
BJ’s Wholesale Club Inc., Initial Loan, 7.00%, 9/30/18 | | United States | | | 15,000,000 | | | | 15,072,975 | |
| | | | | | | | | | |
Financials 0.8% | | | | | | | | | | |
iStar Financial Inc., Tranche A2 Term Loan, 7.00%, 6/30/14 | | United States | | | 60,000,000 | | | | 58,350,000 | |
| | | | | | | | | | |
Health Care 0.4% | | | | | | | | | | |
Kinetic Concepts Inc., Term Loan B-1, 7.00%, 5/04/18 | | United States | | | 30,000,000 | | | | 30,308,250 | |
| | | | | | | | | | |
FI-19
Franklin Templeton Variable Insurance Products Trust
Statement of Investments, December 31, 2011 (continued)
| | | | | | | | | | |
| Franklin Income Securities Fund | | Country | | Principal
Amount* | | | Value | |
Senior Floating Rate Interests (continued) | | | | | | | | | | |
Industrials 0.5% | | | | | | | | | | |
Altegrity Inc., | | | | | | | | | | |
Term Loan B, 3.037%, 2/21/15 | | United States | | | 13,821,896 | | | $ | 12,871,640 | |
Tranche D Term Loan, 7.75%, 2/21/15 | | United States | | | 13,942,573 | | | | 13,826,390 | |
Ceva Group PLC, | | | | | | | | | | |
Dollar Tranche B L/C, 5.579%, 8/31/16 | | United Kingdom | | | 2,105,263 | | | | 1,940,352 | |
EGL Tranche B Term Loans, 5.428%, 8/31/16 | | United Kingdom | | | 12,291,882 | | | | 11,393,038 | |
| | | | | | | | | | |
| | | | | | | | | 40,031,420 | |
| | | | | | | | | | |
Information Technology 1.7% | | | | | | | | | | |
First Data Corp., | | | | | | | | | | |
2018 Term Loan, 4.294%, 3/24/18 | | United States | | | 22,436,455 | | | | 18,874,667 | |
Term Loan B-1, 3.044%, 9/24/14 | | United States | | | 13,650,417 | | | | 12,498,595 | |
Term Loan B-2, 3.044%, 9/24/14 | | United States | | | 64,638,495 | | | | 59,184,299 | |
Term Loan B-3, 3.044%, 9/24/14 | | United States | | | 2,387,693 | | | | 2,186,219 | |
Freescale Semiconductor Inc., Extended Term Loan, 4.52%, 12/01/16 | | United States | | | 2,581,931 | | | | 2,491,563 | |
Go Daddy Operating Co. LLC, Initial Term Loan, 7.00%, 12/16/18 | | United States | | | 17,456,250 | | | | 17,425,876 | |
lSophia LP (Datatel), Initial Term Loan, 7.25%, 7/31/18 | | United States | | | 7,500,000 | | | | 7,514,063 | |
SRA International Inc., Term Loan, 6.50%, 7/20/18 | | United States | | | 9,657,143 | | | | 9,093,813 | |
| | | | | | | | | | |
| | | | | | | | | 129,269,095 | |
| | | | | | | | | | |
Utilities 2.5% | | | | | | | | | | |
Dynegy Midwest Generation LLC, Term Loan, 9.25%, 8/05/16 | | United States | | | 10,473,750 | | | | 10,586,343 | |
Dynegy Power LLC, Term Loan, 9.25%, 8/05/16 | | United States | | | 19,451,250 | | | | 19,788,165 | |
Samson Investment Co., Bridge Term Loan, 8.00%, 12/16/12 | | United States | | | 10,000,000 | | | | 10,000,000 | |
Texas Competitive Electric Holdings Co. LLC, | | | | | | | | | | |
2014 Term Loan, 3.776%, 10/10/14 | | United States | | | 5,000,000 | | | | 3,507,815 | |
2017 Term Loan, 4.776%, 10/10/17 | | United States | | | 224,606,875 | | | | 142,999,786 | |
| | | | | | | | | | |
| | | | | | | | | 186,882,109 | |
| | | | | | | | | | |
Total Senior Floating Rate Interests (Cost $675,544,729) | | | | | | | | | 608,082,864 | |
| | | | | | | | | | |
Asset-Backed Securities and Commercial Mortgage-Backed Securities (Cost $33,245,301) 0.5% | | | | | | | | | | |
Financials 0.5% | | | | | | | | | | |
d,fBanc of America Large Loan, 2010-HLTN, 144A, FRN, 2.028%, 11/15/15 | | United States | | | 38,212,989 | | | | 34,608,377 | |
| | | | | | | | | | |
Municipal Bonds 0.3% | | | | | | | | | | |
California State GO, | | | | | | | | | | |
7.95%, 3/01/36 | | United States | | | 9,060,000 | | | | 10,253,927 | |
5.25%, 11/01/40 | | United States | | | 1,405,000 | | | | 1,476,768 | |
Build America Bonds, 7.60%, 11/01/40 | | United States | | | 6,603,000 | | | | 8,159,393 | |
San Joaquin County Transportation Authority Sales Tax Revenue, Refunding, 5.50%, 3/01/41 | | United States | | | 4,395,000 | | | | 4,871,110 | |
| | | | | | | | | | |
Total Municipal Bonds (Cost $21,236,388) | | | | | | | | | 24,761,198 | |
| | | | | | | | | | |
Total Investments before Short Term Investments
(Cost $7,607,475,968) | | | | | | | | | 7,391,061,222 | |
| | | | | | | | | | |
FI-20
Franklin Templeton Variable Insurance Products Trust
Statement of Investments, December 31, 2011 (continued)
| | | | | | | | | | | | |
| Franklin Income Securities Fund | | Country | | | Principal
Amount* | | | Value | |
Short Term Investments 2.3% | | | | | | | | | | | | |
Repurchase Agreements (Cost $177,501,703) 2.3% | | | | | | | | | | | | |
mJoint Repurchase Agreement, 0.011%, 1/03/12 (Maturity Value $177,501,917) | | | United States | | | | 177,501,703 | | | $ | 177,501,703 | |
BNP Paribas Securities Corp. (Maturity Value $21,477,732) Credit Suisse Securities (USA) LLC (Maturity Value $25,771,503) Deutsche Bank Securities Inc. (Maturity Value $27,163,118) HSBC Securities (USA) Inc. (Maturity Value $42,955,465) Merrill Lynch, Pierce, Fenner & Smith Inc. (Maturity Value $25,771,503) Morgan Stanley & Co. LLC (Maturity Value $8,591,093) UBS Securities LLC (Maturity Value $25,771,503) | | | | | | | | | | | | |
Collateralized by U.S. Government Agency Securities, 0.16% - 5.25%, 6/07/12 - 2/05/14; nU.S. Treasury Bills, 1/12/12 - 9/20/12; U.S. Treasury Bonds, 0.50 % - 11.25%, 5/31/13 - 2/15/16; and U.S. Treasury Notes, 0.125% - 4.875%, 12/31/11 - 5/15/19 (valued at $181,145,557) | | | | | | | | | | | | |
| | | |
| | | | | | Shares | | | | |
oInvestments from Cash Collateral Received for Loaned Securities
(Cost $1,380,000) 0.0%† | | | | | | | | | | | | |
Money Market Funds 0.0%† | | | | | | | | | | | | |
pBNY Mellon Overnight Government Fund, 0.039% | | | United States | | | | 1,380,000 | | | | 1,380,000 | |
| | | | | | | | | | | | |
Total Investments (Cost $7,786,357,671) 99.0% | | | | | | | | | | | 7,569,942,925 | |
Other Assets, less Liabilities 1.0% | | | | | | | | | | | 78,064,037 | |
| | | | | | | | | | | | |
Net Assets 100.0% | | | | | | | | | | $ | 7,648,006,962 | |
| | | | | | | | | | | | |
See Abbreviations on page FI-35.
†Rounds to less than 0.1% of net assets.
*The principal amount is stated in U.S. dollars unless otherwise indicated.
aNon-income producing.
bSee Note 9 regarding holdings of 5% voting securities.
cAt December 31, 2011, pursuant to the Fund’s policies and the requirements of applicable securities law, the Fund may be restricted from trading these securities for a limited or extended period of time due to ownership limits and/or potential possession of material non-public information.
dSecurity was purchased pursuant to Rule 144A under the Securities Act of 1933 and may be sold in transactions exempt from registration only to qualified institutional buyers or in a public offering registered under the Securities Act of 1933. These securities have been deemed liquid under guidelines approved by the Trust’s Board of Trustees. At December 31, 2011, the aggregate value of these securities was $1,622,390,825, representing 21.21% of net assets.
eSee Note 1(f) regarding equity-linked securities.
fThe coupon rate shown represents the rate at period end.
gIncome may be received in additional securities and/or cash.
hA portion or all of the security is on loan at December 31, 2011. See Note 1(g).
iPerpetual security with no stated maturity date.
jSee Note 7 regarding defaulted securities.
kSee Note 1(h) regarding senior floating rate interests.
lSecurity purchased on a delayed delivery basis. See Note 1(d).
mSee Note 1(c) regarding joint repurchase agreement.
nThe security is traded on a discount basis with no stated coupon rate.
oSee Note 1(g) regarding securities on loan.
pThe rate shown is the annualized seven-day yield at period end.
The accompanying notes are an integral part of these financial statements.
FI-21
Franklin Templeton Variable Insurance Products Trust
Financial Statements
Statement of Assets and Liabilities
December 31, 2011
| | | | |
| | | Franklin Income
Securities Fund | |
Assets: | | | | |
Investments in securities: | | | | |
Cost - Unaffiliated issuers | | $ | 7,464,220,842 | |
Cost - Non-controlled affiliated issuers (Note 9) | | | 144,635,126 | |
Cost - Repurchase agreements | | | 177,501,703 | |
| | | | |
Total cost of investments | | $ | 7,786,357,671 | |
| | | | |
Value - Unaffiliated issuers | | $ | 7,378,261,522 | |
Value - Non-controlled affiliated issuers (Note 9) | | | 14,179,700 | |
Value - Repurchase agreements | | | 177,501,703 | |
| | | | |
Total value of investments (includes securities loaned in the amount of $1,314,000) | | | 7,569,942,925 | |
Cash | | | 564,611 | |
Receivables: | | | | |
Capital shares sold | | | 2,335,811 | |
Dividends and interest | | | 94,012,839 | |
Other assets | | | 21,025 | |
| | | | |
Total assets | | | 7,666,877,211 | |
| | | | |
Liabilities: | | | | |
Payables: | | | | |
Investment securities purchased | | | 7,364,068 | |
Capital shares redeemed | | | 3,183,086 | |
Affiliates | | | 5,589,807 | |
Reports to shareholders | | | 1,137,839 | |
Payable upon return of securities loaned | | | 1,380,000 | |
Accrued expenses and other liabilities | | | 215,449 | |
| | | | |
Total liabilities | | | 18,870,249 | |
| | | | |
Net assets, at value | | $ | 7,648,006,962 | |
| | | | |
Net assets consist of: | | | | |
Paid-in capital | | $ | 8,363,066,982 | |
Undistributed net investment income | | | 491,942,579 | |
Net unrealized appreciation (depreciation) | | | (216,608,469 | ) |
Accumulated net realized gain (loss) | | | (990,394,130 | ) |
| | | | |
Net assets, at value | | $ | 7,648,006,962 | |
| | | | |
The accompanying notes are an integral part of these financial statements.
FI-22
Franklin Templeton Variable Insurance Products Trust
Financial Statements (continued)
Statement of Assets and Liabilities (continued)
December 31, 2011
| | | | |
| | | Franklin Income
Securities Fund | |
Class 1: | | | | |
Net assets, at value | | $ | 1,300,934,635 | |
| | | | |
Shares outstanding | | | 88,643,213 | |
| | | | |
Net asset value and maximum offering price per share | | $ | 14.68 | |
| | | | |
Class 2: | | | | |
Net assets, at value | | $ | 5,915,637,404 | |
| | | | |
Shares outstanding | | | 413,177,789 | |
| | | | |
Net asset value and maximum offering price per share | | $ | 14.32 | |
| | | | |
Class 4: | | | | |
Net assets, at value | | $ | 431,434,923 | |
| | | | |
Shares outstanding | | | 29,666,638 | |
| | | | |
Net asset value and maximum offering price per share | | $ | 14.54 | |
| | | | |
The accompanying notes are an integral part of these financial statements.
FI-23
Franklin Templeton Variable Insurance Products Trust
Financial Statements (continued)
Statement of Operations
for the year ended December 31, 2011
| | | | |
| | | Franklin Income
Securities Fund | |
Investment income: | | | | |
Dividends | | $ | 137,006,448 | |
Interest: | | | | |
Unaffiliated issuers | | | 412,718,330 | |
Non-controlled affiliated issuers (Note 9) | | | 3,758,355 | |
Income from securities loaned | | | 443,260 | |
| | | | |
Total investment income | | | 553,926,393 | |
| | | | |
Expenses: | | | | |
Management fees (Note 3a) | | | 36,750,388 | |
Distribution fees: (Note 3c) | | | | |
Class 2 | | | 15,490,776 | |
Class 4 | | | 1,520,494 | |
Unaffiliated transfer agent fees | | | 4,861 | |
Custodian fees (Note 4) | | | 223,528 | |
Reports to shareholders | | | 1,016,771 | |
Professional fees | | | 205,931 | |
Trustees’ fees and expenses | | | 30,647 | |
Other | | | 157,121 | |
| | | | |
Total expenses | | | 55,400,517 | |
Expense reductions (Note 4) | | | (31 | ) |
| | | | |
Net expenses | | | 55,400,486 | |
| | | | |
Net investment income | | | 498,525,907 | |
| | | | |
Realized and unrealized gains (losses): | | | | |
Net realized gain (loss) from: | | | | |
Investments: | | | | |
Unaffiliated issuers | | | 223,883,734 | |
Non-controlled affiliated issuers (Note 9) | | | 145,148 | |
Written options | | | 415,499 | |
Foreign currency transactions | | | (129,930 | ) |
| | | | |
Net realized gain (loss) | | | 224,314,451 | |
| | | | |
Net change in unrealized appreciation (depreciation) on: | | | | |
Investments | | | (562,165,563 | ) |
Translation of other assets and liabilities denominated in foreign currencies | | | (155,625 | ) |
| | | | |
Net change in unrealized appreciation (depreciation) | | | (562,321,188 | ) |
| | | | |
Net realized and unrealized gain (loss) | | | (338,006,737 | ) |
| | | | |
Net increase (decrease) in net assets resulting from operations | | $ | 160,519,170 | |
| | | | |
The accompanying notes are an integral part of these financial statements.
FI-24
Franklin Templeton Variable Insurance Products Trust
Financial Statements (continued)
Statements of Changes in Net Assets
| | | | | | | | |
| | | Franklin Income
Securities Fund | |
| | | Year Ended December 31, | |
| | | 2011 | | | 2010 | |
| | | | |
Increase (decrease) in net assets: | | | | | | | | |
Operations: | | | | | | | | |
Net investment income | | $ | 498,525,907 | | | $ | 459,831,319 | |
Net realized gain (loss) from investments, written options and foreign currency transactions | | | 224,314,451 | | | | 1,566,016 | |
Net change in unrealized appreciation (depreciation) on investments and translation of other assets and liabilities denominated in foreign currencies | | | (562,321,188 | ) | | | 446,658,211 | |
| | | | |
Net increase (decrease) in net assets resulting from operations | | | 160,519,170 | | | | 908,055,546 | |
| | | | |
Distributions to shareholders from: | | | | | | | | |
Net investment income: | | | | | | | | |
Class 1 | | | (96,601,395 | ) | | | (70,751,613 | ) |
Class 2 | | | (356,087,463 | ) | | | (403,393,475 | ) |
Class 4 | | | (24,430,578 | ) | | | (24,551,628 | ) |
| | | | |
Total distributions to shareholders | | | (477,119,436 | ) | | | (498,696,716 | ) |
| | | | |
Capital share transactions: (Note 2) | | | | | | | | |
Class 1 | | | (55,103,339 | ) | | | 469,690,616 | |
Class 2 | | | (185,660,731 | ) | | | (125,499,592 | ) |
Class 4 | | | 31,595,919 | | | | 47,090,132 | |
| | | | |
Total capital share transactions | | | (209,168,151 | ) | | | 391,281,156 | |
| | | | |
Net increase (decrease) in net assets | | | (525,768,417 | ) | | | 800,639,986 | |
Net assets: | | | | | | | | |
Beginning of year | | | 8,173,775,379 | | | | 7,373,135,393 | |
| | | | |
End of year | | $ | 7,648,006,962 | | | $ | 8,173,775,379 | |
| | | | |
Undistributed net investment income included in net assets: | | | | | | | | |
End of year | | $ | 491,942,579 | | | $ | 459,449,020 | |
| | | | |
The accompanying notes are an integral part of these financial statements.
FI-25
Franklin Templeton Variable Insurance Products Trust
Notes to Financial Statements
Franklin Income Securities Fund
1. ORGANIZATION AND SIGNIFICANT ACCOUNTING POLICIES
Franklin Templeton Variable Insurance Products Trust (Trust) is registered under the Investment Company Act of 1940, as amended, (1940 Act) as an open-end investment company, consisting of twenty separate funds. The Franklin Income Securities Fund (Fund) is included in this report. The financial statements of the remaining funds in the Trust are presented separately. Shares of the Fund are generally sold only to insurance company separate accounts to fund the benefits of variable life insurance policies or variable annuity contracts. The Fund offers three classes of shares: Class 1, Class 2 and Class 4. Each class of shares differs by its distribution fees, voting rights on matters affecting a single class and its exchange privilege.
The following summarizes the Fund’s significant accounting policies.
a. Financial Instrument Valuation
The Fund’s investments in securities and other financial instruments are carried at fair value daily. Fair value is the price that would be received to sell an asset or paid to transfer a liability in an orderly transaction between market participants on the measurement date. Under procedures approved by the Trust’s Board of Trustees, the Fund may utilize independent pricing services, quotations from securities and financial instrument dealers, and other market sources to determine fair value.
Equity securities listed on an exchange or on the NASDAQ National Market System are valued at the last quoted sale price or the official closing price of the day, respectively. Foreign equity securities are valued as of the close of trading on the foreign stock exchange on which the security is primarily traded, or the NYSE, whichever is earlier. The value is then converted into its U.S. dollar equivalent at the foreign exchange rate in effect at the close of the NYSE on the day that the value of the security is determined. Over-the-counter securities are valued within the range of the most recent quoted bid and ask prices. Securities that trade in multiple markets or on multiple exchanges are valued according to the broadest and most representative market. Certain equity securities are valued based upon fundamental characteristics or relationships to similar securities. Investments in non-registered money market funds are valued at the closing net asset value.
Debt securities generally trade in the over-the-counter market rather than on a securities exchange. The Fund’s pricing services use multiple valuation techniques to determine fair value. In instances where sufficient market activity exists, the pricing services may utilize a market-based approach through which quotes from market makers are used to determine fair value. In instances where sufficient market activity may not exist or is limited, the pricing services also utilize proprietary valuation models which may consider market characteristics such as benchmark yield curves, option-adjusted spreads, credit spreads, estimated default rates, coupon rates, anticipated timing of principal repayments, underlying collateral, and other unique security features in order to estimate the relevant cash flows, which are then discounted to calculate the fair value. Securities denominated in a foreign currency are converted into their U.S. dollar equivalent at the foreign exchange rate in effect at the close of the NYSE on the date that the values of the foreign debt securities are determined. Repurchase agreements are valued at cost, which approximates market value.
The Fund has procedures to determine the fair value of securities and other financial instruments for which market prices are not readily available or which may not be reliably priced. Under these procedures, the Fund primarily employs a market-based approach which may use related or comparable assets or liabilities, recent transactions, market multiples, book values, and other relevant information for the investment to determine the fair value of the investment. The Fund may also use an income-based valuation approach in which the anticipated future cash flows of the investment are discounted to calculate fair value. Discounts may also be applied due to the nature or duration of any restrictions on the disposition of the investments. Due to the inherent uncertainty of valuations of such investments, the fair values may differ significantly from the values that would have been used had an active market existed.
Trading in securities on foreign securities stock exchanges and over-the-counter markets may be completed before the daily close of business on the NYSE. Occasionally, events occur between the time at which trading in a foreign security is completed and the close of the NYSE that might call into question the reliability of the value of a portfolio security held by the Fund. As a result,
FI-26
Franklin Templeton Variable Insurance Products Trust
Notes to Financial Statements (continued)
Franklin Income Securities Fund
1. ORGANIZATION AND SIGNIFICANT ACCOUNTING POLICIES (continued)
a. Financial Instrument Valuation (continued)
differences may arise between the value of the Fund’s portfolio securities as determined at the foreign market close and the latest indications of value at the close of the NYSE. In order to minimize the potential for these differences, the investment manager monitors price movements following the close of trading in foreign stock markets through a series of country specific market proxies (such as baskets of American Depositary Receipts, futures contracts and exchange traded funds). These price movements are measured against established trigger thresholds for each specific market proxy to assist in determining if an event has occurred that may call into question the reliability of the values of the foreign securities held by the Fund. If such an event occurs, the securities may be valued using fair value procedures, which may include the use of independent pricing services.
b. Foreign Currency Translation
Portfolio securities and other assets and liabilities denominated in foreign currencies are translated into U.S. dollars based on the exchange rate of such currencies against U.S. dollars on the date of valuation. The Fund may enter into foreign currency exchange contracts to facilitate transactions denominated in a foreign currency. Purchases and sales of securities, income and expense items denominated in foreign currencies are translated into U.S. dollars at the exchange rate in effect on the transaction date. Portfolio securities and assets and liabilities denominated in foreign currencies contain risks that those currencies will decline in value relative to the U.S. dollar. Occasionally, events may impact the availability or reliability of foreign exchange rates used to convert the U.S. dollar equivalent value. If such an event occurs, the foreign exchange rate will be valued at fair value using procedures established and approved by the Trust’s Board of Trustees.
The Fund does not separately report the effect of changes in foreign exchange rates from changes in market prices on securities held. Such changes are included in net realized and unrealized gain or loss from investments on the Statement of Operations.
Realized foreign exchange gains or losses arise from sales of foreign currencies, currency gains or losses realized between the trade and settlement dates on securities transactions and the difference between the recorded amounts of dividends, interest, and foreign withholding taxes and the U.S. dollar equivalent of the amounts actually received or paid. Net unrealized foreign exchange gains and losses arise from changes in foreign exchange rates on foreign denominated assets and liabilities other than investments in securities held at the end of the reporting period.
c. Joint Repurchase Agreement
The Fund enters into a joint repurchase agreement whereby its uninvested cash balance is deposited into a joint cash account with other funds managed by the investment manager or an affiliate of the investment manager and is used to invest in one or more repurchase agreements. The value and face amount of the joint repurchase agreement are allocated to the funds based on their pro-rata interest. A repurchase agreement is accounted for as a loan by the fund to the seller, collateralized by securities which are delivered to the fund’s custodian. The market value, including accrued interest, of the initial collateralization is required to be at least 102% of the dollar amount invested by the funds, with the value of the underlying securities marked to market daily to maintain coverage of at least 100%. The joint repurchase agreement held by the Fund at year end had been entered into on December 30, 2011.
d. Securities Purchased on a Delayed Delivery Basis
The Fund purchases securities on a delayed delivery basis, with payment and delivery scheduled for a future date. These transactions are subject to market fluctuations and are subject to the risk that the value at delivery may be more or less than the trade date purchase price. Although the Fund will generally purchase these securities with the intention of holding the securities, it may sell the securities before the settlement date. Sufficient assets have been segregated for these securities.
FI-27
Franklin Templeton Variable Insurance Products Trust
Notes to Financial Statements (continued)
Franklin Income Securities Fund
1. ORGANIZATION AND SIGNIFICANT ACCOUNTING POLICIES (continued)
e. Derivative Financial Instruments
The Fund invested in derivatives in order to manage risk or gain exposure to various other investments or markets. Derivatives are financial contracts based on an underlying or notional amount, require no initial investment or an initial net investment that is smaller than would normally be required to have a similar response to changes in market factors, and require or permit net settlement. Derivatives contain various risks including the potential inability of the counterparty to fulfill their obligations under the terms of the contract, the potential for an illiquid secondary market, and/or the potential for market movements which expose the Fund to gains or losses in excess of the amounts shown on the Statement of Assets and Liabilities. Realized gain and loss and unrealized appreciation and depreciation on these contracts for the period are included in the Statement of Operations.
The Fund purchased or wrote option contracts primarily to manage and/or gain exposure to equity price risk. An option is a contract entitling the holder to purchase or sell a specific amount of shares or units of an asset or notional amount of a swap (swaption), at a specified price. Options purchased are recorded as an asset while options written are recorded as a liability. Upon exercise of an option, the acquisition cost or sales proceeds of the underlying investment is adjusted by any premium received or paid. Upon expiration of an option, any premium received or paid is recorded as a realized gain or loss. Upon closing an option other than through expiration or exercise, the difference between the premium and the cost to close the position is recorded as a realized gain or loss. Pursuant to the terms of the written option contract, cash or securities may be required to be deposited as collateral.
See Notes 6 and 8 regarding investment transactions and other derivative information, respectively.
f. Equity-Linked Securities
The Fund invests in equity-linked securities. Equity-linked securities are hybrid financial instruments that generally combine both debt and equity characteristics into a single note form. Income received from equity linked securities is recorded as realized gains in the Statement of Operations and may be based on the performance of an underlying equity security, an equity index, or an option position. The risks of investing in equity-linked securities include unfavorable price movements in the underlying security and the credit risk of the issuing financial institution. There may be no guarantee of a return of principal with equity linked securities and the appreciation potential may be limited. Equity-linked securities may be more volatile and less liquid than other investments held by the Fund.
g. Securities Lending
The Fund participates in an agency based security lending program. The Fund receives cash collateral against the loaned securities in an amount equal to at least 102% of the market value of the loaned securities. Collateral is maintained over the life of the loan in an amount not less than 100% of the market value of loaned securities, as determined at the close of Fund business each day, any additional collateral required due to changes in security values is delivered to the Fund on the next business day. The collateral is invested in a non-registered money fund managed by the Fund’s custodian on the Fund’s behalf. The Fund receives income from the investment of cash collateral, in addition to lending fees and rebates paid by the borrower. The Fund bears the market risk with respect to the collateral investment, securities loaned, and the risk that the agent may default on its obligations to the Fund. The securities lending agent has agreed to indemnify the Fund in the event of default by a third party borrower.
h. Senior Floating Rate Interests
The Fund invests in senior secured corporate loans that pay interest at rates which are periodically reset by reference to a base lending rate plus a spread. These base lending rates are generally the prime rate offered by a designated U.S. bank or the London InterBank Offered Rate (LIBOR). Senior secured corporate loans often require prepayment of principal from excess cash flows or at the discretion of the borrower. As a result, actual maturity may be substantially less than the stated maturity.
FI-28
Franklin Templeton Variable Insurance Products Trust
Notes to Financial Statements (continued)
Franklin Income Securities Fund
1. ORGANIZATION AND SIGNIFICANT ACCOUNTING POLICIES (continued)
h. Senior Floating Rate Interests (continued)
Senior secured corporate loans in which the Fund invests are generally readily marketable, but may be subject to some restrictions on resale.
i. Income Taxes
It is the Fund’s policy to qualify as a regulated investment company under the Internal Revenue Code. The Fund intends to distribute to shareholders substantially all of its taxable income and net realized gains to relieve it from federal income and excise taxes. As a result, no provision for U.S. federal income taxes is required.
The Fund may be subject to foreign taxation related to income received, capital gains on the sale of securities and certain foreign currency transactions in the foreign jurisdictions in which it invests. Foreign taxes, if any, are recorded based on the tax regulations and rates that exist in the foreign markets in which the Fund invests. When a capital gain tax is determined to apply the Fund records an estimated deferred tax liability in an amount that would be payable if the securities were disposed of on the valuation date.
The Fund recognizes the tax benefits of uncertain tax positions only when the position is “more likely than not” to be sustained upon examination by the tax authorities based on the technical merits of the tax position. As of December 31, 2011, and for all open tax years, the Fund has determined that no liability for unrecognized tax benefits is required in the Fund’s financial statements related to uncertain tax positions taken on a tax return (or expected to be taken on future tax returns). Open tax years are those that remain subject to examination and are based on each tax jurisdiction statute of limitation.
j. Security Transactions, Investment Income, Expenses and Distributions
Security transactions are accounted for on trade date. Realized gains and losses on security transactions are determined on a specific identification basis. Interest income and estimated expenses are accrued daily. Amortization of premium and accretion of discount on debt securities are included in interest income. Facility fees are recognized as income over the expected term of the loan. Dividend income is recorded on the ex-dividend date except that certain dividends from foreign securities are recognized as soon as the Fund is notified of the ex-dividend date. Distributions to shareholders are recorded on the ex-dividend date and are determined according to income tax regulations (tax basis). Distributable earnings determined on a tax basis may differ from earnings recorded in accordance with accounting principles generally accepted in the United States of America. These differences may be permanent or temporary. Permanent differences are reclassified among capital accounts to reflect their tax character. These reclassifications have no impact on net assets or the results of operations. Temporary differences are not reclassified, as they may reverse in subsequent periods.
Common expenses incurred by the Trust are allocated among the funds based on the ratio of net assets of each fund to the combined net assets of the Trust. Fund specific expenses are charged directly to the fund that incurred the expense.
Realized and unrealized gains and losses and net investment income, not including class specific expenses, are allocated daily to each class of shares based upon the relative proportion of net assets of each class. Differences in per share distributions, by class, are generally due to differences in class specific expenses.
k. Accounting Estimates
The preparation of financial statements in accordance with accounting principles generally accepted in the United States of America requires management to make estimates and assumptions that affect the reported amounts of assets and liabilities at the date of the financial statements and the amounts of income and expenses during the reporting period. Actual results could differ from those estimates.
FI-29
Franklin Templeton Variable Insurance Products Trust
Notes to Financial Statements (continued)
Franklin Income Securities Fund
1. ORGANIZATION AND SIGNIFICANT ACCOUNTING POLICIES (continued)
l. Guarantees and Indemnifications
Under the Trust’s organizational documents, its officers and trustees are indemnified by the Trust against certain liabilities arising out of the performance of their duties to the Trust. Additionally, in the normal course of business, the Trust, on behalf of the Fund, enters into contracts with service providers that contain general indemnification clauses. The Trust’s maximum exposure under these arrangements is unknown as this would involve future claims that may be made against the Trust that have not yet occurred. Currently, the Trust expects the risk of loss to be remote.
2. SHARES OF BENEFICIAL INTEREST
At December 31, 2011, there were an unlimited number of shares authorized (without par value). Transactions in the Fund’s shares were as follows:
| | | | | | | | | | | | | | | | |
| | | Year Ended December 31, | |
| | | 2011 | | | 2010 | |
| Class 1 Shares: | | Shares | | | Amount | | | Shares | | | Amount | |
Shares sold | | | 46,373,672 | | | $ | 684,944,435 | | | | 44,758,864 | | | $ | 645,042,814 | |
Shares issued in reinvestment of distributions | | | 6,487,669 | | | | 96,601,395 | | | | 5,206,153 | | | | 70,751,613 | |
Shares redeemed | | | (59,777,035 | ) | | | (836,649,169 | ) | | | (17,515,669 | ) | | | (246,103,811 | ) |
| | | | |
Net increase (decrease) | | | (6,915,694 | ) | | $ | (55,103,339 | ) | | | 32,449,348 | | | $ | 469,690,616 | |
| | | | |
Class 2 Shares: | | | | | | | | | | | | | | | | |
Shares sold | | | 36,881,385 | | | $ | 540,163,327 | | | | 26,818,536 | | | $ | 380,019,084 | |
Shares issued in reinvestment of distributions | | | 24,473,365 | | | | 356,087,463 | | | | 30,330,336 | | | | 403,393,475 | |
Shares redeemed | | | (74,034,875 | ) | | | (1,081,911,521 | ) | | | (64,334,274 | ) | | | (908,912,151 | ) |
| | | | |
Net increase (decrease) | | | (12,680,125 | ) | | $ | (185,660,731 | ) | | | (7,185,402 | ) | | $ | (125,499,592 | ) |
| | | | |
Class 4 Shares: | | | | | | | | | | | | | | | | |
Shares sold | | | 4,165,273 | | | $ | 62,663,608 | | | | 4,608,224 | | | $ | 66,369,834 | |
Shares issued on reinvestment of distributions | | | 1,652,948 | | | | 24,430,578 | | | | 1,817,293 | | | | 24,551,628 | |
Shares redeemed | | | (3,777,871 | ) | | | (55,498,267 | ) | | | (3,057,456 | ) | | | (43,831,330 | ) |
| | | | |
Net increase (decrease) | | | 2,040,350 | | | $ | 31,595,919 | | | | 3,368,061 | | | $ | 47,090,132 | |
| | | | |
3. TRANSACTIONS WITH AFFILIATES
Franklin Resources, Inc. is the holding company for various subsidiaries that together are referred to as Franklin Templeton Investments. Certain officers and trustees of the Fund are also officers and/or directors of the following subsidiaries:
| | |
| Subsidiary | | Affiliation |
Franklin Advisers, Inc. (Advisers) | | Investment manager |
Franklin Templeton Services, LLC (FT Services) | | Administrative manager |
Franklin Templeton Distributors, Inc. (Distributors) | | Principal underwriter |
Franklin Templeton Investor Services, LLC (Investor Services) | | Transfer agent |
FI-30
Franklin Templeton Variable Insurance Products Trust
Notes to Financial Statements (continued)
Franklin Income Securities Fund
3. TRANSACTIONS WITH AFFILIATES (continued)
a. Management Fees
The Fund pays an investment management fee to Advisers based on the average daily net assets of the Fund as follows:
| | |
| Annualized Fee Rate | | Net Assets |
| 0.625% | | Up to and including $100 million |
| 0.500% | | Over $100 million, up to and including $250 million |
| 0.450% | | Over $250 million, up to and including $7.5 billion |
| 0.440% | | Over $7.5 billion, up to and including $10 billion |
| 0.430% | | Over $10 billion, up to and including $12.5 billion |
| 0.420% | | Over $12.5 billion, up to and including $15 billion |
| 0.400% | | In excess of $15 billion |
b. Administrative Fees
Under an agreement with Advisers, FT Services provides administrative services to the Fund. The fee is paid by Advisers based on average daily net assets, and is not an additional expense of the Fund.
c. Distribution Fees
The Trust’s Board of Trustees has adopted distribution plans for Class 2 and Class 4 shares pursuant to Rule 12b-1 under the 1940 Act. Under the Fund’s compensation distribution plans, the Fund pays Distributors for costs incurred in connection with the servicing, sale and distribution of the Fund’s shares up to 0.35% per year of its average daily net assets of each class. The Board of Trustees has agreed to limit the current rate to 0.25% per year for Class 2.
d. Transfer Agent Fees
Investor Services, under terms of an agreement, performs shareholder servicing for the Fund and is not paid by the Fund for the services.
f. Other Affiliated Transactions
At December 31, 2011, Franklin Templeton Variable Insurance Products Trust – Franklin Templeton VIP Founding Funds Allocation Fund owned 13.38% of the Fund’s outstanding shares.
4. EXPENSE OFFSET ARRANGEMENT
The Fund has entered into an arrangement with its custodian whereby credits realized as a result of uninvested cash balances are used to reduce a portion of the Fund’s custodian expenses. During the year ended December 31, 2011, the custodian fees were reduced as noted in the Statement of Operations.
5. INCOME TAXES
For tax purposes, capital losses may be carried over to offset future capital gains, if any. Under the Regulated Investment Company Modernization Act of 2010, capital losses incurred by the Fund in taxable years beginning after December 22, 2010 are not subject to expiration and such losses retain their character as either short-term or long-term, rather than being considered short-term as under previous law. Post-enactment capital losses must be fully utilized prior to utilizing any losses incurred in pre-enactment tax years.
FI-31
Franklin Templeton Variable Insurance Products Trust
Notes to Financial Statements (continued)
Franklin Income Securities Fund
5. INCOME TAXES (continued)
At December 31, 2011, capital loss carryforwards were as follows:
| | | | |
Capital loss carryforwards subject to expiration: | | | | |
2016 | | $ | 310,579,601 | |
2017 | | | 521,405,875 | |
2018 | | | 157,561,044 | |
| | | | |
| | $ | 989,546,520 | |
| | | | |
During the year ended December 31, 2011, the Fund utilized $214,403,056 of capital loss carryforwards.
The tax character of distributions paid during the years ended December 31, 2011 and 2010, was as follows:
| | | | | | | | |
| | | 2011 | | | 2010 | |
Distributions paid from ordinary income | | $ | 477,119,436 | | | $ | 498,696,716 | |
At December 31, 2011, the cost of investments, net unrealized appreciation (depreciation) and undistributed ordinary income for income tax purposes were as follows:
| | | | |
Cost of investments | | $ | 7,801,715,374 | |
| | | | |
| |
Unrealized appreciation | | $ | 689,042,293 | |
Unrealized depreciation | | | (920,814,742 | ) |
| | | | |
Net unrealized appreciation (depreciation) | | $ | (231,772,449 | ) |
| | | | |
Distributable earnings – undistributed ordinary income | | $ | 511,305,799 | |
| | | | |
Differences between income and/or capital gains as determined on a book basis and a tax basis are primarily due to differing treatments of defaulted securities, foreign currency transactions, payments-in-kind, bond discounts and premiums, corporate actions, and wash sales.
6. INVESTMENT TRANSACTIONS
Purchases and sales of investments (excluding short term securities) for the year ended December 31, 2011, aggregated $2,271,631,420 and $2,446,351,263, respectively.
Transactions in options written during the year ended December 31, 2011, were as follows:
| | | | | | | | |
| | | Number of
Contracts | | | Premiums
Received | |
Options outstanding at December 31, 2010 | | | 3,690 | | | $ | 415,499 | |
Options written | | | — | | | | — | |
Options expired | | | (3,690 | ) | | | (415,499 | ) |
Options exercised | | | — | | | | — | |
Options closed | | | — | | | | — | |
| | | | |
Options outstanding at December 31, 2011 | | | — | | | $ | — | |
| | | | |
See Notes 1(e) and 8 regarding derivative financial instruments and other derivative information, respectively.
FI-32
Franklin Templeton Variable Insurance Products Trust
Notes to Financial Statements (continued)
Franklin Income Securities Fund
7. CREDIT RISK AND DEFAULTED SECURITIES
At December 31, 2011, the Fund had 53.83% of its portfolio invested in high yield securities, senior secured floating rate notes, or other securities rated below investment grade. These securities may be more sensitive to economic conditions causing greater price volatility and are potentially subject to a greater risk of loss due to default than higher rated securities.
The Fund held defaulted securities and/or other securities for which the income has been deemed uncollectible. At December 31, 2011, the aggregate value of these securities was $117,098,330, representing 1.53% of the Fund’s net assets. The Fund discontinues accruing income on securities for which income has been deemed uncollectible and provides an estimate for losses on interest receivable. The securities have been identified on the accompanying Statement of Investments.
8. OTHER DERIVATIVE INFORMATION
For the year ended December 31, 2011, the effect of derivative contracts on the Fund’s Statement of Operations was as follows:
| | | | | | | | | | |
Derivative Contracts Not Accounted
for as Hedging Instruments | | Statement of Operations Locations | | Realized Gain
(Loss) for the
Year | | | Change in Unrealized
Appreciation (Depreciation)
for the Year | |
Equity contracts | | Net realized gain (loss) from written options / Net change in unrealized appreciation (depreciation) on investments | | $ | 415,499 | | | | 3,501 | |
For the year ended December 31, 2011, the average month end market value of derivatives represented less than 0.01% of average month end net assets. The average month end number of open derivative contracts for the year was 1.
See Note 1(e) regarding derivative financial instruments.
9. HOLDINGS OF 5% VOTING SECURITIES OF PORTFOLIO COMPANIES
The 1940 Act defines “affiliated companies” to include investments in portfolio companies in which a fund owns 5% or more of the outstanding voting securities. Investments in “affiliated companies” for the Fund for the year ended December 31, 2011, were as shown below.
| | | | | | | | | | | | | | | | | | | | | | | | | | | | |
| Name of Issuer | | Number of
Shares/Principal
Amount Held at Beginning of Year | | | Gross Additions | | | Gross Reductions | | | Number of
Shares/Principal
Amount Held at End of Year | | | Value at End of Year | | | Investment Income | | | Realized Capital Gain (Loss) | |
Non-Controlled Affiliates | | | | | | | | | | | | | | | | | | | | | | | | | | | | |
aDex Media West LLC, Term Loan B, 7.25%, 10/24/14 | | | 4,783,951 | | | | — | | | | 517,983 | | | | 4,265,968 | | | $ | 2,396,941 | | | $ | 274,187 | | | $ | 145,148 | |
Dex One Corp. | | | 2,642,381 | | | | — | | | | — | | | | 2,642,381 | | | | 4,386,353 | | | | — | | | | — | |
Dex One Corp., senior sub. note, PIK, 7.00%, 1/29/17 | | | 32,511,674 | | | | — | | | | — | | | | 32,511,674 | | | | 7,396,406 | | | | 3,484,168 | | | | — | |
| | | | | | | | | | | | | | | | | | | | |
Total Affiliated Securities
(0.19% of Net Assets) | | | | | | | | | | | | | | | | | | $ | 14,179,700 | | | $ | 3,758,355 | | | $ | 145,148 | |
| | | | | | | | | | | | | | | | | | | | |
aCompany is a wholly owned subsidiary of Dex One Corp.
FI-33
Franklin Templeton Variable Insurance Products Trust
Notes to Financial Statements (continued)
Franklin Income Securities Fund
10. CREDIT FACILITY
The Fund, together with other U.S. registered and foreign investment funds (collectively, Borrowers), managed by Franklin Templeton Investments, are borrowers in a joint syndicated senior unsecured credit facility totaling $750 million (Global Credit Facility) which matured on January 20, 2012. This Global Credit Facility provides a source of funds to the Borrowers for temporary and emergency purposes, including the ability to meet future unanticipated or unusually large redemption requests. Effective January 20, 2012, the Borrowers renewed the Global Credit Facility for a total of $1.5 billion, maturing January 18, 2013.
Under the terms of the Global Credit Facility, the Fund shall, in addition to interest charged on any borrowings made by the Fund and other costs incurred by the Fund, pay its share of fees and expenses incurred in connection with the implementation and maintenance of the Global Credit Facility, based upon its relative share of the aggregate net assets of all of the Borrowers, including an annual commitment fee of 0.08% based upon the unused portion of the Global Credit Facility, which is reflected in other expenses on the Statement of Operations. During the year ended December 31, 2011, the Fund did not use the Global Credit Facility.
11. FAIR VALUE MEASUREMENTS
The Fund follows a fair value hierarchy that distinguishes between market data obtained from independent sources (observable inputs) and the Fund’s own market assumptions (unobservable inputs). These inputs are used in determining the value of the Fund’s investments and are summarized in the following fair value hierarchy:
| | • | | Level 1 – quoted prices in active markets for identical securities |
| | • | | Level 2 – other significant observable inputs (including quoted prices for similar securities, interest rates, prepayment speed, credit risk, etc.) |
| | • | | Level 3 – significant unobservable inputs (including the Fund’s own assumptions in determining the fair value of investments) |
The inputs or methodology used for valuing securities are not an indication of the risk associated with investing in those securities.
For movements between the levels within the fair value hierarchy, the Fund has adopted a policy of recognizing the transfers as of the date of the underlying event which caused the movement.
FI-34
Franklin Templeton Variable Insurance Products Trust
Notes to Financial Statements (continued)
Franklin Income Securities Fund
11. FAIR VALUE MEASUREMENTS (continued)
The following is a summary of the inputs used as of December 31, 2011, in valuing the Fund’s assets and liabilities carried at fair value:
| | | | | | | | | | | | | | | | |
| | | Level 1 | | | Level 2 | | | Level 3 | | | Total | |
| | | | |
Assets: | | | | | | | | | | | | | | | | |
Investments in Securities: | | | | | | | | | | | | | | | | |
Equity Investments:a | | | | | | | | | | | | | | | | |
Consumer Discretionary | | $ | 101,306,003 | | | $ | 5,775,293 | | | $ | — | | | $ | 107,081,296 | |
Energy | | | 413,770,815 | | | | 24,581,250 | | | | — | | | | 438,352,065 | |
Financials | | | 476,653,363 | | | | 93,414,607 | | | | — | | | | 570,067,970 | |
Health Care | | | 486,492,824 | | | | 11,542,500 | | | | — | | | | 498,035,324 | |
All Other Equity Investmentsb | | | 1,304,886,586 | | | | — | | | | — | | | | 1,304,886,586 | |
Equity-Linked Securities | | | — | | | | 111,893,273 | | | | — | | | | 111,893,273 | |
Convertible Bonds | | | — | | | | 80,449,575 | | | | — | | | | 80,449,575 | |
Corporate Bonds | | | — | | | | 3,612,842,694 | | | | — | | | | 3,612,842,694 | |
Senior Floating Rate Interests | | | — | | | | 608,082,864 | | | | — | | | | 608,082,864 | |
Asset-Backed Securities and Commercial Mortgage-Backed Securities | | | — | | | | 34,608,377 | | | | — | | | | 34,608,377 | |
Municipal Bonds | | | — | | | | 24,761,198 | | | | — | | | | 24,761,198 | |
Short Term Investments | | | — | | | | 178,881,703 | | | | — | | | | 178,881,703 | |
| | | | |
Total Investments in Securities | | $ | 2,783,109,591 | | | $ | 4,786,833,334 | | | $ | — | | | $ | 7,569,942,925 | |
| | | | |
aIncludes common, preferred, and convertible preferred stocks as well as other equity investments.
bFor detailed categories, see the accompanying Statement of Investments.
12. NEW ACCOUNTING PRONOUNCEMENTS
In May 2011, the Financial Accounting Standards Board (FASB) issued Accounting Standards Update (ASU) No. 2011-04, Fair Value Measurement (Topic 820): Amendments to Achieve Common Fair Value Measurement and Disclosure Requirements in U.S. GAAP and IFRSs. The amendments in the ASU will improve the comparability of fair value measurements presented and disclosed in financial statements prepared in accordance with U.S. GAAP (Generally Accepted Accounting Principles) and IFRS (International Financial Reporting Standards) and include new guidance for certain fair value measurement principles and disclosure requirements. The ASU is effective for interim and annual periods beginning after December 15, 2011. The Fund believes the adoption of this ASU will not have a material impact on its financial statements.
13. SUBSEQUENT EVENTS
The Fund has evaluated subsequent events through the issuance of the financial statements and determined that no events have occurred that require disclosure other than those already disclosed in the financial statements.
| | | | |
ABBREVIATIONS | | | | |
| Currency | | Selected Portfolio | | |
| | | | |
| Euro - Euro | | ADR - American Depository Receipt | | |
| GBP - British Pound | | FRN - Floating Rate Note | | |
| | GO - General Obligation | | |
| | L/C - Letter of Credit | | |
| | MTN - Medium Term Note | | |
| | PIK - Payment-In-Kind | | |
FI-35
Franklin Templeton Variable Insurance Products Trust
Franklin Income Securities Fund
Report of Independent Registered Public Accounting Firm
To the Board of Trustees and Shareholders of Franklin Templeton Variable Insurance Products Trust
In our opinion, the accompanying statement of assets and liabilities, including the statement of investments, and the related statements of operations and of changes in net assets and the financial highlights present fairly, in all material respects, the financial position of Franklin Income Securities Fund (the “Fund”) at December 31, 2011, the results of its operations for the year then ended, the changes in its net assets for each of the two years in the period then ended and the financial highlights for each of the periods presented, in conformity with accounting principles generally accepted in the United States of America. These financial statements and financial highlights (hereafter referred to as “financial statements”) are the responsibility of the Fund’s management. Our responsibility is to express an opinion on these financial statements based on our audits. We conducted our audits of these financial statements in accordance with the standards of the Public Company Accounting Oversight Board (United States). Those standards require that we plan and perform the audit to obtain reasonable assurance about whether the financial statements are free of material misstatement. An audit includes examining, on a test basis, evidence supporting the amounts and disclosures in the financial statements, assessing the accounting principles used and significant estimates made by management, and evaluating the overall financial statement presentation. We believe that our audits, which included confirmation of securities at December 31, 2011 by correspondence with the custodian and brokers, provide a reasonable basis for our opinion.
PricewaterhouseCoopers LLP
San Francisco, California
February 13, 2012
FI-36
Franklin Templeton Variable Insurance Products Trust
Tax Information (unaudited)
Franklin Income Securities Fund
Under Section 854(b)(1)(A) of the Internal Revenue Code, the Fund hereby reports 20.93% of the ordinary income dividends as income qualifying for the dividends received deduction for the fiscal year ended December 31, 2011.
FI-37
FRANKLIN LARGE CAP GROWTH SECURITIES FUND
This annual report for Franklin Large Cap Growth Securities Fund covers the fiscal year ended December 31, 2011.
Performance Summary as of 12/31/11
Average annual total return of Class 1 shares represents the average annual change in value, assuming reinvestment of dividends and capital gains. Average returns smooth out variations in returns, which can be significant; they are not the same as year-by-year results.
Periods ended 12/31/11
| | | | | | | | | | | | |
| | | 1-Year | | | 5-Year | | | 10-Year | |
Average Annual Total Return | | | -1.22% | | | | +0.08% | | | | +1.83% | |
Total Return Index Comparison for a Hypothetical $10,000 Investment (1/1/02–12/31/11)
The graph below shows the change in value of a hypothetical $10,000 investment in the Fund over the indicated period and includes reinvestment of any income or distributions. The Fund’s performance is compared to the performance of the Standard & Poor’s® 500 Index (S&P 500®) and the Russell 1000® Growth Index. One cannot invest directly in an index, and an index is not representative of the Fund’s portfolio. Please see Important Notes to Performance Information preceding the Fund Summaries.
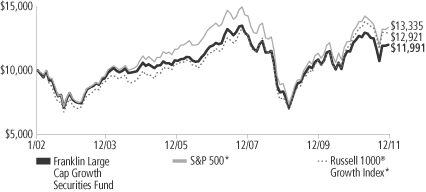
Source: © 2012 Morningstar. Please see Index Descriptions following the Fund Summaries.
Franklin Large Cap Growth Securities Fund Class 1
Performance reflects the Fund’s Class 1 operating expenses, but does not include any contract fees, expenses or sales charges. If they had been included, performance would be lower. These charges and deductions, particularly for variable life policies, can have a significant effect on contract values and insurance benefits. See the contract prospectus for a complete description of these expenses, including sales charges.
Performance data represent past performance, which does not guarantee future results. Investment return and principal value will fluctuate, and you may have a gain or loss when you sell your shares.
Current performance may differ from figures shown.
FLG-1
Fund Goal and Main Investments: Franklin Large Cap Growth Securities Fund seeks capital appreciation. The Fund normally invests at least 80% of its net assets in investments of large-capitalization companies. For this Fund, large-capitalization companies are those with market capitalization values within those of the top 50% of companies in the Russell 1000® Index at the time of purchase.1
Performance Overview
You can find the Fund’s one-year total return in the Performance Summary. The Fund underperformed its primary benchmark, the S&P 500, which posted a +2.11% total return.2 The Fund also underperformed its secondary benchmark, the Russell 1000® Growth Index, which delivered a +2.64% total return for the same period.2
Economic and Market Overview
The U.S. economy improved steadily but modestly in 2011 despite geopolitical, employment and housing pressures. The U.S. manufacturing sector helped power the domestic economy and led global manufacturing output heading into 2012. Although manufacturing growth slowed in the second half of the year as high commodity prices reduced purchasing power and demand ebbed, the trend began to reverse near year-end. U.S. gross domestic product (GDP) growth advanced each quarter, and the nation’s unemployment rate fell from 9.4% to 8.5%.3
The U.S. financial system and household balance sheets continued to improve, but the country still faced persistently high unemployment, a prolonged housing market slump and massive national debt. The U.S. Federal Reserve Board (Fed) cut the country’s growth forecast partly due to the heightened potential for recession in Europe and cooling GDP trends across much of Asia. Inflation rose for much of the world but stayed relatively contained in the U.S., even slowing toward year-end amid declining energy and food prices. The Fed sought to boost economic growth by maintaining its accommodative monetary policy and undertook a second round of quantitative easing that ended on June 30. Subsequently, the Fed continued to purchase Treasuries with proceeds from maturing debt in an effort to support economic growth.
1. Please see Index Descriptions following the Fund Summaries.
2. Source: © 2012 Morningstar. One cannot invest directly in an index, and an index is not representative of the Fund’s portfolio. Please see Index Descriptions following the Fund Summaries.
3. Source: Bureau of Labor Statistics.
Fund Risks: All investments involve risks. Stock prices fluctuate, sometimes rapidly and dramatically, due to factors affecting individual companies, particular industries or sectors, or general market conditions. The Fund may have substantial investments in particular sectors from time to time, such as the technology sector (including health care technology, electronic technology and technology services), which has been among the most volatile sectors in the market, as well as the communications and financial services sectors, and may be at greater risk from adverse developments in a sector than a fund that invests more broadly. Smaller and midsize company securities can increase the risk of greater price fluctuations, particularly over the short term. Foreign investing involves additional risks, including currency fluctuations, economic instability, market volatility, and political and social instability. The Fund is actively managed but there is no guarantee that the manager’s investment decisions will produce the desired results. The Fund’s prospectus also includes a description of the main investment risks.
FLG-2
Although U.S. stock markets rallied in the spring, worrisome global events and slowing global growth dampened investor sentiment and market volatility surged. Risk-averse investors sought perceived safe havens and seemed to ignore that many U.S. companies generated record profits. Despite large swings, U.S. stocks as measured by the S&P 500 gained 2.11% in 2011.2 The Dow Jones Industrial Average rose 8.38%, reflecting investors’ general preference for large, established U.S. companies.2 Notably, the U.S. was a global market leader in 2011 as the country continued to be a relative haven. During the year, sector performance varied widely. Noncyclical, income-producing sectors such as utilities, consumer staples and health care led the market, while economically sensitive sectors such as materials and industrials lagged. Financials in the S&P 500 experienced the worst sector decline, as U.S. bank stocks generally tracked their European peers. Against this backdrop, growth stocks fared better than their value counterparts; large-capitalization stocks advanced slightly as a group, with modestly negative results for most small- and mid-sized company stocks, as measured by Russell capitalization-based indexes.
Investment Strategy
We employ our long-held strategy: bottom-up, individual-company, fundamental research aimed at opportunistically finding what we believe to be outstanding large-cap companies across all sectors, at valuations we believe understate their fair worth, with future growth potential being a key driver of estimated worth. In doing so, we work hard seeking to ensure we are being adequately compensated for the risks that are inherent to all forecasting efforts, aiming to own those stocks that make the most sense from a risk/return perspective. We believe this disciplined, bottom-up analysis of future growth potential, current valuation and other risks on a stock-by-stock basis best supports our efforts to maintain a portfolio with superior risk/return characteristics and thus affords us the best prospects for strong performance over the long term.
Manager’s Discussion
Looking back on the key factors impacting the Fund’s returns during the year under review, we would like to remind shareholders that our investment strategy is primarily bottom-up and driven by individual stock selection. However, we recognize that a sector-based discussion can be a helpful way to organize a portfolio review of key performance drivers.
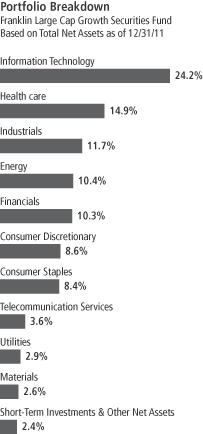
FLG-3
From a sector perspective, our underweighted allocation and stock selection in the materials sector helped the Fund’s performance relative to the S&P 500. In particular, our position in precious metals producer Freeport-McMoRan Copper & Gold boosted performance.4 Our decision to avoid several poor-performing telecommunication services stocks also aided relative results. Stock selection in the energy sector aided performance, largely due to our holding in independent oil and natural gas company Petrohawk Energy.4, 5 Petrohawk shares rose as the company was acquired by BHP Billiton during the year.
Other key contributors to relative Fund returns included health insurer Aetna, credit services company MasterCard and investment bank Goldman Sachs Group.4
In contrast, the Fund’s holdings in the consumer discretionary area detracted from performance relative to the S&P 500, particularly our position in hotel operator Marriott International.4
The Fund’s holdings in the information technology sector also detracted from relative returns. In particular, the shares of mobile phone manufacturer Research in Motion5 and electronic equipment manufacturer Hewlett-Packard both lost value in part due to disappointing results related to declines in their market share.
Thank you for your participation in Franklin Large Cap Growth Securities Fund. We look forward to serving your future investment needs.
4. Sold by period-end.
5. This holding is not an index component.
The foregoing information reflects our analysis, opinions and portfolio holdings as of December 31, 2011, the end of the reporting period. The way we implement our main investment strategies and the resulting portfolio holdings may change depending on factors such as market and economic conditions. These opinions may not be relied upon as investment advice or an offer for a particular security. The information is not a complete analysis of every aspect of any market, country, industry, security or the Fund. Statements of fact are from sources considered reliable, but the investment manager makes no representation or warranty as to their completeness or accuracy. Although historical performance is no guarantee of future results, these insights may help you understand our investment management philosophy.
Top 10 Holdings
Franklin Large Cap Growth
Securities Fund
12/31/11
| | | | |
Company
Sector/Industry | | % of Total
Net Assets | |
| Apple Inc. | | | 3.8% | |
| Information Technology | | | | |
| Wells Fargo & Co. | | | 3.2% | |
| Financials | | | | |
| Google Inc. | | | 2.7% | |
| Information Technology | | | | |
| U.S. Bancorp | | | 2.4% | |
| Financials | | | | |
| JPMorgan Chase & Co. | | | 2.2% | |
| Financials | | | | |
| AT&T Inc. | | | 2.1% | |
| Telecommunication Services | | | | |
| The Boeing Co. | | | 2.1% | |
| Industrials | | | | |
| General Electric Co. | | | 2.1% | |
| Industrials | | | | |
| Anadarko Petroleum Corp. | | | 2.0% | |
| Energy | | | | |
| PepsiCo Inc. | | | 2.0% | |
| Consumer Staples | | | | |
The dollar value, number of shares or principal amount, and names of all portfolio holdings are listed in the Fund’s Statement of Investments.
FLG-4
Fund Expenses
As an investor in a variable insurance contract (Contract) that indirectly provides for investment in an underlying mutual fund, you can incur transaction and/or ongoing expenses at both the Fund level and the Contract level.
| • | | Transaction expenses can include sales charges (loads) on purchases, redemption fees, surrender fees, transfer fees and premium taxes. |
| • | | Ongoing expenses can include management fees, distribution and service (12b-1) fees, contract fees, annual maintenance fees, mortality and expense risk fees and other fees and expenses. All mutual funds and Contracts have some types of ongoing expenses. |
The expenses shown in the table are meant to highlight ongoing expenses at the Fund level only and do not include ongoing expenses at the Contract level, or transaction expenses at either the Fund or Contract level. While the Fund does not have transaction expenses, if the transaction and ongoing expenses at the Contract level were included, the expenses shown would be higher. You should consult your Contract prospectus or disclosure document for more information.
The table shows Fund-level ongoing expenses and can help you understand these expenses and compare them with those of other mutual funds offered through the Contract. The table assumes a $1,000 investment held for the six months indicated. Please refer to the Fund prospectus for additional information on operating expenses.
Actual Fund Expenses
The first line (Actual) of the table provides actual account values and expenses. The “Ending Account Value” is derived from the Fund’s actual return, which includes the effect of ongoing Fund expenses, but does not include the effect of ongoing Contract expenses.
You can estimate the Fund-level expenses you incurred during the period by following these steps. Of course, your account value and expenses will differ from those in this illustration:
| 1. | Divide your account value by $1,000. |
If an account had an $8,600 value, then $8,600 ÷ $1,000 = 8.6.
| 2. | Multiply the result by the number under the heading “Fund-Level Expenses Incurred During Period.” |
If Fund-Level Expenses Incurred During Period were $7.50, then 8.6 x $7.50 = $64.50.
In this illustration, the estimated expenses incurred this period at the Fund level are $64.50.
Franklin Large Cap Growth Securities Fund Class 1
FLG-5
Hypothetical Example for Comparison with Other Mutual Funds
Information in the second line (Hypothetical) of the table can help you compare ongoing expenses of the Fund with those of other mutual funds offered through the Contract. This information may not be used to estimate the actual ending account balance or expenses you incurred during the period. The hypothetical “Ending Account Value” is based on the Fund’s actual expense ratio and an assumed 5% annual rate of return before expenses, which does not represent the Fund’s actual return. The figure under the heading “Fund-Level Expenses Incurred During Period” shows the hypothetical expenses your account would have incurred under this scenario. You can compare this figure with the 5% hypothetical examples that appear in shareholder reports of other funds offered through a Contract.
| | | | | | | | | | | | |
| Class 1 | | Beginning
Account Value 7/1/11 | | | Ending
Account
Value 12/31/11 | | | Fund-Level
Expenses Incurred
During Period*
7/1/11–12/31/11 | |
Actual | | $ | 1,000 | | | $ | 955.90 | | | $ | 3.94 | |
Hypothetical (5% return before expenses) | | $ | 1,000 | | | $ | 1,021.17 | | | $ | 4.08 | |
*Expenses are calculated using the most recent six-month annualized expense ratio for the Fund’s Class 1 shares (0.80%), which does not include any ongoing expenses of the Contract for which the Fund is an investment option, multiplied by the average account value over the period, multiplied by 184/365 to reflect the one-half year period.
FLG-6
Franklin Templeton Variable Insurance Products Trust
Financial Highlights
Franklin Large Cap Growth Securities Fund
| | | | | | | | | | | | | | | | | | | | |
| | | Year Ended December 31, | |
| Class 1 | | 2011 | | | 2010 | | | 2009 | | | 2008 | | | 2007 | |
| | | | |
Per share operating performance | | | | | | | | | | | | | | | | | | | | |
(for a share outstanding throughout the year) | | | | | | | | | | | | | | | | | | | | |
Net asset value, beginning of year | | $ | 15.07 | | | $ | 13.62 | | | $ | 10.66 | | | $ | 17.51 | | | $ | 16.70 | |
| | | | |
Income from investment operationsa: | | | | | | | | | | | | | | | | | | | | |
Net investment incomeb | | | 0.15 | | | | 0.12 | | | | 0.12 | | | | 0.17 | | | | 0.21 | |
Net realized and unrealized gains (losses) | | | (0.33 | ) | | | 1.48 | | | | 3.04 | | | | (5.82 | ) | | | 0.89 | |
| | | | |
Total from investment operations | | | (0.18 | ) | | | 1.60 | | | | 3.16 | | | | (5.65 | ) | | | 1.10 | |
| | | | |
Less distributions from: | | | | | | | | | | | | | | | | | | | | |
Net investment income | | | (0.14 | ) | | | (0.15 | ) | | | (0.20 | ) | | | (0.24 | ) | | | (0.16 | ) |
Net realized gains | | | — | | | | — | | | | — | | | | (0.96 | ) | | | (0.13 | ) |
| | | | |
Total distributions | | | (0.14 | ) | | | (0.15 | ) | | | (0.20 | ) | | | (1.20 | ) | | | (0.29 | ) |
| | | | |
Net asset value, end of year | | $ | 14.75 | | | $ | 15.07 | | | $ | 13.62 | | | $ | 10.66 | | | $ | 17.51 | |
| | | | |
| | | | | |
Total returnc | | | (1.22)% | | | | 11.85% | | | | 30.04% | | | | (34.39)% | | | | 6.53% | |
Ratios to average net assets | | | | | | | | | | | | | | | | | | | | |
Expenses | | | 0.80% | | | | 0.79% | | | | 0.81% | d | | | 0.77% | d | | | 0.74% | d |
Net investment income | | | 0.99% | | | | 0.86% | | | | 1.03% | | | | 1.19% | | | | 1.21% | |
| | | | | |
Supplemental data | | | | | | | | | | | | | | | | | | | | |
Net assets, end of year (000’s) | | $ | 48,666 | | | $ | 58,265 | | | $ | 58,287 | | | $ | 51,651 | | | $ | 96,920 | |
Portfolio turnover rate | | | 56.61% | | | | 46.75% | | | | 71.95% | | | | 66.04% | | | | 50.67% | |
aThe amount shown for a share outstanding throughout the period may not correlate with the Statement of Operations for the period due to the timing of sales and repurchases of the Fund shares in relation to income earned and/or fluctuating market value of the investments of the Fund.
bBased on average daily shares outstanding.
cTotal return does not include fees, charges or expenses imposed by the variable annuity and life insurance contracts for which the Franklin Templeton Variable Insurance Products Trust serves as an underlying investment vehicle.
dBenefit of expense reduction rounds to less than 0.01%.
The accompanying notes are an integral part of these financial statements.
FLG-7
Franklin Templeton Variable Insurance Products Trust
Financial Highlights (continued)
Franklin Large Cap Growth Securities Fund
| | | | | | | | | | | | | | | | | | | | |
| | | Year Ended December 31, | |
| Class 2 | | 2011 | | | 2010 | | | 2009 | | | 2008 | | | 2007 | |
| | | | |
Per share operating performance | | | | | | | | | | | | | | | | | | | | |
(for a share outstanding throughout the year) | | | | | | | | | | | | | | | | | | | | |
Net asset value, beginning of year | | $ | 14.86 | | | $ | 13.43 | | | $ | 10.50 | | | $ | 17.25 | | | $ | 16.47 | |
| | | | |
Income from investment operationsa: | | | | | | | | | | | | | | | | | | | | |
Net investment incomeb | | | 0.11 | | | | 0.08 | | | | 0.09 | | | | 0.13 | | | | 0.17 | |
Net realized and unrealized gains (losses) | | | (0.33 | ) | | | 1.46 | | | | 3.00 | | | | (5.73 | ) | | | 0.87 | |
| | | | |
Total from investment operations | | | (0.22 | ) | | | 1.54 | | | | 3.09 | | | | (5.60 | ) | | | 1.04 | |
| | | | |
Less distributions from: | | | | | | | | | | | | | | | | | | | | |
Net investment income | | | (0.10 | ) | | | (0.11 | ) | | | (0.16 | ) | | | (0.19 | ) | | | (0.13 | ) |
Net realized gains | | | — | | | | — | | | | — | | | | (0.96 | ) | | | (0.13 | ) |
| | | | |
Total distributions | | | (0.10 | ) | | | (0.11 | ) | | | (0.16 | ) | | | (1.15 | ) | | | (0.26 | ) |
| | | | |
Net asset value, end of year | | $ | 14.54 | | | $ | 14.86 | | | $ | 13.43 | | | $ | 10.50 | | | $ | 17.25 | |
| | | | |
| | | | | |
Total returnc | | | (1.51)% | | | | 11.59% | | | | 29.73% | | | | (34.53)% | | | | 6.23% | |
Ratios to average net assets | | | | | | | | | | | | | | | | | | | | |
Expenses | | | 1.05% | | | | 1.04% | | | | 1.06% | d | | | 1.02% | d | | | 0.99% | d |
Net investment income | | | 0.74% | | | | 0.61% | | | | 0.78% | | | | 0.94% | | | | 0.96% | |
| | | | | |
Supplemental data | | | | | | | | | | | | | | | | | | | | |
Net assets, end of year (000’s) | | $ | 293,226 | | | $ | 357,405 | | | $ | 373,821 | | | $ | 328,597 | | | $ | 642,351 | |
Portfolio turnover rate | | | 56.61% | | | | 46.75% | | | | 71.95% | | | | 66.04% | | | | 50.67% | |
aThe amount shown for a share outstanding throughout the period may not correlate with the Statement of Operations for the period due to the timing of sales and repurchases of the Fund shares in relation to income earned and/or fluctuating market value of the investments of the Fund.
bBased on average daily shares outstanding.
cTotal return does not include fees, charges or expenses imposed by the variable annuity and life insurance contracts for which the Franklin Templeton Variable Insurance Products Trust serves as an underlying investment vehicle.
dBenefit of expense reduction rounds to less than 0.01%.
The accompanying notes are an integral part of these financial statements.
FLG-8
Franklin Templeton Variable Insurance Products Trust
Statement of Investments, December 31, 2011
| | | | | | | | | | |
| Franklin Large Cap Growth Securities Fund | | Country | | Shares | | | Value | |
Common Stocks 97.6% | | | | | | | | | | |
Consumer Discretionary 8.6% | | | | | | | | | | |
Abercrombie & Fitch Co., A | | United States | | | 53,800 | | | $ | 2,627,592 | |
aAmazon.com Inc. | | United States | | | 8,600 | | | | 1,488,660 | |
aBorgWarner Inc. | | United States | | | 76,300 | | | | 4,863,362 | |
Comcast Corp., A | | United States | | | 225,300 | | | | 5,341,863 | |
aFord Motor Co. | | United States | | | 134,900 | | | | 1,451,524 | |
Kohl’s Corp. | | United States | | | 72,900 | | | | 3,597,615 | |
NIKE Inc., B | | United States | | | 19,100 | | | | 1,840,667 | |
Target Corp. | | United States | | | 55,100 | | | | 2,822,222 | |
The Walt Disney Co. | | United States | | | 139,400 | | | | 5,227,500 | |
| | | | | | | | | | |
| | | | | | | | | 29,261,005 | |
| | | | | | | | | | |
Consumer Staples 8.4% | | | | | | | | | | |
Altria Group Inc. | | United States | | | 57,400 | | | | 1,701,910 | |
Costco Wholesale Corp. | | United States | | | 16,900 | | | | 1,408,108 | |
CVS Caremark Corp. | | United States | | | 114,500 | | | | 4,669,310 | |
PepsiCo Inc. | | United States | | | 104,400 | | | | 6,926,940 | |
Philip Morris International Inc. | | United States | | | 81,400 | | | | 6,388,272 | |
The Procter & Gamble Co. | | United States | | | 66,945 | | | | 4,465,901 | |
Wal-Mart Stores Inc. | | United States | | | 27,000 | | | | 1,613,520 | |
Walgreen Co. | | United States | | | 43,554 | | | | 1,439,895 | |
| | | | | | | | | | |
| | | | | | | | | 28,613,856 | |
| | | | | | | | | | |
Energy 10.4% | | | | | | | | | | |
Anadarko Petroleum Corp. | | United States | | | 91,050 | | | | 6,949,846 | |
Chevron Corp. | | United States | | | 50,700 | | | | 5,394,480 | |
ConocoPhillips | | United States | | | 64,700 | | | | 4,714,689 | |
Devon Energy Corp. | | United States | | | 56,700 | | | | 3,515,400 | |
Exxon Mobil Corp. | | United States | | | 57,700 | | | | 4,890,652 | |
Halliburton Co. | | United States | | | 114,800 | | | | 3,961,748 | |
Schlumberger Ltd. | | United States | | | 63,970 | | | | 4,369,791 | |
aSuperior Energy Services Inc. | | United States | | | 64,600 | | | | 1,837,224 | |
| | | | | | | | | | |
| | | | | | | | | 35,633,830 | |
| | | | | | | | | | |
Financials 10.3% | | | | | | | | | | |
Aflac Inc. | | United States | | | 38,900 | | | | 1,682,814 | |
American Express Co. | | United States | | | 26,400 | | | | 1,245,288 | |
Bank of America Corp. | | United States | | | 140,700 | | | | 782,292 | |
BlackRock Inc. | | United States | | | 12,900 | | | | 2,299,296 | |
Citigroup Inc. | | United States | | | 34,990 | | | | 920,587 | |
Invesco Ltd. | | United States | | | 81,300 | | | | 1,633,317 | |
JPMorgan Chase & Co. | | United States | | | 227,145 | | | | 7,552,571 | |
U.S. Bancorp | | United States | | | 298,627 | | | | 8,077,861 | |
Wells Fargo & Co. | | United States | | | 393,700 | | | | 10,850,372 | |
| | | | | | | | | | |
| | | | | | | | | 35,044,398 | |
| | | | | | | | | | |
Health Care 14.9% | | | | | | | | | | |
Aetna Inc. | | United States | | | 157,000 | | | | 6,623,830 | |
aAgilent Technologies Inc. | | United States | | | 115,300 | | | | 4,027,429 | |
aExpress Scripts Inc. | | United States | | | 148,900 | | | | 6,654,341 | |
aGilead Sciences Inc. | | United States | | | 95,700 | | | | 3,917,001 | |
aIllumina Inc. | | United States | | | 45,800 | | | | 1,395,984 | |
Johnson & Johnson | | United States | | | 90,900 | | | | 5,961,222 | |
Medtronic Inc. | | United States | | | 56,500 | | | | 2,161,125 | |
Merck & Co. Inc. | | United States | | | 149,575 | | | | 5,638,977 | |
FLG-9
Franklin Templeton Variable Insurance Products Trust
Statement of Investments, December 31, 2011 (continued)
| | | | | | | | | | |
| Franklin Large Cap Growth Securities Fund | | Country | | Shares | | | Value | |
Common Stocks (continued) | | | | | | | | | | |
Health Care (continued) | | | | | | | | | | |
Pfizer Inc. | | United States | | | 218,700 | | | $ | 4,732,668 | |
Roche Holding AG, ADR | | Switzerland | | | 124,000 | | | | 5,276,200 | |
Teva Pharmaceutical Industries Ltd., ADR | | Israel | | | 51,416 | | | | 2,075,150 | |
aThoratec Corp. | | United States | | | 77,200 | | | | 2,590,832 | |
| | | | | | | | | | |
| | | | | | | | | 51,054,759 | |
| | | | | | | | | | |
Industrials 11.7% | | | | | | | | | | |
The Boeing Co. | | United States | | | 98,100 | | | | 7,195,635 | |
Caterpillar Inc. | | United States | | | 32,300 | | | | 2,926,380 | |
Emerson Electric Co. | | United States | | | 95,600 | | | | 4,454,004 | |
Expeditors International of Washington Inc. | | United States | | | 94,090 | | | | 3,853,926 | |
FedEx Corp. | | United States | | | 47,100 | | | | 3,933,321 | |
General Electric Co. | | United States | | | 394,100 | | | | 7,058,331 | |
Precision Castparts Corp. | | United States | | | 19,200 | | | | 3,163,968 | |
Union Pacific Corp. | | United States | | | 29,200 | | | | 3,093,448 | |
United Technologies Corp. | | United States | | | 60,900 | | | | 4,451,181 | |
| | | | | | | | | | |
| | | | | | | | | 40,130,194 | |
| | | | | | | | | | |
Information Technology 24.2% | | | | | | | | | | |
aApple Inc. | | United States | | | 32,200 | | | | 13,041,000 | |
Broadcom Corp., A | | United States | | | 39,600 | | | | 1,162,656 | |
Cisco Systems Inc. | | United States | | | 169,300 | | | | 3,060,944 | |
Corning Inc. | | United States | | | 153,600 | | | | 1,993,728 | |
aDell Inc. | | United States | | | 269,600 | | | | 3,944,248 | |
aEMC Corp. | | United States | | | 237,400 | | | | 5,113,596 | |
FLIR Systems Inc. | | United States | | | 60,900 | | | | 1,526,763 | |
aGoogle Inc., A | | United States | | | 14,300 | | | | 9,236,370 | |
Hewlett-Packard Co. | | United States | | | 87,200 | | | | 2,246,272 | |
Intel Corp. | | United States | | | 98,100 | | | | 2,378,925 | |
International Business Machines Corp. | | United States | | | 35,000 | | | | 6,435,800 | |
aLam Research Corp. | | United States | | | 88,900 | | | | 3,291,078 | |
MasterCard Inc., A | | United States | | | 6,330 | | | | 2,359,951 | |
Microsoft Corp. | | United States | | | 205,300 | | | | 5,329,588 | |
aNetApp Inc. | | United States | | | 78,170 | | | | 2,835,226 | |
Oracle Corp. | | United States | | | 98,500 | | | | 2,526,525 | |
aPolycom Inc. | | United States | | | 129,000 | | | | 2,102,700 | |
QUALCOMM Inc. | | United States | | | 107,990 | | | | 5,907,053 | |
aResearch In Motion Ltd. | | Canada | | | 90,400 | | | | 1,310,800 | |
Visa Inc., A | | United States | | | 25,700 | | | | 2,609,321 | |
Xerox Corp. | | United States | | | 451,400 | | | | 3,593,144 | |
Xilinx Inc. | | United States | | | 24,800 | | | | 795,088 | |
| | | | | | | | | | |
| | | | | | | | | 82,800,776 | |
| | | | | | | | | | |
Materials 2.6% | | | | | | | | | | |
Celanese Corp., A | | United States | | | 147,800 | | | | 6,543,106 | |
E. I. du Pont de Nemours and Co. | | United States | | | 19,200 | | | | 878,976 | |
Randgold Resources Ltd., ADR | | United Kingdom | | | 15,600 | | | | 1,592,760 | |
| | | | | | | | | | |
| | | | | | | | | 9,014,842 | |
| | | | | | | | | | |
Telecommunication Services 3.6% | | | | | | | | | | |
AT&T Inc. | | United States | | | 241,562 | | | | 7,304,835 | |
aSprint Nextel Corp. | | United States | | | 354,300 | | | | 829,062 | |
Vodafone Group PLC, ADR | | United Kingdom | | | 154,000 | | | | 4,316,620 | |
| | | | | | | | | | |
| | | | | | | | | 12,450,517 | |
| | | | | | | | | | |
FLG-10
Franklin Templeton Variable Insurance Products Trust
Statement of Investments, December 31, 2011 (continued)
| | | | | | | | | | |
| Franklin Large Cap Growth Securities Fund | | Country | | Shares | | | Value | |
Common Stocks (continued) | | | | | | | | | | |
Utilities 2.9% | | | | | | | | | | |
MDU Resources Group Inc. | | United States | | | 39,300 | | | $ | 843,378 | |
National Grid PLC, ADR | | United Kingdom | | | 42,800 | | | | 2,074,944 | |
PG&E Corp. | | United States | | | 65,850 | | | | 2,714,337 | |
Sempra Energy | | United States | | | 29,400 | | | | 1,617,000 | |
The Southern Co. | | United States | | | 57,100 | | | | 2,643,159 | |
| | | | | | | | | | |
| | | | | | | | | 9,892,818 | |
| | | | | | | | | | |
Total Common Stocks (Cost $251,539,736) | | | | | | | | | 333,896,995 | |
| | | | | | | | | | |
| | | |
| | | | | Principal
Amount | | | | |
Short Term Investments (Cost $9,441,757) 2.8% | | | | | | | | | | |
Repurchase Agreements 2.8% | | | | | | | | | | |
bJoint Repurchase Agreement, 0.011%, 1/03/12 (Maturity Value $9,441,768) | | United States | | $ | 9,441,757 | | | | 9,441,757 | |
BNP Paribas Securities Corp. (Maturity Value $1,142,454) | | | | | | | | | | |
Credit Suisse Securities (USA) LLC (Maturity Value $1,370,850) | | | | | | | | | | |
Deutsche Bank Securities Inc. (Maturity Value $1,444,874) | | | | | | | | | | |
HSBC Securities (USA) Inc. (Maturity Value $2,284,908) | | | | | | | | | | |
Merrill Lynch, Pierce, Fenner & Smith Inc. (Maturity Value $1,370,850) | | | | | | | | | | |
Morgan Stanley & Co. LLC (Maturity Value $456,982) | | | | | | | | | | |
UBS Securities LLC (Maturity Value $1,370,850) | | | | | | | | | | |
Collateralized by U.S. Government Agency Securities, 0.16% - 5.25%, 6/07/12 - 2/05/14; cU.S. Treasury Bills, 1/12/12 - 9/20/12; U.S. Treasury Bonds, 0.50% - 11.25%, 5/31/13 - 2/15/16; and U.S. Treasury Notes, 0.125% - 4.875%, 12/31/11 - 5/15/19 (valued at $9,635,582) | | | | | | | | | | |
| | | | | | | | | | |
Total Investments (Cost $260,981,493) 100.4% | | | | | | | | | 343,338,752 | |
Other Assets, less Liabilities (0.4)% | | | | | | | | | (1,446,570 | ) |
| | | | | | | | | | |
Net Assets 100.0% | | | | | | | | $ | 341,892,182 | |
| | | | | | | | | | |
See Abbreviations on page FLG-20.
aNon-income producing.
bSee Note 1(b) regarding joint repurchase agreement.
cThe security is traded on a discount basis with no stated coupon rate.
The accompanying notes are an integral part of these financial statements.
FLG-11
Franklin Templeton Variable Insurance Products Trust
Financial Statements
Statement of Assets and Liabilities
December 31, 2011
| | | | |
| | | Franklin Large
Cap Growth
Securities Fund | |
Assets: | | | | |
Investments in securities: | | | | |
Cost - Unaffiliated issuers | | $ | 251,539,736 | |
Cost - Repurchase agreements | | | 9,441,757 | |
| | | | |
Total cost of investments | | $ | 260,981,493 | |
| | | | |
Value - Unaffiliated issuers | | $ | 333,896,995 | |
Value - Repurchase agreements | | | 9,441,757 | |
| | | | |
Total value of investments | | | 343,338,752 | |
Receivables: | | | | |
Capital shares sold | | | 23,103 | |
Dividends | | | 724,479 | |
Other assets | | | 11 | |
| | | | |
Total assets | | | 344,086,345 | |
| | | | |
Liabilities: | | | | |
Payables: | | | | |
Capital shares redeemed | | | 1,665,398 | |
Affiliates | | | 341,015 | |
Reports to shareholders | | | 154,996 | |
Accrued expenses and other liabilities | | | 32,754 | |
| | | | |
Total liabilities | | | 2,194,163 | |
| | | | |
Net assets, at value | | $ | 341,892,182 | |
| | | | |
Net assets consist of: | | | | |
Paid-in capital | | $ | 348,160,086 | |
Undistributed net investment income | | | 2,936,945 | |
Net unrealized appreciation (depreciation) | | | 82,357,259 | |
Accumulated net realized gain (loss) | | | (91,562,108 | ) |
| | | | |
Net assets, at value | | $ | 341,892,182 | |
| | | | |
Class 1: | | | | |
Net assets, at value | | $ | 48,666,054 | |
| | | | |
Shares outstanding | | | 3,299,787 | |
| | | | |
Net asset value and maximum offering price per share | | $ | 14.75 | |
| | | | |
Class 2: | | | | |
Net assets, at value | | $ | 293,226,128 | |
| | | | |
Shares outstanding | | | 20,167,425 | |
| | | | |
Net asset value and maximum offering price per share | | $ | 14.54 | |
| | | | |
The accompanying notes are an integral part of these financial statements.
FLG-12
Franklin Templeton Variable Insurance Products Trust
Financial Statements (continued)
Statement of Operations
for the year ended December 31, 2011
| | | | |
| | | Franklin Large
Cap Growth
Securities Fund | |
Investment income: | | | | |
Dividends | | $ | 6,788,083 | |
Interest | | | 9,138 | |
| | | | |
Total investment income | | | 6,797,221 | |
| | | | |
Expenses: | | | | |
Management fees (Note 3a) | | | 2,859,788 | |
Distribution fees: (Note 3c) | | | | |
Class 2 | | | 818,014 | |
Class 4 | | | 3 | |
Unaffiliated transfer agent fees | | | 687 | |
Custodian fees (Note 4) | | | 5,411 | |
Reports to shareholders | | | 124,332 | |
Professional fees | | | 29,647 | |
Trustees’ fees and expenses | | | 1,484 | |
Other | | | 20,455 | |
| | | | |
Total expenses | | | 3,859,821 | |
| | | | |
Net investment income | | | 2,937,400 | |
| | | | |
Realized and unrealized gains (losses): | | | | |
Net realized gain (loss) from investments | | | 20,697,833 | |
Net change in unrealized appreciation (depreciation) on investments | | | (28,917,851 | ) |
| | | | |
Net realized and unrealized gain (loss) | | | (8,220,018 | ) |
| | | | |
Net increase (decrease) in net assets resulting from operations | | $ | (5,282,618 | ) |
| | | | |
The accompanying notes are an integral part of these financial statements.
FLG-13
Franklin Templeton Variable Insurance Products Trust
Financial Statements (continued)
Statements of Changes in Net Assets
| | | | | | | | |
| | | Franklin Large Cap Growth
Securities Fund | |
| | | Year Ended December 31, | |
| | | 2011 | | | 2010 | |
| | | | |
Increase (decrease) in net assets: | | | | | | | | |
Operations: | | | | | | | | |
Net investment income | | $ | 2,937,400 | | | $ | 2,645,428 | |
Net realized gain (loss) from investments | | | 20,697,833 | | | | 25,795,539 | |
Net change in unrealized appreciation (depreciation) on investments | | | (28,917,851 | ) | | | 16,339,203 | |
| | | | |
Net increase (decrease) in net assets resulting from operations | | | (5,282,618 | ) | | | 44,780,170 | |
| | | | |
Distributions to shareholders from: | | | | | | | | |
Net investment income: | | | | | | | | |
Class 1 | | | (492,852 | ) | | | (595,893 | ) |
Class 2 | | | (2,152,135 | ) | | | (2,876,875 | ) |
Class 4 | | | — | | | | (33 | ) |
| | | | |
Total distributions to shareholders | | | (2,644,987 | ) | | | (3,472,801 | ) |
| | | | |
Capital share transactions: (Note 2) | | | | | | | | |
Class 1 | | | (8,419,530 | ) | | | (5,756,855 | ) |
Class 2 | | | (57,429,668 | ) | | | (51,989,055 | ) |
Class 4 | | | (4,876 | ) | | | — | |
| | | | |
Total capital share transactions | | | (65,854,074 | ) | | | (57,745,910 | ) |
| | | | |
Net increase (decrease) in net assets | | | (73,781,679 | ) | | | (16,438,541 | ) |
Net assets: | | | | | | | | |
Beginning of year | | | 415,673,861 | | | | 432,112,402 | |
| | | | |
End of year | | $ | 341,892,182 | | | $ | 415,673,861 | |
| | | | |
Undistributed net investment income included in net assets: | | | | | | | | |
End of year | | $ | 2,936,945 | | | $ | 2,644,532 | |
| | | | |
The accompanying notes are an integral part of these financial statements.
FLG-14
Franklin Templeton Variable Insurance Products Trust
Notes to Financial Statements
Franklin Large Cap Growth Securities Fund
1. ORGANIZATION AND SIGNIFICANT ACCOUNTING POLICIES
Franklin Templeton Variable Insurance Products Trust (Trust) is registered under the Investment Company Act of 1940, as amended, (1940 Act) as an open-end investment company, consisting of twenty separate funds. The Franklin Large Cap Growth Securities Fund (Fund) is included in this report. The financial statements of the remaining funds in the Trust are presented separately. Shares of the Fund are generally sold only to insurance company separate accounts to fund the benefits of variable life insurance policies or variable annuity contracts. The Fund offers 2 classes of shares: Class 1 and Class 2. On March 4, 2011, the Fund liquidated Class 4. Each class of shares differs by its distribution fees, voting rights on matters affecting a single class and its exchange privilege.
The following summarizes the Fund’s significant accounting policies.
a. Financial Instrument Valuation
The Fund’s investments in securities and other financial instruments are carried at fair value daily. Fair value is the price that would be received to sell an asset or paid to transfer a liability in an orderly transaction between market participants on the measurement date. Under procedures approved by the Trust’s Board of Trustees, the Fund may utilize independent pricing services, quotations from securities and financial instrument dealers, and other market sources to determine fair value.
Equity securities listed on an exchange or on the NASDAQ National Market System are valued at the last quoted sale price or the official closing price of the day, respectively. Foreign equity securities are valued as of the close of trading on the foreign stock exchange on which the security is primarily traded, or the NYSE, whichever is earlier. The value is then converted into its U.S. dollar equivalent at the foreign exchange rate in effect at the close of the NYSE on the day that the value of the security is determined. Over-the-counter securities are valued within the range of the most recent quoted bid and ask prices. Securities that trade in multiple markets or on multiple exchanges are valued according to the broadest and most representative market. Certain equity securities are valued based upon fundamental characteristics or relationships to similar securities. Repurchase agreements are valued at cost, which approximates market value.
The Fund has procedures to determine the fair value of securities and other financial instruments for which market prices are not readily available or which may not be reliably priced. Under these procedures, the Fund primarily employs a market-based approach which may use related or comparable assets or liabilities, recent transactions, market multiples, book values, and other relevant information for the investment to determine the fair value of the investment. The Fund may also use an income-based valuation approach in which the anticipated future cash flows of the investment are discounted to calculate fair value. Discounts may also be applied due to the nature or duration of any restrictions on the disposition of the investments. Due to the inherent uncertainty of valuations of such investments, the fair values may differ significantly from the values that would have been used had an active market existed.
Trading in securities on foreign securities stock exchanges and over-the-counter markets may be completed before the daily close of business on the NYSE. Occasionally, events occur between the time at which trading in a foreign security is completed and the close of the NYSE that might call into question the reliability of the value of a portfolio security held by the Fund. As a result, differences may arise between the value of the Fund’s portfolio securities as determined at the foreign market close and the latest indications of value at the close of the NYSE. In order to minimize the potential for these differences, the investment manager monitors price movements following the close of trading in foreign stock markets through a series of country specific market proxies (such as baskets of American Depositary Receipts, futures contracts and exchange traded funds). These price movements are measured against established trigger thresholds for each specific market proxy to assist in determining if an event has occurred that may call into question the reliability of the values of the foreign securities held by the Fund. If such an event occurs, the securities may be valued using fair value procedures, which may include the use of independent pricing services.
FLG-15
Franklin Templeton Variable Insurance Products Trust
Notes to Financial Statements (continued)
Franklin Large Cap Growth Securities Fund
1. ORGANIZATION AND SIGNIFICANT ACCOUNTING POLICIES (continued)
b. Joint Repurchase Agreement
The Fund enters into a joint repurchase agreement whereby its uninvested cash balance is deposited into a joint cash account with other funds managed by the investment manager or an affiliate of the investment manager and is used to invest in one or more repurchase agreements. The value and face amount of the joint repurchase agreement are allocated to the funds based on their pro-rata interest. A repurchase agreement is accounted for as a loan by the fund to the seller, collateralized by securities which are delivered to the fund’s custodian. The market value, including accrued interest, of the initial collateralization is required to be at least 102% of the dollar amount invested by the funds, with the value of the underlying securities marked to market daily to maintain coverage of at least 100%. The joint repurchase agreement held by the Fund at year end had been entered into on December 30, 2011.
c. Income Taxes
It is the Fund’s policy to qualify as a regulated investment company under the Internal Revenue Code. The Fund intends to distribute to shareholders substantially all of its taxable income and net realized gains to relieve it from federal income and excise taxes. As a result, no provision for U.S. federal income taxes is required.
The Fund may be subject to foreign taxation related to income received, capital gains on the sale of securities and certain foreign currency transactions in the foreign jurisdictions in which it invests. Foreign taxes, if any, are recorded based on the tax regulations and rates that exist in the foreign markets in which the Fund invests. When a capital gain tax is determined to apply the Fund records an estimated deferred tax liability in an amount that would be payable if the securities were disposed of on the valuation date.
The Fund recognizes the tax benefits of uncertain tax positions only when the position is “more likely than not” to be sustained upon examination by the tax authorities based on the technical merits of the tax position. As of December 31, 2011, and for all open tax years, the Fund has determined that no liability for unrecognized tax benefits is required in the Fund’s financial statements related to uncertain tax positions taken on a tax return (or expected to be taken on future tax returns). Open tax years are those that remain subject to examination and are based on each tax jurisdiction statute of limitation.
d. Security Transactions, Investment Income, Expenses and Distributions
Security transactions are accounted for on trade date. Realized gains and losses on security transactions are determined on a specific identification basis. Interest income and estimated expenses are accrued daily. Dividend income is recorded on the ex-dividend date. Distributions to shareholders are recorded on the ex-dividend date and are determined according to income tax regulations (tax basis). Distributable earnings determined on a tax basis may differ from earnings recorded in accordance with accounting principles generally accepted in the United States of America. These differences may be permanent or temporary. Permanent differences are reclassified among capital accounts to reflect their tax character. These reclassifications have no impact on net assets or the results of operations. Temporary differences are not reclassified, as they may reverse in subsequent periods.
Common expenses incurred by the Trust are allocated among the funds based on the ratio of net assets of each fund to the combined net assets of the Trust. Fund specific expenses are charged directly to the fund that incurred the expense.
Realized and unrealized gains and losses and net investment income, not including class specific expenses, are allocated daily to each class of shares based upon the relative proportion of net assets of each class. Differences in per share distributions, by class, are generally due to differences in class specific expenses.
FLG-16
Franklin Templeton Variable Insurance Products Trust
Notes to Financial Statements (continued)
Franklin Large Cap Growth Securities Fund
1. ORGANIZATION AND SIGNIFICANT ACCOUNTING POLICIES (continued)
e. Accounting Estimates
The preparation of financial statements in accordance with accounting principles generally accepted in the United States of America requires management to make estimates and assumptions that affect the reported amounts of assets and liabilities at the date of the financial statements and the amounts of income and expenses during the reporting period. Actual results could differ from those estimates.
f. Guarantees and Indemnifications
Under the Trust’s organizational documents, its officers and trustees are indemnified by the Trust against certain liabilities arising out of the performance of their duties to the Trust. Additionally, in the normal course of business, the Trust, on behalf of the Fund, enters into contracts with service providers that contain general indemnification clauses. The Trust’s maximum exposure under these arrangements is unknown as this would involve future claims that may be made against the Trust that have not yet occurred. Currently, the Trust expects the risk of loss to be remote.
2. SHARES OF BENEFICIAL INTEREST
At December 31, 2011, there were an unlimited number of shares authorized (without par value). Transactions in the Fund’s shares were as follows:
| | | | | | | | | | | | | | | | |
| | | Year Ended December 31, | |
| | | 2011a | | | 2010b | |
| Class 1 Shares: | | Shares | | | Amount | | | Shares | | | Amount | |
Shares sold | | | 99,760 | | | $ | 1,555,529 | | | | 68,402 | | | $ | 948,510 | |
Shares issued in reinvestment of distributions | | | 33,122 | | | | 492,852 | | | | 44,470 | | | | 595,893 | |
Shares redeemed | | | (698,667 | ) | | | (10,467,911 | ) | | | (527,249 | ) | | | (7,301,258 | ) |
| | | | |
Net increase (decrease) | | | (565,785 | ) | | $ | (8,419,530 | ) | | | (414,377 | ) | | $ | (5,756,855 | ) |
| | | | |
Class 2 Shares: | | | | | | | | | | | | | | | | |
Shares sold | | | 983,185 | | | $ | 14,361,125 | | | | 1,051,169 | | | $ | 13,759,246 | |
Shares issued in reinvestment of distributions | | | 146,503 | | | | 2,152,135 | | | | 217,451 | | | | 2,876,875 | |
Shares redeemed | | | (5,015,686 | ) | | | (73,942,928 | ) | | | (5,055,225 | ) | | | (68,625,176 | ) |
| | | | |
Net increase (decrease) | | | (3,885,998 | ) | | $ | (57,429,668 | ) | | | (3,786,605 | ) | | $ | (51,989,055 | ) |
| | | | |
Class 4 Shares: | | | | | | | | | | | | | | | | |
Shares redeemed | | | (312 | ) | | $ | (4,876 | ) | | | | | | | | |
| | | | | | | | | | |
Net increase (decrease) | | | (312 | ) | | $ | (4,876 | ) | | | | | | | | |
| | | | | | | | | | |
| aEffective | March 4, 2011, Class 4 was liquidated. |
| bDuring | the year Class 4 did not report any share transactions. |
3. TRANSACTIONS WITH AFFILIATES
Franklin Resources, Inc. is the holding company for various subsidiaries that together are referred to as Franklin Templeton Investments. Certain officers and trustees of the Fund are also officers and/or directors of the following subsidiaries:
| | |
| Subsidiary | | Affiliation |
Franklin Advisers, Inc. (Advisers) | | Investment manager |
Franklin Templeton Services, LLC (FT Services) | | Administrative manager |
Franklin Templeton Distributors, Inc. (Distributors) | | Principal underwriter |
Franklin Templeton Investor Services, LLC (Investor Services) | | Transfer agent |
FLG-17
Franklin Templeton Variable Insurance Products Trust
Notes to Financial Statements (continued)
Franklin Large Cap Growth Securities Fund
3. TRANSACTIONS WITH AFFILIATES (continued)
a. Management Fees
The Fund pays an investment management fee to Advisers based on the average daily net assets of the Fund as follows:
| | |
| Annualized Fee Rate | | Net Assets |
| 0.750% | | Up to and including $500 million |
| 0.625% | | Over $500 million, up to and including $1 billion |
| 0.500% | | In excess of $1 billion |
b. Administrative Fees
Under an agreement with Advisers, FT Services provides administrative services to the Fund. The fee is paid by Advisers based on average daily net assets, and is not an additional expense of the Fund.
c. Distribution Fees
The Fund’s Board of Trustees has adopted distribution plans for Class 2 and Class 4 shares pursuant to Rule 12b-1 under the 1940 Act. Under the Fund’s compensation distribution plans, the Fund pays Distributors for costs incurred in connection with the servicing, sale and distribution of the Fund’s shares up to 0.35% per year of its average daily net assets of each class. The Board of Trustees has agreed to limit the current rate to 0.25% per year for Class 2.
d. Transfer Agent Fees
Investor Services, under terms of an agreement, performs shareholder servicing for the Fund and is not paid by the Fund for the services.
4. EXPENSE OFFSET ARRANGEMENT
The Fund has entered into an arrangement with its custodian whereby credits realized as a result of uninvested cash balances are used to reduce a portion of the Fund’s custodian expenses. During the year ended December 31, 2011, there were no credits earned.
5. INCOME TAXES
For tax purposes, capital losses may be carried over to offset future capital gains, if any. Under the Regulated Investment Company Modernization Act of 2010, capital losses incurred by the Fund in taxable years beginning after December 22, 2010 are not subject to expiration and such losses retain their character as either short-term or long-term, rather than being considered short-term as under previous law. Post-enactment capital losses must be fully utilized prior to utilizing any losses incurred in pre-enactment tax years.
At December 31, 2011, capital loss carryforwards were as follows:
| | | | |
Capital loss carryforwards subject to expiration: | | | | |
2016 | | $ | 22,027,788 | |
2017 | | | 62,499,598 | |
| | | | |
| | $ | 84,527,386 | |
| | | | |
During the year ended December 31, 2011, the Fund utilized $21,709,827 of capital loss carryforwards.
FLG-18
Franklin Templeton Variable Insurance Products Trust
Notes to Financial Statements (continued)
Franklin Large Cap Growth Securities Fund
5. INCOME TAXES (continued)
The tax character of distributions paid during the years ended December 31, 2011 and 2010, was as follows:
| | | | | | | | |
| | | 2011 | | | 2010 | |
Distributions paid from ordinary income | | $ | 2,644,987 | | | $ | 3,472,801 | |
| | | | |
At December 31, 2011, the cost of investments, net unrealized appreciation (depreciation), and undistributed ordinary income for income tax purposes were as follows:
| | | | |
Cost of investments | | $ | 268,016,214 | |
| | | | |
| |
Unrealized appreciation | | $ | 85,125,792 | |
Unrealized depreciation | | | (9,803,254 | ) |
| | | | |
Net unrealized appreciation (depreciation) | | $ | 75,322,538 | |
| | | | |
Distributable earnings – undistributed ordinary income | | $ | 2,936,948 | |
| | | | |
Differences between income and/or capital gains as determined on a book basis and a tax basis are primarily due to differing treatment of wash sales.
6. INVESTMENT TRANSACTIONS
Purchases and sales of investments (excluding short term securities) for the year ended December 31, 2011, aggregated $209,323,130 and $268,047,015, respectively.
7. CREDIT FACILITY
The Fund, together with other U.S. registered and foreign investment funds (collectively, Borrowers), managed by Franklin Templeton Investments, are borrowers in a joint syndicated senior unsecured credit facility totaling $750 million (Global Credit Facility) which matured on January 20, 2012. This Global Credit Facility provides a source of funds to the Borrowers for temporary and emergency purposes, including the ability to meet future unanticipated or unusually large redemption requests. Effective January 20, 2012, the Borrowers renewed the Global Credit Facility for a total of $1.5 billion, maturing January 18, 2013.
Under the terms of the Global Credit Facility, the Fund shall, in addition to interest charged on any borrowings made by the Fund and other costs incurred by the Fund, pay its share of fees and expenses incurred in connection with the implementation and maintenance of the Global Credit Facility, based upon its relative share of the aggregate net assets of all of the Borrowers, including an annual commitment fee of 0.08% based upon the unused portion of the Global Credit Facility, which is reflected in other expenses on the Statement of Operations. During the year ended December 31, 2011, the Fund did not use the Global Credit Facility.
8. FAIR VALUE MEASUREMENTS
The Fund follows a fair value hierarchy that distinguishes between market data obtained from independent sources (observable inputs) and the Fund’s own market assumptions (unobservable inputs). These inputs are used in determining the value of the Fund’s investments and are summarized in the following fair value hierarchy:
| | • | | Level 1 – quoted prices in active markets for identical securities |
| | • | | Level 2 – other significant observable inputs (including quoted prices for similar securities, interest rates, prepayment speed, credit risk, etc.) |
FLG-19
Franklin Templeton Variable Insurance Products Trust
Notes to Financial Statements (continued)
Franklin Large Cap Growth Securities Fund
8. FAIR VALUE MEASUREMENTS (continued)
| | • | | Level 3 – significant unobservable inputs (including the Fund’s own assumptions in determining the fair value of investments) |
The inputs or methodology used for valuing securities are not an indication of the risk associated with investing in those securities.
For movements between the levels within the fair value hierarchy, the Fund has adopted a policy of recognizing the transfers as of the date of the underlying event which caused the movement.
The following is a summary of the inputs used as of December 31, 2011, in valuing the Fund’s assets and liabilities carried at fair value:
| | | | | | | | | | | | | | | | |
| | | Level 1 | | | Level 2 | | | Level 3 | | | Total | |
| | | | |
Assets: | | | | | | | | | | | | | | | | |
Investments in Securities: | | | | | | | | | | | | | | | | |
Equity Investmentsa | | $ | 333,896,995 | | | $ | — | | | $ | — | | | $ | 333,896,995 | |
Short Term Investments | | | — | | | | 9,441,757 | | | | — | �� | | | 9,441,757 | |
| | | | |
Total Investments in Securities | | $ | 333,896,995 | | | $ | 9,441,757 | | | $ | — | | | $ | 343,338,752 | |
| | | | |
aFor detailed categories, see the accompanying Statement of Investments.
9. NEW ACCOUNTING PRONOUNCEMENTS
In May 2011, the Financial Accounting Standards Board (FASB) issued Accounting Standards Update (ASU) No. 2011-04, Fair Value Measurement (Topic 820): Amendments to Achieve Common Fair Value Measurement and Disclosure Requirements in U.S. GAAP and IFRSs. The amendments in the ASU will improve the comparability of fair value measurements presented and disclosed in financial statements prepared in accordance with U.S. GAAP (Generally Accepted Accounting Principles) and IFRS (International Financial Reporting Standards) and include new guidance for certain fair value measurement principles and disclosure requirements. The ASU is effective for interim and annual periods beginning after December 15, 2011. The Fund believes the adoption of this ASU will not have a material impact on its financial statements.
10. SUBSEQUENT EVENTS
The Fund has evaluated subsequent events through the issuance of the financial statements and determined that no events have occurred that require disclosure other than those already disclosed in the financial statements.
|
ABBREVIATIONS |
| Selected Portfolio |
|
| ADR - American Depositary Receipt |
FLG-20
Franklin Templeton Variable Insurance Products Trust
Franklin Large Cap Growth Securities Fund
Report of Independent Registered Public Accounting Firm
To the Board of Trustees and Shareholders of
Franklin Templeton Variable Insurance Products Trust
In our opinion, the accompanying statement of assets and liabilities, including the statement of investments, and the related statements of operations and of changes in net assets and the financial highlights present fairly, in all material respects, the financial position of Franklin Large Cap Growth Securities Fund (the “Fund”) at December 31, 2011, the results of its operations for the year then ended, the changes in its net assets for each of the two years in the period then ended and the financial highlights for each of the five years in the period then ended, in conformity with accounting principles generally accepted in the United States of America. These financial statements and financial highlights (hereafter referred to as “financial statements”) are the responsibility of the Fund’s management. Our responsibility is to express an opinion on these financial statements based on our audits. We conducted our audits of these financial statements in accordance with the standards of the Public Company Accounting Oversight Board (United States). Those standards require that we plan and perform the audit to obtain reasonable assurance about whether the financial statements are free of material misstatement. An audit includes examining, on a test basis, evidence supporting the amounts and disclosures in the financial statements, assessing the accounting principles used and significant estimates made by management, and evaluating the overall financial statement presentation. We believe that our audits, which included confirmation of securities at December 31, 2011 by correspondence with the custodian and brokers, provide a reasonable basis for our opinion.
PricewaterhouseCoopers LLP
San Francisco, California
February 13, 2012
FLG-21
Franklin Templeton Variable Insurance Products Trust
Tax Information (unaudited)
Franklin Large Cap Growth Securities Fund
Under Section 854(b)(1)(A) of the Internal Revenue Code, the Fund hereby reports 100% of the ordinary income dividends as income qualifying for the dividends received deduction for the fiscal year ended December 31, 2011.
FLG-22
FRANKLIN RISING DIVIDENDS SECURITIES FUND
We are pleased to bring you Franklin Rising Dividends Securities Fund’s annual report for the fiscal year ended December 31, 2011.
Performance Summary as of 12/31/11
Average annual total return of Class 1 shares represents the average annual change in value, assuming reinvestment of dividends and capital gains. Average returns smooth out variations in returns, which can be significant; they are not the same as year-by-year results.
Periods ended 12/31/11
| | | | | | | | | | | | |
| | | 1-Year | | | 5-Year | | | 10-Year | |
Average Annual Total Return | | | +6.29% | | | | +1.52% | | | | +6.05% | |
Total Return Index Comparison for a Hypothetical $10,000 Investment (1/1/02–12/31/11)
The graph below shows the change in value of a hypothetical $10,000 investment in the Fund over the indicated period and includes reinvestment of any income or distributions. The Fund’s performance is compared to the performance of the Standard & Poor’s® 500 Index (S&P 500®). One cannot invest directly in an index, and an index is not representative of the Fund’s portfolio. Please see Important Notes to Performance Information preceding the Fund Summaries.
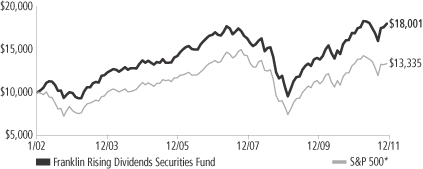
*Source: © 2012 Morningstar. Please see Index Descriptions following the Fund Summaries.
Franklin Rising Dividends Securities Fund – Class 1
Performance reflects the Fund’s Class 1 operating expenses, but does not include any contract fees, expenses or sales charges. If they had been included, performance would be lower. These charges and deductions, particularly for variable life policies, can have a significant effect on contract values and insurance benefits. See the contract prospectus for a complete description of these expenses, including sales charges.
Performance data represent past performance, which does not guarantee future results. Investment return and principal value will fluctuate, and you may have a gain or loss when you sell your shares.
Current performance may differ from figures shown.
FRD-1
Fund Goal and Main Investments: Franklin Rising Dividends Securities Fund seeks long-term capital appreciation, with preservation of capital as an important consideration. The Fund normally invests at least 80% of its net assets in investments of companies that have paid rising dividends.
Performance Overview
You can find the Fund’s one-year total return in the Performance Summary. The Fund outperformed its benchmark, the S&P 500, which rose 2.11% for the same period.1 Please note the Fund employs a bottom-up stock selection process, and the managers invest in securities without regard to benchmark comparisons.
Economic and Market Overview
The U.S. economy improved steadily but modestly in 2011 despite geopolitical, employment and housing pressures. The U.S. manufacturing sector helped power the domestic economy and led global manufacturing output heading into 2012. Although manufacturing growth slowed in the second half of the year as high commodity prices reduced purchasing power and demand ebbed, the trend began to reverse near year-end. U.S. gross domestic product (GDP) growth advanced each quarter, and the nation’s unemployment rate fell from 9.4% to 8.5%.2
The U.S. financial system and household balance sheets continued to improve, but the country still faced persistently high unemployment, a prolonged housing market slump and massive national debt. The U.S. Federal Reserve Board (Fed) cut the country’s growth forecast partly due to the heightened potential for recession in Europe and cooling GDP trends across much of Asia. Inflation rose for much of the world but stayed relatively contained in the U.S., even slowing toward year-end amid declining energy and food prices. The Fed sought to boost economic growth by maintaining its accommodative monetary policy and undertook a second round of quantitative easing that ended on June 30. Subsequently, the Fed continued to purchase Treasuries with proceeds from maturing debt in an effort to support economic growth.
Although U.S. stock markets rallied in the spring, worrisome global events and slowing global growth dampened investor sentiment and market volatility surged. Risk-averse investors sought perceived safe
1. Source: © 2012 Morningstar. One cannot invest directly in an index, and an index is not representative of the Fund’s portfolio. Please see Index Descriptions following the Fund Summaries.
2. Source: Bureau of Labor Statistics.
Fund Risks: All investments involve risks. Stock prices fluctuate, sometimes rapidly and dramatically, due to factors affecting individual companies, particular industries or sectors, or general market conditions. Smaller and midsize company securities can increase the risk of greater price fluctuations, particularly over the short term. The Fund may have significant investments in particular sectors from time to time, such as financial institutions and health care, and may be at greater risk of adverse developments in a sector than a fund that invests more broadly. Foreign investing involves additional risks, including currency fluctuations, economic instability, market volatility, and political and social instability. The Fund is actively managed but there is no guarantee that the manager’s investment decisions will produce the desired results. The Fund’s prospectus also includes a description of the main investment risks.
FRD-2
havens and seemed to ignore that many U.S. companies generated record profits. Despite large swings, U.S. stocks as measured by the S&P 500 gained 2.11% in 2011.1 The Dow Jones Industrial Average rose 8.38%, reflecting investors’ general preference for large, established U.S. companies.1 Notably, the U.S. was a global market leader in 2011 as the country continued to be a relative haven. During the year, sector performance varied widely. Noncyclical, income-producing sectors such as utilities, consumer staples and health care led the market, while economically sensitive sectors such as materials and industrials lagged. Financials in the S&P 500 experienced the worst sector decline, as U.S. bank stocks generally tracked their European peers. Against this backdrop, growth stocks fared better than their value counterparts: large-capitalization stocks advanced slightly as a group, with modestly negative results for most small- and mid-sized company stocks, as measured by Russell capitalization-based indexes.
Investment Strategy
We are a research-driven, fundamental investment adviser, pursuing a disciplined value-oriented strategy. As bottom-up investors concentrating primarily on individual securities, we seek fundamentally sound companies that we believe meet our screening criteria, which include consistent, substantial dividend increases; reinvested earnings; and strong balance sheets. We attempt to acquire such stocks at attractive prices, often when they are out of favor with other investors. In following these criteria, we do not necessarily focus on companies whose securities pay a high dividend but rather on companies that consistently raise their dividends.
Manager’s Discussion
During the 12 months under review, all sectors represented in the Fund except financials contributed positively to performance.3 Key contributors included global information technology software and services provider International Business Machines (IBM), medical products manufacturer Abbott Laboratories and insurer Erie Indemnity. IBM generates significant revenues from its software and services businesses, thus making the company less vulnerable to economic weakness than many other technology companies, in our view. IBM has 16 consecutive years of dividend increases. Abbott shares rebounded after significantly underperforming in late 2010, and it has increased its dividend for the 39th year in a row. Erie Indemnity, a management company for a
3. The financials sector comprises banks, diversified financials and insurance in the SOI.
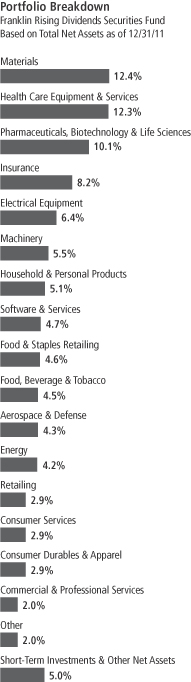
FRD-3
property and casualty insurer, increased in value largely due to its strong capital position, which enabled its shares to perform better than most other financials stocks. Erie has 32 years of dividend increases.
The financials sector hindered performance, with major detractors including insurer Old Republic International, supplemental health insurance provider Aflac, and savings bank Hudson City Bancorp.3 Losses in Old Republic’s mortgage guaranty business remained high as the housing market has failed to recover significantly. Supplemental insurance provider Aflac’s shares fell in value after the company disclosed that its decision to more conservatively position its investment portfolio would result in lower 2012 earnings than analysts’ estimates. Hudson City disclosed declining net interest margin would cause it to restructure its balance sheet. During the year, the company completed a restructuring of its balance sheet that reduced higher cost structured borrowings and allowed for increased net interest income.
The Fund initiated 10 positions during the period in what we considered attractively valued securities: specialty chemicals manufacturer Albemarle (17 years of dividend increases); large integrated energy company Chevron (24 years); insurer Chubb (46 years); household products manufacturer and marketer Colgate-Palmolive (48 years); water, hygiene and energy technologies company Ecolab (20 years); integrated energy company Exxon Mobil (29 years); global auto components and building efficiency systems and services provider Johnson Controls (2 years); memorialization products manufacturer Matthews International (17 years); global athletic footwear and apparel maker NIKE (10 years); and water delivery and thermal systems provider Pentair (36 years). We made significant additions to holdings of the largest franchiser of fast food restaurants, McDonald’s, global snacks and beverages manufacturer PepsiCo, and health care equipment and supplies company Stryker, among others. We liquidated our position in Nordson during the Fund’s fiscal year, and reduced our positions in Erie Indemnity, Family Dollar Stores and Roper Industries, among others.
Our 10 largest positions on December 31, 2011, represented 43.7% of the Fund’s total net assets. It is interesting to note how these 10 companies would respond, in aggregate, to the Fund’s screening criteria based on a simple average of statistical measures. On average, these 10 companies have raised their dividends 32 years in a row and by 284% in the past 10 years. Their most recent year-over-year dividend increases averaged 14.0% with a yield of 2.3% on December 31, 2011,
Top 10 Holdings
Franklin Rising Dividends Securities Fund
12/31/11
| | | | |
Company
Sector/Industry | | % of Total
Net Assets | |
| Abbott Laboratories | | | 5.0% | |
| Pharmaceuticals, Biotechnology & Life Sciences | |
| Praxair Inc. | | | 4.9% | |
| Materials | |
| International Business Machines Corp. | | | 4.7% | |
| Software & Services | |
| The Procter & Gamble Co. | | | 4.7% | |
| Household & Personal Products | |
| Wal-Mart Stores Inc. | | | 4.6% | |
| Food & Staples Retailing | |
| Roper Industries Inc. | | | 4.4% | |
| Electrical Equipment | |
| Becton, Dickinson and Co. | | | 4.3% | |
Health Care Equipment & Services | |
| United Technologies Corp. | | | 4.2% | |
| Aerospace & Defense | |
| Dover Corp. | | | 3.8% | |
| Machinery | |
| Chevron Corp. | | | 3.1% | |
| Energy | |
The dollar value, number of shares or principal amount, and names of all portfolio holdings are listed in the Fund’s Statement of Investments (SOI).
FRD-4
and a dividend payout ratio of 32%, based on estimates of calendar year 2011 operating earnings. The average price/earnings ratio was 14.4 times calendar year 2011 estimates versus 13.0 for that of the unmanaged S&P 500.
Thank you for your participation in Franklin Rising Dividends Securities Fund. We look forward to serving your future investment needs.
The foregoing information reflects our analysis, opinions and portfolio holdings as of December 31, 2011, the end of the reporting period. The way we implement our main investment strategies and the resulting portfolio holdings may change depending on factors such as market and economic conditions. These opinions may not be relied upon as investment advice or an offer for a particular security. The information is not a complete analysis of every aspect of any market, country, industry, security or the Fund. Statements of fact are from sources considered reliable, but the investment manager makes no representation or warranty as to their completeness or accuracy. Although historical performance is no guarantee of future results, these insights may help you understand our investment management philosophy.
FRD-5
Fund Expenses
As an investor in a variable insurance contract (Contract) that indirectly provides for investment in an underlying mutual fund, you can incur transaction and/or ongoing expenses at both the Fund level and the Contract level.
| • | | Transaction expenses can include sales charges (loads) on purchases, redemption fees, surrender fees, transfer fees and premium taxes. |
| • | | Ongoing expenses can include management fees, distribution and service (12b-1) fees, contract fees, annual maintenance fees, mortality and expense risk fees and other fees and expenses. All mutual funds and Contracts have some types of ongoing expenses. |
The expenses shown in the table are meant to highlight ongoing expenses at the Fund level only and do not include ongoing expenses at the Contract level, or transaction expenses at either the Fund or Contract level. While the Fund does not have transaction expenses, if the transaction and ongoing expenses at the Contract level were included, the expenses shown would be higher. You should consult your Contract prospectus or disclosure document for more information.
The table shows Fund-level ongoing expenses and can help you understand these expenses and compare them with those of other mutual funds offered through the Contract. The table assumes a $1,000 investment held for the six months indicated. Please refer to the Fund prospectus for additional information on operating expenses.
Actual Fund Expenses
The first line (Actual) of the table provides actual account values and expenses. The “Ending Account Value” is derived from the Fund’s actual return, which includes the effect of ongoing Fund expenses, but does not include the effect of ongoing Contract expenses.
You can estimate the Fund-level expenses you incurred during the period by following these steps. Of course, your account value and expenses will differ from those in this illustration:
| 1. | Divide your account value by $1,000. |
If an account had an $8,600 value, then $8,600 ÷ $1,000 = 8.6.
| 2. | Multiply the result by the number under the heading “Fund-Level Expenses Incurred During Period.” |
If Fund-Level Expenses Incurred During Period were $7.50, then 8.6 x $7.50 = $64.50.
In this illustration, the estimated expenses incurred this period at the Fund level are $64.50.
Franklin Rising Dividends Securities Fund – Class 1
FRD-6
Hypothetical Example for Comparison with Other Mutual Funds
Information in the second line (Hypothetical) of the table can help you compare ongoing expenses of the Fund with those of other mutual funds offered through the Contract. This information may not be used to estimate the actual ending account balance or expenses you incurred during the period. The hypothetical “Ending Account Value” is based on the Fund’s actual expense ratio and an assumed 5% annual rate of return before expenses, which does not represent the Fund’s actual return. The figure under the heading “Fund-Level Expenses Incurred During Period” shows the hypothetical expenses your account would have incurred under this scenario. You can compare this figure with the 5% hypothetical examples that appear in shareholder reports of other funds offered through a Contract.
| | | | | | | | | | | | |
| Class 1 | | Beginning
Account Value 7/1/11 | | | Ending
Account
Value 12/31/11 | | | Fund-Level Expenses Incurred
During Period* 7/1/11–12/31/11 | |
Actual | | $ | 1,000 | | | $ | 996.00 | | | $ | 3.22 | |
Hypothetical (5% return before expenses) | | $ | 1,000 | | | $ | 1,021.98 | | | $ | 3.26 | |
*Expenses are calculated using the most recent six-month annualized expense ratio for the Fund’s Class 1 shares (0.64%), which does not include any ongoing expenses of the Contract for which the Fund is an investment option, multiplied by the average account value over the period, multiplied by 184/365 to reflect the one-half year period.
FRD-7
Franklin Templeton Variable Insurance Products Trust
Financial Highlights
Franklin Rising Dividends Securities Fund
| | | | | | | | | | | | | | | | | | | | |
| | | Year Ended December 31, | |
| Class 1 | | 2011 | | | 2010 | | | 2009 | | | 2008 | | | 2007 | |
| | | | |
Per share operating performance | | | | | | | | | | | | | | | | | | | | |
(for a share outstanding throughout the year) | | | | | | | | | | | | | | | | | | | | |
Net asset value, beginning of year | | $ | 19.15 | | | $ | 16.13 | | | $ | 13.96 | | | $ | 19.61 | | | $ | 20.88 | |
| | | | |
Income from investment operationsa: | | | | | | | | | | | | | | | | | | | | |
Net investment incomeb | | | 0.36 | | | | 0.32 | | | | 0.14 | c | | | 0.35 | | | | 0.36 | |
Net realized and unrealized gains (losses) | | | 0.83 | | | | 3.01 | | | | 2.28 | | | | (5.51 | ) | | | (0.80 | ) |
| | | | |
Total from investment operations | | | 1.19 | | | | 3.33 | | | | 2.42 | | | | (5.16 | ) | | | (0.44 | ) |
| | | | |
Less distributions from: | | | | | | | | | | | | | | | | | | | | |
Net investment income | | | (0.33 | ) | | | (0.31 | ) | | | (0.25 | ) | | | (0.36 | ) | | | (0.53 | ) |
Net realized gains | | | — | | | | — | | | | — | | | | (0.13 | ) | | | (0.30 | ) |
| | | | |
Total distributions | | | (0.33 | ) | | | (0.31 | ) | | | (0.25 | ) | | | (0.49 | ) | | | (0.83 | ) |
| | | | |
Net asset value, end of year | | $ | 20.01 | | | $ | 19.15 | | | $ | 16.13 | | | $ | 13.96 | | | $ | 19.61 | |
| | | | |
| | | | | |
Total returnd | | | 6.29% | | | | 20.94% | | | | 17.67% | | | | (26.94)% | | | | (2.41)% | |
Ratios to average net assets | | | | | | | | | | | | | | | | | | | | |
Expenses | | | 0.63% | | | | 0.64% | | | | 0.65% | e | | | 0.61% | e | | | 0.59% | e |
Net investment income | | | 1.87% | | | | 1.88% | | | | 0.99% | c | | | 2.05% | | | | 1.72% | |
| | | | | |
Supplemental data | | | | | | | | | | | | | | | | | | | | |
Net assets, end of year (000’s) | | $ | 140,297 | | | $ | 148,544 | | | $ | 139,816 | | | $ | 142,862 | | | $ | 235,946 | |
Portfolio turnover rate | | | 12.76% | | | | 8.97% | | | | 16.99% | | | | 5.39% | | | | 3.29% | |
aThe amount shown for a share outstanding throughout the period may not correlate with the Statement of Operations for the period due to the timing of sales and repurchases of the Fund shares in relation to income earned and/or fluctuating market value of the investments of the Fund.
bBased on average daily shares outstanding.
cNet investment income per share includes approximately $(0.15) per share as a return of capital adjustment to a previously recorded special dividend received by the Fund. Excluding this non-recurring amount, the ratio of net investment income to average net assets would have been 2.07%. See Note 1(d).
dTotal return does not include any fees, charges or expenses imposed by the variable annuity and life insurance contracts for which the Franklin Templeton Variable Insurance Products Trust serves as an underlying investment vehicle.
eBenefit of expense reduction rounds to less than 0.01%.
The accompanying notes are an integral part of these financial statements.
FRD-8
Franklin Templeton Variable Insurance Products Trust
Financial Highlights (continued)
Franklin Rising Dividends Securities Fund
| | | | | | | | | | | | | | | | | | | | |
| | | Year Ended December 31, | |
| Class 2 | | 2011 | | | 2010 | | | 2009 | | | 2008 | | | 2007 | |
| | | | |
Per share operating performance | | | | | | | | | | | | | | | | | | | | |
(for a share outstanding throughout the year) | | | | | | | | | | | | | | | | | | | | |
Net asset value, beginning of year | | $ | 18.82 | | | $ | 15.86 | | | $ | 13.72 | | | $ | 19.27 | | | $ | 20.55 | |
| | | | |
Income from investment operationsa: | | | | | | | | | | | | | | | | | | | | |
Net investment incomeb | | | 0.31 | | | | 0.28 | | | | 0.10 | c | | | 0.31 | | | | 0.30 | |
Net realized and unrealized gains (losses) | | | 0.81 | | | | 2.95 | | | | 2.24 | | | | (5.42 | ) | | | (0.79 | ) |
| | | | |
Total from investment operations | | | 1.12 | | | | 3.23 | | | | 2.34 | | | | (5.11 | ) | | | (0.49 | ) |
| | | | |
Less distributions from: | | | | | | | | | | | | | | | | | | | | |
Net investment income | | | (0.29 | ) | | | (0.27 | ) | | | (0.20 | ) | | | (0.31 | ) | | | (0.49 | ) |
Net realized gains | | | — | | | | — | | | | — | | | | (0.13 | ) | | | (0.30 | ) |
| | | | |
Total distributions | | | (0.29 | ) | | | (0.27 | ) | | | (0.20 | ) | | | (0.44 | ) | | | (0.79 | ) |
| | | | |
Net asset value, end of year | | $ | 19.65 | | | $ | 18.82 | | | $ | 15.86 | | | $ | 13.72 | | | $ | 19.27 | |
| | | | |
| | | | | |
Total returnd | | | 6.00% | | | | 20.64% | | | | 17.34% | | | | (27.10)% | | | | (2.69)% | |
Ratios to average net assets | | | | | | | | | | | | | | | | | | | | |
Expenses | | | 0.88% | | | | 0.89% | | | | 0.90% | e | | | 0.86% | e | | | 0.84% | e |
Net investment income | | | 1.62% | | | | 1.63% | | | | 0.74% | c | | | 1.80% | | | | 1.47% | |
| | | | | |
Supplemental data | | | | | | | | | | | | | | | | | | | | |
Net assets, end of year (000’s) | | $ | 1,523,396 | | | $ | 1,572,732 | | | $ | 1,371,351 | | | $ | 1,286,878 | | | $ | 2,079,366 | |
Portfolio turnover rate | | | 12.76% | | | | 8.97% | | | | 16.99% | | | | 5.39% | | | | 3.29% | |
aThe amount shown for a share outstanding throughout the period may not correlate with the Statement of Operations for the period due to the timing of sales and repurchases of the Fund shares in relation to income earned and/or fluctuating market value of the investments of the Fund.
bBased on average daily shares outstanding.
cNet investment income per share includes approximately $(0.15) per share as a return of capital adjustment to a previously recorded special dividend received by the Fund. Excluding this non-recurring amount, the ratio of net investment income to average net assets would have been 1.82%. See Note 1(d).
dTotal return does not include any fees, charges or expenses imposed by the variable annuity and life insurance contracts for which the Franklin Templeton Variable Insurance Products Trust serves as an underlying investment vehicle.
eBenefit of expense reduction rounds to less than 0.01%.
The accompanying notes are an integral part of these financial statements.
FRD-9
Franklin Templeton Variable Insurance Products Trust
Financial Highlights (continued)
Franklin Rising Dividends Securities Fund
| | | | | | | | | | | | | | | | |
| | | Year Ended December 31, | |
| Class 4 | | 2011 | | | 2010 | | | 2009 | | | 2008a | |
| | | | |
Per share operating performance | | | | | | | | | | | | | | | | |
(for a share outstanding throughout the year) | | | | | | | | | | | | | | | | |
Net asset value, beginning of year | | $ | 19.04 | | | $ | 16.09 | | | $ | 13.92 | | | $ | 18.51 | |
| | | | |
Income from investment operationsb: | | | | | | | | | | | | | | | | |
Net investment incomec | | | 0.31 | | | | 0.32 | | | | 0.13 | d | | | 0.26 | |
Net realized and unrealized gains (losses) | | | 0.80 | | | | 2.94 | | | | 2.24 | | | | (4.36 | ) |
| | | | |
Total from investment operations | | | 1.11 | | | | 3.26 | | | | 2.37 | | | | (4.10 | ) |
| | | | |
Less distributions from: | | | | | | | | | | | | | | | | |
Net investment income | | | (0.32 | ) | | | (0.31 | ) | | | (0.20 | ) | | | (0.36 | ) |
Net realized gains | | | — | | | | — | | | | — | | | | (0.13 | ) |
| | | | |
Total distributions | | | (0.32 | ) | | | (0.31 | ) | | | (0.20 | ) | | | (0.49 | ) |
| | | | |
Net asset value, end of year | | $ | 19.83 | | | $ | 19.04 | | | $ | 16.09 | | | $ | 13.92 | |
| | | | |
| | | | |
Total returne | | | 5.89% | | | | 20.62% | | | | 17.22% | | | | (22.82)% | |
Ratios to average net assetsf | | | | | | | | | | | | | | | | |
Expenses | | | 0.98% | | | | 0.99% | | | | 1.00% | g | | | 0.96% | g |
Net investment income | | | 1.52% | | | | 1.53% | | | | 0.64% | d | | | 1.70% | |
| | | | |
Supplemental data | | | | | | | | | | | | | | | | |
Net assets, end of year (000’s) | | $ | 3,020 | | | $ | 1,007 | | | $ | 15 | | | $ | 4 | |
Portfolio turnover rate | | | 12.76% | | | | 8.97% | | | | 16.99% | | | | 5.39% | |
aFor the period February 29, 2008 (effective date) to December 31, 2008.
bThe amount shown for a share outstanding throughout the period may not correlate with the Statement of Operations for the period due to the timing of sales and repurchases of the Fund shares in relation to income earned and/or fluctuating market value of the investments of the Fund.
cBased on average daily shares outstanding.
dNet investment income per share includes approximately $(0.15) per share as a return of capital adjustment to a previously recorded special dividend received by the Fund. Excluding this non-recurring amount, the ratio of net investment income to average net assets would have been 1.72%. See Note 1(d).
eTotal return does not include any fees, charges or expenses imposed by the variable annuity and life insurance contracts for which the Franklin Templeton Variable Insurance Products Trust serves as an underlying investment vehicle. Total return is not annualized for periods less than one year.
fRatios are annualized for periods less than one year.
gBenefit of expense reduction rounds to less than 0.01%.
The accompanying notes are an integral part of these financial statements.
FRD-10
Franklin Templeton Variable Insurance Products Trust
Statement of Investments, December 31, 2011
| | | | | | | | | | |
| Franklin Rising Dividends Securities Fund | | | | Shares | | | Value | |
Common Stocks 95.0% | | | | | | | | | | |
Aerospace & Defense 4.3% | | | | | | | | | | |
General Dynamics Corp. | | | | | 28,000 | | | $ | 1,859,480 | |
United Technologies Corp. | | | | | 951,400 | | | | 69,537,826 | |
| | | | | | | | | | |
| | | | | | | | | 71,397,306 | |
| | | | | | | | | | |
Automobiles & Components 0.1% | | | | | | | | | | |
Johnson Controls Inc. | | | | | 78,400 | | | | 2,450,784 | |
| | | | | | | | | | |
Banks 0.8% | | | | | | | | | | |
Hudson City Bancorp Inc. | | | | | 1,203,300 | | | | 7,520,625 | |
Peoples Bancorp Inc. | | | | | 54,096 | | | | 801,162 | |
TrustCo Bank Corp. NY | | | | | 147,285 | | | | 826,269 | |
U.S. Bancorp | | | | | 146,449 | | | | 3,961,445 | |
| | | | | | | | | | |
| | | | | | | | | 13,109,501 | |
| | | | | | | | | | |
Commercial & Professional Services 2.0% | | | | | | | | | | |
ABM Industries Inc. | | | | | 951,288 | | | | 19,615,559 | |
Cintas Corp. | | | | | 384,200 | | | | 13,374,002 | |
| | | | | | | | | | |
| | | | | | | | | 32,989,561 | |
| | | | | | | | | | |
Consumer Durables & Apparel 2.9% | | | | | | | | | | |
aKid Brands Inc. | | | | | 265,947 | | | | 840,393 | |
Leggett & Platt Inc. | | | | | 775,800 | | | | 17,874,432 | |
NIKE Inc., B | | | | | 277,000 | | | | 26,694,490 | |
Superior Uniform Group Inc. | | | | | 237,100 | | | | 2,947,153 | |
| | | | | | | | | | |
| | | | | | | | | 48,356,468 | |
| | | | | | | | | | |
Consumer Services 2.9% | | | | | | | | | | |
Hillenbrand Inc. | | | | | 1,191,300 | | | | 26,589,816 | |
Matthews International Corp., A | | | | | 25,000 | | | | 785,750 | |
McDonald’s Corp. | | | | | 212,345 | | | | 21,304,574 | |
| | | | | | | | | | |
| | | | | | | | | 48,680,140 | |
| | | | | | | | | | |
Diversified Financials 0.8% | | | | | | | | | | |
State Street Corp. | | | | | 324,500 | | | | 13,080,595 | |
| | | | | | | | | | |
Electrical Equipment 6.4% | | | | | | | | | | |
Brady Corp., A | | | | | 1,034,496 | | | | 32,659,039 | |
Roper Industries Inc. | | | | | 843,250 | | | | 73,253,127 | |
| | | | | | | | | | |
| | | | | | | | | 105,912,166 | |
| | | | | | | | | | |
Energy 4.2% | | | | | | | | | | |
Chevron Corp. | | | | | 484,500 | | | | 51,550,800 | |
Exxon Mobil Corp. | | | | | 226,500 | | | | 19,198,140 | |
| | | | | | | | | | |
| | | | | | | | | 70,748,940 | |
| | | | | | | | | | |
Food & Staples Retailing 4.6% | | | | | | | | | | |
Wal-Mart Stores Inc. | | | | | 1,279,100 | | | | 76,439,016 | |
| | | | | | | | | | |
Food, Beverage & Tobacco 4.5% | | | | | | | | | | |
Archer-Daniels-Midland Co. | | | | | 293,000 | | | | 8,379,800 | |
McCormick & Co. Inc. | | | | | 897,000 | | | | 45,226,740 | |
PepsiCo Inc. | | | | | 330,000 | | | | 21,895,500 | |
| | | | | | | | | | |
| | | | | | | | | 75,502,040 | |
| | | | | | | | | | |
Health Care Equipment & Services 12.3% | | | | | | | | | | |
Becton, Dickinson and Co. | | | | | 949,143 | | | | 70,919,965 | |
Hill-Rom Holdings Inc. | | | | | 375,103 | | | | 12,637,220 | |
Medtronic Inc. | | | | | 482,000 | | | | 18,436,500 | |
FRD-11
Franklin Templeton Variable Insurance Products Trust
Statement of Investments, December 31, 2011 (continued)
| | | | | | | | |
| Franklin Rising Dividends Securities Fund | | Shares | | | Value | |
Common Stocks (continued) | | | | | | | | |
Health Care Equipment & Services (continued) | | | | | | | | |
Stryker Corp. | | | 620,400 | | | $ | 30,840,084 | |
Teleflex Inc. | | | 506,753 | | | | 31,058,891 | |
West Pharmaceutical Services Inc. | | | 1,087,600 | | | | 41,274,420 | |
| | | | | | | | |
| | | | | | | 205,167,080 | |
| | | | | | | | |
Household & Personal Products 5.1% | | | | | | | | |
Colgate-Palmolive Co. | | | 69,000 | | | | 6,374,910 | |
The Procter & Gamble Co. | | | 1,171,600 | | | | 78,157,436 | |
| | | | | | | | |
| | | | | | | 84,532,346 | |
| | | | | | | | |
Industrial Conglomerates 0.3% | | | | | | | | |
Carlisle Cos. Inc. | | | 106,261 | | | | 4,707,362 | |
| | | | | | | | |
Insurance 8.2% | | | | | | | | |
Aflac Inc. | | | 309,200 | | | | 13,375,992 | |
Arthur J. Gallagher & Co. | | | 753,000 | | | | 25,180,320 | |
Chubb Corp. | | | 45,000 | | | | 3,114,900 | |
Erie Indemnity Co., A | | | 613,585 | | | | 47,957,804 | |
Mercury General Corp. | | | 154,200 | | | | 7,034,604 | |
Old Republic International Corp. | | | 2,986,594 | | | | 27,685,726 | |
RLI Corp. | | | 160,679 | | | | 11,707,072 | |
| | | | | | | | |
| | | | | | | 136,056,418 | |
| | | | | | | | |
Machinery 5.5% | | | | | | | | |
Donaldson Co. Inc. | | | 253,634 | | | | 17,267,403 | |
Dover Corp. | | | 1,096,700 | | | | 63,663,435 | |
Pentair Inc. | | | 314,000 | | | | 10,453,060 | |
| | | | | | | | |
| | | | | | | 91,383,898 | |
| | | | | | | | |
Materials 12.4% | | | | | | | | |
Air Products and Chemicals Inc. | | | 537,500 | | | | 45,789,625 | |
Albemarle Corp. | | | 380,000 | | | | 19,573,800 | |
Bemis Co. Inc. | | | 1,041,300 | | | | 31,322,304 | |
Ecolab Inc. | | | 66,000 | | | | 3,815,460 | |
Nucor Corp. | | | 635,109 | | | | 25,131,263 | |
Praxair Inc. | | | 759,260 | | | | 81,164,894 | |
| | | | | | | | |
| | | | | | | 206,797,346 | |
| | | | | | | | |
Pharmaceuticals, Biotechnology & Life Sciences 10.1% | | | | | | | | |
Abbott Laboratories | | | 1,469,800 | | | | 82,646,854 | |
Johnson & Johnson | | | 601,000 | | | | 39,413,580 | |
Pfizer Inc. | | | 2,158,100 | | | | 46,701,284 | |
| | | | | | | | |
| | | | | | | 168,761,718 | |
| | | | | | | | |
Retailing 2.9% | | | | | | | | |
Family Dollar Stores Inc. | | | 850,335 | | | | 49,030,316 | |
| | | | | | | | |
Semiconductors & Semiconductor Equipment 0.0%† | | | | | | | | |
Cohu Inc. | | | 50,300 | | | | 570,905 | |
| | | | | | | | |
Software & Services 4.7% | | | | | | | | |
International Business Machines Corp. | | | 426,000 | | | | 78,332,880 | |
| | | | | | | | |
Total Common Stocks (Cost $1,128,531,288) | | | | | | | 1,584,006,786 | |
| | | | | | | | |
FRD-12
Franklin Templeton Variable Insurance Products Trust
Statement of Investments, December 31, 2011 (continued)
| | | | | | | | |
| Franklin Rising Dividends Securities Fund | | Shares | | | Value | |
Short Term Investments (Cost $81,469,938) 4.9% | | | | | | | | |
Money Market Funds 4.9% | | | | | | | | |
a,bInstitutional Fiduciary Trust Money Market Portfolio | | | 81,469,938 | | | $ | 81,469,938 | |
| | | | | | | | |
Total Investments (Cost $1,210,001,226) 99.9% | | | | | | | 1,665,476,724 | |
Other Assets, less Liabilities 0.1% | | | | | | | 1,235,556 | |
| | | | | | | | |
Net Assets 100.0% | | | | | | $ | 1,666,712,280 | |
| | | | | | | | |
†Rounds to less than 0.1% of net assets.
aNon-income producing.
bSee Note 7 regarding investments in the Institutional Fiduciary Trust Money Market Portfolio.
The accompanying notes are an integral part of these financial statements.
FRD-13
Franklin Templeton Variable Insurance Products Trust
Financial Statements
Statement of Assets and Liabilities
December 31, 2011
| | | | |
| | | Franklin Rising
Dividends
Securities Fund | |
Assets: | | | | |
Investments in securities: | | | | |
Cost - Unaffiliated issuers | | $ | 1,128,531,288 | |
Cost - Sweep Money Fund (Note 7) | | | 81,469,938 | |
| | | | |
Total cost of investments | | $ | 1,210,001,226 | |
| | | | |
Value - Unaffiliated issuers | | $ | 1,584,006,786 | |
Value - Sweep Money Fund (Note 7) | | | 81,469,938 | |
| | | | |
Total value of investments | | | 1,665,476,724 | |
Receivables: | | | | |
Investment securities sold | | | 926,168 | |
Capital shares sold | | | 633,200 | |
Dividends | | | 2,537,818 | |
Other assets | | | 46 | |
| | | | |
Total assets | | | 1,669,573,956 | |
| | | | |
Liabilities: | | | | |
Payables: | | | | |
Capital shares redeemed | | | 952,946 | |
Affiliates | | | 1,471,756 | |
Reports to shareholders | | | 380,809 | |
Accrued expenses and other liabilities | | | 56,165 | |
| | | | |
Total liabilities | | | 2,861,676 | |
| | | | |
Net assets, at value | | $ | 1,666,712,280 | |
| | | | |
Net assets consist of: | | | | |
Paid-in capital | | $ | 1,309,337,444 | |
Undistributed net investment income | | | 27,653,099 | |
Net unrealized appreciation (depreciation) | | | 455,475,498 | |
Accumulated net realized gain (loss) | | | (125,753,761 | ) |
| | | | |
Net assets, at value | | $ | 1,666,712,280 | |
| | | | |
The accompanying notes are an integral part of these financial statements.
FRD-14
Franklin Templeton Variable Insurance Products Trust
Financial Statements (continued)
Statement of Assets and Liabilities (continued)
December 31, 2011
| | | | |
| | | Franklin Rising
Dividends
Securities Fund | |
Class 1: | | | | |
Net assets, at value | | $ | 140,297,102 | |
| | | | |
Shares outstanding | | | 7,012,203 | |
| | | | |
Net asset value and maximum offering price per share | | $ | 20.01 | |
| | | | |
Class 2: | | | | |
Net assets, at value | | $ | 1,523,395,614 | |
| | | | |
Shares outstanding | | | 77,508,781 | |
| | | | |
Net asset value and maximum offering price per share | | $ | 19.65 | |
| | | | |
Class 4: | | | | |
Net assets, at value | | $ | 3,019,564 | |
| | | | |
Shares outstanding | | | 152,280 | |
| | | | |
Net asset value and maximum offering price per share | | $ | 19.83 | |
| | | | |
The accompanying notes are an integral part of these financial statements.
FRD-15
Franklin Templeton Variable Insurance Products Trust
Financial Statements (continued)
Statement of Operations
for the year ended December 31, 2011
| | | | |
| | | Franklin Rising
Dividends
Securities Fund | |
Investment income: | | | | |
Dividends | | $ | 42,142,969 | |
| | | | |
Expenses: | | | | |
Management fees (Note 3a) | | | 10,183,809 | |
Distribution fees: (Note 3c) | | | | |
Class 2 | | | 3,839,349 | |
Class 4 | | | 6,454 | |
Unaffiliated transfer agent fees | | | 1,899 | |
Custodian fees (Note 4) | | | 23,081 | |
Reports to shareholders | | | 335,877 | |
Professional fees | | | 54,110 | |
Trustees’ fees and expenses | | | 6,322 | |
Other | | | 36,176 | |
| | | | |
Total expenses | | | 14,487,077 | |
| | | | |
Net investment income | | | 27,655,892 | |
| | | | |
Realized and unrealized gains (losses): | | | | |
Net realized gain (loss) from investments | | | 120,463,536 | |
Net change in unrealized appreciation (depreciation) on investments | | | (50,218,731 | ) |
| | | | |
Net realized and unrealized gain (loss) | | | 70,244,805 | |
| | | | |
Net increase (decrease) in net assets resulting from operations | | $ | 97,900,697 | |
| | | | |
The accompanying notes are an integral part of these financial statements.
FRD-16
Franklin Templeton Variable Insurance Products Trust
Financial Statements (continued)
Statements of Changes in Net Assets
| | | | | | | | |
| | | Franklin Rising Dividends
Securities Fund | |
| | | Year Ended December 31, | |
| | | 2011 | | | 2010 | |
| | | | |
Increase (decrease) in net assets: | | | | | | | | |
Operations: | | | | | | | | |
Net investment income | | $ | 27,655,892 | | | $ | 25,813,336 | |
Net realized gain (loss) from investments | | | 120,463,536 | | | | 67,941,220 | |
Net change in unrealized appreciation (depreciation) on investments | | | (50,218,731 | ) | | | 203,294,325 | |
| | | | |
Net increase (decrease) in net assets resulting from operations | | | 97,900,697 | | | | 297,048,881 | |
| | | | |
Distributions to shareholders from: | | | | | | | | |
Net investment income: | | | | | | | | |
Class 1 | | | (2,458,866 | ) | | | (2,516,672 | ) |
Class 2 | | | (23,318,584 | ) | | | (22,710,892 | ) |
Class 4 | | | (30,729 | ) | | | (5,357 | ) |
| | | | |
Total distributions to shareholders | | | (25,808,179 | ) | | | (25,232,921 | ) |
| | | | |
Capital share transactions: (Note 2) | | | | | | | | |
Class 1 | | | (14,479,695 | ) | | | (15,601,529 | ) |
Class 2 | | | (115,088,554 | ) | | | (46,034,000 | ) |
Class 4 | | | 1,904,859 | | | | 920,381 | |
| | | | |
Total capital share transactions | | | (127,663,390 | ) | | | (60,715,148 | ) |
| | | | |
Net increase (decrease) in net assets | | | (55,570,872 | ) | | | 211,100,812 | |
Net assets: | | | | | | | | |
Beginning of year | | | 1,722,283,152 | | | | 1,511,182,340 | |
| | | | |
End of year | | $ | 1,666,712,280 | | | $ | 1,722,283,152 | |
| | | | |
Undistributed net investment income included in net assets: | | | | | | | | |
End of year | | $ | 27,653,099 | | | $ | 25,805,386 | |
| | | | |
The accompanying notes are an integral part of these financial statements.
FRD-17
Franklin Templeton Variable Insurance Products Trust
Notes to Financial Statements
Franklin Rising Dividends Securities Fund
1. ORGANIZATION AND SIGNIFICANT ACCOUNTING POLICIES
Franklin Templeton Variable Insurance Products Trust (Trust) is registered under the Investment Company Act of 1940, as amended, (1940 Act) as an open-end investment company, consisting of twenty separate funds. The Franklin Rising Dividends Securities Fund (Fund) is included in this report. The financial statements of the remaining funds in the Trust are presented separately. Shares of the Fund are generally sold only to insurance company separate accounts to fund the benefits of variable life insurance policies or variable annuity contracts. At December 31, 2011, 60.45% of the Fund’s shares were held through one insurance company. The Fund offers three classes of shares: Class 1, Class 2, and Class 4. Each class of shares differs by its distribution fees, voting rights on matters affecting a single class and its exchange privilege.
The following summarizes the Fund’s significant accounting policies.
a. Financial Instrument Valuation
The Fund’s investments in securities and other financial instruments are carried at fair value daily. Fair value is the price that would be received to sell an asset or paid to transfer a liability in an orderly transaction between market participants on the measurement date. Under procedures approved by the Trust’s Board of Trustees, the Fund may utilize independent pricing services, quotations from securities and financial instrument dealers, and other market sources to determine fair value.
Equity securities listed on an exchange or on the NASDAQ National Market System are valued at the last quoted sale price or the official closing price of the day, respectively. Over-the-counter securities are valued within the range of the most recent quoted bid and ask prices. Securities that trade in multiple markets or on multiple exchanges are valued according to the broadest and most representative market. Certain equity securities are valued based upon fundamental characteristics or relationships to similar securities. Investments in open-end mutual funds are valued at the closing net asset value.
The Fund has procedures to determine the fair value of securities and other financial instruments for which market prices are not readily available or which may not be reliably priced. Under these procedures, the Fund primarily employs a market-based approach which may use related or comparable assets or liabilities, recent transactions, market multiples, book values, and other relevant information for the investment to determine the fair value of the investment. The Fund may also use an income-based valuation approach in which the anticipated future cash flows of the investment are discounted to calculate fair value. Discounts may also be applied due to the nature or duration of any restrictions on the disposition of the investments. Due to the inherent uncertainty of valuations of such investments, the fair values may differ significantly from the values that would have been used had an active market existed.
b. Securities Lending
The Fund participates in a principal based security lending program. The fund receives cash collateral against the loaned securities in an amount equal to at least 102% of the market value of the loaned securities. Collateral is maintained over the life of the loan in an amount not less than 100% of the market value of loaned securities, as determined at the close of fund business each day; any additional collateral required due to changes in security values is delivered to the fund on the next business day. The collateral is invested in a non-registered money fund managed by the Fund’s custodian on the fund’s behalf. The fund receives income from the investment of cash collateral, in addition to lending fees and rebates paid by the borrower. The fund bears the market risk with respect to the collateral investment, securities loaned, and the risk that the principal may default on its obligations to the fund. At December 31, 2011, the Fund had no securities on loan.
c. Income Taxes
It is the Fund’s policy to qualify as a regulated investment company under the Internal Revenue Code. The Fund intends to distribute to shareholders substantially all of its taxable income and net realized gains to relieve it from federal income and excise taxes. As a result, no provision for U.S. federal income taxes is required.
FRD-18
Franklin Templeton Variable Insurance Products Trust
Notes to Financial Statements (continued)
Franklin Rising Dividends Securities Fund
1. ORGANIZATION AND SIGNIFICANT ACCOUNTING POLICIES (continued)
c. Income Taxes (continued)
The Fund recognizes the tax benefits of uncertain tax positions only when the position is “more likely than not” to be sustained upon examination by the tax authorities based on the technical merits of the tax position. As of December 31, 2011, and for all open tax years, the Fund has determined that no liability for unrecognized tax benefits is required in the Fund’s financial statements related to uncertain tax positions taken on a tax return (or expected to be taken on future tax returns). Open tax years are those that remain subject to examination and are based on each tax jurisdiction statute of limitation.
d. Security Transactions, Investment Income, Expenses and Distributions
Security transactions are accounted for on trade date. Realized gains and losses on security transactions are determined on a specific identification basis. Estimated expenses are accrued daily. Dividend income is recorded on the ex-dividend date. Distributions to shareholders are recorded on the ex-dividend date and are determined according to income tax regulations (tax basis). Distributable earnings determined on a tax basis may differ from earnings recorded in accordance with accounting principles generally accepted in the United States of America. These differences may be permanent or temporary. Permanent differences are reclassified among capital accounts to reflect their tax character. These reclassifications have no impact on net assets or the results of operations. Temporary differences are not reclassified, as they may reverse in subsequent periods.
Common expenses incurred by the Trust are allocated among the funds based on the ratio of net assets of each fund to the combined net assets of the Trust. Fund specific expenses are charged directly to the fund that incurred the expense.
Realized and unrealized gains and losses and net investment income, not including class specific expenses, are allocated daily to each class of shares based upon the relative proportion of net assets of each class. Differences in per share distributions, by class, are generally due to differences in class specific expenses.
Distributions received by the Fund from certain securities may be a return of capital (ROC). Such distributions reduce the cost basis of the securities, and any distributions in excess of the cost basis are recognized as capital gains.
e. Accounting Estimates
The preparation of financial statements in accordance with accounting principles generally accepted in the United States of America requires management to make estimates and assumptions that affect the reported amounts of assets and liabilities at the date of the financial statements and the amounts of income and expenses during the reporting period. Actual results could differ from those estimates.
f. Guarantees and Indemnifications
Under the Trust’s organizational documents, its officers and trustees are indemnified by the Trust against certain liabilities arising out of the performance of their duties to the Trust. Additionally, in the normal course of business, the Trust, on behalf of the Fund, enters into contracts with service providers that contain general indemnification clauses. The Trust’s maximum exposure under these arrangements is unknown as this would involve future claims that may be made against the Trust that have not yet occurred. Currently, the Trust expects the risk of loss to be remote.
FRD-19
Franklin Templeton Variable Insurance Products Trust
Notes to Financial Statements (continued)
Franklin Rising Dividends Securities Fund
2. SHARES OF BENEFICIAL INTEREST
At December 31, 2011, there were an unlimited number of shares authorized (without par value). Transactions in the Fund’s shares were as follows:
| | | | | | | | | | | | | | | | |
| | | Year Ended December 31, | |
| | | 2011 | | | 2010 | |
| Class 1 Shares: | | Shares | | | Amount | | | Shares | | | Amount | |
Shares sold | | | 601,890 | | | $ | 11,765,470 | | | | 257,133 | | | $ | 4,557,190 | |
Shares issued in reinvestment of distributions | | | 126,876 | | | | 2,458,866 | | | | 150,879 | | | | 2,516,672 | |
Shares redeemed | | | (1,473,505 | ) | | | (28,704,031 | ) | | | (1,321,083 | ) | | | (22,675,391 | ) |
| | | | |
Net increase (decrease) | | | (744,739 | ) | | $ | (14,479,695 | ) | | | (913,071 | ) | | $ | (15,601,529 | ) |
| | | | |
Class 2 Shares: | | | | | | | | | | | | | | | | |
Shares sold | | | 5,855,934 | | | $ | 111,121,703 | | | | 5,148,488 | | | $ | 89,372,157 | |
Shares issued in reinvestment of distributions | | | 1,222,789 | | | | 23,318,584 | | | | 1,383,124 | | | | 22,710,892 | |
Shares redeemed | | | (13,131,700 | ) | | | (249,528,841 | ) | | | (9,446,580 | ) | | | (158,117,049 | ) |
| | | | |
Net increase (decrease) | | | (6,052,977 | ) | | $ | (115,088,554 | ) | | | (2,914,968 | ) | | $ | (46,034,000 | ) |
| | | | |
Class 4 Shares: | | | | | | | | | | | | | | | | |
Shares sold | | | 125,061 | | | $ | 2,400,178 | | | | 55,672 | | | $ | 986,798 | |
Shares issued on reinvestment of distributions | | | 1,596 | | | | 30,729 | | | | 317 | | | | 5,273 | |
Shares redeemed | | | (27,259 | ) | | | (526,048 | ) | | | (4,068 | ) | | | (71,690 | ) |
| | | | |
Net increase (decrease) | | | 99,398 | | | $ | 1,904,859 | | | | 51,921 | | | $ | 920,381 | |
| | | | |
3. TRANSACTIONS WITH AFFILIATES
Franklin Resources, Inc. is the holding company for various subsidiaries that together are referred to as Franklin Templeton Investments. Certain officers and trustees of the Fund are also officers and/or directors of the following subsidiaries:
| | |
| Subsidiary | | Affiliation |
Franklin Advisory Services, LLC (Advisory Services) | | Investment manager |
Franklin Templeton Services, LLC (FT Services) | | Administrative manager |
Franklin Templeton Distributors, Inc. (Distributors) | | Principal underwriter |
Franklin Templeton Investor Services, LLC (Investor Services) | | Transfer agent |
a. Management Fees
The Fund pays an investment management fee to Advisory Services based on the average daily net assets of the Fund as follows:
| | |
| Annualized Fee Rate | | Net Assets |
| 0.750% | | Up to and including $500 million |
| 0.625% | | Over $500 million, up to and including $1 billion |
| 0.500% | | In excess of $1 billion |
b. Administrative Fees
Under an agreement with Advisory Services, FT Services provides administrative services to the Fund. The fee is paid by Advisory Services based on average daily net assets, and is not an additional expense of the Fund.
FRD-20
Franklin Templeton Variable Insurance Products Trust
Notes to Financial Statements (continued)
Franklin Rising Dividends Securities Fund
3. TRANSACTIONS WITH AFFILIATES (continued)
c. Distribution Fees
The Fund’s Board of Trustees has adopted distribution plans for Class 2 and Class 4 shares pursuant to Rule 12b-1 under the 1940 Act. Under the Fund’s compensation distribution plans, the Fund pays Distributors for costs incurred in connection with the servicing, sale and distribution of the Fund’s shares up to 0.35% per year of its average daily net assets of each class. The Board of Trustees has agreed to limit the current rate to 0.25% per year for Class 2.
d. Transfer Agent Fees
Investor Services, under terms of an agreement, performs shareholder servicing for the Fund and is not paid by the Fund for the services.
4. EXPENSE OFFSET ARRANGEMENT
The Fund has entered into an arrangement with its custodian whereby credits realized as a result of uninvested cash balances are used to reduce a portion of the Fund’s custodian expenses. During the year ended December 31, 2011, there were no credits earned.
5. INCOME TAXES
For tax purposes, capital losses may be carried over to offset future capital gains, if any. Under the Regulated Investment Company Modernization Act of 2010, capital losses incurred by the Fund in taxable years beginning after December 22, 2010 are not subject to expiration and such losses retain their character as either short-term or long-term, rather than being considered short-term as under previous law. Post-enactment capital losses must be fully utilized prior to utilizing any losses incurred in pre-enactment tax years.
At December 31, 2011, capital loss carryforwards were as follows:
| | | | |
Capital loss carryforwards subject to expiration: | | | | |
2016 | | $ | 16,233,576 | |
2017 | | | 107,931,803 | |
| | | | |
| | $ | 124,165,379 | |
| | | | |
During the year ended December 31, 2011, the Fund utilized $119,865,942 of capital loss carryforwards.
The tax character of distributions paid during the years ended December 31, 2011 and 2010, was as follows:
| | | | | | | | |
| | | 2011 | | | 2010 | |
Distributions paid from ordinary income | | $ | 25,808,179 | | | $ | 25,232,921 | |
| | | | |
FRD-21
Franklin Templeton Variable Insurance Products Trust
Notes to Financial Statements (continued)
Franklin Rising Dividends Securities Fund
5. INCOME TAXES (continued)
At December 31, 2011, the cost of investments, net unrealized appreciation (depreciation) and undistributed ordinary income for income tax purposes were as follows:
| | | | |
Cost of investments | | $ | 1,211,589,607 | |
| | | | |
| |
Unrealized appreciation | | $ | 507,753,323 | |
Unrealized depreciation | | | (53,866,206 | ) |
| | | | |
Net unrealized appreciation (depreciation) | | $ | 453,887,117 | |
| | | | |
Distributable earnings – undistributed ordinary income | | $ | 27,653,096 | |
| | | | |
Differences between income and/or capital gains as determined on a book basis and a tax basis are primarily due to differing treatment of wash sales.
6. INVESTMENT TRANSACTIONS
Purchases and sales of investments (excluding short term securities) for the year ended December 31, 2011, aggregated $206,923,415 and $331,078,386, respectively.
7. INVESTMENTS IN INSTITUTIONAL FIDUCIARY TRUST MONEY MARKET PORTFOLIO
The Fund invests in the Institutional Fiduciary Trust Money Market Portfolio (Sweep Money Fund), an open-end investment company managed by Franklin Advisers, Inc. (an affiliate of the investment manager). Management fees paid by the Fund are reduced on assets invested in the Sweep Money Fund, in an amount not to exceed the management and administrative fees paid by the Sweep Money Fund.
8. CREDIT FACILITY
The Fund, together with other U.S. registered and foreign investment funds (collectively, Borrowers), managed by Franklin Templeton Investments, are borrowers in a joint syndicated senior unsecured credit facility totaling $750 million (Global Credit Facility) which matured on January 20, 2012. This Global Credit Facility provides a source of funds to the Borrowers for temporary and emergency purposes, including the ability to meet future unanticipated or unusually large redemption requests. Effective January 20, 2012, the Borrowers renewed the Global Credit Facility for a total of $1.5 billion, maturing January 18, 2013.
Under the terms of the Global Credit Facility, the Fund shall, in addition to interest charged on any borrowings made by the Fund and other costs incurred by the Fund, pay its share of fees and expenses incurred in connection with the implementation and maintenance of the Global Credit Facility, based upon its relative share of the aggregate net assets of all of the Borrowers, including an annual commitment fee of 0.08% based upon the unused portion of the Global Credit Facility, which is reflected in other expenses on the Statement of Operations. During the year ended December 31, 2011, the Fund did not use the Global Credit Facility.
FRD-22
Franklin Templeton Variable Insurance Products Trust
Notes to Financial Statements (continued)
Franklin Rising Dividends Securities Fund
9. FAIR VALUE MEASUREMENTS
The Fund follows a fair value hierarchy that distinguishes between market data obtained from independent sources (observable inputs) and the Fund’s own market assumptions (unobservable inputs). These inputs are used in determining the value of the Fund’s investments and are summarized in the following fair value hierarchy:
| | • | | Level 1 – quoted prices in active markets for identical securities |
| | • | | Level 2 – other significant observable inputs (including quoted prices for similar securities, interest rates, prepayment speed, credit risk, etc.) |
| | • | | Level 3 – significant unobservable inputs (including the Fund’s own assumptions in determining the fair value of investments) |
The inputs or methodology used for valuing securities are not an indication of the risk associated with investing in those securities.
For movements between the levels within the fair value hierarchy, the Fund has adopted a policy of recognizing the transfers as of the date of the underlying event which caused the movement.
At December 31, 2011, all of the Fund’s investments in securities carried at fair value were valued using Level 1 inputs. For detailed categories, see the accompanying Statement of Investments.
10. NEW ACCOUNTING PRONOUNCEMENTS
In May 2011, the Financial Accounting Standards Board (FASB) issued Accounting Standards Update (ASU) No. 2011-04, Fair Value Measurement (Topic 820): Amendments to Achieve Common Fair Value Measurement and Disclosure Requirements in U.S. GAAP and IFRSs. The amendments in the ASU will improve the comparability of fair value measurements presented and disclosed in financial statements prepared in accordance with U.S. GAAP (Generally Accepted Accounting Principles) and IFRS (International Financial Reporting Standards) and include new guidance for certain fair value measurement principles and disclosure requirements. The ASU is effective for interim and annual periods beginning after December 15, 2011. The Fund believes the adoption of this ASU will not have a material impact on its financial statements.
11. SUBSEQUENT EVENTS
The Fund has evaluated subsequent events through the issuance of the financial statements and determined that no events have occurred that require disclosure other than those already disclosed in the financial statements.
FRD-23
Franklin Templeton Variable Insurance Products Trust
Franklin Rising Dividends Securities Fund
Report of Independent Registered Public Accounting Firm
To the Board of Trustees and Shareholders of
Franklin Templeton Variable Insurance Products Trust
In our opinion, the accompanying statement of assets and liabilities, including the statement of investments, and the related statements of operations and of changes in net assets and the financial highlights present fairly, in all material respects, the financial position of Franklin Rising Dividends Securities Fund (the “Fund”) at December 31, 2011, the results of its operations for the year then ended, the changes in its net assets for each of the two years in the period then ended and the financial highlights for the periods presented, in conformity with accounting principles generally accepted in the United States of America. These financial statements and financial highlights (hereafter referred to as “financial statements”) are the responsibility of the Fund’s management. Our responsibility is to express an opinion on these financial statements based on our audits. We conducted our audits of these financial statements in accordance with the standards of the Public Company Accounting Oversight Board (United States). Those standards require that we plan and perform the audit to obtain reasonable assurance about whether the financial statements are free of material misstatement. An audit includes examining, on a test basis, evidence supporting the amounts and disclosures in the financial statements, assessing the accounting principles used and significant estimates made by management, and evaluating the overall financial statement presentation. We believe that our audits, which included confirmation of securities at December 31, 2011 by correspondence with the custodian and brokers, provide a reasonable basis for our opinion.
PricewaterhouseCoopers LLP
San Francisco, California
February 13, 2012
FRD-24
Franklin Templeton Variable Insurance Products Trust
Tax Information (unaudited)
Franklin Rising Dividends Securities Fund
Under Section 854(b)(1)(A) of the Internal Revenue Code, the Fund hereby reports 100% of the ordinary income dividends as income qualifying for the dividends received deduction for the fiscal year ended December 31, 2011.
FRD-25
FRANKLIN SMALL CAP VALUE SECURITIES FUND
This annual report for Franklin Small Cap Value Securities Fund covers the fiscal year ended December 31, 2011.
Performance Summary as of 12/31/11
Average annual total return of Class 1 shares represents the average annual change in value, assuming reinvestment of dividends and capital gains. Average returns smooth out variations in returns, which can be significant; they are not the same as year-by-year results.
Periods ended 12/31/11
| | | | | | | | | | | | |
| | | 1-Year | | | 5-Year | | | 10-Year | |
Average Annual Total Return | | | -3.53% | | | | +1.08% | | | | +7.26% | |
Total Return Index Comparison for a Hypothetical $10,000 Investment (1/1/02–12/31/11)
The graph below shows the change in value of a hypothetical $10,000 investment in the Fund over the indicated period and includes reinvestment of any income or distributions. The Fund’s performance is compared to the performance of the Russell 2500™ Value Index. One cannot invest directly in an index, and an index is not representative of the Fund’s portfolio. Please see Important Notes to Performance Information preceding the Fund Summaries.
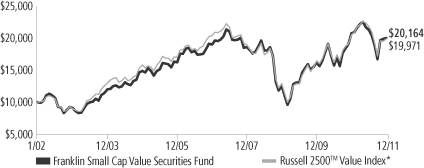
*Source: © 2012 Morningstar. Please see Index Descriptions following the Fund Summaries.
Franklin Small Cap Value Securities Fund – Class 1
Performance reflects the Fund’s Class 1 operating expenses, but does not include any contract fees, expenses or sales charges. If they had been included, performance would be lower. These charges and deductions, particularly for variable life policies, can have a significant effect on contract values and insurance benefits. See the contract prospectus for a complete description of these expenses, including sales charges.
Performance data represent past performance, which does not guarantee future results. Investment return and principal value will fluctuate, and you may have a gain or loss when you sell your shares.
Current performance may differ from figures shown.
FSV-1
Fund Goal and Main Investments: Franklin Small Cap Value Securities Fund seeks long-term total return. The Fund normally invests at least 80% of its net assets in investments of small-capitalization companies. For this Fund, small-capitalization companies are those with market capitalization values under $3.5 billion at the time of purchase. The Fund invests generally in equity securities of companies that the manager believes are undervalued and have the potential for capital appreciation.
Performance Overview
You can find the Fund’s one-year total return in the Performance Summary. The Fund underperformed its benchmark, the Russell 2500™ Value Index, which fell 3.36% for the same period.1 Please note the Fund employs a bottom-up stock selection process, and the managers invest in securities without regard to benchmark comparisons.
Economic and Market Overview
The U.S. economy improved steadily but modestly in 2011 despite geopolitical, employment and housing pressures. The U.S. manufacturing sector helped power the domestic economy and led global manufacturing output heading into 2012. Although manufacturing growth slowed in the second half of the year as high commodity prices reduced purchasing power and demand ebbed, the trend began to reverse near year-end. U.S. gross domestic product (GDP) growth advanced each quarter, and the nation’s unemployment rate fell from 9.4% to 8.5%.2
The U.S. financial system and household balance sheets continued to improve, but the country still faced persistently high unemployment, a prolonged housing market slump and massive national debt. The U.S. Federal Reserve Board (Fed) cut the country’s growth forecast partly due to the heightened potential for recession in Europe and cooling GDP trends across much of Asia. Inflation rose for much of the world but stayed relatively contained in the U.S., even slowing toward year-end amid declining energy and food prices. The Fed sought to boost economic growth by maintaining its accommodative monetary policy and undertook a second round of quantitative easing that ended on June 30. Subsequently, the Fed continued to purchase Treasuries with proceeds from maturing debt in an effort to support economic growth.
1. Source: © 2012 Morningstar. One cannot invest directly in an index, and an index is not representative of the Fund’s portfolio. Please see Index Descriptions following the Fund Summaries.
2. Source: Bureau of Labor Statistics.
Fund Risks: All investments involve risks. Stock prices fluctuate, sometimes rapidly and dramatically, due to factors affecting individual companies, particular industries or sectors, or general market conditions. Smaller company securities can increase the risk of greater price volatility, particularly over the short term. Smaller or relatively new or unseasoned companies can also be particularly sensitive to changing economic conditions, and their prospects for growth are less certain than those of larger, more established companies. The Fund may have significant investments in particular sectors from time to time, such as financial services and energy, and may be at greater risk of adverse developments in a sector than a fund that invests more broadly. Foreign investing involves additional risks, including currency fluctuations, economic instability, market volatility, and political and social instability. The Fund is actively managed but there is no guarantee that the manager’s investment decisions will produce the desired results. The Fund’s prospectus also includes a description of the main investment risks.
FSV-2
Although U.S. stock markets rallied in the spring, worrisome global events and slowing global growth dampened investor sentiment and market volatility surged. Risk-averse investors sought perceived safe havens and seemed to ignore that many U.S. companies generated record profits. Despite large swings, U.S. stocks as measured by the Standard & Poor’s® 500 Index (S&P 500®) gained 2.11% in 2011.1 The Dow Jones Industrial Average rose 8.38%, reflecting investors’ general preference for large, established U.S. companies.1 Notably, the U.S. was a global market leader in 2011 as the country continued to be a relative haven. During the year, sector performance varied widely. Noncyclical, income-producing sectors such as utilities, consumer staples and health care led the market, while economically sensitive sectors such as materials and industrials lagged. Financials in the S&P 500 experienced the worst sector decline, as U.S. bank stocks generally tracked their European peers. Against this backdrop, growth stocks fared better than their value counterparts; large-capitalization stocks advanced slightly as a group, with modestly negative results for most small- and mid-sized company stocks, as measured by Russell capitalization-based indexes.
Investment Strategy
We are a research-driven, fundamental investment adviser, pursuing a disciplined, value-oriented strategy for the Fund. As a bottom-up adviser concentrating primarily on individual securities, we focus on the market price of a company’s securities relative to our evaluation of the company’s potential long-term earnings, asset value or cash flow. We seek bargains among the “unloved,” out-of-favor companies that offer, in our opinion, attractive long-term potential. These might include current growth companies that are being ignored by the market, former growth companies that have stumbled recently, dropping sharply in price but that still have significant growth potential, in our opinion, or companies that may be potential turnaround candidates or takeover targets.
Manager’s Discussion
During the 12 months under review, the utilities, consumer staples and health care sectors represented in the Fund contributed to absolute performance.3 Key contributors included electric utility PNM Resources, food products manufacturer Lancaster Colony, and global contract re-
3. The consumer staples sector comprises food and staples retailing; and food, beverage and tobacco in the SOI. The health care sector comprises health care equipment and services; and pharmaceuticals, biotechnology and life sciences in the SOI.
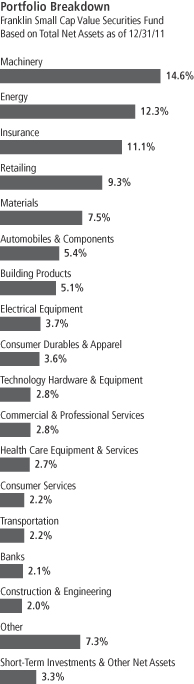
FSV-3
search organization Pharmaceutical Product Development (PPD). In other sectors, some holdings that aided returns included specialty retailers Group 1 Automotive and The Men’s Wearhouse, as well as furniture company La-Z-Boy, plumbing manufacturer Mueller Industries, insurer RLI, offshore energy equipment provider Global Industries, and chemical sealant manufacturer RPM International.
Among sectors hindering performance were energy, information technology, industrials and financials.4 Key detractors from these sectors included petroleum shipping company Overseas Shipholding Group, offshore drilling company Rowan Cos., laser equipment producer Rofin-Sinar Technologies, electronics manufacturing services company Benchmark Electronics, kitchen and bath cabinet manufacturer American Woodmark, engineered industrial products provider EnPro Industries, and insurer Old Republic International. In other sectors, auto safety systems company Autoliv, women’s clothing retailer Christopher & Banks, and carbon steel products producer Steel Dynamics were notable detractors.
In addition to purchasing shares of EnPro Industries, the Fund initiated 13 other positions during the period in what we considered attractively valued securities: aviation products provider AAR, fabricator and distributor of steel and copper products Commercial Metals, industrial battery manufacturer EnerSys, video games retailer GameStop, wire manufacturer General Cable, industrial adhesive producer H.B. Fuller, medical equipment manufacturer Hill-Rom Holdings, machinery manufacturer Kaydon, branded apparel manufacturer Maidenform Brands, provider of flexible circuit materials Multi-Fineline Electronix, Puerto Rico-based bank Oriental Financial Group, water delivery and thermal systems provider Pentair, and brand marketing consultant Schawk. We also added to our positions in plastic compound supplier A. Schulman, women’s fashion retailer The Cato Corp. and The Hanover Insurance Group, among others.
During the period the Fund eliminated PPD, which was subject to an all-cash takeover offer from The Carlyle Group and Hellman & Friedman of $33.25 per share, a 29% premium over PPD’s previous day’s closing price. The Fund also exited its position in oilfield services provider Global Industries, which accepted an $8 all-cash offer from Technip. This per-share bid was a 55% increase over Global Industries’
4. The information technology sector comprises semiconductors and semiconductor equipment, and technology hardware and equipment in the SOI. The industrials sector comprises electrical equipment, industrial conglomerates, machinery and transportation in the SOI. The financials sector comprises banks and insurance in the SOI.
Top 10 Holdings
Franklin Small Cap Value Securities Fund 12/31/11
| | | | |
Company
Sector/Industry | | % of Total
Net Assets | |
| Protective Life Corp. | | | 2.0% | |
| Insurance | | | | |
| Group 1 Automotive Inc. | | | 2.0% | |
| Retailing | | | | |
| Bristow Group Inc. | | | 1.9% | |
| Energy | | | | |
| Trinity Industries Inc. | | | 1.8% | |
| Machinery | | | | |
| Thor Industries Inc. | | | 1.8% | |
| Automobiles & Components | | | | |
| Tidewater Inc. | | | 1.7% | |
| Energy | | | | |
| Reliance Steel & Aluminum Co. | | | 1.7% | |
| Materials | | | | |
| Gentex Corp. | | | 1.5% | |
| Automobiles & Components | | | | |
| Oil States International Inc. | | | 1.5% | |
| Energy | | | | |
| Rowan Cos. Inc. | | | 1.5% | |
| Energy | | | | |
The dollar value, number of shares or principal amount, and names of all portfolio holdings are listed in the Fund’s Statement of Investments (SOI).
FSV-4
prior day’s closing price. We liquidated seven other positions during the fiscal year: Bassett Furniture Industries, CNH Global, Erie Indemnity, Glatfelter, United States Steel, Warnaco Group and Westlake Chemical. We also reduced our positions in life sciences tools and services company Mettler-Toledo International, machinery company Nordson and insurer Transatlantic Holdings, among others.
Thank you for your participation in Franklin Small Cap Value Securities Fund. We look forward to serving your future investment needs.
The foregoing information reflects our analysis, opinions and portfolio holdings as of December 31, 2011, the end of the reporting period. The way we implement our main investment strategies and the resulting portfolio holdings may change depending on factors such as market and economic conditions. These opinions may not be relied upon as investment advice or an offer for a particular security. The information is not a complete analysis of every aspect of any market, country, industry, security or the Fund. Statements of fact are from sources considered reliable, but the investment manager makes no representation or warranty as to their completeness or accuracy. Although historical performance is no guarantee of future results, these insights may help you understand our investment management philosophy.
FSV-5
Fund Expenses
As an investor in a variable insurance contract (Contract) that indirectly provides for investment in an underlying mutual fund, you can incur transaction and/or ongoing expenses at both the Fund level and the Contract level.
| • | | Transaction expenses can include sales charges (loads) on purchases, redemption fees, surrender fees, transfer fees and premium taxes. |
| • | | Ongoing expenses can include management fees, distribution and service (12b-1) fees, contract fees, annual maintenance fees, mortality and expense risk fees and other fees and expenses. All mutual funds and Contracts have some types of ongoing expenses. |
The expenses shown in the table are meant to highlight ongoing expenses at the Fund level only and do not include ongoing expenses at the Contract level, or transaction expenses at either the Fund or Contract level. While the Fund does not have transaction expenses, if the transaction and ongoing expenses at the Contract level were included, the expenses shown below would be higher. You should consult your Contract prospectus or disclosure document for more information.
The table shows Fund-level ongoing expenses and can help you understand these expenses and compare them with those of other mutual funds offered through the Contract. The table assumes a $1,000 investment held for the six months indicated. Please refer to the Fund prospectus for additional information on operating expenses.
Actual Fund Expenses
The first line (Actual) of the table provides actual account values and expenses. The “Ending Account Value” is derived from the Fund’s actual return, which includes the effect of ongoing Fund expenses, but does not include the effect of ongoing Contract expenses.
You can estimate the Fund-level expenses you incurred during the period by following these steps. Of course, your account value and expenses will differ from those in this illustration:
| 1. | Divide your account value by $1,000. |
If an account had an $8,600 value, then $8,600 ÷ $1,000 = 8.6.
| 2. | Multiply the result by the number under the heading “Fund-Level Expenses Incurred During Period.” |
If Fund-Level Expenses Incurred During Period were $7.50, then 8.6 x $7.50 = $64.50.
In this illustration, the estimated expenses incurred this period at the Fund level are $64.50.
Franklin Small Cap Value Securities Fund – Class 1
FSV-6
Hypothetical Example for Comparison with Other Mutual Funds
Information in the second line (Hypothetical) of the table can help you compare ongoing expenses of the Fund with those of other mutual funds offered through the Contract. This information may not be used to estimate the actual ending account balance or expenses you incurred during the period. The hypothetical “Ending Account Value” is based on the Fund’s actual expense ratio and an assumed 5% annual rate of return before expenses, which does not represent the Fund’s actual return. The figure under the heading “Fund-Level Expenses Incurred During Period” shows the hypothetical expenses your account would have incurred under this scenario. You can compare this figure with the 5% hypothetical examples that appear in shareholder reports of other funds offered through a Contract.
| | | | | | | | | | | | |
| Class 1 | | Beginning
Account Value 7/1/11 | | | Ending
Account
Value 12/31/11 | | | Fund-Level Expenses Incurred
During Period* 7/1/11–12/31/11 | |
Actual | | $ | 1,000 | | | $ | 941.70 | | | $ | 3.33 | |
Hypothetical (5% return before expenses) | | $ | 1,000 | | | $ | 1,021.78 | | | $ | 3.47 | |
*Expenses are calculated using the most recent six-month annualized expense ratio for the Fund’s Class 1 shares (0.68%), which does not include any ongoing expenses of the Contract for which the Fund is an investment option, multiplied by the average account value over the period, multiplied by 184/365 to reflect the one-half year period.
FSV-7
Franklin Templeton Variable Insurance Products Trust
Financial Highlights
Franklin Small Cap Value Securities Fund
| | | | | | | | | | | | | | | | | | | | |
| | | Year Ended December 31, | |
| Class 1 | | 2011 | | | 2010 | | | 2009 | | | 2008 | | | 2007 | |
| | | | |
Per share operating performance | | | | | | | | | | | | | | | | | | | | |
(for a share outstanding throughout the year) | | | | | | | | | | | | | | | | | | | | |
Net asset value, beginning of year | | $ | 16.55 | | | $ | 13.00 | | | $ | 10.73 | | | $ | 17.38 | | | $ | 19.07 | |
| | | | |
Income from investment operationsa: | | | | | | | | | | | | | | | | | | | | |
Net investment incomeb | | | 0.16 | | | | 0.14 | | | | 0.15 | | | | 0.24 | | | | 0.22 | |
Net realized and unrealized gains (losses) | | | (0.74 | ) | | | 3.54 | | | | 2.86 | | | | (5.44 | ) | | | (0.44 | ) |
| | | | |
Total from investment operations | | | (0.58 | ) | | | 3.68 | | | | 3.01 | | | | (5.20 | ) | | | (0.22 | ) |
| | | | |
Less distributions from: | | | | | | | | | | | | | | | | | | | | |
Net investment income | | | (0.15 | ) | | | (0.13 | ) | | | (0.22 | ) | | | (0.23 | ) | | | (0.17 | ) |
Net realized gains | | | — | | | | — | | | | (0.52 | ) | | | (1.22 | ) | | | (1.30 | ) |
| | | | |
Total distributions | | | (0.15 | ) | | | (0.13 | ) | | | (0.74 | ) | | | (1.45 | ) | | | (1.47 | ) |
| | | | |
Net asset value, end of year | | $ | 15.82 | | | $ | 16.55 | | | $ | 13.00 | | | $ | 10.73 | | | $ | 17.38 | |
| | | | |
| | | | | |
Total returnc | | | (3.53)% | | | | 28.49% | | | | 29.54% | | | | (32.87)% | | | | (2.14)% | |
Ratios to average net assets | | | | | | | | | | | | | | | | | | | | |
Expenses | | | 0.66% | | | | 0.67% | | | | 0.68% | d | | | 0.67% | d | | | 0.64% | d |
Net investment income | | | 1.02% | | | | 0.98% | | | | 1.29% | | | | 1.62% | | | | 1.13% | |
| | | | | |
Supplemental data | | | | | | | | | | | | | | | | | | | | |
Net assets, end of year (000’s) | | $ | 39,374 | | | $ | 47,300 | | | $ | 42,428 | | | $ | 34,901 | | | $ | 57,045 | |
Portfolio turnover rate | | | 14.39% | | | | 15.92% | | | | 6.68% | | | | 16.98% | | | | 16.27% | |
aThe amount shown for a share outstanding throughout the period may not correlate with the Statement of Operations for the period due to the timing of sales and repurchases of the Fund shares in relation to income earned and/or fluctuating market value of the investments of the Fund.
bBased on average daily shares outstanding.
cTotal return does not include fees, charges or expenses imposed by the variable annuity and life insurance contracts for which the Franklin Templeton Variable Insurance Products Trust serves as an underlying investment vehicle.
dBenefit of expense reduction rounds to less than 0.01%.
The accompanying notes are an integral part of these financial statements.
FSV-8
Franklin Templeton Variable Insurance Products Trust
Financial Highlights (continued)
Franklin Small Cap Value Securities Fund
| | | | | | | | | | | | | | | | | | | | |
| | | Year Ended December 31, | |
| Class 2 | | 2011 | | | 2010 | | | 2009 | | | 2008 | | | 2007 | |
| | | | |
Per share operating performance | | | | | | | | | | | | | | | | | | | | |
(for a share outstanding throughout the year) | | | | | | | | | | | | | | | | | | | | |
Net asset value, beginning of year | | $ | 16.25 | | | $ | 12.77 | | | $ | 10.55 | | | $ | 17.10 | | | $ | 18.79 | |
| | | | |
Income from investment operationsa: | | | | | | | | | | | | | | | | | | | | |
Net investment incomeb | | | 0.12 | | | | 0.10 | | | | 0.12 | | | | 0.20 | | | | 0.17 | |
Net realized and unrealized gains (losses) | | | (0.73 | ) | | | 3.48 | | | | 2.81 | | | | (5.35 | ) | | | (0.43 | ) |
| | | | |
Total from investment operations | | | (0.61 | ) | | | 3.58 | | | | 2.93 | | | | (5.15 | ) | | | (0.26 | ) |
| | | | |
Less distributions from: | | | | | | | | | | | | | | | | | | | | |
Net investment income | | | (0.11 | ) | | | (0.10 | ) | | | (0.19 | ) | | | (0.18 | ) | | | (0.13 | ) |
Net realized gains | | | — | | | | — | | | | (0.52 | ) | | | (1.22 | ) | | | (1.30 | ) |
| | | | |
Total distributions | | | (0.11 | ) | | | (0.10 | ) | | | (0.71 | ) | | | (1.40 | ) | | | (1.43 | ) |
| | | | |
Net asset value, end of year | | $ | 15.53 | | | $ | 16.25 | | | $ | 12.77 | | | $ | 10.55 | | | $ | 17.10 | |
| | | | |
| | | | | |
Total returnc | | | (3.76)% | | | | 28.22% | | | | 29.16% | | | | (33.02)% | | | | (2.38)% | |
Ratios to average net assets | | | | | | | | | | | | | | | | | | | | |
Expenses | | | 0.91% | | | | 0.92% | | | | 0.93% | d | | | 0.92% | d | | | 0.89% | d |
Net investment income | | | 0.77% | | | | 0.73% | | | | 1.04% | | | | 1.37% | | | | 0.88% | |
| | | | | |
Supplemental data | | | | | | | | | | | | | | | | | | | | |
Net assets, end of year (000’s) | | $ | 1,211,168 | | | $ | 1,362,292 | | | $ | 1,109,855 | | | $ | 784,773 | | | $ | 1,177,367 | |
Portfolio turnover rate | | | 14.39% | | | | 15.92% | | | | 6.68% | | | | 16.98% | | | | 16.27% | |
aThe amount shown for a share outstanding throughout the period may not correlate with the Statement of Operations for the period due to the timing of sales and repurchases of the Fund shares in relation to income earned and/or fluctuating market value of the investments of the Fund.
bBased on average daily shares outstanding.
cTotal return does not include fees, charges or expenses imposed by the variable annuity and life insurance contracts for which the Franklin Templeton Variable Insurance Products Trust serves as an underlying investment vehicle.
dBenefit of expense reduction rounds to less than 0.01%.
The accompanying notes are an integral part of these financial statements.
FSV-9
Franklin Templeton Variable Insurance Products Trust
Financial Highlights (continued)
Franklin Small Cap Value Securities Fund
| | | | | | | | | | | | | | | | |
| | | Year Ended December 31, | |
| Class 4 | | 2011 | | | 2010 | | | 2009 | | | 2008a | |
| | | | |
Per share operating performance | | | | | | | | | | | | | | | | |
(for a share outstanding throughout the year) | | | | | | | | | | | | | | | | |
Net asset value, beginning of year | | $ | 16.44 | | | $ | 12.92 | | | $ | 10.70 | | | $ | 16.42 | |
| | | | |
Income from investment operationsb: | | | | | | | | | | | | | | | | |
Net investment incomec | | | 0.11 | | | | 0.09 | | | | 0.11 | | | | 0.15 | |
Net realized and unrealized gains (losses) | | | (0.75 | ) | | | 3.53 | | | | 2.84 | | | | (4.42 | ) |
| | | | |
Total from investment operations | | | (0.64 | ) | | | 3.62 | | | | 2.95 | | | | (4.27 | ) |
| | | | |
Less distributions from: | | | | | | | | | | | | | | | | |
Net investment income | | | (0.09 | ) | | | (0.10 | ) | | | (0.21 | ) | | | (0.23 | ) |
Net realized gains | | | — | | | | — | | | | (0.52 | ) | | | (1.22 | ) |
| | | | |
Total distributions | | | (0.09 | ) | | | (0.10 | ) | | | (0.73 | ) | | | (1.45 | ) |
| | | | |
Net asset value, end of year | | $ | 15.71 | | | $ | 16.44 | | | $ | 12.92 | | | $ | 10.70 | |
| | | | |
| | | | |
Total returnd | | | (3.87)% | | | | 28.14% | | | | 29.04% | | | | (29.14)% | |
Ratios to average net assetse | | | | | | | | | | | | | | | | |
Expenses | | | 1.01% | | | | 1.02% | | | | 1.03% | f | | | 1.02% | f |
Net investment income | | | 0.67% | | | | 0.63% | | | | 0.94% | | | | 1.27% | |
| | | | |
Supplemental data | | | | | | | | | | | | | | | | |
Net assets, end of year (000’s) | | $ | 34,284 | | | $ | 39,075 | | | $ | 28,599 | | | $ | 14,850 | |
Portfolio turnover rate | | | 14.39% | | | | 15.92% | | | | 6.68% | | | | 16.98% | |
aFor the period February 29, 2008 (effective date) to December 31, 2008.
bThe amount shown for a share outstanding throughout the period may not correlate with the Statement of Operations for the period due to the timing of sales and repurchases of the Fund shares in relation to income earned and/or fluctuating market value of the investments of the Fund.
cBased on average daily shares outstanding.
dTotal return does not include fees, charges or expenses imposed by the variable annuity and life insurance contracts for which the Franklin Templeton Variable Insurance Products Trust serves as an underlying investment vehicle. Total return is not annualized for periods less than one year.
eRatios are annualized for periods less than one year.
fBenefit of expense reduction rounds to less than 0.01%.
The accompanying notes are an integral part of these financial statements.
FSV-10
Franklin Templeton Variable Insurance Products Trust
Statement of Investments, December 31, 2011
| | | | | | | | |
| Franklin Small Cap Value Securities Fund | | Shares | | | Value | |
Common Stocks 96.6% | | | | | | | | |
Aerospace & Defense 1.7% | | | | | | | | |
AAR Corp. | | | 599,600 | | | $ | 11,494,332 | |
aCeradyne Inc. | | | 397,500 | | | | 10,645,050 | |
| | | | | | | | |
| | | | | | | 22,139,382 | |
| | | | | | | | |
Automobiles & Components 5.4% | | | | | | | | |
Autoliv Inc. | | | 326,800 | | | | 17,480,532 | |
aDrew Industries Inc. | | | 251,400 | | | | 6,166,842 | |
Gentex Corp. | | | 662,500 | | | | 19,603,375 | |
Thor Industries Inc. | | | 820,000 | | | | 22,492,600 | |
aWinnebago Industries Inc. | | | 423,100 | | | | 3,122,478 | |
| | | | | | | | |
| | | | | | | 68,865,827 | |
| | | | | | | | |
Banks 2.1% | | | | | | | | |
Chemical Financial Corp. | | | 360,854 | | | | 7,693,407 | |
Oriental Financial Group Inc. | | | 602,000 | | | | 7,290,220 | |
Peoples Bancorp Inc. | | | 158,000 | | | | 2,339,980 | |
TrustCo Bank Corp. NY | | | 1,771,878 | | | | 9,940,236 | |
| | | | | | | | |
| | | | | | | 27,263,843 | |
| | | | | | | | |
Building Products 5.1% | | | | | | | | |
A.O. Smith Corp. | | | 126,700 | | | | 5,083,204 | |
American Woodmark Corp. | | | 431,300 | | | | 5,891,558 | |
Apogee Enterprises Inc. | | | 778,100 | | | | 9,539,506 | |
aGibraltar Industries Inc. | | | 900,100 | | | | 12,565,396 | |
Simpson Manufacturing Co. Inc. | | | 433,400 | | | | 14,588,244 | |
Universal Forest Products Inc. | | | 566,000 | | | | 17,472,420 | |
| | | | | | | | |
| | | | | | | 65,140,328 | |
| | | | | | | | |
Commercial & Professional Services 2.8% | | | | | | | | |
ABM Industries Inc. | | | 636,100 | | | | 13,116,382 | |
Insperity Inc. | | | 296,100 | | | | 7,506,135 | |
Mine Safety Appliances Co. | | | 328,300 | | | | 10,873,296 | |
Schawk Inc. | | | 401,900 | | | | 4,505,299 | |
| | | | | | | | |
| | | | | | | 36,001,112 | |
| | | | | | | | |
Construction & Engineering 2.0% | | | | | | | | |
EMCOR Group Inc. | | | 272,700 | | | | 7,311,087 | |
Granite Construction Inc. | | | 747,000 | | | | 17,718,840 | |
| | | | | | | | |
| | | | | | | 25,029,927 | |
| | | | | | | | |
Consumer Durables & Apparel 3.6% | | | | | | | | |
Brunswick Corp. | | | 500,000 | | | | 9,030,000 | |
D.R. Horton Inc. | | | 448,900 | | | | 5,660,629 | |
Ethan Allen Interiors Inc. | | | 159,000 | | | | 3,769,890 | |
Hooker Furniture Corp. | | | 510,700 | | | | 5,857,729 | |
aLa-Z-Boy Inc. | | | 1,089,000 | | | | 12,959,100 | |
M.D.C. Holdings Inc. | | | 213,800 | | | | 3,769,294 | |
aM/I Homes Inc. | | | 435,900 | | | | 4,184,640 | |
aMaidenform Brands Inc. | | | 20,600 | | | | 376,980 | |
| | | | | | | | |
| | | | | | | 45,608,262 | |
| | | | | | | | |
Consumer Services 2.2% | | | | | | | | |
Hillenbrand Inc. | | | 539,000 | | | | 12,030,480 | |
Regis Corp. | | | 992,000 | | | | 16,417,600 | |
| | | | | | | | |
| | | | | | | 28,448,080 | |
| | | | | | | | |
FSV-11
Franklin Templeton Variable Insurance Products Trust
Statement of Investments, December 31, 2011 (continued)
| | | | | | | | |
| Franklin Small Cap Value Securities Fund | | Shares | | | Value | |
Common Stocks (continued) | | | | | | | | |
Electrical Equipment 3.7% | | | | | | | | |
Brady Corp., A | | | 453,000 | | | $ | 14,301,210 | |
aEnerSys | | | 24,100 | | | | 625,877 | |
Franklin Electric Co. Inc. | | | 199,232 | | | | 8,678,546 | |
aGeneral Cable Corp. | | | 103,500 | | | | 2,588,535 | |
aPowell Industries Inc. | | | 220,500 | | | | 6,897,240 | |
Roper Industries Inc. | | | 170,000 | | | | 14,767,900 | |
| | | | | | | | |
| | | | | | | 47,859,308 | |
| | | | | | | | |
Energy 12.3% | | | | | | | | |
Arch Coal Inc. | | | 111,500 | | | | 1,617,865 | |
aAtwood Oceanics Inc. | | | 405,400 | | | | 16,130,866 | |
Bristow Group Inc. | | | 503,800 | | | | 23,875,082 | |
CONSOL Energy Inc. | | | 68,500 | | | | 2,513,950 | |
Energen Corp. | | | 219,000 | | | | 10,950,000 | |
aHelix Energy Solutions Group Inc. | | | 819,500 | | | | 12,948,100 | |
aOil States International Inc. | | | 255,200 | | | | 19,489,624 | |
bOverseas Shipholding Group Inc. | | | 371,000 | | | | 4,055,030 | |
Peabody Energy Corp. | | | 103,200 | | | | 3,416,952 | |
aRowan Cos. Inc. | | | 638,100 | | | | 19,353,573 | |
Teekay Corp. (Canada) | | | 226,831 | | | | 6,063,193 | |
Tidewater Inc. | | | 443,700 | | | | 21,874,410 | |
aUnit Corp. | | | 333,900 | | | | 15,492,960 | |
| | | | | | | | |
| | | | | | | 157,781,605 | |
| | | | | | | | |
Food & Staples Retailing 0.3% | | | | | | | | |
Casey’s General Stores Inc. | | | 73,000 | | | | 3,760,230 | |
| | | | | | | | |
Food, Beverage & Tobacco 1.1% | | | | | �� | | | |
Lancaster Colony Corp. | | | 201,500 | | | | 13,972,010 | |
| | | | | | | | |
Health Care Equipment & Services 2.7% | | | | | | | | |
Hill-Rom Holdings Inc. | | | 113,300 | | | | 3,817,077 | |
STERIS Corp. | | | 382,500 | | | | 11,406,150 | |
Teleflex Inc. | | | 227,900 | | | | 13,967,991 | |
West Pharmaceutical Services Inc. | | | 157,500 | | | | 5,977,125 | |
| | | | | | | | |
| | | | | | | 35,168,343 | |
| | | | | | | | |
Industrial Conglomerates 1.2% | | | | | | | | |
Carlisle Cos. Inc. | | | 353,400 | | | | 15,655,620 | |
| | | | | | | | |
Insurance 11.1% | | | | | | | | |
American National Insurance Co. | | | 3,600 | | | | 262,908 | |
Arthur J. Gallagher & Co. | | | 168,200 | | | | 5,624,608 | |
Aspen Insurance Holdings Ltd. | | | 550,100 | | | | 14,577,650 | |
The Hanover Insurance Group Inc. | | | 372,200 | | | | 13,008,390 | |
HCC Insurance Holdings Inc. | | | 188,200 | | | | 5,175,500 | |
Montpelier Re Holdings Ltd. | | | 649,000 | | | | 11,519,750 | |
Old Republic International Corp. | | | 1,401,500 | | | | 12,991,905 | |
Protective Life Corp. | | | 1,135,000 | | | | 25,605,600 | |
RLI Corp. | | | 66,200 | | | | 4,823,332 | |
StanCorp Financial Group Inc. | | | 401,000 | | | | 14,736,750 | |
Tower Group Inc. | | | 712,400 | | | | 14,369,108 | |
Transatlantic Holdings Inc. | | | 129,000 | | | | 7,060,170 | |
Validus Holdings Ltd. (Bermuda) | | | 422,700 | | | | 13,315,050 | |
| | | | | | | | |
| | | | | | | 143,070,721 | |
| | | | | | | | |
FSV-12
Franklin Templeton Variable Insurance Products Trust
Statement of Investments, December 31, 2011 (continued)
| | | | | | | | |
| Franklin Small Cap Value Securities Fund | | Shares | | | Value | |
Common Stocks (continued) | | | | | | | | |
Machinery 14.5% | | | | | | | | |
aAstec Industries Inc. | | | 330,200 | | | $ | 10,635,742 | |
Briggs & Stratton Corp. | | | 588,900 | | | | 9,122,061 | |
CIRCOR International Inc. | | | 122,102 | | | | 4,311,422 | |
aEnPro Industries Inc. | | | 402,000 | | | | 13,257,960 | |
Gardner Denver Inc. | | | 238,800 | | | | 18,401,928 | |
Graco Inc. | | | 214,900 | | | | 8,787,261 | |
Kaydon Corp. | | | 399,000 | | | | 12,169,500 | |
Kennametal Inc. | | | 397,300 | | | | 14,509,396 | |
Lincoln Electric Holdings Inc. | | | 419,000 | | | | 16,391,280 | |
Mueller Industries Inc. | | | 409,000 | | | | 15,713,780 | |
Nordson Corp. | | | 209,800 | | | | 8,639,564 | |
Pentair Inc. | | | 214,800 | | | | 7,150,692 | |
Timken Co. | | | 90,000 | | | | 3,483,900 | |
Trinity Industries Inc. | | | 764,400 | | | | 22,977,864 | |
aWabash National Corp. | | | 1,473,000 | | | | 11,548,320 | |
Watts Water Technologies Inc., A | | | 257,200 | | | | 8,798,812 | |
| | | | | | | | |
| | | | | | | 185,899,482 | |
| | | | | | | | |
Materials 7.5% | | | | | | | | |
A. Schulman Inc. | | | 459,000 | | | | 9,721,620 | |
AptarGroup Inc. | | | 140,000 | | | | 7,303,800 | |
Cabot Corp. | | | 324,100 | | | | 10,416,574 | |
Commercial Metals Co. | | | 389,000 | | | | 5,379,870 | |
H.B. Fuller Co. | | | 202,100 | | | | 4,670,531 | |
Reliance Steel & Aluminum Co. | | | 436,000 | | | | 21,228,840 | |
RPM International Inc. | | | 753,600 | | | | 18,500,880 | |
Sensient Technologies Corp. | | | 195,300 | | | | 7,401,870 | |
Steel Dynamics Inc. | | | 937,100 | | | | 12,322,865 | |
| | | | | | | | |
| | | | | | | 96,946,850 | |
| | | | | | | | |
Pharmaceuticals, Biotechnology & Life Sciences 0.3% | | | | | | | | |
aMettler-Toledo International Inc. | | | 23,500 | | | | 3,471,185 | |
| | | | | | | | |
Retailing 9.3% | | | | | | | | |
Brown Shoe Co. Inc. | | | 982,000 | | | | 8,739,800 | |
The Cato Corp., A | | | 460,000 | | | | 11,132,000 | |
Christopher & Banks Corp. | | | 1,183,304 | | | | 2,768,931 | |
Fred’s Inc. | | | 510,000 | | | | 7,435,800 | |
aGameStop Corp., A | | | 690,000 | | | | 16,649,700 | |
Group 1 Automotive Inc. | | | 485,900 | | | | 25,169,620 | |
J.C. Penney Co. Inc. | | | 273,000 | | | | 9,595,950 | |
The Men’s Wearhouse Inc. | | | 526,317 | | | | 17,057,934 | |
aPier 1 Imports Inc. | | | 581,000 | | | | 8,093,330 | |
aSaks Inc. | | | 532,548 | | | | 5,192,343 | |
aTuesday Morning Corp. | | | 122,800 | | | | 423,660 | |
aWest Marine Inc. | | | 610,700 | | | | 7,102,441 | |
| | | | | | | | |
| | | | | | | 119,361,509 | |
| | | | | | | | |
Semiconductors & Semiconductor Equipment 0.7% | | | | | | | | |
Cohu Inc. | | | 826,500 | | | | 9,380,775 | |
| | | | | | | | |
Technology Hardware & Equipment 2.8% | | | | | | | | |
aBenchmark Electronics Inc. | | | 1,271,000 | | | | 17,120,370 | |
aMulti-Fineline Electronix Inc. | | | 274,100 | | | | 5,632,755 | |
aRofin-Sinar Technologies Inc. | | | 593,800 | | | | 13,568,330 | |
| | | | | | | | |
| | | | | | | 36,321,455 | |
| | | | | | | | |
FSV-13
Franklin Templeton Variable Insurance Products Trust
Statement of Investments, December 31, 2011 (continued)
| | | | | | | | |
| Franklin Small Cap Value Securities Fund | | Shares | | | Value | |
Common Stocks (continued) | | | | | | | | |
Trading Companies & Distributors 0.5% | | | | | | | | |
Applied Industrial Technologies Inc. | | | 178,700 | | | $ | 6,284,879 | |
| | | | | | | | |
Transportation 2.2% | | | | | | | | |
aGenesee & Wyoming Inc. | | | 260,300 | | | | 15,768,974 | |
SkyWest Inc. | | | 990,000 | | | | 12,464,100 | |
| | | | | | | | |
| | | | | | | 28,233,074 | |
| | | | | | | | |
Utilities 1.5% | | | | | | | | |
NV Energy Inc. | | | 903,500 | | | | 14,772,225 | |
PNM Resources Inc. | | | 253,100 | | | | 4,614,013 | |
| | | | | | | | |
| | | | | | | 19,386,238 | |
| | | | | | | | |
Total Common Stocks (Cost $1,029,072,428) | | | | | | | 1,241,050,045 | |
| | | | | | | | |
| | |
| | | Principal
Amount | | | | |
Corporate Bonds (Cost $1,486,165) 0.1% | | | | | | | | |
Machinery 0.1% | | | | | | | | |
Mueller Industries Inc., 6.00%, 11/01/14 | | $ | 1,494,000 | | | | 1,494,000 | |
| | | | | | | | |
Total Investments before Short Term Investments (Cost $1,030,558,593) | | | | | | | 1,242,544,045 | |
| | | | | | | | |
| | |
| | | Shares | | | | |
Short Term Investments 3.8% | | | | | | | | |
Money Market Funds (Cost $44,766,735) 3.5% | | | | | | | | |
a,cInstitutional Fiduciary Trust Money Market Portfolio | | | 44,766,735 | | | | 44,766,735 | |
| | | | | | | | |
| | |
| | | Principal
Amount | | | | |
dInvestments from Cash Collateral Received for Loaned Securities 0.3% | | | | | | | | |
eRepurchase Agreements 0.3% | | | | | | | | |
BNP Paribas Securities Corp., 0.04%, 1/03/12 (Maturity Value $991,220)
Collateralized by fU.S. Government Agency Discount Notes, 1/31/12 - 4/16/12;
U.S. Government Agency Securities, 0.00% - 10.35%, 1/04/12 - 8/06/38; and
U.S. Government Agency Strips, zero cpn., 5/15/22 (valued at $1,011,041) | | $ | 991,216 | | | | 991,216 | |
Deutsche Bank Securities Inc., 0.05%, 1/03/12 (Maturity Value $991,222)
Collateralized by fU.S. Government Agency Discount Notes, 1/20/12 - 11/08/12; and
U.S. Government Agency Securities, 1.125% - 4.00%, 5/18/12 - 11/14/31 (valued at $1,011,042) | | | 991,216 | | | | 991,216 | |
HSBC Securities (USA) Inc., 0.02%, 1/03/12 (Maturity Value $900,002)
Collateralized by U.S. Government Agency Strips, zero cpn., 10/15/12 - 4/15/30 (valued at $918,012) | | | 900,000 | | | | 900,000 | |
Merrill Lynch, Pierce, Fenner & Smith Inc., 0.02%, 1/03/12 (Maturity Value $900,002)
Collateralized by U.S. Treasury Notes, 1.875% - 4.00%, 2/15/15 - 6/30/15 (valued at $918,001) | | | 900,000 | | | | 900,000 | |
RBC Capital Markets, LLC, 0.01%, 1/03/12 (Maturity Value $391,110)
Collateralized by U.S. Government Agency Strips, zero cpn., 8/15/12 - 2/15/39;
U.S. Treasury Bonds, 1.75% - 4.25%, 1/15/25 - 11/15/40; and U.S. Treasury Notes,
0.125% - 1.25%, 4/15/16 - 7/15/21 (valued at $398,932) | | | 391,110 | | | | 391,110 | |
| | | | | | | | |
Total Repurchase Agreement (Cost $4,173,542) | | | | | | | 4,173,542 | |
| | | | | | | | |
Total Investments (Cost $1,079,498,870) 100.5% | | | | | | | 1,291,484,322 | |
Other Assets, less Liabilities (0.5)% | | | | | | | (6,658,111 | ) |
| | | | | | | | |
Net Assets 100.0% | | | | | | $ | 1,284,826,211 | |
| | | | | | | | |
aNon-income producing.
bA portion or all of the security is on loan at December 31, 2011. See Note 1(c).
cSee Note 7 regarding investments in the Institutional Fiduciary Trust Money Market Portfolio.
dSee Note 1(c) regarding securities on loan.
eSee Note 1(b) regarding repurchase agreements.
fThe security is traded on a discount basis with no stated coupon rate.
The accompanying notes are an integral part of these financial statements.
FSV-14
Franklin Templeton Variable Insurance Products Trust
Financial Statements
Statement of Assets and Liabilities
December 31, 2011
| | | | |
| | | Franklin Small
Cap Value
Securities Fund | |
Assets: | | | | |
Investments in securities: | | | | |
Cost - Unaffiliated issuers | | $ | 1,030,558,593 | |
Cost - Sweep Money Fund (Note 7) | | | 44,766,735 | |
Cost - Repurchase agreements | | | 4,173,542 | |
| | | | |
Total cost of investments | | $ | 1,079,498,870 | |
| | | | |
Value - Unaffiliated issuers | | $ | 1,242,544,045 | |
Value - Sweep Money Fund (Note 7) | | | 44,766,735 | |
Value - Repurchase agreements | | | 4,173,542 | |
| | | | |
Total value of investments (includes securities loaned in the amount of $4,054,658) | | | 1,291,484,322 | |
Receivables: | | | | |
Investment securities sold | | | 301,567 | |
Capital shares sold | | | 731,127 | |
Dividends and interest | | | 1,174,623 | |
Other assets | | | 38 | |
| | | | |
Total assets | | | 1,293,691,677 | |
| | | | |
Liabilities: | | | | |
Payables: | | | | |
Investment securities purchased | | �� | 361,079 | |
Capital shares redeemed | | | 2,733,406 | |
Affiliates | | | 1,200,982 | |
Payable upon return of securities loaned | | | 4,173,542 | |
Accrued expenses and other liabilities | | | 396,457 | |
| | | | |
Total liabilities | | | 8,865,466 | |
| | | | |
Net assets, at value | | $ | 1,284,826,211 | |
| | | | |
Net assets consist of: | | | | |
Paid-in capital | | $ | 1,081,272,857 | |
Undistributed net investment income | | | 10,429,999 | |
Net unrealized appreciation (depreciation) | | | 211,985,452 | |
Accumulated net realized gain (loss) | | | (18,862,097 | ) |
| | | | |
Net assets, at value | | $ | 1,284,826,211 | |
| | | | |
The accompanying notes are an integral part of these financial statements.
FSV-15
Franklin Templeton Variable Insurance Products Trust
Financial Statements (continued)
Statement of Assets and Liabilities (continued)
December 31, 2011
| | | | |
| | | Franklin Small
Cap Value
Securities Fund | |
Class 1: | | | | |
Net assets, at value | | $ | 39,374,050 | |
| | | | |
Shares outstanding | | | 2,488,264 | |
| | | | |
Net asset value and maximum offering price per share | | $ | 15.82 | |
| | | | |
Class 2: | | | | |
Net assets, at value | | $ | 1,211,168,286 | |
| | | | |
Shares outstanding | | | 77,994,232 | |
| | | | |
Net asset value and maximum offering price per share | | $ | 15.53 | |
| | | | |
Class 4: | | | | |
Net assets, at value | | $ | 34,283,875 | |
| | | | |
Shares outstanding | | | 2,182,099 | |
| | | | |
Net asset value and maximum offering price per share | | $ | 15.71 | |
| | | | |
The accompanying notes are an integral part of these financial statements.
FSV-16
Franklin Templeton Variable Insurance Products Trust
Financial Statements (continued)
Statement of Operations
for the year ended December 31, 2011
| | | | |
| | | Franklin Small
Cap Value
Securities Fund | |
Investment income: | | | | |
Dividends | | $ | 22,243,531 | |
Interest | | | 92,071 | |
Income from securities loaned | | | 293,121 | |
| | | | |
Total investment income | | | 22,628,723 | |
| | | | |
Expenses: | | | | |
Management fees (Note 3a) | | | 6,768,569 | |
Administrative fees (Note 3b) | | | 1,577,484 | |
Distribution fees: (Note 3c) | | | | |
Class 2 | | | 3,176,062 | |
Class 4 | | | 121,538 | |
Unaffiliated transfer agent fees | | | 6,246 | |
Custodian fees (Note 4) | | | 18,459 | |
Reports to shareholders | | | 447,878 | |
Professional fees | | | 47,916 | |
Trustees’ fees and expenses | | | 5,120 | |
Other | | | 34,613 | |
| | | | |
Total expenses | | | 12,203,885 | |
| | | | |
Net investment income | | | 10,424,838 | |
| | | | |
Realized and unrealized gains (losses): | | | | |
Net realized gain (loss) from investments | | | 79,690,343 | |
Net change in unrealized appreciation (depreciation) on investments | | | (139,845,262 | ) |
| | | | |
Net realized and unrealized gain (loss) | | | (60,154,919 | ) |
| | | | |
Net increase (decrease) in net assets resulting from operations | | $ | (49,730,081 | ) |
| | | | |
The accompanying notes are an integral part of these financial statements.
FSV-17
Franklin Templeton Variable Insurance Products Trust
Financial Statements (continued)
Statements of Changes in Net Assets
| | | | | | | | |
| | | Franklin Small Cap Value
Securities Fund | |
| | | Year Ended December 31, | |
| | | 2011 | | | 2010 | |
| | | | |
Increase (decrease) in net assets: | | | | | | | | |
Operations: | | | | | | | | |
Net investment income | | $ | 10,424,838 | | | $ | 9,370,933 | |
Net realized gain (loss) from investments | | | 79,690,343 | | | | (9,121,196 | ) |
Net change in unrealized appreciation (depreciation) on investments | | | (139,845,262 | ) | | | 315,120,022 | |
| | | | |
Net increase (decrease) in net assets resulting from operations | | | (49,730,081 | ) | | | 315,369,759 | |
| | | | |
Distributions to shareholders from: | | | | | | | | |
Net investment income: | | | | | | | | |
Class 1 | | | (392,860 | ) | | | (391,013 | ) |
Class 2 | | | (8,773,166 | ) | | | (9,354,014 | ) |
Class 4 | | | (201,936 | ) | | | (225,374 | ) |
| | | | |
Total distributions to shareholders | | | (9,367,962 | ) | | | (9,970,401 | ) |
| | | | |
Capital share transactions: (Note 2) | | | | | | | | |
Class 1 | | | (5,885,116 | ) | | | (5,400,815 | ) |
Class 2 | | | (95,600,673 | ) | | | (34,566,603 | ) |
Class 4 | | | (3,256,590 | ) | | | 2,352,541 | |
| | | | |
Total capital share transactions | | | (104,742,379 | ) | | | (37,614,877 | ) |
| | | | |
Net increase (decrease) in net assets | | | (163,840,422 | ) | | | 267,784,481 | |
Net assets: | | | | | | | | |
Beginning of year | | | 1,448,666,633 | | | | 1,180,882,152 | |
| | | | |
End of year | | $ | 1,284,826,211 | | | $ | 1,448,666,633 | |
| | | | |
Undistributed net investment income included in net assets: | | | | | | | | |
End of year | | $ | 10,429,999 | | | $ | 9,373,123 | |
| | | | |
The accompanying notes are an integral part of these financial statements.
FSV-18
Franklin Templeton Variable Insurance Products Trust
Notes to Financial Statements
Franklin Small Cap Value Securities Fund
1. ORGANIZATION AND SIGNIFICANT ACCOUNTING POLICIES
Franklin Templeton Variable Insurance Products Trust (Trust) is registered under the Investment Company Act of 1940, as amended, (1940 Act) as an open-end investment company, consisting of twenty separate funds. The Franklin Small Cap Value Securities Fund (Fund) is included in this report. The financial statements of the remaining funds in the Trust are presented separately. Shares of the Fund are generally sold only to insurance company separate accounts to fund the benefits of variable life insurance policies or variable annuity contracts. The Fund offers three classes of shares: Class 1, Class 2 and Class 4. Each class of shares differs by its distribution fees, voting rights on matters affecting a single class and its exchange privilege.
The following summarizes the Fund’s significant accounting policies.
a. Financial Instrument Valuation
The Fund’s investments in securities and other financial instruments are carried at fair value daily. Fair value is the price that would be received to sell an asset or paid to transfer a liability in an orderly transaction between market participants on the measurement date. Under procedures approved by the Trust’s Board of Trustees, the Fund may utilize independent pricing services, quotations from securities and financial instrument dealers, and other market sources to determine fair value.
Equity securities listed on an exchange or on the NASDAQ National Market System are valued at the last quoted sale price or the official closing price of the day, respectively. Over-the-counter securities are valued within the range of the most recent quoted bid and ask prices. Securities that trade in multiple markets or on multiple exchanges are valued according to the broadest and most representative market. Certain equity securities are valued based upon fundamental characteristics or relationships to similar securities. Investments in open-end mutual funds are valued at the closing net asset value.
Debt securities generally trade in the over-the-counter market rather than on a securities exchange. The Fund’s pricing services use multiple valuation techniques to determine fair value. In instances where sufficient market activity exists, the pricing services may utilize a market-based approach through which quotes from market makers are used to determine fair value. In instances where sufficient market activity may not exist or is limited, the pricing services also utilize proprietary valuation models which may consider market characteristics such as benchmark yield curves, option-adjusted spreads, credit spreads, estimated default rates, coupon rates, anticipated timing of principal repayments, underlying collateral, and other unique security features in order to estimate the relevant cash flows, which are then discounted to calculate the fair value. Repurchase agreements are valued at cost, which approximates market value.
The Fund has procedures to determine the fair value of securities and other financial instruments for which market prices are not readily available or which may not be reliably priced. Under these procedures, the Fund primarily employs a market-based approach which may use related or comparable assets or liabilities, recent transactions, market multiples, book values, and other relevant information for the investment to determine the fair value of the investment. The Fund may also use an income-based valuation approach in which the anticipated future cash flows of the investment are discounted to calculate fair value. Discounts may also be applied due to the nature or duration of any restrictions on the disposition of the investments. Due to the inherent uncertainty of valuations of such investments, the fair values may differ significantly from the values that would have been used had an active market existed.
b. Repurchase Agreements
The Fund enters into repurchase agreements, which are accounted for as a loan by the Fund to the seller, collateralized by securities which are delivered to the Fund’s custodian. The market value, including accrued interest, of the initial collateralization is required to be at least 102% of the dollar amount invested by the Fund, with the value of the underlying securities marked to market daily to maintain coverage of at least 100%. All repurchase agreements held by the Fund at year end had been entered into on December 30, 2011.
FSV-19
Franklin Templeton Variable Insurance Products Trust
Notes to Financial Statements (continued)
Franklin Small Cap Value Securities Fund
1. ORGANIZATION AND SIGNIFICANT ACCOUNTING POLICIES (continued)
c. Securities Lending
The Fund participates in a principal based security lending program. The Fund receives cash collateral against the loaned securities in an amount equal to at least 102% of the market value of the loaned securities. Collateral is maintained over the life of the loan in an amount not less than 100% of the market value of loaned securities, as determined at the close of Fund business each day; any additional collateral required due to changes in security values is delivered to the Fund on the next business day. The collateral is invested in repurchase agreements managed by the Fund’s custodian on the Fund’s behalf. The Fund receives income from the investment of cash collateral, in addition to lending fees and rebates paid by the borrower. The Fund bears the market risk with respect to the collateral investment, securities loaned, and the risk that the principal may default on its obligations to the Fund.
d. Income Taxes
It is the Fund’s policy to qualify as a regulated investment company under the Internal Revenue Code. The Fund intends to distribute to shareholders substantially all of its taxable income and net realized gains to relieve it from federal income and excise taxes. As a result, no provision for U.S. federal income taxes is required.
The Fund recognizes the tax benefits of uncertain tax positions only when the position is “more likely than not” to be sustained upon examination by the tax authorities based on the technical merits of the tax position. As of December 31, 2011, and for all open tax years, the Fund has determined that no liability for unrecognized tax benefits is required in the Fund’s financial statements related to uncertain tax positions taken on a tax return (or expected to be taken on future tax returns). Open tax years are those that remain subject to examination and are based on each tax jurisdiction statute of limitation.
e. Security Transactions, Investment Income, Expenses and Distributions
Security transactions are accounted for on trade date. Realized gains and losses on security transactions are determined on a specific identification basis. Interest income and estimated expenses are accrued daily. Dividend income is recorded on the ex-dividend date. Distributions to shareholders are recorded on the ex-dividend date and are determined according to income tax regulations (tax basis). Distributable earnings determined on a tax basis may differ from earnings recorded in accordance with accounting principles generally accepted in the United States of America. These differences may be permanent or temporary. Permanent differences are reclassified among capital accounts to reflect their tax character. These reclassifications have no impact on net assets or the results of operations. Temporary differences are not reclassified, as they may reverse in subsequent periods.
Common expenses incurred by the Trust are allocated among the funds based on the ratio of net assets of each fund to the combined net assets of the Trust. Fund specific expenses are charged directly to the fund that incurred the expense.
Realized and unrealized gains and losses and net investment income, not including class specific expenses, are allocated daily to each class of shares based upon the relative proportion of net assets of each class. Differences in per share distributions, by class, are generally due to differences in class specific expenses.
f. Accounting Estimates
The preparation of financial statements in accordance with accounting principles generally accepted in the United States of America requires management to make estimates and assumptions that affect the reported amounts of assets and liabilities at the date of the financial statements and the amounts of income and expenses during the reporting period. Actual results could differ from those estimates.
FSV-20
Franklin Templeton Variable Insurance Products Trust
Notes to Financial Statements (continued)
Franklin Small Cap Value Securities Fund
1. ORGANIZATION AND SIGNIFICANT ACCOUNTING POLICIES (continued)
g. Guarantees and Indemnifications
Under the Trust’s organizational documents, its officers and trustees are indemnified by the Trust against certain liabilities arising out of the performance of their duties to the Trust. Additionally, in the normal course of business, the Trust, on behalf of the Fund, enters into contracts with service providers that contain general indemnification clauses. The Trust’s maximum exposure under these arrangements is unknown as this would involve future claims that may be made against the Trust that have not yet occurred. Currently, the Trust expects the risk of loss to be remote.
2. SHARES OF BENEFICIAL INTEREST
At December 31, 2011, there were an unlimited number of shares authorized (without par value). Transactions in the Fund’s shares were as follows:
| | | | | | | | | | | | | | | | |
| | | Year Ended December 31, | |
| | | 2011 | | | 2010 | |
| Class 1 Shares: | | Shares | | | Amount | | | Shares | | | Amount | |
Shares sold | | | 385,043 | | | $ | 6,445,781 | | | | 487,990 | | | $ | 7,004,812 | |
Shares issued in reinvestment of distributions | | | 24,646 | | | | 392,860 | | | | 28,110 | | | | 391,013 | |
Shares redeemed | | | (778,610 | ) | | | (12,723,757 | ) | | | (923,527 | ) | | | (12,796,640 | ) |
| | | | |
Net increase (decrease) | | | (368,921 | ) | | $ | (5,885,116 | ) | | | (407,427 | ) | | $ | (5,400,815 | ) |
| | | | |
Class 2 Shares: | | | | | | | | | | | | | | | | |
Shares sold | | | 12,352,861 | | | $ | 192,000,345 | | | | 16,505,195 | | | $ | 234,092,954 | |
Shares issued in reinvestment of distributions | | | 559,870 | | | | 8,773,166 | | | | 684,273 | | | | 9,354,014 | |
Shares redeemed | | | (18,752,469 | ) | | | (296,374,184 | ) | | | (20,285,779 | ) | | | (278,013,571 | ) |
| | | | |
Net increase (decrease) | | | (5,839,738 | ) | | $ | (95,600,673 | ) | | | (3,096,311 | ) | | $ | (34,566,603 | ) |
| | | | |
Class 4 Shares: | | | | | | | | | | | | | | | | |
Shares sold | | | 385,949 | | | $ | 6,104,316 | | | | 706,330 | | | $ | 9,842,641 | |
Shares issued on reinvestment of distributions | | | 12,732 | | | | 201,936 | | | | 16,284 | | | | 225,374 | |
Shares redeemed | | | (593,170 | ) | | | (9,562,842 | ) | | | (558,980 | ) | | | (7,715,474 | ) |
| | | | |
Net increase (decrease) | | | (194,489 | ) | | $ | (3,256,590 | ) | | | 163,634 | | | $ | 2,352,541 | |
| | | | |
3. TRANSACTIONS WITH AFFILIATES
Franklin Resources, Inc. is the holding company for various subsidiaries that together are referred to as Franklin Templeton Investments. Certain officers and trustees of the Fund are also officers and/or directors of the following subsidiaries:
| | |
| Subsidiary | | Affiliation |
Franklin Advisory Services, LLC (Advisory Services) | | Investment manager |
Franklin Templeton Services, LLC (FT Services) | | Administrative manager |
Franklin Templeton Distributors, Inc. (Distributors) | | Principal underwriter |
Franklin Templeton Investor Services, LLC (Investor Services) | | Transfer agent |
FSV-21
Franklin Templeton Variable Insurance Products Trust
Notes to Financial Statements (continued)
Franklin Small Cap Value Securities Fund
3. TRANSACTIONS WITH AFFILIATES (continued)
a. Management Fees
The Fund pays an investment management fee to Advisory Services based on the average daily net assets of the Fund as follows:
| | |
| Annualized Fee Rate | | Net Assets |
| 0.600% | | Up to and including $200 million |
| 0.500% | | Over $200 million, up to and including $1.3 billion |
| 0.400% | | In excess of $1.3 billion |
b. Administrative Fees
The Fund pays an administrative fee to FT Services based on the Fund’s average daily net assets as follows:
| | |
| Annualized Fee Rate | | Net Assets |
| 0.150% | | Up to and including $200 million |
| 0.135% | | Over $200 million, up to and including $700 million |
| 0.100% | | Over $700 million, up to and including $1.2 billion |
| 0.075% | | In excess of $1.2 billion |
c. Distribution Fees
The Trust’s Board of Trustees has adopted distribution plans for Class 2 and Class 4 shares pursuant to Rule 12b-1 under the 1940 Act. Under the Fund’s compensation distribution plans, the Fund pays Distributors for costs incurred in connection with the servicing, sale and distribution of the Fund’s shares up to 0.35% per year of its average daily net assets of each class. The Board of Trustees has agreed to limit the current rate to 0.25% per year for Class 2.
d. Transfer Agent Fees
Investor Services, under terms of an agreement, performs shareholder servicing for the Fund and is not paid by the Fund for the services.
4. EXPENSE OFFSET ARRANGEMENT
The Fund has entered into an arrangement with its custodian whereby credits realized as a result of uninvested cash balances are used to reduce a portion of the Fund’s custodian expenses. During the year ended December 31, 2011, there were no credits earned.
5. INCOME TAXES
For tax purposes, capital losses may be carried over to offset future capital gains, if any. Under the Regulated Investment Company Modernization Act of 2010, capital losses incurred by the Fund in taxable years beginning after December 22, 2010 are not subject to expiration and such losses retain their character as either short-term or long-term, rather than being considered short-term as under previous law. Post-enactment capital losses must be fully utilized prior to utilizing any losses incurred in pre-enactment tax years.
At December 31, 2011, the Fund had capital loss carryforwards of $18,771,926 expiring in 2018. During the year ended December 31, 2011, the Fund utilized $79,676,612 of capital loss carryforwards.
FSV-22
Franklin Templeton Variable Insurance Products Trust
Notes to Financial Statements (continued)
Franklin Small Cap Value Securities Fund
5. INCOME TAXES (continued)
The tax character of distributions paid during the years ended December 31, 2011 and 2010, was as follows:
| | | | | | | | |
| | | 2011 | | | 2010 | |
Distributions paid from ordinary income | | $ | 9,367,962 | | | $ | 9,970,401 | |
| | | | |
At December 31, 2011, the cost of investments, net unrealized appreciation (depreciation) and undistributed ordinary income for income tax purposes were as follows:
| | | | |
Cost of investments | | $ | 1,079,574,466 | |
| | | | |
| |
Unrealized appreciation | | $ | 340,204,720 | |
Unrealized depreciation | | | (128,294,864 | ) |
| | | | |
Net unrealized appreciation (depreciation) | | $ | 211,909,856 | |
| | | | |
Distributable earnings – undistributed ordinary income | | $ | 10,415,425 | |
| | | | |
Differences between income and/or capital gains as determined on a book basis and a tax basis are primarily due to differing treatments of bond discounts and premiums and wash sales.
6. INVESTMENT TRANSACTIONS
Purchases and sales of investments (excluding short term securities) for the year ended December 31, 2011, aggregated $190,022,010 and $271,242,069, respectively.
7. INVESTMENTS IN INSTITUTIONAL FIDUCIARY TRUST MONEY MARKET PORTFOLIO
The Fund invests in the Institutional Fiduciary Trust Money Market Portfolio (Sweep Money Fund), an open-end investment company managed by Franklin Advisers, Inc. (an affiliate of the investment manager). Management fees paid by the Fund are reduced on assets invested in the Sweep Money Fund, in an amount not to exceed the management and administrative fees paid by the Sweep Money Fund.
8. CREDIT FACILITY
The Fund, together with other U.S. registered and foreign investment funds (collectively, Borrowers), managed by Franklin Templeton Investments, are borrowers in a joint syndicated senior unsecured credit facility totaling $750 million (Global Credit Facility) which matured on January 20, 2012. This Global Credit Facility provides a source of funds to the Borrowers for temporary and emergency purposes, including the ability to meet future unanticipated or unusually large redemption requests. Effective January 20, 2012, the Borrowers renewed the Global Credit Facility for a total of $1.5 billion, maturing January 18, 2013.
Under the terms of the Global Credit Facility, the Fund shall, in addition to interest charged on any borrowings made by the Fund and other costs incurred by the Fund, pay its share of fees and expenses incurred in connection with the implementation and maintenance of the Global Credit Facility, based upon its relative share of the aggregate net assets of all of the Borrowers, including an annual commitment fee of 0.08% based upon the unused portion of the Global Credit Facility, which is reflected in other expenses on the Statement of Operations. During the year ended December 31, 2011, the Fund did not use the Global Credit Facility.
FSV-23
Franklin Templeton Variable Insurance Products Trust
Notes to Financial Statements (continued)
Franklin Small Cap Value Securities Fund
9. FAIR VALUE MEASUREMENTS
The Fund follows a fair value hierarchy that distinguishes between market data obtained from independent sources (observable inputs) and the Fund’s own market assumptions (unobservable inputs). These inputs are used in determining the value of the Fund’s investments and are summarized in the following fair value hierarchy:
| | • | | Level 1 – quoted prices in active markets for identical securities |
| | • | | Level 2 – other significant observable inputs (including quoted prices for similar securities, interest rates, prepayment speed, credit risk, etc.) |
| | • | | Level 3 – significant unobservable inputs (including the Fund’s own assumptions in determining the fair value of investments) |
The inputs or methodology used for valuing securities are not an indication of the risk associated with investing in those securities.
For movements between the levels within the fair value hierarchy, the Fund has adopted a policy of recognizing the transfers as of the date of the underlying event which caused the movement
The following is a summary of the inputs used as of December 31, 2011, in valuing the Fund’s assets and liabilities carried at fair value:
| | | | | | | | | | | | | | | | |
| | | Level 1 | | | Level 2 | | | Level 3 | | | Total | |
| | | | |
Assets: | | | | | | | | | | | | | | | | |
Investments in Securities | | | | | | | | | | | | | | | | |
Equity Investmentsa | | $ | 1,241,050,045 | | | $ | — | | | $ | — | | | $ | 1,241,050,045 | |
Corporate Bonds | | | — | | | | 1,494,000 | | | | — | | | | 1,494,000 | |
Short Term Investments | | | 44,766,735 | | | | 4,173,542 | | | | — | | | | 48,940,277 | |
| | | | |
Total Investments in Securities | | $ | 1,285,816,780 | | | $ | 5,667,542 | | | $ | — | | | $ | 1,291,484,322 | |
| | | | |
aFor detailed categories, see the accompanying Statement of Investments.
10. NEW ACCOUNTING PRONOUNCEMENTS
In May 2011, the Financial Accounting Standards Board (FASB) issued Accounting Standards Update (ASU) No. 2011-04, Fair Value Measurement (Topic 820): Amendments to Achieve Common Fair Value Measurement and Disclosure Requirements in U.S. GAAP and IFRSs. The amendments in the ASU will improve the comparability of fair value measurements presented and disclosed in financial statements prepared in accordance with U.S. GAAP (Generally Accepted Accounting Principles) and IFRS (International Financial Reporting Standards) and include new guidance for certain fair value measurement principles and disclosure requirements. The ASU is effective for interim and annual periods beginning after December 15, 2011. The Fund believes the adoption of this ASU will not have a material impact on its financial statements.
11. SUBSEQUENT EVENTS
The Fund has evaluated subsequent events through the issuance of the financial statements and determined that no events have occurred that require disclosure other than those already disclosed in the financial statements.
FSV-24
Franklin Templeton Variable Insurance Products Trust
Franklin Small Cap Value Securities Fund
Report of Independent Registered Public Accounting Firm
To the Board of Trustees and Shareholders of
Franklin Templeton Variable Insurance Products Trust
In our opinion, the accompanying statement of assets and liabilities, including the statement of investments, and the related statements of operations and of changes in net assets and the financial highlights present fairly, in all material respects, the financial position of Franklin Small Cap Value Securities Fund (the “Fund”) at December 31, 2011, the results of its operations for the year then ended, the changes in its net assets for each of the two years in the period then ended and the financial highlights for each of the periods presented, in conformity with accounting principles generally accepted in the United States of America. These financial statements and financial highlights (hereafter referred to as “financial statements”) are the responsibility of the Fund’s management. Our responsibility is to express an opinion on these financial statements based on our audits. We conducted our audits of these financial statements in accordance with the standards of the Public Company Accounting Oversight Board (United States). Those standards require that we plan and perform the audit to obtain reasonable assurance about whether the financial statements are free of material misstatement. An audit includes examining, on a test basis, evidence supporting the amounts and disclosures in the financial statements, assessing the accounting principles used and significant estimates made by management, and evaluating the overall financial statement presentation. We believe that our audits, which included confirmation of securities at December 31, 2011 by correspondence with the custodian and brokers, provide a reasonable basis for our opinion.
PricewaterhouseCoopers LLP
San Francisco, California
February 13, 2012
FSV-25
Franklin Templeton Variable Insurance Products Trust
Tax Information (unaudited)
Franklin Small Cap Value Securities Fund
Under Section 854(b)(1)(A) of the Internal Revenue Code, the Fund hereby reports 100% of the ordinary income dividends as income qualifying for the dividends received deduction for the fiscal year ended December 31, 2011.
FSV-26
FRANKLIN SMALL-MID CAP GROWTH SECURITIES FUND
This annual report for Franklin Small-Mid Cap Growth Securities Fund covers the fiscal year ended December 31, 2011.
Performance Summary as of 12/31/11
Average annual total return of Class 1 shares represents the average annual change in value, assuming reinvestment of dividends and capital gains. Average returns smooth out variations in returns, which can be significant; they are not the same as year-by-year results.
Periods ended 12/31/11
| | | | | | | | | | | | |
| | | 1-Year | | | 5-Year | | | 10-Year | |
Average Annual Total Return | | | -4.59% | | | | +2.47% | | | | +3.58% | |
Total Return Index Comparison
for a Hypothetical $10,000 Investment (1/1/02–12/31/11)
The graph below shows the change in value of a hypothetical $10,000 investment in the Fund over the indicated period and includes reinvestment of any income or distributions. The Fund’s performance is compared to the performance of the Standard & Poor’s® 500 Index (S&P 500®) and the Russell Midcap® Growth Index. One cannot invest directly in an index, and an index is not representative of the Fund’s portfolio. Please see Important Notes to Performance Information preceding the Fund Summaries.
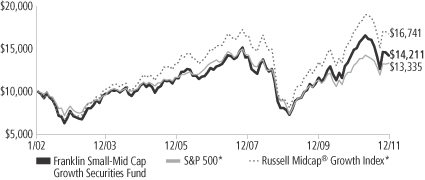
*Source: © 2012 Morningstar. Please see Index Descriptions following the Fund Summaries.
Franklin Small-Mid Cap
Growth Securities Fund
Class 1
Performance reflects the Fund’s Class 1 operating expenses, but does not include any contract fees, expenses or sales charges. If they had been included, performance would be lower. These charges and deductions, particularly for variable life policies, can have a significant effect on contract values and insurance benefits. See the contract prospectus for a complete description of these expenses, including sales charges.
Performance data represent past performance, which does not guarantee future results. Investment return and principal value will fluctuate, and you may have a gain or loss when you sell your shares.
Current performance may differ from figures shown.
FSC-1
Fund Goal and Main Investments: Franklin Small-Mid Cap Growth Securities Fund seeks long-term capital growth. The Fund normally invests at least 80% of its net assets in investments of small-capitalization (small cap) and mid-capitalization (midcap) companies. For this Fund, small cap companies are those within the market capitalization range of companies in the Russell 2500™ Index at the time of purchase, and midcap companies are companies within the market capitalization range of companies in the Russell Midcap® Index at the time of purchase.1
Performance Overview
You can find the Fund’s one-year total return in the Performance Summary. The Fund underperformed its narrow benchmark, the Russell Midcap® Growth Index, which had a total return of -1.65%, and its broad benchmark, the S&P 500, which posted a +2.11% total return, for the same period.2
Economic and Market Overview
The U.S. economy improved steadily but modestly in 2011 despite geopolitical, employment and housing pressures. The U.S. manufacturing sector helped power the domestic economy and led global manufacturing output heading into 2012. Although manufacturing growth slowed in the second half of the year as high commodity prices reduced purchasing power and demand ebbed, the trend began to reverse near year-end. U.S. gross domestic product (GDP) growth advanced each quarter, and the nation’s unemployment rate fell from 9.4% to 8.5%.3
The U.S. financial system and household balance sheets continued to improve, but the country still faced persistently high unemployment, a prolonged housing market slump and massive national debt. The U.S. Federal Reserve Board (Fed) cut the country’s growth forecast partly due to the heightened potential for recession in Europe and cooling GDP trends across much of Asia. Inflation rose for much of the world but stayed relatively contained in the U.S., even slowing toward year-end amid declining energy and food prices. The Fed sought to boost economic growth by maintaining its accommodative monetary policy and undertook a second round of quantitative easing that ended on June 30. Subsequently, the Fed continued to purchase Treasuries with proceeds from maturing debt in an effort to support economic growth.
1. Please see Index Descriptions following the Fund Summaries.
2. Source: © 2012 Morningstar. One cannot invest directly in an index, and an index is not representative of the Fund’s portfolio. Please see Index Descriptions following the Fund Summaries.
3. Source: Bureau of Labor Statistics.
Fund Risks: All investments involve risks. Stock prices fluctuate, sometimes rapidly and dramatically, due to factors affecting individual companies, particular industries or sectors, or general market conditions. Smaller and midsize company securities can increase the risk of greater price fluctuations, particularly over the short term. Smaller or relatively new or unseasoned companies can also be particularly sensitive to changing economic conditions, and their prospects for growth are less certain than those of larger, more established companies. The Fund may have significant investments in particular sectors from time to time, such as technology, which has been among the most volatile sectors in the market and involves special risks. The Fund is actively managed but there is no guarantee that the manager’s investment decisions will produce the desired results. The Fund’s prospectus also includes a description of the main investment risks.
FSC-2
Although U.S. stock markets rallied in the spring, worrisome global events and slowing global growth dampened investor sentiment and market volatility surged. Risk-averse investors sought perceived safe havens and seemed to ignore that many U.S. companies generated record profits. Despite large swings, U.S. stocks as measured by the S&P 500 gained 2.11% in 2011.2 The Dow Jones Industrial Average rose 8.38%, reflecting investors’ general preference for large, established U.S. companies.2 Notably, the U.S. was a global market leader in 2011 as the country continued to be a relative haven. During the year, sector performance varied widely. Noncyclical, income-producing sectors such as utilities, consumer staples and health care led the market, while economically sensitive sectors such as materials and industrials lagged. Financials in the S&P 500 experienced the worst sector decline, as U.S. bank stocks generally tracked their European peers. Against this backdrop, growth stocks fared better than their value counterparts; large-capitalization stocks advanced slightly as a group, with modestly negative results for most small- and mid-sized company stocks, as measured by Russell capitalization-based indexes.
Investment Strategy
We use fundamental, bottom-up research to seek companies meeting our criteria of growth potential, quality and valuation. In seeking sustainable growth characteristics, we look for companies we believe can produce sustainable earnings and cash flow growth, evaluating the long-term market opportunity and competitive structure of an industry to target leaders and emerging leaders. We define quality companies as those with strong and improving competitive positions in attractive markets. We also believe important attributes of quality are experienced and talented management teams as well as financial strength reflected in the capital structure, gross and operating margins, free cash flow generation and returns on capital employed. Our valuation analysis includes a range of potential outcomes based on an assessment of multiple scenarios. In assessing value, we consider whether security prices fully reflect the balance of the sustainable growth opportunities relative to business and financial risks.
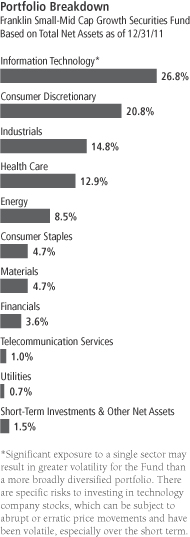
FSC-3
Manager’s Discussion
During the year under review, stock selection in the health care sector was a major detractor from the Fund’s performance relative to the benchmark Russell Midcap® Growth Index. Our position in underperforming hospital operator Community Health Systems and underweighted position in outperforming surgical systems designer and manufacturer Intuitive Surgical hurt relative returns.4 Key individual detractors included coal producer Alpha Natural Resources4 in the energy sector, machinery products and equipment manufacturer Terex4, 5 in the industrials sector, and asset management and financial advisory firm Lazard in the financials sector.
Stock selection in the information technology sector was a key contributor to the Fund’s relative performance. Our positions in voice and language solutions provider Nuance Communications and semiconductor company NetLogic Microsystems4, 5 boosted relative results. Other individual contributors included oil and gas company SM Energy in the energy sector, beverages company Hansen Natural in the consumer staples sector, and restaurant operator and franchisor Buffalo Wild Wings5 in the consumer discretionary sector.
Thank you for your participation in Franklin Small-Mid Cap Growth Securities Fund. We look forward to serving your future investment needs.
4. No longer held by period-end.
5. This holding is not an index component.
The foregoing information reflects our analysis, opinions and portfolio holdings as of December 31, 2011, the end of the reporting period. The way we implement our main investment strategies and the resulting portfolio holdings may change depending on factors such as market and economic conditions. These opinions may not be relied upon as investment advice or an offer for a particular security. The information is not a complete analysis of every aspect of any market, country, industry, security or the Fund. Statements of fact are from sources considered reliable, but the investment manager makes no representation or warranty as to their completeness or accuracy. Although historical performance is no guarantee of future results, these insights may help you understand our investment management philosophy.
Top 10 Holdings
Franklin Small-Mid Cap Growth Securities Fund
12/31/11
| | | | |
Company
Sector/Industry | | % of Total
Net Assets | |
| Nuance Communications Inc. | | | 2.3% | |
| Information Technology | | | | |
| Celanese Corp., A | | | 2.1% | |
| Materials | | | | |
| Rockwell Automation Inc. | | | 2.0% | |
| Industrials | | | | |
| AMETEK Inc. | | | 1.9% | |
| Industrials | | | | |
| Whiting Petroleum Corp. | | | 1.8% | |
| Energy | | | | |
| QEP Resources Inc. | | | 1.7% | |
| Energy | | | | |
| Trimble Navigation Ltd. | | | 1.6% | |
| Information Technology | | | | |
| Gardner Denver Inc. | | | 1.6% | |
| Industrials | | | | |
| SM Energy Co. | | | 1.6% | |
| Energy | | | | |
| BorgWarner Inc. | | | 1.5% | |
| Consumer Discretionary | | | | |
The dollar value, number of shares or principal amount, and names of all portfolio holdings are listed in the Fund’s Statement of Investments.
FSC-4
Fund Expenses
As an investor in a variable insurance contract (Contract) that indirectly provides for investment in an underlying mutual fund, you can incur transaction and/or ongoing expenses at both the Fund level and the Contract level.
| • | | Transaction expenses can include sales charges (loads) on purchases, redemption fees, surrender fees, transfer fees and premium taxes. |
| • | | Ongoing expenses can include management fees, distribution and service (12b-1) fees, contract fees, annual maintenance fees, mortality and expense risk fees and other fees and expenses. All mutual funds and Contracts have some types of ongoing expenses. |
The expenses shown in the table are meant to highlight ongoing expenses at the Fund level only and do not include ongoing expenses at the Contract level, or transaction expenses at either the Fund or Contract level. While the Fund does not have transaction expenses, if the transaction and ongoing expenses at the Contract level were included, the expenses shown below would be higher. You should consult your Contract prospectus or disclosure document for more information.
The table shows Fund-level ongoing expenses and can help you understand these expenses and compare them with those of other mutual funds offered through the Contract. The table assumes a $1,000 investment held for the six months indicated. Please refer to the Fund prospectus for additional information on operating expenses.
Actual Fund Expenses
The first line (Actual) of the table provides actual account values and expenses. The “Ending Account Value” is derived from the Fund’s actual return, which includes the effect of ongoing Fund expenses, but does not include the effect of ongoing Contract expenses.
You can estimate the Fund-level expenses you incurred during the period by following these steps. Of course, your account value and expenses will differ from those in this illustration:
| 1. | Divide your account value by $1,000. |
If an account had an $8,600 value, then $8,600 ÷ $1,000 = 8.6.
| 2. | Multiply the result by the number under the heading “Fund-Level Expenses Incurred During Period.” |
If Fund-Level Expenses Incurred During Period were $7.50, then 8.6 x $7.50 = $64.50.
In this illustration, the estimated expenses incurred this period at the Fund level are $64.50.
Franklin Small-Mid Cap
Growth Securities Fund
Class 1
FSC-5
Hypothetical Example for Comparison with Other Mutual Funds
Information in the second line (Hypothetical) of the table can help you compare ongoing expenses of the Fund with those of other mutual funds offered through the Contract. This information may not be used to estimate the actual ending account balance or expenses you incurred during the period. The hypothetical “Ending Account Value” is based on the Fund’s actual expense ratio and an assumed 5% annual rate of return before expenses, which does not represent the Fund’s actual return. The figure under the heading “Fund-Level Expenses Incurred During Period” shows the hypothetical expenses your account would have incurred under this scenario. You can compare this figure with the 5% hypothetical examples that appear in shareholder reports of other funds offered through a Contract.
| | | | | | | | | | | | |
| Class 1 | | Beginning
Account Value 7/1/11 | | | Ending
Account Value 12/31/11 | | | Fund-Level Expenses Incurred
During Period*
7/1/11–12/31/11 | |
Actual | | $ | 1,000 | | | $ | 884.40 | | | $ | 3.85 | |
Hypothetical (5% return before expenses) | | $ | 1,000 | | | $ | 1,021.12 | | | $ | 4.13 | |
*Expenses are calculated using the most recent six-month annualized expense ratio for the Fund’s Class 1 shares (0.81%), which does not include any ongoing expenses of the Contract for which the Fund is an investment option, multiplied by the average account value over the period, multiplied by 184/365 to reflect the one-half year period.
FSC-6
Franklin Templeton Variable Insurance Products Trust
Financial Highlights
Franklin Small-Mid Cap Growth Securities Fund
| | | | | | | | | | | | | | | | | | | | |
| | | Year Ended December 31, | |
| Class 1 | | 2011 | | | 2010 | | | 2009 | | | 2008 | | | 2007 | |
| | | | |
Per share operating performance | | | | | | | | | | | | | | | | | | | | |
(for a share outstanding throughout the year) | | | | | | | | | | | | | | | | | | | | |
Net asset value, beginning of year | | $ | 22.21 | | | $ | 17.36 | | | $ | 12.06 | | | $ | 23.39 | | | $ | 22.51 | |
| | | | |
Income from investment operationsa: | | | | | | | | | | | | | | | | | | | | |
Net investment income (loss)b | | | (0.05 | ) | | | (0.01 | ) | | | (0.10 | )c | | | 0.01 | | | | (0.02 | ) |
Net realized and unrealized gains (losses) | | | (0.97 | ) | | | 4.86 | | | | 5.40 | | | | (8.98 | ) | | | 2.65 | |
| | | | |
Total from investment operations | | | (1.02 | ) | | | 4.85 | | | | 5.30 | | | | (8.97 | ) | | | 2.63 | |
| | | | |
Less distributions from net realized gains | | | — | | | | — | | | | — | | | | (2.36 | ) | | | (1.75 | ) |
| | | | |
Net asset value, end of year | | $ | 21.19 | | | $ | 22.21 | | | $ | 17.36 | | | $ | 12.06 | | | $ | 23.39 | |
| | | | |
| | | | | |
Total returnd | | | (4.59)% | | | | 27.94% | | | | 43.95% | | | | (42.34)% | | | | 11.51% | |
Ratios to average net assets | | | | | | | | | | | | | | | | | | | | |
Expenses | | | 0.79% | | | | 0.79% | | | | 0.80% | e | | | 0.76% | e | | | 0.74% | e |
Net investment income (loss) | | | (0.21)% | | | | (0.07)% | | | | (0.72)% | c | | | 0.06% | | | | (0.10)% | |
| | | | | |
Supplemental data | | | | | | | | | | | | | | | | | | | | |
Net assets, end of year (000’s) | | $ | 76,384 | | | $ | 89,826 | | | $ | 79,670 | | | $ | 63,531 | | | $ | 127,602 | |
Portfolio turnover rate | | | 45.00% | | | | 46.69% | | | | 63.93% | | | | 60.12% | | | | 66.94% | |
aThe amount shown for a share outstanding throughout the period may not correlate with the Statement of Operations for the period due to the timing of sales and repurchases of the Fund shares in relation to income earned and/or fluctuating market value of the investments of the Fund.
bBased on average daily shares outstanding.
cNet investment income per share includes approximately $(0.06) per share as a return of capital adjustment to a previously recorded special dividend received by the Fund. Excluding this non-recurring amount, the ratio of net investment income to average net assets would have been (0.22)%.
dTotal return does not include fees, charges or expenses imposed by the variable annuity and life insurance contracts for which the Franklin Templeton Variable Insurance Products Trust serves as an underlying investment vehicle.
eBenefit of expense reduction rounds to less than 0.01%.
The accompanying notes are an integral part of these financial statements.
FSC-7
Franklin Templeton Variable Insurance Products Trust
Financial Highlights (continued)
Franklin Small-Mid Cap Growth Securities Fund
| | | | | | | | | | | | | | | | | | | | |
| | | Year Ended December 31, | |
| Class 2 | | 2011 | | | 2010 | | | 2009 | | | 2008 | | | 2007 | |
| | | | |
Per share operating performance | | | | | | | | | | | | | | | | | | | | |
(for a share outstanding throughout the year) | | | | | | | | | | | | | | | | | | | | |
Net asset value, beginning of year | | $ | 21.54 | | | $ | 16.87 | | | $ | 11.75 | | | $ | 22.91 | | | $ | 22.13 | |
| | | | |
Income from investment operationsa: | | | | | | | | | | | | | | | | | | | | |
Net investment income (loss)b | | | (0.10 | ) | | | (0.06 | ) | | | (0.13 | )c | | | (0.03 | ) | | | (0.08 | ) |
Net realized and unrealized gains (losses) | | | (0.95 | ) | | | 4.73 | | | | 5.25 | | | | (8.77 | ) | | | 2.61 | |
| | | | |
Total from investment operations | | | (1.05 | ) | | | 4.67 | | | | 5.12 | | | | (8.80 | ) | | | 2.53 | |
| | | | |
Less distributions from net realized gains | | | — | | | | — | | | | — | | | | (2.36 | ) | | | (1.75 | ) |
| | | | |
Net asset value, end of year | | $ | 20.49 | | | $ | 21.54 | | | $ | 16.87 | | | $ | 11.75 | | | $ | 22.91 | |
| | | | |
| | | | | |
Total returnd | | | (4.87)% | | | | 27.68% | | | | 43.57% | | | | (42.49)% | | | | 11.24% | |
Ratios to average net assets | | | | | | | | | | | | | | | | | | | | |
Expenses | | | 1.04% | | | | 1.04% | | | | 1.05% | e | | | 1.01% | e | | | 0.99% | e |
Net investment income (loss) | | | (0.46)% | | | | (0.32)% | | | | (0.97)% | c | | | (0.19)% | | | | (0.35)% | |
| | | | | |
Supplemental data | | | | | | | | | | | | | | | | | | | | |
Net assets, end of year (000’s) | | $ | 717,086 | | | $ | 939,481 | | | $ | 813,480 | | | $ | 614,053 | | | $ | 1,217,177 | |
Portfolio turnover rate | | | 45.00% | | | | 46.69% | | | | 63.93% | | | | 60.12% | | | | 66.94% | |
aThe amount shown for a share outstanding throughout the period may not correlate with the Statement of Operations for the period due to the timing of sales and repurchases of the Fund shares in relation to income earned and/or fluctuating market value of the investments of the Fund.
bBased on average daily shares outstanding.
cNet investment income per share includes approximately $(0.06) per share as a return of capital adjustment to a previously recorded special dividend received by the Fund. Excluding this non-recurring amount, the ratio of net investment income to average net assets would have been (0.47)%.
dTotal return does not include fees, charges or expenses imposed by the variable annuity and life insurance contracts for which the Franklin Templeton Variable Insurance Products Trust serves as an underlying investment vehicle.
eBenefit of expense reduction rounds to less than 0.01%.
The accompanying notes are an integral part of these financial statements.
FSC-8
Franklin Templeton Variable Insurance Products Trust
Financial Highlights (continued)
Franklin Small-Mid Cap Growth Securities Fund
| | | | | | | | | | | | | | | | |
| | | Year Ended December 31, | |
| Class 4 | | 2011 | | | 2010 | | | 2009 | | | 2008a | |
| | | | |
Per share operating performance | | | | | | | | | | | | | | | | |
(for a share outstanding throughout the year) | | | | | | | | | | | | | | | | |
Net asset value, beginning of year | | $ | 21.98 | | | $ | 17.24 | | | $ | 12.02 | | | $ | 20.60 | |
| | | | |
Income from investment operationsb: | | | | | | | | | | | | | | | | |
Net investment income (loss)c | | | (0.12 | ) | | | (0.07 | ) | | | (0.15 | )d | | | 0.02 | |
Net realized and unrealized gains (losses) | | | (0.96 | ) | | | 4.81 | | | | 5.37 | | | | (6.24 | ) |
| | | | |
Total from investment operations | | | (1.08 | ) | | | 4.74 | | | | 5.22 | | | | (6.22 | ) |
| | | | |
Less distributions from net realized gains | | | — | | | | — | | | | — | | | | (2.36 | ) |
| | | | |
Net asset value, end of year | | $ | 20.90 | | | $ | 21.98 | | | $ | 17.24 | | | $ | 12.02 | |
| | | | |
| | | | |
Total returne | | | (4.91)% | | | | 27.49% | | | | 43.43% | | | | (34.74)% | |
Ratios to average net assetsf | | | | | | | | | | | | | | | | |
Expenses | | | 1.14% | | | | 1.14% | | | | 1.15% | g | | | 1.11% | g |
Net investment income (loss) | | | (0.56)% | | | | (0.42)% | | | | (1.07)% | d | | | (0.29)% | |
| | | | |
Supplemental data | | | | | | | | | | | | | | | | |
Net assets, end of year (000’s) | | $ | 12,664 | | | $ | 15,413 | | | $ | 11,029 | | | $ | 3,538 | |
Portfolio turnover rate | | | 45.00% | | | | 46.69% | | | | 63.93% | | | | 60.12% | |
aFor the period February 29, 2008 (effective date) to December 31, 2008.
bThe amount shown for a share outstanding throughout the period may not correlate with the Statement of Operations for the period due to the timing of sales and repurchases of the Fund shares in relation to income earned and/or fluctuating market value of the investments of the Fund.
cBased on average daily shares outstanding.
dNet investment income per share includes approximately $(0.06) per share as a return of capital adjustment to a previously recorded special dividend received by the Fund. Excluding this non-recurring amount, the ratio of net investment income to average net assets would have been (0.57)%.
eTotal return does not include fees, charges or expenses imposed by the variable annuity and life insurance contracts for which the Franklin Templeton Variable Insurance Products Trust serves as an underlying investment vehicle. Total return is not annualized for periods less than one year.
fRatios are annualized for periods less than one year.
gBenefit of expense reduction rounds to less than 0.01%.
The accompanying notes are an integral part of these financial statements.
FSC-9
Franklin Templeton Variable Insurance Products Trust
Statement of Investments, December 31, 2011
| | | | | | | | |
| Franklin Small-Mid Cap Growth Securities Fund | | Shares | | | Value | |
Common Stocks 98.5% | | | | | | | | |
Consumer Discretionary 20.8% | | | | | | | | |
Abercrombie & Fitch Co., A | | | 125,000 | | | $ | 6,105,000 | |
a,bBlue Nile Inc. | | | 73,500 | | | | 3,004,680 | |
aBorgWarner Inc. | | | 192,000 | | | | 12,238,080 | |
aBuffalo Wild Wings Inc. | | | 139,300 | | | | 9,404,143 | |
aChipotle Mexican Grill Inc. | | | 23,000 | | | | 7,768,020 | |
Dick’s Sporting Goods Inc. | | | 259,300 | | | | 9,562,984 | |
aDiscovery Communications Inc., A | | | 142,700 | | | | 5,846,419 | |
aDiscovery Communications Inc., C | | | 62,400 | | | | 2,352,480 | |
aDollar General Corp. | | | 250,000 | | | | 10,285,000 | |
Guess? Inc. | | | 240,100 | | | | 7,159,782 | |
aIconix Brand Group Inc. | | | 168,100 | | | | 2,738,349 | |
International Game Technology | | | 360,200 | | | | 6,195,440 | |
Jarden Corp. | | | 312,200 | | | | 9,328,536 | |
Nordstrom Inc. | | | 85,000 | | | | 4,225,350 | |
aPeet’s Coffee & Tea Inc. | | | 132,000 | | | | 8,273,760 | |
Ralph Lauren Corp. | | | 55,000 | | | | 7,594,400 | |
Starwood Hotels & Resorts Worldwide Inc. | | | 96,100 | | | | 4,609,917 | |
aTenneco Inc. | | | 201,600 | | | | 6,003,648 | |
Tractor Supply Co. | | | 124,000 | | | | 8,698,600 | |
aUlta Salon Cosmetics & Fragrance Inc. | | | 75,000 | | | | 4,869,000 | |
aUnder Armour Inc., A | | | 96,100 | | | | 6,899,019 | |
aUrban Outfitters Inc. | | | 297,700 | | | | 8,204,612 | |
Wolverine World Wide Inc. | | | 300,000 | | | | 10,692,000 | |
Wynn Resorts Ltd. | | | 48,000 | | | | 5,303,520 | |
| | | | | | | | |
| | | | | | | 167,362,739 | |
| | | | | | | | |
Consumer Staples 4.7% | | | | | | | | |
aBoston Beer Inc., A | | | 70,000 | | | | 7,599,200 | |
aHansen Natural Corp. | | | 90,000 | | | | 8,292,600 | |
Mead Johnson Nutrition Co., A. | |
| 110,400
|
| |
| 7,587,792
|
|
aTreeHouse Foods Inc. | | | 129,600 | | | | 8,473,248 | |
Whole Foods Market Inc. | | | 90,000 | | | | 6,262,200 | |
| | | | | | | | |
| | | | | | | 38,215,040 | |
| | | | | | | | |
Energy 8.5% | | | | | | | | |
aCameron International Corp. | | | 153,700 | | | | 7,560,503 | |
aFMC Technologies Inc. | | | 120,000 | | | | 6,267,600 | |
aOil States International Inc. | | | 72,000 | | | | 5,498,640 | |
QEP Resources Inc. | | | 475,000 | | | | 13,917,500 | |
SM Energy Co. | | | 176,500 | | | | 12,902,150 | |
aSuperior Energy Services Inc. | | | 268,389 | | | | 7,632,983 | |
aWhiting Petroleum Corp. | | | 310,000 | | | | 14,473,900 | |
| | | | | | | | |
| | | | | | | 68,253,276 | |
| | | | | | | | |
Financials 3.6% | | | | | | | | |
aAffiliated Managers Group Inc. | | | 96,100 | | | | 9,220,795 | |
Hancock Holding Co. | | | 156,000 | | | | 4,987,320 | |
aIntercontinentalExchange Inc. | | | 42,800 | | | | 5,159,540 | |
Lazard Ltd., A | | | 81,823 | | | | 2,136,399 | |
aSignature Bank | | | 125,000 | | | | 7,498,750 | |
| | | | | | | | |
| | | | | | | 29,002,804 | |
| | | | | | | | |
Health Care 12.9% | | | | | | | | |
aAgilent Technologies Inc. | | | 150,000 | | | | 5,239,500 | |
FSC-10
Franklin Templeton Variable Insurance Products Trust
Statement of Investments, December 31, 2011 (continued)
| | | | | | | | |
| Franklin Small-Mid Cap Growth Securities Fund | | Shares | | | Value | |
Common Stocks (continued) | | | | | | | | |
Health Care (continued) | | | | | | | | |
aAlexion Pharmaceuticals Inc. | | | 60,000 | | | $ | 4,290,000 | |
aAllscripts Healthcare Solutions Inc. | | | 275,600 | | | | 5,219,864 | |
aArQule Inc. | | | 383,800 | | | | 2,164,632 | |
C. R. Bard Inc. | | | 55,000 | | | | 4,702,500 | |
aCareFusion Corp. | | | 240,000 | | | | 6,098,400 | |
aCerner Corp. | | | 144,000 | | | | 8,820,000 | |
aCoventry Health Care Inc. | | | 162,400 | | | | 4,932,088 | |
aDaVita Inc. | | | 111,700 | | | | 8,467,977 | |
aDexCom Inc. | | | 175,000 | | | | 1,629,250 | |
aEdwards Lifesciences Corp. | | | 70,000 | | | | 4,949,000 | |
aHeartWare International Inc. | | | 36,500 | | | | 2,518,500 | |
aHologic Inc. | | | 250,000 | | | | 4,377,500 | |
aHuman Genome Sciences Inc. | | | 216,100 | | | | 1,596,979 | |
aIllumina Inc. | | | 65,000 | | | | 1,981,200 | |
aInterMune Inc. | | | 225,000 | | | | 2,835,000 | |
aMettler-Toledo International Inc. | | | 80,000 | | | | 11,816,800 | |
aStereotaxis Inc. | | | 631,400 | | | | 520,021 | |
aThoratec Corp. | | | 72,000 | | | | 2,416,320 | |
aVarian Medical Systems Inc. | | | 115,000 | | | | 7,719,950 | |
aWaters Corp. | | | 130,000 | | | | 9,626,500 | |
aWatson Pharmaceuticals Inc. | | | 37,100 | | | | 2,238,614 | |
| | | | | | | | |
| | | | | | | 104,160,595 | |
| | | | | | | | |
Industrials 14.8% | | | | | | | | |
aAllegiant Travel Co. | | | 86,500 | | | | 4,613,910 | |
AMETEK Inc. | | | 360,200 | | | | 15,164,420 | |
Cummins Inc. | | | 115,300 | | | | 10,148,706 | |
Expeditors International of Washington Inc. | | | 84,900 | | | | 3,477,504 | |
Fastenal Co. | | | 192,000 | | | | 8,373,120 | |
Fluor Corp. | | | 90,300 | | | | 4,537,575 | |
Gardner Denver Inc. | | | 168,100 | | | | 12,953,786 | |
aHexcel Corp. | | | 115,000 | | | | 2,784,150 | |
J.B. Hunt Transport Services Inc. | | | 124,300 | | | | 5,602,201 | |
Joy Global Inc. | | | 80,000 | | | | 5,997,600 | |
aKansas City Southern | | | 72,000 | | | | 4,896,720 | |
Pall Corp. | | | 52,500 | | | | 3,000,375 | |
Robert Half International Inc. | | | 192,000 | | | | 5,464,320 | |
Rockwell Automation Inc. | | | 220,000 | | | | 16,141,400 | |
Roper Industries Inc. | | | 72,000 | | | | 6,254,640 | |
aSensata Technologies Holding NV | | | 362,900 | | | | 9,537,012 | |
| | | | | | | | |
| | | | | | | 118,947,439 | |
| | | | | | | | |
Information Technology 26.8% | | | | | | | | |
aAcme Packet Inc. | | | 100,000 | | | | 3,091,000 | |
aAlliance Data Systems Corp. | | | 59,400 | | | | 6,168,096 | |
aANSYS Inc. | | | 165,000 | | | | 9,451,200 | |
aAruba Networks Inc. | | | 240,100 | | | | 4,446,652 | |
Avago Technologies Ltd. (Singapore) | | | 216,100 | | | | 6,236,646 | |
aBottomline Technologies Inc. | | | 145,000 | | | | 3,359,650 | |
aCheck Point Software Technologies Ltd. (Israel) | | | 75,000 | | | | 3,940,500 | |
aCommVault Systems Inc. | | | 110,000 | | | | 4,699,200 | |
aF5 Networks Inc. | | | 100,000 | | | | 10,612,000 | |
FactSet Research Systems Inc. | | | 110,000 | | | | 9,600,800 | |
aFortinet Inc. | | | 275,000 | | | | 5,997,750 | |
FSC-11
Franklin Templeton Variable Insurance Products Trust
Statement of Investments, December 31, 2011 (continued)
| | | | | | | | |
| Franklin Small-Mid Cap Growth Securities Fund | | Shares | | | Value | |
Common Stocks (continued) | | | | | | | | |
Information Technology (continued) | | | | | | | | |
aFreescale Semiconductor Holdings I Ltd. | | | 317,047 | | | $ | 4,010,644 | |
Global Payments Inc. | | | 120,000 | | | | 5,685,600 | |
a,bHigher One Holdings Inc. | | | 228,634 | | | | 4,216,011 | |
aHittite Microwave Corp. | | | 165,800 | | | | 8,187,204 | |
aInformatica Corp. | | | 150,000 | | | | 5,539,500 | |
aLam Research Corp. | | | 100,800 | | | | 3,731,616 | |
aNetApp Inc. | | | 140,000 | | | | 5,077,800 | |
aNuance Communications Inc. | | | 734,800 | | | | 18,487,568 | |
aNXP Semiconductors NV (Netherlands) | | | 480,300 | | | | 7,382,211 | |
aPolycom Inc. | | | 400,000 | | | | 6,520,000 | |
aRed Hat Inc. | | | 264,200 | | | | 10,908,818 | |
aShoretel Inc. | | | 288,100 | | | | 1,838,078 | |
aSilicon Laboratories Inc. | | | 222,700 | | | | 9,669,634 | |
aSMART Technologies Inc., A (Canada) | | | 480,400 | | | | 1,772,676 | |
aTaleo Corp., A | | | 120,000 | | | | 4,642,800 | |
aTeradata Corp. | | | 110,000 | | | | 5,336,100 | |
aTrimble Navigation Ltd. | | | 300,000 | | | | 13,020,000 | |
aVeriFone Systems Inc. | | | 135,000 | | | | 4,795,200 | |
aViaSat Inc. | | | 163,300 | | | | 7,531,396 | |
Western Union Co. | | | 399,018 | | | | 7,286,069 | |
Xilinx Inc. | | | 264,200 | | | | 8,470,252 | |
aZynga Inc. | | | 507,300 | | | | 4,773,693 | |
| | | | | | | | |
| | | | | | | 216,486,364 | |
| | | | | | | | |
Materials 4.7% | | | | | | | | |
Celanese Corp., A | | | 384,200 | | | | 17,008,534 | |
CF Industries Holdings Inc. | | | 45,000 | | | | 6,524,100 | |
Ecolab Inc. | | | 105,700 | | | | 6,110,517 | |
The Scotts Miracle-Gro Co., A | | | 100,000 | | | | 4,669,000 | |
The Sherwin-Williams Co. | | | 40,000 | | | | 3,570,800 | |
| | | | | | | | |
| | | | | | | 37,882,951 | |
| | | | | | | | |
Telecommunication Services 1.0% | | | | | | | | |
aSBA Communications Corp. | | | 192,000 | | | | 8,248,320 | |
| | | | | | | | |
Utilities 0.7% | | | | | | | | |
aCalpine Corp. | | | 336,200 | | | | 5,490,146 | |
| | | | | | | | |
Total Common Stocks (Cost $617,390,948) | | | | | | | 794,049,674 | |
| | | | | | | | |
Short Term Investments 2.8% | | | | | | | | |
Money Market Funds (Cost $17,966,000) 2.2% | | | | | | | | |
a,cInstitutional Fiduciary Trust Money Market Portfolio | | | 17,966,000 | | | | 17,966,000 | |
| | | | | | | | |
dInvestments from Cash Collateral Received for Loaned Securities
(Cost $4,309,600) 0.6% | | | | | | | | |
Money Market Funds 0.6% | | | | | | | | |
eBNY Mellon Overnight Government Fund, 0.039% | | | 4,309,600 | | | | 4,309,600 | |
| | | | | | | | |
Total Investments (Cost $639,666,548) 101.3% | | | | | | | 816,325,274 | |
Other Assets, less Liabilities (1.3)% | | | | | | | (10,190,926 | ) |
| | | | | | | | |
Net Assets 100.0% | | | | | | $ | 806,134,348 | |
| | | | | | | | |
aNon-income producing.
bA portion or all of the security is on loan at December 31, 2011. See Note 1(c).
cSee Note 7 regarding investments in the Institutional Fiduciary Trust Money Market Portfolio.
dSee Note 1(c) regarding securities on loan.
eThe rate shown is the annualized seven-day yield at period end.
The accompanying notes are an integral part of these financial statements.
FSC-12
Franklin Templeton Variable Insurance Products Trust
Financial Statements
Statement of Assets and Liabilities
December 31, 2011
| | | | |
| | | Franklin Small-Mid
Cap Growth
Securities Fund | |
Assets: | | | | |
Investments in securities: | | | | |
Cost - Unaffiliated issuers | | $ | 621,700,548 | |
Cost - Sweep Money Fund (Note 7) | | | 17,966,000 | |
| | | | |
Total cost of investments | �� | $ | 639,666,548 | |
| | | | |
Value - Unaffiliated issuers | | $ | 798,359,274 | |
Value - Sweep Money Fund (Note 7) | | | 17,966,000 | |
| | | | |
Total value of investments (includes securities loaned in the amount of $4,250,280) | | | 816,325,274 | |
Receivables: | | | | |
Investment securities sold | | | 192,549 | |
Capital shares sold | | | 150,562 | |
Dividends and interest | | | 237,704 | |
Other assets | | | 104,533 | |
| | | | |
Total assets | | | 817,010,622 | |
| | | | |
Liabilities: | | | | |
Payables: | | | | |
Investment securities purchased | | | 2,387,429 | |
Capital shares redeemed | | | 2,947,368 | |
Affiliates | | | 834,906 | |
Payable upon return of securities loaned | | | 4,309,600 | |
Accrued expenses and other liabilities | | | 396,971 | |
| | | | |
Total liabilities | | | 10,876,274 | |
| | | | |
Net assets, at value | | $ | 806,134,348 | |
| | | | |
Net assets consist of: | | | | |
Paid-in capital | | $ | 573,077,039 | |
Net unrealized appreciation (depreciation) | | | 176,658,726 | |
Accumulated net realized gain (loss) | | | 56,398,583 | |
| | | | |
Net assets, at value | | $ | 806,134,348 | |
| | | | |
The accompanying notes are an integral part of these financial statements.
FSC-13
Franklin Templeton Variable Insurance Products Trust
Financial Statements (continued)
Statement of Assets and Liabilities (continued)
December 31, 2011
| | | | |
| | | Franklin Small-Mid
Cap Growth
Securities Fund | |
Class 1: | | | | |
Net assets, at value | | $ | 76,384,111 | |
| | | | |
Shares outstanding | | | 3,604,080 | |
| | | | |
Net asset value and maximum offering price per share | | $ | 21.19 | |
| | | | |
Class 2: | | | | |
Net assets, at value | | $ | 717,086,390 | |
| | | | |
Shares outstanding | | | 34,990,521 | |
| | | | |
Net asset value and maximum offering price per share | | $ | 20.49 | |
| | | | |
Class 4: | | | | |
Net assets, at value | | $ | 12,663,847 | |
| | | | |
Shares outstanding | | | 606,062 | |
| | | | |
Net asset value and maximum offering price per share | | $ | 20.90 | |
| | | | |
The accompanying notes are an integral part of these financial statements.
FSC-14
Franklin Templeton Variable Insurance Products Trust
Financial Statements (continued)
Statement of Operations
for the year ended December 31, 2011
| | | | |
| | | Franklin Small-Mid
Cap Growth
Securities Fund | |
Investment income: | | | | |
Dividends | | $ | 5,069,403 | |
Income from securities loaned | | | 502,338 | |
| | | | |
Total investment income | | | 5,571,741 | |
| | | | |
Expenses: | | | | |
Management fees (Note 3a) | | | 4,743,790 | |
Administrative fees (Note 3b) | | | 2,391,708 | |
Distribution fees: (Note 3c) | | | | |
Class 2 | | | 2,137,962 | |
Class 4 | | | 55,063 | |
Unaffiliated transfer agent fees | | | 3,579 | |
Custodian fees (Note 4) | | | 18,632 | |
Reports to shareholders | | | 324,675 | |
Professional fees | | | 44,340 | |
Trustees’ fees and expenses | | | 3,726 | |
Other | | | 29,576 | |
| | | | |
Total expenses | | | 9,753,051 | |
| | | | |
Net investment income (loss) | | | (4,181,310 | ) |
| | | | |
Realized and unrealized gains (losses): | | | | |
Net realized gain (loss) from investments | | | 95,464,105 | |
Net change in unrealized appreciation (depreciation) on investments | | | (133,141,452 | ) |
| | | | |
Net realized and unrealized gain (loss) | | | (37,677,347 | ) |
| | | | |
Net increase (decrease) in net assets resulting from operations | | $ | (41,858,657 | ) |
| | | | |
The accompanying notes are an integral part of these financial statements.
FSC-15
Franklin Templeton Variable Insurance Products Trust
Financial Statements (continued)
Statements of Changes in Net Assets
| | | | | | | | |
| | | Franklin Small-Mid Cap Growth
Securities Fund | |
| | | Year Ended December 31, | |
| | | 2011 | | | 2010 | |
| | | | |
Increase (decrease) in net assets: | | | | | | | | |
Operations: | | | | | | | | |
Net investment income (loss) | | $ | (4,181,310 | ) | | $ | (2,680,101 | ) |
Net realized gain (loss) from investments | | | 95,464,105 | | | | 110,745,622 | |
Net change in unrealized appreciation (depreciation) on investments | | | (133,141,452 | ) | | | 119,428,953 | |
| | | | |
Net increase (decrease) in net assets resulting from operations | | | (41,858,657 | ) | | | 227,494,474 | |
| | | | |
Capital share transactions: (Note 2) | | | | | | | | |
Class 1 | | | (9,862,944 | ) | | | (10,074,842 | ) |
Class 2 | | | (184,782,471 | ) | | | (78,124,046 | ) |
Class 4 | | | (2,082,119 | ) | | | 1,246,003 | |
| | | | |
Total capital share transactions | | | (196,727,534 | ) | | | (86,952,885 | ) |
| | | | |
Net increase (decrease) in net assets | | | (238,586,191 | ) | | | 140,541,589 | |
Net assets (there is no undistributed net investment income at beginning or end of year): | | | | | | | | |
Beginning of year | | | 1,044,720,539 | | | | 904,178,950 | |
| | | | |
End of year | | $ | 806,134,348 | | | $ | 1,044,720,539 | |
| | | | |
The accompanying notes are an integral part of these financial statements.
FSC-16
Franklin Templeton Variable Insurance Products Trust
Notes to Financial Statements
Franklin Small-Mid Cap Growth Securities Fund
1. ORGANIZATION AND SIGNIFICANT ACCOUNTING POLICIES
Franklin Templeton Variable Insurance Products Trust (Trust) is registered under the Investment Company Act of 1940, as amended, (1940 Act) as an open-end investment company, consisting of twenty separate funds. The Franklin Small-Mid Cap Growth Securities Fund (Fund) is included in this report. The financial statements of the remaining funds in the Trust are presented separately. Shares of the Fund are generally sold only to insurance company separate accounts to fund the benefits of variable life insurance policies or variable annuity contracts. The Fund offers three classes of shares: Class 1, Class 2, and Class 4. Each class of shares differs by its distribution fees, voting rights on matters affecting a single class and its exchange privilege.
The following summarizes the Fund’s significant accounting policies.
a. Financial Instrument Valuation
The Fund’s investments in securities and other financial instruments are carried at fair value daily. Fair value is the price that would be received to sell an asset or paid to transfer a liability in an orderly transaction between market participants on the measurement date. Under procedures approved by the Trust’s Board of Trustees, the Fund may utilize independent pricing services, quotations from securities and financial instrument dealers, and other market sources to determine fair value.
Equity securities listed on an exchange or on the NASDAQ National Market System are valued at the last quoted sale price or the official closing price of the day, respectively. Foreign equity securities are valued as of the close of trading on the foreign stock exchange on which the security is primarily traded, or the NYSE, whichever is earlier. The value is then converted into its U.S. dollar equivalent at the foreign exchange rate in effect at the close of the NYSE on the day that the value of the security is determined. Over-the-counter securities are valued within the range of the most recent quoted bid and ask prices. Securities that trade in multiple markets or on multiple exchanges are valued according to the broadest and most representative market. Certain equity securities are valued based upon fundamental characteristics or relationships to similar securities. Investments in open-end mutual funds and non-registered money market funds are valued at the closing net asset value.
The Fund has procedures to determine the fair value of securities and other financial instruments for which market prices are not readily available or which may not be reliably priced. Under these procedures, the Fund primarily employs a market-based approach which may use related or comparable assets or liabilities, recent transactions, market multiples, book values, and other relevant information for the investment to determine the fair value of the investment. The Fund may also use an income-based valuation approach in which the anticipated future cash flows of the investment are discounted to calculate fair value. Discounts may also be applied due to the nature or duration of any restrictions on the disposition of the investments. Due to the inherent uncertainty of valuations of such investments, the fair values may differ significantly from the values that would have been used had an active market existed.
Trading in securities on foreign securities stock exchanges and over-the-counter markets may be completed before the daily close of business on the NYSE. Occasionally, events occur between the time at which trading in a foreign security is completed and the close of the NYSE that might call into question the reliability of the value of a portfolio security held by the Fund. As a result, differences may arise between the value of the Fund’s portfolio securities as determined at the foreign market close and the latest indications of value at the close of the NYSE. In order to minimize the potential for these differences, the investment manager monitors price movements following the close of trading in foreign stock markets through a series of country specific market proxies (such as baskets of American Depositary Receipts, futures contracts and exchange traded funds). These price movements are measured against established trigger thresholds for each specific market proxy to assist in determining if an event has occurred that may call into question the reliability of the values of the foreign securities held by the Fund. If such an event occurs, the securities may be valued using fair value procedures, which may include the use of independent pricing services.
FSC-17
Franklin Templeton Variable Insurance Products Trust
Notes to Financial Statements (continued)
Franklin Small-Mid Cap Growth Securities Fund
1. ORGANIZATION AND SIGNIFICANT ACCOUNTING POLICIES (continued)
b. Foreign Currency Translation
Portfolio securities and other assets and liabilities denominated in foreign currencies are translated into U.S. dollars based on the exchange rate of such currencies against U.S. dollars on the date of valuation. The Fund may enter into foreign currency exchange contracts to facilitate transactions denominated in a foreign currency. Purchases and sales of securities, income and expense items denominated in foreign currencies are translated into U.S. dollars at the exchange rate in effect on the transaction date. Portfolio securities and assets and liabilities denominated in foreign currencies contain risks that those currencies will decline in value relative to the U.S. dollar. Occasionally, events may impact the availability or reliability of foreign exchange rates used to convert the U.S. dollar equivalent value. If such an event occurs, the foreign exchange rate will be valued at fair value using procedures established and approved by the Trust’s Board of Trustees.
The Fund does not separately report the effect of changes in foreign exchange rates from changes in market prices on securities held. Such changes are included in net realized and unrealized gain or loss from investments on the Statement of Operations.
Realized foreign exchange gains or losses arise from sales of foreign currencies, currency gains or losses realized between the trade and settlement dates on securities transactions and the difference between the recorded amounts of dividends, interest, and foreign withholding taxes and the U.S. dollar equivalent of the amounts actually received or paid. Net unrealized foreign exchange gains and losses arise from changes in foreign exchange rates on foreign denominated assets and liabilities other than investments in securities held at the end of the reporting period.
c. Securities Lending
The Fund participates in an agency based security lending program. The fund receives cash collateral against the loaned securities in an amount equal to at least 102% of the market value of the loaned securities. Collateral is maintained over the life of the loan in an amount not less than 100% of the market value of loaned securities, as determined at the close of fund business each day; any additional collateral required due to changes in security values is delivered to the fund on the next business day. The collateral is invested in a non-registered money fund managed by the fund’s custodian on the fund’s behalf. The fund receives income from the investment of cash collateral, in addition to lending fees and rebates paid by the borrower. The fund bears the market risk with respect to the collateral investment, securities loaned, and the risk that the agent may default on its obligations to the fund. The securities lending agent has agreed to indemnify the fund in the event of default by a third party borrower.
d. Income Taxes
It is the Fund’s policy to qualify as a regulated investment company under the Internal Revenue Code. The Fund intends to distribute to shareholders substantially all of its taxable income and net realized gains to relieve it from federal income and excise taxes. As a result, no provision for U.S. federal income taxes is required.
The Fund recognizes the tax benefits of uncertain tax positions only when the position is “more likely than not” to be sustained upon examination by the tax authorities based on the technical merits of the tax position. As of December 31, 2011, and for all open tax years, the Fund has determined that no liability for unrecognized tax benefits is required in the Fund’s financial statements related to uncertain tax positions taken on a tax return (or expected to be taken on future tax returns). Open tax years are those that remain subject to examination and are based on each tax jurisdiction statute of limitation.
e. Security Transactions, Investment Income, Expenses and Distributions
Security transactions are accounted for on trade date. Realized gains and losses on security transactions are determined on a specific identification basis. Estimated expenses are accrued daily. Dividend income is recorded on the ex-dividend date except
FSC-18
Franklin Templeton Variable Insurance Products Trust
Notes to Financial Statements (continued)
Franklin Small-Mid Cap Growth Securities Fund
1. ORGANIZATION AND SIGNIFICANT ACCOUNTING POLICIES (continued)
e. Security Transactions, Investment Income, Expenses and Distributions (continued)
that certain dividends from foreign securities are recognized as soon as the Fund is notified of the ex-dividend date. Distributions to shareholders are recorded on the ex-dividend date and are determined according to income tax regulations (tax basis). Distributable earnings determined on a tax basis may differ from earnings recorded in accordance with accounting principles generally accepted in the United States of America. These differences may be permanent or temporary. Permanent differences are reclassified among capital accounts to reflect their tax character. These reclassifications have no impact on net assets or the results of operations. Temporary differences are not reclassified, as they may reverse in subsequent periods.
Common expenses incurred by the Trust are allocated among the funds based on the ratio of net assets of each fund to the combined net assets of the Trust. Fund specific expenses are charged directly to the fund that incurred the expense.
Realized and unrealized gains and losses and net investment income, not including class specific expenses, are allocated daily to each class of shares based upon the relative proportion of net assets of each class. Differences in per share distributions, by class, are generally due to differences in class specific expenses.
f. Accounting Estimates
The preparation of financial statements in accordance with accounting principles generally accepted in the United States of America requires management to make estimates and assumptions that affect the reported amounts of assets and liabilities at the date of the financial statements and the amounts of income and expenses during the reporting period. Actual results could differ from those estimates.
g. Guarantees and Indemnifications
Under the Trust’s organizational documents, its officers and trustees are indemnified by the Trust against certain liabilities arising out of the performance of their duties to the Trust. Additionally, in the normal course of business, the Trust, on behalf of the Fund, enters into contracts with service providers that contain general indemnification clauses. The Trust’s maximum exposure under these arrangements is unknown as this would involve future claims that may be made against the Trust that have not yet occurred. Currently, the Trust expects the risk of loss to be remote.
2. SHARES OF BENEFICIAL INTEREST
At December 31, 2011, there were an unlimited number of shares authorized (without par value). Transactions in the Fund’s shares were as follows:
| | | | | | | | | | | | | | | | |
| | | Year Ended December 31, | |
| | | 2011 | | | 2010 | |
| Class 1 Shares: | | Shares | | | Amount | | | Shares | | | Amount | |
Shares sold | | | 213,179 | | | $ | 4,851,501 | | | | 293,329 | | | $ | 5,660,759 | |
Shares redeemed | | | (652,643 | ) | | | (14,714,445 | ) | | | (838,792 | ) | | | (15,735,601 | ) |
| | | | |
Net increase (decrease) | | | (439,464 | ) | | $ | (9,862,944 | ) | | | (545,463 | ) | | $ | (10,074,842 | ) |
| | | | |
Class 2 Shares: | | | | | | | | | | | | | | | | |
Shares sold | | | 3,213,965 | | | $ | 70,946,756 | | | | 4,961,508 | | | $ | 92,319,522 | |
Shares redeemed | | | (11,848,847 | ) | | | (255,729,227 | ) | | | (9,551,006 | ) | | | (170,443,568 | ) |
| | | | |
Net increase (decrease) | | | (8,634,882 | ) | | $ | (184,782,471 | ) | | | (4,589,498 | ) | | $ | (78,124,046 | ) |
| | | | |
FSC-19
Franklin Templeton Variable Insurance Products Trust
Notes to Financial Statements (continued)
Franklin Small-Mid Cap Growth Securities Fund
2. SHARES OF BENEFICIAL INTEREST (continued)
| | | | | | | | | | | | | | | | |
| | | Year Ended December 31, | |
| | | 2011 | | | 2010 | |
| | | Shares | | | Amount | | | Shares | | | Amount | |
Class 4 Shares: | | | | | | | | | | | | | | | | |
Shares sold | | | 311,193 | | | $ | 7,039,340 | | | | 320,420 | | | $ | 6,087,006 | |
Shares redeemed | | | (406,340 | ) | | | (9,121,459 | ) | | | (258,807 | ) | | | (4,841,003 | ) |
| | | | |
Net increase (decrease) | | | (95,147 | ) | | $ | (2,082,119 | ) | | | 61,613 | | | $ | 1,246,003 | |
| | | | |
3. TRANSACTIONS WITH AFFILIATES
Franklin Resources, Inc. is the holding company for various subsidiaries that together are referred to as Franklin Templeton Investments. Certain officers and trustees of the Fund are also officers and/or directors of the following subsidiaries:
| | |
| Subsidiary | | Affiliation |
Franklin Advisers, Inc. (Advisers) | | Investment manager |
Franklin Templeton Services, LLC (FT Services) | | Administrative manager |
Franklin Templeton Distributors, Inc. (Distributors) | | Principal underwriter |
Franklin Templeton Investor Services, LLC (Investor Services) | | Transfer agent |
a. Management Fees
The Fund pays an investment management fee to Advisers based on the average daily net assets of the Fund as follows:
| | |
| Annualized Fee Rate | | Net Assets |
| 0.550% | | Up to and including $500 million |
| 0.450% | | Over $500 million, up to and including $1 billion |
| 0.400% | | Over $1 billion, up to and including $1.5 billion |
| 0.350% | | Over $1.5 billion, up to and including $6.5 billion |
| 0.325% | | Over $6.5 billion, up to and including $11.5 billion |
| 0.300% | | Over $11.5 billion, up to and including $16.5 billion |
| 0.290% | | Over $16.5 billion, up to and including $19 billion |
| 0.280% | | Over $19 billion, up to and including $21.5 billion |
| 0.270% | | In excess of $21.5 billion |
b. Administrative Fees
The Fund pays an administrative fee to FT Services of 0.25% per year of the average daily net assets of the Fund.
c. Distribution Fees
The Fund’s Board of Trustees has adopted distribution plans for Class 2 and Class 4 shares pursuant to Rule 12b-1 under the 1940 Act. Under the Fund’s compensation distribution plans, the Fund pays Distributors for costs incurred in connection with the servicing, sale and distribution of the Fund’s shares up to 0.35% per year of its average daily net assets of each class. The Board of Trustees has agreed to limit the current rate to 0.25% per year for Class 2.
FSC-20
Franklin Templeton Variable Insurance Products Trust
Notes to Financial Statements (continued)
Franklin Small-Mid Cap Growth Securities Fund
3. TRANSACTIONS WITH AFFILIATES (continued)
d. Transfer Agent Fees
Investor Services, under terms of an agreement, performs shareholder servicing for the Fund and is not paid by the Fund for the services.
4. EXPENSE OFFSET ARRANGEMENT
The Fund has entered into an arrangement with its custodian whereby credits realized as a result of uninvested cash balances are used to reduce a portion of the Fund’s custodian expenses. During the year ended December 31, 2011, there were no credits earned.
5. INCOME TAXES
For tax purposes, capital losses may be carried over to offset future capital gains, if any. Under the Regulated Investment Company Modernization Act of 2010, capital losses incurred by the Fund in taxable years beginning after December 22, 2010 are not subject to expiration and such losses retain their character as short-term or long-term, rather than being considered short-term as under previous law. Post-enactment capital losses must be fully utilized prior to utilizing any losses incurred in pre-enactment tax years. During the year ended December 31, 2011, the Fund utilized $38,181,161 of capital loss carryforwards.
At December 31, 2011, the cost of investments, net unrealized appreciation (depreciation), and undistributed long term capital gains for income tax purposes were as follows:
| | | | |
Cost of investments | | $ | 642,000,572 | |
| | | | |
| |
Unrealized appreciation | | $ | 215,091,056 | |
Unrealized depreciation | | $ | (40,766,354 | ) |
| | | | |
Net unrealized appreciation (depreciation) | | $ | 174,324,702 | |
| | | | |
Distributable earnings-undistributed long term capital gains | | $ | 58,581,083 | |
| | | | |
Differences between income and/or capital gains as determined on a book basis and a tax basis are primarily due to differing treatment of wash sales.
6. INVESTMENT TRANSACTIONS
Purchases and sales of investments (excluding short term securities) for the year ended December 31, 2011, aggregated $421,291,348 and $589,508,692, respectively.
7. INVESTMENTS IN INSTITUTIONAL FIDUCIARY TRUST MONEY MARKET PORTFOLIO
The Fund invests in the Institutional Fiduciary Trust Money Market Portfolio (Sweep Money Fund), an open-end investment company managed by Advisers. Management fees paid by the Fund are reduced on assets invested in the Sweep Money Fund, in an amount not to exceed the management and administrative fees paid by the Sweep Money Fund.
8. CREDIT FACILITY
The Fund, together with other U.S. registered and foreign investment funds (collectively, “Borrowers”), managed by Franklin Templeton Investments, are borrowers in a joint syndicated senior unsecured credit facility totaling $750 million (Global Credit
FSC-21
Franklin Templeton Variable Insurance Products Trust
Notes to Financial Statements (continued)
Franklin Small-Mid Cap Growth Securities Fund
8. CREDIT FACILITY (continued)
Facility) which matured on January 20, 2012. This Global Credit Facility provides a source of funds to the Borrowers for temporary and emergency purposes, including the ability to meet future unanticipated or unusually large redemption requests. Effective January 20, 2012, the Borrowers renewed the Global Credit Facility for a total of $1.5 billion, maturing January 18, 2013.
Under the terms of the Global Credit Facility, the Fund shall, in addition to interest charged on any borrowings made by the Fund and other costs incurred by the Fund, pay its share of fees and expenses incurred in connection with the implementation and maintenance of the Global Credit Facility, based upon its relative share of the aggregate net assets of all of the Borrowers, including an annual commitment fee of 0.08% based upon the unused portion of the Global Credit Facility, which is reflected in other expenses on the Statement of Operations. During the year ended December 31, 2011, the Fund did not use the Global Credit Facility.
9. FAIR VALUE MEASUREMENTS
The Fund follows a fair value hierarchy that distinguishes between market data obtained from independent sources (observable inputs) and the Fund’s own market assumptions (unobservable inputs). These inputs are used in determining the value of the Fund’s investments and are summarized in the following fair value hierarchy:
| | • | | Level 1 – quoted prices in active markets for identical securities |
| | • | | Level 2 – other significant observable inputs (including quoted prices for similar securities, interest rates, prepayment speed, credit risk, etc.) |
| | • | | Level 3 – significant unobservable inputs (including the Fund’s own assumptions in determining the fair value of investments) |
The inputs or methodology used for valuing securities are not an indication of the risk associated with investing in those securities.
For movements between the levels within the fair value hierarchy, the Fund has adopted a policy of recognizing the transfers as of the date of the underlying event which caused the movement.
The following is a summary of the inputs used as of December 31, 2011, in valuing the Fund’s assets and liabilities carried at fair value:
| | | | | | | | | | | | | | | | |
| | | Level 1 | | | Level 2 | | | Level 3 | | | Total | |
| | | | |
Assets: | | | | | | | | | | | | | | | | |
Investments in Securities: | | | | | | | | | | | | | | | | |
Equity Securitiesa | | $ | 794,049,674 | | | $ | — | | | $ | — | | | $ | 794,049,674 | |
Short Term Investments | | | 17,966,000 | | | | 4,309,600 | | | | — | | | | 22,275,600 | |
| | | | |
Total Investments in Securities | | $ | 812,015,674 | | | $ | 4,309,600 | | | $ | — | | | $ | 816,325,274 | |
| | | | |
aFor detailed categories, see the accompanying Statement of Investments.
10. NEW ACCOUNTING PRONOUNCEMENTS
In May 2011, the Financial Accounting Standards Board (FASB) issued Accounting Standards Update (ASU) No. 2011-04, Fair Value Measurement (Topic 820): Amendments to Achieve Common Fair Value Measurement and Disclosure Requirements in U.S. GAAP and IFRSs. The amendments in the ASU will improve the comparability of fair value measurements presented and disclosed in financial statements prepared in accordance with U.S. GAAP (Generally Accepted Accounting Principles) and IFRS (International Financial Reporting Standards) and include new guidance for certain fair value measurement principles and
FSC-22
Franklin Templeton Variable Insurance Products Trust
Notes to Financial Statements (continued)
Franklin Small-Mid Cap Growth Securities Fund
10. NEW ACCOUNTING PRONOUNCEMENTS (continued)
disclosure requirements. The ASU is effective for interim and annual periods beginning after December 15, 2011. The Fund believes the adoption of this ASU will not have a material impact on its financial statements.
11. SUBSEQUENT EVENTS
The Fund has evaluated subsequent events through the issuance of the financial statements and determined that no events have occurred that require disclosure other than those already disclosed in the financial statements.
FSC-23
Franklin Templeton Variable Insurance Products Trust
Franklin Small-Mid Cap Growth Securities Fund
Report of Independent Registered Public Accounting Firm
To the Board of Trustees and Shareholders of Franklin Templeton Variable Insurance Products Trust
In our opinion, the accompanying statement of assets and liabilities, including the statement of investments, and the related statements of operations and of changes in net assets and the financial highlights present fairly, in all material respects, the financial position of Franklin Small-Mid Growth Securities Fund (the “Fund”) at December 31, 2011, the results of its operations for the year then ended, the changes in its net assets for each of the two years in the period then ended and the financial highlights for the periods presented, in conformity with accounting principles generally accepted in the United States of America. These financial statements and financial highlights (hereafter referred to as “financial statements”) are the responsibility of the Fund’s management. Our responsibility is to express an opinion on these financial statements based on our audits. We conducted our audits of these financial statements in accordance with the standards of the Public Company Accounting Oversight Board (United States). Those standards require that we plan and perform the audit to obtain reasonable assurance about whether the financial statements are free of material misstatement. An audit includes examining, on a test basis, evidence supporting the amounts and disclosures in the financial statements, assessing the accounting principles used and significant estimates made by management, and evaluating the overall financial statement presentation. We believe that our audits, which included confirmation of securities at December 31, 2011 by correspondence with the custodian and brokers, provide a reasonable basis for our opinion.
PricewaterhouseCoopers LLP
San Francisco, California
February 13, 2012
FSC-24
FRANKLIN STRATEGIC INCOME SECURITIES FUND
This annual report for Franklin Strategic Income Securities Fund covers the fiscal year ended December 31, 2011.
Performance Summary as of 12/31/11
Average annual total return of Class 1 shares represents the average annual change in value, assuming reinvestment of dividends and capital gains. Average returns smooth out variations in returns, which can be significant; they are not the same as year-by-year results.
Periods ended 12/31/11
| | | | | | | | | | | | |
| | | 1-Year | | | 5-Year | | | 10-Year | |
Average Annual Total Return | | | +2.78% | | | | +6.37% | | | | +7.66% | |
Total Return Index Comparison for a Hypothetical $10,000 Investment (1/1/02–12/31/11)
The graph below shows the change in value of a hypothetical $10,000 investment in the Fund over the indicated period and includes reinvestment of any income or distributions. The Fund’s performance is compared to the performance of the Barclays Capital (BC) U.S. Aggregate Index and the Lipper Multi-Sector Income Funds Classification Average. One cannot invest directly in an index, and an index is not representative of the Fund’s portfolio. Please see Important Notes to Performance Information preceding the Fund Summaries.
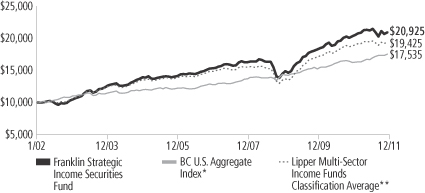
*Source: © 2012 Morningstar. Please see Index Descriptions following the Fund Summaries.
**Source: Lipper Inc. Please see Index Descriptions following the Fund Summaries.
Franklin Strategic Income Securities Fund – Class 1
Performance reflects the Fund’s Class 1 operating expenses, but does not include any contract fees, expenses or sales charges. If they had been included, performance would be lower. These charges and deductions, particularly for variable life policies, can have a significant effect on contract values and insurance benefits. See the contract prospectus for a complete description of these expenses, including sales charges.
Performance data represent past performance, which does not guarantee future results. Investment return and principal value will fluctuate, and you may have a gain or loss when you sell your shares.
Current performance may differ from figures shown.
FSI-1
Fund Goals and Main Investments: Franklin Strategic Income Securities Fund seeks a high level of current income, with capital appreciation over the long term as a secondary goal. The Fund normally invests primarily to predominantly in U.S. and foreign debt securities, including those in emerging markets.
Performance Overview
You can find the Fund’s one-year total return in the Performance Summary. The Fund underperformed the +7.84% total return of its benchmark, the BC U.S. Aggregate Index.1 The Fund underperformed the +2.89% total return of its peers, as measured by the Lipper Multi-Sector Income Funds Classification Average.2
Economic and Market Overview
During the 12 months under review, Federal Reserve Board (Fed) policymakers maintained historically low interest rates while adopting a more restrained view of the economy largely because of the European sovereign debt crisis and signs the U.S. economic expansion lacked momentum. To promote a stronger recovery and help maintain inflation levels the Fed believed consistent with its dual mandate to foster maximum employment and price stability, the Fed undertook a second round of quantitative easing consisting of a $600 billion purchase of longer term U.S. Treasuries, which ended on June 30. Subsequently, the Fed continued to purchase U.S. Treasuries with proceeds from maturing debt in an effort to support economic growth. In September, the Fed announced plans designed to boost the economy by driving down long-term interest rates. The Fed intends to sell $400 billion in short-term securities over the next year and purchase an equal amount of long-term securities. The Fed also anticipated it would keep short-term rates near zero through mid-2013.
The economy grew more slowly than expected, and unemployment remained high. Home foreclosures increased, but federal lawmakers made efforts to strengthen the real estate market by removing some eligibility restrictions and charges associated with refinancing. After showing improvement early in the reporting period, manufacturing activity weakened partly because of global supply-chain disruptions following Japan’s natural disasters. Geopolitical instability in some oil-producing regions drove up oil prices for much of the period.
1. Source: © 2012 Morningstar.
2. Lipper Inc.
One cannot invest directly in an index, and an index is not representative of the Fund’s portfolio. Please see Index Descriptions following the Fund Summaries.
Fund Risks: All investments involve risks. Because the Fund invests in bonds and other debt obligations, its share price and yield will be affected by interest rate movements. Bond prices generally move in the opposite direction of interest rates. Thus, as prices of bonds in the Fund adjust to a rise in interest rates, the Fund’s share price may decline. High yield, lower rated (junk) bonds generally have greater price swings and higher default risks than investment-grade bonds. Bank loans and loan participations involve credit, interest rate and illiquidity risks. Foreign investing, especially in developing markets, involves additional risks, including currency fluctuations, economic instability, market volatility, and political and social instability. Mortgage- and asset-backed securities are subject to prepayment and extension risks. The value of convertible securities may rise and fall with the market value of the underlying stock or, like a debt security, vary with changes in interest rates and the credit quality of the issuer. The Fund may also use certain derivative instruments, which may be volatile and illiquid, may give rise to leverage and may involve a small investment relative to the risk assumed. The Fund is actively managed but there is no guarantee that the manager’s investment decisions will produce the desired results. The Fund’s prospectus also includes a description of the main investment risks.
FSI-2
However, investor concerns over weak economic data contributed to a drop in crude oil prices from their 12-month high of $114 per barrel on April 29 to $99 at period-end. Storms and droughts in several states reduced crop yields, pushing up grain prices. As oil and food prices rose, the pace of inflation accelerated during the period. By year-end, various U.S. economic gauges began to show some improvement, leading some economists to express more optimism near year-end about the economy’s prospects.
Outside the U.S., emerging markets led the global recovery while many developed economies had below trend growth rates. Where recoveries were strong, monetary authorities tightened policy, but G-3 (U.S., eurozone and Japan) policymakers sought to maintain historically accommodative monetary policy. Separately, concerns about the solvency of highly indebted eurozone governments resurfaced as policymakers struggled to develop a coordinated plan to address the significant fiscal challenges. As the sovereign debt crisis in Europe played out, investor risk aversion rose and contributed to depreciation of most currencies against those of the largest developed economies. The U.S. dollar, historically seen as a safe-haven asset, appreciated as a result of this trend.
During the 12 months under review, U.S. fixed income markets, as measured by the BC U.S. Aggregate Index, and the global government bond market, as measured by the JPMorgan Global Government Bond Index, posted moderate gains. Overall for the period, however, investors sought the perceived safety of U.S. Treasuries, which performed better than most other fixed income asset classes.
Investment Strategy
We allocate our investments among the various types of debt available based on our assessment of changing economic, global market, industry and issuer conditions. We use a top-down analysis of macroeconomic trends, combined with a bottom-up fundamental analysis of market sectors, industries and issuers, seeking to take advantage of varying sector reactions to economic events. For example, we may evaluate business cycles, yield curves, country risk, and the relative interest rates among currencies, and values between and within markets. In selecting debt securities, we generally conduct our own analysis of the security’s intrinsic value rather than simply relying on the coupon rate or rating. We may also enter into various transactions involving certain currency-, interest rate- or credit-related derivative instruments for hedging purposes, to enhance returns or to obtain exposure to various market sectors.
FSI-3
Manager’s Discussion
During the 12 months under review, developments surrounding the eurozone debt crisis as well as the U.S. debt ceiling debate and the subsequent sovereign ratings downgrade drove financial markets. Although the markets reached what we believe was their “peak of pessimism” toward the end of the third quarter and experienced a moderate rebound during the fourth quarter, overall risk assets experienced pressure during 2011. For equity markets, the Standard & Poor’s® 500 Index was relatively flat in 2011, delivering a 2.11% total return.1 On the other hand, the safe-haven perception of U.S. Treasuries led to lower long-term rates in certain developed markets (the U.S., Germany, Japan and Canada), with the 10-year U.S. Treasury yield falling from 3.30% at the beginning of the year to 1.89% by year-end. Consequently, across global fixed income markets the non-government bond sectors tended to underperform, given their greater sensitivity to this perceived elevation of financial market risk compared to government-issued bonds. Similarly, currencies in many emerging and, to a lesser extent, developed markets weakened relative to the U.S. dollar.
The Fund posted a slightly positive total return in this environment, though lagging the performance of the benchmark BC U.S. Aggregate Index and the Lipper Multi-Sector Income Funds Classification Average. The Fund’s underweighting in longer duration, U.S. interest rate-sensitive fixed income sectors (Treasuries and agency bonds) weighed on performance compared to the BC U.S. Aggregate Index. Compared to the Lipper Average, the Fund’s higher exposure to below-investment-grade sectors and non-dollar denominated holdings constrained returns.
The notable decline in longer-term U.S. Treasury yields drove healthy returns for the more interest-rate sensitive sectors of the U.S. fixed income market, with the longest maturity bonds generally delivering the highest total returns. Given their shorter effective maturities and potential prepayment risk, agency mortgage-backed securities underperformed longer-dated Treasuries but still posted positive total returns for the year. Although we believe the slack in the U.S. economy is likely to keep inflationary pressures subdued, we did not find compelling value in fixed income U.S. government securities at recent yield levels. Consequently, we maintained a relatively low weighting in these sectors while favoring agency mortgages’ higher current yield relative to Treasuries. Given what we perceived as an increase in risk aversion during the period, the commercial mortgage-backed securities (CMBS) sector
FSI-4
Portfolio Breakdown
Franklin Strategic Income Securities Fund
Based on Total Net Assets
| | | | | | | | |
| | | 12/31/11 | | | 12/31/10 | |
| High Yield Corporate Bonds & Preferred Securities | | | 30.8% | | | | 29.6% | |
| | |
| International Government & Agency Bonds (non-$US) | | | 25.0% | | | | 21.9% | |
| | |
| Floating Rate Bank Loans | | | 16.1% | | | | 15.7% | |
| | |
| Investment Grade Corporate Bonds & Preferred Securities | | | 5.0% | | | | 7.1% | |
| | |
| Mortgage-Backed Securities | | | 5.0% | | | | 6.9% | |
| | |
| Municipal Bonds | | | 3.5% | | | | 5.8% | |
| | |
| International Government & Agency Bonds ($US) | | | 3.1% | | | | 3.2% | |
| | |
| Commercial Mortgage-Backed Securities | | | 2.4% | | | | 3.6% | |
| | |
| U.S. Treasury Securities | | | 1.5% | | | | 1.3% | |
| | |
| Asset-Backed Securities | | | 1.0% | | | | 1.9% | |
| | |
| Common Stocks | | | 0.5% | | | | 0.2% | |
| | |
| Convertible Securities | | | 0.2% | | | | 0.0% | * |
| | |
| Short-Term Investments & Other Net Assets** | | | 5.9% | | | | 2.8% | |
*Rounds to less than 0.1% of total net assets.
**Includes unrealized gains/losses on forward currency contracts. Does not include short-term foreign government securities.
The dollar value, number of shares or principal amount, and names of all portfolio holdings are listed in the Fund’s Statement of Investments.
experienced downward pricing pressure but rebounded by year-end. Commercial real estate fundamentals remained weak in our view, although asset valuations supported recoveries for many CMBS securities. The municipal bond sector experienced a healthy bounce-back during the period, as investors realized the municipal bond default rate would fall well below the bearish levels expressed in previous headlines. In addition, the longer duration of many of the Fund’s municipal bond holdings allowed these securities to benefit given the decline in long-term interest rates. The Fund built up its municipal bond position early in 2011, but we began reducing exposure to the sector in the latter part of the period following strong performance.
Corporate credit fundamentals remained supportive in 2011, with companies generally reporting year-over-year earnings gains, albeit with a slowdown in growth rates anticipated for the fourth quarter. Investment-grade, non-financial balance sheets generally remained in solid condition, in our view, with high liquidity levels and relatively low interest burdens, while below-investment-grade default rates remained near cycle lows. With headline news keeping market volatility high in our view, many senior management teams kept fairly defensive
FSI-5
postures toward spending, supporting our outlook for credit fundamentals. However, eurozone crisis concerns combined with U.S. deficit issues led corporate credit sectors overall to underperform Treasuries. Volatile stock markets along with worry of impaired access to debt capital markets contributed to widening yield spreads across the investment-grade, high yield and floating rate bank loan sectors. The Fund sought to take advantage of this volatility and increased high yield exposure, as valuations materially fell in the late summer despite a still supportive fundamental backdrop. Our exposure to bank loans and high yield corporate bonds included some positions in derivative instruments.
Similarly, the flight to quality across financial markets led many non-dollar currencies, particularly in certain developing markets, to depreciate relative to the U.S. dollar in 2011. This weakness detracted from performance of the Fund’s holdings in foreign currency government bonds and other non-dollar denominated securities. In particular, the Fund’s non-dollar denominated holdings in Poland, Brazil, Mexico and Hungary experienced currency weakness, as did Fund bond holdings in India and other parts of Asia. The Fund’s short position in the Japanese yen also weighed on performance, given the yen’s perceived safe-haven status at times during the period. However, we believe the relatively stronger economic outlook for the countries and currencies of Fund holdings should support longer term performance for those currencies relative to the U.S. dollar, euro and yen. Conversely, we maintained only a modest weighting in U.S. dollar-denominated emerging market sovereign bonds, as we believe valuations remained somewhat rich relative to longer term averages.
Thank you for your participation in Franklin Strategic Income Securities Fund. We look forward to serving your future investment needs.
The foregoing information reflects our analysis, opinions and portfolio holdings as of December 31, 2011, the end of the reporting period. The way we implement our main investment strategies and the resulting portfolio holdings may change depending on factors such as market and economic conditions. These opinions may not be relied upon as investment advice or an offer for a particular security. The information is not a complete analysis of every aspect of any market, country, industry, security or the Fund. Statements of fact are from sources considered reliable, but the investment manager makes no representation or warranty as to their completeness or accuracy. Although historical performance is no guarantee of future results, these insights may help you understand our investment management philosophy.
FSI-6
Fund Expenses
As an investor in a variable insurance contract (Contract) that indirectly provides for investment in an underlying mutual fund, you can incur transaction and/or ongoing expenses at both the Fund level and the Contract level.
| • | | Transaction expenses can include sales charges (loads) on purchases, redemption fees, surrender fees, transfer fees and premium taxes. |
| • | | Ongoing expenses can include management fees, distribution and service (12b-1) fees, contract fees, annual maintenance fees, mortality and expense risk fees and other fees and expenses. All mutual funds and Contracts have some types of ongoing expenses. |
The expenses shown in the table are meant to highlight ongoing expenses at the Fund level only and do not include ongoing expenses at the Contract level, or transaction expenses at either the Fund or Contract level. While the Fund does not have transaction expenses, if the transaction and ongoing expenses at the Contract level were included, the expenses shown below would be higher. You should consult your Contract prospectus or disclosure document for more information.
The table shows Fund-level ongoing expenses and can help you understand these expenses and compare them with those of other mutual funds offered through the Contract. The table assumes a $1,000 investment held for the six months indicated. Please refer to the Fund prospectus for additional information on operating expenses.
Actual Fund Expenses
The first line (Actual) of the table provides actual account values and expenses. The “Ending Account Value” is derived from the Fund’s actual return, which includes the effect of ongoing Fund expenses, but does not include the effect of ongoing Contract expenses.
You can estimate the Fund-level expenses you incurred during the period by following these steps. Of course, your account value and expenses will differ from those in this illustration:
| 1. | Divide your account value by $1,000. |
If an account had an $8,600 value, then $8,600 ÷ $1,000 = 8.6.
| 2. | Multiply the result by the number under the heading “Fund-Level Expenses Incurred During Period.” |
If Fund-Level Expenses Incurred During Period were $7.50, then 8.6 x $7.50 = $64.50.
In this illustration, the estimated expenses incurred this period at the Fund level are $64.50.
Franklin Strategic Income Securities Fund – Class 1
FSI-7
Hypothetical Example for Comparison with Other Mutual Funds
Information in the second line (Hypothetical) of the table can help you compare ongoing expenses of the Fund with those of other mutual funds offered through the Contract. This information may not be used to estimate the actual ending account balance or expenses you incurred during the period. The hypothetical “Ending Account Value” is based on the Fund’s actual expense ratio and an assumed 5% annual rate of return before expenses, which does not represent the Fund’s actual return. The figure under the heading “Fund-Level Expenses Incurred During Period” shows the hypothetical expenses your account would have incurred under this scenario. You can compare this figure with the 5% hypothetical examples that appear in shareholder reports of other funds offered through a Contract.
| | | | | | | | | | | | |
| Class 1 | | Beginning
Account
Value 7/1/11 | | | Ending
Account
Value 12/31/11 | | | Fund-Level
Expenses Incurred
During Period*
7/1/11–12/31/11 | |
Actual | | $ | 1,000 | | | $ | 985.10 | | | $ | 3.10 | |
Hypothetical (5% return before expenses) | | $ | 1,000 | | | $ | 1,022.08 | | | $ | 3.16 | |
*Expenses are calculated using the most recent six-month annualized expense ratio for the Fund’s Class 1 shares (0.62%), which does not include any ongoing expenses of the Contract for which the Fund is an investment option, multiplied by the average account value over the period, multiplied by 184/365 to reflect the one-half year period.
FSI-8
Franklin Templeton Variable Insurance Products Trust
Financial Highlights
Franklin Strategic Income Securities Fund
| | | | | | | | | | | | | | | | | | | | |
| | | Year Ended December 31, | |
| Class 1 | | 2011 | | | 2010 | | | 2009 | | | 2008 | | | 2007 | |
| | | | |
Per share operating performance | | | | | | | | | | | | | | | | | | | | |
(for a share outstanding throughout the year) | | | | | | | | | | | | | | | | | | | | |
Net asset value, beginning of year | | $ | 12.99 | | | $ | 12.28 | | | $ | 10.58 | | | $ | 12.78 | | | $ | 12.73 | |
| | | | |
Income from investment operationsa: | | | | | | | | | | | | | | | | | | | | |
Net investment incomeb | | | 0.69 | | | | 0.72 | | | | 0.70 | | | | 0.69 | | | | 0.73 | |
Net realized and unrealized gains (losses) | | | (0.32 | ) | | | 0.61 | | | | 1.95 | | | | (1.99 | ) | | | 0.04 | |
| | | | |
Total from investment operations | | | 0.37 | | | | 1.33 | | | | 2.65 | | | | (1.30 | ) | | | 0.77 | |
| | | | |
Less distributions from: | | | | | | | | | | | | | | | | | | | | |
Net investment income and net foreign currency gains | | | (0.81 | ) | | | (0.62 | ) | | | (0.95 | ) | | | (0.87 | ) | | | (0.68 | ) |
Net realized gains | | | — | | | | — | | | | — | | | | (0.03 | ) | | | (0.04 | ) |
| | | | |
Total distributions | | | (0.81 | ) | | | (0.62 | ) | | | (0.95 | ) | | | (0.90 | ) | | | (0.72 | ) |
| | | | |
Net asset value, end of year | | $ | 12.55 | | | $ | 12.99 | | | $ | 12.28 | | | $ | 10.58 | | | $ | 12.78 | |
| | | | |
| | | | | |
Total returnc | | | 2.78% | | | | 11.21% | | | | 26.11% | | | | (11.03)% | | | | 6.20% | |
Ratios to average net assets | | | | | | | | | | | | | | | | | | | | |
Expensesd | | | 0.60% | | | | 0.59% | | | | 0.58% | | | | 0.61% | | | | 0.62% | |
Net investment income | | | 5.36% | | | | 5.71% | | | | 6.13% | | | | 5.83% | | | | 5.72% | |
| | | | | |
Supplemental data | | | | | | | | | | | | | | | | | | | | |
Net assets, end of year (000’s) | | $ | 1,043,690 | | | $ | 1,195,149 | | | $ | 1,173,313 | | | $ | 903,358 | | | $ | 1,086,850 | |
Portfolio turnover rate | | | 55.65% | | | | 56.46% | | | | 56.19% | | | | 47.68% | | | | 46.88% | |
Portfolio turnover rate excluding mortgage dollar rollse | | | 55.65% | | | | 56.46% | | | | 56.19% | | | | 47.68% | | | | 46.43% | |
aThe amount shown for a share outstanding throughout the period may not correlate with the Statement of Operations for the period due to the timing of sales and repurchases of the Fund shares in relation to income earned and/or fluctuating market value of the investments of the Fund.
bBased on average daily shares outstanding.
cTotal return does not include fees, charges or expenses imposed by the variable annuity and life insurance contracts for which the Franklin Templeton Variable Insurance Products Trust serves as an underlying investment vehicle.
dBenefit of expense reduction rounds to less than 0.01%.
eSee Note 1(f) regarding mortgage dollar rolls.
The accompanying notes are an integral part of these financial statements.
FSI-9
Franklin Templeton Variable Insurance Products Trust
Financial Highlights (continued)
Franklin Strategic Income Securities Fund
| | | | | | | | | | | | | | | | | | | | |
| | | Year Ended December 31, | |
| Class 2 | | 2011 | | | 2010 | | | 2009 | | | 2008 | | | 2007 | |
| | | | |
Per share operating performance | | | | | | | | | | | | | | | | | | | | |
(for a share outstanding throughout the year) | | | | | | | | | | | | | | | | | | | | |
Net asset value, beginning of year | | $ | 12.72 | | | $ | 12.05 | | | $ | 10.41 | | | $ | 12.60 | | | $ | 12.56 | |
| | | | |
Income from investment operationsa: | | | | | | | | | | | | | | | | | | | | |
Net investment incomeb | | | 0.64 | | | | 0.68 | | | | 0.66 | | | | 0.65 | | | | 0.69 | |
Net realized and unrealized gains (losses) | | | (0.30 | ) | | | 0.59 | | | | 1.91 | | | | (1.96 | ) | | | 0.05 | |
| | | | |
Total from investment operations | | | 0.34 | | | | 1.27 | | | | 2.57 | | | | (1.31 | ) | | | 0.74 | |
| | | | |
Less distributions from: | | | | | | | | | | | | | | | | | | | | |
Net investment income and net foreign currency gains | | | (0.79 | ) | | | (0.60 | ) | | | (0.93 | ) | | | (0.85 | ) | | | (0.66 | ) |
Net realized gains | | | — | | | | — | | | | — | | | | (0.03 | ) | | | (0.04 | ) |
| | | | |
Total distributions | | | (0.79 | ) | | | (0.60 | ) | | | (0.93 | ) | | | (0.88 | ) | | | (0.70 | ) |
| | | | |
Net asset value, end of year | | $ | 12.27 | | | $ | 12.72 | | | $ | 12.05 | | | $ | 10.41 | | | $ | 12.60 | |
| | | | |
| | | | | |
Total returnc | | | 2.57% | | | | 10.91% | | | | 25.75% | | | | (11.24)% | | | | 5.91% | |
Ratios to average net assets | | | | | | | | | | | | | | | | | | | | |
Expensesd | | | 0.85% | | | | 0.84% | | | | 0.83% | | | | 0.86% | | | | 0.87% | |
Net investment income | | | 5.11% | | | | 5.46% | | | | 5.88% | | | | 5.58% | | | | 5.47% | |
| | | | | |
Supplemental data | | | | | | | | | | | | | | | | | | | | |
Net assets, end of year (000’s) | | $ | 123,749 | | | $ | 101,347 | | | $ | 68,240 | | | $ | 33,155 | | | $ | 24,613 | |
Portfolio turnover rate | | | 55.65% | | | | 56.46% | | | | 56.19% | | | | 47.68% | | | | 46.88% | |
Portfolio turnover rate excluding mortgage dollar rollse | | | 55.65% | | | | 56.46% | | | | 56.19% | | | | 47.68% | | | | 46.43% | |
aThe amount shown for a share outstanding throughout the period may not correlate with the Statement of Operations for the period due to the timing of sales and repurchases of the Fund shares in relation to income earned and/or fluctuating market value of the investments of the Fund.
bBased on average daily shares outstanding.
cTotal return does not include fees, charges or expenses imposed by the variable annuity and life insurance contracts for which the Franklin Templeton Variable Insurance Products Trust serves as an underlying investment vehicle.
dBenefit of expense reduction rounds to less than 0.01%.
eSee Note 1(f) regarding mortgage dollar rolls.
The accompanying notes are an integral part of these financial statements.
FSI-10
Franklin Templeton Variable Insurance Products Trust
Financial Highlights (continued)
Franklin Strategic Income Securities Fund
| | | | | | | | | | | | | | | | |
| | | Year Ended December 31, | |
| Class 4 | | 2011 | | | 2010 | | | 2009 | | | 2008a | |
| | | | |
Per share operating performance | | | | | | | | | | | | | | | | |
(for a share outstanding throughout the year) | | | | | | | | | | | | | | | | |
Net asset value, beginning of year | | $ | 12.88 | | | $ | 12.20 | | | $ | 10.54 | | | $ | 12.84 | |
| | | | |
Income from investment operationsb: | | | | | | | | | | | | | | | | |
Net investment incomec | | | 0.64 | | | | 0.67 | | | | 0.66 | | | | 0.53 | |
Net realized and unrealized gains (losses) | | | (0.31 | ) | | | 0.60 | | | | 1.94 | | | | (1.93 | ) |
| | | | |
Total from investment operations | | | 0.33 | | | | 1.27 | | | | 2.60 | | | | (1.40 | ) |
| | | | |
Less distributions from: | | | | | | | | | | | | | | | | |
Net investment income and net foreign currency gains | | | (0.77 | ) | | | (0.59 | ) | | | (0.94 | ) | | | (0.87 | ) |
Net realized gains | | | — | | | | — | | | | — | | | | (0.03 | ) |
| | | | |
Total distributions | | | (0.77 | ) | | | (0.59 | ) | | | (0.94 | ) | | | (0.90 | ) |
| | | | |
Net asset value, end of year | | $ | 12.44 | | | $ | 12.88 | | | $ | 12.20 | | | $ | 10.54 | |
| | | | |
| | | | |
Total returnd | | | 2.46% | | | | 10.88% | | | | 25.52% | | | | (11.69)% | |
Ratios to average net assetse | | | | | | | | | | | | | | | | |
Expensesf | | | 0.95% | | | | 0.94% | | | | 0.93% | | | | 0.96% | |
Net investment income | | | 5.01% | | | | 5.36% | | | | 5.78% | | | | 5.48% | |
| | | | |
Supplemental data | | | | | | | | | | | | | | | | |
Net assets, end of year (000’s) | | $ | 188,786 | | | $ | 188,178 | | | $ | 162,074 | | | $ | 59,766 | |
Portfolio turnover rate | | | 55.65% | | | | 56.46% | | | | 56.19% | | | | 47.68% | |
aFor the period February 29, 2008 (effective date) to December 31, 2008.
bThe amount shown for a share outstanding throughout the period may not correlate with the Statement of Operations for the period due to the timing of sales and repurchases of the Fund shares in relation to income earned and/or fluctuating market value of the investments of the Fund.
cBased on average daily shares outstanding.
dTotal return does not include fees, charges or expenses imposed by the variable annuity and life insurance contracts for which the Franklin Templeton Variable Insurance Products Trust serves as an underlying investment vehicle. Total return is not annualized for periods less than one year.
eRatios are annualized for periods less than one year.
fBenefit of expense reduction rounds to less than 0.01%.
The accompanying notes are an integral part of these financial statements.
FSI-11
Franklin Templeton Variable Insurance Products Trust
Statement of Investments, December 31, 2011
| | | | | | | | | | |
| Franklin Strategic Income Securities Fund | | Country | | Shares | | | Value | |
Common Stocks 0.5% | | | | | | | | | | |
Consumer Durables & Apparel 0.0%† | | | | | | | | | | |
a,b,cComfort Co. Inc. | | United States | | | 13,427 | | | $ | 343,060 | |
| | | | | | | | | | |
Consumer Services 0.1% | | | | | | | | | | |
a,d,eTurtle Bay Resort | | United States | | | 1,901,449 | | | | 1,948,985 | |
| | | | | | | | | | |
Media 0.4% | | | | | | | | | | |
a,dDex One Corp. | | United States | | | 40,000 | | | | 66,400 | |
aMGM Holdings Inc., A | | United States | | | 240,995 | | | | 5,040,820 | |
| | | | | | | | | | |
| | | | | | | | | 5,107,220 | |
| | | | | | | | | | |
Total Common Stocks (Cost $10,679,525) | | | | | | | | | 7,399,265 | |
| | | | | | | | | | |
Preferred Stocks (Cost $865,000) 0.1% | | | | | | | | | | |
Diversified Financials 0.1% | | | | | | | | | | |
GMAC Capital Trust I, 8.125%, pfd. | | United States | | | 34,600 | | | | 669,164 | |
| | | | | | | | | | |
| | | |
| | | | | Principal
Amount* | | | | |
Convertible Bonds 0.2% | | | | | | | | | | |
Materials 0.2% | | | | | | | | | | |
fCemex SAB de CV, cvt., sub. note, 144A, | | | | | | | | | | |
3.25%, 3/15/16 | | Mexico | | | 2,000,000 | | | | 1,312,500 | |
3.75%, 3/15/18 | | Mexico | | | 2,000,000 | | | | 1,307,500 | |
| | | | | | | | | | |
Total Convertible Bonds (Cost $3,994,611) | | | | | | | | | 2,620,000 | |
| | | | | | | | | | |
Corporate Bonds 36.2% | | | | | | | | | | |
Automobiles & Components 1.1% | | | | | | | | | | |
Exide Technologies, senior secured note, 8.625%, 2/01/18 | | United States | | | 1,200,000 | | | | 930,000 | |
Ford Motor Credit Co. LLC, senior note, | | | | | | | | | | |
7.00%, 4/15/15 | | United States | | | 2,000,000 | | | | 2,155,000 | |
6.625%, 8/15/17 | | United States | | | 1,000,000 | | | | 1,090,098 | |
5.00%, 5/15/18 | | United States | | | 1,000,000 | | | | 1,004,822 | |
8.125%, 1/15/20 | | United States | | | 1,200,000 | | | | 1,416,553 | |
5.75%, 2/01/21 | | United States | | | 1,000,000 | | | | 1,044,263 | |
5.875%, 8/02/21 | | United States | | | 1,000,000 | | | | 1,043,735 | |
The Goodyear Tire & Rubber Co., senior note, 8.25%, 8/15/20 | | United States | | | 3,500,000 | | | | 3,832,500 | |
fTRW Automotive Inc., senior note, 144A, 7.25%, 3/15/17 | | United States | | | 2,500,000 | | | | 2,687,500 | |
| | | | | | | | | | |
| | | | | | | | | 15,204,471 | |
| | | | | | | | | | |
Banks 1.0% | | | | | | | | | | |
fBanco do Brasil SA, sub. note, 144A, 5.875%, 1/26/22 | | Brazil | | | 3,000,000 | | | | 3,024,435 | |
HSBC USA Inc., sub. note, 5.00%, 9/27/20 | | United States | | | 4,000,000 | | | | 3,785,268 | |
Regions Bank, sub. note, 7.50%, 5/15/18 | | United States | | | 1,000,000 | | | | 997,500 | |
Regions Financial Corp., senior note, | | | | | | | | | | |
7.75%, 11/10/14 | | United States | | | 2,500,000 | | | | 2,537,500 | |
5.75%, 6/15/15 | | United States | | | 300,000 | | | | 289,500 | |
UBS AG Stamford, senior note, 5.875%, 12/20/17 | | United States | | | 2,400,000 | | | | 2,502,276 | |
| | | | | | | | | | |
| | | | | | | | | 13,136,479 | |
| | | | | | | | | | |
Capital Goods 1.4% | | | | | | | | | | |
fAbengoa Finance SAU, senior note, 144A, 8.875%, 11/01/17 | | Spain | | | 4,000,000 | | | | 3,840,000 | |
The Manitowoc Co. Inc., senior note, | | | | | | | | | | |
9.50%, 2/15/18 | | United States | | | 2,500,000 | | | | 2,675,000 | |
8.50%, 11/01/20 | | United States | | | 1,500,000 | | | | 1,588,125 | |
FSI-12
Franklin Templeton Variable Insurance Products Trust
Statement of Investments, December 31, 2011 (continued)
| | | | | | | | | | |
| Franklin Strategic Income Securities Fund | | Country | | Principal
Amount* | | | Value | |
Corporate Bonds (continued) | | | | | | | | | | |
Capital Goods (continued) | | | | | | | | | | |
Meritor Inc., senior note, 10.625%, 3/15/18 | | United States | | | 3,000,000 | | | $ | 2,835,000 | |
RBS Global & Rexnord Corp., senior note, 8.50%, 5/01/18 | | United States | | | 3,500,000 | | | | 3,727,500 | |
United Rentals North America Inc., senior sub. note, 8.375%, 9/15/20 | | United States | | | 4,000,000 | | | | 3,920,000 | |
| | | | | | | | | | |
| | | | | | | | | 18,585,625 | |
| | | | | | | | | | |
Consumer Durables & Apparel 1.0% | | | | | | | | | | |
Jarden Corp., senior sub. note, 7.50%, | | | | | | | | | | |
5/01/17 | | United States | | | 2,500,000 | | | | 2,662,500 | |
1/15/20 | | United States | | | 500,000 | | | | 535,000 | |
KB Home, senior note, 6.25%, 6/15/15 | | United States | | | 2,400,000 | | | | 2,220,000 | |
M/I Homes Inc., senior note, 8.625%, 11/15/18 | | United States | | | 2,500,000 | | | | 2,225,000 | |
fShea Homes LP/Funding Corp., senior secured note, 144A, 8.625%, 5/15/19 | | United States | | | 2,000,000 | | | | 1,875,000 | |
Visant Corp., senior note, 10.00%, 10/01/17 | | United States | | | 4,000,000 | | | | 3,680,000 | |
| | | | | | | | | | |
| | | | | | | | | 13,197,500 | |
| | | | | | | | | | |
Consumer Services 2.1% | | | | | | | | | | |
fCityCenter Holdings/Finance, senior secured note, 144A, 7.625%, 1/15/16 | | United States | | | 300,000 | | | | 309,000 | |
CKE Restaurants Inc., senior secured note, 11.375%, 7/15/18 | | United States | | | 2,000,000 | | | | 2,190,000 | |
ClubCorp Club Operations Inc., senior note, 10.00%, 12/01/18 | | United States | | | 2,900,000 | | | | 2,798,500 | |
f,gFontainebleau Las Vegas, 144A, 11.00%, 6/15/15 | | United States | | | 2,500,000 | | | | 1,563 | |
fGala Group Finance Ltd, senior secured bond, 144A, 8.875%, 9/01/18 | | United Kingdom | | | 2,500,000 | GBP | | | 2,834,778 | |
Harrah’s Operating Co. Inc., senior secured note, 11.25%, 6/01/17 | | United States | | | 5,500,000 | | | | 5,864,375 | |
MGM Resorts International, senior note, 6.625%, 7/15/15 | | United States | | | 4,500,000 | | | | 4,297,500 | |
Pinnacle Entertainment Inc., | | | | | | | | | | |
senior note, 8.625%, 8/01/17 | | United States | | | 1,500,000 | | | | 1,593,750 | |
senior sub. note, 7.50%, 6/15/15 | | United States | | | 1,000,000 | | | | 995,000 | |
Royal Caribbean Cruises Ltd., senior deb., 7.25%, 3/15/18 | | United States | | | 2,100,000 | | | | 2,210,250 | |
fShingle Springs Tribal Gaming Authority, senior note, 144A, 9.375%, 6/15/15 | | United States | | | 2,000,000 | | | | 1,140,000 | |
Starwood Hotels & Resorts Worldwide Inc., senior note, | | | | | | | | | | |
6.75%, 5/15/18 | | United States | | | 2,000,000 | | | | 2,270,000 | |
7.15%, 12/01/19 | | United States | | | 500,000 | | | | 574,375 | |
Universal City Development, | | | | | | | | | | |
senior note, 8.875%, 11/15/15 | | United States | | | 1,286,000 | | | | 1,430,675 | |
senior sub. note, 10.875%, 11/15/16 | | United States | | | 284,000 | | | | 345,060 | |
| | | | | | | | | | |
| | | | | | | | | 28,854,826 | |
| | | | | | | | | | |
Diversified Financials 4.2% | | | | | | | | | | |
Ally Financial Inc., senior note, 7.50%, 9/15/20 | | United States | | | 2,500,000 | | | | 2,534,375 | |
Bank of America Corp., | | | | | | | | | | |
hpfd., sub. bond, M, 8.125% to 5/15/18, FRN thereafter, Perpetual | | United States | | | 5,000,000 | | | | 4,493,750 | |
senior note, 5.65%, 5/01/18 | | United States | | | 1,500,000 | | | | 1,430,619 | |
Capital One Capital VI, pfd., junior sub. bond, 8.875%, 5/15/40 | | United States | | | 3,000,000 | | | | 3,124,398 | |
fCIT Group Inc., | | | | | | | | | | |
secured bond, 144A, 7.00%, 5/02/17 | | United States | | | 5,500,000 | | | | 5,500,000 | |
secured note, 144A, 6.625%, 4/01/18 | | United States | | | 500,000 | | | | 520,000 | |
Citigroup Inc.,
senior note, 6.125%, 11/21/17 | | United States | | | 1,500,000 | | | | 1,603,221 | |
senior note, 5.375%, 8/09/20 | | United States | | | 500,000 | | | | 514,841 | |
sub. note, 5.00%, 9/15/14 | | United States | | | 3,000,000 | | | | 2,971,344 | |
General Electric Capital Corp., | | | | | | | | | | |
senior note, A, 8.50%, 4/06/18 | | United States | | | 64,000,000 | MXN | | | 4,405,845 | |
sub. note, 5.30%, 2/11/21 | | United States | | | 1,800,000 | | | | 1,926,905 | |
FSI-13
Franklin Templeton Variable Insurance Products Trust
Statement of Investments, December 31, 2011 (continued)
| | | | | | | | | | |
| Franklin Strategic Income Securities Fund | | Country | | Principal
Amount* | | | Value | |
Corporate Bonds (continued) | | | | | | | | | | |
Diversified Financials (continued) | | | | | | | | | | |
GMAC Inc., | | | | | | | | | | |
senior note, 6.875%, 8/28/12 | | United States | | | 2,000,000 | | | $ | 2,030,000 | |
sub. note, 8.00%, 12/31/18 | | United States | | | 900,000 | | | | 888,750 | |
International Lease Finance Corp., | | | | | | | | | | |
senior note, 8.25%, 12/15/20 | | United States | | | 1,400,000 | | | | 1,417,500 | |
fsenior secured note, 144A, 6.75%, 9/01/16 | | United States | | | 4,000,000 | | | | 4,120,000 | |
JPMorgan Chase & Co., | | | | | | | | | | |
6.00%, 1/15/18 | | United States | | | 1,500,000 | | | | 1,675,228 | |
senior note, 4.25%, 10/15/20 | | United States | | | 1,000,000 | | | | 1,008,489 | |
JPMorgan Chase Capital XXII, sub. bond, 6.45%, 2/02/37 | | United States | | | 3,000,000 | | | | 3,030,000 | |
fKKR Group Finance Co., senior note, 144A, 6.375%, 9/29/20 | | United States | | | 3,000,000 | | | | 3,084,927 | |
Merrill Lynch & Co. Inc., senior note, 6.40%, 8/28/17 | | United States | | | 2,500,000 | | | | 2,424,140 | |
Moody’s Corp., senior note, 5.50%, 9/01/20 | | United States | | | 2,600,000 | | | | 2,689,716 | |
Morgan Stanley, senior note, | | | | | | | | | | |
6.00%, 4/28/15 | | United States | | | 3,000,000 | | | | 3,007,899 | |
5.50%, 7/24/20 | | United States | | | 1,000,000 | | | | 910,434 | |
5.50%, 7/28/21 | | United States | | | 800,000 | | | | 740,778 | |
TransUnion LLC/TransUnion FICO, senior note, 11.375%, 6/15/18 | | United States | | | 1,000,000 | | | | 1,147,500 | |
| | | | | | | | | | |
| | | | | | | | | 57,200,659 | |
| | | | | | | | | | |
Energy 6.4% | | | | | | | | | | |
Alpha Natural Resources Inc., senior note, | | | | | | | | | | |
6.00%, 6/01/19 | | United States | | | 1,200,000 | | | | 1,170,000 | |
6.25%, 6/01/21 | | United States | | | 1,500,000 | | | | 1,462,500 | |
Antero Resources Finance Corp., senior note, | | | | | | | | | | |
9.375%, 12/01/17 | | United States | | | 2,500,000 | | | | 2,712,500 | |
f144A, 7.25%, 8/01/19 | | United States | | | 300,000 | | | | 309,000 | |
fArch Coal Inc., senior note, 144A, | | | | | | | | | | |
7.00%, 6/15/19 | | United States | | | 800,000 | | | | 820,000 | |
7.25%, 6/15/21 | | United States | | | 2,000,000 | | | | 2,065,000 | |
fAtlas Pipeline Partners LP/Finance Corp., senior note, 144A, 8.75%, 6/15/18 | | United States | | | 1,800,000 | | | | 1,890,000 | |
Berry Petroleum Co., senior note, 6.75%, 11/01/20 | | United States | | | 2,000,000 | | | | 2,030,000 | |
Chaparral Energy Inc., senior note, | | | | | | | | | | |
9.875%, 10/01/20 | | United States | | | 2,000,000 | | | | 2,170,000 | |
8.25%, 9/01/21 | | United States | | | 1,000,000 | | | | 1,017,500 | |
fCHC Helicopter SA, senior secured note, 144A, 9.25%, 10/15/20 | | Canada | | | 4,000,000 | | | | 3,620,000 | |
Chesapeake Energy Corp., senior note, | | | | | | | | | | |
7.25%, 12/15/18 | | United States | | | 300,000 | | | | 333,000 | |
6.625%, 8/15/20 | | United States | | | 3,500,000 | | | | 3,771,250 | |
6.125%, 2/15/21 | | United States | | | 1,500,000 | | | | 1,548,750 | |
Compagnie Generale de Geophysique-Veritas, senior note, | | | | | | | | | | |
9.50%, 5/15/16 | | France | | | 100,000 | | | | 108,500 | |
7.75%, 5/15/17 | | France | | | 2,100,000 | | | | 2,136,750 | |
6.50%, 6/01/21 | | France | | | 2,000,000 | | | | 1,950,000 | |
CONSOL Energy Inc., senior note, | | | | | | | | | | |
8.00%, 4/01/17 | | United States | | | 1,500,000 | | | | 1,650,000 | |
8.25%, 4/01/20 | | United States | | | 800,000 | | | | 888,000 | |
f144A, 6.375%, 3/01/21 | | United States | | | 200,000 | | | | 203,000 | |
Crosstex Energy LP/Crosstex Energy Finance Corp., senior note, 8.875%, 2/15/18 | | United States | | | 3,500,000 | | | | 3,841,250 | |
El Paso Corp., | | | | | | | | | | |
senior bond, 6.50%, 9/15/20 | | United States | | | 2,300,000 | | | | 2,496,953 | |
senior note, 7.00%, 6/15/17 | | United States | | | 1,000,000 | | | | 1,100,402 | |
FSI-14
Franklin Templeton Variable Insurance Products Trust
Statement of Investments, December 31, 2011 (continued)
| | | | | | | | | | |
| Franklin Strategic Income Securities Fund | | Country | | Principal
Amount* | | | Value | |
Corporate Bonds (continued) | | | | | | | | | | |
Energy (continued) | | | | | | | | | | |
Energy Transfer Equity LP, senior note, 7.50%, 10/15/20 | | United States | | | 4,000,000 | | | $ | 4,390,000 | |
Energy XXI Gulf Coast Inc., senior note, 9.25%, 12/15/17 | | United States | | | 3,500,000 | | | | 3,815,000 | |
iEnterprise Products Operating LLC, junior sub. note, FRN, 7.034%, 1/15/68 | | United States | | | 2,000,000 | | | | 2,082,544 | |
fExpro Finance Luxembourg, senior secured note, 144A, 8.50%, 12/15/16 | | United Kingdom | | | 4,000,000 | | | | 3,540,000 | |
fGaz Capital SA, senior note, 144A, 5.092%, 11/29/15 | | Russia | | | 3,000,000 | | | | 3,043,575 | |
fKinder Morgan Finance Co. LLC, senior secured note, 144A, 6.00%, 1/15/18 | | United States | | | 3,500,000 | | | | 3,578,750 | |
Linn Energy LLC/Finance Corp., senior note, | | | | | | | | | | |
8.625%, 4/15/20 | | United States | | | 3,000,000 | | | | 3,270,000 | |
7.75%, 2/01/21 | | United States | | | 1,000,000 | | | | 1,045,000 | |
Martin Midstream Partners LP, senior note, 8.875%, 4/01/18 | | United States | | | 1,500,000 | | | | 1,552,500 | |
Offshore Group Investment Ltd., senior secured note, 11.50%, 8/01/15 | | United States | | | 2,100,000 | | | | 2,281,125 | |
Peabody Energy Corp., senior note, | | | | | | | | | | |
6.50%, 9/15/20 | | United States | | | 2,500,000 | | | | 2,637,500 | |
f144A, 6.00%, 11/15/18 | | United States | | | 700,000 | | | | 717,500 | |
Petrohawk Energy Corp., senior note, | | | | | | | | | | |
10.50%, 8/01/14 | | United States | | | 1,500,000 | | | | 1,676,250 | |
7.25%, 8/15/18 | | United States | | | 600,000 | | | | 678,000 | |
6.25%, 6/01/19 | | United States | | | 500,000 | | | | 552,500 | |
fPetroplus Finance Ltd., senior note, 144A, 6.75%, 5/01/14 | | Switzerland | | | 2,100,000 | | | | 1,144,500 | |
Plains Exploration & Production Co., senior note, 7.625%, 6/01/18 | | United States | | | 3,200,000 | | | | 3,408,000 | |
Quicksilver Resources Inc., senior note, | | | | | | | | | | |
8.25%, 8/01/15 | | United States | | | 3,000,000 | | | | 3,120,000 | |
9.125%, 8/15/19 | | United States | | | 300,000 | | | | 319,500 | |
SandRidge Energy Inc., senior note, | | | | | | | | | | |
8.75%, 1/15/20 | | United States | | | 500,000 | | | | 518,750 | |
f144A, 8.00%, 6/01/18 | | United States | | | 3,000,000 | | | | 3,045,000 | |
fW&T Offshore Inc., senior note, 144A, 8.50%, 6/15/19 | | United States | | | 1,500,000 | | | | 1,560,000 | |
| | | | | | | | | | |
| | | | | | | | | 87,270,349 | |
| | | | | | | | | | |
Food & Staples Retailing 0.3% | | | | | | | | | | |
Rite Aid Corp., senior secured note, | | | | | | | | | | |
9.75%, 6/12/16 | | United States | | | 2,000,000 | | | | 2,200,000 | |
8.00%, 8/15/20 | | United States | | | 1,500,000 | | | | 1,665,000 | |
| | | | | | | | | | |
| | | | | | | | | 3,865,000 | |
| | | | | | | | | | |
Food, Beverage & Tobacco 1.6% | | | | | | | | | | |
fBoparan Holdings Ltd., senior note, 144A, 9.75%, 4/30/18 | | United Kingdom | | | 2,500,000 | EUR | | | 2,629,047 | |
fCampofrio Food Group SA, senior note, 144A, 8.25%, 10/31/16 | | Spain | | | 3,000,000 | EUR | | | 3,846,226 | |
fCEDC Finance Corp. International Inc., senior secured note, 144A, 9.125%, 12/01/16 | | Poland | | | 1,800,000 | | | | 1,282,500 | |
Dean Foods Co., senior note, 9.75%, 12/15/18 | | United States | | | 3,400,000 | | | | 3,638,000 | |
Del Monte Corp., senior note, 7.625%, 2/15/19 | | United States | | | 4,000,000 | | | | 3,860,000 | |
JBS USA LLC/Finance Inc., senior note, 11.625%, 5/01/14 | | United States | | | 1,500,000 | | | | 1,704,375 | |
Pinnacle Foods Finance LLC, senior note, 9.25%, 4/01/15 | | United States | | | 2,500,000 | | | | 2,578,125 | |
fRefresco Group BV, senior secured sub. bond, 144A, 7.375%, 5/15/18 | | Netherlands | | | 2,000,000 | EUR | | | 2,459,170 | |
| | | | | | | | | | |
| | | | | | | | | 21,997,443 | |
| | | | | | | | | | |
Health Care Equipment & Services 1.5% | | | | | | | | | | |
Amerigroup Corp., senior note, 7.50%, 11/15/19 | | United States | | | 2,000,000 | | | | 2,070,000 | |
Boston Scientific Corp., senior note, 6.00%, 1/15/20 | | United States | | | 2,500,000 | | | | 2,794,450 | |
Community Health Systems Inc., senior note, 8.875%, 7/15/15 | | United States | | | 2,289,000 | | | | 2,369,115 | |
DaVita Inc., senior note, 6.375%, 11/01/18 | | United States | | | 1,000,000 | | | | 1,026,250 | |
Emergency Medical Services Corp., senior note, 8.125%, 6/01/19 | | United States | | | 2,500,000 | | | | 2,506,250 | |
fFresenius US Finance II, senior note, 144A, 9.00%, 7/15/15 | | Germany | | | 700,000 | | | | 788,375 | |
FSI-15
Franklin Templeton Variable Insurance Products Trust
Statement of Investments, December 31, 2011 (continued)
| | | | | | | | | | |
| Franklin Strategic Income Securities Fund | | Country | | Principal
Amount* | | | Value | |
Corporate Bonds (continued) | | | | | | | | | | |
Health Care Equipment & Services (continued) | | | | | | | | | | |
HCA Inc., | | | | | | | | | | |
senior note, 6.50%, 2/15/16 | | United States | | | 800,000 | | | $ | 816,000 | |
senior note, 7.50%, 2/15/22 | | United States | | | 2,000,000 | | | | 2,050,000 | |
senior secured bond, 7.25%, 9/15/20 | | United States | | | 300,000 | | | | 318,000 | |
fHealth Management Associates Inc., senior note, 144A, 7.375%, 1/15/20 | | United States | | | 500,000 | | | | 521,250 | |
jUnited Surgical Partners International Inc., senior sub. note, PIK, 9.25%, 5/01/17 | | United States | | | 3,000,000 | | | | 3,030,000 | |
Vanguard Health Holding Co. II LLC/Inc., senior note, 8.00%, 2/01/18 | | United States | | | 2,500,000 | | | | 2,493,750 | |
Vanguard Health Systems Inc., senior note, zero cpn., 2/01/16 | | United States | | | 30,000 | | | | 18,900 | |
| | | | | | | | | | |
| | | | | | | | | 20,802,340 | |
| | | | | | | | | | |
Insurance 0.1% | | | | | | | | | | |
iMetLife Inc., junior sub. note, FRN, 6.40%, 12/15/66 | | United States | | | 2,000,000 | | | | 1,899,546 | |
| | | | | | | | | | |
Materials 3.3% | | | | | | | | | | |
ArcelorMittal, senior note, 5.50%, 3/01/21 | | Luxembourg | | | 4,000,000 | | | | 3,686,540 | |
Atkore International Inc., senior secured note, 9.875%, 1/01/18 | | United States | | | 1,000,000 | | | | 962,500 | |
fCemex SAB de CV, senior secured note, 144A, 9.00%, 1/11/18 | | Mexico | | | 3,000,000 | | | | 2,412,495 | |
fEuramax International Inc., senior secured note, 144A, 9.50%, 4/01/16 | | United States | | | 2,500,000 | | | | 1,962,500 | |
fFMG Resources August 2006 Pty. Ltd., senior note, 144A, | | | | | | | | | | |
7.00%, 11/01/15 | | Australia | | | 1,200,000 | | | | 1,193,250 | |
6.875%, 2/01/18 | | Australia | | | 3,000,000 | | | | 2,887,500 | |
Huntsman International LLC, senior sub. note, 8.625%, 3/15/21 | | United States | | | 2,600,000 | | | | 2,769,000 | |
fIneos Finance PLC, senior secured note, 144A, | | | | | | | | | | |
9.00%, 5/15/15 | | United Kingdom | | | 500,000 | | | | 510,000 | |
9.25%, 5/15/15 | | United Kingdom | | | 100,000 | EUR | | | 128,136 | |
fIneos Group Holdings Ltd., | | | | | | | | | | |
senior note, 144A, 7.875%, 2/15/16 | | United Kingdom | | | 900,000 | EUR | | | 867,828 | |
senior secured note, 144A, 8.50%, 2/15/16 | | United Kingdom | | | 2,600,000 | | | | 2,080,000 | |
fKerling PLC, senior secured note, 144A, 10.625%, 1/28/17 | | United Kingdom | | | 3,000,000 | EUR | | | 3,449,316 | |
fKinove German Bondco GmbH, senior secured bond, 144A, 10.00%, 6/15/18 | | Germany | | | 2,500,000 | EUR | | | 2,895,996 | |
fMacDermid Inc., senior sub. note, 144A, 9.50%, 4/15/17 | | United States | | | 3,000,000 | | | | 3,000,000 | |
gNewPage Corp., senior secured note, 11.375%, 12/31/14 | | United States | | | 3,500,000 | | | | 2,408,438 | |
Novelis Inc., senior note, | | | | | | | | | | |
8.375%, 12/15/17 | | Canada | | | 1,500,000 | | | | 1,601,250 | |
8.75%, 12/15/20 | | Canada | | | 1,600,000 | | | | 1,724,000 | |
fReynolds Group Issuer Inc./LLC/SA, | | | | | | | | | | |
senior note, 144A, 9.00%, 5/15/18 | | United States | | | 4,000,000 | | | | 3,850,000 | |
senior note, 144A, 9.875%, 8/15/19 | | United States | | | 100,000 | | | | 97,500 | |
senior note, 144A, 8.25%, 2/15/21 | | United States | | | 500,000 | | | | 445,000 | |
senior secured note, 144A, 7.125%, 4/15/19 | | United States | | | 1,000,000 | | | | 1,022,500 | |
fSealed Air Corp., senior note, 144A, | | | | | | | | | | |
8.125%, 9/15/19 | | United States | | | 1,000,000 | | | | 1,100,000 | |
8.375%, 9/15/21 | | United States | | | 500,000 | | | | 555,000 | |
Solo Cup Co., senior sub. note, 8.50%, 2/15/14 | | United States | | | 1,500,000 | | | | 1,387,500 | |
fXstrata Canada Financial Corp., senior note, 144A, 4.95%, 11/15/21 | | Canada | | | 2,000,000 | | | | 2,046,426 | |
| | | | | | | | | | |
| | | | | | | | | 45,042,675 | |
| | | | | | | | | | |
Media 3.3% | | | | | | | | | | |
fAMC Networks Inc., senior note, 144A, 7.75%, 7/15/21 | | United States | | | 1,300,000 | | | | 1,420,250 | |
Cablevision Systems Corp., senior note, 8.625%, 9/15/17 | | United States | | | 500,000 | | | | 556,250 | |
CCH II LLC/CCH II Capital Corp., senior note, 13.50%, 11/30/16 | | United States | | | 1,500,000 | | | | 1,740,000 | |
CCO Holdings LLC/Capital Corp., senior note, | | | | | | | | | | |
8.125%, 4/30/20 | | United States | | | 900,000 | | | | 990,000 | |
6.50%, 4/30/21 | | United States | | | 2,500,000 | | | | 2,543,750 | |
FSI-16
Franklin Templeton Variable Insurance Products Trust
Statement of Investments, December 31, 2011 (continued)
| | | | | | | | | | |
| Franklin Strategic Income Securities Fund | | Country | | Principal
Amount* | | | Value | |
Corporate Bonds (continued) | | | | | | | | | | |
Media (continued) | | | | | | | | | | |
Clear Channel Communications Inc., senior note, 9.00%, 3/01/21 | | United States | | | 5,500,000 | | | $ | 4,661,250 | |
CSC Holdings Inc., | | | | | | | | | | |
senior deb., 7.625%, 7/15/18 | | United States | | | 1,500,000 | | | | 1,657,500 | |
fsenior note, 144A, 6.75%, 11/15/21 | | United States | | | 2,000,000 | | | | 2,115,000 | |
DIRECTV Holdings LLC/DIRECTV Financing Co. Inc., senior note, 4.60%, 2/15/21 | | United States | | | 2,000,000 | | | | 2,082,592 | |
DISH DBS Corp., senior note, | | | | | | | | | | |
7.75%, 5/31/15 | | United States | | | 1,000,000 | | | | 1,105,000 | |
7.125%, 2/01/16 | | United States | | | 4,000,000 | | | | 4,330,000 | |
6.75%, 6/01/21 | | United States | | | 500,000 | | | | 541,250 | |
Media General Inc., senior secured note, 11.75%, 2/15/17 | | United States | | | 2,000,000 | | | | 1,920,000 | |
fMusketeer GmbH, senior secured note, 144A, 9.50%, 3/15/21 | | Germany | | | 1,500,000 | EUR | | | 1,931,917 | |
jRadio One Inc., senior sub. note, PIK, 15.00%, 5/24/16 | | United States | | | 2,181,355 | | | | 1,547,329 | |
fSeat Pagine Gialle SpA, senior secured note, 144A, 10.50%, 1/31/17 | | Italy | | | 2,000,000 | EUR | | | 1,439,909 | |
Time Warner Inc., 7.625%, 4/15/31 | | United States | | | 2,500,000 | | | | 3,231,535 | |
fUnivision Communications Inc., senior secured note, 144A, | | | | | | | | | | |
6.875%, 5/15/19 | | United States | | | 400,000 | | | | 388,000 | |
7.875%, 11/01/20 | | United States | | | 2,500,000 | | | | 2,550,000 | |
fUPCB Finance II Ltd., senior secured note, 144A, 6.375%, 7/01/20 | | Cayman Islands | | | 2,000,000 | EUR | | | 2,420,341 | |
WMG Acquisition Corp., senior secured note, 9.50%, 6/15/16 | | United States | | | 2,500,000 | | | | 2,725,000 | |
fZiggo Bond Co., senior bond, 144A, 8.00%, 5/15/18 | | Netherlands | | | 2,500,000 | EUR | | | 3,268,108 | |
| | | | | | | | | | |
| | | | | | | | | 45,164,981 | |
| | | | | | | | | | |
Pharmaceuticals, Biotechnology & Life Sciences 1.1% | | | | | | | | | | |
fCapsugel FinanceCo SCA, senior note, 144A, 9.875%, 8/01/19 | | United States | | | 900,000 | EUR | | | 1,186,711 | |
Endo Pharmaceuticals Holdings Inc., senior note, 7.00%, 7/15/19 | | United States | | | 900,000 | | | | 963,000 | |
Giant Funding Corp., senior secured note, 8.25%, 2/01/18 | | Spain | | | 2,100,000 | | | | 2,215,500 | |
Gilead Sciences Inc., senior note, | | | | | | | | | | |
4.50%, 4/01/21 | | United States | | | 2,500,000 | | | | 2,654,613 | |
4.40%, 12/01/21 | | United States | | | 1,500,000 | | | | 1,590,543 | |
finVentiv Health Inc., senior note, 144A, 10.00%, 8/15/18 | | United States | | | 2,300,000 | | | | 2,116,000 | |
fMylan Inc., senior note, 144A, 7.875%, 7/15/20 | | United States | | | 3,500,000 | | | | 3,880,625 | |
| | | | | | | | | | |
| | | | | | | | | 14,606,992 | |
| | | | | | | | | | |
Real Estate 0.2% | | | | | | | | | | |
Forest City Enterprises Inc., senior note, 7.625%, 6/01/15 | | United States | | | 2,300,000 | | | | 2,271,250 | |
| | | | | | | | | | |
Retailing 1.1% | | | | | | | | | | |
fAcademy Ltd./Finance Corp., senior note, 144A, 9.25%, 8/01/19 | | United States | | | 2,000,000 | | | | 1,985,000 | |
f,iEdcon Pty. Ltd., senior secured note, 144A, FRN, 4.676%, 6/15/14 | | South Africa | | | 3,000,000 | EUR | | | 2,883,053 | |
fMatalan Finance Ltd., senior secured note, 144A, 8.875%, 4/29/16 | | United Kingdom | | | 2,300,000 | GBP | | | 2,398,917 | |
Michaels Stores Inc., senior note, 7.75%, 11/01/18 | | United States | | | 4,000,000 | | | | 4,060,000 | |
fPetco Animal Supplies Inc., senior note, 144A, 9.25%, 12/01/18 | | United States | | | 3,000,000 | | | | 3,232,500 | |
| | | | | | | | | | |
| | | | | | | | | 14,559,470 | |
| | | | | | | | | | |
Semiconductors & Semiconductor Equipment 0.8% | | | | | | | | | | |
Advanced Micro Devices Inc., senior note, | | | | | | | | | | |
8.125%, 12/15/17 | | United States | | | 1,500,000 | | | | 1,563,750 | |
7.75%, 8/01/20 | | United States | | | 2,000,000 | | | | 2,065,000 | |
Freescale Semiconductor Inc., | | | | | | | | | | |
senior note, 8.875%, 12/15/14 | | United States | | | 660,000 | | | | 679,800 | |
senior note, 10.125%, 12/15/16 | | United States | | | 100,000 | | | | 105,750 | |
senior note, 8.05%, 2/01/20 | | United States | | | 1,600,000 | | | | 1,512,000 | |
FSI-17
Franklin Templeton Variable Insurance Products Trust
Statement of Investments, December 31, 2011 (continued)
| | | | | | | | | | |
| Franklin Strategic Income Securities Fund | | Country | | Principal
Amount* | | | Value | |
Corporate Bonds (continued) | | | | | | | | | | |
Semiconductors & Semiconductor Equipment (continued) | | | | | | | | | | |
Freescale Semiconductor Inc., (continued) | | | | | | | | | | |
senior note, 10.75%, 8/01/20 | | United States | | | 1,382,000 | | | $ | 1,447,645 | |
fsenior secured note, 144A, 9.25%, 4/15/18 | | United States | | | 500,000 | | | | 536,875 | |
fNXP BV/NXP Funding LLC, senior secured note, 144A, 9.75%, 8/01/18 | | Netherlands | | | 2,200,000 | | | | 2,428,250 | |
| | | | | | | | | | |
| | | | | | | | | 10,339,070 | |
| | | | | | | | | | |
Software & Services 0.9% | | | | | | | | | | |
feAccess Ltd., senior note, 144A, | | | | | | | | | | |
8.25%, 4/01/18 | | Japan | | | 1,800,000 | | | | 1,710,000 | |
8.375%, 4/01/18 | | Japan | | | 200,000 | EUR | | | 224,776 | |
fFirst Data Corp., senior secured bond, 144A, 8.25%, 1/15/21 | | United States | | | 4,000,000 | | | | 3,600,000 | |
Sitel LLC/Finance Corp., senior note, 11.50%, 4/01/18 | | United States | | | 2,500,000 | | | | 1,856,250 | |
fSterling Merger Inc., senior note, 144A, 11.00%, 10/01/19 | | United States | | | 700,000 | | | | 686,000 | |
SunGard Data Systems Inc., | | | | | | | | | | |
senior note, 7.625%, 11/15/20 | | United States | | | 3,000,000 | | | | 3,097,500 | |
senior sub. note, 10.25%, 8/15/15 | | United States | | | 800,000 | | | | 833,000 | |
| | | | | | | | | | |
| | | | | | | | | 12,007,526 | |
| | | | | | | | | | |
Technology Hardware & Equipment 0.5% | | | | | | | | | | |
CDW LLC/Finance Corp., senior note, 8.50%, 4/01/19 | | United States | | | 3,500,000 | | | | 3,543,750 | |
fCommScope Inc., senior note, 144A, 8.25%, 1/15/19 | | United States | | | 3,000,000 | | | | 3,015,000 | |
| | | | | | | | | | |
| | | | | | | | | 6,558,750 | |
| | | | | | | | | | |
Telecommunication Services 2.7% | | | | | | | | | | |
CenturyLink Inc., senior note, | | | | | | | | | | |
6.00%, 4/01/17 | | United States | | | 3,000,000 | | | | 3,045,669 | |
6.45%, 6/15/21 | | United States | | | 1,000,000 | | | | 1,003,246 | |
Cricket Communications Inc., senior note, 7.75%, 10/15/20 | | United States | | | 4,000,000 | | | | 3,510,000 | |
Crown Castle International Corp., senior bond, 7.125%, 11/01/19 | | United States | | | 200,000 | | | | 217,000 | |
fDigicel Group Ltd., senior note, 144A, | | | | | | | | | | |
8.875%, 1/15/15 | | Jamaica | | | 2,500,000 | | | | 2,475,000 | |
8.25%, 9/01/17 | | Jamaica | | | 300,000 | | | | 304,500 | |
Frontier Communications Corp., senior note, | | | | | | | | | | |
8.50%, 4/15/20 | | United States | | | 3,000,000 | | | | 3,086,250 | |
8.75%, 4/15/22 | | United States | | | 1,500,000 | | | | 1,492,500 | |
fIntegra Telecom Inc., senior secured note, 144A, 10.75%, 4/15/16 | | United States | | | 2,700,000 | | | | 2,214,000 | |
Intelsat Jackson Holdings SA, senior note, | | | | | | | | | | |
11.25%, 6/15/16 | | Luxembourg | | | 2,000,000 | | | | 2,106,250 | |
f144A, 7.50%, 4/01/21 | | Luxembourg | | | 1,500,000 | | | | 1,520,625 | |
Intelsat Luxembourg SA, senior note, 11.25%, 2/04/17 | | Luxembourg | | | 700,000 | | | | 679,000 | |
MetroPCS Wireless Inc., senior note, 7.875%, 9/01/18 | | United States | | | 2,500,000 | | | | 2,546,875 | |
Sprint Nextel Corp., senior note, | | | | | | | | | | |
8.375%, 8/15/17 | | United States | | | 4,000,000 | | | | 3,605,000 | |
f144A, 9.00%, 11/15/18 | | United States | | | 2,000,000 | | | | 2,105,000 | |
West Corp., senior note, 7.875%, 1/15/19 | | United States | | | 4,000,000 | | | | 3,990,000 | |
fWind Acquisition Finance SA, senior secured note, 144A, 11.75%, 7/15/17 | | Italy | | | 3,500,000 | | | | 3,117,187 | |
f,jWind Acquisition Holdings Finance SA, senior secured note, 144A, PIK, 12.25%, 7/15/17 | | Italy | | | 603,365 | EUR | | | 538,679 | |
| | | | | | | | | | |
| | | | | | | | | 37,556,781 | |
| | | | | | | | | | |
FSI-18
Franklin Templeton Variable Insurance Products Trust
Statement of Investments, December 31, 2011 (continued)
| | | | | | | | | | |
| Franklin Strategic Income Securities Fund | | Country | | Principal
Amount* | | | Value | |
Corporate Bonds (continued) | | | | | | | | | | |
Transportation 0.4% | | | | | | | | | | |
f,gAmerican Airlines Inc., senior secured note, 144A, 7.50%, 3/15/16 | | United States | | | 4,000,000 | | | $ | 2,880,000 | |
fCeva Group PLC, senior secured note, 144A, | | | | | | | | | | |
11.625%, 10/01/16 | | United Kingdom | | | 300,000 | | | | 299,250 | |
8.375%, 12/01/17 | | United Kingdom | | | 500,000 | | | | 478,750 | |
11.50%, 4/01/18 | | United Kingdom | | | 2,000,000 | | | | 1,847,202 | |
| | | | | | | | | | |
| | | | | | | | | 5,505,202 | |
| | | | | | | | | | |
Utilities 1.2% | | | | | | | | | | |
fCalpine Corp., senior secured note, 144A, | | | | | | | | | | |
7.875%, 7/31/20 | | United States | | | 1,100,000 | | | | 1,190,750 | |
7.50%, 2/15/21 | | United States | | | 2,500,000 | | | | 2,687,500 | |
7.875%, 1/15/23 | | United States | | | 500,000 | | | | 540,000 | |
CMS Energy Corp., senior note, 8.75%, 6/15/19 | | United States | | | 2,000,000 | | | | 2,378,822 | |
fInfinis PLC, senior note, 144A, 9.125%, 12/15/14 | | United Kingdom | | | 600,000 | GBP | | | 945,929 | |
fIntergen NV, senior secured note, 144A, 9.00%, 6/30/17 | | Netherlands | | | 3,000,000 | | | | 3,172,500 | |
Texas Competitive Electric Holdings Co. LLC, senior note, A, 10.25%, 11/01/15 | | United States | | | 1,000,000 | | | | 360,000 | |
Texas Competitive Electric Holdings Co. LLC/Texas Competitive Electric Holdings Finance Inc., senior secured note, | | | | | | | | | | |
f144A, 11.50%, 10/01/20 | | United States | | | 3,000,000 | | | | 2,561,250 | |
B, 15.00%, 4/01/21 | | United States | | | 2,130,000 | | | | 1,182,150 | |
| | | | | | | | | | |
| | | | | | | | | 15,018,901 | |
| | | | | | | | | | |
Total Corporate Bonds (Cost $494,772,525) | | | | | | | | | 490,645,836 | |
| | | | | | | | | | |
i,kSenior Floating Rate Interests 16.1% | | | | | | | | | | |
Automobiles & Components 0.1% | | | | | | | | | | |
Key Safety Systems Inc., Term Loan B, 2.535% - 2.546%, 3/10/14 | | United States | | | 1,595,723 | | | | 1,507,958 | |
| | | | | | | | | | |
Capital Goods 1.1% | | | | | | | | | | |
bColfax Corp., Term Loan B, 5.75%, 1/01/19 | | United States | | | 1,122,063 | | | | 1,123,992 | |
Goodman Global Inc., Initial Term Loan, 5.75%, 10/28/16 | | United States | | | 2,758,572 | | | | 2,761,582 | |
RBS Global Inc. (Rexnord), Tranche B-1 Term B Loan, 2.813% - 2.938%, 7/22/13 | | United States | | | 3,827,036 | | | | 3,779,198 | |
Sensus USA Inc., Second Lien Term Loan, 8.50%, 5/09/18 | | United States | | | 1,913,988 | | | | 1,885,278 | |
Terex Corp., U.S. Term Loan, 5.50%, 4/28/17 | | United States | | | 2,127,443 | | | | 2,138,968 | |
Tomkins LLC and Tomkins Inc., Term B-1 Loan, 4.25%, 9/29/16 | | United States | | | 1,771,813 | | | | 1,769,046 | |
TransDigm Inc., Term Loan B, 4.00%, 2/14/17 | | United States | | | 1,969,515 | | | | 1,955,975 | |
| | | | | | | | | | |
| | | | | | | | | 15,414,039 | |
| | | | | | | | | | |
Commercial & Professional Services 1.2% | | | | | | | | | | |
ARAMARK Corp., | | | | | | | | | | |
Extended Synthetic L/C, 3.395%, 7/26/16 | | United States | | | 186,538 | | | | 182,264 | |
Synthetic L/C, 2.02%, 1/26/14 | | United States | | | 91,726 | | | | 90,006 | |
Term Loan B, 2.454%, 1/26/14 | | United States | | | 1,138,629 | | | | 1,117,281 | |
Term Loan B Extended, 3.829%, 7/26/16 | | United States | | | 2,834,838 | | | | 2,769,875 | |
Brock Holdings III Inc., Second Lien Term Loan, 10.00%, 3/16/18 | | United States | | | 2,047,000 | | | | 1,885,799 | |
EnviroSolutions Real Property Holdings Inc., Second Lien Term Loan, 8.00%, 7/29/14 | | United States | | | 628,673 | | | | 619,242 | |
Interactive Data Corp., Term B Loans, 4.50%, 2/11/18 | | United States | | | 4,471,711 | | | | 4,434,448 | |
KAR Auction Services Inc. (Adesa), Term Loan, 5.00%, 5/19/17 | | United States | | | 5,340,985 | | | | 5,280,899 | |
| | | | | | | | | | |
| | | | | | | | | 16,379,814 | |
| | | | | | | | | | |
FSI-19
Franklin Templeton Variable Insurance Products Trust
Statement of Investments, December 31, 2011 (continued)
| | | | | | | | | | |
| Franklin Strategic Income Securities Fund | | Country | | Principal
Amount* | | | Value | |
i,kSenior Floating Rate Interests (continued) | | | | | | | | | | |
Consumer Durables & Apparel 0.7% | | | | | | | | | | |
b,c,jSleep Innovations Inc., Term Loan, PIK, 11.50%, 3/05/15 | | United States | | | 1,341,906 | | | $ | 1,341,906 | |
Visant Corp. (Jostens), Term Loan B, 5.25% - 6.25%, 12/22/16 | | United States | | | 8,249,920 | | | | 7,754,924 | |
| | | | | | | | | | |
| | | | | | | | | 9,096,830 | |
| | | | | | | | | | |
Consumer Services 1.4% | | | | | | | | | | |
Ameristar Casinos Inc., B Term Loan, 4.00%, 4/14/18 | | United States | | | 2,602,935 | | | | 2,605,103 | |
Burger King Holdings Inc., Tranche B Term Loan, 4.50%, 10/19/16 | | United States | | | 8,507,975 | | | | 8,378,586 | |
DineEquity Inc., Term B-1 Loan, 4.25% - 5.25%, 10/19/17 | | United States | | | 1,895,563 | | | | 1,872,343 | |
Revel AC Inc., Tranche B Term Loan, 9.00%, 2/17/17 | | United States | | | 1,206,407 | | | | 1,106,878 | |
d,jTurtle Bay Holdings LLC, | | | | | | | | | | |
Term Loan A, PIK, 10.375%, 3/01/13 | | United States | | | 2,011,261 | | | | 1,950,923 | |
Term Loan B, PIK, 3.125%, 2/09/15 | | United States | | | 4,039,244 | | | | 3,271,788 | |
| | | | | | | | | | |
| | | | | | | | | 19,185,621 | |
| | | | | | | | | | |
Diversified Financials 0.7% | | | | | | | | | | |
Asurion LLC, Second Lien Term Loan, 9.00%, 5/24/19 | | United States | | | 2,814,806 | | | | 2,786,658 | |
MoneyGram Payment Systems Worldwide Inc., | | | | | | | | | | |
Term Loan, 4.50%, 11/18/17 | | United States | | | 1,569,830 | | | | 1,549,226 | |
Tranche B-1 Loan, 4.50%, 11/18/17 | | United States | | | 425,633 | | | | 418,717 | |
MSCI Inc., Term Loan B, 3.75%, 3/09/17 | | United States | | | 1,315,007 | | | | 1,325,691 | |
TransUnion LLC/TransUnion FICO, Term Loan, 4.75%, 2/10/18 | | United States | | | 2,757,359 | | | | 2,755,636 | |
| | | | | | | | | | |
| | | | | | | | | 8,835,928 | |
| | | | | | | | | | |
Food & Staples Retailing 0.5% | | | | | | | | | | |
BJ’s Wholesale Club Inc., | | | | | | | | | | |
Initial Loan, 7.00%, 9/30/18 | | United States | | | 3,340,313 | | | | 3,356,563 | |
Second Lien Term Loan, 10.00%, 3/30/19 | | United States | | | 3,940,000 | | | | 3,979,400 | |
| | | | | | | | | | |
| | | | | | | | | 7,335,963 | |
| | | | | | | | | | |
Food, Beverage & Tobacco 0.6% | | | | | | | | | | |
Del Monte Foods Co., Initial Term Loan, 4.50%, 3/08/18 | | United States | | | 8,199,817 | | | | 7,810,326 | |
| | | | | | | | | | |
Health Care Equipment & Services 2.1% | | | | | | | | | | |
Bausch & Lomb Inc., | | | | | | | | | | |
Delayed Draw Term Loan, 3.546%, 4/28/15 | | United States | | | 1,105,377 | | | | 1,082,579 | |
Parent Term Loan, 3.546% - 3.829%, 4/28/15 | | United States | | | 4,529,638 | | | | 4,436,214 | |
Community Health Systems Inc., | | | | | | | | | | |
Delayed Draw Term Loan, 2.546%, 7/25/14 | | United States | | | 161,022 | | | | 156,623 | |
Extended Term Loan, 3.796% - 4.023%, 1/25/17 | | United States | | | 5,350,080 | | | | 5,187,347 | |
Term Loan, 2.546% - 2.773%, 7/25/14 | | United States | | | 3,135,021 | | | | 3,049,369 | |
DaVita Inc., Tranche B Term Loan, 4.50%, 10/20/16 | | United States | | | 1,983,910 | | | | 1,984,902 | |
HCA Inc., Tranche B-2 Term Loan, 3.829%, 3/31/17 | | United States | | | 8,194,043 | | | | 7,794,583 | |
Kinetic Concepts Inc., Term B-2 Loan, 6.50%, 11/04/16 | | United States | | | 380,201 | | | | 380,042 | |
Universal Health Services Inc., New Tranche B Term Loan, 3.75%, 11/15/16 | | United States | | | 4,396,480 | | | | 4,394,809 | |
| | | | | | | | | | |
| | | | | | | | | 28,466,468 | |
| | | | | | | | | | |
Materials 2.2% | | | | | | | | | | |
bAmerican Rock Salt Co. LLC, Initial Loan, 5.50%, 4/25/17 | | United States | | | 3,647,019 | | | | 3,610,549 | |
Anchor Glass Container Corp., Second Lien Term Loan, 10.00%, 9/02/16 | | United States | | | 5,813,900 | | | | 5,799,365 | |
Ashland Inc., Term B Loan, 3.75%, 8/23/18 | | United States | | | 2,347,552 | | | | 2,359,839 | |
Consolidated Container Co. LLC, Second Lien Term Loan, 5.813%, 9/28/14 | | United States | | | 2,114,283 | | | | 1,797,141 | |
bNewPage Corp., DIP Term Loan, 8.00%, 3/07/13 | | United States | | | 4,115,982 | | | | 4,172,576 | |
Potters Holdings II LP, Second Lien Term Loan, 10.25%, 11/06/17 | | United States | | | 247,452 | | | | 246,627 | |
FSI-20
Franklin Templeton Variable Insurance Products Trust
Statement of Investments, December 31, 2011 (continued)
| | | | | | | | | | |
| Franklin Strategic Income Securities Fund | | Country | | Principal
Amount* | | | Value | |
i,kSenior Floating Rate Interests (continued) | | | | | | | | | | |
Materials (continued) | | | | | | | | | | |
Reynolds Group Holdings Inc., | | | | | | | | | | |
Tranche B Term Loan, 6.50%, 2/09/18 | | United States | | | 2,869,112 | | | $ | 2,847,594 | |
bTranche C Term Loan, 6.50%, 8/09/18 | | United States | | | 4,801,014 | | | | 4,781,512 | |
Rockwood Specialties Group Inc., Term Loan, 3.50%, 2/10/18 | | United States | | | 1,550,428 | | | | 1,557,858 | |
bWalter Energy Inc., B Term Loan, 4.00%, 4/01/18 | | United States | | | 2,254,511 | | | | 2,240,654 | |
| | | | | | | | | | |
| | | | | | | | | 29,413,715 | |
| | | | | | | | | | |
Media 2.5% | | | | | | | | | | |
Cinemark USA Inc., Extended Term Loan, 3.53% - 3.83%, 4/30/16 | | United States | | | 1,580,795 | | | | 1,574,696 | |
Clear Channel Communications Inc., | | | | | | | | | | |
Tranche A Term Loan, 3.696%, 5/13/14 | | United States | | | 1,693,252 | | | | 1,483,712 | |
Tranche B Term Loan, 3.946%, 1/29/16 | | United States | | | 5,094,789 | | | | 3,780,048 | |
CSC Holdings Inc. (Cablevision), Incremental Term Loan B-2, 2.044%, 3/29/16 | | United States | | | 4,262,277 | | | | 4,187,687 | |
Cumulus Media Holdings Inc., Second Lien Term Loan, 7.50%, 9/16/19 | | United States | | | 5,450,000 | | | | 5,295,585 | |
Hubbard Radio LLC, Second Lien Term Loan, 8.75%, 4/29/18 | | United States | | | 1,192,409 | | | | 1,186,446 | |
R.H. Donnelley Inc., Term Loan B, 9.00%, 10/24/14 | | United States | | | 6,392,486 | | | | 2,314,080 | |
bRegal Cinemas Corp., Term Loan, 3.579%, 8/23/17 | | United States | | | 2,211,099 | | | | 2,196,819 | |
bSinclair Television Group Inc, Incremental Term Loan B, 5.25%, 10/29/16 | | United States | | | 2,484,000 | | | | 2,483,938 | |
Summit Entertainment LLC, Term Loan, 7.50%, 9/07/16 | | United States | | | 3,778,254 | | | | 3,740,472 | |
TWCC Holding Corp., Term Loan, 4.25%, 2/11/17 | | United States | | | 2,816,889 | | | | 2,816,303 | |
Univision Communications Inc., Extended First Lien Term Loan, 4.546%, 3/31/17 | | United States | | | 2,141,315 | | | | 1,917,147 | |
UPC Financing Partnership, Term Loan T, 3.872%, 12/31/16 | | Netherlands | | | 1,491,092 | | | | 1,442,632 | |
| | | | | | | | | | |
| | | | | | | | | 34,419,565 | |
| | | | | | | | | | |
Pharmaceuticals, Biotechnology & Life Sciences 0.4% | | | | | | | | | | |
Warner Chilcott Co. LLC, Term B-2 Loan, 4.25%, 3/15/18 | | Puerto Rico | | | 1,316,779 | | | | 1,302,788 | |
Warner Chilcott Corp., Term B-1 Loan, 4.25%, 3/15/18 | | United States | | | 2,633,558 | | | | 2,605,577 | |
WC Luxco S.A.R.L., Term B-3 Loan, 4.25%, 3/15/18 | | Luxembourg | | | 1,810,571 | | | | 1,791,334 | |
| | | | | | | | | | |
| | | | | | | | | 5,699,699 | |
| | | | | | | | | | |
Software & Services 1.3% | | | | | | | | | | |
AVG Technologies NV, Term Loan, 7.50%, 3/15/16 | | Netherlands | | | 6,763,438 | | | | 6,357,631 | |
bFidelity National Information Services Inc., | | | | | | | | | | |
Add-on Term Loan A-2, 4.50%, 7/18/14 | | United States | | | 781,500 | | | | 776,941 | |
Term Loan B, 5.50%, 7/18/16 | | United States | | | 1,794,153 | | | | 1,791,928 | |
First Data Corp., | | | | | | | | | | |
Term Loan B-1, 3.044%, 9/24/14 | | United States | | | 3,687,802 | | | | 3,376,626 | |
Term Loan B-2, 3.044%, 9/24/14 | | United States | | | 328,445 | | | | 300,731 | |
Term Loan B-3, 3.044%, 9/24/14 | | United States | | | 328,445 | | | | 300,731 | |
SunGard Data Systems Inc., Tranche B U.S. Term Loan, 3.969% - 4.063%, 2/28/16 | | United States | | | 2,403,719 | | | | 2,348,133 | |
Vertafore Inc., Second Lien Term Loan, 9.75%, 10/27/17 | | United States | | | 1,832,000 | | | | 1,781,620 | |
| | | | | | | | | | |
| | | | | | | | | 17,034,341 | |
| | | | | | | | | | |
Technology Hardware & Equipment 0.1% | | | | | | | | | | |
bFlextronics International USA Inc., | | | | | | | | | | |
A-1-B Delayed Draw Term Loan, 4.50%, 10/01/14 | | United States | | | 120,839 | | | | 119,404 | |
A-2 Delayed Draw Term Loan, 4.50%, 10/01/14 | | United States | | | 424,460 | | | | 419,420 | |
A-3 Delayed Draw Term Loan, 4.50%, 10/01/14 | | United States | | | 495,465 | | | | 489,581 | |
| | | | | | | | | | |
| | | | | | | | | 1,028,405 | |
| | | | | | | | | | |
FSI-21
Franklin Templeton Variable Insurance Products Trust
Statement of Investments, December 31, 2011 (continued)
| | | | | | | | | | |
| Franklin Strategic Income Securities Fund | | Country | | Principal
Amount* | | | Value | |
i,kSenior Floating Rate Interests (continued) | | | | | | | | | | |
Telecommunication Services 0.7% | | | | | | | | | | |
Intelsat Jackson Holdings SA, Tranche B Term Loan, 5.25%, 4/02/18 | | Luxembourg | | | 8,342,888 | | | $ | 8,325,510 | |
SBA Senior Finance II LLC, Term Loan, 3.75%, 6/30/18 | | United States | | | 1,727,748 | | | | 1,720,189 | |
| | | | | | | | | | |
| | | | | | | | | 10,045,699 | |
| | | | | | | | | | |
Transportation 0.5% | | | | | | | | | | |
Evergreen International Aviation Inc., Term Loan, 12.25%, 6/30/15 | | United States | | | 1,175,125 | | | | 1,060,550 | |
Hertz Corp., | | | | | | | | | | |
Credit Linked Deposit, 3.75%, 3/11/18 | | United States | | | 1,736,300 | | | | 1,641,568 | |
Tranche B Term Loan, 3.75%, 3/11/18 | | United States | | | 3,880,675 | | | | 3,818,421 | |
YRCW Receivables LLC, Term B Loan, 11.25%, 9/30/14 | | United States | | | 220,769 | | | | 208,627 | |
| | | | | | | | | | |
| | | | | | | | | 6,729,166 | |
| | | | | | | | | | |
Total Senior Floating Rate Interests (Cost $224,103,761) | | | | | | | | | 218,403,537 | |
| | | | | | | | | | |
Foreign Government and Agency Securities 24.0% | | | | | | | | | | |
fArab Republic of Egypt, 144A, 5.75%, 4/29/20 | | Egypt | | | 3,560,000 | | | | 3,112,953 | |
The Export-Import Bank of Korea, senior note, 8.125%, 1/21/14 | | South Korea | | | 2,770,000 | | | | 3,075,692 | |
i,lGovernment of Argentina, senior bond, FRN, 0.439%, 8/03/12 | | Argentina | | | 30,000,000 | | | | 3,648,928 | |
Government of Australia, senior bond, 5.75%, 4/15/12 | | Australia | | | 20,350,000 | AUD | | | 20,924,163 | |
Government of Hungary, | | | | | | | | | | |
5.50%, 2/12/14 | | Hungary | | | 1,443,700,000 | HUF | | | 5,539,447 | |
5.50%, 2/12/16 | | Hungary | | | 1,864,700,000 | HUF | | | 6,708,992 | |
6.50%, 6/24/19 | | Hungary | | | 206,000,000 | HUF | | | 705,735 | |
7.50%, 11/12/20 | | Hungary | | | 312,600,000 | HUF | | | 1,117,493 | |
senior note, 6.25%, 1/29/20 | | Hungary | | | 5,507,000 | | | | 5,067,541 | |
Government of Indonesia, | | | | | | | | | | |
FR19, 14.25%, 6/15/13 | | Indonesia | | | 35,480,000,000 | IDR | | | 4,426,048 | |
FR20, 14.275%, 12/15/13 | | Indonesia | | | 23,637,000,000 | IDR | | | 3,050,861 | |
FR26, 11.00%, 10/15/14 | | Indonesia | | | 1,800,000,000 | IDR | | | 227,846 | |
FR34, 12.80%, 6/15/21 | | Indonesia | | | 49,955,000,000 | IDR | | | 8,169,701 | |
FR42, 10.25%, 7/15/27 | | Indonesia | | | 2,000,000,000 | IDR | | | 290,047 | |
FR44, 10.00%, 9/15/24 | | Indonesia | | | 9,300,000,000 | IDR | | | 1,326,821 | |
Government of Ireland, | | | | | | | | | | |
4.00%, 1/15/14 | | Ireland | | | 2,232,000 | EUR | | | 2,703,123 | |
4.60%, 4/18/16 | | Ireland | | | 466,000 | EUR | | | 545,013 | |
5.90%, 10/18/19 | | Ireland | | | 2,177,000 | EUR | | | 2,444,981 | |
4.50%, 4/18/20 | | Ireland | | | 1,234,000 | EUR | | | 1,237,804 | |
5.00%, 10/18/20 | | Ireland | | | 2,088,000 | EUR | | | 2,163,566 | |
senior bond, 4.50%, 10/18/18 | | Ireland | | | 748,000 | EUR | | | 789,757 | |
senior bond, 4.40%, 6/18/19 | | Ireland | | | 887,000 | EUR | | | 919,744 | |
senior bond, 5.40%, 3/13/25 | | Ireland | | | 1,488,000 | EUR | | | 1,524,509 | |
Government of Israel, | | | | | | | | | | |
4.00%, 3/30/12 | | Israel | | | 3,315,000 | ILS | | | 872,625 | |
5.00%, 3/31/13 | | Israel | | | 3,170,000 | ILS | | | 854,971 | |
3.50%, 9/30/13 | | Israel | | | 10,405,000 | ILS | | | 2,766,163 | |
Government of Malaysia, senior bond, | | | | | | | | | | |
2.711%, 2/14/12 | | Malaysia | | | 490,000 | MYR | | | 154,527 | |
3.718%, 6/15/12 | | Malaysia | | | 14,410,000 | MYR | | | 4,561,347 | |
2.509%, 8/27/12 | | Malaysia | | | 19,215,000 | MYR | | | 6,045,506 | |
3.702%, 2/25/13 | | Malaysia | | | 19,133,000 | MYR | | | 6,089,907 | |
3.70%, 5/15/13 | | Malaysia | | | 1,720,000 | MYR | | | 548,299 | |
3.21%, 5/31/13 | | Malaysia | | | 2,570,000 | MYR | | | 814,050 | |
3.461%, 7/31/13 | | Malaysia | | | 12,900,000 | MYR | | | 4,103,177 | |
FSI-22
Franklin Templeton Variable Insurance Products Trust
Statement of Investments, December 31, 2011 (continued)
| | | | | | | | | | |
| Franklin Strategic Income Securities Fund | | Country | | Principal
Amount* | | | Value | |
Foreign Government and Agency Securities (continued) | | | | | | | | | | |
Government of Malaysia, senior bond, (continued) | | | | | | | | | | |
3.814%, 2/15/17 | | Malaysia | | | 11,400,000 | MYR | | $ | 3,671,343 | |
4.24%, 2/07/18 | | Malaysia | | | 600,000 | MYR | | | 197,602 | |
Government of Mexico, | | | | | | | | | | |
M, 9.00%, 6/20/13 | | Mexico | | | 514,800 | m MXN | | | 3,904,854 | |
M, 7.00%, 6/19/14 | | Mexico | | | 120,000 | m MXN | | | 899,791 | |
M, 8.00%, 12/17/15 | | Mexico | | | 140,000 | m MXN | | | 1,097,290 | |
MI, 9.00%, 12/20/12 | | Mexico | | | 58,000 | m MXN | | | 432,688 | |
MI, 8.00%, 12/19/13 | | Mexico | | | 1,062,700 | m MXN | | | 8,058,493 | |
Government of Poland, | | | | | | | | | | |
4.75%, 4/25/12 | | Poland | | | 44,240,000 | PLN | | | 12,834,600 | |
5.25%, 4/25/13 | | Poland | | | 3,170,000 | PLN | | | 925,299 | |
5.75%, 4/25/14 | | Poland | | | 14,470,000 | PLN | | | 4,270,862 | |
6.25%, 10/24/15 | | Poland | | | 9,100,000 | PLN | | | 2,739,033 | |
5.75%, 9/23/22 | | Poland | | | 4,300,000 | PLN | | | 1,233,828 | |
senior note, 6.375%, 7/15/19 | | Poland | | | 4,000,000 | | | | 4,455,720 | |
Strip, 1/25/13 | | Poland | | | 1,330,000 | PLN | | | 367,615 | |
Strip, 7/25/13 | | Poland | | | 9,270,000 | PLN | | | 2,500,187 | |
fGovernment of Russia, 144A, 7.50%, 3/31/30 | | Russia | | | 5,211,235 | | | | 6,061,318 | |
Government of Singapore, senior bond, 2.625%, 4/01/12 | | Singapore | | | 3,660,000 | SGD | | | 2,836,360 | |
Government of Sri Lanka, | | | | | | | | | | |
A, 6.90%, 8/01/12 | | Sri Lanka | | | 1,900,000 | LKR | | | 16,507 | |
A, 8.50%, 1/15/13 | | Sri Lanka | | | 50,900,000 | LKR | | | 445,388 | |
A, 13.50%, 2/01/13 | | Sri Lanka | | | 59,500,000 | LKR | | | 544,621 | |
A, 7.00%, 3/01/14 | | Sri Lanka | | | 7,020,000 | LKR | | | 58,510 | |
A, 11.25%, 7/15/14 | | Sri Lanka | | | 176,100,000 | LKR | | | 1,599,279 | |
A, 11.75%, 3/15/15 | | Sri Lanka | | | 1,160,000 | LKR | | | 10,728 | |
A, 6.50%, 7/15/15 | | Sri Lanka | | | 28,980,000 | LKR | | | 230,096 | |
A, 11.00%, 8/01/15 | | Sri Lanka | | | 200,400,000 | LKR | | | 1,818,775 | |
A, 6.40%, 8/01/16 | | Sri Lanka | | | 19,500,000 | LKR | | | 149,238 | |
B, 6.60%, 6/01/14 | | Sri Lanka | | | 7,100,000 | LKR | | | 58,264 | |
B, 6.40%, 10/01/16 | | Sri Lanka | | | 16,000,000 | LKR | | | 122,371 | |
Government of Sweden, | | | | | | | | | | |
5.50%, 10/08/12 | | Sweden | | | 107,565,000 | SEK | | | 16,168,868 | |
1.50%, 8/30/13 | | Sweden | | | 80,270,000 | SEK | | | 11,823,194 | |
Government of the Philippines, | | | | | | | | | | |
senior bond, 5.75%, 2/21/12 | | Philippines | | | 19,830,000 | PHP | | | 454,226 | |
senior bond, 8.75%, 3/03/13 | | Philippines | | | 55,690,000 | PHP | | | 1,352,150 | |
bsenior note, 6.25%, 1/27/14 | | Philippines | | | 80,300,000 | PHP | | | 1,944,914 | |
b,fGovernment of Ukraine, 144A, 7.75%, 9/23/20 | | Ukraine | | | 6,000,000 | | | | 5,220,000 | |
nGovernment of Uruguay, senior note, | | | | | | | | | | |
Index Linked, 4.375%, 12/15/28 | | Uruguay | | | 119,300,000 | UYU | | | 6,039,937 | |
Government of Venezuela, 10.75%, 9/19/13 | | Venezuela | | | 2,500,000 | | | | 2,534,437 | |
fGovernment of Vietnam, 144A, 6.75%, 1/29/20 | | Vietnam | | | 2,500,000 | | | | 2,510,937 | |
Korea Treasury Bond, | | | | | | | | | | |
5.25%, 9/10/12 | | South Korea | | | 2,850,000,000 | KRW | | | 2,489,097 | |
5.25%, 3/10/13 | | South Korea | | | 346,570,000 | KRW | | | 305,257 | |
senior bond, 4.00%, 6/10/12 | | South Korea | | | 31,013,880,000 | KRW | | | 26,822,593 | |
senior bond, 4.25%, 12/10/12 | | South Korea | | | 3,560,000,000 | KRW | | | 3,094,073 | |
senior bond, 5.00%, 3/26/13 | | South Korea | | | 1,163,000,000 | KRW | | | 1,008,831 | |
senior bond, 3.75%, 6/10/13 | | South Korea | | | 5,340,340,000 | KRW | | | 4,629,641 | |
senior bond, 3.00%, 12/10/13 | | South Korea | | | 14,844,210,000 | KRW | | | 12,726,007 | |
New South Wales Treasury Corp., | | | | | | | | | | |
6.00%, 5/01/12 | | Australia | | | 280,000 | AUD | | | 288,203 | |
FSI-23
Franklin Templeton Variable Insurance Products Trust
Statement of Investments, December 31, 2011 (continued)
| | | | | | | | | | |
| Franklin Strategic Income Securities Fund | | Country | | Principal
Amount* | | | Value | |
Foreign Government and Agency Securities (continued) | | | | | | | | | | |
New South Wales Treasury Corp., (continued) | | | | | | | | | | |
5.50%, 8/01/13 | | Australia | | | 860,000 | AUD | | $ | 902,033 | |
senior note, 5.50%, 3/01/17 | | Australia | | | 3,540,000 | AUD | | | 3,845,079 | |
Nota Do Tesouro Nacional, | | | | | | | | | | |
10.00%, 1/01/12 | | Brazil | | | 6,910 | o BRL | | | 3,708,506 | |
10.00%, 1/01/14 | | Brazil | | | 2,700 | o BRL | | | 1,435,261 | |
10.00%, 1/01/17 | | Brazil | | | 7,400 | o BRL | | | 3,821,346 | |
nIndex Linked, 6.00%, 5/15/15 | | Brazil | | | 3,890 | o BRL | | | 4,507,521 | |
Queensland Treasury Corp., | | | | | | | | | | |
6.00%, 8/14/13 | | Australia | | | 600,000 | AUD | | | 634,829 | |
6.00%, 9/14/17 | | Australia | | | 1,200,000 | AUD | | | 1,329,229 | |
senior note, 6.00%, 8/21/13 | | Australia | | | 2,705,000 | AUD | | | 2,846,383 | |
United Kingdom Treasury Bond, 5.00%, 3/07/12 | | United Kingdom | | | 7,459,000 | GBP | | | 11,680,659 | |
United Kingdom Treasury Note, 5.25%, 6/07/12 | | United Kingdom | | | 7,977,000 | GBP | | | 12,650,780 | |
Western Australia Treasury Corp., | | | | | | | | | | |
5.50%, 7/17/12 | | Australia | | | 9,065,000 | AUD | | | 9,344,737 | |
8.00%, 6/15/13 | | Australia | | | 1,000,000 | AUD | | | 1,082,778 | |
| | | | | | | | | | |
Total Foreign Government and Agency Securities
(Cost $325,983,558) | | | | | | | | | 325,273,503 | |
| | | | | | | | | | |
U.S. Government and Agency Securities 1.5% | | | | | | | | | | |
U.S. Treasury Bond, | | | | | | | | | | |
4.50%, 2/15/16 | | United States | | | 3,000,000 | | | | 3,469,689 | |
7.875%, 2/15/21 | | United States | | | 900,000 | | | | 1,373,203 | |
7.125%, 2/15/23 | | United States | | | 1,980,000 | | | | 2,993,821 | |
U.S. Treasury Note, | | | | | | | | | | |
2.375%, 3/31/16 | | United States | | | 3,500,000 | | | | 3,749,102 | |
4.625%, 2/15/17 | | United States | | | 600,000 | | | | 712,219 | |
4.75%, 8/15/17 | | United States | | | 2,900,000 | | | | 3,493,140 | |
pIndex Linked, 0.125%, 4/15/16 | | United States | | | 2,359,617 | | | | 2,462,114 | |
pIndex Linked, 0.625%, 7/15/21 | | United States | | | 2,511,840 | | | | 2,688,256 | |
| | | | | | | | | | |
Total U.S. Government and Agency Securities
(Cost $18,928,394) | | | | | | | | | 20,941,544 | |
| | | | | | | | | | |
Asset-Backed Securities and Commercial Mortgage-Backed Securities 3.4% | | | | | | | | | | |
Banks 1.4% | | | | | | | | | | |
f,iBanc of America Large Loan, 2010-HLTN, 144A, FRN, 2.028%, 11/15/15 | | United States | | | 4,298,961 | | | | 3,893,442 | |
Countrywide Asset-Backed Certificates, 2005-11, AF4, 5.21%, 3/25/34 | | United States | | | 1,275,000 | | | | 647,559 | |
iGS Mortgage Securities Corp. II, 2006-GG6, A4, FRN, 5.553%, 4/10/38 | | United States | | | 2,405,000 | | | | 2,622,748 | |
iHomebanc Mortgage Trust, 2005-4, A1, FRN, 0.564%, 10/25/35 | | United States | | | 2,090,461 | | | | 1,429,750 | |
f,iWachovia Bank Commercial Mortgage Trust, 2007-WHL8, A1, 144A, FRN, 0.358%, 6/15/20 | | United States | | | 5,849,355 | | | | 5,236,320 | |
Wells Fargo Mortgage Backed Securities Trust,
i2004-W, A9, FRN, 2.762%, 11/25/34 | | United States | | | 2,169,236 | | | | 2,061,851 | |
2007-3, 3A1, 5.50%, 4/25/37 | | United States | | | 2,548,623 | | | | 2,631,935 | |
| | | | | | | | | | |
| | | | | | | | | 18,523,605 | |
| | | | | | | | | | |
Diversified Financials 2.0% | | | | | | | | | | |
f,iARES CLO Funds, 2007-12A, B, 144A, FRN, 1.506%, 11/25/20 | | Cayman Islands | | | 1,380,000 | | | | 1,153,818 | |
f,iArmstrong Loan Funding Ltd., 2008-1A, B, 144A, FRN, 1.429%, 8/01/16 | | Cayman Islands | | | 3,570,093 | | | | 3,458,314 | |
f,iCent CDO Ltd., 2007-15A, A2B, 144A, FRN, 0.88%, 3/11/21 | | Cayman Islands | | | 1,251,000 | | | | 1,011,115 | |
FSI-24
Franklin Templeton Variable Insurance Products Trust
Statement of Investments, December 31, 2011 (continued)
| | | | | | | | | | |
| Franklin Strategic Income Securities Fund | | Country | | Principal
Amount* | | | Value | |
Asset-Backed Securities and Commercial Mortgage-Backed Securities (continued) | | | | | | | | | | |
Diversified Financials (continued) | | | | | | | | | | |
Citigroup Commercial Mortgage Trust,
i2007-C6, AM, FRN, 5.698%, 6/10/17 | | United States | | | 1,700,000 | | | $ | 1,679,343 | |
2008-C7, A4, 6.072%, 12/10/49 | | United States | | | 8,700,000 | | | | 9,702,866 | |
iCitigroup/Deutsche Bank Commercial Mortgage Trust, 2005-CD1, AJ, FRN,
5.399%, 7/15/44 | | United States | | | 2,230,000 | | | | 2,001,406 | |
f,iColumbus Nova CLO Ltd., 2007-2A, A2, 144A, FRN, 1.403%, 10/15/21 | | Cayman Islands | | | 860,000 | | | | 723,329 | |
f,iCommercial Industrial Finance Corp., 2007-3A, A1J, 144A, FRN, 0.82%, 7/26/21 | | Cayman Islands | | | 960,000 | | | | 784,267 | |
f,iCredit Suisse Mortgage Capital Certificates, 2006-TF2A, A2, 144A, FRN, 0.448%, 10/15/21 | | United States | | | 418,006 | | | | 385,564 | |
f,iGleneagles CLO Ltd., 2005-1A, 144A, FRN, 0.829%, 11/01/17 | | Cayman Islands | | | 1,000,000 | | | | 800,005 | |
JPMorgan Chase Commercial Mortgage Securities Corp., 2005-LDP2, AM, 4.78%, 7/15/42 | | United States | | | 775,000 | | | | 804,362 | |
f,iMAPS CLO Fund LLC, 2005-1A, B, 144A, FRN, 1.067%, 12/21/17 | | United States | | | 1,400,000 | | | | 1,301,587 | |
Residential Asset Securities Corp., 2004-KS1, AI4, 4.213%, 4/25/32 | | United States | | | 71,205 | | | | 69,655 | |
f,iWestchester CLO Ltd., 2007-1A, A1A, 144A, FRN, 0.654%, 8/01/22 | | Cayman Islands | | | 4,596,472 | | | | 4,058,110 | |
| | | | | | | | | | |
| | | | | | | | | 27,933,741 | |
| | | | | | | | | | |
Total Asset-Backed Securities and Commercial Mortgage-Backed Securities (Cost $44,943,830) | | | | | | | | | 46,457,346 | |
| | | | | | | | | | |
Mortgage-Backed Securities 5.0% | | | | | | | | | | |
iFederal Home Loan Mortgage Corp. (FHLMC) Adjustable Rate 0.0%† | | | | | | | | | | |
FHLMC, 2.473%, 1/01/33 | | United States | | | 85,520 | | | | 88,805 | |
| | | | | | | | | | |
Federal Home Loan Mortgage Corp. (FHLMC) Fixed Rate 1.5% | | | | | | | | | | |
FHLMC Gold 15 Year, 4.50%, 10/01/18 - 6/01/19 | | United States | | | 1,118,466 | | | | 1,188,746 | |
FHLMC Gold 15 Year, 5.00%, 12/01/17 - 9/01/19 | | United States | | | 1,325,134 | | | | 1,428,537 | |
FHLMC Gold 15 Year, 5.50%, 7/01/17 - 7/01/19 | | United States | | | 341,607 | | | | 370,864 | |
FHLMC Gold 15 Year, 6.00%, 5/01/17 | | United States | | | 13,741 | | | | 14,955 | |
FHLMC Gold 15 Year, 6.50%, 5/01/16 | | United States | | | 4,061 | | | | 4,346 | |
FHLMC Gold 30 Year, 4.00%, 9/01/40 | | United States | | | 4,685,747 | | | | 4,923,081 | |
FHLMC Gold 30 Year, 4.50%, 10/01/40 | | United States | | | 3,004,432 | | | | 3,186,378 | |
FHLMC Gold 30 Year, 5.00%, 4/01/34 - 8/01/35 | | United States | | | 1,429,254 | | | | 1,538,063 | |
FHLMC Gold 30 Year, 5.50%, 3/01/33 - 6/01/36 | | United States | | | 3,674,145 | | | | 4,018,056 | |
FHLMC Gold 30 Year, 6.00%, 4/01/33 - 6/01/37 | | United States | | | 3,501,123 | | | | 3,867,764 | |
FHLMC Gold 30 Year, 6.50%, 12/01/23 - 6/01/36 | | United States | | | 254,746 | | | | 288,063 | |
FHLMC Gold 30 Year, 7.00%, 9/01/21 - 4/01/30 | | United States | | | 64,366 | | | | 74,065 | |
FHLMC Gold 30 Year, 7.50%, 3/01/30 - 7/01/31 | | United States | | | 1,971 | | | | 2,135 | |
| | | | | | | | | | |
| | | | | | | | | 20,905,053 | |
| | | | | | | | | | |
iFederal National Mortgage Association (FNMA) Adjustable Rate 0.0%† | | | | | | | | | | |
FNMA, 2.31%, 12/01/34 | | United States | | | 291,904 | | | | 305,590 | |
FNMA, 2.419%, 4/01/20 | | United States | | | 61,602 | | | | 62,470 | |
| | | | | | | | | | |
| | | | | | | | | 368,060 | |
| | | | | | | | | | |
Federal National Mortgage Association (FNMA) Fixed Rate 3.2% | | | | | | | | | | |
FNMA 15 Year, 4.50%, 6/01/19 - 3/01/20 | | United States | | | 256,748 | | | | 274,789 | |
FNMA 15 Year, 5.00%, 10/01/17 - 6/01/18 | | United States | | | 280,638 | | | | 303,158 | |
FNMA 15 Year, 5.50%, 11/01/13 - 11/01/18 | | United States | | | 2,853,557 | | | | 3,095,536 | |
FNMA 15 Year, 6.00%, 4/01/16 - 7/01/16 | | United States | | | 5,216 | | | | 5,641 | |
FNMA 15 Year, 7.00%, 5/01/12 | | United States | | | 52 | | | | 52 | |
FNMA 30 Year, 4.00%, 1/01/41 - 10/01/41 | | United States | | | 10,886,095 | | | | 11,452,083 | |
FNMA 30 Year, 4.50%, 7/01/40 - 12/01/40 | | United States | | | 8,915,191 | | | | 9,497,284 | |
FNMA 30 Year, 5.00%, 4/01/34 - 9/01/39 | | United States | | | 5,638,148 | | | | 6,115,563 | |
FSI-25
Franklin Templeton Variable Insurance Products Trust
Statement of Investments, December 31, 2011 (continued)
| | | | | | | | | | |
| Franklin Strategic Income Securities Fund | | Country | | Principal
Amount* | | | Value | |
Mortgage-Backed Securities (continued) | | | | | | | | | | |
Federal National Mortgage Association (FNMA) Fixed Rate (continued) | | | | | | | | | | |
FNMA 30 Year, 5.50%, 8/01/33 - 9/01/35 | | United States | | | 2,062,144 | | | $ | 2,253,325 | |
FNMA 30 Year, 6.00%, 6/01/34 - 5/01/38 | | United States | | | 7,430,562 | | | | 8,211,924 | |
FNMA 30 Year, 6.50%, 6/01/28 - 10/01/37 | | United States | | | 1,455,413 | | | | 1,640,906 | |
| | | | | | | | | | |
| | | | | | | | | 42,850,261 | |
| | | | | | | | | | |
Government National Mortgage Association (GNMA) Fixed Rate 0.3% | | | | | | | | | | |
GNMA I SF 30 Year, 5.00%, 11/15/33 - 7/15/34 | | United States | | | 1,025,283 | | | | 1,142,179 | |
GNMA I SF 30 Year, 5.50%, 12/15/32 - 6/15/36 | | United States | | | 1,064,738 | | | | 1,201,816 | |
GNMA I SF 30 Year, 6.50%, 11/15/31 - 2/15/32 | | United States | | | 6,693 | | | | 7,761 | |
GNMA I SF 30 Year, 7.00%, 10/15/28 - 6/15/32 | | United States | | | 63,249 | | | | 73,791 | |
GNMA I SF 30 Year, 7.50%, 9/15/30 | | United States | | | 1,986 | | | | 2,379 | |
GNMA II SF 30 Year, 5.00%, 9/20/33 - 11/20/33 | | United States | | | 283,537 | | | | 315,629 | |
GNMA II SF 30 Year, 6.00%, 11/20/34 | | United States | | | 315,748 | | | | 358,630 | |
GNMA II SF 30 Year, 6.50%, 4/20/31 - 2/20/34 | | United States | | | 118,711 | | | | 135,877 | |
GNMA II SF 30 Year, 7.50%, 1/20/28 - 4/20/32 | | United States | | | 31,997 | | | | 38,222 | |
| | | | | | | | | | |
| | | | | | | | | 3,276,284 | |
| | | | | | | | | | |
Total Mortgage-Backed Securities (Cost $65,024,638) | | | | | | | | | 67,488,463 | |
| | | | | | | | | | |
Municipal Bonds 3.5% | | | | | | | | | | |
Bay Area Toll Authority Toll Bridge Revenue, Build America Bonds, Series S1, 7.043%, 4/01/50 | | United States | | | 5,000,000 | | | | 6,583,700 | |
California State GO, | | | | | | | | | | |
7.625%, 3/01/40 | | United States | | | 1,500,000 | | | | 1,847,025 | |
5.25%, 11/01/40 | | United States | | | 560,000 | | | | 588,605 | |
Refunding, 5.00%, 4/01/38 | | United States | | | 9,700,000 | | | | 9,902,439 | |
Various Purpose, 6.00%, 4/01/38 | | United States | | | 2,500,000 | | | | 2,823,125 | |
Various Purpose, 6.00%, 11/01/39 | | United States | | | 160,000 | | | | 181,992 | |
Various Purpose, Refunding, 5.25%, 3/01/38 | | United States | | | 1,500,000 | | | | 1,558,170 | |
Various Purpose, Refunding, NATL Insured, 4.50%, 12/01/32 | | United States | | | 300,000 | | | | 303,543 | |
Various Purpose, Refunding, Series 1, AGMC Insured, 4.75%, 9/01/31 | | United States | | | 290,000 | | | | 295,788 | |
Chicago Waterworks Revenue, second lien, Refunding, 5.25%, 11/01/38 | | United States | | | 1,895,000 | | | | 1,982,094 | |
Clovis USD, GO, Capital Appreciation, Election of 2004, Series A, NATL RE, FGIC Insured, zero cpn., | | | | | | | | | | |
8/01/25 | | United States | | | 2,500,000 | | | | 1,268,800 | |
8/01/26 | | United States | | | 1,290,000 | | | | 613,137 | |
8/01/27 | | United States | | | 1,720,000 | | | | 763,972 | |
8/01/29 | | United States | | | 1,720,000 | | | | 666,328 | |
Illinois State GO, | | | | | | | | | | |
5.877%, 3/01/19 | | United States | | | 3,575,000 | | | | 3,852,670 | |
Build America Bonds, 7.35%, 7/01/35 | | United States | | | 4,600,000 | | | | 5,078,952 | |
fNew York City IDA, 144A, 11.00%, 3/01/29 | | United States | | | 600,000 | | | | 761,388 | |
Poway USD, GO, Election of 2008, ID No. 2007-1, Series A, zero cpn., | | | | | | | | | | |
8/01/27 | | United States | | | 370,000 | | | | 163,596 | |
8/01/30 | | United States | | | 370,000 | | | | 132,416 | |
8/01/32 | | United States | | | 460,000 | | | | 141,882 | |
8/01/33 | | United States | | | 245,000 | | | | 70,183 | |
Redondo Beach USD, GO, Build America Bonds, Election of 2008, Direct Payment to District, Series D, 6.461%, 8/01/40 | | United States | | | 1,510,000 | | | | 1,609,116 | |
San Francisco City and County GO, Build America Bonds, | | | | | | | | | | |
5.75%, 6/15/27 | | United States | | | 1,700,000 | | | | 1,943,015 | |
5.93%, 6/15/28 | | United States | | | 1,520,000 | | | | 1,738,804 | |
FSI-26
Franklin Templeton Variable Insurance Products Trust
Statement of Investments, December 31, 2011 (continued)
| | | | | | | | | | |
| Franklin Strategic Income Securities Fund | | Country | | Principal
Amount* | | | Value | |
Municipal Bonds (continued) | | | | | | | | | | |
San Mateo County Community College District GO, Election of 2001, Series C, NATL Insured, zero cpn., | | | | | | | | | | |
9/01/30 | | United States | | | 895,000 | | | $ | 352,344 | |
3/01/31 | | United States | | | 245,000 | | | | 92,331 | |
Sonoma County Pension Obligation Revenue, Series A, 6.00%, 12/01/29 | | United States | | | 2,100,000 | | | | 2,259,999 | |
| | | | | | | | | | |
Total Municipal Bonds (Cost $42,302,833) | | | | | | | | | 47,575,414 | |
| | | | | | | | | | |
Total Investments before Short Term Investments
(Cost $1,231,598,675) | | | | | | | | | 1,227,474,072 | |
| | | | | | | | | | |
Short Term Investments 8.1% | | | | | | | | | | |
Foreign Government and Agency Securities 3.6% | | | | | | | | | | |
qBank of Negara Monetary Note, 1/17/12 - 5/17/12 | | Malaysia | | | 23,590,000 | MYR | | | 7,413,321 | |
qEgypt Treasury Bill, 2/21/12 | | Egypt | | | 11,950,000 | EGP | | | 1,946,023 | |
qIsrael Treasury Bills, 1/04/12 - 5/02/12 | | Israel | | | 47,930,000 | ILS | | | 12,518,512 | |
qMalaysia Treasury Bills, 1/20/12 - 7/27/12 | | Malaysia | | | 12,880,000 | MYR | | | 4,012,404 | |
qNorway Treasury Bill, 3/21/12 | | Norway | | | 114,510,000 | NOK | | | 19,095,626 | |
qPhilippine Treasury Bills, 1/11/12 - 7/11/12 | | Philippines | | | 18,380,000 | PHP | | | 418,567 | |
qSingapore Treasury Bill, 11/01/12 | | Singapore | | | 3,750,000 | SGD | | | 2,883,849 | |
qSri Lanka Treasury Bills, 1/27/12 - 9/28/12 | | Sri Lanka | | | 26,470,000 | LKR | | | 227,880 | |
| | | | | | | | | | |
Total Foreign Government and Agency Securities
(Cost $52,814,034) | | | | | | | | | 48,516,182 | |
| | | | | | | | | | |
Total Investments before Money Market Funds
(Cost $1,284,412,709) | | | | | | | | | 1,275,990,254 | |
| | | | | | | | | | |
| | | |
| | | | | Shares | | | | |
Money Market Funds (Cost $61,664,899) 4.5% | | | | | | | | | | |
a,rInstitutional Fiduciary Trust Money Market Portfolio | | United States | | | 61,664,899 | | | | 61,664,899 | |
| | | | | | | | | | |
Total Investments (Cost $1,346,077,608) 98.6%
| | | | | | | | | 1,337,655,153 | |
Other Assets, less Liabilities 1.4% | | | | | | | | | 18,570,601 | |
| | | | | | | | | | |
Net Assets 100.0% | | | | | | | | $ | 1,356,225,754 | |
| | | | | | | | | | |
See Abbreviations on page 47.
FSI-27
Franklin Templeton Variable Insurance Products Trust
Statement of Investments, December 31, 2011 (continued)
†Rounds to less than 0.1% of net assets.
*The principal amount is stated in U.S. dollars unless otherwise indicated.
aNon-income producing.
bA portion or all of the security purchased on a delayed delivery basis. See Note 1(c).
cSecurity has been deemed illiquid because it may not be able to be sold within seven days. At December 31, 2011, the aggregate value of these securities was $1,684,966, representing 0.12% of net assets.
dAt December 31, 2011, pursuant to the Fund’s policies and the requirements of applicable securities law, the Fund may be restricted from trading these securities for a limited or extended period of time due to ownership limits and/or potential possession of material non-public information.
eSee Note 1(e) regarding investment in FT Holdings Corporation III.
fSecurity was purchased pursuant to Rule 144A under the Securities Act of 1933 and may be sold in transactions exempt from registration only to qualified institutional buyers or in a public offering registered under the Securities Act of 1933. These securities have been deemed liquid under guidelines approved by the Trust’s Board of Trustees. At December 31, 2011, the aggregate value of these securities was $213,891,364, representing 15.77% of net assets.
gSee Note 8 regarding defaulted securities.
hPerpetual security with no stated maturity date.
iThe coupon rate shown represents the rate at period end.
jIncome may be received in additional securities and/or cash.
kSee Note 1(g) regarding senior floating rate interests.
lThe principal amount is stated in original face, and scheduled paydowns are reflected in the market price on ex-date.
mPrincipal amount is stated in 100 Mexican Peso Units.
nRedemption price at maturity is adjusted for inflation. See Note 1(j).
oPrincipal amount is stated in 1,000 Brazilian Real Units.
pPrincipal amount of security is adjusted for inflation. See Note 1(j).
qThe security is traded on a discount basis with no stated coupon rate.
rSee Note 7 regarding investments in the Institutional Fiduciary Trust Money Market Portfolio.
FSI-28
Franklin Templeton Variable Insurance Products Trust
Statement of Investments, December 31, 2011 (continued)
| | | | | | |
| Franklin Strategic Income Securities Fund |
At December 31, 2011, the Fund had the following forward exchange contracts outstanding. See Note 1(d).
Forward Exchange Contracts
| | | | | | | | | | | | | | | | | | | | | | | | | | | | |
| Currency | | Counterparty | | | Type | | | Quantity | | | Contract
Amount* | | | Settlement
Date | | | Unrealized
Appreciation | | | Unrealized
Depreciation | |
Chilean Peso | | | DBAB | | | | Buy | | | | 2,449,000,000 | | | | 4,829,994 | | | | 1/10/12 | | | $ | — | | | $ | (123,884 | ) |
Indian Rupee | | | HSBC | | | | Buy | | | | 139,650,000 | | | | 2,922,159 | | | | 1/10/12 | | | | — | | | | (294,451 | ) |
Indian Rupee | | | HSBC | | | | Sell | | | | 45,250,000 | | | | 987,991 | | | | 1/10/12 | | | | 136,550 | | | | — | |
Japanese Yen | | | HSBC | | | | Sell | | | | 183,560,000 | | | | 2,246,756 | | | | 1/10/12 | | | | — | | | | (138,631 | ) |
Euro | | | BZWS | | | | Sell | | | | 1,691,484 | | | | 2,188,781 | | | | 1/11/12 | | | | — | | | | (686 | ) |
Euro | | | DBAB | | | | Sell | | | | 2,187,000 | | | | 2,834,111 | | | | 1/11/12 | | | | 3,247 | | | | — | |
Euro | | | UBSW | | | | Sell | | | | 3,940,000 | | | | 5,100,035 | | | | 1/11/12 | | | | 77 | | | | — | |
Euro | | | JPHQ | | | | Sell | | | | 1,802,953 | | | | 2,331,669 | | | | 1/13/12 | | | | — | | | | (2,115 | ) |
Japanese Yen | | | BZWS | | | | Sell | | | | 460,675,000 | | | | 5,577,179 | | | | 1/13/12 | | | | — | | | | (409,633 | ) |
Philippine Peso | | | JPHQ | | | | Buy | | | | 35,843,000 | | | | 814,151 | | | | 1/13/12 | | | | 2,914 | | | | — | |
Philippine Peso | | | HSBC | | | | Buy | | | | 5,750,000 | | | | 130,732 | | | | 1/17/12 | | | | 319 | | | | — | |
Euro | | | BZWS | | | | Sell | | | | 2,912,410 | | | | 3,881,369 | | | | 1/19/12 | | | | 111,325 | | | | — | |
Japanese Yen | | | DBAB | | | | Sell | | | | 271,680,000 | | | | 3,293,490 | | | | 1/19/12 | | | | — | | | | (237,521 | ) |
Euro | | | DBAB | | | | Sell | | | | 2,000,000 | | | | 2,716,500 | | | | 1/26/12 | | | | 127,426 | | | | — | |
Euro | | | BZWS | | | | Sell | | | | 1,007,118 | | | | 1,357,595 | | | | 1/26/12 | | | | 53,843 | | | | — | |
Euro | | | DBAB | | | | Sell | | | | 1,587,264 | | | | 2,146,426 | | | | 1/27/12 | | | | 91,639 | | | | — | |
Euro | | | DBAB | | | | Sell | | | | 3,014,151 | | | | 4,103,767 | | | | 2/02/12 | | | | 201,605 | | | | — | |
Chilean Peso | | | DBAB | | | | Buy | | | | 725,000,000 | | | | 1,472,081 | | | | 2/08/12 | | | | — | | | | (84,247 | ) |
Chilean Peso | | | JPHQ | | | | Buy | | | | 482,900,000 | | | | 976,049 | | | | 2/08/12 | | | | — | | | | (51,655 | ) |
Chilean Peso | | | BZWS | | | | Buy | | | | 486,100,000 | | | | 981,227 | | | | 2/08/12 | | | | — | | | | (50,708 | ) |
Indian Rupee | | | HSBC | | | | Buy | | | | 186,760,000 | | | | 3,883,552 | | | | 2/08/12 | | | | — | | | | (390,643 | ) |
Chilean Peso | | | BZWS | | | | Buy | | | | 1,001,200,000 | | | | 2,020,789 | | | | 2/09/12 | | | | — | | | | (104,413 | ) |
Euro | | | UBSW | | | | Sell | | | | 2,151,000 | | | | 2,920,563 | | | | 2/13/12 | | | | 135,552 | | | | — | |
Euro | | | DBAB | | | | Sell | | | | 1,250,438 | | | | 1,690,529 | | | | 2/14/12 | | | | 71,507 | | | | — | |
Singapore Dollar | | | DBAB | | | | Buy | | | | 1,158,000 | | | | 905,912 | | | | 2/24/12 | | | | — | | | | (13,237 | ) |
Singapore Dollar | | | DBAB | | | | Buy | | | | 722,000 | | | | 566,230 | | | | 2/27/12 | | | | — | | | | (9,657 | ) |
Singapore Dollar | | | DBAB | | | | Buy | | | | 723,000 | | | | 566,295 | | | | 2/29/12 | | | | — | | | | (8,947 | ) |
Euro | | | UBSW | | | | Sell | | | | 2,581,000 | | | | 3,523,246 | | | | 3/01/12 | | | | 180,927 | | | | — | |
Japanese Yen | | | UBSW | | | | Sell | | | | 95,700,000 | | | | 1,177,209 | | | | 3/01/12 | | | | — | | | | (67,551 | ) |
Japanese Yen | | | JPHQ | | | | Sell | | | | 85,800,000 | | | | 1,055,610 | | | | 3/01/12 | | | | — | | | | (60,381 | ) |
Japanese Yen | | | HSBC | | | | Sell | | | | 85,800,000 | | | | 1,056,000 | | | | 3/01/12 | | | | — | | | | (59,991 | ) |
Euro | | | DBAB | | | | Sell | | | | 1,500,000 | | | | 2,101,800 | | | | 3/15/12 | | | | 159,025 | | | | — | |
Singapore Dollar | | | JPHQ | | | | Buy | | | | 1,394,000 | | | | 1,089,999 | | | | 3/19/12 | | | | — | | | | (15,232 | ) |
Singapore Dollar | | | HSBC | | | | Buy | | | | 1,113,000 | | | | 872,284 | | | | 3/19/12 | | | | — | | | | (14,167 | ) |
Singapore Dollar | | | DBAB | | | | Buy | | | | 973,400 | | | | 763,050 | | | | 3/19/12 | | | | — | | | | (12,563 | ) |
Singapore Dollar | | | DBAB | | | | Buy | | | | 1,048,000 | | | | 817,536 | | | | 3/21/12 | | | | — | | | | (9,521 | ) |
Singapore Dollar | | | HSBC | | | | Buy | | | | 837,000 | | | | 653,676 | | | | 3/21/12 | | | | — | | | | (8,344 | ) |
Euro | | | DBAB | | | | Sell | | | | 714,000 | | | | 999,343 | | | | 4/05/12 | | | | 74,325 | | | | — | |
British Pound | | | DBAB | | | | Sell | | | | 1,089,000 | | | | 1,762,547 | | | | 4/11/12 | | | | 72,800 | | | | — | |
Indian Rupee | | | DBAB | | | | Buy | | | | 20,841,000 | | | | 444,845 | | | | 4/11/12 | | | | — | | | | (59,096 | ) |
Indian Rupee | | | DBAB | | | | Buy | | | | 44,691,000 | | | | 957,391 | | | | 4/13/12 | | | | — | | | | (130,456 | ) |
Chilean Peso | | | MSCO | | | | Buy | | | | 116,230,000 | | | | 236,120 | | | | 4/16/12 | | | | — | | | | (15,130 | ) |
Indian Rupee | | | JPHQ | | | | Buy | | | | 30,019,000 | | | | 641,432 | | | | 4/16/12 | | | | — | | | | (86,239 | ) |
Indian Rupee | | | JPHQ | | | | Buy | | | | 29,466,000 | | | | 625,871 | | | | 4/18/12 | | | | — | | | | (81,076 | ) |
Euro | | | DBAB | | | | Sell | | | | 1,888,220 | | | | 2,692,035 | | | | 4/19/12 | | | | 245,213 | | | | — | |
Indian Rupee | | | JPHQ | | | | Buy | | | | 14,719,000 | | | | 312,373 | | | | 4/19/12 | | | | — | | | | (40,276 | ) |
Indian Rupee | | | DBAB | | | | Buy | | | | 10,360,000 | | | | 219,352 | | | | 4/19/12 | | | | — | | | | (27,837 | ) |
Chilean Peso | | | MSCO | | | | Buy | | | | 104,150,000 | | | | 210,404 | | | | 4/20/12 | | | | — | | | | (12,446 | ) |
Euro | | | DBAB | | | | Sell | | | | 1,001,008 | | | | 1,416,527 | | | | 4/23/12 | | | | 119,301 | | | | — | |
FSI-29
Franklin Templeton Variable Insurance Products Trust
Statement of Investments, December 31, 2011 (continued)
| | | | | | |
| Franklin Strategic Income Securities Fund |
Forward Exchange Contracts (continued)
| | | | | | | | | | | | | | | | | | | | | | | | | | | | |
| Currency | | Counterparty | | | Type | | | Quantity | | | Contract
Amount* | | | Settlement
Date | | | Unrealized
Appreciation | | | Unrealized
Depreciation | |
Indian Rupee | | | DBAB | | | | Buy | | | | 20,931,000 | | | | 444,489 | | | | 4/26/12 | | | $ | — | | | $ | (57,980 | ) |
Singapore Dollar | | | DBAB | | | | Buy | | | | 6,168,500 | | | | 5,000,000 | | | | 4/26/12 | | | | — | | | | (242,123 | ) |
Chilean Peso | | | JPHQ | | | | Buy | | | | 234,301,000 | | | | 475,159 | | | | 4/27/12 | | | | — | | | | (30,073 | ) |
Indian Rupee | | | JPHQ | | | | Buy | | | | 17,801,000 | | | | 377,540 | | | | 4/27/12 | | | | — | | | | (48,880 | ) |
Chilean Peso | | | CITI | | | | Buy | | | | 377,668,000 | | | | 776,296 | | | | 4/30/12 | | | | — | | | | (59,039 | ) |
Indian Rupee | | | JPHQ | | | | Buy | | | | 14,829,000 | | | | 314,841 | | | | 4/30/12 | | | | — | | | | (41,181 | ) |
Chilean Peso | | | DBAB | | | | Buy | | | | 1,554,000,000 | | | | 3,233,458 | | | | 5/04/12 | | | | — | | | | (283,090 | ) |
Euro | | | DBAB | | | | Sell | | | | 180,000 | | | | 264,204 | | | | 5/04/12 | | | | 30,897 | | | | — | |
Philippine Peso | | | JPHQ | | | | Buy | | | | 91,360,000 | | | | 2,135,228 | | | | 5/04/12 | | | | — | | | | (65,286 | ) |
British Pound | | | DBAB | | | | Sell | | | | 913,406 | | | | 1,489,364 | | | | 5/10/12 | | | | 72,520 | | | | — | |
Euro | | | DBAB | | | | Sell | | | | 600,000 | | | | 844,476 | | | | 5/10/12 | | | | 66,711 | | | | — | |
Singapore Dollar | | | DBAB | | | | Buy | | | | 3,707,640 | | | | 3,000,000 | | | | 5/10/12 | | | | — | | | | (139,740 | ) |
Euro | | | DBAB | | | | Sell | | | | 429,000 | | | | 605,386 | | | | 5/11/12 | | | | 49,275 | | | | — | |
British Pound | | | DBAB | | | | Sell | | | | 2,287,500 | | | | 3,700,489 | | | | 5/17/12 | | | | 152,467 | | | | — | |
Indian Rupee | | | DBAB | | | | Buy | | | | 28,359,000 | | | | 594,279 | | | | 6/01/12 | | | | — | | | | (73,529 | ) |
Indian Rupee | | | HSBC | | | | Buy | | | | 32,771,000 | | | | 694,154 | | | | 6/04/12 | | | | — | | | | (92,666 | ) |
Euro | | | DBAB | | | | Sell | | | | 1,053,792 | | | | 1,505,279 | | | | 6/06/12 | | | | 138,679 | | | | — | |
Singapore Dollar | | | JPHQ | | | | Buy | | | | 4,945,200 | | | | 4,000,000 | | | | 6/06/12 | | | | — | | | | (183,766 | ) |
Euro | | | DBAB | | | | Sell | | | | 2,000,000 | | | | 2,831,300 | | | | 6/07/12 | | | | 237,578 | | | | — | |
Indian Rupee | | | DBAB | | | | Buy | | | | 20,889,000 | | | | 440,510 | | | | 6/07/12 | | | | — | | | | (57,286 | ) |
Indian Rupee | | | HSBC | | | | Buy | �� | | | 5,576,000 | | | | 118,412 | | | | 6/08/12 | | | | — | | | | (16,132 | ) |
Euro | | | DBAB | | | | Sell | | | | 937,500 | | | | 1,350,563 | | | | 6/11/12 | | | | 134,677 | | | | — | |
Indian Rupee | | | DBAB | | | | Buy | | | | 5,655,000 | | | | 120,038 | | | | 6/11/12 | | | | — | | | | (16,357 | ) |
Indian Rupee | | | HSBC | | | | Buy | | | | 14,080,000 | | | | 298,938 | | | | 6/13/12 | | | | — | | | | (40,871 | ) |
Indian Rupee | | | DBAB | | | | Buy | | | | 14,156,000 | | | | 299,852 | | | | 6/18/12 | | | | — | | | | (40,591 | ) |
Indian Rupee | | | DBAB | | | | Buy | | | | 12,894,000 | | | | 272,083 | | | | 6/20/12 | | | | — | | | | (36,008 | ) |
Euro | | | DBAB | | | | Sell | | | | 2,926,890 | | | | 3,846,449 | | | | 6/27/12 | | | | 49,453 | | | | — | |
Euro | | | UBSW | | | | Sell | | | | 4,274,000 | | | | 5,999,841 | | | | 6/29/12 | | | | 455,055 | | | | — | |
Japanese Yen | | | BOFA | | | | Sell | | | | 620,288,000 | | | | 8,001,909 | | | | 6/29/12 | | | | — | | | | (90,608 | ) |
British Pound | | | DBAB | | | | Sell | | | | 297,656 | | | | 474,018 | | | | 7/09/12 | | | | 12,604 | | | | — | |
Euro | | | DBAB | | | | Sell | | | | 2,065,396 | | | | 2,924,600 | | | | 7/09/12 | | | | 244,591 | | | | — | |
Indian Rupee | | | JPHQ | | | | Buy | | | | 192,280,000 | | | | 4,121,069 | | | | 7/16/12 | | | | — | | | | (612,407 | ) |
Euro | | | DBAB | | | | Sell | | | | 900,000 | | | | 1,280,340 | | | | 7/25/12 | | | | 112,165 | | | | — | |
Euro | | | BZWS | | | | Sell | | | | 3,140,000 | | | | 4,450,008 | | | | 8/01/12 | | | | 373,831 | | | | — | |
Euro | | | DBAB | | | | Sell | | | | 1,056,111 | | | | 1,501,209 | | | | 8/06/12 | | | | 130,093 | | | | — | |
Euro | | | CITI | | | | Sell | | | | 317,220 | | | | 445,361 | | | | 8/08/12 | | | | 33,508 | | | | — | |
British Pound | | | DBAB | | | | Sell | | | | 169,385 | | | | 275,589 | | | | 8/09/12 | | | | 13,106 | | | | — | |
Euro | | | CITI | | | | Sell | | | | 92,411 | | | | 130,027 | | | | 8/09/12 | | | | 10,046 | | | | — | |
Chilean Peso | | | JPHQ | | | | Buy | | | | 1,141,336,600 | | | | 2,333,745 | | | | 8/20/12 | | | | — | | | | (185,468 | ) |
Euro | | | DBAB | | | | Sell | | | | 193,056 | | | | 276,726 | | | | 8/20/12 | | | | 26,021 | | | | — | |
Japanese Yen | | | UBSW | | | | Sell | | | | 32,055,000 | | | | 420,228 | | | | 8/20/12 | | | | 1,433 | | | | — | |
Japanese Yen | | | JPHQ | | | | Sell | | | | 15,928,000 | | | | 208,359 | | | | 8/20/12 | | | | 261 | | | | — | |
Japanese Yen | | | DBAB | | | | Sell | | | | 19,550,000 | | | | 255,887 | | | | 8/20/12 | | | | 468 | | | | — | |
Japanese Yen | | | HSBC | | | | Sell | | | | 65,957,000 | | | | 865,478 | | | | 8/20/12 | | | | 3,757 | | | | — | |
Euro | | | UBSW | | | | Sell | | | | 3,500,000 | | | | 4,984,525 | | | | 8/22/12 | | | | 439,196 | | | | — | |
Euro | | | BZWS | | | | Sell | | | | 2,124,000 | | | | 3,043,692 | | | | 8/22/12 | | | | 285,327 | | | | — | |
Japanese Yen | | | MSCO | | | | Sell | | | | 12,500,000 | | | | 164,184 | | | | 8/22/12 | | | | 864 | | | | — | |
Japanese Yen | | | DBAB | | | | Sell | | | | 15,915,000 | | | | 209,026 | | | | 8/22/12 | | | | 1,086 | | | | — | |
Japanese Yen | | | BZWS | | | | Sell | | | | 15,895,000 | | | | 208,788 | | | | 8/22/12 | | | | 1,110 | | | | — | |
Euro | | | BZWS | | | | Sell | | | | 263,159 | | | | 378,423 | | | | 8/23/12 | | | | 36,661 | | | | — | |
Japanese Yen | | | FBCO | | | | Sell | | | | 31,524,000 | | | | 414,299 | | | | 8/23/12 | | | | 2,407 | | | | — | |
FSI-30
Franklin Templeton Variable Insurance Products Trust
Statement of Investments, December 31, 2011 (continued)
| | | | | | |
| Franklin Strategic Income Securities Fund |
Forward Exchange Contracts (continued)
| | | | | | | | | | | | | | | | | | | | | | | | | | | | |
| Currency | | Counterparty | | | Type | | | Quantity | | | Contract
Amount* | | | Settlement
Date | | | Unrealized
Appreciation | | | Unrealized
Depreciation | |
Japanese Yen | | | CITI | | | | Sell | | | | 31,757,000 | | | | 418,075 | | | | 8/23/12 | | | $ | 3,139 | | | $ | — | |
Japanese Yen | | | DBAB | | | | Sell | | | | 15,708,000 | | | | 207,130 | | | | 8/23/12 | | | | 1,890 | | | | — | |
Euro | | | BZWS | | | | Sell | | | | 441,303 | | | | 633,093 | | | | 8/24/12 | | | | 59,966 | | | | — | |
Japanese Yen | | | JPHQ | | | | Sell | | | | 31,689,000 | | | | 415,403 | | | | 8/24/12 | | | | 1,344 | | | | — | |
Euro | | | BZWS | | | | Sell | | | | 3,068,753 | | | | 4,414,138 | | | | 8/27/12 | | | | 428,475 | | | | — | |
Euro | | | DBAB | | | | Sell | | | | 298,304 | | | | 429,901 | | | | 8/27/12 | | | | 42,467 | | | | — | |
Japanese Yen | | | BZWS | | | | Sell | | | | 44,152,000 | | | | 578,929 | | | | 8/27/12 | | | | 1,977 | | | | — | |
Japanese Yen | | | DBAB | | | | Sell | | | | 427,099,000 | | | | 5,620,315 | | | | 8/27/12 | | | | 39,243 | | | | — | |
Japanese Yen | | | UBSW | | | | Sell | | | | 34,903,000 | | | | 459,054 | | | | 8/27/12 | | | | 2,962 | | | | — | |
Japanese Yen | | | JPHQ | | | | Sell | | | | 15,991,000 | | | | 210,270 | | | | 8/27/12 | | | | 1,309 | | | | — | |
Japanese Yen | | | HSBC | | | | Sell | | | | 50,145,000 | | | | 657,855 | | | | 8/27/12 | | | | 2,590 | | | | — | |
United States Dollar | | | UBSW | | | | Buy | | | | 3,000,000 | | | | 2,085,332 | EUR | | | 8/27/12 | | | | 291,593 | | | | — | |
Euro | | | DBAB | | | | Sell | | | | 1,383,356 | | | | 1,980,412 | | | | 8/29/12 | | | | 183,656 | | | | — | |
Euro | | | DBAB | | | | Sell | | | | 690,000 | | | | 991,530 | | | | 8/30/12 | | | | 95,314 | | | | — | |
Japanese Yen | | | BZWS | | | | Sell | | | | 37,600,000 | | | | 493,438 | | | | 8/30/12 | | | | 2,064 | | | | — | |
Euro | | | DBAB | | | | Sell | | | | 12,470 | | | | 18,035 | | | | 8/31/12 | | | | 1,838 | | | | — | |
Japanese Yen | | | JPHQ | | | | Sell | | | | 15,743,000 | | | | 206,317 | | | | 8/31/12 | | | | 574 | | | | — | |
Euro | | | BZWS | | | | Sell | | | | 271,320 | | | | 380,960 | | | | 9/10/12 | | | | 28,479 | | | | — | |
Euro | | | BZWS | | | | Sell | | | | 266,006 | | | | 371,876 | | | | 9/12/12 | | | | 26,285 | | | | — | |
Euro | | | BZWS | | | | Sell | | | | 759,073 | | | | 1,038,279 | | | | 9/14/12 | | | | 52,065 | | | | — | |
Euro | | | UBSW | | | | Sell | | | | 708,181 | | | | 970,704 | | | | 9/17/12 | | | | 50,557 | | | | — | |
Euro | | | BZWS | | | | Sell | | | | 178,354 | | | | 247,234 | | | | 9/19/12 | | | | 15,488 | | | | — | |
Euro | | | BZWS | | | | Sell | | | | 469,210 | | | | 638,370 | | | | 9/24/12 | | | | 28,639 | | | | — | |
Euro | | | DBAB | | | | Sell | | | | 185,654 | | | | 249,909 | | | | 10/04/12 | | | | 8,605 | | | | — | |
Philippine Peso | | | DBAB | | | | Buy | | | | 21,010,000 | | | | 482,434 | | | | 10/04/12 | | | | — | | | | (8,916 | ) |
Philippine Peso | | | HSBC | | | | Buy | | | | 16,853,000 | | | | 382,319 | | | | 10/04/12 | | | | — | | | | (2,490 | ) |
Euro | | | UBSW | | | | Sell | | | | 2,850,000 | | | | 3,797,696 | | | | 10/05/12 | | | | 93,323 | | | | — | |
Philippine Peso | | | DBAB | | | | Buy | | | | 25,119,000 | | | | 576,785 | | | | 10/05/12 | | | | — | | | | (10,667 | ) |
Philippine Peso | | | HSBC | | | | Buy | | | | 25,126,000 | | | | 566,398 | | | | 10/05/12 | | | | — | | | | (122 | ) |
Philippine Peso | | | DBAB | | | | Buy | | | | 20,621,000 | | | | 473,774 | | | | 10/09/12 | | | | — | | | | (9,052 | ) |
Philippine Peso | | | JPHQ | | | | Buy | | | | 6,636,000 | | | | 152,132 | | | | 10/09/12 | | | | — | | | | (2,581 | ) |
Euro | | | BZWS | | | | Sell | | | | 2,749,000 | | | | 3,645,641 | | | | 10/11/12 | | | | 72,097 | | | | — | |
Philippine Peso | | | HSBC | | | | Buy | | | | 24,786,000 | | | | 569,911 | | | | 10/11/12 | | | | — | | | | (11,339 | ) |
Philippine Peso | | | DBAB | | | | Buy | | | | 16,501,000 | | | | 379,072 | | | | 10/11/12 | | | | — | | | | (7,209 | ) |
Philippine Peso | | | JPHQ | | | | Buy | | | | 8,232,000 | | | | 188,721 | | | | 10/11/12 | | | | — | | | | (3,206 | ) |
Philippine Peso | | | DBAB | | | | Buy | | | | 4,913,000 | | | | 112,554 | | | | 10/12/12 | | | | — | | | | (1,838 | ) |
Euro | | | DBAB | | | | Sell | | | | 121,043 | | | | 166,845 | | | | 10/15/12 | | | | 9,483 | | | | — | |
Philippine Peso | | | JPHQ | | | | Buy | | | | 18,311,000 | | | | 420,018 | | | | 10/15/12 | | | | — | | | | (7,386 | ) |
Philippine Peso | | | HSBC | | | | Buy | | | | 8,192,000 | | | | 187,739 | | | | 10/15/12 | | | | — | | | | (3,135 | ) |
Euro | | | DBAB | | | | Sell | | | | 587,951 | | | | 811,125 | | | | 10/18/12 | | | | 46,710 | | | | — | |
Japanese Yen | | | DBAB | | | | Sell | | | | 382,080,000 | | | | 5,015,687 | | | | 10/22/12 | | | | 14,903 | | | | — | |
Philippine Peso | | | JPHQ | | | | Buy | | | | 237,550,000 | | | | 5,469,721 | | | | 10/22/12 | | | | — | | | | (117,085 | ) |
Euro | | | BZWS | | | | Sell | | | | 217,715 | | | | 299,162 | | | | 10/24/12 | | | | 16,068 | | | | — | |
Euro | | | BZWS | | | | Sell | | | | 1,659,340 | | | | 2,302,168 | | | | 10/25/12 | | | | 144,488 | | | | — | |
Euro | | | CITI | | | | Sell | | | | 648,569 | | | | 902,918 | | | | 10/26/12 | | | | 59,551 | | | | — | |
Euro | | | BZWS | | | | Sell | | | | 1,993,000 | | | | 2,759,886 | | | | 10/26/12 | | | | 168,286 | | | | — | |
Japanese Yen | | | JPHQ | | | | Sell | | | | 270,990,000 | | | | 3,577,355 | | | | 10/26/12 | | | | 30,128 | | | | — | |
Euro | | | UBSW | | | | Sell | | | | 2,679,000 | | | | 3,729,168 | | | | 10/29/12 | | | | 245,307 | | | | — | |
Euro | | | DBAB | | | | Sell | | | | 1,494,524 | | | | 2,106,995 | | | | 10/31/12 | | | | 163,385 | | | | — | |
Japanese Yen | | | JPHQ | | | | Sell | | | | 360,360,000 | | | | 4,785,340 | | | | 10/31/12 | | | | 67,564 | | | | — | |
Euro | | | DBAB | | | | Sell | | | | 243,767 | | | | 339,065 | | | | 11/02/12 | | | | 22,036 | | | | — | |
FSI-31
Franklin Templeton Variable Insurance Products Trust
Statement of Investments, December 31, 2011 (continued)
| | | | | | |
| Franklin Strategic Income Securities Fund |
Forward Exchange Contracts (continued)
| | | | | | | | | | | | | | | | | | | | | | | | | | | | |
| Currency | | Counterparty | | | Type | | | Quantity | | | Contract
Amount* | | | Settlement
Date | | | Unrealized
Appreciation | | | Unrealized
Depreciation | |
Euro | | | BZWS | | | | Sell | | | | 529,706 | | | | 730,253 | | | | 11/05/12 | | | $ | 41,304 | | | $ | — | |
Euro | | | BZWS | | | | Sell | | | | 473,670 | | | | 651,367 | | | | 11/08/12 | | | | 35,262 | | | | — | |
Euro | | | BZWS | | | | Sell | | | | 227,970 | | | | 311,031 | | | | 11/15/12 | | | | 14,466 | | | | — | |
Euro | | | UBSW | | | | Sell | | | | 1,480,440 | | | | 2,011,770 | | | | 11/19/12 | | | | 85,709 | | | | — | |
Euro | | | BZWS | | | | Sell | | | | 63,419 | | | | 86,938 | | | | 11/19/12 | | | | 4,429 | | | | — | |
Euro | | | BZWS | | | | Sell | | | | 221,993 | | | | 301,245 | | | | 11/21/12 | | | | 12,418 | | | | — | |
Euro | | | BZWS | | | | Sell | | | | 201,376 | | | | 273,328 | | | | 11/23/12 | | | | 11,314 | | | | — | |
Euro | | | UBSW | | | | Sell | | | | 2,020,000 | | | | 2,731,444 | | | | 12/03/12 | | | | 102,642 | | | | — | |
Japanese Yen | | | BZWS | | | | Sell | | | | 257,790,000 | | | | 3,343,580 | | | | 12/06/12 | | | | — | | | | (35,006 | ) |
Euro | | | DBAB | | | | Sell | | | | 5,466,617 | | | | 7,331,882 | | | | 12/10/12 | | | | 216,653 | | | | — | |
Euro | | | UBSW | | | | Sell | | | | 3,400,000 | | | | 4,552,566 | | | | 12/10/12 | | | | 127,201 | | | | — | |
Japanese Yen | | | UBSW | | | | Sell | | | | 351,760,000 | | | | 4,586,778 | | | | 12/12/12 | | | | — | | | | (24,206 | ) |
British Pound | | | DBAB | | | | Sell | | | | 600,000 | | | | 922,440 | | | | 12/17/12 | | | | — | | | | (6,200 | ) |
Euro | | | DBAB | | | | Sell | | | | 486,875 | | | | 639,705 | | | | 12/17/12 | | | | 5,906 | | | | — | |
Euro | | | CITI | | | | Sell | | | | 3,868,000 | | | | 5,051,879 | | | | 12/17/12 | | | | 16,636 | | | | — | |
Euro | | | DBAB | | | | Sell | | | | 262,167 | | | | 343,177 | | | | 12/20/12 | | | | 1,874 | | | | — | |
Euro | | | UBSW | | | | Sell | | | | 2,137,312 | | | | 2,799,559 | | | | 12/20/12 | | | | 17,098 | | | | — | |
| | | | | | | | | | | | | | | | | | | | | | | | |
Unrealized appreciation (depreciation) | | | | 8,120,202 | | | | (5,284,253 | ) |
| | | | | | | | | | | | | | | | | | | | | | | | |
Net unrealized appreciation (depreciation) | | | $ | 2,835,949 | | | | | |
| | | | | | | | | | | | | | | | | | | | | | | | | | | | |
*In U.S. dollars unless otherwise indicated.
At December 31, 2011, the Fund had the following credit default swap contracts outstanding. See Note 1(d).
Credit Default Swap Contracts
| | | | | | | | | | | | | | | | | | | | | | | | | | | | | | | | | | |
| Description | | Counter-
partya | | | Notional
Amountb | | | Periodic
Payment
Rate | | | Expiration
Date | | | Upfront
Premiums
Paid
(Received) | | | Unrealized
Appreciation | | | Unrealized
Depreciation | | | Market
Value | | | Ratingc |
Contracts to Sell Protectiond | | | | | | | | | | | | | | | | | | | | | | | | | | | |
Traded Index | | | | | | | | | | | | | | | | | | | | | | | | | | | | | | | | | | |
CDX.NA.HY.17 | | | GSCO | | | $ | 34,300,000 | | | | 5.00% | | | | 12/20/16 | | | $ | (3,118,516 | ) | | $ | 776,779 | | | $ | — | | | $ | (2,341,737 | ) | | Non Investment
Grade |
| | | | | | | | | | | | | | | | | | | | | | | | | | | | | | |
Net unrealized appreciation (depreciation) | | | $ | 776,779 | | | | | | | | | | | |
| | | | | | | | | | | | | | | | | | | | | | | | | | | | | | | | | | |
aPositions are generally not collateralized if the market value is under $250,000. Collateral requirements may be net of current positions at the individual counterparty for the fund. The table below summarizes the cash and/or securities held as collateral for each applicable counterparty at year end:
| | | | |
| Counterparty | | Collateral Posted (Received) | |
GSCO | | $ | 2,520,000 | |
| | | | |
bIn U.S. dollars unless otherwise indicated. For contracts to sell protection, the notional amount is equal to the maximum potential amount of the future payments and no recourse provisions have been entered into in association with the contracts.
cBased on Standard and Poor’s (S&P) Rating for single name swaps and internal ratings for index swaps. Internal ratings based on mapping into equivalent ratings from external vendors.
dThe fund enters contracts to sell protection to create a long credit position. Performance triggers include failure to pay or bankruptcy for traded index swaps.
See Abbreviations on page 47.
The accompanying notes are an integral part of these financial statements.
FSI-32
Franklin Templeton Variable Insurance Products Trust
Financial Statements
Statement of Assets and Liabilities
December 31, 2011
| | | | |
| | | Franklin
Strategic Income
Securities Fund | |
Assets: | | | | |
Investments in securities: | | | | |
Cost - Unaffiliated issuers | | $ | 1,284,412,709 | |
Cost - Sweep Money Fund (Note 7) | | | 61,664,899 | |
| | | | |
Total cost of investments | | $ | 1,346,077,608 | |
| | | | |
Value - Unaffiliated issuers | | $ | 1,275,990,254 | |
Value - Sweep Money Fund (Note 7) | | | 61,664,899 | |
| | | | |
Total value of investments | | | 1,337,655,153 | |
Cash | | | 847,366 | |
Restricted cash (Note 1h) | | | 3,195,000 | |
Foreign currency, at value (cost $7,031,003) | | | 7,047,028 | |
Receivables: | | | | |
Investment securities sold | | | 2,652,552 | |
Capital shares sold | | | 900,182 | |
Interest | | | 17,023,682 | |
Due from brokers | | | 4,800,000 | |
Unrealized appreciation on forward exchange contracts | | | 8,120,202 | |
Unrealized appreciation on swap contracts | | | 776,779 | |
Other assets | | | 38 | |
| | | | |
Total assets | | | 1,383,017,982 | |
| | | | |
Liabilities: | | | | |
Payables: | | | | |
Investment securities purchased | | | 12,518,170 | |
Capital shares redeemed | | | 883,253 | |
Affiliates | | | 789,323 | |
Due to brokers | | | 3,195,000 | |
Swaps (premiums received $3,279,938) | | | 3,118,516 | |
Unrealized depreciation on forward exchange contracts | | | 5,284,253 | |
Unrealized depreciation on unfunded loan commitments (Note 9) | | | 3,519 | |
Deferred tax | | | 276,888 | |
Accrued expenses and other liabilities | | | 723,306 | |
| | | | |
Total liabilities | | | 26,792,228 | |
| | | | |
Net assets, at value | | $ | 1,356,225,754 | |
| | | | |
Net assets consist of: | | | | |
Paid-in capital | | $ | 1,276,208,900 | |
Undistributed net investment income | | | 84,105,225 | |
Net unrealized appreciation (depreciation) | | | (5,363,380 | ) |
Accumulated net realized gain (loss) | | | 1,275,009 | |
| | | | |
Net assets, at value | | $ | 1,356,225,754 | |
| | | | |
The accompanying notes are an integral part of these financial statements.
FSI-33
Franklin Templeton Variable Insurance Products Trust
Financial Statements (continued)
Statement of Assets and Liabilities (continued)
December 31, 2011
| | | | |
| | | Franklin
Strategic Income
Securities Fund | |
Class 1: | | | | |
Net assets, at value | | $ | 1,043,689,988 | |
| | | | |
Shares outstanding | | | 83,136,790 | |
| | | | |
Net asset value and maximum offering price per share | | $ | 12.55 | |
| | | | |
Class 2: | | | | |
Net assets, at value | | $ | 123,749,477 | |
| | | | |
Shares outstanding | | | 10,086,825 | |
| | | | |
Net asset value and maximum offering price per share | | $ | 12.27 | |
| | | | |
Class 4: | | | | |
Net assets, at value | | $ | 188,786,289 | |
| | | | |
Shares outstanding | | | 15,177,270 | |
| | | | |
Net asset value and maximum offering price per share | | $ | 12.44 | |
| | | | |
The accompanying notes are an integral part of these financial statements.
FSI-34
Franklin Templeton Variable Insurance Products Trust
Financial Statements (continued)
Statement of Operations
for the year ended December 31, 2011
| | | | |
| | | Franklin
Strategic Income
Securities Fund | |
Investment income: | | | | |
Dividends | | $ | 62,486 | |
Interest | | | 85,886,794 | |
| | | | |
Total investment income | | | 85,949,280 | |
| | | | |
Expenses: | | | | |
Management fees (Note 3a) | | | 4,911,675 | |
Administrative fees (Note 3b) | | | 2,884,139 | |
Distribution fees: (Note 3c) | | | | |
Class 2 | | | 291,663 | |
Class 4 | | | 677,463 | |
Unaffiliated transfer agent fees | | | 1,640 | |
Custodian fees (Note 4) | | | 336,834 | |
Reports to shareholders | | | 341,770 | |
Professional fees | | | 85,026 | |
Trustees’ fees and expenses | | | 5,488 | |
Other | | | 72,858 | |
| | | | |
Total expenses | | | 9,608,556 | |
Expense reductions (Note 4) | | | (13 | ) |
| | | | |
Net expenses | | | 9,608,543 | |
| | | | |
Net investment income | | | 76,340,737 | |
| | | | |
Realized and unrealized gains (losses): | | | | |
Net realized gain (loss) from: | | | | |
Investments | | | 39,350,684 | |
Foreign currency transactions | | | (3,783,546 | ) |
Swap contracts | | | (2,052,379 | ) |
| | | | |
Net realized gain (loss) | | | 33,514,759 | |
| | | | |
Net change in unrealized appreciation (depreciation) on: | | | | |
Investments | | | (72,662,023 | ) |
Translation of other assets and liabilities denominated in foreign currencies | | | 1,856,972 | |
Change in deferred taxes on unrealized appreciation | | | (276,888 | ) |
| | | | |
Net change in unrealized appreciation (depreciation) | | | (71,081,939 | ) |
| | | | |
Net realized and unrealized gain (loss) | | | (37,567,180 | ) |
| | | | |
Net increase (decrease) in net assets resulting from operations | | $ | 38,773,557 | |
| | | | |
The accompanying notes are an integral part of these financial statements.
FSI-35
Franklin Templeton Variable Insurance Products Trust
Financial Statements (continued)
Statements of Changes in Net Assets
| | | | | | | | |
| | | Franklin Strategic Income
Securities Fund | |
| | | Year Ended December 31, | |
| | | 2011 | | | 2010 | |
| | | | |
Increase (decrease) in net assets: | | | | | | | | |
Operations: | | | | | | | | |
Net investment income | | $ | 76,340,737 | | | $ | 82,801,087 | |
Net realized gain (loss) from investments, foreign currency transactions and swap contracts | | | 33,514,759 | | | | 57,948,653 | |
Net change in unrealized appreciation (depreciation) on investments, translation of other assets and liabilities denominated in foreign currencies and deferred taxes | | | (71,081,939 | ) | | | 13,730,001 | |
| | | | |
Net increase (decrease) in net assets resulting from operations | | | 38,773,557 | | | | 154,479,741 | |
| | | | |
Distributions to shareholders from and net foreign currency gains: | | | | | | | | |
Net investment income: | | | | | | | | |
Class 1 | | | (69,631,166 | ) | | | (57,255,268 | ) |
Class 2 | | | (7,304,903 | ) | | | (3,841,288 | ) |
Class 4 | | | (11,235,444 | ) | | | (8,302,315 | ) |
| | | | |
Total distributions to shareholders | | | (88,171,513 | ) | | | (69,398,871 | ) |
| | | | |
Capital share transactions: (Note 2) | | | | | | | | |
Class 1 | | | (114,013,494 | ) | | | (48,613,654 | ) |
Class 2 | | | 27,304,975 | | | | 28,343,361 | |
Class 4 | | | 7,657,719 | | | | 16,237,324 | |
| | | | |
Total capital share transactions | | | (79,050,800 | ) | | | (4,032,969 | ) |
| | | | |
Net increase (decrease) in net assets | | | (128,448,756 | ) | | | 81,047,901 | |
Net assets: | | | | | | | | |
Beginning of year | | | 1,484,674,510 | | | | 1,403,626,609 | |
| | | | |
End of year | | $ | 1,356,225,754 | | | $ | 1,484,674,510 | |
| | | | |
Undistributed net investment income included in net assets: | | | | | | | | |
End of year | | $ | 84,105,225 | | | $ | 83,363,411 | |
| | | | |
The accompanying notes are an integral part of these financial statements.
FSI-36
Franklin Templeton Variable Insurance Products Trust
Notes to Financial Statements
Franklin Strategic Income Securities Fund
1. ORGANIZATION AND SIGNIFICANT ACCOUNTING POLICIES
Franklin Templeton Variable Insurance Products Trust (Trust) is registered under the Investment Company Act of 1940, as amended, (1940 Act) as an open-end investment company, consisting of twenty separate funds. The Franklin Strategic Income Securities Fund (Fund) is included in this report. The financial statements of the remaining funds in the Trust are presented separately. Shares of the Fund are generally sold only to insurance company separate accounts to fund the benefits of variable life insurance policies or variable annuity contracts. At December 31, 2011, 91.92% of the Fund’s shares were held through one insurance company. The Fund offers three classes of shares: Class 1, Class 2, and Class 4. Each class of shares differs by its distribution fees, voting rights on matters affecting a single class and its exchange privilege.
The following summarizes the Fund’s significant accounting policies.
a. Financial Instrument Valuation
The Fund’s investments in securities and other financial instruments are carried at fair value daily. Fair value is the price that would be received to sell an asset or paid to transfer a liability in an orderly transaction between market participants on the measurement date. Under procedures approved by the Trust’s Board of Trustees, the Fund may utilize independent pricing services, quotations from securities and financial instrument dealers, and other market sources to determine fair value.
Equity securities listed on an exchange or on the NASDAQ National Market System are valued at the last quoted sale price or the official closing price of the day, respectively. Over-the-counter securities are valued within the range of the most recent quoted bid and ask prices. Securities that trade in multiple markets or on multiple exchanges are valued according to the broadest and most representative market. Certain equity securities are valued based upon fundamental characteristics or relationships to similar securities. Investments in open-end mutual funds are valued at the closing net asset value.
Debt securities generally trade in the over-the-counter market rather than on a securities exchange. The Fund’s pricing services use multiple valuation techniques to determine fair value. In instances where sufficient market activity exists, the pricing services may utilize a market-based approach through which quotes from market makers are used to determine fair value. In instances where sufficient market activity may not exist or is limited, the pricing services also utilize proprietary valuation models which may consider market characteristics such as benchmark yield curves, option-adjusted spreads, credit spreads, estimated default rates, coupon rates, anticipated timing of principal repayments, underlying collateral, and other unique security features in order to estimate the relevant cash flows, which are then discounted to calculate the fair value. Securities denominated in a foreign currency are converted into their U.S. dollar equivalent at the foreign exchange rate in effect at the close of the NYSE on the date that the values of the foreign debt securities are determined.
Certain derivative financial instruments (derivatives) trade in the over-the-counter market. The Fund’s pricing services use various techniques including industry standard option pricing models and proprietary discounted cash flow models to determine the fair value of those instruments. The Fund’s net benefit or obligation under the derivative contract, as measured by the fair market value of the contract, is included in net assets.
The Fund has procedures to determine the fair value of securities and other financial instruments for which market prices are not readily available or which may not be reliably priced. Under these procedures, the Fund primarily employs a market-based approach which may use related or comparable assets or liabilities, recent transactions, market multiples, book values, and other relevant information for the investment to determine the fair value of the investment. The Fund may also use an income-based valuation approach in which the anticipated future cash flows of the investment are discounted to calculate fair value. Discounts may also be applied due to the nature or duration of any restrictions on the disposition of the investments. Due to the inherent uncertainty of valuations of such investments, the fair values may differ significantly from the values that would have been used had an active market existed.
FSI-37
Franklin Templeton Variable Insurance Products Trust
Notes to Financial Statements (continued)
Franklin Strategic Income Securities Fund
1. ORGANIZATION AND SIGNIFICANT ACCOUNTING POLICIES (continued)
b. Foreign Currency Translation
Portfolio securities and other assets and liabilities denominated in foreign currencies are translated into U.S. dollars based on the exchange rate of such currencies against U.S. dollars on the date of valuation. The Fund may enter into foreign currency exchange contracts to facilitate transactions denominated in a foreign currency. Purchases and sales of securities, income and expense items denominated in foreign currencies are translated into U.S. dollars at the exchange rate in effect on the transaction date. Portfolio securities and assets and liabilities denominated in foreign currencies contain risks that those currencies will decline in value relative to the U.S. dollar. Occasionally, events may impact the availability or reliability of foreign exchange rates used to convert the U.S. dollar equivalent value. If such an event occurs, the foreign exchange rate will be valued at fair value using procedures established and approved by the Trust’s Board of Trustees.
The Fund does not separately report the effect of changes in foreign exchange rates from changes in market prices on securities held. Such changes are included in net realized and unrealized gain or loss from investments on the Statement of Operations.
Realized foreign exchange gains or losses arise from sales of foreign currencies, currency gains or losses realized between the trade and settlement dates on securities transactions and the difference between the recorded amounts of dividends, interest, and foreign withholding taxes and the U.S. dollar equivalent of the amounts actually received or paid. Net unrealized foreign exchange gains and losses arise from changes in foreign exchange rates on foreign denominated assets and liabilities other than investments in securities held at the end of the reporting period.
c. Securities Purchased on a Delayed Delivery Basis
The Fund purchases securities on a delayed delivery basis, with payment and delivery scheduled for a future date. These transactions are subject to market fluctuations and are subject to the risk that the value at delivery may be more or less than the trade date purchase price. Although the Fund will generally purchase these securities with the intention of holding the securities, it may sell the securities before the settlement date. Sufficient assets have been segregated for these securities.
d. Derivative Financial Instruments
The Fund invested in derivatives in order to manage risk or gain exposure to various other investments or markets. Derivatives are financial contracts based on an underlying or notional amount, require no initial investment or an initial net investment that is smaller than would normally be required to have a similar response to changes in market factors, and require or permit net settlement. Derivatives contain various risks including the potential inability of the counterparty to fulfill their obligations under the terms of the contract, the potential for an illiquid secondary market, and/or the potential for market movements which expose the Fund to gains or losses in excess of the amounts shown on the Statement of Assets and Liabilities. Realized gain and loss and unrealized appreciation and depreciation on these contracts for the period are included in the Statement of Operations.
The Fund entered into forward exchange contracts primarily to manage and/or gain exposure to certain foreign currencies. A forward exchange contract is an agreement between the Fund and a counterparty to buy or sell a foreign currency for a specific exchange rate on a future date. Pursuant to the terms of the forward exchange contracts, cash or securities may be required to be deposited as collateral. Unrestricted cash may be invested according to the Fund’s investment objectives.
The Fund entered into credit default swap contracts primarily to manage and/or gain exposure to credit risk. A credit default swap is an agreement between the Fund and a counterparty whereby the buyer of the contract receives credit protection and the seller of the contract guarantees the credit worthiness of a referenced debt obligation. The underlying referenced debt obligation may be a single issuer of corporate or sovereign debt, a credit index, or a tranche of a credit index. In the event of a default of the underlying referenced debt obligation, the buyer is entitled to receive the notional amount of the credit default swap contract from the seller in exchange for the referenced debt obligation, a net settlement amount equal to the notional amount of the credit
FSI-38
Franklin Templeton Variable Insurance Products Trust
Notes to Financial Statements (continued)
Franklin Strategic Income Securities Fund
1. ORGANIZATION AND SIGNIFICANT ACCOUNTING POLICIES (continued)
d. Derivative Financial Instruments (continued)
default swap less the recovery value of the referenced debt obligation, or other agreed upon amount. Over the term of the contract, the buyer pays the seller a periodic stream of payments, provided that no event of default has occurred. Such periodic payments are accrued daily as an unrealized appreciation or depreciation until the payments are made, at which time they are realized. Payments received or paid to initiate a credit default swap contract are reflected on the Statement of Assets and Liabilities and represent compensating factors between stated terms of the credit default swap agreement and prevailing market conditions (credit spreads and other relevant factors). These upfront payments are amortized over the term of the contract as a realized gain or loss on the Statement of Operations. Pursuant to the terms of the credit default swap contract, cash or securities may be required to be deposited as collateral. Unrestricted cash may be invested according to the Fund’s investment objectives.
At December 31, 2011, the Fund holds $2,230,469 in U.S. treasury notes as collateral for derivatives.
See Note 10 regarding other derivative information.
e. FT Holdings Corporation III
The Fund invests in certain securities through its investment in FT Holdings Corporation III, a Delaware Corporation and a wholly-owned subsidiary (Subsidiary) of the Fund. The Subsidiary has the ability to invest in securities consistent with the investment objective of the Fund. At December 31, 2011, all Subsidiary investments as well as any other assets and liabilities are reflected in the Fund’s Statement of Investments and Statement of Assets and Liabilities. All income and expenses of the Subsidiary during the period ended December 31, 2011, have been included in the Fund’s Statement of Operations.
f. Mortgage Dollar Rolls
The Fund enters into mortgage dollar rolls, typically on a TBA basis. Mortgage dollar rolls are agreements between the Fund and a financial institution to simultaneously sell and repurchase mortgage-backed securities at a future date. Gains or losses are realized on the initial sale, and the difference between the repurchase price and the sale price is recorded as an unrealized gain or loss to the fund upon entering into the mortgage dollar roll. In addition, the Fund may invest the cash proceeds that are received from the initial sale. During the period between the sale and repurchase, the Fund is not entitled to principal and interest paid on the mortgage backed securities. The risks of mortgage dollar roll transactions include the potential inability of the counterparty to fulfill its obligations.
g. Senior Floating Rate Interests
The Fund invests in senior secured corporate loans that pay interest at rates which are periodically reset by reference to a base lending rate plus a spread. These base lending rates are generally the prime rate offered by a designated U.S. bank or the London InterBank Offered Rate (LIBOR). Senior secured corporate loans often require prepayment of principal from excess cash flows or at the discretion of the borrower. As a result, actual maturity may be substantially less than the stated maturity.
Senior secured corporate loans in which the Fund invests are generally readily marketable, but may be subject to some restrictions on resale.
h. Restricted Cash
At December 31, 2011, the Fund held restricted cash in connection with investments in certain derivative securities. Restricted cash is held in a segregated account with the Fund’s custodian/counterparty broker and is reflected in the Statement of Assets and Liabilities.
FSI-39
Franklin Templeton Variable Insurance Products Trust
Notes to Financial Statements (continued)
Franklin Strategic Income Securities Fund
1. ORGANIZATION AND SIGNIFICANT ACCOUNTING POLICIES (continued)
i. Income Taxes
It is the Fund’s policy to qualify as a regulated investment company under the Internal Revenue Code. The Fund intends to distribute to shareholders substantially all of its taxable income and net realized gains to relieve it from federal income and excise taxes. As a result, no provision for U.S. federal income taxes is required.
The Fund may be subject to foreign taxation related to income received, capital gains on the sale of securities and certain foreign currency transactions in the foreign jurisdictions in which it invests. Foreign taxes, if any, are recorded based on the tax regulations and rates that exist in the foreign markets in which the Fund invests. When a capital gain tax is determined to apply the Fund records an estimated deferred tax liability in an amount that would be payable if the securities were disposed of on the valuation date.
The Fund recognizes the tax benefits of uncertain tax positions only when the position is “more likely than not” to be sustained upon examination by the tax authorities based on the technical merits of the tax position. As of December 31, 2011, and for all open tax years, the Fund has determined that no liability for unrecognized tax benefits is required in the Fund’s financial statements related to uncertain tax positions taken on a tax return (or expected to be taken on future tax returns). Open tax years are those that remain subject to examination and are based on each tax jurisdiction statute of limitation.
j. Security Transactions, Investment Income, Expenses and Distributions
Security transactions are accounted for on trade date. Realized gains and losses on security transactions are determined on a specific identification basis. Interest income and estimated expenses are accrued daily. Amortization of premium and accretion of discount on debt securities are included in interest income. Facility fees are recognized as income over the expected term of the loan. Distributions to shareholders are recorded on the ex-dividend date and are determined according to income tax regulations (tax basis). Dividend income is recorded on the ex-dividend date. Distributable earnings determined on a tax basis may differ from earnings recorded in accordance with accounting principles generally accepted in the United States of America. These differences may be permanent or temporary. Permanent differences are reclassified among capital accounts to reflect their tax character. These reclassifications have no impact on net assets or the results of operations. Temporary differences are not reclassified, as they may reverse in subsequent periods.
Common expenses incurred by the Trust are allocated among the funds based on the ratio of net assets of each fund to the combined net assets of the Trust. Fund specific expenses are charged directly to the fund that incurred the expense.
Realized and unrealized gains and losses and net investment income, not including class specific expenses, are allocated daily to each class of shares based upon the relative proportion of net assets of each class. Differences in per share distributions, by class, are generally due to differences in class specific expenses.
Inflation-indexed bonds are adjusted for inflation through periodic increases or decreases in the security’s interest accruals, face amount, or principal redemption value, by amounts corresponding to the rate of inflation as measured by an index. Any increase or decrease in the face amount or principal redemption value will be included as interest income on the Statement of Operations.
k. Accounting Estimates
The preparation of financial statements in accordance with accounting principles generally accepted in the United States of America requires management to make estimates and assumptions that affect the reported amounts of assets and liabilities at the date of the financial statements and the amounts of income and expenses during the reporting period. Actual results could differ from those estimates.
FSI-40
Franklin Templeton Variable Insurance Products Trust
Notes to Financial Statements (continued)
Franklin Strategic Income Securities Fund
1. ORGANIZATION AND SIGNIFICANT ACCOUNTING POLICIES (continued)
l. Guarantees and Indemnifications
Under the Trust’s organizational documents, its officers and trustees are indemnified by the Trust against certain liabilities arising out of the performance of their duties to the Trust. Additionally, in the normal course of business, the Trust, on behalf of the Fund, enters into contracts with service providers that contain general indemnification clauses. The Trust’s maximum exposure under these arrangements is unknown as this would involve future claims that may be made against the Trust that have not yet occurred. Currently, the Trust expects the risk of loss to be remote.
2. SHARES OF BENEFICIAL INTEREST
At December 31, 2011, there were an unlimited number of shares authorized (without par value). Transactions in the Fund’s shares were as follows:
| | | | | | | | | | | | | | | | |
| | | Year Ended December 31, | |
| | | 2011 | | | 2010 | |
| Class 1 Shares: | | Shares | | | Amount | | | Shares | | | Amount | |
Shares sold | | | 2,569,621 | | | $ | 33,265,626 | | | | 4,513,968 | | | $ | 56,940,927 | |
Shares issued in reinvestment of distributions | | | 5,474,148 | | | | 69,631,166 | | | | 4,747,535 | | | | 57,255,268 | |
Shares redeemed | | | (16,887,770 | ) | | | (216,910,286 | ) | | | (12,820,410 | ) | | | (162,809,849 | ) |
| | | | |
Net increase (decrease) | | | (8,844,001 | ) | | $ | (114,013,494 | ) | | | (3,558,907 | ) | | $ | (48,613,654 | ) |
| | | | |
Class 2 Shares: | | | | | | | | | | | | | | | | |
Shares sold | | | 3,778,943 | | | $ | 48,008,160 | | | | 3,451,058 | | | $ | 42,785,482 | |
Shares issued in reinvestment of distributions | | | 586,739 | | | | 7,304,903 | | | | 324,982 | | | | 3,841,288 | |
Shares redeemed | | | (2,243,563 | ) | | | (28,008,088 | ) | | | (1,474,432 | ) | | | (18,283,409 | ) |
| | | | |
Net increase (decrease) | | | 2,122,119 | | | $ | 27,304,975 | | | | 2,301,608 | | | $ | 28,343,361 | |
| | | | |
Class 4 Shares: | | | | | | | | | | | | | | | | |
Shares sold | | | 2,126,744 | | | $ | 27,218,734 | | | | 2,251,182 | | | $ | 28,170,784 | |
Shares issued on reinvestment of distributions | | | 889,584 | | | | 11,235,444 | | | | 693,015 | | | | 8,302,315 | |
Shares redeemed | | | (2,444,718 | ) | | | (30,796,459 | ) | | | (1,626,043 | ) | | | (20,235,775 | ) |
| | | | |
Net increase (decrease) | | | 571,610 | | | $ | 7,657,719 | | | | 1,318,154 | | | $ | 16,237,324 | |
| | | | |
3. TRANSACTIONS WITH AFFILIATES
Franklin Resources, Inc. is the holding company for various subsidiaries that together are referred to as Franklin Templeton Investments. Certain officers and trustees of the Fund are also officers and/or directors of the following subsidiaries:
| | |
| Subsidiary | | Affiliation |
Franklin Advisers, Inc. (Advisers) | | Investment manager |
Franklin Templeton Services, LLC (FT Services) | | Administrative manager |
Franklin Templeton Distributors, Inc. (Distributors) | | Principal underwriter |
Franklin Templeton Investor Services, LLC (Investor Services) | | Transfer agent |
FSI-41
Franklin Templeton Variable Insurance Products Trust
Notes to Financial Statements (continued)
Franklin Strategic Income Securities Fund
3. TRANSACTIONS WITH AFFILIATES (continued)
a. Management Fees
The Fund pays an investment management fee to Advisers based on the average daily net assets of the Fund as follows:
| | |
| Annualized Fee Rate | | Net Assets |
| 0.425% | | Up to and including $500 million |
| 0.325% | | Over $500 million, up to and including $1 billion |
| 0.280% | | Over $1 billion, up to and including $1.5 billion |
| 0.235% | | Over $1.5 billion, up to and including $6.5 billion |
| 0.215% | | Over $6.5 billion, up to and including $11.5 billion |
| 0.200% | | Over $11.5 billion, up to and including $16.5 billion |
| 0.190% | | Over $16.5 billion, up to and including $19 billion |
| 0.180% | | Over $19 billion, up to and including $21.5 billion |
| 0.170% | | In excess of $21.5 billion |
b. Administrative Fees
The Fund pays an administrative fee to FT Services of 0.20% per year of the average daily net assets of the Fund.
c. Distribution Fees
The Trust’s Board of Trustees has adopted distribution plans for Class 2 and Class 4 shares pursuant to Rule 12b-1 under the 1940 Act. Under the Fund’s compensation distribution plans, the Fund pays Distributors for costs incurred in connection with the servicing, sale and distribution of the Fund’s shares up to 0.25% and 0.35% per year of its average daily net assets of Class 2 and Class 4, respectively.
d. Transfer Agent Fees
Investor Services, under terms of an agreement, performs shareholder servicing for the Fund and is not paid by the Fund for the services.
4. EXPENSE OFFSET ARRANGEMENT
The Fund has entered into an arrangement with its custodian whereby credits realized as a result of uninvested cash balances are used to reduce a portion of the Fund’s custodian expenses. During the year ended December 31, 2011, the custodian fees were reduced as noted in the Statement of Operations.
5. INCOME TAXES
During the year ended December 31, 2011, the Fund utilized $19,139,048 of capital loss carryforwards.
The tax character of distributions paid during the years ended December 31, 2011 and 2010, was as follows:
| | | | | | | | |
| | | 2011 | | | 2010 | |
Distributions paid from ordinary income | | $ | 88,171,513 | | | $
| 69,467,803
|
|
FSI-42
Franklin Templeton Variable Insurance Products Trust
Notes to Financial Statements (continued)
Franklin Strategic Income Securities Fund
5. INCOME TAXES (continued)
At December 31, 2011, the cost of investments, net unrealized appreciation (depreciation), undistributed ordinary income and undistributed long term capital gains for income tax purposes were as follows:
| | | | |
Cost of investments | | $
| 1,349,774,143
|
|
| | | | |
| |
Unrealized appreciation | | $
| 49,514,420
|
|
Unrealized depreciation | |
| (61,633,410
| )
|
| | | | |
Net unrealized appreciation (depreciation) | | $
| (12,118,990
| )
|
| | | | |
Undistributed ordinary income | | $
| 95,083,077
|
|
Undistributed long term capital gains | |
| 1,471,874
|
|
| | | | |
Distributable earnings | | $
| 96,554,951
|
|
| | | | |
Differences between income and/or capital gains as determined on a book basis and a tax basis are primarily due to differing treatments of defaulted securities, foreign currency transactions, paydown losses, payments-in-kind, bond discounts and premiums, swaps, tax straddles, inflation related adjustments on foreign securities and wash sales.
6. INVESTMENT TRANSACTIONS
Purchases and sales of investments (excluding short term securities) for the year ended December 31, 2011, aggregated $731,197,297 and $879,119,073, respectively.
7. INVESTMENTS IN INSTITUTIONAL FIDUCIARY TRUST MONEY MARKET PORTFOLIO
The Fund invests in the Institutional Fiduciary Trust Money Market Portfolio (Sweep Money Fund), an open-end investment company managed by Advisers. Management fees paid by the Fund are reduced on assets invested in the Sweep Money Fund, in an amount not to exceed the management and administrative fees paid by the Sweep Money Fund.
8. CREDIT RISK AND DEFAULTED SECURITIES
At December 31, 2011, the Fund had 51.84% of its portfolio invested in high yield securities, senior secured floating rate notes, or other securities rated below investment grade. These securities may be more sensitive to economic conditions causing greater price volatility and are potentially subject to a greater risk of loss due to default than higher rated securities.
The Fund held defaulted securities and/or other securities for which the income has been deemed uncollectible. At December 31, 2011, the aggregate value of these securities was $5,290,001, representing 0.39% of the Fund’s net assets. The Fund discontinues accruing income on securities for which income has been deemed uncollectible and provides an estimate for losses on interest receivable. The securities have been identified on the accompanying Statement of Investments.
9. UNFUNDED LOAN COMMITMENTS
The Fund enters into certain credit agreements, all or a portion of which may be unfunded. The Fund is obligated to fund these loan commitments at the borrowers’ discretion. Funded portions of credit agreements are presented on the Statement of Investments.
FSI-43
Franklin Templeton Variable Insurance Products Trust
Notes to Financial Statements (continued)
Franklin Strategic Income Securities Fund
9. UNFUNDED LOAN COMMITMENTS (continued)
At December 31, 2011, unfunded commitments were as follows:
| | | | |
| Borrower | | Unfunded
Commitment | |
EnviroSolutions Real Property Holdings Inc., DIP Revolver | | $ | 703,908 | |
| | | | |
Unfunded loan commitments and funded portions of credit agreements are marked to market daily and any unrealized appreciation or depreciation is included in the Statement of Assets and Liabilities and Statement of Operations.
10. OTHER DERIVATIVE INFORMATION
At December 31, 2011, the Fund has invested in derivative contracts which are reflected on the Statement of Assets and Liabilities as follows:
| | | | | | | | | | | | |
| | | Asset Derivatives | | | Liability Derivatives | |
Derivative Contracts Not Accounted
for as Hedging Instruments | | Statement of Assets and
Liabilities Location | | Fair
Value
Amount | | | Statement of Assets and
Liabilities Location | | Fair
Value
Amount | |
Foreign exchange contracts | | Unrealized appreciation on forward exchange contracts | | $ | 8,120,202 | | | Unrealized depreciation on forward exchange contracts | | $ | 5,284,253 | |
Credit contracts | | Unrealized appreciation on swap contracts | | | 776,779 | | | | | | | |
For the year ended December 31, 2011, the effect of derivative contracts on the Fund’s Statement of Operations was as follows:
| | | | | | | | | | |
Derivative Contracts Not Accounted
for as Hedging Instruments | | Statement of Operations Locations | | Realized Gain
(Loss) for
the Year | | | Change in
Unrealized
Appreciation
(Depreciation)
for the Year | |
Foreign exchange contracts | | Net realized gain (loss) from foreign currency transactions / Net change in unrealized appreciation (depreciation) on translation of other assets and liabilities denominated in foreign currencies | | $ | (3,810,538 | ) | | $ | 2,349,306 | |
Credit contracts | | Net realized gain (loss) from swap contracts / Net change in unrealized appreciation (depreciation) on investments | | | (2,052,379 | ) | | | 776,779 | |
For the year ended December 31,2011, the average month end market value of derivatives represented 0.86% of average month end net assets. The average month end number of open derivative contracts for the year was 163.
See Note 1(d) regarding derivative financial instruments.
FSI-44
Franklin Templeton Variable Insurance Products Trust
Notes to Financial Statements (continued)
Franklin Strategic Income Securities Fund
11. CREDIT FACILITY
The Fund, together with other U.S. registered and foreign investment funds (collectively, Borrowers), managed by Franklin Templeton Investments, are borrowers in a joint syndicated senior unsecured credit facility totaling $750 million (Global Credit Facility) which matured on January 20, 2012. This Global Credit Facility provides a source of funds to the Borrowers for temporary and emergency purposes, including the ability to meet future unanticipated or unusually large redemption requests. Effective January 20, 2012, the Borrowers renewed the Global Credit Facility for a total of $1.5 billion, maturing January 18, 2013.
Under the terms of the Global Credit Facility, the Fund shall, in addition to interest charged on any borrowings made by the Fund and other costs incurred by the Fund, pay its share of fees and expenses incurred in connection with the implementation and maintenance of the Global Credit Facility, based upon its relative share of the aggregate net assets of all of the Borrowers, including an annual commitment fee of 0.08% based upon the unused portion of the Global Credit Facility, which is reflected in other expenses on the Statement of Operations. During the year ended December 31, 2011, the Fund did not use the Global Credit Facility.
12. FAIR VALUE MEASUREMENTS
The Fund follows a fair value hierarchy that distinguishes between market data obtained from independent sources (observable inputs) and the Fund’s own market assumptions (unobservable inputs). These inputs are used in determining the value of the Fund’s investments and are summarized in the following fair value hierarchy:
| | • | | Level 1 – quoted prices in active markets for identical securities |
| | • | | Level 2 – other significant observable inputs (including quoted prices for similar securities, interest rates, prepayment speed, credit risk, etc.) |
| | • | | Level 3 – significant unobservable inputs (including the Fund’s own assumptions in determining the fair value of investments) |
The inputs or methodology used for valuing securities are not an indication of the risk associated with investing in those securities.
For movements between the levels within the fair value hierarchy, the Fund has adopted a policy of recognizing the transfers as of the date of the underlying event which caused the movement.
FSI-45
Franklin Templeton Variable Insurance Products Trust
Notes to Financial Statements (continued)
Franklin Strategic Income Securities Fund
12. FAIR VALUE MEASUREMENTS (continued)
The following is a summary of the inputs used as of December 31, 2011, in valuing the Fund’s assets and liabilities carried at fair value:
| | | | | | | | | | | | | | | | |
| | | Level 1 | | | | Level 2 | | | | Level 3 | | | | Total | |
| | | | |
Assets: | | | | | | | | | | | | | | | | |
Investments in Securities | | | | | | | | | | | | | | | | |
Equity Investments:a | | | | | | | | | | | | | | | | |
Consumer Durables & Apparel | | $ | — | | | $ | — | | | $ | 343,060 | | | $ | 343,060 | |
Media | | | 66,400 | | | | 5,040,820 | | | | — | | | | 5,107,220 | |
Other Equity Investmentsb | | | 669,164 | | | | 1,948,985 | | | | — | | | | 2,618,149 | |
Convertible Bonds | | | — | | | | 2,620,000 | | | | — | | | | 2,620,000 | |
Corporate Bonds | | | — | | | | 490,645,836 | | | | — | | | | 490,645,836 | |
Senior Floating Rate Interests | | | — | | | | 217,061,631 | | | | 1,341,906 | | | | 218,403,537 | |
Foreign Government and Agency Securities | | | — | | | | 325,273,503 | | | | — | | | | 325,273,503 | |
U.S. Government and Agency Securities | | | — | | | | 20,941,544 | | | | — | | | | 20,941,544 | |
Asset-Backed Securities and Commercial Mortgage-Backed Securities | | | — | | | | 46,457,346 | | | | — | | | | 46,457,346 | |
Mortgage-Backed Securities | | | — | | | | 67,488,463 | | | | — | | | | 67,488,463 | |
Municipal Bonds | | | — | | | | 47,575,414 | | | | — | | | | 47,575,414 | |
Short Term Investments | | | 61,664,899 | | | | 48,516,182 | | | | — | | | | 110,181,081 | |
| | | | |
Total Investments in Securities | | $ | 62,400,463 | | | $ | 1,273,569,724 | | | $ | 1,684,966 | | | $ | 1,337,655,153 | |
| | | | |
Forward Exchange Contracts | | | — | | | | 8,120,202 | | | | — | | | | 8,120,202 | |
Swaps | | | — | | | | 776,779 | | | | — | | | | 776,779 | |
Liabilities: | | | | | | | | | | | | | | | | |
Forward Exchange Contracts | | | — | | | | 5,284,253 | | | | — | | | | 5,284,253 | |
Unfunded Loan Commitments | | | — | | | | 3,519 | | | | — | | | | 3,519 | |
aIncludes common and preferred stocks.
bFor detailed categories, see the accompanying Statement of Investments.
At December 31, 2011, the reconciliation of assets in which significant unobservable inputs (Level 3) were used in determining fair value, is as follows:
| | | | | | | | | | | | | | | | | | | | | | | | | | | | | | | | | | | | | | | | |
| | | Balance at
Beginning
of Year | | | Purchases | | | Sales | | | Transfers
Into
Level 3 | | | Transfers
Out of
Level 3a | | | Cost Basis
Adjustmentsb | | | Net
Realized
Gain
(Loss) | | | Net
Unrealized
Gain
(Loss) | | | Balance
at End
of Year | | | Net Change
in Unrealized
Appreciation
(Depreciation)
on Assets
Held at
Year End | |
| | | | |
Assets | | | | | | | | | | | | | | | | | | | | | | | | | | | | | | | | | | | | | | | | |
Investments in Securities: | | | | | | | | | | | | | | | | | | | | | | | | | | | | | | | | | | | | | | | | |
Equity Investments:c | | | | | | | | | | | | | | | | | | | | | | | | | | | | | | | | | | | | | | | | |
Consumer Services | | $ | 1,901,449 | | | $ | — | | | $ | — | | | $ | — | | | $ | (1,901,449 | ) | | $ | — | | | $ | — | | | $ | — | | | $ | — | | | $ | — | |
Consumer Durables & Apparel | | | —d | | | | 113,482 | | | | — | | | | — | | | | — | | | | — | | | | — | | | | 229,578 | | | | 343,060 | | | | 229,578 | |
Senior Floating Rate Interests | | | 835,411 | | | | 718,849 | | | | (309,097 | ) | | | — | | | | — | | | | 114,710 | | | | 59,561 | | | | (77,528 | ) | | | 1,341,906 | | | | (3,315 | ) |
| | | | |
Total | | $ | 2,736,860 | | | $ | 832,331 | | | $ | (309,097 | ) | | $ | — | | | $ | (1,901,449 | ) | | $ | 114,710 | | | $ | 59,561 | | | $ | 152,050 | | | $ | 1,684,966 | | | $ | 226,263 | |
| | | | |
aThe investment was transferred out of Level 3 as a result of the availability of a quoted price in an active market for identical securities.
bMay include accretion, amortization, partnership adjustments, and/or other cost basis adjustments.
cIncludes common and preferred stocks.
dIncludes securities determined to have no value.
FSI-46
Franklin Templeton Variable Insurance Products Trust
Notes to Financial Statements (continued)
Franklin Strategic Income Securities Fund
13. NEW ACCOUNTING PRONOUNCEMENTS
In May 2011, the Financial Accounting Standards Board (FASB) issued Accounting Standards Update (ASU) No. 2011-04, Fair Value Measurement (Topic 820): Amendments to Achieve Common Fair Value Measurement and Disclosure Requirements in U.S. GAAP and IFRSs. The amendments in the ASU will improve the comparability of fair value measurements presented and disclosed in financial statements prepared in accordance with U.S. GAAP (Generally Accepted Accounting Principles) and IFRS (International Financial Reporting Standards) and include new guidance for certain fair value measurement principles and disclosure requirements. The ASU is effective for interim and annual periods beginning after December 15, 2011. The Fund believes the adoption of this ASU will not have a material impact on its financial statements.
14. SUBSEQUENT EVENTS
The Fund has evaluated subsequent events through the issuance of the financial statements and determined that no events have occurred that require disclosure other than those already disclosed in the financial statements.
| | | | |
ABBREVIATIONS | | | | |
| Counterparty | | Currency | | Selected Portfolio |
| | | | |
| BOFA - Bank of America N.A. | | AUD - Australian Dollar | | AGMC - Assured Guaranty Municipal Corp. |
| BZWS - Barclays Bank PLC | | BRL - Brazilian Real | | CDO - Collateralized Debt Obligation |
| CITI - Citigroup, Inc. | | EGP - Egyptian Pound | | CLO - Collateralized Loan Obligation |
| DBAB - Deutsche Bank AG | | EUR - Euro | | DIP - Debtor-In-Possession |
| FBCO - Credit Suisse Group AG | | GBP - British Pound | | FGIC - Financial Guaranty Insurance Co. |
| HSBC - HSBC Bank USA, N.A. | | HUF - Hungarian Forint | | FICO - Financing Corp. |
| JPHQ - JPMorgan Chase & Co. | | IDR - Indonesian Rupiah | | FRN - Floating Rate Note |
| MSCO - Morgan Stanley | | ILS - New Israeli Shekel | | GO - General Obligation |
| UBSW - UBS AG | | KRW - South Korean Won | | ID - Improvement District |
| | LKR - Sri Lankan Rupee | | IDA - Industrial Development Authority/Agency |
| | MXN - Mexican Peso | | L/C - Letter of Credit |
| | MYR - Malaysian Ringgit | | NATL - National Public Financial Guarantee Corp. |
| | NOK - Norwegian Krone PHP - Philippine Peso | | NATL RE - National Public Financial Guarantee Corp. Reinsured |
| | PLN - Polish Zloty | | PIK - Payment-In-Kind |
| | SEK - Swedish Krona | | SBA - Small Business Administration |
| | SGD - Singapore Dollar | | SF - Single Family |
| | UYU - Uraguayan Peso | | USD - Unified/Union School District |
FSI-47
Franklin Templeton Variable Insurance Products Trust
Franklin Strategic Income Securities Fund
Report of Independent Registered Public Accounting Firm
To the Board of Trustees and Shareholders of
Franklin Templeton Variable Insurance Products Trust
In our opinion, the accompanying statement of assets and liabilities, including the statement of investments, and the related statements of operations and of changes in net assets and the financial highlights present fairly, in all material respects, the financial position of Franklin Strategic Income Securities Fund (the “Fund”) at December 31, 2011, the results of its operations for the year then ended, the changes in its net assets for each of the two years in the period then ended and the financial highlights for each of the periods presented, in conformity with accounting principles generally accepted in the United States of America. These financial statements and financial highlights (hereafter referred to as “financial statements”) are the responsibility of the Fund’s management. Our responsibility is to express an opinion on these financial statements based on our audits. We conducted our audits of these financial statements in accordance with the standards of the Public Company Accounting Oversight Board (United States). Those standards require that we plan and perform the audit to obtain reasonable assurance about whether the financial statements are free of material misstatement. An audit includes examining, on a test basis, evidence supporting the amounts and disclosures in the financial statements, assessing the accounting principles used and significant estimates made by management, and evaluating the overall financial statement presentation. We believe that our audits, which included confirmation of securities at December 31, 2011 by correspondence with the custodian and brokers, provide a reasonable basis for our opinion.
PricewaterhouseCoopers LLP
San Francisco, California
February 13, 2012
FSI-48
FRANKLIN TEMPLETON VIP FOUNDING FUNDS ALLOCATION FUND
This annual report for Franklin Templeton VIP Founding Funds Allocation Fund covers the fiscal year ended December 31, 2011.
Performance Summary as of 12/31/11
Average annual total return of Class 1 shares* represents the average annual change in value, assuming reinvestment of dividends and capital gains. Average returns smooth out variations in returns, which can be significant; they are not the same as year-by-year results.
Periods ended 12/31/11
| | | | | | | | | | | | |
| | | 1-Year | | | 3-Year | | | Inception
(7/2/07) | |
Average Annual Total Return | | | -1.28% | | | | +12.53% | | | | -3.44% | |
*The administrator has contractually agreed to waive or assume certain expenses so that common expenses of the Fund (excluding Rule 12b-1 fees and acquired fund fees and expenses) do not exceed 0.10% (other than certain nonroutine expenses) until 4/30/12. If the administrator had not waived fees, the Fund’s total returns would have been lower.
Total Return Index Comparison for a Hypothetical $10,000 Investment (7/2/07–12/31/11)
The graph below shows the change in value of a hypothetical $10,000 investment in the Fund over the indicated period and includes reinvestment of any income or distributions. The Fund’s performance* is compared to the performance of the Standard & Poor’s® 500 Index (S&P 500®) and MSCI World Index. One cannot invest directly in an index, and an index is not representative of the Fund’s portfolio. Please see Important Notes to Performance Information preceding the Fund Summaries.
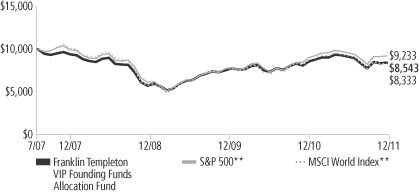
**Source: © 2012 Morningstar. Please see Index Descriptions following the Fund Summaries.
Franklin Templeton VIP Founding Funds Allocation Fund – Class 1
Performance reflects the Fund’s Class 1 operating expenses, but does not include any contract fees, expenses or sales charges. If they had been included, performance would be lower. These charges and deductions, particularly for variable life policies, can have a significant effect on contract values and insurance benefits. See the contract prospectus for a complete description of these expenses, including sales charges.
Performance data represent past performance, which does not guarantee future results. Investment return and principal value will fluctuate, and you may have a gain or loss when you sell your shares.
Current performance may differ from figures shown.
FFA-1
Fund Goals and Main Investments: Franklin Templeton VIP Founding Funds Allocation Fund seeks capital appreciation, with income as a secondary goal. The Fund normally invests equal portions in Class 1 shares of Franklin Income Securities Fund, Mutual Shares Securities Fund and Templeton Growth Securities Fund.
Performance Overview
You can find the Fund’s one-year total return in the Performance Summary. The Fund underperformed the S&P 500’s +2.11% total return but performed better than the MSCI World Index’s -5.02% total return for the same period.1
Economic and Market Overview
The U.S. economy improved steadily but modestly in 2011 despite geopolitical, employment and housing pressures. In contrast, growth outside the U.S. began to slow, which some attributed partly to the effects of Japan’s earthquake on the global supply chain and populist uprisings across the oil-and-gas-producing regions of the Middle East and North Africa. Although manufacturing growth slowed in the second half of the year as high commodity prices reduced purchasing power and demand ebbed, the trend began to reverse near year-end. The U.S. manufacturing sector helped power the domestic economy and led global manufacturing output heading into 2012. European and Asian manufacturing, however, generally weakened throughout 2011 as parts of Europe were in danger of falling back into recession.
The U.S. financial system and household balance sheets continued to improve, but the country still faced persistently high unemployment, a prolonged housing market slump and massive national debt. Inflation rose across much of the world but stayed relatively contained in the U.S., even slowing toward year-end amid declining energy and food prices. The Federal Reserve Board (Fed) sought to boost economic growth by maintaining its accommodative monetary policy and undertook a second round of quantitative easing that ended on June 30. Subsequently, the Fed continued to purchase U.S. Treasuries with proceeds from maturing debt in an effort to support economic growth. Outside the U.S., European policymakers ultimately stepped up their response to their sovereign debt and banking crisis. The European Central Bank cut short-term interest rates and expanded bank lending facilities, and six key global central banks agreed to lower dollar funding costs for
1. Source: © 2012 Morningstar. Please see Index descriptions following the Fund summaries.
Fund Risks: All investments involve risks. Because the Fund invests in underlying funds that may engage in a variety of investment strategies involving certain risks, this Fund may be subject to those same risks. Stock prices fluctuate, sometimes rapidly and dramatically, due to factors affecting individual companies, particular industries or sectors, or general market conditions. Because the underlying funds invest in bonds and other debt obligations, the Fund’s share price and yield will be affected by interest rate movements. Bond prices generally move in the opposite direction from interest rates. Thus, as prices of bonds in the Fund adjust to a rise in interest rates, the Fund’s share price may decline. High yield, lower rated (junk) bonds generally have greater price swings and higher default risks than investment-grade bonds. Foreign investing, especially in developing markets, involves additional risks, including currency fluctuations, economic instability, market volatility, and political and social instability. Smaller and midsize company securities can increase the risk of greater price fluctuations, particularly over the short term. Underlying funds may use certain derivative instruments which may be volatile and illiquid, may give rise to leverage and may involve a small investment relative to the risk assumed. These and other risks are described more fully in the Fund’s and underlying funds’ prospectuses.
FFA-2
Europe’s distressed commercial banks. Chinese policymakers lowered commercial bank reserve requirements and the International Monetary Fund revamped its credit line and eased its lending terms.
Although U.S. stock markets rallied in the spring, worrisome global events and slowing global growth dampened investor sentiment and market volatility surged. Risk-averse investors sought perceived safe havens and seemed to ignore that many companies generated record profits. Despite large swings, U.S. stocks as measured by the S&P 500 gained 2.11% in 2011.1 The Dow Jones Industrial Average rose 8.38%, reflecting investors’ general preference for large, established U.S. companies.1 In contrast, developed and emerging world stocks as measured by the MSCI All Country World Index fell 6.86%. Amid general global market declines, perceived safe-haven currencies such as the Japanese yen and Swiss franc rallied strongly, and U.S. Treasuries posted their best one-year return since 2008.
Investment Strategy
The Fund invests its assets in an equally weighted combination of Class 1 shares of Franklin Income Securities Fund, Mutual Shares Securities Fund and Templeton Growth Securities Fund. These underlying funds, in turn, invest in a variety of U.S. and foreign equity securities and, to a lesser extent, fixed income and money market securities. As market conditions affect the underlying funds, we rebalance the Fund’s allocations seeking to maintain equal weightings of approximately 33 1/3% of total net assets in each underlying fund whenever the actual allocations exceed plus or minus 3% of the fixed allocation percentages.
Manager’s Discussion
The Fund’s performance can be attributed largely to its allocation among the underlying funds and their investments in domestic and foreign equities, fixed income securities, and short-term investments and other net assets.
During the fiscal year under review, Franklin Income Securities Fund — Class 1 outperformed the S&P 500, while Mutual Shares Securities Fund — Class 1 underperformed the S&P 500. Templeton Growth Securities Fund — Class 1 underperformed the MSCI World Index.
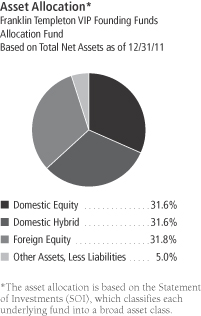
The dollar value, number of shares or principal amount, and names of all portfolio holdings are listed in the Fund’s SOI.
FFA-3
Thank you for your participation in Franklin Templeton VIP Founding Funds Allocation Fund. We look forward to serving your future investment needs.
The foregoing information reflects our analysis, opinions and portfolio holdings as of December 31, 2011, the end of the reporting period. The way we implement our main investment strategies and the resulting portfolio holdings may change depending on factors such as market and economic conditions. These opinions may not be relied upon as investment advice or an offer for a particular security. The information is not a complete analysis of every aspect of any market, country, industry, security or the Fund. Statements of fact are from sources considered reliable, but the investment manager makes no representation or warranty as to their completeness or accuracy. Although historical performance is no guarantee of future results, these insights may help you understand our investment management philosophy.
FFA-4
Fund Expenses
As an investor in a variable insurance contract (Contract) that indirectly provides for investment in an underlying mutual fund, you can incur transaction and/or ongoing expenses at both the Fund level and the Contract level.
| • | | Transaction expenses can include sales charges (loads) on purchases, redemption fees, surrender fees, transfer fees and premium taxes. |
| • | | Ongoing expenses can include management fees, distribution and service (12b-1) fees, contract fees, annual maintenance fees, mortality and expense risk fees and other fees and expenses. All mutual funds and Contracts have some types of ongoing expenses. |
The expenses shown in the table are meant to highlight ongoing expenses at the Fund level only and do not include ongoing expenses at the Contract level, or transaction expenses at either the Fund or Contract level. While the Fund does not have transaction expenses, if the transaction and ongoing expenses at the Contract level were included, the expenses shown would be higher. You should consult your Contract prospectus or disclosure document for more information.
The table shows Fund-level ongoing expenses and can help you understand these expenses and compare them with those of other mutual funds offered through the Contract. The table assumes a $1,000 investment held for the six months indicated. Please refer to the Fund prospectus for additional information on operating expenses.
Actual Fund Expenses
The first line (Actual) of the table provides actual account values and expenses. The “Ending Account Value” is derived from the Fund’s actual return, which includes the effect of ongoing Fund expenses, but does not include the effect of ongoing Contract expenses.
You can estimate the Fund-level expenses you incurred during the period by following these steps. Of course, your account value and expenses will differ from those in this illustration:
| 1. | Divide your account value by $1,000. |
If an account had an $8,600 value, then $8,600 ÷ $1,000 = 8.6.
| 2. | Multiply the result by the number under the heading “Fund-Level Expenses Incurred During Period.” |
If Fund-Level Expenses Incurred During Period were $7.50, then 8.6 x $7.50 = $64.50.
In this illustration, the estimated expenses incurred this period at the Fund level are $64.50.
Franklin Templeton VIP Founding Funds Allocation Fund – Class 1
FFA-5
Hypothetical Example for Comparison with Other Mutual Funds
Information in the second line (Hypothetical) of the table can help you compare ongoing expenses of the Fund with those of other mutual funds offered through the Contract. This information may not be used to estimate the actual ending account balance or expenses you incurred during the period. The hypothetical “Ending Account Value” is based on the Fund’s actual expense ratio and an assumed 5% annual rate of return before expenses, which does not represent the Fund’s actual return. The figure under the heading “Fund-Level Expenses Incurred During Period” shows the hypothetical expenses your account would have incurred under this scenario. You can compare this figure with the 5% hypothetical examples that appear in shareholder reports of other funds offered through a Contract.
| | | | | | | | | | | | | | | | |
| Class 1 | | Beginning
Account
Value 7/1/11 | | | Ending
Account
Value 12/31/11 | | | Expenses Paid
During Period*
7/1/11–12/31/11 | | | Expenses Paid
During Period** 7/1/11–12/31/11 | |
Actual | | $ | 1,000 | | | $ | 926.00 | | | $ | 0.49 | | | $ | 3.64 | |
Hypothetical (5% return before expenses) | | $ | 1,000 | | | $ | 1,024.70 | | | $ | 0.51 | | | $ | 3.82 | |
*Expenses are calculated using the most recent six-month annualized expense ratio excluding expenses of the underlying funds, net of expense waivers, for the Fund’s Class 1 shares (0.10%), which does not include any ongoing expenses of the Contract for which the Fund is an investment option, multiplied by the average account value over the period, multiplied by 184/365 to reflect the one-half year period.
**Expenses are calculated using the most recent six-month annualized expense ratio including expenses of the underlying funds, net of expense waivers, for the Fund’s Class 1 shares (0.75%), which does not include any ongoing expenses of the Contract for which the Fund is an investment option, multiplied by the average account value over the period, multiplied by 184/365 to reflect the one-half year period.
FFA-6
Franklin Templeton Variable Insurance Products Trust
Financial Highlights
Franklin Templeton VIP Founding Funds Allocation Fund
| | | | | | | | | | | | | | | | | | | | |
| | | Year Ended December 31, | |
| Class 1 | | 2011 | | | 2010 | | | 2009 | | | 2008 | | | 2007a | |
| | | | |
Per share operating performance | | | | | | | | | | | | | | | | | | | | |
(for a share outstanding throughout the year) | | | | | | | | | | | | | | | | | | | | |
Net asset value, beginning of year | | $ | 7.73 | | | $ | 7.15 | | | $ | 5.61 | | | $ | 9.33 | | | $ | 10.00 | |
| | | | |
Income from investment operationsb: | | | | | | | | | | | | | | | | | | | | |
Net investment income (loss)c,d | | | 0.25 | | | | 0.24 | | | | 0.26 | | | | 0.28 | | | | (0.19 | ) |
Net realized and unrealized gains (losses) | | | (0.35 | ) | | | 0.52 | | | | 1.46 | | | | (3.64 | ) | | | (0.48 | ) |
| | | | |
Total from investment operations | | | (0.10 | ) | | | 0.76 | | | | 1.72 | | | | (3.36 | ) | | | (0.67 | ) |
| | | | |
Less distributions from: | | | | | | | | | | | | | | | | | | | | |
Net investment income | | | — | e | | | (0.18 | ) | | | (0.18 | ) | | | (0.19 | ) | | | — | |
Net realized gains | | | — | | | | — | e | | | — | | | | (0.17 | ) | | | — | |
| | | | |
Total distributions | | | — | e | | | (0.18 | ) | | | (0.18 | ) | | | (0.36 | ) | | | — | |
| | | | |
Net asset value, end of year | | $ | 7.63 | | | $ | 7.73 | | | $ | 7.15 | | | $ | 5.61 | | | $ | 9.33 | |
| | | | |
| | | | | |
Total returnf | | | (1.28)% | | | | 10.64% | | | | 30.47% | | | | (35.75)% | | | | (6.70)% | |
Ratios to average net assetsg | | | | | | | | | | | | | | | | | | | | |
Expenses before waiver and payments by affiliatesh | | | 0.11% | | | | 0.11% | | | | 0.12% | | | | 0.13% | | | | 0.41% | |
Expenses net of waiver and payments by affiliatesh | | | 0.10% | | | | 0.10% | | | | 0.10% | | | | 0.13% | | | | 0.41% | |
Net investment income (loss)d | | | 3.44% | | | | 3.04% | | | | 4.16% | | | | 3.81% | | | | (0.41)% | |
| | | | | |
Supplemental data | | | | | | | | | | | | | | | | | | | | |
Net assets, end of year (000’s) | | $ | 470 | | | $ | 437 | | | $ | 629 | | | $ | 339 | | | $ | 466 | |
Portfolio turnover rate | | | 58.42% | | | | 17.81% | | | | 4.23% | | | | 22.09% | | | | 0.04% | |
aFor the period July 2, 2007 (commencement of operations) to December 31, 2007.
bThe amount shown for a share outstanding throughout the period may not correlate with the Statement of Operations for the period due to the timing of sales and repurchases of the Fund shares in relation to income earned and/or fluctuating market value of the investments of the Fund.
cBased on average daily shares outstanding.
dRecognition of net investment income by the Fund is affected by the timing of declaration of dividends by the Underlying Funds in which the Fund invests.
eAmount rounds to less than $0.01 per share.
fTotal return does not include fees, charges or expenses imposed by the variable annuity and life insurance contracts for which the Franklin Templeton Variable Insurance Products Trust serves as an underlying investment vehicle. Total return is not annualized for periods less than one year.
gRatios are annualized for periods less than one year.
hDoes not include expenses of the Underlying Funds in which the Fund invests. The annualized weighted average expense ratio of the Underlying Funds was 0.65% for the year ended December 31, 2011.
The accompanying notes are an integral part of these financial statements.
FFA-7
Franklin Templeton Variable Insurance Products Trust
Financial Highlights (continued)
Franklin Templeton VIP Founding Funds Allocation Fund
| | | | | | | | | | | | | | | | | | | | |
| | | Year Ended December 31, | |
| Class 2 | | 2011 | | | 2010 | | | 2009 | | | 2008 | | | 2007a | |
| | | | |
Per share operating performance | | | | | | | | | | | | | | | | | | | | |
(for a share outstanding throughout the year) | | | | | | | | | | | | | | | | | | | | |
Net asset value, beginning of year | | $ | 7.71 | | | $ | 7.14 | | | $ | 5.61 | | | $ | 9.31 | | | $ | 10.00 | |
| | | | |
Income from investment operationsb: | | | | | | | | | | | | | | | | | | | | |
Net investment income (loss)c,d | | | 0.23 | | | | 0.21 | | | | 0.26 | | | | 0.27 | | | | (0.03 | ) |
Net realized and unrealized gains (losses) | | | (0.35 | ) | | | 0.52 | | | | 1.44 | | | | (3.63 | ) | | | (0.66 | ) |
| | | | |
Total from investment operations | | | (0.12 | ) | | | 0.73 | | | | 1.70 | | | | (3.36 | ) | | | (0.69 | ) |
| | | | |
Less distributions from: | | | | | | | | | | | | | | | | | | | | |
Net investment income | | | — | e | | | (0.16 | ) | | | (0.17 | ) | | | (0.17 | ) | | | — | |
Net realized gains | | | — | | | | — | e | | | — | | | | (0.17 | ) | | | — | |
| | | | |
Total distributions | | | — | e | | | (0.16 | ) | | | (0.17 | ) | | | (0.34 | ) | | | — | |
| | | | |
Net asset value, end of year | | $ | 7.59 | | | $ | 7.71 | | | $ | 7.14 | | | $ | 5.61 | | | $ | 9.31 | |
| | | | |
| | | | | |
Total returnf | | | (1.54)% | | | | 10.25% | | | | 30.25% | | | | (35.87)% | | | | (6.90)% | |
Ratios to average net assetsg | | | | | | | | | | | | | | | | | | | | |
Expenses before waiver and payments by affiliatesh | | | 0.36% | | | | 0.36% | | | | 0.37% | | | | 0.38% | | | | 0.66% | |
Expenses net of waiver and payments by affiliatesh | | | 0.35% | | | | 0.35% | | | | 0.35% | | | | 0.38% | | | | 0.66% | |
Net investment income (loss)d | | | 3.19% | | | | 2.79% | | | | 3.91% | | | | 3.56% | | | | (0.66)% | |
| | | | | |
Supplemental data | | | | | | | | | | | | | | | | | | | | |
Net assets, end of year (000’s) | | $ | 448,101 | | | $ | 488,057 | | | $ | 474,176 | | | $ | 338,320 | | | $ | 131,710 | |
Portfolio turnover rate | | | 58.42% | | | | 17.81% | | | | 4.23% | | | | 22.09% | | | | 0.04% | |
aFor the period July 2, 2007 (commencement of operations) to December 31, 2007.
bThe amount shown for a share outstanding throughout the period may not correlate with the Statement of Operations for the period due to the timing of sales and repurchases of the Fund shares in relation to income earned and/or fluctuating market value of the investments of the Fund.
cBased on average daily shares outstanding.
dRecognition of net investment income by the Fund is affected by the timing of declaration of dividends by the Underlying Funds in which the Fund invests.
eAmount rounds to less than $0.01 per share.
fTotal return does not include fees, charges or expenses imposed by the variable annuity and life insurance contracts for which the Franklin Templeton Variable Insurance Products Trust serves as an underlying investment vehicle. Total return is not annualized for periods less than one year.
gRatios are annualized for periods less than one year.
hDoes not include expenses of the Underlying Funds in which the Fund invests. The annualized weighted average expense ratio of the Underlying Funds was 0.65% for the year ended December 31, 2011.
The accompanying notes are an integral part of these financial statements.
FFA-8
Franklin Templeton Variable Insurance Products Trust
Financial Highlights (continued)
Franklin Templeton VIP Founding Funds Allocation Fund
| | | | | | | | | | | | | | | | |
| | | Year Ended December 31, | |
| Class 4 | | 2011 | | | 2010 | | | 2009 | | | 2008a | |
| | | | |
Per share operating performance | | | | | | | | | | | | | | | | |
(for a share outstanding throughout the year) | | | | | | | | | | | | | | | | |
Net asset value, beginning of year | | $ | 7.71 | | | $ | 7.14 | | | $ | 5.62 | | | $ | 8.65 | |
| | | | |
Income from investment operationsb: | | | | | | | | | | | | | | | | |
Net investment incomec,d | | | 0.24 | | | | 0.19 | | | | 0.23 | | | | 0.19 | |
Net realized and unrealized gains (losses) | | | (0.37 | ) | | | 0.54 | | | | 1.46 | | | | (2.87 | ) |
| | | | |
Total from investment operations | | | (0.13 | ) | | | 0.73 | | | | 1.69 | | | | (2.68 | ) |
| | | | |
Less distributions from: | | | | | | | | | | | | | | | | |
Net investment income | | | — | e | | | (0.16 | ) | | | (0.17 | ) | | | (0.18 | ) |
Net realized gains | | | — | | | | — | e | | | — | | | | (0.17 | ) |
| | | | |
Total distributions | | | — | e | | | (0.16 | ) | | | (0.17 | ) | | | (0.35 | ) |
| | | | |
Net asset value, end of year | | $ | 7.58 | | | $ | 7.71 | | | $ | 7.14 | | | $ | 5.62 | |
| | | | |
| | | | |
Total returnf | | | (1.67)% | | | | 10.24% | | | | 30.06% | | | | (30.81)% | |
Ratios to average net assetsg | | | | | | | | | | | | | | | | |
Expenses before waiver and payments by affiliatesh | | | 0.46% | | | | 0.46% | | | | 0.47% | | | | 0.48% | |
Expenses net of waiver and payments by affiliatesh | | | 0.45% | | | | 0.45% | | | | 0.45% | | | | 0.48% | |
Net investment incomed | | | 3.09% | | | | 2.69% | | | | 3.81% | | | | 3.46% | |
| | | | |
Supplemental data | | | | | | | | | | | | | | | | |
Net assets, end of year (000’s) | | $ | 2,860,928 | | | $ | 3,036,272 | | | $ | 1,424,479 | | | $ | 263,001 | |
Portfolio turnover rate | | | 58.42% | | | | 17.81% | | | | 4.23% | | | | 22.09% | |
aFor the period February 29, 2008 (effective date) to December 31, 2008.
bThe amount shown for a share outstanding throughout the period may not correlate with the Statement of Operations for the period due to the timing of sales and repurchases of the Fund shares in relation to income earned and/or fluctuating market value of the investments of the Fund.
cBased on average daily shares outstanding.
dRecognition of net investment income by the Fund is affected by the timing of declaration of dividends by the Underlying Funds in which the Fund invests.
eAmount rounds to less than $0.01 per share.
fTotal return does not include fees, charges or expenses imposed by the variable annuity and life insurance contracts for which the Franklin Templeton Variable Insurance Products Trust serves as an underlying investment vehicle. Total return is not annualized for periods less than one year.
gRatios are annualized for periods less than one year.
hDoes not include expenses of the Underlying Funds in which the Fund invests. The annualized weighted average expense ratio of the Underlying Funds was 0.65% for the year ended December 31, 2011.
The accompanying notes are an integral part of these financial statements.
FFA-9
Franklin Templeton Variable Insurance Products Trust
Statement of Investments, December 31, 2011
| | | | | | |
| Franklin Templeton VIP Founding Funds Allocation Fund | | Shares | | Value | |
Investments in Underlying Fundsa | | | | | | |
Domestic Equity 31.6% | | | | | | |
Mutual Shares Securities Fund, Class 1 | | 67,201,395 | | $ | 1,046,325,725 | |
| | | | | | |
Domestic Hybrid 31.6% | | | | | | |
Franklin Income Securities Fund, Class 1 | | 71,098,618 | | | 1,043,727,706 | |
| | | | | | |
Foreign Equity 31.8% | | | | | | |
Templeton Growth Securities Fund, Class 1 | | 102,526,012 | | | 1,052,942,139 | |
| | | | | | |
Total Investments in Underlying Funds (Cost $2,851,807,737) 95.0% | | | | | 3,142,995,570 | |
Other Assets, less Liabilities 5.0% | | | | | 166,503,342 | |
| | | | | | |
Net Assets 100.0% | | | | $ | 3,309,498,912 | |
| | | | | | |
aSee Note 7 regarding investments in Underlying Funds.
The accompanying notes are an integral part of these financial statements.
FFA-10
Franklin Templeton Variable Insurance Products Trust
Financial Statements
Statement of Assets and Liabilities
December 31, 2011
| | | | |
| | | Franklin
Templeton VIP
Founding Funds
Allocation Fund | |
Assets: | | | | |
Investments in Underlying Funds: (Note 7) | | | | |
Cost | | $ | 2,851,807,737 | |
| | | | |
Value | | $ | 3,142,995,570 | |
Cash | | | 160,842,931 | |
Receivables: | | | | |
Investment securities sold | | | 187,563 | |
Capital shares sold | | | 8,130,543 | |
Other assets | | | 91 | |
| | | | |
Total assets | | | 3,312,156,698 | |
| | | | |
Liabilities: | | | | |
Payables: | | | | |
Capital shares redeemed | | | 474,905 | |
Affiliates | | | 1,986,530 | |
Reports to shareholders | | | 143,902 | |
Accrued expenses and other liabilities | | | 52,449 | |
| | | | |
Total liabilities | | | 2,657,786 | |
| | | | |
Net assets, at value | | $ | 3,309,498,912 | |
| | | | |
Net assets consist of: | | | | |
Paid-in capital | | $ | 3,267,118,803 | |
Undistributed net investment income | | | 115,004,672 | |
Net unrealized appreciation (depreciation) | | | 291,187,833 | |
Accumulated net realized gain (loss) | | | (363,812,396 | ) |
| | | | |
Net assets, at value | | $ | 3,309,498,912 | |
| | | | |
Class 1: | | | | |
Net assets, at value | | $ | 470,202 | |
| | | | |
Shares outstanding | | | 61,636 | |
| | | | |
Net asset value and maximum offering price per share | | $ | 7.63 | |
| | | | |
Class 2: | | | | |
Net assets, at value | | $ | 448,100,747 | |
| | | | |
Shares outstanding | | | 59,021,545 | |
| | | | |
Net asset value and maximum offering price per share | | $ | 7.59 | |
| | | | |
Class 4: | | | | |
Net assets, at value | | $ | 2,860,927,963 | |
| | | | |
Shares outstanding | | | 377,511,860 | |
| | | | |
Net asset value and maximum offering price per share | | $ | 7.58 | |
| | | | |
The accompanying notes are an integral part of these financial statements.
FFA-11
Franklin Templeton Variable Insurance Products Trust
Financial Statements (continued)
Statement of Operations
for the year ended December 31, 2011
| | | | |
| | | Franklin
Templeton VIP
Founding Funds
Allocation Fund | |
Investment income: | | | | |
Dividends from Underlying Funds (Note 7) | | $ | 131,232,167 | |
| | | | |
Expenses: | | | | |
Administrative fees (Note 3a) | | | 3,708,840 | |
Distribution fees: (Note 3b) | | | | |
Class 2 | | | 1,195,566 | |
Class 4 | | | 11,300,550 | |
Unaffiliated transfer agent fees | | | 3,684 | |
Custodian fees (Note 4) | | | 3,306 | |
Reports to shareholders | | | 333,870 | |
Professional fees | | | 67,810 | |
Trustees’ fees and expenses | | | 13,842 | |
Other | | | 51,629 | |
| | | | |
Total expenses | | | 16,679,097 | |
Expenses waived/paid by affiliates (Note 3d) | | | (474,139 | ) |
| | | | |
Net expenses | | | 16,204,958 | |
| | | | |
Net investment income | | | 115,027,209 | |
| | | | |
Realized and unrealized gains (losses): | | | | |
Net realized gain (loss) from sale of investments in Underlying Funds (Note 7) | | | (183,417,581 | ) |
Net change in unrealized appreciation (depreciation) on investments in Underlying Funds | | | (140,904,024 | ) |
| | | | |
Net realized and unrealized gain (loss) | | | (324,321,605 | ) |
| | | | |
Net increase (decrease) in net assets resulting from operations | | $ | (209,294,396 | ) |
| | | | |
The accompanying notes are an integral part of these financial statements.
FFA-12
Franklin Templeton Variable Insurance Products Trust
Financial Statements (continued)
Statements of Changes in Net Assets
| | | | | | | | |
| | | Franklin Templeton VIP Founding
Funds Allocation Fund | |
| | | Year Ended December 31, | |
| | | 2011 | | | 2010 | |
| | | | |
Increase (decrease) in net assets: | | | | | | | | |
Operations: | | | | | | | | |
Net investment income | | $ | 115,027,209 | | | $ | 69,934,841 | |
Net realized gain (loss) from Underlying Funds | | | (183,417,581 | ) | | | (102,829,602 | ) |
Net change in unrealized appreciation (depreciation) on investments in Underlying Funds | | | (140,904,024 | ) | | | 305,671,809 | |
| | | | |
Net increase (decrease) in net assets resulting from operations | | | (209,294,396 | ) | | | 272,777,048 | |
| | | | |
Distributions to shareholders from: | | | | | | | | |
Net investment income: | | | | | | | | |
Class 1 | | | (68 | ) | | | (19,195 | ) |
Class 2 | | | (73,496 | ) | | | (9,975,426 | ) |
Class 4 | | | (555,926 | ) | | | (59,699,243 | ) |
Net realized gains: | | | | | | | | |
Class 1 | | | — | | | | (64 | ) |
Class 2 | | | — | | | | (37,379 | ) |
Class 4 | | | — | | | | (225,645 | ) |
| | | | |
Total distributions to shareholders | | | (629,490 | ) | | | (69,956,952 | ) |
| | | | |
Capital share transactions: (Note 2) | | | | | | | | |
Class 1 | | | 45,474 | | | | (249,343 | ) |
Class 2 | | | (32,955,021 | ) | | | (22,011,518 | ) |
Class 4 | | | 27,566,498 | | | | 1,444,922,739 | |
| | | | |
Total capital share transactions | | | (5,343,049 | ) | | | 1,422,661,878 | |
| | | | |
Net increase (decrease) in net assets | | | (215,266,935 | ) | | | 1,625,481,974 | |
Net assets: | | | | | | | | |
Beginning of year | | | 3,524,765,847 | | | | 1,899,283,873 | |
| | | | |
End of year | | $ | 3,309,498,912 | | | $ | 3,524,765,847 | |
| | | | |
Undistributed net investment income included in net assets: | | | | | | | | |
End of year | | $ | 115,004,672 | | | $ | 606,953 | |
| | | | |
The accompanying notes are an integral part of these financial statements.
FFA-13
Franklin Templeton Variable Insurance Products Trust
Notes to Financial Statements
Franklin Templeton VIP Founding Funds Allocation Fund
1. ORGANIZATION AND SIGNIFICANT ACCOUNTING POLICIES
Franklin Templeton Variable Insurance Products Trust (Trust) is registered under the Investment Company Act of 1940, as amended, (1940 Act) as an open-end investment company, consisting of twenty separate funds. The Franklin Templeton VIP Founding Funds Allocation Fund (Fund) is included in this report. The financial statements of the remaining funds in the Trust are presented separately. The Fund invests primarily in other funds of the Trust (Underlying Funds). Shares of the Fund are generally sold only to insurance company separate accounts to fund the benefits of variable life insurance policies or variable annuity contracts. At December 31, 2011, 72.66% of the Fund’s shares were held through one insurance company. The Fund offers three classes of shares: Class 1, Class 2 and Class 4. Each class of shares differs by its distribution fees, voting rights on matters affecting a single class and its exchange privilege.
The following summarizes the Fund’s significant accounting policies.
a. Financial Instrument Valuation
Net asset value per share is calculated as of the close of trading of the NYSE. Investments in the Underlying Funds are valued at their closing net asset value each trading day.
b. Income Taxes
It is the Fund’s policy to qualify as a regulated investment company under the Internal Revenue Code. The Fund intends to distribute to shareholders substantially all of its taxable income and net realized gains to relieve it from federal income and excise taxes. As a result, no provision for U.S. federal income taxes is required.
The Fund recognizes the tax benefits of uncertain tax positions only when the position is “more likely than not” to be sustained upon examination by the tax authorities based on the technical merits of the tax position. As of December 31, 2011, and for all open tax years, the Fund has determined that no liability for unrecognized tax benefits is required in the Fund’s financial statements related to uncertain tax positions taken on a tax return (or expected to be taken on future tax returns). Open tax years are those that remain subject to examination and are based on each tax jurisdiction statute of limitation.
c. Security Transactions, Investment Income, Expenses and Distributions
Security transactions are accounted for on trade date. Realized gains and losses on security transactions are determined on a specific identification basis. Estimated expenses are accrued daily. Dividend income and realized gain distributions by Underlying Funds are recorded on the ex-dividend date. Distributions to shareholders are recorded on the ex-dividend date and are determined according to income tax regulations (tax basis). Distributable earnings determined on a tax basis may differ from earnings recorded in accordance with accounting principles generally accepted in the United States of America. These differences may be permanent or temporary. Permanent differences are reclassified among capital accounts to reflect their tax character. These reclassifications have no impact on net assets or the results of operations. Temporary differences are not reclassified, as they may reverse in subsequent periods.
Common expenses incurred by the Trust are allocated among the funds based on the ratio of net assets of each fund to the combined net assets of the Trust. Fund specific expenses are charged directly to the fund that incurred the expense.
The Fund indirectly bears its proportionate share of expenses from the Underlying Funds. Since the Underlying Funds have varied expense levels and the Fund may own different proportions of the Underlying Funds at different times, the amount of expenses incurred indirectly by the Fund will vary.
Realized and unrealized gains and losses and net investment income, not including class specific expenses, are allocated daily to each class of shares based upon the relative proportion of net assets of each class. Differences in per share distributions, by class, are generally due to differences in class specific expenses.
FFA-14
Franklin Templeton Variable Insurance Products Trust
Notes to Financial Statements (continued)
Franklin Templeton VIP Founding Funds Allocation Fund
1. ORGANIZATION AND SIGNIFICANT ACCOUNTING POLICIES (continued)
d. Accounting Estimates
The preparation of financial statements in accordance with accounting principles generally accepted in the United States of America requires management to make estimates and assumptions that affect the reported amounts of assets and liabilities at the date of the financial statements and the amounts of income and expenses during the reporting period. Actual results could differ from those estimates.
e. Guarantees and Indemnifications
Under the Trust’s organizational documents, its officers and trustees are indemnified by the Trust against certain liabilities arising out of the performance of their duties to the Trust. Additionally, in the normal course of business, the Trust, on behalf of the Fund, enters into contracts with service providers that contain general indemnification clauses. The Trust’s maximum exposure under these arrangements is unknown as this would involve future claims that may be made against the Trust that have not yet occurred. Currently, the Trust expects the risk of loss to be remote.
2. SHARES OF BENEFICIAL INTEREST
At December 31, 2011, there were an unlimited number of shares authorized (without par value). Transactions in the Fund’s shares were as follows:
| | | | | | | | | | | | | | | | |
| | | Year Ended December 31, | |
| | | 2011 | | | 2010 | |
| Class 1 Shares: | | Shares | | | Amount | | | Shares | | | Amount | |
Shares sold | | | 12,893 | | | $ | 104,448 | | | | 28,887 | | | $ | 212,938 | |
Shares issued in reinvestment of distributions | | | 9 | | | | 68 | | | | 2,512 | | | | 19,259 | |
Shares redeemed | | | (7,764 | ) | | | (59,042 | ) | | | (62,828 | ) | | | (481,540 | ) |
| | | | |
Net increase (decrease) | | | 5,138 | | | $ | 45,474 | | | | (31,429 | ) | | $ | (249,343 | ) |
| | | | |
Class 2 Shares: | | | | | | | | | | | | | | | | |
Shares sold | | | 6,091,791 | | | $ | 47,334,953 | | | | 5,965,854 | | | $ | 43,444,607 | |
Shares issued in reinvestment of distributions | | | 9,187 | | | | 73,496 | | | | 1,309,697 | | | | 10,012,805 | |
Shares redeemed | | | (10,341,627 | ) | | | (80,363,470 | ) | | | (10,412,128 | ) | | | (75,468,930 | ) |
| | | | |
Net increase (decrease) | | | (4,240,649 | ) | | $ | (32,955,021 | ) | | | (3,136,577 | ) | | $ | (22,011,518 | ) |
| | | | |
Class 4 Shares: | | | | | | | | | | | | | | | | |
Shares sold | | | 298,702,307 | | | $ | 2,283,542,888 | | | | 260,520,140 | | | $ | 1,895,056,899 | |
Shares issued on reinvestment of distributions | | | 69,578 | | | | 555,926 | | | | 7,836,782 | | | | 59,924,888 | |
Shares redeemed | | | (315,059,008 | ) | | | (2,256,532,316 | ) | | | (73,968,871 | ) | | | (510,059,048 | ) |
| | | | |
Net increase (decrease) | | | (16,287,123 | ) | | $ | 27,566,498 | | | | 194,388,051 | | | $ | 1,444,922,739 | |
| | | | |
3. TRANSACTIONS WITH AFFILIATES
Franklin Resources, Inc. is the holding company for various subsidiaries that together are referred to as Franklin Templeton Investments. Certain officers and trustees of the Fund are also officers and/or directors of certain of the Underlying Funds and of the following subsidiaries:
| | |
| Subsidiary | | Affiliation |
Franklin Templeton Services, LLC (FT Services) | | Administrative manager |
Franklin Templeton Distributors, Inc. (Distributors) | | Principal underwriter |
Franklin Templeton Investor Services, LLC (Investor Services) | | Transfer agent |
FFA-15
Franklin Templeton Variable Insurance Products Trust
Notes to Financial Statements (continued)
Franklin Templeton VIP Founding Funds Allocation Fund
3. TRANSACTIONS WITH AFFILIATES (continued)
a. Administrative Fees
The Fund pays an administrative fee to FT Services of 0.10% per year of the average daily net assets of the Fund for administrative services including monitoring and rebalancing the percentage of each Fund’s investment in the Underlying Funds.
b. Distribution Fees
The Trust’s Board of Trustees has adopted distribution plans for Class 2 and Class 4 shares pursuant to Rule 12b-1 under the 1940 Act. Under the Fund’s compensation distribution plans, the Fund pays Distributors for costs incurred in connection with the servicing, sale and distribution of the Fund’s shares up to 0.35% per year of its average daily net assets of each class. The Board of Trustees has agreed to limit the current rate to 0.25% per year for Class 2.
c. Transfer Agent Fees
Investor Services, under terms of an agreement, performs shareholder servicing for the Fund and is not paid by the Fund for the services.
d. Waiver and Expense Reimbursements
FT Services has contractually agreed in advance to waive or limit its fees and to assume as its own expense certain expenses otherwise payable by the fund so that the common expenses (i.e. a combination of administrative fees and other expenses, but excluding distribution fees, and acquired fund fees and expenses) for each class of the Fund do not exceed 0.10% (other than certain non-routine expenses or costs, including those relating to litigation, indemnification, reorganizations, and liquidations) until April 30, 2012.
4. EXPENSE OFFSET ARRANGEMENT
The Fund has entered into an arrangement with its custodian whereby credits realized as a result of uninvested cash balances are used to reduce a portion of the Fund’s custodian expenses. During the year ended December 31, 2011, there were no credits earned.
5. INCOME TAXES
For tax purposes, capital losses may be carried over to offset future capital gains, if any. Under the Regulated Investment Company Modernization Act of 2010, capital losses incurred by the Fund in taxable years beginning after December 22, 2010 are not subject to expiration and such losses retain their character as short-term or long-term. During the year ended December 31, 2011, the Fund had capital loss carryforwards not subject to expiration of $114,009,192.
The tax character of distributions paid during the years ended December 31, 2011 and 2010, was as follows:
| | | | | | | | |
| | | 2011 | | | 2010 | |
Distributions paid from: | | | | | | | | |
Ordinary income | | $ | 629,490 | | | $ | 69,719,533 | |
Long term capital gain | | | — | | | | 237,419 | |
| | | | |
| | $ | 629,490 | | �� | $ | 69,956,952 | |
| | | | |
FFA-16
Franklin Templeton Variable Insurance Products Trust
Notes to Financial Statements (continued)
Franklin Templeton VIP Founding Funds Allocation Fund
5. INCOME TAXES (continued)
At December 31, 2011, the cost of investments, net unrealized appreciation (depreciation) and undistributed ordinary income for income tax purposes were as follows:
| | | | |
Cost of investments | | $ | 3,101,610,943 | |
| | | | |
| |
Unrealized appreciation | | $ | 72,444,980 | |
Unrealized depreciation | | | (31,060,353 | ) |
| | | | |
Net unrealized appreciation (depreciation) | | $ | 41,384,627 | |
| | | | |
Distributable earnings – undistributed ordinary income | | $ | 115,004,672 | |
| | | | |
Differences between income and/or capital gains as determined on a book basis and a tax basis are primarily due to differing treatment of wash sales.
6. INVESTMENT TRANSACTIONS
Purchases and sales of Underlying Funds (excluding short term securities) for the year ended December 31, 2011, aggregated $2,142,232,167 and $2,170,193,792, respectively.
7. INVESTMENTS IN UNDERLYING FUNDS
The Fund invests primarily in the Underlying Funds which are managed by affiliates of the Fund’s administrative manager, FT Services. The Fund does not invest in the Underlying Funds for the purpose of exercising a controlling influence over the management or policies. Investments in Underlying Funds for the year ended December 31, 2011, were as follows:
| | | | | | | | | | | | | | | | | | | | | | | | | | | | | | | | |
| Underlying Funds | | Number of
Shares
Held at
Beginning
of Year | | | Gross
Additions | | | Gross
Reductions | | | Number of
Shares
Held at
End of
Year | | | Value at
End of
Year | | | Investment
Income | | | Realized
Capital
Gain (Loss) | | | % of
Underlying
Fund
Shares
Outstanding
Held at End
of Year | |
Franklin Income Securities Fund, Class 1 | | | 77,056,138 | | | | 50,750,679 | | | | 56,708,199 | | | | 71,098,618 | | | $ | 1,043,727,706 | | | $ | 80,509,469 | | | $ | (52,538,930 | ) | | | 13.38% | |
Mutual Shares Securities Fund, Class 1 | | | 72,027,638 | | | | 43,726,090 | | | | 48,552,333 | | | | 67,201,395 | | | | 1,046,325,725 | | | | 29,521,165 | | | | (57,031,675 | ) | | | 19.75% | |
Templeton Growth Securities Fund, Class 1 | | | 104,073,430 | | | | 65,742,515 | | | | 67,289,933 | | | | 102,526,012 | | | | 1,052,942,139 | | | | 21,201,533 | | | | (73,846,976 | ) | | | 41.58% | |
| | | | | | | | | | | | | | | | | | | | | | | | |
Total | | | | | | | | | | | | | | | | | | $ | 3,142,995,570 | | | $ | 131,232,167 | | | $ | (183,417,581 | ) | | | | |
| | | | | | | | | | | | | | | | | | | | | | | | |
8. CREDIT FACILITY
The Fund, together with other U.S. registered and foreign investment funds (collectively, Borrowers), managed by Franklin Templeton Investments, are borrowers in a joint syndicated senior unsecured credit facility totaling $750 million (Global Credit Facility) which matured on January 20, 2012. This Global Credit Facility provides a source of funds to the Borrowers for temporary and emergency purposes, including the ability to meet future unanticipated or unusually large redemption requests. Effective January 20, 2012, the Borrowers renewed the Global Credit Facility for a total of $1.5 billion, maturing January 18, 2013.
FFA-17
Franklin Templeton Variable Insurance Products Trust
Notes to Financial Statements (continued)
Franklin Templeton VIP Founding Funds Allocation Fund
8. CREDIT FACILITY (continued)
Under the terms of the Global Credit Facility, the Fund shall, in addition to interest charged on any borrowings made by the Fund and other costs incurred by the Fund, pay its share of fees and expenses incurred in connection with the implementation and maintenance of the Global Credit Facility, based upon its relative share of the aggregate net assets of all of the Borrowers, including an annual commitment fee of 0.08% based upon the unused portion of the Global Credit Facility, which is reflected in other expenses on the Statement of Operations. During the year ended December 31, 2011, the Fund did not use the Global Credit Facility.
9. FAIR VALUE MEASUREMENTS
The Fund follows a fair value hierarchy that distinguishes between market data obtained from independent sources (observable inputs) and the Fund’s own market assumptions (unobservable inputs). These inputs are used in determining the value of the Fund’s investments and are summarized in the following fair value hierarchy:
| | • | | Level 1 – quoted prices in active markets for identical securities |
| | • | | Level 2 – other significant observable inputs (including quoted prices for similar securities, interest rates, prepayment speed, credit risk, etc.) |
| | • | | Level 3 – significant unobservable inputs (including the Fund’s own assumptions in determining the fair value of investments) |
The inputs or methodology used for valuing securities are not an indication of the risk associated with investing in those securities.
For movements between the levels within the fair value hierarchy, the Fund has adopted a policy of recognizing the transfers as of the date of the underlying event which caused the movement.
At December 31, 2011, all of the Fund’s investments in Underlying Funds carried at fair value were valued using Level 1 inputs. For detailed categories, see the accompanying Statement of Investments.
10. NEW ACCOUNTING PRONOUNCEMENTS
In May 2011, the Financial Accounting Standards Board (FASB) issued Accounting Standards Update (ASU) No. 2011-04, Fair Value Measurement (Topic 820): Amendments to Achieve Common Fair Value Measurement and Disclosure Requirements in U.S. GAAP and IFRSs. The amendments in the ASU will improve the comparability of fair value measurements presented and disclosed in financial statements prepared in accordance with U.S. GAAP (Generally Accepted Accounting Principles) and IFRS (International Financial Reporting Standards) and include new guidance for certain fair value measurement principles and disclosure requirements. The ASU is effective for interim and annual periods beginning after December 15, 2011. The Fund believes the adoption of this ASU will not have a material impact on its financial statements.
11. SUBSEQUENT EVENTS
The Fund has evaluated subsequent events through the issuance of the financial statements and determined that no events have occurred that require disclosure other than those already disclosed in the financial statements.
FFA-18
Franklin Templeton Variable Insurance Products Trust
Franklin Templeton VIP Founding Funds Allocation Fund
Report of Independent Registered Public Accounting Firm
To the Board of Trustees and Shareholders of
Franklin Templeton Variable Insurance Products Trust
In our opinion, the accompanying statement of assets and liabilities, including the statement of investments, and the related statements of operations and of changes in net assets and the financial highlights present fairly, in all material respects, the financial position of Franklin Templeton VIP Founding Funds Allocation Fund (the “Fund”) at December 31, 2011, the results of its operations for the year then ended, the changes in its net assets for each of the two years in the period then ended and the financial highlights for the periods presented, in conformity with accounting principles generally accepted in the United States of America. These financial statements and financial highlights (hereafter referred to as “financial statements”) are the responsibility of the Fund’s management. Our responsibility is to express an opinion on these financial statements based on our audits. We conducted our audits of these financial statements in accordance with the standards of the Public Company Accounting Oversight Board (United States). Those standards require that we plan and perform the audit to obtain reasonable assurance about whether the financial statements are free of material misstatement. An audit includes examining, on a test basis, evidence supporting the amounts and disclosures in the financial statements, assessing the accounting principles used and significant estimates made by management, and evaluating the overall financial statement presentation. We believe that our audits, which included confirmation of securities at December 31, 2011 by correspondence with the custodian and brokers, provide a reasonable basis for our opinion.
PricewaterhouseCoopers LLP
San Francisco, California
February 13, 2012
FFA-19
Franklin Templeton Variable Insurance Products Trust
Tax Information (unaudited)
Franklin Templeton VIP Founding Funds Allocation Fund
Under Section 854(b)(1)(A) of the Internal Revenue Code, the Fund hereby reports 100% of the ordinary income dividends as income qualifying for the dividends received deduction for the fiscal year ended December 31, 2011.
FFA-20
FRANKLIN U.S. GOVERNMENT FUND
This annual report for Franklin U.S. Government Fund covers the fiscal year ended December 31, 2011.
Performance Summary as of 12/31/11
Average annual total return of Class 1 shares represents the average annual change in value, assuming reinvestment of dividends and capital gains. Average returns smooth out variations in returns, which can be significant; they are not the same as year-by-year results.
Periods ended 12/31/11
| | | | | | | | | | | | |
| | | 1-Year | | | 5-Year | | | 10-Year | |
Average Annual Total Return | | | +5.96% | | | | +5.91% | | | | +5.25% | |
Total Return Index Comparison for a Hypothetical $10,000 Investment (1/1/02–12/31/11)
The graph below shows the change in value of a hypothetical $10,000 investment in the Fund over the indicated period and includes reinvestment of any income or distributions. The Fund’s performance is compared to the performance of the Barclays Capital (BC) U.S. Government: Intermediate Index, the Lipper VIP General U.S. Government Funds Classification Average and the Consumer Price Index (CPI). One cannot invest directly in an index, and an index is not representative of the Fund’s portfolio. Please see Important Notes to Performance Information preceding the Fund Summaries.
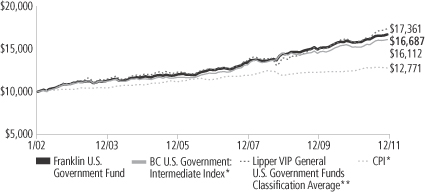
*Source: © 2012 Morningstar. Please see Index Descriptions following the Fund Summaries.
**Source: Lipper Inc. Please see Index Descriptions following the Fund Summaries.
Franklin U.S. Government Fund – Class 1
Performance reflects the Fund’s Class 1 operating expenses, but does not include any contract fees, expenses or sales charges. If they had been included, performance would be lower. These charges and deductions, particularly for variable life policies, can have a significant effect on contract values and insurance benefits. See the contract prospectus for a complete description of these expenses, including sales charges.
Performance data represent past performance, which does not guarantee future results. Investment return and principal value will fluctuate, and you may have a gain or loss when you sell your shares.
Current performance may differ from figures shown.
FUS-1
Fund Goal and Main Investments: Franklin U.S. Government Fund seeks income. The Fund normally invests at least 80% of its net assets in U.S. government securities.
Performance Overview
You can find the Fund’s one-year total return in the Performance Summary. The Fund’s benchmark, the BC U.S. Government: Intermediate Index, delivered a +6.08% return.1 The Fund underperformed the Lipper VIP General U.S. Government Funds Classification Average, which posted a +10.05% total return.2 Funds in the Lipper average may allocate as much as 35% of their fund’s investments in asset types other than U.S. government and agency mortgage-backed securities.
Economic and Market Overview
During the 12 months under review, Federal Reserve Board (Fed) policymakers maintained historically low interest rates while adopting a more restrained view of the economy largely because of the European sovereign debt crisis and signs the U.S. economic expansion lacked momentum. To promote a stronger recovery and help maintain inflation levels the Fed believed consistent with its dual mandate to foster maximum employment and price stability, the Fed undertook a second round of quantitative easing consisting of a $600 billion purchase of longer term U.S. Treasuries, which ended on June 30. Subsequently, the Fed continued to purchase U.S. Treasuries with proceeds from maturing debt in an effort to support economic growth. In September, the Fed announced plans designed to boost the economy by driving down long-term interest rates. The Fed intends to sell $400 billion in short-term securities over the next year and purchase an equal amount of long-term securities. The Fed also anticipated it would keep short-term rates near zero through mid-2013.
The economy grew more slowly than expected, and unemployment remained high. Home foreclosures increased, but federal lawmakers made efforts to strengthen the real estate market by removing some eligibility restrictions and charges associated with refinancing. After showing improvement early in the reporting period, manufacturing activity weakened partly because of global supply-chain disruptions following Japan’s natural disasters. Geopolitical instability in some oil-producing regions drove up oil prices for much of the period.
1. Source: © 2012 Morningstar.
2. Source: Lipper, Inc.
One cannot invest directly in an index, and index is not representative of the Fund’s portfolio. Please see Index Descriptions following the Fund Summaries.
Fund Risks: All investments involve risks. Interest rate movements and mortgage prepayment rates may impact the Fund’s share price and yield. Bond prices generally move in the opposite direction of interest rates. Thus, as the prices of bonds in the Fund’s portfolio adjust to a rise in interest rates, the Fund’s share price may decline. U.S. government securities owned by the Fund, but not shares of the Fund, may be guaranteed by the U.S. government, its agencies or instrumentalities as to the timely payment of principal and interest. The Fund’s yield and share price are not guaranteed and will fluctuate with market conditions. The Fund is actively managed but there is no guarantee that the manager’s investment decisions will produce the desired results. The Fund’s prospectus also includes a description of the main investment risks.
FUS-2
However, investor concerns over weak economic data contributed to a drop in crude oil prices from their 12-month high of $114 per barrel on April 29 to $99 at period-end. Storms and droughts in several states reduced crop yields, pushing up grain prices. As oil and food prices rose, the pace of inflation accelerated during the period. Various U.S. economic gauges began to show some improvement, leading some economists to become more optimistic near year-end about the economy’s prospects.
Generally favorable economic improvements and positive corporate earnings reports somewhat eased investor concerns. During the 12 months under review, fixed income markets, as measured by the BC U.S. Aggregate Index, and U.S. stocks, as measured by the Standard & Poor’s® 500 Index, posted gains.1 Heightened volatility, however, roiled global financial markets amid U.S. lawmakers’ protracted debate and eventual compromise on the debt limit, independent credit rating agency Standard & Poor’s downgrade of the long-term U.S. credit rating to AA+ from AAA, and fears of sovereign debt crisis contagion in Europe. In November, the unemployment rate fell to its lowest level in more than two years, which helped consumer confidence climb to its highest level in more than eight years. Overall for the period, however, investors sought the perceived safety of U.S. Treasuries, which drove their prices higher and yields lower.
Investment Strategy
Using our straightforward investment approach, we seek to produce current income with a high degree of credit safety from a conservatively managed portfolio of U.S. government securities. Analyzing securities using proprietary and nonproprietary research, we seek to identify attractive investment opportunities.
Manager’s Discussion
During the year under review, the Fed initiated a program (dubbed Operation Twist by commentators) intended to further reduce longer term borrowing costs and spur refinancing and economic activity. As a part of Operation Twist, the Fed will reinvest mortgage principal and agency debenture payments into mortgage-backed securities (MBS). This program will keep the Fed’s MBS portfolio from declining, and some analysts believe it could support the MBS sector.
The overall MBS market delivered positive total returns but could not keep pace with the rally and strong performance of U.S. Treasuries. With the market priced at a premium and mortgage rates near historical
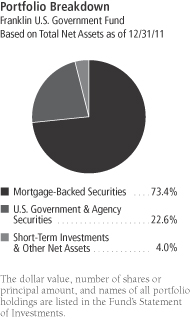
FUS-3
lows, prepayment risk remained heightened. Actual prepayment levels, however, have been constrained due to the associated cost of refinancing, loss of home equity, tighter underwriting standards and declining home prices.
Over the period, Ginnie Mae (GNMA) MBS underperformed comparable high credit-quality U.S. Treasuries, but outperformed their conventional Fannie Mae (FNMA) and Freddie Mac MBS counterparts. Within the GNMA sector, on an excess return basis, higher coupon 5.5% and 6.0% GNMAs were the best performers, while their lower coupon 4.0% and 4.5% counterparts lagged.
Franklin U.S. Government Fund’s investment process and strategy did not change, and the investment team continued to look for strong cash flow fundamentals and valuations to uncover opportunities across the agency mortgage and agency debenture universe. The Fund emphasized agency pass-throughs, primarily GNMA MBS, which remain the only MBS backed by the full faith and credit of the U.S. government, and invested in other agency securities for diversification.3 We remained weighted toward the GNMA sector and added to lower coupon 4.0% and 4.5% GNMA II (comprising multiple-issuer pools) securities. We decreased the Fund’s allocation to 5.0% through 6.0% coupon GNMA I (comprising single-issuer pools) and II securities, and purchased lower coupon (4.0% through 5.0%) FNMA MBS.
Thank you for your participation in Franklin U.S. Government Fund. We look forward to serving your future investment needs.
3. Securities owned by the Fund, but not shares of the Fund, are guaranteed by the U.S. government, its agencies or instrumentalities as to timely payment of principal and interest. The Fund’s yield and share price are not guaranteed and will vary with market conditions.
The foregoing information reflects our analysis, opinions and portfolio holdings as of December 31, 2011, the end of the reporting period. The way we implement our main investment strategies and the resulting portfolio holdings may change depending on factors such as market and economic conditions. These opinions may not be relied upon as investment advice or an offer for a particular security. The information is not a complete analysis of every aspect of any market, country, industry, security or the Fund. Statements of fact are from sources considered reliable, but the investment manager makes no representation or warranty as to their completeness or accuracy. Although historical performance is no guarantee of future results, these insights may help you understand our investment management philosophy.
FUS-4
Fund Expenses
As an investor in a variable insurance contract (Contract) that indirectly provides for investment in an underlying mutual fund, you can incur transaction and/or ongoing expenses at both the Fund level and the Contract level.
| • | | Transaction expenses can include sales charges (loads) on purchases, redemption fees, surrender fees, transfer fees and premium taxes. |
| • | | Ongoing expenses can include management fees, distribution and service (12b-1) fees, contract fees, annual maintenance fees, mortality and expense risk fees and other fees and expenses. All mutual funds and Contracts have some types of ongoing expenses. |
The expenses shown in the table are meant to highlight ongoing expenses at the Fund level only and do not include ongoing expenses at the Contract level, or transaction expenses at either the Fund or Contract level. While the Fund does not have transaction expenses, if the transaction and ongoing expenses at the Contract level were included, the expenses shown below would be higher. You should consult your Contract prospectus or disclosure document for more information.
The table shows Fund-level ongoing expenses and can help you understand these expenses and compare them with those of other mutual funds offered through the Contract. The table assumes a $1,000 investment held for the six months indicated. Please refer to the Fund prospectus for additional information on operating expenses.
Actual Fund Expenses
The first line (Actual) of the table provides actual account values and expenses. The “Ending Account Value” is derived from the Fund’s actual return, which includes the effect of ongoing Fund expenses, but does not include the effect of ongoing Contract expenses.
You can estimate the Fund-level expenses you incurred during the period by following these steps. Of course, your account value and expenses will differ from those in this illustration:
| 1. | Divide your account value by $1,000. |
If an account had an $8,600 value, then $8,600 ÷ $1,000 = 8.6.
| 2. | Multiply the result by the number under the heading “Fund-Level Expenses Incurred During Period.” |
If Fund-Level Expenses Incurred During Period were $7.50, then 8.6 x $7.50 = $64.50.
In this illustration, the estimated expenses incurred this period at the Fund level are $64.50.
Franklin U.S. Government Fund – Class 1
FUS-5
Hypothetical Example for Comparison with Other Mutual Funds
Information in the second line (Hypothetical) of the table can help you compare ongoing expenses of the Fund with those of other mutual funds offered through the Contract. This information may not be used to estimate the actual ending account balance or expenses you incurred during the period. The hypothetical “Ending Account Value” is based on the Fund’s actual expense ratio and an assumed 5% annual rate of return before expenses, which does not represent the Fund’s actual return. The figure under the heading “Fund-Level Expenses Incurred During Period” shows the hypothetical expenses your account would have incurred under this scenario. You can compare this figure with the 5% hypothetical examples that appear in shareholder reports of other funds offered through a Contract.
| | | | | | | | | | | | |
| Class 1 | | Beginning
Account Value 7/1/11 | | | Ending
Account Value 12/31/11 | | | Fund-Level Expenses Incurred
During Period* 7/1/11–12/31/11 | |
Actual | | $ | 1,000 | | | $ | 1,033.30 | | | $ | 2.61 | |
Hypothetical (5% return before expenses) | | $ | 1,000 | | | $ | 1,015.48 | | | $ | 2.60 | |
*Expenses are calculated using the most recent six-month annualized expense ratio for the Fund’s Class 1 shares (0.51%), which does not include any ongoing expenses of the Contract for which the Fund is an investment option, multiplied by the average account value over the period, multiplied by 184/365 to reflect the one-half year period.
FUS-6
Franklin Templeton Variable Insurance Products Trust
Financial Highlights
Franklin U.S. Government Fund
| | | | | | | | | | | | | | | | | | | | |
| | | Year Ended December 31, | |
| Class 1 | | 2011 | | | 2010 | | | 2009 | | | 2008 | | | 2007 | |
| | | | |
Per share operating performance | | | | | | | | | | | | | | | | | | | | |
(for a share outstanding throughout the year) | | | | | | | | | | | | | | | | | | | | |
Net asset value, beginning of year | | $ | 13.34 | | | $ | 13.08 | | | $ | 13.19 | | | $ | 12.89 | | | $ | 12.69 | |
| | | | |
Income from investment operationsa: | | | | | | | | | | | | | | | | | | | | |
Net investment incomeb | | | 0.42 | | | | 0.46 | | | | 0.51 | | | | 0.58 | | | | 0.61 | |
Net realized and unrealized gains (losses) | | | 0.36 | | | | 0.26 | | | | (0.08 | ) | | | 0.39 | | | | 0.22 | |
| | | | |
Total from investment operations | | | 0.78 | | | | 0.72 | | | | 0.43 | | | | 0.97 | | | | 0.83 | |
| | | | |
Less distributions from net investment income | | | (0.45 | ) | | | (0.46 | ) | | | (0.54 | ) | | | (0.67 | ) | | | (0.63 | ) |
| | | | |
Net asset value, end of year | | $ | 13.67 | | | $ | 13.34 | | | $ | 13.08 | | | $ | 13.19 | | | $ | 12.89 | |
| | | | |
| | | | | |
Total returnc | | | 5.96% | | | | 5.56% | | | | 3.34% | | | | 7.91% | | | | 6.85% | |
Ratios to average net assets | | | | | | | | | | | | | | | | | | | | |
Expenses | | | 0.51% | | | | 0.52% | | | | 0.53% | | | | 0.53% | d | | | 0.53% | d |
Net investment income | | | 3.07% | | | | 3.47% | | | | 3.91% | | | | 4.54% | | | | 4.83% | |
| | | | | |
Supplemental data | | | | | | | | | | | | | | | | | | | | |
Net assets, end of year (000’s) | | $ | 136,628 | | | $ | 157,551 | | | $ | 162,524 | | | $ | 173,018 | | | $ | 167,700 | |
Portfolio turnover rate | | | 37.89% | | | | 51.04% | | | | 27.51% | | | | 17.06% | | | | 27.50% | |
aThe amount shown for a share outstanding throughout the period may not correlate with the Statement of Operations for the period due to the timing of sales and repurchases of the Fund shares in relation to income earned and/or fluctuating market value of the investments of the Fund.
bBased on average daily shares outstanding.
cTotal return does not include fees, charges or expenses imposed by the variable annuity and life insurance contracts for which the Franklin Templeton Variable Insurance Products Trust serves as an underlying investment vehicle.
dBenefit of expense reduction rounds to less than 0.01%.
The accompanying notes are an integral part of these financial statements.
FUS-7
Franklin Templeton Variable Insurance Products Trust
Financial Highlights (continued)
Franklin U.S. Government Fund
| | | | | | | | | | | | | | | | | | | | |
| | | Year Ended December 31, | |
| Class 2 | | 2011 | | | 2010 | | | 2009 | | | 2008 | | | 2007 | |
| | | | |
Per share operating performance | | | | | | | | | | | | | | | | | | | | |
(for a share outstanding throughout the year) | | | | | | | | | | | | | | | | | | | | |
Net asset value, beginning of year | | $ | 13.11 | | | $ | 12.87 | | | $ | 12.99 | | | $ | 12.71 | | | $ | 12.52 | |
| | | | |
Income from investment operationsa: | | | | | | | | | | | | | | | | | | | | |
Net investment incomeb | | | 0.37 | | | | 0.42 | | | | 0.47 | | | | 0.54 | | | | 0.57 | |
Net realized and unrealized gains (losses) | | | 0.36 | | | | 0.25 | | | | (0.08 | ) | | | 0.38 | | | | 0.22 | |
| | | | |
Total from investment operations | | | 0.73 | | | | 0.67 | | | | 0.39 | | | | 0.92 | | | | 0.79 | |
| | | | |
Less distributions from net investment income | | | (0.42 | ) | | | (0.43 | ) | | | (0.51 | ) | | | (0.64 | ) | | | (0.60 | ) |
| | | | |
Net asset value, end of year | | $ | 13.42 | | | $ | 13.11 | | | $ | 12.87 | | | $ | 12.99 | | | $ | 12.71 | |
| | | | |
| | | | | |
Total returnc | | | 5.68% | | | | 5.28% | | | | 3.09% | | | | 7.59% | | | | 6.61% | |
Ratios to average net assets | | | | | | | | | | | | | | | | | | | | |
Expenses | | | 0.76% | | | | 0.77% | | | | 0.78% | | | | 0.78% | d | | | 0.78% | d |
Net investment income | | | 2.82% | | | | 3.22% | | | | 3.66% | | | | 4.29% | | | | 4.58% | |
| | | | | |
Supplemental data | | | | | | | | | | | | | | | | | | | | |
Net assets, end of year (000’s) | | $ | 894,699 | | | $ | 703,997 | | | $ | 557,809 | | | $ | 450,603 | | | $ | 379,386 | |
Portfolio turnover rate | | | 37.89% | | | | 51.04% | | | | 27.51% | | | | 17.06% | | | | 27.50% | |
aThe amount shown for a share outstanding throughout the period may not correlate with the Statement of Operations for the period due to the timing of sales and repurchases of the Fund shares in relation to income earned and/or fluctuating market value of the investments of the Fund.
bBased on average daily shares outstanding.
cTotal return does not include any fees, charges or expenses imposed by the variable annuity and life insurance contracts for which the Franklin Templeton Variable Insurance Products Trust serves as an underlying investment vehicle.
dBenefit of expense reduction rounds to less than 0.01%.
The accompanying notes are an integral part of these financial statements.
FUS-8
Franklin Templeton Variable Insurance Products Trust
Statement of Investments, December 31, 2011
| | | | | | | | |
| Franklin U.S. Government Fund | | Principal
Amount | | | Value | |
Mortgage-Backed Securities 73.4% | | | | | | | | |
aFederal Home Loan Mortgage Corp. (FHLMC) Adjustable Rate 0.0%† | | | | | | | | |
FHLMC, 2.277%, 6/01/22 | | $ | 160,507 | | | $ | 166,783 | |
FHLMC, 2.445%, 2/01/19 | | | 108,115 | | | | 113,658 | |
| | | | | | | | |
| | | | | | | 280,441 | |
| | | | | | | | |
Federal Home Loan Mortgage Corp. (FHLMC) Fixed Rate 9.4% | | | | | | | | |
FHLMC Gold 15 Year, 4.50%, 3/01/25 - 4/01/25 | | | 13,870,818 | | | | 14,753,094 | |
FHLMC Gold 30 Year, 4.00%, 9/01/40 | | | 5,185,880 | | | | 5,448,546 | |
FHLMC Gold 30 Year, 4.00%, 2/01/41 | | | 10,967,714 | | | | 11,523,231 | |
FHLMC Gold 30 Year, 4.50%, 5/01/40 - 7/01/41 | | | 18,258,246 | | | | 19,362,622 | |
FHLMC Gold 30 Year, 5.00%, 9/01/33 - 4/01/40 | | | 23,964,122 | | | | 25,782,976 | |
FHLMC Gold 30 Year, 5.50%, 7/01/33 - 5/01/38 | | | 9,695,177 | | | | 10,551,430 | |
FHLMC Gold 30 Year, 6.00%, 1/01/24 - 8/01/35 | | | 4,552,104 | | | | 5,069,924 | |
FHLMC Gold 30 Year, 6.50%, 12/01/23 - 5/01/35 | | | 1,737,306 | | | | 1,973,742 | |
FHLMC Gold 30 Year, 7.00%, 4/01/24 - 10/01/32 | | | 730,350 | | | | 841,247 | |
FHLMC Gold 30 Year, 7.50%, 12/01/22 - 5/01/24 | | | 29,907 | | | | 31,485 | |
FHLMC Gold 30 Year, 8.00%, 7/01/21 - 5/01/22 | | | 21,547 | | | | 23,782 | |
FHLMC Gold 30 Year, 8.50%, 10/01/21 - 7/01/31 | | | 1,002,900 | | | | 1,221,410 | |
FHLMC PC 30 Year, 8.00%, 1/01/17 - 5/01/17 | | | 5,649 | | | | 5,710 | |
FHLMC PC 30 Year, 8.50%, 9/01/20 | | | 1,103 | | | | 1,277 | |
| | | | | | | | |
| | | | | | | 96,590,476 | |
| | | | | | | | |
aFederal National Mortgage Association (FNMA) Adjustable Rate 0.1% | | | | | | | | |
FNMA, 2.21%, 1/01/18 | | | 746,671 | | | | 783,942 | |
FNMA, 2.308%, 2/01/19 | | | 114,160 | | | | 120,560 | |
FNMA, 2.471%, 9/01/18 | | | 249,648 | | | | 264,580 | |
FNMA, 4.421%, 7/01/19 | | | 104,440 | | | | 105,244 | |
FNMA, 4.505%, 3/01/20 | | | 93,742 | | | | 99,911 | |
| | | | | | | | |
| | | | | | | 1,374,237 | |
| | | | | | | | |
Federal National Mortgage Association (FNMA) Fixed Rate 19.3% | | | | | | | | |
FNMA 15 Year, 5.50%, 6/01/16 - 11/01/17 | | | 582,343 | | | | 628,652 | |
FNMA 15 Year, 5.50%, 1/01/25 | | | 9,910,636 | | | | 10,762,685 | |
FNMA 15 Year, 6.00%, 8/01/17 - 9/01/17 | | | 555,797 | | | | 601,828 | |
FNMA 30 Year, 4.00%, 6/01/41 | | | 15,122,955 | | | | 15,910,204 | |
FNMA 30 Year, 4.00%, 8/01/41 | | | 10,414,756 | | | | 10,956,912 | |
FNMA 30 Year, 4.00%, 3/01/39 - 9/01/41 | | | 44,547,826 | | | | 46,856,834 | |
FNMA 30 Year, 4.50%, 12/01/40 | | | 18,917,586 | | | | 20,152,760 | |
FNMA 30 Year, 4.50%, 8/01/40 - 6/01/41 | | | 15,431,159 | | | | 16,438,695 | |
FNMA 30 Year, 5.00%, 3/01/34 - 7/01/41 | | | 32,755,525 | | | | 35,436,385 | |
FNMA 30 Year, 5.50%, 12/01/32 - 8/01/35 | | | 7,794,517 | | | | 8,523,988 | |
FNMA 30 Year, 6.00%, 1/01/24 - 8/01/38 | | | 21,658,929 | | | | 23,900,157 | |
FNMA 30 Year, 6.50%, 1/01/24 - 9/01/36 | | | 3,717,857 | | | | 4,191,324 | |
FNMA 30 Year, 7.50%, 4/01/23 - 8/01/25 | | | 79,700 | | | | 88,732 | |
FNMA 30 Year, 8.00%, 7/01/16 - 2/01/25 | | | 172,418 | | | | 185,138 | |
FNMA 30 Year, 8.50%, 10/01/19 - 6/01/21 | | | 2,060 | | | | 2,368 | |
FNMA 30 Year, 9.00%, 10/01/26 | | | 366,086 | | | | 447,747 | |
FNMA GL 30 Year, 8.00%, 8/01/19 - 6/01/20 | | | 48,564 | | | | 49,629 | |
FNMA PL 30 Year, 5.50%, 4/01/34 | | | 3,522,310 | | | | 3,855,403 | |
| | | | | | | | |
| | | | | | | 198,989,441 | |
| | | | | | | | |
Government National Mortgage Association (GNMA) Fixed Rate 44.6% | | | | | | | | |
GNMA I SF 30 Year, 4.00%, 9/15/41 | | | 5,079,216 | | | | 5,458,411 | |
GNMA I SF 30 Year, 4.50%, 7/15/40 | | | 12,007,883 | | | | 13,102,476 | |
GNMA I SF 30 Year, 4.50%, 1/15/39 - 4/15/41 | | | 74,542,851 | | | | 81,509,828 | |
FUS-9
Franklin Templeton Variable Insurance Products Trust
Statement of Investments, December 31, 2011 (continued)
| | | | | | | | |
| Franklin U.S. Government Fund | | Principal
Amount | | | Value | |
Mortgage-Backed Securities (continued) | | | | | | | | |
Government National Mortgage Association (GNMA) Fixed Rate (continued) | | | | | | | | |
GNMA I SF 30 Year, 5.00%, 2/15/40 | | $ | 13,947,745 | | | $ | 15,532,557 | |
GNMA I SF 30 Year, 5.00%, 6/15/30 - 9/15/40 | | | 76,438,907 | | | | 85,048,815 | |
GNMA I SF 30 Year, 5.50%, 11/15/28 - 10/15/39 | | | 31,804,306 | | | | 35,889,442 | |
GNMA I SF 30 Year, 6.00%, 11/15/23 - 11/15/38 | | | 16,994,234 | | | | 19,309,878 | |
GNMA I SF 30 Year, 6.50%, 5/15/23 - 9/15/38 | | | 5,735,637 | | | | 6,610,201 | |
GNMA I SF 30 Year, 7.00%, 3/15/22 - 1/15/32 | | | 1,625,190 | | | | 1,885,111 | |
GNMA I SF 30 Year, 7.50%, 2/15/17 - 8/15/33 | | | 1,516,567 | | | | 1,755,727 | |
GNMA I SF 30 Year, 8.00%, 2/15/17 - 5/15/24 | | | 448,011 | | | | 488,418 | |
GNMA I SF 30 Year, 8.25%, 4/15/25 | | | 18,935 | | | | 19,138 | |
GNMA I SF 30 Year, 8.50%, 6/15/22 - 12/15/24 | | | 154,192 | | | | 170,726 | |
GNMA I SF 30 Year, 9.00%, 6/15/16 - 5/15/20 | | | 50,457 | | | | 52,289 | |
GNMA I SF 30 Year, 9.50%, 7/15/16 - 6/15/21 | | | 170,252 | | | | 181,808 | |
GNMA I SF 30 Year, 10.00%, 10/15/17 - 8/15/21 | | | 94,863 | | | | 102,229 | |
GNMA II SF 30 Year, 4.00%, 11/20/40 | | | 10,373,218 | | | | 11,118,468 | |
GNMA II SF 30 Year, 4.00%, 12/20/40 - 7/20/41 | | | 8,021,222 | | | | 8,597,496 | |
GNMA II SF 30 Year, 4.00%, 11/20/41 | | | 14,054,364 | | | | 15,059,690 | |
GNMA II SF 30 Year, 4.50%, 10/20/39 - 3/20/41 | | | 23,213,372 | | | | 25,385,583 | |
GNMA II SF 30 Year, 4.50%, 4/20/41 | | | 13,415,002 | | | | 14,663,853 | |
GNMA II SF 30 Year, 4.50%, 5/20/41 | | | 12,376,913 | | | | 13,529,125 | |
GNMA II SF 30 Year, 4.50%, 6/20/41 | | | 18,300,885 | | | | 20,004,581 | |
GNMA II SF 30 Year, 4.50%, 7/20/41 | | | 12,544,415 | | | | 13,712,220 | |
GNMA II SF 30 Year, 5.00%, 9/20/33 - 6/20/40 | | | 19,276,692 | | | | 21,410,821 | |
GNMA II SF 30 Year, 5.50%, 2/20/36 | | | 9,204,943 | | | | 10,383,463 | |
GNMA II SF 30 Year, 5.50%, 5/20/34 - 6/20/38 | | | 16,571,194 | | | | 18,691,673 | |
GNMA II SF 30 Year, 6.00%, 11/20/23 - 7/20/39 | | | 15,834,429 | | | | 17,965,673 | |
GNMA II SF 30 Year, 6.50%, 12/20/27 - 4/20/34 | | | 1,462,613 | | | | 1,673,048 | |
GNMA II SF 30 Year, 7.00%, 5/20/32 | | | 26,035 | | | | 30,414 | |
GNMA II SF 30 Year, 7.50%, 5/20/17 - 5/20/33 | | | 300,481 | | | | 346,061 | |
GNMA II SF 30 Year, 8.00%, 7/20/16 - 8/20/26 | | | 32,736 | | | | 35,698 | |
GNMA II SF 30 Year, 9.50%, 4/20/25 | | | 3,001 | | | | 3,052 | |
| | | | | | | | |
| | | | | | | 459,727,973 | |
| | | | | | | | |
Total Mortgage-Backed Securities (Cost $717,909,032) | | | | | | | 756,962,568 | |
| | | | | | | | |
U.S. Government and Agency Securities 22.6% | | | | | | | | |
FFCB, 1.50%, 11/16/15 | | | 10,000,000 | | | | 10,223,440 | |
FHLB, | | | | | | | | |
0.875%, 8/22/12 | | | 20,000,000 | | | | 20,084,160 | |
3.625%, 5/29/13 | | | 4,500,000 | | | | 4,708,980 | |
3.625%, 10/18/13 | | | 15,000,000 | | | | 15,862,890 | |
4.75%, 12/16/16 | | | 17,000,000 | | | | 20,005,515 | |
5.125%, 8/14/13 | | | 11,000,000 | | | | 11,852,478 | |
5.25%, 6/05/17 | | | 9,000,000 | | | | 10,803,078 | |
FICO, 15, Strip, 3/07/16 | | | 15,000,000 | | | | 14,372,940 | |
FNMA, | | | | | | | | |
1.25%, 6/22/12 | | | 15,500,000 | | | | 15,583,638 | |
1.75%, 5/07/13 | | | 7,900,000 | | | | 8,051,593 | |
senior note, 5.375%, 6/12/17 | | | 17,800,000 | | | | 21,542,806 | |
HUD, 96-A, | | | | | | | | |
7.63%, 8/01/14 | | | 355,000 | | | | 357,031 | |
7.66%, 8/01/15 | | | 457,582 | | | | 460,220 | |
FUS-10
Franklin Templeton Variable Insurance Products Trust
Statement of Investments, December 31, 2011 (continued)
| | | | | | | | |
| Franklin U.S. Government Fund | | Principal
Amount | | | Value | |
U.S. Government and Agency Securities (continued) | | | | | | | | |
SBA, | | | | | | | | |
aFRN, 2.85%, 6/25/19 | | $ | 333,159 | | | $ | 343,940 | |
aFRN, 3.125%, 3/25/18 | | | 484,862 | | | | 497,952 | |
PC, 1995-20L, 1, 6.45%, 12/01/15 | | | 254,215 | | | | 272,779 | |
PC, 1996-20L, 1, 6.70%, 12/01/16 | | | 327,711 | | | | 355,953 | |
PC, 1997-20G, 1, 6.85%, 7/01/17 | | | 411,179 | | | | 448,065 | |
PC, 1998-20I, 1, 6.00%, 9/01/18 | | | 1,175,142 | | | | 1,277,489 | |
TVA, | | | | | | | | |
5.88%, 4/01/36 | | | 5,000,000 | | | | 6,830,935 | |
zero cpn. to 4/15/12, 8.25% thereafter, 4/15/42 | | | 6,000,000 | | | | 6,298,980 | |
U.S. Treasury Note, | | | | | | | | |
0.875%, 11/30/16 | | | 2,500,000 | | | | 2,508,400 | |
1.75%, 10/31/18 | | | 3,000,000 | | | | 3,088,125 | |
2.375%, 9/30/14 | | | 17,000,000 | | | | 17,941,647 | |
2.375%, 8/31/14 - 10/31/14 | | | 15,000,000 | | | | 15,826,409 | |
2.50%, 4/30/15 | | | 6,950,000 | | | | 7,419,667 | |
3.125%, 8/31/13 | | | 7,000,000 | | | | 7,335,510 | |
4.75%, 5/15/14 | | | 8,000,000 | | | | 8,838,752 | |
| | | | | | | | |
Total U.S. Government and Agency Securities (Cost $217,565,275) | | | | | | | 233,193,372 | |
| | | | | | | | |
Total Investments before Short Term Investments (Cost $935,474,307) | | | | | | | 990,155,940 | |
| | | | | | | | |
Short Term Investments (Cost $37,099,097) 3.6% | | | | | | | | |
Repurchase Agreements 3.6% | | | | | | | | |
bJoint Repurchase Agreement, 0.011%, 1/03/12 (Maturity Value $37,099,142) | | | 37,099,097 | | | | 37,099,097 | |
BNP Paribas Securities Corp. (Maturity Value $4,488,996) | | | | | | | | |
Credit Suisse Securities (USA) LLC (Maturity Value $5,386,424) | | | | | | | | |
Deutsche Bank Securities Inc. (Maturity Value $5,677,283) | | | | | | | | |
HSBC Securities (USA) Inc. (Maturity Value $8,977,993) | | | | | | | | |
Merrill Lynch, Pierce, Fenner & Smith Inc. (Maturity Value $5,386,424) | | | | | | | | |
Morgan Stanley & Co. LLC (Maturity Value $1,795,598) | | | | | | | | |
UBS Securities LLC (Maturity Value $5,386,424) | | | | | | | | |
Collateralized by U.S. Government Agency Securities, 0.16% - 5.25%, 6/07/12 - 2/05/14;
cU.S. Treasury Bills, 1/12/12 - 9/20/12; U.S. Treasury Bonds, 0.50% - 11.25%, 5/31/13 - 2/15/16; and U.S. Treasury Notes, 0.125% - 4.875%, 12/31/11 - 5/15/19 (valued at $37,860,688) | | | | | | | | |
| | | | | | | | |
Total Investments (Cost $972,573,404) 99.6% | | | | | | | 1,027,255,037 | |
Other Assets, less Liabilities 0.4% | | | | | | | 4,071,767 | |
| | | | | | | | |
Net Assets 100.0% | | | | | | $ | 1,031,326,804 | |
| | | | | | | | |
See Abbreviations on page FUS-20.
†Rounds to less than 0.1% of net assets.
aThe coupon rate shown represents the rate at period end.
bSee Note 1(b) regarding joint repurchase agreement.
cThe security is traded on a discount basis with no stated coupon rate.
The accompanying notes are an integral part of these financial statements.
FUS-11
Franklin Templeton Variable Insurance Products Trust
Financial Statements
Statement of Assets and Liabilities
December 31, 2011
| | | | |
| | | Franklin U.S.
Government Fund | |
Assets: | | | | |
Investments in securities: | | | | |
Cost - Unaffiliated issuers | | $ | 935,474,307 | |
Cost - Repurchase agreements | | | 37,099,097 | |
| | | | |
Total cost of investments | | $ | 972,573,404 | |
| | | | |
Value - Unaffiliated issuers | | $ | 990,155,940 | |
Value - Repurchase agreements | | | 37,099,097 | |
| | | | |
Total value of investments | | | 1,027,255,037 | |
Receivables: | | | | |
Investment securities sold | | | 13,525 | |
Capital shares sold | | | 1,981,004 | |
Interest | | | 3,758,943 | |
Other assets | | | 21 | |
| | | | |
Total assets | | | 1,033,008,530 | |
| | | | |
Liabilities: | | | | |
Payables: | | | | |
Capital shares redeemed | | | 753,745 | |
Affiliates | | | 769,128 | |
Reports to shareholders | | | 115,545 | |
Accrued expenses and other liabilities | | | 43,308 | |
| | | | |
Total liabilities | | | 1,681,726 | |
| | | | |
Net assets, at value | | $ | 1,031,326,804 | |
| | | | |
Net assets consist of: | | | | |
Paid-in capital | | $ | 958,775,656 | |
Undistributed net investment income | | | 29,334,459 | |
Net unrealized appreciation (depreciation) | | | 54,681,633 | |
Accumulated net realized gain (loss) | | | (11,464,944 | ) |
| | | | |
Net assets, at value | | $ | 1,031,326,804 | |
| | | | |
Class 1: | | | | |
Net assets, at value | | $ | 136,627,815 | |
| | | | |
Shares outstanding | | | 9,997,615 | |
| | | | |
Net asset value and maximum offering price per share | | $ | 13.67 | |
| | | | |
Class 2: | | | | |
Net assets, at value | | $ | 894,698,989 | |
| | | | |
Shares outstanding | | | 66,672,659 | |
| | | | |
Net asset value and maximum offering price per share | | $ | 13.42 | |
| | | | |
The accompanying notes are an integral part of these financial statements.
FUS-12
Franklin Templeton Variable Insurance Products Trust
Financial Statements (continued)
Statement of Operations
for the year ended December 31, 2011
| | | | |
| | | Franklin U.S.
Government Fund | |
Investment income: | | | | |
Interest | | $ | 33,076,985 | |
| | | | |
Expenses: | | | | |
Management fees (Note 3a) | | | 4,408,079 | |
Distribution fees: (Note 3c) | | | | |
Class 2 | | | 1,939,651 | |
Class 4 | | | 3 | |
Unaffiliated transfer agent fees | | | 1,674 | |
Custodian fees (Note 4) | | | 13,358 | |
Reports to shareholders | | | 176,504 | |
Professional fees | | | 42,650 | |
Trustees’ fees and expenses | | | 3,322 | |
Other | | | 38,177 | |
| | | | |
Total expenses | | | 6,623,418 | |
| | | | |
Net investment income | | | 26,453,567 | |
| | | | |
Realized and unrealized gains (losses): | | | | |
Net realized gain (loss) from investments | | | 4,945,621 | |
Net change in unrealized appreciation (depreciation) on investments | | | 19,413,703 | |
| | | | |
Net realized and unrealized gain (loss) | | | 24,359,324 | |
| | | | |
Net increase (decrease) in net assets resulting from operations | | $ | 50,812,891 | |
| | | | |
The accompanying notes are an integral part of these financial statements.
FUS-13
Franklin Templeton Variable Insurance Products Trust
Financial Statements (continued)
Statements of Changes in Net Assets
| | | | | | | | |
| | | Franklin U.S.
Government Fund | |
| | | Year Ended December 31, | |
| | | 2011 | | | 2010 | |
| | | | |
Increase (decrease) in net assets: | | | | | | | | |
Operations: | | | | | | | | |
Net investment income | | $ | 26,453,567 | | | $ | 26,503,056 | |
Net realized gain (loss) from investments | | | 4,945,621 | | | | 545,240 | |
Net change in unrealized appreciation (depreciation) on investments | | | 19,413,703 | | | | 13,639,024 | |
| | | | |
Net increase (decrease) in net assets resulting from operations | | | 50,812,891 | | | | 40,687,320 | |
| | | | |
Distributions to shareholders from net investment income: | | | | | | | | |
Net investment income: | | | | | | | | |
Class 1 | | | (4,966,923 | ) | | | (5,536,228 | ) |
Class 2 | | | (24,186,254 | ) | | | (21,255,018 | ) |
Class 4 | | | — | | | | (156 | ) |
| | | | |
Total distributions to shareholders | | | (29,153,177 | ) | | | (26,791,402 | ) |
| | | | |
Capital share transactions: (Note 2) | | | | | | | | |
Class 1 | | | (24,494,530 | ) | | | (8,339,790 | ) |
Class 2 | | | 172,613,515 | | | | 135,659,032 | |
Class 4 | | | (5,048 | ) | | | — | |
| | | | |
Total capital share transactions | | | 148,113,937 | | | | 127,319,242 | |
| | | | |
Net increase (decrease) in net assets | | | 169,773,651 | | | | 141,215,160 | |
Net assets: | | | | | | | | |
Beginning of year | | | 861,553,153 | | | | 720,337,993 | |
| | | | |
End of year | | $ | 1,031,326,804 | | | $ | 861,553,153 | |
| | | | |
Undistributed net investment income included in net assets: | | | | | | | | |
End of year | | $ | 29,334,459 | | | $ | 28,069,944 | |
| | | | |
The accompanying notes are an integral part of these financial statements.
FUS-14
Franklin Templeton Variable Insurance Products Trust
Notes to Financial Statements
Franklin U.S. Government Fund
1. ORGANIZATION AND SIGNIFICANT ACCOUNTING POLICIES
Franklin Templeton Variable Insurance Products Trust (Trust) is registered under the Investment Company Act of 1940, as amended, (1940 Act) as an open-end investment company, consisting of twenty separate funds. The Franklin U.S. Government Fund (Fund) is included in this report. The financial statements of the remaining funds in the Trust are presented separately. Shares of the Fund are generally sold only to insurance company separate accounts to fund the benefits of variable life insurance policies or variable annuity contracts. The Fund offers two classes of shares: Class 1 and Class 2. On March 4, 2011, the Fund liquidated Class 4. Each class of shares differs by its distribution fees, voting rights on matters affecting a single class and its exchange privilege.
The following summarizes the Fund’s significant accounting policies.
a. Financial Instrument Valuation
The Fund’s investments in securities and other financial instruments are carried at fair value daily. Fair value is the price that would be received to sell an asset or paid to transfer a liability in an orderly transaction between market participants on the measurement date. Under procedures approved by the Trust’s Board of Trustees, the Fund may utilize independent pricing services, quotations from securities and financial instrument dealers, and other market sources to determine fair value.
Debt securities generally trade in the over-the-counter market rather than on a securities exchange. The Fund’s pricing services use multiple valuation techniques to determine fair value. In instances where sufficient market activity exists, the pricing services may utilize a market-based approach through which quotes from market makers are used to determine fair value. In instances where sufficient market activity may not exist or is limited, the pricing services also utilize proprietary valuation models which may consider market characteristics such as benchmark yield curves, option-adjusted spreads, credit spreads, estimated default rates, coupon rates, anticipated timing of principal repayments, underlying collateral, and other unique security features in order to estimate the relevant cash flows, which are then discounted to calculate the fair value. Repurchase agreements are valued at cost, which approximates market value.
The Fund has procedures to determine the fair value of securities and other financial instruments for which market prices are not readily available or which may not be reliably priced. Under these procedures, the Fund primarily employs a market-based approach which may use related or comparable assets or liabilities, recent transactions, market multiples, book values, and other relevant information for the investment to determine the fair value of the investment. The Fund may also use an income-based valuation approach in which the anticipated future cash flows of the investment are discounted to calculate fair value. Discounts may also be applied due to the nature or duration of any restrictions on the disposition of the investments. Due to the inherent uncertainty of valuations of such investments, the fair values may differ significantly from the values that would have been used had an active market existed.
b. Joint Repurchase Agreement
The Fund enters into a joint repurchase agreement whereby its uninvested cash balance is deposited into a joint cash account with other funds managed by the investment manager or an affiliate of the investment manager and is used to invest in one or more repurchase agreements. The value and face amount of the joint repurchase agreement are allocated to the funds based on their pro-rata interest. A repurchase agreement is accounted for as a loan by the fund to the seller, collateralized by securities which are delivered to the fund’s custodian. The market value, including accrued interest, of the initial collateralization is required to be at least 102% of the dollar amount invested by the funds, with the value of the underlying securities marked to market daily to maintain coverage of at least 100%. The joint repurchase agreement held by the Fund at year end had been entered into on December 30, 2011.
FUS-15
Franklin Templeton Variable Insurance Products Trust
Notes to Financial Statements (continued)
Franklin U.S. Government Fund
1. ORGANIZATION AND SIGNIFICANT ACCOUNTING POLICIES (continued)
c. Income Taxes
It is the Fund’s policy to qualify as a regulated investment company under the Internal Revenue Code. The Fund intends to distribute to shareholders substantially all of its taxable income and net realized gains to relieve it from federal income and excise taxes. As a result, no provision for U.S. federal income taxes is required.
The Fund recognizes the tax benefits of uncertain tax positions only when the position is “more likely than not” to be sustained upon examination by the tax authorities based on the technical merits of the tax position. As of December 31, 2011, and for all open tax years, the Fund has determined that no liability for unrecognized tax benefits is required in the Fund’s financial statements related to uncertain tax positions taken on a tax return (or expected to be taken on future tax returns). Open tax years are those that remain subject to examination and are based on each tax jurisdiction statute of limitation.
d. Security Transactions, Investment Income, Expenses and Distributions
Security transactions are accounted for on trade date. Realized gains and losses on security transactions are determined on a specific identification basis. Interest income and estimated expenses are accrued daily. Amortization of premium and accretion of discount on debt securities are included in interest income. Distributions to shareholders are recorded on the ex-dividend date and are determined according to income tax regulations (tax basis). Distributable earnings determined on a tax basis may differ from earnings recorded in accordance with accounting principles generally accepted in the United States of America. These differences may be permanent or temporary. Permanent differences are reclassified among capital accounts to reflect their tax character. These reclassifications have no impact on net assets or the results of operations. Temporary differences are not reclassified, as they may reverse in subsequent periods.
Common expenses incurred by the Trust are allocated among the funds based on the ratio of net assets of each fund to the combined net assets of the Trust. Fund specific expenses are charged directly to the fund that incurred the expense.
Realized and unrealized gains and losses and net investment income, not including class specific expenses, are allocated daily to each class of shares based upon the relative proportion of net assets of each class. Differences in per share distributions, by class, are generally due to differences in class specific expenses.
e. Accounting Estimates
The preparation of financial statements in accordance with accounting principles generally accepted in the United States of America requires management to make estimates and assumptions that affect the reported amounts of assets and liabilities at the date of the financial statements and the amounts of income and expenses during the reporting period. Actual results could differ from those estimates.
f. Guarantees and Indemnifications
Under the Trust’s organizational documents, its officers and trustees are indemnified by the Trust against certain liabilities arising out of the performance of their duties to the Trust. Additionally, in the normal course of business, the Trust, on behalf of the Fund, enters into contracts with service providers that contain general indemnification clauses. The Trust’s maximum exposure under these arrangements is unknown as this would involve future claims that may be made against the Trust that have not yet occurred. Currently, the Trust expects the risk of loss to be remote.
FUS-16
Franklin Templeton Variable Insurance Products Trust
Notes to Financial Statements (continued)
Franklin U.S. Government Fund
2. SHARES OF BENEFICIAL INTEREST
At December 31, 2011, there were an unlimited number of shares authorized (without par value). Transactions in the Fund’s shares were as follows:
| | | | | | | | | | | | | | | | |
| | | Year Ended December 31, | |
| | | 2011a | | | 2010b | |
| Class 1 Shares: | | Shares | | | Amount | | | Shares | | | Amount | |
Shares sold | | | 756,773 | | | $ | 10,178,368 | | | | 792,069 | | | $ | 10,574,203 | |
Shares issued in reinvestment of distributions | | | 374,862 | | | | 4,966,923 | | | | 422,290 | | | | 5,536,228 | |
Shares redeemed | | | (2,941,594 | ) | | | (39,639,821 | ) | | | (1,831,372 | ) | | | (24,450,221 | ) |
| | | | |
Net increase (decrease) | | | (1,809,959 | ) | | $ | (24,494,530 | ) | | | (617,013 | ) | | $ | (8,339,790 | ) |
| | | | |
Class 2 Shares: | | | | | | | | | | | | | | | | |
Shares sold | | | 22,722,855 | | | $ | 301,179,226 | | | | 19,436,114 | | | $ | 255,318,751 | |
Shares issued in reinvestment of distributions | | | 1,856,198 | | | | 24,186,254 | | | | 1,647,676 | | | | 21,255,018 | |
Shares redeemed | | | (11,586,947 | ) | | | (152,751,965 | ) | | | (10,741,522 | ) | | | (140,914,737 | ) |
| | | | |
Net increase (decrease) | | | 12,992,106 | | | $ | 172,613,515 | | | | 10,342,268 | | | $ | 135,659,032 | |
| | | | |
Class 4 Shares: | | | | | | | | | | | | | | | | |
Shares redeemed | | | (379 | ) | | $ | (5,048 | ) | | | | | | | | |
| | | | | | | | | | |
Net increase (decrease) | | | (379 | ) | | $ | (5,048 | ) | | | | | | | | |
| | | | | | | | | | |
| aEffective | March 4, 2011, Class 4 was liquidated. |
| bDuring | the year Class 4 did not report any share transactions. |
3. TRANSACTIONS WITH AFFILIATES
Franklin Resources, Inc. is the holding company for various subsidiaries that together are referred to as Franklin Templeton Investments. Certain officers and trustees of the Fund are also officers and/or directors of the following subsidiaries:
| | |
| Subsidiary | | Affiliation |
Franklin Advisers, Inc. (Advisers) | | Investment manager |
Franklin Templeton Services, LLC (FT Services) | | Administrative manager |
Franklin Templeton Distributors, Inc. (Distributors) | | Principal underwriter |
Franklin Templeton Investor Services, LLC (Investor Services) | | Transfer agent |
a. Management Fees
The Fund pays an investment management fee to Advisers based on the average daily net assets of the Fund as follows:
| | |
| Annualized Fee Rate | | Net Assets |
0.625% | | Up to and including $100 million |
0.500% | | Over $100 million, up to and including $250 million |
0.450% | | Over $250 million, up to and including $7.5 billion |
0.440% | | Over $7.5 billion, up to and including $10 billion |
0.430% | | Over $10 billion, up to and including $12.5 billion |
0.420% | | Over $12.5 billion, up to and including $15 billion |
0.400% | | In excess of $15 billion |
FUS-17
Franklin Templeton Variable Insurance Products Trust
Notes to Financial Statements (continued)
Franklin U.S. Government Fund
3. TRANSACTIONS WITH AFFILIATES (continued)
b. Administrative Fees
Under an agreement with Advisers, FT Services provides administrative services to the Fund. The fee is paid by Advisers based on average daily net assets, and is not an additional expense of the Fund.
c. Distribution Fees
The Fund’s Board of Trustees has adopted distribution plans for Class 2 and Class 4 shares pursuant to Rule 12b-1 under the 1940 Act. Under the Fund’s compensation distribution plans, the Fund pays Distributors for costs incurred in connection with the servicing, sale and distribution of the Fund’s shares up to 0.35% per year of its average daily net assets. The Board of Trustees has agreed to limit the current rate to 0.25% per year for Class 2.
d. Transfer Agent Fees
Investor Services, under terms of an agreement, performs shareholder servicing for the Fund and is not paid by the Fund for the services.
4. EXPENSE OFFSET ARRANGEMENT
The Fund has entered into an arrangement with its custodian whereby credits realized as a result of uninvested cash balances are used to reduce a portion of the Fund’s custodian expenses. During the year ended December 31, 2011, there were no credits earned.
5. INCOME TAXES
For tax purposes, capital losses may be carried over to offset future capital gains, if any. Under the Regulated Investment Company Modernization Act of 2010, capital losses incurred by the Fund in taxable years beginning after December 22, 2010 are not subject to expiration and such losses retain their character as either short-term or long-term, rather than being considered short-term as under previous law. Post-enactment capital losses must be fully utilized prior to utilizing any losses incurred in pre-enactment tax years.
At December 31, 2011, capital loss carryforwards were as follows:
| | | | |
Capital loss carryforwards subject to expiration: | | | | |
2012 | | $ | 3,331,578 | |
2013 | | | 2,102,640 | |
2014 | | | 1,618,397 | |
2015 | | | 2,329,071 | |
2016 | | | 841,479 | |
2017 | | | 401,851 | |
2018 | | | 426,637 | |
| |
Capital loss carryforwards not subject to expiration | | | 373,160 | |
| | | | |
| | $ | 11,424,813 | |
| | | | |
On December 1, 2011, the Fund had expired pre-enactment capital loss carryforwards of $4,558,723, which were reclassified to paid-in capital.
FUS-18
Franklin Templeton Variable Insurance Products Trust
Notes to Financial Statements (continued)
Franklin U.S. Government Fund
5. INCOME TAXES (continued)
The tax character of distributions paid during the years ended December 31, 2011 and 2010, was as follows:
| | | | | | | | |
| | | 2011 | | | 2010 | |
Distributions paid from ordinary income | | $ | 29,153,177 | | | $ | 26,791,402 | |
At December 31, 2011, the cost of investments, net unrealized appreciation (depreciation), and undistributed ordinary income for income tax purposes were as follows:
| | | | |
Cost of investments | | $ | 973,957,671 | |
| | | | |
| |
Unrealized appreciation | | $ | 53,542,264 | |
Unrealized depreciation | | | (244,898 | ) |
| | | | |
Net unrealized appreciation (depreciation) | | $ | 53,297,366 | |
| | | | |
Distributable earnings – undistributed ordinary income | | $ | 30,678,595 | |
| | | | |
Differences between income and/or capital gains as determined on a book basis and a tax basis are primarily due to differing treatments of paydown losses and bond discounts and premiums.
6. INVESTMENT TRANSACTIONS
Purchases and sales of investments (excluding short term securities) for the year ended December 31, 2011, aggregated $466,223,868 and $340,718,866, respectively.
7. CREDIT FACILITY
The Fund, together with other U.S. registered and foreign investment funds (collectively, Borrowers), managed by Franklin Templeton Investments, are borrowers in a joint syndicated senior unsecured credit facility totaling $750 million (Global Credit Facility) which matured on January 20, 2012. This Global Credit Facility provides a source of funds to the Borrowers for temporary and emergency purposes, including the ability to meet future unanticipated or unusually large redemption requests. Effective January 20, 2012, the Borrowers renewed the Global Credit Facility for a total of $1.5 billion, maturing January 18, 2013.
Under the terms of the Global Credit Facility, the Fund shall, in addition to interest charged on any borrowings made by the Fund and other costs incurred by the Fund, pay its share of fees and expenses incurred in connection with the implementation and maintenance of the Global Credit Facility, based upon its relative share of the aggregate net assets of all of the Borrowers, including an annual commitment fee of 0.08% based upon the unused portion of the Global Credit Facility, which is reflected in other expenses on the Statement of Operations. During the year ended December 31, 2011, the Fund did not use the Global Credit Facility.
8. FAIR VALUE MEASUREMENTS
The Fund follows a fair value hierarchy that distinguishes between market data obtained from independent sources (observable inputs) and the Fund’s own market assumptions (unobservable inputs). These inputs are used in determining the value of the Fund’s investments and are summarized in the following fair value hierarchy:
| | • | | Level 1 – quoted prices in active markets for identical securities |
| | • | | Level 2 – other significant observable inputs (including quoted prices for similar securities, interest rates, prepayment speed, credit risk, etc.) |
FUS-19
Franklin Templeton Variable Insurance Products Trust
Notes to Financial Statements (continued)
Franklin U.S. Government Fund
8. FAIR VALUE MEASUREMENTS (continued)
| | • | | Level 3 – significant unobservable inputs (including the Fund’s own assumptions in determining the fair value of investments) |
The inputs or methodology used for valuing securities are not an indication of the risk associated with investing in those securities.
For movements between the levels within the fair value hierarchy, the Fund has adopted a policy of recognizing the transfers as of the date of the underlying event which caused the movement.
At December 31, 2011, all of the Fund’s investments in securities carried at fair value were valued using Level 2 inputs. For detailed categories, see the accompanying Statement of Investments.
9. NEW ACCOUNTING PRONOUNCEMENTS
In May 2011, FASB issued ASU No. 2011-04, Fair Value Measurement (Topic 820): Amendments to Achieve Common Fair Value Measurement and Disclosure Requirements in U.S. GAAP and IFRSs. The amendments in the ASU will improve the comparability of fair value measurements presented and disclosed in financial statements prepared in accordance with U.S. GAAP (Generally Accepted Accounting Principles) and IFRS (International Financial Reporting Standards) and include new guidance for certain fair value measurement principles and disclosure requirements. The ASU is effective for interim and annual periods beginning after December 15, 2011. The Fund believes the adoption of this ASU will not have a material impact on its financial statements.
10. SUBSEQUENT EVENTS
The Fund has evaluated subsequent events through the issuance of the financial statements and determined that no events have occurred that require disclosure other than those already disclosed in the financial statements.
| | | | |
ABBREVIATIONS | | | | |
| Selected Portfolio | | | | |
| | | | |
| FFCB - Federal Farm Credit Bank | | | | |
| FHLB - Federal Home Loan Bank | | | | |
| FICO - Financing Corp. | | | | |
| FRN - Floating Rate Note | | | | |
| GL - Government Loan | | | | |
| HUD - Housing and Urban Development | | | | |
| PC - Participation Certificate | | | | |
| PL - Project Loan | | | | |
| SBA - Small Business Administration | | | | |
| SF - Single Family | | | | |
| TVA - Tennessee Valley Authority | | | | |
FUS-20
Franklin Templeton Variable Insurance Products Trust
Franklin U.S. Government Fund
Report of Independent Registered Public Accounting Firm
To the Board of Trustees and Shareholders of
Franklin Templeton Variable Insurance Products Trust
In our opinion, the accompanying statement of assets and liabilities, including the statement of investments, and the related statements of operations and of changes in net assets and the financial highlights present fairly, in all material respects, the financial position of Franklin U.S. Government Fund (the “Fund”) at December 31, 2011, the results of its operations for the year then ended, the changes in its net assets for each of the two years in the period then ended and the financial highlights for each of the five years in the period then ended, in conformity with accounting principles generally accepted in the United States of America. These financial statements and financial highlights (hereafter referred to as “financial statements”) are the responsibility of the Fund’s management. Our responsibility is to express an opinion on these financial statements based on our audits. We conducted our audits of these financial statements in accordance with the standards of the Public Company Accounting Oversight Board (United States). Those standards require that we plan and perform the audit to obtain reasonable assurance about whether the financial statements are free of material misstatement. An audit includes examining, on a test basis, evidence supporting the amounts and disclosures in the financial statements, assessing the accounting principles used and significant estimates made by management, and evaluating the overall financial statement presentation. We believe that our audits, which included confirmation of securities at December 31, 2011 by correspondence with the custodian and brokers, provide a reasonable basis for our opinion.
PricewaterhouseCoopers LLP
San Francisco, California
February 13, 2012
FUS-21
MUTUAL GLOBAL DISCOVERY SECURITIES FUND
This annual report for Mutual Global Discovery Securities Fund covers the fiscal year ended December 31, 2011.
Performance Summary as of 12/31/11
Average annual total return of Class 1 shares represents the average annual change in value, assuming reinvestment of dividends and capital gains. Average returns smooth out variations in returns, which can be significant; they are not the same as year-by-year results.
Periods ended 12/31/11
| | | | | | | | | | | | |
| | | 1-Year | | | 5-Year | | | 10-Year | |
Average Annual Total Return | | | -2.73% | | | | +1.66% | | | | +8.05% | |
Total Return Index Comparison for a Hypothetical $10,000 Investment (1/1/02–12/31/11)
The graph below shows the change in value of a hypothetical $10,000 investment in the Fund over the indicated period and includes reinvestment of any income or distributions. The Fund’s performance is compared to the performance of the Standard & Poor’s® 500 Index (S&P 500®) and the MSCI World Index. One cannot invest directly in an index, and an index is not representative of the Fund’s portfolio. Please see Important Notes to Performance Information preceding the Fund Summaries.
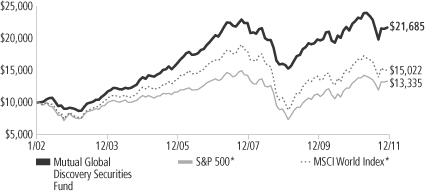
*Source: © 2012 Morningstar. Please see Index Descriptions following the Fund Summaries.
Mutual Global Discovery Securities Fund – Class 1
Performance reflects the Fund’s Class 1 operating expenses, but does not include any contract fees, expenses or sales charges. If they had been included, performance would be lower. These charges and deductions, particularly for variable life policies, can have a significant effect on contract values and insurance benefits. See the contract prospectus for a complete description of these expenses, including sales charges.
Performance data represent past performance, which does not guarantee future results. Investment return and principal value will fluctuate, and you may have a gain or loss when you sell your shares.
Current performance may differ from figures shown.
MGD-1
Fund Goal and Main Investments: Mutual Global Discovery Securities Fund seeks capital appreciation. The Fund normally invests primarily in U.S. and foreign equity securities that the manager believes are undervalued.
Performance Overview
You can find the Fund’s one-year total return in the Performance Summary. The Fund performed better than the -5.02% total return of the MSCI World Index, but underperformed the S&P 500, which posted a +2.11% total return for the same period.1
Economic and Market Overview
Global stocks declined in 2011 as deepening sovereign debt, political paralysis and economic growth concerns led to escalating investor anxiety and severe market volatility. Stocks entered the year supported by positive momentum in corporate earnings and renewed economic stimulus measures in the developed world. However, a number of events interrupted the market’s rise early in 2011, including a severe natural disaster and nuclear crisis in Japan and populist uprisings across the oil-and-gas-producing regions of the Middle East and North Africa. Global markets recovered quickly from these setbacks but soon faced more significant turmoil as Europe’s sovereign debt crisis worsened in the summer. Portugal, Greece and Ireland received bailouts and had their credit ratings slashed to junk grade, while rising bond yields in the larger economies of Italy and Spain, and eventually in the critical core economies of Germany and France, threatened the survival of the European Monetary Union. The U.S.’s sovereign debt issues and political dysfunction, accompanied by the downgrade of its AAA credit rating to AA+, further pressured investor sentiment during the summer months. Additionally, the precarious state of the global banking system as well as emerging signs of a renewed global economic slowdown and possible hard landing in China weighed on the markets.
Despite these global challenges, corporate profits remained remarkably resilient, some signs of U.S. economic improvement emerged toward year-end, and European policymakers ultimately stepped up their response to their sovereign debt and banking crisis. Greek and Italian prime ministers were replaced with technocrats tasked with arresting a debt spiral, the European Central Bank cut short-term interest rates and expanded bank lending facilities, and six key global central banks
1. Source: © 2012 Morningstar. One cannot invest directly in an index, and an index is not representative of the Fund’s portfolio. Please see Index Descriptions following the Fund Summaries.
Fund Risks: All investments involve risks. Stock prices fluctuate, sometimes rapidly and dramatically, due to factors affecting individual companies, particular industries or sectors, or general market conditions. Foreign investing, especially in developing markets, involves additional risks, including currency fluctuations, economic instability, market volatility, and political and social instability. Investments in companies involved in mergers, liquidations, reorganizations and distressed bankruptcy, which may include defaulted debt, involve higher credit and other risks. Smaller and midsize company securities involve special risks, such as relatively small revenues, limited product lines and small market share. The Fund’s investment in certain hedging and derivative instruments may involve a small investment relative to the risk assumed. The Fund is actively managed but there is no guarantee that the manager’s investment decisions will produce the desired results. The Fund’s prospectus also includes a description of the main investment risks.
MGD-2
agreed to lower dollar funding costs for Europe’s distressed commercial banks. Meanwhile, the Federal Reserve Board increased purchases of long-dated bonds to reduce key borrowing costs and hinted at “additional policy accommodation.” Chinese policymakers lowered commercial bank reserve requirements and the International Monetary Fund revamped its credit line and eased its lending terms. Commodities initially rallied due to the coordinated monetary stimulus, but most ultimately declined as global economic prospects weakened. Gold and oil, however, made annual gains. In currency markets, the euro declined with escalating weakness at year-end, while the dollar ultimately rose after a late surge. Amid general global market declines, perceived safe-haven currencies such as the Japanese yen and Swiss franc rallied strongly, and U.S. Treasuries posted their best one-year return since 2008.
Investment Strategy
At Mutual Series, we are committed to our distinctive value approach to investing. Our major investment strategy is investing in undervalued stocks. When selecting undervalued equities, we are attracted to fundamentally strong companies with healthy balance sheets, high-quality assets, substantial free cash flow and shareholder-oriented management teams and whose stocks are trading at discounts to our assessment of the companies’ intrinsic or business value. We also look for asset rich companies whose shares may be trading at depressed levels due to concerns over short-term earnings disappointments, litigation, management strategy or other perceived negatives. While the vast majority of our undervalued equity investments are made in publicly traded companies globally, we may invest occasionally in privately held companies as well.
We complement this more traditional investment strategy with two others. One is distressed investing, which is complex and can take many forms. The most common distressed investment the Fund undertakes is the purchase of financially troubled or bankrupt companies’ debt at a substantial discount to face value. After the financially distressed company is reorganized, often in bankruptcy court, the old debt is typically replaced with new securities issued by the financially stronger company.
The other piece of our investment strategy is participating in arbitrage situations, another highly specialized field. When companies announce proposed mergers or takeovers, commonly referred to as “deals,” the
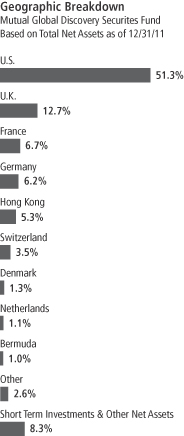
MGD-3
target company may trade at a discount to the bid it ultimately accepts. One form of arbitrage involves purchasing the target company’s stock when it is trading below the value we believe it would receive in a deal. In keeping with our commitment to a relatively conservative investment approach, we typically focus our arbitrage efforts on announced deals, and eschew rumored deals or other situations we consider relatively risky.
In addition, it is our practice to hedge the Fund’s currency exposure when we deem it advantageous for our shareholders.
Manager’s Discussion
Despite the weak performance of global stock markets in 2011, several Fund investments increased in value. Three particularly strong performers were U.K.-based tobacco companies British American Tobacco (BAT) and Imperial Tobacco Group, and U.S. managed health care provider UnitedHealth Group.
BAT shares were a key contributor to Fund performance as the company announced operating results that repeatedly exceeded market expectations through the third quarter of 2011. Management also announced it had completed a five-year goal to realize £800 million in cost savings two years ahead of schedule, and it laid out a new goal to continue growing operating margins for the next six to seven years by increasing prices and cutting costs. In 2011, BAT and other tobacco stocks also benefited from the defensive nature of their business models, which include pricing power, reasonably predictable operating profits and high dividend payout ratios. BAT has been a long-term Fund holding, and we continue to believe the shares are an attractive investment in a market fraught with uncertainty.
During the year, Imperial Tobacco reported sufficient progress in deleveraging its balance sheet, and announced a dividend increase and share buyback program. In light of Imperial’s year-end 2011 stock valuation, we believed the share buyback was an attractive way for the company to return cash to shareholders while simultaneously enhancing earnings growth. In addition, the company announced it intends to increase the dividend payout ratio and narrow the gap with its closest competitors. In our analysis, what we consider the stock’s attractive valuation and the potential for future dividend growth to exceed the pace of its peers could enable Imperial management to generate meaningful total shareholder returns in the medium term.
Top 10 Sectors/Industries
Mutual Global Discovery Securities Fund 12/31/11
| | | | |
| | | % of Total
Net Assets | |
| Tobacco | | | 10.8% | |
| Pharmaceuticals | | | 6.9% | |
| Oil, Gas & Consumable Fuels | | | 6.3% | |
| Insurance | | | 5.0% | |
| Commercial Banks | | | 4.3% | |
| Food & Staples Retailing | | | 3.6% | |
| Media | | | 3.5% | |
| Beverages | | | 3.0% | |
| Industrial Conglomerates | | | 3.0% | |
| Software | | | 2.9% | |
MGD-4
UnitedHealth’s shares rose during the year as its earnings beat management’s initial guidance in part due to lower-than-expected utilization of medical services by its members in addition to strong membership growth. The company increased its dividend in 2011, while its board of directors re-authorized the company’s share repurchase plan. At a UnitedHealth investor day convening in late November, management reaffirmed its 13% to 15% long-term earnings growth rate goal, which it seeks to achieve via high, single-digit topline growth and productivity enhancements.
Given the highly volatile year for global stock markets in general, several holdings had a negative effect on the Fund. These included large U.S. financial institutions Bank of America and Morgan Stanley, and German industrial conglomerate ThyssenKrupp.
Bank of America shares declined in 2011 as investors reacted to the company’s potential exposure to large mortgage-related losses. There was also a growing concern that related losses might force the company into a dilutive, capital-raising scenario. Bank of America also faced a very difficult general operating environment in 2011. Low interest rates, weak lending, the impact of new consumer rules on fees, and a drop-off in capital markets activity all pressured earnings and the stock price. Like many other financial stocks, Bank of America was also impacted by contagion fears from Europe, changes in capital requirements and uncertainty over the impact of new regulations such as Dodd-Frank. Although we still believed this holding held value, we exited our position in Bank of America and reallocated the capital proceeds to companies where we thought better risk-reward characteristics existed.
Morgan Stanley’s stock price decline was driven largely by negative sentiment toward global investment banks, given economic and regulatory uncertainty, particularly in the U.S. and Europe. Additional fears surfaced during the second half of 2011 that Morgan Stanley held excessive sovereign exposure to certain highly leveraged European countries in its accounts, although this turned out to be false. Morgan Stanley also faced operating challenges in its two main business segments, wealth management and institutional securities, due to client risk aversion and weak capital markets activity levels. At year-end, we continued to view Morgan Stanley as an attractive investment given its low stock valuation and strong earnings potential, according to our analysis. We also think the company has made great strides over the past few years in terms of strengthening its balance sheet while improving funding and capital positions.
Top 10 Holdings
Mutual Global Discovery Securities Fund 12/31/11
| | | | |
Company
Sector/Industry,
Country | | % of Total
Net Assets | |
| Imperial Tobacco Group PLC | | | 2.8% | |
| Tobacco, U.K. | |
| British American Tobacco PLC | | | 2.7% | |
| Tobacco, U.K. | |
| CVS Caremark Corp. | | | 2.5% | |
| Food & Staples Retailing, U.S. | |
| Lorillard Inc. | | | 2.3% | |
| Tobacco, U.S. | |
| Merck & Co Inc. | | | 2.2% | |
| Pharmaceuticals, U.S. | |
| Vodafone Group PLC | | | 2.2% | |
Wireless Telecommunication
Services, U.K. | |
| Pernod Ricard SA | | | 2.1% | |
| Beverages, France | |
| ACE Ltd. | | | 2.0% | |
| Insurance, U.S. | |
| Pfizer Inc. | | | 2.0% | |
| Pharmaceuticals, U.S. | |
| Kraft Foods Inc., A | | | 2.0% | |
| Food Products, U.S. | |
The dollar value, number of shares or principal amount, and names of all portfolio holdings are listed in the Fund’s Statement of Investments.
MGD-5
ThyssenKrupp is an industrial conglomerate that has two lines of business — materials and technology. The materials segment includes one of the world’s largest non-integrated steel producers, while the technology division is diverse and includes segments that manufacture elevators, produce components for the automotive industry and build large scale industrial plants, military ships and submarines. Thyssen-Krupp is a restructuring story with new management working to deliver on past investments and improve productivity. Its stock price moved lower in the second half of 2011 due to concerns the global economic recovery was stalling and as leaders struggled to contain the European sovereign debt crisis. German industrial companies, including ThyssenKrupp, suffered as they are generally perceived to be most exposed to a weakening Europe. The stock also moved lower because of company delays in ramping up a significant steel project in the Americas. Despite the recent pullback, we continue to believe the company is in the early stages of transformation and that the company’s ongoing restructuring efforts could be a positive catalyst in streamlining its businesses.
During the year, the Fund held currency forwards to somewhat hedge the currency risk of the portfolio’s non-U.S. dollar investments. The hedges had a negligible impact on the Fund’s performance during the period.
Thank you for your participation in Mutual Global Discovery Securities Fund. We look forward to serving your future investment needs.
The foregoing information reflects our analysis, opinions and portfolio holdings as of December 31, 2011, the end of the reporting period. The way we implement our main investment strategies and the resulting portfolio holdings may change depending on factors such as market and economic conditions. These opinions may not be relied upon as investment advice or an offer for a particular security. The information is not a complete analysis of every aspect of any market, country, industry, security or the Fund. Statements of fact are from sources considered reliable, but the investment manager makes no representation or warranty as to their completeness or accuracy. Although historical performance is no guarantee of future results, these insights may help you understand our investment management philosophy.
MGD-6
Fund Expenses
As an investor in a variable insurance contract (Contract) that indirectly provides for investment in an underlying mutual fund, you can incur transaction and/or ongoing expenses at both the Fund level and the Contract level.
| • | | Transaction expenses can include sales charges (loads) on purchases, redemption fees, surrender fees, transfer fees and premium taxes. |
| • | | Ongoing expenses can include management fees, distribution and service (12b-1) fees, contract fees, annual maintenance fees, mortality and expense risk fees and other fees and expenses. All mutual funds and Contracts have some types of ongoing expenses. |
The expenses shown in the table are meant to highlight ongoing expenses at the Fund level only and do not include ongoing expenses at the Contract level, or transaction expenses at either the Fund or Contract level. While the Fund does not have transaction expenses, if the transaction and ongoing expenses at the Contract level were included, the expenses shown below would be higher. You should consult your Contract prospectus or disclosure document for more information.
The table shows Fund-level ongoing expenses and can help you understand these expenses and compare them with those of other mutual funds offered through the Contract. The table assumes a $1,000 investment held for the six months indicated. Please refer to the Fund prospectus for additional information on operating expenses.
Actual Fund Expenses
The first line (Actual) of the table provides actual account values and expenses. The “Ending Account Value” is derived from the Fund’s actual return, which includes the effect of ongoing Fund expenses, but does not include the effect of ongoing Contract expenses.
You can estimate the Fund-level expenses you incurred during the period by following these steps. Of course, your account value and expenses will differ from those in this illustration:
| 1. | Divide your account value by $1,000. |
If an account had an $8,600 value, then $8,600 ÷ $1,000 = 8.6.
| 2. | Multiply the result by the number under the heading “Fund-Level Expenses Incurred During Period.” |
If Fund-Level Expenses Incurred During Period were $7.50, then 8.6 x $7.50 = $64.50.
In this illustration, the estimated expenses incurred this period at the Fund level are $64.50.
Mutual Global Discovery Securities Fund – Class 1
MGD-7
Hypothetical Example for Comparison with Other Mutual Funds
Information in the second line (Hypothetical) of the table can help you compare ongoing expenses of the Fund with those of other mutual funds offered through the Contract. This information may not be used to estimate the actual ending account balance or expenses you incurred during the period. The hypothetical “Ending Account Value” is based on the Fund’s actual expense ratio and an assumed 5% annual rate of return before expenses, which does not represent the Fund’s actual return. The figure under the heading “Fund-Level Expenses Incurred During Period” shows the hypothetical expenses your account would have incurred under this scenario. You can compare this figure with the 5% hypothetical examples that appear in shareholder reports of other funds offered through a Contract.
| | | | | | | | | | | | |
| Class 1 | | Beginning Account Value 7/1/11 | | | Ending Account Value 12/31/11 | | | Fund-Level Expenses Incurred During Period* 7/1/11–12/31/11 | |
Actual | | $ | 1,000 | | | $ | 922.10 | | | $ | 4.75 | |
Hypothetical (5% return before expenses) | | $ | 1,000 | | | $ | 1,020.27 | | | $ | 4.99 | |
*Expenses are calculated using the most recent six-month annualized expense ratio for the Fund’s Class 1 shares (0.98%), which does not include any ongoing expenses of the Contract for which the Fund is an investment option, multiplied by the average account value over the period, multiplied by 184/365 to reflect the one-half year period.
MGD-8
Franklin Templeton Variable Insurance Products Trust
Financial Highlights
Mutual Global Discovery Securities Fund
| | | | | | | | | | | | | | | | | | | | |
| | | Year Ended December 31, | |
| Class 1 | | 2011 | | | 2010 | | | 2009 | | | 2008 | | | 2007 | |
| | | | |
Per share operating performance | | | | | | | | | | | | | | | | | | | | |
(for a share outstanding throughout the year) | | | | | | | | | | | | | | | | | | | | |
Net asset value, beginning of year | | $ | 21.16 | | | $ | 19.14 | | | $ | 16.12 | | | $ | 24.08 | | | $ | 22.05 | |
| | | | |
Income from investment operationsa: | | | | | | | | | | | | | | | | | | | | |
Net investment incomeb | | | 0.52 | | | | 0.38 | | | | 0.19 | c | | | 0.37 | | | | 0.47 | |
Net realized and unrealized gains (losses) | | | (1.09 | ) | | | 1.94 | | | | 3.57 | | | | (6.95 | ) | | | 2.22 | |
| | | | |
Total from investment operations | | | (0.57 | ) | | | 2.32 | | | | 3.76 | | | | (6.58 | ) | | | 2.69 | |
| | | | |
Less distributions from: | | | | | | | | | | | | | | | | | | | | |
Net investment income | | | (0.50 | ) | | | (0.30 | ) | | | (0.26 | ) | | | (0.52 | ) | | | (0.38 | ) |
Net realized gains | | | (0.43 | ) | | | — | | | | (0.48 | ) | | | (0.86 | ) | | | (0.28 | ) |
| | | | |
Total distributions | | | (0.93 | ) | | | (0.30 | ) | | | (0.74 | ) | | | (1.38 | ) | | | (0.66 | ) |
| | | | |
Net asset value, end of year | | $ | 19.66 | | | $ | 21.16 | | | $ | 19.14 | | | $ | 16.12 | | | $ | 24.08 | |
| | | | |
| | | | | |
Total returnd | | | (2.73)% | | | | 12.24% | | | | 23.63% | | | | (28.29)% | | | | 12.17% | |
Ratios to average net assets | | | | | | | | | | | | | | | | | | | | |
Expensese,f | | | 0.97% | | | | 1.00% | | | | 1.06% | | | | 0.98% | | | | 0.97% | |
Expenses incurred in connection with securities sold short | | | —% | g | | | 0.02% | | | | 0.09% | | | | 0.01% | | | | —% | g |
Net investment income | | | 2.34% | | | | 1.93% | | | | 1.07% | c | | | 1.82% | | | | 1.96% | |
| | | | | |
Supplemental data | | | | | | | | | | | | | | | | | | | | |
Net assets, end of year (000’s) | | $ | 974 | | | $ | 84,213 | | | $ | 86,755 | | | $ | 81,320 | | | $ | 142,751 | |
Portfolio turnover rate | | | 26.17% | h | | | 49.31% | | | | 43.35% | | | | 22.76% | | | | 28.20% | |
aThe amount shown for a share outstanding throughout the period may not correlate with the Statement of Operations for the period due to the timing of sales and repurchases of the Fund shares in relation to income earned and/or fluctuating market value of the investments of the Fund.
bBased on average daily shares outstanding.
cNet investment income per share includes approximately $(0.03) per share related to an adjustment for uncollectible interest. Excluding the effect of this adjustment, the ratio of net investment income to average net assets would have been 1.26%.
dTotal return does not include fees, charges or expenses imposed by the variable annuity and life insurance contracts for which the Franklin Templeton Variable Insurance Products Trust serves as an underlying investment vehicle.
eBenefit of expense reduction rounds to less than 0.01%.
fIncludes dividend expense on securities sold short and borrowing fees, if any. See below for the ratios of such expenses to average net assets for the periods presented. See Note 1(e).
gRounds to less than 0.01%.
hExcludes the value of portfolio securities delivered as a result of a redemption in-kind. See Note 14.
The accompanying notes are an integral part of these financial statements.
MGD-9
Franklin Templeton Variable Insurance Products Trust
Financial Highlights (continued)
Mutual Global Discovery Securities Fund
| | | | | | | | | | | | | | | | | | | | |
| | | Year Ended December 31, | |
| Class 2 | | 2011 | | | 2010 | | | 2009 | | | 2008 | | | 2007 | |
| | | | |
Per share operating performance | | | | | | | | | | | | | | | | | | | | |
(for a share outstanding throughout the year) | | | | | | | | | | | | | | | | | | | | |
Net asset value, beginning of year | | $ | 20.80 | | | $ | 18.81 | | | $ | 15.85 | | | $ | 23.69 | | | $ | 21.73 | |
| | | | |
Income from investment operationsa: | | | | | | | | | | | | | | | | | | | | |
Net investment incomeb | | | 0.43 | | | | 0.33 | | | | 0.14 | c | | | 0.32 | | | | 0.40 | |
Net realized and unrealized gains (losses) | | | (1.04 | ) | | | 1.91 | | | | 3.50 | | | | (6.84 | ) | | | 2.18 | |
| | | | |
Total from investment operations | | | (0.61 | ) | | | 2.24 | | | | 3.64 | | | | (6.52 | ) | | | 2.58 | |
| | | | |
Less distributions from: | | | | | | | | | | | | | | | | | | | | |
Net investment income | | | (0.46 | ) | | | (0.25 | ) | | | (0.20 | ) | | | (0.46 | ) | | | (0.34 | ) |
Net realized gains | | | (0.43 | ) | | | — | | | | (0.48 | ) | | | (0.86 | ) | | | (0.28 | ) |
| | | | |
Total distributions | | | (0.89 | ) | | | (0.25 | ) | | | (0.68 | ) | | | (1.32 | ) | | | (0.62 | ) |
| | | | |
Net asset value, end of year | | $ | 19.30 | | | $ | 20.80 | | | $ | 18.81 | | | $ | 15.85 | | | $ | 23.69 | |
| | | | |
| | | | | |
Total returnd | | | (2.96)% | | | | 11.96% | | | | 23.31% | | | | (28.45)% | | | | 11.85% | |
Ratios to average net assets | | | | | | | | | | | | | | | | | | | | |
Expensese,f | | | 1.22% | | | | 1.25% | | | | 1.31% | | | | 1.23% | | | | 1.22% | |
Expenses incurred in connection with securities sold short | | | —% | g | | | 0.02% | | | | 0.09% | | | | 0.01% | | | | —% | g |
Net investment income | | | 2.09% | | | | 1.68% | | | | 0.82% | c | | | 1.57% | | | | 1.71% | |
| | | | | |
Supplemental data | | | | | | | | | | | | | | | | | | | | |
Net assets, end of year (000’s) | | $ | 712,161 | | | $ | 1,351,223 | | | $ | 1,309,852 | | | $ | 1,113,720 | | | $ | 1,867,484 | |
Portfolio turnover rate | | | 26.17% | h | | | 49.31% | | | | 43.35% | | | | 22.76% | | | | 28.20% | |
aThe amount shown for a share outstanding throughout the period may not correlate with the Statement of Operations for the period due to the timing of sales and repurchases of the Fund shares in relation to income earned and/or fluctuating market value of the investments of the Fund.
bBased on average daily shares outstanding.
cNet investment income per share includes approximately $(0.03) per share related to an adjustment for uncollectible interest. Excluding the effect of this adjustment, the ratio of net investment income to average net assets would have been 1.01%.
dTotal return does not include fees, charges or expenses imposed by the variable annuity and life insurance contracts for which the Franklin Templeton Variable Insurance Products Trust serves as an underlying investment vehicle.
eBenefit of expense reduction rounds to less than 0.01%.
fIncludes dividend expense on securities sold short and borrowing fees, if any. See below for the ratios of such expenses to average net assets for the periods presented. See Note 1(e).
gRounds to less than 0.01%.
hExcludes the value of portfolio securities delivered as a result of a redemption in-kind. See Note 14.
The accompanying notes are an integral part of these financial statements.
MGD-10
Franklin Templeton Variable Insurance Products Trust
Financial Highlights (continued)
Mutual Global Discovery Securities Fund
| | | | | | | | | | | | | | | | |
| | | Year Ended December 31, | |
| Class 4 | | 2011 | | | 2010 | | | 2009 | | | 2008a | |
| | | | |
Per share operating performance | | | | | | | | | | | | | | | | |
(for a share outstanding throughout the year) | | | | | | | | | | | | | | | | |
Net asset value, beginning of year | | $ | 21.02 | | | $ | 19.02 | | | $ | 16.07 | | | $ | 22.50 | |
| | | | |
Income from investment operationsb: | | | | | | | | | | | | | | | | |
Net investment incomec | | | 0.40 | | | | 0.31 | | | | 0.11 | d | | | 0.09 | |
Net realized and unrealized gains (losses) | | | (1.05 | ) | | | 1.94 | | | | 3.56 | | | | (5.14 | ) |
| | | | |
Total from investment operations | | | (0.65 | ) | | | 2.25 | | | | 3.67 | | | | (5.05 | ) |
| | | | |
Less distributions from: | | | | | | | | | | | | | | | | |
Net investment income | | | (0.44 | ) | | | (0.25 | ) | | | (0.24 | ) | | | (0.52 | ) |
Net realized gains | | | (0.43 | ) | | | — | | | | (0.48 | ) | | | (0.86 | ) |
| | | | |
Total distributions | | | (0.87 | ) | | | (0.25 | ) | | | (0.72 | ) | | | (1.38 | ) |
| | | | |
Net asset value, end of year | | $ | 19.50 | | | $ | 21.02 | | | $ | 19.02 | | | $ | 16.07 | |
| | | | |
| | | | |
Total returne | | | (3.08)% | | | | 11.87% | | | | 23.19% | | | | (23.48)% | |
Ratios to average net assetsf | | | | | | | | | | | | | | | | |
Expensesg,h | | | 1.32% | | | | 1.35% | | | | 1.41% | | | | 1.33% | |
Expenses incurred in connection with securities sold short | | | —% | i | | | 0.02% | | | | 0.09% | | | | 0.01% | |
Net investment income | | | 1.99% | | | | 1.58% | | | | 0.72% | d | | | 1.47% | |
| | | | |
Supplemental data | | | | | | | | | | | | | | | | |
Net assets, end of year (000’s) | | $ | 66,695 | | | $ | 70,613 | | | $ | 59,178 | | | $ | 23,981 | |
Portfolio turnover rate | | | 26.17% | j | | | 49.31% | | | | 43.35% | | | | 22.76% | |
aFor the period February 29, 2008 (effective date) to December 31, 2008.
bThe amount shown for a share outstanding throughout the period may not correlate with the Statement of Operations for the period due to the timing of sales and repurchases of the Fund shares in relation to income earned and/or fluctuating market value of the investments of the Fund.
cBased on average daily shares outstanding.
dNet investment income per share includes approximately $(0.03) per share related to an adjustment for uncollectible interest. Excluding the effect of this adjustment, the ratio of net investment income to average net assets would have been 0.91%.
eTotal return does not include fees, charges or expenses imposed by the variable annuity and life insurance contracts for which the Franklin Templeton Variable Insurance Products Trust serves as an underlying investment vehicle. Total return is not annualized for periods less than one year.
fRatios are annualized for periods less than one year.
gBenefit of expense reduction rounds to less than 0.01%.
hIncludes dividend expense on securities sold short and borrowing fees, if any. See below for the ratios of such expenses to average net assets for the periods presented. See Note 1(e).
iRounds to less than 0.01%.
jExcludes the value of portfolio securities delivered as a result of a redemption in-kind. See Note 14.
The accompanying notes are an integral part of these financial statements.
MGD-11
Franklin Templeton Variable Insurance Products Trust
Statement of Investments, December 31, 2011
| | | | | | | | | | |
| Mutual Global Discovery Securities Fund | | Country | | Shares | | | Value | |
Common Stocks and Other Equity Interests 85.9% | | | | | | | | | | |
Aerospace & Defense 0.9% | | | | | | | | | | |
aRaytheon Co. | | United States | | | 142,446 | | | $ | 6,891,537 | |
| | | | | | | | | | |
Auto Components 0.7% | | | | | | | | | | |
b,c,dCollins & Aikman Products Co., Contingent Distribution | | United States | | | 218,708 | | | | 728 | |
bContinental AG | | Germany | | | 61,983 | | | | 3,842,678 | |
b,eInternational Automotive Components Group Brazil LLC | | Brazil | | | 424,073 | | | | 344,190 | |
e,fInternational Automotive Components Group North America, LLC | | United States | | | 3,000,220 | | | | 1,271,794 | |
| | | | | | | | | | |
| | | | | | | | | 5,459,390 | |
| | | | | | | | | | |
Automobiles 0.8% | | | | | | | | | | |
Daimler AG | | Germany | | | 84,148 | | | | 3,677,766 | |
bGeneral Motors Co. | | United States | | | 136,940 | | | | 2,775,774 | |
| | | | | | | | | | |
| | | | | | | | | 6,453,540 | |
| | | | | | | | | | |
Beverages 3.0% | | | | | | | | | | |
Coca-Cola Enterprises Inc. | | United Kingdom | | | 107,220 | | | | 2,764,132 | |
Dr. Pepper Snapple Group Inc. | | United States | | | 120,110 | | | | 4,741,943 | |
Pernod Ricard SA | | France | | | 172,800 | | | | 16,027,120 | |
| | | | | | | | | | |
| | | | | | | | | 23,533,195 | |
| | | | | | | | | | |
Biotechnology 1.1% | | | | | | | | | | |
Amgen Inc. | | United States | | | 127,884 | | | | 8,211,432 | |
| | | | | | | | | | |
Capital Markets 1.7% | | | | | | | | | | |
Morgan Stanley | | United States | | | 450,600 | | | | 6,817,578 | |
bUBS AG | | Switzerland | | | 551,086 | | | | 6,565,931 | |
| | | | | | | | | | |
| | | | | | | | | 13,383,509 | |
| | | | | | | | | | |
Chemicals 1.1% | | | | | | | | | | |
Linde AG | | Germany | | | 55,814 | | | | 8,303,995 | |
| | | | | | | | | | |
Commercial Banks 4.3% | | | | | | | | | | |
b,e,gThe Bankshares Inc. | | United States | | | 800,000 | | | | 2,859,392 | |
bCIT Group Inc. | | United States | | | 81,872 | | | | 2,854,877 | |
b,eElephant Capital Holdings Ltd. | | Japan | | | 1,903 | | | | — | |
HSBC Holdings PLC | | United Kingdom | | | 187,440 | | | | 1,429,794 | |
KB Financial Group Inc. | | South Korea | | | 101,400 | | | | 3,175,174 | |
b,eNCB Warrant Holdings Ltd., A | | Japan | | | 9,306 | | | | — | |
PNC Financial Services Group Inc. | | United States | | | 157,001 | | | | 9,054,248 | |
Wells Fargo & Co. | | United States | | | 503,540 | | | | 13,877,562 | |
| | | | | | | | | | |
| | | | | | | | | 33,251,047 | |
| | | | | | | | | | |
Commercial Services & Supplies 0.3% | | | | | | | | | | |
Edenred | | France | | | 82,673 | | | | 2,035,210 | |
| | | | | | | | | | |
Communications Equipment 0.9% | | | | | | | | | | |
Cisco Systems Inc. | | United States | | | 399,250 | | | | 7,218,440 | |
| | | | | | | | | | |
Construction & Engineering 0.6% | | | | | | | | | | |
Vinci SA | | France | | | 99,255 | | | | 4,337,004 | |
| | | | | | | | | | |
Construction Materials 0.5% | | | | | | | | | | |
CRH PLC | | Ireland | | | 211,723 | | | | 4,209,148 | |
| | | | | | | | | | |
Consumer Finance 0.0%† | | | | | | | | | | |
bComdisco Holding Co. Inc. | | United States | | | 44 | | | | 260 | |
| | | | | | | | | | |
Containers & Packaging 0.7% | | | | | | | | | | |
Rexam PLC | | United Kingdom | | | 1,039,817 | | | | 5,688,367 | |
| | | | | | | | | | |
MGD-12
Franklin Templeton Variable Insurance Products Trust
Statement of Investments, December 31, 2011 (continued)
| | | | | | | | | | |
| Mutual Global Discovery Securities Fund | | Country | | Shares | | | Value | |
Common Stocks and Other Equity Interests (continued) | | | | | | | | | | |
Diversified Financial Services 2.5% | | | | | | | | | | |
Citigroup Inc. | | United States | | | 167,204 | | | $ | 4,399,137 | |
bDeutsche Boerse AG | | Germany | | | 155,457 | | | | 8,150,936 | |
b,hNorth American Financial Holdings Inc., A, 144A | | United States | | | 78,494 | | | | 1,177,410 | |
b,hNorth American Financial Holdings Inc., B, 144A, non-voting | | United States | | | 269,922 | | | | 4,048,830 | |
NYSE Euronext | | United States | | | 77,522 | | | | 2,023,324 | |
| | | | | | | | | | |
| | | | | | | | | 19,799,637 | |
| | | | | | | | | | |
Diversified Telecommunication Services 0.9% | | | | | | | | | | |
bAboveNet Inc. | | United States | | | 24,161 | | | | 1,570,707 | |
Cable & Wireless Communication PLC | | United Kingdom | | | 2,250,099 | | | | 1,331,232 | |
b,c,dGlobal Crossing Holdings Ltd., Contingent Distribution | | United States | | | 2,236,777 | | | | — | |
b,c,dMarconi Corp., Contingent Distribution | | United Kingdom | | | 1,739,100 | | | | 32,340 | |
Vivendi SA | | France | | | 177,539 | | | | 3,888,025 | |
| | | | | | | | | | |
| | | | | | | | | 6,822,304 | |
| | | | | | | | | | |
Electric Utilities 2.6% | | | | | | | | | | |
b,eAET&D Holdings No. 1 Pty. Ltd. | | Australia | | | 1,361,600 | | | | — | |
E.ON AG | | Germany | | | 367,602 | | | | 7,864,764 | |
Exelon Corp. | | United States | | | 288,450 | | | | 12,510,076 | |
| | | | | | | | | | |
| | | | | | | | | 20,374,840 | |
| | | | | | | | | | |
Electrical Equipment 0.3% | | | | | | | | | | |
Alstom SA | | France | | | 82,608 | | | | 2,505,125 | |
| | | | | | | | | | |
Energy Equipment & Services 0.9% | | | | | | | | | | |
Ensco PLC, ADR | | United States | | | 95,904 | | | | 4,499,815 | |
bPetroleum Geo-Services ASA | | Norway | | | 7,349 | | | | 80,425 | |
Transocean Ltd. | | United States | | | 73,643 | | | | 2,827,155 | |
| | | | | | | | | | |
| | | | | | | | | 7,407,395 | |
| | | | | | | | | | |
Food & Staples Retailing 3.6% | | | | | | | | | | |
CVS Caremark Corp. | | United States | | | 480,292 | | | | 19,586,308 | |
Koninklijke Ahold NV | | Netherlands | | | 647,986 | | | | 8,726,551 | |
| | | | | | | | | | |
| | | | | | | | | 28,312,859 | |
| | | | | | | | | | |
Food Products 2.0% | | | | | | | | | | |
Farmer Brothers Co. | | United States | | | 37,760 | | | | 288,487 | |
Kraft Foods Inc., A | | United States | | | 411,076 | | | | 15,357,799 | |
| | | | | | | | | | |
| | | | | | | | | 15,646,286 | |
| | | | | | | | | | |
Health Care Equipment & Supplies 1.8% | | | | | | | | | | |
bBoston Scientific Corp. | | United States | | | 777,474 | | | | 4,151,711 | |
Medtronic Inc. | | United States | | | 257,934 | | | | 9,865,976 | |
| | | | | | | | | | |
| | | | | | | | | 14,017,687 | |
| | | | | | | | | | |
Health Care Providers & Services 2.5% | | | | | | | | | | |
bMedco Health Solutions Inc. | | United States | | | 134,507 | | | | 7,518,941 | |
Rhoen-Klinikum AG | | Germany | | | 381,880 | | | | 7,275,614 | |
UnitedHealth Group Inc. | | United States | | | 91,060 | | | | 4,614,921 | |
| | | | | | | | | | |
| | | | | | | | | 19,409,476 | |
| | | | | | | | | | |
Hotels, Restaurants & Leisure 1.4% | | | | | | | | | | |
Accor SA | | France | | | 174,646 | | | | 4,427,078 | |
Ladbrokes PLC | | United Kingdom | | | 3,059,589 | | | | 6,185,127 | |
| | | | | | | | | | |
| | | | | | | | | 10,612,205 | |
| | | | | | | | | | |
MGD-13
Franklin Templeton Variable Insurance Products Trust
Statement of Investments, December 31, 2011 (continued)
| | | | | | | | | | |
| Mutual Global Discovery Securities Fund | | Country | | Shares | | | Value | |
Common Stocks and Other Equity Interests (continued) | | | | | | | | | | |
Independent Power Producers & Energy Traders 0.8% | | | | | | | | | | |
bNRG Energy Inc. | | United States | | | 364,067 | | | $ | 6,596,894 | |
| | | | | | | | | | |
Industrial Conglomerates 3.0% | | | | | | | | | | |
Jardine Matheson Holdings Ltd. | | Hong Kong | | | 189,097 | | | | 8,897,013 | |
Jardine Strategic Holdings Ltd. | | Hong Kong | | | 526,698 | | | | 14,573,734 | |
| | | | | | | | | | |
| | | | | | | | | 23,470,747 | |
| | | | | | | | | | |
Insurance 5.0% | | | | | | | | | | |
ACE Ltd. | | United States | | | 223,660 | | | | 15,683,039 | |
bAlleghany Corp. | | United States | | | 2,730 | | | | 778,842 | |
American International Group Inc. | | United States | | | 278,620 | | | | 6,463,984 | |
E-L Financial Corp. Ltd. | | Canada | | | 5,378 | | | | 1,794,161 | |
b,eImagine Group Holdings Ltd. | | Bermuda | | | 120,290 | | | | 1,505,983 | |
MetLife Inc. | | United States | | | 78,866 | | | | 2,459,042 | |
b,eOlympus Re Holdings Ltd. | | United States | | | 2,140 | | | | — | |
PartnerRe Ltd. | | Bermuda | | | 94,940 | | | | 6,096,097 | |
Zurich Financial Services AG | | Switzerland | | | 17,558 | | | | 3,976,208 | |
| | | | | | | | | | |
| | | | | | | | | 38,757,356 | |
| | | | | | | | | | |
IT Services 0.0%† | | | | | | | | | | |
Glodyne Technoserve Ltd. | | India | | | 1,746 | | | | 7,865 | |
| | | | | | | | | | |
Machinery 1.7% | | | | | | | | | | |
Schindler Holding AG, PC | | Switzerland | | | 79,195 | | | | 9,233,157 | |
Stanley Black & Decker Inc. | | United States | | | 58,667 | | | | 3,965,889 | |
| | | | | | | | | | |
| | | | | | | | | 13,199,046 | |
| | | | | | | | | | |
Marine 1.3% | | | | | | | | | | |
A.P. Moller – Maersk AS, B | | Denmark | | | 1,565 | | | | 10,333,594 | |
| | | | | | | | | | |
Media 3.5% | | | | | | | | | | |
Daekyo Co. Ltd. | | South Korea | | | 5,820 | | | | 31,328 | |
Eutelsat Communications | | France | | | 238,364 | | | | 9,301,713 | |
News Corp., A | | United States | | | 213,888 | | | | 3,815,762 | |
News Corp., B | | United States | | | 10,538 | | | | 191,580 | |
Time Warner Cable Inc. | | United States | | | 66,570 | | | | 4,231,855 | |
Viacom Inc., B | | United States | | | 219,200 | | | | 9,953,872 | |
| | | | | | | | | | |
| | | | | | | | | 27,526,110 | |
| | | | | | | | | | |
Metals & Mining 0.7% | | | | | | | | | | |
ThyssenKrupp AG | | Germany | | | 233,491 | | | | 5,364,786 | |
| | | | | | | | | | |
Multi-Utilities 1.5% | | | | | | | | | | |
GDF Suez | | France | | | 368,134 | | | | 10,063,170 | |
Hera SpA | | Italy | | | 1,169,832 | | | | 1,670,067 | |
| | | | | | | | | | |
| | | | | | | | | 11,733,237 | |
| | | | | | | | | | |
Multiline Retail 0.4% | | | | | | | | | | |
Kohl’s Corp. | | United States | | | 62,320 | | | | 3,075,492 | |
| | | | | | | | | | |
Office Electronics 1.3% | | | | | | | | | | |
Xerox Corp. | | United States | | | 1,261,817 | | | | 10,044,063 | |
| | | | | | | | | | |
Oil, Gas & Consumable Fuels 6.3% | | | | | | | | | | |
Apache Corp. | | United States | | | 88,500 | | | | 8,016,330 | |
BP PLC | | United Kingdom | | | 799,477 | | | | 5,714,086 | |
Marathon Oil Corp. | | United States | | | 198,761 | | | | 5,817,734 | |
Marathon Petroleum Corp. | | United States | | | 100,535 | | | | 3,346,810 | |
MGD-14
Franklin Templeton Variable Insurance Products Trust
Statement of Investments, December 31, 2011 (continued)
| | | | | | | | | | |
| Mutual Global Discovery Securities Fund | | Country | | Shares | | | Value | |
Common Stocks and Other Equity Interests (continued) | | | | | | | | | | |
Oil, Gas & Consumable Fuels (continued) | | | | | | | | | | |
Murphy Oil Corp. | | United States | | | 93,480 | | | $ | 5,210,575 | |
Royal Dutch Shell PLC, A | | United Kingdom | | | 413,620 | | | | 15,070,057 | |
The Williams Cos. Inc. | | United States | | | 178,970 | | | | 5,909,589 | |
| | | | | | | | | | |
| | | | | | | | | 49,085,181 | |
| | | | | | | | | | |
Pharmaceuticals 6.9% | | | | | | | | | | |
Eli Lilly & Co. | | United States | | | 226,320 | | | | 9,405,859 | |
Merck & Co. Inc. | | United States | | | 455,858 | | | | 17,185,847 | |
Novartis AG, ADR | | Switzerland | | | 126,364 | | | | 7,224,230 | |
Pfizer Inc. | | United States | | | 723,271 | | | | 15,651,584 | |
Teva Pharmaceutical Industries Ltd., ADR | | Israel | | | 115,150 | | | | 4,647,454 | |
| | | | | | | | | | |
| | | | | | | | | 54,114,974 | |
| | | | | | | | | | |
Real Estate Investment Trusts (REITs) 1.6% | | | | | | | | | | |
The Link REIT | | Hong Kong | | | 3,457,876 | | | | 12,733,404 | |
| | | | | | | | | | |
Real Estate Management & Development 0.9% | | | | | | | | | | |
dCanary Wharf Group PLC | | United Kingdom | | | 487,324 | | | | 1,789,048 | |
Great Eagle Holdings Ltd. | | Hong Kong | | | 1,012,524 | | | | 1,986,824 | |
Swire Pacific Ltd., B | | Hong Kong | | | 1,224,472 | | | | 2,878,848 | |
| | | | | | | | | | |
| | | | | | | | | 6,654,720 | |
| | | | | | | | | | |
Software 2.9% | | | | | | | | | | |
Microsoft Corp. | | United States | | | 506,298 | | | | 13,143,496 | |
Nintendo Co. Ltd. | | Japan | | | 29,900 | | | | 4,117,976 | |
bSymantec Corp. | | United States | | | 330,339 | | | | 5,169,805 | |
| | | | | | | | | | |
| | | | | | | | | 22,431,277 | |
| | | | | | | | | | |
Tobacco 10.8% | | | | | | | | | | |
Altria Group Inc. | | United States | | | 309,171 | | | | 9,166,920 | |
British American Tobacco PLC | | United Kingdom | | | 435,916 | | | | 20,708,690 | |
Imperial Tobacco Group PLC | | United Kingdom | | | 566,874 | | | | 21,457,712 | |
a,iLorillard Inc. | | United States | | | 160,378 | | | | 18,283,092 | |
Philip Morris International Inc. | | United States | | | 122,891 | | | | 9,644,486 | |
Reynolds American Inc. | | United States | | | 115,475 | | | | 4,782,974 | |
| | | | | | | | | | |
| | | | | | | | | 84,043,874 | |
| | | | | | | | | | |
Wireless Telecommunication Services 2.2% | | | | | | | | | | |
Vodafone Group PLC | | United Kingdom | | | 6,057,446 | | | | 16,836,918 | |
| | | | | | | | | | |
Total Common Stocks and Other Equity Interests
(Cost $600,731,036) | | | | | | | | | 669,893,426 | |
| | | | | | | | | | |
Preferred Stocks 0.8% | | | | | | | | | | |
Automobiles 0.5% | | | | | | | | | | |
Volkswagen AG, pfd. | | Germany | | | 23,398 | | | | 3,487,085 | |
| | | | | | | | | | |
Diversified Financial Services 0.3% | | | | | | | | | | |
b,eHightower Holding LLC, pfd., A, Series 2 | | United States | | | 1,114,214 | | | | 2,333,811 | |
| | | | | | | | | | |
Total Preferred Stocks (Cost $4,767,787) | | | | | | | | | 5,820,896 | |
| | | | | | | | | | |
MGD-15
Franklin Templeton Variable Insurance Products Trust
Statement of Investments, December 31, 2011 (continued)
| | | | | | | | | | |
| Mutual Global Discovery Securities Fund | | Country | | Principal
Amount* | | | Value | |
Corporate Bonds, Notes and Senior Floating Rate Interests 4.7% | | | | | | | | | | |
Clear Channel Communications Inc., | | | | | | | | | | |
j,kDelayed Draw 2 Term Loan, 3.946%, 1/29/16 | | United States | | | 1,509,000 | | | $ | 1,094,968 | |
lsenior note, PIK, 11.00%, 8/01/16 | | United States | | | 2,001,000 | | | | 1,270,635 | |
j,kTranche B Term Loan, 3.946%, 1/29/16 | | United States | | | 8,869,000 | | | | 6,580,302 | |
j,kTranche C Term Loan, 3.946%, 1/29/16 | | United States | | | 1,802,075 | | | | 1,308,757 | |
Realogy Corp., | | | | | | | | | | |
j,kExtended First Lien Term Loan, 4.691%, 10/10/16 | | United States | | | 10,563,406 | | | | 9,478,766 | |
j,kExtended Synthetic Letter of Credit, 4.545%, 10/10/16 | | United States | | | 720,146 | | | | 646,202 | |
hsenior secured note, 144A, 7.875%, 2/15/19 | | United States | | | 411,000 | | | | 359,625 | |
Rite Aid Corp., senior note, | | | | | | | | | | |
8.625%, 3/01/15 | | United States | | | 1,177,000 | | | | 1,141,690 | |
9.375%, 12/15/15 | | United States | | | 1,886,000 | | | | 1,829,420 | |
j,kTexas Competitive Electric Holdings Co. LLC, Extended Term Loan, 4.776%, 10/10/17 | | United States | | | 12,912,264 | | | | 8,220,812 | |
hTexas Competitive Electric Holdings Co. LLC/Texas Competitive Electric Holdings Finance Inc.,
senior secured note, 144A, 11.50%, 10/01/20 | | United States | | | 5,895,000 | | | | 5,032,856 | |
| | | | | | | | | | |
Total Corporate Bonds, Notes and Senior Floating Rate Interests
(Cost $42,233,538) | | | | | | | | | 36,964,033 | |
| | | | | | | | | | |
Corporate Notes and Senior Floating Rate Interests in Reorganization 0.9% | | | | | | | | | | |
e,mBroadband Ventures III LLC, secured promissory note, 5.00%, 2/01/12 | | United States | | | 722 | | | | — | |
mNewPage Corp., senior secured note, 11.375%, 12/31/14 | | United States | | | 4,854,000 | | | | 3,616,230 | |
j,k,mTribune Co., 6/04/14, | | | | | | | | | | |
Incremental Term Loan, 7.25% | | United States | | | 761,000 | | | | 433,295 | |
nInitial Tranche B Term Loan, 5.25% | | United States | | | 4,769,000 | | | | 2,799,136 | |
| | | | | | | | | | |
Total Corporate Notes and Senior Floating Rate Interests in Reorganization (Cost $8,491,633) | | | | | | | | | 6,848,661 | |
| | | | | | | | | | |
| | | |
| | | | | Shares | | | | |
Companies in Liquidation 0.0%† | | | | | | | | | | |
bAdelphia Recovery Trust | | United States | | | 5,379,562 | | | | 5,379 | |
b,cAdelphia Recovery Trust, Arahova Contingent Value Vehicle, Contingent Distribution | | United States | | | 386,774 | | | | 15,858 | |
b,c,dCentury Communications Corp., Contingent Distribution | | United States | | | 1,074,000 | | | | — | |
b,eFIM Coinvestor Holdings I, LLC | | United States | | | 2,077,368 | | | | — | |
| | | | | | | | | | |
Total Companies in Liquidation (Cost $497,457) | | | | | | | | | 21,237 | |
| | | | | | | | | | |
Total Investments before Short Term Investments (Cost $656,721,451) | | | | | | | | | 719,548,253 | |
| | | | | | | | | | |
| | | |
| | | | | Principal
Amount* | | | | |
Short Term Investments 3.1% | | | | | | | | | | |
U.S. Government and Agency Securities 3.1% | | | | | | | | | | |
oFHLB, 1/03/12 | | United States | | | 500,000 | | | | 500,000 | |
a,oU.S. Treasury Bills, 3/22/12 - 6/28/12 | | United States | | | 24,000,000 | | | | 23,995,798 | |
| | | | | | | | | | |
Total U.S. Government and Agency Securities (Cost $24,495,299) | | | | | | | | | 24,495,798 | |
| | | | | | | | | | |
Total Investments (Cost $681,216,750) 95.4% | | | | | | | | | 744,044,051 | |
Options Written (0.0)%† | | | | | | | | | (70,560 | ) |
Securities Sold Short (0.6)% | | | | | | | | | (4,868,663 | ) |
Other Assets, less Liabilities 5.2% | | | | | | | | | 40,724,443 | |
| | | | | | | | | | |
Net Assets 100.0% | | | | | | | | $ | 779,829,271 | |
| | | | | | | | | | |
MGD-16
Franklin Templeton Variable Insurance Products Trust
Statement of Investments, December 31, 2011 (continued)
| | | | | | | | | | |
| Mutual Global Discovery Securities Fund | | Country | | Number of
Contracts | | | Value | |
pOptions Written (Premiums received $62,276) (0.0)%† | | | | | | | | | | |
Calls – Exchange-Traded | | | | | | | | | | |
Tobacco (0.0)%† | | | | | | | | | | |
Lorillard Inc., February Strike Price $115, Expires 2/18/12 | | United States | | | 160 | | | $ | (70,560 | ) |
| | | | | | | | | | |
| | | |
| | | | | Shares | | | | |
qSecurities Sold Short (Proceeds $5,581,075) (0.6)% | | | | | | | | | | |
Health Care Providers & Services (0.6)% | | | | | | | | | | |
Express Scripts Inc. | | United States | | | 108,943 | | | | (4,868,663) | |
| | | | | | | | | | |
*The principal amount is stated in U.S. dollars unless otherwise indicated.
†Rounds to less than 0.1% of net assets.
aSecurity or a portion of the security has been pledged as collateral for securities sold short, open futures and written options contracts. At December 31, 2011, the aggregate value of these securities and/or cash pledged as collateral was $11,543,217, representing 1.48% of net assets.
bNon-income producing.
cContingent distributions represent the right to receive additional distributions, if any, during the reorganization of the underlying company. Shares represent total underlying principal of debt securities.
dSecurity has been deemed illiquid because it may not be able to be sold within seven days. At December 31, 2011, the aggregate value of these securities was $1,822,116, representing 0.23% of net assets.
eSee Note 9 regarding restricted securities.
fAt December 31, 2011, pursuant to the Fund’s policies and the requirements of applicable securities law, the Fund may be restricted from trading this security for a limited or extended period of time due to ownership limits and/or potential possession of material non-public information.
gSee Note 12 regarding holdings of 5% voting securities.
hSecurity was purchased pursuant to Rule 144A under the Securities Act of 1933 and may be sold in transactions exempt from registration only to qualified institutional buyers or in a public offering registered under the Securities Act of 1933. These securities have been deemed liquid under guidelines approved by the Trust’s Board of Trustees. At December 31, 2011, the aggregate value of these securities was $10,618,721, representing 1.36% of net assets.
iA portion or all of the security is held in connection with written option contracts open at year end.
jThe coupon rate shown represents the rate at period end.
kSee Note 1(g) regarding senior floating rate interests.
lIncome may be received in additional securities and/or cash.
mSee Note 7 regarding credit risk and defaulted securities.
nA portion or all of the security purchased on a delayed delivery basis. See Note 1(c).
oThe security is traded on a discount basis with no stated coupon rate.
pSee Note 1(d) regarding written options.
qSee Note 1(e) regarding securities sold short.
MGD-17
Franklin Templeton Variable Insurance Products Trust
Statement of Investments, December 31, 2011 (continued)
| | | | |
| Mutual Global Discovery Securities Fund | | | | |
At December 31, 2011, the Fund had the following futures contracts outstanding. See Note 1(d).
Futures Contracts
| | | | | | | | | | | | | | | | | | | | | | | | |
| Description | | Type | | | Number of
Contracts | | | Notional
Value | | | Expiration
Date | | | Unrealized
Appreciation | | | Unrealized
Depreciation | |
EUR/USD | | | Short | | | | 166 | | | $ | 26,908,600 | | | | 3/19/12 | | | $ | 201,464 | | | $ | — | |
GBP/USD | | | Short | | | | 95 | | | | 9,203,125 | | | | 3/19/12 | | | | — | | | | (197 | ) |
| | | | | | | | | | | | | | | | | | | | |
Unrealized appreciation (depreciation) | | | | | | | | | | | | | | | | | | | 201,464 | | | | (197 | ) |
| | | | | | | | | | | | | | | | | | | | |
Net unrealized appreciation (depreciation) | | | | | | | | | | | | | | | | | | $ | 201,267 | | | | | |
| | | | | | | | | | | | | | | | | | | | | | | | |
At December 31, 2011, the Fund had the following forward exchange contracts outstanding. See Note 1(d).
Forward Exchange Contracts
| | | | | | | | | | | | | | | | | | | | | | | | | | | | |
| Currency | | Counterparty | | | Type | | | Quantity | | | Contract
Amount | | | Settlement
Date | | | Unrealized
Appreciation | | | Unrealized
Depreciation | |
British Pound | | | BZWS | | | | Buy | | | | 70,046 | | | $ | 109,408 | | | | 1/17/12 | | | $ | — | | | $ | (627 | ) |
British Pound | | | BZWS | | | | Buy | | | | 117,130 | | | | 181,492 | | | | 1/17/12 | | | | 408 | | | | — | |
British Pound | | | HAND | | | | Buy | | | | 117,130 | | | | 181,550 | | | | 1/17/12 | | | | 351 | | | | — | |
British Pound | | | BZWS | | | | Sell | | | | 5,393,465 | | | | 8,473,284 | | | | 1/17/12 | | | | 97,310 | | | | — | |
British Pound | | | HSBC | | | | Sell | | | | 5,023,225 | | | | 7,884,068 | | | | 1/17/12 | | | | 83,071 | | | | — | |
British Pound | | | BOFA | | | | Sell | | | | 171,206 | | | | 275,867 | | | | 1/17/12 | | | | 9,985 | | | | — | |
British Pound | | | DBAB | | | | Sell | | | | 435,663 | | | | 700,990 | | | | 1/17/12 | | | | 24,411 | | | | — | |
Euro | | | BOFA | | | | Buy | | | | 2,712,011 | | | | 3,529,388 | | | | 1/18/12 | | | | — | | | | (18,780 | ) |
Euro | | | SSBT | | | | Buy | | | | 293,735 | | | | 393,429 | | | | 1/18/12 | | | | — | | | | (13,198 | ) |
Euro | | | BZWS | | | | Buy | | | | 1,064,349 | | | | 1,386,292 | | | | 1/18/12 | | | | — | | | | (8,528 | ) |
Euro | | | BOFA | | | | Sell | | | | 6,372,851 | | | | 8,848,696 | | | | 1/18/12 | | | | 599,251 | | | | — | |
Euro | | | SSBT | | | | Sell | | | | 4,881,997 | | | | 6,771,330 | | | | 1/18/12 | | | | 451,746 | | | | — | |
Euro | | | HSBC | | | | Sell | | | | 344,540 | | | | 488,401 | | | | 1/18/12 | | | | 42,405 | | | | — | |
Euro | | | BZWS | | | | Sell | | | | 344,540 | | | | 487,827 | | | | 1/18/12 | | | | 41,831 | | | | — | |
Euro | | | DBAB | | | | Sell | | | | 179,754 | | | | 254,981 | | | | 1/18/12 | | | | 22,295 | | | | — | |
Japanese Yen | | | HSBC | | | | Sell | | | | 6,500,000 | | | | 83,925 | | | | 1/20/12 | | | | — | | | | (556 | ) |
Japanese Yen | | | BOFA | | | | Buy | | | | 10,250,205 | | | | 133,358 | | | | 1/20/12 | | | | — | | | | (134 | ) |
Japanese Yen | | | DBAB | | | | Buy | | | | 4,320,500 | | | | 55,467 | | | | 1/20/12 | | | | 687 | | | | — | |
Japanese Yen | | | BOFA | | | | Buy | | | | 4,574,750 | | | | 58,809 | | | | 1/20/12 | | | | 650 | | | | — | |
Japanese Yen | | | DBAB | | | | Sell | | | | 151,157,205 | | | | 1,972,289 | | | | 1/20/12 | | | | 7,676 | | | | — | |
Canadian Dollar | | | BOFA | | | | Buy | | | | 152,663 | | | | 146,631 | | | | 1/31/12 | | | | 3,050 | | | | — | |
Canadian Dollar | | | DBAB | | | | Buy | | | | 212,100 | | | | 206,951 | | | | 1/31/12 | | | | 1,006 | | | | — | |
Canadian Dollar | | | BOFA | | | | Sell | | | | 2,001,423 | | | | 2,007,173 | | | | 1/31/12 | | | | 44,846 | | | | — | |
Swiss Franc | | | SSBT | | | | Buy | | | | 3,700,000 | | | | 5,000,541 | | | | 2/10/12 | | | | — | | | | (1,054,229 | ) |
Swiss Franc | | | DBAB | | | | Buy | | | | 9,249,366 | | | | 10,573,451 | | | | 2/10/12 | | | | — | | | | (708,348 | ) |
Swiss Franc | | | BOFA | | | | Buy | | | | 7,946,913 | | | | 8,884,833 | | | | 2/10/12 | | | | — | | | | (408,888 | ) |
Swiss Franc | | | BZWS | | | | Buy | | | | 3,118,657 | | | | 3,602,119 | | | | 2/10/12 | | | | — | | | | (275,852 | ) |
Swiss Franc | | | HAND | | | | Buy | | | | 1,655,715 | | | | 1,869,386 | | | | 2/10/12 | | | | — | | | | (103,449 | ) |
Swiss Franc | | | BZWS | | | | Sell | | | | 18,992,776 | | | | 24,788,850 | | | | 2/10/12 | | | | 4,531,713 | | | | — | |
Swiss Franc | | | DBAB | | | | Sell | | | | 19,056,405 | | | | 24,824,309 | | | | 2/10/12 | | | | 4,499,307 | | | | — | |
Swiss Franc | | | HSBC | | | | Sell | | | | 464,576 | | | | 511,146 | | | | 2/10/12 | | | | 15,643 | | | | — | |
Swiss Franc | | | BOFA | | | | Sell | | | | 529,129 | | | | 568,442 | | | | 2/10/12 | | | | 4,089 | | | | — | |
British Pound | | | HSBC | | | | Sell | | | | 3,023,880 | | | | 4,671,895 | | | | 2/21/12 | | | | — | | | | (22,570 | ) |
British Pound | | | BOFA | | | | Sell | | | | 7,634,280 | | | | 12,039,260 | | | | 2/21/12 | | | | 187,316 | | | | — | |
British Pound | | | DBAB | | | | Sell | | | | 591,532 | | | | 926,169 | | | | 2/21/12 | | | | 7,838 | | | | — | |
British Pound | | | SSBT | | | | Sell | | | | 158,314 | | | | 248,418 | | | | 2/21/12 | | | | 2,642 | | | | — | |
British Pound | | | HSBC | | | | Sell | | | | 158,314 | | | | 248,477 | | | | 2/21/12 | | | | 2,700 | | | | — | |
British Pound | | | BZWS | | | | Sell | | | | 158,314 | | | | 248,290 | | | | 2/21/12 | | | | 2,514 | | | | — | |
Australian Dollar | | | BZWS | | | | Sell | | | | 37,079 | | | | 35,784 | | | | 2/23/12 | | | | — | | | | (1,908 | ) |
MGD-18
Franklin Templeton Variable Insurance Products Trust
Statement of Investments, December 31, 2011 (continued)
| | | | | | | | | | | | | | | | | | | | | | | | | | | | |
| Mutual Global Discovery Securities Fund | | | | | | | | | | |
| Currency | | Counterparty | | | Type | | | Quantity | | | Contract
Amount | | | Settlement
Date | | | Unrealized
Appreciation | | | Unrealized
Depreciation | |
Australian Dollar | | | DBAB | | | | Sell | | | | 14,921 | | | $ | 14,401 | | | | 2/23/12 | | | $ | — | | | $ | (767 | ) |
Australian Dollar | | | SSBT | | | | Buy | | | | 52,000 | | | | 52,182 | | | | 2/23/12 | | | | 678 | | | | — | |
Euro | | | BZWS | | | | Buy | | | | 1,534,695 | | | | 2,077,483 | | | | 2/29/12 | | | | — | | | | (90,121 | ) |
Euro | | | BZWS | | | | Sell | | | | 15,548,317 | | | | 22,395,153 | | | | 2/29/12 | | | | 2,260,777 | | | | — | |
Euro | | | DBAB | | | | Sell | | | | 7,151,741 | | | | 9,726,878 | | | | 2/29/12 | | | | 465,693 | | | | — | |
Euro | | | BZWS | | | | Buy | | | | 2,133,445 | | | | 2,890,130 | | | | 3/15/12 | | | | — | | | | (126,927 | ) |
Euro | | | DBAB | | | | Buy | | | | 83,370 | | | | 115,628 | | | | 3/15/12 | | | | — | | | | (7,649 | ) |
Euro | | | BZWS | | | | Sell | | | | 10,582,715 | | | | 14,444,556 | | | | 3/15/12 | | | | 737,999 | | | | — | |
Euro | | | BOFA | | | | Sell | | | | 10,277,067 | | | | 14,042,877 | | | | 3/15/12 | | | | 732,190 | | | | — | |
Euro | | | DBAB | | | | Sell | | | | 201,599 | | | | 264,774 | | | | 3/15/12 | | | | 3,666 | | | | — | |
British Pound | | | BZWS | | | | Sell | | | | 5,929,177 | | | | 9,154,650 | | | | 3/19/12 | | | | — | | | | (47,618 | ) |
British Pound | | | BOFA | | | | Sell | | | | 6,155,233 | | | | 9,700,647 | | | | 3/19/12 | | | | 147,534 | | | | — | |
British Pound | | | BOFA | | | | Sell | | | | 3,084,472 | | | | 4,754,114 | | | | 4/16/12 | | | | — | | | | (31,648 | ) |
British Pound | | | DBAB | | | | Sell | | | | 113,122 | | | | 175,319 | | | | 4/16/12 | | | | — | | | | (198 | ) |
Euro | | | BZWS | | | | Sell | | | | 10,937,179 | | | | 14,634,472 | | | | 4/16/12 | | | | 462,373 | | | | — | |
Euro | | | HSBC | | | | Sell | | | | 1,306,390 | | | | 1,763,071 | | | | 4/16/12 | | | | 70,287 | | | | — | |
Euro | | | SSBT | | | | Sell | | | | 224,184 | | | | 302,234 | | | | 4/16/12 | | | | 11,742 | | | | — | |
Euro | | | DBAB | | | | Sell | | | | 2,697,542 | | | | 3,622,975 | | | | 4/16/12 | | | | 127,574 | | | | — | |
Euro | | | BOFA | | | | Sell | | | | 2,264,233 | | | | 3,044,735 | | | | 4/16/12 | | | | 110,803 | | | | — | |
Euro | | | HAND | | | | Sell | | | | 1,362,079 | | | | 1,833,636 | | | | 4/16/12 | | | | 68,691 | | | | — | |
| | | | | | | | | | | | | | | | | | | | | | | | |
Unrealized appreciation (depreciation) | | | | | | | | | | | | | | | | 15,884,748 | | | | (2,921,995 | ) |
| | | | | | | | | | | | | | | | | | | | | | | | |
Net unrealized appreciation (depreciation) | | | | | | | | | | | | | | | $ | 12,962,753 | | | | | |
| | | | | | | | | | | | | | | | | | | | | | | | | | | | |
See Abbreviations on page MGD-36.
The accompanying notes are an integral part of these financial statements.
MGD-19
Franklin Templeton Variable Insurance Products Trust
Financial Statements
Statement of Assets and Liabilities
December 31, 2011
| | | | |
| | | Mutual Global
Discovery
Securities Fund | |
Assets: | | | | |
Investments in securities: | | | | |
Cost - Unaffiliated issuers | | $ | 673,216,750 | |
Cost - Non-controlled affiliated issuers (Note 12) | | | 8,000,000 | |
| | | | |
Total cost of investments | | $ | 681,216,750 | |
| | | | |
Value - Unaffiliated issuers | | $ | 741,184,659 | |
Value - Non-controlled affiliated issuers (Note 12) | | | 2,859,392 | |
| | | | |
Total value of investments | | | 744,044,051 | |
Cash | | | 13,291,120 | |
Restricted cash (Note 1h) | | | 11,937,000 | |
Foreign currency, at value (cost $8,880,109) | | | 8,882,560 | |
Receivables: | | | | |
Investment securities sold | | | 1,149,387 | |
Capital shares sold | | | 347,599 | |
Dividends and interest | | | 4,165,049 | |
Due from brokers | | | 4,572,351 | |
Unrealized appreciation on forward exchange contracts | | | 15,884,748 | |
Other assets | | | 76 | |
| | | | |
Total assets | | | 804,273,941 | |
| | | | |
Liabilities: | | | | |
Payables: | | | | |
Investment securities purchased | | | 2,704,356 | |
Capital shares redeemed | | | 380,689 | |
Affiliates | | | 959,291 | |
Variation margin | | | 113,638 | |
Options written, at value (premiums received $62,276) | | | 70,560 | |
Securities sold short, at value (proceeds $5,581,075) | | | 4,868,663 | |
Due to brokers | | | 11,937,000 | |
Unrealized depreciation on forward exchange contracts | | | 2,921,995 | |
Accrued expenses and other liabilities | | | 488,478 | |
| | | | |
Total liabilities | | | 24,444,670 | |
| | | | |
Net assets, at value | | $ | 779,829,271 | |
| | | | |
Net assets consist of: | | | | |
Paid-in capital | | $ | 663,662,452 | |
Undistributed net investment income | | | 19,317,601 | |
Net unrealized appreciation (depreciation) | | | 76,725,734 | |
Accumulated net realized gain (loss) | | | 20,123,484 | |
| | | | |
Net assets, at value | | $ | 779,829,271 | |
| | | | |
The accompanying notes are an integral part of these financial statements.
MGD-20
Franklin Templeton Variable Insurance Products Trust
Financial Statements (continued)
Statement of Assets and Liabilities (continued)
December 31, 2011
| | | | |
| | | Mutual Global
Discovery
Securities Fund | |
Class 1: | | | | |
Net assets, at value | | $ | 974,043 | |
| | | | |
Shares outstanding | | | 49,547 | |
| | | | |
Net asset value and maximum offering price per share | | $ | 19.66 | |
| | | | |
Class 2: | | | | |
Net assets, at value | | $ | 712,160,599 | |
| | | | |
Shares outstanding | | | 36,904,143 | |
| | | | |
Net asset value and maximum offering price per share | | $ | 19.30 | |
| | | | |
Class 4: | | | | |
Net assets, at value | | $ | 66,694,629 | |
| | | | |
Shares outstanding | | | 3,420,045 | |
| | | | |
Net asset value and maximum offering price per share | | $ | 19.50 | |
| | | | |
The accompanying notes are an integral part of these financial statements.
MGD-21
Franklin Templeton Variable Insurance Products Trust
Financial Statements (continued)
Statement of Operations
for the year ended December 31, 2011
| | | | |
| | | Mutual Global
Discovery
Securities Fund | |
Investment income: | | | | |
Dividends | | $ | 37,293,078 | |
Interest | | | 3,811,562 | |
Income from securities loaned | | | 919,252 | |
| | | | |
Total investment income | | | 42,023,892 | |
| | | | |
Expenses: | | | | |
Management fees (Note 3a) | | | 10,166,989 | |
Administrative fees (Note 3b) | | | 1,498,074 | |
Distribution fees: (Note 3c) | | | | |
Class 2 | | | 2,850,055 | |
Class 4 | | | 247,578 | |
Unaffiliated transfer agent fees | | | 2,139 | |
Custodian fees (Note 4) | | | 128,088 | |
Reports to shareholders | | | 305,630 | |
Professional fees | | | 145,121 | |
Trustees’ fees and expenses | | | 5,435 | |
Dividends on securities sold short | | | 2,392 | |
Other | | | 53,450 | |
| | | | |
Total expenses | | | 15,404,951 | |
Expense reductions (Note 4) | | | (10 | ) |
| | | | |
Net expenses | | | 15,404,941 | |
| | | | |
Net investment income | | | 26,618,951 | |
| | | | |
Realized and unrealized gains (losses): | | | | |
Net realized gain (loss) from: | | | | |
Investments (net of foreign taxes of $723,702) (includes gains from a redemption in-kind of $45,310,078) (Note 14) | | | 100,159,280 | |
Written options | | | 51,143 | |
Foreign currency transactions | | | (34,356,927 | ) |
Futures contracts | | | 2,793,153 | |
Securities sold short | | | (27,184 | ) |
| | | | |
Net realized gain (loss) | | | 68,619,465 | |
| | | | |
Net change in unrealized appreciation (depreciation) on: | | | | |
Investments | | | (170,885,232 | ) |
Translation of other assets and liabilities denominated in foreign currencies | | | 18,223,705 | |
Change in deferred taxes on unrealized appreciation | | | 734,375 | |
| | | | |
Net change in unrealized appreciation (depreciation) | | | (151,927,152 | ) |
| | | | |
Net realized and unrealized gain (loss) | | | (83,307,687 | ) |
| | | | |
Net increase (decrease) in net assets resulting from operations | | $ | (56,688,736 | ) |
| | | | |
The accompanying notes are an integral part of these financial statements.
MGD-22
Franklin Templeton Variable Insurance Products Trust
Financial Statements (continued)
Statements of Changes in Net Assets
| | | | | | | | |
| | | Mutual Global Discovery
Securities Fund | |
| | | Year Ended December 31, | |
| | | 2011 | | | 2010 | |
| | | | |
Increase (decrease) in net assets: | | | | | | | | |
Operations: | | | | | | | | |
Net investment income | | $ | 26,618,951 | | | $ | 24,486,967 | |
Net realized gain (loss) from investments, written options, foreign currency transactions, futures contracts and securities sold short | | | 68,619,465 | | | | 99,792,243 | |
Net change in unrealized appreciation (depreciation) on investments, translation of other assets and liabilities denominated in foreign currencies and deferred taxes | | | (151,927,152 | ) | | | 38,245,944 | |
| | | | |
Net increase (decrease) in net assets resulting from operations | | | (56,688,736 | ) | | | 162,525,154 | |
| | | | |
Distributions to shareholders from: | | | | | | | | |
Net investment income: | | | | | | | | |
Class 1 | | | (1,808,753 | ) | | | (1,245,461 | ) |
Class 2 | | | (27,559,671 | ) | | | (16,267,624 | ) |
Class 4 | | | (1,533,102 | ) | | | (816,963 | ) |
Net realized gains: | | | | | | | | |
Class 1 | | | (1,558,774 | ) | | | — | |
Class 2 | | | (25,603,997 | ) | | | — | |
Class 4 | | | (1,468,422 | ) | | | — | |
| | | | |
Total distributions to shareholders | | | (59,532,719 | ) | | | (18,330,048 | ) |
| | | | |
Capital share transactions: (Note 2) | | | | | | | | |
Class 1 | | | (75,411,767 | ) | | | (10,957,474 | ) |
Class 2 | | | (536,023,097 | ) | | | (87,938,794 | ) |
Class 4 | | | 1,436,142 | | | | 4,965,152 | |
| | | | |
Total capital share transactions | | | (609,998,722 | ) | | | (93,931,116 | ) |
| | | | |
Net increase (decrease) in net assets | | | (726,220,177 | ) | | | 50,263,990 | |
Net assets: | | | | | | | | |
Beginning of year | | | 1,506,049,448 | | | | 1,455,785,458 | |
| | | | |
End of year | | $ | 779,829,271 | | | $ | 1,506,049,448 | |
| | | | |
Undistributed net investment income included in net assets: | | | | | | | | |
End of year | | $ | 19,317,601 | | | $ | 22,625,559 | |
| | | | |
The accompanying notes are an integral part of these financial statements.
MGD-23
Franklin Templeton Variable Insurance Products Trust
Notes to Financial Statements
Mutual Global Discovery Securities Fund
1. ORGANIZATION AND SIGNIFICANT ACCOUNTING POLICIES
Franklin Templeton Variable Insurance Products Trust (Trust) is registered under the Investment Company Act of 1940, as amended, (1940 Act) as an open-end investment company, consisting of twenty separate funds. The Mutual Global Discovery Securities (Fund) is included in this report. The financial statements of the remaining funds in the Trust are presented separately. Shares of the Fund are generally sold only to insurance company separate accounts to fund the benefits of variable life insurance policies or variable annuity contracts. At December 31, 2011, 86.59% of the Fund’s shares were held through one insurance company. The Fund offers three classes of shares: Class 1, Class 2, and Class 4. Each class of shares differs by its distribution fees, voting rights on matters affecting a single class and its exchange privilege.
The following summarizes the Fund’s significant accounting policies.
a. Financial Instrument Valuation
The Fund’s investments in securities and other financial instruments are carried at fair value daily. Fair value is the price that would be received to sell an asset or paid to transfer a liability in an orderly transaction between market participants on the measurement date. Under procedures approved by the Trust’s Board of Trustees, the Fund may utilize independent pricing services, quotations from securities and financial instrument dealers, and other market sources to determine fair value.
Equity securities and derivative financial instruments (derivatives) listed on an exchange or on the NASDAQ National Market System are valued at the last quoted sale price or the official closing price of the day, respectively. Foreign equity securities are valued as of the close of trading on the foreign stock exchange on which the security is primarily traded, or the NYSE, whichever is earlier. The value is then converted into its U.S. dollar equivalent at the foreign exchange rate in effect at the close of the NYSE on the day that the value of the security is determined. Over-the-counter securities are valued within the range of the most recent quoted bid and ask prices. Securities that trade in multiple markets or on multiple exchanges are valued according to the broadest and most representative market. Certain equity securities are valued based upon fundamental characteristics or relationships to similar securities.
Debt securities generally trade in the over-the-counter market rather than on a securities exchange. The Fund’s pricing services use multiple valuation techniques to determine fair value. In instances where sufficient market activity exists, the pricing services may utilize a market-based approach through which quotes from market makers are used to determine fair value. In instances where sufficient market activity may not exist or is limited, the pricing services also utilize proprietary valuation models which may consider market characteristics such as benchmark yield curves, option-adjusted spreads, credit spreads, estimated default rates, coupon rates, anticipated timing of principal repayments, underlying collateral, and other unique security features in order to estimate the relevant cash flows, which are then discounted to calculate the fair value. Securities denominated in a foreign currency are converted into their U.S. dollar equivalent at the foreign exchange rate in effect at the close of the NYSE on the date that the values of the foreign debt securities are determined.
Certain derivatives trade in the over-the-counter market. The Fund’s pricing services use various techniques including industry standard option pricing models and proprietary discounted cash flow models to determine the fair value of those instruments. The Fund’s net benefit or obligation under the derivative contract, as measured by the fair market value of the contract, is included in net assets.
The Fund has procedures to determine the fair value of securities and other financial instruments for which market prices are not readily available or which may not be reliably priced. Under these procedures, the Fund primarily employs a market-based approach which may use related or comparable assets or liabilities, recent transactions, market multiples, book values, and other relevant information for the investment to determine the fair value of the investment. The Fund may also use an income-based valuation approach in which the anticipated future cash flows of the investment are discounted to calculate fair value. Discounts may also be applied due to the nature or duration of any restrictions on the disposition of the investments. Due to the inherent uncertainty of valuations of such investments, the fair values may differ significantly from the values that would have been used had an active market existed.
MGD-24
Franklin Templeton Variable Insurance Products Trust
Notes to Financial Statements (continued)
Mutual Global Discovery Securities Fund
1. ORGANIZATION AND SIGNIFICANT ACCOUNTING POLICIES (continued)
a. Financial Instrument Valuation (continued)
Trading in securities on foreign securities stock exchanges and over-the-counter markets may be completed before the daily close of business on the NYSE. Occasionally, events occur between the time at which trading in a foreign security is completed and the close of the NYSE that might call into question the reliability of the value of a portfolio security held by the Fund. As a result, differences may arise between the value of the Fund’s portfolio securities as determined at the foreign market close and the latest indications of value at the close of the NYSE. In order to minimize the potential for these differences, the investment manager monitors price movements following the close of trading in foreign stock markets through a series of country specific market proxies (such as baskets of American Depositary Receipts, futures contracts and exchange traded funds). These price movements are measured against established trigger thresholds for each specific market proxy to assist in determining if an event has occurred that may call into question the reliability of the values of the foreign securities held by the Fund. If such an event occurs, the securities may be valued using fair value procedures, which may include the use of independent pricing services.
b. Foreign Currency Translation
Portfolio securities and other assets and liabilities denominated in foreign currencies are translated into U.S. dollars based on the exchange rate of such currencies against U.S. dollars on the date of valuation. The Fund may enter into foreign currency exchange contracts to facilitate transactions denominated in a foreign currency. Purchases and sales of securities, income and expense items denominated in foreign currencies are translated into U.S. dollars at the exchange rate in effect on the transaction date. Portfolio securities and assets and liabilities denominated in foreign currencies contain risks that those currencies will decline in value relative to the U.S. dollar. Occasionally, events may impact the availability or reliability of foreign exchange rates used to convert the U.S. dollar equivalent value. If such an event occurs, the foreign exchange rate will be valued at fair value using procedures established and approved by the Trust’s Board of Trustees.
The Fund does not separately report the effect of changes in foreign exchange rates from changes in market prices on securities held. Such changes are included in net realized and unrealized gain or loss from investments on the Statement of Operations.
Realized foreign exchange gains or losses arise from sales of foreign currencies, currency gains or losses realized between the trade and settlement dates on securities transactions and the difference between the recorded amounts of dividends, interest, and foreign withholding taxes and the U.S. dollar equivalent of the amounts actually received or paid. Net unrealized foreign exchange gains and losses arise from changes in foreign exchange rates on foreign denominated assets and liabilities other than investments in securities held at the end of the reporting period.
c. Securities Purchased on a Delayed Delivery Basis
The Fund purchases securities on a delayed delivery basis, with payment and delivery scheduled for a future date. These transactions are subject to market fluctuations and are subject to the risk that the value at delivery may be more or less than the trade date purchase price. Although the Fund will generally purchase these securities with the intention of holding the securities, it may sell the securities before the settlement date. Sufficient assets have been segregated for these securities.
d. Derivative Financial Instruments
The Fund invested in derivatives in order to manage risk or gain exposure to various other investments or markets. Derivatives are financial contracts based on an underlying or notional amount, require no initial investment or an initial net investment that is smaller than would normally be required to have a similar response to changes in market factors, and require or permit net settlement. Derivatives contain various risks including the potential inability of the counterparty to fulfill their obligations under the terms of the contract, the potential for an illiquid secondary market, and/or the potential for market movements which expose the Fund to gains or losses in excess of the amounts shown on the Statement of Assets and Liabilities. Realized gain and loss and unrealized appreciation and depreciation on these contracts for the period are included in the Statement of Operations.
MGD-25
Franklin Templeton Variable Insurance Products Trust
Notes to Financial Statements (continued)
Mutual Global Discovery Securities Fund
1. ORGANIZATION AND SIGNIFICANT ACCOUNTING POLICIES (continued)
d. Derivative Financial Instruments (continued)
The Fund entered into futures contracts primarily to manage exposure to certain foreign currencies. A futures contract is an agreement between the Fund and a counterparty to buy or sell an asset for a specified price on a future date. Required initial margin deposits of cash or securities are pledged by the Fund. Subsequent payments, known as variation margin, are made or received by the Fund, depending on fluctuations in the value of the underlying security. Such variation margin is accounted for as unrealized appreciation or depreciation until the contract is closed, at which time the gains or losses are realized.
The Fund entered into forward exchange contracts primarily to manage exposure to certain foreign currencies. A forward exchange contract is an agreement between the Fund and a counterparty to buy or sell a foreign currency for a specific exchange rate on a future date. Pursuant to the terms of the forward exchange contracts, cash or securities may be required to be deposited as collateral. Unrestricted cash may be invested according to the Fund’s investment objectives.
The Fund purchased or wrote option contracts primarily to manage and/or gain exposure to equity price risk. An option is a contract entitling the holder to purchase or sell a specific amount of shares or units of an asset or notional amount of a swap (swaption), at a specified price. Options purchased are recorded as an asset while options written are recorded as a liability. Upon exercise of an option, the acquisition cost or sales proceeds of the underlying investment is adjusted by any premium received or paid. Upon expiration of an option, any premium received or paid is recorded as a realized gain or loss. Upon closing an option other than through expiration or exercise, the difference between the premium and the cost to close the position is recorded as a realized gain or loss. Pursuant to the terms of the written option contract, cash or securities may be required to be deposited as collateral.
At December 31, 2011, the Fund holds $1,941,996 in United Kingdom treasury bills and U.S. treasury bills, notes, and bonds as collateral for derivatives.
See Notes 6 and 11 regarding investment transactions and other derivative information, respectively.
e. Securities Sold Short
The Fund is engaged in selling securities short, which obligates the fund to replace a borrowed security with the same security at current market value. The fund incurs a loss if the price of the security increases between the date of the short sale and the date on which the fund replaces the borrowed security. The fund realizes a gain if the price of the security declines between those dates. Gains are limited to the price at which the fund sold the security short, while losses are potentially unlimited in size.
The fund is required to establish a margin account with the broker lending the security sold short. While the short sale is outstanding, the broker retains the proceeds of the short sale and the fund must maintain a deposit with the broker consisting of cash and/or securities having a value equal to a specified percentage of the value of the securities sold short. The fund is obligated to pay fees for borrowing the securities sold short and is required to pay the counterparty any dividends or interest due on securities sold short. Such dividends or interest and any security borrowing fees are recorded as an expense to the fund.
f. Securities Lending
The Fund participates in an agency based security lending program. The fund receives cash collateral against the loaned securities in an amount equal to at least 102% of the market value of the loaned securities. Collateral is maintained over the life of the loan in an amount not less than 100% of the market value of loaned securities, as determined at the close of fund business each day; any additional collateral required due to changes in security values is delivered to the fund on the next business day. The collateral is invested in a non-registered money fund managed by the fund’s custodian on the fund’s behalf. The fund receives income from the investment of cash collateral, in addition to lending fees and rebates paid by the borrower. The fund bears the market risk with respect to the collateral investment, securities loaned, and the risk that the agent may default on its
MGD-26
Franklin Templeton Variable Insurance Products Trust
Notes to Financial Statements (continued)
Mutual Global Discovery Securities Fund
1. ORGANIZATION AND SIGNIFICANT ACCOUNTING POLICIES (continued)
f. Securities Lending (continued)
obligations to the fund. The securities lending agent has agreed to indemnify the fund in the event of default by a third party borrower. At December 31, 2011, the Fund had no securities on loan.
g. Senior Floating Rate Interests
The Fund invests in senior secured corporate loans that pay interest at rates which are periodically reset by reference to a base lending rate plus a spread. These base lending rates are generally the prime rate offered by a designated U.S. bank or the London InterBank Offered Rate (LIBOR). Senior secured corporate loans often require prepayment of principal from excess cash flows or at the discretion of the borrower. As a result, actual maturity may be substantially less than the stated maturity.
Senior secured corporate loans in which the Fund invests are generally readily marketable, but may be subject to some restrictions on resale.
h. Restricted Cash
At December 31, 2011, the Fund held restricted cash in connection with investments in certain derivative securities. Restricted cash is held in a segregated account with the Fund’s custodian/counterparty broker and is reflected in the Statement of Assets and liabilities.
i. Income and Deferred Taxes
It is the Fund’s policy to qualify as a regulated investment company under the Internal Revenue Code. The Fund intends to distribute to shareholders substantially all of its taxable income and net realized gains to relieve it from federal income and excise taxes. As a result, no provision for U.S. federal income taxes is required.
The Fund may be subject to foreign taxation related to income received, capital gains on the sale of securities and certain foreign currency transactions in the foreign jurisdictions in which it invests. Foreign taxes, if any, are recorded based on the tax regulations and rates that exist in the foreign markets in which the Fund invests. When a capital gain tax is determined to apply the Fund records an estimated deferred tax liability in an amount that would be payable if the securities were disposed of on the valuation date.
The Fund recognizes the tax benefits of uncertain tax positions only when the position is “more likely than not” to be sustained upon examination by the tax authorities based on the technical merits of the tax position. As of December 31, 2011, and for all open tax years, the Fund has determined that no liability for unrecognized tax benefits is required in the Fund’s financial statements related to uncertain tax positions taken on a tax return (or expected to be taken on future tax returns). Open tax years are those that remain subject to examination and are based on each tax jurisdiction statute of limitation.
j. Security Transactions, Investment Income, Expenses and Distributions
Security transactions are accounted for on trade date. Realized gains and losses on security transactions are determined on a specific identification basis. Interest income and estimated expenses are accrued daily. Amortization of premium and accretion of discount on debt securities are included in interest income. Facility fees are recognized as income over the expected term of the loan. Dividend income and dividends declared on securities sold short are recorded on the ex-dividend date except that certain dividends from foreign securities are recognized as soon as the Fund is notified of the ex-dividend date. Distributions to shareholders are recorded on the ex-dividend date and are determined according to income tax regulations (tax basis). Distributable earnings determined on a tax basis may differ from earnings recorded in accordance with accounting principles
MGD-27
Franklin Templeton Variable Insurance Products Trust
Notes to Financial Statements (continued)
Mutual Global Discovery Securities Fund
1. ORGANIZATION AND SIGNIFICANT ACCOUNTING POLICIES (continued)
j. Security Transactions, Investment Income, Expenses and Distributions (continued)
generally accepted in the United States of America. These differences may be permanent or temporary. Permanent differences are reclassified among capital accounts to reflect their tax character. These reclassifications have no impact on net assets or the results of operations. Temporary differences are not reclassified, as they may reverse in subsequent periods.
Common expenses incurred by the Trust are allocated among the funds based on the ratio of net assets of each fund to the combined net assets of the Trust. Fund specific expenses are charged directly to the fund that incurred the expense.
Realized and unrealized gains and losses and net investment income, not including class specific expenses, are allocated daily to each class of shares based upon the relative proportion of net assets of each class. Differences in per share distributions, by class, are generally due to differences in class specific expenses.
k. Accounting Estimates
The preparation of financial statements in accordance with accounting principles generally accepted in the United States of America requires management to make estimates and assumptions that affect the reported amounts of assets and liabilities at the date of the financial statements and the amounts of income and expenses during the reporting period. Actual results could differ from those estimates.
l. Guarantees and Indemnifications
Under the Trust’s organizational documents, its officers and trustees are indemnified by the Trust against certain liabilities arising out of the performance of their duties to the Trust. Additionally, in the normal course of business, the Trust, on behalf of the Fund, enters into contracts with service providers that contain general indemnification clauses. The Trust’s maximum exposure under these arrangements is unknown as this would involve future claims that may be made against the Trust that have not yet occurred. Currently, the Trust expects the risk of loss to be remote.
2. SHARES OF BENEFICIAL INTEREST
At December 31, 2011, there were an unlimited number of shares authorized (without par value). Transactions in the Fund’s shares were as follows:
| | | | | | | | | | | | | | | | |
| | | Year Ended December 31, | |
| | | 2011 | | | 2010 | |
| Class 1 Shares: | | Shares | | | Amount | | | Shares | | | Amount | |
Shares sold | | | 140,069 | | | $ | 3,084,356 | | | | 105,161 | | | $ | 2,092,188 | |
Shares issued in reinvestment of distributions | | | 168,285 | | | | 3,367,527 | | | | 63,093 | | | | 1,245,461 | |
Shares redeemed in-kind (Note 14) | | | (3,394,333 | ) | | | (67,951,585 | ) | | | — | | | | — | |
Shares redeemed | | | (843,405 | ) | | | (13,912,065 | ) | | | (722,443 | ) | | | (14,295,123 | ) |
| | | | |
Net increase (decrease) | | | (3,929,384 | ) | | $ | (75,411,767 | ) | | | (554,189 | ) | | $ | (10,957,474 | ) |
| | | | |
Class 2 Shares: | | | | | | | | | | | | | | | | |
Shares sold | | | 1,990,050 | | | $ | 40,633,273 | | | | 3,059,169 | | | $ | 60,514,460 | |
Shares issued in reinvestment of distributions | | | 2,709,831 | | | | 53,163,668 | | | | 837,674 | | | | 16,267,624 | |
Shares redeemed in-kind (Note 14) | | | (21,446,416 | ) | | | (398,285,682 | ) | | | — | | | | — | |
Shares redeemed | | | (11,321,410 | ) | | | (231,534,356 | ) | | | (8,564,469 | ) | | | (164,720,878 | ) |
| | | | |
Net increase (decrease) | | | (28,067,945 | ) | | $ | (536,023,097 | ) | | | (4,667,626 | ) | | $ | (87,938,794 | ) |
| | | | |
MGD-28
Franklin Templeton Variable Insurance Products Trust
Notes to Financial Statements (continued)
Mutual Global Discovery Securities Fund
2. SHARES OF BENEFICIAL INTEREST (continued)
| | | | | | | | | | | | | | | | |
| | | Year Ended December 31, | |
| | | 2011 | | | 2010 | |
| Class 4 Shares: | | Shares | | | Amount | | | Shares | | | Amount | |
Shares sold | | | 410,892 | | | $ | 8,602,556 | | | | 535,481 | | | $ | 10,579,920 | |
Shares issued on reinvestment of distributions | | | 151,460 | | | | 3,001,524 | | | | 41,618 | | | | 816,963 | |
Shares redeemed | | | (502,145 | ) | | | (10,167,938 | ) | | | (327,974 | ) | | | (6,431,731 | ) |
| | | | |
Net increase (decrease) | | | 60,207 | | | $ | 1,436,142 | | | | 249,125 | | | $ | 4,965,152 | |
| | | | |
3. TRANSACTIONS WITH AFFILIATES
Franklin Resources, Inc. is the holding company for various subsidiaries that together are referred to as Franklin Templeton Investments. Certain officers and trustees of the Fund are also officers and/or directors of the following subsidiaries:
| | |
| Subsidiary | | Affiliation |
Franklin Mutual Advisers, LLC (Franklin Mutual) | | Investment manager |
Franklin Templeton Services, LLC (FT Services) | | Administrative manager |
Franklin Templeton Distributors, Inc. (Distributors) | | Principal underwriter |
Franklin Templeton Investor Services, LLC (Investor Services) | | Transfer agent |
a. Management Fees
The Fund pays an investment management fee to Franklin Mutual based on the average daily net assets of the Fund as follows:
| | |
| Annualized Fee Rate | | Net Assets |
| 0.800% | | Up to and including $4 billion |
| 0.770% | | Over $4 billion, up to and including $7 billion |
| 0.750% | | Over $7 billion, up to and including $10 billion |
| 0.730% | | In excess of $10 billion |
b. Administrative Fees
The Fund pays an administrative fee to FT Services based on the Fund’s average daily net assets as follows:
| | |
| Annualized Fee Rate | | Net Assets |
| 0.150% | | Up to and including $200 million |
| 0.135% | | Over $200 million, up to and including $700 million |
| 0.100% | | Over $700 million, up to and including $1.2 billion |
| 0.075% | | In excess of $1.2 billion |
c. Distribution Fees
The Fund’s Board of Trustees has adopted distribution plans for Class 2 and Class 4 shares pursuant to Rule 12b-1 under the 1940 Act. Under the Fund’s compensation distribution plans, the Fund pays Distributors for costs incurred in connection with the servicing, sale and distribution of the Fund’s shares up to 0.35% per year of its average daily net assets of each class. The Board of Trustees has agreed to limit the current rate to 0.25% per year for Class 2.
MGD-29
Franklin Templeton Variable Insurance Products Trust
Notes to Financial Statements (continued)
Mutual Global Discovery Securities Fund
3. TRANSACTIONS WITH AFFILIATES (continued)
d. Transfer Agent Fees
Investor Services, under terms of an agreement, performs shareholder servicing for the Fund and is not paid by the Fund for the services.
4. EXPENSE OFFSET ARRANGEMENT
The Fund has entered into an arrangement with its custodian whereby credits realized as a result of uninvested cash balances are used to reduce a portion of the Fund’s custodian expenses. During the year ended December 31, 2011, the custodian fees were reduced as noted in the Statement of Operations.
5. INCOME TAXES
The tax character of distributions paid during the years ended December 31, 2011 and 2010, was as follows:
| | | | | | | | |
| | | 2011 | | | 2010 | |
Distributions paid from: | | | | | | | | |
Ordinary income | | $ | 30,901,526 | | | $ | 18,330,048 | |
Long term capital gain | | | 28,631,193 | | | | — | |
| | | | |
| | $ | 59,532,719 | | | $ | 18,330,048 | |
| | | | |
At December 31, 2011, the cost of investments, net unrealized appreciation (depreciation), undistributed ordinary income and undistributed long term capital gains for income tax purposes were as follows:
| | | | |
Cost of investments | | $ | 682,489,839 | |
| | | | |
| |
Unrealized appreciation | | $ | 141,173,241 | |
Unrealized depreciation | | | (79,619,029 | ) |
| | | | |
Net unrealized appreciation (depreciation) | | $ | 61,554,212 | |
| | | | |
Undistributed ordinary income | | $ | 25,828,618 | |
Undistributed long term capital gains | | | 32,219,466 | |
| | | | |
Distributable earnings | | $ | 58,048,084 | |
| | | | |
Differences between income and/or capital gains as determined on a book basis and a tax basis are primarily due to differing treatments of foreign currency transactions, passive foreign investment company shares, foreign capital gain tax, bond discounts and premium, corporate actions, and gains realized on a redemption in-kind.
6. INVESTMENT TRANSACTIONS
Purchases and sales of investments (excluding short term securities and securities sold short) for the year ended December 31, 2011, aggregated $315,401,241 and $459,657,075, respectively. Sales of investments excludes redemption in-kind of $415,032,658.
MGD-30
Franklin Templeton Variable Insurance Products Trust
Notes to Financial Statements (continued)
Mutual Global Discovery Securities Fund
6. INVESTMENT TRANSACTIONS (continued)
Transactions in options written during the year ended December 31, 2011, were as follows:
| | | | | | | | |
| | | Number of
Contracts | | | Premiums
Received | |
Options outstanding at December 31, 2010 | | | — | | | $ | — | |
Options written | | | 274 | | | | 123,230 | |
Options expired | | | — | | | | — | |
Options exercised | | | — | | | | — | |
Options closed | | | (114 | ) | | | (60,954 | ) |
| | | | |
Options outstanding at December 31, 2011 | | | 160 | | | $ | 62,276 | |
| | | | |
See Notes 1(d) and 11 regarding derivative financial instruments and other derivative information, respectively.
7. CREDIT RISK AND DEFAULTED SECURITIES
The Fund may purchase the pre-default or defaulted debt of distressed companies. Distressed companies are financially troubled and are about to be or are already involved in financial restructuring or bankruptcy. Risks associated with purchasing these securities include the possibility that the bankruptcy or other restructuring process takes longer than expected, or that distributions in restructuring are less than anticipated, either or both of which may result in unfavorable consequences to the Fund. If it becomes probable that the income on debt securities, including those of distressed companies, will not be collected, the Fund discontinues accruing income and recognizes an adjustment for uncollectible interest. At December 31, 2011, the aggregate value of distressed company securities for which interest recognition has been discontinued was $6,848,661, representing 0.88% of the Fund’s net assets. For information as to specific securities, see the accompanying Statement of Investments.
8. CONCENTRATION OF RISK
Investing in foreign securities may include certain risks and considerations not typically associated with investing in U.S. securities, such as fluctuating currency values and changing local and regional economic, political and social conditions, which may result in greater market volatility. In addition, certain foreign securities may not be as liquid as U.S. securities.
9. RESTRICTED SECURITIES
The Fund invests in securities that are restricted under the Securities Act of 1933 (1933 Act) or which are subject to legal, contractual, or other agreed upon restrictions on resale. Restricted securities are often purchased in private placement transactions, and cannot be sold without prior registration unless the sale is pursuant to an exemption under the 1933 Act. Disposal of these securities may require greater effort and expense, and prompt sale at an acceptable price may be difficult. The Fund may have registration rights for restricted securities. The issuer generally incurs all registration costs.
MGD-31
Franklin Templeton Variable Insurance Products Trust
Notes to Financial Statements (continued)
Mutual Global Discovery Securities Fund
9. RESTRICTED SECURITIES (continued)
At December 31, 2011, the Fund held investments in restricted securities, excluding certain securities exempt from registration under the 1933 Act deemed to be liquid, as follows:
| | | | | | | | | | | | | | |
Principal
Amount/ Shares | | | Issuer | | Acquisition
Dates | | Cost | | | Value | |
| | 1,361,600 | | | AET&D Holdings No. 1 Pty. Ltd. | | 10/13/10 | | $ | — | | | $ | — | |
| | 800,000 | | | The Bankshares Inc. | | 3/22/07 | | | 8,000,000 | | | | 2,859,392 | |
| | 722 | | | Broadband Ventures III LLC, secured promissory note, 5.00%, 2/01/12 | | 7/01/10 | | | 722 | | | | — | |
| | 1,903 | | | Elephant Capital Holdings Ltd. | | 8/23/04 - 3/10/08 | | | 294,226 | | | | — | |
| | 2,077,368 | | | FIM Coinvestor Holdings I, LLC | | 11/20/06 - 6/02/09 | | | — | | | | — | |
| | 1,114,214 | | | Hightower Holding LLC, pfd., A, Series 2 | | 6/10/10 - 3/31/11 | | | 2,785,536 | | | | 2,333,811 | |
| | 120,290 | | | Imagine Group Holdings Ltd. | | 8/31/04 | | | 1,231,950 | | | | 1,505,983 | |
| | 424,073 | | | International Automotive Components Group Brazil LLC | | 4/13/06 - 12/26/08 | | | 281,629 | | | | 344,190 | |
| | 3,000,220 | | | International Automotive Components Group North America, LLC | | 1/12/06 - 10/10/07 | | | 3,599,443 | | | | 1,271,794 | |
| | 9,306 | | | NCB Warrant Holdings Ltd., A | | 12/16/05 - 3/10/08 | | | 87,597 | | | | — | |
| | 2,140 | | | Olympus Re Holdings Ltd. | | 12/19/01 | | | 201,741 | | | | — | |
| | | | | | | | | | | | | | |
| | | | Total Restricted Securities (1.07% of Net Assets) | | | | | | | | $ | 8,315,170 | |
| | | | | | | | | | | | | | |
10. UNFUNDED CAPITAL COMMITMENTS
The Fund enters into certain capital commitments and may be obligated to perform on such agreements at a future date. The Fund monitors these commitments and assesses the probability of required performance. For any agreements whose probability of performance is determined to be greater than remote, the Fund assesses the fair value of the commitment. In instances where the probability of performance is greater than remote and the performance under the commitment would result in an unrealized loss, the Fund recognizes such losses on the Statement of Assets and Liabilities and the Statement of Operations.
At December 31, 2011, the Fund had aggregate unfunded capital commitments of $2,644,464, for which no depreciation has been recognized.
11. OTHER DERIVATIVE INFORMATION
At December 31, 2011, the Fund has invested in derivative contracts which are reflected on the Statement of Assets and Liabilities as follows:
| | | | | | | | | | | | |
| | | Asset Derivatives | | | Liability Derivatives | |
Derivative Contracts Not Accounted
for as Hedging Instruments | | Statement of Assets and
Liabilities Location | | Fair
Value
Amount | | | Statement of Assets and
Liabilities Location | | Fair
Value
Amount | |
Foreign exchange contracts | | Unrealized appreciation on forward exchange contracts/Net assets consist of-net unrealized appreciation (depreciation) | | $ | 16,086,212a | | | Unrealized depreciation on forward exchange contracts/Net assets consist of-net unrealized appreciation (depreciation) | | $ | 2,922,192 | a |
Equity contracts | | | | | | | | Options written, at value | | | 70,560 | |
aIncludes cumulative appreciation (depreciation) of futures contracts as reported in the Statement of Investments. Only current day’s variation margin is separately reported within the Statement of Assets and Liabilities.
MGD-32
Franklin Templeton Variable Insurance Products Trust
Notes to Financial Statements (continued)
Mutual Global Discovery Securities Fund
11. OTHER DERIVATIVE INFORMATION (continued)
For the year ended December 31, 2011, the effect of derivative contracts on the Fund’s Statement of Operations was as follows:
| | | | | | | | | | |
Derivative Contracts Not Accounted
for as Hedging Instruments | | Statement of Operations Locations | | Realized Gain
(Loss) for the
Year | | | Change in
Unrealized
Appreciation
(Depreciation)
for the
Year | |
Foreign exchange contracts | | Net realized gain (loss) from foreign currency transactions and future contracts/Net change in unrealized appreciation (depreciation) on translation of other assets and liabilities denominated in foreign currencies | | $ | (30,390,312 | ) | | $ | 18,301,853 | |
Equity contracts | | Net realized gain (loss) from written options/Net change in unrealized appreciation (depreciation) on investments | | | 51,143 | | | | (8,284 | ) |
For the year ended December 31, 2011, the average month end market value of derivatives represented 1.23% of average month end net assets. The average month end number of open derivative contracts for the year was 94.
See Note 1(d) and 6 regarding derivative financial instruments and investment transactions, respectively.
12. HOLDINGS OF 5% VOTING SECURITIES OF PORTFOLIO COMPANIES
The 1940 Act defines “affiliated companies” to include investments in portfolio companies in which a fund owns 5% or more of the outstanding voting securities. Investments in “affiliated companies” for the Fund for the year ended December 31, 2011, were as shown below.
| | | | | | | | | | | | | | | | | | | | | | | | | | | | |
| Name of Issuer | | Number of Shares
Held at Beginning
of Year | | | Gross
Additions | | | Gross
Reductions | | | Number of Shares
Held at End
of Year | | | Value at
End of
Year | | | Investment
Income | | | Realized Capital
Gain (Loss) | |
Non-Controlled Affiliates | | | | | | | | | | | | | | | | | | | | | | | | | | | | |
The Bankshares Inc. (0.37% of Net Assets) | | | 800,000 | | | | — | | | | — | | | | 800,000 | | | $ | 2,859,392 | | | $ | — | | | $ | — | |
| | | | | | | | | | | | | | | | |
13. CREDIT FACILITY
The Fund, together with other U.S. registered and foreign investment funds (collectively, Borrowers), managed by Franklin Templeton Investments, are borrowers in a joint syndicated senior unsecured credit facility totaling $750 million (Global Credit Facility) which matured on January 20, 2012. This Global Credit Facility provides a source of funds to the Borrowers for temporary and emergency purposes, including the ability to meet future unanticipated or unusually large redemption requests. Effective January 20, 2012, the Borrowers renewed the Global Credit Facility for a total of $1.5 billion, maturing January 18, 2013.
Under the terms of the Global Credit Facility, the Fund shall, in addition to interest charged on any borrowings made by the Fund and other costs incurred by the Fund, pay its share of fees and expenses incurred in connection with the implementation and maintenance of the Global Credit Facility, based upon its relative share of the aggregate net assets of all of the Borrowers, including an annual commitment fee of 0.08% based upon the unused portion of the Global Credit Facility, which is reflected in other expenses on the Statement of Operations. During the year ended December 31, 2011, the Fund did not use the Global Credit Facility.
MGD-33
Franklin Templeton Variable Insurance Products Trust
Notes to Financial Statements (continued)
Mutual Global Discovery Securities Fund
14. REDEMPTION IN-KIND
During the year ended December 31, 2011, the Fund realized $45,310,078 of net gains resulting from a redemption in-kind in which a shareholder redeemed fund shares for securities held by the Fund rather than for cash. Because such gains are not taxable to the Fund and are not netted with capital gains that are distributed to remaining shareholders, they have been reclassified from accumulated net realized gains to paid-in capital.
15. FAIR VALUE MEASUREMENTS
The Fund follows a fair value hierarchy that distinguishes between market data obtained from independent sources (observable inputs) and the Fund’s own market assumptions (unobservable inputs). These inputs are used in determining the value of the Fund’s investments and are summarized in the following fair value hierarchy:
| | • | | Level 1 – quoted prices in active markets for identical securities |
| | • | | Level 2 – other significant observable inputs (including quoted prices for similar securities, interest rates, prepayment speed, credit risk, etc.) |
| | • | | Level 3 – significant unobservable inputs (including the Fund’s own assumptions in determining the fair value of investments) |
The inputs or methodology used for valuing securities are not an indication of the risk associated with investing in those securities.
For movements between the levels within the fair value hierarchy, the Fund has adopted a policy of recognizing the transfers as of the date of the underlying event which caused the movement.
The following is a summary of the inputs used as of December 31, 2011, in valuing the Fund’s assets and liabilities carried at fair value:
| | | | | | | | | | | | | | | | |
| | | Level 1 | | | Level 2 | | | Level 3 | | | Total | |
| | | | |
Assets: | | | | | | | | | | | | | | | | |
Investments in Securities: | | | | | | | | | | | | | | | | |
Equity Investments:a | | | | | | | | | | | | | | | | |
Auto Components | | $ | 3,842,678 | | | $ | — | | | $ | 1,616,712 | | | $ | 5,459,390 | |
Commercial Banks | | | 30,391,655 | | | | — | | | | 2,859,392 | b | | | 33,251,047 | |
Consumer Finance | | | — | | | | 260 | | | | — | | | | 260 | |
Diversified Financial Services | | | 14,573,397 | | | | 5,226,240 | | | | 2,333,811 | | | | 22,133,448 | |
Diversified Telecommunication Services | | | 6,789,964 | | | | — | | | | 32,340 | b | | | 6,822,304 | |
Insurance | | | 37,251,373 | | | | — | | | | 1,505,983 | b | | | 38,757,356 | |
Real Estate Management & Development | | | 4,865,672 | | | | — | | | | 1,789,048 | | | | 6,654,720 | |
Other Equity Investmentsc | | | 562,635,797 | | | | — | | | | — | b | | | 562,635,797 | |
Corporate Bonds, Notes and Senior Floating Rate Interests | | | — | | | | 36,964,033 | | | | — | | | | 36,964,033 | |
Corporate Notes and Senior Floating Rate Interests in Reorganization | | | — | | | | 6,848,661 | | | | — | b | | | 6,848,661 | |
Companies in Liquidation | | | — | | | | 21,237 | | | | — | b | | | 21,237 | |
Short Term Investments | | | 23,995,798 | | | | 500,000 | | | | — | | | | 24,495,798 | |
| | | | |
Total Investments in Securities | | $ | 684,346,334 | | | $ | 49,560,431 | | | $ | 10,137,286 | | | $ | 744,044,051 | |
| | | | |
Forward Exchange Contracts | | | — | | | | 15,884,748 | | | | — | | | | 15,884,748 | |
Futures Contracts | | | 201,464 | | | | — | | | | — | | | | 201,464 | |
Liabilities: | | | | | | | | | | | | | | | | |
Options Written | | | 70,560 | | | | — | | | | — | | | | 70,560 | |
Securities Sold Short | | | 4,868,663 | | | | — | | | | — | | | | 4,868,663 | |
Forward Exchange Contracts | | | — | | | | 2,921,995 | | | | — | | | | 2,921,995 | |
Futures Contracts | | | 197 | | | | — | | | | — | | | | 197 | |
MGD-34
Franklin Templeton Variable Insurance Products Trust
Notes to Financial Statements (continued)
Mutual Global Discovery Securities Fund
15. FAIR VALUE MEASUREMENTS (continued)
aIncludes common and preferred stocks as well as other equity investments.
bIncludes securities determined to have no value.
cFor detailed categories, see the accompanying Statement of Investments.
At December 31, 2011, the reconciliation of assets in which significant unobservable inputs (Level 3) were used in determining fair value, is as follows:
| | | | | | | | | | | | | | | | | | | | | | | | | | | | | | | | | | | | | | | | |
| | | Balance at
Beginning
of Year | | | Purchases | | | Sales | | | Transfers
Into
Level 3 | | | Transfers
Out of
Level 3a | | | Cost Basis
Adjustmentsb | | | Net
Realized
Gain
(Loss) | | | Net
Unrealized
Gain
(Loss) | | | Balance at
End of
Year | | | Net Change in
Unrealized
Appreciation
(Depreciation)
on Assets
Held at
Year End | |
| | | | |
Assets | | | | | | | | | | | | | | | | | | | | | | | | | | | | | | | | | | | | | | | | |
Investments in Securities: | | | | | | | | | | | | | | | | | | | | | | | | | | | | | | | | | | | | | | | | |
Equity Investments:c | | | | | | | | | | | | | | | | | | | | | | | | | | | | | | | | | | | | | | | | |
Airlines | | $ | — | d | | $ | — | | | $ | — | | | $ | — | | | $ | — | | | $ | (5,961 | ) | | $ | (259,679 | ) | | $ | 265,640 | | | $ | — | | | $ | — | |
Auto Components | | | 4,555,503 | d | | | — | | | | (5,976 | ) | | | — | | | | — | | | | (94,887 | ) | | | (5,248 | ) | | | (2,832,680 | ) | | | 1,616,712 | | | | (2,938,319 | ) |
Commercial Banks | | | 2,905,224 | d | | | — | | | | — | | | | — | | | | — | | | | — | | | | — | | | | (45,832 | ) | | | 2,859,392 | d | | | (45,832 | ) |
Computers & Peripherals | | | — | d | | | — | | | | — | | | | — | | | | — | | | | (3,661 | ) | | | (2,182 | ) | | | 5,843 | | | | — | | | | — | |
Consumer Finance | | | 4,924,234 | | | | — | | | | (4,924,234 | ) | | | — | | | | — | | | | — | | | | (1,136,557 | ) | | | 1,136,557 | | | | — | | | | — | |
Diversified Financial Services | | | 1,158,855 | | | | 1,392,768 | | | | — | | | | — | | | | — | | | | — | | | | — | | | | (217,812 | ) | | | 2,333,811 | | | | (217,812 | ) |
Diversified Telecommunication Services | | | — | d | | | — | | | | — | | | | — | | | | — | | | | (49 | ) | | | 49 | | | | 32,340 | | | | 32,340 | d | | | 32,340 | |
Electric Utilities | | | 6,878,803 | d | | | — | | | | (6,475,783 | ) | | | — | | | | — | | | | — | | | | — | | | | (403,020 | ) | | | — | d | | | — | |
Insurance | | | 2,143,167 | | | | — | | | | (686,854 | ) | | | — | | | | — | | | | (743 | ) | | | 153,078 | | | | (102,665 | ) | | | 1,505,983 | d | | | 11,189 | |
IT Services | | | 19,161 | | | | — | | | | — | | | | — | | | | (17,139 | ) | | | — | | | | — | | | | (2,022 | ) | | | — | | | | — | |
Real Estate Management & Development | | | 2,112,892 | | | | — | | | | — | | | | — | | | | — | | | | — | | | | — | | | | (323,844 | ) | | | 1,789,048 | | | | (323,844 | ) |
Corporate Bonds, Notes and Senior Floating Rate Interests | | | 4,249,735 | | | | — | | | | (4,249,735 | ) | | | — | | | | — | | | | — | | | | (901,265 | ) | | | 901,265 | | | | — | | | | — | |
Corporate Notes and Senior Floating Rate Interests in Reorganization | | | 1,443 | | | | — | | | | (722 | ) | | | — | | | | — | | | | — | | | | — | | | | (721 | ) | | | — | d | | | (721 | ) |
Companies in Liquidation | | | — | d | | | — | | | | — | | | | — | | | | — | | | | (4,203 | ) | | | 4,203 | | | | — | | | | — | d | | | — | |
| | | | |
Total | | $ | 28,949,017 | | | $ | 1,392,768 | | | $ | (16,343,304 | ) | | $ | — | | | $ | (17,139 | ) | | $ | (109,504 | ) | | $ | (2,147,601 | ) | | $ | (1,586,951 | ) | | $ | 10,137,286 | | | $ | (3,482,999 | ) |
| | | | |
aThe investment was transferred out of Level 3 as a result of the availability of a quoted market price in an active market for identical securities.
bMay include accretion, amortization, partnership adjustments, and/or other cost basis adjustments.
cIncludes common and preferred stocks as well as other equity investments.
dIncludes securities determined to have no value.
MGD-35
Franklin Templeton Variable Insurance Products Trust
Notes to Financial Statements (continued)
Mutual Global Discovery Securities Fund
16. NEW ACCOUNTING PRONOUNCEMENTS
In May 2011, the Financial Accounting Standards Board (FASB) issued Accounting Standards Update (ASU) No. 2011-04, Fair Value Measurement (Topic 820): Amendments to Achieve Common Fair Value Measurement and Disclosure Requirements in U.S. GAAP and IFRSs. The amendments in the ASU will improve the comparability of fair value measurements presented and disclosed in financial statements prepared in accordance with U.S. GAAP (Generally Accepted Accounting Principles) and IFRS (International Financial Reporting Standards) and include new guidance for certain fair value measurement principles and disclosure requirements. The ASU is effective for interim and annual periods beginning after December 15, 2011. The Fund believes the adoption of this ASU will not have a material impact on its financial statements.
17. SUBSEQUENT EVENTS
The Fund has evaluated subsequent events through the issuance of the financial statements and determined that no events have occurred that require disclosure other than those already disclosed in the financial statements.
| | | | |
ABBREVIATIONS | | | | |
| Counterparty | | Currency | | Selected Portfolio |
| | | | |
| BOFA - Bank of America Corp. | | EUR - Euro | | ADR - American Depository Receipt |
| BZWS - Barclays Bank PLC | | GBP - British Pound | | FHLB - Federal Home Loan Bank |
| DBAB - Deutsche Bank AG | | USD - United States Dollar | | PC - Participation Certificate |
| HAND - Svenska Handelsbanken | | | | PIK - Payment-In-Kind |
| HSBC - HSBC Bank USA, N.A. | | | | |
| SSBT - State Street Bank and Trust Co. | | | | |
MGD-36
Franklin Templeton Variable Insurance Products Trust
Mutual Global Discovery Securities Fund
Report of Independent Registered Public Accounting Firm
To the Board of Trustees and Shareholders of Franklin Templeton Variable Insurance Products Trust
In our opinion, the accompanying statement of assets and liabilities, including the statement of investments, and the related statements of operations and of changes in net assets and the financial highlights present fairly, in all material respects, the financial position of Mutual Global Discovery Securities Fund (the “Fund”) at December 31, 2011, the results of its operations for the year then ended, the changes in its net assets for each of the two years in the period then ended and the financial highlights for the periods presented, in conformity with accounting principles generally accepted in the United States of America. These financial statements and financial highlights (hereafter referred to as “financial statements”) are the responsibility of the Fund’s management. Our responsibility is to express an opinion on these financial statements based on our audits. We conducted our audits of these financial statements in accordance with the standards of the Public Company Accounting Oversight Board (United States). Those standards require that we plan and perform the audit to obtain reasonable assurance about whether the financial statements are free of material misstatement. An audit includes examining, on a test basis, evidence supporting the amounts and disclosures in the financial statements, assessing the accounting principles used and significant estimates made by management, and evaluating the overall financial statement presentation. We believe that our audits, which included confirmation of securities at December 31, 2011 by correspondence with the custodian and brokers, provide a reasonable basis for our opinion.
PricewaterhouseCoopers LLP
San Francisco, California
February 13, 2012
MGD-37
Franklin Templeton Variable Insurance Products Trust
Tax Information (unaudited)
Mutual Global Discovery Securities Fund
Under Section 852(b)(3)(C) of the Internal Revenue Code (Code), the Fund hereby reports the maximum amount allowable but no less than $28,631,193 as a long term capital gain dividend for the fiscal year ended December 31, 2011.
Under Section 854(b)(1)(A) of the Code, the Fund hereby reports 40.55% of the ordinary income dividends as income qualifying for the dividends received deduction for the fiscal year ended December 31, 2011.
MGD-38
MUTUAL SHARES SECURITIES FUND
This annual report for Mutual Shares Securities Fund covers the fiscal year ended December 31, 2011.
Performance Summary as of 12/31/11
Average annual total return of Class 1 shares represents the average annual change in value, assuming reinvestment of dividends and capital gains. Average returns smooth out variations in returns, which can be significant; they are not the same as year-by-year results.
Periods ended 12/31/11
| | | | | | | | | | | | |
| | | 1-Year | | | 5-Year | | | 10-Year | |
Average Annual Total Return | | | -0.79% | | | | -1.78% | | | | +4.18% | |
Total Return Index Comparison for a Hypothetical $10,000 Investment (1/1/02–12/31/11)
The graph below shows the change in value of a hypothetical $10,000 investment in the Fund over the indicated period and includes reinvestment of any income and distributions. The Fund’s performance is compared to the performance of the Standard & Poor’s 500® Index (S&P 500®). One cannot invest directly in an index, and an index is not representative of the Fund’s portfolio. Please see Important Notes to Performance Information preceding the Fund Summaries.
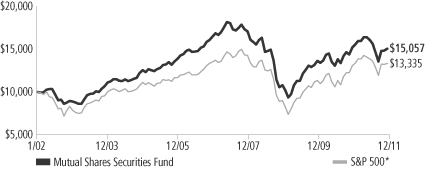
*Source: © 2012 Morningstar. Please see Index Descriptions following the Fund Summaries.
Mutual Shares Securities Fund – Class 1
Performance reflects the Fund’s Class 1 operating expenses, but does not include any contract fees, expenses or sales charges. If they had been included, performance would be lower. These charges and deductions, particularly for variable life policies, can have a significant effect on contract values and insurance benefits. See the contract prospectus for a complete description of these expenses, including sales charges.
Performance data represent past performance, which does not guarantee future results. Investment return and principal value will fluctuate, and you may have a gain or loss when you sell your shares.
Current performance may differ from figures shown.
MS-1
Fund Goals and Main Investments: Mutual Shares Securities Fund seeks capital appreciation, with income as a secondary goal. The Fund normally invests primarily in U.S. and foreign equity securities that the manager believes are undervalued.
Performance Overview
You can find the Fund’s one-year total return in the Performance Summary. The Fund underperformed its benchmark, the S&P 500, which delivered a +2.11% total return for the period under review.1
Economic and Market Overview
The U.S. economy improved steadily but modestly in 2011 despite geopolitical, employment and housing pressures. In contrast, growth outside the U.S. began to slow, which some attributed partly to the effects of Japan’s earthquake on the global supply chain and populist uprisings across the oil-and-gas-producing regions of the Middle East and North Africa. Although manufacturing growth slowed in the second half of the year as high commodity prices reduced purchasing power and demand ebbed, the trend began to reverse near year-end. The U.S. manufacturing sector helped power the domestic economy and led global manufacturing output heading into 2012. European and Asian manufacturing, however, generally weakened throughout 2011 as parts of Europe were in danger of falling back into recession.
The U.S. financial system and household balance sheets continued to improve, but the country still faced persistently high unemployment, a prolonged housing market slump and massive national debt. Inflation rose across much of the world but stayed relatively contained in the U.S., even slowing toward year-end amid declining energy and food prices. The Federal Reserve Board (Fed) sought to boost economic growth by maintaining its accommodative monetary policy and undertook a second round of quantitative easing that ended on June 30. Subsequently, the Fed continued to purchase U.S. Treasuries with proceeds from maturing debt in an effort to support economic growth. Outside the U.S., European policymakers ultimately stepped up their response to their sovereign debt and banking crisis. The European Central Bank cut short-term interest rates and expanded bank lending facilities, and six key global central banks agreed to lower dollar funding costs for Europe’s distressed commercial banks. Chinese policymakers lowered
1. Source: © 2012 Morningstar. One cannot invest directly in an index, and an index is not representative of the Fund’s portfolio. Please see Index Descriptions following the Fund Summaries.
Fund Risks: All investments involve risks. Stock prices fluctuate, sometimes rapidly and dramatically, due to factors affecting individual companies, particular industries or sectors, or general market conditions. Investments in companies involved in mergers, liquidations, reorganizations and distressed bankruptcy, which may include defaulted debt, involve higher credit and other risks. Foreign investing involves additional risks, including currency fluctuations, economic instability, market volatility, and political and social instability. Smaller and midsize company securities involve special risks, such as relatively small revenues, limited product lines and small market share. The Fund’s investment in certain hedging and derivative instruments may involve a small investment relative to the risk assumed. The Fund is actively managed but there is no guarantee that the manager’s investment decisions will produce the desired results. The Fund’s prospectus also includes a description of the main investment risks.
MS-2
commercial bank reserve requirements and the International Monetary Fund revamped its credit line and eased its lending terms.
Although U.S. stock markets rallied in the spring, worrisome global events and slowing global growth dampened investor sentiment and market volatility surged. Risk-averse investors sought perceived safe havens and seemed to ignore that many companies generated record profits. Despite large swings, U.S. stocks as measured by the S&P 500 gained 2.11% in 2011.1 The Dow Jones Industrial Average rose 8.38%, reflecting investors’ general preference for large, established U.S. companies.1 In contrast, developed and emerging world stocks as measured by the MSCI All Country World Index fell 6.86%.1 Amid general global market declines, perceived safe-haven currencies such as the Japanese yen and Swiss franc rallied strongly, and U.S. Treasuries posted their best one-year return since 2008.
Investment Strategy
At Mutual Series, we are committed to our distinctive value approach to investing. Our major investment strategy is investing in undervalued stocks. When selecting undervalued equities, we are attracted to fundamentally strong companies with healthy balance sheets, high-quality assets, substantial free cash flow and shareholder-oriented management teams and whose stocks are trading at discounts to our assessment of the companies’ intrinsic or business value. We also look for asset rich companies whose shares may be trading at depressed levels due to concerns over short-term earnings disappointments, litigation, management strategy or other perceived negatives. While the vast majority of our undervalued equity investments are made in publicly traded companies globally, we may invest occasionally in privately held companies as well.
We complement this more traditional investment strategy with two others. One is distressed investing, which is complex and can take many forms. The most common distressed investment the Fund undertakes is the purchase of financially troubled or bankrupt companies’ debt at a substantial discount to face value. After the financially distressed company is reorganized, often in bankruptcy court, the old debt is typically replaced with new securities issued by the financially stronger company.
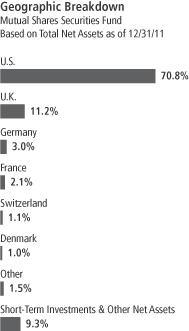
MS-3
The other piece of our investment strategy is participating in arbitrage situations, another highly specialized field. When companies announce proposed mergers or takeovers, commonly referred to as “deals,” the target company may trade at a discount to the bid it ultimately accepts. One form of arbitrage involves purchasing the target company’s stock when it is trading below the value we believe it would receive in a deal. In keeping with our commitment to a relatively conservative investment approach, we typically focus our arbitrage efforts on announced deals, and eschew rumored deals or other situations we consider relatively risky.
In addition, it is our practice to hedge the Fund’s currency exposure when we deem it advantageous for our shareholders.
Manager’s Discussion
Despite the weak performance of global stock markets in 2011, several Fund investments increased in value. Three particularly strong performers were managed care company UnitedHealth Group, U.K.-based cigarette manufacturer British American Tobacco (BAT), and White Mountains Insurance Group.
UnitedHealth’s shares rose during the year as its earnings beat management’s initial guidance in part due to lower-than-expected utilization of medical services by its members in addition to strong membership growth. The company increased its dividend in 2011, while its board of directors re-authorized the company’s share repurchase plan. At a UnitedHealth investor day convening in late November, management reaffirmed its 13% to 15% long-term earnings growth rate goal, which it seeks to achieve via high, single-digit topline growth and productivity enhancements.
BAT shares were another key contributor to Fund performance as the company announced operating results that repeatedly exceeded market expectations through the third quarter of 2011. Management also announced it had completed a five-year goal to realize £800 million in cost savings two years ahead of schedule, and it laid out a new goal to continue growing operating margins for the next six to seven years by increasing prices and cutting costs. In 2011, BAT and other tobacco stocks also benefited from the defensive nature of their business models, which include pricing power, reasonably predictable operating profits and high dividend payout ratios. BAT has been a long-term Fund holding, and we continue to believe the shares are an attractive investment in a market fraught with uncertainty.
Top 10 Sectors/Industries
Mutual Shares Securities Fund
Based on Equity Securities 12/31/11
| | | | |
| | | % of Total
Net Assets | |
| Tobacco | | | 9.1% | |
| Oil, Gas & Consumable Fuels | | | 8.1% | |
| Pharmaceuticals | | | 7.3% | |
| Media | | | 5.0% | |
| Insurance | | | 5.0% | |
| Food & Staples Retailing | | | 4.8% | |
| Beverages | | | 3.8% | |
| Software | | | 3.2% | |
| Food Products | | | 3.1% | |
| Health Care Providers & Services | | | 3.0% | |
MS-4
We had long thought that the market had underappreciated the value of long-time Fund holding White Mountains, and in particular its Esurance and Answer Financial subsidiaries. In 2011, White Mountains sold those businesses to Allstate at a significant premium to book value, driving White Mountains, share price higher. At period-end, we believed the stock was still trading at a significant discount to its tangible book value, of which almost two-thirds is excess capital that White Mountains could use to generate shareholder value in 2012.
During a highly volatile year for global stock markets in general, several holdings hurt Fund performance, including Community Health Systems, which operates more than 130 hospitals mostly in rural areas or small cities in 30 U.S. states, Bank of America, and computer and printer manufacturer Hewlett-Packard.
Community Health Systems was involved in a lawsuit filed by Tenet Healthcare alleging that Community Health Systems had engaged in inappropriate patient-admissions practices and made false statements in their proxy documents related to a purchase offer for Tenet. The lawsuit and ensuing investigation caused a significant drop in Community Health’s share price. Furthermore, uncertainty over future reimbursement rates for hospitals from government programs have weighed on the hospital industry. In particular, a Congressional budgetary “supercommittee” appointed to reach a grand deficit reduction plan for the heavily indebted U.S. government failed amid ongoing partisan bickering in Washington, DC. The lack of a comprehensive budget deal could trigger automatic spending cuts in 2013 to many federally funded programs, including Medicare. Because Medicare is a significant source of payments for hospitals, the fear surrounding potential payment cuts continued to depress hospital valuations. However, we believed the risk in reimbursement cuts was more than adequately priced in at year-end 2011, and that Community Health shares represented a good value at those levels.
Bank of America shares declined in 2011 as investors reacted to the company’s potential exposure to large mortgage-related losses. There was also a growing concern that related losses might force the company into a dilutive, capital-raising scenario. Bank of America also faced a very difficult general operating environment in 2011. Low interest rates, weak lending, the impact of new consumer rules on fees, and a drop-off in capital markets activity all pressured earnings and the stock price. Like many other financial stocks, Bank of America was also impacted by contagion fears from Europe, changes in capital requirements
Top 10 Holdings
Mutual Shares Securities Fund 12/31/11
| | | | |
Company
Sector/Industry,
Country | | % of Total
Net Assets | |
| CVS Caremark Corp. | | | 2.9% | |
| Food & Staples Retailing, U.S. | |
| British American Tobacco PLC, ord. & ADR | | | 2.8% | |
| Tobacco, U.K. | |
| Merck & Co. Inc. | | | 2.7% | |
| Pharmaceuticals, U.S. | |
| Pfizer Inc. | | | 2.3% | |
| Pharmaceuticals, U.S. | |
| Imperial Tobacco Group PLC | | | 2.3% | |
| Tobacco, U.K. | |
| Microsoft Corp. | | | 2.2% | |
| Software, U.S. | |
| Kraft Foods Inc., A | | | 2.1% | |
| Food Products, U.S. | |
| Vodafone Group PLC | | | 1.9% | |
Wireless Telecommunication
Services, U.K. | |
| Royal Dutch Shell PLC, A | | | 1.8% | |
| Oil, Gas & Consumable Fuels, U.K. | | | | |
| Marathon Oil Corp. | | | 1.8% | |
| Oil, Gas & Consumable Fuels, U.S. | | | | |
The dollar value, number of shares or principal amount, and names of all portfolio holdings are listed in the Fund’s Statement of Investments.
MS-5
and uncertainty over the impact of new regulations such as Dodd-Frank. Although we still believed this holding held value, we exited our position in Bank of America and reallocated the capital proceeds to companies where we thought better risk-reward characteristics existed.
The Fund originally initiated a Hewlett-Packard position after the well-publicized departure of CEO Mark Hurd caused shares to drop to valuations near the bottom end of historical ranges based on earnings and cash flow. The company’s dominant franchise in printing, number-one market share in personal computers and servers, large base of recurring revenues, and history of strong cash flow generation are all positive characteristics for Hewlett-Packard. However, a number of operational and strategic missteps, including a large, dilutive acquisition of a U.K. software firm, weighed on the shares and caused us to revise downward our estimates of intrinsic value and downside protection. Therefore, we decided to sell the Fund’s position.
During the year, the Fund held currency forwards to somewhat hedge the currency risk of the portfolio’s non-U.S. dollar investments. The hedges had a negligible impact on the Fund’s performance during the period.
Thank you for your participation in Mutual Shares Securities Fund. We look forward to serving your future investment needs.
The foregoing information reflects our analysis, opinions and portfolio holdings as of December 31, 2011, the end of the reporting period. The way we implement our main investment strategies and the resulting portfolio holdings may change depending on factors such as market and economic conditions. These opinions may not be relied upon as investment advice or an offer for a particular security. The information is not a complete analysis of every aspect of any market, country, industry, security or the Fund. Statements of fact are from sources considered reliable, but the investment manager makes no representation or warranty as to their completeness or accuracy. Although historical performance is no guarantee of future results, these insights may help you understand our investment management philosophy.
MS-6
Fund Expenses
As an investor in a variable insurance contract (Contract) that indirectly provides for investment in an underlying mutual fund, you can incur transaction and/or ongoing expenses at both the Fund level and the Contract level.
| • | | Transaction expenses can include sales charges (loads) on purchases, redemption fees, surrender fees, transfer fees and premium taxes. |
| • | | Ongoing expenses can include management fees, distribution and service (12b-1) fees, contract fees, annual maintenance fees, mortality and expense risk fees and other fees and expenses. All mutual funds and Contracts have some types of ongoing expenses. |
The expenses shown in the table are meant to highlight ongoing expenses at the Fund level only and do not include ongoing expenses at the Contract level, or transaction expenses at either the Fund or Contract level. While the Fund does not have transaction expenses, if the transaction and ongoing expenses at the Contract level were included, the expenses shown below would be higher. You should consult your Contract prospectus or disclosure document for more information.
The table shows Fund-level ongoing expenses and can help you understand these expenses and compare them with those of other mutual funds offered through the Contract. The table assumes a $1,000 investment held for the six months indicated. Please refer to the Fund prospectus for additional information on operating expenses.
Actual Fund Expenses
The first line (Actual) of the table provides actual account values and expenses. The “Ending Account Value” is derived from the Fund’s actual return, which includes the effect of ongoing Fund expenses, but does not include the effect of ongoing Contract expenses.
You can estimate the Fund-level expenses you incurred during the period by following these steps. Of course, your account value and expenses will differ from those in this illustration:
| 1. | Divide your account value by $1,000. |
If an account had an $8,600 value, then $8,600 ÷ $1,000 = 8.6.
| 2. | Multiply the result by the number under the heading “Fund-Level Expenses Incurred During Period.” |
If Fund-Level Expenses Incurred During Period were $7.50, then 8.6 x $7.50 = $64.50.
In this illustration, the estimated expenses incurred this period at the Fund level are $64.50.
Mutual Shares Securities Fund – Class 1
MS-7
Hypothetical Example for Comparison with Other Mutual Funds
Information in the second line (Hypothetical) of the table can help you compare ongoing expenses of the Fund with those of other mutual funds offered through the Contract. This information may not be used to estimate the actual ending account balance or expenses you incurred during the period. The hypothetical “Ending Account Value” is based on the Fund’s actual expense ratio and an assumed 5% annual rate of return before expenses, which does not represent the Fund’s actual return. The figure under the heading “Fund-Level Expenses Incurred During Period” shows the hypothetical expenses your account would have incurred under this scenario. You can compare this figure with the 5% hypothetical examples that appear in shareholder reports of other funds offered through a Contract.
| | | | | | | | | | | | |
| Class 1 | | Beginning Account Value 7/1/11 | | | Ending Account Value 12/31/11 | | | Fund-Level Expenses Incurred During Period* 7/1/11–12/31/11 | |
Actual | | $ | 1,000 | | | $ | 936.90 | | | $ | 3.56 | |
Hypothetical (5% return before expenses) | | $ | 1,000 | | | $ | 1,021.53 | | | $ | 3.72 | |
*Expenses are calculated using the most recent six-month annualized expense ratio for the Fund’s Class 1 shares (0.73%), which does not include any ongoing expenses of the Contract for which the Fund is an investment option, multiplied by the average account value over the period, multiplied by 184/365 to reflect the one-half year period.
MS-8
Franklin Templeton Variable Insurance Products Trust
Financial Highlights
Mutual Shares Securities Fund
| | | | | | | | | | | | | | | | | | | | |
| | | Year Ended December 31, | |
| Class 1 | | 2011 | | | 2010 | | | 2009 | | | 2008 | | | 2007 | |
| | | | |
Per share operating performance | | | | | | | | | | | | | | | | | | | | |
(for a share outstanding throughout the year) | | | | | | | | | | | | | | | | | | | | |
Net asset value, beginning of year | | $ | 16.14 | | | $ | 14.75 | | | $ | 11.92 | | | $ | 20.42 | | | $ | 20.67 | |
| | | | |
Income from investment operationsa: | | | | | | | | | | | | | | | | | | | | |
Net investment incomeb | | | 0.38 | c | | | 0.40 | d | | | 0.23 | e | | | 0.34 | | | | 0.54 | |
Net realized and unrealized gains (losses) | | | (0.53 | ) | | | 1.27 | | | | 2.89 | | | | (7.54 | ) | | | 0.31 | |
| | | | |
Total from investment operations | | | (0.15 | ) | | | 1.67 | | | | 3.12 | | | | (7.20 | ) | | | 0.85 | |
| | | | |
Less distributions from: | | | | | | | | | | | | | | | | | | | | |
Net investment income | | | (0.42 | ) | | | (0.28 | ) | | | (0.29 | ) | | | (0.57 | ) | | | (0.35 | ) |
Net realized gains | | | — | | | | — | | | | — | | | | (0.73 | ) | | | (0.75 | ) |
| | | | |
Total distributions | | | (0.42 | ) | | | (0.28 | ) | | | (0.29 | ) | | | (1.30 | ) | | | (1.10 | ) |
| | | | |
Net asset value, end of year | | $ | 15.57 | | | $ | 16.14 | | | $ | 14.75 | | | $ | 11.92 | | | $ | 20.42 | |
| | | | |
| | | | | |
Total returnf | | | (0.79)% | | | | 11.47% | | | | 26.35% | | | | (36.93)% | | | | 3.72% | |
Ratios to average net assets | | | | | | | | | | | | | | | | | | | | |
Expensesg,h | | | 0.73% | | | | 0.74% | | | | 0.78% | | | | 0.73% | | | | 0.72% | |
Expenses incurred in connection with securities sold short | | | —% | i | | | 0.02% | | | | 0.06% | | | | —% | i | | | —% | i |
Net investment income | | | 2.28% | c | | | 2.66% | d | | | 1.85% | e | | | 2.16% | | | | 2.58% | |
| | | | | |
Supplemental data | | | | | | | | | | | | | | | | | | | | |
Net assets, end of year (000’s) | | $ | 1,170,781 | | | $ | 1,301,520 | | | $ | 767,553 | | | $ | 319,703 | | | $ | 272,509 | |
Portfolio turnover rate | | | 41.02% | | | | 32.05% | | | | 49.33% | | | | 44.11% | | | | 41.73% | j |
aThe amount shown for a share outstanding throughout the period may not correlate with the Statement of Operations for the period due to the timing of sales and repurchases of the Fund shares in relation to income earned and/or fluctuating market value of the investments of the Fund.
bBased on average daily shares outstanding.
cNet investment income per share includes approximately $0.02 per share related to interest income received that had previously been deemed uncollectible. Excluding this amount, the ratio of net investment income to average net assets would have been 2.14%.
dNet investment income per share includes approximately $0.11 per share received in the form of a special dividend paid in connection with a corporate real estate investment trust (REIT) conversion. Excluding this non-recurring amount, the ratio of the net investment income to average net assets would have been 1.93%.
eNet investment income per share includes approximately $(0.03) per share related to an adjustment for uncollectible interest. Excluding the effect of this adjustment, the ratio of net investment income to average net assets would have been 2.08%.
fTotal return does not include fees, charges or expenses imposed by the variable annuity and life insurance contracts for which the Franklin Templeton Variable Insurance Products Trust serves as an underlying investment vehicle.
gBenefit of expense reduction rounds to less than 0.01%.
hIncludes dividend expense on securities sold short and borrowing fees, if any. See below for the ratios of such expenses to average net assets for the periods presented. See Note 1(e).
iRounds to less than 0.01%.
jExcludes the value of portfolio securities delivered as a result of redemption in-kind.
The accompanying notes are an integral part of these financial statements.
MS-9
Franklin Templeton Variable Insurance Products Trust
Financial Highlights (continued)
Mutual Shares Securities Fund
| | | | | | | | | | | | | | | | | | | | |
| | | Year Ended December 31, | |
| Class 2 | | 2011 | | | 2010 | | | 2009 | | | 2008 | | | 2007 | |
| | | | |
Per share operating performance | | | | | | | | | | | | | | | | | | | | |
(for a share outstanding throughout the year) | | | | | | | | | | | | | | | | | | | | |
Net asset value, beginning of year | | $ | 15.95 | | | $ | 14.58 | | | $ | 11.78 | | | $ | 20.19 | | | $ | 20.46 | |
| | | | |
Income from investment operationsa: | | | | | | | | | | | | | | | | | | | | |
Net investment incomeb | | | 0.32 | c | | | 0.36 | d | | | 0.20 | e | | | 0.32 | | | | 0.48 | |
Net realized and unrealized gains (losses) | | | (0.51 | ) | | | 1.25 | | | | 2.85 | | | | (7.49 | ) | | | 0.31 | |
| | | | |
Total from investment operations | | | (0.19 | ) | | | 1.61 | | | | 3.05 | | | | (7.17 | ) | | | 0.79 | |
| | | | |
Less distributions from: | | | | | | | | | | | | | | | | | | | | |
Net investment income | | | (0.38 | ) | | | (0.24 | ) | | | (0.25 | ) | | | (0.51 | ) | | | (0.31 | ) |
Net realized gains | | | — | | | | — | | | | — | | | | (0.73 | ) | | | (0.75 | ) |
| | | | |
Total distributions | | | (0.38 | ) | | | (0.24 | ) | | | (0.25 | ) | | | (1.24 | ) | | | (1.06 | ) |
| | | | |
Net asset value, end of year | | $ | 15.38 | | | $ | 15.95 | | | $ | 14.58 | | | $ | 11.78 | | | $ | 20.19 | |
| | | | |
| | | | | |
Total returnf | | | (1.04)% | | | | 11.19% | | | | 26.05% | | | | (37.11)% | | | | 3.48% | |
Ratios to average net assets | | | | | | | | | | | | | | | | | | | | |
Expensesg,h | | | 0.98% | | | | 0.99% | | | | 1.03% | | | | 0.98% | | | | 0.97% | |
Expenses incurred in connection with securities sold short | | | —% | i | | | 0.02% | | | | 0.06% | | | | —%i | | | | —% | i |
Net investment income | | | 2.03% | c | | | 2.41% | d | | | 1.60% | e | | | 1.91% | | | | 2.33% | |
| | | | | |
Supplemental data | | | | | | | | | | | | | | | | | | | | |
Net assets, end of year (000’s) | | $ | 3,913,220 | | | $ | 4,188,821 | | | $ | 3,953,435 | | | $ | 3,303,761 | | | $ | 5,925,551 | |
Portfolio turnover rate | | | 41.02% | | | | 32.05% | | | | 49.33% | | | | 44.11% | | | | 41.73%j | |
aThe amount shown for a share outstanding throughout the period may not correlate with the Statement of Operations for the period due to the timing of sales and repurchases of the Fund shares in relation to income earned and/or fluctuating market value of the investments of the Fund.
bBased on average daily shares outstanding.
cNet investment income per share includes approximately $0.02 per share related to interest income received that had previously been deemed uncollectible. Excluding this amount, the ratio of net investment income to average net assets would have been 1.89%.
dNet investment income per share includes approximately $0.11 per share received in the form of a special dividend paid in connection with a corporate real estate investment trust (REIT) conversion. Excluding this non-recurring amount, the ratio of the net investment income to average net assets would have been 1.68%.
eNet investment income per share includes approximately $(0.03) per share related to an adjustment for uncollectible interest. Excluding the effect of this
adjustment, the ratio of net investment income to average net assets would have been 1.83%.
fTotal return does not include fees, charges or expenses imposed by the variable annuity and life insurance contracts for which the Franklin Templeton Variable Insurance Products Trust serves as an underlying investment vehicle.
gBenefit of expense reduction rounds to less than 0.01%.
hIncludes dividend expense on securities sold short and borrowing fees, if any. See below for the ratios of such expenses to average net assets for the periods presented. See Note 1(e).
iRounds to less than 0.01%.
jExcludes the value of portfolio securities delivered as a result of redemption in-kind.
The accompanying notes are an integral part of these financial statements.
MS-10
Franklin Templeton Variable Insurance Products Trust
Financial Highlights (continued)
Mutual Shares Securities Fund
| | | | | | | | | | | | | | | | |
| | | Year Ended December 31, | |
| Class 4 | | 2011 | | | 2010 | | | 2009 | | | 2008a | |
| | | | |
Per share operating performance | | | | | | | | | | | | | | | | |
(for a share outstanding throughout the year) | | | | | | | | | | | | | | | | |
Net asset value, beginning of year | | $ | 16.03 | | | $ | 14.66 | | | $ | 11.88 | | | $ | 18.91 | |
| | | | |
Income from investment operationsb: | | | | | | | | | | | | | | | | |
Net investment incomec | | | 0.30 | d | | | 0.35 | e | | | 0.19 | f | | | 0.17 | |
Net realized and unrealized gains (losses) | | | (0.51 | ) | | | 1.26 | | | | 2.87 | | | | (5.90 | ) |
| | | | |
Total from investment operations | | | (0.21 | ) | | | 1.61 | | | | 3.06 | �� | | | (5.73 | ) |
| | | | |
Less distributions from: | | | | | | | | | | | | | | | | |
Net investment income | | | (0.37 | ) | | | (0.24 | ) | | | (0.28 | ) | | | (0.57 | ) |
Net realized gains | | | — | | | | — | | | | — | | | | (0.73 | ) |
| | | | |
Total distributions | | | (0.37 | ) | | | (0.24 | ) | | | (0.28 | ) | | | (1.30 | ) |
| | | | |
Net asset value, end of year | | $ | 15.45 | | | $ | 16.03 | | | $ | 14.66 | | | $ | 11.88 | |
| | | | |
| | | | |
Total returng | | | (1.12)% | | | | 11.06% | | | | 25.94% | | | | (32.12)% | |
Ratios to average net assetsh | | | | | | | | | | | | | | | | |
Expensesi,j | | | 1.08% | | | | 1.09% | | | | 1.13% | | | | 1.08% | |
Expenses incurred in connection with securities sold short | | | —% | k | | | 0.02% | | | | 0.06% | | | | —% | k |
Net investment income | | | 1.93% | d | | | 2.31% | e | | | 1.50% | f | | | 1.81% | |
| | | | |
Supplemental data | | | | | | | | | | | | | | | | |
Net assets, end of year (000’s) | | $ | 162,049 | | | $ | 167,274 | | | $ | 141,446 | | | $ | 57,266 | |
Portfolio turnover rate | | | 41.02% | | | | 32.05% | | | | 49.33% | | | | 44.11% | |
aFor the period February 29, 2008 (effective date) to December 31, 2008.
bThe amount shown for a share outstanding throughout the period may not correlate with the Statement of Operations for the period due to the timing of sales and repurchases of the Fund shares in relation to income earned and/or fluctuating market value of the investments of the Fund.
cBased on average daily shares outstanding.
dNet investment income per share includes approximately $0.02 per share related to interest income received that had previously been deemed uncollectible. Excluding this amount, the ratio of net investment income to average net assets would have been 1.79%.
eNet investment income per share includes approximately $0.11 per share received in the form of a special dividend paid in connection with a corporate real estate investment trust (REIT) conversion. Excluding this non-recurring amount, the ratio of the net investment income to average net assets would have been 1.58%.
fNet investment income per share includes approximately $(0.03) per share related to an adjustment for uncollectible interest. Excluding the effect of this
adjustment, the ratio of net investment income to average net assets would have been 1.73%.
gTotal return does not include fees, charges or expenses imposed by the variable annuity and life insurance contracts for which the Franklin Templeton Variable Insurance Products Trust serves as an underlying investment vehicle. Total return is not annualized for periods less than one year.
hRatios are annualized for periods less than one year.
iBenefit of expense reduction rounds to less than 0.01%.
jIncludes dividend expense on securities sold short and borrowing fees, if any. See below for the ratios of such expenses to average net assets for the periods presented. See Note 1(e).
kRounds to less than 0.01%.
The accompanying notes are an integral part of these financial statements.
MS-11
Franklin Templeton Variable Insurance Products Trust
Statement of Investments, December 31, 2011
| | | | | | | | | | | | |
| Mutual Shares Securities Fund | | Country | | | Shares | | | Value | |
Common Stocks and Other Equity Interests 86.9% | | | | | | | | | | | | |
Aerospace & Defense 2.3% | | | | | | | | | | | | |
aGenCorp Inc. | | | United States | | | | 494,180 | | | $ | 2,629,038 | |
Goodrich Corp. | | | United States | | | | 215,480 | | | | 26,654,876 | |
aHuntington Ingalls Industries Inc. | | | United States | | | | 852,088 | | | | 26,653,313 | |
Raytheon Co. | | | United States | | | | 1,393,541 | | | | 67,419,513 | |
| | | | | | | | | | | | |
| | | | | | | | | | | 123,356,740 | |
| | | | | | | | | | | | |
Air Freight & Logistics 0.3% | | | | | | | | | | | | |
PostNL NV | | | Netherlands | | | | 1,297,371 | | | | 4,130,801 | |
TNT Express NV | | | Netherlands | | | | 1,232,905 | | | | 9,213,854 | |
| | | | | | | | | | | | |
| | | | | | | | | | | 13,344,655 | |
| | | | | | | | | | | | |
Auto Components 0.1% | | | | | | | | | | | | |
a,b,cCollins & Aikman Products Co., Contingent Distribution | | | United States | | | | 929,505 | | | | 3,095 | |
a,dInternational Automotive Components Group Brazil LLC | | | Brazil | | | | 1,730,515 | | | | 1,404,538 | |
d,eInternational Automotive Components Group North America, LLC | | | United States | | | | 11,387,027 | | | | 4,826,961 | |
| | | | | | | | | | | | |
| | | | | | | | | | | 6,234,594 | |
| | | | | | | | | | | | |
Automobiles 0.7% | | | | | | | | | | | | |
Daimler AG | | | Germany | | | | 56,802 | | | | 2,482,584 | |
aGeneral Motors Co. | | | United States | | | | 1,614,500 | | | | 32,725,915 | |
| | | | | | | | | | | | |
| | | | | | | | | | | 35,208,499 | |
| | | | | | | | | | | | |
Beverages 3.8% | | | | | | | | | | | | |
Coca-Cola Enterprises Inc. | | | United Kingdom | | | | 1,187,600 | | | | 30,616,328 | |
Dr. Pepper Snapple Group Inc. | | | United States | | | | 1,226,621 | | | | 48,426,997 | |
PepsiCo Inc. | | | United States | | | | 604,368 | | | | 40,099,817 | |
Pernod Ricard SA | | | France | | | | 845,913 | | | | 78,458,040 | |
| | | | | | | | | | | | |
| | | | | | | | | | | 197,601,182 | |
| | | | | | | | | | | | |
Biotechnology 1.5% | | | | | | | | | | | | |
Amgen Inc. | | | United States | | | | 1,262,613 | | | | 81,072,381 | |
| | | | | | | | | | | | |
Building Products 0.7% | | | | | | | | | | | | |
aOwens Corning Inc. | | | United States | | | | 1,372,085 | | | | 39,406,281 | |
| | | | | | | | | | | | |
Capital Markets 1.3% | | | | | | | | | | | | |
Morgan Stanley | | | United States | | | | 2,688,648 | | | | 40,679,244 | |
aUBS AG | | | Switzerland | | | | 2,356,378 | | | | 28,075,138 | |
| | | | | | | | | | | | |
| | | | | | | | | | | 68,754,382 | |
| | | | | | | | | | | | |
Chemicals 1.0% | | | | | | | | | | | | |
a,b,cDow Corning Corp., Contingent Distribution | | | United States | | | | 100,000 | | | | 25,000 | |
Linde AG | | | Germany | | | | 344,530 | | | | 51,259,099 | |
| | | | | | | | | | | | |
| | | | | | | | | | | 51,284,099 | |
| | | | | | | | | | | | |
Commercial Banks 2.9% | | | | | | | | | | | | |
aCIT Group Inc. | | | United States | | | | 517,223 | | | | 18,035,566 | |
a,dElephant Capital Holdings Ltd. | | | Japan | | | | 11,728 | | | | — | |
a,dFirst Southern Bancorp Inc. | | | United States | | | | 140,952 | | | | 1,370,054 | |
aGuaranty Bancorp | | | United States | | | | 1,288,316 | | | | 1,893,825 | |
KB Financial Group Inc. | | | South Korea | | | | 410,501 | | | | 12,854,161 | |
a,dNCB Warrant Holdings Ltd., A | | | Japan | | | | 57,295 | | | | — | |
PNC Financial Services Group Inc. | | | United States | | | | 1,432,099 | | | | 82,589,149 | |
aState Bank Financial Corp. | | | United States | | | | 433,000 | | | | 6,542,630 | |
Wells Fargo & Co. | | | United States | | | | 1,143,870 | | | | 31,525,057 | |
| | | | | | | | | | | | |
| | | | | | | | | | | 154,810,442 | |
| | | | | | | | | | | | |
MS-12
Franklin Templeton Variable Insurance Products Trust
Statement of Investments, December 31, 2011 (continued)
| | | | | | | | | | |
| Mutual Shares Securities Fund | | Country | | Shares | | | Value | |
Common Stocks and Other Equity Interests (continued) | | | | | | | | | | |
Communications Equipment 1.7% | | | | | | | | | | |
Cisco Systems Inc. | | United States | | | 3,456,570 | | | $ | 62,494,786 | |
aMotorola Mobility Holdings Inc. | | United States | | | 661,410 | | | | 25,662,708 | |
| | | | | | | | | | |
| | | | | | | | | 88,157,494 | |
| | | | | | | | | | |
Consumer Finance 0.2% | | | | | | | | | | |
a,dAlly Financial Inc. | | United States | | | 1,376 | | | | 7,157,592 | |
a,dCerberus CG Investor I LLC | | United States | | | 16,365,800 | | | | 1,718,409 | |
a,dCerberus CG Investor II LLC | | United States | | | 16,365,662 | | | | 1,718,395 | |
a,dCerberus CG Investor III LLC | | United States | | | 8,183,451 | | | | 859,262 | |
aComdisco Holding Co. Inc. | | United States | | | 180 | | | | 1,062 | |
| | | | | | | | | | |
| | | | | | | | | 11,454,720 | |
| | | | | | | | | | |
Diversified Financial Services 1.6% | | | | | | | | | | |
a,fBond Street Holdings LLC, A, 144A | | United States | | | 493,723 | | | | 9,504,168 | |
Citigroup Inc. | | United States | | | 881,210 | | | | 23,184,635 | |
aDeutsche Boerse AG | | Germany | | | 492,140 | | | | 25,803,930 | |
NYSE Euronext | | United States | | | 888,040 | | | | 23,177,844 | |
| | | | | | | | | | |
| | | | | | | | | 81,670,577 | |
| | | | | | | | | | |
Diversified Telecommunication Services 0.4% | | | | | | | | | | |
aAboveNet Inc. | | United States | | | 131,103 | | | | 8,523,006 | |
Cable & Wireless Communication PLC | | United Kingdom | | | 20,212,409 | | | | 11,958,326 | |
a,b,cGlobal Crossing Holdings Ltd., Contingent Distribution | | United States | | | 9,005,048 | | | | — | |
a,b,cMarconi Corp., Contingent Distribution | | United Kingdom | | | 9,945,700 | | �� | | 184,900 | |
| | | | | | | | | | |
| | | | | | | | | 20,666,232 | |
| | | | | | | | | | |
Electric Utilities 2.2% | | | | | | | | | | |
a,dAET&D Holdings No. 1 Pty. Ltd. | | Australia | | | 4,709,226 | | | | — | |
E.ON AG | | Germany | | | 2,040,643 | | | | 43,659,106 | |
Entergy Corp. | | United States | | | 319,190 | | | | 23,316,830 | |
Exelon Corp. | | United States | | | 1,171,239 | | | | 50,796,635 | |
| | | | | | | | | | |
| | | | | | | | | 117,772,571 | |
| | | | | | | | | | |
Electronic Equipment, Instruments & Components 0.8% | | | | | | | | | | |
TE Connectivity Ltd. | | United States | | | 1,304,472 | | | | 40,190,782 | |
| | | | | | | | | | |
Energy Equipment & Services 1.2% | | | | | | | | | | |
Ensco PLC, ADR | | United States | | | 448,574 | | | | 21,047,092 | |
aExterran Holding Inc. | | United States | | | 613,890 | | | | 5,586,399 | |
Transocean Ltd. | | United States | | | 1,017,107 | | | | 39,046,738 | |
| | | | | | | | | | |
| | | | | | | | | 65,680,229 | |
| | | | | | | | | | |
Food & Staples Retailing 4.8% | | | | | | | | | | |
CVS Caremark Corp. | | United States | | | 3,738,143 | | | | 152,441,472 | |
The Kroger Co. | | United States | | | 2,667,378 | | | | 64,603,895 | |
Wal-Mart Stores Inc. | | United States | | | 627,442 | | | | 37,495,934 | |
| | | | | | | | | | |
| | | | | | | | | 254,541,301 | |
| | | | | | | | | | |
Food Products 3.1% | | | | | | | | | | |
General Mills Inc. | | United States | | | 1,243,890 | | | | 50,265,595 | |
Kraft Foods Inc., A | | United States | | | 2,996,329 | | | | 111,942,851 | |
| | | | | | | | | | |
| | | | | | | | | 162,208,446 | |
| | | | | | | | | | |
Health Care Equipment & Supplies 2.0% | | | | | | | | | | |
aBoston Scientific Corp. | | United States | | | 5,499,880 | | | | 29,369,359 | |
Medtronic Inc. | | United States | | | 1,934,392 | | | | 73,990,494 | |
| | | | | | | | | | |
| | | | | | | | | 103,359,853 | |
| | | | | | | | | | |
MS-13
Franklin Templeton Variable Insurance Products Trust
Statement of Investments, December 31, 2011 (continued)
| | | | | | | | | | |
| Mutual Shares Securities Fund | | Country | | Shares | | | Value | |
Common Stocks and Other Equity Interests (continued) | | | | | | | | | | |
Health Care Providers & Services 3.7% | | | | | | | | | | |
aCommunity Health Systems Inc. | | United States | | | 1,277,022 | | | $ | 22,284,034 | |
aCoventry Health Care Inc. | | United States | | | 684,730 | | | | 20,795,250 | |
aMedco Health Solutions Inc. | | United States | | | 938,011 | | | | 52,434,815 | |
aTenet Healthcare Corp. | | United States | | | 6,379,987 | | | | 32,729,333 | |
UnitedHealth Group Inc. | | United States | | | 1,270,074 | | | | 64,367,350 | |
| | | | | | | | | | |
| | | | | | | | | 192,610,782 | |
| | | | | | | | | | |
Hotels, Restaurants & Leisure 0.0% | | | | | | | | | | |
a,d,gGLCP Harrah’s Investment LP | | United States | | | 5,565,600 | | | | — | |
| | | | | | | | | | |
Household Durables 0.3% | | | | | | | | | | |
D.R. Horton Inc. | | United States | | | 1,427,161 | | | | 17,996,500 | |
| | | | | | | | | | |
Independent Power Producers & Energy Traders 0.7% | | | | | | | | | | |
aNRG Energy Inc. | | United States | | | 1,941,240 | | | | 35,175,269 | |
| | | | | | | | | | |
Industrial Conglomerates 0.1% | | | | | | | | | | |
Orkla ASA | | Norway | | | 573,160 | | | | 4,279,066 | |
| | | | | | | | | | |
Insurance 5.0% | | | | | | | | | | |
ACE Ltd. | | United States | | | 982,915 | | | | 68,922,000 | |
aAlleghany Corp. | | United States | | | 24,779 | | | | 7,069,201 | |
American International Group Inc. | | United States | | | 1,967,760 | | | | 45,652,032 | |
aCNO Financial Group Inc. | | United States | | | 964,957 | | | | 6,088,879 | |
MetLife Inc. | | United States | | | 996,593 | | | | 31,073,770 | |
Old Republic International Corp. | | United States | | | 823,197 | | | | 7,631,036 | |
a,dOlympus Re Holdings Ltd. | | United States | | | 16,280 | | | | — | |
White Mountains Insurance Group Ltd. | | United States | | | 140,935 | | | | 63,908,385 | |
Zurich Financial Services AG | | Switzerland | | | 137,066 | | | | 31,040,150 | |
| | | | | | | | | | |
| | | | | | | | | 261,385,453 | |
| | | | | | | | | | |
Internet Software & Services 0.9% | | | | | | | | | | |
a,hGoogle Inc., A | | United States | | | 70,590 | | | | 45,594,081 | |
| | | | | | | | | | |
IT Services 0.0%† | | | | | | | | | | |
Glodyne Technoserve Ltd. | | India | | | 8,705 | | | | 39,211 | |
| | | | | | | | | | |
Leisure Equipment & Products 0.6% | | | | | | | | | | |
Mattel Inc. | | United States | | | 1,059,204 | | | | 29,403,503 | |
| | | | | | | | | | |
Machinery 1.1% | | | | | | | | | | |
aFederal Signal Corp. | | United States | | | 930,921 | | | | 3,863,322 | |
aOshkosh Corp. | | United States | | | 1,098,890 | | | | 23,494,268 | |
Stanley Black & Decker Inc. | | United States | | | 475,544 | | | | 32,146,775 | |
| | | | | | | | | | |
| | | | | | | | | 59,504,365 | |
| | | | | | | | | | |
Marine 1.0% | | | | | | | | | | |
A.P. Moller – Maersk AS, B | | Denmark | | | 7,799 | | | | 51,496,296 | |
| | | | | | | | | | |
Media 5.0% | | | | | | | | | | |
British Sky Broadcasting Group PLC | | United Kingdom | | | 3,977,185 | | | | 45,281,531 | |
News Corp., A | | United States | | | 4,119,651 | | | | 73,494,574 | |
News Corp., B | | United States | | | 393,003 | | | | 7,144,795 | |
Time Warner Cable Inc. | | United States | | | 1,052,303 | | | | 66,894,902 | |
Viacom Inc., B | | United States | | | 1,561,830 | | | | 70,922,700 | |
| | | | | | | | | | |
| | | | | | | | | 263,738,502 | |
| | | | | | | | | | |
MS-14
Franklin Templeton Variable Insurance Products Trust
Statement of Investments, December 31, 2011 (continued)
| | | | | | | | | | |
| Mutual Shares Securities Fund | | Country | | Shares | | | Value | |
Common Stocks and Other Equity Interests (continued) | | | | | | | | | | |
Metals & Mining 0.7% | | | | | | | | | | |
ThyssenKrupp AG | | Germany | | | 1,543,348 | | | $ | 35,460,602 | |
| | | | | | | | | | |
Multi-Utilities 0.6% | | | | | | | | | | |
GDF Suez | | France | | | 1,065,032 | | | | 29,113,306 | |
| | | | | | | | | | |
Multiline Retail 0.5% | | | | | | | | | | |
Kohl’s Corp. | | United States | | | 540,960 | | | | 26,696,376 | |
| | | | | | | | | | |
Office Electronics 1.5% | | | | | | | | | | |
Xerox Corp. | | United States | | | 9,776,214 | | | | 77,818,663 | |
| | | | | | | | | | |
Oil, Gas & Consumable Fuels 8.1% | | | | | | | | | | |
Apache Corp. | | United States | | | 616,550 | | | | 55,847,099 | |
BP PLC | | United Kingdom | | | 4,439,900 | | | | 31,733,206 | |
El Paso Corp. | | United States | | | 1,293,429 | | | | 34,366,409 | |
Marathon Oil Corp. | | United States | | | 3,143,898 | | | | 92,021,894 | |
Marathon Petroleum Corp. | | United States | | | 948,739 | | | | 31,583,521 | |
Murphy Oil Corp. | | United States | | | 665,920 | | | | 37,118,381 | |
Royal Dutch Shell PLC, A | | United Kingdom | | | 2,595,384 | | | | 94,561,636 | |
The Williams Cos. Inc. | | United States | | | 1,394,324 | | | | 46,040,578 | |
| | | | | | | | | | |
| | | | | | | | | 423,272,724 | |
| | | | | | | | | | |
Paper & Forest Products 2.5% | | | | | | | | | | |
Domtar Corp. | | United States | | | 251,569 | | | | 20,115,457 | |
International Paper Co. | | United States | | | 2,328,654 | | | | 68,928,159 | |
MeadWestvaco Corp. | | United States | | | 1,464,799 | | | | 43,870,730 | |
| | | | | | | | | | |
| | | | | | | | | 132,914,346 | |
| | | | | | | | | | |
Pharmaceuticals 7.3% | | | | | | | | | | |
Eli Lilly & Co. | | United States | | | 1,519,278 | | | | 63,141,194 | |
aHospira Inc. | | United States | | | 804,948 | | | | 24,446,271 | |
Merck & Co. Inc. | | United States | | | 3,779,978 | | | | 142,505,170 | |
Pfizer Inc. | | United States | | | 5,550,274 | | | | 120,107,929 | |
Teva Pharmaceutical Industries Ltd., ADR | | Israel | | | 769,899 | | | | 31,073,124 | |
| | | | | | | | | | |
| | | | | | | | | 381,273,688 | |
| | | | | | | | | | |
Real Estate Investment Trusts (REITs) 0.3% | | | | | | | | | | |
Alexander’s Inc. | | United States | | | 49,326 | | | | 18,252,100 | |
| | | | | | | | | | |
Real Estate Management & Development 0.2% | | | | | | | | | | |
cCanary Wharf Group PLC | | United Kingdom | | | 1,535,898 | | | | 5,638,540 | |
aForestar Group Inc. | | United States | | | 320,853 | | | | 4,854,506 | |
| | | | | | | | | | |
| | | | | | | | | 10,493,046 | |
| | | | | | | | | | |
Software 3.2% | | | | | | | | | | |
Microsoft Corp. | | United States | | | 4,444,983 | | | | 115,391,759 | |
Nintendo Co. Ltd. | | Japan | | | 123,923 | | | | 17,067,288 | |
aSymantec Corp. | | United States | | | 2,229,001 | | | | 34,883,865 | |
| | | | | | | | | | |
| | | | | | | | | 167,342,912 | |
| | | | | | | | | | |
Tobacco 9.1% | | | | | | | | | | |
Altria Group Inc. | | United States | | | 2,888,624 | | | | 85,647,702 | |
British American Tobacco PLC | | United Kingdom | | | 3,122,320 | | | | 148,329,398 | |
British American Tobacco PLC, ADR | | United Kingdom | | | 4,218 | | | | 400,204 | |
Imperial Tobacco Group PLC | | United Kingdom | | | 3,122,880 | | | | 118,209,441 | |
Lorillard Inc. | | United States | | | 428,964 | | | | 48,901,896 | |
Philip Morris International Inc. | | United States | | | 593,230 | | | | 46,556,690 | |
MS-15
Franklin Templeton Variable Insurance Products Trust
Statement of Investments, December 31, 2011 (continued)
| | | | | | | | | | |
| Mutual Shares Securities Fund | | Country | | Shares | | | Value | |
Common Stocks and Other Equity Interests (continued) | | | | | | | | | | |
Tobacco (continued) | | | | | | | | | | |
Reynolds American Inc. | | United States | | | 690,951 | | | $ | 28,619,190 | |
| | | | | | | | | | |
| | | | | | | | | 476,664,521 | |
| | | | | | | | | | |
Wireless Telecommunication Services 1.9% | | | | | | | | | | |
Vodafone Group PLC | | United Kingdom | | | 35,967,880 | | | | 99,974,187 | |
| | | | | | | | | | |
Total Common Stocks and Other Equity Interests
(Cost $4,287,345,075) | | | | | | | | | 4,557,274,959 | |
| | | | | | | | | | |
Convertible Preferred Stocks (Cost $241,000) 0.0%† | | | | | | | | | | |
Commercial Banks 0.0%† | | | | | | | | | | |
a,dFirst Southern Bancorp Inc., cvt. pfd., C | | United States | | | 241 | | | | 887,690 | |
| | | | | | | | | | |
| | | |
| | | | | Principal
Amount* | | | | |
Corporate Bonds, Notes and Senior Floating Rate Interests 4.2% | | | | | | | | | | |
i,jCapmark Financial Group Inc., senior secured note, B, 9.00%, 9/30/17 | | United States | | | 5,598,000 | | | | 5,695,965 | |
Clear Channel Communications Inc., | | | | | | | | | | |
i,jDelayed Draw 2 Term Loan, 3.946%, 1/29/16 | | United States | | | 5,945,000 | | | | 4,313,841 | |
senior note, 9.00%, 3/01/21 | | United States | | | 2,981,000 | | | | 2,526,398 | |
ksenior note, PIK, 11.00%, 8/01/16 | | United States | | | 12,556,000 | | | | 7,973,060 | |
i,jTranche B Term Loan, 3.946%, 1/29/16 | | United States | | | 35,406,000 | | | | 26,269,269 | |
i,jTranche C Term Loan, 3.946%, 1/29/16 | | United States | | | 6,902,668 | | | | 5,013,062 | |
i,jiStar Financial Inc., | | | | | | | | | | |
Tranche A1 Term Loan, 5.00%, 6/28/13 | | United States | | | 2,588,847 | | | | 2,575,440 | |
Tranche A2 Term Loan, 7.00%, 6/30/14 | | United States | | | 1,926,000 | | | | 1,873,035 | |
NRG Energy Inc., senior note, 7.375%, 1/15/17 | | United States | | | 9,010,000 | | | | 9,370,400 | |
Realogy Corp., | | | | | | | | | | |
i,jExtended First Lien Term Loan, 4.691%, 10/10/16 | | United States | | | 38,503,226 | | | | 34,549,753 | |
i,jExtended Revolver, 7.278%, 4/10/16 | | United States | | | 2,156,694 | | | | 1,711,336 | |
i,jExtended Synthetic Letter of Credit, 4.545%, 10/10/16 | | United States | | | 2,932,330 | | | | 2,631,242 | |
Second Lien Term Loan, 13.50%, 10/15/17 | | United States | | | 5,314,000 | | | | 5,333,927 | |
senior note, 11.50%, 4/15/17 | | United States | | | 3,654,000 | | | | 2,868,390 | |
fsenior secured note, 144A, 7.875%, 2/15/19 | | United States | | | 4,388,000 | | | | 3,839,500 | |
Rite Aid Corp., senior note, | | | | | | | | | | |
8.625%, 3/01/15 | | United States | | | 6,445,000 | | | | 6,251,650 | |
9.375%, 12/15/15 | | United States | | | 8,300,000 | | | | 8,051,000 | |
i,jTexas Competitive Electric Holdings Co. LLC, Extended Term Loan, 4.776%, 10/10/17 | | United States | | | 90,618,405 | | | | 57,693,748 | |
fTexas Competitive Electric Holdings Co. LLC/Texas Competitive Electric Holdings Finance Inc., senior secured note, 144A, 11.50%, 10/01/20 | | United States | | | 39,308,000 | | | | 33,559,205 | |
| | | | | | | | | | |
Total Corporate Bonds, Notes and Senior Floating Rate Interests
(Cost $249,191,681) | | | | | | | | | 222,100,221 | |
| | | | | | | | | | |
Corporate Notes and Senior Floating Rate Interests in Reorganization 0.3% | | | | | | | | | | |
d,lBroadband Ventures III LLC, secured promissory note, 5.00%, 2/01/12 | | United States | | | 2,128 | | | | — | |
i,j,lTribune Co., | | | | | | | | | | |
Incremental Term Loan, 7.25%, 6/04/14 | | United States | | | 3,098,000 | | | | 1,763,924 | |
mInitial Tranche B Term Loan, 5.25%, 6/04/14 | | United States | | | 19,651,000 | | | | 11,534,036 | |
| | | | | | | | | | |
Total Corporate Notes and Senior Floating Rate Interests in Reorganization (Cost $15,189,619) | | | | | | | | | 13,297,960 | |
| | | | | | | | | | |
MS-16
Franklin Templeton Variable Insurance Products Trust
Statement of Investments, December 31, 2011 (continued)
| | | | | | | | | | |
| Mutual Shares Securities Fund | | Country | | Shares | | | Value | |
Companies in Liquidation 0.0%† | | | | | | | | | | |
aAdelphia Recovery Trust | | United States | | | 29,283,354 | | | $ | 29,283 | |
a,bAdelphia Recovery Trust, Arahova Contingent Value Vehicle, Contingent Distribution | | United States | | | 1,955,453 | | | | 80,174 | |
a,d,e,gCB FIM Coinvestors LLC | | United States | | | 6,400,507 | | | | — | |
a,b,cCentury Communications Corp., Contingent Distribution | | United States | | | 5,487,000 | | | | — | |
a,dFIM Coinvestor Holdings I, LLC | | United States | | | 8,006,950 | | | | — | |
a,b,cTropicana Litigation Trust, Contingent Distribution | | United States | | | 18,305,000 | | | | — | |
| | | |
| | | | | Principal
Amount* | | | | |
c,lPeregrine Investments Holdings Ltd., 1/15/98 | | Hong Kong | | | 5,000,000 | JPY | | | — | |
c,lPIV Investment Finance (Cayman) Ltd., 12/01/00 | | Hong Kong | | | 12,200,000 | | | | — | |
| | | | | | | | | | |
Total Companies in Liquidation (Cost $2,791,061) | | | | | | | | | 109,457 | |
| | | | | | | | | | |
Total Investments before Short Term Investments
(Cost $4,554,758,436) | | | | | | | | | 4,793,670,287 | |
| | | | | | | | | | |
Short Term Investments 7.0% | | | | | | | | | | |
Convertible Notes (Cost $6,601,983) 0.1% | | | | | | | | | | |
iiStar Financial Inc., cvt., senior note, FRN, 0.872%, 10/01/12 | | United States | | | 7,096,000 | | | | 6,386,400 | |
| | | | | | | | | | |
U.S. Government and Agency Securities 6.9% | | | | | | | | | | |
nFHLB, 1/03/12 | | United States | | | 1,300,000 | | | | 1,300,000 | |
n,oU.S. Treasury Bills, 1/05/12 - 7/26/12 | | United States | | | 360,000,000 | | | | 359,960,457 | |
| | | | | | | | | | |
Total U.S. Government and Agency Securities
(Cost $361,253,915) | | | | | | | | | 361,260,457 | |
| | | | | | | | | | |
Total Investments (Cost $4,922,614,334) 98.4% | | | | | | | | | 5,161,317,144 | |
Options Written (0.0)%† | | | | | | | | | (344,040 | ) |
Securities Sold Short (0.7)% | | | | | | | | | (33,955,149 | ) |
Other Assets, less Liabilities 2.3% | | | | | | | | | 119,032,283 | |
| | | | | | | | | | |
Net Assets 100.0% | | | | | | | | $ | 5,246,050,238 | |
| | | | | | | | | | |
| | | |
| | | | | Number of
Contracts | | | | |
pOptions Written (Premiums received $247,051) (0.0)%† | | | | | | | | | | |
Calls – Exchange-Traded | | | | | | | | | | |
Internet Software & Services (0.0)%† | | | | | | | | | | |
Google Inc., A, February Strike Price $645, Expires 2/18/12 | | United States | | | 122 | | | | (344,040 | ) |
| | | | | | | | | | |
| | | |
| | | | | Shares | | | | |
qSecurities Sold Short (Proceeds $36,014,854) (0.7)% | | | | | | | | | | |
Health Care Providers & Services (0.7)% | | | | | | | | | | |
Express Scripts Inc. | | United States | | | 759,793 | | | | (33,955,149 | ) |
| | | | | | | | | | |
MS-17
Franklin Templeton Variable Insurance Products Trust
Statement of Investments, December 31, 2011 (continued)
| | | | | | |
| Mutual Shares Securities Fund | | | | | | |
†Rounds to less than 0.1% of net assets.
*The principle amount is stated in U.S. dollars unless otherwise indicated.
aNon-income producing.
bContingent distributions represent the right to receive additional distributions, if any, during the reorganization of the underlying company. Shares represent total underlying principal of debt securities.
cSecurity has been deemed illiquid because it may not be able to be sold within seven days. At December 31, 2011, the aggregate value of these securities was $5,851,535, representing 0.11% of net assets.
dSee Note 9 regarding restricted securities.
eAt December 31, 2011, pursuant to the Fund’s policies and the requirements of applicable securities law, the Fund may be restricted from trading these securities for a limited or extended period of time due to ownership limits and/or potential possession of material non-public information.
fSecurity was purchased pursuant to Rule 144A under the Securities Act of 1933 and may be sold in transactions exempt from registration only to qualified institutional buyers or in a public offering registered under the Securities Act of 1933. These securities have been deemed liquid under guidelines approved by the Trust’s Board of Trustees. At December 31, 2011, the aggregate value of these securities was $46,902,873, representing 0.89% of net assets.
gSee Note 13 regarding holdings of 5% voting securities.
hA portion or all of the security is held in connection with written option contracts open at year end.
iThe coupon rate shown represents the rate at period end.
jSee Note 1(g) regarding senior floating rate interests.
kIncome may be received in additional securities and/or cash.
lSee Note 7 regarding credit risk and defaulted securities.
mA portion or all of the security purchased on a delayed delivery basis. See Note 1(c).
nThe security is traded on a discount basis with no stated coupon rate.
oSecurity or a portion of the security has been pledged as collateral for securities sold short, open futures and written options contracts. At December 31, 2011, the value of these securities and/or cash pledged as collateral was $59,483,235, representing 1.13% of net assets.
pSee Note 1(d) regarding written options.
qSee Note 1(e) regarding securities sold short.
MS-18
Franklin Templeton Variable Insurance Products Trust
Statement of Investments, December 31, 2011 (continued)
| | | | | | |
| Mutual Shares Securities Fund | | | | | | |
At December 31, 2011, the Fund had the following futures contracts outstanding. See Note 1(d).
Futures Contracts
| | | | | | | | | | | | | | | | | | | | | | | | |
| Description | | Type | | | Number of
Contracts | | | Notional
Value | | | Expiration
Date | | | Unrealized
Appreciation | | | Unrealized
Depreciation | |
EUR/USD | | | Short | | | | 273 | | | $ | 44,253,300 | | | | 3/19/12 | | | $ | 331,495 | | | $ | — | |
GBP/USD | | | Short | | | | 270 | | | | 26,156,250 | | | | 3/19/12 | | | | — | | | | (1,226 | ) |
| | | | | | | | | | | | | | | | | | | | |
Unrealized appreciation (depreciation) | | | | | | | | | | | | | | | | | | | 331,495 | | | | (1,226 | ) |
| | | | | | | | | | | | | | | | | | | | |
Net unrealized appreciation (depreciation) | | | | | | | | | | | | | | | | | | $ | 330,269 | | | | | |
| | | | | | | | | | | | | | | | | | | | | | | | |
At December 31, 2011, the Fund had the following forward exchange contracts outstanding. See Note 1(d).
Forward Exchange Contracts
| | | | | | | | | | | | | | | | | | | | | | | | | | | | |
| Currency | | Counterparty | | | Type | | | Quantity | | | Contract
Amount | | | Settlement
Date | | | Unrealized
Appreciation | | | Unrealized
Depreciation | |
British Pound | | | DBAB | | | | Sell | | | | 4,572,968 | | | $ | 7,278,122 | | | | 1/17/12 | | | $ | 176,367 | | | $ | — | |
British Pound | | | BZWS | | | | Sell | | | | 32,069,312 | | | | 50,496,624 | | | | 1/17/12 | | | | 693,433 | | | | — | |
British Pound | | | HSBC | | | | Sell | | | | 23,769,808 | | | | 37,274,317 | | | | 1/17/12 | | | | 360,141 | | | | — | |
British Pound | | | BOFA | | | | Sell | | | | 2,638,666 | | | | 4,255,441 | | | | 1/17/12 | | | | 157,630 | | | | — | |
Euro | | | BOFA | | | | Buy | | | | 5,303,484 | | | | 6,894,081 | | | | 1/18/12 | | | | — | | | | (28,896 | ) |
Euro | | | DBAB | | | | Buy | | | | 3,800,000 | | | | 4,945,350 | | | | 1/18/12 | | | | — | | | | (26,376 | ) |
Euro | | | SSBT | | | | Buy | | | | 1,138,136 | | | | 1,488,386 | | | | 1/18/12 | | | | — | | | | (15,107 | ) |
Euro | | | BZWS | | | | Buy | | | | 2,303,484 | | | | 2,990,314 | | | | 1/18/12 | | | | — | | | | (8,530 | ) |
Euro | | | SSBT | | | | Buy | | | | 4,001,200 | | | | 5,170,191 | | | | 1/18/12 | | | | 9,230 | | | | — | |
Euro | | | BOFA | | | | Sell | | | | 20,807,231 | | | | 28,934,685 | | | | 1/18/12 | | | | 2,000,413 | | | | — | |
Euro | | | SSBT | | | | Sell | | | | 16,545,183 | | | | 22,942,526 | | | | 1/18/12 | | | | 1,525,333 | | | | — | |
Euro | | | HSBC | | | | Sell | | | | 799,395 | | | | 1,133,304 | | | | 1/18/12 | | | | 98,514 | | | | — | |
Euro | | | BZWS | | | | Sell | | | | 799,395 | | | | 1,131,861 | | | | 1/18/12 | | | | 97,071 | | | | — | |
Euro | | | DBAB | | | | Sell | | | | 482,498 | | | | 684,423 | | | | 1/18/12 | | | | 59,846 | | | | — | |
Japanese Yen | | | HSBC | | | | Sell | | | | 26,900,000 | | | | 347,321 | | | | 1/20/12 | | | | — | | | | (2,303 | ) |
Japanese Yen | | | BOFA | | | | Buy | | | | 42,659,861 | | | | 555,015 | | | | 1/20/12 | | | | — | | | | (558 | ) |
Japanese Yen | | | DBAB | | | | Buy | | | | 17,906,800 | | | | 229,891 | | | | 1/20/12 | | | | 2,847 | | | | — | |
Japanese Yen | | | BOFA | | | | Buy | | | | 18,960,293 | | | | 243,737 | | | | 1/20/12 | | | | 2,693 | | | | — | |
Japanese Yen | | | DBAB | | | | Sell | | | | 626,700,251 | | | | 8,177,142 | | | | 1/20/12 | | | | 31,824 | | | | — | |
Swiss Franc | | | DBAB | | | | Buy | | | | 17,907,635 | | | | 21,232,004 | | | | 2/10/12 | | | | — | | | | (2,132,247 | ) |
Swiss Franc | | | BZWS | | | | Buy | | | | 11,789,692 | | | | 13,464,506 | | | | 2/10/12 | | | | — | | | | (889,966 | ) |
Swiss Franc | | | BOFA | | | | Buy | | | | 11,873,649 | | | | 13,088,985 | | | | 2/10/12 | | | | — | | | | (424,900 | ) |
Swiss Franc | | | SSBT | | | | Buy | | | | 3,155,907 | | | | 3,691,483 | | | | 2/10/12 | | | | — | | | | (325,485 | ) |
Swiss Franc | | | HAND | | | | Buy | | | | 290,688 | | | | 328,201 | | | | 2/10/12 | | | | — | | | | (18,162 | ) |
Swiss Franc | | | BZWS | | | | Sell | | | | 32,638,454 | | | | 42,466,805 | | | | 2/10/12 | | | | 7,655,588 | | | | — | |
Swiss Franc | | | DBAB | | | | Sell | | | | 32,410,462 | | | | 42,274,466 | | | | 2/10/12 | | | | 7,706,418 | | | | — | |
Swiss Franc | | | HSBC | | | | Sell | | | | 139,747 | | | | 153,755 | | | | 2/10/12 | | | | 4,706 | | | | — | |
Swiss Franc | | | BOFA | | | | Sell | | | | 1,017,372 | | | | 1,093,667 | | | | 2/10/12 | | | | 8,567 | | | | — | |
British Pound | | | HSBC | | | | Sell | | | | 19,327,242 | | | | 29,860,589 | | | | 2/21/12 | | | | — | | | | (144,255 | ) |
British Pound | | | BOFA | | | | Sell | | | | 33,489,979 | | | | 52,813,696 | | | | 2/21/12 | | | | 821,716 | | | | — | |
British Pound | | | SSBT | | | | Sell | | | | 1,055,391 | | | | 1,656,066 | | | | 2/21/12 | | | | 17,610 | | | | — | |
British Pound | | | HSBC | | | | Sell | | | | 1,055,391 | | | | 1,656,457 | | | | 2/21/12 | | | | 18,001 | | | | — | |
British Pound | | | DBAB | | | | Sell | | | | 2,787,676 | | | | 4,375,536 | | | | 2/21/12 | | | | 47,770 | | | | — | |
British Pound | | | BZWS | | | | Sell | | | | 1,055,391 | | | | 1,655,214 | | | | 2/21/12 | | | | 16,758 | | | | — | |
Australian Dollar | | | BZWS | | | | Sell | | | | 1,178,532 | | | | 1,137,378 | | | | 2/23/12 | | | | — | | | | (60,642 | ) |
Australian Dollar | | | DBAB | | | | Sell | | | | 474,268 | | | | 457,716 | | | | 2/23/12 | | | | — | | | | (24,394 | ) |
Australian Dollar | | | BZWS | | | | Buy | | | | 21,192,314 | | | | 21,192,314 | | | | 2/23/12 | | | | 350,421 | | | | — | |
Australian Dollar | | | BOFA | | | | Sell | | | | 19,539,514 | | | | 19,988,922 | | | | 2/23/12 | | | | 126,317 | | | | — | |
MS-19
Franklin Templeton Variable Insurance Products Trust
Statement of Investments, December 31, 2011 (continued)
| | | | | | |
| Mutual Shares Securities Fund | | | | | | |
Forward Exchange Contracts (continued)
| | | | | | | | | | | | | | | | | | | | | | | | | | | | |
| Currency | | Counterparty | | | Type | | | Quantity | | | Contract
Amount | | | Settlement
Date | | | Unrealized
Appreciation | | | Unrealized
Depreciation | |
Euro | | | BZWS | | | | Sell | | | | 30,070,447 | | | $ | 43,602,149 | | | | 2/29/12 | | | $ | 4,662,264 | | | $ | — | |
Euro | | | DBAB | | | | Sell | | | | 17,655,717 | | | | 24,015,306 | | | | 2/29/12 | | | | 1,151,942 | | | | — | |
Euro | | | BZWS | | | | Sell | | | | 21,015,749 | | | | 28,641,645 | | | | 3/15/12 | | | | 1,422,394 | | | | — | |
Euro | | | BOFA | | | | Sell | | | | 12,406,502 | | | | 16,964,404 | | | | 3/15/12 | | | | 895,708 | | | | — | |
Euro | | | DBAB | | | | Sell | | | | 259,199 | | | | 340,424 | | | | 3/15/12 | | | | 4,714 | | | | — | |
British Pound | | | BZWS | | | | Sell | | | | 37,896,554 | | | | 58,512,279 | | | | 3/19/12 | | | | — | | | | (304,353 | ) |
British Pound | | | BOFA | | | | Sell | | | | 27,001,710 | | | | 42,554,695 | | | | 3/19/12 | | | | 647,200 | | | | — | |
British Pound | | | BOFA | | | | Sell | | | | 20,145,336 | | | | 31,053,586 | | | | 4/16/12 | | | | — | | | | (203,238 | ) |
British Pound | | | DBAB | | | | Sell | | | | 1,153,846 | | | | 1,788,254 | | | | 4/16/12 | | | | — | | | | (2,014 | ) |
Euro | | | SSBT | | | | Sell | | | | 640,248 | | | | 863,150 | | | | 4/16/12 | | | | 33,535 | | | | — | |
Euro | | | DBAB | | | | Sell | | | | 6,218,379 | | | | 8,352,381 | | | | 4/16/12 | | | | 294,775 | | | | — | |
Euro | | | BZWS | | | | Sell | | | | 45,362,750 | | | | 60,668,205 | | | | 4/16/12 | | | | 1,888,388 | | | | — | |
Euro | | | HSBC | | | | Sell | | | | 3,726,926 | | | | 5,029,766 | | | | 4/16/12 | | | | 200,517 | | | | — | |
Euro | | | BOFA | | | | Sell | | | | 5,688,919 | | | | 7,652,768 | | | | 4/16/12 | | | | 281,221 | | | | — | |
Euro | | | HAND | | | | Sell | | | | 3,605,814 | | | | 4,855,349 | | | | 4/16/12 | | | | 183,035 | | | | — | |
Norwegian Krone | | | HAND | | | | Sell | | | | 23,019,240 | | | | 3,826,973 | | | | 6/19/12 | | | | — | | | | (36 | ) |
Norwegian Krone | | | HAND | | | | Sell | | | | 1,330,000 | | | | 221,648 | | | | 6/19/12 | | | | 533 | | | | — | |
| | | | | | | | | | | | | | | | | | | | | | | | |
Unrealized appreciation (depreciation) | | | | | | | | 33,655,440 | | | | (4,611,462 | ) |
| | | | | | | | | | | | | | | | | | | | | | | | |
Net unrealized appreciation (depreciation) | | | | | | | $ | 29,043,978 | | | | | |
| | | | | | | | | | | | | | | | | | | | | | | | | | | | |
See Abbreviations on page MS-37.
The accompanying notes are an integral part of these financial statements.
MS-20
Franklin Templeton Variable Insurance Products Trust
Financial Statements
Statement of Assets and Liabilities
December 31, 2011
| | | | |
| | | Mutual Shares
Securities Fund | |
Assets: | | | | |
Investments in securities: | | | | |
Cost - Unaffiliated issuers | | $ | 4,917,046,401 | |
Cost - Non-controlled affiliated issuers (Note 13) | | | 5,567,933 | |
| | | | |
Total cost of investments | | $ | 4,922,614,334 | |
| | | | |
Value | | $ | 5,161,317,144 | |
Cash | | | 39,926,695 | |
Restricted cash (Note 1h) | | | 19,315,000 | |
Foreign currency, at value (cost $37,370,122) | | | 37,340,479 | |
Receivables: | | | | |
Investment securities sold | | | 9,323,149 | |
Capital shares sold | | | 811,067 | |
Dividends and interest | | | 17,864,551 | |
Due from brokers | | | 31,810,243 | |
Unrealized appreciation on forward exchange contracts | | | 33,655,440 | |
Other assets | | | 199,550 | |
| | | | |
Total assets | | | 5,351,563,318 | |
| | | | |
Liabilities: | | | | |
Payables: | | | | |
Investment securities purchased | | | 37,129,551 | |
Capital shares redeemed | | | 2,602,821 | |
Affiliates | | | 4,709,197 | |
Variation margin | | | 270,788 | |
Options written, at value (premiums received $247,051) | | | 344,040 | |
Securities sold short, at value (proceeds $36,014,854) | | | 33,955,149 | |
Due to brokers | | | 19,315,000 | |
Unrealized depreciation on forward exchange contracts | | | 4,611,462 | |
Unrealized depreciation on unfunded loan commitments (Note 10) | | | 1,101,620 | |
Accrued expenses and other liabilities | | | 1,473,452 | |
| | | | |
Total liabilities | | | 105,513,080 | |
| | | | |
Net assets, at value | | $ | 5,246,050,238 | |
| | | | |
Net assets consist of: | | | | |
Paid-in capital | | $ | 5,468,187,630 | |
Undistributed net investment income | | | 98,882,928 | |
Net unrealized appreciation (depreciation) | | | 268,880,748 | |
Accumulated net realized gain (loss) | | | (589,901,068 | ) |
| | | | |
Net assets, at value | | $ | 5,246,050,238 | |
| | | | |
The accompanying notes are an integral part of these financial statements.
MS-21
Franklin Templeton Variable Insurance Products Trust
Financial Statements (continued)
Statement of Assets and Liabilities (continued)
December 31, 2011
| | | | |
| | | Mutual Shares
Securities Fund | |
Class 1: | | | | |
Net assets, at value | | $ | 1,170,780,709 | |
| | | | |
Shares outstanding | | | 75,203,571 | |
| | | | |
Net asset value and maximum offering price per share | | $ | 15.57 | |
| | | | |
Class 2: | | | | |
Net assets, at value | | $ | 3,913,220,074 | |
| | | | |
Shares outstanding | | | 254,506,962 | |
| | | | |
Net asset value and maximum offering price per share | | $ | 15.38 | |
| | | | |
Class 4: | | | | |
Net assets, at value | | $ | 162,049,455 | |
| | | | |
Shares outstanding | | | 10,490,127 | |
| | | | |
Net asset value and maximum offering price per share | | $ | 15.45 | |
| | | | |
The accompanying notes are an integral part of these financial statements.
MS-22
Franklin Templeton Variable Insurance Products Trust
Financial Statements (continued)
Statement of Operations
for the year ended December 31, 2011
| | | | |
| | | Mutual Shares
Securities Fund | |
Investment income: | | | | |
Dividends | | $ | 140,979,904 | |
Interest | | | 25,518,337 | |
Income from securities loaned | | | 2,157,159 | |
| | | | |
Total investment income | | | 168,655,400 | |
| | | | |
Expenses: | | | | |
Management fees (Note 3a) | | | 33,402,927 | |
Administrative fees (Note 3b) | | | 4,773,508 | |
Distribution fees: (Note 3c) | | | | |
Class 2 | | | 10,206,801 | |
Class 4 | | | 577,474 | |
Unaffiliated transfer agent fees | | | 5,330 | |
Custodian fees (Note 4) | | | 314,209 | |
Reports to shareholders | | | 1,035,376 | |
Professional fees | | | 1,251,197 | |
Trustees’ fees and expenses | | | 21,161 | |
Dividends on securities sold short | | | 9,928 | |
Other | | | 138,096 | |
| | | | |
Total expenses | | | 51,736,007 | |
Expense reductions (Note 4) | | | (22 | ) |
| | | | |
Net expenses | | | 51,735,985 | |
| | | | |
Net investment income | | | 116,919,415 | |
| | | | |
Realized and unrealized gains (losses): | | | | |
Net realized gain (loss) from: | | | | |
Investments | | | (15,793,927 | ) |
Written options | | | 137,832 | |
Foreign currency transactions | | | (67,783,800 | ) |
Futures contracts | | | 4,822,033 | |
Securities sold short | | | 9,420,387 | |
| | | | |
Net realized gain (loss) | | | (69,197,475 | ) |
| | | | |
Net change in unrealized appreciation (depreciation) on: | | | | |
Investments | | | (192,340,088 | ) |
Translation of other assets and liabilities denominated in foreign currencies | | | 40,496,303 | |
| | | | |
Net change in unrealized appreciation (depreciation) | | | (151,843,785 | ) |
| | | | |
Net realized and unrealized gain (loss) | | | (221,041,260 | ) |
| | | | |
Net increase (decrease) in net assets resulting from operations | | $ | (104,121,845 | ) |
| | | | |
The accompanying notes are an integral part of these financial statements.
MS-23
Franklin Templeton Variable Insurance Products Trust
Financial Statements (continued)
Statements of Changes in Net Assets
| | | | | | | | |
| | | Mutual Shares Securities Fund | |
| | | Year Ended December 31, | |
| | | 2011 | | | 2010 | |
| | | | |
Increase (decrease) in net assets: | | | | | | | | |
Operations: | | | | | | | | |
Net investment income | | $ | 116,919,415 | | | $ | 125,525,670 | |
Net realized gain (loss) from investments, written options, foreign currency transactions, futures contracts and securities sold short | | | (69,197,475 | ) | | | 126,268,882 | |
Net change in unrealized appreciation (depreciation) on investments and translation of other assets and liabilities denominated in foreign currencies | | | (151,843,785 | ) | | | 300,848,655 | |
| | | | |
Net increase (decrease) in net assets resulting from operations | | | (104,121,845 | ) | | | 552,643,207 | |
| | | | |
Distributions to shareholders from: | | | | | | | | |
Net investment income: | | | | | | | | |
Class 1 | | | (32,920,483 | ) | | | (18,628,775 | ) |
Class 2 | | | (95,354,646 | ) | | | (62,378,105 | ) |
Class 4 | | | (3,732,632 | ) | | | (2,455,400 | ) |
| | | | |
Total distributions to shareholders | | | (132,007,761 | ) | | | (83,462,280 | ) |
| | | | |
Capital share transactions: (Note 2) | | | | | | | | |
Class 1 | | | (34,519,147 | ) | | | 440,450,926 | |
Class 2 | | | (141,255,692 | ) | | | (125,986,124 | ) |
Class 4 | | | 339,468 | | | | 11,534,796 | |
| | | | |
Total capital share transactions | | | (175,435,371 | ) | | | 325,999,598 | |
| | | | |
Net increase (decrease) in net assets | | | (411,564,977 | ) | | | 795,180,525 | |
Net assets: | | | | | | | | |
Beginning of year | | | 5,657,615,215 | | | | 4,862,434,690 | |
| | | | |
End of year | | $ | 5,246,050,238 | | | $ | 5,657,615,215 | |
| | | | |
Undistributed net investment income included in net assets: | | | | | | | | |
End of year | | $ | 98,882,928 | | | $ | 115,196,471 | |
| | | | |
The accompanying notes are an integral part of these financial statements.
MS-24
Franklin Templeton Variable Insurance Products Trust
Notes to Financial Statements
Mutual Shares Securities Fund
1. ORGANIZATION AND SIGNIFICANT ACCOUNTING POLICIES
Franklin Templeton Variable Insurance Products Trust (Trust) is registered under the Investment Company Act of 1940, as amended, (1940 Act) as an open-end investment company, consisting of twenty separate funds. The Mutual Shares Securities Fund (Fund) is included in this report. The financial statements of the remaining funds in the Trust are presented separately. Shares of the Fund are generally sold only to insurance company separate accounts to fund the benefits of variable life insurance policies or variable annuity contracts. The Fund offers three classes of shares: Class 1, Class 2, and Class 4. Each class of shares differs by its distribution fees, voting rights on matters affecting a single class and its exchange privilege.
The following summarizes the Fund’s significant accounting policies.
a. Financial Instrument Valuation
The Fund’s investments in securities and other financial instruments are carried at fair value daily. Fair value is the price that would be received to sell an asset or paid to transfer a liability in an orderly transaction between market participants on the measurement date. Under procedures approved by the Trust’s Board of Trustees, the Fund may utilize independent pricing services, quotations from securities and financial instrument dealers, and other market sources to determine fair value.
Equity securities and derivative financial instruments (derivatives) listed on an exchange or on the NASDAQ National Market System are valued at the last quoted sale price or the official closing price of the day, respectively. Foreign equity securities are valued as of the close of trading on the foreign stock exchange on which the security is primarily traded, or the NYSE, whichever is earlier. The value is then converted into its U.S. dollar equivalent at the foreign exchange rate in effect at the close of the NYSE on the day that the value of the security is determined. Over-the-counter securities are valued within the range of the most recent quoted bid and ask prices. Securities that trade in multiple markets or on multiple exchanges are valued according to the broadest and most representative market. Certain equity securities are valued based upon fundamental characteristics or relationships to similar securities.
Debt securities generally trade in the over-the-counter market rather than on a securities exchange. The Fund’s pricing services use multiple valuation techniques to determine fair value. In instances where sufficient market activity exists, the pricing services may utilize a market-based approach through which quotes from market makers are used to determine fair value. In instances where sufficient market activity may not exist or is limited, the pricing services also utilize proprietary valuation models which may consider market characteristics such as benchmark yield curves, option-adjusted spreads, credit spreads, estimated default rates, coupon rates, anticipated timing of principal repayments, underlying collateral, and other unique security features in order to estimate the relevant cash flows, which are then discounted to calculate the fair value. Securities denominated in a foreign currency are converted into their U.S. dollar equivalent at the foreign exchange rate in effect at the close of the NYSE on the date that the values of the foreign debt securities are determined.
Certain derivatives trade in the over-the-counter market. The Fund’s pricing services use various techniques including industry standard option pricing models and proprietary discounted cash flow models to determine the fair value of those instruments. The Fund’s net benefit or obligation under the derivative contract, as measured by the fair market value of the contract, is included in net assets.
The Fund has procedures to determine the fair value of securities and other financial instruments for which market prices are not readily available or which may not be reliably priced. Under these procedures, the Fund primarily employs a market-based approach which may use related or comparable assets or liabilities, recent transactions, market multiples, book values, and other relevant information for the investment to determine the fair value of the investment. The Fund may also use an income-based valuation approach in which the anticipated future cash flows of the investment are discounted to calculate fair value. Discounts may also be applied due to the nature or duration of any restrictions on the disposition of the investments. Due to the inherent uncertainty of valuations of such investments, the fair values may differ significantly from the values that would have been used had an active market existed.
MS-25
Franklin Templeton Variable Insurance Products Trust
Notes to Financial Statements (continued)
Mutual Shares Securities Fund
1. ORGANIZATION AND SIGNIFICANT ACCOUNTING POLICIES (continued)
a. Financial Instrument Valuation (continued)
Trading in securities on foreign securities stock exchanges and over-the-counter markets may be completed before the daily close of business on the NYSE. Occasionally, events occur between the time at which trading in a foreign security is completed and the close of the NYSE that might call into question the reliability of the value of a portfolio security held by the Fund. As a result, differences may arise between the value of the Fund’s portfolio securities as determined at the foreign market close and the latest indications of value at the close of the NYSE. In order to minimize the potential for these differences, the investment manager monitors price movements following the close of trading in foreign stock markets through a series of country specific market proxies (such as baskets of American Depositary Receipts, futures contracts and exchange traded funds). These price movements are measured against established trigger thresholds for each specific market proxy to assist in determining if an event has occurred that may call into question the reliability of the values of the foreign securities held by the Fund. If such an event occurs, the securities may be valued using fair value procedures, which may include the use of independent pricing services.
b. Foreign Currency Translation
Portfolio securities and other assets and liabilities denominated in foreign currencies are translated into U.S. dollars based on the exchange rate of such currencies against U.S. dollars on the date of valuation. The Fund may enter into foreign currency exchange contracts to facilitate transactions denominated in a foreign currency. Purchases and sales of securities, income and expense items denominated in foreign currencies are translated into U.S. dollars at the exchange rate in effect on the transaction date. Portfolio securities and assets and liabilities denominated in foreign currencies contain risks that those currencies will decline in value relative to the U.S. dollar. Occasionally, events may impact the availability or reliability of foreign exchange rates used to convert the U.S. dollar equivalent value. If such an event occurs, the foreign exchange rate will be valued at fair value using procedures established and approved by the Trust’s Board of Trustees.
The Fund does not separately report the effect of changes in foreign exchange rates from changes in market prices on securities held. Such changes are included in net realized and unrealized gain or loss from investments on the Statement of Operations.
Realized foreign exchange gains or losses arise from sales of foreign currencies, currency gains or losses realized between the trade and settlement dates on securities transactions and the difference between the recorded amounts of dividends, interest, and foreign withholding taxes and the U.S. dollar equivalent of the amounts actually received or paid. Net unrealized foreign exchange gains and losses arise from changes in foreign exchange rates on foreign denominated assets and liabilities other than investments in securities held at the end of the reporting period.
c. Securities Purchased on a Delayed Delivery Basis
The Fund purchases securities on a delayed delivery basis, with payment and delivery scheduled for a future date. These transactions are subject to market fluctuations and are subject to the risk that the value at delivery may be more or less than the trade date purchase price. Although the Fund will generally purchase these securities with the intention of holding the securities, it may sell the securities before the settlement date. Sufficient assets have been segregated for these securities.
d. Derivative Financial Instruments
The Fund invested in derivatives in order to manage risk or gain exposure to various other investments or markets. Derivatives are financial contracts based on an underlying or notional amount, require no initial investment or an initial net investment that is smaller than would normally be required to have a similar response to changes in market factors, and require or permit net settlement. Derivatives contain various risks including the potential inability of the counterparty to fulfill their obligations under the terms of the contract, the potential for an illiquid secondary market, and/or the potential for market movements which expose the Fund to gains or losses in excess of the amounts shown on the Statement of Assets and Liabilities. Realized gain and loss and unrealized appreciation and depreciation on these contracts for the period are included in the Statement of Operations.
MS-26
Franklin Templeton Variable Insurance Products Trust
Notes to Financial Statements (continued)
Mutual Shares Securities Fund
1. ORGANIZATION AND SIGNIFICANT ACCOUNTING POLICIES (continued)
d. Derivative Financial Instruments (continued)
The Fund entered into futures contracts primarily to manage exposure to certain foreign currencies. A futures contract is an agreement between the Fund and a counterparty to buy or sell an asset for a specified price on a future date. Required initial margin deposits of cash or securities are pledged by the Fund. Subsequent payments, known as variation margin, are made or received by the Fund, depending on fluctuations in the value of the underlying security. Such variation margin is accounted for as unrealized appreciation or depreciation until the contract is closed, at which time the gains or losses are realized.
The Fund entered into forward exchange contracts primarily to manage exposure to certain foreign currencies. A forward exchange contract is an agreement between the Fund and a counterparty to buy or sell a foreign currency for a specific exchange rate on a future date. Pursuant to the terms of the forward exchange contracts, cash or securities may be required to be deposited as collateral. Unrestricted cash may be invested according to the Fund’s investment objectives.
The Fund purchased or wrote option contracts primarily to manage exposure to equity price risk. An option is a contract entitling the holder to purchase or sell a specific amount of shares or units of an asset or notional amount of a swap (swaption), at a specified price. Options purchased are recorded as an asset while options written are recorded as a liability. Upon exercise of an option, the acquisition cost or sales proceeds of the underlying investment is adjusted by any premium received or paid. Upon expiration of an option, any premium received or paid is recorded as a realized gain or loss. Upon closing an option other than through expiration or exercise, the difference between the premium and the cost to close the position is recorded as a realized gain or loss. Pursuant to the terms of the written option contract, cash or securities may be required to be deposited as collateral.
At December 31, 2011, the Fund holds $9,992,205 in United Kingdom treasury bonds and U.S. treasury bills, bonds, and notes as collateral for derivatives.
See Notes 6 and 12 regarding investment transactions and other derivative information, respectively.
e. Securities Sold Short
The Fund is engaged in selling securities short, which obligates the Fund to replace a borrowed security with the same security at current market value. The Fund incurs a loss if the price of the security increases between the date of the short sale and the date on which the Fund replaces the borrowed security. The Fund realizes a gain if the price of the security declines between those dates. Gains are limited to the price at which the Fund sold the security short, while losses are potentially unlimited in size.
The Fund is required to establish a margin account with the broker lending the security sold short. While the short sale is outstanding, the broker retains the proceeds of the short sale and the Fund must maintain a deposit with the broker consisting of cash and/or securities having a value equal to a specified percentage of the value of the securities sold short. The Fund is obligated to pay fees for borrowing the securities sold short and is required to pay the counterparty any dividends or interest due on securities sold short. Such dividends or interest and any security borrowing fees are recorded as an expense to the Fund.
f. Securities Lending
The Fund participates in an agency based security lending program. The Fund receives cash collateral against the loaned securities in an amount equal to at least 102% of the market value of the loaned securities. Collateral is maintained over the life of the loan in an amount not less than 100% of the market value of loaned securities, as determined at the close of Fund business each day; any additional collateral required due to changes in security values is delivered to the Fund on the next business
MS-27
Franklin Templeton Variable Insurance Products Trust
Notes to Financial Statements (continued)
Mutual Shares Securities Fund
1. ORGANIZATION AND SIGNIFICANT ACCOUNTING POLICIES (continued)
f. Securities Lending (continued)
day. The collateral is invested in a non-registered money fund managed by the Fund’s custodian on the Fund’s behalf. The Fund receives income from the investment of cash collateral, in addition to lending fees and rebates paid by the borrower. The Fund bears the market risk with respect to the collateral investment, securities loaned, and the risk that the agent may default on its obligations to the Fund. The securities lending agent has agreed to indemnify the Fund in the event of default by a third party borrower. At December 31, 2011, the Fund had no securities on loan.
g. Senior Floating Rate Interests
The Fund invests in senior secured corporate loans that pay interest at rates which are periodically reset by reference to a base lending rate plus a spread. These base lending rates are generally the prime rate offered by a designated U.S. bank or the London InterBank Offered Rate (LIBOR). Senior secured corporate loans often require prepayment of principal from excess cash flows or at the discretion of the borrower. As a result, actual maturity may be substantially less than the stated maturity.
Senior secured corporate loans in which the Fund invests are generally readily marketable, but may be subject to some restrictions on resale.
h. Restricted Cash
At December 31, 2011, the Fund held restricted cash in connection with investments in certain derivative securities. Restricted cash is held in a segregated account with the Fund’s custodian/counterparty broker and is reflected in the Statement of Assets and Liabilities.
i. Income Taxes
It is the Fund’s policy to qualify as a regulated investment company under the Internal Revenue Code. The Fund intends to distribute to shareholders substantially all of its taxable income and net realized gains to relieve it from federal income and excise taxes. As a result, no provision for U.S. federal income taxes is required.
The Fund may be subject to foreign taxation related to income received, capital gains on the sale of securities and certain foreign currency transactions in the foreign jurisdictions in which it invests. Foreign taxes, if any, are recorded based on the tax regulations and rates that exist in the foreign markets in which the Fund invests. When a capital gain tax is determined to apply the Fund records an estimated deferred tax liability in an amount that would be payable if the securities were disposed of on the valuation date.
The Fund recognizes the tax benefits of uncertain tax positions only when the position is “more likely than not” to be sustained upon examination by the tax authorities based on the technical merits of the tax position. As of December 31, 2011, and for all open tax years, the Fund has determined that no liability for unrecognized tax benefits is required in the Fund’s financial statements related to uncertain tax positions taken on a tax return (or expected to be taken on future tax returns). Open tax years are those that remain subject to examination and are based on each tax jurisdiction statute of limitation.
j. Security Transactions, Investment Income, Expenses and Distributions
Security transactions are accounted for on trade date. Realized gains and losses on security transactions are determined on a specific identification basis. Interest income and estimated expenses are accrued daily. Amortization of premium and accretion of discount on debt securities are included in interest income. Facility fees are recognized as income over the expected term of the loan. Dividend income and dividends declared on securities sold short are recorded on the ex-dividend date except that certain dividends from foreign securities are recognized as soon as the Fund is notified of the ex-dividend date. Distributions to
MS-28
Franklin Templeton Variable Insurance Products Trust
Notes to Financial Statements (continued)
Mutual Shares Securities Fund
1. ORGANIZATION AND SIGNIFICANT ACCOUNTING POLICIES (continued)
j. Security Transactions, Investment Income, Expenses and Distributions (continued)
shareholders are recorded on the ex-dividend date and are determined according to income tax regulations (tax basis). Distributable earnings determined on a tax basis may differ from earnings recorded in accordance with accounting principles generally accepted in the United States of America. These differences may be permanent or temporary. Permanent differences are reclassified among capital accounts to reflect their tax character. These reclassifications have no impact on net assets or the results of operations. Temporary differences are not reclassified, as they may reverse in subsequent periods.
Common expenses incurred by the Trust are allocated among the funds based on the ratio of net assets of each fund to the combined net assets of the Trust. Fund specific expenses are charged directly to the fund that incurred the expense.
Realized and unrealized gains and losses and net investment income, not including class specific expenses, are allocated daily to each class of shares based upon the relative proportion of net assets of each class. Differences in per share distributions, by class, are generally due to differences in class specific expenses.
k. Accounting Estimates
The preparation of financial statements in accordance with accounting principles generally accepted in the United States of America requires management to make estimates and assumptions that affect the reported amounts of assets and liabilities at the date of the financial statements and the amounts of income and expenses during the reporting period. Actual results could differ from those estimates.
l. Guarantees and Indemnifications
Under the Trust’s organizational documents, its officers and trustees are indemnified by the Trust against certain liabilities arising out of the performance of their duties to the Trust. Additionally, in the normal course of business, the Trust, on behalf of the Fund, enters into contracts with service providers that contain general indemnification clauses. The Trust’s maximum exposure under these arrangements is unknown as this would involve future claims that may be made against the Trust that have not yet occurred. Currently, the Trust expects the risk of loss to be remote.
2. SHARES OF BENEFICIAL INTEREST
At December 31, 2011, there were an unlimited number of shares authorized (without par value). Transactions in the Fund’s shares were as follows:
| | | | | | | | | | | | | | | | |
| | | Year Ended December 31, | |
| | | 2011 | | | 2010 | |
| Class 1 Shares: | | Shares | | | Amount | | | Shares | | | Amount | |
Shares sold | | | 42,708,405 | | | $ | 674,448,160 | | | | 37,999,296 | | | $ | 576,826,047 | |
Shares issued in reinvestment of distributions | | | 2,247,132 | | | | 32,920,483 | | | | 1,260,404 | | | | 18,628,775 | |
Shares redeemed | | | (50,368,429 | ) | | | (741,887,790 | ) | | | (10,669,332 | ) | | | (155,003,896 | ) |
| | | | |
Net increase (decrease) | | | (5,412,892 | ) | | $ | (34,519,147 | ) | | | 28,590,368 | | | $ | 440,450,926 | |
| | | | |
Class 2 Shares: | | | | | | | | | | | | | | | | |
Shares sold | | | 25,072,748 | | | $ | 394,507,314 | | | | 24,723,011 | | | $ | 370,497,941 | |
Shares issued in reinvestment of distributions | | | 6,585,266 | | | | 95,354,646 | | | | 4,269,549 | | | | 62,378,105 | |
Shares redeemed | | | (39,735,152 | ) | | | (631,117,652 | ) | | | (37,538,246 | ) | | | (558,862,170 | ) |
| | | | |
Net increase (decrease) | | | (8,077,138 | ) | | $ | (141,255,692 | ) | | | (8,545,686 | ) | | $ | (125,986,124 | ) |
| | | | |
MS-29
Franklin Templeton Variable Insurance Products Trust
Notes to Financial Statements (continued)
Mutual Shares Securities Fund
2. SHARES OF BENEFICIAL INTEREST (continued)
| | | | | | | | | | | | | | | | |
| | | Year Ended December 31, | |
| | | 2011 | | | 2010 | |
| | | Shares | | | Amount | | | Shares | | | Amount | |
Class 4 Shares: | | | | | | | | | | | | | | | | |
Shares sold | | | 534,093 | | | $ | 8,261,151 | | | | 1,277,647 | | | $ | 19,039,058 | |
Shares issued on reinvestment of distributions | | | 256,538 | | | | 3,732,632 | | | | 167,148 | | | | 2,455,400 | |
Shares redeemed | | | (736,961 | ) | | | (11,654,315 | ) | | | (654,528 | ) | | | (9,959,662 | ) |
| | | | |
Net increase (decrease) | | | 53,670 | | | $ | 339,468 | | | | 790,267 | | | $ | 11,534,796 | |
| | | | |
3. TRANSACTIONS WITH AFFILIATES
Franklin Resources, Inc. is the holding company for various subsidiaries that together are referred to as Franklin Templeton Investments. Certain officers and trustees of the Fund are also officers and/or directors of the following subsidiaries:
| | |
| Subsidiary | | Affiliation |
Franklin Mutual Advisers, LLC (Franklin Mutual) | | Investment manager |
Franklin Templeton Services, LLC (FT Services) | | Administrative manager |
Franklin Templeton Distributors, Inc. (Distributors) | | Principal underwriter |
Franklin Templeton Investor Services, LLC (Investor Services) | | Transfer agent |
a. Management Fees
The Fund pays an investment management fee to Franklin Mutual based on the average daily net assets of the Fund as follows:
| | |
| Annualized Fee Rate | | Net Assets |
| 0.600% | | Up to and including $5 billion |
| 0.570% | | Over $5 billion, up to and including $10 billion |
| 0.550% | | Over $10 billion, up to and including $15 billion |
| 0.530% | | Over $15 billion, up to and including $20 billion |
| 0.510% | | In excess of $20 billion |
b. Administrative Fees
The Fund pays an administrative fee to FT Services based on the Fund’s average daily net assets as follows:
| | |
| Annualized Fee Rate | | Net Assets |
| 0.150% | | Up to and including $200 million |
| 0.135% | | Over $200 million, up to and including $700 million |
| 0.100% | | Over $700 million, up to and including $1.2 billion |
| 0.075% | | In excess of $1.2 billion |
c. Distribution Fees
The Trust’s Board of Trustees has adopted distribution plans for Class 2 and Class 4 shares pursuant to Rule 12b-1 under the 1940 Act. Under the Fund’s compensation distribution plans, the Fund pays Distributors for costs incurred in connection with the servicing, sale and distribution of the Fund’s shares up to 0.35% per year of its average daily net assets of each class. The Board of Trustees has agreed to limit the current rate to 0.25% per year for Class 2.
MS-30
Franklin Templeton Variable Insurance Products Trust
Notes to Financial Statements (continued)
Mutual Shares Securities Fund
3. TRANSACTIONS WITH AFFILIATES (continued)
d. Transfer Agent Fees
Investor Services, under terms of an agreement, performs shareholder servicing for the Fund and is not paid by the Fund for the services.
e. Other Affiliated Transactions
At December 31, 2011, Franklin Templeton Variable Insurance Products Trust – Franklin Templeton VIP Founding Funds Allocation Fund owned 19.75% of the Fund’s outstanding shares.
4. EXPENSE OFFSET ARRANGEMENT
The Fund has entered into an arrangement with its custodian whereby credits realized as a result of uninvested cash balances are used to reduce a portion of the Fund’s custodian expenses. During the year ended December 31, 2011, the custodian fees were reduced as noted in the Statement of Operations.
5. INCOME TAXES
For tax purposes, capital losses may be carried over to offset future capital gains, if any. Under the Regulated Investment Company Modernization Act of 2010, capital losses incurred by the Fund in taxable years beginning after December 22, 2010 are not subject to expiration and such losses retain their character as either short-term or long-term, rather than being considered short-term as under previous law. Post-enactment capital losses must be fully utilized prior to utilizing any losses incurred in pre-enactment tax years.
At December 31, 2011, the Fund had capital loss carryforwards of $508,530,121 expiring in 2017 and capital loss carryforwards of $11,314,074 not subject to expiration.
The tax character of distributions paid during the years ended December 31, 2011 and 2010, was as follows:
| | | | | | | | |
| | | 2011 | | | 2010 | |
Distributions paid from ordinary income | | $ | 132,007,761 | | | $ | 83,462,280 | |
| | | | |
At December 31, 2011, the cost of investments, net unrealized appreciation (depreciation), and undistributed ordinary income for income tax purposes were as follows:
| | | | |
Cost of investments | | $ | 4,986,368,955 | |
| | | | |
| |
Unrealized appreciation | | $ | 762,945,651 | |
Unrealized depreciation | | | (587,997,462 | ) |
| | | | |
Net unrealized appreciation (depreciation) | | $ | 174,948,189 | |
| | | | |
Distributable earnings – undistributed ordinary income | | $ | 121,954,971 | |
| | | | |
Differences between income and/or capital gains as determined on a book basis and a tax basis are primarily due to differing treatments of foreign currency transactions, corporate actions, and wash sales.
MS-31
Franklin Templeton Variable Insurance Products Trust
Notes to Financial Statements (continued)
Mutual Shares Securities Fund
6. INVESTMENT TRANSACTIONS
Purchases and sales of investments (excluding short term securities and securities sold short) for the year ended December 31, 2011, aggregated $2,121,842,543 and $2,191,502,295, respectively.
Transactions in options written during the year ended December 31, 2011, were as follows:
| | | | | | | | |
| | | Number of
Contracts | | | Premiums
Received | |
Options outstanding at December 31, 2010 | | | — | | | $ | — | |
Options written | | | 1,649 | | | | 384,883 | |
Options expired | | | (1,527 | ) | | | (137,832 | ) |
Options exercised | | | — | | | | — | |
Options closed | | | — | | | | — | |
| | | | |
Options outstanding at December 31, 2011 | | | 122 | | | $ | 247,051 | |
| | | | |
See Notes 1(d) and 12 regarding derivative financial instruments and other derivative information, respectively.
7. CREDIT RISK AND DEFAULTED SECURITIES
The Fund may purchase the pre-default or defaulted debt of distressed companies. Distressed companies are financially troubled and are about to be or are already involved in financial restructuring or bankruptcy. Risks associated with purchasing these securities include the possibility that the bankruptcy or other restructuring process takes longer than expected, or that distributions in restructuring are less than anticipated, either or both of which may result in unfavorable consequences to the Fund. If it becomes probable that the income on debt securities, including those of distressed companies, will not be collected, the Fund discontinues accruing income and recognizes an adjustment for uncollectible interest.
At December 31, 2011, the aggregate value of distressed company securities for which interest recognition has been discontinued was $13,297,960, representing 0.25% of the Fund’s net assets. For information as to specific securities, see the accompanying Statement of Investments.
8. CONCENTRATION OF RISK
Investing in foreign securities may include certain risks and considerations not typically associated with investing in U.S. securities, such as fluctuating currency values and changing local and regional economic, political and social conditions, which may result in greater market volatility. In addition, certain foreign securities may not be as liquid as U.S. securities.
9. RESTRICTED SECURITIES
The Fund invests in securities that are restricted under the Securities Act of 1933 (1933 Act) or which are subject to legal, contractual, or other agreed upon restrictions on resale. Restricted securities are often purchased in private placement transactions, and cannot be sold without prior registration unless the sale is pursuant to an exemption under the 1933 Act. Disposal of these securities may require greater effort and expense, and prompt sale at an acceptable price may be difficult. The Fund may have registration rights for restricted securities. The issuer generally incurs all registration costs.
MS-32
Franklin Templeton Variable Insurance Products Trust
Notes to Financial Statements (continued)
Mutual Shares Securities Fund
9. RESTRICTED SECURITIES (continued)
At December 31, 2011, the Fund held investments in restricted securities, excluding certain securities exempt from registration under the 1933 Act deemed to be liquid, as follows:
| | | | | | | | | | | | | | | | |
Principal
Amount/
Shares | | | Issuer | | Acquisition
Dates | | | Cost | | | Value | |
| | 4,709,226 | | | AET&D Holdings No. 1 Pty. Ltd. | | | 10/13/10 | | | $ | — | | | $ | — | |
| | 1,376 | | | Ally Financial Inc. | | | 11/20/06 - 6/02/09 | | | | 6,501,522 | | | | 7,157,592 | |
| | 2,128 | | | Broadband Ventures III LLC, secured promissory note, 5.00%, 2/01/12 | | | 7/01/10 | | | | 2,128 | | | | — | |
| | 6,400,507 | | | CB FIM Coinvestors LLC | | | 1/15/09 - 6/02/09 | | | | — | | | | — | |
| | 16,365,800 | | | Cerberus CG Investor I LLC | | | 7/26/07 - 4/28/10 | | | | 7,639,123 | | | | 1,718,409 | |
| | 16,365,662 | | | Cerberus CG Investor II LLC | | | 7/26/07 - 4/28/10 | | | | 7,639,035 | | | | 1,718,395 | |
| | 8,183,451 | | | Cerberus CG Investor III LLC | | | 7/26/07 - 4/28/10 | | | | 3,819,912 | | | | 859,262 | |
| | 11,728 | | | Elephant Capital Holdings Ltd. | | | 8/29/03 - 3/10/08 | | | | 1,813,542 | | | | — | |
| | 8,006,950 | | | FIM Coinvestor Holdings I, LLC | | | 11/20/06 - 6/02/09 | | | | — | | | | — | |
| | 140,952 | | | First Southern Bancorp Inc. | | | 1/27/10 - 7/07/10 | | | | 2,974,087 | | | | 1,370,054 | |
| | 241 | | | First Southern Bancorp Inc., cvt. pfd., C | | | 1/27/10 - 7/07/10 | | | | 241,000 | | | | 887,690 | |
| | 5,565,600 | | | GLCP Harrah’s Investment LP | | | 1/15/08 | | | | 5,567,933 | | | | — | |
| | 1,730,515 | | | International Automotive Components Group Brazil LLC | | | 4/13/06 - 12/26/08 | | | | 1,149,241 | | | | 1,404,538 | |
| | 11,387,027 | | | International Automotive Components Group North America, LLC | | | 1/12/06 - 10/10/07 | | | | 13,926,539 | | | | 4,826,961 | |
| | 57,295 | | | NCB Warrant Holdings Ltd., A | | | 12/16/05 - 3/10/08 | | | | 539,528 | | | | — | |
| | 16,280 | | | Olympus Re Holdings Ltd. | | | 12/19/01 | | | | 1,534,738 | | | | — | |
| | | | | | | | | | | | | | | | |
| | | | Total Restricted Securities (0.38% of Net Assets) | | | | | | | | | | $ | 19,942,901 | |
| | | | | | | | | | | | | | | | |
10. UNFUNDED LOAN COMMITMENTS
The Fund enters into certain credit agreements, all or a portion of which may be unfunded. The Fund is obligated to fund these loan commitments at the borrowers’ discretion. Funded portions of credit agreements are presented on the Statement of Investments.
At December 31, 2011, unfunded commitments were as follows:
| | | | |
| Borrower | | Unfunded
Commitment | |
Realogy Corp., Extended Revolver, 7.278%, 4/10/16 | | $ | 5,876,669 | |
| | | | |
Unfunded loan commitments and funded portions of credit agreements are marked to market daily and any unrealized appreciation or depreciation is included in the Statement of Assets and Liabilities and the Statement of Operations.
11. UNFUNDED CAPITAL COMMITMENTS
The Fund enters into certain capital commitments and may be obligated to perform on such agreements at a future date. The Fund monitors these commitments and assesses the probability of required performance. For any agreements whose probability of performance is determined to be greater than remote, the Fund assesses the fair value of the commitment. In instances where the probability of performance is greater than remote and the performance under the commitment would result in an unrealized loss, the Fund recognizes such losses on the Statement of Assets and Liabilities and the Statement of Operations.
At December 31, 2011, the Fund had aggregate unfunded capital commitments of $329,837, for which no depreciation has been recognized.
MS-33
Franklin Templeton Variable Insurance Products Trust
Notes to Financial Statements (continued)
Mutual Shares Securities Fund
12. OTHER DERIVATIVE INFORMATION
At December 31, 2011, the Fund has invested in derivative contracts which are reflected on the Statement of Assets and Liabilities as follows:
| | | | | | | | | | | | |
| | | Asset Derivatives | | | Liability Derivatives | |
Derivative Contracts Not Accounted
for as Hedging Instruments | | Statement of Assets and
Liabilities Location | | Fair
Value
Amount | | | Statement of Assets and
Liabilities Location | | Fair
Value
Amount | |
Foreign exchange contracts | | Unrealized appreciation on forward exchange contracts / Net assets consist of – net unrealized appreciation (depreciation) | | $ | 33,986,935 | a | | Unrealized depreciation on forward exchange contracts / Net assets consist of – net unrealized appreciation (depreciation) | | $ | 4,612,688 | a |
Equity contracts | | | | | | | | Options written, at value | | | 344,040 | |
aIncludes cumulative appreciation (depreciation) of futures contracts as reported in the Statement of Investments. Only current day’s variation margin is separately reported within the Statement of Assets and Liabilities.
For the year ended December 31, 2011, the effect of derivative contracts on the Fund’s Statement of Operations was as follows:
| | | | | | | | | | |
Derivative Contracts Not Accounted
for as Hedging Instruments | | Statement of Operations Locations | | Realized Gain
(Loss) for the
Year | | | Change in
Unrealized
Appreciation
(Depreciation)
for the Year | |
Foreign exchange contracts | | Net realized gain (loss) from foreign currency transactions and futures contracts / Net change in unrealized appreciation (depreciation) on translation of other assets and liabilities denominated in foreign currencies | | $ | (59,713,370 | ) | | $ | 41,037,402 | |
Equity contracts | | Net realized gain (loss) from written options / Net change in unrealized appreciation (depreciation) on investments | | | 137,832 | | | | (96,989 | ) |
For the year ended December 31, 2011, the average month end market value of derivatives represented 0.56% of average month end net assets. The average month end number of open derivative contracts for the year was 119.
See Notes 1(d) and 6 regarding derivative financial instruments and investment transactions, respectively.
13. HOLDINGS OF 5% VOTING SECURITIES OF PORTFOLIO COMPANIES
The 1940 Act defines “affiliated companies” to include investments in portfolio companies in which a fund owns 5% or more of the outstanding voting securities. Investments in “affiliated companies” for the Fund for the year ended December 31, 2011, were as shown below.
| | | | | | | | | | | | | | | | | | | | | | | | | | | | |
Name of Issuer | | Number of
Shares
Held at Beginning
of Year | | | Gross
Additions | | | Gross
Reductions | | | Number of
Shares
Held at End
of Year | | | Value at
End of
Year | | | Investment
Income | | | Realized
Capital
Gain (Loss) | |
Non-Controlled Affiliates | | | | | | | | | | | | | | | | | | | | | | | | | | | | |
CB FIM Coinvestors LLC | | | 6,400,507 | | | | — | | | | — | | | | 6,400,507 | | | $ | — | | | $ | — | | | $ | — | |
GLCP Harrah’s Investment LP | | | 5,565,600 | | | | — | | | | — | | | | 5,565,600 | | | | — | | | | — | | | | — | |
| | | | | | | | | | | | | | | | | | | | |
Total Affiliated Securities (0.00% of Net Assets) | | | $ | — | | | $ | — | | | $ | — | |
| | | | | | | | | | | | | | | | | | | | |
MS-34
Franklin Templeton Variable Insurance Products Trust
Notes to Financial Statements (continued)
Mutual Shares Securities Fund
14. CREDIT FACILITY
The Fund, together with other U.S. registered and foreign investment funds (collectively, Borrowers), managed by Franklin Templeton Investments, are borrowers in a joint syndicated senior unsecured credit facility totaling $750 million (Global Credit Facility) which matured on January 20, 2012. This Global Credit Facility provides a source of funds to the Borrowers for temporary and emergency purposes, including the ability to meet future unanticipated or unusually large redemption requests. Effective January 20, 2012, the Borrowers renewed the Global Credit Facility for a total of $1.5 billion, maturing January 18, 2013.
Under the terms of the Global Credit Facility, the Fund shall, in addition to interest charged on any borrowings made by the Fund and other costs incurred by the Fund, pay its share of fees and expenses incurred in connection with the implementation and maintenance of the Global Credit Facility, based upon its relative share of the aggregate net assets of all of the Borrowers, including an annual commitment fee of 0.08% based upon the unused portion of the Global Credit Facility, which is reflected in other expenses on the Statement of Operations. During the year ended December 31, 2011, the Fund did not use the Global Credit Facility.
15. FAIR VALUE MEASUREMENTS
The Fund follows a fair value hierarchy that distinguishes between market data obtained from independent sources (observable inputs) and the Fund’s own market assumptions (unobservable inputs). These inputs are used in determining the value of the Fund’s investments and are summarized in the following fair value hierarchy:
| | • | | Level 1 – quoted prices in active markets for identical securities |
| | • | | Level 2 – other significant observable inputs (including quoted prices for similar securities, interest rates, prepayment speed, credit risk, etc.) |
| | • | | Level 3 – significant unobservable inputs (including the Fund’s own assumptions in determining the fair value of investments) |
The inputs or methodology used for valuing securities are not an indication of the risk associated with investing in those securities.
For movements between the levels within the fair value hierarchy, the Fund has adopted a policy of recognizing the transfers as of the date of the underlying event which caused the movement.
The following is a summary of the inputs used as of December 31, 2011, in valuing the Fund’s assets and liabilities carried at fair value:
| | | | | | | | | | | | | | | | |
| | | Level 1 | | | Level 2 | | | Level 3 | | | Total | |
| | | | |
Assets: | | | | | | | | | | | | | | | | |
Investments in Securities: | | | | | | | | | | | | | | | | |
Equity Investments:a | | | | | | | | | | | | | | | | |
Auto Components | | $ | — | | | $ | — | | | $ | 6,234,594 | | | $ | 6,234,594 | |
Chemicals | | | 51,259,099 | | | | — | | | | 25,000 | | | | 51,284,099 | |
Commercial Banks | | | 153,440,388 | | | | — | | | | 2,257,744 | b | | | 155,698,132 | |
Consumer Finance | | | — | | | | 1,062 | | | | 11,453,658 | | | | 11,454,720 | |
Diversified Financial Services | | | 72,166,409 | | | | 9,504,168 | | | | — | | | | 81,670,577 | |
Diversified Telecommunication Services | | | 20,481,332 | | | | — | | | | 184,900 | b | | | 20,666,232 | |
Real Estate Management & Development | | | 4,854,506 | | | | — | | | | 5,638,540 | | | | 10,493,046 | |
Other Equity Investmentsc | | | 4,220,661,249 | | | | — | | | | — | b | | | 4,220,661,249 | |
Corporate Bonds, Notes and Senior Floating Rate Interests | | | — | | | | 222,100,221 | | | | — | | | | 222,100,221 | |
Corporate Notes and Senior Floating Rate Interests in Reorganization | | | — | | | | 13,297,960 | | | | — | b | | | 13,297,960 | |
Companies in Liquidation | | | — | | | | 109,457 | | | | — | b | | | 109,457 | |
Short Term Investments | | | 359,960,457 | | | | 7,686,400 | | | | — | | | | 367,646,857 | |
| | | | |
Total Investments in Securities | | $ | 4,882,823,440 | | | $ | 252,699,268 | | | $ | 25,794,436 | | | $ | 5,161,317,144 | |
| | | | |
MS-35
Franklin Templeton Variable Insurance Products Trust
Notes to Financial Statements (continued)
Mutual Shares Securities Fund
15. FAIR VALUE MEASUREMENTS (continued)
| | | | | | | | | | | | | | | | |
| | | Level 1 | | | Level 2 | | | Level 3 | | | Total | |
| | | | |
Forward Exchange Contracts | | $ | — | | | $ | 33,655,440 | | | $ | — | | | $ | 33,655,440 | |
Futures Contracts | | | 331,495 | | | | — | | | | — | | | | 331,495 | |
Liabilities: | | | | | | | | | | | | | | | | |
Options Written | | | 344,040 | | | | — | | | | — | | | | 344,040 | |
Securities Sold Short | | | 33,955,149 | | | | — | | | | — | | | | 33,955,149 | |
Forward Exchange Contracts | | | — | | | | 4,611,462 | | | | — | | | | 4,611,462 | |
Futures Contracts | | | 1,226 | | | | — | | | | — | | | | 1,226 | |
Unfunded Loan Commitments | | | — | | | | 1,101,620 | | | | — | | | | 1,101,620 | |
aIncludes common and convertible preferred stocks as well as other equity investments.
bIncludes securities determined to have no value.
cFor detailed categories, see the accompanying Statement of Investments.
At December 31, 2011, the reconciliation of assets in which significant unobservable inputs (Level 3) were used in determining fair value, is as follows:
| | | | | | | | | | | | | | | | | | | | | | | | | | | | | | | | | | | | | | | | |
| | | Balance at
Beginning of
Year | | | Purchases | | | Sales | | | Transfers
Into
Level 3 | | | Transfers
Out of
Level 3a | | | Cost Basis
Adjustmentsb | | | Net Realized
Gain (Loss) | | | Net Unrealized
Gain (Loss) | | | Balance at
End of
Year | | | Net Change in
Unrealized
Appreciation
(Depreciation)
on Assets Held
at Year End | |
Assets | | | | | | | | | | | | | | | | | | | | | | | | | | | | | | | | | | | | | | | | |
Investments in Securities: | | | | | | | | | | | | | | | | | | | | | | | | | | | | | | | | | | | | | | | | |
Equity Investments:c | | | | | | | | | | | | | | | | | | | | | | | | | | | | | | | | | | | | | | | | |
Airlines | | $ | — | d | | $ | — | | | $ | — | | | $ | — | | | $ | — | | | $ | (20,190 | ) | | $ | (879,733 | ) | | $ | 899,923 | | | $ | — | | | $ | — | |
Auto Components | | | 17,504,881 | d | | | — | | | | (21,358 | ) | | | — | | | | — | | | | (370,936 | ) | | | (13,191 | ) | | | (10,864,802 | ) | | | 6,234,594 | | | | (11,268,597 | ) |
Chemicals | | | 25,000 | | | | — | | | | — | | | | — | | | | — | | | | — | | | | — | | | | — | | | | 25,000 | | | | — | |
Commercial Banks | | | 2,688,630 | d | | | — | | | | — | | | | — | | | | — | | | | — | | | | — | | | | (430,886 | ) | | | 2,257,744 | d | | | (430,886 | ) |
Computers & Peripherals | | | — | d | | | — | | | | — | | | | — | | | | — | | | | (18,251 | ) | | | (10,867 | ) | | | 29,118 | | | | — | | | | — | |
Consumer Finance | | | 28,388,621 | | | | — | | | | — | | | | — | | | | — | | | | (3,814,368 | ) | | | — | | | | (13,120,595 | ) | | | 11,453,658 | | | | (13,120,595 | ) |
Diversified Telecommunication Services | | | — | d | | | — | | | | — | | | | — | | | | — | | | | (194 | ) | | | 194 | | | | 184,900 | | | | 184,900 | d | | | 184,900 | |
Electric Utilities | | | 23,791,010 | d | | | — | | | | (22,079,951 | ) | | | — | | | | — | | | | — | | | | — | | | | (1,711,059 | ) | | | — | d | | | — | |
Hotels Restaurants & Leisure | | | 2,369,832 | | | | — | | | | — | | | | — | | | | — | | | | — | | | | — | | | | (2,369,832 | ) | | | — | d | | | (2,369,832 | ) |
Insurance | | | 6,186 | | | | — | | | | — | | | | — | | | | — | | | | (5,652 | ) | | | — | | | | (534 | ) | | | — | d | | | (534 | ) |
IT Services | | | 95,515 | | | | — | | | | — | | | | — | | | | (51,270 | ) | | | — | | | | — | | | | (44,245 | ) | | | — | | | | — | |
Real Estate Management & Development | | | 6,659,198 | | | | — | | | | — | | | | — | | | | — | | | | — | | | | — | | | | (1,020,658 | ) | | | 5,638,540 | | | | (1,020,658 | ) |
Corporate Bonds, Notes, and Senior Floating Rate Interests | | | 15,981,825 | | | | — | | | | (19,388,999 | ) | | | — | | | | — | | | | — | | | | — | | | | 3,407,175 | | | | — | | | | — | |
MS-36
Franklin Templeton Variable Insurance Products Trust
Notes to Financial Statements (continued)
Mutual Shares Securities Fund
15. FAIR VALUE MEASUREMENTS (continued)
| | | | | | | | | | | | | | | | | | | | | | | | | | | | | | | | | | | | | | | | |
| | | Balance at
Beginning of
Year | | | Purchases | | | Sales | | | Transfers
Into
Level 3 | | | Transfers
Out of
Level 3a | | | Cost Basis
Adjustmentsb | | | Net Realized
Gain (Loss) | | | Net Unrealized
Gain (Loss) | | | Balance at
End of
Year | | | Net Change in
Unrealized
Appreciation
(Depreciation)
on Assets Held
at Year End | |
Corporate Notes and Senior Floating Rate Interests in Reorganization | | $ | 4,255 | | | $ | — | | | $ | (2,128 | ) | | $ | — | | | $ | — | | | $ | — | | | $ | — | | | $ | (2,128 | ) | | $ | — | d | | $ | (2,128 | ) |
Companies in Liquidation | | | — | d | | | — | | | | — | | | | — | | | | — | | | | (21,250 | ) | | | 21,250 | | | | — | | | | — | d | | | — | |
| | | | |
Total | | $ | 97,514,953 | | | $ | — | | | $ | (41,492,436 | ) | | $ | — | | | $ | (51,270 | ) | | $ | (4,250,841 | ) | | $ | (882,347 | ) | | $ | (25,043,623 | ) | | $ | 25,794,436 | | | $ | (28,028,330 | ) |
| | | | |
aThe investment was transferred out of Level 3 as a result of the availability of a quoted price in an active market for identical securities.
bMay include accretion, amortization, partnership adjustments, and/or other cost basis adjustments.
cIncludes common and convertible preferred stocks as well as other equity investments.
dIncludes securities determined to have no value.
16. NEW ACCOUNTING PRONOUNCEMENTS
In May 2011, the Financial Accounting Standards Board (FASB) issued Accounting Standards Update (ASU) No. 2011-04, Fair Value Measurement (Topic 820): Amendments to Achieve Common Fair Value Measurement and Disclosure Requirements in U.S. GAAP and IFRSs. The amendments in the ASU will improve the comparability of fair value measurements presented and disclosed in financial statements prepared in accordance with U.S. GAAP (Generally Accepted Accounting Principles) and IFRS (International Financial Reporting Standards) and include new guidance for certain fair value measurement principles and disclosure requirements. The ASU is effective for interim and annual periods beginning after December 15, 2011. The Fund believes the adoption of this ASU will not have a material impact on its financial statements.
17. SUBSEQUENT EVENTS
The Fund has evaluated subsequent events through the issuance of the financial statements and determined that no events have occurred that require disclosure other than those already disclosed in the financial statements.
| | | | |
ABBREVIATIONS | | | | |
| Counterparty | | Currency | | Selected Portfolio |
| | | | |
| BOFA - Bank of America Corp. | | EUR - Euro | | ADR - American Depository Receipt |
| BZWS - Barclays Bank PLC | | GBP - British Pound | | FHLB - Federal Home Loan Bank |
| DBAB - Deutsche Bank AG | | JPY - Japanese Yen | | FRN - Floating Rate Note |
| HAND - Svenska Handelsbanken | | USD - United States Dollar | | PIK - Payment-In-Kind |
| HSBC - HSBC Bank USA, N.A. | | | | |
| SSBT - State Street Bank and Trust Co. | | | | |
MS-37
Franklin Templeton Variable Insurance Products Trust
Mutual Shares Securities Fund
Report of Independent Registered Public Accounting Firm
To the Board of Trustees and Shareholders of Franklin Templeton Variable Insurance Products Trust
In our opinion, the accompanying statement of assets and liabilities, including the statement of investments, and the related statements of operations and of changes in net assets and the financial highlights present fairly, in all material respects, the financial position of Mutual Shares Securities Fund (the “Fund”) at December 31, 2011, the results of its operations for the year then ended, the changes in its net assets for each of the two years in the period then ended and the financial highlights for the periods presented, in conformity with accounting principles generally accepted in the United States of America. These financial statements and financial highlights (hereafter referred to as “financial statements”) are the responsibility of the Fund’s management. Our responsibility is to express an opinion on these financial statements based on our audits. We conducted our audits of these financial statements in accordance with the standards of the Public Company Accounting Oversight Board (United States). Those standards require that we plan and perform the audit to obtain reasonable assurance about whether the financial statements are free of material misstatement. An audit includes examining, on a test basis, evidence supporting the amounts and disclosures in the financial statements, assessing the accounting principles used and significant estimates made by management, and evaluating the overall financial statement presentation. We believe that our audits, which included confirmation of securities at December 31, 2011 by correspondence with the custodian and brokers, provide a reasonable basis for our opinion.
PricewaterhouseCoopers LLP
San Francisco, California
February 13, 2012
MS-38
Franklin Templeton Variable Insurance Products Trust
Tax Information (unaudited)
Mutual Shares Securities Fund
Under Section 854(b)(1)(A) of the Internal Revenue Code, the Fund hereby reports 55.50% of the ordinary income dividends as income qualifying for the dividends received deduction for the fiscal year ended December 31, 2011.
MS-39
TEMPLETON DEVELOPING MARKETS SECURITIES FUND
This annual report for Templeton Developing Markets Securities Fund covers the fiscal year ended December 31, 2011.
Performance Summary as of 12/31/11
Average annual total return of Class 1 shares represents the average annual change in value, assuming reinvestment of dividends and capital gains. Average returns smooth out variations in returns, which can be significant; they are not the same as year-by-year results.
Periods ended 12/31/11
| | | | | | | | | | | | |
| | | 1-Year | | | 5-Year | | | 10-Year | |
Average Annual Total Return | | | -15.67% | | | | +1.04% | | | | +12.74% | |
Total Return Index Comparison for a Hypothetical $10,000 Investment (1/1/02–12/31/11)
The graph below shows the change in value of a hypothetical $10,000 investment in the Fund over the indicated period and includes reinvestment of any income or distributions. The Fund’s performance is compared to the performance of MSCI Emerging Markets (EM) Index and the Standard & Poor’s®/International Finance Corporation Investable (S&P®/IFCI) Composite Index. One cannot invest directly in an index, and an index is not representative of the Fund’s portfolio. Please see Important Notes to Performance Information preceding the Fund Summaries.
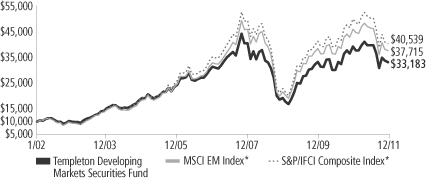
*Source: © 2012 Morningstar. Please see Index Descriptions following the Fund Summaries.
Templeton Developing Markets Securities Fund Class 1
Performance reflects the Fund’s Class 1 operating expenses, but does not include any contract fees, expenses or sales charges. If they had been included, performance would be lower. These charges and deductions, particularly for variable life policies, can have a significant effect on contract values and insurance benefits. See the contract prospectus for a complete description of these expenses, including sales charges.
Performance data represent past performance, which does not guarantee future results. Investment return and principal value will fluctuate, and you may have a gain or loss when you sell your shares.
Current performance may differ from figures shown.
TD-1
Fund Goal and Main Investments: Franklin Templeton Developing Markets Securities Fund seeks long-term capital appreciation. The Fund normally invests at least 80% of its net assets in emerging market investments.
Performance Overview
You can find the Fund’s one-year total return in the Performance Summary. In comparison, the MSCI EM Index had a -18.17% total return, and the S&P/IFCI Composite Index had a -19.03% total return for the same period.1 Please note that index performance numbers are for reference and we do not attempt to track an index but rather undertake investments on the basis of fundamental research.
Economic and Market Overview
The fundamental and financial strength of emerging markets was evident in 2011, as emerging market countries continued to report generally strong economic data, albeit a moderation from 2010. This strength, however, was not reflected in emerging market equity prices as the eurozone sovereign debt crisis and U.S. fiscal concerns led many investors to hold cash, shying away from many investments in developed and emerging markets.
Global stock prices were largely range bound in the first half of 2011. Markets, however, declined in August, largely due to S&P’s downgrade of the U.S. long-term sovereign credit rating to AA+ from AAA, and then again in September, as the prolonged eurozone sovereign debt crisis and lack of a comprehensive solution created significant confusion and volatility in global financial markets.
In October, however, global equity prices rallied, and emerging markets as measured by the MSCI EM Index recorded a double-digit return for the month. Investors welcomed strong corporate earnings reports, the release of positive U.S. economic data, and the European Union’s plans to recapitalize its banks and leverage the European Financial Stability Facility. This rally proved short-lived, and global equity markets corrected again in the final two months of 2011, largely due to the slow progress by European leaders to resolve the eurozone debt crisis.
Heightened volatility and increased uncertainty also gave investors reasons to lock in profits from 2009 and 2010, when many emerging
1. Source: © 2012 Morningstar. One cannot invest directly in an index, and an index is not representative of the Fund’s portfolio. Please see Index Descriptions following the Fund Summaries.
Fund Risks: All investments involve risks. Stock prices fluctuate, sometimes rapidly and dramatically, due to factors affecting individual companies, particular industries or sectors, or general market conditions. Investing in emerging or developing markets is subject to all the risks of foreign investing generally as well as additional, heightened risks, including currency fluctuations, economic instability, market volatility, political and social instability, the relatively smaller size and lesser liquidity of these markets, and less government supervision and regulation of business and industry practices. The Fund may have significant investments in one or more countries or in particular sectors or industries from time to time, and may carry greater risk of adverse developments in a country, sector or industry than a fund that invests more broadly. Smaller and midsize company securities can increase the risk of greater price fluctuations, particularly over the short term. The Fund is actively managed but there is no guarantee that the manager’s investment decisions will produce the desired results. The Fund’s prospectus also includes a description of the main investment risks.
TD-2
markets returned more than 100% in U.S. dollar (USD) terms, as measured by the components of the MSCI EM Index.1 Against this backdrop, emerging markets, as represented by the MSCI EM Index, declined -18.17% in USD terms in 2011.1
Within emerging markets, Southeast Asian stocks were among the better performers in 2011. Strong domestic demand, rising disposable incomes and relatively low unemployment made the region’s economies more resilient to global uncertainties. Relatively more export-dependent markets such as China and Taiwan, however, underperformed their regional peers. India was among the worst emerging market performers for the year due to high inflation and interest rates, a weak rupee and global economic uncertainties. Generally weaker emerging market currencies and a global commodity price correction adversely impacted Latin American markets.
Eastern European markets were among the poorest performers, largely due to their proximity to their western counterparts and a weaker euro rather than a significant deterioration in the region’s economies. South Africa significantly outperformed most of its emerging market counterparts in local currency terms but ended the period with double-digit declines in USD terms due to a weaker rand.
Investment Strategy
We employ a fundamental research, value-oriented, long-term investment approach. We focus on the market price of a company’s securities relative to our evaluation of its long-term earnings, asset value and cash flow potential. We also consider a company’s profit and loss outlook, balance sheet strength, cash flow trends and asset value in relation to the current price. Our analysis considers the company’s corporate governance behavior as well as its position in its sector, the economic framework and political environment. We invest in securities without regard to benchmark comparisons.
Manager’s Discussion
During the 12 months under review, major detractors from the Fund’s absolute performance were Brazil-based Vale, the world’s largest iron ore producer and second-largest nickel producer; Norilsk Nickel (Mining and Metallurgical Co. Norilsk Nickel), a Russia-based major producer of nickel, palladium, and other base and precious metals; and Tata Consultancy Services, one of India’s largest information technology consulting and services firms, with outsourcing services primarily in the
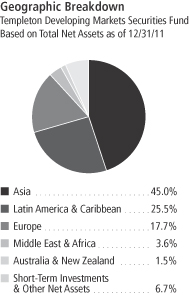
TD-3
Americas, Europe and India. Weak commodity metal prices and higher raw material costs weighed on Vale’s share price. However, at year-end we believed Vale could benefit from the long-term uptrend in commodity demand due to emerging market industrialization. Vale’s strong cash flow and attractive valuations, in our view, underscored our belief in its long-term potential. Investor concerns that Norilsk Nickel could become embroiled in Russian domestic politics after a major shareholder’s December announcement of his intention to run in the presidential election added to the adverse effects of metal price weakness on the company’s shares. In our long-term view, Norilsk Nickel’s strong global market share in base metal and platinum group metal production, huge reserves and low-cost nickel production put the company in a strong position. Tata’s share price performed poorly in U.S. dollar terms due to weakness in the Indian rupee, which reached a record low against the dollar in December. Based on our analysis, we believed Tata remained well positioned to benefit from the global outsourcing trend of services to Indian consulting companies.
Major contributors to absolute performance during the reporting period were Astra International, Indonesia’s leading car and motorcycle company; Brazil-based AmBev (Companhia de Bebidas das Americas), one of the world’s largest beer and soft drink producers; and Souza Cruz, Brazil’s major cigarette company. Astra is a leader in the Indonesian car and motorcycle markets, which have been enjoying strong secular growth trends. The company continued to benefit from Indonesia’s robust economic growth, higher incomes and affordable credit. The strong market positions of AmBev and Souza Cruz have allowed their businesses to achieve superior returns and build market share as consumers become wealthier and more discerning. In our view, the companies’ strong operations, low debt levels, good dividend yield and strong brands made them attractive investments.
It is important to recognize the effect of currency movements on the Fund’s performance. In general, if the value of the U.S. dollar goes up compared with a foreign currency, an investment traded in that foreign currency will go down in value because it will be worth fewer U.S. dollars. This can have a negative effect on Fund performance. Conversely, when the U.S. dollar weakens in relation to a foreign currency, an investment traded in that foreign currency will increase in value, which can contribute to Fund performance. For the 12 months ended December 31, 2011, the U.S. dollar rose in value relative to most
Top 10 Holdings
Templeton Developing Markets
Securities Fund
12/31/11
| | | | |
Company
Sector/Industry,
Country | | % of Total
Net Assets | |
| AmBev (Companhia de Bebidas das Americas) | | | 6.7% | |
| Beverages, Brazil | |
| PT Astra International Tbk | | | 6.3% | |
| Automobiles, Indonesia | |
| Vale SA, ADR, pfd., A | | | 5.0% | |
| Metals & Mining, Brazil | |
| Tata Consultancy Services Ltd. | | | 4.6% | |
| IT Services, India | |
| Souza Cruz SA | | | 3.9% | |
| Tobacco, Brazil | |
| LUKOIL Holdings, ADR | | | 3.5% | |
Oil, Gas & Consumable Fuels,
Russia | |
| President Chain Store Corp. | | | 3.3% | |
| Food & Staples Retailing, Taiwan | | | | |
| Itau Unibanco Holding SA, ADR | | | 3.3% | |
| Commercial Banks, Brazil | |
| Gazprom, ADR | | | 3.0% | |
Oil, Gas & Consumable Fuels,
Russia | |
| PT Bank Central Asia Tbk | | | 2.9% | |
| Commercial Banks, Indonesia | |
The dollar value, number of shares or principal amount, and names of all portfolio holdings are listed in the Fund’s Statement of Investments.
TD-4
currencies. As a result, the Fund’s performance was negatively affected by the portfolio’s investment predominantly in securities with non-U.S. currency exposure.
During the 12-month reporting period, we initiated positions in Australia, Malaysia and Qatar as we continued to search for what we considered to be attractive investment opportunities. We added construction, casinos and gaming, Internet software and services, specialty store and apparel retail companies. Key purchases included new positions in Australia-based BHP Billiton, a major diversified natural resources company with significant sales in emerging markets; Singapore-based SembCorp Marine, a premier global marine and offshore engineering group; and Anhui Conch Cement, one of China’s largest cement producers.
Conversely, we reduced the Fund’s investments in India, Brazil, Russia and China via Hong Kong-listed China H shares to focus on stocks we considered more attractively valued within our investment universe and raise funds for redemptions.2 We reduced the Fund’s holdings largely in diversified banks, oil and gas, diversified metals and mining, and automobile companies. Additionally, we sold our holdings in select companies that reached their target prices during the reporting period. Key sales included reductions of our positions in Brazilian financial conglomerate Itau Unibanco Holding and Chinese automobile manufacturer Guangzhou Automobile Group, as well as elimination of our holding in Brazilian cosmetics company Natura Cosmeticos.
Thank you for your participation in Templeton Developing Markets Securities Fund. We look forward to serving your future investment needs.
2. “China-H” denotes shares of China-incorporated, Hong Kong Stock Exchange-listed companies with most businesses in China.
The foregoing information reflects our analysis, opinions and portfolio holdings as of December 31, 2011, the end of the reporting period. The way we implement our main investment strategies and the resulting portfolio holdings may change depending on factors such as market and economic conditions. These opinions may not be relied upon as investment advice or an offer for a particular security. The information is not a complete analysis of every aspect of any market, country, industry, security or the Fund. Statements of fact are from sources considered reliable, but the investment manager makes no representation or warranty as to their completeness or accuracy. Although historical performance is no guarantee of future results, these insights may help you understand our investment management philosophy.
Top 10 Countries
Templeton Developing Markets
Securities Fund
12/31/11
| | | | |
| | | % of Total
Net Assets | |
| Brazil | | | 20.7% | |
| Russia | | | 14.8% | |
| Indonesia | | | 11.1% | |
| China | | | 8.8% | |
| India | | | 8.8% | |
| Thailand | | | 5.7% | |
| Hong Kong | | | 3.9% | |
| Chile | | | 3.3% | |
| Taiwan | | | 3.3% | |
| Singapore | | | 2.3% | |
TD-5
Fund Expenses
As an investor in a variable insurance contract (Contract) that indirectly provides for investment in an underlying mutual fund, you can incur transaction and/or ongoing expenses at both the Fund level and the Contract level.
| • | | Transaction expenses can include sales charges (loads) on purchases, redemption fees, surrender fees, transfer fees and premium taxes. |
| • | | Ongoing expenses can include management fees, distribution and service (12b-1) fees, contract fees, annual maintenance fees, mortality and expense risk fees and other fees and expenses. All mutual funds and Contracts have some types of ongoing expenses. |
The expenses shown in the table are meant to highlight ongoing expenses at the Fund level only and do not include ongoing expenses at the Contract level, or transaction expenses at either the Fund or Contract level. While the Fund does not have transaction expenses, if the transaction and ongoing expenses at the Contract level were included, the expenses shown below would be higher. You should consult your Contract prospectus or disclosure document for more information.
The table shows Fund-level ongoing expenses and can help you understand these expenses and compare them with those of other mutual funds offered through the Contract. The table assumes a $1,000 investment held for the six months indicated. Please refer to the Fund prospectus for additional information on operating expenses.
Actual Fund Expenses
The first line (Actual) of the table provides actual account values and expenses. The “Ending Account Value” is derived from the Fund’s actual return, which includes the effect of ongoing Fund expenses, but does not include the effect of ongoing Contract expenses.
You can estimate the Fund-level expenses you incurred during the period by following these steps. Of course, your account value and expenses will differ from those in this illustration:
| 1. | Divide your account value by $1,000. |
If an account had an $8,600 value, then $8,600 ÷ $1,000 = 8.6.
| 2. | Multiply the result by the number under the heading “Fund-Level Expenses Incurred During Period.” |
If Fund-Level Expenses Incurred During Period were $7.50, then 8.6 x $7.50 = $64.50.
In this illustration, the estimated expenses incurred this period at the Fund level are $64.50.
Templeton Developing Markets Securities Fund Class 1
TD-6
Hypothetical Example for Comparison with Other Mutual Funds
Information in the second line (Hypothetical) of the table can help you compare ongoing expenses of the Fund with those of other mutual funds offered through the Contract. This information may not be used to estimate the actual ending account balance or expenses you incurred during the period. The hypothetical “Ending Account Value” is based on the Fund’s actual expense ratio and an assumed 5% annual rate of return before expenses, which does not represent the Fund’s actual return. The figure under the heading “Fund-Level Expenses Incurred During Period” shows the hypothetical expenses your account would have incurred under this scenario. You can compare this figure with the 5% hypothetical examples that appear in shareholder reports of other funds offered through a Contract.
| | | | | | | | | | | | |
| Class 1 | | Beginning
Account Value 7/1/11 | | | Ending
Account Value 12/31/11 | | | Fund-Level Expenses Incurred
During Period* 7/1/11–12/31/11 | |
Actual | | $ | 1,000 | | | $ | 833.30 | | | $ | 6.33 | |
Hypothetical (5% return before expenses) | | $ | 1,000 | | | $ | 1,018.30 | | | $ | 6.97 | |
*Expenses are calculated using the most recent six-month annualized expense ratio for the Fund’s Class 1 shares (1.37%), which does not include any ongoing expenses of the Contract for which the Fund is an investment option, multiplied by the average account value over the period, multiplied by 184/365 to reflect the one-half year period.
TD-7
Franklin Templeton Variable Insurance Products Trust
Financial Highlights
Templeton Developing Markets Securities Fund
| | | | | | | | | | | | | | | | | | | | |
| | | Year Ended December 31, | |
| Class 1 | | 2011 | | | 2010 | | | 2009 | | | 2008 | | | 2007 | |
| | | | |
Per share operating performance | | | | | | | | | | | | | | | | | | | | |
(for a share outstanding throughout the year) | | | | | | | | | | | | | | | | | | | | |
Net asset value, beginning of year | | $ | 11.40 | | | $ | 9.86 | | | $ | 6.11 | | | $ | 16.16 | | | $ | 13.92 | |
| | | | |
Income from investment operationsa: | | | | | | | | | | | | | | | | | | | | |
Net investment incomeb | | | 0.17 | | | | 0.09 | | | | 0.12 | | | | 0.16 | | | | 0.32 | |
Net realized and unrealized gains (losses) | | | (1.94 | ) | | | 1.63 | | | | 4.02 | | | | (7.40 | ) | | | 3.51 | |
| | | | |
Total from investment operations | | | (1.77 | ) | | | 1.72 | | | | 4.14 | | | | (7.24 | ) | | | 3.83 | |
| | | | |
Less distributions from: | | | | | | | | | | | | | | | | | | | | |
Net investment income | | | (0.13 | ) | | | (0.18 | ) | | | (0.36 | ) | | | (0.37 | ) | | | (0.38 | ) |
Net realized gains | | | — | | | | — | | | | (0.03 | ) | | | (2.44 | ) | | | (1.21 | ) |
| | | | |
Total distributions | | | (0.13 | ) | | | (0.18 | ) | | | (0.39 | ) | | | (2.81 | ) | | | (1.59 | ) |
| | | | |
Redemption feesc | | | — | | | | — | | | | — | | | | — | | | | — | |
| | | | |
Net asset value, end of year | | $ | 9.50 | | | $ | 11.40 | | | $ | 9.86 | | | $ | 6.11 | | | $ | 16.16 | |
| | | | |
| | | | | |
Total returnd | | | (15.67)% | | | | 17.83% | | | | 73.32% | | | | (52.62)% | | | | 29.09% | |
Ratios to average net assets | | | | | | | | | | | | | | | | | | | | |
Expenses | | | 1.40% | | | | 1.49% | e | | | 1.45% | e | | | 1.52% | e | | | 1.48% | e |
Net investment income | | | 1.57% | | | | 0.87% | | | | 1.64% | | | | 1.52% | | | | 2.07% | |
| | | | | |
Supplemental data | | | | | | | | | | | | | | | | | | | | |
Net assets, end of year (000’s) | | $ | 232,544 | | | $ | 347,242 | | | $ | 325,927 | | | $ | 234,213 | | | $ | 753,843 | |
Portfolio turnover rate | | | 14.90% | | | | 24.41% | | | | 56.58% | f | | | 75.11% | f | | | 98.32% | |
aThe amount shown for a share outstanding throughout the period may not correlate with the Statement of Operations for the period due to the timing of sales and repurchases of the Fund shares in relation to income earned and/or fluctuating market value of the investments of the Fund.
bBased on average daily shares outstanding.
cAmount rounds to less than $0.01 per share.
dTotal return does not include fees, charges or expenses imposed by the variable annuity and life insurance contracts for which the Franklin Templeton Variable Insurance Products Trust serves as an underlying investment vehicle.
eBenefit of expense reduction rounds to less than 0.01%.
fExcludes the value of portfolio securities delivered as a result of redemptions in-kind.
The accompanying notes are an integral part of these financial statements.
TD-8
Franklin Templeton Variable Insurance Products Trust
Financial Highlights (continued)
Templeton Developing Markets Securities Fund
| | | | | | | | | | | | | | | | | | | | |
| | | Year Ended December 31, | |
| Class 2 | | 2011 | | | 2010 | | | 2009 | | | 2008 | | | 2007 | |
| | | | |
Per share operating performance | | | | | | | | | | | | | | | | | | | | |
(for a share outstanding throughout the year) | | | | | | | | | | | | | | | | | | | | |
Net asset value, beginning of year | | $ | 11.30 | | | $ | 9.78 | | | $ | 6.04 | | | $ | 15.99 | | | $ | 13.79 | |
| | | | |
Income from investment operationsa: | | | | | | | | | | | | | | | | | | | | |
Net investment incomeb | | | 0.14 | | | | 0.06 | | | | 0.11 | | | | 0.15 | | | | 0.27 | |
Net realized and unrealized gains (losses) | | | (1.92 | ) | | | 1.62 | | | | 3.98 | | | | (7.33 | ) | | | 3.49 | |
| | | | |
Total from investment operations | | | (1.78 | ) | | | 1.68 | | | | 4.09 | | | | (7.18 | ) | | | 3.76 | |
| | | | |
Less distributions from: | | | | | | | | | | | | | | | | | | | | |
Net investment income | | | (0.10 | ) | | | (0.16 | ) | | | (0.32 | ) | | | (0.33 | ) | | | (0.35 | ) |
Net realized gains | | | — | | | | — | | | | (0.03 | ) | | | (2.44 | ) | | | (1.21 | ) |
| | | | |
Total distributions | | | (0.10 | ) | | | (0.16 | ) | | | (0.35 | ) | | | (2.77 | ) | | | (1.56 | ) |
| | | | |
Redemption feesc | | | — | | | | — | | | | — | | | | — | | | | — | |
| | | | |
Net asset value, end of year | | $ | 9.42 | | | $ | 11.30 | | | $ | 9.78 | | | $ | 6.04 | | | $ | 15.99 | |
| | | | |
| | | | | |
Total returnd | | | (15.86)% | | | | 17.58% | | | | 72.59% | | | | (52.70)% | | | | 28.78% | |
Ratios to average net assets | | | | | | | | | | | | | | | | | | | | |
Expenses | | | 1.65% | | | | 1.74% | e | | | 1.70% | e | | | 1.77% | e | | | 1.73% | e |
Net investment income | | | 1.32% | | | | 0.62% | | | | 1.39% | | | | 1.27% | | | | 1.82% | |
| | | | | |
Supplemental data | | | | | | | | | | | | | | | | | | | | |
Net assets, end of year (000’s) | | $ | 295,223 | | | $ | 392,546 | | | $ | 435,947 | | | $ | 264,186 | | | $ | 1,090,549 | |
Portfolio turnover rate | | | 14.90% | | | | 24.41% | | | | 56.58% | f | | | 75.11% | f | | | 98.32% | |
aThe amount shown for a share outstanding throughout the period may not correlate with the Statement of Operations for the period due to the timing of sales and repurchases of the Fund shares in relation to income earned and/or fluctuating market value of the investments of the Fund.
bBased on average daily shares outstanding.
cAmount rounds to less than $0.01 per share.
dTotal return does not include fees, charges or expenses imposed by the variable annuity and life insurance contracts for which the Franklin Templeton Variable Insurance Products Trust serves as an underlying investment vehicle.
eBenefit of expense reduction rounds to less than 0.01%.
fExcludes the value of portfolio securities delivered as a result of redemptions in-kind.
The accompanying notes are an integral part of these financial statements.
TD-9
Franklin Templeton Variable Insurance Products Trust
Financial Highlights (continued)
Templeton Developing Markets Securities Fund
| | | | | | | | | | | | | | | | | | | | |
| | | Year Ended December 31, | |
| Class 3 | | 2011 | | | 2010 | | | 2009 | | | 2008 | | | 2007 | |
| | | | |
Per share operating performance | | | | | | | | | | | | | | | | | | | | |
(for a share outstanding throughout the year) | | | | | | | | | | | | | | | | | | | | |
Net asset value, beginning of year | | $ | 11.23 | | | $ | 9.73 | | | $ | 6.02 | | | $ | 15.96 | | | $ | 13.78 | |
| | | | |
Income from investment operationsa: | | | | | | | | | | | | | | | | | | | | |
Net investment incomeb | | | 0.14 | | | | 0.06 | | | | 0.10 | | | | 0.11 | | | | 0.24 | |
Net realized and unrealized gains (losses) | | | (1.91 | ) | | | 1.60 | | | | 3.97 | | | | (7.27 | ) | | | 3.52 | |
| | | | |
Total from investment operations | | | (1.77 | ) | | | 1.66 | | | | 4.07 | | | | (7.16 | ) | | | 3.76 | |
| | | | |
Less distributions from: | | | | | | | | | | | | | | | | | | | | |
Net investment income | | | (0.10 | ) | | | (0.16 | ) | | | (0.33 | ) | | | (0.34 | ) | | | (0.37 | ) |
Net realized gains | | | — | | | | — | | | | (0.03 | ) | | | (2.44 | ) | | | (1.21 | ) |
| | | | |
Total distributions | | | (0.10 | ) | | | (0.16 | ) | | | (0.36 | ) | | | (2.78 | ) | | | (1.58 | ) |
| | | | |
Redemption feesc | | | — | | | | — | | | | — | | | | — | | | | — | |
| | | | |
Net asset value, end of year | | $ | 9.36 | | | $ | 11.23 | | | $ | 9.73 | | | $ | 6.02 | | | $ | 15.96 | |
| | | | |
| | | | | |
Total returnd | | | (15.86)% | | | | 17.51% | | | | 72.63% | | | | (52.67)% | | | | 28.70% | |
Ratios to average net assets | | | | | | | | | | | | | | | | | | | | |
Expenses | | | 1.65% | | | | 1.74% | e | | | 1.70% | e | | | 1.77% | e | | | 1.73% | e |
Net investment income | | | 1.32% | | | | 0.62% | | | | 1.39% | | | | 1.27% | | | | 1.82% | |
| | | | | |
Supplemental data | | | | | | | | | | | | | | | | | | | | |
Net assets, end of year (000’s) | | $ | 44,702 | | | $ | 66,484 | | | $ | 66,718 | | | $ | 32,953 | | | $ | 100,961 | |
Portfolio turnover rate | | | 14.90% | | | | 24.41% | | | | 56.58% | f | | | 75.11% | f | | | 98.32% | |
aThe amount shown for a share outstanding throughout the period may not correlate with the Statement of Operations for the period due to the timing of sales and repurchases of the Fund shares in relation to income earned and/or fluctuating market value of the investments of the Fund.
bBased on average daily shares outstanding.
cAmount rounds to less than $0.01 per share.
dTotal return does not include fees, charges or expenses imposed by the variable annuity and life insurance contracts for which the Franklin Templeton Variable Insurance Products Trust serves as an underlying investment vehicle.
eBenefit of expense reduction rounds to less than 0.01%.
fExcludes the value of portfolio securities delivered as a result of redemptions in-kind.
The accompanying notes are an integral part of these financial statements.
TD-10
Franklin Templeton Variable Insurance Products Trust
Financial Highlights (continued)
Templeton Developing Markets Securities Fund
| | | | | | | | | | | | | | | | |
| | | Year Ended December 31, | |
| Class 4 | | 2011 | | | 2010 | | | 2009 | | | 2008a | |
| | | | |
Per share operating performance | | | | | | | | | | | | | | | | |
(for a share outstanding throughout the year) | | | | | | | | | | | | | | | | |
Net asset value, beginning of year | | $ | 11.30 | | | $ | 9.80 | | | $ | 6.09 | | | $ | 14.88 | |
| | | | |
Income from investment operationsb: | | | | | | | | | | | | | | | | |
Net investment income (loss)c | | | 0.13 | | | | 0.05 | | | | 0.09 | | | | (0.33 | ) |
Net realized and unrealized gains (losses) | | | (1.91 | ) | | | 1.61 | | | | 4.00 | | | | (5.65 | ) |
| | | | |
Total from investment operations | | | (1.78 | ) | | | 1.66 | | | | 4.09 | | | | (5.98 | ) |
| | | | |
Less distributions from: | | | | | | | | | | | | | | | | |
Net investment income | | | (0.10 | ) | | | (0.16 | ) | | | (0.35 | ) | | | (0.37 | ) |
Net realized gains | | | — | | | | — | | | | (0.03 | ) | | | (2.44 | ) |
| | | | |
Total distributions | | | (0.10 | ) | | | (0.16 | ) | | | (0.38 | ) | | | (2.81 | ) |
| | | | |
Redemption feesd | | | — | | | | — | | | | — | | | | — | |
| | | | |
Net asset value, end of year | | $ | 9.42 | | | $ | 11.30 | | | $ | 9.80 | | | $ | 6.09 | |
| | | | |
| | | | |
Total returne | | | (15.88)% | | | | 17.41% | | | | 72.45% | | | | (48.66)% | |
Ratios to average net assetsf | | | | | | | | | | | | | | | | |
Expenses | | | 1.75% | | | | 1.84% | g | | | 1.80% | g | | | 1.87% | g |
Net investment income | | | 1.22% | | | | 0.52% | | | | 1.29% | | | | 1.17% | |
| | | | |
Supplemental data | | | | | | | | | | | | | | | | |
Net assets, end of year (000’s) | | $ | 24,380 | | | $ | 37,198 | | | $ | 26,362 | | | $ | 7,208 | |
Portfolio turnover rate | | | 14.90% | | | | 24.41% | | | | 56.58% | h | | | 75.11% | h |
aFor the period February 29, 2008 (effective date) to December 31, 2008.
bThe amount shown for a share outstanding throughout the period may not correlate with the Statement of Operations for the period due to the timing of sales and repurchases of the Fund shares in relation to income earned and/or fluctuating market value of the investments of the Fund.
cBased on average daily shares outstanding.
dAmount rounds to less than $0.01 per share.
eTotal return does not include fees, charges or expenses imposed by the variable annuity and life insurance contracts for which the Franklin Templeton Variable Insurance Products Trust serves as an underlying investment vehicle. Total return is not annualized for periods less than one year.
fRatios are annualized for periods less than one year.
gBenefit of expense reduction rounds to less than 0.01%.
hExcludes the value of portfolio securities delivered as a result of redemptions in-kind.
The accompanying notes are an integral part of these financial statements.
TD-11
Franklin Templeton Variable Insurance Products Trust
Statement of Investments, December 31, 2011
| | | | | | | | | | |
| Templeton Developing Markets Securities Fund | | Industry | | Shares | | | Value | |
Common Stocks 85.4% | | | | | | | | | | |
Australia 1.5% | | | | | | | | | | |
BHP Billiton Ltd. | | Metals & Mining | | | 250,162 | | | $ | 8,809,050 | |
| | | | | | | | | | |
Brazil 13.9% | | | | | | | | | | |
Companhia de Bebidas das Americas (AmBev) | | Beverages | | | 1,362,350 | | | | 39,922,880 | |
Itau Unibanco Holding SA, ADR | | Commercial Banks | | | 1,053,474 | | | | 19,552,477 | |
Souza Cruz SA | | Tobacco | | | 1,888,597 | | | | 23,222,283 | |
| | | | | | | | | | |
| | | | | | | | | 82,697,640 | |
| | | | | | | | | | |
Chile 2.2% | | | | | | | | | | |
Antofagasta PLC | | Metals & Mining | | | 704,479 | | | | 13,322,274 | |
| | | | | | | | | | |
China 8.8% | | | | | | | | | | |
Anhui Conch Cement Co. Ltd., H | | Construction Materials | | | 1,725,000 | | | | 5,119,518 | |
CNOOC Ltd. | | Oil, Gas & Consumable Fuels | | | 7,181,000 | | | | 12,593,055 | |
aGreat Wall Motor Co. Ltd., H | | Automobiles | | | 2,460,677 | | | | 3,592,830 | |
Guangzhou Automobile Group Co. Ltd., H | | Automobiles | | | 916,396 | | | | 764,588 | |
PetroChina Co. Ltd., H | | Oil, Gas & Consumable Fuels | | | 13,880,000 | | | | 17,317,385 | |
Tencent Holdings Ltd. | | Internet Software & Services | | | 137,000 | | | | 2,751,783 | |
aUni-President China Holdings Ltd. | | Food Products | | | 927,675 | | | | 555,415 | |
Yantai Changyu Pioneer Wine Co. Ltd., B | | Beverages | | | 532,700 | | | | 5,830,029 | |
Yanzhou Coal Mining Co. Ltd., H | | Oil, Gas & Consumable Fuels | | | 1,948,000 | | | | 4,158,556 | |
| | | | | | | | | | |
| | | | | | | | | 52,683,159 | |
| | | | | | | | | | |
Hong Kong 3.9% | | | | | | | | | | |
Dairy Farm International Holdings Ltd. | | Food & Staples Retailing | | | 1,014,733 | | | | 9,467,459 | |
Giordano International Ltd. | | Specialty Retail | | | 474,000 | | | | 342,992 | |
I.T Ltd. | | Specialty Retail | | | 3,540,000 | | | | 1,950,815 | |
Luk Fook Holdings (International) Ltd. | | Specialty Retail | | | 999,000 | | | | 3,485,811 | |
SJM Holdings Ltd. | | Hotels, Restaurants & Leisure | | | 1,885,000 | | | | 3,058,095 | |
VTech Holdings Ltd. | | Communications Equipment | | | 506,300 | | | | 5,078,254 | |
| | | | | | | | | | |
| | | | | | | | | 23,383,426 | |
| | | | | | | | | | |
India 8.8% | | | | | | | | | | |
Grasim Industries Ltd. | | Construction Materials | | | 31,224 | | | | 1,477,449 | |
Infosys Ltd. | | IT Services | | | 169,190 | | | | 8,824,273 | |
National Aluminium Co. Ltd. | | Metals & Mining | | | 1,578,595 | | | | 1,508,174 | |
Oil & Natural Gas Corp. Ltd. | | Oil, Gas & Consumable Fuels | | | 1,826,624 | | | | 8,853,174 | |
Tata Chemicals Ltd. | | Chemicals | | | 701,855 | | | | 4,121,900 | |
Tata Consultancy Services Ltd. | | IT Services | | | 1,258,688 | | | | 27,570,526 | |
| | | | | | | | | | |
| | | | | | | | | 52,355,496 | |
| | | | | | | | | | |
Indonesia 11.1% | | | | | | | | | | |
PT Astra International Tbk | | Automobiles | | | 4,610,000 | | | | 37,622,277 | |
PT Bank Central Asia Tbk | | Commercial Banks | | | 19,763,532 | | | | 17,436,808 | |
PT Bank Rakyat Indonesia (Persero) Tbk | | Commercial Banks | | | 15,197,500 | | | | 11,313,276 | |
| | | | | | | | | | |
| | | | | | | | | 66,372,361 | |
| | | | | | | | | | |
Malaysia 0.1% | | | | | | | | | | |
Genting Bhd. | | Hotels, Restaurants & Leisure | | | 179,000 | | | | 621,136 | |
| | | | | | | | | | |
Mexico 1.5% | | | | | | | | | | |
America Movil SAB de CV, L, ADR | | Wireless Telecommunication Services | | | 246,434 | | | | 5,569,409 | |
Kimberly Clark de Mexico SAB de CV, A | | Household Products | | | 650,871 | | | | 3,540,105 | |
| | | | | | | | | | |
| | | | | | | | | 9,109,514 | |
| | | | | | | | | | |
TD-12
Franklin Templeton Variable Insurance Products Trust
Statement of Investments, December 31, 2011 (continued)
| | | | | | | | | | |
| Templeton Developing Markets Securities Fund | | Industry | | Shares | | | Value | |
Common Stocks (continued) | | | | | | | | | | |
Nigeria 0.2% | | | | | | | | | | |
Nigerian Breweries PLC | | Beverages | | | 1,629,905 | | | $ | 948,117 | |
| | | | | | | | | | |
Pakistan 0.0%† | | | | | | | | | | |
MCB Bank Ltd. | | Commercial Banks | | | 126,042 | | | | 187,913 | |
| | | | | | | | | | |
Qatar 0.1% | | | | | | | | | | |
Industries Qatar | | Industrial Conglomerates | | | 20,901 | | | | 763,397 | |
| | | | | | | | | | |
Russia 14.8% | | | | | | | | | | |
Gazprom, ADR | | Oil, Gas & Consumable Fuels | | | 1,193,200 | | | | 12,744,569 | |
Gazprom, ADR (London Stock Exchange) | | Oil, Gas & Consumable Fuels | | | 470,200 | | | | 5,014,683 | |
bLUKOIL Holdings, ADR | | Oil, Gas & Consumable Fuels | | | 75,208 | | | | 4,001,066 | |
bLUKOIL Holdings, ADR (London Stock Exchange) | | Oil, Gas & Consumable Fuels | | | 317,168 | | | | 16,786,117 | |
Mining and Metallurgical Co. Norilsk Nickel, ADR | | Metals & Mining | | | 636,443 | | | | 9,756,671 | |
Sberbank RF | | Commercial Banks | | | 6,061,420 | | | | 14,842,988 | |
TNK-BP | | Oil, Gas & Consumable Fuels | | | 5,340,274 | | | | 13,760,276 | |
cUralkali OJSC, GDR, Reg S | | Chemicals | | | 311,996 | | | | 11,227,176 | |
| | | | | | | | | | |
| | | | | | | | | 88,133,546 | |
| | | | | | | | | | |
Singapore 2.3% | | | | | | | | | | |
Keppel Corp. Ltd. | | Industrial Conglomerates | | | 1,006,557 | | | | 7,216,853 | |
SembCorp Marine Ltd. | | Machinery | | | 2,165,000 | | | | 6,375,993 | |
| | | | | | | | | | |
| | | | | | | | | 13,592,846 | |
| | | | | | | | | | |
South Africa 2.3% | | | | | | | | | | |
Exxaro Resources Ltd. | | Metals & Mining | | | 94,600 | | | | 1,965,787 | |
Remgro Ltd. | | Diversified Financial Services | | | 504,061 | | | | 7,395,663 | |
Tiger Brands Ltd. | | Food Products | | | 130,520 | | | | 4,050,226 | |
| | | | | | | | | | |
| | | | | | | | | 13,411,676 | |
| | | | | | | | | | |
South Korea 0.9% | | | | | | | | | | |
SK Innovation Co. Ltd. | | Oil, Gas & Consumable Fuels | | | 43,125 | | | | 5,282,510 | |
| | | | | | | | | | |
Taiwan 3.3% | | | | | | | | | | |
President Chain Store Corp. | | Food & Staples Retailing | | | 3,628,075 | | | | 19,766,629 | |
| | | | | | | | | | |
Thailand 5.7% | | | | | | | | | | |
Kasikornbank PCL, fgn. | | Commercial Banks | | | 3,116,500 | | | | 12,292,230 | |
PTT Exploration and Production PCL, fgn. | | Oil, Gas & Consumable Fuels | | | 2,021,223 | | | | 10,789,675 | |
PTT PCL, fgn. | | Oil, Gas & Consumable Fuels | | | 938,100 | | | | 9,450,841 | |
Supalai PCL, fgn. | | Real Estate Management & Development | | | 3,888,100 | | | | 1,761,439 | |
| | | | | | | | | | |
| | | | | | | | | 34,294,185 | |
| | | | | | | | | | |
Turkey 1.5% | | | | | | | | | | |
Tupras-Turkiye Petrol Rafinerileri AS | | Oil, Gas & Consumable Fuels | | | 423,426 | | | | 8,985,167 | |
| | | | | | | | | | |
United Arab Emirates 1.1% | | | | | | | | | | |
Emaar Properties PJSC | | Real Estate Management & Development | | | 8,942,377 | | | | 6,256,730 | |
| | | | | | | | | | |
United Kingdom 1.4% | | | | | | | | | | |
Anglo American PLC | | Metals & Mining | | | 230,149 | | | | 8,426,299 | |
| | | | | | | | | | |
Total Common Stocks (Cost $346,162,340) | | | | | | | | | 509,403,071 | |
| | | | | | | | | | |
TD-13
Franklin Templeton Variable Insurance Products Trust
Statement of Investments, December 31, 2011 (continued)
| | | | | | | | | | |
| Templeton Developing Markets Securities Fund | | Industry | | Shares | | | Value | |
Preferred Stocks 7.9% | | | | | | | | | | |
Brazil 6.8% | | | | | | | | | | |
Banco Bradesco SA, ADR, pfd. | | Commercial Banks | | | 418,531 | | | $ | 6,981,097 | |
Itausa - Investimentos Itau SA, pfd. | | Commercial Banks | | | 642,096 | | | | 3,887,314 | |
Vale SA, ADR, pfd., A | | Metals & Mining | | | 1,440,625 | | | | 29,676,875 | |
| | | | | | | | | | |
| | | | | | | | | 40,545,286 | |
| | | | | | | | | | |
Chile 1.1% | | | | | | | | | | |
Embotelladora Andina SA, pfd., A | | Beverages | | | 1,918,947 | | | | 6,833,593 | |
| | | | | | | | | | |
Total Preferred Stocks (Cost $23,121,348) | | | | | | | | | 47,378,879 | |
| | | | | | | | | | |
Total Investments before Short Term Investments
(Cost $369,283,688) | | | | | | | | | 556,781,950 | |
| | | | | | | | | | |
Short Term Investments 7.1% | | | | | | | | | | |
Money Market Funds (Cost $40,518,516) 6.8% | | | | | | | | | | |
United States 6.8% | | | | | | | | | | |
d,eInstitutional Fiduciary Trust Money Market Portfolio | | | | | 40,518,516 | | | | 40,518,516 | |
| | | | | | | | | | |
fInvestments from Cash Collateral Received for Loaned Securities
(Cost $2,122,374) 0.3% | | | | | | | | | | |
Money Market Funds 0.3% | | | | | | | | | | |
United States 0.3% | | | | | | | | | | |
gBNY Mellon Overnight Government Fund, 0.039% | | | | | 2,122,374 | | | | 2,122,374 | |
| | | | | | | | | | |
Total Investments (Cost $411,924,578) 100.4% | | | | | | | | | 599,422,840 | |
Other Assets, less Liabilities (0.4)% | | | | | | | | | (2,573,365 | ) |
| | | | | | | | | | |
Net Assets 100.0% | | | | | | | | $ | 596,849,475 | |
| | | | | | | | | | |
See Abbreviations on page TD-26.
†Rounds to less than 0.1% of net assets.
aA portion or all of the security is on loan at December 31, 2011. See Note 1(c).
bAt December 31, 2011, pursuant to the Fund’s policies and the requirements of applicable securities law, the Fund may be restricted from trading these securities for a limited or extended period of time due to ownership limits and/or potential possession of material non-public information.
cSecurity was purchased pursuant to Regulation S under the Securities Act of 1933, which exempts from registration securities offered and sold outside of the United States. Such a security cannot be sold in the United States without either an effective registration statement filed pursuant to the Securities Act of 1933, or pursuant to an exemption from registration. This security has been deemed liquid under guidelines approved by the Trust’s Board of Trustees. At December 31, 2011, the value of this security was $11,227,176, representing 1.88% of net assets.
dNon-income producing.
eSee Note 7 regarding investments in the Institutional Fiduciary Trust Money Market Portfolio.
fSee Note 1(c) regarding securities on loan.
gThe rate shown is the annualized seven-day yield at period end.
The accompanying notes are an integral part of these financial statements.
TD-14
Franklin Templeton Variable Insurance Products Trust
Financial Statements
Statement of Assets and Liabilities
December 31, 2011
| | | | |
| | | Templeton
Developing Markets
Securities Fund | |
Assets: | | | | |
Investments in securities: | | | | |
Cost - Unaffiliated issuers | | $ | 371,406,062 | |
Cost - Sweep Money Fund (Note 7) | | | 40,518,516 | |
| | | | |
Total cost of investments | | $ | 411,924,578 | |
| | | | |
Value - Unaffiliated issuers | | $ | 558,904,324 | |
Value - Sweep Money Fund (Note 7) | | | 40,518,516 | |
| | | | |
Total value of investments (includes securities loaned in the amount of $1,993,705) | | | 599,422,840 | |
Foreign currency, at value and cost | | | 27,953 | |
Receivables: | | | | |
Investment securities sold | | | 298,006 | |
Capital shares sold | | | 1,044,669 | |
Dividends | | | 567,788 | |
Foreign tax | | | 51,726 | |
Other assets | | | 23 | |
| | | | |
Total assets | | | 601,413,005 | |
| | | | |
Liabilities: | | | | |
Payables: | | | | |
Investment securities purchased | | | 238,923 | |
Capital shares redeemed | | | 969,695 | |
Affiliates | | | 794,283 | |
Reports to shareholders | | | 297,351 | |
Payable upon return of securities loaned | | | 2,122,374 | |
Accrued expenses and other liabilities | | | 140,904 | |
| | | | |
Total liabilities | | | 4,563,530 | |
| | | | |
Net assets, at value | | $ | 596,849,475 | |
| | | | |
Net assets consist of: | | | | |
Paid-in capital | | $ | 538,777,200 | |
Undistributed net investment income | | | 2,273,752 | |
Net unrealized appreciation (depreciation) | | | 187,475,625 | |
Accumulated net realized gain (loss) | | | (131,677,102 | ) |
| | | | |
Net assets, at value | | $ | 596,849,475 | |
| | | | |
The accompanying notes are an integral part of these financial statements.
TD-15
Franklin Templeton Variable Insurance Products Trust
Financial Statements (continued)
Statement of Assets and Liabilities (continued)
December 31, 2011
| | | | |
| | | Templeton
Developing Markets
Securities Fund | |
Class 1: | | | | |
Net assets, at value | | $ | 232,543,859 | |
| | | | |
Shares outstanding | | | 24,477,057 | |
| | | | |
Net asset value and maximum offering price per share | | $ | 9.50 | |
| | | | |
Class 2: | | | | |
Net assets, at value | | $ | 295,223,498 | |
| | | | |
Shares outstanding | | | 31,333,936 | |
| | | | |
Net asset value and maximum offering price per share | | $ | 9.42 | |
| | | | |
Class 3: | | | | |
Net assets, at value | | $ | 44,702,020 | |
| | | | |
Shares outstanding | | | 4,773,813 | |
| | | | |
Net asset value and maximum offering price per sharea | | $ | 9.36 | |
| | | | |
Class 4: | | | | |
Net assets, at value | | $ | 24,380,098 | |
| | | | |
Shares outstanding | | | 2,588,782 | |
| | | | |
Net asset value and maximum offering price per share | | $ | 9.42 | |
| | | | |
aRedemption price is equal to net asset value less redemption fees retained by the Fund.
The accompanying notes are an integral part of these financial statements.
TD-16
Franklin Templeton Variable Insurance Products Trust
Financial Statements (continued)
Statement of Operations
for the year ended December 31, 2011
| | | | |
| | | Templeton
Developing Markets
Securities Fund | |
Investment income: | | | | |
Dividends (net of foreign taxes of $2,230,499) | | $ | 21,338,029 | |
Interest | | | 22,148 | |
Income from securities loaned | | | 88,114 | |
| | | | |
Total investment income | | | 21,448,291 | |
| | | | |
Expenses: | | | | |
Management fees (Note 3a) | | | 8,287,243 | |
Administrative fees (Note 3b) | | | 985,804 | |
Distribution fees: (Note 3c) | | | | |
Class 2 | | | 855,545 | |
Class 3 | | | 140,593 | |
Class 4 | | | 112,586 | |
Unaffiliated transfer agent fees | | | 2,549 | |
Custodian fees (Note 4) | | | 481,218 | |
Reports to shareholders | | | 260,457 | |
Professional fees | | | 74,918 | |
Trustees’ fees and expenses | | | 2,872 | |
Other | | | 27,374 | |
| | | | |
Total expenses | | | 11,231,159 | |
| | | | |
Net investment income | | | 10,217,132 | |
| | | | |
Realized and unrealized gains (losses): | | | | |
Net realized gain (loss) from: | | | | |
Investments | | | 41,497,378 | |
Foreign currency transactions | | | (405,209 | ) |
| | | | |
Net realized gain (loss) | | | 41,092,169 | |
| | | | |
Net change in unrealized appreciation (depreciation) on: | | | | |
Investments | | | (168,785,410 | ) |
Translation of other assets and liabilities denominated in foreign currencies | | | (3,998 | ) |
Change in deferred taxes on unrealized appreciation | | | 53,321 | |
| | | | |
Net change in unrealized appreciation (depreciation) | | | (168,736,087 | ) |
| | | | |
Net realized and unrealized gain (loss) | | | (127,643,918 | ) |
| | | | |
Net increase (decrease) in net assets resulting from operations | | $ | (117,426,786 | ) |
| | | | |
The accompanying notes are an integral part of these financial statements.
TD-17
Franklin Templeton Variable Insurance Products Trust
Financial Statements (continued)
Statements of Changes in Net Assets
| | | | | | | | |
| | | Templeton Developing Markets
Securities Fund | |
| | | Year Ended December 31, | |
| | | 2011 | | | 2010 | |
| | | | |
Increase (decrease) in net assets: | | | | | | | | |
Operations: | | | | | | | | |
Net investment income | | $ | 10,217,132 | | | $ | 5,592,076 | |
Net realized gain (loss) from investments and foreign currency transactions | | | 41,092,169 | | | | 49,761,078 | |
Net change in unrealized appreciation (depreciation) on investments, translation of other assets and liabilities denominated in foreign currencies and deferred taxes | | | (168,736,087 | ) | | | 68,457,067 | |
| | | | |
Net increase (decrease) in net assets resulting from operations | | | (117,426,786 | ) | | | 123,810,221 | |
| | | | |
Distributions to shareholders from: | | | | | | | | |
Net investment income: | | | | | | | | |
Class 1 | | | (3,575,470 | ) | | | (5,483,924 | ) |
Class 2 | | | (3,331,863 | ) | | | (5,656,521 | ) |
Class 3 | | | (556,039 | ) | | | (947,886 | ) |
Class 4 | | | (314,405 | ) | | | (471,295 | ) |
| | | | |
Total distributions to shareholders | | | (7,777,777 | ) | | | (12,559,626 | ) |
| | | | |
Capital share transactions: (Note 2) | | | | | | | | |
Class 1 | | | (64,505,854 | ) | | | (22,233,537 | ) |
Class 2 | | | (37,899,841 | ) | | | (97,764,544 | ) |
Class 3 | | | (11,807,405 | ) | | | (9,001,736 | ) |
Class 4 | | | (7,237,721 | ) | | | 6,238,252 | |
| | | | |
Total capital share transactions | | | (121,450,821 | ) | | | (122,761,565 | ) |
| | | | |
Redemption fees | | | 34,912 | | | | 26,367 | |
| | | | |
Net increase (decrease) in net assets | | | (246,620,472 | ) | | | (11,484,603 | ) |
Net assets: | | | | | | | | |
Beginning of year | | | 843,469,947 | | | | 854,954,550 | |
| | | | |
End of year | | $ | 596,849,475 | | | $ | 843,469,947 | |
| | | | |
Undistributed net investment income included in net assets: | | | | | | | | |
End of year | | $ | 2,273,752 | | | $ | 163,727 | |
| | | | |
The accompanying notes are an integral part of these financial statements.
TD-18
Franklin Templeton Variable Insurance Products Trust
Notes to Financial Statements
Templeton Developing Markets Securities Fund
1. ORGANIZATION AND SIGNIFICANT ACCOUNTING POLICIES
Franklin Templeton Variable Insurance Products Trust (Trust) is registered under the Investment Company Act of 1940, as amended, (1940 Act) as an open-end investment company, consisting of twenty separate funds. The Templeton Developing Markets Securities Fund (Fund) is included in this report. The financial statements of the remaining funds in the Trust are presented separately. Shares of the Fund are generally sold only to insurance company separate accounts to fund the benefits of variable life insurance policies or variable annuity contracts. The Fund offers four classes of shares: Class 1, Class 2, Class 3, and Class 4. Each class of shares differs by its distribution fees, voting rights on matters affecting a single class and its exchange privilege.
The following summarizes the Fund’s significant accounting policies.
a. Financial Instrument Valuation
The Fund’s investments in securities and other financial instruments are carried at fair value daily. Fair value is the price that would be received to sell an asset or paid to transfer a liability in an orderly transaction between market participants on the measurement date. Under procedures approved by the Trust’s Board of Trustees, the Fund may utilize independent pricing services, quotations from securities and financial instrument dealers, and other market sources to determine fair value.
Equity securities listed on an exchange or on the NASDAQ National Market System are valued at the last quoted sale price or the official closing price of the day, respectively. Foreign equity securities are valued as of the close of trading on the foreign stock exchange on which the security is primarily traded, or the NYSE, whichever is earlier. The value is then converted into its U.S. dollar equivalent at the foreign exchange rate in effect at the close of the NYSE on the day that the value of the security is determined. Over-the-counter securities are valued within the range of the most recent quoted bid and ask prices. Securities that trade in multiple markets or on multiple exchanges are valued according to the broadest and most representative market. Certain equity securities are valued based upon fundamental characteristics or relationships to similar securities. Investments in open-end mutual funds and non-registered money market funds are valued at the closing net asset value.
The Fund has procedures to determine the fair value of securities and other financial instruments for which market prices are not readily available or which may not be reliably priced. Under these procedures, the Fund primarily employs a market-based approach which may use related or comparable assets or liabilities, recent transactions, market multiples, book values, and other relevant information for the investment to determine the fair value of the investment. The Fund may also use an income-based valuation approach in which the anticipated future cash flows of the investment are discounted to calculate fair value. Discounts may also be applied due to the nature or duration of any restrictions on the disposition of the investments. Due to the inherent uncertainty of valuations of such investments, the fair values may differ significantly from the values that would have been used had an active market existed.
Trading in securities on foreign securities stock exchanges and over-the-counter markets may be completed before the daily close of business on the NYSE. Occasionally, events occur between the time at which trading in a foreign security is completed and the close of the NYSE that might call into question the reliability of the value of a portfolio security held by the Fund. As a result, differences may arise between the value of the Fund’s portfolio securities as determined at the foreign market close and the latest indications of value at the close of the NYSE. In order to minimize the potential for these differences, the investment manager monitors price movements following the close of trading in foreign stock markets through a series of country specific market proxies (such as baskets of American Depositary Receipts, futures contracts and exchange traded funds). These price movements are measured against established trigger thresholds for each specific market proxy to assist in determining if an event has occurred that may call into question the reliability of the values of the foreign securities held by the Fund. If such an event occurs, the securities may be valued using fair value procedures, which may include the use of independent pricing services.
TD-19
Franklin Templeton Variable Insurance Products Trust
Notes to Financial Statements (continued)
Templeton Developing Markets Securities Fund
1. ORGANIZATION AND SIGNIFICANT ACCOUNTING POLICIES (continued)
b. Foreign Currency Translation
Portfolio securities and other assets and liabilities denominated in foreign currencies are translated into U.S. dollars based on the exchange rate of such currencies against U.S. dollars on the date of valuation. The Fund may enter into foreign currency exchange contracts to facilitate transactions denominated in a foreign currency. Purchases and sales of securities, income and expense items denominated in foreign currencies are translated into U.S. dollars at the exchange rate in effect on the transaction date. Portfolio securities and assets and liabilities denominated in foreign currencies contain risks that those currencies will decline in value relative to the U.S. dollar. Occasionally, events may impact the availability or reliability of foreign exchange rates used to convert the U.S. dollar equivalent value. If such an event occurs, the foreign exchange rate will be valued at fair value using procedures established and approved by the Trust’s Board of Trustees.
The Fund does not separately report the effect of changes in foreign exchange rates from changes in market prices on securities held. Such changes are included in net realized and unrealized gain or loss from investments on the Statement of Operations.
Realized foreign exchange gains or losses arise from sales of foreign currencies, currency gains or losses realized between the trade and settlement dates on securities transactions and the difference between the recorded amounts of dividends, interest, and foreign withholding taxes and the U.S. dollar equivalent of the amounts actually received or paid. Net unrealized foreign exchange gains and losses arise from changes in foreign exchange rates on foreign denominated assets and liabilities other than investments in securities held at the end of the reporting period.
c. Securities Lending
The Fund participates in an agency based security lending program. The fund receives cash collateral against the loaned securities in an amount equal to at least 102% of the market value of the loaned securities. Collateral is maintained over the life of the loan in an amount not less than 100% of the market value of loaned securities, as determined at the close of fund business each day; any additional collateral required due to changes in security values is delivered to the fund on the next business day. The collateral is invested in a non-registered money fund by the fund’s custodian on the fund’s behalf. The fund receives income from the investment of cash collateral, in addition to lending fees and rebates paid by the borrower. The fund bears the market risk with respect to the collateral investment, securities loaned, and the risk that the agent may default on its obligations to the fund. The securities lending agent has agreed to indemnify the fund in the event of default by a third party borrower.
d. Income and Deferred Taxes
It is the Fund’s policy to qualify as a regulated investment company under the Internal Revenue Code. The Fund intends to distribute to shareholders substantially all of its taxable income and net realized gains to relieve it from federal income and excise taxes. As a result, no provision for U.S. federal income taxes is required.
The Fund may be subject to foreign taxation related to income received, capital gains on the sale of securities and certain foreign currency transactions in the foreign jurisdictions in which it invests. Foreign taxes, if any, are recorded based on the tax regulations and rates that exist in the foreign markets in which the Fund invests. When a capital gain tax is determined to apply the Fund records an estimated deferred tax liability in an amount that would be payable if the securities were disposed of on the valuation date.
The Fund recognizes the tax benefits of uncertain tax positions only when the position is “more likely than not” to be sustained upon examination by the tax authorities based on the technical merits of the tax position. As of December 31, 2011, and for all open tax years, the Fund has determined that no liability for unrecognized tax benefits is required in the Fund’s financial statements related to uncertain tax positions taken on a tax return (or expected to be taken on future tax returns). Open tax years are those that remain subject to examination and are based on each tax jurisdiction statute of limitation.
TD-20
Franklin Templeton Variable Insurance Products Trust
Notes to Financial Statements (continued)
Templeton Developing Markets Securities Fund
1. ORGANIZATION AND SIGNIFICANT ACCOUNTING POLICIES (continued)
e. Security Transactions, Investment Income, Expenses and Distributions
Security transactions are accounted for on trade date. Realized gains and losses on security transactions are determined on a specific identification basis. Dividend income is recorded on the ex-dividend date except that certain dividends from foreign securities are recognized as soon as the Fund is notified of the ex-dividend date. Distributions to shareholders are recorded on the ex-dividend date and are determined according to income tax regulations (tax basis). Distributable earnings determined on a tax basis may differ from earnings recorded in accordance with accounting principles generally accepted in the United States of America. These differences may be permanent or temporary. Permanent differences are reclassified among capital accounts to reflect their tax character. These reclassifications have no impact on net assets or the results of operations. Temporary differences are not reclassified, as they may reverse in subsequent periods.
Common expenses incurred by the Trust are allocated among the funds based on the ratio of net assets of each fund to the combined net assets of the Trust. Fund specific expenses are charged directly to the fund that incurred the expense.
Realized and unrealized gains and losses and net investment income, not including class specific expenses, are allocated daily to each class of shares based upon the relative proportion of net assets of each class. Differences in per share distributions, by class, are generally due to differences in class specific expenses.
f. Accounting Estimates
The preparation of financial statements in accordance with accounting principles generally accepted in the United States of America requires management to make estimates and assumptions that affect the reported amounts of assets and liabilities at the date of the financial statements and the amounts of income and expenses during the reporting period. Actual results could differ from those estimates.
g. Redemption Fees
Redemptions and exchanges of interests in an insurance company subaccount that invests in Class 3 shares of the Fund will be subject to a 1.0% short term trading fee if the interest in the subaccount has been held for less than 60 days. Such fees are retained by the Fund and accounted for as an addition to paid-in capital, allocated to each class of shares based upon the relative proportion of net assets of each class.
h. Guarantees and Indemnifications
Under the Trust’s organizational documents, its officers and trustees are indemnified by the Trust against certain liabilities arising out of the performance of their duties to the Trust. Additionally, in the normal course of business, the Trust, on behalf of the Fund, enters into contracts with service providers that contain general indemnification clauses. The Trust’s maximum exposure under these arrangements is unknown as this would involve future claims that may be made against the Trust that have not yet occurred. Currently, the Trust expects the risk of loss to be remote.
TD-21
Franklin Templeton Variable Insurance Products Trust
Notes to Financial Statements (continued)
Templeton Developing Markets Securities Fund
2. SHARES OF BENEFICIAL INTEREST
At December 31, 2011, there were an unlimited number of shares authorized (without par value). Transactions in the Fund’s shares were as follows:
| | | | | | | | | | | | | | | | |
| | | Year Ended December 31, | |
| | | 2011 | | | 2010 | |
| Class 1 Shares: | | Shares | | | Amount | | | Shares | | | Amount | |
Shares sold | | | 2,813,987 | | | $ | 30,009,154 | | | | 4,235,745 | | | $ | 44,045,245 | |
Shares issued in reinvestment of distributions | | | 324,453 | | | | 3,575,470 | | | | 603,956 | | | | 5,483,924 | |
Shares redeemed | | | (9,124,103 | ) | | | (98,090,478 | ) | | | (7,418,014 | ) | | | (71,762,706 | ) |
| | | | |
Net increase (decrease) | | | (5,985,663 | ) | | $ | (64,505,854 | ) | | | (2,578,313 | ) | | $ | (22,233,537 | ) |
| | | | |
Class 2 Shares: | | | | | | | | | | | | | | | | |
Shares sold | | | 6,746,331 | | | $ | 70,699,788 | | | | 9,770,557 | | | $ | 97,538,996 | |
Shares issued in reinvestment of distributions | | | 304,558 | | | | 3,331,863 | | | | 627,805 | | | | 5,656,521 | |
Shares redeemed | | | (10,448,699 | ) | | | (111,931,492 | ) | | | (20,231,375 | ) | | | (200,960,061 | ) |
| | | | |
Net increase (decrease) | | | (3,397,810 | ) | | $ | (37,899,841 | ) | | | (9,833,013 | ) | | $ | (97,764,544 | ) |
| | | | |
Class 3 Shares: | | | | | | | | | | | | | | | | |
Shares sold | | | 848,211 | | | $ | 9,362,399 | | | | 1,343,547 | | | $ | 13,467,640 | |
Shares issued in reinvestment of distributions | | | 51,154 | | | | 556,039 | | | | 105,791 | | | | 947,886 | |
Shares redeemed | | | (2,043,372 | ) | | | (21,725,843 | ) | | | (2,390,224 | ) | | | (23,417,262 | ) |
| | | | |
Net increase (decrease) | | | (1,144,007 | ) | | $ | (11,807,405 | ) | | | (940,886 | ) | | $ | (9,001,736 | ) |
| | | | |
Class 4 Shares: | | | | | | | | | | | | | | | | |
Shares sold | | | 464,313 | | | $ | 5,040,717 | | | | 1,189,893 | | | $ | 11,893,157 | |
Shares issued on reinvestment of distributions | | | 28,739 | | | | 314,405 | | | | 52,250 | | | | 471,295 | |
Shares redeemed | | | (1,194,944 | ) | | | (12,592,843 | ) | | | (641,932 | ) | | | (6,126,200 | ) |
| | | | |
Net increase (decrease) | | | (701,892 | ) | | $ | (7,237,721 | ) | | | 600,211 | | | $ | 6,238,252 | |
| | | | |
3. TRANSACTIONS WITH AFFILIATES
Franklin Resources, Inc. is the holding company for various subsidiaries that together are referred to as Franklin Templeton Investments. Certain officers and trustees of the Fund are also officers and/or directors of the following subsidiaries:
| | |
| Subsidiary | | Affiliation |
Templeton Asset Management Ltd. (TAML) | | Investment manager |
Franklin Templeton Services, LLC (FT Services) | | Administrative manager |
Franklin Templeton Distributors, Inc. (Distributors) | | Principal underwriter |
Franklin Templeton Investor Services, LLC (Investor Services) | | Transfer agent |
TD-22
Franklin Templeton Variable Insurance Products Trust
Notes to Financial Statements (continued)
Templeton Developing Markets Securities Fund
3. TRANSACTIONS WITH AFFILIATES (continued)
a. Management Fees
Effective May 1, 2011, the Fund pays an investment management fee to TAML based on the average daily net assets of the Fund as follows:
| | |
| Annualized Fee Rate | | Net Assets |
| 1.100% | | Up to and including $1 billion |
| 1.050% | | Over $1 billion, up to and including $5 billion |
| 1.000% | | Over $5 billion, up to and including $10 billion |
| 0.950% | | Over $10 billion, up to and including $15 billion |
| 0.900% | | Over $15 billion, up to and including $20 billion |
| 0.850% | | In excess of $20 billion |
Prior to May 1, 2011, the Fund paid an investment management fee to TAML based on the average daily net assets of the Fund as follows:
| | |
| Annualized Fee Rate | | Net Assets |
| 1.250% | | Up to and including $500 million |
| 1.200% | | Over $500 million, up to and including $3 billion |
| 1.150% | | Over $3 billion, up to and including $4 billion |
| 1.100% | | Over $4 billion, up to and including $15 billion |
| 1.050% | | Over $15 billion, up to and including $20 billion |
| 1.000% | | In excess of $20 billion |
b. Administrative Fees
The Fund pays an administrative fee to FT Services based on the Fund’s average daily net assets as follows:
| | |
| Fee Rate | | Net Assets |
| 0.150% | | Up to and including $200 million |
| 0.135% | | Over $200 million, up to and including $700 million |
| 0.100% | | Over $700 million, up to and including $1.2 billion |
| 0.075% | | In excess of $1.2 billion |
c. Distribution Fees
The Fund’s Board of Trustees has adopted distribution plans for Class 2, Class 3, and Class 4 shares pursuant to Rule 12b-1 under the 1940 Act. Under the Fund’s compensation distribution plans, the Fund pays Distributors for costs incurred in connection with the servicing, sale and distribution of the Fund’s shares up to 0.25%, 0.35%, and 0.35% per year of its average daily net assets of Class 2, Class 3, and Class 4, respectively. The Board of Trustees has agreed to limit the current rate to 0.25% per year for Class 3.
d. Transfer Agent Fees
Investor Services, under terms of an agreement, performs shareholder servicing for the Fund and is not paid by the Fund for the services.
TD-23
Franklin Templeton Variable Insurance Products Trust
Notes to Financial Statements (continued)
Templeton Developing Markets Securities Fund
4. EXPENSE OFFSET ARRANGEMENT
The Fund has entered into an arrangement with its custodian whereby credits realized as a result of uninvested cash balances are used to reduce a portion of the Fund’s custodian expenses. During the year ended December 31, 2011, there were no credits earned.
5. INCOME TAXES
For tax purposes, capital losses may be carried over to offset future capital gains, if any. Under the Regulated Investment Company Modernization Act of 2010, capital losses incurred by the Fund in taxable years beginning after December 22, 2010 are not subject to expiration and such losses retain their character as either short-term or long-term, rather than being considered short-term as under previous law. Post-enactment capital losses must be fully utilized prior to utilizing any losses incurred in pre-enactment tax years.
At December 31, 2011, the Fund had capital loss carryforwards of $125,392,863 expiring in 2017. During the year ended December 31, 2011, the Fund utilized $41,015,504 of capital loss carryforwards.
The tax character of distributions paid during the years ended December 31, 2011 and 2010, was as follows:
| | | | | | | | |
| | | 2011 | | | 2010 | |
Distributions paid from ordinary income | | $ | 7,777,777 | | | $ | 12,559,626 | |
| | | | |
At December 31, 2011, the cost of investments, net unrealized appreciation (depreciation), and undistributed ordinary income for income tax purposes were as follows:
| | | | |
Cost of investments | | $ | 424,579,565 | |
| | | | |
| |
Unrealized appreciation | | $ | 194,161,792 | |
Unrealized depreciation | | $ | (19,318,517 | ) |
| | | | |
Net unrealized appreciation (depreciation) | | $ | 174,843,275 | |
| | | | |
Distributable earnings - undistributed ordinary income | | $ | 8,644,499 | |
| | | | |
Differences between income and/or capital gains as determined on a book basis and a tax basis are primarily due to differing treatments of foreign currency transactions, passive foreign investment company shares, corporate actions, foreign capital gains tax, and wash sales.
6. INVESTMENT TRANSACTIONS
Purchases and sales of investments (excluding short term securities) for the year ended December 31, 2011, aggregated $107,148,613 and $255,595,141, respectively.
7. INVESTMENTS IN INSTITUTIONAL FIDUCIARY TRUST MONEY MARKET PORTFOLIO
The Fund invests in the Institutional Fiduciary Trust Money Market Portfolio (Sweep Money Fund), an open-end investment company managed by Franklin Advisers, Inc. (an affiliate of the investment manager). Management fees paid by the Fund are reduced on assets invested in the Sweep Money Fund, in an amount not to exceed the management and administrative fees paid by the Sweep Money Fund.
TD-24
Franklin Templeton Variable Insurance Products Trust
Notes to Financial Statements (continued)
Templeton Developing Markets Securities Fund
8. CONCENTRATION OF RISK
Investing in foreign securities may include certain risks and considerations not typically associated with investing in U.S. securities, such as fluctuating currency values and changing local and regional economic, political and social conditions, which may result in greater market volatility. In addition, certain foreign securities may not be as liquid as U.S. securities.
9. CREDIT FACILITY
The Fund, together with other U.S. registered and foreign investment funds (collectively, Borrowers), managed by Franklin Templeton Investments, are borrowers in a joint syndicated senior unsecured credit facility totaling $750 million (Global Credit Facility) which matured on January 20, 2012. This Global Credit Facility provides a source of funds to the Borrowers for temporary and emergency purposes, including the ability to meet future unanticipated or unusually large redemption requests. Effective January 20, 2012, the Borrowers renewed the Global Credit Facility for a total of $1.5 billion, maturing January 18, 2013.
Under the terms of the Global Credit Facility, the Fund shall, in addition to interest charged on any borrowings made by the Fund and other costs incurred by the Fund, pay its share of fees and expenses incurred in connection with the implementation and maintenance of the Global Credit Facility, based upon its relative share of the aggregate net assets of all of the Borrowers, including an annual commitment fee of 0.08% based upon the unused portion of the Global Credit Facility, which is reflected in other expenses on the Statement of Operations. During the year ended December 31, 2011, the Fund did not use the Global Credit Facility.
10. FAIR VALUE MEASUREMENTS
The Fund follows a fair value hierarchy that distinguishes between market data obtained from independent sources (observable inputs) and the Fund’s own market assumptions (unobservable inputs). These inputs are used in determining the value of the Fund’s investments and are summarized in the following fair value hierarchy:
| | • | | Level 1 – quoted prices in active markets for identical securities |
| | • | | Level 2 – other significant observable inputs (including quoted prices for similar securities, interest rates, prepayment speed, credit risk, etc.) |
| | • | | Level 3 – significant unobservable inputs (including the Fund’s own assumptions in determining the fair value of investments) |
The inputs or methodology used for valuing securities are not an indication of the risk associated with investing in those securities.
For movements between the levels within the fair value hierarchy, the Fund has adopted a policy of recognizing the transfers as of the date of the underlying event which caused the movement.
The following is a summary of the inputs used as of December 31, 2011, in valuing the Fund’s assets and liabilities carried at fair value:
| | | | | | | | | | | | | | | | |
| | | Level 1 | | | Level 2 | | | Level 3 | | | Total | |
| | | | |
Assets: | | | | | | | | | | | | | | | | |
Investments in Securities: | | | | | | | | | | | | | | | | |
Equity Investmentsa,b | | $ | 556,781,950 | | | $ | — | | | $ | — | | | $ | 556,781,950 | |
Short Term Investments | | | 40,518,516 | | | | 2,122,374 | | | | — | | | | 42,640,890 | |
| | | | |
Total Investments in Securities | | $ | 597,300,466 | | | $ | 2,122,374 | | | $ | — | | | $ | 599,422,840 | |
| | | | |
aFor detailed categories, see the accompanying Statement of Investments.
bIncludes common and preferred stocks.
TD-25
Franklin Templeton Variable Insurance Products Trust
Notes to Financial Statements (continued)
Templeton Developing Markets Securities Fund
11. NEW ACCOUNTING PRONOUNCEMENTS
In May 2011, the Financial Accounting Standards Board (FASB) issued Accounting Standards Update (ASU) No. 2011-04, Fair Value Measurement (Topic 820): Amendments to Achieve Common Fair Value Measurement and Disclosure Requirements in U.S. GAAP and IFRSs. The amendments in the ASU will improve the comparability of fair value measurements presented and disclosed in financial statements prepared in accordance with U.S. GAAP (Generally Accepted Accounting Principles) and IFRS (International Financial Reporting Standards) and include new guidance for certain fair value measurement principles and disclosure requirements. The ASU is effective for interim and annual periods beginning after December 15, 2011. The Fund believes the adoption of this ASU will not have a material impact on its financial statements.
12. SUBSEQUENT EVENTS
The Fund has evaluated subsequent events through the issuance of the financial statements and determined that no events have occurred that require disclosure other than those already disclosed in the financial statements.
| | | | |
ABBREVIATIONS | | | | |
| Selected Portfolio | | | | |
| | | | |
| ADR - American Depositary Receipt | | | | |
| GDR - Global Depositary Receipt | | | | |
TD-26
Franklin Templeton Variable Insurance Products Trust
Templeton Developing Markets Securities Fund
Report of Independent Registered Public Accounting Firm
To the Board of Trustees and Shareholders of Franklin Templeton Variable Insurance Products Trust
In our opinion, the accompanying statement of assets and liabilities, including the statement of investments, and the related statements of operations and of changes in net assets and the financial highlights present fairly, in all material respects, the financial position of Templeton Developing Markets Securities Fund (the “Fund”) at December 31, 2011, the results of its operations for the year then ended, the changes in its net assets for each of the two years in the period then ended and the financial highlights for each of the periods presented, in conformity with accounting principles generally accepted in the United States of America. These financial statements and financial highlights (hereafter referred to as “financial statements”) are the responsibility of the Fund’s management. Our responsibility is to express an opinion on these financial statements based on our audits. We conducted our audits of these financial statements in accordance with the standards of the Public Company Accounting Oversight Board (United States). Those standards require that we plan and perform the audit to obtain reasonable assurance about whether the financial statements are free of material misstatement. An audit includes examining, on a test basis, evidence supporting the amounts and disclosures in the financial statements, assessing the accounting principles used and significant estimates made by management, and evaluating the overall financial statement presentation. We believe that our audits, which included confirmation of securities at December 31, 2011 by correspondence with the custodian and brokers, provide a reasonable basis for our opinion.
PricewaterhouseCoopers LLP
San Francisco, California
February 13, 2012
TD-27
Franklin Templeton Variable Insurance Products Trust
Tax Information (unaudited)
Templeton Developing Markets Securities Fund
At December 31, 2011, more than 50% of the Fund’s total assets were invested in securities of foreign issuers. In most instances, foreign taxes were withheld from income paid to the Fund on these investments. The Fund elects to treat foreign taxes paid as allowed under Section 853 of the Internal Revenue Code. This election will allow shareholders of record as of the 2012 distribution date, to treat their proportionate share of foreign taxes paid by the Funds as having been paid directly by them. The shareholder shall consider these amounts as foreign taxes paid in the tax year in which they receive the Fund distribution.
TD-28
TEMPLETON FOREIGN SECURITIES FUND
This annual report for Templeton Foreign Securities Fund covers the fiscal year ended December 31, 2011.
Performance Summary as of 12/31/11
Average annual total return of Class 1 shares represents the average annual change in value, assuming reinvestment of dividends and capital gains. Average returns smooth out variations in returns, which can be significant; they are not the same as year-by-year results.
Periods ended 12/31/11
| | | | | | | | | | | | |
| | | 1-Year | | | 5-Year | | | 10-Year | |
Average Annual Total Return | | | -10.44% | | | | -1.55% | | | | +4.80% | |
Total Return Index Comparison
for a Hypothetical $10,000 Investment (1/1/02–12/31/11)
The graph below shows the change in value of a hypothetical $10,000 investment in the Fund over the indicated period and includes reinvestment of any income or distributions. The Fund’s performance is compared to the performance of the MSCI Europe, Australasia, Far East (EAFE) Index. One cannot invest directly in an index, and an index is not representative of the Fund’s portfolio. Please see Important Notes to Performance Information preceding the Fund Summaries.
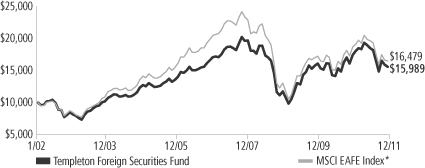
*Source: © 2012 Morningstar. Please see Index Descriptions following the Fund Summaries.
Templeton Foreign
Securities Fund – Class 1
Performance reflects the Fund’s Class 1 operating expenses, but does not include any contract fees, expenses or sales charges. If they had been included, performance would be lower. These charges and deductions, particularly for variable life policies, can have a significant effect on contract values and insurance benefits. See the contract prospectus for a complete description of these expenses, including sales charges.
Performance data represent past performance, which does not guarantee future results. Investment return and principal value will fluctuate, and you may have a gain or loss when you sell your shares.
Current performance may differ from figures shown.
TF-1
Fund Goal and Main Investments: Templeton Foreign Securities Fund seeks long-term capital growth. The Fund normally invests at least 80% of its net assets in investments of issuers located outside the U.S., including those in emerging markets.
Performance Overview
You can find the Fund’s one-year total return in the Performance Summary. The Fund performed better than its benchmark, the MSCI EAFE Index, which had a -11.73% total return for the same period.1 Please note, index performance information is provided for reference and we do not attempt to track the index but rather undertake investments on the basis of fundamental research.
Economic and Market Overview
Global stocks declined in 2011 as deepening sovereign debt, political paralysis and economic growth concerns led to escalating investor anxiety and severe market volatility. Stocks entered the year supported by positive momentum in corporate earnings and renewed economic stimulus measures in the developed world. However, a number of events interrupted the market’s rise early in 2011, including a severe natural disaster and nuclear crisis in Japan and populist uprisings across the oil-and-gas-producing regions of the Middle East and North Africa. Global markets recovered quickly from these setbacks but soon faced more significant turmoil as Europe’s sovereign debt crisis worsened in the summer. Portugal, Greece and Ireland received bailouts and had their credit ratings slashed to junk grade, while rising bond yields in the larger economies of Italy and Spain, and eventually in the critical core economies of Germany and France, threatened the survival of the European Monetary Union. The U.S.’s sovereign debt issues and political dysfunction, accompanied by the downgrade of its AAA credit rating to AA+, further pressured investor sentiment during the summer months. Additionally, the precarious state of the global banking system as well as emerging signs of a renewed global economic slowdown and possible hard landing in China weighed on the markets.
Despite these global challenges, corporate profits remained remarkably resilient, some signs of U.S. economic improvement emerged toward year-end, and European policymakers ultimately stepped up their response to their sovereign debt and banking crisis. Greek and Italian
1. Source: © 2012 Morningstar. One cannot invest directly in an index, and an index is not representative of the Fund’s portfolio. Please see Index Descriptions following the Fund Summaries.
Fund Risks: All investments involve risks. Stock prices fluctuate, sometimes rapidly and dramatically, due to factors affecting individual companies, particular industries or sectors, or general market conditions. Foreign investing, especially in emerging or developing markets, involves additional risks, including currency fluctuations, economic instability, market volatility, and political and social instability. The Fund may have significant investments in one or more countries or in particular sectors, such as technology and financial services, from time to time, and may carry greater risk of adverse developments in a country or sector than a fund that invests more broadly. Smaller and midsize company securities can increase the risk of greater price fluctuations, particularly over the short term. The Fund is actively managed but there is no guarantee that the manager’s investment decisions will produce the desired results. The Fund’s prospectus also includes a description of the main investment risks.
TF-2
prime ministers were replaced with technocrats tasked with arresting a debt spiral, the European Central Bank cut short-term interest rates and expanded bank lending facilities, and six key global central banks agreed to lower dollar funding costs for Europe’s distressed commercial banks. Meanwhile, the Federal Reserve Board increased purchases of long-dated bonds to reduce key borrowing costs and hinted at “additional policy accommodation.” Chinese policymakers lowered commercial bank reserve requirements and the International Monetary Fund revamped its credit line and eased its lending terms. Commodities initially rallied due to the coordinated monetary stimulus, but most ultimately declined as global economic prospects weakened. Gold and oil, however, made annual gains. In currency markets, the euro declined with escalating weakness at year-end, while the dollar ultimately rose after a late surge. Amid general global market declines, perceived safe-haven currencies such as the Japanese yen and Swiss franc rallied strongly, and U.S. Treasuries posted their best one-year return since 2008.
Investment Strategy
Our investment philosophy is bottom up, value oriented and long term. In choosing investments, we generally focus on the market price of a company’s securities relative to our evaluation of the company’s potential long-term earnings, asset value and cash flow. Among factors we consider are a company’s historical value measures, including price/earnings ratio, profit margins and liquidation value. We do in-depth research to construct a bargain list from which we buy.
Manager’s Discussion
During the year under review, our underweighting in the consumer staples sector was a key detractor from the Fund’s performance relative to the MSCI EAFE Index.2 Stock selection in the financials sector, which was negatively affected by the European sovereign debt and banking crisis, also weighed on relative results.3 Notable detractors included commercial banks KB Financial Group (South Korea)4 and UniCredit (Italy), as well as financial services companies Credit Suisse Group (Switzerland), ING Groep (Netherlands) and Nomura Holdings (Japan). Stock selection in the energy sector also weighed on relative results, particularly oil and gas companies Talisman Energy (Canada)4
2. The consumer staples sector comprises food and staples retailing in the SOI.
3. The financials sector comprises capital markets, commercial banks, diversified financial services, insurance, and real estate management and development in the SOI.
4. Not an index component.
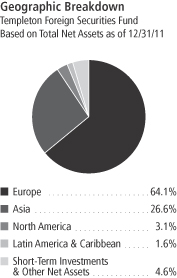
TF-3
and Reliance Industries4 (India).5 Other detractors included video game hardware and software manufacturer Nintendo (Japan) in the information technology (IT) sector and specialist recruitment company Hays4 (U.K.) in the industrials sector.6
Our stock selection and overweighting in the traditionally defensive health care sector was a major contributor to the Fund’s relative performance.7 Within the sector, our positions in pharmaceutical manufacturers Sanofi (France), Roche Holding (Switzerland), Merck KGaA (Germany) and GlaxoSmithKline (U.K.) boosted relative returns. Underweighting and stock selection in the economically sensitive materials sector, which suffered from a global commodity price correction, aided relative results.8 Overweighting in the telecommunication services sector helped relative returns, and major contributors included mobile telecommunication services provider Vodafone Group (U.K.) and diversified telecommunications companies Telenor (Norway) and Singapore Telecommunications.9 Stock selection in the IT sector enhanced relative returns, particularly two companies that benefited from global demand for smartphones and tablet PCs: semiconductor, telecommunication and digital media products manufacturer Samsung Electronics (South Korea) and integrated circuit and semiconductor devices company Taiwan Semiconductor Manufacturing.4 Another key contributor was oil and gas company Statoil (Norway) in the energy sector.
It is important to recognize the effect of currency movements on the Fund’s absolute performance. In general, if the value of the U.S. dollar goes up compared with a foreign currency, an investment traded in that foreign currency will go down in value because it will be worth fewer U.S. dollars. This can have a negative effect on Fund performance. Conversely, when the U.S. dollar weakens in relation to a foreign currency, an investment traded in that foreign currency will increase in value, which can contribute to Fund performance. For the 12 months ended December 31, 2011, the U.S. dollar rose in value relative to most
5. The energy sector comprises energy equipment and services and oil, gas and consumable fuels in the SOI
6. The IT sector comprises communications equipment; computers and peripherals; electronic equipment, instruments and components; semiconductors and semiconductor equipment; and software in the SOI. The industrials sector comprises aerospace and defense, airlines, automobiles, commercial services and supplies, industrial conglomerates, professional services, and trading companies and distributors in the SOI.
7. The health care sector comprises life sciences tools and services and pharmaceuticals in the SOI.
8. The materials sector comprises chemicals, construction materials, containers and packaging, and metals and mining in the SOI.
9. The telecommunication services sector comprises diversified telecommunication services and wireless telecommunication services in the SOI.
Top 10 Holdings
Templeton Foreign Securities Fund 12/31/11
| | | | |
Company
Sector/Industry,
Country | | % of Total
Net Assets | |
| Sanofi | | | 3.5% | |
| Pharmaceuticals, France | | | | |
| Samsung Electronics Co. Ltd. | | | 3.4% | |
| Semiconductors & Semiconductor Equipment, South Korea | | | | |
| Roche Holding AG | | | 3.3% | |
Pharmaceuticals,
Switzerland | | | | |
| Vodafone Group PLC, ADR | | | 2.7% | |
| Wireless Telecommunication Services, U.K. | | | | |
| GlaxoSmithKline PLC | | | 2.7% | |
| Pharmaceuticals, U.K. | | | | |
| Statoil ASA | | | 2.7% | |
| Oil, Gas & Consumable Fuels, Norway | | | | |
| Tesco PLC | | | 2.5% | |
| Food & Staples Retailing, U.K. | | | | |
| Telenor ASA | | | 2.2% | |
| Diversified Telecommunication Services, Norway | | | | |
| Taiwan Semiconductor Manufacturing Co. Ltd. | | | 2.2% | |
| Semiconductors & Semiconductor Equipment, Taiwan | | | | |
| Total SA, B | | | 2.1% | |
| Oil, Gas & Consumable Fuels, France | | | | |
The dollar value, number of shares or principal amount, and names of all portfolio holdings are listed in the Fund’s Statement of Investments (SOI).
TF-4
currencies. As a result, the Fund’s performance was negatively affected by the portfolio’s investment predominantly in securities with non-U.S. currency exposure.
From a geographic perspective, the Fund’s holdings in North America hindered relative results mainly due to the poor performance of our investments in Canada.4 Our positions in Brazil4 and Australia also weighed on relative performance. In contrast, our stock selection in Europe boosted the Fund’s relative performance, as a number of our investments in France, Germany, Norway and the U.K. outperformed. Our overweighting and stock selection in Asia were also beneficial, particularly our positions in China,4 Taiwan,4 and Hong Kong.
Thank you for your participation in Templeton Foreign Securities Fund. We look forward to serving your future investment needs.
The foregoing information reflects our analysis, opinions and portfolio holdings as of December 31, 2011, the end of the reporting period. The way we implement our main investment strategies and the resulting portfolio holdings may change depending on factors such as market and economic conditions. These opinions may not be relied upon as investment advice or an offer for a particular security. The information is not a complete analysis of every aspect of any market, country, industry, security or the Fund. Statements of fact are from sources considered reliable, but the investment manager makes no representation or warranty as to their completeness or accuracy. Although historical performance is no guarantee of future results, these insights may help you understand our investment management philosophy.
TF-5
Fund Expenses
As an investor in a variable insurance contract (Contract) that indirectly provides for investment in an underlying mutual fund, you can incur transaction and/or ongoing expenses at both the Fund level and the Contract level.
| • | | Transaction expenses can include sales charges (loads) on purchases, redemption fees, surrender fees, transfer fees and premium taxes. |
| • | | Ongoing expenses can include management fees, distribution and service (12b-1) fees, contract fees, annual maintenance fees, mortality and expense risk fees and other fees and expenses. All mutual funds and Contracts have some types of ongoing expenses. |
The expenses shown in the table are meant to highlight ongoing expenses at the Fund level only and do not include ongoing expenses at the Contract level, or transaction expenses at either the Fund or Contract level. While the Fund does not have transaction expenses, if the transaction and ongoing expenses at the Contract level were included, the expenses shown below would be higher. You should consult your Contract prospectus or disclosure document for more information.
The table shows Fund-level ongoing expenses and can help you understand these expenses and compare them with those of other mutual funds offered through the Contract. The table assumes a $1,000 investment held for the six months indicated. Please refer to the Fund prospectus for additional information on operating expenses.
Actual Fund Expenses
The first line (Actual) of the table provides actual account values and expenses. The “Ending Account Value” is derived from the Fund’s actual return, which includes the effect of ongoing Fund expenses, but does not include the effect of ongoing Contract expenses.
You can estimate the Fund-level expenses you incurred during the period by following these steps. Of course, your account value and expenses will differ from those in this illustration:
| 1. | Divide your account value by $1,000. |
If an account had an $8,600 value, then $8,600 ÷ $1,000 = 8.6.
| 2. | Multiply the result by the number under the heading “Fund-Level Expenses Incurred During Period.” |
If Fund-Level Expenses Incurred During Period were $7.50, then 8.6 x $7.50 = $64.50.
In this illustration, the estimated expenses incurred this period at the Fund level are $64.50.
Templeton Foreign
Securities Fund – Class 1
TF-6
Hypothetical Example for Comparison with Other Mutual Funds
Information in the second line (Hypothetical) of the table can help you compare ongoing expenses of the Fund with those of other mutual funds offered through the Contract. This information may not be used to estimate the actual ending account balance or expenses you incurred during the period. The hypothetical “Ending Account Value” is based on the Fund’s actual expense ratio and an assumed 5% annual rate of return before expenses, which does not represent the Fund’s actual return. The figure under the heading “Fund-Level Expenses Incurred During Period” shows the hypothetical expenses your account would have incurred under this scenario. You can compare this figure with the 5% hypothetical examples that appear in shareholder reports of other funds offered through a Contract.
| | | | | | | | | | | | |
| Class 1 | | Beginning
Account Value 7/1/11 | | | Ending
Account Value 12/31/11 | | | Fund-Level Expenses Incurred
During Period* 7/1/11–12/31/11 | |
Actual | | $ | 1,000 | | | $ | 843.60 | | | $ | 3.72 | |
Hypothetical (5% return before expenses) | | $ | 1,000 | | | $ | 1,021.17 | | | $ | 4.08 | |
*Expenses are calculated using the most recent six-month annualized expense ratio for the Fund’s Class 1 shares (0.80%), which does not include any ongoing expenses of the Contract for which the Fund is an investment option, multiplied by the average account value over the period, multiplied by 184/365 to reflect the one-half year period.
TF-7
Franklin Templeton Variable Insurance Products Trust
Financial Highlights
Templeton Foreign Securities Fund
| | | | | | | | | | | | | | | | | | | | |
| | | Year Ended December 31, | |
| Class 1 | | 2011 | | | 2010 | | | 2009 | | | 2008 | | | 2007 | |
| | | | |
Per share operating performance | | | | | | | | | | | | | | | | | | | | |
(for a share outstanding throughout the year) | | | | | | | | | | | | | | | | | | | | |
Net asset value, beginning of year | | $ | 14.54 | | | $ | 13.68 | | | $ | 10.95 | | | $ | 20.57 | | | $ | 19.00 | |
| | | | |
Income from investment operationsa: | | | | | | | | | | | | | | | | | | | | |
Net investment incomeb | | | 0.42 | | | | 0.28 | | | | 0.25 | | | | 0.45 | | | | 0.45 | |
Net realized and unrealized gains (losses) | | | (1.90 | ) | | | 0.86 | | | | 3.39 | | | | (8.01 | ) | | | 2.46 | |
| | | | |
Total from investment operations | | | (1.48 | ) | | | 1.14 | | | | 3.64 | | | | (7.56 | ) | | | 2.91 | |
| | | | |
Less distributions from: | | | | | | | | | | | | | | | | | | | | |
Net investment income | | | (0.28 | ) | | | (0.28 | ) | | | (0.43 | ) | | | (0.45 | ) | | | (0.44 | ) |
Net realized gains | | | — | | | | — | | | | (0.48 | ) | | | (1.61 | ) | | | (0.90 | ) |
| | | | |
Total distributions | | | (0.28 | ) | | | (0.28 | ) | | | (0.91 | ) | | | (2.06 | ) | | | (1.34 | ) |
| | | | |
Redemption feesc | | | — | | | | — | | | | — | | | | — | | | | — | |
| | | | |
Net asset value, end of year | | $ | 12.78 | | | $ | 14.54 | | | $ | 13.68 | | | $ | 10.95 | | | $ | 20.57 | |
| | | | |
| | | | | |
Total returnd | | | (10.44)% | | | | 8.67% | | | | 37.34% | | | | (40.23)% | | | | 15.79% | |
Ratios to average net assets | | | | | | | | | | | | | | | | | | | | |
Expensese | | | 0.79% | | | | 0.78% | | | | 0.78% | | | | 0.77% | | | | 0.75% | |
Net investment income | | | 2.92% | | | | 2.10% | | | | 2.28% | | | | 2.82% | | | | 2.22% | |
| | | | | |
Supplemental data | | | | | | | | | | | | | | | | | | | | |
Net assets, end of year (000’s) | | $ | 254,292 | | | $ | 321,282 | | | $ | 318,173 | | | $ | 262,725 | | | $ | 531,377 | |
Portfolio turnover rate | | | 21.09% | | | | 19.16% | | | | 22.50% | | | | 18.27% | | | | 26.74% | |
aThe amount shown for a share outstanding throughout the period may not correlate with the Statement of Operations for the period due to the timing of sales and repurchases of the Fund shares in relation to income earned and/or fluctuating market value of the investments of the Fund.
bBased on average daily shares outstanding.
cAmount rounds to less than $0.01 per share.
dTotal return does not include fees, charges or expenses imposed by the variable annuity and life insurance contracts for which the Franklin Templeton Variable Insurance Products Trust serves as an underlying investment vehicle.
eBenefit of expense reduction rounds to less than 0.01%.
The accompanying notes are an integral part of these financial statements.
TF-8
Franklin Templeton Variable Insurance Products Trust
Financial Highlights (continued)
Templeton Foreign Securities Fund
| | | | | | | | | | | | | | | | | | | | |
| | | Year Ended December 31, | |
| Class 2 | | 2011 | | | 2010 | | | 2009 | | | 2008 | | | 2007 | |
| | | | |
Per share operating performance | | | | | | | | | | | | | | | | | | | | |
(for a share outstanding throughout the year) | | | | | | | | | | | | | | | | | | | | |
Net asset value, beginning of year | | $ | 14.29 | | | $ | 13.45 | | | $ | 10.76 | | | $ | 20.25 | | | $ | 18.73 | |
| | | | |
Income from investment operationsa: | | | | | | | | | | | | | | | | | | | | |
Net investment incomeb | | | 0.37 | | | | 0.25 | | | | 0.22 | | | | 0.40 | | | | 0.38 | |
Net realized and unrealized gains (losses) | | | (1.86 | ) | | | 0.84 | | | | 3.34 | | | | (7.89 | ) | | | 2.44 | |
| | | | |
Total from investment operations | | | (1.49 | ) | | | 1.09 | | | | 3.56 | | | | (7.49 | ) | | | 2.82 | |
| | | | |
Less distributions from: | | | | | | | | | | | | | | | | | | | | |
Net investment income | | | (0.24 | ) | | | (0.25 | ) | | | (0.39 | ) | | | (0.39 | ) | | | (0.40 | ) |
Net realized gains | | | — | | | | — | | | | (0.48 | ) | | | (1.61 | ) | | | (0.90 | ) |
| | | | |
Total distributions | | | (0.24 | ) | | | (0.25 | ) | | | (0.87 | ) | | | (2.00 | ) | | | (1.30 | ) |
| | | | |
Redemption feesc | | | — | | | | — | | | | — | | | | — | | | | — | |
| | | | |
Net asset value, end of year | | $ | 12.56 | | | $ | 14.29 | | | $ | 13.45 | | | $ | 10.76 | | | $ | 20.25 | |
| | | | |
| | | | | |
Total returnd | | | (10.63)% | | | | 8.41% | | | | 37.04% | | | | (40.38)% | | | | 15.46% | |
Ratios to average net assets | | | | | | | | | | | | | | | | | | | | |
Expensese | | | 1.04% | | | | 1.03% | | | | 1.03% | | | | 1.02% | | | | 1.00% | |
Net investment income | | | 2.67% | | | | 1.85% | | | | 2.03% | | | | 2.57% | | | | 1.97% | |
| | | | | |
Supplemental data | | | | | | | | | | | | | | | | | | | | |
Net assets, end of year (000’s) | | $ | 1,679,412 | | | $ | 2,090,757 | | | $ | 2,010,268 | | | $ | 1,702,038 | | | $ | 3,255,154 | |
Portfolio turnover rate | | | 21.09% | | | | 19.16% | | | | 22.50% | | | | 18.27% | | | | 26.74% | |
aThe amount shown for a share outstanding throughout the period may not correlate with the Statement of Operations for the period due to the timing of sales and repurchases of the Fund shares in relation to income earned and/or fluctuating market value of the investments of the Fund.
bBased on average daily shares outstanding.
cAmount rounds to less than $0.01 per share.
dTotal return does not include fees, charges or expenses imposed by the variable annuity and life insurance contracts for which the Franklin Templeton Variable Insurance Products Trust serves as an underlying investment vehicle.
eBenefit of expense reduction rounds to less than 0.01%.
The accompanying notes are an integral part of these financial statements.
TF-9
Franklin Templeton Variable Insurance Products Trust
Financial Highlights (continued)
Templeton Foreign Securities Fund
| | | | | | | | | | | | | | | | | | | | |
| | | Year Ended December 31, | |
| Class 3 | | 2011 | | | 2010 | | | 2009 | | | 2008 | | | 2007 | |
| | | | |
Per share operating performance | | | | | | | | | | | | | | | | | | | | |
(for a share outstanding throughout the year) | | | | | | | | | | | | | | | | | | | | |
Net asset value, beginning of year | | $ | 14.24 | | | $ | 13.37 | | | $ | 10.70 | | | $ | 20.18 | | | $ | 18.68 | |
| | | | |
Income from investment operationsa: | | | | | | | | | | | | | | | | | | | | |
Net investment incomeb | | | 0.37 | | | | 0.25 | | | | 0.25 | | | | 0.39 | | | | 0.37 | |
Net realized and unrealized gains (losses) | | | (1.86 | ) | | | 0.84 | | | | 3.30 | | | | (7.84 | ) | | | 2.45 | |
| | | | |
Total from investment operations | | | (1.49 | ) | | | 1.09 | | | | 3.55 | | | | (7.45 | ) | | | 2.82 | |
| | | | |
Less distributions from: | | | | | | | | | | | | | | | | | | | | |
Net investment income | | | (0.24 | ) | | | (0.22 | ) | | | (0.40 | ) | | | (0.42 | ) | | | (0.42 | ) |
Net realized gains | | | — | | | | — | | | | (0.48 | ) | | | (1.61 | ) | | | (0.90 | ) |
| | | | |
Total distributions | | | (0.24 | ) | | | (0.22 | ) | | | (0.88 | ) | | | (2.03 | ) | | | (1.32 | ) |
| | | | |
Redemption feesc | | | — | | | | — | | | | — | | | | — | | | | — | |
| | | | |
Net asset value, end of year | | $ | 12.51 | | | $ | 14.24 | | | $ | 13.37 | | | $ | 10.70 | | | $ | 20.18 | |
| | | | |
| | | | | |
Total returnd | | | (10.68)% | | | | 8.41% | | | | 37.20% | | | | (40.39)% | | | | 15.45% | |
Ratios to average net assets | | | | | | | | | | | | | | | | | | | | |
Expensese | | | 1.04% | | | | 1.03% | | | | 1.03% | | | | 1.02% | | | | 1.00% | |
Net investment income | | | 2.67% | | | | 1.85% | | | | 2.03% | | | | 2.57% | | | | 1.97% | |
| | | | | |
Supplemental data | | | | | | | | | | | | | | | | | | | | |
Net assets, end of year (000’s) | | $ | 88,380 | | | $ | 108,766 | | | $ | 115,364 | | | $ | 271,061 | | | $ | 313,505 | |
Portfolio turnover rate | | | 21.09% | | | | 19.16% | | | | 22.50% | | | | 18.27% | | | | 26.74% | |
aThe amount shown for a share outstanding throughout the period may not correlate with the Statement of Operations for the period due to the timing of sales and repurchases of the Fund shares in relation to income earned and/or fluctuating market value of the investments of the Fund.
bBased on average daily shares outstanding.
cAmount rounds to less than $0.01 per share.
dTotal return does not include fees, charges or expenses imposed by the variable annuity and life insurance contracts for which the Franklin Templeton Variable Insurance Products Trust serves as an underlying investment vehicle.
eBenefit of expense reduction rounds to less than 0.01%.
The accompanying notes are an integral part of these financial statements.
TF-10
Franklin Templeton Variable Insurance Products Trust
Financial Highlights (continued)
Templeton Foreign Securities Fund
| | | | | | | | | | | | | | | | |
| | | Year Ended December 31, | |
| Class 4 | | 2011 | | | 2010 | | | 2009 | | | 2008a | |
| | | | |
Per share operating performance | | | | | | | | | | | | | | | | |
(for a share outstanding throughout the year) | | | | | | | | | | | | | | | | |
Net asset value, beginning of year | | $ | 14.43 | | | $ | 13.59 | | | $ | 10.91 | | | $ | 18.90 | |
| | | | |
Income from investment operationsb: | | | | | | | | | | | | | | | | |
Net investment incomec | | | 0.36 | | | | 0.17 | | | | 0.21 | | | | 0.15 | |
Net realized and unrealized gains (losses) | | | (1.88 | ) | | | 0.92 | | | | 3.37 | | | | (6.08 | ) |
| | | | |
Total from investment operations | | | (1.52 | ) | | | 1.09 | | | | 3.58 | | | | (5.93 | ) |
| | | | |
Less distributions from: | | | | | | | | | | | | | | | | |
Net investment income | | | (0.25 | ) | | | (0.25 | ) | | | (0.42 | ) | | | (0.45 | ) |
Net realized gains | | | — | | | | — | | | | (0.48 | ) | | | (1.61 | ) |
| | | | |
Total distributions | | | (0.25 | ) | | | (0.25 | ) | | | (0.90 | ) | | | (2.06 | ) |
| | | | |
Redemption feesd | | | — | | | | — | | | | — | | | | — | |
| | | | |
Net asset value, end of year | | $ | 12.66 | | | $ | 14.43 | | | $ | 13.59 | | | $ | 10.91 | |
| | | | |
| | | | |
Total returne | | | (10.74)% | | | | 8.38% | | | | 36.84% | | | | (35.15)% | |
Ratios to average net assetsf | | | | | | | | | | | | | | | | |
Expensesg | | | 1.14% | | | | 1.13% | | | | 1.13% | | | | 1.12% | |
Net investment income | | | 2.57% | | | | 1.75% | | | | 1.93% | | | | 2.47% | |
| | | | |
Supplemental data | | | | | | | | | | | | | | | | |
Net assets, end of year (000’s) | | $ | 353,346 | | | $ | 305,505 | | | $ | 48,501 | | | $ | 14,287 | |
Portfolio turnover rate | | | 21.09% | | | | 19.16% | | | | 22.50% | | | | 18.27% | |
aFor the period February 29, 2008 (effective date) to December 31, 2008.
bThe amount shown for a share outstanding throughout the period may not correlate with the Statement of Operations for the period due to the timing of sales and repurchases of the Fund shares in relation to income earned and/or fluctuating market value of the investments of the Fund.
cBased on average daily shares outstanding.
dAmount rounds to less than $0.01 per share.
eTotal return does not include fees, charges or expenses imposed by the variable annuity and life insurance contracts for which the Franklin Templeton Variable Insurance Products Trust serves as an underlying investment vehicle.
fRatios are annualized for periods less than one year.
gBenefit of expense reduction rounds to less than 0.01%.
The accompanying notes are an integral part of these financial statements.
TF-11
Franklin Templeton Variable Insurance Products Trust
Statement of Investments, December 31, 2011
| | | | | | | | | | |
| Templeton Foreign Securities Fund | | Country | | Shares/
Units | | | Value | |
Common Stocks and Other Equity Interests 93.8% | | | | | | | | | | |
Aerospace & Defense 0.8% | | | | | | | | | | |
BAE Systems PLC | | United Kingdom | | | 4,453,130 | | | $ | 19,699,114 | |
| | | | | | | | | | |
Airlines 0.4% | | | | | | | | | | |
Deutsche Lufthansa AG | | Germany | | | 871,940 | | | | 10,326,250 | |
| | | | | | | | | | |
Automobiles 1.6% | | | | | | | | | | |
aMazda Motor Corp. | | Japan | | | 5,453,000 | | | | 9,635,652 | |
Toyota Motor Corp., ADR | | Japan | | | 440,460 | | | | 29,127,620 | |
| | | | | | | | | | |
| | | | | | | | | 38,763,272 | |
| | | | | | | | | | |
Capital Markets 4.6% | | | | | | | | | | |
Credit Suisse Group AG | | Switzerland | | | 1,969,870 | | | | 46,331,359 | |
KKR & Co., LP | | United States | | | 1,155,000 | | | | 14,818,650 | |
Nomura Holdings Inc. | | Japan | | | 5,636,100 | | | | 17,062,448 | |
aUBS AG | | Switzerland | | | 2,504,440 | | | | 29,839,228 | |
| | | | | | | | | | |
| | | | | | | | | 108,051,685 | |
| | | | | | | | | | |
Chemicals 0.9% | | | | | | | | | | |
Akzo Nobel NV | | Netherlands | | | 454,250 | | | | 21,965,281 | |
| | | | | | | | | | |
Commercial Banks 6.5% | | | | | | | | | | |
BNP Paribas SA | | France | | | 786,460 | | | | 30,893,726 | |
DBS Group Holdings Ltd. | | Singapore | | | 2,993,520 | | | | 26,586,501 | |
HSBC Holdings PLC | | United Kingdom | | | 3,065,200 | | | | 23,285,196 | |
KB Financial Group Inc., ADR | | South Korea | | | 1,220,681 | | | | 38,256,143 | |
UniCredit SpA | | Italy | | | 2,788,463 | | | | 23,170,463 | |
United Overseas Bank Ltd. | | Singapore | | | 985,000 | | | | 11,595,829 | |
| | | | | | | | | | |
| | | | | | | | | 153,787,858 | |
| | | | | | | | | | |
Commercial Services & Supplies 0.9% | | | | | | | | | | |
G4S PLC | | United Kingdom | | | 5,045,810 | | | | 21,258,958 | |
| | | | | | | | | | |
Communications Equipment 0.7% | | | | | | | | | | |
Telefonaktiebolaget LM Ericsson, B, ADR | | Sweden | | | 1,675,840 | | | | 16,976,259 | |
| | | | | | | | | | |
Computers & Peripherals 1.8% | | | | | | | | | | |
Compal Electronics Inc. | | Taiwan | | | 28,536,431 | | | | 28,456,339 | |
Lite-On Technology Corp. | | Taiwan | | | 11,802,124 | | | | 13,288,837 | |
| | | | | | | | | | |
| | | | | | | | | 41,745,176 | |
| | | | | | | | | | |
Construction Materials 0.6% | | | | | | | | | | |
CRH PLC | | Ireland | | | 659,820 | | | | 13,117,517 | |
| | | | | | | | | | |
Containers & Packaging 0.7% | | | | | | | | | | |
Rexam PLC | | United Kingdom | | | 3,021,290 | | | | 16,528,106 | |
| | | | | | | | | | |
Diversified Financial Services 1.8% | | | | | | | | | | |
aING Groep NV | | Netherlands | | | 5,880,644 | | | | 42,318,926 | |
| | | | | | | | | | |
Diversified Telecommunication Services 10.0% | | | | | | | | | | |
China Telecom Corp. Ltd., H | | China | | | 69,378,357 | | | | 39,483,473 | |
France Telecom SA | | France | | | 2,164,143 | | | | 33,990,745 | |
Singapore Telecommunications Ltd. | | Singapore | | | 16,934,000 | | | | 40,340,806 | |
Telefonica SA, ADR | | Spain | | | 1,813,382 | | | | 31,172,037 | |
Telekom Austria AG | | Austria | | | 1,711,400 | | | | 20,462,771 | |
Telenor ASA | | Norway | | | 3,226,804 | | | | 52,928,941 | |
Vivendi SA | | France | | | 898,479 | | | | 19,676,291 | |
| | | | | | | | | | |
| | | | | | | | | 238,055,064 | |
| | | | | | | | | | |
TF-12
Franklin Templeton Variable Insurance Products Trust
Statement of Investments, December 31, 2011 (continued)
| | | | | | | | | | |
| Templeton Foreign Securities Fund | | Country | | Shares/
Units | | | Value | |
Common Stocks and Other Equity Interests (continued) | | | | | | | | | | |
Electric Utilities 0.8% | | | | | | | | | | |
E.ON AG | | Germany | | | 917,590 | | | $ | 19,631,635 | |
| | | | | | | | | | |
Electronic Equipment, Instruments & Components 1.2% | | | | | | | | | | |
aFlextronics International Ltd. | | Singapore | | | 4,961,670 | | | | 28,083,052 | |
| | | | | | | | | | |
Energy Equipment & Services 0.7% | | | | | | | | | | |
Aker Solutions ASA | | Norway | | | 1,617,940 | | | | 17,029,808 | |
| | | | | | | | | | |
Food & Staples Retailing 2.5% | | | | | | | | | | |
Tesco PLC | | United Kingdom | | | 9,326,670 | | | | 58,457,252 | |
| | | | | | | | | | |
Industrial Conglomerates 3.3% | | | | | | | | | | |
Hutchison Whampoa Ltd. | | Hong Kong | | | 2,500,239 | | | | 21,021,503 | |
Koninklijke Philips Electronics NV | | Netherlands | | | 1,473,320 | | | | 31,044,627 | |
Siemens AG | | Germany | | | 285,414 | | | | 27,275,117 | |
| | | | | | | | | | |
| | | | | | | | | 79,341,247 | |
| | | | | | | | | | |
Insurance 10.4% | | | | | | | | | | |
ACE Ltd. | | United States | | | 377,449 | | | | 26,466,724 | |
AIA Group Ltd. | | Hong Kong | | | 11,111,000 | | | | 34,692,369 | |
Aviva PLC | | United Kingdom | | | 9,269,960 | | | | 43,267,686 | |
AXA SA | | France | | | 2,547,968 | | | | 33,126,752 | |
Muenchener Rueckversicherungs-Gesellschaft AG | | Germany | | | 249,150 | | | | 30,504,186 | |
NKSJ Holdings Inc. | | Japan | | | 1,054,500 | | | | 20,688,560 | |
PartnerRe Ltd. | | Bermuda | | | 196,480 | | | | 12,615,981 | |
aSwiss Re Ltd. | | Switzerland | | | 917,340 | | | | 46,798,173 | |
| | | | | | | | | | |
| | | | | | | | | 248,160,431 | |
| | | | | | | | | | |
Life Sciences Tools & Services 0.4% | | | | | | | | | | |
Lonza Group AG | | Switzerland | | | 175,440 | | | | 10,376,640 | |
| | | | | | | | | | |
Media 1.0% | | | | | | | | | | |
Reed Elsevier NV | | Netherlands | | | 2,017,693 | | | | 23,521,781 | |
| | | | | | | | | | |
Metals & Mining 0.9% | | | | | | | | | | |
POSCO | | South Korea | | | 66,052 | | | | 21,651,723 | |
| | | | | | | | | | |
Multi-Utilities 0.8% | | | | | | | | | | |
GDF Suez | | France | | | 697,431 | | | | 19,064,706 | |
| | | | | | | | | | |
Multiline Retail 0.5% | | | | | | | | | | |
Marks & Spencer Group PLC | | United Kingdom | | | 2,350,320 | | | | 11,333,394 | |
| | | | | | | | | | |
Oil, Gas & Consumable Fuels 10.7% | | | | | | | | | | |
BP PLC | | United Kingdom | | | 4,406,715 | | | | 31,496,024 | |
Gazprom, ADR | | Russia | | | 2,623,000 | | | | 28,016,263 | |
Reliance Industries Ltd. | | India | | | 998,145 | | | | 13,045,641 | |
Royal Dutch Shell PLC, A | | United Kingdom | | | 16,803 | | | | 618,030 | |
Royal Dutch Shell PLC, B | | United Kingdom | | | 1,292,973 | | | | 49,278,912 | |
Statoil ASA | | Norway | | | 2,455,740 | | | | 63,029,284 | |
Talisman Energy Inc. | | Canada | | | 1,506,600 | | | | 19,188,214 | |
bTotal SA, B | | France | | | 979,926 | | | | 50,098,570 | |
| | | | | | | | | | |
| | | | | | | | | 254,770,938 | |
| | | | | | | | | | |
Pharmaceuticals 12.1% | | | | | | | | | | |
GlaxoSmithKline PLC | | United Kingdom | | | 2,772,585 | | | | 63,359,637 | |
Merck KGaA | | Germany | | | 405,300 | | | | 40,448,774 | |
Novartis AG | | Switzerland | | | 360,330 | | | | 20,621,006 | |
Roche Holding AG | | Switzerland | | | 468,100 | | | | 79,417,616 | |
TF-13
Franklin Templeton Variable Insurance Products Trust
Statement of Investments, December 31, 2011 (continued)
| | | | | | | | | | |
| Templeton Foreign Securities Fund | | Country | | Shares/
Units | | | Value | |
Common Stocks and Other Equity Interests (continued) | | | | | | | | | | |
Pharmaceuticals (continued) | | | | | | | | | | |
Sanofi | | France | | | 1,127,925 | | | $ | 82,847,812 | |
| | | | | | | | | | |
| | | | | | | | | 286,694,845 | |
| | | | | | | | | | |
Professional Services 1.1% | | | | | | | | | | |
Hays PLC | | United Kingdom | | | 11,353,070 | | | | 11,343,170 | |
Randstad Holding NV | | Netherlands | | | 477,910 | | | | 14,140,257 | |
| | | | | | | | | | |
| | | | | | | | | 25,483,427 | |
| | | | | | | | | | |
Real Estate Management & Development 0.0%† | | | | | | | | | | |
Cheung Kong (Holdings) Ltd. | | Hong Kong | | | 922 | | | | 10,987 | |
| | | | | | | | | | |
Semiconductors & Semiconductor Equipment 6.5% | | | | | | | | | | |
Infineon Technologies AG | | Germany | | | 1,103,225 | | | | 8,281,844 | |
Samsung Electronics Co. Ltd. | | South Korea | | | 89,088 | | | | 81,306,969 | |
Siliconware Precision Industries Co. | | Taiwan | | | 14,515,000 | | | | 12,988,493 | |
Taiwan Semiconductor Manufacturing Co. Ltd. | | Taiwan | | | 20,849,526 | | | | 52,184,054 | |
| | | | | | | | | | |
| | | | | | | | | 154,761,360 | |
| | | | | | | | | | |
Software 2.9% | | | | | | | | | | |
Nintendo Co. Ltd. | | Japan | | | 166,400 | | | | 22,917,430 | |
SAP AG, ADR | | Germany | | | 370,760 | | | | 19,631,742 | |
Trend Micro Inc. | | Japan | | | 868,100 | | | | 25,953,331 | |
| | | | | | | | | | |
| | | | | | | | | 68,502,503 | |
| | | | | | | | | | |
Specialty Retail 1.5% | | | | | | | | | | |
Kingfisher PLC | | United Kingdom | | | 9,366,486 | | | | 36,465,799 | |
| | | | | | | | | | |
Trading Companies & Distributors 0.9% | | | | | | | | | | |
Itochu Corp. | | Japan | | | 2,102,500 | | | | 21,362,373 | |
| | | | | | | | | | |
Wireless Telecommunication Services 4.3% | | | | | | | | | | |
China Mobile Ltd. | | China | | | 2,340,000 | | | | 22,867,922 | |
Mobile TeleSystems, ADR | | Russia | | | 914,865 | | | | 13,430,218 | |
Vodafone Group PLC, ADR | | United Kingdom | | | 2,323,300 | | | | 65,122,099 | |
| | | | | | | | | | |
| | | | | | | | | 101,420,239 | |
| | | | | | | | | | |
Total Common Stocks and Other Equity Interests
(Cost $2,388,902,314) | | | | | | | | | 2,228,717,606 | |
| | | | | | | | | | |
Preferred Stocks 1.6% | | | | | | | | | | |
Metals & Mining 1.1% | | | | | | | | | | |
Vale SA, ADR, pfd., A | | Brazil | | | 1,210,222 | | | | 24,930,573 | |
| | | | | | | | | | |
Oil, Gas & Consumable Fuels 0.5% | | | | | | | | | | |
Petroleo Brasileiro SA, ADR, pfd. | | Brazil | | | 517,880 | | | | 12,165,001 | |
| | | | | | | | | | |
Total Preferred Stocks (Cost $13,315,242) | | | | | | | | | 37,095,574 | |
| | | | | | | | | | |
Total Investments before Short Term Investments
(Cost $2,402,217,556) | | | | | | | | | 2,265,813,180 | |
| | | | | | | | | | |
TF-14
Franklin Templeton Variable Insurance Products Trust
Statement of Investments, December 31, 2011 (continued)
| | | | | | | | | | |
| Templeton Foreign Securities Fund | | Country | | Shares/
Units | | | Value | |
Short Term Investments 4.5% | | | | | | | | | | |
Money Market Funds (Cost $106,174,453) 4.5% | | | | | | | | | | |
a,cInstitutional Fiduciary Trust Money Market Portfolio | | United States | | | 106,174,453 | | | $ | 106,174,453 | |
| | | | | | | | | | |
dInvestments from Cash Collateral Received for Loaned Securities
(Cost $138,503) 0.0%† | | | | | | | | | | |
Money Market Funds 0.0%† | | | | | | | | | | |
eBNY Mellon Overnight Government Fund, 0.039% | | United States | | | 138,503 | | | | 138,503 | |
| | | | | | | | | | |
Total Investments (Cost $2,508,530,512) 99.9% | | | | | | | | | 2,372,126,136 | |
Other Assets, less Liabilities 0.1% | | | | | | | | | 3,303,938 | |
| | | | | | | | | | |
Net Assets 100.0% | | | | | | | | $ | 2,375,430,074 | |
| | | | | | | | | | |
See Abbreviations on page TF-26.
†Rounds to less than 0.1% of net assets.
aNon-income producing.
bA portion or all of the security is on loan at December 31, 2011. See Note 1(c).
cSee Note 7 regarding investments in the Institutional Fiduciary Trust Money Market Portfolio.
dSee Note 1(c) regarding securities on loan.
eThe rate shown is the annualized seven-day yield at period end.
The accompanying notes are an integral part of these financial statements.
TF-15
Franklin Templeton Variable Insurance Products Trust
Financial Statements
Statements of Assets and Liabilities
December 31, 2011
| | | | |
| | | Templeton
Foreign
Securities Fund | |
Assets: | | | | |
Investments in securities: | | | | |
Cost - Unaffiliated issuers | | $ | 2,402,356,059 | |
Cost - Sweep Money Fund (Note 7) | | | 106,174,453 | |
| | | | |
Total cost of investments | | $ | 2,508,530,512 | |
| | | | |
Value - Unaffiliated issuers | | $ | 2,265,951,683 | |
Value - Sweep Money Fund (Note 7) | | | 106,174,453 | |
| | | | |
Total value of investments (includes securities loaned in the amount $131,856) | | | 2,372,126,136 | |
Cash | | | 172,980 | |
Receivables: | | | | |
Capital shares sold | | | 1,547,647 | |
Dividends and interest | | | 6,865,931 | |
Other assets | | | 75 | |
| | | | |
Total assets | | | 2,380,712,769 | |
| | | | |
Liabilities: | | | | |
Payables: | | | | |
Capital shares redeemed | | | 1,877,410 | |
Affiliates | | | 2,452,002 | |
Reports to shareholders | | | 640,351 | |
Payable upon return of securities loaned | | | 138,503 | |
Accrued expenses and other liabilities | | | 174,429 | |
| | | | |
Total liabilities | | | 5,282,695 | |
| | | | |
Net assets, at value | | $ | 2,375,430,074 | |
| | | | |
Net assets consist of: | | | | |
Paid-in capital | | $ | 2,569,122,780 | |
Undistributed net investment income | | | 72,574,104 | |
Net unrealized appreciation (depreciation) | | | (136,417,326 | ) |
Accumulated net realized gain (loss) | | | (129,849,484 | ) |
| | | | |
Net assets, at value | | $ | 2,375,430,074 | |
| | | | |
The accompanying notes are an integral part of these financial statements.
TF-16
Franklin Templeton Variable Insurance Products Trust
Financial Statements (continued)
Statements of Assets and Liabilities (continued)
December 31, 2011
| | | | |
| | | Templeton
Foreign
Securities Fund | |
Class 1: | | | | |
Net assets, at value | | $ | 254,292,005 | |
| | | | |
Shares outstanding | | | 19,894,351 | |
| | | | |
Net asset value and maximum offering price per share | | $ | 12.78 | |
| | | | |
Class 2: | | | | |
Net assets, at value | | $ | 1,679,411,889 | |
| | | | |
Shares outstanding | | | 133,750,747 | |
| | | | |
Net asset value and maximum offering price per share | | $ | 12.56 | |
| | | | |
Class 3: | | | | |
Net assets, at value | | $ | 88,380,234 | |
| | | | |
Shares outstanding | | | 7,064,247 | |
| | | | |
Net asset value and maximum offering price per sharea | | $ | 12.51 | |
| | | | |
Class 4: | | | | |
Net assets, at value | | $ | 353,345,946 | |
| | | | |
Shares outstanding | | | 27,919,791 | |
| | | | |
Net asset value and maximum offering price per share | | $ | 12.66 | |
| | | | |
aRedemption price is equal to net asset value less any redemption fees retained by the fund.
The accompanying notes are an integral part of these financial statements.
TF-17
Franklin Templeton Variable Insurance Products Trust
Financial Statements (continued)
Statement of Operations
for the year ended December 31, 2011
| | | | |
| | | Templeton
Foreign
Securities Fund | |
Investment income: | | | | |
Dividends (net of foreign taxes of $10,047,845) | | $ | 95,839,331 | |
Income from securities loaned | | | 3,918,257 | |
| | | | |
Total investment income | | | 99,757,588 | |
| | | | |
Expenses: | | | | |
Management fees (Note 3a) | | | 17,160,771 | |
Administrative fees (Note 3b) | | | 2,592,887 | |
Distribution fees: (Note 3c) | | | | |
Class 2 | | | 4,871,796 | |
Class 3 | | | 255,374 | |
Class 4 | | | 1,189,998 | |
Unaffiliated transfer agent fees | | | 7,664 | |
Custodian fees (Note 4) | | | 571,227 | |
Reports to shareholders | | | 674,731 | |
Professional fees | | | 131,433 | |
Trustees’ fees and expenses | | | 9,695 | |
Other | | | 52,264 | |
| | | | |
Total expenses | | | 27,517,840 | |
Expense reductions (Note 4) | | | (18 | ) |
| | | | |
Net expenses | | | 27,517,822 | |
| | | | |
Net investment income | | | 72,239,766 | |
| | | | |
Realized and unrealized gains (losses): | | | | |
Net realized gain (loss) from: | | | | |
Investments | | | 136,320,840 | |
Foreign currency transactions | | | 677,995 | |
| | | �� | |
Net realized gain (loss) | | | 136,998,835 | |
| | | | |
Net change in unrealized appreciation (depreciation) on: | | | | |
Investments | | | (482,109,964 | ) |
Translation of other assets and liabilities denominated in foreign currencies | | | (202,130 | ) |
| | | | |
Net change in unrealized appreciation (depreciation) | | | (482,312,094 | ) |
| | | | |
Net realized and unrealized gain (loss) | | | (345,313,259 | ) |
| | | | |
Net increase (decrease) in net assets resulting from operations | | $ | (273,073,493 | ) |
| | | | |
The accompanying notes are an integral part of these financial statements.
TF-18
Franklin Templeton Variable Insurance Products Trust
Financial Statements (continued)
Statements of Changes in Net Assets
| | | | | | | | |
| | | Templeton Foreign
Securities Fund | |
| | | Year Ended December 31, | |
| | | 2011 | | | 2010 | |
| | | | |
Increase (decrease) in net assets: | | | | | | | | |
Operations: | | | | | | | | |
Net investment income | | $ | 72,239,766 | | | $ | 47,212,887 | |
Net realized gain (loss) from investments and foreign currency transactions | | | 136,998,835 | | | | 35,915,484 | |
Net change in unrealized appreciation (depreciation) on investments and translation of other assets and liabilities denominated in foreign currencies | | | (482,312,094 | ) | | | 171,263,300 | |
| | | | |
Net increase (decrease) in net assets resulting from operations | | | (273,073,493 | ) | | | 254,391,671 | |
| | | | |
Distributions to shareholders from: | | | | | | | | |
Net investment income: | | | | | | | | |
Class 1 | | | (5,782,491 | ) | | | (6,186,591 | ) |
Class 2 | | | (33,309,204 | ) | | | (35,909,578 | ) |
Class 3 | | | (1,749,311 | ) | | | (1,738,264 | ) |
Class 4 | | | (5,966,192 | ) | | | (1,159,055 | ) |
| | | | |
Total distributions to shareholders | | | (46,807,198 | ) | | | (44,993,488 | ) |
| | | | |
Capital share transactions: (Note 2) | | | | | | | | |
Class 1 | | | (31,404,883 | ) | | | (16,391,025 | ) |
Class 2 | | | (183,781,604 | ) | | | (56,686,127 | ) |
Class 3 | | | (8,583,165 | ) | | | (13,133,254 | ) |
Class 4 | | | 92,765,363 | | | | 210,807,534 | |
| | | | |
Total capital share transactions | | | (131,004,289 | ) | | | 124,597,128 | |
| | | | |
Redemption fees | | | 4,895 | | | | 9,228 | |
| | | | |
Net increase (decrease) in net assets | | | (450,880,085 | ) | | | 334,004,539 | |
Net assets: | | | | | | | | |
Beginning of year | | | 2,826,310,159 | | | | 2,492,305,620 | |
| | | | |
End of year | | $ | 2,375,430,074 | | | $ | 2,826,310,159 | |
| | | | |
Undistributed net investment income included in net assets: | | | | | | | | |
End of year | | $ | 72,574,104 | | | $ | 46,209,487 | |
| | | | |
The accompanying notes are an integral part of these financial statements.
TF-19
Franklin Templeton Variable Insurance Products Trust
Notes to Financial Statements
Templeton Foreign Securities Fund
1. ORGANIZATION AND SIGNIFICANT ACCOUNTING POLICIES
Franklin Templeton Variable Insurance Products Trust (Trust) is registered under the Investment Company Act of 1940, as amended, (1940 Act) as an open-end investment company, consisting of twenty separate funds. The Templeton Foreign Securities (Fund) is included in this report. The financial statements of the remaining funds in the Trust are presented separately. Shares of the Fund are generally sold only to insurance company separate accounts to fund the benefits of variable life insurance policies or variable annuity contracts. The Fund offers four classes of shares: Class 1, Class 2, Class 3, and Class 4. Each class of shares differs by its distribution fees, voting rights on matters affecting a single class and its exchange privilege.
The following summarizes the Fund’s significant accounting policies.
a. Financial Instrument Valuation
The Fund’s investments in securities and other financial instruments are carried at fair value daily. Fair value is the price that would be received to sell an asset or paid to transfer a liability in an orderly transaction between market participants on the measurement date. Under procedures approved by the Trust’s Board of Trustees, the Fund may utilize independent pricing services, quotations from securities and financial instrument dealers, and other market sources to determine fair value.
Equity securities listed on an exchange or on the NASDAQ National Market System are valued at the last quoted sale price or the official closing price of the day, respectively. Foreign equity securities are valued as of the close of trading on the foreign stock exchange on which the security is primarily traded, or the NYSE, whichever is earlier. The value is then converted into its U.S. dollar equivalent at the foreign exchange rate in effect at the close of the NYSE on the day that the value of the security is determined. Over-the-counter securities are valued within the range of the most recent quoted bid and ask prices. Securities that trade in multiple markets or on multiple exchanges are valued according to the broadest and most representative market. Certain equity securities are valued based upon fundamental characteristics or relationships to similar securities. Investments in open-end mutual funds and non-registered money market funds are valued at the closing net asset value.
The Fund has procedures to determine the fair value of securities and other financial instruments for which market prices are not readily available or which may not be reliably priced. Under these procedures, the Fund primarily employs a market-based approach which may use related or comparable assets or liabilities, recent transactions, market multiples, book values, and other relevant information for the investment to determine the fair value of the investment. The Fund may also use an income-based valuation approach in which the anticipated future cash flows of the investment are discounted to calculate fair value. Discounts may also be applied due to the nature or duration of any restrictions on the disposition of the investments. Due to the inherent uncertainty of valuations of such investments, the fair values may differ significantly from the values that would have been used had an active market existed.
Trading in securities on foreign securities stock exchanges and over-the-counter markets may be completed before the daily close of business on the NYSE. Occasionally, events occur between the time at which trading in a foreign security is completed and the close of the NYSE that might call into question the reliability of the value of a portfolio security held by the Fund. As a result, differences may arise between the value of the Fund’s portfolio securities as determined at the foreign market close and the latest indications of value at the close of the NYSE. In order to minimize the potential for these differences, the investment manager monitors price movements following the close of trading in foreign stock markets through a series of country specific market proxies (such as baskets of American Depositary Receipts, futures contracts and exchange traded funds). These price movements are measured against established trigger thresholds for each specific market proxy to assist in determining if an event has occurred that may call into question the reliability of the values of the foreign securities held by the Fund. If such an event occurs, the securities may be valued using fair value procedures, which may include the use of independent pricing services.
b. Foreign Currency Translation
Portfolio securities and other assets and liabilities denominated in foreign currencies are translated into U.S. dollars based on the exchange rate of such currencies against U.S. dollars on the date of valuation. The Fund may enter into foreign currency
TF-20
Franklin Templeton Variable Insurance Products Trust
Notes to Financial Statements (continued)
Templeton Foreign Securities Fund
1. ORGANIZATION AND SIGNIFICANT ACCOUNTING POLICIES (continued)
b. Foreign Currency Translation (continued)
exchange contracts to facilitate transactions denominated in a foreign currency. Purchases and sales of securities, income and expense items denominated in foreign currencies are translated into U.S. dollars at the exchange rate in effect on the transaction date. Portfolio securities and assets and liabilities denominated in foreign currencies contain risks that those currencies will decline in value relative to the U.S. dollar. Occasionally, events may impact the availability or reliability of foreign exchange rates used to convert the U.S. dollar equivalent value. If such an event occurs, the foreign exchange rate will be valued at fair value using procedures established and approved by the Trust’s Board of Trustees.
The Fund does not separately report the effect of changes in foreign exchange rates from changes in market prices on securities held. Such changes are included in net realized and unrealized gain or loss from investments on the Statement of Operations.
Realized foreign exchange gains or losses arise from sales of foreign currencies, currency gains or losses realized between the trade and settlement dates on securities transactions and the difference between the recorded amounts of dividends, interest, and foreign withholding taxes and the U.S. dollar equivalent of the amounts actually received or paid. Net unrealized foreign exchange gains and losses arise from changes in foreign exchange rates on foreign denominated assets and liabilities other than investments in securities held at the end of the reporting period.
c. Securities Lending
The Fund participates in an agency based security lending program. The Fund receives cash collateral against the loaned securities in an amount equal to at least 102% of the market value of the loaned securities. Collateral is maintained over the life of the loan in an amount not less than 100% of the market value of loaned securities, as determined at the close of Fund business each day; any additional collateral required due to changes in security values is delivered to the Fund on the next business day. The collateral is invested in a money market fund managed by the Fund’s custodian on the fund’s behalf. The Fund receives income from the investment of cash collateral, in addition to lending fees and rebates paid by the borrower. The Fund bears the market risk with respect to the collateral investment, securities loaned, and the risk that the agent may default on its obligations to the Fund. The securities lending agent has agreed to indemnify the Fund in the event of default by a third party borrower.
d. Income Taxes
It is the Fund’s policy to qualify as a regulated investment company under the Internal Revenue Code. The Fund intends to distribute to shareholders substantially all of its taxable income and net realized gains to relieve it from federal income and excise taxes. As a result, no provision for U.S. federal income taxes is required.
The Fund may be subject to foreign taxation related to income received, capital gains on the sale of securities and certain foreign currency transactions in the foreign jurisdictions in which it invests. Foreign taxes, if any, are recorded based on the tax regulations and rates that exist in the foreign markets in which the Fund invests. When a capital gain tax is determined to apply the Fund records an estimated deferred tax liability in an amount that would be payable if the securities were disposed of on the valuation date.
The Fund recognizes the tax benefits of uncertain tax positions only when the position is “more likely than not” to be sustained upon examination by the tax authorities based on the technical merits of the tax position. As of December 31, 2011, and for all open tax years, the Fund has determined that no liability for unrecognized tax benefits is required in the Fund’s financial statements related to uncertain tax positions taken on a tax return (or expected to be taken on future tax returns). Open tax years are those that remain subject to examination and are based on each tax jurisdiction statute of limitation.
TF-21
Franklin Templeton Variable Insurance Products Trust
Notes to Financial Statements (continued)
Templeton Foreign Securities Fund
1. ORGANIZATION AND SIGNIFICANT ACCOUNTING POLICIES (continued)
e. Security Transactions, Investment Income, Expenses and Distributions
Security transactions are accounted for on trade date. Realized gains and losses on security transactions are determined on a specific identification basis . Estimated expenses are accrued daily. Dividend income is recorded on the ex-dividend date except that certain dividends from foreign securities are recognized as soon as the Fund is notified of the ex-dividend date. Distributions to shareholders are recorded on the ex-dividend date and are determined according to income tax regulations (tax basis). Distributable earnings determined on a tax basis may differ from earnings recorded in accordance with accounting principles generally accepted in the United States of America. These differences may be permanent or temporary. Permanent differences are reclassified among capital accounts to reflect their tax character. These reclassifications have no impact on net assets or the results of operations. Temporary differences are not reclassified, as they may reverse in subsequent periods.
Common expenses incurred by the Trust are allocated among the funds based on the ratio of net assets of each fund to the combined net assets of the Trust. Fund specific expenses are charged directly to the fund that incurred the expense.
Realized and unrealized gains and losses and net investment income, not including class specific expenses, are allocated daily to each class of shares based upon the relative proportion of net assets of each class. Differences in per share distributions, by class, are generally due to differences in class specific expenses.
f. Accounting Estimates
The preparation of financial statements in accordance with accounting principles generally accepted in the United States of America requires management to make estimates and assumptions that affect the reported amounts of assets and liabilities at the date of the financial statements and the amounts of income and expenses during the reporting period. Actual results could differ from those estimates.
g. Redemption Fees
Redemptions and exchanges of interests in an insurance company subaccount that invests in Class 3 shares of the Fund will be subject to a 1.0% short term trading fee if the interest in the subaccount has been held for less than 60 days. Such fees are retained by the Fund and accounted for as an addition to paid-in capital, allocated to each class of shares based upon the relative proportion of net assets of each class.
h. Guarantees and Indemnifications
Under the Trust’s organizational documents, its officers and trustees are indemnified by the Trust against certain liabilities arising out of the performance of their duties to the Trust. Additionally, in the normal course of business, the Trust, on behalf of the Fund, enters into contracts with service providers that contain general indemnification clauses. The Trust’s maximum exposure under these arrangements is unknown as this would involve future claims that may be made against the Trust that have not yet occurred. Currently, the Trust expects the risk of loss to be remote.
TF-22
Franklin Templeton Variable Insurance Products Trust
Notes to Financial Statements (continued)
Templeton Foreign Securities Fund
2. SHARES OF BENEFICIAL INTEREST
At December 31, 2011, there were an unlimited number of shares authorized (without par value). Transactions in the Fund’s shares were as follows:
| | | | | | | | | | | | | | | | |
| | | Year Ended December 31, | |
| | | 2011 | | | 2010 | |
| Class 1 Shares: | | Shares | | | Amount | | | Shares | | | Amount | |
Shares sold | | | 596,966 | | | $ | 8,620,768 | | | | 1,834,739 | | | $ | 24,009,210 | |
Shares issued in reinvestment of distributions | | | 392,832 | | | | 5,782,491 | | | | 500,533 | | | | 6,186,591 | |
Shares redeemed | | | (3,184,900 | ) | | | (45,808,142 | ) | | | (3,507,687 | ) | | | (46,586,826 | ) |
| | | | |
Net increase (decrease) | | | (2,195,102 | ) | | $ | (31,404,883 | ) | | | (1,172,415 | ) | | $ | (16,391,025 | ) |
| | | | |
Class 2 Shares: | | | | | | | | | | | | | | | | |
Shares sold | | | 14,900,290 | | | $ | 201,768,630 | | | | 24,359,823 | | | $ | 304,453,001 | |
Shares issued in reinvestment of distributions | | | 2,300,359 | | | | 33,309,204 | | | | 2,950,664 | | | | 35,909,578 | |
Shares redeemed | | | (29,726,460 | ) | | | (418,859,438 | ) | | | (30,526,296 | ) | | | (397,048,706 | ) |
| | | | |
Net increase (decrease) | | | (12,525,811 | ) | | $ | (183,781,604 | ) | | | (3,215,809 | ) | | $ | (56,686,127 | ) |
| | | | |
Class 3 Shares: | | | | | | | | | | | | | | | | |
Shares sold | | | 712,054 | | | $ | 9,594,087 | | | | 488,049 | | | $ | 6,145,010 | |
Shares issued in reinvestment of distributions | | | 121,227 | | | | 1,749,311 | | | | 143,421 | | | | 1,738,264 | |
Shares redeemed | | | (1,406,375 | ) | | | (19,926,563 | ) | | | (1,625,745 | ) | | | (21,016,528 | ) |
| | | | |
Net increase (decrease) | | | (573,094 | ) | | $ | (8,583,165 | ) | | | (994,275 | ) | | $ | (13,133,254 | ) |
| | | | |
Class 4 Shares: | | | | | | | | | | | | | | | | |
Shares sold | | | 10,343,049 | | | $ | 143,108,311 | | | | 19,836,996 | | | $ | 240,414,850 | |
Shares issued on reinvestment of distributions | | | 408,643 | | | | 5,966,192 | | | | 94,309 | | | | 1,159,055 | |
Shares redeemed | | | (4,003,106 | ) | | | (56,309,140 | ) | | | (2,328,115 | ) | | | (30,766,371 | ) |
| | | | |
Net increase (decrease) | | | 6,748,586 | | | $ | 92,765,363 | | | | 17,603,190 | | | $ | 210,807,534 | |
| | | | |
3. TRANSACTIONS WITH AFFILIATES
Franklin Resources, Inc. is the holding company for various subsidiaries that together are referred to as Franklin Templeton Investments. Certain officers and trustees of the Fund are also officers and/or directors of the following subsidiaries:
| | |
| Subsidiary | | Affiliation |
Templeton Investment Counsel, LLC (TIC) | | Investment manager |
Franklin Templeton Services, LLC (FT Services) | | Administrative manager |
Franklin Templeton Distributors, Inc. (Distributors) | | Principal underwriter |
Franklin Templeton Investor Services, LLC (Investor Services) | | Transfer agent |
a. Management Fees
The Fund pays an investment management fee to TIC based on the average daily net assets of the Fund as follows:
| | |
| Annualized Fee Rate | | Net Assets |
| 0.750% | | Up to and including $200 million |
| 0.675% | | Over $200 million, up to and including $1.3 billion |
| 0.600% | | Over $1.3 billion, up to and including $10 billion |
| 0.580% | | Over $10 billion, up to and including $15 billion |
| 0.560% | | Over $15 billion, up to and including $20 billion |
| 0.540% | | In excess of $20 billion |
TF-23
Franklin Templeton Variable Insurance Products Trust
Notes to Financial Statements (continued)
Templeton Foreign Securities Fund
3. TRANSACTIONS WITH AFFILIATES (continued)
b. Administrative Fees
The Fund pays an administrative fee to FT Services based on the Fund’s average daily net assets as follows:
| | |
| Annualized Fee Rate | | Net Assets |
| 0.150% | | Up to and including $200 million |
| 0.135% | | Over $200 million, up to and including $700 million |
| 0.100% | | Over $700 million, up to and including $1.2 billion |
| 0.075% | | In excess of $1.2 billion |
c. Distribution Fees
The Fund’s Board of Trustees has adopted distribution plans for Class 2, Class 3, and Class 4 shares pursuant to Rule 12b-1 under the 1940 Act. Under the Fund’s compensation distribution plans, the Fund pays Distributors for costs incurred in connection with the servicing, sale and distribution of the Fund’s shares up to 0.25%, 0.35%, and 0.35% per year of its average daily net assets of Class 2, Class 3, and Class 4, respectively. The Board of Trustees has agreed to limit the current rate to 0.25% per year for Class 3.
d. Transfer Agent Fees
Investor Services, under terms of an agreement, performs shareholder servicing for the Fund and is not paid by the Fund for the services.
4. EXPENSE OFFSET ARRANGEMENT
The Fund has entered into an arrangement with its custodian whereby credits realized as a result of uninvested cash balances are used to reduce a portion of the Fund’s custodian expenses. During the year ended December 31, 2011, the custodian fees were reduced as noted in the Statement of Operations.
5. INCOME TAXES
For tax purposes, capital losses may be carried over to offset future capital gains, if any. Under the Regulated Investment Company Modernization Act of 2010, capital losses incurred by the Fund in taxable years beginning after December 22, 2010 are not subject to expiration and such losses retain their character as either short-term or long-term, rather than being considered short-term as under previous law. Post-enactment capital losses must be fully utilized prior to utilizing any losses incurred in pre-enactment tax years.
At December 31, 2011, the Fund had capital loss carryforwards of $128,971,444 expiring in 2017. During the year ended December 31, 2011, the Fund utilized $136,320,840 of capital loss carryforwards.
The tax character of distributions paid during the years ended December 31, 2011 and 2010, was as follows:
| | | | | | | | |
| | | 2011 | | | 2010 | |
Distributions paid from ordinary income | | $ | 46,807,198 | | | $ | 44,993,488 | |
| | | | |
TF-24
Franklin Templeton Variable Insurance Products Trust
Notes to Financial Statements (continued)
Templeton Foreign Securities Fund
5. INCOME TAXES (continued)
At December 31, 2011, the cost of investments, net unrealized appreciation (depreciation), undistributed ordinary income for income tax purposes were as follows:
| | | | |
Cost of investments | | $ | 2,509,847,444 | |
| | | | |
| |
Unrealized appreciation | | $ | 303,823,609 | |
Unrealized depreciation | | | (441,544,917 | ) |
| | | | |
Net unrealized appreciation (depreciation) | | $ | (137,721,308 | ) |
| | | | |
Distributable earnings – undistributed ordinary income | | $ | 73,012,989 | |
| | | | |
Differences between income and/or capital gains as determined on a book basis and a tax basis are primarily due to differing treatment of pass-through entity income.
6. INVESTMENT TRANSACTIONS
Purchases and sales of investments (excluding short term securities) for the year ended December 31, 2011, aggregated $555,333,584 and $693,180,056, respectively.
7. INVESTMENTS IN INSTITUTIONAL FIDUCIARY TRUST MONEY MARKET PORTFOLIO
The Fund invests in the Institutional Fiduciary Trust Money Market Portfolio (Sweep Money Fund), an open-end investment company managed by Franklin Advisers, Inc. (an affiliate of the investment manager). Management fees paid by the Fund are reduced on assets invested in the Sweep Money Fund, in an amount not to exceed the management and administrative fees paid by the Sweep Money Fund.
8. CONCENTRATION OF RISK
Investing in foreign securities may include certain risks and considerations not typically associated with investing in U.S. securities, such as fluctuating currency values and changing local and regional economic, political and social conditions, which may result in greater market volatility. In addition, certain foreign securities may not be as liquid as U.S. securities.
9. CREDIT FACILITY
The Fund, together with other U.S. registered and foreign investment funds (collectively, Borrowers), managed by Franklin Templeton Investments, are borrowers in a joint syndicated senior unsecured credit facility totaling $750 million (Global Credit Facility) which matured on January 20, 2012. This Global Credit Facility provides a source of funds to the Borrowers for temporary and emergency purposes, including the ability to meet future unanticipated or unusually large redemption requests. Effective January 20, 2012, the Borrowers renewed the Global Credit Facility for a total of $1.5 billion, maturing January 18, 2013.
Under the terms of the Global Credit Facility, the Fund shall, in addition to interest charged on any borrowings made by the Fund and other costs incurred by the Fund, pay its share of fees and expenses incurred in connection with the implementation and maintenance of the Global Credit Facility, based upon its relative share of the aggregate net assets of all of the Borrowers, including an annual commitment fee of 0.08% based upon the unused portion of the Global Credit Facility, which is reflected in other expenses on the Statement of Operations. During the year ended December 31, 2011, the Fund did not use the Global Credit Facility.
TF-25
Franklin Templeton Variable Insurance Products Trust
Notes to Financial Statements (continued)
Templeton Foreign Securities Fund
10. FAIR VALUE MEASUREMENTS
The Fund follows a fair value hierarchy that distinguishes between market data obtained from independent sources (observable inputs) and the Fund’s own market assumptions (unobservable inputs). These inputs are used in determining the value of the Fund’s investments and are summarized in the following fair value hierarchy:
| | • | | Level 1 – quoted prices in active markets for identical securities |
| | • | | Level 2 – other significant observable inputs (including quoted prices for similar securities, interest rates, prepayment speed, credit risk, etc.) |
| | • | | Level 3 – significant unobservable inputs (including the Fund’s own assumptions in determining the fair value of investments) |
The inputs or methodology used for valuing securities are not an indication of the risk associated with investing in those securities.
For movements between the levels within the fair value hierarchy, the Fund has adopted a policy of recognizing the transfers as of the date of the underlying event which caused the movement.
The following is a summary of the inputs used as of December 31, 2011, in valuing the Fund’s assets and liabilities carried at fair value:
| | | | | | | | | | | | | | | | |
| | | Level 1 | | | Level 2 | | | Level 3 | | | Total | |
| | | | |
Assets: | | | | | | | | | | | | | | | | |
Investments in Securities | | | | | | | | | | | | | | | | |
Equity Investmentsa,b | | $ | 2,265,813,180 | | | $ | — | | | $ | — | | | $ | 2,265,813,180 | |
Short Term Investments | | | 106,174,453 | | | | 138,503 | | | | — | | | | 106,312,956 | |
| | | | |
Total Investments in Securities | | $ | 2,371,987,633 | | | $ | 138,503 | | | $ | — | | | $ | 2,372,126,136 | |
| | | | |
aIncludes common and preferred stock as well as other equity investments.
bFor detailed categories, see the accompanying Statement of Investments.
11. NEW ACCOUNTING PRONOUNCEMENTS
In May 2011, the Financial Accounting Standards Board (FASB) issued Accounting Standards Update (ASU) No. 2011-04, Fair Value Measurement (Topic 820): Amendments to Achieve Common Fair Value Measurement and Disclosure Requirements in U.S. GAAP and IFRSs. The amendments in the ASU will improve the comparability of fair value measurements presented and disclosed in financial statements prepared in accordance with U.S. GAAP (Generally Accepted Accounting Principles) and IFRS (International Financial Reporting Standards) and include new guidance for certain fair value measurement principles and disclosure requirements. The ASU is effective for interim and annual periods beginning after December 15, 2011. The Fund believes the adoption of this ASU will not have a material impact on its financial statements.
12. SUBSEQUENT EVENTS
The Fund has evaluated subsequent events through the issuance of the financial statements and determined that no events have occurred that require disclosure other than those already disclosed in the financial statements.
| | |
ABBREVIATIONS | | |
| Selected Portfolio | | |
| | |
| ADR - American Depositary Receipt | | |
TF-26
Franklin Templeton Variable Insurance Products Trust
Templeton Foreign Securities Fund
Report of Independent Registered Public Accounting Firm
To the Board of Trustees and Shareholders of
Franklin Templeton Variable Insurance Products Trust
In our opinion, the accompanying statement of assets and liabilities, including the statement of investments, and the related statements of operations and of changes in net assets and the financial highlights present fairly, in all material respects, the financial position of Templeton Foreign Securities Fund (the “Fund”) at December 31, 2011, the results of its operations for the year then ended, the changes in its net assets for each of the two years in the period then ended and the financial highlights for the periods presented, in conformity with accounting principles generally accepted in the United States of America. These financial statements and financial highlights (hereafter referred to as “financial statements”) are the responsibility of the Fund’s management. Our responsibility is to express an opinion on these financial statements based on our audits. We conducted our audits of these financial statements in accordance with the standards of the Public Company Accounting Oversight Board (United States). Those standards require that we plan and perform the audit to obtain reasonable assurance about whether the financial statements are free of material misstatement. An audit includes examining, on a test basis, evidence supporting the amounts and disclosures in the financial statements, assessing the accounting principles used and significant estimates made by management, and evaluating the overall financial statement presentation. We believe that our audits, which included confirmation of securities at December 31, 2011 by correspondence with the custodian and brokers, provide a reasonable basis for our opinion.
PricewaterhouseCoopers LLP
San Francisco, California
February 13, 2012
TF-27
Franklin Templeton Variable Insurance Products Trust
Tax Information (unaudited)
Templeton Foreign Securities Fund
At December 31, 2011, more than 50% of the Fund’s total assets were invested in securities of foreign issuers. In most instances, foreign taxes were withheld from income paid to the Fund on these investments. The Fund elects to treat foreign taxes paid as allowed under Section 853 of the Internal Revenue Code. This election will allow shareholders of record as of the 2012 distribution date, to treat their proportionate share of foreign taxes paid by the Fund as having been paid directly by them. The shareholder shall consider these amounts as foreign taxes paid in the tax year in which they receive the Fund distribution.
TF-28
TEMPLETON GLOBAL BOND SECURITIES FUND
This annual report for Templeton Global Bond Securities Fund covers the fiscal year ended December 31, 2011.
Performance Summary as of 12/31/11
Average annual total return of Class 1 shares represents the average annual change in value, assuming reinvestment of dividends and capital gains. Average returns smooth out variations in returns, which can be significant; they are not the same as year-by-year results.
Periods ended 12/31/11
| | | | | | | | | | | | |
| | | 1-Year | | | 5-Year | | | 10-Year | |
Average Annual Total Return | | | -0.61% | | | | +9.95% | | | | +11.71% | |
Total Return Index Comparison for a Hypothetical $10,000 Investment (1/1/02–12/31/11)
The graph below shows the change in value of a hypothetical $10,000 investment in the Fund over the indicated period and includes reinvestment of any income or distributions. The Fund’s performance is compared to the performance of the J.P. Morgan (JPM) Global Government Bond Index (GGBI), the Citigroup World Government Bond Index (WGBI) and the Consumer Price Index (CPI). One cannot invest directly in an index, and an index is not representative of the Fund’s portfolio. Please see Important Notes to Performance Information preceding the Fund Summaries.
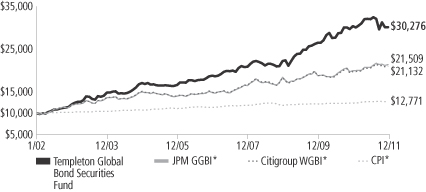
*Source: © 2012 Morningstar. Please see Index Descriptions following the Fund Summaries.
Templeton Global Bond Securities Fund – Class 1
Performance reflects the Fund’s Class 1 operating expenses, but does not include any contract fees, expenses or sales charges. If they had been included, performance would be lower. These charges and deductions, particularly for variable life policies, can have a significant effect on contract values and insurance benefits. See the contract prospectus for a complete description of these expenses, including sales charges.
Performance data represent past performance, which does not guarantee future results. Investment return and principal value will fluctuate, and you may have a gain or loss when you sell your shares.
Current performance may differ from figures shown.
TGB-1
Fund Goal and Main Investments: Templeton Global Bond Securities Fund seeks high current income, consistent with preservation of capital, with capital appreciation as a secondary consideration. The Fund normally invests at least 80% of its net assets in bonds, which include debt securities of any maturity, such as bonds, notes, bills and debentures.
Performance Overview
You can find the Fund’s one-year total return in the Performance Summary. The Fund underperformed its benchmarks, the JPM GGBI, which posted a +7.22% total return in U.S. dollar terms, and the Citigroup WGBI, which produced a +6.35% total return for the same period.1
Economic and Market Overview
Early in the year under review, emerging markets continued to lead the global recovery as several emerging economies returned to or exceeded their respective pre-crisis activity levels. Where recoveries were strong, monetary authorities tightened policy as output gaps closed and early indicators of inflationary pressure became more pronounced. In much of the developed world, however, economic growth was below trend and significant slack remained. Although some developed economies, such as those of Australia and some Scandinavian nations, enjoyed relatively strong recoveries, growth in the G-3 (U.S., eurozone and Japan) was slow by the standards of previous recoveries. Therefore, G-3 policymakers sought to maintain historically accommodative monetary policy.
This divergence in economic conditions and the subsequent policy responses supported a further increase of capital flows to emerging markets. Although increased foreign investment supported recovery in these economies, it also prompted fears of potential asset price bubbles, economic overheating and currency overvaluation. Overall, these conditions supported risk assets, as equity markets performed well and bond yields generally rose for much of the period.
Toward the latter half of the year, softer economic reports in most advanced and some emerging economies raised concerns that the global recovery might be faltering. Markets seemed to price in an end to the current recovery phase rather than a mid-business-cycle slowdown. However, neither the traditional signs of U.S. overcapacity nor evidence
1. Source: © 2012 Morningstar. One cannot invest directly in an index, and an index is not representative of the Fund’s portfolio. Please see Index Descriptions following the Fund Summaries.
Fund Risks: All investments involve risks. Because the Fund invests in bonds and other debt obligations, its share price and yield will be affected by interest rate movements. Bond prices generally move in the opposite direction of interest rates. Thus, as prices of bonds in the Fund adjust to a rise in interest rates, the Fund’s share price may decline. High yield, lower rated (junk) bonds generally have greater price swings and higher default risks than investment-grade bonds. Foreign investing, especially in emerging or developing markets, involves additional risks, including currency fluctuations, economic instability, market volatility, and political and social instability. The Fund’s investment in certain hedging and derivative instruments may involve a small investment relative to the risk assumed. As a nondiversified fund, the Fund may be more sensitive to economic, business, political or other changes affecting similar issuers or securities, which may result in greater fluctuation in the value of the Fund’s shares. The Fund is actively managed but there is no guarantee that the manager’s investment decisions will produce the desired results. The Fund’s prospectus also includes a description of the main investment risks.
TGB-2
of housing or other asset bubbles were present. Despite strong fundamentals, corporations remained restrained in hiring and capacity-building and a tendency toward leaner staffing stymied recovery in the labor market. We were not surprised by this soft patch in the recovery, given the degree of leverage that had developed in the system in the years leading up to the global financial crisis. There was some moderation in the trajectories of emerging economies, but we believe this allowed growth to ease to more sustainable levels and reduced the potential for overheating.
Economic performance in Asia excluding Japan was stronger than in other regions, even as economic activity in the region showed signs of moderating toward the end of the Fund’s fiscal year.
In the third quarter of 2011, real gross domestic product (GDP) grew 9.1% in China, 5.8% in Malaysia and 3.5% in South Korea from the same period a year ago.2 Asian policymakers generally tightened monetary policy as measures of economic slack decreased. China reined in liquidity seeking to prevent the formation of asset bubbles and to encourage a more sustainable economic growth rate. Elsewhere in the region, policymakers hiked interest rates 225 basis points (bps; 100 bps equal one percentage point) in India, 75 bps in South Korea, 50 bps in the Philippines and 25 bps in Malaysia. In contrast, third-quarter year-over-year GDP growth was 1.5% in the U.S., 1.3% in the eurozone and -0.7% in Japan, leading U.S. and Japanese policymakers to maintain historically low interest rates.3
Against this economic backdrop, markets absorbed several shocks throughout the review period. Populist uprisings in Tunisia, Egypt and Libya led to the fall of those countries’ long-time rulers and helped inspire a wave of regional unrest. An earthquake and subsequent tsunami struck serious blows to Japan’s economy and led to global supply-chain disruptions. Global economic activity began to normalize as Japan began reconstruction and firms attempted to recover. These events contributed to significant short-term market volatility. Particularly, oil prices rose during the period as Libyan exports declined and investors became skittish due to fears about the potential effects of regional instability.
2. Sources: National Bureau of Statistics (China), Department of Statistics (Malaysia), Bank of Korea (South Korea).
3. Sources: Bureau of Economic Analysis (U.S.), Eurostat (eurozone), Economic and Social Research Institute (Japan).
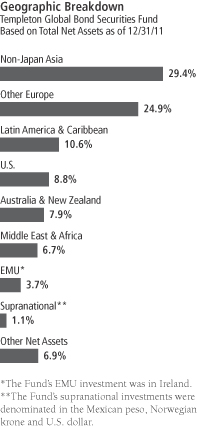
TGB-3
Separately, concerns about the solvency of highly indebted eurozone governments resurfaced as policymakers struggled to develop a coordinated plan to address the significant fiscal challenges in Ireland, Portugal, Greece, Spain and Italy. The persistent eurozone sovereign debt crisis contributed to periods of elevated risk aversion, during which yields declined, equity markets sold off and perceived safe-haven assets rallied. These alternated with periods of heightened risk appetite, during which yields increased and investors again favored risk assets. Meanwhile, an extended and confrontational debate in Congress regarding an increase to the U.S. debt ceiling led Standard & Poor’s to downgrade its rating of long-term U.S. sovereign debt. The downgrade elevated investor risk aversion, and this sentiment became particularly strong in September as the eurozone crisis spread to Italy. Toward the end of the year, the European Central Bank (ECB) announced two long-term refinancing operations (LTRO), a broadening of the collateral pool, and a decrease in reserve requirements. The impact of these operations was a 20% increase in the ECB balance sheet over the fourth quarter. In the first of the two LTROs alone, the ECB injected nearly 500 billion euros into the banking sector overnight with the aim of easing pressure on the credit markets and mitigating the risk of financial contagion.
Investment Strategy
We invest selectively in bonds around the world based upon our assessment of changing market, political and economic conditions. While seeking opportunities, we monitor various factors including changes in interest rates, currency exchange rates and credit risks. We seek to manage the Fund’s exposure to various currencies and may utilize currency forward contracts.
Manager’s Discussion
The Fund’s total return was influenced by various factors, including interest rate developments, currency movements and exposure to sovereign debt markets. During the period under review, interest rate strategies and sovereign credit exposures contributed to absolute results, while currency positions detracted.
Interest Rate Strategy
During the Fund’s fiscal year, we shortened the portfolio’s duration as many policymakers around the world, including in the eurozone, hiked interest rates in attempts to prevent potential inflationary effects and as concerns grew surrounding the sustainability of historically
What is a currency forward contract?
A currency forward contract is an agreement between the Fund and a counterparty to buy or sell a foreign currency for a specific exchange rate on a future date.
What is duration?
Duration is a measure of a bond’s price sensitivity to interest rate changes. In general, a portfolio of securities with a lower duration can be expected to be less sensitive to interest rate changes than a portfolio with a higher duration.
TGB-4
accommodative monetary and fiscal policies in the U.S. By period-end, we generally held shorter duration positioning in Latin America, given our outlook for some countries to tighten interest rates in the region. With U.S. and Japanese interest rates at historically low levels, the Federal Reserve (Fed) and Bank of Japan supplying significant liquidity to the financial sector, and rising fiscal deficits in both countries, we saw limited value in American and Japanese government bonds. Our exposure to these countries detracted from relative performance as yields did not increase significantly during the review period. The Fund maintained little duration exposure in emerging markets, except in a select few countries where rates were already quite high. The decline of long-term bond yields in Latin America and Asia excluding Japan, and the correspondingly high returns generated by our holdings in these regions, contributed to relative performance.
Currency Strategy
The Fund’s diversified currency exposure overall detracted from relative performance. As part of the Fund’s investment strategy, the Fund utilized currency forward contracts to hedge or gain exposure to various currencies during the review period. The U.S. dollar was broadly unchanged during the year even as most foreign economies grew at faster rates and attracted more substantial foreign investment than the U.S. economy. For the year, the U.S. dollar rose 0.18% against its major trading partners.4 The dollar was particularly weak early in the period as the market priced in Fed Chairman Bernanke’s announcement of a second round of quantitative easing shortly before 2011 began.
However, as the sovereign debt crisis in Europe played out, risk aversion increased among investors, contributing to a depreciation of most currencies against those of the largest developed economies. The U.S. dollar, historically seen as a safe-haven asset, appreciated as a result of this trend. The Fund’s currency exposures to Latin America detracted from absolute performance. During the fiscal year, the Mexican peso depreciated 11.62% against the U.S. dollar, underperforming the Brazilian real and Chilean peso, which were down 11.00% and 9.91% against the U.S. dollar, respectively.5
The Fund’s exposure to Asian currencies also detracted from performance during the period. The Japanese yen gained 5.41%5 against the U.S. dollar during the period as yields on 10-year U.S. government
4. Source: Federal Reserve H10 Report.
5. Source: IDC/Exshare.
Currency Breakdown
Templeton Global Bond Securities Fund
12/31/11
| | | | |
| | | % of Total Net Assets | |
| |
Americas | | | 58.3% | |
| U.S. Dollar | | | 42.6% | |
| Mexican Peso | | | 6.7% | |
| Chilean Peso | | | 5.3% | |
| Brazilian Real | | | 3.5% | |
| Peruvian Nuevo Sol | | | 0.2% | |
| |
Asia Pacific | | | 41.8% | |
| South Korean Won | | | 14.7% | |
| Malaysian Ringgit | | | 10.8% | |
| Australian Dollar | | | 10.4% | |
| Singapore Dollar | | | 7.7% | |
| Indonesian Rupiah | | | 6.7% | |
| Philippine Peso | | | 4.6% | |
| Indian Rupee | | | 3.6% | |
| Sri Lankan Rupee | | | 1.6% | |
| Japanese Yen* | | | -18.3% | |
| |
Middle East & Africa | | | 4.0% | |
| New Israeli Shekel | | | 3.8% | |
| Egyptian Pound | | | 0.2% | |
| |
Europe* | | | -4.1% | |
| Swedish Krona | | | 11.1% | |
| Polish Zloty | | | 8.5% | |
| Norwegian Krone | | | 6.1% | |
| British Pound | | | 4.1% | |
| Hungarian Forint | | | 1.3% | |
| Euro* | | | -35.2% | |
*Holding is a negative percentage because of the Fund’s holdings of currency forward contracts.
The dollar value, number of shares or principal amount, and names of all portfolio holdings are listed in the Fund’s Statement of Investments.
TGB-5
bonds fell 141 bps. Our net negative yen exposure, through the use of currency forwards, hindered relative performance. While the Australian dollar appreciated 0.01% against the U.S. dollar, supported by high Chinese demand for Australian exports as well as domestic strength, currencies elsewhere in Asia excluding Japan declined against the U.S. dollar.5 Central Banks in South Korea and the Philippines tightened monetary policy as capital flowed into these economies, but the South Korean won and Philippine peso finished the period down 1.48% and 0.10% for the year, respectively, against the dollar.5 The Indian rupee, Indonesian rupiah and Malaysian ringgit depreciated 15.80%, 0.63% and 2.73%, respectively, against the U.S. dollar.5
The euro strengthened against the dollar as building inflationary pressures and the strength of large, regional economies such as Germany’s led the ECB to hike policy rates in the early part of 2011, although the rate hikes were subsequently reversed toward year-end. The euro depreciated 3.24% against the U.S. dollar for the year, and the Fund’s net negative position, through the use of currency forwards, added to relative performance.5 However, this effect was partially offset by the Fund’s exposure to some other European currencies that depreciated against the U.S. dollar. For example, the Polish zloty, Swedish krona and Norwegian krone depreciated 13.96%, 1.93% and 2.60%, respectively, against the U.S. dollar.5
Global Sovereign Debt Strategy
The Fund purchased investment grade and sub-investment grade hard currency-denominated sovereign debt that typically compensates for greater credit risk by offering higher yields relative to U.S. Treasury and European benchmark bonds. Although risk aversion during the year led spreads to widen between high yielding sovereign credits and the underlying “risk-free assets,” such as U.S. Treasuries and German bunds, declining yields on U.S. Treasuries and the correspondingly high returns from these positions led sovereign credit exposures to benefit the Fund’s relative performance overall. As financial markets began reflecting the underlying strength of emerging economies, governments of some countries traditionally considered emerging markets could borrow more cheaply than some eurozone members and, in several cases, U.S. states. U.S. dollar-denominated emerging market debt posted a total return of +8.46% during the period, as measured by the JPM Emerging Markets Bond Index (EMBI) Global.1 Sovereign
TGB-6
interest rate credit spreads rose 137 bps during the period.6 Regionally, Latin American sovereign debt posted a +13.43% total return, Asian debt a +9.04% total return, and central and eastern European debt a +2.19% total return, as measured by subindexes of the JPM EMBI Global.6
Thank you for your participation in the Templeton Global Bond Securities Fund. We look forward to serving your future investment needs.
6. Source: J.P. Morgan.
The foregoing information reflects our analysis, opinions and portfolio holdings as of December 31, 2011, the end of the reporting period. The way we implement our main investment strategies and the resulting portfolio holdings may change depending on factors such as market and economic conditions. These opinions may not be relied upon as investment advice or an offer for a particular security. The information is not a complete analysis of every aspect of any market, country, industry, security or the Fund. Statements of fact are from sources considered reliable, but the investment manager makes no representation or warranty as to their completeness or accuracy. Although historical performance is no guarantee of future results, these insights may help you understand our investment management philosophy.
TGB-7
Fund Expenses
As an investor in a variable insurance contract (Contract) that indirectly provides for investment in an underlying mutual fund, you can incur transaction and/or ongoing expenses at both the Fund level and the Contract level.
| • | | Transaction expenses can include sales charges (loads) on purchases, redemption fees, surrender fees, transfer fees and premium taxes. |
| • | | Ongoing expenses can include management fees, distribution and service (12b-1) fees, contract fees, annual maintenance fees, mortality and expense risk fees and other fees and expenses. All mutual funds and Contracts have some types of ongoing expenses. |
The expenses shown in the table are meant to highlight ongoing expenses at the Fund level only and do not include ongoing expenses at the Contract level, or transaction expenses at either the Fund or Contract level. While the Fund does not have transaction expenses, if the transaction and ongoing expenses at the Contract level were included, the expenses shown below would be higher. You should consult your Contract prospectus or disclosure document for more information.
The table shows Fund-level ongoing expenses and can help you understand these expenses and compare them with those of other mutual funds offered through the Contract. The table assumes a $1,000 investment held for the six months indicated. Please refer to the Fund prospectus for additional information on operating expenses.
Actual Fund Expenses
The first line (Actual) of the table provides actual account values and expenses. The “Ending Account Value” is derived from the Fund’s actual return, which includes the effect of ongoing Fund expenses, but does not include the effect of ongoing Contract expenses.
You can estimate the Fund-level expenses you incurred during the period by following these steps. Of course, your account value and expenses will differ from those in this illustration:
| 1. | Divide your account value by $1,000. |
If an account had an $8,600 value, then $8,600 ÷ $1,000 = 8.6.
| 2. | Multiply the result by the number under the heading “Fund-Level Expenses Incurred During Period.” |
If Fund-Level Expenses Incurred During Period were $7.50, then 8.6 x $7.50 = $64.50.
In this illustration, the estimated expenses incurred this period at the Fund level are $64.50.
Templeton Global Bond Securities Fund – Class 1
TGB-8
Hypothetical Example for Comparison with Other Mutual Funds
Information in the second line (Hypothetical) of the table can help you compare ongoing expenses of the Fund with those of other mutual funds offered through the Contract. This information may not be used to estimate the actual ending account balance or expenses you incurred during the period. The hypothetical “Ending Account Value” is based on the Fund’s actual expense ratio for each class and an assumed 5% annual rate of return before expenses, which does not represent the Fund’s actual return. The figure under the heading “Fund-Level Expenses Incurred During Period” shows the hypothetical expenses your account would have incurred under this scenario. You can compare this figure with the 5% hypothetical examples that appear in shareholder reports of other funds offered through a Contract.
| | | | | | | | | | | | |
| Class 1 | | Beginning
Account Value 7/1/11 | | | Ending
Account Value 12/31/11 | | | Fund-Level Expenses Incurred During Period* 7/1/11–12/31/11 | |
Actual | | $ | 1,000 | | | $ | 942.80 | | | $ | 2.74 | |
Hypothetical (5% return before expenses) | | $ | 1,000 | | | $ | 1,022.38 | | | $ | 2.85 | |
*Expenses are calculated using the most recent six-month annualized expense ratio for the Fund’s Class 1 shares (0.56%), which does not include any ongoing expenses of the Contract for which the Fund is an investment option, multiplied by the average account value over the period, multiplied by 184/365 to reflect the one-half year period.
TGB-9
SUPPLEMENT DATED JANUARY 3, 2012
TOTHE PROSPECTUS
DATED MAY 1, 2011
TEMPLETON GLOBAL BOND SECURITIES FUND
(Franklin Templeton Variable Insurance Products Trust)
I. The “FUND SUMMARY – Principal Investment Strategies” and the “FUND DETAILS – Principal Investment Policies and Practices” sections are revised by adding the following:
For purposes of pursuing its investment goals, the Fund regularly uses various currency related transactions involving derivative instruments, principally currency and cross currency forwards, but may also use currency and currency index futures contracts. The Fund maintains significant positions in currency related derivative instruments as a hedging technique or to implement a currency investment strategy, which could expose a large amount of the Fund’s assets to obligations under the instruments. The use of these derivative transactions may allow the Fund to obtain net long or net negative (short) exposure to selected currencies.
II. The “FUND SUMMARY – Principal Risks” and the “FUND DETAILS – Principal Risks” sections are revised by adding the following:
Currency Management Strategies Currency management strategies may substantially change the Fund’s exposure to currency exchange rates and could result in losses to the Fund if currencies do not perform as the investment manager expects. In addition, currency management strategies, to the extent that they reduce the Fund’s exposure to currency risks, may also reduce the Fund’s ability to benefit from favorable changes in currency exchange rates. Using currency management strategies for purposes other than hedging further increases the Fund’s exposure to foreign investment losses. Currency markets generally are not as regulated as securities markets. In addition, currency rates may fluctuate significantly over short periods of time, and can reduce returns.
III. The “FUND SUMMARY – Principal Risks” and the “FUND DETAILS – Principal Risks” sections are revised by replacing the disclosure under the heading “Derivative Instruments” with the following:
Derivative Instruments The performance of derivative instruments (including currency related derivatives) depends largely on the performance of an underlying currency, security or index and such instruments often have risks similar to their underlying instrument, in addition to other risks. Derivatives involve costs and can create economic leverage in the portfolio which may result in significant volatility and cause the fund to participate in losses (as well as enable gains) on an amount that exceeds the Fund’s initial investment. Other risks include illiquidity in the Fund, mispricing or improper valuation, and imperfect correlation between the value of the derivative and the underlying instrument so that the Fund may not realize the intended benefits. When used for hedging, the change in value of the derivative may also not correlate specifically with the currency, security or other risk being hedged. With over-the-counter derivatives, there is the risk that the other party to the transaction will fail to perform.
Please keep this supplement for future reference.
TGB-10
Franklin Templeton Variable Insurance Products Trust
Financial Highlights
Templeton Global Bond Securities Fund
| | | | | | | | | | | | | | | | | | | | |
| | | Year Ended December 31, | |
| Class 1 | | 2011 | | | 2010 | | | 2009 | | | 2008 | | | 2007 | |
| | | | |
Per share operating performance | | | | | | | | | | | | | | | | | | | | |
(for a share outstanding throughout the year) | | | | | | | | | | | | | | | | | | | | |
Net asset value, beginning of year | | $ | 19.94 | | | $ | 17.72 | | | $ | 17.42 | | | $ | 17.00 | | | $ | 15.73 | |
| | | | |
Income from investment operationsa: | | | | | | | | | | | | | | | | | | | | |
Net investment incomeb | | | 0.87 | | | | 1.00 | | | | 0.99 | | | | 0.80 | | | | 0.77 | |
Net realized and unrealized gains (losses) | | | (0.92 | ) | | | 1.58 | | | | 2.01 | | | | 0.27 | | | | 0.97 | |
| | | | |
Total from investment operations | | | (0.05 | ) | | | 2.58 | | | | 3.00 | | | | 1.07 | | | | 1.74 | |
| | | | |
Less distributions from: | | | | | | | | | | | | | | | | | | | | |
Net investment income and net foreign currency gains | | | (1.15 | ) | | | (0.31 | ) | | | (2.70 | ) | | | (0.65 | ) | | | (0.47 | ) |
Net realized gains | | | (0.13 | ) | | | (0.05 | ) | | | — | | | | — | | | | — | |
| | | | |
Total distributions | | | (1.28 | ) | | | (0.36 | ) | | | (2.70 | ) | | | (0.65 | ) | | | (0.47 | ) |
| | | | |
Redemption feesc | | | — | | | | — | | | | — | | | | — | | | | — | |
| | | | |
Net asset value, end of year | | $ | 18.61 | | | $ | 19.94 | | | $ | 17.72 | | | $ | 17.42 | | | $ | 17.00 | |
| | | | |
| | | | | |
Total returnd | | | (0.61)% | | | | 14.71% | | | | 18.98% | | | | 6.46% | | | | 11.27% | |
Ratios to average net assets | | | | | | | | | | | | | | | | | | | | |
Expensese | | | 0.56% | | | | 0.55% | | | | 0.54% | | | | 0.58% | | | | 0.64% | |
Net investment income | | | 4.40% | | | | 5.27% | | | | 5.73% | | | | 4.66% | | | | 4.70% | |
| | | | | |
Supplemental data | | | | | | | | | | | | | | | | | | | | |
Net assets, end of year (000’s) | | $ | 269,819 | | | $ | 272,232 | | | $ | 195,662 | | | $ | 220,588 | | | $ | 137,700 | |
Portfolio turnover rate | | | 34.18% | | | | 8.77% | | | | 20.84% | | | | 28.46% | | | | 47.33% | |
aThe amount shown for a share outstanding throughout the period may not correlate with the Statement of Operations for the period due to the timing of sales and repurchases of the Fund shares in relation to income earned and/or fluctuating market value of the investments of the Fund.
bBased on average daily shares outstanding.
cAmount rounds to less than $0.01 per share.
dTotal return does not include fees, charges or expenses imposed by the variable annuity and life insurance contracts for which the Franklin Templeton Variable Insurance Products Trust serves as an underlying investment vehicle.
eBenefit of expense reduction rounds to less than 0.01%.
The accompanying notes are an integral part of these financial statements.
TGB-11
Franklin Templeton Variable Insurance Products Trust
Financial Highlights (continued)
Templeton Global Bond Securities Fund
| | | | | | | | | | | | | | | | | | | | |
| | | Year Ended December 31, | |
| Class 2 | | 2011 | | | 2010 | | | 2009 | | | 2008 | | | 2007 | |
| | | | |
Per share operating performance | | | | | | | | | | | | | | | | | | | | |
(for a share outstanding throughout the year) | | | | | | | | | | | | | | | | | | | | |
Net asset value, beginning of year | | $ | 19.49 | | | $ | 17.34 | | | $ | 17.10 | | | $ | 16.72 | | | $ | 15.50 | |
| | | | |
Income from investment operationsa: | | | | | | | | | | | | | | | | | | | | |
Net investment incomeb | | | 0.79 | | | | 0.93 | | | | 0.93 | | | | 0.74 | | | | 0.72 | |
Net realized and unrealized gains (losses) | | | (0.89 | ) | | | 1.54 | | | | 1.98 | | | | 0.27 | | | | 0.96 | |
| | | | |
Total from investment operations | | | (0.10 | ) | | | 2.47 | | | | 2.91 | | | | 1.01 | | | | 1.68 | |
| | | | |
Less distributions from: | | | | | | | | | | | | | | | | | | | | |
Net investment income and net foreign currency gains | | | (1.11 | ) | | | (0.27 | ) | | | (2.67 | ) | | | (0.63 | ) | | | (0.46 | ) |
Net realized gains | | | (0.13 | ) | | | (0.05 | ) | | | — | | | | — | | | | — | |
| | | | |
Total distributions | | | (1.24 | ) | | | (0.32 | ) | | | (2.67 | ) | | | (0.63 | ) | | | (0.46 | ) |
| | | | |
Redemption feesc | | | — | | | | — | | | | — | | | | — | | | | — | |
| | | | |
Net asset value, end of year | | $ | 18.15 | | | $ | 19.49 | | | $ | 17.34 | | | $ | 17.10 | | | $ | 16.72 | |
| | | | |
| | | | | |
Total returnd | | | (0.87)% | | | | 14.45% | | | | 18.68% | | | | 6.21% | | | | 11.00% | |
Ratios to average net assets | | | | | | | | | | | | | | | | | | | | |
Expensese | | | 0.81% | | | | 0.80% | | | | 0.79% | | | | 0.83% | | | | 0.89% | |
Net investment income | | | 4.15% | | | | 5.02% | | | | 5.48% | | | | 4.41% | | | | 4.45% | |
| | | | | |
Supplemental data | | | | | | | | | | | | | | | | | | | | |
Net assets, end of year (000’s) | | $ | 1,812,814 | | | $ | 1,490,794 | | | $ | 1,262,783 | | | $ | 793,773 | | | $ | 480,649 | |
Portfolio turnover rate | | | 34.18% | | | | 8.77% | | | | 20.84% | | | | 28.46% | | | | 47.33% | |
aThe amount shown for a share outstanding throughout the period may not correlate with the Statement of Operations for the period due to the timing of sales and repurchases of the Fund shares in relation to income earned and/or fluctuating market value of the investments of the Fund.
bBased on average daily shares outstanding.
cAmount rounds to less than $0.01 per share.
dTotal return does not include fees, charges or expenses imposed by the variable annuity and life insurance contracts for which the Franklin Templeton Variable Insurance Products Trust serves as an underlying investment vehicle.
eBenefit of expense reduction rounds to less than 0.01%.
The accompanying notes are an integral part of these financial statements.
TGB-12
Franklin Templeton Variable Insurance Products Trust
Financial Highlights (continued)
Templeton Global Bond Securities Fund
| | | | | | | | | | | | | | | | | | | | |
| | | Year Ended December 31, | |
| Class 3 | | 2011 | | | 2010 | | | 2009 | | | 2008 | | | 2007 | |
| | | | |
Per share operating performance | | | | | | | | | | | | | | | | | | | | |
(for a share outstanding throughout the year) | | | | | | | | | | | | | | | | | | | | |
Net asset value, beginning of year | | $ | 19.48 | | | $ | 17.33 | | | $ | 17.08 | | | $ | 16.70 | | | $ | 15.49 | |
| | | | |
Income from investment operationsa: | | | | | | | | | | | | | | | | | | | | |
Net investment incomeb | | | 0.80 | | | | 0.93 | | | | 0.93 | | | | 0.74 | | | | 0.72 | |
Net realized and unrealized gains (losses) | | | (0.90 | ) | | | 1.54 | | | | 1.98 | | | | 0.27 | | | | 0.95 | |
| | | | |
Total from investment operations | | | (0.10 | ) | | | 2.47 | | | | 2.91 | | | | 1.01 | | | | 1.67 | |
| | | | |
Less distributions from: | | | | | | | | | | | | | | | | | | | | |
Net investment income and net foreign currency gains | | | (1.10 | ) | | | (0.27 | ) | | | (2.66 | ) | | | (0.63 | ) | | | (0.46 | ) |
Net realized gains | | | (0.13 | ) | | | (0.05 | ) | | | — | | | | — | | | | — | |
| | | | |
Total distributions | | | (1.23 | ) | | | (0.32 | ) | | | (2.66 | ) | | | (0.63 | ) | | | (0.46 | ) |
| | | | |
Redemption feesc | | | — | | | | — | | | | — | | | | — | | | | — | |
| | | | |
Net asset value, end of year | | $ | 18.15 | | | $ | 19.48 | | | $ | 17.33 | | | $ | 17.08 | | | $ | 16.70 | |
| | | | |
| | | | | |
Total returnd | | | (0.83)% | | | | 14.38% | | | | 18.69% | | | | 6.21% | | | | 11.03% | |
Ratios to average net assets | | | | | | | | | | | | | | | | | | | | |
Expensese | | | 0.81% | | | | 0.80% | | | | 0.79% | | | | 0.83% | | | | 0.89% | |
Net investment income | | | 4.15% | | | | 5.02% | | | | 5.48% | | | | 4.41% | | | | 4.45% | |
| | | | | |
Supplemental data | | | | | | | | | | | | | | | | | | | | |
Net assets, end of year (000’s) | | $ | 185,811 | | | $ | 183,380 | | | $ | 143,264 | | | $ | 128,155 | | | $ | 91,162 | |
Portfolio turnover rate | | | 34.18% | | | | 8.77% | | | | 20.84% | | | | 28.46% | | | | 47.33% | |
aThe amount shown for a share outstanding throughout the period may not correlate with the Statement of Operations for the period due to the timing of sales and repurchases of the Fund shares in relation to income earned and/or fluctuating market value of the investments of the Fund.
bBased on average daily shares outstanding.
cAmount rounds to less than $0.01 per share.
dTotal return does not include fees, charges or expenses imposed by the variable annuity and life insurance contracts for which the Franklin Templeton Variable Insurance Products Trust serves as an underlying investment vehicle.
eBenefit of expense reduction rounds to less than 0.01%.
The accompanying notes are an integral part of these financial statements.
TGB-13
Franklin Templeton Variable Insurance Products Trust
Financial Highlights (continued)
Templeton Global Bond Securities Fund
| | | | | | | | | | | | | | | | |
| | | Year Ended December 31, | |
| Class 4 | | 2011 | | | 2010 | | | 2009 | | | 2008a | |
| | | | |
Per share operating performance | | | | | | | | | | | | | | | | |
(for a share outstanding throughout the year) | | | | | | | | | | | | | | | | |
Net asset value, beginning of year | | $ | 19.78 | | | $ | 17.61 | | | $ | 17.37 | | | $ | 18.00 | |
| | | | |
Income from investment operationsb: | | | | | | | | | | | | | | | | |
Net investment incomec | | | 0.79 | | | | 0.93 | | | | 0.93 | | | | 0.66 | |
Net realized and unrealized gains (losses) | | | (0.91 | ) | | | 1.56 | | | | 2.00 | | | | (0.64 | ) |
| | | | |
Total from investment operations | | | (0.12 | ) | | | 2.49 | | | | 2.93 | | | | 0.02 | |
| | | | |
Less distributions from: | | | | | | | | | | | | | | | | |
Net investment income and net foreign currency gains | | | (1.09 | ) | | | (0.27 | ) | | | (2.69 | ) | | | (0.65 | ) |
Net realized gains | | | (0.13 | ) | | | (0.05 | ) | | | — | | | | — | |
| | | | |
Total distributions | | | (1.22 | ) | | | (0.32 | ) | | | (2.69 | ) | | | (0.65 | ) |
| | | | |
Redemption feesd | | | — | | | | — | | | | — | | | | — | |
| | | | |
Net asset value, end of year | | $ | 18.44 | | | $ | 19.78 | | | $ | 17.61 | | | $ | 17.37 | |
| | | | |
| | | | |
Total returne | | | (0.96)% | | | | 14.28% | | | | 18.58% | | | | 0.26% | |
Ratios to average net assetsf | | | | | | | | | | | | | | | | |
Expensesg | | | 0.91% | | | | 0.90% | | | | 0.89% | | | | 0.93% | |
Net investment income | | | 4.05% | | | | 4.92% | | | | 5.38% | | | | 4.31% | |
| | | | |
Supplemental data | | | | | | | | | | | | | | | | |
Net assets, end of year (000’s) | | $ | 151,695 | | | $ | 150,891 | | | $ | 108,910 | | | $ | 43,069 | |
Portfolio turnover rate | | | 34.18% | | | | 8.77% | | | | 20.84% | | | | 28.46% | |
aFor the period February 29, 2008 (effective date) to December 31, 2008.
bThe amount shown for a share outstanding throughout the period may not correlate with the Statement of Operations for the period due to the timing of sales and repurchases of the Fund shares in relation to income earned and/or fluctuating market value of the investments of the Fund.
cBased on average daily shares outstanding.
dAmount rounds to less than $0.01 per share.
eTotal return does not include fees, charges or expenses imposed by the variable annuity and life insurance contracts for which the Franklin Templeton Variable Insurance Products Trust serves as an underlying investment vehicle. Total return is not annualized for periods less than one year.
fRatios are annualized for periods less than one year.
gBenefit of expense reduction rounds to less than 0.01%.
The accompanying notes are an integral part of these financial statements.
TGB-14
Franklin Templeton Variable Insurance Products Trust
Statement of Investments, December 31, 2011
| | | | | | | | |
| Templeton Global Bond Securities Fund | | Principal
Amount* | | | Value | |
Foreign Government and Agency Securities 76.2% | | | | | | | | |
Argentina 0.5% | | | | | | | | |
a,bGovernment of Argentina, senior bond, FRN, 0.439%, 8/03/12 | | | 107,485,000 | | | $ | 13,073,503 | |
| | | | | | | | |
Australia 7.9% | | | | | | | | |
Government of Australia, senior bond, 5.75%, 4/15/12 | | | 43,700,000 | AUD | | | 44,932,969 | |
New South Wales Treasury Corp., | | | | | | | | |
6.00%, 5/01/12 | | | 10,590,000 | AUD | | | 10,900,253 | |
6.00%, 5/01/12 (London Exchange) | | | 13,180,000 | AUD | | | 13,565,376 | |
5.50%, 8/01/13 | | | 3,710,000 | AUD | | | 3,891,330 | |
senior note, 5.50%, 3/01/17 | | | 32,225,000 | AUD | | | 35,002,163 | |
Queensland Treasury Corp., | | | | | | | | |
6.00%, 8/14/13 | | | 24,450,000 | AUD | | | 25,869,263 | |
6.00%, 9/14/17 | | | 13,160,000 | AUD | | | 14,577,214 | |
senior note, 6.00%, 8/21/13 | | | 8,888,000 | AUD | | | 9,352,552 | |
Western Australia Treasury Corp., | | | | | | | | |
5.50%, 7/17/12 | | | 26,480,000 | AUD | | | 27,297,146 | |
8.00%, 6/15/13 | | | 4,350,000 | AUD | | | 4,710,083 | |
| | | | | | | | |
| | | | | | | 190,098,349 | |
| | | | | | | | |
Brazil 3.5% | | | | | | | | |
Nota Do Tesouro Nacional, | | | | | | | | |
10.00%, 1/01/12 | | | 38,245 | c BRL | | | 20,525,589 | |
10.00%, 1/01/14 | | | 7,100 | c BRL | | | 3,774,205 | |
10.00%, 1/01/17 | | | 22,490 | c BRL | | | 11,613,794 | |
dIndex Linked, 6.00%, 5/15/15 | | | 29,822 | c BRL | | | 34,556,113 | |
dIndex Linked, 6.00%, 5/15/45 | | | 10,825 | c BRL | | | 13,087,225 | |
| | | | | | | | |
| | | | | | | 83,556,926 | |
| | | | | | | | |
Hungary 2.8% | | | | | | | | |
Government of Hungary, | | | | | | | | |
5.50%, 2/12/14 | | | 608,600,000 | HUF | | | 2,335,185 | |
5.50%, 2/12/16 | | | 436,800,000 | HUF | | | 1,571,560 | |
6.50%, 6/24/19 | | | 389,700,000 | HUF | | | 1,335,072 | |
7.50%, 11/12/20 | | | 28,000,000 | HUF | | | 100,095 | |
A, 8.00%, 2/12/15 | | | 280,000,000 | HUF | | | 1,113,076 | |
A, 6.75%, 11/24/17 | | | 1,443,600,000 | HUF | | | 5,183,575 | |
A, 7.00%, 6/24/22 | | | 249,200,000 | HUF | | | 842,228 | |
B, 6.75%, 2/24/17 | | | 394,700,000 | HUF | | | 1,437,819 | |
D, 6.75%, 2/12/13 | | | 310,800,000 | HUF | | | 1,256,350 | |
D, 6.75%, 8/22/14 | | | 1,760,900,000 | HUF | | | 6,851,660 | |
E, 7.50%, 10/24/13 | | | 248,600,000 | HUF | | | 1,004,047 | |
senior note, 3.50%, 7/18/16 | | | 1,055,000 | EUR | | | 1,097,988 | |
senior note, 4.375%, 7/04/17 | | | 5,380,000 | EUR | | | 5,588,076 | |
senior note, 5.75%, 6/11/18 | | | 13,795,000 | EUR | | | 14,944,436 | |
senior note, 6.25%, 1/29/20 | | | 6,420,000 | | | | 5,907,684 | |
senior note, 3.875%, 2/24/20 | | | 3,120,000 | EUR | | | 2,935,480 | |
senior note, 6.375%, 3/29/21 | | | 14,820,000 | | | | 13,566,969 | |
| | | | | | | | |
| | | | | | | 67,071,300 | |
| | | | | | | | |
Indonesia 7.9% | | | | | | | | |
Government of Indonesia, | | | | | | | | |
FR20, 14.275%, 12/15/13 | | | 14,267,000,000 | IDR | | | 1,841,462 | |
FR31, 11.00%, 11/15/20 | | | 167,351,000,000 | IDR | | | 24,745,054 | |
FR34, 12.80%, 6/15/21 | | | 207,810,000,000 | IDR | | | 33,985,497 | |
TGB-15
Franklin Templeton Variable Insurance Products Trust
Statement of Investments, December 31, 2011 (continued)
| | | | | | | | |
| Templeton Global Bond Securities Fund | | Principal
Amount* | | | Value | |
Foreign Government and Agency Securities (continued) | | | | | | | | |
Indonesia (continued) | | | | | | | | |
Government of Indonesia (continued) | | | | | | | | |
FR35, 12.90%, 6/15/22 | | | 66,582,000,000 | IDR | | $ | 10,978,739 | |
FR36, 11.50%, 9/15/19 | | | 30,075,000,000 | IDR | | | 4,440,023 | |
FR37, 12.00%, 9/15/26 | | | 8,230,000,000 | IDR | | | 1,350,065 | |
FR39, 11.75%, 8/15/23 | | | 5,491,000,000 | IDR | | | 860,569 | |
FR40, 11.00%, 9/15/25 | | | 61,856,000,000 | IDR | | | 9,495,261 | |
FR42, 10.25%, 7/15/27 | | | 88,574,000,000 | IDR | | | 12,845,303 | |
FR43, 10.25%, 7/15/22 | | | 68,340,000,000 | IDR | | | 9,814,546 | |
FR44, 10.00%, 9/15/24 | | | 4,454,000,000 | IDR | | | 635,447 | |
FR46, 9.50%, 7/15/23 | | | 226,780,000,000 | IDR | | | 31,004,137 | |
FR47, 10.00%, 2/15/28 | | | 61,737,000,000 | IDR | | | 8,764,339 | |
FR48, 9.00%, 9/15/18 | | | 16,920,000,000 | IDR | | | 2,188,086 | |
FR49, 9.00%, 9/15/13 | | | 35,030,000,000 | IDR | | | 4,116,754 | |
esenior bond, 144A, 8.50%, 10/12/35 | | | 7,259,000 | | | | 10,525,550 | |
esenior bond, 144A, 6.625%, 2/17/37 | | | 1,930,000 | | | | 2,355,208 | |
esenior bond, 144A, 7.75%, 1/17/38 | | | 8,650,000 | | | | 11,745,835 | |
esenior note, 144A, 11.625%, 3/04/19 | | | 6,410,000 | | | | 9,484,332 | |
| | | | | | | | |
| | | | | | | 191,176,207 | |
| | | | | | | | |
Iraq 0.3% | | | | | | | | |
Government of Iraq, | | | | | | | | |
e144A, 5.80%, 1/15/28 | | | 5,055,000 | | | | 4,160,113 | |
fReg S, 5.80%, 1/15/28 | | | 3,440,000 | | | | 2,831,017 | |
| | | | | | | | |
| | | | | | | 6,991,130 | |
| | | | | | | | |
Ireland 3.7% | | | | | | | | |
Government of Ireland, | | | | | | | | |
4.00%, 1/15/14 | | | 14,291,000 | EUR | | | 17,307,495 | |
4.60%, 4/18/16 | | | 9,213,000 | EUR | | | 10,775,114 | |
5.90%, 10/18/19 | | | 10,562,000 | EUR | | | 11,862,145 | |
4.50%, 4/18/20 | | | 6,289,000 | EUR | | | 6,308,386 | |
5.00%, 10/18/20 | | | 9,329,000 | EUR | | | 9,666,623 | |
senior bond, 4.50%, 10/18/18 | | | 7,339,000 | EUR | | | 7,748,701 | |
senior bond, 4.40%, 6/18/19 | | | 12,246,000 | EUR | | | 12,698,067 | |
senior bond, 5.40%, 3/13/25 | | | 12,847,000 | EUR | | | 13,162,208 | |
| | | | | | | | |
| | | | | | | 89,528,739 | |
| | | | | | | | |
Israel 1.7% | | | | | | | | |
Government of Israel, | | | | | | | | |
5.00%, 3/31/13 | | | 53,945,000 | ILS | | | 14,549,343 | |
3.50%, 9/30/13 | | | 101,009,000 | ILS | | | 26,853,183 | |
| | | | | | | | |
| | | | | | | 41,402,526 | |
| | | | | | | | |
Lithuania 1.5% | | | | | | | | |
eGovernment of Lithuania, 144A, | | | | | | | | |
6.75%, 1/15/15 | | | 19,480,000 | | | | 20,478,350 | |
7.375%, 2/11/20 | | | 12,690,000 | | | | 13,797,139 | |
6.125%, 3/09/21 | | | 3,240,000 | | | | 3,251,421 | |
| | | | | | | | |
| | | | | | | 37,526,910 | |
| | | | | | | | |
Malaysia 2.5% | | | | | | | | |
Government of Malaysia, senior bond, | | | | | | | | |
2.711%, 2/14/12 | | | 720,000 | MYR | | | 227,060 | |
3.718%, 6/15/12 | | | 51,643,000 | MYR | | | 16,347,095 | |
TGB-16
Franklin Templeton Variable Insurance Products Trust
Statement of Investments, December 31, 2011 (continued)
| | | | | | | | |
| Templeton Global Bond Securities Fund | | Principal
Amount* | | | Value | |
Foreign Government and Agency Securities (continued) | | | | | | | | |
Malaysia (continued) | | | | | | | | |
Government of Malaysia, senior bond (continued) | | | | | | | | |
2.509%, 8/27/12 | | | 26,335,000 | MYR | | $ | 8,285,631 | |
3.702%, 2/25/13 | | | 27,704,000 | MYR | | | 8,818,000 | |
3.70%, 5/15/13 | | | 210,000 | MYR | | | 66,943 | |
3.21%, 5/31/13 | | | 2,950,000 | MYR | | | 934,415 | |
3.461%, 7/31/13 | | | 13,390,000 | MYR | | | 4,259,034 | |
3.814%, 2/15/17 | | | 18,885,000 | MYR | | | 6,081,869 | |
4.24%, 2/07/18 | | | 44,360,000 | MYR | | | 14,609,413 | |
| | | | | | | | |
| | | | | | | 59,629,460 | |
| | | | | | | | |
Mexico 5.9% | | | | | | | | |
Government of Mexico, | | | | | | | | |
M, 9.00%, 6/20/13 | | | 2,982,300 | g MXN | | | 22,621,301 | |
M, 8.00%, 12/17/15 | | | 726,000 | g MXN | | | 5,690,235 | |
M, 7.25%, 12/15/16 | | | 250,000 | g MXN | | | 1,921,127 | |
M, 7.75%, 12/14/17 | | | 4,473,000 | g MXN | | | 35,204,832 | |
MI, 9.00%, 12/20/12 | | | 265,000 | g MXN | | | 1,976,937 | |
MI, 8.00%, 12/19/13 | | | 9,939,900 | g MXN | | | 75,374,625 | |
| | | | | | | | |
| | | | | | | 142,789,057 | |
| | | | | | | | |
Norway 0.4% | | | | | | | | |
Government of Norway, 6.50%, 5/15/13 | | | 49,400,000 | NOK | | | 8,842,713 | |
| | | | | | | | |
Peru 0.2% | | | | | | | | |
Government of Peru, 7.84%, 8/12/20 | | | 11,090,000 | PEN | | | 4,700,285 | |
| | | | | | | | |
Philippines 0.3% | | | | | | | | |
Government of the Philippines, senior bond, | | | | | | | | |
5.75%, 2/21/12 | | | 134,520,000 | PHP | | | 3,081,319 | |
5.25%, 1/07/13 | | | 61,770,000 | PHP | | | 1,449,265 | |
8.75%, 3/03/13 | | | 162,650,000 | PHP | | | 3,949,133 | |
R3-7, 5.25%, 9/24/12 | | | 2,090,000 | PHP | | | 48,688 | |
| | | | | | | | |
| | | | | | | 8,528,405 | |
| | | | | | | | |
Poland 7.9% | | | | | | | | |
Government of Poland, | | | | | | | | |
4.75%, 4/25/12 | | | 58,025,000 | PLN | | | 16,833,808 | |
5.25%, 4/25/13 | | | 22,950,000 | PLN | | | 6,698,932 | |
5.00%, 10/24/13 | | | 16,810,000 | PLN | | | 4,891,610 | |
5.75%, 4/25/14 | | | 92,590,000 | PLN | | | 27,328,205 | |
6.25%, 10/24/15 | | | 44,730,000 | PLN | | | 13,463,399 | |
5.75%, 9/23/22 | | | 48,750,000 | PLN | | | 13,988,163 | |
senior note, 6.375%, 7/15/19 | | | 27,200,000 | | | | 30,298,896 | |
Strip, 1/25/12 | | | 7,670,000 | PLN | | | 2,217,365 | |
Strip, 7/25/12 | | | 11,905,000 | PLN | | | 3,366,039 | |
Strip, 10/25/12 | | | 90,245,000 | PLN | | | 25,218,515 | |
Strip, 1/25/13 | | | 99,335,000 | PLN | | | 27,456,390 | |
Strip, 7/25/13 | | | 76,175,000 | PLN | | | 20,544,953 | |
| | | | | | | | |
| | | | | | | 192,306,275 | |
| | | | | | | | |
Qatar 0.6% | | | | | | | | |
eGovernment of Qatar, senior note, 144A, 6.55%, 4/09/19 | | | 11,830,000 | | | | 14,018,964 | |
| | | | | | | | |
Russia 2.8% | | | | | | | | |
eGovernment of Russia, 144A, 7.50%, 3/31/30 | | | 59,148,895 | | | | 68,797,559 | |
| | | | | | | | |
TGB-17
Franklin Templeton Variable Insurance Products Trust
Statement of Investments, December 31, 2011 (continued)
| | | | | | | | |
| Templeton Global Bond Securities Fund | | Principal
Amount* | | | Value | |
Foreign Government and Agency Securities (continued) | | | | | | | | |
Singapore 1.3% | | | | | | | | |
Government of Singapore, senior bond, | | | | | | | | |
2.50%, 10/01/12 | | | 6,340,000 | SGD | | $ | 4,965,988 | |
1.625%, 4/01/13 | | | 34,700,000 | SGD | | | 27,182,692 | |
| | | | | | | | |
| | | | | | | 32,148,680 | |
| | | | | | | | |
South Africa 1.6% | | | | | | | | |
Government of South Africa, | | | | | | | | |
5.25%, 5/16/13 | | | 3,590,000 | EUR | | | 4,780,304 | |
4.50%, 4/05/16 | | | 1,874,000 | EUR | | | 2,500,910 | |
6.875%, 5/27/19 | | | 21,215,000 | | | | 25,535,591 | |
senior note, 6.50%, 6/02/14 | | | 805,000 | | | | 885,500 | |
senior note, 5.875%, 5/30/22 | | | 3,485,000 | | | | 4,020,434 | |
| | | | | | | | |
| | | | | | | 37,722,739 | |
| | | | | | | | |
South Korea 11.0% | | | | | | | | |
The Export-Import Bank of Korea, senior note, 4.625%, 2/20/17 | | | 230,000 | EUR | | | 309,939 | |
KDICB Redemption Fund Bond, senior bond, | | | | | | | | |
07-1, 5.57%, 9/14/12 | | | 6,600,000,000 | KRW | | | 5,771,111 | |
08-1, 5.28%, 2/15/13 | | | 880,000,000 | KRW | | | 773,165 | |
Korea Treasury Bond, | | | | | | | | |
5.25%, 9/10/12 | | | 28,539,000,000 | KRW | | | 24,925,032 | |
5.25%, 3/10/13 | | | 6,483,790,000 | KRW | | | 5,710,879 | |
5.00%, 9/10/16 | | | 2,806,000,000 | KRW | | | 2,573,856 | |
senior bond, 4.00%, 6/10/12 | | | 134,277,650,000 | KRW | | | 116,131,059 | |
senior bond, 4.25%, 12/10/12 | | | 23,404,000,000 | KRW | | | 20,340,922 | |
senior bond, 3.75%, 6/10/13 | | | 57,125,360,000 | KRW | | | 49,523,049 | |
senior bond, 3.00%, 12/10/13 | | | 47,514,850,000 | KRW | | | 40,734,690 | |
| | | | | | | | |
| | | | | | | 266,793,702 | |
| | | | | | | | |
Sri Lanka 1.5% | | | | | | | | |
Government of Sri Lanka, | | | | | | | | |
A, 6.90%, 8/01/12 | | | 14,600,000 | LKR | | | 126,843 | |
A, 8.50%, 1/15/13 | | | 694,400,000 | LKR | | | 6,076,183 | |
A, 13.50%, 2/01/13 | | | 674,300,000 | LKR | | | 6,172,065 | |
A, 7.00%, 3/01/14 | | | 43,380,000 | LKR | | | 361,560 | |
A, 11.25%, 7/15/14 | | | 773,000,000 | LKR | | | 7,020,116 | |
A, 11.75%, 3/15/15 | | | 8,520,000 | LKR | | | 78,798 | |
A, 6.50%, 7/15/15 | | | 218,480,000 | LKR | | | 1,734,691 | |
A, 11.00%, 8/01/15 | | | 1,349,700,000 | LKR | | | 12,249,505 | |
A, 6.40%, 8/01/16 | | | 109,200,000 | LKR | | | 835,735 | |
B, 6.60%, 6/01/14 | | | 56,800,000 | LKR | | | 466,109 | |
B, 6.40%, 10/01/16 | | | 119,100,000 | LKR | | | 910,901 | |
| | | | | | | | |
| | | | | | | 36,032,506 | |
| | | | | | | | |
hSupranational 1.1% | | | | | | | | |
Corporacion Andina De Fomento, 8.125%, 6/04/19 | | | 5,260,000 | | | | 6,471,168 | |
European Investment Bank, senior note, 4.50%, 5/15/13 | | | 33,700,000 | NOK | | | 5,785,522 | |
Inter-American Development Bank, senior note, 7.50%, 12/05/24 | | | 200,000,000 | MXN | | | 13,415,695 | |
| | | | | | | | |
| | | | | | | 25,672,385 | |
| | | | | | | | |
Sweden 4.3% | | | | | | | | |
Government of Sweden, | | | | | | | | |
5.50%, 10/08/12 | | | 509,640,000 | SEK | | | 76,607,652 | |
1.50%, 8/30/13 | | | 166,040,000 | SEK | | | 24,456,498 | |
TGB-18
Franklin Templeton Variable Insurance Products Trust
Statement of Investments, December 31, 2011 (continued)
| | | | | | | | |
| Templeton Global Bond Securities Fund | | Principal
Amount* | | | Value | |
Foreign Government and Agency Securities (continued) | | | | | | | | |
Sweden (continued) | | | | | | | | |
Kommuninvest I Sverige AB, senior note, 1.75%, 10/08/12 | | | 24,400,000 | SEK | | $ | 3,524,671 | |
| | | | | | | | |
| | | | | | | 104,588,821 | |
| | | | | | | | |
Ukraine 0.7% | | | | | | | | |
eFinancing of Infrastructure Projects State Enterprise, 144A, 7.40%, 4/20/18 | | | 840,000 | | | | 690,375 | |
eGovernment of Ukraine, | | | | | | | | |
144A, 7.65%, 6/11/13 | | | 760,000 | | | | 734,350 | |
144A, 6.25%, 6/17/16 | | | 1,210,000 | | | | 1,065,556 | |
144A, 7.75%, 9/23/20 | | | 480,000 | | | | 417,600 | |
senior note, 144A, 4.95%, 10/13/15 | | | 290,000 | EUR | | | 310,118 | |
senior note, 144A, 7.95%, 2/23/21 | | | 16,530,000 | | | | 14,587,725 | |
| | | | | | | | |
| | | | | | | 17,805,724 | |
| | | | | | | | |
United Arab Emirates 0.6% | | | | | | | | |
eEmirate of Abu Dhabi, 144A, 6.75%, 4/08/19 | | | 11,840,000 | | | | 14,533,600 | |
| | | | | | | | |
United Kingdom 2.6% | | | | | | | | |
United Kingdom Treasury Bond, 5.00%, 3/07/12 | | | 17,642,000 | GBP | | | 27,627,053 | |
United Kingdom Treasury Note, 5.25%, 6/07/12 | | | 22,260,000 | GBP | | | 35,302,289 | |
| | | | | | | | |
| | | | | | | 62,929,342 | |
| | | | | | | | |
Venezuela 0.6% | | | | | | | | |
Government of Venezuela, 10.75%, 9/19/13 | | | 13,570,000 | | | | 13,756,927 | |
| | | | | | | | |
Vietnam 0.5% | | | | | | | | |
eGovernment of Vietnam, 144A, 6.75%, 1/29/20 | | | 13,110,000 | | | | 13,167,356 | |
| | | | | | | | |
Total Foreign Government and Agency Securities (Cost $1,794,910,963) | | | | | | | 1,845,190,090 | |
| | | | | | | | |
Municipal Bonds 1.1% | | | | | | | | |
United States 1.1% | | | | | | | | |
Alabama State University Revenue, General Tuition and Fee, Assured Guaranty, 5.00%, 9/01/29 | | | 175,000 | | | | 190,892 | |
Bexar County Revenue, Venue Project, Refunding, Series A, BHAC Insured, 5.25%, 8/15/47 | | | 1,450,000 | | | | 1,585,125 | |
California State GO, | | | | | | | | |
7.625%, 3/01/40 | | | 1,320,000 | | | | 1,625,382 | |
Refunding, 5.125%, 4/01/33 | | | 3,800,000 | | | | 3,967,580 | |
Refunding, 5.00%, 4/01/38 | | | 1,370,000 | | | | 1,398,592 | |
Various Purpose, 6.00%, 4/01/38 | | | 10,740,000 | | | | 12,128,145 | |
Illinois Municipal Electricity Agency Power Supply Revenue, Series A, BHAC Insured, 5.00%, 2/01/35 | | | 2,155,000 | | | | 2,227,990 | |
Philadelphia GO, Refunding, Series A, Assured Guaranty, 5.00%, 8/01/24 | | | 500,000 | | | | 536,085 | |
Tarrant County Cultural Education Facilities Finance Corp. Revenue, Christus Health, Refunding, Series A, Assured Guaranty, 6.25%, 7/01/28 | | | 1,500,000 | | | | 1,715,790 | |
| | | | | | | | |
Total Municipal Bonds (Cost $22,747,056) | | | | | | | 25,375,581 | |
| | | | | | | | |
Total Investments before Short Term Investments (Cost $1,817,658,019) | | | | | | $ | 1,870,565,671 | |
| | | | | | | | |
Short Term Investments 15.8% | | | | | | | | |
Foreign Government and Agency Securities 8.1% | | | | | | | | |
Egypt 0.2% | | | | | | | | |
iEgypt Treasury Bill, 2/21/12 | | | 26,475,000 | EGP | | | 4,311,376 | |
| | | | | | | | |
Hungary 0.1% | | | | | | | | |
iHungary Treasury Bill, 8/22/12 | | | 502,600,000 | HUF | | | 1,964,800 | |
| | | | | | | | |
TGB-19
Franklin Templeton Variable Insurance Products Trust
Statement of Investments, December 31, 2011 (continued)
| | | | | | | | |
| Templeton Global Bond Securities Fund | | Principal
Amount* | | | Value | |
Short Term Investments (continued) | | | | | | | | |
Foreign Government and Agency Securities (continued) | | | | | | | | |
Israel 1.8% | | | | | | | | |
Government of Israel, 4.00%, 3/30/12 | | | 26,865,000 | ILS | | $ | 7,071,820 | |
iIsrael Treasury Bills, 1/04/12 - 5/02/12 | | | 140,940,000 | ILS | | | 36,839,081 | |
| | | | | | | | |
| | | | | | | 43,910,901 | |
| | | | | | | | |
Malaysia 2.3% | | | | | | | | |
iBank of Negara Monetary Note, 1/03/12 - 6/14/12 | | | 170,890,000 | MYR | | | 53,638,717 | |
iMalaysia Treasury Bills, 1/20/12 - 7/27/12 | | | 7,680,000 | MYR | | | 2,401,595 | |
| | | | | | | | |
| | | | | | | 56,040,312 | |
| | | | | | | | |
Norway 1.7% | | | | | | | | |
iNorway Treasury Bill, 3/21/12 | | | 240,230,000 | NOK | | | 40,060,627 | |
| | | | | | | | |
Philippines 0.1% | | | | | | | | |
iPhilippine Treasury Bills, 1/11/12 - 8/22/12 | | | 116,440,000 | PHP | | | 2,646,732 | |
| | | | | | | | |
Singapore 1.8% | | | | | | | | |
Government of Singapore, senior bond, | | | | | | | | |
2.625%, 4/01/12 | | | 37,720,000 | SGD | | | 29,231,561 | |
3.50%, 7/01/12 | | | 2,120,000 | SGD | | | 1,660,031 | |
iSingapore Treasury Bills, 5/02/12 - 11/01/12 | | | 17,140,000 | SGD | | | 13,186,884 | |
| | | | | | | | |
| | | | | | | 44,078,476 | |
| | | | | | | | |
Sri Lanka 0.1% | | | | | | | | |
iSri Lanka Treasury Bills, 1/27/12 - 9/28/12 | | | 213,370,000 | LKR | | | 1,832,844 | |
| | | | | | | | |
Total Foreign Government and Agency Securities (Cost $210,293,047) | | | | | | | 194,846,068 | |
| | | | | | | | |
Total Investments before Repurchase Agreements (Cost $2,027,951,066) | | | | | | | 2,065,411,739 | |
| | | | | | | | |
Repurchase Agreements (Cost $186,697,298) 7.7% | | | | | | | | |
United States 7.7% | | | | | | | | |
jJoint Repurchase Agreement, 0.011%, 1/03/12 (Maturity Value $186,697,523) | | | 186,697,298 | | | | 186,697,298 | |
BNP Paribas Securities Corp. (Maturity Value $22,590,400) | | | | | | | | |
Credit Suisse Securities (USA) LLC (Maturity Value $27,106,613) | | | | | | | | |
Deutsche Bank Securities Inc. (Maturity Value $28,570,322) | | | | | | | | |
HSBC Securities (USA) Inc. (Maturity Value $45,180,802) | | | | | | | | |
Merrill Lynch, Pierce, Fenner & Smith Inc. (Maturity Value $27,106,613) | | | | | | | | |
Morgan Stanley & Co. LLC (Maturity Value $9,036,160) | | | | | | | | |
UBS Securities LLC (Maturity Value $27,106,613) | | | | | | | | |
Collateralized by U.S. Government Agency Securities, 0.16% - 5.25%, 6/07/12 - 2/05/14;
iU.S. Treasury Bills, 1/12/12 - 9/20/12; U.S. Treasury Bonds, 0.50% - 11.25%, 5/31/13 - 2/15/16; and U.S. Treasury Notes, 0.125% - 4.875%, 12/31/11 - 5/15/19 (valued at $190,529,923) | | | | | | | | |
| | | | | | | | |
Total Investments (Cost $2,214,648,364) 93.1% | | | | | | | 2,252,109,037 | |
Other Assets, less Liabilities 6.9% | | | | | | | 168,028,522 | |
| | | | | | | | |
Net Assets 100.0% | | | | | | $ | 2,420,137,559 | |
| | | | | | | | |
See Abbreviations on page TGB-43.
TGB-20
Franklin Templeton Variable Insurance Products Trust
Statement of Investments, December 31, 2011 (continued)
| | | | |
| Templeton Global Bond Securities Fund | | | | |
*The principal amount is stated in U.S. dollars unless otherwise indicated.
aThe coupon rate shown represents the rate at period end.
bThe principal amount is stated in original face, and scheduled paydowns are reflected in the market price on ex-date.
cPrincipal amount is stated in 1,000 Brazilian Real Units.
dRedemption price at maturity is adjusted for inflation. See Note 1(g).
eSecurity was purchased pursuant to Rule 144A under the Securities Act of 1933 and may be sold in transactions exempt from registration only to qualified institutional buyers or in a public offering registered under the Securities Act of 1933. These securities have been deemed liquid under guidelines approved by the Trust’s Board of Trustees. At December 31, 2011, the aggregate value of these securities was $204,121,151, representing 8.43% of net assets.
fSecurity was purchased pursuant to Regulation S under the Securities Act of 1933, which exempts from registration securities offered and sold outside of the United States. Such a security cannot be sold in the United States without either an effective registration statement filed pursuant to the Securities Act of 1933, or pursuant to an exemption from registration. This security has been deemed liquid under guidelines approved by the Trust’s Board of Trustees. At December 31, 2011, the value of this security was $2,831,017, representing 0.12% of net assets.
gPrincipal amount is stated in 100 Mexican Peso Units.
hA supranational organization is an entity formed by two or more central governments through international treaties.
iThe security is traded on a discount basis with no stated coupon rate.
jSee Note 1(c) regarding joint repurchase agreement.
TGB-21
Franklin Templeton Variable Insurance Products Trust
Statement of Investments, December 31, 2011 (continued)
| | | | | | |
| Templeton Global Bond Securities Fund | | | | | | |
At December 31, 2011, the Fund had the following forward exchange contracts outstanding. See Note 1(d).
Forward Exchange Contracts
| | | | | | | | | | | | | | | | | | | | | | | | | | | | | | |
| Currency | | Counterparty | | | Type | | | Quantity | | | Contract
Amount* | | | | | Settlement
Date | | | Unrealized
Appreciation | | | Unrealized
Depreciation | |
Japanese Yen | | | DBAB | | | | Sell | | | | 770,370,000 | | | | 9,941,541 | | | | | | 1/04/12 | | | $ | — | | | $ | (68,590 | ) |
Swedish Krona | | | DBAB | | | | Buy | | | | 136,332,733 | | | | 15,020,408 | | | EUR | | | 1/05/12 | | | | 365,426 | | | | — | |
Euro | | | CITI | | | | Sell | | | | 5,040,000 | | | | 6,519,290 | | | | | | 1/10/12 | | | | — | | | | (4,469 | ) |
Japanese Yen | | | BZWS | | | | Sell | | | | 277,330,000 | | | | 3,353,446 | | | | | | 1/10/12 | | | | — | | | | (250,495 | ) |
Japanese Yen | | | UBSW | | | | Sell | | | | 138,650,000 | | | | 1,676,805 | | | | | | 1/10/12 | | | | — | | | | (124,970 | ) |
Japanese Yen | | | CITI | | | | Sell | | | | 138,680,000 | | | | 1,677,960 | | | | | | 1/10/12 | | | | — | | | | (124,206 | ) |
Euro | | | BZWS | | | | Sell | | | | 1,726,000 | | | | 2,233,444 | | | | | | 1/11/12 | | | | — | | | | (700 | ) |
Euro | | | UBSW | | | | Sell | | | | 13,846,000 | | | | 17,922,609 | | | | | | 1/11/12 | | | | 271 | | | | — | |
Euro | | | DBAB | | | | Sell | | | | 9,460,000 | | | | 12,259,119 | | | | | | 1/11/12 | | | | 14,044 | | | | — | |
Japanese Yen | | | DBAB | | | | Sell | | | | 139,110,000 | | | | 1,682,491 | | | | | | 1/12/12 | | | | — | | | | (125,319 | ) |
Japanese Yen | | | HSBC | | | | Sell | | | | 139,250,000 | | | | 1,687,572 | | | | | | 1/12/12 | | | | — | | | | (122,057 | ) |
Chilean Peso | | | MSCO | | | | Buy | | | | 2,254,600,000 | | | | 4,442,999 | | | | | | 1/13/12 | | | | — | | | | (112,471 | ) |
Euro | | | JPHQ | | | | Sell | | | | 937,000 | | | | 1,211,775 | | | | | | 1/13/12 | | | | — | | | | (1,099 | ) |
Japanese Yen | | | BZWS | | | | Sell | | | | 394,150,000 | | | | 4,771,792 | | | | | | 1/13/12 | | | | — | | | | (350,479 | ) |
Japanese Yen | | | HSBC | | | | Sell | | | | 397,130,000 | | | | 4,811,539 | | | | | | 1/13/12 | | | | — | | | | (349,459 | ) |
Japanese Yen | | | UBSW | | | | Sell | | | | 313,510,000 | | | | 3,797,176 | | | | | | 1/13/12 | | | | — | | | | (277,119 | ) |
Philippine Peso | | | JPHQ | | | | Buy | | | | 374,905,000 | | | | 8,515,730 | | | | | | 1/13/12 | | | | 30,477 | | | | — | |
Philippine Peso | | | HSBC | | | | Buy | | | | 60,160,000 | | | | 1,367,801 | | | | | | 1/17/12 | | | | 3,336 | | | | — | |
Euro | | | DBAB | | | | Sell | | | | 4,856,000 | | | | 6,438,109 | | | | | | 1/18/12 | | | | 152,178 | | | | — | |
Philippine Peso | | | HSBC | | | | Buy | | | | 115,942,000 | | | | 2,602,806 | | | | | | 1/18/12 | | | | 39,566 | | | | — | |
Philippine Peso | | | DBAB | | | | Buy | | | | 66,125,000 | | | | 1,484,121 | | | | | | 1/18/12 | | | | 22,899 | | | | — | |
Philippine Peso | | | JPHQ | | | | Buy | | | | 165,119,000 | | | | 3,670,535 | | | | | | 1/19/12 | | | | 92,433 | | | | — | |
Philippine Peso | | | DBAB | | | | Buy | | | | 41,372,000 | | | | 931,592 | | | | | | 1/19/12 | | | | 11,252 | | | | — | |
British Pound | | | BZWS | | | | Buy | | | | 906,238 | | | | 1,435,872 | | | | | | 1/24/12 | | | | — | | | | (28,590 | ) |
British Pound | | | DBAB | | | | Buy | | | | 903,679 | | | | 1,430,452 | | | | | | 1/24/12 | | | | — | | | | (27,144 | ) |
British Pound | | | CITI | | | | Buy | | | | 603,463 | | | | 953,634 | | | | | | 1/24/12 | | | | — | | | | (16,527 | ) |
British Pound | | | DBAB | | | | Buy | | | | 474,519 | | | | 755,031 | | | | | | 1/26/12 | | | | — | | | | (18,172 | ) |
Japanese Yen | | | BZWS | | | | Sell | | | | 1,079,470,000 | | | | 13,122,660 | | | | | | 1/26/12 | | | | — | | | | (908,680 | ) |
Japanese Yen | | | UBSW | | | | Sell | | | | 944,420,000 | | | | 11,488,596 | | | | | | 1/26/12 | | | | — | | | | (787,316 | ) |
Japanese Yen | | | DBAB | | | | Sell | | | | 897,860,782 | | | | 10,935,263 | | | | | | 1/26/12 | | | | — | | | | (735,456 | ) |
Philippine Peso | | | HSBC | | | | Buy | | | | 154,149,000 | | | | 3,423,251 | | | | | | 1/26/12 | | | | 88,596 | | | | — | |
British Pound | | | BZWS | | | | Buy | | | | 601,378 | | | | 945,862 | | | | | | 1/27/12 | | | | — | | | | (12,019 | ) |
British Pound | | | MSCO | | | | Buy | | | | 358,395 | | | | 564,198 | | | | | | 1/27/12 | | | | — | | | | (7,668 | ) |
British Pound | | | JPHQ | | | | Buy | | | | 119,423 | | | | 190,002 | | | | | | 1/27/12 | | | | — | | | | (4,557 | ) |
Chilean Peso | | | DBAB | | | | Buy | | | | 2,227,910,000 | | | | 4,404,290 | | | | | | 1/27/12 | | | | — | | | | (134,289 | ) |
Euro | | | CITI | | | | Sell | | | | 4,998,400 | | | | 6,758,487 | | | | | | 1/27/12 | | | | 287,828 | | | | — | |
Japanese Yen | | | HSBC | | | | Sell | | | | 1,162,462,488 | | | | 14,183,290 | | | | | | 1/27/12 | | | | — | | | | (927,050 | ) |
British Pound | | | JPHQ | | | | Buy | | | | 237,230 | | | | 373,367 | | | | | | 1/30/12 | | | | — | | | | (4,997 | ) |
Chilean Peso | | | DBAB | | | | Buy | | | | 5,127,860,000 | | | | 10,218,932 | | | | | | 1/30/12 | | | | — | | | | (394,837 | ) |
Chilean Peso | | | JPHQ | | | | Buy | | | | 675,370,000 | | | | 1,337,102 | | | | | | 1/30/12 | | | | — | | | | (43,209 | ) |
British Pound | | | MSCO | | | | Buy | | | | 116,956 | | | | 185,153 | | | | | | 1/31/12 | | | | — | | | | (3,546 | ) |
Chilean Peso | | | DBAB | | | | Buy | | | | 3,093,470,000 | | | | 6,161,677 | | | | | | 1/31/12 | | | | — | | | | (235,663 | ) |
Euro | | | DBAB | | | | Sell | | | | 31,205,000 | | | | 42,438,800 | | | | | | 1/31/12 | | | | 2,041,161 | | | | — | |
Philippine Peso | | | DBAB | | | | Buy | | | | 128,745,000 | | | | 2,986,361 | | | | | | 1/31/12 | | | | — | | | | (53,985 | ) |
British Pound | | | CITI | | | | Buy | | | | 391,619 | | | | 619,451 | | | | | | 2/01/12 | | | | — | | | | (11,359 | ) |
British Pound | | | MSCO | | | | Buy | | | | 450,886 | | | | 710,738 | | | | | | 2/01/12 | | | | — | | | | (10,618 | ) |
British Pound | | | BZWS | | | | Buy | | | | 48,594 | | | | 76,617 | | | | | | 2/01/12 | | | | — | | | | (1,162 | ) |
Euro | | | UBSW | | | | Sell | | | | 5,540,000 | | | | 7,543,763 | | | | | | 2/01/12 | | | | 371,672 | | | | — | |
Philippine Peso | | | DBAB | | | | Buy | | | | 155,800,000 | | | | 3,505,772 | | | | | | 2/03/12 | | | | 42,260 | | | | — | |
Philippine Peso | | | HSBC | | | | Buy | | | | 99,500,000 | | | | 2,237,354 | | | | | | 2/03/12 | | | | 28,559 | | | | — | |
Indian Rupee | | | JPHQ | | | | Buy | | | | 21,500,000 | | | | 445,873 | | | | | | 2/06/12 | | | | — | | | | (43,618 | ) |
TGB-22
Franklin Templeton Variable Insurance Products Trust
Statement of Investments, December 31, 2011 (continued)
| | | | | | |
| Templeton Global Bond Securities Fund | | | | | | |
Forward Exchange Contracts (continued)
| | | | | | | | | | | | | | | | | | | | | | | | | | | | | | | | |
| Currency | | Counterparty | | | Type | | | Quantity | | | Contract
Amount* | | | | | | Settlement
Date | | | Unrealized
Appreciation | | | Unrealized
Depreciation | |
Philippine Peso | | | HSBC | | | | Buy | | | | 84,800,000 | | | | 1,916,384 | | | | | | | | 2/06/12 | | | $ | 14,458 | | | $ | — | |
Philippine Peso | | | JPHQ | | | | Buy | | | | 60,500,000 | | | | 1,362,613 | | | | | | | | 2/07/12 | | | | 14,861 | | | | — | |
Singapore Dollar | | | HSBC | | | | Buy | | | | 6,206,000 | | | | 4,860,284 | | | | | | | | 2/07/12 | | | | — | | | | (76,226 | ) |
Singapore Dollar | | | DBAB | | | | Buy | | | | 6,207,000 | | | | 4,860,459 | | | | | | | | 2/07/12 | | | | — | | | | (75,629 | ) |
Australian Dollar | | | UBSW | | | | Buy | | | | 10,557,970 | | | | 10,238,591 | | | | | | | | 2/08/12 | | | | 510,979 | | | | — | |
Australian Dollar | | | MSCO | | | | Buy | | | | 10,560,886 | | | | 10,268,877 | | | | | | | | 2/08/12 | | | | 483,661 | | | | — | |
Euro | | | UBSW | | | | Sell | | | | 4,929,000 | | | | 6,676,084 | | | | | | | | 2/08/12 | | | | 294,562 | | | | — | |
Euro | | | CITI | | | | Sell | | | | 6,572,000 | | | | 8,878,181 | | | | | | | | 2/08/12 | | | | 369,484 | | | | — | |
Euro | | | HSBC | | | | Sell | | | | 1,200,000 | | | | 1,621,680 | | | | | | | | 2/08/12 | | | | 68,053 | | | | — | |
Norwegian Krone | | | UBSW | | | | Buy | | | | 72,121,400 | | | | 9,100,722 | | | | EUR | | | | 2/08/12 | | | | 259,205 | | | | — | |
Singapore Dollar | | | DBAB | | | | Buy | | | | 12,363,000 | | | | 9,721,129 | | | | | | | | 2/08/12 | | | | — | | | | (190,785 | ) |
Australian Dollar | | | DBAB | | | | Buy | | | | 3,351,000 | | | | 265,995,678 | | | | JPY | | | | 2/09/12 | | | | — | | | | (46,932 | ) |
Australian Dollar | | | CITI | | | | Buy | | | | 3,351,000 | | | | 265,901,850 | | | | JPY | | | | 2/09/12 | | | | — | | | | (45,712 | ) |
Australian Dollar | | | BZWS | | | | Buy | | | | 3,351,000 | | | | 265,734,300 | | | | JPY | | | | 2/09/12 | | | | — | | | | (43,533 | ) |
Euro | | | JPHQ | | | | Sell | | | | 300,000 | | | | 405,840 | | | | | | | | 2/09/12 | | | | 17,430 | | | | — | |
Euro | | | HSBC | | | | Sell | | | | 600,000 | | | | 806,880 | | | | | | | | 2/09/12 | | | | 30,059 | | | | — | |
Euro | | | BZWS | | | | Sell | | | | 800,000 | | | | 1,078,400 | | | | | | | | 2/09/12 | | | | 42,639 | | | | — | |
Euro | | | DBAB | | | | Sell | | | | 180,000 | | | | 242,431 | | | | | | | | 2/09/12 | | | | 9,385 | | | | — | |
Norwegian Krone | | | UBSW | | | | Buy | | | | 100,802,700 | | | | 12,673,686 | | | | EUR | | | | 2/09/12 | | | | 421,309 | | | | — | |
Norwegian Krone | | | DBAB | | | | Buy | | | | 144,025,000 | | | | 18,112,935 | | | | EUR | | | | 2/09/12 | | | | 595,472 | | | | — | |
Polish Zloty | | | DBAB | | | | Buy | | | | 17,528,000 | | | | 4,407,896 | | | | EUR | | | | 2/09/12 | | | | — | | | | (647,273 | ) |
Singapore Dollar | | | BZWS | | | | Buy | | | | 1,717,028 | | | | 1,347,894 | | | | | | | | 2/09/12 | | | | — | | | | (24,278 | ) |
Chilean Peso | | | DBAB | | | | Buy | | | | 1,145,000,000 | | | | 2,326,290 | | | | | | | | 2/10/12 | | | | — | | | | (134,869 | ) |
Euro | | | BZWS | | | | Sell | | | | 612,000 | | | | 829,872 | | | | | | | | 2/10/12 | | | | 37,507 | | | | — | |
Japanese Yen | | | HSBC | | | | Sell | | | | 413,563,000 | | | | 5,052,077 | | | | | | | | 2/10/12 | | | | — | | | | (325,026 | ) |
Japanese Yen | | | MSCO | | | | Sell | | | | 394,373,000 | | | | 4,826,319 | | | | | | | | 2/10/12 | | | | — | | | | (301,278 | ) |
Polish Zloty | | | BZWS | | | | Buy | | | | 17,528,000 | | | | 4,405,238 | | | | EUR | | | | 2/10/12 | | | | — | | | | (644,368 | ) |
Chilean Peso | | | BZWS | | | | Buy | | | | 1,142,900,000 | | | | 2,319,196 | | | | | | | | 2/13/12 | | | | — | | | | (132,393 | ) |
Chilean Peso | | | DBAB | | | | Buy | | | | 1,058,220,000 | | | | 2,149,980 | | | | | | | | 2/13/12 | | | | — | | | | (125,201 | ) |
Euro | | | UBSW | | | | Sell | | | | 657,000 | | | | 892,055 | | | | | | | | 2/13/12 | | | | 41,403 | | | | — | |
Singapore Dollar | | | HSBC | | | | Buy | | | | 6,117,200 | | | | 4,803,595 | | | | | | | | 2/13/12 | | | | — | | | | (87,991 | ) |
British Pound | | | BZWS | | | | Buy | | | | 2,562,230 | | | | 4,082,606 | | | | | | | | 2/14/12 | | | | — | | | | (104,567 | ) |
Chilean Peso | | | MSCO | | | | Buy | | | | 1,963,430,000 | | | | 4,038,733 | | | | | | | | 2/14/12 | | | | — | | | | (282,285 | ) |
Chilean Peso | | | DBAB | | | | Buy | | | | 1,130,600,000 | | | | 2,305,465 | | | | | | | | 2/14/12 | | | | — | | | | (142,393 | ) |
Malaysian Ringgit | | | DBAB | | | | Buy | | | | 97,443,480 | | | | 31,603,632 | | | | | | | | 2/14/12 | | | | — | | | | (954,218 | ) |
Polish Zloty | | | DBAB | | | | Buy | | | | 17,528,000 | | | | 4,365,194 | | | | EUR | | | | 2/14/12 | | | | — | | | | (594,669 | ) |
Singapore Dollar | | | HSBC | | | | Buy | | | | 4,404,400 | | | | 3,458,582 | | | | | | | | 2/14/12 | | | | — | | | | (63,334 | ) |
Japanese Yen | | | JPHQ | | | | Sell | | | | 144,920,000 | | | | 1,765,595 | | | | | | | | 2/15/12 | | | | — | | | | (118,817 | ) |
Japanese Yen | | | DBAB | | | | Sell | | | | 123,057,280 | | | | 1,497,958 | | | | | | | | 2/15/12 | | | | — | | | | (102,170 | ) |
Chilean Peso | | | MSCO | | | | Buy | | | | 3,554,470,000 | | | | 7,382,077 | | | | | | | | 2/16/12 | | | | — | | | | (582,881 | ) |
Euro | | | JPHQ | | | | Sell | | | | 1,971,000 | | | | 2,636,410 | | | | | | | | 2/16/12 | | | | 84,380 | | | | — | |
Euro | | | UBSW | | | | Sell | | | | 1,971,000 | | | | 2,637,533 | | | | | | | | 2/16/12 | | | | 85,503 | | | | — | |
Euro | | | DBAB | | | | Sell | | | | 2,038,000 | | | | 2,734,629 | | | | | | | | 2/17/12 | | | | 95,823 | | | | — | |
Malaysian Ringgit | | | HSBC | | | | Buy | | | | 4,899,000 | | | | 1,582,569 | | | | | | | | 2/17/12 | | | | — | | | | (41,869 | ) |
Singapore Dollar | | | HSBC | | | | Buy | | | | 7,334,000 | | | | 5,736,724 | | | | | | | | 2/17/12 | | | | — | | | | (83,117 | ) |
Singapore Dollar | | | DBAB | | | | Buy | | | | 7,334,000 | | | | 5,736,544 | | | | | | | | 2/17/12 | | | | — | | | | (82,938 | ) |
Singapore Dollar | | | BZWS | | | | Buy | | | | 4,886,000 | | | | 3,824,209 | | | | | | | | 2/17/12 | | | | — | | | | (57,707 | ) |
Chilean Peso | | | DBAB | | | | Buy | | | | 1,455,470,000 | | | | 3,009,657 | | | | | | | | 2/21/12 | | | | — | | | | (226,818 | ) |
Chilean Peso | | | JPHQ | | | | Buy | | | | 1,055,800,000 | | | | 2,167,411 | | | | | | | | 2/21/12 | | | | — | | | | (148,736 | ) |
Euro | | | UBSW | | | | Sell | | | | 2,038,000 | | | | 2,728,495 | | | | | | | | 2/21/12 | | | | 89,586 | | | | — | |
Chilean Peso | | | JPHQ | | | | Buy | | | | 1,792,000,000 | | | | 3,719,772 | | | | | | | | 2/22/12 | | | | — | | | | (293,805 | ) |
Japanese Yen | | | HSBC | | | | Sell | | | | 385,460,000 | | | | 4,651,662 | | | | | | | | 2/22/12 | | | | — | | | | (361,179 | ) |
TGB-23
Franklin Templeton Variable Insurance Products Trust
Statement of Investments, December 31, 2011 (continued)
| | | | | | |
| Templeton Global Bond Securities Fund | | | | | | |
Forward Exchange Contracts (continued)
| | | | | | | | | | | | | | | | | | | | | | | | | | | | | | |
| Currency | | Counterparty | | | Type | | | Quantity | | | Contract
Amount* | | | | | Settlement
Date | | | Unrealized
Appreciation | | | Unrealized
Depreciation | |
Chilean Peso | | | DBAB | | | | Buy | | | | 1,435,490,000 | | | | 2,965,643 | | | | | | 2/23/12 | | | $ | — | | | $ | (221,506 | ) |
Japanese Yen | | | JPHQ | | | | Sell | | | | 385,700,000 | | | | 4,652,313 | | | | | | 2/23/12 | | | | — | | | | (363,744 | ) |
Singapore Dollar | | | DBAB | | | | Buy | | | | 9,547,000 | | | | 7,468,688 | | | | | | 2/24/12 | | | | — | | | | (109,132 | ) |
Chilean Peso | | | CITI | | | | Buy | | | | 2,285,090,000 | | | | 4,709,098 | | | | | | 2/27/12 | | | | — | | | | (342,426 | ) |
Chilean Peso | | | MSCO | | | | Buy | | | | 2,254,540,000 | | | | 4,646,859 | | | | | | 2/27/12 | | | | — | | | | (338,566 | ) |
Chilean Peso | | | DBAB | | | | Buy | | | | 2,094,920,000 | | | | 4,297,757 | | | | | | 2/27/12 | | | | — | | | | (294,488 | ) |
Euro | | | DBAB | | | | Sell | | | | 5,346,000 | | | | 7,284,299 | | | | | | 2/27/12 | | | | 361,617 | | | | — | |
Singapore Dollar | | | DBAB | | | | Buy | | | | 5,952,000 | | | | 4,667,869 | | | | | | 2/27/12 | | | | — | | | | (79,613 | ) |
Chilean Peso | | | MSCO | | | | Buy | | | | 1,559,200,000 | | | | 3,181,392 | | | | | | 2/28/12 | | | | — | | | | (202,123 | ) |
Chilean Peso | | | JPHQ | | | | Buy | | | | 593,800,000 | | | | 1,223,069 | | | | | | 2/28/12 | | | | — | | | | (88,455 | ) |
Chilean Peso | | | BZWS | | | | Buy | | | | 2,006,200,000 | | | | 4,086,779 | | | | | | 2/29/12 | | | | — | | | | (253,847 | ) |
Chilean Peso | | | DBAB | | | | Buy | | | | 790,050,000 | | | | 1,632,200 | | | | | | 2/29/12 | | | | — | | | | (122,775 | ) |
Euro | | | DBAB | | | | Sell | | | | 3,252,140 | | | | 4,444,049 | | | | | | 2/29/12 | | | | 232,673 | | | | — | |
Singapore Dollar | | | DBAB | | | | Buy | | | | 5,960,000 | | | | 4,668,212 | | | | | | 2/29/12 | | | | — | | | | (73,754 | ) |
Chilean Peso | | | DBAB | | | | Buy | | | | 1,253,970,000 | | | | 2,553,390 | | | | | | 3/01/12 | | | | — | | | | (157,907 | ) |
Chilean Peso | | | BZWS | | | | Buy | | | | 1,004,500,000 | | | | 2,043,328 | | | | | | 3/01/12 | | | | — | | | | (124,412 | ) |
Euro | | | DBAB | | | | Sell | | | | 1,530,900 | | | | 2,087,306 | | | | | | 3/01/12 | | | | 104,835 | | | | — | |
Japanese Yen | | | UBSW | | | | Sell | | | | 447,200,000 | | | | 5,501,021 | | | | | | 3/01/12 | | | | — | | | | (315,662 | ) |
Japanese Yen | | | JPHQ | | | | Sell | | | | 401,100,000 | | | | 4,934,793 | | | | | | 3/01/12 | | | | — | | | | (282,272 | ) |
Japanese Yen | | | HSBC | | | | Sell | | | | 400,800,000 | | | | 4,932,923 | | | | | | 3/01/12 | | | | — | | | | (280,240 | ) |
Chilean Peso | | | DBAB | | | | Buy | | | | 1,253,970,000 | | | | 2,553,390 | | | | | | 3/02/12 | | | | — | | | | (158,188 | ) |
Chilean Peso | | | DBAB | | | | Buy | | | | 1,328,230,000 | | | | 2,706,255 | | | | | | 3/05/12 | | | | — | | | | (170,100 | ) |
Euro | | | DBAB | | | | Sell | | | | 1,536,000 | | | | 2,099,251 | | | | | | 3/05/12 | | | | 110,083 | | | | — | |
Chilean Peso | | | DBAB | | | | Buy | | | | 1,320,220,000 | | | | 2,682,556 | | | | | | 3/07/12 | | | | — | | | | (162,286 | ) |
Euro | | | UBSW | | | | Sell | | | | 6,915,000 | | | | 9,567,248 | | | | | | 3/08/12 | | | | 611,791 | | | | — | |
Euro | | | MSCO | | | | Sell | | | | 5,225,000 | | | | 7,228,526 | | | | | | 3/08/12 | | | | 461,749 | | | | — | |
Euro | | | HSBC | | | | Sell | | | | 1,844,000 | | | | 2,548,408 | | | | | | 3/08/12 | | | | 160,286 | | | | — | |
Chilean Peso | | | DBAB | | | | Buy | | | | 1,284,460,000 | | | | 2,629,396 | | | | | | 3/09/12 | | | | — | | | | (177,965 | ) |
Chilean Peso | | | MSCO | | | | Buy | | | | 662,100,000 | | | | 1,346,279 | | | | | | 3/12/12 | | | | — | | | | (83,085 | ) |
Chilean Peso | | | DBAB | | | | Buy | | | | 2,600,220,000 | | | | 5,301,695 | | | | | | 3/15/12 | | | | — | | | | (342,579 | ) |
Japanese Yen | | | CITI | | | | Sell | | | | 286,112,008 | | | | 3,688,722 | | | | | | 3/15/12 | | | | — | | | | (33,907 | ) |
Australian Dollar | | | CITI | | | | Buy | | | | 16,742,000 | | | | 15,737,313 | | | | | | 3/19/12 | | | | 1,237,293 | | | | — | |
Japanese Yen | | | CITI | | | | Sell | | | | 407,702,000 | | | | 5,074,644 | | | | | | 3/19/12 | | | | — | | | | (230,491 | ) |
Japanese Yen | | | UBSW | | | | Sell | | | | 330,530,000 | | | | 4,114,396 | | | | | | 3/19/12 | | | | — | | | | (186,555 | ) |
Japanese Yen | | | MSCO | | | | Sell | | | | 244,700,000 | | | | 3,044,896 | | | | | | 3/19/12 | | | | — | | | | (139,211 | ) |
Singapore Dollar | | | JPHQ | | | | Buy | | | | 11,426,000 | | | | 8,934,240 | | | | | | 3/19/12 | | | | — | | | | (124,850 | ) |
Singapore Dollar | | | HSBC | | | | Buy | | | | 9,120,000 | | | | 7,147,559 | | | | | | 3/19/12 | | | | — | | | | (116,084 | ) |
Singapore Dollar | | | DBAB | | | | Buy | | | | 7,978,100 | | | | 6,254,047 | | | | | | 3/19/12 | | | | — | | | | (102,970 | ) |
Australian Dollar | | | DBAB | | | | Buy | | | | 8,192,166 | | | | 7,679,992 | | | | | | 3/21/12 | | | | 624,272 | | | | — | |
Chilean Peso | | | JPHQ | | | | Buy | | | | 1,065,000,000 | | | | 2,137,481 | | | | | | 3/21/12 | | | | — | | | | (107,747 | ) |
Singapore Dollar | | | DBAB | | | | Buy | | | | 8,589,700 | | | | 6,700,757 | | | | | | 3/21/12 | | | | — | | | | (78,037 | ) |
Singapore Dollar | | | HSBC | | | | Buy | | | | 6,864,000 | | | | 5,360,615 | | | | | | 3/21/12 | | | | — | | | | (68,423 | ) |
Australian Dollar | | | DBAB | | | | Buy | | | | 537,776 | | | | 503,606 | | | | | | 3/22/12 | | | | 41,472 | | | | — | |
Japanese Yen | | | UBSW | | | | Sell | | | | 242,774,840 | | | | 3,005,643 | | | | | | 3/23/12 | | | | — | | | | (153,703 | ) |
Euro | | | DBAB | | | | Sell | | | | 2,736,000 | | | | 3,829,333 | | | | | | 3/26/12 | | | | 285,253 | | | | — | |
Malaysian Ringgit | | | DBAB | | | | Buy | | | | 16,025,000 | | | | 5,047,403 | | | | | | 3/26/12 | | | | — | | | | (14,070 | ) |
Malaysian Ringgit | | | HSBC | | | | Buy | | | | 7,634,000 | | | | 2,403,463 | | | | | | 3/26/12 | | | | — | | | | (5,681 | ) |
Singapore Dollar | | | MSCO | | | | Buy | | | | 10,570,700 | | | | 8,235,134 | | | | | | 3/26/12 | | | | — | | | | (84,735 | ) |
Singapore Dollar | | | FBCO | | | | Buy | | | | 10,578,000 | | | | 8,235,111 | | | | | | 3/26/12 | | | | — | | | | (79,084 | ) |
British Pound | | | MSCO | | | | Buy | | | | 2,852,773 | | | | 4,545,238 | | | | | | 3/29/12 | | | | — | | | | (118,112 | ) |
British Pound | | | DBAB | | | | Buy | | | | 2,853,149 | | | | 4,545,238 | | | | | | 3/29/12 | | | | — | | | | (117,528 | ) |
British Pound | | | BZWS | | | | Buy | | | | 5,722,896 | | | | 9,090,477 | | | | | | 3/30/12 | | | | — | | | | (209,396 | ) |
TGB-24
Franklin Templeton Variable Insurance Products Trust
Statement of Investments, December 31, 2011 (continued)
| | | | | | |
| Templeton Global Bond Securities Fund | | | | | | |
Forward Exchange Contracts (continued)
| | | | | | | | | | | | | | | | | | | | | | | | | | | | | | | | |
| Currency | | Counterparty | | | Type | | | Quantity | | | Contract
Amount* | | | | | | Settlement
Date | | | Unrealized
Appreciation | | | Unrealized
Depreciation | |
Chilean Peso | | | DBAB | | | | Buy | | | | 1,252,750,000 | | | | 2,510,018 | | | | | | | | 3/30/12 | | | $ | — | | | $ | (124,883 | ) |
New Israeli Shekel | | | MSCO | | | | Buy | | | | 9,296,110 | | | | 2,596,996 | | | | | | | | 3/30/12 | | | | — | | | | (161,179 | ) |
British Pound | | | FBCO | | | | Buy | | | | 3,431,879 | | | | 5,454,285 | | | | | | | | 4/02/12 | | | | — | | | | (128,694 | ) |
Chilean Peso | | | DBAB | | | | Buy | | | | 1,330,940,000 | | | | 2,656,408 | | | | | | | | 4/02/12 | | | | — | | | | (123,018 | ) |
Euro | | | DBAB | | | | Sell | | | | 3,712,000 | | | | 5,214,432 | | | | | | | | 4/04/12 | | | | 405,455 | | | | — | |
Euro | | | DBAB | | | | Sell | | | | 2,488,000 | | | | 3,482,304 | | | | | | | | 4/05/12 | | | | 258,994 | | | | — | |
Euro | | | DBAB | | | | Sell | | | | 7,243,000 | | | | 10,201,041 | | | | | | | | 4/10/12 | | | | 816,668 | | | | — | |
Euro | | | HSBC | | | | Sell | | | | 8,692,000 | | | | 12,212,434 | | | | | | | | 4/10/12 | | | | 950,667 | | | | — | |
Euro | | | UBSW | | | | Sell | | | | 4,346,000 | | | | 6,102,436 | | | | | | | | 4/10/12 | | | | 471,553 | | | | — | |
Indian Rupee | | | DBAB | | | | Buy | | | | 159,915,000 | | | | 3,413,340 | | | | | | | | 4/11/12 | | | | — | | | | (453,447 | ) |
Euro | | | UBSW | | | | Sell | | | | 3,907,000 | | | | 5,569,722 | | | | | | | | 4/12/12 | | | | 507,464 | | | | — | |
Indian Rupee | | | DBAB | | | | Buy | | | | 342,913,000 | | | | 7,346,037 | | | | | | | | 4/13/12 | | | | — | | | | (1,000,986 | ) |
Chilean Peso | | | MSCO | | | | Buy | | | | 2,645,530,000 | | | | 5,374,363 | | | | | | | | 4/16/12 | | | | — | | | | (344,379 | ) |
Euro | | | HSBC | | | | Sell | | | | 6,919,000 | | | | 9,915,481 | | | | | | | | 4/16/12 | | | | 950,029 | | | | — | |
Indian Rupee | | | JPHQ | | | | Buy | | | | 230,330,000 | | | | 4,921,581 | | | | | | | | 4/16/12 | | | | — | | | | (661,693 | ) |
Indian Rupee | | | JPHQ | | | | Buy | | | | 226,092,000 | | | | 4,802,294 | | | | | | | | 4/18/12 | | | | — | | | | (622,093 | ) |
Indian Rupee | | | JPHQ | | | | Buy | | | | 112,941,000 | | | | 2,396,880 | | | | | | | | 4/19/12 | | | | — | | | | (309,047 | ) |
Indian Rupee | | | DBAB | | | | Buy | | | | 79,271,000 | | | | 1,678,404 | | | | | | | | 4/19/12 | | | | — | | | | (212,996 | ) |
Malaysian Ringgit | | | JPHQ | | | | Buy | | | | 4,069,213 | | | | 1,329,330 | | | | | | | | 4/19/12 | | | | — | | | | (51,795 | ) |
Chilean Peso | | | MSCO | | | | Buy | | | | 2,370,410,000 | | | | 4,788,707 | | | | | | | | 4/20/12 | | | | — | | | | (283,263 | ) |
Japanese Yen | | | UBSW | | | | Sell | | | | 261,900,000 | | | | 3,188,653 | | | | | | | | 4/20/12 | | | | — | | | | (221,992 | ) |
Japanese Yen | | | CITI | | | | Sell | | | | 261,800,000 | | | | 3,189,299 | | | | | | | | 4/20/12 | | | | — | | | | (220,044 | ) |
Euro | | | DBAB | | | | Sell | | | | 4,545,000 | | | | 6,425,948 | | | | | | | | 4/23/12 | | | | 535,996 | | | | — | |
Malaysian Ringgit | | | JPHQ | | | | Buy | | | | 11,659,000 | | | | 3,812,498 | | | | | | | | 4/23/12 | | | | — | | | | (152,390 | ) |
Indian Rupee | | | DBAB | | | | Buy | | | | 160,601,000 | | | | 3,410,512 | | | | | | | | 4/26/12 | | | | — | | | | (444,874 | ) |
Chilean Peso | | | JPHQ | | | | Buy | | | | 1,501,938,000 | | | | 3,045,910 | | | | | | | | 4/27/12 | | | | — | | | | (192,780 | ) |
Indian Rupee | | | JPHQ | | | | Buy | | | | 136,582,000 | | | | 2,896,755 | | | | | | | | 4/27/12 | | | | — | | | | (375,042 | ) |
Chilean Peso | | | CITI | | | | Buy | | | | 2,420,966,000 | | | | 4,976,292 | | | | | | | | 4/30/12 | | | | — | | | | (378,456 | ) |
Indian Rupee | | | JPHQ | | | | Buy | | | | 113,782,000 | | | | 2,415,754 | | | | | | | | 4/30/12 | | | | — | | | | (315,979 | ) |
Indian Rupee | | | DBAB | | | | Buy | | | | 71,377,981 | | | | 1,505,547 | | | | | | | | 4/30/12 | | | | — | | | | (188,312 | ) |
Swedish Krona | | | BZWS | | | | Buy | | | | 122,773,200 | | | | 13,607,901 | | | | EUR | | | | 4/30/12 | | | | 118,922 | | | | — | |
Euro | | | DBAB | | | | Sell | | | | 2,045,000 | | | | 2,991,017 | | | | | | | | 5/07/12 | | | | 340,263 | | | | — | |
Euro | | | FBCO | | | | Sell | | | | 1,731,000 | | | | 2,537,646 | | | | | | | | 5/07/12 | | | | 293,903 | | | | — | |
Euro | | | BZWS | | | | Sell | | | | 1,259,000 | | | | 1,850,818 | | | | | | | | 5/07/12 | | | | 218,887 | | | | — | |
Euro | | | MSCO | | | | Sell | | | | 1,259,000 | | | | 1,851,970 | | | | | | | | 5/07/12 | | | | 220,039 | | | | — | |
Euro | | | DBAB | | | | Sell | | | | 1,259,000 | | | | 1,816,422 | | | | | | | | 5/09/12 | | | | 184,439 | | | | — | |
Euro | | | UBSW | | | | Sell | | | | 629,000 | | | | 902,238 | | | | | | | | 5/09/12 | | | | 86,894 | | | | — | |
Japanese Yen | | | CITI | | | | Sell | | | | 733,721,000 | | | | 9,128,949 | | | | | | | | 5/10/12 | | | | — | | | | (431,032 | ) |
Chilean Peso | | | MSCO | | | | Buy | | | | 1,150,200,000 | | | | 2,368,958 | | | | | | | | 5/11/12 | | | | — | | | | (186,458 | ) |
Japanese Yen | | | UBSW | | | | Sell | | | | 733,361,000 | | | | 9,122,540 | | | | | | | | 5/11/12 | | | | — | | | | (432,997 | ) |
Japanese Yen | | | DBAB | | | | Sell | | | | 490,555,000 | | | | 6,101,962 | | | | | | | | 5/11/12 | | | | — | | | | (289,865 | ) |
Euro | | | DBAB | | | | Sell | | | | 1,812,000 | | | | 2,538,521 | | | | | | | | 5/18/12 | | | | 189,368 | | | | — | |
Euro | | | DBAB | | | | Sell | | | | 2,642,000 | | | | 3,691,346 | | | | | | | | 5/21/12 | | | | 265,979 | | | | — | |
Euro | | | UBSW | | | | Sell | | | | 1,812,000 | | | | 2,531,002 | | | | | | | | 5/21/12 | | | | 181,734 | | | | — | |
Chilean Peso | | | MSCO | | | | Buy | | | | 420,740,000 | | | | 852,512 | | | | | | | | 5/22/12 | | | | — | | | | (54,864 | ) |
Euro | | | DBAB | | | | Sell | | | | 1,300,570 | | | | 1,740,065 | | | | | | | | 5/25/12 | | | | 53,761 | | | | — | |
Indian Rupee | | | DBAB | | | | Buy | | | | 217,594,000 | | | | 4,559,807 | | | | | | | | 6/01/12 | | | | — | | | | (564,173 | ) |
Indian Rupee | | | HSBC | | | | Buy | | | | 251,448,000 | | | | 5,326,160 | | | | | | | | 6/04/12 | | | | — | | | | (711,019 | ) |
Euro | | | DBAB | | | | Sell | | | | 785,200 | | | | 1,123,692 | | | | | | | | 6/06/12 | | | | 105,413 | | | | — | |
Euro | | | DBAB | | | | Sell | | | | 2,033,100 | | | | 2,927,969 | | | | | | | | 6/07/12 | | | | 291,321 | | | | — | |
Euro | | | UBSW | | | | Sell | | | | 1,057,200 | | | | 1,517,505 | | | | | | | | 6/07/12 | | | | 146,463 | | | | — | |
Indian Rupee | | | DBAB | | | | Buy | | | | 160,277,000 | | | | 3,379,945 | | | | | | | | 6/07/12 | | | | — | | | | (439,547 | ) |
TGB-25
Franklin Templeton Variable Insurance Products Trust
Statement of Investments, December 31, 2011 (continued)
| | | | | | |
| Templeton Global Bond Securities Fund | | | | | | |
Forward Exchange Contracts (continued)
| | | | | | | | | | | | | | | | | | | | | | | | | | | | | | | | |
| Currency | | Counterparty | | | Type | | | Quantity | | | Contract
Amount* | | | | | | Settlement
Date | | | Unrealized
Appreciation | | | Unrealized
Depreciation | |
Indian Rupee | | | HSBC | | | | Buy | | | | 42,784,000 | | | | 908,558 | | | | | | | | 6/08/12 | | | $ | — | | | $ | (123,776 | ) |
Polish Zloty | | | DBAB | | | | Buy | | | | 30,704,000 | | | | 7,583,856 | | | | EUR | | | | 6/08/12 | | | | — | | | | (1,059,465 | ) |
Polish Zloty | | | CITI | | | | Buy | | | | 5,990,000 | | | | 1,480,328 | | | | EUR | | | | 6/08/12 | | | | — | | | | (207,733 | ) |
Euro | | | DBAB | | | | Sell | | | | 16,210,600 | | | | 23,377,407 | | | | | | | | 6/11/12 | | | | 2,353,154 | | | | — | |
Indian Rupee | | | DBAB | | | | Buy | | | | 43,392,000 | | | | 921,078 | | | | | | | | 6/11/12 | | | | — | | | | (125,514 | ) |
Swedish Krona | | | DBAB | | | | Buy | | | | 41,300,000 | | | | 4,531,649 | | | | EUR | | | | 6/11/12 | | | | 88,274 | | | | — | |
Swedish Krona | | | MSCO | | | | Buy | | | | 55,369,800 | | | | 6,074,660 | | | | EUR | | | | 6/11/12 | | | | 119,384 | | | | — | |
Euro | | | DBAB | | | | Sell | | | | 6,935,000 | | | | 9,949,645 | | | | | | | | 6/13/12 | | | | 955,042 | | | | — | |
Indian Rupee | | | HSBC | | | | Buy | | | | 108,000,000 | | | | 2,292,994 | | | | | | | | 6/13/12 | | | | — | | | | (313,495 | ) |
Swedish Krona | | | BZWS | | | | Buy | | | | 24,372,000 | | | | 2,664,986 | | | | EUR | | | | 6/13/12 | | | | 63,754 | | | | — | |
Swedish Krona | | | MSCO | | | | Buy | | | | 27,990,100 | | | | 3,064,681 | | | | EUR | | | | 6/13/12 | | | | 67,940 | | | | — | |
Euro | | | DBAB | | | | Sell | | | | 1,448,000 | | | | 2,068,989 | | | | | | | | 6/14/12 | | | | 190,922 | | | | — | |
Swedish Krona | | | MSCO | | | | Buy | | | | 21,992,000 | | | | 2,398,444 | | | | EUR | | | | 6/14/12 | | | | 65,555 | | | | — | |
Japanese Yen | | | CITI | | | | Sell | | | | 310,702,000 | | | | 4,014,341 | | | | | | | | 6/15/12 | | | | — | | | | (37,715 | ) |
Indian Rupee | | | DBAB | | | | Buy | | | | 108,614,000 | | | | 2,300,657 | | | | | | | | 6/18/12 | | | | — | | | | (311,444 | ) |
Indian Rupee | | | DBAB | | | | Buy | | | | 98,937,000 | | | | 2,087,719 | | | | | | | | 6/20/12 | | | | — | | | | (276,296 | ) |
Indian Rupee | | | JPHQ | | | | Buy | | | | 79,054,000 | | | | 1,669,567 | | | | | | | | 6/22/12 | | | | — | | | | (222,626 | ) |
Indian Rupee | | | DBAB | | | | Buy | | | | 119,627,000 | | | | 2,538,773 | | | | | | | | 6/25/12 | | | | — | | | | (350,232 | ) |
Indian Rupee | | | HSBC | | | | Buy | | | | 80,337,000 | | | | 1,702,416 | | | | | | | | 6/27/12 | | | | — | | | | (233,128 | ) |
South Korean Won | | | DBAB | | | | Buy | | | | 10,730,000,000 | | | | 9,225,346 | | | | | | | | 6/27/12 | | | | — | | | | (52,446 | ) |
South Korean Won | | | DBAB | | | | Buy | | | | 10,710,000,000 | | | | 9,129,267 | | | | | | | | 6/27/12 | | | | 26,535 | | | | — | |
Malaysian Ringgit | | | JPHQ | | | | Buy | | | | 14,772,000 | | | | 4,766,853 | | | | | | | | 6/29/12 | | | | — | | | | (134,922 | ) |
Swedish Krona | | | UBSW | | | | Buy | | | | 302,991,000 | | | | 32,586,637 | | | | EUR | | | | 6/29/12 | | | | 1,467,682 | | | | — | |
Indian Rupee | | | DBAB | | | | Buy | | | | 79,423,000 | | | | 1,704,455 | | | | | | | | 7/11/12 | | | | — | | | | (254,307 | ) |
Indian Rupee | | | JPHQ | | | | Buy | | | | 127,745,000 | | | | 2,753,345 | | | | | | | | 7/12/12 | | | | — | | | | (421,185 | ) |
Indian Rupee | | | DBAB | | | | Buy | | | | 40,128,000 | | | | 861,351 | | | | | | | | 7/12/12 | | | | — | | | | (128,759 | ) |
Malaysian Ringgit | | | DBAB | | | | Buy | | | | 18,006,622 | | | | 5,897,043 | | | | | | | | 7/12/12 | | | | — | | | | (252,777 | ) |
Malaysian Ringgit | | | DBAB | | | | Buy | | | | 13,610,000 | | | | 4,466,835 | | | | | | | | 7/13/12 | | | | — | | | | (200,823 | ) |
Euro | | | DBAB | | | | Sell | | | | 2,243,000 | | | | 3,142,533 | | | | | | | | 7/16/12 | | | | 231,680 | | | | — | |
Euro | | | UBSW | | | | Sell | | | | 8,965,000 | | | | 12,558,620 | | | | | | | | 7/16/12 | | | | 924,294 | | | | — | |
Euro | | | MSCO | | | | Sell | | | | 7,888,000 | | | | 11,004,746 | | | | | | | | 7/16/12 | | | | 768,096 | | | | — | |
Euro | | | UBSW | | | | Sell | | | | 8,965,000 | | | | 12,571,171 | | | | | | | | 7/18/12 | | | | 936,401 | | | | — | |
Euro | | | DBAB | | | | Sell | | | | 3,518,000 | | | | 4,934,663 | | | | | | | | 7/18/12 | | | | 369,006 | | | | — | |
Euro | | | MSCO | | | | Sell | | | | 1,791,000 | | | | 2,507,400 | | | | | | | | 7/18/12 | | | | 183,042 | | | | — | |
Malaysian Ringgit | | | DBAB | | | | Buy | | | | 2,637,000 | | | | 865,896 | | | | | | | | 7/18/12 | | | | — | | | | (39,445 | ) |
Malaysian Ringgit | | | DBAB | | | | Buy | | | | 11,455,000 | | | | 2,669,790 | | | | EUR | | | | 7/18/12 | | | | 125,214 | | | | — | |
Euro | | | BZWS | | | | Sell | | | | 2,638,000 | | | | 3,696,102 | | | | | | | | 7/19/12 | | | | 272,442 | | | | — | |
Indian Rupee | | | JPHQ | | | | Buy | | | | 39,422,000 | | | | 848,332 | | | | | | | | 7/19/12 | | | | — | | | | (129,230 | ) |
Euro | | | MSCO | | | | Sell | | | | 12,182,000 | | | | 16,976,226 | | | | | | | | 7/20/12 | | | | 1,165,834 | | | | — | |
Euro | | | DBAB | | | | Sell | | | | 1,935,000 | | | | 2,699,035 | | | | | | | | 7/20/12 | | | | 187,698 | | | | — | |
Malaysian Ringgit | | | DBAB | | | | Buy | | | | 4,160,000 | | | | 1,361,880 | | | | | | | | 7/20/12 | | | | — | | | | (58,180 | ) |
Malaysian Ringgit | | | DBAB | | | | Buy | | | | 12,933,000 | | | | 3,036,058 | | | | EUR | | | | 7/20/12 | | | | 112,723 | | | | — | |
Euro | | | DBAB | | | | Sell | | | | 1,759,000 | | | | 2,467,437 | | | | | | | | 7/23/12 | | | | 184,391 | | | | — | |
Malaysian Ringgit | | | DBAB | | | | Buy | | | | 5,058,000 | | | | 1,667,216 | | | | | | | | 7/25/12 | | | | — | | | | (82,299 | ) |
Malaysian Ringgit | | | DBAB | | | | Buy | | | | 16,628,000 | | | | 3,885,501 | | | | EUR | | | | 7/25/12 | | | | 167,089 | | | | — | |
Malaysian Ringgit | | | JPHQ | | | | Buy | | | | 5,318,000 | | | | 1,763,964 | | | | | | | | 7/27/12 | | | | — | | | | (97,663 | ) |
Malaysian Ringgit | | | JPHQ | | | | Buy | | | | 16,628,000 | | | | 3,875,268 | | | | EUR | | | | 7/27/12 | | | | 179,907 | | | | — | |
Malaysian Ringgit | | | HSBC | | | | Buy | | | | 3,005,000 | | | | 1,009,745 | | | | | | | | 7/31/12 | | | | — | | | | (68,279 | ) |
Euro | | | BZWS | | | | Sell | | | | 185,174 | | | | 262,429 | | | | | | | | 8/01/12 | | | | 22,046 | | | | — | |
Euro | | | BZWS | | | | Sell | | | | 97,724 | | | | 139,325 | | | | | | | | 8/02/12 | | | | 12,463 | | | | — | |
Euro | | | DBAB | | | | Sell | | | | 5,724,900 | | | | 8,099,168 | | | | | | | | 8/06/12 | | | | 666,706 | | | | — | |
Euro | | | BZWS | | | | Sell | | | | 2,762,518 | | | | 3,924,433 | | | | | | | | 8/06/12 | | | | 337,941 | | | | — | |
TGB-26
Franklin Templeton Variable Insurance Products Trust
Statement of Investments, December 31, 2011 (continued)
| | | | | | |
| Templeton Global Bond Securities Fund | | | | | | |
Forward Exchange Contracts (continued)
| | | | | | | | | | | | | | | | | | | | | | | | | | | | | | | | |
| Currency | | Counterparty | | | Type | | | Quantity | | | Contract
Amount* | | | | | | Settlement
Date | | | Unrealized
Appreciation | | | Unrealized
Depreciation | |
Malaysian Ringgit | | | JPHQ | | | | Buy | | | | 1,100,000 | | | | 365,509 | | | | | | | | 8/06/12 | | | $ | — | | | $ | (20,934 | ) |
Euro | | | CITI | | | | Sell | | | | 1,210,637 | | | | 1,699,674 | | | | | | | | 8/08/12 | | | | 127,881 | | | | — | |
Euro | | | DBAB | | | | Sell | | | | 6,343,900 | | | | 8,927,453 | | | | | | | | 8/08/12 | | | | 691,049 | | | | — | |
Malaysian Ringgit | | | HSBC | | | | Buy | | | | 6,100,000 | | | | 2,030,220 | | | | | | | | 8/08/12 | | | | — | | | | (119,492 | ) |
Euro | | | CITI | | | | Sell | | | | 351,512 | | | | 494,595 | | | | | | | | 8/09/12 | | | | 38,212 | | | | — | |
Euro | | | DBAB | | | | Sell | | | | 4,845,000 | | | | 6,861,651 | | | | | | | | 8/09/12 | | | | 571,177 | | | | — | |
South Korean Won | | | HSBC | | | | Buy | | | | 21,363,430,000 | | | | 19,660,804 | | | | | | | | 8/09/12 | | | | — | | | | (1,409,747 | ) |
Euro | | | DBAB | | | | Sell | | | | 2,166,000 | | | | 3,061,186 | | | | | | | | 8/10/12 | | | | 248,920 | | | | — | |
Euro | | | DBAB | | | | Sell | | | | 4,115,000 | | | | 5,828,152 | | | | | | | | 8/13/12 | | | | 485,061 | | | | — | |
Polish Zloty | | | DBAB | | | | Buy | | | | 59,155,000 | | | | 13,945,073 | | | | EUR | | | | 8/16/12 | | | | — | | | | (1,278,338 | ) |
Euro | | | BZWS | | | | Sell | | | | 19,627,000 | | | | 28,201,112 | | | | | | | | 8/20/12 | | | | 2,713,177 | | | | — | |
Euro | | | FBCO | | | | Sell | | | | 7,851,000 | | | | 11,275,606 | | | | | | | | 8/20/12 | | | | 1,080,173 | | | | — | |
Euro | | | DBAB | | | | Sell | | | | 7,851,000 | | | | 11,258,098 | | | | | | | | 8/20/12 | | | | 1,062,665 | | | | — | |
Euro | | | MSCO | | | | Sell | | | | 3,925,000 | | | | 5,631,786 | | | | | | | | 8/20/12 | | | | 534,719 | | | | — | |
Japanese Yen | | | UBSW | | | | Sell | | | | 758,781,000 | | | | 9,947,313 | | | | | | | | 8/20/12 | | | | 33,913 | | | | — | |
Japanese Yen | | | JPHQ | | | | Sell | | | | 377,047,000 | | | | 4,932,265 | | | | | | | | 8/20/12 | | | | 6,183 | | | | — | |
Japanese Yen | | | DBAB | | | | Sell | | | | 461,885,000 | | | | 6,045,536 | | | | | | | | 8/20/12 | | | | 11,054 | | | | — | |
Japanese Yen | | | HSBC | | | | Sell | | | | 1,621,372,000 | | | | 21,274,729 | | | | | | | | 8/20/12 | | | | 91,663 | | | | — | |
Japanese Yen | | | BZWS | | | | Sell | | | | 376,247,000 | | | | 4,942,165 | | | | | | | | 8/22/12 | | | | 26,266 | | | | — | |
Japanese Yen | | | MSCO | | | | Sell | | | | 300,000,000 | | | | 3,940,421 | | | | | | | | 8/22/12 | | | | 20,736 | | | | — | |
Japanese Yen | | | DBAB | | | | Sell | | | | 376,727,000 | | | | 4,947,885 | | | | | | | | 8/22/12 | | | | 25,715 | | | | — | |
Euro | | | BZWS | | | | Sell | | | | 1,002,141 | | | | 1,441,079 | | | | | | | | 8/23/12 | | | | 139,608 | | | | — | |
Japanese Yen | | | FBCO | | | | Sell | | | | 746,218,000 | | | | 9,807,044 | | | | | | | | 8/23/12 | | | | 56,981 | | | | — | |
Japanese Yen | | | CITI | | | | Sell | | | | 751,731,000 | | | | 9,896,406 | | | | | | | | 8/23/12 | | | | 74,310 | | | | — | |
Japanese Yen | | | DBAB | | | | Sell | | | | 371,821,000 | | | | 4,902,929 | | | | | | | | 8/23/12 | | | | 44,727 | | | | — | |
Euro | | | BZWS | | | | Sell | | | | 1,678,784 | | �� | | 2,408,384 | | | | | | | | 8/24/12 | | | | 228,122 | | | | — | |
Indian Rupee | | | HSBC | | | | Buy | | | | 143,891,000 | | | | 3,048,648 | | | | | | | | 8/24/12 | | | | — | | | | (435,114 | ) |
Indian Rupee | | | DBAB | | | | Buy | | | | 124,700,000 | | | | 2,639,248 | | | | | | | | 8/24/12 | | | | — | | | | (374,286 | ) |
Japanese Yen | | | JPHQ | | | | Sell | | | | 750,133,000 | | | | 9,833,296 | | | | | | | | 8/24/12 | | | | 31,812 | | | | — | |
Euro | | | BZWS | | | | Sell | | | | 8,738,369 | | | | 12,570,326 | | | | | | | | 8/27/12 | | | | 1,221,027 | | | | — | |
Euro | | | HSBC | | | | Sell | | | | 18,537,726 | | | | 26,609,988 | | | | | | | | 8/27/12 | | | | 2,533,388 | | | | — | |
Japanese Yen | | | BZWS | | | | Sell | | | | 1,085,075,000 | | | | 14,227,693 | | | | | | | | 8/27/12 | | | | 48,586 | | | | — | |
Japanese Yen | | | DBAB | | | | Sell | | | | 685,950,000 | | | | 9,026,608 | | | | | | | | 8/27/12 | | | | 63,026 | | | | — | |
Japanese Yen | | | UBSW | | | | Sell | | | | 937,086,000 | | | | 12,324,808 | | | | | | | | 8/27/12 | | | | 79,533 | | | | — | |
Japanese Yen | | | JPHQ | | | | Sell | | | | 751,903,000 | | | | 9,886,956 | | | | | | | | 8/27/12 | | | | 61,540 | | | | — | |
Japanese Yen | | | HSBC | | | | Sell | | | | 1,247,125,000 | | | | 16,361,102 | | | | | | | | 8/27/12 | | | | 64,423 | | | | — | |
Malaysian Ringgit | | | JPHQ | | | | Buy | | | | 8,340,000 | | | | 2,788,645 | | | | | | | | 8/27/12 | | | | — | | | | (177,567 | ) |
Swedish Krona | | | UBSW | | | | Buy | | | | 30,000,000 | | | | 3,253,973 | | | | EUR | | | | 8/27/12 | | | | 99,551 | | | | — | |
United States Dollar | | | CITI | | | | Buy | | | | 7,760,297 | | | | 5,387,112 | | | | EUR | | | | 8/27/12 | | | | 763,573 | | | | — | |
United States Dollar | | | UBSW | | | | Buy | | | | 16,993,151 | | | | 11,812,119 | | | | EUR | | | | 8/27/12 | | | | 1,651,697 | | | | — | |
United States Dollar | | | JPHQ | | | | Buy | | | | 11,099,031 | | | | 7,711,034 | | | | EUR | | | | 8/27/12 | | | | 1,084,023 | | | | — | |
Euro | | | JPHQ | | | | Sell | | | | 6,190,317 | | | | 8,900,685 | | | | | | | | 8/29/12 | | | | 860,461 | | | | — | |
Euro | | | DBAB | | | | Sell | | | | 1,011,997 | | | | 1,448,775 | | | | | | | | 8/29/12 | | | | 134,354 | | | | — | |
Japanese Yen | | | BZWS | | | | Sell | | | | 890,300,000 | | | | 11,683,727 | | | | | | | | 8/30/12 | | | | 48,870 | | | | — | |
Euro | | | DBAB | | | | Sell | | | | 46,315 | | | | 66,985 | | | | | | | | 8/31/12 | | | | 6,827 | | | | — | |
Japanese Yen | | | JPHQ | | | | Sell | | | | 372,662,000 | | | | 4,883,848 | | | | | | | | 8/31/12 | | | | 13,593 | | | | — | |
Euro | | | DBAB | | | | Sell | | | | 541,000 | | | | 767,582 | | | | | | | | 9/06/12 | | | | 64,803 | | | | — | |
Indian Rupee | | | DBAB | | | | Buy | | | | 88,183,000 | | | | 1,858,088 | | | | | | | | 9/06/12 | | | | — | | | | (258,860 | ) |
Euro | | | BZWS | | | | Sell | | | | 1,033,224 | | | | 1,450,750 | | | | | | | | 9/10/12 | | | | 108,451 | | | | — | |
Euro | | | DBAB | | | | Sell | | | | 1,191,000 | | | | 1,665,983 | | | | | | | | 9/10/12 | | | | 118,712 | | | | — | |
Euro | | | BZWS | | | | Sell | | | | 1,012,110 | | | | 1,414,930 | | | | | | | | 9/12/12 | | | | 100,011 | | | | — | |
Euro | | | DBAB | | | | Sell | | | | 541,000 | | | | 740,256 | | | | | | | | 9/13/12 | | | | 37,383 | | | | — | |
TGB-27
Franklin Templeton Variable Insurance Products Trust
Statement of Investments, December 31, 2011 (continued)
| | | | | | |
| Templeton Global Bond Securities Fund | | | | | | |
Forward Exchange Contracts (continued)
| | | | | | | | | | | | | | | | | | | | | | | | | | | | | | | | |
| Currency | | Counterparty | | | Type | | | Quantity | | | Contract
Amount* | | | | | | Settlement
Date | | | Unrealized
Appreciation | | | Unrealized
Depreciation | |
Euro | | | BZWS | | | | Sell | | | | 2,890,070 | | | | 3,953,110 | | | | | | | | 9/14/12 | | | $ | 198,229 | | | $ | — | |
Euro | | | UBSW | | | | Sell | | | | 2,694,506 | | | | 3,693,359 | | | | | | | | 9/17/12 | | | | 192,362 | | | | — | |
Japanese Yen | | | BZWS | | | | Sell | | | | 285,057,504 | | | | 3,677,924 | | | | | | | | 9/18/12 | | | | — | | | | (49,274 | ) |
Euro | | | BZWS | | | | Sell | | | | 678,250 | | | | 940,190 | | | | | | | | 9/19/12 | | | | 58,900 | | | | — | |
Euro | | | BZWS | | | | Sell | | | | 1,647,381 | | | | 2,241,295 | | | | | | | | 9/24/12 | | | | 100,551 | | | | — | |
Euro | | | DBAB | | | | Sell | | | | 8,070,000 | | | | 11,027,953 | | | | | | | | 9/24/12 | | | | 541,124 | | | | — | |
Philippine Peso | | | DBAB | | | | Buy | | | | 165,158,000 | | | | 3,711,833 | | | | | | | | 9/24/12 | | | | 10,951 | | | | — | |
Euro | | | DBAB | | | | Sell | | | | 3,753,000 | | | | 5,077,396 | | | | | | | | 9/26/12 | | | | 200,241 | | | | — | |
Malaysian Ringgit | | | HSBC | | | | Buy | | | | 11,490,000 | | | | 3,605,271 | | | | | | | | 9/26/12 | | | | — | | | | (10,765 | ) |
Malaysian Ringgit | | | DBAB | | | | Buy | | | | 3,068,000 | | | | 961,349 | | | | | | | | 9/26/12 | | | | — | | | | (1,562 | ) |
South Korean Won | | | HSBC | | | | Buy | | | | 21,510,000,000 | | | | 18,213,995 | | | | | | | | 9/26/12 | | | | 148,507 | | | | — | |
Indian Rupee | | | DBAB | | | | Buy | | | | 25,000,000 | | | | 485,692 | | | | | | | | 9/27/12 | | | | — | | | | (33,404 | ) |
Euro | | | HSBC | | | | Sell | | | | 5,430,000 | | | | 7,294,553 | | | | | | | | 9/28/12 | | | | 237,782 | | | | — | |
Euro | | | DBAB | | | | Sell | | | | 14,880,000 | | | | 20,050,113 | | | | | | | | 9/28/12 | | | | 712,220 | | | | — | |
Euro | | | MSCO | | | | Sell | | | | 4,020,000 | | | | 5,461,472 | | | | | | | | 9/28/12 | | | | 237,121 | | | | — | |
Euro | | | FBCO | | | | Sell | | | | 12,170,000 | | | | 16,453,565 | | | | | | | | 9/28/12 | | | | 637,560 | | | | — | |
Hungary Forint | | | DBAB | | | | Buy | | | | 1,517,800,000 | | | | 6,921,755 | | | | | | | | 9/28/12 | | | | — | | | | (856,503 | ) |
Japanese Yen | | | JPHQ | | | | Sell | | | | 172,207,000 | | | | 2,268,867 | | | | | | | | 9/28/12 | | | | 16,585 | | | | — | |
Philippine Peso | | | HSBC | | | | Buy | | | | 49,600,000 | | | | 1,134,648 | | | | | | | | 9/28/12 | | | | — | | | | (16,692 | ) |
Philippine Peso | | | HSBC | | | | Buy | | | | 39,700,000 | | | | 904,431 | | | | | | | | 10/03/12 | | | | — | | | | (9,671 | ) |
Swedish Krona | | | DBAB | | | | Buy | | | | 340,320,000 | | | | 49,645,514 | | | | | | | | 10/03/12 | | | | — | | | | (611,724 | ) |
Philippine Peso | | | DBAB | | | | Buy | | | | 195,560,000 | | | | 4,490,471 | | | | | | | | 10/04/12 | | | | — | | | | (82,988 | ) |
Philippine Peso | | | HSBC | | | | Buy | | | | 156,866,000 | | | | 3,558,585 | | | | | | | | 10/04/12 | | | | — | | | | (23,179 | ) |
Euro | | | UBSW | | | | Sell | | | | 6,370,000 | | | | 8,488,184 | | | | | | | | 10/05/12 | | | | 208,586 | | | | — | |
Philippine Peso | | | DBAB | | | | Buy | | | | 233,811,000 | | | | 5,368,794 | | | | | | | | 10/05/12 | | | | — | | | | (99,286 | ) |
Philippine Peso | | | HSBC | | | | Buy | | | | 233,867,000 | | | | 5,271,906 | | | | | | | | 10/05/12 | | | | — | | | | (1,135 | ) |
Euro | | | DBAB | | | | Sell | | | | 12,680,000 | | | | 16,748,632 | | | | | | | | 10/09/12 | | | | 266,041 | | | | — | |
Philippine Peso | | | DBAB | | | | Buy | | | | 191,936,000 | | | | 4,409,787 | | | | | | | | 10/09/12 | | | | — | | | | (84,253 | ) |
Philippine Peso | | | JPHQ | | | | Buy | | | | 61,767,000 | | | | 1,416,025 | | | | | | | | 10/09/12 | | | | — | | | | (24,023 | ) |
Philippine Peso | | | HSBC | | | | Buy | | | | 230,704,000 | | | | 5,304,638 | | | | | | | | 10/11/12 | | | | — | | | | (105,544 | ) |
Philippine Peso | | | DBAB | | | | Buy | | | | 153,588,000 | | | | 3,528,325 | | | | | | | | 10/11/12 | | | | — | | | | (67,101 | ) |
Philippine Peso | | | JPHQ | | | | Buy | | | | 76,627,000 | | | | 1,756,694 | | | | | | | | 10/11/12 | | | | — | | | | (29,845 | ) |
Malaysian Ringgit | | | DBAB | | | | Buy | | | | 11,434,805 | | | | 3,598,680 | | | | | | | | 10/12/12 | | | | — | | | | (22,236 | ) |
Philippine Peso | | | JPHQ | | | | Buy | | | | 108,152,000 | | | | 2,500,624 | | | | | | | | 10/12/12 | | | | — | | | | (63,366 | ) |
Philippine Peso | | | DBAB | | | | Buy | | | | 45,732,000 | | | | 1,047,698 | | | | | | | | 10/12/12 | | | | — | | | | (17,104 | ) |
Malaysian Ringgit | | | DBAB | | | | Buy | | | | 4,934,783 | | | | 1,552,893 | | | | | | | | 10/15/12 | | | | — | | | | (9,514 | ) |
Philippine Peso | | | JPHQ | | | | Buy | | | | 194,374,000 | | | | 4,458,552 | | | | | | | | 10/15/12 | | | | — | | | | (78,403 | ) |
Philippine Peso | | | HSBC | | | | Buy | | | | 76,252,000 | | | | 1,747,496 | | | | | | | | 10/15/12 | | | | — | | | | (29,184 | ) |
Euro | | | HSBC | | | | Sell | | | | 12,569,000 | | | | 17,260,839 | | | | | | | | 10/17/12 | | | | 919,799 | | | | — | |
Norwegian Krone | | | BZWS | | | | Buy | | | | 61,773,000 | | | | 7,840,706 | | | | EUR | | | | 10/18/12 | | | | 38,348 | | | | — | |
Philippine Peso | | | HSBC | | | | Buy | | | | 154,149,000 | | | | 3,574,801 | | | | | | | | 10/19/12 | | | | — | | | | (101,282 | ) |
Philippine Peso | | | DBAB | | | | Buy | | | | 41,880,000 | | | | 959,011 | | | | | | | | 10/19/12 | | | | — | | | | (15,307 | ) |
Philippine Peso | | | DBAB | | | | Buy | | | | 167,411,000 | | | | 3,834,425 | | | | | | | | 10/22/12 | | | | — | | | | (62,208 | ) |
Philippine Peso | | | JPHQ | | | | Buy | | | | 84,061,000 | | | | 1,935,551 | | | | | | | | 10/22/12 | | | | — | | | | (41,432 | ) |
Chilean Peso | | | CITI | | | | Buy | | | | 921,291,798 | | | | 1,731,752 | | | | | | | | 10/24/12 | | | | — | | | | (5,680 | ) |
Euro | | | BZWS | | | | Sell | | | | 649,907 | | | | 893,037 | | | | | | | | 10/24/12 | | | | 47,965 | | | | — | |
Euro | | | BZWS | | | | Sell | | | | 4,954,399 | | | | 6,873,733 | | | | | | | | 10/25/12 | | | | 431,408 | | | | — | |
Euro | | | CITI | | | | Sell | | | | 1,935,410 | | | | 2,694,420 | | | | | | | | 10/26/12 | | | | 177,706 | | | | — | |
Chilean Peso | | | DBAB | | | | Buy | | | | 398,486,000 | | | | 763,749 | | | | | | | | 10/29/12 | | | | — | | | | (17,401 | ) |
Chilean Peso | | | BZWS | | | | Buy | | | | 199,342,000 | | | | 382,028 | | | | | | | | 10/29/12 | | | | — | | | | (8,668 | ) |
Indian Rupee | | | HSBC | | | | Buy | | | | 213,392,000 | | | | 4,137,549 | | | | | | | | 10/29/12 | | | | — | | | | (287,680 | ) |
Indian Rupee | | | DBAB | | | | Buy | | | | 208,500,000 | | | | 4,036,434 | | | | | | | | 10/29/12 | | | | — | | | | (274,824 | ) |
TGB-28
Franklin Templeton Variable Insurance Products Trust
Statement of Investments, December 31, 2011 (continued)
| | | | | | |
| Templeton Global Bond Securities Fund | | | | | | |
Forward Exchange Contracts (continued)
| | | | | | | | | | | | | | | | | | | | | | | | | | | | | | | | |
| Currency | | Counterparty | | | Type | | | Quantity | | | Contract
Amount* | | | | | | Settlement
Date | | | Unrealized
Appreciation | | | Unrealized
Depreciation | |
Norwegian Krone | | | BZWS | | | | Buy | | | | 61,766,000 | | | | 7,904,530 | | | | EUR | | | | 10/29/12 | | | $ | — | | | $ | (51,441 | ) |
Philippine Peso | | | JPHQ | | | | Buy | | | | 82,631,000 | | | | 1,919,821 | | | | | | | | 10/29/12 | | | | — | | | | (58,087 | ) |
Philippine Peso | | | MSCO | | | | Buy | | | | 17,610,000 | | | | 407,639 | | | | | | | | 10/29/12 | | | | — | | | | (10,873 | ) |
Euro | | | DBAB | | | | Sell | | | | 3,319,244 | | | | 4,679,503 | | | | | | | | 10/31/12 | | | | 362,867 | | | | — | |
Indian Rupee | | | DBAB | | | | Buy | | | | 440,314,000 | | | | 8,559,792 | | | | | | | | 10/31/12 | | | | — | | | | (617,334 | ) |
Indian Rupee | | | HSBC | | | | Buy | | | | 317,880,000 | | | | 6,178,426 | | | | | | | | 10/31/12 | | | | — | | | | (444,453 | ) |
Euro | | | DBAB | | | | Sell | | | | 224,556 | | | | 312,344 | | | | | | | | 11/02/12 | | | | 20,299 | | | | — | |
Euro | | | BZWS | | | | Sell | | | | 1,581,109 | | | | 2,179,717 | | | | | | | | 11/05/12 | | | | 123,289 | | | | — | |
Euro | | | BZWS | | | | Sell | | | | 8,969,211 | | | | 12,334,011 | | | | | | | | 11/08/12 | | | | 667,707 | | | | — | |
Japanese Yen | | | CITI | | | | Sell | | | | 341,992,119 | | | | 4,415,023 | | | | | | | | 11/08/12 | | | | — | | | | (63,356 | ) |
Norwegian Krone | | | UBSW | | | | Buy | | | | 47,173,200 | | | | 5,985,687 | | | | EUR | | | | 11/08/12 | | | | 23,547 | | | | — | |
Japanese Yen | | | BZWS | | | | Sell | | | | 335,950,000 | | | | 4,355,069 | | | | | | | | 11/13/12 | | | | — | | | | (44,847 | ) |
Japanese Yen | | | BZWS | | | | Sell | | | | 429,663,000 | | | | 5,572,802 | | | | | | | | 11/14/12 | | | | — | | | | (54,636 | ) |
Japanese Yen | | | UBSW | | | | Sell | | | | 340,600,700 | | | | 4,423,099 | | | | | | | | 11/14/12 | | | | — | | | | (37,861 | ) |
Philippine Peso | | | DBAB | | | | Buy | | | | 48,500,000 | | | | 1,121,647 | | | | | | | | 11/14/12 | | | | — | | | | (29,126 | ) |
Euro | | | BZWS | | | | Sell | | | | 10,778,730 | | | | 14,705,960 | | | | | | | | 11/15/12 | | | | 683,949 | | | | — | |
Japanese Yen | | | DBAB | | | | Sell | | | | 796,770,000 | | | | 10,433,980 | | | | | | | | 11/16/12 | | | | — | | | | (2,202 | ) |
Euro | | | UBSW | | | | Sell | | | | 4,794,427 | | | | 6,515,147 | | | | | | | | 11/19/12 | | | | 277,571 | | | | — | |
Euro | | | BZWS | | | | Sell | | | | 3,019,521 | | | | 4,139,310 | | | | | | | | 11/19/12 | | | | 210,897 | | | | — | |
Euro | | | DBAB | | | | Sell | | | | 933,877 | | | | 1,266,617 | | | | | | | | 11/19/12 | | | | 51,638 | | | | — | |
Japanese Yen | | | JPHQ | | | | Sell | | | | 397,873,000 | | | | 5,207,421 | | | | | | | | 11/19/12 | | | | — | | | | (4,432 | ) |
Japanese Yen | | | UBSW | | | | Sell | | | | 317,836,000 | | | | 4,168,341 | | | | | | | | 11/19/12 | | | | 4,915 | | | | — | |
Japanese Yen | | | HSBC | | | | Sell | | | | 207,909,000 | | | | 2,723,818 | | | | | | | | 11/19/12 | | | | 357 | | | | — | |
Japanese Yen | | | BZWS | | | | Sell | | | | 986,239,000 | | | | 12,942,769 | | | | | | | | 11/19/12 | | | | 23,738 | | | | — | |
Euro | | | BZWS | | | | Sell | | | | 10,515,154 | | | | 14,269,064 | | | | | | | | 11/21/12 | | | | 588,219 | | | | — | |
Japanese Yen | | | BZWS | | | | Sell | | | | 1,107,834,000 | | | | 14,557,608 | | | | | | | | 11/21/12 | | | | 44,900 | | | | — | |
Euro | | | BZWS | | | | Sell | | | | 4,730,771 | | | | 6,421,075 | | | | | | | | 11/23/12 | | | | 265,801 | | | | — | |
Euro | | | DBAB | | | | Sell | | | | 5,440,000 | | | | 7,321,696 | | | | | | | | 12/03/12 | | | | 242,150 | | | | — | |
Euro | | | HSBC | | | | Sell | | | | 2,155,292 | | | | 2,897,574 | | | | | | | | 12/07/12 | | | | 92,470 | | | | — | |
Euro | | | UBSW | | | | Sell | | | | 1,343,551 | | | | 1,798,948 | | | | | | | | 12/10/12 | | | | 50,210 | | | | — | |
Euro | | | BZWS | | | | Sell | | | | 5,095,000 | | | | 6,861,437 | | | | | | | | 12/12/12 | | | | 229,617 | | | | — | |
Malaysian Ringgit | | | JPHQ | | | | Buy | | | | 13,361,013 | | | | 4,138,330 | | | | | | | | 12/17/12 | | | | 36,739 | | | | — | |
Japanese Yen | | | JPHQ | | | | Sell | | | | 285,510,329 | | | | 3,694,970 | | | | | | | | 12/27/12 | | | | — | | | | (49,273 | ) |
| | | | | | | | | | | | | | | | | | | | | | | | | | | | |
Unrealized appreciation (depreciation) | | | | 58,119,290 | | | | (44,123,134 | ) |
| | | | | | | | | | | | | | | | | | | | | | | | | | | | |
Net unrealized appreciation (depreciation) | | | $ | 13,996,156 | | | | | |
| | | | | | | | | | | | | | | | | | | | | | | | | | | | | | | | |
*In U.S. dollars unless otherwise indicated.
At December 31, 2011, the Fund had the following interest rate swap contracts outstanding. See Note 1(d).
Interest Rate Swap Contracts
| | | | | | | | | | | | | | | | | | | | | | | | | | |
| Counterparty | | Pay/Receive
Floating Rate | | | Fixed
Rate | | | Floating Rate | | Notional
Amount* | | | Expiration
Date | | | Unrealized
Appreciation | | | Unrealized
Depreciation | |
JPHQ | | | Receive | | | | 3.558% | | | 3-month USD BBA LIBOR | | | 3,240,000 | | | | 3/4/21 | | | $ | — | | | $ | (479,748 | ) |
DBAB | | | Receive | | | | 3.523% | | | 3-month USD BBA LIBOR | | | 14,630,000 | | | | 3/28/21 | | | | — | | | | (2,100,146 | ) |
CITI | | | Receive | | | | 4.347% | | | 3-month USD BBA LIBOR | | | 7,460,000 | | | | 2/25/41 | | | | — | | | | (2,802,849 | ) |
JPHQ | | | Receive | | | | 4.349% | | | 3-month USD BBA LIBOR | | | 7,460,000 | | | | 2/25/41 | | | | — | | | | (2,888,155 | ) |
JPHQ | | | Receive | | | | 4.320% | | | 3-month USD BBA LIBOR | | | 5,600,000 | | | | 2/28/41 | | | | — | | | | (2,079,888 | ) |
JPHQ | | | Receive | | | | 4.299% | | | 3-month USD BBA LIBOR | | | 1,870,000 | | | | 3/1/41 | | | | — | | | | (682,813 | ) |
| | | | | | | | | | | | | | | | | | | | | | |
Net unrealized appreciation (depreciation) | | | | | | | | | | | | | | | | | $ | — | | | $ | (11,033,599 | ) |
| | | | | | | | | | | | | | | | | | | | | | |
*In U.S. Dollars unless otherwise indicated.
The accompanying notes are an integral part of these financial statements.
TGB-29
Franklin Templeton Variable Insurance Products Trust
Financial Statements
Statement of Assets and Liabilities
December 31, 2011
| | | | |
| | | Templeton
Global Bond
Securities Fund | |
Assets: | | | | |
Investments in securities: | | | | |
Cost - Unaffiliated issuers | | $ | 2,027,951,066 | |
Cost - Repurchase agreements | | | 186,697,298 | |
| | | | |
Total cost of investments | | $ | 2,214,648,364 | |
| | | | |
Value - Unaffiliated issuers | | $ | 2,065,411,739 | |
Value - Repurchase agreements | | | 186,697,298 | |
| | | | |
Total value of investments | | | 2,252,109,037 | |
Restricted cash (Note 1e) | | | 6,920,000 | |
Foreign currency, at value (cost $124,578,395) | | | 124,679,223 | |
Receivables: | | | | |
Investment securities sold | | | 121,134 | |
Capital shares sold | | | 9,296,517 | |
Interest | | | 29,257,286 | |
Due from brokers | | | 12,205,000 | |
Unrealized appreciation on forward exchange contracts | | | 58,119,290 | |
Other assets | | | 55 | |
| | | | |
Total assets | | | 2,492,707,542 | |
| | | | |
Liabilities: | | | | |
Payables: | | | | |
Capital shares redeemed | | | 1,815,032 | |
Affiliates | | | 1,854,413 | |
Funds advanced by custodian | | | 82,618 | |
Due to brokers | | | 6,920,000 | |
Unrealized depreciation on forward exchange contracts | | | 44,123,134 | |
Unrealized depreciation on swap contracts | | | 11,033,599 | |
Deferred tax | | | 5,397,098 | |
Accrued expenses and other liabilities | | | 1,344,089 | |
| | | | |
Total liabilities | | | 72,569,983 | |
| | | | |
Net assets, at value | | $ | 2,420,137,559 | |
| | | | |
Net assets consist of: | | | | |
Paid-in capital | | $ | 2,263,842,907 | |
Undistributed net investment income | | | 117,957,425 | |
Net unrealized appreciation (depreciation) | | | 34,069,657 | |
Accumulated net realized gain (loss) | | | 4,267,570 | |
| | | | |
Net assets, at value | | $ | 2,420,137,559 | |
| | | | |
The accompanying notes are an integral part of these financial statements.
TGB-30
Franklin Templeton Variable Insurance Products Trust
Financial Statements (continued)
Statement of Assets and Liabilities (continued)
December 31, 2011
| | | | |
| | | Templeton
Global Bond
Securities Fund | |
Class 1: | | | | |
Net assets, at value | | $ | 269,818,678 | |
| | | | |
Shares outstanding | | | 14,495,798 | |
| | | | |
Net asset value and maximum offering price per share | | $ | 18.61 | |
| | | | |
Class 2: | | | | |
Net assets, at value | | $ | 1,812,813,528 | |
| | | | |
Shares outstanding | | | 99,856,649 | |
| | | | |
Net asset value and maximum offering price per share | | $ | 18.15 | |
| | | | |
Class 3: | | | | |
Net assets, at value | | $ | 185,810,513 | |
| | | | |
Shares outstanding | | | 10,236,976 | |
| | | | |
Net asset value and maximum offering price per sharea | | $ | 18.15 | |
| | | | |
Class 4: | | | | |
Net assets, at value | | $ | 151,694,840 | |
| | | | |
Shares outstanding | | | 8,224,200 | |
| | | | |
Net asset value and maximum offering price per share | | $ | 18.44 | |
| | | | |
aRedemption price is equal to net asset value less redemption fees retained by the Fund.
The accompanying notes are an integral part of these financial statements.
TGB-31
Franklin Templeton Variable Insurance Products Trust
Financial Statements (continued)
Statement of Operations
for the year ended December 31, 2011
| | | | |
| | | Templeton
Global Bond
Securities Fund | |
Investment income: | | | | |
Interest (net of foreign taxes of $4,220,818) | | $ | 115,048,301 | |
| | | | |
Expenses: | | | | |
Management fees (Note 3a) | | | 10,704,656 | |
Distribution fees: (Note 3c) | | | | |
Class 2 | | | 4,232,572 | |
Class 3 | | | 481,772 | |
Class 4 | | | 557,170 | |
Unaffiliated transfer agent fees | | | 4,571 | |
Custodian fees (Note 4) | | | 1,534,910 | |
Reports to shareholders | | | 526,303 | |
Professional fees | | | 75,763 | |
Trustees’ fees and expenses | | | 8,325 | |
Other | | | 47,441 | |
| | | | |
Total expenses | | | 18,173,483 | |
Expense reductions (Note 4) | | | (19 | ) |
| | | | |
Net expenses | | | 18,173,464 | |
| | | | |
Net investment income | | | 96,874,837 | |
| | | | |
Realized and unrealized gains (losses): | | | | |
Net realized gain (loss) from: | | | | |
Investments | | | 53,540,262 | |
Foreign currency transactions | | | (227,615 | ) |
Futures contracts | | | 3,393 | |
Swap contracts | | | (711,473 | ) |
| | | | |
Net realized gain (loss) | | | 52,604,567 | |
| | | | |
Net change in unrealized appreciation (depreciation) on: | | | | |
Investments | | | (165,488,912 | ) |
Translation of other assets and liabilities denominated in foreign currencies | | | (9,182,902 | ) |
Change in deferred taxes on unrealized appreciation | | | (5,397,098 | ) |
| | | | |
Net change in unrealized appreciation (depreciation) | | | (180,068,912 | ) |
| | | | |
Net realized and unrealized gain (loss) | | | (127,464,345 | ) |
| | | | |
Net increase (decrease) in net assets resulting from operations | | $ | (30,589,508 | ) |
| | | | |
The accompanying notes are an integral part of these financial statements.
TGB-32
Franklin Templeton Variable Insurance Products Trust
Financial Statements (continued)
Statements of Changes in Net Assets
| | | | | | | | |
| | | Templeton Global Bond
Securities Fund | |
| | | Year Ended December 31, | |
| | | 2011 | | | 2010 | |
| | | | |
Increase (decrease) in net assets: | | | | | | | | |
Operations: | | | | | | | | |
Net investment income | | $ | 96,874,837 | | | $ | 93,415,601 | |
Net realized gain (loss) from investments, foreign currency transactions, futures contracts and swap contracts | | | 52,604,567 | | | | 26,725,973 | |
Net change in unrealized appreciation (depreciation) on investments, translation of other assets and liabilities denominated in foreign currencies and deferred taxes | | | (180,068,912 | ) | | | 123,023,722 | |
| | | | |
Net increase (decrease) in net assets resulting from operations | | | (30,589,508 | ) | | | 243,165,296 | |
| | | | |
Distributions to shareholders from: | | | | | | | | |
Net investment income and net foreign currency gains: | | | | | | | | |
Class 1 | | | (15,683,467 | ) | | | (3,860,853 | ) |
Class 2 | | | (93,946,669 | ) | | | (17,334,382 | ) |
Class 3 | | | (10,753,201 | ) | | | (2,167,994 | ) |
Class 4 | | | (8,615,701 | ) | | | (1,885,595 | ) |
Net realized gains: | | | | | | | | |
Class 1 | | | (1,762,080 | ) | | | (610,541 | ) |
Class 2 | | | (10,925,216 | ) | | | (3,135,836 | ) |
Class 3 | | | (1,252,885 | ) | | | (394,847 | ) |
Class 4 | | | (1,020,280 | ) | | | (338,834 | ) |
| | | | |
Total distributions to shareholders | | | (143,959,499 | ) | | | (29,728,882 | ) |
| | | | |
Capital share transactions: (Note 2) | | | | | | | | |
Class 1 | | | 17,171,380 | | | | 48,911,860 | |
Class 2 | | | 451,366,379 | | | | 75,615,219 | |
Class 3 | | | 16,706,473 | | | | 21,722,929 | |
Class 4 | | | 12,126,720 | | | | 26,968,281 | |
| | | | |
Total capital share transactions | | | 497,370,952 | | | | 173,218,289 | |
| | | | |
Redemption fees | | | 18,113 | | | | 23,708 | |
| | | | |
Net increase (decrease) in net assets | | | 322,840,058 | | | | 386,678,411 | |
Net assets: | | | | | | | | |
Beginning of year | | | 2,097,297,501 | | | | 1,710,619,090 | |
| | | | |
End of year | | $ | 2,420,137,559 | | | $ | 2,097,297,501 | |
| | | | |
Undistributed net investment income included in net assets: | | | | | | | | |
End of year | | $ | 117,957,425 | | | $ | 102,069,075 | |
| | | | |
The accompanying notes are an integral part of these financial statements.
TGB-33
Franklin Templeton Variable Insurance Products Trust
Notes to Financial Statements
Templeton Global Bond Securities Fund
1. ORGANIZATION AND SIGNIFICANT ACCOUNTING POLICIES
Franklin Templeton Variable Insurance Products Trust (Trust) is registered under the Investment Company Act of 1940, as amended, (1940 Act) as an open-end investment company, consisting of twenty separate funds. The Templeton Global Bond Securities Fund (Fund) is included in this report. The financial statements of the remaining funds in the Trust are presented separately. Shares of the Fund are generally sold only to insurance company separate accounts to fund the benefits of variable life insurance policies or variable annuity contracts. The Fund offers four classes of shares: Class 1, Class 2, Class 3, and Class 4. Each class of shares differs by its distribution fees, voting rights on matters affecting a single class and its exchange privilege.
The following summarizes the Fund’s significant accounting policies.
a. Financial Instrument Valuation
The Fund’s investments in securities and other financial instruments are carried at fair value daily. Fair value is the price that would be received to sell an asset or paid to transfer a liability in an orderly transaction between market participants on the measurement date. Under procedures approved by the Trust’s Board of Trustees, the Fund may utilize independent pricing services, quotations from securities and financial instrument dealers, and other market sources to determine fair value.
Debt securities generally trade in the over-the-counter market rather than on a securities exchange. The Fund’s pricing services use multiple valuation techniques to determine fair value. In instances where sufficient market activity exists, the pricing services may utilize a market-based approach through which quotes from market makers are used to determine fair value. In instances where sufficient market activity may not exist or is limited, the pricing services also utilize proprietary valuation models which may consider market characteristics such as benchmark yield curves, option-adjusted spreads, credit spreads, estimated default rates, coupon rates, anticipated timing of principal repayments, underlying collateral, and other unique security features in order to estimate the relevant cash flows, which are then discounted to calculate the fair value. Securities denominated in a foreign currency are converted into their U.S. dollar equivalent at the foreign exchange rate in effect at the close of the NYSE on the date that the values of the foreign debt securities are determined. Repurchase agreements are valued at cost, which approximates market value.
Certain derivative financial instruments (derivatives) trade in the over-the-counter market. The Fund’s pricing services use various techniques including industry standard option pricing models and proprietary discounted cash flow models to determine the fair value of those instruments. The Fund’s net benefit or obligation under the derivative contract, as measured by the fair market value of the contract, is included in net assets.
The Fund has procedures to determine the fair value of securities and other financial instruments for which market prices are not readily available or which may not be reliably priced. Under these procedures, the Fund primarily employs a market-based approach which may use related or comparable assets or liabilities, recent transactions, market multiples, book values, and other relevant information for the investment to determine the fair value of the investment. The Fund may also use an income-based valuation approach in which the anticipated future cash flows of the investment are discounted to calculate fair value. Discounts may also be applied due to the nature or duration of any restrictions on the disposition of the investments. Due to the inherent uncertainty of valuations of such investments, the fair values may differ significantly from the values that would have been used had an active market existed.
Trading in securities on foreign securities stock exchanges and over-the-counter markets may be completed before the daily close of business on the NYSE. Occasionally, events occur between the time at which trading in a foreign security is completed and the close of the NYSE that might call into question the reliability of the value of a portfolio security held by the Fund. As a result, differences may arise between the value of the Fund’s portfolio securities as determined at the foreign market close and the latest indications of value at the close of the NYSE. In order to minimize the potential for these differences, the investment manager monitors price movements following the close of trading in foreign stock markets through a series of country specific market proxies (such as baskets of American Depositary Receipts, futures contracts and exchange traded funds). These price movements
TGB-34
Franklin Templeton Variable Insurance Products Trust
Notes to Financial Statements (continued)
Templeton Global Bond Securities Fund
1. ORGANIZATION AND SIGNIFICANT ACCOUNTING POLICIES (continued)
a. Financial Instrument Valuation (continued)
are measured against established trigger thresholds for each specific market proxy to assist in determining if an event has occurred that may call into question the reliability of the values of the foreign securities held by the Fund. If such an event occurs, the securities may be valued using fair value procedures, which may include the use of independent pricing services.
b. Foreign Currency Translation
Portfolio securities and other assets and liabilities denominated in foreign currencies are translated into U.S. dollars based on the exchange rate of such currencies against U.S. dollars on the date of valuation. The Fund may enter into foreign currency exchange contracts to facilitate transactions denominated in a foreign currency. Purchases and sales of securities, income and expense items denominated in foreign currencies are translated into U.S. dollars at the exchange rate in effect on the transaction date. Portfolio securities and assets and liabilities denominated in foreign currencies contain risks that those currencies will decline in value relative to the U.S. dollar. Occasionally, events may impact the availability or reliability of foreign exchange rates used to convert the U.S. dollar equivalent value. If such an event occurs, the foreign exchange rate will be valued at fair value using procedures established and approved by the Trust’s Board of Trustees.
The Fund does not separately report the effect of changes in foreign exchange rates from changes in market prices on securities held. Such changes are included in net realized and unrealized gain or loss from investments on the Statement of Operations.
Realized foreign exchange gains or losses arise from sales of foreign currencies, currency gains or losses realized between the trade and settlement dates on securities transactions and the difference between the recorded amounts of dividends, interest, and foreign withholding taxes and the U.S. dollar equivalent of the amounts actually received or paid. Net unrealized foreign exchange gains and losses arise from changes in foreign exchange rates on foreign denominated assets and liabilities other than investments in securities held at the end of the reporting period.
c. Joint Repurchase Agreement
The Fund enters into a joint repurchase agreement whereby its uninvested cash balance is deposited into a joint cash account with other funds managed by the investment manager or an affiliate of the investment manager and is used to invest in one or more repurchase agreements. The value and face amount of the joint repurchase agreement are allocated to the funds based on their pro-rata interest. A repurchase agreement is accounted for as a loan by the fund to the seller, collateralized by securities which are delivered to the fund’s custodian. The market value, including accrued interest, of the initial collateralization is required to be at least 102% of the dollar amount invested by the funds, with the value of the underlying securities marked to market daily to maintain coverage of at least 100%. The joint repurchase agreement held by the Fund at year end had been entered into on December 30, 2011.
d. Derivative Financial Instruments
The Fund invested in derivatives in order to manage risk or gain exposure to various other investments or markets. Derivatives are financial contracts based on an underlying or notional amount, require no initial investment or an initial net investment that is smaller than would normally be required to have a similar response to changes in market factors, and require or permit net settlement. Derivatives contain various risks including the potential inability of the counterparty to fulfill their obligations under the terms of the contract, the potential for an illiquid secondary market, and/or the potential for market movements which expose the Fund to gains or losses in excess of the amounts shown on the Statement of Assets and Liabilities. Realized gain and loss and unrealized appreciation and depreciation on these contracts for the period are included in the Statement of Operations.
TGB-35
Franklin Templeton Variable Insurance Products Trust
Notes to Financial Statements (continued)
Templeton Global Bond Securities Fund
1. ORGANIZATION AND SIGNIFICANT ACCOUNTING POLICIES (continued)
d. Derivative Financial Instruments (continued)
The Fund entered into futures contracts primarily to manage interest rate and/or foreign exchange rate risk. A futures contract is an agreement between the Fund and a counterparty to buy or sell an asset for a specified price on a future date. Required initial margin deposits of cash or securities are pledged by the Fund. Subsequent payments, known as variation margin, are made or received by the Fund, depending on fluctuations in the value of the underlying security. Such variation margin is accounted for as unrealized appreciation or depreciation until the contract is closed, at which time the gains or losses are realized.
The Fund entered into forward exchange contracts primarily to manage and/or gain exposure to certain foreign currencies. A forward exchange contract is an agreement between the Fund and a counterparty to buy or sell a foreign currency for a specific exchange rate on a future date. Pursuant to the terms of the forward exchange contracts, cash or securities may be required to be deposited as collateral. Unrestricted cash may be invested according to the Fund’s investment objectives.
The Fund entered into interest rate swap contracts primarily to manage interest rate risk. An interest rate swap is an agreement between the Fund and a counterparty to exchange cash flows based on the difference between two interest rates, applied to a notional principal amount. Over the term of the contract, contractually required payments to be paid and to be received are accrued daily and recorded as unrealized depreciation and appreciation until the payments are made, at which time they are realized. Pursuant to the terms of the interest rate swap contract, cash or securities may be required to be deposited as collateral. Unrestricted cash may be invested according to the Fund’s investment objectives.
At December 31, 2011, the Fund holds $10,141,489 in U.S. treasury bills, bonds, and notes and Government National Mortgage Association bonds as collateral for derivatives.
See Note 9 regarding other derivative information.
e. Restricted Cash
At December 31, 2011, the Fund held restricted cash in connection with investments in certain derivative securities. Restricted cash is held in a segregated account with the Fund’s custodian/counterparty broker and is reflected in the Statement of Assets and Liabilities.
f. Income and Deferred Taxes
It is the Fund’s policy to qualify as a regulated investment company under the Internal Revenue Code. The Fund intends to distribute to shareholders substantially all of its taxable income and net realized gains to relieve it from federal income and excise taxes. As a result, no provision for U.S. federal income taxes is required.
The Fund may be subject to foreign taxation related to income received, capital gains on the sale of securities and certain foreign currency transactions in the foreign jurisdictions in which it invests. Foreign taxes, if any, are recorded based on the tax regulations and rates that exist in the foreign markets in which the Fund invests. When a capital gain tax is determined to apply the Fund records an estimated deferred tax liability in an amount that would be payable if the securities were disposed of on the valuation date.
The Fund recognizes the tax benefits of uncertain tax positions only when the position is “more likely than not” to be sustained upon examination by the tax authorities based on the technical merits of the tax position. As of December 31, 2011, and for all open tax years, the Fund has determined that no liability for unrecognized tax benefits is required in the Fund’s financial statements related to uncertain tax positions taken on a tax return (or expected to be taken on future tax returns). Open tax years are those that remain subject to examination and are based on each tax jurisdiction statute of limitation.
TGB-36
Franklin Templeton Variable Insurance Products Trust
Notes to Financial Statements (continued)
Templeton Global Bond Securities Fund
1. ORGANIZATION AND SIGNIFICANT ACCOUNTING POLICIES (continued)
g. Security Transactions, Investment Income, Expenses and Distributions
Security transactions are accounted for on trade date. Realized gains and losses on security transactions are determined on a specific identification basis. Interest income and estimated expenses are accrued daily. Amortization of premium and accretion of discount on debt securities are included in interest income. Distributions to shareholders are recorded on the ex-dividend date and are determined according to income tax regulations (tax basis). Distributable earnings determined on a tax basis may differ from earnings recorded in accordance with accounting principles generally accepted in the United States of America. These differences may be permanent or temporary. Permanent differences are reclassified among capital accounts to reflect their tax character. These reclassifications have no impact on net assets or the results of operations. Temporary differences are not reclassified, as they may reverse in subsequent periods.
Common expenses incurred by the Trust are allocated among the funds based on the ratio of net assets of each fund to the combined net assets of the Trust. Fund specific expenses are charged directly to the fund that incurred the expense.
Realized and unrealized gains and losses and net investment income, not including class specific expenses, are allocated daily to each class of shares based upon the relative proportion of net assets of each class. Differences in per share distributions, by class, are generally due to differences in class specific expenses.
Inflation-indexed bonds are adjusted for inflation through periodic increases or decreases in the security’s interest accruals, face amount, or principal redemption value, by amounts corresponding to the rate of inflation as measured by an index. Any increase or decrease in the face amount or principal redemption value will be included as interest income on the Statement of Operations.
h. Accounting Estimates
The preparation of financial statements in accordance with accounting principles generally accepted in the United States of America requires management to make estimates and assumptions that affect the reported amounts of assets and liabilities at the date of the financial statements and the amounts of income and expenses during the reporting period. Actual results could differ from those estimates.
i. Redemption Fees
Redemptions and exchanges of interests in an insurance company subaccount that invests in Class 3 shares of the Fund will be subject to a 1.0% short term trading fee if the interest in the subaccount has been held for less than 60 days. Such fees are retained by the Fund and accounted for as an addition to paid-in capital, allocated to each class of shares based upon the relative proportion of net assets of each class.
j. Guarantees and Indemnifications
Under the Trust’s organizational documents, its officers and trustees are indemnified by the Trust against certain liabilities arising out of the performance of their duties to the Trust. Additionally, in the normal course of business, the Trust, on behalf of the Fund, enters into contracts with service providers that contain general indemnification clauses. The Trust’s maximum exposure under these arrangements is unknown as this would involve future claims that may be made against the Trust that have not yet occurred. Currently, the Trust expects the risk of loss to be remote.
TGB-37
Franklin Templeton Variable Insurance Products Trust
Notes to Financial Statements (continued)
Templeton Global Bond Securities Fund
2. SHARES OF BENEFICIAL INTEREST
At December 31, 2011, there were an unlimited number of shares authorized (without par value). Transactions in the Fund’s shares were as follows:
| | | | | | | | | | | | | | | | |
| | | Year Ended December 31, | |
| | | 2011 | | | 2010 | |
| Class 1 Shares: | | Shares | | | Amount | | | Shares | | | Amount | |
Shares sold | | | 2,403,657 | | | $ | 47,343,365 | | | | 4,522,323 | | | $ | 85,300,049 | |
Shares issued in reinvestment of distributions | | | 889,172 | | | | 17,445,546 | | | | 243,806 | | | | 4,471,394 | |
Shares redeemed | | | (2,450,491 | ) | | | (47,617,531 | ) | | | (2,152,653 | ) | | | (40,859,583 | ) |
| | | | |
Net increase (decrease) | | | 842,338 | | | $ | 17,171,380 | | | | 2,613,476 | | | $ | 48,911,860 | |
| | | | |
Class 2 Shares: | | | | | | | | | | | | | | | | |
Shares sold | | | 29,318,184 | | | $ | 564,580,203 | | | | 23,116,184 | | | $ | 432,400,311 | |
Shares issued in reinvestment of distributions | | | 5,473,480 | | | | 104,871,884 | | | | 1,140,402 | | | | 20,470,218 | |
Shares redeemed | | | (11,438,342 | ) | | | (218,085,708 | ) | | | (20,598,509 | ) | | | (377,255,310 | ) |
| | | | |
Net increase (decrease) | | | 23,353,322 | | | $ | 451,366,379 | | | | 3,658,077 | | | $ | 75,615,219 | |
| | | | |
Class 3 Shares: | | | | | | | | | | | | | | | | |
Shares sold | | | 1,851,973 | | | $ | 36,090,442 | | | | 2,390,123 | | | $ | 44,722,862 | |
Shares issued in reinvestment of distributions | | | 626,622 | | | | 12,006,087 | | | | 142,856 | | | | 2,562,841 | |
Shares redeemed | | | (1,654,785 | ) | | | (31,390,056 | ) | | | (1,387,144 | ) | | | (25,562,774 | ) |
| | | | |
Net increase (decrease) | | | 823,810 | | | $ | 16,706,473 | | | | 1,145,835 | | | $ | 21,722,929 | |
| | | | |
Class 4 Shares: | | | | | | | | | | | | | | | | |
Shares sold | | | 1,191,215 | | | $ | 23,562,082 | | | | 1,871,353 | | | $ | 34,938,015 | |
Shares issued on reinvestment of distributions | | | 494,660 | | | | 9,635,982 | | | | 122,020 | | | | 2,224,429 | |
Shares redeemed | | | (1,090,109 | ) | | | (21,071,344 | ) | | | (549,061 | ) | | | (10,194,163 | ) |
| | | | |
Net increase (decrease) | | | 595,766 | | | $ | 12,126,720 | | | | 1,444,312 | | | $ | 26,968,281 | |
| | | | |
3. TRANSACTIONS WITH AFFILIATES
Franklin Resources, Inc. is the holding company for various subsidiaries that together are referred to as Franklin Templeton Investments. Certain officers and trustees of the Fund are also officers and/or directors of the following subsidiaries:
| | |
| Subsidiary | | Affiliation |
Franklin Advisers, Inc. (Advisers) | | Investment manager |
Franklin Templeton Services, LLC (FT Services) | | Administrative manager |
Franklin Templeton Distributors, Inc. (Distributors) | | Principal underwriter |
Franklin Templeton Investor Services, LLC (Investor Services) | | Transfer agent |
a. Management Fees
The Fund pays an investment management fee to Advisers based on the average daily net assets of the Fund as follows:
| | |
| Annualized Fee Rate | | Net Assets |
| 0.625% | | Up to and including $100 million |
| 0.500% | | Over $100 million, up to and including $250 million |
| 0.450% | | Over $250 million, up to and including $7.5 billion |
| 0.440% | | Over $7.5 billion, up to and including $10 billion |
TGB-38
Franklin Templeton Variable Insurance Products Trust
Notes to Financial Statements (continued)
Templeton Global Bond Securities Fund
3. TRANSACTIONS WITH AFFILIATES (continued)
a. Management Fees (continued)
| | |
| Annualized Fee Rate | | Net Assets |
| 0.430% | | Over $10 billion, up to and including $12.5 billion |
| 0.420% | | Over $12.5 billion, up to and including $15 billion |
| 0.400% | | In excess of $15 billion |
b. Administrative Fees
Under an agreement with Advisers, FT Services provides administrative services to the Fund. The fee is paid by Advisers based on average daily net assets, and is not an additional expense of the Fund.
c. Distribution Fees
The Fund’s Board of Trustees has adopted distribution plans for Class 2, Class 3, and Class 4 shares pursuant to Rule 12b-1 under the 1940 Act. Under the Fund’s compensation distribution plans, the Fund pays Distributors for costs incurred in connection with the servicing, sale and distribution of the Fund’s shares up to 0.25%, 0.35%, and 0.35% per year of its average daily net assets of Class 2, Class 3, and Class 4, respectively. The Board of Trustees has agreed to limit the current rate to 0.25% per year for Class 3.
d. Transfer Agent Fees
Investor Services, under terms of an agreement, performs shareholder servicing for the Fund and is not paid by the Fund for the services.
4. EXPENSE OFFSET ARRANGEMENT
The Fund has entered into an arrangement with its custodian whereby credits realized as a result of uninvested cash balances are used to reduce a portion of the Fund’s custodian expenses. During the year ended December 31, 2011, the custodian fees were reduced as noted in the Statement of Operations.
5. INCOME TAXES
The tax character of distributions paid during the years ended December 31, 2011 and 2010, was as follows:
| | | | | | | | |
| | | 2011 | | | 2010 | |
Distributions paid from: | | | | | | | | |
Ordinary Income | | $ | 130,777,554 | | | $ | 25,248,824 | |
Long term capital gain | | | 13,181,945 | | | | 4,480,058 | |
| | | | |
| | $ | 143,959,499 | | | $ | 29,728,882 | |
| | | | |
TGB-39
Franklin Templeton Variable Insurance Products Trust
Notes to Financial Statements (continued)
Templeton Global Bond Securities Fund
5. INCOME TAXES (continued)
At December 31, 2011, the cost of investments, net unrealized appreciation (depreciation), undistributed ordinary income and undistributed long term capital gains for income tax purposes were as follows:
| | | | |
Cost of investments | | $ | 2,228,846,787 | |
| | | | |
| |
Unrealized appreciation | | $ | 149,299,655 | |
Unrealized depreciation | | | (126,037,405 | ) |
| | | | |
Net unrealized appreciation (depreciation) | | $ | 23,262,250 | |
| | | | |
Undistributed ordinary income | | $ | 173,648,253 | |
Undistributed long term capital gains | | | 4,334,661 | |
| | | | |
Distributable earnings | | $ | 177,982,914 | |
| | | | |
Differences between income and/or capital gains as determined on a book basis and a tax basis are primarily due to differing treatments of foreign currency transactions, bond discounts and premiums, tax straddles, and inflation related adjustments on foreign securities.
6. INVESTMENT TRANSACTIONS
Purchases and sales of investments (excluding short term securities) for the year ended December 31, 2011, aggregated $893,596,104 and $637,958,693, respectively.
7. CREDIT RISK
At December 31, 2011, the Fund had 16.71% of its portfolio invested in high yield or other securities rated below investment grade. These securities may be more sensitive to economic conditions causing greater price volatility and are potentially subject to a greater risk of loss due to default than higher rated securities.
8. CONCENTRATION OF RISK
Investing in foreign securities may include certain risks and considerations not typically associated with investing in U.S. securities, such as fluctuating currency values and changing local and regional economic, political and social conditions, which may result in greater market volatility. In addition, certain foreign securities may not be as liquid as U.S. securities.
9. OTHER DERIVATIVE INFORMATION
At December 31, 2011, the Fund has invested in derivative contracts which are reflected on the Statement of Assets and Liabilities as follows:
| | | | | | | | | | | | |
| | | Asset Derivatives | | | Liability Derivatives | |
Derivative Contracts Not Accounted
for as Hedging Instruments | | Statement of Assets and
Liabilities Location | | Fair
Value
Amount | | | Statement of Assets and
Liabilities Location | | Fair
Value
Amount | |
Interest rate contracts | | Unrealized appreciation on swap contracts | | $ | — | | | Unrealized depreciation on swap contracts | | $ | 11,033,599 | |
Foreign exchange contracts | | Unrealized appreciation on forward exchange contracts | | | 58,119,290 | | | Unrealized depreciation on forward exchange contracts | | | 44,123,134 | |
TGB-40
Franklin Templeton Variable Insurance Products Trust
Notes to Financial Statements (continued)
Templeton Global Bond Securities Fund
9. OTHER DERIVATIVE INFORMATION (continued)
For the period ended December 31, 2011, the effect of derivative contracts on the Fund’s Statement of Operations was as follows:
| | | | | | | | | | |
Derivative Contracts Not Accounted
for as Hedging Instruments | | Statement of Operations Locations | | Realized Gain
(Loss) for the
Year Ended
December 31, 2011 | | | Change in
Unrealized
Appreciation
(Depreciation)
for the
Year Ended
December 31, 2011 | |
Interest rate contracts | | Net realized gain (loss) from futures/swap contracts/Net change in unrealized appreciation (depreciation) on investments | | $ | (708,080 | ) | | $ | (11,036,651 | ) |
Foreign exchange contracts | | Net realized gain (loss) from foreign currency transactions / Net change in unrealized appreciation (depreciation) on translation of other assets and liabilities denominated in foreign currencies | | | (2,279,806 | ) | | | (7,512,599 | ) |
For the year ended December 31, 2011, the average month end market value of derivatives represented 3.40% of average month end net assets. The average month end number of open derivative contracts for the year was 412.
See Note 1(d) regarding derivative financial instruments.
10. CREDIT FACILITY
The Fund, together with other U.S. registered and foreign investment funds (collectively, Borrowers), managed by Franklin Templeton Investments, are borrowers in a joint syndicated senior unsecured credit facility totaling $750 million (Global Credit Facility) which matured on January 20, 2012. This Global Credit Facility provides a source of funds to the Borrowers for temporary and emergency purposes, including the ability to meet future unanticipated or unusually large redemption requests. Effective January 20, 2012, the Borrowers renewed the Global Credit Facility for a total of $1.5 billion, maturing January 18, 2013.
Under the terms of the Global Credit Facility, the Fund shall, in addition to interest charged on any borrowings made by the Fund and other costs incurred by the Fund, pay its share of fees and expenses incurred in connection with the implementation and maintenance of the Global Credit Facility, based upon its relative share of the aggregate net assets of all of the Borrowers, including an annual commitment fee of 0.08% based upon the unused portion of the Global Credit Facility, which is reflected in other expenses on the Statement of Operations. During the year ended December 31, 2011, the Fund did not use the Global Credit Facility.
11. FAIR VALUE MEASUREMENTS
The Fund follows a fair value hierarchy that distinguishes between market data obtained from independent sources (observable inputs) and the Fund’s own market assumptions (unobservable inputs). These inputs are used in determining the value of the Fund’s investments and are summarized in the following fair value hierarchy:
| | • | | Level 1 – quoted prices in active markets for identical securities |
| | • | | Level 2 – other significant observable inputs (including quoted prices for similar securities, interest rates, prepayment speed, credit risk, etc.) |
| | • | | Level 3 – significant unobservable inputs (including the Fund’s own assumptions in determining the fair value of investments) |
TGB-41
Franklin Templeton Variable Insurance Products Trust
Notes to Financial Statements (continued)
Templeton Global Bond Securities Fund
11. FAIR VALUE MEASUREMENTS (continued)
The inputs or methodology used for valuing securities are not an indication of the risk associated with investing in those securities.
For movements between the levels within the fair value hierarchy, the Fund has adopted a policy of recognizing the transfers as of the date of the underlying event which caused the movement.
The following is a summary of the inputs used as of December 31, 2011, in valuing the Fund’s assets and liabilities carried at fair value:
| | | | | | | | | | | | | | | | |
| | | Level 1 | | | Level 2 | | | Level 3 | | | Total | |
| | | | |
Assets: | | | | | | | | | | | | | | | | |
Investments in Securities: | | | | | | | | | | | | | | | | |
Foreign Government and Agency Securities | | $ | — | | | $ | 1,845,190,090 | | | $ | — | | | $ | 1,845,190,090 | |
Municipal Bonds | | | — | | | | 25,375,581 | | | | — | | | | 25,375,581 | |
Short Term Investments | | | — | | | | 381,543,366 | | | | — | | | | 381,543,366 | |
| | | | |
Total Investments in Securities | | $ | — | | | $ | 2,252,109,037 | | | $ | — | | | $ | 2,252,109,037 | |
| | | | |
Forward Exchange Contracts | | | — | | | | 58,119,290 | | | | — | | | | 58,119,290 | |
Liabilities: | | | | | | | | | | | | | | | | |
Swaps | | | — | | | | 11,033,599 | | | | — | | | | 11,033,599 | |
Forward Exchange Contracts | | | — | | | | 44,123,134 | | | | — | | | | 44,123,134 | |
12. NEW ACCOUNTING PRONOUNCEMENTS
In May 2011, the Financial Accounting Standards Board (FASB) issued Accounting Standards Update (ASU) No. 2011-04, Fair Value Measurement (Topic 820): Amendments to Achieve Common Fair Value Measurement and Disclosure Requirements in U.S. GAAP and IFRSs. The amendments in the ASU will improve the comparability of fair value measurements presented and disclosed in financial statements prepared in accordance with U.S. GAAP (Generally Accepted Accounting Principles) and IFRS (International Financial Reporting Standards) and include new guidance for certain fair value measurement principles and disclosure requirements. The ASU is effective for interim and annual periods beginning after December 15, 2011. The Fund believes the adoption of this ASU will not have a material impact on its financial statements.
13. SUBSEQUENT EVENTS
The Fund has evaluated subsequent events through the issuance of the financial statements and determined that no events have occurred that require disclosure other than those already disclosed in the financial statements.
TGB-42
Franklin Templeton Variable Insurance Products Trust
Notes to Financial Statements (continued)
Templeton Global Bond Securities Fund
| | | | |
ABBREVIATIONS | | | | |
| Counterparty | | Currency | | Selected Portfolio |
| | | | |
BZWS - Barclays Bank PLC | | AUD - Australian Dollar | | BHAC - Berkshire Hathaway Assurance Corp. |
CITI - Citigroup, Inc. | | BRL - Brazilian Real | | FRN - Floating Rate Note |
DBAB - Deutsche Bank AG | | EGP - Egyptian Pound | | GO - General Obligation |
FBCO - Credit Suisse Group AG | | EUR - Euro | | |
HSBC - HSBC Bank USA, N.A. | | GBP - British Pound | | |
JPHQ - JP Morgan Chase & Co. | | HUF - Hungarian Forint | | |
MSCO - Morgan Stanley | | IDR - Indonesian Rupiah | | |
UBSW - UBS AG | | ILS - New Israeli Shekel | | |
| | JPY - Japanese Yen | | |
| | KRW - South Korean Won | | |
| | LKR - Sri Lankan Rupee | | |
| | MXN - Mexican Peso | | |
| | MYR - Malaysian Ringgit | | |
| | NOK - Norwegian Krone | | |
| | PEN - Peruvian Nuevo Sol | | |
| | PHP - Philippine Peso | | |
| | PLN - Polish Zloty | | |
| | SEK - Swedish Krona | | |
| | SGD - Singapore Dollar | | |
TGB-43
Franklin Templeton Variable Insurance Products Trust
Templeton Global Bond Securities Fund
Report of Independent Registered Public Accounting Firm
To the Board of Trustees and Shareholders of Franklin Templeton Variable Insurance Products Trust
In our opinion, the accompanying statement of assets and liabilities, including the statement of investments, and the related statements of operations and of changes in net assets and the financial highlights present fairly, in all material respects, the financial position of Templeton Global Bond Securities Fund (the “Fund”) at December 31, 2011, the results of its operations for the year then ended, the changes in its net assets for each of the two years in the period then ended and the financial highlights for the periods presented, in conformity with accounting principles generally accepted in the United States of America. These financial statements and financial highlights (hereafter referred to as “financial statements”) are the responsibility of the Fund’s management. Our responsibility is to express an opinion on these financial statements based on our audits. We conducted our audits of these financial statements in accordance with the standards of the Public Company Accounting Oversight Board (United States). Those standards require that we plan and perform the audit to obtain reasonable assurance about whether the financial statements are free of material misstatement. An audit includes examining, on a test basis, evidence supporting the amounts and disclosures in the financial statements, assessing the accounting principles used and significant estimates made by management, and evaluating the overall financial statement presentation. We believe that our audits, which included confirmation of securities at December 31, 2011 by correspondence with the custodian and brokers, provide a reasonable basis for our opinion.
PricewaterhouseCoopers LLP
San Francisco, California
February 13, 2012
TGB-44
Franklin Templeton Variable Insurance Products Trust
Tax Information (unaudited)
Templeton Global Bond Securities Fund
Under Section 852(b)(3)(C) of the Internal Revenue Code (Code), the Fund hereby reports the maximum amount allowable but no less than $13,181,945 as a long term capital gain dividend for the fiscal year ended December 31, 2011.
At December 31, 2011, more than 50% of the Fund’s total assets were invested in securities of foreign issuers. In most instances, foreign taxes were withheld from income paid to the Fund on these investments. The Fund elects to treat foreign taxes paid as allowed under Section 853 of the Code. This election will allow shareholders of record as of the 2012 distribution date, to treat their proportionate share of foreign taxes paid by the Fund as having been paid directly by them. The shareholder shall consider these amounts as foreign taxes paid in the tax year in which they receive the Fund distribution.
TGB-45
TEMPLETON GROWTH SECURITIES FUND
This annual report for Templeton Growth Securities Fund covers the fiscal year ended December 31, 2011.
Performance Summary as of 12/31/11
Average annual total return of Class 1 shares represents the average annual change in value, assuming reinvestment of dividends and capital gains. Average returns smooth out variations in returns, which can be significant; they are not the same as year-by-year results.
Periods ended 12/31/11
| | | | | | | | | | | | |
| | | 1-Year | | | 5-Year | | | 10-Year | |
Average Annual Total Return | | | -6.80% | | | | -4.78% | | | | +2.76% | |
Total Return Index Comparison for a Hypothetical $10,000 Investment (1/1/02–12/31/11)
The graph below shows the change in value of a hypothetical $10,000 investment in the Fund over the indicated period and includes reinvestment of any income or distributions. The Fund’s performance is compared to the performance of the MSCI World Index. One cannot invest directly in an index, and an index is not representative of the Fund’s portfolio. Please see Important Notes to Performance Information preceding the Fund Summaries.
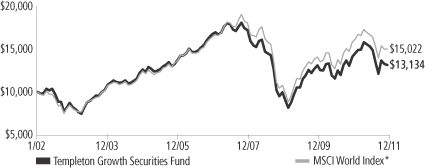
*Source: © 2012 Morningstar. Please see Index Descriptions following the Fund Summaries.
Templeton Growth Securities Fund – Class 1
Performance reflects the Fund’s Class 1 operating expenses, but does not include any contract fees, expenses or sales charges. If they had been included, performance would be lower. These charges and deductions, particularly for variable life policies, can have a significant effect on contract values and insurance benefits. See the contract prospectus for a complete description of these expenses, including sales charges.
Performance data represent past performance, which does not guarantee future results. Investment return and principal value will fluctuate, and you may have a gain or loss when you sell your shares.
Current performance may differ from figures shown.
TG-1
Fund Goal and Main Investments: Templeton Growth Securities Fund seeks long-term capital growth. The Fund normally invests primarily in equity securities of companies located anywhere in the world, including those in the U.S. and in emerging markets.
Performance Overview
You can find the Fund’s one-year total return in the Performance Summary. The Fund underperformed the -5.02% total return of the MSCI World Index for the period under review.1
Economic and Market Overview
Global stocks declined in 2011 as deepening sovereign debt, political paralysis and economic growth concerns led to escalating investor anxiety and severe market volatility. Stocks entered the year supported by positive momentum in corporate earnings and renewed economic stimulus measures in the developed world. However, a number of events interrupted the market’s rise early in 2011, including a severe natural disaster and nuclear crisis in Japan and populist uprisings across the oil-and-gas-producing regions of the Middle East and North Africa. Global markets recovered quickly from these setbacks but soon faced more significant turmoil as Europe’s sovereign debt crisis worsened in the summer. Portugal, Greece and Ireland received bailouts and had their credit ratings slashed to junk grade, while rising bond yields in the larger economies of Italy and Spain, and eventually in the critical core economies of Germany and France, threatened the survival of the European Monetary Union. The U.S.’s sovereign debt issues and political dysfunction, accompanied by the downgrade of its AAA credit rating to AA+, further pressured investor sentiment during the summer months. Additionally, the precarious state of the global banking system as well as emerging signs of a renewed global economic slowdown and possible hard landing in China weighed on the markets.
Despite these global challenges, corporate profits remained remarkably resilient, some signs of U.S. economic improvement emerged toward year-end, and European policymakers ultimately stepped up their response to their sovereign debt and banking crisis. Greek and Italian prime ministers were replaced with technocrats tasked with arresting a debt spiral, the European Central Bank cut short-term interest rates and expanded bank lending facilities, and six key global central banks agreed
1. Source: © 2012 Morningstar. One cannot invest directly in an index, and an index is not representative of the Fund’s portfolio. Please see Index Descriptions following the Fund Summaries.
Fund Risks: All investments involve risks. Stock prices fluctuate, sometimes rapidly and dramatically, due to factors affecting individual companies, particular industries or sectors, or general market conditions. Foreign investing, especially in emerging or developing markets, involves additional risks, including currency fluctuations, economic instability, market volatility, and political and social instability. The Fund may have significant investments in one or more countries or in particular sectors, such as financial services, from time to time and may be at greater risk of adverse developments in a country or sector than a fund that invests more broadly. Because the Fund may invest in bonds and other debt obligations, its share price and yield may be affected by interest rate movements. The Fund is actively managed but there is no guarantee that the manager’s investment decisions will produce the desired results. The Fund’s prospectus also includes a description of the main investment risks.
TG-2
to lower dollar funding costs for Europe’s distressed commercial banks. Meanwhile, the Federal Reserve Board increased purchases of long-dated bonds to reduce key borrowing costs and hinted at “additional policy accommodation.” Chinese policymakers lowered commercial bank reserve requirements and the International Monetary Fund revamped its credit line and eased its lending terms. Commodities initially rallied due to the coordinated monetary stimulus, but most ultimately declined as global economic prospects weakened. Gold and oil, however, made annual gains. In currency markets, the euro declined with escalating weakness at year-end, while the dollar ultimately rose after a late surge. Amid general global market declines, perceived safe-haven currencies such as the Japanese yen and Swiss franc rallied strongly, and U.S. Treasuries posted their best one-year return since 2008.
Investment Strategy
Our investment philosophy is bottom up, value oriented and long term. In choosing investments, we will focus on the market price of a company’s securities relative to our evaluation of the company’s potential long-term earnings, asset value and cash flow. Among factors we may consider are a company’s historical value measures, including price/earnings ratio, profit margins and liquidation value. We do in-depth research to construct a bargain list from which we buy.
Manager’s Discussion
Global stocks, as measured by the MSCI World Index, declined in 2011 amid sensitivity to the changing global economic outlook. In our opinion, investors overlooked business fundamental prospects during the period as they focused on short-term economic or political developments. Although equity markets began 2011 with positive momentum after stocks staged a strong rally in the last six months of 2010, growing concerns about economic growth rates and sovereign debt led to heightened volatility. Traditionally defensive sectors and regions ultimately led market returns in 2011.
For the Fund, allocations and stock selection among defensive and cyclical sectors delivered some of the best returns. Among defensive sectors, health care holdings outperformed the MSCI World Index in absolute terms.2 Our health care positions also aided relative returns, benefiting from an overweighted Fund allocation as well as stock-specific
2. The health care sector comprises biotechnology, health care equipment and supplies, health care providers and services, life sciences tools and services, and pharmaceuticals in the SOI.
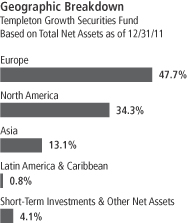
TG-3
strength. Two major pharmaceuticals manufacturers, the U.S.’s Pfizer and the U.K.’s GlaxoSmithKline, along with U.S. biotechnology firm Amgen, represented top sector contributors. Although we believe the global health care sector’s strength was partly attributable to the market’s defensive rotation, we believe pharmaceuticals industry valuations at roughly half their long-term average present the opportunity for future outperformance given the industry’s strong fundamentals and long-term earnings potential we believe has been overlooked.
Among cyclical sectors, the Fund’s materials holdings helped relative results, benefiting from our underweighted exposure during a period of commodity price weakness and from stock selection within the sector.3 Our underweighting of what we viewed as expensive metals and mining stocks and our selective participation in the undervalued construction materials industry notably contributed to performance. With overall metals prices barely off their 100-year highs in 2011, we found what we considered to be more attractive value opportunities elsewhere. Energy stocks, for example, seemed to offer compelling cyclically leveraged opportunities given valuations that we believed understated future earnings potential for select firms capable of extracting increasingly valuable carbon reserves.4 The Fund’s energy holdings were key contributors in 2011, led by European oil companies from outside the eurozone, including the U.K.’s Royal Dutch Shell and Norway’s Statoil. Shell is consolidating its operational and financial turnaround with production volume growth above consensus expectations and consistent earnings, and we remained favorable toward the stock at recent, low valuations.
The relative contribution of the Fund’s consumer discretionary positions demonstrated, in our opinion, how value-oriented stock selection can add value.5 Strong corporate fundamentals helped the Fund’s holdings in the diverse consumer discretionary sector, led by South Korean auto manufacturer Hyundai Motor6 and U.S.-based media conglomerate News Corp., which ultimately posted strong annual gains despite considerable controversy and volatility in 2011.
Industrials represent another sector where we believe investors overlooked certain company management’s prudent capital allocation
3. The materials sector comprises chemicals, construction materials, metals and mining, and paper and forest products in the SOI.
4. The energy sector comprises energy equipment and services; and oil, gas and consumable fuels in the SOI.
5. The consumer discretionary sector comprises auto components; automobiles; hotels, restaurants and leisure; Internet and catalog retail; media; multiline retail; and specialty retail in the SOI.
6. This holding is not an index component and was sold during the period.
Top 10 Holdings
Templeton Growth Securities Fund
12/31/11
| | | | |
Company Sector/Industry,
Country | | % of Total
Net Assets | |
| Amgen Inc. | | | 2.5% | |
| Biotechnology, U.S. | | | | |
| Pfizer Inc. | | | 2.4% | |
| Pharmaceuticals, U.S. | | | | |
| Microsoft Corp. | | | 2.3% | |
| Software, U.S. | | | | |
| Samsung Electronics Co. Ltd. | | | 2.3% | |
| Semiconductors & Semiconductor Equipment, South Korea | | | | |
| Sanofi | | | 2.2% | |
| Pharmaceuticals, France | | | | |
| GlaxoSmithKline PLC | | | 2.2% | |
| Pharmaceuticals, U.K. | | | | |
| Royal Dutch Shell PLC | | | 2.1% | |
| Oil, Gas & Consumable Fuels, U.K. | | | | |
| Vodafone Group PLC | | | 2.0% | |
| Wireless Telecommunication Services, U.K. | | | | |
| Singapore Telecommunications Ltd. | | | 2.0% | |
| Diversified Telecommunication Services, Singapore | | | | |
| Comcast Corp. | | | 1.8% | |
| Media, U.S. | | | | |
The dollar value, number of shares or principal amount, and names of all portfolio holdings are listed in the Fund’s Statement of Investments (SOI).
TG-4
strategies within an attractive global opportunity set.7 The Fund’s industrials stock selection detracted from performance as we believe investors treated industrial concerns as economic proxies, indiscriminately selling as global growth prospects dimmed. Early cyclical professional services firms such as Switzerland’s Adecco and the Netherlands’ Randstad Holding were easy targets for increasingly pessimistic investors, as were cyclical airline stocks such as International Consolidated Airlines Group, the parent of British Airways and Spain’s Iberia. Share price declines even affected Fund holdings we believed would be more resilient amid cyclicality, such as global industrial conglomerates including Germany’s Siemens and the Netherlands’ Koninklijke Philips Electronics. We remained favorable toward these stocks given their low valuations and leading market positions across a diverse range of product lines and geographies.
Among cyclical sectors, our financials stock selection was another significant detractor, with weakness from European financial concerns such as Italy’s Unicredit and France’s Credit Agricole.8 While we remained cautiously underweighted given the sector’s lack of political and regulatory visibility, we believe contrarian investors can find selective financials opportunities in this environment. Europe’s average bank price-to-book multiple stood at 0.6 times at year-end compared to an average of 1.5 times over the last decade.9 This valuation seems overly negative, even acknowledging that the higher capital requirements mandated under accelerated Basel III regulatory provisions may restrain future industry returns. U.S. banks traded at undemanding valuations despite having repaid nearly all federal bailout funds and having what we believe to be dramatically improved capital ratios, credit losses, liquidity, loan-to-value ratios and earnings. Although Asian bank valuations traded at somewhat higher valuations, many Asian bank stocks looked reasonable to us given the region’s higher returns on equity, stronger balance sheets and secular earnings drivers. In our assessment, select opportunities also emerged for investment banks, asset managers and insurers whose valuations we believe overstated the long-term risks of systemic volatility and muted economic growth.
7. The industrials sector comprises aerospace and defense, air freight and logistics, airlines, commercial services and supplies, construction and engineering, electrical equipment, industrial conglomerates, machinery, professional services, road and rail, and trading companies and distributors in the SOI.
8. The financials sector comprises capital markets, commercial banks, consumer finance, diversified financial services, insurance, and real estate management and development in the SOI.
9. Source: MSCI, Inc.
TG-5
We found less long-term potential in the consumer staples sector, where a 30% premium valuation to the broader market seemed unjustified given the potential margin impact of growing competitive pressures and volatile input prices.9,10 Our resulting underweighting detracted from relative performance during the year because in our view, risk-averse investors flocked to staples stocks for their perceived defensive characteristics. We found compelling opportunities in telecommunication services, where robust dividend yields and diverse global growth opportunities were available at what we believed were low valuations.11 Although the Fund’s overweighted position contributed to performance, Fund holding U.S. wireless carrier Sprint Nextel declined mainly due to growing liquidity concerns. We believed Sprint’s cash flow issues were largely a function of better-than-expected growth, and though increased capital expenditures may constrain the firm’s liquidity in the near-term, we believe they represent a critical investment in the firm’s long-term competitive prospects.
From a regional perspective, stock selection in Asia benefited relative performance. Although a steady stream of negative news flowed out of developed Europe, global emerging markets represented the worst-performing group in 2011 as investor capital retreated to traditionally safe-haven markets. This trend supported bellwether U.S. stocks, although the Fund’s underweighting in North America offset much of the stock selection benefit. Value-added stock selection in Europe did not offset our detractive overweighting in the troubled region during the year, and European stocks ultimately lagged.
It is important to recognize the effect of currency movements on the Fund’s performance. In general, if the value of the U.S. dollar goes up compared with a foreign currency, an investment traded in that foreign currency will go down in value because it will be worth fewer U.S. dollars. This can have a negative effect on Fund performance. Conversely, when the U.S. dollar weakens in relation to a foreign currency, an investment traded in that foreign currency will increase in value, which can contribute to Fund performance. For the 12 months ended December 31, 2011, the U.S. dollar rose in value relative to most currencies. As a result, the Fund’s performance was negatively affected by the portfolio’s substantial investment in securities with non-U.S. currency exposure.
10. The consumer staples sector comprises food and staples retailing and food products in the SOI.
11. The telecommunication services sector comprises diversified telecommunication services and wireless telecommunication services in the SOI.
TG-6
At year-end, we believe increasing fiscal consolidation and regulation in the developed world and a potential slowdown in emerging markets following the withdrawal of immense stimulus may increase the likelihood of a period of below trend economic growth. The importance of strong business fundamentals may again rise to the forefront, benefiting a value philosophy that has been challenging in macro-driven markets but performed well over longer term horizons. Volatility can continue to create compelling equity opportunities for disciplined, long-term value investors. We believe investors should also focus on total return as company managers seek to enhance shareholder value in an uncertain environment, keeping in mind that dividend income has accounted for 71% of total returns for the MSCI World Index since 1970.9 International equities looked attractive to us with an average earnings yield of over 8% and dividend yield of 3.5%, compared to 10-year Treasuries, German bunds and Japanese government bonds, which were each yielding at or below 2.0% at year-end.12 We remember the words of Sir John Templeton, who advised, “Whenever you can buy a large amount of future earnings power for a low price, you have made a good investment.”
Thank you for your participation in Templeton Growth Securities Fund. We look forward to serving your future investment needs.
12. Sources: Bloomberg LP (U.S. Treasury and Japanese government bonds); Deutsche Bundesbank (German bunds).
The foregoing information reflects our analysis, opinions and portfolio holdings as of December 31, 2011, the end of the reporting period. The way we implement our main investment strategies and the resulting portfolio holdings may change depending on factors such as market and economic conditions. These opinions may not be relied upon as investment advice or an offer for a particular security. The information is not a complete analysis of every aspect of any market, country, industry, security or the Fund. Statements of fact are from sources considered reliable, but the investment manager makes no representation or warranty as to their completeness or accuracy. Although historical performance is no guarantee of future results, these insights may help you understand our investment management philosophy.
TG-7
Fund Expenses
As an investor in a variable insurance contract (Contract) that indirectly provides for investment in an underlying mutual fund, you can incur transaction and/or ongoing expenses at both the Fund level and the Contract level.
| • | | Transaction expenses can include sales charges (loads) on purchases, redemption fees, surrender fees, transfer fees and premium taxes. |
| • | | Ongoing expenses can include management fees, distribution and service (12b-1) fees, contract fees, annual maintenance fees, mortality and expense risk fees and other fees and expenses. All mutual funds and Contracts have some types of ongoing expenses. |
The expenses shown in the table are meant to highlight ongoing expenses at the Fund level only and do not include ongoing expenses at the Contract level, or transaction expenses at either the Fund or Contract level. While the Fund does not have transaction expenses, if the transaction and ongoing expenses at the Contract level were included, the expenses shown below would be higher. You should consult your Contract prospectus or disclosure document for more information.
The table shows Fund-level ongoing expenses and can help you understand these expenses and compare them with those of other mutual funds offered through the Contract. The table assumes a $1,000 investment held for the six months indicated. Please refer to the Fund prospectus for additional information on operating expenses.
Actual Fund Expenses
The first line (Actual) of the table provides actual account values and expenses. The “Ending Account Value” is derived from the Fund’s actual return, which includes the effect of ongoing Fund expenses, but does not include the effect of ongoing Contract expenses.
You can estimate the Fund-level expenses you incurred during the period by following these steps. Of course, your account value and expenses will differ from those in this illustration:
| 1. | Divide your account value by $1,000. |
If an account had an $8,600 value, then $8,600 ÷ $1,000 = 8.6.
| 2. | Multiply the result by the number under the heading “Fund-Level Expenses Incurred During Period.” |
If Fund-Level Expenses Incurred During Period were $7.50, then
8.6 x $7.50 = $64.50.
In this illustration, the estimated expenses incurred this period at the Fund level are $64.50.
Templeton Growth Securities Fund – Class 1
TG-8
Hypothetical Example for Comparison with Other Mutual Funds
Information in the second line (Hypothetical) of the table can help you compare ongoing expenses of the Fund with those of other mutual funds offered through the Contract. This information may not be used to estimate the actual ending account balance or expenses you incurred during the period. The hypothetical “Ending Account Value” is based on the Fund’s actual expense ratio and an assumed 5% annual rate of return before expenses, which does not represent the Fund’s actual return. The figure under the heading “Fund-Level Expenses Incurred During Period” shows the hypothetical expenses your account would have incurred under this scenario. You can compare this figure with the 5% hypothetical examples that appear in shareholder reports of other funds offered through a Contract.
| | | | | | | | | | | | |
| Class 1 | | Beginning
Account
Value 7/1/11 | | | Ending
Account
Value 12/31/11 | | | Fund-Level
Expenses Incurred
During Period*
7/1/11–12/31/11 | |
Actual | | $ | 1,000 | | | $ | 858.00 | | | $ | 3.65 | |
Hypothetical (5% return before expenses) | | $ | 1,000 | | | $ | 1,021.27 | | | $ | 3.97 | |
*Expenses are calculated using the most recent six-month annualized expense ratio for the Fund’s Class 1 shares (0.78%), which does not include any ongoing expenses of the Contract for which the Fund is an investment option, multiplied by the average account value over the period, multiplied by 184/365 to reflect the one-half year period.
TG-9
Franklin Templeton Variable Insurance Products Trust
Financial Highlights
Templeton Growth Securities Fund
| | | | | | | | | | | | | | | | | | | | |
| | | Year Ended December 31, | |
| Class 1 | | 2011 | | | 2010 | | | 2009 | | | 2008 | | | 2007 | |
| | | | |
Per share operating performance | | | | | | | | | | | | | | | | | | | | |
(for a share outstanding throughout the year) | | | | | | | | | | | | | | | | | | | | |
Net asset value, beginning of year | | $ | 11.19 | | | $ | 10.56 | | | $ | 8.34 | | | $ | 15.68 | | | $ | 16.16 | |
| | | | |
Income from investment operationsa: | | | | | | | | | | | | | | | | | | | | |
Net investment incomeb | | | 0.25 | | | | 0.17 | | | | 0.17 | | | | 0.29 | | | | 0.27 | |
Net realized and unrealized gains (losses) | | | (0.99 | ) | | | 0.62 | | | | 2.36 | | | | (6.50 | ) | | | 0.19 | |
| | | | |
Total from investment operations | | | (0.74 | ) | | | 0.79 | | | | 2.53 | | | | (6.21 | ) | | | 0.46 | |
| | | | |
Less distributions from: | | | | | | | | | | | | | | | | | | | | |
Net investment income | | | (0.18 | ) | | | (0.16 | ) | | | (0.31 | ) | | | (0.26 | ) | | | (0.25 | ) |
Net realized gains | | | — | | | | — | | | | — | | | | (0.87 | ) | | | (0.69 | ) |
| | | | |
Total distributions | | | (0.18 | ) | | | (0.16 | ) | | | (0.31 | ) | | | (1.13 | ) | | | (0.94 | ) |
| | | | |
Net asset value, end of year | | $ | 10.27 | | | $ | 11.19 | | | $ | 10.56 | | | $ | 8.34 | | | $ | 15.68 | |
| | | | |
| | | | | |
Total returnc | | | (6.80)% | | | | 7.74% | | | | 31.33% | | | | (42.13)% | | | | 2.55% | |
Ratios to average net assets | | | | | | | | | | | | | | | | | | | | |
Expenses before expense reduction | | | 0.78% | | | | 0.77% | | | | 0.79% | | | | 0.78% | | | | 0.77% | |
Expenses net of expense reduction | | | 0.78% | d | | | 0.77% | d | | | 0.79% | d | | | 0.78% | d | | | 0.76% | |
Net investment income | | | 2.22% | | | | 1.71% | | | | 2.00% | | | | 2.64% | | | | 1.64% | |
| | | | | |
Supplemental data | | | | | | | | | | | | | | | | | | | | |
Net assets, end of year (000’s) | | $ | 1,200,682 | | | $ | 1,348,622 | | | $ | 824,575 | | | $ | 371,700 | | | $ | 406,538 | |
Portfolio turnover rate | | | 42.13% | e | | | 9.61% | | | | 14.95% | | | | 18.37% | | | | 20.45% | |
aThe amount shown for a share outstanding throughout the period may not correlate with the Statement of Operations for the period due to the timing of sales and repurchases of the Fund shares in relation to income earned and/or fluctuating market value of the investments of the Fund.
bBased on average daily shares outstanding.
cTotal return does not include fees, charges or expenses imposed by the variable annuity and life insurance contracts for which the Franklin Templeton Variable Insurance Products Trust serves as an underlying investment vehicle.
dBenefit of expense reduction rounds to less than 0.01%.
eExcludes the value of portfolio securities delivered as a result of a redemption in-kind.
The accompanying notes are an integral part of these financial statements.
TG-10
Franklin Templeton Variable Insurance Products Trust
Financial Highlights (continued)
Templeton Growth Securities Fund
| | | | | | | | | | | | | | | | | | | | |
| | | Year Ended December 31, | |
| Class 2 | | 2011 | | | 2010 | | | 2009 | | | 2008 | | | 2007 | |
| | | | |
Per share operating performance | | | | | | | | | | | | | | | | | | | | |
(for a share outstanding throughout the year) | | | | | | | | | | | | | | | | | | | | |
Net asset value, beginning of year | | $ | 11.01 | | | $ | 10.40 | | | $ | 8.20 | | | $ | 15.44 | | | $ | 15.93 | |
| | | | |
Income from investment operationsa: | | | | | | | | | | | | | | | | | | | | |
Net investment incomeb | | | 0.21 | | | | 0.15 | | | | 0.16 | | | | 0.29 | | | | 0.22 | |
Net realized and unrealized gains (losses) | | | (0.96 | ) | | | 0.60 | | | | 2.32 | | | | (6.44 | ) | | | 0.20 | |
| | | | |
Total from investment operations | | | (0.75 | ) | | | 0.75 | | | | 2.48 | | | | (6.15 | ) | | | 0.42 | |
| | | | |
Less distributions from: | | | | | | | | | | | | | | | | | | | | |
Net investment income | | | (0.15 | ) | | | (0.14 | ) | | | (0.28 | ) | | | (0.22 | ) | | | (0.22 | ) |
Net realized gains | | | — | | | | — | | | | — | | | | (0.87 | ) | | | (0.69 | ) |
| | | | |
Total distributions | | | (0.15 | ) | | | (0.14 | ) | | | (0.28 | ) | | | (1.09 | ) | | | (0.91 | ) |
| | | | |
Net asset value, end of year | | $ | 10.11 | | | $ | 11.01 | | | $ | 10.40 | | | $ | 8.20 | | | $ | 15.44 | |
| | | | |
| | | | | |
Total returnc | | | (6.97)% | | | | 7.39% | | | | 31.10% | | | | (42.32)% | | | | 2.35% | |
Ratios to average net assets | | | | | | | | | | | | | | | | | | | | |
Expenses before expense reduction | | | 1.03% | | | | 1.02% | | | | 1.04% | | | | 1.03% | | | | 1.02% | |
Expenses net of expense reduction | | | 1.03% | d | | | 1.02% | d | | | 1.04% | d | | | 1.03% | d | | | 1.01% | |
Net investment income | | | 1.97% | | | | 1.46% | | | | 1.75% | | | | 2.39% | | | | 1.39% | |
| | | | | |
Supplemental data | | | | | | | | | | | | | | | | | | | | |
Net assets, end of year (000’s) | | $ | 1,254,193 | | | $ | 1,626,885 | | | $ | 1,718,894 | | | $ | 1,513,557 | | | $ | 3,182,203 | |
Portfolio turnover rate | | | 42.13% | e | | | 9.61% | | | | 14.95% | | | | 18.37% | | | | 20.45% | |
aThe amount shown for a share outstanding throughout the period may not correlate with the Statement of Operations for the period due to the timing of sales and repurchases of the Fund shares in relation to income earned and/or fluctuating market value of the investments of the Fund.
bBased on average daily shares outstanding.
cTotal return does not include fees, charges or expenses imposed by the variable annuity and life insurance contracts for which the Franklin Templeton Variable Insurance Products Trust serves as an underlying investment vehicle.
dBenefit of expense reduction rounds to less than 0.01%.
eExcludes the value of portfolio securities delivered as a result of a redemption in-kind.
The accompanying notes are an integral part of these financial statements.
TG-11
Franklin Templeton Variable Insurance Products Trust
Financial Highlights (continued)
Templeton Growth Securities Fund
| | | | | | | | | | | | | | | | |
| | | Year Ended December 31, | |
| Class 4 | | 2011 | | | 2010 | | | 2009 | | | 2008a | |
| | | | |
Per share operating performance | | | | | | | | | | | | | | | | |
(for a share outstanding throughout the year) | | | | | | | | | | | | | | | | |
Net asset value, beginning of year | | $ | 11.11 | | | $ | 10.50 | | | $ | 8.31 | | | $ | 14.08 | |
| | | | |
Income from investment operationsb: | | | | | | | | | | | | | | | | |
Net investment incomec | | | 0.20 | | | | 0.14 | | | | 0.14 | | | | 0.09 | |
Net realized and unrealized gains (losses) | | | (0.98 | ) | | | 0.61 | | | | 2.36 | | | | (4.73 | ) |
| | | | |
Total from investment operations | | | (0.78 | ) | | | 0.75 | | | | 2.50 | | | | (4.64 | ) |
| | | | |
Less distributions from: | | | | | | | | | | | | | | | | |
Net investment incomee | | | (0.14 | ) | | | (0.14 | ) | | | (0.31 | ) | | | (0.26 | ) |
Net realized gains | | | — | | | | — | | | | — | | | | (0.87 | ) |
| | | | |
Total distributions | | | (0.14 | ) | | | (0.14 | ) | | | (0.31 | ) | | | (1.13 | ) |
| | | | |
Net asset value, end of year | | $ | 10.19 | | | $ | 11.11 | | | $ | 10.50 | | | $ | 8.31 | |
| | | | |
| | | | |
Total returnd | | | (7.14)% | | | | 7.31% | | | | 30.98% | | | | (35.79)% | |
Ratios to average net assetse | | | | | | | | | | | | | | | | |
Expensesf | | | 1.13% | | | | 1.12% | | | | 1.14% | | | | 1.13% | |
Net investment income | | | 1.87% | | | | 1.36% | | | | 1.65% | | | | 2.29% | |
| | | | |
Supplemental data | | | | | | | | | | | | | | | | |
Net assets, end of year (000’s) | | $ | 56,170 | | | $ | 60,569 | | | $ | 56,218 | | | $ | 24,877 | |
Portfolio turnover rate | | | 42.13% | g | | | 9.61% | | | | 14.95% | | | | 18.37% | |
aFor the period February 29, 2008 (effective date) to December 31, 2008.
bThe amount shown for a share outstanding throughout the period may not correlate with the Statement of Operations for the period due to the timing of sales and repurchases of the Fund shares in relation to income earned and/or fluctuating market value of the investments of the Fund.
cBased on average daily shares outstanding.
dTotal return does not include fees, charges or expenses imposed by the variable annuity and life insurance contracts for which the Franklin Templeton Variable Insurance Products Trust serves as an underlying investment vehicle. Total return is not annualized for periods less than one year.
eRatios are annualized for periods less than one year.
fBenefit of expense reduction rounds to less than 0.01%.
gExcludes the value of portfolio securities delivered as a result of a redemption in-kind.
The accompanying notes are an integral part of these financial statements.
TG-12
Franklin Templeton Variable Insurance Products Trust
Statement of Investments, December 31, 2011
| | | | | | | | | | |
| Templeton Growth Securities Fund | | Country | | Shares | | | Value | |
Common Stocks 94.7% | | | | | | | | | | |
Aerospace & Defense 0.4% | | | | | | | | | | |
BAE Systems PLC | | United Kingdom | | | 2,385,309 | | | $ | 10,551,787 | |
| | | | | | | | | | |
Air Freight & Logistics 2.1% | | | | | | | | | | |
Deutsche Post AG | | Germany | | | 798,754 | | | | 12,343,898 | |
FedEx Corp. | | United States | | | 197,560 | | | | 16,498,236 | |
United Parcel Service Inc., B | | United States | | | 339,990 | | | | 24,883,868 | |
| | | | | | | | | | |
| | | | | | | | | 53,726,002 | |
| | | | | | | | | | |
Airlines 2.0% | | | | | | | | | | |
Deutsche Lufthansa AG | | Germany | | | 2,101,944 | | | | 24,892,997 | |
aInternational Consolidated Airlines Group SA | | United Kingdom | | | 11,509,160 | | | | 26,403,741 | |
| | | | | | | | | | |
| | | | | | | | | 51,296,738 | |
| | | | | | | | | | |
Auto Components 0.6% | | | | | | | | | | |
Compagnie Generale des Etablissements Michelin, B | | France | | | 259,222 | | | | 15,324,467 | |
| | | | | | | | | | |
Automobiles 2.3% | | | | | | | | | | |
aMazda Motor Corp. | | Japan | | | 8,460,370 | | | | 14,949,786 | |
Nissan Motor Co. Ltd. | | Japan | | | 1,718,430 | | | | 15,450,576 | |
Toyota Motor Corp. | | Japan | | | 785,840 | | | | 26,189,562 | |
| | | | | | | | | | |
| | | | | | | | | 56,589,924 | |
| | | | | | | | | | |
Biotechnology 2.5% | | | | | | | | | | |
Amgen Inc. | | United States | | | 963,620 | | | | 61,874,040 | |
| | | | | | | | | | |
Capital Markets 2.8% | | | | | | | | | | |
Credit Suisse Group AG | | Switzerland | | | 817,506 | | | | 19,227,748 | |
Morgan Stanley | | United States | | | 1,414,280 | | | | 21,398,057 | |
Nomura Holdings Inc. | | Japan | | | 3,221,100 | | | | 9,751,397 | |
aUBS AG | | Switzerland | | | 1,632,469 | | | | 19,450,102 | |
| | | | | | | | | | |
| | | | | | | | | 69,827,304 | |
| | | | | | | | | | |
Chemicals 1.0% | | | | | | | | | | |
Akzo Nobel NV | | Netherlands | | | 496,137 | | | | 23,990,729 | |
| | | | | | | | | | |
Commercial Banks 5.3% | | | | | | | | | | |
BNP Paribas SA | | France | | | 315,040 | | | | 12,375,403 | |
Credit Agricole SA | | France | | | 2,566,880 | | | | 14,485,284 | |
aDanske Bank AS | | Denmark | | | 152,716 | | | | 1,939,897 | |
DBS Group Holdings Ltd. | | Singapore | | | 1,338,690 | | | | 11,889,375 | |
HSBC Holdings PLC | | United Kingdom | | | 2,748,024 | | | | 20,875,726 | |
ICICI Bank Ltd., ADR | | India | | | 416,350 | | | | 11,004,130 | |
Intesa Sanpaolo SpA | | Italy | | | 16,216,401 | | | | 27,159,621 | |
KB Financial Group Inc. | | South Korea | | | 594,254 | | | | 18,608,083 | |
UniCredit SpA | | Italy | | | 1,813,084 | | | | 15,065,648 | |
| | | | | | | | | | |
| | | | | | | | | 133,403,167 | |
| | | | | | | | | | |
Commercial Services & Supplies 0.2% | | | | | | | | | | |
aRentokil Initial PLC | | United Kingdom | | | 5,180,715 | | | | 5,055,493 | |
| | | | | | | | | | |
Communications Equipment 3.1% | | | | | | | | | | |
aBrocade Communications Systems Inc. | | United States | | | 2,621,030 | | | | 13,603,146 | |
Cisco Systems Inc. | | United States | | | 2,119,990 | | | | 38,329,419 | |
Telefonaktiebolaget LM Ericsson, B | | Sweden | | | 2,458,661 | | | | 25,155,649 | |
| | | | | | | | | | |
| | | | | | | | | 77,088,214 | |
| | | | | | | | | | |
TG-13
Franklin Templeton Variable Insurance Products Trust
Statement of Investments, December 31, 2011 (continued)
| | | | | | | | | | |
| Templeton Growth Securities Fund | | Country | | Shares | | | Value | |
Common Stocks (continued) | | | | | | | | | | |
Computers & Peripherals 1.5% | | | | | | | | | | |
aDell Inc. | | United States | | | 779,240 | | | $ | 11,400,281 | |
Seagate Technology | | United States | | | 1,626,148 | | | | 26,668,827 | |
| | | | | | | | | | |
| | | | | | | | | 38,069,108 | |
| | | | | | | | | | |
Construction & Engineering 0.1% | | | | | | | | | | |
Carillion PLC | | United Kingdom | | | 727,680 | | | | 3,409,456 | |
| | | | | | | | | | |
Construction Materials 1.5% | | | | | | | | | | |
CRH PLC | | Ireland | | | 1,833,961 | | | | 36,459,967 | |
| | | | | | | | | | |
Consumer Finance 0.8% | | | | | | | | | | |
American Express Co. | | United States | | | 435,650 | | | | 20,549,611 | |
| | | | | | | | | | |
Diversified Financial Services 2.7% | | | | | | | | | | |
Bank of America Corp. | | United States | | | 1,119,120 | | | | 6,222,307 | |
Citigroup Inc. | | United States | | | 771,230 | | | | 20,291,061 | |
aING Groep NV | | Netherlands | | | 3,990,689 | | | | 28,718,227 | |
JPMorgan Chase & Co. | | United States | | | 358,850 | | | | 11,931,763 | |
| | | | | | | | | | |
| | | | | | | | | 67,163,358 | |
| | | | | | | | | | |
Diversified Telecommunication Services 5.3% | | | | | | | | | | |
France Telecom SA | | France | | | 1,949,580 | | | | 30,620,748 | |
Singapore Telecommunications Ltd. | | Singapore | | | 20,628,160 | | | | 49,141,172 | |
Telefonica SA | | Spain | | | 1,292,628 | | | | 22,393,753 | |
Telekom Austria AG | | Austria | | | 512,129 | | | | 6,123,395 | |
Vivendi SA | | France | | | 1,137,882 | | | | 24,919,111 | |
| | | | | | | | | | |
| | | | | | | | | 133,198,179 | |
| | | | | | | | | | |
Electrical Equipment 1.0% | | | | | | | | | | |
Alstom SA | | France | | | 847,234 | | | | 25,692,752 | |
| | | | | | | | | | |
Electronic Equipment, Instruments & Components 1.0% | | | | | | | | | | |
aFlextronics International Ltd. | | Singapore | | | 1,972,800 | | | | 11,166,048 | |
TE Connectivity Ltd. | | United States | | | 415,598 | | | | 12,804,574 | |
| | | | | | | | | | |
| | | | | | | | | 23,970,622 | |
| | | | | | | | | | |
Energy Equipment & Services 2.5% | | | | | | | | | | |
Baker Hughes Inc. | | United States | | | 429,070 | | | | 20,869,965 | |
Halliburton Co. | | United States | | | 314,450 | | | | 10,851,670 | |
Noble Corp. | | United States | | | 640,470 | | | | 19,355,003 | |
SBM Offshore NV | | Netherlands | | | 544,135 | | | | 11,212,041 | |
| | | | | | | | | | |
| | | | | | | | | 62,288,679 | |
| | | | | | | | | | |
Food & Staples Retailing 2.4% | | | | | | | | | | |
CVS Caremark Corp. | | United States | | | 716,870 | | | | 29,233,958 | |
Tesco PLC | | United Kingdom | | | 4,978,078 | | | | 31,201,357 | |
| | | | | | | | | | |
| | | | | | | | | 60,435,315 | |
| | | | | | | | | | |
Health Care Equipment & Supplies 1.1% | | | | | | | | | | |
Medtronic Inc. | | United States | | | 714,240 | | | | 27,319,680 | |
| | | | | | | | | | |
Industrial Conglomerates 3.3% | | | | | | | | | | |
Citic Pacific Ltd. | | China | | | 7,000 | | | | 12,618 | |
General Electric Co. | | United States | | | 1,336,230 | | | | 23,931,880 | |
Koninklijke Philips Electronics NV | | Netherlands | | | 1,428,011 | | | | 30,089,911 | |
Siemens AG | | Germany | | | 289,596 | | | | 27,674,763 | |
| | | | | | | | | | |
| | | | | | | | | 81,709,172 | |
| | | | | | | | | | |
TG-14
Franklin Templeton Variable Insurance Products Trust
Statement of Investments, December 31, 2011 (continued)
| | | | | | | | | | |
| Templeton Growth Securities Fund | | Country | | Shares | | | Value | |
Common Stocks (continued) | | | | | | | | | | |
Insurance 5.2% | | | | | | | | | | |
AIA Group Ltd. | | Hong Kong | | | 3,332,200 | | | $ | 10,404,276 | |
Aviva PLC | | United Kingdom | | | 5,708,745 | | | | 26,645,658 | |
AXA SA | | France | | | 1,770,080 | | | | 23,013,241 | |
Muenchener Rueckversicherungs-Gesellschaft AG | | Germany | | | 191,967 | | | | 23,503,099 | |
RenaissanceRe Holdings Ltd. | | United States | | | 274,670 | | | | 20,427,208 | |
aSwiss Re Ltd. | | Switzerland | | | 541,112 | | | | 27,604,872 | |
| | | | | | | | | | |
| | | | | | | | | 131,598,354 | |
| | | | | | | | | | |
Life Sciences Tools & Services 0.5% | | | | | | | | | | |
Lonza Group AG | | Switzerland | | | 191,947 | | | | 11,352,969 | |
| | | | | | | | | | |
Machinery 0.4% | | | | | | | | | | |
aNavistar International Corp. | | United States | | | 258,030 | | | | 9,774,176 | |
| | | | | | | | | | |
Media 6.1% | | | | | | | | | | |
Comcast Corp., Special A | | United States | | | 1,952,832 | | | | 46,008,722 | |
News Corp., A | | United States | | | 1,880,832 | | | | 33,554,043 | |
Time Warner Cable Inc. | | United States | | | 348,940 | | | | 22,182,116 | |
Time Warner Inc. | | United States | | | 604,180 | | | | 21,835,065 | |
Viacom Inc., B | | United States | | | 235,808 | | | | 10,708,041 | |
The Walt Disney Co. | | United States | | | 528,110 | | | | 19,804,125 | |
| | | | | | | | | | |
| | | | | | | | | 154,092,112 | |
| | | | | | | | | | |
Multiline Retail 0.6% | | | | | | | | | | |
Target Corp. | | United States | | | 304,580 | | | | 15,600,588 | |
| | | | | | | | | | |
Oil, Gas & Consumable Fuels 10.0% | | | | | | | | | | |
BP PLC | | United Kingdom | | | 6,212,477 | | | | 44,402,310 | |
Chevron Corp. | | United States | | | 280,000 | | | | 29,792,000 | |
Eni SpA | | Italy | | | 1,115,195 | | | | 23,108,784 | |
Gazprom, ADR | | Russia | | | 2,053,300 | | | | 21,931,297 | |
Royal Dutch Shell PLC, B | | United Kingdom | | | 1,361,951 | | | | 51,907,861 | |
Statoil ASA | | Norway | | | 756,852 | | | | 19,425,444 | |
Talisman Energy Inc. | | Canada | | | 1,092,260 | | | | 13,911,137 | |
bTotal SA, B | | France | | | 888,216 | | | | 45,409,910 | |
| | | | | | | | | | |
| | | | | | | | | 249,888,743 | |
| | | | | | | | | | |
Pharmaceuticals 10.8% | | | | | | | | | | |
GlaxoSmithKline PLC | | United Kingdom | | | 2,369,672 | | | | 54,152,193 | |
Merck & Co. Inc. | | United States | | | 1,102,571 | | | | 41,566,927 | |
Merck KGaA | | Germany | | | 186,167 | | | | 18,579,390 | |
Pfizer Inc. | | United States | | | 2,770,073 | | | | 59,944,380 | |
Roche Holding AG | | Switzerland | | | 248,138 | | | | 42,098,971 | |
Sanofi | | France | | | 757,937 | | | | 55,671,629 | |
| | | | | | | | | | |
| | | | | | | | | 272,013,490 | |
| | | | | | | | | | |
Professional Services 1.3% | | | | | | | | | | |
Adecco SA | | Switzerland | | | 140,580 | | | | 5,895,266 | |
Hays PLC | | United Kingdom | | | 3,623 | | | | 3,620 | |
Randstad Holding NV | | Netherlands | | | 909,891 | | | | 26,921,580 | |
| | | | | | | | | | |
| | | | | | | | | 32,820,466 | |
| | | | | | | | | | |
Real Estate Management & Development 0.4% | | | | | | | | | | |
Cheung Kong (Holdings) Ltd. | | Hong Kong | | | 933,303 | | | | 11,121,622 | |
| | | | | | | | | | |
TG-15
Franklin Templeton Variable Insurance Products Trust
Statement of Investments, December 31, 2011 (continued)
| | | | | | | | | | | | |
| Templeton Growth Securities Fund | | Country | | | Shares | | | Value | |
Common Stocks (continued) | | | | | | | | | | | | |
Semiconductors & Semiconductor Equipment 3.2% | | | | | | | | | | | | |
Samsung Electronics Co. Ltd. | | | South Korea | | | | 62,450 | | | $ | 56,995,557 | |
Taiwan Semiconductor Manufacturing Co. Ltd. | | | Taiwan | | | | 9,628,585 | | | | 24,099,282 | |
| | | | | | | | | | | | |
| | | | | | | | | | | 81,094,839 | |
| | | | | | | | | | | | |
Software 5.3% | | | | | | | | | | | | |
Microsoft Corp. | | | United States | | | | 2,230,739 | | | | 57,909,984 | |
Nintendo Co. Ltd. | | | Japan | | | | 157,640 | | | | 21,710,960 | |
Oracle Corp. | | | United States | | | | 790,290 | | | | 20,270,938 | |
SAP AG | | | Germany | | | | 637,693 | | | | 33,773,979 | |
| | | | | | | | | | | | |
| | | | | | | | | | | 133,665,861 | |
| | | | | | | | | | | | |
Specialty Retail 0.8% | | | | | | | | | | | | |
Kingfisher PLC | | | United Kingdom | | | | 5,183,728 | | | | 20,181,398 | |
| | | | | | | | | | | | |
Trading Companies & Distributors 0.7% | | | | | | | | | | | | |
Itochu Corp. | | | Japan | | | | 1,707,480 | | | | 17,348,787 | |
| | | | | | | | | | | | |
Wireless Telecommunication Services 3.9% | | | | | | | | | | | | |
China Mobile Ltd. | | | China | | | | 811,850 | | | | 7,933,898 | |
aSprint Nextel Corp. | | | United States | | | | 8,776,630 | | | | 20,537,314 | |
aTurkcell Iletisim Hizmetleri AS, ADR | | | Turkey | | | | 1,655,120 | | | | 19,464,211 | |
Vodafone Group PLC | | | United Kingdom | | | | 18,096,428 | | | | 50,299,759 | |
| | | | | | | | | | | | |
| | | | | | | | | | | 98,235,182 | |
| | | | | | | | | | | | |
Total Common Stocks (Cost $2,625,810,541) | | | | | | | | | | | 2,377,782,351 | |
| | | | | | | | | | | | |
Preferred Stocks 0.7% | | | | | | | | | | | | |
Metals & Mining 0.5% | | | | | | | | | | | | |
Vale SA, ADR, pfd., A | | | Brazil | | | | 592,750 | | | | 12,210,650 | |
| | | | | | | | | | | | |
Oil, Gas & Consumable Fuels 0.2% | | | | | | | | | | | | |
Petroleo Brasileiro SA, ADR, pfd. | | | Brazil | | | | 274,380 | | | | 6,445,186 | |
| | | | | | | | | | | | |
Total Preferred Stocks (Cost $18,810,970) | | | | | | | | | | | 18,655,836 | |
| | | | | | | | | | | | |
Non-Registered Mutual Funds (Cost $11,935,000) 0.5% | | | | | | | | | | | | |
Diversified Financial Services 0.5% | | | | | | | | | | | | |
a,c,d,eTempleton China Opportunities Fund, Ltd., Reg D | | | China | | | | 1,194,518 | | | | 12,184,081 | |
| | | | | | | | | | | | |
Total Investments before Short Term Investments
(Cost $2,656,556,511) | | | | | | | | | | | 2,408,622,268 | |
| | | | | | | | | | | | |
| | | |
| | | | | | Principal
Amount | | | | |
Short Term Investments 4.0% | | | | | | | | | | | | |
Time Deposits (Cost $101,000,000) 4.0% | | | | | | | | | | | | |
Royal Bank of Canada, 0.01%, 1/03/12 | | | United States | | | $ | 101,000,000 | | | | 101,000,000 | |
| | | | | | | | | | | | |
TG-16
Franklin Templeton Variable Insurance Products Trust
Statement of Investments, December 31, 2011 (continued)
| | | | | | | | | | | | |
| Templeton Growth Securities Fund | | Country | | | Shares | | | Value | |
Short Term Investments (continued) | | | | | | | | | | | | |
fInvestments from Cash Collateral Received for Loaned Securities
(Cost $13,526) 0.0%† | | | | | | | | | | | | |
Money Market Funds 0.0%† | | | | | | | | | | | | |
gBNY Mellon Overnight Government Fund, 0.039% | | | United States | | | | 13,526 | | | $ | 13,526 | |
| | | | | | | | | | | | |
Total Short Term Investments (Cost $101,013,526) | | | | | | | | | | | 101,013,526 | |
| | | | | | | | | | | | |
Total Investments (Cost $2,757,570,037) 99.9% | | | | | | | | | | | 2,509,635,794 | |
Other Assets, less Liabilities 0.1% | | | | | | | | | | | 1,409,325 | |
| | | | | | | | | | | | |
Net Assets 100.0% | | | | | | | | | | $ | 2,511,045,119 | |
| | | | | | | | | | | | |
See Abbreviations on page TG-30.
†Rounds to less than 0.1% of net assets.
aNon-income producing.
bA portion or all of the security is on loan at December 31, 2011. See Note 1(d).
cSee Note 1(c) regarding investment in Templeton China Opportunities Fund, Ltd.
dSee Note 8 regarding restricted securities.
eSee Note 9 regarding holdings of 5% voting securities.
fSee Note 1(d) regarding securities on loan.
gThe rate shown is the annualized seven-day yield at period end.
The accompanying notes are an integral part of these financial statements.
TG-17
Franklin Templeton Variable Insurance Products Trust
Financial Statements
Statement of Assets and Liabilities
December 31, 2011
| | | | |
| | | Templeton Growth
Securities Fund | |
Assets: | | | | |
Investments in securities: | | | | |
Cost - Unaffiliated issuers | | $ | 2,745,635,037 | |
Cost - Non-controlled affiliated issuers (Note 9) | | | 11,935,000 | |
| | | | |
Total cost of investments | | $ | 2,757,570,037 | |
| | | | |
Value - Unaffiliated issuers | | $ | 2,497,451,713 | |
Value - Non-controlled affiliated issuers (Note 9) | | | 12,184,081 | |
| | | | |
Total value of investments (includes securities loaned in the amount $12,876) | | | 2,509,635,794 | |
Cash | | | 235,467 | |
Receivables: | | | | |
Investment securities sold | | | 92,536 | |
Capital shares sold | | | 94,897 | |
Dividends and interest | | | 6,369,095 | |
Other assets | | | 81 | |
| | | | |
Total assets | | | 2,516,427,870 | |
| | | | |
Liabilities: | | | | |
Payables: | | | | |
Investment securities purchased | | | 1,951,199 | |
Capital shares redeemed | | | 684,386 | |
Affiliates | | | 2,110,694 | |
Reports to shareholders | | | 513,435 | |
Payable upon return of securities loaned | | | 13,526 | |
Accrued expenses and other liabilities | | | 109,511 | |
| | | | |
Total liabilities | | | 5,382,751 | |
| | | | |
Net assets, at value | | $ | 2,511,045,119 | |
| | | | |
Net assets consist of: | | | | |
Paid-in capital | | $ | 3,053,263,375 | |
Undistributed net investment income | | | 58,485,038 | |
Net unrealized appreciation (depreciation) | | | (248,007,804 | ) |
Accumulated net realized gain (loss) | | | (352,695,490 | ) |
| | | | |
Net assets, at value | | $ | 2,511,045,119 | |
| | | | |
The accompanying notes are an integral part of these financial statements.
TG-18
Franklin Templeton Variable Insurance Products Trust
Financial Statements (continued)
Statement of Assets and Liabilities (continued)
December 31, 2011
| | | | |
| | | Templeton Growth
Securities Fund | |
Class 1: | | | | |
Net assets, at value | | $ | 1,200,681,988 | |
| | | | |
Shares outstanding | | | 116,957,241 | |
| | | | |
Net asset value and maximum offering price per share | | $ | 10.27 | |
| | | | |
Class 2: | | | | |
Net assets, at value | | $ | 1,254,193,485 | |
| | | | |
Shares outstanding | | | 124,090,975 | |
| | | | |
Net asset value and maximum offering price per share | | $ | 10.11 | |
| | | | |
Class 4: | | | | |
Net assets, at value | | $ | 56,169,646 | |
| | | | |
Shares outstanding | | | 5,511,306 | |
| | | | |
Net asset value and maximum offering price per share | | $ | 10.19 | |
| | | | |
The accompanying notes are an integral part of these financial statements.
TG-19
Franklin Templeton Variable Insurance Products Trust
Financial Statements (continued)
Statement of Operations
for the year ended December 31, 2011
| | | | |
| | | Templeton Growth
Securities Fund | |
Investment income: | | | | |
Dividends (net of foreign taxes $6,082,203) | | $ | 84,464,694 | |
Interest | | | 70,448 | |
Income from securities loaned | | | 2,830,011 | |
| | | | |
Total investment income | | | 87,365,153 | |
| | | | |
Expenses: | | | | |
Management fees (Note 3a) | | | 21,549,019 | |
Distribution fees: (Note 3c) | | | | |
Class 2 | | | 3,675,317 | |
Class 4 | | | 209,937 | |
Unaffiliated transfer agent fees | | | 3,678 | |
Custodian fees (Note 4) | | | 350,210 | |
Reports to shareholders | | | 529,624 | |
Professional fees | | | 141,797 | |
Trustees’ fees and expenses | | | 11,242 | |
Other | | | 69,492 | |
| | | | |
Total expenses | | | 26,540,316 | |
Expense reductions (Note 4) | | | (75 | ) |
| | | | |
Net expenses | | | 26,540,241 | |
| | | | |
Net investment income | | | 60,824,912 | |
| | | | |
Realized and unrealized gains (losses): | | | | |
Net realized gain (loss) from: | | | | |
Investments (includes gains from a redemption in-kind of $9,941,638) (Note 11) | | | 119,014,189 | |
Foreign currency transactions | | | 349,359 | |
| | | | |
Net realized gain (loss) | | | 119,363,548 | |
| | | | |
Net change in unrealized appreciation (depreciation) on: | | | | |
Investments | | | (404,067,405 | ) |
Translation of other assets and liabilities denominated in foreign currencies | | | (340,544 | ) |
| | | | |
Net change in unrealized appreciation (depreciation) | | | (404,407,949 | ) |
| | | | |
Net realized and unrealized gain (loss) | | | (285,044,401 | ) |
| | | | |
Net increase (decrease) in net assets resulting from operations | | $ | (224,219,489 | ) |
| | | | |
The accompanying notes are an integral part of these financial statements.
TG-20
Franklin Templeton Variable Insurance Products Trust
Financial Statements (continued)
Statements of Changes in Net Assets
| | | | | | | | |
| | | Templeton Growth
Securities Fund | |
| | | Year Ended December 31, | |
| | | 2011 | | | 2010 | |
| | | | |
Increase (decrease) in net assets: | | | | | | | | |
Operations: | | | | | | | | |
Net investment income | | $ | 60,824,912 | | | $ | 41,851,542 | |
Net realized gain (loss) from investments and foreign currency transactions | | | 119,363,548 | | | | (42,734,201 | ) |
Net change in unrealized appreciation (depreciation) on investments and translation of other assets and liabilities denominated in foreign currencies | | | (404,407,949 | ) | | | 206,309,126 | |
| | | | |
Net increase (decrease) in net assets resulting from operations | | | (224,219,489 | ) | | | 205,426,467 | |
| | | | |
Distributions to shareholders from: | | | | | | | | |
Net investment income: | | | | | | | | |
Class 1 | | | (23,962,804 | ) | | | (15,588,191 | ) |
Class 2 | | | (19,367,342 | ) | | | (21,721,910 | ) |
Class 4 | | | (766,075 | ) | | | (762,562 | ) |
| | | | |
Total distributions to shareholders | | | (44,096,221 | ) | | | (38,072,663 | ) |
| | | | |
Capital share transactions: (Note 2) | | | | | | | | |
Class 1 | | | 15,269,781 | | | | 446,712,026 | |
Class 2 | | | (272,568,653 | ) | | | (178,452,057 | ) |
Class 4 | | | 582,974 | | | | 774,782 | |
| | | | |
Total capital share transactions | | | (256,715,898 | ) | | | 269,034,751 | |
| | | | |
Net increase (decrease) in net assets | | | (525,031,608 | ) | | | 436,388,555 | |
Net assets: | | | | | | | | |
Beginning of year | | | 3,036,076,727 | | | | 2,599,688,172 | |
| | | | |
End of year | | $ | 2,511,045,119 | | | $ | 3,036,076,727 | |
| | | | |
Undistributed net investment income included in net assets: | | | | | | | | |
End of year | | $ | 58,485,038 | | | $ | 41,408,000 | |
| | | | |
The accompanying notes are an integral part of these financial statements.
TG-21
Franklin Templeton Variable Insurance Products Trust
Notes to Financial Statements
Templeton Growth Securities Fund
1. ORGANIZATION AND SIGNIFICANT ACCOUNTING POLICIES
Franklin Templeton Variable Insurance Products Trust (Trust) is registered under the Investment Company Act of 1940, as amended, (1940 Act) as an open-end investment company, consisting of twenty separate funds. The Templeton Growth Securities Fund (Fund) is included in this report. The financial statements of the remaining funds in the Trust are presented separately. Shares of the Fund are generally sold only to insurance company separate accounts to fund the benefits of variable life insurance policies or variable annuity contracts. The Fund offers three classes of shares: Class 1, Class 2, and Class 4. Each class of shares differs by its distribution fees, voting rights on matters affecting a single class and its exchange privilege.
The following summarizes the Fund’s significant accounting policies.
a. Financial Instrument Valuation
The Fund’s investments in securities and other financial instruments are carried at fair value daily. Fair value is the price that would be received to sell an asset or paid to transfer a liability in an orderly transaction between market participants on the measurement date. Under procedures approved by the Trust’s Board of Trustees, the Fund may utilize independent pricing services, quotations from securities and financial instrument dealers, and other market sources to determine fair value.
Equity securities listed on an exchange or on the NASDAQ National Market System are valued at the last quoted sale price or the official closing price of the day, respectively. Foreign equity securities are valued as of the close of trading on the foreign stock exchange on which the security is primarily traded, or the NYSE, whichever is earlier. The value is then converted into its U.S. dollar equivalent at the foreign exchange rate in effect at the close of the NYSE on the day that the value of the security is determined. Over-the-counter securities are valued within the range of the most recent quoted bid and ask prices. Securities that trade in multiple markets or on multiple exchanges are valued according to the broadest and most representative market. Certain equity securities are valued based upon fundamental characteristics or relationships to similar securities.
Debt securities generally trade in the over-the-counter market rather than on a securities exchange. The Fund’s pricing services use multiple valuation techniques to determine fair value. In instances where sufficient market activity exists, the pricing services may utilize a market-based approach through which quotes from market makers are used to determine fair value. In instances where sufficient market activity may not exist or is limited, the pricing services also utilize proprietary valuation models which may consider market characteristics such as benchmark yield curves, option-adjusted spreads, credit spreads, estimated default rates, coupon rates, anticipated timing of principal repayments, underlying collateral, and other unique security features in order to estimate the relevant cash flows, which are then discounted to calculate the fair value. Investments in non-registered money market funds are valued at the closing net asset value. Time deposits are valued at cost, which approximates market value.
The Fund has procedures to determine the fair value of securities and other financial instruments for which market prices are not readily available or which may not be reliably priced. Under these procedures, the Fund primarily employs a market-based approach which may use related or comparable assets or liabilities, recent transactions, market multiples, book values, and other relevant information for the investment to determine the fair value of the investment. The Fund may also use an income-based valuation approach in which the anticipated future cash flows of the investment are discounted to calculate fair value. Discounts may also be applied due to the nature or duration of any restrictions on the disposition of the investments. Due to the inherent uncertainty of valuations of such investments, the fair values may differ significantly from the values that would have been used had an active market existed.
Trading in securities on foreign securities stock exchanges and over-the-counter markets may be completed before the daily close of business on the NYSE. Occasionally, events occur between the time at which trading in a foreign security is completed and the close of the NYSE that might call into question the reliability of the value of a portfolio security held by the Fund. As a result, differences may arise between the value of the Fund’s portfolio securities as determined at the foreign market close and the latest indications of value at the close of the NYSE. In order to minimize the potential for these differences, the investment manager monitors price movements following the close of trading in foreign stock markets through a series of country specific market
TG-22
Franklin Templeton Variable Insurance Products Trust
Notes to Financial Statements (continued)
Templeton Growth Securities Fund
1. ORGANIZATION AND SIGNIFICANT ACCOUNTING POLICIES (continued)
a. Financial Instrument Valuation (continued)
proxies (such as baskets of American Depositary Receipts, futures contracts and exchange traded funds). These price movements are measured against established trigger thresholds for each specific market proxy to assist in determining if an event has occurred that may call into question the reliability of the values of the foreign securities held by the Fund. If such an event occurs, the securities may be valued using fair value procedures, which may include the use of independent pricing services.
b. Foreign Currency Translation
Portfolio securities and other assets and liabilities denominated in foreign currencies are translated into U.S. dollars based on the exchange rate of such currencies against U.S. dollars on the date of valuation. The Fund may enter into foreign currency exchange contracts to facilitate transactions denominated in a foreign currency. Purchases and sales of securities, income and expense items denominated in foreign currencies are translated into U.S. dollars at the exchange rate in effect on the transaction date. Portfolio securities and assets and liabilities denominated in foreign currencies contain risks that those currencies will decline in value relative to the U.S. dollar. Occasionally, events may impact the availability or reliability of foreign exchange rates used to convert the U.S. dollar equivalent value. If such an event occurs, the foreign exchange rate will be valued at fair value using procedures established and approved by the Trust’s Board of Trustees.
The Fund does not separately report the effect of changes in foreign exchange rates from changes in market prices on securities held. Such changes are included in net realized and unrealized gain or loss from investments on the Statement of Operations.
Realized foreign exchange gains or losses arise from sales of foreign currencies, currency gains or losses realized between the trade and settlement dates on securities transactions and the difference between the recorded amounts of dividends, interest, and foreign withholding taxes and the U.S. dollar equivalent of the amounts actually received or paid. Net unrealized foreign exchange gains and losses arise from changes in foreign exchange rates on foreign denominated assets and liabilities other than investments in securities held at the end of the reporting period.
c. Investment in Templeton China Opportunities Fund, Ltd.
The Fund invests in Templeton China Opportunities Fund, Ltd. (China Fund), a private offering of unregistered shares in a Cayman Islands Exempt Company. The China Fund investment objective is to seek capital growth primarily through investments in A-shares of Chinese companies listed on the Shanghai and Shenzhen stock exchanges. Chinese A-shares are traded in Chinese Renminbi and are only available as an investment to domestic (Chinese) investors and holders of a Qualified Foreign Institutional Investors license. The China Fund is managed by Templeton Investment Counsel, LLC (an affiliate of the investment manager). No additional management or administrative fees are incurred on assets invested in the China Fund.
The China Fund may be subject to certain restrictions and administrative processes relating to its ability to repatriate cash balances, investment proceeds and earnings associated with its investment, as such activities are subject to approval by agencies of the Chinese government and thus the Fund may incur delays in redeeming its investment in the China Fund. The Fund’s investment in the China Fund is valued based upon the fair value of the China Fund’s portfolio securities and other assets and liabilities.
d. Securities Lending
The Fund participates in an agency based security lending program. The Fund receives cash collateral against the loaned securities in an amount equal to at least 102% of the market value of the loaned securities. Collateral is maintained over the life of the loan in an amount not less than 100% of the market value of loaned securities, as determined at the close of Fund business each day; any additional collateral required due to changes in security values is delivered to the fund on the next business
TG-23
Franklin Templeton Variable Insurance Products Trust
Notes to Financial Statements (continued)
Templeton Growth Securities Fund
1. ORGANIZATION AND SIGNIFICANT ACCOUNTING POLICIES (continued)
d. Securities Lending (continued)
day. The collateral is invested in a money market fund managed by the Fund’s custodian on the Fund’s behalf. The Fund receives income from the investment of cash collateral, in addition to lending fees and rebates paid by the borrower. The Fund bears the market risk with respect to the collateral investment, securities loaned, and the risk that the agent may default on its obligations to the Fund. The securities lending agent has agreed to indemnify the Fund in the event of default by a third party borrower.
e. Income Taxes
It is the Fund’s policy to qualify as a regulated investment company under the Internal Revenue Code. The Fund intends to distribute to shareholders substantially all of its taxable income and net realized gains to relieve it from federal income and excise taxes. As a result, no provision for U.S. federal income taxes is required.
The Fund may be subject to foreign taxation related to income received, capital gains on the sale of securities and certain foreign currency transactions in the foreign jurisdictions in which it invests. Foreign taxes, if any, are recorded based on the tax regulations and rates that exist in the foreign markets in which the Fund invests. When a capital gain tax is determined to apply the Fund records an estimated deferred tax liability in an amount that would be payable if the securities were disposed of on the valuation date.
The Fund recognizes the tax benefits of uncertain tax positions only when the position is “more likely than not” to be sustained upon examination by the tax authorities based on the technical merits of the tax position. As of December 31, 2011, and for all open tax years, the Fund has determined that no liability for unrecognized tax benefits is required in the Fund’s financial statements related to uncertain tax positions taken on a tax return (or expected to be taken on future tax returns). Open tax years are those that remain subject to examination and are based on each tax jurisdiction statute of limitation.
f. Security Transactions, Investment Income, Expenses and Distributions
Security transactions are accounted for on trade date. Realized gains and losses on security transactions are determined on a specific identification basis. Interest income and estimated expenses are accrued daily. Amortization of premium and accretion of discount on debt securities are included in interest income. Dividend income is recorded on the ex-dividend date except that certain dividends from foreign securities are recognized as soon as the Fund is notified of the ex-dividend date. Distributions to shareholders are recorded on the ex-dividend date and are determined according to income tax regulations (tax basis). Distributable earnings determined on a tax basis may differ from earnings recorded in accordance with accounting principles generally accepted in the United States of America. These differences may be permanent or temporary. Permanent differences are reclassified among capital accounts to reflect their tax character. These reclassifications have no impact on net assets or the results of operations. Temporary differences are not reclassified, as they may reverse in subsequent periods.
Common expenses incurred by the Trust are allocated among the funds based on the ratio of net assets of each fund to the combined net assets of the Trust. Fund specific expenses are charged directly to the fund that incurred the expense.
Realized and unrealized gains and losses and net investment income, not including class specific expenses, are allocated daily to each class of shares based upon the relative proportion of net assets of each class. Differences in per share distributions, by class, are generally due to differences in class specific expenses.
TG-24
Franklin Templeton Variable Insurance Products Trust
Notes to Financial Statements (continued)
Templeton Growth Securities Fund
1. ORGANIZATION AND SIGNIFICANT ACCOUNTING POLICIES (continued)
g. Accounting Estimates
The preparation of financial statements in accordance with accounting principles generally accepted in the United States of America requires management to make estimates and assumptions that affect the reported amounts of assets and liabilities at the date of the financial statements and the amounts of income and expenses during the reporting period. Actual results could differ from those estimates.
h. Guarantees and Indemnifications
Under the Trust’s organizational documents, its officers and trustees are indemnified by the Trust against certain liabilities arising out of the performance of their duties to the Trust. Additionally, in the normal course of business, the Trust, on behalf of the Fund, enters into contracts with service providers that contain general indemnification clauses. The Trust’s maximum exposure under these arrangements is unknown as this would involve future claims that may be made against the Trust that have not yet occurred. Currently, the Trust expects the risk of loss to be remote.
2. SHARES OF BENEFICIAL INTEREST
At December 31, 2011, there were an unlimited number of shares authorized (without par value). Transactions in the Fund’s shares were as follows:
| | | | | | | | | | | | | | | | |
| | | Year Ended December 31, | |
| | | 2011 | | | 2010 | |
| Class 1 Shares: | | Shares | | | Amount | | | Shares | | | Amount | |
Shares sold | | | 64,351,377 | | | $ | 689,220,432 | | | | 56,324,674 | | | $ | 579,159,138 | |
Shares issued in reinvestment of distributions | | | 2,081,912 | | | | 23,962,804 | | | | 1,592,257 | | | | 15,588,191 | |
Shares redeemed in-kind (Note 11) | | | (62,046 | ) | | | (778,675 | ) | | | — | | | | — | |
Shares redeemed | | | (69,960,205 | ) | | | (697,134,780 | ) | | | (15,424,906 | ) | | | (148,035,303 | ) |
| | | | |
Net increase (decrease) | | | (3,588,962 | ) | | $ | 15,269,781 | | | | 42,492,025 | | | $ | 446,712,026 | |
| | | | |
Class 2 Shares: | | | | | | | | | | | | | | | | |
Shares sold | | | 8,669,643 | | | $ | 93,168,510 | | | | 7,805,671 | | | $ | 79,205,936 | |
Shares issued in reinvestment of distributions | | | 1,706,374 | | | | 19,367,342 | | | | 2,250,975 | | | | 21,721,910 | |
Shares redeemed in-kind (Note 11) | | | (7,322,431 | ) | | | (90,358,797 | ) | | | — | | | | — | |
Shares redeemed | | | (26,665,336 | ) | | | (294,745,708 | ) | | | (27,579,182 | ) | | | (279,379,903 | ) |
| | | | |
Net increase (decrease) | | | (23,611,750 | ) | | $ | (272,568,653 | ) | | | (17,522,536 | ) | | $ | (178,452,057 | ) |
| | | | |
Class 4 Shares: | | | | | | | | | | | | | | | | |
Shares sold | | | 552,161 | | | $ | 6,020,586 | | | | 792,359 | | | $ | 8,038,832 | |
Shares issued on reinvestment of distributions | | | 66,906 | | | | 766,075 | | | | 78,292 | | | | 762,562 | |
Shares redeemed | | | (559,011 | ) | | | (6,203,687 | ) | | | (772,020 | ) | | | (8,026,612 | ) |
| | | | |
Net increase (decrease) | | | 60,056 | | | $ | 582,974 | | | | 98,631 | | | $ | 774,782 | |
| | | | |
TG-25
Franklin Templeton Variable Insurance Products Trust
Notes to Financial Statements (continued)
Templeton Growth Securities Fund
3. TRANSACTIONS WITH AFFILIATES
Franklin Resources, Inc. is the holding company for various subsidiaries that together are referred to as Franklin Templeton Investments. Certain officers and trustees of the Fund are also officers and/or directors of the following subsidiaries:
| | |
| Subsidiary | | Affiliation |
Templeton Global Advisors Limited (TGAL) | | Investment manager |
Franklin Templeton Services, LLC (FT Services) | | Administrative manager |
Franklin Templeton Distributors, Inc. (Distributors) | | Principal underwriter |
Franklin Templeton Investor Services, LLC (Investor Services) | | Transfer agent |
a. Management Fees
The Fund pays an investment management fee to TGAL based on the average daily net assets of the Fund as follows:
| | |
| Annualized Fee Rate | | Net Assets |
1.000% | | Up to and including $100 million |
0.900% | | over $100 million, up to and including $250 million |
0.800% | | over $250 million, up to and including $500 million |
0.750% | | over $500 million, up to and including $1 billion |
0.700% | | over $1 billion, up to and including $5 billion |
0.675% | | over $5 billion, up to and including $10 billion |
0.655% | | over $10 billion, up to and including $15 billion |
0.635% | | over $15 billion, up to and including $20 billion |
0.615% | | In excess of $20 billion |
b. Administrative Fees
Under an agreement with TGAL, FT Services provides administrative services to the Fund. The fee is paid by TGAL based on average daily net assets, and is not an additional expense of the Fund.
c. Distribution Fees
The Fund’s Board of Trustees has adopted distribution plans for Class 2 and Class 4 shares pursuant to Rule 12b-1 under the 1940 Act. Under the Fund’s compensation distribution plans, the Fund pays Distributors for costs incurred in connection with the servicing, sale and distribution of the Fund’s shares up to 0.35% per year of its average daily net assets of each class. The Board of Trustees has agreed to limit the current rate to 0.25% per year for Class 2.
d. Transfer Agent Fees
Investor Services, under terms of an agreement, performs shareholder servicing for the Fund and is not paid by the Fund for the services.
f. Other Affiliated Transactions
At December 31, 2011, Franklin Templeton Variable Insurance Products Trust – Franklin Templeton VIP Founding Funds Allocation Fund owned 41.58% of the Fund’s outstanding shares.
TG-26
Franklin Templeton Variable Insurance Products Trust
Notes to Financial Statements (continued)
Templeton Growth Securities Fund
4. EXPENSE OFFSET ARRANGEMENT
The Fund has entered into an arrangement with its custodian whereby credits realized as a result of uninvested cash balances are used to reduce a portion of the Fund’s custodian expenses. During the year ended December 31, 2011, the custodian fees were reduced as noted in the Statement of Operations.
5. INCOME TAXES
For tax purposes, capital losses may be carried over to offset future capital gains, if any. Under the Regulated Investment Company Modernization Act of 2010, capital losses incurred by the Fund in taxable years beginning after December 22, 2010 are not subject to expiration and such losses retain their character as either short-term or long-term, rather than being considered short-term as under previous law. Post-enactment capital losses must be fully utilized prior to utilizing any losses incurred in pre-enactment tax years.
At December 31, 2011, capital loss carryforwards were as follows:
| | | | |
Capital loss carryforwards expiring in: | | | | |
2017 | | $ | 240,654,060 | |
2018 | | | 55,299,629 | |
| | | | |
| | $ | 295,953,689 | |
| | | | |
During the year ended December 31, 2011, the Fund utilized $157,539,421 of capital loss carryforwards.
The tax character of distributions paid during the years ended December 31, 2011 and 2010, was as follows:
| | | | | | | | |
| | | 2011 | | | 2010 | |
Distributions paid from ordinary income | | $ | 44,096,221 | | | $ | 38,072,663 | |
| | | | |
At December 31, 2011, the cost of investments, net unrealized appreciation (depreciation), undistributed ordinary income for income tax purposes were as follows:
| | | | |
Cost of investments | | $ | 2,814,562,195 | |
| | | | |
| |
Unrealized appreciation | | $ | 229,259,904 | |
Unrealized depreciation | | | (534,186,305 | ) |
| | | | |
Net unrealized appreciation (depreciation) | | $ | (304,926,401 | ) |
| | | | |
Distributable earnings – undistributed ordinary income | | $ | 58,735,395 | |
| | | | |
Differences between income and/or capital gains as determined on a book basis and a tax basis are primarily due to differing treatment of wash sales.
6. INVESTMENT TRANSACTIONS
Purchases and sales of investments (excluding short term securities) for the year ended December 31, 2011, aggregated $1,198,508,134 and 1,284,923,812, respectively. Sales of investments excludes redemptions in-kind of $86,085,875.
TG-27
Franklin Templeton Variable Insurance Products Trust
Notes to Financial Statements (continued)
Templeton Growth Securities Fund
7. CONCENTRATION OF RISK
Investing in foreign securities may include certain risks and considerations not typically associated with investing in U.S. securities, such as fluctuating currency values and changing local and regional economic, political and social conditions, which may result in greater market volatility. In addition, certain foreign securities may not be as liquid as U.S. securities.
8. RESTRICTED SECURITIES
The Fund invests in securities that are restricted under the Securities Act of 1933 (1933 Act) or which are subject to legal, contractual, or other agreed upon restrictions on resale. Restricted securities are often purchased in private placement transactions, and cannot be sold without prior registration unless the sale is pursuant to an exemption under the 1933 Act. Disposal of these securities may require greater effort and expense, and prompt sale at an acceptable price may be difficult. The Fund may have registration rights for restricted securities. The issuer generally incurs all registration costs.
At December 31, 2011, the Fund held investments in restricted securities, excluding certain securities exempt from registration under the 1933 Act deemed to be liquid, as follows:
| | | | | | | | | | | | | | | | |
| Shares | | | Issuer | | Acquisition
Dates | | | Cost | | | Value | |
| | 1,194,518 | | | Templeton China Opportunities Fund, Ltd., Reg D (0.49% of Net Assets) | | | 3/17/10-12/1/11 | | | $ | 11,935,000 | | | $ | 12,184,081 | |
| | | | | | | | | | | | | | | | |
9. HOLDINGS OF 5% VOTING SECURITIES OF PORTFOLIO COMPANIES
The 1940 Act defines “affiliated companies” to include investments in portfolio companies in which a fund owns 5% or more of the outstanding voting securities. Investments in “affiliated companies” for the Fund for the year ended December 31, 2011, were as shown below.
| | | | | | | | | | | | | | | | | | | | | | | | | | | | |
| Name of Issuer | | Number of
Shares
Held at
Beginning
of Year | | | Gross
Additions | | | Gross
Reductions | | | Number of
Shares
Held at
End of
Year | | | Value at
End of
Year | | | Investment
Income | | | Realized
Capital
Gain (Loss) | |
Non-Controlled Affiliates | | | | | | | | | | | | | | | | | | | | | | | | | | | | |
Templeton China Opportunities Fund, Ltd., Reg D | | | 1,192,192 | | | | 2,326 | | | | — | | | | 1,194,518 | | | $ | 12,184,081 | | | $ | — | | | $ | — | |
| | | | | | | | | | | | | | | | | | | | |
Total Affiliated Securities (0.49% of Net Assets) | | | | | | | | | | | | | | | | | | | | | | | | | | | | |
10. CREDIT FACILITY
The Fund, together with other U.S. registered and foreign investment funds (collectively, Borrowers), managed by Franklin Templeton Investments, are borrowers in a joint syndicated senior unsecured credit facility totaling $750 million (Global Credit Facility) which matured on January 20, 2012. This Global Credit Facility provides a source of funds to the Borrowers for temporary and emergency purposes, including the ability to meet future unanticipated or unusually large redemption requests. Effective January 20, 2012, the Borrowers renewed the Global Credit Facility for a total of $1.5 billion, maturing January 18, 2013.
Under the terms of the Global Credit Facility, the Fund shall, in addition to interest charged on any borrowings made by the Fund and other costs incurred by the Fund, pay its share of fees and expenses incurred in connection with the implementation and maintenance of the Global Credit Facility, based upon its relative share of the aggregate net assets of all of the Borrowers,
TG-28
Franklin Templeton Variable Insurance Products Trust
Notes to Financial Statements (continued)
Templeton Growth Securities Fund
10. CREDIT FACILITY (continued)
including an annual commitment fee of 0.08% based upon the unused portion of the Global Credit Facility, which is reflected in other expenses on the Statement of Operations. During the year ended December 31, 2011, the Fund did not use the Global Credit Facility.
11. REDEMPTION IN-KIND
During the year ended December 31, 2011, the Fund realized $9,941,638 of net gains resulting from a redemption in-kind in which a shareholder redeemed fund shares for securities held by the Fund rather than for cash. Because such gains are not taxable to the Fund, and are not distributed to remaining shareholders they will be reclassified from accumulated net realized gains to paid-in capital.
12. FAIR VALUE MEASUREMENTS
The Fund follows a fair value hierarchy that distinguishes between market data obtained from independent sources (observable inputs) and the Fund’s own market assumptions (unobservable inputs). These inputs are used in determining the value of the Fund’s investments and are summarized in the following fair value hierarchy:
| | • | | Level 1 – quoted prices in active markets for identical securities |
| | • | | Level 2 – other significant observable inputs (including quoted prices for similar securities, interest rates, prepayment speed, credit risk, etc.) |
| | • | | Level 3 – significant unobservable inputs (including the Fund’s own assumptions in determining the fair value of investments) |
The inputs or methodology used for valuing securities are not an indication of the risk associated with investing in those securities.
For movements between the levels within the fair value hierarchy, the Fund has adopted a policy of recognizing the transfers as of the date of the underlying event which caused the movement.
The following is a summary of the inputs used as of December 31, 2011, in valuing the Fund’s assets and liabilities carried at fair value:
| | | | | | | | | | | | | | | | |
| | | Level 1 | | | Level 2 | | | Level 3 | | | Total | |
| | | | |
Assets: | | | | | | | | | | | | | | | | |
Investments in Securities | | | | | | | | | | | | | | | | |
Equity Investments: | | | | | | | | | | | | | | | | |
Diversified Financial Services | | $ | 67,163,358 | | | $ | — | | | $ | 12,184,081 | | | $ | 79,347,439 | |
Other Equity Investmentsa,b | | | 2,329,274,829 | | | | — | | | | — | | | | 2,329,274,829 | |
Short Term Investments | | | 101,000,000 | | | | 13,526 | | | | — | | | | 101,013,526 | |
| | | | |
Total Investments in Securities | | $ | 2,497,438,187 | | | $ | 13,526 | | | $ | 12,184,081 | | | $ | 2,509,635,794 | |
| | | | |
aIncludes common preferred stocks as well as other equity investments.
bFor detailed categories, see the accompanying Statement of Investments.
TG-29
Franklin Templeton Variable Insurance Products Trust
Notes to Financial Statements (continued)
Templeton Growth Securities Fund
12. FAIR VALUE MEASUREMENTS (continued)
At December 31, 2011, the reconciliation of assets in which significant unobservable inputs (Level 3) were used in determining fair value, is as follows:
| | | | | | | | | | | | | | | | | | | | | | | | | | | | | | | | | | | | |
| | | Balance at
Beginning of
Year | | | Purchases | | | Sales | | | Transfers
Into
(Out of)
Level 3 | | | Cost Basis
Adjustmentsa | | | Net Realized
Gain (Loss) | | | Net Unrealized
Gain (Loss) | | | Balance at
End of
Year | | | Net Change in
Unrealized
Appreciation
(Depreciation)
on Assets Held
at Year End | |
Assets | | | | | | | | | | | | | | | | | | | | | | | | | | | | | | | | | | | | |
Equity Investments-Diversified Financial Services | | $ | 14,592,433 | | | $ | 25,000 | | | $ | — | | | $ | — | | | $ | — | | | $ | — | | | $ | (2,433,352 | ) | | $ | 12,184,081 | | | $ | (2,433,352 | ) |
| | | | |
aMay include accretion, amortization, partnership adjustments, and/or other cost basis adjustments.
13. NEW ACCOUNTING PRONOUNCEMENTS
In May 2011, the Financial Accounting Standards Board (FASB) issued Accounting Standards Update (ASU) No. 2011-04, Fair Value Measurement (Topic 820): Amendments to Achieve Common Fair Value Measurement and Disclosure Requirements in U.S. GAAP and IFRSs. The amendments in the ASU will improve the comparability of fair value measurements presented and disclosed in financial statements prepared in accordance with U.S. GAAP (Generally Accepted Accounting Principles) and IFRS (International Financial Reporting Standards) and include new guidance for certain fair value measurement principles and disclosure requirements. The ASU is effective for interim and annual periods beginning after December 15, 2011. The Fund believes the adoption of this ASU will not have a material impact on its financial statements.
14. SUBSEQUENT EVENTS
The Fund has evaluated subsequent events through the issuance of the financial statements and determined that no events have occurred that require disclosure other than those already disclosed in the financial statements.
| | |
ABBREVIATIONS | | |
| Portfolio Abbreviations | | |
| | |
| ADR - American Depositary Receipt | | |
TG-30
Franklin Templeton Variable Insurance Products Trust
Templeton Growth Securities Fund
Report of Independent Registered Public Accounting Firm
To the Board of Trustees and Shareholders of
Franklin Templeton Variable Insurance Products Trust
In our opinion, the accompanying statement of assets and liabilities, including the statement of investments, and the related statements of operations and of changes in net assets and the financial highlights present fairly, in all material respects, the financial position of Templeton Growth Securities Fund (the “Fund”) at December 31, 2011, the results of its operations for the year then ended, the changes in its net assets for each of the two years in the period then ended and the financial highlights for the periods presented, in conformity with accounting principles generally accepted in the United States of America. These financial statements and financial highlights (hereafter referred to as “financial statements”) are the responsibility of the Fund’s management. Our responsibility is to express an opinion on these financial statements based on our audits. We conducted our audits of these financial statements in accordance with the standards of the Public Company Accounting Oversight Board (United States). Those standards require that we plan and perform the audit to obtain reasonable assurance about whether the financial statements are free of material misstatement. An audit includes examining, on a test basis, evidence supporting the amounts and disclosures in the financial statements, assessing the accounting principles used and significant estimates made by management, and evaluating the overall financial statement presentation. We believe that our audits, which included confirmation of securities at December 31, 2011 by correspondence with the custodian and brokers, provide a reasonable basis for our opinion.
PricewaterhouseCoopers LLP
San Francisco, California
February 13, 2012
TG-31
Franklin Templeton Variable Insurance Products Trust
Tax Information (unaudited)
Templeton Growth Securities Fund
Under Section 854(b)(1)(A) of the Internal Revenue Code (Code), the Fund hereby reports 41.54% of the ordinary income dividends as income qualifying for the dividends received deduction for the fiscal year ended December 31, 2011.
At December 31, 2011, more than 50% of the Fund’s total assets were invested in securities of foreign issuers. In most instances, foreign taxes were withheld from income paid to the Fund on these investments. The Fund elects to treat foreign taxes paid as allowed under Section 853 of the Code. This election will allow shareholders of record as of the 2012 distribution date, to treat their proportionate share of foreign taxes paid by the Fund as having been paid directly by them. The shareholder shall consider these amounts as foreign taxes paid in the tax year in which they receive the Fund distribution.
TG-32
INDEX DESCRIPTIONS
The indexes are unmanaged and include reinvested distributions.
For indexes sourced by Morningstar: © 2012 Morningstar. All Rights Reserved. The information contained herein: (1) is proprietary to Morningstar and/or its content providers; (2) may not be copied or distributed; and (3) is not warranted to be accurate, complete or timely. Neither Morningstar nor its content providers are responsible for any damages or losses arising from any use of this information.
Russell® is a trademark and RussellTM is a servicemark of the Frank Russell Company.
Barclays Capital (BC) U.S. Aggregate Index is a market capitalization-weighted index representing the U.S. investment-grade, fixed-rate, taxable bond market with index components for government and corporate, mortgage pass-through and asset-backed securities. All issues included are SEC registered, taxable, dollar denominated and nonconvertible, must have at least one year to final maturity and must be rated investment grade (Baa3/BBB-/BBB- or higher) using the middle rating of Moody’s, Standard & Poor’s and Fitch, respectively.
Barclays Capital (BC) U.S. Government Index: Intermediate Component is the intermediate component of the BC U.S. Government Index, which includes public obligations of the U.S. Treasury with at least one year to final maturity and publicly issued debt of U.S. government agencies, quasi-federal corporations, and corporate or foreign debt guaranteed by the U.S. government.
Citigroup World Government Bond Index is a market capitalization-weighted index consisting of investment-grade world government bond markets.
Consumer Price Index (CPI), calculated by the U.S. Bureau of Labor Statistics, is a commonly used measure of the inflation rate.
Credit Suisse (CS) High Yield Index is designed to mirror the investable universe of the U.S. dollar-denominated high yield debt market.
Dow Jones Industrial Average is a price-weighted average of blue-chip stocks that are generally the leaders in their industry.
FTSE EPRA/NAREIT Developed Index is a free float-adjusted index designed to measure the performance of publicly traded real estate securities in the North American, European and Asian real estate markets. FTSE® is a trademark of London Stock Exchange Plc and The Financial Times Limited and is used by FTSE under license. All rights in and to the FTSE MPF Index series (including currency adjusted indices) are vested in FTSE. All information is provided for information purposes only. Every effort is made to ensure that all information given in this publication is accurate, but no responsibility or liability can be accepted by FTSE for any errors or for any loss arising from use of this publication.
J.P. Morgan Emerging Markets Bond Index (EMBI) Global tracks total returns for U.S. dollar denominated debt instruments issued by emerging market sovereign and quasi-sovereign entities: Brady bonds, loans and Eurobonds.
J.P. Morgan (JPM) Global Government Bond Index (GGBI) tracks total returns for liquid, fixed-rate, domestic government bonds with maturities greater than one year issued by developed countries globally.
Lipper Multi-Sector Income Funds Classification Average is calculated by averaging the total returns of all funds within the Lipper Multi-Sector Income Funds classification in the Lipper Open-End underlying funds universe. Lipper Multi-Sector Income Funds are defined as funds that seek current income by allocating assets among different fixed income securities sectors (not primarily in one sector except for defensive purposes), including U.S. and foreign governments, with a significant portion rated below investment grade. For the 12-month period ended 12/31/11, there were 192 funds in this category. Lipper calculations do not include contract fees, expenses or sales charges, and may have been different if such charges had been considered.
Lipper VIP Equity Income Funds Classification Average is an equally weighted average calculation of performance figures for all funds within the Lipper Equity Income Funds classification in the Lipper VIP underlying funds universe. Lipper Equity Income Funds seek relatively high current income and growth of income through investing 60% or more of their portfolios in equities. For the 12-month period ended 12/31/11, there were 61 funds in this category. Lipper calculations do not include contract fees, expenses or sales charges, and may have been different if such charges had been considered.
Lipper VIP General U.S. Government Funds Classification Average is an equally weighted average calculation of performance figures for all funds within the Lipper General U.S. Government Funds classification in the Lipper VIP underlying funds universe. Lipper General U.S. Government Funds invest primarily in U.S. government and agency issues. For the 12-month period ended 12/31/11, there were 78 funds in this category. Lipper calculations do not include contract fees, expenses or sales charges, and may have been different if such charges had been considered.
I-1
Lipper VIP High Current Yield Funds Classification Average is an equally weighted average calculation of performance figures for all funds within the Lipper High Current Yield Funds Classification in the Lipper VIP underlying funds universe. Lipper High Current Yield Funds aim at high (relative) current yield from fixed income securities, have no quality or maturity restrictions, and tend to invest in lower grade debt issues. For the 12-month period ended 12/31/11, there were 123 funds in this category. Lipper calculations do not include contract fees, expenses or sales charges, and may have been different if such charges had been considered.
MSCI All Country (AC) World Index is a free float-adjusted, market capitalization-weighted index designed to measure equity market performance in global developed and emerging markets.
MSCI Emerging Markets (EM) Index is a free float-adjusted, market capitalization-weighted index designed to measure equity market performance in global emerging markets.
MSCI Europe, Australasia, Far East (EAFE) Index is a free float-adjusted, market capitalization-weighted index designed to measure equity market performance in global developed markets excluding the U.S. and Canada.
MSCI Europe, Australasia, Far East (EAFE) Index Net Return (Local Currency) is a free float-adjusted, market capitalization-weighted index designed to measure equity market performance of global developed markets excluding the U.S. and Canada. The index is calculated in local currency and includes reinvested daily net dividends.
MSCI World Index is a free float-adjusted, market capitalization-weighted index designed to measure equity market performance in global developed markets.
Russell 1000® Growth Index is market capitalization weighted and measures performance of those Russell 1000 Index companies with higher price-to-book ratios and higher forecasted growth values.
Russell 1000® Index is market capitalization weighted and measures performance of the largest companies in the Russell 3000® Index, which represents the majority of the U.S. market’s total capitalization.
Russell 1000® Value Index is market capitalization weighted and measures performance of those Russell 1000® Index companies with lower price-to-book ratios and lower forecasted growth values.
Russell 2500™ Index is market capitalization weighted and measures performance of the smallest companies in the Russell 3000® Index, which represent a modest amount of the Russell 3000® Index’s total market capitalization.
Russell 2500™ Value Index is market capitalization weighted and measures performance of those Russell 2500™ Index companies with lower price-to-book ratios and lower forecasted growth values.
Russell 3000® Growth Index is market capitalization weighted and measures performance of those Russell 3000® Index companies with higher price-to-book ratios and higher forecasted growth values.
Russell 3000® Index is market capitalization weighted and measures performance of the largest U.S. companies based on total market capitalization and represents the majority of the investable U.S. equity market.
Russell Midcap® Growth Index is market capitalization weighted and measures performance of those Russell Midcap® Index companies with higher price-to-book ratios and higher forecasted growth values.
Russell Midcap® Index is market capitalization weighted and measures performance of the smallest companies in the Russell 1000® Index, which represent a modest amount of the Russell 1000® Index’s total market capitalization.
Standard & Poor’s 500 Index (S&P 500) is a market capitalization-weighted index of 500 stocks designed to measure total U.S. equity market performance. STANDARD & POOR’S®, S&P® and S&P 500® are registered trademarks of Standard & Poor’s Financial Services LLC. Standard & Poor’s does not sponsor, endorse, sell or promote any S&P index-based product.
Standard & Poor’s Global REIT Index is designed to measure performance of the investable universe of publicly traded real estate investment trusts. Index constituents generally derive the majority of their revenue from real estate development, management, rental, and/or direct investment in physical property and with local REIT or property trust tax status.
Standard & Poor’s/International Finance Corporation Investable (S&P/IFCI) Composite Index is a free float-adjusted, market capitalization-weighted index designed to measure equity performance in global emerging markets.
I-2
Board Members and Officers
The name, year of birth and address of the officers and board members, as well as their affiliations, positions held with the Trust, principal occupation during at least the past five years and number of portfolios overseen in the Franklin Templeton Investments fund complex are shown below. Generally, each board member serves until that person’s successor is elected and qualified.
Independent Board Members
| | | | | | | | |
| Name, Year of Birth and Address | | Position | | Length of
Time Served | | Number of
Portfolios in Fund
Complex Overseen
by Board Member* | | Other Directorships Held
During at Least the Past 5 Years |
Harris J. Ashton (1932) One Franklin Parkway San Mateo, CA 94403-1906 | | Trustee | | Since 1988 | | 132 | | Bar-S Foods (meat packing company) (1981-2010). |
|
Principal Occupation During at Least the Past 5 Years: Director of various companies; and formerly, Director, RBC Holdings, Inc. (bank holding company) (until 2002); and President, Chief Executive Officer and Chairman of the Board, General Host Corporation (nursery and craft centers) (until 1998). |
Sam Ginn (1937) One Franklin Parkway San Mateo, CA 94403-1906 | | Trustee | | Since 2007 | | 107 | | ICO Global Communications (Holdings) Limited (satellite company) (2006-2010), Chevron Corporation (global energy company) (1989-2009), Hewlett-Packard Company (technology company) (1996-2002), Safeway, Inc. (grocery retailer) (1991-1998) and TransAmerica Corporation (insurance company) (1989-1999). |
|
Principal Occupation During at Least the Past 5 Years: Private investor; and formerly, Chairman of the Board, Vodafone AirTouch, PLC (wireless company); Chairman of the Board and Chief Executive Officer, AirTouch Communications (cellular communications) (1993-1998) and Pacific Telesis Group (telephone holding company) (1988-1994). |
Edith E. Holiday (1952) One Franklin Parkway San Mateo, CA 94403-1906 | | Trustee | | Since 2005 | | 132 | | Hess Corporation (exploration and refining of oil and gas), H.J. Heinz Company (processed foods and allied products), RTI International Metals, Inc. (manufacture and distribution of titanium), Canadian National Railway (railroad) and White Mountains Insurance Group, Ltd. (holding company). |
|
Principal Occupation During at Least the Past 5 Years: Director or Trustee of various companies and trusts; and formerly, Assistant to the President of the United States and Secretary of the Cabinet (1990-1993); General Counsel to the United States Treasury Department (1989-1990); and Counselor to the Secretary and Assistant Secretary for Public Affairs and Public Liaison-United States Treasury Department (1988-1989). |
J. Michael Luttig (1954) One Franklin Parkway San Mateo, CA 94403-1906 | | Trustee | | Since 2009 | | 132 | | Boeing Capital Corporation (aircraft financing). |
|
Principal Occupation During at Least the Past 5 Years: Executive Vice President, General Counsel and member of Executive Council, The Boeing Company; and formerly, Federal Appeals Court Judge, U.S. Court of Appeals for the Fourth Circuit (1991-2006). |
Frank A. Olson (1932) One Franklin Parkway San Mateo, CA 94403-1906 | | Trustee | | Since 2005 | | 132 | | Hess Corporation (exploration and refining of oil and gas). |
|
Principal Occupation During at Least the Past 5 Years: Chairman Emeritus, The Hertz Corporation (car rental) (since 2000) (Chairman of the Board (1980-2000) and Chief Executive Officer (1977-1999)); and formerly, Chairman of the Board, President and Chief Executive Officer, UAL Corporation (airlines). |
BOD-1
| | | | | | | | |
| Name, Year of Birth and Address | | Position | | Length of
Time Served | | Number of
Portfolios in Fund
Complex Overseen
by Board Member* | | Other Directorships Held
During at Least the Past 5 Years |
Larry D. Thompson (1945) One Franklin Parkway San Mateo, CA 94403-1906 | | Trustee | | Since 2007 | | 142 | | Cbeyond, Inc. (business communications provider), The Southern Company (energy company) and The Washington Post Company (education and media organization). |
|
Principal Occupation During at Least the Past 5 Years: John A. Sibley Professor of Corporate and Business Law, University of Georgia School of Law (2011); and formerly, Senior Vice President—Government Affairs, General Counsel and Secretary, PepsiCo, Inc. (consumer products) (2004-May 2011); Senior Fellow of The Brookings Institution (2003-2004); Visiting Professor, University of Georgia School of Law (2004); and Deputy Attorney General, U.S. Department of Justice (2001-2003). |
John B. Wilson (1959) One Franklin Parkway San Mateo, CA 94403-1906 | | Lead Independent Trustee | | Trustee since 2007 and Lead Independent Trustee since 2008 | | 107 | | None |
|
Principal Occupation During at Least the Past 5 Years: President and Founder, Hyannis Port Capital, Inc. (real estate and private equity investing); serves on private and non-profit boards; and formerly, Chief Operating Officer and Executive Vice President, Gap, Inc. (retail) (1996-2000); Chief Financial Officer and Executive Vice President—Finance and Strategy, Staples, Inc. (office supplies) (1992-1996); Senior Vice President—Corporate Planning, Northwest Airlines, Inc. (airlines) (1990-1992); and Vice President and Partner, Bain & Company (consulting firm) (1986-1990). |
Interested Board Members and Officers
| | | | | | | | |
| Name, Year of Birth and Address | | Position | | Length of
Time Served | | Number of
Portfolios in Fund
Complex Overseen
by Board Member* | | Other Directorships Held
During at Least the Past 5 Years |
**Charles B. Johnson (1933) One Franklin Parkway San Mateo, CA 94403-1906 | | Trustee and Chairman of the Board | | Trustee since 1988 and Chairman of the Board since 1993 | | 132 | | None |
|
Principal Occupation During at Least the Past 5 Years: Chairman of the Board, Member—Office of the Chairman and Director, Franklin Resources, Inc.; and officer and/or director or trustee, as the case may be, of some of the other subsidiaries of Franklin Resources, Inc. and of 41 of the investment companies in Franklin Templeton Investments. |
**Rupert H. Johnson, Jr. (1940) One Franklin Parkway San Mateo, CA 94403-1906 | | Trustee | | Since 1988 | | 50 | | None |
|
Principal Occupation During at Least the Past 5 Years: Vice Chairman, Member—Office of the Chairman and Director, Franklin Resources, Inc.; Director, Franklin Advisers, Inc.; Senior Vice President, Franklin Advisory Services, LLC; and officer and/or director or trustee, as the case may be, of some of the other subsidiaries of Franklin Resources, Inc. and of 25 of the investment companies in Franklin Templeton Investments. |
James M. Davis (1952) One Franklin Parkway San Mateo, CA 94403-1906 | | Chief Compliance Officer and Vice President— AML Compliance | | Chief Compliance Officer since 2004 and Vice President— AML Compliance since 2006 | | Not
Applicable | | Not Applicable |
|
Principal Occupation During at Least the Past 5 Years: Director, Global Compliance, Franklin Resources, Inc.; and officer of 46 of the investment companies in Franklin Templeton Investments. |
BOD-2
| | | | | | | | |
| Name, Year of Birth and Address | | Position | | Length of
Time Served | | Number of
Portfolios in Fund
Complex Overseen
by Board Member* | | Other Directorships Held
During at Least the Past 5 Years |
Laura F. Fergerson (1962) One Franklin Parkway San Mateo, CA 94403-1906 | | Chief Executive Officer— Finance and Administration | | Since 2009 | | Not
Applicable | | Not Applicable |
|
Principal Occupation During at Least the Past 5 Years: Senior Vice President, Franklin Templeton Services, LLC; officer of 46 of the investment companies in Franklin Templeton Investments; and formerly, Director and member of Audit and Valuation Committees, Runkel Funds, Inc. (2003-2004); Assistant Treasurer of most of the investment companies in Franklin Templeton Investments (1997-2003); and Vice President, Franklin Templeton Services, LLC (1997-2003). |
Gaston Gardey (1967) One Franklin Parkway San Mateo, CA 94403-1906 | | Treasurer, Chief Financial Officer and Chief Accounting Officer | | Since 2009 | | Not
Applicable | | Not Applicable |
|
Principal Occupation During at Least the Past 5 Years: Director, Fund Accounting, Franklin Templeton Investments; and officer of 27 of the investment companies in Franklin Templeton Investments. |
Aliya S. Gordon (1973) One Franklin Parkway San Mateo, CA 94403-1906 | | Vice President | | Since 2009 | | Not
Applicable | | Not Applicable |
|
Principal Occupation During at Least the Past 5 Years: Senior Associate General Counsel, Franklin Templeton Investments; officer of 46 of the investment companies in Franklin Templeton Investments; and formerly, Litigation Associate, Steefel, Levitt & Weiss, LLP (2000-2004). |
David P. Goss (1947) One Franklin Parkway San Mateo, CA 94403-1906 | | Vice President | | Since 2000 | | Not
Applicable | | Not Applicable |
|
Principal Occupation During at Least the Past 5 Years: Senior Associate General Counsel, Franklin Templeton Investments; and officer and/or director, as the case may be, of some of the other subsidiaries of Franklin Resources, Inc. and of 46 of the investment companies in Franklin Templeton Investments. |
Steven J. Gray (1955) One Franklin Parkway San Mateo, CA 94403-1906 | | Vice President | | Since 2009 | | Not
Applicable | | Not Applicable |
|
Principal Occupation During at Least the Past 5 Years: Senior Associate General Counsel, Franklin Templeton Investments; Vice President, Franklin Templeton Distributors, Inc.; and officer of 46 of the investment companies in Franklin Templeton Investments. |
Edward B. Jamieson (1948) One Franklin Parkway San Mateo, CA 94403-1906 | | President and Chief Executive Officer—Investment Management | | Since 2010 | | Not
Applicable | | Not Applicable |
|
Principal Occupation During at Least the Past 5 Years: President, Chief Investment Officer and Director, Franklin Advisers, Inc.; Executive Vice President, Franklin Templeton Institutional, LLC; and officer and/or trustee, as the case may be, of some of the other subsidiaries of Franklin Resources, Inc. and of 10 of the investment companies in Franklin Templeton Investments. |
BOD-3
| | | | | | | | |
| Name, Year of Birth and Address | | Position | | Length of
Time Served | | Number of
Portfolios in Fund
Complex Overseen
by Board Member* | | Other Directorships Held
During at Least the Past 5 Years |
Robert C. Rosselot (1960) 300 S.E. 2nd Street Fort Lauderdale, FL 33301-1923 | | Vice President | | Since 2009 | | Not
Applicable | | Not Applicable |
|
Principal Occupation During at Least the Past 5 Years: Senior Associate General Counsel, Franklin Templeton Investments; Assistant Secretary, Franklin Resources, Inc.; Vice President and Secretary, Templeton Investment Counsel, LLC; Vice President, Secretary and Trust Officer, Fiduciary Trust International of the South; and officer of 46 of the investment companies in Franklin Templeton Investments. |
Karen L. Skidmore (1952) One Franklin Parkway San Mateo, CA 94403-1906 | | Vice President and Secretary | | Since 2006 | | Not
Applicable | | Not Applicable |
|
Principal Occupation During at Least the Past 5 Years: Senior Associate General Counsel, Franklin Templeton Investments; and officer of 46 of the investment companies in Franklin Templeton Investments. |
Craig S. Tyle (1960) One Franklin Parkway San Mateo, CA 94403-1906 | | Vice President | | Since 2005 | | Not
Applicable | | Not Applicable |
|
Principal Occupation During at Least the Past 5 Years: General Counsel and Executive Vice President, Franklin Resources, Inc.; officer of some of the other subsidiaries of Franklin Resources, Inc. and of 46 of the investment companies in Franklin Templeton Investments; and formerly, Partner, Shearman & Sterling, LLP (2004-2005); and General Counsel, Investment Company Institute (ICI) (1997-2004). |
Lori A. Weber (1964) 300 S.E. 2nd Street Fort Lauderdale, FL 33301-1923 | | Vice President | | Since May 2011 | | Not
Applicable | | Not Applicable |
|
Principal Occupation During at Least the Past 5 Years: Associate General Counsel, Franklin Templeton Investments; Assistant Secretary, Franklin Resources, Inc.; Vice President and Assistant Secretary, Templeton Investment Counsel, LLC; and officer of 45 of the investment companies in Franklin Templeton Investments. |
| * | We base the number of portfolios on each separate series of the U.S. registered investment companies within the Franklin Templeton Investments fund complex. These portfolios have a common investment manager or affiliated investment managers. |
| ** | Charles B. Johnson and Rupert H. Johnson, Jr. are considered to be interested persons of the Trust under the federal securities laws due to their positions as officers and directors and major shareholders of Franklin Resources, Inc., which is the parent company of the Trust’s investment manager and distributor. |
Note 1: Charles B. Johnson and Rupert H. Johnson, Jr. are brothers.
Note 2: Officer information is current as of the date of this report. It is possible that after this date, information about officers may change.
The Sarbanes-Oxley Act of 2002 and Rules adopted by the Securities and Exchange Commission require the Fund to disclose whether the Fund’s Audit Committee includes at least one member who is an audit committee financial expert within the meaning of such Act and Rules. The Fund’s Board has determined that there is at least one such financial expert on the Audit Committee and has designated John B. Wilson as its audit committee financial expert. The Board believes that Mr. Wilson qualifies as such an expert in view of his extensive business background and experience, including service as chief financial officer of Staples, Inc. from 1992 to 1996. Mr. Wilson has been a Member and Chairman of the Fund’s Audit Committee since 2007. As a result of such background and experience, the Board believes that Mr. Wilson has acquired an understanding of generally accepted accounting principles and financial statements, the general application of such principles in connection with the accounting estimates, accruals and reserves, and analyzing and evaluating financial statements that present a breadth and level of complexity of accounting issues generally comparable to those of the Fund, as well as an understanding of internal controls and procedures for financial reporting and an understanding of audit committee functions. Mr. Wilson is an independent Board member as that term is defined under the relevant Securities and Exchange Commission Rules and Releases.
The Statement of Additional Information (SAI) includes additional information about the board members and is available, without charge, upon request. Shareholders may call (800) 321-8563 or their insurance companies to request the SAI.
BOD-4
Franklin Templeton Variable Insurance Products Trust
Shareholder Information
Proxy Voting Policies and Procedures
The Trust’s investment manager has established Proxy Voting Policies and Procedures (Policies) that the Trust uses to determine how to vote proxies relating to portfolio securities. Shareholders may view the Trust’s complete Policies online at franklintempleton.com. Alternatively, shareholders may request copies of the Policies free of charge by calling the Proxy Group collect at (954) 527-7678 or by sending a written request to: Franklin Templeton Companies, LLC, 300 S.E. 2nd Street, Fort Lauderdale, FL 33301, Attention: Proxy Group. Copies of the Trust’s proxy voting records are also made available online at franklintempleton.com and posted on the U.S. Securities and Exchange Commission’s website at sec.gov and reflect the most recent 12-month period ended June 30.
Quarterly Statement of Investments
The Trust files a complete statement of investments with the U.S. Securities and Exchange Commission for the first and third quarters for each fiscal year on Form N-Q. Shareholders may view the filed Form N-Q by visiting the Commission’s website at sec.gov. The filed form may also be viewed and copied at the Commission’s Public Reference Room in Washington, DC. Information regarding the operations of the Public Reference Room may be obtained by calling (800) SEC-0330.
SI-1
| | | | | | | | | | | | | | | | |
| VALUE | | BLEND | | GROWTH | | SECTOR | | GLOBAL | | INTERNATIONAL | | HYBRID | | ASSET ALLOCATION | | FIXED INCOME |
| | |
 | | < GAIN FROM OUR PERSPECTIVE® > |
Annual Report
FRANKLIN TEMPLETON
VARIABLE INSURANCE PRODUCTS TRUST
Investment Managers
Franklin Advisers, Inc.
Franklin Advisory Services, LLC
Franklin Mutual Advisers, LLC
Franklin Templeton Institutional, LLC
Templeton Asset Management, Ltd.
Templeton Global Advisors Limited
Templeton Investment Counsel, LLC
Fund Administrator
Franklin Templeton Services, LLC
Distributor
Franklin Templeton Distributors, Inc.
Franklin Templeton Variable Insurance Products Trust (FTVIP) shares are not offered to the public; they are offered and sold only to: (1) insurance company separate accounts (Separate Account) to serve as the underlying investment vehicle for variable contracts; (2) certain qualified plans; and (3) other mutual funds (funds of funds).
Authorized for distribution to investors in Separate Accounts only when accompanied or preceded by the current prospectus for the applicable contract, which includes the Separate Account and the FTVIP prospectuses. Investors should carefully consider a fund’s investment goals, risks, charges and expenses before investing. The prospectus contains this and other information; please read it carefully before investing.
To ensure the highest quality of service, telephone calls to or from our service departments may be monitored, recorded and accessed. These calls can be identified by the presence of a regular beeping tone.
| | |
| © 2012 Franklin Templeton Investments. All rights reserved. | | FTVIP A 02/12 |
| (a) | The Registrant has adopted a code of ethics that applies to its principal executive officers and principal financial and accounting officer. |
| (f) | Pursuant to Item 12(a)(1), the Registrant is attaching as an exhibit a copy of its code of ethics that applies to its principal executive officers and principal financial and accounting officer. |
| Item 3. | Audit Committee Financial Expert. |
| (a)(1) | The Registrant has an audit committee financial expert serving on its audit committee. |
| (2) | The audit committee financial expert is John B. Wilson and he is “independent” as defined under the relevant Securities and Exchange Commission Rules and Releases. |
| Item 4. | Principal Accountant Fees and Services. |
The aggregate fees paid to the principal accountant for professional services rendered by the principal accountant for the audit of the registrant’s annual financial statements or for services that are normally provided by the principal accountant in connection with statutory and regulatory filings or engagements were $912,438 for the fiscal year ended December 31, 2011 and $849,457 for the fiscal year ended December 31, 2010.
The aggregate fees paid to the principal accountant for assurance and related services rendered by the principal accountant to the registrant that are reasonably related to the performance of the audit of the registrant’s financial statements and are not reported under paragraph (a) of Item 4 were $10,000 for the fiscal year ended December 31, 2011 and $0 for the fiscal year ended December 31, 2010. The services for which these fees were paid included attestation services.
There were no fees paid to the principal accountant for assurance and related services rendered by the principal accountant to the registrant’s investment adviser and any entity controlling, controlled by or under common control with the investment adviser that provides ongoing services to the registrant that are reasonably related to the performance of the audit of their financial statements.
The aggregate fees paid to the principal accountant for professional services rendered by the principal accountant to the registrant for tax compliance, tax advice and tax planning were $1,295 for the fiscal year ended December 31, 2011 and $1,290 for the fiscal year ended December 31, 2010. The services for which these fees were paid included preparation of tax returns for foreign governments.
The aggregate fees paid to the principal accountant for professional services rendered by the principal accountant to the registrant’s investment adviser and any entity controlling, controlled by or under common control with the investment adviser that provides ongoing services to the registrant for tax compliance, tax advice and tax planning were $100,000 for the fiscal year ended December 31, 2011 and $35,000 for the fiscal year ended December 31, 2010. The services for which these fees were paid included technical tax consultation for capital gain tax reporting to foreign governments and derivative instruments.
The aggregate fees paid to the principal accountant for products and services rendered by the principal accountant to the registrant not reported in paragraphs (a)-(c) of Item 4 were $0 for the fiscal year ended December 31, 2011 and $12,501 for the fiscal year ended December 31, 2010. The services for which these fees were paid include review of materials provided to the fund Board in connection with the investment management contract renewal process.
The aggregate fees paid to the principal accountant for products and services rendered by the principal accountant to the registrant’s investment adviser and any entity controlling, controlled by or under common control with the investment adviser that provides ongoing services to the registrant other than services reported in paragraphs (a)-(c) of Item 4 were $0 for the fiscal year ended December 31, 2011 and $132,299 for the fiscal year ended December 31, 2010. The services for which these fees were paid include review of materials provided to the fund Board in connection with the investment management contract renewal process.
(e) (1) The registrant’s audit committee is directly responsible for approving the services to be provided by the auditors, including:
(i) pre-approval of all audit and audit related services;
(ii) pre-approval of all non-audit related services to be provided to the Fund by the auditors;
(iii) pre-approval of all non-audit related services to be provided to the registrant by the auditors to the registrant’s investment adviser or to any entity that controls, is controlled by or is under common control with the registrant’s investment adviser and that provides ongoing services to the registrant where the non-audit services relate directly to the operations or financial reporting of the registrant; and
(iv) establishment by the audit committee, if deemed necessary or appropriate, as an alternative to committee pre-approval of services to be provided by the auditors, as required by paragraphs (ii) and (iii) above, of policies and procedures to permit such services to be pre-approved by other means, such as through establishment of guidelines or by action of a designated member or members of the committee; provided the policies and procedures are detailed as to the particular service and the committee is informed of each service and such policies and procedures do not include delegation of audit committee responsibilities, as contemplated under the Securities Exchange Act of 1934, to management; subject, in the case of (ii) through (iv), to any waivers, exceptions or exemptions that may be available under applicable law or rules.
(e) (2) None of the services provided to the registrant described in paragraphs (b)-(d) of Item 4 were approved by the audit committee pursuant to paragraph (c)(7)(i)(C) of Rule 2-01 of regulation S-X.
(f) No disclosures are required by this Item 4(f).
(g) The aggregate non-audit fees paid to the principal accountant for services rendered by the principal accountant to the registrant and the registrant’s investment adviser and any entity controlling, controlled by or under common control with the investment adviser that provides ongoing services to the registrant were $111,295 for the fiscal year ended December 31, 2011 and $181,090 for the fiscal year ended December 31, 2010.
(h) The registrant’s audit committee of the board has considered whether the provision of non-audit services that were rendered to the registrant’s investment adviser (not including any sub-adviser whose role is primarily portfolio management and is subcontracted with or overseen by another investment adviser), and any entity controlling, controlled by, or under common control with the investment adviser that provides ongoing services to the registrant that were not pre-approved pursuant to paragraph (c)(7)(ii) of Rule 2-01 of Regulation S-X is compatible with maintaining the principal accountant’s independence.
| Item 5. | Audit Committee of Listed Registrants. N/A |
| Item 6. | Schedule of Investments. N/A |
| Item 7. | Disclosure of Proxy Voting Policies and Procedures for Closed-End Management Investment Companies. N/A |
| Item 8. | Portfolio Managers of Closed-End Management Investment Companies. N/A |
| Item 9. | Purchases of Equity Securities by Closed-End Management Investment Companies and Affiliated Purchasers. N/A |
| Item 10. | Submission of Matters to a vote of Security Holders. |
There have been no changes to the procedures by which shareholders may recommend nominees to the Registrant’s Board of Trustees that would require disclosure herein.
| Item 11. | Controls and Procedures. |
(a) Evaluation of Disclosure Controls and Procedures. The Registrant maintains disclosure controls and procedures that are designed to ensure that information required to be disclosed in the Registrant’s filings under the Securities Exchange Act of 1934 and the Investment Company Act of 1940 is recorded, processed, summarized and reported within the periods specified in the rules and forms of the Securities and Exchange Commission. Such information is accumulated and communicated to the Registrant’s management, including its principal executive officer and principal financial officer, as appropriate, to allow timely decisions regarding required disclosure. The Registrant’s management, including the principal executive officer and the principal financial officer, recognizes that any set of controls and procedures, no matter how well designed and operated, can provide only reasonable assurance of achieving the desired control objectives.
Within 90 days prior to the filing date of this Shareholder Report on Form N-CSR, the Registrant had carried out an evaluation, under the supervision and with the participation of the Registrant’s management, including the Registrant’s principal executive officer and the Registrant’s principal financial officer, of the effectiveness of the design and operation of the Registrant’s disclosure controls and procedures. Based on such evaluation, the Registrant’s principal executive officer and principal financial officer concluded that the Registrant’s disclosure controls and procedures are effective.
(b) Changes in Internal Controls. There have been no significant changes in the Registrant’s internal controls or in other factors that could significantly affect the internal controls subsequent to the date of their evaluation in connection with the preparation of this Shareholder Report on Form N-CSR.
(a)(1) Code of Ethics
(a) (2) Certifications pursuant to Section 302 of the Sarbanes-Oxley Act of 2002 of Laura F. Fergerson, Chief Executive Officer—Finance and Administration, and Gaston Gardey, Chief Financial Officer and Chief Accounting Officer
(b) Certifications pursuant to Section 906 of the Sarbanes-Oxley Act of 2002 of Laura F. Fergerson, Chief Executive Officer—Finance and Administration, and Gaston Gardey, Chief Financial Officer and Chief Accounting Officer
SIGNATURES
Pursuant to the requirements of the Securities Exchange Act of 1934 and the Investment Company Act of 1940, the registrant has duly caused this report to be signed on its behalf by the undersigned, thereunto duly authorized.
FRANKLIN TEMPLETON VARIABLE INSURANCE PRODUCTS TRUST
| | |
| |
| By: | | /S/ LAURA F. FERGERSON |
| | Laura F. Fergerson Chief Executive Officer – Finance and Administration |
Date February 24, 2012
Pursuant to the requirements of the Securities Exchange Act of 1934 and the Investment Company Act of 1940, this report has been signed below by the following persons on behalf of the registrant and in the capacities and on the dates indicated.
| | |
| By: | | /S/ LAURA F. FERGERSON |
| | Laura F. Fergerson Chief Executive Officer – Finance and Administration |
Date February 24, 2012
| | |
| |
| By: | | /S/ GASTON GARDEY |
| | Gaston Gardey Chief Financial Officer and Chief Accounting Officer |
Date February 24, 2012